Hemap User Guide
User Manual:
Open the PDF directly: View PDF ![]() .
.
Page Count: 36

!
!
HEMAP: Online resource for interactive exploration and e-staining of
hematopoietic cancer data
Table of Contents
HEMAP Overview!..........................................................................................................!1!
Home page!...............................................................................................................................!2!
Explore:!............................................................................................................................!3!
e-staining the gene expression state with FLT3!.........................................................!4!
e-staining Pathway ROSS_AML_WITH_PML_RARA_FUSION!...............................!5!
e-staining acute precursor B cell vs. chronic lymphocytic leukemia clusters!7!
Accessing pairwise analysis results!..............................................................................!8!
Search: cancermap cluster CLL and GEXP type......................................................................!9!
Search: cancermap cluster aml and DrugSigDB type with GSK subfiltering!........!10!
Gene sets of pathway and drug signatures!...............................................................................!11!
TCGA AML Map!...........................................................................................................!13!
Additional data types for TCGA AML map: GNAB, CNVR, METH, MIRN and
CLIN categories!...................................................................................................................!14!
e-staining mir-125 across METH and MIRNA!............................................................!14!
Lookup of copy number aberrations by gene name, vice versa!...................................!15!
Annotation Search, e-staining, and box plotting!.............................................!16!
Main Category: Leukemia AND Cytogenetics: crlf2 analysis to IRX3!..............!16!
Sample groups from map cluster selection (mouse) and plotting combined
with annotation search!.....................................................................................................!18!
Annotation categories to gene expression e-staining...........................................!19!
Use case examples!....................................................................................................!24!
Exploring surface protein expression in lymphomas!............................................!24!
Finding!Myeloma!cluster!specific!genes/pathways!...................................................!25!
Finding subtype specific druggable genes!...............................................................!28!
In silico drug repurposing analysis using Hemap and DSigDB!.........................!29!
In silico drug screening using Hemap!........................................................................!30!
Settings!..........................................................................................................................!36!
Info!...................................................................................................................................!36!
HEMAP Overview
Hemap (http://ruoho.uta.fi/hemap) is the interactive online resource component
of the project Hemap: An interactive online resource for characterizing
molecular phenotypes across cancers of hematopoietic origin. Please contact
Merja Heinaniemi (merja.heinaniemi@uef.fi) and Matti Nykter
(matti.nykter@uta.fi) for credentials. The HTML5 application is designed for
interactive exploration of ~10,000 samples across cell types and hematological
malignancies. For AML, additional ~100 samples of the TCGA dataset are
included. The samples are curated with detailed annotations, including clinical
and cytogenetic info. E-staining, dynamic coloring for interactive examination
!
!
of sample clustering, is supported across annotation term searches,
Pathway/Drug gene set scores and omics profiles. Alternatively, gene
expression profiles can be visualized with boxplots of custom sample groups
and cluster selections. The main analysis feature of Hemap is the pairwise
exploration of cancer cluster, drug, and genomic pathway associations with
various feature types to characterize the sample groups. Hemap is optimized
for HTML5 compatible browsers and has been extensively tested on recent
versions of Chrome, Firefox and IE 11+.
Home page
The resource is organized into visualization, exploration (e-staining and
analysis) and annotation tabs, followed by additional tools (boxplots), settings
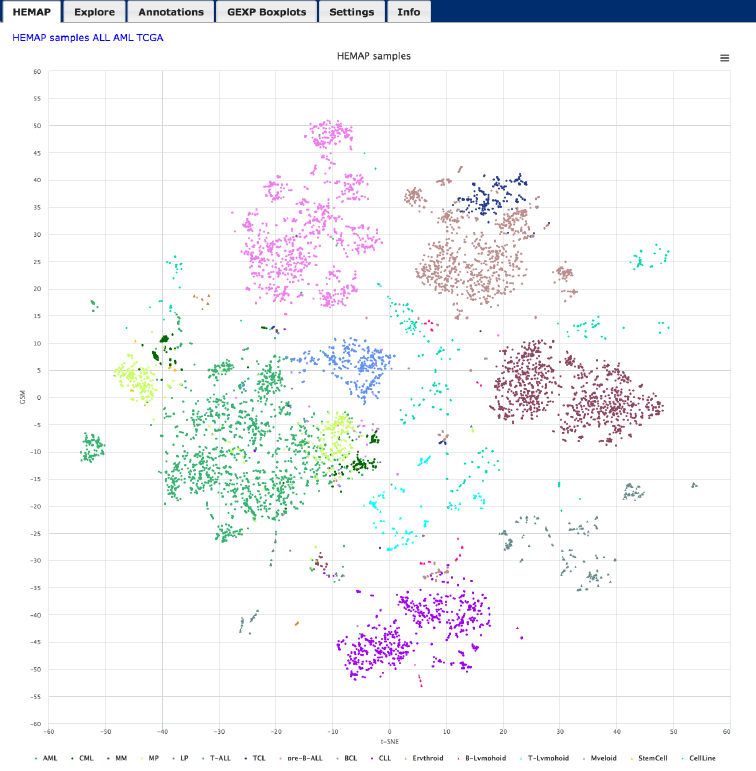
and information tabs. The home page shows the main maps (HEMAP samples,
ALL, AML Lymphoma and TCGA). The can be selected and toggle by clicking
on the provided links on the upper left corner. Map session element sizes can
be changed on the Settings pane. Every map supports zooming and direct
viewing of annotations, custom group box plots are enabled using mouse
drags. Details are provided below, including e-staining in the Explore panel.
!
!
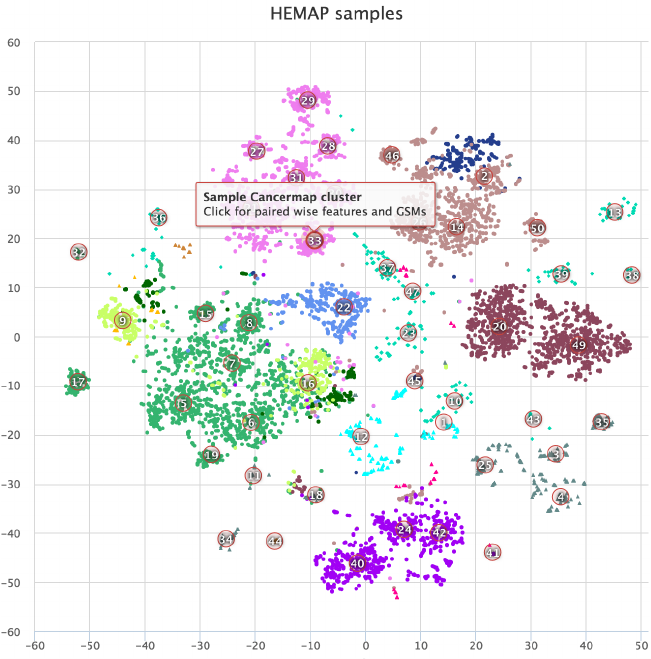
Figure 1. HEMAP home page shows samples (colored data points) on the 2D map obtained by t-
SNE. The sample colors are from cell type annotations and disease classifications. The map
supports zooming and accessing annotation views from selected samples.
Explore:
The Explore interface supports e-staining by gene, and pathway and drug
marker signatures on maps [HEMAP samples, ALL, AML Lymphoma, and
TCGA]. TCGA map allows staining on copy number, methylation and other
omic types. In addition, samples annotated by class/clusters can also be
selected. Different analysis results for clusters and cluster comparisons can be
accessed using inputs provided for searching pairwise/pairwise results. These
sortable records can be selected for e-stain for visual inspection directly from
the result table. The Settings tab allows customizing map and pairwise search
parameters, such as order by, legend placement and visibility, max records and
staining category colors. Example usages are listed below.
Interface Overview
The Gene and Pathway/DrugSig form allows users to enter gene/gene set (for
pathways and drugs) and cluster/class values for e-staining of selected maps.
The Gene/Pathway/Drug Signature input field is implemented with type ahead
(auto complete) where the possible choices are determined by Type selection.
For example, if GEXP is selected, then only Gene names are suggested.
Selecting TCGA map with GEXP also dictates the program to have the source
type ahead of TCGA genes.
Pairwise results associated with cluster/class values can be explored and
downloaded upon searching. The pairwise results are associated with specific
Types (DrugSigDB, CLIN, GEXP, GSVA for Leukemia and AML; TCGA those
four as well as GNAB, CNVR, METH and MIRN designations). P-Value,
Correlation and Hypergeometric Test measures are provided for pairwise
filtering, other resultant columns are listed in the pairwise search section below.
!
!
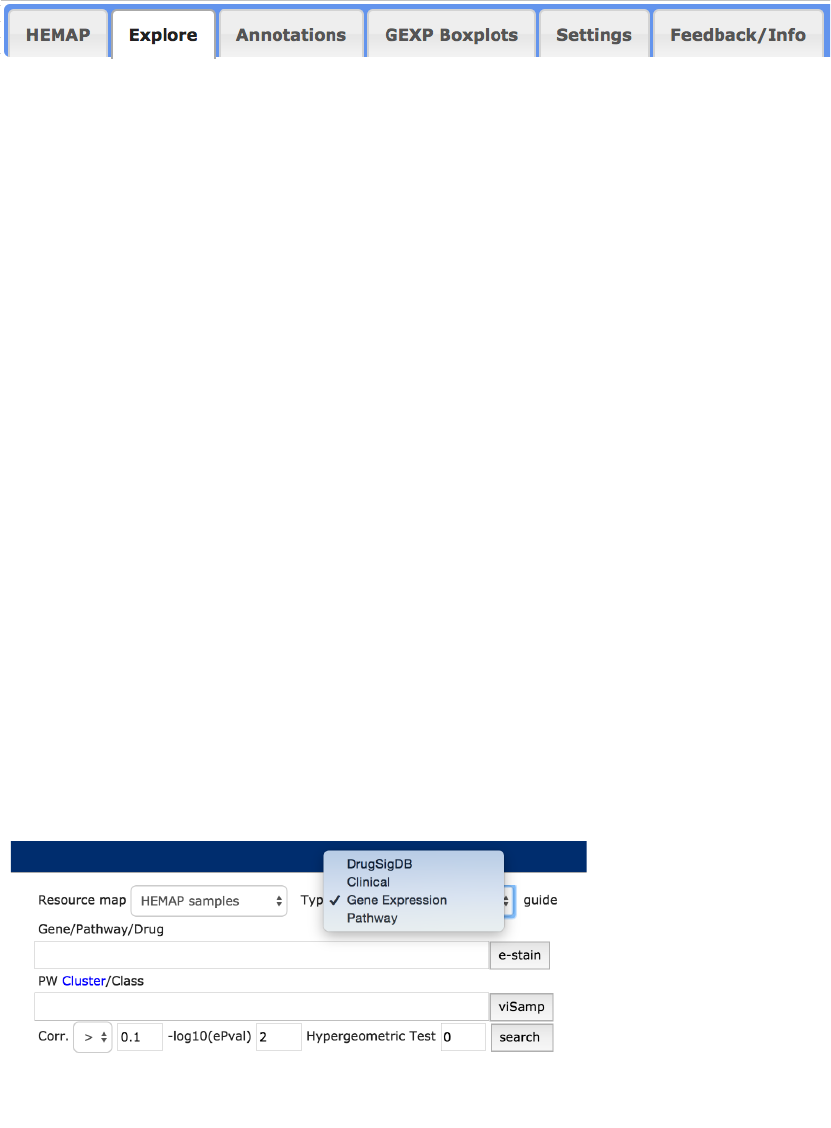
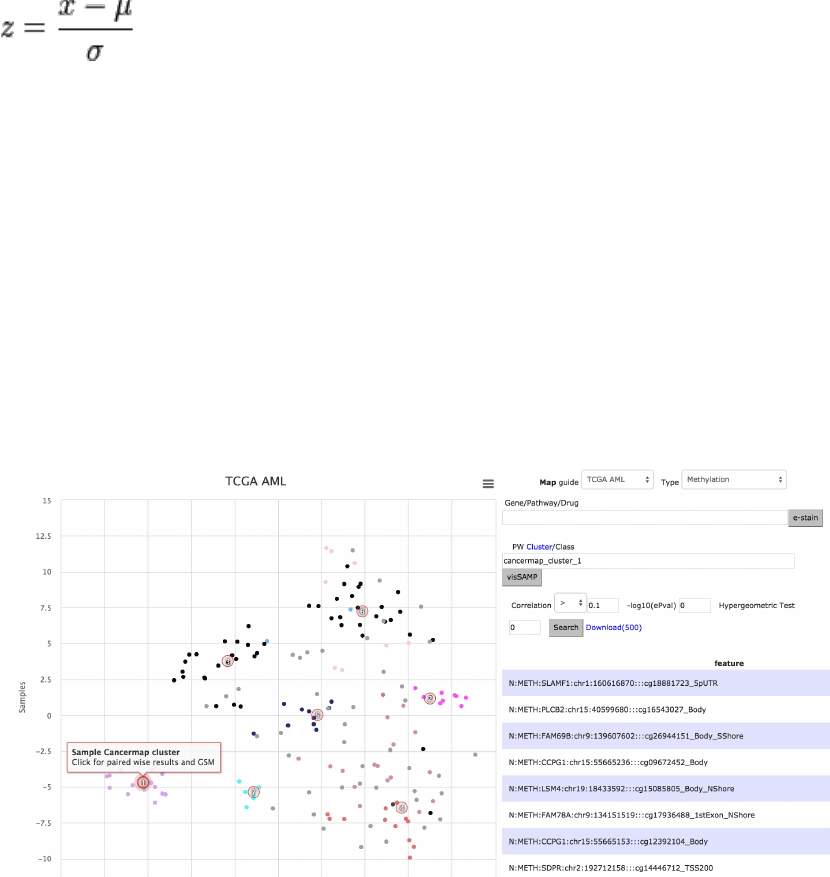
Figure 2. The explore interface provides intuitive search of pairwise cluster to feature
associations and then e-staining. The omic types are DrugSigDB, Clinical, GEXP and GSVA. The
bottom figure shows additional TCGA cluster/class types, including copy number and
methylation.
e-staining the gene expression state with FLT3
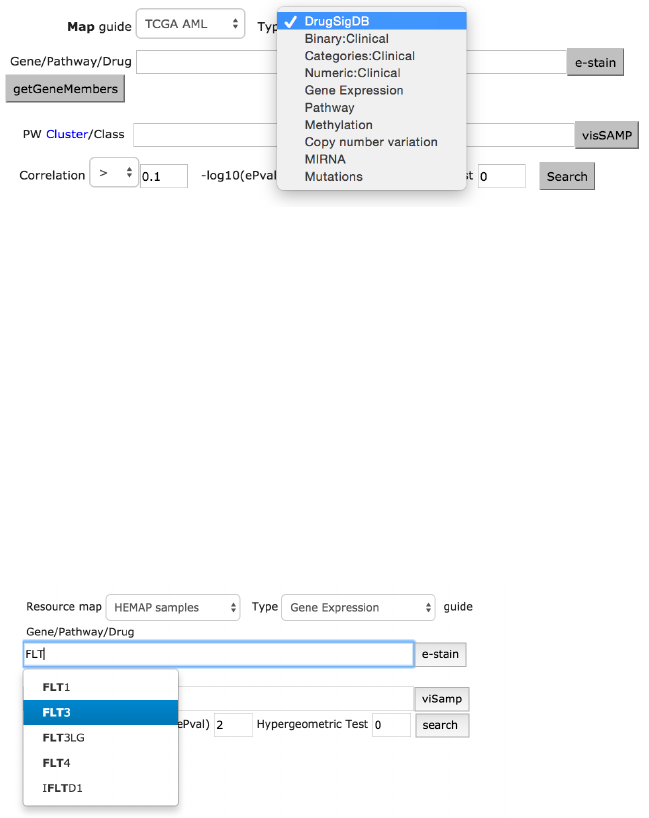
Auto-suggestions (type aheads) are built into Gene, pathways, and
cluster/class fields to ensure valid selections. The example here shows how to
visualize FLT3 e-staining and as well as image export functionality.
!
!
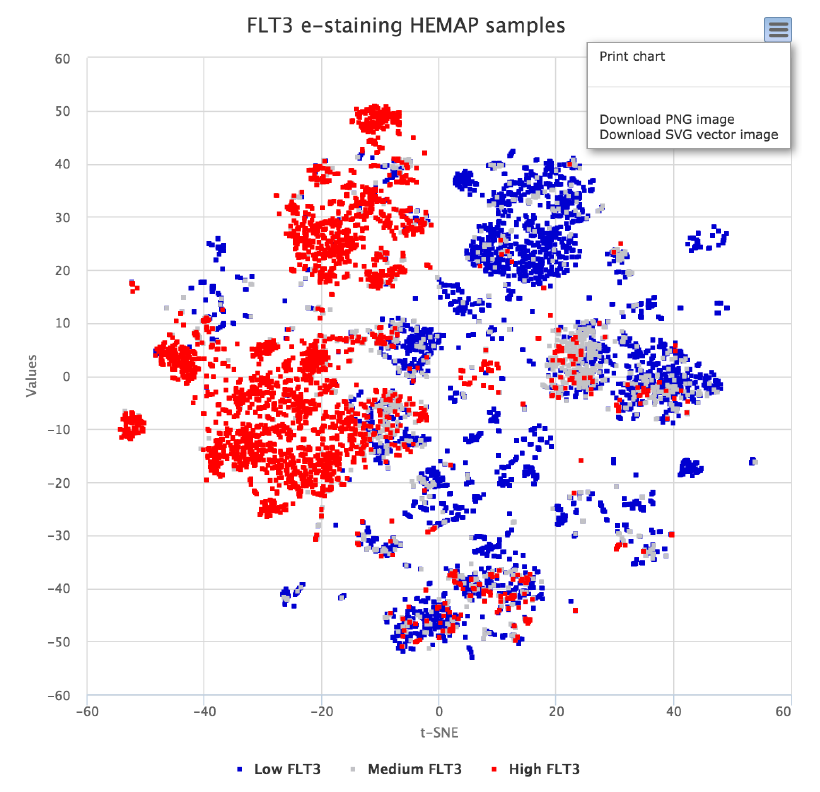
Figure 3. e-staining is performed using FLT3, where low expressing samples are blue, medium
grey and high red. Samples in the map are selectable and advanced functions include mouse
dragging for summary plotting. Details are provided in the use case section.
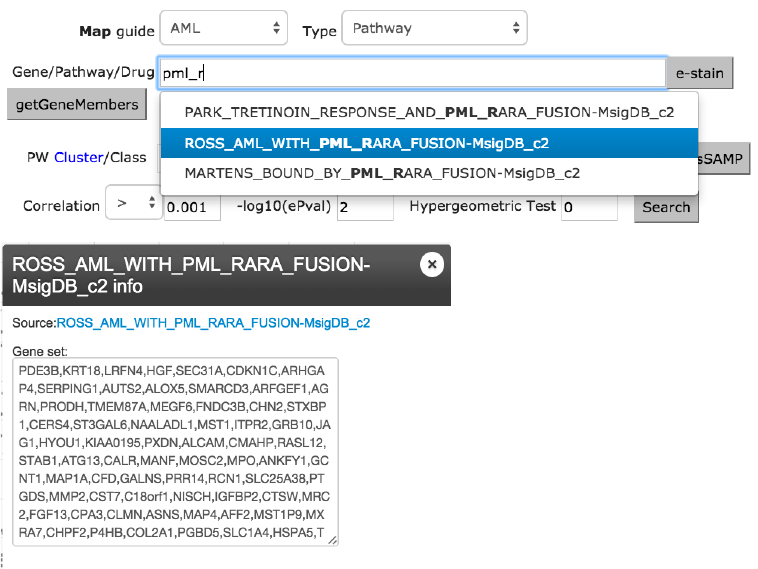
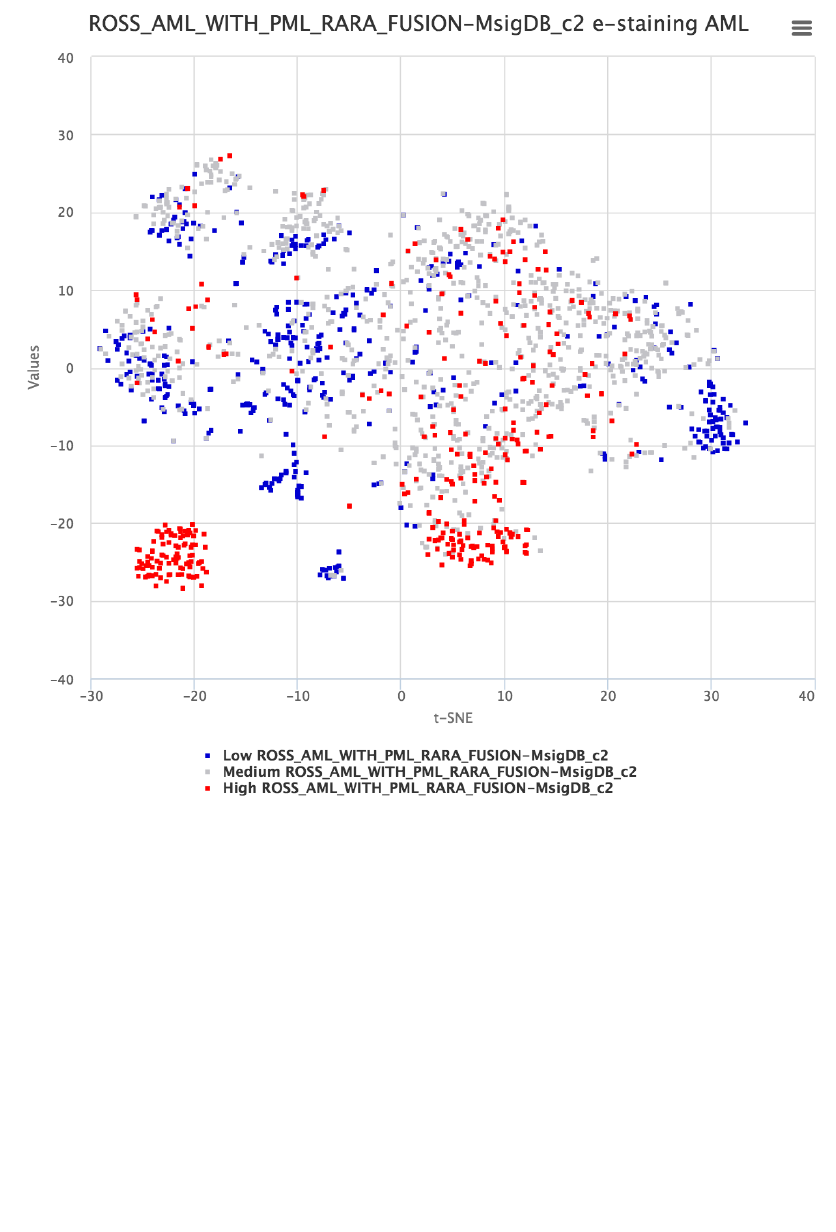
e-staining Pathway ROSS_AML_WITH_PML_RARA_FUSION
The example here uses the AML map to locate samples with the PML-RARA
fusion gene based on a previously published gene set for this subtype. Shown
in figure 4, entry of “PML_RAR” automatically brings up suitable matches and
the ROSS_AML_WITH_PML_RARA_FUSION from MsigDB is selected and
then e-stained. The graph in the middle lists the gene members of this pathway.
To reproduce the result shown below, the FDR cut-off should be set to 0.001
from the Settings tab.
!
!
!
!
Figure 4. AML map e-stained with ROSS_AML_WITH_PML_RARA fusion event reported in
MsigDB. The resource contains type specific autosuggestions and gene membership retrieval
functions. The middle figures list gene members of the selected pathway.
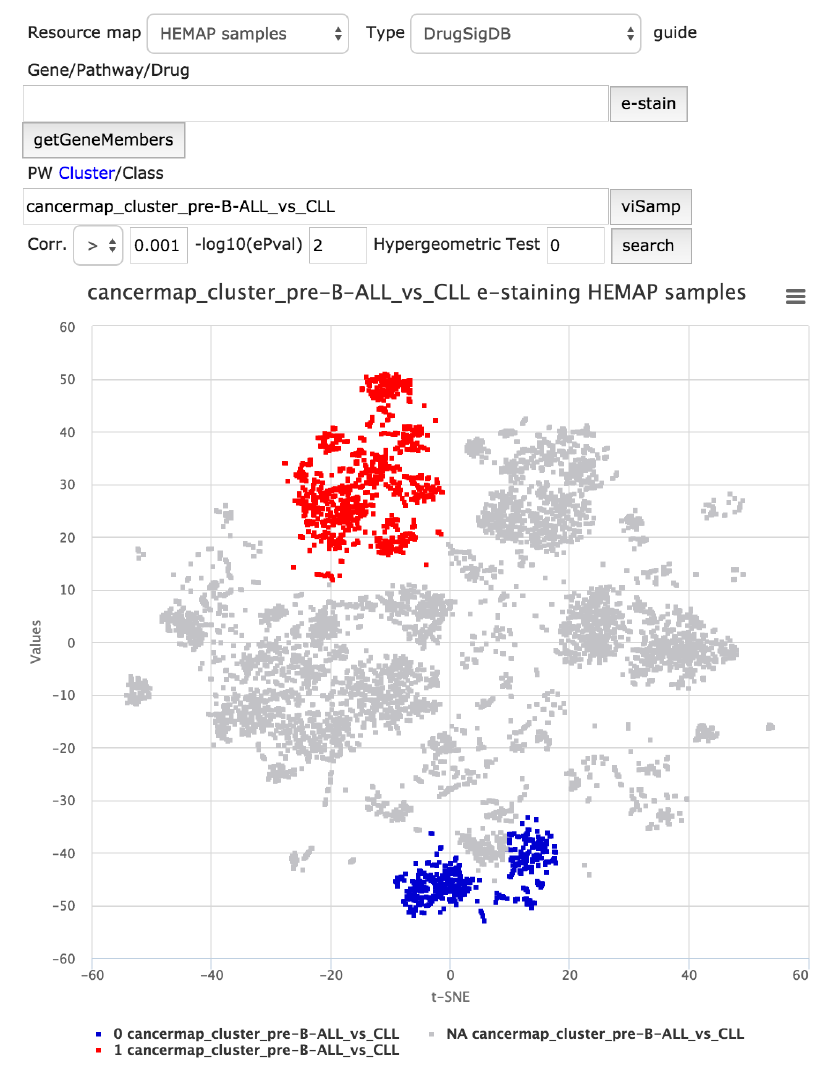
e-staining acute precursor B cell vs. chronic lymphocytic
leukemia clusters
In order to make the cluster exploration intuitive, it is easy to find out where the
samples belonging to a cluster (or clusters being compared) are located on the
map as a first step. The scenario below, figure 5, shows the location of acute
precursor B cell (pre-B-ALL) vs. chronic lymphocytic leukemia (CLL) using
VisSAMP that indicates cluster locations with binary labels vice versa: blue for
the 2nd (CLL) category and red for the first (pre-B-ALL), grey nodes are NA.
Both diseases have a tight cluster confirming the original map sample
placements. VisSAMP stains samples of “_and_” clusters red if both categories
applied.
!
!
Figure 5. Samples can be directly colored from cluster features. Recalled that pre-B-ALL
samples on the original map shared the same location as the red highly expressed samples
here. In contrast, the blue samples represent CLL labels.
Accessing pairwise analysis results
In addition to exploration of selected gene features and gene sets (based on
expert knowledge on disease biology), the PW Cluster/Class field enables the
user to analyze in an unbiased manner the pairwise comparisons between
!
!
cluster assignment and different sample features. The features of interest are
selected from the “Type” drop-down menu and the cluster(s) of interest are
specified in the PW Cluster/Class field.
The results (default to max 5000, see Settings at the end of the guide for
adjustment) can be downloaded as a table and individual features (rows) can
be selected directly for e-staining. Each column is sortable and they are:
1. Feature (e.g. a Gene or a pathway gene set)
2. Spearman correlation
3. Adjusted –log 10(P-pvalue) from correlation test
4. Adjusted –log 10(P-pvalue) from cluster enrichment test
(hypergeometric test), applicable for GSVA/Drug Signature
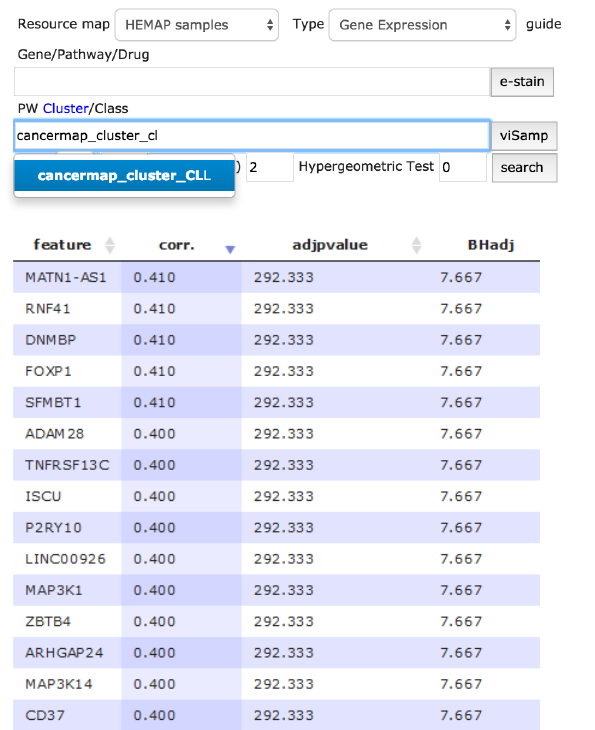
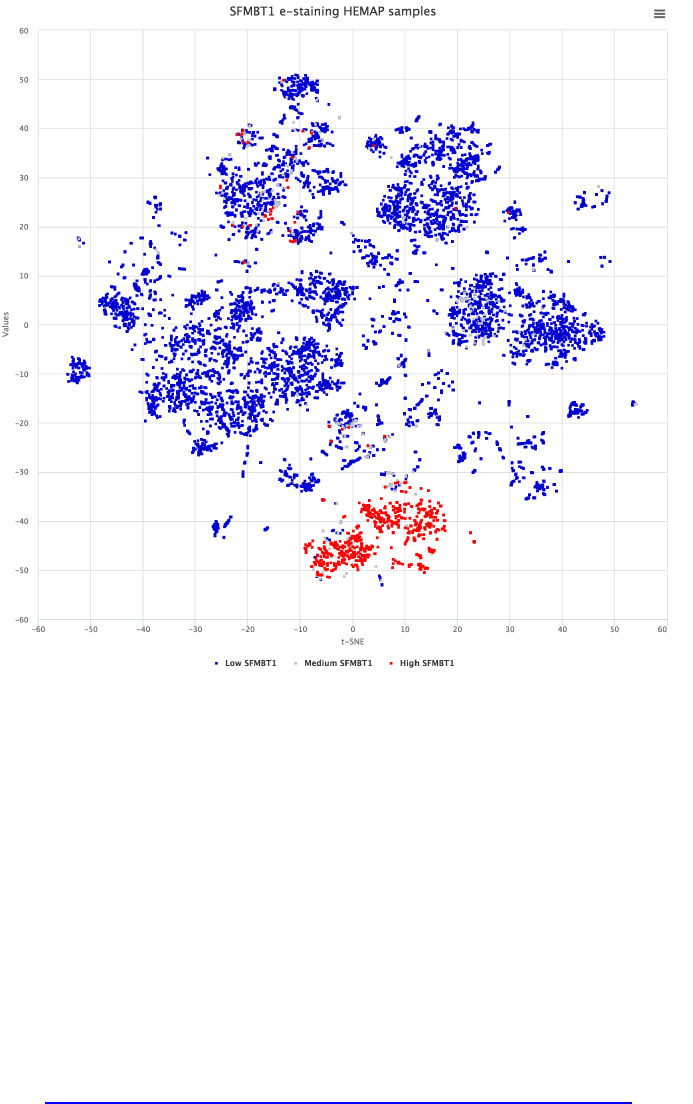
Search: cancermap cluster CLL and GEXP type
The figure below describes cancer map cluster CLL selection and clicking
search where resultant rows (4917) ordered by adjusted P-value are returned
and can be downloaded. All columns are sortable. In the example below, the
result was sorted by correlation (highest first) (arrows in the column names are
clickable to sort in both directions). The map can be directly stained from results
by gene name selection on the row; figure 6 bottom panel is map stained by
selection of SFMTB1, the 5th record ordered by P-value.
!
!
Figure 6. This use case details cancer cluster CLL analysis of finding highly correlated pairwise
gene features. The results can be downloaded for advanced statistical studies. Here, SFMBT1 is
selected after correlation sorting and then interactively e-stained thus confirming CLL original
samples.
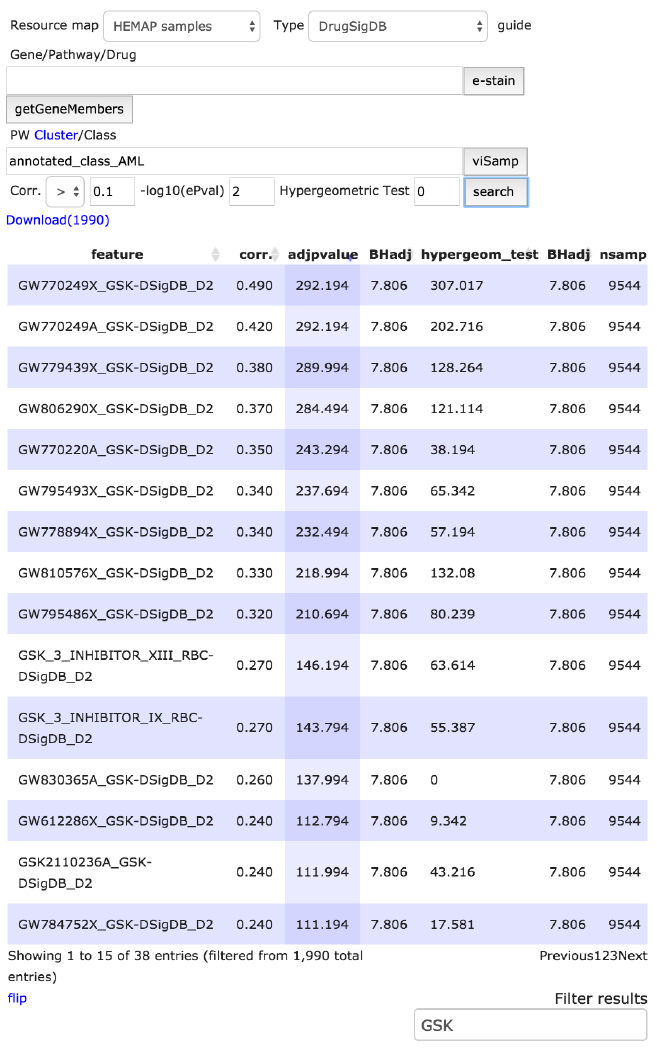
Search: cancermap cluster aml and DrugSigDB type with GSK
subfiltering
DrugSigDB and Pathway features are sets of curated gene lists from known
published resources, including Drug Signature DataBase (DSigDB),
Wikipathways and PWCommons. The figure below shows the 38 results upon
sub-filtering (original with 1990) for pathway features labeled ‘GSK’ (Glaxo-
Smith-Kline) developed drugs. Number of rows shown per page is defaulted to
15 and can be adjusted in Settings.
See http://software.broadinstitute.org/gsea/msigdb/index.jsp for more details
on different gene set collections. MsigDB_c2 would filter on MsigDB curated
gene sets.
!
!
Figure 7. Sub filtering, using GSK, is demonstrated on AML class features. The number of rows
is adjusted to 38 from 1990. Sub-filtering is functional across all columns with character
matching.
!
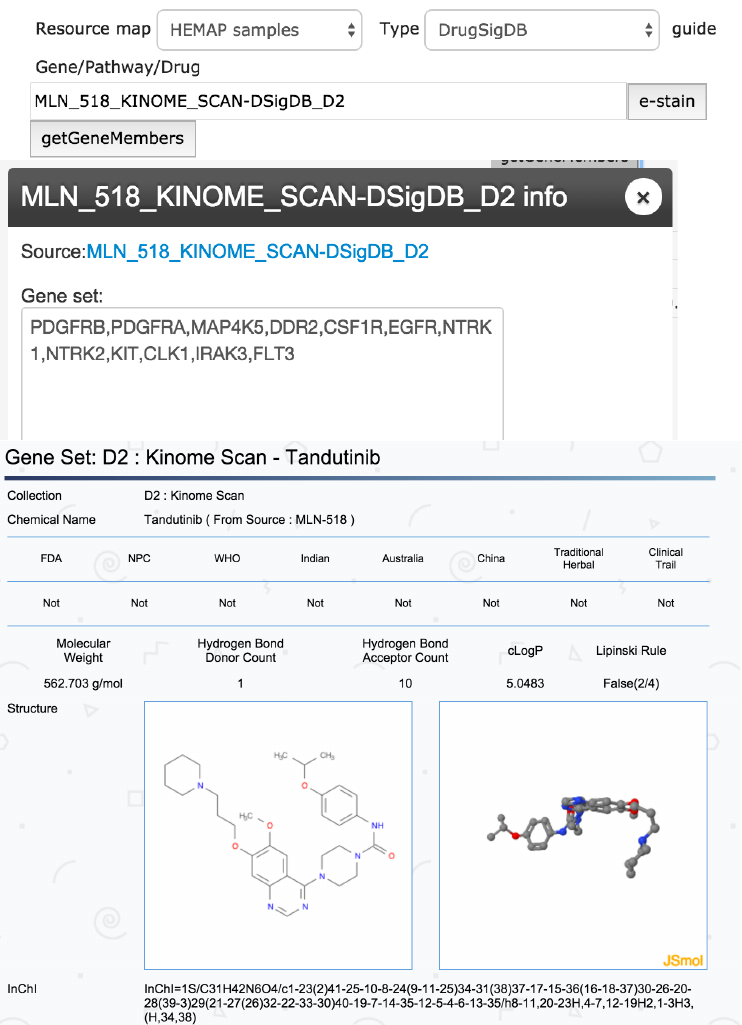
Gene sets of pathway and drug signatures
Gene members upon pathway/drug gene set selection can be easily looked
up. Clicking on the getGeneMembers brings up a dialog box showing the
source link and gene set.
!
!
Figure 8. The top panel shows MLN-518 (synonym for Tandutinib) drug signature selection and
its gene members are shown. The bottom graph shows results of clicking on the source DSigDB
(Tan lab) link.
!
!
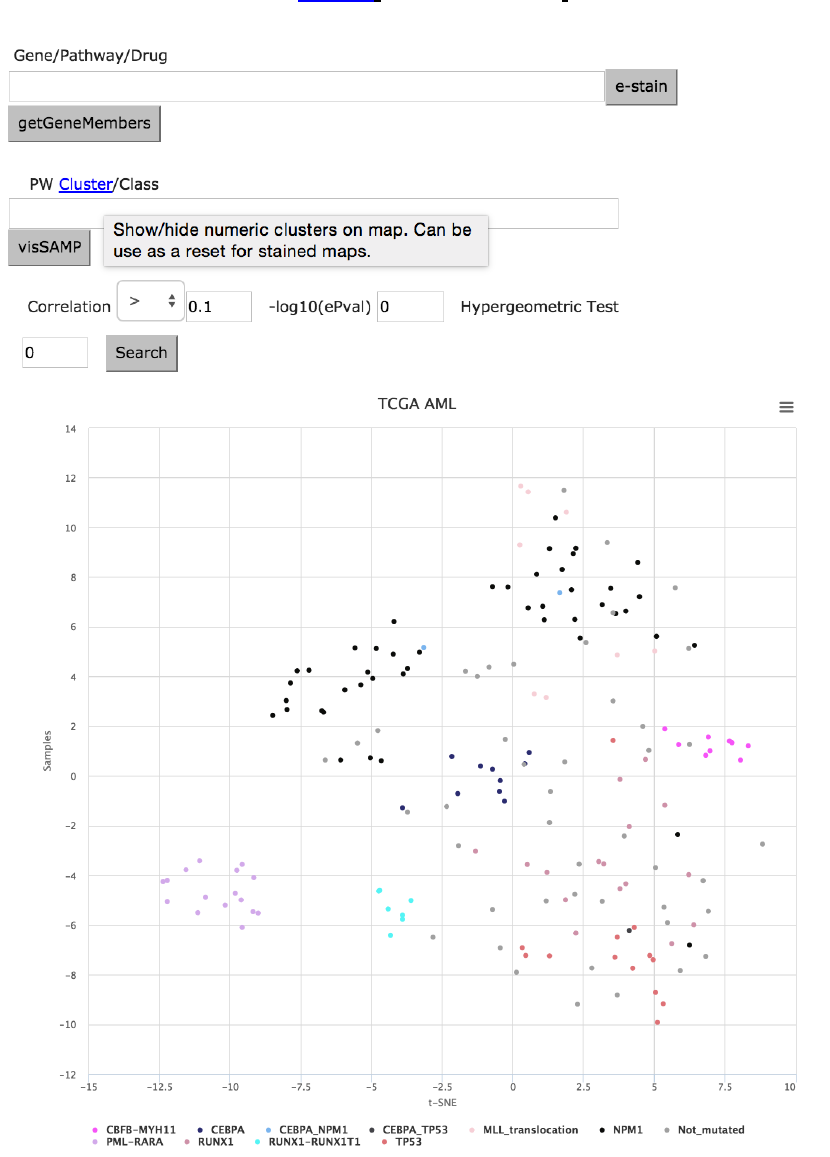
TCGA AML Map
The default map of TCGA colors the samples by cytogenetic subtypes (fusion
genes and mutations) Alternatively, the map can be re-plotted with the t-SNE
cluster labels by clicking on Cluster link shown below.
Figure 9. The default view of theTCGA map indicates the location of patients with gene fusion
and mutation events in color.
!
!
Additional data types for TCGA AML map: GNAB, CNVR,
METH, MIRN and CLIN categories
The genome-wide mutation, methylation and copy number profiles are
available for the TCGA samples with the feature names GNAB, METH and
CNVR. Pairwise exploration of cluster association with these features works
the same as described above. Below we will look at a few of the data types and
the easy manner they can be explored and e-stained.
Certain TCGA data types are continuous numeric values therefore statistic
significance/ranking across each element is rank using z-score, computed as
(x – mean)/standard deviation:
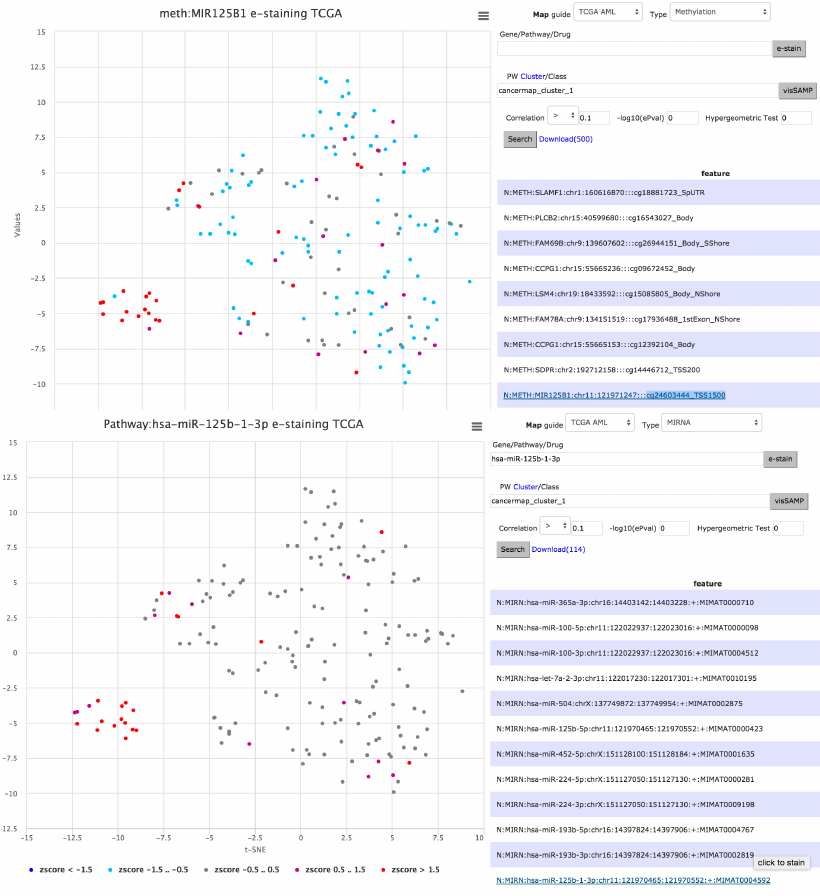
e-staining mir-125 across METH and MIRNA
The scenario below finds mir-125b-1 with high positive correlation (.47 to
cancermap cluster 1) after selecting the METH datatype and clicking on cluster
1 (PML-RARA cases) in the map. The quick-selection of interesting clusters for
pairwise analysis is also supported for other feature types. As explained earlier,
e-staining the methylation data is performed on clicking the feature (gene)
name directly on the table (middle figure). It is also possible to check whether
the differential methylation status affects the miRNA expression, by choosing
Type MIRNA and entering the official identifier to the Gene field (hsa-miR-125b-
1) (bottom figure, correlation .48).
!
!
Figure 10. Data analysis is performed visually for mir-125 via e-staining across methylation and
miRNA. Pairwise results are interactively retrieved with cluster label mouse click on map.
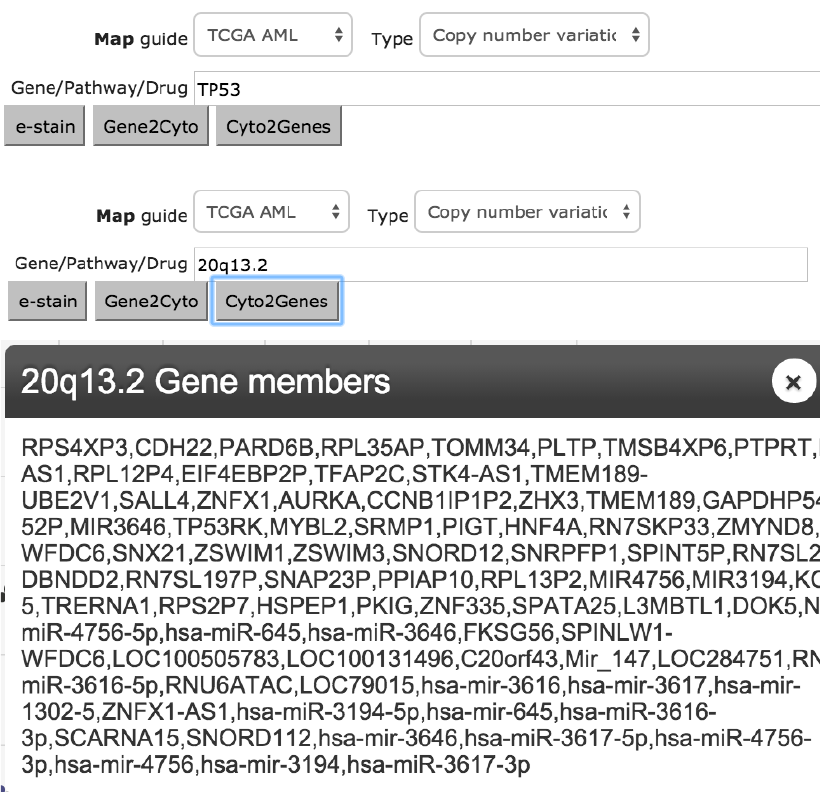
Lookup of copy number aberrations by gene name, vice versa
Copy number aberrations often include large chromosomal region gains or
losses that houses multiple genes. As such, it is useful to search by gene name
and then look up the corresponding copy number labels, often in cytoband
terms. The figure below illustrates the situation of looking up TP53, 20q13.2 is
displayed upon clicking Gene2Cyto, Cyto2Genes click returns gene members.
!
!
Figure 11. Copy number features are often named as cytobands inclusive of many genes. Hemap
allows for lookups in both directions. Example depicts looking up TP53 (top) for 20q13.2(middle)
and then all members within the cytoband.
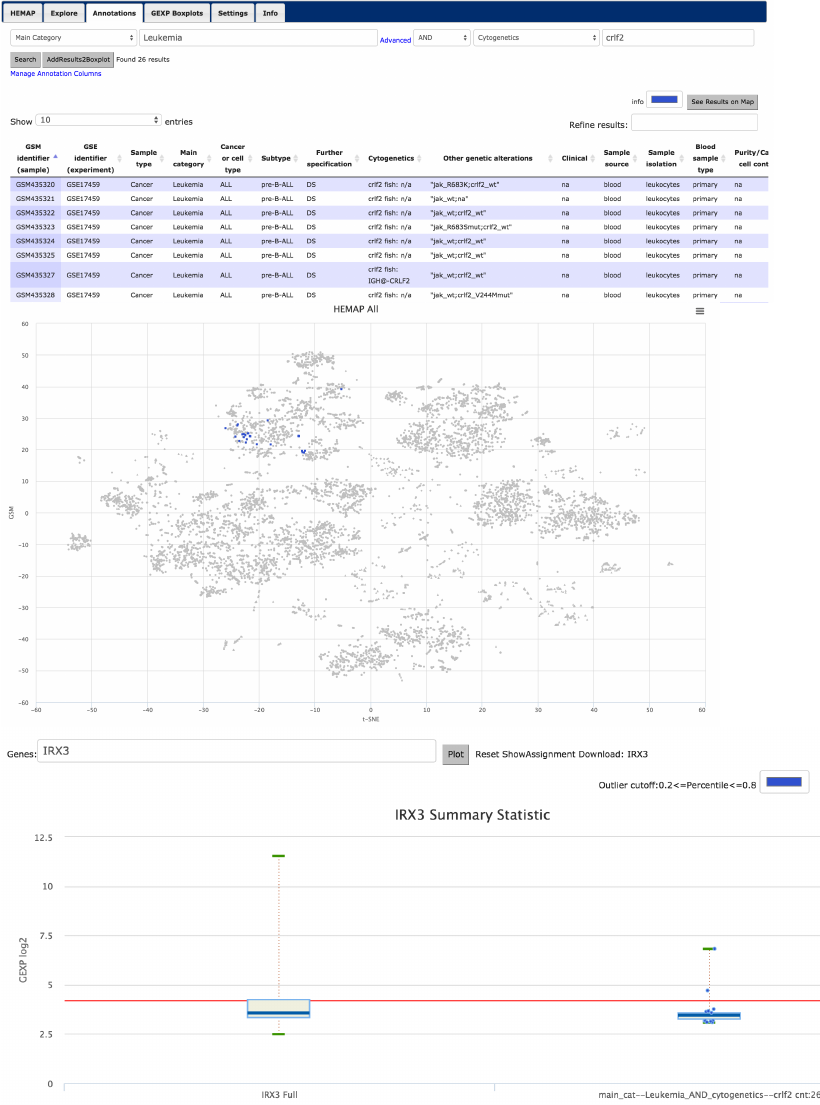
Annotation Search, e-staining, and box plotting
Main Category: Leukemia AND Cytogenetics: crlf2 analysis to
IRX3
The web application allows for flexible searches across all annotations
supporting type ahead and wild card search. For example and detailed in figure
12, updating the column dropdown to Main Category and typing in Leukemia
(or use type ahead) returns 4778 records (not shown). The advanced interface
is turned on (or hide) by clicking on Advanced link and setting the 2nd column
dropdown to Cytogenetics with crlf2 entry with AND clause, 26 records are
returned as depicted in figure 11 (top with partial number of rows). Using the
button “See Results on Map” on upper right corner, the middle figure shows the
26 samples (including all crlf2 cytogenetic deletions and fish) in blue (color
picker available as shown). From the annotation results next to the Search
button is AddResults2BoxPlot. This adds the sample group to Hemap GEXP
!
!
box plots; more custom groups can be added across user selected gene(s); in
this case IRX3.
Figure 12. Annotation search allows for intuitive basic search but also provides powerful
advanced functions. Almost 5000 records are labeled Leukemia and shown here is Leukemia
samples annotated also with Cytogenetics crlf2. The 26 results are then visualized on the map
and then gene FLT3’s expression summary statistics are plotted and contrasted, revealing
substantially higher mean expression.
!
!
Sample groups from map cluster selection (mouse) and
plotting combined with annotation search
From the main map, the 9,544 samples have been classified into 50 clusters.
Prior, we described toggling the map labels using Explore interface ‘Clusters’
link for the main map and for pairwise TCGA searches. Cluster selection on the
main map can also add the clustered samples for box plotting. Figure 13 shows
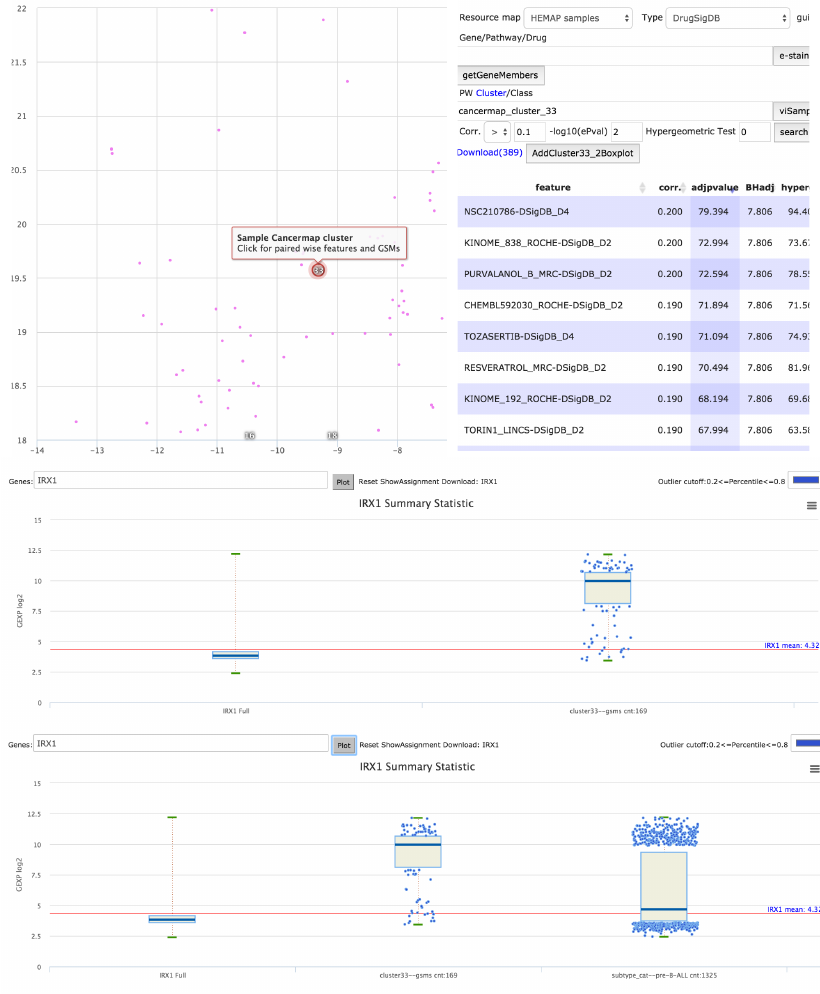
selection of Cluster 33 (169 samples) and then the box plot result with IRX3
expression values. User needs to select the cluster label (red enlarged circles),
not sample nodes (selection on sample nodes opens up GEO), the 2nd panel
shows a zoomed in area of cluster 33 for easier selection. Upon clicking, the
AddCluster33_2Boxplot button needs to be clicked, also in the Explore
interface, above the tabular results and shown in same panel. The IRX1 box
plot for the 169 samples (from prompt after button) is shown in 3rd panel of
figure 13. Hemap is integrated across maps, annotations and plotting. The
bottom panel includes cluster 33 IRX3 together with annotation search of
subtype pre-B-ALL. Other annotation searches or cluster selections are also
compatible.
!
!
Figure 13. Labeled cluster 33 selection triggers pairwise selection and the samples classified to
cluster 33 can also be added to box plot. This sample groups is plotted to IRX1 and the bottom
most figure demonstrates combining annotation search on subtype pre-B-ALL, contrasting with
cluster selection and also revealing higher IRX1 expression on pre-B-ALL samples.
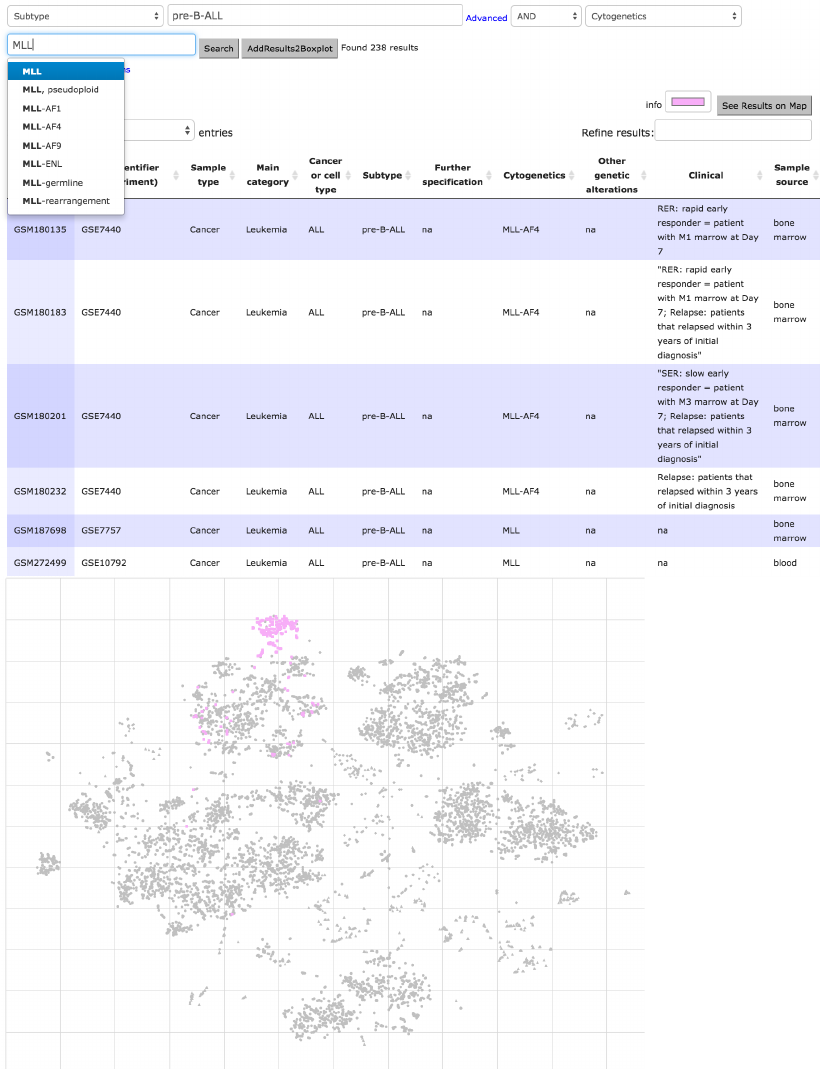
Annotation categories to gene expression e-staining
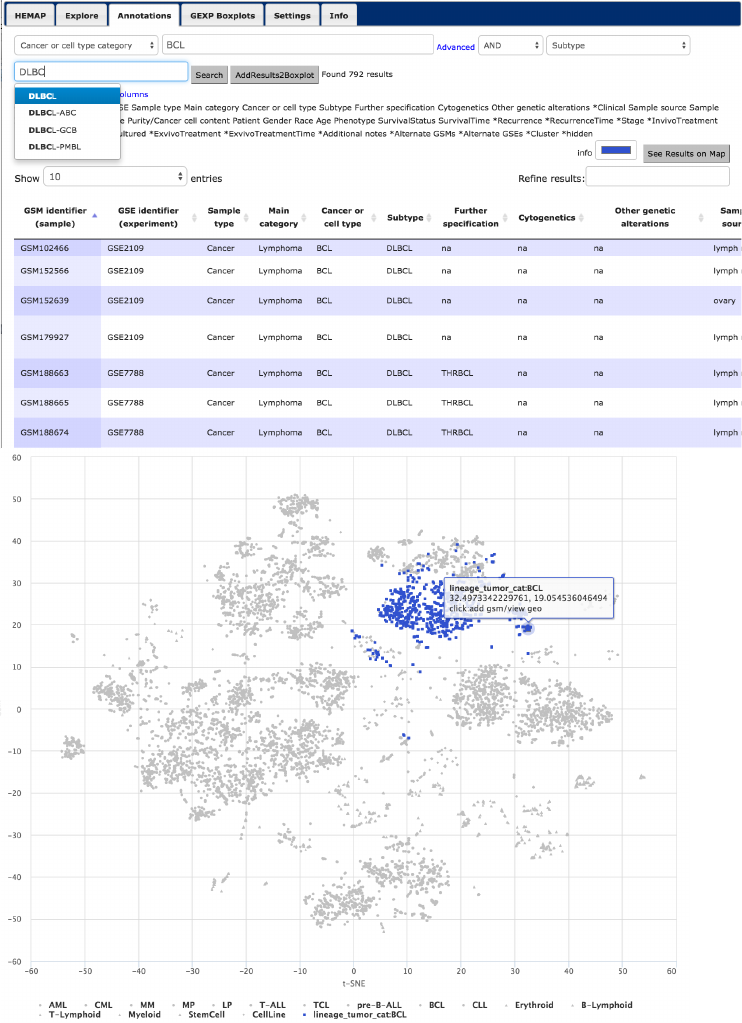
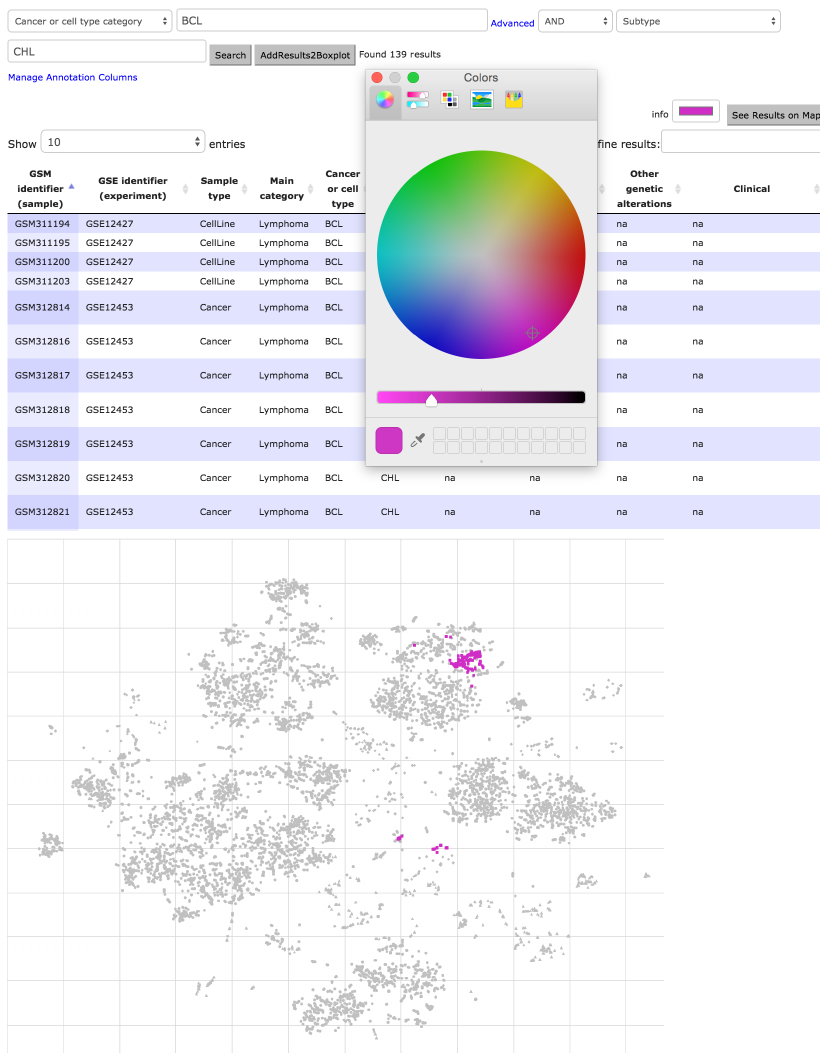
This example illustrates the usage of combining filtering values to locate
samples from three cancer types. The first filter is BCL cancer/cell type and
next we select across subtypes DLBCL (792 samples stained blue (Fig. 14 rows
1 and 2)) or CHL (139 samples stained purple, see row 3 usage of color picker
!
!
(Fig. 14 rows 3 and 4)). In a similar manner, more BCL types can be stained
on the map (not shown). Without the advanced AND subtype filtering, there are
1280 BCL labeled samples. As third example, the subtype selection of pre-B-
ALL with MLL cytogenetic labeled samples (238) are stained pink in the same
figure.
!
!
!
!
Figure 14. HEMAP samples are further classified and e-stained based on cancer type BCL
subtypes DLBCL (1st 2nd rows) and CHL (middle 3rd,4th rows). The results are obtained via
combining cancer/cell type with subtype. Filtering and its combinations are highly flexible, as
demonstrated in rows 5 and 6 of 238 samples via using subtype pre-B-ALL and MLL cytogenetic
event.
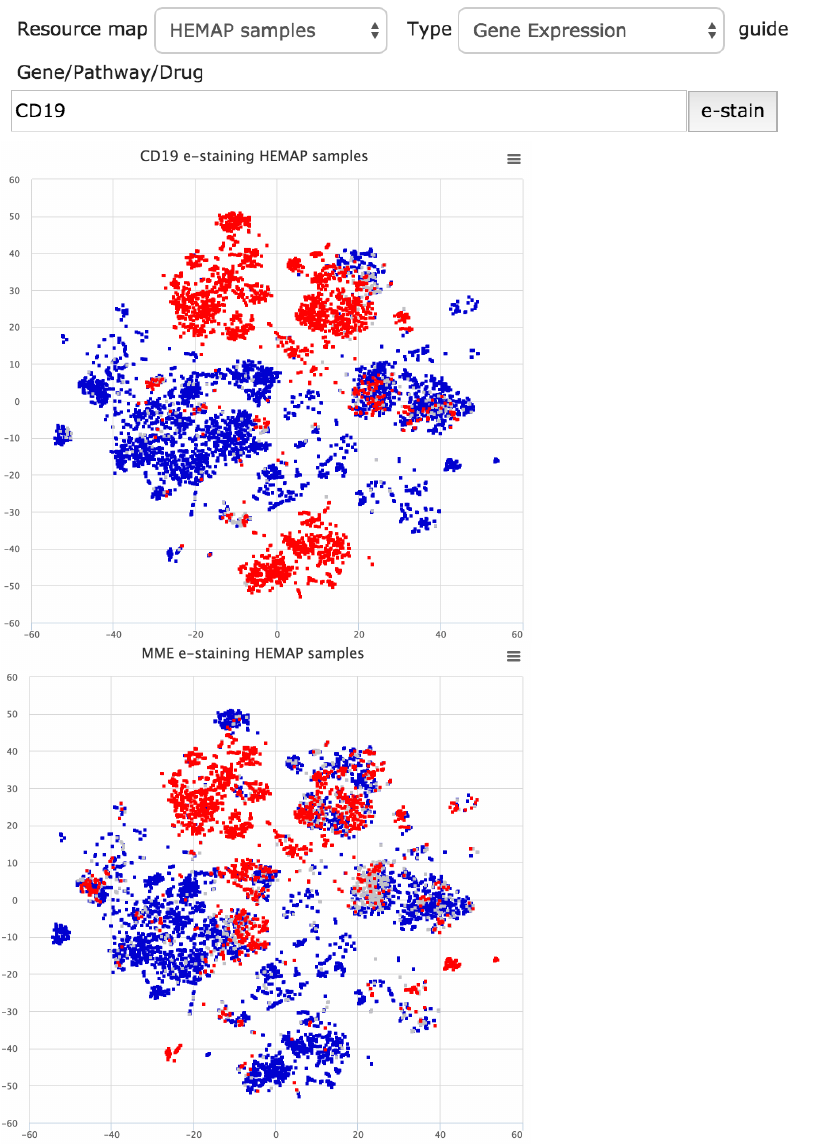
The Explore tab allows for easy gene and pathway e-staining as well as
pairwise statistical data analysis, highlighted in the next Advanced use case
section. Here in Fig. 15, the cell surface genes CD19 and MME (aka CD10) e-
staining maps are plotted. The gene input, as well as pathway and drug
signature fields, provides type ahead.
!
!
Figure 15. Gene based e-staining is accomplished for cell surface protein coding CD19 and MME
(aka CD10) genes. The maps are exportable. Low, medium and high colors can be customized
using the settings, described in the last section of this guide.
!
!
Use case examples
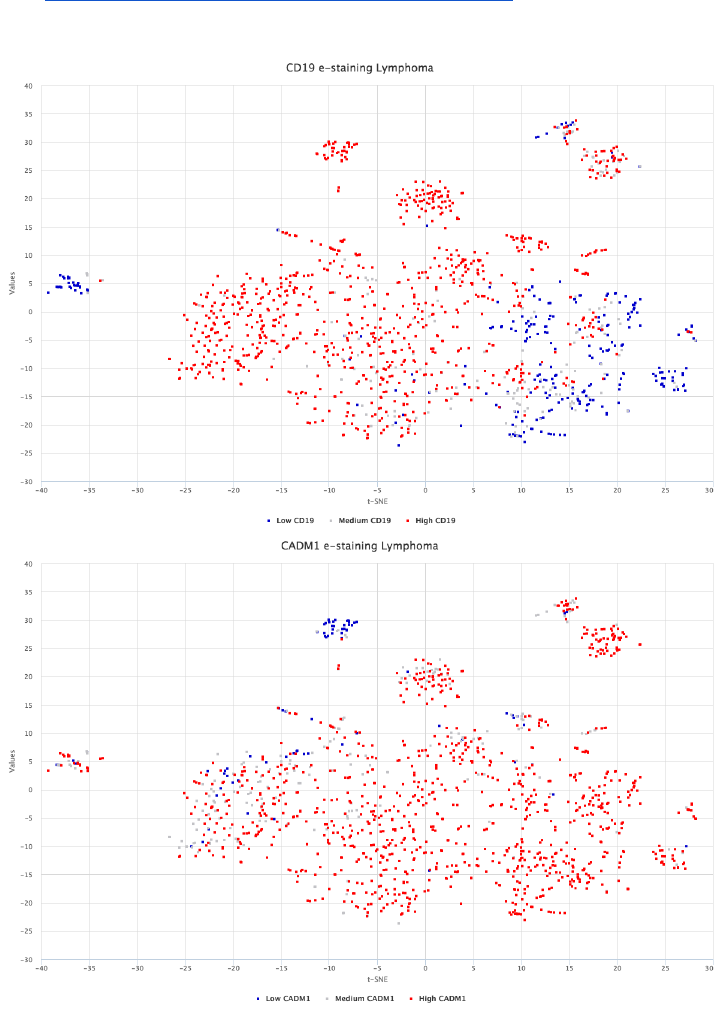
Exploring surface protein expression in lymphomas
In the following analysis, a new surface protein candidate for immunotherapy
is compared to CD19 that is currently used in B-lymphoid cancers. High
expression of CADM1 has been previously linked with T-cell lymphoma.
The relevant reference for CADM1 is
here https://www.ncbi.nlm.nih.gov/pubmed/22706526
Figure 16: CADM1 shows a consistent RNA expression within the lymphoma disease context
and low levels in normal blood cell types. Its expression in lymphoma patient material can be
further confirmed using Surface Protein Atlas.
!
!
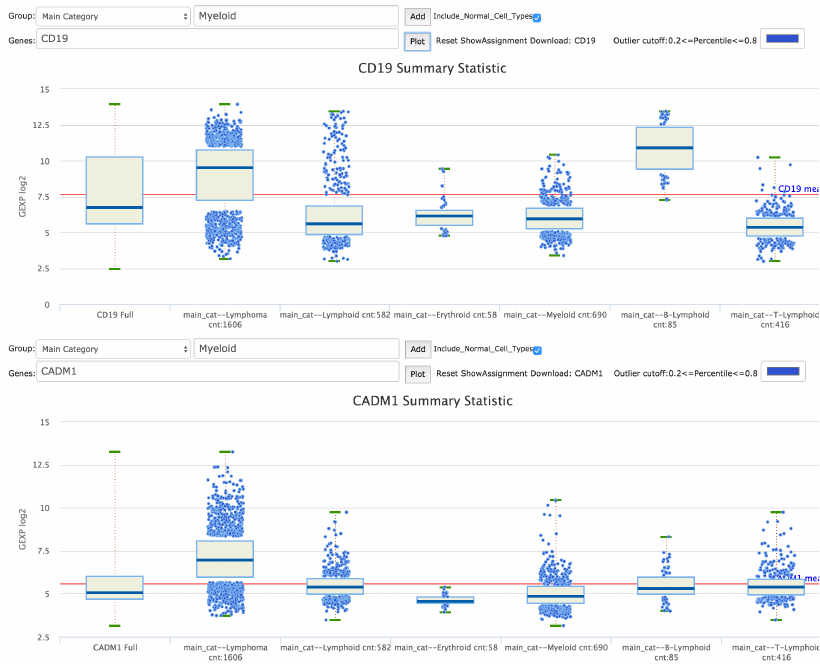
Gene expression box plots across main categories for CD19 and CADM1.
Figure 17. Comparing CD19 and CADM1 gene expressions. From the GEXP Boxplot interface,
categories Lymphoma, Lymphoid, T-Lymphoid, B-Lymphoid, Erythroid, and Myeloid are entered
one at a time and then the genes CD19 and CADM1 are plotted. It is visually evident the
difference in their expressions across the different lymphoma categories.
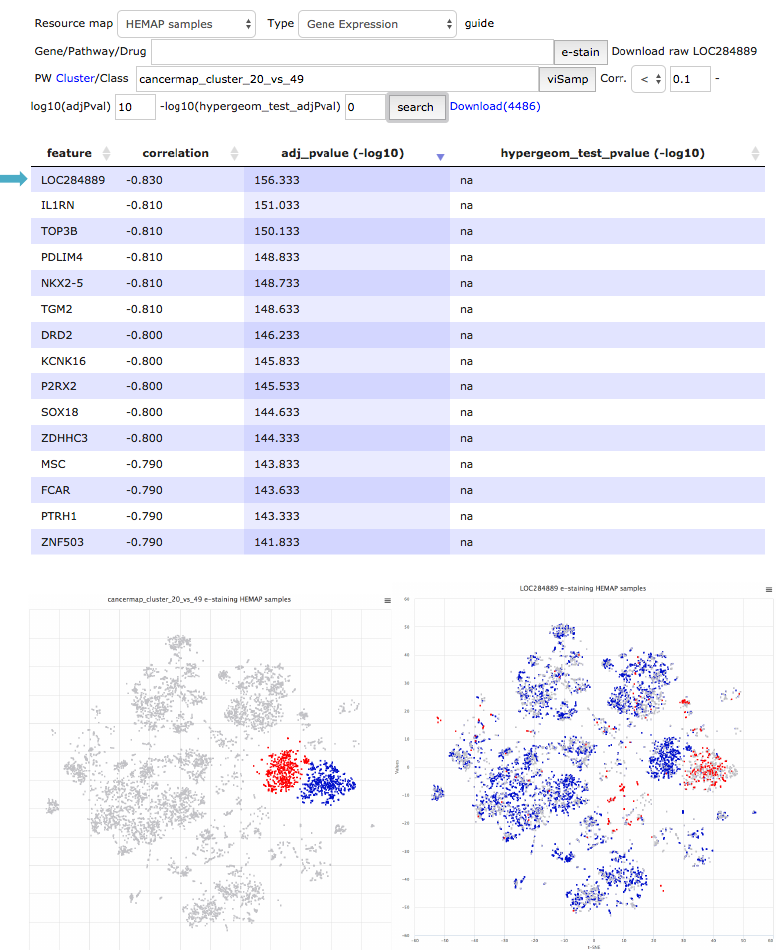
Finding Myeloma cluster specific genes/pathways
In this example Hemap resource is used for characterizing Myeloma clusters.
First, genes that best distinguish two myeloma clusters are extracted from the
pairwise results. Similar analysis is also used for finding pathways that can
distinguish the clusters.
!
!
Figure 18. Genes distinguishing cluster 49 from cluster 20 are explored using pairwise results.
Top result LOC284889 (MIF-AS) is plotted to cancermap using e-staining.
!
!
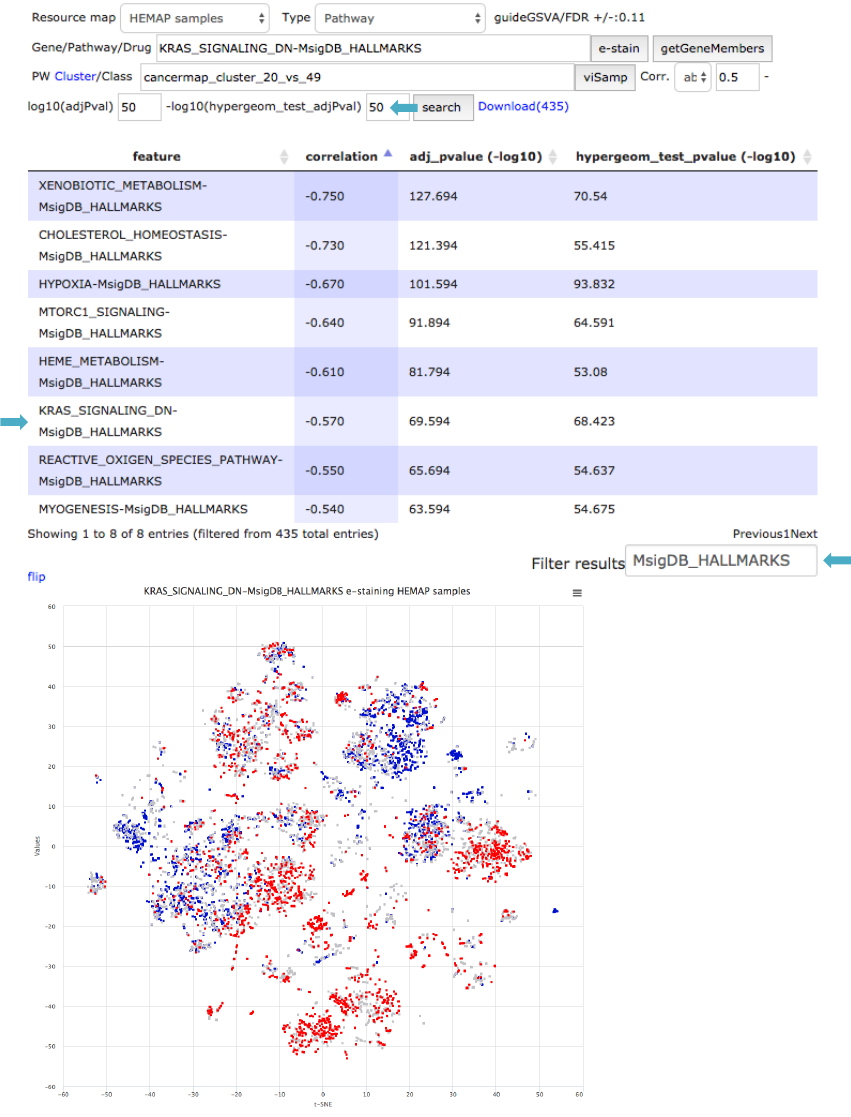
Figure 19. Pathways distinguishing cluster 49 from cluster 20 are explored using pairwise
results. Results are filtered using correlation and hypergeometric test adjusted P-values and
correlation coefficient. Pathway source (MsigDB_HALLMARKS) is filtered using “Filter results”
field. KRAS signature separates clusters 49 and 20.
!
!
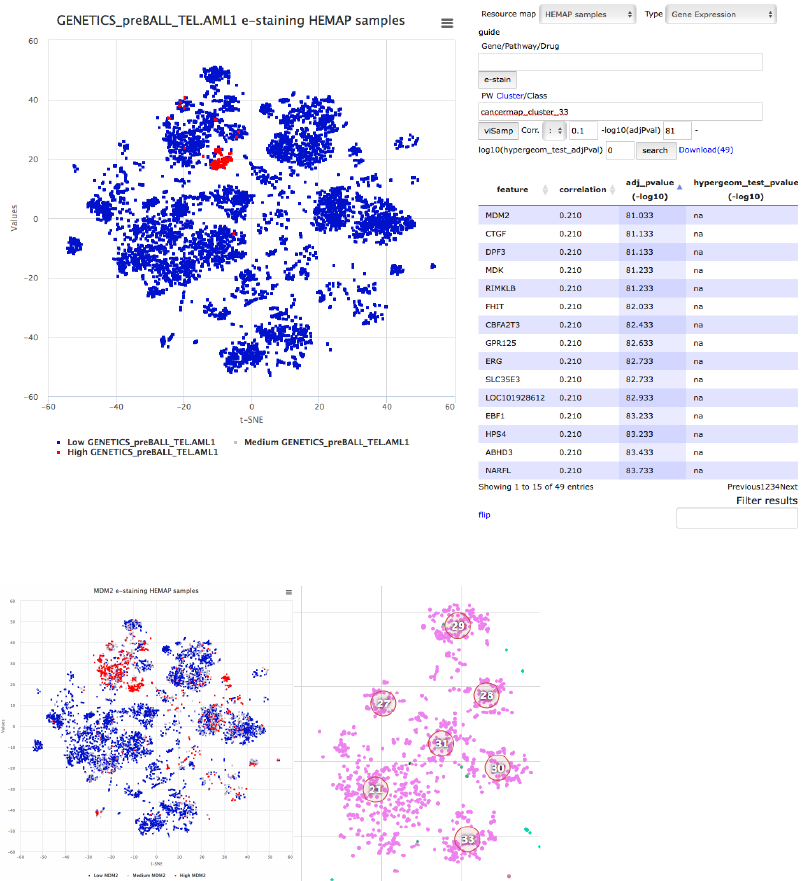
Finding subtype specific druggable genes
In this example, genes with high expression are obtained for the ETV6-
RUNX1 (also known as TEL-AML1) pre-B-ALL subtype, here visualized based
on e-staining the clinical feature (GENETICS_preBALL_TEL.AML1). One of
these genes is MDM2 that represents a recently characterized vulnerability in
pre-B-ALL and particularly TEL-AML1 (PMIDs: 26459177, 24240203). MDM2
is also a top gene for cluster 33 when analyzing existing drug targets.
Expression of MDM2 is also compared to other leukemia subtypes as
boxplots to confirm the association.
Figure20. Finding TEL-AML1 (cluster 33) specific genes.
!
!
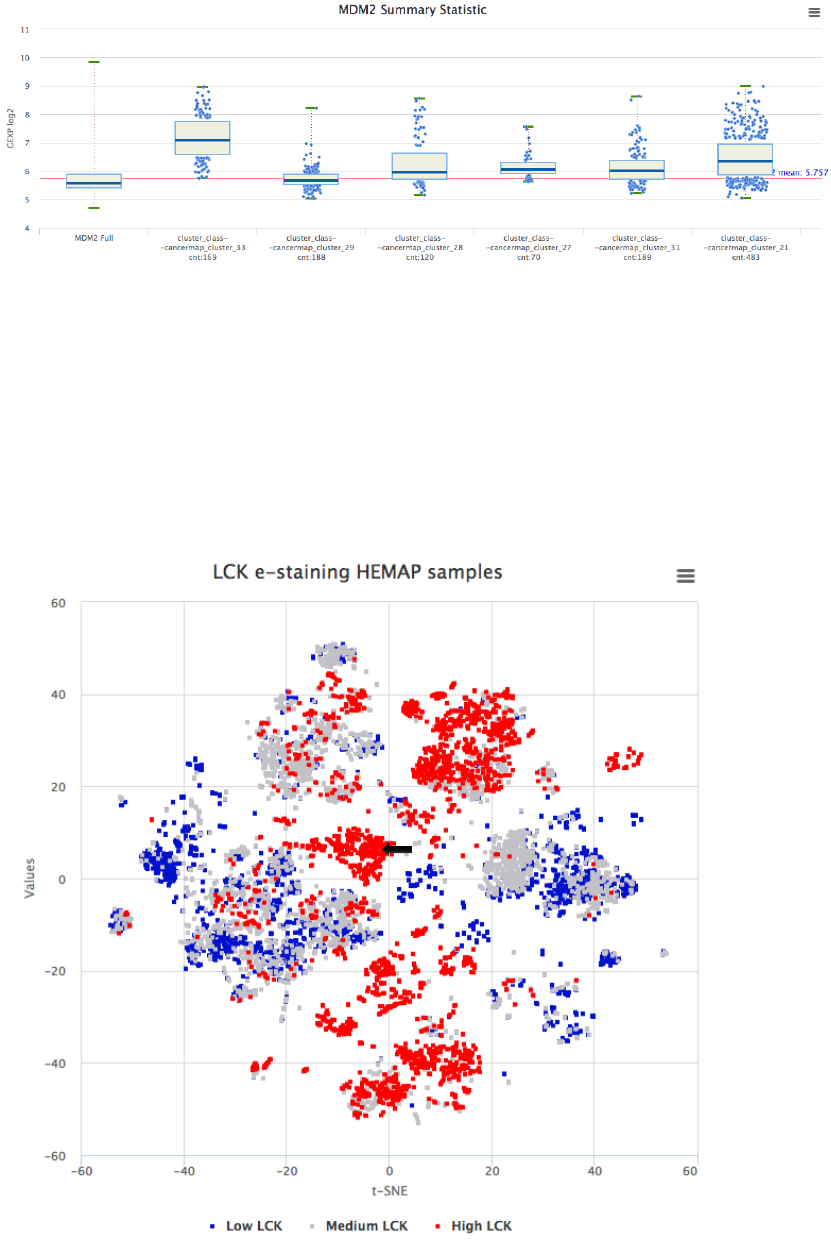
Figure 21. Comparing MDM2 expression to other pre-B-ALL clusters to verify high subtype
specificity. Clusters were added to boxplot from the GEXP Boxplot interface.
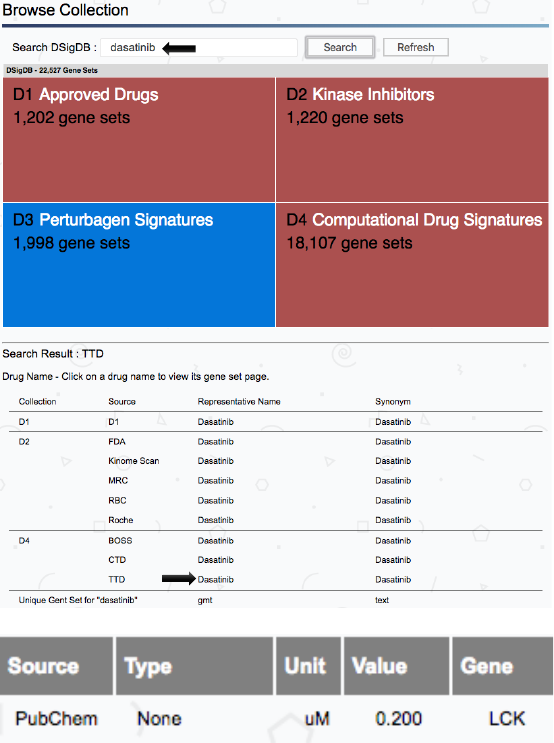
In silico drug repurposing analysis using Hemap and DSigDB
This example illustrates how the Hemap resource can be used for in silico drug
repurposing analysis (following the target example from PMID:28885610).
Dasatinib is currently in use to treat pre-B-ALL. Several Dasatinib targets were
expressed also in lymphoma and in T-ALL, motivating exploring drug
repurposing in those diseases. LCK was identified as one of the top Dasatinib
targets for T-ALL. Drugs targeting LCK were retrieved assessed from chemical
screening database to evaluate their specificity for LCK.
Figure 22. E-staining of LCK
!
!
Figure 23. Checking Dasatinib target specificity from DSigDB. Several sources contain chemical
screening data. Clicking TTD same targets as in tableS6 for Dasatinib are shown with chemical
screening results from PubChem.
In silico drug screening using Hemap
This example illustrates how the Hemap resource can be used for in silico drug
screening. First, the pairwise results are used to find signaling pathways that
could be targeted in pre-B-ALL and as a next step to find candidate drugs that
specifically target this signaling pathway. Furthermore, as a third step, drug
gene set details of drug chemical screening are used to evaluate drug target
specificity. As a final step, gene e-staining and boxplot functions are used to
compare gene expression in disease and normal cells to assess drug safety
and potential side effects.
!
!
Figure 24. pre-B-ALL clusters stained using visSAMP.
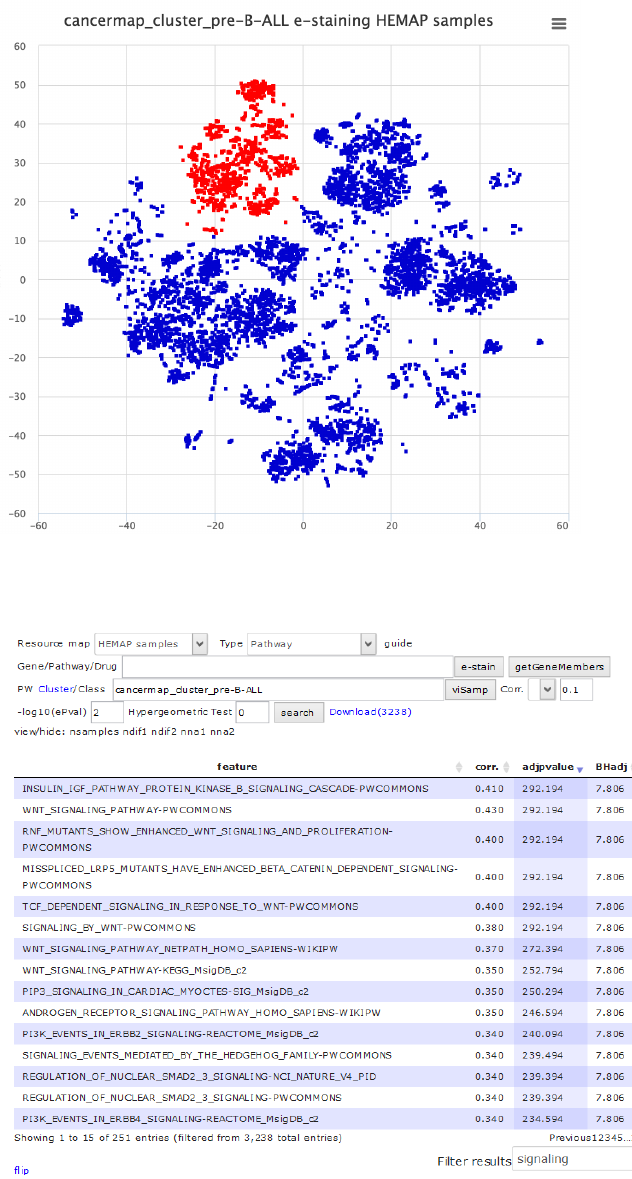
Step 1: Identification of candidate pathways
!
!
Figure 25. Searching for pre-B-ALL cluster correlated gene sets in pairwise results and filtering
using term signaling. PI3K pathway is enriched in pre-B-ALL samples as shown in e-staining.
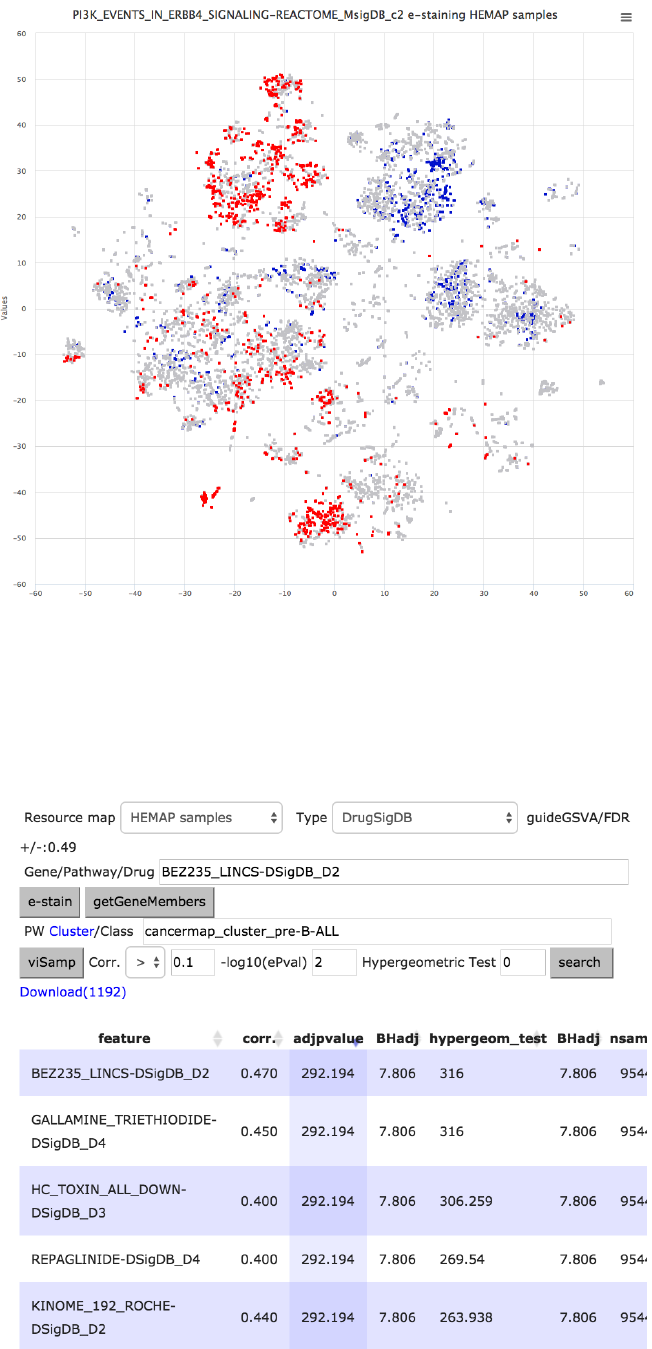
Step 2: Identification of candidate drugs
!
!
Figure 26. Searching for pre-B-ALL cluster correlated drug gene sets in pairwise results. Search
is filtered to contain only LINCS chemical screen drugs. Two PI3K inhibitors, BEZ235 and
AZD_6482, are among top correlated drug gene sets for pre-B-ALL. BEZ235 e-staining reveals
high specificity for pre-B-ALL
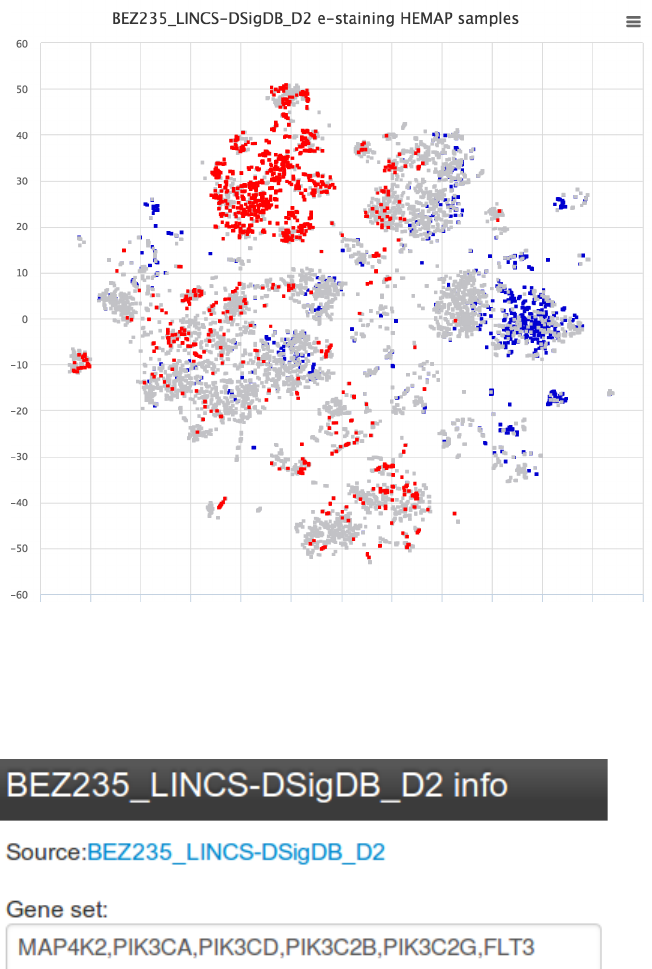
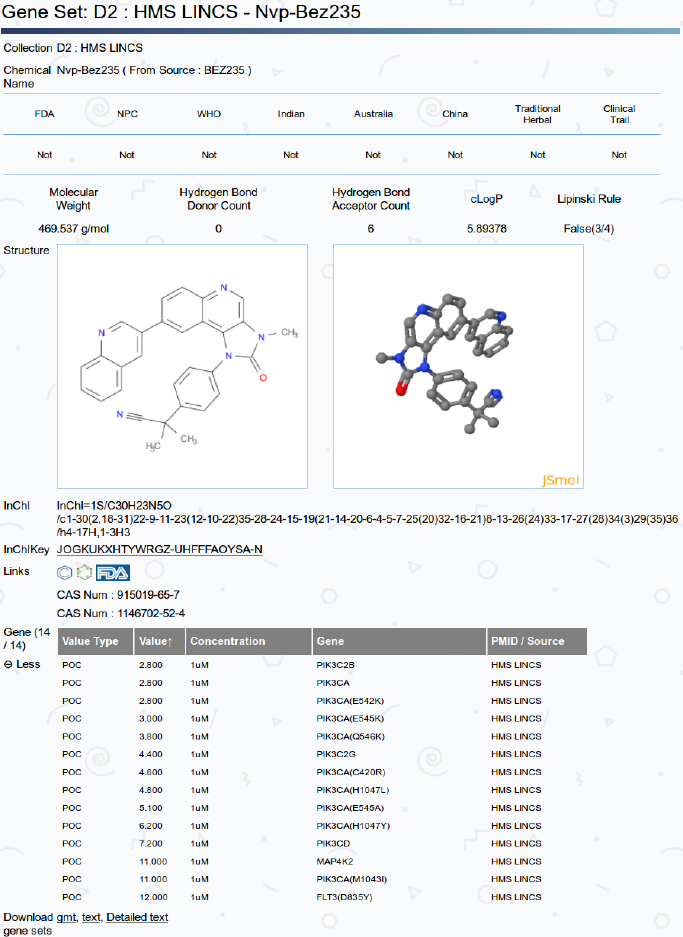
Step 3: Examining the drug gene set and accessing drug target information
Figure 21. BEZ235 gene set composition and link to drug details can be accessed by clicking
GetGeneMembers
!
!
Figure 27. Drug target details for BEZ235 reveal that PIK3C2B and PIK3CA have the highest
specificity for BEZ235.
!
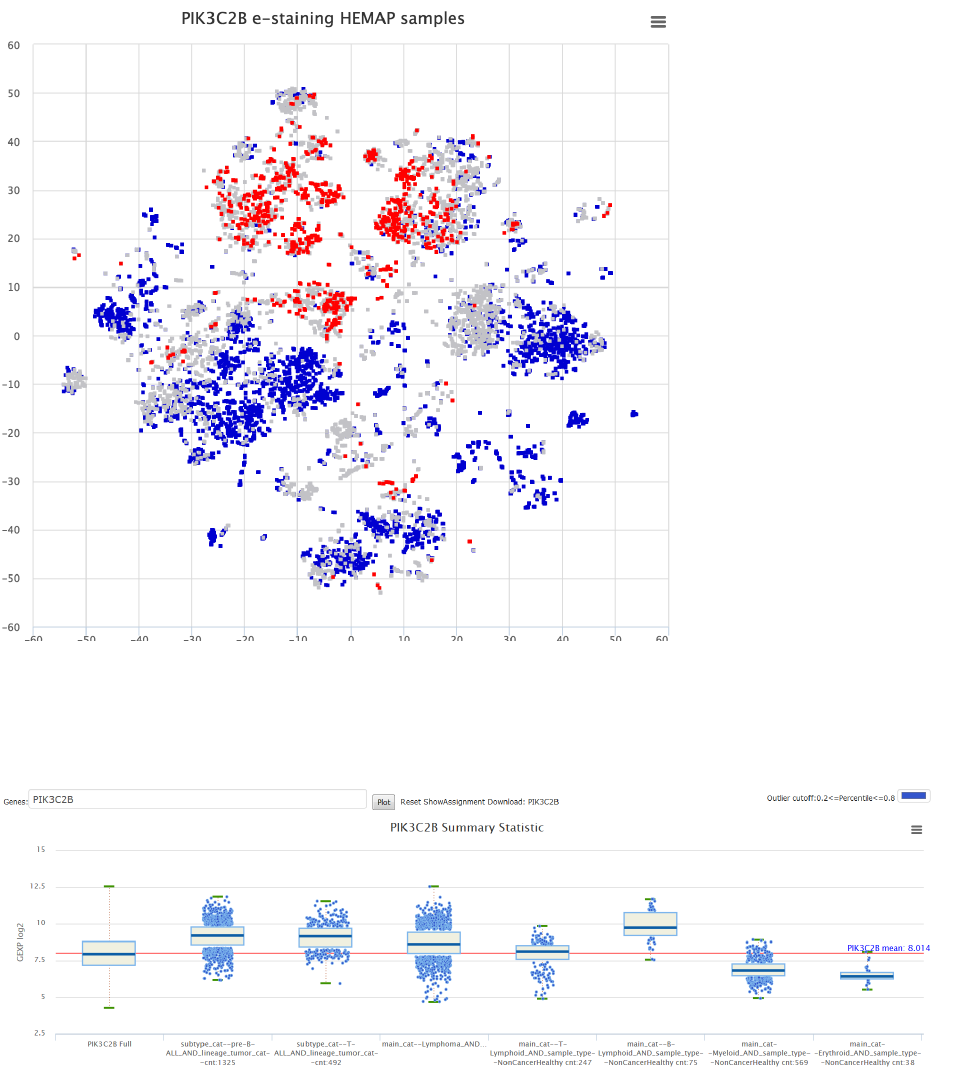
!
Figure 28. e-staining PIK3C2B shows that high expression of this drug target is prevalent in pre-
B-ALL.
Final step: Comparing the expression in cancer to normal cell types using
boxplots
Figure 29. Sample sets of interest (pre-B-ALL, T-ALL and lymphoma vs T-Lymphoid, B-lymphoid,
Erythroid and Myeloid) were defined using the Annotation table and selected for box plotting. The
result shows that PIK3C2B is highly expressed in pre-B-ALL and T-ALL but is also highly
expressed in normal B-lymphoid cells, which could indicate potential side effects.
!
!
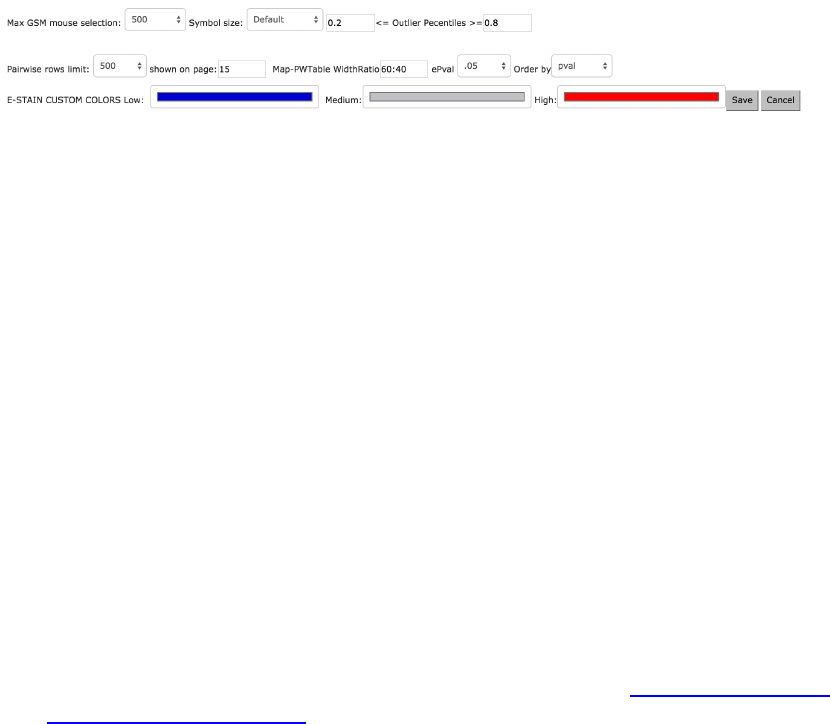
Settings
Users can specify custom plotting and database search settings. It should be
noted that plotting and search peformance have large dependencies on
network and browser RAM memory capacity. Brief descriptions are listed
below.
Figure 30. Hemap allows for session customization of max number of selections, rows returned
and colors. These settings are stored at the session and will revert to defaults on closing of the
browse.
The default settings can be individually updated using the Settings interface.
Max mouse sample map selections – default 500
Map Symbol size, can increase or decrease using drop down.
Outlier Percentiles for Boxplots <20% and >80%
Max number of pairwise rows – default 5000, values 500 to 50,000
Rows shown per page – default 15
Map:Table Explore Screen Ratio – default 60:40 (flip function in Explore
interface)
ePval default .05, empirical Pvalue used for pairwise cutoff – drop down
Custom e-staining colors
Info
This section provides contact information and project issue tracker. Hemap is
open sourced and free for non-profit usage. The software is use as it is and
does not offer any warranty or guarantee. Please contact matti.nykter@uta.fi
and merja.heinaniemi@uef.fi for commercial usage permissions.
