Instructions 18
instructions
User Manual:
Open the PDF directly: View PDF ![]() .
.
Page Count: 6
Music classification mini project: Instructions
January 25, 2018, Version 1.1
Andreas Svensson, andreas.svensson@it.uu.se
Department of Information Technology, Uppsala University
Abstract
This document contains the instructions for the mini project on classification for
the course Statistical Machine Learning, 1RT700. The problem is to classify a set
of 100 songs, and predict whether Andreas Svensson would like them or not, with
the help from a training data set with 500 songs. You are expected to (i) try some
(or all) classification methods from the course and evaluate their performance on
the problem, and (ii) make a decision which one to use and ‘put in production’ by
uploading your predictions to a website, where your prediction will be evaluated
and also compared to the performances of the other student groups. You will
document your project by writing a report, which will be reviewed anonymously
by your peers. A very well implemented and documented project will earn you a
‘gold star’, which gives bonus points on the exam.
0 Requirements
The project is to be done in groups of 3-4 students. All tasks described in this document have to be
done in order to pass the project, and of course all group members have to take part in the project.
1 Problem
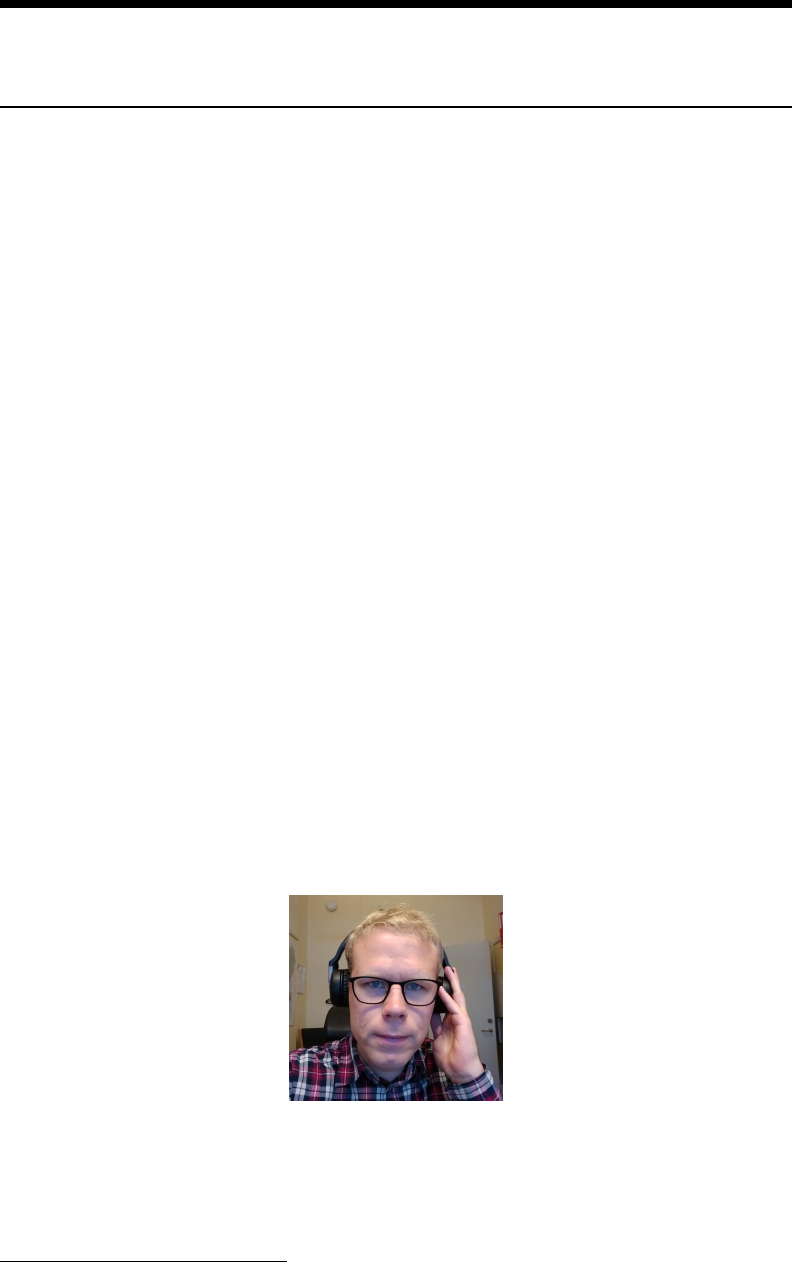
The problem is to tell which songs, in a dataset of 100 songs, Andreas Svensson is going to like (see
Figure 1). The data set consists not of the songs themselves, but of high-level features extracted
using the web-API from Spotify
1
. These high-level features describe characteristics such as the
acousticness, danceability, energy, instrumentalness, valence and tempo of each song.
Figure 1: Andreas Svensson listening to music.
To your help, you are provided a training data set with 500 songs, each of which Andreas has labeled
with LIKE or DISLIKE. You are expected to use all the knowledge that you have acquired in the
course about classification algorithms, to come up with one algorithm that you think is suited for this
problem and which you decide to put ‘in production’.
1https://developer.spotify.com/web-api/get-audio-features/
Table 1: Details on the available features (from the Spotify API documentation)
Name Type Description
acousticness float A confidence measure from 0.0 to 1.0 of whether the track is acoustic. 1.0 represents high confidence the track is acoustic.
danceability float Danceability describes how suitable a track is for dancing based on a combination of musical elements including tempo, rhythm
stability, beat strength, and overall regularity. A value of 0.0 is least danceable and 1.0 is most danceable.
duration_ms int The duration of the track in milliseconds.
energy float Energy is a measure from 0.0 to 1.0 and represents a perceptual measure of intensity and activity. Typically, energetic tracks
feel fast, loud, and noisy. For example, death metal has high energy, while a Bach prelude scores low on the scale. Perceptual
features contributing to this attribute include dynamic range, perceived loudness, timbre, onset rate, and general entropy.
instrumentalness float Predicts whether a track contains no vocals. "Ooh" and "aah" sounds are treated as instrumental in this context. Rap or spoken
word tracks are clearly "vocal". The closer the instrumentalness value is to 1.0, the greater likelihood the track contains no vocal
content. Values above 0.5 are intended to represent instrumental tracks, but confidence is higher as the value approaches 1.0.
key int The key the track is in. Integers map to pitches using standard Pitch Class notation. E.g. 0 = C, 1 = C major/D minor, 2 = D, and
so on.
liveness float Detects the presence of an audience in the recording. Higher liveness values represent an increased probability that the track was
performed live. A value above 0.8 provides strong likelihood that the track is live.
loudness float The overall loudness of a track in decibels (dB). Loudness values are averaged across the entire track and are useful for comparing
relative loudness of tracks. Loudness is the quality of a sound that is the primary psychological correlate of physical strength
(amplitude). Values typical range between -60 and 0 db.
mode string Mode indicates the modality (major or minor) of a track, the type of scale from which its melodic content is derived.
speechiness float Speechiness detects the presence of spoken words in a track. The more exclusively speech-like the recording (e.g. talk show,
audio book, poetry), the closer to 1.0 the attribute value. Values above 0.66 describe tracks that are probably made entirely
of spoken words. Values between 0.33 and 0.66 describe tracks that may contain both music and speech, either in sections or
layered, including such cases as rap music. Values below 0.33 most likely represent music and other non-speech-like tracks.
tempo float The overall estimated tempo of a track in beats per minute (BPM). In musical terminology, tempo is the speed or pace of a given
piece and derives directly from the average beat duration.
time_signature int An estimated overall time signature of a track. The time signature (meter) is a notational convention to specify how many beats
are in each bar (or measure).
valence float A measure from 0.0 to 1.0 describing the musical positiveness conveyed by a track. Tracks with high valence sound more positive
(e.g. happy, cheerful, euphoric), while tracks with low valence sound more negative (e.g. sad, depressed, angry).
1.1 Data sets
The data set to classify is available as , and the training data is available
as . The format of the data files is described in . For details on
the extracted features, see Table 1. The data sets are available at http://www.it.uu.se/edu/course/
homepage/sml/project/.
1.2 Background
The problem of predicting user preferences is a hot research topic both in academia and industry:
you have probably seen “you would perhaps also like . . . ” in online services. Within music, a big
player has been the Echo Nest, founded in 2005 as a research spin-off from the MIT Media Lab and
later acquired by Spotify. Their focus was methods for automated understanding of music, and in
2011 they released a popular benchmark dataset ‘the million song dataset’ (Bertin-Mahieux et al.
2011) which has become popular in the research community (see, for example, Fu et al. 2011; Oord,
Dieleman, and Schrauwen 2013), and has similarities to this project. An overview of the scientific
field of music recommendation is found in Kaminskas and Ricci (2012), and some pointers to recent
advances can be found in Dieleman (2016) and Jacobson et al. (2016).
2 Technical tasks
2.1 Methods to explore
The course has (so far2) covered the five following ‘families’ of classification methods:
(i) logistic regression
(ii) discriminant analysis: LDA, QDA
(iii) K-nearest neighbor
(iv) Tree-based methods: classification trees, random forests, bagging
(v) Boosting
2
Deep learning, which will be covered later, is also possible to use for classification. You are of course
welcome to explore this as well, in addition to the minimum requirements.
2
In this project, you decide upon at least as many ‘families’ as you are group members, and decide in
each ‘family’ at least one method to explore. Thus, if you are 4 group members, you explore at least
4 methods from at least 4 different ‘families’.
In addition, you should also consider the very simple classifier of always predicting LIKE.
2.2 What to do with each method
For each method you decide to explore, you should do the following:
(a)
Implement the method. We suggest that you use R, and you may write your own code or use
packages (the material from the problem solving sessions can be useful).
(b) Tune the method to perform well.
(c)
Evaluate its performance using, e.g., cross validation. Note that each model needs to be evaluated
using only the labeled data that is available in , i.e. for the purpose of
model validation and selection you should not use the test data from .
Exactly how to carry out this evaluation is up to you to decide.
Once you have completed the aforementioned tasks, you should with a good motivation select which
method you decide to use ‘in production’. Inspiration for a ‘good motivation’ can for instance
be found in Section 4.5 in James et al. (2013). When you have decided which method to try ‘in
production’, run it on the test data (for which you do not have the true labels) and submit your results
to http://www.it.uu.se/edu/course/homepage/sml/project/submit/ to see how well it performs. You
submit your results as a string like , where means DISLIKE and means LIKE. The web
site also contains a leader board, where you can see how well you are doing in predicting Andreas’
music taste, compared to the other groups.
To pass the project, you only need to submit your final solution to the homepage
once
!However, for
the sake of a fun competition during the project, we allow each group to submit up to one solution
per day (only the latest submission each day will be considered). The leader board will be updated at
midnight every night.
3 Documentation
You should summarize your work by writing a report, which will be reviewed by your coursemates as
well as the teaching assistants.
3.1 What to include in your report
The report should include the following:
(1) A brief introduction to the problem
(2)
A concise description of each of the considered methods, and how they are applied to the problem.
Even if you used high-level commands, such as for logistic regression, you should explain
what is ‘under the hood’ of the command! Please, use your own words. We already know
what is written in the book and on Wikipedia, so do not copy-paste from there. Writing concice
summaries are for your own learning, and their quality is crucial to obtain a gold star.
(3)
How the methods were applied to the data (which inputs were used, if the inputs were considered
as qualitative or quantitative, how parameters were tuned, etc), including motivations of the
choices made.
(4) Your evaluation of how well each method performs on the problem.
(5) Which method you decided to use ‘in production’, and your (good) arguments for your choice!
(6)
How well your method performs ‘in production’ (as obtained from http://www.it.uu.se/edu/
course/homepage/sml/project/submit/).
(7) Your conclusions.
(8) Appropriate references.
(9) All code needed to reproduce your reported findings (in an appendix).
3
3.2 How to format your report
Your report should be submitted as a PDF-file following the style used for the prestigious machine
learning conference Neural Information Processing Systems (NIPS), which also is the style used for
this document. In the NIPS format, your report should be no longer than 6 pages (not counting the
reference list and code appendix). Except for the page limitation, you should follow the NIPS style
closely, including its instructions for figures, tables, citations, etc.
The recommended word processor to use is Latex. You can access the Latex files from the conference
webpage https://nips.cc/Conferences/2017/PaperInformation/StyleFiles. If you prefer not to install
a Latex compiler on your computer, you can use online services such as ShareLatex (https://www.
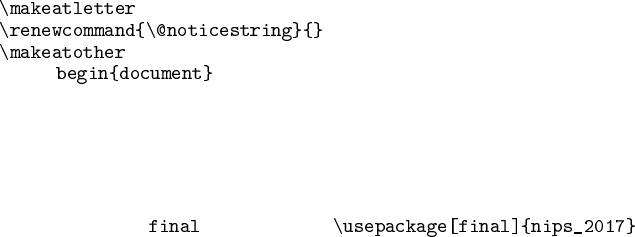
sharelatex.com/) or Overleaf (https://www.overleaf.com/). In your .tex-file, add the lines
before to suppress the conference-specific footnote.
If you instead prefer using Microsoft Word, OpenOffice, LibreOffice or similar, you may use the
older NIPS style files available at https://nips.cc/Conferences/2015/PaperInformation/StyleFiles.
When you submit your report for the first time, you should not include your own names in the report
(since it will be reviewed anonymously by your colleagues)! This is the default status in the Latex
files. If you later submit a revised report you should, however, include your names. In Latex this
is achieved by the option, i.e., use . In the .docx or .rtf
format you have to do the changes manually.
3.3 The title of your report
The title of your report should read "Group SXXX (K members): Mini Project Report", where SXXX
is the submission-id you will receive in a separate e-mail from the teaching assistants and K is the
number of group members in your group (this information needs to be specified manually since the
report is submitted anonymously).
3.4 How to submit your report
You submit your report using the student portal. (PhD students not registered via the student portal
submit per e-mail to andreas.svensson@it.uu.se.) All submitted reports will automatically be checked
for plagiarism using Urkund (http://www.urkund.com).
3.5 Contribution statements
As a separate document (a simple text file is enough), you should clearly state the contributions of
each group member, clarifying who contributed to which part, etc.
3.6 Peer review of the reports
Your report will be reviewed by another group. You will also receive the report of another group,
which you have to review. As a peer reviewer, you are expected to comment on the following aspects
of the report:
(I)
Whether the subset of methods chosen to explore is sufficiently large (methods from at least as
many ‘families’ as there is group members, plus the method of always predicting LIKE)
(II) If all tasks (a-c) from Section 2.2 are made for each method.
(III)
Make an assessment of the technical quality of the proposed solution. Have the considered
methods been used in a relevant way to address the problem at hand? Are there any flaws in
the reasoning and/or motivations used?
(IV) The report includes everything required from Section 3.1.
(V) The quality of the language in the report is satisfactory.
4
The review process is “double blind”, meaning that both the project report and the review report are
anonymous. The review report should be submitted as a simple text file (.txt). Start your review
report with the following lines:
Peer review of the report from group SYYY
The review is done by group SXXX
Here, SXXX is your submission-id, and SYYY is the submission-id of the group whose report you
have reviewed. There is no strict page limit for the review report, but a guideline is 1/2–1 page in
plain text. The review report is also submitted via the student portal.
Of course, you should use a polite and constructive language in your review. (Tip: think about how
you would assess your own report before you submit it!)
After you have submitted your review of the other report, you will get the review on your report from
another group, as well as comments and grades from the teaching assistants.
4 Grading
The first submission of the report will be graded with one out of four possible grades:
•
Fail, if the deadline is missed or the report is far from meeting the criteria. No revision is
possible until next time the course is given.
•
Revise, if there are only minor issues. A revised version should be handed in before the
revision deadline.
•Pass, if the report fulfills all criteria.
•
Pass with gold star, if the report fulfills all criteria, and in addition is written such that a
thorough understanding of the methods is conveyed and has a technical contribution beyond
the minimum requirements. This will earn you
5 bonus points
on the written exam (worth
roughly half a grade on the exam). The bonus points are valid for the exam in March and the
re-exams in June and August, 2018. After these three opportunities, the bonus points expire.
If applicable, the
second submission
of the report (after revision) will be graded with one out of two
possible grades:
•
Fail, if the deadlined is missed or the revised report still does not meet the criteria. No more
revision is possible until next time the course is given.
•Pass, if the report fulfills all criteria.
Please not that sub-standard reports will not be given the chance to be revised, and gold stars are
only handed out at the first submission.
5 Tip for getting started
Most background (methods, theory, R commands, etc.) you need to complete the mini project have
been/will be covered at lecture 3, 4, 5, 6 and 7 and problem solving sessions 3, 4, 5, 6, 7, 8 and
9. If you choose not to try boosting, you do not need lecture 7 and problem solving session 9, etc.
However, to get started, you only need the material from lecture 3 and 4.
5

6 Deadlines & other important dates
Moment Date
Last chance to submit to
http://www.it.uu.se/edu/course/homepage/sml/project/submit/ Thursday February 22
Submission of report Friday February 23
Receive the report of another group to peer review Monday February 26
Submit your peer review of another group’s report Thursday March 1
Receive peer review and teaching assistants’ comments Wednesday March 7 (at the latest)
Hand in revised report (if required) Sunday March 18
All deadlines are one minute before midnight, i.e., 23:59. All tasks in the table above are mandatory
in order to pass the project.
Good luck!
References
Bertin-Mahieux, Thierry, Daniel P.W. Ellis, Brian Whitman, and Paul Lamere (2011). “The million
song dataset”. In: Proceedings of the 12
th
International Society for Music Information Retrieval
Conference (ISMIR).
Dieleman, Sander (2016). “Keynote: Deep learning for audio-based music recommendation”. In:
Proceedings of the 1st Workshop on Deep Learning for Recommender Systems.
Fu, Zhouyu, Guojun Lu, Kai Ming Ting, and Dengsheng Zhang (2011). “A survey of audio-based
music classification and annotation”. In: IEEE Transactions on Multimedia 13.2.
Jacobson, Kurt, Vidhya Murali, Edward Newett, Brian Whitman, and Romain Yon (2016). “Music
Personalization at Spotify”. In: Proceedings of the 10th ACM Conference on Recommender Systems.
James, Gareth, Daniela Witten, Trevor Hastie, and Robert Tibshirani (2013). An introduction to
statistical learning. With applications in R. Springer.
Kaminskas, Marius and Francesco Ricci (2012). “Contextual music information retrieval and recom-
mendation: state of the art and challenges”. In: Computer Science Review 6.
Oord, Aaron van den, Sander Dieleman, and Benjamin Schrauwen (2013). “Deep content-based
music recommendation”. In: Advances in Neural Information Processing Systems 26 (NIPS).
6
