IReport Ultimate Guide
User Manual:
Open the PDF directly: View PDF ![]() .
.
Page Count: 364 [warning: Documents this large are best viewed by clicking the View PDF Link!]
- Chapter 1 Introduction
- Chapter 2 Getting Started
- Chapter 3 Basic Notions of JasperReports
- 3.1 The Report Life Cycle
- 3.2 JRXML Sources and Jasper Files
- 3.3 Data Sources and Print Formats
- 3.4 Compatibility Between Versions
- 3.5 Expressions
- 3.6 Using Java as a Language for Expressions
- 3.7 Using Groovy as a Language for Expressions
- 3.8 Using JavaScript as a Language for Expressions
- 3.9 Using JasperReports Extensions in iReport
- 3.10 A Simple Program
- Chapter 4 Report Structure
- Chapter 5 Report Elements
- Chapter 6 Fields, Parameters, and Variables
- Chapter 7 Bands and Groups
- Chapter 8 Fonts and Styles
- Chapter 9 Templates
- Chapter 10 Data Sources and Query Executers
- 10.1 How a JasperReports Data Source Works
- 10.2 Understanding Data Sources and Connections in iReport
- 10.3 Creating and Using JDBC Connections
- 10.4 Working with Your JDBC Connection
- 10.5 Understanding the JRDataSource Interface
- 10.6 Data Source Types
- 10.6.1 Using JavaBeans Set Data Sources
- 10.6.2 Fields of a JavaBean Set Data Source
- 10.6.3 Using XML Data Sources
- 10.6.4 Registration of the Fields for an XML Data Source
- 10.6.5 XML Data Source and Subreports
- 10.6.6 Using CSV Data Sources
- 10.6.7 Registration of the Fields for a CSV Data Source
- 10.6.8 Using JREmptyDataSource
- 10.6.9 Using HQL and Hibernate Connections
- 10.6.10 Using a Hadoop Hive Connection
- 10.6.11 How to Implement a New JRDataSource
- 10.6.12 Using a Personalized JRDataSource with iReport
- 10.7 Importing and Exporting Data Sources
- 10.8 Creating Custom Languages and Query Executers
- Chapter 11 Charts
- Chapter 12 Flash Charts
- Chapter 13 Lists, Tables, and Barcodes
- Chapter 14 Subdatasets
- Chapter 15 Crosstabs
- Chapter 16 Internationalization
- Chapter 17 Subreports
- Chapter 18 Scriptlets
- Chapter 19 Additional Tools
- Appendix A Chart Theme Example
- Index

ULTIMATE GUIDE
Jaspersoft
iReport Designer

iReport Ultimate Guide
2
Copyright © 2013 Jaspersoft Corporation. All rights reserved. Printed in the U.S.A. Jaspersoft, the Jaspersoft logo, Jaspersoft
iReport Designer, JasperReports Library, JasperReports Server, Jaspersoft OLAP, and Jaspersoft ETL are trademarks and/or
registered trademarks of Jaspersoft Corporation in the United States and in jurisdictions throughout the world. All other
company and product names are or may be trade names or trademarks of their respective owners.
This is version 0113-UGI50-6 of the iReport Ultimate Guide.

Table of Contents
3
TABLE OF CONTENTS
Chapter 1 Introduction . . . . . . . . . . . . . . . . . . . . . . . . . . . . . . . . . . . . . . . . . . . . . . . . . . . . . . . . . . . 9
1.1 Features of iReport . . . . . . . . . . . . . . . . . . . . . . . . . . . . . . . . . . . . . . . . . . . . . . . . . . . . . . . . . . . . . . . . 9
1.2 The iReport Community . . . . . . . . . . . . . . . . . . . . . . . . . . . . . . . . . . . . . . . . . . . . . . . . . . . . . . . . . . . . 10
1.3 JasperReports Commercial License . . . . . . . . . . . . . . . . . . . . . . . . . . . . . . . . . . . . . . . . . . . . . . . . . . 10
1.4 Code Used in This Book . . . . . . . . . . . . . . . . . . . . . . . . . . . . . . . . . . . . . . . . . . . . . . . . . . . . . . . . . . . 11
Chapter 2 Getting Started . . . . . . . . . . . . . . . . . . . . . . . . . . . . . . . . . . . . . . . . . . . . . . . . . . . . . . . . 13
2.1 Platform Requirements . . . . . . . . . . . . . . . . . . . . . . . . . . . . . . . . . . . . . . . . . . . . . . . . . . . . . . . . . . . . 13
2.2 Downloads . . . . . . . . . . . . . . . . . . . . . . . . . . . . . . . . . . . . . . . . . . . . . . . . . . . . . . . . . . . . . . . . . . . . . . 13
2.3 Development Versions . . . . . . . . . . . . . . . . . . . . . . . . . . . . . . . . . . . . . . . . . . . . . . . . . . . . . . . . . . . . . 14
2.4 Compiling iReport . . . . . . . . . . . . . . . . . . . . . . . . . . . . . . . . . . . . . . . . . . . . . . . . . . . . . . . . . . . . . . . . . 14
2.5 Installing iReport . . . . . . . . . . . . . . . . . . . . . . . . . . . . . . . . . . . . . . . . . . . . . . . . . . . . . . . . . . . . . . . . . 16
2.6 The Windows Installer . . . . . . . . . . . . . . . . . . . . . . . . . . . . . . . . . . . . . . . . . . . . . . . . . . . . . . . . . . . . . 17
2.7 Installing iReport on Mac OSX . . . . . . . . . . . . . . . . . . . . . . . . . . . . . . . . . . . . . . . . . . . . . . . . . . . . . . . 19
2.8 First iReport Execution . . . . . . . . . . . . . . . . . . . . . . . . . . . . . . . . . . . . . . . . . . . . . . . . . . . . . . . . . . . . . 19
2.9 Creating a JDBC Connection . . . . . . . . . . . . . . . . . . . . . . . . . . . . . . . . . . . . . . . . . . . . . . . . . . . . . . . . 21
2.10 Creating Your First Report . . . . . . . . . . . . . . . . . . . . . . . . . . . . . . . . . . . . . . . . . . . . . . . . . . . . . . . . . . 25
2.10.1 Using the Sample Database . . . . . . . . . . . . . . . . . . . . . . . . . . . . . . . . . . . . . . . . . . . . . . . . . 25
2.10.2 Using the Report Wizard . . . . . . . . . . . . . . . . . . . . . . . . . . . . . . . . . . . . . . . . . . . . . . . . . . . 25
Chapter 3 Basic Notions of JasperReports . . . . . . . . . . . . . . . . . . . . . . . . . . . . . . . . . . . . . . . . . 31
3.1 The Report Life Cycle . . . . . . . . . . . . . . . . . . . . . . . . . . . . . . . . . . . . . . . . . . . . . . . . . . . . . . . . . . . . . 31
3.2 JRXML Sources and Jasper Files . . . . . . . . . . . . . . . . . . . . . . . . . . . . . . . . . . . . . . . . . . . . . . . . . . . . 32
3.3 Data Sources and Print Formats . . . . . . . . . . . . . . . . . . . . . . . . . . . . . . . . . . . . . . . . . . . . . . . . . . . . . 37
3.4 Compatibility Between Versions . . . . . . . . . . . . . . . . . . . . . . . . . . . . . . . . . . . . . . . . . . . . . . . . . . . . . . 37
3.5 Expressions . . . . . . . . . . . . . . . . . . . . . . . . . . . . . . . . . . . . . . . . . . . . . . . . . . . . . . . . . . . . . . . . . . . . . 38
3.5.1 The Type of an Expression . . . . . . . . . . . . . . . . . . . . . . . . . . . . . . . . . . . . . . . . . . . . . . . . . . 38
3.5.2 Expression Operators and Object Methods . . . . . . . . . . . . . . . . . . . . . . . . . . . . . . . . . . . . . 39
3.5.3 Using an If-Else Construct in an Expression . . . . . . . . . . . . . . . . . . . . . . . . . . . . . . . . . . . . 40

4
Jaspersoft Style Guide and FrameMaker Template
3.6 Using Java as a Language for Expressions . . . . . . . . . . . . . . . . . . . . . . . . . . . . . . . . . . . . . . . . . . . . . 41
3.7 Using Groovy as a Language for Expressions . . . . . . . . . . . . . . . . . . . . . . . . . . . . . . . . . . . . . . . . . . . 41
3.8 Using JavaScript as a Language for Expressions . . . . . . . . . . . . . . . . . . . . . . . . . . . . . . . . . . . . . . . . 42
3.9 Using JasperReports Extensions in iReport . . . . . . . . . . . . . . . . . . . . . . . . . . . . . . . . . . . . . . . . . . . . . 43
3.10 A Simple Program . . . . . . . . . . . . . . . . . . . . . . . . . . . . . . . . . . . . . . . . . . . . . . . . . . . . . . . . . . . . . . . . 43
Chapter 4 Report Structure . . . . . . . . . . . . . . . . . . . . . . . . . . . . . . . . . . . . . . . . . . . . . . . . . . . . . . 45
4.1 Bands . . . . . . . . . . . . . . . . . . . . . . . . . . . . . . . . . . . . . . . . . . . . . . . . . . . . . . . . . . . . . . . . . . . . . . . . . . 45
4.1.1 Report Properties . . . . . . . . . . . . . . . . . . . . . . . . . . . . . . . . . . . . . . . . . . . . . . . . . . . . . . . . . 47
4.1.2 Columns . . . . . . . . . . . . . . . . . . . . . . . . . . . . . . . . . . . . . . . . . . . . . . . . . . . . . . . . . . . . . . . . 49
4.1.3 Advanced Report Options . . . . . . . . . . . . . . . . . . . . . . . . . . . . . . . . . . . . . . . . . . . . . . . . . . 53
4.2 Working with Bands . . . . . . . . . . . . . . . . . . . . . . . . . . . . . . . . . . . . . . . . . . . . . . . . . . . . . . . . . . . . . . . 59
4.2.1 Band Height . . . . . . . . . . . . . . . . . . . . . . . . . . . . . . . . . . . . . . . . . . . . . . . . . . . . . . . . . . . . . 60
4.2.2 Print When Expression . . . . . . . . . . . . . . . . . . . . . . . . . . . . . . . . . . . . . . . . . . . . . . . . . . . . . 60
4.2.3 Split Allowed and Split Type . . . . . . . . . . . . . . . . . . . . . . . . . . . . . . . . . . . . . . . . . . . . . . . . . 61
4.3 Summary . . . . . . . . . . . . . . . . . . . . . . . . . . . . . . . . . . . . . . . . . . . . . . . . . . . . . . . . . . . . . . . . . . . . . . . 61
Chapter 5 Report Elements . . . . . . . . . . . . . . . . . . . . . . . . . . . . . . . . . . . . . . . . . . . . . . . . . . . . . . 63
5.1 Working with Elements . . . . . . . . . . . . . . . . . . . . . . . . . . . . . . . . . . . . . . . . . . . . . . . . . . . . . . . . . . . . . 64
5.1.1 Formatting Tools . . . . . . . . . . . . . . . . . . . . . . . . . . . . . . . . . . . . . . . . . . . . . . . . . . . . . . . . . . 68
5.1.2 Managing Elements with the Report Inspector . . . . . . . . . . . . . . . . . . . . . . . . . . . . . . . . . . . 70
5.1.3 Basic Element Attributes . . . . . . . . . . . . . . . . . . . . . . . . . . . . . . . . . . . . . . . . . . . . . . . . . . . 70
5.1.4 Element Custom Properties . . . . . . . . . . . . . . . . . . . . . . . . . . . . . . . . . . . . . . . . . . . . . . . . . 72
5.1.5 Graphic Elements . . . . . . . . . . . . . . . . . . . . . . . . . . . . . . . . . . . . . . . . . . . . . . . . . . . . . . . . . 73
5.2 Working with Images . . . . . . . . . . . . . . . . . . . . . . . . . . . . . . . . . . . . . . . . . . . . . . . . . . . . . . . . . . . . . . 76
5.2.1 Padding and Borders . . . . . . . . . . . . . . . . . . . . . . . . . . . . . . . . . . . . . . . . . . . . . . . . . . . . . . 79
5.2.2 Loading an Image from the Database (BLOB Field) . . . . . . . . . . . . . . . . . . . . . . . . . . . . . . . 80
5.2.3 Creating an Image Dynamically . . . . . . . . . . . . . . . . . . . . . . . . . . . . . . . . . . . . . . . . . . . . . . 80
5.3 Working with Text . . . . . . . . . . . . . . . . . . . . . . . . . . . . . . . . . . . . . . . . . . . . . . . . . . . . . . . . . . . . . . . . . 83
5.3.1 Static Text . . . . . . . . . . . . . . . . . . . . . . . . . . . . . . . . . . . . . . . . . . . . . . . . . . . . . . . . . . . . . . . 87
5.3.2 Textfields . . . . . . . . . . . . . . . . . . . . . . . . . . . . . . . . . . . . . . . . . . . . . . . . . . . . . . . . . . . . . . . 87
5.4 Other Elements . . . . . . . . . . . . . . . . . . . . . . . . . . . . . . . . . . . . . . . . . . . . . . . . . . . . . . . . . . . . . . . . . . 90
5.4.1 Subreports . . . . . . . . . . . . . . . . . . . . . . . . . . . . . . . . . . . . . . . . . . . . . . . . . . . . . . . . . . . . . . 90
5.4.2 Frame . . . . . . . . . . . . . . . . . . . . . . . . . . . . . . . . . . . . . . . . . . . . . . . . . . . . . . . . . . . . . . . . . . 91
5.4.3 Chart . . . . . . . . . . . . . . . . . . . . . . . . . . . . . . . . . . . . . . . . . . . . . . . . . . . . . . . . . . . . . . . . . . . 92
5.4.4 Crosstab . . . . . . . . . . . . . . . . . . . . . . . . . . . . . . . . . . . . . . . . . . . . . . . . . . . . . . . . . . . . . . . . 92
5.4.5 Page/Column Break . . . . . . . . . . . . . . . . . . . . . . . . . . . . . . . . . . . . . . . . . . . . . . . . . . . . . . . 92
5.5 Adding Custom Components and Generic Elements . . . . . . . . . . . . . . . . . . . . . . . . . . . . . . . . . . . . . . 93
5.6 Anchors . . . . . . . . . . . . . . . . . . . . . . . . . . . . . . . . . . . . . . . . . . . . . . . . . . . . . . . . . . . . . . . . . . . . . . . . 93
5.6.1 Hyperlink Type . . . . . . . . . . . . . . . . . . . . . . . . . . . . . . . . . . . . . . . . . . . . . . . . . . . . . . . . . . . 94
5.6.2 Hyperlink Parameters . . . . . . . . . . . . . . . . . . . . . . . . . . . . . . . . . . . . . . . . . . . . . . . . . . . . . . 94
5.6.3 Hyperlink Tooltip . . . . . . . . . . . . . . . . . . . . . . . . . . . . . . . . . . . . . . . . . . . . . . . . . . . . . . . . . . 94
Chapter 6 Fields, Parameters, and Variables . . . . . . . . . . . . . . . . . . . . . . . . . . . . . . . . . . . . . . . . 95
6.1 Working with Fields . . . . . . . . . . . . . . . . . . . . . . . . . . . . . . . . . . . . . . . . . . . . . . . . . . . . . . . . . . . . . . . 96

Table of Contents
5
6.1.1 Registration of the Fields from a SQL Query . . . . . . . . . . . . . . . . . . . . . . . . . . . . . . . . . . . . 97
6.1.2 Accessing the SQL Query Designer . . . . . . . . . . . . . . . . . . . . . . . . . . . . . . . . . . . . . . . . . . . 99
6.1.3 Registration of the Fields of a JavaBean . . . . . . . . . . . . . . . . . . . . . . . . . . . . . . . . . . . . . . . 99
6.1.4 Fields and Textfields . . . . . . . . . . . . . . . . . . . . . . . . . . . . . . . . . . . . . . . . . . . . . . . . . . . . . . 100
6.2 Working with Parameters . . . . . . . . . . . . . . . . . . . . . . . . . . . . . . . . . . . . . . . . . . . . . . . . . . . . . . . . . . 101
6.2.1 Using Parameters in a Query . . . . . . . . . . . . . . . . . . . . . . . . . . . . . . . . . . . . . . . . . . . . . . . 101
6.2.2 IN and NOTIN clause . . . . . . . . . . . . . . . . . . . . . . . . . . . . . . . . . . . . . . . . . . . . . . . . . . . . . 102
6.2.3 Built-in Parameters . . . . . . . . . . . . . . . . . . . . . . . . . . . . . . . . . . . . . . . . . . . . . . . . . . . . . . . 103
6.2.4 Relative Dates . . . . . . . . . . . . . . . . . . . . . . . . . . . . . . . . . . . . . . . . . . . . . . . . . . . . . . . . . . 104
6.2.5 Passing Parameters from a Program . . . . . . . . . . . . . . . . . . . . . . . . . . . . . . . . . . . . . . . . . 106
6.3 Working with Variables . . . . . . . . . . . . . . . . . . . . . . . . . . . . . . . . . . . . . . . . . . . . . . . . . . . . . . . . . . . . 108
6.4 Evaluating Elements During Report Generation . . . . . . . . . . . . . . . . . . . . . . . . . . . . . . . . . . . . . . . . 110
Chapter 7 Bands and Groups . . . . . . . . . . . . . . . . . . . . . . . . . . . . . . . . . . . . . . . . . . . . . . . . . . . 113
7.1 Modifying Bands . . . . . . . . . . . . . . . . . . . . . . . . . . . . . . . . . . . . . . . . . . . . . . . . . . . . . . . . . . . . . . . . . 113
7.2 Working with Groups . . . . . . . . . . . . . . . . . . . . . . . . . . . . . . . . . . . . . . . . . . . . . . . . . . . . . . . . . . . . . 114
7.3 Other Group Options . . . . . . . . . . . . . . . . . . . . . . . . . . . . . . . . . . . . . . . . . . . . . . . . . . . . . . . . . . . . . 123
Chapter 8 Fonts and Styles . . . . . . . . . . . . . . . . . . . . . . . . . . . . . . . . . . . . . . . . . . . . . . . . . . . . . 125
8.1 Working with Fonts . . . . . . . . . . . . . . . . . . . . . . . . . . . . . . . . . . . . . . . . . . . . . . . . . . . . . . . . . . . . . . . 125
8.2 Using TrueType Fonts . . . . . . . . . . . . . . . . . . . . . . . . . . . . . . . . . . . . . . . . . . . . . . . . . . . . . . . . . . . . 126
8.3 Using the Font Extensions . . . . . . . . . . . . . . . . . . . . . . . . . . . . . . . . . . . . . . . . . . . . . . . . . . . . . . . . . 127
8.4 Character Encoding . . . . . . . . . . . . . . . . . . . . . . . . . . . . . . . . . . . . . . . . . . . . . . . . . . . . . . . . . . . . . . 133
8.5 Use of Unicode Characters . . . . . . . . . . . . . . . . . . . . . . . . . . . . . . . . . . . . . . . . . . . . . . . . . . . . . . . . 133
8.6 Working with Styles . . . . . . . . . . . . . . . . . . . . . . . . . . . . . . . . . . . . . . . . . . . . . . . . . . . . . . . . . . . . . . 133
8.7 Creating Style Conditions . . . . . . . . . . . . . . . . . . . . . . . . . . . . . . . . . . . . . . . . . . . . . . . . . . . . . . . . . . 135
8.8 Referencing Styles in External Property Sheets . . . . . . . . . . . . . . . . . . . . . . . . . . . . . . . . . . . . . . . . 137
Chapter 9 Templates . . . . . . . . . . . . . . . . . . . . . . . . . . . . . . . . . . . . . . . . . . . . . . . . . . . . . . . . . . . 139
9.1 Template Structure Overview . . . . . . . . . . . . . . . . . . . . . . . . . . . . . . . . . . . . . . . . . . . . . . . . . . . . . . . 140
9.2 Groups . . . . . . . . . . . . . . . . . . . . . . . . . . . . . . . . . . . . . . . . . . . . . . . . . . . . . . . . . . . . . . . . . . . . . . . . 144
9.3 Column Header . . . . . . . . . . . . . . . . . . . . . . . . . . . . . . . . . . . . . . . . . . . . . . . . . . . . . . . . . . . . . . . . . 145
9.4 Detail Band . . . . . . . . . . . . . . . . . . . . . . . . . . . . . . . . . . . . . . . . . . . . . . . . . . . . . . . . . . . . . . . . . . . . . 145
9.5 Template Type and Other Options . . . . . . . . . . . . . . . . . . . . . . . . . . . . . . . . . . . . . . . . . . . . . . . . . . . 145
9.6 Creating a New Template . . . . . . . . . . . . . . . . . . . . . . . . . . . . . . . . . . . . . . . . . . . . . . . . . . . . . . . . . 146
9.7 Installing and Using the Template . . . . . . . . . . . . . . . . . . . . . . . . . . . . . . . . . . . . . . . . . . . . . . . . . . . 147
Chapter 10 Data Sources and Query Executers . . . . . . . . . . . . . . . . . . . . . . . . . . . . . . . . . . . . . . 153
10.1 How a JasperReports Data Source Works . . . . . . . . . . . . . . . . . . . . . . . . . . . . . . . . . . . . . . . . . . . . 153
10.2 Understanding Data Sources and Connections in iReport . . . . . . . . . . . . . . . . . . . . . . . . . . . . . . . . . 154
10.3 Creating and Using JDBC Connections . . . . . . . . . . . . . . . . . . . . . . . . . . . . . . . . . . . . . . . . . . . . . . . 156
10.3.1 ClassNotFoundError . . . . . . . . . . . . . . . . . . . . . . . . . . . . . . . . . . . . . . . . . . . . . . . . . . . . . . 158
10.3.2 URL Not Correct . . . . . . . . . . . . . . . . . . . . . . . . . . . . . . . . . . . . . . . . . . . . . . . . . . . . . . . . . 159
10.3.3 Parameters Not Correct for the Connection . . . . . . . . . . . . . . . . . . . . . . . . . . . . . . . . . . . . 159
10.3.4 Creating a JDBC Connection via the Services View . . . . . . . . . . . . . . . . . . . . . . . . . . . . . 159

6
Jaspersoft Style Guide and FrameMaker Template
10.4 Working with Your JDBC Connection . . . . . . . . . . . . . . . . . . . . . . . . . . . . . . . . . . . . . . . . . . . . . . . . 161
10.4.1 Fields Registration . . . . . . . . . . . . . . . . . . . . . . . . . . . . . . . . . . . . . . . . . . . . . . . . . . . . . . . 162
10.4.2 Sorting and Filtering Records . . . . . . . . . . . . . . . . . . . . . . . . . . . . . . . . . . . . . . . . . . . . . . . 162
10.5 Understanding the JRDataSource Interface . . . . . . . . . . . . . . . . . . . . . . . . . . . . . . . . . . . . . . . . . . . 163
10.6 Data Source Types . . . . . . . . . . . . . . . . . . . . . . . . . . . . . . . . . . . . . . . . . . . . . . . . . . . . . . . . . . . . . . 164
10.6.1 Using JavaBeans Set Data Sources . . . . . . . . . . . . . . . . . . . . . . . . . . . . . . . . . . . . . . . . . 164
10.6.2 Fields of a JavaBean Set Data Source . . . . . . . . . . . . . . . . . . . . . . . . . . . . . . . . . . . . . . . . 167
10.6.3 Using XML Data Sources . . . . . . . . . . . . . . . . . . . . . . . . . . . . . . . . . . . . . . . . . . . . . . . . . . 169
10.6.4 Registration of the Fields for an XML Data Source . . . . . . . . . . . . . . . . . . . . . . . . . . . . . . 171
10.6.5 XML Data Source and Subreports . . . . . . . . . . . . . . . . . . . . . . . . . . . . . . . . . . . . . . . . . . . 173
10.6.6 Using CSV Data Sources . . . . . . . . . . . . . . . . . . . . . . . . . . . . . . . . . . . . . . . . . . . . . . . . . 177
10.6.7 Registration of the Fields for a CSV Data Source . . . . . . . . . . . . . . . . . . . . . . . . . . . . . . . 179
10.6.8 Using JREmptyDataSource . . . . . . . . . . . . . . . . . . . . . . . . . . . . . . . . . . . . . . . . . . . . . . . . 180
10.6.9 Using HQL and Hibernate Connections . . . . . . . . . . . . . . . . . . . . . . . . . . . . . . . . . . . . . . . 180
10.6.10 Using a Hadoop Hive Connection . . . . . . . . . . . . . . . . . . . . . . . . . . . . . . . . . . . . . . . . . . . 183
10.6.11 How to Implement a New JRDataSource . . . . . . . . . . . . . . . . . . . . . . . . . . . . . . . . . . . . . . 185
10.6.12 Using a Personalized JRDataSource with iReport . . . . . . . . . . . . . . . . . . . . . . . . . . . . . . . 187
10.7 Importing and Exporting Data Sources . . . . . . . . . . . . . . . . . . . . . . . . . . . . . . . . . . . . . . . . . . . . . . . 189
10.8 Creating Custom Languages and Query Executers . . . . . . . . . . . . . . . . . . . . . . . . . . . . . . . . . . . . . . 190
10.8.1 Creating a Query Executer for a Custom Language . . . . . . . . . . . . . . . . . . . . . . . . . . . . . . 191
10.8.2 Creating a FieldsProvider . . . . . . . . . . . . . . . . . . . . . . . . . . . . . . . . . . . . . . . . . . . . . . . . . . 198
Chapter 11 Charts . . . . . . . . . . . . . . . . . . . . . . . . . . . . . . . . . . . . . . . . . . . . . . . . . . . . . . . . . . . . . . 203
11.1 Creating a Simple Chart . . . . . . . . . . . . . . . . . . . . . . . . . . . . . . . . . . . . . . . . . . . . . . . . . . . . . . . . . . . 203
11.2 Using Datasets . . . . . . . . . . . . . . . . . . . . . . . . . . . . . . . . . . . . . . . . . . . . . . . . . . . . . . . . . . . . . . . . . 209
11.3 Value Hyperlinks . . . . . . . . . . . . . . . . . . . . . . . . . . . . . . . . . . . . . . . . . . . . . . . . . . . . . . . . . . . . . . . . 209
11.4 Properties of Charts . . . . . . . . . . . . . . . . . . . . . . . . . . . . . . . . . . . . . . . . . . . . . . . . . . . . . . . . . . . . . . 210
11.5 Using Chart Themes . . . . . . . . . . . . . . . . . . . . . . . . . . . . . . . . . . . . . . . . . . . . . . . . . . . . . . . . . . . . . 211
11.5.1 Using the Chart Theme Designer . . . . . . . . . . . . . . . . . . . . . . . . . . . . . . . . . . . . . . . . . . . . 211
11.5.2 Creating a JasperReports Extension for a Chart Theme . . . . . . . . . . . . . . . . . . . . . . . . . . 212
11.5.3 Using a Chart Theme in the Report Designer . . . . . . . . . . . . . . . . . . . . . . . . . . . . . . . . . . . 213
11.6 HTML5 Charts . . . . . . . . . . . . . . . . . . . . . . . . . . . . . . . . . . . . . . . . . . . . . . . . . . . . . . . . . . . . . . . . . . 215
Chapter 12 Flash Charts . . . . . . . . . . . . . . . . . . . . . . . . . . . . . . . . . . . . . . . . . . . . . . . . . . . . . . . . . 223
12.1 Viewing Flash Objects . . . . . . . . . . . . . . . . . . . . . . . . . . . . . . . . . . . . . . . . . . . . . . . . . . . . . . . . . . . . 224
12.2 Using Maps Pro . . . . . . . . . . . . . . . . . . . . . . . . . . . . . . . . . . . . . . . . . . . . . . . . . . . . . . . . . . . . . . . . . 224
12.2.1 Creating Maps . . . . . . . . . . . . . . . . . . . . . . . . . . . . . . . . . . . . . . . . . . . . . . . . . . . . . . . . . . 224
12.2.2 Determining Map Entity IDs . . . . . . . . . . . . . . . . . . . . . . . . . . . . . . . . . . . . . . . . . . . . . . . . 226
12.2.3 Specifying Map Data . . . . . . . . . . . . . . . . . . . . . . . . . . . . . . . . . . . . . . . . . . . . . . . . . . . . . 229
12.2.4 Specifying Map Colors . . . . . . . . . . . . . . . . . . . . . . . . . . . . . . . . . . . . . . . . . . . . . . . . . . . . 232
12.2.5 Localizing Maps . . . . . . . . . . . . . . . . . . . . . . . . . . . . . . . . . . . . . . . . . . . . . . . . . . . . . . . . . 233
12.3 Using Charts Pro . . . . . . . . . . . . . . . . . . . . . . . . . . . . . . . . . . . . . . . . . . . . . . . . . . . . . . . . . . . . . . . . 234
12.3.1 Creating Charts . . . . . . . . . . . . . . . . . . . . . . . . . . . . . . . . . . . . . . . . . . . . . . . . . . . . . . . . . 236
12.3.2 Specifying Chart Data . . . . . . . . . . . . . . . . . . . . . . . . . . . . . . . . . . . . . . . . . . . . . . . . . . . . . 239
12.3.3 Defining Trend Lines . . . . . . . . . . . . . . . . . . . . . . . . . . . . . . . . . . . . . . . . . . . . . . . . . . . . . 242

Table of Contents
7
12.4 Using Widgets Pro . . . . . . . . . . . . . . . . . . . . . . . . . . . . . . . . . . . . . . . . . . . . . . . . . . . . . . . . . . . . . . . 243
12.4.1 Widget Types . . . . . . . . . . . . . . . . . . . . . . . . . . . . . . . . . . . . . . . . . . . . . . . . . . . . . . . . . . . 243
12.4.2 Creating Widgets . . . . . . . . . . . . . . . . . . . . . . . . . . . . . . . . . . . . . . . . . . . . . . . . . . . . . . . . 245
12.4.3 Specifying Widget Data . . . . . . . . . . . . . . . . . . . . . . . . . . . . . . . . . . . . . . . . . . . . . . . . . . . 248
12.5 Embedding Components in a Java Application . . . . . . . . . . . . . . . . . . . . . . . . . . . . . . . . . . . . . . . . . 257
12.6 Localizing a Component . . . . . . . . . . . . . . . . . . . . . . . . . . . . . . . . . . . . . . . . . . . . . . . . . . . . . . . . . . . 258
12.7 Component Limitations . . . . . . . . . . . . . . . . . . . . . . . . . . . . . . . . . . . . . . . . . . . . . . . . . . . . . . . . . . . 258
Chapter 13 Lists, Tables, and Barcodes . . . . . . . . . . . . . . . . . . . . . . . . . . . . . . . . . . . . . . . . . . . . 259
13.1 Lists . . . . . . . . . . . . . . . . . . . . . . . . . . . . . . . . . . . . . . . . . . . . . . . . . . . . . . . . . . . . . . . . . . . . . . . . . . 259
13.1.1 Working with the List Component . . . . . . . . . . . . . . . . . . . . . . . . . . . . . . . . . . . . . . . . . . . . 259
13.1.2 Parameters and Variables in a List Element . . . . . . . . . . . . . . . . . . . . . . . . . . . . . . . . . . . . 262
13.1.3 List Component Issues . . . . . . . . . . . . . . . . . . . . . . . . . . . . . . . . . . . . . . . . . . . . . . . . . . . . 265
13.1.4 Print Order: Vertical and Horizontal Lists . . . . . . . . . . . . . . . . . . . . . . . . . . . . . . . . . . . . . . 266
13.1.5 Other Uses of the List . . . . . . . . . . . . . . . . . . . . . . . . . . . . . . . . . . . . . . . . . . . . . . . . . . . . . 266
13.1.6 Compatibility . . . . . . . . . . . . . . . . . . . . . . . . . . . . . . . . . . . . . . . . . . . . . . . . . . . . . . . . . . . . 266
13.2 Tables . . . . . . . . . . . . . . . . . . . . . . . . . . . . . . . . . . . . . . . . . . . . . . . . . . . . . . . . . . . . . . . . . . . . . . . . 267
13.2.1 Creating a Table . . . . . . . . . . . . . . . . . . . . . . . . . . . . . . . . . . . . . . . . . . . . . . . . . . . . . . . . . 267
13.2.2 Table Structure . . . . . . . . . . . . . . . . . . . . . . . . . . . . . . . . . . . . . . . . . . . . . . . . . . . . . . . . . . 269
13.2.3 Editing the Table Layout . . . . . . . . . . . . . . . . . . . . . . . . . . . . . . . . . . . . . . . . . . . . . . . . . . . 273
13.2.4 Editing the Dataset Run . . . . . . . . . . . . . . . . . . . . . . . . . . . . . . . . . . . . . . . . . . . . . . . . . . . 273
13.2.5 Working with Columns . . . . . . . . . . . . . . . . . . . . . . . . . . . . . . . . . . . . . . . . . . . . . . . . . . . . 274
13.2.6 Compatibility . . . . . . . . . . . . . . . . . . . . . . . . . . . . . . . . . . . . . . . . . . . . . . . . . . . . . . . . . . . . 275
13.3 Barcodes . . . . . . . . . . . . . . . . . . . . . . . . . . . . . . . . . . . . . . . . . . . . . . . . . . . . . . . . . . . . . . . . . . . . . . 275
13.3.1 Working with Barcodes . . . . . . . . . . . . . . . . . . . . . . . . . . . . . . . . . . . . . . . . . . . . . . . . . . . . 276
13.3.2 Barbecue Component . . . . . . . . . . . . . . . . . . . . . . . . . . . . . . . . . . . . . . . . . . . . . . . . . . . . . 278
13.3.3 Barcode4J Component . . . . . . . . . . . . . . . . . . . . . . . . . . . . . . . . . . . . . . . . . . . . . . . . . . . . 278
13.3.4 Compatibility . . . . . . . . . . . . . . . . . . . . . . . . . . . . . . . . . . . . . . . . . . . . . . . . . . . . . . . . . . . . 280
Chapter 14 Subdatasets . . . . . . . . . . . . . . . . . . . . . . . . . . . . . . . . . . . . . . . . . . . . . . . . . . . . . . . . 281
14.1 Creating a Subdataset . . . . . . . . . . . . . . . . . . . . . . . . . . . . . . . . . . . . . . . . . . . . . . . . . . . . . . . . . . . . 281
14.2 Creating Dataset Runs . . . . . . . . . . . . . . . . . . . . . . . . . . . . . . . . . . . . . . . . . . . . . . . . . . . . . . . . . . . . 283
14.3 Working Through an Example Subdataset . . . . . . . . . . . . . . . . . . . . . . . . . . . . . . . . . . . . . . . . . . . . 284
Chapter 15 Crosstabs . . . . . . . . . . . . . . . . . . . . . . . . . . . . . . . . . . . . . . . . . . . . . . . . . . . . . . . . . . . 289
15.1 Using the Crosstab Wizard . . . . . . . . . . . . . . . . . . . . . . . . . . . . . . . . . . . . . . . . . . . . . . . . . . . . . . . . 289
15.2 Working with Columns, Rows, and Measures . . . . . . . . . . . . . . . . . . . . . . . . . . . . . . . . . . . . . . . . . . 294
15.2.1 Modifying Cells . . . . . . . . . . . . . . . . . . . . . . . . . . . . . . . . . . . . . . . . . . . . . . . . . . . . . . . . . . 297
15.2.2 Understanding Measures . . . . . . . . . . . . . . . . . . . . . . . . . . . . . . . . . . . . . . . . . . . . . . . . . . 298
15.3 Modifying Crosstab Element Properties . . . . . . . . . . . . . . . . . . . . . . . . . . . . . . . . . . . . . . . . . . . . . . . 298
15.4 Crosstab Parameters . . . . . . . . . . . . . . . . . . . . . . . . . . . . . . . . . . . . . . . . . . . . . . . . . . . . . . . . . . . . . 299
15.5 Working with Crosstab Data . . . . . . . . . . . . . . . . . . . . . . . . . . . . . . . . . . . . . . . . . . . . . . . . . . . . . . . . 300
15.6 Using Crosstab Total Variables . . . . . . . . . . . . . . . . . . . . . . . . . . . . . . . . . . . . . . . . . . . . . . . . . . . . . 301

8
Jaspersoft Style Guide and FrameMaker Template
Chapter 16 Internationalization . . . . . . . . . . . . . . . . . . . . . . . . . . . . . . . . . . . . . . . . . . . . . . . . . . . 305
16.1 Using a Resource Bundle Base Name . . . . . . . . . . . . . . . . . . . . . . . . . . . . . . . . . . . . . . . . . . . . . . . . 305
16.2 Retrieving Localized Strings . . . . . . . . . . . . . . . . . . . . . . . . . . . . . . . . . . . . . . . . . . . . . . . . . . . . . . . . 309
16.3 Formatting Messages . . . . . . . . . . . . . . . . . . . . . . . . . . . . . . . . . . . . . . . . . . . . . . . . . . . . . . . . . . . . . 309
16.4 Deploying Localized Reports . . . . . . . . . . . . . . . . . . . . . . . . . . . . . . . . . . . . . . . . . . . . . . . . . . . . . . . 310
16.5 Generating a Report Using a Specific Locale and Time Zone . . . . . . . . . . . . . . . . . . . . . . . . . . . . . . 310
Chapter 17 Subreports . . . . . . . . . . . . . . . . . . . . . . . . . . . . . . . . . . . . . . . . . . . . . . . . . . . . . . . . . . 313
17.1 Creating a Subreport . . . . . . . . . . . . . . . . . . . . . . . . . . . . . . . . . . . . . . . . . . . . . . . . . . . . . . . . . . . . . 313
17.1.1 Linking a Subreport to the Parent Report . . . . . . . . . . . . . . . . . . . . . . . . . . . . . . . . . . . . . . 314
17.1.2 Specifying the Subreport . . . . . . . . . . . . . . . . . . . . . . . . . . . . . . . . . . . . . . . . . . . . . . . . . . 315
17.1.3 Specifying the Data Source . . . . . . . . . . . . . . . . . . . . . . . . . . . . . . . . . . . . . . . . . . . . . . . . 316
17.1.4 Passing Parameters . . . . . . . . . . . . . . . . . . . . . . . . . . . . . . . . . . . . . . . . . . . . . . . . . . . . . . 316
17.2 A Step-by-Step Example . . . . . . . . . . . . . . . . . . . . . . . . . . . . . . . . . . . . . . . . . . . . . . . . . . . . . . . . . . 317
17.3 Returning Values from a Subreport . . . . . . . . . . . . . . . . . . . . . . . . . . . . . . . . . . . . . . . . . . . . . . . . . . 324
17.4 Using the Subreport Wizard . . . . . . . . . . . . . . . . . . . . . . . . . . . . . . . . . . . . . . . . . . . . . . . . . . . . . . . . 327
17.4.1 Create a New Report via the Subreport Wizard . . . . . . . . . . . . . . . . . . . . . . . . . . . . . . . . . 327
17.4.2 Specifying an Existing Report in the Subreport Wizard . . . . . . . . . . . . . . . . . . . . . . . . . . . 328
Chapter 18 Scriptlets . . . . . . . . . . . . . . . . . . . . . . . . . . . . . . . . . . . . . . . . . . . . . . . . . . . . . . . . . . . 333
18.1 Understanding the JRAbstractScriptlet Class . . . . . . . . . . . . . . . . . . . . . . . . . . . . . . . . . . . . . . . 333
18.2 Creating a Simple Scriptlet . . . . . . . . . . . . . . . . . . . . . . . . . . . . . . . . . . . . . . . . . . . . . . . . . . . . . . . . . 335
18.3 Testing a Scriptlet in iReport . . . . . . . . . . . . . . . . . . . . . . . . . . . . . . . . . . . . . . . . . . . . . . . . . . . . . . . 339
18.4 Accessing iReport Objects . . . . . . . . . . . . . . . . . . . . . . . . . . . . . . . . . . . . . . . . . . . . . . . . . . . . . . . . . 341
18.5 Debugging a Scriptlet . . . . . . . . . . . . . . . . . . . . . . . . . . . . . . . . . . . . . . . . . . . . . . . . . . . . . . . . . . . . . 342
18.6 Deploying Reports That Use Scriptlets . . . . . . . . . . . . . . . . . . . . . . . . . . . . . . . . . . . . . . . . . . . . . . . 345
Chapter 19 Additional Tools . . . . . . . . . . . . . . . . . . . . . . . . . . . . . . . . . . . . . . . . . . . . . . . . . . . . . 347
19.1 Callout Tool . . . . . . . . . . . . . . . . . . . . . . . . . . . . . . . . . . . . . . . . . . . . . . . . . . . . . . . . . . . . . . . . . . . . 347
19.1.1 Current Date Tool . . . . . . . . . . . . . . . . . . . . . . . . . . . . . . . . . . . . . . . . . . . . . . . . . . . . . . . . 348
19.2 Page Number, Total Pages and Page X of Y Tools . . . . . . . . . . . . . . . . . . . . . . . . . . . . . . . . . . . . . . 349
19.2.1 Page Number Tools . . . . . . . . . . . . . . . . . . . . . . . . . . . . . . . . . . . . . . . . . . . . . . . . . . . . . . 349
19.2.2 Printing Page X of Y in a Single Textfield . . . . . . . . . . . . . . . . . . . . . . . . . . . . . . . . . . . . . . 349
19.3 Percentage Tool . . . . . . . . . . . . . . . . . . . . . . . . . . . . . . . . . . . . . . . . . . . . . . . . . . . . . . . . . . . . . . . . . 350
19.4 Using a Background Image as Reference . . . . . . . . . . . . . . . . . . . . . . . . . . . . . . . . . . . . . . . . . . . . . 351
19.5 How to Run the Samples . . . . . . . . . . . . . . . . . . . . . . . . . . . . . . . . . . . . . . . . . . . . . . . . . . . . . . . . . . 353
Appendix A Chart Theme Example . . . . . . . . . . . . . . . . . . . . . . . . . . . . . . . . . . . . . . . . . . . . . . . 355
Index . . . . . . . . . . . . . . . . . . . . . . . . . . . . . . . . . . . . . . . . . . . . . . . . . . . . . . . . . . . . . . . . . . . . . . . . . 359

Introduction
9
CHAPTER 1INTRODUCTION
iReport Designer is an open source authoring tool that can create complex reports from any kind of Java application through
the JasperReports library. It is written in 100% pure Java and is distributed with source code according to the GNU General
Public License.
Through an intuitive and rich graphic interface, iReport lets you rapidly create any kind of report very easily. iReport enables
engineers who are just learning this technology to access all the functions of JasperReports, as well as helping skilled users to
save a lot of time during the development of very elaborate reports.
For Version 5.0, iReport was almost completely rewritten, with the new application based on the NetBeans rich client
platform. Even though the user interface appears pretty much the same, a complete new design of the iReport core and the use
of the NetBeans platform will allow us to quickly create new features, making iReport even easier to learn and use.
With this iReport Ultimate Guide you’ll learn how to add visual and analytic features to complex reports with charts, images,
and subreports. This informative guide has transformed many a newcomer into designers of pixel-perfect, complex, and highly
interactive reports. It is written and updated by Giulio Toffoli, iReport project founder and architect.
This chapter has the following sections:
Features of iReport
The iReport Community
JasperReports Commercial License
Code Used in This Book
1.1 Features of iReport
The following list describes some of the most important new features of iReport 5.0:
Support for relative dates.
HTML5 charts.
XML/A support of MSAS.
Nested tables.
Version 4.7 added the following features:
100% support of JasperReports XML tags.
WYSIWYG editor for the creation of reports. It has complete tools for drawing rectangles, lines, ellipses, textfields,
labels, charts, subreports and crosstabs.
Built-in editor with syntax highlighting for writing expressions.
Support for Unicode and non-Latin languages (Russian, Chinese, Japanese, Korean, etc.).

10
iReport Ultimate Guide
Browser for document structure.
Integrated report compiler, filler, and exporter.
Support for all databases accessible by JDBC.
Virtual support for all kinds of data sources.Wizard for creating reports and subreport automatically.
Support for document templates.
TrueType fonts support.
Support for localization.
Extensibility through plug-ins.
Support for charts.
Management of a library of standard objects (for example, numbers of pages).
Drag-and-drop functionality.
Unlimited undo/redo.
Wizard for creating crosstabs.
Styles library.
Integrated preview.
Error manager.
JasperServer repository explorer.
Integrated SQL and MDX query designer.
Additional features in Professional Edition.
Version 3.6 added support for visual components based on Adobe Flash.
Version 3.7 has these new features:
Instructions on installing iReport on Mac OSX.
Enhanced page formatting, including band features that enable multiple bands and subbands of the same type and a new
Page Format dialog.
Keep Together and Footer Position properties for groups.
Query executers and fields providers to enable you to use custom query languages.
1.2 The iReport Community
The iReport team comprises many skilled and experienced programmers who come from every part of the world. They work
daily to add new functionality and fix bugs. The iReport project site is at http://ireport.sourceforge.net. If you need help with
iReport, there is a discussion forum in English. This is the place where you can send requests for help and technical questions
about the use of the program, as well as post comments, discuss implementation choices, and propose new functionality. There
is no guarantee of a prompt reply, but requests are usually satisfied within a few days’ time. This service is free. If you need
information concerning commercial support, you can write to sales@jaspersoft.com.
Please report bugs at the following address: http://community.jaspersoft.com/bug-tracker
At the project site, there is a system to send requests for enhancement (RFE). There is also the ability to suggest patches and
integrative code. All members of the iReport team value feedback from the user community and seriously consider all
suggestions, criticism, and advice from iReport users.
1.3 JasperReports Commercial License
The Pro components of JasperReports Professional require a commercial license. iReport Professional includes a full-featured,
30-day evaluation license that must be replaced with the commercial license provided by Jaspersoft. The commercial license
can be installed using the License Manager.
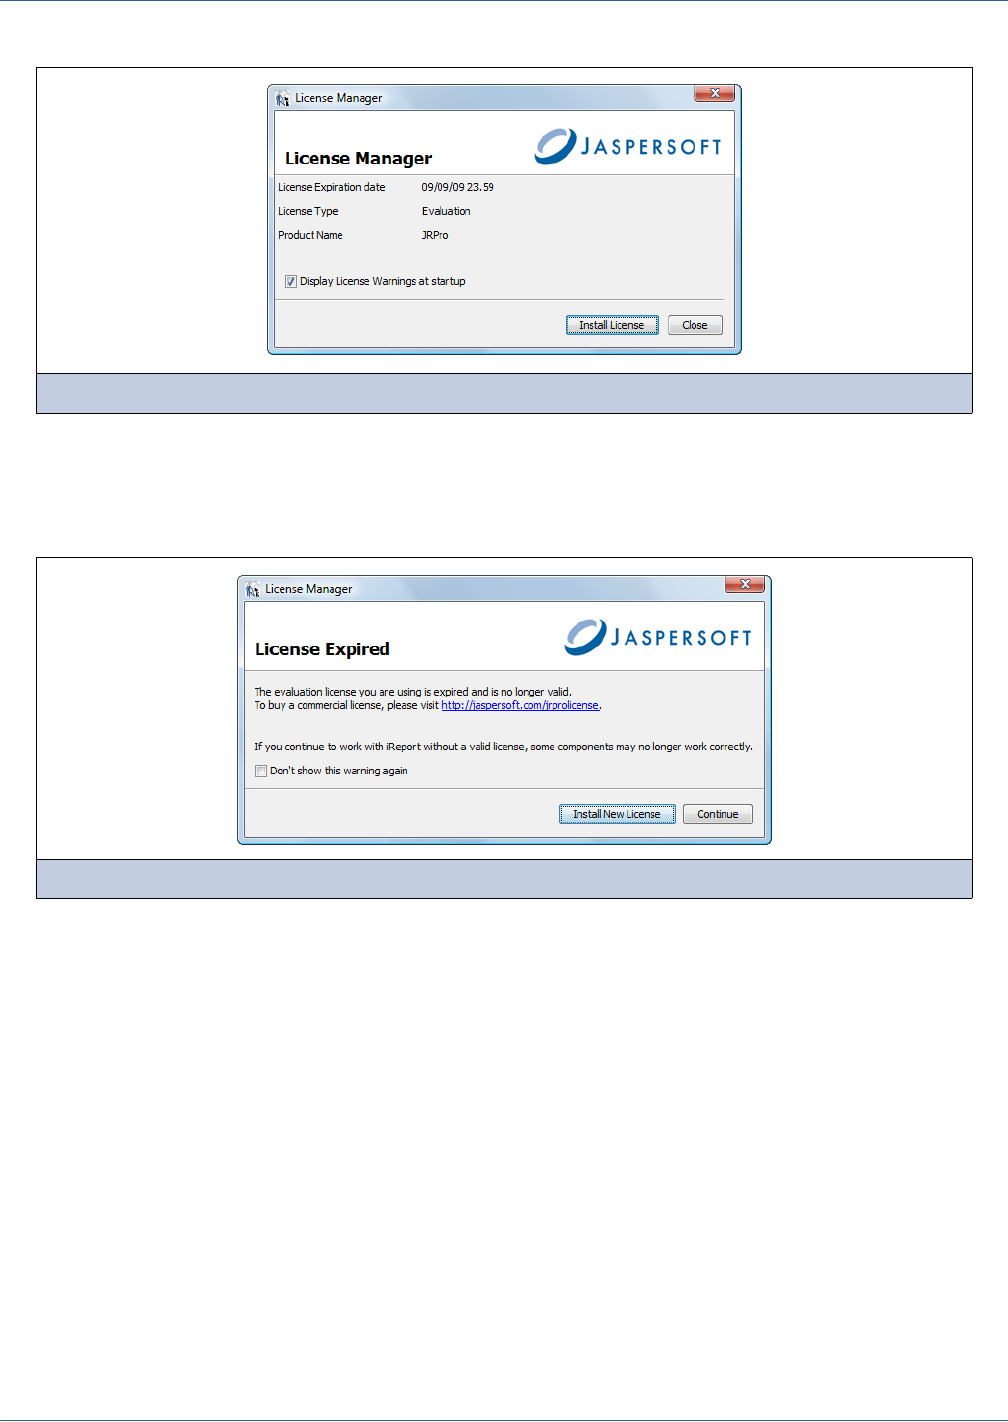
Introduction
11
To open the License Manager select Help → License Manager:
Click Install License and select the license file to use. iReport will copy the provided file in the user directory with the name
jasperreports.license. If the license is not valid, a message will explain the problem and what do to.
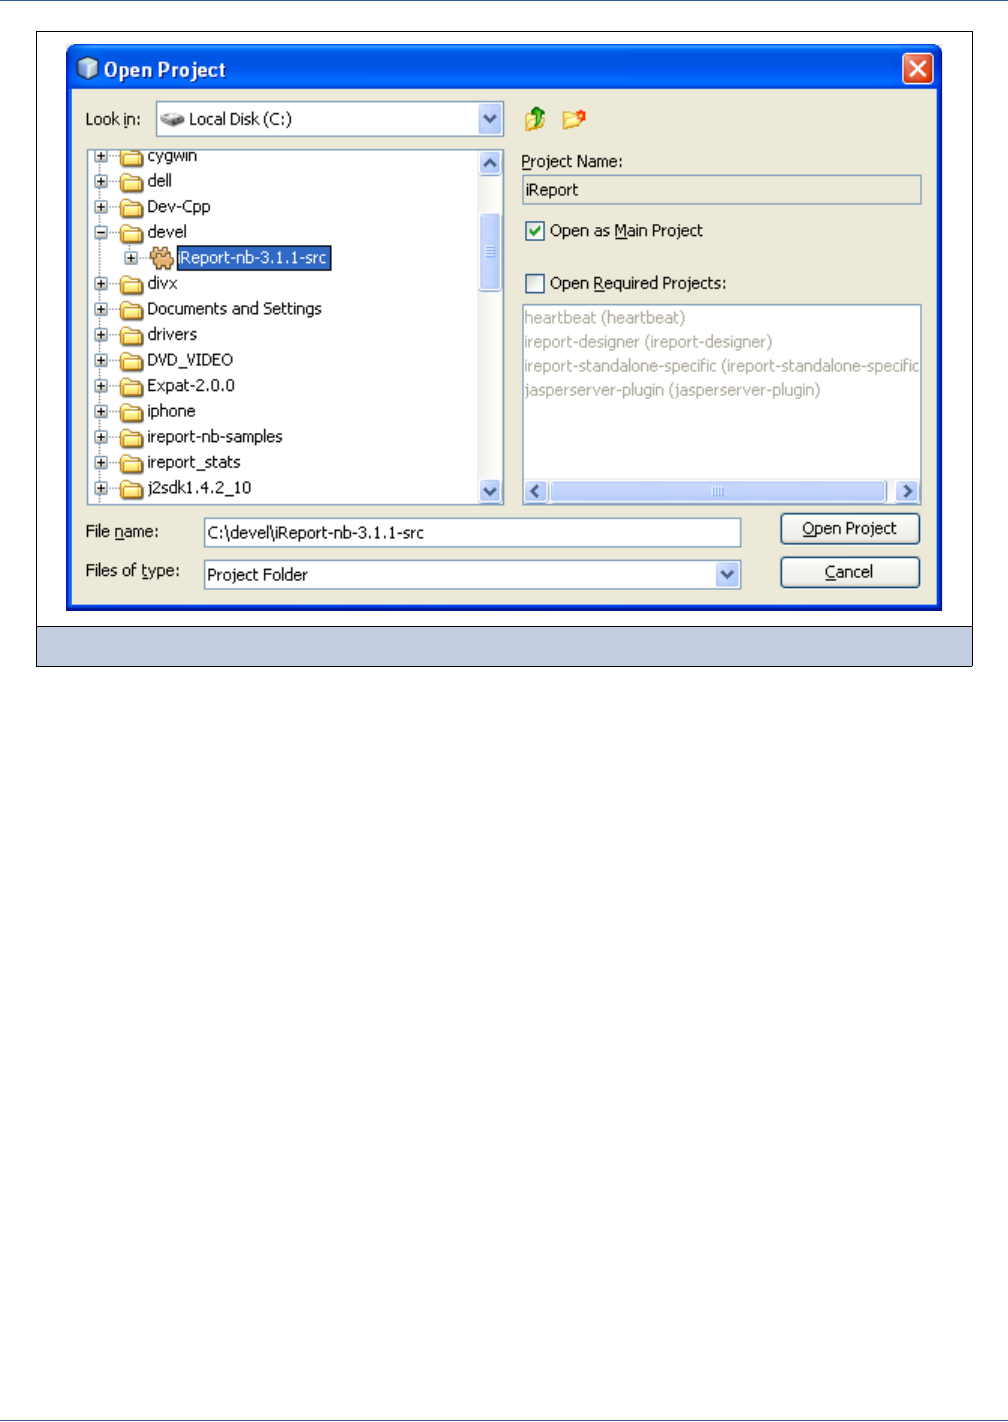
If you do not purchase the commercial license and the evaluation license expires, iReport shows the following message at
startup. You can still use iReport with the expired license, but you cannot run reports that use Pro components:
1.4 Code Used in This Book
JasperReports supports the following languages for expressions:
Java
JavaScript
Groovy
All the sample expressions used in this guide are written in JavaScript.
Figure 1-1 License Manager Dialog
Figure 1-2 License Manager Dialog When License Expires

12
iReport Ultimate Guide

Getting Started
13
CHAPTER 2GETTING STARTED
In this chapter you will learn the basic requirements for using iReport, where you can get it and how to install it.
This chapter has the following sections:
Platform Requirements
Downloads
Development Versions
Compiling iReport
Installing iReport
The Windows Installer
First iReport Execution
Creating a JDBC Connection
Creating Your First Report
2.1 Platform Requirements
iReport needs the Sun Java 2 SDK to run, Version 1.5 or newer. If you want to build the tool from the source code or write a
plug-in, you will also need NetBeans IDE and the NetBeans platform 6.5.1.
As for hardware, like all Java programs, iReport consumes a lot of RAM, so it is necessary to have at least 256 MB of memory
available as well as about 50 MB of free disk space.
Some features documented in this guide require Jaspersoft Professional software. The features are indicated with a special
note.
2.2 Downloads
You can download iReport from the dedicated project page on SourceForge.net, where you can always find the most recent
released iReport distributions (http://www.jaspersoft.com/jaspersoft-business-intelligence-software-trial). Four different
distributions are available:
iReport-x.x.x.zip. This is the official binary distribution in ZIP format.
In order to avoid problems with the file chooser in iReport, Windows Vista users should have Java 1.5.0_17-b04 or
newer installed. Windows 7 users should have Java 1.6.0_18-b03 or 1.7.0-b74.

14
iReport Ultimate Guide
iReport-x.x.x.tgz. This is the official binary distribution in TAR GZ format.
iReport-x-x-x-src.zip. This is the official distribution of source files in ZIP format.
iReport-x.x.x-windows-installer.exe. This is the official Win32 installer.
iReport-x.x.x.dmg. This is the official binary distribution for Mac OSX in Disk Image format.
x.x.x represents the version number of iReport*. Every distribution contains all needed libraries from third parties necessary to
use the program and additional files, such as templates and base documentation in HTML format.
iReport is also available as a native plug-in for NetBeans IDE 6.x. You can download the plug-in from SourceForge or
NetBeans.
At the time of writing we are planning an OS X distribution to support Macintosh systems; it may be available in the future.
2.3 Development Versions
If you want to test pre-release versions of iReport, you can directly access the developmental source repository with SVN. In
this case, you must have an SVN client (my favorite is Tortoise SVN). If you don’t have one, you will need to create an
account at http://community.jaspersoft.com/ in order to access the repository.
The URL of the SVN repository for iReport is:
http://anonsvn:anonsvn@community.jaspersoft.com/svn/repos/ireportfornetbeans
2.4 Compiling iReport
The distribution with sources contains a NetBeans project. In order to compile the project and run iReport, you need NetBeans
IDE and the platform 6.0.1 (or 6.5.1 starting from iReport 3.6.1). If you are using NetBeans 6.0, the platform is the same as the
IDE; otherwise you’ll need to download the platform separately at this URL:
http://download.netbeans.org/netbeans/6.0/final/zip/netbeans-6.0.1-200801291616-mml.zip
If you need to work with iReport 3.6.1 sources, you need NetBeans 6.5.1; otherwise, you can download the 6.5.1 platform
from the NetBeans site.
http://bits.netbeans.org/download/6.5.1/fcs/zip.html
The file to download is netbeans-6.5.1-200903060201-all-in-one.zip.
Download iReport-x.x.x-src.zip and unzip it in the directory of your choice, such as c:\devel (or /usr/devel on a UNIX system).
* Up to iReport 3.6.1, the version number contains the “nb” prefix (for “NetBeans”). This prefix was introduced when iReport was
rewritten on top of the NetBeans platform (version 3.1.0). The prefix has been removed starting with version 3.6.2.
Pre-release iReport source code is no longer available on SourceForge CVS Server.
Please note that NetBeans IDE is the development environment, while NetBeans 6.5.1 is the version of the platform
(which can be considered something like an external library or dependency; it has very little to do with the IDE).
iReport is built on NetBeans Rich Client Platform version 6.5.1. In order to build iReport you can use any version of
NetBeans IDE, but you need this specific NetBeans platform to successfully compile the source.
Getting Started
15
Run NetBeans IDE and open the iReport project (see Figure 2-1).
The project is actually a suite that contains several subprojects, or modules.
To run iReport, click the Run main project button on the tool bar.
Figure 2-1 NetBeans IDE project chooser
16
iReport Ultimate Guide
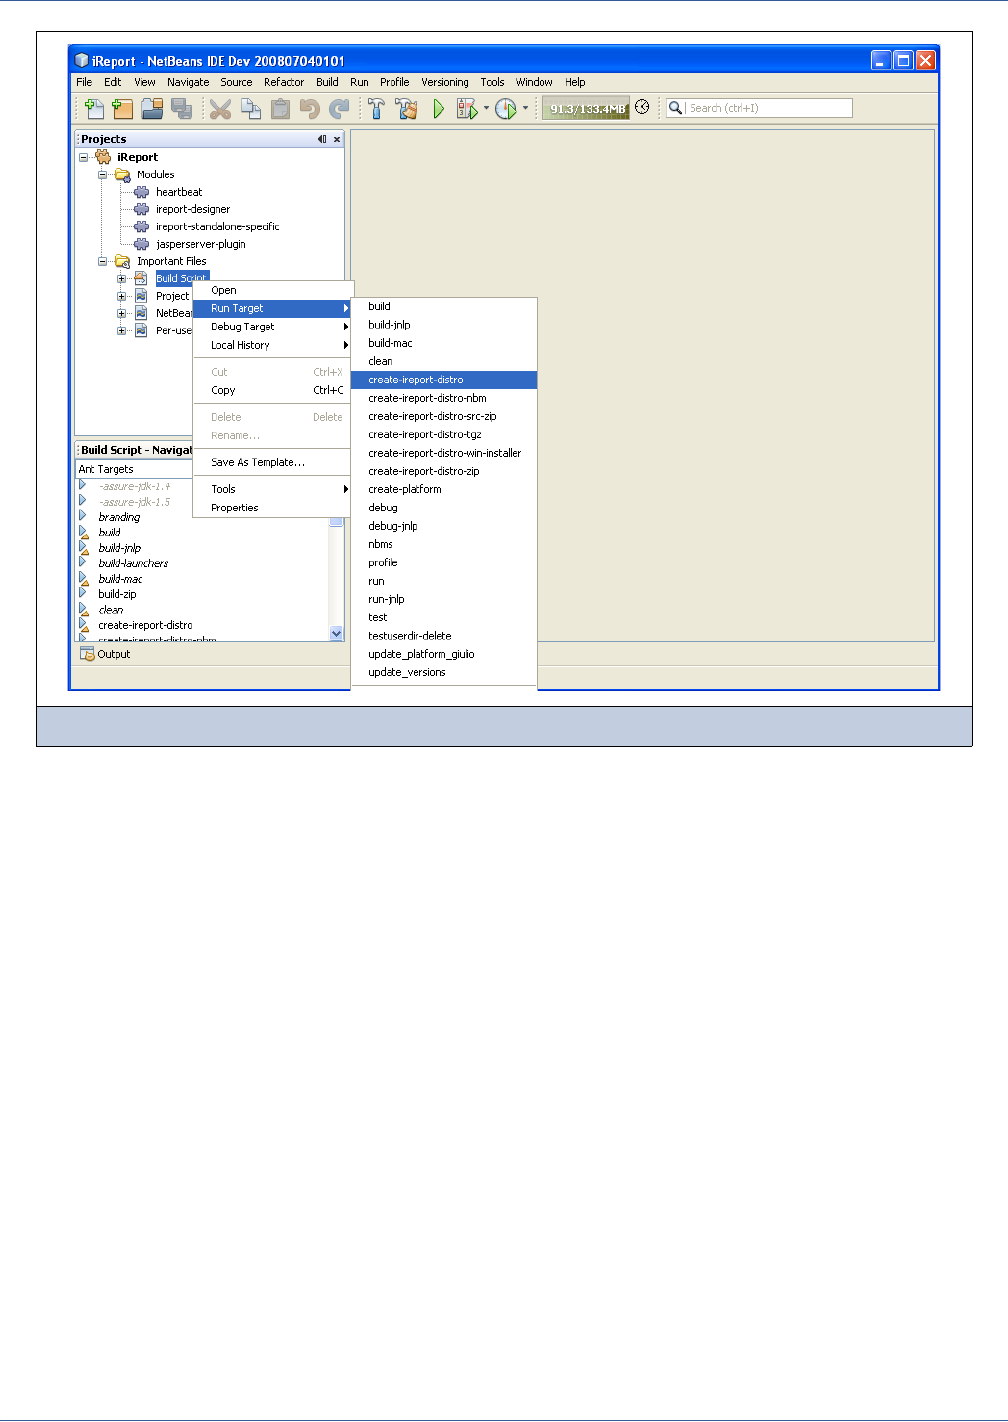
If you want to build all the distributions, run the create-ireport-distro target provided in the build script. To do it, select the
build.xml (Build Script) file located in the project folder Important Files. Right-click the file and select the appropriate target
to run (see Figure 2-2).
2.5 Installing iReport
If you download the binary version of iReport, do the following:
1. Unpack the distribution archive into the directory of your choice; for example, to c:\devel (or /usr/devel on a UNIX
system).
2. Open a command prompt or a shell, go to the directory where the archive was unpacked, change to the iReport directory,
then to the \bin subdirectory, and enter:
ireport.exe
In Unix, use the chmod +x command to make the installation script executable, then, in the root directory, enter:
./ireport
Figure 2-2 Build script containing a set of targets to create several iReport distributions
Getting Started
17
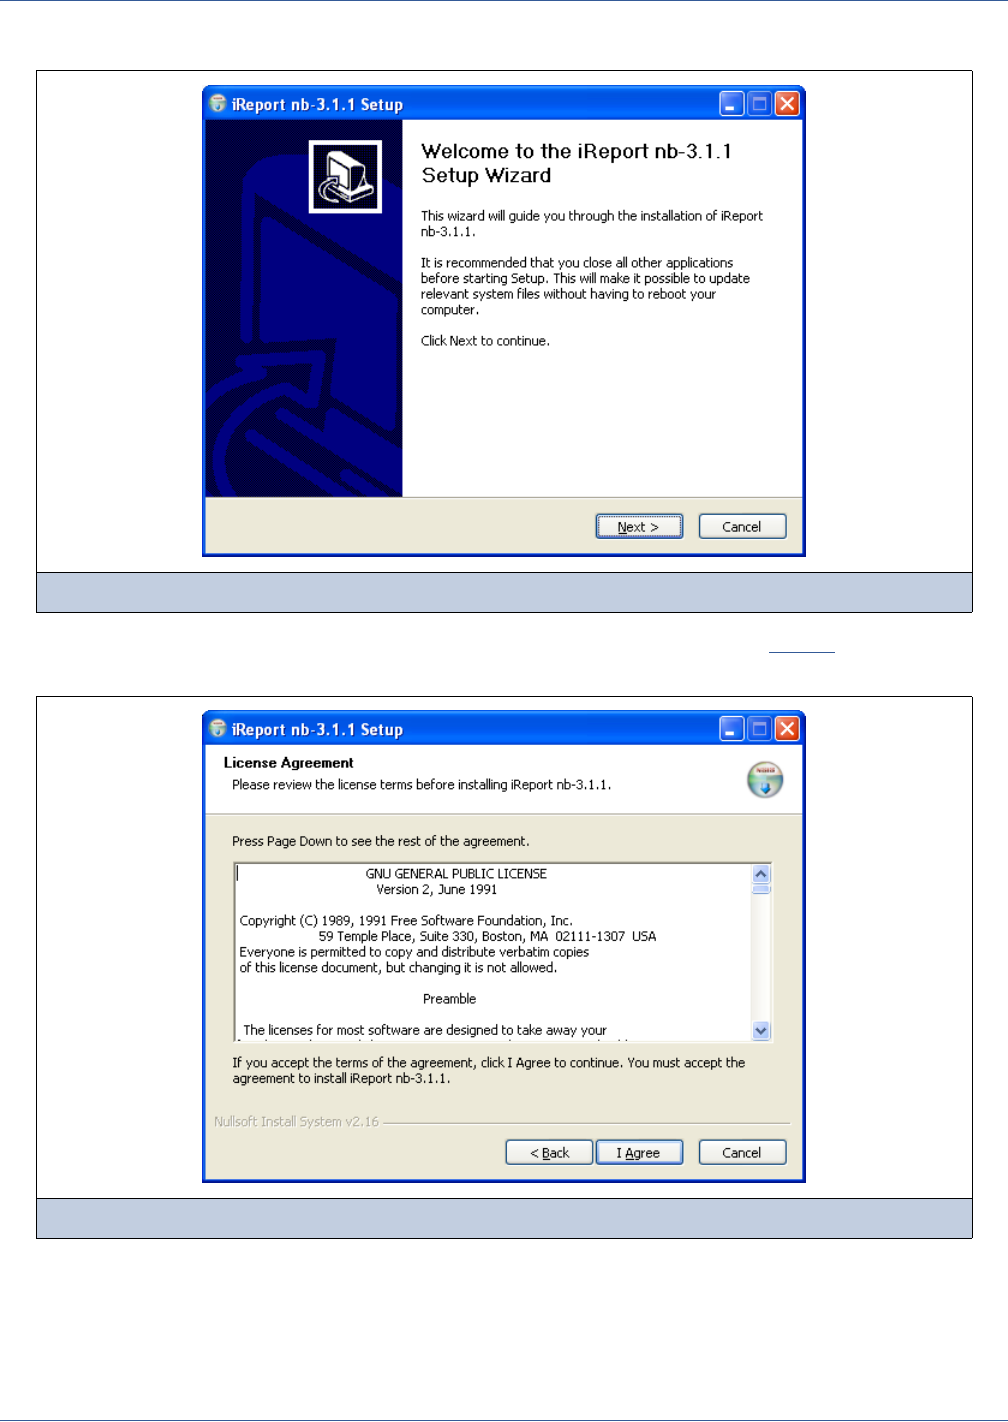
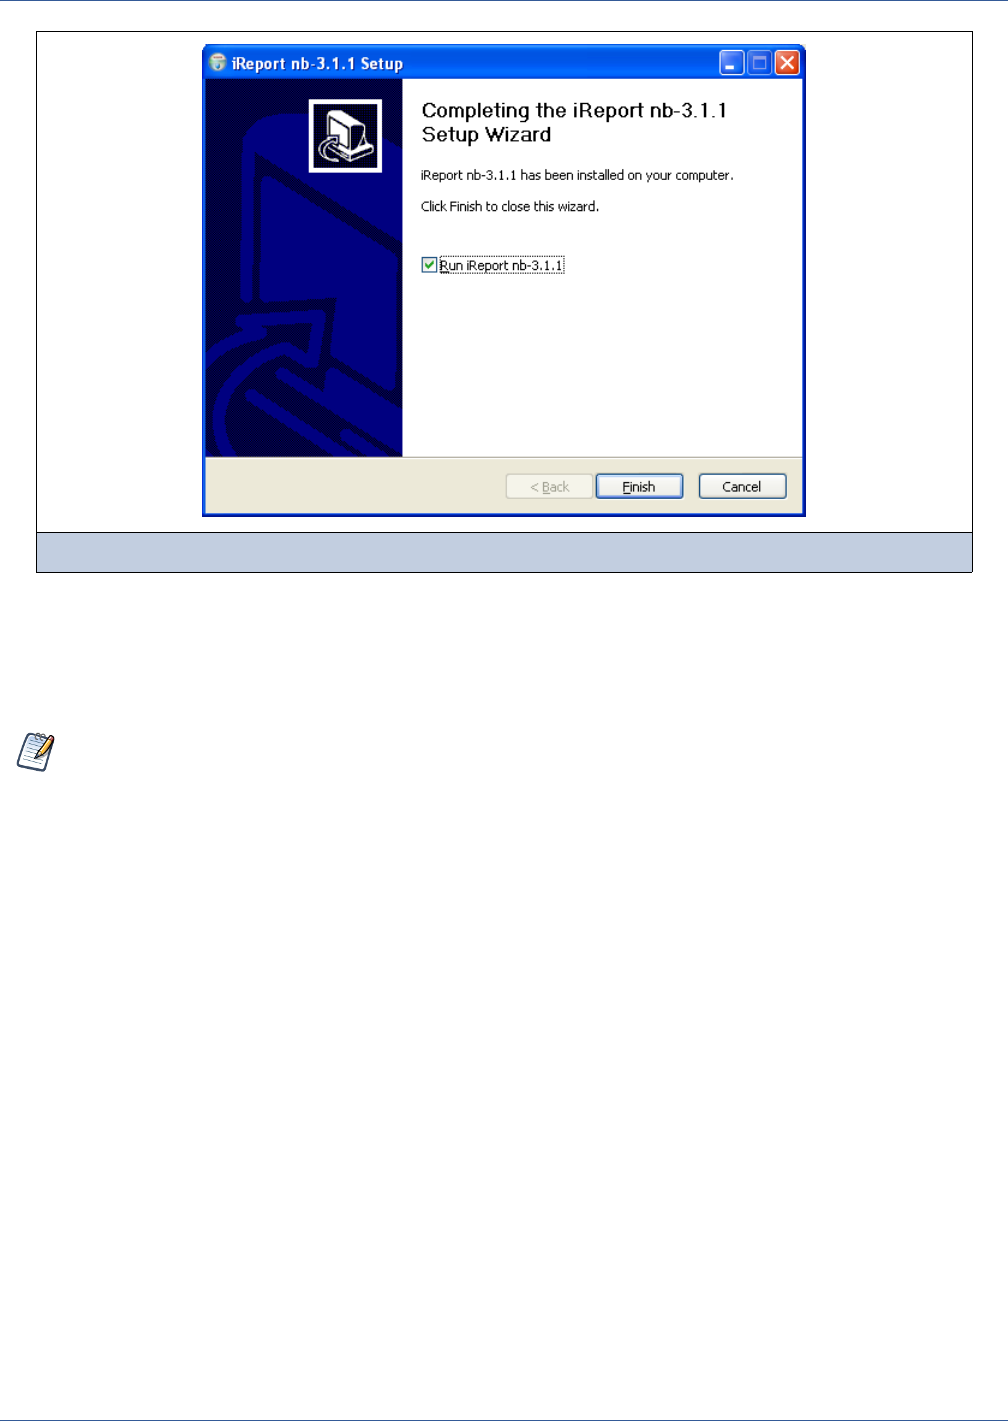
2.6 The Windows Installer
iReport provides a convenient Windows installer created using NSIS, the popular installer from Nullsoft. To install iReport,
double-click iReport-nb-x.x.x-windows-installer.exe to bring up the screen shown in Figure 2-4.
Click Next and follow the instructions in the Install wizard until the installation is complete (Figure 2-5).
Figure 2-3 Windows Installer – Step 1
Figure 2-4 Windows Installer — Step 2
18
iReport Ultimate Guide
After the installation, there will be a new menu item in the Programs menu (Start → Programs → Jaspersoft → iReport-nb-
x.x.x).
The installer creates a shortcut to launch iReport, linking the shortcut to iReport.exe (present in the /bin directory under the
Jaspersoft home directory).
Figure 2-5 Windows Installer - Last Step
You can install more than one version of iReport on your machine at the same time, but all the versions will share the
same configuration files.
Getting Started
19
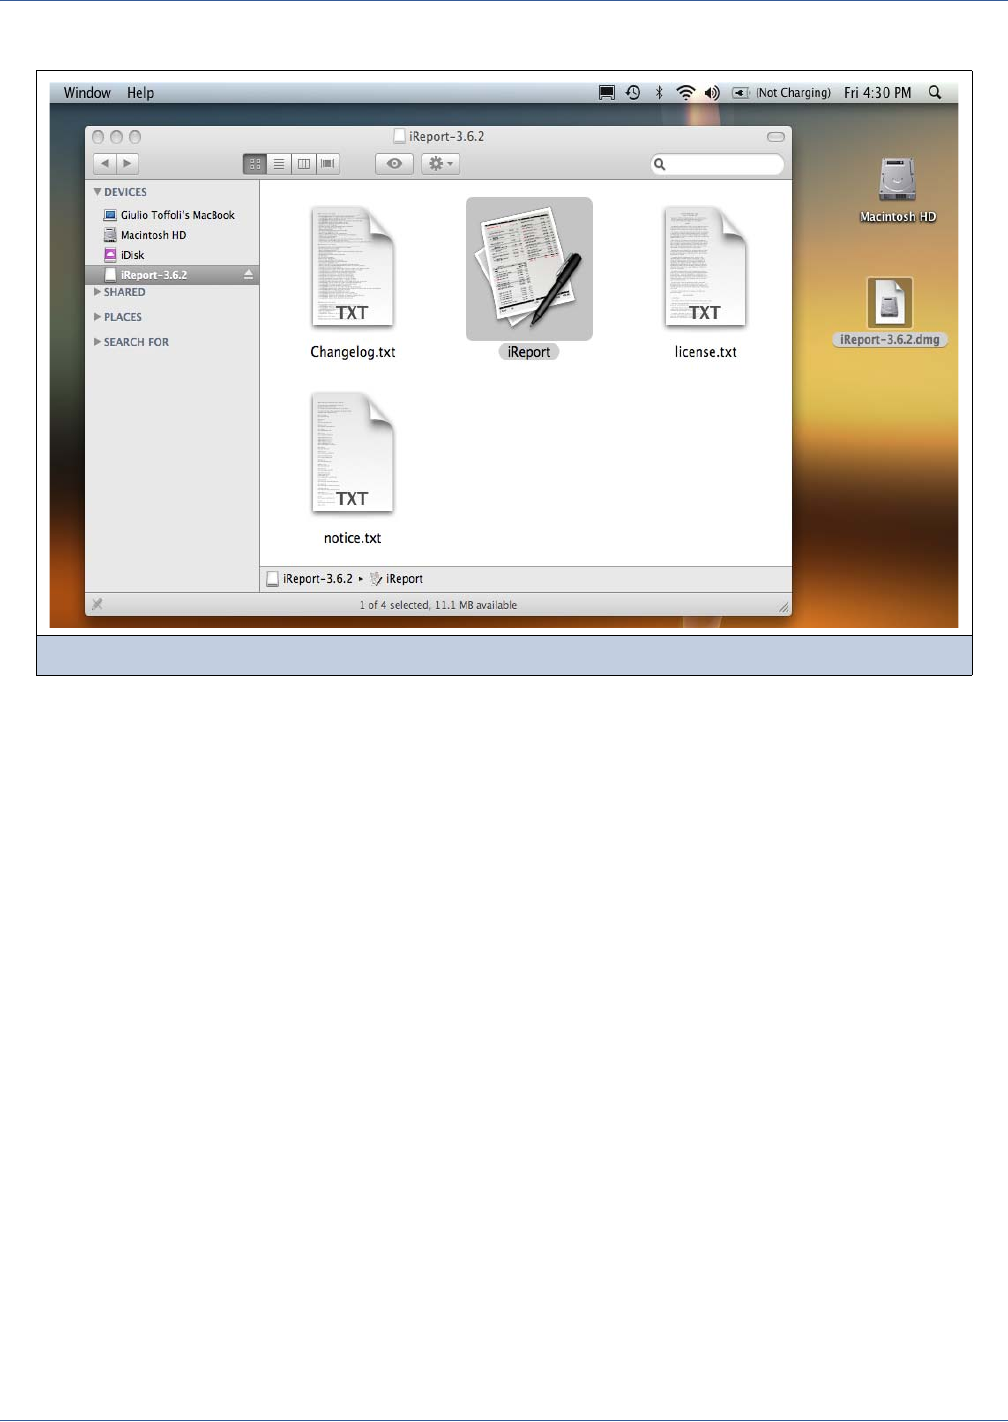
2.7 Installing iReport on Mac OSX
Mac OSX does not require any special installation procedure, just double-click the DMG (Disk Image) archive and drag
iReport into the Applications folder.
To run iReport, double-click the iReport icon.
2.8 First iReport Execution
When you run iReport for the first time, you will need to configure a couple of options in order to start designing reports,
including a data source to be used with the reports and, optionally, the location of the external programs to preview the reports
(only if you don’t want to use the internal preview).
Figure 2-6 The Disk Image mounted on Mac OSX
20
iReport Ultimate Guide
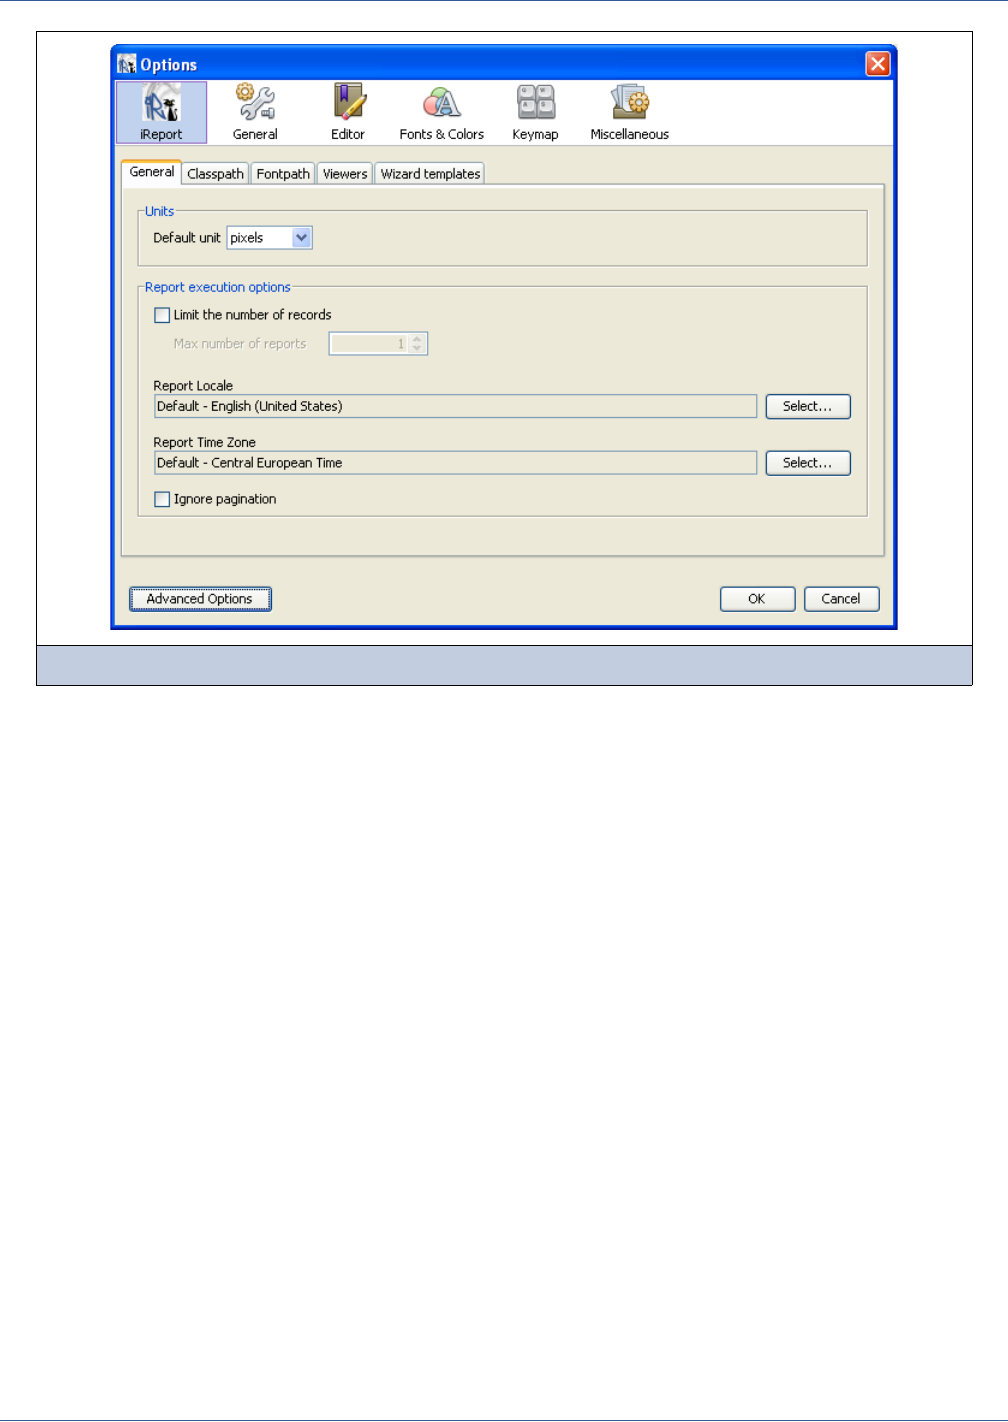
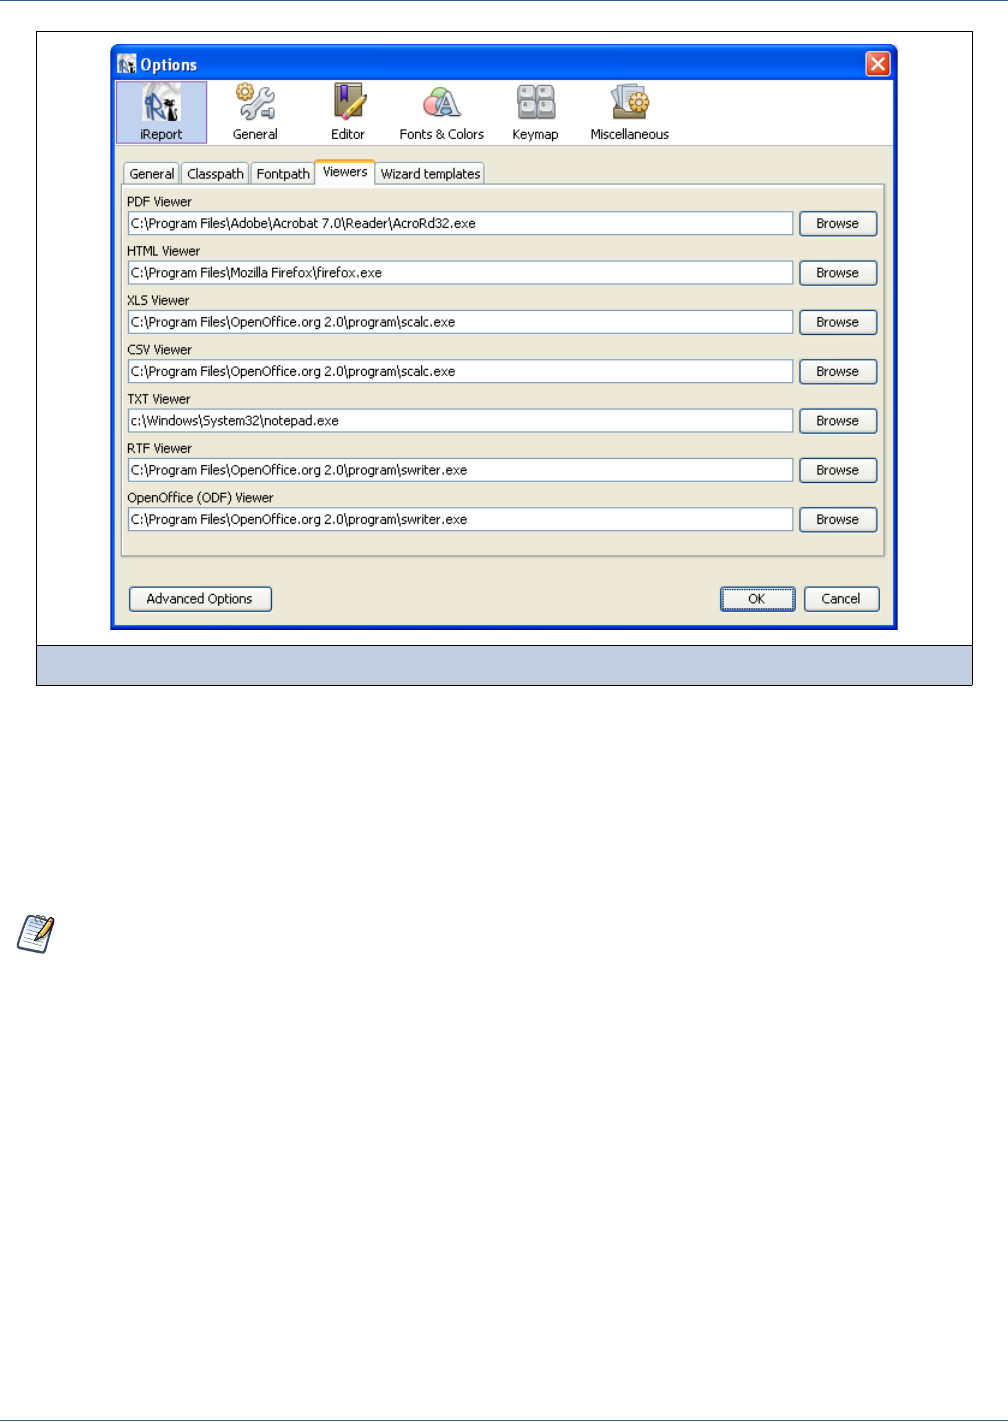
To display the window shown here in Figure 2-7, run iReport and select Tools → Options. I will discuss all the options
shown in this panel in later chapters. For now, click the Viewers tab (see Figure 2-8) and configure the applications that you
will use to view your output reports.
Figure 2-7 Options Window – General Options
Getting Started
21
Test the configuration by creating a new blank report:
1. Select File → New empty report.
2. Select where to save it and confirm.
3. Click the Preview button on the tool bar.
If everything is okay, iReport generates a Jasper file and displays a preview of a blank page. This means you have installed and
configured iReport correctly.
On Windows and Mac OSX it is not necessary to configure the viewers. If they are not configured, the system default is used
to open the generated files.
2.9 Creating a JDBC Connection
The most common data source for filling a report is a relational database, so, next, you will see how to set up a JDBC
connection in iReport:
1. Click Select Tools → Reports and click the New button in the window with the connections list. A new window will
appear for configuration of the new connection (see Figure 2-9).
Figure 2-8 Options Window – Viewers
iReport stores report templates as XML files, with extension of .jrxml (JRXML files). Compiled versions of the
templates are stored as binary files, with the extension .jasper (Jasper files). The latter are used to actually generate
the reports.
22
iReport Ultimate Guide
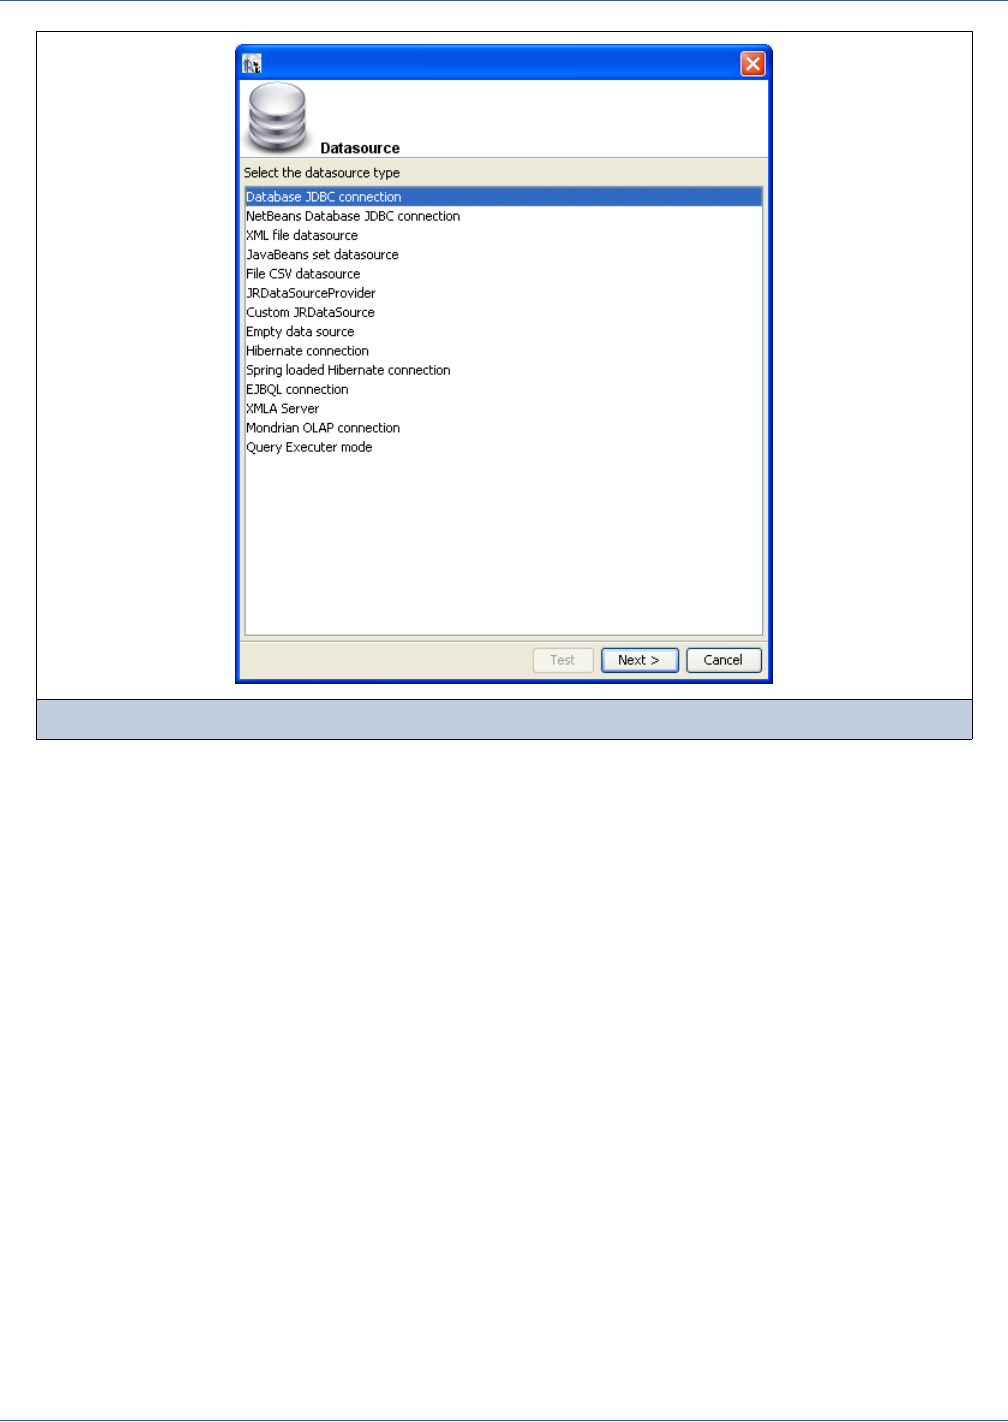
2. Select Database JDBC connection and click Next.
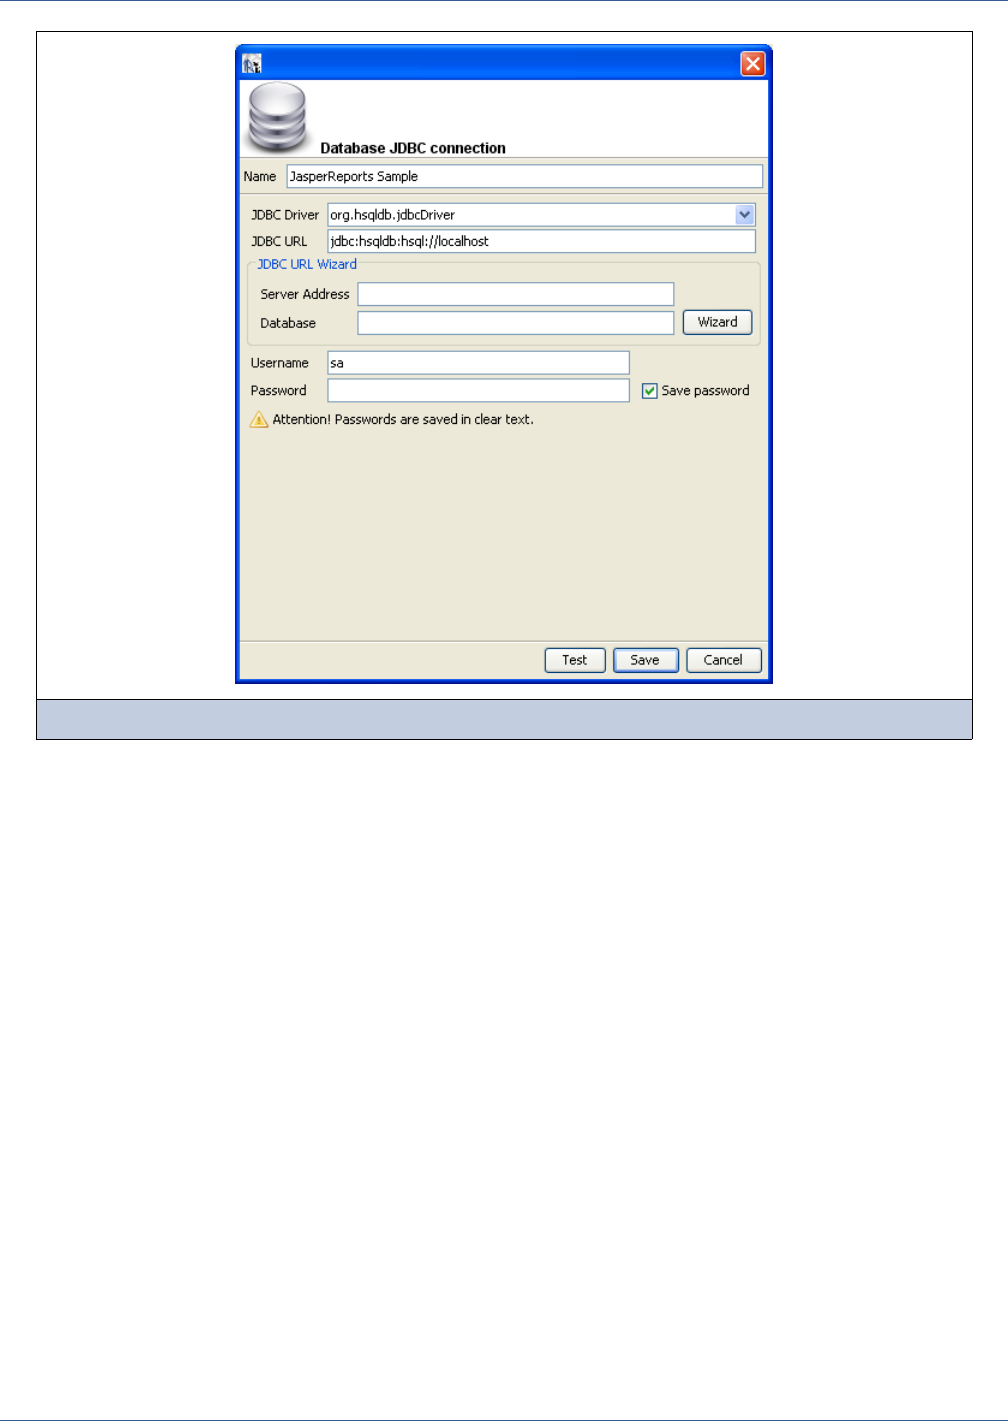
3. In the Database JDBC Connection window, enter the connection name (for example, “My new connection”) and select the
right JDBC driver.
iReport recognizes the URL syntax of many JDBC drivers. You can automatically create the URL by entering the server
address and database name in the corresponding boxes and clicking the Wizard button.
Figure 2-9 Data Source Type Selection
Getting Started
23
4. To complete the connection configuration, enter the username and password for access to the database.
If you want to save the password, select the Save password check box.
I suggest that you test the connection configuration before moving on, which you can do by clicking the Test button.
iReport provides the JDBC driver for the following SQL-compliant database systems:
HSQL
MySQL
PostgreSQL
If iReport returns a ClassNotFound error, it is possible that there is no JAR archive (or ZIP) in the classpath that contains the
selected database driver. In this case, there are two options:
Adding the required JAR to the iReport classpath.
To extend the iReport classpath, select the menu item Tools → Options, go to the classpath tab under the iReport
category, and add the JAR to the list of paths.
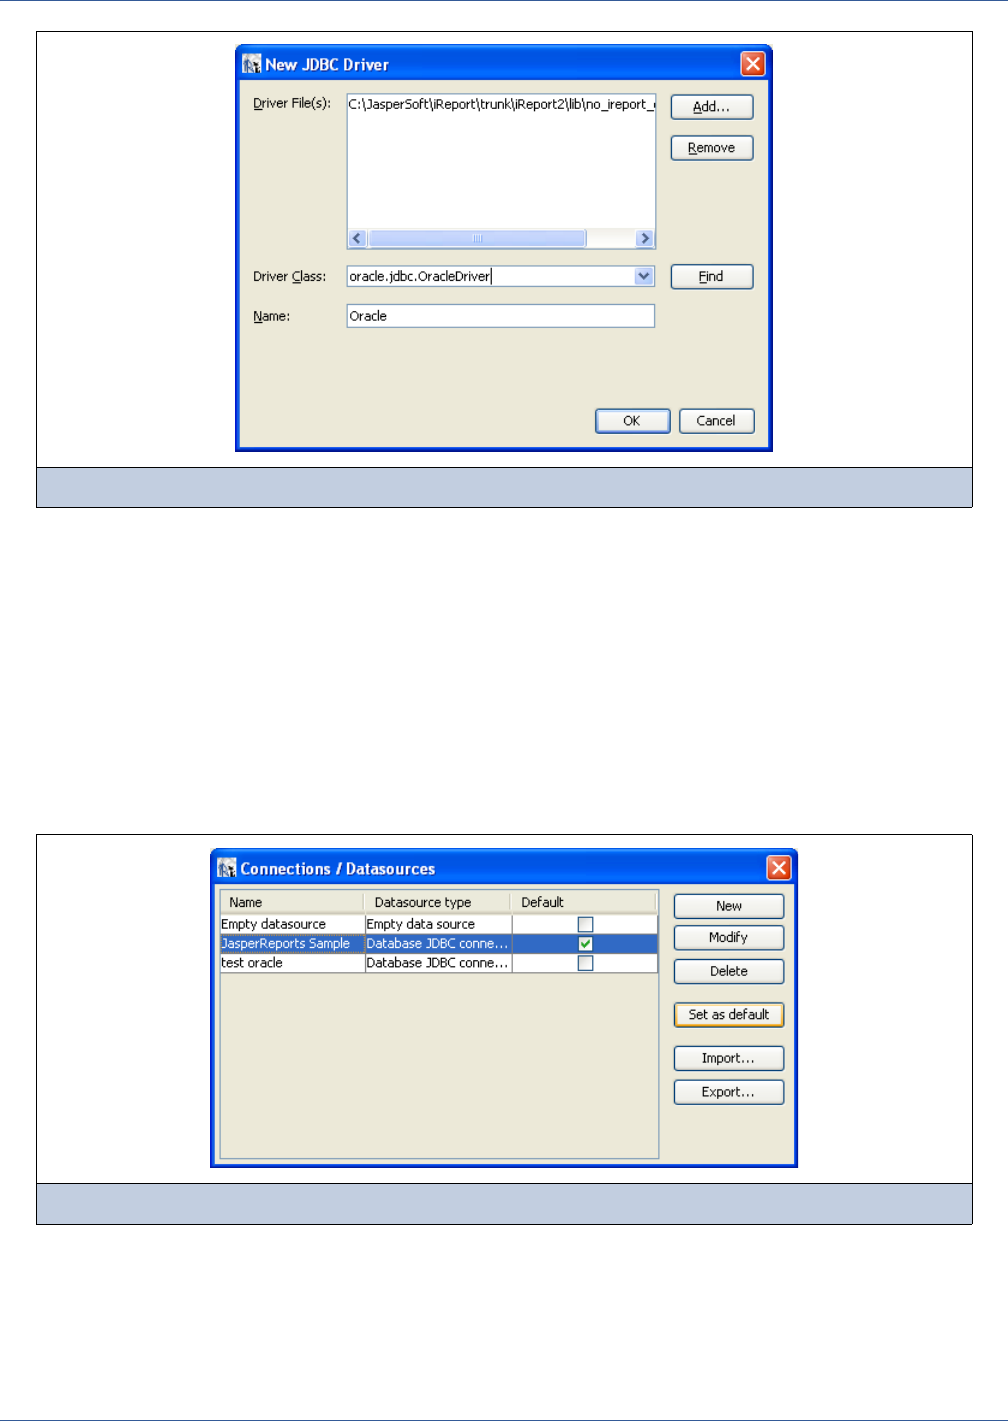
Registering the new driver through the service window.
If you prefer this second way, open the services window (Window → Services or CTRL+5), select the Databases node,
then the Drivers node.
Right-click the Drivers node and select New Driver. The dialog shown in Figure 2-11 will pop up.
Figure 2-10 JDBC Connection Using a Built-in JDBC Driver
24
iReport Ultimate Guide
Resume the testing without closing iReport by copying the JDBC driver into the /lib directory and clicking Test again. iReport
automatically locates the required JAR file and loads the driver from it. In Chapter 10, I will explain the configuration
methods for various data sources in greater detail.
If the test is successful, click the Save button to store the new connection.
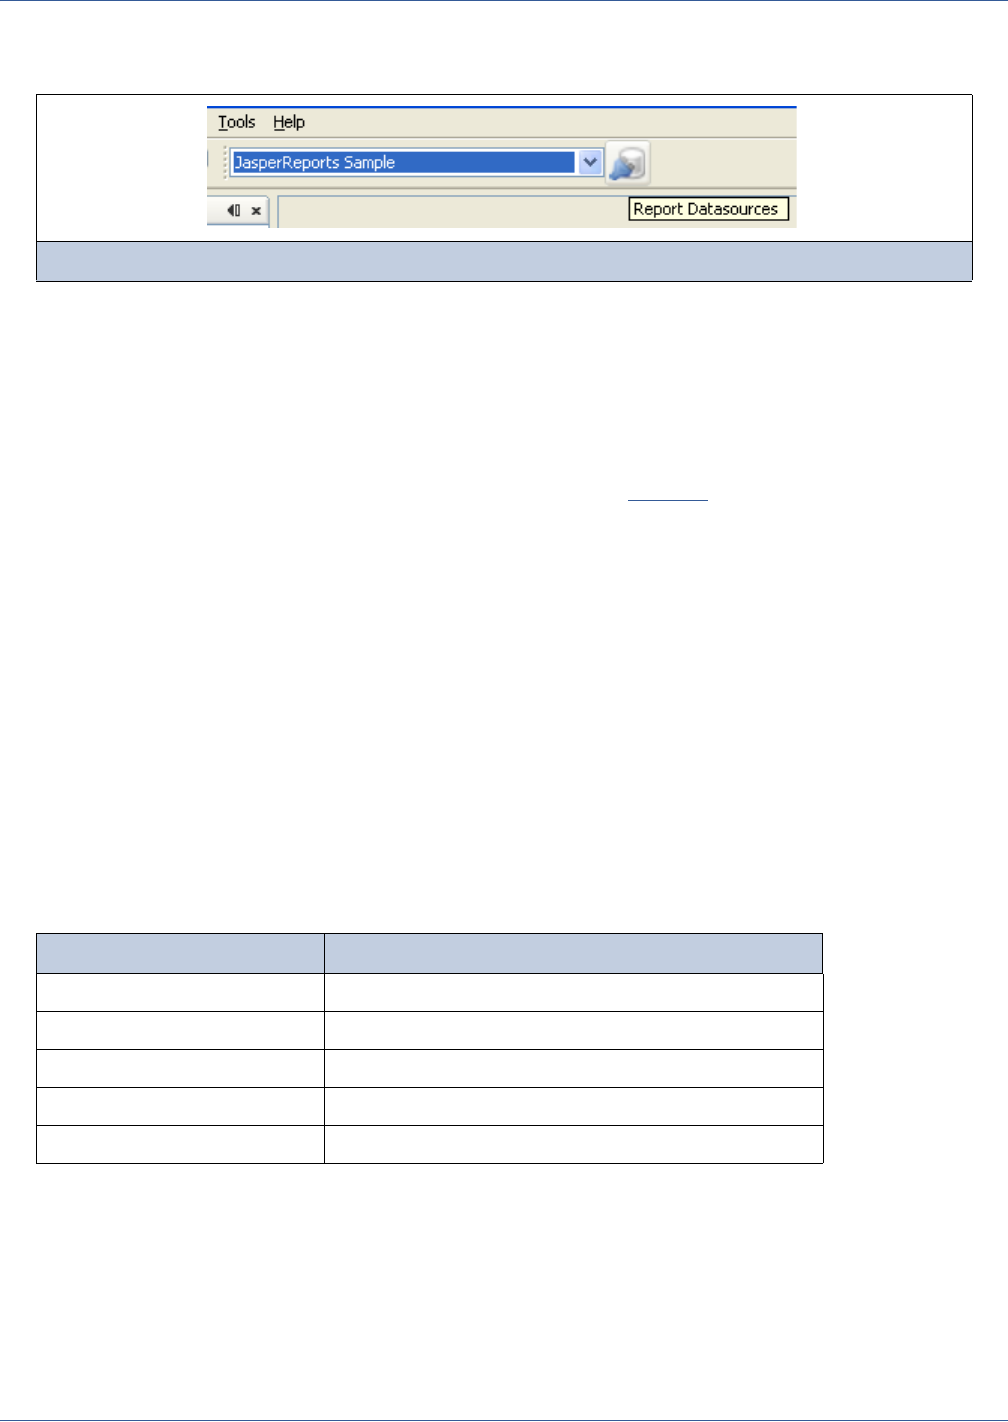
The connection will appear in the data source drop-down list in the main tool bar (Figure 2-12). Select it to make it the active
connection.
Another way to set the active connection is by opening the data source window (Figure 2-12):
1. Select the Tools → Report data sources menu item (or by clicking the button on the tool bar next to the data sources drop-
down list).
2. Select the data source that you want to make active:
3. Click Set as default.
The selected data source is the one used to fill the report and perform other operations, such as the acquisition of the fields
selected through SQL queries. There is no strict binding between a report and a data source, so you can run a report with
different data sources, but only one at time. Later, we will see how subreports can be used to create a report that uses multiple
data sources.
Figure 2-11 Oracle Driver Loaded from an External JAR
Figure 2-12 Data Sources Window
Getting Started
25
The Data Sources drop-down menu allows you to select the active data source; the ◄ button on the left opens the Data Sources
window:
2.10 Creating Your First Report
Now that you have installed and configured iReport and prepared a JDBC connection to the database, you will proceed to
create a simple report using the Wizard.
For this example and many of those following, you will use HSQLDB, a small relational database written in Java and supplied
with a JDBC driver. You can learn more about this small jewel by visiting the HSQLDB web site.
2.10.1 Using the Sample Database
For sample reports, we will use the sample database that comes with JasperReports.
Download JasperReports (the biggest distribution) and unpack it. Open a command prompt (or a shell) and change to the
<JasperReports installation folder>/demo/hsqldb. I
If you have Ant (and you know what it is), just run:
ant runServer
Otherwise, run this command (all in a single line):
java -cp ..\..\lib\hsqldb-1.7.1.jar org.hsqldb.Server
The database server will start and we will be ready to use it with iReport.
2.10.2 Using the Report Wizard
The table below lists the parameters you should use to connect to the sample database:
When the password is blank, as in this case, remember to set the Save password check box when configuring the connection.
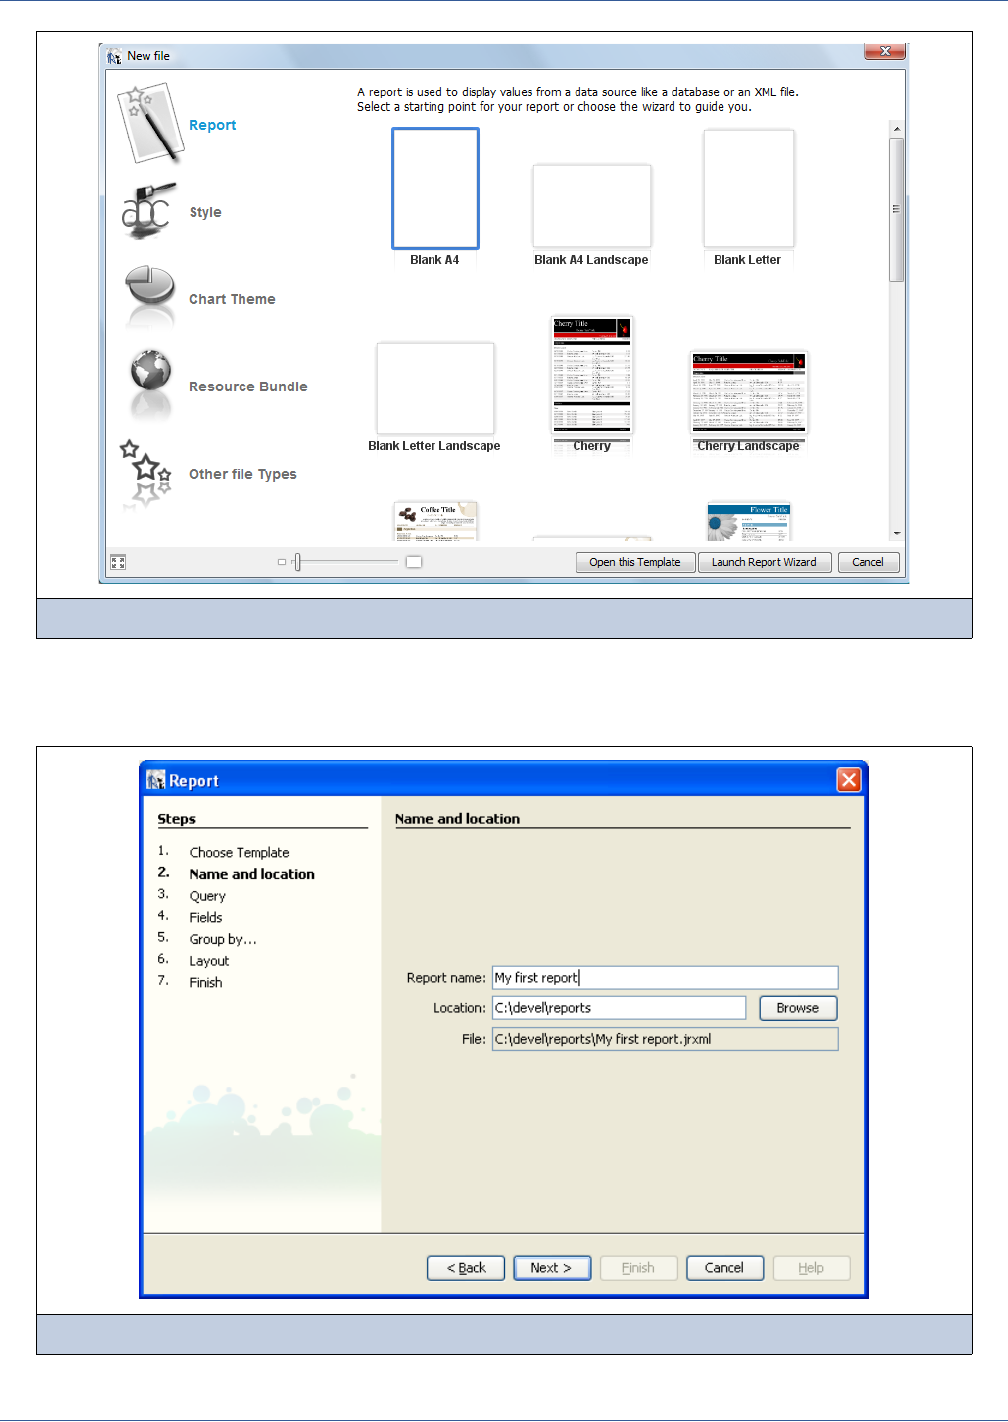
1. Click File → Report Wizard. This loads a wizard (Figure 2-14) for the step-by-step creation of a report, starting with the
selection of the template followed by the selection of the name and the location of the new report.
Figure 2-13 Data Sources Drop-Down Menu
Parameter Value
Name JasperReports Sample
JDBC Driver org.hsqldb.jdbcDriver
JDBC URL jdbc:hsqldb:hsql://localhost
Username sa
Password
26
iReport Ultimate Guide
2. Select the template and click Launch Report Wizard to proceed with the report creation. (You can create a simple report
that duplicates the selected template just by clicking Open this Template. However, we’ll use the wizard for this
example.)
Figure 2-14 Report Wizard – Template Selection
Figure 2-15 Report Wizard – New Report Name and Location
Getting Started
27
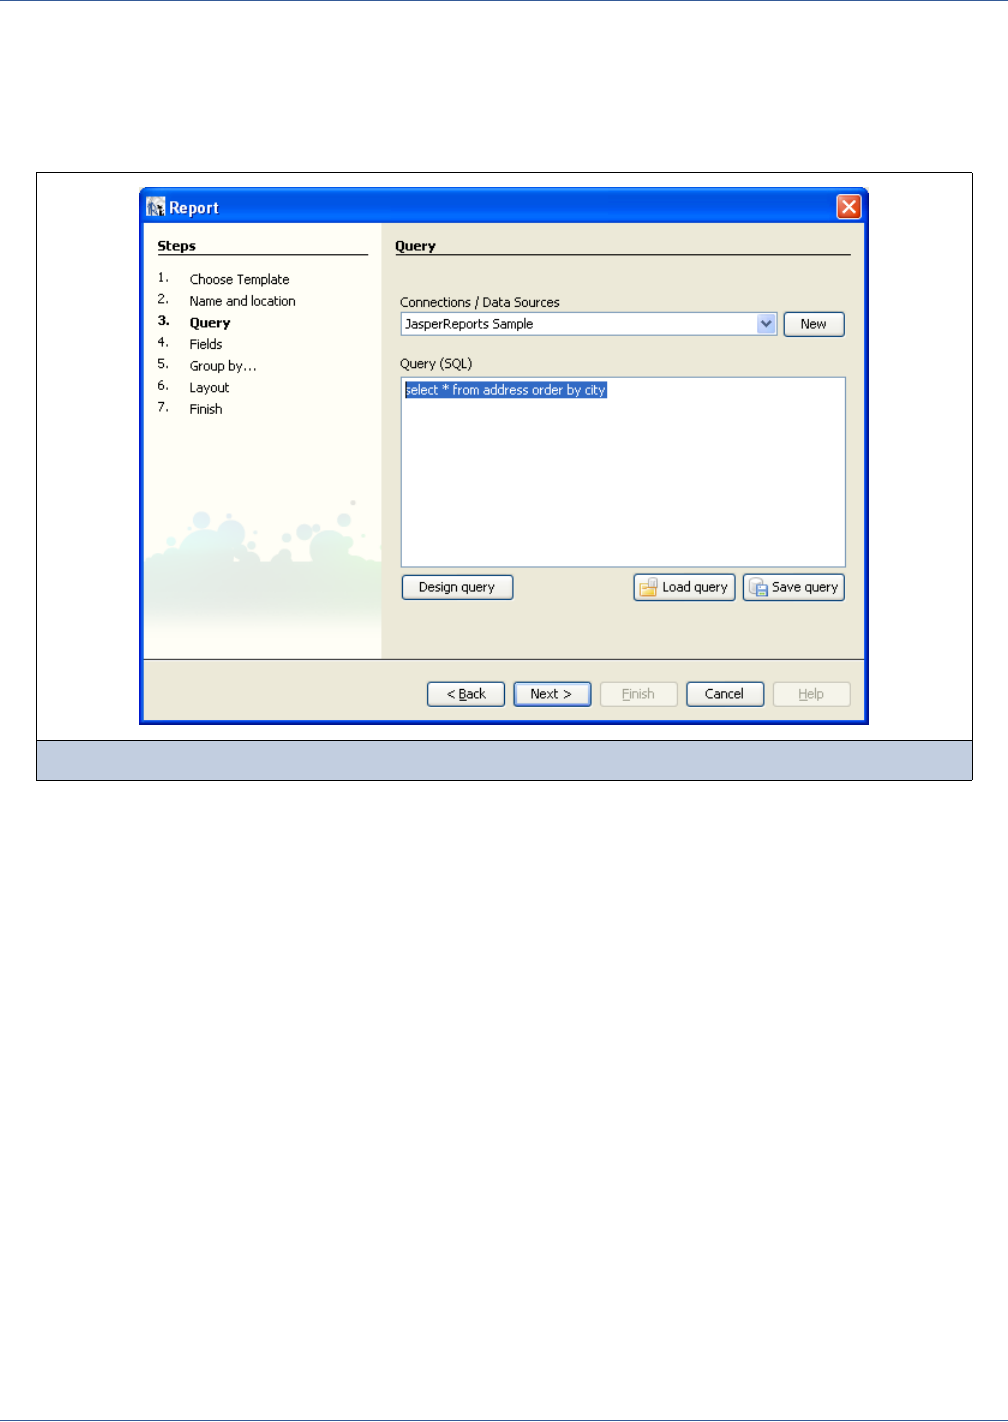
3. In the third step, select the JDBC connection we configured in the previous step. The wizard will detect that we are
working with a connection that allows the use of SQL queries and will prompt a text area to specify an SQL query
(Figure 2-16). Optionally, we can design the query visually by clicking Design query.
We assume that you know at least a bit of SQL, so we will directly enter a simple query, as follows:
select * from address order by city
4. Click Next. The clause “order by” is important to the following choice of sort order (I will discuss the details a little later).
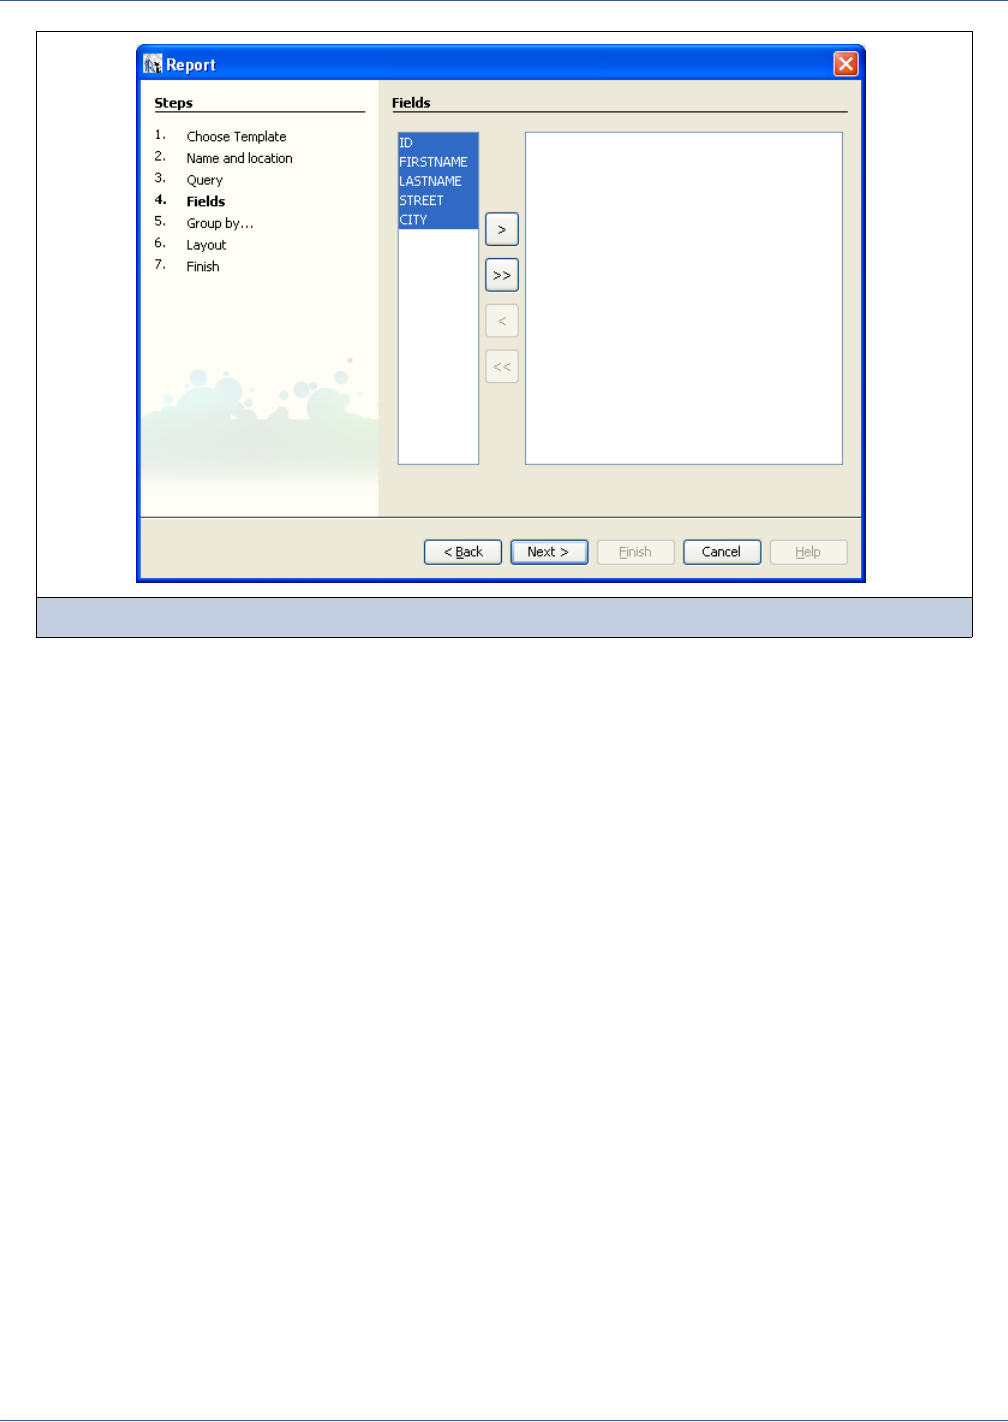
iReport reads the fields of the addresses table and presents them in the next screen of the Wizard, as shown in
Figure 2-17.
Figure 2-16 Report Wizard – SQL Query
28
iReport Ultimate Guide
5. Select the fields you wish to include and click Next.
6. Now that you have selected the fields to put in the report, you are prompted to choose which fields to use for sorting, if
any (see Figure 2-17).
Using the wizard, you can create up to four groups. You can define more fields later. (In fact, it is possible to set up an
arbitrary number of groupings.)
Figure 2-17 Report Wizard – Fields Selection

30
iReport Ultimate Guide
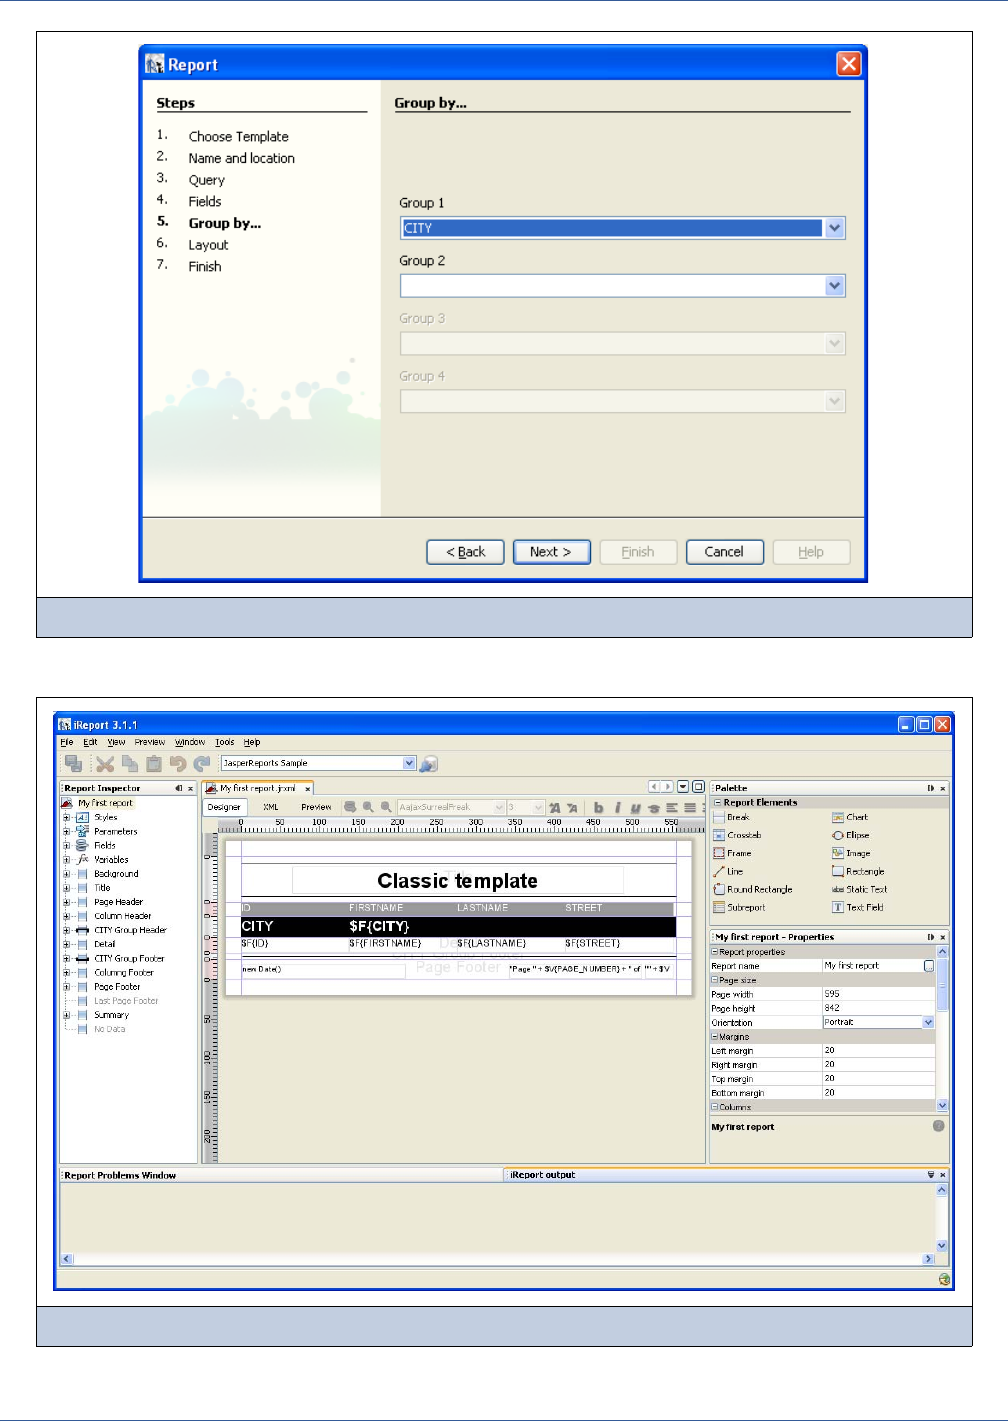
9. The last screen of the wizard will appear, and it will tell you the outcome of the operation. Click Finish to create the
report, which will appear in the iReport central area, ready to be generated, as shown below.
10. Click the Preview button to see the final result.
When you click Preview, iReport compiles the report, generating the JASPER file and executing the report against the
specified data source. You can track the progress in the output window, which is below the main window.
If, for some reason, the execution fails, you can see a set of problems in the Report Problems window, and other error tracking
information (for example, a full stack trace) in the iReport output window.
In this example, everything should work just fine, and you should see the report in the preview as shown above (Figure 2-19).
Also note:
You can save the report by clicking on the disk icon in the window tool bar. iReport can save reports in several formats,
including PDF and HTML.
To automatically export the report in a particular format and run the appropriate viewer application, select a format from
the Preview menu.
To run the report again from the preview window, click the Reload button in the preview tool bar, or, if you change the
report design, save the design and click Preview.

Basic Notions of JasperReports
31
CHAPTER 3BASIC NOTIONS OF JASPERREPORTS
The heart of iReport is JasperReports, an open source library developed and maintained by Jaspersoft Corporation under the
direction of Teodor Danciu and Lucian Chirita. It is the most widely distributed and powerful free software library for report
creation available today.
In this chapter, I will illustrate JasperReports’s base concepts for a better understanding of how iReport works.
The JasperReports API, the XML syntax for report definition, and all the details for using the library in your own programs are
documented very well in The JasperReports Ultimate Guide. This guide is available from Jaspersoft. Other information and
examples are directly available on the official JasperReports site at http //jasperreports.sourceforge.net.
JasperReports is published under the LGPL license, which is less restrictive a GPL license. JasperReports can be freely used
on commercial programs without buying very expensive software licenses and without remaining trapped in the complicated
net of open source licenses. This is fundamental when reports created with iReport have to be used in a commercial product; in
fact, programs only need the JasperReports library to produce prints, which work something like a run time executable.
On the other hand, iReport is distributed with a GPL license. Without the appropriate commercial license (available upon
request), you can only use iReport as a development tool, and only programs published under the terms of the GPL license
may include iReport as a component.
This chapter has the following sections:
The Report Life Cycle
JRXML Sources and Jasper Files
Data Sources and Print Formats
Compatibility Between Versions
Expressions
Using Java as a Language for Expressions
Using Groovy as a Language for Expressions
Using JavaScript as a Language for Expressions
A Simple Program
3.1 The Report Life Cycle
When we think about a report, only the final document comes to mind, such as a PDF or Excel file. But this is only the final
stage of a report lifecycle, which starts with the report design. Designing a report means creating some sort of template, such
as a form where we leave blank space that can be filled with data. Some portions of a page defined in this way are reused,
others stretch to fit the content, and so on.

32
iReport Ultimate Guide
When we are finished, we save this template as an XML file sub-type that we call JRXML (“JR” for JasperReports). It
contains all the basic information about the report layout, including complex formulas to perform calculations, an optional
query to retrieve data out of a data source, and other functionality we will discuss in detail in later chapters.
A JRXML cannot be used as-is. For performance reasons, and for the benefit of the program that will run the report, iReport
compiles the JRXML and saves it as an executable binary, a JASPER file. A JASPER file is the template that JasperReports
uses to generate a report melding the template and the data retrieved from the data source. The result is a “meta print”—an
interim output report—that can then be exported in one or more formats, giving life to the final document.
The life cycle can be divided into two distinct action sets:
Tasks executed during the development phase (design and planning of the report, and compilation of a Jasper file source,
the JRXML).
Tasks that must be executed in run time (loading of the Jasper file, filling of the report, and export of the print in a final
format).
The main role of iReport in the cycle is to design a report and create an associated JASPER file, though it is able to preview
the result and export it in all the supported formats. iReport also provides support for a wide range of data sources and allows
the user to test their own data sources, thereby becoming a complete environment for report development and testing.
3.2 JRXML Sources and Jasper Files
As already explained, JasperReports defines a report with an XML file. In previous versions, JasperReports defined the XML
syntax with a DTD file (jasperreport.dtd). Starting with Version 3.0.1, JasperReports changed the definition method to allow
for support of user defined report elements. The set of tags was extended and the new XML documents must be validated
using an XML-Schema document (jasperreport.xsd).
Table 3-1
A JRXML file is composed of a set of sections, some of them concerning the report’s physical characteristics, such as the
dimension of the page, the positioning of the fields, and the height of the bands; and some of them concerning the logical
characteristics, such as the declaration of the parameters and variables, and the definition of a query for data selection.
The syntax has grown more and more complicated with the maturity of JasperReports. This is why many times a tool like
iReport is indispensable.
The following figure shows the source code of the report described in the previous chapter (Figure 2-19):
.Code Example 3-1 A simple JRMXL file example
<?xml version="1.0" encoding="UTF-8"?>
<jasperReport xmlns="http://jasperreports.sourceforge.net/jasperreports"
xmlns:xsi="http://www.w3.org/2001/XMLSchema-instance" xsi:schemaLocation="http://
jasperreports.sourceforge.net/jasperreports http://jasperreports.sourceforge.net/
xsd/jasperreport.xsd" name="My first report" pageWidth="595" pageHeight="842"
columnWidth="535" leftMargin="20" rightMargin="20" topMargin="20" bottomMargin="20">
<queryString language="SQL">
<![CDATA[select * from address order by city]]>
</queryString>
<field name="ID" class="java.lang.Integer">
<fieldDescription><![CDATA[]]></fieldDescription>
</field>
<field name="FIRSTNAME" class="java.lang.String">
<fieldDescription><![CDATA[]]></fieldDescription>
</field>
<field name="LASTNAME" class="java.lang.String">
<fieldDescription><![CDATA[]]></fieldDescription>
</field>

Basic Notions of JasperReports
33
<field name="STREET" class="java.lang.String">
<fieldDescription><![CDATA[]]></fieldDescription>
</field>
<field name="CITY" class="java.lang.String">
<fieldDescription><![CDATA[]]></fieldDescription>
</field>
<group name="CITY">
<groupExpression><![CDATA[$F{CITY}]]></groupExpression>
<groupHeader>
<band height="27">
<staticText>
<reportElement mode="Opaque" x="0" y="0" width="139" height="27"
forecolor="#FFFFFF" backcolor="#000000"/>
<textElement>
<font size="18"/>
</textElement>
<text><![CDATA[CITY]]></text>
</staticText>
<textField hyperlinkType="None">
<reportElement mode="Opaque" x="139" y="0" width="416" height="27"
forecolor="#FFFFFF" backcolor="#000000"/>
<textElement>
<font size="18" isBold="true"/>
</textElement>
<textFieldExpression class="java.lang.String"><![CDATA[$F{CITY}]]>
</textFieldExpression>
</textField>
</band>
</groupHeader>
<groupFooter>
<band height="8">
<line direction="BottomUp">
<reportElement key="line" x="1" y="4" width="554" height="1"/>
</line>
</band>
</groupFooter>
</group>
<background>
<band/>
</background>
<title>
<band height="58">
<line>
<reportElement x="0" y="8" width="555" height="1"/>
</line>
<line>
<reportElement positionType="FixRelativeToBottom" x="0" y="51" width="555"
height="1"/>
</line>
Code Example 3-1 A simple JRMXL file example, continued

34
iReport Ultimate Guide
<staticText>
<reportElement x=”65” y=”13” width ”424” height=”35”/>
<textElement textAlignment=”Center”>
<font size=”26” isBold=”true”/>
</textElement>
<text><![CDATE[Classic template]]> </text>
</staticText>
</band>
</title>
<pageHeader>
<band/>
</pageHeader>
<columnHeader>
<band height="18">
<staticText>
<reportElement mode="Opaque" x="0" y="0" width="138" height="18"
forecolor="#FFFFFF" backcolor="#999999"/>
<textElement>
<font size="12"/>
</textElement>
<text><![CDATA[ID]]></text>
</staticText>
<staticText>
<reportElement mode="Opaque" x="138" y="0" width="138" height="18"
forecolor="#FFFFFF" backcolor="#999999"/>
<textElement>
<font size="12"/>
</textElement>
<text><![CDATA[FIRSTNAME]]></text>
</staticText>
<staticText>
<reportElement mode="Opaque" x="276" y="0" width="138" height="18"
forecolor="#FFFFFF" backcolor="#999999"/>
<textElement>
<font size="12"/>
</textElement>
<text><![CDATA[LASTNAME]]></text>
</staticText>
<staticText>
<reportElement mode="Opaque" x="414" y="0" width="138" height="18"
forecolor="#FFFFFF" backcolor="#999999"/>
<textElement>
<font size="12"/>
</textElement>
<text><![CDATA[STREET]]></text>
</staticText>
</band>
</columnHeader>
Code Example 3-1 A simple JRMXL file example, continued

Basic Notions of JasperReports
35
<detail>
<band height="20">
<textField hyperlinkType="None">
<reportElement x="0" y="0" width="138" height="20"/>
<textElement>
<font size="12"/>
</textElement>
<textFieldExpression class="java.lang.Integer"><![CDATA[$F{ID}]]>
</textFieldExpression>
</textField>
<textField hyperlinkType="None">
<reportElement x="138" y="0" width="138" height="20"/>
</textField>
<textElement>
<font size="12"/>
</textElement>
<textFieldExpression class="java.lang.String"><![CDATA[$F{FIRSTNAME}]]>
</textFieldExpression>
<textField hyperlinkType="None">
<reportElement x="276" y="0" width="138" height="20"/>
<textElement>
<font size="12"/>
</textElement>
<textFieldExpression class="java.lang.String"><![CDATA[$F{LASTNAME}]]>
</textFieldExpression>
</textField>
<textField hyperlinkType="None">
<reportElement x="414" y="0" width="138" height="20"/>
<textElement>
<font size="12"/>
</textElement>
<textFieldExpression class="java.lang.String"><![CDATA[$F{STREET}]]>
</textFieldExpression>
</textField>
</band>
</detail>
<columnFooter>
<band/>
</columnFooter>
<pageFooter>
<band height="26">
<textField evaluationTime="Report" pattern="" isBlankWhenNull="false"
hyperlinkType="None">
<reportElement key="textField" x="516" y="6" width="36" height="19"
forecolor="#000000" backcolor="#FFFFFF"/>
<textElement>
<font size="10"/>
</textElement>
Code Example 3-1 A simple JRMXL file example, continued

36
iReport Ultimate Guide
During compilation of the JRXML file (using some JasperReports classes), the XML is parsed and loaded in a JasperDesign
object, which is a rich data structure that allows you to represent the exact XML contents in memory. Without going into
details, regardless of which language is used for expressions inside the JRXML, JasperReports creates a special Java class that
represents the whole report. The report is then compiled, instanced and serialized in a JASPER file, ready for loading at any
time.
JasperReports’s speedy operation is due to all of a report’s formulas being compiled into Java-native bytecode and the report
structure being verified during compilation instead of run time. The JASPER file does not contain extraneous resources, such
as images used in the report, resource bundles to run the report in different languages, or extra scriptlets and external style
definitions. All these resources must be provided by the host application and located at run time.
<textFieldExpression class="java.lang.String"><![CDATA["" +
$V{PAGE_NUMBER}]]></textFieldExpression>
</textField>
<textField pattern="" isBlankWhenNull="false" hyperlinkType="None">
<reportElement key="textField" x="342" y="6" width="170" height="19"
forecolor="#000000" backcolor="#FFFFFF"/>
<box>
<topPen lineWidth="0.0" lineStyle="Solid" lineColor="#000000"/>
<leftPen lineWidth="0.0" lineStyle="Solid" lineColor="#000000"/>
<bottomPen lineWidth="0.0" lineStyle="Solid" lineColor="#000000"/>
<rightPen lineWidth="0.0" lineStyle="Solid" lineColor="#000000"/>
</box>
<textElement textAlignment="Right">
<font size="10"/>
</textElement>
<textFieldExpression class="java.lang.String"><![CDATA["Page " +
$V{PAGE_NUMBER} + " of "]]></textFieldExpression>
</textField>
<textField pattern="" isBlankWhenNull="false" hyperlinkType="None">
<reportElement key="textField" x="1" y="6" width="209" height="19"
forecolor="#000000" backcolor="#FFFFFF"/>
<box>
<topPen lineWidth="0.0" lineStyle="Solid" lineColor="#000000"/>
<leftPen lineWidth="0.0" lineStyle="Solid" lineColor="#000000"/>
<bottomPen lineWidth="0.0" lineStyle="Solid" lineColor="#000000"/>
<rightPen lineWidth="0.0" lineStyle="Solid" lineColor="#000000"/>
</box>
<textElement>
<font size="10"/>
</textElement>
<textFieldExpression class="java.util.Date"><![CDATA[new Date()]]>
</textFieldExpression>
</textField>
</band>
</pageFooter>
<summary>
<band/>
</summary>
</jasperReport>
Code Example 3-1 A simple JRMXL file example, continued
Basic Notions of JasperReports
37
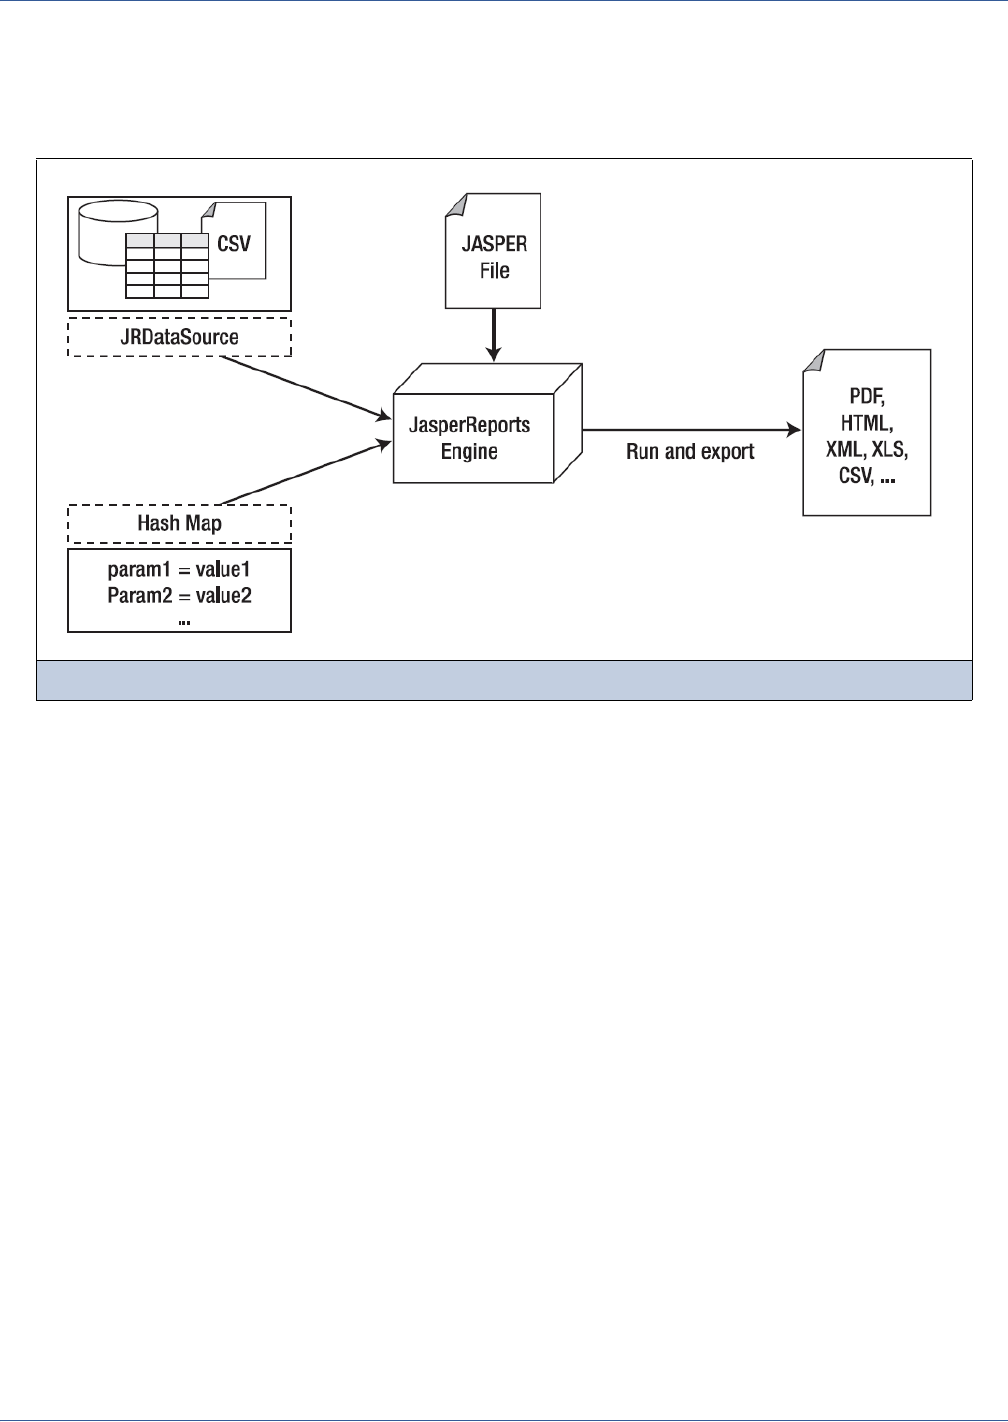
3.3 Data Sources and Print Formats
Without a means of supplying content from a dynamic data source, even the most sophisticated and appealing report would be
useless. JasperReports allows you to specify fill data for the output report in two ways: parameters and data sources. Either
kinds of data are presented by means of a generic interface named JRDataSource, as shown in Figure 3-1.
Chapter Chapter 10, “Data Sources and Query Executers,” on page 153 is dedicated to data sources; it explains how they
can be used in iReport and how it is possible to define custom data sources (in case those supplied with JasperReports are not
right for your requirements).
JRDataSource allows a set of records that are organized in tables (rows and columns) to be read. It enables JasperReports to
fill a report with data from an explicit data source, using a JDBC connection (already instanced and opened) to whichever
relational database you want to run a SQL query on (which is specified in the report).
If the data (passed through a data source) don't meet the requirements of the user, that is, when it is necessary to specify
particular values to condition the report’s execution, it is possible to produce name/value pairs to “transmit” to the print
engine. These pairs are named parameters, and they have to be “preventively declared” in the report. Through fillManager,
it is possible to join a JASPER file and a data source in a JasperPrint object. This object is a meta-print that can create a real
print after you have exported it in the desired format through appropriate classes that implement the JRExporter interface.
JasperReports puts at your disposal different pre-defined exporters, such as those for creating files in such formats as PDF,
XLS, CVS, XML, RTF, ODF, text, HTML and SWF. Through the JRViewer class, you can view the print directly on the
screen and print a hardcopy.
3.4 Compatibility Between Versions
When a new version of JasperReports is distributed, some classes usually change. These modified classes typically impact the
XML syntax and the JASPER file structure.
Before JasperReports 1.1.0, this was a serious problem and a major upgrade deterrent, since it required recompiling all the
JRXML files in order to be used with the new library version. Things changed after the release of Version 1.1.0, after which
JasperReports assured backwards compatibility, that is, the library is able to understand and execute any JASPER file
generated with a previous version of JasperReports.
Figure 3-1 Data source and parameter Flows for Report Creation

38
iReport Ultimate Guide
With JasperReports 3.1, the JRXML syntax moved from a DTD-based definition to XML-based schema. The XML source
declaration syntax now references a schema file, rather than a DTD. Based on what we said previously, this is not a problem
since JasperReports assures backwards compatibility. However, many people have been used to designing reports with early
versions of iReport then generating the reports by compiling JRXML in JasperReports. This was always a risky operation, but
it was still valid because the user was not using a new tag in the XML. With the move to an XML schema, the JRXML output
of iReport 3.1.1 and newer can only be compiled with a JasperReports 3.1.0 or later.
3.5 Expressions
Though I designed iReport to be useful for non-technical report designers, many settings in a report are defined using formulas
(such as conditions to hide an element, special calculations, text processing, and so on) that require a minimum knowledge of
a scripting language.
Fortunately, formulas can be written in at least three languages, two of which (JavaScript and Groovy) are pretty simple and
can be used without knowledge of programming methods.
All of the formulas in JasperReports are defined through expressions. The default expression language is Java, but I suggest
that you design your projects with JavaScript or Groovy. Both hide a lot of the Java complexity and are definitively the
languages to use if you don’t know Java. The language is a property of the document, so, to set it, select the document root
node in the Outline view and choose your language in the Language property in the Properties view. We will go through all
the languages in the following sections, but let’s concentrate for a moment on our definition of an “expression,” in particular
the type you will declare for it and why that is important in JasperReports.
An expression is just a formula that operates on some values and returns a result. Think of an expression as the formula you
might define for a spreadsheet cell. A cell can have a simple value or you can use a complex formula that refers to other
values; in a spreadsheet you would refer to values contained in other cells, whereas in JasperReports you will use the report
fields, parameters, and variables. The main point is that whatever you have in your expression, when it is computed it gives a
value as result (which can be null; that’s still a value).
3.5.1 The Type of an Expression
The type of an expression is the nature of the value resulting from it; the type is determined by the context in which the
expression is used. For example, if your expression is used to evaluate a condition, the type of the expression should be
Boolean (true or false); if you are creating an expression that should be displayed in a textfield, it will probably be a String or
a number (Integer or Double). We could simplify the declaration of types by limiting them to text, numbers, Booleans, and
generic object values. Unfortunately, JasperReports is a bit more formal and in many cases you have to be very precise when
setting the type of your expression.
So far, we are discussing only Java types (regardless of the language used). Some of the most important types are:
java.lang.Boolean Defines an Object that represents a boolean value such as true and
false
java.lang.Byte Defines an Object that represents a byte
java.lang.Short Defines an Object that represents an short integer
java.lang.Integer Defines an Object that represents integer numbers
java.lang.Long Defines an Object that represents long integer numbers
java.lang.Float Defines an Object that represents floating point numbers
java.lang.Double Defines an Object that represents real numbers
java.lang.String Defines an Object that represents a text
Basic Notions of JasperReports
39
As noted, if the expression is used to determine the value of a condition that determines, for instance, whether an element
should be printed, the return type will be java.lang.Boolean; to create it, you need an expression that returns an instance of
a Boolean object. Similarly, if I’m writing the expression to show a number in a textfield, the return type will be
java.lang.Integer or java.lang.Double.
Fortunately, JavaScript and Groovy are not particularly formal about types, since they are not typed languages; the language
itself treats a value in the best way by trying to guess the value type or by performing implicit casts (conversion of the type).
3.5.2 Expression Operators and Object Methods
Operators in Java, Groovy and JavaScript are similar because these languages share the same basic syntax. Operators can be
applied to a single operand (unary operators) or on two operands (binary operators).
The table shows a number of operators. This is not a complete list; they are the ones I suggest. For instance, there is a unary
operator to add 1 to a variable (++), but in my opinion it is not easy to read and can be replaced easily with x + 1. Better, no?
Within the expression, you can the syntax that’s summarized in Table 3-3 to refer to the parameters, variables, and fields
which are defined in the report.
java.util.Date Defines an Object that represents a date or a timestamp
java.lang.Object A generic java Object
Table 3-2 Expression operators
Operator Description Example
+Sum (it can be used to sum two numbers or to concatenate two strings) A + B
-Subtraction A - B
/Division A / B
%Rest, it returns the rest of an integer division A % B
|| Boolean operator OR A || B
&& Boolean operator AND A && B
== Equals*
* In Java the == operator can only be used to compare two primitive values. With objects, you need to use the special
method “equals”; for example, you cannot write an expression like “test” == “test”, you need to write “test”.equals(“test”).
!= can only be used to compare two primitive values, as well.
A == B
!= Not equals*A != B
!Boolean operator NOT !A
Table 3-3 Syntax for referring to report objects
Syntax Description
$F{name_field} Specifies the name_field field ("F" means field).
$V{name_variable} Specifies the name_ variable variable.
$P{name_parameter} Specifies the name_parameter parameter.
$P!{name_parameter} Special syntax used in the report SQL query to indicate that the parameter does not
have to be dealt as a value to transfer to a prepared statement, but that it represents a
little piece of the query.
$R{resource_key} Special syntax for localization of strings.
40
iReport Ultimate Guide
We will describe the nature of fields, variables, and parameters in the next chapter. For now we just have to keep in mind that
they always represent objects (that is, they can have a null value) and that you specify their type when you declare them within
a report. Version 0.6.2 of JasperReports introduced a new syntax: $R{resource_key}. This is used to localize strings. I will
discuss this at greater lengths in Chapter Chapter 16, “Internationalization,” on page 305.
In spite of the possible complexity of an expression, usually it is a simple operation that returns a value. It is not a snippet of
code, or a set of many instructions, and you cannot use complex constructs or flow control keywords, such as switches, loops,
for and while cycles, if and else.
Be that as it may, there is a simple if-else expression construct that is very useful in many situations. An expression is just an
arbitrary operation (however complicated) that returns a value. You can use all the mathematical operators or call object
methods, but at any stage the expression must represent a value. In Java, all these operators can be applied only to primitive
values, except for the sum operator (+). The sum operator can be applied to a String expression with the special meaning of
“concatenate”. So, for example:
$F{city} + “, ” + $F{state}
will result in a string like this:
San Francisco, California
All the objects in an expression may include methods. A method can accept zero or more arguments, and it can return or not a
value; in an expression you can use only methods that return a value (otherwise you would have nothing to return from your
expression). The syntax of a method call is:
Object.method(argument1, argument2, and so on.)
Some examples:
All the methods of each object are usually explained in a set of documents called “Javadocs;” they are freely available on the
Internet.
You can use parentheses to isolate expressions and make the overall expression more readable.
3.5.3 Using an If-Else Construct in an Expression
A way to create an if-else-like expression is by using the special question mark operator. Here is a sample:
(($F{name}.length() > 50) ? $F{name}.substring(0,50) : $F{name})
The syntax is (<condition>) ? <value on true> : <value on false>. It is extremely useful, and the good news is
that it can be recursive, meaning that the value on true and false can be represented by another expression which can be a
new condition:
(($F{name}.length() > 50) ?
(($F{name}.startsWidth(“A”)) ? “AAAA” : “BBB”)
:
$F{name})
This expression returns the String “AAAA” when the value of the field name is longer than 50 characters and starts with A,
returns BBB if it is longer than 50 characters but does not start with A, and, finally, returns the original field value if neither of
these conditions is true.
Despite the possible complexity of an expression (having multiple if-else instructions and so on), it can be insufficient to
define a needed value. For example, if you want to print a number in Roman numerals or give back the name of the weekday
Expression Result
“test”.length() 4
“test”.substring(0, 3) “tes”
“test”.startsWith(“A”) false
“test”.substring(1, 2).startsWith(“e”) true

Basic Notions of JasperReports
41
of a date, it is possible to transfer the elaborations to an external Java class method, which must be declared as static, as shown
in the following:
MyFormatter.toRomanNumber( $F{MyInteger}.intValue() )
The function operand toRomanNumber is a static method of the MyFormatter class, which takes an int as argument (the
conversion from Integer to int is done by means of the intValue() method; it is required only when using Java as language)
and gives back the Roman version of a number in a lace.
This technique can be used for many purposes; for example, to read the text from a CLOB field or to add a value into a
HashMap (a convenient Java object that represents a set of key/value pairs).
3.6 Using Java as a Language for Expressions
First of all, there is no reason to prefer Java over other languages when working with iReport. It is the first language supported
by JasperReports and this is the only reason for which it is still the commonly-used language (and the default one).
Following are some examples of Java expressions:
“This is an expression”
new Boolean(true)
new Integer(3)
(($P{MyParam}.equals("S")) ? "Yes" : "No")
The first thing to note is that each of these expressions represents a Java Object, meaning that the result of each expression is a
non-primitive value. The difference between an object and a primitive value makes sense only in Java, but it is very important:
a primitive value is a pure value like the number 5 or the Boolean value true. Operations between primitive values have as a
result a new primitive value, so the expression:
5+5
results in the primitive value 10. Objects are complex types that can have methods, can be null, and must be “instanced” with
the keyword “new” most of the time. In the second example above, for instance (new Boolean(true)), we must wrap the
primitive value true in an object that represents it.
By contrast, in a scripting language such as Groovy and JavaScript, primitive values are automatically wrapped into objects, so
the distinction between primitive values and objects wanes. When using Java, the result of our expression must be an object,
which is why the expression 5+5 is not legal as-is but must be fixed with something like this:
new Integer( 5 + 5 )
The fix creates a new object of type Integer representing the primitive value 10.
So, if you use Java as the default language for your expressions, remember that expressions like the following are not valid:
3 + 2 * 5
true
(($P{MyParam} == 1) ? "Yes" : "No")
These expressions don’t make the correct use of objects. In particular, the first and the second expressions are not valid
because they are of primitive types (integer in the first case and boolean in the second case) which do not produce an
object as a result. The third expression is not valid because it assumes that the MyParam parameter is a primitive type and that
it can be compared through the == operator with an int, but it cannot. In fact, we said that parameters, variables, and fields are
always objects and primitive values cannot be compared or used directly in a mathematical expression with an object.
Since JasperReports is compiled to work with Java 1.4, the auto-boxing functionality of Java 1.5, that would in some cases
solve the use of objects as primitive values and vice versa, is not leveraged.
3.7 Using Groovy as a Language for Expressions
The modular architecture of JasperReports provides a way to plug in support for languages other than Java. By default, the
library supports two additional languages: Groovy and JavaScript (the latter starting with version 3.1.3).

42
iReport Ultimate Guide
Groovy is a full language for the Java 2 Platform. Inside the Groovy language you can use all classes and JARs that are
available for Java. Table 3-4 compares some typical JasperReports expressions written in Java and Groovy.
The following is a correct Groovy expression:
new JREmptyDataSource($F{num_of_void_records})
JREmptyDataSource is a class of JasperReports that creates an empty record set (meaning with the all fields set to null). You
can see how you can instance this class (a pure Java class) in Groovy without any problem. At the same time, Groovy allows
you to use a simple expression like this one:
5+5
The language automatically encapsulates the primitive value 10 (the result of that expression) in a proper object. Actually, you
can do more: you can treat this value as an object of type String and create an expression such as:
5 + 5+ ”my value”
Whether or not such an expression resolves to a rational value, it is still a legal expression and the result will be an object of
type String with the value:
10 my value
Hiding the difference between objects and primitive values, Groovy allows the comparison of different types of objects and
primitive values, such as the legal expression:
$F{Name} == “John”
This expression returns true or false, or, again:
Groovy provides a way to greatly simplify expressions and never complains about null objects that can crash a Java expression
throwing a NullPointerException. It really does open the doors of JasperReports to people who don’t know Java.
3.8 Using JavaScript as a Language for Expressions
JavaScript is a popular scripting language with a syntax very similar to Java and Groovy. The support for JavaScript has been
requested for a long time from the community and was finally introduced in JasperReports 3.1.2, using the open source Rhino
JavaScript implementation.
JavaScript has a set of functions and object methods that in some cases differ from Java and Groovy. For example, the method
String.startsWith(...) does not exist in JavaScript. The good news is that you can still use Java objects in JavaScript. A
simple example is:
Table 3-4 Groovy and Java code samples
Expression Java Groovy
Field $F{field_name} $F{field_name}
Sum of two
double fields
new Double($F{f1}.doubleValue() + $F{f2}.doubleValue()) $F{f1} + $F{f2}
Comparison of
numbers
new Boolean($F{f}.intValue() == 1) $F{f} == 1
Comparison of
strings
new Boolean($F{f} != null && $F{f}.equals("test")) $F{f} == "test"
$F{Age} > 18 Returns true if the Age object interpreted as a number is greater than
18.
“340” < 100 Always returns false.
“340”.substring(0,2) < 100 Always returns true (since the substring method call will produce the
string “34”, which is less than 100).

Basic Notions of JasperReports
43
(new java.lang.String("test")).startsWith("t")
This is a valid JavaScript expression. As you can see, we are able to create a Java object (in this case a java.lang.String)
and use its methods.
JavaScript is the best choice for people who have absolutely no knowledge of other languages, since it is easy to learn and
there are plenty of JavaScript manuals and references on the web. The other significant advantage is that it is not interpreted at
run time, but generates pure Java byte-code, instead. As a result, it produces almost the same performance as Java itself.
3.9 Using JasperReports Extensions in iReport
JasperReports provides several ways to extend its functionality. In general, extensions (like components, fonts, query
executors, chart themes, and so on) are packaged in JARs. To use these extensions in iReport, just add the required JARs to the
iReport classpath. The iReport classpath is composed of static and reloadable paths. Extensions must be set as static paths,
while other objects which don’t require a proper descriptor or special loading mechanism (such as scriptlets and custom data
sources) can be reloadable.
3.10 A Simple Program
I finish this introduction to JasperReports by presenting an example of a simple program that shows how to produce a PDF file
from a Jasper file using a data source named JREmptyDataSource, which is a utility data source that provides zero or more
records without fields. The file test.jasper, referenced in the example, is the compiled version of the code in Code
Example 3-1.
Code Example 3-2 JasperTest.java
import net.sf.jasperreports.engine.*;
import net.sf.jasperreports.engine.export.*;
import java.util.*;
public class JasperTest
{
public static void main(String[] args)
{
String fileName = "/devel/examples/test.jasper";
String outFileName = "/devel/examples/test.pdf";
HashMap hm = new HashMap();
try
{
JasperPrint print = JasperFillManager.fillReport(
fileName,
hm,
new JREmptyDataSource());
JRExporter exporter =
new net.sf.jasperreports.engine.export.JRPdfExporter();

44
iReport Ultimate Guide
exporter.setParameter(
JRExporterParameter.OUTPUT_FILE_NAME,
outFileName);
exporter.setParameter(
JRExporterParameter.JASPER_PRINT,print);
exporter.exportReport();
System.out.println("Created file: " + outFileName);
}
catch (JRException e)
{
e.printStackTrace();
System.exit(1);
}
catch (Exception e)
{
e.printStackTrace();
System.exit(1);
}
}
}
Code Example 3-2 JasperTest.java, continued

Report Structure
45
CHAPTER 4REPORT STRUCTURE
In this chapter we will analyze the report structure, the underlying template that determines the style and organization of a
report. We will see the parts that compose it and how they behave in relation to input data as iReport creates an output report.
This chapter has the following sections:
Bands
Working with Bands
Summary
4.1 Bands
A report is defined by means of a type page. This page is divided into different horizontal portions named “bands.” When the
report is joined with data to run the print, these sections are printed many times according to their function (and according to
the rules that the report author has set up). For instance, the page header is repeated at the beginning of every page, while the
Detail band is repeated for every elaborated record.
Figure 4-1 on page 46 shows a type page divided into the nine main pre-defined bands to which new groups are added. In
fact, iReport manages a heading band (Group header) and a recapitulation band (Group footer) for every group. Detail, Group
Header and Group Footer bands can then be split further into several bands, so we can have Detail 1, Detail 2, and so on.
A band is always as wide as the usable page width (that is, excluding the right and left margins). However, its height, even if it
is established during the design phase, can vary during the print creation according to the contained elements; it can lengthen
towards the bottom of page in an arbitrary way. This typically occurs when bands contain subreports or textfields that have to
adapt to the content. Generally, the height specified by the user should be considered the minimal height of the band. Not all
bands can stretch dynamically according to the content, in particular the Column Footer, Page Footer and Last Page Footer
bands.
In general, the sum of all band heights (except for the background) always has to be less than or equal to the page height minus
the top and bottom margins. This rule actually is much more complicated, in fact, there are several different cases and options
that must be considered; for example, the Title band may be printed on a different page, the Page Footer and the Last Page
Footer may have different sizes and are never considered together, and so on. For your convenience, the maximum allowed
band size is dynamically calculated at design time by iReport, which prevents the user from setting invalid band heights
(which would lead to a layout verification error at compile time).
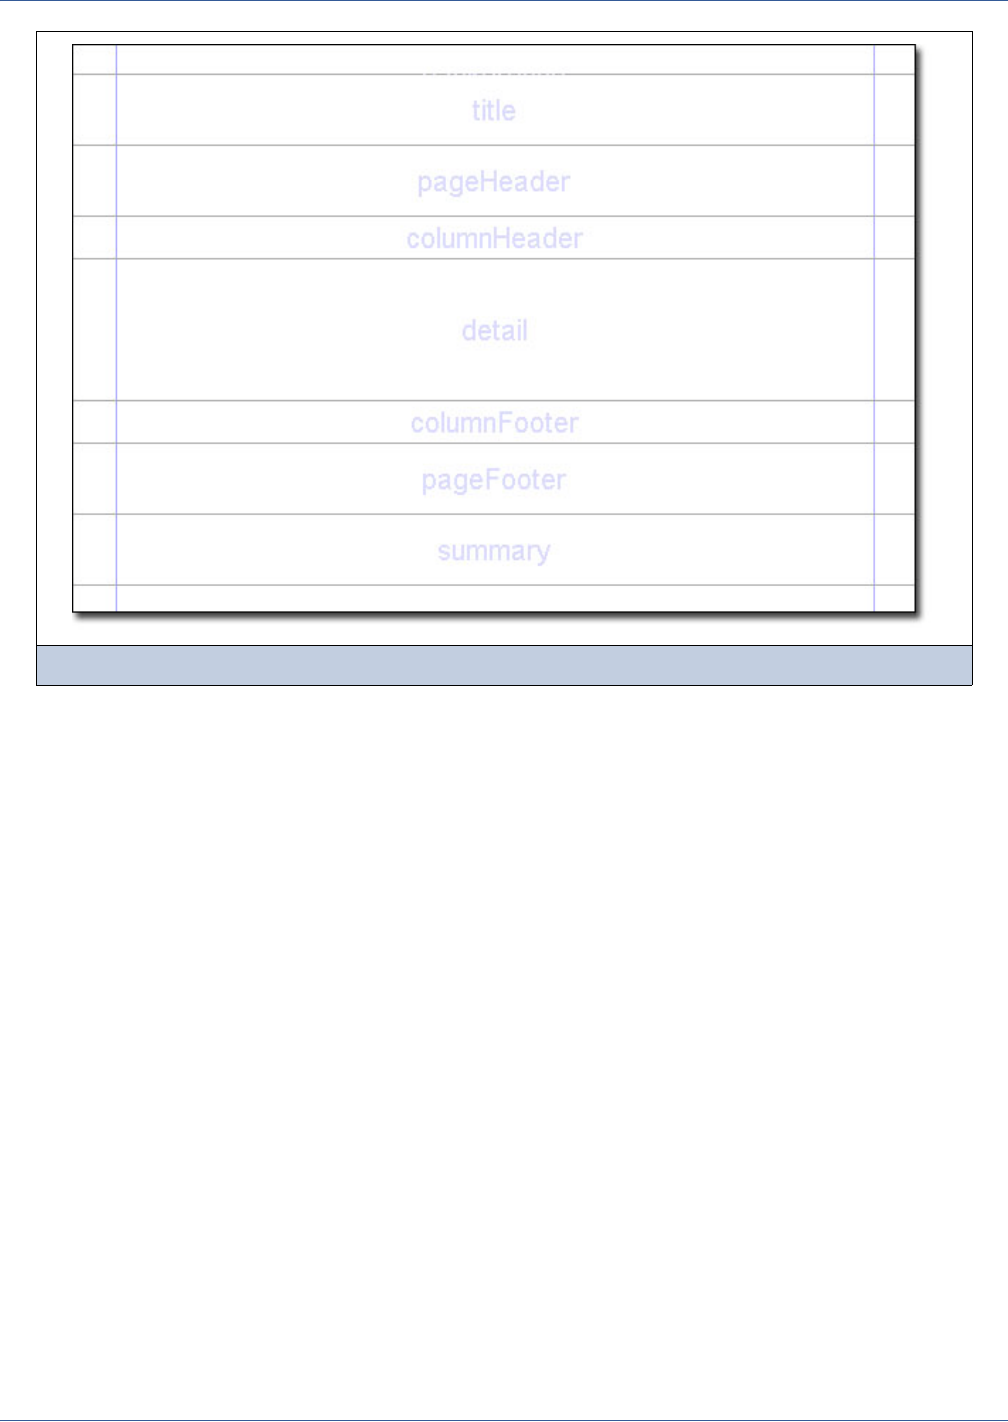
46
iReport Ultimate Guide
The following is a list of the pre-defined bands:
Figure 4-1 Pre-defined bands of a document
Title The Title band is the first visible band. It is created only once and can be printed on a
separate page. Regarding the defined dimensions, it is not possible during design time to
exceed the report page height (top and bottom margins are included). If the title is printed
on a separate page, this band height is not included in the calculation of the total sum of all
band heights, which has to be less than or equal to the page height.
Page Header The PageHeader band allows you to define a header at the top of the page. The height
specified during the design phase usually does not change during the creation process
(except for the insertion of vertically re-sizable components, such as textfields that contain
long text and subreports). The page header appears on all printed pages in the same position
defined during the design phase. Title and Summary bands do not include the page header
when printed on a separate page.
Column Header The ColumnHeader band is printed at the beginning of each detail column. (The column
concept will be explained in the “Columns” section later in this chapter.) Usually, labels
containing the column names of the tabular report are inserted in this band.

Report Structure
47
4.1.1 Report Properties
Now that you have seen the individual parts that comprise a report, you can proceed to create a new one. Select New Empty
Report from the File menu, choose a name for the document, and click the Finish button. A new empty report will appear in
the design area of the main window.
Group Header A report can contain zero or more group bands, which permit the collection of detail records
in real groups. A GroupHeader is always accompanied by a GroupFooter (both can be
independently visible or not). Different properties are associated with each group. They
determine its behavior from the graphic point of view. It is possible to always force a group
header on a new page or in a new column and to print this band on all pages if the bands
below it overflow the single page (as a page header, but at group level). It is possible to fix
a minimum height required to print a group header; if it exceeds this height, the Group
Header band will be printed on a new page. Other policies can be set by means of footer
position and the keep together properties. About the Group Header and Group Footer bands,
they can be split in several bands, obtaining an arbitrary set of group headers and a footers.
When split, the bands are enumerated starting from 1. (I will discuss groups in greater detail
later on in this chapter.)
Detail A Detail band corresponds to every record that is read by the data source that feeds the
print. In all probability, most of the print elements will be put here. A report can have
several Detail bands; in other words, the Detail band can be split in a set of sub-bands,
although by default a report has only one Detail band.
Group Footer The GroupFooter band completes a group. Usually it contains fields to view subtotals or
separation graphic elements, such as lines. Like the Detail and the Group Header bandS, the
Group Footer band can be split into several bands.
Column Footer The Column Footer band appears at the end of every column. Its dimensions are not
adjustable at run time (not even if it contained re-sizable elements such as subreports or
textfields with a variable number of text lines).
Page Footer The Page Footer band appears on every page where there is a page header. Like the Column
Footer band, it is not re-sizable at run time.
Last Page Footer If you want to make the footer on the last page of your report different from the other
footers, use the Last Page Footer band. If the band height is 0, it is ignored and the layout
established for the common page will be used also for the last page. This band first
appeared in JasperReports version 0.6.2.
Summary The Summary band allows you to insert fields concerning total calculations, means, or
whatever you want to insert at the end of the report. In other systems, this band is often
named “report footer.”
Background The Background band appeared for the first time in JasperReports version 0.4.6. It was
introduced after requests from many users who wanted to be able to create watermarks and
similar effects (such as a frame around the whole page). It can have a maximum height
equal to the page height and its content will appear on all the pages without being
influenced by the page content defined in the other bands.
No Data The No Data band is an optional report section that is printed only if the data source does
not return any record and the report property When no data type is set to No Data
section. Since this band will be printed instead of all the other bands, the height can be the
same as the report page, excluding margins.
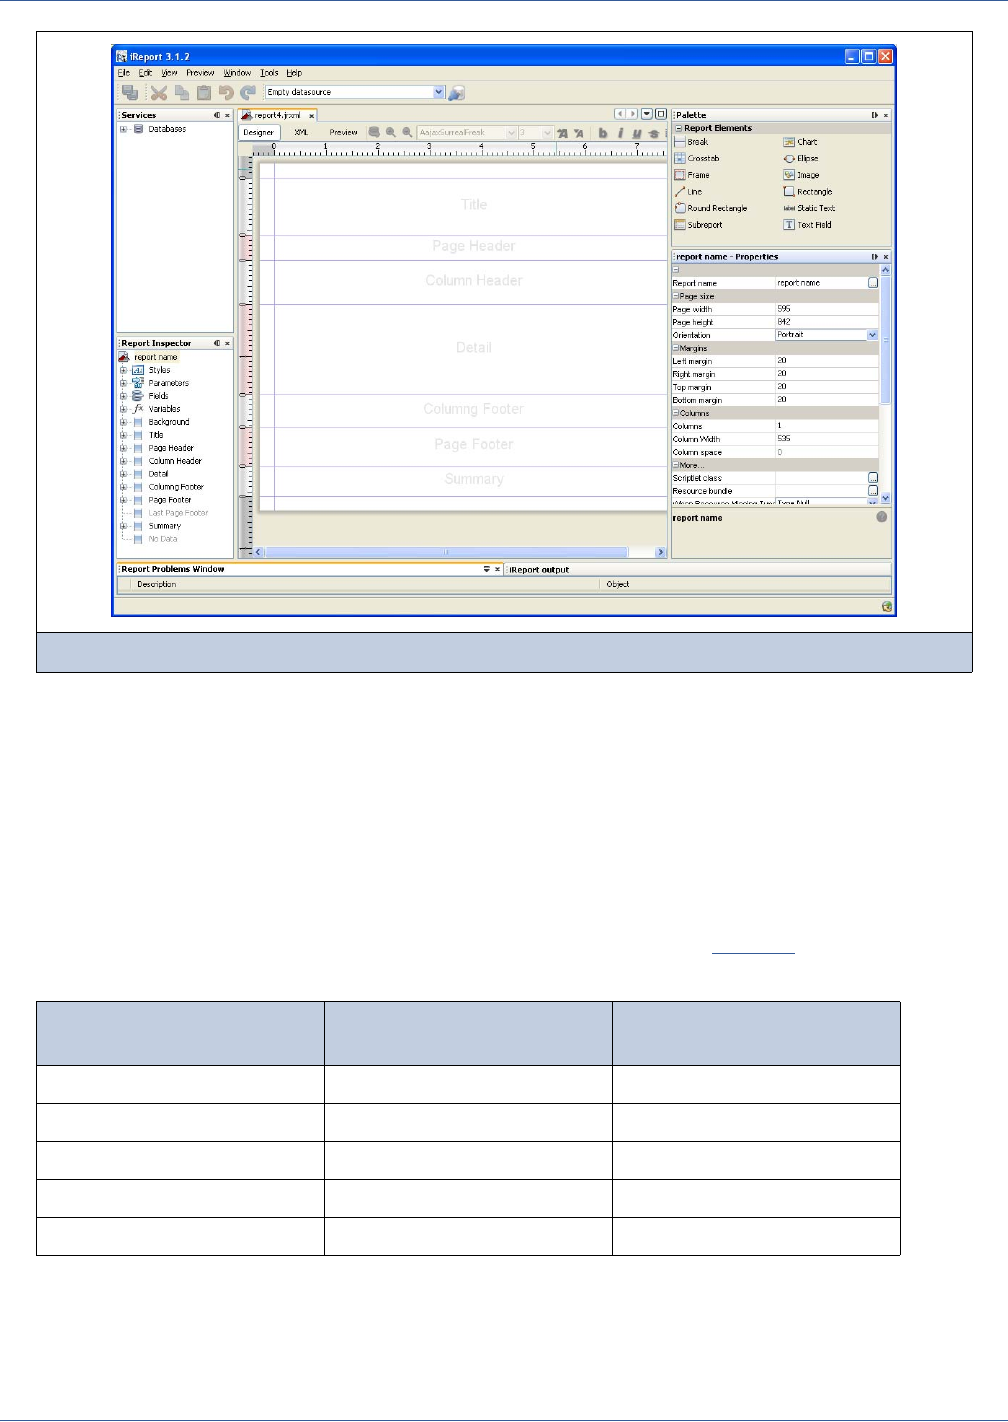
48
iReport Ultimate Guide
The Properties view (on the right side of the main window) shows the properties of the object that is currently selected in the
Report Inspector view (on the left side of the main window) or in the design area (such as a band or an element). When a new
report is created, the property sheet displays the report properties. You can recall the report properties at any time by selecting
the root node in the Report Inspector (showing the report name) or by clicking any area outside the document in the main
window.
The first property is the report name. It is a logical name, independent of the source file’s name, and is used only by the
JasperReports library (for example, as base name for the temporary Java file produced when a report is compiled).
The page dimensions are probably the report’s most important properties. The unit of measurement used by iReport and
JasperReports is the pixel (which has a resolution of 75 dpi, or dots per inch). Table 4-1 lists some standard page formats and
their dimensions in pixels. These are the common formats; a complete list is available in Wikipedia:
By modifying width and height, it is possible to create a report of whatever size you like. The page orientation option,
Landscape or Portrait, in reality is not meaningful, because the page dimensions are characterized by width and height,
independently of the sheet orientation. However, this property can be used by certain report exporters to decide how to orient
the report in a printer.
Figure 4-2 A new empty report in main design window
Table 4-1 Size of a Few Common Page Formats
Format Size in Native Unit of
Measurement
Size in Pixels
(rounded to whole number)
US Letter 8.5 x 11 inches 638 x 825
US Legal 8.5 x 14 inches 638 x 1050
A4 210 × 297 mm 623 x 878
A5 148 × 210 mm 435 x 623
A6 105 × 148 mm 308 x 435
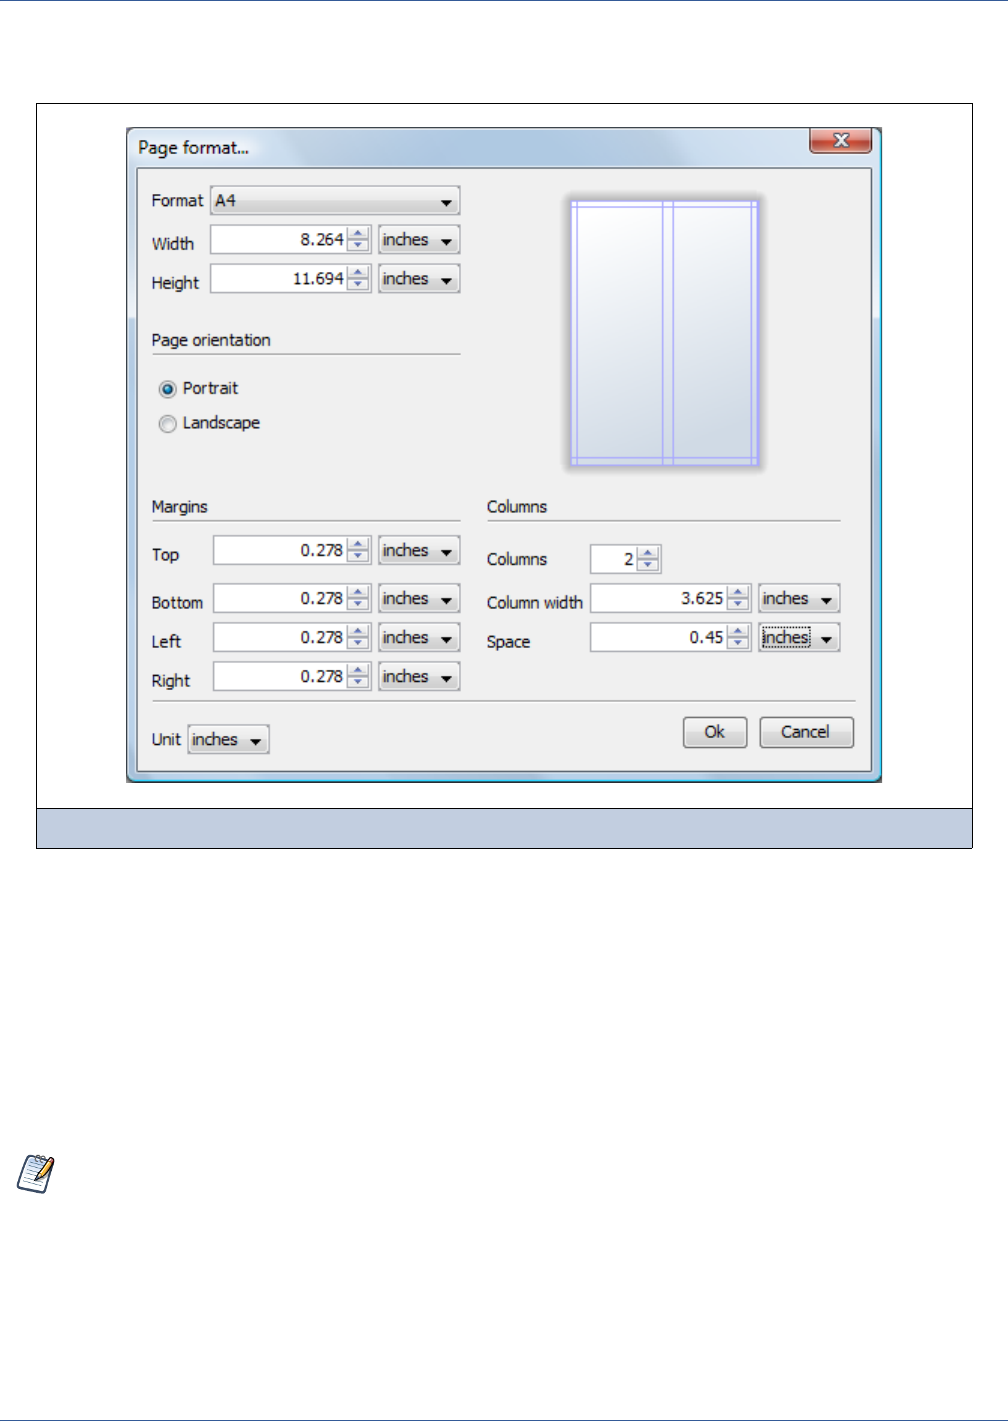
Report Structure
49
The page margin dimensions are set by means of the four fields in the Margins section of the window.
To more easily set the page properties, click Format → Page Format to open the Page Format dialog (Figure 4-3).
The Format drop-down contains all the presets listed in Table 4-1. The Unit selector at the bottom of the window allows you
to change the unit of the measures.
4.1.2 Columns
As we have seen (4.1, “Bands,” on page 45), a report is divided into horizontal sections, that is, bands.
The page, which comprises the report, presents portions which are independent of the records coming from the data source
(such as the title section, or the page footers), as well as other sections that are driven by those records (such as the group
headers/footers and the detail). These last portions can be divided into vertical columns in order to optimize the available
space.
Figure 4-3 Page Format dialog
In this context, the concept of “column” can be easily confused with that of “field”. A column is not connected to a
record field; we are just defining the layout of the page, not a table or something tied to the format of the data to print.
This means that if you want to print records having, for instance, ten fields, and you want to create a report that looks
like a table, you don’t need ten report columns, but you’ll have to place the report elements (labels and textfields) in a
single column report in order to get the table effect.
Use columns when you need a layout similar to that of newspapers, where the text rows are presented on several
columns to improve readability and make better use of the space on the page.
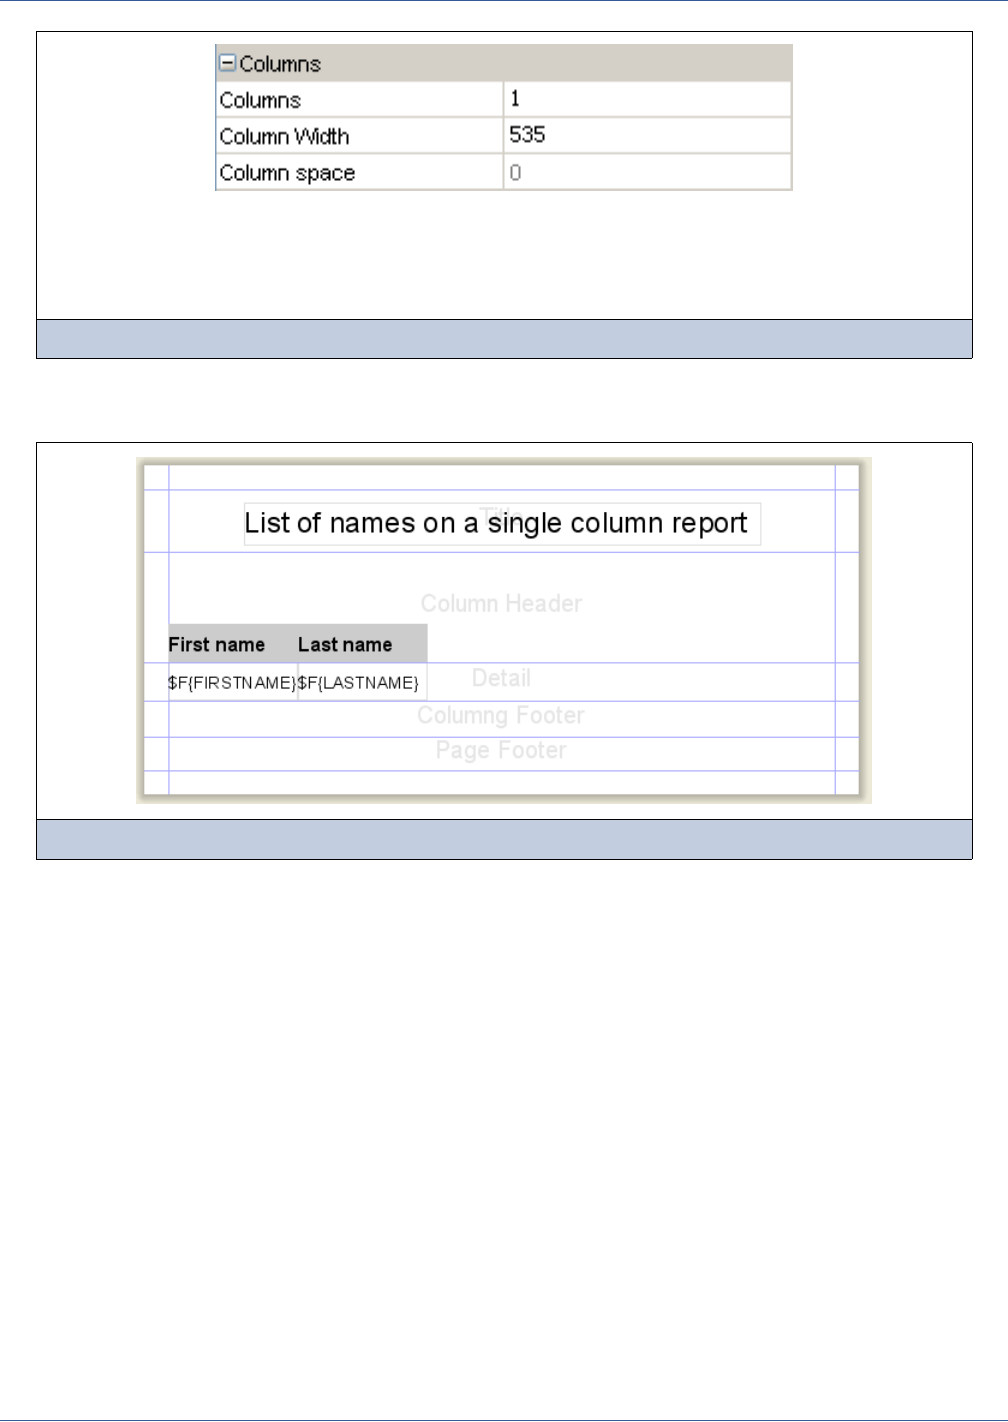
50
iReport Ultimate Guide
In the following figures we present two examples. The first shows how to set up a report to use a single column (actually, this
is the default and most common configuration; in this particular case the size of the page is a regular A4).
The values are set in the Report Properties view. The number of columns is 1 and the width is equal to the entire page width,
except for the margins (that’s 535 pixels). Since there is just a single column, the space between columns is not meaningful
and it is set to zero (this property is actually disabled when the column number is 1).
Figure 4-4 Report objects in the outline view
Figure 4-5 Layout of a single column report showing a set of names
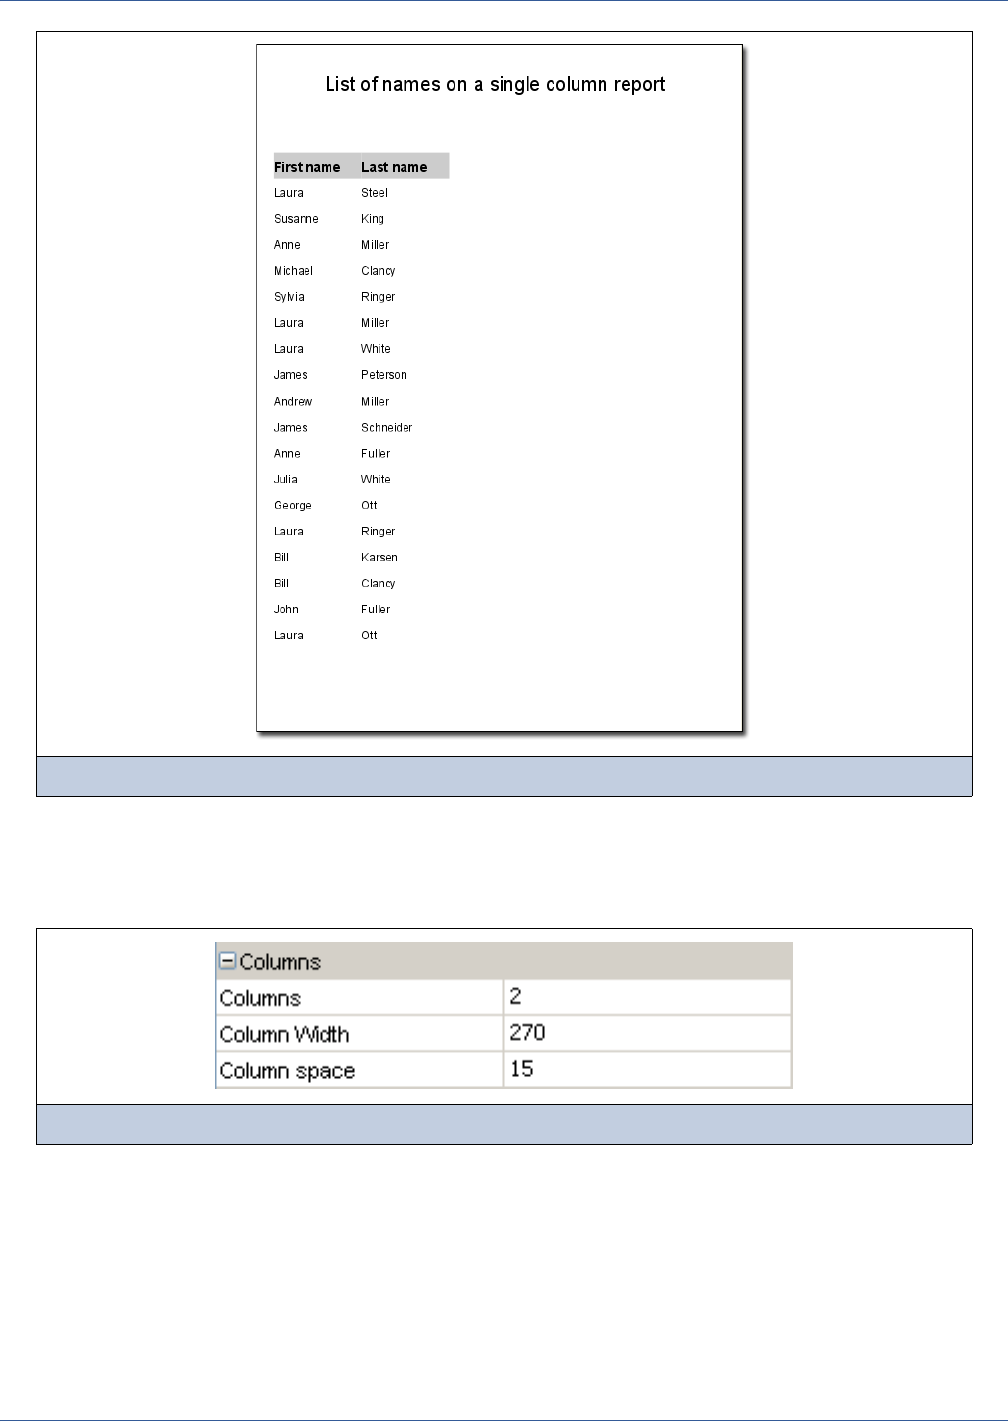
Report Structure
51
As you can see in Figure 4-6, most of the page is not used (the figure shows only the first page, but the report is composed of
other pages that look very similar); in fact, each record takes the whole horizontal width of the page. So the idea here is to split
the pages in two columns, so that when the first column reaches the end of the page, we can start to print in this page again in
the second column. Figure 4-7 shows the values used for a two-column report.
In this case, the columns number property is set to 2. iReport will automatically calculate the maximum column width
according to the margins and page width. If you want to increase the space between the columns, just increase the value of the
Column Space property.
Figure 4-6 Result of a report using the single column layout
Figure 4-7 Settings for a two-column report
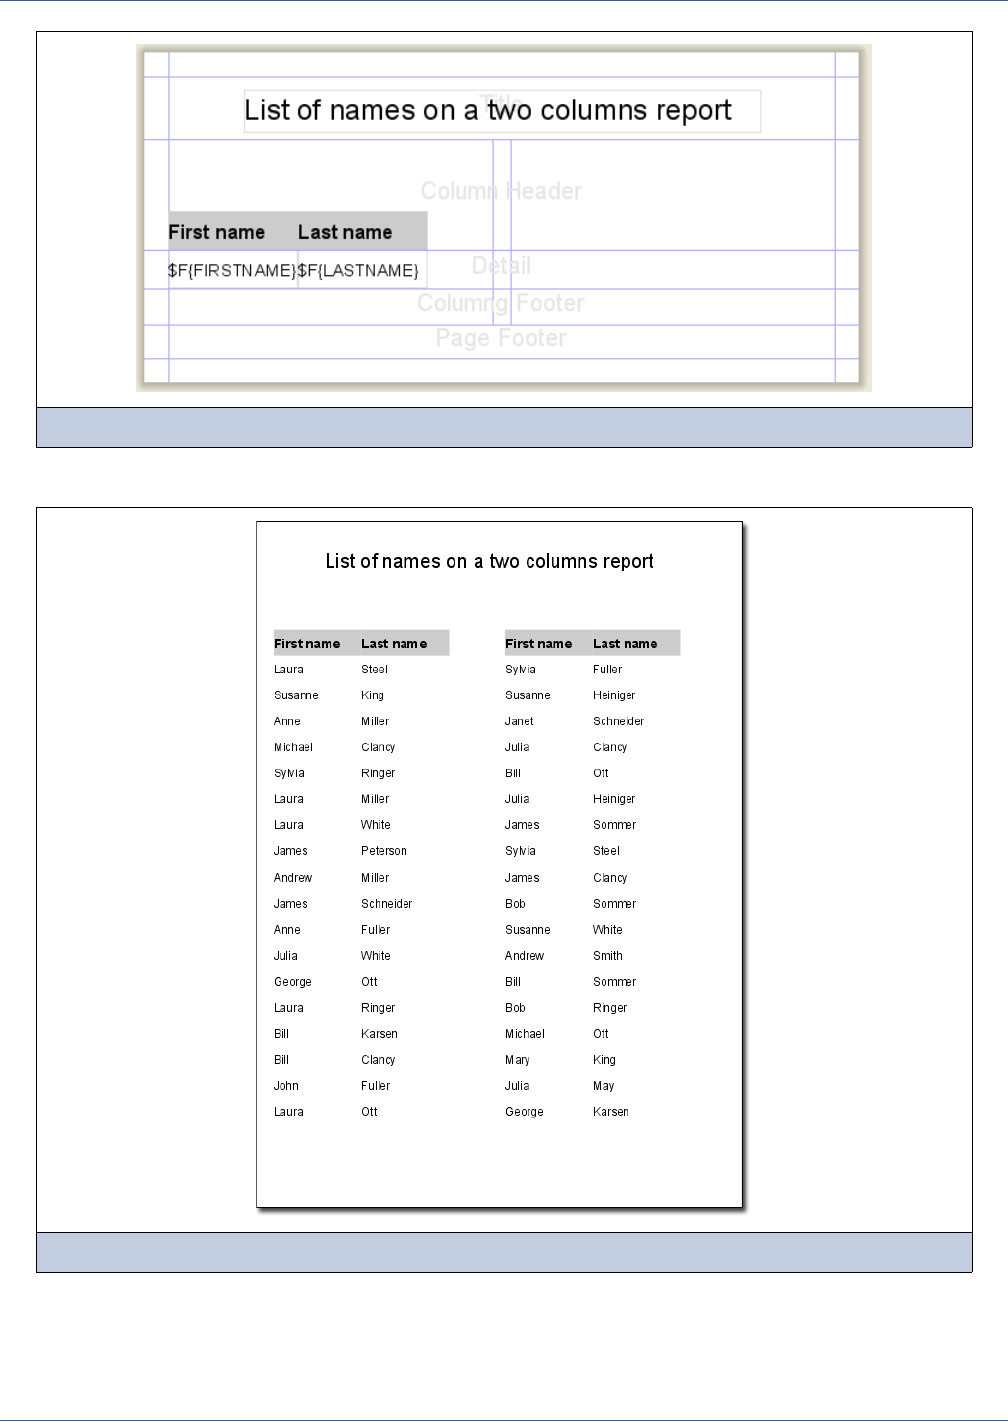
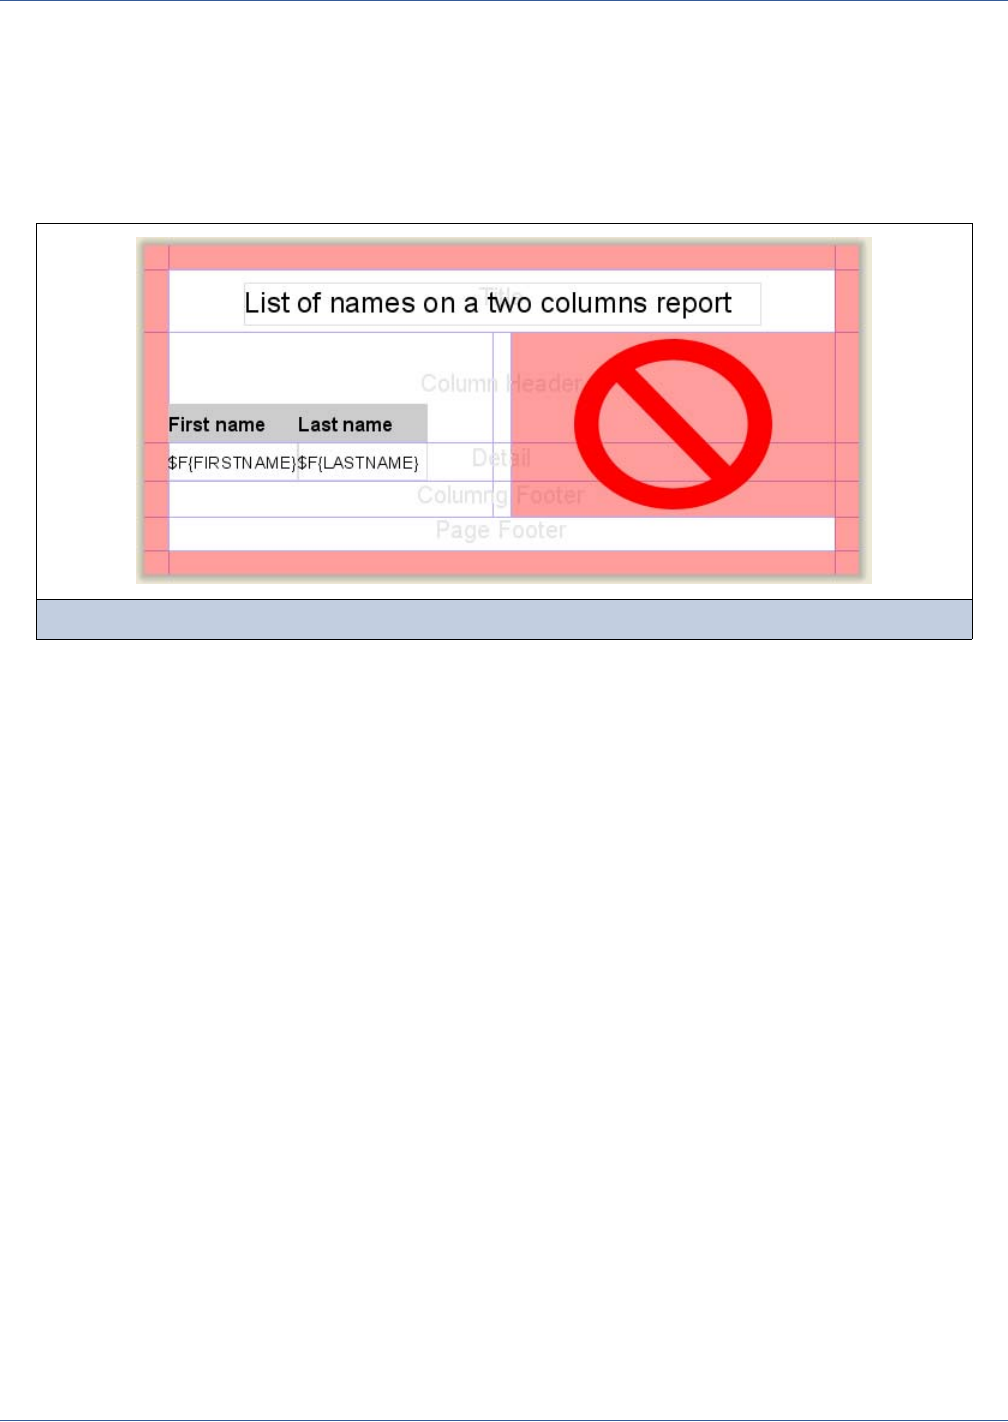
Report Structure
53
Multiple columns are commonly used for prints of very long lists (for example, the telephone book). The sum of the margins,
column widths and every space between columns, has to be less than or equal to the page width. If this condition is not
verified, the compilation can result in error.
When working with more than one column, you should put elements (fields, images, etc.) inside the first column only. The
other columns are displayed in the designer just for reference, but any element placed here at design time would be treated as
part of the first column (in fact, you are just defining a detail template, so there are no restrictions about placing elements
outside the horizontal band’s bounds, but it would be like putting elements outside the page).
The following picture shows the unsafe areas. They are essentially the margins and all of the page to the right of the first
column.
Of course, the rules about placing elements are applied to the report even if there is only a single column.
4.1.3 Advanced Report Options
Up to now we have seen only basic characteristics concerning the layout. Now we will see some advanced options. Some of
them will be examined thoroughly and explained in every detail in the following chapters, but some of them can be fully
understood and applied in a useful way only after you become familiar with JasperReports.
4.1.3.1 Scriptlet
A scriptlet is a Java class whose methods are executed according to specific events during report creation, such as the
beginning of a new page or the end of a group. For those who are familiar with visual tools such as Microsoft Access or
Microsoft Excel, a scriptlet can be compared with a module in which procedures associated with other events or functions (for
example, the expression of a textfield) are inserted. The scriptlet property identifies only the main scriptlet, but other scriptlets
can be added to the report by using the Report Inspector. I discuss scriptlets at length in Chapter 18.
4.1.3.2 Resource Bundle
The resource bundle is a property used when you want to internationalize a report. A resource bundle is the set of files that
contain the text of the labels, sentences, and expressions used within a report in one defined language. What you set in the
resource bundle property is the resource bundle base name that’s the prefix through which you can find the file with the correct
translation. In order to reconstruct the file name required for a particular language, some language/country initials (for
example, “_it_IT” for Italian-Italy) are added to this prefix, as well as the .properties extension. I will explain
internationalization in greater detail in Chapter 16.
Figure 4-10 Safe area to place report elements (textfields, images, etc.)
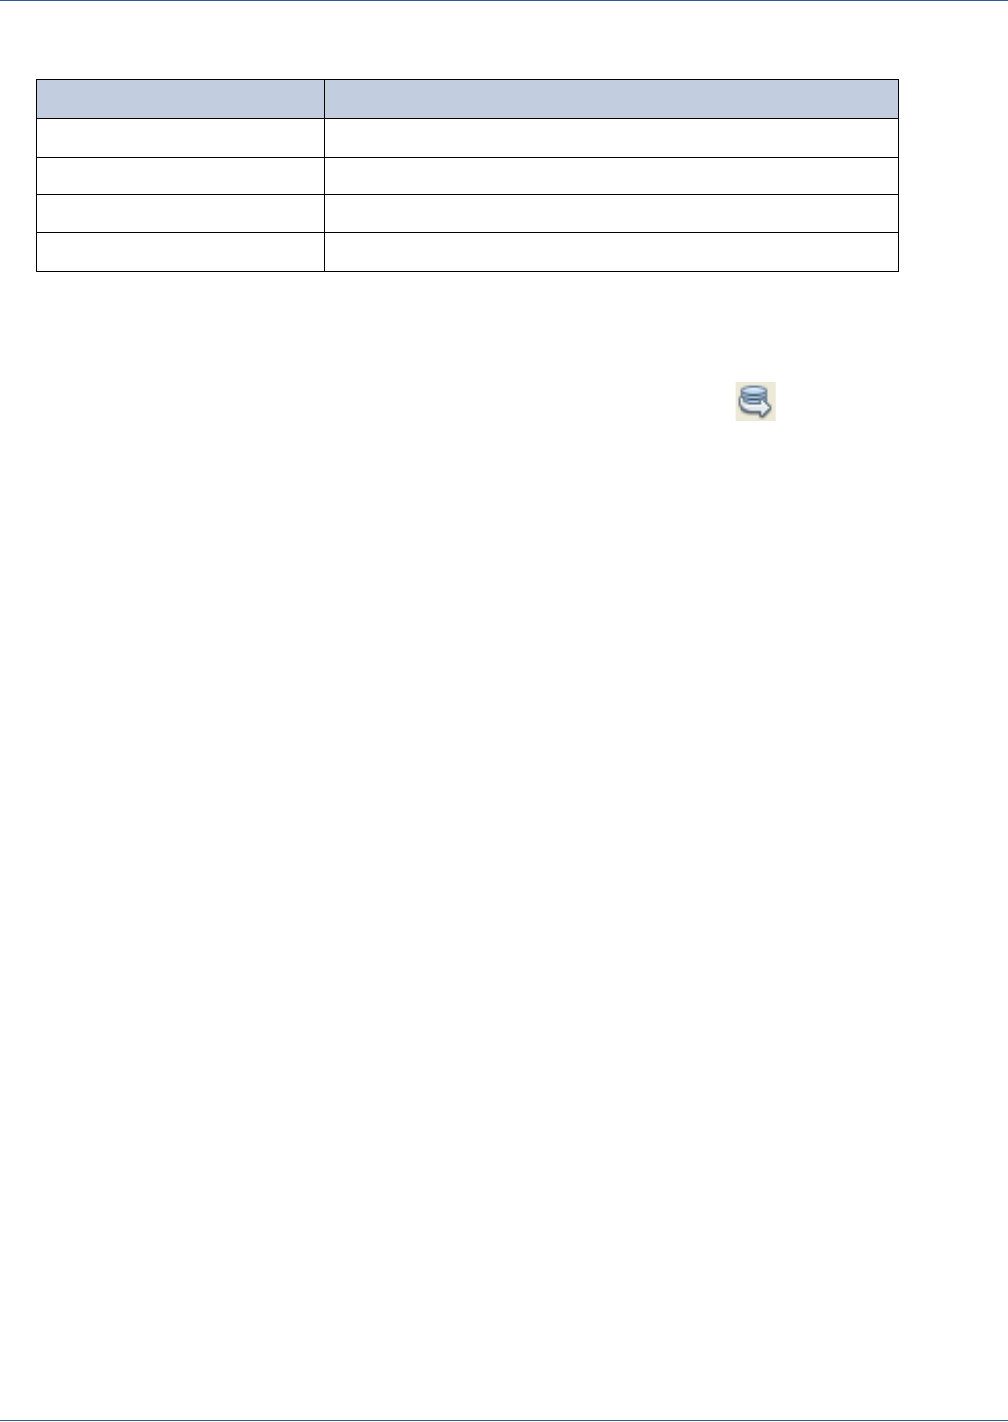
54
iReport Ultimate Guide
If a resource is not available, you can specify what to do by choosing an option from the property When resource missing
type. The available options are listed in the following table:
4.1.3.3 Query
The Query property is used to set a query to select data. The language of the query is set through the The language for
the dataset query property. Although the query and its language are presented in the property sheet, it is much more
convenient to edit them using the Query Editor that’s accessible through the tool bar button .
4.1.3.4 Filter Expression
The filter expression is another property that can be edited from the Query Editor. It is a Boolean expression that can use all
the objects of the report (parameters, variables and fields) to determine whether records that are read from the data source
should be used.
Here are some examples of filter expressions:
Filter only records where the field FIRSTNAME starts with the letter “L”:
JavaScript: $F{FIRSTNAME}.substr(0,1) == "L"
Groovy: $F{FIRSTNAME}.startsWith("L")
Filter only records where the length of the field FIRSTNAME is less than 5:
JavaScript: $F{FIRSTNAME}.length < 5
Groovy: $F{FIRSTNAME}.length() < 5
Filter only records where the field FIRSTNAME is the one provided by the parameter NAME:
JavaScript: $F{FIRSTNAME} == $P{NAME}
Groovy: $F{FIRSTNAME} == $P{NAME}
4.1.3.5 Properties
It is possible to define a set of name/value pairs in a report. These pairs are what we call “report properties.” The names and
values are simple strings and they are used for a lot of purposes, including driving special exporter features, overriding
JasperReports default values, and so on. We will see that the same kind of properties can be set for report elements, too.
When editing the properties, the dialog in Figure 4-11 pops up.
Option Description
Null Prints the “Null” string (this is the default option).
Empty Prints nothing.
AllSectionsNoDetails Prints the missing key name.
Error Throws an exception stopping the fill process.
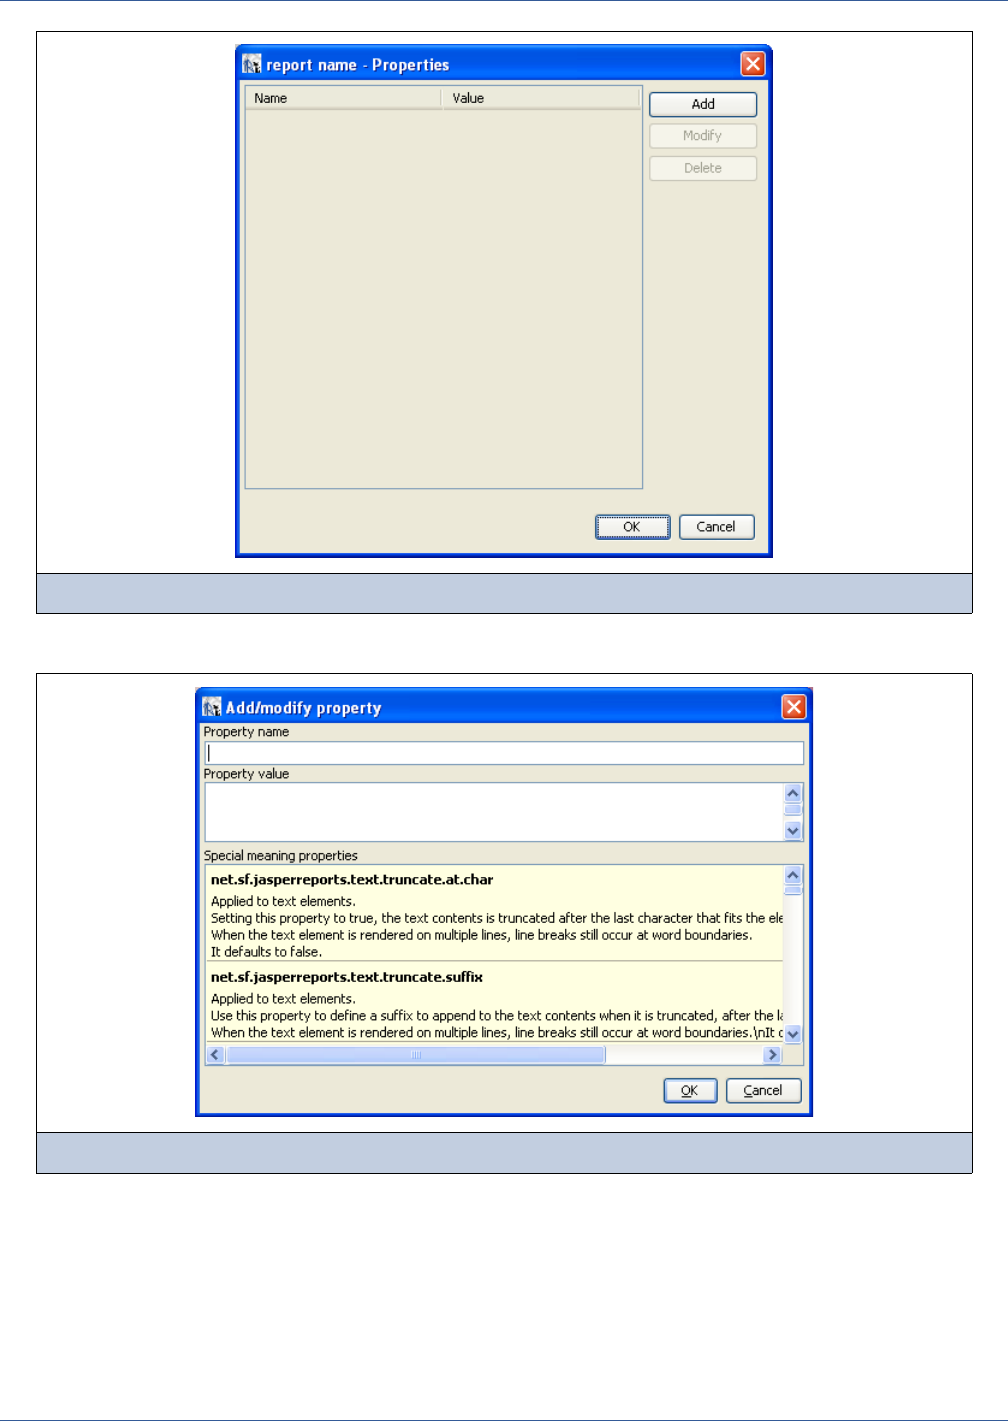
Report Structure
55
Click Add to create a new property. A new window will open (Figure 4-12).
The dialog allows you to specify a property name and value. In the lower part of the window there is a list of special meaning
properties. You can double-click one of them to set the Property name field with that name.
The list of special meaning properties is not exhaustive, but it contains the important properties that have a special meaning
understood by JasperReports. If you scroll the list, you’ll notice that these special properties can be used for a lot of different
tasks, such as specifying particular attributes when the report is exported in a specific format (that is, to avoid pagination when
exporting in XLS), activating special exporter directives (that is, to encrypt the file when exported in PDF), or even specifying
a particular theme to be used with the charts in the document.
Figure 4-11 Properties Dialog
Figure 4-12 Report Properties – Add Property
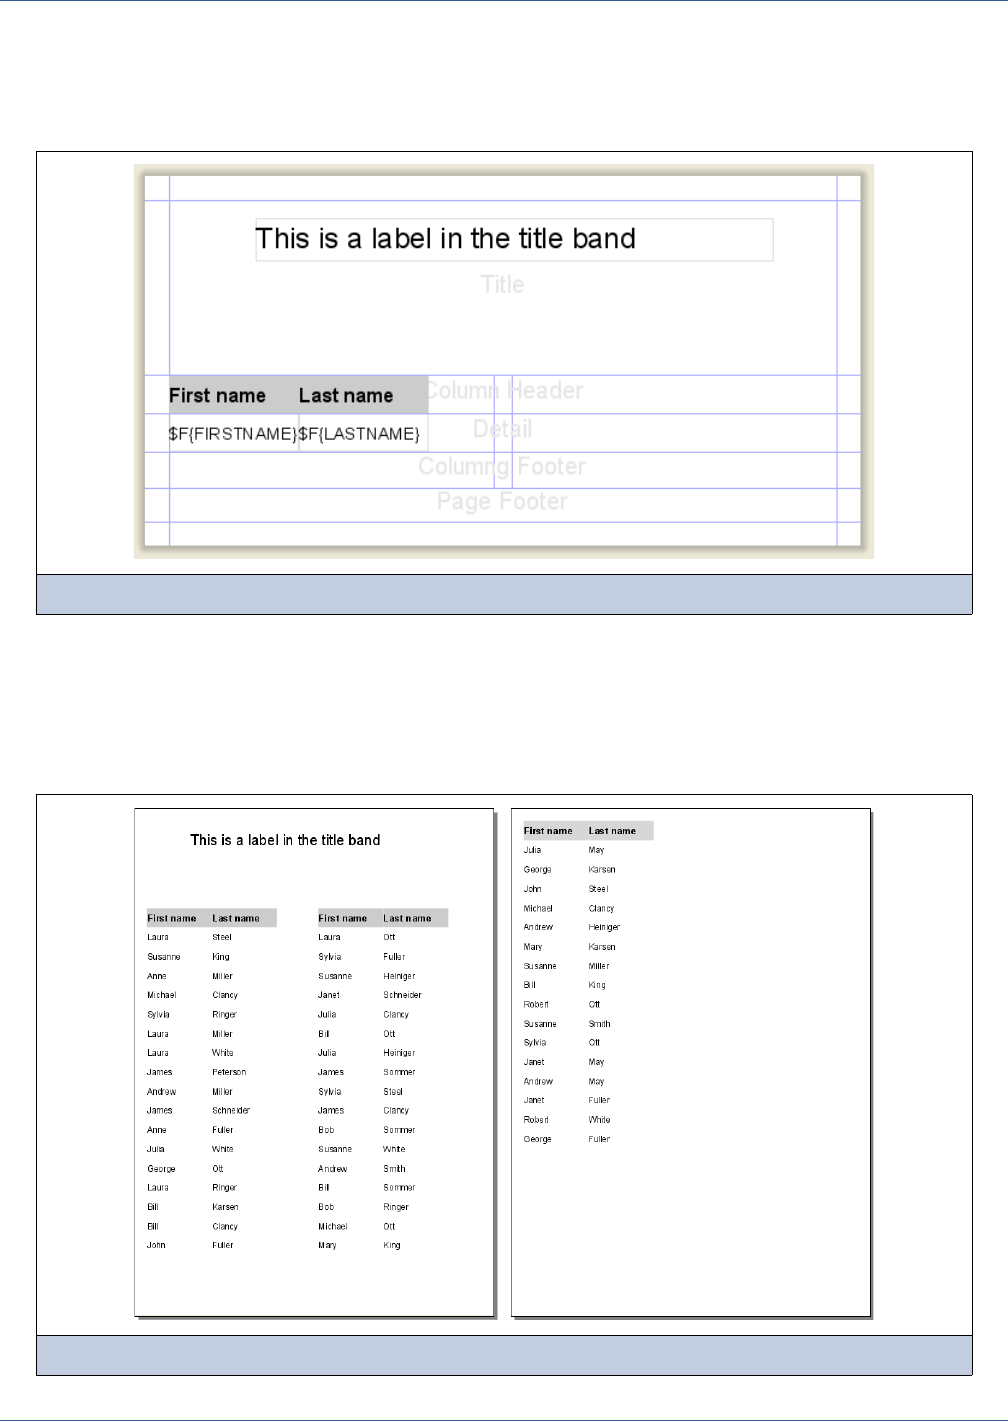
56
iReport Ultimate Guide
4.1.3.6 Title and Summary on a New Page
The Title on a New Page option specifies that the Title band is to be printed on a new page by forcing a page break at the end
of the Title band. By default this option is not activated. As an example, take a look at Figure 4-13, which shows a simple
report.
Changing the option does not affect the design window. In the editor, the Title band is always drawn above the other bands
(except, when present, the background).
When the report is run, the Title band may go on a separate page, based on the value of the Title on a New Page option.
Figure 4-14 and Figure 4-15 show the same report, the first printed without setting the title on a new page, the second setting
it to true.
Figure 4-13 Title band
Figure 4-14 Default printing of the Title band
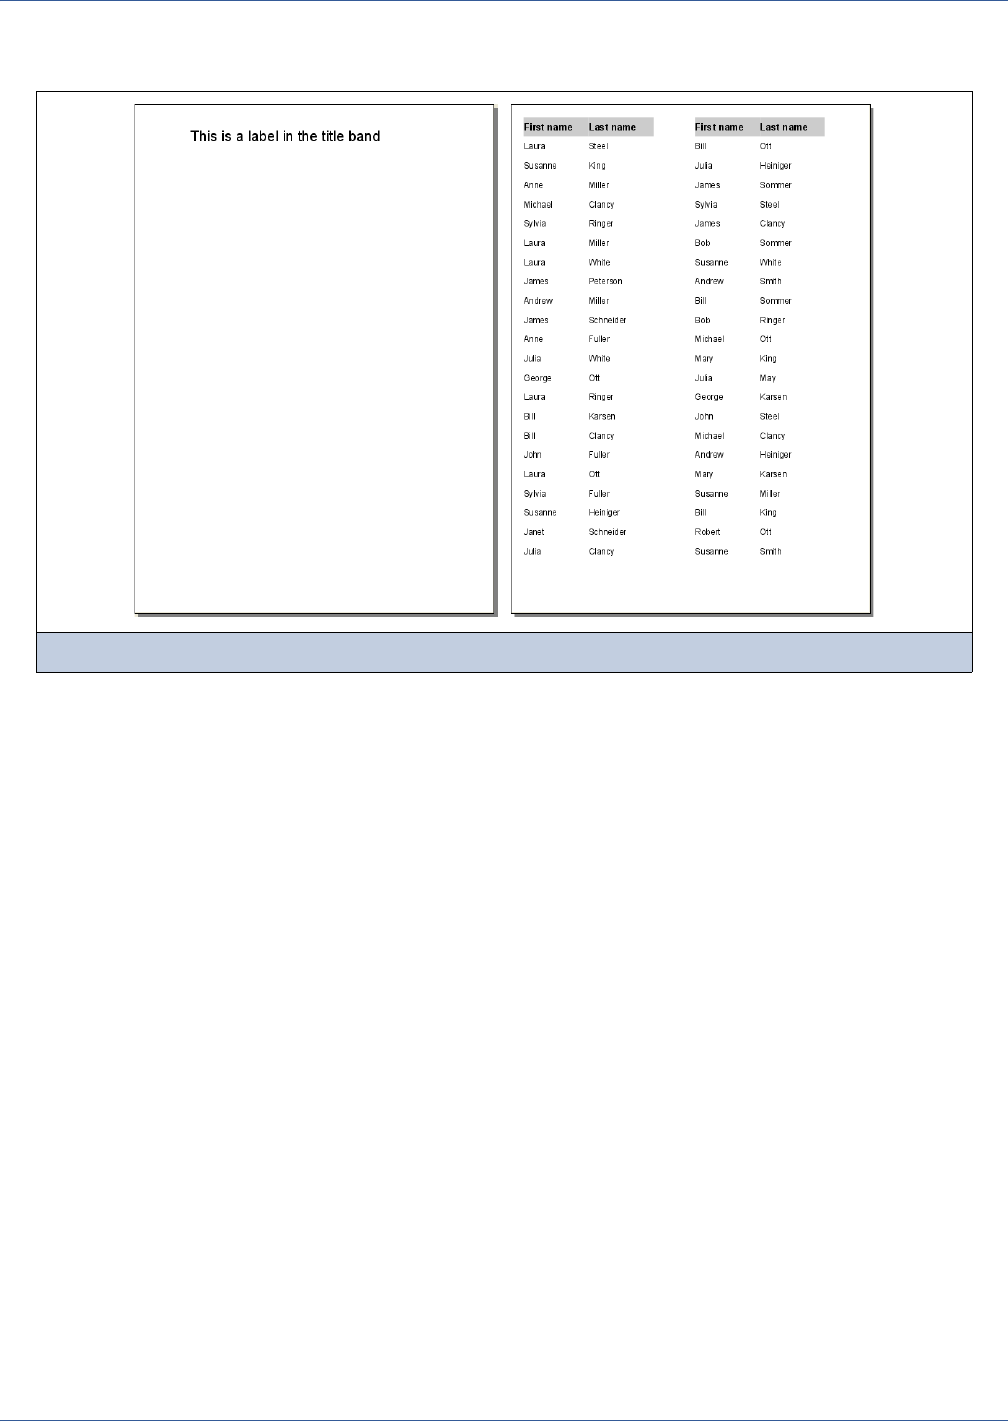
Report Structure
57
As you can see in Figure 4-15, when the Title on a New Page option is activated, no other band is printed on the title page, not
even the page header or footer. The page is still counted in the total pages numeration.
4.1.3.7 Summary with Page Header and Footer
The Title on a New Page option is available for the Summary band, as well, the difference being that the Summary band is
printed as the last page. You can print this band on a new page that only contains the Summary band.
By default, the Summary band (which can span one or more pages) does not contain the page header and footer. The option
Summary with Page Header and Footer changes this behavior and forces the header and footer bands (if defined in the
document) to be added when the Summary band is rendered.
4.1.3.8 Floating Column Footer Option
This option allows you to force the printing of the Column Footer band immediately after the last Detail band (or Group
Footer) instead of at the end of the column. This option is used, for example, when you want to create tables using the report
elements (see the JasperReports tables.jrxml example for more details).
4.1.3.9 Print Order
The Print Order option determines how the print data is organized on the page when using multiple columns. The default
setting is Vertical, that is, the records are printed one after the other, passing to a new column only when the previous
column has reached the end of the page (as in a newspaper or phone book).
Figure 4-15 Title band on a new page
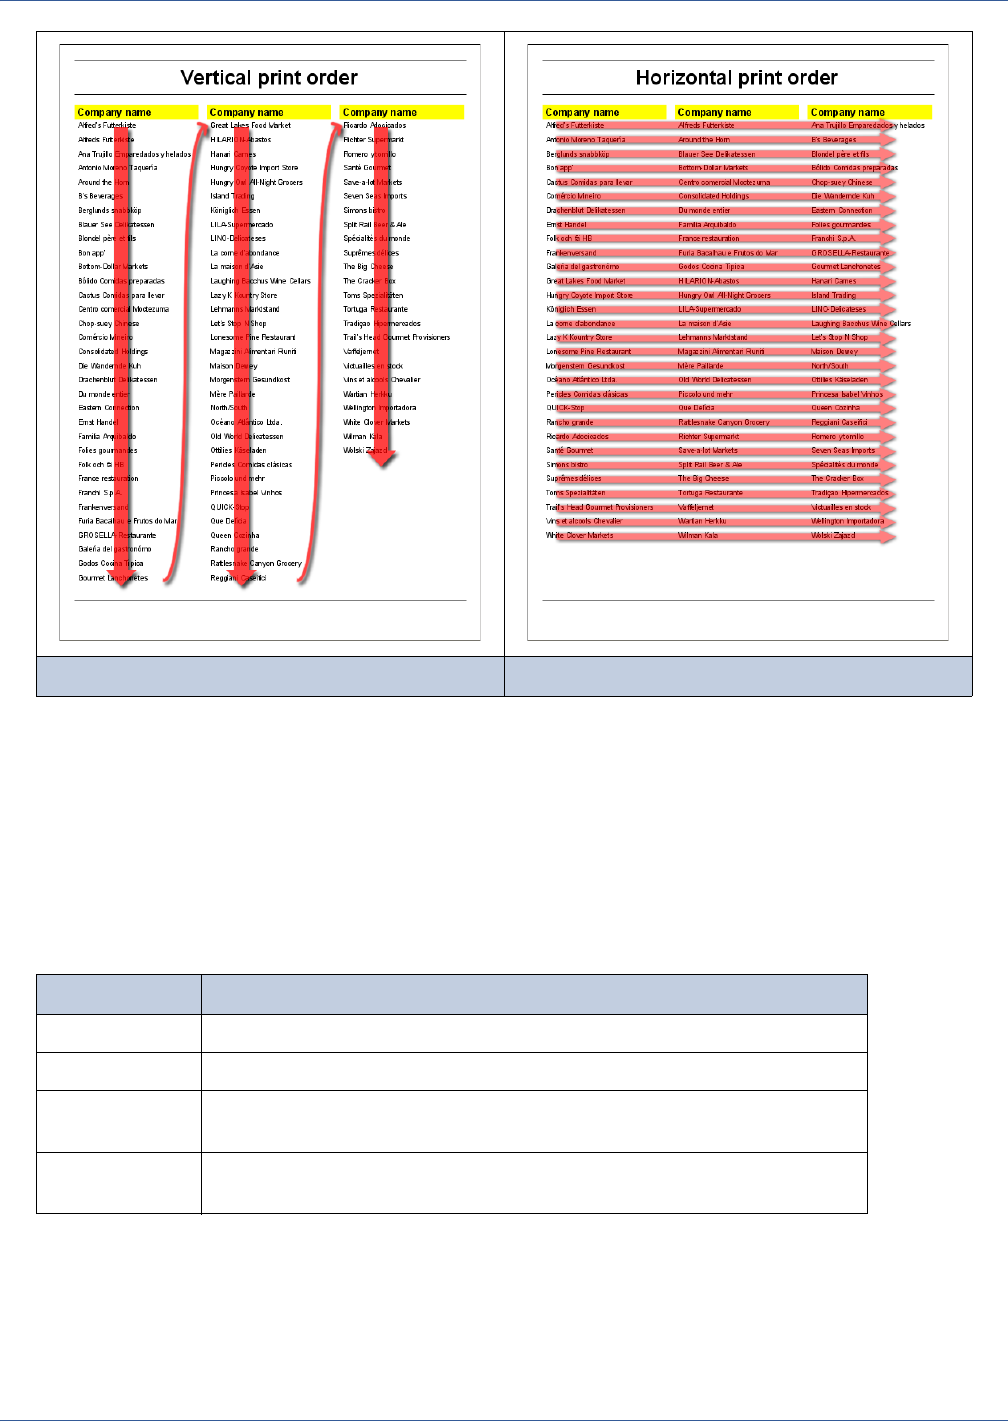
58
iReport Ultimate Guide
Horizontal print order prints horizontally across the page, occupying all of the available columns before passing to a new line.
The print orders in shown in the two figures illustrate print order. As you can see, the names are printed in alphabetical order.
In Figure 4-16, they are printed in vertical order (filling in the first column and then passing to the following column), and in
Figure 4-17, they are printed in horizontal order (filling all columns horizontally before passing to the following line).
4.1.3.10 Print without data
When an empty data set is supplied as the print number or the SQL query associated with the report gives back no records, an
empty file is created or a stream of zero byte length is given back. This default behavior can be modified with the Print without
data option; it specifies what to do when there is no data. This table summarizes the option’s possible values and their
meaning.
4.1.3.11 Format Factory Class
A format factory class is a class that implements the interface
net.sf.jasperreports.engine.util.FormatFactory. You can set a custom implementation of the class; it will be
used to define the default format template for numbers and dates.
Figure 4-16 Vertical Print Order Figure 4-17 Horizontal Print Order
Value Description
NoPages This is the default; the final result is an empty buffer.
BlankPage This gives back an empty page.
AllSectionsNo
Details
This gives back a page composed of all the bands except for the Detail band.
No Data
section
Print the No Data band.
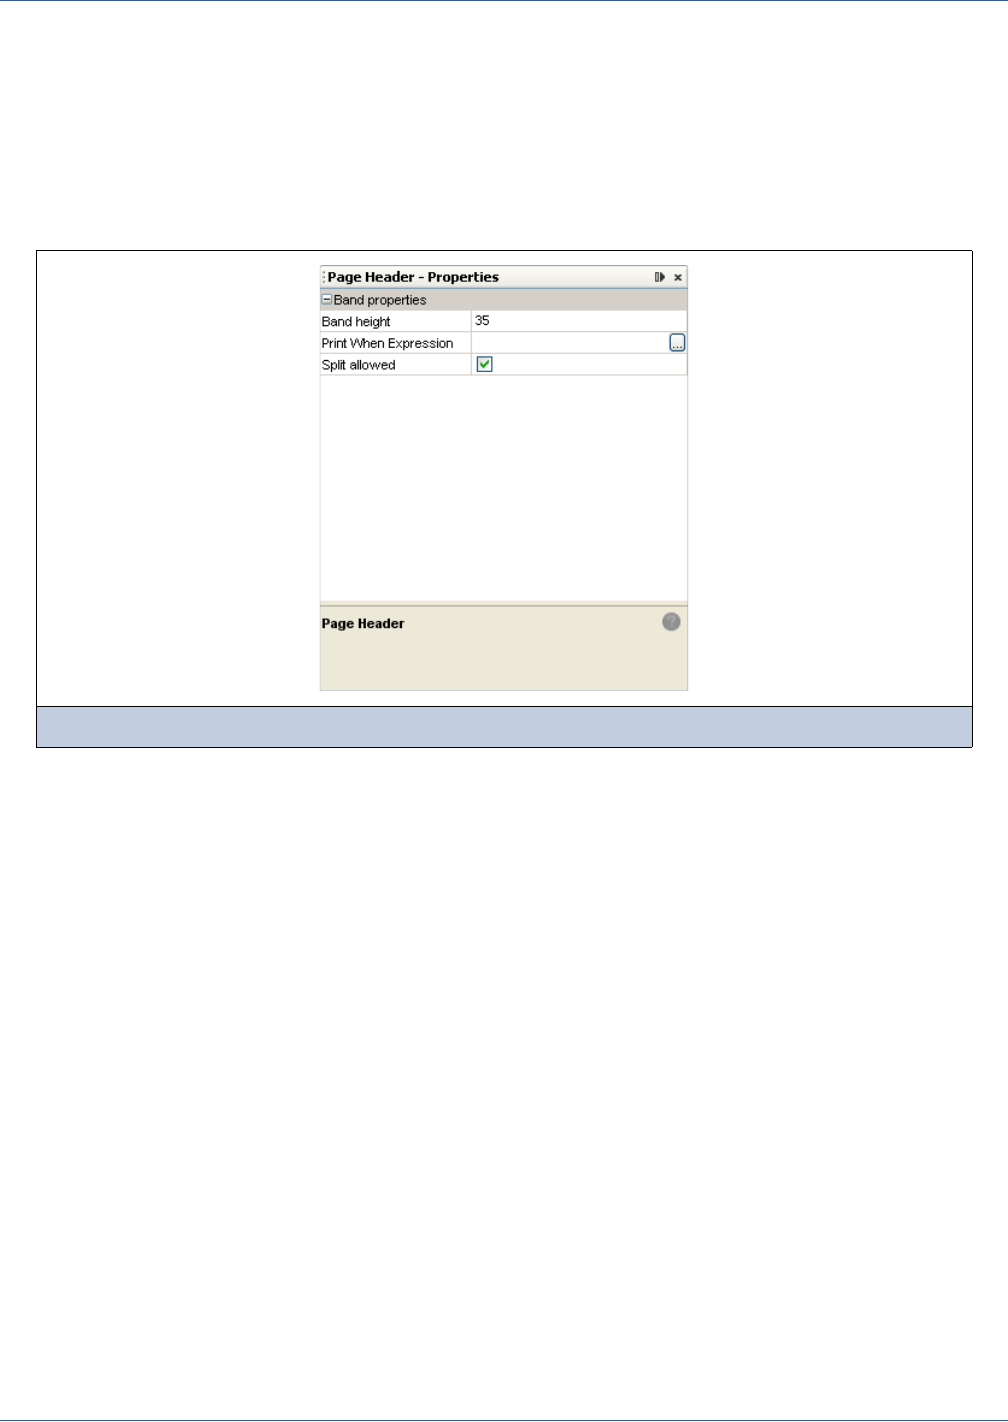
Report Structure
59
4.1.3.12 Imports
The imports property is used to add Java-style import directives in the form of a fully referenced class (that is,
java.uitl.List) or with the wild card notation (that is, java.util.*). The purpose is the same as in Java, that is, to
reference classes in expressions without fully referencing them.
4.2 Working with Bands
When creating a new empty report, the default template provides a set of pre-defined bands (background, title, page header,
column header, detail, column footer, page footer and summary). You can see the available bands, as well as other components
of the report, in the Report Inspector.
Figure 4-18 Band properties dialog
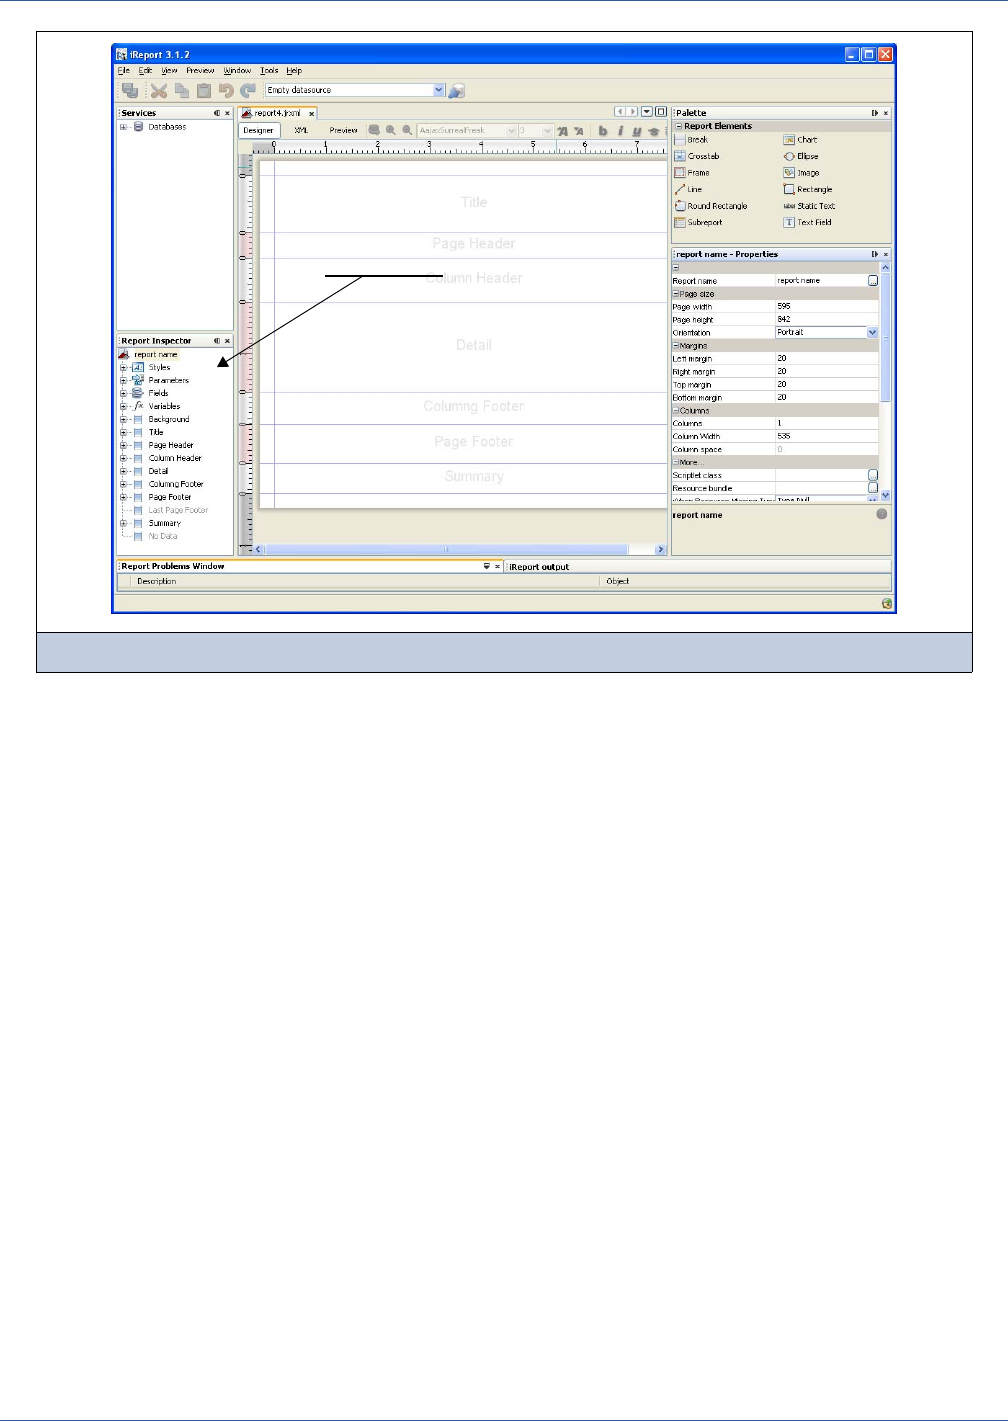
60
iReport Ultimate Guide
To add a band to the report, right-click the band in the Report Inspector and select the menu item Add Band from the
menu that appears.
The bands displayed in gray in the Report Inspector (Last Page Footer and No Data) are not present in the report, which
means that if you want to use them, you need to add them.
The pre-defined height of the background band is zero, so you actually don’t see it in the designer but it is present in the
report.
To remove a band from the report, right-click the band in the Report Inspector and select the menu item Delete Band.
You can set the height of unwanted bands to zero, with one exception: the Last Page Footer band. This band is not in the
default template. It automatically replaces the Page Footer band on the last page of the report; you must add it if you want
it in the report.
The properties of the bands can be modified by selecting the band in the Report Inspector or by clicking the free area of
the band in the main designer (not over an element or outside the band bounds).
4.2.1 Band Height
Band Height is the design height of the band. As explained earlier in this chapter, the band height can change during the filling
process. The height of a band in general does not get less than the specified value, even if this is possible because the Remove
Line When Blank option is set in one or more elements in that band and all the conditions to remove the horizontal space taken
by these elements at filling time are verified (the Remove Line When Blank option is explained on page 72 in the next
chapter).When the Band Height property is modified, iReport checks to determine whether the modified value is acceptable
(calculating the available space in the page and taking in consideration options like Title on a new page and Summary on a
new page). If the modified value does not fit the requirements, iReport suggests the possible value range.
4.2.2 Print When Expression
Print When Expression is a Boolean expression (so it must return true or false) that can be used to hide a band and prevent
it from being included in the output report. The expression is evaluated every time the band is referenced in a report. So, for
Figure 4-19 Report Inspector in main design window
Report Inspector
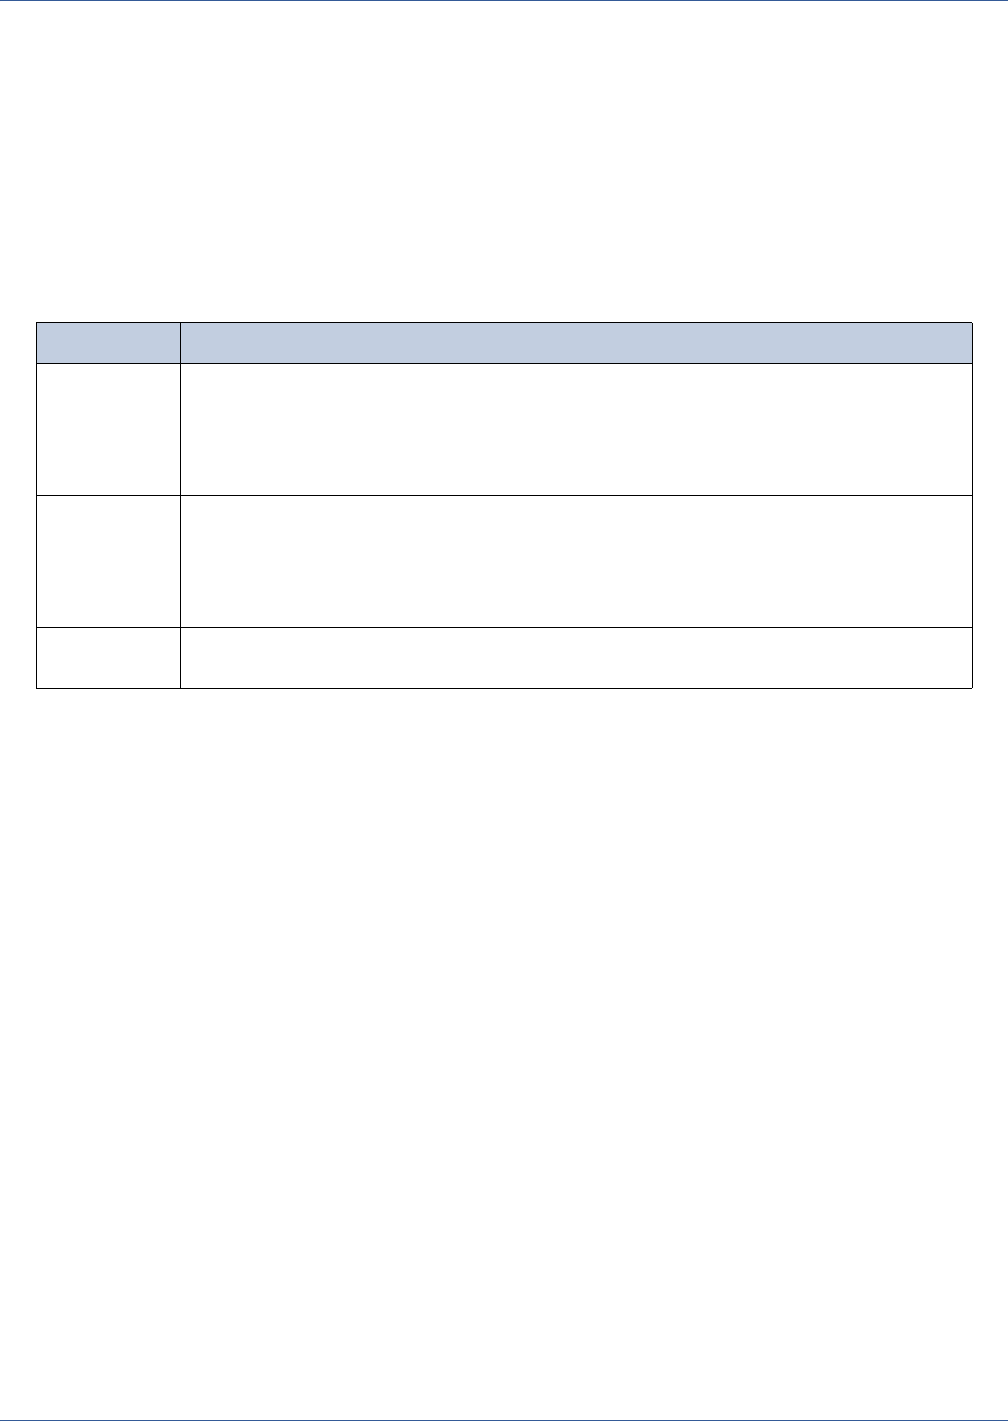
Report Structure
61
example, in a report page the title band is evaluated only once, while for the page header it is evaluated every time a new page
is produced and for the Detail band it is evaluated every time a new record is processed.
As in all the expressions, you are free to use all the report objects available (fields, parameters and variables).
4.2.3 Split Allowed and Split Type
The Split Allowed option is deprecated, and its use has been replaced by the Split Type property. It is used to control what
to do when a band cannot be fully rendered in the remaining space on the page. Keeping in mind that bands can grow
dynamically during the filling process, it is easy for a band to expand so much that it no longer fits on the current page or
column.
Here is a reference to the options for Split Type (from the JasperReports XSD schema):
4.3 Summary
At this point, you should understand the structure of a page and how it is divided into several bands. You should also
understand the conditional nature of bands, as well as how iReport evaluates whether and how to include a band in a report
page. In the bands we will add the content to be printed.
In the next chapter, we will see how to use the group header and the group footer bands, and what other options can be set to
place band groups in a new column or on a new page.
Option Description
Stretch The band is allowed to split, but not within its declared height.
This type allows a band to be split only if the band is stretched and only if the band expands
beyond the declared band height. If we have a declared band height of 100 pixels, the band
cannot break within the first 100 pixels. Any break must occur beyond 100. For instance, if the
band has a total of 110 pixels, a break can only occur in the final 10 pixels.
Prevent Prevents the band from splitting on the first break attempt. On subsequent pages, the band is
allowed to split any number of times.
If there is not enough space on the current page to render the band, the entire band is rendered
on the next page. If the available space on the new page is still not enough, the remaining band
can be split any number of times.
Immediate The band is allowed to split anywhere, as early as needed, but not before at least one element is
printed on the current page.

62
iReport Ultimate Guide

Report Elements
63
CHAPTER 5REPORT ELEMENTS
In this chapter, I will explain the main objects that can be inserted in a report and discuss their characteristics.
The basic unit of reports is the element. By “element,” I mean a graphical object, such as a text string or a rectangle. Unlike in
a word processing program, in iReport the concept of line or paragraph does not exist; everything is created by means of
elements, which can contain text, create tables when they are opportunely aligned, and so on. This approach follows the model
used by the majority of report authoring tools.
Nine basic elements are offered by the JasperReports library:
Line
Rectangle
Ellipse
Static text
Textfield (or simply Field)
Image
Frame
Subreport
Crosstab
Chart
Break
Through a combination of these elements, it is possible to produce every kind of report. JasperReports also allows developers
to implement their own generic elements and custom components for which it is possible to add support in iReport to create a
proper plug-in.
All elements have common properties, such as height, width, position, and the band to which they belong. Other properties are
specific to the type of element (for example, font or, in the case of a rectangle, thickness of the border). There are several
types; graphic elements are used to create shapes and display images (they are line, rectangle, ellipse, image); text elements are
used to print text strings such as labels or fields (they are static text and textfield); the frame element is used to group a set of
elements and optionally draw a border around them. Subreports, charts and crosstabs are more complex elements, so I will
touch briefly on them later in the this chapter and discuss them in more detail in separate chapters. Finally, there is a special
element used to insert a fixed-in-place page or column break.
Elements are inserted into bands, and every element is associated indissolubly with its band. If an element is not completely
contained within the band that it is part of, the report compiler will return a message that informs you about the position of the
element; the report will be compiled despite such an error, and in the worst case, the out-of-band element will not be printed.
This chapter has the following sections:
Working with Elements
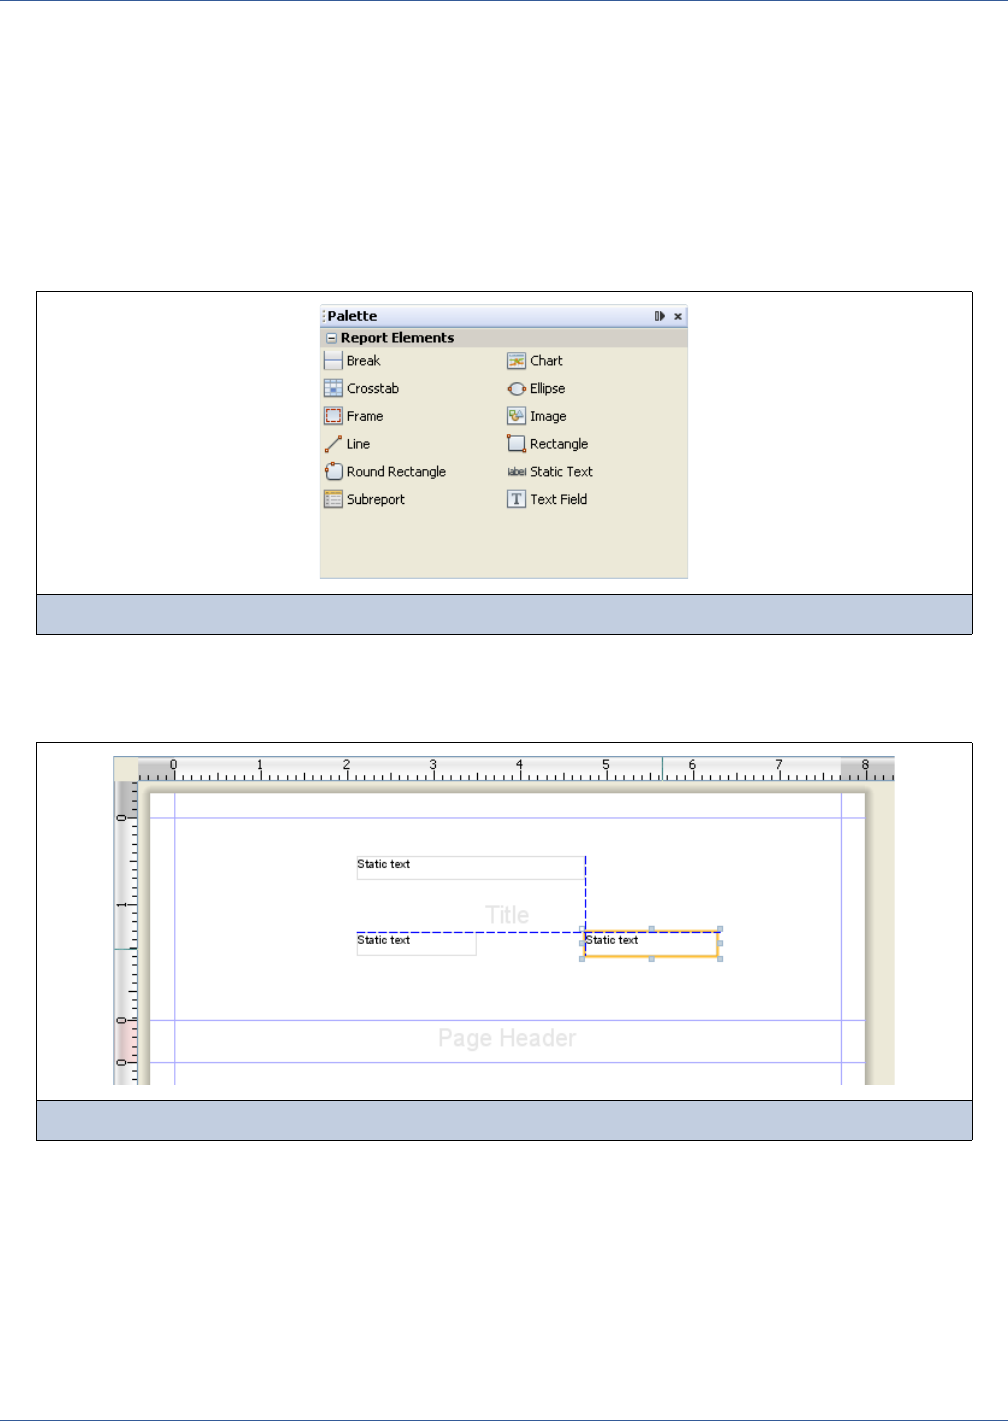
64
iReport Ultimate Guide
Working with Images
Working with Text
Other Elements
Adding Custom Components and Generic Elements
5.1 Working with Elements
The elements are presented in a palette, usually located in the top right portion of the main window (see Figure 5-1).
To insert an element in a report, drag the element from the palette into a report band. The new element will be created with a
standard size and will appear in the Report Inspector. To select the element, click it in the designer or in the Report Inspector.
You can adjust the element position by dragging it; to modify its size, select it then drag a corner of the orange selection frame.
When dragging or resizing an element, iReport suggests places to align it, based on the elements already in the design pane,
the band bounds, and (if present) guidelines.
To obtain greater precision in the movement, use the arrows keys to move the element one pixel at a time; similarly, using the
arrow keys while pressing the Shift key moves the element 10 pixels.
If you need reference points to position and align elements in the page, you can turn on the grid in the design pane by selecting
the menu item View → Report Designer → Show Grid.
To force the elements to snap to the grid, select View → Report Designer → Snap to Grid.
Figure 5-1 Tools palette
Figure 5-2 Suggested alignment with other elements
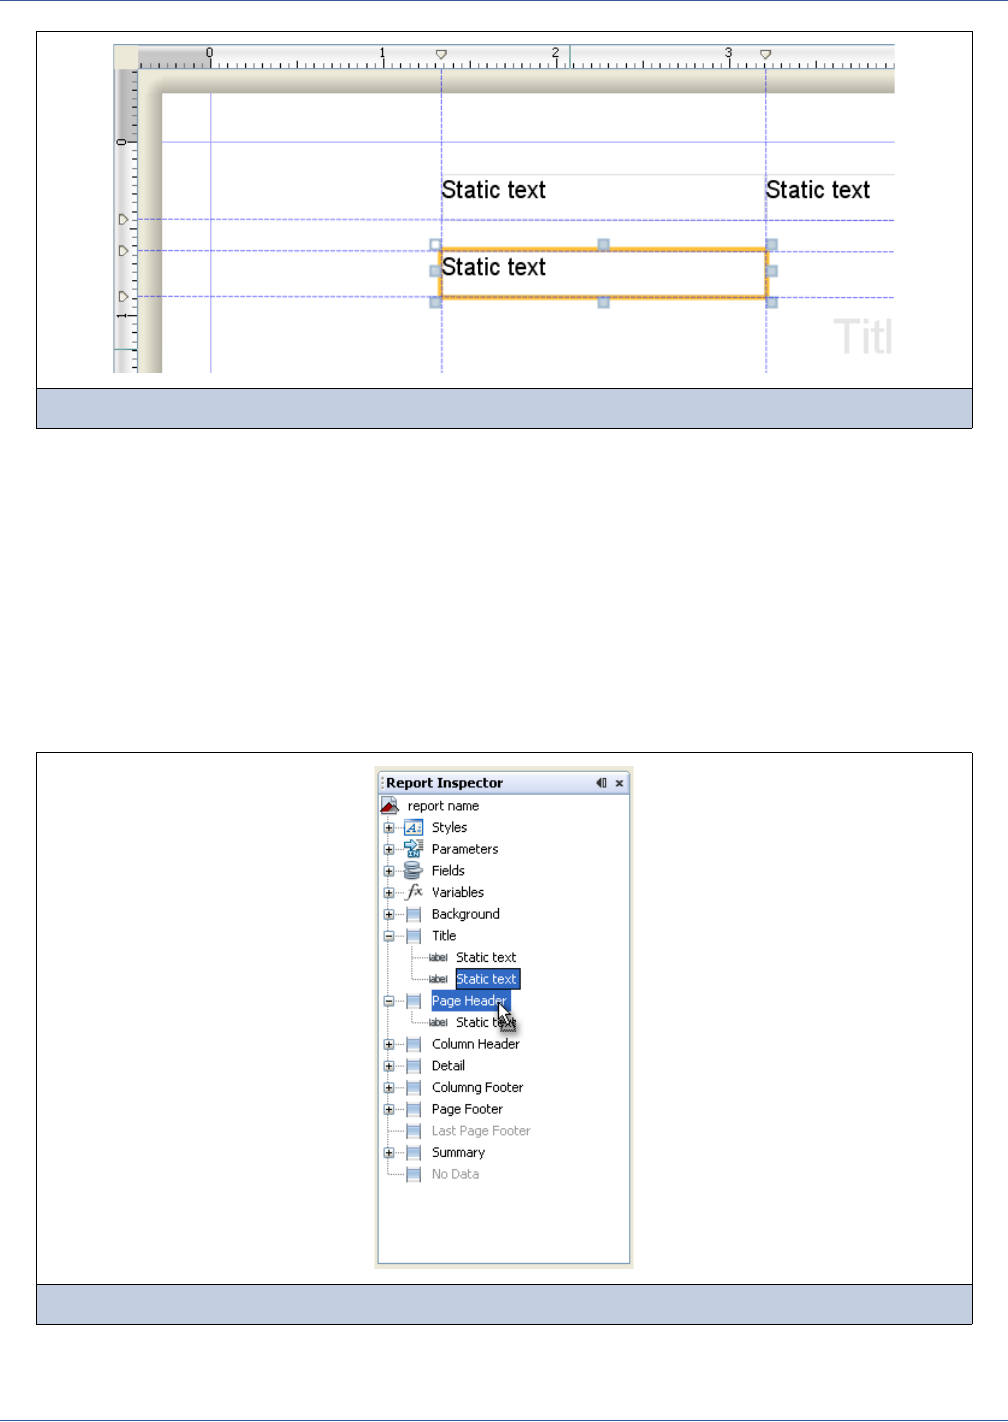
Report Elements
65
Guidelines are also useful to position your elements in the report. With the guidelines’ magnetic effect, it is easy to place the
elements in the right position. To create a guideline, just click a ruler (vertical or horizontal) and drag the guideline to the
wanted position (see Figure 5-3). By default, rulers use inches as their unit of measure. In the Options panel (Tools >
Options), you can set a different unit.
You can drag and change the position of a guideline at any time; this will have no effect on the element’s position.
To remove a guideline, drag it to the top/left corner of the design pane.
The top and left values that define the element’s position are always relative to the parent band, or, to be more accurate, to the
parent container, which is usually a band but could be a frame element.
If you want to move an element from its initial band to another band or a frame, or vice versa, drag the element node from the
Report Inspector to the new band (or frame) node, as shown in Figure 5-4.
Figure 5-3 Guidelines
Figure 5-4 Moving an element from one band to another
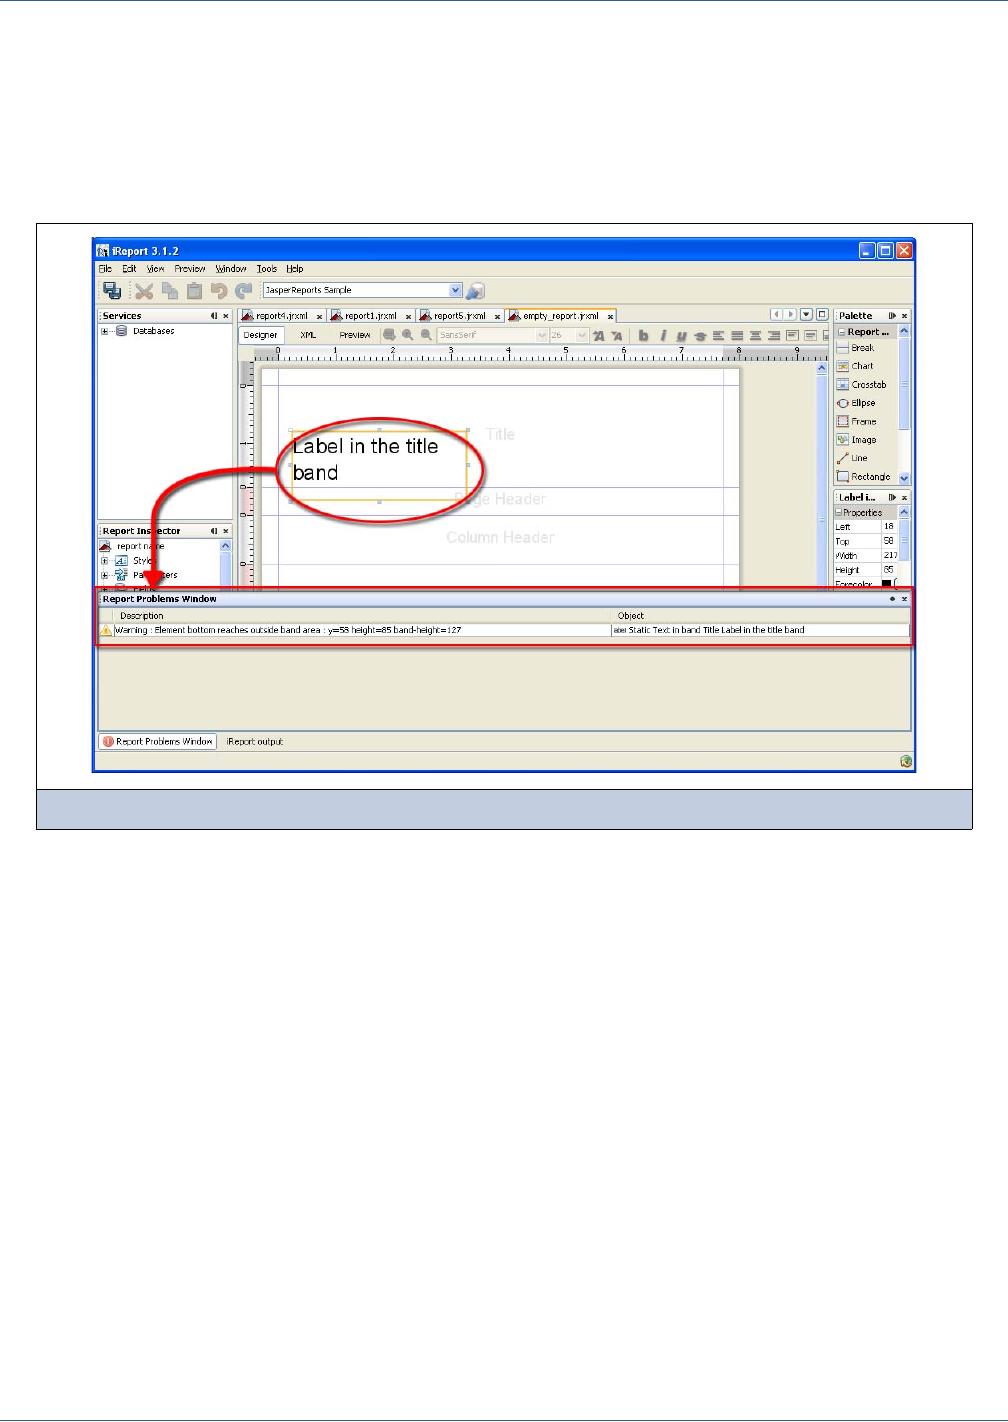
66
iReport Ultimate Guide
In the designer window, you can drag an element from one band to another band, but the element’s parent band will not
change. Although we said that an element must be contained in its band, there are several exceptions to this rule. iReport
allows you to move an element anywhere in the report without changing or updating the parent band.
As general rule, an element must remain in its parent band; it should not be moved even partially out of the band. A design
error will be displayed in the Report Problems view and the report will not run. In Figure 5-5 we have a text element which
has the Title as parent band. Since the element height spans the Page Header band below the Title band, a warning about the
invalid element position appears in the Report Problems view.
You can use the property sheet to edit an element properties; it is usually located on the right side of the designer window. The
property sheet is not used only for elements; it can be used to edit the properties of all the components that make up the report,
including the page format, the band options, parameters, variables and fields options, and so on. When something is selected in
the designer or in the Report Inspector view, the property sheet shows the options for the selected object.
Figure 5-5 Element not correctly positioned
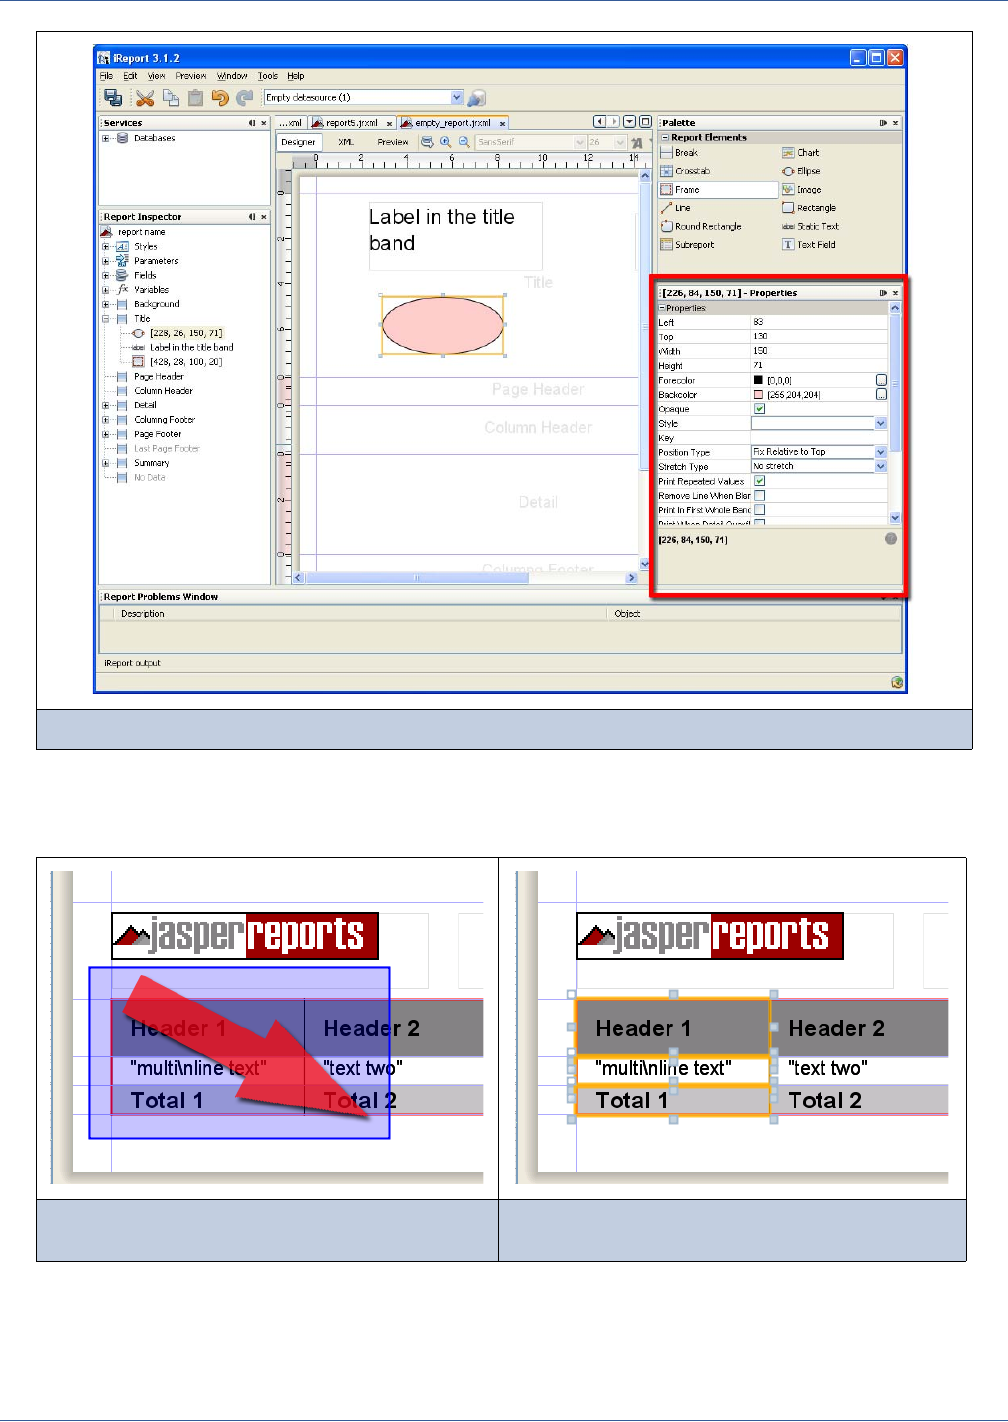
Report Elements
67
It is possible to select several elements at the same time by drawing a rectangle around the elements with the arrow tool.
Depending on the direction in which the rectangle is drawn, elements can be selected only if fully contained in the selected
area or partially selected.
Alternatively, it is possible to select more than one element at the same time by holding down the Shift key and clicking all the
desired elements.
Figure 5-6 Element not correctly positioned
Figure 5-7 Selection left to right Figure 5-8 Only elements fully contained in
the selected area are selected
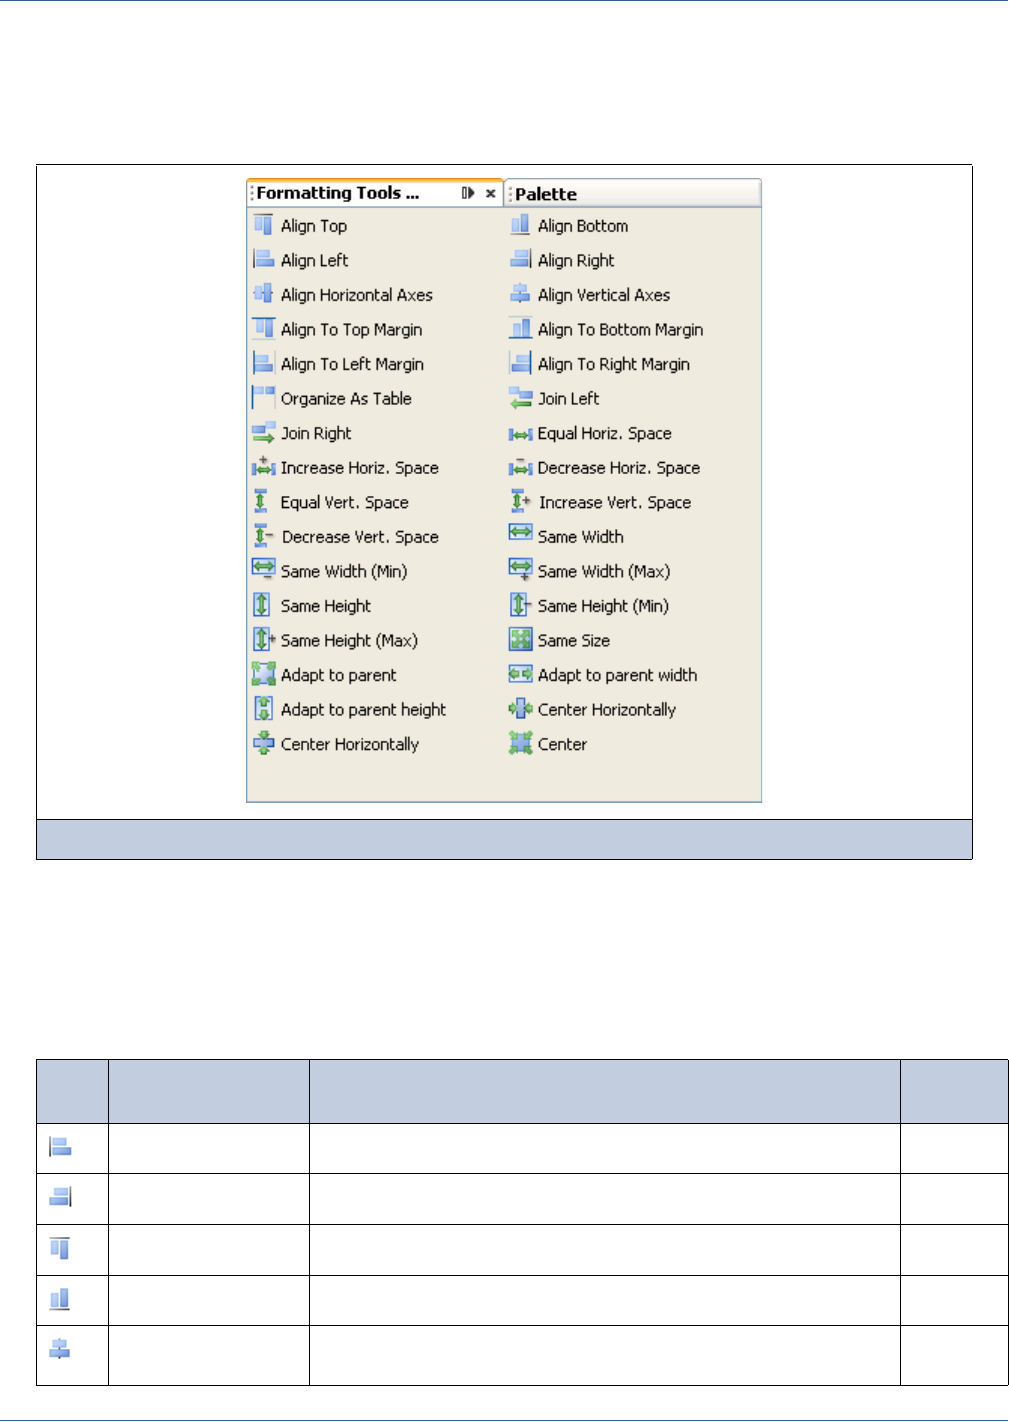
68
iReport Ultimate Guide
Specifying a value for a particular property applies that value to all selected elements. However, if two or more elements are
selected, only their common properties are displayed in the property sheet. If the values of the properties are different, the
value fields will be blank (usually the field is shown empty). To edit properties unique to one element, select only that element.
5.1.1 Formatting Tools
To better organize the elements in the designer window, a comprehensive set of tools is provided. To access the formatting
tools view, select the Window → Formatting tools. The tools view will appear. Each tool is enabled only when the selection
matches its minimum requirements (single or multiple selection).
Table 5-1 lists the available tools, specifying what kind of selection each tool requires (single or multiple selection) and
briefly explaining what each tool does.
Figure 5-9 Formatting Tools view
Table 5-1 Formatting Tools
Icon Tool Description Multiple
select?
Align left Aligns the left sides to that of the primary element. √
Align right Aligns the right sides to that of the primary element. √
Align top Aligns the top sides (or the upper part) to that of the primary element. √
Align bottom Aligns the bottom sides to that of the primary element. √
Align vertical axis Centers horizontally the selected elements according to the primary
element.
√
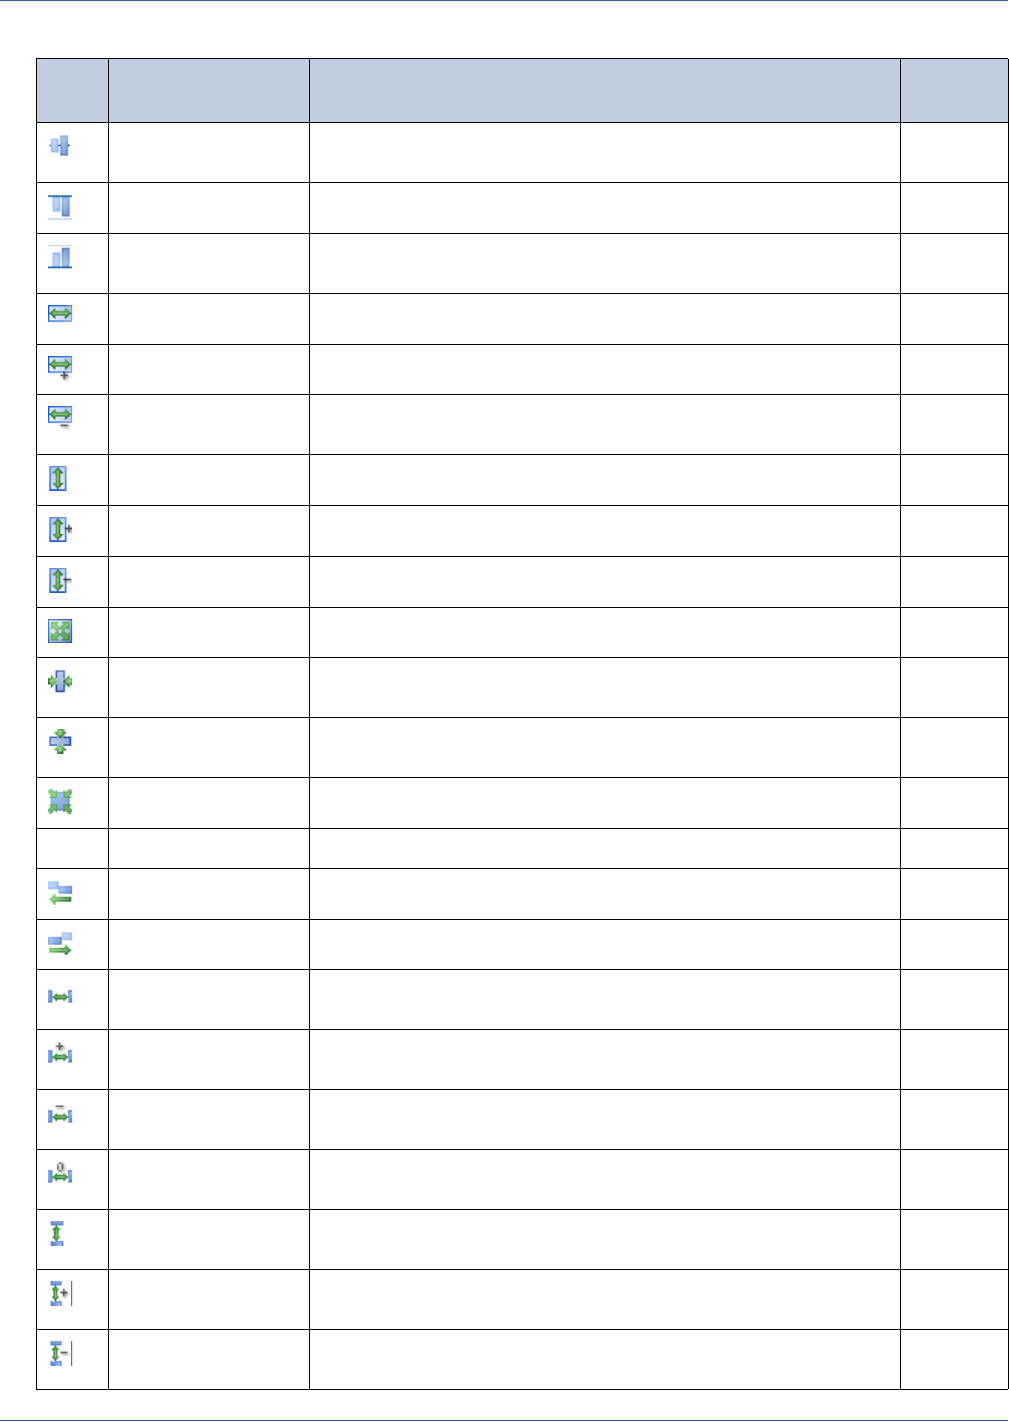
Report Elements
69
Align horizontal axis Centers vertically the selected elements according to the primary
element.
√
Align to band top Sets the top value at 0.
Align to band bottom Puts the elements in the position at the bottom as much as possible
according to the band to which it belongs.
Same width Sets the selected elements width equal to that of the primary element. √
Same width (max) Sets the selected elements width equal to that of the widest element. √
Same width (min) Sets the selected elements width equal to that of the most narrow
element.
√
Same height Sets the selected elements height equal to that of the primary element. √
Same height (max) Sets the selected elements height equal to that of the highest element. √
Same height (min) Sets the selected elements height equal to that of the lowest element. √
Same size Sets the selected elements dimension to that of the primary element √
Center horizontally
(band-based)
Puts horizontally the selected elements in the center of the band
Center vertically
(band-based)
Puts vertically the selected elements in the center of the band
Center in band Puts the elements in the center of the band
Center in background Puts the elements in the center of the page in the background
Join sides left Joins horizontally the elements by moving them to the left √
Join sides right Joins horizontally the elements by moving them towards right √
Horiz. Space →Make
equal
Distributes equally the horizontal space among elements √
Horiz. Space
→Increase
Increases by 5 pixels the horizontal space among elements by moving
them to the right
√
Horiz. Space
→Decrease
Decreases by 5 pixels the horizontal space among elements by moving
them to the left
√
Horiz. Space
→Remove
Removes the horizontal space among elements by moving them to the
left
√
Vert. Space →Make
equal
Distributes equally the horizontal space among elements √
Vert. Space
→Increase
Increases by 5 pixels the horizontal space among elements (by moving
them towards right)
√
Vert. Space
→Decrease
Decreases by 5 pixels the horizontal space among elements by moving
them to the left
√
Table 5-1 Formatting Tools, continued
Icon Tool Description Multiple
select?
70
iReport Ultimate Guide
5.1.2 Managing Elements with the Report Inspector
The Report Inspector shows the complete report structure. The root node represents the page; you can select it to modify all the
general report properties, as we have seen in the previous chapter. The following nodes are used for the style, the parameters,
the fields and the variables and other report objects if present (like subdatasets).
After these nodes there are the bands. Each band contains the elements. Container elements (like frames) can have other
elements represented as subnodes. The order of the elements in the Inspector is important because it is the z-order (the position
from the depth point of view). In other words, if an element precedes other elements in the Inspector view, it will be printed
before them. If an element overlaps some predecessors, it will cover them.
Please note that some exporters (like the HTML exporter) do not support overlapping elements, so they are skipped during the
rendering; at other times you can have two or more overlapped elements and print only one of them, using the print when
condition; this is a simple trick to print different content-based on a condition.
To change the z-order, you can move the elements by dragging them in the Inspector, or you can use the Move Down and
Move Up menu items. Remember that elements on top of the list are printed first, so to bring an element to front, you need to
move it down in the list.
All the elements can be copied and pasted, except for charts and crosstabs. When an element is pasted, it keeps the top/left
coordinates used in its previous container (a band, a cell or a frame). If the new container is smaller than the previous one, you
may need to adjust the element position since it could be outside the new container’s bounds.
The Report Inspector allows you to select elements inside the report even if those elements are not visible in the designer or
even if they are hard to select due to the complexity of the report.
5.1.3 Basic Element Attributes
All the elements have a set of common properties, or attributes; they are presented in the element properties view (as shown
earlier in Figure 5-1). These attributes concern information about element positioning on the page. The following table
describes the available attributes.
Figure 5-10 shows how iReport positions an element relative to the band to which the element belongs (or, more broadly, to
its container). The band width is always equal to the document page width minus the left and right margins; its height can
change depending on the type of band and the contained elements.
Vert. Space
→Remove
Removes the horizontal space among elements by moving them to the
left
√
Adapt to parent Increases the size of the element to fit the size of its container (a band,
a cell or a frame)
Adapt to parent width Increases the width of the element to fit the width of its container (a
band, a cell or a frame)
Adapt to parent height Increases the height of the element to fit the height of its container (a
band, a cell or a frame)
Organize as a table Aligns the selected elements by their tops and makes equal the
horizontal space between them
Table 5-1 Formatting Tools, continued
Icon Tool Description Multiple
select?
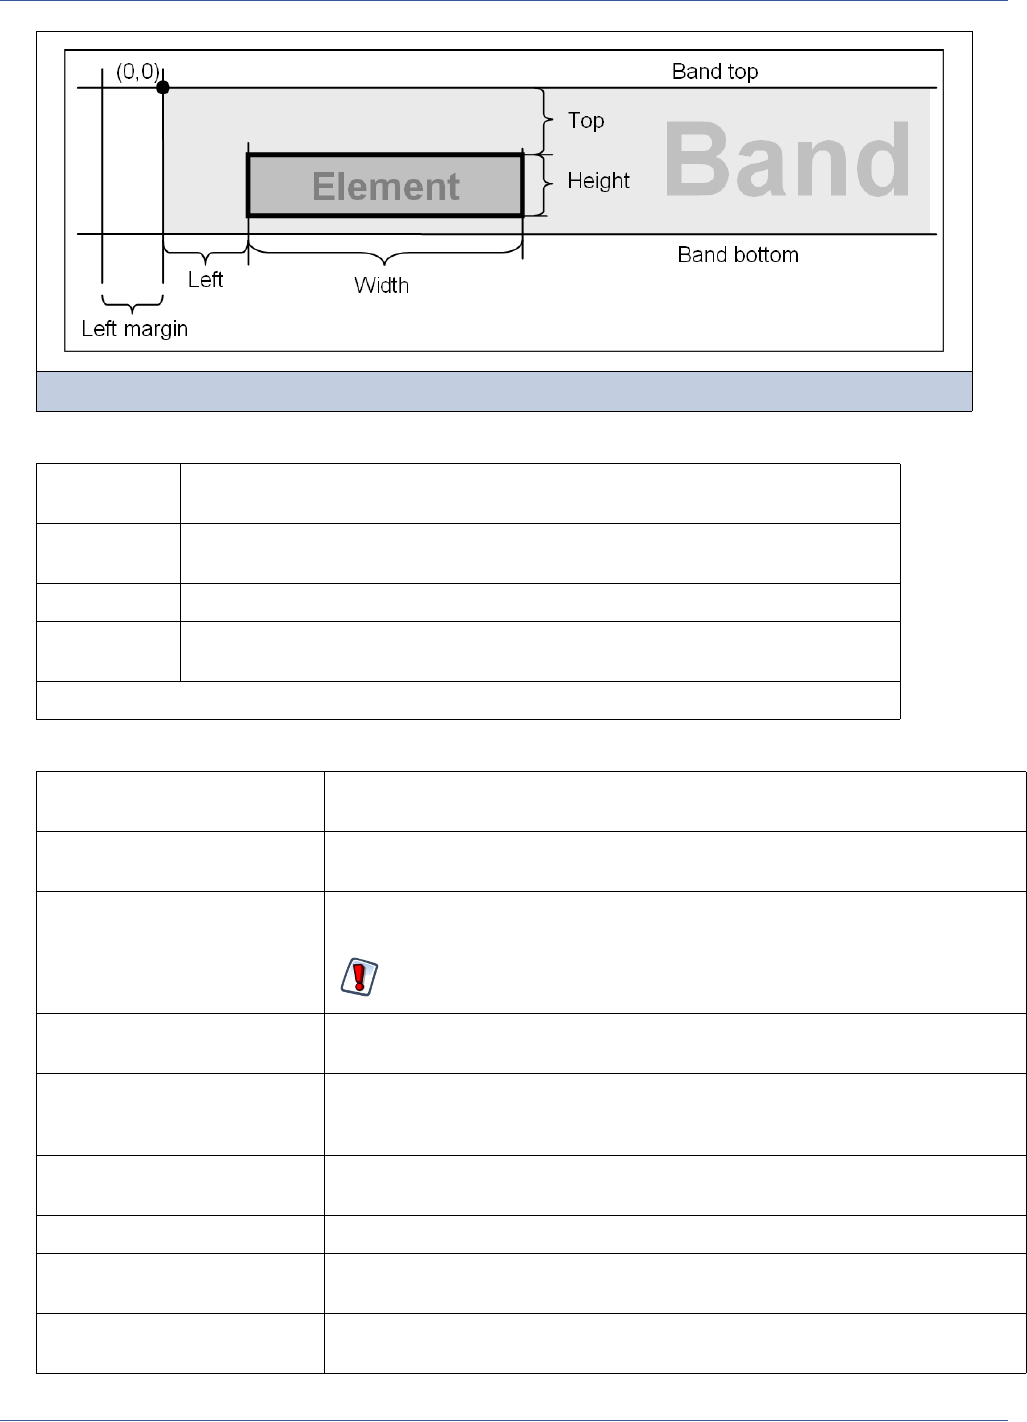
Report Elements
71
Figure 5-10 Element positioning
Table 5-2 Element positioning properties
Top This is the distance of the top-left corner of the element from the top of the container the
element belongs.
Left This is the distance of the top-right corner of the element from the left margin of the
container.
Width This is the element width.
Height This is the element height; in reality, this indicates a minimum value that can increase
during the print creation according to the value of the other attributes.
* Coordinates and dimensions are always expressed in pixels in relation to a 72-pixel-per-inch resolution.
Table 5-3 Other element properties
Foreground This is the color with which the text elements are printed and the lines and the
element corners are drawn.
Background This is the color with which the element background is filled. Since, by default, some
elements are transparent, remember to make the element opaque.
Opaque This option controls whether the element background is transparent or not; the
transparency involves only the parts that should be filled with the background.
Not all export formats support the transparency attribute.
Style If the user has defined one or more styles in the report, it is possible to apply a style to
the element by selecting it from the list.
Key This is the element name, which has to be unique in the report (iReport proposes it
automatically), and it is used by the programs that need to modify the field properties
at run time.
Position type This option determines how the top coordinates have to be considered if the band
changes its height during the filling process. The three possible values are as follows:
FixRelativeToTop This is the pre-defined position type; the coordinate values never change.
Float The element is progressively pushed toward the bottom by the previous elements that
increase their height.
FixRelativeToBottom The distance of the element from the bottom of the band remains constant; usually
this is used for lines that separate records.
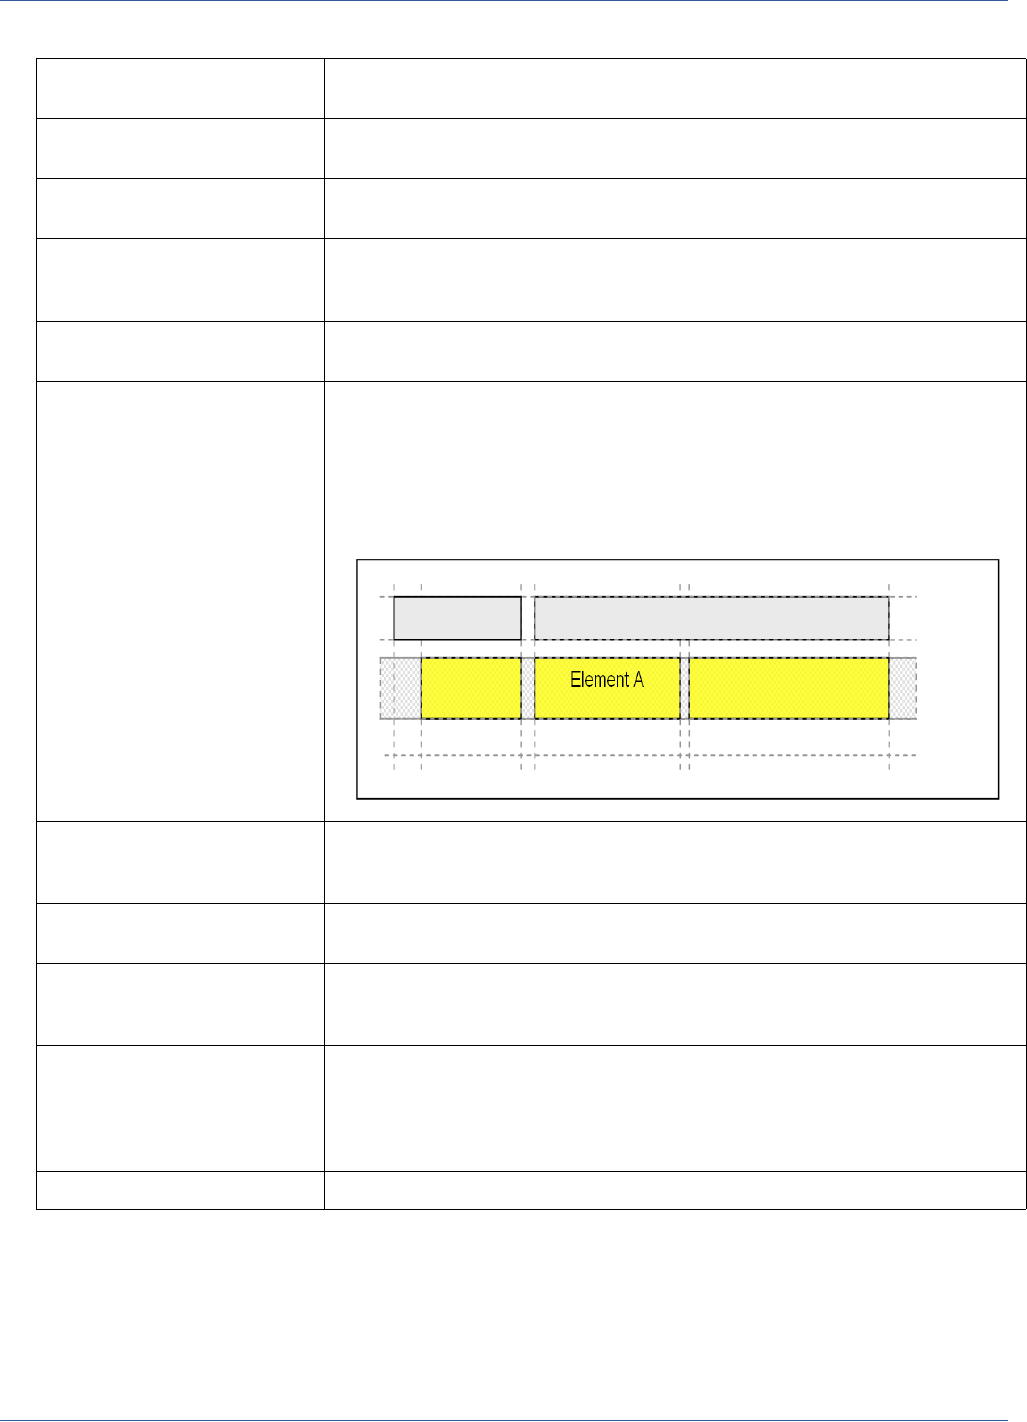
72
iReport Ultimate Guide
5.1.4 Element Custom Properties
For each element it is possible to define a set of custom properties; each property is a pair key/value where both key and value
are simple text strings. The value can be generated using an expression (that will have to return a string, of course).
Element custom properties are set by modifying the Properties expressions attribute in the property sheet displayed
when the element is selected (see Figure 5-11).
Stretch type This attribute defines how to calculate the element height during the print elaboration;
the three possible values are as follows:
NoStretch This is the pre-defined stretch type, and it dictates that the element height should be
kept equal.
RelativeToBandHeight The element height is increased proportionally to the increasing size of the band; this
is useful for vertical lines that simulate table borders.
RelativeToTallestObject The element modifies its height according to the deformation of the nearest element:
this option is also used with the element group, which is an element group mechanism
not managed by iReport.
Print repeated values This option determines whether to print the element when its value is equal to that
which is used in the previous record.
Remove line when blank This option takes away the vertical space occupied by an object if the object is not
visible; the element visibility is determined by the value of the expression contained in
the Print when expression attribute or in case of textfields by the Blank when
null attribute. Think of the page as a grid where the elements are placed, with a line
being the space the element occupies. The figure below highlights the element A line;
in order to remove this line, all the elements that share a portion of the line have to be
null (that is, they will not be printed).
Print in first whole
band
This option ensures that an element is printed in the next page or column if the band
overflows the page or column; this type of guarantee is useful when the Print
repeated values attribute is enabled.
Print when detail
overflows
This option prints the element in the following page or column, if the entire band is not
printable in the present page or column.
Print when group changes In this combo box, all report groups are presented. If one of them is selected, the
element will be printed only when the expression associated with the group changes,
that is, when a new break of the selected group is created.
Print when expression This is an expression like those described in Chapter 3, and it must return a Boolean
object. Besides being associated with elements, this expression is associated with the
bands, as well. If the expression returns true, the element is hidden. An empty
expression or a null value implicitly identifies an expression like new
Boolean(true), which will print the element unconditionally.
Properties expressions These are a set of key/value pairs that can be defined for each element.
Table 5-3 Other element properties, continued
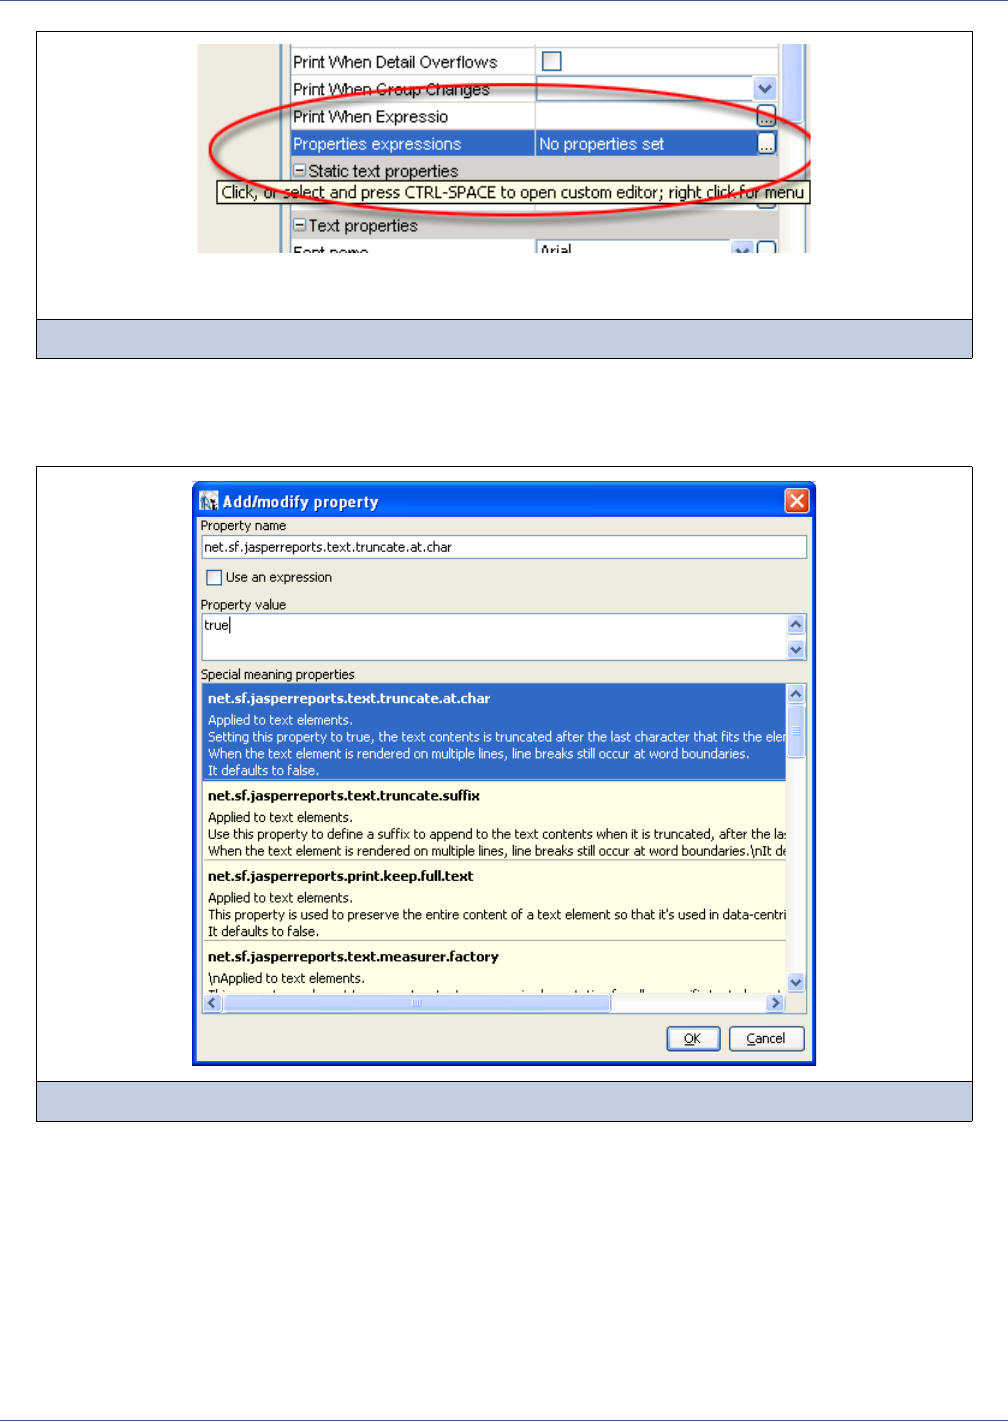
Report Elements
73
Custom element properties can be used for many purposes, such as specifying special behavior for an element when it is
exported in a particular format, or setting how characters should be treated in a textfield or, again, setting special tags like
those required by Standard 508 to define the structure of a document.
When a property is created, the property dialog suggests some of the most important common property keys with a short
description of the property meaning.
To use an expression, check the Use an expression check box.The text area will become an expression area and the button to
open the expression editor will appear.
5.1.5 Graphic Elements
Graphic elements are drawing objects such as line and rectangle; they do not show data generally, but they are used to make
prints more readable and agreeable from an aesthetic point of view. All elements have the pen and the fill properties.
Figure 5-11 Custom element properties
Figure 5-12 Custom property dialog
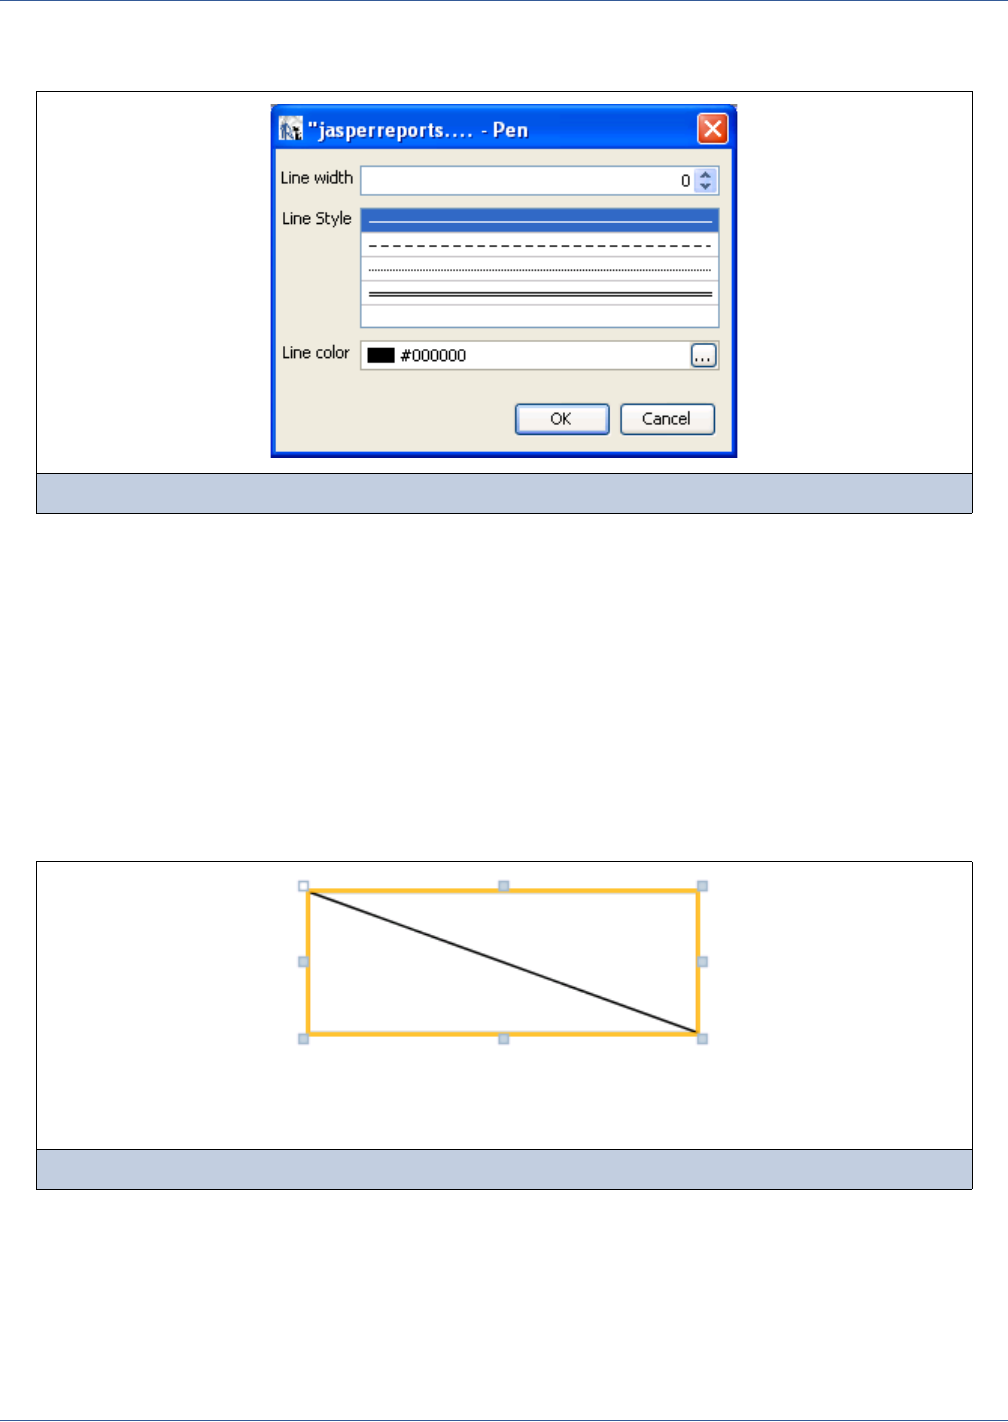
74
iReport Ultimate Guide
pen is used to draw a shape (or just the borders of the element in case of images). This property is edited with the Pen dialog
(see Figure 5-13).
It is possible to set a particular line width (a zero line width means that no lines will be painted) and choose between 4 different
styles: normal, dashed, dotted and double.
By default, the color used to paint the lines is the element foreground color, but it is possible to override that value by
specifying a different value. To reset the color the default value you need to reset the whole pen right clicking the Pen item in
the property sheet and selecting Restore Default Value.
The default values for the pen (like for many other common element properties) depend on the specific element. Lines,
rectangles and ellipses have a default width of 1 pixel, while for images the default line width is zero.
The Fill property has a single possible value: Solid.
5.1.5.1 Line
In JasperReports, a line is defined by a rectangle for which the line represents the diagonal (see Figure 5-14).
The line is drawn using the pen settings. If they are not set, the foreground color is used as the default color and a normal 1-
pixel-width line is used as the line style.
The only specific property of a line is the Line direction, used to indicate which of the two rectangle diagonals represents
the line; the possible values are Top Down and Bottom Up.
Figure 5-13 Pen Definition
Figure 5-14 Line element of type top-down
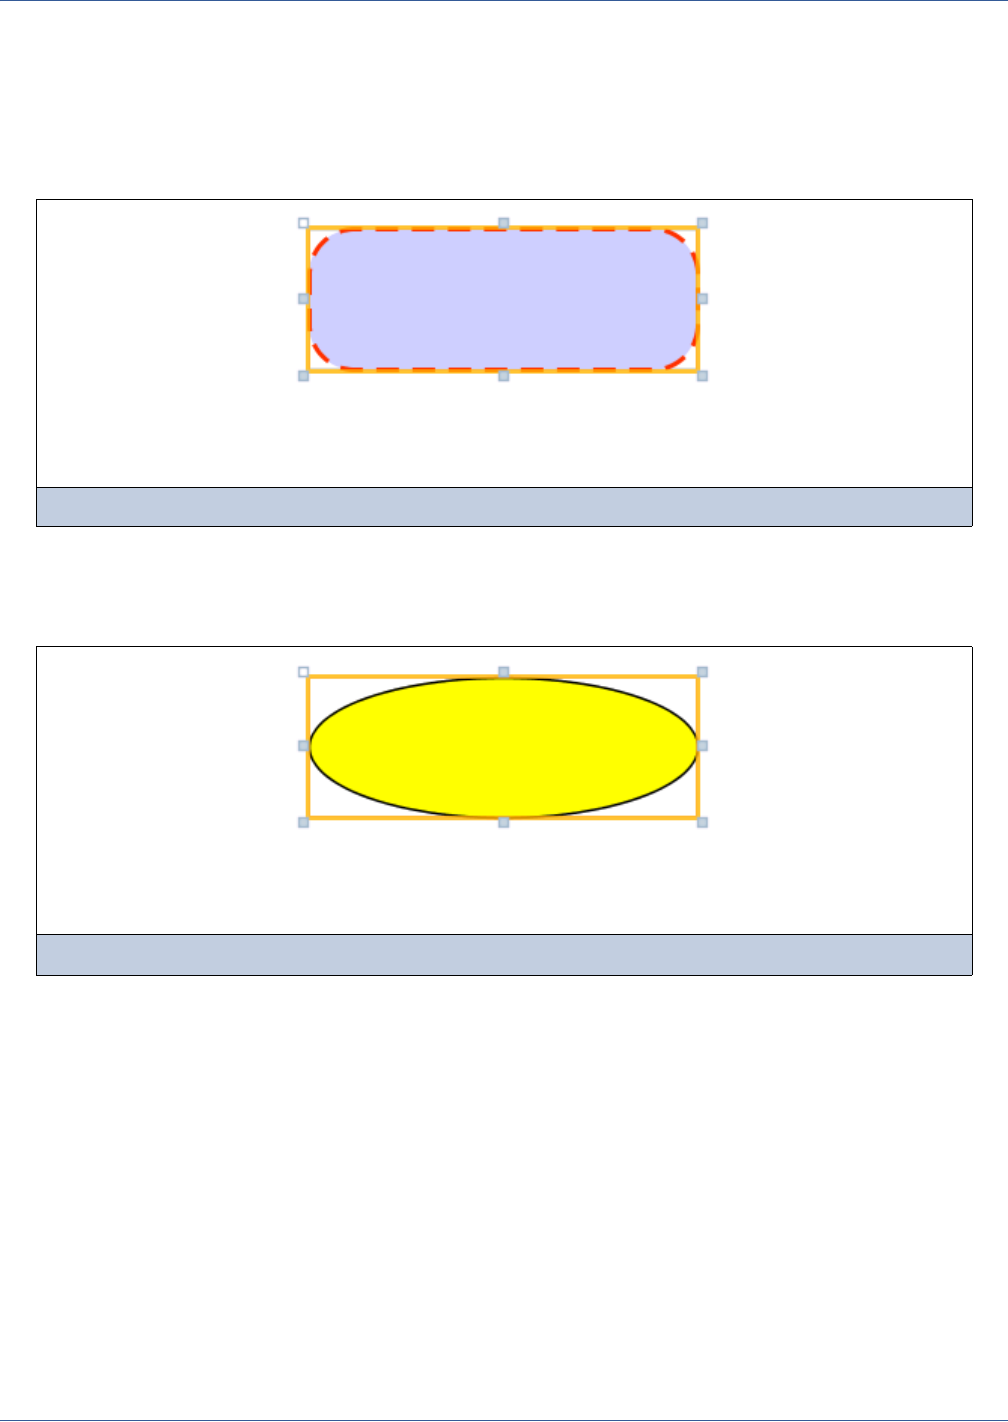
Report Elements
75
5.1.5.2 Rectangle
The rectangle element is usually used to draw frames around other elements (even if it is preferable to use a frame element for
this specific purpose in order to avoid overlapping elements). Similarly to the line element, the rectangle border is drawn using
the pen settings. If they are not set, the Foreground setting is used as color (which is black by default) and a normal 1-pixel-
width line is used as line style. The background is filled with the color specified with the Background setting if the element has
not been defined as transparent.
In JasperReports, it is possible to have a rectangle with rounded corners (see Figure 5-15). The rounded corners are defined by
means of the Radius attribute, which represents the curvature radius of the corners, expressed in pixels.
5.1.5.3 Ellipse
The ellipse is the only element that has no attributes specific to it. The ellipse is drawn in a rectangle that defines the maximum
height and width (see Figure 5-16). The border is drawn using the pen settings. If they are not set, the Foreground is used as
color (which is black by default) and a normal 1-pixel-width line is used as line style. The background is filled with the
Background color setting if the element has not been defined as transparent.
Figure 5-15 Rectangle element with radius set to 20
Figure 5-16 Ellipse element and its rectangular boundary
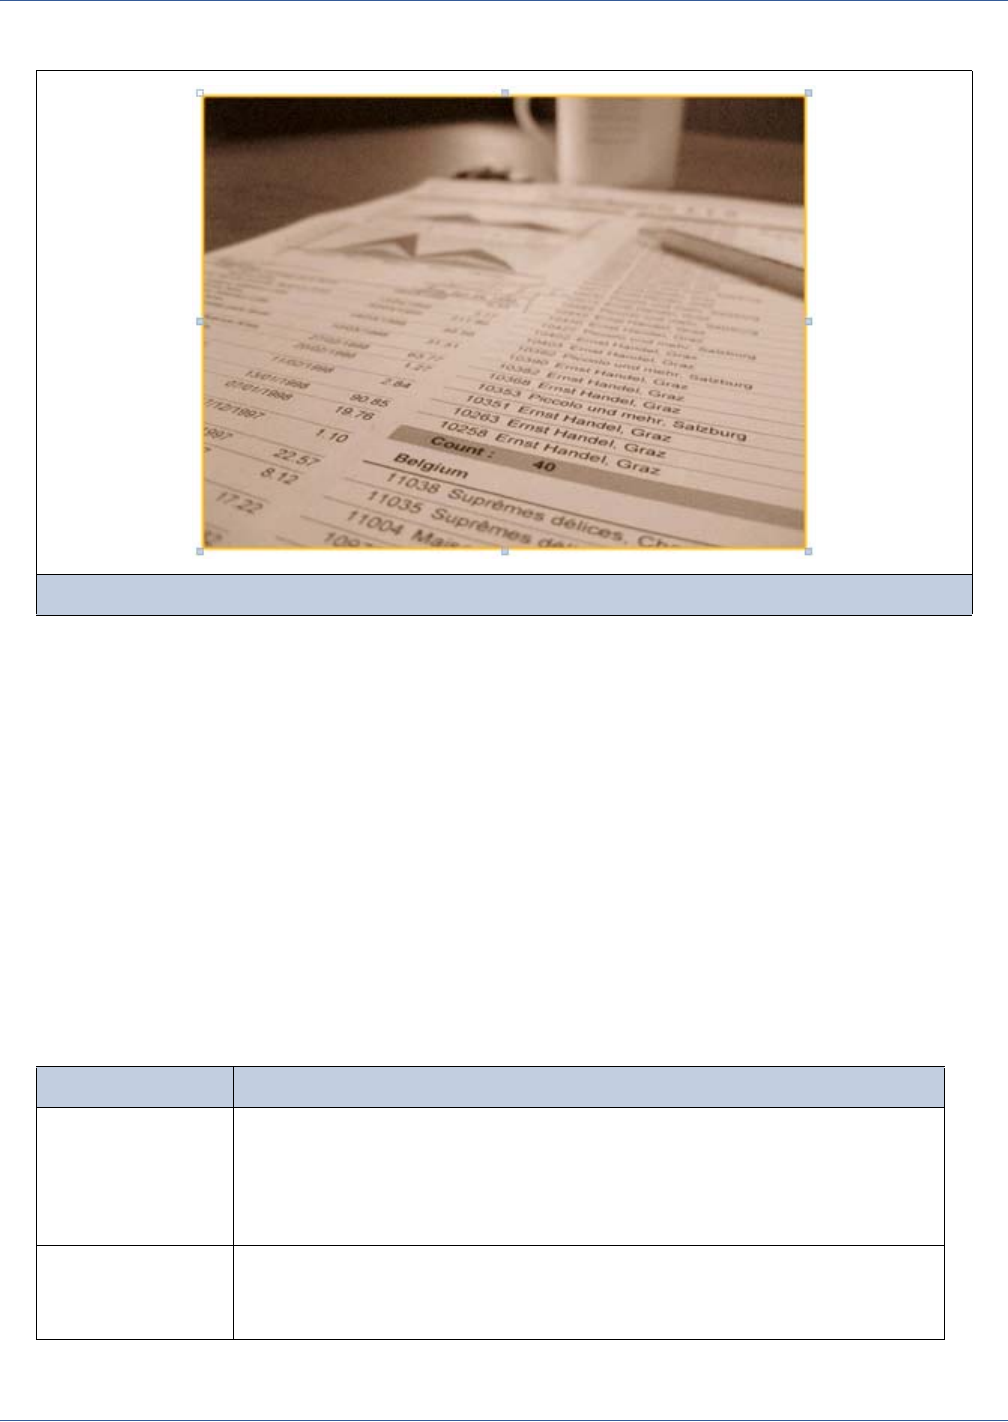
76
iReport Ultimate Guide
5.2 Working with Images
An image is the most complex of the graphic elements. It can be used to insert raster images (such as GIF, PNG and JPEG
images) in the report, but it can be also used as a canvas object to render, for example, a Swing component, or to leverage
some custom rendering code.
When you drag an image element from the Palette into the Designer, iReport pops up a file chooser dialog. This is the most
convenient way to specify an image to use in the report. iReport will not save or store the selected image anywhere, it will just
use the file location, translating the absolute path of the selected image into an expression to locate the file when the report is
executed. The expression is then set as the value for the Image Expression property. Here is a sample expression:
"C:\\Documents and Settings\\gtoffoli\\Desktop\\splashscreen.png"
As you can see, this is a Java (or Groovy or JavaScript) expression, not just the value of a file path. It starts and ends with
double quotes, and the back slash character (\) is escaped with another back slash (\\).
The Image Expression Class defines what kind of object is returned by the Image Expression. In this case, it is of the type
java.lang.String, but there are several other options.
Table 5-4 summarizes the values that the Image Expression Class can adopt and describes how the Image Expression
result is interpreted and used.
Figure 5-17 Image element
Table 5-4 Image Expression Class Values
Type Interpretation
java.lang.String A string is interpreted like a file name. JasperReports will try to interpret the string like
an absolute path. If no file is found, it will try to load a resource from the classpath with
the specified name. Correct expressions are:
“c:\\devel\\ireport\\myImage.jpg”
“com/mycompany/resources/icons/logo.gif”
java.io.File Specifies a file object to load as an image.
A correct expression could be:
new java.io.File(“c:\\myImage.jpg”)
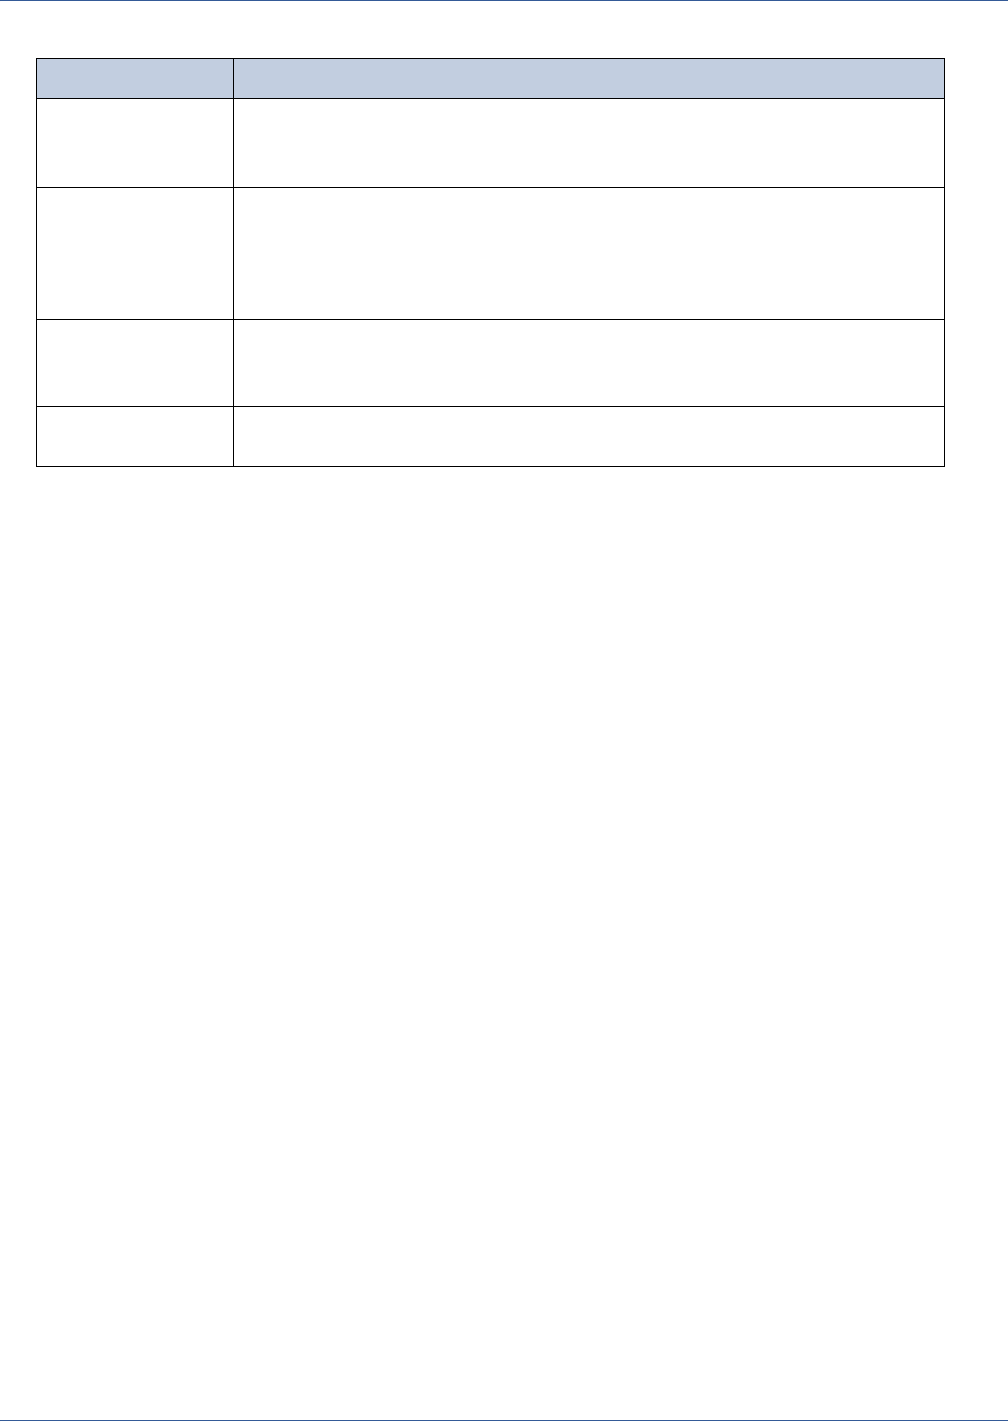
Report Elements
77
You are free to add an image by explicitly defining the full absolute path of the image file in your expression. This is an easy
way to add an image to the report, but, overall, it has a big impact on the report’s portability, since the file may not be found on
another machine (for instance, after deploying the report on a web server or running the report on a different computer).
There are two best practices here:
Parametrize the image expression containing the folder where your images resides (possibly using a parameter with a
default value), then composing the expression like this:
$P{MY_IMAGES_DIRECTORY} + “myImage.png”
At run time in a hypothetical application, the value for the parameter MY_IMAGES_DIRECTORY can be set by the
application itself. If a value for the parameter is not provided, we can still return a default value (we’ll see how to create a
parameter and set a default value in the next chapter). The advantage of this solution is that the location of the directory
where the images reside is not defined discretely within the report, but can be provided dynamically.
The second option is to use the classpath. The classpath defines the directories and JAR file locations where a Java
application like JasperReports looks for classes and resources. If the application uses the Java Virtual Machine, it is
usually easy to add directories to the classpath.
In iReport, the classpath can be extended from the Options dialog (Window > Options > iReport > Classpath). When an
image is in the classpath, the only required information JasperReports needs in order to find and render the image is the
resource name (that is a kind of path that is relative to the classpath). By default, when executing a report, iReport adds the
directory in which the report resides to the classpath. Suppose you have a report in a certain directory, let’s say
c:\test\myReport.jrxml, and in the same directory you have an image named myImage.png. To use it in the report, you can
set Image Expression to myImage.png. Since the report’s directory is in the classpath, the image will be found
automatically.
This process is still valid if the image resides in a subdirectory of the classpath. You will have to specify the subdirectory
path, using a Unix-style path notation. For example, if your image resides in c:\test\images rather than c:\test, the resource
is found with the expression /images/myImage.png.
This method of resolving resource locations is applied in many other parts of JasperReports, as well (for example, in
locating a subreport Jasper file, a resource bundle, a scriptlet class, and so on).
java.net.URL Specifies the java.net.URL object. It is useful when you have to export the report in
HTML format. A correct expression could be:
new java.net.URL(“http://127.0.0.1/test.jpg”)
java.io.InputStr
eam
Specifies a java.io.InputStream object which is ready for reading. In this case,
we do not consider that the image exists and that it is in a file. In particular, we could
read the image from a database and return the inputStream for reading. A correct
expression could be:
MyUtil.getInputStream(${MyField})
java.awt.Image Specifies a java.awt.Image object; it is probably the simplest object to return when
an image has to be created dynamically. A correct expression could be:
MyUtil.createImage()
JRRenderable Specifies an object that uses the
net.sf.jasperreports.engine.JRRenderable interface.
Table 5-4 Image Expression Class Values, continued
Type Interpretation
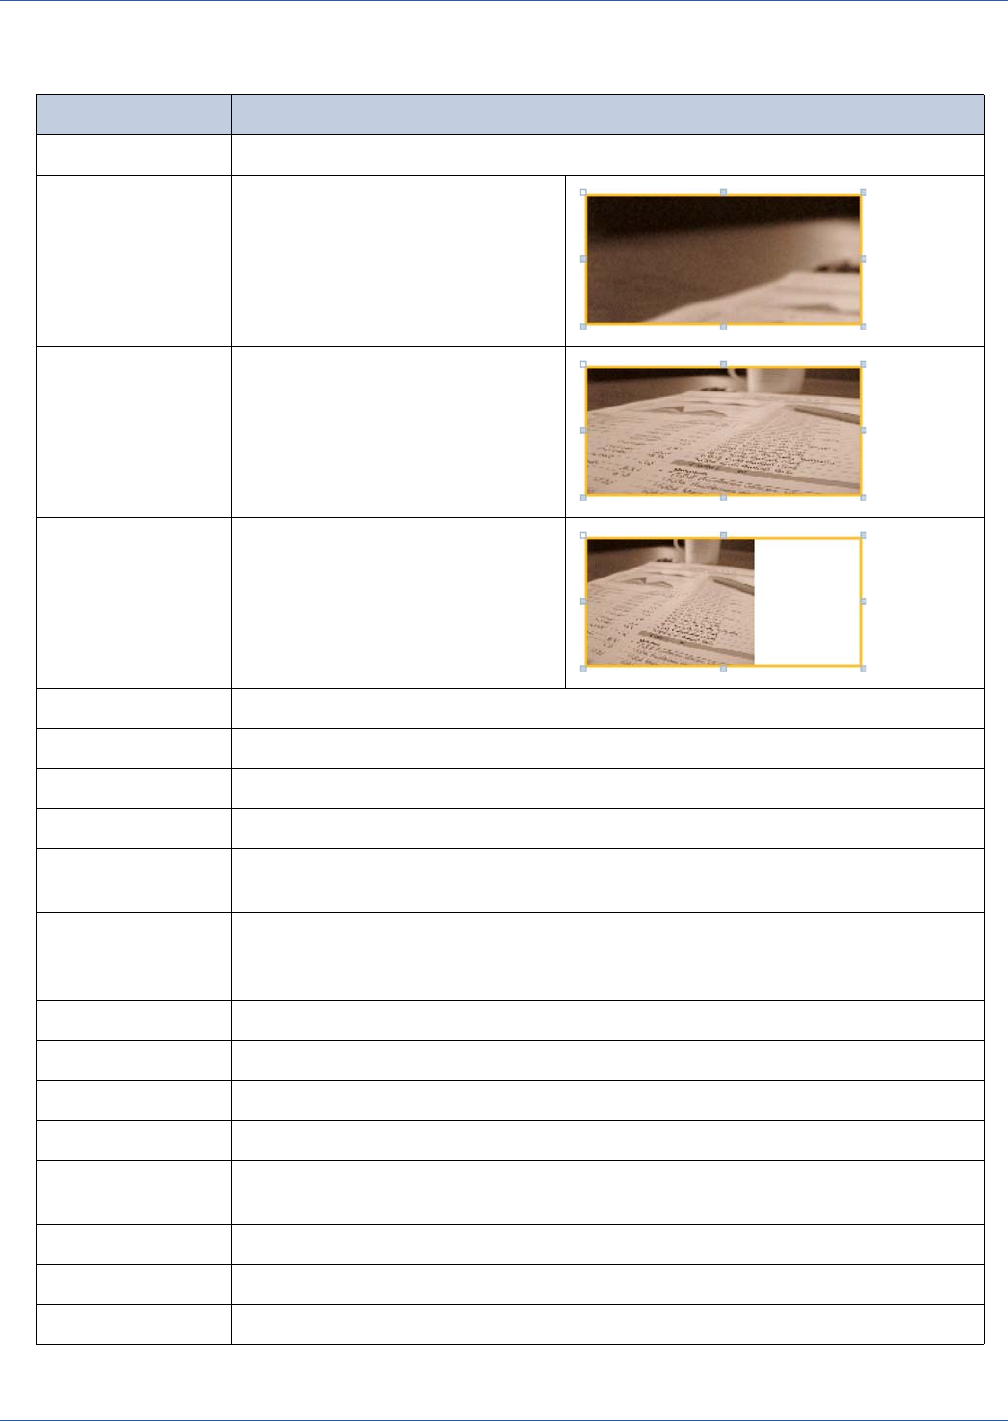
78
iReport Ultimate Guide
Let’s take a look at the remaining options:
Table 5-5 Image Expression Class Options
Option Explanation
Scale Image Defines how the image has to adapt to the element dimension; the possible values are three:
Clip The image dimension is not changed
FillFrame The image is adapted to the element
dimension (becoming deformed)
RetainShape The image is adapted to the element
dimension by keeping the original
proportions
On error type Defines what to do if the image loading fails:
Error A java exception stopping the filling process
Blank The image is not printed, and a blank space will be placed in the report instead
Icon An icon is printed instead of the original image
Is Lazy Avoids the loading of the image at fill time; the image will be loaded when the report is
exported. Useful when an image is loaded from a URL.
Using cache Allows to keep the image into the memory in order to use it again if the element is printed
newly; the image is kept in cache only if the Image Expression Class is set to
java.lang.String.
Vertical alignment Defines the image vertical alignment according to the element area; the possible values are:
Top Aligned at the top edge of the element area
Middle Image is centered vertically according to the element area
Bottom Aligned at the bottom edge of the element area
Horizontal alignment Defines the image horizontal alignment according to the element area; the possible values
are:
Left Aligned to the left edge of the element area
Center Image is centered horizontally according to the element area
Right Aligned to the right edge of the element area
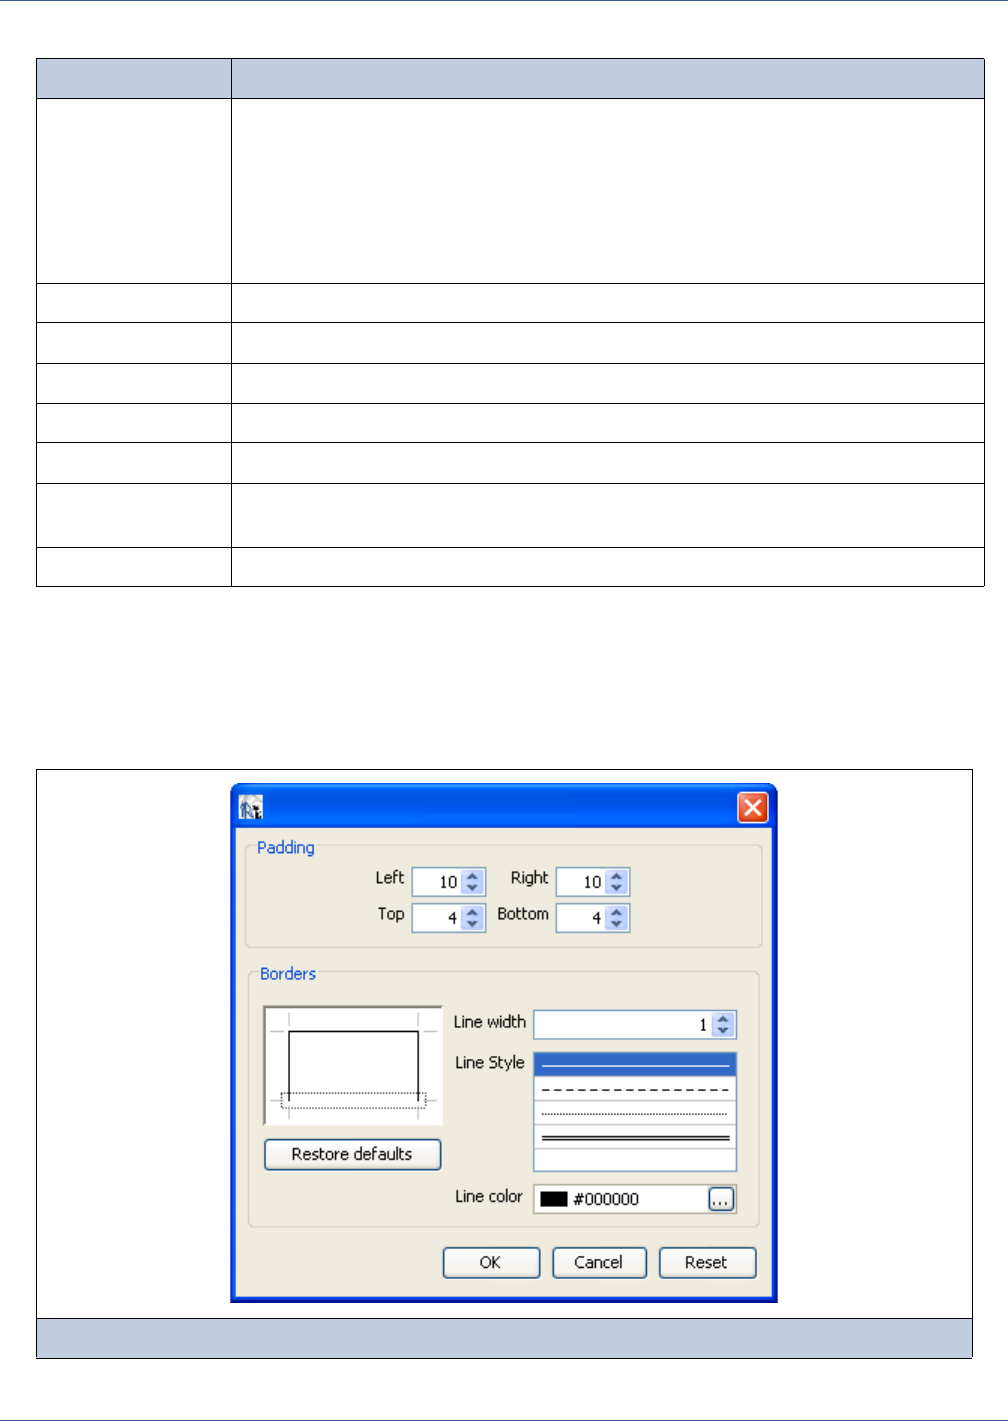
Report Elements
79
5.2.1 Padding and Borders
For the image element (and for the text elements) it is possible to visualize a frame or to define a particular padding for the
four sides. It is the space between the element border and its content. Border and padding are specified by right-clicking the
element (or the element node in the Inspector view) and selecting the menu item Padding and Borders. This will open the
dialog box shown in Figure 5-18.
Evaluation time Defines the time at which the Image Expression has to be processed. The evaluation of
an expression can be done when the report engine “encounters” the element during the
creation of the report (evaluation time “now”) or it can be postponed.For example, it might
be postponed because the image depends on calculations that have not yet been completed.
The evaluation time is applied to the evaluation of many expressions (including textfields
and variables). An in-depth explanation of the evaluation time is available in the next
chapter. The possible values for the evaluation time are:
Now Evaluate the expression immediately
Report Evaluate the expression at the end of the report
Page Evaluate the expression at the end of the page
Column Evaluate the expression at the end of this column
Group Evaluate the expression of the group which is specified in Evaluation group
Band Evaluate this expression after the evaluation of the current band (used to evaluate
expressions that deal with subreport return values)
Evaluation group See the preceding Group value description for the Evaluation time setting.
Figure 5-18 Padding and borders
Table 5-5 Image Expression Class Options, continued
Option Explanation

80
iReport Ultimate Guide
As always, all the measurements must be set in pixels.
The four sides of the border can be edited individually by selecting them in the preview frame. When no sides are selected,
changes are applied to all of them.
Image elements can have a hyperlink. Not all the export formats support them, but they have been verified in HTML, PDF and
XLS. To define a hyperlink, right-click the image element and select the Hyperlink menu item. The hyperlink definition dialog
will appear. We will explain in depth how to define an hyperlink using this dialog later in the chapter.
5.2.2 Loading an Image from the Database (BLOB Field)
If you need to print images that are stored in a database (that is, using a BLOB column) what you need to do is assign the field
that will get the BLOB value the type java.awt.Image (report fields will be explained in the next chapter). Create an image
element by dragging the image element tool from the palette into the designer (that is, into the Detail band), click Cancel when
the file chooser prompts. Then, in the image element properties sheet, change the Image Expression Class to
java.awt.Image and set as Image Expression the field object (that is, $F{MyImageField} ).
5.2.3 Creating an Image Dynamically
To create an image dynamically requires some Java knowledge. Here we will show the best solution to modify or create an
image to be printed in a report.
There are several ways to create an image dynamically in JasperReports. The first option is to write a class that produces a
java.awt.Image object and call a method of this class in the Image Expression of the image element. The expression would
look like:
MyImageGenerator.generateImage()
where MyImageGenerator is a class with the static method generateImage() that returns the java.awt.Image object.
The problem with this solution is that, since the image created would be a raster image with a specific with and height, in the
final result there could be there a loss of quality, especially when the document is zoomed in, or when the final output is a PDF
file.
Generally speaking, the best format of an image that must be rendered in a document is an SVG, which provides high image
quality regardless of original capture resolution. In order to ease the generation of a custom image, JasperReports provides an
interface called JRRenderable that a developer can implement to get the best rendering result. A convenient class to initial
use of this interface is JRAbstractSVGRenderable. The only method to implement here is:
public void render(Graphics2D g2d, Rectangle2D rect)
which is where you should put your code to render the image. Code Example 5-1 shows a simple implementation of a
JRAbstractSVGRenderable to paint the outline text “JasperReports!!” inside an image element using a gradient
background.
Code Example 5-1 Dynamic image generation
package com.jaspersoft.ireport.samples;
import java.awt.Color;
import java.awt.Font;
import java.awt.GradientPaint;
import java.awt.Graphics2D;
import java.awt.Rectangle;
import java.awt.Shape;
import java.awt.font.FontRenderContext;
import java.awt.font.TextLayout;
import java.awt.geom.AffineTransform;
import java.awt.geom.Rectangle2D;import
net.sf.jasperreports.engine.JRAbstractSvgRenderer;
import net.sf.jasperreports.engine.JRException;

Report Elements
81
The final result is shown in Figure 5-19. The CustomImageRenderer class implements the interface
JRAbstractSvgRenderer. The renderer just fills the background with the fillRect method using a Gradient Paint, creates
a shape out of the “JasperReports!!!” text, and renders the shape centered with a translation.
/**
*
* @author gtoffoli
*/
public class CustomImageRenderer extends JRAbstractSvgRenderer {
public void render(Graphics2D g2d, Rectangle2D rect) throws JRException {
// Save the Graphics2D affine transform
AffineTransform savedTrans = g2d.getTransform();
Font savedFont = g2d.getFont();
// Paint a nice background...
g2d.setPaint(new GradientPaint(0,0, Color.ORANGE,
0,(int)rect.getHeight(), Color.PINK));
g2d.fillRect(0,0 , (int)rect.getWidth(), (int)rect.getHeight());
Font myfont = new Font("Arial Black", Font.PLAIN, 50);
g2d.setFont(myfont);
FontRenderContext frc = g2d.getFontRenderContext();
String text = new String("JasperReports!!!");
TextLayout textLayout = new TextLayout(text, myfont, frc);
Shape outline = textLayout.getOutline(null);
Rectangle r = outline.getBounds();
// Translate the graphic to center the text
g2d.translate(
(rect.getWidth()/2)-(r.width/2),
rect.getHeight()/2+(r.height/2));
g2d.setColor(Color.BLACK);
g2d.draw(outline);
// Restore the Graphics2D affine transform
g2d.setFont(savedFont);
g2d.setTransform( savedTrans );
}
}
Code Example 5-1 Dynamic image generation, continued

82
iReport Ultimate Guide
What we did is to set the Image Element Expression to:
new com.jaspersoft.ireport.samples.CustomImageRenderer()
and the Image Expression Class to net.sf.jasperreports.engine.JRRenderable. We have not passed any
argument to our implementation class, but this is possible, allowing the final user to pass to the renderer extra information to
produce the image.
With a similar approach it is possible to modify an image (rotate, transform and so on), add a watermark to an image or even
insert into the report a Swing component.
Code Example 5-2 shows how to print a JTable. The code is not much different from what we have seen in the previous
sample; the idea is to force the component to paint itself into the provided Graphics2D. The result is incredibly good and there
is no loss of quality when using the internal JasperReports preview component (see Figure 5-20) or when exporting to PDF.
.
Figure 5-19 An image element rendered using a custom JRRenderable object
Code Example 5-2 Printing a JTable
package com.jaspersoft.ireport.samples;
import java.awt.Graphics2D;
import java.awt.geom.AffineTransform;
import java.awt.geom.Rectangle2D;
import javax.swing.JTable;
import javax.swing.table.DefaultTableModel;
import javax.swing.table.JTableHeader;
import net.sf.jasperreports.engine.JRAbstractSvgRenderer;
import net.sf.jasperreports.engine.JRException;
/**
*
* @author gtoffoli
*/
public class SwingComponentRenderer extends JRAbstractSvgRenderer {
public void render(Graphics2D g2d, Rectangle2D rect) throws JRException {
/ Save the Graphics2D affine transform
AffineTransform trans = g2d.getTransform();

Report Elements
83
5.3 Working with Text
There are two elements specifically designed to display text in a report: static text and textfield. The first is used for creating
labels or more in general to print static text set at design time and not supposed to change when the report is generated. That
said, in some cases you will still use a textfield to print labels too, since the nature of the static text elements prevents the
ability to display text dynamically translated in different languages when the report is executed with a specific locale and it is
configured to use a resource bundle leveraging the JasperReports internationalization capabilities.
// Create a simple table model
DefaultTableModel model = new DefaultTableModel(
new Object[][] {
{"Mercury","NO"},
{"Venus","NO"},
{"Earth","YES"},
{"Mars","YES"},
{"Jupiter","YES"},
{"Saturn","YES"},
{"Uranus","YES"},
{"Neptune","YES"},
{"Pluto","YES"}},
new String[]{"Planet","Has satellites"});
// Create the table using the model
JTable table = new JTable(model);
// Set the column size
table.getColumn("Planet").setWidth(100);
table.getColumn("Has satellites").setWidth(100);
// Resize the table to accommodate the new size
table.setSize(table.getPreferredSize());
// Get the header and set the size to the preferred size
JTableHeader tableHeader = table.getTableHeader();
tableHeader.setSize(tableHeader.getPreferredSize());
// Paint the header
tableHeader.paint(g2d);
// Paint the table
g2d.translate(0, tableHeader.getHeight());
table.paint(g2d);
// Restore the Graphics2D affine transform
g2d.setTransform( trans );
}
}
Code Example 5-2 Printing a JTable, continued
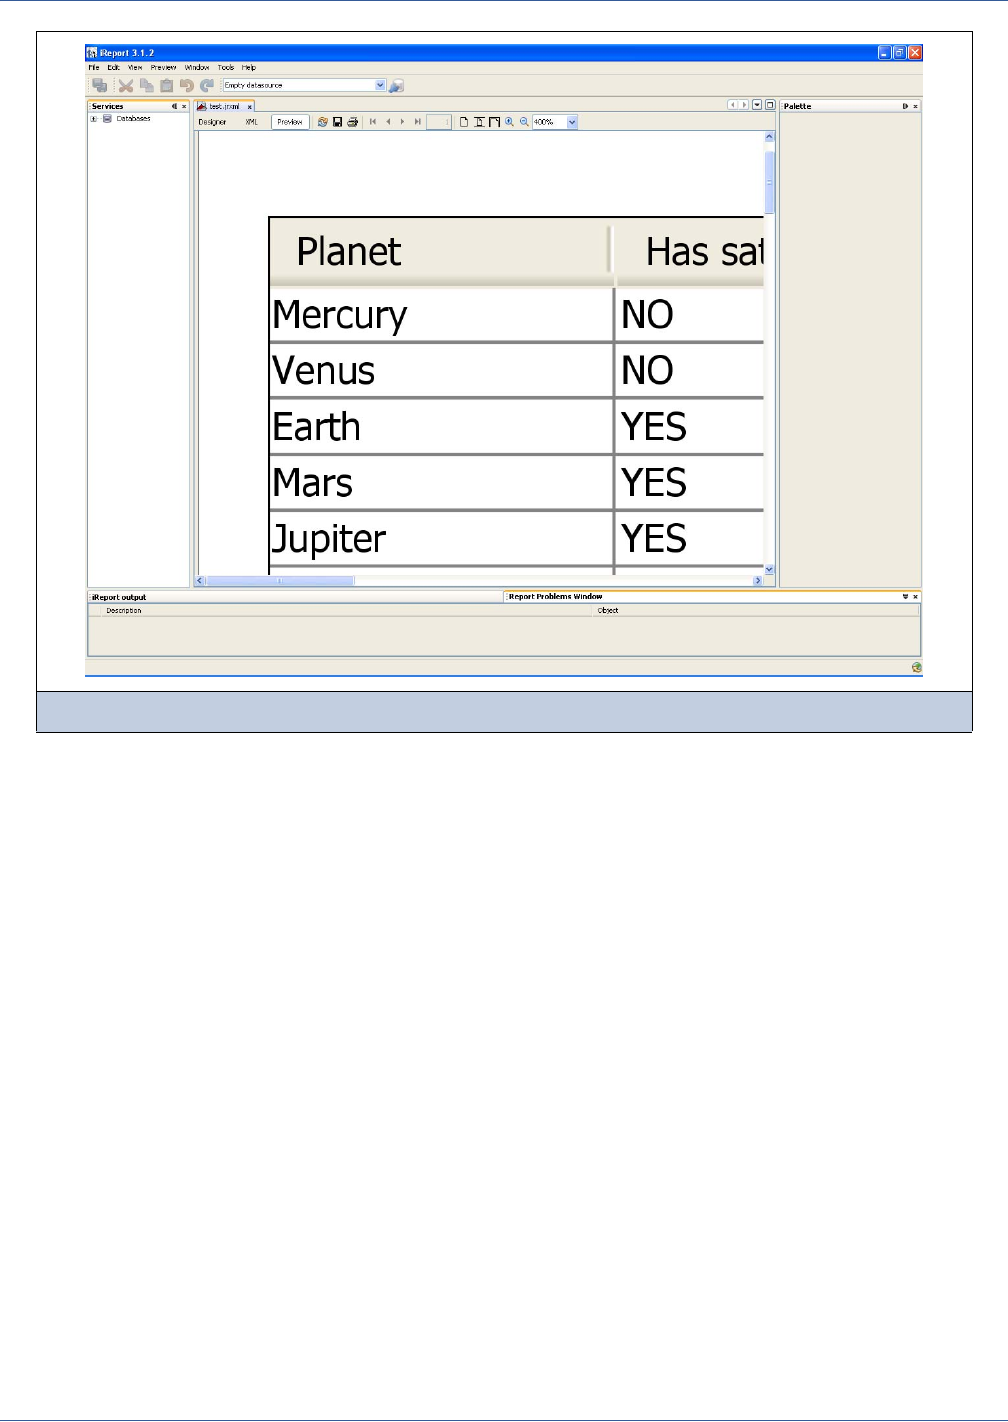
84
iReport Ultimate Guide
A textfield acts in a way similar to a static text string, but the content (the text to print) is provided using an expression (that
actually could be a simple static text string itself). That expression can return several kinds of value types, not just String,
allowing the user to specify a pattern to format that value (this can be applied in example on numeric values and dates). Since
the text specified dynamically can have an arbitrary length, a textfield provides several options about how the text must be
treated regarding alignment, position, line breaks and so on. Optionally, the textfield is able to grow vertically to fit the content
when required. By default text elements are transparent with no border and with a black foreground color. All these properties
can be modified using the common portion of the element property sheet and using the pop-up menu Padding And Borders.
Textfields support hyperlinks too, refer the section about how to define them later in this chapter for more information.
Static texts and textfields share a set of common properties to define text alignment and fonts. Let’s take a look at these
options:
Figure 5-20 A JTable printed inside an image element
Font name This is the name of the font, the list presents all the fonts found in the system.
Like often happens with text documents, you may see fonts that are could not
be found on other machines, so choose your font name carefully to keep the
maximum compatibility. When exporting in PDF, this property is ignored, since
PDF requires and the PDF font name is used instead. More information about
the correct use of the fonts are provided in the “Fonts” chapter.
Font size This is the size of the font. Only integer numbers are allowed, meaning that you
cannot define that is, a size of 10.5.
Bold
Italic
Set the text style to bold and italic. These two properties does not work when
the report is exported in PDF. In that case you need to specify a proper PDF
font.
Underline
Strikethrough
Set the text style to underline and strikethrough.
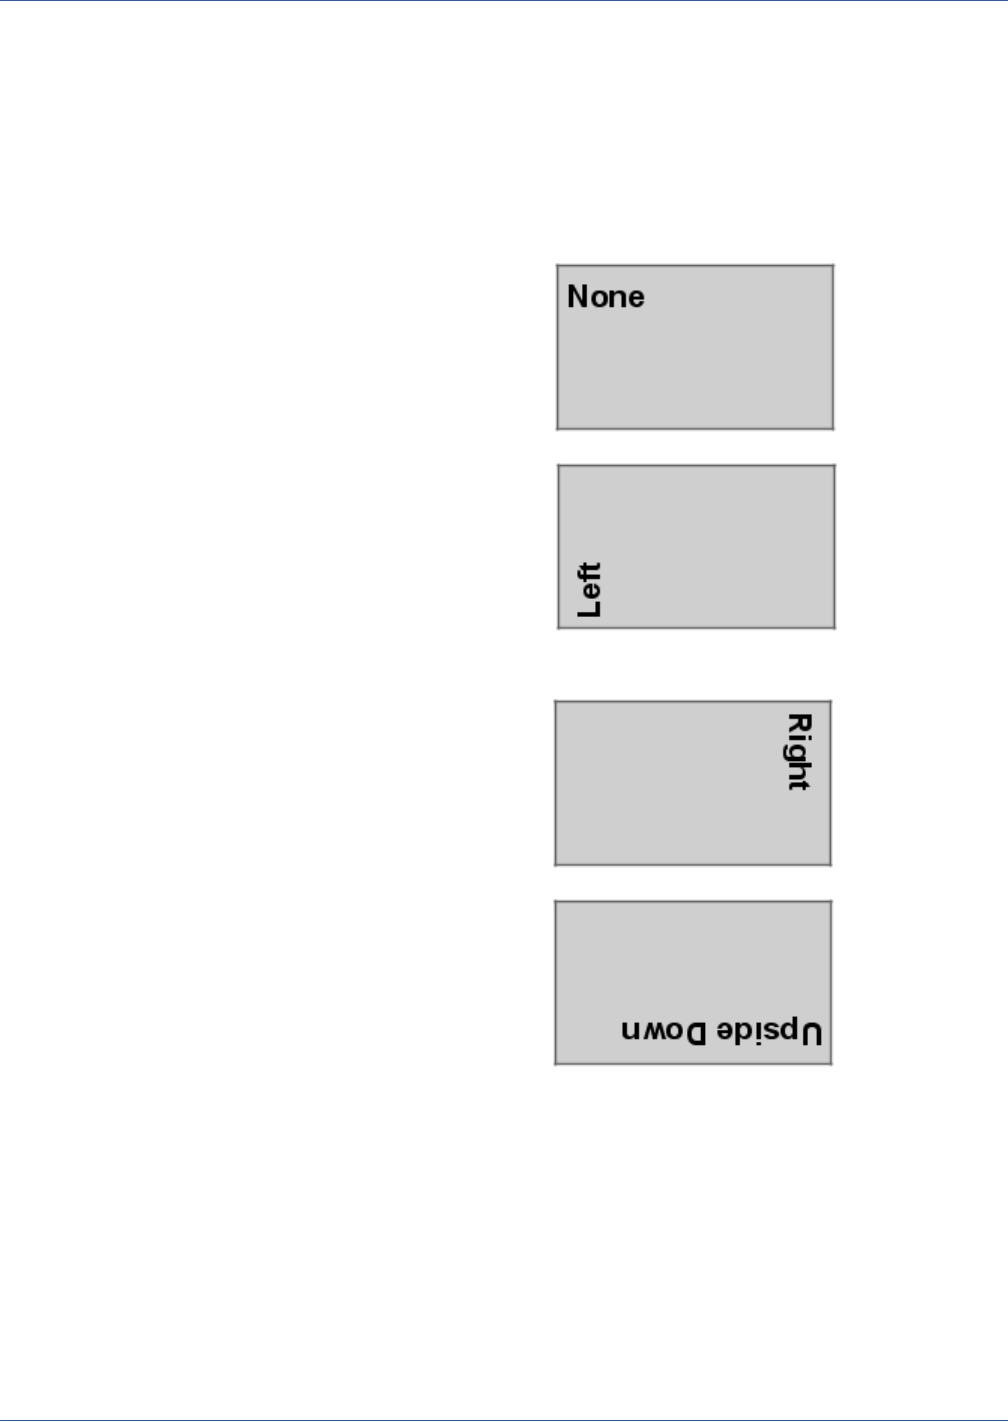
Report Elements
85
PDF font name
PDF encoding
PDF embedded
These flags are explained in 8.3, “Using the Font Extensions,” on page 127.
Horizontal align This is the horizontal alignment of the text according to the element.
Vertical align This is the vertical alignment of the text according to the element.
Rotation This specifies how the text has to be printed. The possible values are as
follows:
None The text is printed normally from
left to right and from top to
bottom.
Left The text is rotated of 90 degrees
counterclockwise; it is printed
from bottom to top, and the
horizontal and vertical
alignments follow the text
rotation (for example, the bottom
vertical alignment will print the
text along the right side of the
rectangle that delimits the
element area)
Right The text is rotated of 90 degrees
clockwise from top to bottom,
and the horizontal and vertical
alignments are set according to
the text rotation.
UpsideDown The text is rotated 180 degrees
clockwise.
Line spacing This is the interline (spacing between lines) value. The possible values are as
follows:
Single Single interline (pre-defined value)
1.5 Interline of one line and a half
Double Double interline
Markup This attribute allows you to format the text using a specific markup language.
This is extremely useful when you have to print some text that is pre-formatted,
that is, in HTML or RTF. Simple HTML style tags (like <b> for bold and <i> for
Italic) can be used in example to highlight a particular chunk of the text. The
possible values are as follows:
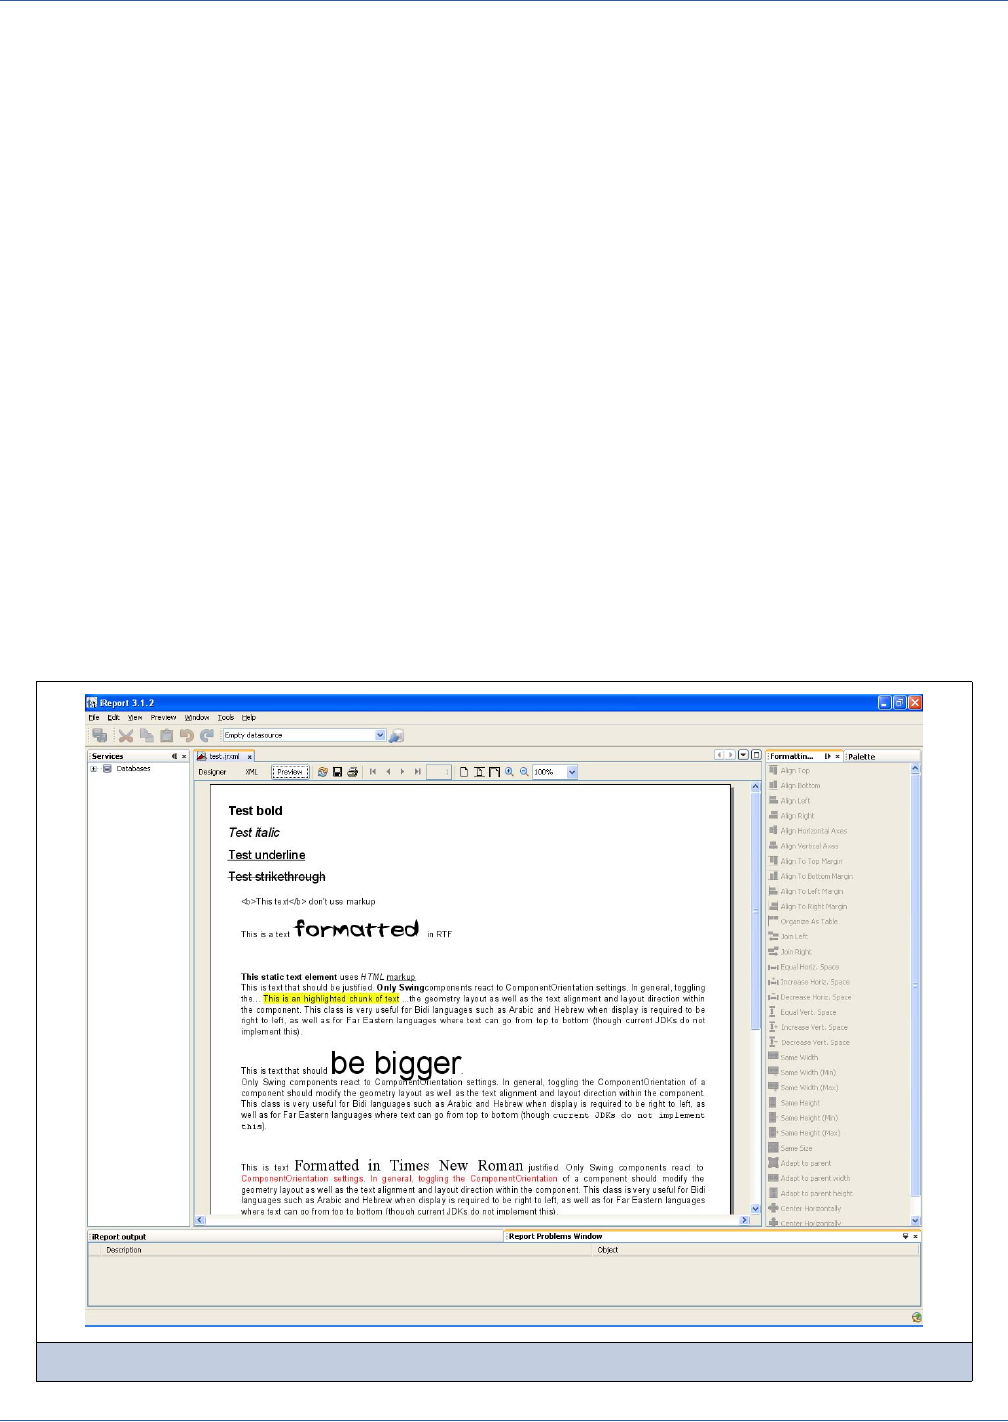
86
iReport Ultimate Guide
None No processing on the text is performed, and the text is printed exactly like it is
provided.
Styled This markup is capable to format the text using a set of HTML-like tags and it is
pretty popular in the Java environments. It allows to set a specific font for
chunks of text, color, background, style and so on. It’s often good enough to
format the text programmatically.
HTML If you want to print some HTML text into your report, this is what you need, but
it’s primary use is to format text, so don’t expect to be able to print tables or add
images.
RTF Setting the markup to this value, the content will be interpreted as RTF code.
RTF is a popular document format stored in pure text. The little piece of text
saying “this is a text formatted in RTF” in Illustration 19 has been generated
using the string:
{\rtf1\ansi\ansicpg1252\deff0\deflang1033{\fonttbl{\f0\fswiss\fcharset0
Arial;}{\f1\fnil\fprq2\fcharset0 Swift;}}
{\*\generator Msftedit 5.41.15.1507;}\viewkind4\uc1\pard\f0\fs20 This is a
text \f1\fs52 formatted \f0\fs20 in RTF\par
}
The string is actually an RTF file created using a simple word processor.
Report font This is the name of a preset font, from which will be taken all the character
properties. This attribute is deprecated and it is there only for compatibility
reason (that’s why it the label is lined out. In order to define a particular style of
text to use all over your document, use a style (explained in Chapter 8).
Figure 5-21 Text formatted with several markups and styles
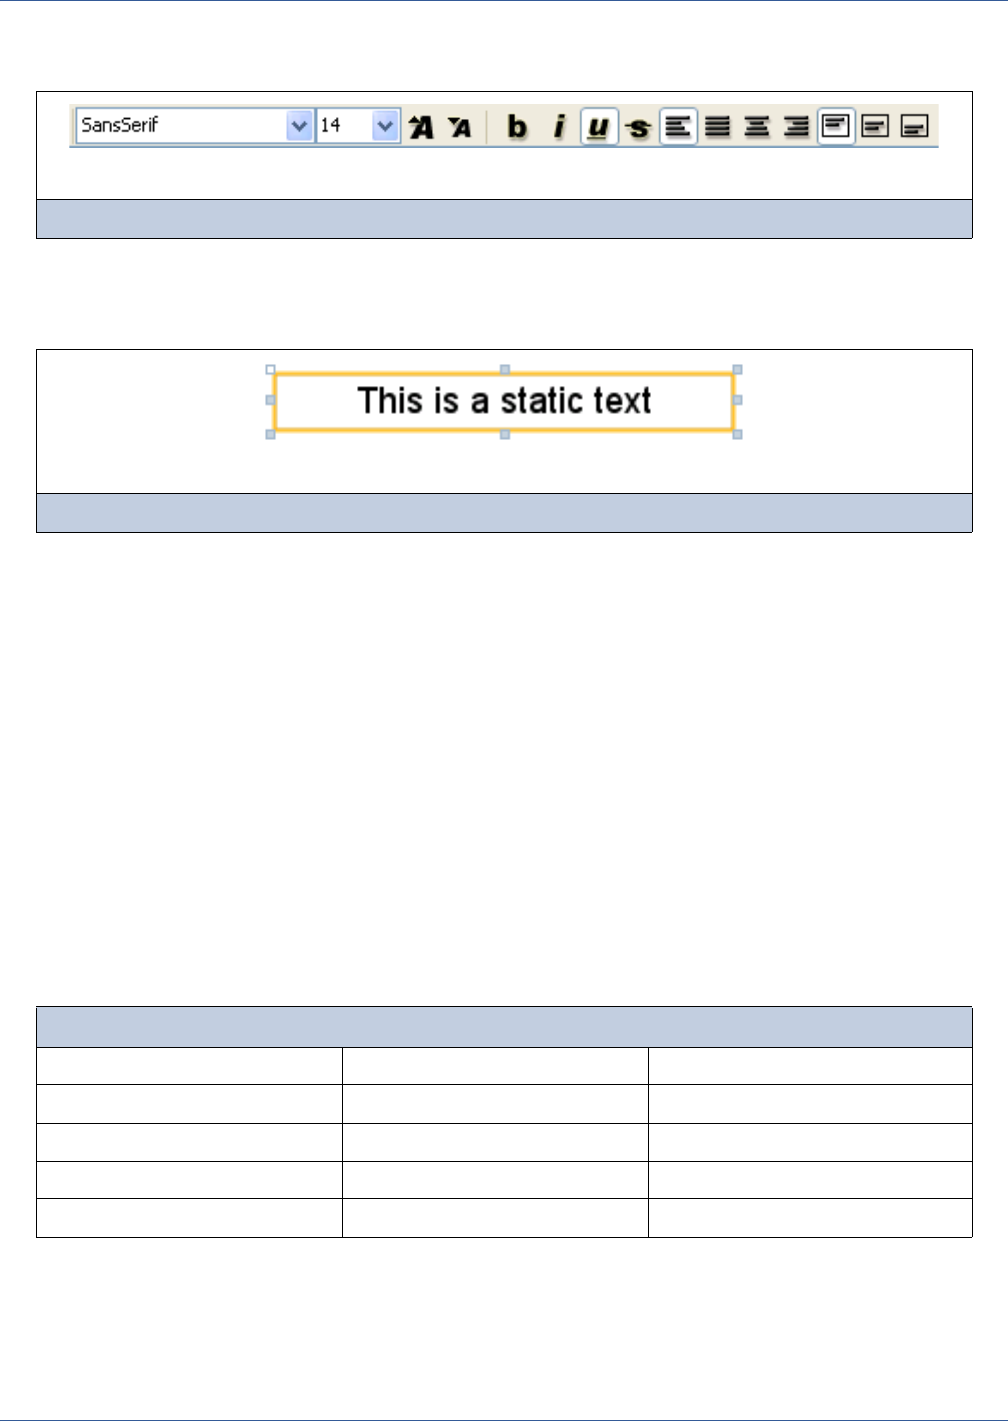
Report Elements
87
For your convenience, the most used text properties can be modified using the text tool bar (see Figure 5-22) that is displayed
when a text element is selected.
The first two buttons on the left of the font size selector can be used to increase and decrease the font size.
5.3.1 Static Text
The static text element is used to show non-dynamic text in reports (see Figure 5-23). The only parameter that distinguishes
this element from a generic text element is the Text property, where the text to view is specified: it is normal text, not an
expression, and so it is not necessary to enclose it in double quotes in order to respect the conventions of Java, Groovy, or
JavaScript syntax.
5.3.2 Textfields
A textfield allows you to print an arbitrary section of text (or a number or a date) created using an expression. The simplest
case of use of a textfield is to print a constant string (java.lang.String) created using an expression like this:
"This is a text"
A textfield that prints a constant value like the one returned by this expression can be easily replaced by a static field; actually,
the use of an expression to define the content of a textfield provides a high level of control on the generated text (even if it’s
just constant text). A common case is when labels have to be internationalized and loaded from a resource bundle.
In general, an expression can contain fields, variables and parameters, so you can print in a textfield the value of a field and set
the format of the value to present. For this purpose, a textfield expression does not have to return necessarily a string (that’s a
text value): the textfield expression class name property specifies what type of value will be returned by the
expression. It can be one of the following:
An incorrect expression class is frequently the cause of compilation errors. If you use Groovy or JavaScript you can choose
String as expression type without causing an error when the report is compiled. The side effect is that without specifying the
right expression class, the pattern (if set) is not applied to the value.
Figure 5-22 Text tool bar
Figure 5-23 A static text element
Valid Expression Types
java.lang.Object java.sql.Time java.lang.Long
java.lang.Boolean java.lang.Double java.lang.Short
java.lang.Byte java.lang.Float java.math.BigDecimal
java.util.Date java.lang.Integer java.lang.String
java.sql.Timestamp java.io.InputStream
88
iReport Ultimate Guide
Let’s see what properties can be set for a textfield:
The following tables provide some parameters and examples of data and number patterns.
Blank when null If set to true, this option will avoid to print the textfield content if the expression result is a
null object that would be produce the text “null” when converted in a string.
Evaluation time Determines in which phase of the report creation the Textfield Expression has to be
elaborated (an in depth explanation of the evaluation time is available in the next chapter).
Evaluation group The group to which the evaluation time is referred if it is set to Group.
Stretch with
overflow
When it is selected, this option allows the textfield to adapt vertically to the content, if the
element is not sufficient to contain all the text lines.
Pattern The pattern property allows you to set a mask to format a value. It is used only when the
expression class is congruent with the pattern to apply, meaning you need a numeric value
to apply a mask to format a number, or a date to use a date pattern.
Table 5-6 Mask Codes for Dates
Mask Code Date Components Examples
G Era designator AD
y Year 1996; 96
M Month in year July; Jul; 07
w Week in year 27
W Week in month 2
D Day in year 189
d Day in month 10
F Day of week in month 2
E Day in week Tuesday; Tue
a Am/pm marker PM
H Hour in day (0-23) 0
k Hour in day (1-24) 24
K Hour in am/pm (0-11) 0
h Hour in am/pm (1-12) 12
m Minute in hour 30
s Second in minute 55
S Millisecond 978
z Time zone Pacific Standard Time; PST; GMT-08:00
Z Time zone -0800
Report Elements
89
Here there are some examples of date and time formats:
The next table has examples of how certain special characters are parsed as symbols in numeric strings:
Here are some examples of formatting of numbers:
Table 5-7 Examples of Date and Time Formats
Date and Time Patterns Result
"yyyy.MM.dd G 'at' HH:mm:ss z" 2001.07.04 AD at 12:08:56 PDT
"EEE, MMM d, ''yy" Wed, Jul 4, '01
"h:mm a" 12:08 PM
"hh 'o''clock' a, zzzz" 12 o'clock PM, Pacific Daylight Time
"K:mm a, z" 0:08 PM, PDT
"yyyyy.MMMMM.dd GGG hh:mm aaa" 02001.July.04 AD 12:08 PM
"EEE, d MMM yyyy HH:mm:ss Z" Wed, 4 Jul 2001 12:08:56 -0700
"yyMMddHHmmssZ" 010704120856-0700
Table 5-8 Special Symbols Used in Numeric Strings
Symbol Location Localized? Meaning
0 Number Yes Digit
# Number Yes Digit, zero shows as absent
. Number Yes Decimal separator or monetary decimal separator
- Number Yes Minus sign
, Number Yes Grouping separator
E Number Yes Separates mantissa and exponent in scientific notation.
Need not be quoted in prefix or suffix.
; Subpattern
boundary
Yes Separates positive and negative subpatterns
% Prefix or suffix Yes Multiply by 100 and show as percentage
\u2030 Prefix or suffix Yes Multiply by 1000 and show as per thousand
¤ (\u00A4) Prefix or suffix No Currency sign, replaced by currency symbol. If doubled,
replaced by international currency symbol. If present in a
pattern, the monetary decimal separator is used instead of
the decimal separator.
' Prefix or suffix No Used to quote special characters in a prefix or suffix; for
example, "'#'#" formats 123 to "#123". To create a single
quote itself, use two in a row: "# o''clock".
Table 5-9 Examples of Number Formats
Number Formats Examples
"#,##0.00" 1.234,56
"#,##0.00;(#,##0.00)" 1.234,56 (-1.234.56)
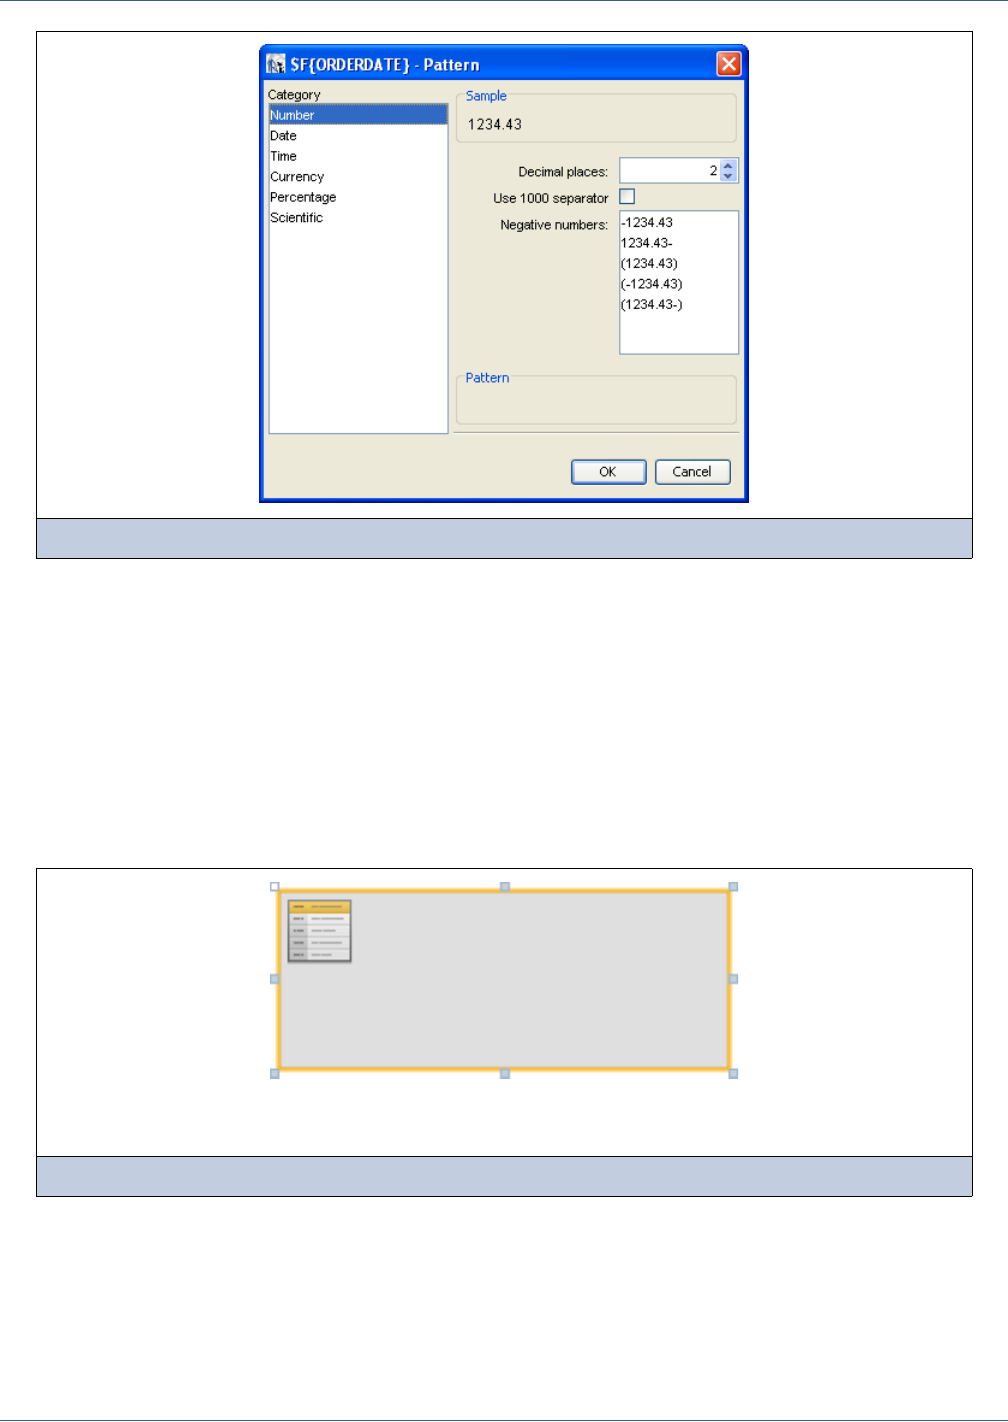
90
iReport Ultimate Guide
To provide a convenient way to define string patterns, iReport provides a simple pattern editor. To open it, click the button
labeled “...” for the pattern property in the property sheet.
5.4 Other Elements
5.4.1 Subreports
The Subreport element is used to include inside a report another report represented by an external Jasper file and feed using the
same database connection used by the parent report or thought a data source that is specified in the subreport properties.
Figure 5-24 Date pattern
Figure 5-25 Subreport element
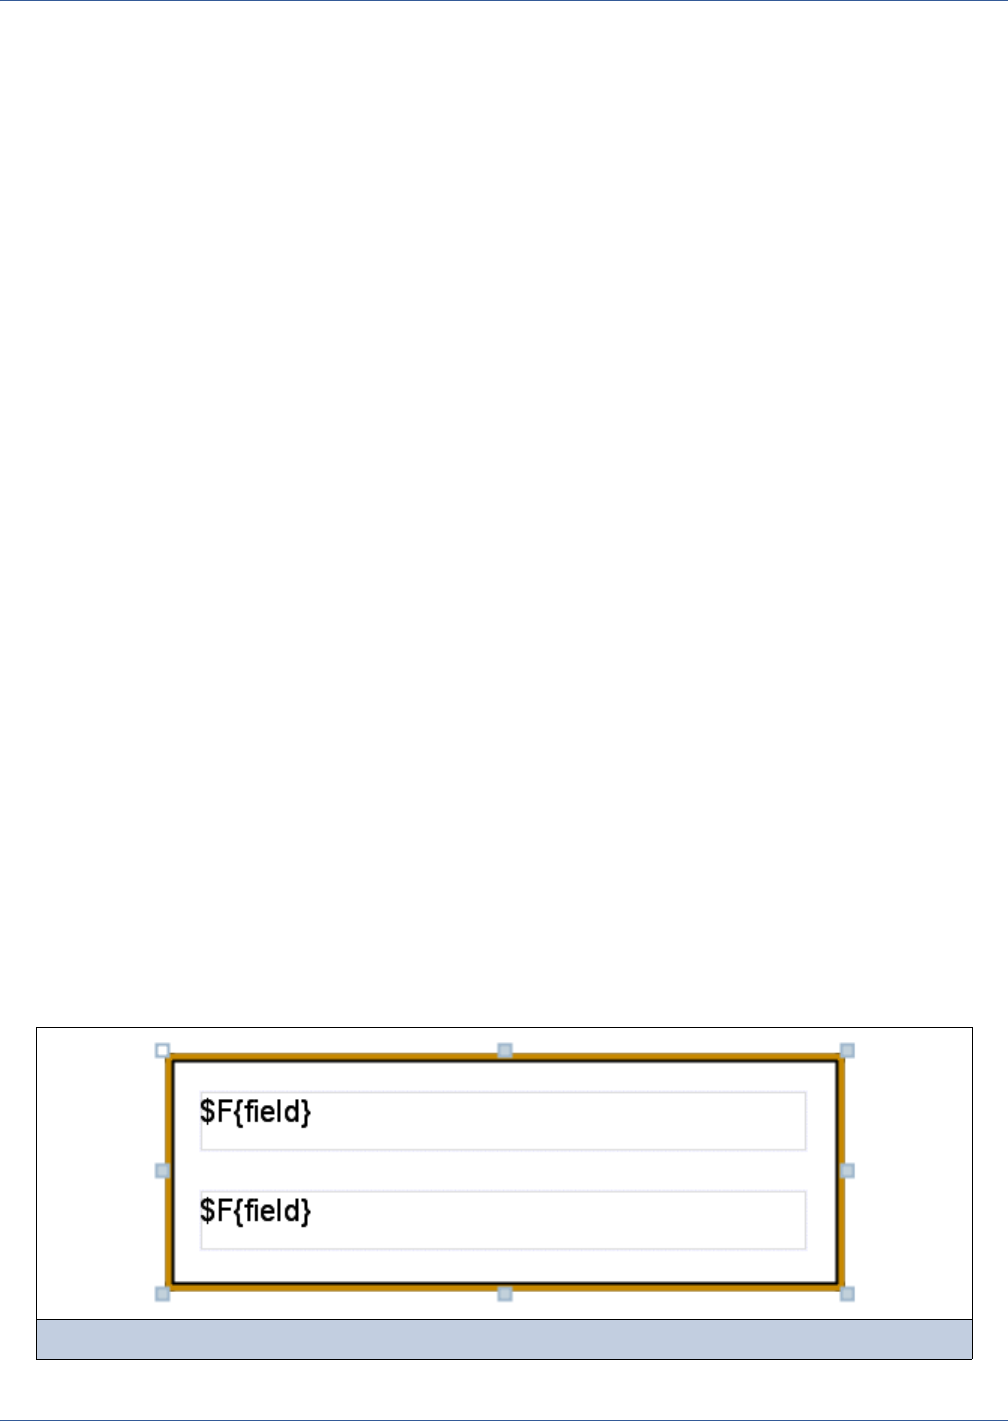
Report Elements
91
The following briefly describes the characteristics of subreports:
5.4.2 Frame
A frame is an element that can contain other elements and optionally draw a border around them, as shown in Figure 5-26.
Subreport Expression This identifies the expression that will return a subreport expression class object at
run time. According to the return type, the expression is evaluated in order to
recover a Jasper object to be used to produce the subreport. In case the expression
class is set to java.lang.String, JasperReports will look for a file following
the same approach explained for the Image Expression of the Image element.
Subreport Expression
Class
This is the class type of the expression; there are several options, each of one
subtends to a different way to load the JasperReport object used to fill the
subreport.
Using cache This specifies whether to keep in memory the report object used to create the
subreport in order to avoid to reload it all the times it will be used inside the report.
It is common that a subreport element placed, for instance, into the Detail band is
printed more than once (or once for each record in the main dataset). The cache
works only if the subreport expression is of type String since that string is used
as key for the cache.
Connection/Datasource
Expression
This identifies the expression that will return at run time a JDBC connection or a
JRDataSource used to fill in the subreport. Alternatively the user can choose to
avoid to pass any data. This last option is possible and many times it is very useful,
but requires some expedient in order to make the subreport to work. Since a
subreport (like a common report) will return an empty document if no data are
provided, the subreport document should have the document property When No
Data Type set to something like All Sections, No Detail.
Parameters Map
Expression
This optional expression can be used to produce at run time an object of type
java.util.Map. The map must be contain a set of coupled names/objects that
will be passed to the subreport in order to set a value for its parameters. Nothing
disallows to use this expression in order to pass as parameters map to the subreport
a map previously passed as parameter to the parent report.
Subreport parameters This table allows you to define some coupled names/expressions that are useful for
dynamically set a value for the subreport parameters by using calculated
expressions.
Subreport return values This table allows you to define how to store in local variables values calculated or
processed in the subreport (such as totals and record count).
Figure 5-26 Frame element
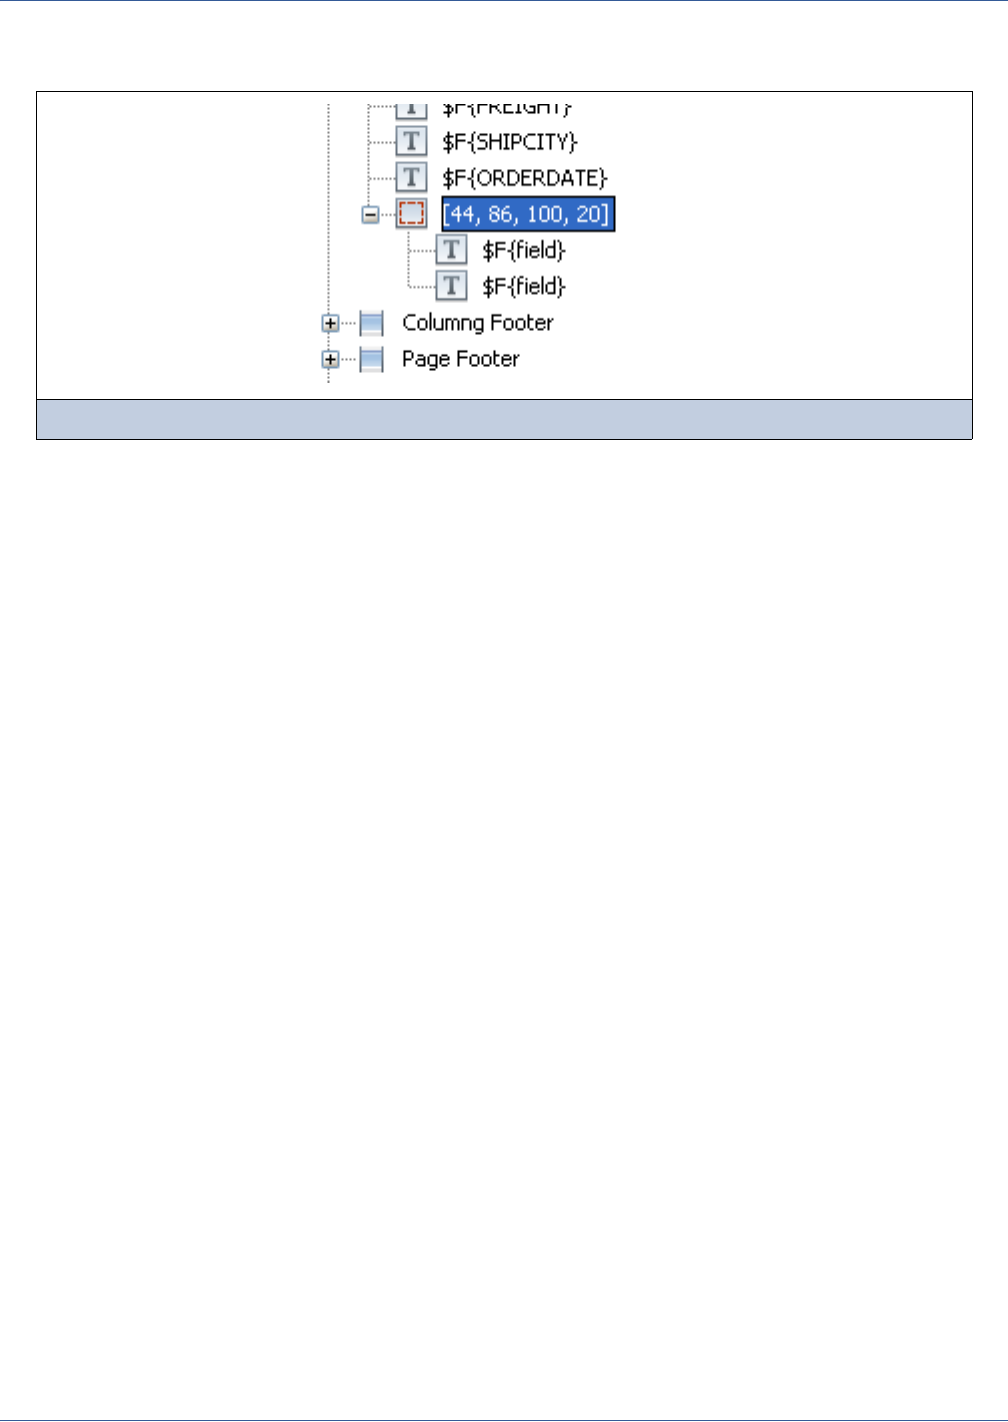
92
iReport Ultimate Guide
Since a frame is a container of other elements, in the document outline view the frame is represented as a node containing
other elements (Figure 5-27).
A frame can contain other frames, and so on recursively. To add an element to a frame, just drag the new element from the
palette inside the frame. Alternatively you can use the outline view and drag elements from a band into the frame and so on.
The position of an element is always relative to the container position. If the container is a band, the element position will be
relative to the top of the band and the left margin. If the container (or element parent) is a frame, the element coordinates will
be relative to the top left corner of the frame. Since an element dragged from a container to another does not change its top/left
properties, when moving an element from a container to another its position is recalculated based on the new container
location.
The advantages of using a frame to draw a border around a set of elements, with respect to using a simple rectangle element,
are:
When you move a frame, all the elements contained in the frame will move in concert.
While using a rectangle to overlap some elements, the elements inside the rectangle will not treated as overlapped (respect
to the frame), so you will not have problems when exporting in HTML (which does not support overlapped elements).
Finally, the frame will automatically stretch accordingly to its content, and the element position type property of its
elements will refer to the frame itself, not to the band, making the design a bit easier to manage.
5.4.3 Chart
For all the details regarding charts, see Chapter 11.
5.4.4 Crosstab
For all the details regarding crosstabs, see Chapter 15.
5.4.5 Page/Column Break
Page and column breaks are used to force the report engine to make a jump to the next page or column. A column break in a
single column report has the same effect as a page break.
In the design view they are represented as a small line. If you try to resize them, the size will be reset to the default, this
because they are used just to set a particular vertical position in the page (or better, in the band) at which iReport forces a page
or column break.
The type of break can be changed in the property sheet.
Figure 5-27 A frame in the outline view
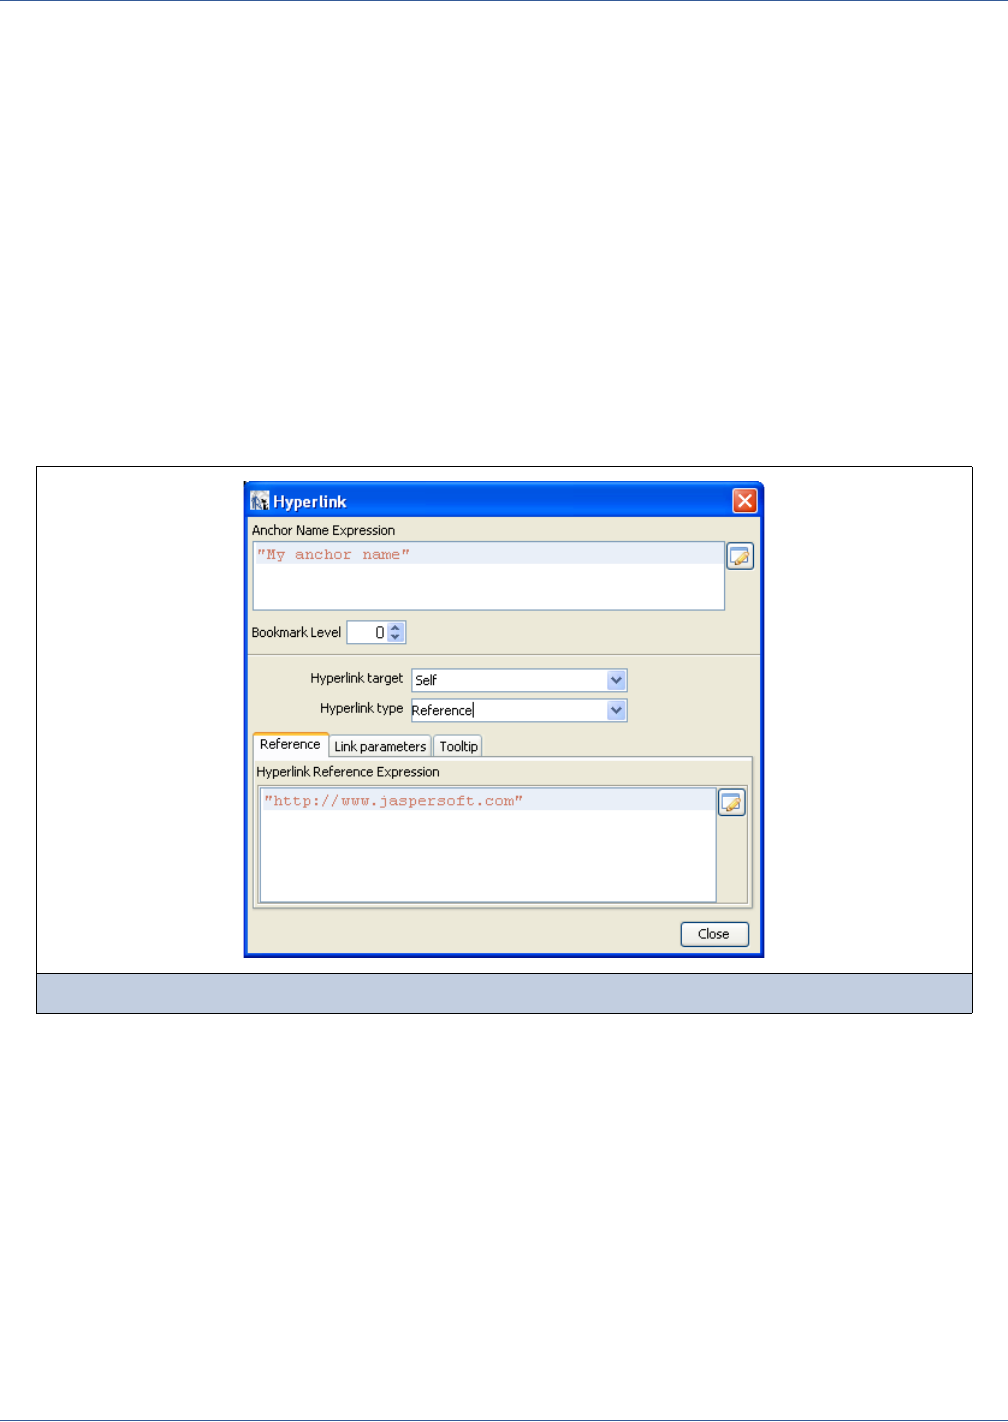
Report Elements
93
5.5 Adding Custom Components and Generic Elements
Besides the built-in elements seen up to now, JasperReports supports two technologies that enable you to plug-in new
JasperReport objects respectively called “custom components” and “generic elements.” Both are supported by iReport.
Without a specific plug-in offered by the custom element provider, there is not much you can do with it; you can just set the
common element properties. Therefore, a custom element developer should provide a plug-in for iReport through which you
can, at least, add the element to a report (maybe adding a palette item) and modify the element properties (implementing what
is required to display the additional properties in the property sheet when the element is selected.
For more information, see the JasperReports Ultimate Guide.
5.6 Anchors
Image, textfield, and chart elements can be used both as anchors into a document and as hypertext links to external sources or
other local anchors. An anchor is a kind of label that identifies a specific position in the document. The hypertext links and
anchors are defined by means of the Hyperlink dialog, shown in Figure 5-28.
This dialog is divided in two parts. In the upper part is a text area through which it is possible to specify the expression that
will be the name of the anchor. This name can be referenced by other links. If you plan to export your report as a PDF
document, you can use the bookmark level to populate the bookmark tree, making the final document navigation much more
easier. To make an anchor available in the bookmark, simply choose a bookmark level greater than 1. The use of a greater
level makes possible the creation of nested bookmarks.
The lower part is dedicated to the link definition towards an external source or a position in the document. Through the
Hyperlink target option, it is possible to specify whether the exploration of a particular link has to be made in the current
window (this is the pre-defined setting and the target is Self) or in a new window (the target is Blank). This kind of behavior
control makes sense only in certain output formats such as HTML and PDF, specially the last two possible targets (Top and
Parent) used to indicate respectively to display the linked document in the current window but outside eventual frames, and in
the parent window (if available).
The following text outlines some of the remaining options in the Hyperlink window.
Figure 5-28 Hyperlink windows

94
iReport Ultimate Guide
5.6.1 Hyperlink Type
JasperReports provides five types of built-in hypertext links: Reference, LocalAnchor, LocalPage, RemoteAnchor and
RemotePage. Anyway, other types can be implemented and plugged into JasperReports (like the type ReportExecution
used by JasperServer to implement the drill down features). Here is a list of the link types:
5.6.2 Hyperlink Parameters
Sometimes you will need to define some parameters that must be “attached” to the link. The Link parameters table provides a
convenient way to define them. The parameter value can be set using an expression. The parameter expression is supposed to
be a string (since it will be encoded in the URL). But when using custom link types it makes sense to set different types for
parameters.
5.6.3 Hyperlink Tooltip
The tooltip expression is used to set a text to display as tooltip when the mouse is over the element that represents the
hyperlink (this only works when the document is exported in a format that supports this type of interactive use).
Reference The Reference link indicates an external source that is identified by a normal URL.
This is ideal to point, for example, to a servility to manage a record drill-down tools.
The only expression required is the hyperlink reference expression.
LocalAnchor To point to a local anchor means to create a link between two locations into the
same document. It can be used, for example, to link the titles of a summary to the
chapters to which they refer.
To define the local anchor, it is necessary to specify a hyperlink anchor expression,
which will have to produce a valid anchor name.
LocalPage If instead of pointing to an anchor you want to point to a specific current report
page, you need to create a LocalPage link. In this case, it is necessary to specify
the page number you are pointing to by means of a hyperlink page expression (the
expression has to return an Integer object).
RemoteAnchor If you want to point to a particular anchor that resides in an external document, you
use the RemoteAnchor link. In this case, the URL of the external file pointed to will
have to be specified in the Hyperlink Reference Expression field, and the name of
the anchor will have to be specified in the Hyperlink Anchor Expression field.
RemotePage This link allows you to point to a particular page of an external document. Similarly,
in this case the URL of the external file pointed to will have to be specified in the
Hyperlink Reference Expression field, and the page number will have to be
specified by means of the hyperlink page expression.
Some export formats have no support for hypertext links.
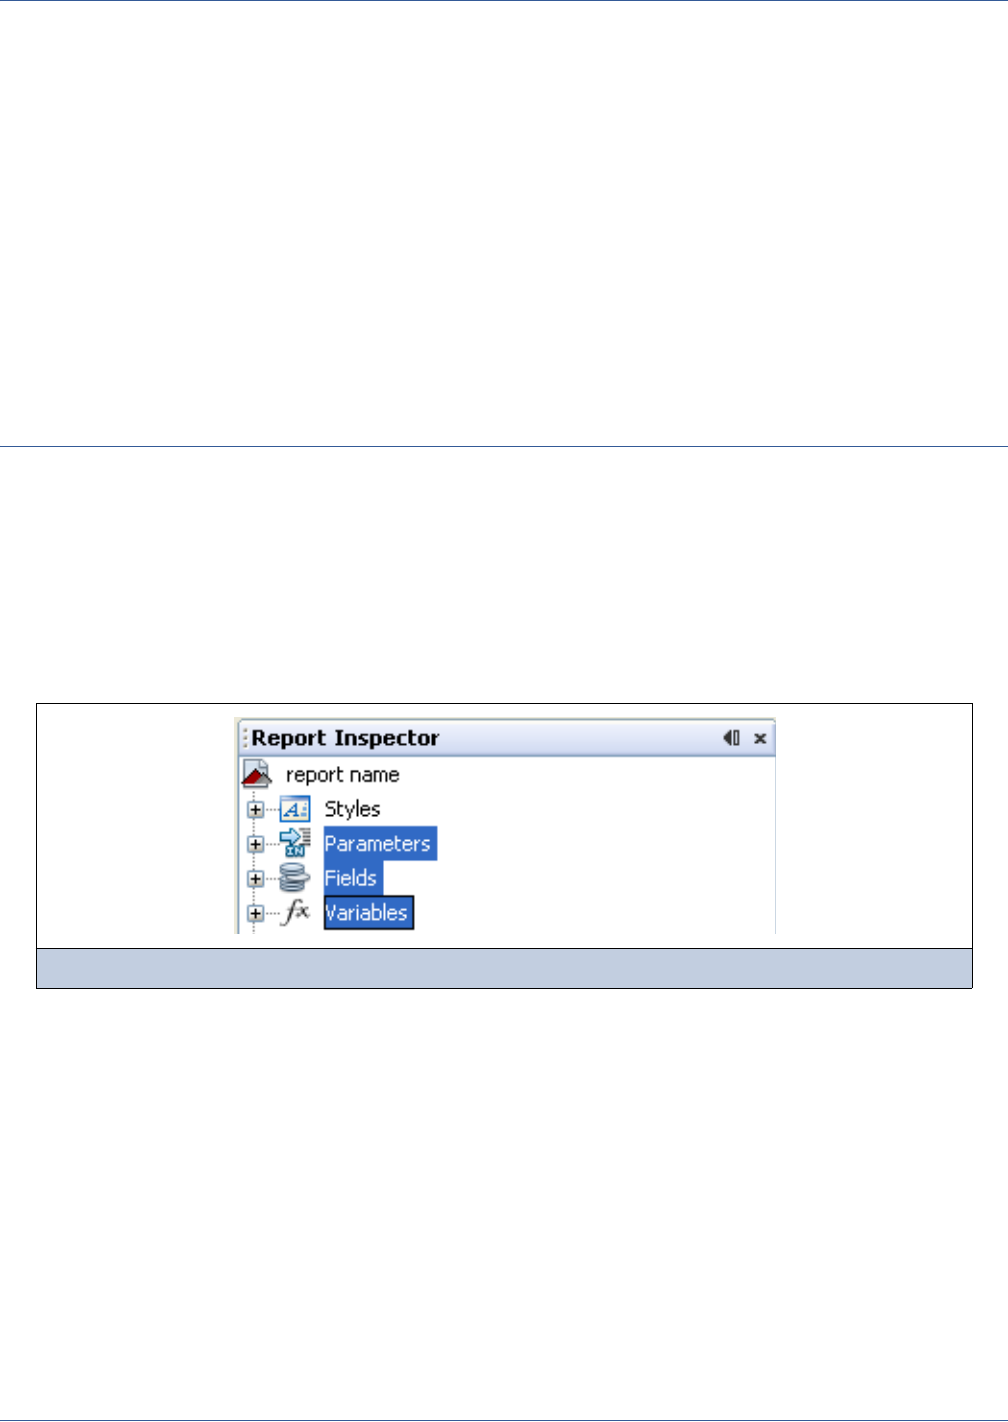
Fields, Parameters, and Variables
95
CHAPTER 6FIELDS, PARAMETERS, AND VARIABLES
In a report, there are three groups of objects that can store values:
Fields
Parameters
Variables
iReport uses these objects in data source queries. In order to use these objects in a report, they must be declared with a discrete
type that corresponds to a Java class, such as String or Double. After they have been declared in a report design, the objects
can be modified or updated during the report generation process.
After they have been declared, they can be managed using the Report Inspector view. In the Report Inspector you can modify
or remove objects and declare new objects, as well.
This chapter has the following sections:
Working with Fields
Working with Parameters
Working with Variables
Evaluating Elements During Report Generation
Figure 6-1 Report objects in outline view
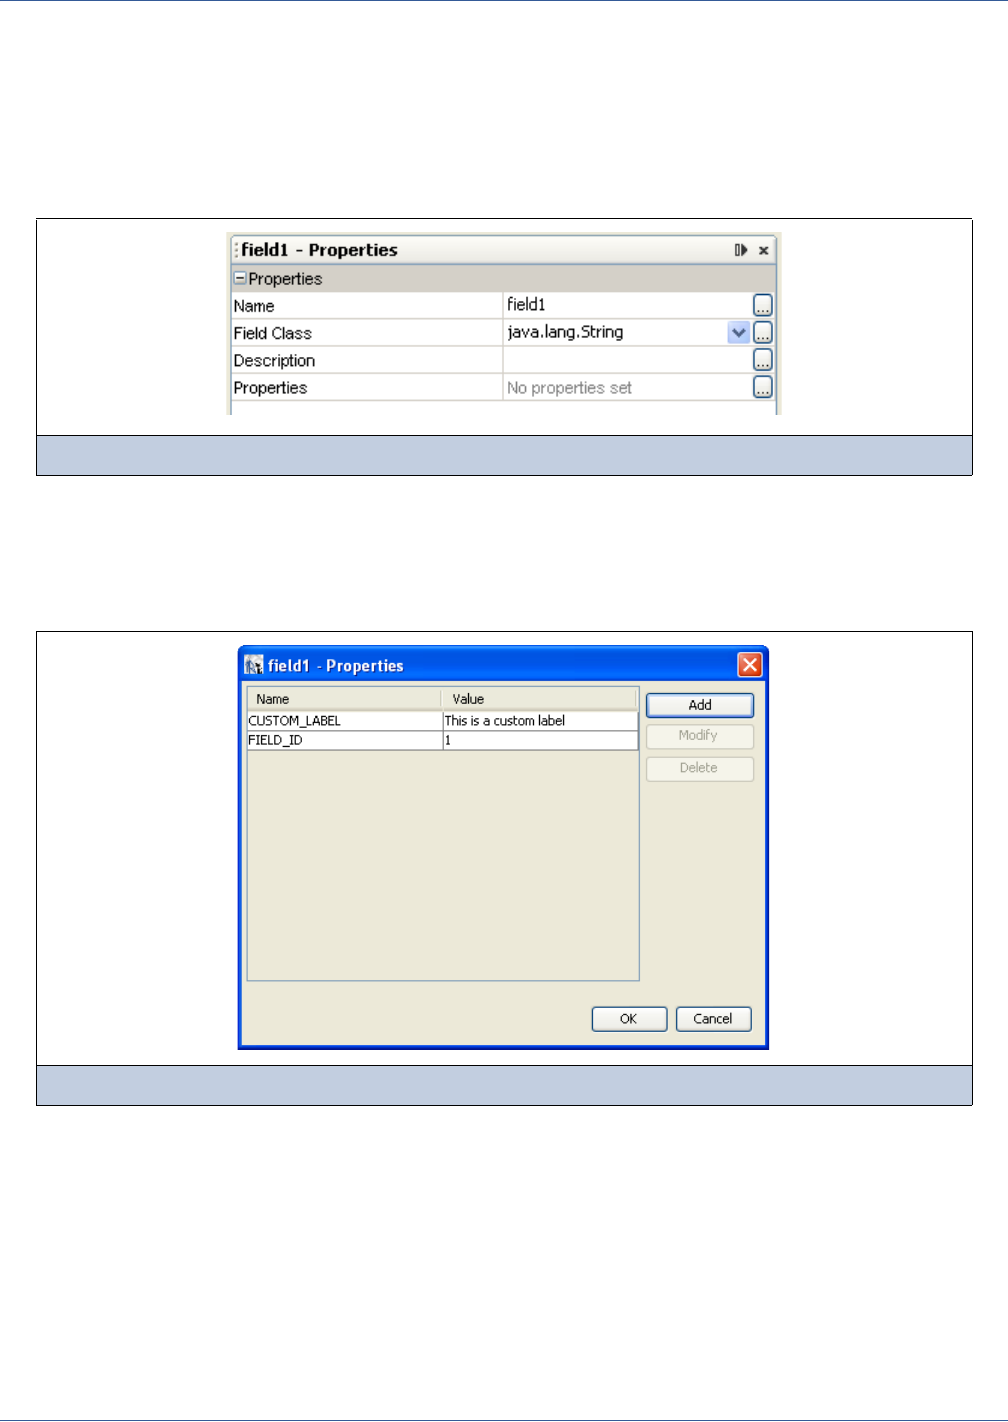
96
iReport Ultimate Guide
6.1 Working with Fields
A print is commonly created starting from a data source that provides a set of records composed of a series of fields. This
behavior is exactly like obtaining the results of an SQL query.
iReport displays available fields as children of the Fields node in the document outline view. To create a field, right-click the
Fields node and select the Add Field menu item. The new field will be included as an undefined child node in the Report
Inspector, from which you can configure the field properties by selecting it and using the property sheet (Figure 6-2).
A field is identified by a unique name, a type, and an optional description. Additionally, you can define a set of name/value
pair properties for each field. These custom properties are not used directly by JasperReports, but they can be used by external
applications or by some custom modules of JasperReports (such as a special query executor). You can set the custom
properties with the Properties Editor (Figure 6-2), which you can open by clicking on the Editor button “...” in the column to
the right in the outline view.
Before the introduction of custom properties, iReport included additional information regarding the selected field in its
description field. An example of this would be the definition of fields to be used with an XML data source (that is, a data
source based on an XML file), where the field name can be arbitrary while the description holds an Xpath expression to locate
the value within the XML document.
iReport determines the value for a field based on the data source you are using. For instance, when using an SQL query to fill
a report, iReport assumes that the name of the field is the same as the name of a field in the query result set. You must ensure
that the field name and type match the field name and type in the data source. We will see, though, how you can systematically
declare and configure large numbers of fields using the tools provided by iReport. Since the number of fields in a report can be
quite large (possibly reaching the hundreds), iReport provides different tools for handling declaration fields retrieved from
particular types of data sources.
Figure 6-2 Field Properties dialog
Figure 6-3 Field - Custom Properties
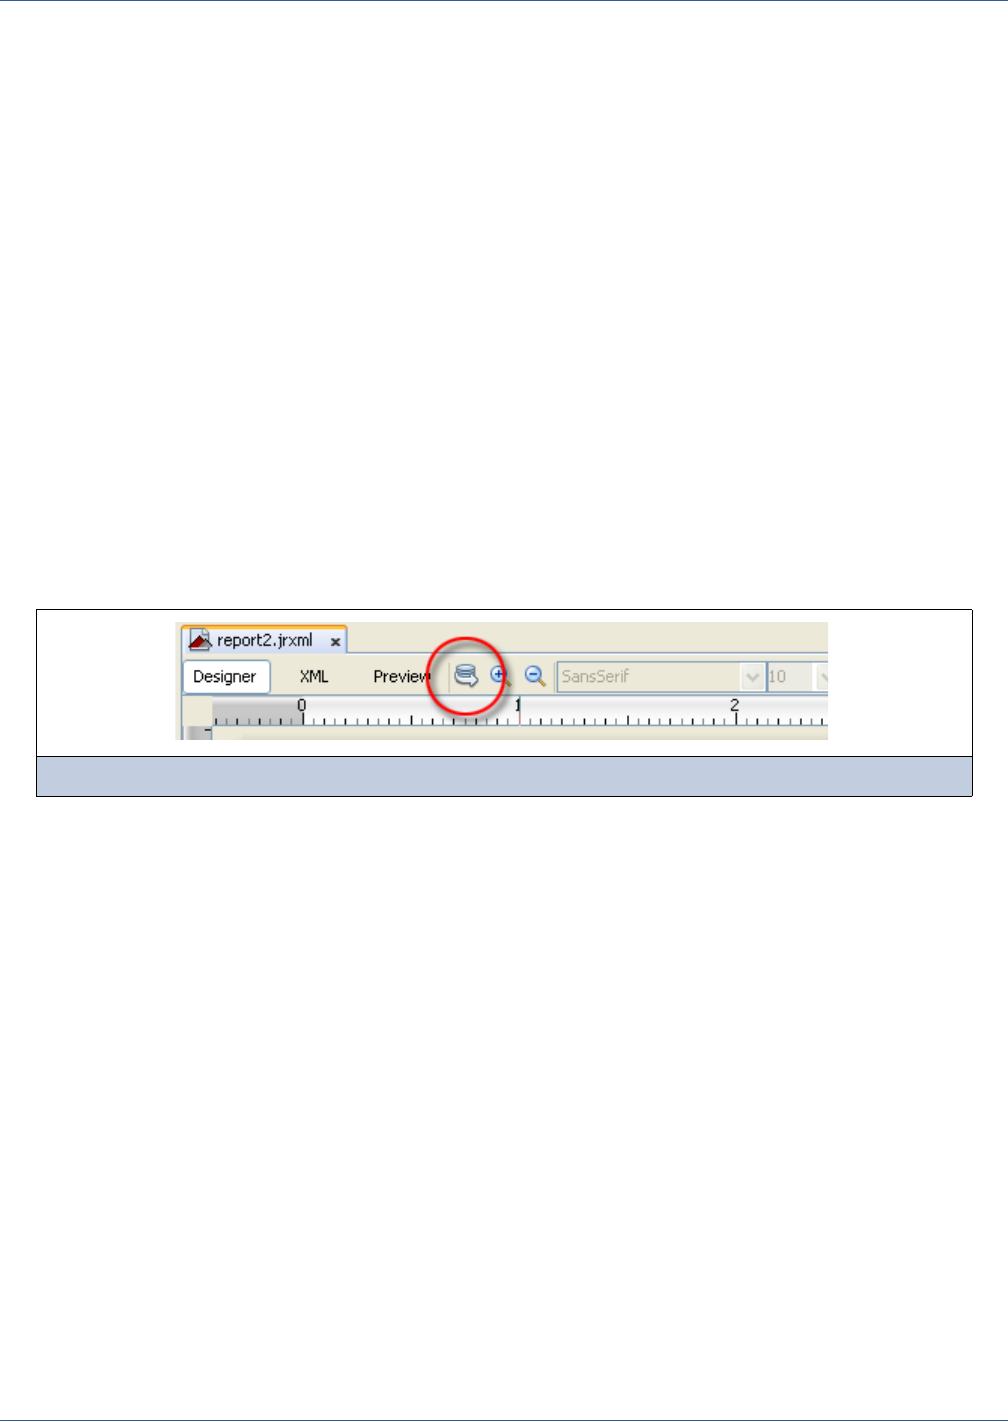
Fields, Parameters, and Variables
97
Inside each report expression (like the one used to set the content of a textfield) iReport specifies a field object, using the
following syntax:
$F{<field name>}
where <field name> must be replaced with the name of the field. When using a field expression (for example, calling a
method on it), keep in mind that it can have a value of null, so you should check for that condition. An example of a Java
expression that checks for a null value is:
($F{myField} != null) ? $F{myFiled}.doSomething() : null
This method is generally valid for all the objects, not just fields. Using Groovy or JavaScript this is rarely a problem, since
those languages handle a null value exception in a more transparent way, usually returning an empty string. This is another
reason why I recommend that you use Groovy or JavaScript instead of Java.
In Chapter 10 we’ll see that in some cases a field can be a complex object, like a JavaBean, not just a simple value like a
String or an Integer. A trick to convert a generic object to a String is to concatenate it to a empty string this way:
$F{myfield}+ “”
All Java objects can be converted to a string; the result of this expression depends on the individual object implementation
(specifically, by the implementation of the toString() method). If the object is null, the result will return the literal text
string “null” as a value.
6.1.1 Registration of the Fields from a SQL Query
The most common way to fill a report is by using an SQL query. iReport provides several tools to work with SQL, including a
query designer, and a way to automatically retrieve and register the fields derived from a query in the report.
You can open the query dialog by clicking the cylinder icon in the designer tool bar (Figure 6-4).
Before you open the query dialog, however, pay attention to the active connection/data source (the selected item in the combo
box located in the main tool bar). All the operations performed by the tools in the query dialog will use that data source, so
make sure that you select the correct connection/data source in the combo box.
The report query dialog includes four query tools, each accessed by the appropriate tab, as shown in Figure 6-5:
Report query
JavaBean Datasource
DataSource Provider
CSV Datasource
Right now I’m going to describe for you the features of the Report query tab. Here you can define a query that iReport will
use when generating a report.
Figure 6-4 Query dialog button
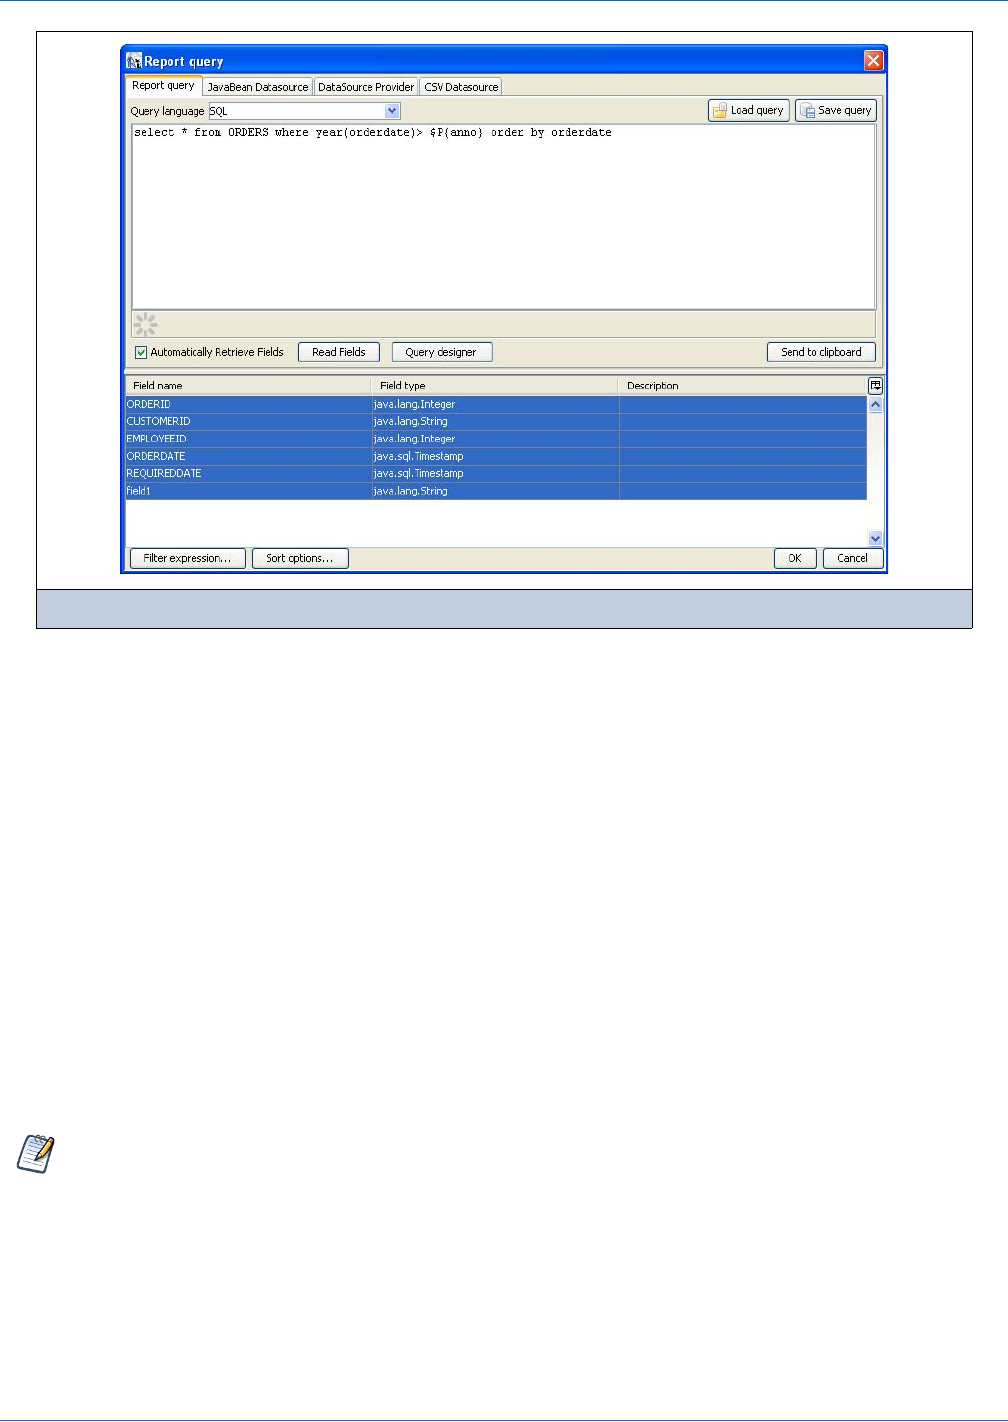
98
iReport Ultimate Guide
iReport does not need you to define a query in order to generate a report. In fact, iReport could obtain data records from a data
source that is not defined by a query execution. Regardless, here is where you define it. The language of the query can be one
of those items listed in the combo box on the top of the query dialog. JasperReports supports the most common query
languages:
SQL
HQL
EJBQL
Xpath
MDX (both the standard and XMLA-encapsulated versions)
Let’s focus on SQL. If the selected data source is a JDBC connection, iReport will test the access connection to the data source
as you define the query. This allows iReport to identify the fields using the query metadata in the result set. The design tool
lists the discovered fields in the bottom portion of the window. For each field, iReport determines the name and the Java type
specified for that field by the JDBC driver.
A query that accesses one or more tables containing a large amount of data may require a long delay while iReport scans the
data source to discover field names. You may want to disable the Automatically Retrieve Fields option in order to quickly
finish your query definition. When you have completed the query, click the Read Fields button in order to start the fields
discovery scan.
In case of an error during the query execution (due to a syntax error or to an unavailable database connection), an error
message will be displayed instead of the fields list.
The field name scan may return a large number of field names if you are working with complex tables. I suggest that you
review the list of discovered names and remove any fields that you are not planning to use in your report, in order to reduce
unnecessary complexity.When you click the OK button all the fields in the list will be included in the report design. You can
also remove them later in the outline view, but it’s a good idea at this point in the design process to remove any field names
that you won’t be using.
Figure 6-5 Query dialog
All fields used in a query must have a unique name. Use alias field names in the query for fields having the same
name.
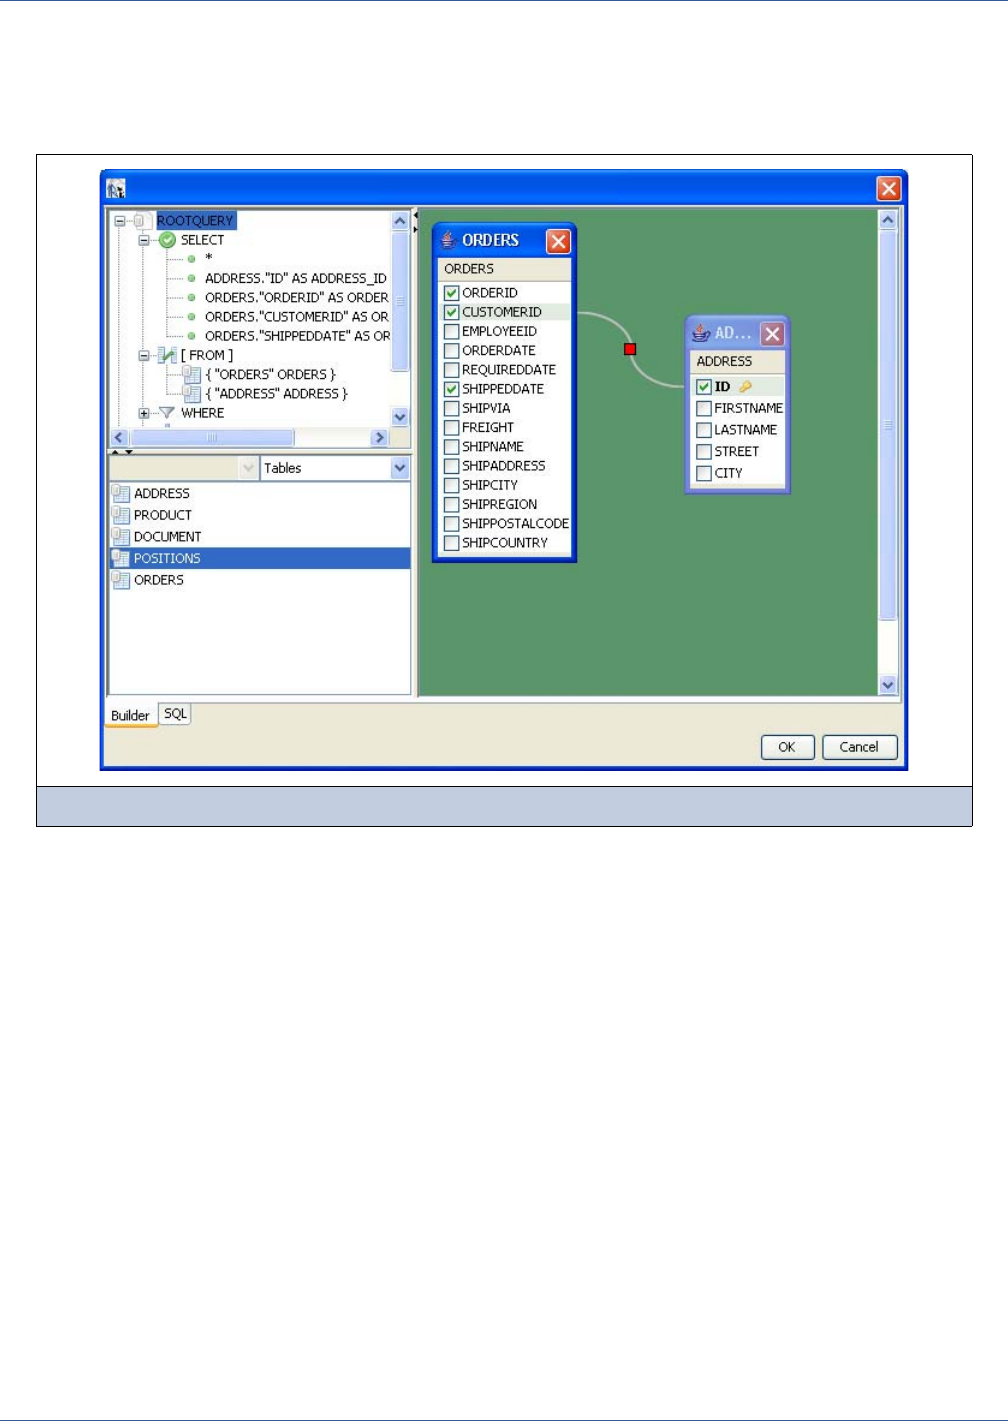
Fields, Parameters, and Variables
99
6.1.2 Accessing the SQL Query Designer
iReport provides a simple visual query designer to help you create simple SQL queries without having to know a particular
language. You can access the tool by clicking the button labeled Query designer (a JDBC connection must be active, and the
selected language of the query must be SQL).
This SQL query designer, which comes from the SQLeonardo open source project, provides a drag-and-drop way to create
queries (see Figure 6-6).
To create a query you need to drag the required tables into the main panel. Check which fields you will need. The designer
allows you to define table joins. To join two tables, drag the field of one table over the field of another. Edit the join type by
right-clicking the red, square joint icon in the middle of the join line. To add a condition, right-click the Where node in the
query tree. To add a field to the Group By and Order By nodes, right-click a field under the SELECT node.
6.1.3 Registration of the Fields of a JavaBean
One of the most advanced features of JasperReports is the ability to manage data sources that are not based on simple SQL
queries. One example of this is JavaBean collections. In a JavaBean collection, each item in the collection represents a record.
JasperReports assumes that all objects in the collection are instances of the same Java class. In this case the “fields” are the
object attributes (or even attributes of attributes).
By selecting the JavaBean Datasource tab in the query designer, you can register the fields which correspond to the specified
Java classes. The concept here is that you will know which Java classes correspond to the objects that you will be using in your
report.
Figure 6-6 SQLeonardo Query Designer
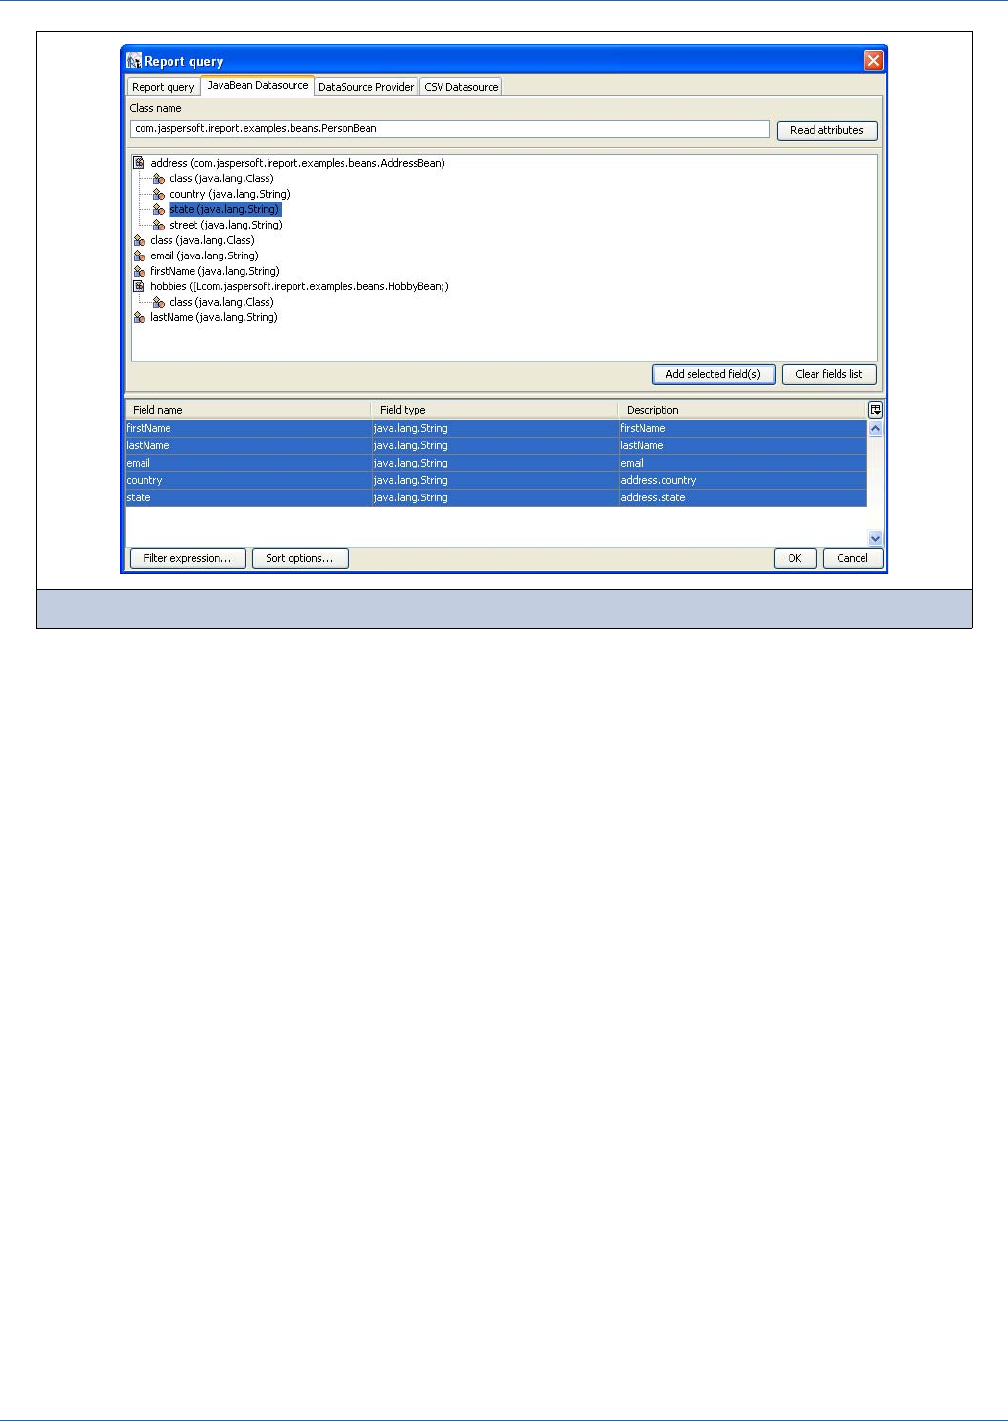
100
iReport Ultimate Guide
Suppose that you are using objects of this Java class:
com.jaspersoft.ireport.examples.beans.PersonBean
To register fields for the class:
1. Put the class name in the name field and click Read attributes. iReport will scan the class.
2. Check the scan results to make sure that iReport has captured the correct object attributes for the class type.
3. Select the fields you want to use in your report and click Add selected field(s).
4. iReport creates new fields corresponding to the selected attributes and adhesion to the list. The description, in this case,
will be used to store the method that the data source must invoke in order to retrieve the value for the specified field.
iReport parses a description such as address.state (with a period character between the two attributes) as an attribute path.
This attribute path will be passed to the function getAddress() in order to locate the target attribute, and then to
getState() in order to query the status of the attribute. Paths may be arbitrary long, and iReport can recursively parse
attribute trees within complex JavaBeans and in order to register very specific fields.
We have just discussed the two tools used most frequently to register fields, but we’re not done yet. There are many other tools
you can use to discover and register fields, for instance, the HQL and XML node mapping tools. These will be discussed in
Chapter 10.
6.1.4 Fields and Textfields
To print a field in a text element, you will need to set the expression and the textfield class type correctly. You may also
need to define a formatting pattern for the field. For more details about format patterns see 5.3.2, “Textfields,” on page 87.
To create a corresponding textfield, drag the field you wish to display from the Report Inspector view into the design panel.
iReport will create a new textfield with the correct expression (e.g., $F{fieldname}) and assign the correct class name.
Figure 6-7 JavaBeans data source fields registration
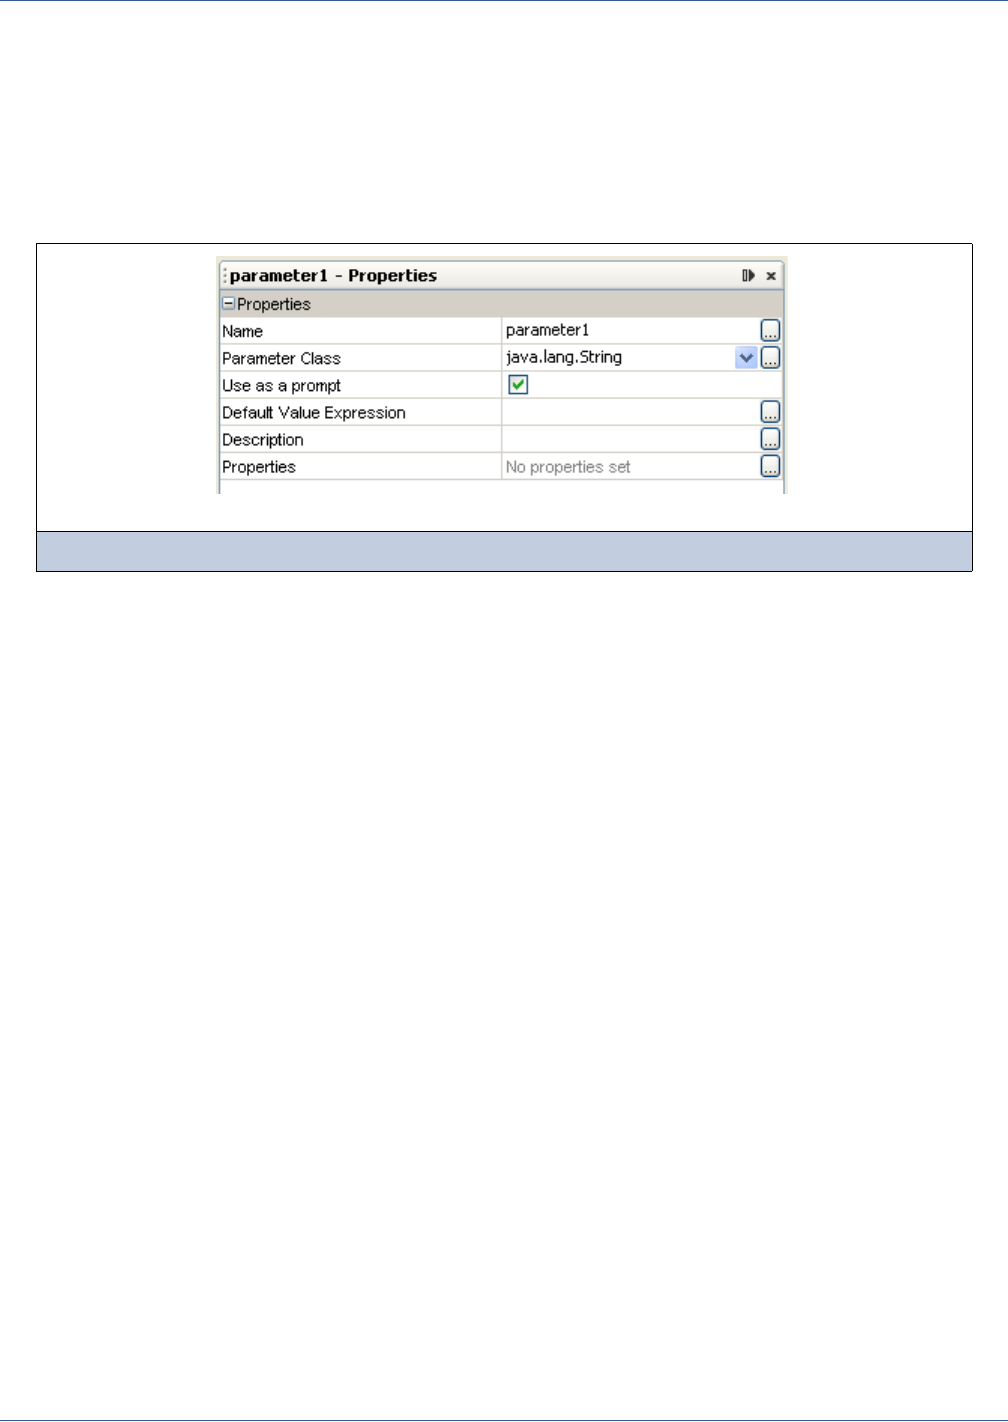
Fields, Parameters, and Variables
101
6.2 Working with Parameters
Parameters are values usually passed to the report from the application that originally requested it. They can be used for
configuring features of a particular report during report generation (such as the value to use for a condition in a SQL query)
and to supply additional data to the report that cannot properly provided by the data source (e.g., a custom title for the report,
an application-specific path to search for images, or even a more complex object like an image).
Just as with other report objects, parameters must have a class type and must be declared in the report design (see Figure 6-8).
The type of the parameters may be arbitrary, but the parameter name must be unique.
The property Use as prompt is not used directly by JasperReports. It is a special flag for the parameter that may be used by
external applications; you can examine the report template to discover what parameters you should use to prompt for input.
The Default Value Expression permits you to set a pre-defined value for the parameter. This value will be used if no
value is provided for the parameter from the application that executes the report. The type of value must match the type
declared in Parameter Class. In this expression it is not possible to use fields and/or variables, since the value of the
parameter must be set before fetching the first record from the data source.
You may legally define another parameter as the value of Default Value Expression, but this method requires careful
report design. iReport parses parameters in the same order in which they are declared, so a default value parameter must be
declared before the current parameter. I realize this sounds a bit tricky, but it can be useful to employ a parameter that depends
on another one, especially if we want to process it.
In the next section we will see how to use a parameter in an SQL query to specify not just the value of a parameter, but a piece
of or even the whole SQL query. This will allow you to dynamically create an input-dependent query to be stored in a
parameter.
The parameter Description is another attribute that is not used directly by JasperReports, but like the Use as a prompt
attribute, may be passed to an external application.
Finally, just as with fields, you may specify pairs of type name/value as properties for each parameter. This is just a way to add
extra information to the parameter, information that will be used by external applications. For example, the designer can use
properties to include the description of the parameter in different languages, or perhaps add instructions about the format of the
input prompt.
6.2.1 Using Parameters in a Query
Generally, parameters can be used in the query associated with a report even if not all the languages support them. In this
chapter we will focus on using parameters in SQL queries, which is probably the most common type of query.
Suppose we have a report that displays information about a customer. When we generate the report we would need to specify
the ID of the customer to display. In order to get data regarding the customer we need to pass this information to the query; in
other words, we want to filter the query to obtain only the data relevant to a particular customer ID. The query will look like
this:
select * from customers where CUSTOMERID = $P{MyCustomerId}
Figure 6-8 Parameter Definition

102
iReport Ultimate Guide
MyCustomerID is a parameter, and the syntax to use for the parameter in the query is the same one used when referring to a
parameter in an expression. Without going into too much depth on how parameters work in SQL, let’s just say that
JasperReports will interpret this query as:
select * from customers where CUSTOMERID = ?
The question mark character is the canonical symbol in SQL that says “here goes a value provided to the SQL statement before
query execution.” This is exactly what JasperReports will do: it will execute the query, passing the value of each parameter
used in the query to the SQL statement.
This approach has a major advantage with respect to concatenating the parameter value to the query string—you do not have
to take care of special characters or sanitize your parameter, since the database will do it for you. At the same time, this method
places limits on the control you have on the query structure. For example, you cannot specify a portion of a query with a
parameter (for example, storing the entire WHERE or GROUP BY clause). The solution is to use this special syntax:
$P!{<parameter name>}
Note the exclamation mark after the $P. The exclamation mark notifies JasperReports not to bind the parameter to an SQL
parameter (using the question mark (?) like in the previous case), but rather to calculate the value of the parameter and
evaluate it as a raw subsection of a query. For example, if you have a parameter named MyWhere with the value of "where
CUSTOMERID = 5", the query:
select * from customers $P!{CUSTOMERID}
will be transformed into:
select * from customers where CUSTOMERID = 5
without using the logic of the SQL parameter. The drawback is that you must be 100percent sure that the parameter value is
correct in order to avoid an error during the query execution.
6.2.2 IN and NOTIN clause
JasperReports provides a special syntax to use with a where condition: the clause IN and NOTIN.
The clause is used to check whether a particular value is present in a discrete set of values. Here is an example:
SELECT * FROM ORDERS WHERE SHIPCOUNTRY IS IN ('USA','Italy','Germany')
The set here is defined by the countries USA, Italy and Germany. Assuming we are passing the set of countries in a list (or
better a java.util.Collection) or in an array, the syntax to make the previous query dynamic in reference to the set of
countries is:
SELECT * FROM ORDERS WHERE $X{IN, SHIPCOUNTRY, myCountries}
where myCountries is the name of the parameter that contains the set of country names. The $X{} clause recognizes three
parameters:
Type of function to apply (IN or NOTIN)
Field name to be evaluated
Parameter name
JasperReports will handle special characters in each value. If the parameter is null or contains an empty list, meaning no
value has been set for the parameter, the entire $X{} clause is evaluated as the always true statement “0 = 0”.
Fields, Parameters, and Variables
103
6.2.3 Built-in Parameters
JasperReports provides some built-in parameters (they are internal to the reporting engine) that you may read but cannot
modify. These parameters are presented in the following table:
Table 6-1 JasperReports Built-in parameters
Parameter Explanation
REPORT_PARAMETERS_MAP This is the java.util.Map passed to the fillReport method; it
contains the parameter values defined by the user.
REPORT_CONNECTION This is the JDBC connection passed to the report when the report is
created through a SQL query.
REPORT_DATASOURCE This is the data source used by the report when it is not using a JDBC
connection.
REPORT_SCRIPTLET This represents the scriptlet instance used during creation. If no scriptlet
is specified, this parameter uses an instance of
net.sf.jasperreports.engine.JRDefaultScriptlet.*
* Starting with JasperReports 1.0.0, an implicit cast to the provided scriptlet class is performed. This simplifies many
expressions that use the provided scriptlet class.
IS_IGNORE_PAGINATION You can switch the pagination system on and off with this parameter (it
must be a Boolean object). By default, pagination is used except when
exporting to HTML and Excel formats.
REPORT_LOCALE This is used to set the locale used to fill the report. If no locale is
provided, the system default will be used.
REPORT_TIME_ZONE This is used to set the time zone used to fill the report. If no value is
provided, the system default will be used.
REPORT_MAX_COUNT This is used to limit the number of records filling a report. If no value is
provided, no limit will be set.
REPORT_RESOURCE_BOUNDLE This is the resource bundle loaded for this report. See Chapter 10 for
how to provide a resource bundle for a report.
REPORT_VIRTUALIZER This defines the class for the report filler that implements the
JRVirtualizer interface for filling the report.
REPORT_FORMAT_FACTORY This is an instance of a
net.sf.jasperreports.engine.util.FormatFactory. The
user can replace the default one and specify a custom version using a
parameter. Another way to use a particular format factory is by setting
the report property format factory class.
REPORT_CLASS_LOADER This parameter can be used to set the class loader to use when filling
the report.
REPORT_URL_HANDLER_FACTORY Class used to create URL handlers. If specified, it will replace the
default one.
REPORT_FILE_RESOLVER This is an instance of
net.sf.jasperreports.engine.util.FileResolver used to
resolve resource locations that can be passed to the report in order to
replace the default implementation.
REPORT_TEMPLATES This is an optional collection of styles (JRTemplate) that can be used
in the report in addition to the ones defined in the report.
104
iReport Ultimate Guide
6.2.4 Relative Dates
iReport 5.0 introduces relative dates. This feature enables you create reports that to filter information based on a date range
relative to the current system date. To do this, use the following template:
<Keyword> <+/-> <N> where:
<Keyword> indicates the time span you want to use. Options include: DAY, WEEK, MONTH, QUARTER, SEMI, and YEAR.
<+/-> indicates whether the time span occurs before or after the chosen date.
<N> indicates the number of the above-mentioned time spans you want to include in the filter.
For example, if you want to look at Sales for the prior month, your expression would be MONTH - 1.
The class attribute of a JR Parameter of type Relative Date should have one of the following values:
net.sf.jasperreports.engine.rd.DateRange – if you want to use java.util.Date (Date only).
For example: <parameter name=”myParameter” class="net.sf.jasperreports.engine.rd.DateRange”>
net.sf.jasperreports.engine.rd.TimestampRange – if you want to use java.sql.Timestamp (Date and
Time).
For example: <parameter name=”myParam” class="net.sf.jasperreports.engine.rd.TimestampRange”>
Following are two examples of when and how to use relative dates:
If you want to set a relative date as a default value expression of a JR parameter, use the following relative date-builder
pattern:
new DateRangeBuilder("DAY-1").toDateRange()
new DateRangeBuilder("WEEK").set(Timestamp.class).toDateRange()
new DateRangeBuilder("2012-08-01").toDateRange()
new DateRangeBuilder("2012-08-01 12:34:56").toDateRange();
For queries, Relative dates are not supported by the $P{} function because it can handle only a limited number of classes
(standard Java classes Integer, String etc.). Instead, a new implementation of pluggable functions and parameters in
JasperReports supports relative dates with $X{} functions.
Relative dates are sensitive to time zones. The relative date expression is calculated in the time zone of the logged-in
user.
Only one property is configurable: the start day of the week does not depend on locale.
Problem Solution
Find all purchases made
previous to this quarter
Relative data parameter called STARTDATE takes this value: QUARTER
"QUARTER" evaluates to the first day (the first instant, really) of this quarter.
SQL: select * from orders where order_date < $P{STARTDATE}
Find all purchases made in this
quarter
Valid answer:
select * from orders where order_date >= QUARTER and
order_date < QUARTER + 1
Better answer using DateRanges:
select * from orders where $X{EQUAL, order_date, QUARTER}
Fields, Parameters, and Variables
105
The following is a JRXML example that shows data from the previous day:
<parameter name=“myParameter” class=“net.sf.jasperreports.engine.rd.DateRange”>
<defaultValueExpression>
<![CDATA[
new DateRangeBuilder("DAY-1").toDateRange()
]]>
</defaultValueExpression>
</parameter>
<queryString>
<![CDATA[
Select * from account where $X{EQUAL, OpportunityCloseDate, SelectedDateRange}
]]>
</queryString>
Older reports which have date parameters will work just as before, and Relative Dates functionality will be
unavailable. In order to make older reports support relative dates, you will need to modify the JRXML: change the
parameter class, and, if needed, set a default value expression. In addition, remember to use the $X{} function
instead of $P{}.
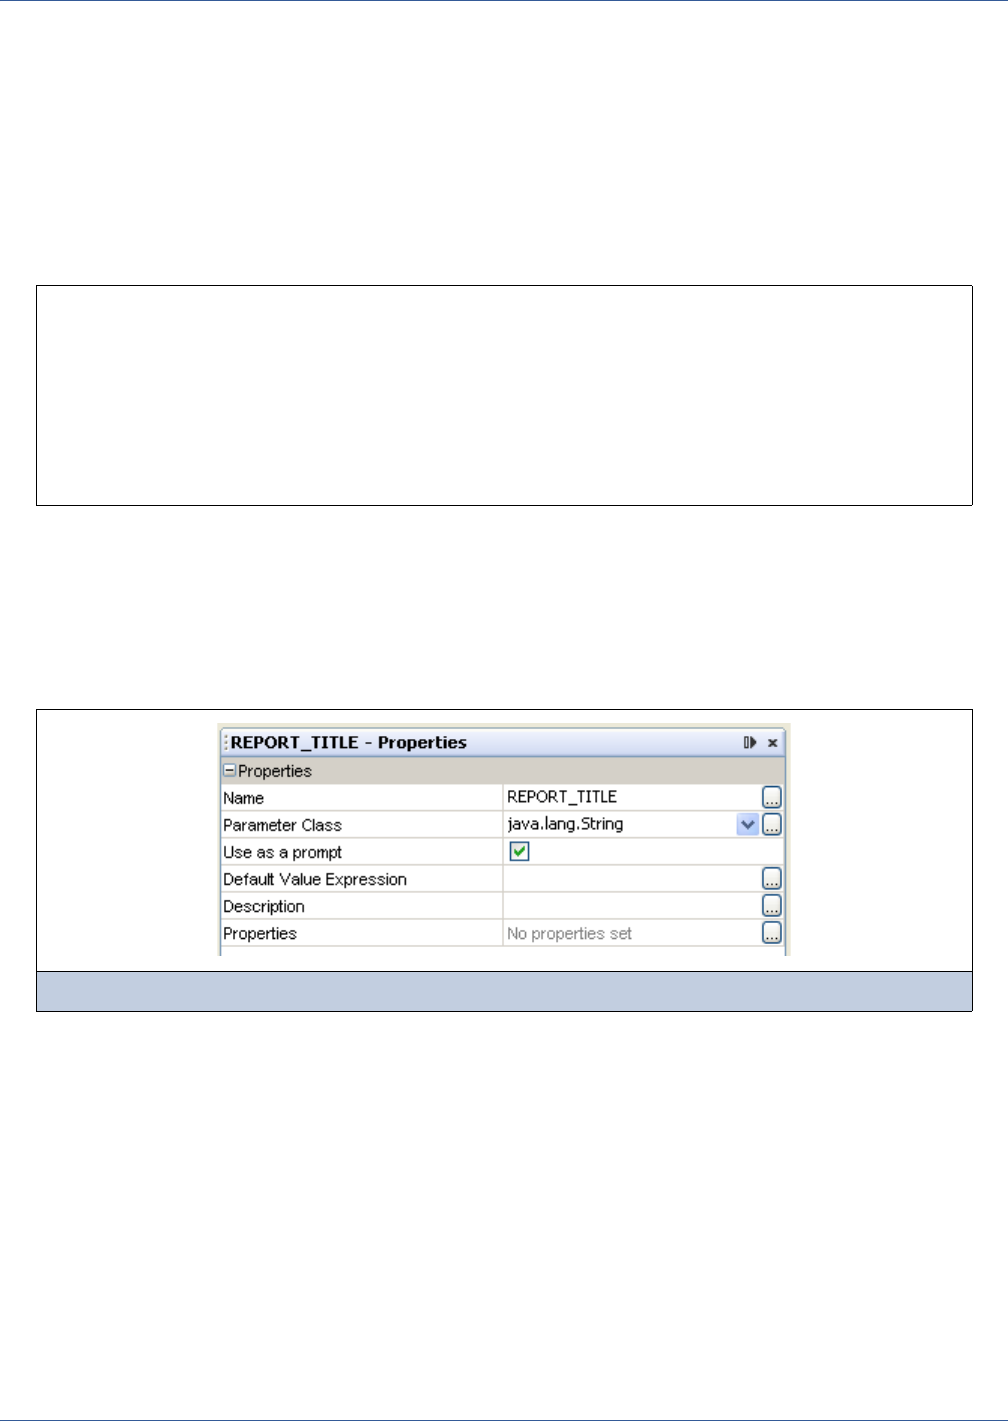
106
iReport Ultimate Guide
Relative dates currently do not support keywords like “Week-To-Date”(from the start of the current week to the end of the
current day). However, you can emulate that by using IS_BETWEEN:
In JRXML, the query use is:$X{IS_BETWEEN, column, startParam, endParam}
where startParam has value WEEK and endParam has value DAY.
Likewise, you can do the same for other time ranges: Year-To-Week, Year-To-Month, etc.
6.2.5 Passing Parameters from a Program
iReport passes parameters from a program “caller” to the print generator using a class that extends the java.util.Map
interface. Consider the code in Code Example 3-2 on page 43, in particular the following lines:
fillReport is a key method that allows you to create a report instance by specifying the file name as a parameter, a
parameter map, and a data source. (This example uses a dummy data source created with the class JREmptyDataSource and
an empty parameter map created using a java.util.HashMap object.)
Let’s see how to pass a simple parameter to a reporting order to specify the title of a report.
The first step is to create a parameter in the report to host the title (that will be a String). We can name this parameter
REPORT_TITLE and the class will be java.lang.String (see Figure 6-9).
...
HashMap hm = new HashMap();
...
JasperPrint print = JasperFillManager.fillReport(
fileName,
hm,
new JREmptyDataSource());
...
Figure 6-9 Definition of the parameter to host the title
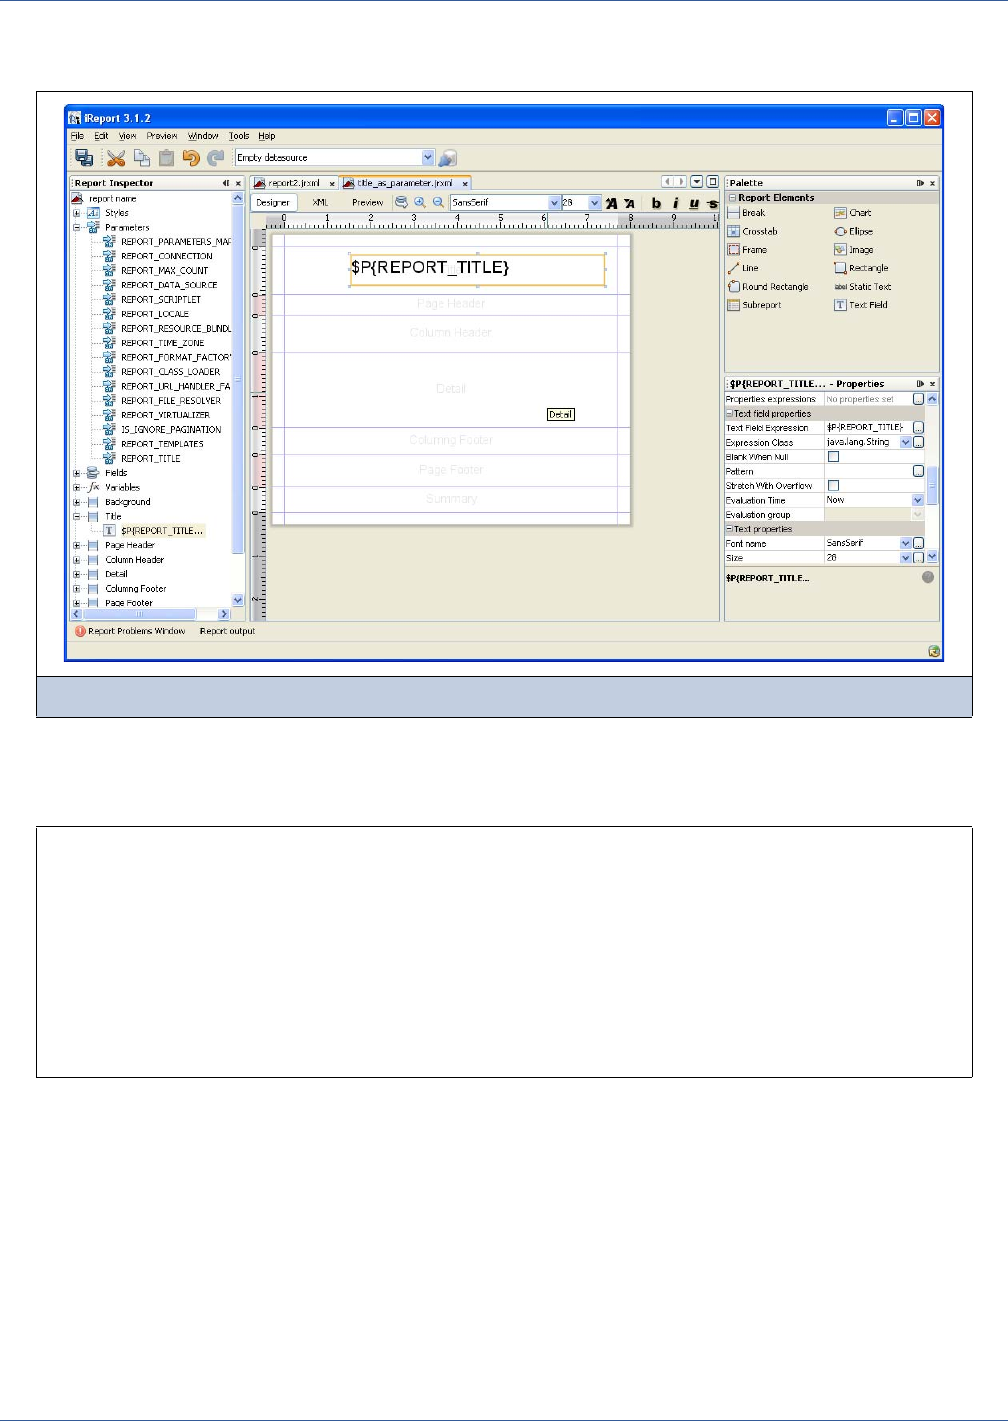
Fields, Parameters, and Variables
107
All the other properties can be left as they are; in particular, we don’t want to set a default value expression. By dragging the
parameter into the Title band we can create a textfield to display the REPORT_TITLE parameter (shown in Figure 6-10).
This example report is very simple. We just want to focus our attention on how to display the parameter.
To set the value of the REPORT_TITLE parameter in our application, modify the code of the previous source code example by
adding:
We have included a value for the REPORT_TITLE parameter in the parameter map. You do not need to pass a value for all the
parameters. If you don’t provide a value for a certain parameter, JasperReports will assign the value of Default Value
Expression to the parameter with the empty expression evaluated as null.
Printing the report, iReport includes the String This is the title of the report in the Title band. In this case we just
used a simple String. However, it is possible to pass much more complex objects as parameters, such as an image
(java.awt.Image) or a data source instance configured to provide a specified subreport with data. The most important thing
to remember is that the object passed in the map as the value for a certain parameter must have the same type (or at least be a
super class) of the type of the parameter in the report. Otherwise, iReport fails to generate the report, returning a
ClassCastException error. This is actually pretty obvious; you cannot, for example, assign the value of a
java.util.Date to a a parameter declared as an Integer.
Figure 6-10 Design panel with the REPORT_PARAMETER displayed in the title band
...
HashMap hm = new HashMap();
hm.put(“REPORT_TITLE”,”This is the title of the report”);
...
JasperPrint print = JasperFillManager.fillReport(
fileName,
hm,
new JREmptyDataSource());
...
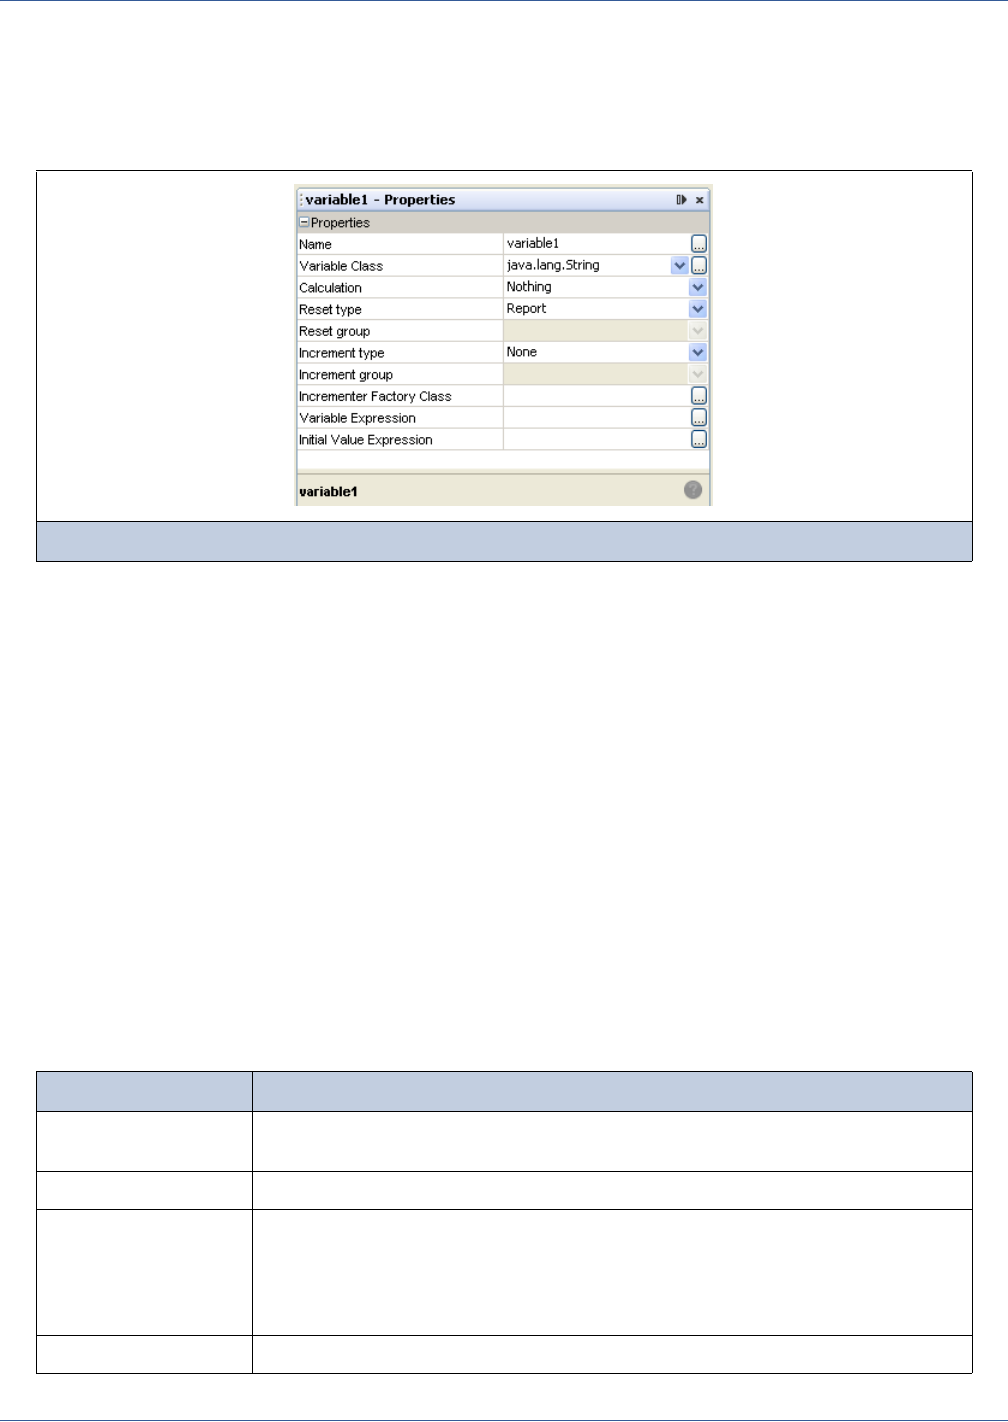
108
iReport Ultimate Guide
6.3 Working with Variables
Variables are objects used to store the results of calculations, such as subtotals, sums, and so on. Again, just as with fields and
parameters, you must define the Java type of a variable when it is declared.
To add a new variable, select the variables node in the outline view and select the menu item Add Variable.
Figure 6-11 shows the property sheet for a variable. Below is a list describing the meaning of each property.
Figure 6-11 Variable Properties dialog
Name This is the name of the variable. The name must be unique (meaning you cannot have
two variables with the same name). Similar to fields and parameters, you refer to a
variable using the following syntax in an expression:
$V{<variable name>}
Variable Class This is the Java type of the variable. In the combo box, you can see some of the most
common types such as java.lang.String and java.lang.Double.
Calculation This is the type of a pre-defined calculation used to store the result by the variable.
When the pre-defined value is Nothing, it means “don’t perform any calculation
automatically.” JasperReports performs the specified calculation by changing the
variable’s value for every new record that is read from the data source.
To perform a calculation of a variable means to evaluate its expression (defined in the
Variable Expression property). If the calculation type is Nothing, JasperReports will
assign to the variable the value that resulted from the evaluation of the variable
expressions. If a calculation type is other than Nothing, the expression result will
represent a new input value for the chosen calculation, and the variable value will be the
result of this calculation. The calculation types are listed in Table 6-2.
Table 6-2 Calculation types for the variables
Type Definition
Distinct Count This counts the number of different expression results; the order of expression
evaluation does not matter.
Sum This adds to each iteration the expression value to the variable’s current value.
Average This calculates the arithmetic average of all the expressions received in input. From a
developer’s point of view, declaring a variable to type System is pretty much like just
declare a variable in a program, without actually use it. Someone will set a value for it.
This “someone” is usually a scriptlet tied to the report or some other Java code executed
through an expression.
Lowest This returns the lowest expression value received in input.
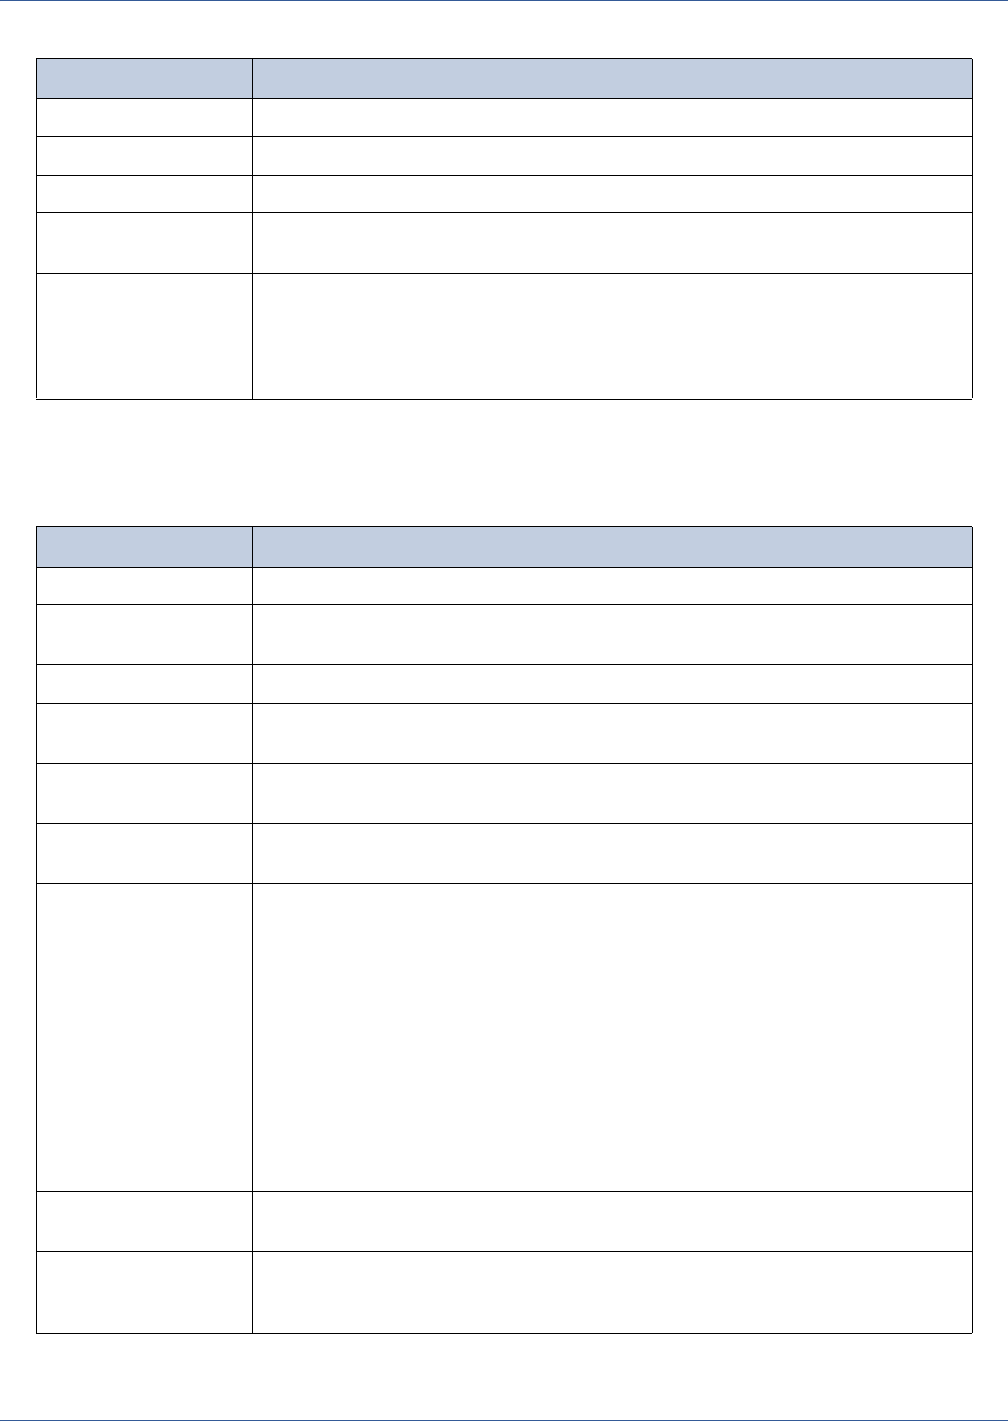
Fields, Parameters, and Variables
109
Highest This returns the highest expression value received in input.
StandardDeviation This returns the standard deviation of all the expressions received in input.
Variance This returns the variance of all the expressions received in input.
System*This does not make any calculation, and the expression is not evaluated. In this case,
the report engine keeps only the last value set for this variable in memory.
Reset type This specifies when a variable value has to be reset to the initial value (or to null if no
initial value expression has been provided). The variable reset concept is fundamental
when you want to make group calculations, such as subtotals or averages. When a
group changes, you should reset the variable value and restart the calculation. The
reset types are listed in Table 6-3.
* From a developer’s point of view, declaring a variable to type System is pretty much like just declaring a variable in a
program, without actually using it. Someone will set a value for it. This “someone” is usually a scriptlet tied to the report or
some other Java code executed through an expression.
Table 6-3 Reset types
Reset Type Description
None The initial value expression is ignored.
Report The variable is initialized only once at the beginning of report creation by using the initial
value expression.
Page The variable is initialized again in each new page.
Column The variable is initialized again in each new column (or in each page if the report is
composed of only one column).
Group The variable is initialized again in each new group (the group specified in the Reset
group setting)
Reset Group This specifies the group that determines which variable to reset when the Group reset
type is selected.
Increment type This specifies when a variable value has to be evaluated. By default, a variable is
updated every time a record is fetched from the data source, but sometimes the
calculation we want to perform must be performed only at certain times. The increment
types are the same as the calculation types listed in Table 6-2.
To clarify the use of increment type a little bit, consider this example: to have a report
with a list of names ordered alphabetically and grouped by the first letter, we have the
group for the letter A containing a certain amount of names, the group B, and so on to Z.
Suppose we want to calculate with a variable the average number of names for each
letter. We need to create a variable that performs an average calculation on the number
or records present in each group. To correctly perform this calculation, the variable must
be updated only when the first letter in the names changes, which happens at the end of
each group. In this case, the increment type (meaning the exact moment at which a new
input value must be acquired to perform the calculation) should be Group.
Increment group This specifies the group that determines the variable increment if the Group increment
type is selected.
Custom
Incrementer
Factory Class
This is the name of a Java class that implements the JRIncrementerFactory
interface, which is useful for defining operations such as the sum of non-numerical
types. In other words, a developer has the ability to implement his custom calculation.
Table 6-2 Calculation types for the variables, continued
Type Definition
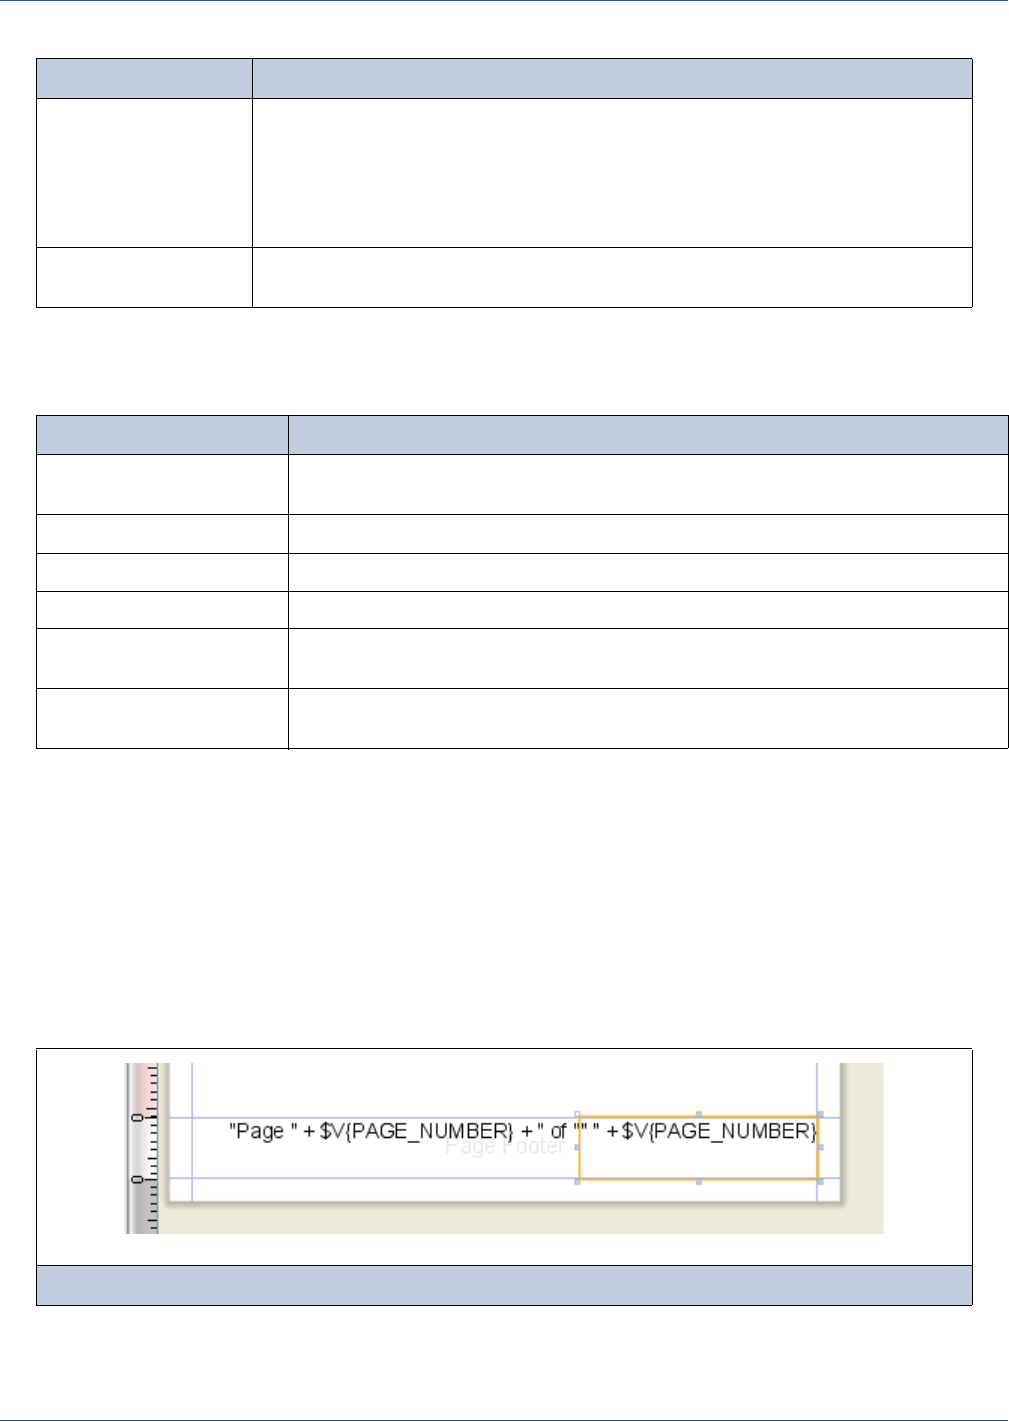
110
iReport Ultimate Guide
As with parameters, JasperReports provides some built-in variables (which are directly managed by the reporting engine). You
can read these variables but cannot modify them. Table 6-4 lists the built-in variables.
6.4 Evaluating Elements During Report Generation
There is a strict correlation between the physical location of an element in a report and the point at which JasperReports
evaluates the element during report generation. When the report filling process starts, JasperReports retrieves the first record
from the data source, updates the value of the record’s fields, and recalculates the necessary variables. The first band to be
evaluated is the title, followed by the page header, the column header, group headers, detail, and so on. When all the detail
bands have been filled, the engine next retrieves the second record, updating all the fields and variables again, and continues
the fill process. By default, the engine evaluates the expression of textfield and image elements as they are encountered during
the report generation process.
Sometimes this is not what the we want. An example is when we want to show the final result of a calculation in a textfield that
is evaluated before the end of the calculation, such as when printing the total number of pages in the page footer (as in the
example shown in Figure 6-12). There is no variable that contains the total number of pages in the report, there is just the
Variable
expression
This is the expression that identifies the input value of the variable to each iteration. The
result must be congruent to the type of the variable and its calculation. For example, if
we are just counting objects, the expression can return any kind of result, and the
variable will be incremented only when a not-null result is provided, independently of
the expression result type.However, if we are summing something, the calculator
expects an object of the same type as the variable (like a Double or an Integer).
Initial value
expression
This is an expression used to set the initial value for the variable. If blank, the variable is
initialized to null.
Table 6-4 Built-in variables
Variable Name Definition
PAGE_NUMBER Contains the current number of pages. At “report” time, this variable will contain the total
number of pages.
COLUMN_NUMBER Contains the current number of columns.
REPORT_COUNT Contains the current number of records that have been processed.
PAGE_COUNT Contains the current number of records that have been processed in the current page.
COLUMN_COUNT Contains the current number of records that have been processed during the current
column creation.
<group name>_COUNT Contains the current number of records that have been processed for the group
specified as a variable prefix.
Figure 6-12 How to print Page X of Y using the evaluation time
Table 6-3 Reset types, continued
Reset Type Description

Fields, Parameters, and Variables
111
PAGE_NUMBER variable that defines the value of the current page number. So we have to force JasperReports to wait to fill that
particular element until the calculation process completes.
Using the example of Page X of Y, we need two textfields:
A textfield to print the current page number (or better the string “Page X of”), where X is the current value of the variable
PAGE_NUMBER.
A second textfield to print Y (the total number of pages).
For the second textfield we set the evaluation time to REPORT, which signifies “when the last page has been reached.”At that
time, the value of PAGE_NUMBER will contain the total number of pages.
You can use this method to set the evaluation time for any textfield or image. For example, you can use it to print a subtotal in
the header of a group. The calculation requires the records in the group to be processed first, but it is possible to place a
textfield showing the variable associated with the calculation in a textfield of the group header, with the evaluation time set to
GROUP (and the evaluation group to the proper group).
Two particular evaluation times deserve special attention: BAND and AUTO:
BAND forces JasperReports to evaluate a variable that is the result of a calculation performed after processing the entire
band. This is often used in the Detail band in two cases: a value returned from a subreport (for example, the number of
records printed in the subreport) and a value of a variable that was set by an external agent, such as a scriptlet.
AUTO evaluation time occurs when the last record of the given dataset is processed; the time is defined by the reset type,
which, in these cases, would usually be REPORT or GROUP. It allows you to mix values that are determined at different
times, such as the current value of a field and the calculated value of a variable. The most common use is calculating a
percentage. Suppose we have a list of numbers, and we want to print the percentage of incidence for each single number
with respect to the total of all the numbers. You can calculate the percentage by dividing the current value of evaluation
time NOW by a variable that calculates the total when the report completes.
Here comes the conflict: we need to consider two values having different evaluation times. The AUTO evaluation time
provides the solution. JasperReports will use the evaluation time NOW for the field named in the expression, while waiting
to evaluate the variable until the evaluation time that corresponds to the field’s reset type.
For another use of evaluation times and reset types, see 19.2.2, “Printing Page X of Y in a Single Textfield,” on page 349.

112
iReport Ultimate Guide
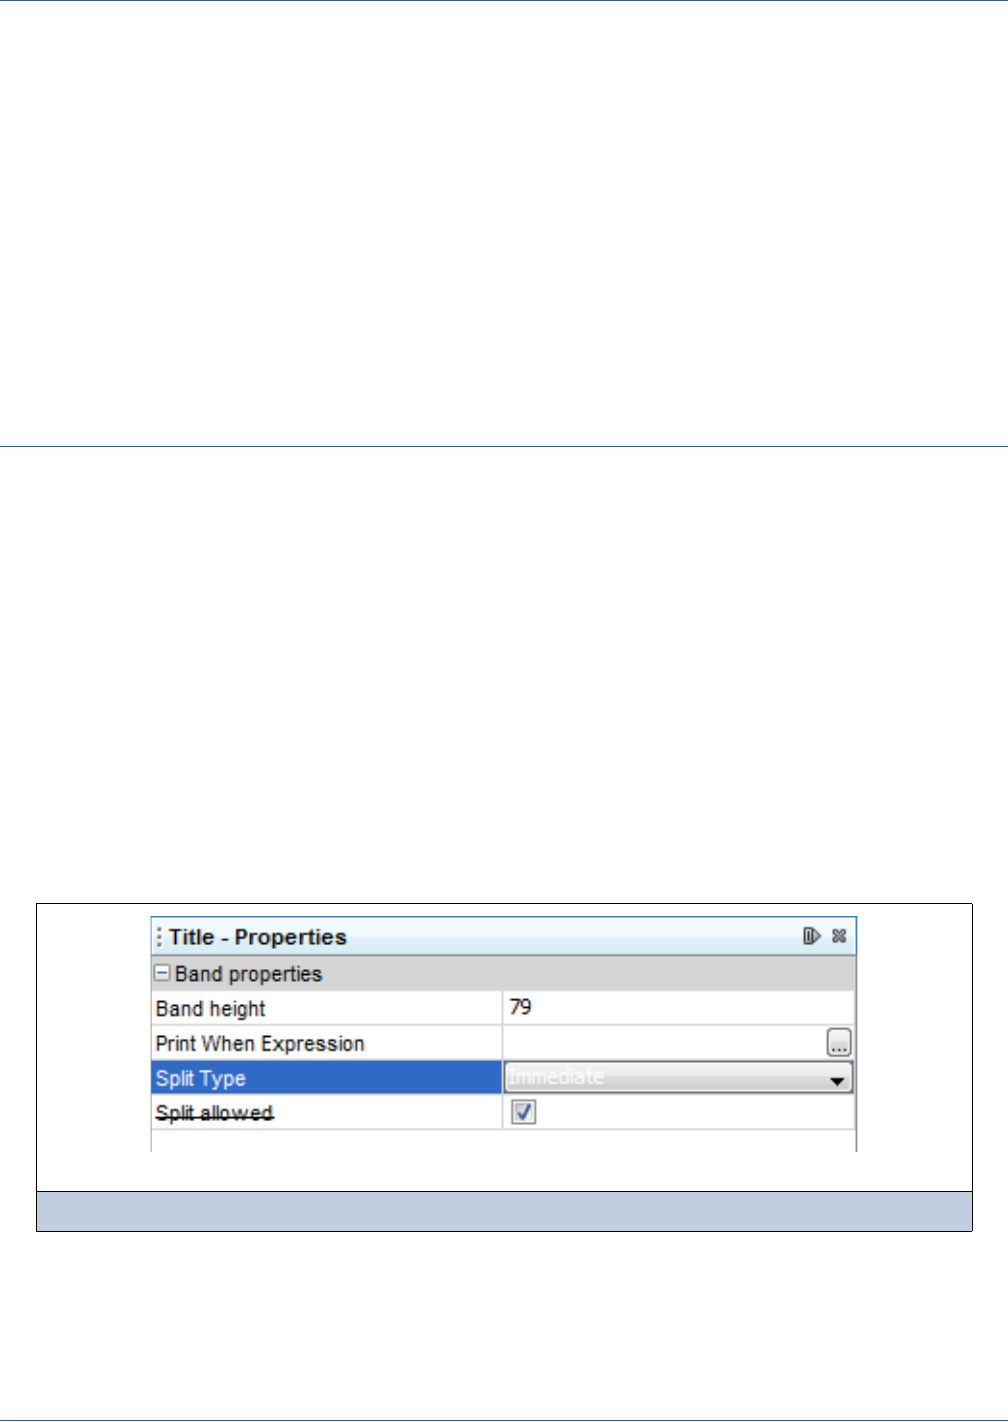
Bands and Groups
113
CHAPTER 7BANDS AND GROUPS
In this chapter, I will explain how to manage bands and groups when using iReport. In Chapter 4, you learned how reports are
structured, and you have seen how the report is divided into bands. Here, in this chapter, you will see how to adjust the
properties of the bands. You will also learn how to use groups, how to create breaks in a report, and how to manage subtotals.
This chapter has the following sections:
Modifying Bands
Working with Groups
Other Group Options
7.1 Modifying Bands
JasperReports divides a report into eight main bands and a background (plus the special No Data band). To this set of standard
bands you can add two supplemental bands for each group: the Group Header band and the Group Footer band.
When you select a band in the report outline view, the band properties are displayed in the property sheet (Figure 7-1).
The band height represents the height of the band at design time. If the content of the band expands vertically (that is, due to a
subreport or a long text in a textfield with the Stretch with Overflow property set to true), the band increases in height
accordingly during report execution. The band height is expressed in pixels (always using the same resolution of 72 pixels per
inch). You can set the height with the property sheet or by dragging the bottom border of the band directly into the designer
window.
Figure 7-1 Band properties
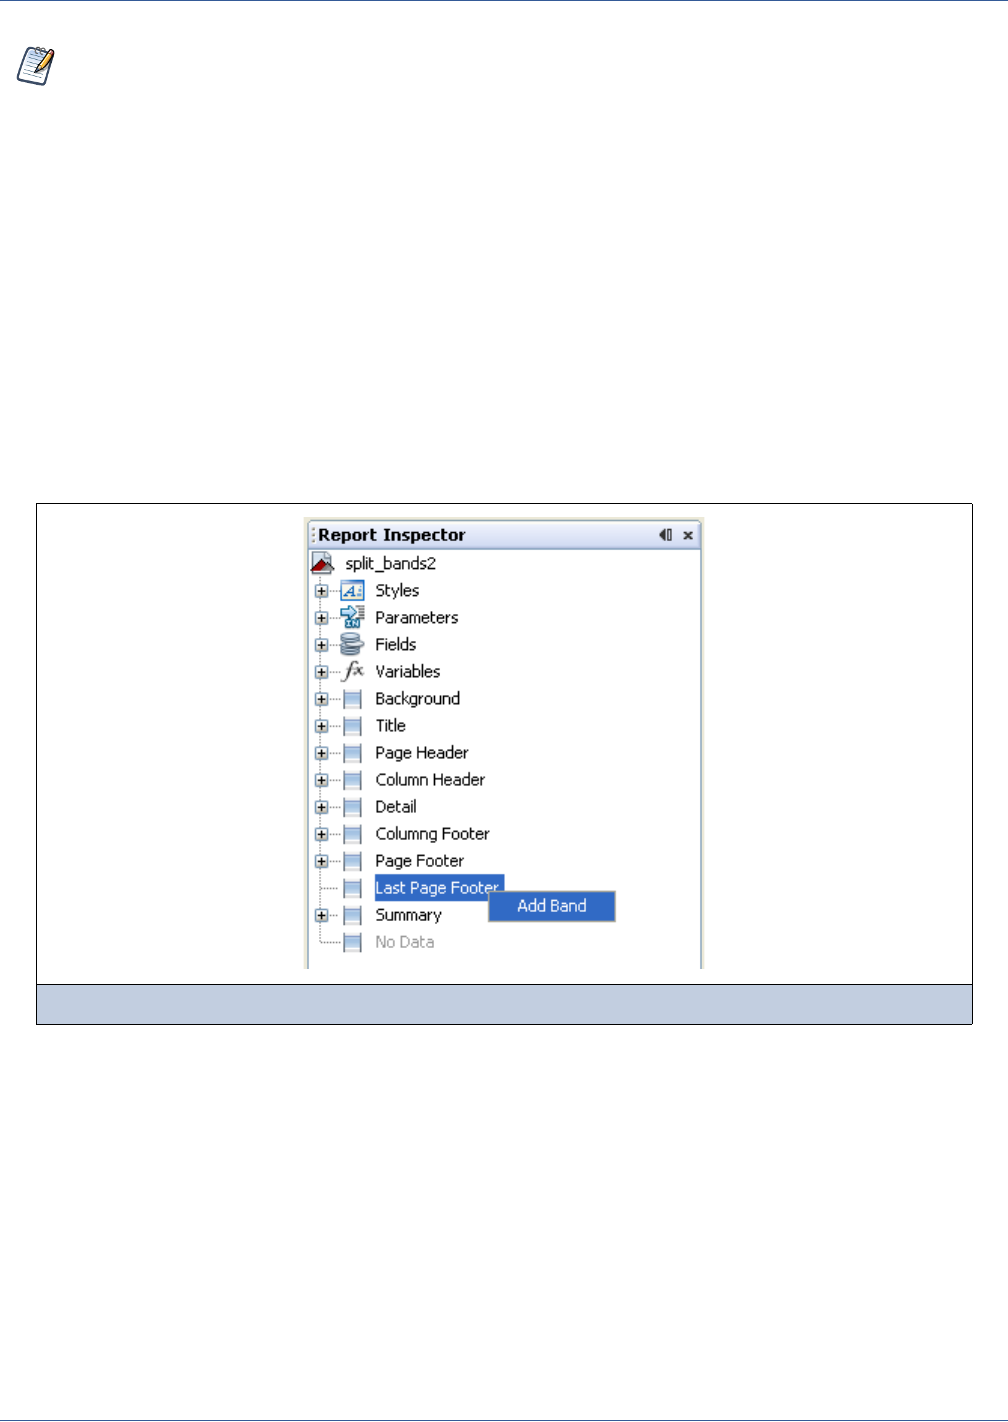
114
iReport Ultimate Guide
The Print When Expression property is used to hide or display the band under the circumstances described by the
expression. The expression must return a Boolean value. In particular, it must return true to display the band and false to hide
it. By default, when no value is defined for the expression, the band is displayed.
JasperReports reserves enough space in a page for bands like the title, the page header and footer and the column header and
footer. All the other bands cannot fit in the remaining space when repeated several times. This may result in a Detail band
beginning in one page and ending on another page.
If you want to be ensure that a band displays completely within one page, deselect the Split allowed property. Every time
the band is printed, JasperReports will check the available space in the current page. If it is not enough, the band will start on
the next page. Of course, this does not mean that the band will completely fit in the next page, this still depends of the band
content.
The default report template includes all the pre-defined bands, except the Last Page Footer and the No Data bands. If you are
not interested in using a band, you can remove it by right-clicking the band (or the band node in the outline view) and selecting
the menu item Delete Band. When a band is no longer present in the report, it is displayed as a grayed node (see Figure 7-2).
To add the band to the report, right-click the band and select Add Band.
In general, there is no valid reason to remove a band apart the generation of a less complex JRXML file (the report source
code). In order to prevent the printing of a band, set its height to 0. The only exceptions are the Last Page Footer and No Data
bands.
If present, the Last Page Footer band always replaces the Page Footer band in the last page, so if we don’t want or need this
behavior the band must be not present. The No Data band is a very special band that replaces the entire report if the data source
does not contain any records and if, at the document level, the property When No Data Type has been set to No Data
Section.
7.2 Working with Groups
Groups allow you to organize the records of a report in order to create some structures. A group is defined through an
expression. JasperReports evaluates this expression thus: a new group begins when the expression value changes. An
Consecutive zero-height bands may become obscured while working in the design panel. You can increase the height
of a selected band by pressing the Shift key while dragging the bottom margin of the band down.
Figure 7-2 Adding a pre-defined band
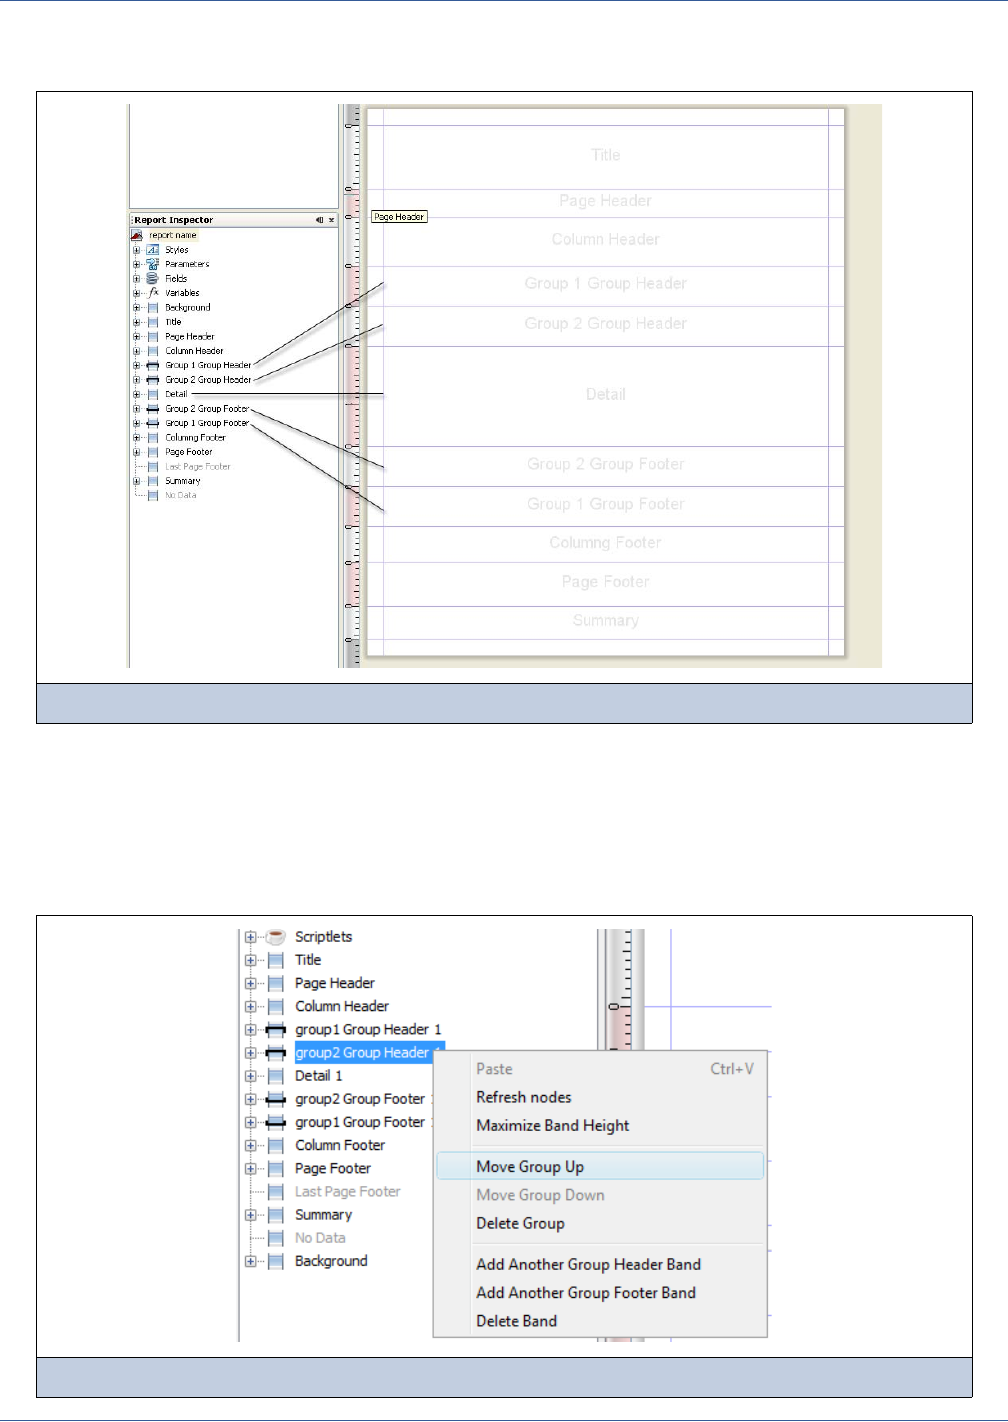
Bands and Groups
115
expression may be represented just by a specific field (that is, you may want to group a set of contacts by city, or country), but
it can be more complex as well. For example, you may want to group a set of contact names by initial letter.
Each group can have one or more header and one or more footer bands. Group headers and footers are printed just before and
after the Detail band. You can define an arbitrary number of groups (that is, you can have a first-level group that contains
contacts by Country and a nested group containing the contacts in each country by City).
The order of the groups in the Report Inspector determines the groups’ nesting order. The group order can be changed by right-
clicking a group node (header or footer) and selecting the Move Group Up or Move Group Down menu items (see Figure 7-4
on page 115).
Figure 7-3 Group bands
Figure 7-4 Changing the groups order
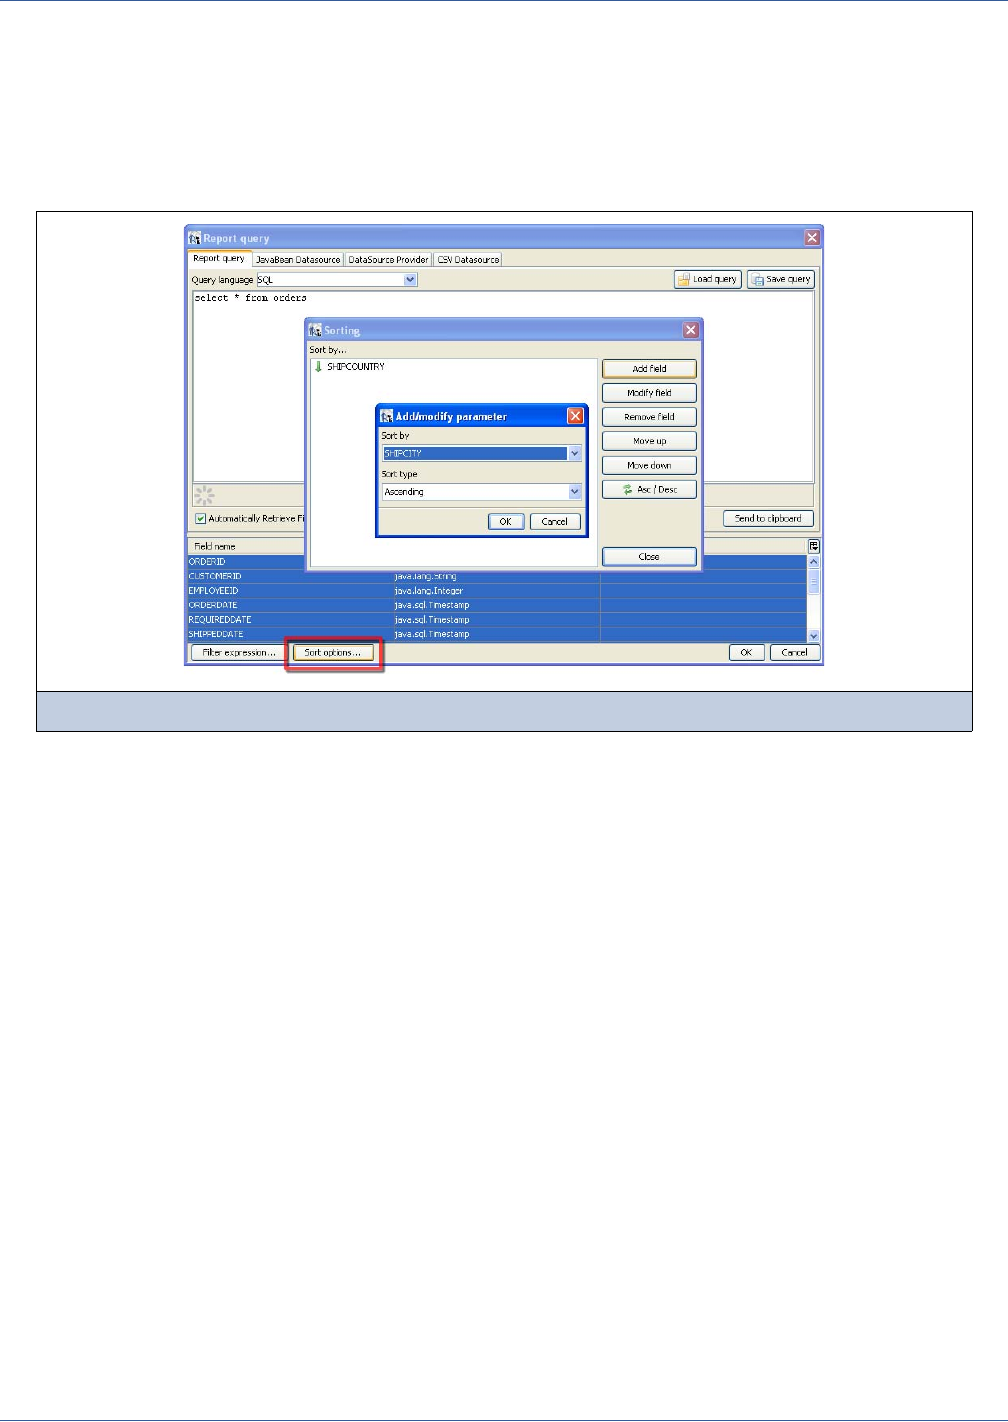
116
iReport Ultimate Guide
JasperReports groups records by evaluating the group expression. Every time the expression’s value changes, a new group
instance is created. The engine does not perform any record sorting if not explicitly requested, so when we define groups we
should always provide for the sorting. For instance, if we want to group a set of addresses by country, we have to sort the
records before running the report. We can use a SQL query with an ORDER BY clause or, when this is not possible (that is,
when obtaining the records from a data source which does not provide a way to sort the records, like an XML document or an
Excel file), we can request that JasperReports sort the data for us. This can be done using the sort options available in the
iReport query window (Figure 7-5).
In order to use the Sort options, you must have some fields already registered in the report. Sorting can only be performed on
fields (you cannot sort records using an expression). You can define a sort using any of the fields in the database. Each field
can use a different sort type (ascending or descending). The sorting is performed in memory, so it’s use is discouraged if you
are working with very large amounts of data, but it is useful with a reasonable number of records (depending on the available
memory).
Let’s see how groups work in an example. Suppose you have a list of people. You want to create a report where the names of
the people are grouped last-name-first as in a phone book. Run iReport and open a new empty report. Next, take the data from
a database by using a SQL query with a proper ORDER BY clause (we will use the sample database provided with
JasperReports). For this example, use the following SQL query:
SELECT * FROM ADDRESS ORDER BY LASTNAME, FIRSTNAME
The selected records will be ordered according to the last then first name of the customers. The fields selected by the query
should be ID, FIRSTNAME, LASTNAME, STREET and CITY.
Figure 7-5 Sorting Options
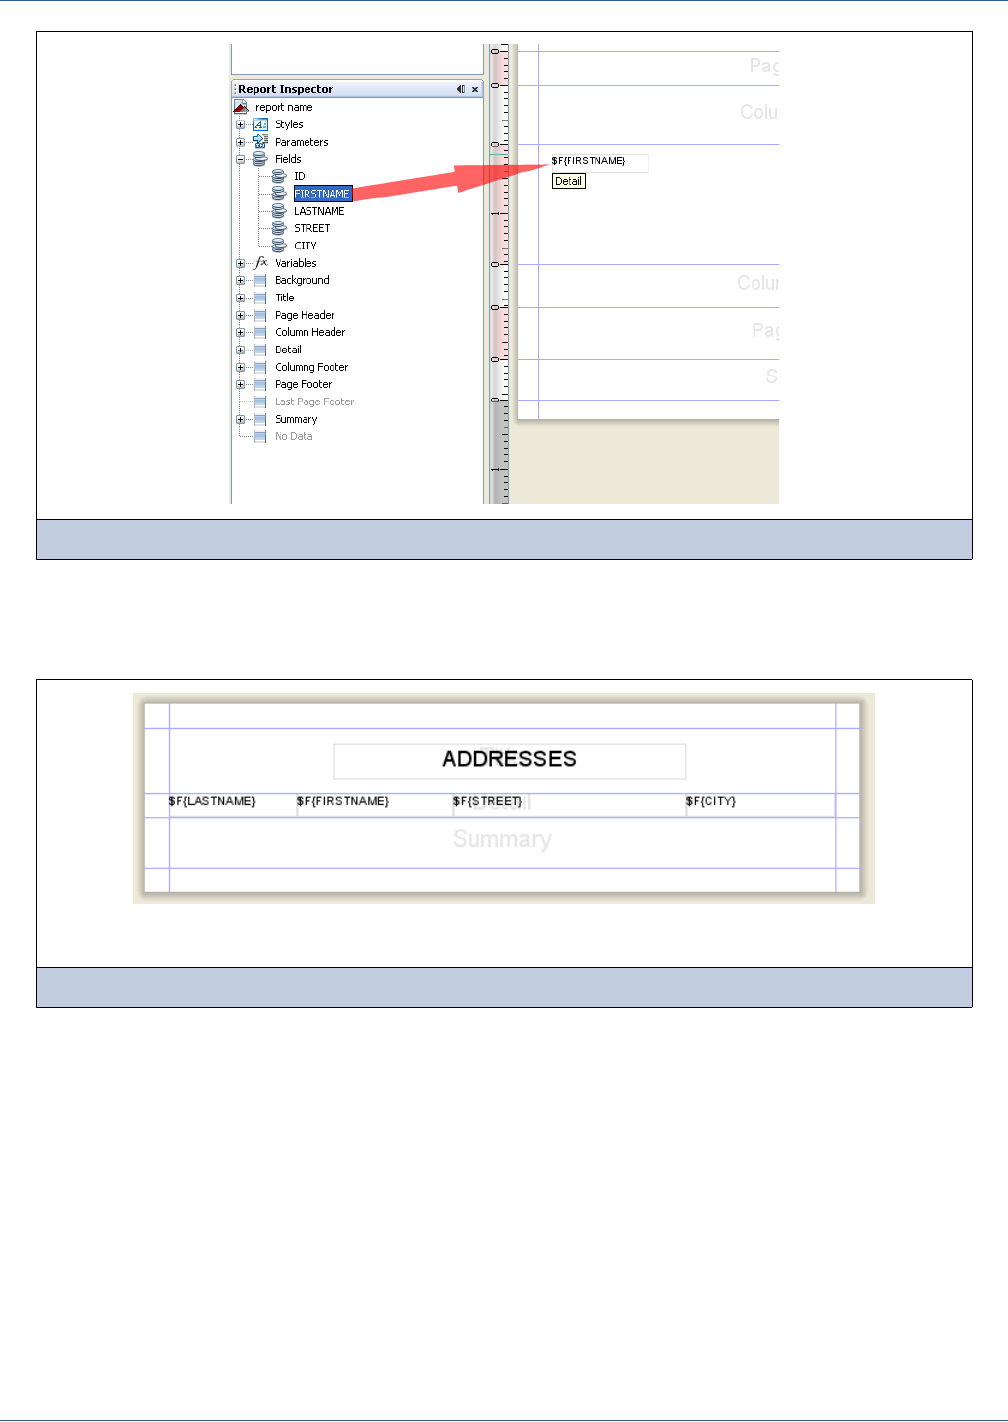
Bands and Groups
117
Before continuing with creating your group, make sure that everything works correctly by inserting in the Detail band the
FIRSTNAME, STREET and CITY fields (move them from the outline view to the Detail band, as shown in Figure 7-6).
Then create a layout similar to the one proposed in Figure 7-7 and preview the report.
The result should be similar to that of Figure 7-8.
Figure 7-6 Dragging a field into the Detail band
Figure 7-7 Layout before adding the groups
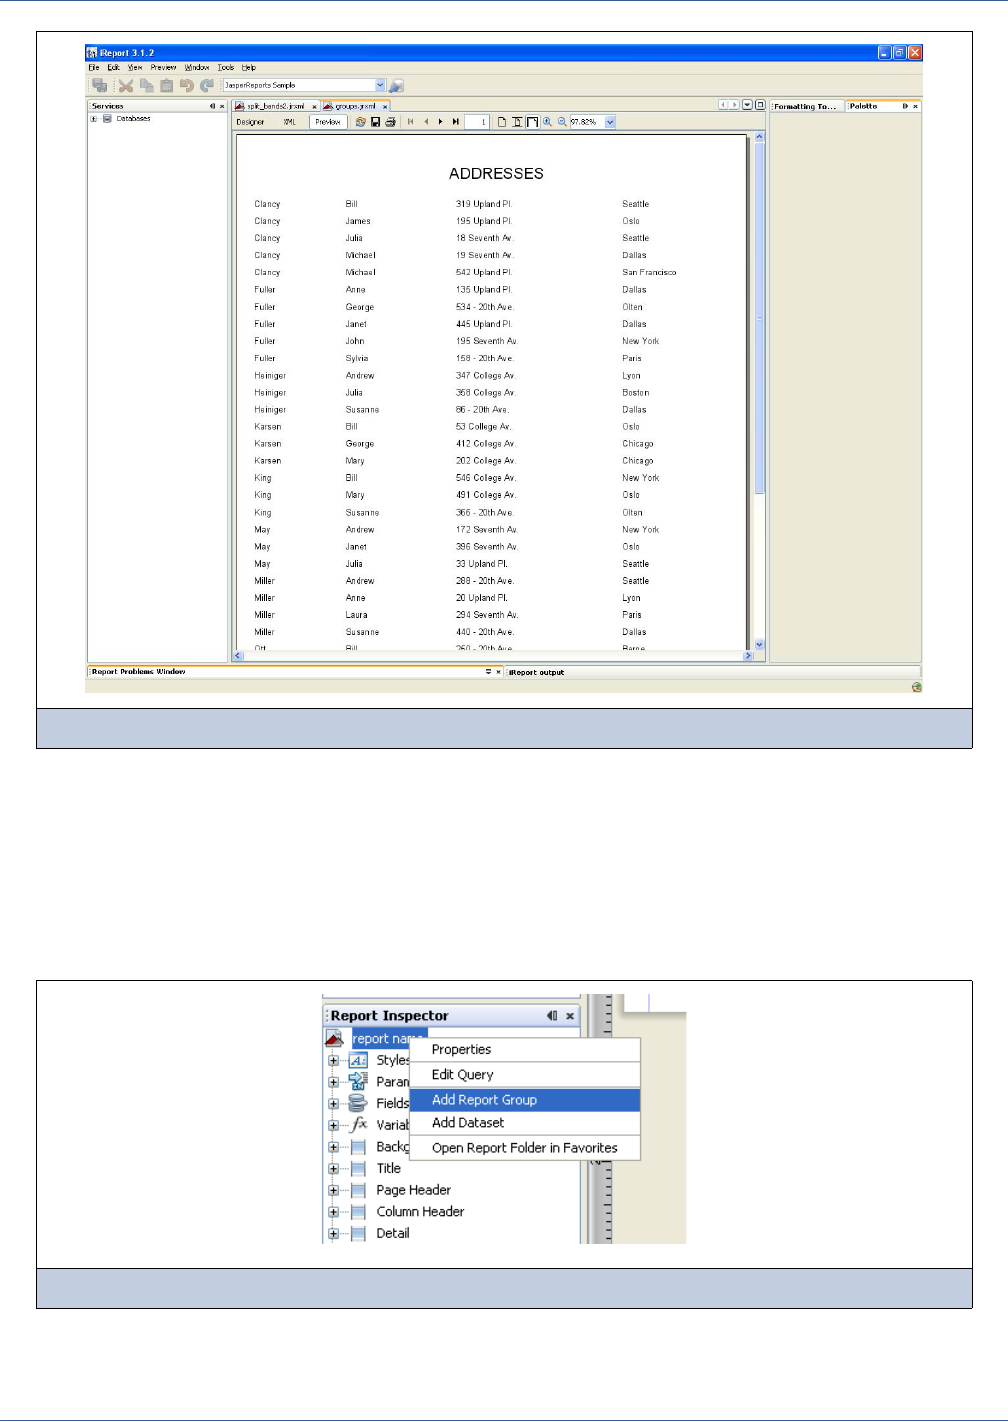
118
iReport Ultimate Guide
What we have is just a simple flat report showing an ordered list of addresses. Let’s proceed to group the records by the first
letter of the last name. The first letter of the name can be extracted with a simple expression (both in Groovy and JavaScript).
Here is:
$F{LASTNAME}.charAt(0)
If you use Groovy or JavaScript as suggested, remember to set it in the document properties
To add the new group to the report, select the document root node in the outline view and select the Add Report Group menu
item (Figure 7-10).
This opens a simple wizard (Figure 7-10). Use it to set the group name (that is, First_Letter) and add the expression that
extracts the first letter from a string.
Figure 7-8 The addresses not grouped
Figure 7-9 Add Report Group
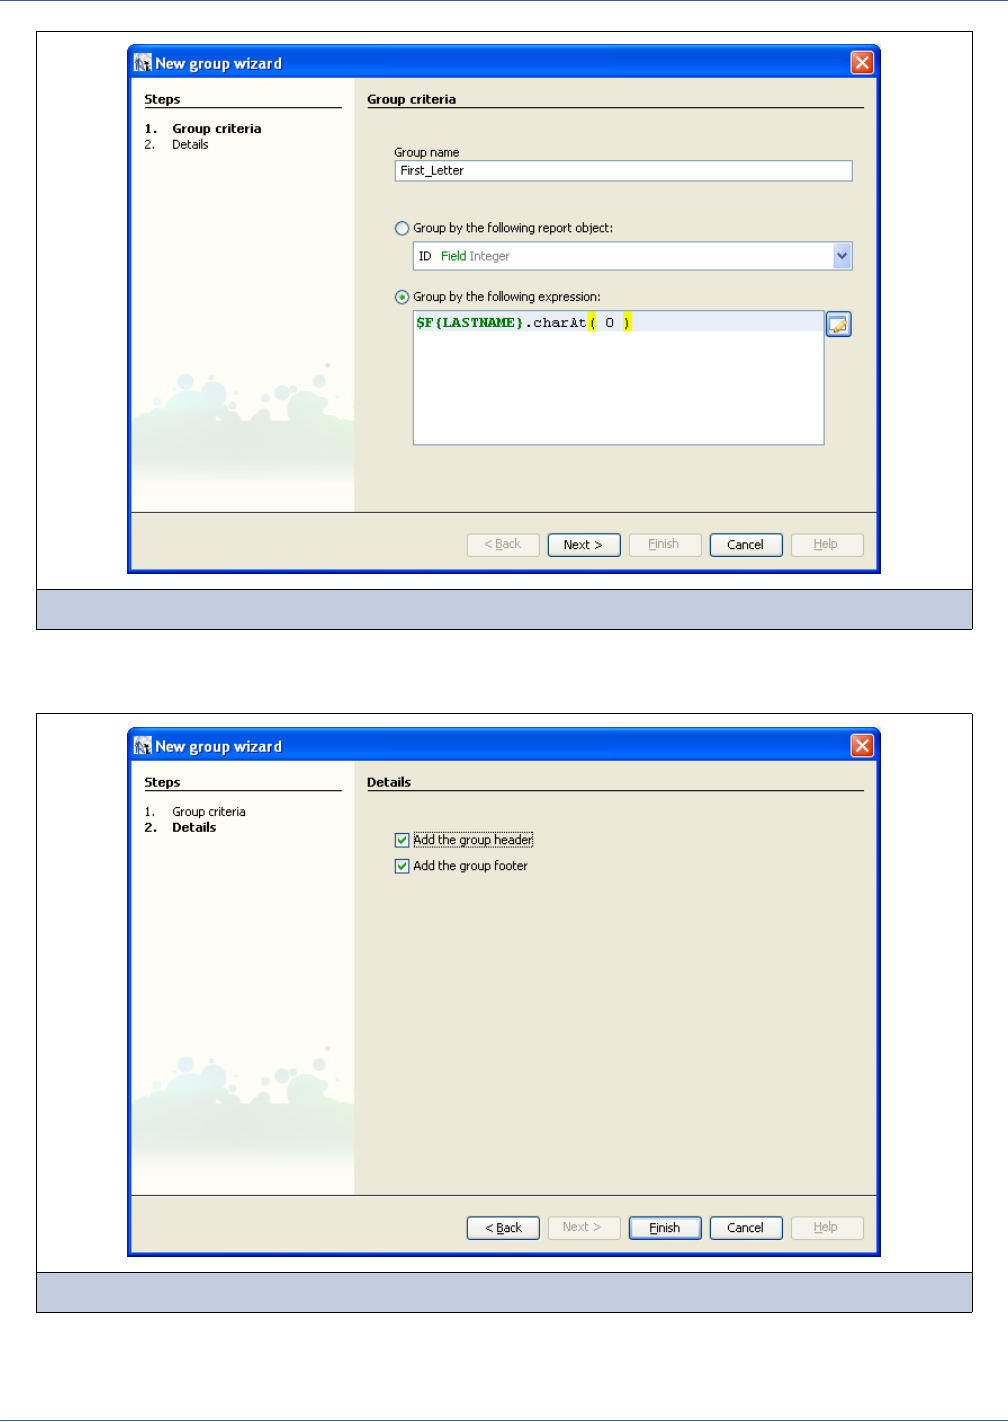
Bands and Groups
119
In the second step (Figure 7-11) we have the option of creating header and footer bands for the group. Select both and click
Finish to complete the group creation.
The new two bands (Group Header and Group Footer) will appear in the design window, and the corresponding nodes will be
added to the report structure in the outline view (Figure 7-12).
Figure 7-10 The first step of the new group wizard
Figure 7-11 The second step of the new group wizard
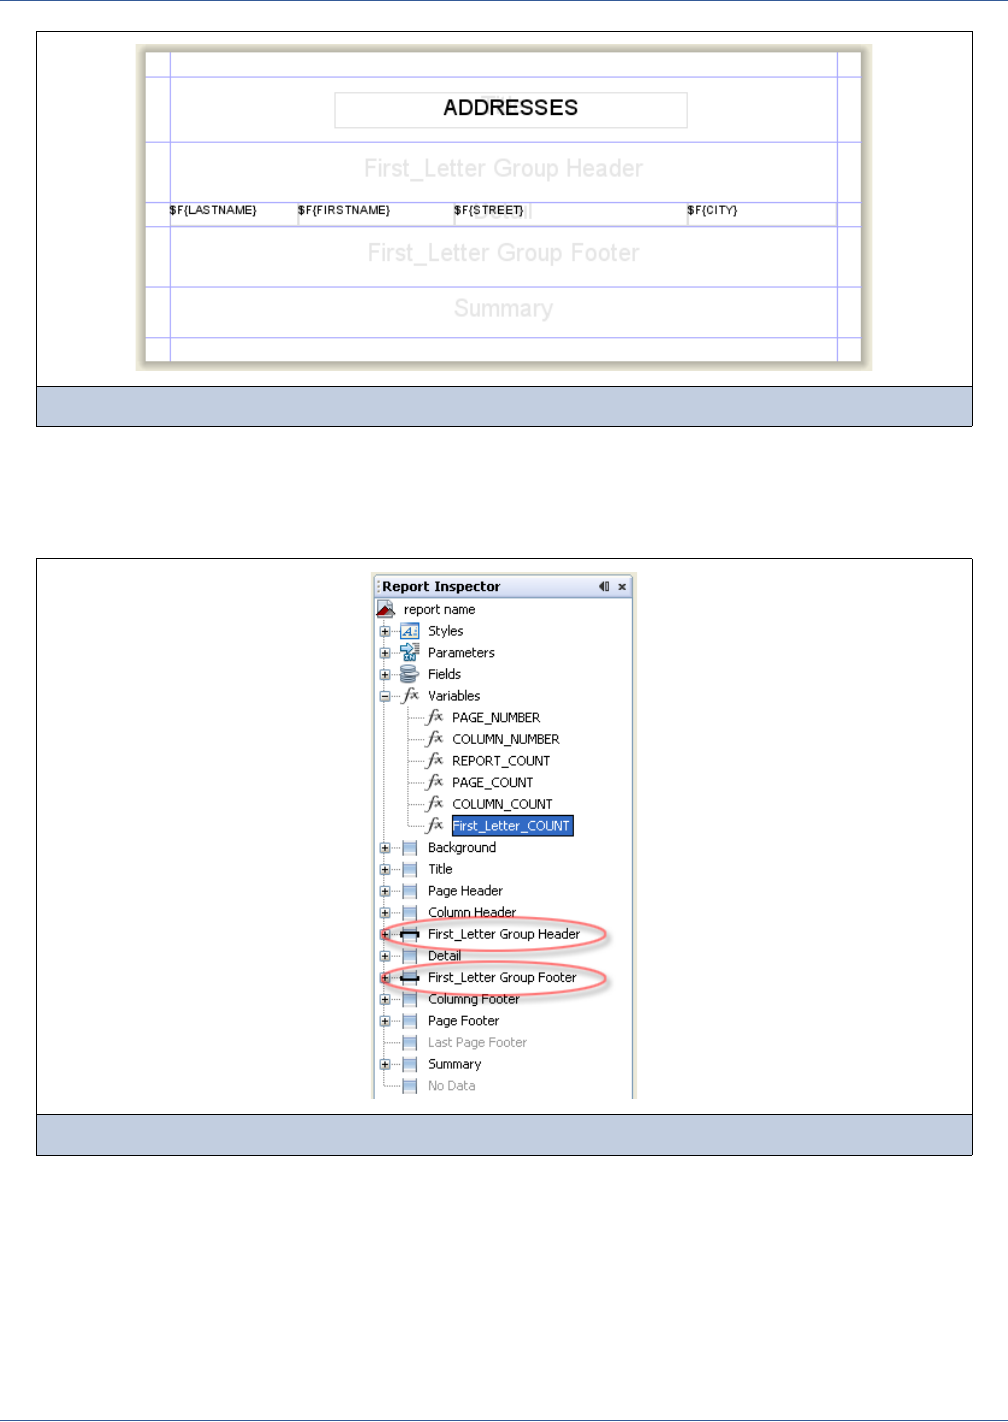
120
iReport Ultimate Guide
When you add a group to the document, iReport creates an instance of the built-in variable <group name>_COUNT for the
new group. In our case, the variable is named First_Letter_COUNT (Figure 7-13). It represents the number of records
processed for the group; if we display this variable in a textfield in the group footer, it will display how many records the group
contains.
Now we can add some content to the group header and footer. In particular, we can add the initial letter to which the group
refers, and we can add in the footer the First_Letter_COUNT variable. For the letter, just add a Textfield in the group header
and use the same textfield expression as you did for the group. The textfield class can be set to String (because we are using
Groovy or JavaScript). If you use Java, the expression for the textfield should be changed a little bit. Java is a bit more severe
in terms of type matching, and since the charAt() function returns a char, we can convert this value in a String by
concatenating an empty string. (This is actually a dirty but simple way to cast any Java object in a String without checking if
the object is null). So the expression in Java should be:
“” +$F{LASTNAME}.charAt(0)
Figure 7-12 The new group bands in the design panel
Figure 7-13 The group in the outline view
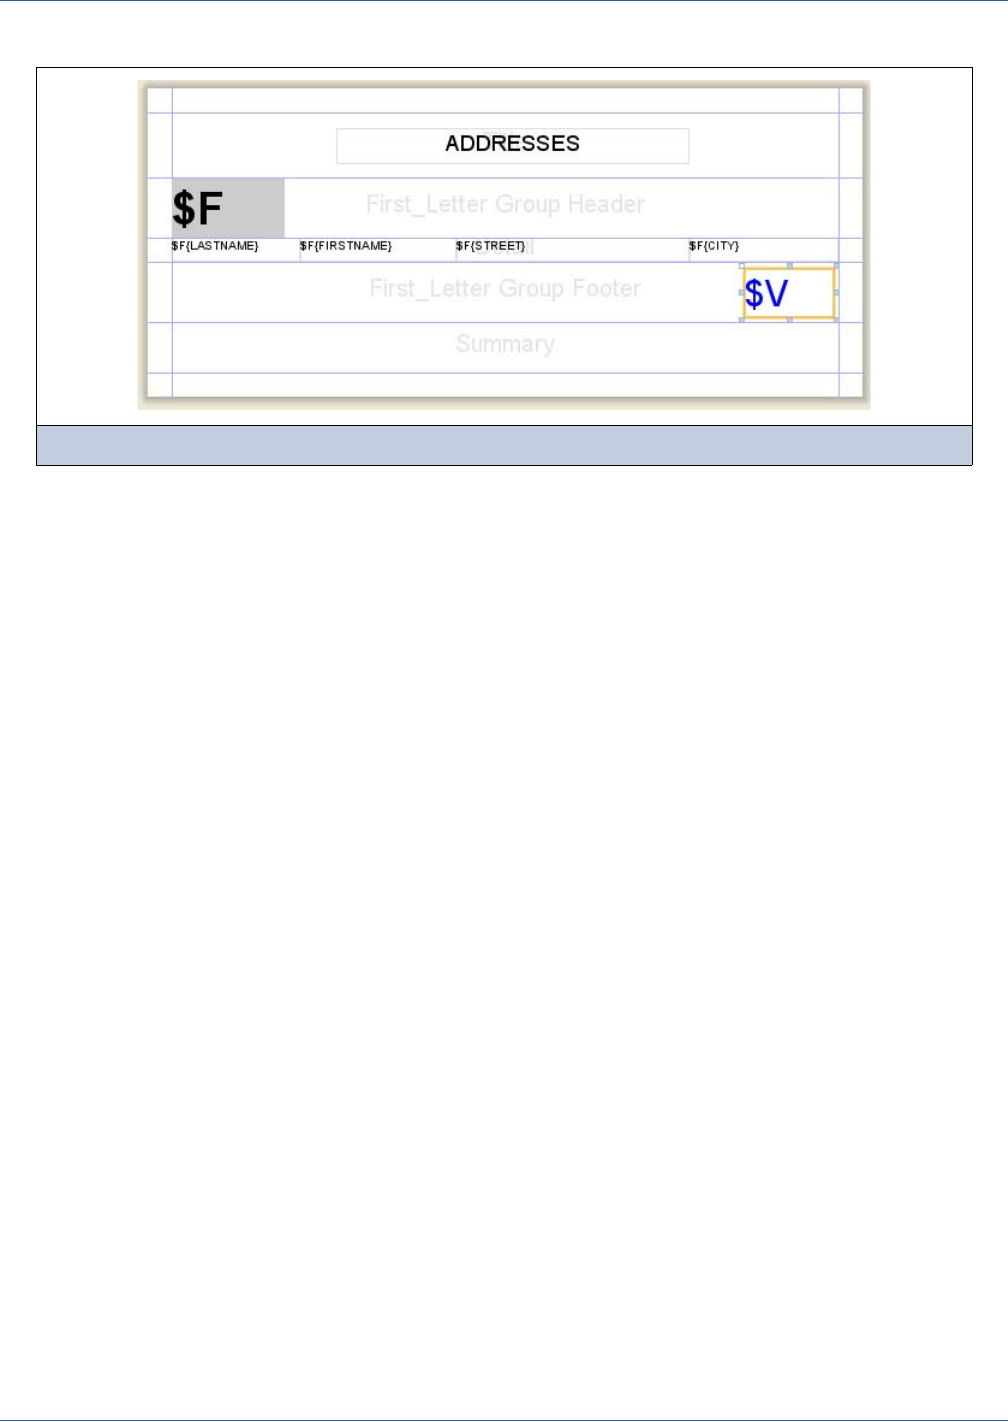
Bands and Groups
121
Figure 7-14 shows the final definition of the report.
The blue field (in the group footer) displays the variable First_Letter_COUNT that we created by dragging this variable
from the outline view into Group Footer band. If we want to display the same value in the group header, we need to change the
textfield evaluation time to Group and set the evaluation group to First_Letter. See Section 6.4, “Evaluating Elements
During Report Generation,” on page 110 for a discussion of evaluation times.
Figure 7-15 shows the final generated report.
Figure 7-14 Final Layout
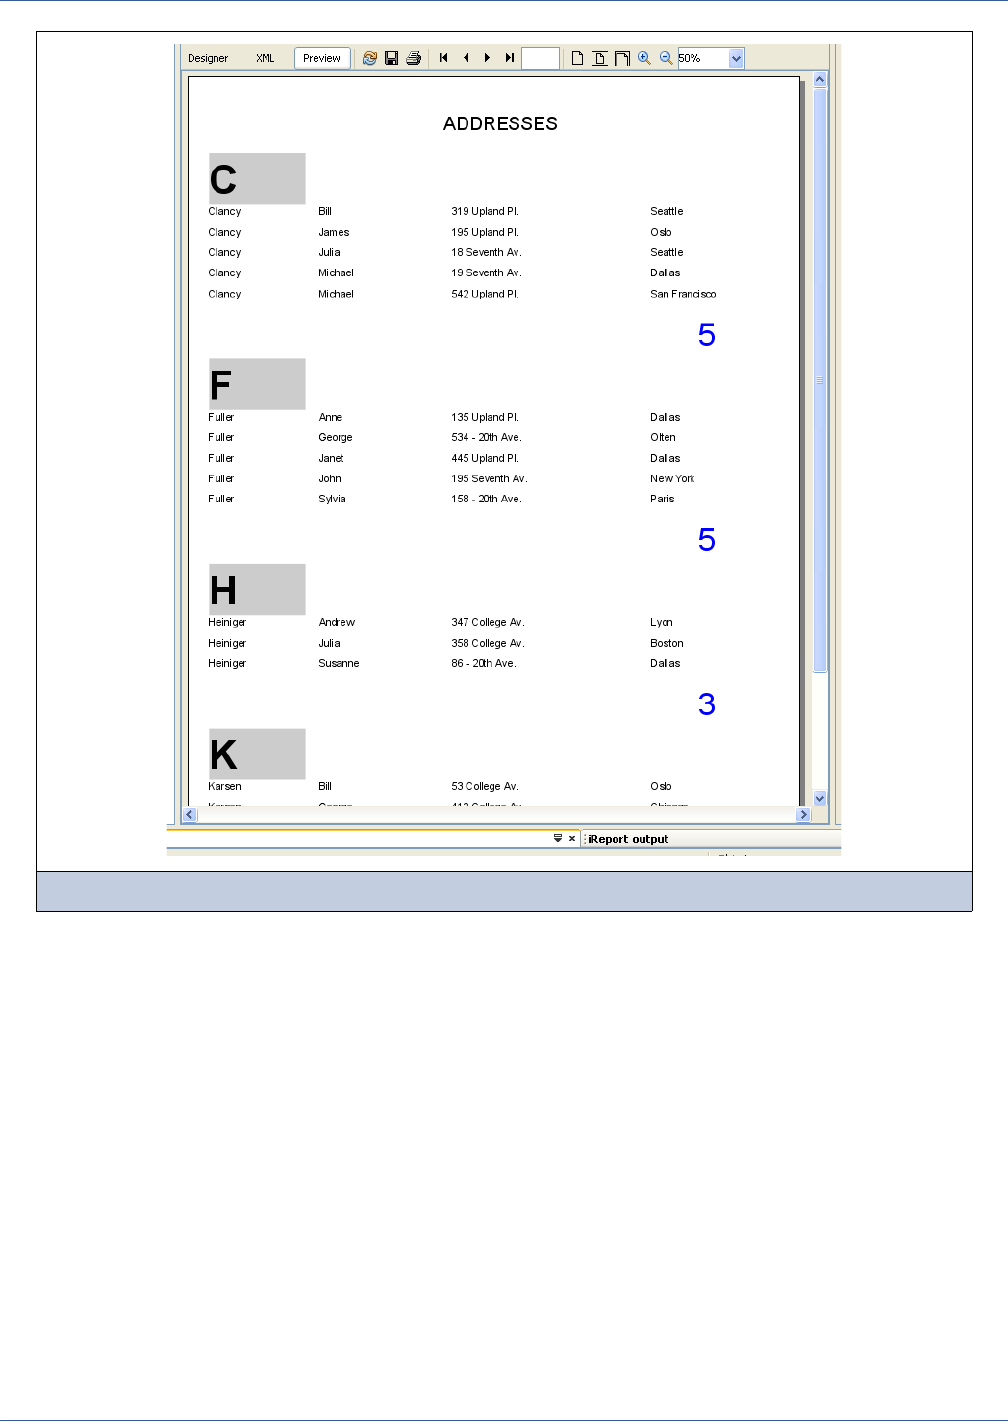
122
iReport Ultimate Guide
Figure 7-15 The final result
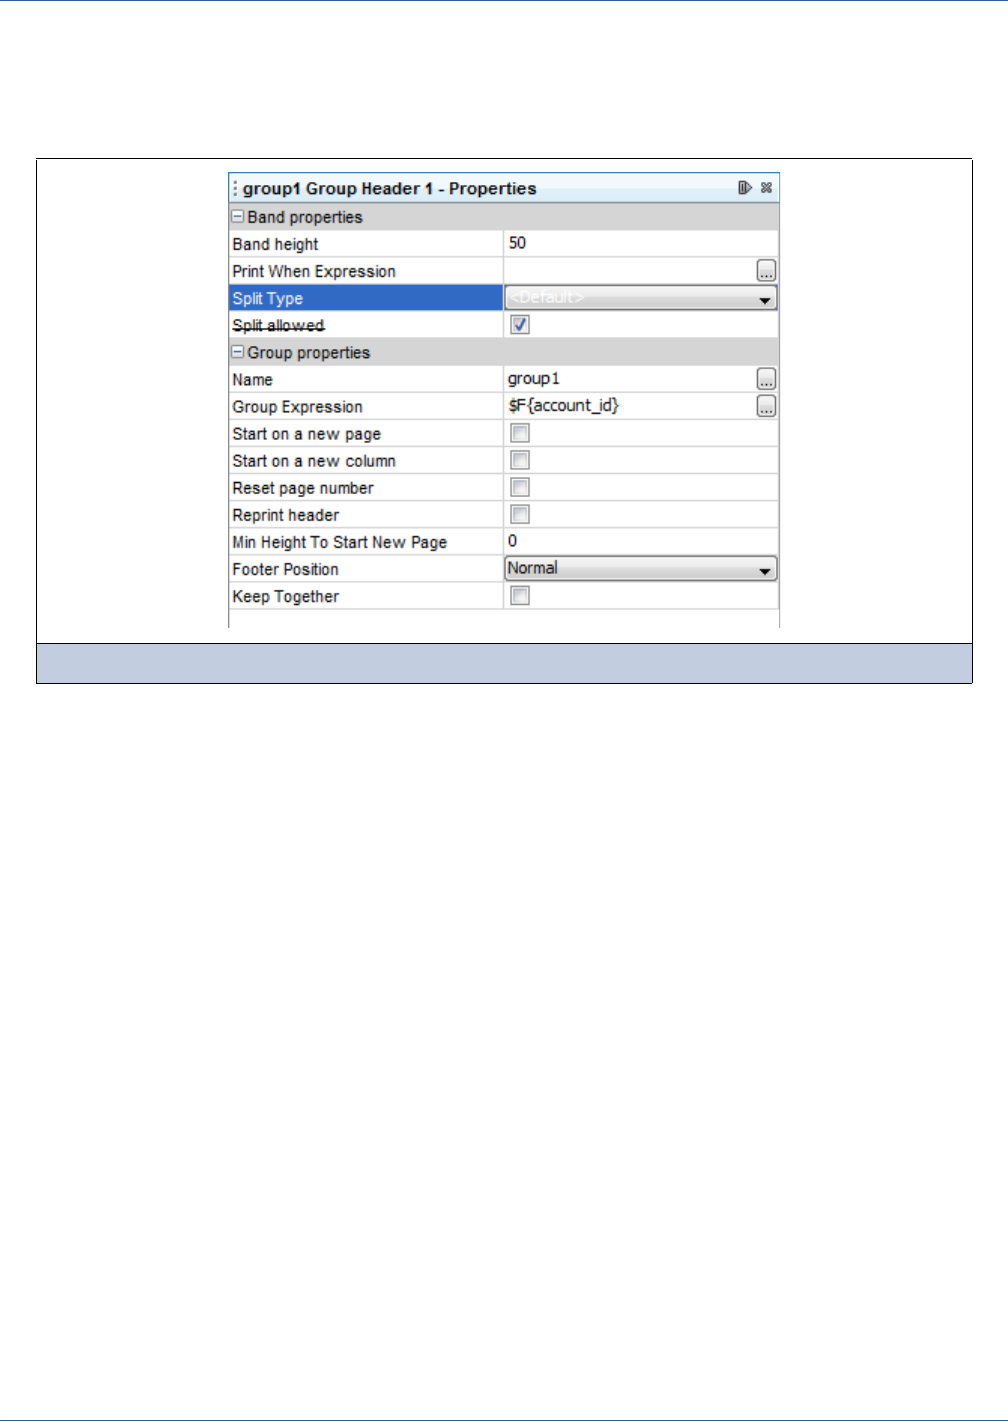
Bands and Groups
123
7.3 Other Group Options
In the previous example, we learned how to create a group using the group wizard, we set the group name, and we set the
group expression. There are many other options that you can set to control how a group is displayed. By selecting a group band
in the outline view (header or footer), in the property sheet you will see all these options (Figure 7-16):
Figure 7-16 Group options
Group Expression This is the expression that JasperReports will evaluate against each record. When
the expression changes in value, a new group is created. If this expression is
empty, it is equal to null, and since a null expression will never change in value,
the result is a single group header and a single group footer, respectively, after the
first column header and before the last column footer.
Start on a New Column If this option is selected, it forces a column break at the end of the group (that is, at
the beginning of a new group); if in the report there is only one column, a column
break becomes a page break.
Start on a New Page If this option is selected, it forces a page break at the end of the group (that is, at
the beginning of a new group).
Reset Page Number This option resets the number of pages at the beginning of a new group.
Reprint header If this option is selected, it prints the Group Header band on all the pages on which
the group’s content is printed (if the content requires more than one page for the
printed report).
Min Height to Start New Page If the value is other than 0, JasperReports will start to print this group on a new
page if the space remaining on the current page is less than the minimum specified.
This option is usually used to avoid splitting a report section composed of fields
that we want to remain together (such as a title followed by the text of a
paragraph).

124
iReport Ultimate Guide
Footer Position This option controls where to place the footer bands. By default they are placed
just after the end of the group (without leaving any space before the previous
band). This behavior can be changed, the available options are:
Stack At BottomThe group footer section is rendered at bottom of the current page,
provided that an inner group having this value would force outer group footers to
stack at the bottom of the current page, regardless of the outer group footer setting.
Force At BottomThe group footer section is rendered at bottom of the current page,
provided that an inner group having this value would render its footer right at the
bottom of the page, forcing the outer group footers to render on the next page.
Collate At BottomThe group footer section is rendered at bottom of the current
page, provided that the outer footers have a similar footer display option to render
at the page bottom as well, because otherwise, they cannot be forced to change
their behavior in any way.
Keep Together This flag is used to prevent the group from splitting across two pages or columns,
but only on the first break attempt.

Fonts and Styles
125
CHAPTER 8FONTS AND STYLES
Fonts describe the features (shape and dimension) of text characters. In JasperReports, you can specify the font properties for
each text element.
You can save time defining the look of your elements, included all the font settings, by using styles. A style is a collection of
pre-defined properties that refer to aspects of elements (like background color, borders, and font). Instead of continually
selecting individual settings, you can define a default style for your report and all undefined properties of your elements will
refer to it.
This chapter has the following sections:
Working with Fonts
Using TrueType Fonts
Character Encoding
Use of Unicode Characters
Working with Styles
Creating Style Conditions
8.1 Working with Fonts
Usually a font is defined by the following basic characteristics:
Font name (font family)
Font dimension
Attributes (bold, italics, underline, strikethrough)
If you plan to export a report as a PDF file, JasperReports requires the following additional information:
If the report is not exported to PDF format, the font the report engine uses is the one specified by the font name and enriched
with the specified attributes. In the case of a PDF document, the PDF font name identifies the font used. The report engine
PDF font name The name of the font (it could be a pre-defined PDF font or the name of a TTF file
present in the classpath)
PDF embedded A flag that specifies whether an external TrueType font (TTF) file should be included
in the PDF file
PDF encoding A string that specifies the name of the character encoding
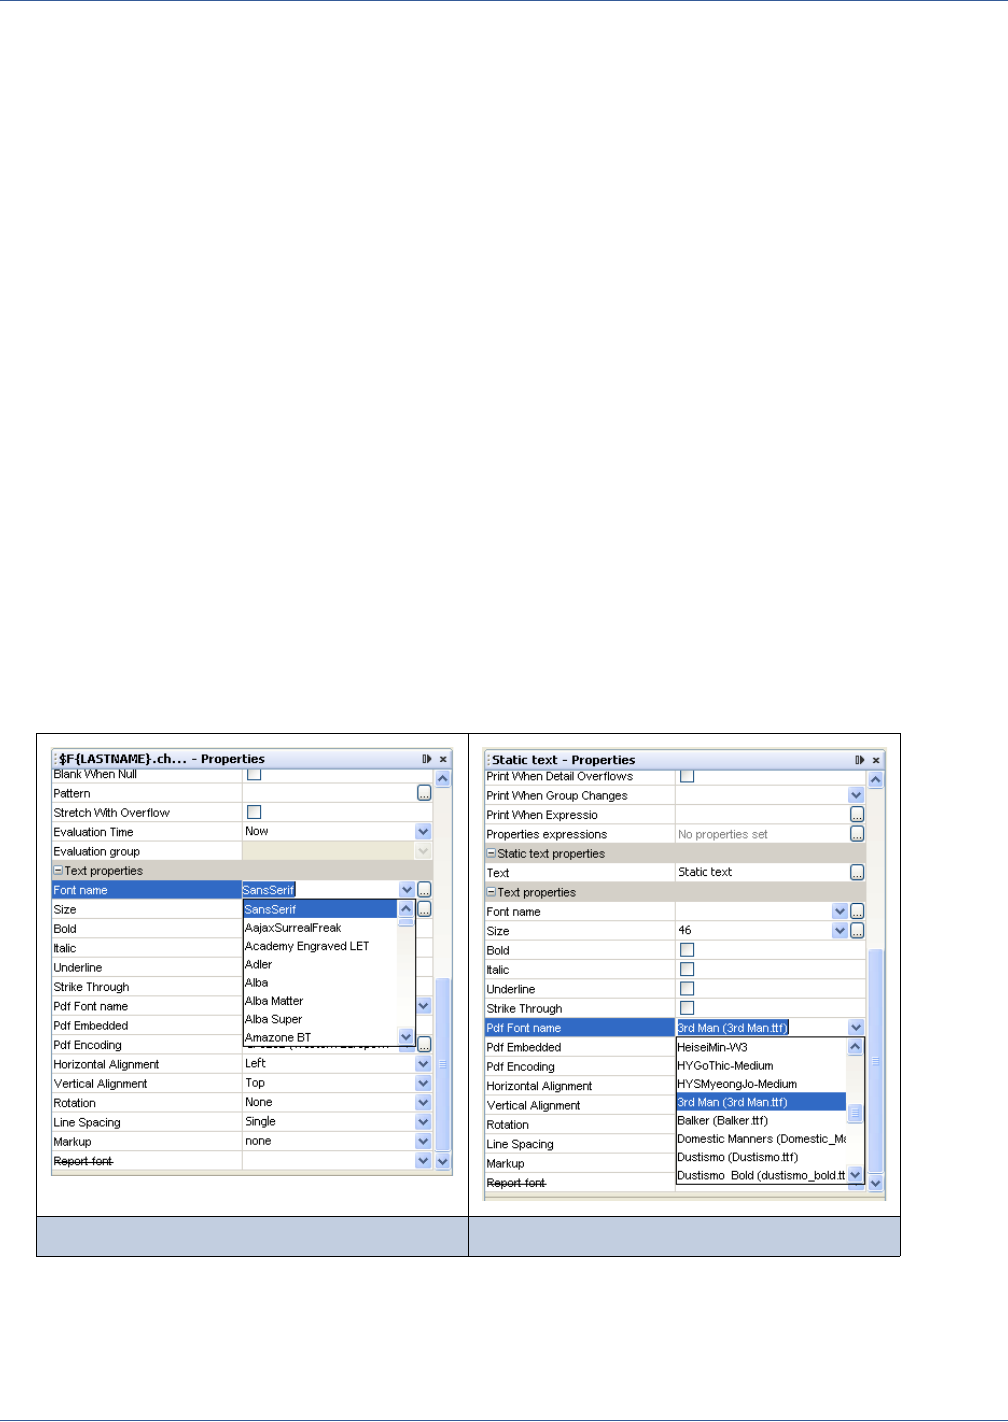
126
iReport Ultimate Guide
ignores the Bold and Italics attributes when exporting a report as a PDF, since these particular characteristics are part of the
font itself and cannot be overridden. If you look at the list of pre-defined PDF fonts you will see something like this:
Helvetica
Helvetica-Bold
Helvetica-BoldOblique
Helvetica-Oblique
...
So, for example, if your report includes text formatted in Helvetica and the textfield must be rendered in bold, you have to
choose the Helvetica-Bold font. You will also see that some attributes, such as underline and strikethrough, do not exist as
separate font names because they are built into all fonts.
8.2 Using TrueType Fonts
You can use an external TrueType font. To do so, the external fonts (files with .ttf extensions) must appear in the classpath.
Note that any TrueType fonts you use must be available as you design the report in iReport and whenever the JasperReports
report engine generates an instance of the report, such as when a servlet or Java or Swing program prints a version. This simple
way to use True Type font has been actually deprecated. If you are using True Type fonts, you are probably exporting your
report in PDF and probably your requirement is to embed the custom font inside your documents. To do that, there are specific
PDF-related properties for the text elements in JasperReports, but all of them has been deprecated since version 3.6.2. The best
solution is to use a Font Extension, a kind of JasperReports plug-in to deploy the fonts you are using in your application. The
font extensions are explained later in this chapter. For now, let’s continue to explore the old way to use a TrueType font.
In the Font name combo box in the property sheet for static and textfields, only the font families available as extensions and
the system fonts, managed by the Java Virtual Machine (JVM), are shown (see Figure 8-1). These are usually inherited by the
operating system. Therefore, you must install an external TrueType font on your system before use it in non-PDF reports or
better create a font extension for it.
The Font name property can be freely edited. If the specified font name is not found, JasperReports will use the default font
instead (which is an open source font called DejaVu).
Figure 8-1 System fonts Figure 8-2 PDF font names
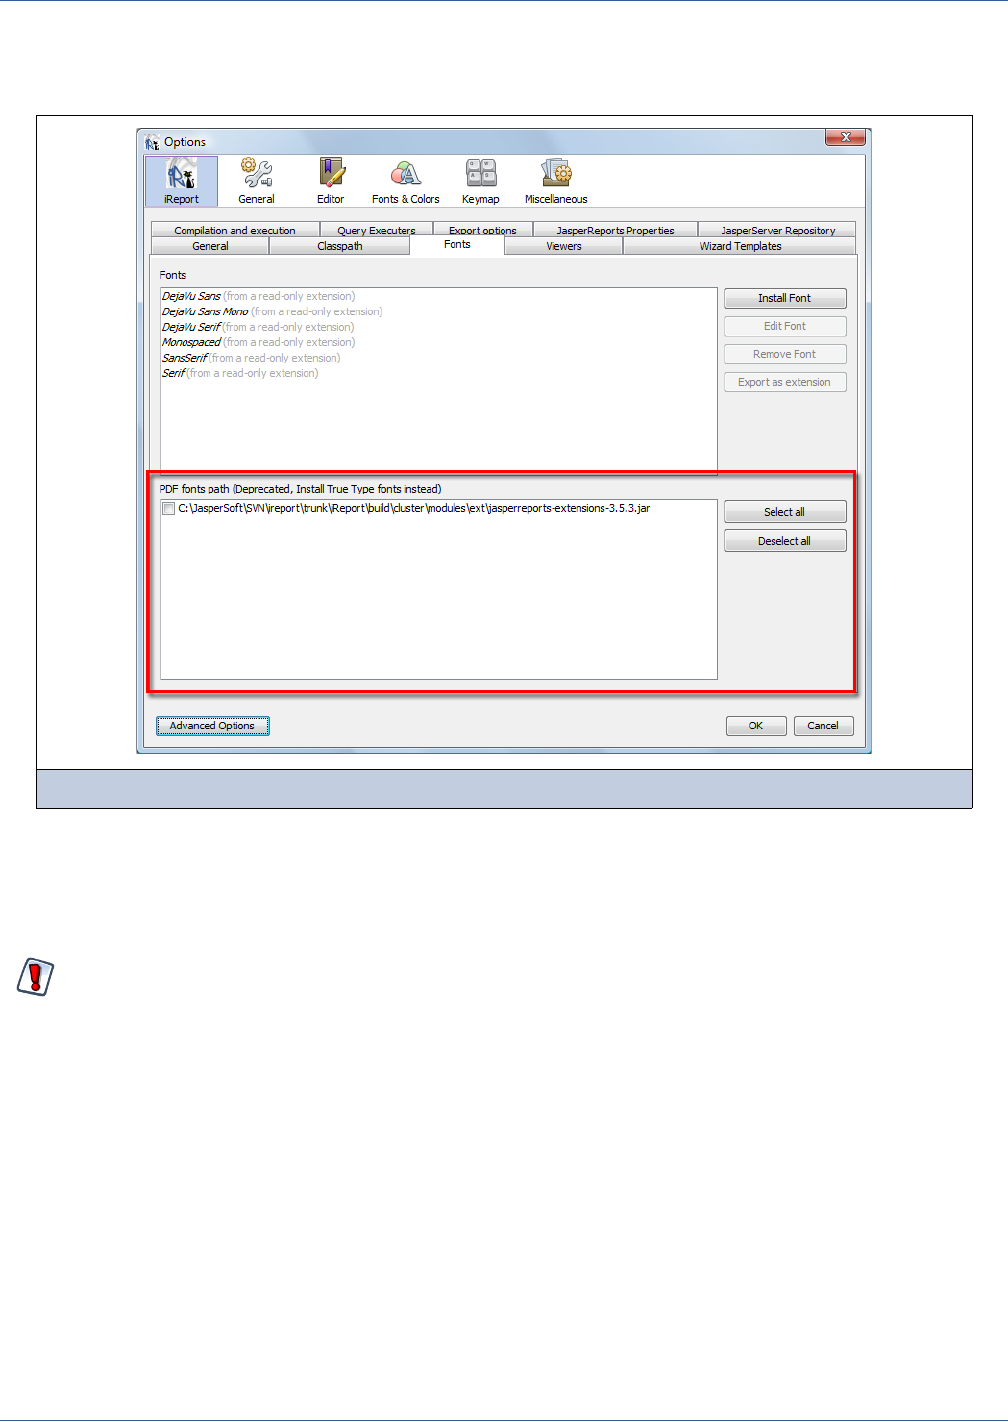
Fonts and Styles
127
The list of available PDF Font names is compiled from the set of built-in PDF fonts and the list of the TrueType fonts found in
the font paths (each item is presented with the font name and the name of the TrueType font to which it refers). You can set the
font paths in the Options dialog.
In general, JasperReports (the report engine) looks for fonts in the classpath. Since scanning the entire classpath for all the
available fonts can significantly delay report generation, iReport uses a subset of the classpath paths when looking for fonts.
To set the fonts paths, add them to the classpath first (see the Classpath tab in the Options dialog), then check them in the
Fontpath tab.
If you need to use a TrueType font that is not available when you are designing your report, edit the TTF file name directly in
the combo box. Please note that if the file is not found when the report is run, an error will result when you export it as a PDF.
If the selected font is an external TTF font, to ensure that the font is viewed correctly in the exported PDF document, select the
PDF Embedded check box.This forces the report engine to include the required fonts as metadata in the PDF file (but note that
it increases the document size).
8.3 Using the Font Extensions
As we hinted in the previous chapter, the best way to define and use a font in JasperReports is to create and use a font
extension. Support for font extensions was introduced in iReport 3.6.2 even though it was available in JasperReports for a long
time before. The aim of a font extension it to be sure that a text element that uses a particular font family is rendered in the
same way on different systems. This is not obvious. In particular, the Java virtual machine can map different logical font
family names to different physical fonts. This can lead, for instance, to losing parts of the text in a text element that has been
Figure 8-3 Font paths in the Options dialog
Avoid adding hundreds of TrueType fonts to the fontpath because they slow down iReport’s startup. For Windows in
particular, avoid adding the %WINDIR%\fonts directory to the fontpath.
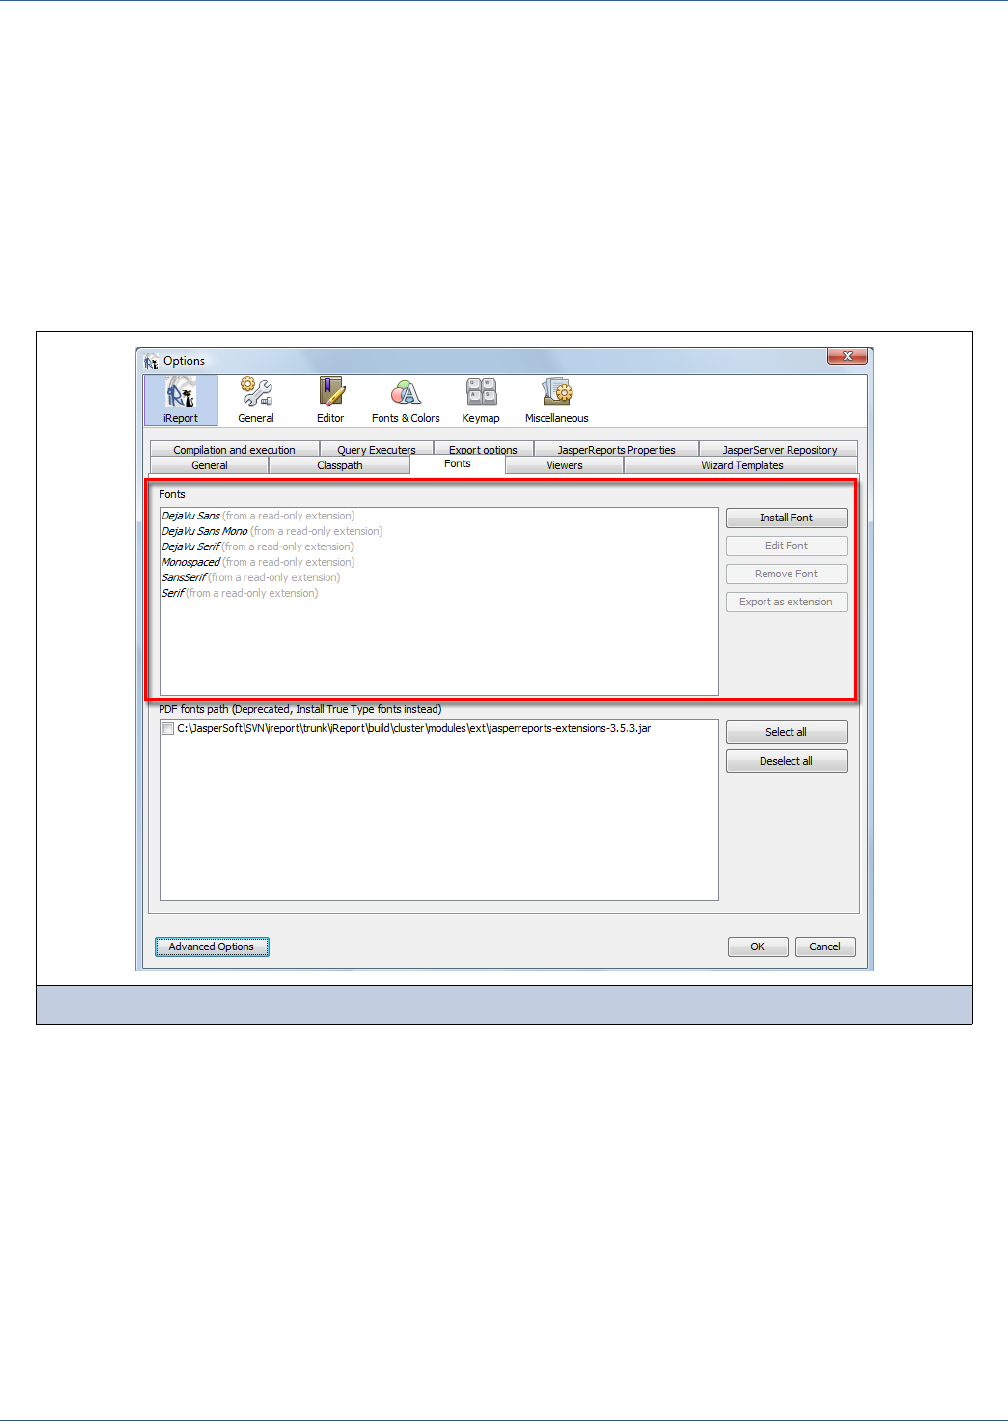
128
iReport Ultimate Guide
designed for a specific font on a specific platform. On other platforms, the same font might be rendered differently or it might
not be available at all.
There are then other advantages mainly when working with PDF files: when using an extensions, is no longer required to set
the font to use when the report is exported in PDF (note that the font specified in the property font name is not the same font
used when the report is exported in PDF), the bold and italic fonts can be specified inside the extension and finally there is no
longer needed to set the text encoding of a particular text element. All these information are defined inside the font extension.
The idea behind a font extension is to force JasperReports to work with True Type fonts instead of using built-in or system
fonts. This assures that a specific font behaves in the same way wherever the report is executed. Font extensions can be created
in the Options panel of iReport (Tools → Options) in the Fonts tab (Figure 8-4). What you need it a TrueType font file (and,
depending on the font and its font styles, or typefaces, files containing the corresponding bold, italic, and bold-italic versions
of the font).
By clicking Install Font it is possible to create a font extension managed internally by iReport. This font extension can be
modified and exported to a JAR to be used in other applications.
1. Once you have clicked Install Font, the Font Installation wizard pops up. In the first step, specify the main TrueType font
file (Figure 8-5).
Figure 8-4 Font extensions
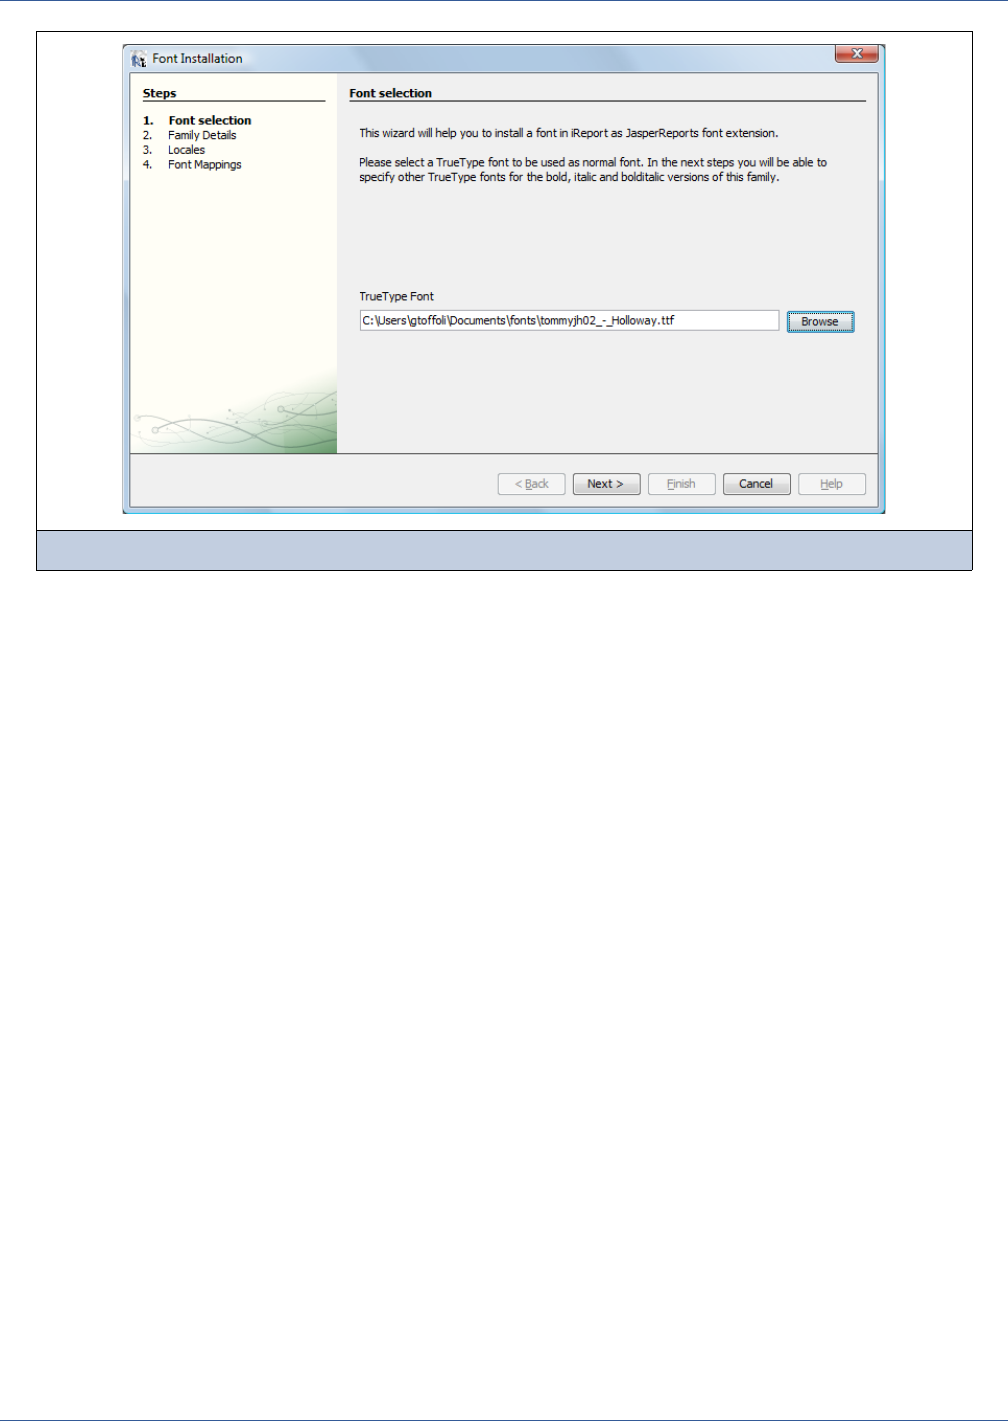
Fonts and Styles
129
2. Click Next.
iReport reads the font and selects the font’s family name that is embedded in the TTF file (Figure 8-6). This name is the
logical name used by JasperReports and it is arbitrary. When JasperReports renders a text element, if the font name
property is set, it looks for a font extension corresponding to the font name. If an extension is found, JasperReports
renders the text. If an extension is not found, the font name will be treated as a system font name and the Java Virtual
Machine will be responsible for providing the correct font.
In this step it is also possible to specify the TTF files for the bold, italic and bold italic versions of the font. Professional
fonts usually have all these four TTF files (normal, bold, italic, bold-italic).
Finally, it is possible to specify the encoding of the font (this depends by which characters the font contains) and whether
the font should be embedded in the PDF documents (which is strongly suggested for custom fonts).
Figure 8-5 Font Extension Wizard - Font selection
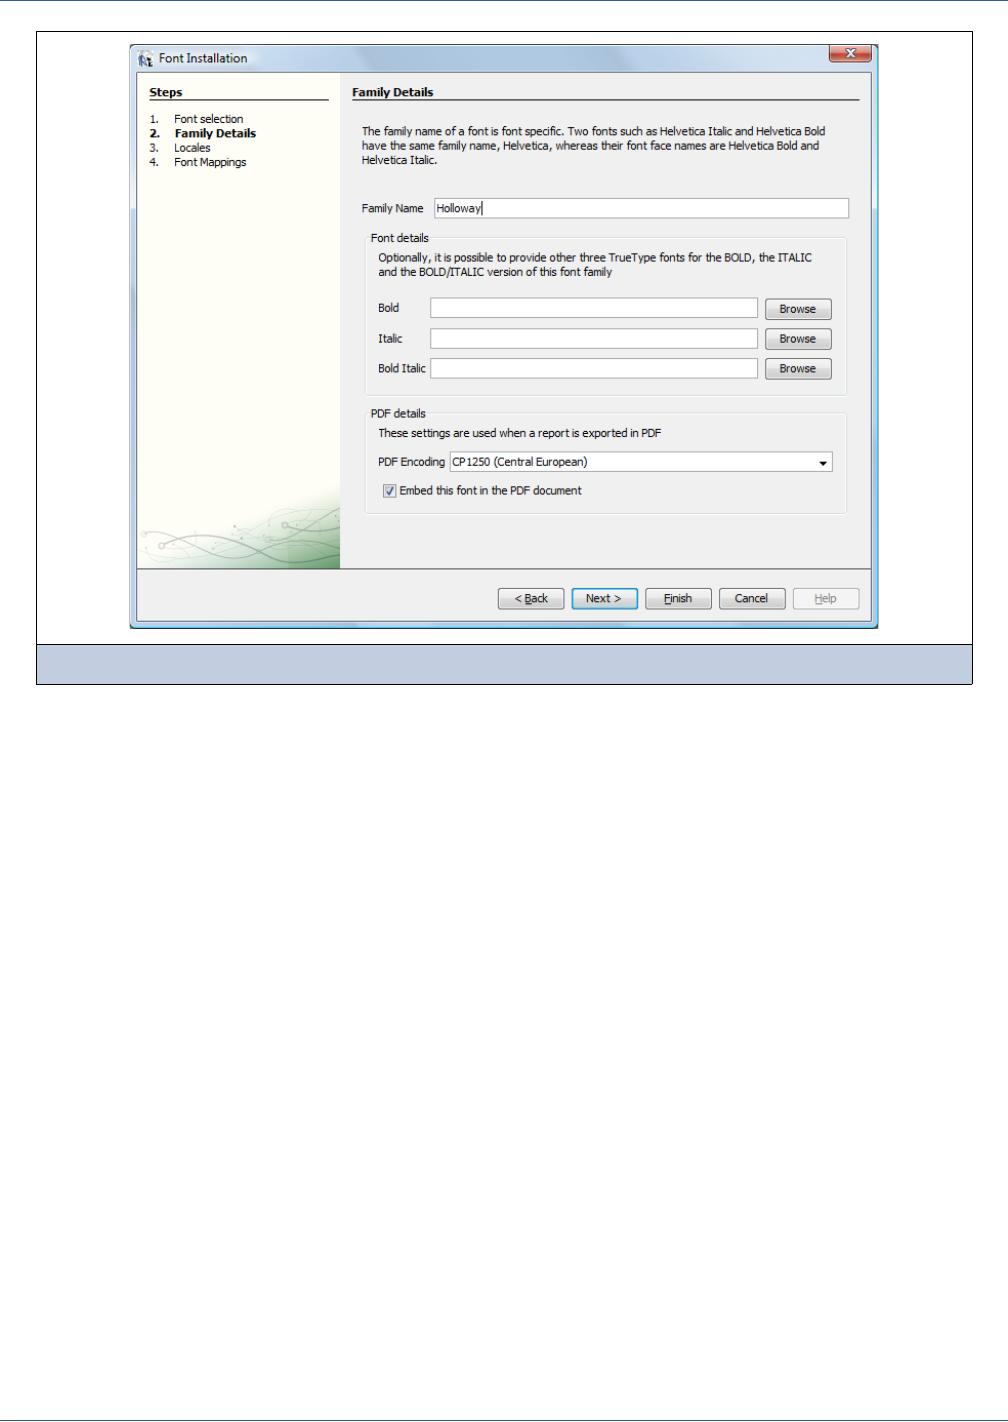
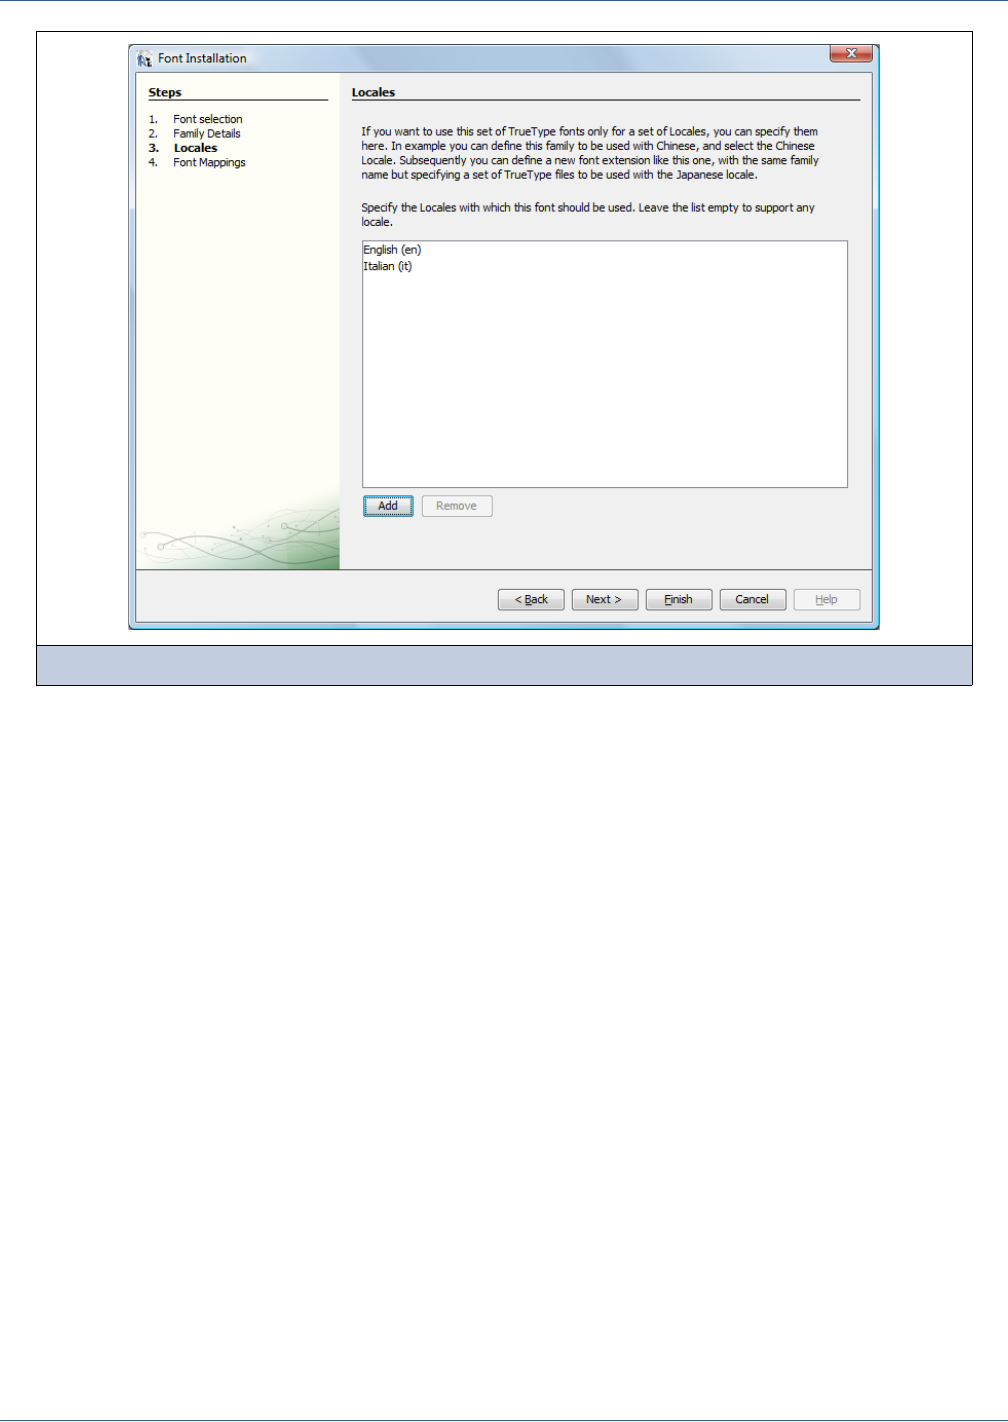
Fonts and Styles
131
For example, you can define an extension for the family MyFontFamily that is valid only for Latin languages, and another
extension with the same font family name that is valid for Asian languages that may require special glyphs usually not
available in the TTF files. Leave the list empty if the font can be used with any languages.
2. The final step (Figure 8-8) can be used to define the font family’s font names to be used by the HTML and RTF
exporters.
Suppose we are exporting to an HTML document a report having a text element with font name MyFontFamily. The font
MyFontFamily cannot be recognized by a browser since it does not refer to a known system font, and the TTF file of the
extension cannot be used by the browser. So we set the name of a replacement font that can be used instead, such as
”Arial.” For HTML, we can set more than one name, such as “Verdana, Arial.” The order of the font names indicates the
order in which the web browser should search for the replacement font. Once a replacement font is found, the browser
stops searching and renders the text.
Figure 8-7 Font Extension Wizard - Locales
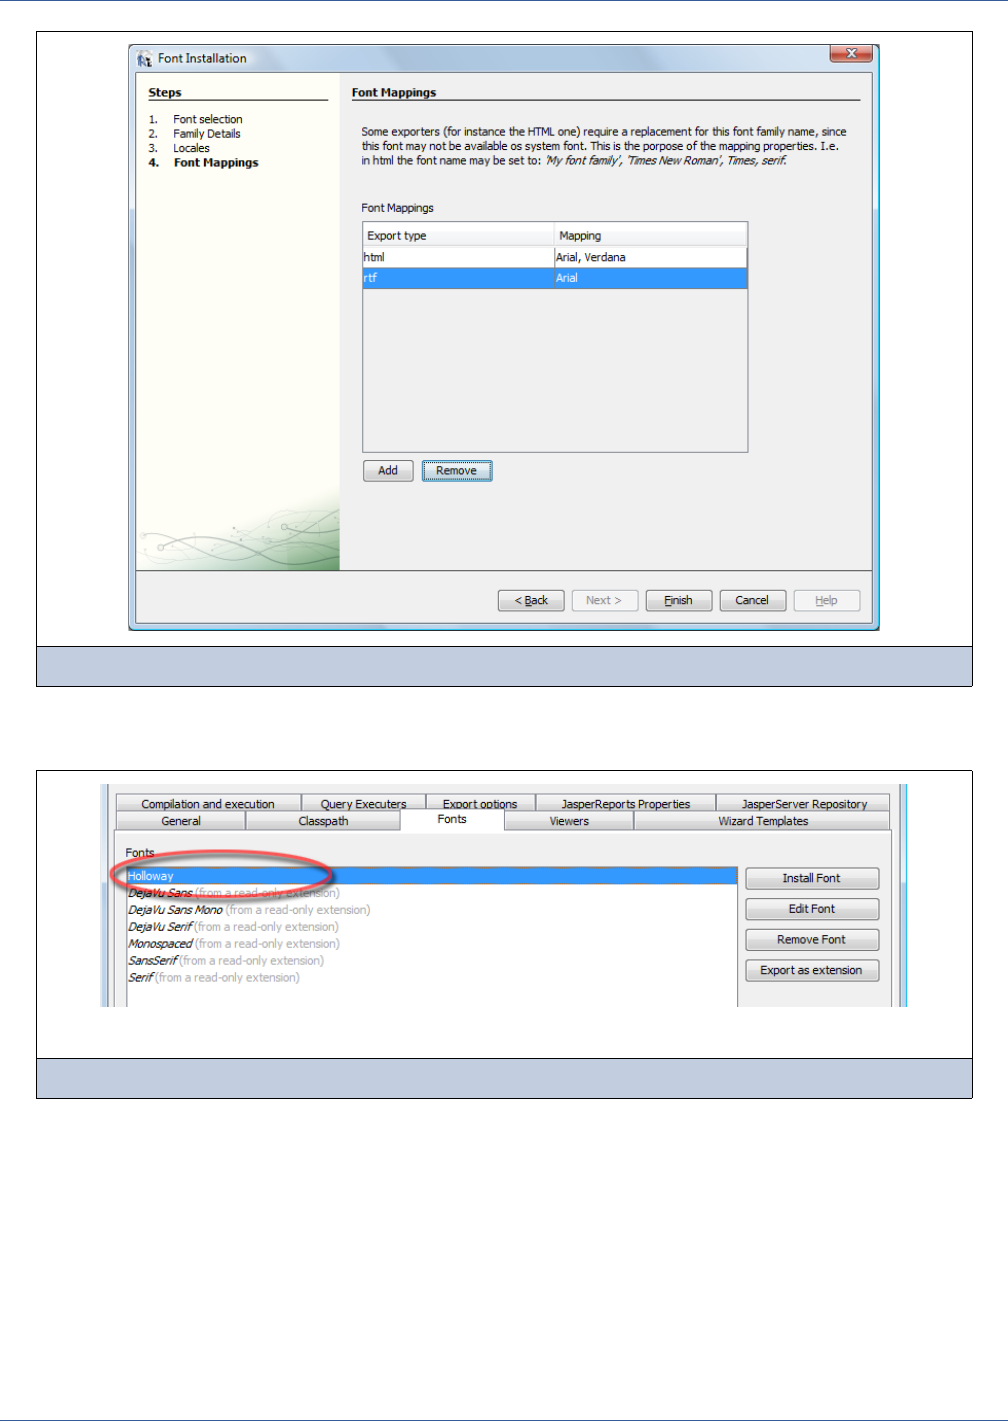
132
iReport Ultimate Guide
When the extension has been completed, iReport installs it. The new extension becomes visible in the fonts list in the Options
panel (Figure 8-9), and it is added to the font combo box in the Text tool bar (Figure 8-10).
Figure 8-8 Font Extension Wizard - Font Mappings
Figure 8-9 Font Extension Wizard - Family Details
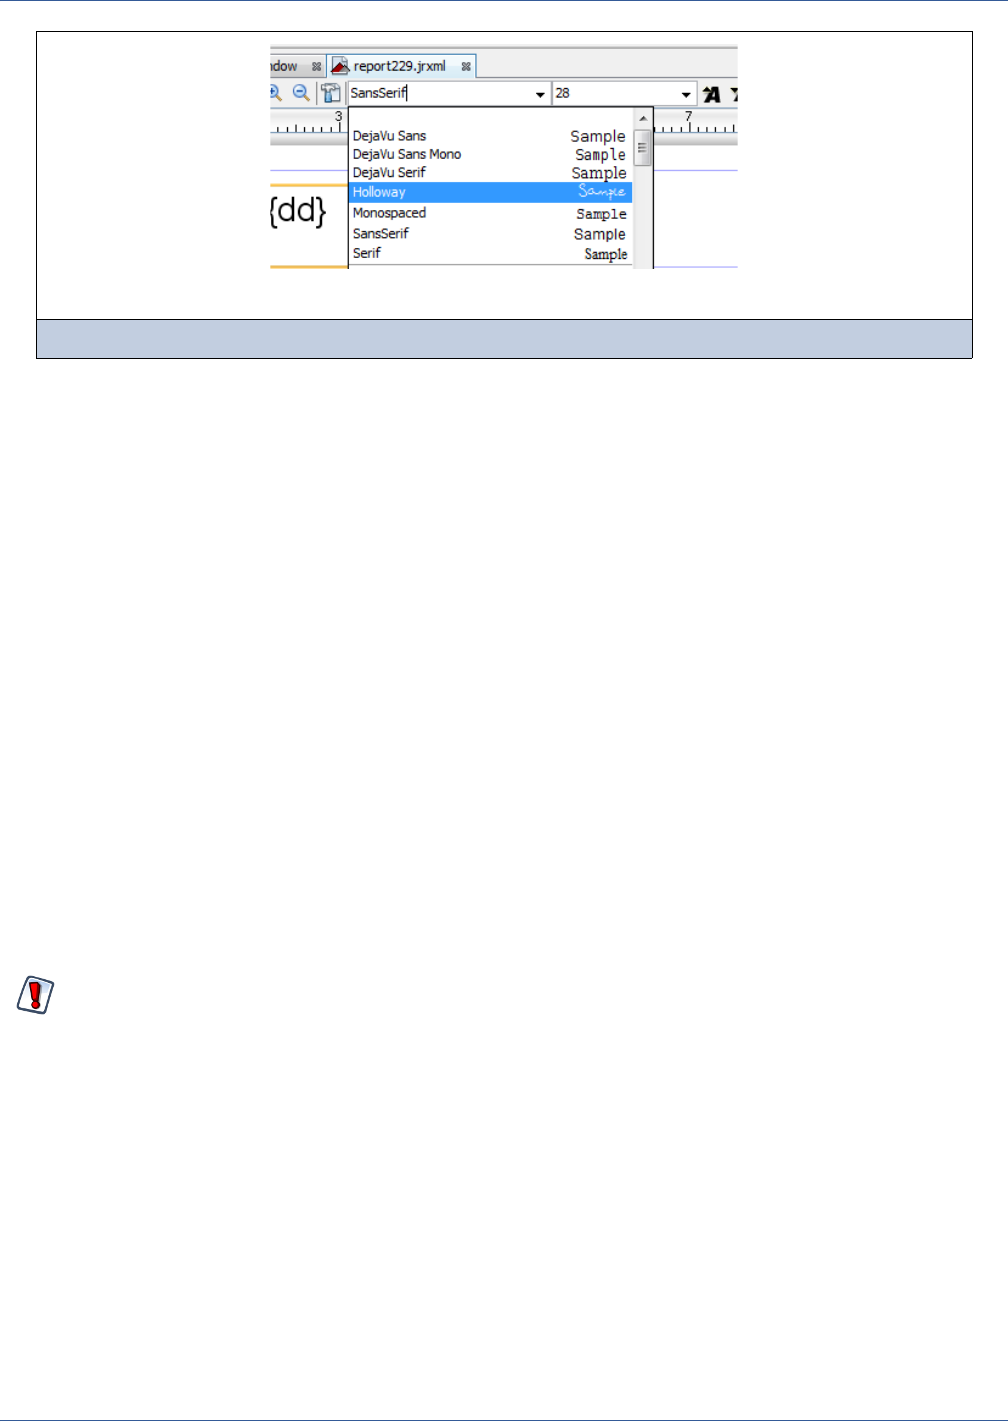
Fonts and Styles
133
By clicking Export as extension, it is possible to export one or more font families and create JasperReports extensions
automatically (in the form of a JAR that must be added to the classpath of your application).
If you already have a font extension, you can install it by adding the JAR to the iReport classpath.
8.4 Character Encoding
Correct character encoding is crucial in JasperReports, particularly when you have to print in PDF format. Therefore, it is very
important to choose the right PDF encoding. The encoding specifies how characters are to be interpreted. In Italian, for
example, to print correctly accented characters (such as è, ò, a, and ù), you must use CP1252 encoding (Western European
ANSI, also known as WinAnsi). iReport provides an extensive set of pre-defined encoding types in the PDF Encoding combo
box in the Font tab of the element properties window.
If you have problems with reports containing non-standard characters in PDF format, make sure that all the fields have the
same encoding type and check the charset used by the database from which the report data is read.
8.5 Use of Unicode Characters
You can use Unicode syntax to write non-Latin-based characters (such as Greek, Cyrillic, and Asian characters). For these
characters, specify the Unicode code in the expression that identifies the field text. For example, to print the Euro symbol, use
the Unicode \u20ac character escape.
8.6 Working with Styles
The Report Inspector displays the available styles in the outline view, in the node labeled Styles. To create a new style, right-
click the Styles node and select Add style from the contextual menu (see Figure 8-11).
Figure 8-10 The new font family available in the Fonts combo box
The expression \u20ac is not simple text; it is a Java expression that identifies a string containing the € character. If
you write this text into a static text element, “\u20ac” will appear; the value of a static field is not interpreted as a Java
(or other language) expression (this only happens with the textfields where the context is provided using an
expression).
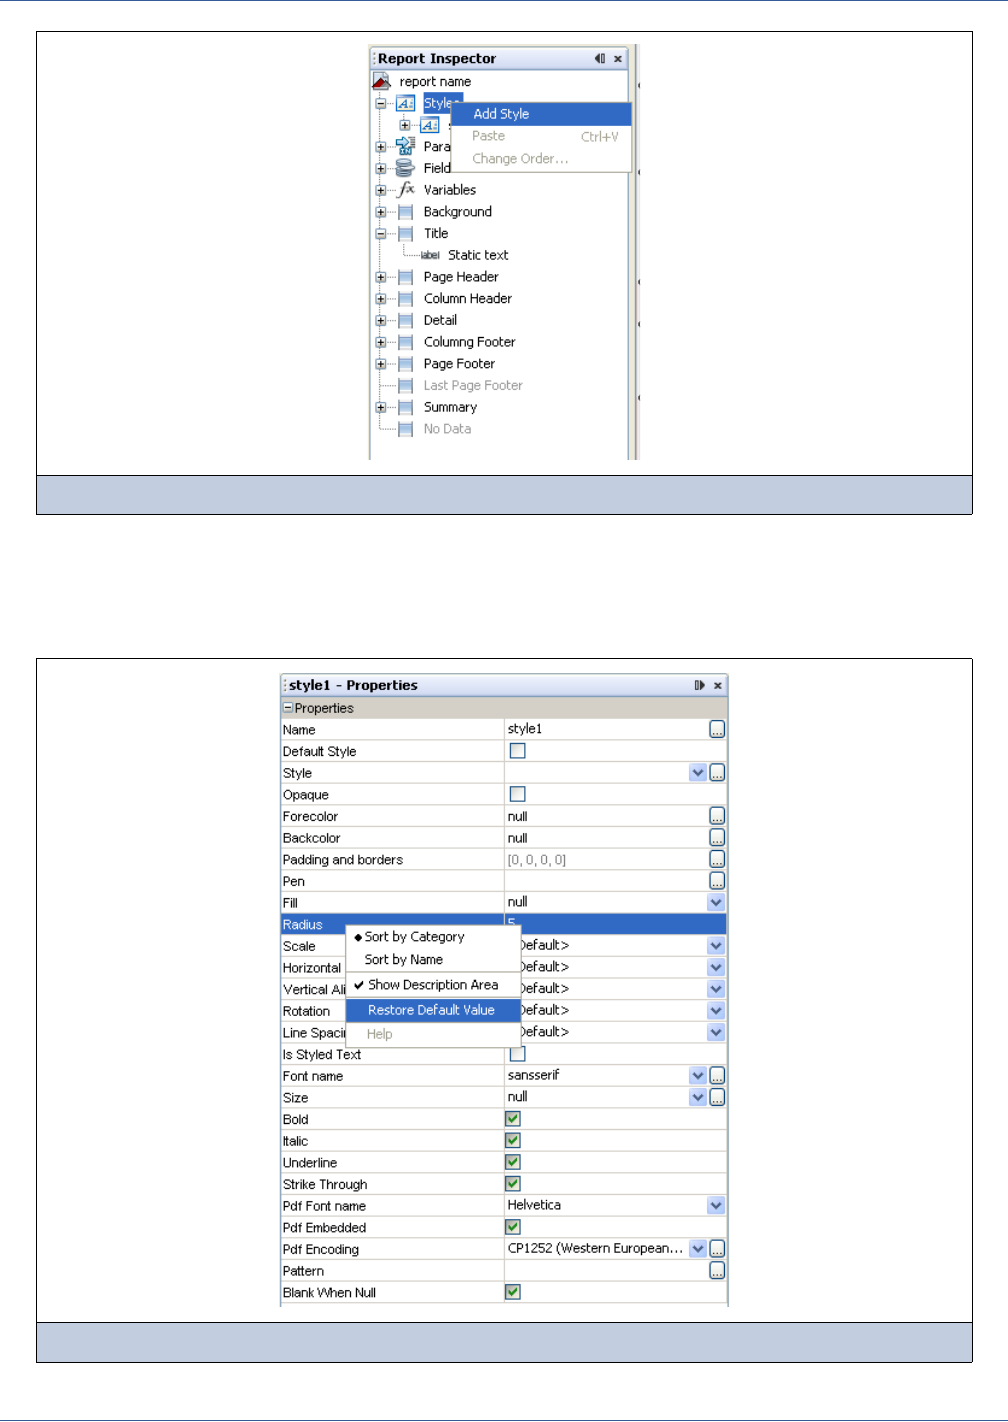
134
iReport Ultimate Guide
You can define many properties for a style, which are then shown in the property sheet (Figure 8-12). The only property value
of a style that must be set is Name. All other properties are optional.
Leave the default value as-is when you don’t want to set a specific value for a property. To restore a default value, right-click
the property name and select Reset to default value. (This works with all the element properties that support a default value.)
Figure 8-11 Adding a new style to the document
Figure 8-12 All the properties of a style
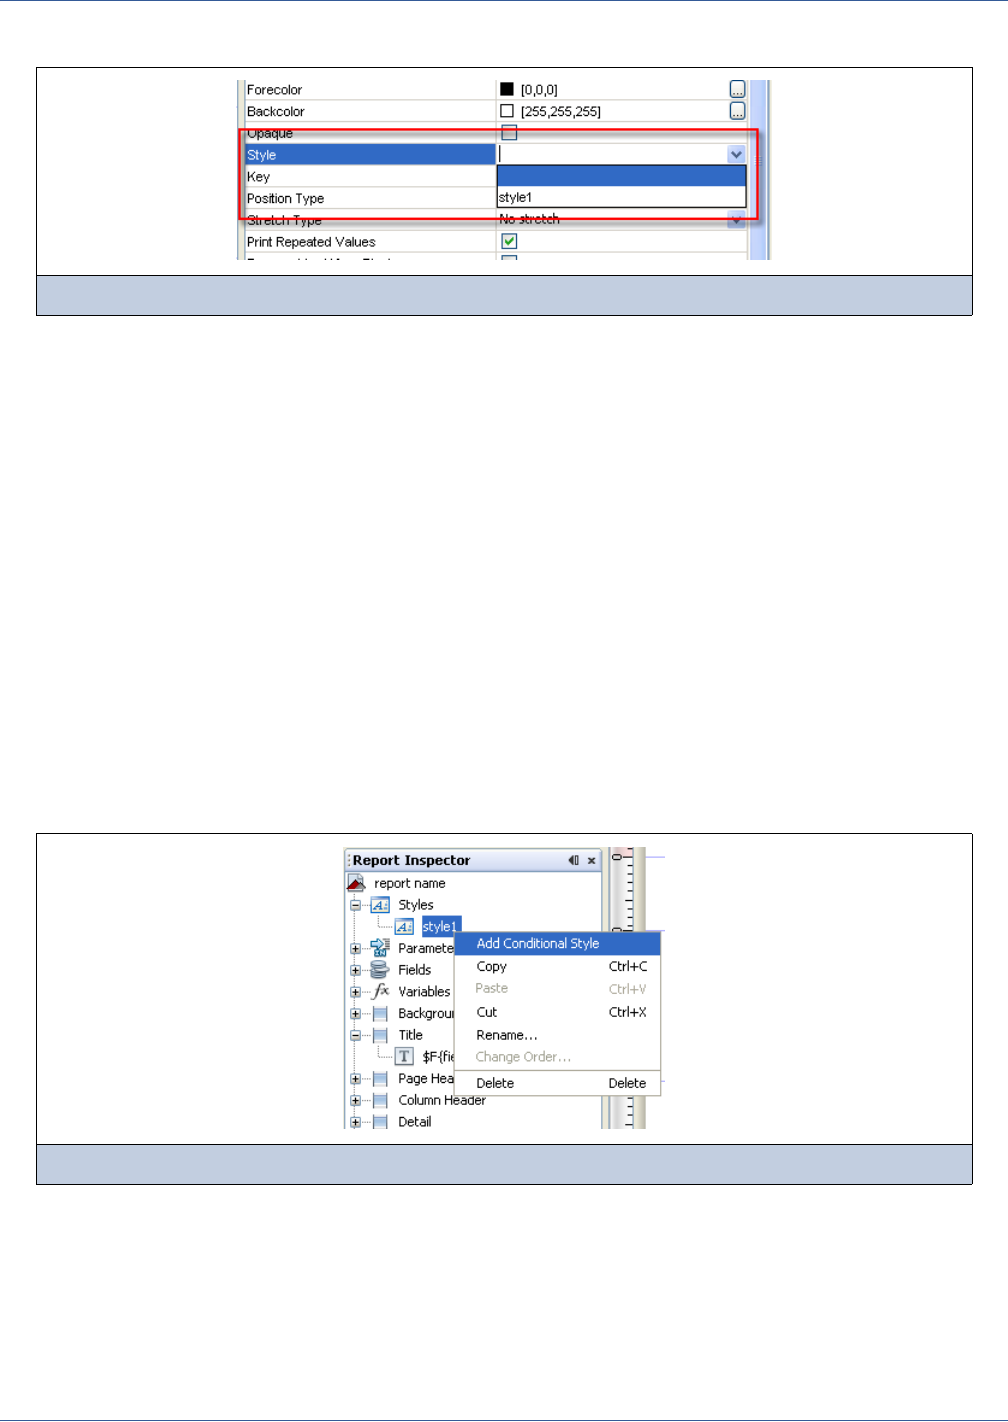
Fonts and Styles
135
To apply a style to an element, select the element and set the desired style in the property sheet (Figure 8-13).
You can choose a specific style to be the default style for your report. When setting a default style, all the element properties
having an unspecified value will implicitly inherit their value from the default style. The Parent style property defines the style
from which the current one inherits default properties.
The remaining properties fall into the following four categories:
Common properties
Graphics properties
Border and padding properties
Text properties
For details about the properties, refer to Chapter 5.
8.7 Creating Style Conditions
You can design your report so that a style changes dynamically. For example, you can set the foreground color of a textfield to
black if a particular value is positive and red when it is negative. iReport creates conditional styles as deriving from an existing
style, for which we set the condition and change some properties.
To apply a condition to a style, right-click the style node and select Add Conditional Style (see Figure 8-14).
You can reconfigure all the values of the parent style. The new values will be used instead of the ones defined in the parent
when the condition is true. The new conditional style will appear in the outline view. You need to set the condition (actually an
expression that returns a Boolean value) that will be evaluated during the rendering of elements that use the style.
In the condition expression you can use all the properties of the report object. Please note that the conditions cannot be generic,
for instance, you cannot set a condition like “if the number is positive” or “if the string is null.” You must be very specific,
specifying, for example, that a particular value (field, parameter, variable or any expression involving them) must be positive
or null, and so on.
Figure 8-13 Style property of an element
Figure 8-14 Setting a conditional style
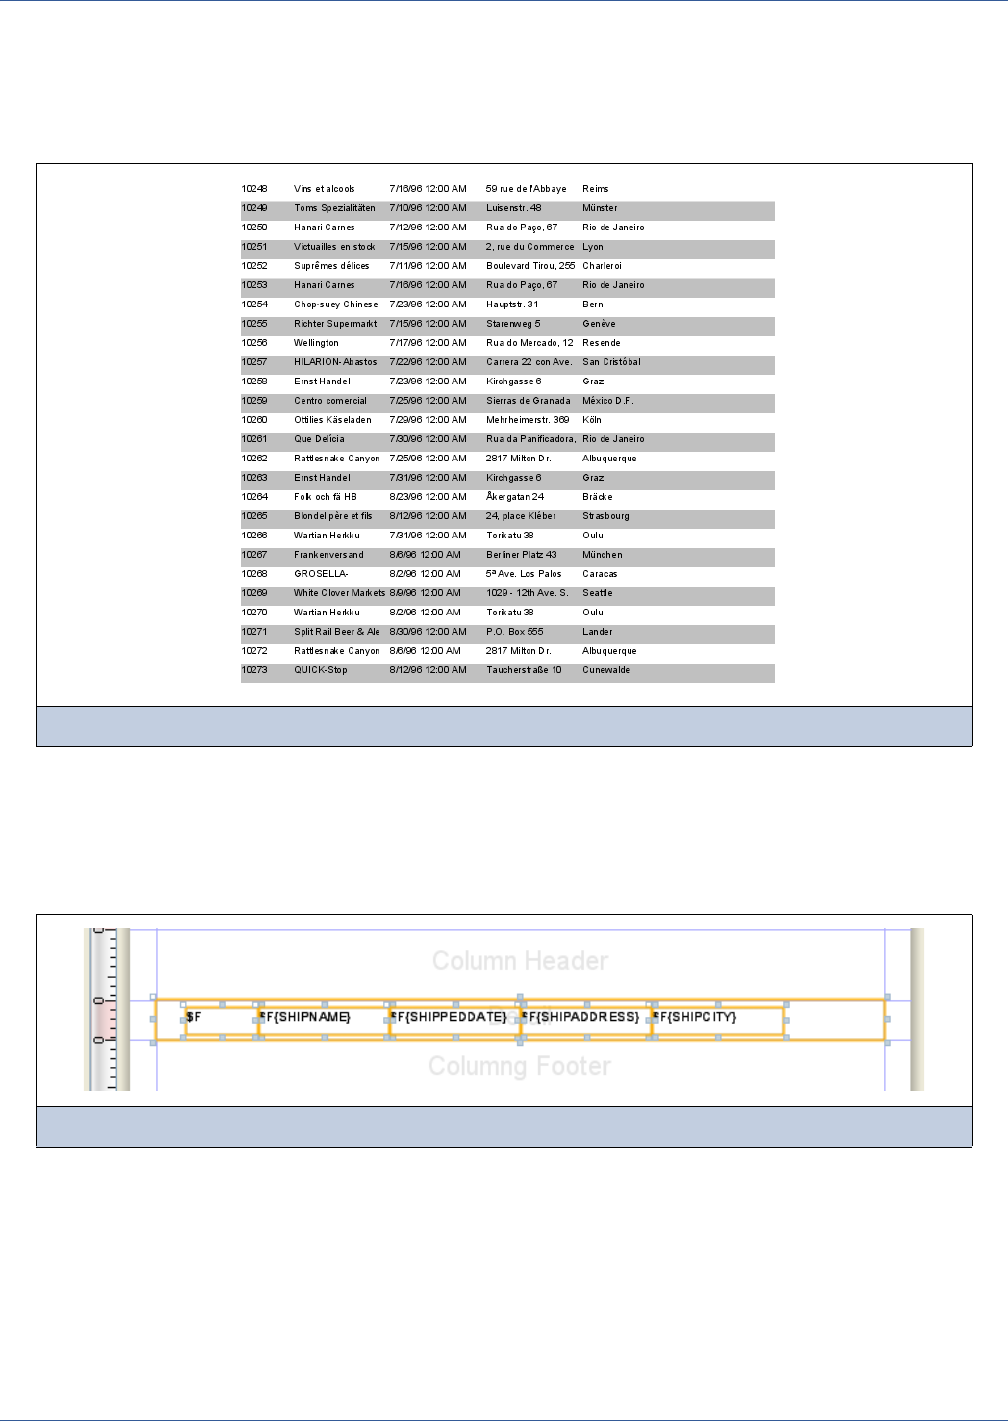
136
iReport Ultimate Guide
A style can have an arbitrary number of conditional styles. A good example of this would be designing your report to display a
particular field in a different color (let’s say depending on the total number of orders placed). You would set the foreground
color as red in the base style, then add a conditional style to be used when the variable $V{total_orders} is less that 5 for
which the color would be red, another conditional style with the foreground color set to yellow when the same value is
between 6 and 10, and green for another conditional style for a number of order greater than 20.
Let’s see an example of using a conditional style to achieve the effect of having an alternating background for each row. The
effect is shown in Figure 8-15.
The trick is pretty simple. The first step is to add a frame element in the Detail band. The frame will contain all the elements of
the band, so we are using the frame as if it were the background for the band itself; in fact, the frame should take all the space
available in the band. Then all the textfields will be placed inside the frame (see Figure 8-16 and Figure 8-17).
Figure 8-16 does not reflect the real design, I just tried to project the idea that the textfields showing the real data are inside a
the frame that covers the entire surface of the band.
Figure 8-15 Alternated color for each row
Figure 8-16 All the elements are placed inside the frame

Fonts and Styles
137
This should be particularly clear looking at the outline view (Figure 8-17).
First we define a new style (let’s call it Style1). We will keep all the default values, since we are not interested in changing
them when the row number is odd (1, 3, 5, etc...). Now we add a conditional style and set as the condition the expression:
($V{REPORT_COUNT} % 2) == 0
Remember, we have been using Groovy or JavaScript as the report language. In Java the expression would be a bit more
complicated; for example:
($V{REPORT_COUNT}.intValue() % 2) == 0
What the expression does is calculate the rest of the set by 2 (the operator % has this function). We need to see if the remainder
is 0. If it is, the current row number (held by the REPORT_COUNT built-in variable) is even, we use the conditional style Style1.
For this style, we set the background property to a light gray (or any other color of our choice) and the opaque property to true
(otherwise the previous property will not take effect). Finally, we apply the style to the frame element by selecting the frame
and setting the style property to Style1.
Run the report. The results should be exactly what is presented in Figure 8-15.
8.8 Referencing Styles in External Property Sheets
Often you will want to use the same styles in multiple reports. You can create a property sheet for each style in a JRTX file and
reference the file in all the reports, rather than define the style in every report separately. Using the referenced file, you can
apply style changes across all the reports and insure that the reports have the same properties.
To create a style property sheet in a JRTX file:
1. In the main menu, click New and select an empty report.
2. Select File → New.
3. Select Style from the left side of the New File panel.
4. Click the Finish button.
5. Enter a name and location for the new JRTX file.
For best performance, save the file locally rather than on a shared or network drive.
Note that the template file extension is .jrtx.
6. Click Finish.
7. Select New Style in the Template Inspector.
8. In the Property panel, set the properties of the style (see Figure 8-12).
9. Save the style.
10. Create and save as many additional styles as you need.
Figure 8-17 The outline view shows the elements hierarchy

138
iReport Ultimate Guide
11. Save the template.
12. Close the report.
To apply styles from a JRTX file:
1. Open the report that will use the styles.
2. In the Report Inspector, right-click Styles and select Add → Style reference.
3. In the file window that opens, select the template file.
The template’s styles should now appear in the Report Inspector.
4. Apply the styles to the report.
5. Save the report.
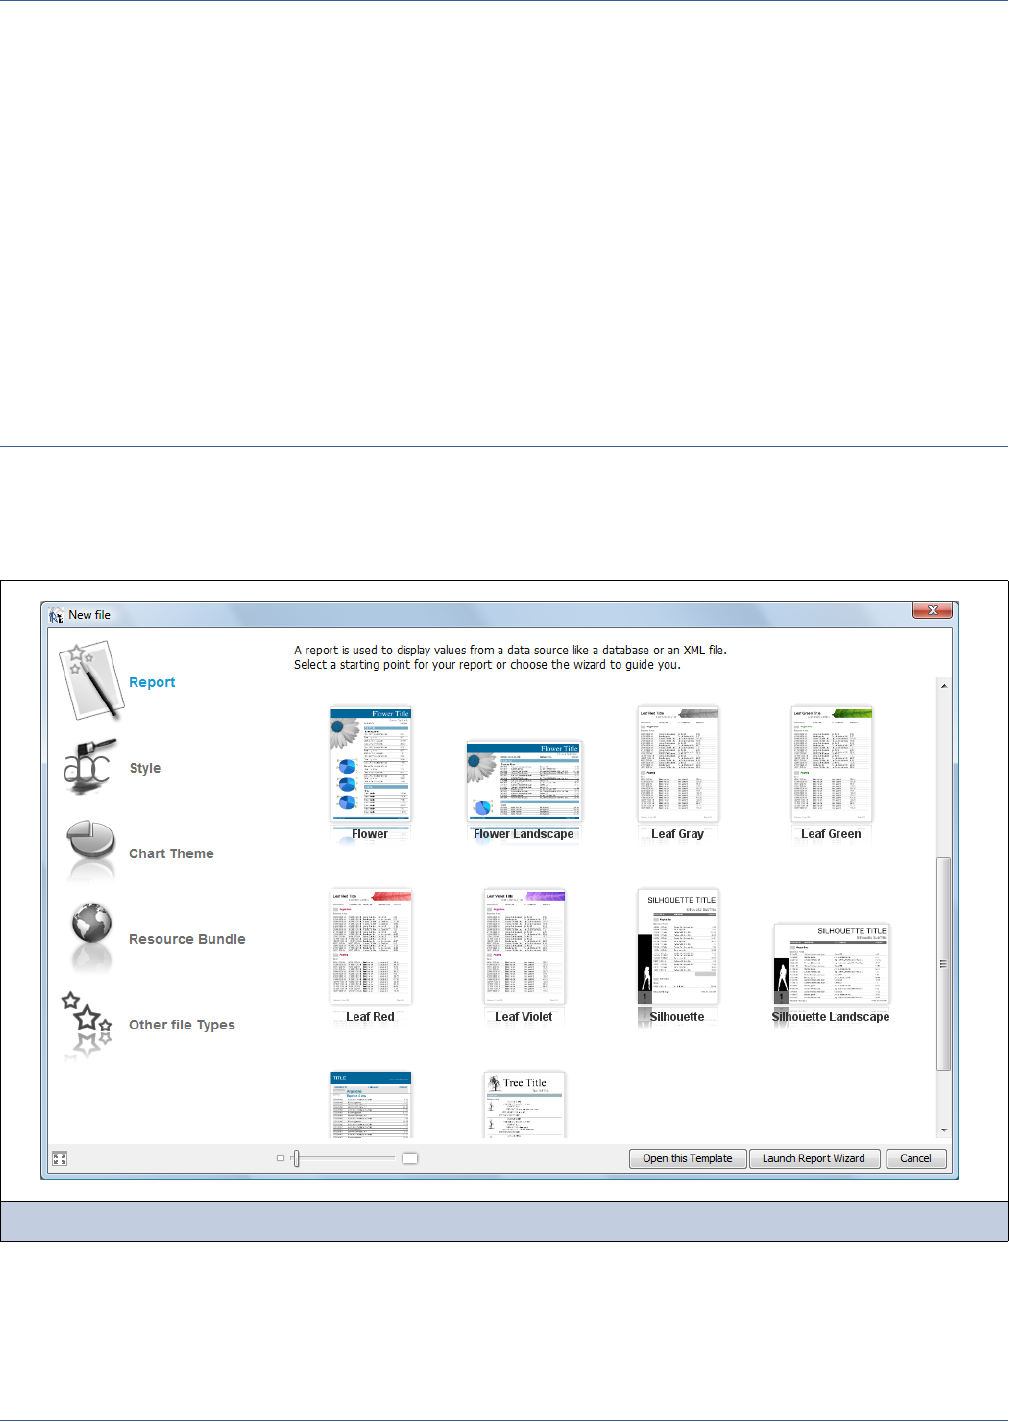
Templates
139
CHAPTER 9TEMPLATES
One of the most useful tools of iReport is the Template Chooser (Figure 9-1), from which the user can pick a template, a kind
of pre-built report. Templates can be used as the base for new reports with no further changes, and they can be used as a model
to which fields, textfields and groups can be added in the Report Wizard.
When the Template Chooser pops up, it scans the directory <ireport home>/ireport/templates, looking for JRXML files. In
addition, all the paths specified in the options as template directories or as template files are scanned in the same way. The
valid JRXML files found are proposed as possible templates. If a template provides a preview image, it is used in the file
chooser.
Figure 9-1 Template chooser

140
iReport Ultimate Guide
In this chapter, I will explain how to build a custom template that works well with the wizard as well as how to add new
templates to the ones already available so that they appear in the Template Chooser.
This chapter has the following sections:
Template Structure Overview
Groups
Column Header
Detail Band
Template Type and Other Options
Creating a New Template
Installing and Using the Template
9.1 Template Structure Overview
A template is a normal JRXML file. When a new report is created using the Report Wizard, the JRXML file of the selected
template is loaded and modified according to the options you have specified in the wizard steps. If the user chooses not to use
the wizard, the selected template is just copied along with all the referenced images in the location the user has specified.
In general, a template does not require special formatting or structure, especially if it is meant to be used only as the starting
point for a new report. However, with a little effort, we can provide templates that can be used by the wizard in really
productive ways.
The Report Wizard is able to create from a list of fields (selected by the user during the wizard steps) two types of reports,.
Even better, it is able to populate a template adding textfields and labels, organizing them in two ways: columnar and tabular.
The former is realized by adding two elements to each field in the record: a static text which is used as the label for the field
and displays the field name plus a textfield that displays the field value (Figure 9-2). The result is that for each record we get
a column with the names of the fields and a column with their values. All are placed in the Detail band. Notice that the Column
Header band is not used at all.

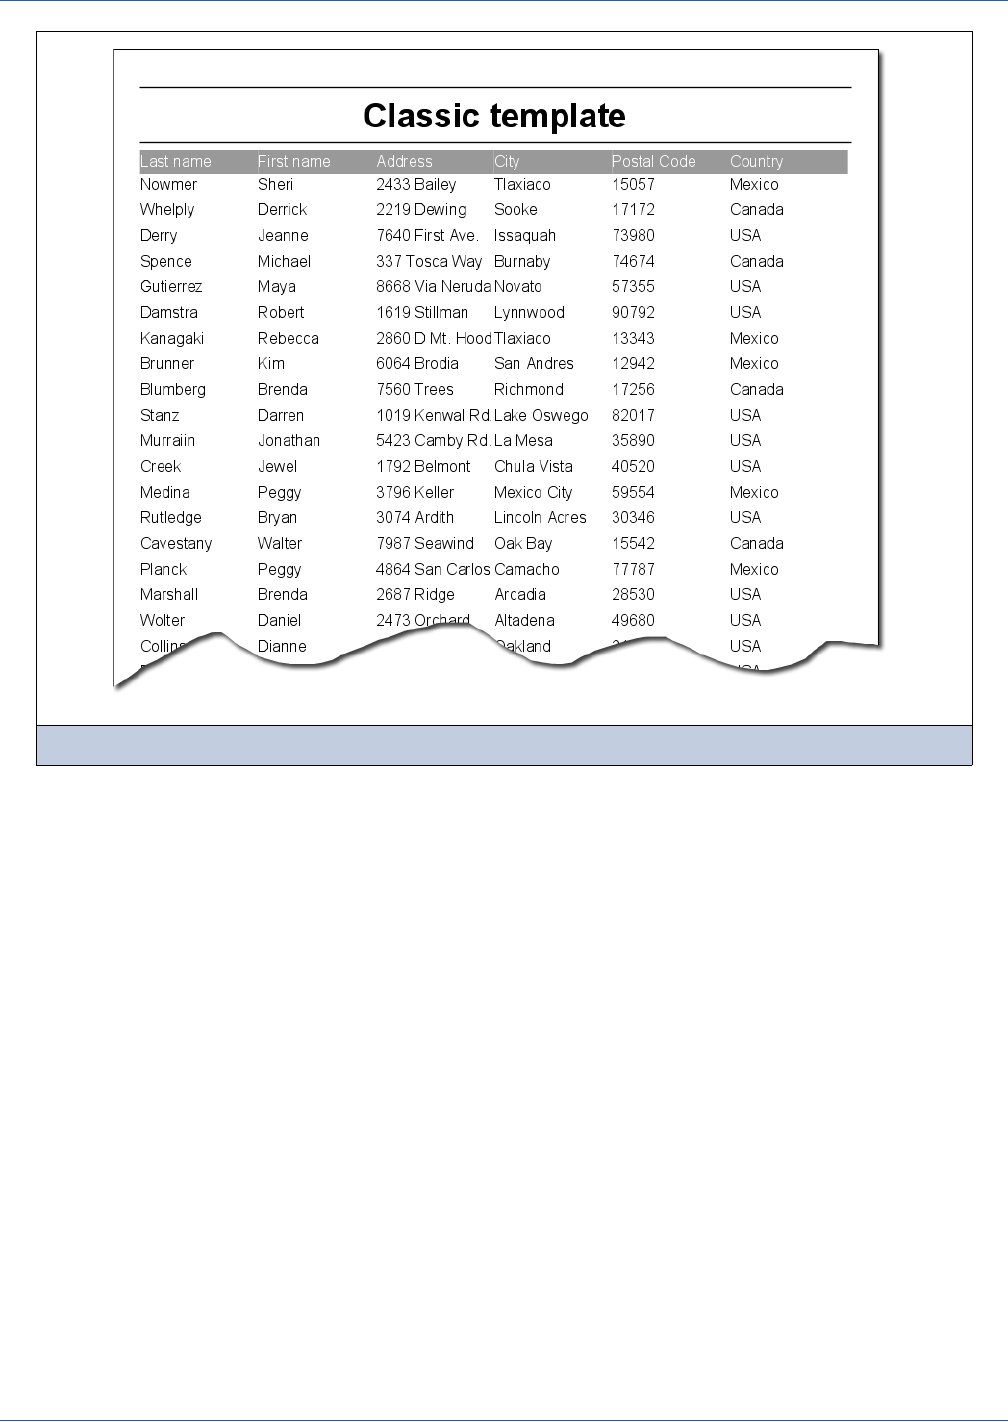
142
iReport Ultimate Guide
The labels for the field values are placed in the Column Header band, while for each field in the record, a textfield is placed in
the Detail band. The result is a column header showing the value names and, in the Detail band, many rows, one for each
record, showing the record data.
When the user chooses to group the data using the wizard step shown in Figure 9-4, the wizard creates all the necessary report
structures to produce the requested groups. The Report Wizard permits the creation of up to four groups, and a group header
and group footer is associated with each group. If the template defines one or more groups and the user requested to group the
data, the wizard tries to use the existing groups before creating new ones. By default, groups in the template are deleted if they
are not used. For each group, the wizard sets the group expression and adds a label for the name and a textfield showing the
value of the group expression (which is always a field name, since the grouping criteria set using the wizard is one of the
selected fields).
Figure 9-3 Tabular report
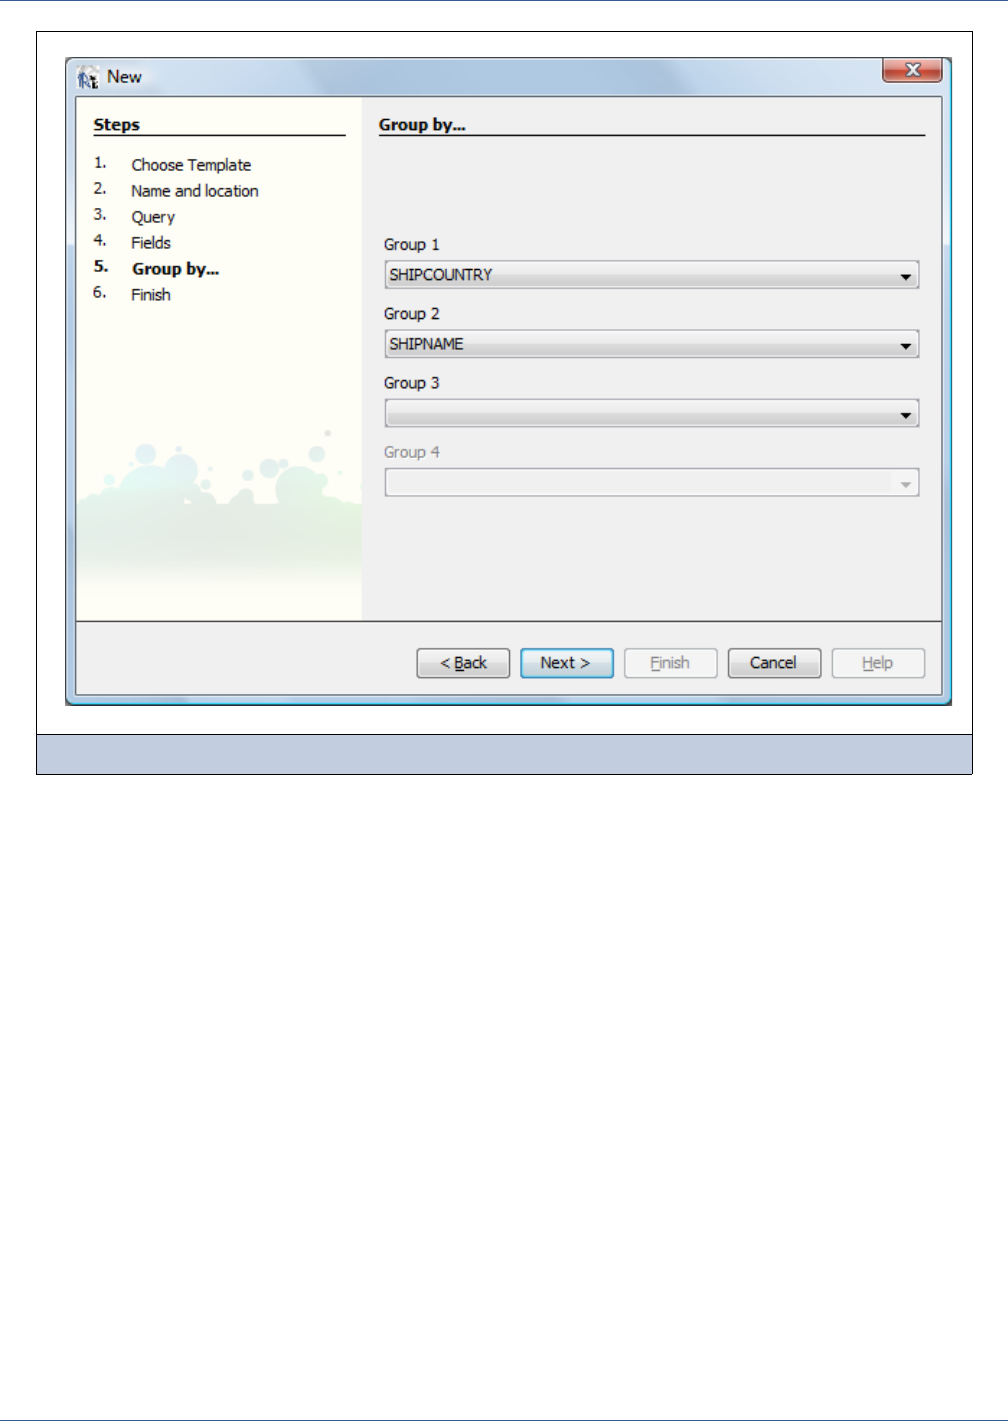
Templates
143
Summarizing, a template is a JRXML file with, optionally, some images. It can be used with no further changes when creating
a new file. If used with the Report Wizard, the wizard is able to modify the template adding field definitions, labels, and
textfields organized in a columnar or tabular way (if nothing is specified, the tabular format is used by default) as well as
groups.
Let’s see how to design a template to leverage the wizard capabilities by analyzing an old template file called classicC.jrxml.
This template is no longer shipped with iReport—it has been replaced by new templates—but given its basic graphic, it is
perfect for illustrating how a template should be structured.
The file is shown in Figure 9-5. It contains four groups: Group1, Group2, Group3, and Group4, for which the Group Header
and the Group Footer bands are visible.
Figure 9-4 Group by step in Report Wizard
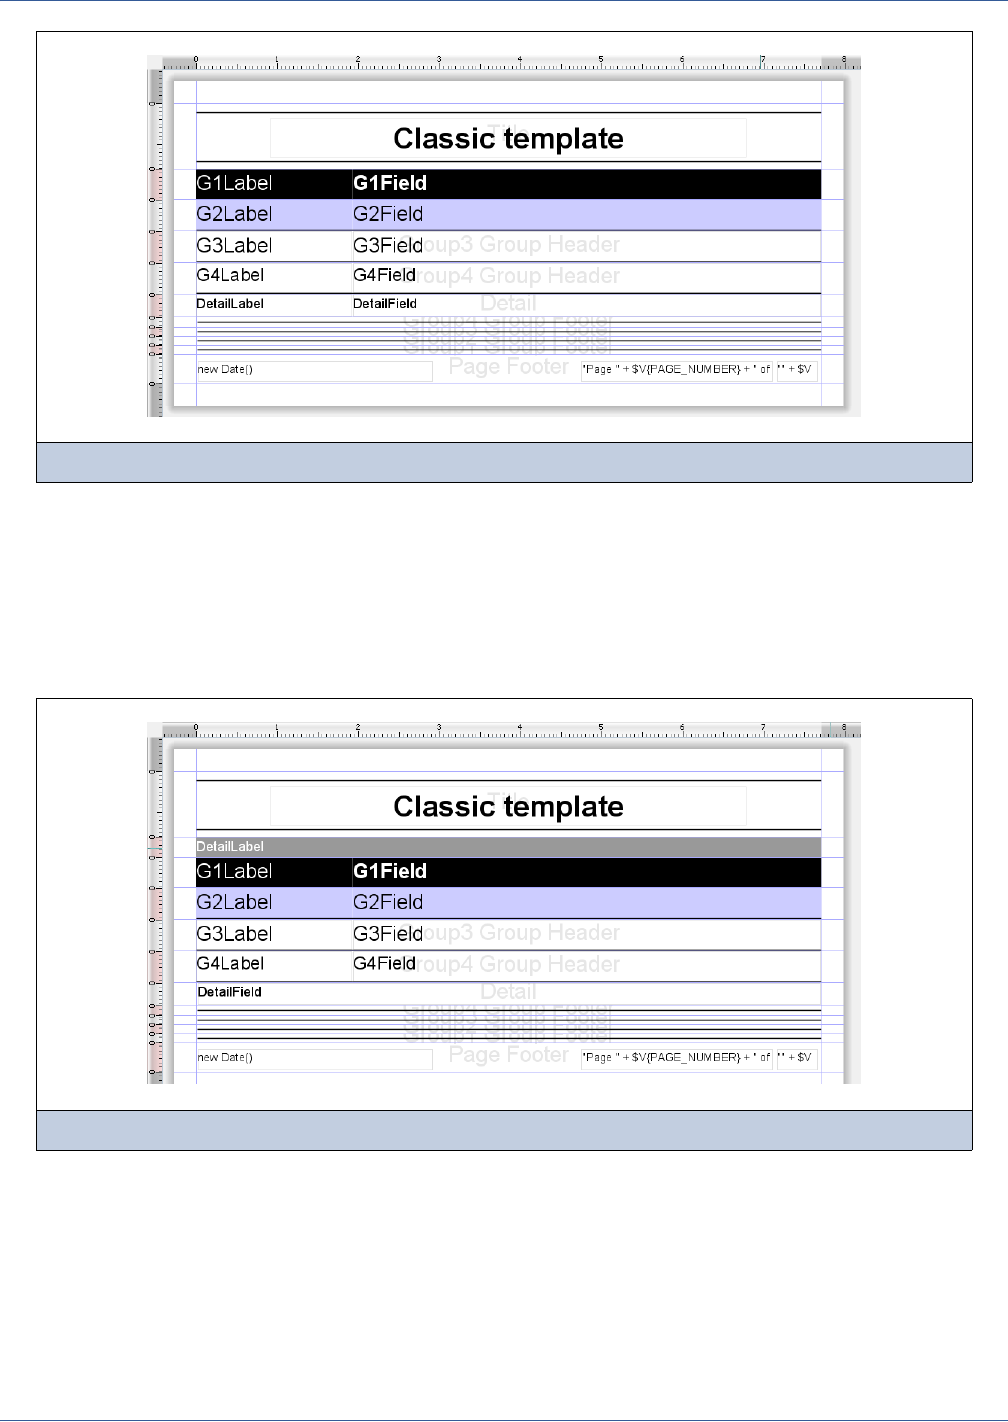
144
iReport Ultimate Guide
The Column Header band is hidden because this is a columnar report and the band is not useful, while in the Detail band there
are static text labels and textfields. Some elements (like the one in the title that shows the template name or the one in the page
footer that shows the page number) are ignored by the wizard which will not modify them. As well, there are some labels and
textfields which contain a special keyword as text. These will be used by the wizard as templates to create new fields or
populated with proper expressions to show specific data. Here are the rules to follow to specify how the wizard will work with
these elements.
And here is the corresponding tabular report format.
9.2 Groups
We have said the wizard uses up to four groups. They are used in order from first last, respecting the group order defined in the
report. For example. if the user decides to group the data by COUNTRY, and this is the only group requested, the wizard will
use only Group1 (the one that is all black in the illustration 5). If the user decides to have to levels of group, let’s say
COUNTRY and CITY, the wizard will use Group1 for the COUNTRY and the nested Group2 for the CITY.
The group header and footer can contain any arbitrary element.
Figure 9-5 classicC.jrxml report
Figure 9-6 classicT.jrxml report

Templates
145
If a static text element is present in a group header and it contains one of the following strings, the value of the label is set to
the name of the field selected in the wizard as criterion for the group (that is, COUNTRY):
GroupLabel
Group Label
Label
Group name
GnLabel (where n in the last string represents the group number)
If a textfield element is present in a group header and it contains one of the following expressions, the textfield is set to the
field selected in the wizard as criterion for the group (that is, $F{COUNTRY}):
“GroupField”
“Group Field”
“Field”
“GnField” (where n in the last string represents the group number)
Please note that all the expressions are accepted with or without the apices (for compatibility with the old templates). If the
apices are omitted, you get an invalid Java expression which indicates that the report did not compile correctly. I suggest you
always use the apices so you can preview your template without problems while designing it, which is extremely useful.
9.3 Column Header
The Column Header band is analyzed by the wizard when the report is tabular, which is the default format used by the wizard.
In the illustration 6 there is another old template, very similar to the ClassicC we have see in the figure 5, called ClassicT (“T”
stands for Tabular). It contains a Column Header band composed of a frame element (the gray portion) and a static text with
the value DetailLabel. This is the static text the wizard will look for in order to create a label for each field. In particular, the
wizard will look for a static text with one of the following strings:
DetailLabel
Label
Header
If such static text is found, the label text is replaced with the name of the field that will be shown in the Detail band at the same
position.
9.4 Detail Band
Finally, the Detail band. If the report is meant to be tabular, the wizard will look for a textfield with one of the following
expressions:
“DetailField”
“Field”
If such a textfield is found, its expression is set to the proper field (that is, $F{ORDER_ID}).
If the report template is columnar, the wizard will look in the Detail band for a static text with the same criteria described for
the column header.
The Report Wizard replicates the Detail Label and the Detail Field, creating as many static text/textfield pairs as there are in
the report’s selected fields, except for the fields used in the groups.
All the other bands can contain whatever elements you desire; the wizard will ignore them.
9.5 Template Type and Other Options
We have not said yet how to force the wizard to produce a columnar layout instead of a tabular one. This can be done by
adding to the report template the report property template.type. The possible values for this property are tabular and
columnar.
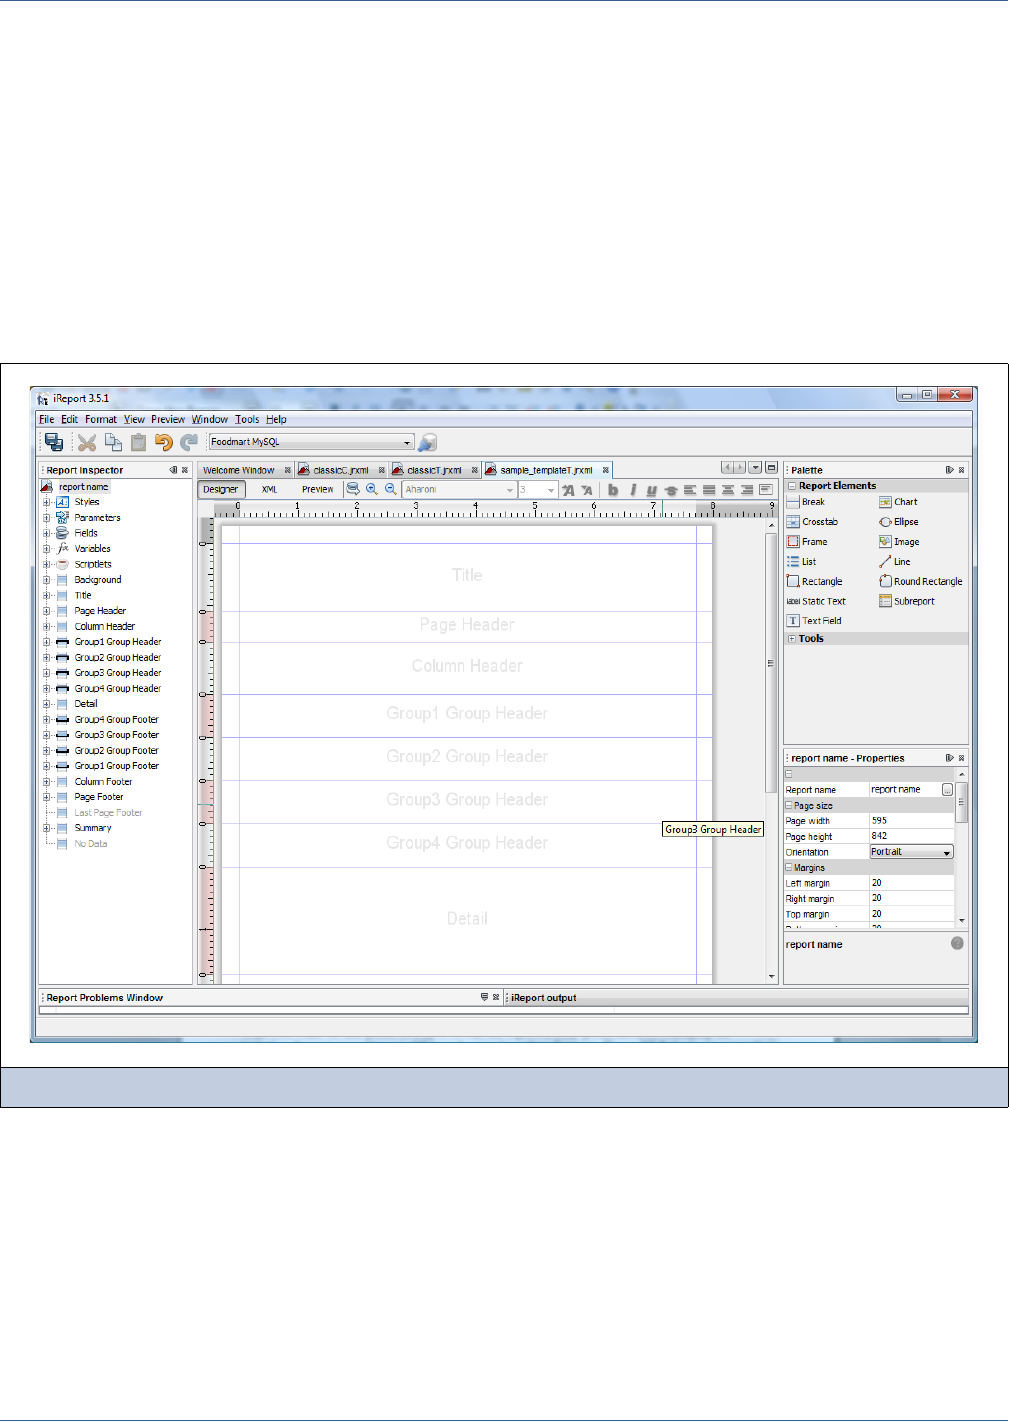
146
iReport Ultimate Guide
To force the wizard to keep unused groups, just set the property template.keepExtraGroups to true.
9.6 Creating a New Template
Let’s see how to create and use a custom template from scratch, starting from an empty report. In this sample, we will create a
tabular template called sample_template.jrxml. The name of the file will be used as the name of the template in the Report
Wizard. Once we create the new report, we will add to it four groups named, Group1, Group2, Group3, and Group4, and we
will add header and footer bands. The group names can be arbitrary, but it’s good practice in template design to set a number.
First, we’ll create the JRXML file. In the main menu, click New... and select an empty report. To create a group, right-click the
report root node in the Report Inspector and click Add Report Group. The group expression can be empty; the wizard will set
a proper value for it if one is required. Figure 9-7 shows a simple design with the four groups.
It’s time to add the required template elements to the Group Header and Detail bands. Add a label element in all the group
headers, setting a text Label and a textfield element with the expression Field. In Figure 9-8, the labels and the textfield
use the syntax GnLabel and “GnField”. The template we are working on is a tabular type, so we need to provide a label
element in the column header and a textfield in the Detail band (with the text DetailLabel and the expression
“DetailField”, respectively).
Figure 9-7 Empty report with four groups
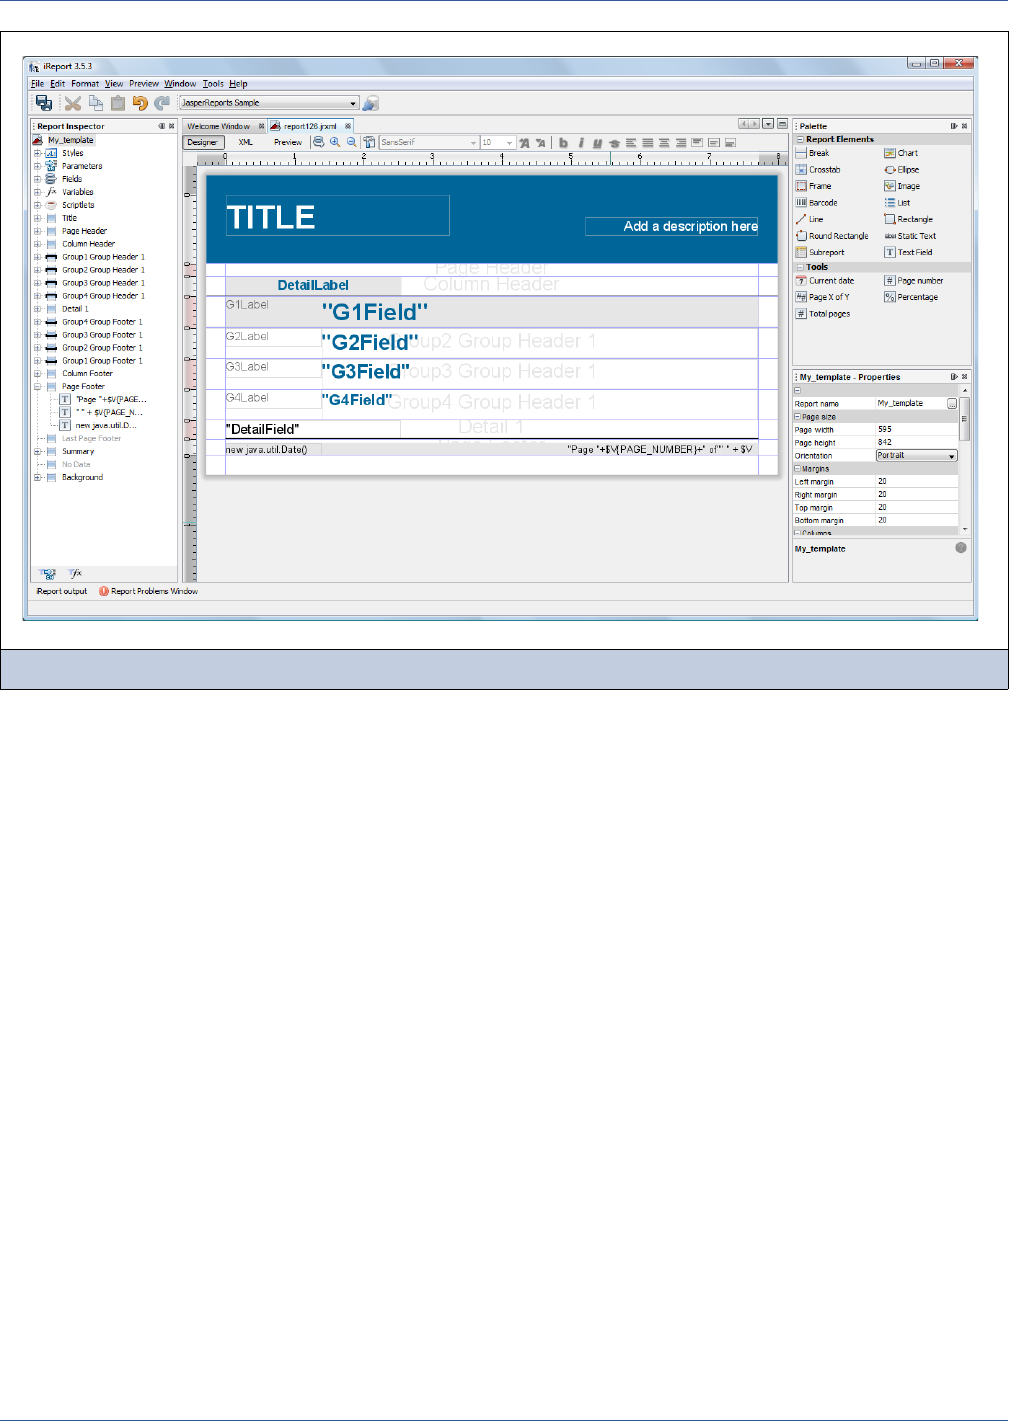
Templates
147
The mandatory part is done now, so you can proceed to adding some graphics to achieve a complete template.
9.7 Installing and Using the Template
Now that we created the JRXML for the new template, we have to add it to the list of available templates. Click Tools →
Options, go to the iReport section, and select the Wizard Templates tab. On the tab, add the new file (Figure 9-9).
Figure 9-8 Your custom template
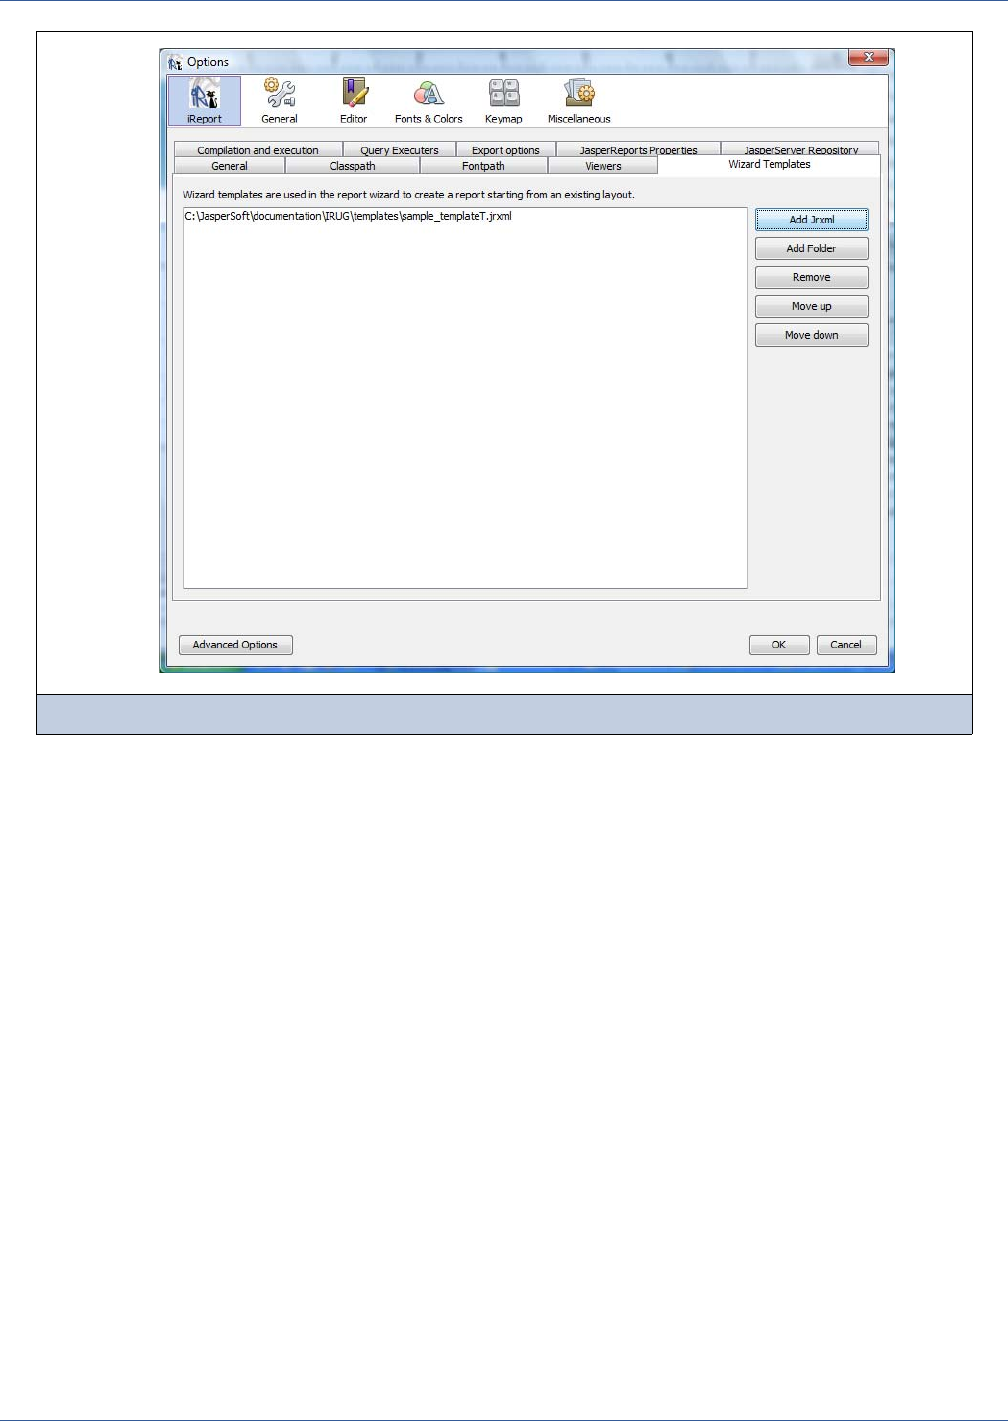
148
iReport Ultimate Guide
A final option is to put your template in the templates directory of iReport.
Let’s try the new template by creating a file. The new template appears in the Template Chooser.
Figure 9-9 New template added to list in wizard
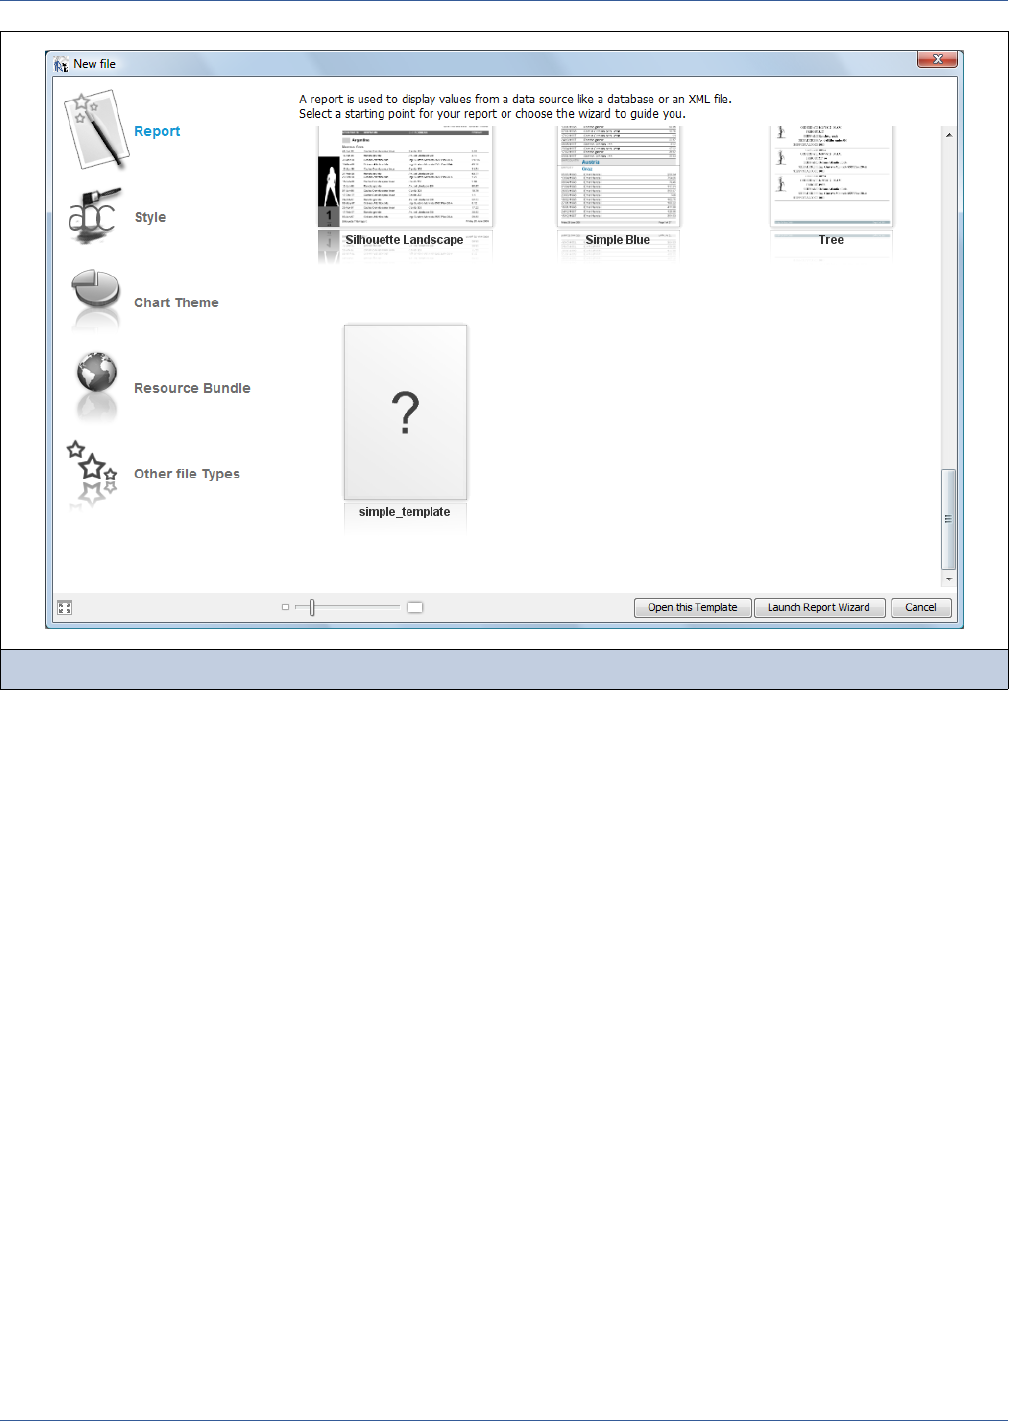
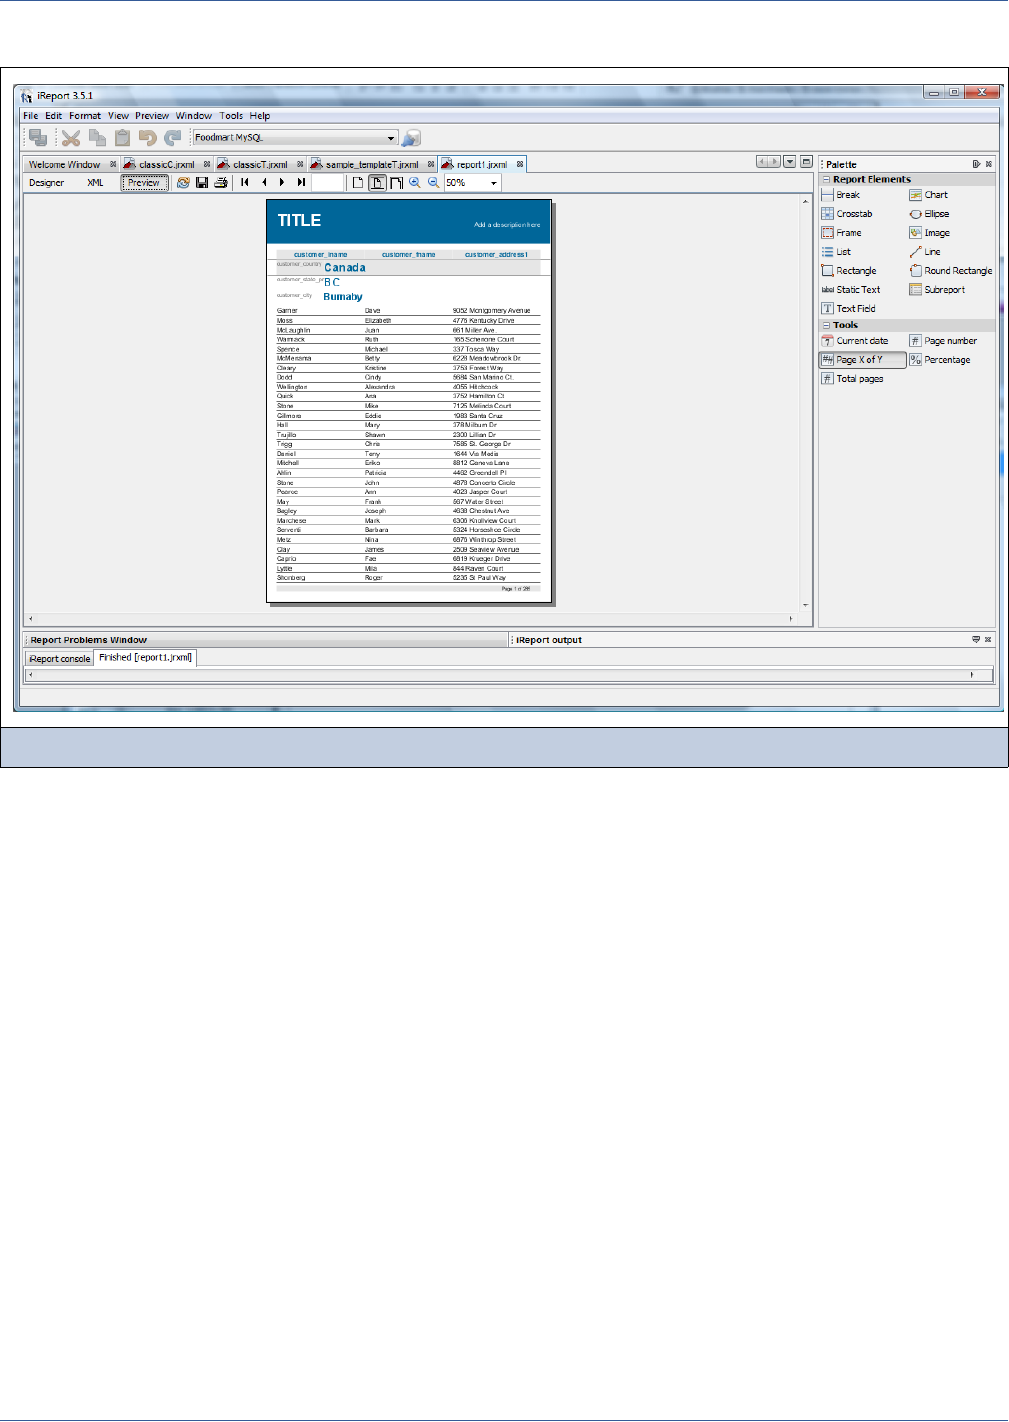
150
iReport Ultimate Guide
Figure 9-11 shows the report that results:
If the result is correct, we can produce an image to be used as a preview (PNG or GIF format). This is really simple. Preview
the report as in 2.10.2, “Using the Report Wizard,” on page 25. Then, in preview mode (Figure 9-12), click the Preview
button to save the image of the current page.
The image must be saved in the same directory as the template and it must be given the same name as the template (plus the
extension .png or .gif). Opening the Template Chooser again, you should see the preview image of your template.
If you develop a nice template and you want to share it with the iReport community, save it as a patch on the iReport web site.
Figure 9-11 Report created from new template
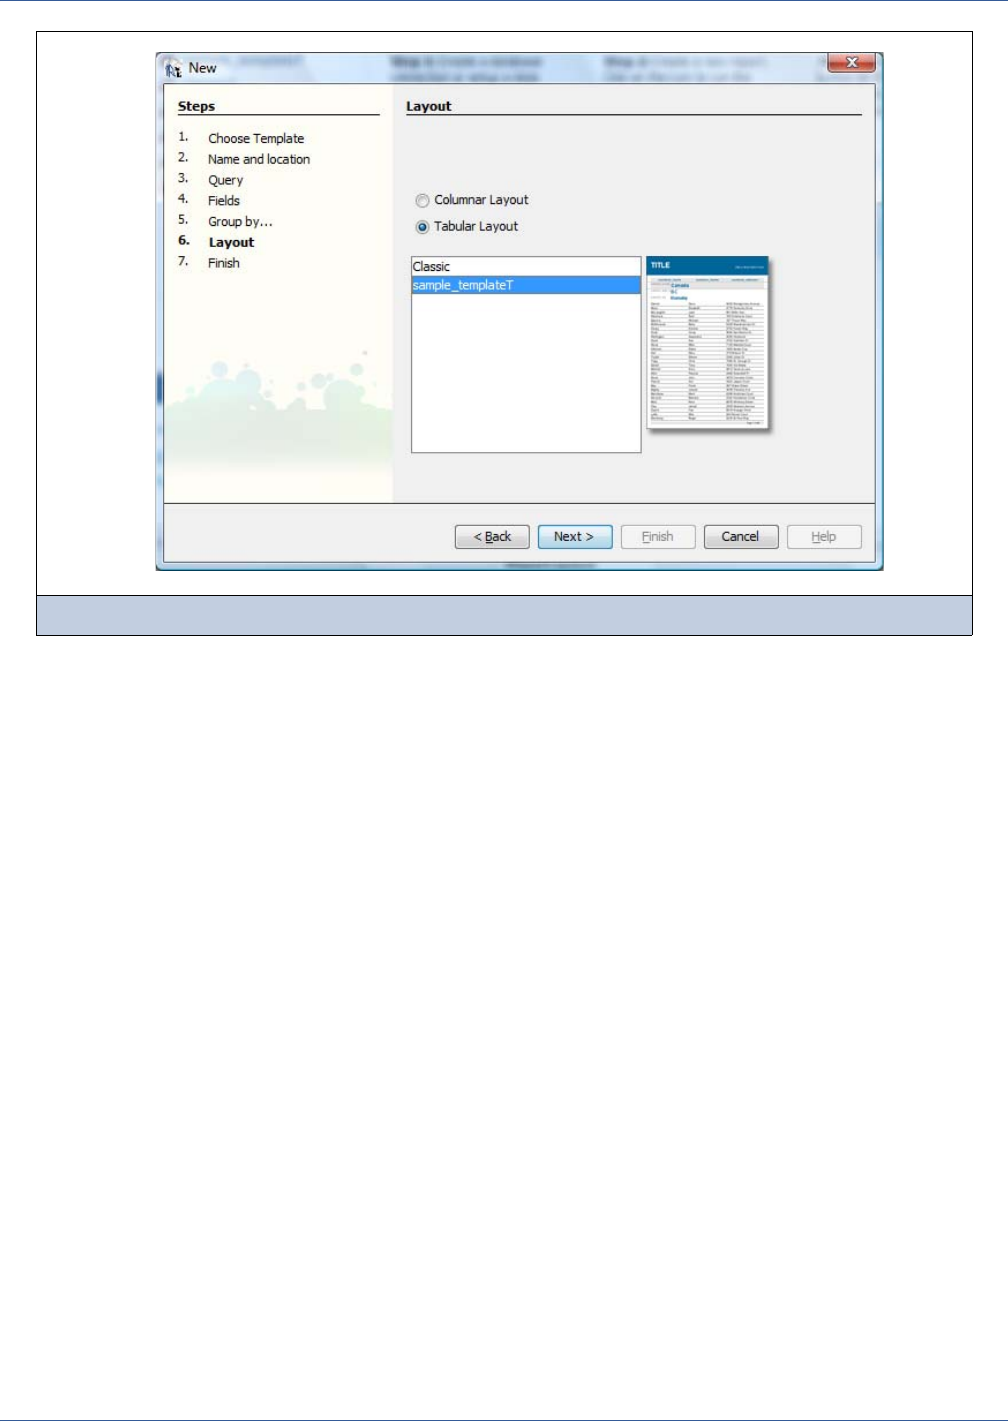
Templates
151
Figure 9-12 Preview of report created from new template

152
iReport Ultimate Guide

Data Sources and Query Executers
153
CHAPTER 10 DATA SOURCES AND QUERY EXECUTERS
There are several ways that JasperReports can provide data to fill a report. For example, you can put an SQL query directly
inside a report and provide a connection to a database against which to execute the query and read the resulting record set, or
you can use a more sophisticated custom technology to provide a table-like set of values.
iReport provides direct support for a rich set of query languages, including SQL, HQL, EJBQL, and MDX, and supports other
languages like XPath (XML Path Language). Moreover, in iReport, you can use custom languages by registering plug-in
engines called query executors to interpret and execute the report query.
If you don’t want to use a query language, or you simply don’t want to put the query inside a report, you can use a
JasperReports data source. Basically, a JR data source is an object that iterates on a record set that is organized like a simple
table.
All the data sources implement the JRDataSource interface. JasperReports provides many ready-to-use implementations of
data sources to wrap generic data structures, like arrays or collections of JavaBeans, result sets, table models, CSV and XML
files, and so on. In this chapter I will present some of these data sources, and you will see how easy it is to create a custom data
source to fit any possible need. Finally, you will see how to define a custom query language and a custom query executor, as
well as how to use them.
iReport provides support for all these things: you can define JDBC (Java Database Connectivity) connections to execute SQL
queries, set up Hibernate connections using Spring, and test your own JRDataSource or your custom query language.
This chapter has the following sections:
How a JasperReports Data Source Works
Understanding Data Sources and Connections in iReport
Creating and Using JDBC Connections
Working with Your JDBC Connection
Understanding the JRDataSource Interface
Data Source Types
Importing and Exporting Data Sources
10.1 How a JasperReports Data Source Works
JasperReports is a records-based engine; to print a report, you have to provide a set of records. When the report runs,
JasperReports will iterate on this record set, creating and filling the bands according to the report definition. Bands, groups,
variables—their elaboration is strictly tied to the record set used to fill the report. This is why JasperReports defines only one
query per report. However, multiple queries/data sources can be used when inserting subreports or defining subdatasets. Each

154
iReport Ultimate Guide
one will have its own query (or data source), fields, parameters, variables, and so on. Subdatasets are only used to feed a
crosstab or a chart.
Each record is a set of fields. These fields must be declared in the report in order to be used, as explained in Chapter 6. But
what is the difference between using a query inside a report and providing data using a JRDataSource?
Basically, there is no difference. In fact, what happens behind the scenes when iReport uses a query instead of a
JRDataSource is that JasperReports executes the query using a built-in or user-defined query executor that will produce a
JRDataSource. There are circumstances when providing a JDBC connection to the engine and using a query defined at
report level can simplify the use of subreports.
A JRDataSource is a consumable object, which means that you cannot use the same instance of JRDataSource to fill more
than one report or subreport. A typical error is trying to use the same JRDataSource object (for example, one provided to the
report as a parameter) to feed a subreport placed in the Detail band. If the Detail band is printed more than once (and normally
it is printed for every record present in the main data source), the subreport will be filled for each main record, and every time
the subreport will iterate on the same JRDataSource. This will give results only the first time the data source is used.
At the end of this chapter, you will know how to avoid this kind of error, and you’ll have all the tools you need in order to
decide the best way to fill your report with any of these:
A query in a language supported by JasperReports.
A built-in data source.
A custom data source.
A custom query language with the relative query executor.
10.2 Understanding Data Sources and Connections in iReport
iReport allows you to manage and configure different types of data sources to fill reports. These data sources are stored in the
iReport configuration and activated when needed.
When I talk about data sources, you need to understand there is a distinction between real data sources (or objects that
implement the JRDataSource interface) and connections, used in combination with a query that is defined inside the report.
In addition, the term “data source” used in JasperReports is not the same as the concept in javax.sql.Datasource, which is
only a means of getting a physical connection to the database (usually with JNDI the lookup). The data source object I refer to
in the JasperReports realm contains concrete data.
Here is a list of the data source and connection types provided by iReport:
JDBC connection
JavaBean collection data source
XML data source
CSV data source
Hibernate connection
Spring-loaded Hibernate connection
Hadoop Hive data source
JRDataSourceProvider
Custom data source
Mondrian OLAP connection
XMLA connection
EJBQL connection
Empty data source
Finally, there is a special mode to execute a report, called query executor mode, that you can use to force the report’s creation
without passing any connection or data source to the report engine.
All the connections are “opened” and passed directly to JasperReports during report generation. For many connections,
JasperReports provides one or more built-in parameters that can be used inside the report for several purposes (for example, to
fill a subreport that needs the same connection as the parent).
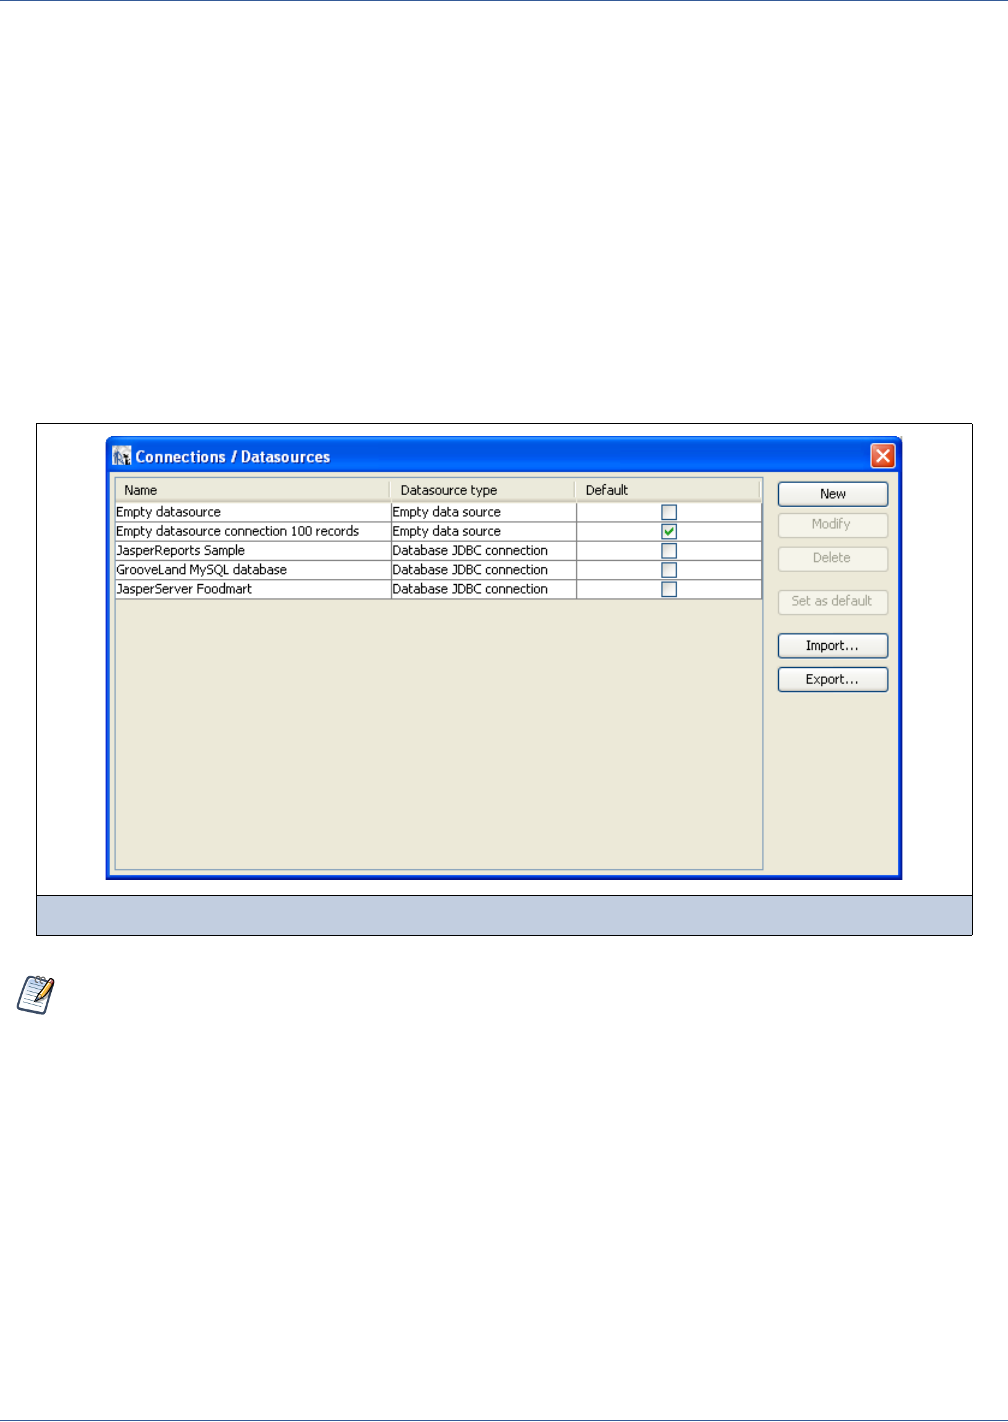
Data Sources and Query Executers
155
The XML data source allows you to take data from an XML document.
A CSV (comma-separated values) data source allows you to open a CSV file for use in a report.
The JavaBean set data source, custom data source, and JRDataSourceProvider allow you to print data using purposely
written Java classes.
The Hibernate connection provides the environment to execute HQL (Hibernate Query Language) queries (this
connection can be configured using Spring, as well).
EJBQL (Enterprise JavaBean Query Language) queries can be used with an EJBQL connection.
MDX queries can be used with a native direct connection to a Mondrian server or using the standard XML/A interface to
interrogate a generic OLAP database.
An empty data source is something like a generator of records having zero fields. This kind of data source is used for test
purposes or to achieve very particular needs (like static content reports or subreports).
Connections and data sources are managed through the menu command Tools > Report Datasources, which opens the
configured connections list (Figure 10-1). To set up a new data source, you can also click the Report Datasources button on
the toolbar.
Even if you keep an arbitrary number of data sources ready to use, iReport works always with only one source at a time. You
can set the active data source in several ways. The easiest and most intuitive way is to select the data source from the combo
box located on the tool bar. (see Figure 10-2). You can also set the active data source by selecting a data source in the
Connections/Datasources dialog box and clicking the Set as default button.
Figure 10-1 Report Data Sources dialog
As mentioned previously, a connection and a data source are different objects. However, from this point on, I will use
these two words interchangeably because their functions are so similar.
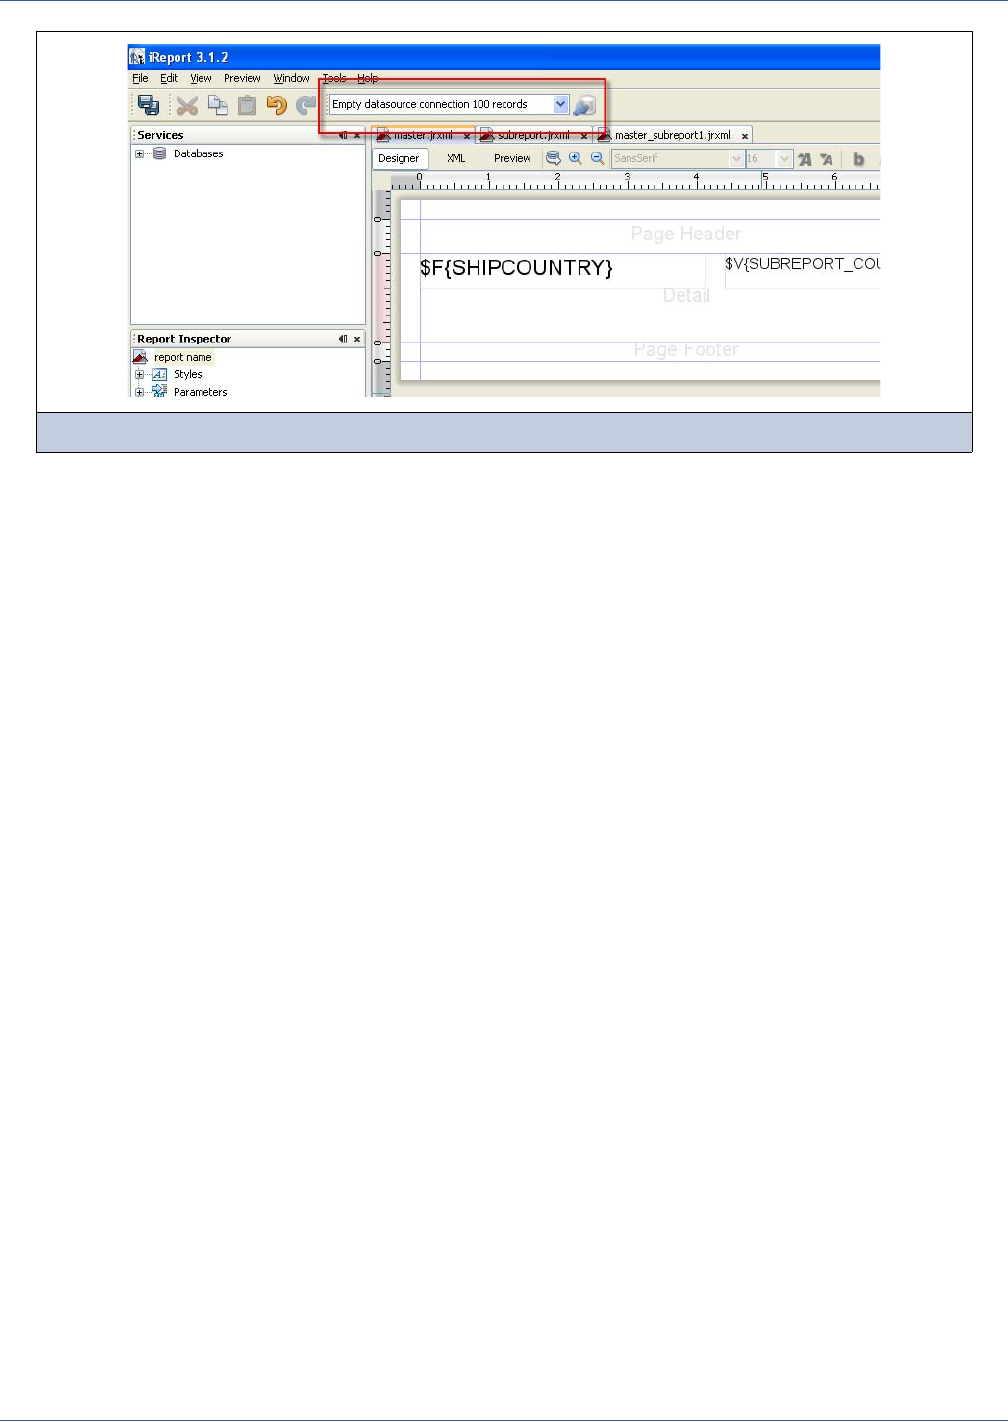
156
iReport Ultimate Guide
If no data source is selected, it is not possible to fill a report with data, therefore, when iReport starts for the first time, a pre-
configured empty data source is defined and selected by default. Datasources can be used in conjunction with the Report
Wizard, too. That’s why configuring the connection to your data is usually the first step when starting with iReport.
10.3 Creating and Using JDBC Connections
A JDBC connection allows you to use a relational DBMS (or, in general, whatever databases are accessible through a JDBC
driver) as a data source. To set a new JDBC connection, click the New button in the Connections/Datasources dialog box
(shown earlier in Figure 10-1) to open the interface for creation of a new connection (or data source). From the list, select
Database JDBC connection to bring up the window shown in Figure 10-3.
Figure 10-2 The data sources combo box shows the active data source
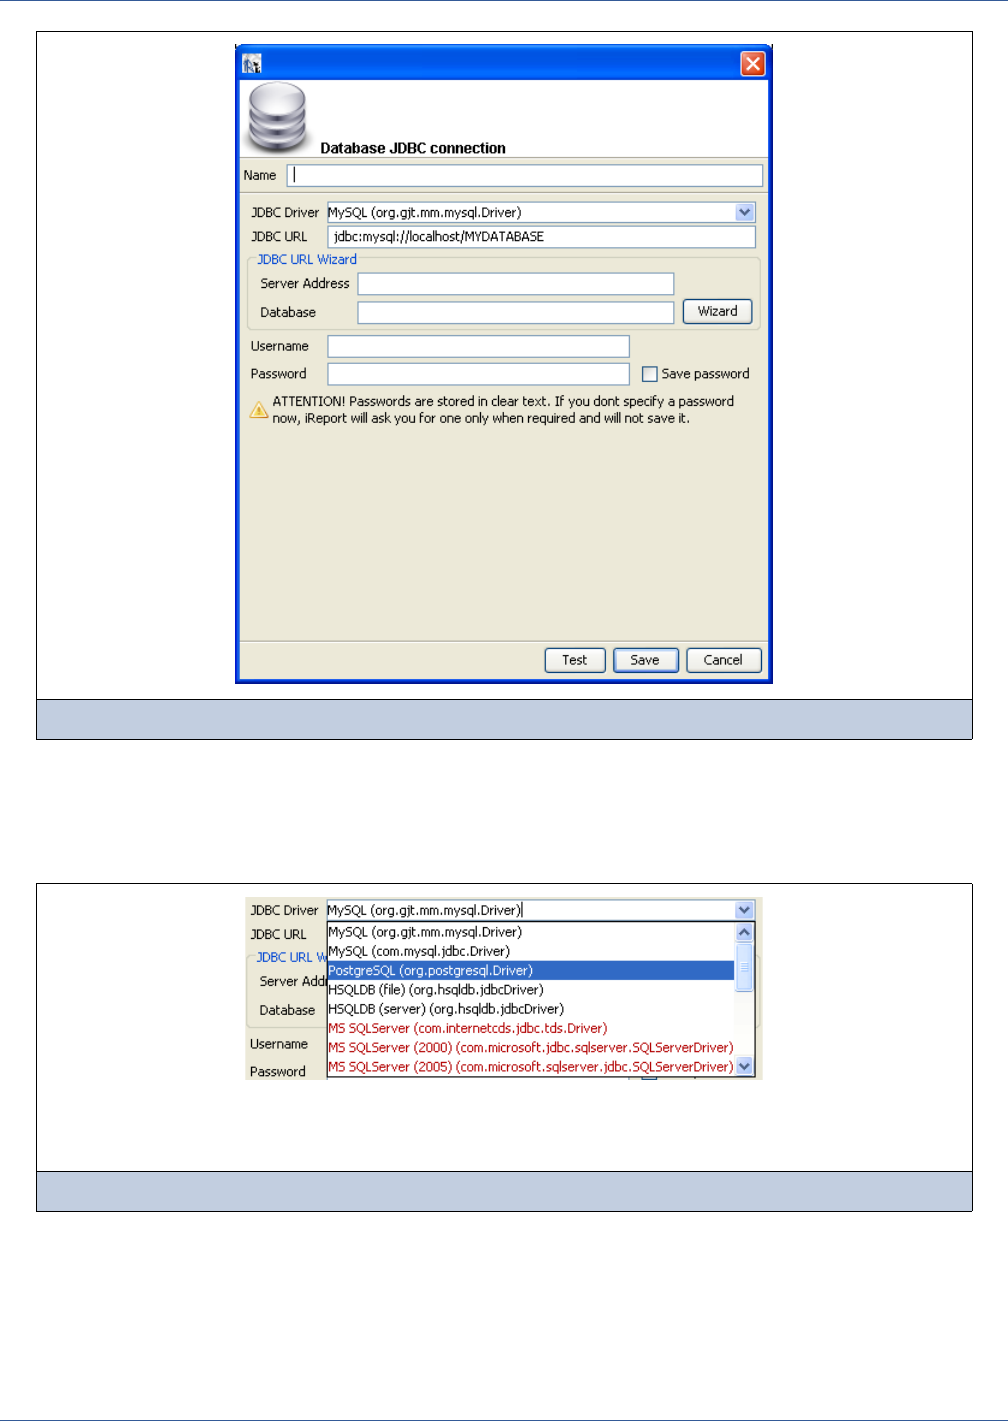
Data Sources and Query Executers
157
The first thing to do is to name the connection (possibly using a significant name, such as Mysql – Test). iReport will
always use the specified name to refer to this connection.
In the JDBC Driver field, you specify the name of the JDBC driver to use for the connection to the database. The combo box
proposes the names of the most common JDBC drivers (see Figure 10-4).
If a driver is displayed in red, the JDBC driver class for that driver is not present in the classpath and it is not possible to use it.
See Chapter 10.3.4, “Creating a JDBC Connection via the Services View,” on page 159 for how to install a JDBC driver.
Thanks to the JDBC URL Wizard, it is possible to automatically construct the JDBC URL to use the connection to the
database by inserting the server name and the database name in the correct text fields. Click the Wizard button to create the
URL.
Figure 10-3 Configuring a JDBC connection
Figure 10-4 JDBC drivers list
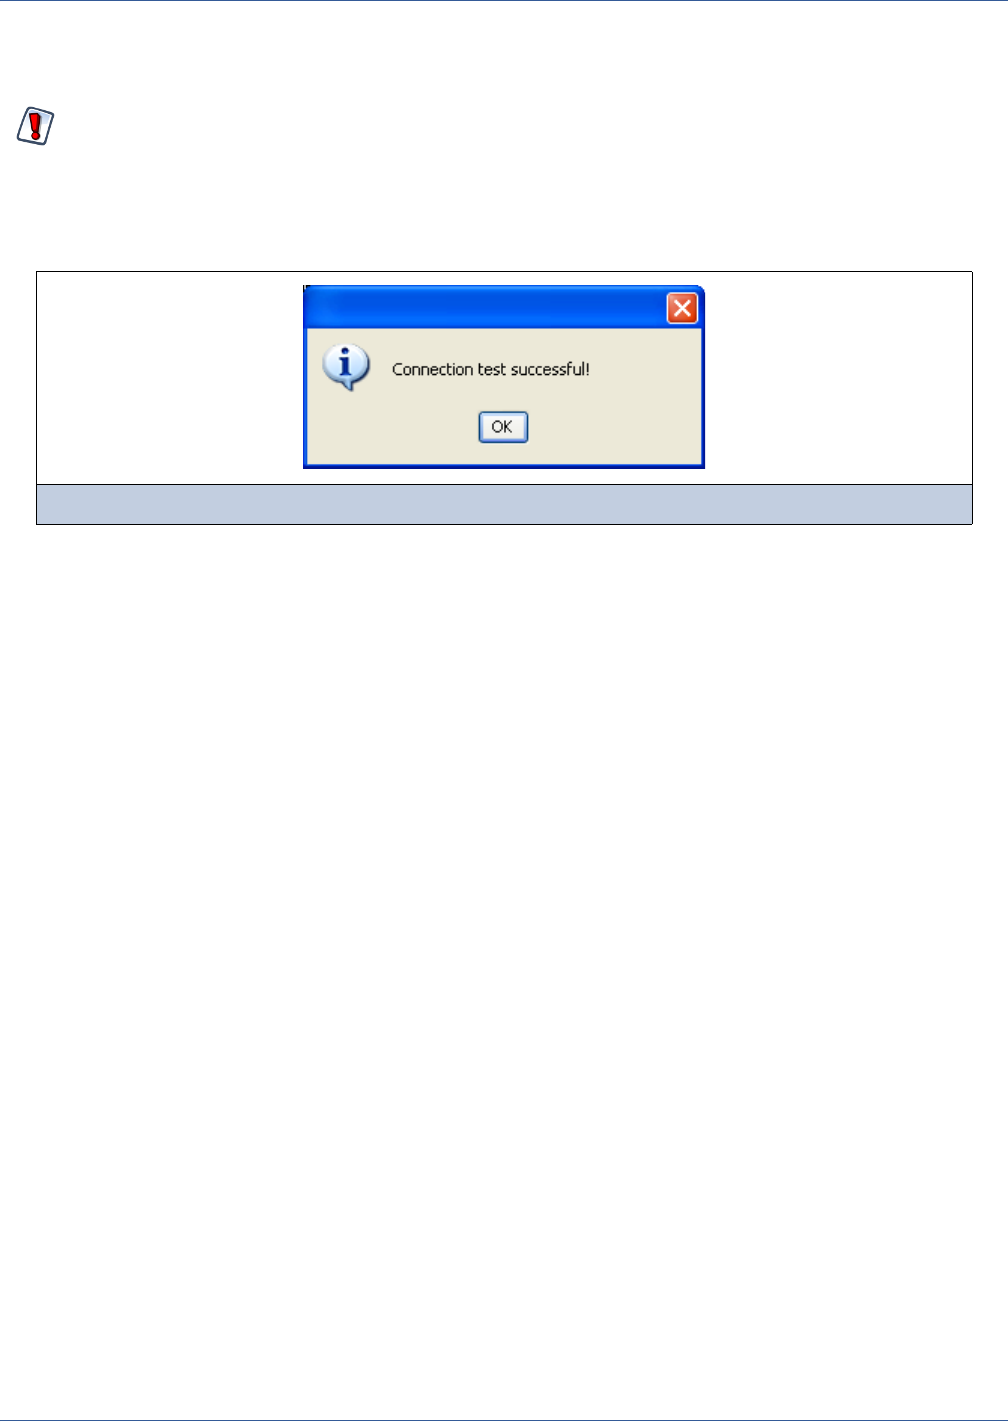
158
iReport Ultimate Guide
Enter a username and password to access the database. By means of a check box option, you can save the password for the
connection.
If the password is empty, it is better if you specify that it be saved.
After you have inserted all the data, it is possible to verify the connection by clicking the Test button. If everything is okay, the
dialog box shown in Figure 10-5 will appear.
When you create a new data source, iReport sets it as the active one automatically for your convenience.
In general, the test can fail for a lot of reasons, the most frequent of which are the following:
A ClassNotFoundError was thrown.
The URL is not correct.
Parameters are not correct for the connection (database is not found, the username or password is wrong, etc.).
Let’s take a closer look at these issues.
10.3.1 ClassNotFoundError
The ClassNotFoundError exception occurs when the required JDBC driver is not present in the classpath. For example,
suppose you wish to create a connection to an Oracle database. iReport has no driver for this database, but you could be
deceived by the presence of the oracle.jdbc.driver.OracleDriver driver in the JDBC drivers list shown in the window
for creating new connections. If you were to select this driver, when you test the connection, the program will throw the
ClassNotFoundException, as shown in Figure 10-6.
iReport saves the password as clear text.
Figure 10-5 Test Confirmation dialog
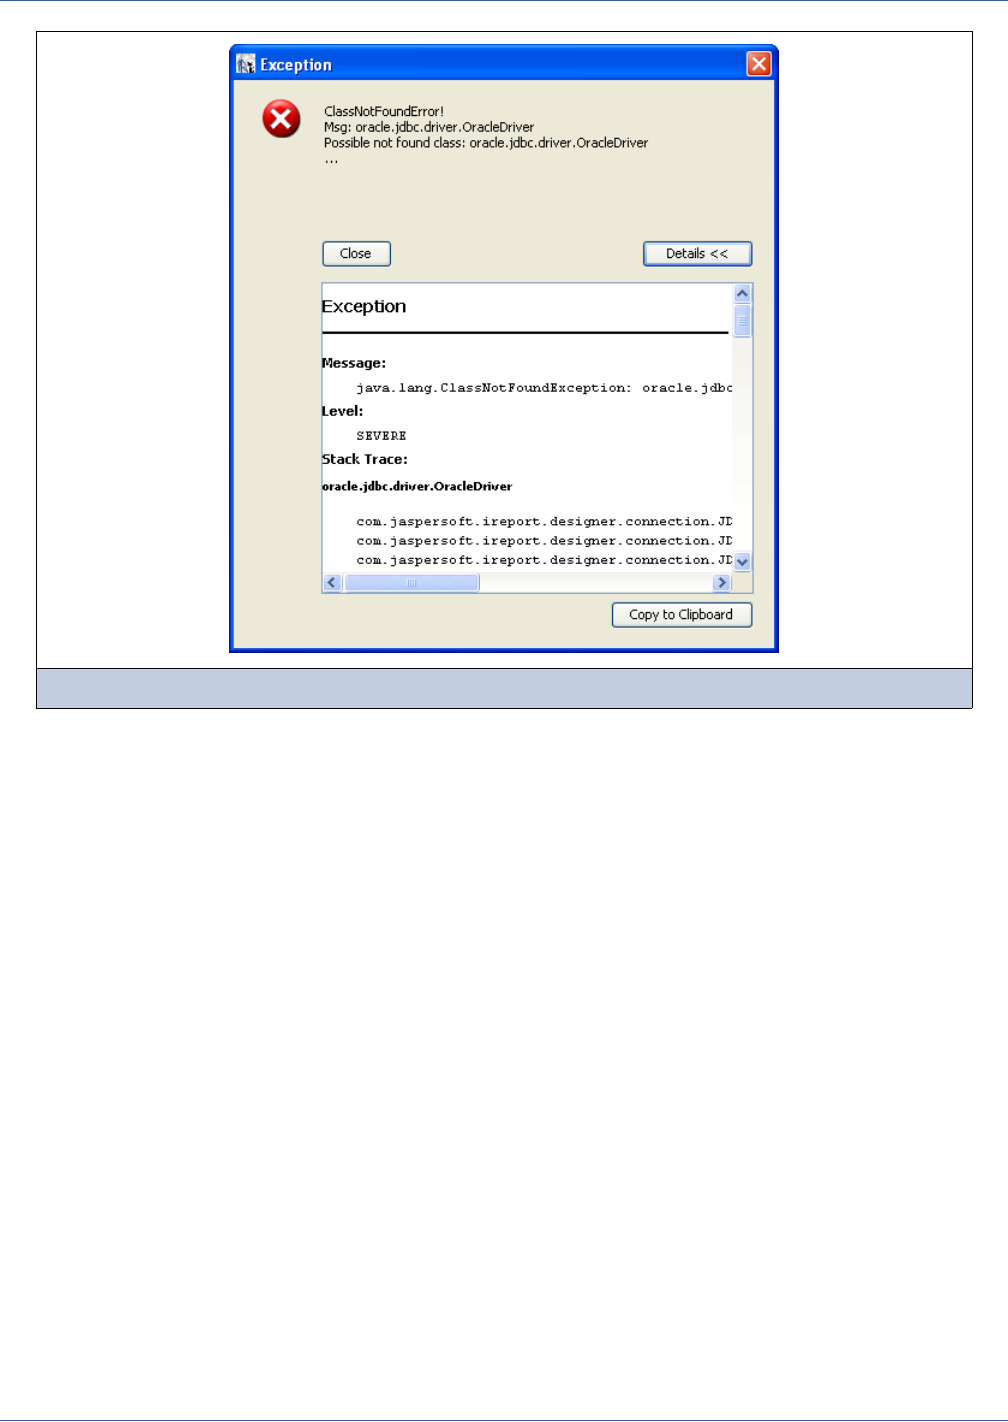
Data Sources and Query Executers
159
What you have to do is to add the JDBC driver for Oracle, which is a file named ojdbc14.jar (or classes12.zip or classes11.zip
for older versions) to the classpath (which is where the JVM searches for classes). As iReport uses its own class loader, it will
be enough add the ojdbc14.jar file to the iReport classpath in the Options window (Tools→Options); the same can be done for
directories containing classes and other resources.
10.3.2 URL Not Correct
If a wrong URL is specified (for example, due to a typing error), you’ll get an arbitrary exception when you click the Test
button. The exact cause of the error can be deduced by the stack trace available in the exception dialog box.
In this case, if possible, it is better to use the JDBC URL Wizard to build the JDBC URL and try again.
10.3.3 Parameters Not Correct for the Connection
The less-problematic error scenario is one in which you try to establish a connection to a database with the wrong parameters
(invalid username or password, nonexistent of not running database, etc.). In this case, the same database will return a message
that will be more or less explicit about the failure of the connection.
10.3.4 Creating a JDBC Connection via the Services View
iReport provides a second way to configure JDBC connection coming from the NetBeans platform. From the Services view,
select New connection (see Figure 10-7).
Figure 10-6 ClassNotFoundError exception
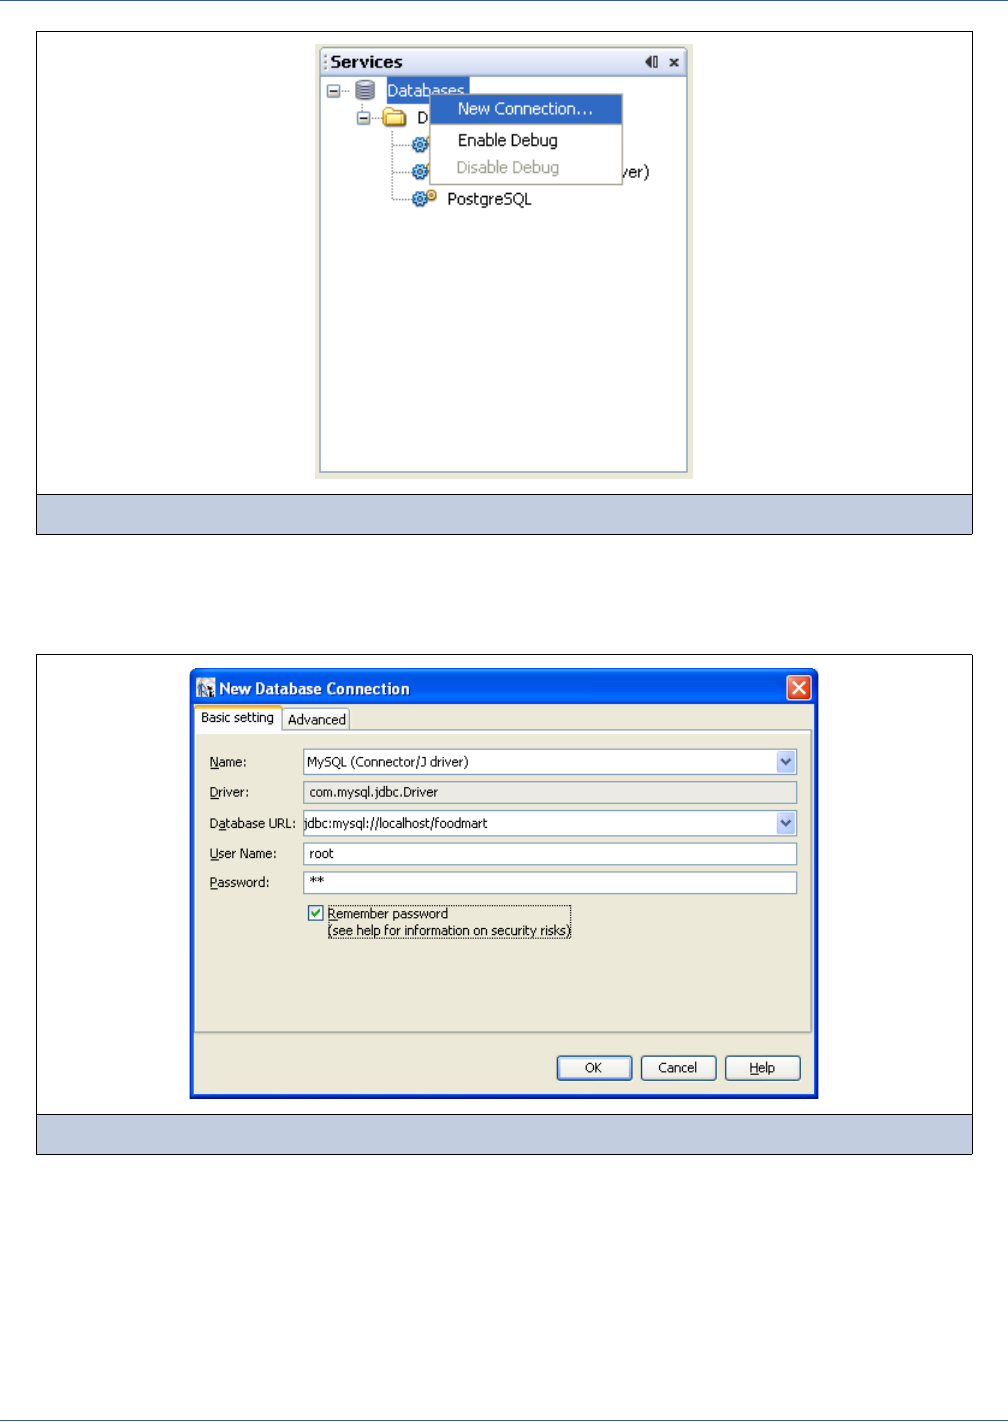
160
iReport Ultimate Guide
The Services view allows you to register new JDBC drivers (by default iReport ships with drivers for MySQL, PostreSQL,
and the JDBC-ODBC bridge, but the last is not recommended).
The interface to configure a JDBC connection is similar to the one proposed by iReport and is shown in Figure 10-8.
When the connection has been configured, it will appear in the Services view (Figure 10-9).
Figure 10-7 Services view
Figure 10-8 Creation of a database connection using the Services view
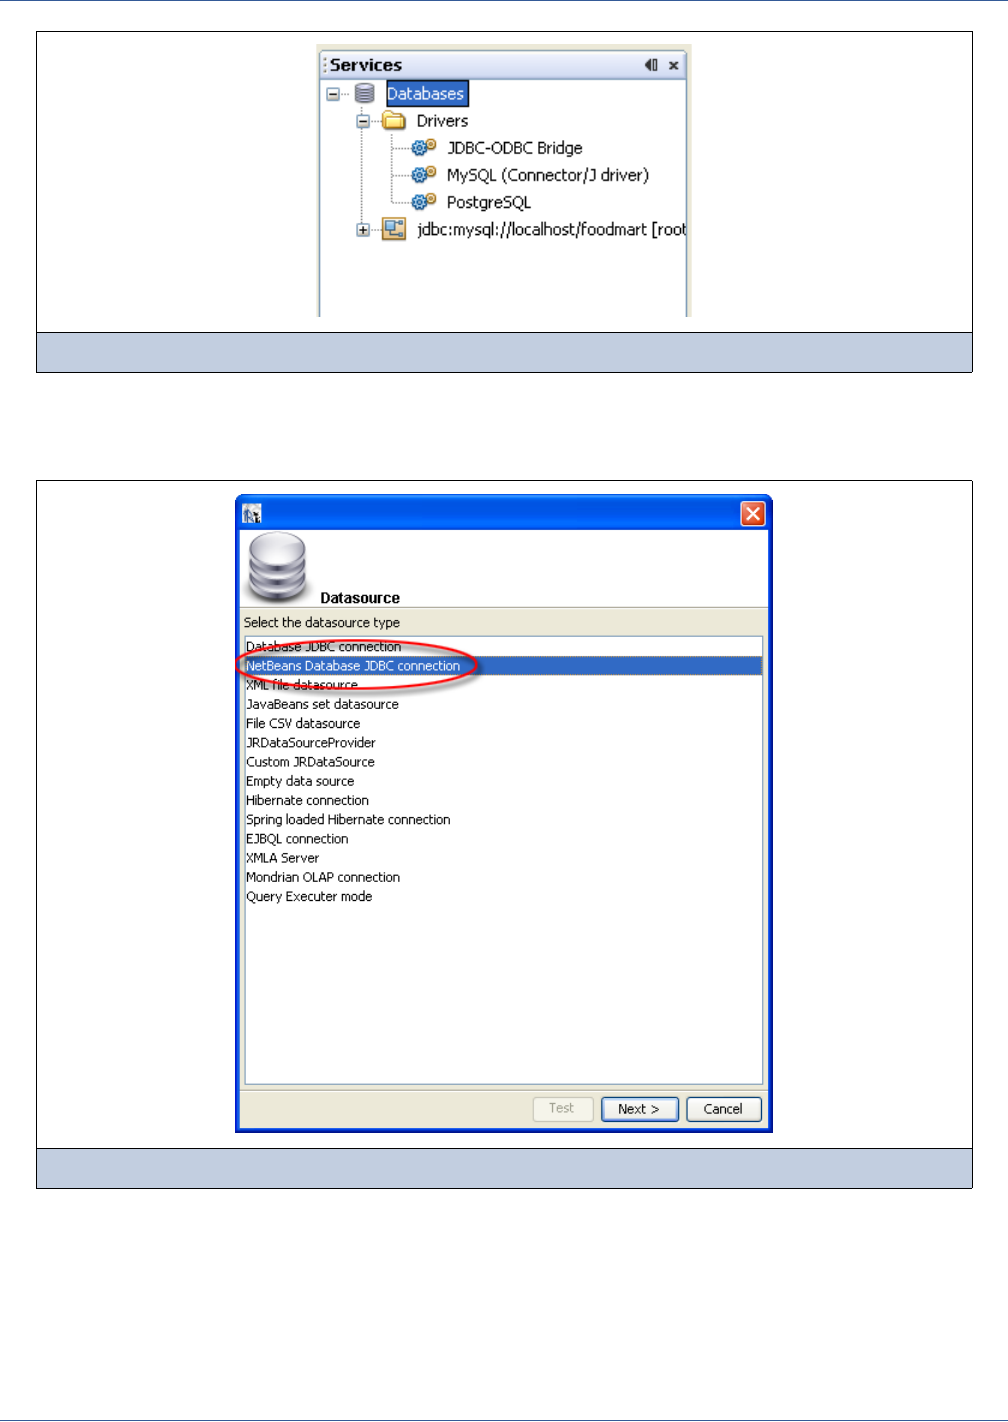
Data Sources and Query Executers
161
The last step for using this connection is to create a new iReport connection/data source; it will point to the one just
configured. Follow the steps indicated to create a new connection/data source and, from the connection type list, select
NetBeans Database JDBC connection, as shown in Figure 10-10, and click Next.
There are no distinct advantages to using one method or the other to configure a JDBC connection, it’s your choice.
10.4 Working with Your JDBC Connection
When the report is created by using a JDBC connection, you specify a SQL query to extract the records to print from the
database. This connection can also be used by a subreport or, for example, by a personalized lookup function for the decoding
Figure 10-9 The new connection in the Services view
Figure 10-10 The NetBeans “bridge” connection
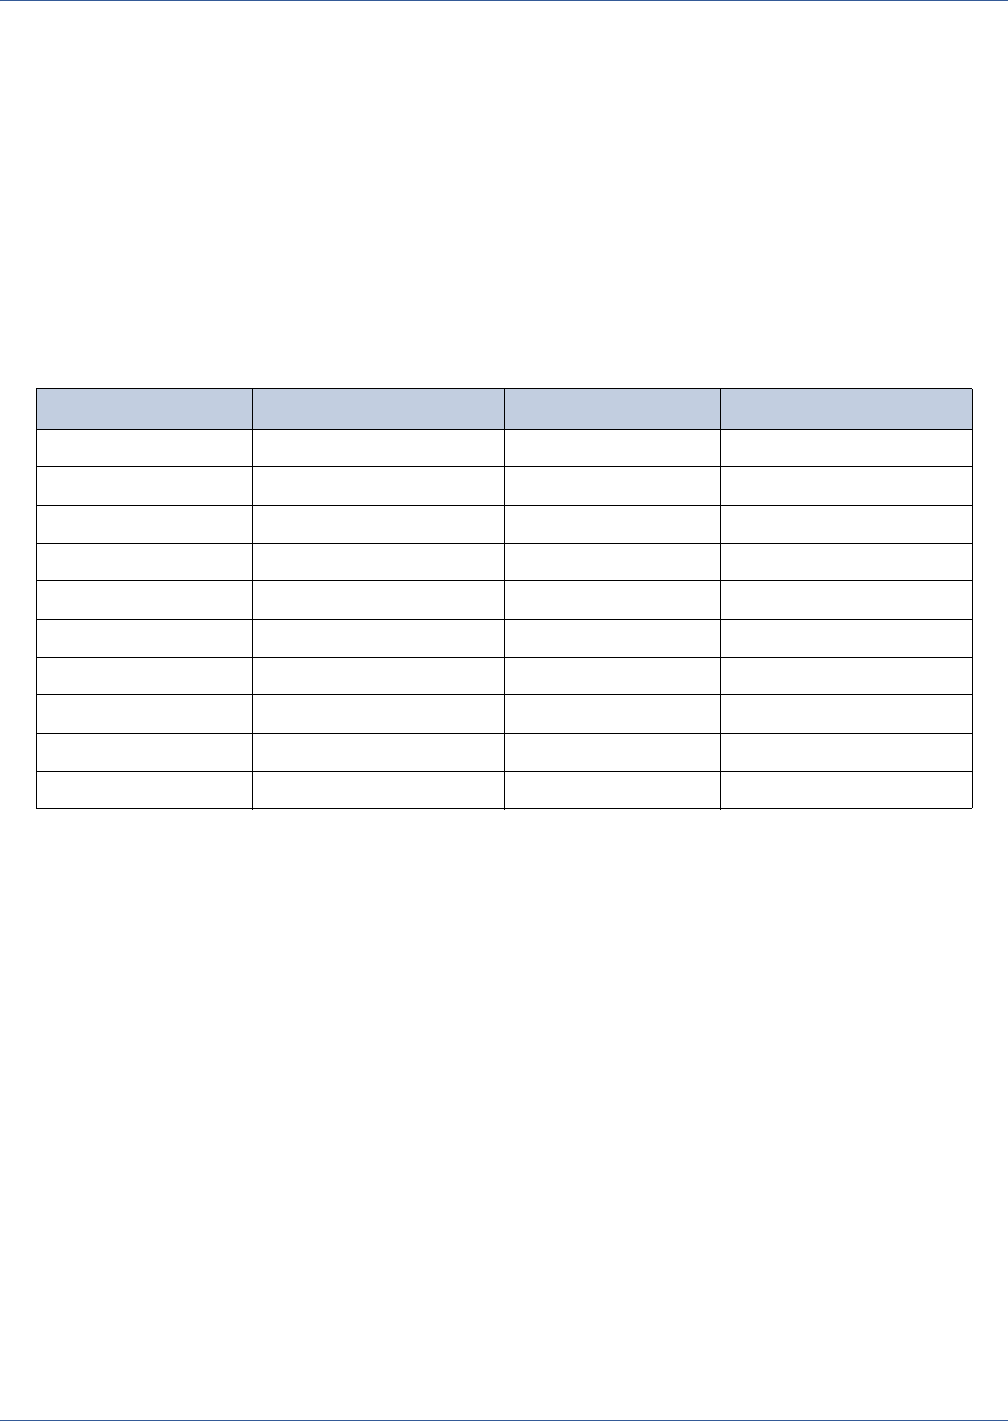
162
iReport Ultimate Guide
of particular data. For this reason, JasperReports puts at your disposal a special parameter named REPORT_CONNECTION of the
java.sql.Connection type; it can be used in whatever expression you like, with a parameters syntax as follows:
$P{REPORT_CONNECTION}
This parameter contains the java.sql.Connection class passed to JasperReports from the calling program.
The use of JDBC or SQL connections is the simplest and easiest way to fill a report. The details for how to create a SQL query
are explained in Chapter 6.
10.4.1 Fields Registration
In order to use SQL query fields in a report, you need to register them. It is not necessary to register all the selected fields—
only those effectively used in the report are enough. For each field, you must specify its name and type. Table 10-1 shows the
mapping of the SQL types to the corresponding Java types.
The table does not include the BLOB and CLOB types and other special types, such as ARRAY, STRUCT, and REF, because
these types cannot be managed automatically by JasperReports. However, it is possible to use them by declaring them
generically as Object and managing them by writing supporting static methods. The BINARY, VARBINARY, and
LONGBINARY types should be dealt with in a similar way. With many databases, BLOB and CLOB can be declared as
java.io.InputStream.
Whether a SQL type is converted to a Java object depends on the JDBC driver used.
For the automatic registration of SQL query fields, iReport relies on the type proposed for each field by the driver itself.
10.4.2 Sorting and Filtering Records
The records retrieved from a data source (or from the execution of a query through a connection) can be ordered and filtered.
Sort and filter options may be set from the Report query dialog box by clicking Filter Expressions and Sort Options and (see
Figure 10-11).
Table 10-1 Conversion of SQL and JAVA types
SQL Type Java Object SQL Type Java Object
CHAR String REAL Float
VARCHAR String FLOAT Double
LONGVARCHAR String DOUBLE Double
NUMERIC java.math.BigDecimal BINARY byte[]
DECIMAL java.math.BigDecimal VARBINARY byte[]
BIT Boolean LONGVARBINARY byte[]
TINYINT Integer DATE java.sql.Date
SMALLINT Integer TIME java.sql.Time
INTEGER Integer TIMESTAMP java.sql.Timestamp
BIGINT Long
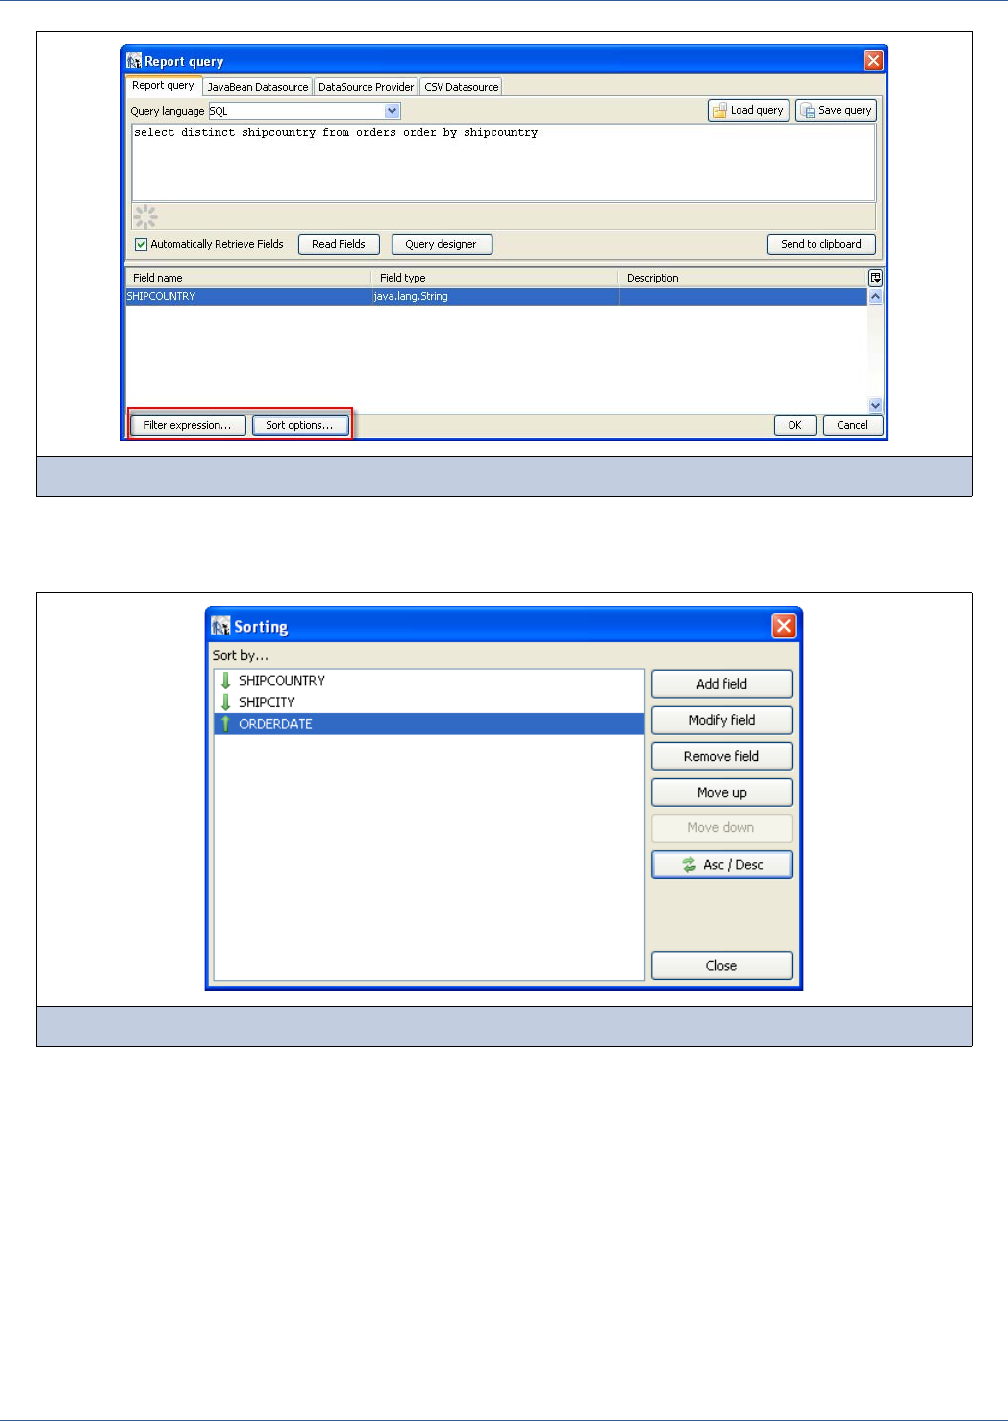
Data Sources and Query Executers
163
The filter expression must return a Boolean object: true if a particular record can be kept, false otherwise.
The sorting is based on one or more fields. Each field can be sorted in ascending or a descending order (see Figure 10-12).
If no fields can be selected with the Add field button, check to see if the report contains fields. If it does not, close the query
dialog and register the fields and resume the sorting.
10.5 Understanding the JRDataSource Interface
Before proceeding with exploration of the different data sources iReport provides at your disposal, it is necessary to
understand how the JRDataSource interface works. Every JRDataSource must implement both of these methods:
public boolean next()
public Object getFieldValue(JRField jrField)
The first method, public boolean next(), is useful for moving a virtual cursor to the next record. In fact, data supplied by
a JRDataSource is ideally organized into records as in a table. The second method, public Object
Figure 10-11 The Filter expression and Sort options buttons
Figure 10-12 Sorting options

164
iReport Ultimate Guide
getFieldValue(JRField jrField), returns true if the cursor is positioned correctly in the subsequent record, false if
there are no more available records.
Every time that JasperReports executes the public boolean next() method, all the fields declared in the report are filled
and all the expressions (starting from those associated with the variables) are calculated again; subsequently, it will be decided
whether to print the header of a new group, to go to a new page, and so on. When next returns false, the report is ended by
printing all final bands (Group Footer, Column Footer, Last Page Footer, and Summary). The method can be called as many
times as there are records present (or represented) from the data source instance.
The method public Object getFieldValue(JRField jrField) is called by JasperReports after a call to next results
in a true value. In particular, it is executed for every single field declared in the report (see Chapter 6 for the details on how to
declare a report field). In the call, a JRField object is passed as a parameter; it is used to specify the name, the description and
the type of the field from which you want to obtain the value (all this information, depending by the specific data source
implementation, can be combined to extract the field value).
The type of the value returned by the public Object getFieldValue(JRField jrField) method has to be adequate to
that declared in the JRField parameter, except when a null is returned. If the type of the field was declared as
java.lang.Object, the method can return an arbitrary type. In this case, if required, a cast can be used in the expressions. A
cast is a way to dynamically indicate the type on an object, the syntax of a cast is:
(type)object
in example:
(com.jaspersoft.ireport.examples.beans.PersonBean)$F{my_person}
Usually a cast is required when you need to call a method on the object that belongs to a particular class.
10.6 Data Source Types
10.6.1 Using JavaBeans Set Data Sources
A JavaBeans set data source allows you to use JavaBeans as data to fill a report. In this context, a JavaBean is a Java class that
exposes its attributes with a series of getter methods, with the following syntax:
public <returnType> getXXX()
where <returnType> (the return value) is a generic Java class or a primitive type (such as int, double, and so on).
In order to create a connection to handle JavaBeans, after clicking New in the Connections/Datasources dialog, select
JavaBeans set data source in the list of data source types to bring up the dialog box shown in Figure 10-13.
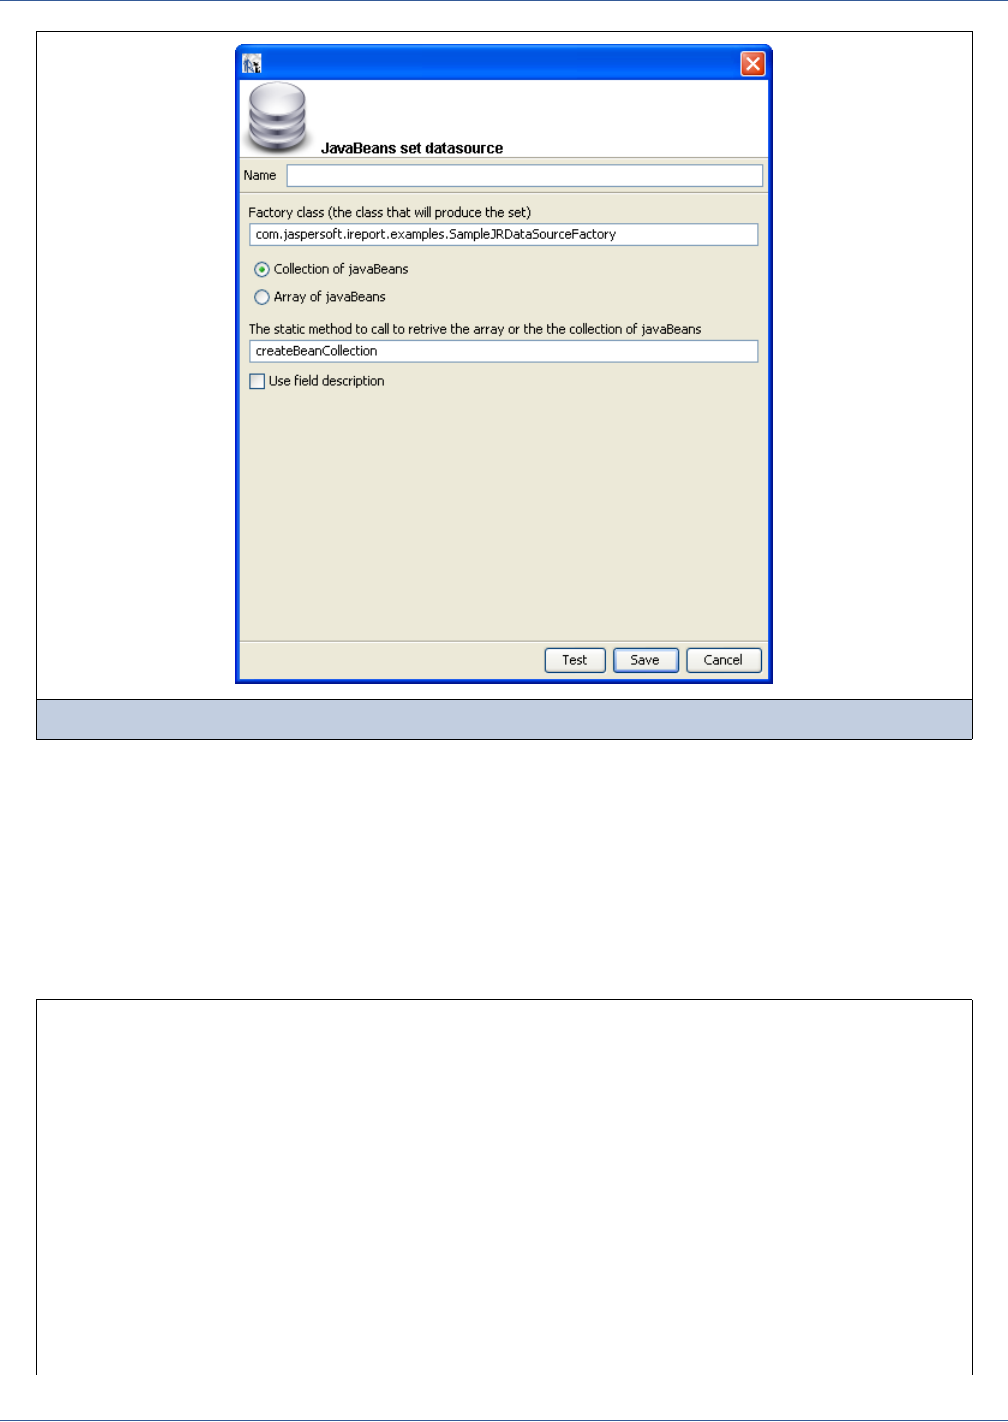
Data Sources and Query Executers
165
Once again, the first thing to do is to specify the name of the new data source.
The JavaBeans set data source uses an external class (named Factory) to produce some objects (the JavaBeans) that constitute
the data to pass to the report. Enter your Java class (the complete name of which you specify in the Factory class field) that has
a static method to instantiate different JavaBeans and to return them as a collection (java.util.Collection) or an array
(Object[]). The method name and the return type have to be specified in the other fields of the window.
Let’s see how to write this Factory class. Suppose that your data is represented by a set of objects of type PersonBean;
following is the code of this class, which shows two fields: name (the person’s name) and age:
Figure 10-13 JavaBeans set data source
Code Example 10-1 PersonBean example
public class PersonBean
{
private String name = "";
private int age = 0;
public PersonBean(String name, int age)
{
this.name = name;
this.age = age;
}
public int getAge()
{
return age;
}

166
iReport Ultimate Guide
Your class, which you will name TestFactory, will be something similar to this:
Your data source will represent five JavaBeans of PersonBean type.
The parameters for the data source configuration will be as follows (see Figure 10-15):
Factory name: “TestFactory?
Factory class: TestFactory
Method to call: generateCollection
Return type: Collection of JavaBean
public String getName()
{
return name;
}
}
Code Example 10-2 PersonBean example - Class result
public class TestFactory
{
public static java.util.Collection generateCollection()
{
java.util.Vector collection = new java.util.Vector();
collection.add(new PersonBean("Ted", 20) );
collection.add(new PersonBean("Jack", 34) );
collection.add(new PersonBean("Bob", 56) );
collection.add(new PersonBean("Alice",12) );
collection.add(new PersonBean("Robin",22) );
collection.add(new PersonBean("Peter",28) );
return collection;
}
}
Code Example 10-1 PersonBean example, continued
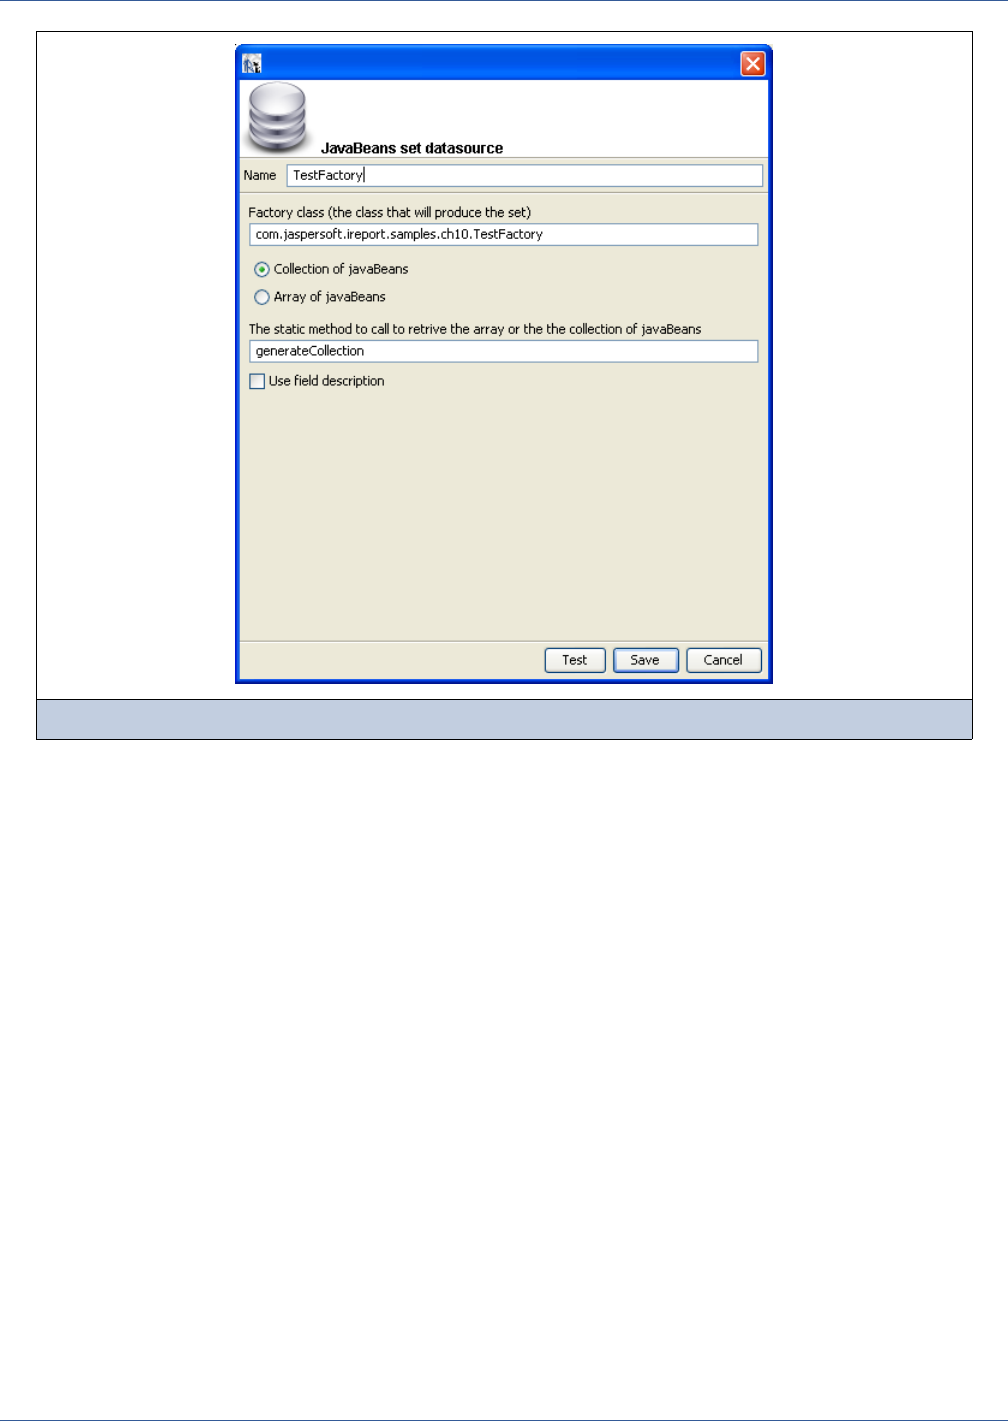
Data Sources and Query Executers
167
10.6.2 Fields of a JavaBean Set Data Source
One peculiarity of a JavaBeans set data source is that the fields are exposed through get methods. This means that if the
JavaBean has a getXyz() method, xyz is the name of a record field (the JavaBean represent the record).
In this example, the PersonBean object shows two fields: name and age; register them in the fields list as String and
Integer, respectively.
Create a new empty report and add the two fields by right-clicking the Fields node in the outline view and selecting Add field.
The name and the type of the fields are: name (java.lang.String) and age (java.lang.Integer).
Drag the fields into the Detail band and run the report (being sure the active connection is the Test Factory). Figure 10-15
shows how your report should appear during design time, while Figure 10-16 shows the result of the printed report filled with
the JavaBeans set.
Figure 10-14 Configuration of the factory data source
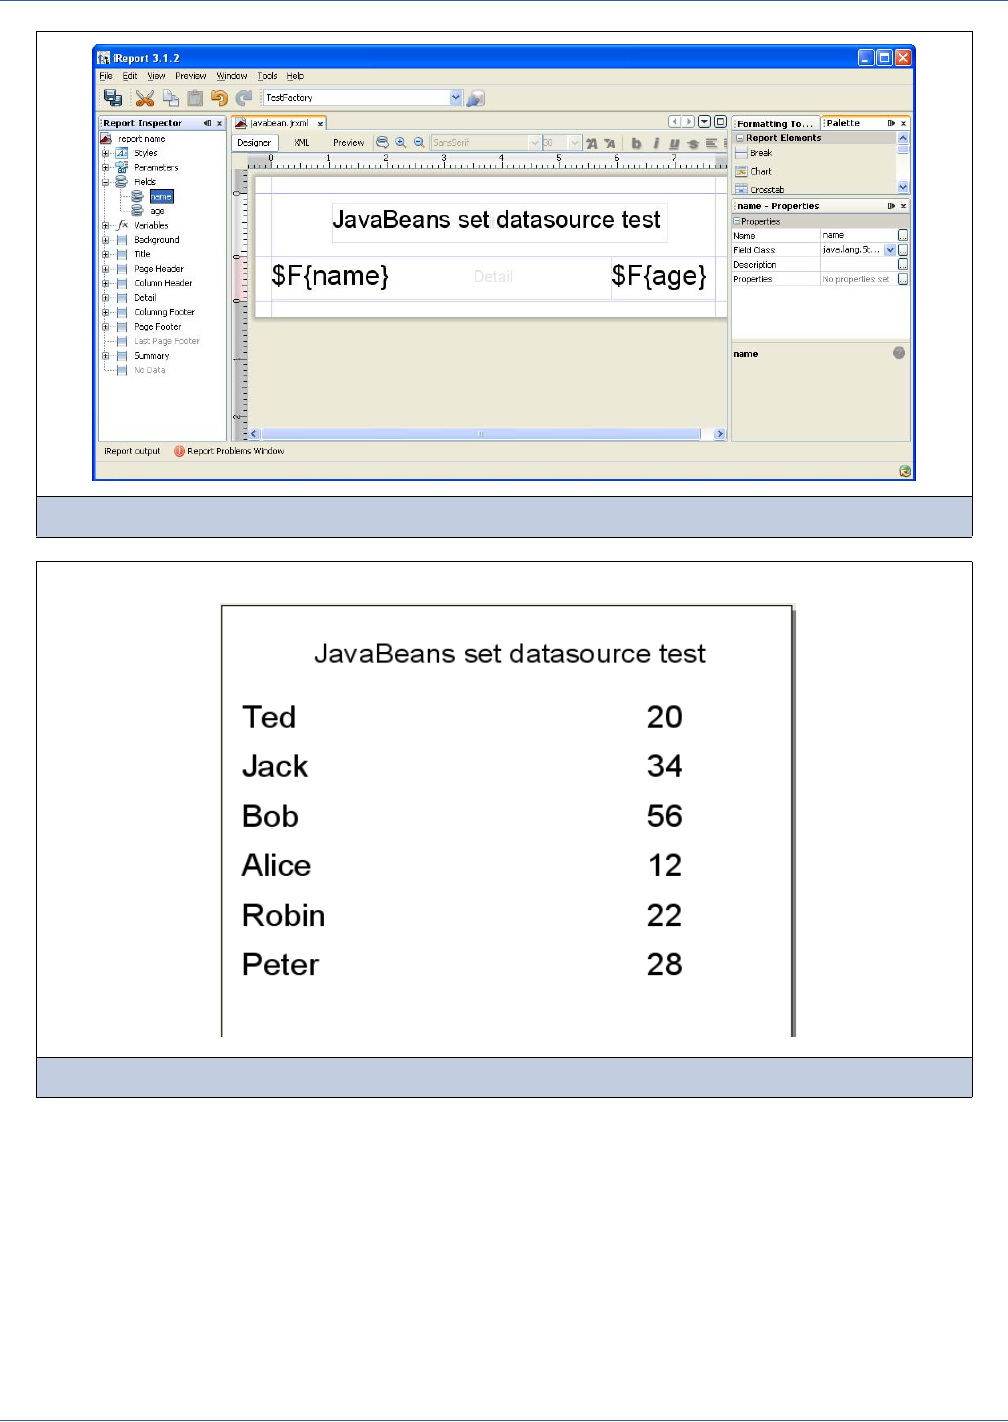
168
iReport Ultimate Guide
To refer to an attribute of an attribute, you can use a special notation in which attributes are separated by periods. For example,
to access the street attribute of a hypothetical Address class contained in the PersonBean, you can use the syntax
address.street. The real call would be <someBean>.getAddress().getStreet().
If the flag Use field description is set when you are specifying the properties of your JavaBeans set data source, the
mapping between JavaBean attribute and field value is done using the field description instead of the field name. The data
source will consider only the description to look up the field value, and the field can have any name.
iReport provides a visual tool to map JavaBean attributes to report fields. To use it, open the query window, go to the tab
JavaBean Data Source, insert the full class name of the bean you want to explore, and click Read attributes. The tab will be
populated with the attributes of the specified bean class (Figure 10-17).
For attributes that are also Java objects, you can double-click the objects to display the objects’ other attributes.
Figure 10-15 Layout of the JavaBeans-based report
Figure 10-16 The generated report
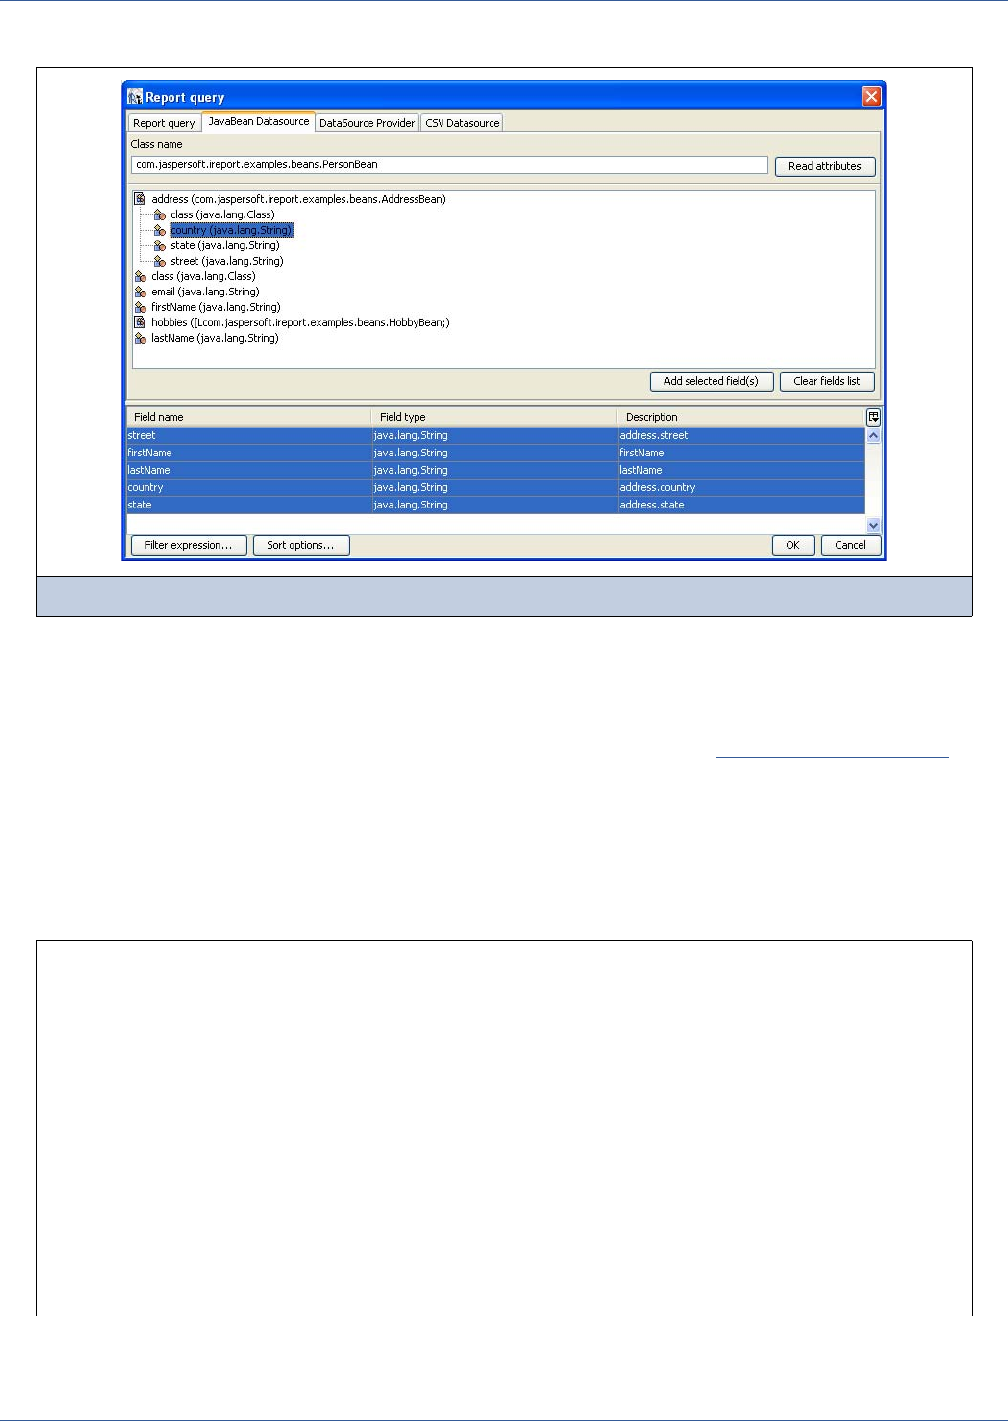
Data Sources and Query Executers
169
To map a field, select an attribute name and click the Add Selected Field(s) button.
10.6.3 Using XML Data Sources
JasperReports provides the ability to use an XML document as data source. An XML document is typically organized as a
tree, and its structure hardly matches the table-like form required by JasperReports. For this reason, you have to use an XPath
expression to define a node set. The specifications of the XPath language are available at http://www.w3.org/TR/xpath; it is
used to identify values or nodes in an XML document. Some examples will be useful to help you to know how to define the
nodes.
Consider the XML file in Table 10-1. It is a hypothetical address book in which different people appear, grouped in
categories. At the end of the categories list, a second list, of favorites objects, appears. In this case, it is possible to define
different node set types. The choice is determined by how you want to organize the data in your report.
Figure 10-17 Exploring a JavaBean to map the fields of the report
Code Example 10-3 Example XML file
<addressbook>
<category name="home">
<person id="1">
<lastname>Davolio</lastname>
<firstname>Nancy</firstname>
</person>
<person id="2">
<lastname>Fuller</lastname>
<firstname>Andrew</firstname>
</person>
<person id="3">
<lastname>Leverling</lastname>
</person>
</category>
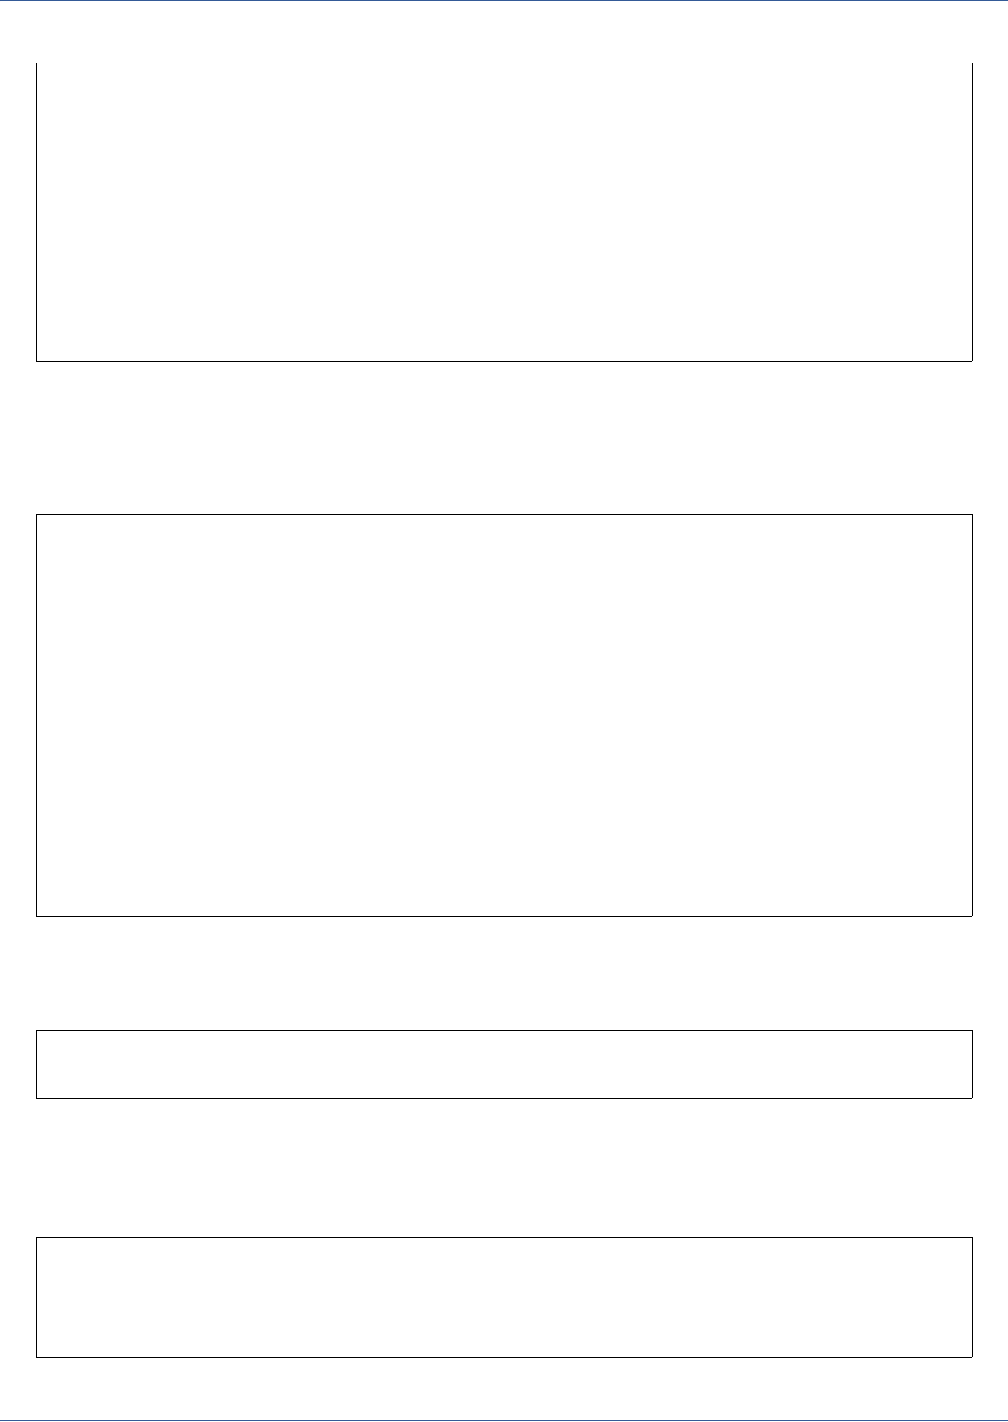
170
iReport Ultimate Guide
To select only the people contained in the categories (that is, all the people in the address book), use the following expression:
/addressbook/category/person
Four nodes will be returned. These are shown in Table 10-1.
If you want to select the people appearing in the favorites node, the expression to use is
/addressbook/favorites/person
Two nodes will be returned nodes.
Here is another expression. It is a bit more complex, but it shows all the power of the Xpath language. The idea is to select the
person nodes belonging to the work category. The expression to use is the following:
/addressbook/category[@name = "work"]/person
The expression will return only one node, that with an ID equal to 4, as shown here.
<category name="work">
<person id="4">
<lastname>Peacock</lastname>
<firstname>Margaret</firstname>
</person>
</category>
<favorites>
<person id="1"/>
<person id="3"/>
</favorites>
</addressbook>
Code Example 10-4 Node set with expression /addressbook/category/person
<person id="1">
<lastname>Davolio</lastname>
<firstname>Nancy</firstname>
</person>
<person id="2">
<lastname>Fuller</lastname>
<firstname>Andrew</firstname>
</person>
<person id="3">
<lastname>Leverling</lastname>
</person>
<person id="4">
<lastname>Peacock</lastname>
<firstname>Margaret</firstname>
</person>
<person id="1"/>
<person id="3"/>
<person id="4">
<lastname>Peacock</lastname>
<firstname>Margaret</firstname>
</person>
Code Example 10-3 Example XML file, continued
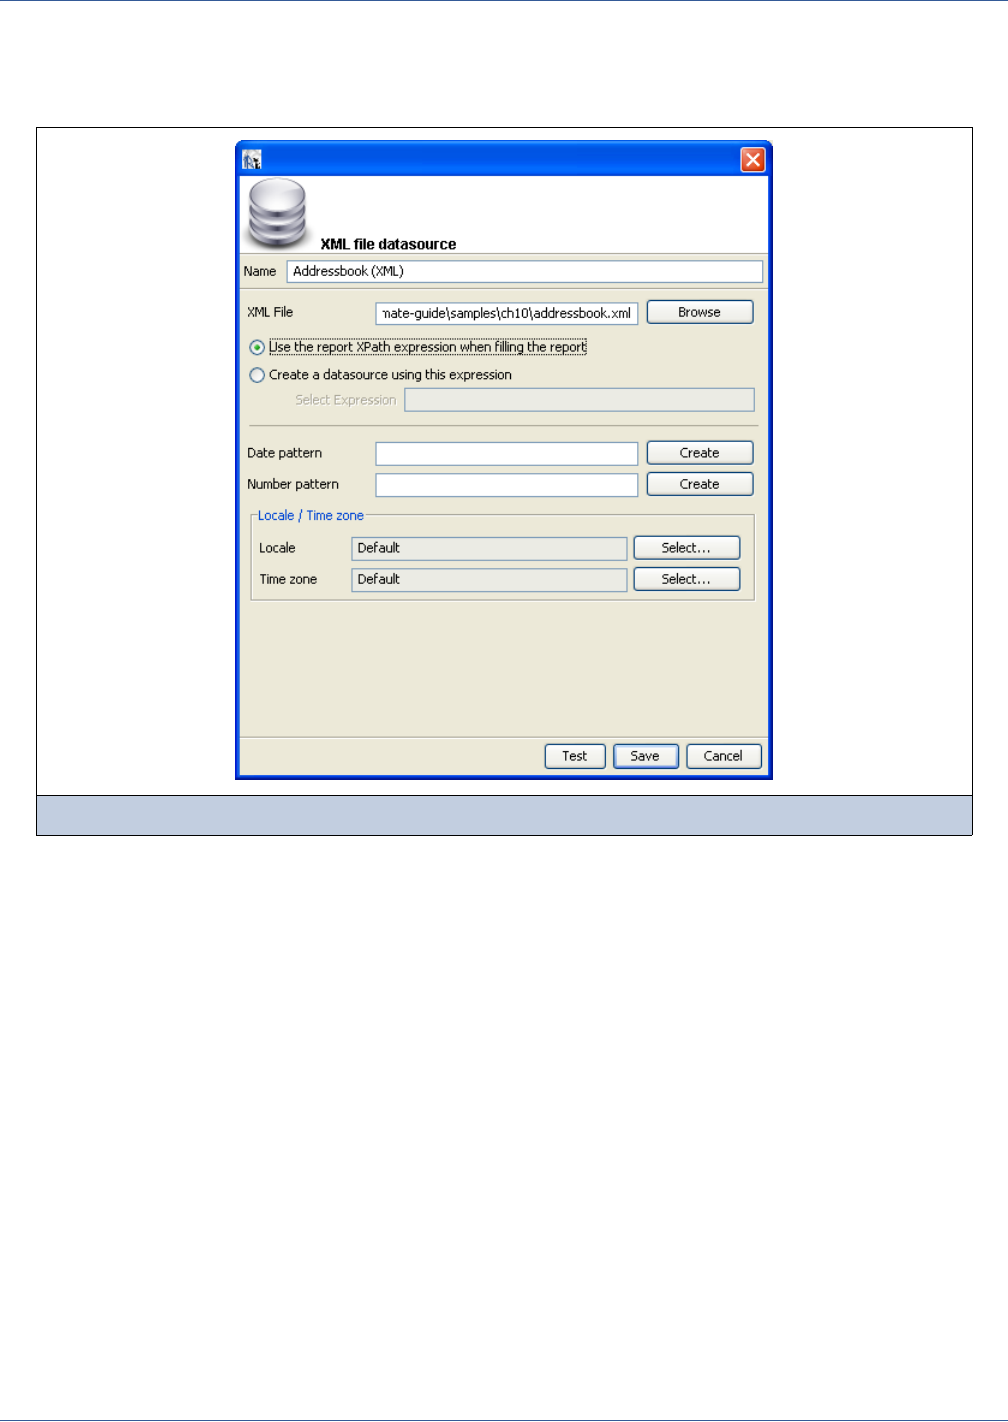
Data Sources and Query Executers
171
After you have created an expression for the selection of a node set, you can proceed to the creation of an XML data source.
Open the window for creating a new data source and select XML File data source from the list of connection types to bring up
the dialog box shown in Figure 10-18.
The only mandatory information to specify is the XML file name. Optionally, you can provide a set of nodes, using a pre-
defined static XPath expression. Alternatively, the XPath expression can be set directly inside the report.
I always suggest that you use a report-defined XPath expression. The advantage of this solution is the ability to use parameters
inside the XPath expression, which acts like a real query on the supplied XML data. Optionally, you can specify Java patterns
to convert dates and numbers from plain strings to more appropriate Java objects (like Date and Double). For the same
purpose, you can define a specific locale and time zone to use when parsing the XML stream.
10.6.4 Registration of the Fields for an XML Data Source
In the case of an XML data source, the definition of a field in the report needs a particular expression inserted as a field
description in addition to the type and the name. As the data source aims always to be one node of the selected node set, the
expressions are relative to the current node.
To select the value of an attribute of the current node, use the following syntax:
@<name attribute>
For example, to define a field that must point to the id attribute of a person (attribute id of the node person), it is sufficient to
create a new field, name it as you want, and set the description to
@id
Similarly, it is possible to get to the child nodes of the current node. For example, if you want to refer to the lastname node,
child of person, use the following syntax:
lastname
Figure 10-18 Configuring an XML data source
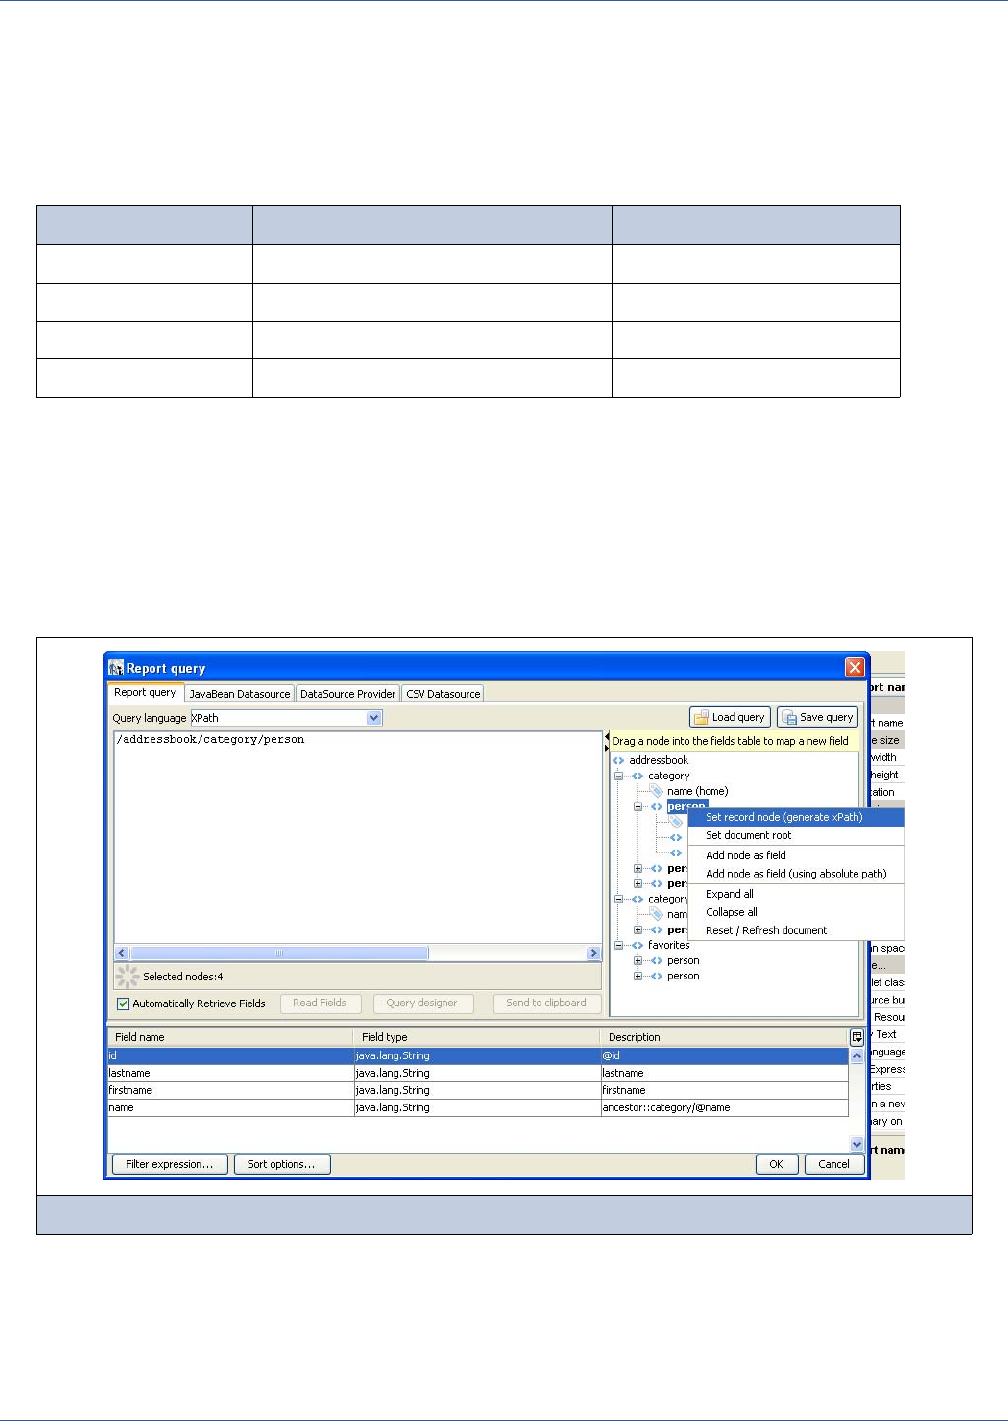
172
iReport Ultimate Guide
To move to the parent value of the current node (for example, to determine the category to which a person belongs), use a
slightly different syntax:
ancestor::category/@name
The ancestor keyword indicates that you are referring to a parent node of the current node; in particular, you are referring to
the first parent of category type, of which you want to know the value of the name attribute.
Now, let’s see everything in action. Prepare a simple report with the registered fields shown here:
iReport provides a visual tool to map XML nodes to report fields; to use it, open the query window and select XPath as the
query language. If the active connection is a valid XML DataSource, the associated XML document will be shown in a tree
view. To register the fields, set the record node by right-clicking a Person node and selecting the menu item Set record node
(as shown in Figure 10-19). The record nodes will become bold.
Then one by one, select the nodes or attributes and select the pop-up menu item Add node as field to map them to report
fields. iReport will determine the correct XPath expression to use and will create the fields for you. You can modify the
generated field name and set a more suitable field type after the registration of the field in the report (which happens when you
close the query dialog).
Field name Description Type
id @id Integer
lastname lastname String
firstname firstname String
name of category ancestor::category/@name String
Figure 10-19 The XML node mapping tool
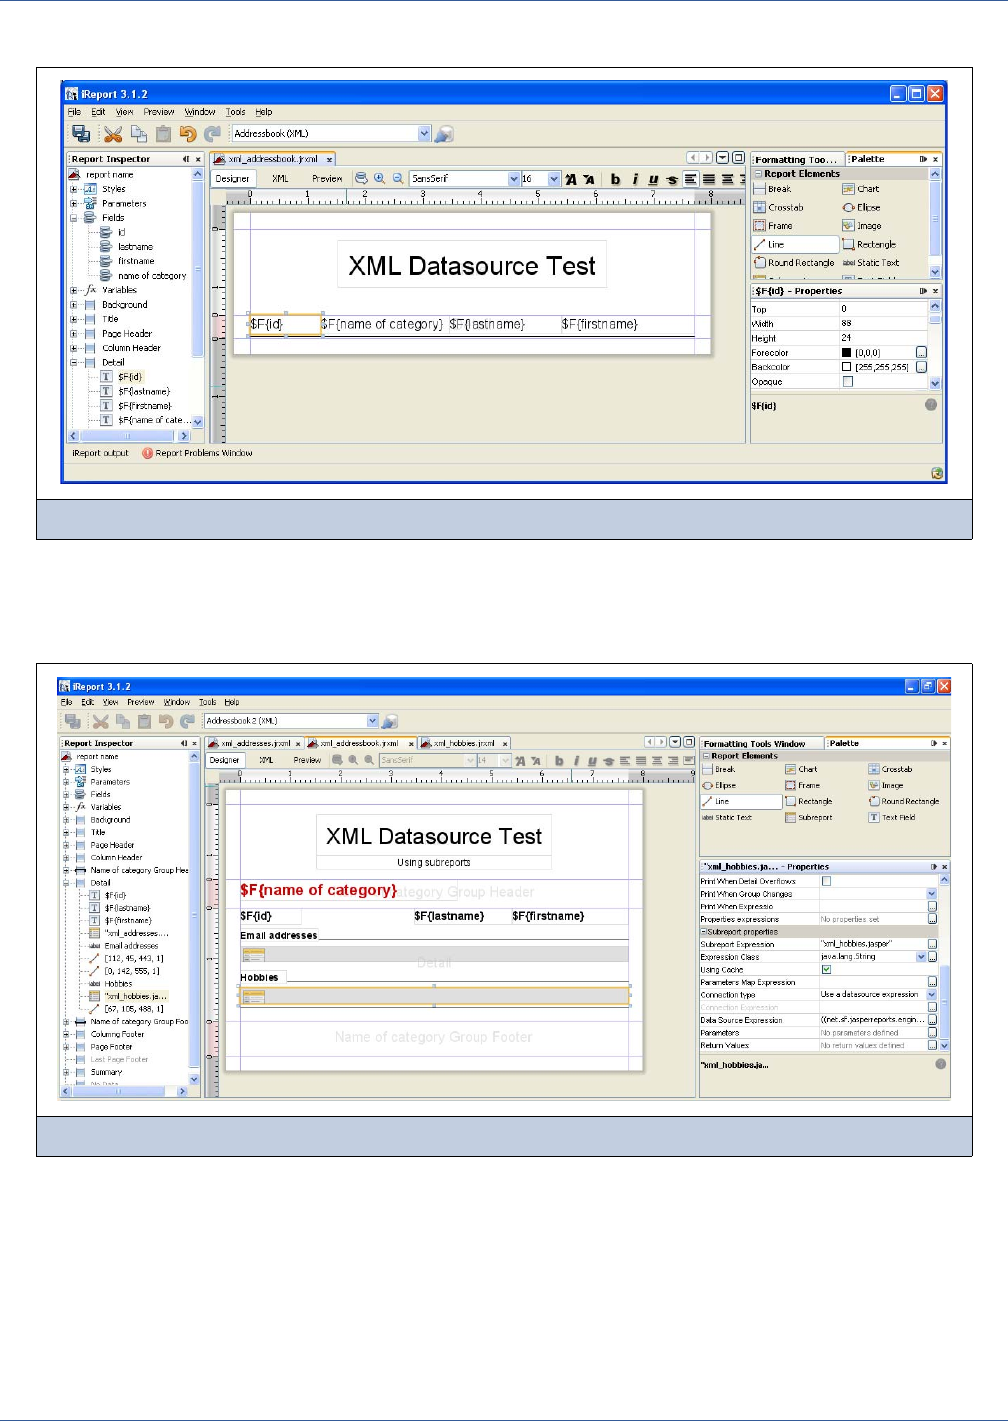
Data Sources and Query Executers
173
Insert the different fields into the Detail band (Figure 10-20). The XML file used to fill the report is that shown:
The XPath expression for the node set selection specified in the query dialog is:
/addressbook/category/person
The final result appears in Figure 10-21.
10.6.5 XML Data Source and Subreports
A node set allows you to identify a series of nodes that represent, from a JRDataSource point of view, some records.
However, due to the tree-like nature of an XML document, it may be necessary to see other node sets that are subordinated to
the main nodes.
Consider the XML in Table 10-1. This is a slightly modified version of the document presented in Code Example 10-3. For
each person node, a hobbies node is added which contains a series of hobby nodes and one or more e-mail addresses.
Figure 10-20 The XML-based report layout
Figure 10-21 The result of the XML-based report

174
iReport Ultimate Guide
What we want to produce is a document that is more elaborate than those you have seen until now—for each person, we want
to present their e-mail addresses, hobbies, and favorite people.
To obtain such a document, it is necessary to use subreports; in particular, you will need a subreport for the e-mail addresses
list, one for hobbies, and one for favorite people (that is a set of nodes out of the scope of the XPath query we used). To
generate these subreports, you need to understand how to produce new data sources to feed them. In this case, you use the
JRXmlDataSource, which exposes two extremely useful methods:
Code Example 10-5 Complex XML example
<addressbook>
<category name="home">
<person id="1">
<lastname>Davolio</lastname>
<firstname>Nancy</firstname>
<email>davolio1@sf.net</email>
<email>davolio2@sf.net</email>
<hobbies>
<hobby>Music</hobby>
<hobby>Sport</hobby>
</hobbies>
</person>
<person id="2">
<lastname>Fuller</lastname>
<firstname>Andrew</firstname>
<email>af@test.net</email>
<email>afullera@fuller.org</email>
<hobbies>
<hobby>Cinema</hobby>
<hobby>Sport</hobby>
</hobbies>
</person>
</category>
<category name="work">
<person id="3">
<lastname>Leverling</lastname>
<email>leverling@xyz.it</email>
</person>
<person id="4">
<lastname>Peacock</lastname>
<firstname>Margaret</firstname>
<email>margaret@foo.org</email>
<hobbies>
<hobby>Food</hobby>
<hobby>Books</hobby>
</hobbies>
</person>
</category>
<favorites>
<person id="1"/>
<person id="3"/>
</favorites>
</addressbook>
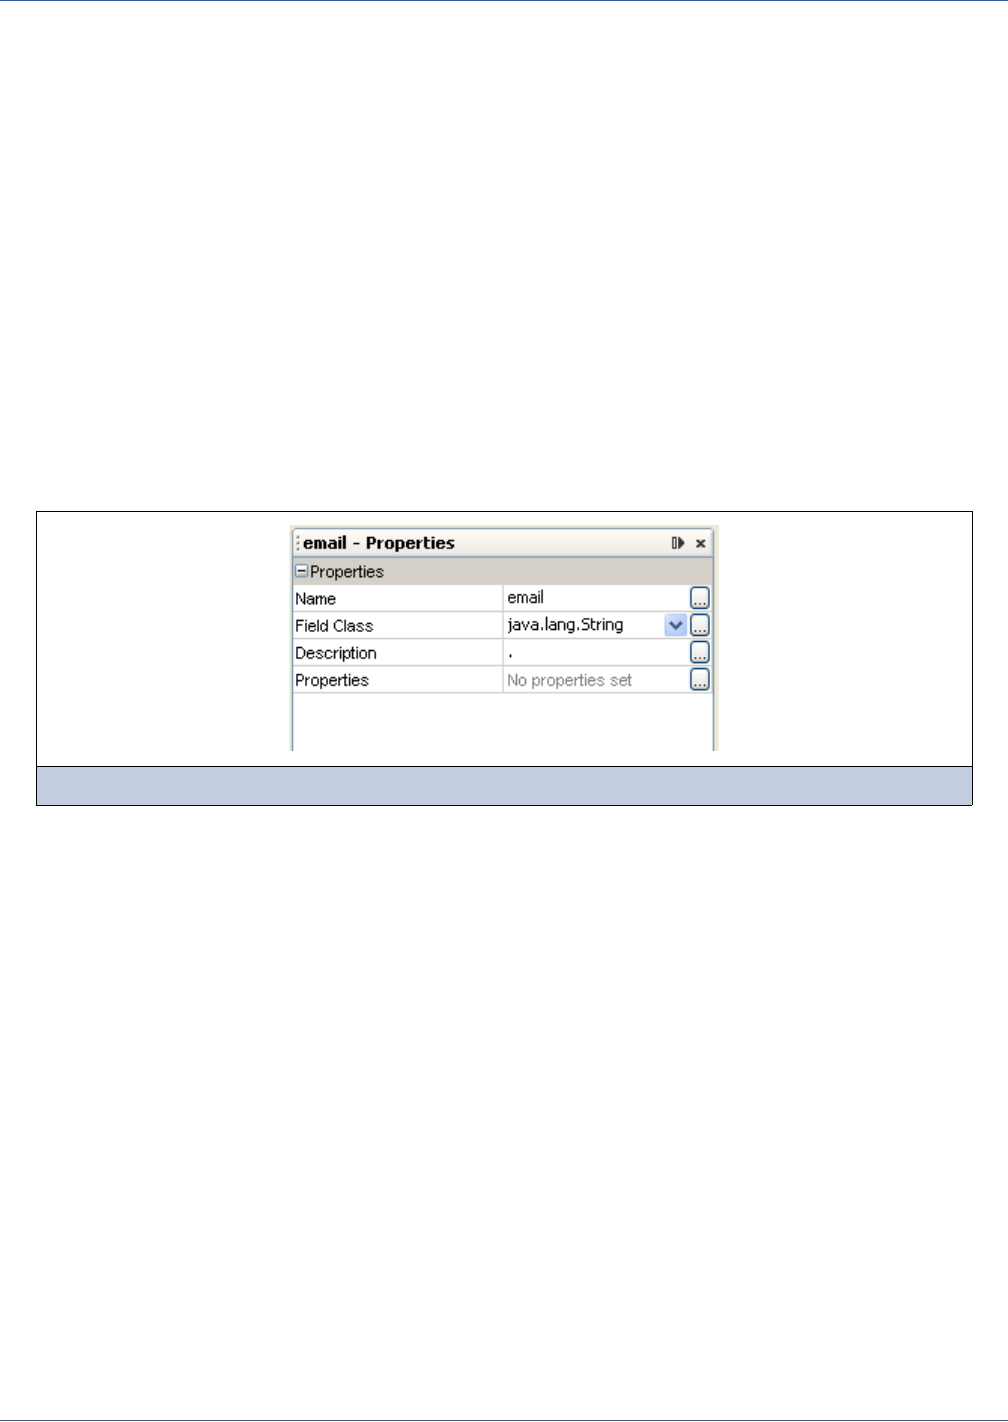
Data Sources and Query Executers
175
public JRXmlDataSource dataSource(String selectExpression)
public JRXmlDataSource subDataSource(String selectExpression)
The difference between the two is that the first method processes the expression by applying it to the whole document, starting
from the actual root, while the second assumes the current node is the root.
Both methods can be used in the data source expression of a subreport element to produce dynamically the data source to pass
to the element. The most important thing to note is that this mechanism allows you to make both the data source production
and the expression of node selection dynamic.
The expression to create the data source that will feed the subreport of the e-mail addresses will be
((net.sf.jasperreports.engine.data.JRXmlDataSource)
$P{REPORT_DATA_SOURCE}).subDataSource("/person/email")
This code returns all the e-mail nodes that are direct descendants of the present node (person).
The expression for the hobbies subreport will be similar, except for the node selection:
((net.sf.jasperreports.engine.data.JRXmlDataSource)
$P{REPORT_DATA_SOURCE}).subDataSource("/person/hobbies/hobby")
Next, declare the master report’s fields, as shown in Figure 10-20. In the subreport, you have to refer to the current node
value, so the field expression will be simply a dot (.), as shown in Figure 10-22.
Proceed with building your three reports: xml_addressbook.jasper, xml_addresses.jasper, and
xml_hobbies.jasper.
In the master report, xml_addressbook.jrxml, insert a group named “Name of category,” in which you associate the
expression for the category field ($F{name of category}), as shown in Figure 10-23. In the header band for Name of
category, insert a field in which you will view the category name. By doing this, the names of the different people will be
grouped by category (as in the XML file).
Figure 10-22 Mapping of the e-mail field in the subreport
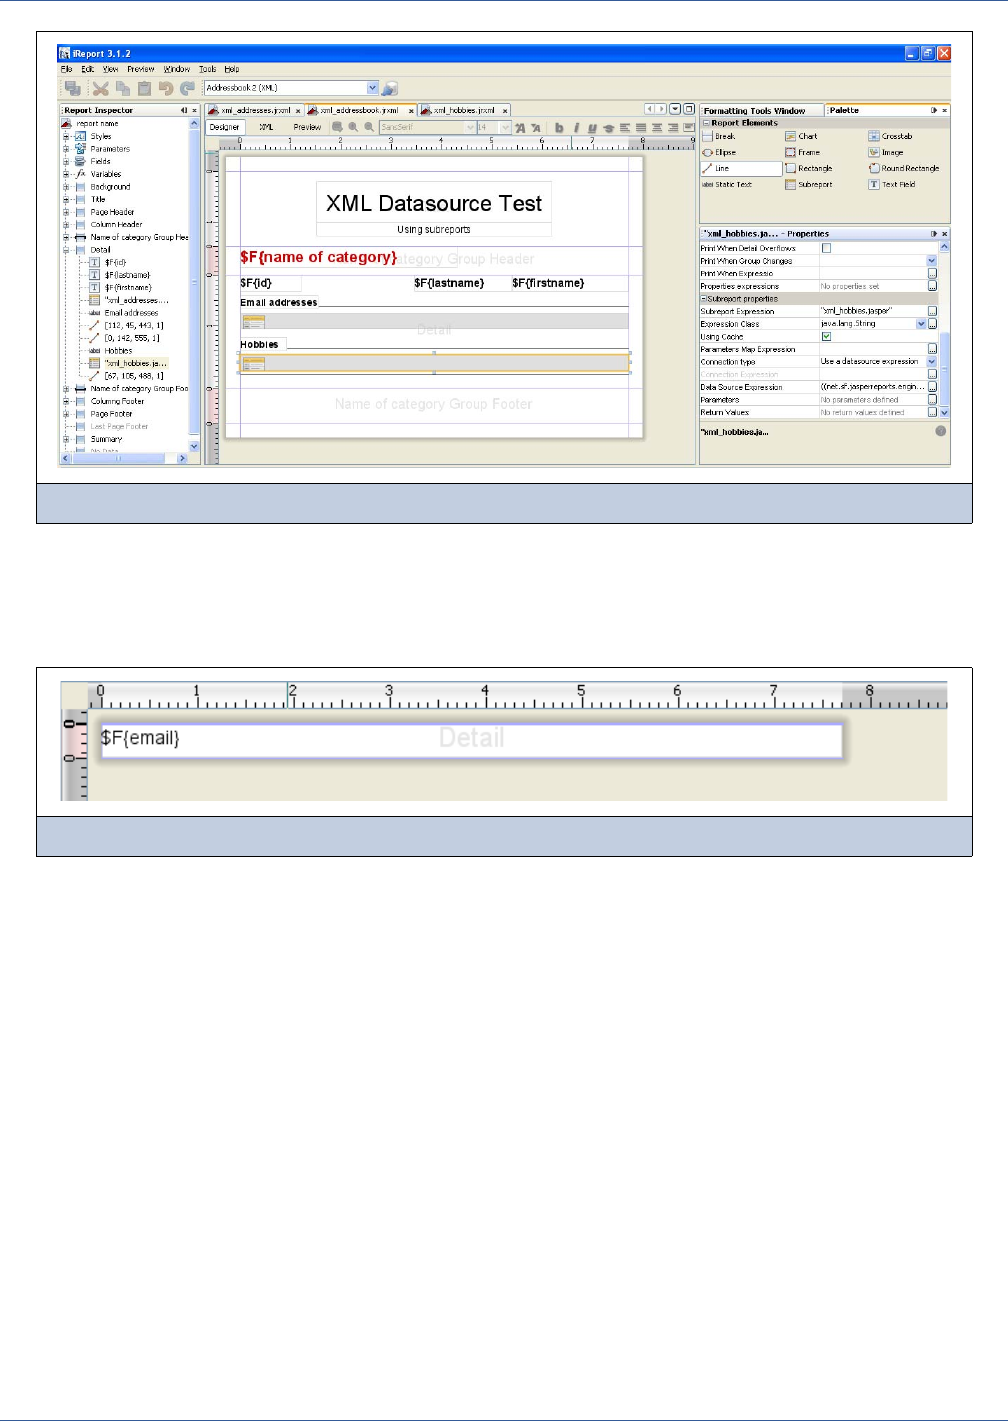
176
iReport Ultimate Guide
In the Detail band, position the id, lastname, and firstname fields. Underneath these fields, add the two Subreport
elements, the first for the e-mail addresses, the second for the hobbies.
The e-mail and hobby subreports are identical except for the name of the field in each one (see Figure 10-22). The two reports
should be as large as the Subreport elements in the master report, so remove the margins and set the report width accordingly.
Preview both the subreports just to compile them and generate the relative .jasper files. You will get an error during the fill
process, but it’s okay. We have not set an Xpath query, so JasperReports is not able to get any data. You can resolve the
problem by setting a simple Xpath query (it will not be used in the final report), or you can preview the subreport using an
empty data source (you will have to select it from the combo box in the tool bar).
When the subreports are done, execute the master report. If everything is okay, you will see the print shown in Figure 10-25.
It displays people grouped by home and work categories and the subreports associated with every person.
Figure 10-23 The master report with the two subreports for addresses and hobbies
Figure 10-24 The subreport layout
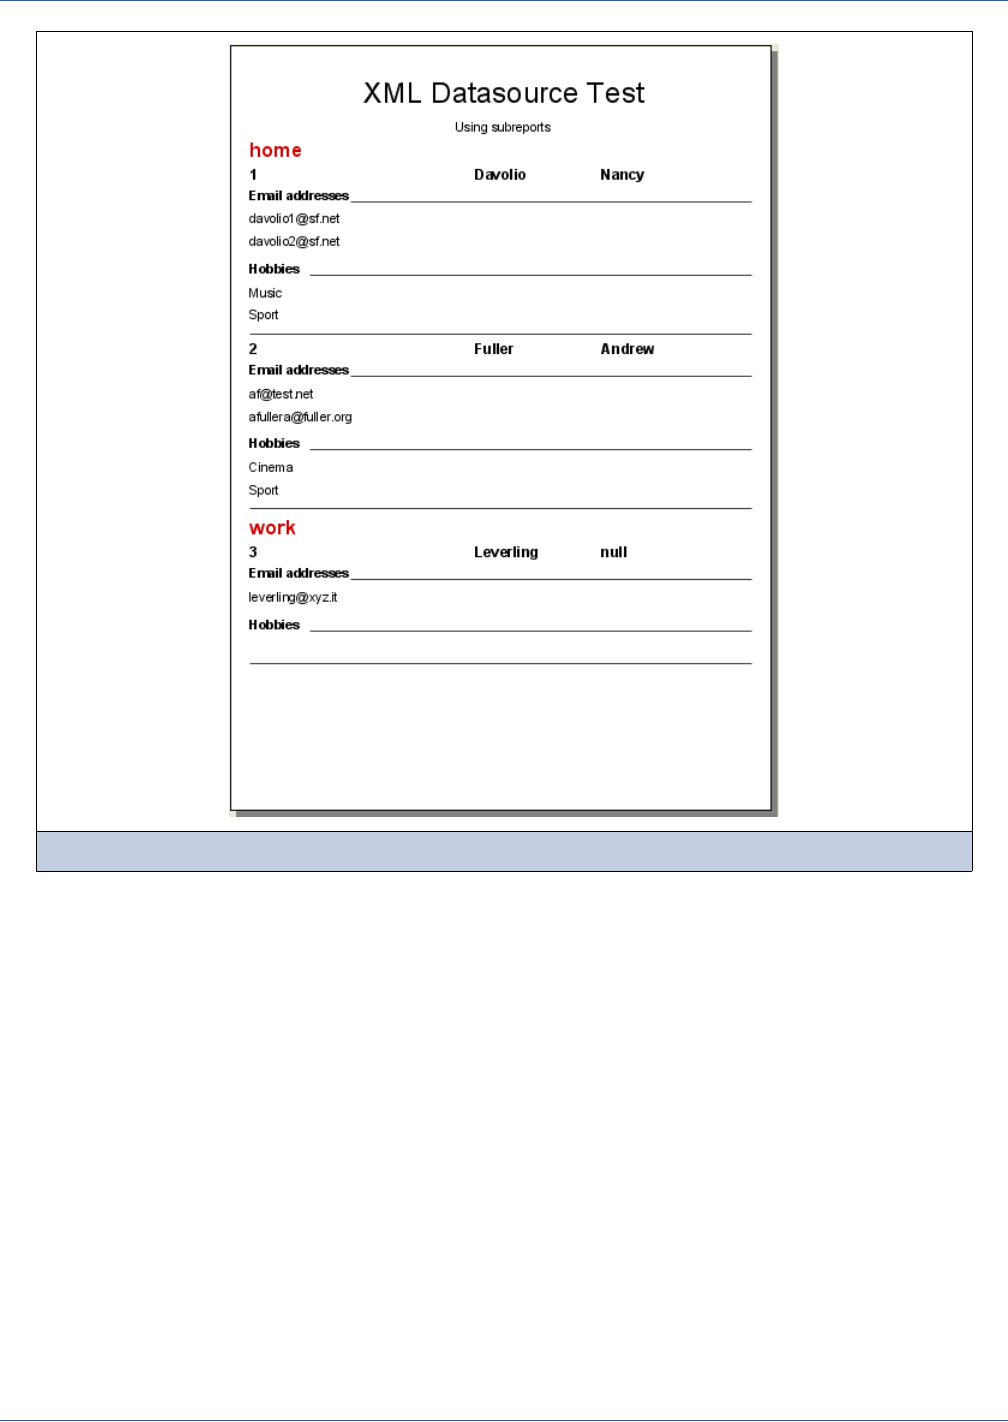
Data Sources and Query Executers
177
As this example demonstrates, the real power of the XML data source is the versatility of XPath, which allows navigating the
node selection in a refined manner.
10.6.6 Using CSV Data Sources
Initially, the data source for CSV documents was a very simple data source proof-of-concept that showed how to implement a
custom data source. The CSV data source interface was improved when JasperReports added a native implementation to fill a
report using a CSV file.
To create a connection based on a CSV file, click the New button in the Connections/Datasources dialog box and select File
CSV data source from the data source types list to bring up the dialog box shown in Figure 10-26.
Figure 10-25 The first page of the final result
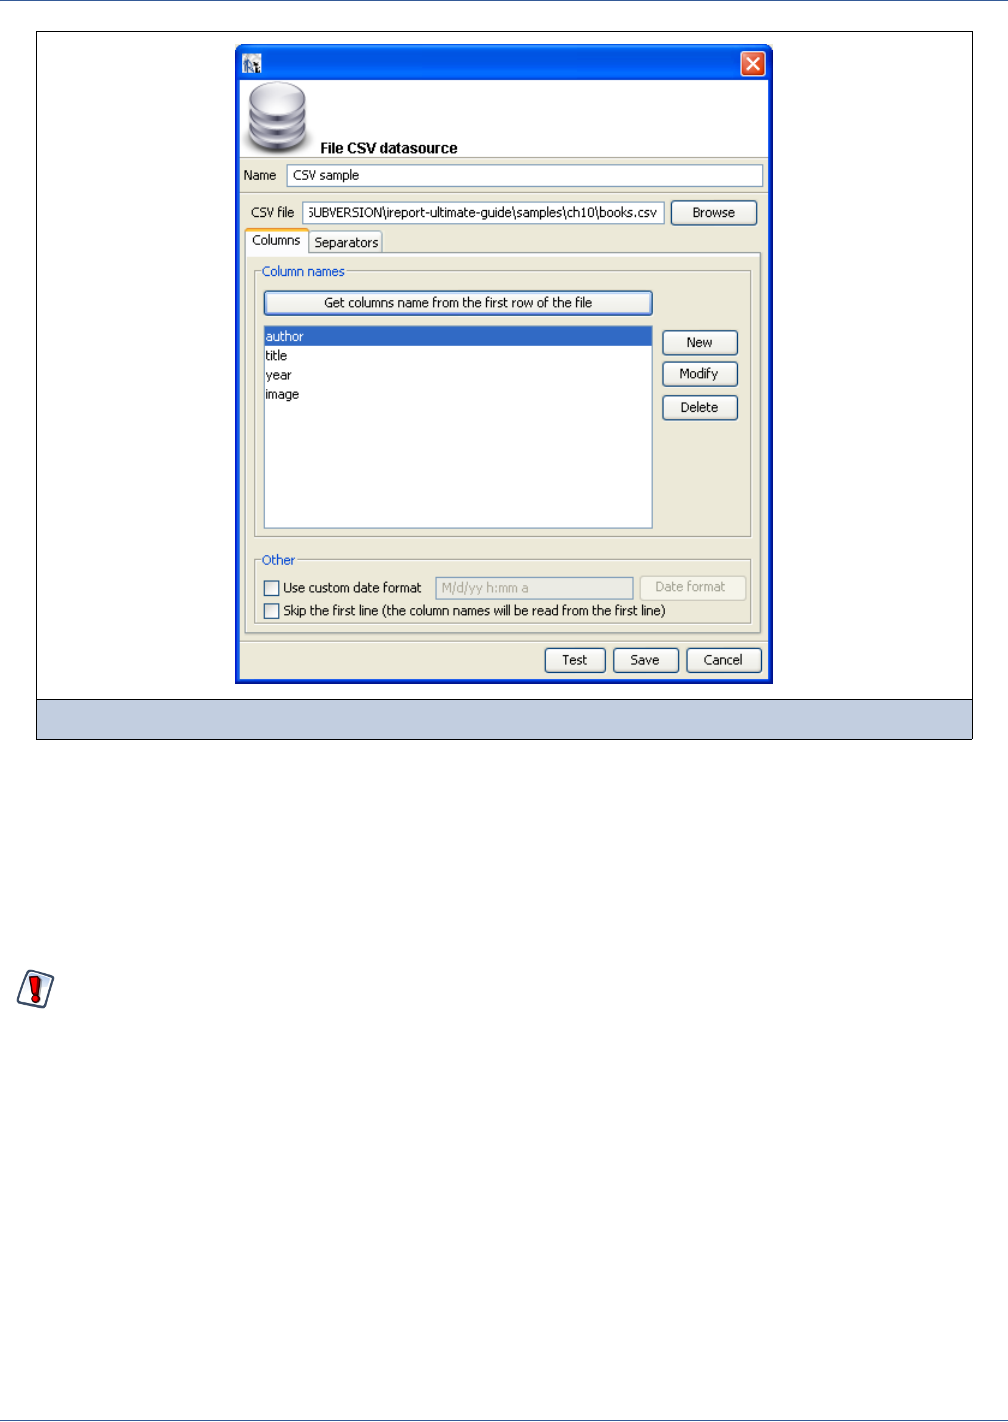
178
iReport Ultimate Guide
Set a name for the connection and choose a CSV file. Then declare the fields in the data source.
If the first line in your file contains the names of the columns, click the Get column names from the first row of the file
button and select the Skip the first line check box option. This forces JasperReports to skip the first line (the one
containing your column labels). In any case, the column names that are read from the file are used instead of the declared
ones, so avoid modifying the names found with the Get column names button.
If the first line of your CSV file doesn’t contain the column names, set a name for each column using the syntax
COLUMN_0, COLUMN_1, and so on.
JasperReports assumes that, for each row, all the columns have a value (even if they are empty).
If your CSV file uses nonstandard characters to separate fields and rows, you can adjust the default setting for separators using
the Separators tab, shown in Figure 10-27.
Figure 10-26 CSV data source
If you define more columns than the ones available, you’ll get an exception at report filling time.
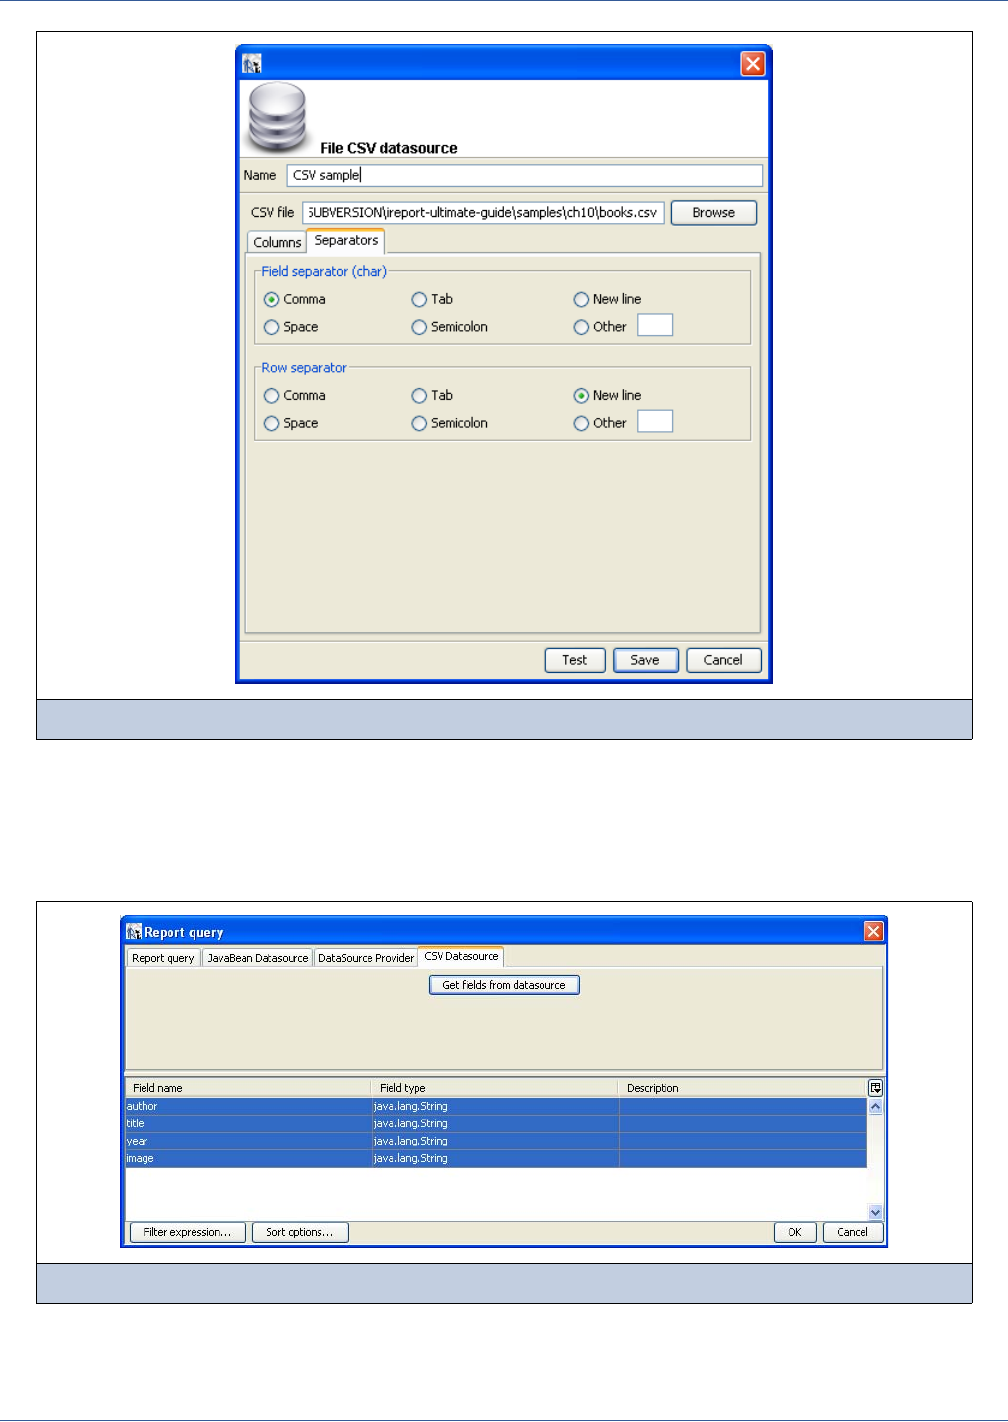
Data Sources and Query Executers
179
10.6.7 Registration of the Fields for a CSV Data Source
When you create a CSV data source, you must define a set of column names that will be used as fields for your report. To add
them to the fields list, set your CSV data source as the active connection and open the Report query dialog box. Go to the tab
labeled CSV Datasource and click the Get fields from data source button, as shown in Figure 10-28.
By default, iReport sets the class type of all fields to java.lang.String. If you are sure that the text of a particular column
can be easily converted to a number, a date, or a Boolean value, set the correct field type yourself after the fields are added to
your report.
Figure 10-27 Column and row separators
Figure 10-28 Registering CSV file fields
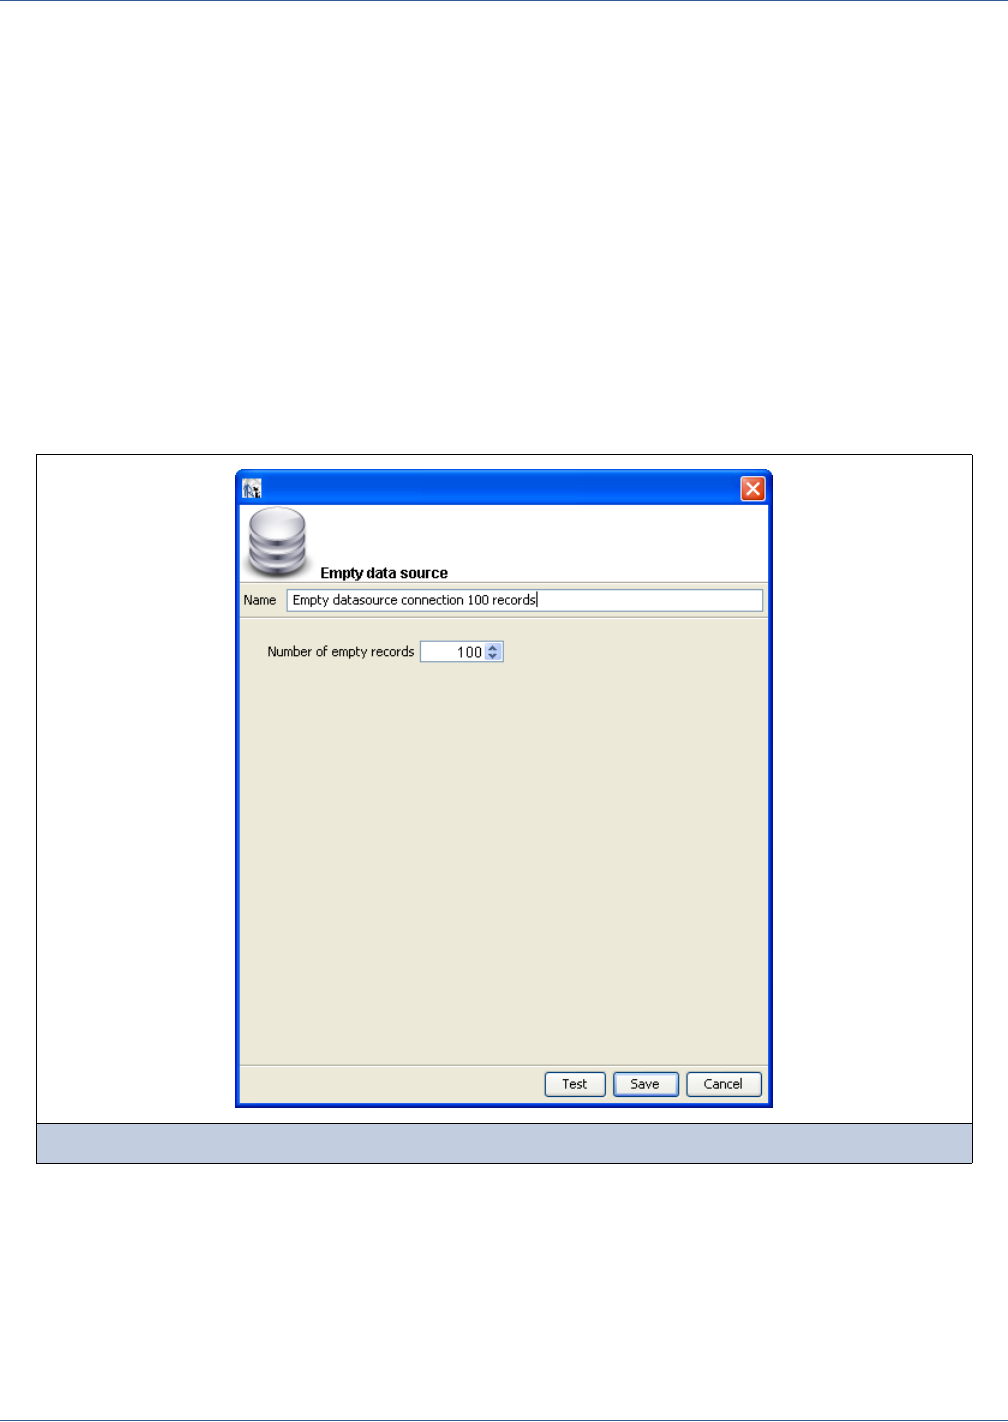
180
iReport Ultimate Guide
The pattern used to recognize a timestamp (or date) object can be configured at the data source level by selecting the Use
custom date format check box option.
10.6.8 Using JREmptyDataSource
JasperReports provides a special data source named JREmptyDataSource.
This source returns true to the next method for the record number (by default only one), and always returns null to every call
of the getFieldValue method. It is like having records without fields, that is, an empty data source.
The two constructors of this class are:
public JREmptyDataSource(int count)
public JREmptyDataSource()
The first constructor indicates how many records to return, and the second sets the number of records to one.
By default, iReport provides a pre-configured empty data source that returns a single record. To create a new empty data
source with more records, select Empty Datasource from the list of available connection types. You will prompted with the
dialog shown in Figure 10-29.
Set the number or empty records that you need. Remember, whatever field you will add to the report, its value will be set to
null. Since this data source doesn’t care about field names or types, this is a perfect way to test any report (keeping in mind
that the fields will be always set to null).
10.6.9 Using HQL and Hibernate Connections
JasperReports provides a way to use HQL directly in your report. To do so, first set up a Hibernate connection. Expand your
classpath to include all classes, JARs, and configuration files used by your Hibernate mapping. In other words, iReport must
Figure 10-29 Empty data source
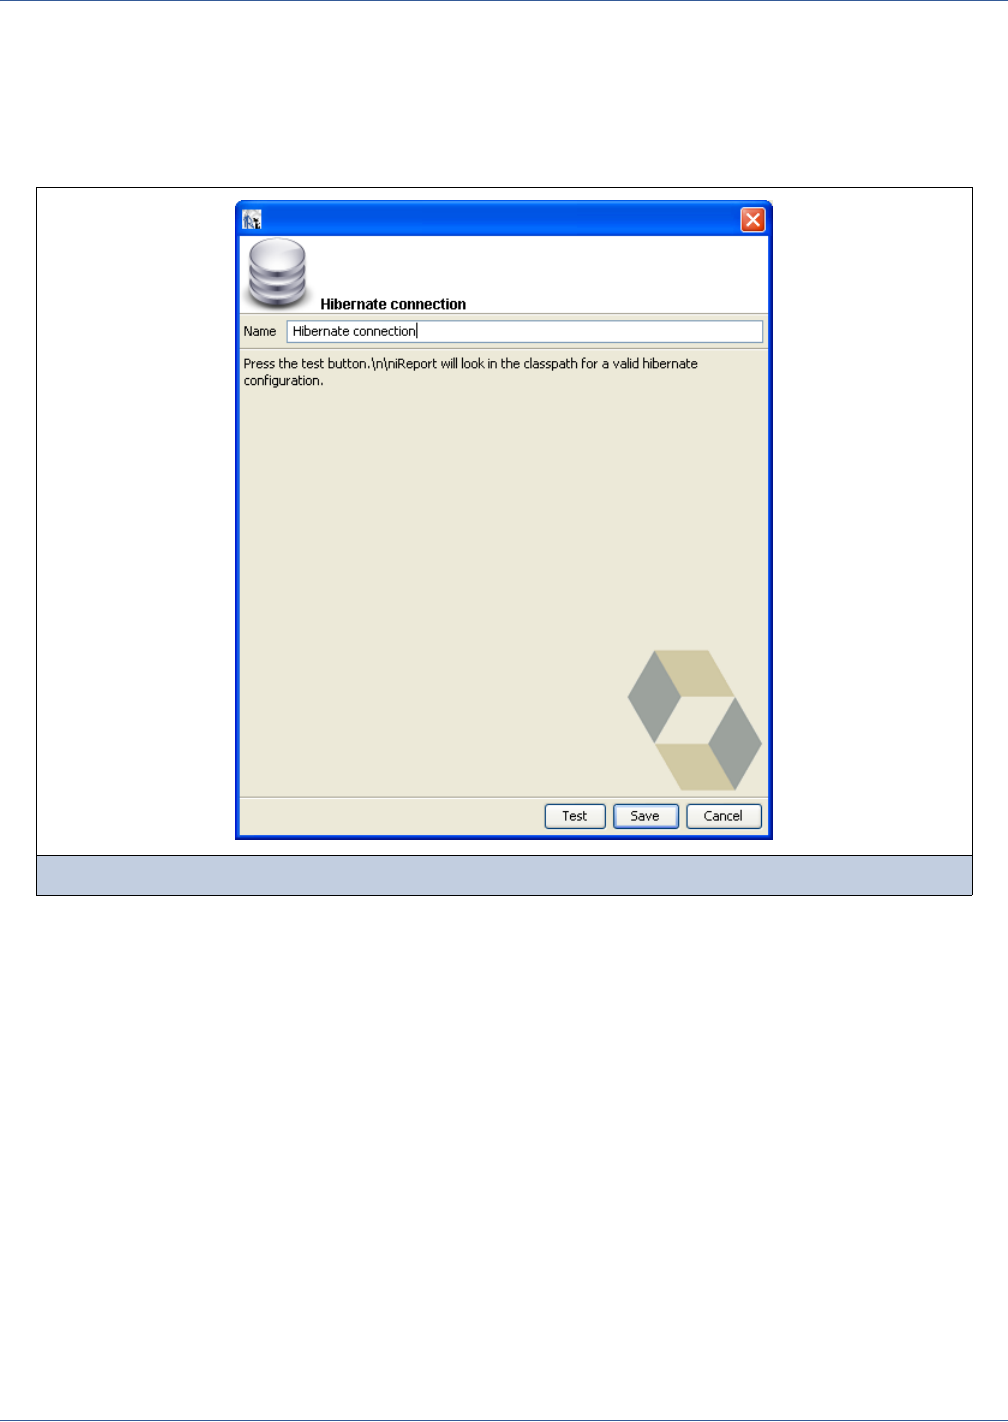
Data Sources and Query Executers
181
be able to access all the *.hbm.xml files you plan to use, the JavaBeans declared in those files, the hibernate.cfg.xml file,
and any other JARs used (for example, JARs that access the database under Hibernate).
To add these objects to the classpath, select Tools → Options and click the Classpath tab.
Once you’ve expanded the classpath, open the Connections/Datasources dialog box, click the New button, and choose the
Hibernate connection as your data source type. This brings up the dialog box shown in Figure 10-30.
Click the Test button to check the path resolution so that you can be certain that hibernate.cfg.xml is in the classpath.
Currently, iReport works only with a single Hibernate configuration (that is, the first hibernate.cfg.xml file found in the
classpath).
If you use the Spring framework, you can use a Spring configuration file to define your connection. In this case, you’ll need to
set the configuration file name and the Session Factory Bean ID (see Figure 10-31).
Figure 10-30 Hibernate connection
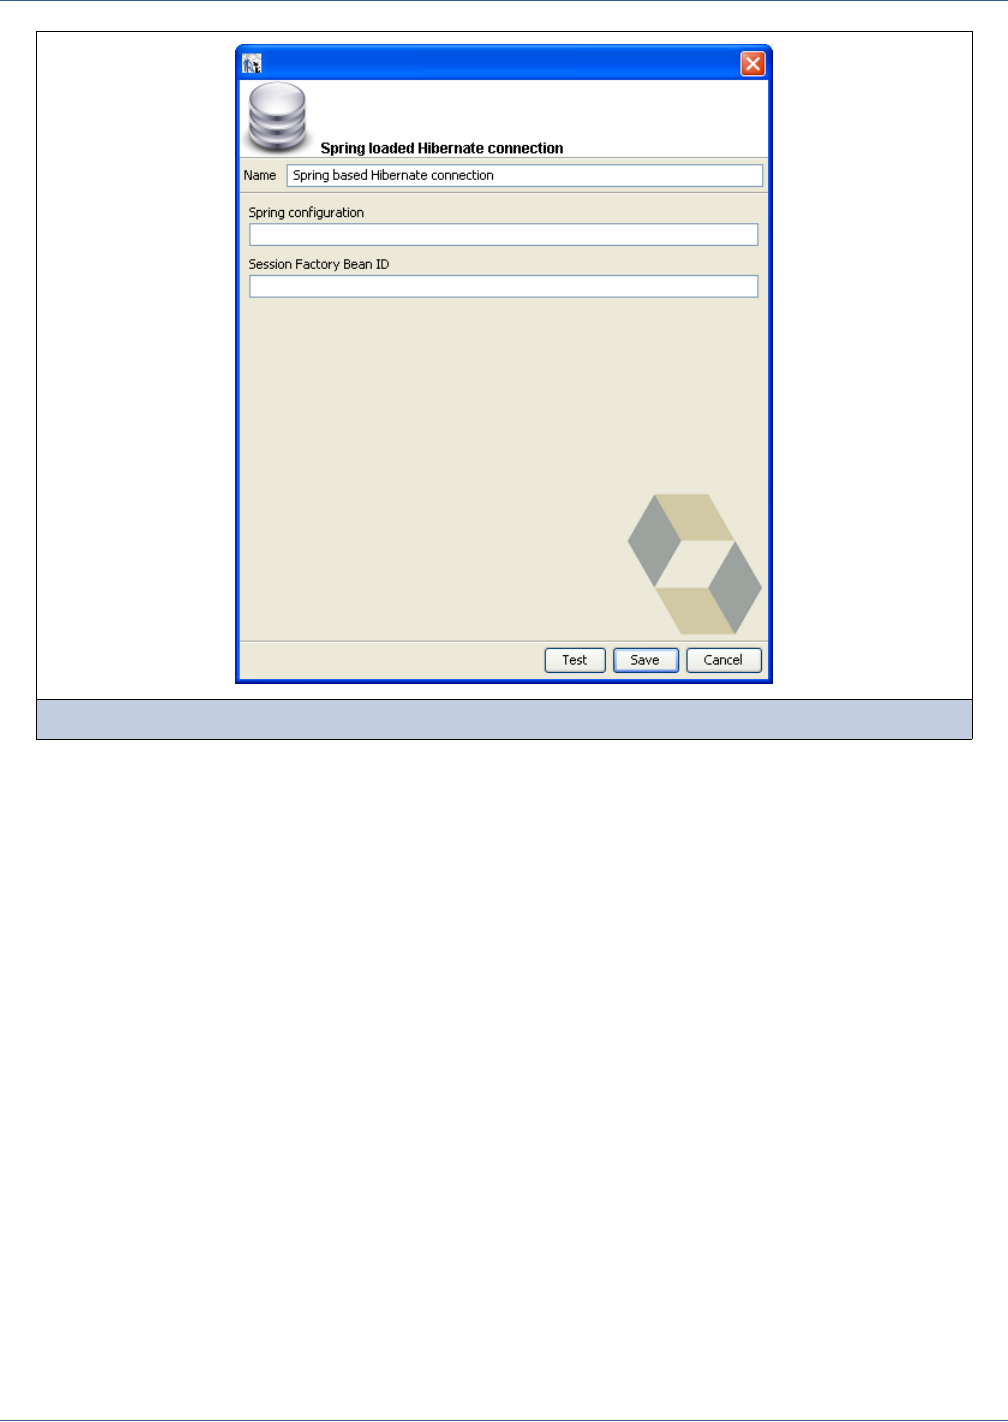
182
iReport Ultimate Guide
Now that a Hibernate connection is available, use an HQL query to select the data to print. You can use HQL in the same way
that you use SQL: open the Report query dialog box and choose HQL as the query language from the combo box at the top of
the window (see Figure 10-32).
Figure 10-31 Spring-based Hibernate connection
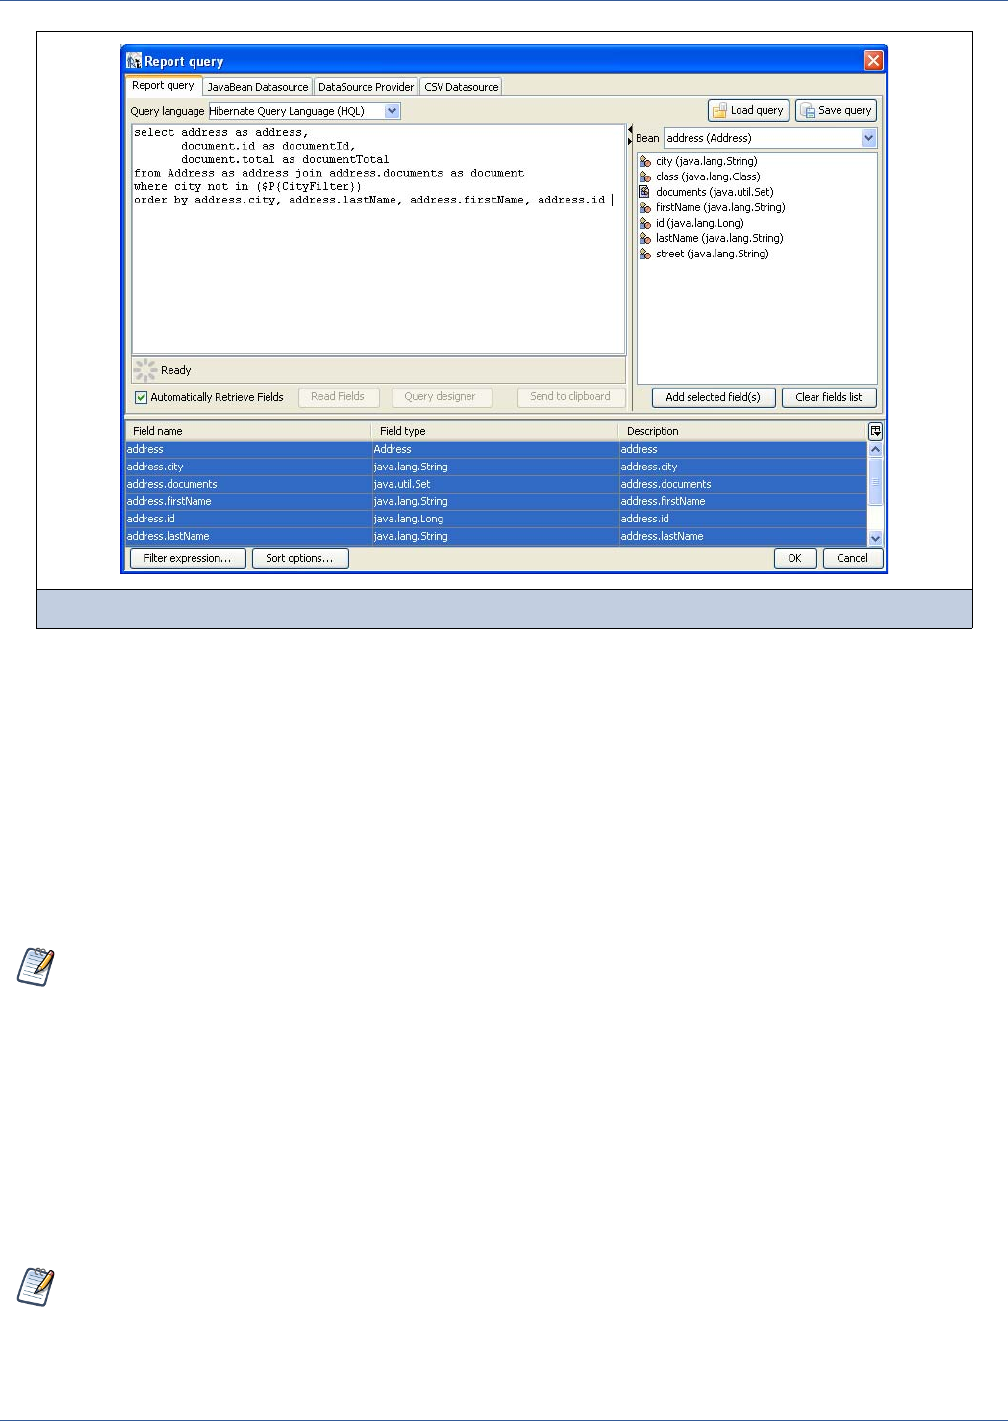
Data Sources and Query Executers
183
When you enter an HQL query, iReport tries to retrieve the available fields. According to the JasperReports documentation,
the field mappings are resolved as follows:
If the query returns one object per row, a field mapping can be one of the following:
If the object’s type is a Hibernate entity or component type, the field mappings are resolved as the property names of
the entity/component. If a select alias is present, it can be used to map a field to the whole entity/component object.
Otherwise, the object type is considered scalar, and only one field can be mapped to its value.
If the query returns a tuple (object array) per row, a field mapping can be one of the following:
A select alias. The field will be mapped to the value corresponding to the alias.
A property name prefixed by a select alias and a “.”. The field will be mapped to the value of the property for the
object corresponding to the alias. The type corresponding to the select alias has to be an entity or component.
iReport provides a mapping tool to map objects and attributes to report fields. The objects (or JavaBeans) available in each
record are listed in the combo box on top of the object tree.
To add a field from the tree, select the corresponding node and click the Add selected field(s) button.
10.6.10 Using a Hadoop Hive Connection
JasperReports provides a way to use Hive in your reports. Unlike traditional databases, Hadoop systems support huge amounts
of data, generally called big data. But this capability has a cost: high latency with access times between 30 seconds and 2
minutes.
To use Hadoop Hive with iReport, first set up a Hadoop Hive connection. To do this, click the Report Datasources icon, click
the New button, and choose the Hadoop Hive connection as your data source type.
Figure 10-32 The HQL and the HQL mapping tool
If you don’t understand this field mapping information, simply accept the fields listed by iReport when the query is
parsed.
Because of the latency, reports based on Hadoop-Hive data sources are best suited to be run in the background or to
be scheduled. For example, the report could be run at 6 a.m. and the HTML or PDF could be exported and stored for
anyone wanting to access the report during the day.
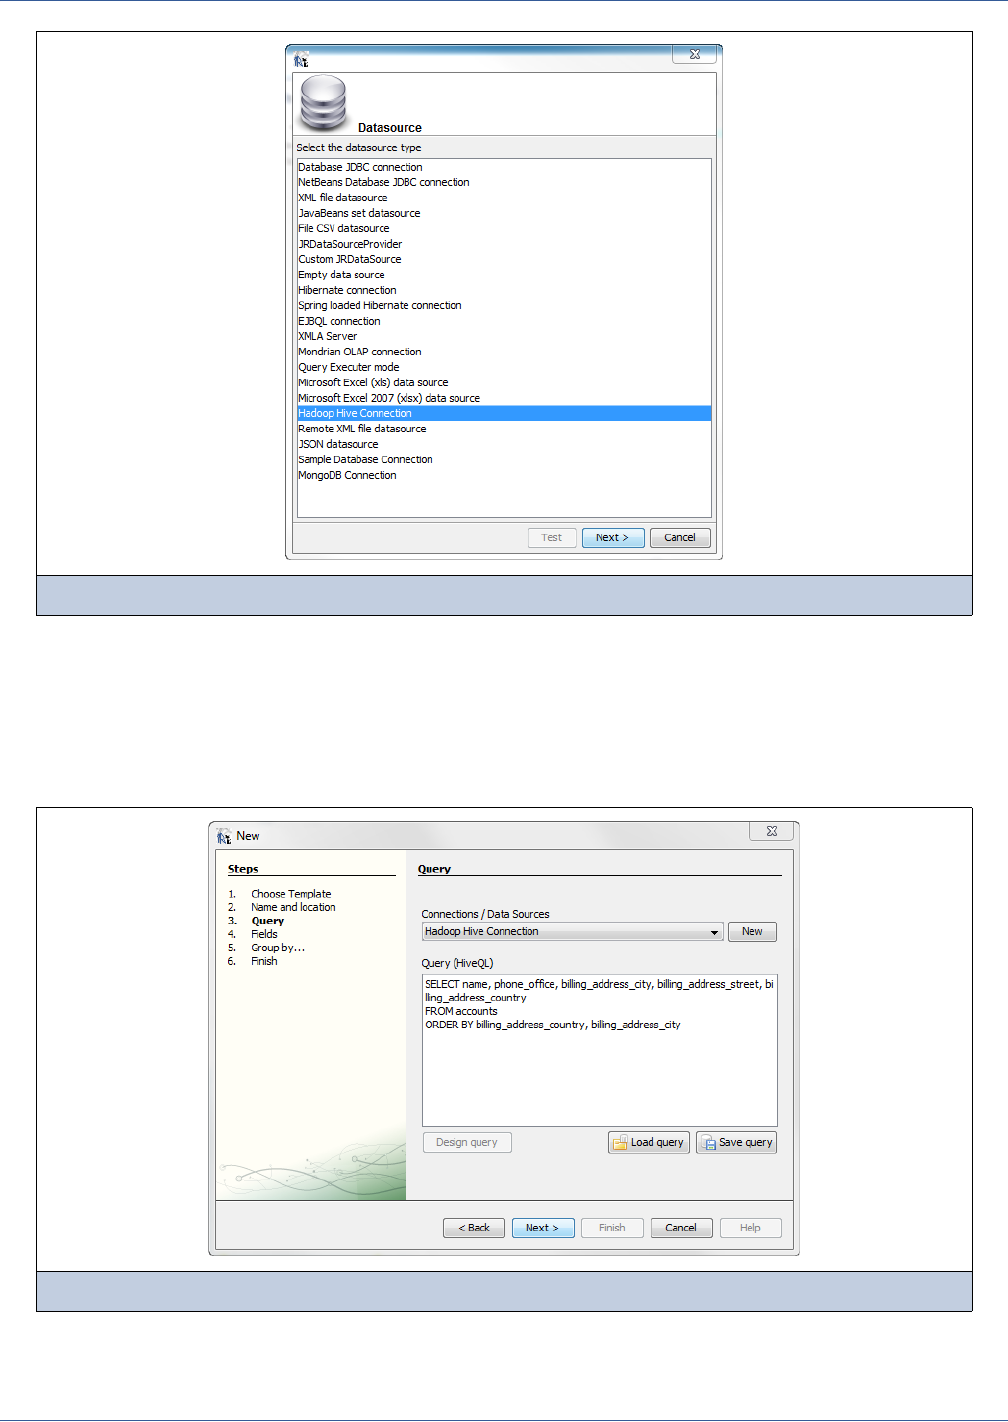
184
iReport Ultimate Guide
Enter the path to your HIve JDBC. Usually it will look something like jdbc:hive://50.19.3.244:10000/default.
Click the Test button to check the path resolution.
Now that a Hive connection is available, use a HiveQL query to retrieve data in your report. You can use HiveQL in the same
way that you use SQL. To use a HiveQL query, open the Report Query dialog box and choose HiveQL as the query language
from the combo box at the top of the window. Alternatively, you can choose HiveQL in the Wizard that creates a report from
the Welcome Window (see Figure 10-34).
Figure 10-33 Hadoop Hive Connection
Figure 10-34 HiveQL Query and the Report Wizard
Data Sources and Query Executers
185
When you enter a HiveQL query, iReport retrieves all available fields. In the next two screens, select the fields you wish to
display in your report, and how you want to group them. After defining your HiveQL query and choosing your fields, your
report is configured to receive data from your Hadoop Hive data source.
10.6.11 How to Implement a New JRDataSource
Sometimes the JRDataSource supplied with JasperReports cannot satisfy your needs. In these cases, it is possible to write a
new JRDataSource. This operation is not complex; in fact, all you have to do is create a class that implements the
JRDataSource interface that exposes two simple methods: next and getFieldValue:
The next method is used to set the current record into the data source. It has to return true if a new record to elaborate exists;
otherwise it returns false.
If the next method has been called positively, the getFieldValue method has to return the value of the requested field or
null. In particular, the requested field name is contained in the JRField object passed as a parameter. Also, JRField is an
interface through which it is possible to get the information associated with a field—the name, description, and Java type that
represents it (as mentioned previously in Chapter 10.5, “Understanding the JRDataSource Interface,” on page 163).
Now try writing your personalized data source. The idea is a little original—you have to write a data source that explores the
directory of a file system and returns the found objects (files or directories). The fields you will make to manage your data
source will be the file name, which you will name FILENAME; a flag that indicates whether the object is a file or a directory,
which you will name IS_DIRECTORY; and the file size, if available, which you will name SIZE.
There will be two constructors for your data source: the first will receive as a parameter the directory to scan, the second will
have no parameters and will use the current directory to scan.
Once instantiated, the data source will look for the files and the directories present in the way you indicate and fill the array
files.
The next method will increase the index variable that you use to keep track of the position reached in the array files, and it
will return true until you reach the end of the array.
The Hive JDBC driver does not yet fully implement the JDBC specifications, and it does not yet work correctly with the
JasperReports Server metadata layer (Data Domains). If reporting against a Hive data source and you are using
JasperReports Server, use Topics rather than Domains.
Code Example 10-6 The JRDataSource interface
package net.sf.jasperreports.engine;
public interface JRDataSource
{
public boolean next() throws JRException;
public Object getFieldValue(JRField jrField) throws JRException;
}

186
iReport Ultimate Guide
Code Example 10-7 Sample personalized data source
import net.sf.jasperreports.engine.*;
import java.io.*;
public class JRFileSystemDataSource implements JRDataSource
{
File[] files = null;
int index = -1;
public JRFileSystemDataSource(String path)
{
File dir = new File(path);
if (dir.exists() && dir.isDirectory())
{
files = dir.listFiles();
}
}
public JRFileSystemDataSource()
{
this(".");
}
public boolean next() throws JRException
{
index++;
if (files != null && index < files.length)
{
return true;
}
return false;
}
public Object getFieldValue(JRField jrField) throws JRException
{
File f = files[index];
if (f == null) return null;
if (jrField.getName().equals("FILENAME"))
{
return f.getName();
}
else if (jrField.getName().equals("IS_DIRECTORY"))
{
return new Boolean(f.isDirectory());
}
Data Sources and Query Executers
187
The getFieldValue method will return the requested file information. Your implementation does not use the information
regarding the return type expected by the caller of the method, but it assumes that the name has to be returned as a string, the
flag IS_DIRECTORY as a Boolean object, and the file size as a Long object.
In the next section, you will learn how to use your personalized data source in iReport and test it.
10.6.12 Using a Personalized JRDataSource with iReport
iReport provides support for almost all the data sources provided by JasperReports, such as JRXmlDataSource,
JRBeanArrayDataSource, and JRBeanCollectionDataSource.
To use your personalized data sources, a special connection is provided. It is useful for employing whatever JRDataSource
you want to use through some kind of factory class that provides an instance of that JRDataSource implementation. The
factory is just a simple Java class useful to test your data source and to fill a report in iReport. The idea is the same as what you
have seen for the JavaBeans set data source—it is necessary to write a Java class that creates the data source through a static
method and returns it. For example, if you want to test the JRFileSystemDataSource in the previous section, you need to
create a simple class like that shown in this code sample:
This class, and in particular the static method that will be called, will execute all the necessary code for instancing the data
source correctly. In this case, you create a new JRFileSystemDataSource object by specifying a way to scan the directory
root ("/").
Now that you have defined the way to obtain the JRDataSource you prepared and the data source is ready to be used, you can
create the connection through which it will be used.
Create a new connection as you normally would (see Chapter 10.3, “Creating and Using JDBC Connections,” on
page 156), then select Custom JRDataSource from the data source type list and specify a data source name such as
TestFileSystemDataSource (or whatever name you wish), as shown in Figure 10-35.
else if (jrField.getName().equals("SIZE"))
{
return new Long(f.length());
}
// Field not found...
return null;
}
}
Code Example 10-8 Class for testing a personalized data source
import net.sf.jasperreports.engine.*;
public class FileSystemDataSourceFactory {
public static JRDataSource createDatasource()
{
return new JRFileSystemDataSource("/");
}
}
Code Example 10-7 Sample personalized data source, continued
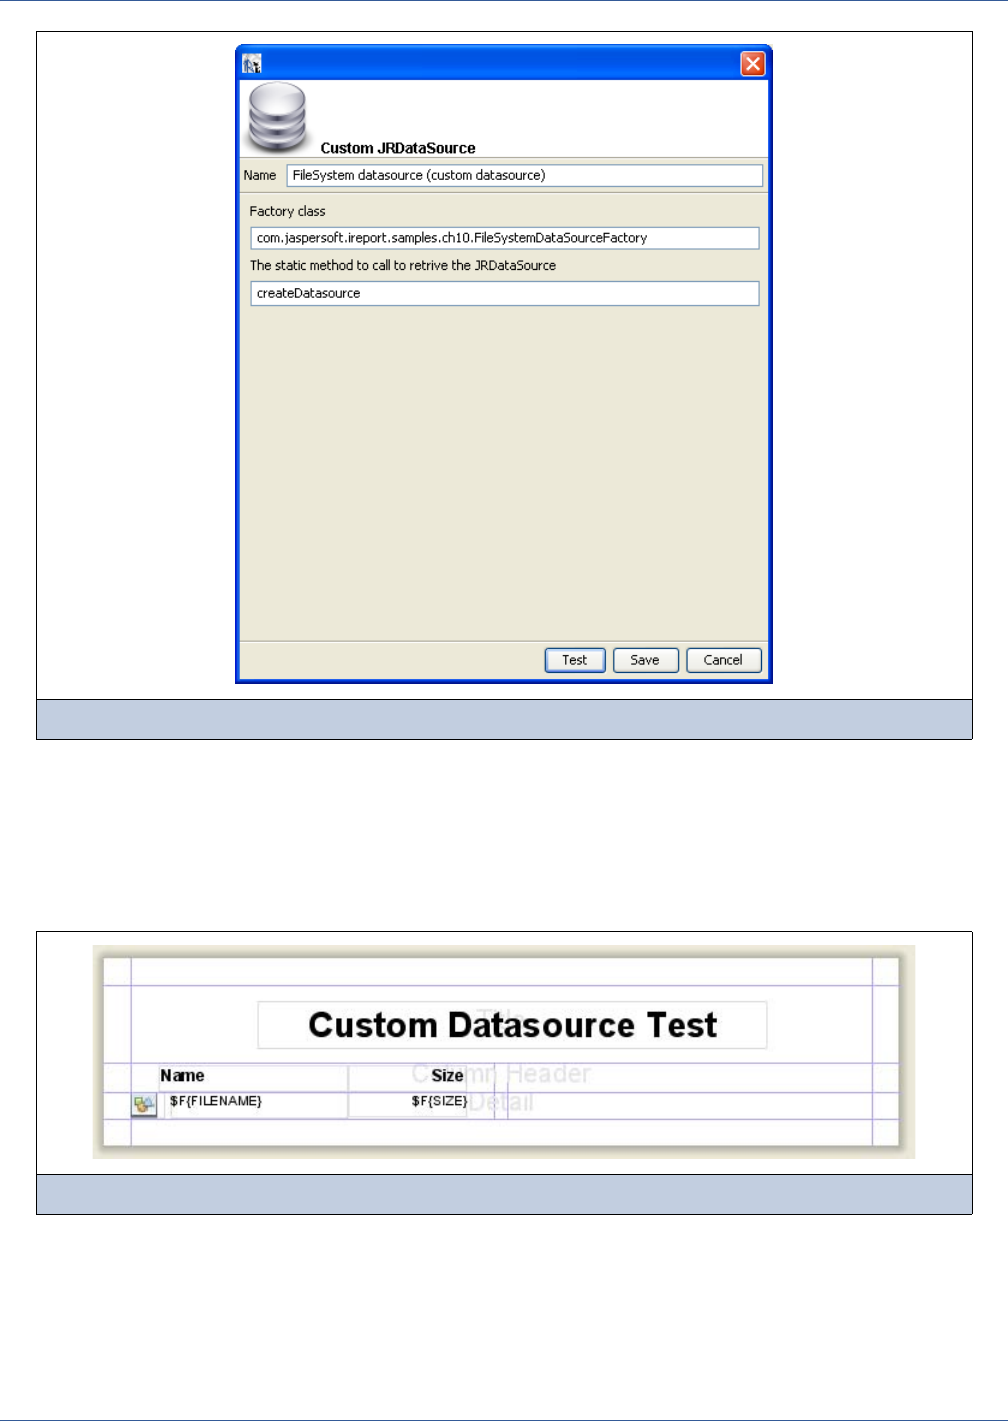
188
iReport Ultimate Guide
Next, specify the class and method to use to obtain an instance of your JRFileSystemDataSource, that is,
TestFileSystemDataSource and test.
Prepare a new report with fields managed by the data source. No method to find the fields managed by a data source exists. In
this case, you know that the JRFileSystemDataSource provides three fields: FILENAME (String), IS_DIRECTORY
(Boolean), and SIZE (Long). After you have created these fields, insert them in the report’s Detail band as shown in
Figure 10-36.
Divide the report into two columns, and in the Column Header band, insert Filename and Size tags. Then add two images, one
representing a document and the other an open folder. In the Print when expression setting of the Image element that is
placed in the foreground, insert the expression $F{IS_DIRECTORY}, or use as your image expression a condition like this:
($F{IS_DIRECTORY}) ? “folder.png” : “file.png”
The final report is shown in Figure 10-37.
Figure 10-35 Configuration of the custom data source
Figure 10-36 The layout for the file list

Data Sources and Query Executers
189
In this example, the class that instantiated the JRFileSystemDataSource was very simple. However, you can use more
complex classes, such as one that obtains the data source by calling an Enterprise JavaBean or by calling a web service.
10.7 Importing and Exporting Data Sources
To simplify the process of sharing data source configurations, iReport provides a mechanism to import and export data source
definitions.
To export one or more data sources, select from the Connections/Datasources window the items to export and click the Export
button (see Figure 10-38). iReport will ask you to name the file and indicate the destination for the exported information. The
created file is a simple XML file and can be edited with a common text editor, if needed. A file exported with iReport can be
imported by clicking Import. Since an exported file can contain more than one data source or connection definition, the import
process will add all the data sources found in the specified file to the current list.
Figure 10-37 The result produced with the custom data source
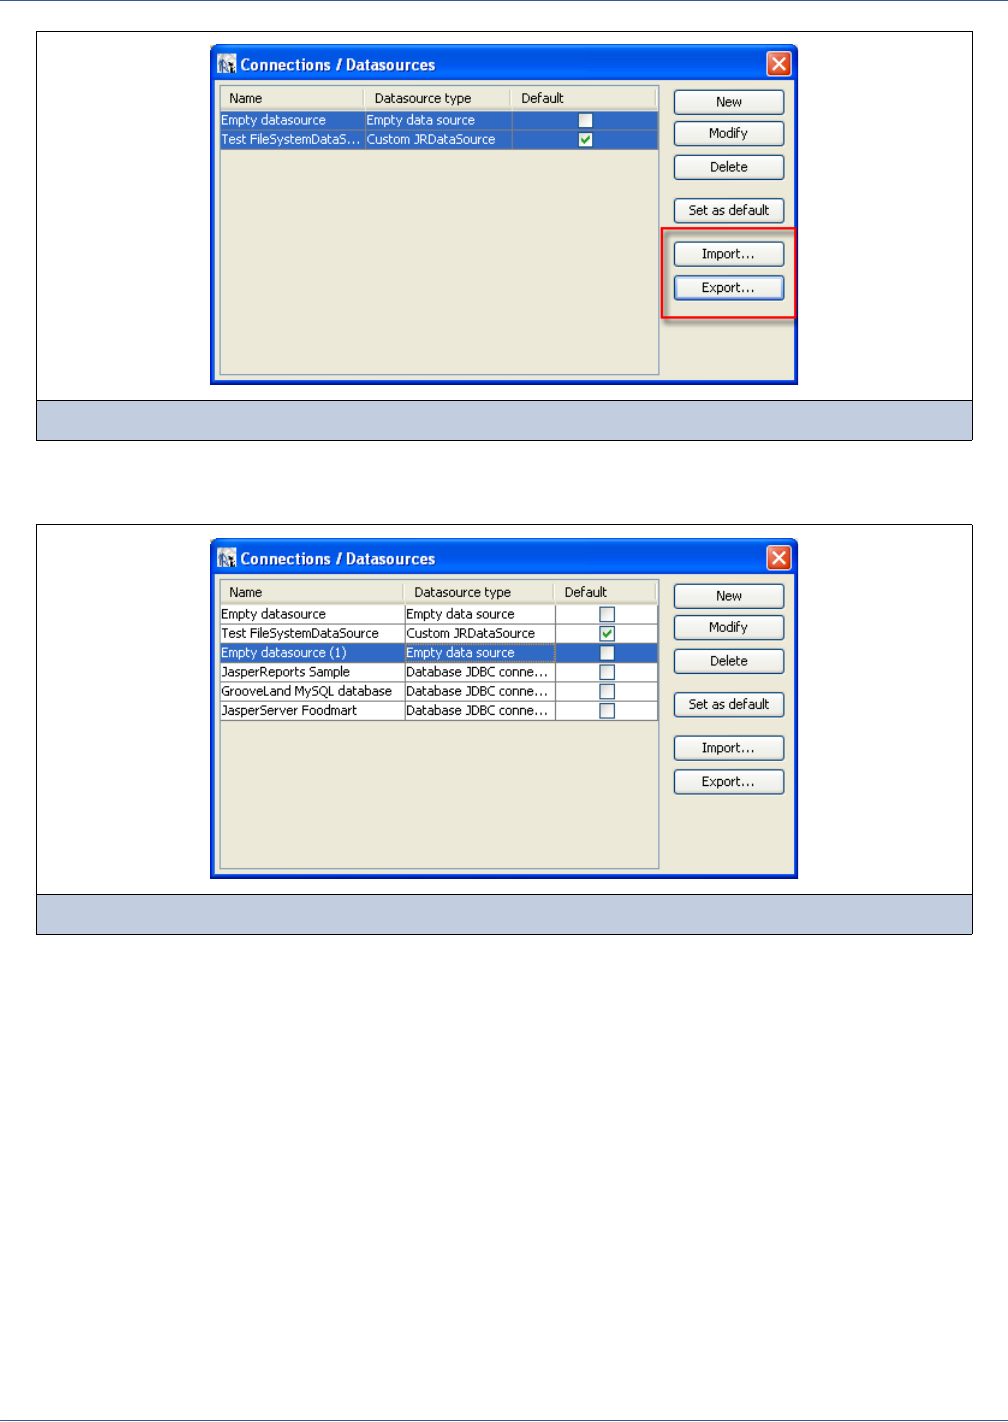
190
iReport Ultimate Guide
If a duplicated data source name is found during the import, iReport will append a number to the imported data source name,
as shown in Figure 10-39.
10.8 Creating Custom Languages and Query Executers
One of the most exciting improvements since JasperReports 1.2.6 is the ability to use custom languages inside iReport to
perform a query. Currently, JasperReports provides native support for the following query languages: SQL, HQL, XPath,
EJBQL, and MDX.
A custom language is a query language that is not supported natively by JasperReports. The language will be used by the
report query by which data to print will be selected. A custom language is tied to a query executer, which is an object that will
be used by JasperReports to process the custom query and get data as a JRDataSource object.
In order to use a new language, you have to register it. This can be done from the Options dialog in the Query Executers tab
(see Figure 10-40).
Figure 10-38 Export connection and data source definitions
Figure 10-39 Imported data source (Empty data source is duplicated)
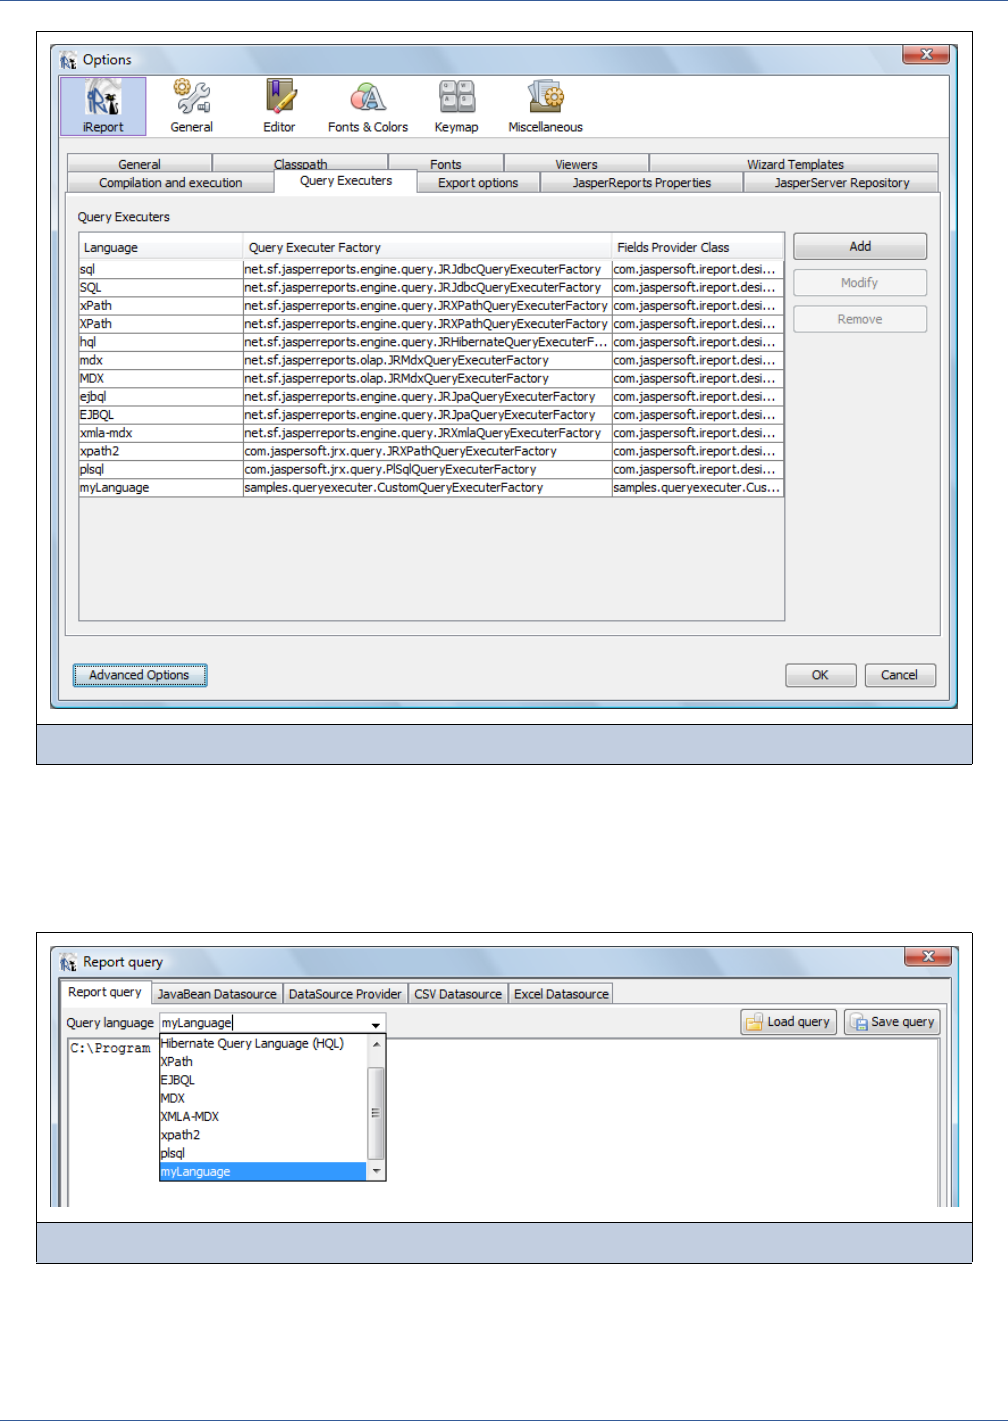
Data Sources and Query Executers
191
A new language can be added by setting the language name and the Factory class that is used to get an instance of the query
executer. Optionally, it is possible to provide a FieldsProvider class that help the user use the custom language, design the
query, and map the fields in the report.
Be sure that all the classes and JARs required by the query executer are in the classpath. From this point, you will be able to
use the new query language in the report, set it, and enter an appropriate query in the Report query dialog box (Figure 10-41).
10.8.1 Creating a Query Executer for a Custom Language
In this section, we will see how to write support for a custom query executer (a very simple one), how to use it in iReport, and
how to implement a FieldsProvider, which is a tool to simplify the use of the new language. The new language will be
Figure 10-40 The Query Executers tab in the Options dialog
Figure 10-41 The custom language (myLanguage) in the query dialog
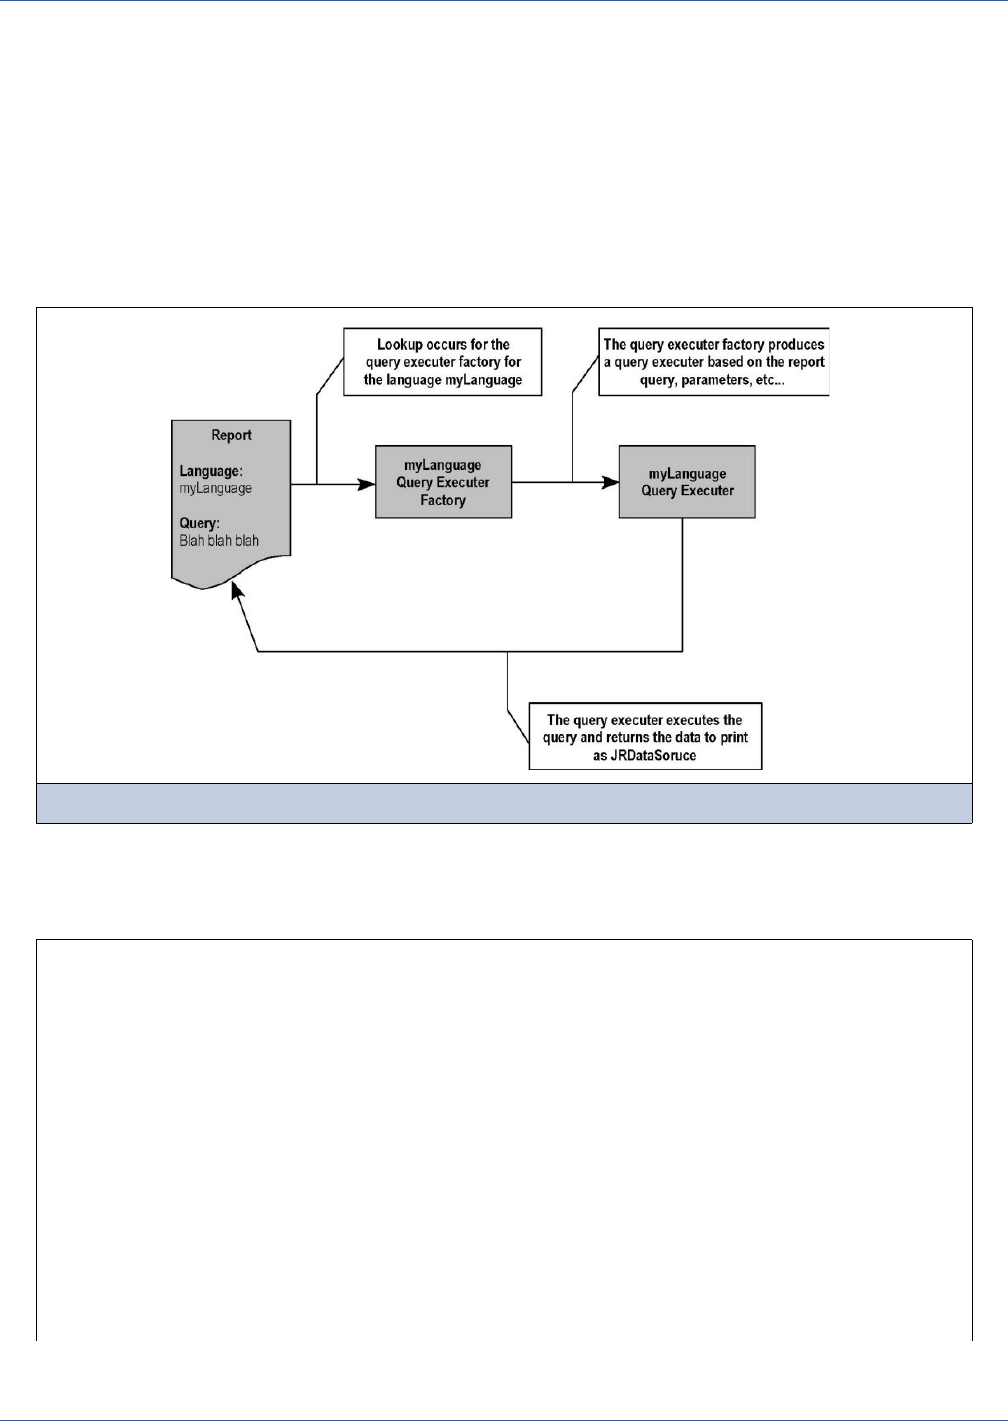
192
iReport Ultimate Guide
specified as a directory path (for instance, C:\My Query Executer Folder). The query executer will read the path (which is
actually our query) and will return a data source with the list of objects in the specified directory (files and subdirectories).
The responsibility for managing query parameters belongs to the query executer implementation. Please note that the query
can always accept parameters using the canonical syntax $P{parameter name}.
A query executer is composed of two objects: the query executer factory and the actual query executer. Figure 10-42 shows
how a query is processed. JasperReports instantiates the query executer factory, matching the language of the report query. It
also calls the method createQueryExecuter, passing as arguments a JRDataset (a structure to manage fields, parameters,
variables, queries, and query languages declared in the report), and a map containing the values provided for each parameter.
createQueryExecuter returns an instance of a JRQueryExecuter that provides the method createDatasource. The
engine will call it to get the data source to fill the report.
.
Let’s start with the query executer factory. JasperReports provides an interface to create this kind of object:
JRQueryExecuterFactory.
Figure 10-42 Flow chart of the query execution
Code Example 10-9 Interface JRQueryExecuterFactory provided by JasperReports
package net.sf.jasperreports.engine.query;
import java.util.Map;
import net.sf.jasperreports.engine.JRDataset;
import net.sf.jasperreports.engine.JRException;
import net.sf.jasperreports.engine.JRValueParameter;
/**
* Factory classes used to create query executers.
* For each query language, a query executer factory must be created
* and registered as a JR property.
* Query executer factory instances must be thread-safe as they are cached
* and used as singletons.
*/
public interface JRQueryExecuterFactory

Data Sources and Query Executers
193
There are three methods to implement: getBuiltinParameters, createQueryExecuter, and
supportsQueryParameterType:
The first method returns an array containing names and types of built-in parameters that the query executer makes
available. This feature is useful when the query is executed against some kind of session object or against a connection to
an external entity, such as a database or a server.
For example, the query executer factory for SQL provides the built-in parameter REPORT_CONNECTION, storing the
java.sql.Connection instance used to execute the query. This object can be used by subreports to execute their SQL
queries. Similarly, the query executer factory for HQL provides as a parameter the Hibernate session required to perform
the query.
The second method (createQueryExecuter) is responsible for creating the query executer instance, making it possibly
the most important one of the three methods.
* These parameters will be created as system-defined parameters for each
* report/dataset having a query of this type.
* The returned array should contain consecutive pairs of parameter
* names and parameter classes
* (e.g. <code>{"Param1", String.class, "Param2", "List.class"}</code>).
* @return array of built-in parameter names and types associated
* with this query type
*/
public Object[] getBuiltinParameters();
/**
* Creates a query executer.
* This method is called at fill time for reports/datasets having a
* query supported by
* this factory.
* @param dataset the dataset containing the query, fields, etc.
* @param parameters map of value parameters (instances of
* {@link JRValueParameter JRValueParameter})
* indexed by name
*
* @return a query executer
* @throws JRException
*/
public JRQueryExecuter createQueryExecuter(
JRDataset dataset, Map parameters) throws JRException;
/**
* Decides whether the query executers created by this factory support
* a query parameter type.
* This check is performed for all $P{..} parameters in the query.
*
* @param className the value class name of the parameter
* @return whether the parameter value type is supported
*/
public boolean supportsQueryParameterType(String className);
}
Code Example 10-9 Interface JRQueryExecuterFactory provided by JasperReports, continued

194
iReport Ultimate Guide
Finally, you can filter the accepted parameter types by implementing the supportsQueryParameterType method,
which returns true if the class name given as an argument is accepted, and false otherwise.
In this implementation, you will not return any built-in parameter, and you will accept all types of parameters (actually, your
query executer factory ignores any $P{} directives in the query).
Here is the code:
The only relevant portion of this implementation is the createQueryExecuter method, which looks into the dataset passed
as argument for the query string. We assume that the query is a directory path (remember that our data source lists the files
contained in a specified directory path). With the directory path we instance a CustomQueryExecuter, the class that will
make use of the parsed query (or the File object created starting from the query).
If you would like to add support for parameters in the query string, this may be the right place to implement the parameters’
parsing and replacement. We have everything we need: the query string, the dataset, and the map with the values of the
Code Example 10-10 CustomQueryExecuterFactory source code
import java.io.File;
import java.util.Map;
import net.sf.jasperreports.engine.JRDataset;
import net.sf.jasperreports.engine.JRException;
import net.sf.jasperreports.engine.query.JRQueryExecuter;
import net.sf.jasperreports.engine.query.JRQueryExecuterFactory;
/**
*
* @version $Id: CustomQueryExecuterFactory.java 0 2009-12-08 11:45:45 CET gtoffoli $
* @author Giulio Toffoli (giulio@jaspersoft.com)
*
*/
public class CustomQueryExecuterFactory implements JRQueryExecuterFactory {
public Object[] getBuiltinParameters() {
return new Object[]{};
}
public JRQueryExecuter createQueryExecuter(JRDataset jrd, Map map)
throws JRException {
File directory = null;
try {
directory = new File(jrd.getQuery().getText());
} catch (Exception ex)
{
throw new JRException(ex);
}
return new CustomQueryExecuter(directory);
}
public boolean supportsQueryParameterType(String string) {
return true;
}
}

Data Sources and Query Executers
195
parameters). Another solution would be to pass all this information to the query executer implementation and delegate the
query parsing to it.
The query executer has a simple interface, too. Again, there are three methods:
One that will produce the JRDataSource to fill the report (createDatasource).
One to clean up everything at the end of the execution (close).
And a method to interrupt the query execution (cancelQuery).
The very simple query executer we are creating will do nothing when the close and the cancelQuery methods are invoked.
The main method, createDatasource, will create an instance of CustomDataSource, providing the report query as a path
Code Example 10-11 Query executer interface
/**
* Query executer interface.
* An implementation of this interface is created when the input data
* of a report/dataset is specified by a query.
* The implementation will run the query and create a JRDataSource
* from the result.
* The query executers would usually be initialized by a JRQueryExecuterFactory
* with the query and the parameter values.
*/
public interface JRQueryExecuter
{
/**
* Executes the query and creates a JRDataSource out of the result.
*
* @return a JRDataSource wrapping the query execution result.
* @throws JRException
*/
public JRDataSource createDatasource() throws JRException;
/**
* Closes resources kept open during the datasource iteration.
* This method is called after the report is filled or the dataset is
* iterated.
* If a resource is not needed after the datasource has been created,
* it should be released at the end of createDatasource.
*/
public void close();
/**
* Cancels the query if it’s currently running.
* This method will be called from a different thread if the client
* decides to cancel the filling process.
*
* @return <code>true</code> iff the query was running and it has been
* cancelled
* @throws JRException
*/
public boolean cancelQuery() throws JRException;
}

196
iReport Ultimate Guide
of the directory name to list. The aim of the operation, in fact, is to return a list of file names encapsulated in a bean array data
source.
Our CustomQueryExecuter will look like the following:
Up to now we have created the CustomQueryExecuterFactory and the CustomQueryExecuter, which uses a class called
CustomDataSource. This class extends the JRBeanArrayDataSource. In this sample, we may just use a
JRBeanArrayDataSource, but the implementation of another custom data source can be useful to introduce the next task:
creating and using a FieldsProvider.
Code Example 10-12 The source of our QueryExecuter implementation
package samples.queryexecuter;
import java.io.File;
import net.sf.jasperreports.engine.JRDataSource;
import net.sf.jasperreports.engine.JRException;
import net.sf.jasperreports.engine.data.JRBeanArrayDataSource;
import net.sf.jasperreports.engine.query.JRQueryExecuter;
public class CustomQueryExecuter implements JRQueryExecuter {
File directory = null;
public CustomQueryExecuter(File directory)
{
this.directory = directory;
}
public JRDataSource createDatasource() throws JRException {
// Creates a list of files and present them using the CustomDataSource
if (directory != null && directory.exists() && directory.isDirectory())
{
File[] files = directory.listFiles();
return new CustomDataSource(files);
}
throw new JRException("Invalid directory!");
}
public void close() {
// Nothing to do in this implementation
}
public boolean cancelQuery() throws JRException {
// Too fast to be interrupted... :-)
return false;
}
}

Data Sources and Query Executers
197
Table 10-1 shows the code of the CustomDataSource:
As we said, our data source extends the JRBeanArrayDataSource, so most of the implementation is inherited by the super
class. We just added some logic to the getField method. In particular, when the user requests a field of name “size”, the data
source returns the size of this file, while if the field lastModified is requested, the data source return the data of the last
change of the file.
The methods next and moveFirst are overridden here only because we need to keep track of the current index in the array of
beans.
Code Example 10-13 CustomDataSource code
package samples.queryexecuter;
import java.io.File;
import net.sf.jasperreports.engine.JRException;
import net.sf.jasperreports.engine.JRField;
import net.sf.jasperreports.engine.data.JRBeanArrayDataSource;
public class CustomDataSource extends JRBeanArrayDataSource {
private int currentIndex = -1;
public CustomDataSource(File[] array)
{
super(array, true);
}
@Override
public Object getFieldValue(JRField field) throws JRException {
File f = (File)getData()[currentIndex];
if (field.getName().equals("size"))
{
return new Long(f.length());
}
else if (field.getName().equals("lastModified"))
{
return new Long(f.lastModified());
}
return super.getFieldValue(field);
}
@Override
public boolean next() {
currentIndex++;
return super.next();
}
@Override
public void moveFirst() {
currentIndex = -1;
super.moveFirst();
}
}
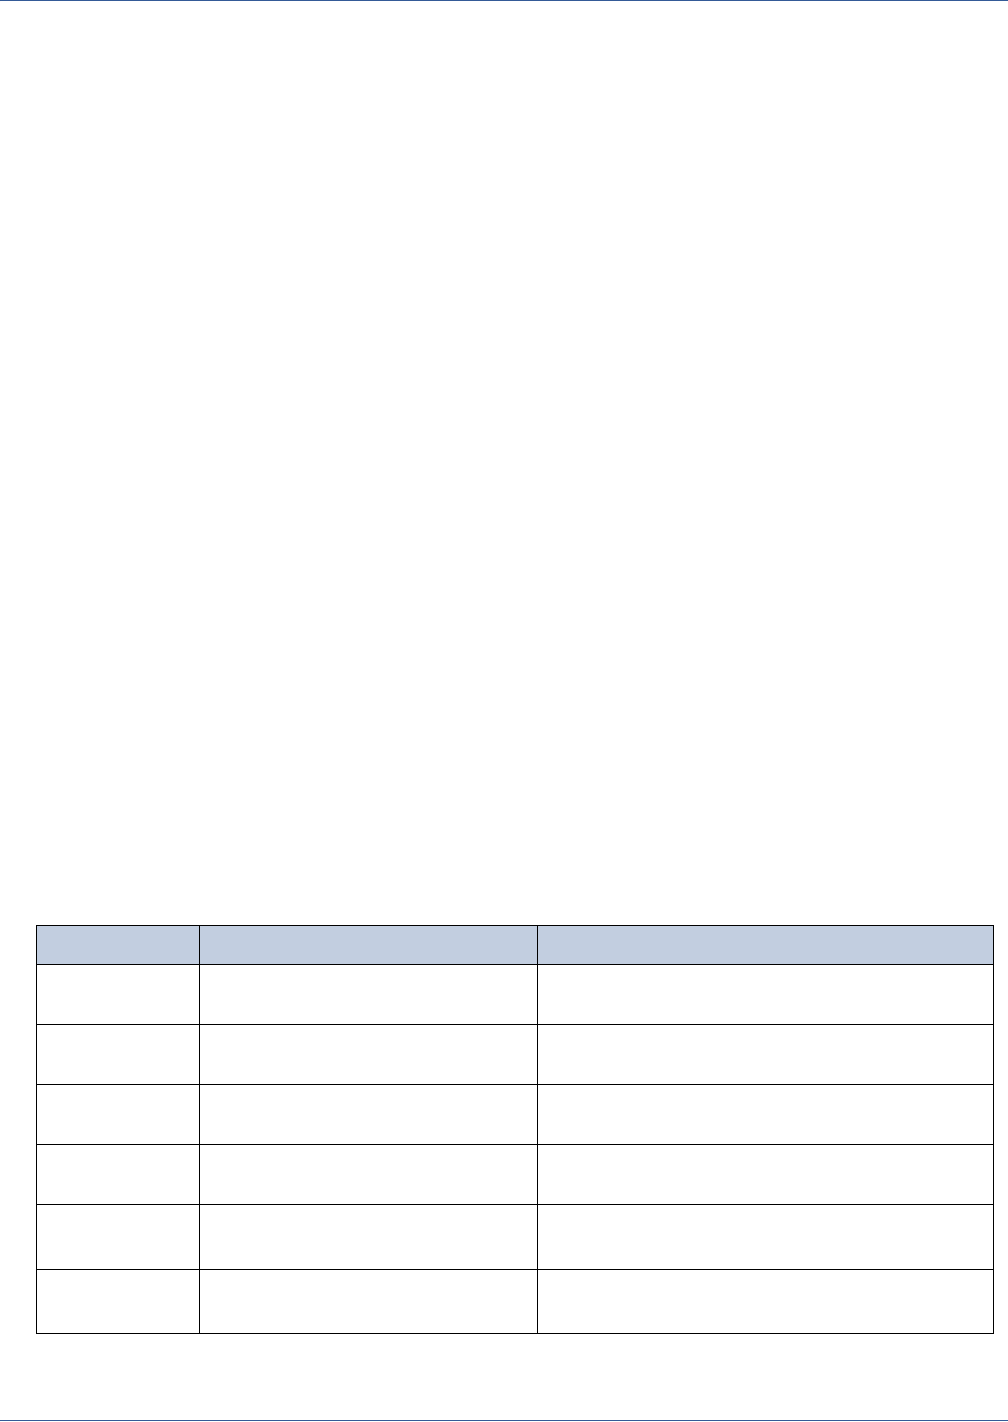
198
iReport Ultimate Guide
This data source acts like a Bean data source on a set of objects of type java.io.File, but it is able to provide two fields that
are not accessible when using a File as bean: lastModified and size.
Simple, right? Now that you have the query executer and the query executer factory, you can try your new language in iReport.
But before doing that, let’s see how we can improve the user experience by implementing a FieldsProvider.
10.8.2 Creating a FieldsProvider
A custom query executer i sa very personalized way to provide data. Like a simple data source, a query executer does not
provide any information about the name of the fields that will be available inside the report. For SQL, iReport provides a
mechanism to detect the available fields by executing the query and to find out which fields are exposed by the result set.
Moreover, for SQL, iReport provides a query designer that helps to create the query itself. Similar tools are provided for
languages like XPath, for which there is a tool to explore the XML file, generate the query, and map the fields.
iReport also provides a way to plug-in a FieldsProvider for a custom language. When creating a new query executer for a
custom language, it makes sense to provide a FieldsProvider to help the user with the new language.
In the previous section we discussed a very simple language for which we provided a query executer. The language is just a
path name (such as C:\My Query Executer). The query executer we wrote uses this “query” to list the files inside the directory
specified by the query. Okay, this “language” is really too simple to think about a designer, but we can try. Our designer will
be just a file chooser dialog to select a directory on the disk. Then we can think about a way to “auto-detect” the fields
provided by our data source. All these features will be added to iReport by implementing a FieldsProvider.
So let’s take a step back. When you write a query in the Report query dialog box, be it a simple SQL statement or a very long
and complex expression in a custom language, it is very useful to have a tool capable of analyzing the query and, if necessary,
executing it to detect and extract the available fields, or a tool to help you with field mapping, or a visual designer in which
you can easily design the query itself.
iReport provides natively tools of this sort for SQL, HQL, EJBQL, and MDX. For example, when editing an SQL query, the
list of available fields can be read using the Read Fields button, and when editing an HQL query, you can explore the result to
select the fields you desire.
To extend these capabilities or replace the ones available for a specific language, you can write a fields provider. Through this
interface, a visual designer, a tool to help with field mapping, and a tool to read available fields from a query can be provided
for each language type.
A fields provider is plugged into iReport similarly to the way a query executer is plugged in, that is, by using the Query
Executers tab in the Options dialog (Figure 10-40). Table 10-2 lists the default values of the query executer factory and the
fields provider class for each built-in language of JasperReports.
Table 10-2 Default Language Query Executer Factory and Fields Provider Classes
Language Query Executer Factory Fields Provider Class
sql (or SQL) net.sf.jasperreports.engine.query.
JRJdbcQueryExecuterFactory
com.jaspersoft.ireport.designer.data.
fieldsproviders.SQLFieldsProvider
hql (or HQL) net.sf.jasperreports.engine.query.
JRHibernateQueryExecuterFactory
com.jaspersoft.ireport.designer.data.
fieldsproviders.HQLFieldsProvider
ejbql (or EJBQL) net.sf.jasperreports.engine.query.
JRJpaQueryExecuterFactory
com.jaspersoft.ireport.designer.data.
fieldsproviders.EJBQLFieldsProvider
mdx (or MDX) net.sf.jasperreports.olap.
JRMondrianQueryExecuterFactory
com.jaspersoft.ireport.designer.data.
fieldsproviders.MDXFieldsProvider
xmla-mdx net.sf.jasperreports.engine.query.
JRXmlaQueryExecuterFactory
com.jaspersoft.ireport.designer.data.
fieldsproviders.CincomMDXFieldsProvider
xPath (or XPath) net.sf.jasperreports.engine.query.
JRXPathQueryExecuterFactory
com.jaspersoft.ireport.designer.data.
fieldsproviders.XMLFieldsProvider

Data Sources and Query Executers
199
The fields provider interface is defined in com.jaspersoft.ireport.designer.FieldsProvider. Here is the code of the interface:
Code Example 10-14 Fields provider interface code
package com.jaspersoft.ireport.designer;
import com.jaspersoft.ireport.designer.data.ReportQueryDialog;
import java.util.Map;
import net.sf.jasperreports.engine.JRDataset;
import net.sf.jasperreports.engine.JRException;
import net.sf.jasperreports.engine.JRField;
/**
*
* @author gtoffoli
*/
public interface FieldsProvider {
/**
* Returns true if the provider supports the {@link
#getFields(IReportConnection,JRDataset,Map) getFields}
* that it is able to introspect the data source and discover the available
fields.
*
* @return true if the getFields() operation is supported.
*/
public boolean supportsGetFieldsOperation();
/**
* Returns the fields that are available from a query of a specific language
* The provider can use the passed in report to extract some additional
* configuration information such as report properties.
* The IReportConnection object can be used to execute the query.
*
* @param con the IReportConnection active in iReport.
* @param the JRDataset that will be filled using the data source created by this
provider.
* The passed in report can be null. That means that no compiled report is
available yet.
* @param parameters map containing the interpreted default value of each
parameter
* @return a non null fields array. If there are no fields then an empty array must
be returned.
*
* @throws UnsupportedOperationException is the method is not supported
* @throws JRException if an error occurs.
*/
public JRField[] getFields(IReportConnection con, JRDataset reportDataset, Map
parameters ) throws JRException, UnsupportedOperationException;

200
iReport Ultimate Guide
Technically, there are seven methods to implement:
supportsGetFieldsOperation
getFields
supportsAutomaticQueryExecution
hasQueryDesigner
/**
* Returns true if the getFields can be run in a background thread each time the user
changes the query.
* This approach cannot be valid for a fieldsProvider that requires considerable
time to return the list of fields.
*/
public boolean supportsAutomaticQueryExecution();
/**
* Returns true if the FieldsProvider can run and own query designer
*/
public boolean hasQueryDesigner();
/**
* Returns true if the FieldsProvider can run an own editor
*/
public boolean hasEditorComponent();
/**
* This method is used to run a query designer for the specific language.
*
* @param con the IReportConnection active in iReport.
* @param query the query to modify
* @param reportQueryDialog the parent reportQueryDialog. It can be used to get
all (sub)dataset informations
* with reportQueryDialog.getSubDataset();
*
*/
public String designQuery(IReportConnection con, String query, ReportQueryDialog
reportQueryDialog ) throws JRException, UnsupportedOperationException;
/**
* The component that will stay on the right of the query panel. To listen for
query changes, the component must implement
* the interface FieldsProviderEditor. The component will be visible only when a
queryChanged is succesfully executed.
* The component can store the reference to the report query dialog in which it
will appear.
*
* The editor can
*/
public FieldsProviderEditor getEditorComponent( ReportQueryDialog
reportQueryDialog );
}
Code Example 10-14 Fields provider interface code, continued
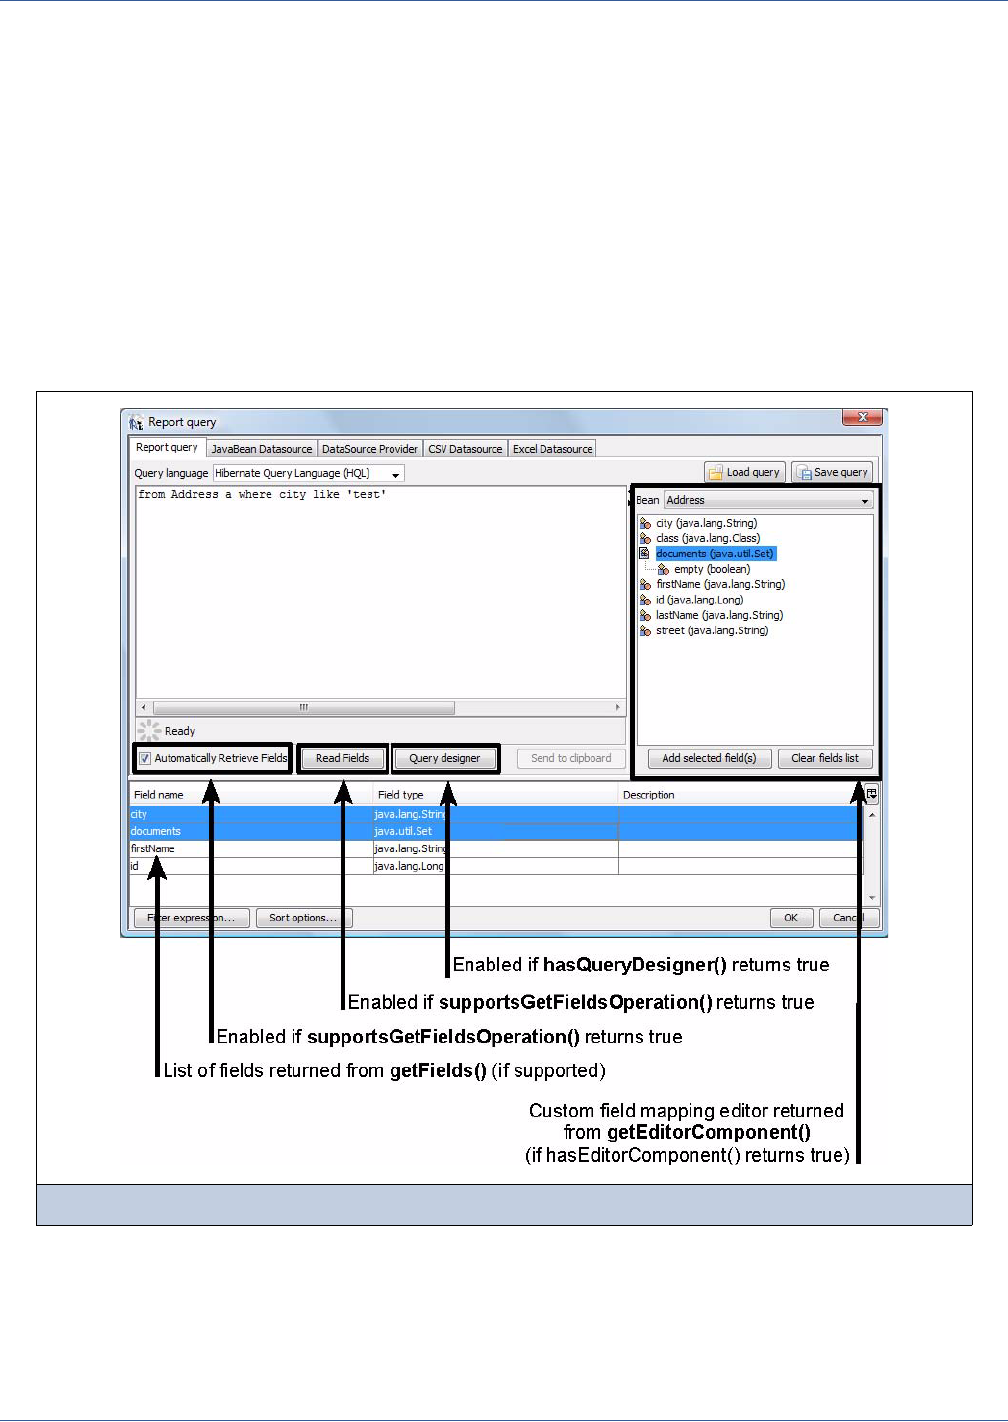
Data Sources and Query Executers
201
hasEditorComponent
designQuery
getEditorComponent.
Four of them define what the specific fields provider is able to do, and three are related to fields provider’s main tasks:
designing the query, reading the fields, and providing a fields editor.
supportsGetFieldsOperation indicates whether the fields provider implementation is able to get fields from the
query (that is, by executing it, as happens for the SQL). If this method returns true, iReport assumes that the method
getFields returns a non-null array of fields (net.sf.jasperreports.engine.JRField).
hasQueryDesigner and hasEditorComponent return true if the fields provider implementation supports visual query
designing and has a tool to edit field mapping, respectively.
These methods are called when a language is selected in the Report query dialog box. iReport looks for the matching fields
provider and, if available, enables/disables the Read Fields and Query designer buttons according to the return values
(Figure 10-43). If an editor component is available, it is displayed at the right of the query text area.
Every time you change the query text, if both supportsAutomaticQueryExecution and
supportsGetFieldsOperation return true and the Automatically Retrieve Fields check box option is selected, the
method getFields is called. The resulting JRField array is used to populate the fields list.
If the editor component is present, it can receive a query-changed event through the FieldsProviderEditor interface
(implemented by the components returned by the getEditorComponent method).
Figure 10-43 Query dialog and custom fields provider

202
iReport Ultimate Guide
If the method hasQueryDesigner returns true, the Query designer button will be enabled. When it is clicked, iReport calls
the method designQuery, passing as parameters the currently selected instance of IReportConnection, the query string to
edit (which can be blank), and a reference to the Report query dialog box (which can be null). The method must return a string
containing the new query, or null if the operation was canceled by the user.
Sample implementations of fields providers are available in the iReport source code, in the package
com.jaspersoft.ireport.designer.data.fieldsproviders.
The query executer mechanism and the integration with the fields providers open the door to making an infinite number of
implementations and languages available for JasperReports. Using this feature, it’s easy to create support for any custom query
language.

Charts
203
CHAPTER 11 CHARTS
JasperReports provides the ability to render charts inside a report to different ways. You can use JFreeChart, a powerful
open source chart-generation library, or as of version 5.0 you can use HTML5 charts.
In a chart, it is possible to print the data coming from the main dataset or using a subdataset (we will deal with subdatasets in
Chapter 14). This allows you to include many different charts in one document without using subreports.
JasperReports supports a wide variety of chart types: Area, Bar, Bar 3D, Bubble, Line, Pie, Pie 3D, Scatter Plot, Stacked Bar,
Stacked Bar 3D, Time Series, XY Area, Stacked Area, XY Bar, XY Line, Meter, Thermometer, Candlestick and High Low
Open Close charts. A MultiAxis chart can be used to aggregate multiple charts into a single one.
This chapter has the following sections:
Creating a Simple Chart
Using Datasets
Value Hyperlinks
Properties of Charts
Using Chart Themes
HTML5 Charts
11.1 Creating a Simple Chart
In this section, you will learn how to use the Chart tool to build a report containing a Pie 3D chart, then you will explore the
details of chart management.We will use the JasperReports sample database for this example:
1. Create a new empty document.
2. Open the Report query dialog box (Figure 11-1) by clicking the button representing a cylinder in the designer tool bar.
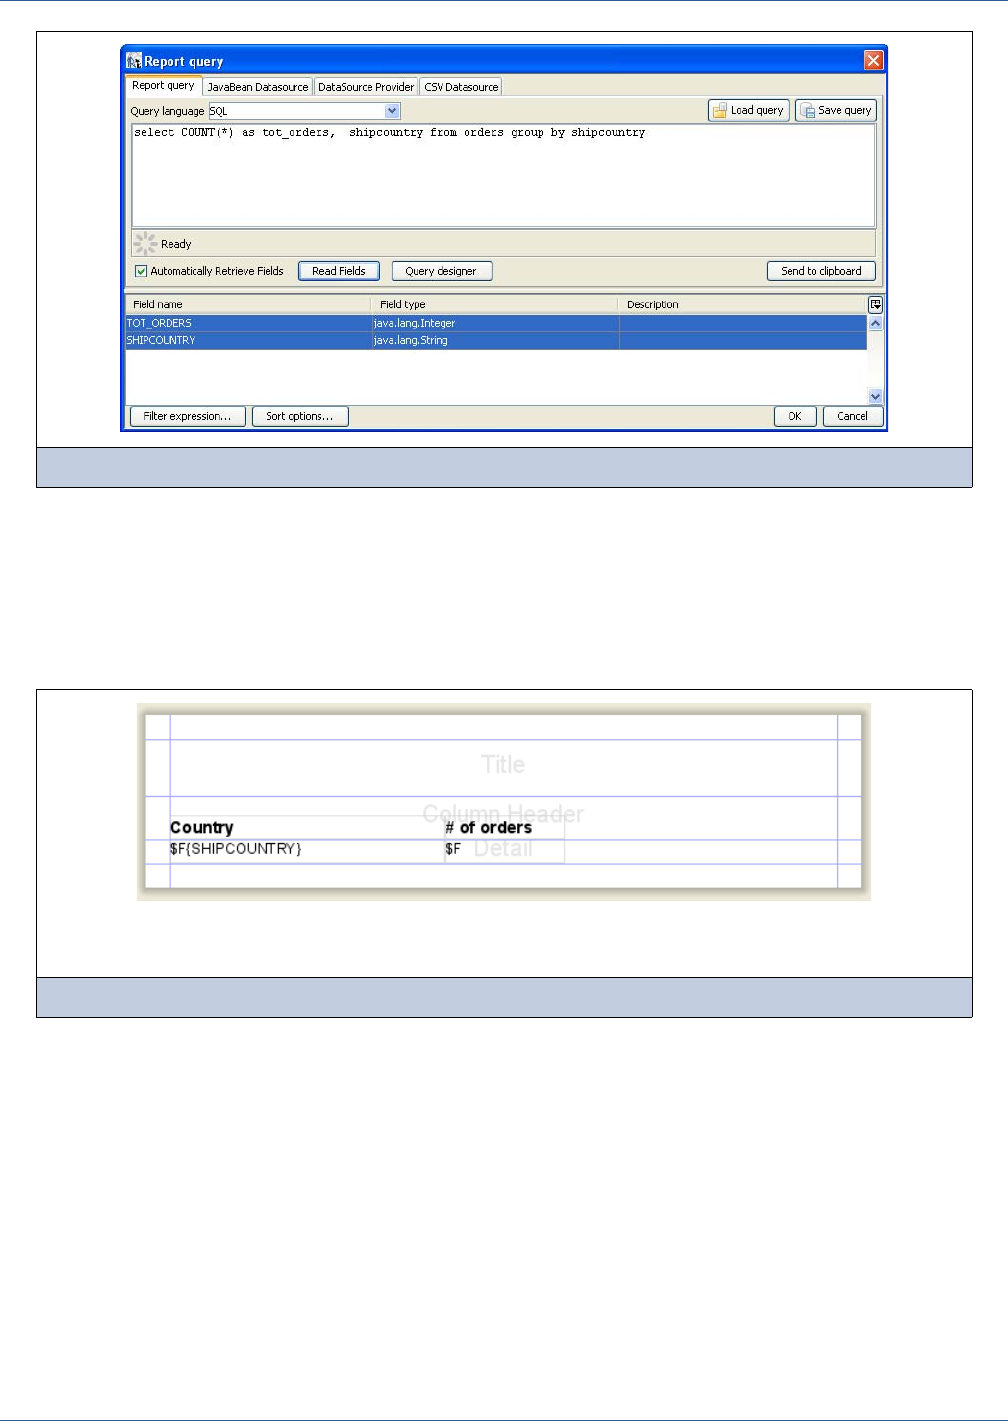
204
iReport Ultimate Guide
3. Use this simple query to display the count of orders in different countries:
select COUNT(*) as orders, shipcountry from orders group by shipcountry
4. Confirm your query by clicking OK.
iReport will register the query-selected fields.
5. Place the fields in the Detail band by dragging them from the outline view (Figure 11-2). this will create a small table of
the values that we want to display in the chart.
6. Rearrange the bands and expand the summary; this is where we will place our new chart.
7. Select the Chart tool and drag it into the Summary band. When you add a new chart element to a report, iReport shows the
Chart Selection window from which you can pick the chart type (Figure 11-3).
Figure 11-1 Query dialog
Figure 11-2 The initial design
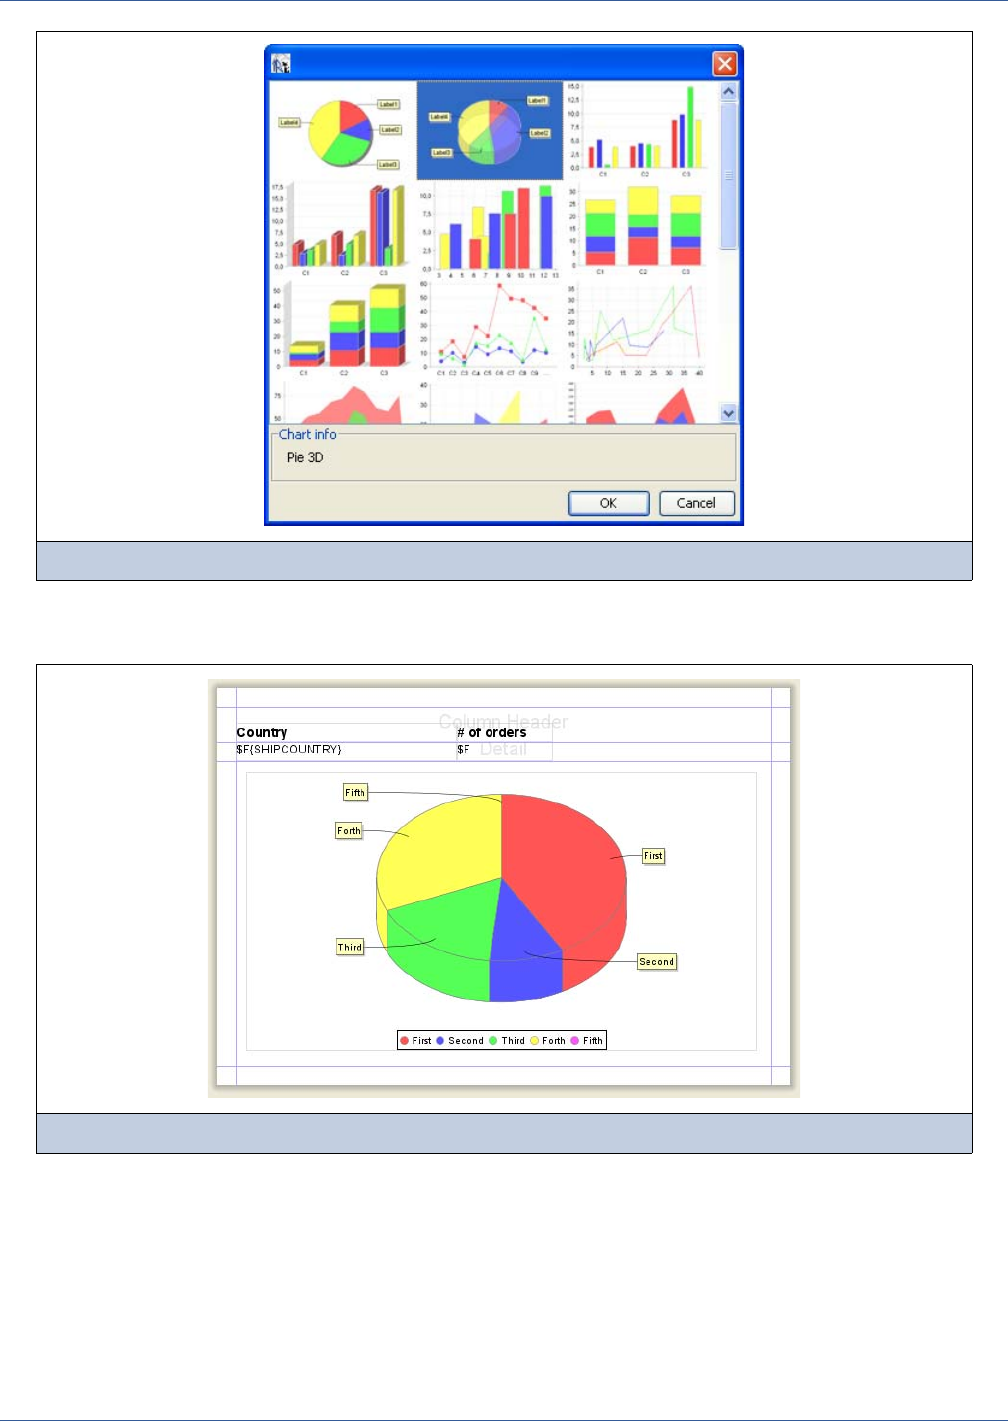
Charts
205
8. Select the Pie 3D icon and click OK. Figure 11-4 is an example of a generic image to show roughly where the chart will
be displayed. iReport does not display live data and charts in the Designer.
Now we have to configure the chart.
9. Right-click the chart element and select the menu item Chart Data. The Chart Details window opens (Figure 11-5).
In this window you can select the data to use in order to create the chart.
10. In the Type of Dataset combo box, select Pie dataset.
This combo box allows you to specify the dataset types to generate the graph. Usually one dataset type is available, except
when generating an XY Bar chart.
11. In the Dataset tab, you can define the dataset within the context of the report. Specifically, Reset Type and Reset Group
allow you to periodically reset the dataset. This is useful, for example, when summarizing data relative to a special
Figure 11-3 Chart selection window
Figure 11-4 The chart is placed in the Summary band
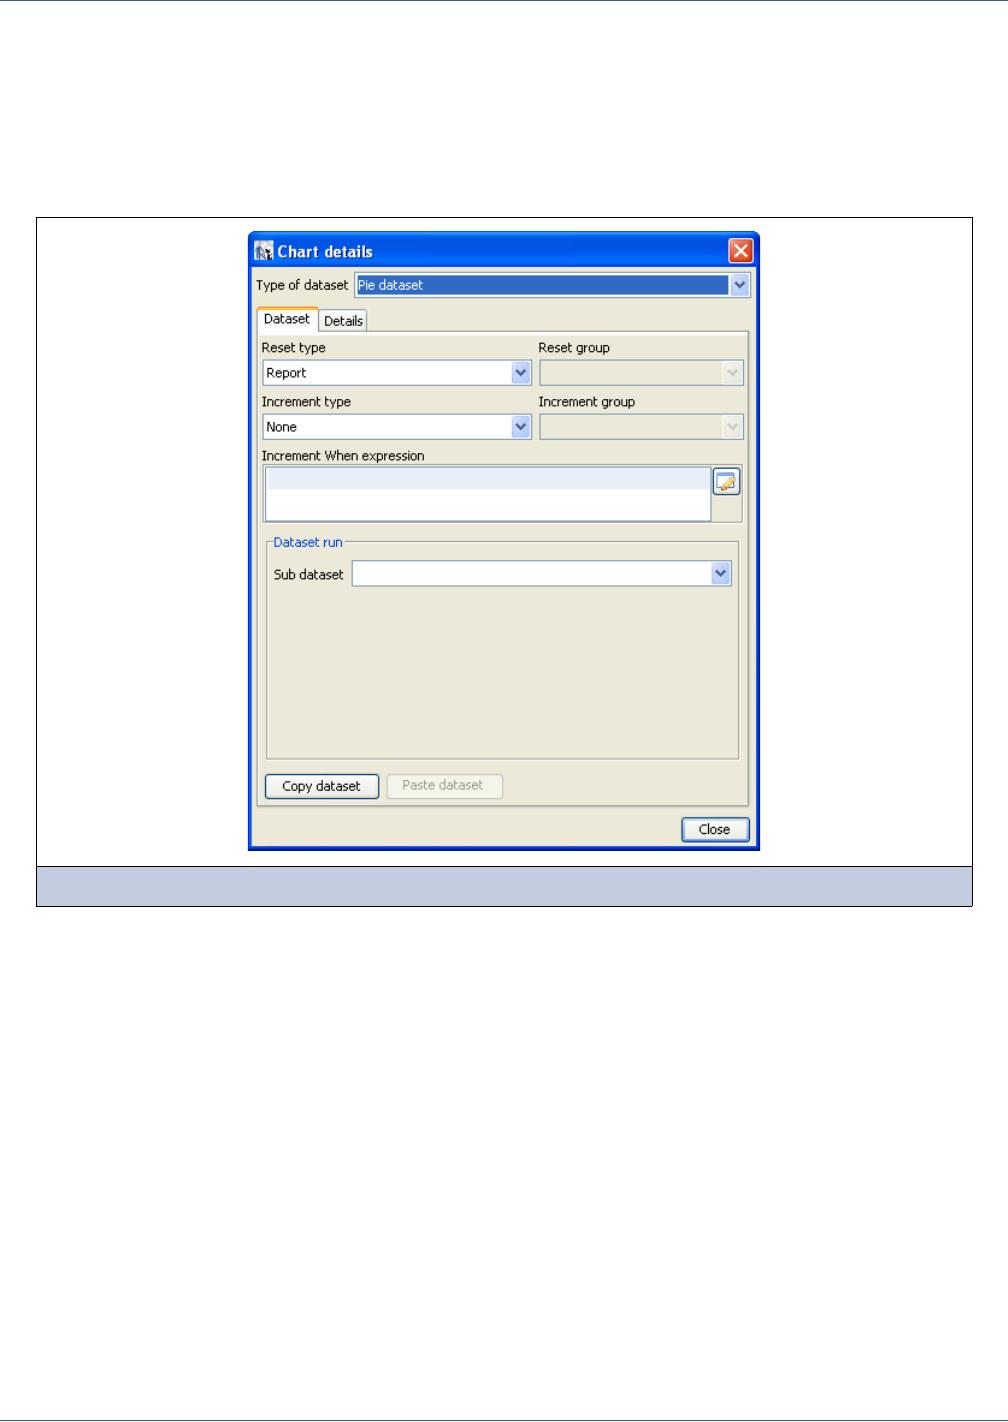
206
iReport Ultimate Guide
grouping. Increment Type and Increment Group specify the events that determine when new values must be added to the
dataset.By default, each record of the dataset used to fill the chart corresponds to a value printed in the chart. This
behavior can be changed, forcing the engine to collect the data for the chart at a specific time (for instance, every time the
end of a group is reached).
The Increment When expression area allows you to add a flag to determine whether to add a record to the record set
designed to feed the chart. This expression must return a Boolean value. iReport considers a blank string to mean “add all
the records.”
For the purposes of this example, set the Reset Type to Report since you don’t want the data to be reset, and leave the
Increment Type set to None so that each record will be appended to your dataset.
12. In the Details tab, enter an expression to associate with every value in the data source. For the Pie 3D chart type, three
expressions can be entered: key, value, and label (Figure 11-6).
Key expression must be a unique value to identify a slice of the pie chart. If a key value is repeated, the label and
value values previously associated with that key are overwritten. A key can never be null.
Value expression specifies the numeric value associated with the key.
Figure 11-5 The Chart Details window
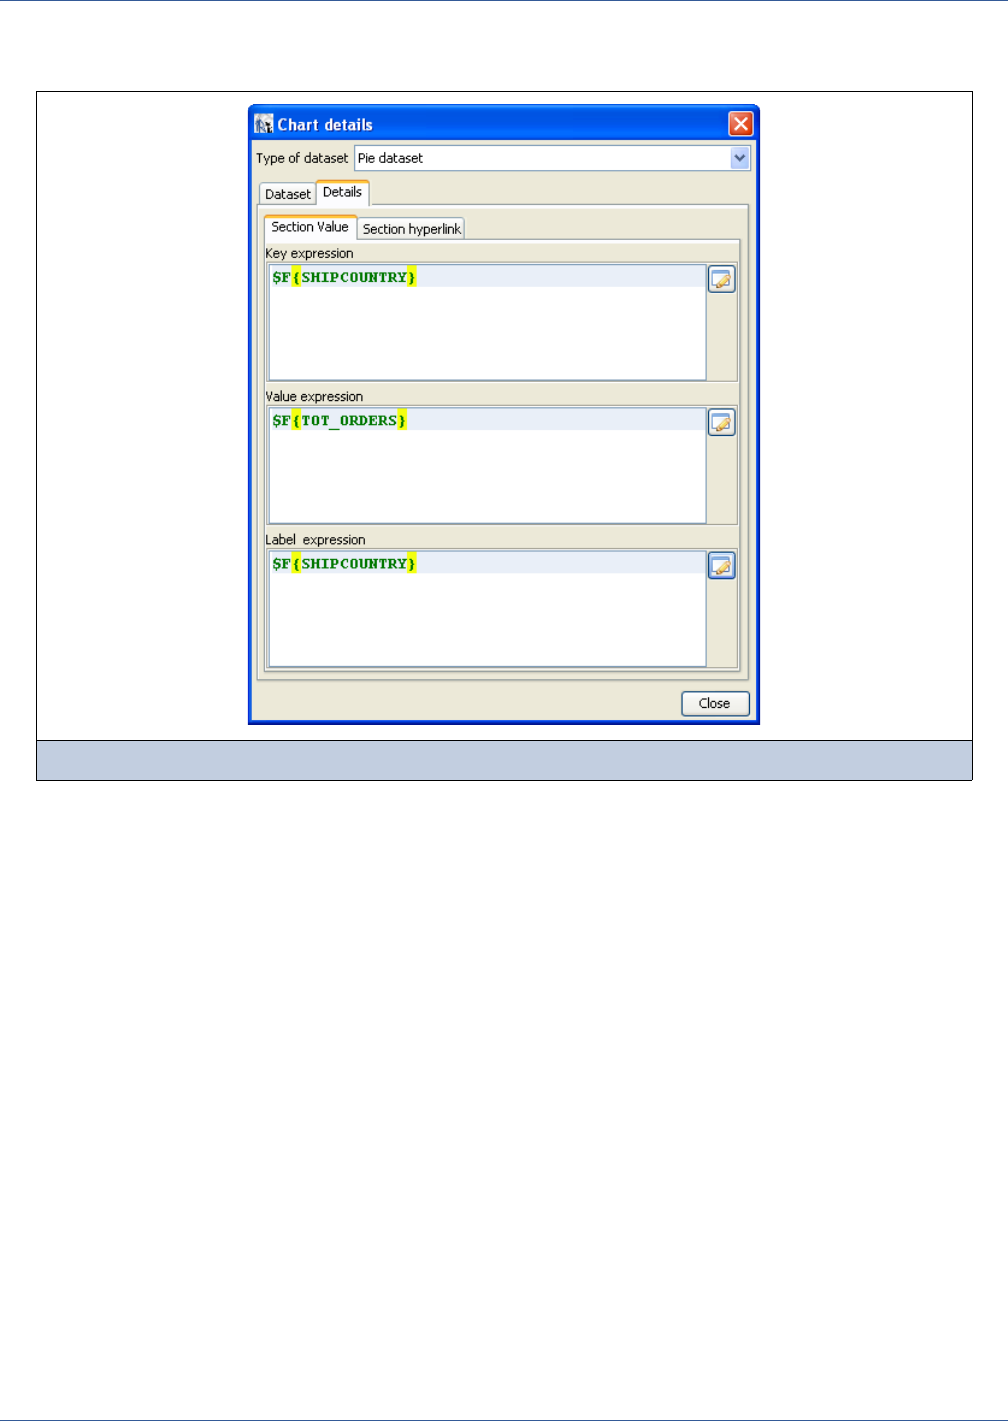
Charts
207
Label expression allows you to specify a label for each slice of the pie chart. This expression is optional, and the
default value is the key value.
Figure 11-6 Dataset configuration
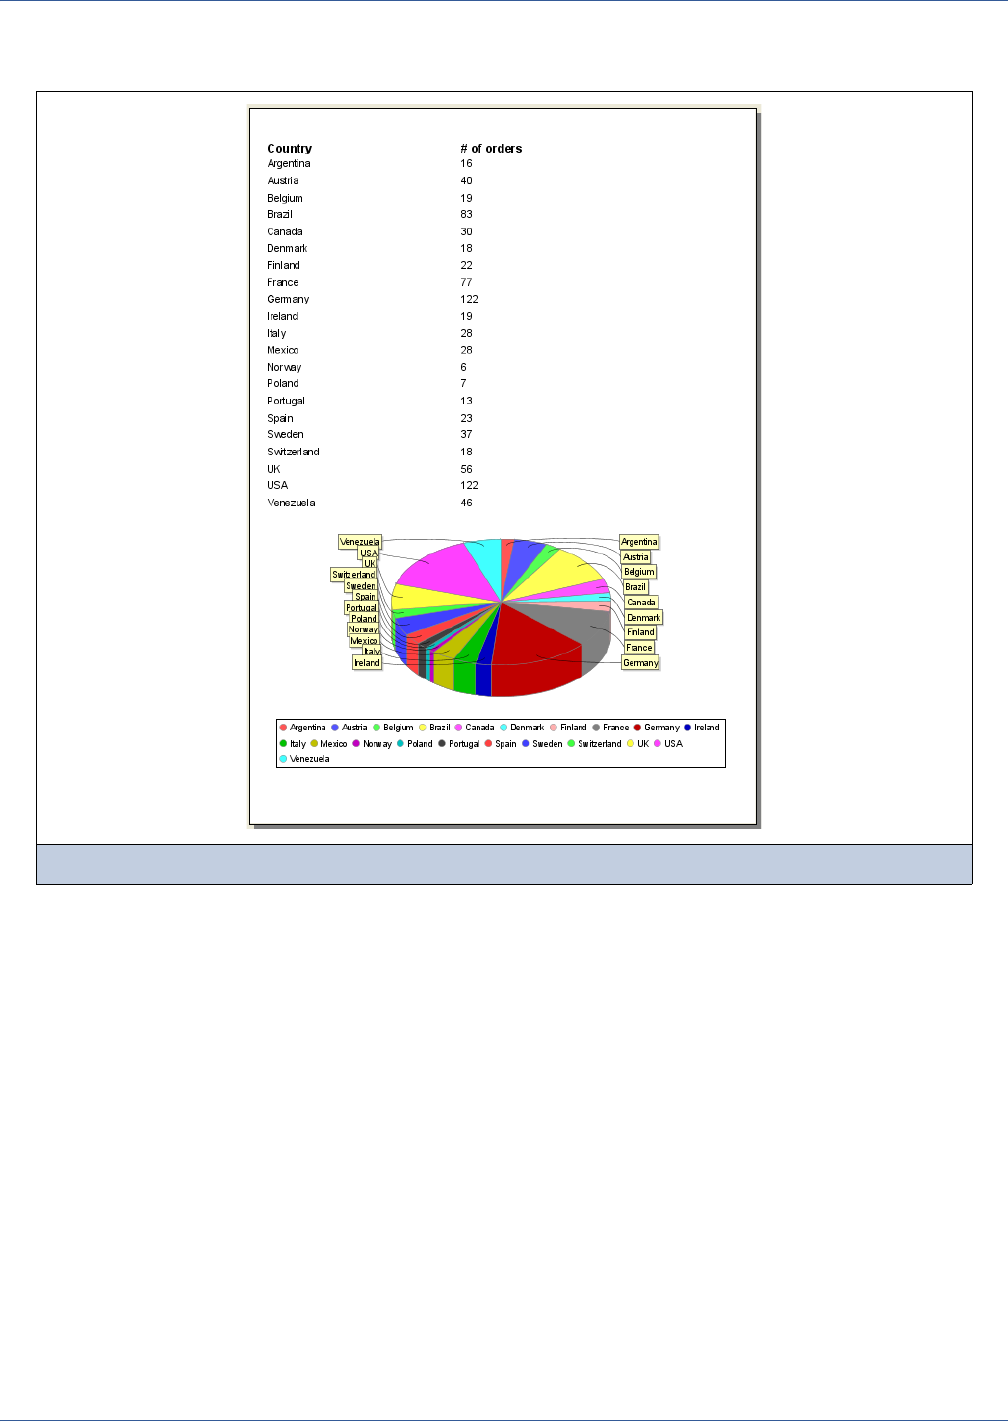
208
iReport Ultimate Guide
13. The configuration of this simple chart is complete, and we can preview the report to see the result, as shown in
Figure 11-7.
14. In this example, enter the expressions shown in Figure 11-6, then close the dialog.
In this case, each slice represents a country, and the value of the slice is the shipping total for that country. The chart itself
takes care of computing the total shipping for all countries and creating the size of the slice relative to the total.
Figure 11-7 The final report
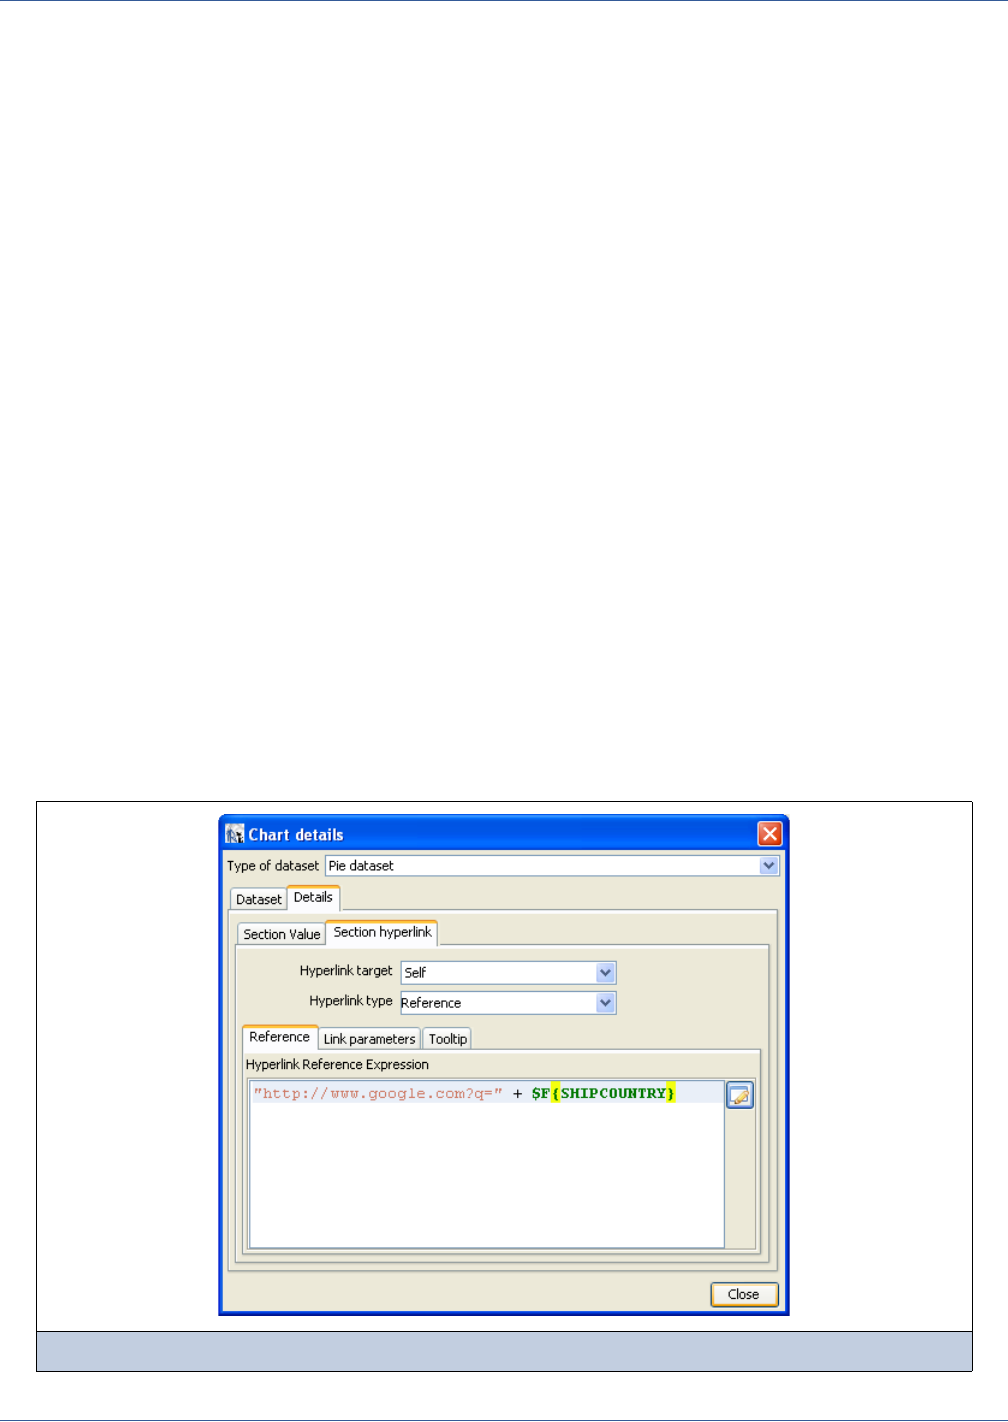
Charts
209
11.2 Using Datasets
The data represented within charts is collected when the report is generated and stored within the associated dataset. The
dataset types are as follows:
Pie
Category
Time period
Time series
XY
XYZ
High low
Value
Think of a dataset as a table. Each dataset has different columns (fields). When a new record is inserted into the dataset, values
are added to the fields.
The parameters and expressions you choose for your chart dataset in the Chart Details dialog, shown in Figure 11-5,
determine when and how JasperReports collects data for the chart. Specifically, you can indicate whether and when the dataset
should be emptied (Reset Type and Reset Group settings) and when to append a new record to the dataset (Increment Type
and Increment Group settings). These four fields have the same effect as the corresponding fields used for report variables
(see the discussion of variables in 6.3, “Working with Variables,” on page 108).
Depending on the dataset type that you have selected, the window’s Chart Data tab shows the fields within the specified
dataset. Detailed descriptions of the various field types and their functionality are available in JasperReports Ultimate Guide.
11.3 Value Hyperlinks
Some types of datasets provide a way to assign a hyperlink to the value represented in the chart, enhancing the user experience
by allowing the user to open a web page or navigate through the report by clicking the chart. To set the hyperlink parameters,
go to the Hyperlink tab on the Details tab of the Chart Details dialog, as shown in the following figure.
Figure 11-8 Hyperlink for a slice in a pie dataset
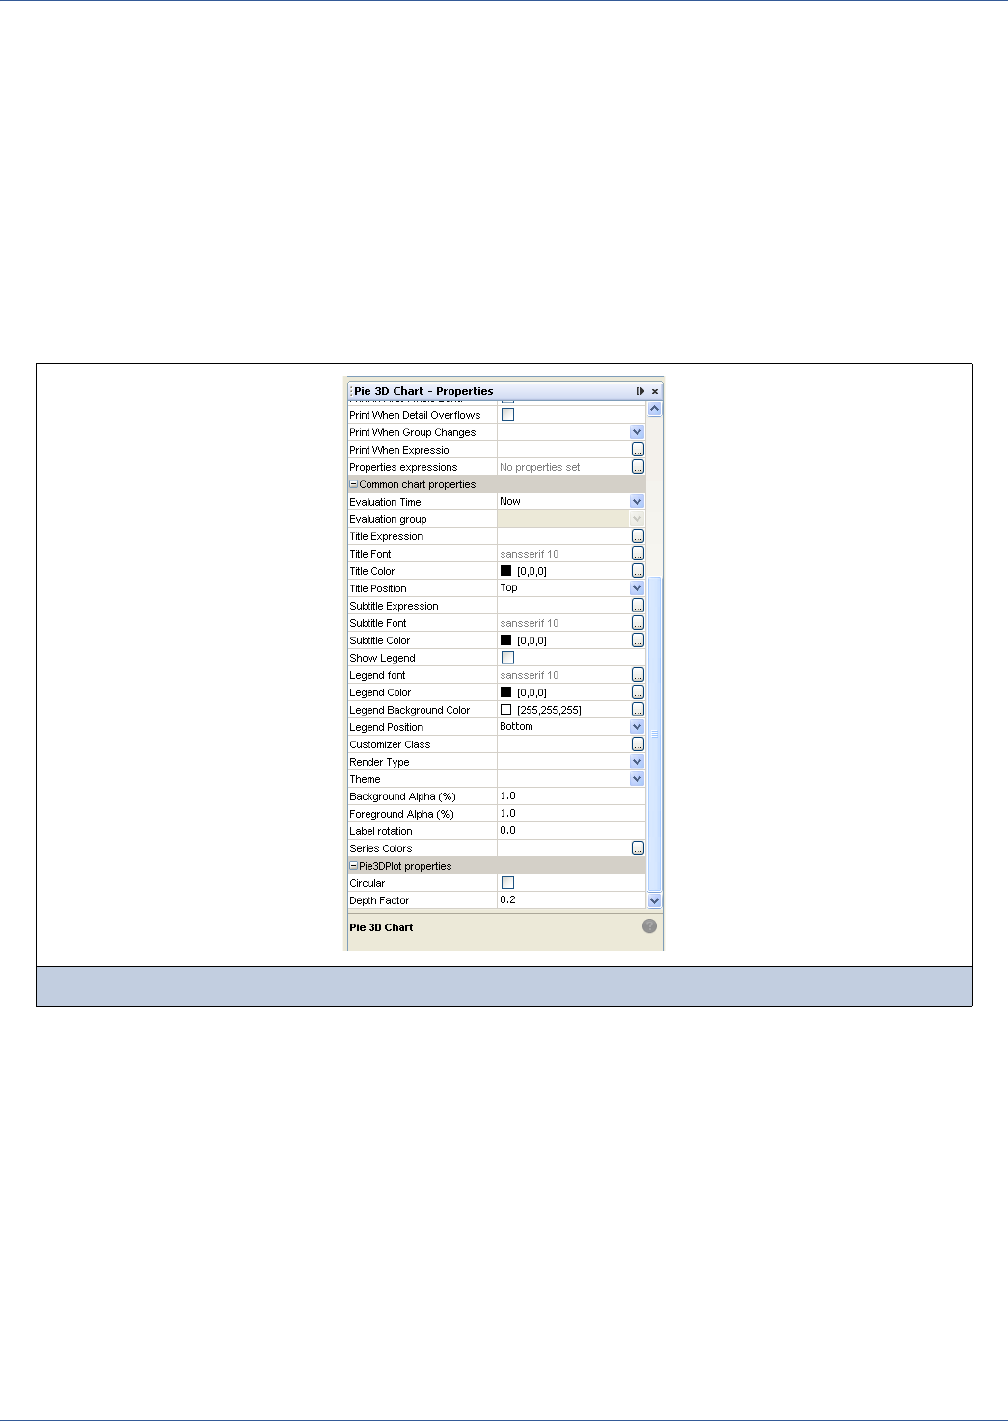
210
iReport Ultimate Guide
The click-enabled area depends on the chart type. For pie charts, the hyperlink is linked to each slice of the pie; for bar charts,
the click-enabled areas are the bars themselves.
Adding hyperlinks to elements is described in 5.5, “Adding Custom Components and Generic Elements,” on page 93.
Recall from that discussion that hyperlinks include expressions to reference all the fields, variables, and parameters of the
dataset used by a chart.
11.4 Properties of Charts
The appearance of a chart can be configured using the chart element property sheet (see Figure 11-9). You can edit properties
common to all charts and graphs (such as the title and the visibility of the legend) as well as properties specific to the chart or
graph that is being created. Properties that differ among chart types are known as plot properties.
Currently, JasperReports takes advantage of only a small portion of the capabilities of the JFreeChart library. To customize
a graph, a class must be written that implements the following interface:
net.sf.jasperreports.engine.JRChartCustomizer
The only method available from this interface is the following:
public void customize(JFreeChart chart, JRChart jasperChart);
It takes a JFreeChart object and a JRChart object as its arguments. The first object is used to actually produce the image,
while the second contains all the features you specify during the design phase that are relevant to the customize method.
Figure 11-9 Chart element property sheet
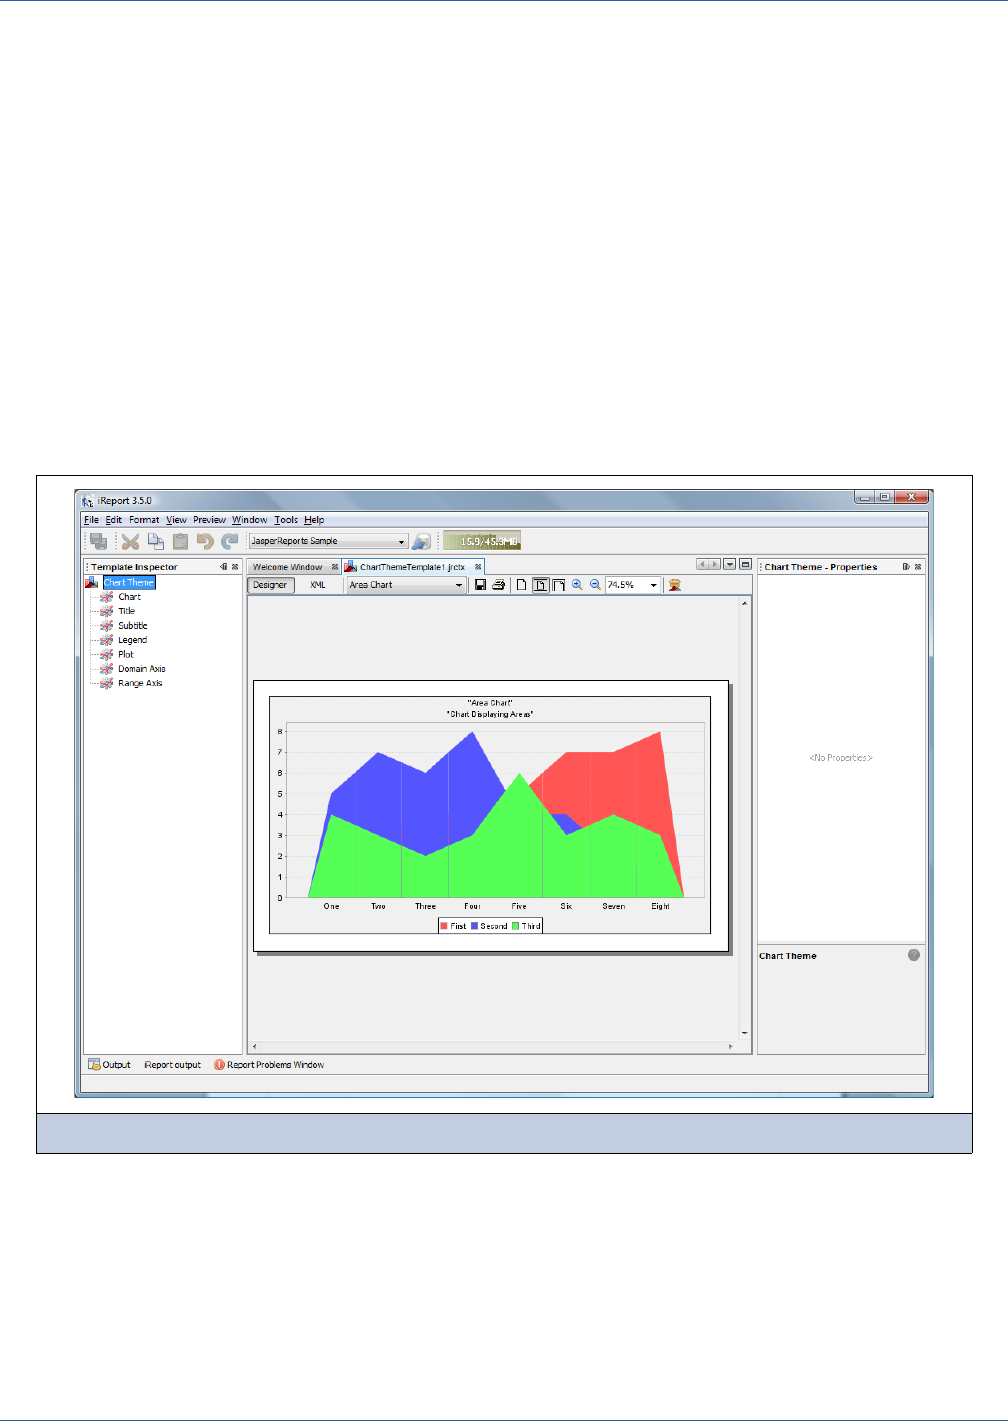
Charts
211
11.5 Using Chart Themes
Another way to customize graphs is by creating a chart theme, which gives you full control over the style of the chart. Chart
themes allow you to customize the design of a chart. Chart themes are reusable: you can use the same chart theme in many
reports to have a unified appearance. You can also update a chart theme to modify the appearance across all reports. There are
several techniques for creating a chart theme, but the simplest one for the end user is to create a JRCTX file (JasperReports
Chart Theme XML) using iReport. In this section we will see how to create such a file and how to use it in a report.
To create a JasperReports Chart Theme XML file, select New → Chart Theme from the File menu and specify where to store
the new file (which has the file extension .jrctx).
11.5.1 Using the Chart Theme Designer
When you create a new chart theme, iReport automatically opens the theme in the Chart Theme Designer, as shown in
Figure 11-10. This designer has three main panels:
Template Inspector. Tree view showing the several sections of the chart that you can customize.
Main view. Displays a real time preview of the theme.
Property sheet. Lists the properties that you can modify.
JasperReports organizes a chart theme into seven sub-sections that are visible in the Template Inspector panel:
Chart
Title
Subtitle
Legend
Plot
Domain Axis
Range Axis
Figure 11-10 Chart Theme Designer
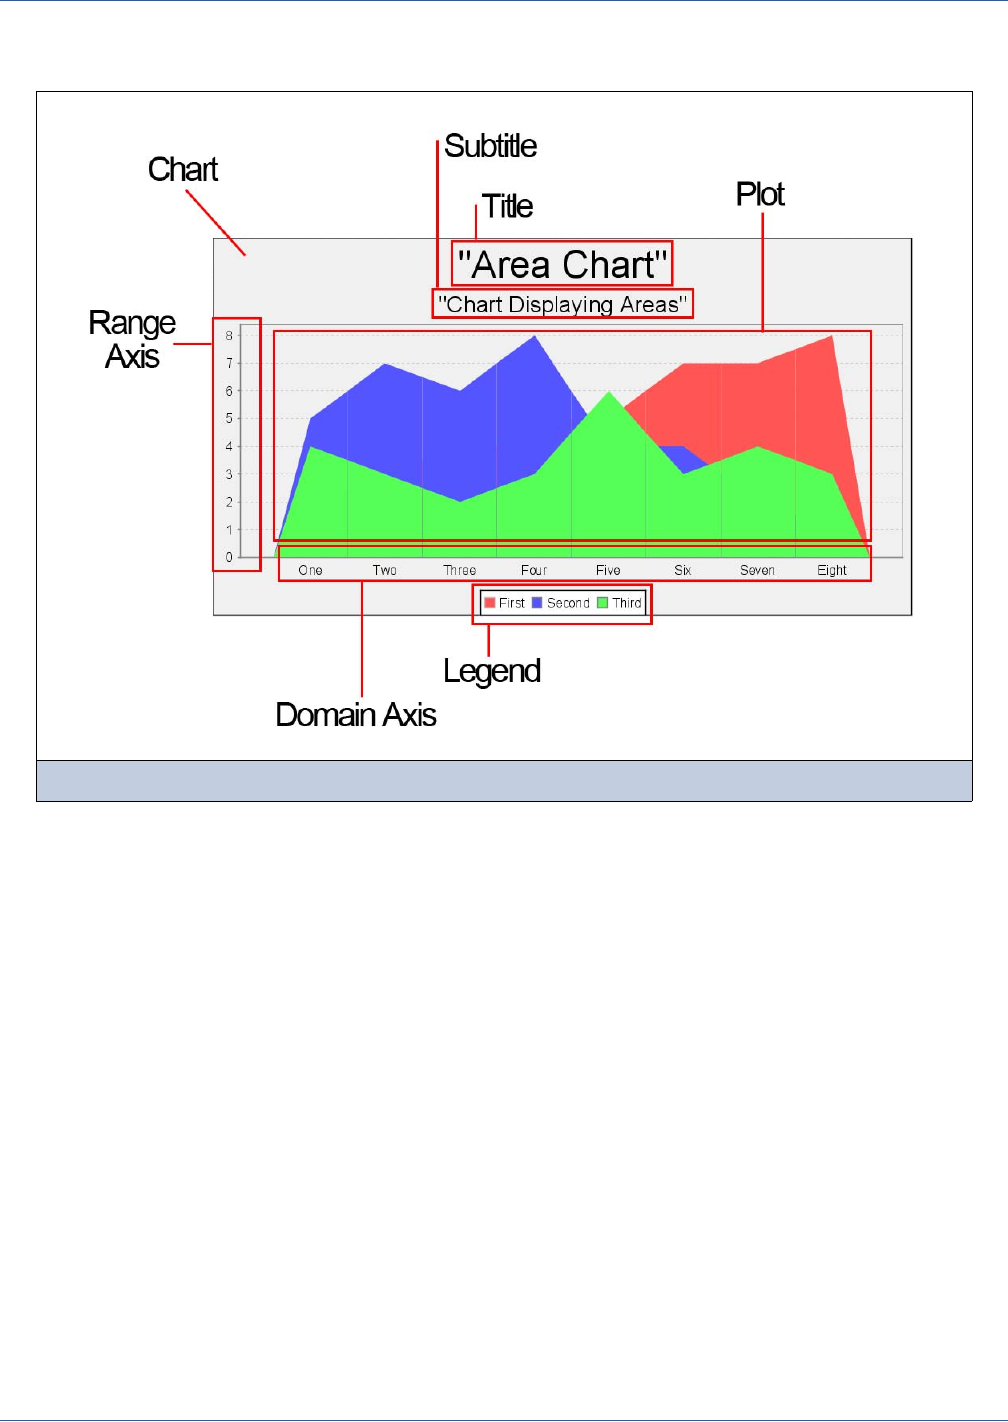
212
iReport Ultimate Guide
iReport allows you to design the properties for each part of the chart theme. Figure 11-11 shows which part of the chart these
sections affect.
By selecting a sub-section of the Template Inspector, the properties available for that section are displayed in the property
sheet. The properties are applied to all chart types, but the preview shows only one type. To preview the impact of the new
theme on a different chart type, select the type from the combo box in the tool bar of the Preview window.
The properties are fairly self-explanatory so I will not describe them any further.
11.5.1.1 Editing Chart Theme XML
The Chart Theme Designer allows you to view and edit the XML for your chart theme via the XML tab in the Preview window.
I suggest, however, that only those users quite experienced with XML architecture should modify a chart theme with direct
edits of the source file.
11.5.2 Creating a JasperReports Extension for a Chart Theme
The JRCTX file we have created cannot be used in a report yet. It only describes some properties of the chart; it needs to be
wrapped into a JasperReports extension JAR first. We need to set a name for the new theme, produce a
jasperreports_extension.properties file to describe the JasperReports extension, and package the .jrctx and
.properties files in a JAR. This can be done in a single step by right-clicking the Chart Theme root node in the tree view and
selecting the Export as a Jar... menu item. Optionally, clicking the button showing a little package situated in the Preview
window tool bar has the same effect.
Figure 11-11 Chart sections
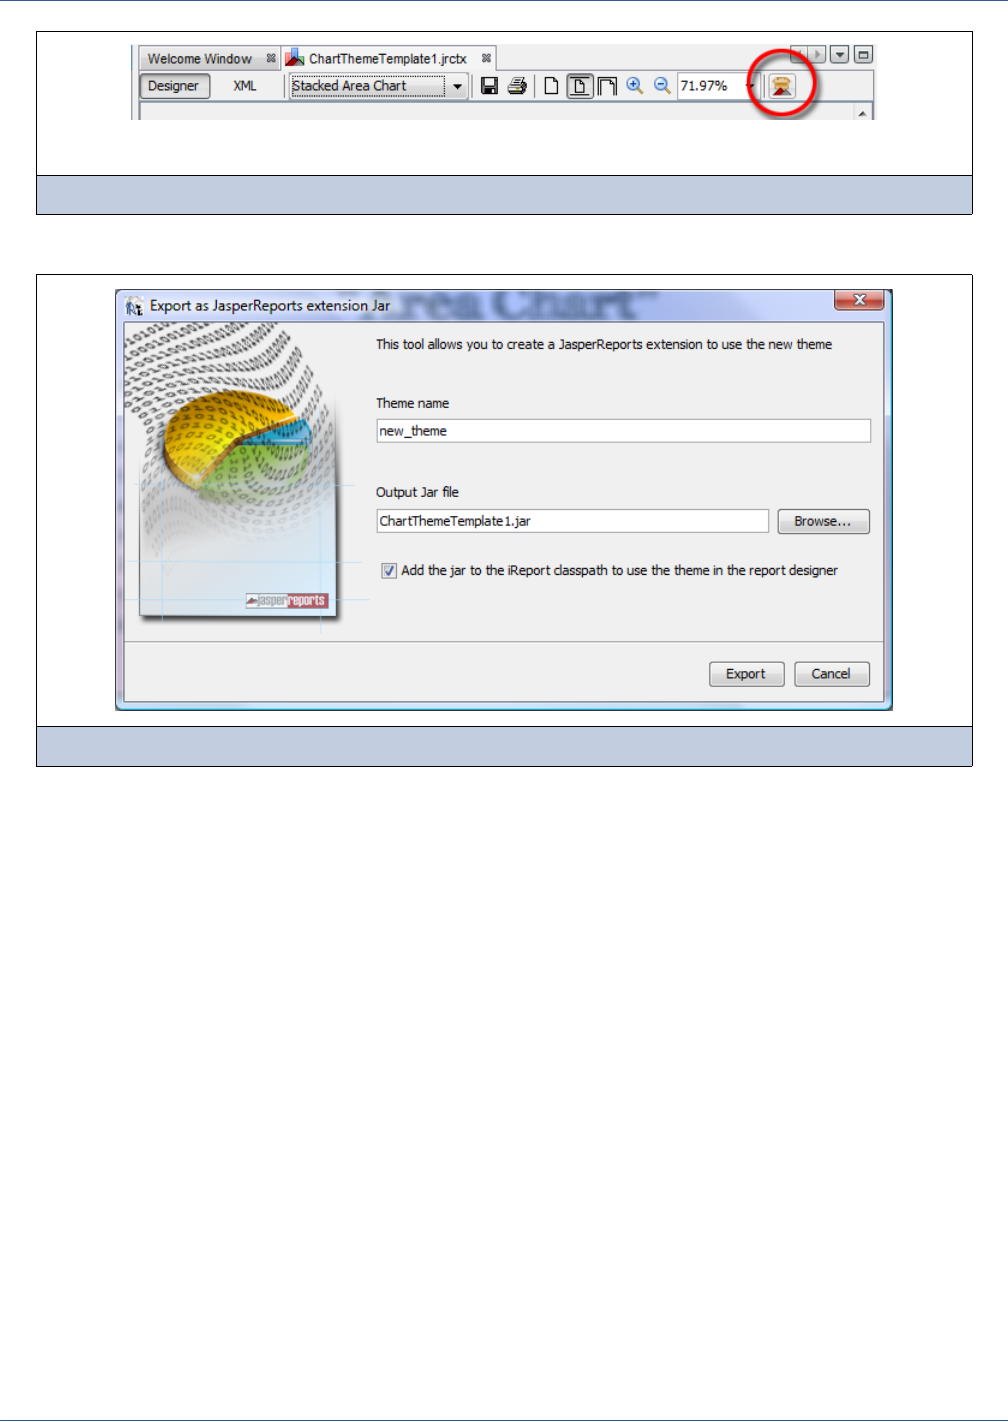
Charts
213
The Export window pops up (Figure 11-13).
You can set a name for your new theme in the window; this is the name that will be used by JasperReports to identify your
theme. Select the JAR to create. Optionally, you can automatically add the JAR to the iReport classpath, but remember to add
that JAR to your application, too, when you deploy the reports.
11.5.3 Using a Chart Theme in the Report Designer
Once you have the chart theme extension in the classpath, you should see it in the Theme Property combo box (the chart
properties are shown in the property sheet when a chart element is selected).
Select the new chart theme. In the chart theme that has just been added to the classpath, the real time preview could not be
available (if you need it, just restart iReport).
Figure 11-12 Export as a Jar button
Figure 11-13 Chart theme exporter
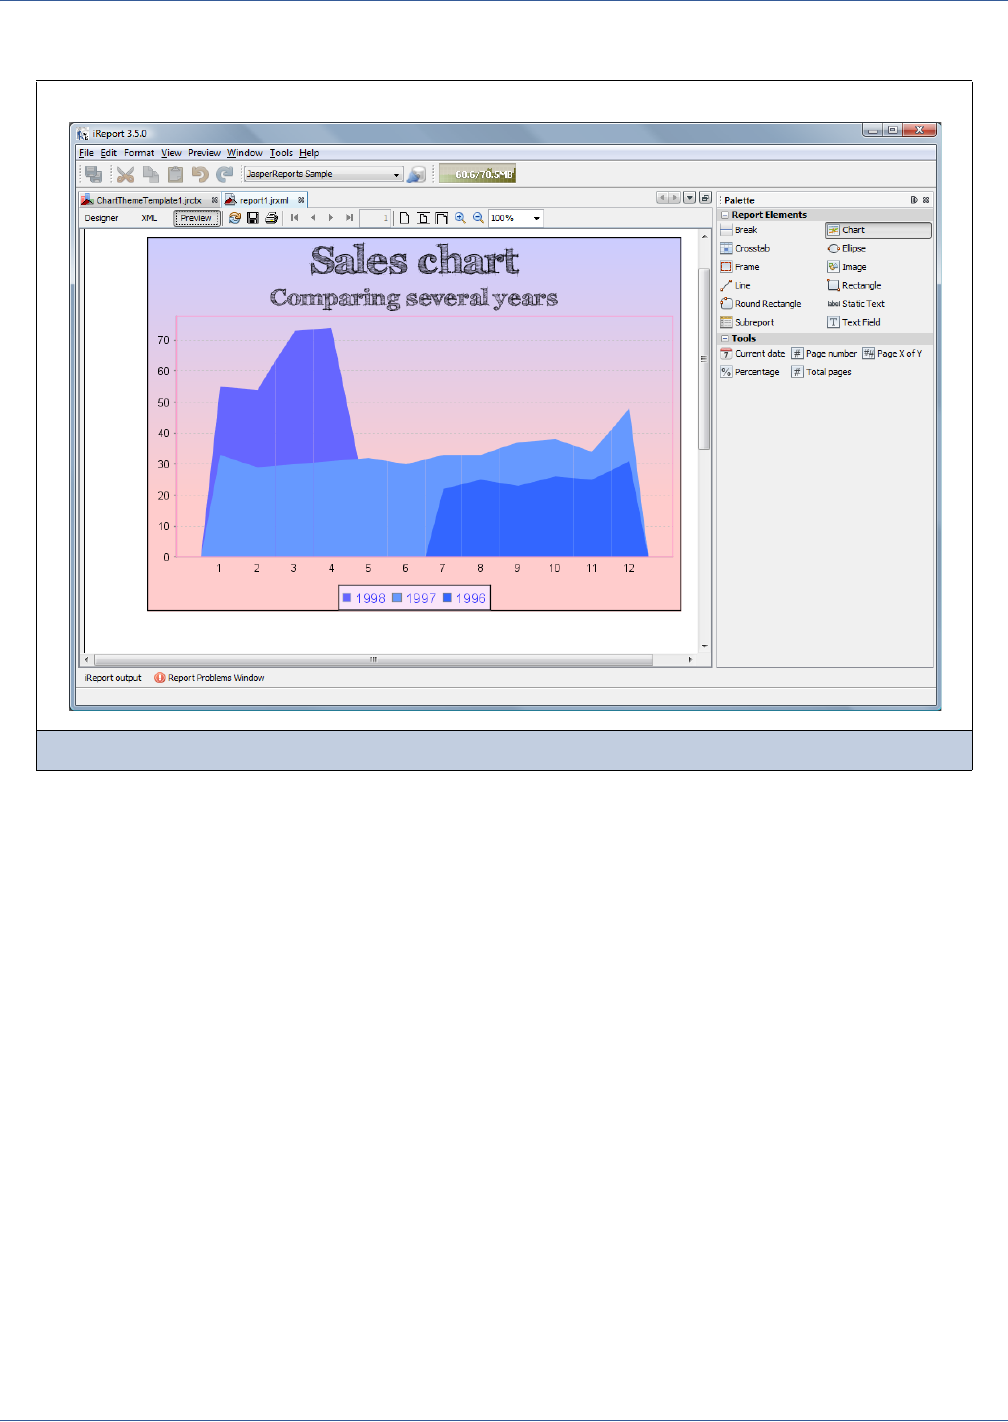
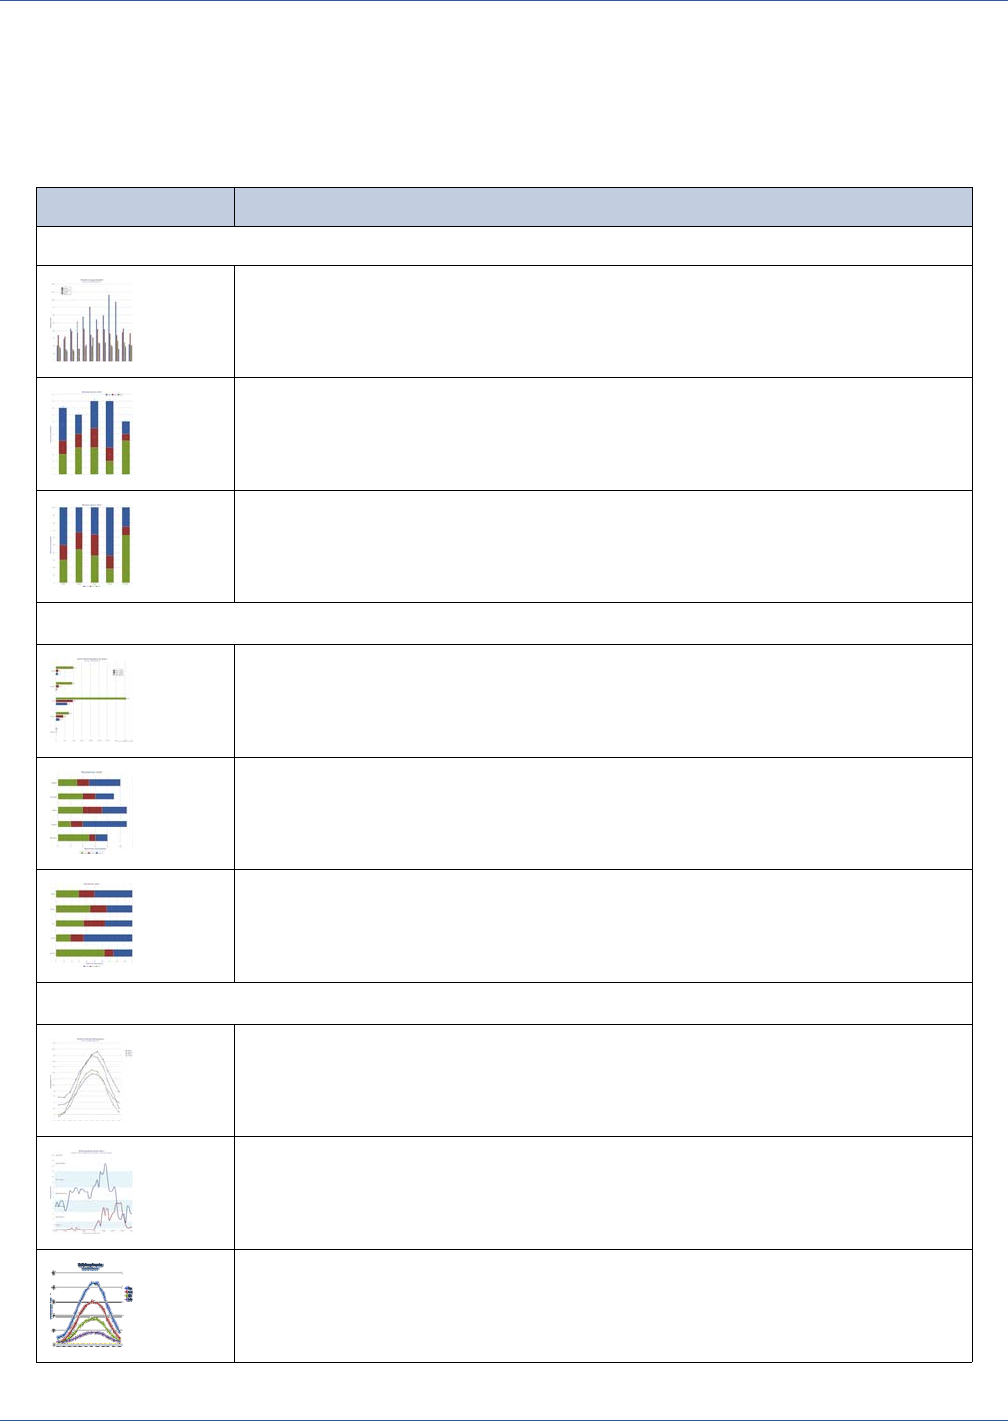
Charts
215
11.6 HTML5 Charts
HTML5 charts can be used to create interactive reports. They are also more attractive than the basic charts available in
iReport. In this section, you will learn how to build a report containing a simple HTML5 chart. The following table describes
the available chart types:
Table 11-1 HTML5 Chart Types
Icon Description
Column charts - Compare values displayed as columns
Column. Multiple measures of a group are depicted as individual columns.
Stacked Column. Multiple measures of a group are depicted as portions of a single
column whose size reflects the aggregate value of the group.
Stacked Percent Column. Multiple measures of a group are depicted as portions of a
single column of fixed size.
Bar charts - Compare values displayed as bars
Bar. Multiple measures of a group are depicted as individual bars.
Stacked Bar. Multiple measures of a group are depicted as portions of a single bar whose
size reflects the aggregate value of the group.
Stacked Percent Bar. Multiple measures of a group are depicted as portions of a single
bar of fixed size.
Line charts - Compare values displayed as points connected by lines
Line. Displays data points connected with straight lines.
Spline. Displays data points connected with a fitted curve.
Stacked Line. Displays series as a set of points connected by a line .Values are
represented on the y-axis and categories are displayed on the x-axis. Lines do not overlap
because they are cumulative at each point
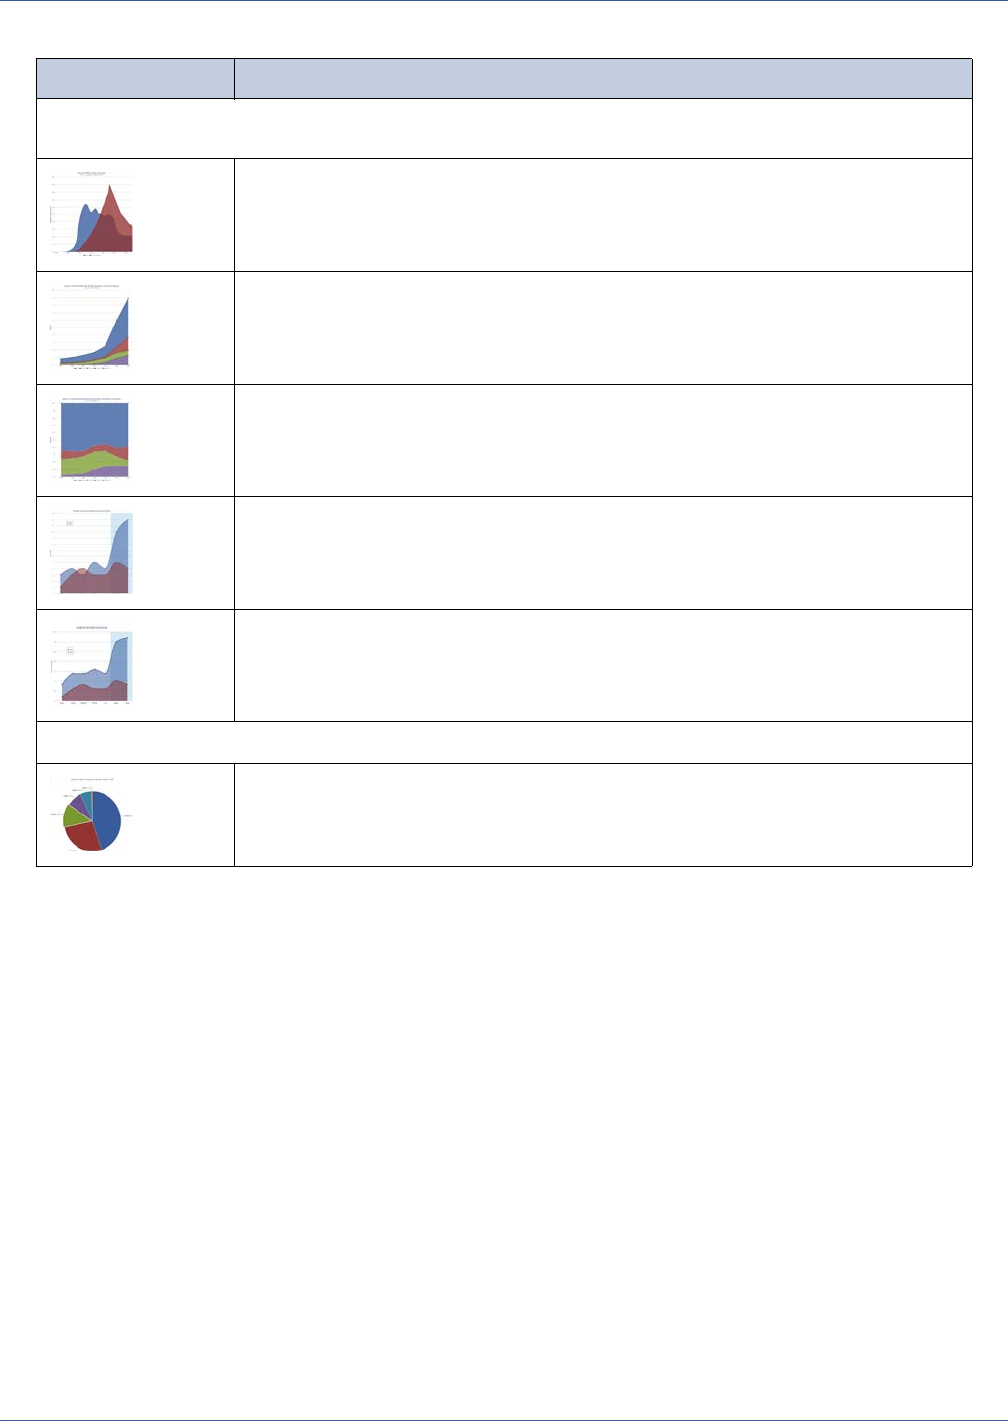
216
iReport Ultimate Guide
Area charts - Compare values displayed as shaded areas. Compared to line charts, area charts emphasize
quantities rather than trends.
Area. Displays data points connected with a straight line and a color below the line; groups
are displayed as transparent overlays.
Stacked Area. Displays data points connected with a straight line and a solid color below
the line; groups are displayed as solid areas arranged vertically, one on top of another.
Stacked Percent Area. Displays data points connected with a straight line and a solid
color below the line; groups are displayed as portions of an area of fixed sized, and
arranged vertically one on top of the another.
Area Spline. Displays data points connected with a fitted curve and a color below the line;
groups are displayed as transparent overlays.
Stacked Area Spline. Displays series as a set of points connected by a smooth line with
the area below the line filled in. Values are represented on the y-axis and categories are
displayed on the x-axis. Areas do not overlap because they are cumulative at each point.
Pie charts - Compare values displayed as slices of a circular graph
Pie. Multiple measures of a group are displayed as sectors of a circle.
Table 11-1 HTML5 Chart Types
Icon Description
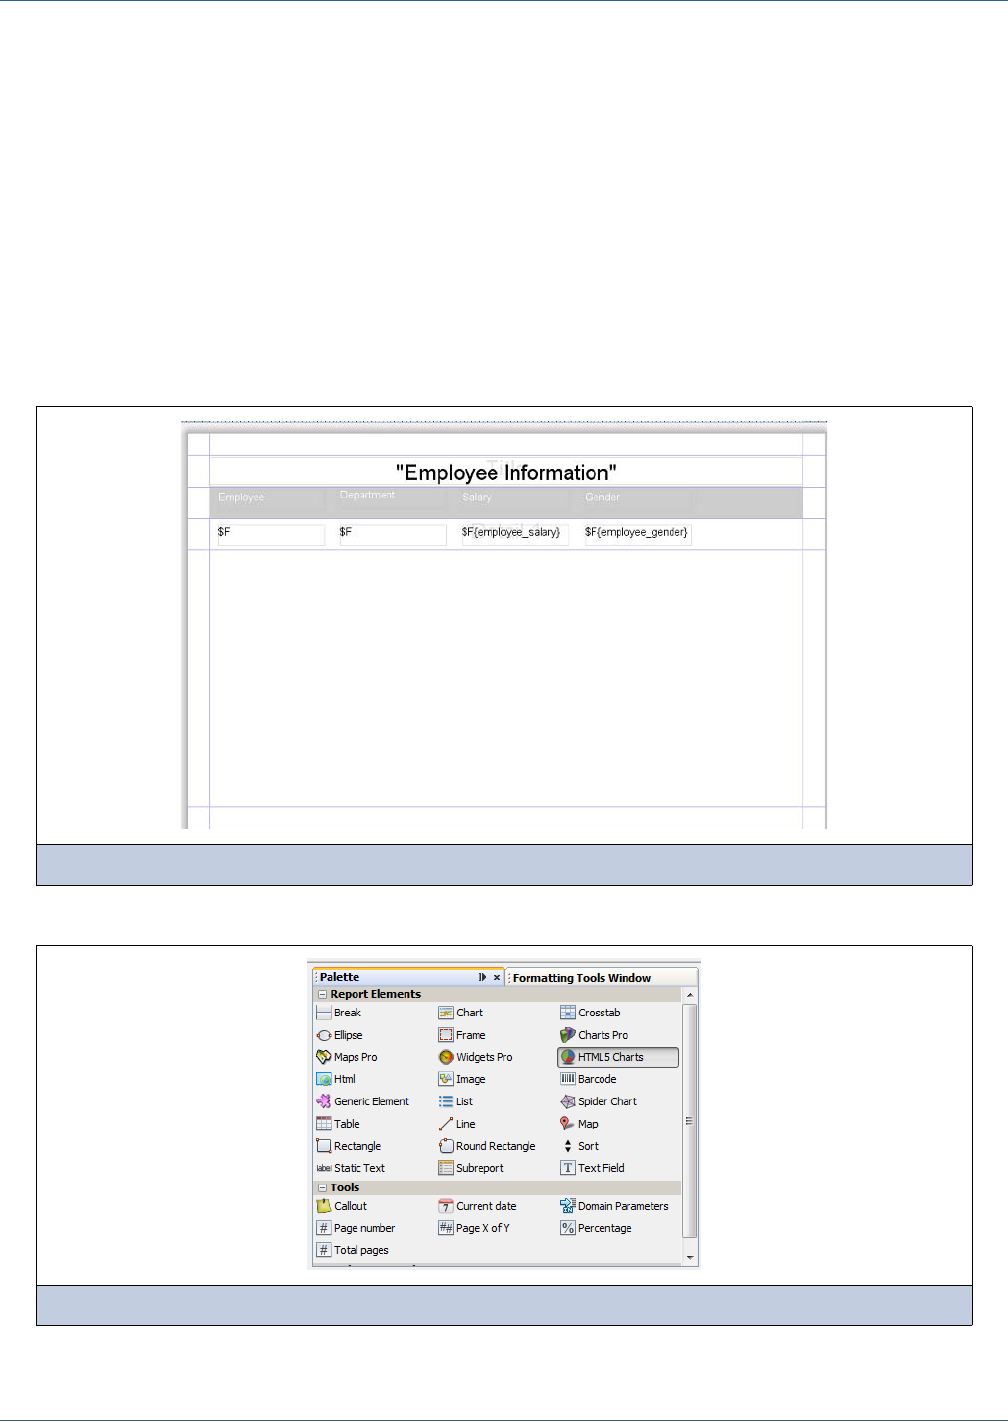
Charts
217
To include an HTML5 chart in your iReport:
1. First create a report with the following query:
SELECT
department."department_description" AS department_department_description,
department."department_id" AS department_department_id,
employee."employee_id" AS employee_employee_id,
employee."full_name" AS employee_full_name,
employee."salary" AS employee_salary,
employee."gender" AS employee_gender,
employee."position_title" AS employee_position_title,
employee."department_id" AS employee_department_id
FROM
"public"."department" department INNER JOIN "public"."employee" employee ON
department."department_id" = employee."department_id".
2. Choose HTML5 Charts from the Report Elements palette, and drag it into your report.
Figure 11-15 Report before a chart is added
Figure 11-16 Report Elements palette
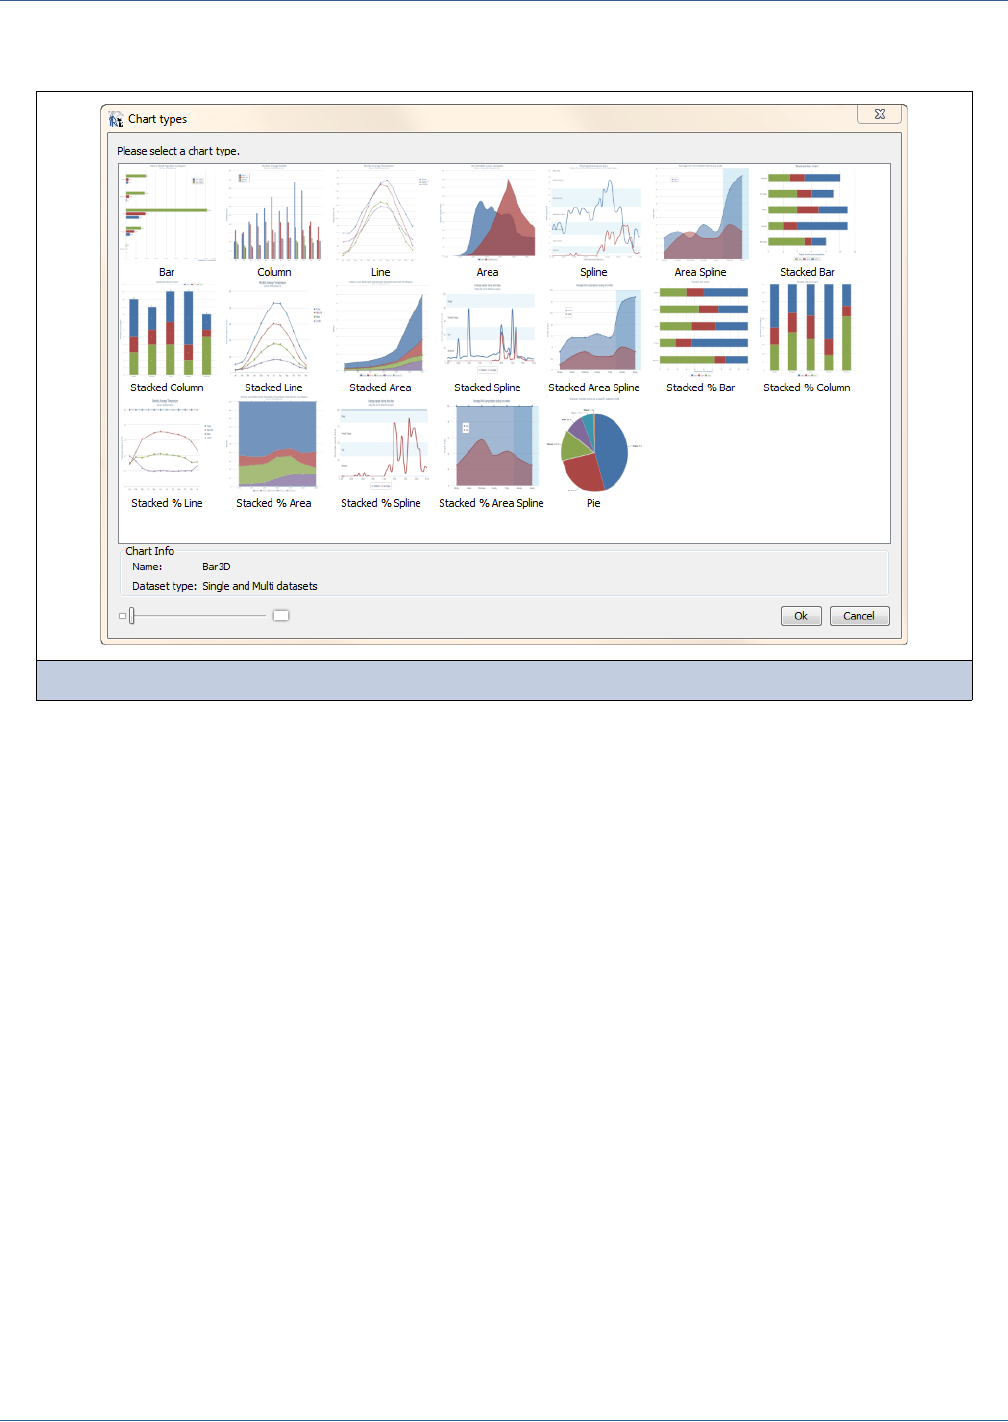
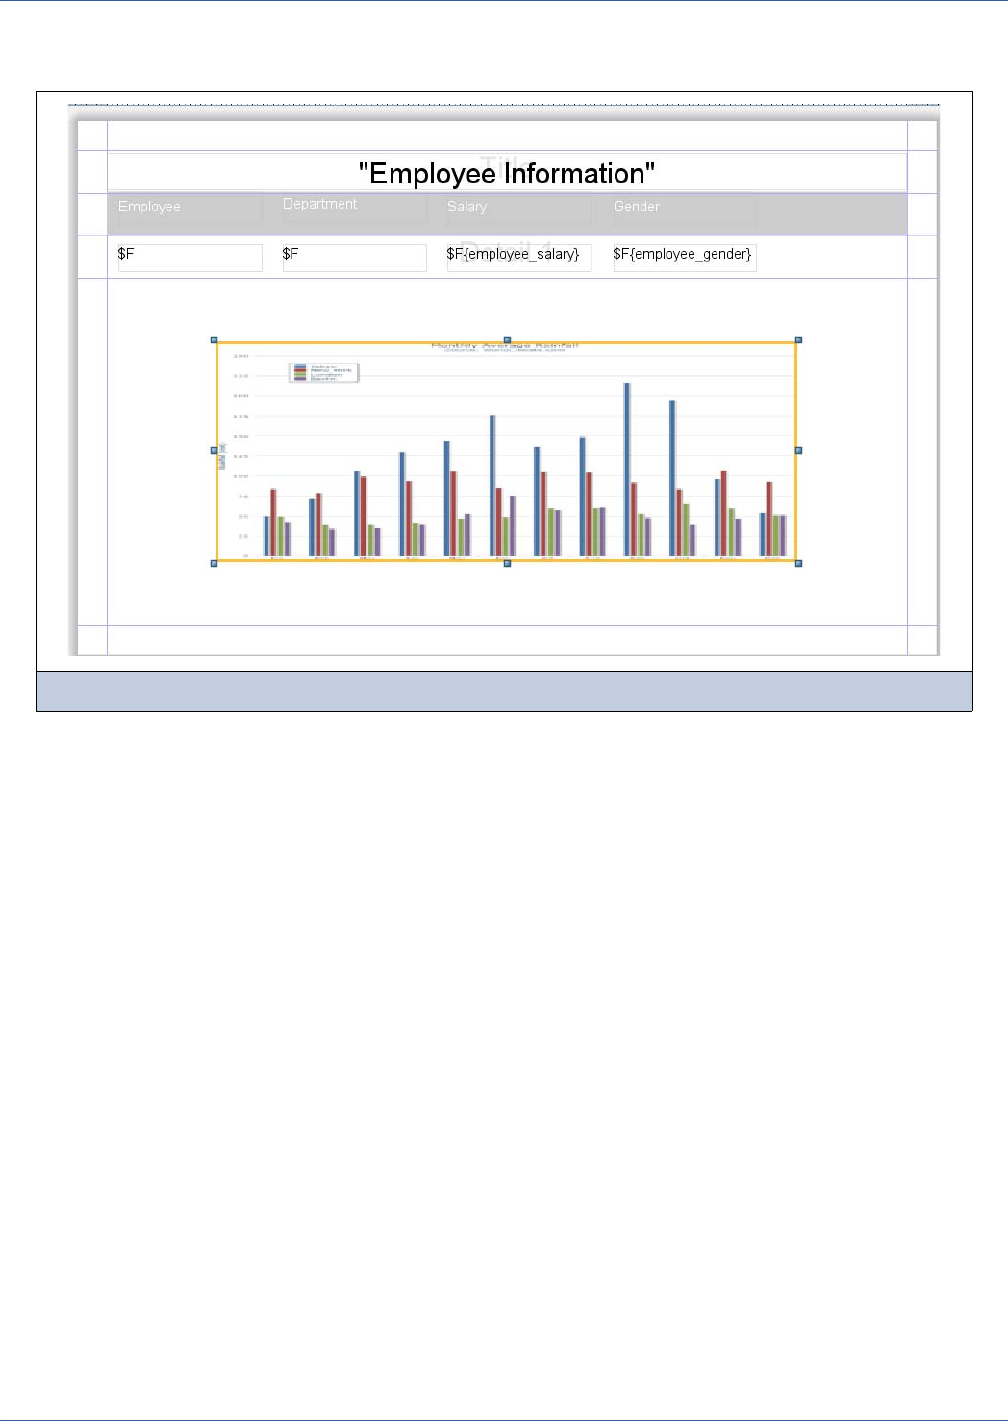
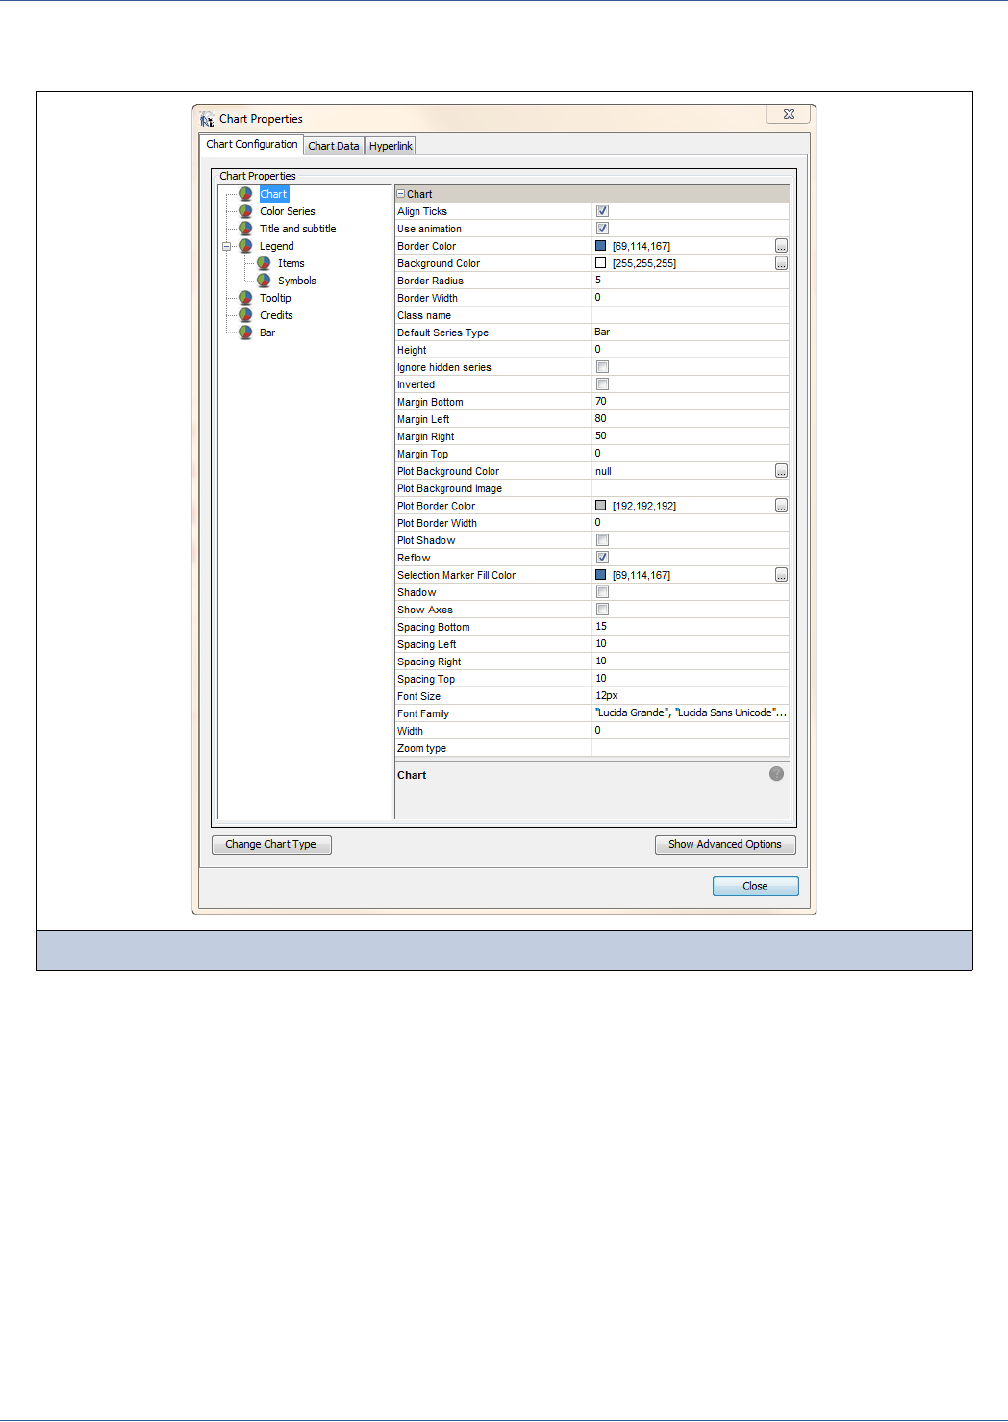
220
iReport Ultimate Guide
4. Right-click on the chart and select Edit Chart Properties. The Chart Properties dialog appears with tabs for configuring
the chart, its dataset, and optional hyperlinks.
The properties on the Chart Configuration tab cover many aspects of chart appearance and behavior as well as enable
you to customize your chart extensively On the left you have the following categories:
Chart
Color Series
Title and subtitle
Legend
Items
Symbols
Tooltip
Credits
Bar
Each of these categories has many areas you can customize.
Figure 11-19 Chart Properties
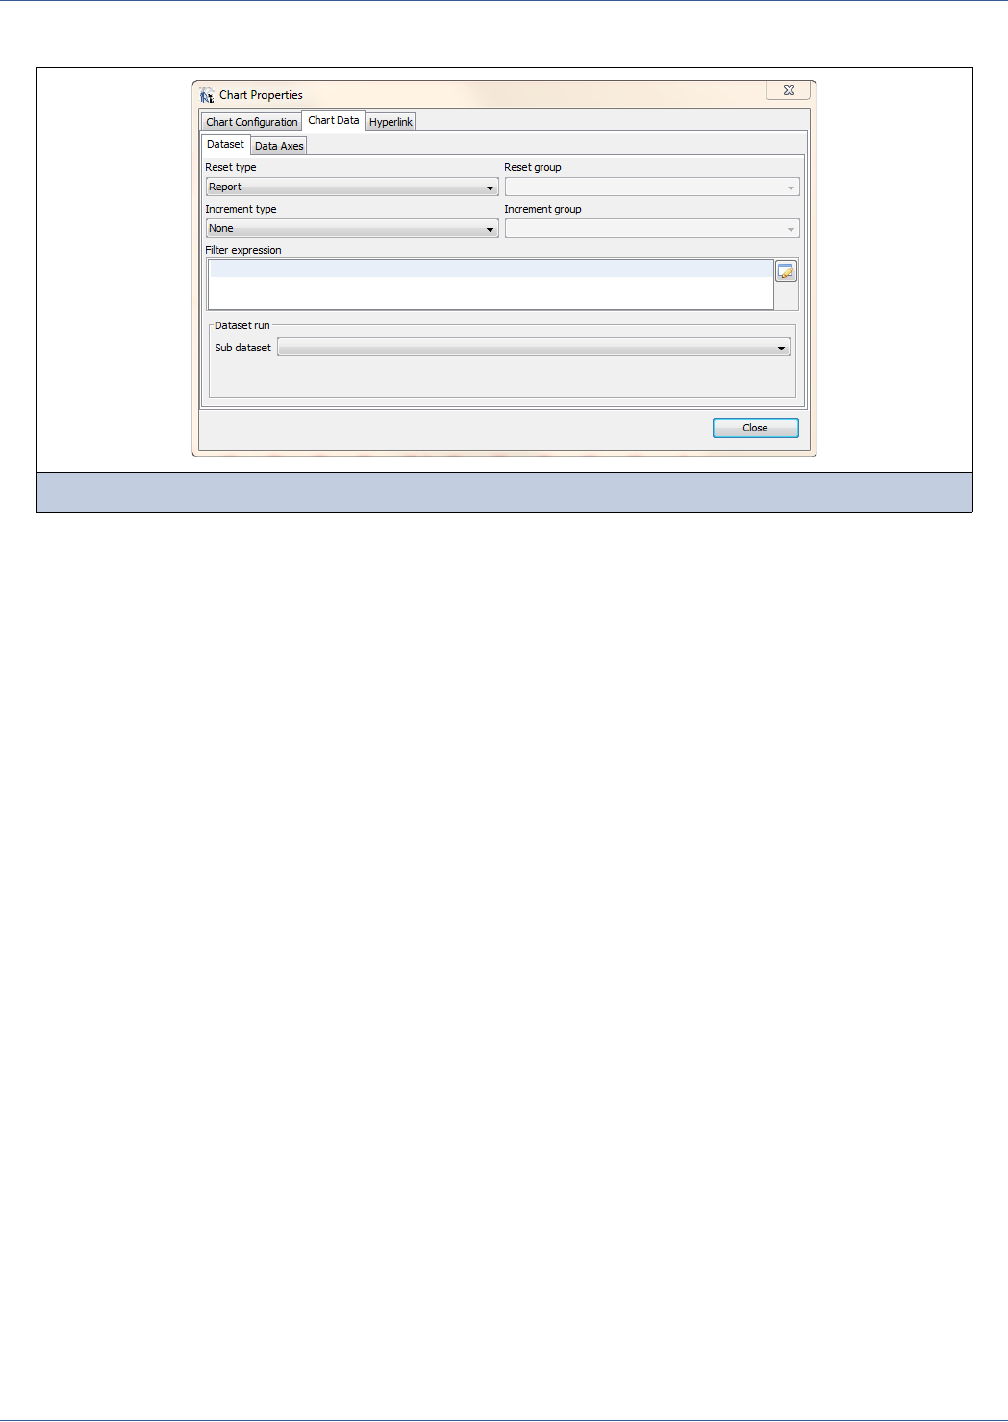
Charts
221
5. Select the Chart Data tab.
In the Chart Data tab, you add a Filter expression and Data Axes. What you see in this tab will vary, depending on the
type of chart you selected.
6. Click Preview to view the report with your chart.
Figure 11-20 Chart data tab

222
iReport Ultimate Guide
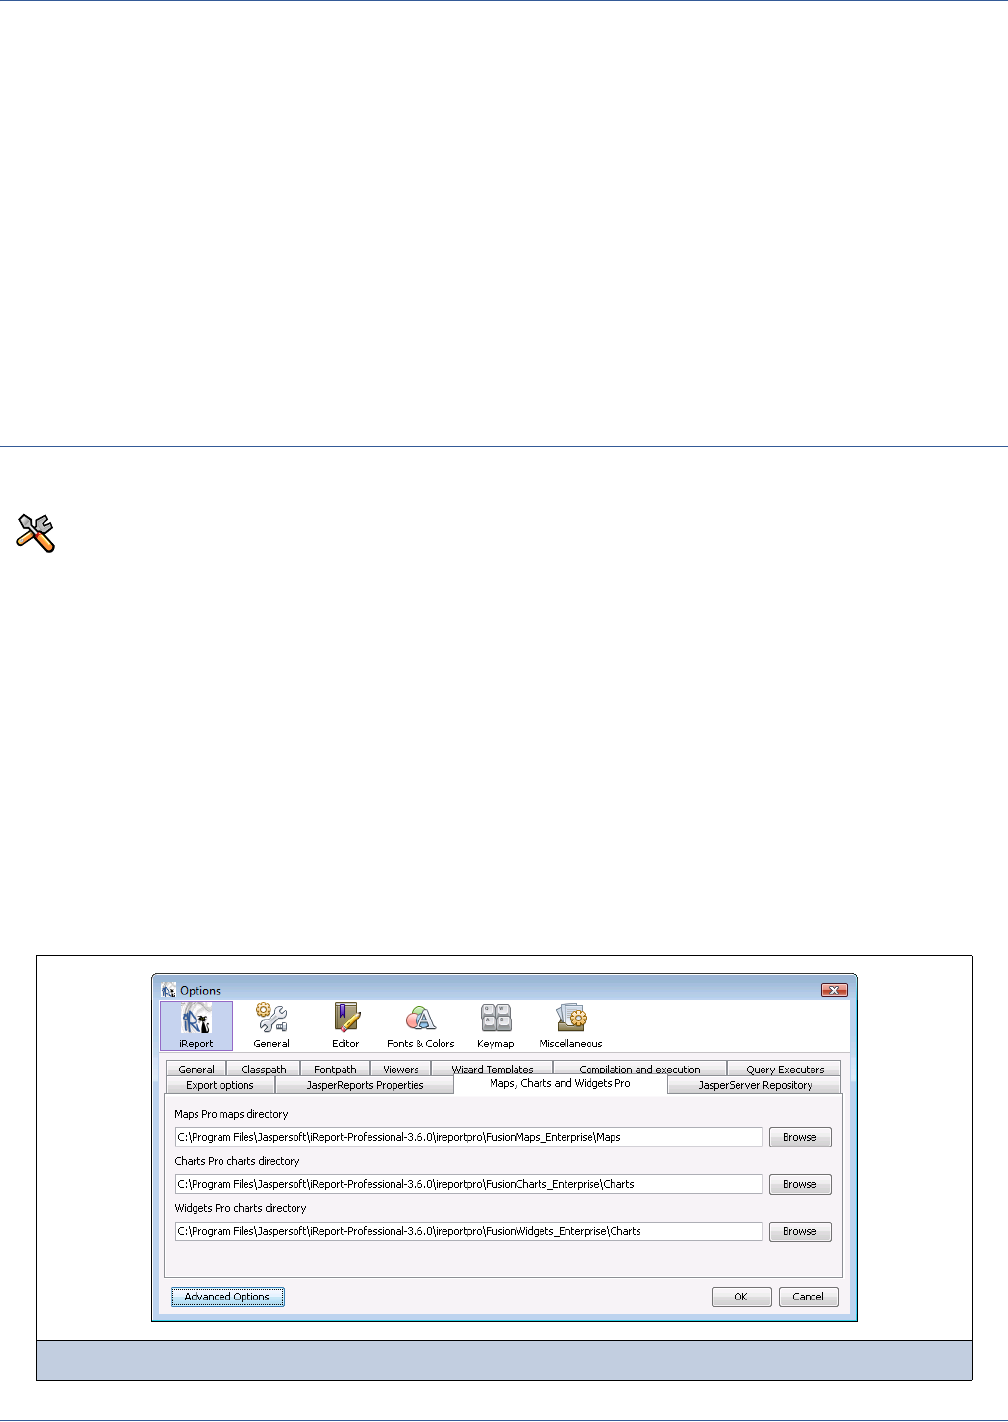
Flash Charts
223
CHAPTER 12 FLASH CHARTS
JasperReports Professional supports Adobe Flash, using three sets of components:
Maps Pro. Color-coded maps covering all countries and regions of the globe.
Charts Pro. Standard and stacked charts with animation and interactivity.
Widgets Pro. Non-standard charts such as gauges, funnels, spark lines, and Gantt charts.
The components are based on Fusion libraries and generate Flash output that can be included in HTML and PDF reports. This
section of the iReport guide focuses on how to configure these components in iReport Professional.
By default, the Maps, Charts, and Widgets Pro component libraries are included in the iReport Professional (3.6 and above)
installation. The default location for the Pro component libraries is <ir-install>/ireportpro, and iReport is automatically
configured to use the correct path for each component. The placeholder <ir-install> is the location where you installed iReport;
by default it is C:\Program Files\Jaspersoft\iReport-Professional-x.x.x (where x.x.x is the version number; for example,
iReport-Professional-3.6.0).
The directory for the Pro component libraries can be changed at any time on the Maps, Charts, and Widgets Pro tab of the
Options window (Tools → Options).
This section describes functionality that is available only in iReport Professional edition. Contact Jaspersoft to obtain
the software.
Figure 12-1 Viewing or setting the library directories
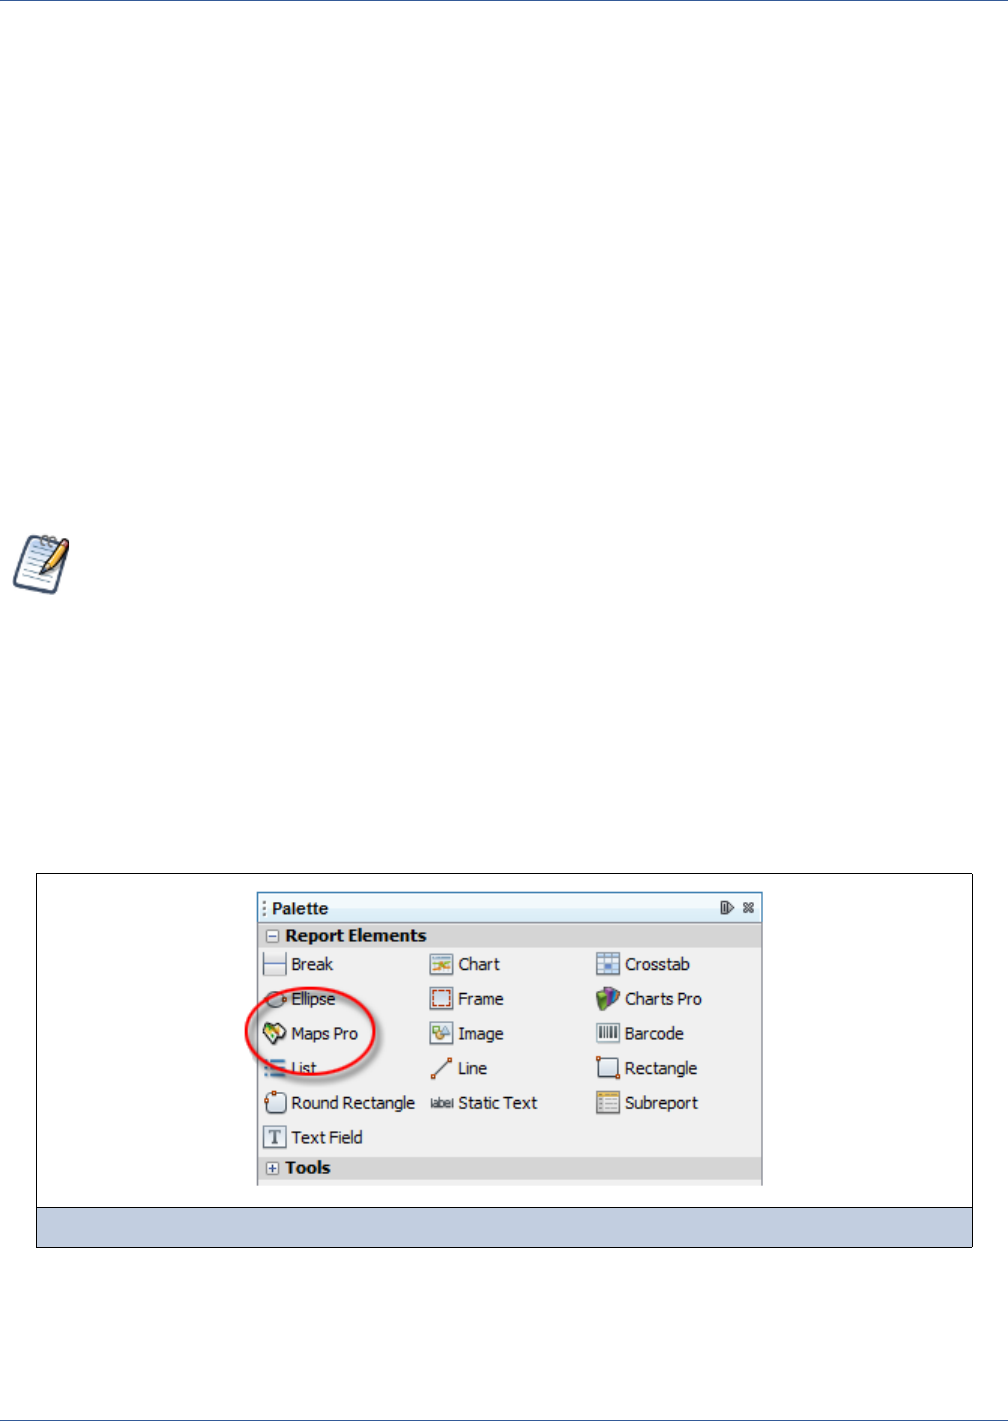
224
iReport Ultimate Guide
If the corresponding directory is invalid or not specified when you insert a Maps, Charts, or Widgets Pro element, iReport will
prompt you to specify a directory at that time.
This chapter has the following sections:
Viewing Flash Objects
Using Maps Pro
Using Charts Pro
Using Widgets Pro
Embedding Components in a Java Application
Localizing a Component
Component Limitations
12.1 Viewing Flash Objects
Maps Pro, Charts Pro, and Widgets Pro elements are rendered as Flash objects embedded in HTML and PDF output. When a
report containing a Maps, Charts, or Widgets Pro element is exported in a format other than HTML or PDF, the space used by
the element remains blank.
12.2 Using Maps Pro
12.2.1 Creating Maps
In Maps Pro, maps and their data are configured in the interface provided by the Fusion plug-in. In iReport Professional, the
Maps Pro element appears in the palette.
Drag the Maps Pro element from the palette to a section of the report. The Maps Pro element doesn’t have a special
representation at design time, so it is represented as a generic custom element.
Depending on the band where you place the new map element, iReport sets the proper evaluation time for the map element.
The evaluation time and evaluation group properties specify the time at which the element should be evaluated.
To view Maps, Charts, and Widgets Pro elements in HTML output, make sure Flash is installed and enabled on your
browser.
To view Maps, Charts, and Widgets Pro elements in PDF output, be sure to use a Flash-enabled PDF viewer such as
Adobe Reader 9.
Figure 12-2 The Maps Pro element in the palette
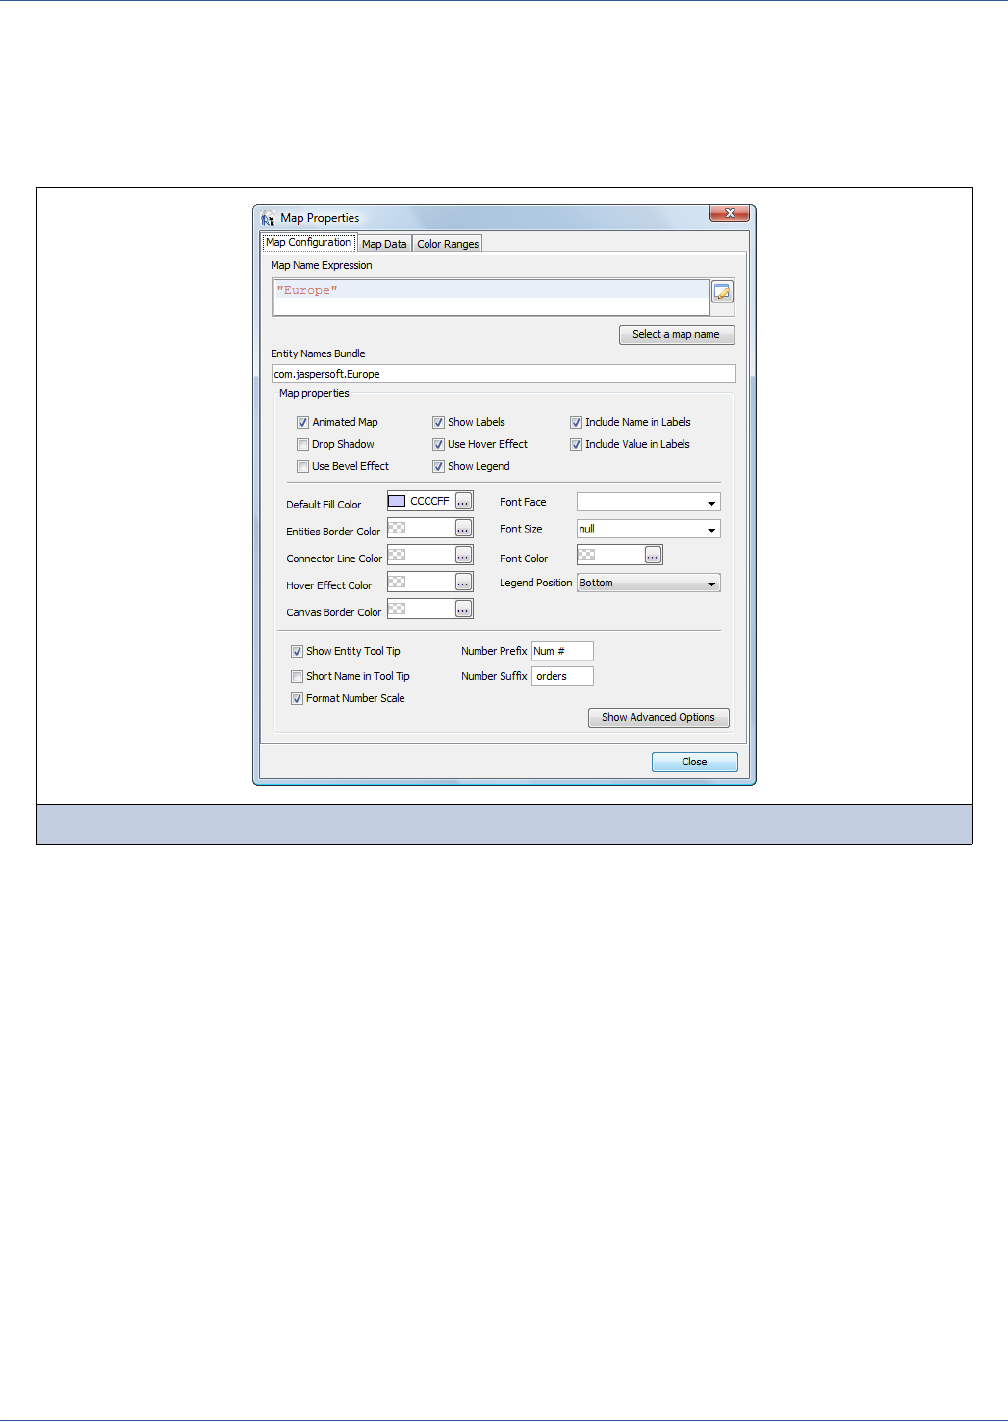
Flash Charts
225
The layout properties for the Maps Pro element (such as position and size) are managed using the standard property window in
iReport.
The contents of a map are configured through map-specific properties. To access the map properties, right-click the Maps Pro
element in your report and select Edit Map Properties from the context menu.
The Map Properties window provides the Map Configuration, Map Data and Color Ranges tabs (Figure 12-3).
Use the Map Configuration tab in this window to select a map and configure its appearance:
The Map Name Expression field specifies the map to use for this element.
Click Select a map name to see a list of available maps. Double-click the map you need. When you select a map name,
the map is defined statically, but you can also enter a complex expression that selects one of the map names dynamically.
The Entity Names Bundle field is for localizing the labels on the chosen map. By default, this field is blank and maps are
labeled in English. To create resource bundles for other languages, see 12.2.5, “Localizing Maps,” on page 233.
The rest of the map properties on the tab modify the map’s look and feel. JasperReports lets you set many different
attributes for a map. iReport provides this simplified UI to quickly set the most common map options.
To view and modify the expressions corresponding to the map properties, click Show Advanced Options.
The Map properties area of the tab changes to display a list of properties and their expression values:
Figure 12-3 Map Configuration Tab of the Map Properties window
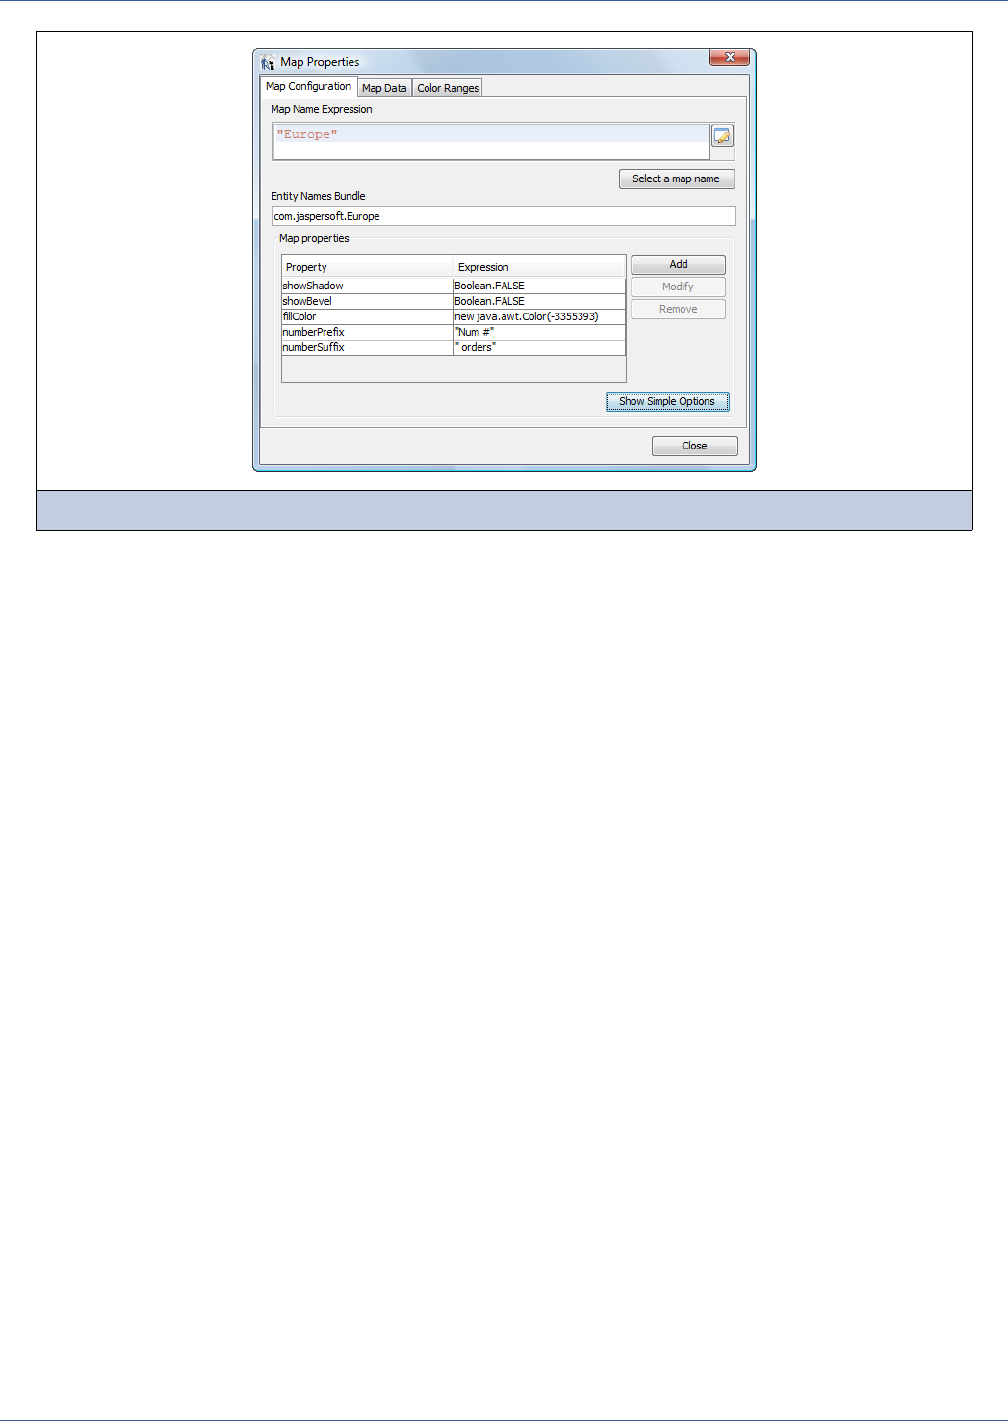
226
iReport Ultimate Guide
With the advanced properties you can enter static or dynamic expressions for any property that is supported by JasperReports
on map elements.
Click Add to add a property. In the Map property window that appears, enter a property name or select one from the drop-
down menu, and specify a proper expression. For information about all the available properties, refer to the Fusion Maps
HTML documentation at <ir-install>/ireportpro/FusionMaps_Enterprise/Maps/index.html.
It is important that the expressions return the Java types expected for each property.
Properties that you toggle on and off with check boxes in the Simple Options view must have an expression that evaluates
to a Boolean value.
Properties that represent a color must return an object of type java.awt.Color.
Numbers must return valid numeric objects.
The rest of the attributes are of type String.
To define a color you can use an expression such as:
java.awt.Color.RED
new java.awt.Color(255,255,255) /* This is the color white */
Refer to the Javadoc of the java.awt.Color class for the list of static color names and instantiation parameters.
Regardless of whether you use the simple or advanced properties, the map configuration that is saved in the XML of your
report consists of pairs of property names and value expressions.
12.2.2 Determining Map Entity IDs
The countries or other geographical regions in a map are called “entities” in Maps Pro. Each entity is identified by an ID that is
unique within a map but not among all maps. Entity IDs are sometimes called entity codes. In some cases, entity IDs
correspond to the geographical regions they represent; in other cases they are simply numbers.
Figure 12-4 Advanced options on the Map Configuration tab
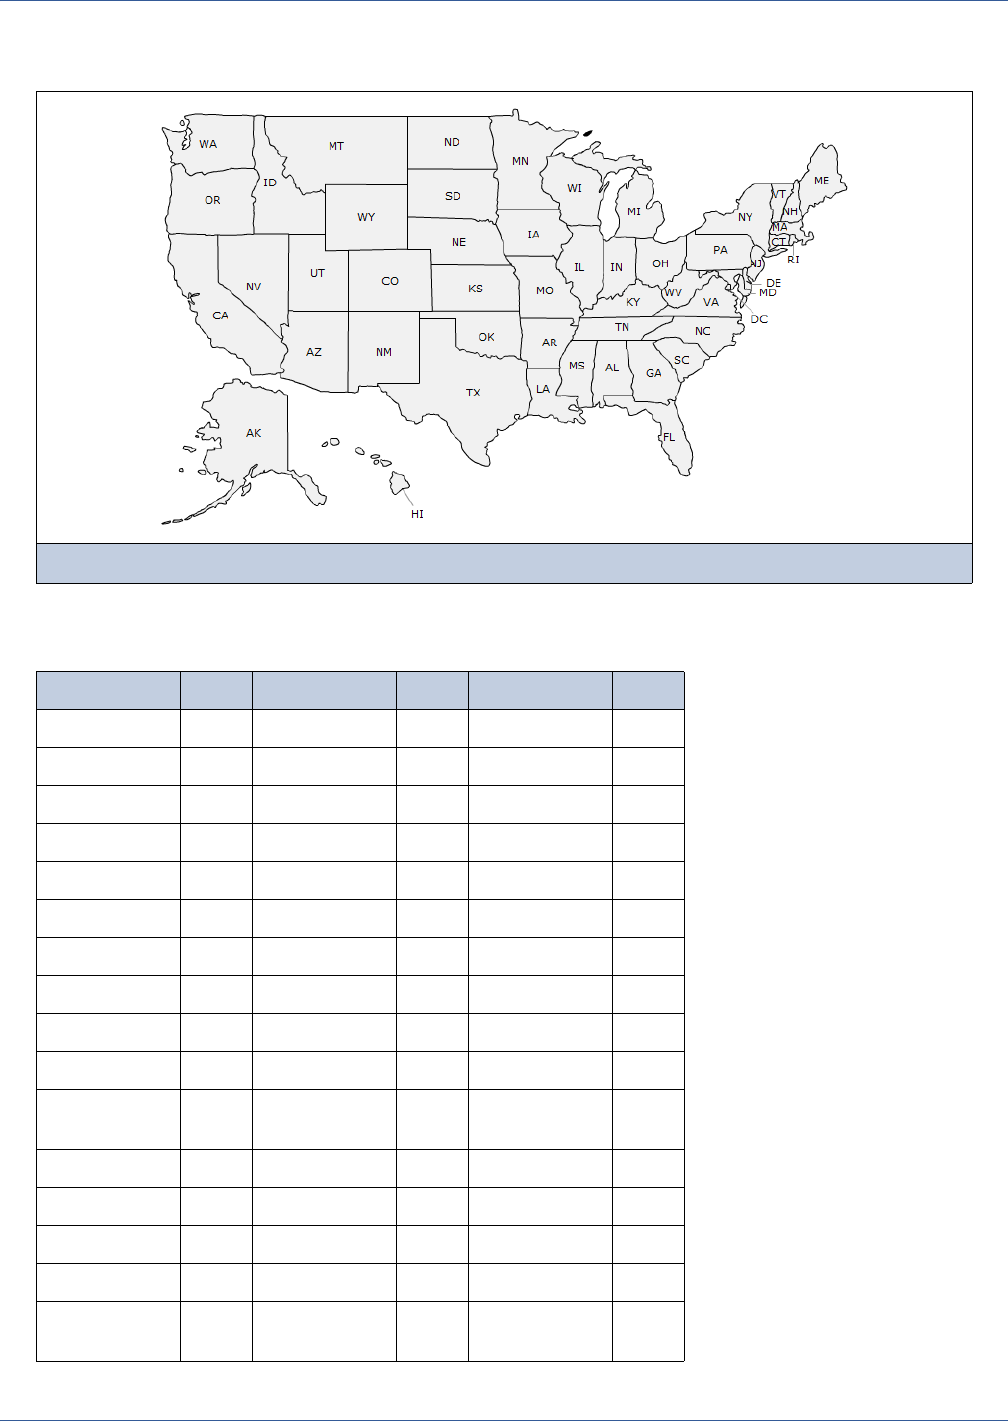
Flash Charts
227
The following figure shows a map of the United States of America, which is composed of 51 entities representing the states
plus the District of Columbia:
In the case of the United States, the entity IDs for the states are the same as their two-letter postal abbreviations:
Figure 12-5 Map of the United States of America
Table 12-1 Entity IDs of States of the USA
Entity ID Entity ID Entity ID
Alabama AL Louisiana LA Ohio OH
Alaska AK Maine ME Oklahoma OK
Arizona AZ Maryland MD Pennsylvania PA
California CA Michigan MI Rhode Island RI
Colorado CO Minnesota MN South Carolina SC
Connecticut CT Mississippi MS South Dakota SD
Delaware DE Missouri MO Tennessee TN
Florida FL Montana MT Texas TX
Georgia GA Nebraska NE Utah UT
Hawaii HI Nevada NV Vermont VT
Idaho ID New
Hampshire
NH Virginia VA
Illinois IL New Jersey NJ Washington WA
Indiana IN New Mexico NM West Virginia WV
Iowa IA New York NY Wisconsin WI
Kansas KS North Carolina NC Wyoming WY
Kentucky KY North Dakota ND District of
Columbia
DC
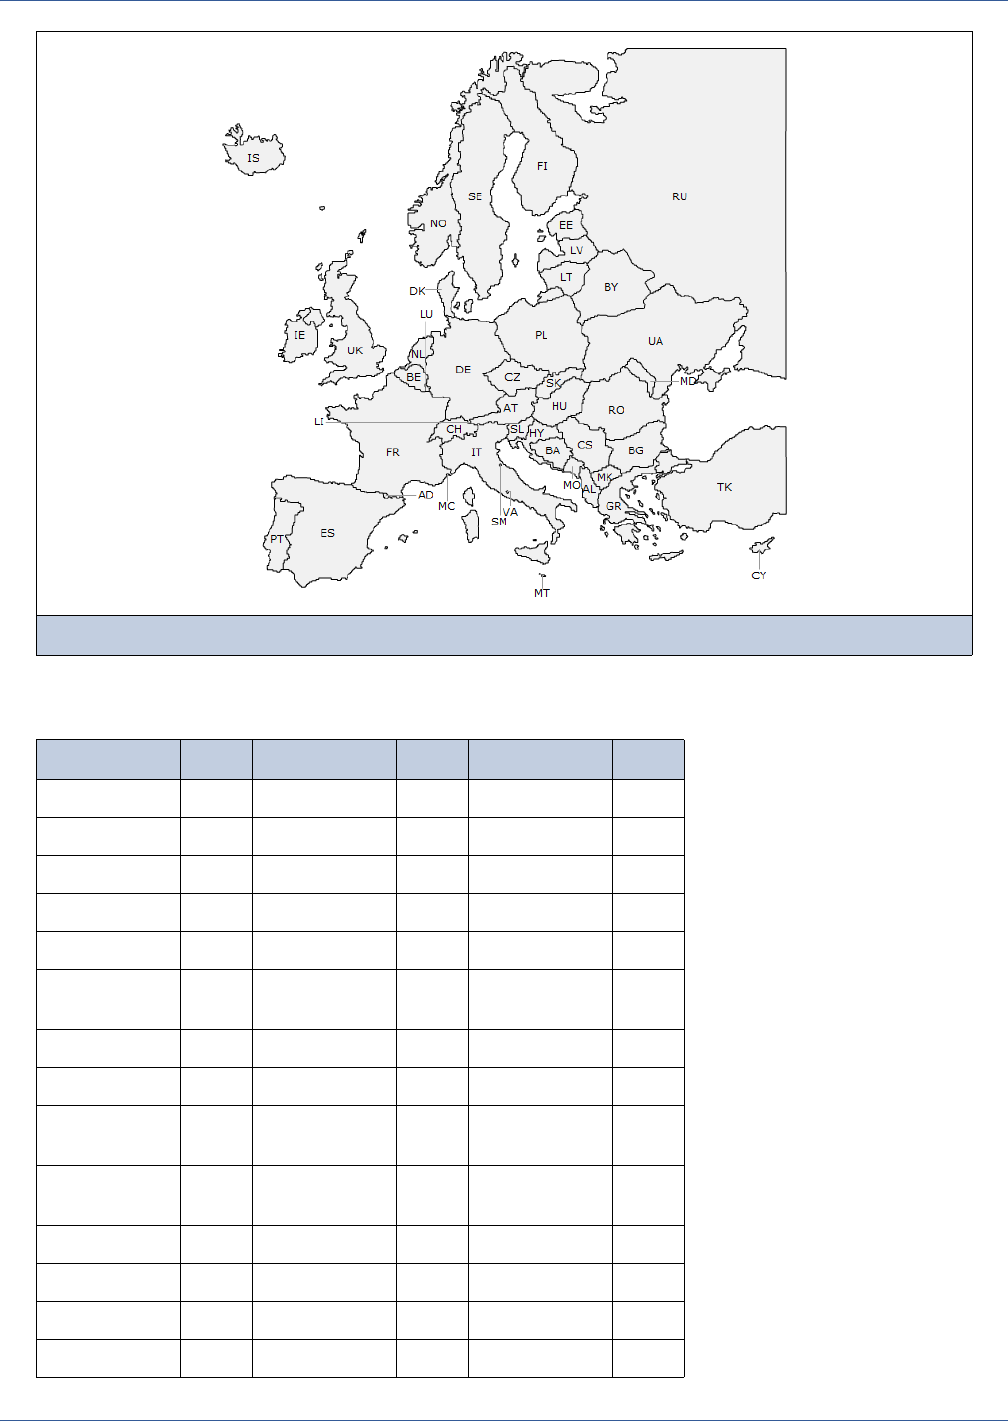
228
iReport Ultimate Guide
The map of Europe is composed of 46 entities that have the following IDs:
Figure 12-6 Map of Europe
Table 12-2 Entity IDs of European Countries
Entity ID Entity ID Entity ID
Albania 001 Iceland 017 Romania 033
Andorra 002 Ireland 018 San Marino 034
Austria 003 Italy 019 Serbia 035
Belarus 004 Latvia 020 Slovakia 036
Belgium 005 Liechtenstein 021 Slovenia 037
Bosnia and
Herzegovina
006 Lithuania 022 Spain 038
Bulgaria 007 Luxembourg 023 Sweden 039
Croatia 008 Macedonia 024 Switzerland 040
Czech
Republic
009 Malta 025 Ukraine 041
Denmark 010 Moldova 026 United
Kingdom
042
Estonia 011 Monaco 027 Vatican City 043
Finland 012 Montenegro 028 Cyprus 044
France 013 Netherlands 029 Turkey 045
Germany 014 Norway 030 Russia 046
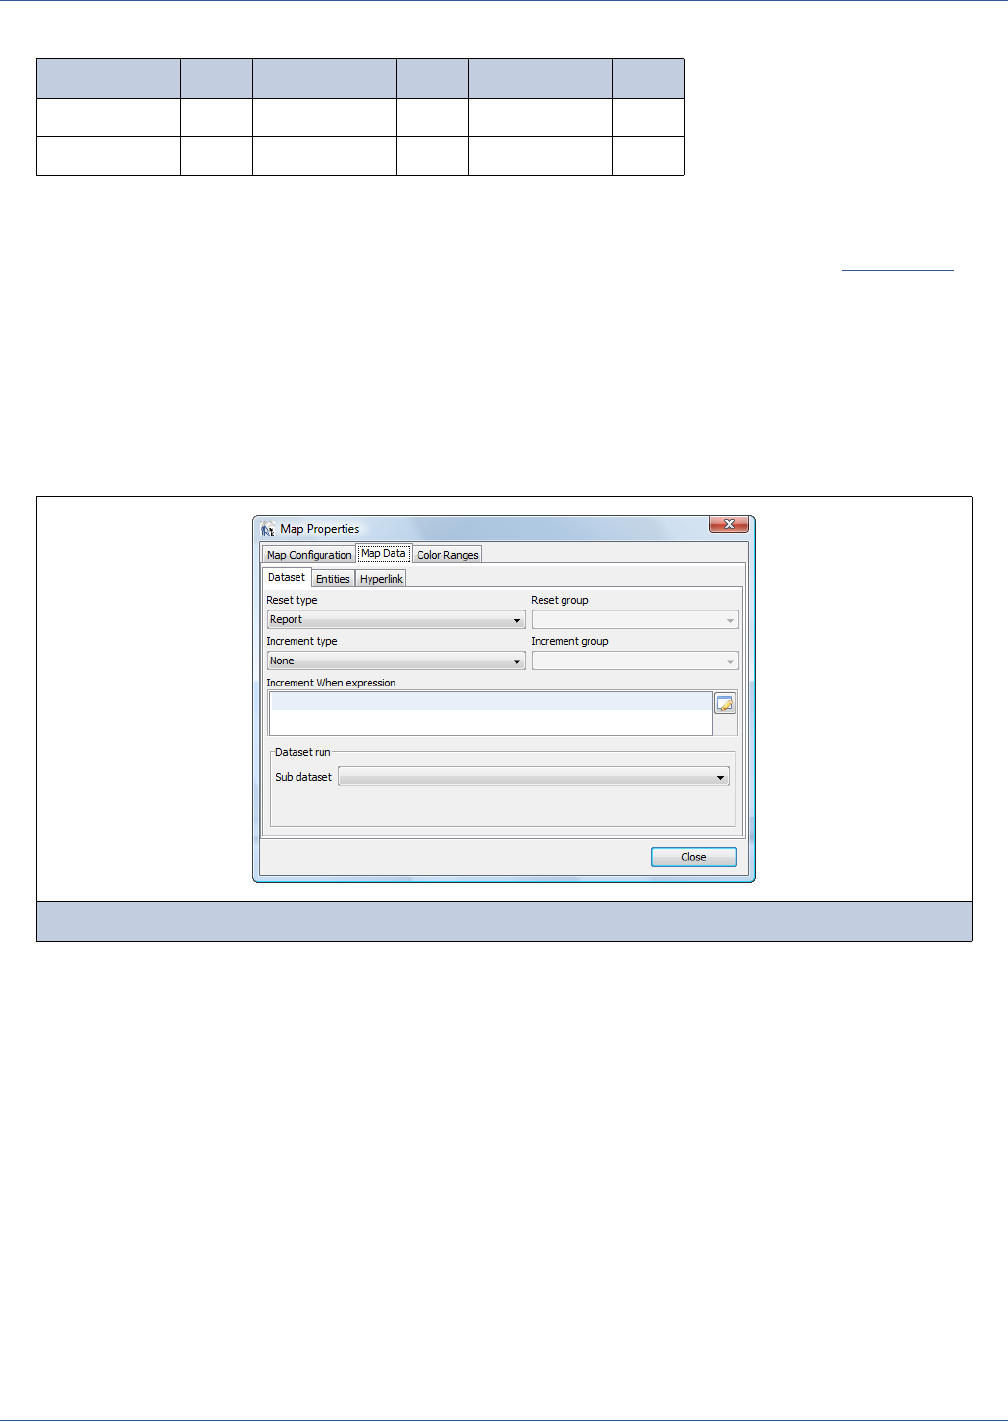
Flash Charts
229
In the case of Europe, the IDs don’t always reflect the name of the country or a region represented by the entity. In most cases,
you must correlate the numeric ID with the geographical names in your data.
To find the ID for the entities of a specific map, you can use the map demonstration website provided by Fusion Charts.
Choose a map on that website, then find the ID for each of the map’s entities on the Data tab below the map.
12.2.3 Specifying Map Data
Based on the entity IDs for your chosen map, use the Map Data tab to specify how your data should populate the map. First,
you need to define the dataset that is used with the map. Then, for each entity on the map, you can specify expressions to
render a value, a label, and a fill color. Optionally, you can also specify a URL to make each entity an active link.
The Map Data tab provides the Dataset, Entities, and Hyperlink tabs to make these settings.
On the Dataset tab, specify the dataset to use and how to acquire its data. For Maps Pro elements, this tab behaves similarly to
the same tab in regular chart and crosstab elements. Refer to the crosstab and chart documentation elsewhere in this guide for
instructions on the fields of the Dataset tab.
The Entities tab in Figure 12-7 lists the entity definition for your map. An entity definition specifies how your data is
associated with the entities on the map.
Greece 015 Poland 031
Hungary 016 Portugal 032
Figure 12-7 Specifying the dataset on the Map Data tab
Table 12-2 Entity IDs of European Countries, continued
Entity ID Entity ID Entity ID
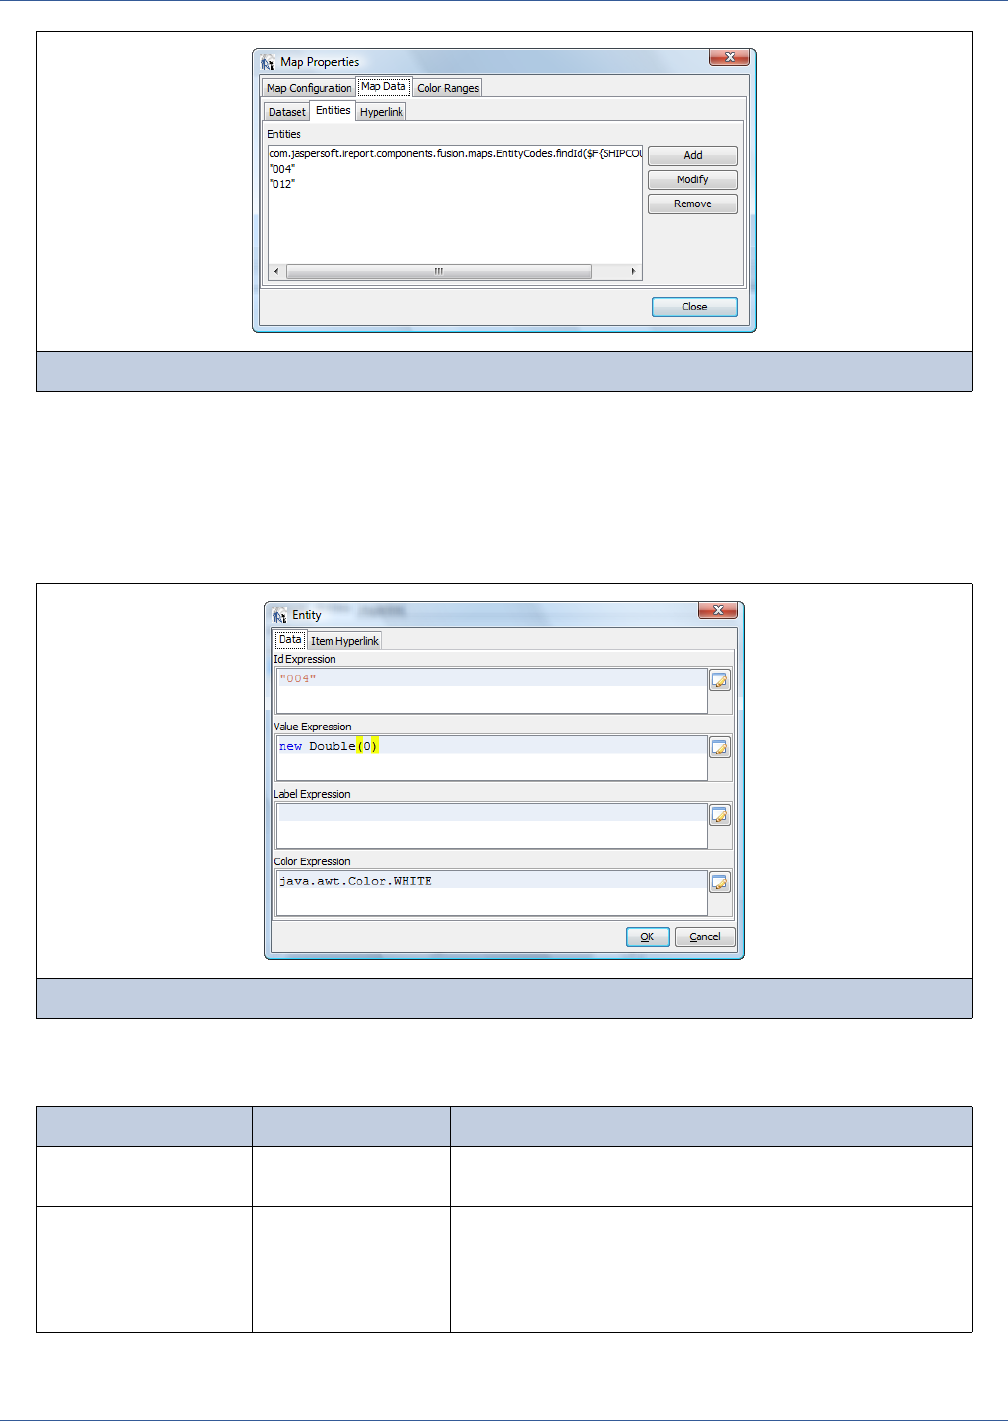
230
iReport Ultimate Guide
The entity list must contain the definition of at least one entity; in other words, the list cannot be empty. If no entries are
defined, the JRXML of your report be invalid, which will cause an error the next time you open the file. For your convenience,
iReport provides a default entity so that the report is valid even before you have specified any map entities.
Click the Add, Modify, and Remove buttons to the right of the list to define each of the entities in the map. The Entity window
appears to create or modify the settings for an entity, such as the data, label, and color that you want to associate with each
entity on the map.
An entity has several expressions that control the way it is displayed in the map. Table 12-3 details the expressions.
Figure 12-8 Specifying the entities on the Map Data tab
Figure 12-9 Entering the expressions for a new entity
Table 12-3 Entity expressions
Expression Type Description
ID Expression String Computes the ID of the map entity to which these settings
apply.
Value Expression Appropriate numeric
type
Computes the numeric data value that you associate with the
entity. The value appears on the map in a mouse-over tool tip
for the entity. Using the properties on the Map Configuration
tab, you can also choose whether it appears in the label of the
entity itself.
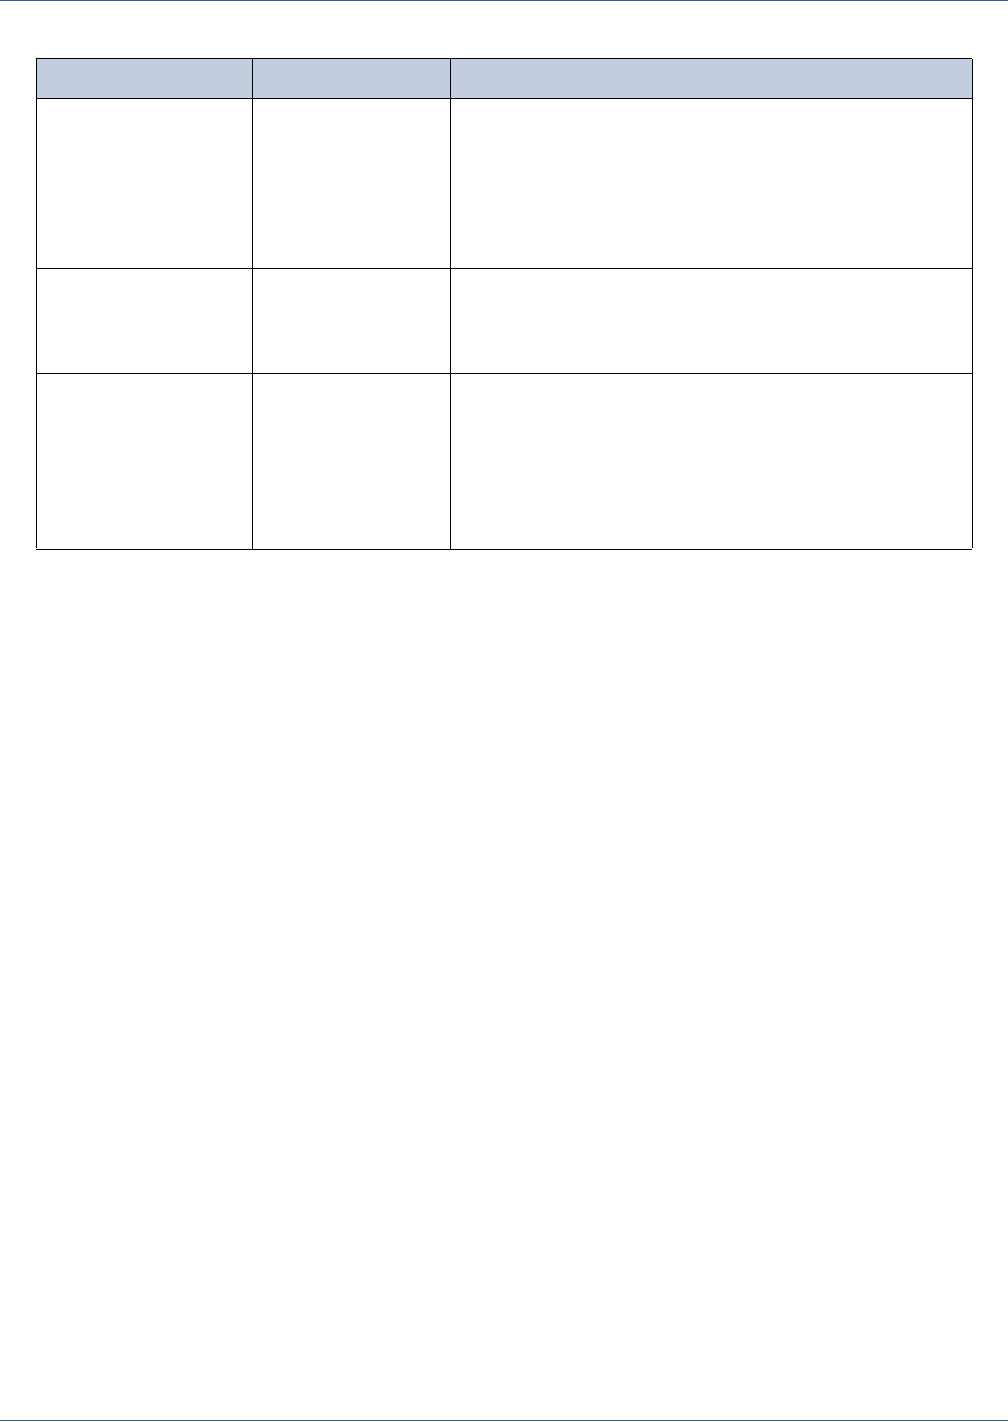
Flash Charts
231
The entities may be defined statically or dynamically. When defined statically, you must define an entity for every region of
the map you chose. ID Expression is then the entity ID for each region. Alternatively, you can define a single dynamic
entity whose ID Expression returns a different ID for each record in your dataset. In this case, the Value Expression
should also return a value that is determined by the current record in the dataset. For example, you could have a single
dynamic entity whose value expression computes the total count of orders for each county.
Using dynamic entities is not simple because ID Expression must return a valid entity ID for the map you have chosen. In
order to do so, you must have the map’s entity codes directly in your database and make them appear in the chosen dataset, or
you must write a helper class to determine the ID from the geographic name as it appears in your dataset.
Label Expression String An optional expression that determines the display name for
the entity. If you do not specify a label expression, the default
label on the entity is the name or code of the geographical
region, state or country it represents. The label appears on the
map in a mouse-over tool tips for the associated entity. Using
the properties on the Map Configuration tab, you can also
choose whether or not it appears as the label of the entity itself.
Color Expression java.awt.Color An optional expression that determines the color to apply to the
geographical region of the entity. See page 11 for examples of
color expressions. For more information about colors, see
12.2.4, “Specifying Map Colors,” on page 232.
URL n/a On the Item Hyperlink tab, you can specify a URL expression
that makes the corresponding map region an active link. You
can use it, for example, to drill down on a city or postal zone.
To make the whole map a single, active link, define the URL on
the Hyperlink tab of the Data tab shown in Figure 12-8 on
page 230. A map hyperlink defined in this manner overrides all
item hyperlinks.
Table 12-3 Entity expressions, continued
Expression Type Description

232
iReport Ultimate Guide
Maps Pro includes a sample helper class EntityCodes in com.jaspersoft.ireport.components.fusion.maps. It converts the
name of a European country to the corresponding entity ID in the map of Europe. The following is an extract from that class:
EntityCodes is used in the default entity provided with the Europe map. The following expression in the ID Expression
field assumes there is a database field called COUNTRY that contains the English names of the European countries:
com.jaspersoft.ireport.components.fusion.maps.EntityCodes.findId($F{COUNTRY})
When the value of the COUNTRY field for each record in the dataset is passed to the findId method of the class, it returns the
corresponding entity ID that is valid for the map of Europe.
12.2.4 Specifying Map Colors
There are three ways to set the color of an entity on a map:
Set a default fill color on the Map Configuration tab. All entities not colored otherwise will have the default color.
Use the Color Range tab to define a set of colors, each associated with a numeric range. All entities whose computed data
value falls within one of the ranges will be automatically rendered with the associated color.
Use the Color Expression field to calculate a color dynamically. If the color expression is based on the same data as the
value expression, it is similar to the color range functionality, but it allows other color schemes such as minimum and
maximum colors. If the color expression is based on different data, it can be used to express a different dimension on the
same map. For example, the data value could express total sales while the color expression could indicate market share.
Using color ranges is the easiest way to apply colors based on map data. Select the Color Ranges tab to define your map
colors and a numeric range associated with each color (Figure 12-10).
Code Example 12-1 Extract from EntityCodes class
package com.jaspersoft.ireport.components.fusion.maps;
import java.util.HashMap;import java.util.Map;
/**
* @author gtoffoli
*/
public class EntityCodes {
static final Map<String,String> mapId;
static {
mapId = new HashMap<String,String>();
mapId.put("Albania","001");
mapId.put("Andorra","002");
mapId.put("Austria","003");
...
mapId.put("United Kingdom","042");
mapId.put("UK","042");
mapId.put("Vatican City”,”043”);
mapId.put("Cyprus","044");
mapId.put("Turkey","045");
mapId.put("Russia","046");
}
public static String findId(String s) {
return mapId.get(s);
}
}
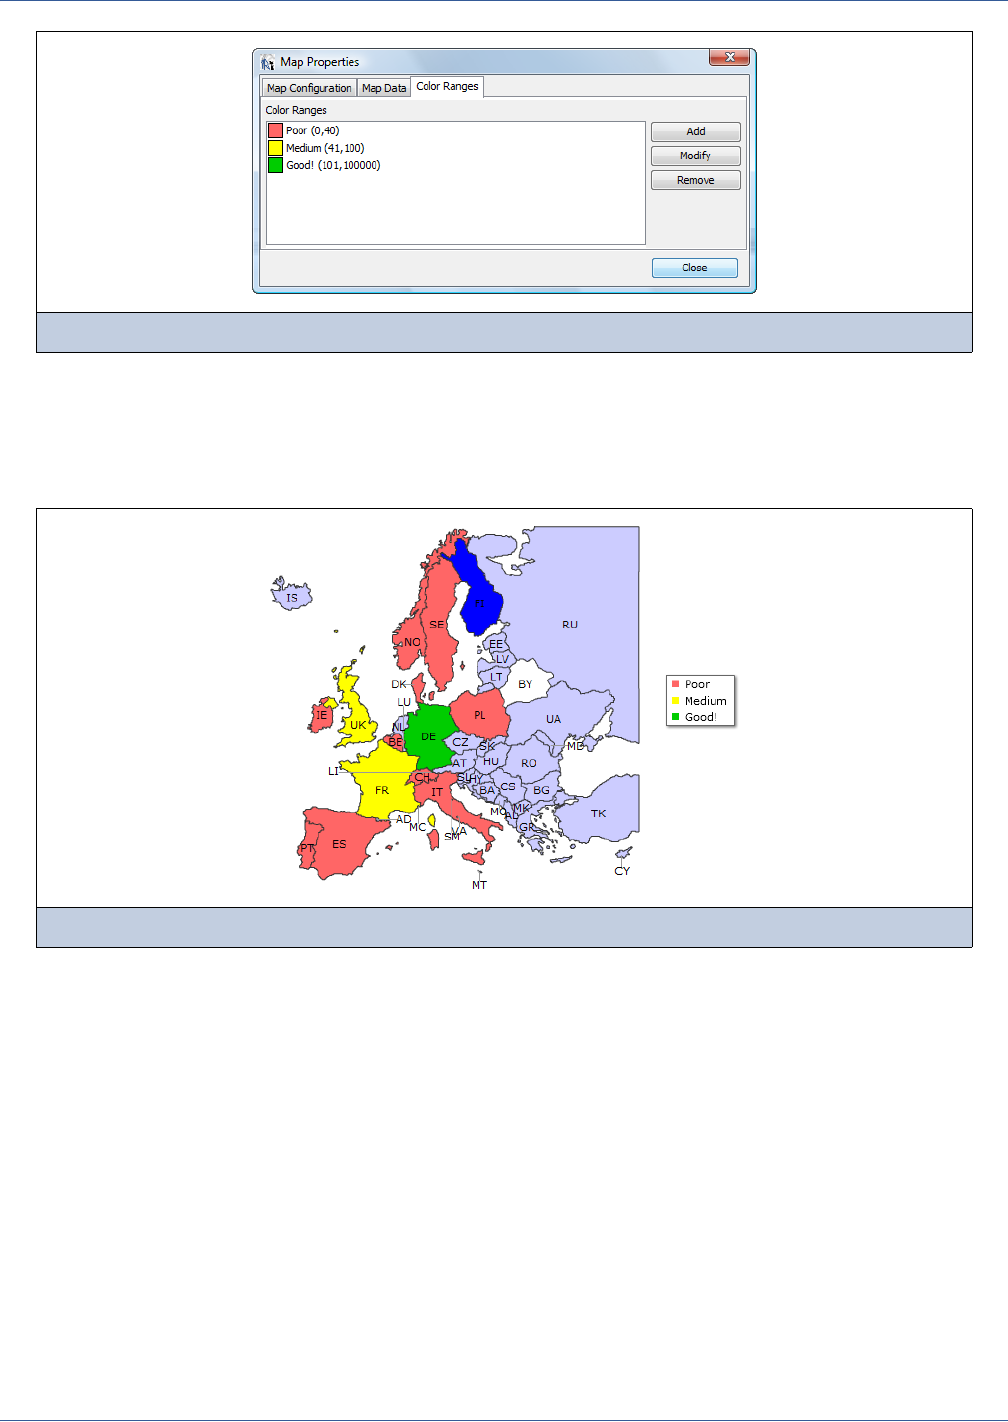
Flash Charts
233
Use Add, Modify, and Remove to define your set of color ranges. The numeric range applies to the data value calculated from
the data expression for each entity. Ranges are not dynamic; the minimum and maximum values for each range are statically
defined. For each range, you then define the fill color for the entities that match and a label that appears in a legend for the
map. The following figure gives an example of the color ranges in Figure 12-10 applied to a map of Europe; the data
represents the total number of orders placed in each country.
When defined, color ranges apply to all entities that do not have a color expression. If you have defined a color expression for
any given entity, the color expression takes precedence to determine the color of that entity. In Figure 12-11, for example,
Finland (FI, entity ID 012) is blue and Belarus (BY, entity ID 004) is white because they each have a static color expression in
the list of entities, as shown in Figure 12-8 and Figure 12-9. In order to use color ranges accurately, make sure the color
expression for all entities is blank.
Figure 12-11 also shows that entities whose ID is not computed by the ID expression of any entity definition are colored in the
default fill color.
12.2.5 Localizing Maps
All maps have a short and a long name for each of their entities, for example, the name of the countries on the map of Europe.
All the names are in English. In order to translate them to different languages, it is possible to provide a resource bundle file
that contains the list of the translated names. The file must follow the naming conventions for resource bundles, where the base
name of the bundle is the case-sensitive map name; for example, in the file name Europe_it.properties, the base name is
Europe.
Figure 12-10 Specifying color ranges
Figure 12-11 Color ranges applied to a map of Europe

234
iReport Ultimate Guide
The resource bundle must be placed in the classpath and referenced in the Entity names bundle field of the Map
Configuration tab, as shown in Figure 12-3.
The resource bundle is a properties file containing key-value pairs. For each entity ID in the map, the resource bundle will
contain the translation for the short name and the long name. The keys for the short and long names are, respectively:
map.short.name.<entityID>
map.long.name.<entityID>
Here is a sample from the Europe_it.properties file:
Alternatively, the localization can be defined with a JasperReports extension. This allows you to have localized maps without
having to specify all the resource bundle base names for every map instance. Creating the extension involves creating a JAR
file with the following content:
A file called jasperreports_extensions.properties.
One or more resource bundle files for the maps.
The contents of jasperreports_extensions.properties has the following format:
net.sf.jasperreports.extension.registry.factory.map.entities=com.jaspersoft.fusion.jasperr
eports.maps.BundleEntityDefsExtensions
com.jaspersoft.fusion.jasperreports.map.entities.USA=com.jrpro.usa
The first line specifies the extension type and must be entered as shown, with no line breaks. The subsequent lines specify a
bundle base name for each map:
com.jaspersoft.fusion.jasperreports.map.entities.<map-name>=<bundle-base-name>
The map name is case-sensitive and must match one of the maps names recognized in the Fusion Maps library. The JAR must
contain all the resource bundle files referred to by the properties. When it is added to the iReport classpath (Tools → Options
→ iReport Classpath), the maps are translated automatically according to the locale used to run the report (the locale is not
necessarily the system default; the report can be run with a locale specified in a parameter).
12.3 Using Charts Pro
Charts Pro provides 15 types of charts. Charts are populated using one or more series of data, depending on the chart type. The
following figures show the various chart types that are available. Bar, column, and line/area chart types can be populated using
one or more series; sector chart types make use of a single series of data. Stacked charts can be rendered using a single series
but are really meant to be used with multiple series.
...
map.short.name.019=IT
map.long.name.019=Italia
map.short.name.013=FR
map.long.name.013=Francia
map.short.name.014=DE
map.long.name.014=Germania
...
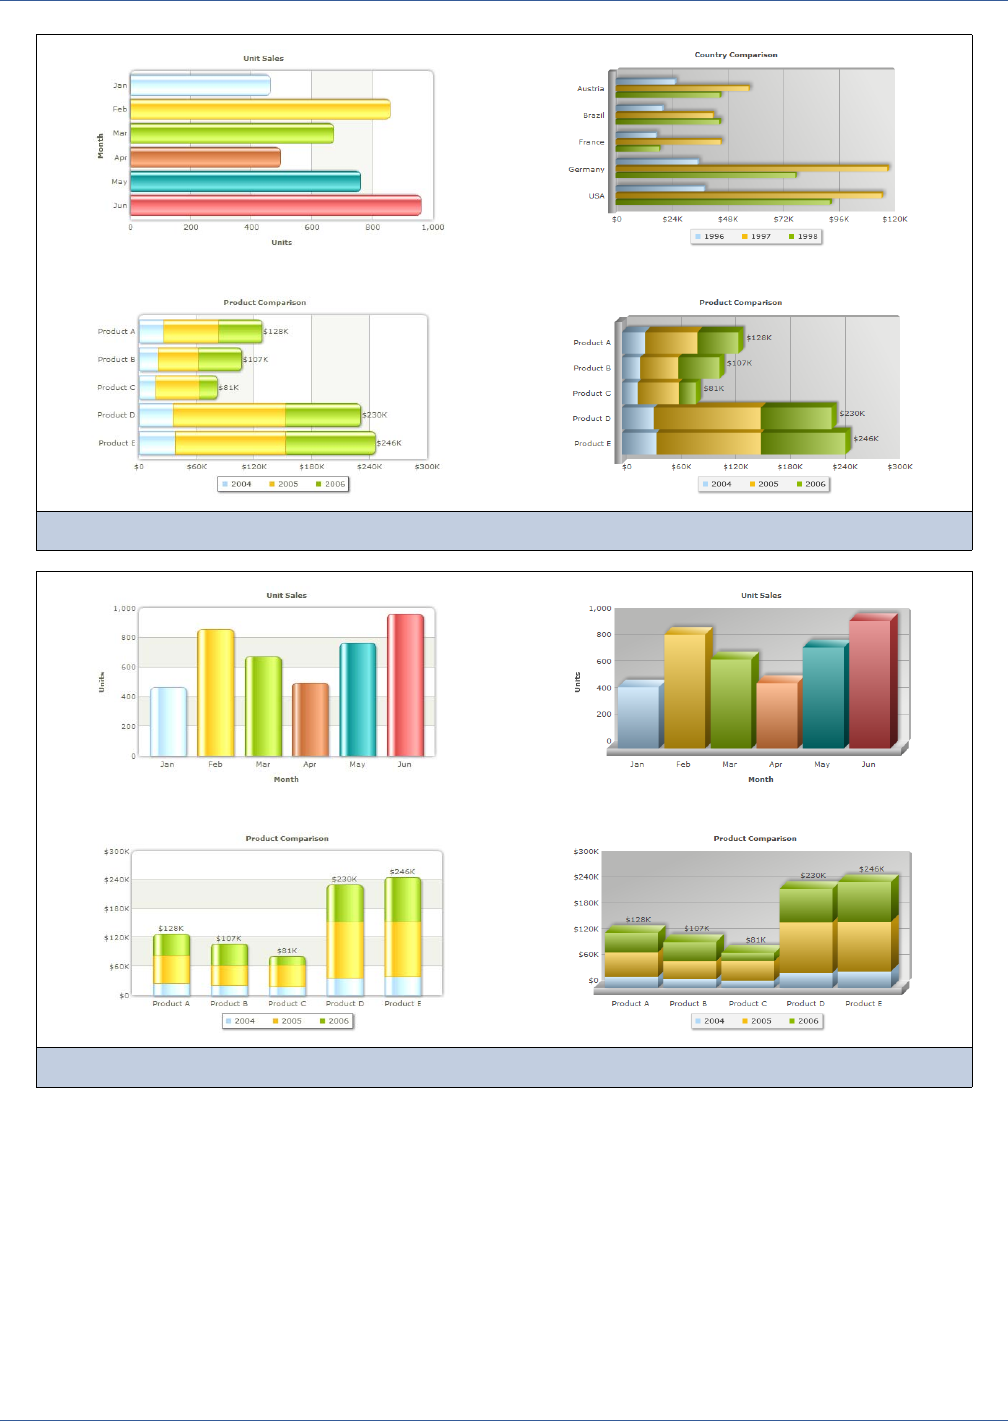
Flash Charts
235
Figure 12-12 Bar chart types in Charts Pro
Figure 12-13 Column chart types in Charts Pro
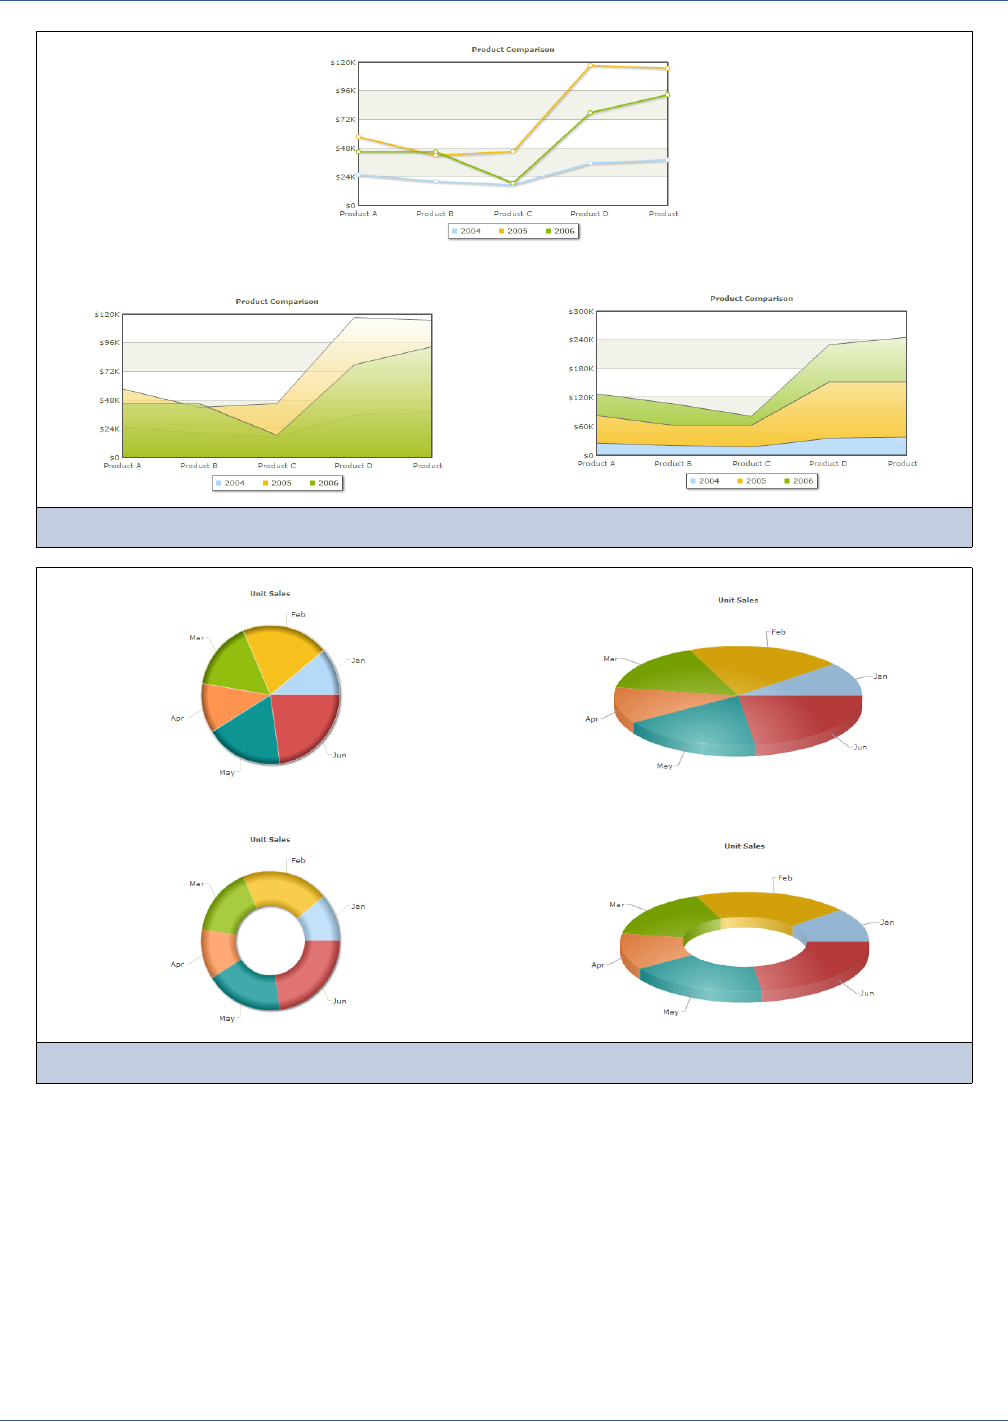
236
iReport Ultimate Guide
12.3.1 Creating Charts
In iReport Professional, the Fusion plug-in is installed by default, and the Charts Pro element appears in the palette.
Figure 12-14 Line chart types in Charts Pro
Figure 12-15 Sector chart types in Charts Pro
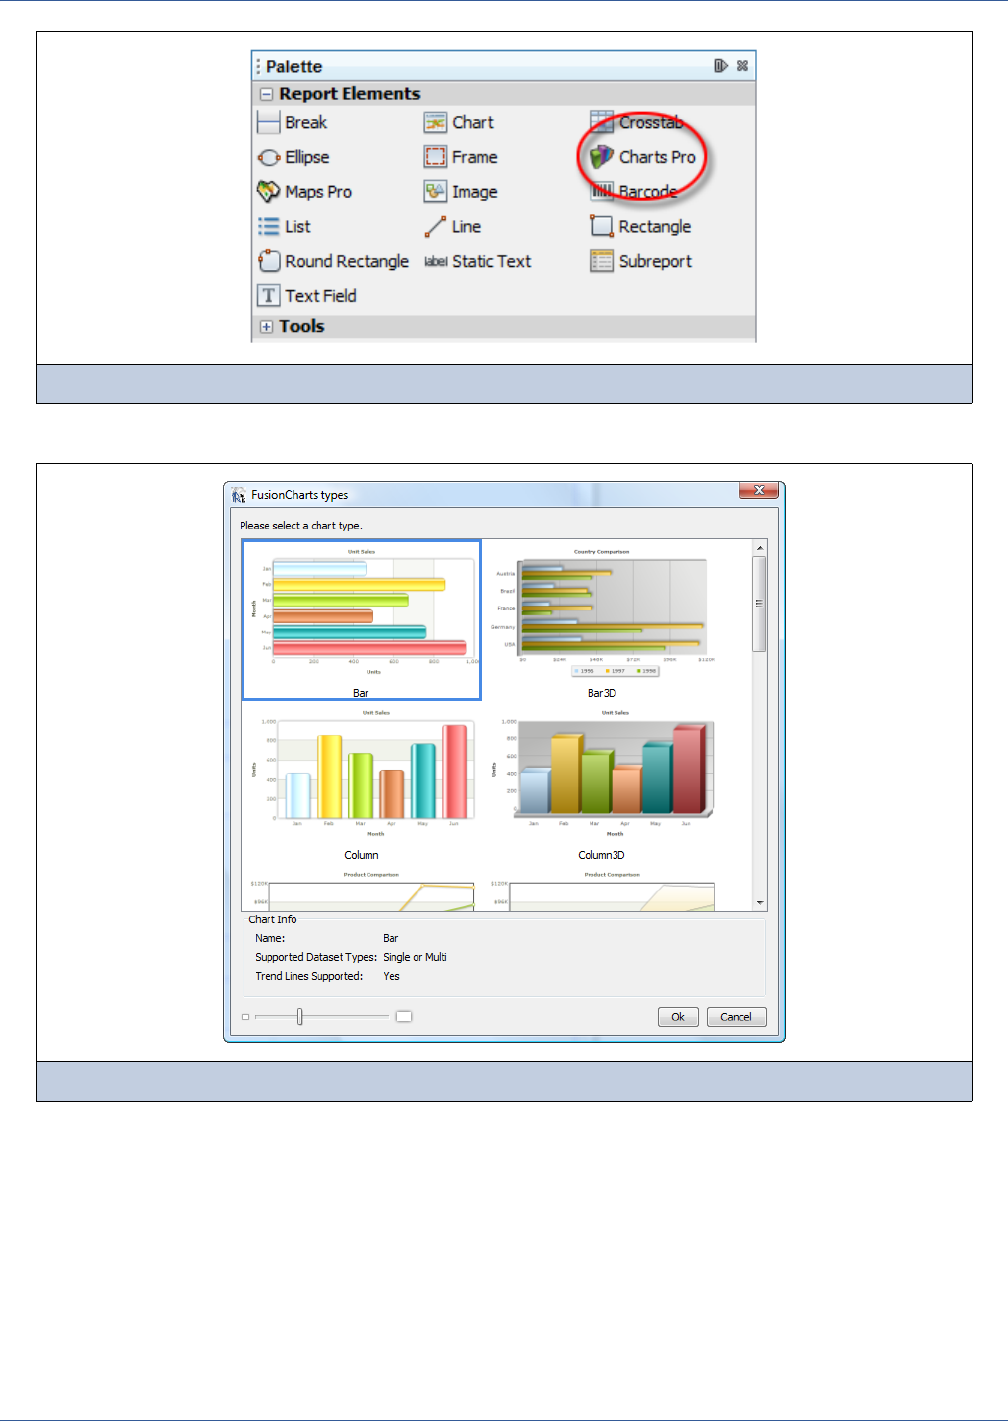
Flash Charts
237
To add a Flash chart to a report, drag the Charts Pro element into the report. iReport displays the chart selector.
Select the chart you want to create. For each chart, the window displays the chart name, the number of series it supports, and
whether it allows trend lines. Use the slider at the bottom of the window to change the size of the chart icons.
After the selection, the new element appears in the design view. In the designer, iReport displays a sample of the chart you
have selected. Please note that this is just an image, it is not a real preview of the chart; the chart rendered in the final report
can be totally different in appearance.
Depending on the band where you place the new chart element, iReport sets the proper evaluation time for that element. The
evaluation time and evaluation group properties specify the time at which the element should be evaluated.
The layout properties for the Charts Pro element (such as position and size) are managed using the standard property window
in iReport. The contents of a chart are configured through chart-specific properties.
Figure 12-16 The Charts Pro component in the palette
Figure 12-17 Selecting a chart type
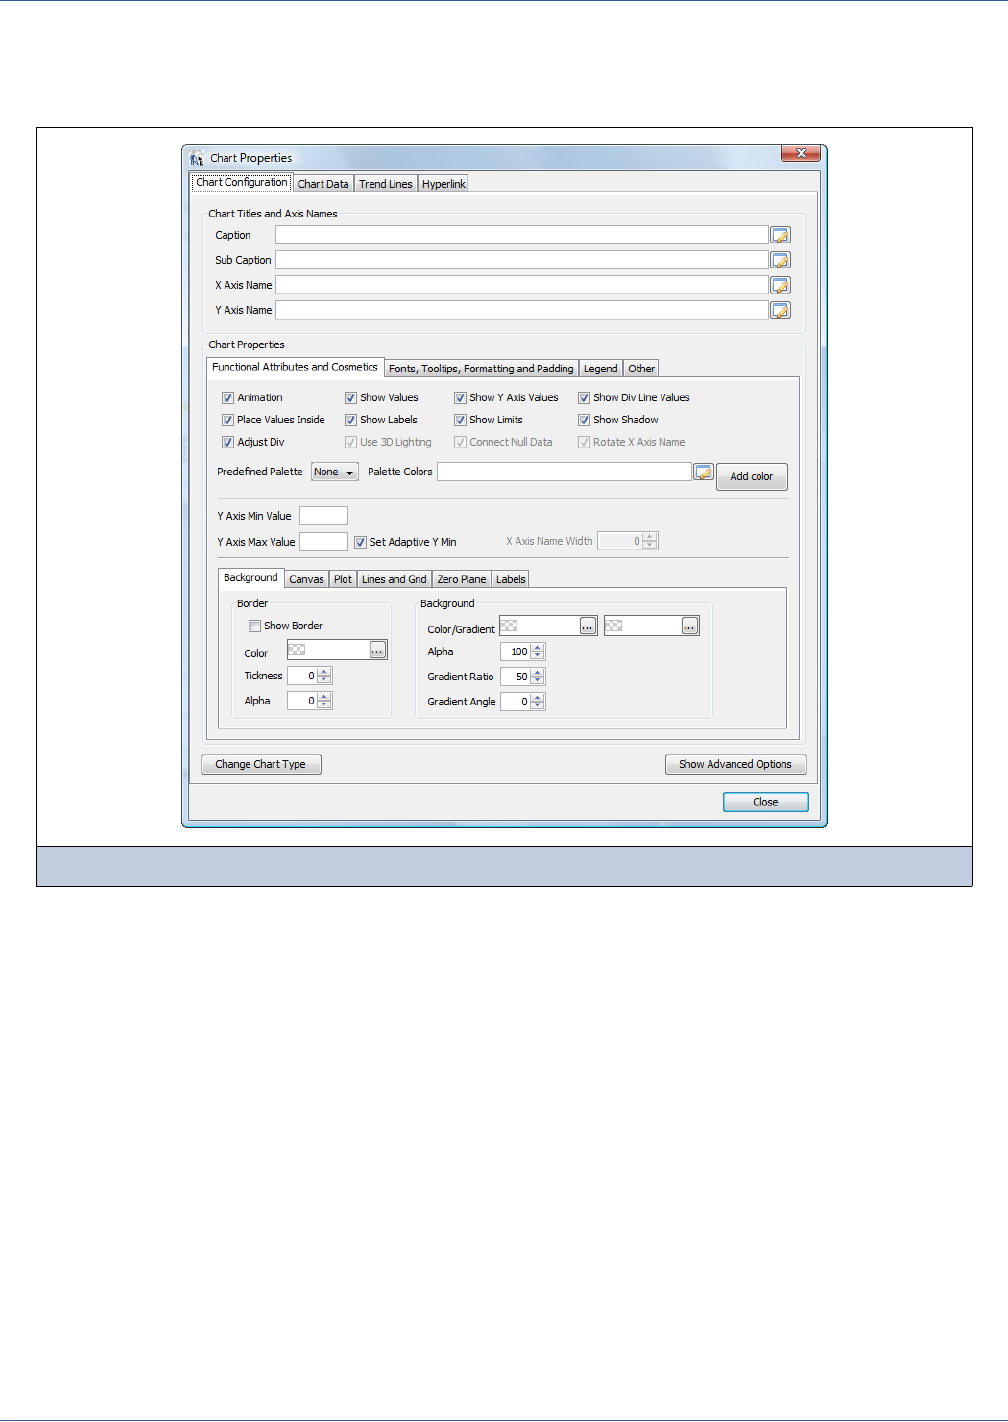
238
iReport Ultimate Guide
To access the chart properties, right-click the Charts Pro element in your report and select Edit Chart Properties from the
context menu.
The Chart Properties window has Chart Configuration, Chart Data, Trend Lines, and Hyperlink tabs.
The Chart Configuration tab is used to configure the chart’s appearance. Properties that do not apply to the chart type you
have selected are disabled. For example, the X Axis Name is not active when using a Pie chart.
For information about all the available properties, refer to the Fusion Charts HTML documentation at <ir-install>/ireportpro/
FusionCharts_Enterprise/Charts/index.html.
The value of every property on the Chart Configuration tab can be given as an expression. When you use the check boxes,
fields, and value choosers on the tab, iReport creates a static value of the appropriate type for the expression. Alternatively,
you can provide dynamic expressions that will determine the chart appearance based on the data available when the report is
generated. To view and set custom property expressions, click Show Advanced Options.
The Chart Configuration tab displays a list of properties and their expression values.
Figure 12-18 Chart Configuration tab of the Chart Properties window
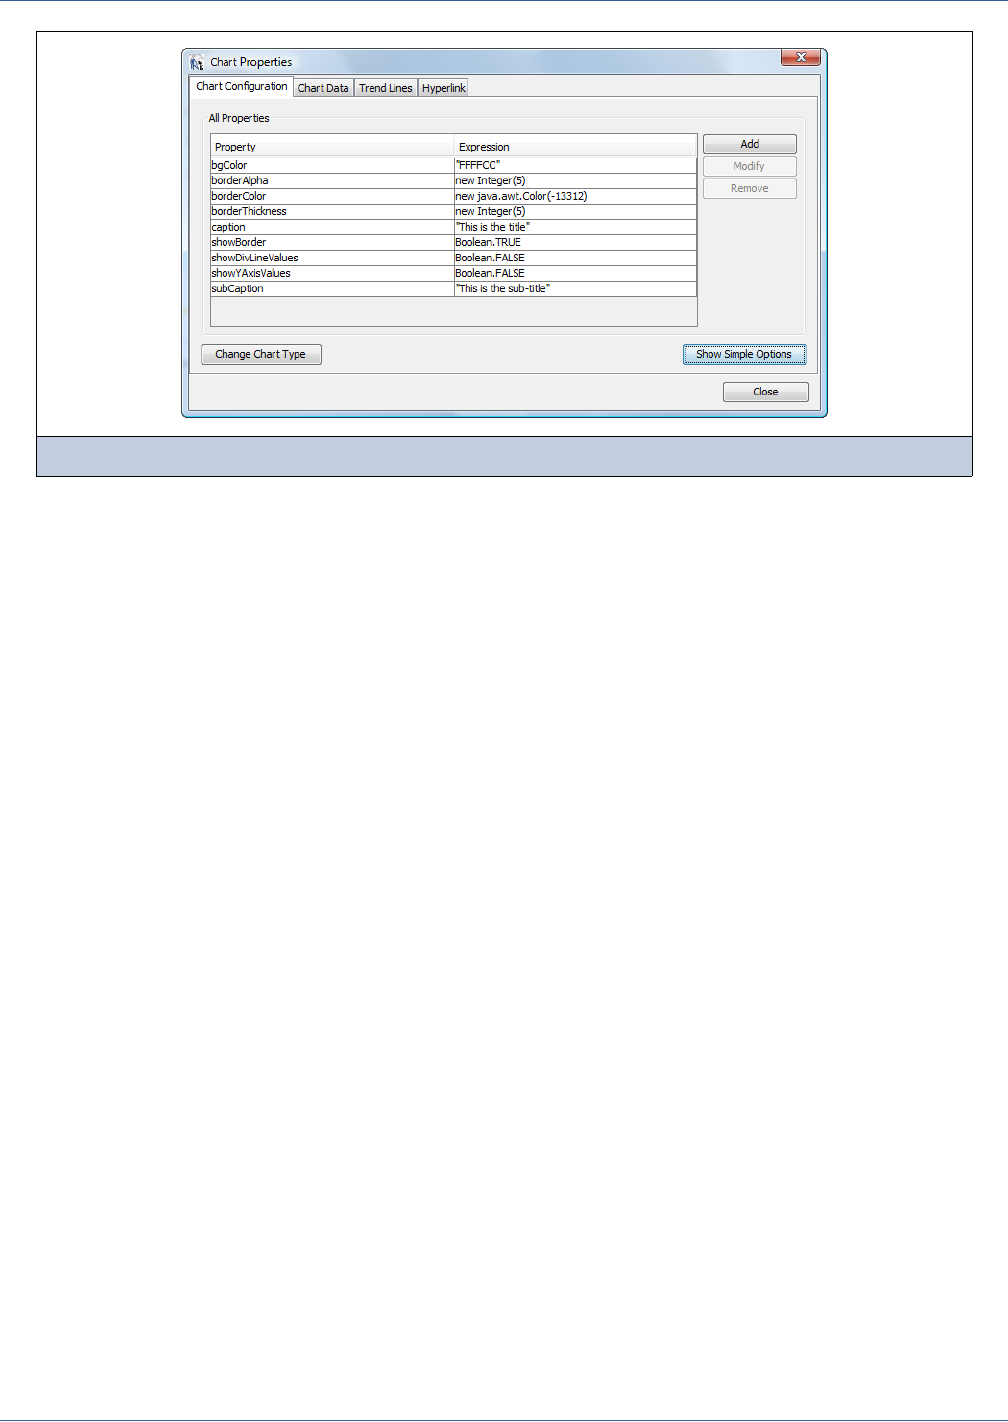
Flash Charts
239
The Simple Options view of the chart properties includes more apparent properties than the advanced view because it includes
many default property values. If you change a property from its default value, it appears in the advanced view with the
overriding value.
In the Advanced view, you can edit the expressions for chart properties. It is important that expressions return the Java types
expected for each property.
Properties that you toggle on and off with check boxes in the simple display must have an expression that evaluates to a
Boolean value.
Numbers must return a valid numeric objects.
Many attributes are of type String.
Click Add, Modify, or Remove to manage the properties in the list.
You can add properties that are not supported in the Simple Options view; for example, the properties logoPosition and
logoURL specify how to display a logo in the chart.
Note that some properties have default values that will apply if you remove them from the list. For reference documentation
about all properties that apply to Charts Pro elements, refer to the documentation at <ir-install>/ireportpro/
FusionCharts_Enterprise/Charts/index.html.
12.3.2 Specifying Chart Data
On the Chart Data tab, specify how your data should populate the chart. It provides the Dataset and the Dataset Items tabs.
Figure 12-19 Advanced options on the Chart Configuration tab
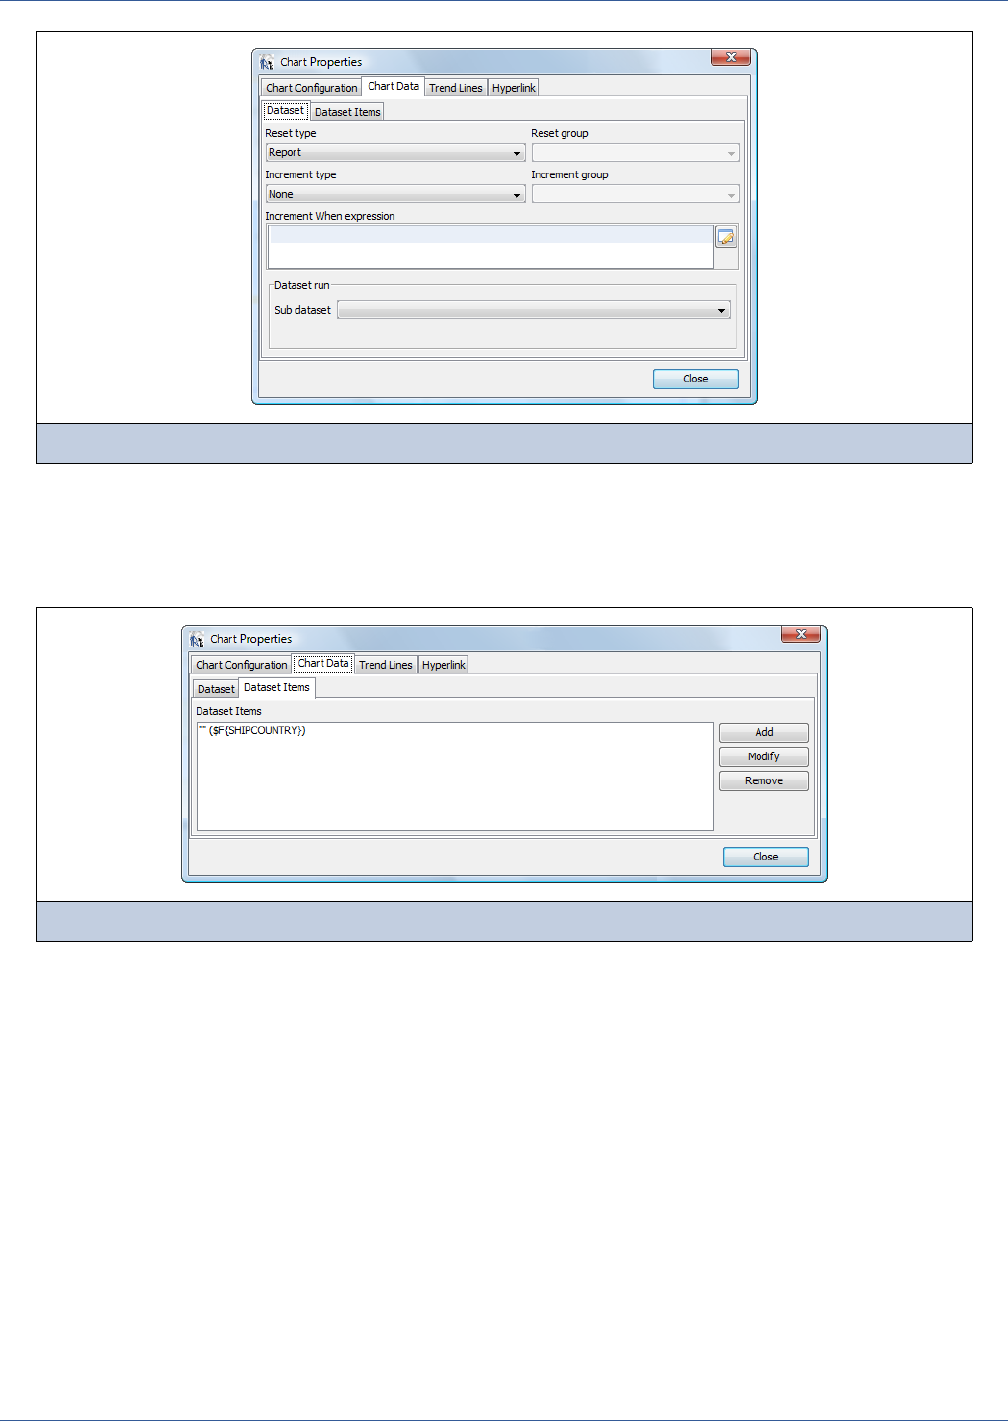
240
iReport Ultimate Guide
On the Dataset tab, specify the dataset to use and how to acquire its data. For Charts Pro elements, this tab behaves similarly
to the same tab in regular chart and crosstab elements. Refer to the chart and crosstab chapters for instructions on the fields of
the Dataset tab (11.2, “Using Datasets,” on page 209 and 15.5, “Working with Crosstab Data,” on page 300).
The most important settings are on the Dataset Items tab shown in Figure 12-21.
Click the Add, Modify, and Remove buttons to the right of the list to define each of the dataset items for your chart.
A dataset item is defined by three expressions, as shown in Figure 12-22.
Figure 12-20 Specifying the dataset on the Chart Data tab
Figure 12-21 Specifying the dataset items on the Chart Data tab
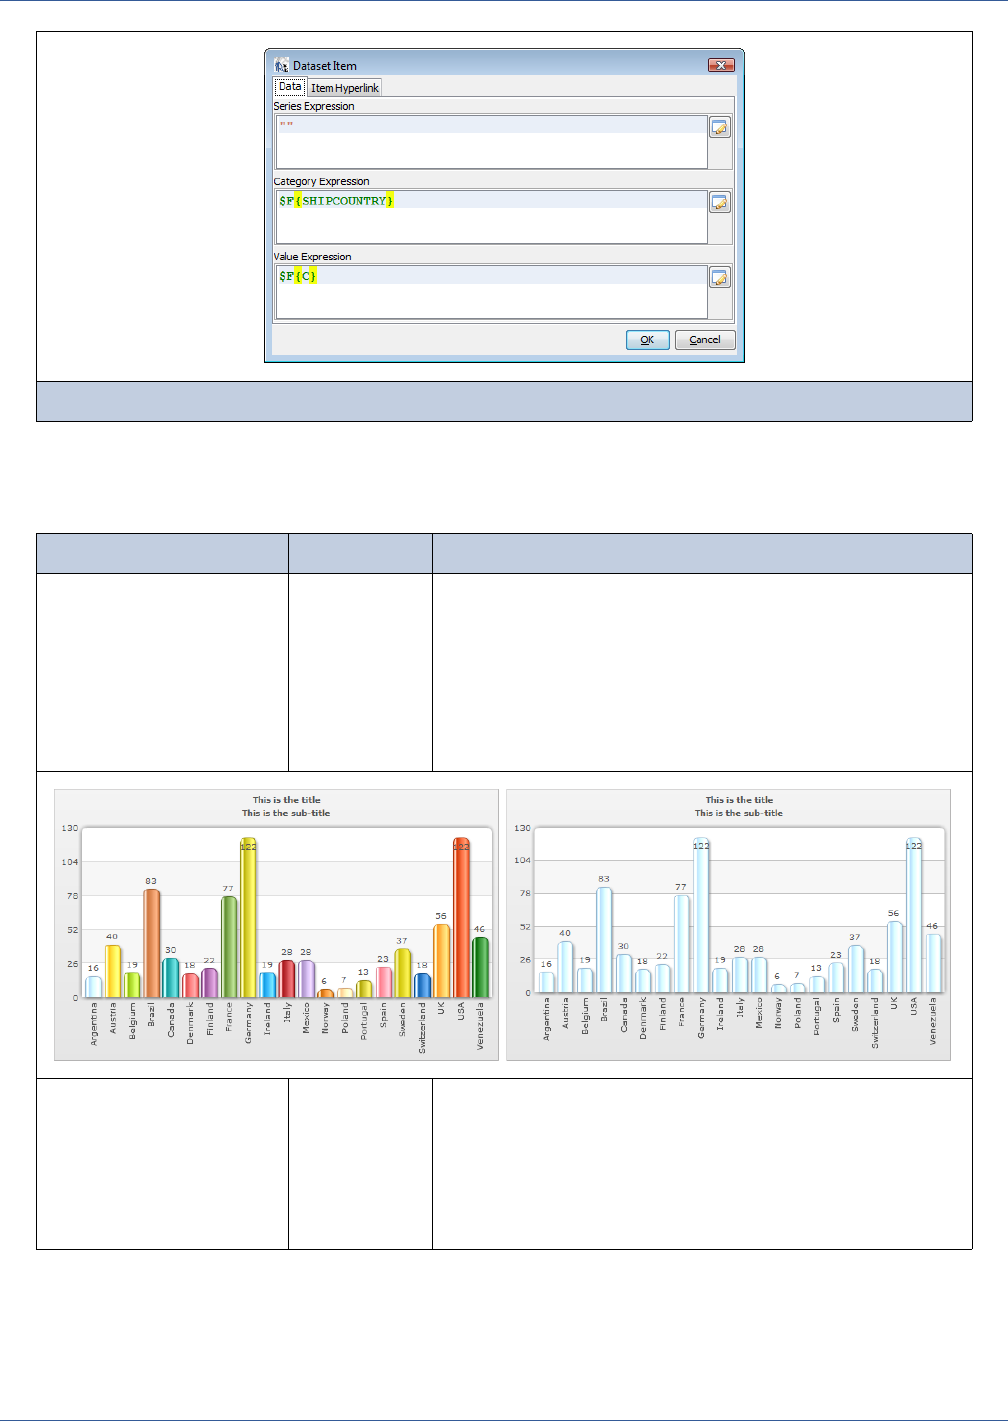
Flash Charts
241
Each expression controls a different aspect of the way data is displayed and grouped in the chart. Table 12-4 details the
expressions.
Figure 12-22 Entering the expressions for a new entity
Table 12-4 Chart dataset expressions
Expression Type Description
Series Expression String Identifies the series name to which the item refers. With a chart
that uses only a single series, set the value of the expression to
the empty string (""). To allow for series expressions that are set
to null, even if in a single series, each value is considered a
separate series and is displayed in a different color.
The figure below shows the effect of the expression setting. In
the chart on the left, the series is set to null; in the chart on the
right, it is set to the empty string "".
Category Expression String Evaluates the category to be charted along the X axis; for
example, country name. When using multi-series charts, the
category names should be present in one or more series. For
example, in a chart that shows revenue over several years and
several countries, the revenue is the value, years are the series,
and countries are category names that are present in one or
more series.
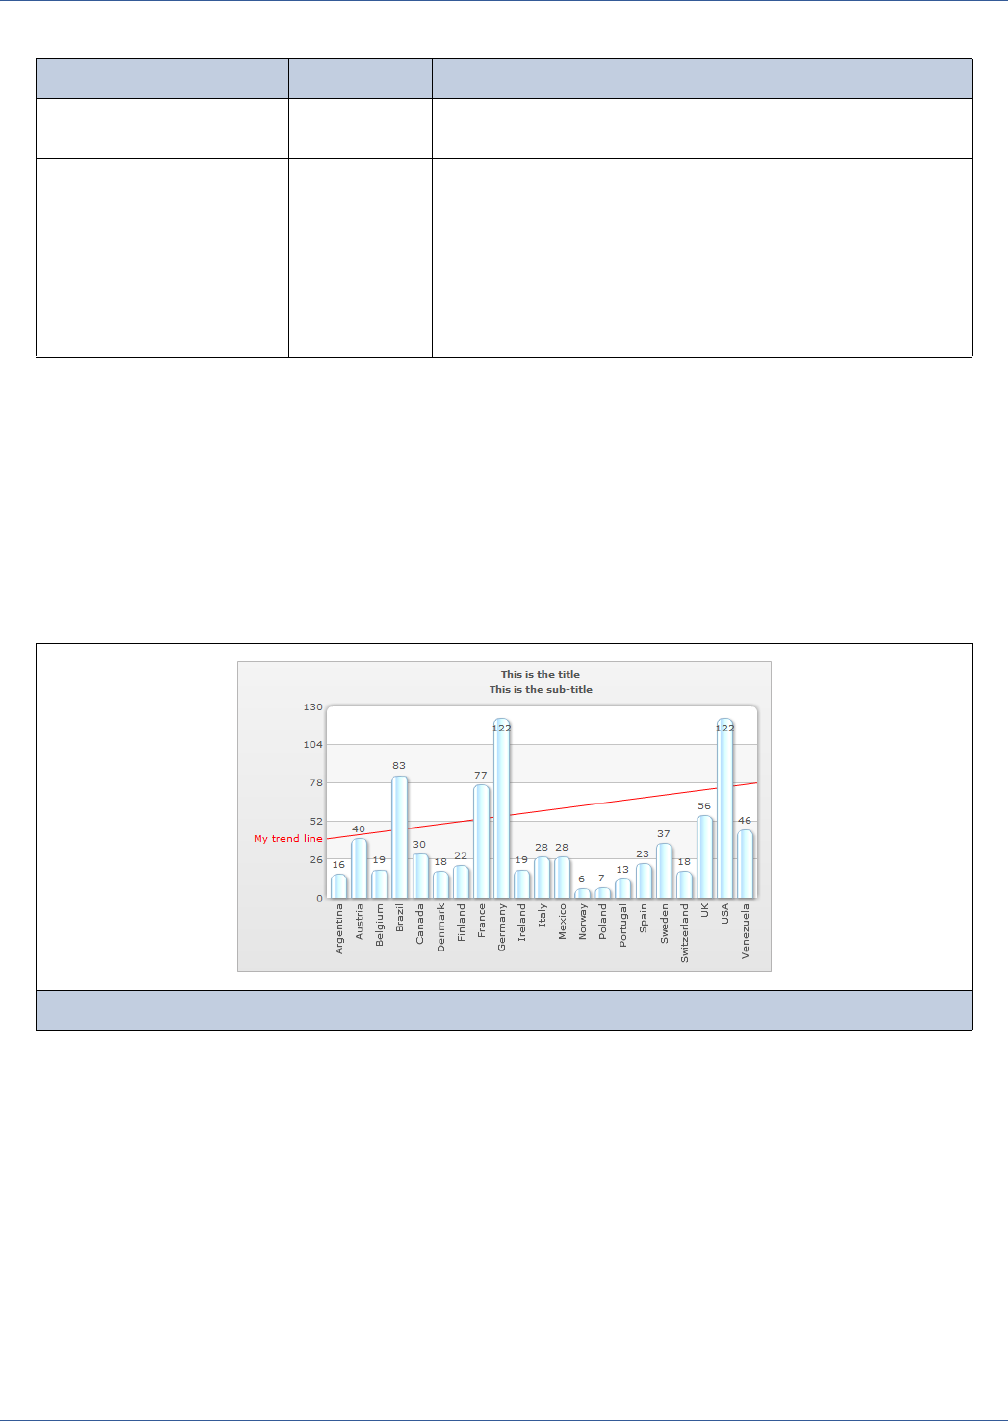
242
iReport Ultimate Guide
In general, you don’t have to create a dataset item for each series, since a single dataset item can produce an arbitrary number
of series, as well as category-value pairs for each series. Having the ability to define more dataset items allows you to use more
values coming from the same record.
12.3.3 Defining Trend Lines
Charts Pro provides a way to display trend lines in the bar, column, and line chart types. Trend lines are defined between two
points, one at each end of the chart. The dataset expressions can dynamically compute end points based on your data, but the
always straight lines defined by only two points.
As shown in the following figure, trend lines have a configurable color and label:
Trend lines are configured in the Trend Lines tab of the Chart Properties window shown in Figure 12-18. You can define any
number of trend lines on a single chart.
To add a new trend line, click the Add button in the Trend Lines tab. The Trend Line dialog appears.
Value Expression Appropriate
numeric type
The value of this item for the given category.
URL n/a On the Item Hyperlink tab, you can specify a URL expression
that makes the corresponding chart region an active link. For
example, the link can be used to create drill-down reports on
selected data points.
To make the whole chart a single active link, define the URL on
the Hyperlink tab of the Chart Properties window shown in
Figure 12-18. A chart hyperlink defined in this manner overrides
all item hyperlinks.
Figure 12-23 Output of a trend line on a chart
Table 12-4 Chart dataset expressions, continued
Expression Type Description
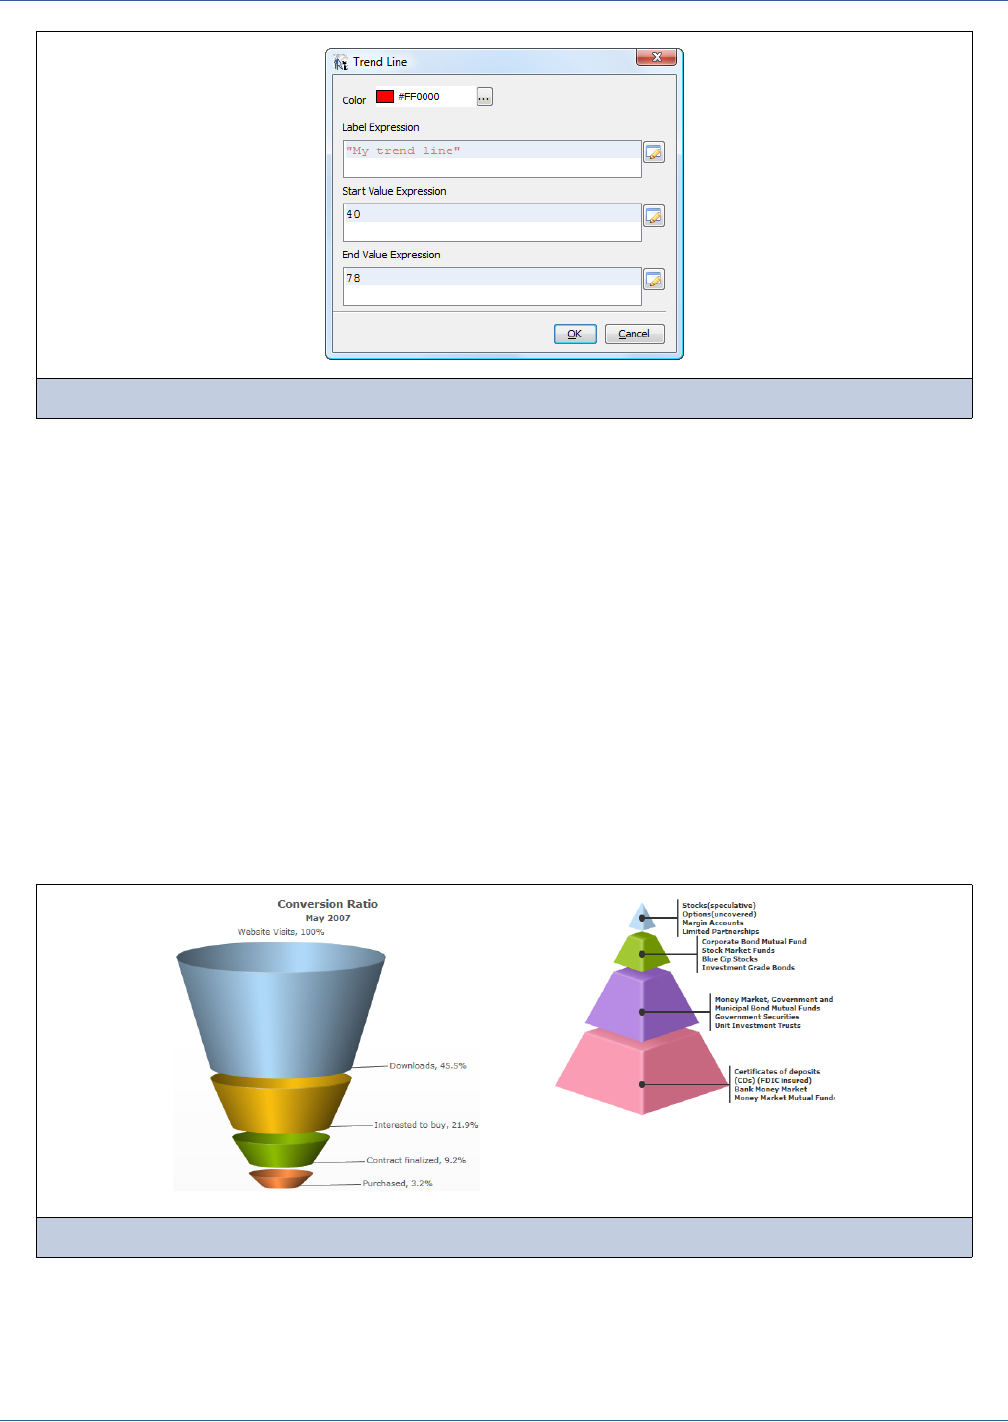
Flash Charts
243
A trend line is defined by a color and three expressions to specify the trend line label, the start value, and the end value. The
color is a static property and can not be defined using an expression. But the start and end values are expressions that can be
used to compute values dynamically based on your data, such as averages, standard deviations, or min-max vales. For
example, if you have an expression that computes the average of all your charted values, enter it in both the start value and end
value expression fields. The result will be a line that makes it apparent which charted values are above or below the average.
12.4 Using Widgets Pro
Widgets Pro displays numerical values in a visual way in your report, in the form of a thermometer or a funnel, for example.
Widgets Pro is based on Fusion Widgets, a library of animated, interactive, which are Flash elements for HTML and PDF
reports. The widgets and the data binding can be configured through the iReport Professional Fusion plug-in interface.
12.4.1 Widget Types
Widgets Pro has fourteen displays and non-standard charts. Widgets are populated using one or more series of data, depending
on the type. The following figures show the available widget types.
...
Figure 12-24 Specifying the trend line expressions
Figure 12-25 Funnel and pyramid types in Widgets Pro
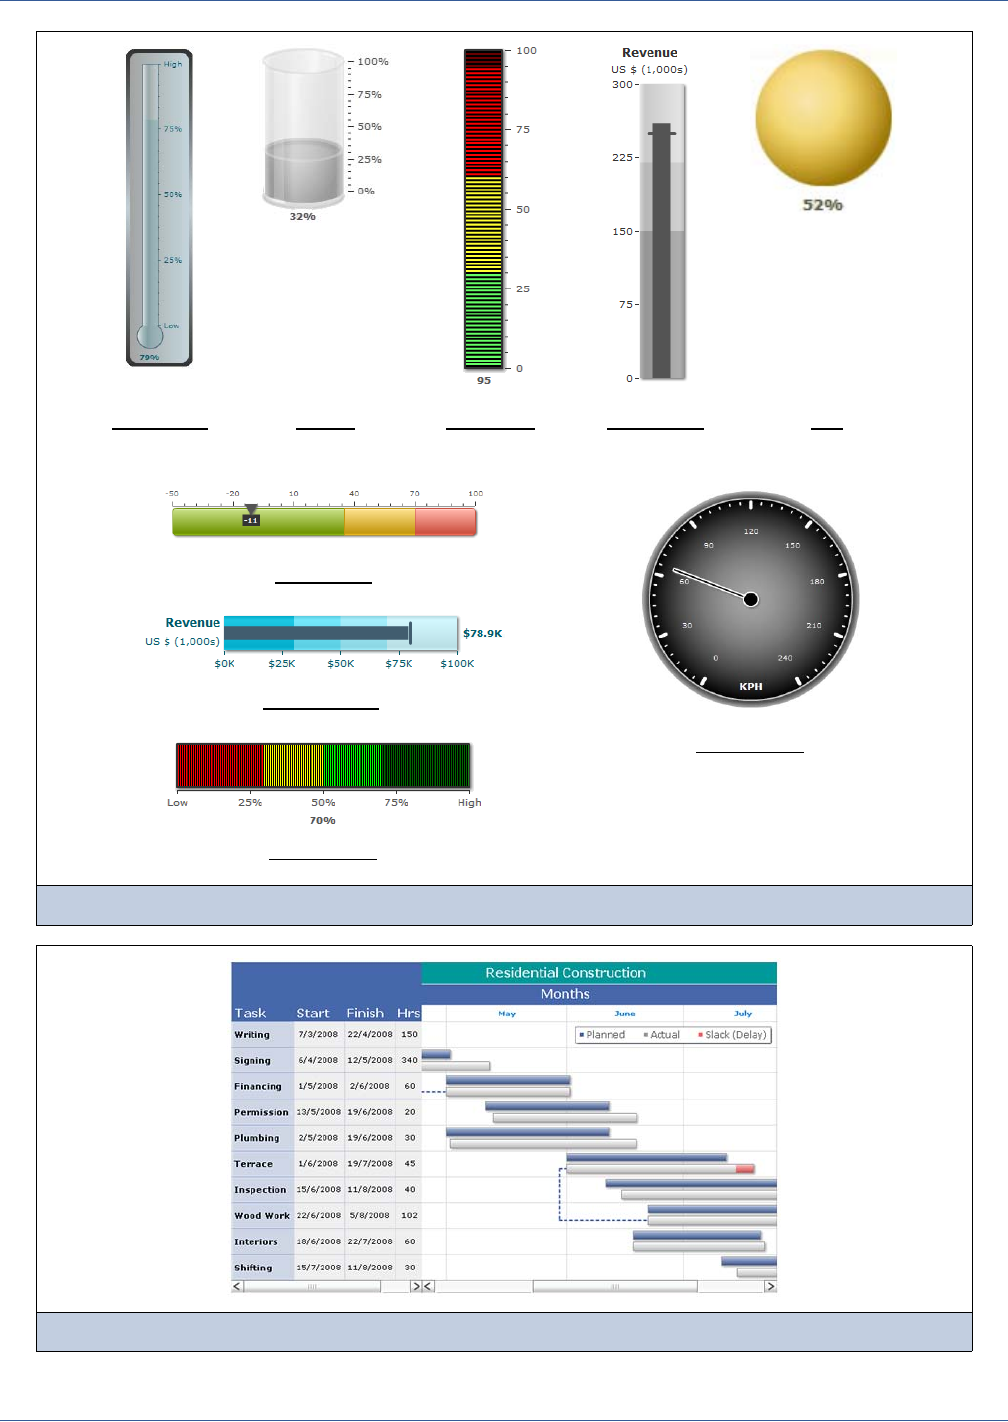
244
iReport Ultimate Guide
Figure 12-26 Gauge types in Widgets Pro
Figure 12-27 Gantt chart in Widgets Pro
Vertical LED Vertical Bullet BulbCylinderThermometer
Linear Gauge
Horizontal LED
Angular Gauge
Horizontal Bullet
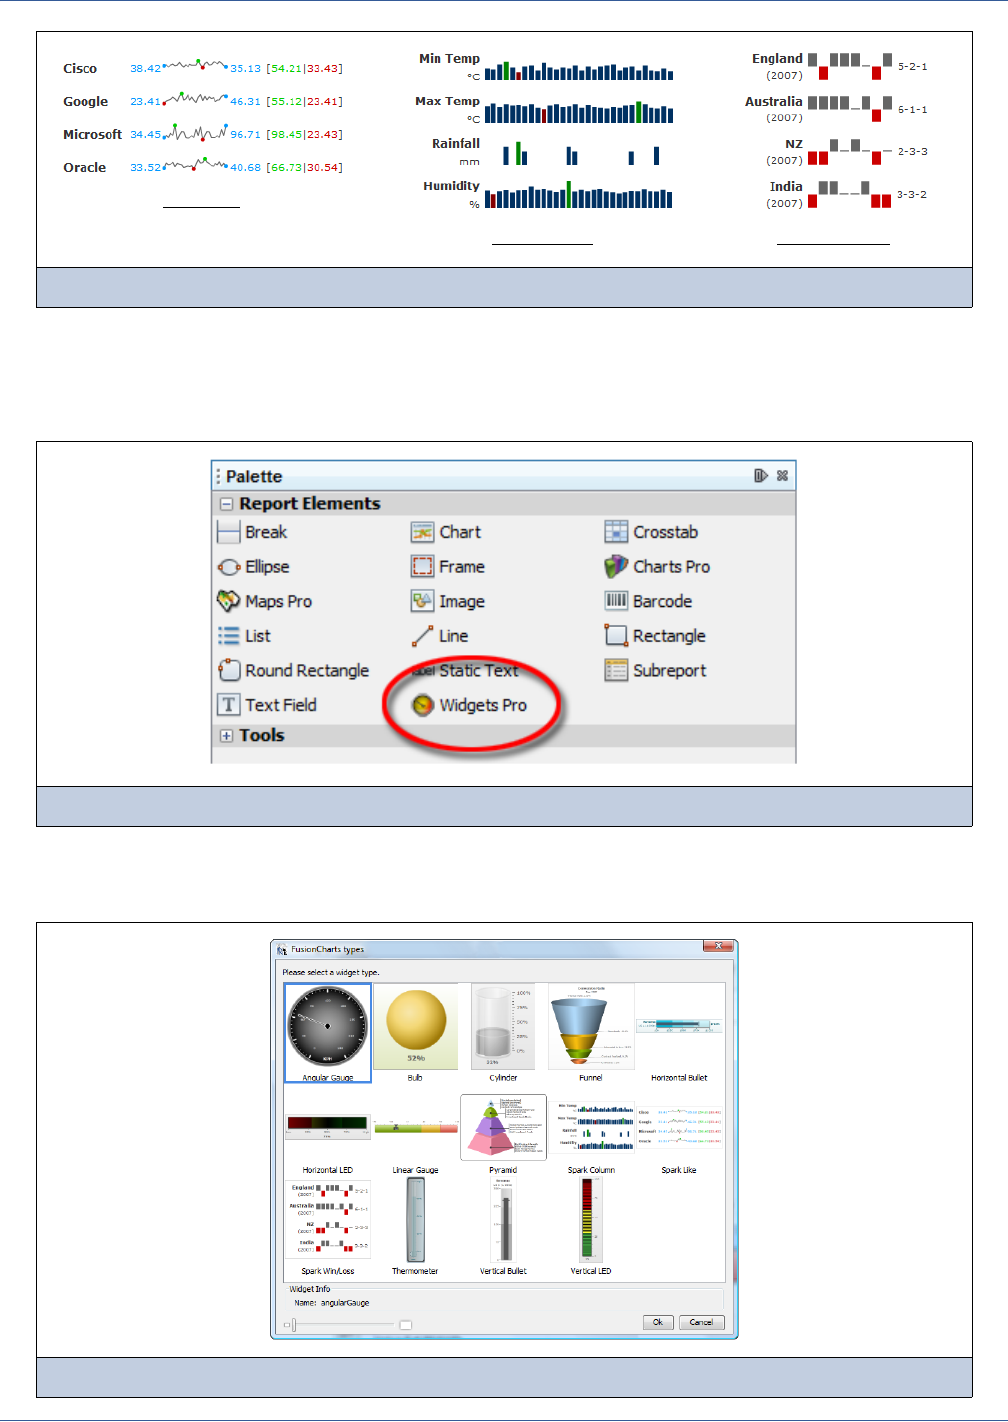
Flash Charts
245
12.4.2 Creating Widgets
In iReport Professional, the Fusion plug-in is installed by default and the Widgets Pro element appears in the palette
(Figure 12-29).
Drag the Widgets Pro element into a section of the report.
iReport displays the widget selector.
Figure 12-28 Spark types in Widgets Pro
Figure 12-29 The Widgets Pro component in the palette
Figure 12-30 Selecting a widget type
Spark Column Spark Win-Loss
Spark Line
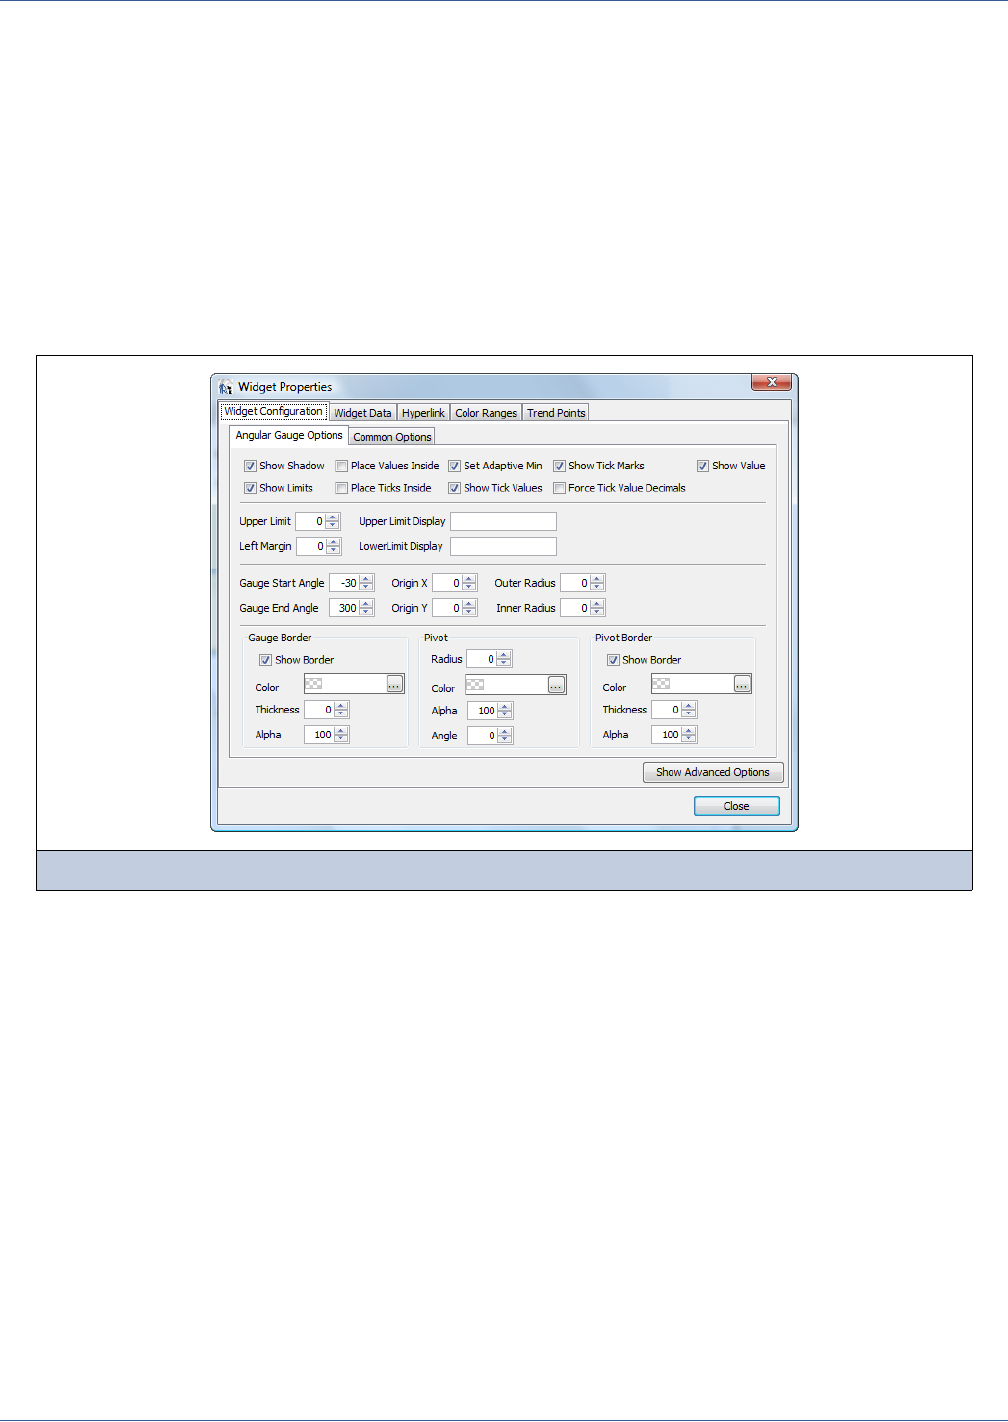
246
iReport Ultimate Guide
Select the widget you want to create. Use the slider at the bottom of the window to change the size of the widget icons.
After the selection, the new element appears in the design view. In the designer, iReport displays a sample of the widget you
have selected. Note that this is not a real preview of the widget; the chart rendered in the final report can be totally different in
terms of color and appearance.
Depending on the band where you place the new widget element, iReport sets the proper evaluation time for the element. The
evaluation time and evaluation group properties specify the time at which the element should be evaluated. The layout
properties for the Charts Pro element (such as position and size) are managed using the standard property window in iReport.
The contents of a chart are configured through widget-specific properties.
To access the widget properties, right-click the Widgets Pro element in your report and select Edit Widget Properties from
the context menu.
The Widget Properties window appears (Figure 12-31). It has several tabs.
The Widget Configuration tab contains two nested tabs, one for widget-specific properties and the other for standard
properties that are common to all widgets. For information about all the properties available for the widget you chose, refer to
the Fusion Widgets HTML documentation at <ir-install>/ireportpro/FusionWidgets_Enterprise/Charts/index.html.
Figure 12-32 shows the nested tab of Common Options.
Figure 12-31 Widget-specific options on the Widget Configuration tab
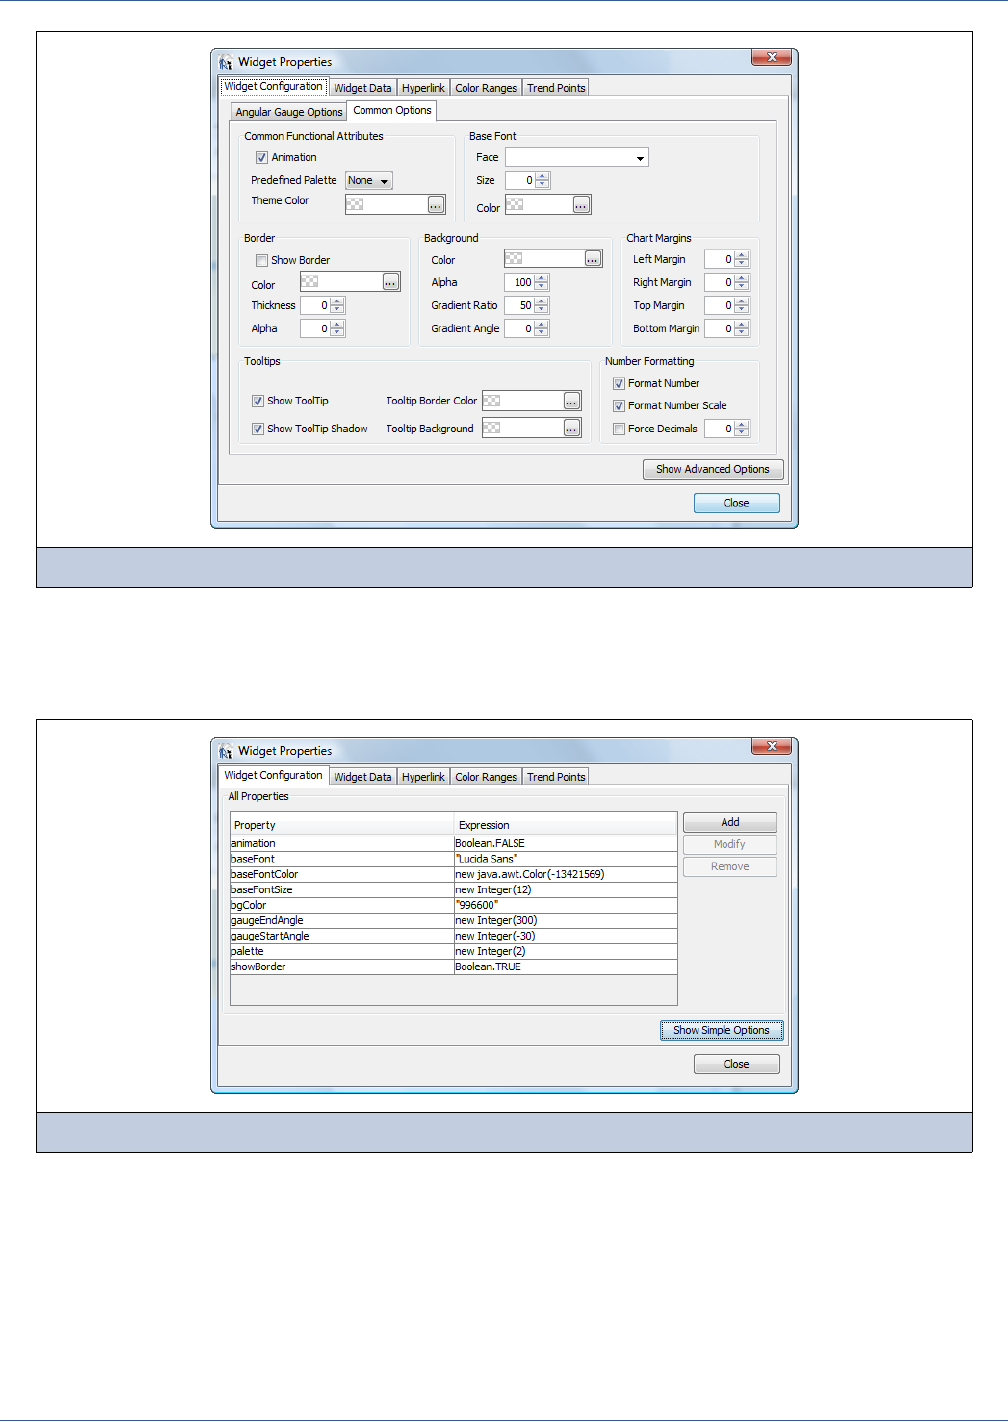
Flash Charts
247
The Widget Configuration tab displays a list of properties and their expression values. The standard view of the properties
includes the commonly-used properties; including many default property values. In the advanced view, all properties, both
widget-specific and common ones, are shown in a single table. If you change a property from its default value, it appears in the
advanced view with the overriding value.
The value of every property on the Widget Configuration tab can be given as an expression. When you use the check boxes,
fields, and value choosers on the tab, iReport creates a static value of the appropriate type for the expression. Alternatively,
you can provide dynamic expressions that will determine the chart appearance based on the data available when the report is
generated. To view and set custom property expressions, click Show Advanced Options.
In the advanced view, you can directly edit the expressions for the widget properties. It is important that expressions return the
Java types expected for each property.
Properties that you toggle on or off with check boxes in the simple display must have an expression that evaluates to a
Boolean value.
Figure 12-32 Common options on the Widget Configuration tab
Figure 12-33 Advanced options on the Widget Configuration tab
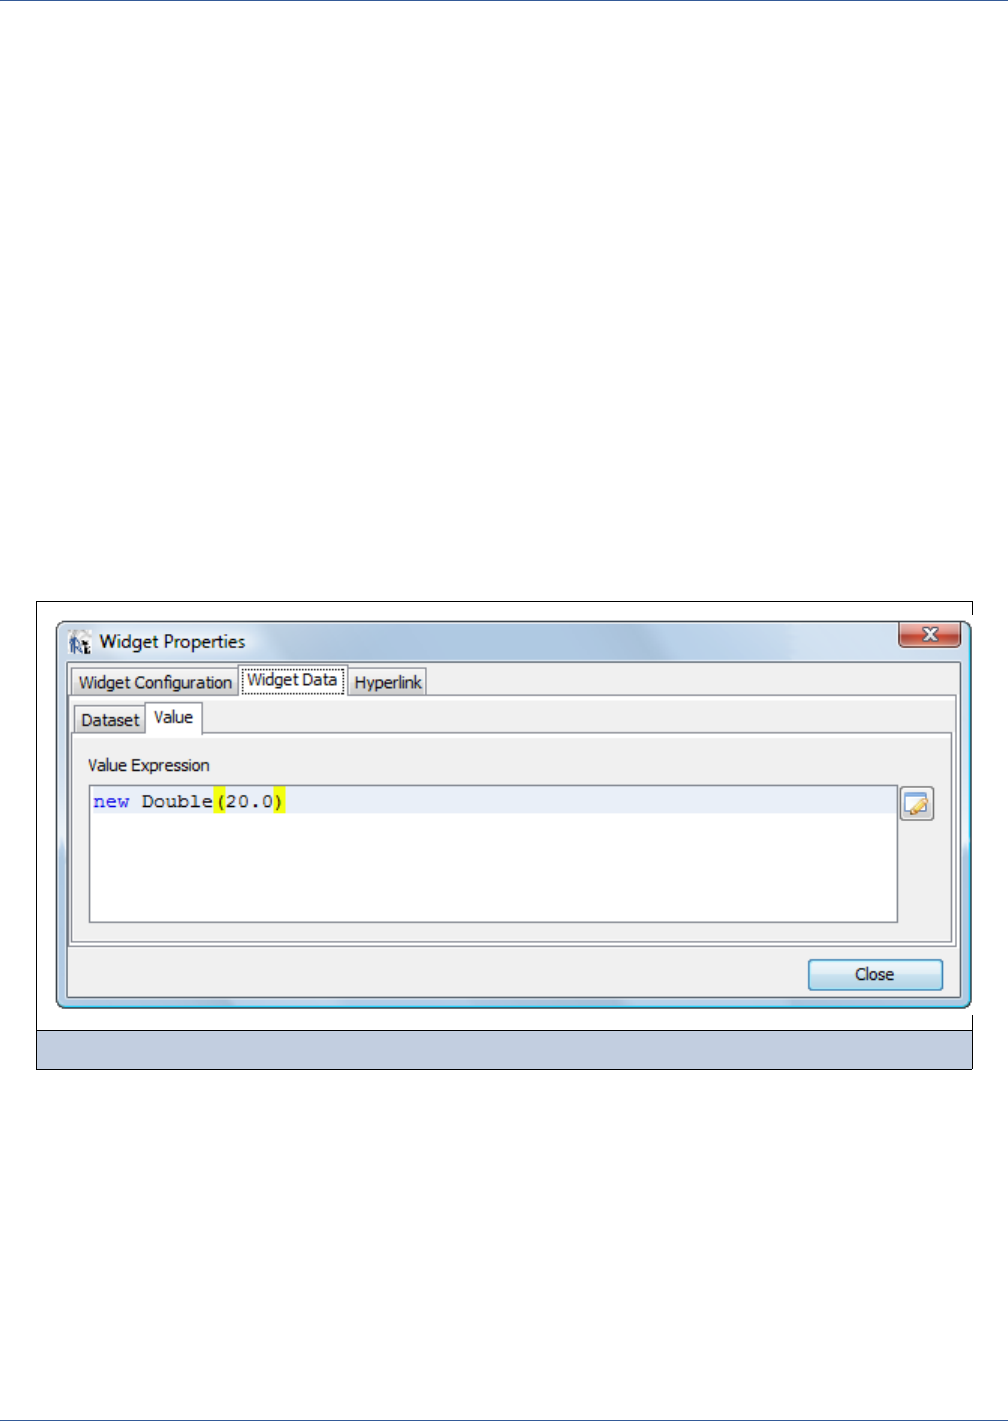
248
iReport Ultimate Guide
Numbers must return a valid numeric objects.
Many attributes are of type String.
Click Add, Modify, or Remove to manage the properties in the list. Note that some properties have default values that will
apply if you remove them from the list. For reference documentation about all the properties that apply to Widgets Pro
elements, refer to the Fusion Charts HTML documentation at <ir-install>/ireportpro/FusionWidgets_Enterprise/Charts/
index.html.
Other widget property tabs also have both simple and advanced views that allow you to see many properties and their default
values or set value expressions.
12.4.3 Specifying Widget Data
On the Widget Data tab, you will specify how your data should populate the chart. All widget types have a nested Dataset tab
where you specify the dataset to use and how to acquire its data. For Widgets Pro elements, this tab behaves similarly to the
same tab in regular chart and crosstab elements. Refer to the chart and crosstab chapters for instructions on the fields of the
Dataset tab (11.2, “Using Datasets,” on page 209 and 15.5, “Working with Crosstab Data,” on page 300).
The other nested tab of the Widget Data tab is specific to each widget because it configures how you display your data in the
widget. The following sections show how to display data for a typical widget in each set of widget types.
12.4.3.1 Cylinder
The cylinder displays a single value between upper and lower bounds. To set the value, open the nested Value tab on the main
Widget Data tab.
Enter an expression based on your data that evaluates to a numeric value. The example in Figure 12-34 shows only a simple
constant value, but it demonstrates how the expression must return an object of the expected type.
The upper and lower bounds represented by the ends of cylinder are set by the Upper Limit and Lower Limit properties on
the nested, widget-specific tab of the Widget Configuration tab. You can enter static values on the simple view of the Widget
Configuration tab or, in the advanced view, enter an expression to compute dynamic values. The property names in the
advanced view are upperLimit and lowerLimit.
The output of the cylinder widget is shown in Figure 12-35.
Figure 12-34 Specifying the cylinder value expression on the Widget Data tab
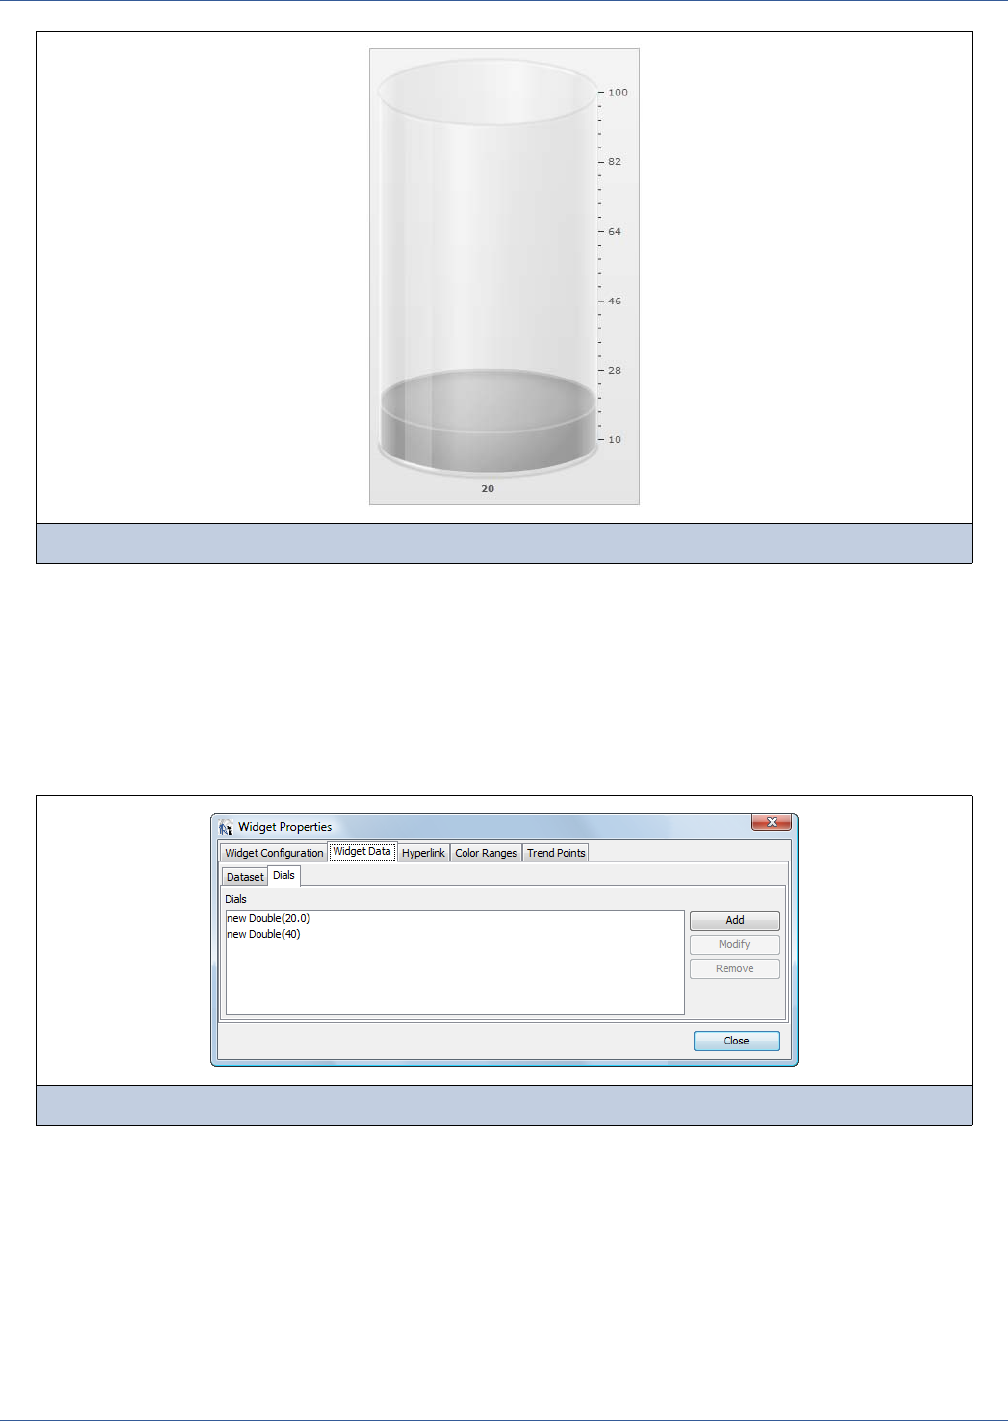
Flash Charts
249
12.4.3.2 Angular and Linear Gauges
The angular and the linear gauges are often used in dashboards. Both show one or more values on a scale that can have
multiple color-coded ranges; for example red, yellow, and green ranges for a revenue gauge. In angular gauges, the values are
indicated by dials (needles) on a circular background, while linear gauges are either horizontal or vertical bars. Certain gauges,
such as the angular gauge, can have several values, while others, such as the thermometer, show only one value. Specifying the
data is very similar for all gauges.
For angular gauges, the nested Dials tab on the Widget Data tab shows the list of defined dials.
When you add or modify a dial, the Dial window lets you define an expressions for the value it points to.
Figure 12-35 Output of the cylinder example
Figure 12-36 Specifying gauge dials on the Widget Data tab
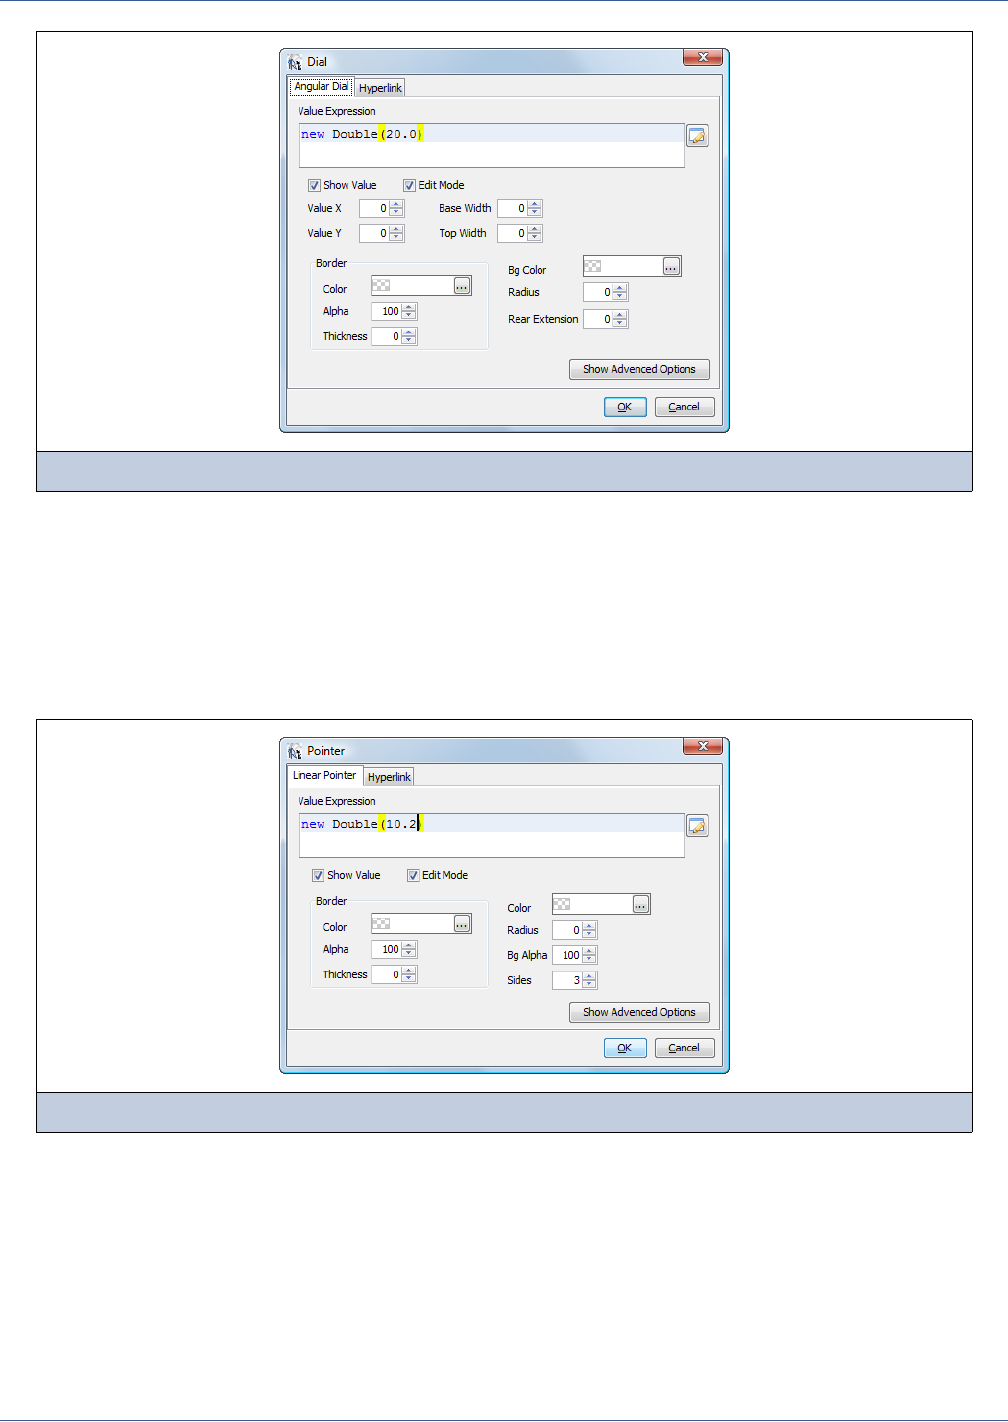
250
iReport Ultimate Guide
Enter an expression based on your data that evaluates to a numeric value. The example in Figure 12-37 shows only a constant
value but demonstrates how the expression must return an object of the expected type.
The Angular Dial tab also includes properties that determine how this particular dial will appear; for example, color, radius,
and rear extension of the pointer. The simple view lets you set these properties statically, or you can click Show Advanced
Options to enter expressions that will set the all properties dynamically based on your data.
The Widget Data tab for the linear pointer gives you a list of pointers, and the dialog to add or modify a pointer is similar to
that of a dial, only with different properties.
For most types of gauges, you can define color ranges for the dials or pointer. A color range defines an area of the chart based
on a minimum and a maximum value. Use the Color Range tab in the Widget Properties window to define one or more color
ranges on your gauge. Figure 12-39 shows an angular dial with two dials (needles) and two color ranges.
Figure 12-37 Specifying the value expression for an angular dial
Figure 12-38 Specifying the value expression for a linear pointer
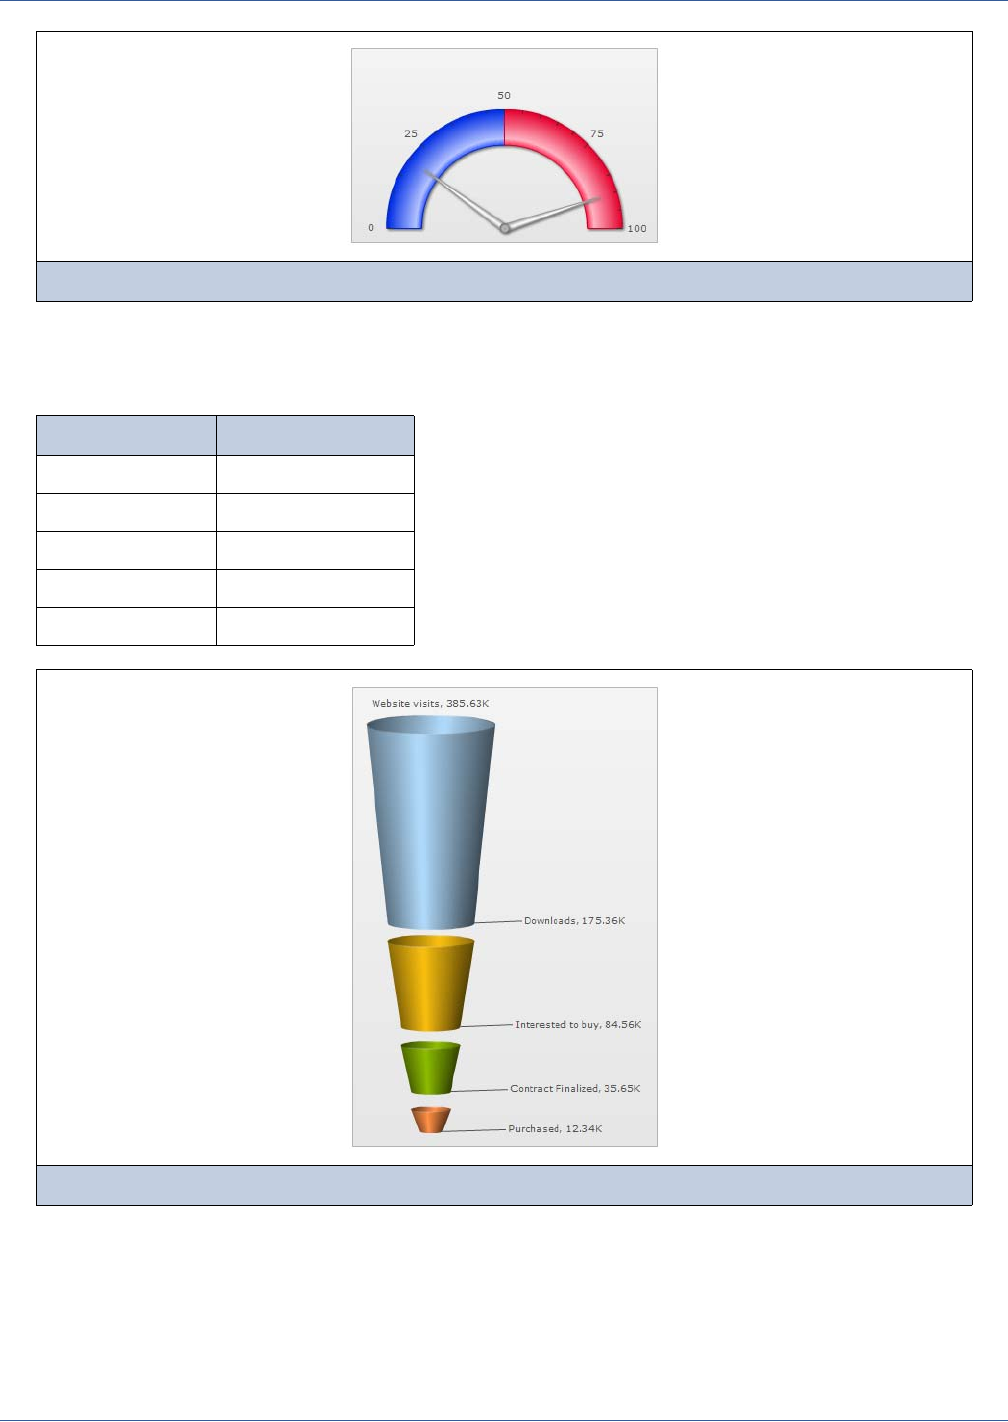
Flash Charts
251
12.4.3.3 Funnel Chart
A funnel chart is composed of one or more funnel segments, with each segment being the connection between two consecutive
data points. For example, given the following records in a database, you can create the chart in Figure 12-40.
The data points used in the funnel are defined by value sets. A single value set that contains expressions referencing the
database fields can generate an entire chart.
The value sets that create the funnel are listed on the nested Value Sets tab of the Widget Data tab.
Figure 12-39 Output of the angular dial example
Label Value
Website visits 385634
Downloads 175361
Interested to buy 84564
Contract Finalized 35654
Purchased 12342
Figure 12-40 Funnel chart created from data sample
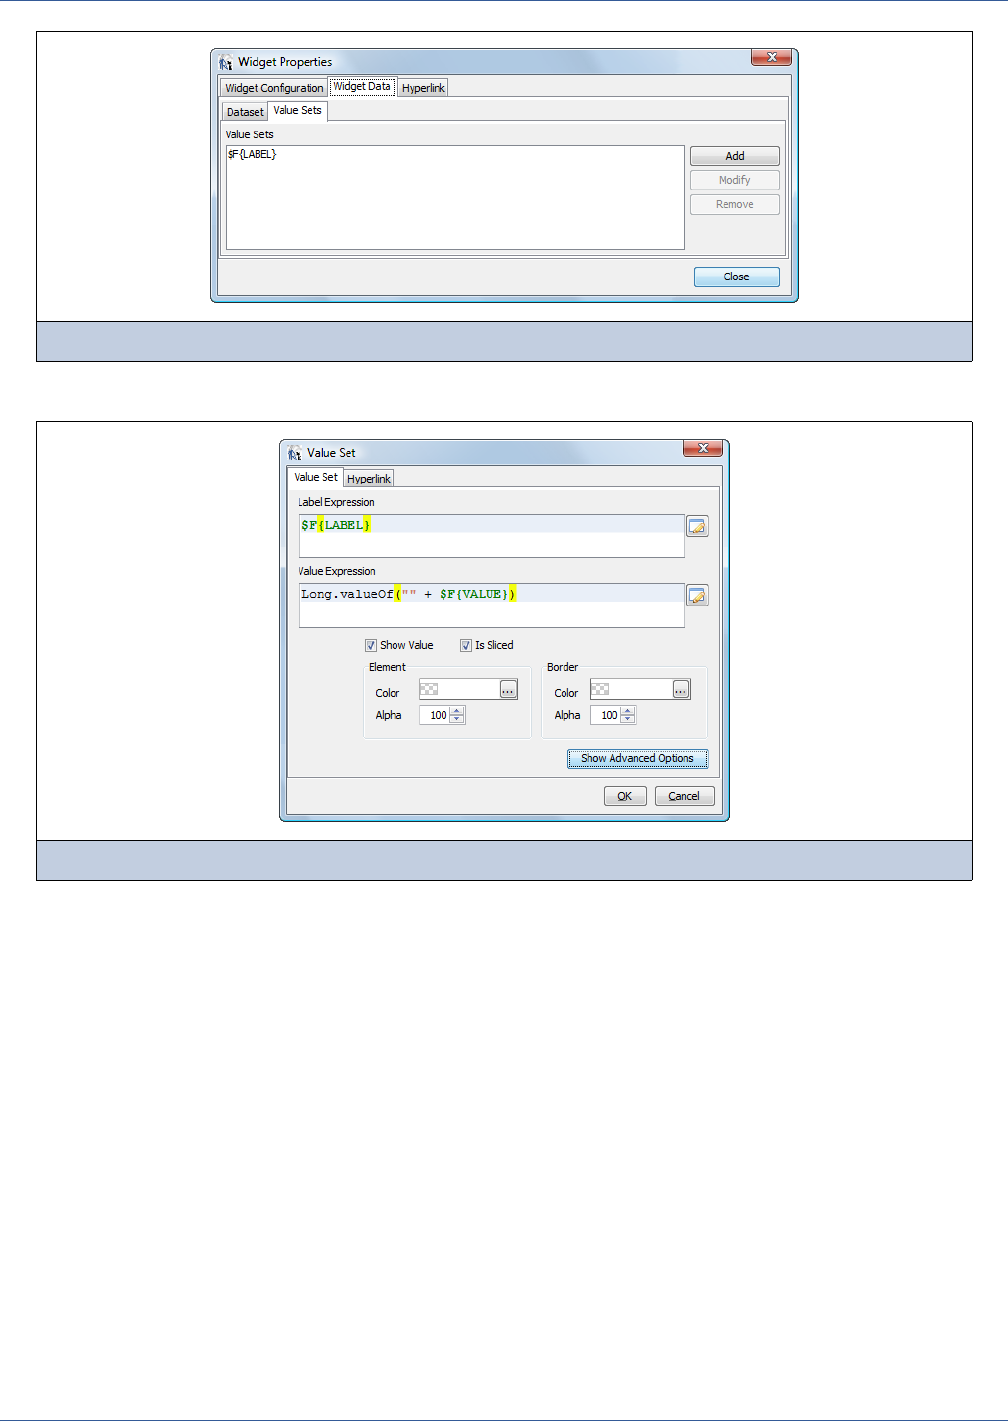
252
iReport Ultimate Guide
When you add or modify a value set, the Value Set window lets you define expressions for the values and labels.
When Value Expression refers to fields in your dataset; each record in the dataset generates one value in the funnel chart.
This is how one value set can define all values in the funnel. In this example, Label Expression references the LABEL field of
our dataset and Value Expression references the VALUE field. Assuming both database fields contain strings, Value
Expression Long.valueOf("" + $F{VALUE}) is used to convert the string to the numeric format expected by the
widget.
The Value Set tab also includes properties that apply to each value in the funnel. The simple view lets you set these properties
statically, or you can click Show Advanced Options to enter expressions that will set the properties dynamically based on
your data.
In this example, a single value set generates the five values used to render the funnel. You can use multiple value sets, each
contributing a single constant value or one or more dynamic values to be displayed together. For example, if you want to
represent values from several different fields of the same record, you will need to define a separate value set with its own value
expression for each field. Having the ability to define several value sets enables you to add values to the funnel using different
strategies.
12.4.3.4 Gantt Chart
The Gantt Chart is the most complex chart, with its data defined by up to four different datasets. Figure 12-43 shows the main
components of a Gantt chart.
Figure 12-41 Specifying funnel value sets on the Widget Data tab
Figure 12-42 Specifying a value set for a Funnel widget
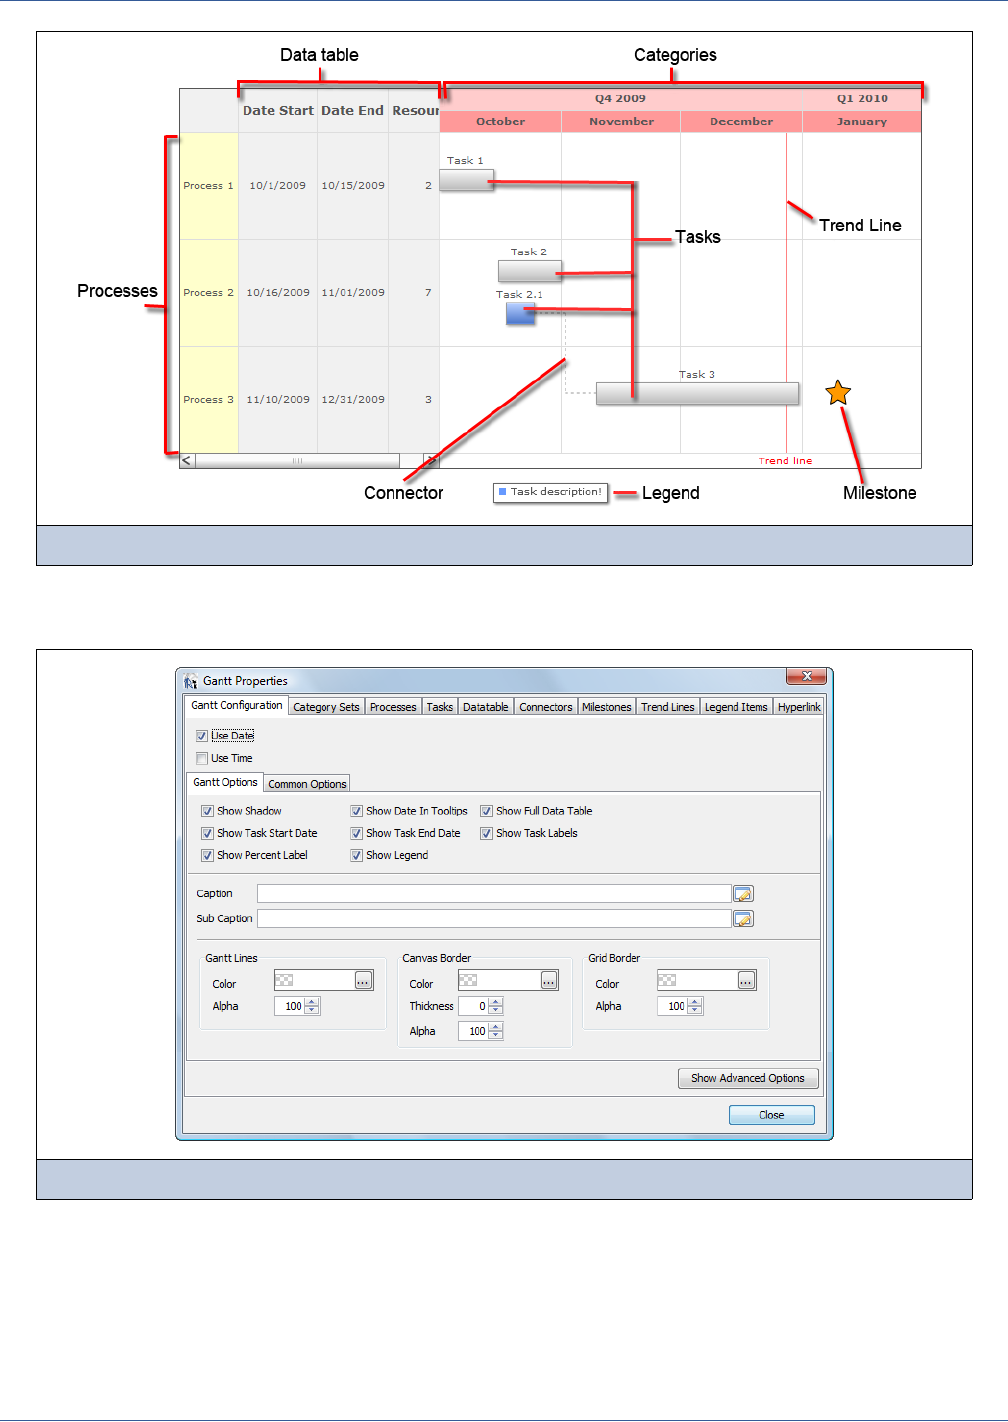
Flash Charts
253
In order to create a Gantt chart, you must define at least a category set, a process and a task. Due to its unique options, the
Gantt chart has more properties tabs than the other widgets.
12.4.3.5 Category Sets
A category set is composed of one or more categories; the categories appear in Gantt charts as column headings (see
Figure 12-43). Each category is defined by a time range and a label. The Gantt chart shown in Figure 12-43 has two category
sets, the first one has two categories, one labeled Q4 2009 and the other Q1 2010. The second category set contains four
categories, one for each month. The date range of each category has been defined to correctly fit the time line, so Q4 2009
spans from 2009-10-01 to 2009-12-31, October spans from 2009-10-01 to 2009-10-31 and so on.
Figure 12-43 Example of a Gantt chart
Figure 12-44 Gantt Configuration tab of the Gantt Properties window
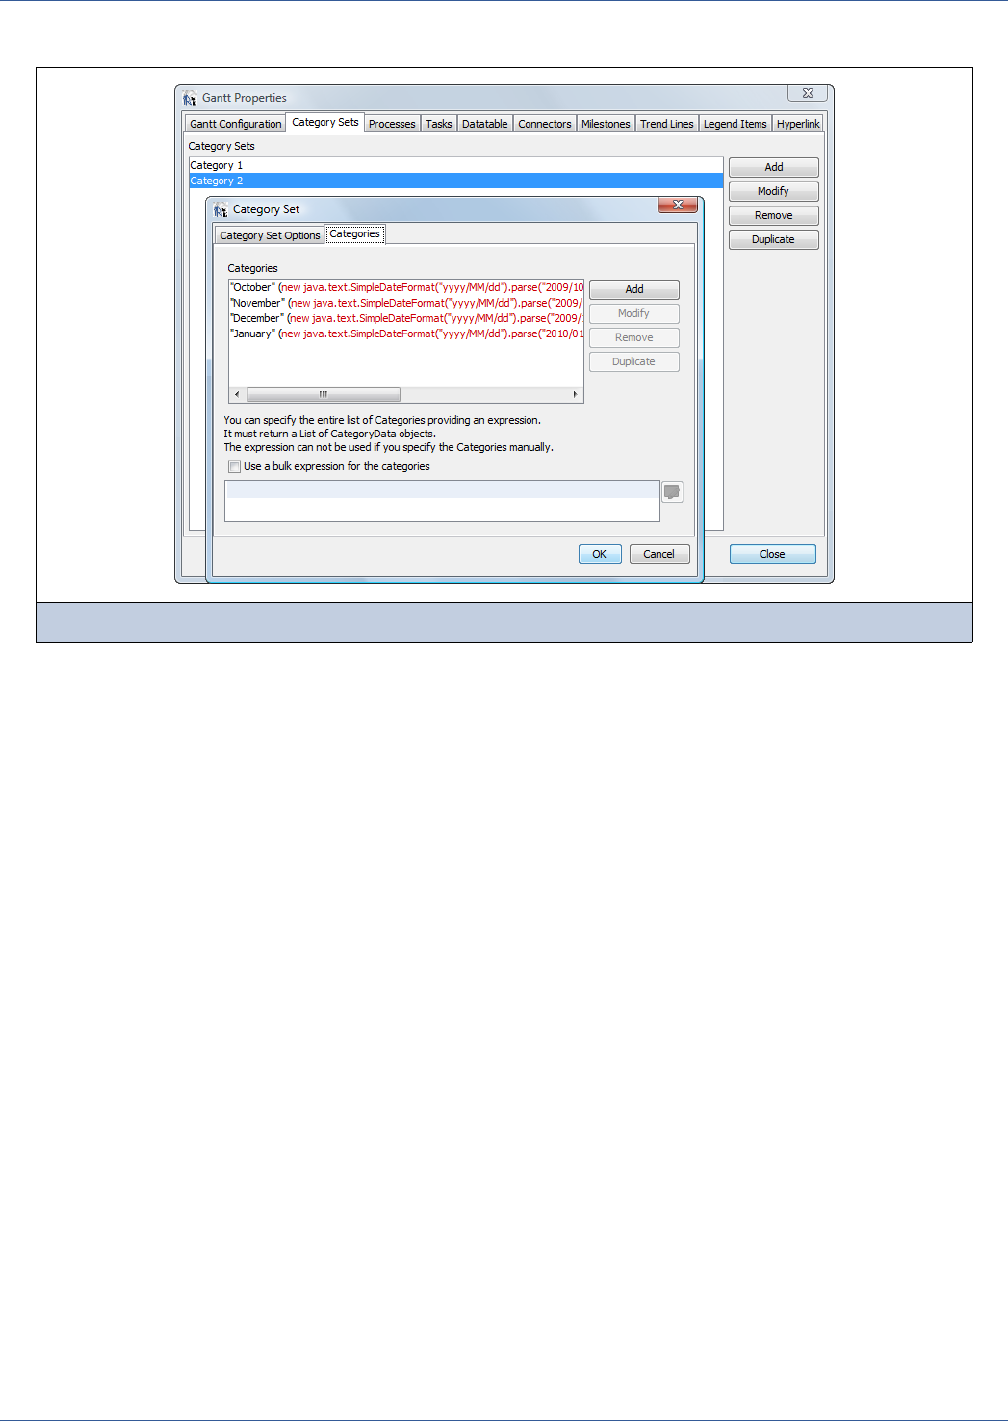
254
iReport Ultimate Guide
Figure 12-45 shows the Category Sets tab and the Category Set window.
Since the definition of each category can be a tedious operation, it’s possible to generate the categories using an expression
that calls a scriptlet method or a custom class to generate your list of categories. Select the Use a bulk expression for the
categories check box on the Categories tab of the Category Set window, and specify your expression. The result of the
expression must be a java.util.Collection or an array of com.jaspersoft.fusion.jasperreports.widgets.Gantt.Category objects.
12.4.3.6 Processes and Tasks
After defining the categories, you must define the processes on the Processes tab of the Gantt Properties window. A process
is defined by an ID, a name for the label, and a set of optional properties that control its appearance in the chart.
The next step is to define the tasks that make up each process. A task is always associated with a single process ID, but any
number of tasks can be associated with the same process.
Tasks are listed on the Tasks tab of the Gantt Properties window. The Task window for defining the tasks is shown in
.Figure 12-46.
Figure 12-45 Specifying category sets in a Gantt chart

Flash Charts
255
A task is defined by its ID, the ID of the process to which it belongs, a label, and a date range. Optionally, you can enter an
expression to display the percent of completion of the task and another expression to show the task as part of a group.
Figure 12-47 show how a task group is displayed.
For each task, you can also define a milestone and a process. Milestones can be defined from the task window or on the
Milestone tab of the main Gantt Properties window. Milestones are further explained in section 12.4.3.7.
The process definition on a task is generally not required because the task is already associated with a process through the
Process ID Expression. However, sometimes a task contains the information to define the process it should belong to.
For example, in a simple Gantt chart it might be possible to define only tasks that are self-contained within their own
processes, which might be quicker than defining the processes separately. In this case, you can use the Task window instead of
the Processes tab of the Gantt Properties window.
If a process is defined directly from a task, the Process ID Expression is ignored.
12.4.3.7 Milestones
Up to now we have seen the mandatory components of the Gantt chart. But many other components can be defined.
A milestone is a symbol that appears in the tasks portion of the Gantt chart, in the same row as the task to which the milestone
belongs. A milestone is always tied to a task and can be created in the Milestones tab in the Gantt Properties window or
directly in the task properties. It is defined by a task ID and a date that identifies the position of the milestone in the time line.
The properties of a milestone include the shape of the milestone in the chart, its color, its border, and so on.
Figure 12-46 Specifying tasks in a Gantt chart
Figure 12-47 Output of a task group on a Gantt chart
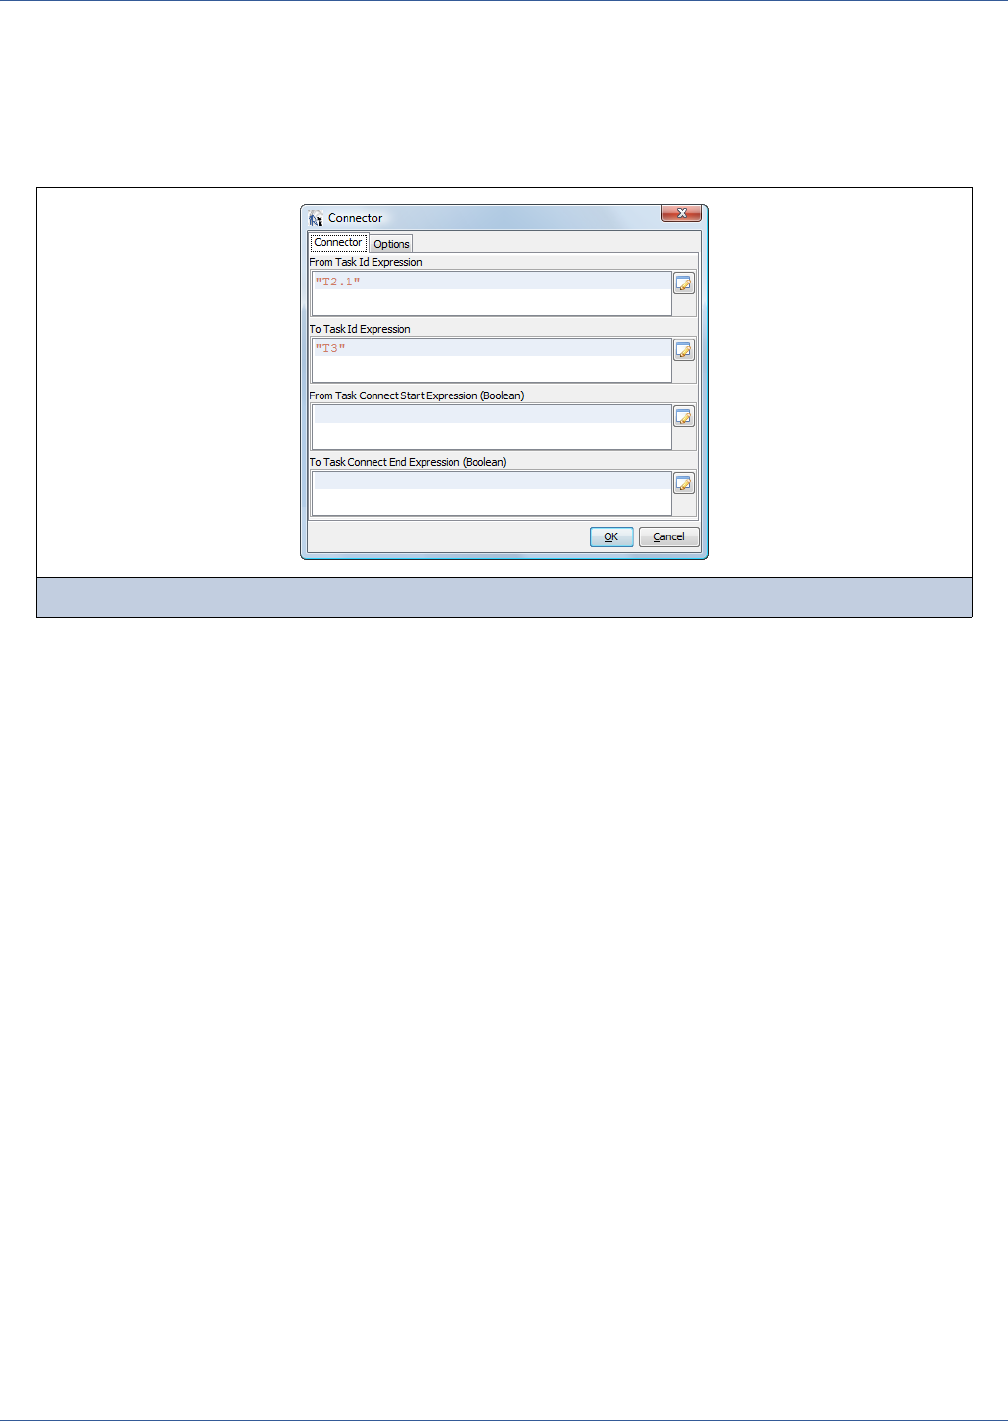
256
iReport Ultimate Guide
12.4.3.8 Connectors
A connector is a line between two tasks. It’s defined by two task IDs, one to identify the task from which the line starts, the
other to define where the line should arrive. Two Boolean properties define from which sides of the task the line must start and
arrive. By default, a connector line starts from the end of the first task and arrives at the start of the second one.
Figure 12-48 shows the window to define the ID and Boolean properties of a connector.
The properties on the Connector Options tab define the appearance of the connector line.
12.4.3.9 Trend Lines
In a Gantt chart, a trend line is a vertical line that spans a series of consecutive dates. Its position is defined by two dates, the
start date and the end date. Use the Trend Lines tab of the main Gantt Properties window to define a trend line and its label.
You can define any number of trend lines in a Gantt chart.
12.4.3.10 Data Table
A data table is a group of columns that display additional information for each process defined in the Gantt chart. If you use a
data table, the processes must be defined using the processes list, not within the tasks (see 12.4.3.6, “Processes and Tasks,”
on page 254).
A data table is defined through the Datatable tab of the main Gantt Properties window.
Figure 12-48 Specifying connectors in a Gantt chart
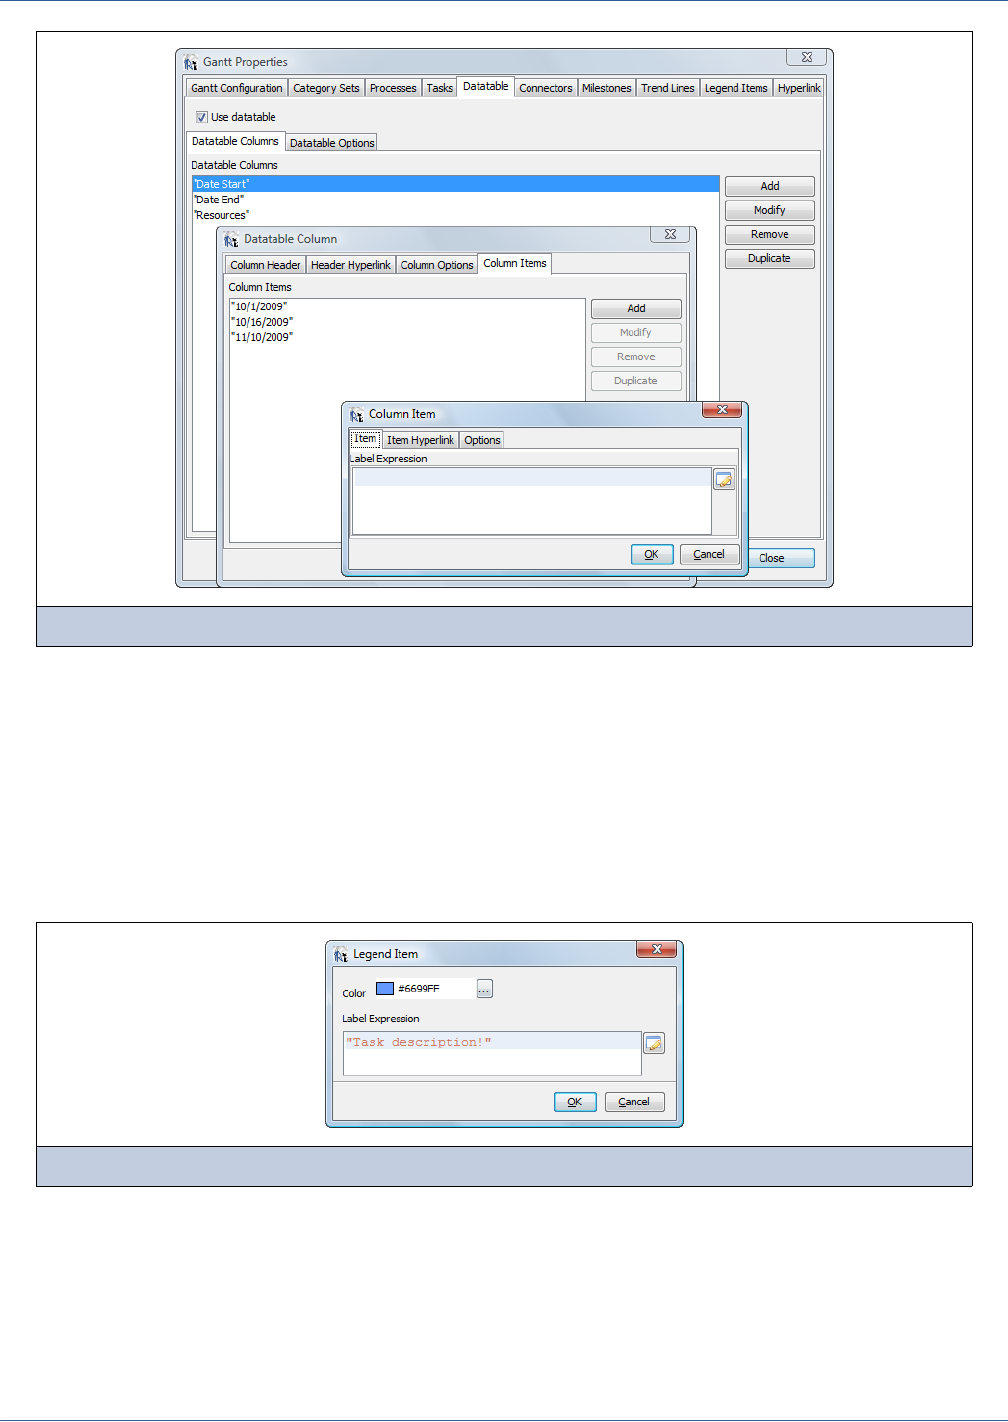
Flash Charts
257
For each column, specify a simple expression for a the column header and a set of column items, each of which is its own
String expression. Each column item is the value of a given process; they should be arranged in the same order that the
processes are defined on the main Processes tab. The number of items in each column must be equal to the number of
processes. If they do not match, the report will not run.
12.4.3.11 Legend Items
The legend on a Gantt chart defines the meanings of the colors that are used in the chart. The legend is optional and is not
generated automatically. If you want one, you must define it on the main Legend tab.
A legend consists of a list of colors, each of which is associated with a label determined by a label expression.
The colors can refer to specific task types, to trend lines, or to any color you used in the components of the Gantt chart. You
can define any number of legend items.
12.5 Embedding Components in a Java Application
Maps, Charts, and Widgets Pro work only with JasperReports Professional 3.6 and above.
Figure 12-49 Specifying a data table in a Gantt chart
Figure 12-50 Specifying legend items in a Gantt chart

258
iReport Ultimate Guide
You can embed JasperReports Professional components in a Java application.The JasperReports Professional license file,
which activates the Professional features, must be placed in the root of a folder or JAR file that is in the embedding
application’s classpath. For example, if JasperReports Professional is embedded in a web application, the license file can be
placed in the application’s WEB-INF/classes folder.
Also, you must set the following JasperReports properties of the URL of your SWF (Flash) files:
com.jaspersoft.jasperreports.fusion.maps.base.swf.url
com.jaspersoft.jasperreports.fusion.charts.base.swf.url
com.jaspersoft.jasperreports.fusion.widgets.base.swf.url
The URL can be a directory or web location. Here is an example of each:
file:///C:\Program Files\iReport-Professional-3.6.0\ireportpro\FusionMaps_Enterprise\Maps
http://localhost/Maps
For more information about building and deploying JasperReports Professional, along with the Maps, Charts, and Widgets Pro
components, see the Release Notes file in your iReport Professional installation.
12.6 Localizing a Component
When a report is meant to be produced in several languages, certain issues should be kept in mind:
All strings that are defined as data in your elements should be localized, including titles, subtitles, labels, and text values.
Since all the data is provided using expressions, the standard $R{...} syntax or all the other methods provided by
JasperReports to load a resource bundle key in an expression, are the best way to provide localized data for the chart.
Since all the data is provided using expressions, the standard $R{...} syntax and the other methods provided by
JasperReports to load a resource bundle key in an expression are the best way to provide localized data for the charts.
The localized formats of numbers and dates must be set explicitly using the advanced properties of each element.
Numbers and dates are not automatically formatted according to the report locale. For numbers, the relevant properties are
formatNumber, decimalSeparator, thousandSeparator, and decimals. For dates, use the property
outputDateFormat. The only chart that takes dates as input is the Gantt chart.
For details about localizing map labels, see 12.2.5, “Localizing Maps,” on page 233.
12.7 Component Limitations
The JasperReports Pro Flash chart components are extremely configurable and powerful, however, they do not expose all
advanced functionality that is available in native Maps, Charts and Widgets Flash implementations. Limitations include:
In all Pro components, it’s not possible to define reusable styles or custom animations.
Maps Pro does not support redefining entity codes and names or defining custom markers on a map.
Charts Pro does not support vertical data separator lines in column charts.

Lists, Tables, and Barcodes
259
CHAPTER 13 LISTS, TABLES, AND BARCODES
iReport supports two additional components: List and Barcode. The List component is a kind of light subreport which does not
require any external report. The Barcode component is used to print barcodes.
This chapter has three sections:
Lists
Tables
Barcodes
13.1 Lists
While the name of the List component might lead you to think it is a simple array of items, the component is really quite
powerful. It is defined entirely within a report, and it allows the items of the list to be defined with several elements, including
textfield, images, and graphic objects. It can be used to present a group of related values or to create a small table that does not
require calculations. The data used to fill the list is acquired using a subdataset—the List component cannot extract data from
a main dataset.
13.1.1 Working with the List Component
To use the List component, drag a List element from the elements palette into any band of the report. When the element is
created in the band, iReport automatically adds a subdataset to the report and links the subdataset with it. You can see the new
subdataset in the Report Inspector. The new subdataset is empty, so you have to define all the required fields and, if the List
element will get data from a database or another source that requires a query, you need to define the query. See Chapter 14 to
learn how to configure it.
To configure a list element, right-click the List element and select Edit List Datasource. The Dataset Run window will open
(Figure 13-1); it is used to define how the List element will use the subdataset.
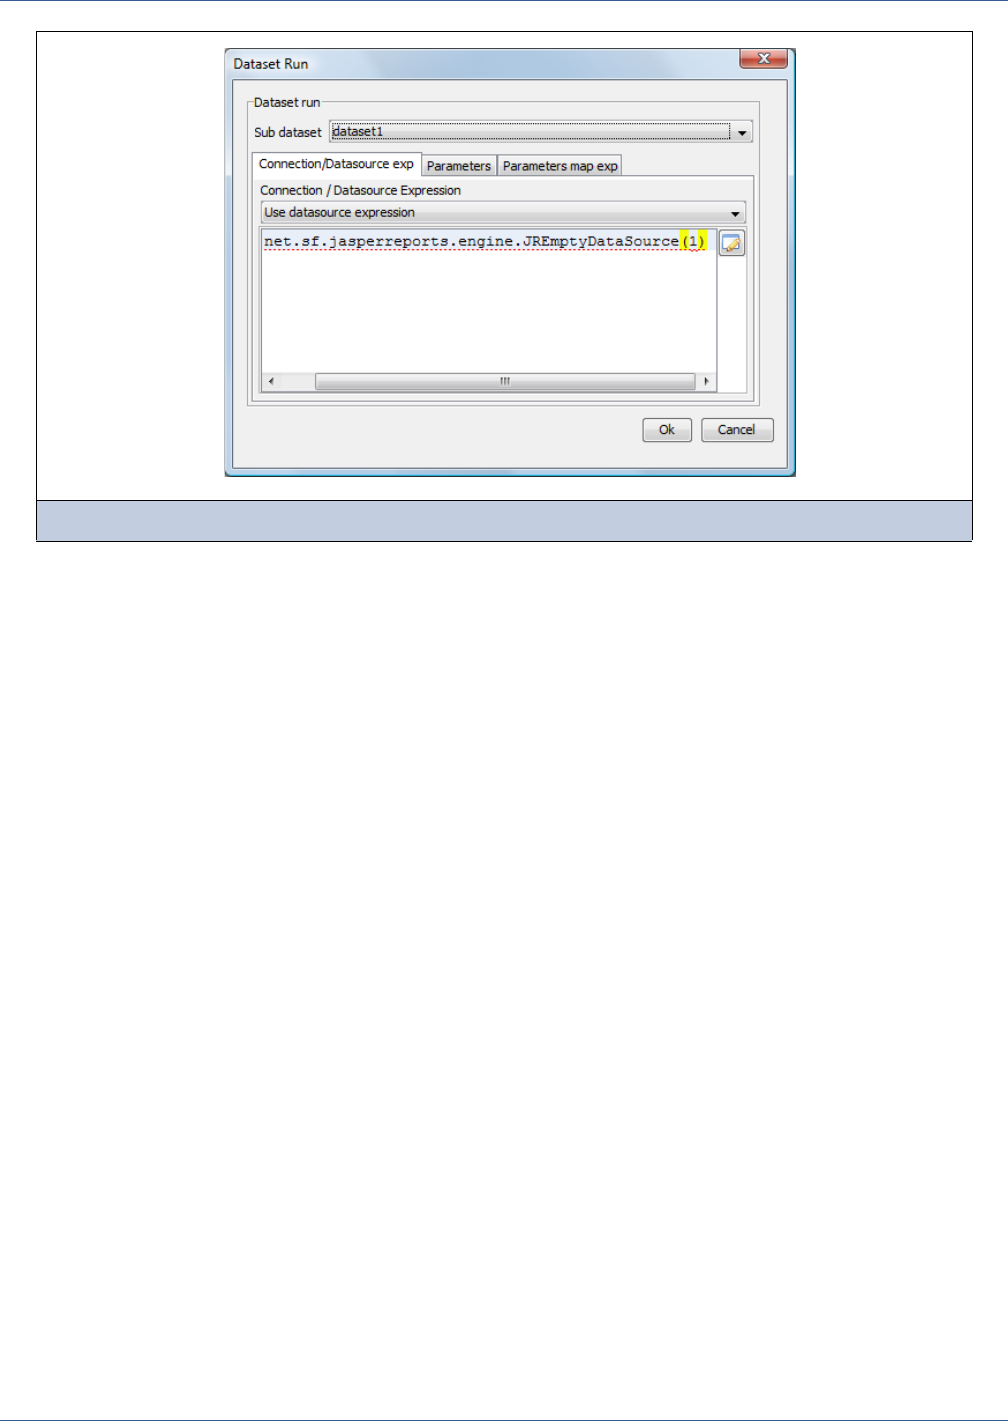
260
iReport Ultimate Guide
By default the data source expression is set by iReport to:
new net.sf.jasperreports.engine.JREmptyDataSource(1)
This expression creates an empty data source having a single record (it is empty because it returns null for any fields). The real
purpose of this default expression is to avoid compilation errors when the List element is used for the first time by someone
who does not know how to use it, but it is not very useful. The most typical setup of the Dataset Run is a bit different.
If the report is based on an SQL query, the expression type should be set to Use Connection Expression. iReport will set
the expression to $P{REPORT_CONNECTION}, which holds the same database connection used by the main dataset. But this is
just one of the many ways to configure the dataset; other examples of dataset run configuration are described in the Charts and
Crosstabs chapters (Chapter 11 and Chapter 15).
The rules for a subdataset run are always the same: the subdataset defines all the objects that compose the dataset, such as
fields, parameters and variables, and optionally defines the query to execute in order to get the field values. However, it does
not contain any information about the connection to use to run the query, the values that must be set for the parameters, and so
on. This is information is provided by the dataset run, which instructs JasperReports on how to feed the subdataset. For
example, the dataset run provides the connection to run an SQL query, defines expressions to set a value for the dataset
parameters, and so on.
In case we are using an SQL query for both the main dataset and the subdataset, we can use the dataset run to pass to the
subdataset the connection used by the main report: the parameter $P{REPORT_CONNECTION} of the main report contains that
connection). In other situations, we may want to use a specific data source or even nothing, if this is not strictly required by the
query language set in the subdataset.
The Dataset Run window allows setting the values for the subdataset parameters. It’s actually very similar to what happens
with subreports (5.4.1, “Subreports,” on page 90), except that here we don’t have to provide a subreport expression to locate
the subreport template.
Once the dataset has been configured, we can focus on designing the list that appears in the report. Visually, a list is like a
Frame in which we can put elements. But what size should the List element be? Element size is actually not very important
except for its width, which will remain the same in the final print. In the properties of the element (in the property sheet) there
is a property called Item height. It defines the height taken by each item in the report when the List is filled. When the
report is executed, for each record in the data source JasperReports prints the content of the item (which is the content of the
List element with a minimum height defined by the item height). In the document, the total vertical space depends on the
number of items in the list, the height of the item, and how the content in the item stretches. If the dataset contains no records,
the space taken is that of the List element, which remains blank.
Figure 13-1 List Dataset Run definition
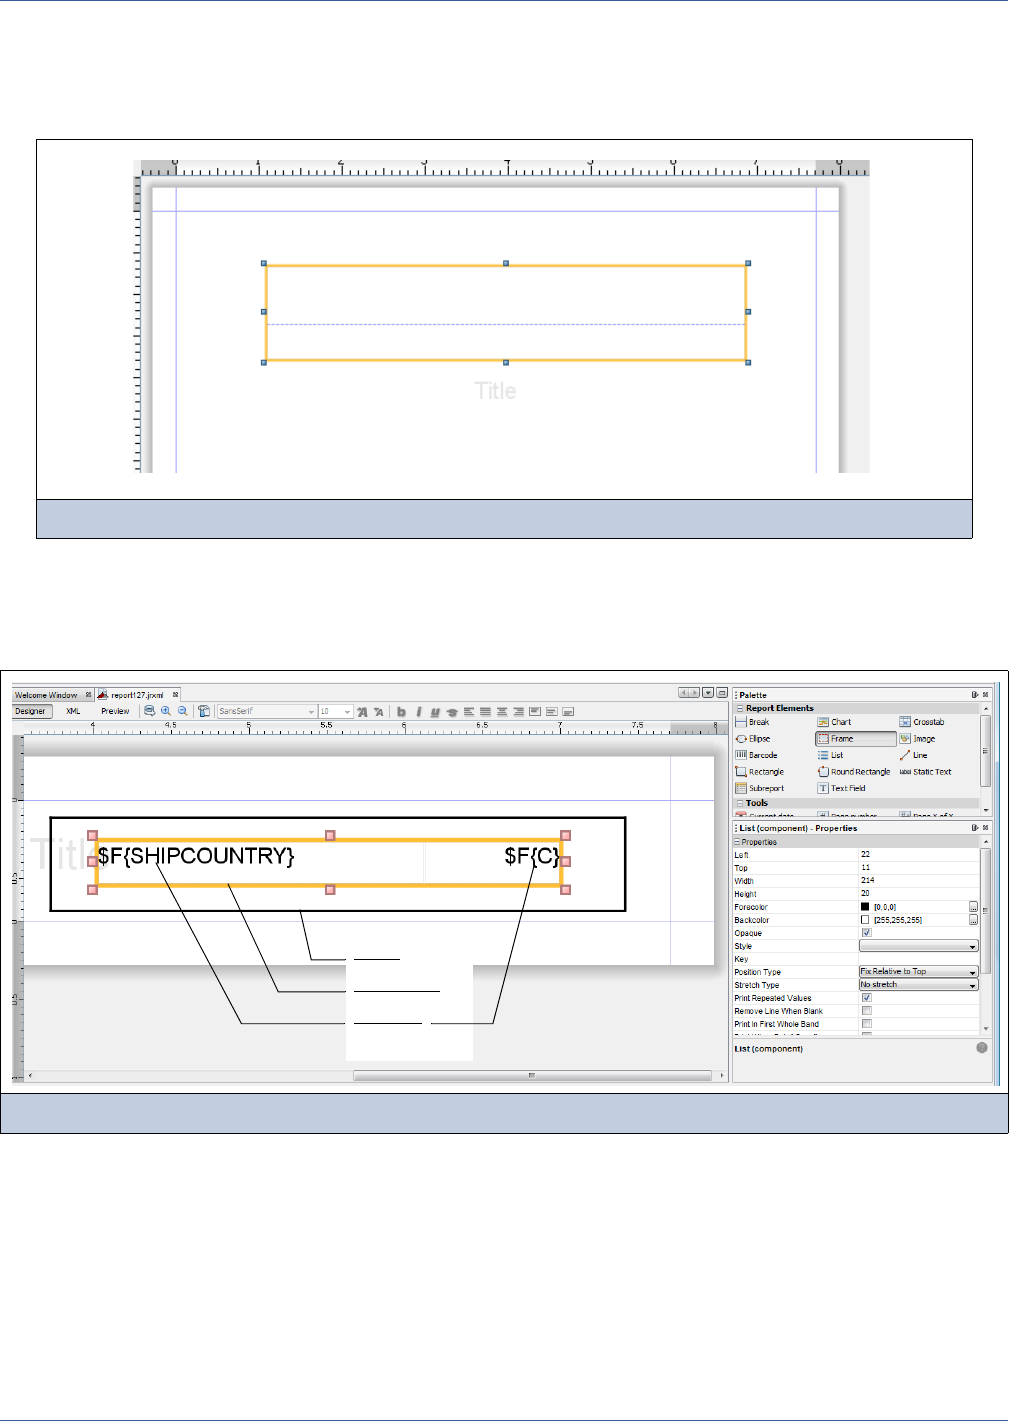
Lists, Tables, and Barcodes
261
For your convenience, iReport synchronizes the Item Height with the height of the List element when the list in the document
is resized. This feature is a way to suggest that you set the size of the List element to the same size of a virtual cell that will
repeat itself vertically, based on the data provided. If the Item Height is set to a different value (and lower than the element
height), the item size will be represented in the designer by a dotted line (Figure 13-2).
At this point, we have placed the List element in a band and we have configured the subdataset and dataset runs, so it’s time to
add some content. All the elements placed inside a List element must be contained inside the Item Height. This is why iReport
synchronizes the element height with the item height. In this way, the magnetic effects in the designer will help to position all
the elements without breaking any design rules. Figure 13-3 shows a completed List element.
The List element is placed inside a Frame, which in this case is used to draw a border. The element contains two textfields. The
first ($F{SHIPCOUNTRY}) shows the name of a country, the second ($F{C}) shows the number of orders placed in that
country. To populate the element, we are using a query which we have seen several times in this manual:
select count(*) c, shipcountry from orders
group by shipcountry order by shipcountry
The query selects the number of orders placed in each country and the related country name. Figure 13-4 shows the final
result.
Figure 13-2 Item height is shown when it is less than the element height
Figure 13-3 Complete list element
Frame
List element
Textfields
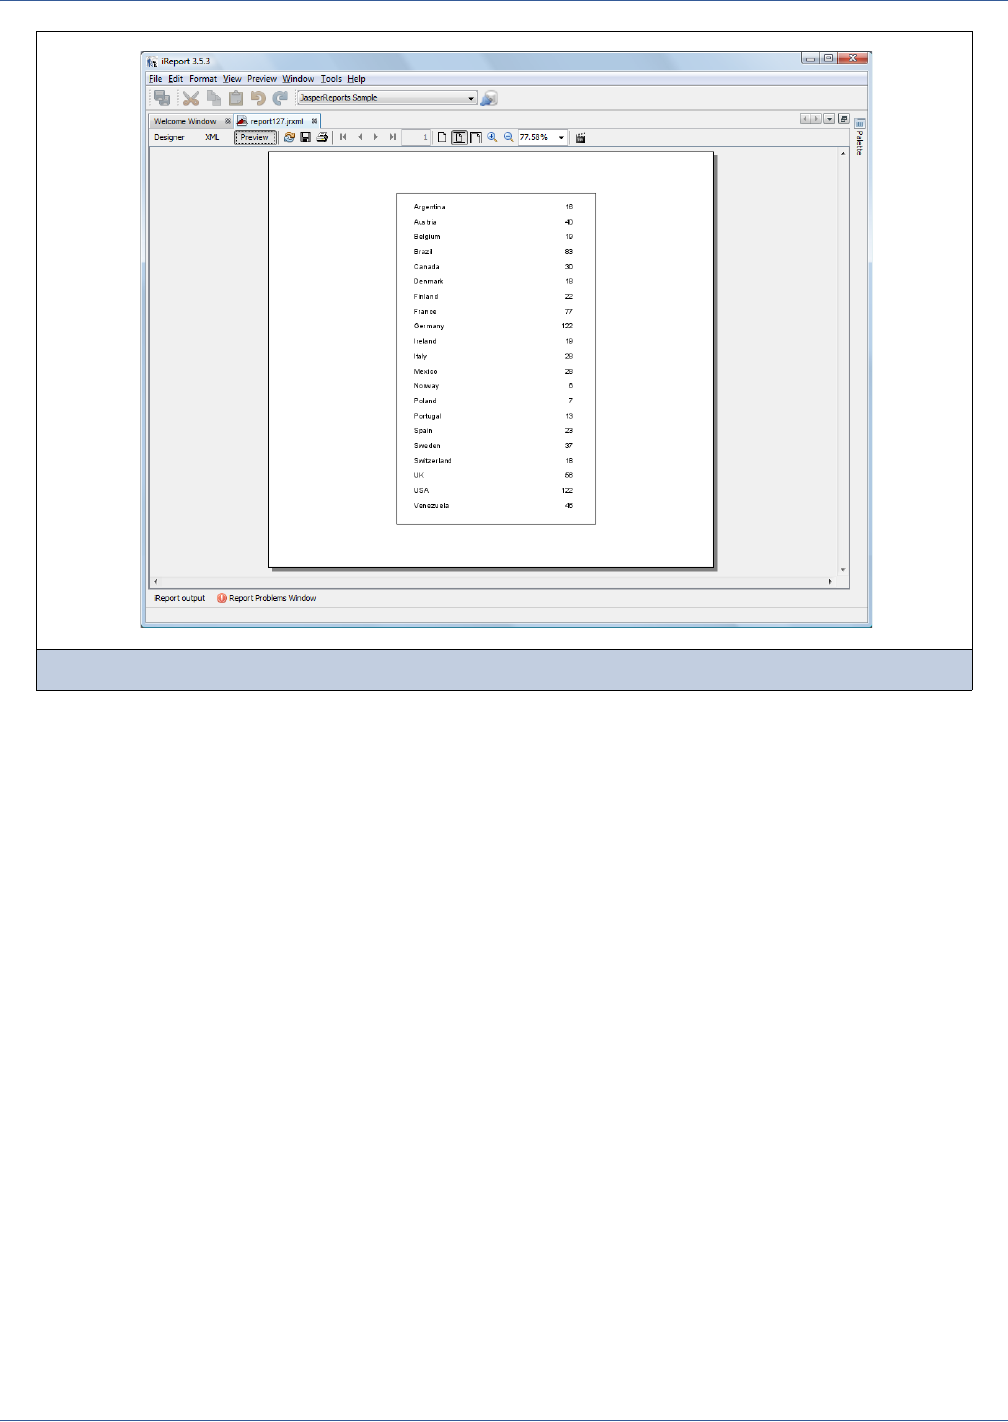
262
iReport Ultimate Guide
So let’s summarize the steps to create this list:
1. We started by adding the List element to a band, in this case, the Title band. When we add the element, iReport creates a
new subdataset and ties it to the dataset run of the report.
2. The next step is to configure the subdataset, which holds the data that will appear in the report. We do that by setting the
query of the subdataset by right-clicking the subdataset node in the Report Inspector view and by selecting the menu item
Edit Query. The query we used in the sample is the one seen above to select countries and the relative orders count. The
query contains two fields, SHIPCOUNTRY and C, which are added to the subdataset fields list.
3. The next step of the data configuration is the configuration of the dataset run, defined by right-clicking the List element
and selecting Edit List Datasource. In the Dataset Run box we change the Connection/Datasource expression to use
the same connection that is used to populate the whole report (by selecting Use Connection expression from the
expression type combo box).
4. The last step is setting the contents of the List element. We drag the two fields (step step 2) over the element and we
adjust their size and position. As we said, whatever we put inside the element will be repeated for every record of the
dataset. The content of the element becomes more or less like the content of a Detail band, which, similarly, is repeated
for each record. Figure 13-4 should clarify that. For each country, we see the country name and the number of orders. The
frame around the list is not part of the list; as explained before, we have put the list inside a Frame element in order to
print a border around it (the thickness of the Frame border is set to 1 pixel).
13.1.2 Parameters and Variables in a List Element
The data printed in a List element comes from the subdataset tied to it. A subdataset can have not only fields, but parameters
and variables as well. Parameters can be used in the where condition of an SQL query and in many other ways. Their values
are set on the Parameters tab of the Dataset Run window (Figure 13-1). The value expressions can contain the main report
objects (fields, parameters, and variables coming from the main dataset).
Suppose an example has a report that prints a set of customers. You want to use a List element to print the list of email
addresses of each customer. In the Detail band of our report, we will place textfields to show the customer name, the customer
Figure 13-4 Query result

Lists, Tables, and Barcodes
263
identifier, the phone number, and finally the List element to print the list of email addresses. The subdataset query used to
extract the email addresses would look like this:
SELECT email from EMAIL_ADDRESSES where CUSTOMER = $P{CustomerID}
In the where condition, the customer ID parameter ($P{CustomerID}) is used to select the email addresses from the
hypothetical table called EMAIL_ADDRESSES. We’ll assume that we have a field in the main dataset. In order to pass the
value of the dataset’s CUSTOMER_ID field to the subdataset, the value of the CustomerID parameter in the dataset run will be
set to $F{CUSTOMERID} (Figure 13-5).
At run time, JasperReports will process all the customers and fill a detail for each one. Every time the List element is
encountered in the details, the report engine will analyze the dataset run to prepare the data acquisition; the value of the
parameter $P{CustomerID} will be set to the current value of the field CUSTOMERID and the query of the subdataset will be
executed. The query result will contain all the email addresses associated with the current customer ID.
If you used parameters with subreports before, you will find this concept to set the value of a subdataset parameter using an
expression very familiar. As we said, the mechanisms of the subdataset run and dataset run are the same ones used to feed
charts and crosstabs. The big difference here is that while charts and crosstabs can use the main dataset, a List can only use a
subdataset.
In a List element, we can print fields (as we have seen in Figure 13-3), and we can print parameters and variables of the
subdataset in the same way (using, for instance, a textfield and any expression that uses combinations of these objects). The
variables printed must be defined in the List subdataset. Figure 13-6 shows the same List element as Figure 13-4 but with an
extra column that is created from a variable that sums the number of orders cumulatively.
Figure 13-5 Dateset Run parameters
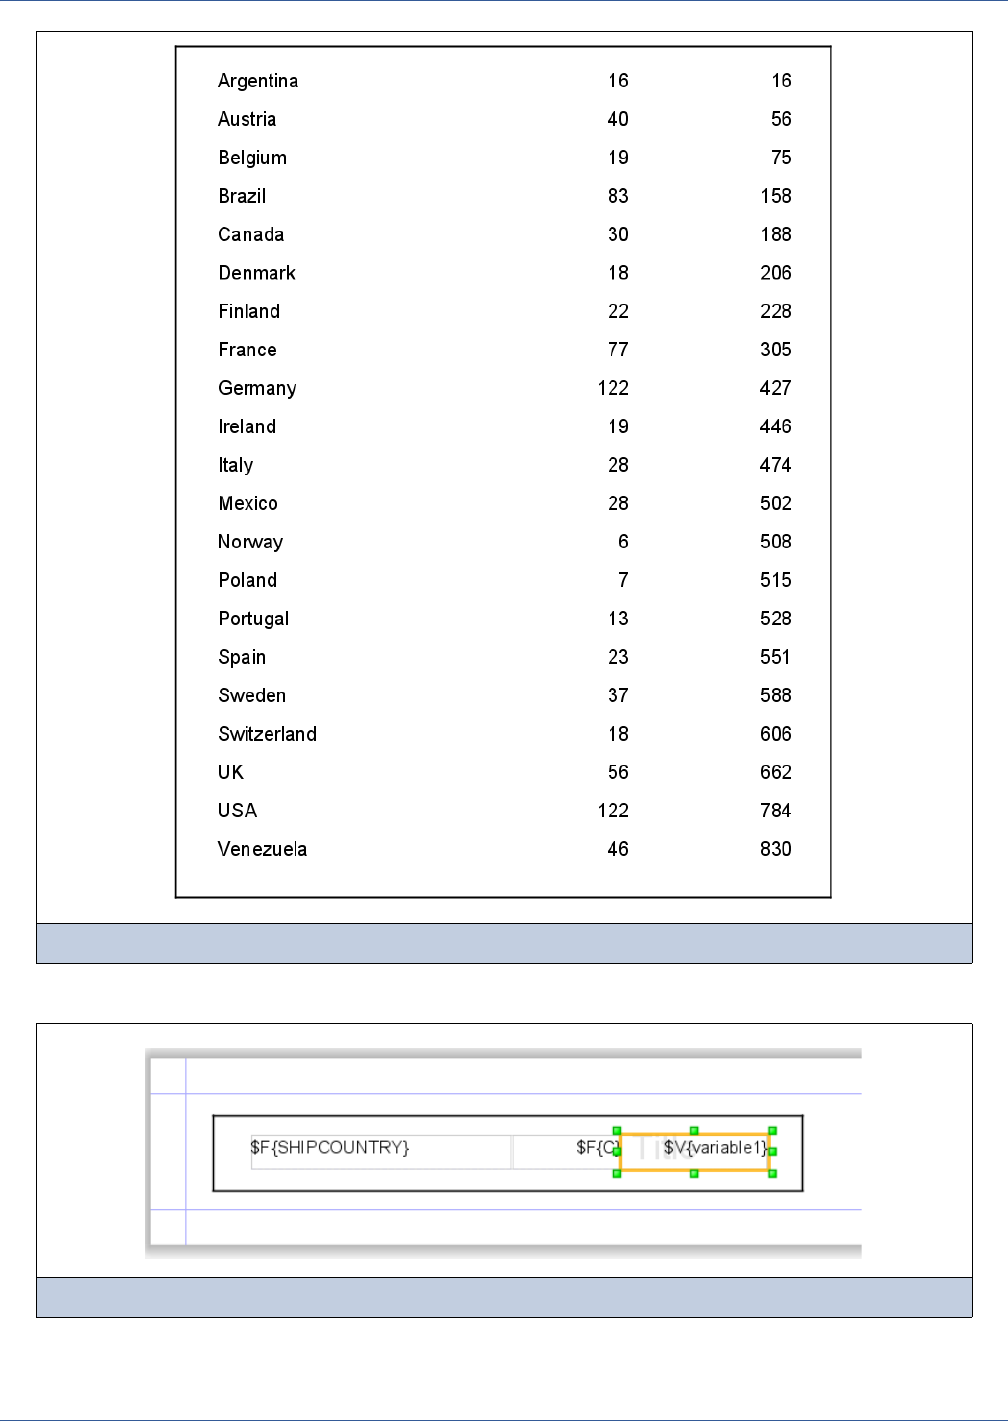
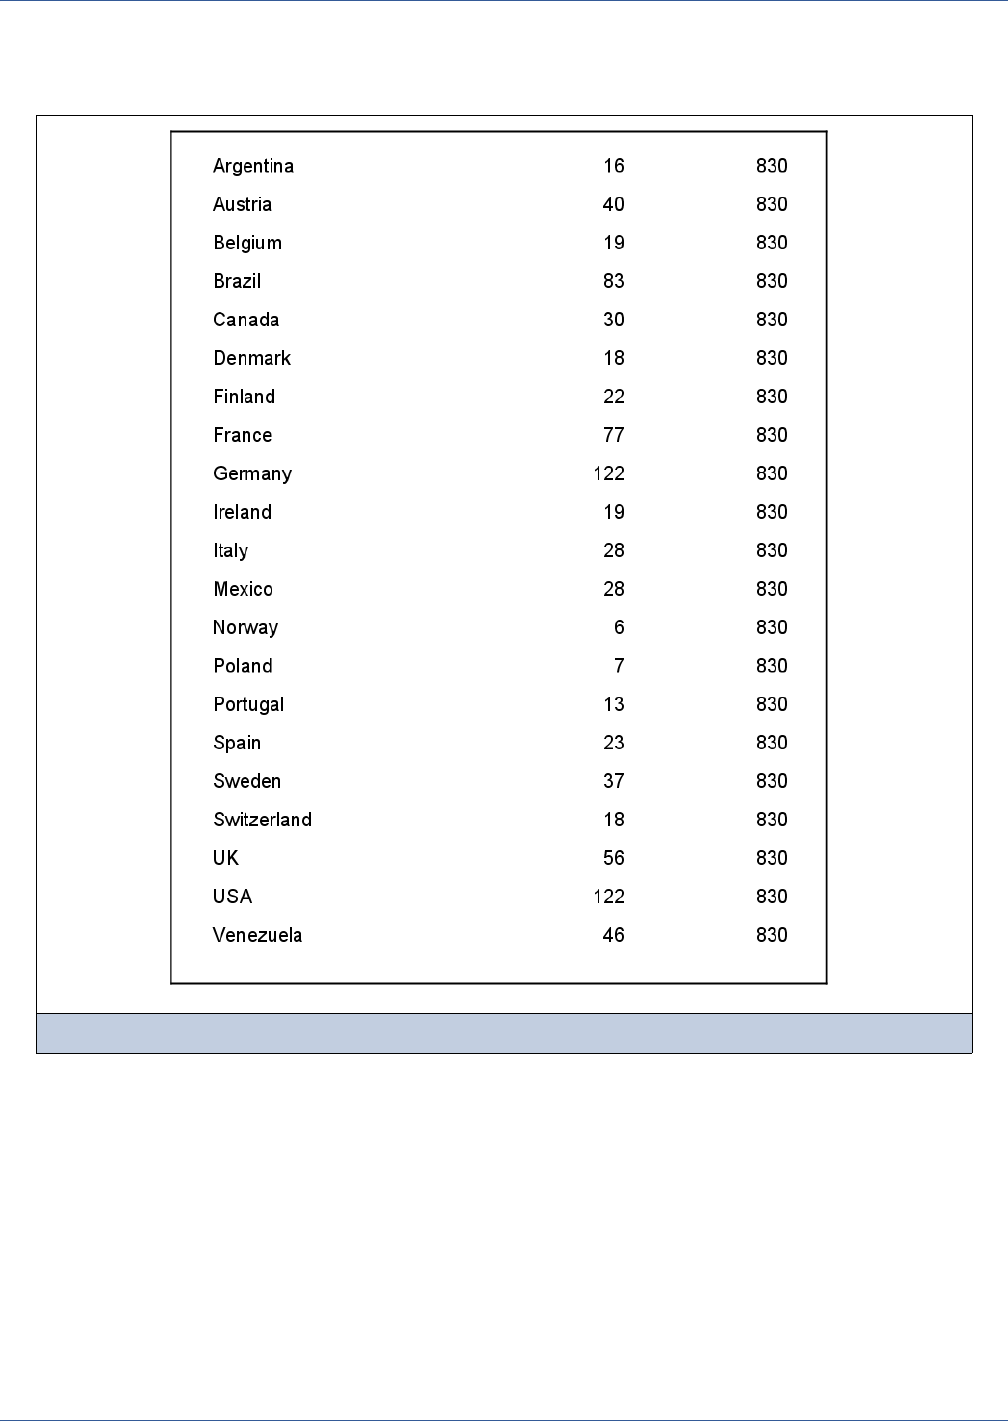
Lists, Tables, and Barcodes
265
List element variable1 has been defined in dataset1 as the sum of the C field—for each record the value of the variable is
the sum of the C fields of the elaborated records. By setting the evaluation time of the variable textfield to Report, we are able
to see the final value assumed by the variable (Figure 13-8).
13.1.3 List Component Issues
What happens if we want to print, for each country, the percentage of orders with respect to the total? The percentage
calculation requires two values: the number of orders of the country (the value of C at evaluation time) and the total number of
orders (the variable1 at evaluation time Report). The formula is pretty simple:
C/variable1
Since C and variable1 must be considered at different evaluation times, the evaluation time of the textfield showing this
result must be set to Auto. However, here we have the first major limitation of the List component, which is that it cannot use
the evaluation time Auto! As a result, to print this percentage we need to use a subreport, or we can precalculate the final value
of variable1.
Figure 13-8 List element with cumulative sum and evaluation time variables

266
iReport Ultimate Guide
Another limitation of the List component is the lack of support for return values. Unlike subreports, there is not a simple way
to return a value calculated in the List to the master report. However, this limitation can be overcome by using a scriptlet or
Java code, sharing a hash map between the main dataset and the List component dataset.
As we said, the List has no evaluation time or, to say it better, the evaluation time of a List element is always “now.” This is
generally not a problem, since List does not use the main dataset to collect the data to print. But it can be a limitation if we
want to print, in the List, data coming from an elaboration of the main dataset. For example, we may want to use a scriptlet to
collect data to print each record of the main dataset, like a table of contents and index, or information for which the data is
collected during the report execution. The problem can be partially overcome by placing the List in a portion of the report that
is reached only when the elaboration has been finished (for example, in the Summary band).
Finally, a List has no header or footer. While it is trivial to add static text on top of the List element, creating the effect of a
table header, the lack of a summary prevents you from printing totals or other calculation results at the top or bottom of the
List. This problem may be overcome by applying the same approaches that are used to return values from the List.
JasperReports provides as a built-in variable for subdatasets the variable REPORT_COUNT. It can be used to create an
alternating background for the list items. The effect is obtained using the same approach we would adopt for a band: instead of
putting the list item elements directly inside the List element, we put them in a Frame and we put the Frame inside the List.
The size of the frame should be the same as the List. Using a conditional style, it is possible to alternate the background of the
frame getting the alternated color for each item in the list.
A note about performance. The performance of a List element, like that of a subreport, depends on how it is used. If you use
many lists and they all perform SQL queries (for example, for each detail), performance can be reduced because you are
executing a query for every record in the main dataset. Of course, this starts to be a problem only if you have many records.
That said, using a List element can be faster than a subreport given its simple structure and the fact that it does not require
loading another Jasper file (which is usually cached).
13.1.4 Print Order: Vertical and Horizontal Lists
Print order is a property of the List that allows you to print the list elements vertically (which is the default) or horizontally. In
the latter case, the List element will grow horizontally. Note that, with some work, you can use a subreport and a horizontal
List element (placed in the Detail band of this subreport) to create something similar to a table with a dynamic number of rows
and columns.
13.1.5 Other Uses of the List
As we have seen, in spite of its name, a List elements is not just a way to print a simple list of items. It is a light subreport with
the convenience of not having to reference an external Jasper file. Moreover, it represents the best way to print data that cannot
be extracted using the main query or data source and for which a subreport would require inconvenient effort. An immediate
application of this property is to use List to decode the value of a field. For example, suppose you have field A which contains
a number. Depending on the number, a specific message or text must appear in the report. We can use a List element to print
the decoded values of A, which can be extracted using a query or data source.
13.1.6 Compatibility
The List component was introduced in JasperReports 3.5.2. This is the minimum version of JasperReports and iReport
required to use a List element. If a previous version of JasperReports is used, an error will be thrown. Since the error usually
refers to the JRXML syntax, it can be cryptic. Here is what you may get:
org.xml.sax.SAXParseException: cvc-complex-type.2.4.a: Invalid content was found starting
with element 'jr:list'. One of '{"http://jasperreports.sourceforge.net/
jasperreports":component}' is expected.
The error indicates that the element list in the namespace jr is not known and cannot be understood and used. The solution
is to upgrade JasperReports or remove the element.
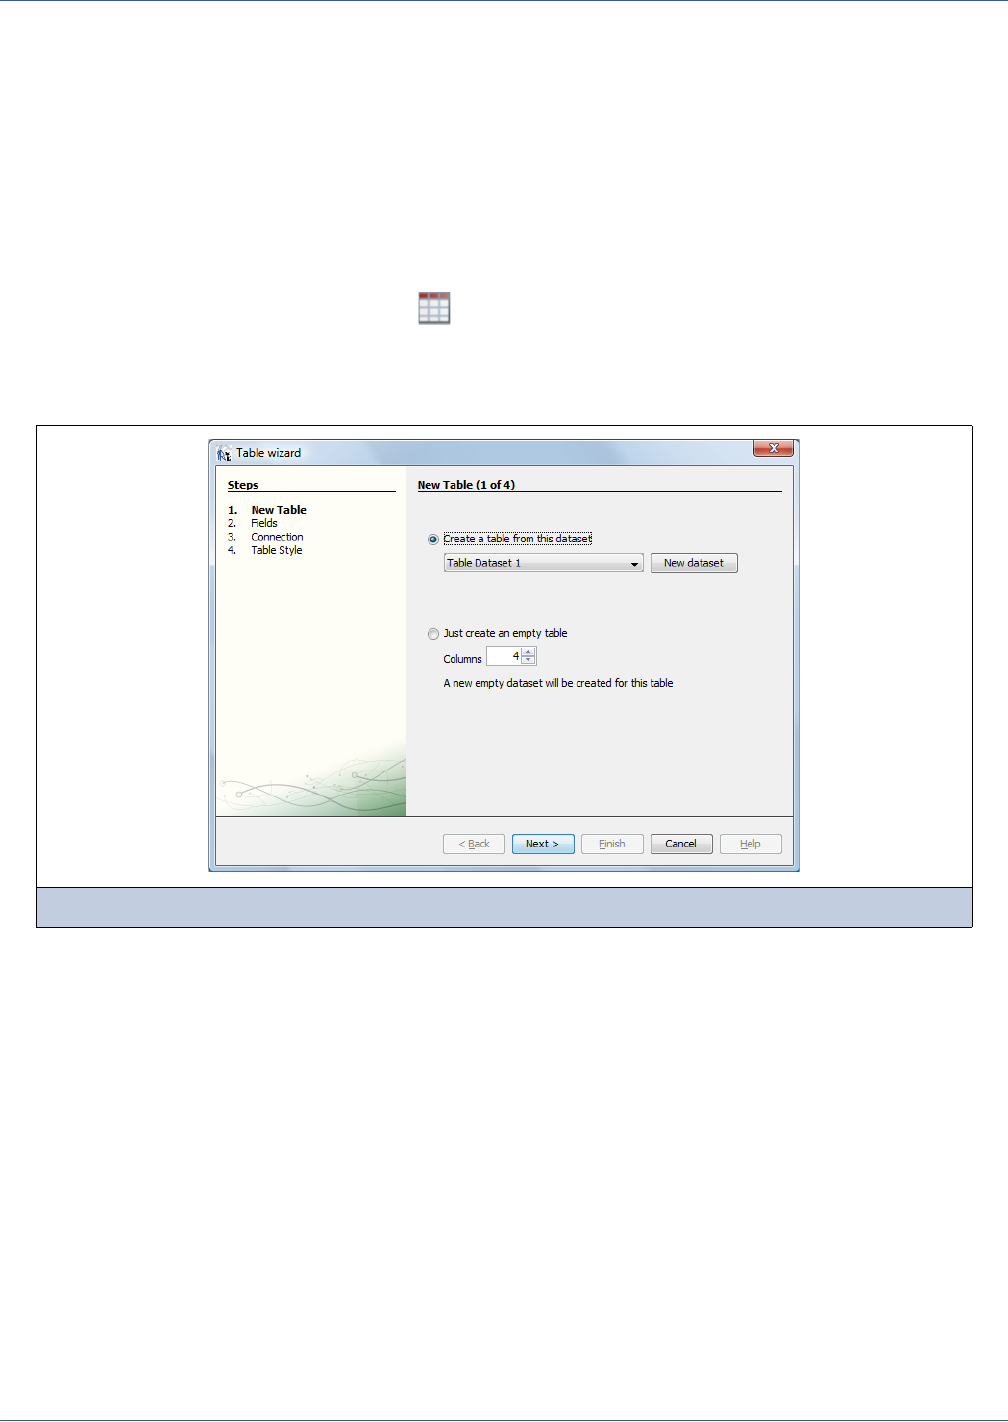
Lists, Tables, and Barcodes
267
13.2 Tables
The Table component displays data coming from a secondary dataset. It is an extremely powerful component which is able in
many situations to replace the use of subreports.
The Table wizard allows you to create a complex table with a few clicks. Each table cell can be a simple text element or it can
contain an arbitrary set of report elements including nested tables, creating very sophisticated layouts.
The Table component is available starting with JasperReports version 3.7.2.
13.2.1 Creating a Table
To create a table in a report, drag the Table element from the elements palette inside any band of the report (for
information about bands, see Chapter 7). This will start up the Report Wizard, which presents two options for creating the
table: create the table from a dataset or create an empty table with a fixed number of columns.
If you choose to create an empty table, a new dataset is created and bound to the table (Figure 13-9).
Creating from a dataset is more convenient. iReport presents a small number of steps for selecting the fields from the
specified dataset to include in the table, then it creates textfields in their proper cells to display the fields and their column
labels.
If an existing dataset is not available, it is possible to create a new dataset by clicking the New dataset button, which
starts the Dataset Wizard. iReport asks for the fields to use in the table.
The next step specifies how to get the data for the table. The data is described by the dataset, but in order to use the dataset, we
need to provide a connection to a database or other data source. This panel in Figure 13-10 provides some options for doing
this.
Figure 13-9 Table wizard - New Table
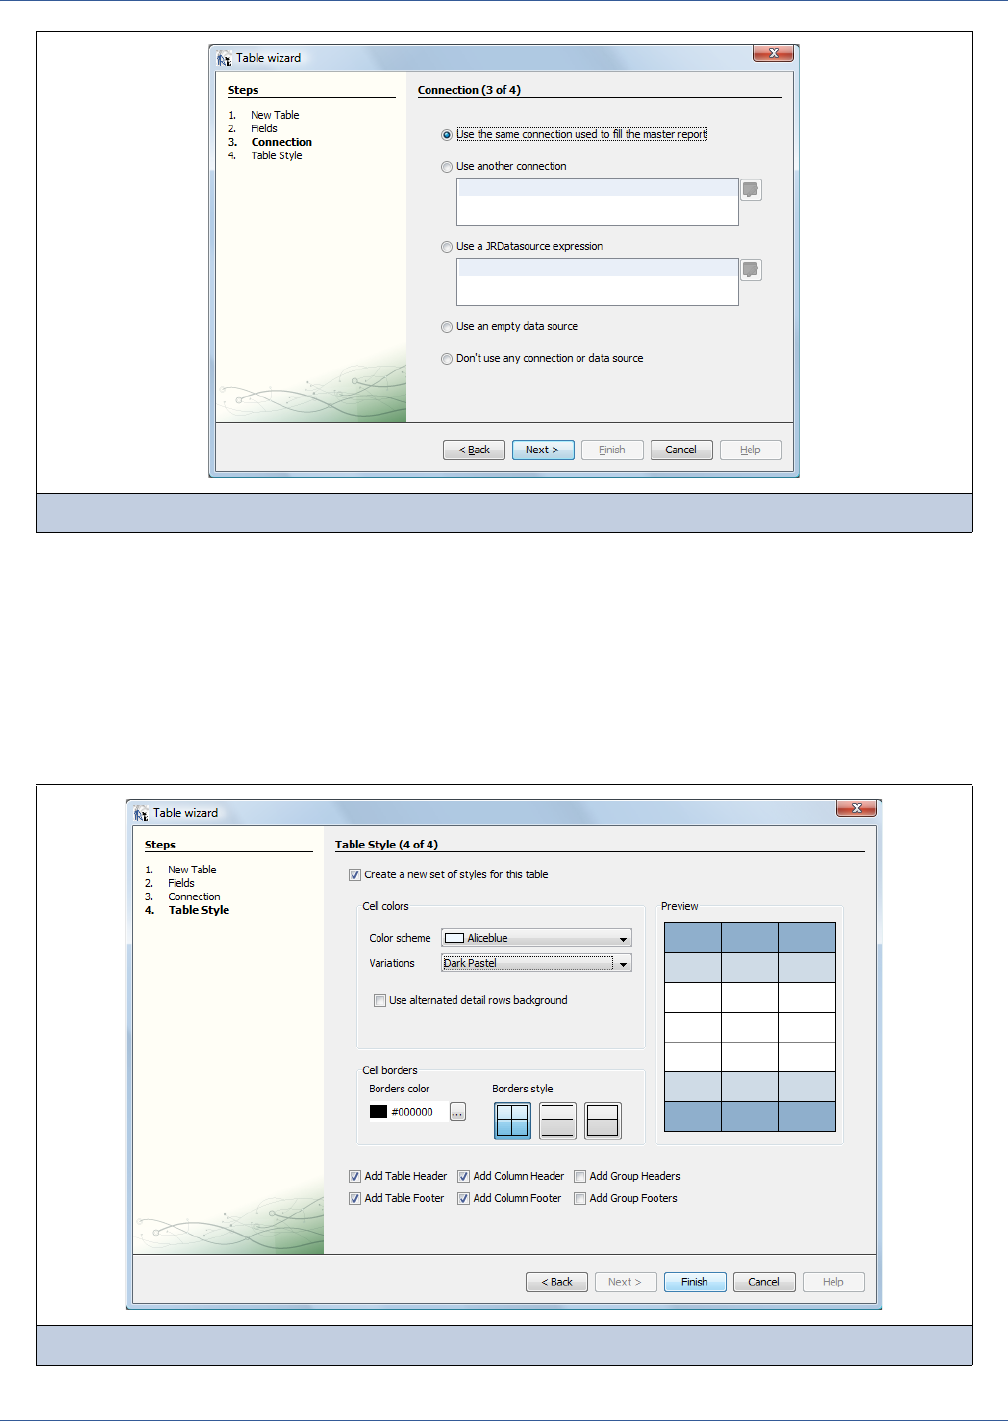
268
iReport Ultimate Guide
When the dataset uses an SQL query, except in very particular cases, the default option (using the same connection that you
used to fill the master report) is effective. If you need to use a different connection or data source (such as a connection
provided as a parameter), select Use another connection and enter a proper expression for it.
The last two options in the panel allow you to use an empty data source (useful when we want to create a table without relying
on external data) or to specify no connection or data source at all (this is a very special case, used, for example, when the
dataset uses a special query executer that does not need a source in order to produce the data).
The final step in creating a table allows you to specify the look and feel of the table (Figure 13-11). This step is presented
regardless the way you choose to create the table.
Figure 13-10 Table wizard - Connection
Figure 13-11 Table wizard - Table Style
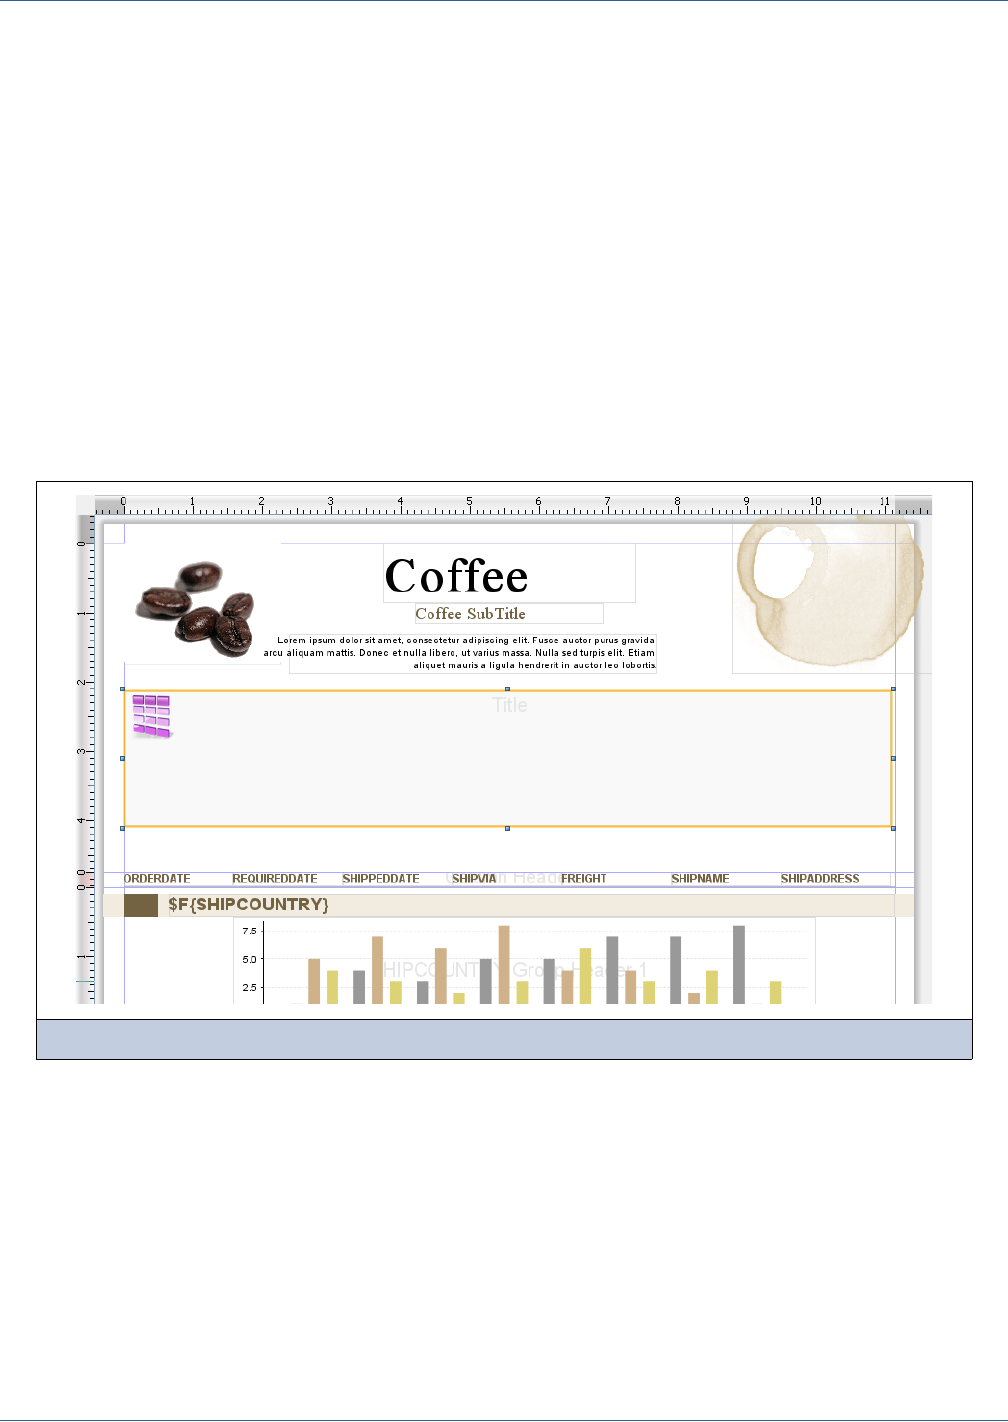
Lists, Tables, and Barcodes
269
iReport proposes in this final step to create a set of four styles to be used with the table; the style names are prefixed by
“Table”:
Table, which defines the external border to the table.
Table_TH, which defines the table header background color and cell borders.
Table_CH, which defines the table column background (we will discuss table structure in the next section).
Table_TD, which defines the detail cell style. This last style can have a nested conditional style to present an alternating
background color for the detail rows.
In addition, the color schema for the table can be created by choosing a schema name and, optionally, a variation. The colors
can be modified at any time. You can also define cell border colors and styles: full grid, horizontal lines for each row, and
horizontal row lines with a table border all round.
Finally, the user can decide which table sections to create. If the dataset for the table contains groups, it can be convenient to
select the check boxes Add Group Headers and Add Group Footers, which are deselected by default. This option will create
group header and footer sections in addition to the other sections.
Finishing the wizard, the new table element is created and the table editor is activated. The table editor works just like the
crosstab editor (Chapter 15)— in the main designer, the table is presented as a gray rectangle with a pink icon representing a
table (Figure 13-12).
13.2.2 Table Structure
13.2.2.1 The Table Element
A table must have at least one column but it can have more than one. A set of columns can be grouped into column groups; the
groups can have headers that span several columns.
Each table is divided into sections similar to the main document bands (Figure 13-13):
Table header and footer, which are printed only once at the beginning and at the end of the table, respectively.
Column header and footer, which are repeated on each page that the table spans. If there are one or more column groups,
the table can display a group header and footer section for each group, as well as for each column.
Figure 13-12 Table editor with new table
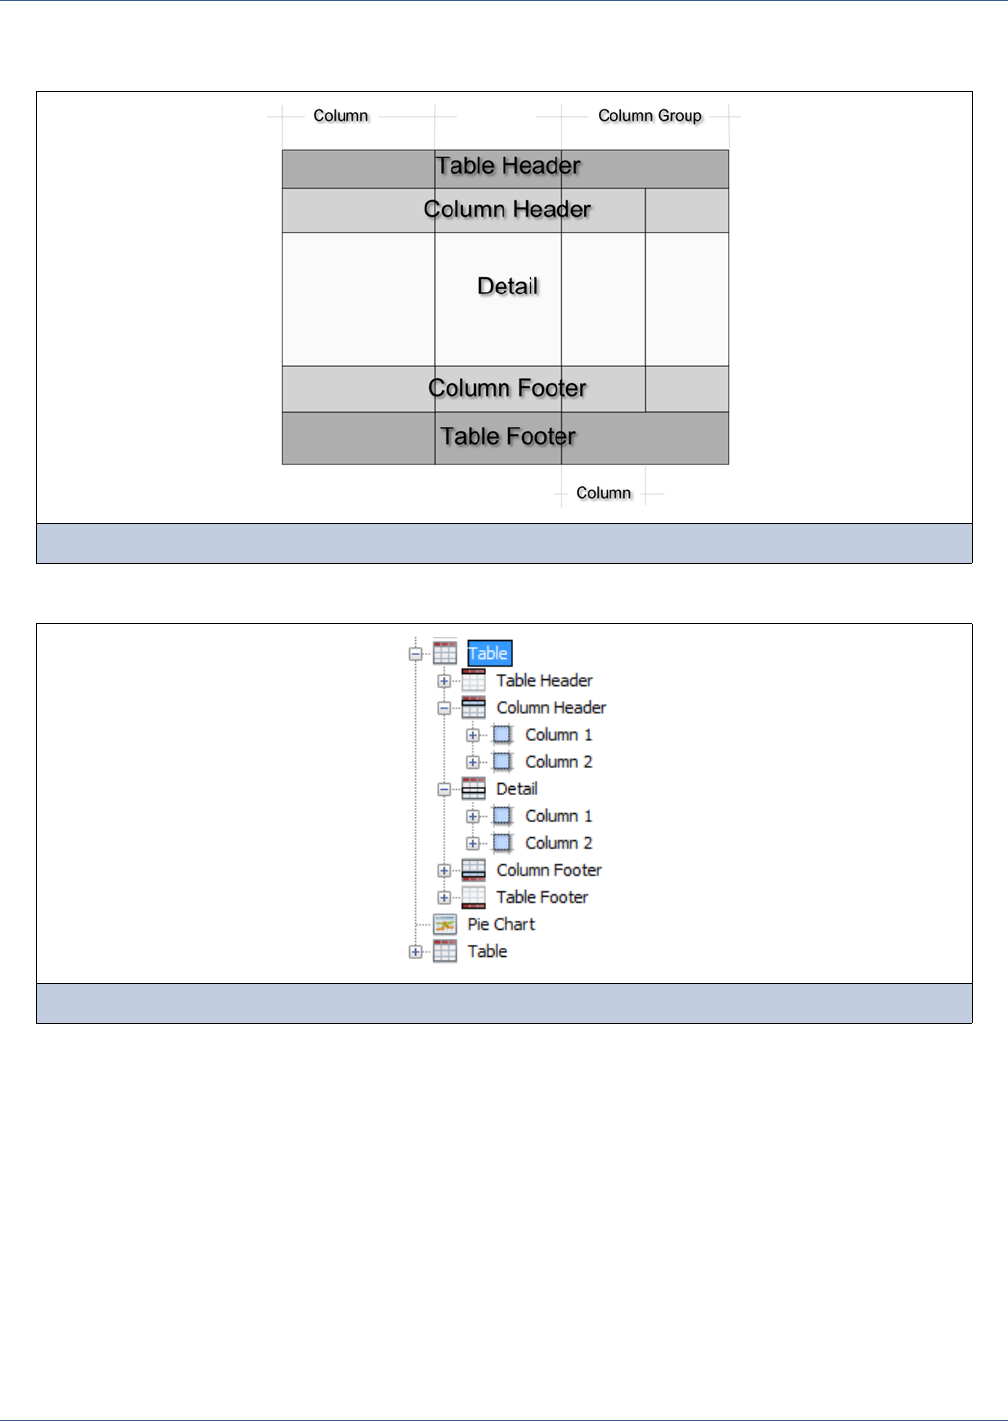
270
iReport Ultimate Guide
Detail section that is repeated for each record of the table. Each column contains only one detail section, and the section
cannot span multiple columns.
In the Report Inspector, table sections are presented as child nodes of the table element node (Figure 13-14).
When working with complex tables, it may hard to distinguish the table sections and cells. For this reason, when a table
section node is selected in the Report Inspector, iReport indicates the selected section with a pink bar in the designer’s side
ruler (Figure 13-15).
Figure 13-13 Table structure
Figure 13-14 Table in Report Inspector
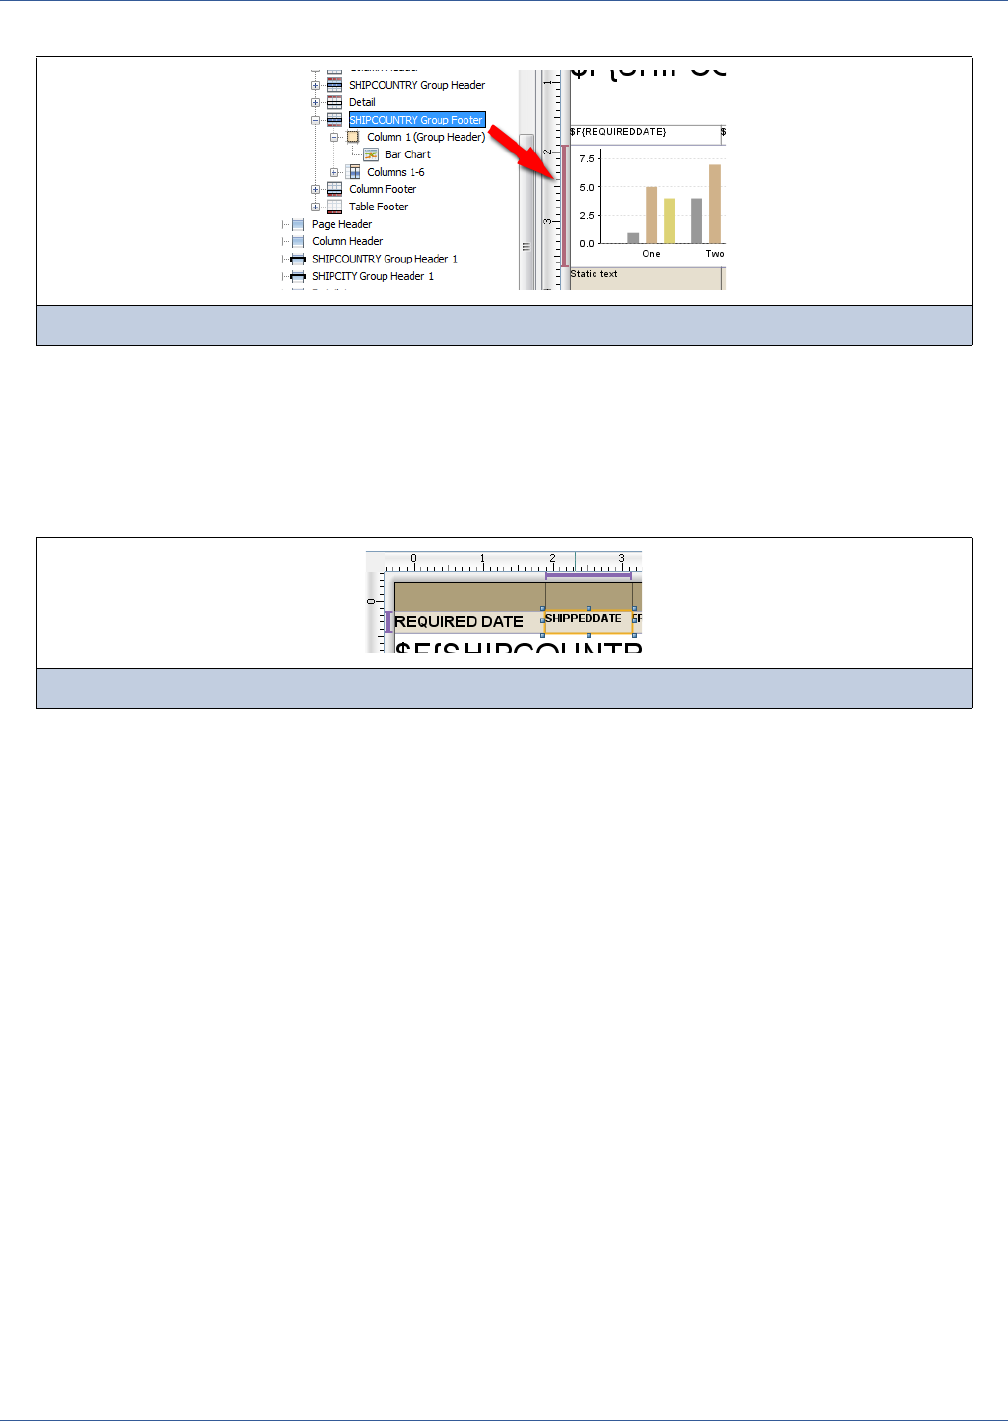
Lists, Tables, and Barcodes
271
In the designer, each column has a cell for each section (for example, one cell for the table header section, another for the table
footer, and so on). A cell can be undefined. If all the cells of a sections are undefined, the section is not printed. If the heights
of all the cells of a section are set to zero, the section is not visible in the designer but it is printed.
When a new table is created, iReport assigns different background colors to each section of the table. This should help to
identify the various sections. When a cell node is selected, violet side and top bars indicate the node’s position and dimensions
(Figure 13-16).
13.2.2.2 Column Groups
As we said before, a column is composed of a set of cells, one for each section of the table. If we want a header that spans
several columns, we have to create a column group. The group must contain one or more columns; it can contain other column
groups, as well. It also provides an additional header cell for each section of the table except for the detail section. These new
header cells span all the columns of the group.
Figure 13-17 shows a column group of two columns with a group header spanning the columns. In the figure, the column on
the left is a simple column. On the right is a column group with the additional header cell (the violet one) that spans the
columns of the group. This new group header cell does not replace the table header cell or the individual column header cells.
Figure 13-15 Section highlighted in Report Inspector
Figure 13-16 Highlighted cell
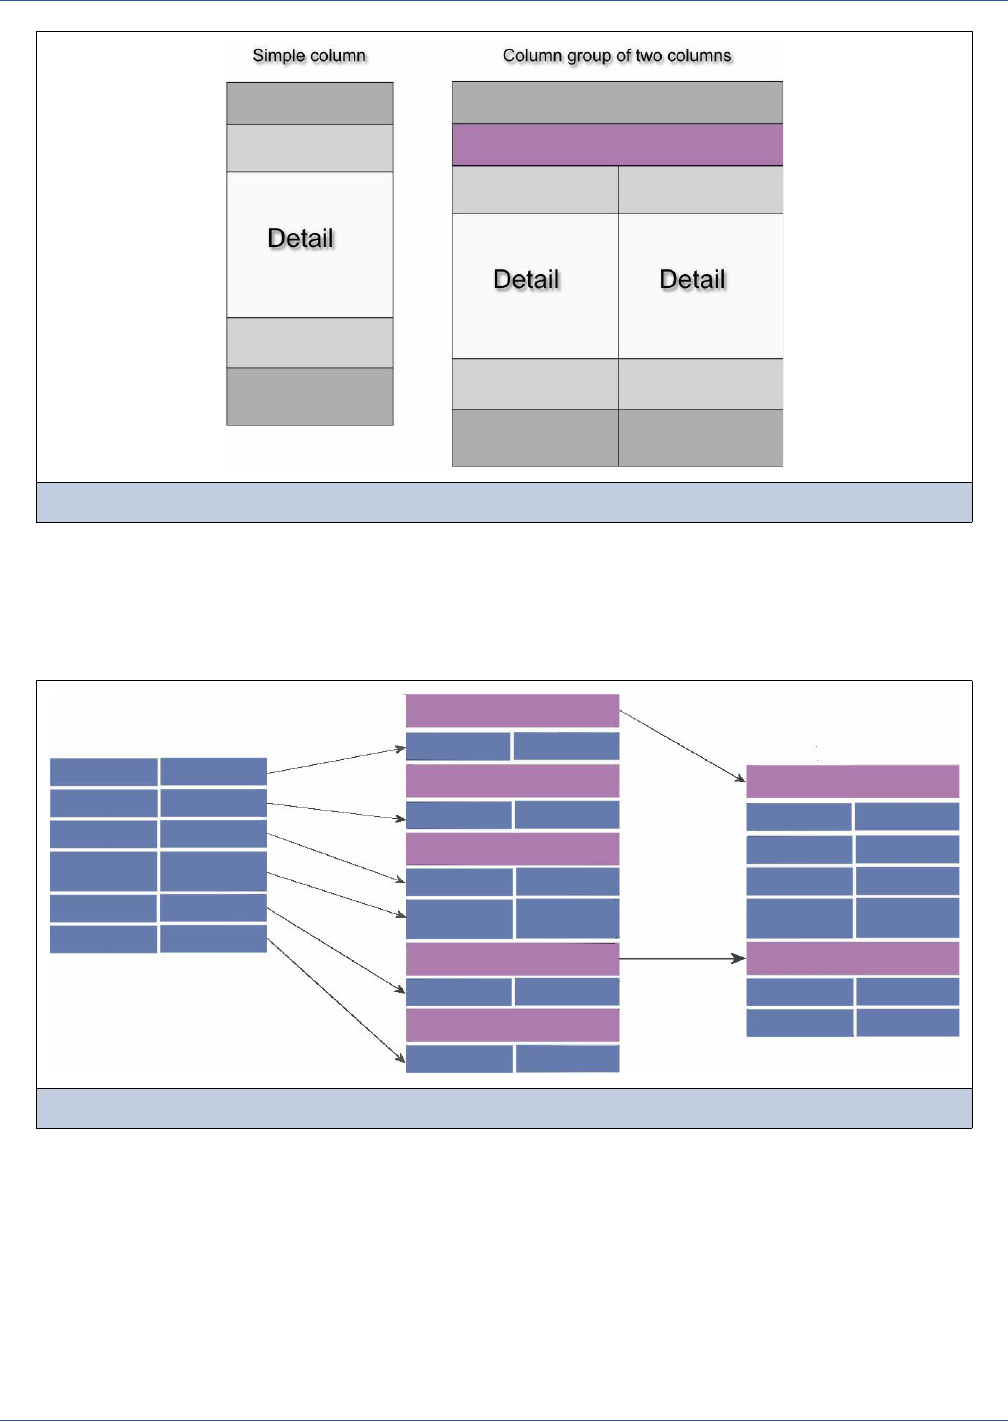
272
iReport Ultimate Guide
When you create a column group, every column section gets an additional header that spans all the columns in the column
group, as shown in Figure 13-18. On the left of the figure there are two columns. When the columns are grouped, each column
section gets a group header, as shown in the center (most of the sections have only one record, but one section has two).
However, most of the group headers are unnecessary, so their heights have been set to zero to hide them, as shown on the right.
13.2.2.3 Table Cells
A cell can contain any element provided by JasperReports, but since usually a cell displays only some text, when an element is
dropped on a cell, iReport automatically arranges the element to fit the cell size. If another element is dropped into the cell, a
vertical layout is performed. The elements in the cell can be arranged differently by right-clicking the cell (or an element in the
cell) and selecting Arrange Elements Vertically or Arrange Elements Horizontally. If this approach does not fit the user
requirements, the best solution is to put a frame element in the cell and add all the required elements to that frame.
If a cell is not required, it can be deleted by selecting the menu item Delete cell. If the cell is the only defined cell for the
column, the entire column will be removed.
Figure 13-17 Simple column vs. column group
Figure 13-18 Group headers
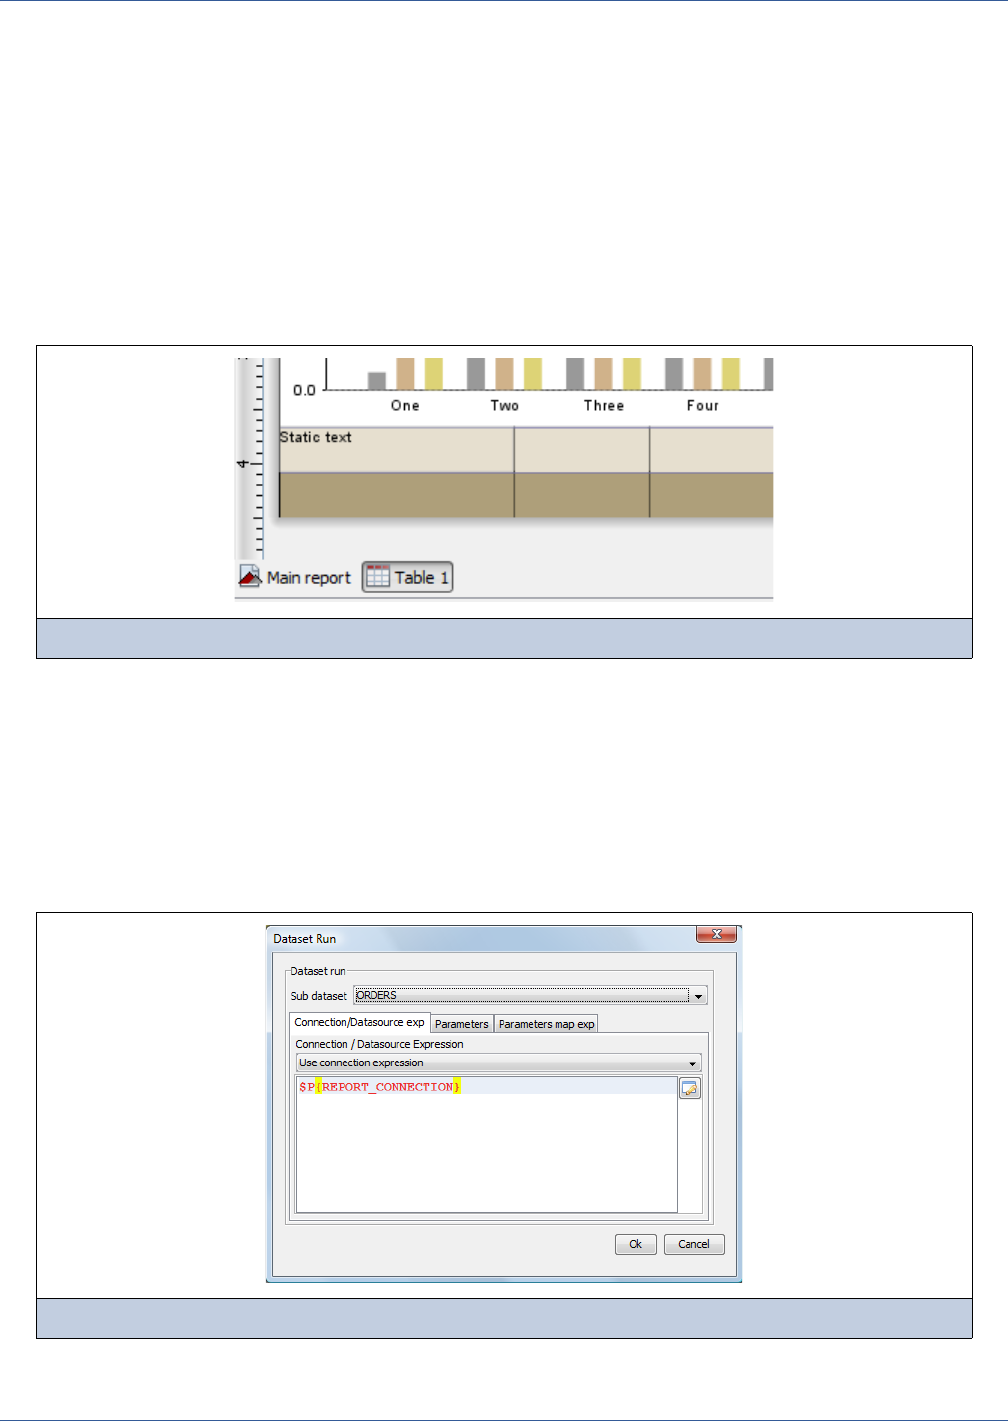
Lists, Tables, and Barcodes
273
Similarly, if a cell is undefined, right click it and select Add cell to create the cell. An undefined cell is automatically created
when the user drag an element into it.
The cell properties can be edited using the property sheet. The cell style is used to define the cell background and borders.
Although it is possible to define the cell padding, this does not work well with iReport. An alternative is to use the padding
available for text fields and image elements. The row span property is handled by iReport. Its use is strictly tied to nested
groups, and in general should never be changed by the user. Finally the cell height defines the height of a cell. When this value
is changed, it is propagated to all the cells on the same row.
13.2.3 Editing the Table Layout
To edit the table layout, switch to the table designer by clicking the designer button at the bottom of the main designer
(Figure 13-19).
Given the complexity of the table component, iReport provides a custom designer to create the table layout (just like for
crosstab elements).
13.2.4 Editing the Dataset Run
The dataset run for the table can be configured by right-clicking the table element and selecting Edit table datasource. The
dataset run defines how the dataset gets data. The dataset run is automatically configured by iReport when the table is created,
using the dataset selections made when the table was first created (13.2.1, “Creating a Table,” on page 267). These
selections can be changed at any time by using the Dataset Run dialog (Figure 13-20).
Figure 13-19 Designer button
Figure 13-20 Configuring the datasource for the dataset run
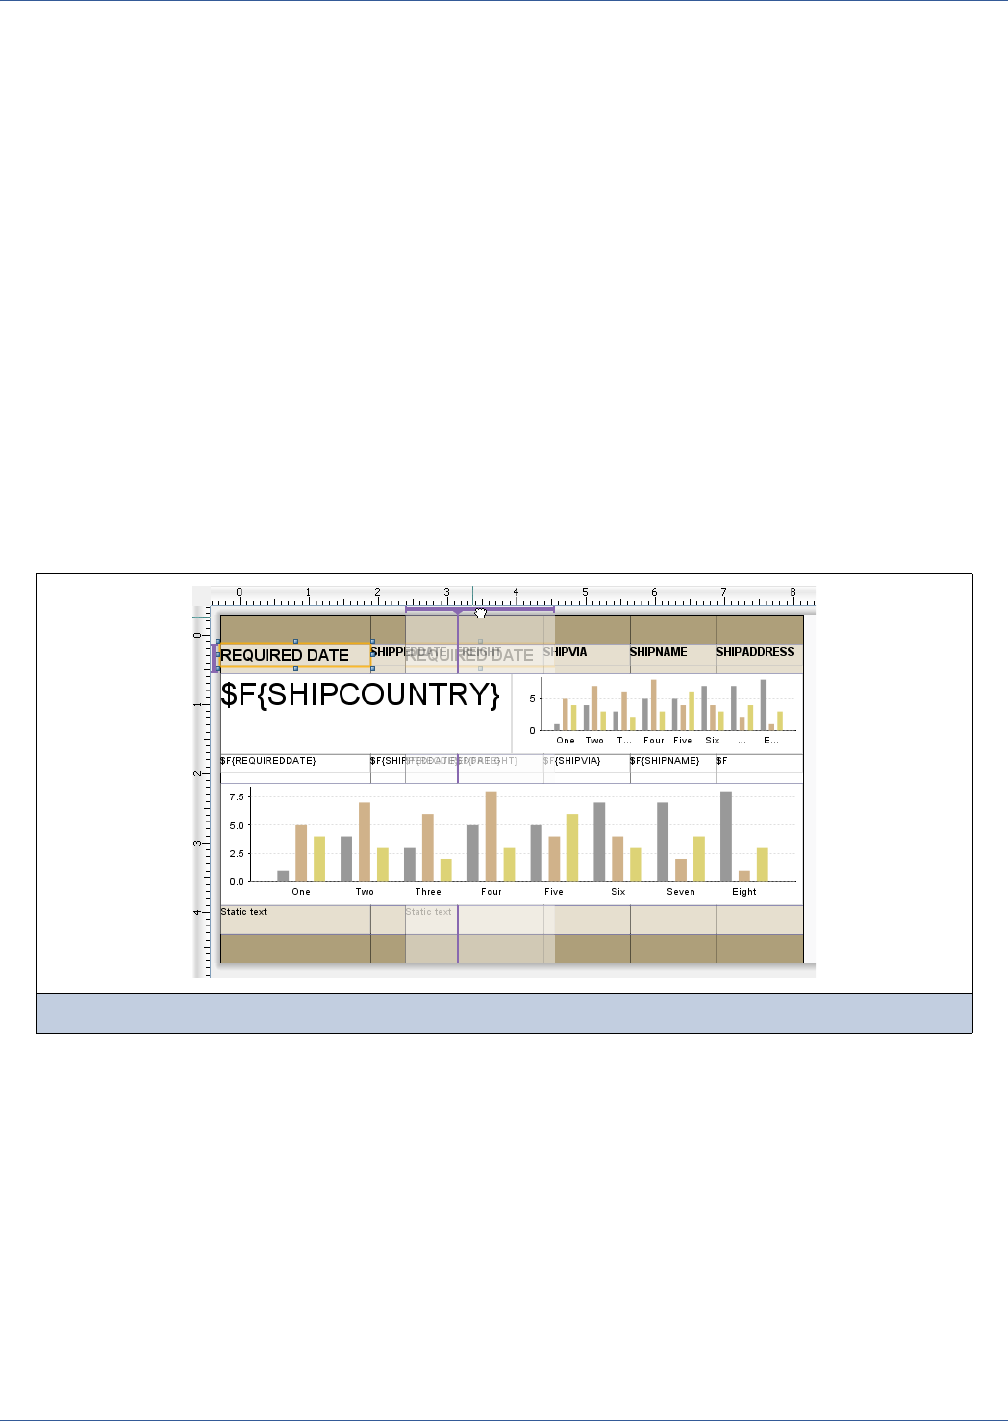
274
iReport Ultimate Guide
In this dialog, it is possible to set the values of the dataset parameters. The use of parameters allows you to dynamically filter
the data used to fill the table. Suppose, for instance, that you have a report that prints a set of orders. If we want to use a table
to display the order details, a parameter allows us to specify the order ID to filter the order details in an SQL query. There is
nothing new here, actually; we have seen how to configure a dataset run and how to use datasets in charts, crosstabs, and the
List component. In general, if we produce content by using a subdataset, we need a dataset run in order to bind the dataset used
by the element (the table element, in this case) and a datasource (regardless of whether it is a database connection or a more
sophisticated datasource). Unlike charts and crosstabs, a table always requires a subdataset; it cannot use the main dataset.
13.2.5 Working with Columns
To add a column to a table, select a section node from the Report Inspector or simply right-click in the table designer view in
an area which does not contain elements and select the menu item Add Column to the beginning or Add Column to the end.
By default, when iReport adds a column, it contains the following cells: detail, table header and footer, column header and
footer. The other cells are undefined; they will be presented like a transparent cell (they may be not visible if the section to
which they belong contains no other cells). The cells have no formatting properties, but it is possible to define their look and
feel using a style (when creating a new column it is good practice to set the proper style to each cell). To do it, select each cell
one by one by clicking in the cell area (or by selecting the cell node in the Report Inspector) and use the property sheet to set
the style.
When a new column group is added to the table, iReport creates a new column group at the end of the table. The group is
created with two columns and all the group cell headers.
A column can be moved by dragging the violet bar above it in the ruler (Figure 13-21).
A column can be dragged in any position, inside or outside of a group. If a column group is selected, the dragging operation
will interest the entire group which will act as a single big column.
If a column is the only column of a group and the column is dragged out of the parent group, iReport displays the message in
Figure 13-22.
Figure 13-21 Dragging a column
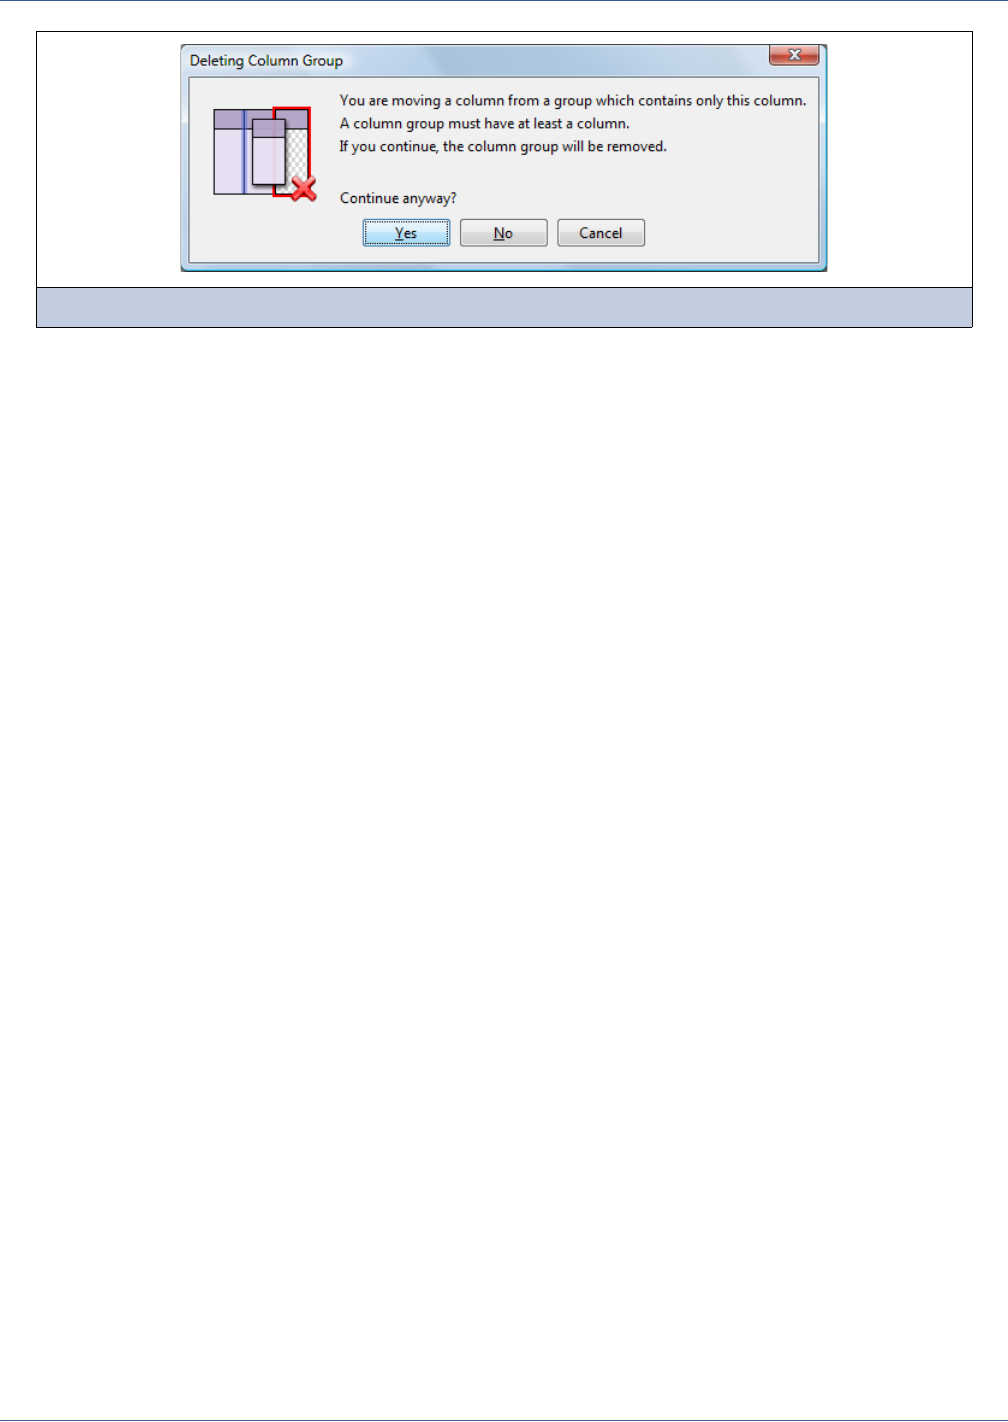
Lists, Tables, and Barcodes
275
This message informs the user that the column we are being to move is the only column inside a column group which will be
removes after the column has moved, since the group will not contain at that point any other columns.
Alternatively, columns can be moved using the Report Inspector by dragging the nodes that represent columns, in the new
location within the same section.
To remove a column, select a cell of the column (or the column node in the inspector view) and select Delete column from the
contextual menu item.
13.2.6 Compatibility
The Table component has been introduced in JasperReports 3.7.2. This is the minimum version of JasperReports and iReport
required to use a Table element. If a previous version of JasperReports is used, an error will be reported. Since the error
usually refers to the JRXML syntax, it can appear really cryptic. Here is a message you may get:
org.xml.sax.SAXParseException: cvc-complex-type.2.4.a: Invalid content was found starting
with element 'jr:table'. One of '{"http://jasperreports.sourceforge.net/
jasperreports":component}' is expected.
The error is just saying that the component table in the namespace jr is not known and cannot be understood or used. The
solution is to remove the Table element or upgrade to JasperReports 3.7.2.
13.3 Barcodes
The barcodes are rendered by two open source libraries: Barbecue and Barcode4J. When a new Barcode element is added to a
report, the user can choose which library to use. Both libraries provide a variety of barcode types, but there are differences in
the options that can be set. We will see them later. The choice of which library to use may be influenced by other factors, as
well; for instance, if a particular library is already used in an application, the designer can choose to use the same library to
design the reports, as well.
Figure 13-22 Deleting a column group

276
iReport Ultimate Guide
The following table shows the barcode types implemented by the two libraries:
13.3.1 Working with Barcodes
To create a barcode, just drag the Barcode element from the elements palette into any band of the report (Figure 13-23).
Barbecue Barcode Component Barcode4J Barcode Component
2 of 7
3 of 9
Bookland
Codabar
Code128
Code128 A
Code128 B
Code128 C
Code39
Code39 (Extended)
EAN128
EAN13
Global Trade Item Number
Interleaves 2 of 5
Monarch
NW7
PDF417
PostNet
Random Weight UPCA
SCC14 Shipping Code
Shipment Identification Number
SSCC18
Std2of5
UCC128
UPCA
USD3
USD4
USPS
Codabar
Code39
Code128
DataMatrix
EAN128
EAN13
EAN8
Royal Mail Customer
USPS Intelligent Mail
Interleaves 2 of 5
UPCA
PostNet
PDF417

Lists, Tables, and Barcodes
277
After dragging the element, the barcode chooser pops up. This allows you to select the barcode type and the library that
implements it (Figure 13-242).
To select a barcode type, double-click it, or select it and click Use Barbecue or Use Barcode4J.
The barcode properties are presented in the property sheet (Figure 13-25). They include the common properties of the element
(such as the position and size) and a set of properties that are specific to the barcode implementation.
Figure 13-23 Barcode element in Report Elements palette
Figure 13-24 Barcode chooser
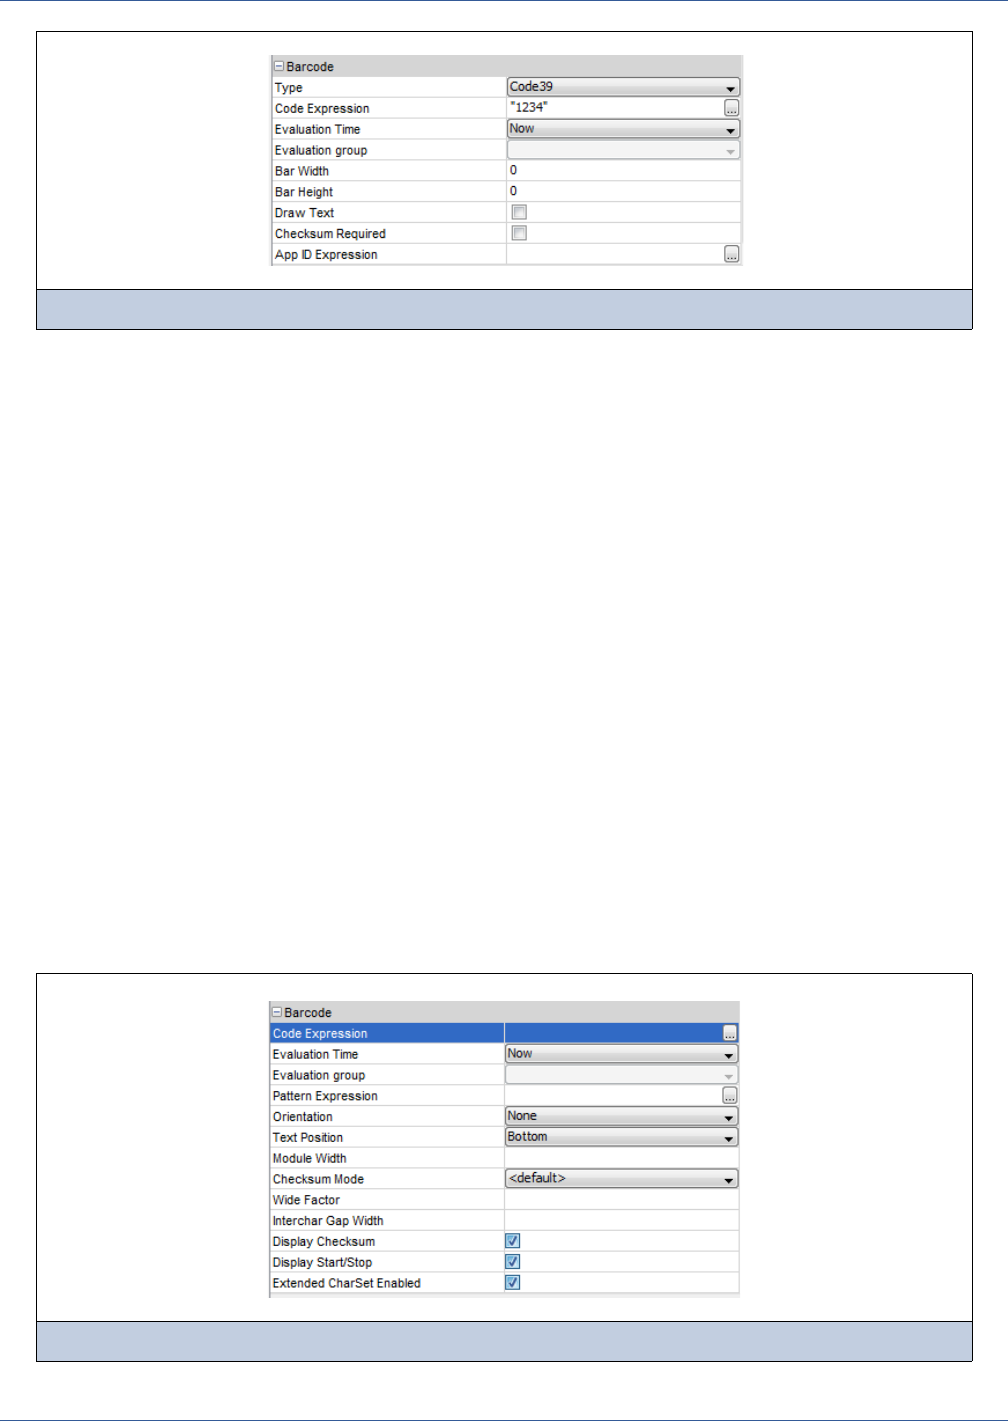
278
iReport Ultimate Guide
13.3.2 Barbecue Component
The Barbecue component provides the following element properties:
13.3.3 Barcode4J Component
Barcode4J provides a smaller set of barcodes with respect to Barbecue, but it has many more options. Some of them are
specific to particular barcode types (Figure 13-26).
Figure 13-25 Barbecue barcode properties
Type This is the barcode type. Even if it is chosen in the barcode chooser, it is possible to
change the type of the barcode at any time.
Code Expression This is the expression used to specify the value of the barcode. It is a string, but
please note that some barcode types1 do not accept all the UTF8 characters, some
of them just accept numbers and others require a fixed length of the provided value.
Evaluation Time The time at which the element expression must be evaluated.
Evaluation Group The group for the evaluation time “Group”.
Bar Width The width of a bar in the barcode.
Bar Height The height of the bars in the barcode
Draw Text If checked, the code expression value is printed as string above the barcode
App ID Expression Expression to define the Application ID. This value is used only by some chart
types.
Figure 13-26 Barcode4J barcode properties
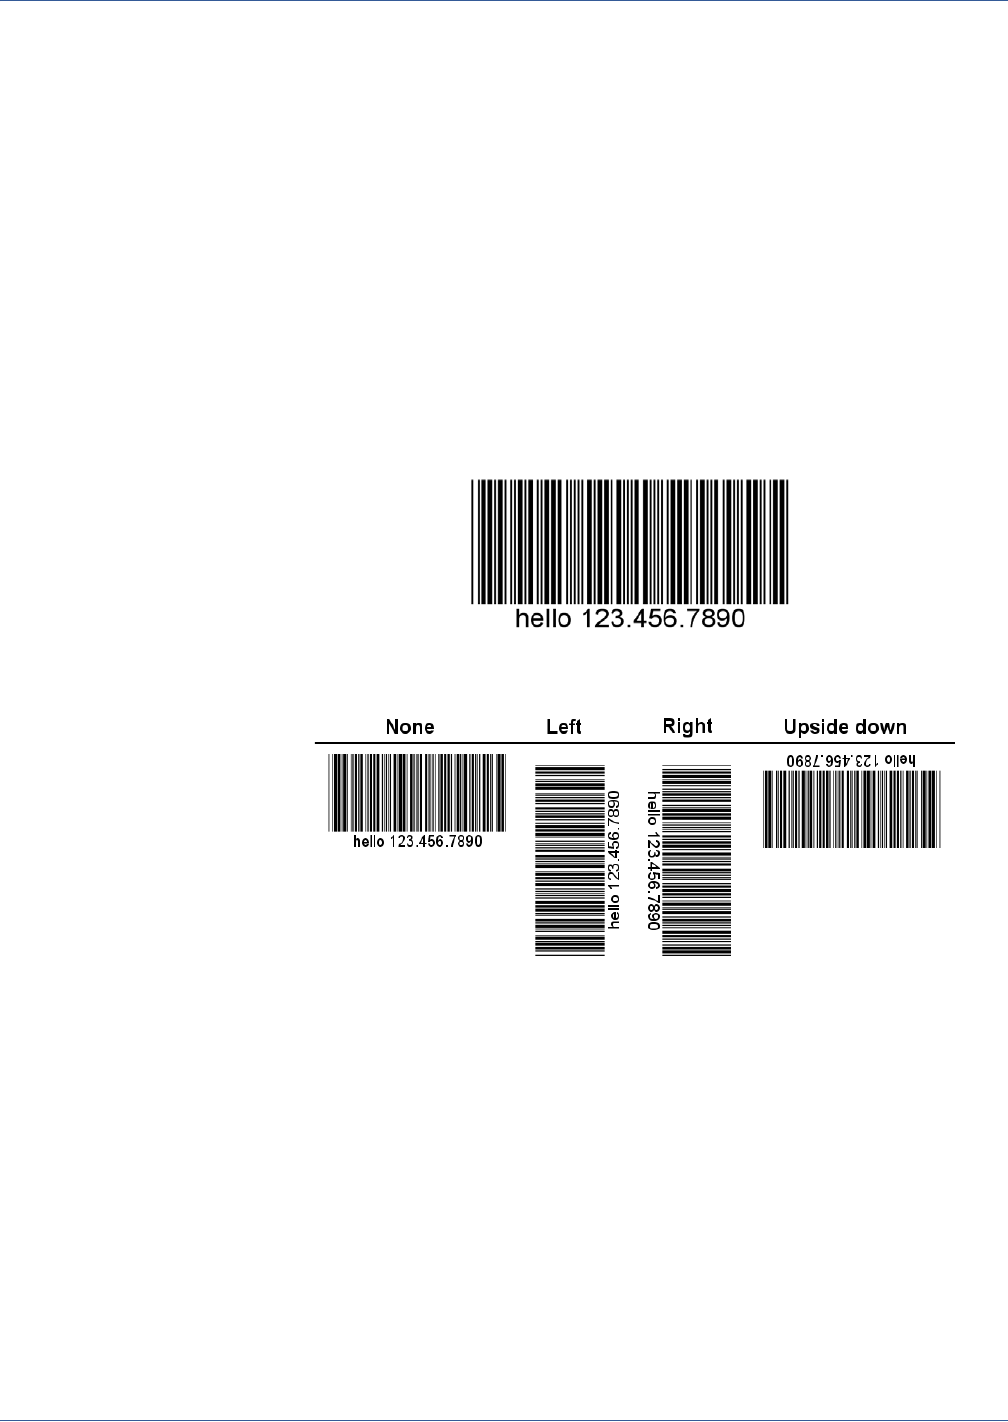
Lists, Tables, and Barcodes
279
When using Barcode4J, the barcode type must be chosen in the barcode chooser. There is not a type property as there is for the
Barbecue implementation (which allows you to change the type later). The Barcode4J properties are as follows:
Code Expression This is the expression used to specify the value of the barcode. It is a string, but note that
some barcode types do not accept all the UTF-8 characters; some of them accept numbers
and others require a fixed-length string.
Evaluation Time The time at which the element expression must be evaluated.
Evaluation Group The group for the evaluation time “Group”.
Pattern Expression This expression is used to specify how to format the value of the barcode so that it is more
easily readable for humans. This is especially useful with long numbers. The pattern is used
only for Interleaves 2 of 5, Code 39, Code 128 and Codabar. The pattern is a simple string
where the character “_” (underscore) is used as placeholder for a single character of the
barcode value. The backslash is an escape character, so to print the underscore in the
printed value, use the sequence “\_”. A double backslash will print a single backslash. All the
other characters are printed normally.
Here is a Code 39 barcode (which accepts only numbers) with the pattern “hello
___.___.___” applied:
Orientation The Orientation property allows setting the orientation of the barcode, which can be
None (default), Left, Right and Upside Down.
Text Position This property indicates where the text should appear. The possible values are: Bottom
(default), None (meaning no text must be shown) and Top.
Module Width This is the width of the thinnest of the bars.
Display Checksum Some barcode types support the calculation of a checksum. This property you allows show
or hide the checksum.
Checksum Mode Some barcode types support the calculation of a checksum. In this case, it is possible to
specify the action that should be performed by the barcode generator. The possible actions
are:
add. The checksum is automatically added to the barcode value.
check. The checksum (which must be present already in the barcode value) is verified
when the barcode is generated.
ignore. No action is performed.
auto. Force the default behavior of the barcode.

280
iReport Ultimate Guide
13.3.4 Compatibility
JasperReports 3.5.1 is the minimum version of JasperReports and iReport required to use a Barcode element. If a previous
version of JasperReports is used, an error will occur. Since the error usually refers to the JRXML syntax, it can appear cryptic.
Here is an example of the error you may get:
org.xml.sax.SAXParseException: cvc-complex-type.2.4.a: Invalid content was found starting
with element 'jr:Code39'. One of '{"http://jasperreports.sourceforge.net/
jasperreports":component}' is expected.
The error just says that the element Code39 in the namespace jr is not known and cannot be understood and used. The
solution is to upgrade JasperReports or remove the barcode element from the XML.
These barcode components are not compatible with the barcode implementation provided in iReport up to version 3.0.0. That
implementation used the Barbecue library to render an image element. This can still work in newer versions of iReport by
adding to the iReport classpath the JAR iReport-utils-3.0.0.jar, which can be generated from any source distribution of iReport
3.0.0. However, there is no longer a UI in which to configure them. In any case, since the old implementation rendered the
barcode as a raster image, you can obtain better quality in documents supporting SVG format by using the new
implementation. It provides many more options and it is tightly integrated with JasperReports.
Wide Factor This value is used to multiply the width of the bars, making the barcode wider.
Interchar Gap
Width
This value controls the space between a group of bars that represent a single character.
Display Start/Stop Code 39 barcode supports special bars to represent the start and the end of the barcode
(these bars represent the character *). This property allows you to show or hide the start/
stop bars.
Extended Charset Code39 by default is able to print only numbers. If this property is set to true, all of the US-
ASCII 7-bit characters can be used.
Shape This property is used by the Data Matrix barcode and allows you to choose the symbol to
use for rendering. The possible values are:
force-none. Both square and rectangular symbols.
force-square. Only square symbols.
force-rectangle. Only rectangular symbols.
Ascender Height Use this for Royal Mail CBC and USPS Intelligent Mail; it allows you to set the height of the
ascender bars
Track Height Use this for Royal Mail CBC and USPS Intelligent Mail; it allows you to set the height of the
track bars.
Short Bar Height This property allows you to set in a POSTNET barcode the height of the short bars.
Baseline Position This property determines whether the short bars in a POSTNET barcode are aligned on the
bottom or top or the barcode.
Min and Max
Columns
In PDF417 barcodes, these numbers set the minimum and maximum number of columns
that can be used to render the barcode. The allowed range is between 1 and 30.
Min and Max Rows In PDF417 barcodes, these numbers set the minimum and maximum number of rows that
can be used to render the barcode. The allowed range is between 3 and 90.
Width to Height
Ratio
This property allows you to set the ratio of the barcode symbols in a PDF417 barcode.
Error Correction
Level
This property is used for PDF417 barcodes; it allows you to set the error correction level,
which must be a value between 0 and 8.

Subdatasets
281
CHAPTER 14 SUBDATASETS
Report generation is based on a single data source, such as a query, a collection of JavaBeans, or an XML file. With a chart or
a crosstab, this might not be sufficient, or it might simply be easier to retrieve data using a specific query or, in general, using
another dataset. In a similar vein, you can use a subdataset to provide a secondary record nested within a report (performing an
additional query using a new data source or even the same connection that is used to fill the master report). Currently, you can
use a subdataset to fill Chart, Crosstab, and List elements, but a developer may be able to use it in other ways by creating a
custom component.
You can have an arbitrary number of subdatasets in a report. Each one has its own fields, variables, and parameters and can
have a query executed as needed. The dataset records can be grouped in one or more groups (like in a main report); these
groups are used in subdataset variables.
A subdataset is linked to its element by means of a dataset run. The dataset run specifies all the information needed by the
subdataset to retrieve and filter data and to process the rows used to fill the element.
This chapter has the following sections:
Creating a Subdataset
Creating Dataset Runs
Working Through an Example Subdataset
14.1 Creating a Subdataset
To create a new subdataset, right-click the root node in the outline view and select Add Dataset from the context menu (see
Figure 14-1).
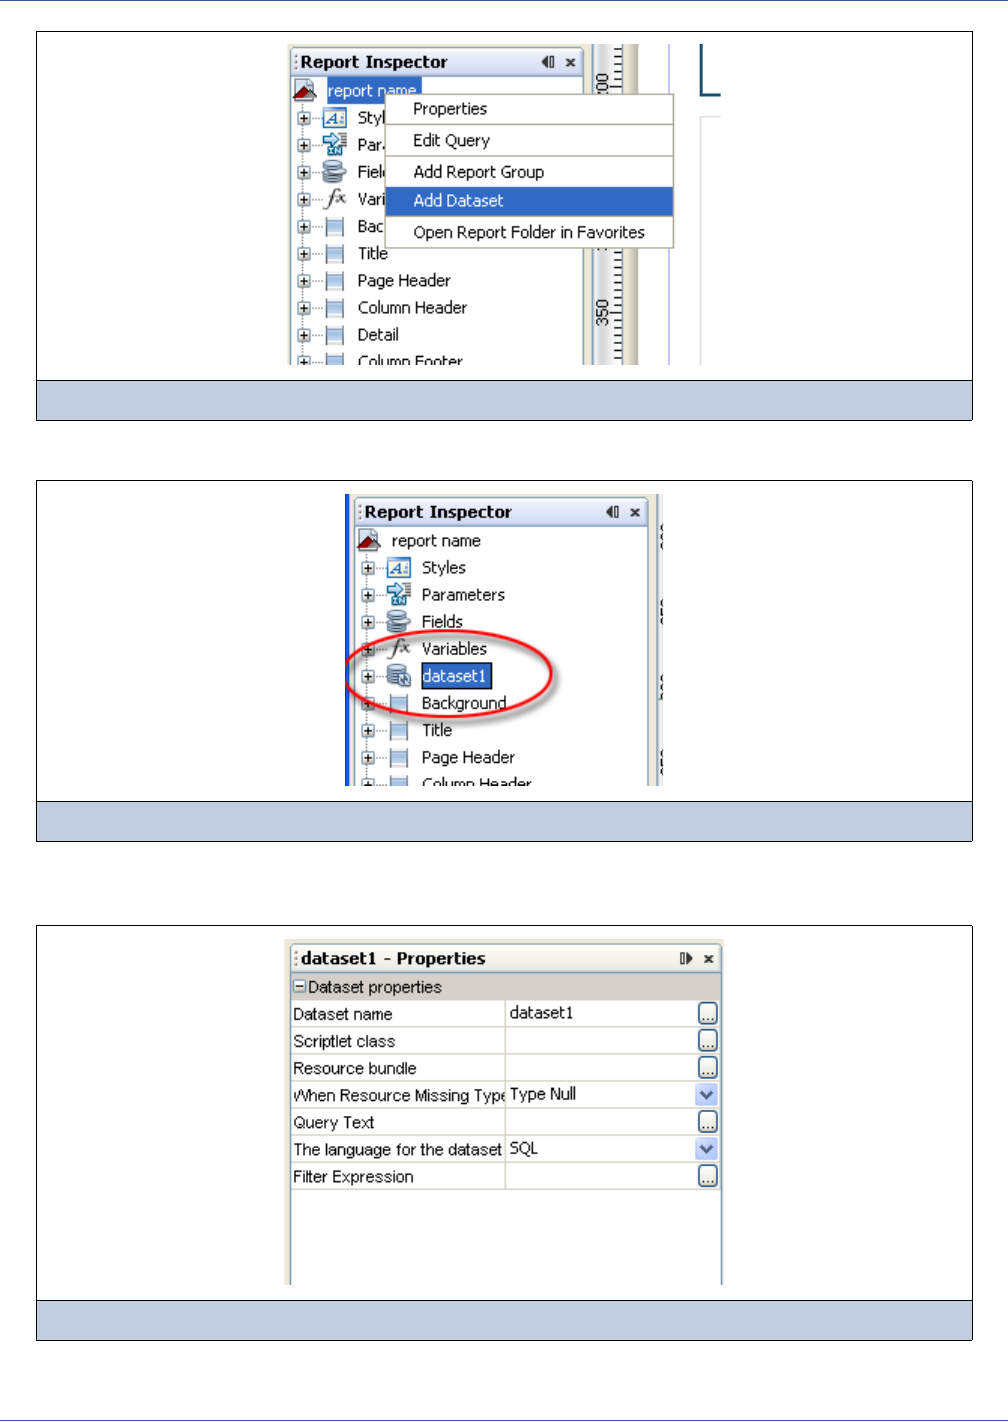
282
iReport Ultimate Guide
The new subdatset appears in the outline view (see Figure 14-2).
The property sheet for a node allows you to specify all the subdataset details (Figure 14-3). You can set the name of the
dataset, which must be unique within your report.
Figure 14-1 Creating a new subdataset
Figure 14-2 The new subdataset in the outline view
Figure 14-3 Subdataset properties
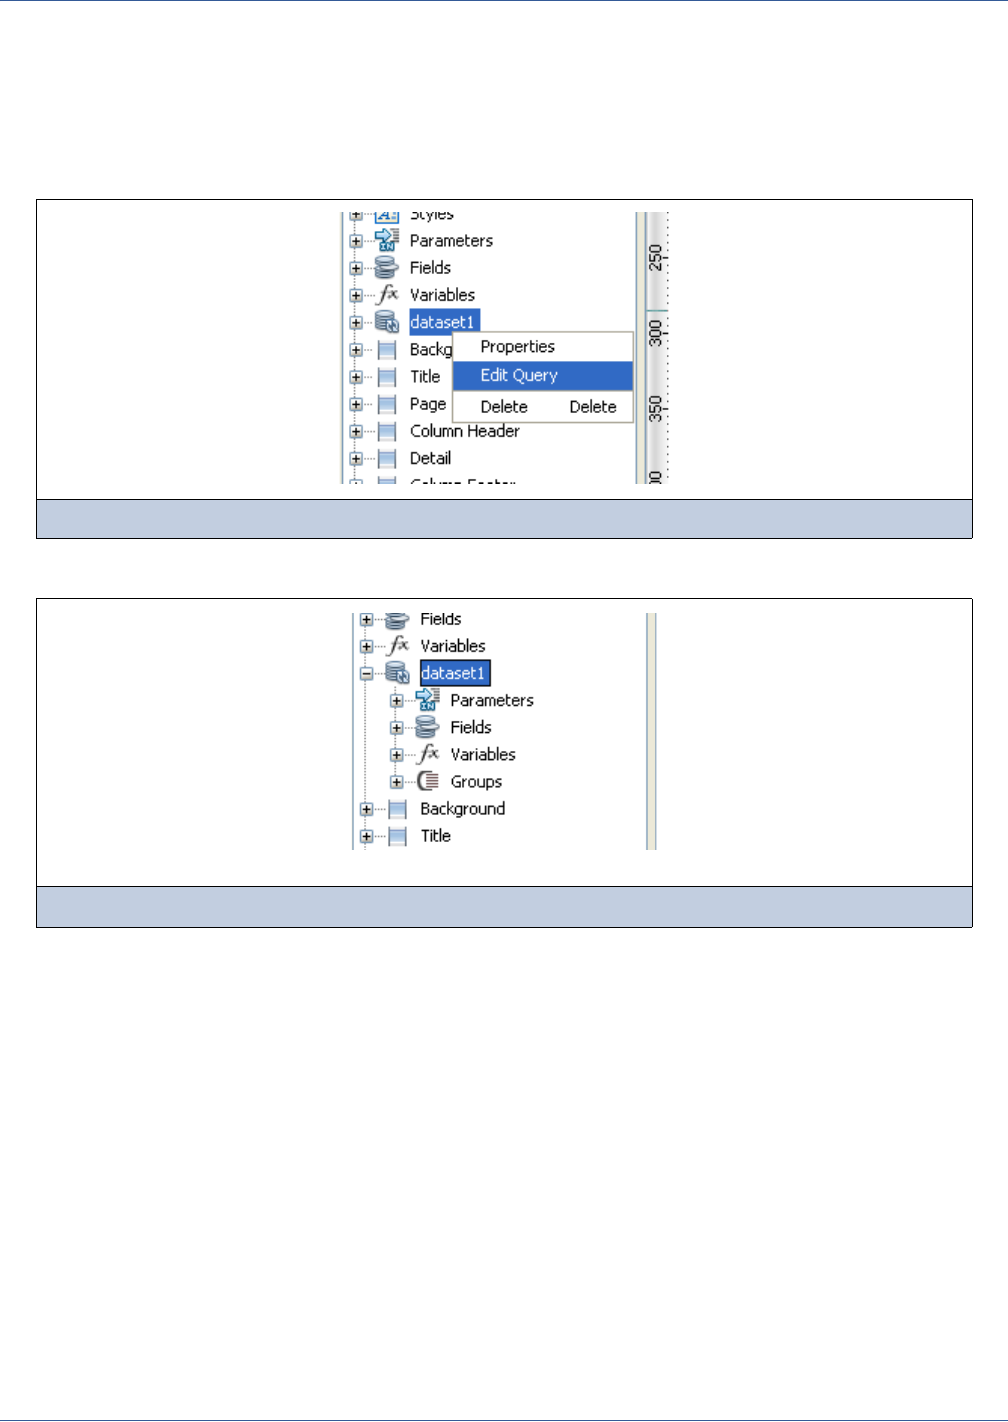
Subdatasets
283
JasperReports permits you to use a scriptlet to perform special calculations on the records of a subdataset in a manner similar
to that provided for the main report. You can set the name of your scriptlet class when you create your new subdataset. You
can also set the name of the resource bundle to be used with the dataset and set the appropriate policy to apply in case of a
missing key.
iReport allows you to edit the query, ordering and filter options for the subdataset from the query dialog. To open it, select the
subdataset node in the outline view and click Edit query (see Figure 14-4).
The fields, variables, parameters, and groups for a subdataset can be managed directly from the outline view (Figure 14-5).
The query dialog can be used to automatically register fields in the subdataset in the same way as the main report (that is,
getting the fields from an SQL query).
In the context of a dataset, groups are only used to group records and there is no discrete portion of the report tied to them (for
example, like the header and footer bands associated with groups). Primarily, dataset groups are used in conjunction with
variable calculations.
14.2 Creating Dataset Runs
As mentioned previously, you can use a subdataset in a chart, crosstab, and list. To provide data to the subdataset,
JasperReports needs some extra information, such as which JDBC connection to access for the subdataset SQL query, or how
to set the value of a specific subdataset parameter. All this information is provided using a dataset run.
Figure 14-4 Subdataset Context menu - Edit Query
Figure 14-5 Subdataset content tree
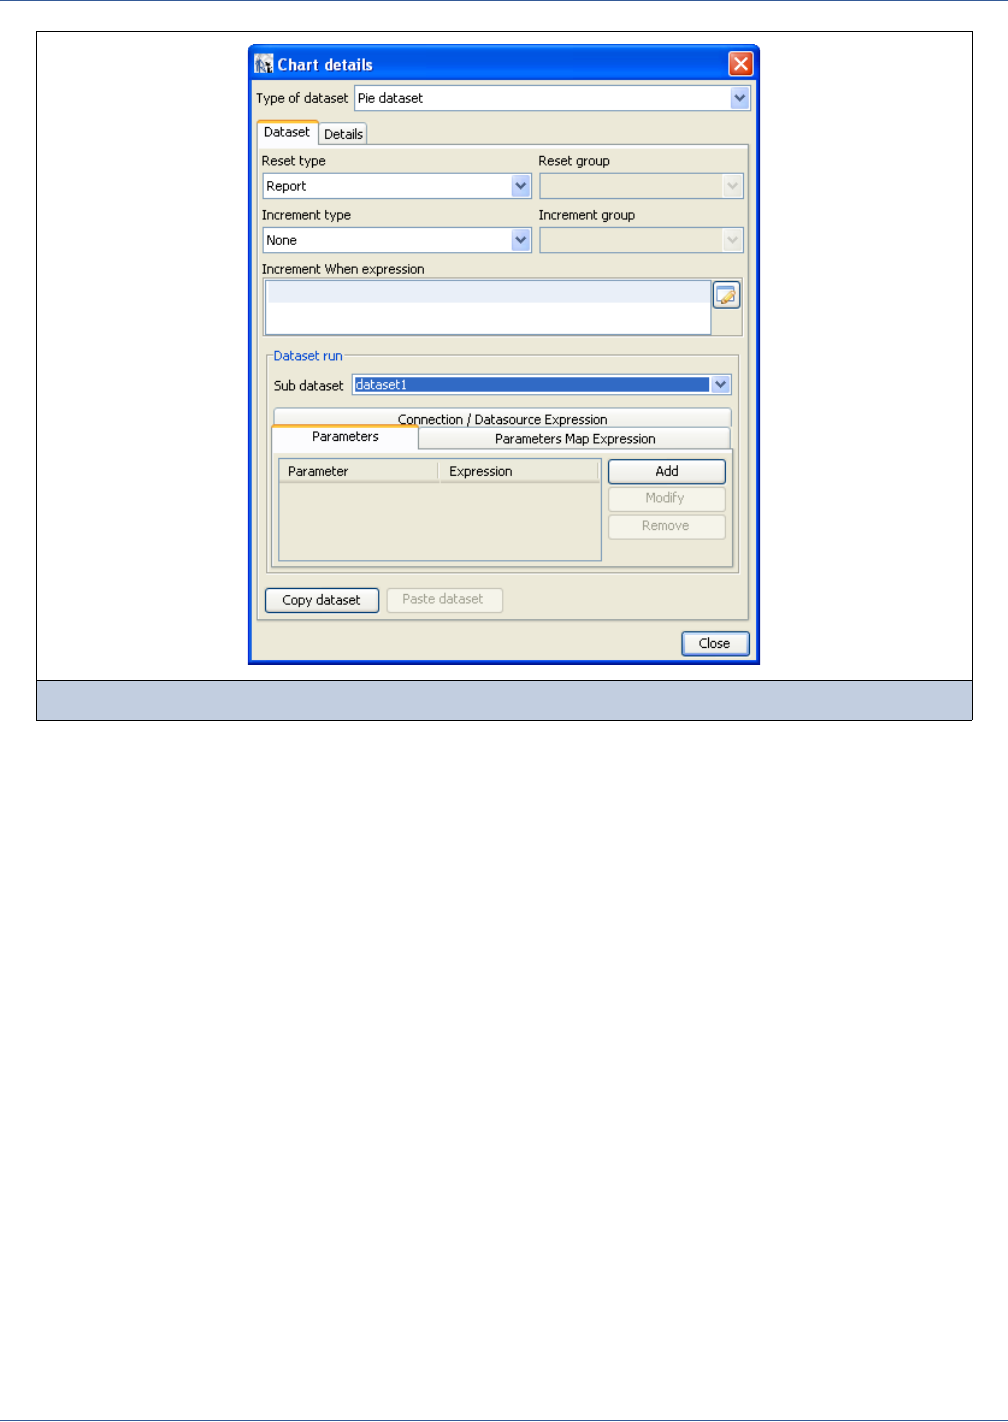
284
iReport Ultimate Guide
Figure 14-6 shows a dataset run for a chart. The dataset run definition is similar to what you use to set up a subreport element.
A subreport itself can be seen as a subdataset, and you need to set values for its parameters and specify a connection to use in
order to get the data. You can set the value of the subdataset parameters using expressions containing main report objects (like
fields, variables, and parameters), define a parameters map to set values for the subdataset parameters at run time, and define
the connection or data source that will be used by the subdataset.
14.3 Working Through an Example Subdataset
The following step-by-step example shows how to use a subdataset to fill a chart.:
1. Create a basic report using a simple SQL query:
(select count(*) as tot_orders from orders)
The resulting main report will have just a single record containing the total number of orders (see Figure 14-7).
Figure 14-6 Dataset Run definition for a chart
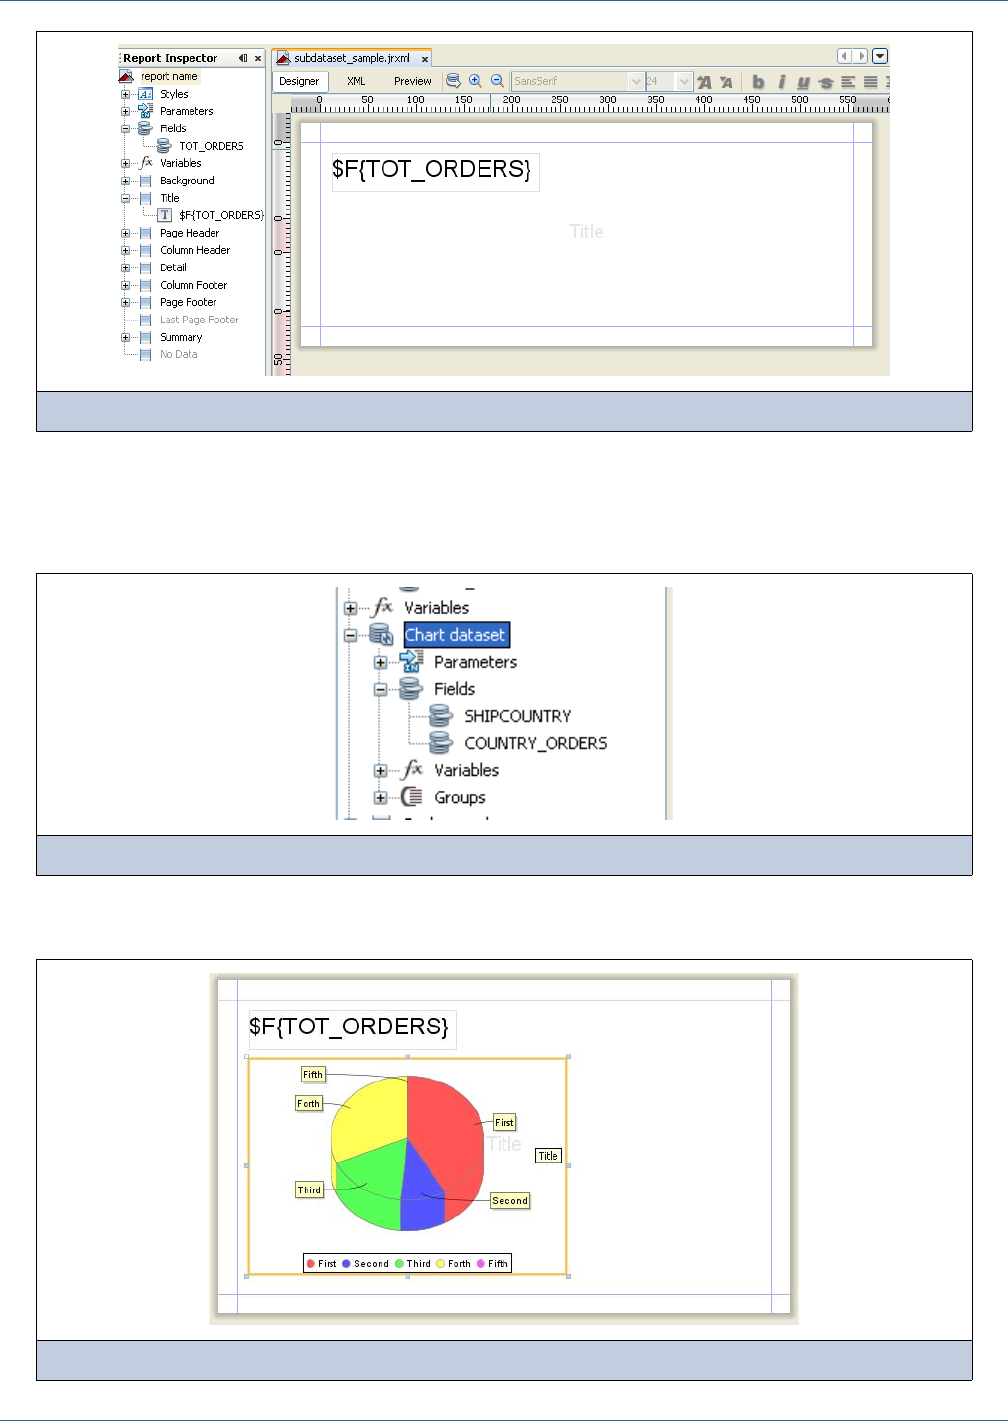
Subdatasets
285
2. Create a subdataset as explained above in this chapter (14.1, “Creating a Subdataset,” on page 281). Edit the subdataset
query and set it to:
select SHIPCOUNTRY, COUNT(*) country_orders from ORDERS group by SHIPCOUNTRY
The fields will be registered in the subdataset (see Figure 14-8).
3. Now create a chart element in the title, for instance, a Pie 3D (like in Figure 14-9). Right-click the chart and select the
chart data menu item to open the chart definition dialog.
Figure 14-7 Initial layout
Figure 14-8 The subdataset to fill the chart
Figure 14-9 The subdataset will be used to fill the chart
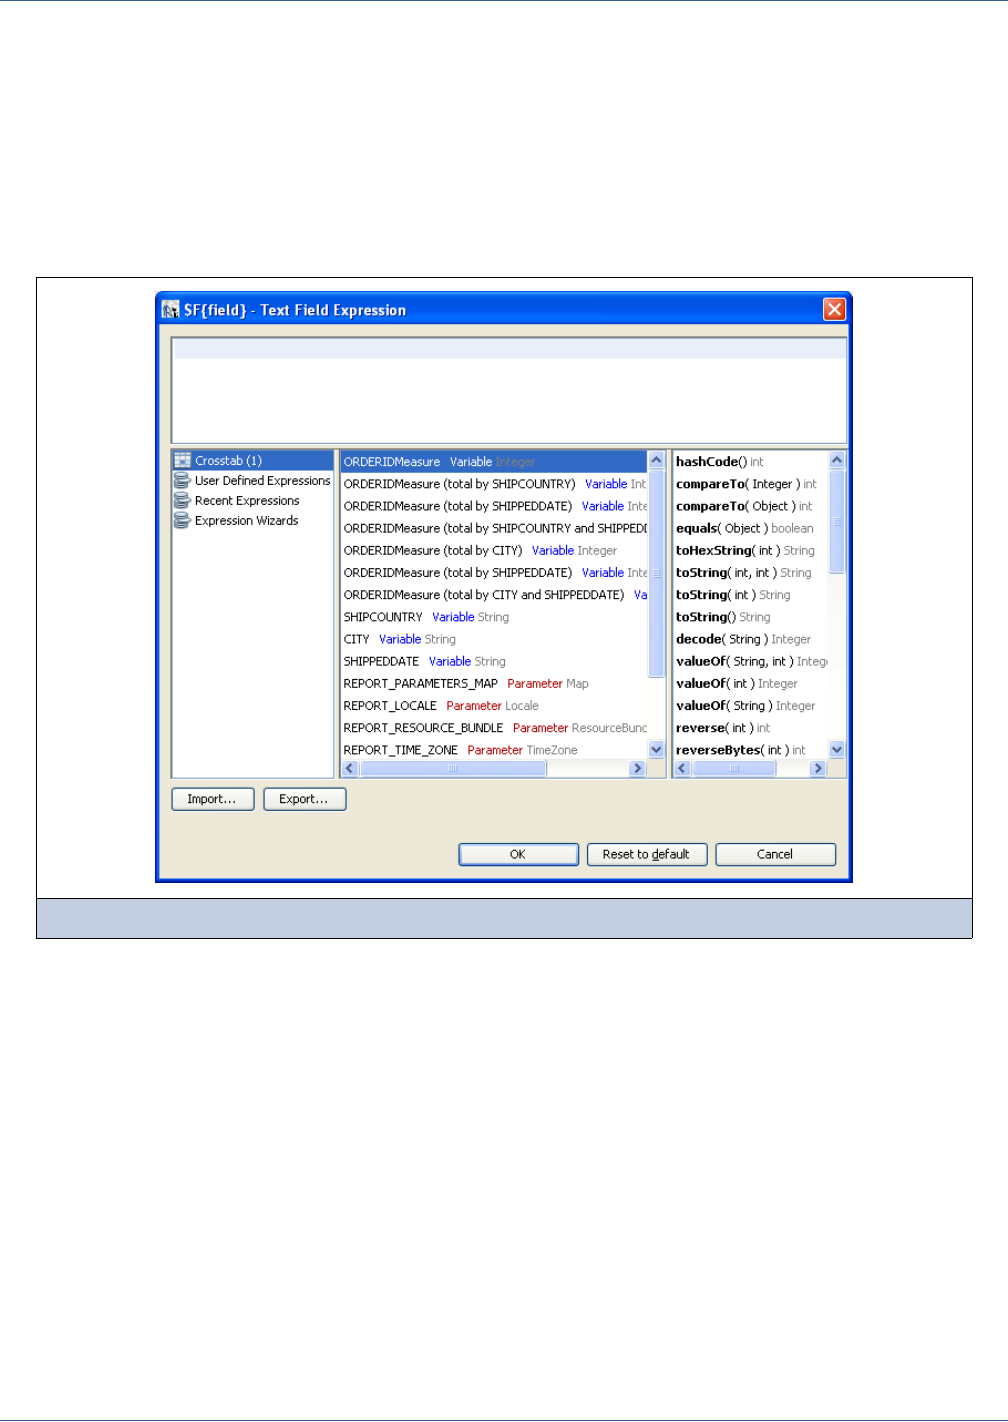
286
iReport Ultimate Guide
4. In the dataset run section, select the dataset we have created.
5. Click the Connection/Datasource Expression tab and select the Use connection expression.
In this example, we will use the same database connection that is used by the report. Selecting Use connection
expression causes the expression to be set automatically to that connection ($P{REPORT_CONNECTION}). If you want to
use a different connection type, you can refer to Chapter 17 where specifying a connection or data source using an
expression is explained in depth.
6. In order to allow the expression context to update the fields, parameters, and values, after the dataset run configuration
you should close the dialog to force an update with your changes, then reopen it. You should now be able to edit the
subdataset fields (see Figure 14-10).
7. Set the chart dataset expressions (the expressions used to fill the chart) as shown in Figure 14-11.
Figure 14-10 Expression editor showing the subdataset fields
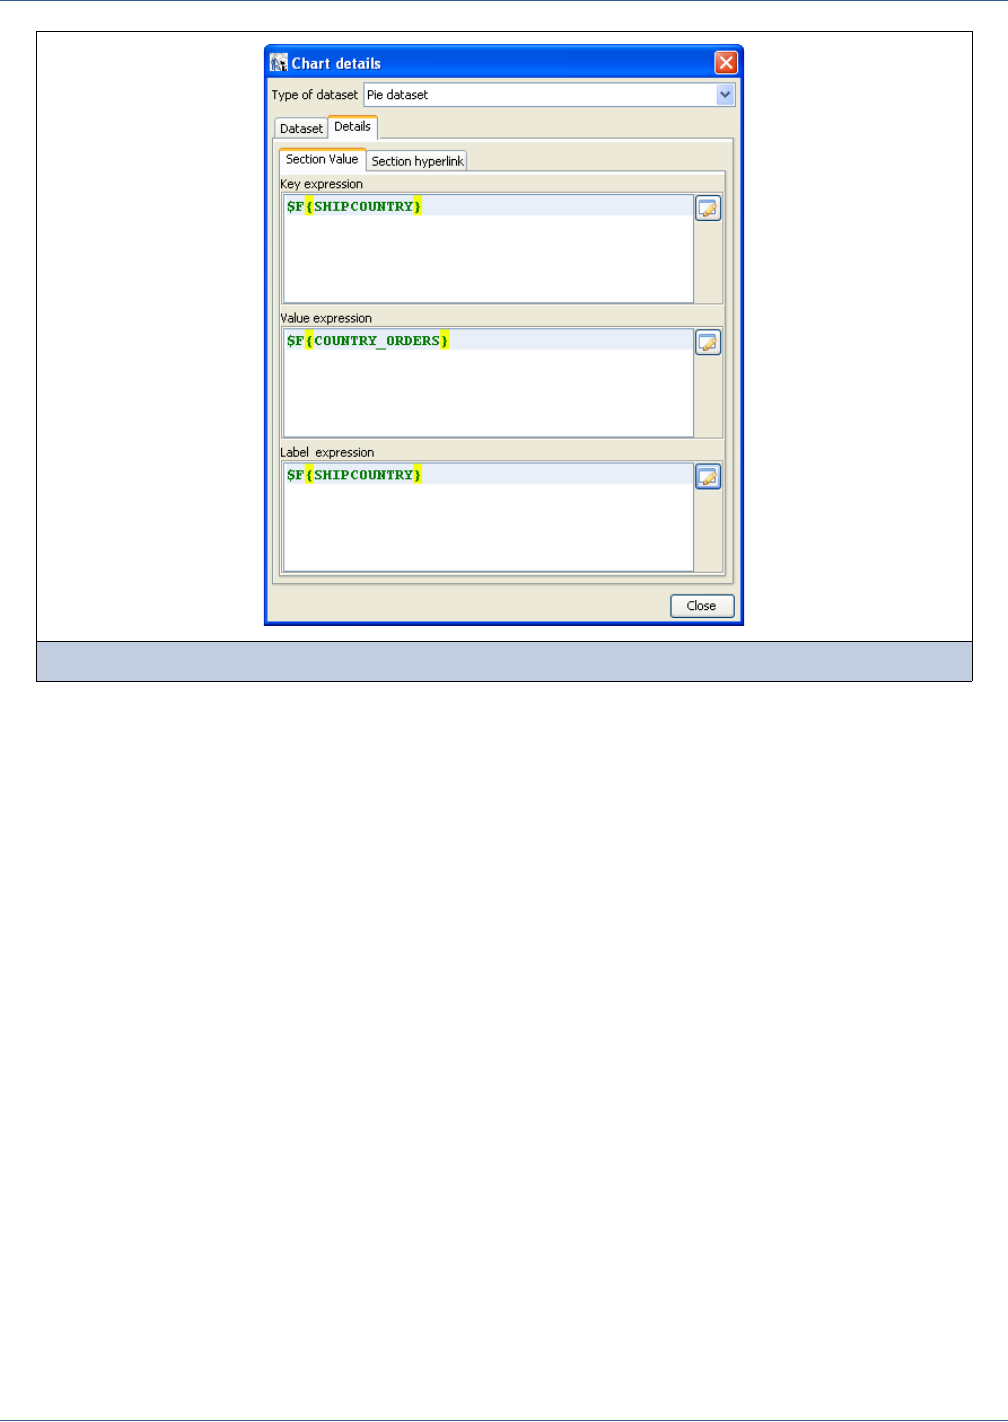
Subdatasets
287
Remember that you cannot use objects coming from the master report dataset in a Chart, Crosstab or List element that
uses a subdataset. Only subdataset objects can be used in these cases.
8. When you are done, run the report. If everything has been performed as explained, you should get a result similar to the
one presented in Figure 14-12.
Figure 14-11 Pie dataset configuration
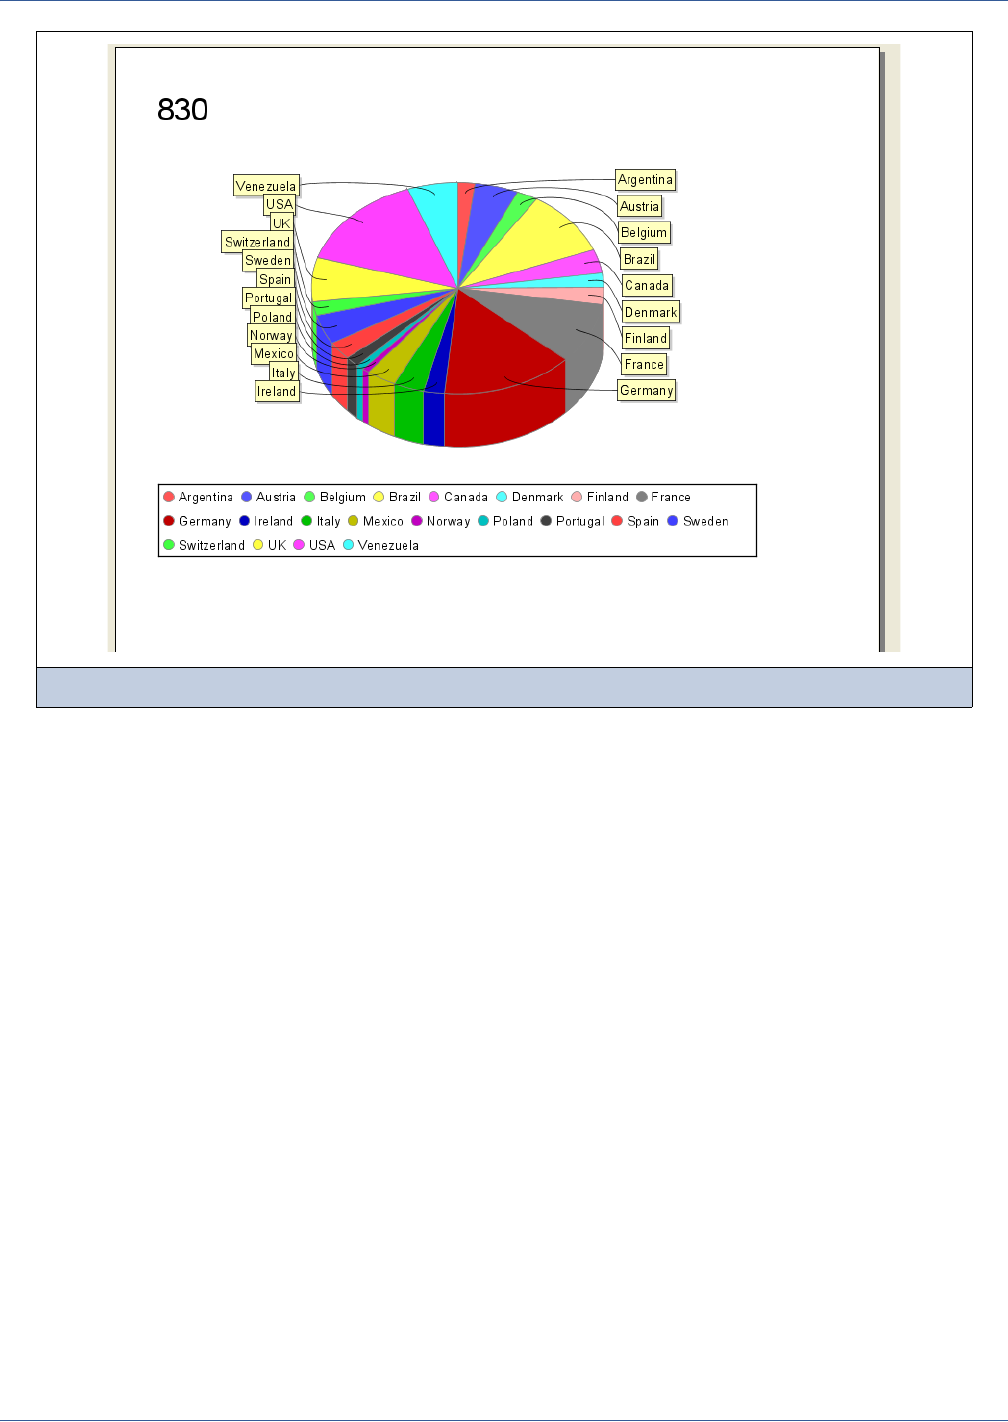
288
iReport Ultimate Guide
Figure 14-12 The chart filled using a subdataset
Crosstabs
289
CHAPTER 15 CROSSTABS
A crosstab is a table where the exact number of rows and columns (variables) remains undefined at design time, such as a table
that shows the sales of some products (rows) during different years (columns). It displays the frequency distribution of the
variables:
The implementation of crosstabs in JasperReports allows the grouping of columns and rows, the calculation of totals, and
individual format configuration of every cell. For each row or column group, you have a detail row/column and an optional
total row/column. Data to fill the crosstab can come from the main report dataset or from a subdataset. Thanks to a wizard,
iReport makes it easy to create and use this powerful reporting component.
This chapter has the following sections:
Using the Crosstab Wizard
Working with Columns, Rows, and Measures
Modifying Crosstab Element Properties
Crosstab Parameters
Working with Crosstab Data
Using Crosstab Total Variables
15.1 Using the Crosstab Wizard
When you add a Crosstab element to a report, iReport displays the Crosstab Wizard automatically. To understand how a
crosstab works, I will walk you through creating one using the wizard.
1. Start with a blank report containing this query:
select * from orders
You will include the crosstab at the end of the report, in the Summary band.
2. Drag the Crosstab tool into the Summary band. The first screen of the Crosstab Wizard appears.
Fruit / Year 2004 2005 2006 ...
Strawberry
Wild Cherry
Big Banana
...
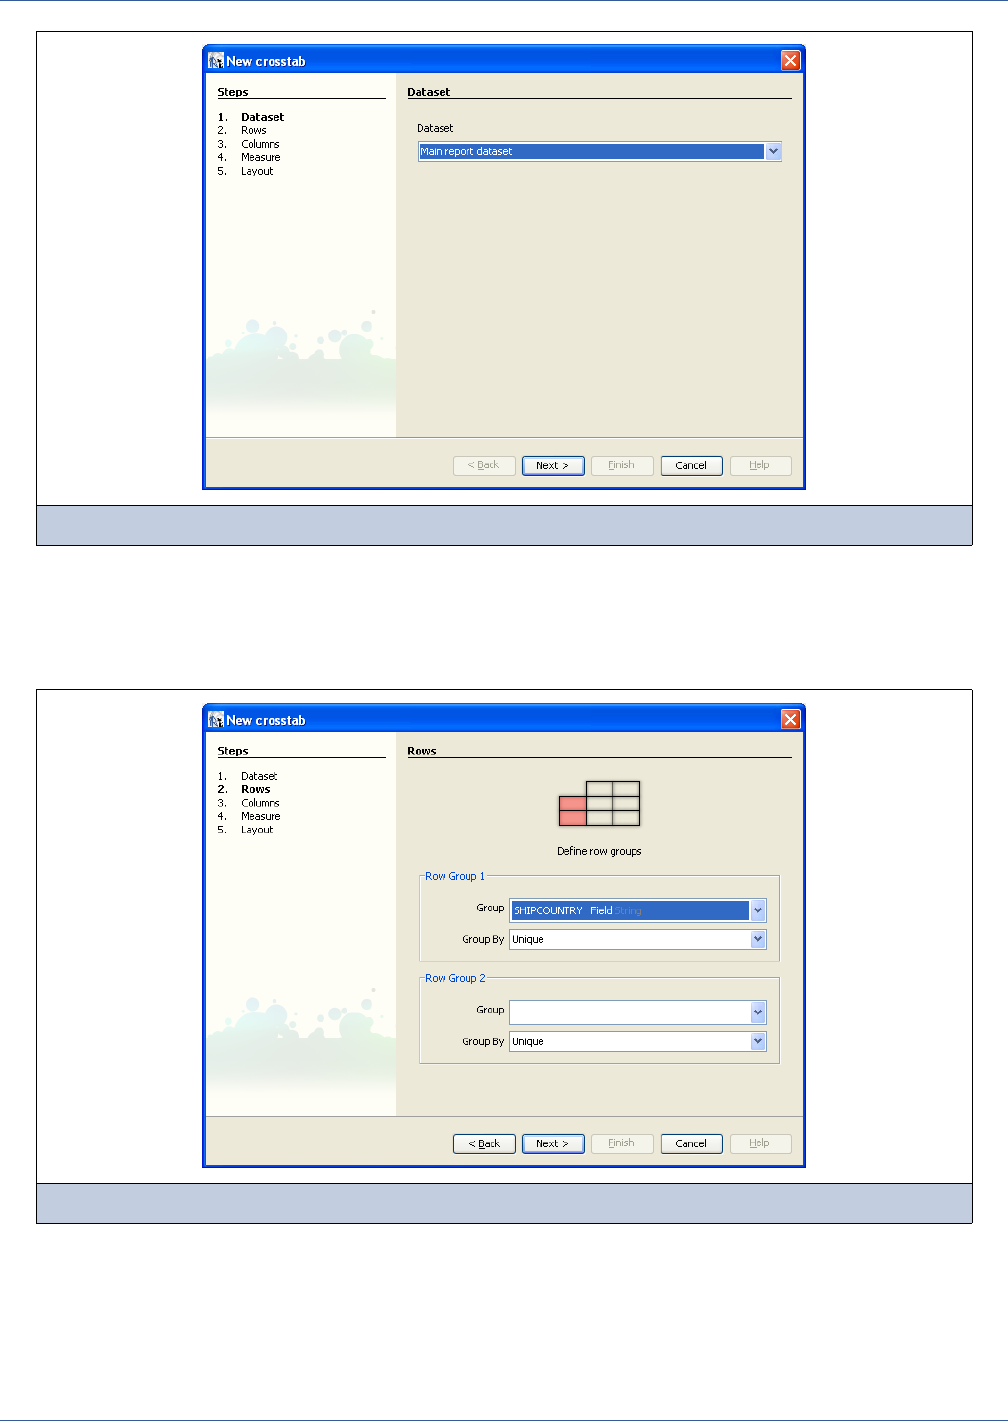
290
iReport Ultimate Guide
3. Choose the dataset to fill the crosstab. Specify the dataset of the main report (as shown in Figure 15-1).
4. Click Next to go to the next step.
5. In the second screen, you have to define at least one row group. For purposes of this example, let’s group all records by
SHIPCOUNTRY, as shown in Figure 15-2.
Grouping by SHIPCOUNTRY results in each row in the crosstab referring to a specific country. Unlike in the main report,
JasperReports will sort the data for you, although you can disable this function to speed up the fill process if your data is
already sorted.
Figure 15-1 The first step of the Crosstab Wizard
Figure 15-2 Second step: row groups definition
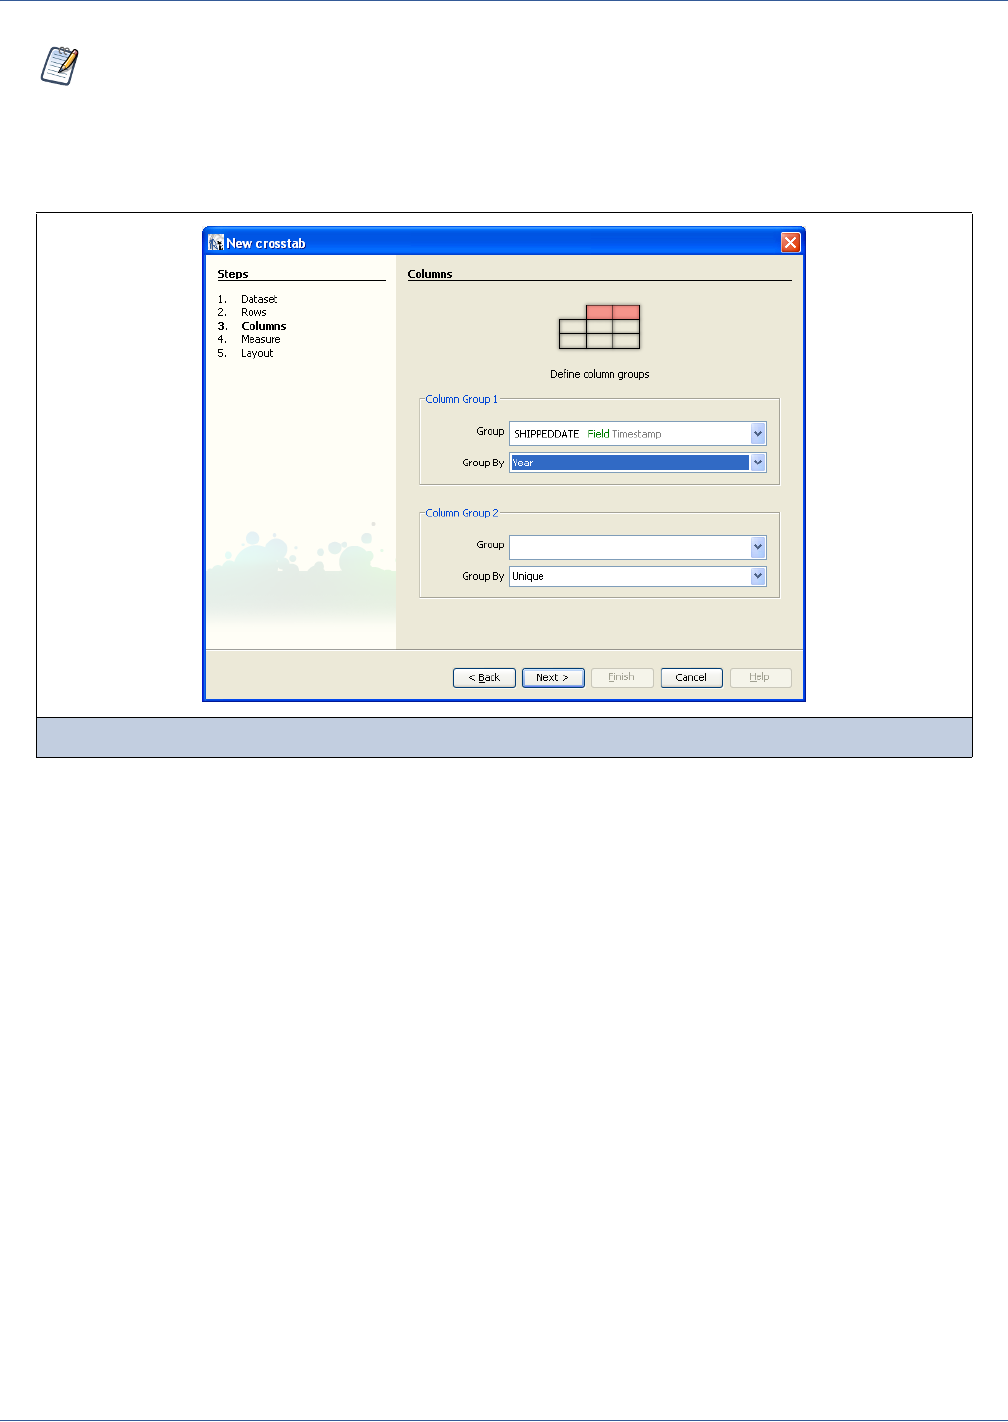
Crosstabs
291
6. Click Next to move to the third step (Figure 15-3).
Group the data by the SHIPPEDDATE field. Specifically, you will use a function that returns the year of the date, thus
grouping the orders by year.
As you can see in Figure 15-3, whenever you have a time field (time stamp, date, and so on), you can use a time-based
aggregation function (such as Year, Month, Week, or Day), or you can treat it as a plain value (in which case you can use
the Unique aggregation function to group records having the same value).
7. Click Next to move to the next step.
8. It’s time to define the detail data. Normally, the detail (or measure) is the result of an aggregation function like the count
of orders by country by year, or the sum of freight for the same combination (country/ year). You will choose to print the
number of orders placed by specifying ORDERID (field) in the Measure combo box and Count in the Function combo
box (see Figure 15-4).
9. Once again, click Next to continue.
Using the Crosstab Wizard, you can define only one or two row and column groups. This is a limitation of the
wizard. In the outline view, you can define as many row and column groups as you need (I’ll talk more about this
later in “Working with Columns, Rows, and Measures” on page 294.)
Figure 15-3 Definition of the column groups
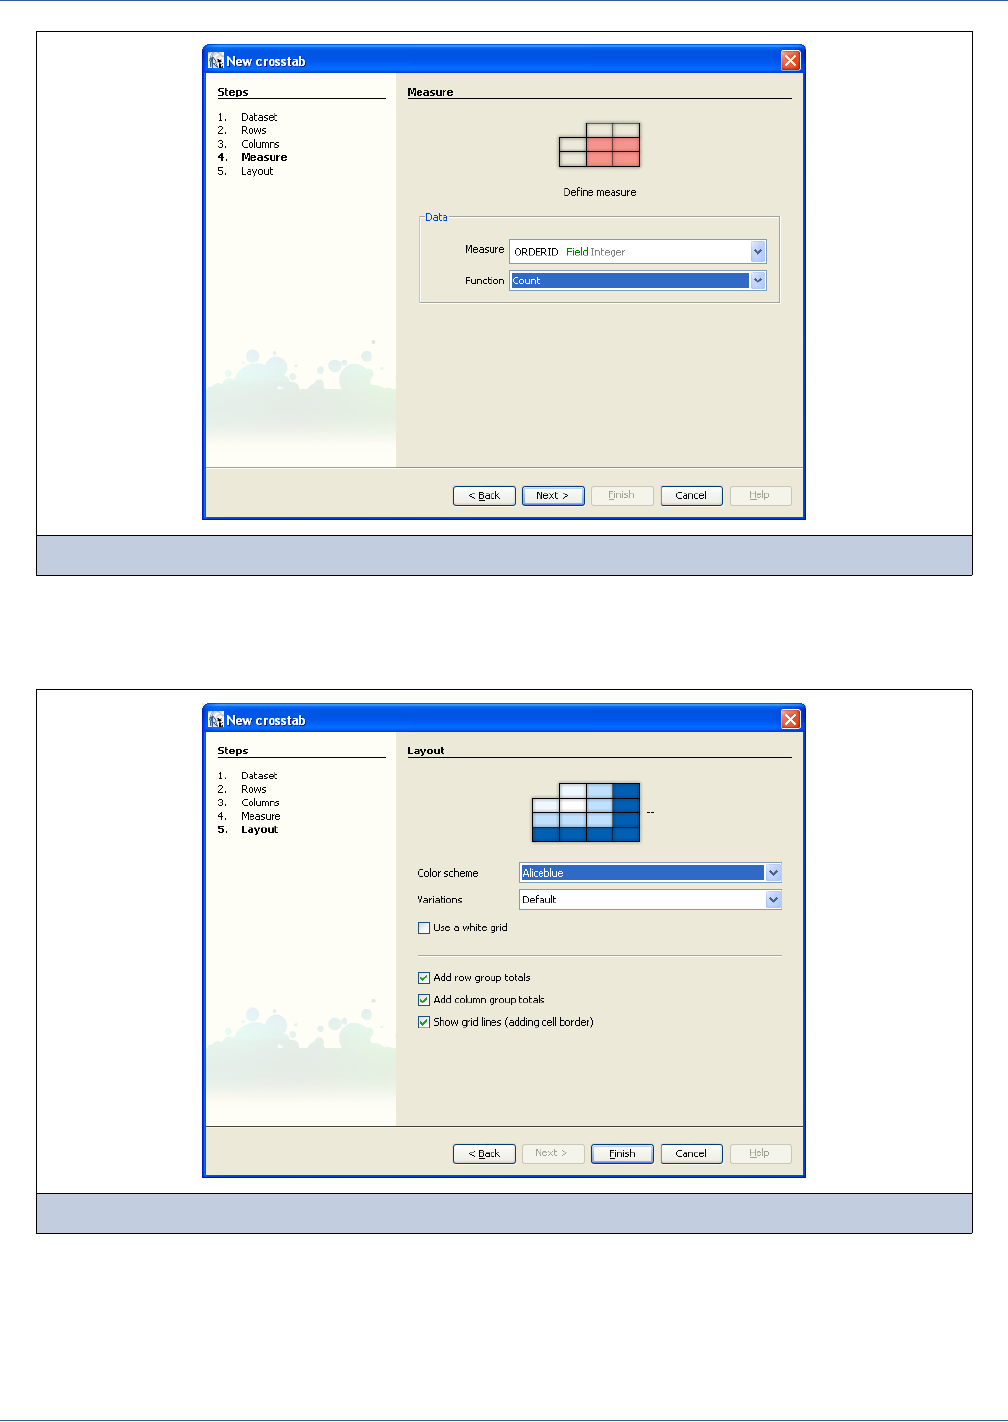
292
iReport Ultimate Guide
10. In the last step, you can set options for the crosstab layout. You can indicate whether you want to see grid lines, use color
set to distinguish totals, headers, and detail cells, and whether to total the rows and columns.
For this example, select all the check box options, as shown in Figure 15-5, and click Finish.
Note that when you add a crosstab to the report, iReport creates a corresponding tab in the Design window. This tab is the
crosstab designer for the new crosstab element.
Figure 15-4 Definition of the measure
Figure 15-5 Some crosstab options
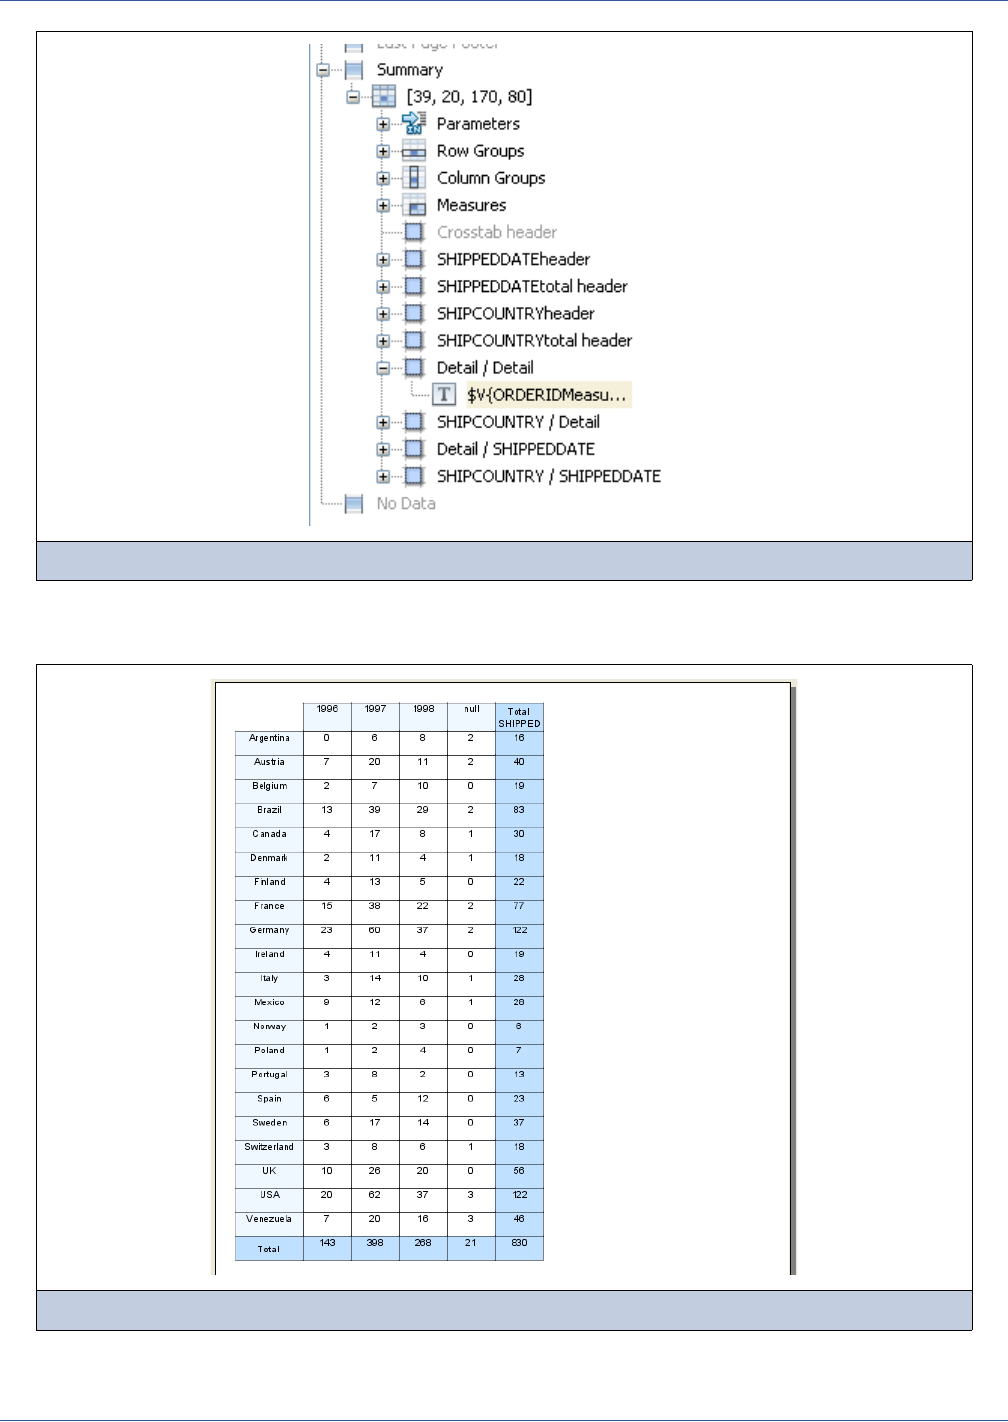
294
iReport Ultimate Guide
When you execute the new report you should get a result similar to the one shown in Figure 15-7. The last column contains
the total for each row, across all columns. The last row contains the total for each column, across all rows. Finally, the last cell
(in the corner on the bottom right) contains the combined total for all orders (830).
15.2 Working with Columns, Rows, and Measures
A crosstab must have at least one row group and one column group. The rows and columns are defined by these groups. Each
row and column group can be totaled. The following is a basic crosstab with one column group and one row group; the groups
are totaled:
When you add a row group, iReport adds the row with a header and subtotal for it.The crosstab appears as follows:
Adding a column group results in a similar change, with a new column, header, and subtotal:
Crosstab
header cell
Column group 1
header
Column group 1
total header
Row group
1 header
Detail Row group 1 total
Row group
1
total
header
Column group 1 total Grand total (Row group 1 total
+ Column group 1 total)
Crosstab
header cell
Column group 1
header
Column group 1
total header
Row group
1 header
Detail Row group 1 total
Row group
2 header
Detail Row group 2 total
Row
groups
total
header
Column group 1 total Grand total (Row group 1 total
+ Row group 2 total + Column
group 1 total)
Crosstab
header cell
Column group 1
header
Column group 2
header
Column groups
total header
Row group
1 header
Detail Detail Row group 1 total
Row group
2 header
Detail Detail Row group 2 total
Row
groups
total
header
Column group 1 total Column group 2 total Grand total (Row group 1 total
+ Row group 2 total + Column
group 1 total + Column group 2
total)
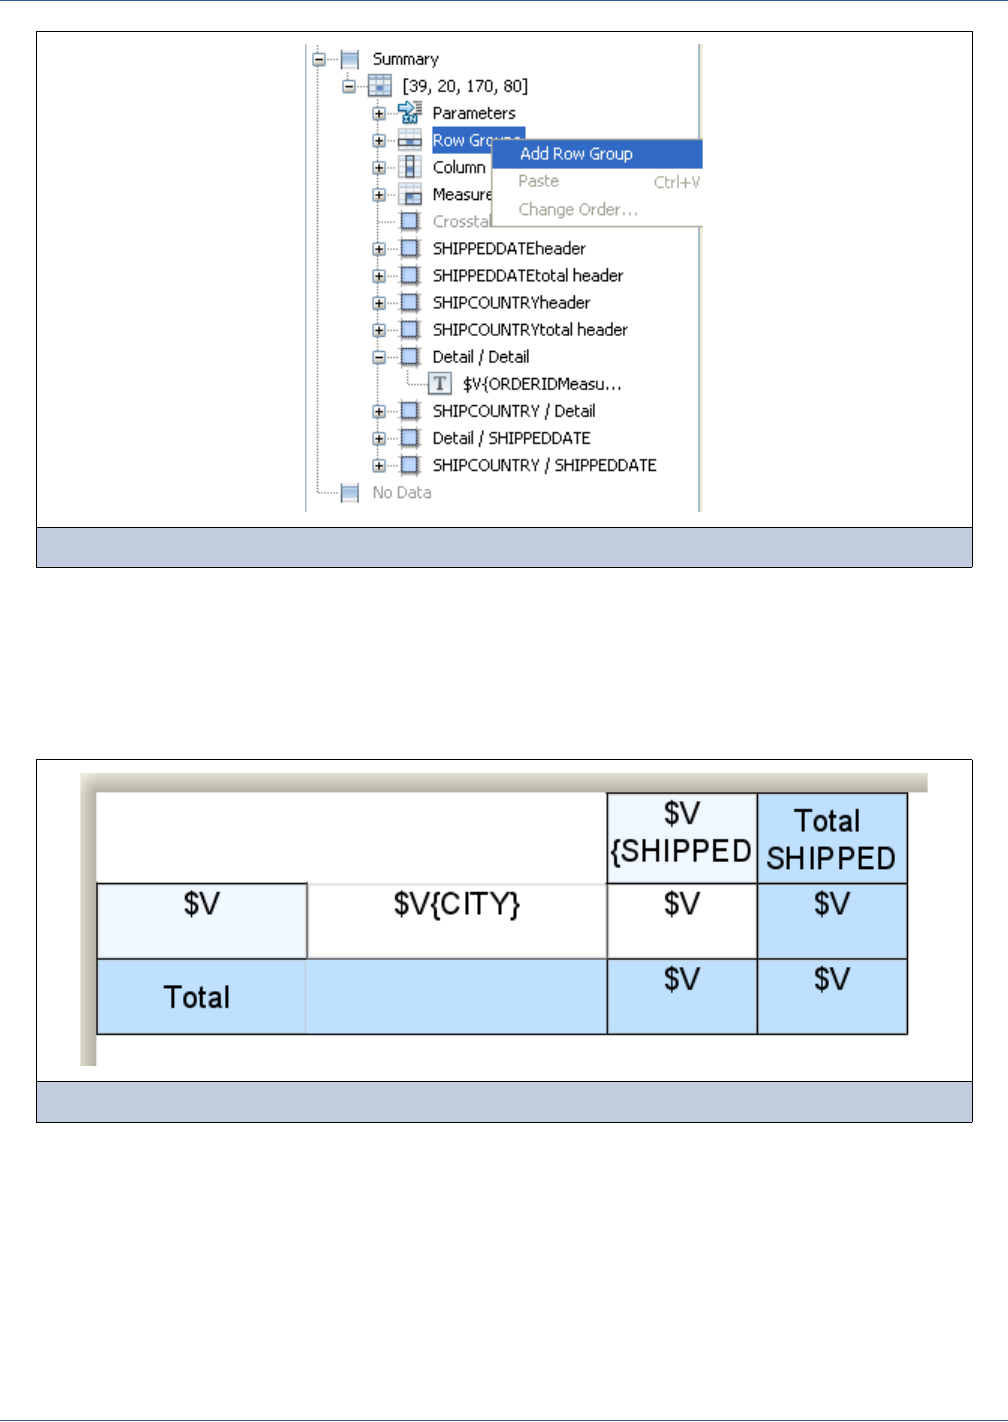
Crosstabs
295
Row and column groups are displayed in the outline view. To add a row group, for instance, right-click the rows node and
select Add Row Group (see Figure 15-8).
The new group appears in the outline view and the relative cells are created in the crosstab designer. You need to set a Bucket
Expression—that’s an expression used to group the rows. For example, we can add a row group to show the cities of each
country. In that case, a valid expression could be the field SHIPCITY (the expression would look like $F{SHIPCITY}). The
expression must be set in the row group properties.
The expression is the only information that must be set for each new group. Other crosstab settings include the following:
Using the designer, column and row sizes can be modified directly by dragging the cells’ edges. The content of each cell must
be completely contained in the cell (more or less as it happens with bands in the master report).
Figure 15-8 Adding a Row Group
Figure 15-9 The layout after the new row
Total position Defines the presence of a row to show subtotals
Order Order of the values in the group (Ascending or Descending)
Comparator expression Returns an instance of java.util.Comparator that must be used to
order the values
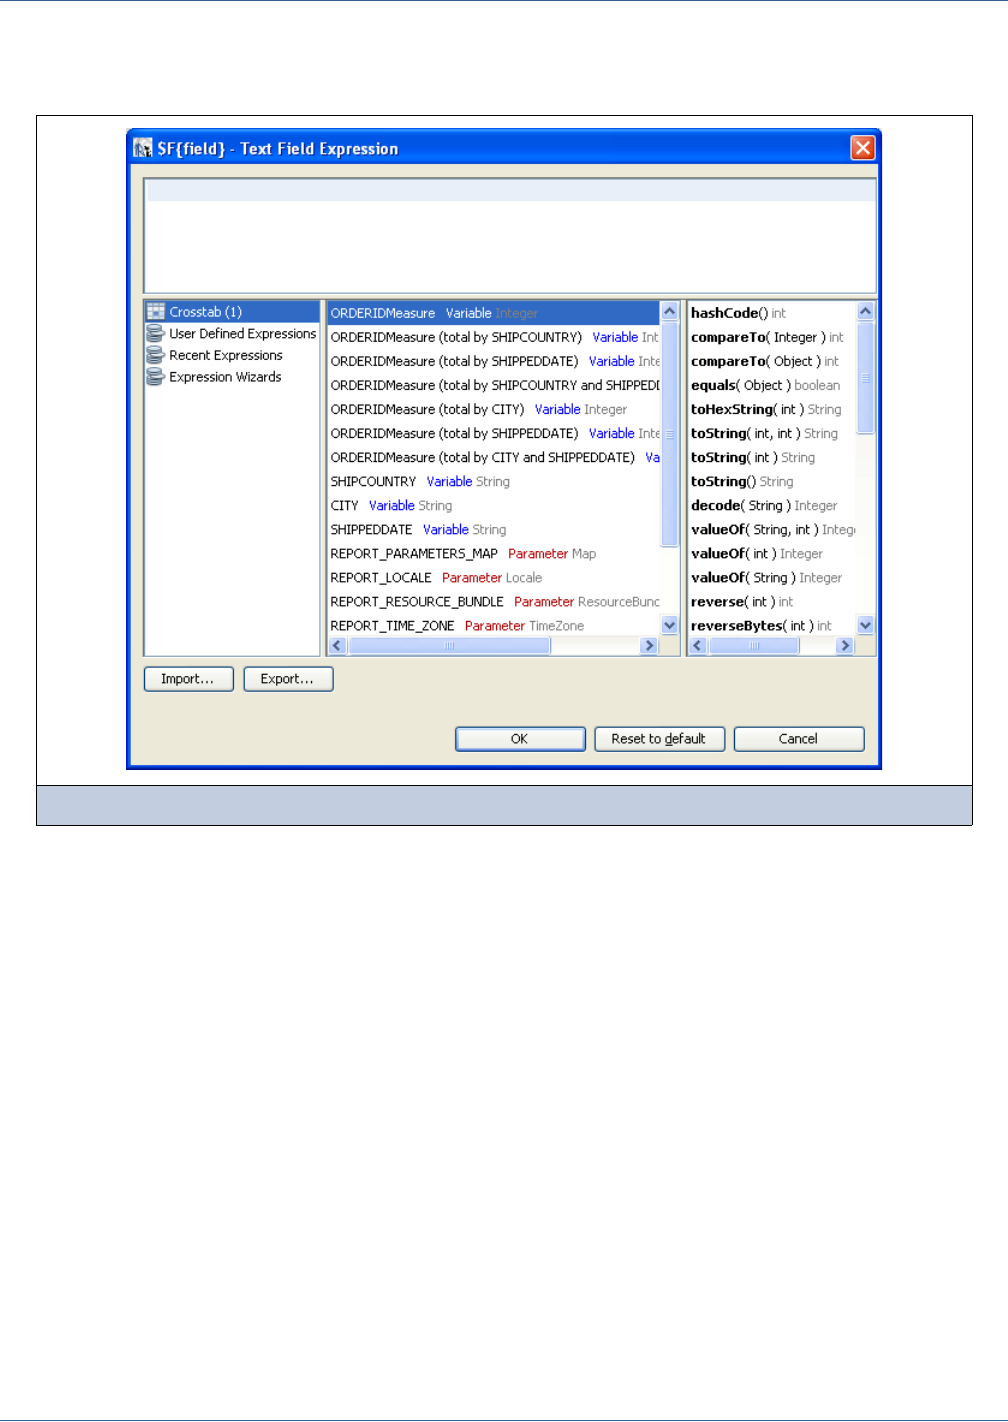
296
iReport Ultimate Guide
When you add a row or column to a crosstab, iReport creates a special variable that refers to the value of the bucket
expression. It has the same name as the new group. When you edit a textfield expression of elements in a cell, the expression
editor pops up. It lists all the objects that can be displayed in a crosstab cell (see Figure 15-10).
When you create a new group, iReport creates the new header cell for the group; in the group, iReport uses a new textfield to
display the group value (using a built-in variable having the same name as the group) and fills the new cell with a textfield to
display the first measure available in the crosstab.
No extra cell display options are applied; in particular, iReport does not set borders for the new cells.
If Total Position is set to a value other from None (usually End), iReport inserts other cells to host the subtotals. Those
cell are created empty, so again you must drag a textfield element into each cell and set a proper expression for the data to
display (see Figure 15-11).
Figure 15-10 Objects that can be used in a crosstab textfield expression
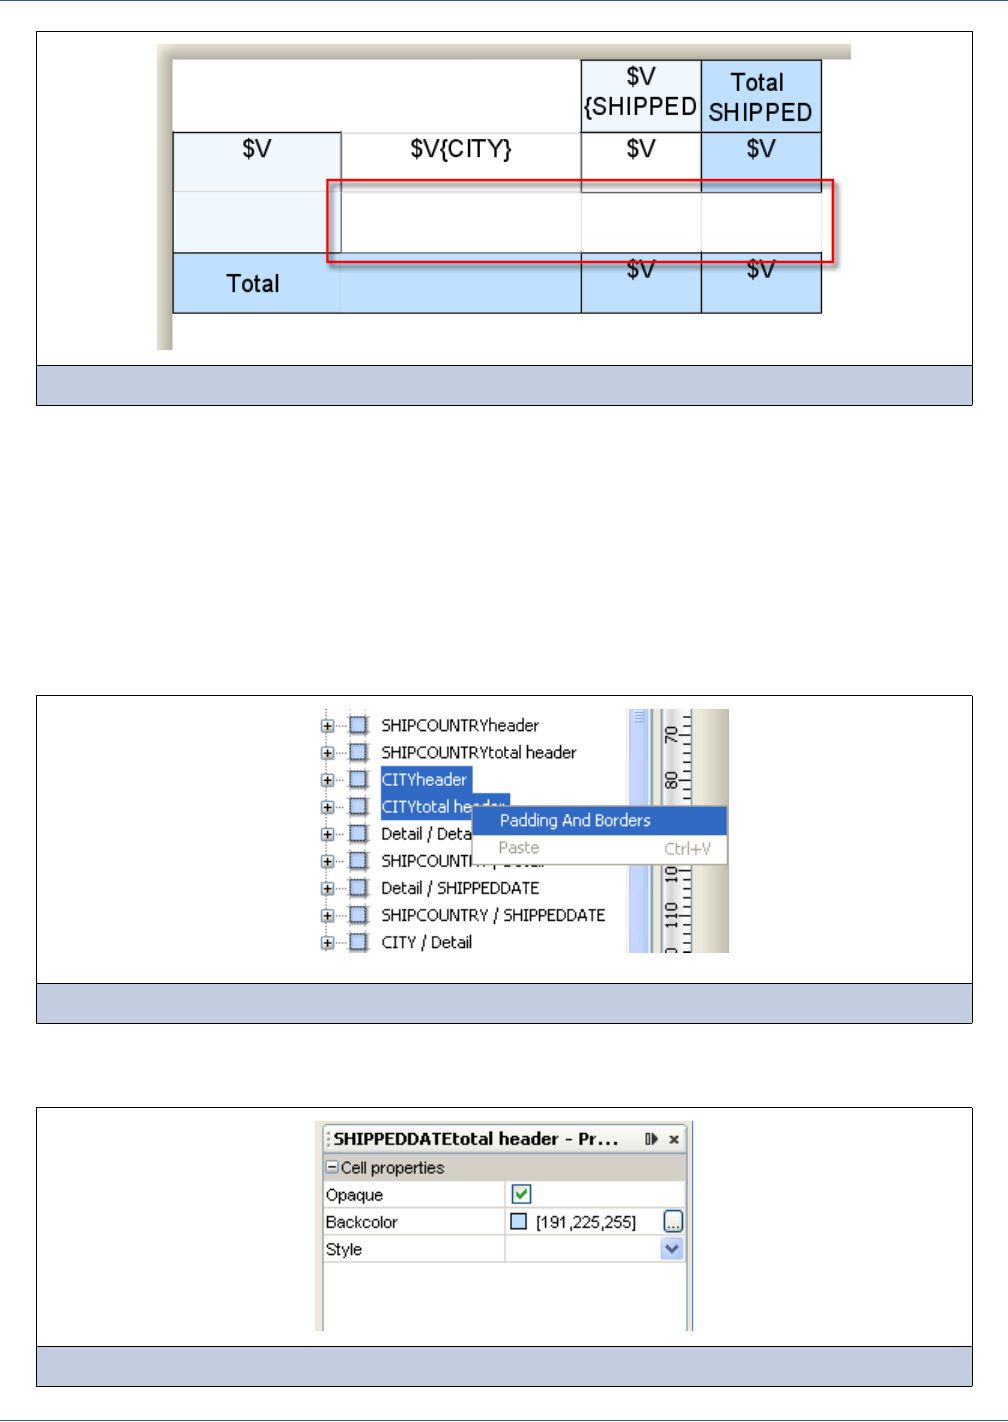
Crosstabs
297
The order of the groups can be changed by dragging them in the outline view. Please note that the crosstab layout is strictly
tied to the group order settings.
15.2.1 Modifying Cells
Crosstab have header cells, total cells, detail cells, and (optional) when-no-data cells. Each intersection between a row and a
column defines a cell. Cells can contain a set of elements, such as textfields, static texts, rectangles, and images, but they can’t
contain a subreport, chart, or another crosstab. Figure 15-11 showed a crosstab with some colored cells and several textfields.
You can modify the background color and borders of each cell: right-click the cell you want to change to display the context
menu and choose Padding And Borders to modify the cell borders (see Figure 15-12).
The cell background and style can be modified in the property sheet when you select a cell node in the outline view (see
Figure 15-13).
Figure 15-11 Empty row total cells
Figure 15-12 Modifying Cell Borders
Figure 15-13 Cell Background and Style
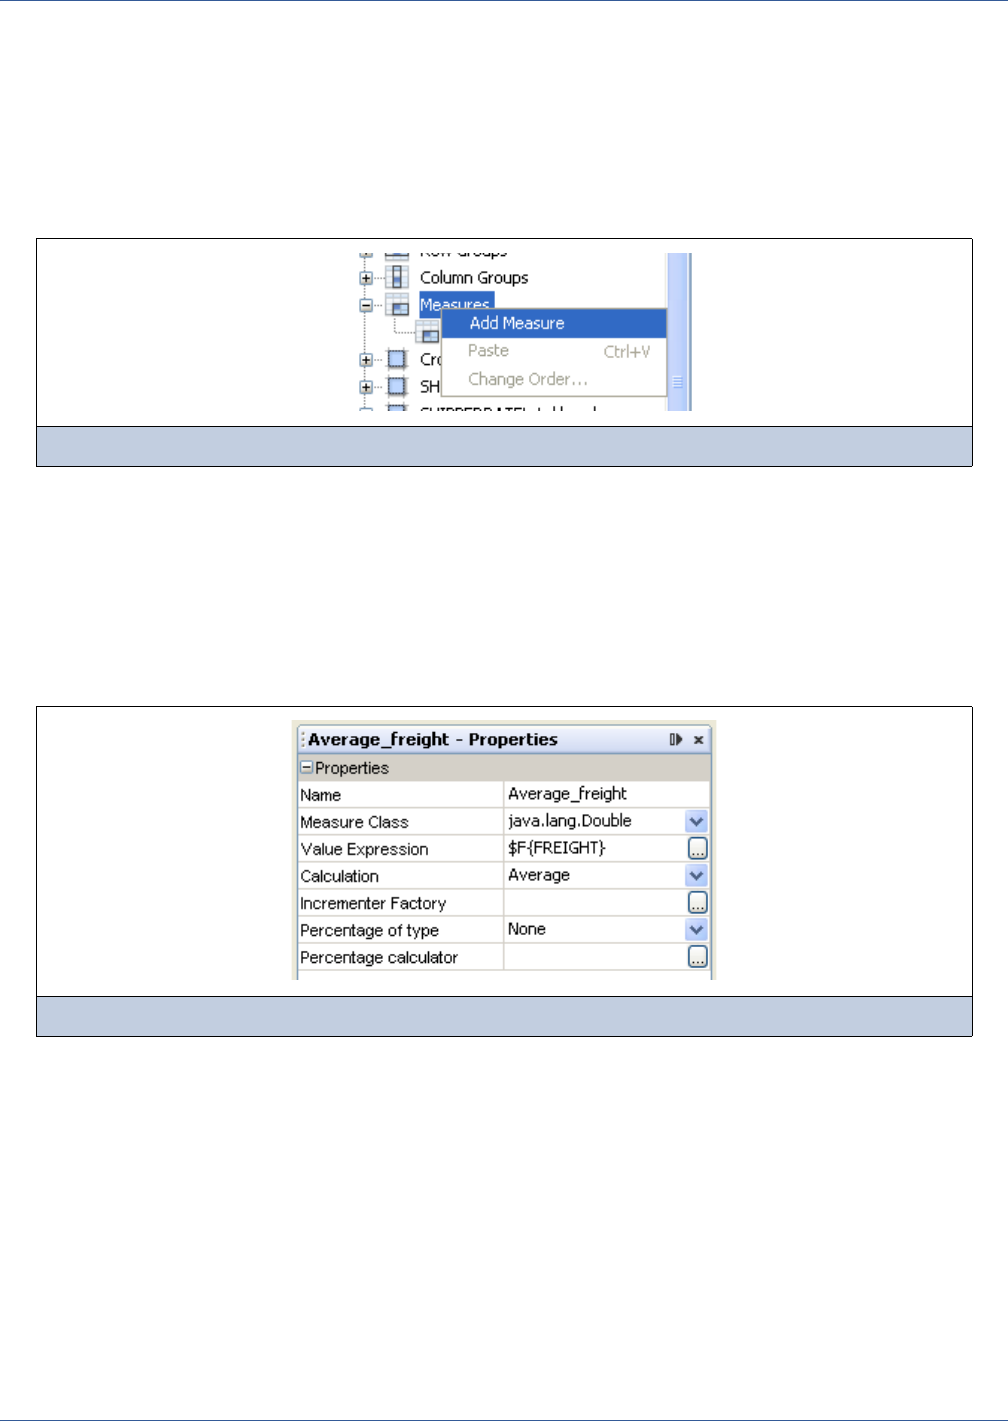
298
iReport Ultimate Guide
15.2.2 Understanding Measures
A measure is an object similar to a variable. It is always, in some way, the result of a calculation performed on a value for each
row and column group that intersect a cell. Expressions for elements in a crosstab, such as print-when expressions and
textfield expressions, can only contain measures. In this context, you cannot use fields, variables, or parameters directly; you
always have to use a measure.
To create a measure, right-click the measures node in the outline view and select Add Measure (see Figure 15-14). iReport
adds the new measure to the outline view.
Just as when you create a new group, you’ll need to define an expression for the measure. The easiest way to display a new
measure is to use a textfield. Drag a textfield element into a cell and set the proper textfield expression (for example, with a
measure name like $V{Average_freight}) and the proper expression class for the textfield, which must be consistent with
the measure type.
There are several options you can use to set a measure. Besides the name, class, and expression, you can set the calculation
type. If the available calculation types are not enough, you can provide a custom Incrementer class by means of a Factory
that returns an instance of that class (the factory must implement the interface
net.sf.jasperreports.engine.fil.JRIncrementerFactory).
If you want to display your measure as a percentage of the grand total, you can set the property Percentage of type to
Grand Total.
Finally, you can specify a custom calculator class to perform the percentage calculation (the class must use the interface
net.sf.jasperreports.crosstabs.fill.JRPercentageCalculator).
15.3 Modifying Crosstab Element Properties
To see the crosstab properties in the property sheet, select the crosstab node in the outline view (see Figure 15-16).
Figure 15-14 Adding a measure
Figure 15-15 Measure Properties
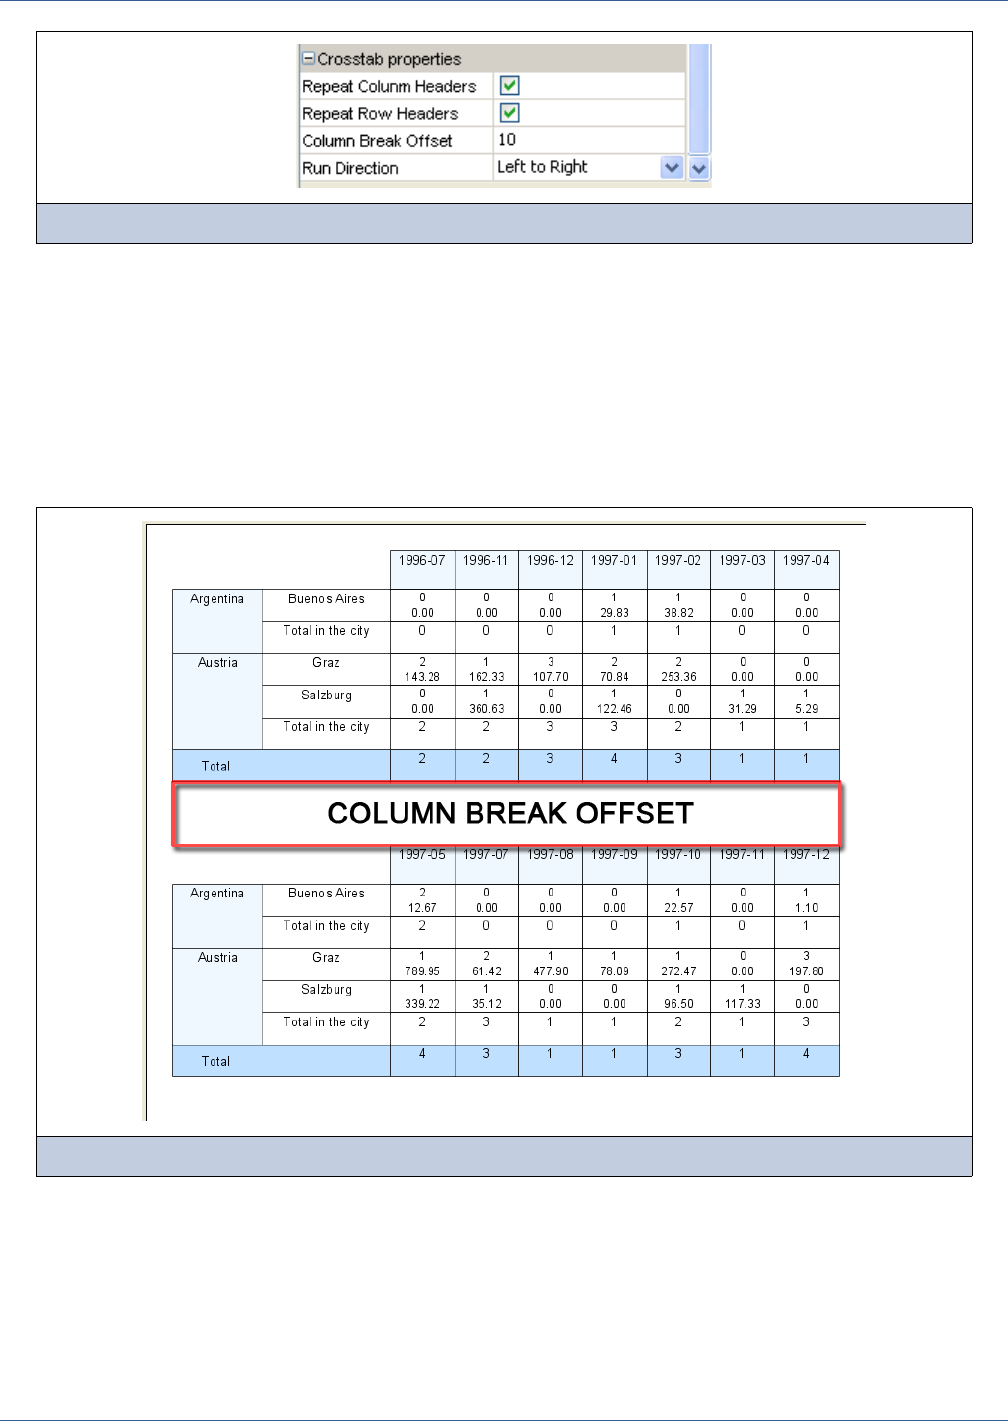
Crosstabs
299
Following is a brief rundown of some of the options in this dialog box:
15.4 Crosstab Parameters
Crosstab parameters may be used in the expressions of elements displayed in the crosstab. They can be defined and managed
through the outline view (see Figure 15-18).
Figure 15-16 Crosstab Properties
Repeat Column Headers If selected, the column headers will be printed on every page when the crosstab
spans additional pages.
Repeat Row Headers If selected, the row headers will be printed on every page when the crosstab spans
additional pages.
Column Break Offset This specifies the space between two pieces of a crosstab when the crosstab
exceeds the page width (see Figure 15-17).
Figure 15-17 Column Break Offset
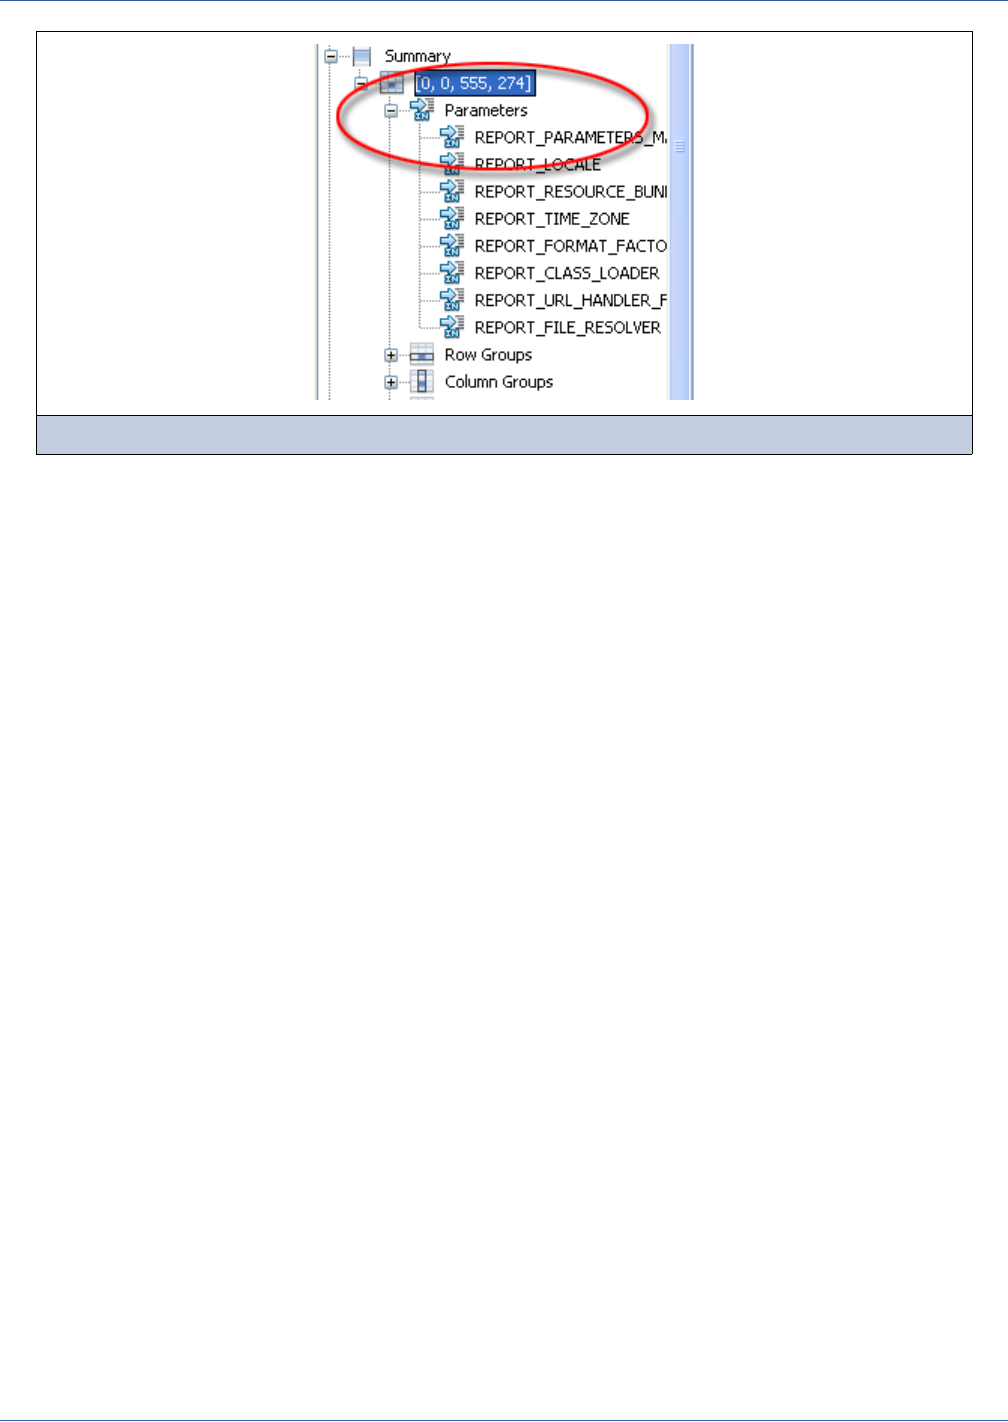
300
iReport Ultimate Guide
To add a parameter, right-click the Parameters node in the Crosstab element and select Add Crosstab Parameter. The
parameter expression for a crosstab parameter can use only objects from the main report, not from an optional subdataset used
to feed the crosstab. Again, these parameters are designed to be used in the crosstab elements. They are not the same as the
dataset parameters that are used in expressions, in the crosstab context, to filter a query and calculate values.
You can use a map to set the value of the declared crosstab parameters at run time. In this case, you’ll need to provide a valid
parameters map expression in the crosstab properties.
15.5 Working with Crosstab Data
As mentioned previously, you can fill a crosstab using data from the main report or from a subdataset. In the latter case, you
must specify the dataset run in the Crosstab Data window, which is accessed by right-clicking the crosstab node (or the
Crosstab element in the designer) and selecting the Crosstab Data menu item (see Figure 15-19).
Figure 15-18 Crosstab Parameters
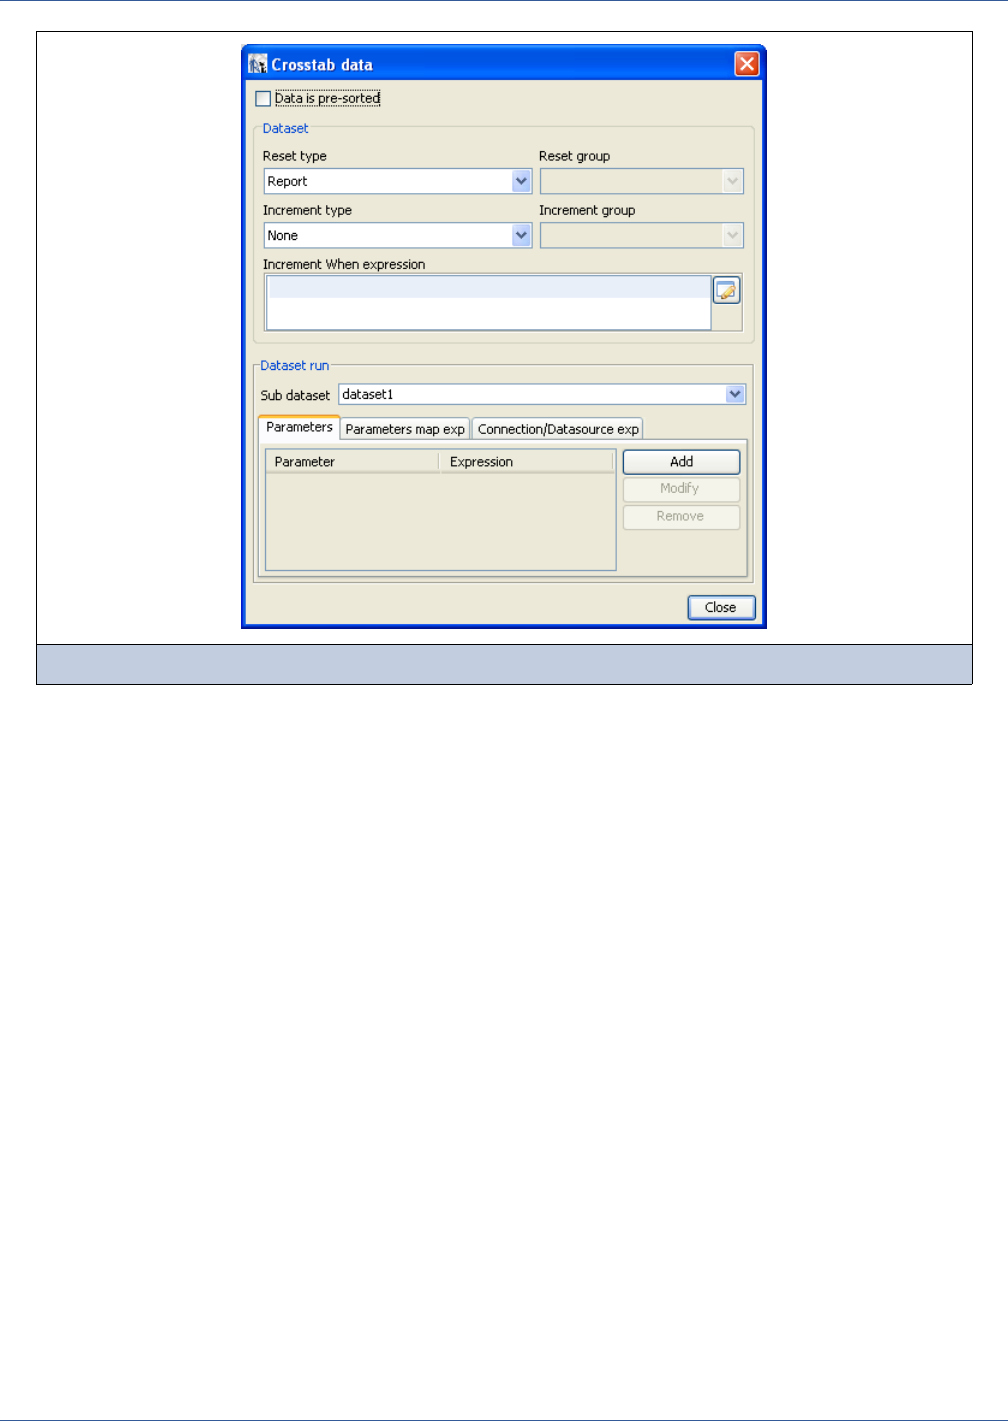
Crosstabs
301
The window’s interface is similar to the one used to provide data for a chart. The mechanism to provide the data to a crosstab
is very similar.
If your data is presorted, you can select the Data is Presorted check box option to speed up the filling process.
You can use the Reset Type/Reset Group and Increment Type/Increment Group options to define when to reset the
collected data or add a record to your dataset.
The Increment When expression is a flag to determine whether to add a record to the record set that feeds the chart. This
expression must return a Boolean value. iReport considers a blank string to mean “add all the records.”
See Chapter 14 for details on how to set the dataset run properties.
15.6 Using Crosstab Total Variables
Crosstab total variables (see Figure 15-20) are built-in objects that you can use inside crosstab textfield expressions to
combine data at different aggregation levels (for example, to calculate a percentage). For each measure, JasperReports creates
variables that store the total value of the measure by each row/column group.
Figure 15-19 Crosstab Data
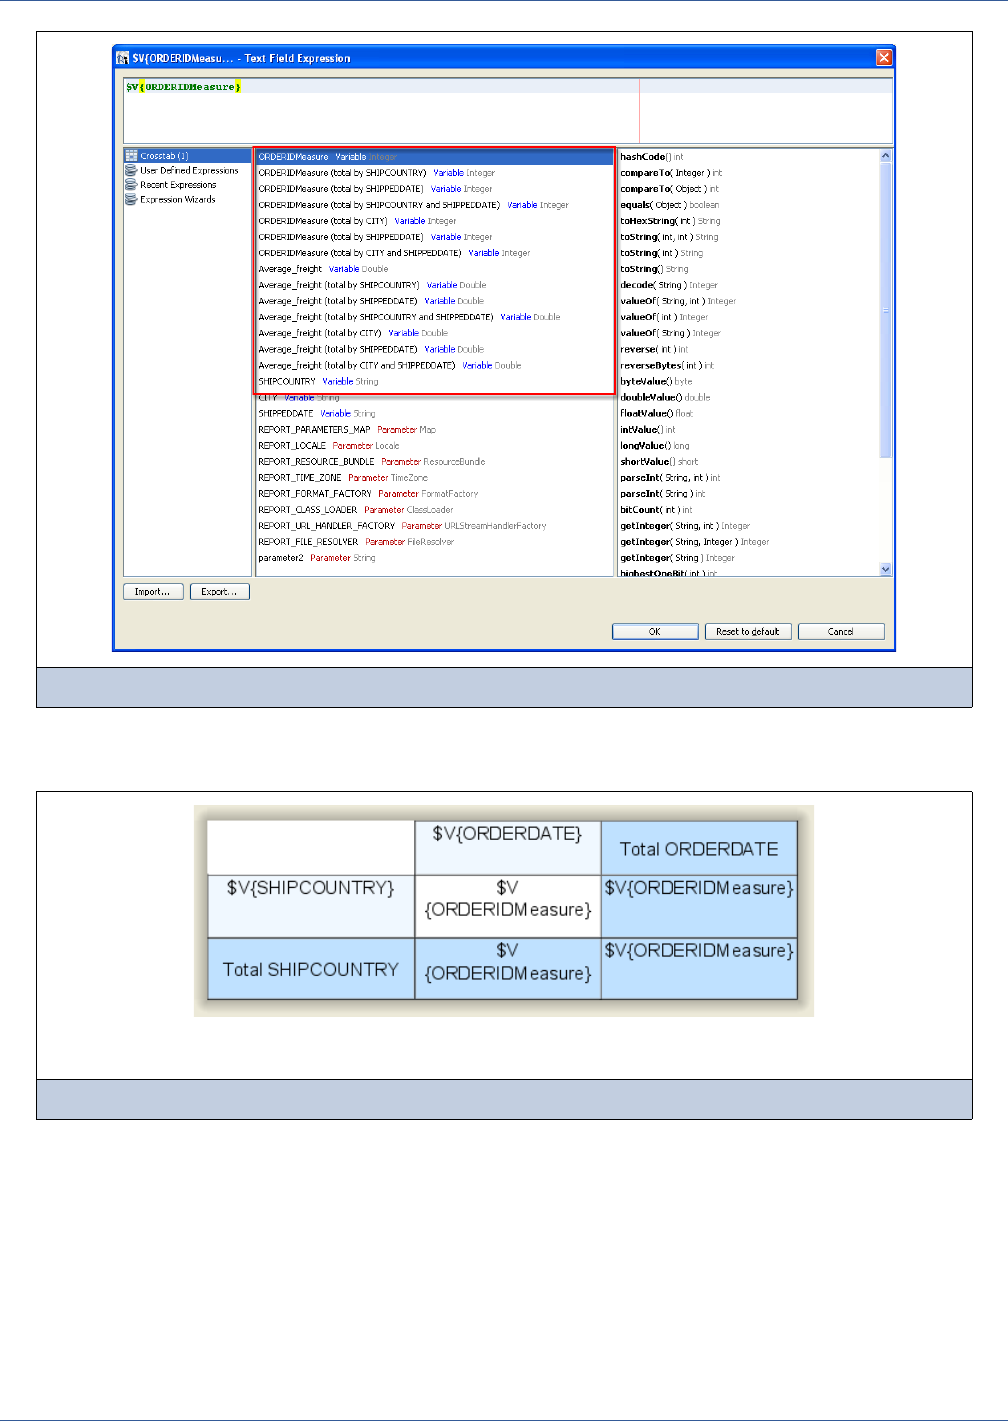
302
iReport Ultimate Guide
The following example is a simple report that shows the number of orders shipped in several regions for several years.
Figure 15-21 shows the simple crosstab layout for the example, and Figure 15-22 shows the printed results.
Figure 15-20 Total variables are suggested in the expression editor
Figure 15-21 Simple crosstab layout
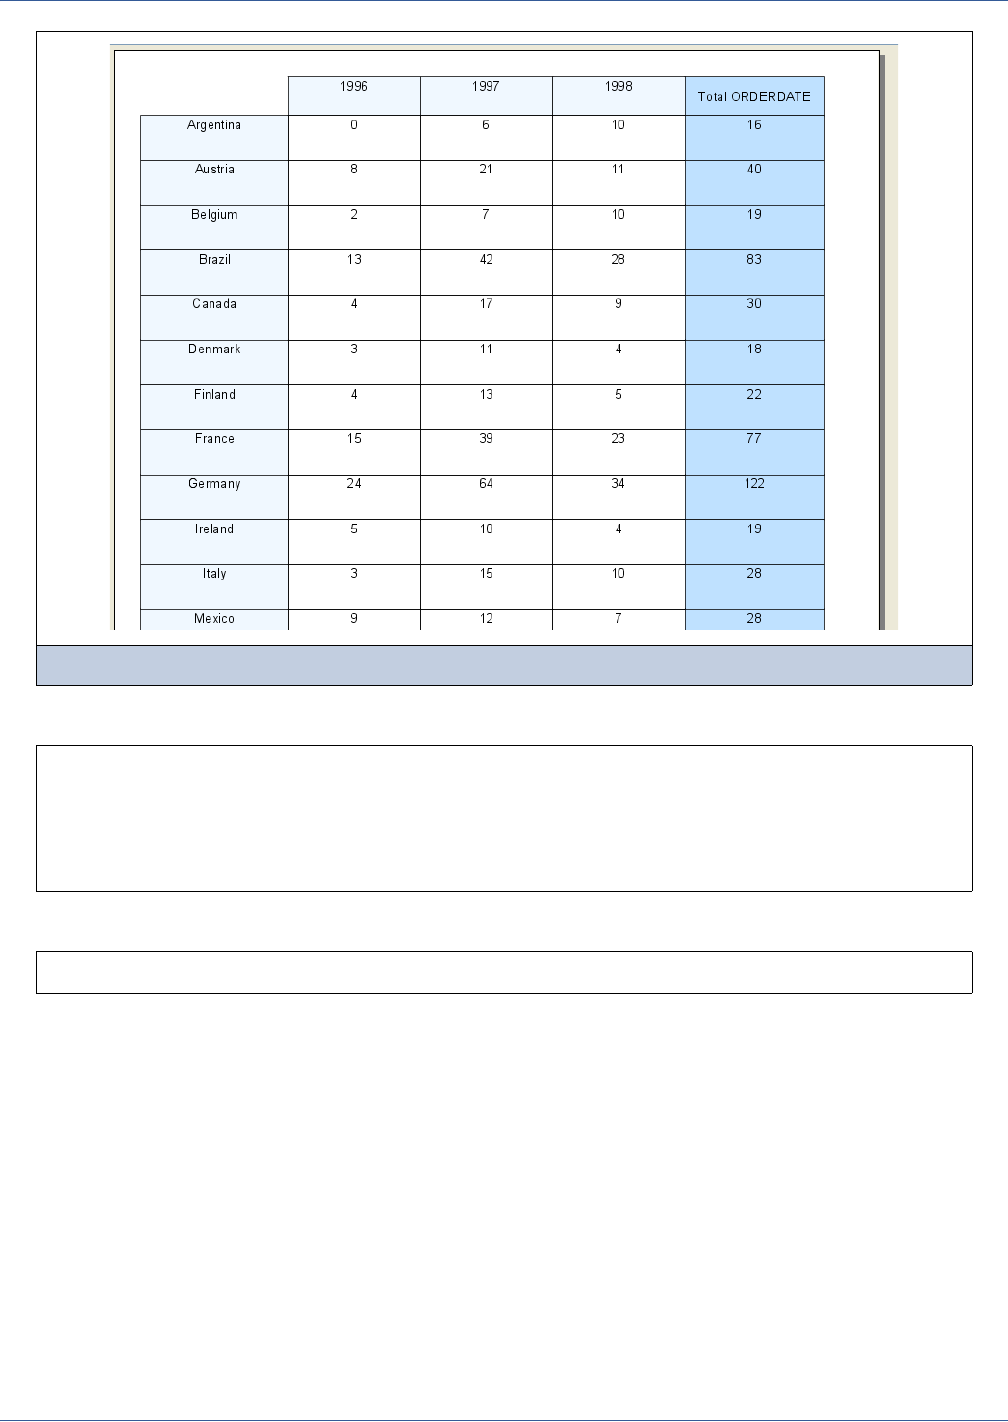
Crosstabs
303
To calculate the percentage of orders placed in each region per year, add a textfield with the following Java expression:
Or, if you use Groovy as suggested, simply:
The basic formula to implement is:
(Number of orders placed in this region and in this year) / (All orders shipped in this region)
A percentage must be treated as a floating-point number. For this reason, extract the double-scalar values from the
ORDERIDMeasure and ORDERIDMeasure_ORDERDATE_ALL objects even if there are objects of class-type Integer
(actually, a percentage derives from a number between 0 and 1, multiplied by 100).
To include the value of the expression as a percentage, set the value of the pattern textfield attribute to #,##0.00%.
Figure 15-23 shows the modified crosstab in the design window, and Figure 15-24 shows the final printed results.
Figure 15-22 The result of the simple layout
new Double(
$V{ORDERIDMeasure}.doubleValue()
/
$V{ORDERIDMeasure_ORDERDATE_ALL.doubleValue()
)
(double)$V{ORDERIDMeasure} / (double)$V{ORDERIDMeasure_ORDERDATE_ALL
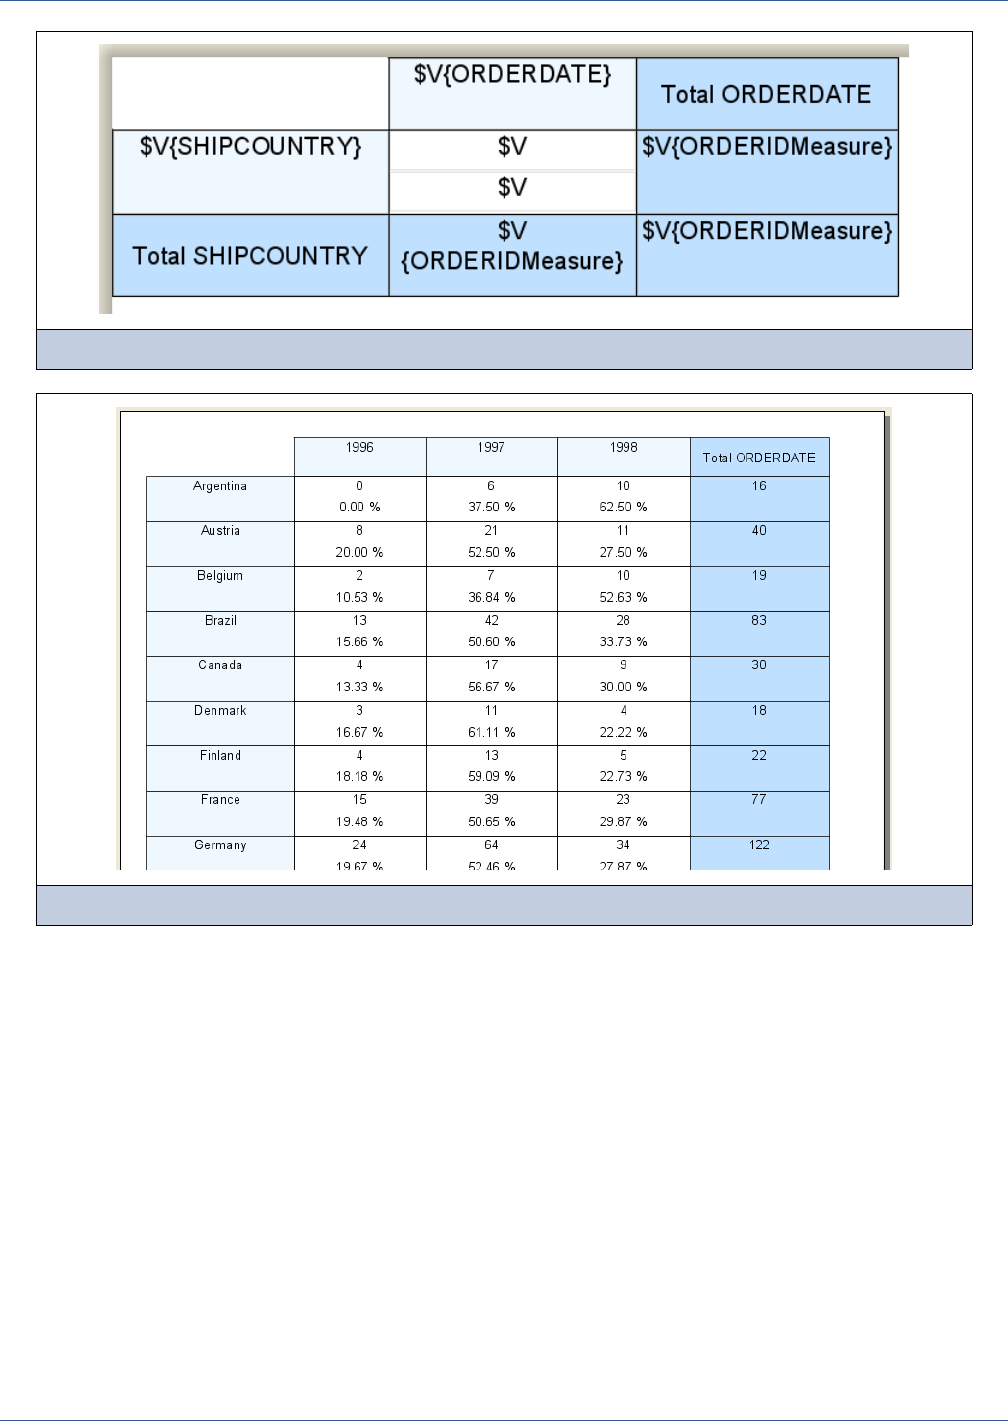
304
iReport Ultimate Guide
Figure 15-23 A second field has been added in the measure cell to show the percentage
Figure 15-24 The final report with percentages included

Internationalization
305
CHAPTER 16 INTERNATIONALIZATION
Internationalization is the process by which applications are made acceptable for multiple cultures. The most important change
that should be made to an application is the language of the UI and output. This part of internationalization is generally called
“localizing.” In iReport, localizing a report requires making all static text that is set at design time, such as labels and
messages, adaptable to locale options at run time; the report engine will print the text using the most appropriate available
translation. The text translations in the different languages supported by the report are stored in resource files called “resource
bundles.” This chapter covers localizing reports and explains using the built-in function msg() to localize very complex
sentences created dynamically.
This chapter has the following sections:
Using a Resource Bundle Base Name
Retrieving Localized Strings
Formatting Messages
Deploying Localized Reports
Generating a Report Using a Specific Locale and Time Zone
16.1 Using a Resource Bundle Base Name
When you internationalize a report, it’s necessary to find all the display text included in the report design that needs to be
customized, such as labels and static strings. A key (a name) is associated with every text fragment and is used to recall these
fragments. These keys and the relative text translation are written in special files (one per language). Below is an example of a
text localization mapping file:
All files containing this information have to be saved with the .properties file extension. The effective file name (that is,
the file name without the file extension and the language/country code, which you will see later in this section) represents the
report Resource Bundle Base Name (for example, the Resource Bundle Base Name for the resource file
i18nReport.properties is i18nReport). When you generate an instance of the report, the report engine will look in the
classpath for a file that has the Resource Bundle Base Name plus the .properties extension (so, for the previous example, it
will look for a file named i18nReport.properties). If the report engine cannot find the file, it uses the default mapping
Title_GeneralData=General Data
Title_Address=Address
Title_Name=Name
Title_Phone=Phone
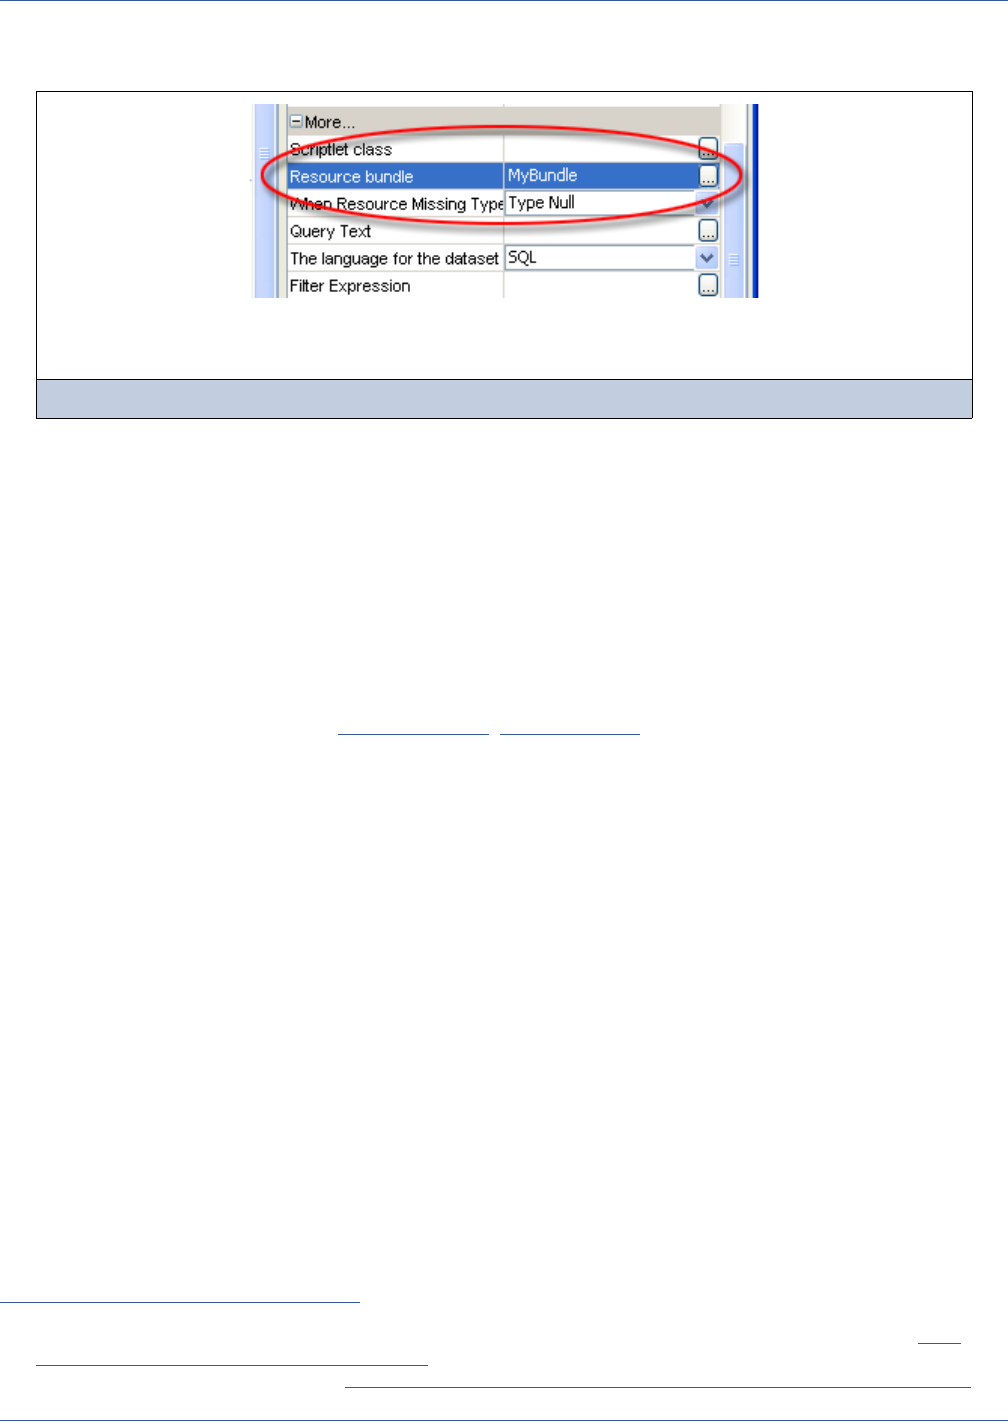
306
iReport Ultimate Guide
resource defined for the report. The Resource Bundle Base Name is specified using the report property sheet as shown in
Figure 16-1.
When you need to generate a report using a specific locale, JasperReports looks for a file starting with the Resource Bundle
Base Name string, followed by the language and country code relative to the requested locale. For example,
i18nReport_it_IT.properties is a file that contains all locale strings to print in Italian; in contrast,
i18nReport_en_US.properties contains the translations in American English.* So it’s important to always create a
default resource file that will contain all the strings in the most widely-used language and a set of language-specific files for
other languages.
The default resource file does not have a language/country code after the Resource Bundle Base Name, and the contained
values are used only if there is no resource file that matches the requested locale, or if the file does not include the key for a
translated string.
The complete resource file name is composed as follows:
<resource bundle base name>[_language code[_country code[_other code]]].properties
Here are some examples of valid resource file names:
i18nReport_fr_CA_UNIX
i18nReport_fr_CA
i18nReport_fr
i18nReport_en_US
i18nReport_en
i18nReport
The “other” code (or alternative code) is usually not used for reports, but it is included to identify very specific resource files.
The alternative code is appended after the language and the country code ( _UNIX in the preceding example).
If a resource key is not found in any of the suitable resource bundles, you can choose what to do by setting the report property
When Resource Missing Type. The possible options are:
iReport provides built-in support for editing the resource bundle files used for report localization.
To create a new resource bundle, select New → Resource Bundle (see Figure 16-2).
Figure 16-1 The Resource Bundle Base Name property
* The language codes are the lower-case, two-letter codes as defined by ISO-639 (a list of this codes is available at this site: http://
www.loc.gov/standards/iso639-2/php/English_list.php), the country codes are the upper-case, two-letter codes as defined by ISO-3166
(a list of this codes is available at this site: http://www.iso.ch/iso/en/prods-services/iso3166ma/02iso-3166-code-lists/list-en1.html).
Type Null The null value is used in the expression (resulting in the string “null”)
Type Empty The empty string is used
Raise an error This will stop the filling process throwing a Java exception
Type the key The value of the key is used as value
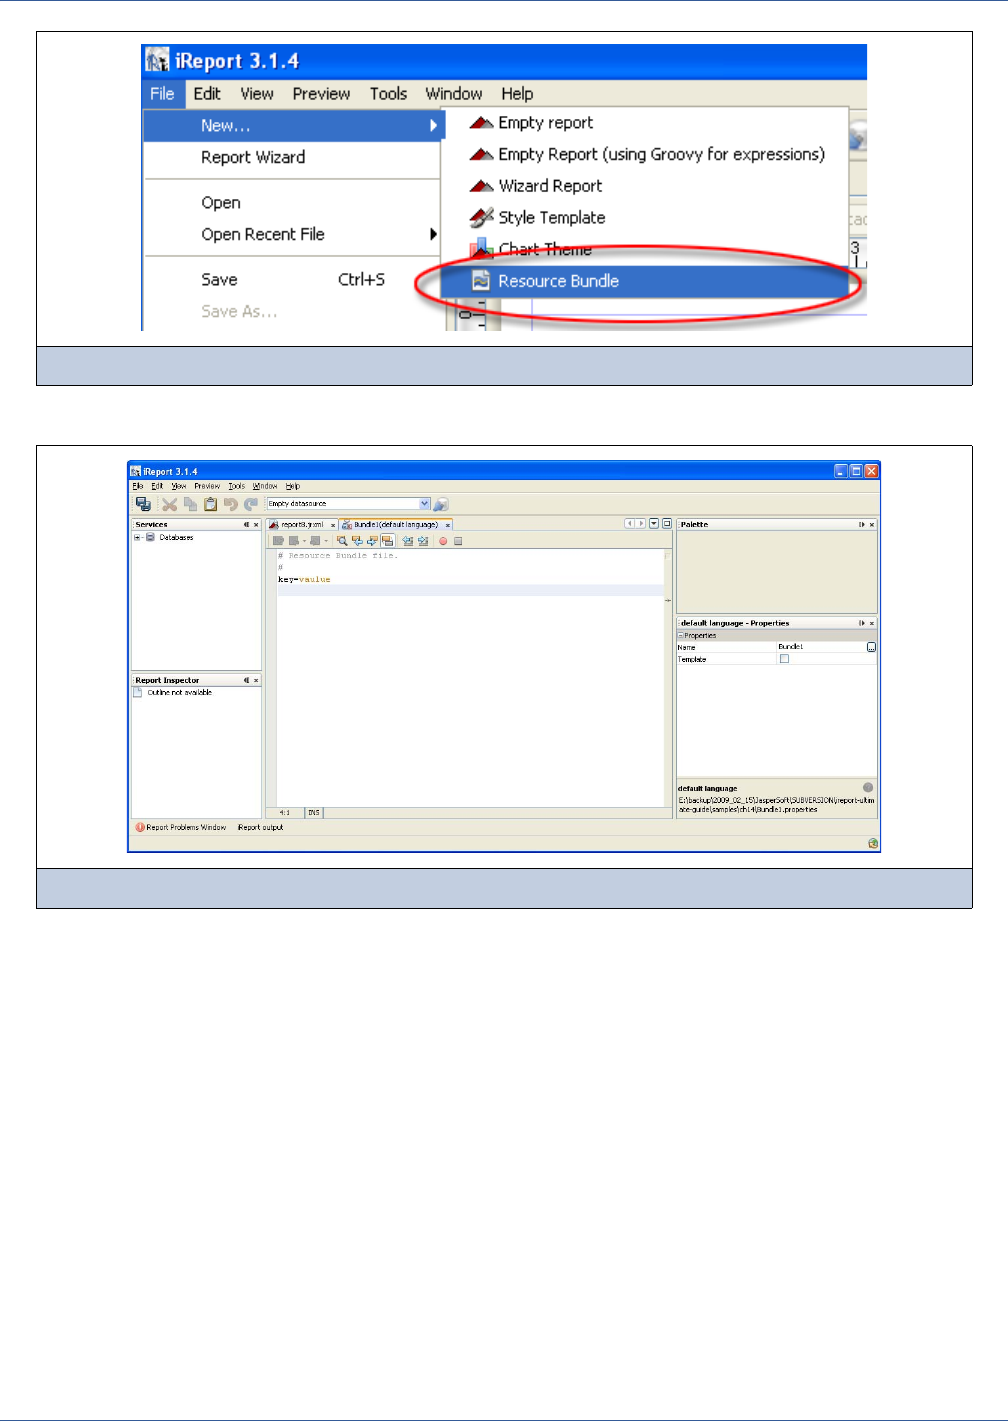
Internationalization
307
Select the file name and where to save it. When done, iReport will open the file as simple text file (see Figure 16-3).
This is just the default bundle. To add new languages or switch to the visual editor for resource bundles, you need to locate the
file using the Favorites window. Select Window→Favorites to open the Favorites view, and locate the resource bundle file
directory. It is important that you add the containing directory, not the file itself; otherwise you’ll be not able to see the
language specific bundles (see Figure 16-4).
Figure 16-2 Creating a new resource bundle
Figure 16-3 The new resource bundle
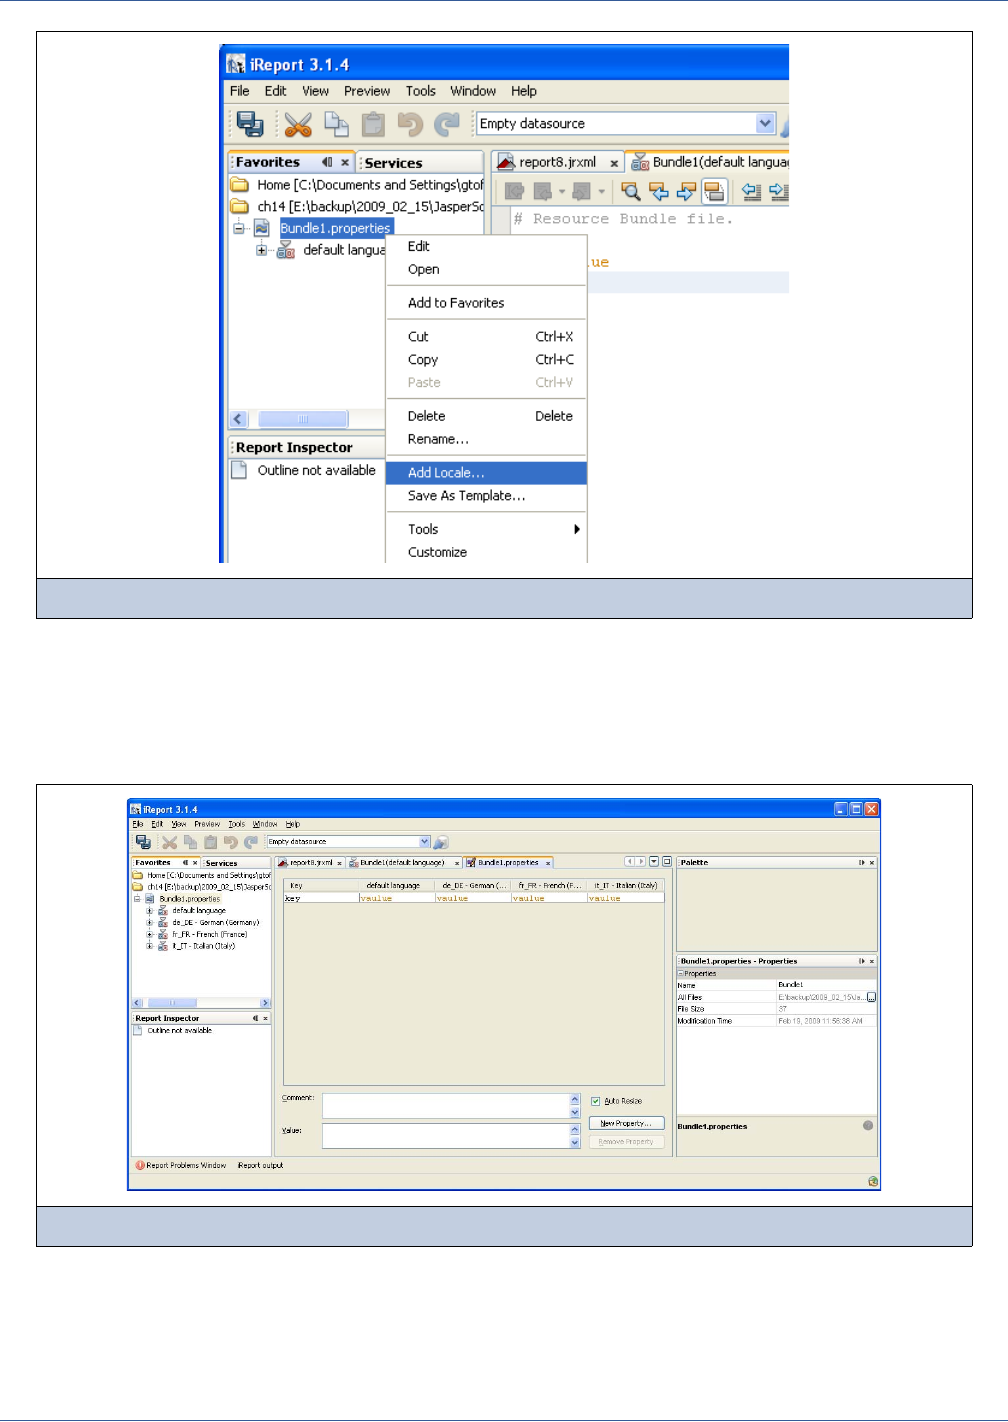
308
iReport Ultimate Guide
The bundle node in Favorites provides several tool features. Right-click the file node to open one of the editing tools for the
resource bundle:
Edit. Opens a resource bundle as a text file (see Figure 16-3)
Open. Opens the visual resource bundle editor that shows at the same time the translations for all the language you are
supporting (see Figure 16-5).
To add a new locale (meaning support for a new language), right-click the resource bundle node and select the menu item Add
locale.... This will pop up the window shown in Figure 16-6. It is used to set the correct language specifications (language,
country and optionally a variant code).
Figure 16-4 The resource bundle in the Favorites view
Figure 16-5 Visual Bundle Editor
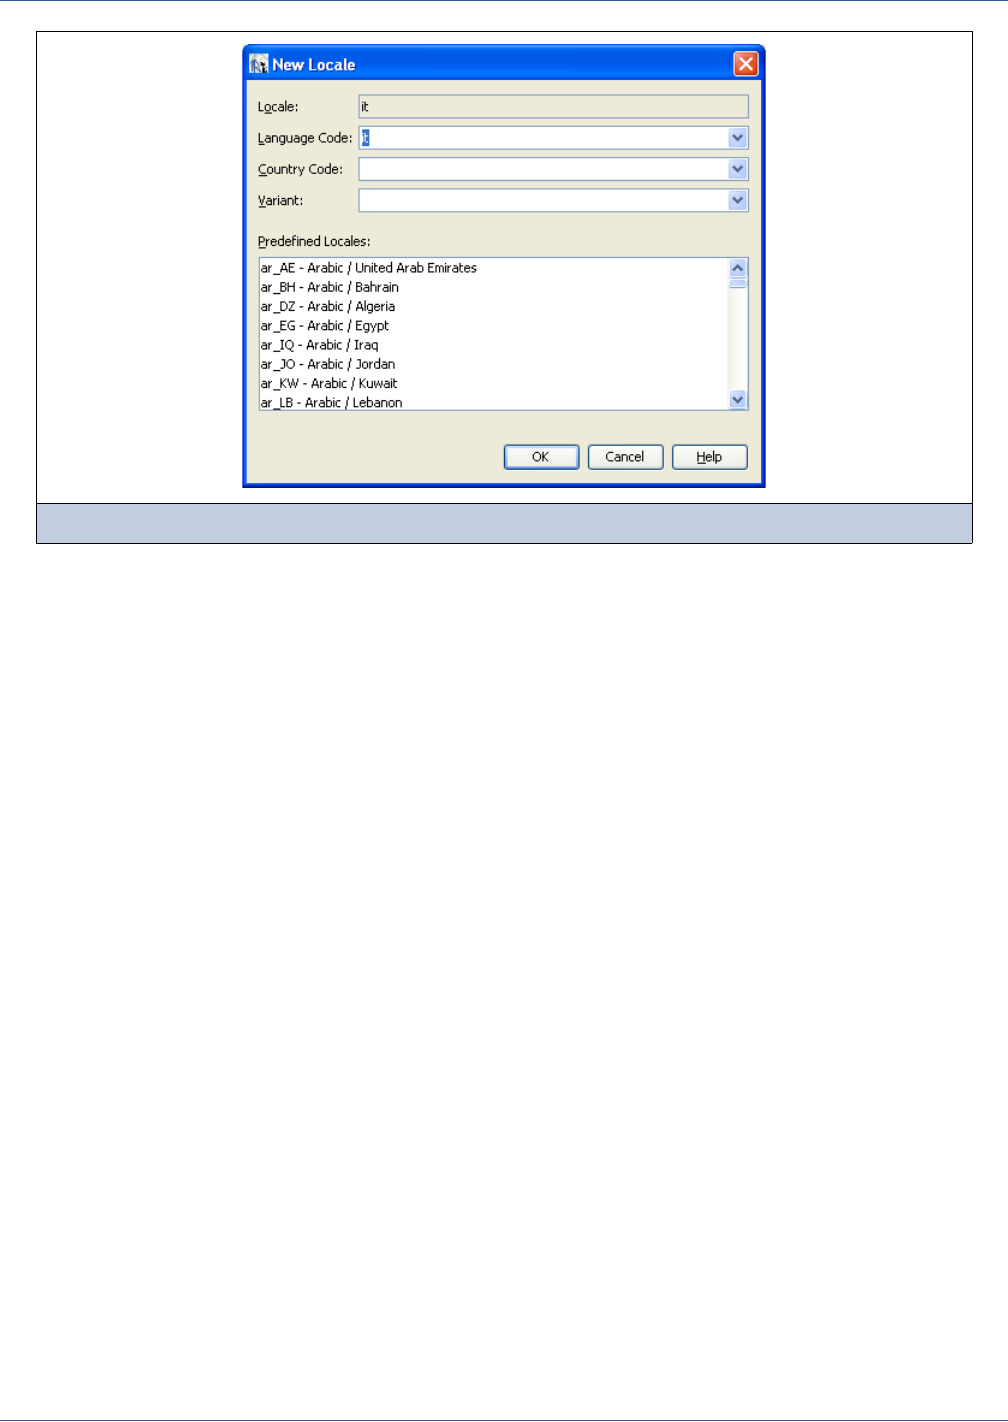
Internationalization
309
By confirming the choice, a new file will be created in the same directory as the default one; it will have the proper localization
abbreviation appended to the file name, and it will be visible as a child of the bundle node in the Favorites view.
16.2 Retrieving Localized Strings
There are two ways to retrieve the localized string for a particular key inside a JasperReports expression:
Use the built-in str("key name") function
Use the special syntax $R{key name}
Here is an example expression for retrieving a localized string:
$R{hello.world}
JasperReports converts the text associated with the key hello.world using the most appropriate available translation for the
selected locale.
16.3 Formatting Messages
The internationalization features included with JasperReports are based on the support provided by Java. One of the most
useful features is the msg function, which you can use to dynamically build messages using arguments. In fact, msg uses
strings as patterns. These patterns define where arguments, passed as parameters to the msg function, must be placed. The
position of an argument is expressed using numbers between braces, as in this example:
“The report contains {0} records.”
The zero specifies where to place the value of the first argument passed to the msg function. The expression:
msg($R{text.message}, $P{number})
uses the string referred to by the key text.message as the pattern for the call to msg. The second parameter is the first
argument to be replaced in the pattern string. If text.message is the string “The report contains {0} records.” and
the value for the report parameter number is 100,JasperReports displays the interpreted text string as:
The report contains 100 records.
Figure 16-6 New locale

310
iReport Ultimate Guide
The reason for using patterns instead of building messages like this by dividing them into substrings translated separately (for
example, [The report contains] {0} [records]), is that sometimes the second approach is not possible. Localization
modules may not be able to create grammatically correct translations for all languages (for example, for languages in which
the verb appears at the end of the sentence).
It’s possible to call the msg function in three ways, as shown below:
The only difference between the three calls is the number of arguments passed to the function.
16.4 Deploying Localized Reports
To deploy a localized report, you must make sure that all .properties files containing the translated strings are present in
the classpath.
JasperReports looks for resource files using the getBundle method of the ResourceBundle Java class. To learn more
about how this class works, visit http://java.sun.com/docs/books/tutorial/i18n/, where you will find all the main concepts about
how Java supports internationalization fully explained.
16.5 Generating a Report Using a Specific Locale and Time Zone
If you wish to use a specific locale or to generate a report using a particular time zone, go to the iReport options dialog (Tools
→ Options) and specify the preferred locale and time zone in the Report execution options section (Figure 16-7).
public String msg(String pattern, Object arg0)
public String msg(String pattern, Object arg0, Object arg1)
public String msg(String pattern, Object arg0, Object arg1, Object arg2)
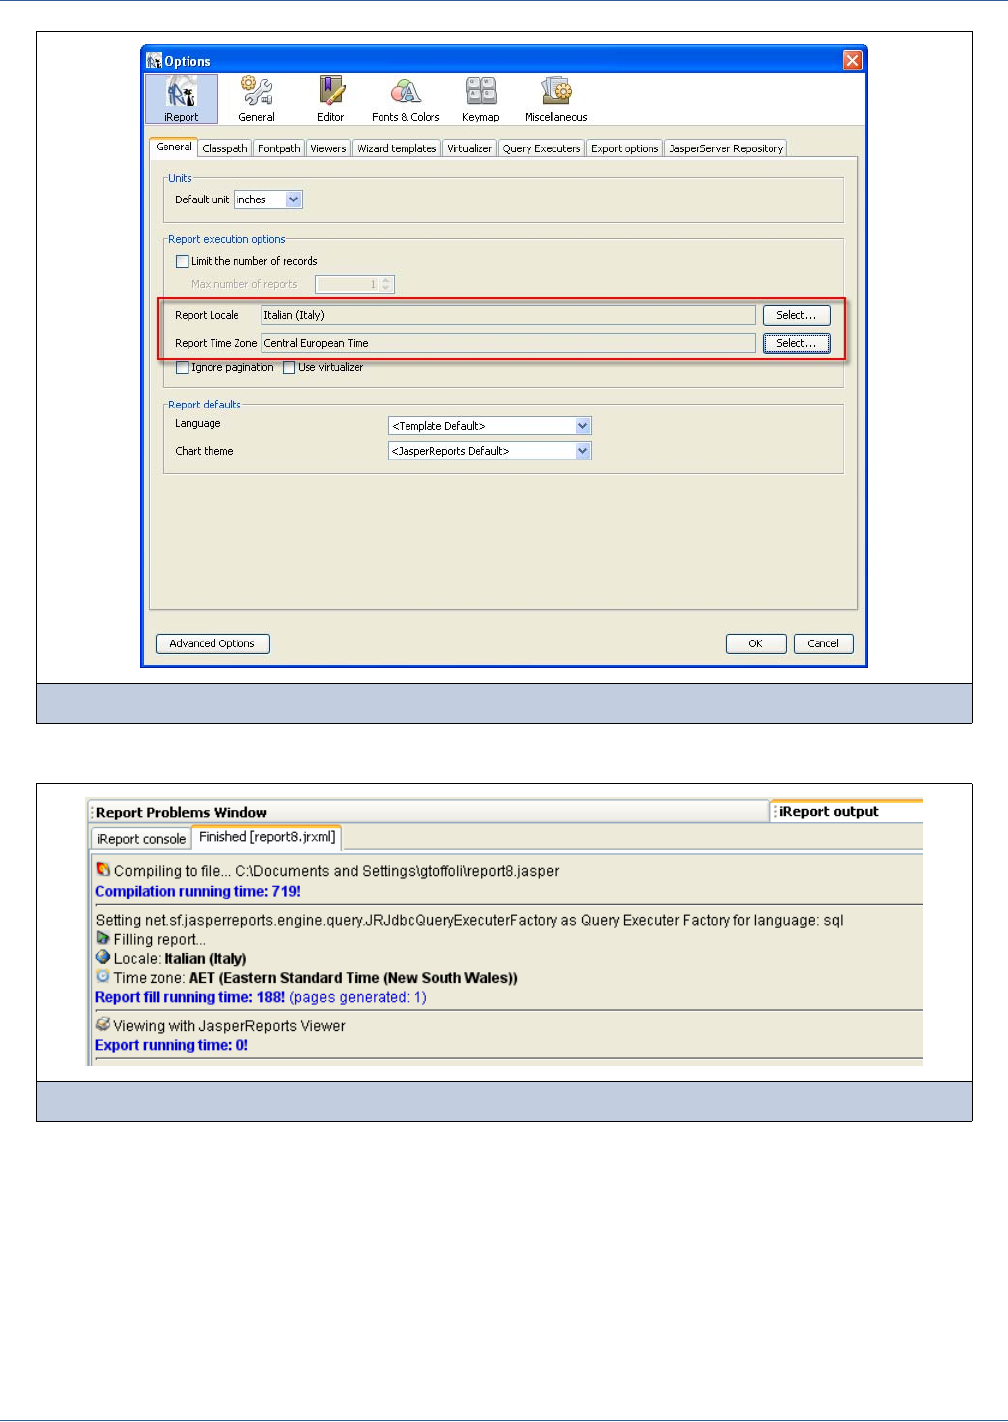

312
iReport Ultimate Guide

Subreports
313
CHAPTER 17 SUBREPORTS
Subreports represent one of the most advanced features of JasperReports. They enable the design of very complex reports
created by inserting one or more reports into another report. All the reports have to be created with similar modalities.
You have seen that to generate a report you need three things: a Jasper file, a parameters map (it can be empty) to set a value
for the report parameters, and a data source (or a JDBC connection) that can be empty. In this chapter, I will explain how to
pass these three objects to the subreport through the parent report and how to create dynamic connections that are able to filter
the records of the subreport based on the parent’s data. Then I will explain how to return information regarding the subreport
creation to the parent report.
This chapter has the following sections:
Creating a Subreport
A Step-by-Step Example
Returning Values from a Subreport
Using the Subreport Wizard
17.1 Creating a Subreport
As noted previously, a subreport is simply a report composed of its own JRXML source and compiled in a Jasper file.
Generally speaking, creating a subreport is very similar to creating any other report. You have to pay attention only to the print
margins, which are usually set to zero for subreports because a subreport is meant to be a portion of a page, not an entire
document. The horizontal dimension of the subreport should be as large as the element into which it is placed in the parent
report. To insert it, we use a Subreport element (Figure 17-1).
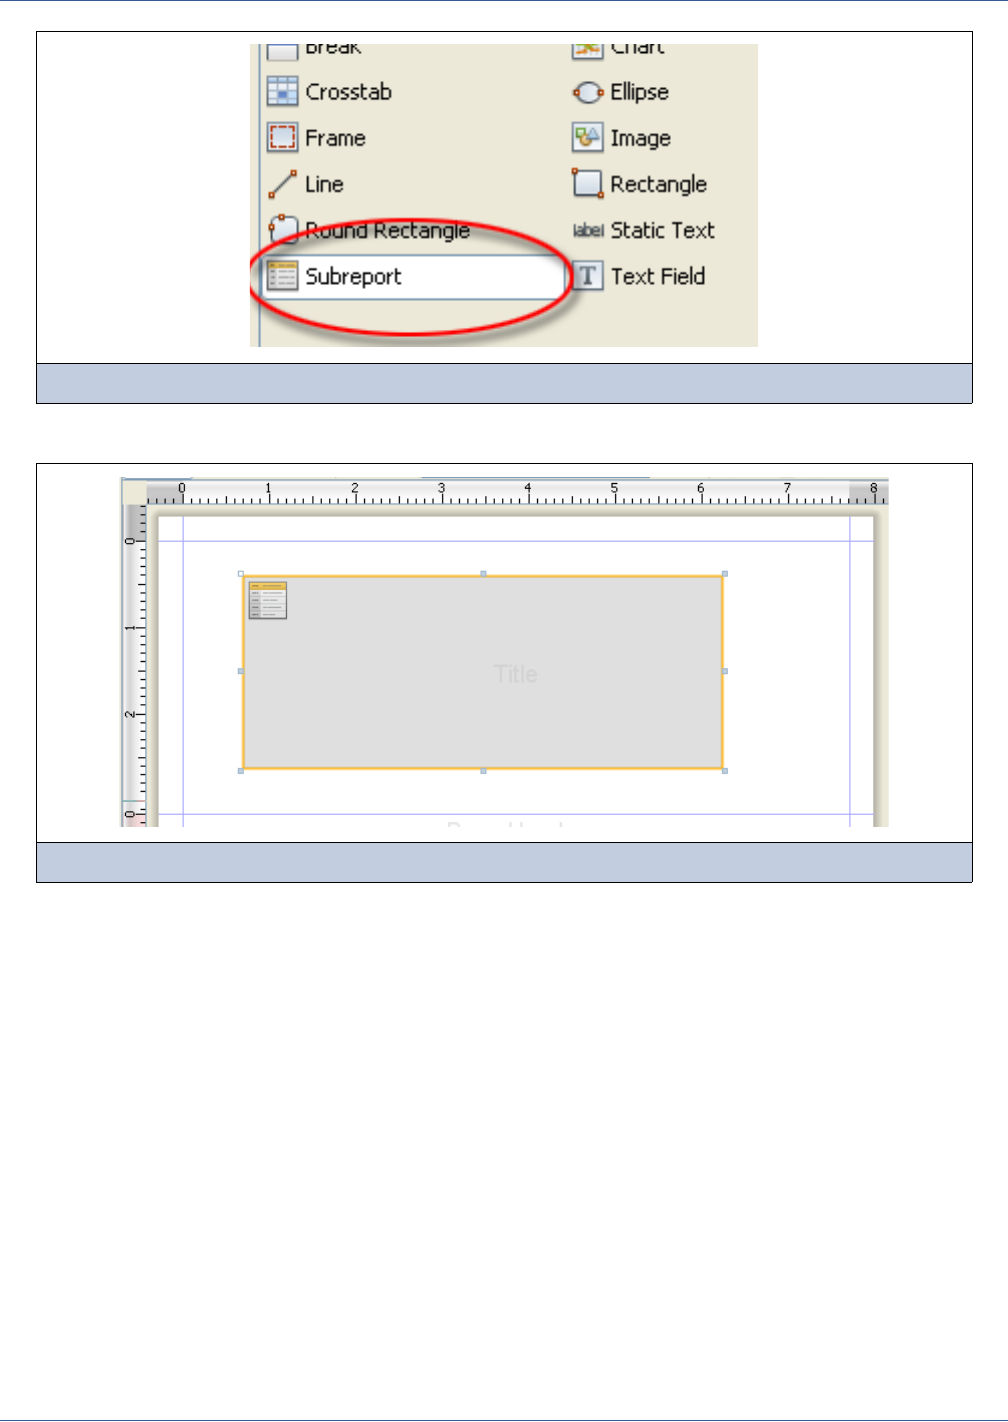
314
iReport Ultimate Guide
At design time the element will be rendered as a rectangle (Figure 17-2).
It is not necessary that the Subreport element be exactly as large as the report we will use as subreport; the element dimensions
are not really meaningful because the subreport will occupy all the space that it needs. You can think of the Subreport element
as a place holder defining the position of the top-left corner to which the subreport will be aligned. However, to avoid
unexpected results, it is always better to be precise.
17.1.1 Linking a Subreport to the Parent Report
To link the subreport to the parent report you have to define three things:
How to recover the Jasper object that implements the subreport.
How to feed the object with data.
How to set the values of the subreport parameters.
All this information can be defined through the Subreport element property sheet (Figure 17-3).
Figure 17-1 The Subreport element
Figure 17-2 Subreport element placed in the Title band
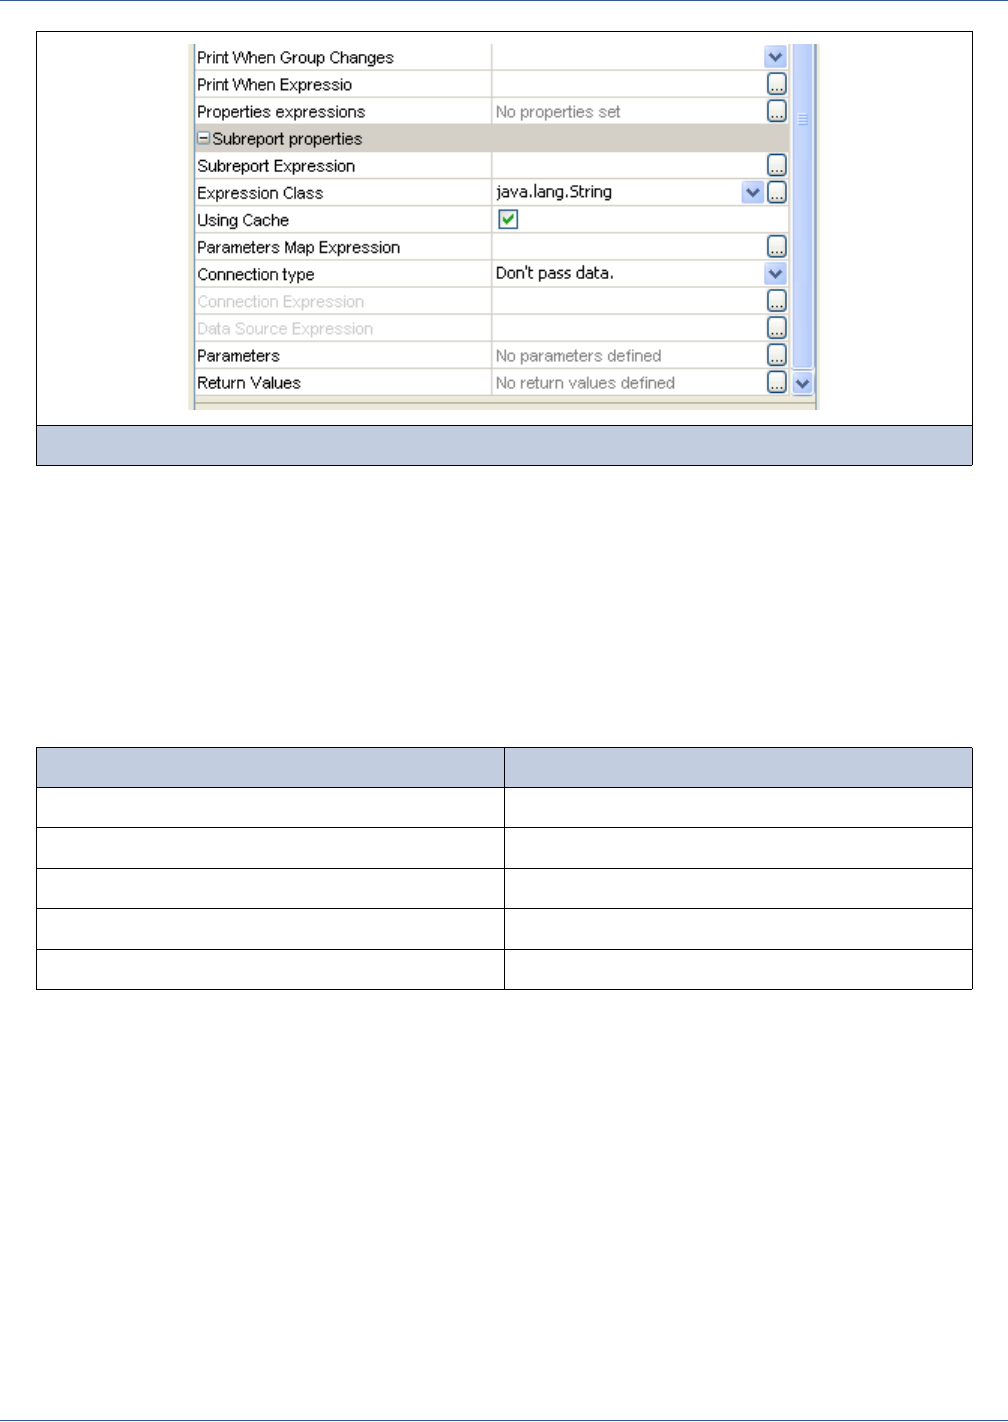
Subreports
315
First, let’s take a look at how subreport parameters are set.
17.1.2 Specifying the Subreport
When we add a subreport to a report, we have to know the location of the Jasper file we’ll use to generate the subreport. We
instruct JasperReports to locate this file or object setting the subreport expression. As in many other contexts where
expressions are involved, we need to set its type, that is, the kind of object returned from the expression. It’s easy to imagine
that JasperReports will act differently according to the expression type. The type is set specifying a value for the Expression
Class property. It must be selected from the combo box (Figure 17-3). Table 17-1 lists the possible object types.
If the expression is a string (java.lang.String), JasperReports will assume that the subreport must be loaded from a Jasper
file and will try to locate the file in the same way that resources are located. Specifically, the string is at first interpreted as a
URL. In case of failure (a MalformedURLException being returned), the string is interpreted as a physical path to a file; if
the file does not exist, the string is interpreted as a resource located in the classpath. This means that using an expression of
type String means you are in some way trying to specify a file path; optionally, you can put your Jasper file in the classpath
and refer to it as a resource (meaning your expression will be something like “subreport.jasper,” assuming that the
directory containing the file subreport.jasper is in the classpath).
You might be concerned about why a relative path cannot be used to locate the subreport file; in other words, why, if you have
a report in c:\myreport\main_report.jasper, you cannot refer to the subreport just by using an expression like
..\\mysubreports\\mysubreport.jasper. Well, you cannot do this because JasperReports does not keep in memory the original
location of the Jasper file that it’s working with. This makes perfect sense, considering that a Jasper object is not necessarily
loaded from a physical file.
The first step in configuring a subreport element should now be clear: create an expression that can be used to load the Jasper
object to use when filling the subreport portion of the document. From experience, 99 percent of the time it will be a Jasper file
Figure 17-3 Subreport element properties
Table 17-1 Possible values for Subreport Expression
Value Explanation
net.sf.jasperreports.engine.JasperReport The Jasper file pre-loaded in a JasperReport object.
java.io.InputStream An open stream of the Jasper file.
java.net.URL A URL file that identifies the location of the Jasper file.
java.io.File A file object that identifies the Jasper file.
java.lang.String The name of the Jasper file.

316
iReport Ultimate Guide
stored somewhere in the file system. So, if we are loading the subreport from the filesystem, I suggest two options to make the
life of the designer and developer a bit easier. Both are very similar to the ones used when referencing images.
First, place the subreport file in a directory that is in the classpath. This permits you to use very simple subreport
expressions, such as a string containing just the name of the subreport file (that is, “subreport.jasper”). iReport
always includes the classpath of the directory of the report that is running, so all the subreport Jasper files can be found
easily if they are located in the same directory.
Second, parametrize the Jasper file location and create on-the-fly the real absolute path of the file to load. This can be
achieved with a parameter containing the parent directory of the subreport (let’s call it SUBREPORT_DIRECTORY) and an
expression like this:
$P{SUBREPORT_DIRECTORY} + “subreport.jasper”
One advantage of this approach is that you can use the Jasper files’ local directory as the default value for the
SUBREPORT_DIRECTORY parameter. The developer who will integrate JasperReports in his applications can set a
different value for that location just by passing a different value for the SUBREPORT_DIRECTORY parameter.
17.1.3 Specifying the Data Source
For JasperReports to retrieve data and fill the subreport, you have to set the subreport data source. Usually we have three
options:
Use an SQL query and the same JDBC connection as the parent (super-easy case); or
Use a different type of data source (such as an XML file) and some data source elements to create an expression to create
or pass the required data source instance.
In very special circumstances, we can pass no data at all to the subreport. We will explain with this last option in depth
since it provides a way to simulate inclusion of static portions of documents (like headers, footers, backgrounds, and so
on).
JDBC connections make using subreports simple enough. A connection expression must identify a java.sql.Connection
object (ready to be used, so a connection to the database is already opened). Typically, we’ll run the SQL query using the same
database connection as the parent report; the connection can be referenced with the REPORT_CONNECTION built-in parameter.
It must be clear that if we pass a JDBC connection to the subreport, it is because we defined an SQL query in the subreport, a
query that will be used to fill it.
Using a different data source is sometimes necessary when a connection like JDBC is not being used; it is more complicated
but extremely powerful. It requires writing a data source expression that returns a JRDataSource instance that you then use
to fill the subreport. Depending on what you want to achieve, you can pass the data source that will feed the subreport through
a parameter, or you can define the data source dynamically every time it is required. If the parent report is executed using a
data source, this data source is stored in the REPORT_DATASOURCE built-in parameter. On the other hand, the
REPORT_DATASOURCE should never be used to feed a subreport; a data source is a consumable object that is usable for feeding
a report only once. Therefore, the parameter technique is not suitable when every record of the master report has its own
subreport (unless there is only one record in the master report). When we discuss data sources this will be more clear and you
will see how this problem is easily solved with custom data sources. You will also see how to create subreports using different
type of connections and data sources.
17.1.4 Passing Parameters
When a report is invoked from a program (using one of the fillReport methods, for instance), a parameters map is passed to
set a value for its parameters. A similar approach is used to set a value for subreport parameters. With subreports you don’t
have to define a map (even, if possible, specifying a Parameters Map Expression). The report engine will take care of that
for you, but you can still create a set of parameter name/object pairs that will be used to set the values of the subreport
parameters.
The major advantage of a parameters map is that values can be provided as expressions, making the map potentially dynamic.
Subreport parameters are set using the parameters property (see Figure 17-3). Click the ... button to pop up the Parameters
dialog (see Figure 17-4). The interface is self-explanatory: by clicking the Add button, you can bring up a dialog box in which
you can add parameters that will feed the parameters map of the subreport.
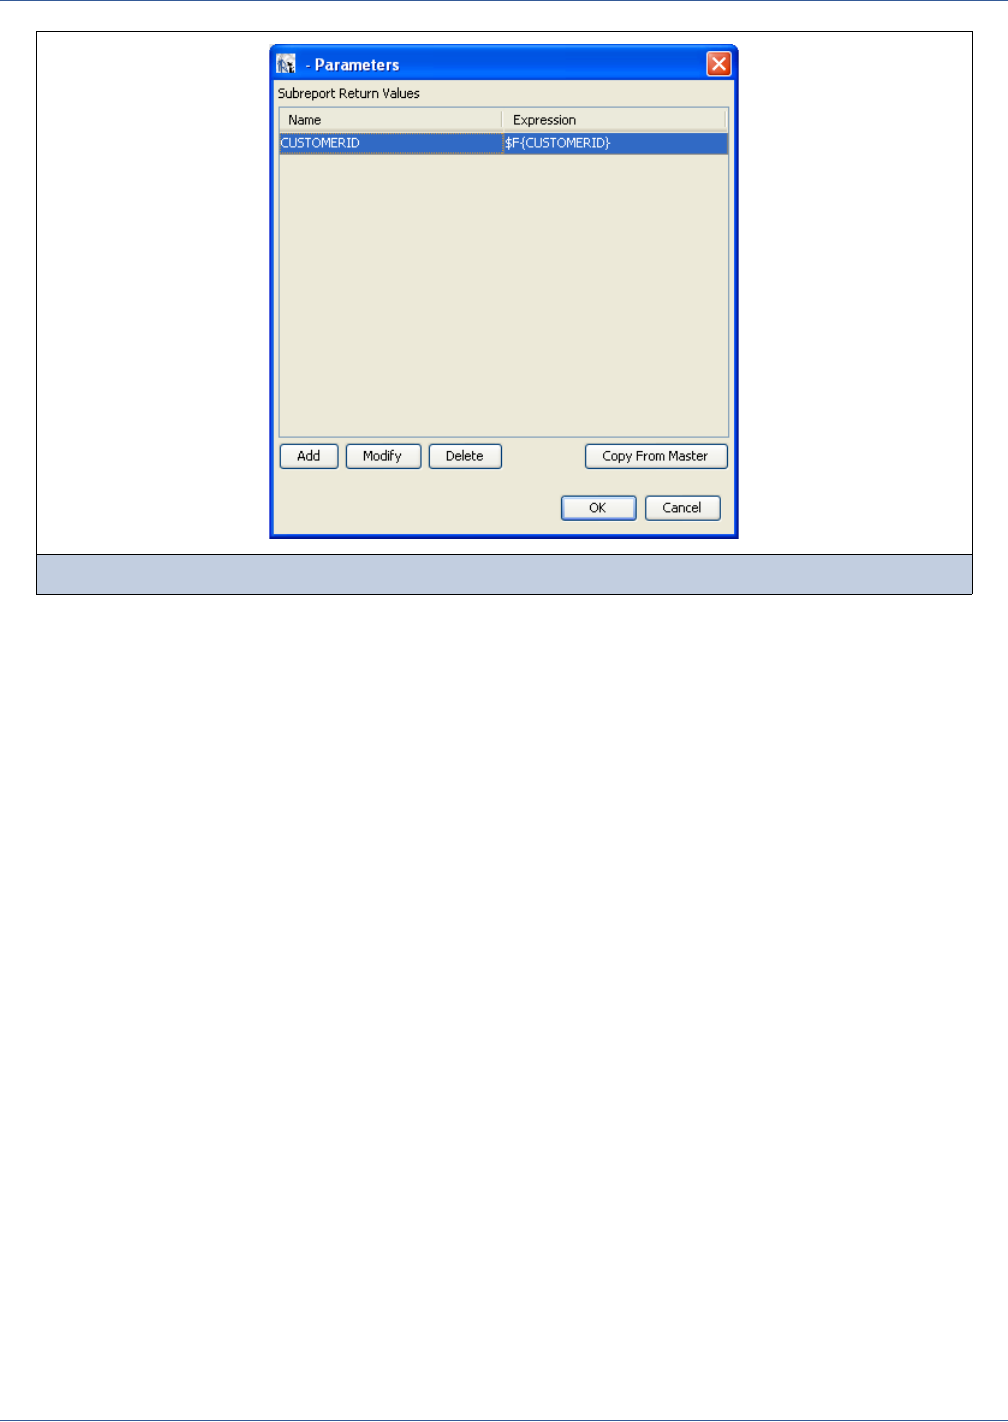
Subreports
317
A parameter name has to be the same as the one declared in the subreport. The names are case-sensitive, so capitalization
counts. If you make an error typing the name or the inserted parameter has not been defined, no error is thrown (but probably
something would end up not working, and you would be left wondering why).
In the ValueExpression field in the Subreport parameter dialog, you supply a standard JasperReports expression in which you
can use fields, parameters, and variables. The return type has to be congruent with the parameter type declared in the
subreport; otherwise, an exception of ClassCastException will occur at run time.
One of the most common uses of subreport parameters is to pass the key of a record printed in the parent report in order to
execute a query in the subreport through which you can extract the records referred to (report headers and lines). For example,
let’s say you have in the master report a set of customers, and you want to show additional information about them, such as
their contact info. The subreports will use the customer ID to get the contact info. The customer ID should be passed to the
subreport as parameter, and its value will change for each record in the master report.
As cited below, you have the option of directly providing a parameters map to be used with the subreport; the Parameters
Map Expression allows you to define an expression, the result of which must be a java.util.Map object. It is possible, for
example, to prepare a map designed for the subreport in your application, pass it to the master report using a parameter, then
use that parameter as an expression (for example, $P{myMap}) to pass the map to the subreport. It is also possible to pass to
the subreport the same parameters map that was provided to the parent by using the built-in parameter
REPORT_PARAMETERS_MAP. In this case the expression looks like t his:
$P{REPORT_PARAMETERS_MAP}
Since the subreport parameters can be used in conjunction with this map, you could even use it to pass common parameters,
such as the username of the user executing the report.
17.2 A Step-by-Step Example
Let’s put into practice what you have learned so far. Say you want to print a list of the countries in which orders have been
placed and use a subreport to list of customers in each country. You will use a JDBC connection to the JasperReports sample
database; the only tables involved are orders (to extract the countries) and address (for the customer information). Please
note that the report we are creating could be realized without using a subreport, but we are just trying to keep things simple to
illustrate the procedure.
Figure 17-4 Subreport Parameters dialog
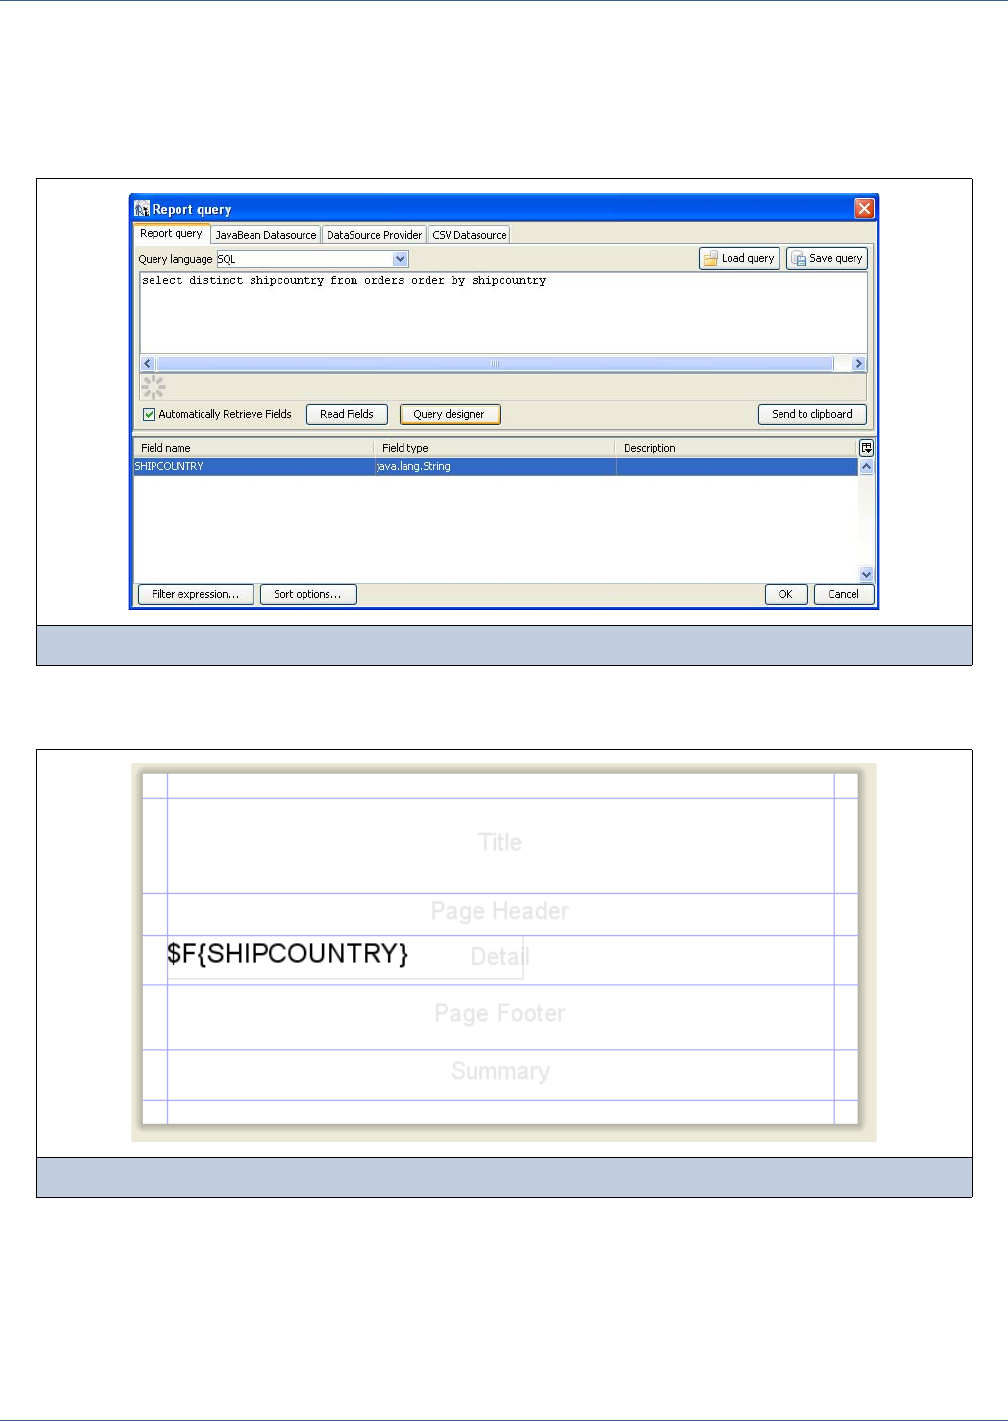
318
iReport Ultimate Guide
1. First, create a new empty report called master.jrxml. Let’s assume that the currently active connection points to
JasperReports Sample database.
2. Set the query as follow; it is designed to extract the names of countries, ordered by name:
select distinct shipcountry from orders order by shipcountry
If iReport does not provide the data automatically, click Read Fields to get the fields from the query (Figure 17-5).
3. The SHIPCOUNTRY field should appear in the outline view. Drag the field into the Detail band, adjusting the textfield
and font size (Figure 17-6).
4. Test the report by clicking the Preview button. You should get something similar to Figure 17-7.
Figure 17-5 Selecting records for the master report
Figure 17-6 SHIPCOUNTRY field in Detail band
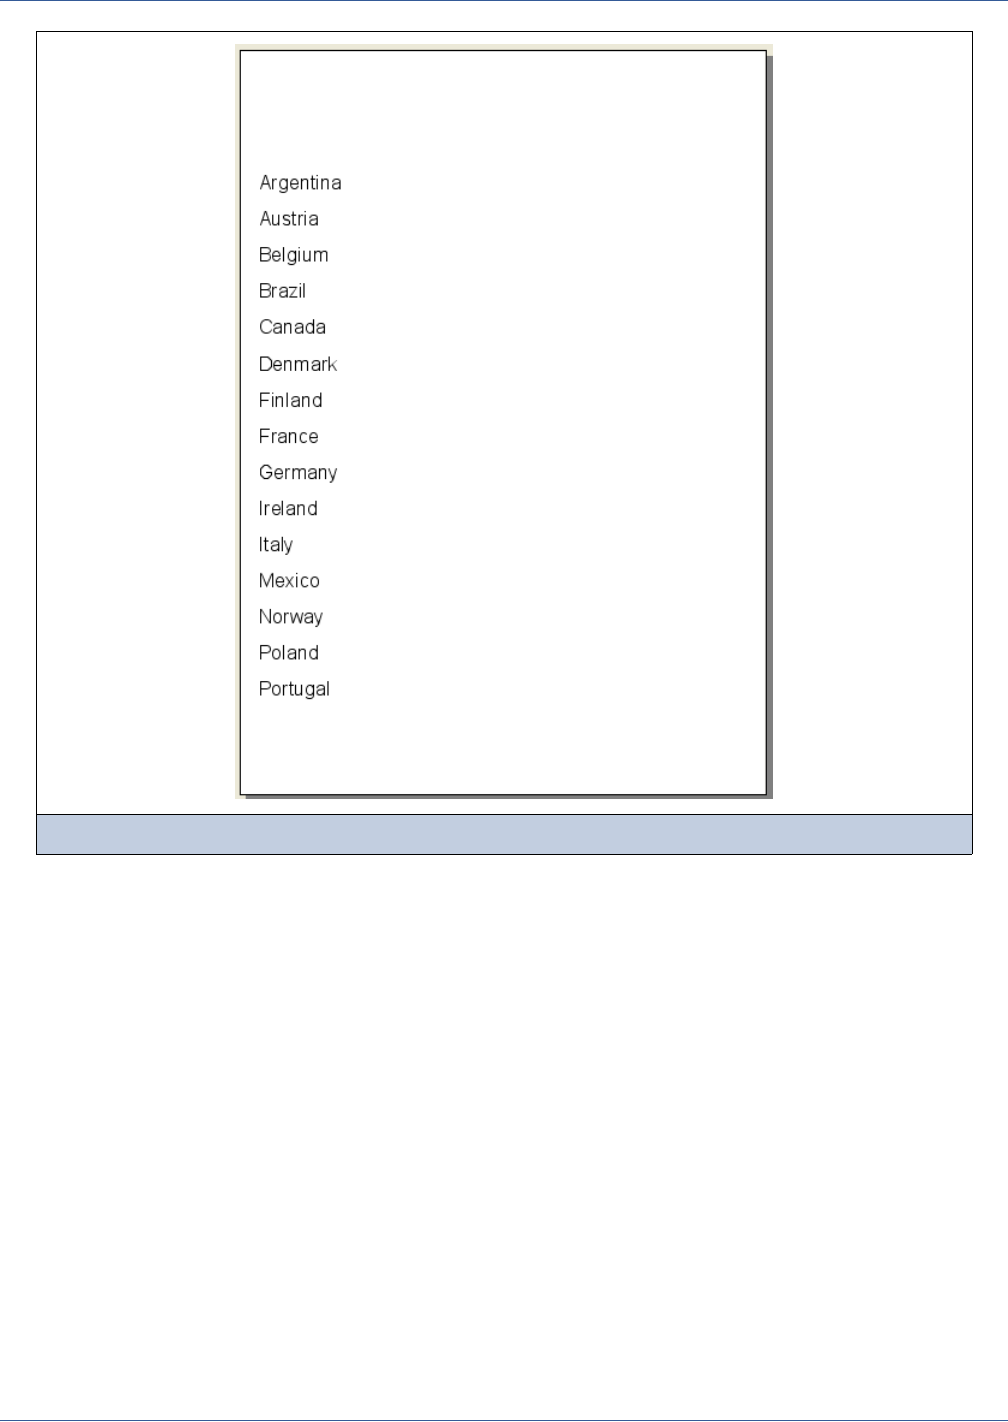
Subreports
319
Next, let’s start to create the report that will be used as the subreport. The subreport must have the following characteristics:
No margins (this is not mandatory, but of course we don’t need them).
No parameter to host the name of the country.
The width must be congruent with the space we want to reserve for it in the master report; let’s use the entire page width
minus the margins.
A set of textfields in the Detail band to show first and last name of each customer.
1. Create a new empty report called subreport.jrxml (if you pick a different name, keep it in mind because we will use it
when connecting the master to the subreport).
2. Remove the page margins and adjust the page width (that is, an A4 page has a width of 595 pixels, subtracting 20 pixels
for the left margin and 20 for the right one, the new page should be set to a width of 555 pixels with margins of 0).
3. Add to this report a parameter that we’ll call COUNTRY.
The type must be set to java.lang.String and the default value to a blank string (“”) or, if you prefer, to a country
name like “Argentina”. This default value will be overridden by whatever we specify from the master report. We are
assigning it to the parameter now only because a default value in iReport (not in JasperReports) is mandatory when using
a parameter inside a report query.
4. Open the query dialog and enter the query to select the customer information based on the order’s country; it can be
something like this:
select distinct shipname, shipcity from orders where shipcountry = $P{COUNTRY}
Figure 17-7 Just a list of countries
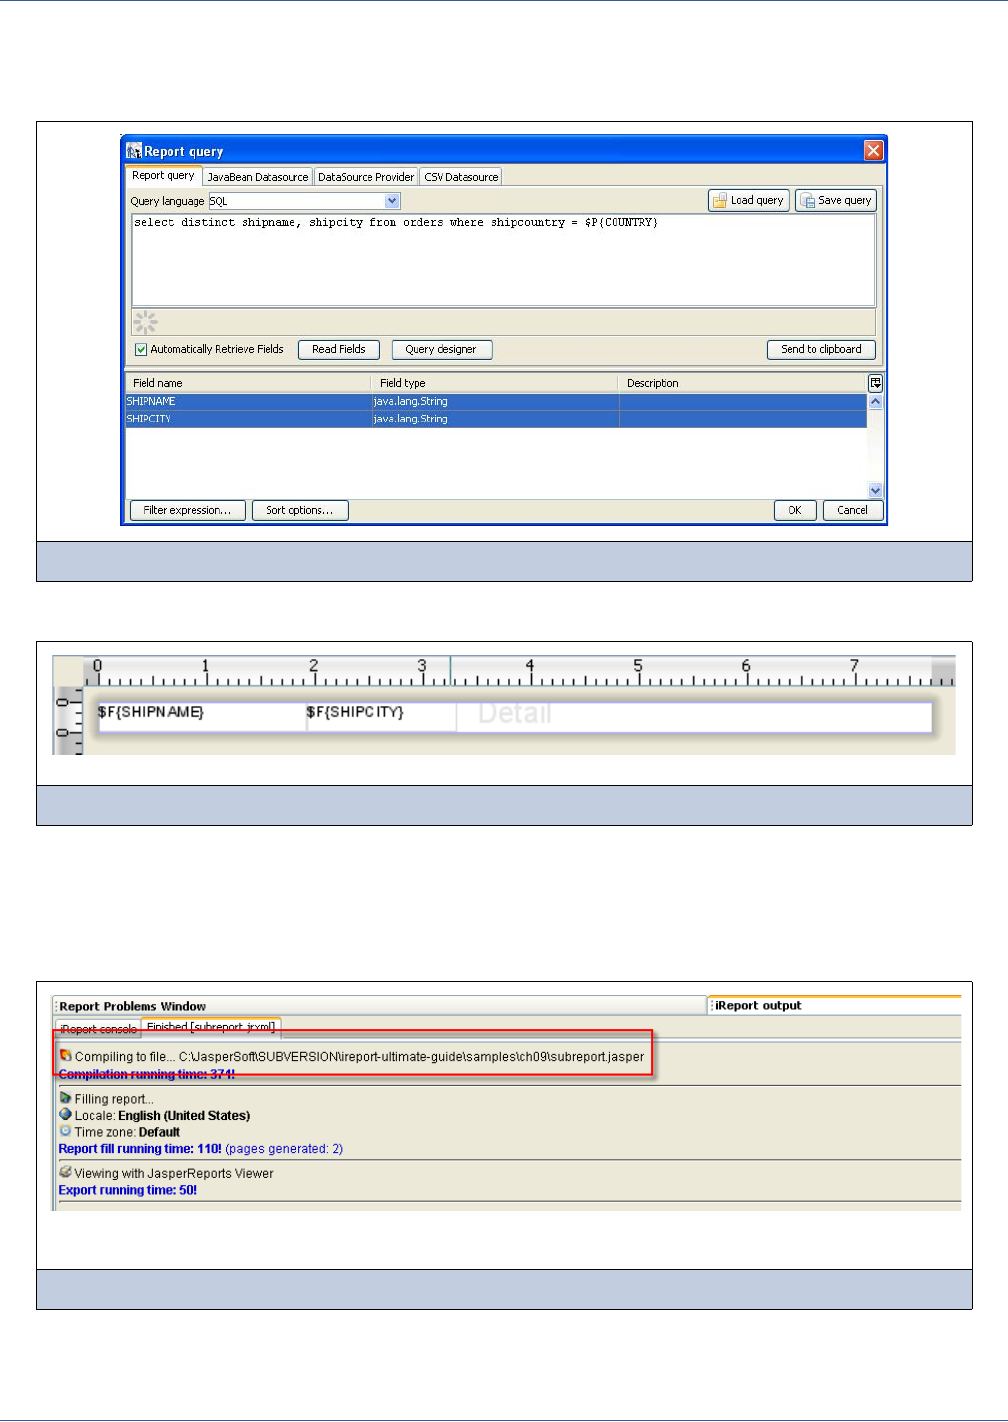
320
iReport Ultimate Guide
We are getting all the distinct address information of customers that place orders in the country represented by the
COUNTRY parameter.
5. iReport should detect the following fields: SHIPNAME and SHIPCITY (Figure 17-8).
6. Let’s put both fields in the Detail band of the report (Figure 17-9).
We now have to test this report. We need to test it because of the way iReport generates the Jasper file that we need when
using this report as a subreport. When running it, pay attention to what iReport displays in the console view (Figure 17-8). In
particular, pay attention to where the Jasper file has been stored. By default, it should be in the same location in which you
saved the JRXML file. In this example, I used the same directory for master and subreport templates, so it will contain both
master.jasper and subreport.jasper.
Depending on the value of COUNTRY, you can get an empty report or a report showing some items. It does not matter very
much at this point, just check that you generated the Jasper file.
Figure 17-8 The query of the report used as subreport
Figure 17-9 Subreport design
Figure 17-10 Output of the execution of the subreport as a standalone report
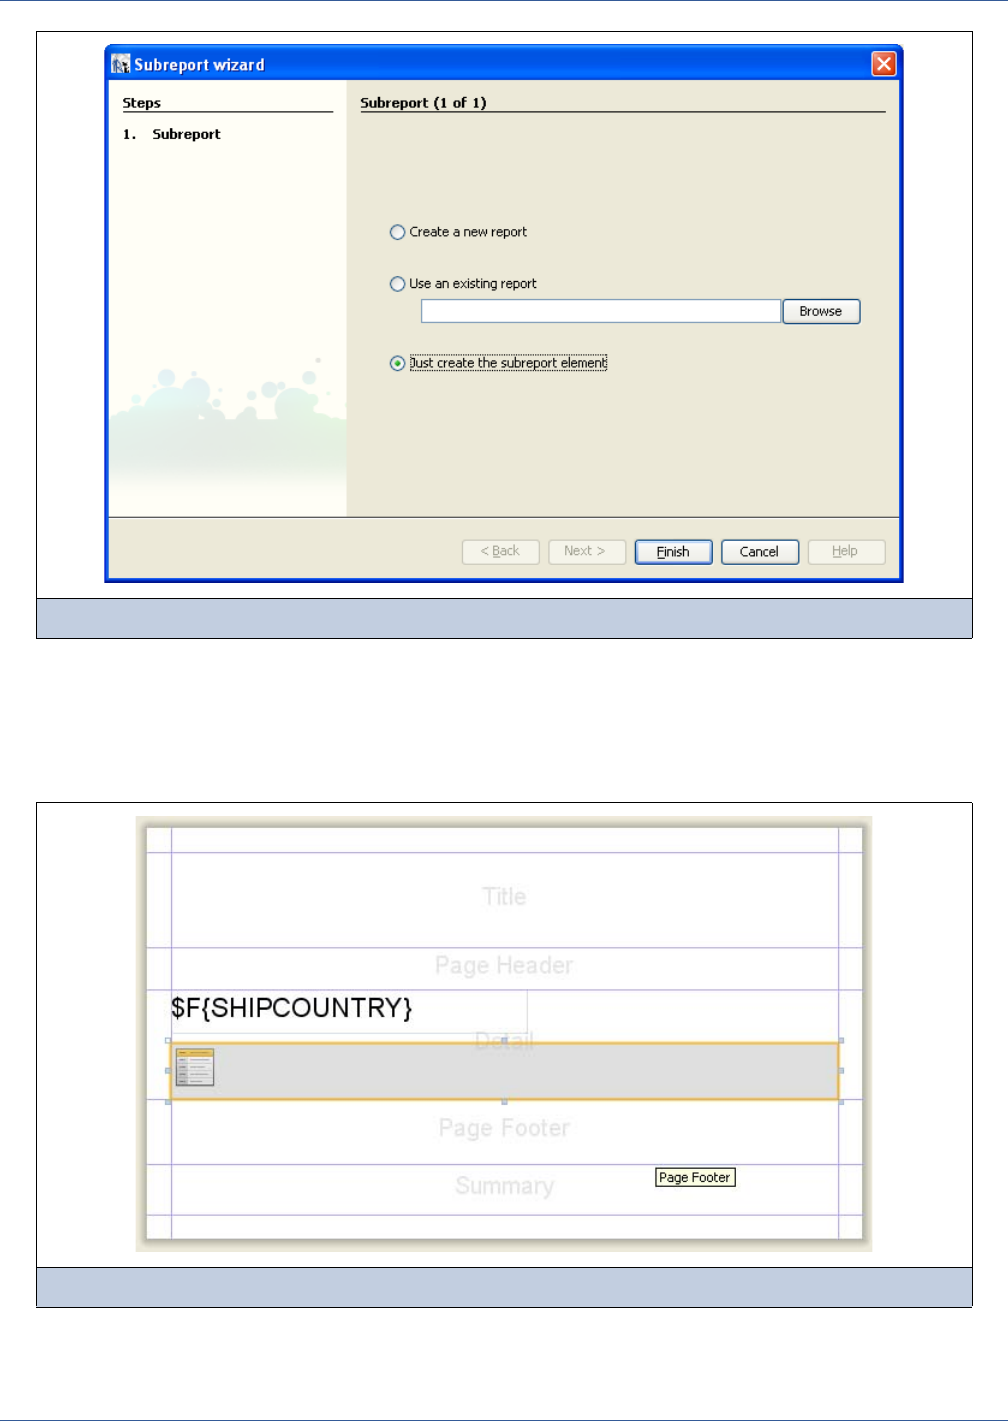
Subreports
321
What we have now is two reports: the master showing the country names, and the soon-to-be subreport, showing the
customers for a particular country. Let’s put them together.
When adding a subreport element, the Subreport Wizard pops up (Figure 17-11). When all the concepts about using
subreports are clear, the wizard will provide a way to save some time. However, for now we will skip the wizard.
1. In the wizard, select the option Just create the subreport elements and click Finish.
2. Adjust the subreport element to use the band’s entire horizontal size.
Figure 17-11 Subreport Wizard
Figure 17-12 The subreport element placed in the Detail band
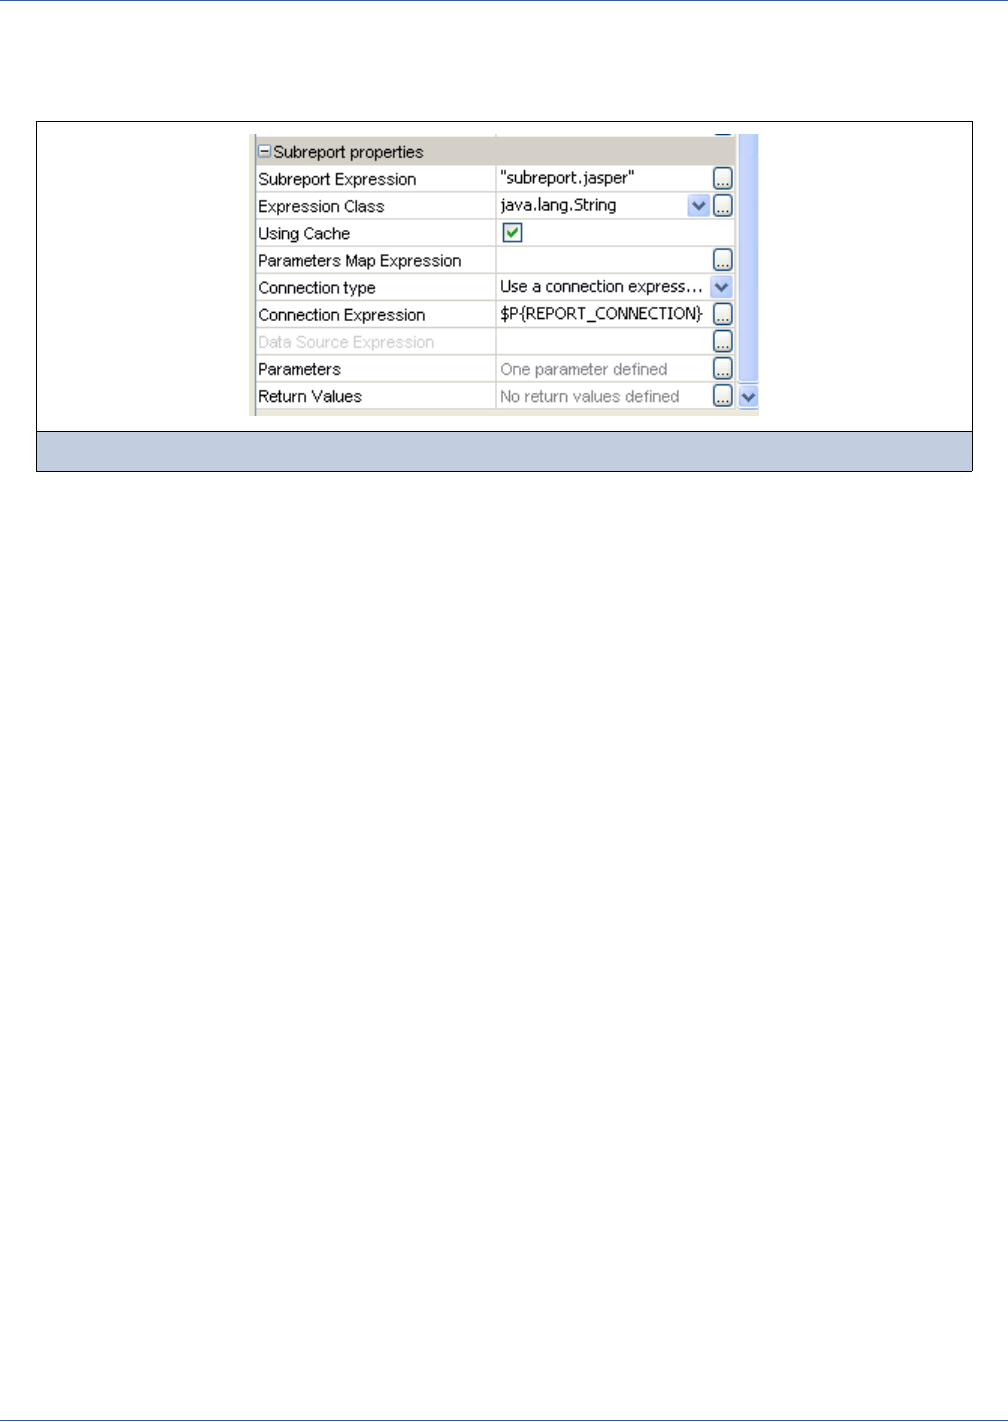
322
iReport Ultimate Guide
The vertical dimension is not important because, when you print the report, JasperReports will use all the vertical space
necessary, regardless of the element size (see Figure 17-12).
3. Select the subreport element so that the property sheet shows its properties (Figure 17-13).
4. We want to use the same database connection we used with the master report to populate the subreport, so set the
connection type to Use a connection expression. The expression will be just $P{REPORT_CONNECTION}.
As explained, REPORT_CONNECTION is a built-in parameter holding a reference to the connection used in the report.
5. Next, define the subreport expression; it is used by JasperReports to locate the report that will be inserted as a subreport.
Assuming the subreport Jasper file is in the classpath (from an iReport perspective it’s enough that it is in the same
directory as the master report), the expression we’ll use is this:
“subreport.jasper”
6. Finally, since the subreport we are using requires the COUNTRY parameter, add a subreport parameter (by clicking on the ...
button of the Parameters property). Click Add and set the subreport parameter name COUNTRY (the name must match
the parameter name we defined in step step 3 on page 319); as expression for the value, we choose the field containing
the country name, that is, $F{SHIPCOUNTRY} (step step 3 on page 318).
7. Preview the report. If everything has been done correctly, you should get a result like the one shown in Figure 17-14.
Figure 17-13 Subreport properties
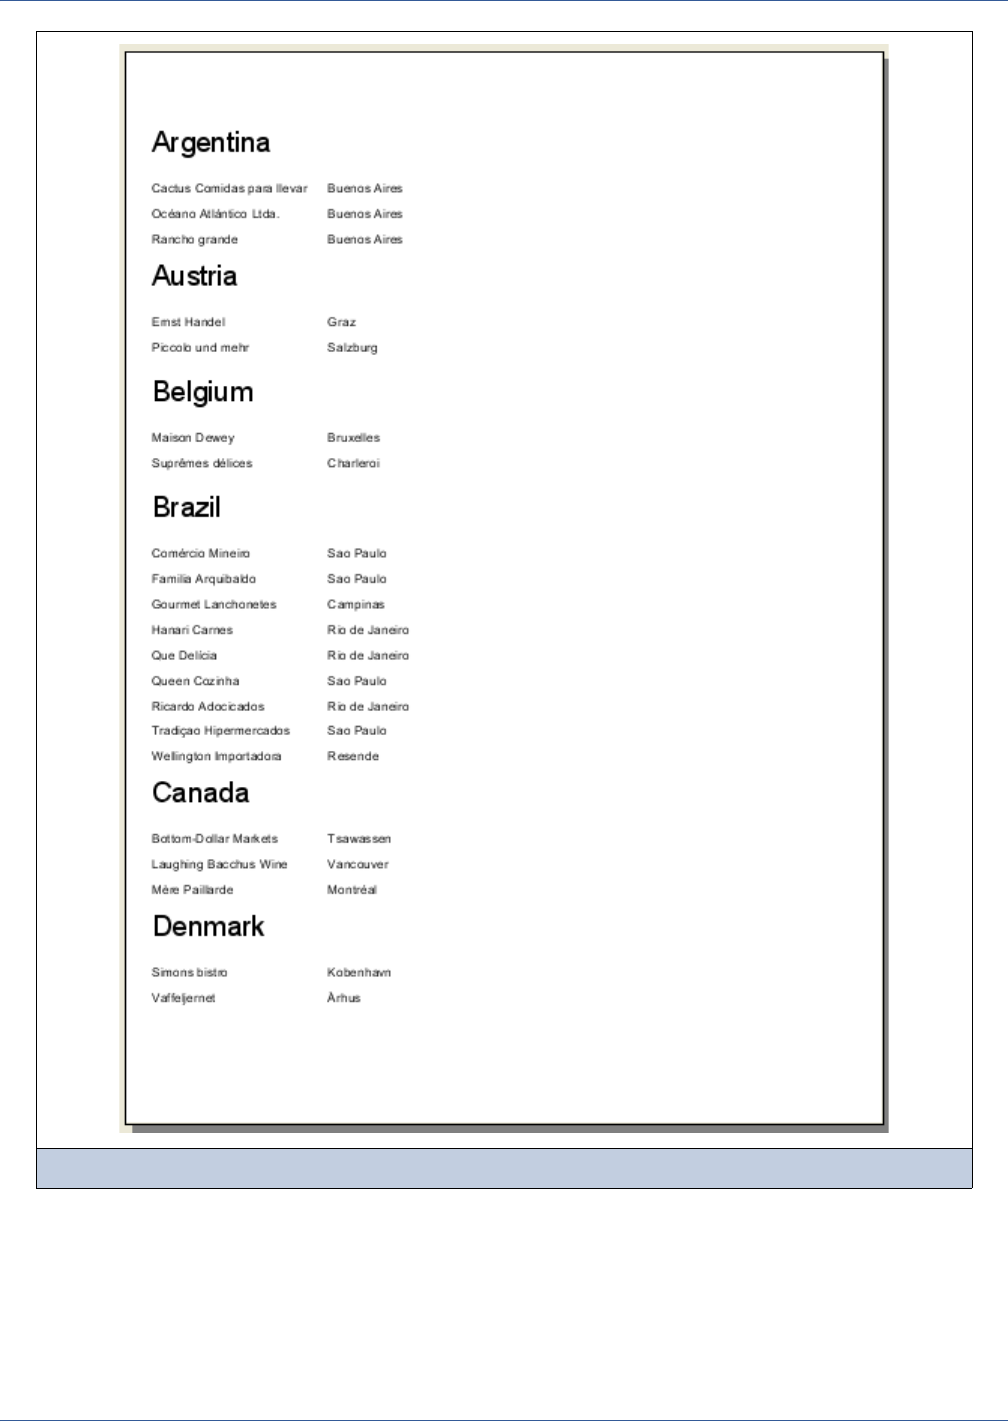
Subreports
323
In this example we created a basic report and subreport. The number of subreports that can be placed in a report is unlimited,
and they can be used recursively, meaning that one subreport can contain other subreports. You can create very small
subreports (only a textfield) and use them to lookup values, you can use a page layout with two subreports side by side
showing two different lists of values, and so on.
A last note. When you have several subreports one after the other, be sure you set the position type of the report element to
Float. In this way, you avoid the risk of overlapping the subreports when the space they require grows. Another suggestion is
that, when using subreports one after the other, place each subreport in a different band, splitting the Detail band using what’s
Figure 17-14 The final result
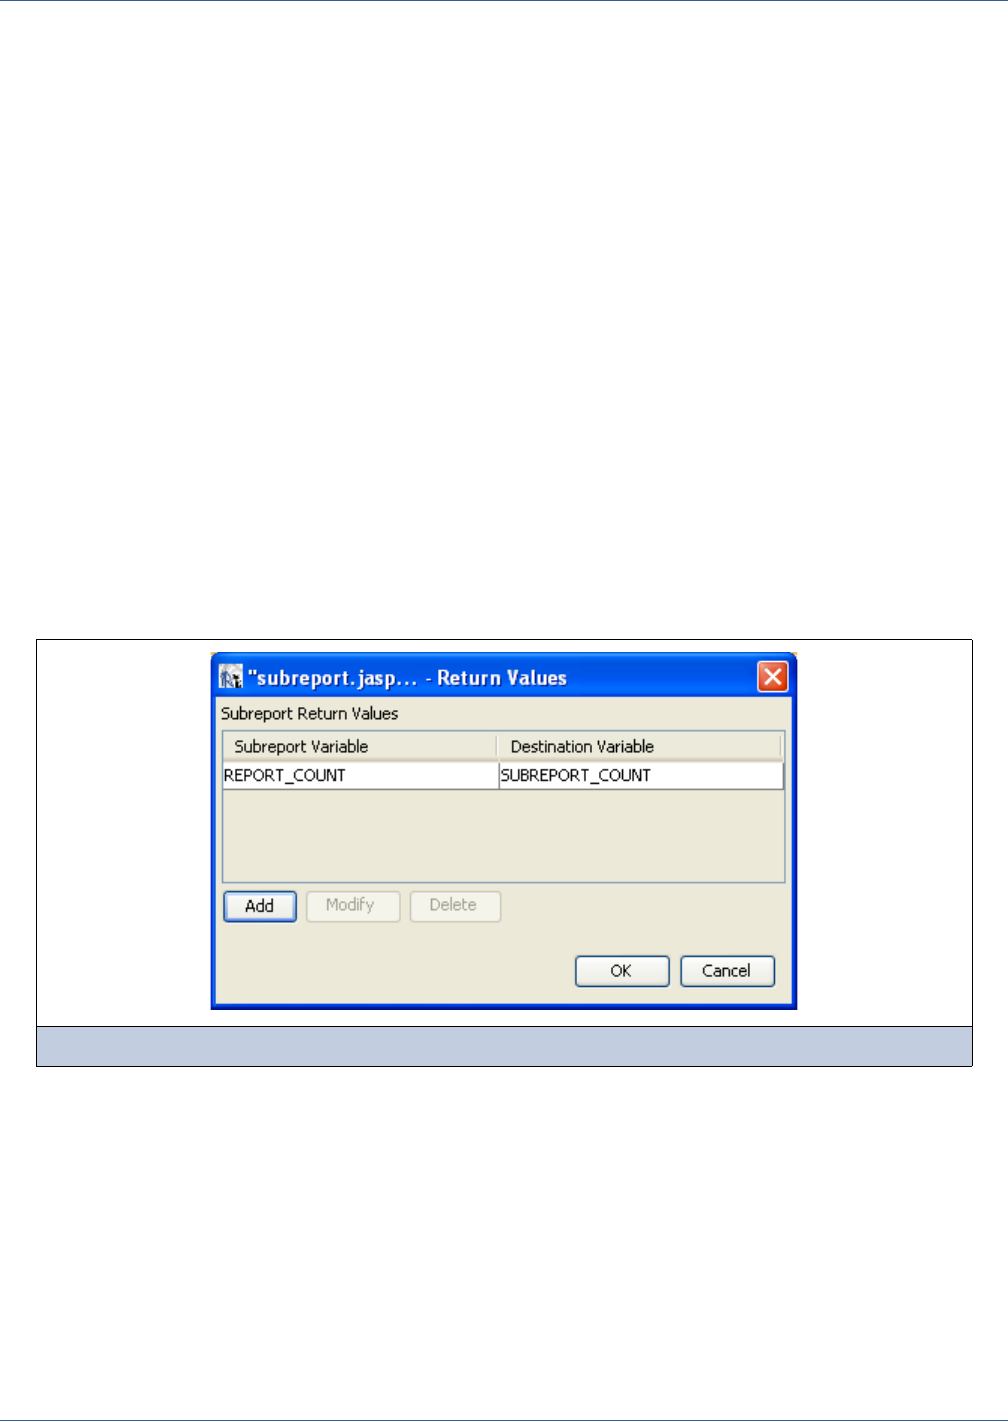
324
iReport Ultimate Guide
called a “fake group.” This is a group having as expression, for instance, the REPORT_COUNT parameter, which ensures that
you will get the fake group header and footer bands for each detail. In this way, you will optimize the report generation.
17.3 Returning Values from a Subreport
In a report, it is often useful to get the result of some kind of calculation that has been performed in a subreport (for instance,
the number of records).
JasperReports provides a feature that allows users to retrieve values from within a subreport. This mechanism works much the
same as passing input parameters to subreports. The idea is to save values calculated during the filling of the subreport into
variables in the master report.
Bindings between calculated values and local variables can be set in the Subreport Return Values property in the property
sheet.
Let’s see how to use it with the sample we created in the previous section. Suppose we want to print in the master report the
number of cities we have found for each country. From the subreport perspective, this value is represented by the
REPORT_COUNT variable, which is not accessible directly from the master report. So the first step is to create a variable to host
this value at the end of the subreport elaboration. The variable must be consistent with the value it will host. In this case, it is
an integer.
1. In the master report, create a new variable (let’s call it SUBREPORT_COUNT) that is type java.lang.Integer and
calculation type System.
2. Select the subreport element and open the Return Values property dialog by clicking the appropriate ... button
(Figure 17-15).
Figure 17-15 Subreport Return Values
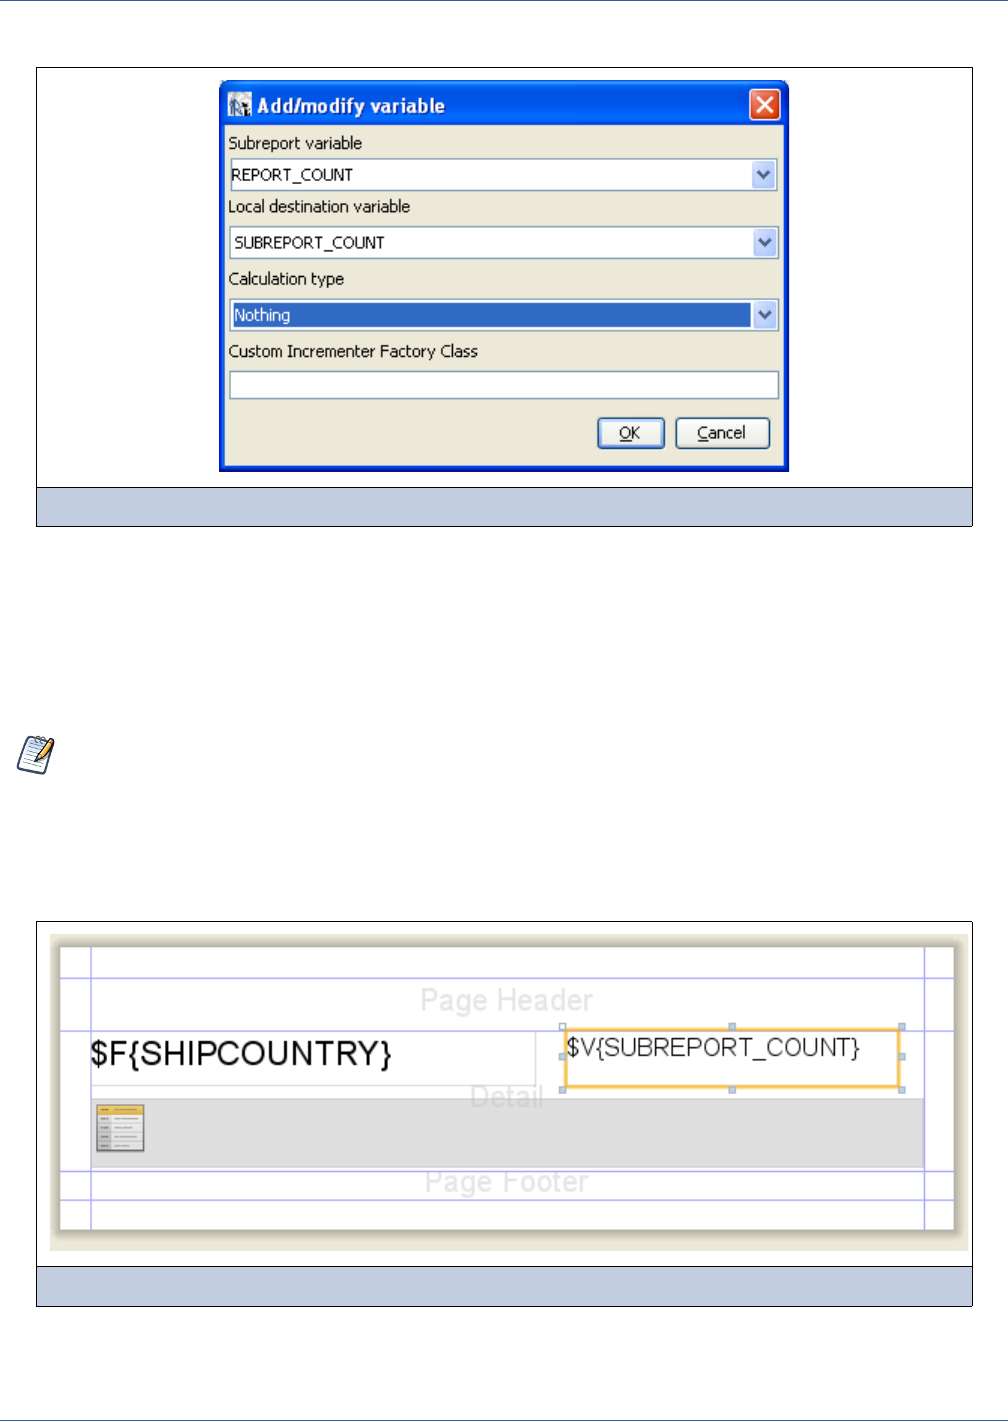
Subreports
325
3. Click the Add button to create the new return value; the Add/Modify variable dialog will appear (Figure 17-16):
4. Select a calculated value from the subreport’s built-in variables (REPORT_COUNT), as well as the local variable that will
contain the values returned by the variable (SUBREPORT_COUNT).
5. Next, select a calculation type.
If you want a subreport value to be returned as-is, select the type Nothing. Otherwise, several calculation types can be
selected. For example, if the desired value is the average of the number of records within a subreport that is invoked
repeatedly, set the calculation type to Average.
The value coming from the subreport is available only when the whole band containing the subreport is printed. If you need to
print this value using a textfield placed in the same band as your subreport, set the evaluation time of the textfield to Band
(Figure 17-17).
The report preview should look like the one in Figure 17-18.
Figure 17-16 The Subreport Return Value Definition dialog
In your master report, when you created a new variable to be used like a container for a returned value, you set the
variable calculation type to System. The effective calculation type performed on the variable values is the one
defined in the dialog box shown in Figure 17-16.
Figure 17-17 A textfield showing the return value (with evaluation time set to Band)
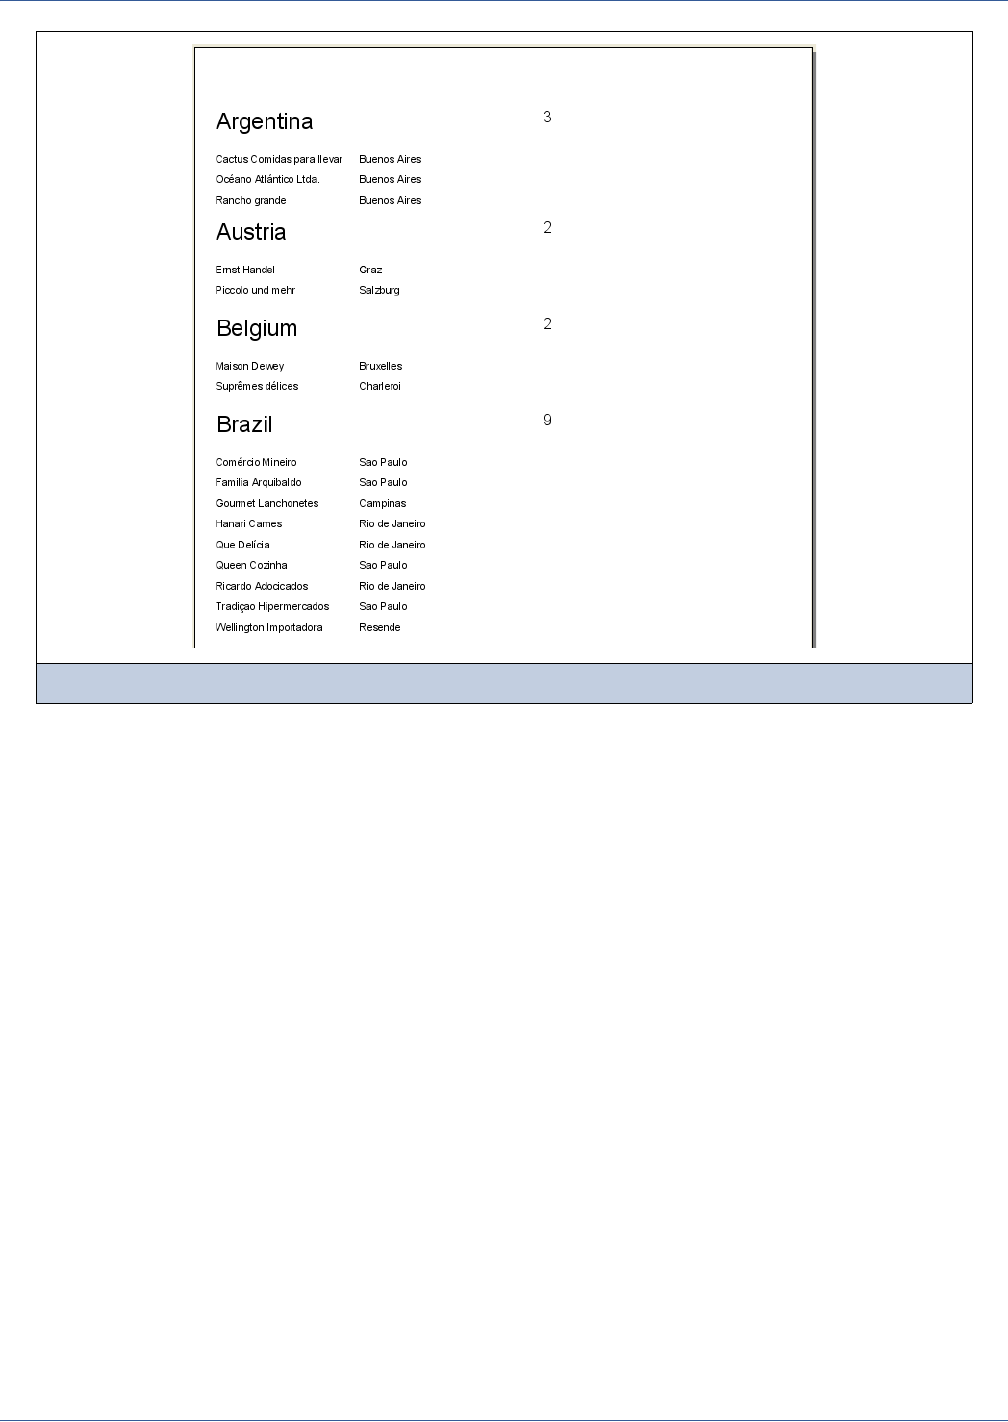
326
iReport Ultimate Guide
Figure 17-18 The final output
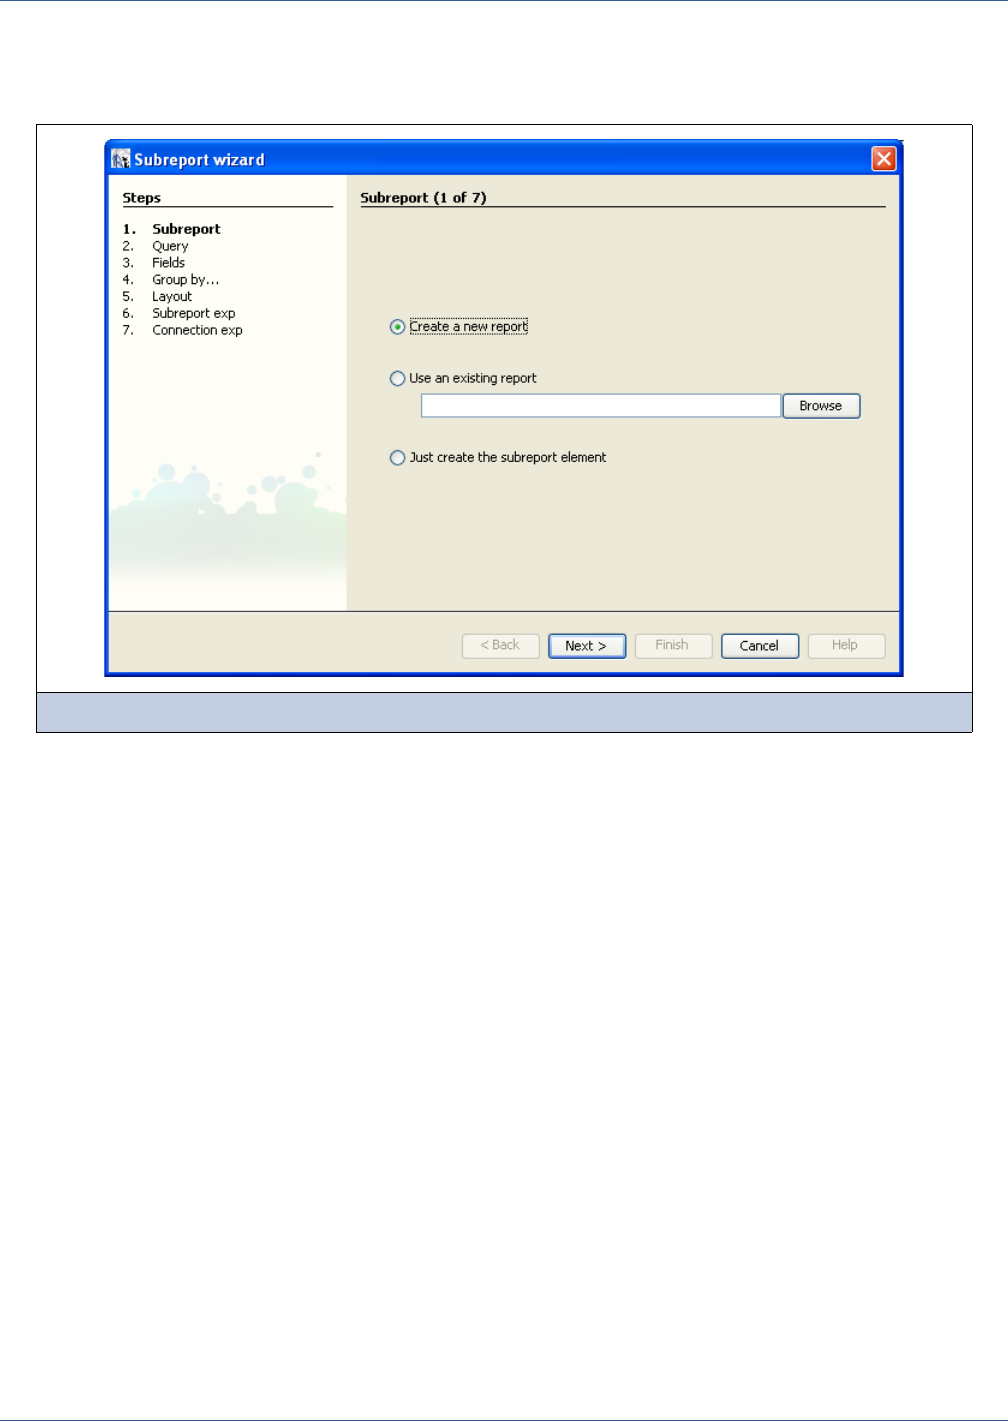
Subreports
327
17.4 Using the Subreport Wizard
To simplify inserting a subreport, a wizard for creating subreports starts automatically when a Subreport element is added to a
report.
You can use the Subreport Wizard, shown in Figure 17-19, to create a brand new report that will be referenced as a subreport
or to refer to an existing report. In the latter case, if the report you choose contains one or more parameters, the wizard
provides an easy way to define values for them.
17.4.1 Create a New Report via the Subreport Wizard
If you are adding a subreport to the current report, the Subreport Wizard can create the report that will be used as the subreport.
The steps to create the new report are very similar to those you follow in the Report Wizard:
1. Select a connection or data source. If the data source requires a query (such as a JDBC or Hibernate connection), you can
write it in the text area or load it from a file.
2. Select fields.
3. Define grouping.
4. Select the layout.
5. Define the subreport expression.
6. Define the connection expression.
The subreport expression is used to refer to the subreport’s Jasper file. The wizard lets you do this in either of two ways:
Store the path part of the subreport URL in a parameter, as shown in Figure 17-20, to make it modifiable at run time by
setting a different value for the parameter (the subreport path is the default value); or
Save the complete path in the expression.
Figure 17-19 The Subreport Wizard
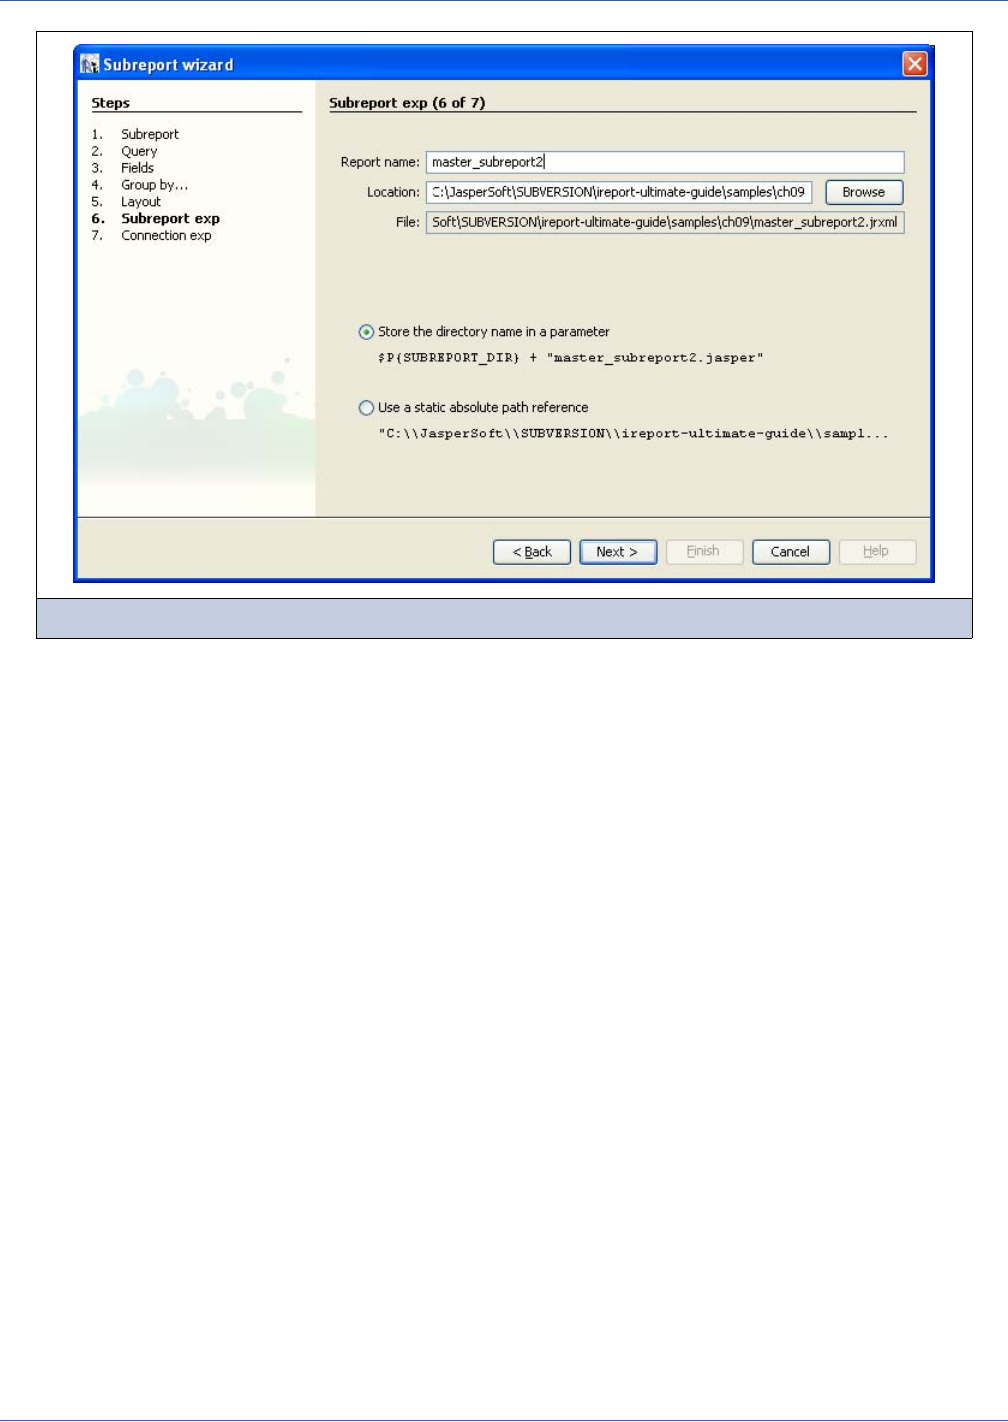
328
iReport Ultimate Guide
If you choose the second option, the expression will store the entire absolute path to the subreport Jasper file. This insures that
everything will work in iReport, but it is not very convenient in other environments. For this reason, I suggest that you modify
the expression using the method I described in 17.1.2, “Specifying the Subreport,” on page 315.
The subreport is not compiled when you create it. To test your report, you must first preview it. This forces it to be compiled.
When you create a new subreport, you can’t specify parameters using the wizard. You will be able to add parameters and use
them in the subreport query after the report is created. So at this point, to filter your subreport query follow these steps:
1. Add a parameter to the report implementing your subreport.
2. Use that parameter in your query with the typical syntax $P{MyParam} (or $!P{MyParam} if the parameter must be
concatenated with the query as-is).
3. In the master report, select the subreport element and add an entry in the subreport parameters list. The new subreport
parameter must be called, like the counterpart in the subreport, and its value must be defined using an expression (see the
section 17.1.4, “Passing Parameters,” on page 316” for details).
4. If your subreport is not based on an SQL or HQL query, you must still set the subreport data source expression to
successfully run your report.
5. As mentioned earlier, you can use the Subreport Wizard to create a brand new report that will be referenced as subreport
or to refer to an existing report. In the latter case, if the chosen report contains one or more parameters, the wizard
provides an easy way to define a value for each one.
17.4.2 Specifying an Existing Report in the Subreport Wizard
You can point to an existing report as a subreport with the Subreport Wizard. The first step is to select a JRXML or a Jasper
file in the first screen of the wizard.
The second step of the wizard manages expressions for the connection or data source used to fill the subreport (Figure 17-21).
Figure 17-20 The Subreport Expression
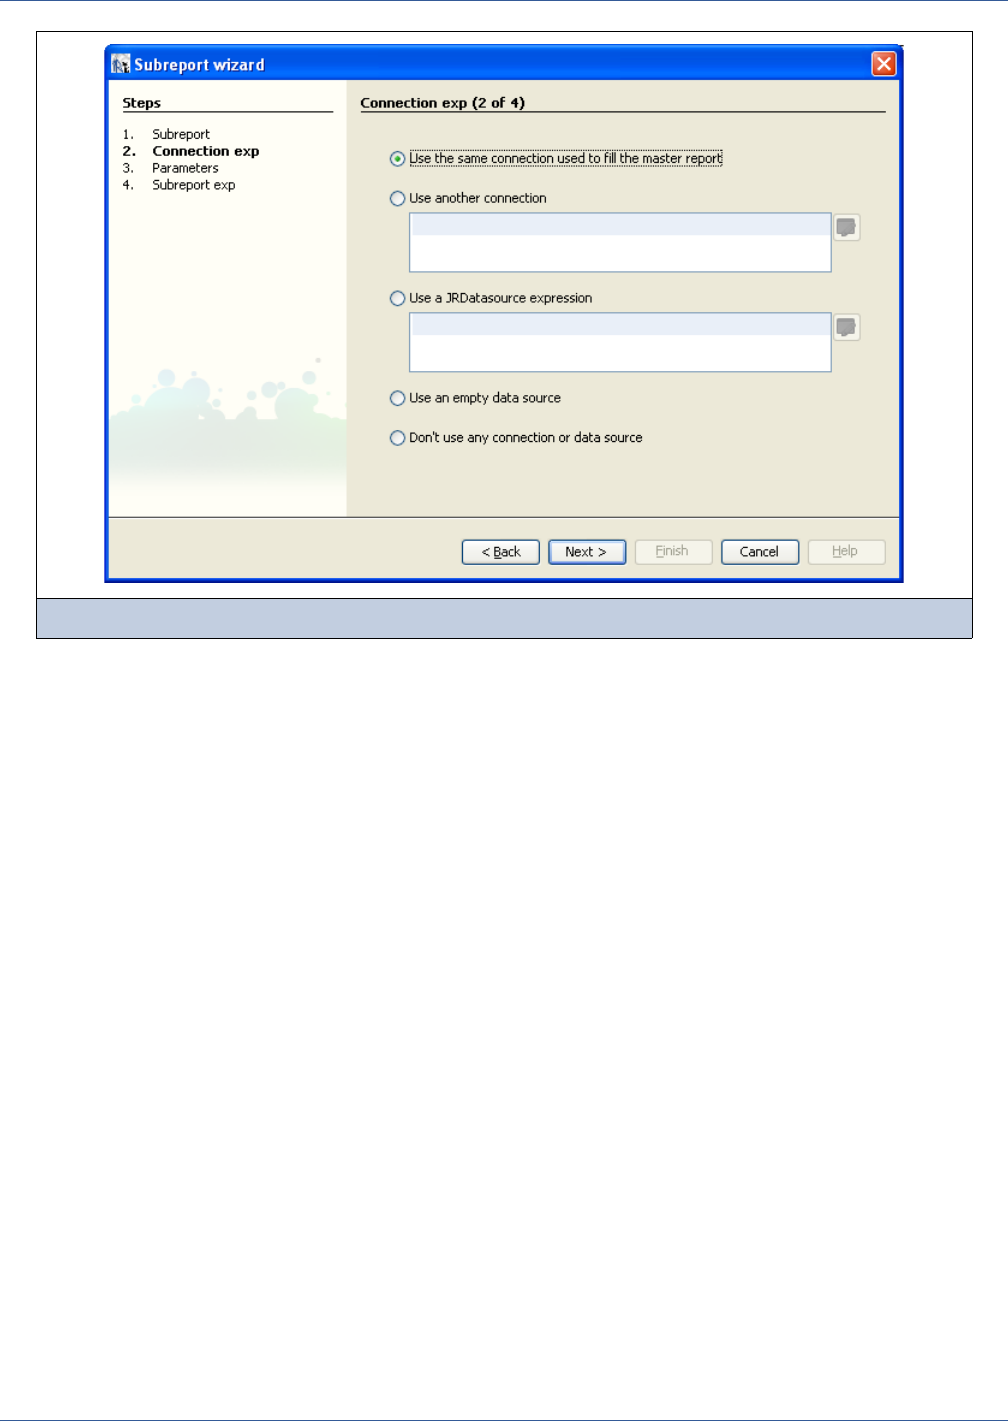
Subreports
329
To select a connection:
You can select Use the same connection used to fill the master report when using a JDBC-based subreport. The JDBC
connection is passed to the subreport to execute it.
To specify a different JDBC connection, select Use another connection.
To use a JRDataSource object to fill the subreport, select Use a JRDataSource expression and write an expression
capable of returning a JRDataSource object.
Select Use an empty datasource to set the data source expression to new JREmptyDataSource(). That creates a
special data source that provides (when declared in this way) a single record with all the field values set to null. This is
very useful when the subreport is used to display static content.
In some cases you may want to avoid using any connection or data source, such as when you are displaying static content.
Usually a data source or a connection is always required to prevent the subreport being blank. When a subreport does not
require a data source, though, it is implied that the report property When no data type is set to All Data No
Details or No Data Section to ensure that at least a portion of the document is actually printed.
If the selected report contains parameters, they are listed next (Figure 17-22). For each parameter, you can set a value by
choosing an object from the combo boxes. Of course, you can write your own expression, but no expression editor is provided
in this context.
Figure 17-21 Subreport connection setup
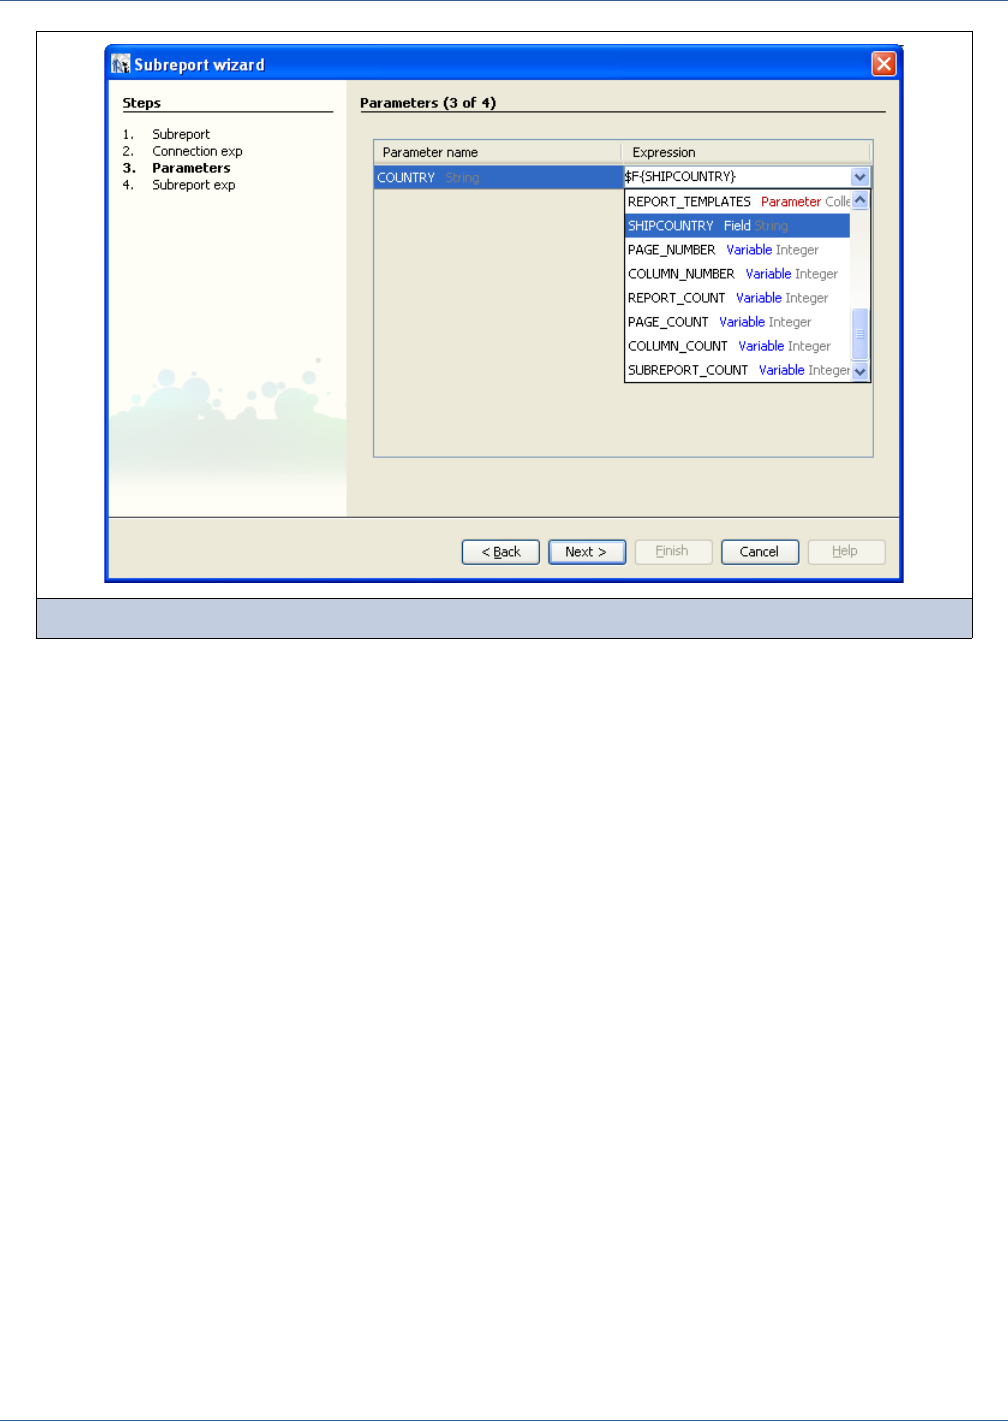
330
iReport Ultimate Guide
You can skip this step and edit the subreport parameters later using the canonical method explained previously in this chapter
(17.1.4, “Passing Parameters,” on page 316).
Finally, you must designate how to generate the subreport expression. Just as for a new subreport, there are two options: store
the path in a parameter to set it dynamically or set a hard-coded path (see Figure 17-23). Again, all choices can be modified
after you leave the Subreport Wizard.
Figure 17-22 Setting subreport parameters
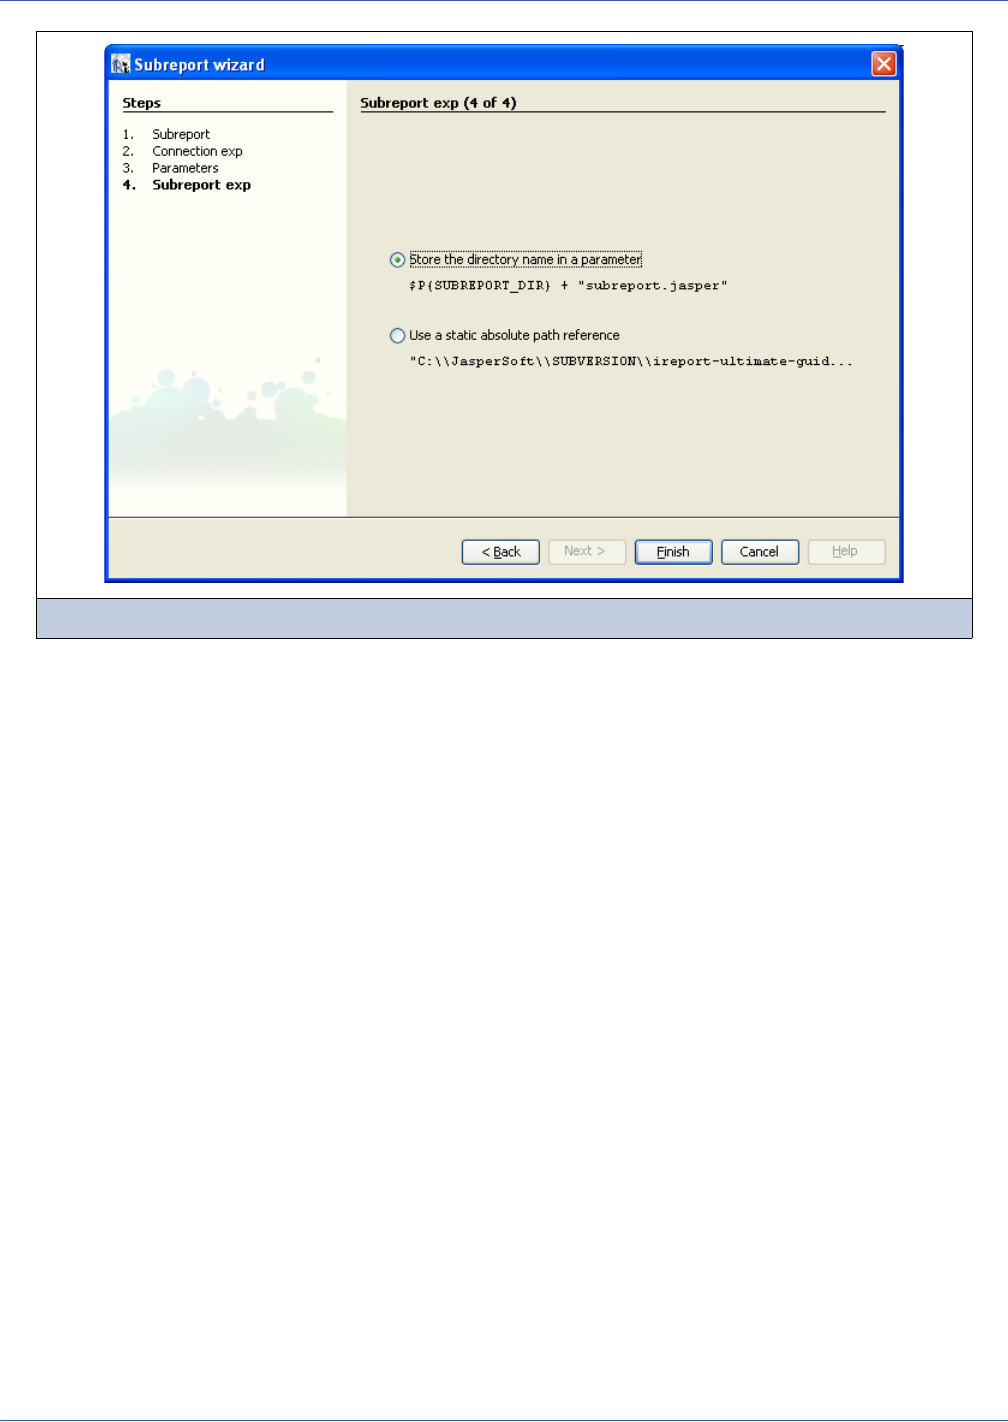
Subreports
331
Figure 17-23 Setting Subreport Expression

332
iReport Ultimate Guide

Scriptlets
333
CHAPTER 18 SCRIPTLETS
A scriptlet is a Java class used to execute special elaborations during report generation. A scriptlet exposes a set of methods
that are invoked by the reporting engine when a particular event occurs, such as the creation of a new page or the end of
processing a detail row.
In this chapter, you will see how to write a simple scriptlet and how to use it in a report. You will also see how iReport handles
scriptlets and what methods are useful when deploying a report using this functionality.
This chapter has the following sections:
Understanding the JRAbstractScriptlet Class
Creating a Simple Scriptlet
Testing a Scriptlet in iReport
Accessing iReport Objects
Debugging a Scriptlet
Deploying Reports That Use Scriptlets
18.1 Understanding the JRAbstractScriptlet Class
To implement a scriptlet, you have to extend the Java class net.sf.jasperreports.engine.JRAbstractScriptlet.
This class exposes all the abstract methods to handle the events that occur during report generation and provides data
structures to access all variables, fields, and parameters present in the report.
The simplest scriptlet implementation is provided directly by JasperReports: it is the class JRDefaultScriptlet, shown in
Code Example 18-1. It extends the class JRAbstractScriptlet and implements all the required abstract methods with a
void function body.
Code Example 18-1 JRDefaultScriptlet
package net.sf.jasperreports.engine;
/**
* @author Teodor Danciu (teodord@users.sourceforge.net)
* @version $Id: JRDefaultScriptlet.java,v 1.3 2004/06/01 20:28:22 teodord Exp $
*/
public class JRDefaultScriptlet extends JRAbstractScriptlet

334
iReport Ultimate Guide
As you can see, the class is formed by a set of methods with a name composed by using the keyword after or before
followed by an event or action name (for example, DetailEval and PageInit). These methods map all of the events that
can be handled by a scriptlet, which are summarized in Table 18-1.
{
public JRDefaultScriptlet() { }
public void beforeReportInit() throws JRScriptletException
{
}
}
public void afterReportInit() throws JRScriptletException
{
}
public void beforePageInit() throws JRScriptletException
{
}
public void afterPageInit() throws JRScriptletException
{
}
public void beforeColumnInit() throws JRScriptletException
{
}
public void afterColumnInit() throws JRScriptletException
{
}
public void beforeGroupInit(String groupName) throws JRScriptletException
{
}
public void afterGroupInit(String groupName) throws JRScriptletException
{
}
public void beforeDetailEval() throws JRScriptletException
{
}
public void afterDetailEval() throws JRScriptletException
{
}
}
Code Example 18-1 JRDefaultScriptlet, continued
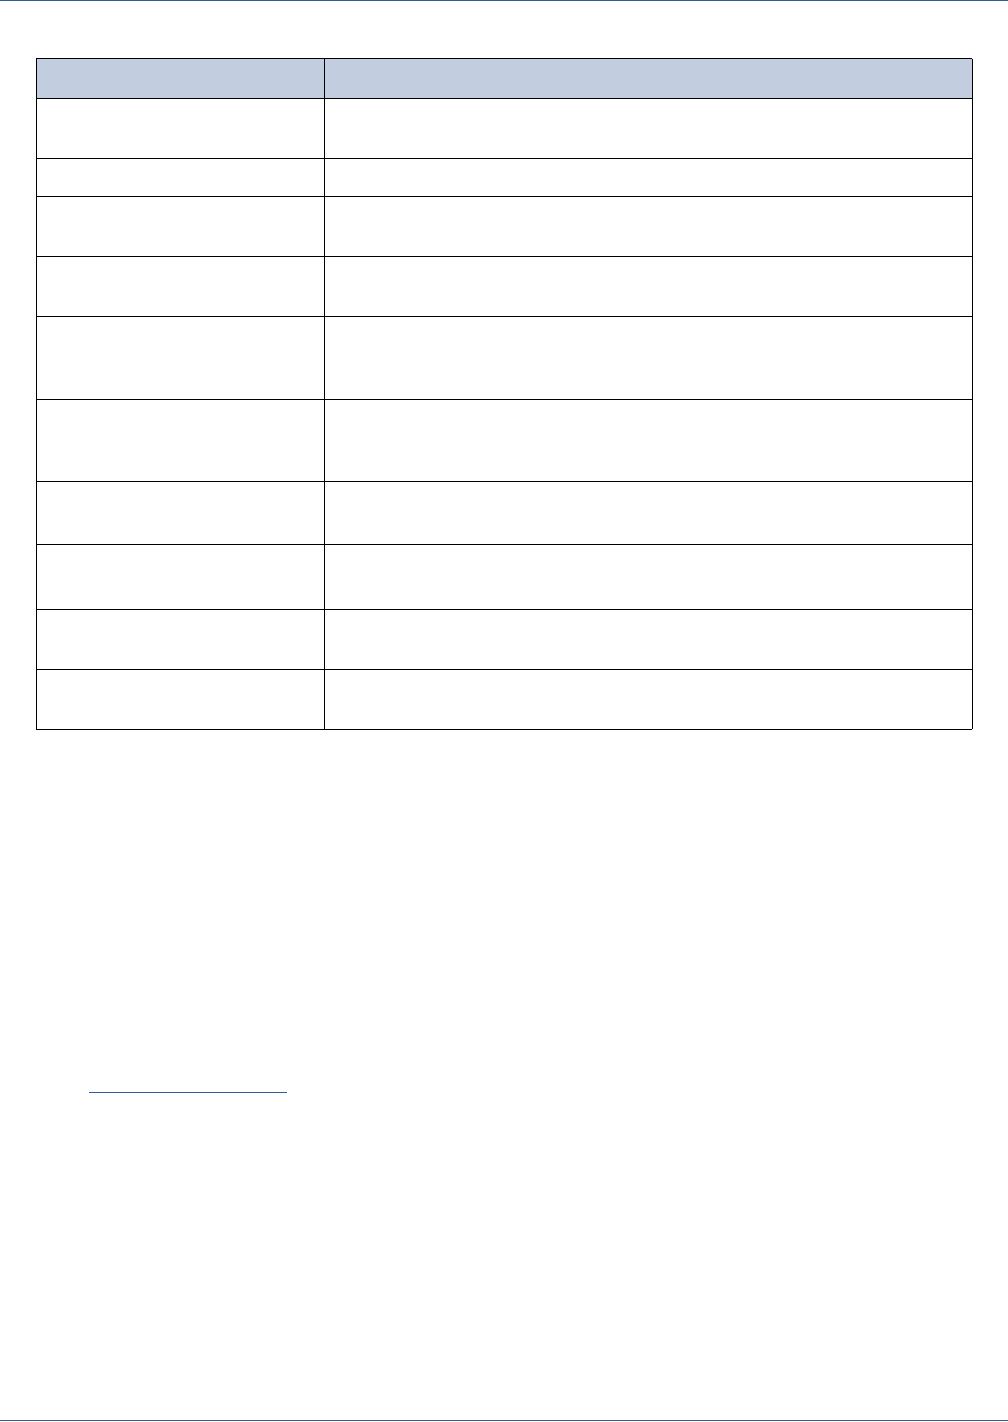
Scriptlets
335
Inside the scriptlet, you can refer to all of the fields, variables, and parameters using the following maps
(java.util.HashMap) defined as class attributes:
fieldsMap
variablesMap
parametersMap
The groups (if present in the report) can be accessed through the attribute groups, which is an array of JRFillGroup.
18.2 Creating a Simple Scriptlet
Like all the Java classes, to create a scriptlet you just need a simple text editor and a Java compiler. But we are not all hard core
developers, so let’s assume we are using an IDE (Integrated Development Environment) to do this. My favorite IDE is
NetBeans (http://www.netbeans.org), but the instructions shown here should be generic enough to understand how to do the
same using another IDE.
The example scriptlet I’m going to show you calculates the time taken to fill each page and prints the time in the page footer.
We will store the system time when a new page is created using the method afterPageInit and provide a method to get the
milliseconds past from that start time. We will then show how long the page took to be rendered by printing this value in a
textfield with evaluation time Page. This is a good example of a scriptlet that can be used to profile a report execution, as well.
We will start with a new Java project. If you are working on a Java application the project could be the same. In NetBeans you
create a new project by selecting File → New Project. The window in Figure 18-1 pops up.
Table 18-1 Report events
Event/Method Description
Before Report Init This is called before the report initialization (that is, before all variables are
initialized).
After Report Init This is called after all variables are initialized.
Before Page Init This is called when a new page is created and before all variables having reset
type Page are initialized.
After Page Init This is called when a new page is created and after all variables having reset
type Page are initialized.
Before Column Init This is called when a new column is created, before all variables having reset
type Column are initialized; this event is not generated if the columns are filled
horizontally.
After Column Init This is called when a new column is created, after all variables having reset
type Column are initialized; this event is not generated if the columns are filled
horizontally.
Before Group x Init This is called when a new group x is created and before all variables having
reset type Group and group name x are initialized.
After Group x Init This is called when a new group x is created and after all variables having
reset type Group and group name x are initialized.
Before Detail Eval This is called before a Detail band is printed and all variables are newly
evaluated.
After Detail Eval This is called after a Detail band is printed and all variables are evaluated for
the current record.
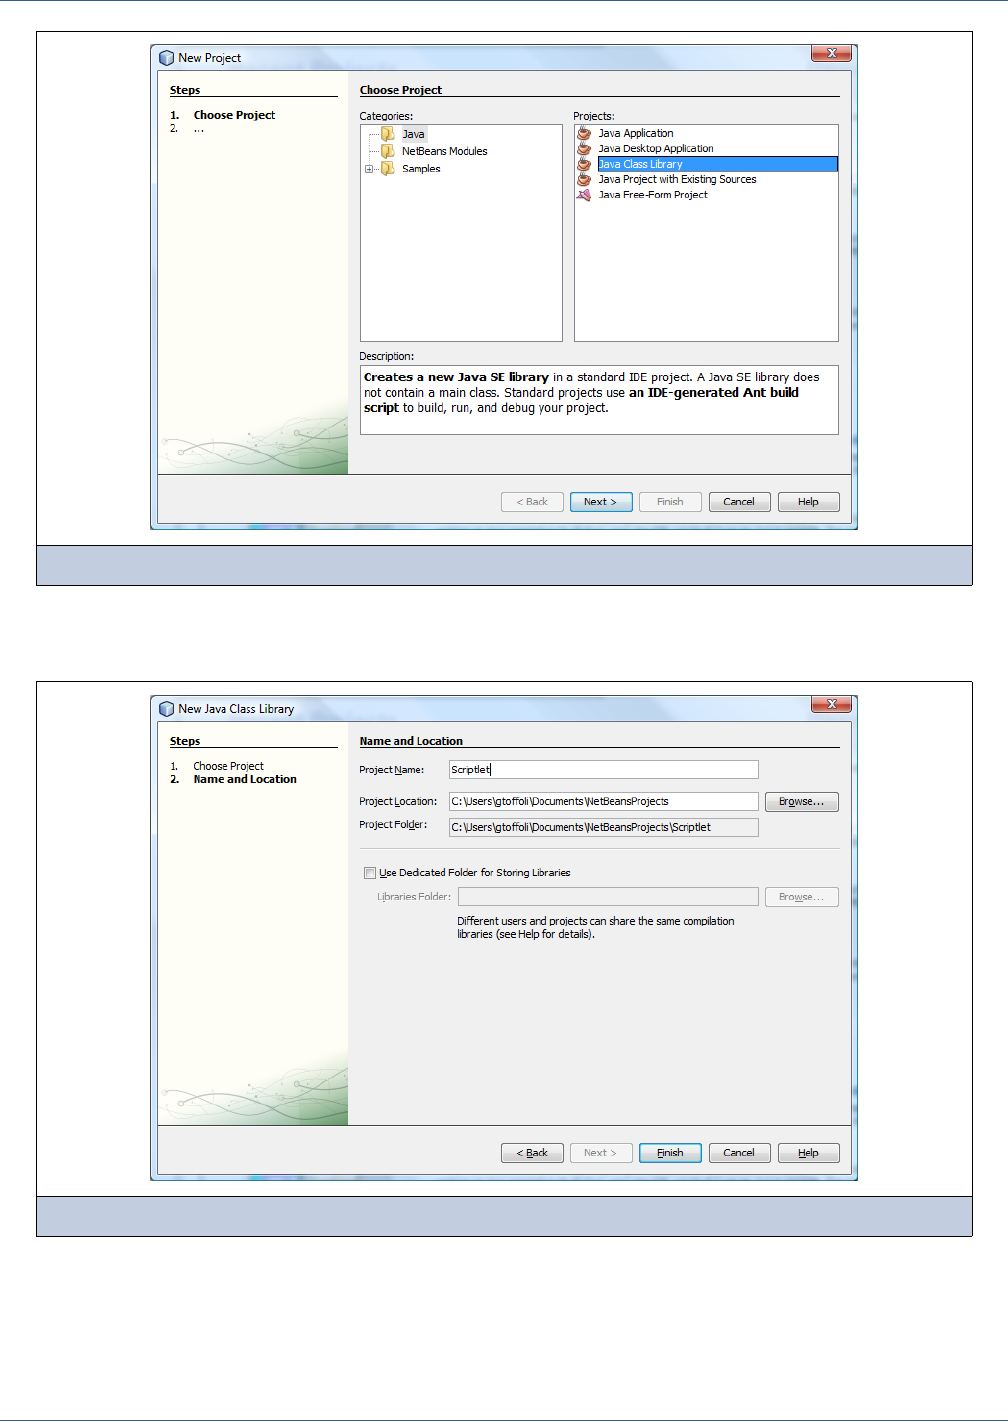
336
iReport Ultimate Guide
The best type of project is a Java Class Library; after all, we only have to write a simple class, not a real application.
In the second step, give a name to the project (that is, the scriptlet) and choose a location for it (Figure 18-2).
The project is now created. The next step is to add to the project the JARs required to write your scriptlet. Technically, the only
one required is jasperreports.jar, but you could add other JARs if required by your particular scriptlet. To do this in NetBeans,
right-click the Libraries node in the Projects view, and select Add JAR/Folder (Figure 18-3).
Figure 18-1 Creation of a new project in NetBeans IDE
Figure 18-2 Project details
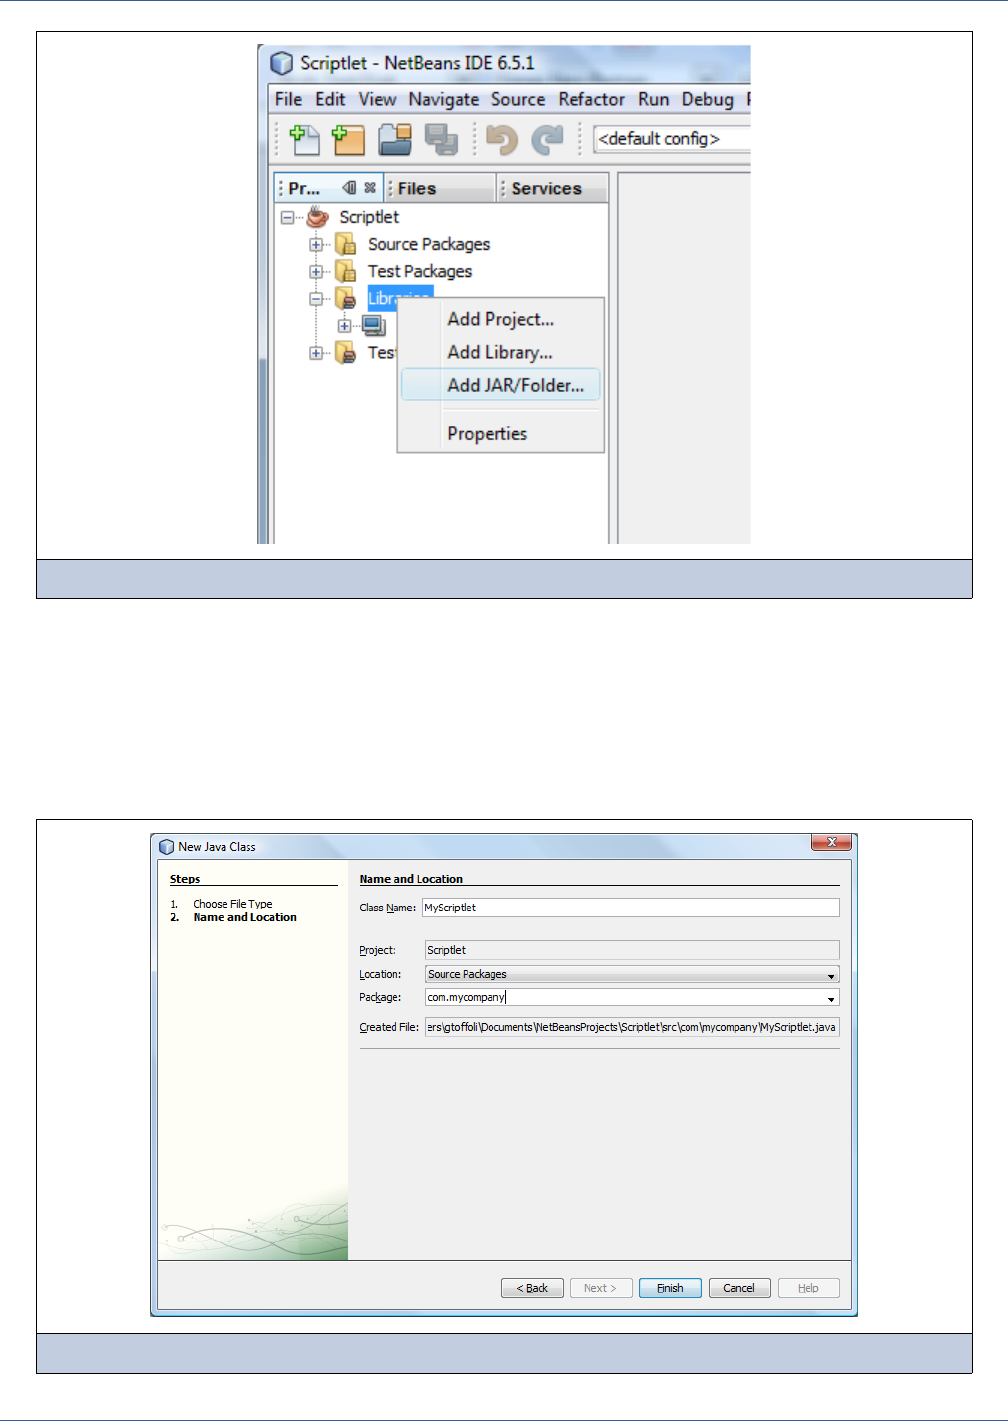
Scriptlets
337
Locate the jasperreports JAR on your computer. If you have never downloaded a distribution of JasperReports, you can
find a copy of this JAR in your iReport installation directory at this location:
<ireport installation directory>/ireport/modules/ext/jasperreports-x.y.z.jar
Now that we have all the required classes in the project classpath, let’s move on to creating a package for the scriptlet and
implement it. Right-click the Source Packages node in Projects and select New > Java Class. The window to create the new
class pops up (Figure 18-4). In the sample I’ll set MyScriptlet as the class name and I’ll set the package name to
com.mycompany.
Figure 18-3 Adding a Jar to the project
Figure 18-4 New Java class

338
iReport Ultimate Guide
When finished, the class is opened in the Java editor. The class must extend the
net.sf.jasperreports.engine.JRDefaultScriptlet.
The following code example shows the source code of the scriptlet:
We overrode the method beforeInitPage and added the method getLastPageTime. This last method returns a Long
object. It is always good to return Objects, since that is what we use in expressions.
Building the project, NetBeans will create a JAR, which is exactly what we need. Click the Build button, and in the output
window we will find the location of the JAR containing the scriptlet (Figure 18-5).
Code Example 18-2 Example scriptlet source code
package com.mycompany;
import net.sf.jasperreports.engine.JRDefaultScriptlet;
import net.sf.jasperreports.engine.JRScriptletException;
public class MyScriptlet extends JRDefaultScriptlet {
long pageInitTime = 0;
@Override
public void beforePageInit() throws JRScriptletException {
pageInitTime = new java.util.Date().getTime();
}
/**
* @return the time past from the last page init
*/
public Long getLastPageTime() {
long now = new java.util.Date().getTime();
return new Long(now - pageInitTime);
}
}
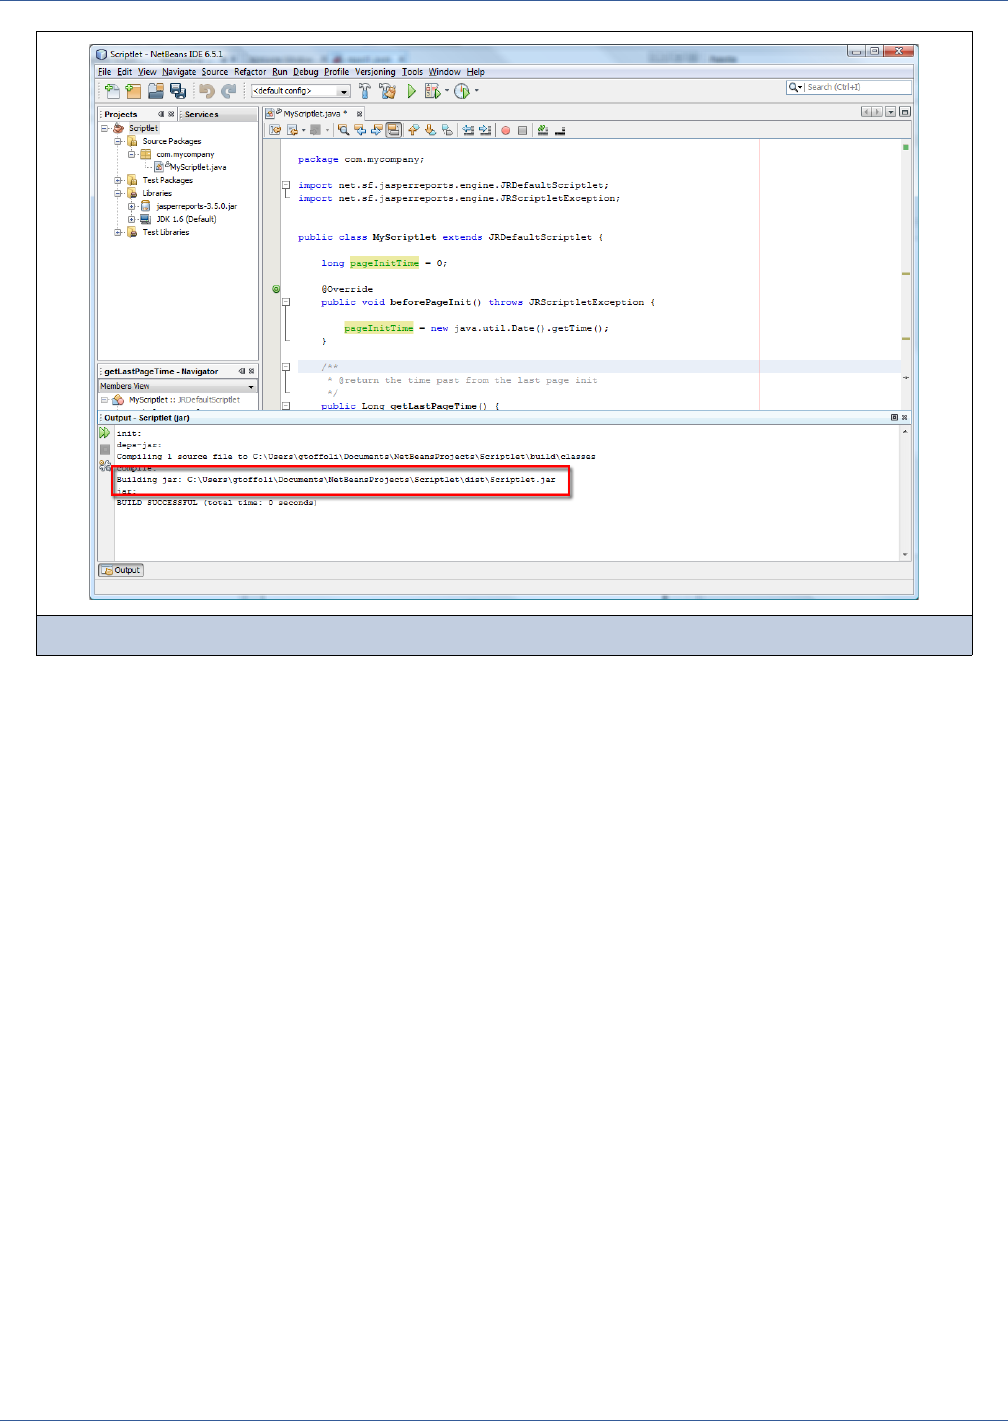
Scriptlets
339
18.3 Testing a Scriptlet in iReport
One of the most interesting features of iReport is the ability to dynamically load JARs. This allow you to rebuild your JARs
and test fresh versions in iReport without having to restart it.The first step to test the scriptlet (in other words, to use it), is to
add to the iReport classpath the JAR we just created in the IDE; this allows the JAR to be reloaded.
Open the iReport options dialog (Tools → Options), move to the iReport section and select the Classpath tab (Figure 18-6).
Add to the list of classpath entries the scriptlet JAR and check the Reloadable flag.
Figure 18-5 Build output
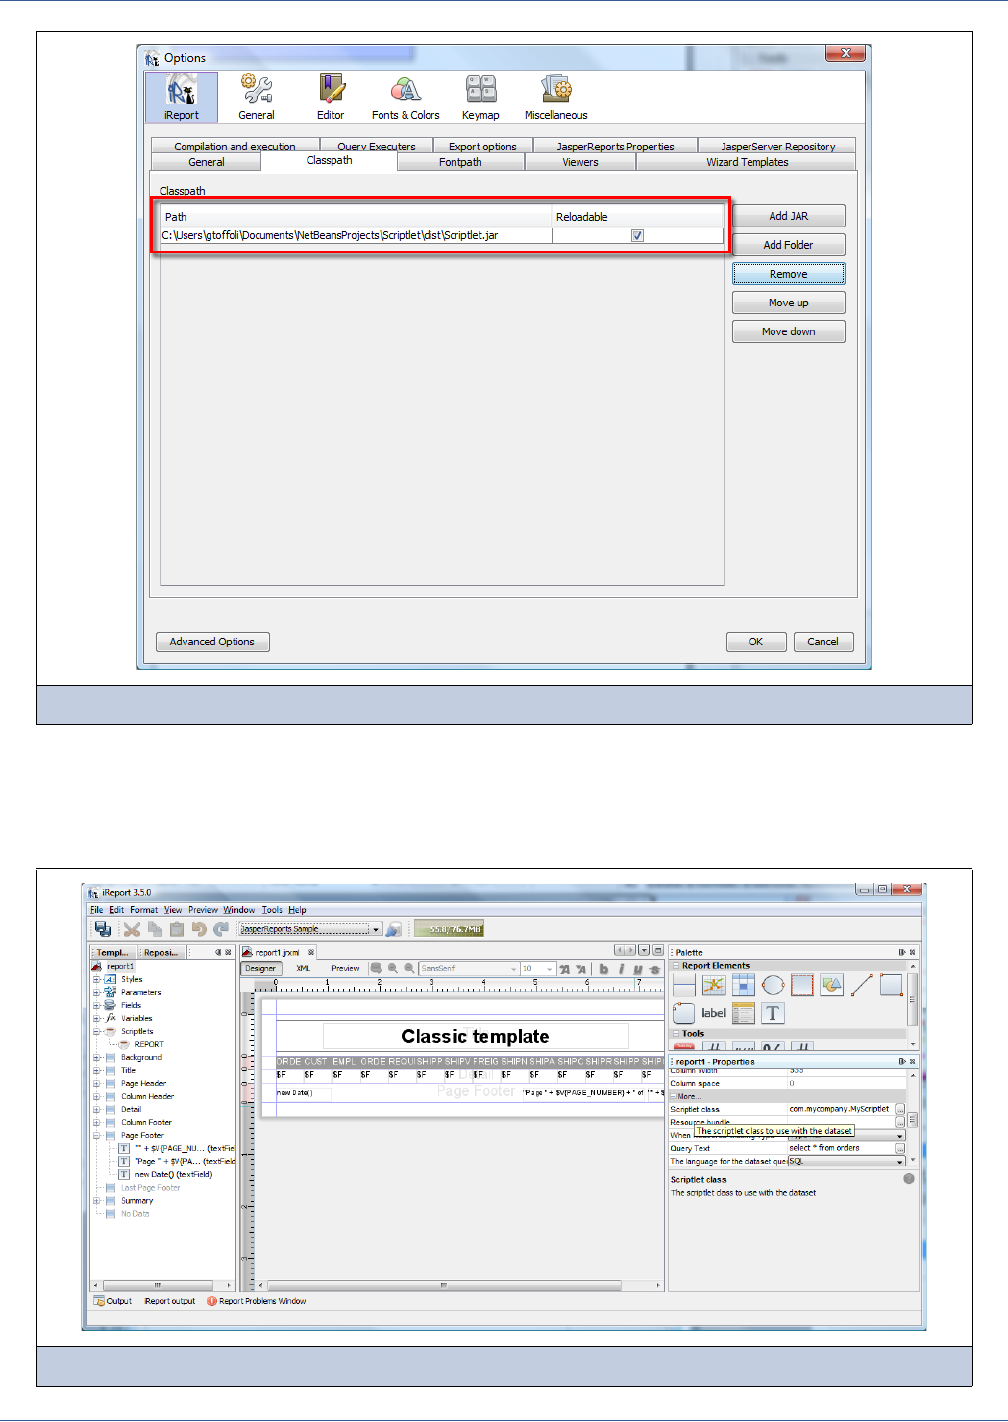
340
iReport Ultimate Guide
Now we can use the class com.mycompany.MyScriptlet in any report. If you already have a report to modify, open it;
otherwise, create a new report that can produce several pages or reuse one of the samples from the previous chapters.
A report can use one or more scriptlets. If you use just one, set the Scriptlet property of the report with the full qualified
name of your scriptlet class (in this case com.mycompany.MyScriptlet), as shown in Figure 18-7.
Figure 18-6 Adding the JAR to the iReport classpath
Figure 18-7 Setting the Scriptlet property

Scriptlets
341
If you want to add more scriptlets, use the Report Inspector view, in which you can find a Scriptlets node. The subnode
REPORT cannot be removed; it always identifies the first scriptlet of the report (the one set in the Scriptlet property). To add
another scriptlet, right-click the Scriptlets node and select Add Scriptlet, then set the correct class name for that scriptlet in the
property sheet view (which is set by default to net.sf.jasperreports.engine.JRDefaultScriptlet).
It’s time to use the scriptlet we just created.
Add a textfield to the Page Footer band. The expression of the textfield will be this:
$P{REPORT_SCRIPTLET}.getLastPageTime()
REPORT_SCRIPTLET is the built-in parameter that references the scriptlet in the report. The other scriptlets can be referenced
by the name <scriptlet name>_SCRIPTLET (.for example, scritplet1_SCRIPTLET). In this report,
REPORT_SCRIPTLET has type MyScriptlet, so we can call the method that returns the number of milliseconds past from the
last page initialization getLastPageTime(). This method returns a Long object, so we need to adjust the textfield class type
(setting it to java.lang.Long). Finally, since we want to get the past time only when the page is complete, set the evaluation
time of the textfield to Page (Figure 18-8).
Preview the report to see the result. On each page you can read the exact number of milliseconds required to fill the particular
page. It is interesting to see how the first page usually takes much more time than the other ones, while the last one is often the
fastest.
If you want to change something in the scriptlet, go back to the IDE, rebuild the scriptlet, and preview the report again (maybe
using the Run again button in the “001” of the preview tab in iReport).
18.4 Accessing iReport Objects
The scriptlet class has access to all the object of the dataset it belongs to (and a subdataset can have its own scriptlet). All the
scriptlets inherit from JRAbstractScriptlet class three java.util.Maps (parametersMap, fieldsMap, and
variablesMap) and an array of JRFillGroup called groups. The Maps use the object names as keys, and some special
objects (JRFillParameter, JRFillField and JRFillVariable) as values. Some convenient functions are provided to
get the value of the objects and set the value of variables:
All of them throw a JRScriptletException in case of error.
Figure 18-8 The textfield details
Object getParameterValue(String parameterName)
Object getParameterValue(String parameterName)
Object getParameterValue(String parameterName, boolean mustBeDeclared)
Object getFieldValue(String fieldName)
Object getVariableValue(String variableName)
void setVariableValue(String variableName, Object value)
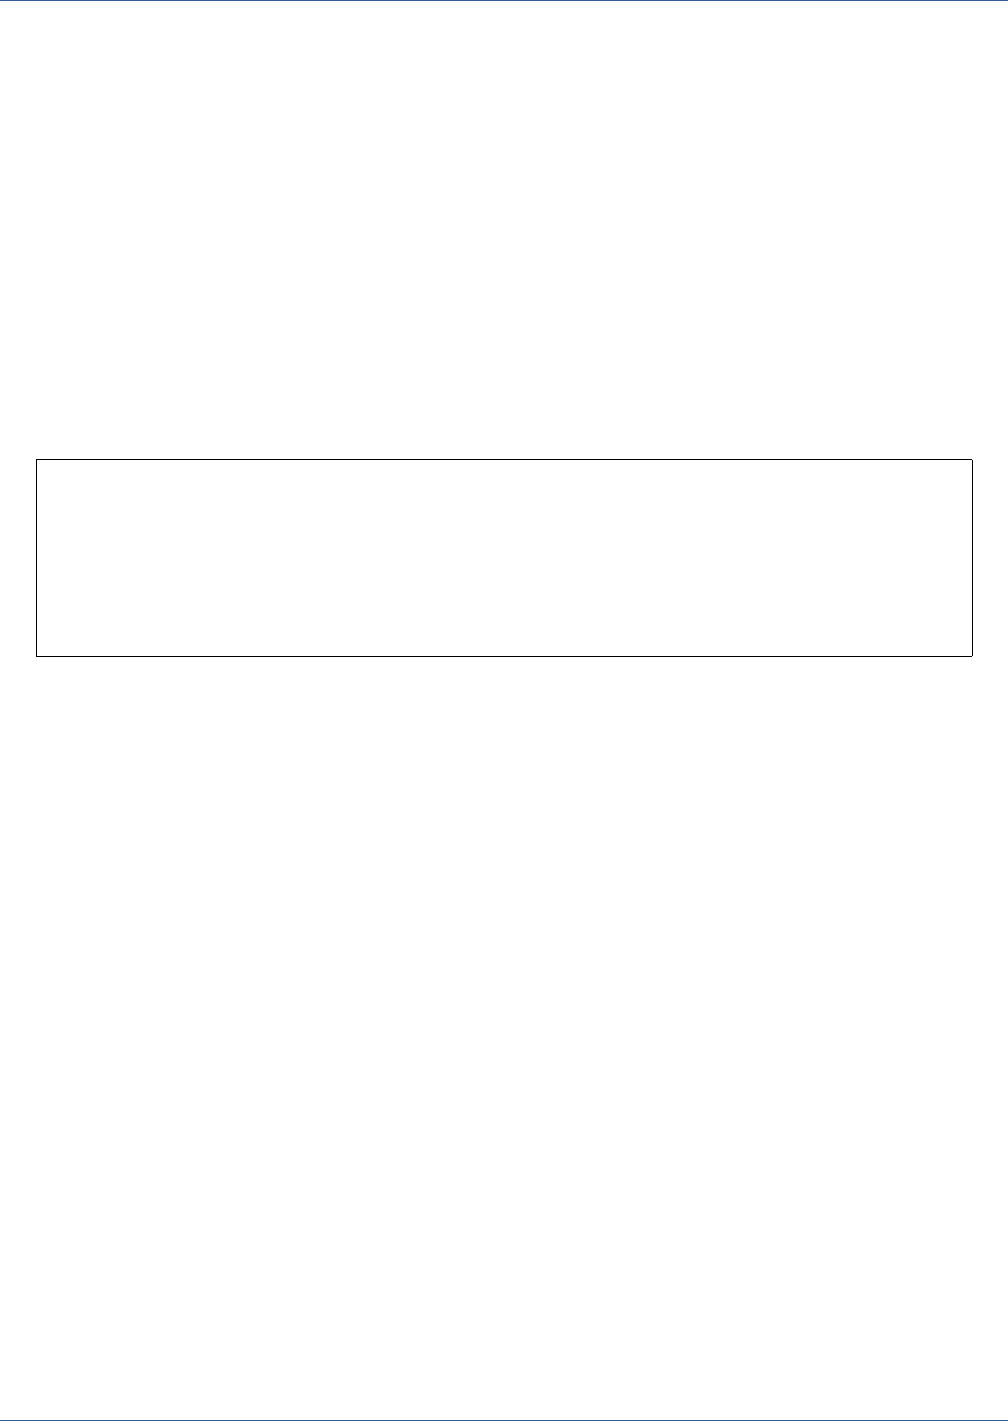
342
iReport Ultimate Guide
Variables are the only objects for which a scriptlet can change the value. Pay attention to the fact that when a scriptlet sets a
value for a variable, it could be in concurrence with the reporting engine (in general when a calculation type has been set for
the variable). For this reason, variables that are supposed to be used by a scriptlet should always have System as calculation
type.
Being able to access the report objects, not just their value, is a great advantage, especially when a scriptlet is thought to be
reusable (since you can identify, for instance, a parameter or field having a certain custom property). In particular, the
JRFillParameter and JRFillField provide a way to read the their properties set at design time, and both JRFillField
and JRFillVariable expose the previous value, which is useful for differential calculations.
18.5 Debugging a Scriptlet
Unfortunately, there is no way to run a step-by-step debugger to debug a scriptlet by setting breakpoints in the code, but there
are several techniques to monitor the scriptlet execution. One of them is using a simple System.out.println(<msg>) to
print informations that will appear in the iReport output console. It is good practice to follow the println call with a flush to
be sure the printed message is shown as soon as possible in the output view. Here is an example:
public void beforePageInit() throws JRScriptletException {
pageInitTime = new java.util.Date().getTime();
System.out.println("I have set the pageInitTime to: " + pageInitTime);
System.out.flush();
}
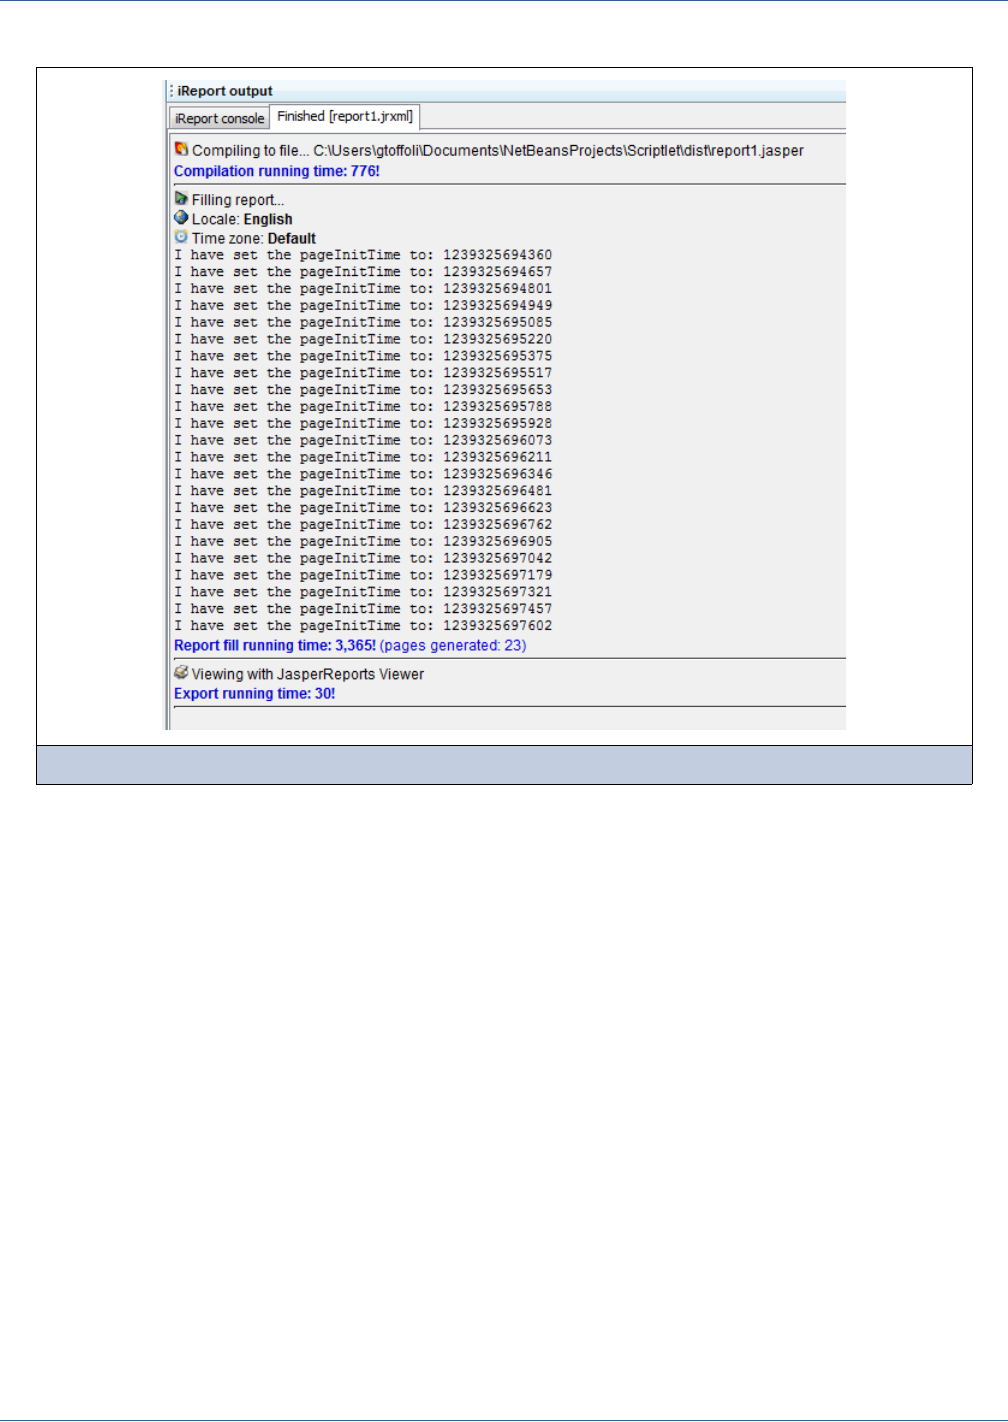
Scriptlets
343
This is what you get in the output console:
A more sophisticated scriptlet (suitable only in a design environment) can pop up a dialog displaying information such as the
current status of the fields and an option to stop the execution, as shown in Figure 18-10.
Figure 18-9 Debug messages coming from the scriptlet
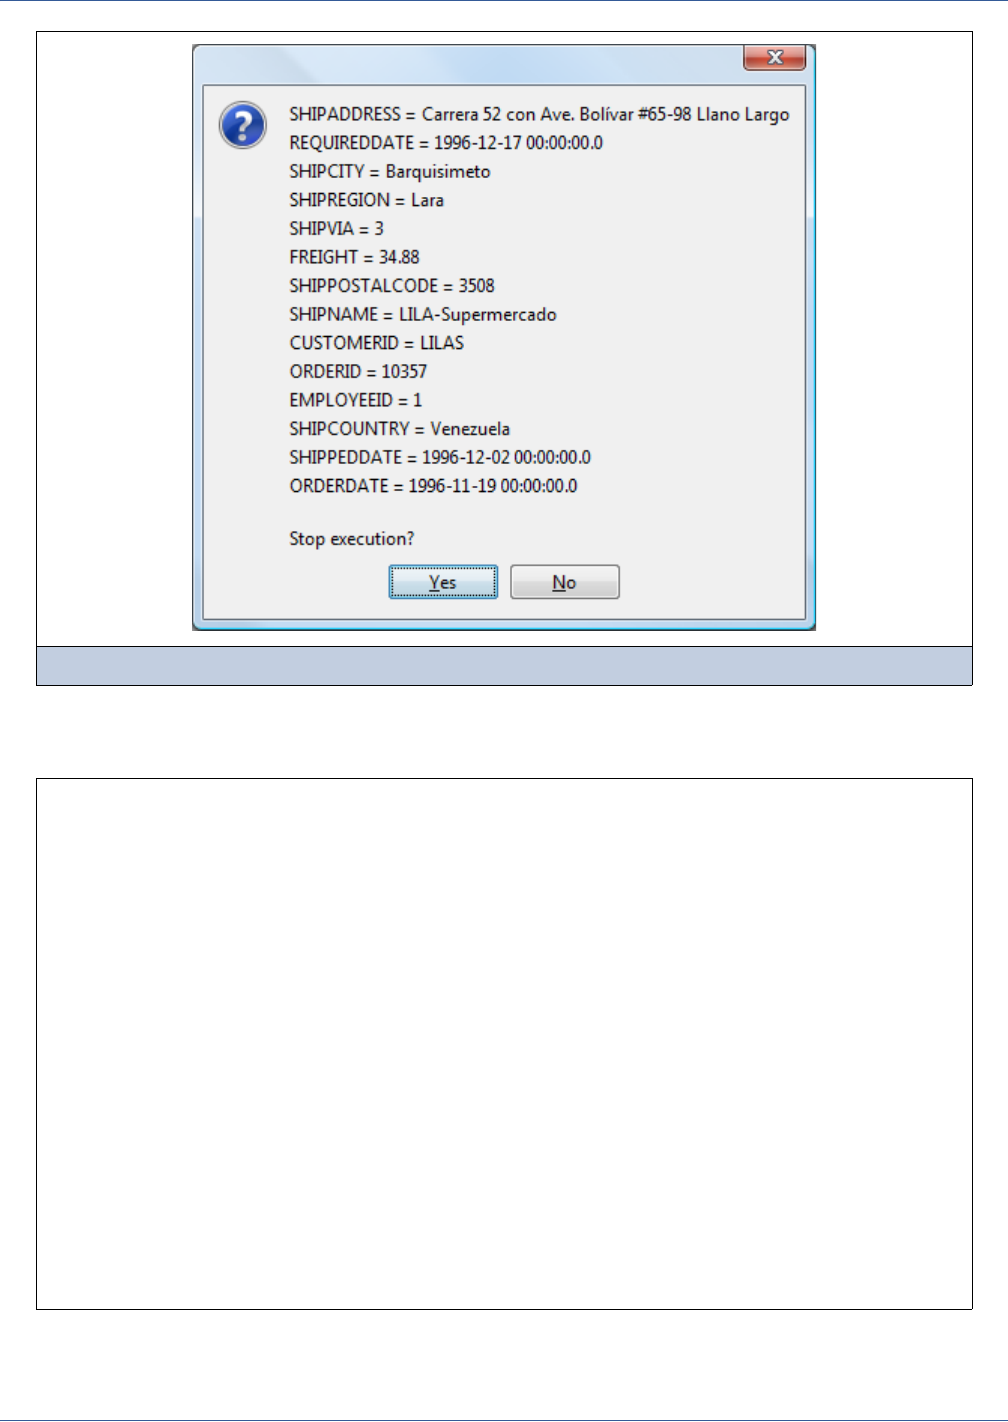
344
iReport Ultimate Guide
The code of the scriptlet is the following:
The dialog will pop up every time a new page is initialized just because we are implementing the method beforePageInit
pausing the report execution. If the user selects Yes (stop the execution), the scriptlet throws a JRScriptletException that
Figure 18-10 Simple field debugging window
Code Example 18-3 Debugging scriptlet example source
public void beforePageInit() throws JRScriptletException {
pageInitTime = new java.util.Date().getTime();
String fieldValuesMsg = "";
Iterator i = fieldsMap.keySet().iterator();
while (i.hasNext())
{
String fieldName = (String)i.next();
fieldValuesMsg += fieldName + " = " + getFieldValue(fieldName) + "\n";
}
fieldValuesMsg += "\nStop execution?";
if ( JOptionPane.showConfirmDialog(null, fieldValuesMsg,"",
JOptionPane.YES_NO_OPTION) == JOptionPane.OK_OPTION)
{
// Stop the execution
throw new JRScriptletException("Execution interrupted by the user");
}
}

Scriptlets
345
terminates the report execution with the message “Execution interrupted by the user.” This technique can be used to
automatically terminate a process that is taking too much time (until one of the scriptlet events is actually invoked), when we
are producing too many pages, and so on.
18.6 Deploying Reports That Use Scriptlets
Sometimes you may create a report that works well in iReport, but that does not work when deployed in an external
application. One of the things to check for is whether the report is using a scriptlet. If it is, be sure that the scriptlet classes are
available in the classpath. Finally, a scriptlet can be used in more than a single report, so consider creating your own library of
scriptlets and putting all of them in a single JAR.

346
iReport Ultimate Guide
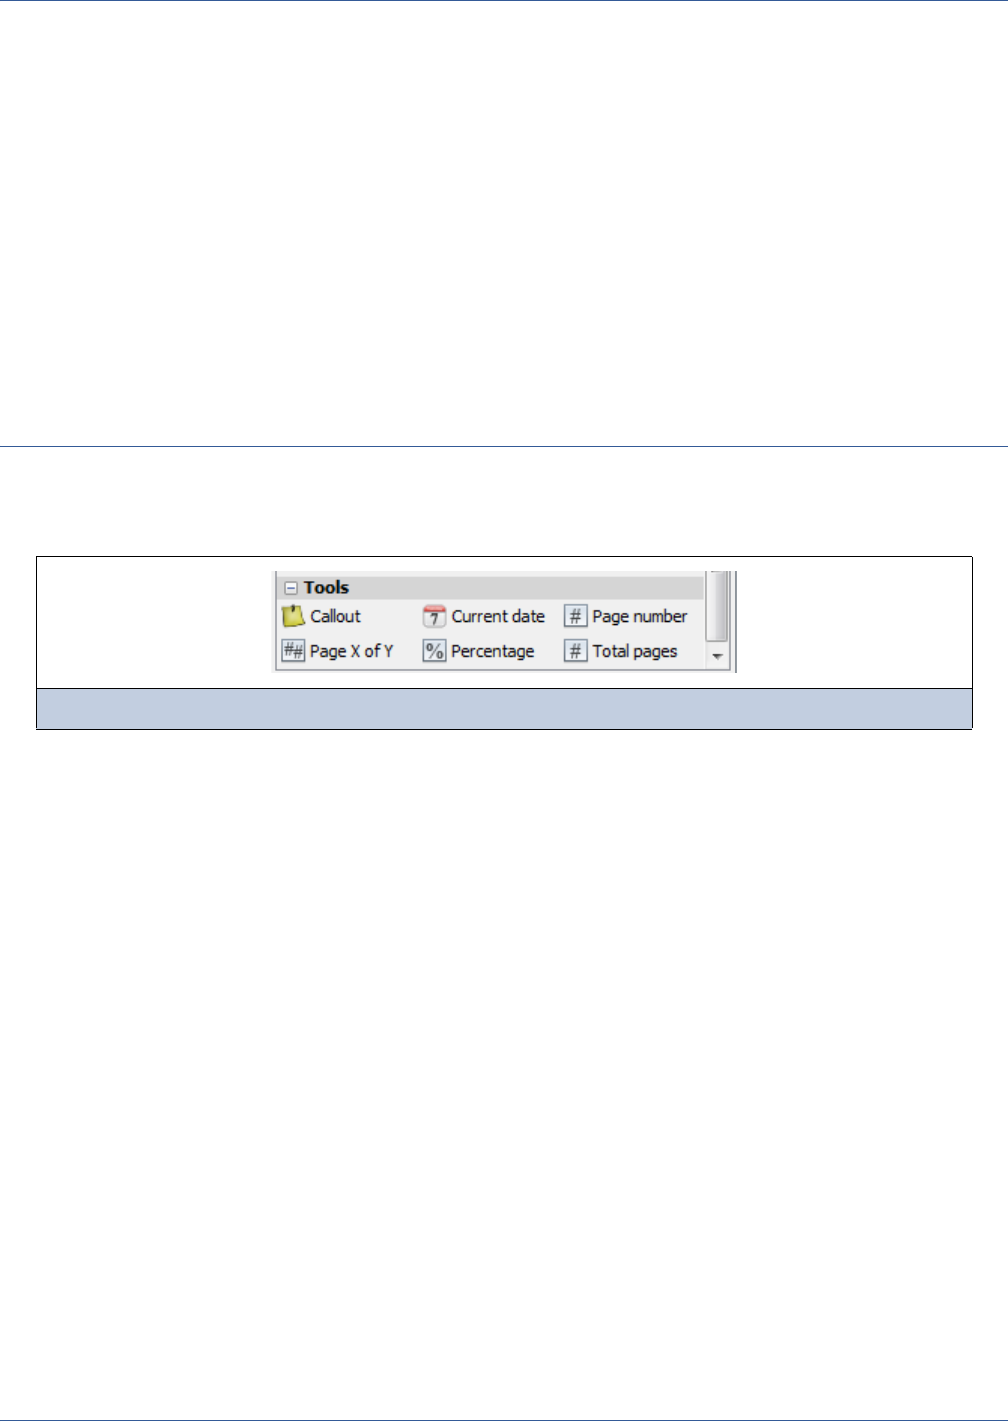
Additional Tools
347
CHAPTER 19 ADDITIONAL TOOLS
In this chapter are presented the tools available in the Tools section of the report designer palette (Figure 19-1) and some other
useful features provided by iReport.
This chapter has the following sections:
Callout Tool
Current Date Tool
Page Number, Total Pages and Page X of Y Tools
Percentage Tool
Using a Background Image as Reference
How to Run the Samples
19.1 Callout Tool
The Callout tool is used to put notes inside a report. The callouts are not report elements and are not printed or visible when the
report is filled and exported.
Currently, the Crosstab and Table designers cannot accept callouts, so callouts can be used only in the main designer.
To create a new callout, drag the Callout tool inside the report page (Figure 19-2).
Figure 19-1 The Tools palette
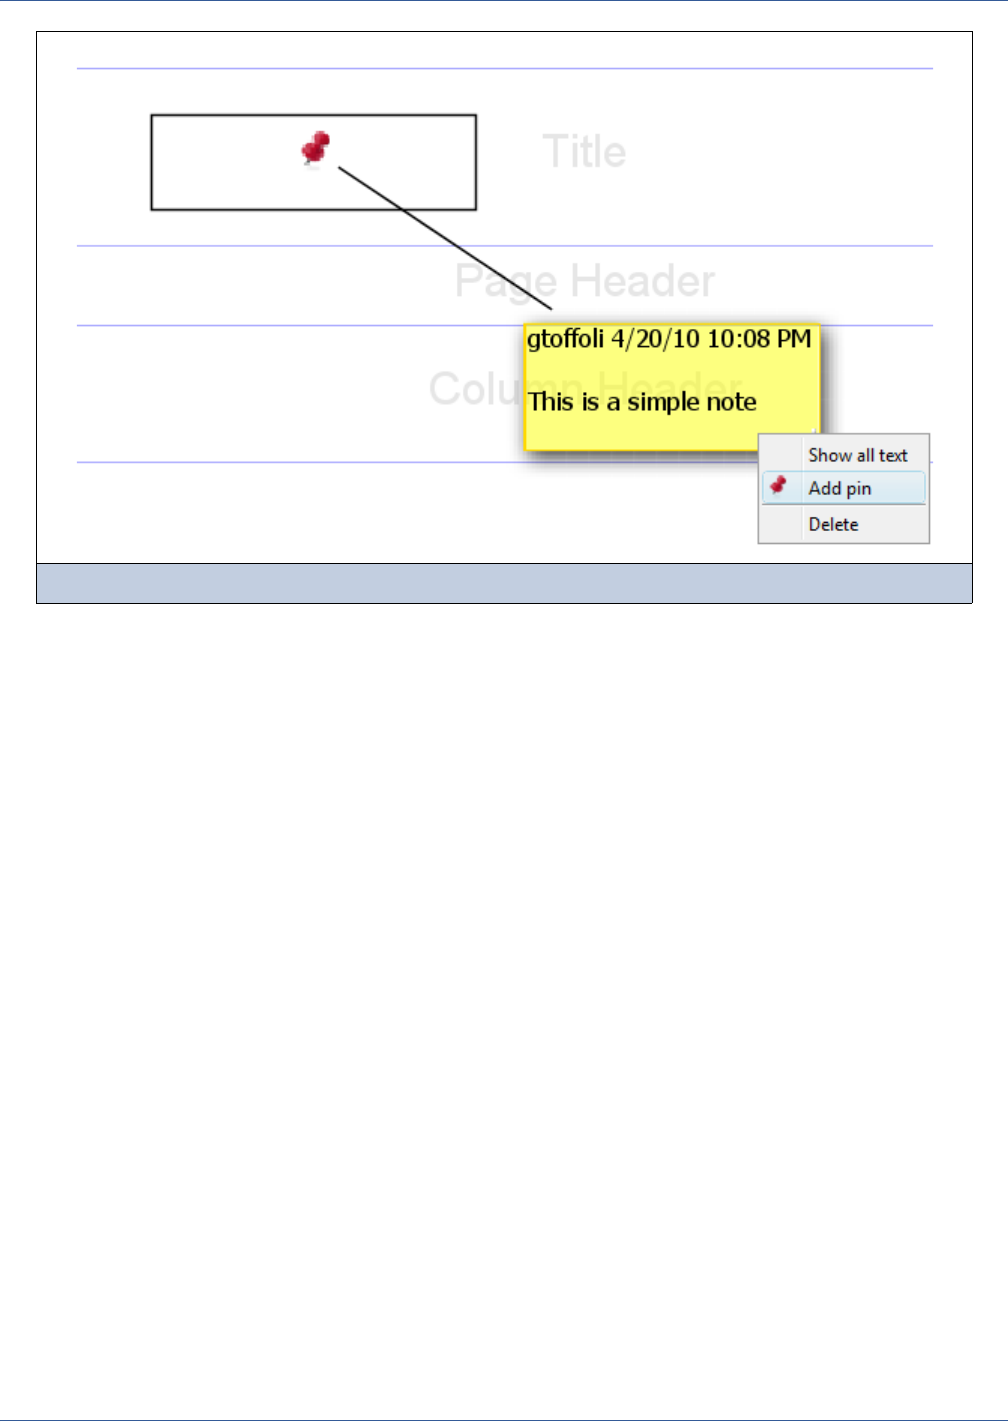
348
iReport Ultimate Guide
By default, the text of a new callout is set to the user name and the current date. Double-click the callout to write your own
text. If the text is very long, you can change the size of the callout and show all its contents; right-click the callout and select
the menu item Show all text (see Figure 19-2).
To delete a callout, right-click it and select Delete.
It is possible to add pins to a callout. A pin indicates the screen object to which a callout refers. It is connected to the callout
with a line. The callout can be dragged around the screen without affecting the pin’s position; the connection line will be
updated automatically.
To add a pin, right-click the callout and select Add pin. Then drag the pin to the screen object. Now you can drag the callout
without moving the pin. (Another way to create a pin is to hold down the ALT key, left-click the callout, and drag the mouse
over a report element.)
Callout data (text, position, pins, etc...) is stored in a report property called ireport.callouts as plain text. This allows
storing callout information in any JRXML file without breaking compatibility with older versions of JasperReports. Since
callouts are being introduced in iReport 3.7.1, that is the only version it is possible to use the callouts in the designer. Using the
report property allows you to open the JRXML file in an older version of JasperReports without destroying the callout data.
The callout will not be visible until you open the file in version 3.7.1 (or later) again.
19.1.1 Current Date Tool
The Current Date tool is an easy way to create a textfield that displays the current date or time. When the tool is dropped in the
report, the Date Format dialog appears, asking the user to specify the display format of the date or time (Figure 19-3).
Figure 19-2 A simple callout
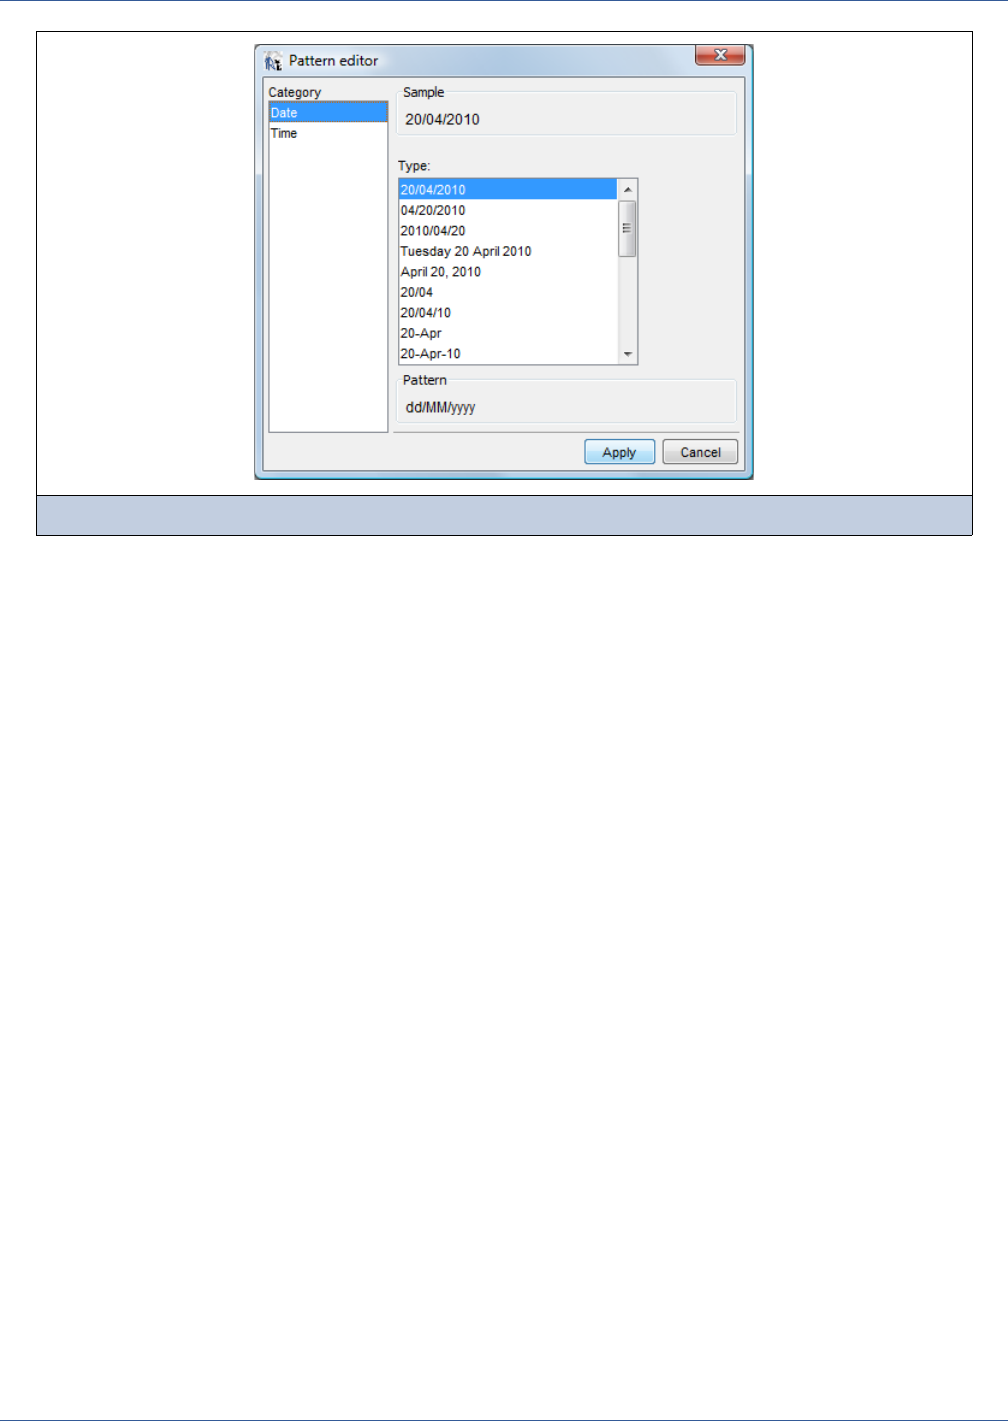
Additional Tools
349
The result is a new textfield element of type java.util.Date. The textfield expression is set to new java.util.Date()
(this expression creates a new Date object initialized with the current date). The Pattern property of the textfield is set to the
format specified by the user.
19.2 Page Number, Total Pages and Page X of Y Tools
19.2.1 Page Number Tools
All of these tools display page numbers:
For more information about PAGE_NUMBER and evaluation times, see 6.3, “Working with Variables,” on page 108 and 6.4,
“Evaluating Elements During Report Generation,” on page 110.
19.2.2 Printing Page X of Y in a Single Textfield
To keep things simple, the Page X of Y tool creates two textfields that print the current and last page numbers of a report (both
these values are held by the variable PAGE_NUMBER which is evaluated at different times, Now and Report).
Figure 19-3 Date and time format dialog
Page Number This tool creates a textfield showing the variable $V{PAGE_NUMBER} at evaluation time now.
The result is the number of the current page.
Total Pages This is very similar to Page Number, but the evaluation time set for the created textfield is
Report. The result is the total number of pages of the report (that is, the value of the built-in
variable PAGE_NUMBER at evaluation time Report; in other words, at the end of the document).
Page X of Y Page X of Y creates two textfields:
The first is very similar to the one created by the Page Number tool, but the expression
displayed is "Page "+$V{PAGE_NUMBER}+" which produces something like Page 100 of
(in this sample 100 is the current page).
The second textfield displays the variable $V{PAGE_NUMBER} at evaluation time Report
(just like Total Pages). Please note that the string Page X of Y can be printed by using just a
single textfield, but this involves creating a new variable, as explained in the next section.
350
iReport Ultimate Guide
With some effort it is possible to produce the same text using in a single textfield. The advantage of using a single textfield is
that it gives you better control over the formatting of the text; in some languages and locales, the text of the fields containing
the current and the total number of pages can vary. With a single textfield, the text does not have to be split into two portions
with separate formatting.
This result can be achieved by using the evaluation time Auto for the textfield elements. This evaluation time considers all the
variables involved in the textfield expression at the time specified by their reset type (reset type is a property of each
variable; it specifies when the variable must be reset). For instance, the reset type of the PAGE_NUMBER built-in variable is
Report, so when PAGE_NUMBER variable is printed in a textfield having evaluation time Auto, what is printed is the total
number of pages (the value of the variable PAGE_NUMBER at the time of its next reset, which in this case is the end of the
report).
The trick to evaluating PAGE_NUMBER at two different evaluation times in the same expression is creating a new variable
which holds the current page number and has reset type Page. To create such of variable is pretty straightforward, just add a
new variable and set the following properties:
Every time a new page is created, this new variable assumes the value of the variable PAGE_NUMBER (which holds the current
page number). Until the next page is reached, this variable will still have the value of the current page. Since the reset type of
this variable is Page, when used in a textfield with evaluation time Auto the variable’s value will be the current page number.
Let’s put everything together:
1. We need a textfield with evaluation time Auto and class java.lang.String having the following text expression:
"Page "+$V{currentPage}+" of " + $V{PAGE_NUMBER}
2. As expected, the result of this expression will be something like:
Page 4 of 30 (where 4 is the current page and 30 the total number of pages in the report).
This expression can be totally changed but the value represented by $V{currentPage} will remain the current page, while
the value $V{PAGE_NUMBER} will be the total number of pages. This allows using expressions like:
MyUtils.formatPageXofY($V{currentPage}, $V{PAGE_NUMBER})
where MyUtils.formatPageXofY can be a user-defined method to generate the Page X of Y label from the value of the
current page and the total number of pages.
For more information on creating variables, PAGE_NUMBER, and evaluation times, see Chapter 6, “Fields, Parameters, and
Variables,” on page 95.
19.3 Percentage Tool
The Percentage tool helps the user create a text field containing a percentage. When you drag-and-drop the Percentage tool
into a report band, the dialog box shown in Figure 19-4 appears. Here you specify the field whose percentage you want to
calculate and the aggregation level on which to perform the calculation.
Property Value
Variable name currentPage
Variable class java.lang.Integer
Calculation Nothing
Reset type Page
Variable Expression $V{PAGE_NUMBER}
All other properties Defaults
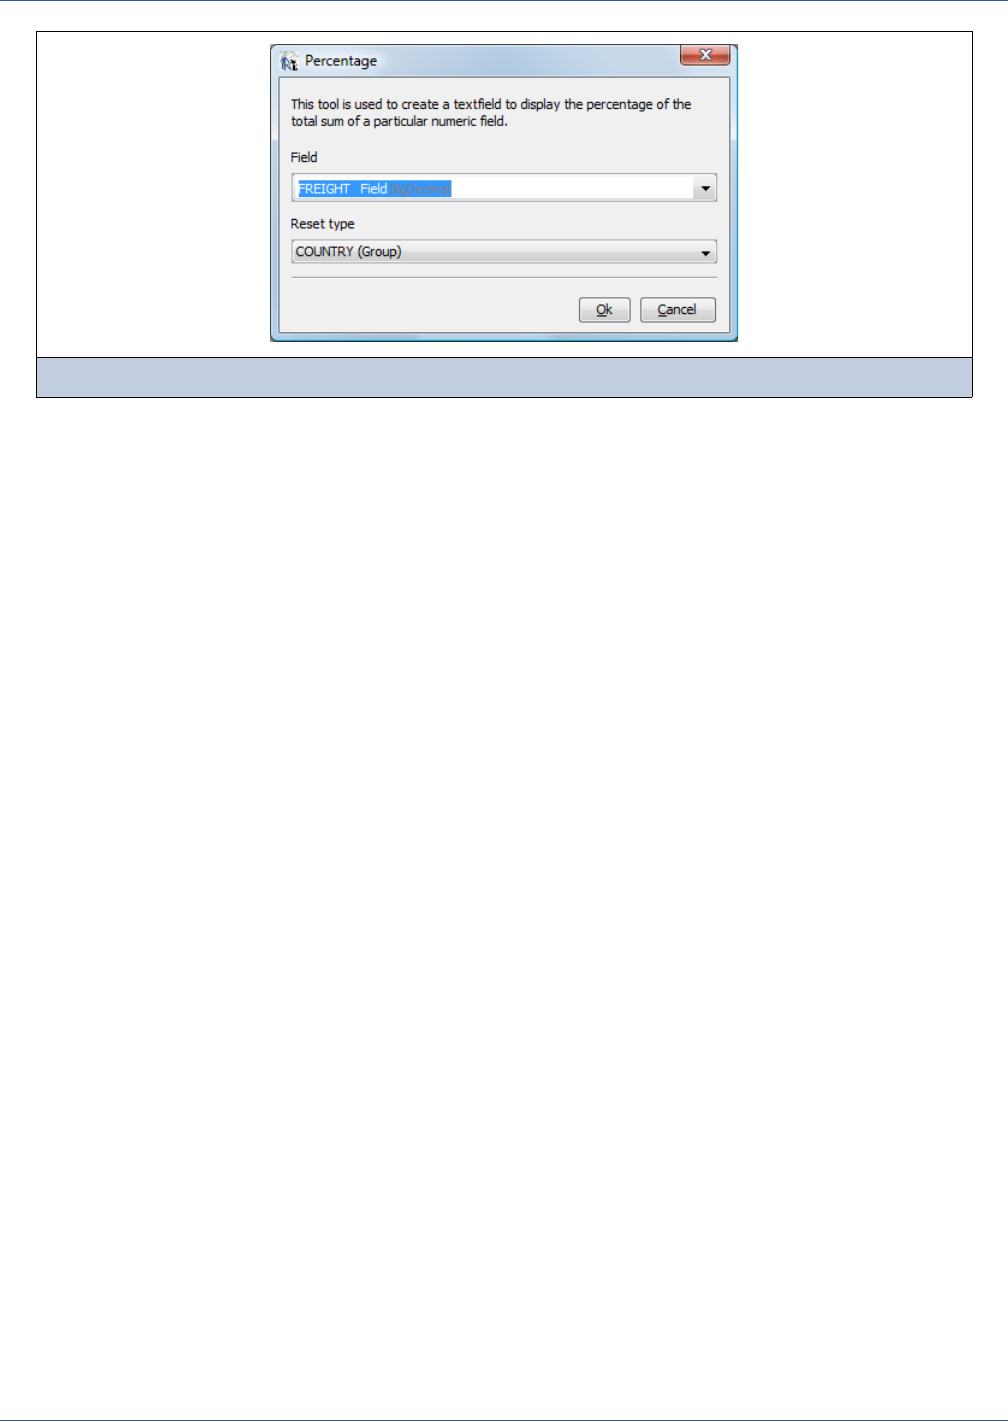
Additional Tools
351
iReport creates a new variable to store the sum of the selected field. The reset type of this variable is set to the selected
aggregation level (such as report, page, or a particular group). The text field expression generated is something like this:
new Double( $F{FREIGHT}.doubleValue() / $V{FREIGHT_SUM}.doubleValue() )
and the evaluation time is set to Auto to allow the evaluation of $F{FREIGHT} and $V{FREIGHT_SUM} at different
aggregation times.
Finally, the pattern of the text field is set to #,##0.00%.
19.4 Using a Background Image as Reference
When a report is designed for a pre-printed page or when it must recreate an existing document exactly, it is convenient to
display a reference image of the pre-printed page or existing document in the designer (Figure 19-5). This can be
implemented by selecting the menu item View > Report Designer > Import Background Image. The image path and
properties are stored in the JRXML so that, when the document is closed and reopened, you don’t have to set the image
properties again.
Figure 19-4 Percentage tool
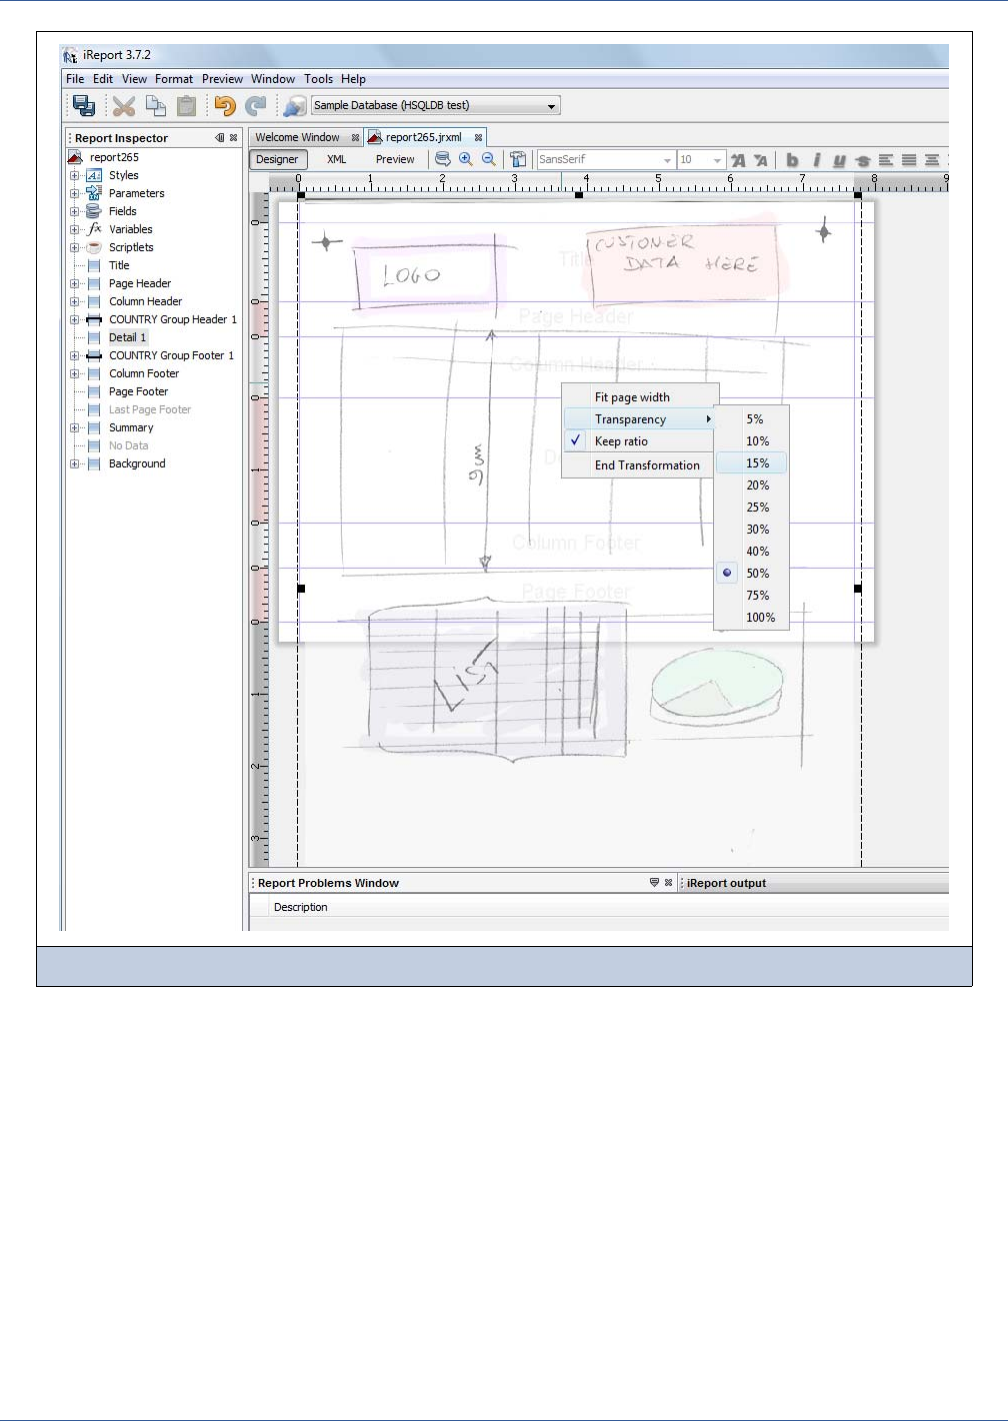
352
iReport Ultimate Guide
To adjust the size, position, and transparency of the image, select View > Report Designer > Transform Background Image.
Drag the image to position it correctly. Drag the black handles to stretch the image. Right-click the image for more options,
such as keeping the image size ratio while stretching it or setting the transparency level.
The Fit page width menu item stretches the image to fit the document width (margins included) and positions the image at the
top left corner of the document. When the image is correctly positioned, select End Transformation by right-clicking the
image or clearing the menu item View > Report Designer > Transform Background Image.
The background image can be hidden or shown at any time with the menu item View > Report Designer > Show Background
Image.
To completely remove the reference image from the JRXML, select View > Report Designer > Delete Background Image.
Figure 19-5 Background image as reference

Additional Tools
353
19.5 How to Run the Samples
iReport comes with a small set of samples to help you get started with iReport. The samples include many callouts that explain
several portions of the report and provide additional information to help you better understand how the samples work.
Samples can be opened from the Help > Samples menu.
All the samples use the HSQL DB sample database that is shipped with iReport. A connection to this database is pre-
configured; the name of the connection, visible in the Connections drop-down list in the iReport tool bar, is Sample Database
(HSQL test). The database starts automatically when it is needed (for example, to run a report or read the fields from a query).
You can also start it manually by selecting Help > Samples > Run Sample Database.

354
iReport Ultimate Guide

Chart Theme Example
355
APPENDIX ACHART THEME EXAMPLE
This code sample is the XML source for the custom chart theme “TricolorAreaChart” shown in Figure 11-11 on
page 212.
Code Example A-1 XML source code for TricolorAreaChart
<?xml version="1.0" encoding="UTF-8"?>
<chart-theme>
<chart-settings
background-image-alignment="Align.BOTTOM"
border-visible="true"
>
<background-paint
xmlns:xsi="http://www.w3.org/2001/XMLSchema-instance"
color1="#CCFFFF"
color2="#FFFFFF"
xsi:type="gradient-paint"
/>
<font/>
</chart-settings>
<title-settings>
<font font-size="18"/>
</title-settings>
<subtitle-settings>
<font font-size="12" italic="true"/>
</subtitle-settings>
<legend-settings>
<font/>
</legend-settings>

iReport Ultimate Guide
356
<plot-settings
background-image-alignment="Align.BOTTOM"
outline-visible="false"
domain-gridline-visible="true"
range-gridline-visible="true"
>
<background-paint
xmlns:xsi="http://www.w3.org/2001/XMLSchema-instance"
color1="#FFFFFF" color2="#CCFFFF" xsi:type="gradient-paint"
/>
<outline-paint
xmlns:xsi="http://www.w3.org/2001/XMLSchema-instance"
color="#000000" xsi:type="color"
/>
<stroke
xmlns:xsi="http://www.w3.org/2001/XMLSchema-instance" width="1.0"
xsi:type="stroke"
/>
<series-color-sequence
xmlns:xsi="http://www.w3.org/2001/XMLSchema-instance"
color="#00CC00" xsi:type="color"
/>
<series-color-sequence
xmlns:xsi="http://www.w3.org/2001/XMLSchema-instance"
color="#FF0000" xsi:type="color"
/>
<series-color-sequence
xmlns:xsi="http://www.w3.org/2001/XMLSchema-instance"
color="#FFFFFF" xsi:type="color"
/>
</plot-settings>
<domain-axis-settings
line-visible="true"
>
<label-font
xmlns:xsi="http://www.w3.org/2001/XMLSchema-instance"
xsi:type="font"
/>
<tick-label-font
xmlns:xsi="http://www.w3.org/2001/XMLSchema-instance"
xsi:type="font"
/>
</domain-axis-settings>
<range-axis-settings
line-visible="false"
>
Code Example A-1 XML source code for TricolorAreaChart, continued

Chart Theme Example
357
<label-font
xmlns:xsi="http://www.w3.org/2001/XMLSchema-instance"
xsi:type="font"
/>
<tick-label-font
xmlns:xsi="http://www.w3.org/2001/XMLSchema-instance"
xsi:type="font"
/>
</range-axis-settings>
</chart-theme>
Code Example A-1 XML source code for TricolorAreaChart, continued

iReport Ultimate Guide
358

Index
359
INDEX
A
Add selected field(s) 183
Adobe Flash. See Flash charts
afterColumnInit() method 335
afterDetailEval() method 335
afterGroupInit() method 335
afterPageInit 335
afterPageInit() method 335
afterReportInit() method 335
anchors
defining 93
attribute groups 335
attributes, elements 70
B
background 45, 47, 56, 60, 71
background images 351
bands 63
adding and removing 60, 61
background 45, 56, 60, 71
columns 49
defining report structure 45
Detail band 47, 58, 80, 114, 115, 117, 136, 140, 145, 319
elements 70
group bands 114
groups 45, 114
header and footer bands 45, 46, 57, 60, 114, 115, 119, 145
height 45, 60
in default template 59, 114
modifying 113
modifying their properties 60, 61, 113
Print When Expression expression 60, 114
printing 57
Split Type property 61
Title 46
type page 45
types 46, 56
barcodes
Barbecue 278
Barcode component 275
Barcode4J 278
localization 279
properties 277
rendered as images 280
types 275
Beans. See Java.
beforeColumnInit() method 335
beforeDetailEval() method 335
beforeGroupInit() method 335
beforeInitPage 338
beforePage Init() method 335
beforeReportInit() method 335
breaks 92
C
callouts 347
character encoding 133
charts
See also Flash charts
datasets 205, 209
example 355
properties 210
themes 211, 355
types 203
Charts Pro
chart properties 238
chart types 234
configuring Flash charts 238
specifying chart data 239
trend lines 242
clear text 158
columns
in List component 271, 274
in report layouts 49

iReport Ultimate Guide
360
commercial license 10, 258
compiling iReport 14
components
Barcode 275
custom components 63, 93, 281
List 259
Table 267
CONNECTION 103
connections
creating 156
in report generation 153
JDBC 156
See data sources
types 154
Connections/Datasources 177
creating a report 25
crosstabs
creating 289
datasets 290
defined 289
properties 298
CSV 177
Add node as field 172
comma-separated values 155
Connections/Datasources 177
PersonBean 167
custom components. See components.
custom languages. See query languages.
D
data sources
connections 154, 155
CSV 177
exporting 189
Hadoop
Hive 183
Hibernate 180
importing 189
importing and exporting 189
in report generation 153
JavaBeans 99, 153, 155, 164, 167
JRDataSource 37, 91, 153, 185, 187
JREmptyDataSource 180
JRXmlDataSource 174
password 158
subdatasets 154
subreports 316
types 153, 154
XML 169
database
sample database 25, 317
datasets
See also subdatasets
and subdatasets 281
charts 205
dataset runs 260
for List component 259
for Table component 267
in charts 205, 209
in Charts Pro 239
in crosstabs 290
in Gantt charts 252
in Maps Pro 229
in Widgets Pro 248
runs 260, 273, 283
types 209
DATASOURCE 103
date textfields 348
declaring objects 95, 101, 107
default template 59, 114
default values 134
DetailEval 334
drivers 157, 158, 159, 160
E
EJBQL 155
elements
and bands 63
attributes 70
bands. See bands.
custom components 63, 281
custom properties 72
defined 63
formatting 68
generic elements 63, 93
in Table component 269
inserting in reports 64
position properties 70
properties 66
Report Inspector 70
types 63
entities
EntityCodes class 232
expressions 230
IDs 226
in resource bundles 234
localizing entity names 225
entity IDs 225
evaluation license 10
evaluation times 350
evaluation types 110
executers, query. See query executers.
extensions 43
F
fields 96
Java types vs. SQL types 162
fields providers. See query languages.
fieldsMap 335
FieldsProvider 191
filter expressions 162
Flash charts

Index
361
and Fusion 223
Charts Pro 234
components 223
embedded in Java applications 258
limitations of JasperReports implementation 258
localizing 258
Maps Pro 224
rendered objects 224
Widgets Pro 243
fonts
basic features 125
character encoding 133
extensions 127
for PDF files 85, 125, 127
in static text and textfields 84
properties 84, 134
styles 71, 133
TrueType 126
Unicode 133
formatting tools 68, 347
frames 91
Fusion 223, 224
G
Gantt charts
creating 253
datasets 252
properties 253
generic elements 63, 93
getBundle 310
getFieldValue 187
getLastPageTime 338
Groovy 38
Group Header 113
groups
attribute groups 335
bands in groups 45, 114
defining 114
in report templates 142
nesting order 115, 144
properties 123
H
Hibernate 180
HQL 155, 180
HTML output 30, 224
hyperlinks 93
hypertext. See hyperlinks.
I
IDE 335, 339
Import 189
Increment When 206
Incrementer 298
installing iReport 16
internationalization. See localizing.
iReport
compiling 14
installing 16
JDBC connections 21
iReport Professional 10, 223
ISO-639 306
J
Jasper files 32
JasperReport
extensions 43
JasperReports Professional
custom components and generic elements 93
embedding in Java applications 258
license 10
jasperreports.jar 336
Jaspersoft Professional 13
Java
and Windows 13
Java Class Library 336
java.util.HashMap 335
JavaBeans 99, 153, 155, 164, 167
JavaScript 38
versions required 13
JDBC connections 21, 156
JDBC driver 158
JDBC drivers 157, 159, 160
JFreeChart 203, 210
JRAbstractScriptlet 333
JRAbstractSVGRenderable 80
JRChart 210
JRCTX files 211, 212
JRDataSource 37, 91, 153, 163, 185, 187, 329
JRDefaultScriptlet 333
JREmptyDataSource 180, 329
JRExporter 37
JRFileSystemDataSource 188, 189
JRFillGroup 335
JRRenderable 80
JRViewer 37
JRXML files 32, 140
JRXmlDataSource 174
JTable 82
L
languages
Java types vs. SQL types 162
XPath 169
languages. See query languages.
license 10, 258
lists
creating 259
datasets and subdatasets 259
List component 259
performance consideration 266
localization
barcodes 279

iReport Ultimate Guide
362
subdatasets 283
localizing
entity names 225
Flash chart components 258
maps 233
reports 305
resource bundles 233, 305
M
Maps Pro
configuring maps 225
entities 225, 226
entity IDs 225
localizing maps 233
map colors 232
properties 225
specifying map data 229
maps, scriptlets and 335
message URL http
//anonsvn
anonsvn@community.jaspersoft.com/svn/repos/
ireportfornetbeans 14
N
nesting order 93, 115, 144
O
ORDERID 291
outputs 30, 37, 82, 224
P
page number textfields 110, 349
PageInit 334
palettes 64
PARAMETERS 103
parameters 107
parametersMap 335
passwords 158
PDF
font features 85, 125, 127
output 30, 82, 224
percentage textfields 350
Pie 3D 203, 206
printing 100, 313
printing reports 57
Professional 13
Professional. See JasperReports Professional.
properties
bands 60, 61, 72, 113
charts 210
Charts Pro 238
element positioning 70
elements 66
font styles 134
fonts 84
groups 123
Maps Pro 225
referencing external property sheets 137
reports 47, 70
resetting default values 134
subreports 91
templates 145
Widgets Pro 246
Q
queries 161
results 162
query executers 190
query languages
and data sources 153
custom languages 190
EJBQL 155
fields providers 198
HQL 155, 182
types 98
XPath 172
R
records, sorting and filtering 162
Report Inspector 70
reports
and connections 153
and data sources 153
bands. See bands.
barcodes 275
breaks 92
charts 203
conditional styles 135
creating 25
crosstabs 289
datasets and subdatasets 281
elements 63
Flash charts 223
frames 91
life cycle 31
lists 259
options 53
output files 37
previewing 30
printing 57
properties 47, 70
Report Inspector 70
Report Wizard 25, 140, 145, 156
scriptlets 53
structure 70
styles 133, 135
subreports 90
templates. See templates.
type page 45
reset times 110
reset types 109, 301, 350
resetting default values on properties 134
resource bundles 233
runs. See datasets and subdatasets.

Index
363
S
samples
database 25, 317, 353
reports 353
scripting languages 38
scriptlets 53
sheets. See properties.
Split Allowed and Split Type 61
Spring 181
SQL queries
field types 162
fields 96
results 162
specifying 161
static text 83, 87
styles
conditional styles 135
in reports 133
referencing styles in external property sheets 137
subdataset
subdataset runs 281
subdatasets
creating 281
data sources 154
example 284
for List component 259
for Table component 267
in crosstabs 300
localization 283
runs 260, 283, 300
subreports
and XML data sources 173
creating 313, 317
data sources 316
elements 90
example 317
printing 313
properties 91
Subreport Wizard 327
vs. Table component 267
T
tables
in report layouts 49
Table component 267
vs. subreports 267
templates
creating a custom template 146
creating reports from templates 139
default 59, 114, 142
JRXML files 140, 146
properties 145
Template Chooser 139
Test button 159
text. See fonts, static text, textfields.
textfields 83, 87
themes 55, 211
time textfields 348
Total Position 296
trend lines 242
U
Unicode 133
V
variablesMap 335
W
Widgets Pro
Gantt charts 252
properties of widgets 246
specifying widget data 248
types 243, 248
Windows and Java 13
X
XML
data sources 169
report file 32
XML files
sample chart theme file 355
XPath 169, 172

iReport Ultimate Guide
364
