Juniper Secure Analytics DSM Configuration Guide Netsight Jsa Configuring
User Manual: Netsight
Open the PDF directly: View PDF ![]() .
.
Page Count: 808 [warning: Documents this large are best viewed by clicking the View PDF Link!]
- About This Guide
- Overview
- Installing DSMs
- 3Com 8800 Series Switch
- Ambiron TrustWave ipAngel
- Apache HTTP Server
- APC UPS
- Amazon AWS CloudTrail
- Apple Mac OS X
- Application Security DbProtect
- Arbor Networks Peakflow
- Arbor Networks Pravail
- Arpeggio SIFT-IT
- Array Networks SSL VPN
- Aruba Mobility Controllers
- Avaya VPN Gateway
- BalaBit IT Security
- Barracuda
- Bit9 Parity
- BlueCat Networks Adonis
- Blue Coat SG
- Bridgewater
- Brocade Fabric OS
- CA Technologies
- Check Point
- Cilasoft QJRN/400
- Cisco
- Cisco ACE Firewall
- Cisco Aironet
- Cisco ACS
- Cisco ASA
- Cisco CallManager
- Cisco CatOS for Catalyst Switches
- Cisco CSA
- Cisco FWSM
- Cisco IDS/IPS
- Cisco IronPort
- Cisco NAC
- Cisco Nexus
- Cisco IOS
- Cisco Pix
- Cisco VPN 3000 Concentrator
- Cisco Wireless Services Module
- Cisco Wireless LAN Controllers
- Cisco Identity Services Engine
- Citrix
- CRYPTOCard CRYPTO-Shield
- Cyber-Ark Vault
- CyberGuard Firewall/VPN Appliance
- Damballa Failsafe
- Digital China Networks (DCN)
- Enterasys
- Extreme Networks ExtremeWare
- F5 Networks
- Fair Warning
- Fidelis XPS
- FireEye
- ForeScout CounterACT
- Fortinet FortiGate
- Foundry FastIron
- Generic Firewall
- Generic Authorization Server
- Great Bay Beacon
- HBGary Active Defense
- Honeycomb Lexicon File Integrity Monitor (FIM)
- HP
- Huawei
- IBM
- IBM AIX
- IBM AS/400 iSeries
- IBM CICS
- IBM Lotus Domino
- IBM Proventia Management SiteProtector
- IBM ISS Proventia
- IBM RACF
- IBM DB2
- IBM WebSphere Application Server
- IBM Informix Audit
- IBM IMS
- IBM Guardium
- IBM Security Directory Server
- IBM Tivoli Access Manager for E-business
- IBM z/Secure Audit
- IBM Tivoli Endpoint Manager
- IBM zSecure Alert
- IBM Security Network Protection (XGS)
- IBM Security Network IPS
- ISC Bind
- Imperva SecureSphere
- Infoblox NIOS
- iT-CUBE agileSI
- Itron Smart Meter
- Juniper Networks
- Juniper Networks AVT
- Juniper DDoS Secure
- Juniper DX Application Acceleration Platform
- Juniper EX Series Ethernet Switch
- Juniper IDP
- Juniper Networks Secure Access
- Juniper Infranet Controller
- Juniper Networks Firewall and VPN
- Juniper Networks Network and Security Manager
- Juniper Junos OS
- Juniper Steel-Belted Radius
- Juniper Networks vGW Virtual Gateway
- Juniper Security Binary Log Collector
- Juniper Junos WebApp Secure
- Juniper Networks WLC Series Wireless LAN Controller
- Kaspersky Security Center
- Lieberman Random Password Manager
- Linux
- McAfee
- MetaInfo MetaIP
- Microsoft
- Motorola Symbol AP
- NetApp Data ONTAP
- Name Value Pair
- Niksun
- Nokia Firewall
- Nominum Vantio
- Nortel Networks
- Nortel Multiprotocol Router
- Nortel Application Switch
- Nortel Contivity
- Nortel Ethernet Routing Switch 2500/4500/5500
- Nortel Ethernet Routing Switch 8300/8600
- Nortel Secure Router
- Nortel Secure Network Access Switch
- Nortel Switched Firewall 5100
- Nortel Switched Firewall 6000
- Nortel Threat Protection System
- Nortel VPN Gateway
- Novell eDirectory
- ObserveIT
- OpenBSD
- Open LDAP
- Open Source SNORT
- Oracle
- OSSEC
- Palo Alto Networks
- Pirean Access: One
- PostFix Mail Transfer Agent
- ProFTPd
- Proofpoint Enterprise Protection and Enterprise Privacy
- Radware DefensePro
- Raz-Lee iSecurity
- Redback ASE
- RSA Authentication Manager
- SafeNet DataSecure
- Samhain Labs
- Sentrigo Hedgehog
- Secure Computing Sidewinder
- SolarWinds Orion
- SonicWALL
- Sophos
- Sourcefire
- Splunk
- Squid Web Proxy
- Starent Networks
- STEALTHbits StealthINTERCEPT
- Stonesoft Management Center
- Sun Solaris
- Sybase ASE
- Symantec
- Symark
- ThreatGRID Malware Threat Intelligence Platform
- Tipping Point
- Top Layer IPS
- Trend Micro
- Tripwire
- Tropos Control
- Trusteer Apex Local Event Aggregator
- Universal DSM
- Universal LEEF
- Venustech Venusense
- Verdasys Digital Guardian
- Vericept Content 360 DSM
- VMWare
- Vormetric Data Security
- Websense V-Series
- Zscaler Nanolog Streaming Service
- Supported DSMs
- Index

Juniper Networks, Inc.
1194 North Mathilda Avenue
Sunnyvale, CA 94089
USA
408-745-2000
www.juniper.net
Published: 2014-11-27
Juniper Secure Analytics
Configuring DSMs
Release 2014.1

2
Copyright Notice
Copyright © 2014 Juniper Networks, Inc. All rights reserved.
Juniper Networks, Junos, Steel-Belted Radius, NetScreen, and ScreenOS are registered trademarks of Juniper Networks, Inc. in the United States and
other countries. The Juniper Networks Logo, the Junos logo, and JunosE are trademarks of Juniper Networks, Inc. All other trademarks, service marks,
registered trademarks, or registered service marks are the property of their respective owners.
Juniper Networks assumes no responsibility for any inaccuracies in this document. Juniper Networks reserves the right to change, modify, transfer, or
otherwise revise this publication without notice.
The following terms are trademarks or registered trademarks of other companies:
JavaTM and all Java-based trademarks and logos are trademarks or registered trademarks of Oracle and/or its affiliates.
FCC Statement
The following information is for FCC compliance of Class A devices: This equipment has been tested and found to comply with the limits for a Class A
digital device, pursuant to part 15 of the FCC rules. These limits are designed to provide reasonable protection against harmful interference when the
equipment is operated in a commercial environment. The equipment generates, uses, and can radiate radio-frequency energy and, if not installed and
used in accordance with the instruction manual, may cause harmful interference to radio communications. Operation of this equipment in a residential
area is likely to cause harmful interference, in which case users will be required to correct the interference at their own expense. The following
information is for FCC compliance of Class B devices: The equipment described in this manual generates and may radiate radio-frequency energy. If it
is not installed in accordance with Juniper Networks’ installation instructions, it may cause interference with radio and television reception. This
equipment has been tested and found to comply with the limits for a Class B digital device in accordance with the specifications in part 15 of the FCC
rules. These specifications are designed to provide reasonable protection against such interference in a residential installation. However, there is no
guarantee that interference will not occur in a particular installation. If this equipment does cause harmful interference to radio or television reception,
which can be determined by turning the equipment off and on, the user is encouraged to try to correct the interference by one or more of the following
measures: Reorient or relocate the receiving antenna. Increase the separation between the equipment and receiver. Consult the dealer or an
experienced radio/TV technician for help. Connect the equipment to an outlet on a circuit different from that to which the receiver is connected.
Caution: Changes or modifications to this product could void the user's warranty and authority to operate this device.
Disclaimer
THE SOFTWARE LICENSE AND LIMITED WARRANTY FOR THE ACCOMPANYING PRODUCT, SUBJECT TO THE MODIFICTAIONS SET FORTH
BELOW ON THIS PAGE, ARE SET FORTH IN THE INFORMATION PACKET THAT SHIPPED WITH THE PRODUCT AND ARE INCORPORATED
HEREIN BY THIS REFERENCE. IF YOU ARE UNABLE TO LOCATE THE SOFTWARE LICENSE OR LIMITED WARRANTY, CONTACT YOUR
JUNIPER NETWORKS REPRESENTATIVE FOR A COPY.
Juniper Secure Analytics Configuring DSMs
Release 2014.1
Copyright © 2014, Juniper Networks, Inc.
All rights reserved. Printed in USA.
Revision History
November 2014—Juniper Secure Analytics Configuring DSMs
The information in this document is current as of the date listed in the revision history.
END USER LICENSE AGREEMENT
The Juniper Networks product that is the subject of this technical documentation consists of (or is intended for use with) Juniper Networks software. Use
of such software is subject to the terms and conditions of the End User License Agreement (“EULA”) posted at http://www.juniper.net/support/eula.html,
as modified by the following text, which shall be treated under the EULA as an Entitlement Document taking precedence over any conflicting provisions
of such EULA as regards such software:
As regards software accompanying the STRM products (the “Program”), such software contains software licensed by Q1Labs and is further
accompanied by third-party software that is described in the applicable documentation or materials provided by Juniper Networks.

CONTENTS
ABOUT THIS GUIDE
Audience . . . . . . . . . . . . . . . . . . . . . . . . . . . . . . . . . . . . . . . . . . . . . . . . . . . . . . . . . . 15
Documentation Conventions . . . . . . . . . . . . . . . . . . . . . . . . . . . . . . . . . . . . . . . . . . . 15
Technical Documentation. . . . . . . . . . . . . . . . . . . . . . . . . . . . . . . . . . . . . . . . . . . . . . 15
Requesting Technical Support . . . . . . . . . . . . . . . . . . . . . . . . . . . . . . . . . . . . . . . . . . 16
1OVERVIEW
2INSTALLING DSMS
Scheduling Automatic Updates . . . . . . . . . . . . . . . . . . . . . . . . . . . . . . . . . . . . . . . . . 21
Viewing Updates . . . . . . . . . . . . . . . . . . . . . . . . . . . . . . . . . . . . . . . . . . . . . . . . . . . . 22
Manually Installing a DSM . . . . . . . . . . . . . . . . . . . . . . . . . . . . . . . . . . . . . . . . . . . . . 24
33COM 8800 SERIES SWITCH
4AMBIRON TRUSTWAVE IPANGEL
5APACHE HTTP SERVER
Configuring Apache HTTP Server with Syslog . . . . . . . . . . . . . . . . . . . . . . . . . . . . . 31
Configuring Apache HTTP Server with Syslog-ng . . . . . . . . . . . . . . . . . . . . . . . . . . . 33
6APC UPS
7AMAZON AWS CLOUDTRAIL
AWS CloudTrail DSM Integration Process. . . . . . . . . . . . . . . . . . . . . . . . . . . . . . . . . 40
Enabling Communication between JSA and AWS CloudTrail . . . . . . . . . . . . . . . . . . 40
Configuring an Amazon AWS CloudTrail Log Source in JSA . . . . . . . . . . . . . . . . . . 40

7APPLE MAC OS X
8APPLICATION SECURITY DBPROTECT
9ARBOR NETWORKS PEAKFLOW
10 ARBOR NETWORKS PRAVAIL
Arbor Networks Pravail DSM Integration Process . . . . . . . . . . . . . . . . . . . . . . . . . . .54
Configuring your Arbor Networks Pravail system for Communication with JSA. . . . .54
Configuring an Arbor Networks Pravail Log Source in Configuring DSMs. . . . . . . . .55
10 ARPEGGIO SIFT-IT
11 ARRAY NETWORKS SSL VPN
12 ARUBA MOBILITY CONTROLLERS
13 AVAYA VPN GATEWAY
Avaya VPN Gateway DSM Integration Process . . . . . . . . . . . . . . . . . . . . . . . . . . . . .66
Configuring your Avaya VPN Gateway System for Communication with JSA . . . . . .66
Configuring an Avaya VPN Gateway Log Source in JSA. . . . . . . . . . . . . . . . . . . . . .67
13 BALABIT IT SECURITY
Configuring BalaBIt IT Security for Microsoft Windows Events . . . . . . . . . . . . . . . . .69
Configuring BalaBit IT Security for Microsoft ISA or TMG Events . . . . . . . . . . . . . . .73
14 BARRACUDA
Barracuda Spam & Virus Firewall. . . . . . . . . . . . . . . . . . . . . . . . . . . . . . . . . . . . . . . .79
Barracuda Web Application Firewall. . . . . . . . . . . . . . . . . . . . . . . . . . . . . . . . . . . . . .80
Barracuda Web Filter . . . . . . . . . . . . . . . . . . . . . . . . . . . . . . . . . . . . . . . . . . . . . . . . .82
15 BIT9 PARITY
16 BLUECAT NETWORKS ADONIS
17 BLUE COAT SG
Creating a Custom Event Format . . . . . . . . . . . . . . . . . . . . . . . . . . . . . . . . . . . . . . . .92
Retrieving Blue Coat Events. . . . . . . . . . . . . . . . . . . . . . . . . . . . . . . . . . . . . . . . . . . .93
Creating Additional Custom Format Key-Value Pairs. . . . . . . . . . . . . . . . . . . . . . . . .99

18 BRIDGEWATER
19 BROCADE FABRIC OS
20 CA TECHNOLOGIES
CA ACF2 . . . . . . . . . . . . . . . . . . . . . . . . . . . . . . . . . . . . . . . . . . . . . . . . . . . . . . . . . 105
CA SiteMinder . . . . . . . . . . . . . . . . . . . . . . . . . . . . . . . . . . . . . . . . . . . . . . . . . . . . . 118
CA Top Secret . . . . . . . . . . . . . . . . . . . . . . . . . . . . . . . . . . . . . . . . . . . . . . . . . . . . . 121
21 CHECK POINT
Check Point FireWall-1 . . . . . . . . . . . . . . . . . . . . . . . . . . . . . . . . . . . . . . . . . . . . . . 135
Check Point Provider-1 . . . . . . . . . . . . . . . . . . . . . . . . . . . . . . . . . . . . . . . . . . . . . . 143
22 CILASOFT QJRN/400
23 CISCO
Cisco ACE Firewall . . . . . . . . . . . . . . . . . . . . . . . . . . . . . . . . . . . . . . . . . . . . . . . . . 153
Cisco Aironet . . . . . . . . . . . . . . . . . . . . . . . . . . . . . . . . . . . . . . . . . . . . . . . . . . . . . . 155
Cisco ACS . . . . . . . . . . . . . . . . . . . . . . . . . . . . . . . . . . . . . . . . . . . . . . . . . . . . . . . . 157
Cisco ASA . . . . . . . . . . . . . . . . . . . . . . . . . . . . . . . . . . . . . . . . . . . . . . . . . . . . . . . . 161
Cisco CallManager. . . . . . . . . . . . . . . . . . . . . . . . . . . . . . . . . . . . . . . . . . . . . . . . . . 166
Cisco CatOS for Catalyst Switches . . . . . . . . . . . . . . . . . . . . . . . . . . . . . . . . . . . . . 167
Cisco CSA . . . . . . . . . . . . . . . . . . . . . . . . . . . . . . . . . . . . . . . . . . . . . . . . . . . . . . . . 169
Cisco FWSM . . . . . . . . . . . . . . . . . . . . . . . . . . . . . . . . . . . . . . . . . . . . . . . . . . . . . . 170
Cisco IDS/IPS . . . . . . . . . . . . . . . . . . . . . . . . . . . . . . . . . . . . . . . . . . . . . . . . . . . . . 172
Cisco IronPort . . . . . . . . . . . . . . . . . . . . . . . . . . . . . . . . . . . . . . . . . . . . . . . . . . . . . 174
Cisco NAC . . . . . . . . . . . . . . . . . . . . . . . . . . . . . . . . . . . . . . . . . . . . . . . . . . . . . . . . 176
Cisco Nexus. . . . . . . . . . . . . . . . . . . . . . . . . . . . . . . . . . . . . . . . . . . . . . . . . . . . . . . 177
Cisco IOS. . . . . . . . . . . . . . . . . . . . . . . . . . . . . . . . . . . . . . . . . . . . . . . . . . . . . . . . . 179
Cisco Pix . . . . . . . . . . . . . . . . . . . . . . . . . . . . . . . . . . . . . . . . . . . . . . . . . . . . . . . . . 181
Cisco VPN 3000 Concentrator. . . . . . . . . . . . . . . . . . . . . . . . . . . . . . . . . . . . . . . . . 182
Cisco Wireless Services Module . . . . . . . . . . . . . . . . . . . . . . . . . . . . . . . . . . . . . . . 183
Cisco Wireless LAN Controllers. . . . . . . . . . . . . . . . . . . . . . . . . . . . . . . . . . . . . . . . 186
Cisco Identity Services Engine . . . . . . . . . . . . . . . . . . . . . . . . . . . . . . . . . . . . . . . . 191
24 CITRIX
Citrix NetScaler . . . . . . . . . . . . . . . . . . . . . . . . . . . . . . . . . . . . . . . . . . . . . . . . . . . . 195
Citrix Access Gateway . . . . . . . . . . . . . . . . . . . . . . . . . . . . . . . . . . . . . . . . . . . . . . . 197

25 CRYPTOCARD CRYPTO-SHIELD
26 CYBER-ARK VAULT
27 CYBERGUARD FIREWALL/VPN APPLIANCE
28 DAMBALLA FAILSAFE
29 DIGITAL CHINA NETWORKS (DCN)
30 ENTERASYS
Enterasys Dragon. . . . . . . . . . . . . . . . . . . . . . . . . . . . . . . . . . . . . . . . . . . . . . . . . . .211
Enterasys HiGuard Wireless IPS . . . . . . . . . . . . . . . . . . . . . . . . . . . . . . . . . . . . . . .218
Enterasys HiPath Wireless Controller . . . . . . . . . . . . . . . . . . . . . . . . . . . . . . . . . . .220
Enterasys Stackable and Standalone Switches . . . . . . . . . . . . . . . . . . . . . . . . . . . .221
Enterasys XSR Security Router . . . . . . . . . . . . . . . . . . . . . . . . . . . . . . . . . . . . . . . .222
Enterasys Matrix Router . . . . . . . . . . . . . . . . . . . . . . . . . . . . . . . . . . . . . . . . . . . . . .223
Enterasys NetSight Automatic Security Manager. . . . . . . . . . . . . . . . . . . . . . . . . . .224
Enterasys Matrix K/N/S Series Switch . . . . . . . . . . . . . . . . . . . . . . . . . . . . . . . . . . .225
Enterasys NAC. . . . . . . . . . . . . . . . . . . . . . . . . . . . . . . . . . . . . . . . . . . . . . . . . . . . .226
Enterasys 800-Series Switch . . . . . . . . . . . . . . . . . . . . . . . . . . . . . . . . . . . . . . . . . .227
31 EXTREME NETWORKS EXTREMEWARE
32 F5 NETWORKS
F5 Networks BIG-IP AFM. . . . . . . . . . . . . . . . . . . . . . . . . . . . . . . . . . . . . . . . . . . . .231
F5 Networks BIG-IP APM. . . . . . . . . . . . . . . . . . . . . . . . . . . . . . . . . . . . . . . . . . . . .236
F5 Networks BIG-IP ASM. . . . . . . . . . . . . . . . . . . . . . . . . . . . . . . . . . . . . . . . . . . . .237
F5 Networks BIG-IP LTM . . . . . . . . . . . . . . . . . . . . . . . . . . . . . . . . . . . . . . . . . . . . .239
F5 Networks FirePass . . . . . . . . . . . . . . . . . . . . . . . . . . . . . . . . . . . . . . . . . . . . . . .241
33 FAIR WARNING
34 FIDELIS XPS
35 FIREEYE
36 FORESCOUT COUNTERACT
37 FORTINET FORTIGATE
Fortinet FortiGate DSM Integration Process . . . . . . . . . . . . . . . . . . . . . . . . . . . . . .257

Configuring a Fortinet FortiGate Log Source . . . . . . . . . . . . . . . . . . . . . . . . . . . . . . 258
38 FOUNDRY FASTIRON
39 GENERIC FIREWALL
40 GENERIC AUTHORIZATION SERVER
41 GREAT BAY BEACON
42 HBGARY ACTIVE DEFENSE
43 HONEYCOMB LEXICON FILE INTEGRITY MONITOR (FIM)
44 HP
HP ProCurve . . . . . . . . . . . . . . . . . . . . . . . . . . . . . . . . . . . . . . . . . . . . . . . . . . . . . . 277
HP Tandem . . . . . . . . . . . . . . . . . . . . . . . . . . . . . . . . . . . . . . . . . . . . . . . . . . . . . . . 278
Hewlett Packard UNIX (HP-UX). . . . . . . . . . . . . . . . . . . . . . . . . . . . . . . . . . . . . . . . 279
45 HUAWEI
Huawei AR Series Router . . . . . . . . . . . . . . . . . . . . . . . . . . . . . . . . . . . . . . . . . . . . 281
Huawei S Series Switch. . . . . . . . . . . . . . . . . . . . . . . . . . . . . . . . . . . . . . . . . . . . . . 283
46 IBM
IBM AIX . . . . . . . . . . . . . . . . . . . . . . . . . . . . . . . . . . . . . . . . . . . . . . . . . . . . . . . . . . 288
IBM AS/400 iSeries . . . . . . . . . . . . . . . . . . . . . . . . . . . . . . . . . . . . . . . . . . . . . . . . . 299
IBM CICS . . . . . . . . . . . . . . . . . . . . . . . . . . . . . . . . . . . . . . . . . . . . . . . . . . . . . . . . . 302
IBM Lotus Domino . . . . . . . . . . . . . . . . . . . . . . . . . . . . . . . . . . . . . . . . . . . . . . . . . . 306
IBM Proventia Management SiteProtector. . . . . . . . . . . . . . . . . . . . . . . . . . . . . . . . 309
IBM ISS Proventia . . . . . . . . . . . . . . . . . . . . . . . . . . . . . . . . . . . . . . . . . . . . . . . . . . 313
IBM RACF . . . . . . . . . . . . . . . . . . . . . . . . . . . . . . . . . . . . . . . . . . . . . . . . . . . . . . . . 314
IBM DB2. . . . . . . . . . . . . . . . . . . . . . . . . . . . . . . . . . . . . . . . . . . . . . . . . . . . . . . . . . 326
IBM WebSphere Application Server. . . . . . . . . . . . . . . . . . . . . . . . . . . . . . . . . . . . . 336
IBM Informix Audit . . . . . . . . . . . . . . . . . . . . . . . . . . . . . . . . . . . . . . . . . . . . . . . . . . 341
IBM IMS . . . . . . . . . . . . . . . . . . . . . . . . . . . . . . . . . . . . . . . . . . . . . . . . . . . . . . . . . . 342
IBM Guardium . . . . . . . . . . . . . . . . . . . . . . . . . . . . . . . . . . . . . . . . . . . . . . . . . . . . . 348
IBM Security Directory Server . . . . . . . . . . . . . . . . . . . . . . . . . . . . . . . . . . . . . . . . . 354
IBM Tivoli Access Manager for E-business . . . . . . . . . . . . . . . . . . . . . . . . . . . . . . . 356
IBM z/Secure Audit . . . . . . . . . . . . . . . . . . . . . . . . . . . . . . . . . . . . . . . . . . . . . . . . . 358
IBM Tivoli Endpoint Manager . . . . . . . . . . . . . . . . . . . . . . . . . . . . . . . . . . . . . . . . . . 363
IBM zSecure Alert . . . . . . . . . . . . . . . . . . . . . . . . . . . . . . . . . . . . . . . . . . . . . . . . . . 364
IBM Security Network Protection (XGS) . . . . . . . . . . . . . . . . . . . . . . . . . . . . . . . . . 365
IBM Security Network IPS . . . . . . . . . . . . . . . . . . . . . . . . . . . . . . . . . . . . . . . . . . . . 368

47 ISC BIND
48 IMPERVA SECURESPHERE
49 INFOBLOX NIOS
50 IT-CUBE AGILESI
51 ITRON SMART METER
52 JUNIPER NETWORKS
Juniper Networks AVT . . . . . . . . . . . . . . . . . . . . . . . . . . . . . . . . . . . . . . . . . . . . . . .389
Juniper DDoS Secure. . . . . . . . . . . . . . . . . . . . . . . . . . . . . . . . . . . . . . . . . . . . . . . .391
Juniper DX Application Acceleration Platform . . . . . . . . . . . . . . . . . . . . . . . . . . . . .391
Juniper EX Series Ethernet Switch. . . . . . . . . . . . . . . . . . . . . . . . . . . . . . . . . . . . . .392
Juniper IDP. . . . . . . . . . . . . . . . . . . . . . . . . . . . . . . . . . . . . . . . . . . . . . . . . . . . . . . .394
Juniper Networks Secure Access. . . . . . . . . . . . . . . . . . . . . . . . . . . . . . . . . . . . . . .395
Juniper Infranet Controller . . . . . . . . . . . . . . . . . . . . . . . . . . . . . . . . . . . . . . . . . . . .398
Juniper Networks Firewall and VPN . . . . . . . . . . . . . . . . . . . . . . . . . . . . . . . . . . . . .399
Juniper Networks Network and Security Manager . . . . . . . . . . . . . . . . . . . . . . . . . .399
Juniper Junos OS. . . . . . . . . . . . . . . . . . . . . . . . . . . . . . . . . . . . . . . . . . . . . . . . . . .401
Juniper Steel-Belted Radius . . . . . . . . . . . . . . . . . . . . . . . . . . . . . . . . . . . . . . . . . . .404
Juniper Networks vGW Virtual Gateway . . . . . . . . . . . . . . . . . . . . . . . . . . . . . . . . .406
Juniper Security Binary Log Collector . . . . . . . . . . . . . . . . . . . . . . . . . . . . . . . . . . .408
Juniper Junos WebApp Secure . . . . . . . . . . . . . . . . . . . . . . . . . . . . . . . . . . . . . . . .411
Juniper Networks WLC Series Wireless LAN Controller . . . . . . . . . . . . . . . . . . . . .414
53 KASPERSKY SECURITY CENTER
54 LIEBERMAN RANDOM PASSWORD MANAGER
55 LINUX
Linux DHCP . . . . . . . . . . . . . . . . . . . . . . . . . . . . . . . . . . . . . . . . . . . . . . . . . . . . . . .427
Linux IPtables. . . . . . . . . . . . . . . . . . . . . . . . . . . . . . . . . . . . . . . . . . . . . . . . . . . . . .428
Linux OS. . . . . . . . . . . . . . . . . . . . . . . . . . . . . . . . . . . . . . . . . . . . . . . . . . . . . . . . . .430
56 MCAFEE
McAfee Intrushield . . . . . . . . . . . . . . . . . . . . . . . . . . . . . . . . . . . . . . . . . . . . . . . . . .435
McAfee ePolicy Orchestrator . . . . . . . . . . . . . . . . . . . . . . . . . . . . . . . . . . . . . . . . . .440
McAfee Application / Change Control. . . . . . . . . . . . . . . . . . . . . . . . . . . . . . . . . . . .449
McAfee Web Gateway . . . . . . . . . . . . . . . . . . . . . . . . . . . . . . . . . . . . . . . . . . . . . . .452
McAfee Web Gateway DSM Integration Process. . . . . . . . . . . . . . . . . . . . . . . . . . .455

57 METAINFO METAIP
58 MICROSOFT
Microsoft Exchange Server . . . . . . . . . . . . . . . . . . . . . . . . . . . . . . . . . . . . . . . . . . . 459
Microsoft IAS Server . . . . . . . . . . . . . . . . . . . . . . . . . . . . . . . . . . . . . . . . . . . . . . . . 466
Microsoft DHCP Server . . . . . . . . . . . . . . . . . . . . . . . . . . . . . . . . . . . . . . . . . . . . . . 466
Microsoft IIS Server . . . . . . . . . . . . . . . . . . . . . . . . . . . . . . . . . . . . . . . . . . . . . . . . . 467
Microsoft ISA . . . . . . . . . . . . . . . . . . . . . . . . . . . . . . . . . . . . . . . . . . . . . . . . . . . . . . 473
Microsoft Hyper-V . . . . . . . . . . . . . . . . . . . . . . . . . . . . . . . . . . . . . . . . . . . . . . . . . . 474
Microsoft SQL Server. . . . . . . . . . . . . . . . . . . . . . . . . . . . . . . . . . . . . . . . . . . . . . . . 475
Microsoft SharePoint . . . . . . . . . . . . . . . . . . . . . . . . . . . . . . . . . . . . . . . . . . . . . . . . 480
Microsoft Windows Security Event Log . . . . . . . . . . . . . . . . . . . . . . . . . . . . . . . . . . 485
Microsoft Operations Manager. . . . . . . . . . . . . . . . . . . . . . . . . . . . . . . . . . . . . . . . . 487
Microsoft System Center Operations Manager . . . . . . . . . . . . . . . . . . . . . . . . . . . . 490
Microsoft Endpoint Protection . . . . . . . . . . . . . . . . . . . . . . . . . . . . . . . . . . . . . . . . . 493
59 MOTOROLA SYMBOL AP
60 NETAPP DATA ONTAP
61 NAME VALUE PAIR
NVP Log Format . . . . . . . . . . . . . . . . . . . . . . . . . . . . . . . . . . . . . . . . . . . . . . . . . . . 503
Examples . . . . . . . . . . . . . . . . . . . . . . . . . . . . . . . . . . . . . . . . . . . . . . . . . . . . . . . . . 505
62 NIKSUN
63 NOKIA FIREWALL
Integrating with a Nokia Firewall Using Syslog . . . . . . . . . . . . . . . . . . . . . . . . . . . . 509
Integrating With a Nokia Firewall Using OPSEC . . . . . . . . . . . . . . . . . . . . . . . . . . . 512
64 NOMINUM VANTIO
65 NORTEL NETWORKS
Nortel Multiprotocol Router . . . . . . . . . . . . . . . . . . . . . . . . . . . . . . . . . . . . . . . . . . . 517
Nortel Application Switch . . . . . . . . . . . . . . . . . . . . . . . . . . . . . . . . . . . . . . . . . . . . . 520
Nortel Contivity. . . . . . . . . . . . . . . . . . . . . . . . . . . . . . . . . . . . . . . . . . . . . . . . . . . . . 521
Nortel Ethernet Routing Switch 2500/4500/5500. . . . . . . . . . . . . . . . . . . . . . . . . . . 521
Nortel Ethernet Routing Switch 8300/8600 . . . . . . . . . . . . . . . . . . . . . . . . . . . . . . . 522
Nortel Secure Router . . . . . . . . . . . . . . . . . . . . . . . . . . . . . . . . . . . . . . . . . . . . . . . . 524
Nortel Secure Network Access Switch. . . . . . . . . . . . . . . . . . . . . . . . . . . . . . . . . . . 525
Nortel Switched Firewall 5100 . . . . . . . . . . . . . . . . . . . . . . . . . . . . . . . . . . . . . . . . . 526
Nortel Switched Firewall 6000 . . . . . . . . . . . . . . . . . . . . . . . . . . . . . . . . . . . . . . . . . 528
Nortel Threat Protection System . . . . . . . . . . . . . . . . . . . . . . . . . . . . . . . . . . . . . . . 530

Nortel VPN Gateway . . . . . . . . . . . . . . . . . . . . . . . . . . . . . . . . . . . . . . . . . . . . . . . .531
66 NOVELL EDIRECTORY
67 OBSERVEIT
68 OPENBSD
69 OPEN LDAP
70 OPEN SOURCE SNORT
71 ORACLE
Oracle Audit Records . . . . . . . . . . . . . . . . . . . . . . . . . . . . . . . . . . . . . . . . . . . . . . . .555
Oracle DB Listener . . . . . . . . . . . . . . . . . . . . . . . . . . . . . . . . . . . . . . . . . . . . . . . . . .559
Oracle Audit Vault. . . . . . . . . . . . . . . . . . . . . . . . . . . . . . . . . . . . . . . . . . . . . . . . . . .563
Oracle OS Audit . . . . . . . . . . . . . . . . . . . . . . . . . . . . . . . . . . . . . . . . . . . . . . . . . . . .564
Oracle BEA WebLogic . . . . . . . . . . . . . . . . . . . . . . . . . . . . . . . . . . . . . . . . . . . . . . .566
Oracle Acme Packet Session Border Controller. . . . . . . . . . . . . . . . . . . . . . . . . . . .571
Oracle Fine Grained Auditing . . . . . . . . . . . . . . . . . . . . . . . . . . . . . . . . . . . . . . . . . .574

72 OSSEC
73 PALO ALTO NETWORKS
74 PIREAN ACCESS: ONE
75 POSTFIX MAIL TRANSFER AGENT
76 PROFTPD
77 PROOFPOINT ENTERPRISE PROTECTION AND ENTERPRISE PRIVACY
78 RADWARE DEFENSEPRO
79 RAZ-LEE ISECURITY
80 REDBACK ASE
81 RSA AUTHENTICATION MANAGER
Configuring Syslog for RSA . . . . . . . . . . . . . . . . . . . . . . . . . . . . . . . . . . . . . . . . . . . 607
Configuring the Log File Protocol for RSA . . . . . . . . . . . . . . . . . . . . . . . . . . . . . . . . 609
82 SAFENET DATASECURE
83 SAMHAIN LABS
Configuring Syslog to Collect Samhain Events . . . . . . . . . . . . . . . . . . . . . . . . . . . . 615
Configuring JDBC to Collect Samhain Events . . . . . . . . . . . . . . . . . . . . . . . . . . . . . 616
84 SENTRIGO HEDGEHOG
85 SECURE COMPUTING SIDEWINDER
86 SOLARWINDS ORION
87 SONICWALL
88 SOPHOS
Sophos Enterprise Console . . . . . . . . . . . . . . . . . . . . . . . . . . . . . . . . . . . . . . . . . . . 627
Sophos PureMessage . . . . . . . . . . . . . . . . . . . . . . . . . . . . . . . . . . . . . . . . . . . . . . . 634

Sophos Astaro Security Gateway. . . . . . . . . . . . . . . . . . . . . . . . . . . . . . . . . . . . . . .641
Sophos Web Security Appliance . . . . . . . . . . . . . . . . . . . . . . . . . . . . . . . . . . . . . . .642
89 SOURCEFIRE
Sourcefire Defense Center (DC) . . . . . . . . . . . . . . . . . . . . . . . . . . . . . . . . . . . . . . .643
Sourcefire Intrusion Sensor . . . . . . . . . . . . . . . . . . . . . . . . . . . . . . . . . . . . . . . . . . .649
90 SPLUNK
Collect Windows Events Forwarded from Splunk Appliances . . . . . . . . . . . . . . . . .651
91 SQUID WEB PROXY
92 STARENT NETWORKS
93 STEALTHBITS STEALTHINTERCEPT
STEALTHbits StealthINTERCEPT DSM Integration Process. . . . . . . . . . . . . . . . . .663
Configuring your STEALTHbits StealthINTERCEPT System for Communication with
JSA. . . . . . . . . . . . . . . . . . . . . . . . . . . . . . . . . . . . . . . . . . . . . . . . . . . . . . . . . . . . . .664
Configuring a STEALTHbits StealthINTERCEPT Log Source in JSA . . . . . . . . . . .665
94 STONESOFT MANAGEMENT CENTER
95 SUN SOLARIS
Sun Solaris . . . . . . . . . . . . . . . . . . . . . . . . . . . . . . . . . . . . . . . . . . . . . . . . . . . . . . . .671
Sun Solaris DHCP . . . . . . . . . . . . . . . . . . . . . . . . . . . . . . . . . . . . . . . . . . . . . . . . . .672
Sun Solaris Sendmail . . . . . . . . . . . . . . . . . . . . . . . . . . . . . . . . . . . . . . . . . . . . . . . .674
Sun Solaris Basic Security Mode (BSM) . . . . . . . . . . . . . . . . . . . . . . . . . . . . . . . . .675
Sun ONE LDAP . . . . . . . . . . . . . . . . . . . . . . . . . . . . . . . . . . . . . . . . . . . . . . . . . . . .680
96 SYBASE ASE
97 SYMANTEC
Symantec Endpoint Protection . . . . . . . . . . . . . . . . . . . . . . . . . . . . . . . . . . . . . . . . .687
Symantec SGS . . . . . . . . . . . . . . . . . . . . . . . . . . . . . . . . . . . . . . . . . . . . . . . . . . . . .688
Symantec System Center. . . . . . . . . . . . . . . . . . . . . . . . . . . . . . . . . . . . . . . . . . . . .688
Symantec Data Loss Prevention (DLP) . . . . . . . . . . . . . . . . . . . . . . . . . . . . . . . . . .692
Symantec PGP Universal Server . . . . . . . . . . . . . . . . . . . . . . . . . . . . . . . . . . . . . . .696

98 SYMARK
99 THREATGRID MALWARE THREAT INTELLIGENCE PLATFORM
100 TIPPING POINT
Tipping Point Intrusion Prevention System . . . . . . . . . . . . . . . . . . . . . . . . . . . . . . . 709
Tipping Point X505/X506 Device . . . . . . . . . . . . . . . . . . . . . . . . . . . . . . . . . . . . . . . 712
101 TOP LAYER IPS
102 TREND MICRO
Trend Micro InterScan VirusWall . . . . . . . . . . . . . . . . . . . . . . . . . . . . . . . . . . . . . . . 715
Trend Micro Control Manager . . . . . . . . . . . . . . . . . . . . . . . . . . . . . . . . . . . . . . . . . 716
Trend Micro Office Scan . . . . . . . . . . . . . . . . . . . . . . . . . . . . . . . . . . . . . . . . . . . . . 717
Trend Micro Deep Discovery . . . . . . . . . . . . . . . . . . . . . . . . . . . . . . . . . . . . . . . . . . 721
103 TRIPWIRE
104 TROPOS CONTROL
105 TRUSTEER APEX LOCAL EVENT AGGREGATOR
106 UNIVERSAL DSM
107 UNIVERSAL LEEF
Configuring a Universal LEEF Log Source . . . . . . . . . . . . . . . . . . . . . . . . . . . . . . . 733
Forwarding Events to JSA . . . . . . . . . . . . . . . . . . . . . . . . . . . . . . . . . . . . . . . . . . . . 737
Creating a Universal LEEF Event Map . . . . . . . . . . . . . . . . . . . . . . . . . . . . . . . . . . 737
108 VENUSTECH VENUSENSE
109 VERDASYS DIGITAL GUARDIAN
110 VERICEPT CONTENT 360 DSM
111 VMWARE
VMware ESX and ESXi . . . . . . . . . . . . . . . . . . . . . . . . . . . . . . . . . . . . . . . . . . . . . . 751
VMware vCenter . . . . . . . . . . . . . . . . . . . . . . . . . . . . . . . . . . . . . . . . . . . . . . . . . . . 756
VMware vCloud Director . . . . . . . . . . . . . . . . . . . . . . . . . . . . . . . . . . . . . . . . . . . . . 757
VMware vShield . . . . . . . . . . . . . . . . . . . . . . . . . . . . . . . . . . . . . . . . . . . . . . . . . . . . 760

112 VORMETRIC DATA SECURITY
Vormetric Data Security DSM Integration Process. . . . . . . . . . . . . . . . . . . . . . . . . .763
Configuring your Vormetric Data Security Systems for Communication with JSA . .764
Configuring a Vormetric Data Security Log Source in JSA. . . . . . . . . . . . . . . . . . . .766
113 WEBSENSE V-SERIES
Websense TRITON . . . . . . . . . . . . . . . . . . . . . . . . . . . . . . . . . . . . . . . . . . . . . . . . .767
Websense V-Series Data Security Suite . . . . . . . . . . . . . . . . . . . . . . . . . . . . . . . . .769
Websense V-Series Content Gateway . . . . . . . . . . . . . . . . . . . . . . . . . . . . . . . . . . .771
114 ZSCALER NANOLOG STREAMING SERVICE
115 SUPPORTED DSMS
INDEX
Configuring DSMs
ABOUT THIS GUIDE
The Juniper Secure Analytics Configuring DSMs guide provides you with
information for configuring Device Support Modules (DSMs).
DSMs allow Juniper Secure Analytics (JSA) to integrate events from security
appliances, software, and devices in your network that forward events to JSA or
Log Analytics. All references to JSA or JSA is intended to refer both the JSA and
Log Analytics product.
Audience This guide is intended for the system administrator responsible for setting up event
collection for JSA in your network.
This guide assumes that you have administrative access and a knowledge of your
corporate network and networking technologies.
Documentation
Conventions
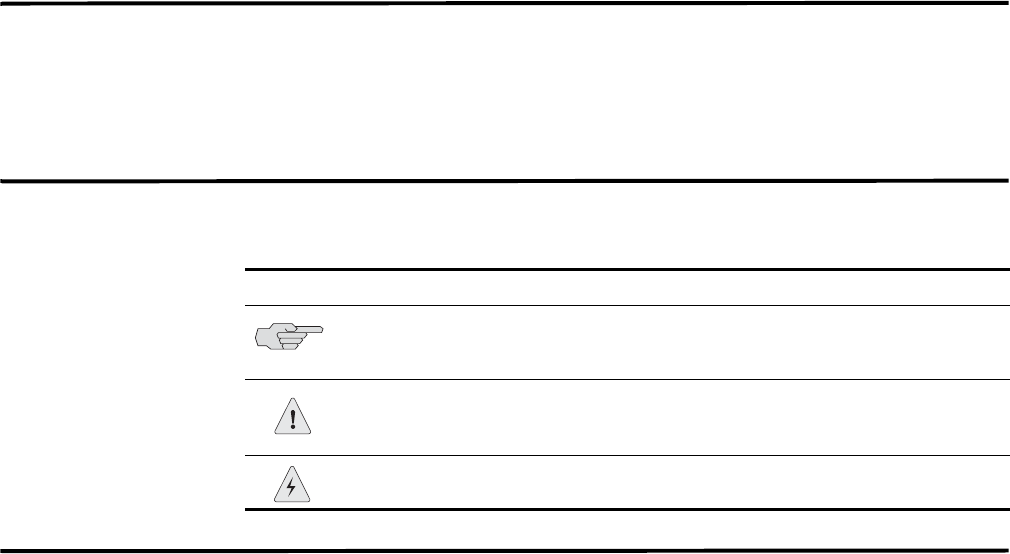
Table 2-1 lists conventions that are used throughout this guide.
Technical
Documentation
You can access technical documentation, technical notes, and release notes
directly from the Juniper Customer Support website at
https://www.juniper.net/support/. Once you access the Juniper Customer Support
Table 2-1 Icons
Icon Type Description
Information note Information that describes important features or
instructions.
Caution Information that alerts you to potential loss of
data or potential damage to an application,
system, device, or network.
Warning Information that alerts you to potential personal
injury.

Configuring DSMs
16 ABOUT THIS GUIDE
website, locate the product and software release for which you require
documentation.
Your comments are important to us. Please send your e-mail comments about this
guide or any of the Juniper Networks documentation to:
techpubs-comments@juniper.net.
Include the following information with your comments:
•Document title
•Page number
Requesting
Technical Support
Technical product support is available through the Juniper Networks Technical
Assistance Center (JTAC). If you are a customer with an active J-Care or JNASC
support contract, or are covered under warranty, and need post-sales technical
support, you can access our tools and resources online or open a case with JTAC.
•JTAC policies—For a complete understanding of our JTAC procedures and
policies, review the JTAC User Guide located at
http://www.juniper.net/us/en/local/pdf/resource-guides/7100059-en.pdf .
•Product warranties—For product warranty information, visit
http://www.juniper.net/support/warranty/.
•JTAC Hours of Operation —The JTAC centers have resources available 24
hours a day, 7 days a week, 365 days a year.
Self-Help Online Tools and Resources
For quick and easy problem resolution, Juniper Networks has designed an online
self-service portal called the Customer Support Center (CSC) that provides you
with the following features:
•Find CSC offerings: http://www.juniper.net/customers/support/
•Find product documentation: http://www.juniper.net/techpubs/
•Find solutions and answer questions using our Knowledge Base:
http://kb.juniper.net/
•Download the latest versions of software and review release notes:
http://www.juniper.net/customers/csc/software/
•Search technical bulletins for relevant hardware and software notifications:
https://www.juniper.net/alerts/
•Join and participate in the Juniper Networks Community Forum:
http://www.juniper.net/company/communities/
•Open a case online in the CSC Case Management tool:
http://www.juniper.net/cm/
Configuring DSMs
Requesting Technical Support 17
To verify service entitlement by product serial number, use our Serial Number
Entitlement (SNE) Tool: https://tools.juniper.net/SerialNumberEntitlementSearch/
Opening a Case with JTAC
You can open a case with JTAC on the Web or by telephone.
•Use the Case Management tool in the CSC at http://www.juniper.net/cm/ .
•Call 1-888-314-JTAC (1-888-314-5822 toll-free in the USA, Canada, and
Mexico).
For international or direct-dial options in countries without toll-free numbers, visit
us at http://www.juniper.net/support/requesting-support.html.
Configuring DSMs
18 ABOUT THIS GUIDE

Configuring DSMs
1OVERVIEW
The DSM Configuration guide is intended to assist with device configurations for
systems, software, or appliances that provide events to Juniper Secure Analytics
(JSA).
Device Support Modules (DSMs) parse event information for JSA products to log
and correlate events received from external sources such as security equipment
(for example, firewalls), and network equipment (for example, switches and
routers).
Events forwarded from your log sources are displayed in the Log Activity tab. All
events are correlated and security and policy offenses are created based on
correlation rules. These offenses are displayed on the Offenses tab. For more
information, see the Juniper Secure Analytics Users Guide.
NOTE
Note: Information found in this documentation about configuring Device Support
Modules (DSMs) is based on the latest RPM files located on the Juniper Customer
Support website at http://www.juniper.net/customer/support/.
To configure JSA to receive events from devices, you must:
1 Configure the device to send events to JSA.
2 Configure log sources for JSA to receive events from specific devices. For more
information, see the Log Sources Users Guide.

Configuring DSMs
2INSTALLING DSMS
You can download and install weekly automatic software updates for DSMs,
protocols, and scanner modules.
After Device Support Modules (DSMs) are installed the Juniper Secure Analytics
(JSA) console provides any rpm file updates to managed hosts after the
configuration changes are deployed. If you are using high availability (HA), DSMs,
protocols, and scanners are installed during replication between the primary and
secondary host. During this installation process, the secondary displays the status
Upgrading. For more information, see Managing High Availability in the Juniper
Secure Analytics Administration Guide.
CAUTION
CAUTION: Uninstalling a Device Support Module (DSM) is not supported in JSA. If
you need technical assistance, contact Juniper Customer Support. For more
information, see Requesting Technical Support.
Scheduling
Automatic Updates
You can schedule when automatic updates are downloaded and installed on your
JSA console.
JSA performs automatic updates on a recurring schedule according to the settings
on the Update Configuration page; however, if you want to schedule an update or a
set of updates to run at a specific time, you can schedule an update using the
Schedule the Updates window. Scheduling your own automatic updates is useful
when you want to schedule a large update to run during off-peak hours, thus
reducing any performance impacts on your system.
If no updates are displayed in the Updates window, either your system has not
been in operation long enough to retrieve the weekly updates or no updates have
been issued. If this occurs, you can manually check for new updates
Procedure
Step 1 Click the Admin tab.
Step 2 On the navigation menu, click System Configuration.

Configuring DSMs
22 INSTALLING DSMS
Step 3 Click the Auto Update icon.
Step 4 Optional. If you want to schedule specific updates, select the updates you want to
schedule.
Step 5 From the Schedule list box, select the type of update you want to schedule.
Options include:
•All Updates
•Selected Updates
•DSM, Scanner, Protocol Updates
•Minor Updates
NOTE
Note: Protocol updates installed automatically require you to restart Tomcat. For
more information on manually restarting Tomcat, see the Log Sources Users
Guide.
Step 6 Using the calendar, select the start date and time of when you want to start your
scheduled updates.
Step 7 Click OK.
The selected updates are now scheduled.
Viewing Updates You can view or install any pending software updates for JSA through the Admin
tab.
Procedure
Step 1 Click the Admin tab.
Step 2 On the navigation menu, click System Configuration.
Step 3 Click the Auto Update icon.
The Updates window is displayed. The window automatically displays the Check
for Updates page, providing the following information:
Table 2-1 Check for Updates Window Parameters
Parameter Description
Updates were
installed
Specifies the date and time the last update was installed.
Next Update install
is scheduled
Specifies the date and time the next update is scheduled to be
installed. If there is no date and time indicated, the update is not
scheduled to run.
Name Specifies the name of the update.
Type Specifies the type of update. Types include:
•DSM, Scanner, Protocol Updates
•Minor Updates

Configuring DSMs
Viewing Updates 23
The Check for Updates page toolbar provides the following functions:
Step 4 To view details on an update, select the update.
The description and any error messages are displayed in the right pane of the
window.
Status Specifies the status of the update. Status types include:
•New - The update is not yet scheduled to be installed.
•Scheduled - The update is scheduled to be installed.
•Installing - The update is currently installing.
•Failed - The updated failed to install.
Date to Install Specifies the date on which this update is scheduled to be
installed.
Table 2-2 Auto Updates Toolbar
Function Description
Hide Select one or more updates, and then click Hide to remove the
selected updates from the Check for Updates page. You can
view and restore the hidden updates on the Restore Hidden
Updates page. For more information, see the Juniper Secure
Analytics Administrator Guide.
Install From this list box, you can manually install updates. When you
manually install updates, the installation process starts within a
minute.
Schedule From this list box, you can configure a specific date and time to
manually install selected updates on your console. This is useful
when you want to schedule the update installation during
off-peak hours.
Unschedule From this list box, you can remove preconfigured schedules for
manually installing updates on your console.
Search By Name In this text box, you can type a keyword and then press Enter to
locate a specific update by name.
Next Refresh This counter displays the amount of time until the next automatic
refresh. The list of updates on the Check for Updates page
automatically refreshes every 60 seconds. The timer is
automatically paused when you select one or more updates.
Pause Click this icon to pause the automatic refresh process. To
resume automatic refresh, click the Play icon.
Refresh Click this icon to manually refresh the list of updates.
Table 2-1 Check for Updates Window Parameters (continued)
Parameter Description
Configuring DSMs
24 INSTALLING DSMS
Manually Installing
a DSM
You can use the Juniper Customer Support website to download and manually
install the latest RPM files for JSA.
http://www.juniper.net/customer/support/
Most users do not need to download updated DSMs as auto updates installs the
latest rpm files on a weekly basis. If your system is restricted from the Internet, you
might need to install rpm updates manually. The DSMs provided on the Juniper
Customer Support website, or through auto updates contain improved event
parsing for network security products and enhancements for event categorization
in the JSA Identifier Map (QID map).
CAUTION
CAUTION: Uninstalling a Device Support Module (DSM) is not supported in JSA. If
you need technical assistance, contact Juniper Customer Support. For more
information, see Requesting Technical Support.
Installing a Single
DSM
The Juniper Customer Support website contain individual DSMs that you can
download and install using the command-line.
Procedure
Step 1 Download the DSM file to your system hosting JSA.
Step 2 Using SSH, log in to JSA as the root user.
Username: root
Password: <password>
Step 3 Navigate to the directory that includes the downloaded file.
Step 4 Type the following command:
rpm -Uvh <filename>
Where <filename> is the name of the downloaded file. For example:
rpm -Uvh DSM-CheckPointFirewall-7.0-209433.noarch.rpm
Step 5 Log in to JSA.
https://<IP Address>
Where <IP Address> is the IP address of the JSA console or Event Collector.
Step 6 On the Admin tab, click Deploy Changes.
The installation is complete.
Configuring DSMs
Manually Installing a DSM 25
Installing a DSM
Bundle
The Juniper Customer Support website contains a DSM bundle which is updated
daily with the latest DSM versions that you can install.
Procedure
Step 1 Download the DSM bundle to your system hosting JSA.
Step 2 Using SSH, log in to JSA as the root user.
Username: root
Password: <password>
Step 3 Navigate to the directory that includes the downloaded file.
Step 4 Type the following command to extract the DSM bundle:
tar -zxvf JSA_bundled-DSM-<version>.tar.gz
Where <version> is your release of JSA.
Step 5 Type the following command:
for FILE in *Common*.rpm DSM-*.rpm; do rpm -Uvh "$FILE"; done
The installation of the DSM bundle can take several minutes to complete.
Step 6 Log in to JSA.
https://<IP Address>
Where <IP Address> is the IP address of JSA.
Step 7 On the Admin tab, click Deploy Changes.
The installation is complete.
Configuring DSMs
33COM 8800 SERIES SWITCH
The 3COM 8800 Series Switch DSM for Juniper Secure Analytics (JSA) accepts
events using syslog.
Supported Event
Types
JSA records all relevant status and network condition events forwarded from your
3Com 8800 Series Switch using syslog.
Configure Your
3COM 8800 Series
Switch
You can configure your 3COM 8800 Series Switch to forward syslog events to
JSA.
Procedure
Step 1 Log in to the 3Com 8800 Series Switch user interface.
Step 2 Enable the information center.
info-center enable
Step 3 Configure the host with the IP address of your JSA system as the loghost, the
severity level threshold value as informational, and the output language to English.
info-center loghost <ip_address> facility <severity> language
english
Where:
<ip_address> is the IP address of your JSA.
<severity> is the facility severity.
Step 4 Configure the ARP and IP information modules to log.
info-center source arp channel loghost log level informational
info-center source ip channel loghost log level informational
The configuration is complete. The log source is added to JSA as 3COM 8800
Series Switch events are automatically discovered. Events forwarded to JSA by
3COM 880 Series Switches are displayed on the Log Activity tab.

Configuring DSMs
28 3COM 8800 SERIES SWITCH
Configure a Log
Source
JSA automatically discovers and creates a log source for syslog events from
3COM 8800 Series Switches. These configuration steps are optional.
Procedure
Step 1 Log in to JSA.
Step 2 Click the Admin tab.
Step 3 On the navigation menu, click Data Sources.
Step 4 Click the Log Sources icon.
Step 5 Click Add.
Step 6 In the Log Source Name field, type a name for your log source.
Step 7 In the Log Source Description field, type a description for the log source.
Step 8 From the Log Source Type list box, select 3Com 8800 Series Switch.
Step 9 Using the Protocol Configuration list box, select Syslog.
The syslog protocol configuration is displayed.
Step 10 Configure the following values:
Step 11 Click Save.
Step 12 On the Admin tab, click Deploy Changes.
The configuration is complete.
Table 3-1 Syslog Parameters
Parameter Description
Log Source Identifier Type the IP address or host name for the log source as an
identifier for events from your 3COM 8800 Series Switch.

Configuring DSMs
4AMBIRON TRUSTWAVE ipANGEL
The Ambiron TrustWave ipAngel DSM for Juniper Secure Analytics (JSA) accepts
events using syslog.
Supported Event
Types
JSA records all Snort-based events from the ipAngel console.
Before You Begin Before you configure JSA to integrate with ipAngel, you must forward your cache
and access logs to your JSA. The events in your cache and access logs that are
forwarded from Ambiron TrustWave ipAngel are not automatically discovered. For
information on forwarding device logs to JSA, see your vendor documentation.
Configure a Log
Source
To integrate Ambiron TrustWave ipAngel events with JSA, you must manually
configure a log source.
Procedure
Step 1 Log in to JSA.
Step 2 Click the Admin tab.
Step 3 On the navigation menu, click Data Sources.
Step 4 Click the Log Sources icon.
Step 5 Click Add.
Step 6 In the Log Source Name field, type a name for your log source.
Step 7 In the Log Source Description field, type a description for the log source.
Step 8 From the Log Source Type list box, select Ambiron TrustWave ipAngel
Intrusion Prevention System (IPS).
Step 9 Using the Protocol Configuration list box, select Syslog.
Step 10 Configure the following values:
Table 4-1 Syslog Parameters
Parameter Description
Log Source Identifier Type the IP address or host name for the log source as an
identifier for events from your Ambiron TrustWave ipAngel
appliance.
Configuring DSMs
30 AMBIRON TRUSTWAVE IPANGEL
Step 11 Click Save.
Step 12 On the Admin tab, click Deploy Changes.
The log source is added to JSA. Events forwarded to JSA by Ambiron TrustWave
ipAngel are displayed on the Log Activity tab.
Configuring DSMs
5APACHE HTTP SERVER
The Apache HTTP Server DSM for Juniper Secure Analytics (JSA) accepts
Apache events using syslog or syslog-ng.
JSA records all relevant HTTP status events. The procedure in this section applies
to Apache DSMs operating on UNIX/Linux platforms only.
CAUTION
CAUTION: Do not run both syslog and syslog-ng at the same time.
Select one of the following configuration methods:
•Configuring Apache HTTP Server with Syslog
•Configuring Apache HTTP Server with Syslog-ng
Configuring
Apache HTTP
Server with Syslog
You can configure your Apache HTTP Server to forward events with the syslog
protocol.
Procedure
Step 1 Log in to the server hosting Apache, as the root user.
Step 2 Edit the Apache configuration file httpd.conf.
Step 3 Add the following information in the Apache configuration file to specify the custom
log format:
LogFormat "%h %A %l %u %t \"%r\" %>s %p %b" <log format name>
Where <log format name> is a variable name you provide to define the log
format.
Step 4 Add the following information in the Apache configuration file to specify a custom
path for the syslog events:
CustomLog “|/usr/bin/logger -t httpd -p
<facility>.<priority>” <log format name>
Where:
<facility> is a syslog facility, for example, local0.
Configuring DSMs
32 APACHE HTTP SERVER
<priority> is a syslog priority, for example, info or notice.
<log format name> is a variable name you provide to define the custom log
format. The log format name must match the log format defined in Step 4.
For example,
CustomLog “|/usr/bin/logger -t httpd -p local1.info”
MyApacheLogs
Step 5 Type the following command to disabled hostname lookup:
HostnameLookups off
Step 6 Save the Apache configuration file.
Step 7 Edit the syslog configuration file.
/etc/syslog.conf
Step 8 Add the following information to your syslog configuration file:
<facility>.<priority> <TAB><TAB>@<host>
Where:
<facility> is the syslog facility, for example, local0. This value must match the
value you typed in Step 4.
<priority> is the syslog priority, for example, info or notice. This value must
match the value you typed in Step 4.
<TAB> indicates you must press the Tab key.
<host> is the IP address of the JSA console or Event Collector.
Step 9 Save the syslog configuration file.
Step 10 Type the following command to restart the syslog service:
/etc/init.d/syslog restart
Step 11 Restart Apache to complete the syslog configuration.
The configuration is complete. The log source is added to JSA as syslog events
from Apache HTTP Servers are automatically discovered. Events forwarded to
JSA by Apache HTTP Servers are displayed on the Log Activity tab of JSA.
Configuring a Log
Source in JSA
You can configure a log source manually for Apache HTTP Server events in JSA.
JSA automatically discovers and creates a log source for syslog events from
Apache HTTP Server. However, you can manually create a log source for JSA to
receive syslog events. These configuration steps are optional.
Procedure
Step 1 Log in to JSA.
Step 2 Click the Admin tab.
Step 3 On the navigation menu, click Data Sources.
Step 4 Click the Log Sources icon.

Configuring DSMs
Configuring Apache HTTP Server with Syslog-ng 33
Step 5 Click Add.
Step 6 In the Log Source Name field, type a name for your log source.
Step 7 In the Log Source Description field, type a description for the log source.
Step 8 From the Log Source Type list box, select Apache HTTP Server.
Step 9 Using the Protocol Configuration list box, select Syslog.
Step 10 Configure the following values:
Step 11 Click Save.
Step 12 On the Admin tab, click Deploy Changes.
The configuration is complete. For more information on Apache, see
http://www.apache.org/.
Configuring
Apache HTTP
Server with
Syslog-ng
You can configure your Apache HTTP Server to forward events with the syslog-ng
protocol.
Procedure
Step 1 Log in to the server hosting Apache, as the root user.
Step 2 Edit the Apache configuration file.
/etc/httpd/conf/httpd.conf
Step 3 Add the following information to the Apache configuration file to specify the
LogLevel:
LogLevel info
The LogLevel might already be configured to the info level depending on your
Apache installation.
Step 4 Add the following to the Apache configuration file to specify the custom log format:
LogFormat "%h %A %l %u %t \"%r\" %>s %p %b" <log format name>
Where <log format name> is a variable name you provide to define the custom
log format.
Step 5 Add the following information to the Apache configuration file to specify a custom
path for the syslog events:
CustomLog "|/usr/bin/logger -t 'httpd' -u
/var/log/httpd/apache_log.socket" <log format name>
The log format name must match the log format defined in Step 4.
Table 5-1 Syslog Parameters
Parameter Description
Log Source Identifier Type the IP address or host name for the log source as an
identifier for events from your Apache installations.
Configuring DSMs
34 APACHE HTTP SERVER
Step 6 Save the Apache configuration file.
Step 7 Edit the syslog-ng configuration file.
/etc/syslog-ng/syslog-ng.conf
Step 8 Add the following information to specify the destination in the syslog-ng
configuration file:
source s_apache {
unix-stream("/var/log/httpd/apache_log.socket"
max-connections(512)
keep-alive(yes));
};
destination auth_destination { <udp|tcp>("<IP address>"
port(514)); };
log{
source(s_apache);
destination(auth_destination);
};
Where:
<IP address> is the IP address of the JSA console or Event Collector.
<udp|tcp> is the protocol you select to forward the syslog event.
Step 9 Save the syslog-ng configuration file.
Step 10 Type the following command to restart syslog-ng:
service syslog-ng restart
Step 11 You are now ready to configure the log source in JSA.
The configuration is complete. The log source is added to JSA as syslog events
from Apache HTTP Servers are automatically discovered. Events forwarded to
JSA by Apache HTTP Servers are displayed on the Log Activity tab of JSA.
Configuring a Log
Source
You can configure a log source manually for Apache HTTP Server events in JSA.
JSA automatically discovers and creates a log source for syslog-ng events from
Apache HTTP Server. However, you can manually create a log source for JSA to
receive syslog events. These configuration steps are optional.
Procedure
Step 1 Log in to JSA.
Step 2 Click the Admin tab.
Step 3 On the navigation menu, click Data Sources.
Step 4 Click the Log Sources icon.

Configuring DSMs
Configuring Apache HTTP Server with Syslog-ng 35
Step 5 Click Add.
Step 6 In the Log Source Name field, type a name for your log source.
Step 7 In the Log Source Description field, type a description for the log source.
Step 8 From the Log Source Type list box, select Apache HTTP Server.
Step 9 Using the Protocol Configuration list box, select Syslog.
Step 10 Configure the following values:
Step 11 Click Save.
Step 12 On the Admin tab, click Deploy Changes.
The configuration is complete. For more information on Apache, see
http://www.apache.org/.
Table 5-2 Syslog Parameters
Parameter Description
Log Source Identifier Type the IP address or host name for the log source as an
identifier for events from your Apache installations.

Configuring DSMs
6APC UPS
The APC UPS DSM for Juniper Secure Analytics (JSA) accepts syslog events
from the APC Smart-UPS family of products.
NOTE
Note: Events from the RC-Series Smart-UPS are not supported.
Supported Event
Types
JSA supports the following APC Smart-UPS syslog events:
•UPS events
•Battery events
•Bypass events
•Communication events
•Input power events
•Low battery condition events
•SmartBoost events
•SmartTrim events
Before You Begin To integrate Smart-UPS events with JSA, you must manually create a log source
to receive syslog events.
Before you can receive events in JSA, you must configure a log source, then
configure your APC UPS to forward syslog events. Syslog events forwarded from
APC Smart-UPS series devices are not automatically discovered. JSA can receive
syslog events on port 514 for both TCP and UDP.
Configuring a Log
Source in JSA
JSA does not automatically discover or create log sources for syslog events from
APC Smart-UPS series appliances.
Procedure
Step 1 Log in to JSA.
Step 2 Click the Admin tab.
Step 3 On the navigation menu, click Data Sources.

Configuring DSMs
38 APC UPS
Step 4 Click the Log Sources icon.
Step 5 Click Add.
Step 6 In the Log Source Name field, type a name for your log source.
Step 7 In the Log Source Description field, type a description for the log source.
Step 8 From the Log Source Type list box, select APC UPS.
Step 9 Using the Protocol Configuration list box, select Syslog.
Step 10 Configure the following values:
Step 11 Click Save.
Step 12 On the Admin tab, click Deploy Changes.
The log source is added to JSA. You are now ready to configure your APC
Smart-UPS to forward syslog events to JSA.
Configuring Your
APC UPD to Forward
Syslog Events
You can configure syslog event forwarding on your APC UPS.
Procedure
Step 1 Log in to the APC Smart-UPS web interface.
Step 2 In the navigation menu, select Network > Syslog.
Step 3 From the Syslog list box, select Enable.
Step 4 From the Facility list box, select a facility level for your syslog messages.
Step 5 In the Syslog Server field, type the IP address of your JSA console or Event
Collector.
Step 6 From the Severity list box, select Informational.
Step 7 Click Apply.
The syslog configuration is complete. Events forwarded to JSA by your APC UPS
are displayed on the Log Activity tab.
Table 6-1 Syslog Parameters
Parameter Description
Log Source Identifier Type the IP address or host name for the log source as an
identifier for events from your APC Smart-UPS series
appliance.

Configuring DSMs
7AMAZON AWS CLOUDTRAIL
The Juniper Secure Analytics (JSA) DSM for Amazon AWS CloudTrail can collect
audit events from your Amazon AWS CloudTrail S3 bucket.
Table 7-1 provides the specifications of the Amazon AWS CloudTrail DSM.
Table 7-1 Amazon AWS CloudTrail DSM Specifications
Specification Value
Manufacturer Amazon
DSM Amazon AWS CloudTrail
Supported
versions
1.0
Protocol Log File
JSA recorded
events
All relevant events
Automatically
discovered
No
Includes identity No
More information http://docs.aws.amazon.com/awscloudtrail/latest/use
rguide/whatisawscloudtrail.html

Configuring DSMs
40 AMAZON AWS CLOUDTRAIL
AWS CloudTrail
DSM Integration
Process
To integrate Amazon AWS CloudTrail with JSA, use the following procedure:
1 Obtain and install a certificate to enable communication between your Amazon
AWS CloudTrail S3 bucket and JSA.
2 Install the most recent version of the Log File Protocol RPM on your JSA consolev.
You can install a protocol by using the procedure to manually install a DSM.
3 Install the Amazon AWS CloudTrail DSM on your JSA console.
4 Configure the Amazon AWS CloudTrail log source in JSA.
Related tasks
•Manually Installing a DSM
•Enabling Communication between JSA and AWS CloudTrail
•Configuring an Amazon AWS CloudTrail Log Source in JSA
Enabling
Communication
between JSA and
AWS CloudTrail
A certificate is required for the HTTP connection between JSA and Amazon AWS
CloudTrail.
Procedure
To enable communication between JSA and AWS CloudTrail:
Step 1 Access your Amazon AWS CloudTrail S3 bucket.
Step 2 Export the certificate as a DER-encoded binary certificate to your desktop system.
The file extension must be .DER.
Step 3 Copy the certificate to the /opt/qradar/conf/trusted_certificates
directory on the JSA host on which you plan to configure the log source.
Configuring an
Amazon AWS
CloudTrail Log
Source in JSA
To collect Amazon AWS CloudTrail events, you must configure a log source in
JSA. When you configure the log source, use the location and keys that are
required to access your Amazon AWS CloudTrail S3 bucket.
Before you begin
Ensure that the following components are installed and deployed on your JSA
host:
•PROTOCOL-LogFileProtocol-build_number.noarch.rpm
•DSM-AmazonAWSCloudTrail-build_number.noarch.rpm
Also ensure that audit logging is enabled on your Amazon AWS CloudTrail S3
bucket. For more information, see your vendor documentation.

Configuring DSMs
Configuring an Amazon AWS CloudTrail Log Source in JSA 41
About this task
Table 7-2 provides more information about some of the extended parameters.
Procedure
To configure Amazon AWS CloudTrail log source in JSA:
Step 1 Log in to JSA.
Step 2 Click the Admin tab.
Step 3 In the navigation menu, click Data Sources.
Step 4 Click the Log Sources icon.
Step 5 Click Add.
Step 6 From the Log Source Type list, select Amazon AWS CloudTrail.
Step 7 From the Protocol Configuration list, select Log File.
Step 8 From the Service Type field, select AWS.
Step 9 Configure the remaining parameters.
Step 10 Click Save.
Step 11 On the Admin tab, click Deploy Changes.
Table 7-2 Amazon AWS CloudTrail Log source Parameters
Parameter Description
Bucket Name The name of the AWS CloudTrail S3 bucket where
the log files are stored.
AWS Access Key The public access key required to access the AWS
CloudTrail S3 bucket.
AWS Secret Key The private access key required to access the AWS
CloudTrail S3 bucket.
Remote Directory The root directory location on the AWS CloudTrail S3
bucket from which the files are retrieved, for
example, \user_account_name
FTP File Pattern .*?\.json\.gz
Processor GZIP
Event Generator Amazon AWS JSON
Applies additional processing to the retrieved event
files.
Recurrence Defines how often the Log File Protocol connects to
the Amazon cloud API, checks for new files, and
retrieves them if they exist. Every access to an AWS
S3 bucket incurs a cost to the account that owns the
bucket. Therefore, a smaller recurrence value
increases the cost.
Configuring DSMs
7APPLE MAC OS X
The Apple Mac OS X DSM for Juniper Secure Analytics (JSA) accepts events
using syslog.
Supported Event
Types
JSA records all relevant firewall, web server access, web server error, privilege
escalation, and informational events.
Before You Begin To integrate Mac OS X events with JSA, you must manually create a log source to
receive syslog events.
To complete this integration, you must configure a log source, then configure your
Mac OS X to forward syslog events. Syslog events forwarded from Mac OS X
devices are not automatically discovered. It is recommended that you create a log
source, then forward events to JSA. Syslog events from Mac OS X can be
forwarded to JSA on TCP port 514 or UDP port 514.
Configuring a Log
Source
JSA does not automatically discover or create log sources for syslog events from
Apple Mac OS X.
Procedure
Step 1 Log in to JSA.
Step 2 Click the Admin tab.
Step 3 On the navigation menu, click Data Sources.
Step 4 Click the Log Sources icon.
Step 5 Click Add.
Step 6 In the Log Source Name field, type a name for your log source.
Step 7 In the Log Source Description field, type a description for the log source.
Step 8 From the Log Source Type list box, select Mac OS X.
Step 9 Using the Protocol Configuration list box, select Syslog.

Configuring DSMs
44 APPLE MAC OS X
Step 10 Configure the following values:
Step 11 Click Save.
Step 12 On the Admin tab, click Deploy Changes.
The log source is added to JSA. You are now ready to configure your Apple Mac
OS X device to forward syslog events to JSA.
Configuring Syslog
on Your Apple Mac
OS X
You can configure syslog on systems running Mac OS X operating systems.
Procedure
Step 1 Using SSH, log in to your Mac OS X device as a root user.
Step 2 Open the /etc/syslog.conf file.
Step 3 Add the following line to the top of the file. Make sure all other lines remain intact:
*.* @<IP address>
Where <IP address> is the IP address of the JSA.
Step 4 Save and exit the file.
Step 5 Send a hang-up signal to the syslog daemon to make sure all changes are
enforced:
sudo killall - HUP syslogd
The syslog configuration is complete. Events forwarded to JSA by your Apple Mac
OS X are displayed on the Log Activity tab. For more information on configuring
Mac OS X, see your Mac OS X vendor documentation.
Table 8-1 Mac OS X Syslog Parameters
Parameter Description
Log Source Identifier Type the IP address or host name for the log source as an
identifier for events from your Apple Mac OS X device.

Configuring DSMs
8APPLICATION SECURITY
DBPROTECT
You can integrate Application Security DbProtect with Juniper Secure Analytics
(JSA).
Supported Event
Types
The Application Security DbProtect DSM for JSA accepts syslog events from
DbProtect devices installed with the Log Enhanced Event Format (LEEF) Service.
Before You Begin To forward syslog events from Application Security DbProtect to JSA requires the
LEEF Relay module.
The LEEF Relay module for DbProtect translates the default events messages to
Log Enhanced Event Format (LEEF) messages for JSA, enabling JSA to record all
relevant DbProtect events. Before you can receive events in JSA, you must install
and configure the LEEF Service for your DbProtect device to forward syslog
events. The DbProtect LEEF Relay requires that you install the .NET 4.0
Framework, which is bundled with the LEEF Relay installation.
Installing the
DbProtect LEEF
Relay Module
The DbProtect LEEF Relay module for DbProtect must be installed on the same
server as the DbProtect console. This allows the DbProtect LEEF Relay to work
alongside an existing installation using the standard hardware and software
prerequisites for a DbProtect console.
NOTE
Note: Windows 2003 hosts require the Windows Imaging Components
(wic_x86.exe). The Windows Imaging Components are located on the Windows
Server Installation CD and must be installed before you continue. For more
information, see your Windows 2003 Operating System documentation.
Procedure
Step 1 Download the DbProtect LEEF Relay module for DbProtect from the Application
Security, Inc. customer portal.
http://www.appsecinc.com
Step 2 Save the setup file to the same host as your DbProtect console.
Step 3 Double click setup.exe to start the DbProtect LEEF Relay installation.
The Microsoft .NET Framework 4 Client Profile is displayed.

Configuring DSMs
46 APPLICATION SECURITY DBPROTECT
Step 4 Click Accept, if you agree with the Microsoft .NET Framework 4 End User License
Agreement.
The Microsoft .NET Framework 4 is installed on your DbProtect console. After the
installation is complete, the DbProtect LEEF Relay module installation Wizard is
displayed.
Step 5 Click Next.
The Installation Folder window is displayed.
Step 6 To select the default installation path, click Next.
If you change the default installation directory, make note of the file location as it is
required later. The Confirm Installation window is displayed.
Step 7 Click Next.
The DbProtect LEEF Relay module is installed.
Step 8 Click Close.
You are now ready to configure the DbProtect LEEF Relay module.
Configuring the
DbProtect LEEF
Relay
After the installation of the DbProtect LEEF Relay is complete, you can configure
the service to forward events to JSA.
NOTE
Note: The DbProtect LEEF Relay must be stopped before you edit any
configuration values.
Procedure
Step 1 Navigate to the DbProtect LEEF Relay installation directory.
C:\Program Files (x86)\AppSecInc\AppSecLEEFConverter
Step 2 Edit the DbProtect LEEF Relay configuration file:
AppSecLEEFConverter.exe.config
Step 3 Configure the following values:
Table 9-1 DbProtect LEEF Relay Configuration Parameters
Parameter Description
SyslogListenerPort Optional. Type the listen port number the DbProtect LEEF
Relay uses to listen for syslog messages from the
DbProtect console. By default, the DbProtect LEEF Relay
listens on port 514.
SyslogDestinationHost Type the IP address of your JSA console or Event
Collector.
SyslogDestinationPort Type 514 as the destination port for LEEF formatted syslog
messages forwarded to JSA.

Configuring DSMs
47
Step 4 Save the configuration changes to the file.
Step 5 On your desktop of the DbProtect console, select Start > Run.
The Run window is displayed.
Step 6 Type the following:
services.msc
Step 7 Click OK.
The Services window is displayed.
Step 8 In the details pane, verify the DbProtect LEEF Relay is started and set to automatic
startup.
Step 9 To change a service property, right-click on the service name, and then click
Properties.
Step 10 Using the Startup type list box, select Automatic.
Step 11 If the DbProtect LEEF Relay is not started, click Start.
You are now ready to configure alerts for your DbProtect console.
Configure DbProtect
alerts
You can configure sensors on your DbProtect console to generate alerts.
Procedure
Step 1 Log in to your DbProtect console.
Step 2 Click the Activity Monitoring tab.
Step 3 Click the Sensors tab.
Step 4 Select a sensor and click Reconfigure.
Any database instances that are configured for your database are displayed.
Step 5 Select any database instances and click Reconfigure.
Step 6 Click Next until the Sensor Manager Policy window is displayed.
Step 7 Select the Syslog check box and click Next.
Step 8 The Syslog Configuration window is displayed.
Step 9 In the Send Alerts to the following Syslog console field, type the IP address of
your DbProtect console.
Step 10 In the Port field, type the port number you configured in the SyslogListenerPort
field of the DbProtect LEEF Relay.
LogFileName Optional. Type a file name for the DbProtect LEEF Relay to
write debug and log messages. The LocalSystem user
account that runs the DbProtect LEEF Relay service must
have write privileges to the file path you specify.
Table 9-1 DbProtect LEEF Relay Configuration Parameters (continued)
Parameter Description

Configuring DSMs
48 APPLICATION SECURITY DBPROTECT
By default, 514 is the default Syslog listen port for the DbProtect LEEF Relay. For
more information, see Configuring the DbProtect LEEF Relay, Step 3.
Step 11 Click Add.
Step 12 Click Next until you reach the Deploy to Sensor window.
Step 13 Click Deploy to Sensor.
The configuration is complete. Events forwarded to JSA by your DbProtect console
are added as a log source and automatically displayed on the Log Activity tab.
Configuring a Log
Source
JSA automatically discovers and creates a log source for syslog events from
Application Security DbProtect. These configuration steps are optional.
Procedure
Step 1 Log in to JSA.
Step 2 Click the Admin tab.
Step 3 On the navigation menu, click Data Sources.
Step 4 Click the Log Sources icon.
Step 5 Click Add.
Step 6 In the Log Source Name field, type a name for your log source.
Step 7 In the Log Source Description field, type a description for the log source.
Step 8 From the Log Source Type list box, select Application Security DbProtect.
Step 9 Using the Protocol Configuration list box, select Syslog.
The syslog protocol configuration is displayed.
Step 10 Configure the following values:
Step 11 Click Save.
Step 12 On the Admin tab, click Deploy Changes.
The log source is added to JSA.
Table 9-2 Syslog Parameters
Parameter Description
Log Source Identifier Type the IP address or host name for the log source as an
identifier for events from your Application Security DbProtect
device.
Configuring DSMs
9ARBOR NETWORKS PEAKFLOW
Juniper Secure Analytics (JSA) can collect and categorize syslog events from
Arbor Networks Peakflow SP appliances that are in your network.
Configuration
Overview
Arbor Networks Peakflow SP appliances store the syslog events locally.
To collect local syslog events, you must configure your Peakflow SP appliance to
forward the syslog events to a remote host. JSA automatically discovers and
creates log sources for syslog events that are forwarded from Arbor Networks
Peakflow SP appliances. JSA supports syslog events that are forwarded from
Peakflow V5.8.
To configure Arbor Networks Peakflow SP, complete the following tasks:
1 On your Peakflow SP appliance, create a notification group for JSA.
2 On your Peakflow SP appliance, configure the global notification settings.
3 On your Peakflow SP appliance, configure your alert notification rules.
4 On your JSA system, verify that the forwarded events are automatically
discovered.
Supported Event
Types for Arbor
Networks Peakflow
SP
The Arbor Networks Peakflow DSM for JSA collects events from several
categories.
Each event category contains low-level events that describe the action that is
taken within the event category. For example, authentication events can have
low-level categories of login successful or login failure.
The following list defines the event categories that are collected by JSA from
Peakflow SP appliances:
•Denial of Service (DoS) events
•Authentication events
•Exploit events
•Suspicious activity events
•System events
Configuring DSMs
50 ARBOR NETWORKS PEAKFLOW
Configuring Remote
Syslog in Peakflow
SP
To collect events, you must configure a new notification group or edit existing
groups to add JSA as a remote syslog destination.
Procedure
To configure Remote Syslog in Peakflow SP:
Step 1 Log in to the configuration interface for your Peakflow SP appliance as an
administrator.
Step 2 In the navigation menu, select Administration > Notification > Groups.
Step 3 Click Add Notification Group.
Step 4 In the Destinations field, type the IP address of your JSA system.
Step 5 In the Port field, type 514 as the port for your syslog destination.
Step 6 From the Facility list, select a syslog facility.
Step 7 From the Severity list, select info.
The informational severity collects all event messages at the informational event
level and higher severity.
Step 8 Click Save.
Step 9 Click Configuration Commit.
Configuring Global
Notifications Settings
for Alerts in Peakflow
SP
Global notifications in Peakflow SP provide system notifications that are not
associated with rules. This procedure defines how to add JSA as the default
notification group and enable system notifications.
Procedure
Step 1 Log in to the configuration interface for your Peakflow SP appliance as an
administrator.
Step 2 In the navigation menu, select Administration > Notification > Global Settings.
Step 3 In the Default Notification Group field, select the notification group that you
created for JSA syslog events.
Step 4 Click Save.
Step 5 Click Configuration Commit to apply the configuration changes.
Step 6 Log in to the Peakflow SP command-line interface as an administrator.
Step 7 Type the following command to list the current alert configuration:
services sp alerts system_errors show
Step 8 Optional. Type the following command to list the fields names that can be
configured:
services sp alerts system_errors ?
Step 9 Type the following command to enable a notification for a system alert:
services sp alerts system_errors <name> notifications enable
Where <name> is the field name of the notification.

Configuring DSMs
51
Step 10 Type the following command to commit the configuration changes:
config write
Configuring Alert
Notification Rules in
Peakflow SP
To generate events, you must edit or add rules to use the notification group that
JSA as a remote syslog destination.
Procedure
Step 1 Log in to the configuration interface for your Peakflow SP appliance as an
administrator.
Step 2 In the navigation menu, select Administration > Notification > Rules.
Step 3 Select one of the following options:
•Click a current rule to edit the rule.
•Click Add Rule to create a new notification rule.
Step 4 Configure the following values:
Step 5 Repeat these steps to configure any other rules you want to forward to JSA.
Step 6 Click Save.
Step 7 Click Configuration Commit to apply the configuration changes.
JSA automatically discovers and creates a log source for Peakflow SP appliances.
Events that are forwarded to JSA are displayed on the Log Activity tab.
Configuring a
Peakflow SP Log
Source
JSA automatically discovers and creates a log source for syslog events forwarded
from Arbor Peakflow. These configuration steps are optional.
Procedure
Step 1 Log in to JSA.
Step 2 Click the Admin tab.
Step 3 In the navigation menu, click Data Sources.
Step 4 Click the Log Sources icon.
Step 5 Click Add.
Table 10-3 Notification Rule Parameters
Parameter Description
Name Type the IP address or host name as an identifier for events
from your Peakflow SP installation.
The log source identifier must be unique value.
Resource Type a CIDR address or select a managed object from the
list of Peakflow resources.
Importance Select the importance of the rule.
Notification Group Select the notification group that you assigned to forward
syslog events to JSA.

Configuring DSMs
52 ARBOR NETWORKS PEAKFLOW
Step 6 In the Log Source Name field, type a name for your log source.
Step 7 Optional. In the Log Source Description field, type a description for your log
source.
Step 8 From the Log Source Type list box, select Arbor Networks Peakflow.
Step 9 From the Protocol Configuration list box, select Syslog.
Step 10 Configure the following values:
Step 11 Click Save.
Step 12 On the Admin tab, click Deploy Changes.
Table 10-4 Syslog Protocol Parameters
Parameter Description
Log Source Identifier Type the IP address or host name as an identifier for events
from your Peakflow SP installation.
The log source identifier must be unique value.
Enabled Select this check box to enable the log source. By default,
the check box is selected.
Credibility Select the credibility of the log source. The range is 0 - 10.
The credibility indicates the integrity of an event or offense
as determined by the credibility rating from the source
devices. Credibility increases if multiple sources report the
same event. The default is 5.
Target Event Collector Select the Event Collector to use as the target for the log
source.
Coalescing Events Select this check box to enable the log source to coalesce
(bundle) events.
By default, automatically discovered log sources inherit the
value of the Coalescing Events list box from the System
Settings in JSA. When you create a log source or edit an
existing configuration, you can override the default value by
configuring this option for each log source.
Incoming Event
Payload
From the list box, select the incoming payload encoder for
parsing and storing the logs.
Store Event Payload Select this check box to enable the log source to store event
payload information.
By default, automatically discovered log sources inherit the
value of the Store Event Payload list box from the System
Settings in JSA. When you create a log source or edit an
existing configuration, you can override the default value by
configuring this option for each log source.

Configuring DSMs
10 ARBOR NETWORKS PRAVAIL
The Juniper Secure Analytics (JSA) DSM for Arbor Networks Pravail can collect
event logs from your Arbor Networks Pravail servers.
Table 11-1 provides the specifications of the Arbor Networks Pravail DSM.
Table 11-1 Arbor Networks Pravail DSM Specifications
Specification Value
Manufacturer Arbor Networks
DSM Arbor Networks Pravail
RPM file name DSM-ArborNetworksPravail-build_number.noarch.rpm
Supported
versions
Protocol Syslog
Configuring
DSMs recorded
events
All relevant events
Automatically
discovered
Yes
Includes identity No
More information http://www.stealthbits.com/resources

Configuring DSMs
54 ARBOR NETWORKS PRAVAIL
Arbor Networks
Pravail DSM
Integration Process
To integrate Arbor Networks Pravail DSM with JSA, use the following procedure:
1 If automatic updates are not enabled, download and install the most recent Arbor
Networks Pravail RPM on your JSA console.
2 For each instance of Arbor Networks Pravail, configure your Arbor Networks
Pravail system to enable communication with JSA.
3 If Configuring DSMs automatically discovers the DSM, for each Arbor Networks
Pravail server you want to integrate, create a log source on the JSA console.
Related tasks
•Manually Installing a DSM
•Configuring your Arbor Networks Pravail system for Communication with
JSA
•Configuring an Arbor Networks Pravail Log Source in Configuring DSMs
Configuring your
Arbor Networks
Pravail system for
Communication
with JSA
To collect all audit logs and system events from Arbor Networks Pravail, you must
add a destination that specifies JSA as the syslog server.
Procedure
To configure Arbor Networks Prevail System for communication with JSA:
Step 1 Log in to your Arbor Networks Pravail server.
Step 2 Click Settings & Reports.
Step 3 Click Administration > Notifications.
Step 4 On the Configure Notifications page, click Add Destinations.
Step 5 Select Syslog.
Step 6 Configure the following parameters:
Table 11-2 Parameters to Configure Arbor Networks Pravail System
Step 7 Click Save.
Parameter Description
Host The IP address for the
Configuring DSMs Console
Port 514
Severity Info
Alert Types The alert types that you want to
send to the Configuring DSMs
Console

Configuring DSMs
Configuring an Arbor Networks Pravail Log Source in Configuring DSMs 55
Configuring an
Arbor Networks
Pravail Log Source
in Configuring
DSMs
To collect Arbor Networks Pravail events, configure a log source in JSA.
Procedure
To configure an Arbor Networks Pravail log source in configuring DSMs:
Step 1 Log in to JSA.
Step 2 Click the Admin tab.
Step 3 In the navigation menu, click Data Sources.
Step 4 Click the Log Sources icon.
Step 5 Click Add.
Step 6 From the Log Source Type list, select Arbor Networks Pravail.
Step 7 From the Protocol Configuration list, select Syslog.
Step 8 Configure the remaining parameters.
Step 9 Click Save.
Step 10 On the Admin tab, click Deploy Changes.
Configuring DSMs
10 ARPEGGIO SIFT-IT
The Juniper Secure Analytics (JSA) SIFT-IT DSM accepts syslog events from
Arpeggio SIFT-IT running on IBM iSeries® that are formatted using the Log
Enhanced Event Protocol (LEEF).
Supported Versions JSA supports events from Arpeggio SIFT-IT 3.1 and above installed on IBM iSeries
version 5 revision 3 (V5R3) and above.
Supported Events Arpeggio SIFT-IT supports syslog events from the journal QAUDJRN in LEEF
format.
For example,
Jan 29 01:33:34 RUFUS LEEF:1.0|Arpeggio|SIFT-IT|3.1|PW_U|sev=3
usrName=ADMIN src=100.100.100.114 srcPort=543 jJobNam=QBASE
jJobUsr=ADMIN jJobNum=1664 jrmtIP=100.100.100.114 jrmtPort=543
jSeqNo=4755 jPgm=QWTMCMNL jPgmLib=QSYS jMsgId=PWU0000 jType=U
jUser=ROOT jDev=QPADEV000F jMsgTxt=Invalid user id ROOT. Device
QPADEV000F.
Events SIFT-IT forwards to JSA are determined with a configuration rule set file.
SIFT-IT includes a default configuration rule set file that you can edit to meet your
security or auditing requirements. For more information on configuring rule set
files, see your SIFT-IT User Guide.
Configuring a SIFT-IT
Agent
Arpeggio SIFT-IT is capable of forwarding syslog events in LEEF format with
SIFT-IT agents.
A SIFT-IT agent configuration defines the location of your JSA installation, the
protocol and formatting of the event message, and the configuration rule set.
Procedure
Step 1 Log in to your IBM iSeries.
Step 2 Type the following command and press Enter to add SIFT-IT to your library list:
ADDLIBLE SIFTITLIB0
Step 3 Type the following command and press Enter to access the SIFT-IT main menu:
GO SIFTIT
Configuring DSMs
58 ARPEGGIO SIFT-IT
Step 4 From the main menu, select 1. Work with SIFT-IT Agent Definitions.
Step 5 Type 1 to add an agent definition for JSA and press Enter.
Step 6 Configure the following agent parameters:
a In the SIFT-IT Agent Name field, type a name.
For example, JSA.
b In the Description field, type a description for the agent.
For example, Arpeggio agent for JSA.
c In the Server host name or IP address field, type the location of your JSA
console or Event Collector.
d In the Connection type field, type either *TCP, *UDP, or *SECURE.
The *SECURE option requires the TLS protocol. For more information, see the
Log Sources Users Guide.
e In the Remote port number field, type 514.
By default, JSA supports both TCP and UDP syslog messages on port 514.
f In the Message format options field, type *JSA.
g Optional. Configure any additional parameters for attributes that are not JSA
specific.
The additional operational parameters are described in the SIFT-IT User Guide.
h Press F3 to exit to the Work with SIFT-IT Agents Description menu.
Step 7 Type 9 and press Enter to load a configuration rule set for JSA.
Step 8 In the Configuration file field, type the path to your JSA configuration rule set file.
For example,
/sifitit/JSAconfig.txt
Step 9 Press F3 to exit to the Work with SIFT-IT Agents Description menu.
Step 10 Type 11 to start the JSA agent.
The configuration is complete.
Next steps
Syslog events forwarded by Arpeggio SIFT-IT in LEEF format are automatically
discovered by JSA. In most cases, the log source is automatically created in JSA
after a small number of events are detected. If the event rate is extremely low, then
you might be required to manually create a log source for Arpeggio SIFT-IT in JSA.
Until the log source is automatically discovered and identified, the event type
displays as Unknown on the Log Activity tab of JSA. Automatically discovered log
sources can be viewed on the Admin tab of JSA by clicking the Log Sources icon.

Configuring DSMs
59
Configuring a Log
Source
JSA automatically discovers and creates a log source for system authentication
events forwarded from Arpeggio SIFT-IT. This procedure is optional.
Procedure
Step 1 Log in to JSA.
Step 2 Click the Admin tab.
Step 3 On the navigation menu, click Data Sources.
Step 4 Click the Log Sources icon.
Step 5 Click Add.
Step 6 In the Log Source Name field, type a name for your log source.
Step 7 In the Log Source Description field, type a description for the log source.
Step 8 From the Log Source Type list box, select Arpeggio SIFT-IT.
Step 9 Using the Protocol Configuration list box, select Syslog.
Step 10 Configure the following values:
Step 11 Click Save.
Step 12 On the Admin tab, click Deploy Changes.
The configuration is complete.
Additional
Information
After you create your JSA agent definition, you can use your Arpeggio SIFT-IT
software and JSA integration to customize your security and auditing
requirements.
This can include:
•Creating custom configurations in Apreggio SIFT-IT with granular filtering on
event attributes.
For example, filtering on job name, user, file or object name, system objects, or
ports. All events forwarded from SIFT-IT and the contents of the event payload
in JSA are easily searchable.
•Configuring rules in JSA to generate alerts or offenses for your security team to
identify potential security threats, data loss, or breaches in real-time.
•Configuring processes in Apreggio SIFT-IT to trigger real-time remediation of
issues on your IBM iSeries.
•Creating offenses for your security team from Arpeggio SIFT-IT events in JSA
with the Offenses tab or configuring email job logs in SIFT-IT for your IBM
iSeries administrators.
Table 12-1 Syslog Parameters
Parameter Description
Log Source Identifier Type the IP address or host name for the log source as an
identifier for events from your Arpeggio SIFT-IT installation.
Configuring DSMs
60 ARPEGGIO SIFT-IT
•Creating multiple configuration rule sets for multiple agents that run
simultaneously to handle specific security or audit events.
For example, you can configure one JSA agent with a specific rule sets for
forwarding all IBM iSeries events, then develop multiple configuration rule sets
for specific compliance purposes. This allows you to easily manage
configuration rule sets for compliance regulations, such as FISMA, PCI. HIPPA,
SOX, or ISO 27001. All of the events forwarded by SIFT-IT JSA agents is
contained in a single log source and categorized to be easily searchable.

Configuring DSMs
11 ARRAY NETWORKS SSL VPN
The Array Networks SSL VPN DSM for Juniper Secure Analytics (JSA) collects
events from an ArrayVPN appliance using syslog.
Supported Event
Types
JSA records all relevant SSL VPN events forwarded using syslog on TCP port 514
or UDP port 514.
Configuring a Log
Source
To integrate Array Networks SSL VPN events with JSA, you must manually create
a log source.
JSA does not automatically discover or create log sources for syslog events from
Array Networks SSL VPN.
Procedure
Step 1 Log in to JSA.
Step 2 Click the Admin tab.
Step 3 On the navigation menu, click Data Sources.
Step 4 Click the Log Sources icon.
Step 5 Click Add.
Step 6 In the Log Source Name field, type a name for your log source.
Step 7 In the Log Source Description field, type a description for the log source.
Step 8 From the Log Source Type list box, select Array Networks SSL VPN Access
Gateways.
Step 9 Using the Protocol Configuration list box, select Syslog.
Step 10 Configure the following values:
Step 11 Click Save.
Table 13-1 Syslog Parameters
Parameter Description
Log Source Identifier Type the IP address or host name for the log source as an
identifier for events from your Array Networks SSL VPN
appliance.
Configuring DSMs
62 ARRAY NETWORKS SSL VPN
Step 12 On the Admin tab, click Deploy Changes.
The log source is added to JSA. Events forwarded to JSA by Array Networks SSL
VPN are displayed on the Log Activity tab.
Next Steps
You are now ready to configure your Array Networks SSL VPN appliance to
forward remote syslog events to JSA. For more information on configuring Array
Networks SSL VPN appliances for remote syslog, please consult your Array
Networks documentation.
Configuring DSMs
12 ARUBA MOBILITY CONTROLLERS
The Aruba Mobility Controllers DSM for Juniper Secure Analytics (JSA) accepts
events using syslog.
Supported Event
Types
JSA records all relevant events forwarded using syslog on TCP port 514 or UDP
port 514.
Configure Your
Aruba Mobility
Controller
You can configure the Aruba Wireless Networks (Mobility Controller) device to
forward syslog events to JSA.
Procedure
Step 1 Log in to the Aruba Mobility Controller user interface.
Step 2 From the top menu, select Configuration.
Step 3 From the Switch menu, select Management.
Step 4 Click the Logging tab.
Step 5 From the Logging Servers menu, select Add.
Step 6 Type the IP address of the JSA server that you want to collect logs.
Step 7 Click Add.
Step 8 Optional. Change the logging level for a module:
a Select the check box next to the name of the logging module.
b Choose the logging level you want to change from the list box that is displayed
at the bottom of the window.
Step 9 Click Done.
Step 10 Click Apply.
The configuration is complete. The log source is added to JSA as Aruba Mobility
Controller events are automatically discovered. Events forwarded to JSA by Aruba
Mobility Controller are displayed on the Log Activity tab of JSA.

Configuring DSMs
64 ARUBA MOBILITY CONTROLLERS
Configuring a Log
Source
JSA automatically discovers and creates a log source for syslog events from Aruba
Mobility Controllers. These configuration steps are optional.
Procedure
Step 1 Log in to JSA.
Step 2 Click the Admin tab.
Step 3 On the navigation menu, click Data Sources.
Step 4 Click the Log Sources icon.
Step 5 Click Add.
Step 6 In the Log Source Name field, type a name for your log source.
Step 7 In the Log Source Description field, type a description for the log source.
Step 8 From the Log Source Type list box, select Aruba Mobility Controller .
Step 9 Using the Protocol Configuration list box, select Syslog.
Step 10 Configure the following values:
Step 11 Click Save.
Step 12 On the Admin tab, click Deploy Changes.
The log source is added to JSA. Events forwarded to JSA by Aruba Mobility
Controller appliances are displayed on the Log Activity tab.
Table 14-1 Syslog Parameters
Parameter Description
Log Source Identifier Type the IP address or host name for the log source as an
identifier for events from your Aruba Mobility Controller.

Configuring DSMs
13 AVAYA VPN GATEWAY
The Juniper Secure Analytics (JSA) DSM for Avaya VPN Gateway can collect
event logs from your Avaya VPN Gateway servers.
Table 15-1 identifies the specifications for the Avaya VPN Gateway DSM.
Table 15-1 Avaya VPN Gateway DSM Specifications
Specification Value
Manufacturer Avaya Inc.
DSM Avaya VPN Gateway
RPM file name DSM-AvayaVPNGateway-7.1-799033.noarch.rpm
DSM-AvayaVPNGateway-7.2-799036.noarch.rpm
Supported
versions
9.0.7.2
Protocol syslog
JSA recorded
events
OS, System Control Process, Traffic Processing, Startup,
Configuration Reload, AAA Subsystem, IPsec Subsystem
Automatically
discovered
Yes
Includes identity Yes
More information http://www.avaya.com

Configuring DSMs
66 AVAYA VPN GATEWAY
Avaya VPN
Gateway DSM
Integration Process
To integrate Avaya VPN Gateway DSM with JSA, use the following procedure:
1 If automatic updates are not enabled, download and install the most recent version
of the following RPMs on your JSA console:
•Syslog protocol RPM
•DSMCommon RPM
•Avaya VPN Gateway RPM
2 For each instance of Avaya VPN Gateway, configure your Avaya VPN Gateway
system to enable communication with JSA.
3 If JSA automatically discovers the log source, for each Avaya VPN Gateway server
you want to integrate, create a log source on the JSA console.
Related tasks
•Manually Installing a DSM
•Configuring your Avaya VPN Gateway System for Communication with JSA
•Configuring an Avaya VPN Gateway Log Source in JSA
Configuring your
Avaya VPN
Gateway System
for Communication
with JSA
To collect all audit logs and system events from Avaya VPN Gateway, you must
specify JSA as the syslog server and configure the message format.
Procedure
To configure your Avaya VPN Gateway system for communication with JSA:
Step 1 Log in to your Avaya VPN Gateway command-line interface (CLI).
Step 2 Type the following command:
/cfg/sys/syslog/add
Step 3 At the prompt, type the IP address of your JSA system.
Step 4 To apply the configuration, type the following command:
apply
Step 5 To verify that the IP address of your JSA system is listed, type the following
command:
/cfg/sys/syslog/list

Configuring DSMs
Configuring an Avaya VPN Gateway Log Source in JSA 67
Configuring an
Avaya VPN
Gateway Log
Source in JSA
To collect Avaya VPN Gateway events, configure a log source in JSA.
Procedure
To configure an Avaya VPN Gateway log source in JSA:
Step 1 Log in to JSA.
Step 2 Click the Admin tab.
Step 3 In the navigation menu, click Data Sources.
Step 4 Click the Log Sources icon.
Step 5 Click Add.
Step 6 From the Log Source Type list, select Avaya VPN Gateway.
Step 7 From the Protocol Configuration list, select Syslog.
Step 8 Configure the remaining parameters.
Step 9 Click Save.
Step 10 On the Admin tab, click Deploy Changes.

Configuring DSMs
13 BALABIT IT SECURITY
The BalaBit Syslog-ng Agent application can collect and forward syslog events for
the Microsoft Security Event Log DSM and the Microsoft ISA DSM in Juniper
Secure Analytics (JSA).
To configure a BalaBIt IT Security agent, select a configuration:
•Configuring BalaBIt IT Security for Microsoft Windows Events
•Configuring BalaBit IT Security for Microsoft ISA or TMG Events
Configuring BalaBIt
IT Security for
Microsoft Windows
Events
The Microsoft Windows Security Event Log DSM in JSA can accept Log Extended
Event Format (LEEF) events from BalaBit’s Syslog-ng Agent.
Supported Event
Types
The BalaBit Syslog-ng Agent forwards Windows events to JSA using syslog.
•Windows security
•Application
•System
•DNS
•DHCP
•Custom container event logs

Configuring DSMs
70 BALABIT IT SECURITY
Before You Begin Before you can receive events from BalaBit IT Security Syslog-ng Agents, you
must install and configure the agent to forward events.
Review the following configuration steps before you attempt to configure the
BalaBit Syslog-ng Agent:
1 Install the BalaBit Syslog-ng Agent in your Windows host. For more information,
see your BalaBit Syslog-ng Agent documentation.
2 Configure Syslog-ng Agent Events.
3 Configure JSA as a destination for the Syslog-ng Agent.
4 Restart the Syslog-ng Agent service.
5 Optional. Configure the log source in JSA.
Configuring the
Syslog-ng Agent
Event Source
Before you can forward events to JSA, you must specify what Windows-based
events the Syslog-ng Agent collects.
Procedure
Step 1 From the Start menu, select All Programs > syslog-ng Agent for Windows >
Configure syslog-ng Agent for Windows.
The Syslog-ng Agent window is displayed.
Step 2 Expand the syslog-ng Agent Settings pane, and select Eventlog Sources.
Step 3 Double-click on Event Containers.
The Event Containers Properties window is displayed.
Step 4 From the Event Containers pane, select the Enable radio button.
Step 5 Select a check box for each event type you want to collect:
•Application - Select this check box if you want the device to monitor the
Windows application event log.
•Security - Select this check box if you want the device to monitor the Windows
security event log.
•System - Select this check box if you want the device to monitor the Windows
system event log.
NOTE
Note: BalaBit’s Syslog-ng Agent supports additional event types, such as DNS or
DHCP events using custom containers. For more information, see your BalaBit
Syslog-ng Agent documentation.
Step 6 Click Apply, and then click OK.
The event configuration for your BalaBit Syslog-ng Agent is complete. You are now
ready to configure JSA as a destination for Syslog-ng Agent events.

Configuring DSMs
Configuring BalaBIt IT Security for Microsoft Windows Events 71
Configuring a Syslog
Destination
The Syslog-ng Agent allows you to configure multiple destinations for your
Windows-based events.
To configure JSA as a destination, you must specify the IP address for JSA, and
then configure a message template for the LEEF format.
Procedure
Step 1 From the Start menu, select All Programs > syslog-ng Agent for Windows >
Configure syslog-ng Agent for Windows.
The Syslog-ng Agent window is displayed.
Step 2 Expand the syslog-ng Agent Settings pane, and click Destinations.
Step 3 Double-click on Add new sever.
The Server Property window is displayed.
Step 4 On the Server tab, click Set Primary Server.
Step 5 Configure the following parameters:
a Server Name - Type the IP address of your JSA console or Event Collector.
b Server Port - Type 514 as the TCP port number for events forwarded to JSA.
Step 6 Click the Messages tab.
Step 7 From the Protocol list box, select Legacy BSD Syslog Protocol.
Step 8 In the Template field, define a custom template message for the protocol by
typing:
<${PRI}>${BSDDATE} ${HOST} LEEF:${MSG}
The information typed in this field is space delimited.
Step 9 From the Event Message Format pane, in the Message Template field, type the
following to define the format for the LEEF events:
1.0|Microsoft|Windows|2k8r2|${EVENT_ID}|devTime=${R_YEAR}-${R_M
ONTH}-${R_DAY}T
${R_HOUR}:${R_MIN}:${R_SEC}GMT${TZOFFSET}
devTimeFormat=yyyy-MM-dd'T'HH:mm:ssz cat=${EVENT_TYPE}
sev=${EVENT_LEVEL} resource=${HOST} usrName=${EVENT_USERNAME}
application=${EVENT_SOURCE} message=${EVENT_MSG}
NOTE
Note: The LEEF format uses tab as a delimiter to separate event attributes from
each other. However, the delimiter does not start until after the last pipe character
for {Event_ID}. The following fields must include a tab before the event name:
devTime, devTimeFormat, cat, sev, resource, usrName, application, and message.
You might need to use a text editor to copy and paste the LEEF message format
into the Message Template field.
Configuring DSMs
72 BALABIT IT SECURITY
Step 10 Click OK.
The destination configuration is complete. You are now ready to restart the
Syslog-ng Agent service.
Restart the Syslog-ng
Agent Service
Before the Syslog-ng Agent can forward LEEF formatted events, you must restart
the Syslog-ng Agent service on the Windows host.
Procedure
Step 1 From the Start menu, select Start > Run.
The Run window is displayed.
Step 2 Type the following:
services.msc
Step 3 Click OK.
The Services window is displayed.
Step 4 In the Name column, right-click on Syslog-ng Agent for Windows, and select
Restart.
After the Syslog-ng Agent for Windows service restarts, the configuration is
complete. Syslog events from the BalaBit Syslog-ng Agent are automatically
discovered by JSA. The Windows events that are automatically discovered are
displayed as Microsoft Windows Security Event Logs on the Log Activity tab.
Configuring a Log
Source
JSA automatically discovers and creates a log source for syslog events from LEEF
formatted messages. These configuration steps are optional.
Procedure
Step 1 Log in to JSA.
Step 2 Click the Admin tab.
Step 3 On the navigation menu, click Data Sources.
Step 4 Click the Log Sources icon.
Step 5 Click Add.
Step 6 In the Log Source Name field, type a name for your BalaBit Syslog-ng Agent log
source.
Step 7 In the Log Source Description field, type a description for the log source.
Step 8 From the Log Source Type list box, select Microsoft Windows Security Event
Log.
Step 9 Using the Protocol Configuration list box, select Syslog.

Configuring DSMs
Configuring BalaBit IT Security for Microsoft ISA or TMG Events 73
Step 10 Configure the following values:
Step 11 Click Save.
Step 12 On the Admin tab, click Deploy Changes.
The configuration is complete.
Configuring BalaBit
IT Security for
Microsoft ISA or
TMG Events
You can integrate the BalaBit Syslog-ng Agent application to forward syslog events
to JSA.
Supported Event
Types
The BalaBit Syslog-ng Agent reads Microsoft ISA or Microsoft TMG event logs and
forwards syslog events using the Log Extended Event Format (LEEF).
The events forwarded by BalaBit IT Security are parsed and categorized by the
Microsoft Internet and Acceleration (ISA) DSM for JSA. The DSM accepts both
Microsoft ISA and Microsoft Threat Management Gateway (TMG) events.
Before You Begin Before you can receive events from BalaBit IT Security Syslog-ng Agents, you
must install and configure the agent to forward events.
NOTE
Note: This integration uses BalaBit’s Syslog-ng Agent for Windows and BalaBit’s
Syslog-ng PE to parse and forward events to JSA for the DSM to interpret.
Review the following configuration steps before you attempt to configure the
BalaBit Syslog-ng Agent:
Table 16-1 Syslog Parameters
Parameter Description
Log Source Identifier Type the IP address or hostname for the log source as an
identifier for events from the BalaBit Syslog-ng Agent.

Configuring DSMs
74 BALABIT IT SECURITY
To configure the BalaBit Syslog-ng Agent, you must:
1 Install the BalaBit Syslog-ng Agent in your Windows host. For more information,
see your BalaBit Syslog-ng Agent vendor documentation.
2 Configure the BalaBit Syslog-ng Agent.
3 Install a BalaBit Syslog-ng PE for Linux or Unix in relay mode to parse and forward
events to JSA. For more information, see your BalaBit Syslog-ng PE vendor
documentation.
4 Configure syslog for BalaBit Syslog-ng PE.
5 Optional. Configure the log source in JSA.
Configure the BalaBit
Syslog-ng Agent
Before you can forward events to JSA, you must specify the file source for
Microsoft ISA or Microsoft TMG events in the Syslog-ng Agent collects.
If your Microsoft ISA or Microsoft TMG appliance is generating event files for the
Web Proxy Server and the Firewall Service, both files can be added.
Configure the file source
File sources allow you to define the base log directory and files monitored by the
Syslog-ng Agent.
Procedure
Step 1 From the Start menu, select All Programs > syslog-ng Agent for Windows >
Configure syslog-ng Agent for Windows.
The Syslog-ng Agent window is displayed.
Step 2 Expand the syslog-ng Agent Settings pane, and select File Sources.
Step 3 Select the Enable radio button.
Step 4 Click Add to add your Microsoft ISA and TMG event files.
Step 5 From the Base Directory field, click Browse and select the folder for your
Microsoft ISA or Microsoft TMG log files.
Step 6 From the File Name Filter field, click Browse and select a log file containing your
Microsoft ISA or Microsoft TMG events.
NOTE
Note: The File Name Filter field supports the wildcard (*) and question mark (?)
characters to follow log files that are replaced after reaching a specific file size or
date.
Step 7 In the Application Name field, type a name to identify the application.
Step 8 From the Log Facility list box, select Use Global Settings.
Step 9 Click OK.
Step 10 To add additional file sources, click Add and repeat this process from Step 4.
Microsoft ISA and TMG store Web Proxy Service events and Firewall Service
events in individual files.
Configuring DSMs
Configuring BalaBit IT Security for Microsoft ISA or TMG Events 75
Step 11 Click Apply, and then click OK.
The event configuration is complete. You are now ready to configure a syslog
destinations and formatting for your Microsoft TMG and ISA events.
Configuring a syslog destination
The event logs captured by Microsoft ISA or TMG cannot be parsed by the BalaBit
Syslog-ng Agent for Windows, so you must forward your logs to a BalaBit
Syslog-ng Premium Edition (PE) for Linux or Unix.
To forward your TMG and ISA event logs, you must specify the IP address for your
PE relay and configure a message template for the LEEF format. The BalaBit
Syslog-ng PE acts as an intermediate syslog server to parse the events and
forward the information to JSA.
Procedure
Step 1 From the Start menu, select All Programs > syslog-ng Agent for Windows >
Configure syslog-ng Agent for Windows.
The Syslog-ng Agent window is displayed.
Step 2 Expand the syslog-ng Agent Settings pane, and click Destinations.
Step 3 Double-click on Add new sever.
Step 4 On the Server tab, click Set Primary Server.
Step 5 Configure the following parameters:
a Server Name - Type the IP address of your BalaBit Syslog-ng PE relay.
b Server Port - Type 514 as the TCP port number for events forwarded to your
BalaBit Syslog-ng PE relay.
Step 6 Click the Messages tab.
Step 7 From the Protocol list box, select Legacy BSD Syslog Protocol.
Step 8 From the File Message Format pane, in the Message Template field, type the
following format command:
${FILE_MESSAGE}${TZOFFSET}
Step 9 Click Apply, and then click OK.
The destination configuration is complete. You are now ready to filter comment
lines from the event log.
Filtering the log file for comment lines
The event log file for Microsoft ISA or Microsoft TMG can contain comment
markers, these comments must be filtered from the event message.
Procedure
Step 1 From the Start menu, select All Programs > syslog-ng Agent for Windows >
Configure syslog-ng Agent for Windows.
The Syslog-ng Agent window is displayed.

Configuring DSMs
76 BALABIT IT SECURITY
Step 2 Expand the syslog-ng Agent Settings pane, and select Destinations.
Step 3 Right-click on your JSA syslog destination and select Event Filters > Properties.
The Global event filters Properties window is displayed.
Step 4 Configure the following values:
•From the Global file filters pane, select Enable.
•From the Filter Type pane, select Black List Filtering.
Step 5 Click OK.
Step 6 From the filter list menu, double-click Message Contents.
The Message Contents Properties window is displayed.
Step 7 From the Message Contents pane, select the Enable radio button.
Step 8 In the Regular Expression field, type the following regular expression:
^#
Step 9 Click Add.
Step 10 Click Apply, and then click OK.
The event messages containing comments are no longer forwarded.
NOTE
Note: You might be required to restart Syslog-ng Agent for Windows service to
begin syslog forwarding. For more information, see your BalaBit Syslog-ng Agent
documentation.
Configuring a BalaBit
Syslog-ng PE Relay
The BalaBit Syslog-ng Agent for Windows sends Microsoft TMG and ISA event
logs to a Balabit Syslog-ng PE installation, which is configured in relay mode.
The relay mode installation is responsible for receiving the event log from the
BalaBit Syslog-ng Agent for Windows, parsing the event logs in to the LEEF
format, then forwarding the events to JSA using syslog.
To configure your BalaBit Syslog-ng PE Relay, you must:
1 Install BalaBit Syslog-ng PE for Linux or Unix in relay mode. For more information,
see your BalaBit Syslog-ne PE vendor documentation.
2 Configure syslog on your Syslog-ng PE relay.
NOTE
Note: For a sample syslog.conf file you can use to configure Microsoft TMG and
ISA logs using your BalaBit Syslog-ng PE relay, see
http://www.juniper.net/customers/support/.
The BalaBit Syslog-ng PE formats the TMG and ISA events in the LEEF format
based on the configuration of your syslog.conf file. The syslog.conf file is
responsible for parsing the event logs and forwarding the events to JSA.

Configuring DSMs
Configuring BalaBit IT Security for Microsoft ISA or TMG Events 77
Procedure
Step 1 Using SSH, log in to your BalaBit Syslog-ng PE relay command-line interface
(CLI).
Step 2 Edit the following file:
/etc/syslog-ng/etc/syslog.conf
Step 3 From the destinations section, add an IP address and port number for each relay
destination.
For example,
######
# destinations
destination d_messages { file("/var/log/messages"); };
destination d_remote_tmgfw { tcp("JSA_IP" port(JSA_PORT)
log_disk_fifo_size(10000000) template(t_tmgfw)); };
destination d_remote_tmgweb { tcp("JSA_IP" port(JSA_PORT)
log_disk_fifo_size(10000000) template(t_tmgweb)); };
Where:
JSA_IP is the IP address of your JSA console or Event Collector.
JSA_PORT is the port number required for JSA to receive syslog events. By default,
JSA receives syslog events on port 514.
Step 4 Save the syslog configuration changes.
Step 5 Restart Syslog-ng PE to force the configuration file to be read.
The BalaBit Syslog-ng PE configuration is complete. Syslog events forwarded from
the BalaBit Syslog-ng relay are automatically discovered by JSA as Microsoft
Windows Security Event Log on the Log Activity tab. For more information, see
the Juniper Secure Analytics Users Guide.
NOTE
Note: When using multiple syslog destinations, messages are considered
delivered after they successfully arrived at the primary syslog destination.
Configuring a Log
Source
JSA automatically discovers and creates a log source for syslog events from LEEF
formatted messages provided by your BalaBit Syslog-ng relay. The following
configuration steps are optional.
Procedure
Step 1 Log in to JSA.
Step 2 Click the Admin tab.
Step 3 On the navigation menu, click Data Sources.
The Data Sources panel is displayed.
Step 4 Click the Log Sources icon.
The Log Sources window is displayed.

Configuring DSMs
Configuring BalaBit IT Security for Microsoft ISA or TMG Events 78
Step 5 Click Add.
The Add a log source window is displayed.
Step 6 In the Log Source Name field, type a name for the log source.
Step 7 In the Log Source Description field, type a description for the log source.
Step 8 From the Log Source Type list box, select Microsoft ISA.
Step 9 From the Protocol Configuration list box, select Syslog.
The syslog protocol configuration is displayed.
Step 10 Configure the following values:
Step 11 Click Save.
Step 12 On the Admin tab, click Deploy Changes.
The BalaBit IT Security configuration for Microsoft ISA and Microsoft TMG events
is complete.
Table 16-2 Syslog Parameters
Parameter Description
Log Source Identifier Type the IP address or hostname for the log source as an
identifier for Microsoft ISA or Microsoft Threat Management
Gateway events from the BalaBit Syslog-ng Agent.

Configuring DSMs
14 BARRACUDA
This section includes information on configuring the following DSMs:
•Barracuda Spam & Virus Firewall
•Barracuda Web Application Firewall
•Barracuda Web Filter
Barracuda Spam &
Virus Firewall
You can integrate Barracuda Spam & Virus Firewall with Juniper Secure Analytics
(JSA).
Supported Event
Types
The Barracuda Spam & Virus Firewall DSM for JSA accepts both Mail syslog
events and Web syslog events from Barracuda Spam & Virus Firewall appliances.
Mail syslog events contain the event and action taken when the firewall processes
email. Web syslog events record information on user activity and configuration
changes on your Barracuda Spam & Virus Firewall appliance.
Before You Begin Before you can receive events in JSA, you must configure your Barracuda Spam &
Virus Firewall to forward syslog events. Syslog messages are sent to JSA from
Barracuda Spam & Virus Firewall using UDP port 514. You must verify any
firewalls between JSA and your Barracuda Spam & Virus Firewall appliance allow
UDP traffic on port 514.
Configuring Syslog
Event Forwarding
You can configure syslog forwarding for Barracuda Spam & Virus Firewall.
Procedure
Step 1 Log in to the Barracuda Spam & Virus Firewall web interface.
Step 2 Click the Advanced tab.
Step 3 From the Advanced menu, select Advanced Networking.
Step 4 From the Mail Syslog field, type IP address of your JSA console or Event
Collector.
Step 5 Click Add.JSA
Step 6 From the Web Interface Syslog field, type IP address of your JSA console or
Event Collector.

Configuring DSMs
80 BARRACUDA
Step 7 Click Add.
The syslog configuration is complete.
Configuring a Log
Source
JSA automatically discovers and creates a log source for syslog events from
Barracuda Spam & Virus Firewall appliances. The following configuration steps are
optional.
Procedure
Step 1 Log in to JSA.
Step 2 Click the Admin tab.
Step 3 On the navigation menu, click Data Sources.
Step 4 Click the Log Sources icon.
Step 5 Click Add.
Step 6 In the Log Source Name field, type a name for your log source.
Step 7 In the Log Source Description field, type a description for the log source.
Step 8 From the Log Source Type list box, select Barracuda Spam & Virus Firewall.
Step 9 Using the Protocol Configuration list box, select Syslog.
Step 10 Configure the following values:
Step 11 Click Save.
Step 12 On the Admin tab, click Deploy Changes.
The log source is added to JSA. Events forwarded to JSA by Barracuda Spam &
Virus Firewall are displayed on the Log Activity tab.
Barracuda Web
Application
Firewall
You can integrate Barracuda Web Application Firewall with JSA.
Supported Event
Types
The Barracuda Web Application Firewall DSM for JSA accepts system, web
firewall log, access log, and audit log events using syslog.
Barracuda Web Application Firewall to forward syslog events to JSA in a custom
name-value pair event format. Syslog events from Barracuda Web Application
Firewall appliances are provided to JSA using UDP port 514.
Table 17-1 Syslog Parameters
Parameter Description
Log Source Identifier Type the IP address or host name for the log source as an
identifier for events from your Barracuda Spam & Virus
Firewall appliance.

Configuring DSMs
Barracuda Web Application Firewall 81
Before You Begin Before you begin you must create a log source for JSA. JSA does not
automatically discover events for Barracuda Web Application Firewall. After you
configure this DSM, we recommend you verify any firewalls between Barracuda
Web Application Firewall appliance and JSA allow UDP traffic on port 514.
Configuring a Log
Source
To integrate Barracuda Web Application Firewall with JSA, you must manually
create a log source to receive Barracuda Web Application Firewall events.
Procedure
Step 1 Log in to JSA.
Step 2 Click the Admin tab.
Step 3 On the navigation menu, click Data Sources.
Step 4 Click the Log Sources icon.
Step 5 Click Add.
Step 6 In the Log Source Name field, type a name for your log source.
Step 7 In the Log Source Description field, type a description for the log source.
Step 8 From the Log Source Type list box, select Barracuda Web Application Firewall.
Step 9 Using the Protocol Configuration list box, select Syslog.
Step 10 Configure the following values:
Step 11 Click Save.
Step 12 On the Admin tab, click Deploy Changes.
The log source is added to JSA.
Configuring Syslog
Event Forwarding
You configure syslog forwarding for Barracuda Web Application Firewall.
Procedure
Step 1 Log in to the Barracuda Web Application Firewall web interface.
Step 2 Click the Advanced tab.
Step 3 From the Advanced menu, select Export Logs.
Step 4 Click Syslog Settings.
Step 5 Configure a syslog facility value for the following options:
•Web Firewall Logs Facility - Select a syslog facility between Local0 and
Local7.
Table 17-2 Syslog Parameters
Parameter Description
Log Source Identifier Type the IP address or host name for the log source as an
identifier for events from your Barracuda Web Application
Firewall appliance.

Configuring DSMs
82 BARRACUDA
•Access Logs Facility - Select a syslog facility between Local0 and Local7.
•Audit Logs Facility - Select a syslog facility between Local0 and Local7.
•System Logs Facility - Select a syslog facility between Local0 and Local7.
Setting a syslog unique facility for each log type allows the Barracuda Web
Application Firewall to divide the logs in to different files.
Step 6 Click Save Changes.
The Export Log window is displayed.
Step 7 In the Name field, type name of the syslog server.
Step 8 In the Syslog field, type IP address of your JSA console or Event Collector.
Step 9 From the Log Time Stamp option, select Yes.
Step 10 From the Log Unit Name option, select Yes.
Step 11 Click Add.
Step 12 From the Web Firewall Logs Format list box, select Custom Format.
Step 13 In the Web Firewall Logs Format field, type the following custom event format:
t=%t|ad=%ad|ci=%ci|cp=%cp|au=%au
Step 14 From the Access Logs Format list box, select Custom Format.
Step 15 In the Access Logs Format field, type the following custom event format:
t=%t|p=%p|s=%s|id=%id|ai=%ai|ap=%ap|ci=%ci|cp=%cp|si=%si|sp=%sp
|cu=%cu
Step 16 From the Access Logs Format list box, select Custom Format.
Step 17 In the Access Logs Format field, type the following custom event format:
t=%t|trt=%trt|an=%an|li=%li|lp=%lp
Step 18 Click Save Changes.
Step 19 From the navigation menu, select Basic > Administration.
Step 20 From the System/Reload/Shutdown pane, click Restart.
The syslog configuration is complete after your Barracuda Web Application
Firewall restarts. Events forwarded to JSA by Barracuda Web Application Firewall
are displayed on the Log Activity tab.
Barracuda Web
Filter
You can integrate Barracuda Web Filter appliance events with JSA.
Supported Event
Types
The Barracuda Web Filter DSM for JSA accepts web traffic and web interface
events in syslog format forwarded by Barracuda Web Filter appliances.
Web traffic events contain the event and action taken when the appliance
processes web traffic. Web interface events contain user login activity and
configuration changes to the Web Filter appliance.

Configuring DSMs
Barracuda Web Filter 83
Before You Begin Before you can receive events in JSA, you must configure your Barracuda Web
Filter to forward syslog events.
Syslog messages are forward to JSA using UDP port 514. You must verify any
firewalls between JSA and your Barracuda Web Filter appliance allow UDP traffic
on port 514.
Configuring Syslog
Event Forwarding
You can configure syslog forwarding for Barracuda Web Filter.
Procedure
Step 1 Log in to the Barracuda Web Filter web interface.
Step 2 Click the Advanced tab.
Step 3 From the Advanced menu, select Syslog.
Step 4 From the Web Traffic Syslog field, type IP address of your JSA console or Event
Collector.
Step 5 Click Add.
Step 6 From the Web Interface Syslog field, type IP address of your JSA console or
Event Collector.
Step 7 Click Add.
The syslog configuration is complete.
Configuring a Log
Source
JSA automatically discovers and creates a log source for syslog events from
Barracuda Web Filter appliances. The following configuration steps are optional.
Procedure
Step 1 Log in to JSA.
Step 2 Click the Admin tab.
Step 3 On the navigation menu, click Data Sources.
Step 4 Click the Log Sources icon.
Step 5 Click Add.
Step 6 In the Log Source Name field, type a name for your log source.
Step 7 In the Log Source Description field, type a description for the log source.
Step 8 From the Log Source Type list box, select Barracuda Web Filter.
Step 9 Using the Protocol Configuration list box, select Syslog.
Step 10 Configure the following values:
Table 17-1 Syslog Parameters
Parameter Description
Log Source Identifier Type the IP address or host name for the log source as an
identifier for events from your Barracuda Web Filter
appliance.
Configuring DSMs
84 BARRACUDA
Step 11 Click Save.
Step 12 On the Admin tab, click Deploy Changes.
The log source is added to JSA. Events forwarded by Barracuda Web Filter are
displayed on the Log Activity tab of JSA.
Configuring DSMs
15 BIT9 PARITY
You can integrate Bit9 Parity events with Juniper Secure Analytics (JSA).
Supported Event
Types
The Bit9 Parity DSM for JSA accepts syslog events using the Log Enhanced Event
Format (LEEF), enabling JSA to record all relevant appliance events.
Configuring Bit9
Parity
To collect events, you must configure your Bit9 Parity device to forward syslog
events in the LEEF format.
Procedure
Step 1 Log in to the Bit9 Parity console with Administrator or PowerUser privileges.
Step 2 From the navigation menu on the left side of the console, select Administration >
System Configuration.
The System Configuration window is displayed.
Step 3 Click Server Status.
The Server Status window is displayed.
Step 4 Click Edit.
Step 5 In the Syslog address field, type the IP address of your JSA.
Step 6 From the Syslog format list box, select LEEF (Q1 Labs).
Step 7 Select the Syslog enabled check box.
Step 8 Click Update.
The configuration is complete. The log source is added to JSA as Bit9 Parity
events are automatically discovered. Events forwarded to JSA by Bit9 Parity are
displayed on the Log Activity tab of JSA.
Configure a Log
Source
JSA automatically discovers and creates a log source for syslog events from Bit9
Parity. These configuration steps are optional.
Procedure
Step 1 Log in to JSA.
Step 2 Click the Admin tab.
Step 3 On the navigation menu, click Data Sources.

Configuring DSMs
86 BIT9 PARITY
Step 4 Click the Log Sources icon.
Step 5 Click Add.
Step 6 In the Log Source Name field, type a name for your log source.
Step 7 In the Log Source Description field, type a description for the log source.
Step 8 From the Log Source Type list box, select Bit9 Parity.
Step 9 Using the Protocol Configuration list box, select Syslog.
Step 10 Configure the following values:
Step 11 Click Save.
Step 12 On the Admin tab, click Deploy Changes.
The configuration is complete.
Table 18-1 Syslog Parameters
Parameter Description
Log Source Identifier Type the IP address or host name for the log source as an
identifier for events from your Bit9 Parity device.
Configuring DSMs
16 BLUECAT NETWORKS ADONIS
The BlueCat Networks Adonis DSM for Juniper Secure Analytics (JSA) accepts
events forwarded in Log Enhanced Event Protocol (LEEF) using syslog from
BlueCat Adonis appliances managed with BlueCat Proteus.
Supported Versions JSA supports BlueCat Networks Adonis appliances using version 6.7.1-P2 and
above.
You might be required to include a patch on your BlueCat Networks Adonis to
integrate DNS and DHCP events with JSA. For more information, see KB-4670
and your BlueCat Networks documentation.
Supported Event
Types
JSA is capable of collecting all relevant events related to DNS and DHCP queries.
This includes the following events:
•DNS IPv4 and IPv6 query events
•DNS name server query events
•DNS mail exchange query events
•DNS text record query events
•DNS record update events
•DHCP discover events
•DHCP request events
•DHCP release events
Event Type Format The LEEF format consists of a pipe ( | ) delimited syslog header and a space
delimited event payload.
For example,
Aug 10 14:55:30 adonis671-184
LEEF:1.0|BCN|Adonis|6.7.1|DNS_Query|cat=A_record
src=10.10.10.10 url=test.example.com
If the syslog events forwarded from your BlueCat Adonis appliance are not
formatted similarly to the sample above, you must examine your device
configuration. Properly formatted LEEF event messages are automatically
Configuring DSMs
88 BLUECAT NETWORKS ADONIS
discovered by the BlueCat Networks Adonis DSM and added as a log source to
JSA.
Before You Begin BlueCat Adonis must be configured to generate events in Log Enhanced Event
Protocol (LEEF) and redirect the event output by way of syslog to JSA.
BlueCat Networks provides a script on their appliance to assist you with
configuring syslog. To complete the syslog redirection, you must have
administrative or root access to the command-line interface of the BlueCat Adonis
or your BlueCat Proteus appliance. If the syslog configuration script is not present
on your appliance, you can contact your BlueCat Networks representative.
Configuring BlueCat
Adonis
You can configure your BlueCat Adonis appliance to forward DNS and DHCP
events to JSA.
Procedure
Step 1 Using SSH, log in to your BlueCat Adonis appliance command-line interface.
Step 2 Type the following command to start the syslog configuration script:
/usr/local/bluecat/qradar/setup-qradar.sh
Step 3 Type the IP address of your JSA console or Event Collector.
Step 4 Type yes or no to confirm the IP address.
The configuration is complete when a success message is displayed.
The log source is added to JSA as BlueCat Networks Adonis syslog events are
automatically discovered. Events forwarded to JSA are displayed on the Log
Activity tab. If the events are not automatically discovered, you can manually
configure a log source.
Configuring a Log
Source in JSA
JSA automatically discovers and creates a log source for syslog events from
BlueCat Networks Adonis. However, you can manually create a log source for JSA
to receive syslog events. The following configuration steps are optional.
Procedure
Step 1 Log in to JSA.
Step 2 Click the Admin tab.
Step 3 On the navigation menu, click Data Sources.
Step 4 Click the Log Sources icon.
Step 5 Click Add.
Step 6 In the Log Source Name field, type a name for your log source.
Step 7 In the Log Source Description field, type a description for the log source.
Step 8 From the Log Source Type list box, select BlueCat Networks Adonis.
Step 9 Using the Protocol Configuration list box, select Syslog.

Configuring DSMs
89
Step 10 Configure the following values:
Step 11 Click Save.
Step 12 On the Admin tab, click Deploy Changes.
The configuration is complete.
Table 19-2 Syslog Parameters
Parameter Description
Log Source Identifier Type the IP address or host name for the log source as an
identifier for events from your BlueCat Networks Adonis
appliance.
Configuring DSMs
17 BLUE COAT SG
The Blue Coat SG DSM for Juniper Secure Analytics (JSA) allows you to integrate
events from a Blue Coat SG appliance with JSA.
JSA records all relevant and available information from name-value events that are
separated by pipe (|) characters.
JSA can receive events from your Blue Coat SG appliance using syslog or can
retrieve events from the Blue Coat SG appliance using the Log File protocol. The
instructions provided describe how to configure Blue Coat SG using a custom
name-value pair format. However, JSA supports the following formats:
•Custom Format
•SQUID
•NCSA
•main
•IM
•Streaming
•smartreporter
•bcereportermain_v1
•bcreporterssl_v1
•p2p
•SSL
•bcreportercifs_v1
•CIFS
•MAPI
For more information about your Blue Coat SG Appliance, see your vendor
documentation.

Configuring DSMs
92 BLUE COAT SG
Creating a Custom
Event Format
The Blue Coat SG DSM for JSA accepts custom formatted events from a Blue
Coat SG appliance.
Procedure
Step 1 Using a web browser, log in to the Blue Coat Management console.
Step 2 Select Configuration > Access Logging > Formats.
Step 3 Select New.
Step 4 Type a format name for the custom format.
Step 5 Select Custom format string.
Step 6 Type the following custom format for JSA:
Bluecoat|src=$(c-ip)|srcport=$(c-port)|dst=$(cs-uri-address)|ds
tport=$(cs-uri-port)|username=$(cs-username)|devicetime=$(gmtti
me)|s-action=$(s-action)|sc-status=$(sc-status)|cs-method=$(cs-
method)|time-taken=$(time-taken)|sc-bytes=$(sc-bytes)|cs-bytes=
$(cs-bytes)|cs-uri-scheme=$(cs-uri-scheme)|cs-host=$(cs-host)|c
s-uri-path=$(cs-uri-path)|cs-uri-query=$(cs-uri-query)|cs-uri-e
xtension=$(cs-uri-extension)|cs-auth-group=$(cs-auth-group)|rs(
Content-Type)=$(rs(Content-Type))|cs(User-Agent)=$(cs(User-Agen
t))|cs(Referer)=$(cs(Referer))|sc-filter-result=$(sc-filter-res
ult)|filter-category=$(sc-filter-category)|cs-uri=$(cs-uri)
Step 7 Select Log Last Header from the list box.
Step 8 Click OK.
Step 9 Click Apply.
NOTE
Note: The custom format for JSA supports additional key-value pairs using the
Blue Coat ELFF format. For more information, see Creating Additional Custom
Format Key-Value Pairs.
You are ready to enable access logging on your Blue Coat device.
Creating a Log
Facility
To use the custom log format created for JSA, you must associate the custom log
format for JSA to a facility.
Procedure
Step 1 Select Configuration > Access Logging > Logs.
Step 2 Click New.
Step 3 Configure the following parameters:
•Log Name - Type a name for the log facility.
•Log Format - Select the custom format you created in Creating a Custom
Event Format,Step 4.
•Description - Type a description for the log facility.

Configuring DSMs
Retrieving Blue Coat Events 93
Step 4 Click OK.
Step 5 Click Apply.
You are ready to enable logging on the Blue Coat device. For more information,
see Enabling Access Logging.
Enabling Access
Logging
You must enable access logging on your Blue Coat SG device.
Procedure
Step 1 Select Configuration > Access Logging > General.
Step 2 Select the Enable Access Logging check box.
If the Enable Access Logging check box is not selected, logging is disabled
globally for all of the formats listed.
Step 3 Click Apply.
You are ready to configure the Blue Coat upload client. For more information, see
Retrieving Blue Coat Events.
Retrieving Blue
Coat Events
Events from your Blue Coat SG appliance are forwarded using the Blue Coat
upload client.
JSA can receive forwarded events using FTP or syslog.
•If you are using FTP, see Log File Protocol Configuration.
•If you are using syslog, see Syslog Configuration.
Log File Protocol
Configuration
To use FTP, you must configure the Blue Coat upload client.
Procedure
Step 1 Select Configuration > Access Logging > Logs > Upload Client.
Step 2 From the Log list box, select the log containing your custom format.
Step 3 From the Client type list box, select FTP Client.
Step 4 Select the text file option.
If you select the gzip file option on your Blue Coat appliance, you must configure a
Processor for your log source with the GZIP option.
Step 5 Click Settings.
Step 6 From the Settings For list box, select Primary FTP Server.
Step 7 Configure the following values:
a Host - Type the IP address of the FTP server receiving the Blue Coat events.
b Port - Type the FTP port number.
c Path - Type a directory path for the log files.
d Username - Type the username required to access the FTP server.

Configuring DSMs
94 BLUE COAT SG
Step 8 Click OK.
Step 9 Select the Upload Schedule tab.
Step 10 From the Upload the access log option, select periodically.
Step 11 Configure the Wait time between connect attempts.
Step 12 Select if you want to upload the log file to the FTP daily or on an interval.
Step 13 Click Apply.
Configuring a Log Source in JSA
Procedure
Step 1 Log in to JSA.
Step 2 Click the Admin tab.
Step 3 On the navigation menu, click Data Sources.
Step 4 Click the Log Sources icon.
Step 5 Click Add.
Step 6 In the Log Source Name field, type a name for your log source.
Step 7 From the Log Source Type list box, select the Bluecoat SG Appliance option.
Step 8 From the Protocol Configuration list box, select the Log File option.
Step 9 Configure the following values:
Table 20-1 Blue Coat SG log file protocol parameters
Parameter Description
Log Source Identifier Type an IP address, host name, or name to identify the event
source. IP addresses or host names are recommended as
they allow JSA to identify a log file to a unique event source.
Service Type From the list box, select the protocol you want to use when
retrieving log files from a remote server. The default is SFTP.
•SFTP - SSH File Transfer Protocol
•FTP - File Transfer Protocol
•SCP - Secure Copy
Note: The underlying protocol used to retrieve log files for the
SCP and SFTP service type requires that the server specified
in the Remote IP or Hostname field has the SFTP subsystem
enabled.
Remote IP or
Hostname
Type the IP address or host name of the device storing your
event log files.

Configuring DSMs
Retrieving Blue Coat Events 95
Remote Port Type the TCP port on the remote host that is running the
selected Service Type. The valid range is 1 to 65535.
The options include:
•FTP - TCP Port 21
•SFTP - TCP Port 22
•SCP - TCP Port 22
Note: If the host for your event files is using a non-standard
port number for FTP, SFTP, or SCP, you must adjust the port
value accordingly.
Remote User Type the user name necessary to log in to the host containing
your event files.
The username can be up to 255 characters in length.
Remote Password Type the password necessary to log in to the host.
Confirm Password Confirm the password necessary to log in to the host.
SSH Key File If you select SCP or SFTP as the Service Type, this
parameter allows you to define an SSH private key file. When
you provide an SSH Key File, the Remote Password field is
ignored.
Remote Directory Type the directory location on the remote host from which the
files are retrieved, relative to the user account you are using
to log in.
Note: For FTP only. If your log files reside in the remote user’s
home directory, you can leave the remote directory blank. This
is to support operating systems where a change in the
working directory (CWD) command is restricted.
Recursive Select this check box if you want the file pattern to search sub
folders in the remote directory. By default, the check box is
clear.
The Recursive option is ignored if you configure SCP as the
Service Type.
FTP File Pattern If you select SFTP or FTP as the Service Type, this option
allows you to configure the regular expression (regex)
required to filter the list of files specified in the Remote
Directory. All matching files are included in the processing.
The FTP file pattern you specify must match the name you
assigned to your event files. For example, to collect files
ending with .log, type the following:
.*\.log
Use of this parameter requires knowledge of regular
expressions (regex). For more information, see the following
website:
http://download.oracle.com/javase/tutorial/essential/regex/
Table 20-1 Blue Coat SG log file protocol parameters (continued)
Parameter Description

Configuring DSMs
96 BLUE COAT SG
FTP Transfer Mode This option only appears if you select FTP as the Service
Type. The FTP Transfer Mode parameter allows you to define
the file transfer mode when retrieving log files over FTP.
From the list box, select the transfer mode you want to apply
to this log source:
•Binary - Select Binary for log sources that require binary
data files or compressed zip, gzip, tar, or tar+gzip archive
files.
•ASCII - Select ASCII for log sources that require an ASCII
FTP file transfer.
You must select NONE for the Processor parameter and
LINEBYLINE the Event Generator parameter when using
ASCII as the FTP Transfer Mode.
SCP Remote File If you select SCP as the Service Type you must type the file
name of the remote file.
Start Time Type the time of day you want the processing to begin. For
example, type 00:00 to schedule the Log File protocol to
collect event files at midnight.
This parameter functions with the Recurrence value to
establish when and how often the Remote Directory is
scanned for files. Type the start time, based on a 24 hour
clock, in the following format: HH:MM.
Recurrence Type the frequency, beginning at the Start Time, that you
want the remote directory to be scanned. Type this value in
hours (H), minutes (M), or days (D).
For example, type 2H if you want the remote directory to be
scanned every 2 hours from the start time. The default is 1H.
Run On Save Select this check box if you want the log file protocol to run
immediately after you click Save.
After the Run On Save completes, the log file protocol follows
your configured start time and recurrence schedule.
Selecting Run On Save clears the list of previously processed
files for the Ignore Previously Processed File parameter.
EPS Throttle Type the number of Events Per Second (EPS) that you do not
want this protocol to exceed. The valid range is 100 to 5000.
Processor If the files located on the remote host are stored in a zip, gzip,
tar, or tar+gzip archive format, select the processor that
allows the archives to be expanded and contents processed.
Table 20-1 Blue Coat SG log file protocol parameters (continued)
Parameter Description

Configuring DSMs
Retrieving Blue Coat Events 97
Step 10 Click Save.
Step 11 On the Admin tab, click Deploy Changes.
The log file protocol configuration for Blue Coat SG is complete.
Syslog Configuration To allow syslog event collection, you must configure your Blue Coat appliance to
forward syslog events.
CAUTION
CAUTION: If your Blue Coat SG appliance is reporting events using syslog (rather
than a file transfer protocol) and the destination syslog server becomes
unavailable, it is possible that other syslog destinations can stop receiving data
until all syslog destinations are again available. This creates the potential for some
syslog data to not be sent at all. If you are sending to multiple syslog destinations,
a disruption in availability in one syslog destination might interrupt the stream of
events to other syslog destinations from your Blue Coat SG appliance.
Procedure
Step 1 Select Configuration > Access Logging > Logs > Upload Client.
Step 2 From the Log list box, select the log containing your custom format.
Step 3 From the Client type drop-down list bow, select Custom Client.
Step 4 Click Settings.
Ignore Previously
Processed File(s)
Select this check box to track and ignore files that have
already been processed by the log file protocol.
JSA examines the log files in the remote directory to
determine if a file has been previously processed by the log
file protocol. If a previously processed file is detected, the log
file protocol does not download the file for processing. All files
that have not been previously processed are downloaded.
This option only applies to FTP and SFTP Service Types.
Change Local
Directory?
Select this check box to define a local directory on your JSA
system for storing downloaded files during processing.
We recommend that you leave this check box clear. When
this check box is selected, the Local Directory field is
displayed, which allows you to configure the local directory to
use for storing files.
Event Generator From the Event Generator list box, select LineByLine.
The Event Generator applies additional processing to the
retrieved event files. Each line of the file is a single event. For
example, if a file has 10 lines of text, 10 separate events are
created.
Table 20-1 Blue Coat SG log file protocol parameters (continued)
Parameter Description

Configuring DSMs
98 BLUE COAT SG
Step 5 From the Settings For list box, select Primary Custom Server.
Step 6 Configure the following values:
a Host - Type the IP address for your JSA.
b Port - Type 514 as the syslog port for JSA.
Step 7 Click OK.
Step 8 Select the Upload Schedule tab.
Step 9 From the Upload the access log, select continuously.
Step 10 Click Apply.
You are now ready to configure a log source for Blue Coat SG events.
Configure a log source
To integrate Barracuda Web Application Firewall with JSA, you must manually
create a log source to receive Blue Coat SG events.
Procedure
Step 1 Log in to JSA.
Step 2 Click the Admin tab.
Step 3 On the navigation menu, click Data Sources.
Step 4 Click the Log Sources icon.
Step 5 Click Add.
Step 6 In the Log Source Name field, type a name for your log source.
Step 7 In the Log Source Description field, type a description for the log source.
Step 8 From the Log Source Type list box, select Blue Coat SG Appliance.
Step 9 Using the Protocol Configuration list box, select Syslog.
Step 10 Configure the following values:
Step 11 Click Save.
Step 12 On the Admin tab, click Deploy Changes.
The log source is added to JSA. Events forwarded to JSA by Blue Coat SG are
displayed on the Log Activity tab.
Table 20-2 Syslog Protocol Parameters
Parameter Description
Log Source Identifier Type the IP address or host name for the log source as an
identifier for events from your Blue Coat SG appliance.

Configuring DSMs
Creating Additional Custom Format Key-Value Pairs 99
Creating Additional
Custom Format
Key-Value Pairs
The custom format allows you to forward specific Blue Coat data or events to JSA
using the Extended Log File Format (ELFF).
The custom format is a series of pipe delimited fields starting with Bluecoat| and
containing $(Blue Coat ELFF Parameter). Custom format fields for JSA must
be separated by the pipe character.
For example:
Bluecoat|src=$(c-ip)|srcport=$(c-port)|dst=$(cs-uri-address)|ds
tport=$(cs-uri-port)|username=$(cs-username)|devicetime=$(gmtti
me)|s-action=$(s-action)|sc-status=$(sc-status)|cs-method=$(cs-
method)
For more information on the available Blue Coat ELFF parameters, see your Blue
Coat appliance documentation.
Table 20-3 JSA Custom Format Examples
Blue Coat ELFF Parameter JSA Custom Format Example
sc-bytes $(sc-bytes)
rs(Content-type) $(rs(Content-Type))

Configuring DSMs
18 BRIDGEWATER
The Bridgewater Systems DSM for Juniper Secure Analytics (JSA) accepts events
using syslog.
Supported Event
Types
JSA records all relevant events forwarded from Bridgewater AAA Service
Controller devices using syslog.
Configuring Syslog
for Your Bridgewater
Systems Device
You must configure your Bridgewater Systems appliance to send syslog events to
JSA.
Procedure
Step 1 Log in to your Bridgewater Systems device command-line interface (CLI).
Step 2 To log operational messages to the RADIUS and Diameter servers, open the
following file:
/etc/syslog.conf
Step 3 To log all operational messages, uncomment the following line:
local1.info /WideSpan/logs/oplog
Step 4 To log error messages only, change the local1.info /WideSpan/logs/oplog
line to the following:
local1.err /WideSpan/logs/oplog
NOTE
Note: RADIUS and Diameter system messages are stored in the
/var/adm/messages file.
Step 5 Add the following line:
local1.*@<IP address>
Where <IP address> is the IP address your JSA console.
Step 6 The RADIUS and Diameter server system messages are stored in the
/var/adm/messages file. Add the following line for the system messages:
<facility>.*@<IP address>
Where:
<facility> is the facility used for logging to the /var/adm/messages file.

Configuring DSMs
102 BRIDGEWATER
<IP address> is the IP address of your JSA console.
Step 7 Save and exit the file.
Step 8 Send a hang-up signal to the syslog daemon to make sure all changes are
enforced:
kill -HUP `cat /var/run/syslog.pid`
The configuration is complete. The log source is added to JSA as Bridgewater
Systems appliance events are automatically discovered. Events forwarded to JSA
by your Bridgewater Systems appliance are displayed on the Log Activity tab.
Configuring a Log
Source
JSA automatically discovers and creates a log source for syslog events from a
Bridgewater Systems appliance. The following configuration steps are optional.
Procedure
Step 1 Log in to JSA.
Step 2 Click the Admin tab.
Step 3 On the navigation menu, click Data Sources.
Step 4 Click the Log Sources icon.
Step 5 Click Add.
Step 6 In the Log Source Name field, type a name for your log source.
Step 7 In the Log Source Description field, type a description for the log source.
Step 8 From the Log Source Type list box, select Bridgewater Systems AAA Service
Controller.
Step 9 Using the Protocol Configuration list box, select Syslog.
Step 10 Configure the following values:
Step 11 Click Save.
Step 12 On the Admin tab, click Deploy Changes.
The configuration is complete.
Table 21-1 Syslog Parameters
Parameter Description
Log Source Identifier Type the IP address or host name for the log source as an
identifier for events from your Bridgewater Systems
appliance.
Configuring DSMs
19 BROCADE FABRIC OS
Juniper Secure Analytics (JSA) can collect and categorize syslog system and audit
events from Brocade switches and appliances that use Fabric OS V7.x.
To collect syslog events, you must configure your switch to forward syslog events.
Each switch or appliance must be configured to forward events.
Events that you forward from Brocade switches are automatically discovered. A
log source is configured for each switch or appliance that forwards events to JSA.
Brocade switches or appliance that run Fabric OS V7.x.
Configuring Syslog
for Brocade Fabric
OS Appliances
To collect events, you must configure syslog on your Brocade appliance to forward
events to JSA.
Procedure
To configure syslog for Brocade Fabric OS appliances:
Step 1 Log in to your appliance as an admin user.
Step 2 To configure an address to forward syslog events, type the following command:
syslogdipadd <IP address>
Where <IP address> is the IP address of the JSA console, Event Processor,
Event Collector, or all-in-one system.
Step 3 To verify the address, type the following command:
syslogdipshow
Result
As events are generated by the Brocade switch, they are forwarded to the syslog
destination you specified. The log source is automatically discovered after enough
events are forwarded by the Brocade appliance. It typically takes a minimum of 25
events to automatically discover a log source.
What to do next
Administrators can log in to the JSA console and verify that the log source is
created on the console and that the Log Activity tab displays events from the
Brocade appliance.

Configuring DSMs
20 CA TECHNOLOGIES
This section provides information on the following DSMs:
•CA ACF2
•CA SiteMinder
•CA Top Secret
CA ACF2 Juniper Secure Analytics (JSA) includes two options for integrating CA Access
Control Facility (ACF2) events:
•Integrate CA ACF2 with JSA Using IBM Security zSecure
•Integrate CA ACF2 with JSA Using Audit Scripts
Integrate CA ACF2
with JSA Using IBM
Security zSecure
The CA ACF2 DSM allows you to integrate LEEF events from an ACF2 image on
an IBM z/OS mainframe using IBM Security zSecure.
Using a zSecure process, events from the System Management Facilities (SMF)
are recorded to an event file in the Log Enhanced Event format (LEEF). JSA
retrieves the LEEF event log files using the log file protocol and processes the
events. You can schedule JSA to retrieve events on a polling interval, which allows
JSA to retrieve the events on the schedule you have defined.
To integrate CA ACF2 events:
1 Confirm your installation meets any prerequisite installation requirements.
2 Configure your CA ACF2 z/OS image to write events in LEEF format. For more
information, see the IBM Security zSecure Suite: CARLa-Driven Components
Installation and Deployment Guide.
3 Create a log source in JSA for CA ACF2 to retrieve your LEEF formatted event
logs.
4 Optional. Create a custom event property for CA ACF2 in JSA. For more
information, see the Custom Event Properties for IBM z/OS technical note.
Before You begin
Before you can configure the data collection process, you must complete the basic
zSecure installation process.
Configuring DSMs
106 CA TECHNOLOGIES
The following installation prerequisites are required:
•You must ensure parmlib member IFAPRDxx is not disabled for IBM Security
zSecure Audit on your z/OS image.
•The SCKRLOAD library must be APF-authorized.
•You must configure a process to periodically refresh your CKFREEZE and
UNLOAD data sets.
•You must configure an SFTP, FTP, or SCP server on your z/OS image for JSA
to download your LEEF event files.
•You must allow SFTP, FTP, or SCP traffic on firewalls located between JSA and
your z/OS image.
After installing the software, you must also perform the post-installation activities to
create and modify the configuration. For instructions on installing and configuring
zSecure, see the IBM Security zSecure Suite: CARLa-Driven Components
Installation and Deployment Guide.
Create a log source for ACF2 in JSA
You can use the Log File protocol to retrieve archived log files containing events
from a remote host.
Log files are transferred, one at a time, to JSA for processing. The log file protocol
can manage plain text event logs, compressed files, or archives. Archives must
contain plain-text files that can be processed one line at a time. Multi-line event
logs are not supported by the log file protocol. IBM z/OS with zSecure writes log
files to a specified directory as gzip archives. JSA extracts the archive and
processes the events, which are written as one event per line in the file.
To retrieve these events, you must create a log source using the Log File protocol.
JSA requires credentials to log in to the system hosting your LEEF formatted event
files and a polling interval.
To configure a log source in JSA for CA ACF2:
Step 1 Log in to JSA.
Step 2 Click the Admin tab.
Step 3 On the navigation menu, click Data Sources.
Step 4 Click the Log Sources icon.
Step 5 Click Add.
Step 6 In the Log Source Name field, type a name for the log source.
Step 7 In the Log Source Description field, type a description for the log source.
Step 8 From the Log Source Type list box, select CA ACF2.
Step 9 From the Protocol Configuration list box, select Log File.

Configuring DSMs
CA ACF2 107
Step 10 Configure the following values:
Table 23-1 CA ACF2 Log File Parameters
Parameter Description
Log Source Identifier Type an IP address, host name, or name to identify the event
source. IP addresses or host names are recommended as
they allow JSA to identify a log file to a unique event source.
For example, if your network contains multiple devices, such
as multiple z/OS images or a file repository containing all of
your event logs, you should specify the IP address or host
name of the device that uniquely identifies the log source.
This allows events to be identified at the device level in your
network, instead of identifying the event for the file repository.
Service Type From the list box, select the protocol you want to use when
retrieving log files from a remote server. The default is SFTP.
•SFTP - SSH File Transfer Protocol
•FTP - File Transfer Protocol
•SCP - Secure Copy
Note: The underlying protocol used to retrieve log files for the
SCP and SFTP service type requires that the server specified
in the Remote IP or Hostname field has the SFTP subsystem
enabled.
Remote IP or
Hostname
Type the IP address or host name of the device storing your
event log files.
Remote Port Type the TCP port on the remote host that is running the
selected Service Type. The valid range is 1 to 65535.
The options include:
•FTP - TCP Port 21
•SFTP - TCP Port 22
•SCP - TCP Port 22
Note: If the host for your event files is using a non-standard
port number for FTP, SFTP, or SCP, you must adjust the port
value accordingly.
Remote User Type the user name necessary to log in to the host containing
your event files.
The username can be up to 255 characters in length.
Remote Password Type the password necessary to log in to the host.
Confirm Password Confirm the password necessary to log in to the host.
SSH Key File If you select SCP or SFTP as the Service Type, this
parameter allows you to define an SSH private key file. When
you provide an SSH Key File, the Remote Password field is
ignored.

Configuring DSMs
108 CA TECHNOLOGIES
Remote Directory Type the directory location on the remote host from which the
files are retrieved, relative to the user account you are using
to log in.
Note: For FTP only. If your log files reside in the remote user’s
home directory, you can leave the remote directory blank. This
is to support operating systems where a change in the
working directory (CWD) command is restricted.
Recursive Select this check box if you want the file pattern to search sub
folders in the remote directory. By default, the check box is
clear.
The Recursive option is ignored if you configure SCP as the
Service Type.
FTP File Pattern If you select SFTP or FTP as the Service Type, this option
allows you to configure the regular expression (regex)
required to filter the list of files specified in the Remote
Directory. All matching files are included in the processing.
IBM z/OS mainframe using IBM Security zSecure Audit writes
event files using the pattern ACF2.<timestamp>.gz
The FTP file pattern you specify must match the name you
assigned to your event files. For example, to collect files
starting with ACF2 and ending with .gz, type the following:
ACF2.*\.gz
Use of this parameter requires knowledge of regular
expressions (regex). For more information, see the following
website:
http://download.oracle.com/javase/tutorial/essential/regex/
FTP Transfer Mode This option only displays if you select FTP as the Service
Type. From the list box, select Binary.
The binary transfer mode is required for event files stored in a
binary or compressed format, such as zip, gzip, tar, or
tar+gzip archive files.
SCP Remote File If you select SCP as the Service Type you must type the file
name of the remote file.
Start Time Type the time of day you want the processing to begin. For
example, type 00:00 to schedule the Log File protocol to
collect event files at midnight.
This parameter functions with the Recurrence value to
establish when and how often the Remote Directory is
scanned for files. Type the start time, based on a 24 hour
clock, in the following format: HH:MM.
Table 23-1 CA ACF2 Log File Parameters (continued)
Parameter Description

Configuring DSMs
CA ACF2 109
Step 11 Click Save.
Step 12 On the Admin tab, click Deploy Changes.
The CA ACF2 configuration is complete. If your configuration requires custom
event properties, see the Custom Event Properties for IBM z/OS technical note.
Recurrence Type the frequency, beginning at the Start Time, that you
want the remote directory to be scanned. Type this value in
hours (H), minutes (M), or days (D).
For example, type 2H if you want the remote directory to be
scanned every 2 hours from the start time. The default is 1H.
Run On Save Select this check box if you want the log file protocol to run
immediately after you click Save.
After the Run On Save completes, the log file protocol follows
your configured start time and recurrence schedule.
Selecting Run On Save clears the list of previously processed
files for the Ignore Previously Processed File parameter.
EPS Throttle Type the number of Events Per Second (EPS) that you do not
want this protocol to exceed. The valid range is 100 to 5000.
Processor From the list box, select gzip.
Processors allow event file archives to be expanded and
contents processed for events. Files are only processed after
they are downloaded to JSA. JSA can process files in zip,
gzip, tar, or tar+gzip archive format.
Ignore Previously
Processed File(s)
Select this check box to track and ignore files that have
already been processed by the log file protocol.
JSA examines the log files in the remote directory to
determine if a file has been previously processed by the log
file protocol. If a previously processed file is detected, the log
file protocol does not download the file for processing. All files
that have not been previously processed are downloaded.
This option only applies to FTP and SFTP Service Types.
Change Local
Directory?
Select this check box to define a local directory on your JSA
for storing downloaded files during processing.
We recommend that you leave this check box clear. When
this check box is selected, the Local Directory field is
displayed, which allows you to configure the local directory to
use for storing files.
Event Generator From the Event Generator list box, select LineByLine.
The Event Generator applies additional processing to the
retrieved event files. Each line of the file is a single event. For
example, if a file has 10 lines of text, 10 separate events are
created.
Table 23-1 CA ACF2 Log File Parameters (continued)
Parameter Description
Configuring DSMs
110 CA TECHNOLOGIES
Integrate CA ACF2
with JSA Using Audit
Scripts
The CA Access Control Facility (ACF2) DSM allows you to use an IBM mainframe
to collect events and audit transactions with the log file protocol.
Configuration overview
QexACF2.load.trs is a TERSED file containing a PDS loadlib with the QEXACF2
program. A tersed file is similar to a zip file and requires you to use the TRSMAIN
program to uncompress the contents. The TRSMAIN program is available from
www.juniper.net/customers/support/.
To upload a TRS file from a workstation, you must pre-allocate a file with the
following DCB attributes: DSORG=PS, RECFM=FB, LRECL= 1024,
BLKSIZE=6144. The file transfer type must be BINARY APPEND. If the transfer
type is TEXT or TEXT APPEND, then the file cannot properly uncompress.
After you upload the file to the mainframe into the preallocated dataset the tersed
file can be UNPACKED using the TRSMAIN utility using the sample JCL also
included in the tar package. A return code of 0008 from the TRSMAIN utility
indicates the dataset is not recognized as a valid TERSED file. This error might be
the result of the file not being uploaded to a file with the correct DCB attributes or
due to the fact that the transfer was not performed using the BINARY APPEND
transfer mechanism.
After you have successfully UNPACKED the loadlib file, you can run the QEXACF2
program with the sample JCL file. The sample JCL file is contained in the tar
collection. To run the QEXACF2 program, you must modify the JCL to your local
naming conventions and JOB card requirements. You might also need to use the
STEPLIB DD if the program is not placed in a LINKLISTED library.
To integrate CA ACF2 events into JSA:
1 The IBM mainframe records all security events as Service Management
Framework (SMF) records in a live repository.
2 The CA ACF2 data is extracted from the live repository using the SMF dump utility.
The SMF file contains all of the events and fields from the previous day in raw SMF
format.
3 The QexACF2.load.trs program pulls data from the SMF formatted file. The
QexACF2.load.trs program only pulls the relevant events and fields for JSA and
writes that information in a condensed format for compatibility. The information is
saved in a location accessible by JSA.
4 JSA uses the log file protocol source to retrieve the output file information on a
scheduled basis. JSA then imports and processes this file.
Configure CA ACF2 to integrate with JSA
JSA uses scripts to write audit events to from CA ACF2 installations., which are
retrieved by JSA using the Log File protocol.

Configuring DSMs
CA ACF2 111
Procedure
Step 1 From the Juniper Networks support website
(http://www.juniper.net/customers/support/), download the following compressed
file:
qexacf2_bundled.tar.gz
Step 2 On a Linux-based operating system, extract the file:
tar -zxvf qexacf2_bundled.tar.gz
The following files are contained in the archive:
QexACF2.JCL.txt - Job Control Language file
QexACF2.load.trs - Compressed program library (requires IBM TRSMAIN)
trsmain sample JCL.txt - Job Control Language for TRSMAIN to decompress the
.trs file
Step 3 Load the files onto the IBM mainframe using the following methods:
a Upload the sample QexACF2_trsmain_JCL.txt and QexACF2.JCL.txt files
using the TEXT protocol.
b Upload the QexACF2.load.trs file using a BINARY mode transfer and
append to a pre-allocated data set. The QexACF2.load.trs file is a tersed file
containing the executable (the mainframe program QexACF2). When you
upload the .trs file from a workstation, pre-allocate a file on the mainframe with
the following DCB attributes: DSORG=PS, RECFM=FB, LRECL=1024,
BLKSIZE=6144. The file transfer type must be binary mode and not text.
NOTE
Note: QexACF2 is a small C mainframe program that reads the output of the
TSSUTIL (EARLOUT data) line by line. QexACF2 adds a header to each record
containing event information, for example, record descriptor, the date, and time.
The program places each field into the output record, suppresses trailing blank
characters, and delimits each field with the pipe character. This output file is
formatted for JSA and the blank suppression reduces network traffic to JSA. This
program does not consume CPU or I/O disk resources.
Step 4 Customize the trsmain sample_JCL.txt file according to your
installation-specific parameters.
For example, jobcard, data set naming conventions, output destinations, retention
periods, and space requirements.
The trsmain sample_JCL.txt file uses the IBM utility TRSMAIN to extract the
program stored in the QexACF2.load.trs file.
An example of the QexACF2_trsmain_JCL.txt file includes:
//TRSMAIN JOB (yourvalidjobcard),Q1 labs,
// MSGCLASS=V
//DEL EXEC PGM=IEFBR14
//D1 DD DISP=(MOD,DELETE),DSN=<yourhlq>.QEXACF2.LOAD.TRS
// UNIT=SYSDA,
Configuring DSMs
112 CA TECHNOLOGIES
// SPACE=(CYL,(10,10))
//TRSMAIN EXEC PGM=TRSMAIN,PARM='UNPACK'
//SYSPRINT DD SYSOUT=*,DCB=(LRECL=133,BLKSIZE=12901,RECFM=FBA)
//INFILE DD DISP=SHR,DSN=<yourhlq>.QEXACF2.LOAD.TRS
//OUTFILE DD DISP=(NEW,CATLG,DELETE),
// DSN=<yourhlq>.LOAD,
// SPACE=(CYL,(10,10,5),RLSE),UNIT=SYSDA
//
The .trs input file is an IBM TERSE formatted library and is extracted by running
the JCL, which calls the TRSMAIN. This tersed file, when extracted, creates a PDS
linklib with the QexACF2 program as a member.
Step 5 You can STEPLIB to this library or choose to move the program to one of the
LINKLIBs that are in LINKLST. The program does not require authorization.
Step 6 After uploading, copy the program to an existing link listed library or add a
STEPLIB DD statement with the correct dataset name of the library that will
contain the program.
Step 7 The QexACF2_jcl.txt file is a text file containing a sample JCL. You must
configure the job card to meet your configuration.
The QexACF2_jcl.txt sample file includes:
//QEXACF2 JOB (T,JXPO,JKSD0093),DEV,NOTIFY=Q1JACK,
// MSGCLASS=P,
// REGION=0M
//*
//*QEXACF2 JCL VERSION 1.0 OCTOBER, 2010
//*
//************************************************************
//* Change below dataset names to sites specific datasets names*
//************************************************************
//SET1 SET SMFIN='MVS1.SMF.RECORDS(0)',
// QEXOUT='Q1JACK.QEXACF2.OUTPUT',
// SMFOUT='Q1JACK.ACF2.DATA'
//************************************************************
//* Delete old datasets *
//************************************************************
//DEL EXEC PGM=IEFBR14
//DD1 DD DISP=(MOD,DELETE),DSN=&SMFOUT,
// UNIT=SYSDA,
// SPACE=(CYL,(10,10)),
// DCB=(RECFM=FB,LRECL=80)
//DD2 DD DISP=(MOD,DELETE),DSN=&QEXOUT,
// UNIT=SYSDA,
// SPACE=(CYL,(10,10)),
// DCB=(RECFM=FB,LRECL=80)
//*************************************************************
//* Allocate new dataset *
//*************************************************************
//ALLOC EXEC PGM=IEFBR14
Configuring DSMs
CA ACF2 113
//DD1 DD DISP=(NEW,CATLG),DSN=&QEXOUT,
// SPACE=(CYL,(100,100)),
// DCB=(RECFM=VB,LRECL=1028,BLKSIZE=6144)
//*************************************************************
//* Execute ACFRPTPP (Report Preprocessor GRO) to extract ACF2*
//* SMF records *
//*************************************************************
//PRESCAN EXEC PGM=ACFRPTPP
//SYSPRINT DD SYSOUT=*
//SYSUDUMP DD SYSOUT=*
//RECMAN1 DD DISP=SHR,DSN=&SMFIN
//SMFFLT DD DSN=&SMFOUT,SPACE=(CYL,(100,100)),DISP=(,CATLG),
// DCB=(RECFM=FB,LRECL=8192,BLKSIZE=40960),
// UNIT=SYSALLDA
//************************************************************
//* execute QEXACF2 *
//************************************************************
//EXTRACT EXEC PGM=QEXACF2,DYNAMNBR=10,
// TIME=1440
//STEPLIB DD DISP=SHR,DSN=Q1JACK.C.LOAD
//SYSTSIN DD DUMMY
//SYSTSPRT DD SYSOUT=*
//SYSPRINT DD SYSOUT=*
//CFG DD DUMMY
//ACFIN DD DISP=SHR,DSN=&SMFOUT
//ACFOUT DD DISP=SHR,DSN=&QEXOUT
//************************************************************
//FTP EXEC PGM=FTP,REGION=3800K
//INPUT DD *
<IPADDR>
<USER>
<PASSWORD>
PUT '<ACFOUT>' EARL_<THEIPOFTHEMAINFRAMEDEVICE>/<ACFOUT>
QUIT
//OUTPUT DD SYSOUT=*
//SYSPRINT DD SYSOUT=*
//*
Step 8 After the output file is created, you must choose one of the following options:
a Schedule a job to a transfer the output file to an interim FTP server.
Each time the job completes, the output file is forwarded to an interim FTP
server. You must configure the following parameters in the sample JCL to
successfully forward the output to an interim FTP server:
For example:
//FTP EXEC PGM=FTP,REGION=3800K
//INPUT DD *
<IPADDR>
<USER>
Configuring DSMs
114 CA TECHNOLOGIES
<PASSWORD>
PUT '<ACFOUT>' EARL_<THEIPOFTHEMAINFRAMEDEVICE>/<ACFOUT>
QUIT
//OUTPUT DD SYSOUT=*
//SYSPRINT DD SYSOUT=*
Where:
<IPADDR> is the IP address or host name of the interim FTP server to receive
the output file.
<USER> is the user name required to access the interim FTP server.
<PASSWORD> is the password required to access the interim FTP server.
<THEIPOFTHEMAINFRAMEDEVICE> is the destination of the mainframe or
interim FTP server receiving the output.
For example:
PUT 'Q1JACK.QEXACF2.OUTPUT.C320' /192.168.1.101/ACF2/QEXACF2.
OUTPUT.C320
<QEXOUTDSN> is the name of the output file saved to the interim FTP server.
You are now ready to create a log source in JSA. For more information, see
Create a log source.
b Schedule JSA to retrieve the output file from CA ACF2.
If the zOS platform is configured to serve files through FTP, SFTP, or allow SCP,
then no interim FTP server is required and JSA can pull the output file directly
from the mainframe. The following text must be commented out using //* or
deleted from the QexACF2_jcl.txt file:
//FTP EXEC PGM=FTP,REGION=3800K
//INPUT DD *
<IPADDR>
<USER>
<PASSWORD>
PUT '<ACFOUT>' EARL_<THEIPOFTHEMAINFRAMEDEVICE>/<ACFOUT>
QUIT
//OUTPUT DD SYSOUT=*
//SYSPRINT DD SYSOUT=*
You are now ready to configure the a log source in JSA.
Create a log source
A log file protocol source allows JSA to retrieve archived log files from a remote
host.
The CA ACF2 DSM supports the bulk loading of log files using the log file protocol
source. When configuring your CA ACF2 DSM to use the log file protocol, make
sure the hostname or IP address configured in the CA ACF2 is the same as
configured in the Remote Host parameter in the Log File protocol configuration.

Configuring DSMs
CA ACF2 115
To configure a log source in JSA for CA ACF2:
Step 1 Log in to JSA.
Step 2 Click the Admin tab.
Step 3 On the navigation menu, click Data Sources.
The Data Sources panel is displayed.
Step 4 Click the Log Sources icon.
The Log Sources window is displayed.
Step 5 Click Add.
The Add a log source window is displayed.
Step 6 In the Log Source Name field, type a name for the log source.
Step 7 In the Log Source Description field, type a description for the log source.
Step 8 From the Log Source Type list box, select CA ACF2.
Step 9 From the Protocol Configuration list box, select Log File.
Step 10 Configure the following values:
Table 23-2 CA ACF2 Log File Parameters
Parameter Description
Log Source Identifier Type an IP address, host name, or name to identify the event
source. IP addresses or host names are recommended as
they allow JSA to identify a log file to a unique event source.
For example, if your network contains multiple devices, such
as multiple z/OS images or a file repository containing all of
your event logs, you should specify the IP address or host
name of the device that uniquely identifies the log source.
This allows events to be identified at the device level in your
network, instead of identifying the event for the file repository.
Service Type From the list box, select the protocol you want to use when
retrieving log files from a remote server. The default is SFTP.
•SFTP - SSH File Transfer Protocol
•FTP - File Transfer Protocol
•SCP - Secure Copy
Note: The underlying protocol used to retrieve log files for the
SCP and SFTP service type requires that the server specified
in the Remote IP or Hostname field has the SFTP subsystem
enabled.
Remote IP or
Hostname
Type the IP address or host name of the device storing your
event log files.

Configuring DSMs
116 CA TECHNOLOGIES
Remote Port Type the TCP port on the remote host that is running the
selected Service Type. The valid range is 1 to 65535.
The options include:
•FTP - TCP Port 21
•SFTP - TCP Port 22
•SCP - TCP Port 22
Note: If the host for your event files is using a non-standard
port number for FTP, SFTP, or SCP, you must adjust the port
value accordingly.
Remote User Type the user name necessary to log in to the host containing
your event files.
The username can be up to 255 characters in length.
Remote Password Type the password necessary to log in to the host.
Confirm Password Confirm the password necessary to log in to the host.
SSH Key File If you select SCP or SFTP as the Service Type, this
parameter allows you to define an SSH private key file. When
you provide an SSH Key File, the Remote Password field is
ignored.
Remote Directory Type the directory location on the remote host from which the
files are retrieved, relative to the user account you are using
to log in.
Note: For FTP only. If your log files reside in the remote user’s
home directory, you can leave the remote directory blank. This
is to support operating systems where a change in the
working directory (CWD) command is restricted.
Recursive Select this check box if you want the file pattern to search sub
folders in the remote directory. By default, the check box is
clear.
The Recursive option is ignored if you configure SCP as the
Service Type.
Table 23-2 CA ACF2 Log File Parameters (continued)
Parameter Description

Configuring DSMs
CA ACF2 117
FTP File Pattern If you select SFTP or FTP as the Service Type, this option
allows you to configure the regular expression (regex)
required to filter the list of files specified in the Remote
Directory. All matching files are included in the processing.
IBM z/OS mainframe using IBM Security zSecure Audit writes
event files using the pattern zOS.<timestamp>.gz
The FTP file pattern you specify must match the name you
assigned to your event files. For example, to collect files
starting with zOS and ending with .gz, type the following:
ACF2.*\.gz
Use of this parameter requires knowledge of regular
expressions (regex). For more information, see the following
website:
http://download.oracle.com/javase/tutorial/essential/regex/
FTP Transfer Mode This option only displays if you select FTP as the Service
Type. From the list box, select Binary.
The binary transfer mode is required for event files stored in a
binary or compressed format, such as zip, gzip, tar, or
tar+gzip archive files.
SCP Remote File If you select SCP as the Service Type you must type the file
name of the remote file.
Start Time Type the time of day you want the processing to begin. For
example, type 00:00 to schedule the Log File protocol to
collect event files at midnight.
This parameter functions with the Recurrence value to
establish when and how often the Remote Directory is
scanned for files. Type the start time, based on a 24 hour
clock, in the following format: HH:MM.
Recurrence Type the frequency, beginning at the Start Time, that you
want the remote directory to be scanned. Type this value in
hours (H), minutes (M), or days (D).
For example, type 2H if you want the remote directory to be
scanned every 2 hours from the start time. The default is 1H.
Run On Save Select this check box if you want the log file protocol to run
immediately after you click Save.
After the Run On Save completes, the log file protocol follows
your configured start time and recurrence schedule.
Selecting Run On Save clears the list of previously processed
files for the Ignore Previously Processed File parameter.
EPS Throttle Type the number of Events Per Second (EPS) that you do not
want this protocol to exceed. The valid range is 100 to 5000.
Table 23-2 CA ACF2 Log File Parameters (continued)
Parameter Description

Configuring DSMs
118 CA TECHNOLOGIES
Step 11 Click Save.
Step 12 On the Admin tab, click Deploy Changes.
The CA ACF2 configuration is complete. If your configuration requires custom
event properties, see the Custom Event Properties for IBM z/OS technical note.
CA SiteMinder The CA SiteMinder DSM collects and categorizes authorization events from CA
SiteMinder appliances using syslog-ng.
Supported Event
Types
The CA SiteMinder DSM accepts access and authorization events logged in
smaccess.log and forwards the events to JSA using syslog-ng.
Configure a Log
Source
CA SiteMinder with JSA does not automatically discover authorization events
forwarded using syslog-ng from CA SiteMinder appliances.
To manually create a CA SiteMinder log source:
Step 1 Click the Admin tab.
Processor From the list box, select gzip.
Processors allow event file archives to be expanded and
contents processed for events. Files are only processed after
they are downloaded to JSA. JSA can process files in zip,
gzip, tar, or tar+gzip archive format.
Ignore Previously
Processed File(s)
Select this check box to track and ignore files that have
already been processed by the log file protocol.
JSA examines the log files in the remote directory to
determine if a file has been previously processed by the log
file protocol. If a previously processed file is detected, the log
file protocol does not download the file for processing. All files
that have not been previously processed are downloaded.
This option only applies to FTP and SFTP Service Types.
Change Local
Directory?
Select this check box to define a local directory on your JSA
for storing downloaded files during processing.
We recommend that you leave this check box clear. When
this check box is selected, the Local Directory field is
displayed, which allows you to configure the local directory to
use for storing files.
Event Generator From the Event Generator list box, select LineByLine.
The Event Generator applies additional processing to the
retrieved event files. Each line of the file is a single event. For
example, if a file has 10 lines of text, 10 separate events are
created.
Table 23-2 CA ACF2 Log File Parameters (continued)
Parameter Description

Configuring DSMs
CA SiteMinder 119
Step 2 On the navigation menu, click Data Sources.
The Data Sources panel is displayed.
Step 3 Click the Log Sources icon.
The Log Sources window is displayed.
Step 4 In the Log Source Name field, type a name for your CA SiteMinder log source.
Step 5 In the Log Source Description field, type a description for the log source.
Step 6 From the Log Source Type list box, select CA SiteMinder.
Step 7 From the Protocol Configuration list box, select Syslog.
The syslog protocol parameters are displayed.
NOTE
Note: The Log File protocol is displayed in the Protocol Configuration list box,
however, polling for log files is not a recommended configuration method.
Step 8 Configure the following values:
Table 23-3 Adding a Syslog Log Source
Parameter Description
Log Source Identifier Type the IP address or hostname for your CA SiteMinder
appliance.
Enabled Select this check box to enable the log source. By default,
this check box is selected.
Credibility From the list box, select the credibility of the log source. The
range is 0 to 10.
The credibility indicates the integrity of an event or offense as
determined by the credibility rating from the source device.
Credibility increases if multiple sources report the same
event. The default is 5.
Target Event Collector From the list box, select the Event Collector to use as the
target for the log source.
Coalescing Events Select this check box to enable the log source to coalesce
(bundle) events.
Automatically discovered log sources use the default value
configured in the Coalescing Events list box in the System
Settings window, which is accessible on the Admin tab.
However, when you create a new log source or update the
configuration for an automatically discovered log source you
can override the default value by configuring this check box
for each log source. For more information on Settings, see
the Juniper Secure Analytics Administration Guide.

Configuring DSMs
120 CA TECHNOLOGIES
Step 9 Click Save.
The Admin tab toolbar detects log source changes and displays a messages to
indicate when you need to deploy a change.
Step 10 On the Admin tab, click Deploy Changes.
You are now ready to configure syslog-ng on your CA SiteMinder appliance to
forward events to JSA.
Configure Syslog-ng
for CA SiteMinder
You must configure your CA SiteMinder appliance to forward syslog-ng events to
your JSA console or Event Collector.
JSA can collect syslog-ng events from TCP or UDP syslog sources on port 514.
To configure syslog-ng for CA SiteMinder:
Step 1 Using SSH, log in to your CA SiteMinder appliance as a root user.
Step 2 Edit the syslog-ng configuration file.
/etc/syslog-ng.conf
Step 3 Add the following information to specify the access log as the event file for
syslog-ng:
source s_siteminder_access {
file("/opt/apps/siteminder/sm66/siteminder/log/smaccess.log");
};
Step 4 Add the following information to specify the destination and message template:
destination d_remote_q1_siteminder {
udp("<JSA IP>" port(514) template ("$PROGRAM $MSG\n"));
};
Where <JSA IP> is the IP address of the JSA console or Event Collector.
Store Event Payload Select this check box to enable or disable JSA from storing
the event payload.
Automatically discovered log sources use the default value
from the Store Event Payload list box in the System
Settings window, which is accessible on the Admin tab.
However, when you create a new log source or update the
configuration for an automatically discovered log source you
can override the default value by configuring this check box
for each log source. For more information on Settings, see
the Juniper Secure Analytics Administration Guide.
Table 23-3 Adding a Syslog Log Source (continued)
Parameter Description

Configuring DSMs
CA Top Secret 121
Step 5 Add the following log entry information:
log {
source(s_siteminder_access);
destination(d_remote_q1_siteminder);
};
Step 6 Save the syslog-ng.conf file.
Step 7 Type the following command to restart syslog-ng:
service syslog-ng restart
After the syslog-ng service restarts, the CA SiteMinder configuration is complete.
Events forwarded to JSA by CA SiteMinder are display on the Log Activity tab.
CA Top Secret JSA includes two options for integrating CA Top Secret events:
•Integrate CA Top Secret with JSA using IBM Security zSecure
•Integrate CA Top Secret with JSA Using Audit Scripts
Integrate CA Top
Secret with JSA
using IBM Security
zSecure
The CA Top Secret DSM allows you to integrate LEEF events from a Top Secret
image on an IBM z/OS mainframe using IBM Security zSecure.
Using a zSecure process, events from the System Management Facilities (SMF)
are recorded to an event file in the Log Enhanced Event format (LEEF). JSA
retrieves the LEEF event log files using the log file protocol and processes the
events. You can schedule JSA to retrieve events on a polling interval, which allows
JSA to retrieve the events on the schedule you have defined.
To integrate CA Top Secret events:
1 Confirm your installation meets any prerequisite installation requirements.
2 Configure your CA Top Secret z/OS image to write events in LEEF format. For
more information, see the IBM Security zSecure Suite: CARLa-Driven
Components Installation and Deployment Guide.
3 Create a log source in JSA for CA Top Secret to retrieve your LEEF formatted
event logs.
4 Optional. Create a custom event property for CA Top Secret in JSA. For more
information, see the Custom Event Properties for IBM z/OS technical note.
Before you begin
Before you can configure the data collection process, you must complete the basic
zSecure installation process.
The following prerequisites are required:
•You must ensure parmlib member IFAPRDxx is not disabled for IBM Security
zSecure Audit on your z/OS image.
•The SCKRLOAD library must be APF-authorized.
Configuring DSMs
122 CA TECHNOLOGIES
•You must configure a process to periodically refresh your CKFREEZE and
UNLOAD data sets.
•You must configure an SFTP, FTP, or SCP server on your z/OS image for JSA
to download your LEEF event files.
•You must allow SFTP, FTP, or SCP traffic on firewalls located between JSA and
your z/OS image.
After installing the software, you must also perform the post-installation activities to
create and modify the configuration. For instructions on installing and configuring
zSecure, see the IBM Security zSecure Suite: CARLa-Driven Components
Installation and Deployment Guide.
Create a log source
The Log File protocol allows JSA to retrieve archived log files from a remote host.
Log files are transferred, one at a time, to JSA for processing. The log file protocol
can manage plain text event logs, compressed files, or archives. Archives must
contain plain-text files that can be processed one line at a time. Multi-line event
logs are not supported by the log file protocol. IBM z/OS with zSecure writes log
files to a specified directory as gzip archives. JSA extracts the archive and
processes the events, which are written as one event per line in the file.
To retrieve these events, you must create a log source using the Log File protocol.
JSA requires credentials to log in to the system hosting your LEEF formatted event
files and a polling interval.
To configure a log source in JSA for CA Top Secret:
Step 1 Log in to JSA.
Step 2 Click the Admin tab.
Step 3 On the navigation menu, click Data Sources.
The Data Sources panel is displayed.
Step 4 Click the Log Sources icon.
The Log Sources window is displayed.
Step 5 Click Add.
The Add a log source window is displayed.
Step 6 In the Log Source Name field, type a name for the log source.
Step 7 In the Log Source Description field, type a description for the log source.
Step 8 From the Log Source Type list box, select CA Top Secret.
Step 9 From the Protocol Configuration list box, select Log File.

Configuring DSMs
CA Top Secret 123
Step 10 Configure the following values:
Table 23-4 CA Top Secret Log File Parameters
Parameter Description
Log Source Identifier Type an IP address, host name, or name to identify the event
source. IP addresses or host names are recommended as
they allow JSA to identify a log file to a unique event source.
For example, if your network contains multiple devices, such
as multiple z/OS images or a file repository containing all of
your event logs, you should specify the IP address or host
name of the device that uniquely identifies the log source.
This allows events to be identified at the device level in your
network, instead of identifying the event for the file repository.
Service Type From the list box, select the protocol you want to use when
retrieving log files from a remote server. The default is SFTP.
•SFTP - SSH File Transfer Protocol
•FTP - File Transfer Protocol
•SCP - Secure Copy
Note: The underlying protocol used to retrieve log files for the
SCP and SFTP service type requires that the server specified
in the Remote IP or Hostname field has the SFTP subsystem
enabled.
Remote IP or
Hostname
Type the IP address or host name of the device storing your
event log files.
Remote Port Type the TCP port on the remote host that is running the
selected Service Type. The valid range is 1 to 65535.
The options include:
•FTP - TCP Port 21
•SFTP - TCP Port 22
•SCP - TCP Port 22
Note: If the host for your event files is using a non-standard
port number for FTP, SFTP, or SCP, you must adjust the port
value accordingly.
Remote User Type the user name necessary to log in to the host containing
your event files.
The username can be up to 255 characters in length.
Remote Password Type the password necessary to log in to the host.
Confirm Password Confirm the password necessary to log in to the host.
SSH Key File If you select SCP or SFTP as the Service Type, this
parameter allows you to define an SSH private key file. When
you provide an SSH Key File, the Remote Password field is
ignored.

Configuring DSMs
124 CA TECHNOLOGIES
Remote Directory Type the directory location on the remote host from which the
files are retrieved, relative to the user account you are using
to log in.
Note: For FTP only. If your log files reside in the remote user’s
home directory, you can leave the remote directory blank. This
is to support operating systems where a change in the
working directory (CWD) command is restricted.
Recursive Select this check box if you want the file pattern to search sub
folders in the remote directory. By default, the check box is
clear.
The Recursive option is ignored if you configure SCP as the
Service Type.
FTP File Pattern If you select SFTP or FTP as the Service Type, this option
allows you to configure the regular expression (regex)
required to filter the list of files specified in the Remote
Directory. All matching files are included in the processing.
IBM z/OS mainframe using IBM Security zSecure Audit writes
event files using the pattern TSS.<timestamp>.gz
The FTP file pattern you specify must match the name you
assigned to your event files. For example, to collect files
starting with TSS and ending with .gz, type the following:
TSS.*\.gz
Use of this parameter requires knowledge of regular
expressions (regex). For more information, see the following
website:
http://download.oracle.com/javase/tutorial/essential/regex/
FTP Transfer Mode This option only displays if you select FTP as the Service
Type. From the list box, select Binary.
The binary transfer mode is required for event files stored in a
binary or compressed format, such as zip, gzip, tar, or
tar+gzip archive files.
SCP Remote File If you select SCP as the Service Type you must type the file
name of the remote file.
Start Time Type the time of day you want the processing to begin. For
example, type 00:00 to schedule the Log File protocol to
collect event files at midnight.
This parameter functions with the Recurrence value to
establish when and how often the Remote Directory is
scanned for files. Type the start time, based on a 24 hour
clock, in the following format: HH:MM.
Table 23-4 CA Top Secret Log File Parameters (continued)
Parameter Description

Configuring DSMs
CA Top Secret 125
Step 11 Click Save.
Step 12 On the Admin tab, click Deploy Changes.
The CA Top Secret configuration is complete. If your configuration requires custom
event properties, see the Custom Event Properties for IBM z/OS technical note.
Recurrence Type the frequency, beginning at the Start Time, that you
want the remote directory to be scanned. Type this value in
hours (H), minutes (M), or days (D).
For example, type 2H if you want the remote directory to be
scanned every 2 hours from the start time. The default is 1H.
Run On Save Select this check box if you want the log file protocol to run
immediately after you click Save.
After the Run On Save completes, the log file protocol follows
your configured start time and recurrence schedule.
Selecting Run On Save clears the list of previously processed
files for the Ignore Previously Processed File parameter.
EPS Throttle Type the number of Events Per Second (EPS) that you do not
want this protocol to exceed. The valid range is 100 to 5000.
Processor From the list box, select gzip.
Processors allow event file archives to be expanded and
contents processed for events. Files are only processed after
they are downloaded to JSA. JSA can process files in zip,
gzip, tar, or tar+gzip archive format.
Ignore Previously
Processed File(s)
Select this check box to track and ignore files that have
already been processed by the log file protocol.
JSA examines the log files in the remote directory to
determine if a file has been previously processed by the log
file protocol. If a previously processed file is detected, the log
file protocol does not download the file for processing. All files
that have not been previously processed are downloaded.
This option only applies to FTP and SFTP Service Types.
Change Local
Directory?
Select this check box to define a local directory on your JSA
for storing downloaded files during processing.
We recommend that you leave this check box clear. When
this check box is selected, the Local Directory field is
displayed, which allows you to configure the local directory to
use for storing files.
Event Generator From the Event Generator list box, select LineByLine.
The Event Generator applies additional processing to the
retrieved event files. Each line of the file is a single event. For
example, if a file has 10 lines of text, 10 separate events are
created.
Table 23-4 CA Top Secret Log File Parameters (continued)
Parameter Description
Configuring DSMs
126 CA TECHNOLOGIES
Integrate CA Top
Secret with JSA
Using Audit Scripts
The CA Top Secret DSM allows you to integrate with an IBM zOS mainframe to
collect events and audit transactions.
JSA records all relevant and available information from the event.
To integrate CA Top Secret events into JSA:
1 The IBM mainframe records all security events as Service Management
Framework (SMF) records in a live repository.
2 At midnight, the CA Top Secret data is extracted from the live repository using the
SMF dump utility. The SMF file contains all of the events and fields from the
previous day in raw SMF format.
3 The qextopsloadlib program pulls data from the SMF formatted file. The
qextopsloadlib program only pulls the relevant events and fields for JSA and
writes that information in a condensed format for compatibility. The information is
saved in a location accessible by JSA.
4 JSA uses the log file protocol source to retrieve the output file information on a
scheduled basis. JSA then imports and processes this file.
Configure CA Top Secret to integrate with JSA
To integrate CA Top Secret with JSA:
Step 1 From the Juniper Networks support website
(http://www.juniper.net/customers/support/), download the following compressed
file:
qextops_bundled.tar.gz
Step 2 On a Linux-based operating system, extract the file:
tar -zxvf qextops_bundled.tar.gz
The following files are contained in the archive:
qextops_jcl.txt
qextopsloadlib.trs
qextops_trsmain_JCL.txt
Step 3 Load the files onto the IBM mainframe using any terminal emulator file transfer
method.
a Upload the sample qextops_trsmain_JCL.txt and qextops_jcl.txt files
using the TEXT protocol.
b Upload the qextopsloadlib.trs file using a BINARY mode transfer. The
qextopsloadlib.trs file is a tersed file containing the executable (the
mainframe program qextops). When you upload the .trs file from a workstation,
pre-allocate a file on the mainframe with the following DCB attributes:
DSORG=PS, RECFM=FB, LRECL=1024, BLKSIZE=6144. The file transfer
type must be binary mode and not text.

Configuring DSMs
CA Top Secret 127
NOTE
Note: Qextops is a small C mainframe program that reads the output of the
TSSUTIL (EARLOUT data) line by line. Qextops adds a header to each record
containing event information, for example, record descriptor, the date, and time.
The program places each field into the output record, suppresses trailing blank
characters, and delimits each field with the pipe character. This output file is
formatted for JSA and the blank suppression reduces network traffic to JSA. This
program does not consume CPU or I/O disk resources.
Step 4 Customize the qextops_trsmain_JCL.txt file according to your
installation-specific requirements.
The qextops_trsmain_JCL.txt file uses the IBM utility TRSMAIN to extract the
program stored in the qextopsloadlib.trs file.
An example of the qextops_trsmain_JCL.txt file includes:
//TRSMAIN JOB (yourvalidjobcard),Q1 labs,
// MSGCLASS=V
//DEL EXEC PGM=IEFBR14
//D1 DD DISP=(MOD,DELETE),DSN=<yourhlq>.QEXTOPS.TRS
// UNIT=SYSDA,
// SPACE=(CYL,(10,10))
//TRSMAIN EXEC PGM=TRSMAIN,PARM='UNPACK'
//SYSPRINT DD SYSOUT=*,DCB=(LRECL=133,BLKSIZE=12901,RECFM=FBA)
//INFILE DD DISP=SHR,DSN=<yourhlq>.QEXTOPS.TRS
//OUTFILE DD DISP=(NEW,CATLG,DELETE),
// DSN=<yourhlq>.LOAD,
// SPACE=(CYL,(10,10,5),RLSE),UNIT=SYSDA
//
You must update the file with your installation specific information for parameters,
for example, jobcard, data set naming conventions, output destinations, retention
periods, and space requirements.
The .trs input file is an IBM TERSE formatted library and is extracted by running
the JCL, which calls the TRSMAIN. This tersed file, when extracted, creates a PDS
linklib with the qextops program as a member.
Step 5 You can STEPLIB to this library or choose to move the program to one of the
LINKLIBs that are in the LINKLST. The program does not require authorization.
Step 6 After uploading, copy the program to an existing link listed library or add a
STEPLIB DD statement with the correct dataset name of the library that will
contain the program.
Step 7 The qextops_jcl.txt file is a text file containing a sample JCL. You must
configure the job card to meet your configuration.
The qextops_jcl.txt sample file includes:
//QEXTOPS JOB (T,JXPO,JKSD0093),DEV,NOTIFY=Q1JACK,
// MSGCLASS=P,
// REGION=0M
//*
Configuring DSMs
128 CA TECHNOLOGIES
//*QEXTOPS JCL version 1.0 September, 2010
//*
//*************************************************************
//* Change below dataset names to sites specific datasets names*
//************************************************************
//SET1 SET TSSOUT='Q1JACK.EARLOUT.ALL',
// EARLOUT='Q1JACK.QEXTOPS.PROGRAM.OUTPUT'
//************************************************************
//* Delete old datasets *
//************************************************************
//DEL EXEC PGM=IEFBR14
//DD1 DD DISP=(MOD,DELETE),DSN=&TSSOUT,
// UNIT=SYSDA,
// SPACE=(CYL,(10,10)),
// DCB=(RECFM=FB,LRECL=80)
//DD2 DD DISP=(MOD,DELETE),DSN=&EARLOUT,
// UNIT=SYSDA,
// SPACE=(CYL,(10,10)),
// DCB=(RECFM=FB,LRECL=80)
//************************************************************
//* Allocate new dataset *
//************************************************************
//ALLOC EXEC PGM=IEFBR14
//DD1 DD DISP=(NEW,CATLG),DSN=&EARLOUT,
// SPACE=(CYL,(100,100)),
// DCB=(RECFM=VB,LRECL=1028,BLKSIZE=6144)
//************************************************************
//* Execute Top Secret TSSUTIL utility to extract smf records*
//************************************************************
//REPORT EXEC PGM=TSSUTIL
//SMFIN DD DISP=SHR,DSN=&SMFIN1
//SMFIN1 DD DISP=SHR,DSN=&SMFIN2
//UTILOUT DD DSN=&UTILOUT,
// DISP=(,CATLG),UNIT=SYSDA,SPACE=(CYL,(50,10),RLSE),
// DCB=(RECFM=FB,LRECL=133,BLKSIZE=0)
//EARLOUT DD DSN=&TSSOUT,
// DISP=(NEW,CATLG),UNIT=SYSDA,
// SPACE=(CYL,(200,100),RLSE),
// DCB=(RECFM=VB,LRECL=456,BLKSIZE=27816)
//UTILIN DD *
NOLEGEND
REPORT EVENT(ALL) END
/*
//************************************************************
//EXTRACT EXEC PGM=QEXTOPS,DYNAMNBR=10,
// TIME=1440
//STEPLIB DD DISP=SHR,DSN=Q1JACK.C.LOAD
//SYSTSIN DD DUMMY
//SYSTSPRT DD SYSOUT=*
//SYSPRINT DD SYSOUT=*
Configuring DSMs
CA Top Secret 129
//CFG DD DUMMY
//EARLIN DD DISP=SHR,DSN=&TSSOUT
//EARLOUT DD DISP=SHR,DSN=&EARLOUT
//************************************************************
//FTP EXEC PGM=FTP,REGION=3800K
//INPUT DD *
<IPADDR>
<USER>
<PASSWORD>
PUT '<EARLOUT>' EARL_<THEIPOFTHEMAINFRAMEDEVICE>/<EARLOUT>
QUIT
//OUTPUT DD SYSOUT=*
//SYSPRINT DD SYSOUT=*
Step 8 After the output file is created, you must choose one of the following options:
a Schedule a job to a transfer the output file to an interim FTP server.
Each time the job completes, the output file is forwarded to an intermin FTP
server. You must configure the following parameters in the sample JCL to
successfully forward the output to an interim FTP server:
For example:
//FTP EXEC PGM=FTP,REGION=3800K
//INPUT DD *
<IPADDR>
<USER>
<PASSWORD>
PUT '<EARLOUT>' EARL_<THEIPOFTHEMAINFRAMEDEVICE>/<EARLOUT>
QUIT
//OUTPUT DD SYSOUT=*
//SYSPRINT DD SYSOUT=*
Where:
<IPADDR> is the IP address or host name of the interim FTP server to receive
the output file.
<USER> is the user name required to access the interim FTP server.
<PASSWORD> is the password required to access the interim FTP server.
<THEIPOFTHEMAINFRAMEDEVICE> is the destination of the mainframe or
interim FTP server receiving the output.
For example:
PUT 'Q1JACK.QEXTOPS.OUTPUT.C320' /192.168.1.101/CA/QEXTOPS.OU
TPUT.C320
<QEXOUTDSN> is the name of the output file saved to the interim FTP server.
You are now ready to configure the Log File protocol. See Create a log source.
b Schedule JSA to retrieve the output file from CA Top Secret.
If the zOS platform is configured to serve files through FTP, SFTP, or allow SCP,
then no interim FTP server is required and JSA can pull the output file directly
Configuring DSMs
130 CA TECHNOLOGIES
from the mainframe. The following text must be commented out using //* or
deleted from the qextops_jcl.txt file:
//FTP EXEC PGM=FTP,REGION=3800K
//INPUT DD *
<IPADDR>
<USER>
<PASSWORD>
PUT '<EARLOUT>' EARL_<THEIPOFTHEMAINFRAMEDEVICE>/<EARLOUT>
QUIT
//OUTPUT DD SYSOUT=*
//SYSPRINT DD SYSOUT=*
You are now ready to configure the Log File protocol. See Create a log source.
Create a log source
A log file protocol source allows JSA to retrieve archived log files from a remote
host. The CA Top Secret DSM supports the bulk loading of log files using the log
file protocol source.
When configuring your CA Top Secret DSM to use the log file protocol, make sure
the hostname or IP address configured in the CA Top Secret is the same as
configured in the Remote Host parameter in the Log File Protocol configuration.
To configure a log source in JSA for CA Top Secret:
Step 1 Log in to JSA.
Step 2 Click the Admin tab.
Step 3 On the navigation menu, click Data Sources.
The Data Sources panel is displayed.
Step 4 Click the Log Sources icon.
The Log Sources window is displayed.
Step 5 Click Add.
The Add a log source window is displayed.
Step 6 In the Log Source Name field, type a name for the log source.
Step 7 In the Log Source Description field, type a description for the log source.
Step 8 From the Log Source Type list box, select CA Top Secret.
Step 9 From the Protocol Configuration list box, select Log File.

Configuring DSMs
CA Top Secret 131
Step 10 Configure the following values:
Table 23-5 CA Top Secret Log File Parameters
Parameter Description
Log Source Identifier Type an IP address, host name, or name to identify the event
source. IP addresses or host names are recommended as
they allow JSA to identify a log file to a unique event source.
For example, if your network contains multiple devices, such
as multiple z/OS images or a file repository containing all of
your event logs, you should specify the IP address or host
name of the device that uniquely identifies the log source.
This allows events to be identified at the device level in your
network, instead of identifying the event for the file repository.
Service Type From the list box, select the protocol you want to use when
retrieving log files from a remote server. The default is SFTP.
•SFTP - SSH File Transfer Protocol
•FTP - File Transfer Protocol
•SCP - Secure Copy
Note: The underlying protocol used to retrieve log files for the
SCP and SFTP service type requires that the server specified
in the Remote IP or Hostname field has the SFTP subsystem
enabled.
Remote IP or
Hostname
Type the IP address or host name of the device storing your
event log files.
Remote Port Type the TCP port on the remote host that is running the
selected Service Type. The valid range is 1 to 65535.
The options include:
•FTP - TCP Port 21
•SFTP - TCP Port 22
•SCP - TCP Port 22
Note: If the host for your event files is using a non-standard
port number for FTP, SFTP, or SCP, you must adjust the port
value accordingly.
Remote User Type the user name necessary to log in to the host containing
your event files.
The username can be up to 255 characters in length.
Remote Password Type the password necessary to log in to the host.
Confirm Password Confirm the password necessary to log in to the host.
SSH Key File If you select SCP or SFTP as the Service Type, this
parameter allows you to define an SSH private key file. When
you provide an SSH Key File, the Remote Password field is
ignored.

Configuring DSMs
132 CA TECHNOLOGIES
Remote Directory Type the directory location on the remote host from which the
files are retrieved, relative to the user account you are using
to log in.
Note: For FTP only. If your log files reside in the remote user’s
home directory, you can leave the remote directory blank. This
is to support operating systems where a change in the
working directory (CWD) command is restricted.
Recursive Select this check box if you want the file pattern to search sub
folders in the remote directory. By default, the check box is
clear.
The Recursive option is ignored if you configure SCP as the
Service Type.
FTP File Pattern If you select SFTP or FTP as the Service Type, this option
allows you to configure the regular expression (regex)
required to filter the list of files specified in the Remote
Directory. All matching files are included in the processing.
The FTP file pattern you specify must match the name you
assigned to your event files.
Use of this parameter requires knowledge of regular
expressions (regex). For more information, see the following
website:
http://download.oracle.com/javase/tutorial/essential/regex/
FTP Transfer Mode This option only displays if you select FTP as the Service
Type. From the list box, select Binary.
The binary transfer mode is required for event files stored in a
binary or compressed format, such as zip, gzip, tar, or
tar+gzip archive files.
SCP Remote File If you select SCP as the Service Type you must type the file
name of the remote file.
Start Time Type the time of day you want the processing to begin. For
example, type 00:00 to schedule the Log File protocol to
collect event files at midnight.
This parameter functions with the Recurrence value to
establish when and how often the Remote Directory is
scanned for files. Type the start time, based on a 24 hour
clock, in the following format: HH:MM.
Recurrence Type the frequency, beginning at the Start Time, that you
want the remote directory to be scanned. Type this value in
hours (H), minutes (M), or days (D).
For example, type 2H if you want the remote directory to be
scanned every 2 hours from the start time. The default is 1H.
Table 23-5 CA Top Secret Log File Parameters (continued)
Parameter Description

Configuring DSMs
CA Top Secret 133
Step 11 Click Save.
Step 12 On the Admin tab, click Deploy Changes.
The CA Top Secret configuration is complete. If your configuration requires custom
event properties, see the Custom Event Properties for IBM z/OS technical note.
Run On Save Select this check box if you want the log file protocol to run
immediately after you click Save.
After the Run On Save completes, the log file protocol follows
your configured start time and recurrence schedule.
Selecting Run On Save clears the list of previously processed
files for the Ignore Previously Processed File parameter.
EPS Throttle Type the number of Events Per Second (EPS) that you do not
want this protocol to exceed. The valid range is 100 to 5000.
Processor From the list box, select gzip.
Processors allow event file archives to be expanded and
contents processed for events. Files are only processed after
they are downloaded to JSA. JSA can process files in zip,
gzip, tar, or tar+gzip archive format.
Ignore Previously
Processed File(s)
Select this check box to track and ignore files that have
already been processed by the log file protocol.
JSA examines the log files in the remote directory to
determine if a file has been previously processed by the log
file protocol. If a previously processed file is detected, the log
file protocol does not download the file for processing. All files
that have not been previously processed are downloaded.
This option only applies to FTP and SFTP Service Types.
Change Local
Directory?
Select this check box to define a local directory on your JSA
for storing downloaded files during processing.
We recommend that you leave this check box clear. When
this check box is selected, the Local Directory field is
displayed, which allows you to configure the local directory to
use for storing files.
Event Generator From the Event Generator list box, select LineByLine.
The Event Generator applies additional processing to the
retrieved event files. Each line of the file is a single event. For
example, if a file has 10 lines of text, 10 separate events are
created.
Table 23-5 CA Top Secret Log File Parameters (continued)
Parameter Description
Configuring DSMs
134 CA TECHNOLOGIES

Configuring DSMs
21 CHECK POINT
This section provides information on the following DSMs for JSA:
•Check Point FireWall-1
•Check Point Provider-1
Check Point
FireWall-1
You can configure Juniper Secure Analytics (JSA) to integrate with a Check Point
FireWall-1 device using one of the following methods:
•Integrating Check Point FireWall-1 Using Syslog
•Integrating Check Point FireWall-1 Using OPSEC
NOTE
Note: Depending on your Operating System, the procedures for the Check Point
FireWall-1 device might vary. The following procedures are based on the Check
Point SecurePlatform Operating system.
Integrating Check
Point FireWall-1
Using Syslog
This section describes how to ensure that the JSA Check Point FireWall-1 DSMs
accepts FireWall-1 events using syslog.
Configuring Syslog for Check Point FireWall-1
Before you configure JSA to integrate with a Check Point FireWall-1 device:
NOTE
Note: If Check Point SmartCenter is installed on Microsoft Windows, you must
integrate Check Point with JSA using OPSEC. For more information, see
Integrating Check Point FireWall-1 Using OPSEC.
Step 1 Type the following command to access the Check Point console as an expert user:
expert
A password prompt is displayed.
Step 2 Type your expert console password. Press the Enter key.
Step 3 Open the following file:
/etc/rc.d/rc3.d/S99local
Configuring DSMs
136 CHECK POINT
Step 4 Add the following lines:
$FWDIR/bin/fw log -ftn | /usr/bin/logger -p
<facility>.<priority> > /dev/null 2>&1 &
Where:
<facility> is a Syslog facility, for example, local3.
<priority> is a Syslog priority, for example, info.
For example:
$FWDIR/bin/fw log -ftn | /usr/bin/logger -p local3.info >
/dev/null 2>&1 &
Step 5 Save and close the file.
Step 6 Open the syslog.conf file.
Step 7 Add the following line:
<facility>.<priority> <TAB><TAB>@<host>
Where:
<facility> is the syslog facility, for example, local3. This value must match the
value you typed in Step 4.
<priority> is the syslog priority, for example, info or notice. This value must
match the value you typed in Step 4.
<TAB> indicates you must press the Tab key.
<host> indicates the JSA console or managed host.
Step 8 Save and close the file.
Step 9 Depending on your operating system, type the following command to restart
syslog:
In Linux: service syslog restart
In Solaris: /etc/init.d/syslog start
Step 10 Type the following command:
nohup $FWDIR/bin/fw log -ftn | /usr/bin/logger -p
<facility>.<priority> > /dev/null 2>&1 &
Where:
<facility> is a Syslog facility, for example, local3. This value must match the
value you typed in Step 4.
<priority> is a Syslog priority, for example, info. This value must match the
value you typed in Step 4.
The configuration is complete. The log source is added to JSA as Check Point
Firewall-1 syslog events are automatically discovered. Events forwarded to JSA
are displayed on the Log Activity tab.

Configuring DSMs
Check Point FireWall-1 137
Configuring a log source
JSA automatically discovers and creates a log source for syslog events from
Check Point FireWall-1. The following configuration steps are optional.
To manually configure a log source:
Step 1 Log in to JSA.
Step 2 Click the Admin tab.
Step 3 On the navigation menu, click Data Sources.
The Data Sources panel is displayed.
Step 4 Click the Log Sources icon.
The Log Sources window is displayed.
Step 5 Click Add.
The Add a log source window is displayed.
Step 6 In the Log Source Name field, type a name for your log source.
Step 7 In the Log Source Description field, type a description for the log source.
Step 8 From the Log Source Type list box, select Check Point FireWall-1.
Step 9 Using the Protocol Configuration list box, select Syslog.
The syslog protocol configuration is displayed.
Step 10 Configure the following values:
Step 11 Click Save.
Step 12 On the Admin tab, click Deploy Changes.
The configuration is complete.
Integrating Check
Point FireWall-1
Using OPSEC
This section describes how to ensure that JSA accepts Check Point FireWall-1
events using Open Platform for Security (OPSEC/LEA).
To integrate Check Point OPSEC/LEA with JSA, you must create two Secure
Internal Communication (SIC) files and enter the information in to JSA as a Check
Point Firewall-1 log source.
Table 24-1 Syslog Parameters
Parameter Description
Log Source Identifier Type the IP address or host name for the log source as an
identifier for events from your Check Point FireWall-1
appliance.
Configuring DSMs
138 CHECK POINT
To integrate Check Point Firewall-1 with JSA, you must complete the following
procedures in sequence:
1 Add JSA as a host for Check Point FireWall-1.
2 Add an OPSEC application to Check Point Firewall-1.
3 Locate the Log Source Secure Internal Communications DN.
4 In JSA, configure the OPSEC LEA protocol.
5 Verify the OPSEC/LEA communications configuration.
Adding a Check Point FireWall-1 Host
To add JSA as a host in Check Point FireWall-1 SmartCenter:
Step 1 Log in to the Check Point SmartDashboard user interface.
Step 2 Select Manage > Network Objects > New > Node > Host.
Step 3 Type parameters for your Check Point Firewall-1 host:
Name: JSA
IP Address: <IP address of JSA>
Comment: <Optional>
Step 4 Click OK.
Step 5 Select Close.
You are now ready to create an OPSEC Application Object for Check Point
Firewall-1.
Creating an OPSEC Application Object
To create the OPSEC Application Object:
Step 1 Open the Check Point SmartDashboard user interface.
Step 2 Select Manage > Servers and OPSEC applications > New > OPSEC
Application Properties.
Step 3 Assign a name to the OPSEC Application Object.
For example:
JSA-OPSEC
The OPSEC Application Object name must be different than the host name you
typed when creating the node in Step 3.
a From the Host list box, select JSA.
b From the Vendor list box, select User Defined.
c In Client Entities, select the LEA check box.
d To generate a Secure Internal Communication (SIC) DN, click
Communication.
e Enter an activation key.

Configuring DSMs
Check Point FireWall-1 139
NOTE
Note: The activation key is a password used to generate the SIC DN. When you
configure your Check Point log source in JSA, the activation key is typed into the
Pull Certificate Password parameter.
f Click Initialize.
The window updates the Trust state from Uninitialized to Initilialized
but trust not established.
g Click Close.
The OPSEC Application Properties window is displayed.
h Write down or copy the displayed SIC DN to a text file.
NOTE
Note: The displayed SIC value is required for the OPSEC Application Object SIC
Attribute parameter when you configure the Check Point log source in JSA. The
OPSEC Application Object SIC resembles the following example:
CN=JSA-OPSEC,O=cpmodule..tdfaaz.
You are now ready to locate the log source SIC for Check Point Firewall-1.
Locating the log source SIC
To locate the Log Source SIC from the Check Point SmartDashboard:
Step 1 Select Manage > Network Objects.
Step 2 Select your Check Point Log Host object.
NOTE
Note: You must know if the Check Point Log Host is a separate object in your
configuration from the Check Point Management Server. In most cases, the Check
Point Log Host is the same object as the Check Point Management Server.
Step 3 Click Edit.
The Check Point Host General Properties window is displayed.
Step 4 Copy the Secure Internal Communication (SIC).
NOTE
Note: Depending on your Check Point version, the Communication button might
not be available to display the SIC attribute. You can locate the SIC attribute from
the Check Point Management Server command-line interface. You must use the
cpca_client lscert command from the command-line interface of the
Management Server to display all certificates. The Log Source SIC Attribute
resembles the following example: cn=cp_mgmt,o=cpmodule…tdfaaz. For more
information, see your Check Point Command Line Interface Guide.
You must now install the Security Policy from the Check Point SmartDashboard
user interface.
Configuring DSMs
140 CHECK POINT
Step 5 Select Policy > Install > OK.
You are now ready to configure the OPSEC LEA protocol.
Configuring an OPSEC/LEA log source in JSA
To configure the log source in JSA:
Step 1 Log in to JSA.
Step 2 Click the Admin tab.
Step 3 On the navigation menu, click Data Sources.
Step 4 Click the Log Sources icon.
Step 5 Click Add.
Step 6 From the Log Source Type list box, select Check Point FireWall-1.
Step 7 Using the Protocol Configuration list box, select OPSEC/LEA.
The OPSEC/LEA protocol parameters appear.
Step 8 Configure the following values:
a Log Source Name - Type a name for the log source.
b Log Source Identifier - Type the IP address for the log source. This value must
match the value you typed in the Server IP parameter.
c Server IP - Type the IP address of the Check Point host or Check Point
Management Server IP.
d Server Port - Type the port used for OPSEC/LEA. The default is 18184.
You must ensure the existing firewall policy permits the LEA/OPSEC
connection from your JSA.
e OPSEC Application Object SIC Attribute - Type the SIC DN of the OPSEC
Application Object displayed in Creating an OPSEC Application Object - Step
h.
f Log Source SIC Attribute - Type the SIC name for the server generating log
sources from Locating the log source SIC - Step 4.
SIC attribute names can be up to 255 characters in length and are case
sensitive.
g Specify Certificate - Ensure the Specify Certificate check box is clear.
h Pull Certificate Password - Type the activation key password from Creating
an OPSEC Application Object - Step e.
i Certificate Authority IP - Type the Check Point Manager Server IP address.
j OPSEC Application - Type the name of the application requesting a certificate.
For example:
If the value is CN=JSA-OPSEC,O=cpmodule...tdfaaz, the OPSEC
Application value is JSA-OPSEC.

Configuring DSMs
Check Point FireWall-1 141
For more information on the OPSEC/LEA parameters, see the Log Sources Users
Guide.
Step 9 Click Save.
Step 10 On the Admin tab, click Deploy Changes.
You are now ready to verify your OPSEC/LEA communications for Check Point
Firewall-1.
Verifing or Editing
Your OPSEC
Communications
Configuration
This section describes how to modify your Check Point FireWall-1 configuration to
allow OPSEC communications on non-standard ports, configure communications
in a clear text, un-authenticated stream, and verify the configuration in JSA.
Changing your Check Point Custom Log Manager (CLM) IP address
If your Check Point configuration includes a Check Point Custom Log Manager
(CLM), you might eventually need to change the IP address for the CLM, which
impacts any of the automatically discovered Check Point log sources from that
CLM in JSA. This is because when you manually add the log source for the CLM
using the OPSEC/LEA protocol, then all Check Point firewalls that forward logs to
the CLM are automatically discovered by JSA. These automatically discovered log
sources cannot be edited. If the CLM IP address changes, you must edit the
original Check Point CLM log source that contains the OPSEC/LEA protocol
configuration and update the server IP address and log source identifier.
After you update the log source for the new Check Point CLM IP address, then any
new events reported from the automatically discovered Check Point log sources
are updated.
NOTE
Note: Do not delete and recreate your Check Point CLM or automatically
discovered log sources in JSA. Deleting a log source does not delete event data,
but can make finding previously recorded events more difficult to find.
To update your Check Point OPSEC log source:
Step 1 Log in to JSA.
Step 2 Click the Admin tab.
Step 3 On the navigation menu, click Data Sources.
Step 4 Click the Log Sources icon.
Step 5 Select the original Check Point CLM log source containing the OPSEC/LEA
protocol configuration and click Edit.
Step 6 In the Log Source Identifier field, type a new identifying name of your Check
Point CLM.
Step 7 In the Server IP field, type the new IP address of your Check Point CLM.
Step 8 Click Save.
The IP address update for your Check Point CLM in JSA is complete.
Configuring DSMs
142 CHECK POINT
Changing the default port for OPSEC LEA communication
To change the default port on which OPSEC LEA communicates (that is, port
18184):
Step 1 At the command-line prompt of your Check Point SmartCenter Server, type the
following command to stop the firewall services:
cpstop
Step 2 Depending on your Check Point SmartCenter Server operating system, open the
following file:
•Linux - $FWDIR\conf\fwopsec.conf
•Windows - %FWDIR%\conf\fwopsec.conf
The default contents of this file are as follows:
# The VPN-1/FireWall-1 default settings are:
#
# sam_server auth_port 0
# sam_server port 18183
#
# lea_server auth_port 18184
# lea_server port 0
#
# ela_server auth_port 18187
# ela_server port 0
#
# cpmi_server auth_port 18190
#
# uaa_server auth_port 19191
# uaa_server port 0
#
Step 3 Change the default lea_server auth_port from 18184 to another port number.
Step 4 Remove the hash (#) mark from that line.
For example:
lea_server auth_port 18888
# lea_server port 0
Step 5 Save and close the file.
Step 6 Type the following command to start the firewall services:
cpstart
Configuring OPSEC LEA for un-encrypted communications
To configure the OPSEC LEA protocol for un-encrypted communications:
Step 1 At the command-line prompt of your Check Point SmartCenter Server, stop the
firewall services by typing the following command:
cpstop

Configuring DSMs
Check Point Provider-1 143
Step 2 Depending on your Check Point SmartCenter Server operating system, open the
following file:
•Linux - $FWDIR\conf\fwopsec.conf
•Windows - %FWDIR%\conf\fwopsec.conf
Step 3 Change the default lea_server auth_port from 18184 to 0.
Step 4 Change the default lea_server port from 0 to 18184.
Step 5 Remove the hash (#) marks from both lines.
For example:
lea_server auth_port 0
lea_server port 18184
Step 6 Save and close the file.
Step 7 Type the following command to start the firewall services:
cpstart
Step 8 You are now ready to configure the log source in JSA.
To configure JSA to receive events from a Check Point Firewall-1 device:
Step 1 From the Log Source Type list box, select Check Point FireWall-1.
Step 2 From the Protocol Configuration list box, select OPSEC/LEA.
For more information on configuring log sources, see the Log Sources Users
Guide.
For more information on configuring your Check Point Firewall-1, see your vendor
documentation.
Check Point
Provider-1
You can configure JSA to integrate with a Check Point Provider-1 device.
All events from Check Point Provider-1 are parsed using the Check Point
FireWall-1 DSM. You can integrate Check Point Provider-1 using one of the
following methods:
•Integrating Syslog for Check Point Provider-1
•Configuring OPSEC for Check Point Provider-1
NOTE
Note: Depending on your Operating System, the procedures for the Check Point
Provider-1 device can vary. The following procedures are based on the Check
Point SecurePlatform operating system.
Integrating Syslog for
Check Point
Provider-1
This method ensures the Check Point FireWall-1 DSM for JSA accepts Check
Point Provider-1 events using syslog.
JSA records all relevant Check Point Provider-1 events.
Configuring DSMs
144 CHECK POINT
Configure syslog on Check Point Provider-1
To configure syslog on your Check Point Provider-1 device:
Step 1 Type the following command to access the console as an expert user:
expert
A password prompt is displayed.
Step 2 Type your expert console password. Press Enter.
Step 3 Type the following command:
csh
Step 4 Select the desired customer logs:
mdsenv <customer name>
Step 5 Type the following command:
# nohup $FWDIR/bin/fw log -ftn | /usr/bin/logger -p
<facility>.<priority> 2>&1 &
Where:
<facility> is a Syslog facility, for example, local3.
<priority> is a Syslog priority, for example, info.
You are now ready to configure the log source in JSA.
The configuration is complete. The log source is added to JSA as Check Point
Firewall-1 syslog events are automatically discovered. Events forwarded to JSA
are displayed on the Log Activity tab.
Configure a log source
JSA automatically discovers and creates a log source for syslog events from
Check Point Provider-1 as Check Point FireWall-1 events. The following
configuration steps are optional.
To manually configure a log source for Check Point Provider-1 syslog events:
Step 1 Log in to JSA.
Step 2 Click the Admin tab.
Step 3 On the navigation menu, click Data Sources.
The Data Sources panel is displayed.
Step 4 Click the Log Sources icon.
The Log Sources window is displayed.
Step 5 Click Add.
The Add a log source window is displayed.
Step 6 In the Log Source Name field, type a name for your log source.
Step 7 In the Log Source Description field, type a description for the log source.

Configuring DSMs
Check Point Provider-1 145
Step 8 From the Log Source Type list box, select Check Point Firewall-1.
Step 9 Using the Protocol Configuration list box, select Syslog.
The syslog protocol configuration is displayed.
Step 10 Configure the following values:
Step 11 Click Save.
Step 12 On the Admin tab, click Deploy Changes.
The configuration is complete.
Configuring OPSEC
for Check Point
Provider-1
This method ensures the JSA Check Point FireWall-1 DSM accepts Check Point
Provider-1 events using OPSEC.
Reconfigure Check Point Provider-1 SmartCenter
This section describes how to reconfigure the Check Point Provider-1
SmartCenter.
In the Check Point Provider-1 Management Domain GUI (MDG), create a host
object representing the JSA. The leapipe is the connection between the Check
Point Provider-1 and JSA.
To reconfigure the Check Point Provider-1 SmartCenter (MDG):
Step 1 To create a host object, open the Check Point SmartDashboard user interface and
select Manage > Network Objects > New > Node > Host.
Step 2 Type the Name, IP Address, and optional Comment for your host.
Step 3 Click OK.
Step 4 Select Close.
Step 5 To create the OPSEC connection, select Manage > Servers and OPSEC
Applications New > OPSEC Application Properties.
Step 6 Type a name and optional comment.
The name you type must be different than the name used in Step 2.
Step 7 From the Host drop-down menu, select the JSA host object that you just created.
Step 8 From Application Properties, select User Defined as the Vendor type.
Step 9 From Client Entries, select LEA.
Step 10 Configure the Secure Internal Communication (SIC) certificate, click
Communication and enter an activation key.
Table 24-2 Syslog Parameters
Parameter Description
Log Source Identifier Type the IP address or host name for the log source as an
identifier for events from your Check Point Provider-1
appliance.
Configuring DSMs
146 CHECK POINT
Step 11 Select OK and then Close.
Step 12 To install the Policy on your firewall, select Policy > Install > OK.
Configure an OPSEC log source
To configure the log source in JSA:
Step 1 Log in to JSA.
Step 2 Click the Admin tab.
Step 3 On the navigation menu, click Data Sources.
The Data Sources panel is displayed.
Step 4 Click the Log Sources icon.
The Log Sources window is displayed.
Step 5 Click Add.
The Add a log source window is displayed.
Step 6 From the Log Source Type list box, select Check Point FireWall-1.
Step 7 Using the Protocol Configuration list box, select OPSEC/LEA.
The OPSEC/LEA protocol parameters appear.
Step 8 Configure the following values:
a Log Source Name - Type a name for the log source.
b Log Source Identifier - Type the IP address for the log source. This value must
match the value you typed in the Server IP parameter.
c Server IP - Type the IP address of the Check Point Provider-1.
d Server Port - Type the port used for OPSEC/LEA. The default is 18184.
You must ensure the existing firewall policy permits the LEA/OPSEC
connection from your JSA.
e OPSEC Application Object SIC Attribute - Type the SIC DN of the OPSEC
Application Object.
f Log Source SIC Attribute - Type the SIC name for the server generating the
log source.
SIC attribute names can be up to 255 characters in length and are case
sensitive.
g Specify Certificate - Ensure the Specify Certificate check box is clear.
h Pull Certificate Password - Type the activation key password.
i Certificate Authority IP - Type the Check Point Manager Server IP address.
j OPSEC Application - Type the name of the application requesting a certificate.
For example:
If the value is CN=JSA-OPSEC,O=cpmodule...tdfaaz, the OPSEC Application
value is JSA-OPSEC.
Configuring DSMs
Check Point Provider-1 147
Step 9 Click Save.
Step 10 On the Admin tab, click Deploy Changes.
The configuration is complete. For detailed information on the OPSEC/LEA
protocol, see the Log Sources Users Guide.
Configuring DSMs
22 CILASOFT QJRN/400
Juniper Secure Analytics (JSA) collects detailed audit events from Cilasoft
QJRN/400 software for IBM i (AS/400, iSeries, System i).
Configuration
Overview
To collect syslog events, you must configure your Cilasoft QJRN/400 to forward
syslog events to JSA. JSA automatically discovers and creates log sources for
syslog events that are forwarded from Cilasoft QJRN/400. JSA supports syslog
events from Cilasoft QJRN/400 V5.14.K and above.
To configure Cilasoft QJRN/400, complete the following tasks:
1 On your Cilasoft QJRN/400 installation, configure the Cilasoft Security Suite to
forward syslog events to JSA.
2 On your JSA system, verify that the forwarded events are automatically
discovered.
Configuring a Syslog
in Cilasoft QJRN/400
To collect events, you must configure queries on your Cilasoft QJRN/400 to
forward syslog events to JSA.
Procedure
Step 1 To start the Cilasoft Security Suite, type the following command:
IJRN/QJRN
The account that is used to make configuration changes must have ADM privileges
or USR privileges with access to specific queries through an Extended Access
parameter.
Step 2 To configure the output type, select one of the following options:
a To edit several selected queries, type 2EV to access the Execution
Environment and change the Output Type field and type SEM.
b To edit large numbers of queries, type the command CHGQJQRYA and change
the Output Type field and type SEM.

Configuring DSMs
150 CILASOFT QJRN/400
Step 3 On the Additional Parameters screen, configure the following parameters:
For more information on Cilasoft configuration parameters, see the Cilasoft
QJRN/400 User’s Guide.
Syslog events that are forwarded to JSA are viewable on the Log Activity tab.
Configuring a
Cilasoft QJRN/400
Log Source
JSA automatically discovers and creates a log source for syslog events that are
forwarded from Cilasoft QJRN/400. These configuration steps are optional.
Procedure
Step 1 Log in to JSA.
Step 2 Click the Admin tab.
Step 3 Click the Log Sources icon.
Step 4 Click Add.
Step 5 In the Log Source Name field, type a name for your log source.
Step 6 From the Log Source Type list box, select Cilasoft QJRN/400.
Step 7 From the Protocol Configuration list box, select Syslog.
Table 25-1 Cilasoft QJRN/400 Output Parameters
Parameter Description
Format Type *LEEF to configure the syslog output to write events in
Log Extended Event Format (LEEF).
LEEF is a special event format that is designed to for JSA.
Output Type *SYSLOG to forward events with the syslog protocol.
IP Address Type the IP address of your JSA system.
If an IP address for JSA is defined as a special value in the
WRKQJVAL command, you can type *CFG.
Events can be forwarded to either the console, an Event
Collector, an Event Processor, or your JSA all-in-one
appliance.
Port Type 514 or *CFG as the port for syslog events.
By default, *CFG automatically selects port 514.
Tag This field is not used by JSA.
Facility This field is not used by JSA.
Severity Select a value for the event severity.
For more information on severity that is assigned to *QRY
destinations, see command WRKQJFVAL in your Cilasoft
documentation.

Configuring DSMs
151
Step 8 Configure the following values:
Step 9 Click Save.
Step 10 On the Admin tab, click Deploy Changes.
Table 25-2 Syslog protocol parameters
Parameter Description
Log Source Identifier Type the IP address as an identifier for events from your
Cilasoft QJRN/400 installation.
The log source identifier must be unique value.
Enabled Select this check box to enable the log source.
By default, the check box is selected.
Credibility Select the credibility of the log source. The range is 0 - 10.
The credibility indicates the integrity of an event or offense
as determined by the credibility rating from the source
devices. Credibility increases if multiple sources report the
same event. The default is 5.
Target Event Collector Select the Event Collector to use as the target for the log
source.
Coalescing Events Select this check box to enable the log source to coalesce
(bundle) events.
By default, automatically discovered log sources inherit the
value of the Coalescing Events list box from the System
Settings in JSA. When you create a log source or edit an
existing configuration, you can override the default value by
configuring this option for each log source.
Incoming Event
Payload
From the list box, select the incoming payload encoder for
parsing and storing the logs.
Store Event Payload Select this check box to enable the log source to store event
payload information.
By default, automatically discovered log sources inherit the
value of the Store Event Payload list box from the System
Settings in JSA. When you create a log source or edit an
existing configuration, you can override the default value by
configuring this option for each log source.

Configuring DSMs
23 CISCO
This section provides information on the following DSMs:
•Cisco ACE Firewall
•Cisco Aironet
•Cisco ACS
•Cisco ASA
•Cisco CallManager
•Cisco CatOS for Catalyst Switches
•Cisco CSA
•Cisco FWSM
•Cisco IDS/IPS
•Cisco IronPort
•Cisco NAC
•Cisco Nexus
•Cisco IOS
•Cisco Pix
•Cisco VPN 3000 Concentrator
•Cisco Wireless Services Module
•Cisco Wireless LAN Controllers
•Cisco Identity Services Engine
Cisco ACE Firewall You can integrate a Cisco ACE firewall with JSA.
Juniper Secure Analytics (JSA) can accept events forwarded from Cisco ACE
Firewalls using syslog. JSA records all relevant events. Before you configure JSA
to integrate with an ACE firewall, you must configure your Cisco ACE Firewall to
forward all device logs to JSA.
Configuring DSMs
154 CISCO
Configure Cisco ACE
Firewall
To forward Cisco ACE device logs to JSA:
Step 1 Log in to your Cisco ACE device.
Step 2 From the shell interface, select Main Menu > Advanced Options > Syslog
Configuration.
Step 3 The Syslog Configuration menu varies depending on whether there are any syslog
destination hosts configured yet. If no syslog destinations have been added, create
one by selecting the Add First Server option. Click OK.
Step 4 Type the hostname or IP address of the destination host and port in the First
Syslog Server field. Click OK.
The system restarts with new settings. When finished, the Syslog server window
displays the host you have configured.
Step 5 Click OK.
The Syslog Configuration menu is displayed. Notice that options for editing the
server configuration, removing the server, or adding a second server are now
available.
Step 6 If you want to add another server, click Add Second Server.
At any time, click the View Syslog options to view existing server configurations.
Step 7 To return to the Advanced Menu, click Return.
The configuration is complete. The log source is added to JSA as Cisco ACE
Firewall events are automatically discovered. Events forwarded to JSA by Cisco
ACE Firewall appliances are displayed on the Log Activity tab of JSA.
Configure a Log
Source
JSA automatically discovers and creates a log source for syslog events from Cisco
ACE Firewalls.
However, you can manually create a log source for JSA to receive syslog events.
The following configuration steps are optional.
To manually configure a log source for Cisco ACE Firewall:
Step 1 Log in to JSA.
Step 2 Click the Admin tab.
Step 3 On the navigation menu, click Data Sources.
The Data Sources panel is displayed.
Step 4 Click the Log Sources icon.
The Log Sources window is displayed.
Step 5 Click Add.
The Add a log source window is displayed.
Step 6 In the Log Source Name field, type a name for your log source.

Configuring DSMs
Cisco Aironet 155
Step 7 In the Log Source Description field, type a description for the log source.
Step 8 From the Log Source Type list box, select Cisco ACE Firewall.
Step 9 Using the Protocol Configuration list box, select Syslog.
The syslog protocol configuration is displayed.
Step 10 Configure the following values:
Step 11 Click Save.
Step 12 On the Admin tab, click Deploy Changes.
The configuration is complete.
Cisco Aironet You can integrate a Cisco Aironet devices with JSA.
A Cisco Aironet DSM accepts Cisco Emblem Format events using syslog. Before
you configure JSA to integrate with a Cisco Aironet device, you must configure
your Cisco Aironet appliance to forward syslog events.
Configure Cisco
Aironet
To configure Cisco Aironet to forward events:
Step 1 Establish a connection to the Cisco Aironet device using one of the following
methods”
•Telnet to the wireless access point
•Access the console
Step 2 Type the following command to access privileged EXEC mode:
enable
Step 3 Type the following command to access global configuration mode:
config terminal
Step 4 Type the following command to enable message logging:
logging on
Step 5 Configure the syslog facility. The default is local7.
logging facility <facility, for example, local7>
Step 6 Type the following command to log messages to your JSA:
logging <IP address of your JSA>
Table 26-1 Syslog Parameters
Parameter Description
Log Source Identifier Type the IP address or host name for the log source as an
identifier for events from your Cisco ACE Firewalls.

Configuring DSMs
156 CISCO
Step 7 Enable timestamp on log messages:
service timestamp log datatime
Step 8 Return to privileged EXEC mode:
end
Step 9 View your entries:
show running-config
Step 10 Save your entries in the configuration file:
copy running-config startup-config
The configuration is complete. The log source is added to JSA as Cisco Aironet
events are automatically discovered. Events forwarded to JSA by Cisco Aironet
appliances are displayed on the Log Activity tab of JSA.
Configure a Log
Source
JSA automatically discovers and creates a log source for syslog events from Cisco
Aironet. The following configuration steps are optional.
To manually configure a log source for Cisco Aironet:
Step 1 Log in to JSA.
Step 2 Click the Admin tab.
Step 3 On the navigation menu, click Data Sources.
The Data Sources panel is displayed.
Step 4 Click the Log Sources icon.
The Log Sources window is displayed.
Step 5 Click Add.
The Add a log source window is displayed.
Step 6 In the Log Source Name field, type a name for your log source.
Step 7 In the Log Source Description field, type a description for the log source.
Step 8 From the Log Source Type list box, select Cisco Aironet.
Step 9 Using the Protocol Configuration list box, select Syslog.
The syslog protocol configuration is displayed.
Step 10 Configure the following values:
Step 11 Click Save.
Step 12 On the Admin tab, click Deploy Changes.
Table 26-2 Syslog Parameters
Parameter Description
Log Source Identifier Type the IP address or host name for the log source as an
identifier for events from your Cisco Aironet appliance.

Configuring DSMs
Cisco ACS 157
The configuration is complete.
Cisco ACS The Cisco ACS DSM for JSA accepts syslog ACS events using syslog.
JSA records all relevant and available information from the event. You can
integrate Cisco ACS with JSA using one of the following methods:
•Configure your Cisco ACS device to directly send syslog to JSA for Cisco ACS
v5.x. See Configure Syslog for Cisco ACS v5.x.
•Configure your Cisco ACS device to directly send syslog to JSA for Cisco ACS
v4.x. See Configure Syslog for Cisco ACS v4.x.
•A server using the JSA Adaptive Log Exporter (Cisco ACS software version 3.x
or later). See Configure Cisco ACS for the Adaptive Log Exporter.
NOTE
Note: JSA only supports Cisco ACS versions prior to v3.x using a Universal DSM.
Configure Syslog for
Cisco ACS v5.x
The configure syslog forwarding from a Cisco ACS appliance with software version
5.x, you must:
Create a Remote Log Target
To create a remote log target for your Cisco ACS appliance:
Step 1 Log in to your Cisco ACS appliance.
Step 2 On the navigation menu, click System Administration > Configuration > Log
Configuration > Remote Log Targets.
The Remote Log Targets page is displayed.
Step 3 Click Create.
Step 4 Configure the following parameters:
Step 5 Click Submit.
You are now ready to configure global policies for event logging on your Cisco
ACS appliance.
Table 26-1 Remote Target Parameters
Parameter Description
Name Type a name for the remote syslog target.
Description Type a description for the remote syslog target.
Type Select Syslog.
IP Address Type the IP address of JSA or your Event Collector.

Configuring DSMs
158 CISCO
Configure global logging categories
To configure Cisco ACS to forward log failed attempts to JSA:
Step 1 On the navigation menu, click System Administration > Configuration > Log
Configuration > Global.
The Logging Categories window is displayed.
Step 2 Select the Failed Attempts logging category and click Edit.
Step 3 Click Remote Syslog Target.
Step 4 From the Available targets window, use the arrow key to move the syslog target
for JSA to the Selected targets window.
Step 5 Click Submit.
You are now ready to configure the log source in JSA.
Configure a log source
JSA automatically discovers and creates a log source for syslog events from Cisco
ACS v5.x.
However, you can manually create a log source for JSA to receive Cisco ACS
events.
To manually configure a log source for Cisco ACS:
Step 1 Log in to JSA.
Step 2 Click the Admin tab.
Step 3 On the navigation menu, click Data Sources.
The Data Sources panel is displayed.
Step 4 Click the Log Sources icon.
The Log Sources window is displayed.
Step 5 Click Add.
The Add a log source window is displayed.
Step 6 From the Log Source Type list box, select Cisco ACS.
Step 7 Using the Protocol Configuration list box, select Syslog.
The syslog protocol configuration is displayed.
Step 8 Configure the following values:
Step 9 Click Save.
Table 26-2 Syslog Parameters
Parameter Description
Log Source Identifier Type the IP address or hostname for the log source as an
identifier for Cisco ACS events.

Configuring DSMs
Cisco ACS 159
Step 10 On the Admin tab, click Deploy Changes.
The configuration is complete.
Configure Syslog for
Cisco ACS v4.x
To configure syslog forwarding from a Cisco ACS appliance with software version
4.x, you must:
Configure syslog forwarding for Cisco ACS v4.x
To configure an ACS device to forward syslog events to JSA:
Step 1 Log in to your Cisco ACS device.
Step 2 On the navigation menu, click System Configuration.
The System Configuration page opens.
Step 3 Click Logging.
The logging configuration is displayed.
Step 4 In the Syslog column for Failed Attempts, click Configure.
The Enable Logging window is displayed.
Step 5 Select the Log to Syslog Failed Attempts report check box.
Step 6 Add the following Logged Attributes:
•Message-Type
•User-Name
•Nas-IP-Address
•Authen-Failure-Code
•Caller-ID
•NAS-Port
•Author-Data
•Group-Name
•Filter Information
•Logged Remotely
Step 7 Configure the following syslog parameters:
•IP - Type the IP address of JSA.
•Port - Type the syslog port number of JSA. The default is port 514.
•Max message length (Bytes) - Type 1024 as the maximum syslog message
length.
NOTE
Note: Cisco ACS provides syslog report information for a maximum of two syslog
servers.
Step 8 Click Submit.

Configuring DSMs
160 CISCO
You are now ready to configure the log source in JSA.
Configure a log source for Cisco ACS v4.x
JSA automatically discovers and creates a log source for syslog events from Cisco
ACS v4.x. The following configuration steps are optional.
To manually create a log source for Cisco ACS v4.x:
Step 1 Log in to JSA.
Step 2 Click the Admin tab.
Step 3 On the navigation menu, click Data Sources.
The Data Sources panel is displayed.
Step 4 Click the Log Sources icon.
The Log Sources window is displayed.
Step 5 Click Add.
The Add a log source window is displayed.
Step 6 From the Log Source Type list box, select Cisco ACS.
Step 7 Using the Protocol Configuration list box, select Syslog.
The syslog protocol configuration is displayed.
Step 8 Configure the following values:
Step 9 Click Save.
Step 10 On the Admin tab, click Deploy Changes.
The configuration is complete.
Configure Cisco ACS
for the Adaptive Log
Exporter
If you are using an older version of Cisco ACS, such as v3.x, you can log events
from your Cisco ACS appliance to a comma-seperated file.
The Cisco ACS device plug-in for the Adaptive Log Exporter can be used to read
and forward events from your comma-separated file to JSA.
Configure Cisco ACS to log events
Your Cisco ACS appliance must be configured to write comma-seperated event
files to integrate with the Adaptive Log Exporter.
Table 26-3 Syslog Parameters
Parameter Description
Log Source Identifier Type the IP address or hostname for the log source as an
identifier for Cisco ACS events.

Configuring DSMs
Cisco ASA 161
To configure Cisco ACS:
Step 1 Log in to your Cisco ACS appliance.
Step 2 On the navigation manu, click System Configuration.
The System Configuration page opens.
Step 3 Click Logging.
The logging configuration is displayed.
Step 4 In the CSV column for Failed Attempts, click Configure.
The Enable Logging window is displayed.
Step 5 Select the Log to CSV Failed Attempts report check box.
Step 6 Add the following Logged Attributes:
•Message-Type
•User-Name
•Nas-IP-Address
•Authen-Failure-Code
•Caller-ID
•NAS-Port
•Author-Data
•Group-Name
•Filter Information
•Logged Remotely
Step 7 Configure a time frame for Cisco ACS to generate a new comma-seperated value
(CSV) file.
Step 8 Click Submit.
You are now ready to configure the Adaptive Log Exporter.
For more information on installing and using the Adaptive Log Exporter, see the
Adaptive Log Exporter Users Guide.
Cisco ASA You can integrate a Cisco Adaptive Security Appliance (ASA) with JSA.
A Cisco ASA DSM accepts events using syslog or NetFlow using NetFlow Security
Event Logging (NSEL). JSA records all relevant events. Before you configure JSA,
you must configure your Cisco ASA device to forward syslog or NetFlow NSEL
events.
Choose one of the following options:
•Forward events to JSA using syslog. See Integrate Cisco ASA Using Syslog

Configuring DSMs
162 CISCO
•Forward events to JSA using NetFlow NSEL. See Integrate Cisco ASA for
NetFlow Using NSEL
Integrate Cisco ASA
Using Syslog
This section includes the following topics:
•Configure syslog forwarding
•Configure a log source
Configure syslog forwarding
This section describes how to configure Cisco ASA to forward syslog events.
Step 1 Log in to the Cisco ASA device.
Step 2 Type the following command to access privileged EXEC mode:
enable
Step 3 Type the following command to access global configuration mode:
conf t
Step 4 Enable logging:
logging enable
Step 5 Configure the logging details:
logging console warning
logging trap warning
logging asdm warning
Step 6 Type the following command to configure logging to JSA:
logging host <interface> <IP address>
Where:
<interface> is the name of the Cisco Adaptive Security Appliance interface.
<IP address> is the IP address of JSA.
NOTE
Note: Using the command show interfaces displays all available interfaces for
your Cisco device.
Step 7 Disable the output object name option:
no names
You must disable the output object name option to ensure that the logs use IP
addresses and not object names.
Step 8 Exit the configuration:
exit
Step 9 Save the changes:
write mem

Configuring DSMs
Cisco ASA 163
The configuration is complete. The log source is added to JSA as Cisco ASA
syslog events are automatically discovered. Events forwarded to JSA by Cisco
ASA are displayed on the Log Activity tab of JSA.
Configure a log source
JSA automatically discovers and creates a log source for syslog events from Cisco
ASA. The following configuration steps are optional.
To manually configure a log source for Cisco ASA syslog events:
Step 1 Log in to JSA.
Step 2 Click the Admin tab.
Step 3 On the navigation menu, click Data Sources.
The Data Sources panel is displayed.
Step 4 Click the Log Sources icon.
The Log Sources window is displayed.
Step 5 Click Add.
The Add a log source window is displayed.
Step 6 In the Log Source Name field, type a name for your log source.
Step 7 In the Log Source Description field, type a description for the log source.
Step 8 From the Log Source Type list box, select Cisco Adaptive Security Appliance
(ASA).
Step 9 Using the Protocol Configuration list box, select Syslog.
The syslog protocol configuration is displayed.
Step 10 Configure the following values:
Step 11 Click Save.
Step 12 On the Admin tab, click Deploy Changes.
The configuration is complete.
Integrate Cisco ASA
for NetFlow Using
NSEL
This section includes the following topics:
•Configure NetFlow Using NSEL
•Configure a log source
Table 26-4 Syslog Parameters
Parameter Description
Log Source Identifier Type the IP address or host name for the log source as an
identifier for events from your OSSEC installations.

Configuring DSMs
164 CISCO
Configure NetFlow Using NSEL
To configure Cisco ASA to forward NetFlow events using NSEL.
Step 1 Log in to the Cisco ASA device command-line interface (CLI).
Step 2 Type the following command to access privileged EXEC mode:
enable
Step 3 Type the following command to access global configuration mode:
conf t
Step 4 Disable the output object name option:
no names
Step 5 Type the following command to enable NetFlow export:
flow-export destination <interface-name> <ipv4-address or
hostname> <udp-port>
Where:
<interface-name> is the name of the Cisco Adaptive Security Appliance
interface for the NetFlow collector.
<ipv4-address or hostname> is the IP address or host name of the Cisco
ASA device with the NetFlow collector application.
<udp-port> is the UDP port number to which NetFlow packets are sent.
NOTE
Note: JSA typically uses port 2055 for NetFlow event data on Flow Processors.
You must configure a different UDP port on your Cisco Adaptive Security
Appliance for NetFlow using NSEL.
Step 6 Type the following command to configure the NSEL class-map:
class-map flow_export_class
Step 7 Choose one of the following traffic options:
a To configure a NetFlow access list to match specific traffic, type the command:
match access-list flow_export_acl
b To configure NetFlow to match any traffic, type the command:
match any
NOTE
Note: The Access Control List (ACL) must exist on the Cisco ASA device before
defining the traffic match option in Step 7.
Step 8 Type the following command to configure the NSEL policy-map:
policy-map flow_export_policy
Step 9 Type the following command to define a class for the flow-export action:
class flow_export_class

Configuring DSMs
Cisco ASA 165
Step 10 Type the following command to configure the flow-export action:
flow-export event-type all destination <IP address>
Where <IP address> is the IP address of JSA.
NOTE
Note: If you are using a Cisco ASA version before v8.3 you can skipStep 10 as the
device defaults to the flow-export destination. For more information, see your
Cisco ASA documentation.
Step 11 Type the following command to add the service policy globally:
service-policy flow_export_policy global
Step 12 Exit the configuration:
exit
Step 13 Save the changes:
write mem
You must verify that your collector applications use the Event Time field to
correlate events.
Configure a log source
To integrate Cisco ASA using NetFlow with JSA, you must manually create a log
source to receive NetFlow events. JSA does not automatically discover or create
log sources for syslog events from Cisco ASA using NetFlow and NSEL.
NOTE
Note: Your system must be running the latest version of the NSEL protocol to
integrate with a Cisco ASA device using NetFlow NSEL. The NSEL protocol is
available on Juniper Customer Support, http://www.juniper.net/customers/support/,
or through auto updates in JSA.
To configure a log source:
Step 1 Log in to JSA.
Step 2 Click the Admin tab.
Step 3 On the navigation menu, click Data Sources.
The Data Sources panel is displayed.
Step 4 Click the Log Sources icon.
The Log Sources window is displayed.
Step 5 Click Add.
The Add a log source window is displayed.
Step 6 In the Log Source Name field, type a name for your log source.
Step 7 In the Log Source Description field, type a description for the log source.

Configuring DSMs
166 CISCO
Step 8 From the Log Source Type list box, select Cisco Adaptive Security Appliance
(ASA).
Step 9 Using the Protocol Configuration list box, select Cisco NSEL.
The syslog protocol configuration is displayed.
Step 10 Configure the following values:
Step 11 Click Save.
Step 12 On the Admin tab, click Deploy Changes.
The log source is added to JSA. Events forwarded to JSA by Cisco ASA are
displayed on the Log Activity tab. For more information on configuring NetFlow
with your Cisco ASA device, see your vendor documentation.
Cisco CallManager The Cisco CallManager DSM for JSA collects application events forwarded from
Cisco CallManager devices using syslog.
Before receiving events in JSA, you must configure your Cisco Call Manager
device to forward events. After you forward syslog events from Cisco CallManager,
JSA automatically detects and adds Cisco CallManager as a log source.
Configure Syslog
Forwarding
To configure syslog on your Cisco CallManager:
Step 1 Log in to your Cisco CallManager interface.
Step 2 Select System > Enterprise Parameters.
The Enterprise Parameters Configuration is displayed.
Step 3 In the Remote Syslog Server Name field, type the IP address of the JSA console.
Step 4 From the Syslog Severity For Remote Syslog messages list box, select
Informational
The informational severity allows you to collect all events at the information level
and above.
Step 5 Click Save.
Table 26-5 Syslog Parameters
Parameter Description
Log Source Identifier Type the IP address or hostname for the log source.
Collector Port Type the UDP port number used by Cisco ASA to forward
NSEL events. The valid range of the Collector Port
parameter is 1-65535.
Note: JSA typically uses port 2055 for NetFlow event data
on Flow Processors. You must define a different UDP port on
your Cisco Adaptive Security Appliance for NetFlow using
NSEL.

Configuring DSMs
Cisco CatOS for Catalyst Switches 167
Step 6 Click Apply Config.
The syslog configuration is complete. You are now ready to configure a syslog log
source for Cisco CallManager.
Configure a Log
Source
JSA automatically discovers and creates a log source for syslog events from Cisco
CallManager devices. The following configuration steps are optional.
To manually configure a syslog log source for Cisco CallManager:
Step 1 Log in to JSA.
Step 2 Click the Admin tab.
Step 3 On the navigation menu, click Data Sources.
The Data Sources panel is displayed.
Step 4 Click the Log Sources icon.
The Log Sources window is displayed.
Step 5 Click Add.
The Add a log source window is displayed.
Step 6 In the Log Source Name field, type a name for your log source.
Step 7 In the Log Source Description field, type a description for the log source.
Step 8 From the Log Source Type list box, select Cisco Call Manager.
Step 9 Using the Protocol Configuration list box, select Syslog.
The syslog protocol configuration is displayed.
Step 10 Configure the following values:
Step 11 Click Save.
Step 12 On the Admin tab, click Deploy Changes.
The configuration is complete.
Cisco CatOS for
Catalyst Switches
The Cisco CatOS for Catalyst Switches DSM for JSA accepts events using syslog.
JSA records all relevant device events. Before configuring a Cisco CatOS device
in JSA, you must configure your device to forward syslog events.
Table 26-6 Syslog Parameters
Parameter Description
Log Source Identifier Type the IP address or host name for the log source as an
identifier for events from your Cisco CallManager.
Configuring DSMs
168 CISCO
Configure Syslog To configure your Cisco CatOS device to forward syslog events:
Step 1 Log in to your Cisco CatOS user interface.
Step 2 Type the following command to access privileged EXEC mode:
enable
Step 3 Configure the system to timestamp messages:
set logging timestamp enable
Step 4 Type the IP address of JSA:
set logging server <IP address>
Step 5 Limit messages that are logged by selecting a severity level:
set logging server severity <server severity level>
Step 6 Configure the facility level that should be used in the message. The default is
local7.
set logging server facility <server facility parameter>
Step 7 Enable the switch to send syslog messages to the JSA.
set logging server enable
You are now ready to configure the log source in JSA.
Configure a Log
Source
JSA automatically discovers and creates a log source for syslog events from Cisco
CatOS appliances. The following configuration steps are optional.
To manually configure a syslog log source for Cisco CatOS:
Step 1 Log in to JSA.
Step 2 Click the Admin tab.
Step 3 On the navigation menu, click Data Sources.
The Data Sources panel is displayed.
Step 4 Click the Log Sources icon.
The Log Sources window is displayed.
Step 5 Click Add.
The Add a log source window is displayed.
Step 6 In the Log Source Name field, type a name for your log source.
Step 7 In the Log Source Description field, type a description for the log source.
Step 8 From the Log Source Type list box, select Cisco CatOS for Catalyst Switches
Step 9 Using the Protocol Configuration list box, select Syslog.
The syslog protocol configuration is displayed.
Step 10 Configure the following values:

Configuring DSMs
Cisco CSA 169
Step 11 Click Save.
Step 12 On the Admin tab, click Deploy Changes.
The configuration is complete.
Cisco CSA You can integrate a Cisco Security Agent (CSA) server with JSA.
Supported Event
Types
The Cisco CSA DSM accepts events using syslog, SNMPv1, and SNMPv2. JSA
records all configured Cisco CSA alerts.
Configure Syslog for
Cisco CSA
To configure your Cisco CSA server to forward events:
Step 1 Open the Cisco CSA user interface.
Step 2 Select Events > Alerts.
Step 3 Click New.
The Configuration View window is displayed.
Step 4 Type in values for the following parameters:
a Name - Type a name you wish to assign to your configuration.
b Description - Type a description for the configuration. This parameter is
optional.
Step 5 From the Send Alerts, select the event set from the list box to generate alerts.
Step 6 Select the SNMP check box.
Step 7 Type a Community name.
The Community name entered in the CSA user interface must match the
Community field configured on JSA. This option is only available using the
SNMPv2 protocol.
Step 8 In the Manager IP address parameter, type the IP address of JSA.
Step 9 Click Save.
You are now ready to configure the log source in JSA.
Configure a Log
Source
JSA automatically discovers and creates a log source for syslog events from Cisco
CSA appliances. The following configuration steps are optional.
Table 26-7 Syslog Parameters
Parameter Description
Log Source Identifier Type the IP address or host name for the log source as an
identifier for events from your Cisco CatOS for Catalyst
Switch appliance.

Configuring DSMs
170 CISCO
To manually configure a syslog log source for Cisco CSA:
Step 1 Log in to JSA.
Step 2 Click the Admin tab.
Step 3 On the navigation menu, click Data Sources.
The Data Sources panel is displayed.
Step 4 Click the Log Sources icon.
The Log Sources window is displayed.
Step 5 Click Add.
The Add a log source window is displayed.
Step 6 In the Log Source Name field, type a name for your log source.
Step 7 In the Log Source Description field, type a description for the log source.
Step 8 From the Log Source Type list box, select Cisco CSA.
Step 9 Using the Protocol Configuration list box, select Syslog.
The syslog protocol configuration is displayed.
Step 10 Configure the following values:
Step 11 Click Save.
Step 12 On the Admin tab, click Deploy Changes.
The configuration is complete.
Cisco FWSM You can integrate Cisco Firewall Service Module (FWSM) with JSA.
Supported Event
Types
The Cisco FWSM DSM for JSA accepts FWSM events using syslog. JSA records
all relevant Cisco FWSM events.
Configure Cisco
FWSM to Forward
Syslog Events
To integrate Cisco FWSM with JSA, you must configure your Cisco FWSM
appliances to forward syslog events to JSA.
To configure Cisco FWSM:
Step 1 Using a console connection, telnet, or SSH, log in to the Cisco FWSM.
Step 2 Enable logging:
logging on
Table 26-8 Syslog Parameters
Parameter Description
Log Source Identifier Type the IP address or host name for the log source as an
identifier for events from your Cisco CSA appliance.

Configuring DSMs
Cisco FWSM 171
Step 3 Change the logging level:
logging trap level (1-7)
By default, the logging level is set to 3 (error).
Step 4 Designate JSA as a host to receive the messages:
logging host [interface] ip_address [tcp[/port] | udp[/port]]
[format emblem]
For example:
logging host dmz1 192.168.1.5
Where 192.168.1.5 is the IP address of your JSA system.
You are now ready to configure the log source in JSA.
Configure a Log
Source
JSA automatically discovers and creates a log source for syslog events from Cisco
FWSM appliances. The following configuration steps are optional.
To manually configure a syslog log source for Cisco FWSM:
Step 1 Log in to JSA.
Step 2 Click the Admin tab.
Step 3 On the navigation menu, click Data Sources.
The Data Sources panel is displayed.
Step 4 Click the Log Sources icon.
The Log Sources window is displayed.
Step 5 Click Add.
The Add a log source window is displayed.
Step 6 In the Log Source Name field, type a name for your log source.
Step 7 In the Log Source Description field, type a description for the log source.
Step 8 From the Log Source Type list box, select Cisco Firewall Services Module
(FWSM).
Step 9 Using the Protocol Configuration list box, select Syslog.
The syslog protocol configuration is displayed.
Step 10 Configure the following values:
Step 11 Click Save.
Step 12 On the Admin tab, click Deploy Changes.
Table 26-9 Syslog Parameters
Parameter Description
Log Source Identifier Type the IP address or host name for the log source as an
identifier for events from your Cisco FWSM appliance.
Configuring DSMs
172 CISCO
The configuration is complete.
Cisco IDS/IPS The Cisco IDS/IPS DSM for JSA polls Cisco IDS/IPS for events using the Security
Device Event Exchange (SDEE) protocol.
The SDEE specification defines the message format and the protocol used to
communicate the events generated by your Cisco IDS/IPS security device. JSA
supports SDEE connections by polling directly to the IDS/IPS device and not the
management software, which controls the device.
NOTE
Note: You must have security access or web authentication on the device before
connecting to JSA.
After you configure your Cisco IDS/IPS device, you must configure the SDEE
protocol in JSA. When configuring the SDEE protocol, you must define the URL
required to access the device.
For example, https://www.mysdeeserver.com/cgi-bin/sdee-server.
You must use an http or https URL, which is specific to your Cisco IDS version:
•If you are using RDEP (for Cisco IDS v4.0), the URL should have
/cgi-bin/event-server at the end. For example:
https://www.my-rdep-server.com/cgi-bin/event-server
•If you are using SDEE/CIDEE (for Cisco IDS v5.x and above), the URL should
have /cgi-bin/sdee-server at the end. For example:
https://www.my-sdee-server/cgi-bin/sdee-server
JSA does not automatically discover or create log sources for syslog events from
Cisco IDS/IPS devices. To integrate Cisco IDS/IPS device events with JSA, you
must manually create a log source for each Cisco IDS/IPS in your network.
To configure a Cisco IDS/IPS log source using SDEE polling:
Step 1 Log in to JSA.
Step 2 Click the Admin tab.
Step 3 On the navigation menu, click Data Sources.
The Data Sources panel is displayed.
Step 4 Click the Log Sources icon.
The Log Sources window is displayed.
Step 5 Click Add.
The Add a log source window is displayed.
Step 6 In the Log Source Name field, type a name for your log source.
Step 7 In the Log Source Description field, type a description for the log source.

Configuring DSMs
Cisco IDS/IPS 173
Step 8 From the Log Source Type list box, select Cisco Intrusion Prevention System
(IPS).
Step 9 Using the Protocol Configuration list box, select SDEE.
The syslog protocol configuration is displayed.
Step 10 Configure the following values:
Table 26-10 SDEE Parameters
Parameter Description
Log Source
Identifier
Type an IP address, hostname, or name to identify the SDEE
event source. IP addresses or hostnames are recommended as
they allow JSA to identify a log file to a unique event source.
The log source identifier must be unique for the log source type.
URL Type the URL required to access the log source, for example,
https://www.mysdeeserver.com/cgi-bin/sdee-server. You must
use an http or https URL.
The options include:
•If you are using SDEE/CIDEE (for Cisco IDS v5.x and
above), the URL should have /cgi-bin/sdee-server at the end.
For example,
https://www.my-sdee-server/cgi-bin/sdee-serv
er
•If you are using RDEP (for Cisco IDS v4.0), the URL should
have /cgi-bin/event-server at the end. For example,
https://www.my-rdep-server.com/cgi-bin/event
-server
Username Type the username. This username must match the SDEE URL
username used to access the SDEE URL. The username can
be up to 255 characters in length.
Password Type the user password. This password must match the SDEE
URL password used to access the SDEE URL. The password
can be up to 255 characters in length.
Events / Query Type the maximum number of events to retrieve per query. The
valid range is 0 to 501 and the default is 100.
Force Subscription Select this check box if you want to force a new SDEE
subscription. By default, the check box is selected.
The check box forces the server to drop the least active
connection and accept a new SDEE subscription connection for
this log source.
Clearing the check box continues with any existing SDEE
subscription.
Severity Filter Low Select this check box if you want to configure the severity level
as low.
Log sources that support SDEE return only the events that
match this severity level. By default, the check box is selected.

Configuring DSMs
174 CISCO
Step 11 Click Save.
Step 12 On the Admin tab, click Deploy Changes.
The log source is added to JSA. Events polled from your Cisco IDS/IPS appliances
are displayed on the Log Activity tab of JSA.
Cisco IronPort The Cisco IronPort DSM for JSA provides event information for email spam, web
content filtering, and corporate email policy enforcement.
Before you configure JSA to integrate with your Cisco IronPort device, you must
select the log type to configure:
•To configure IronPort mail logs, see IronPort Mail Log Configuration.
•To configure IronPort content filtering logs, see IronPort Web Content Filter.
IronPort Mail Log
Configuration
The JSA Cisco IronPort DSM accepts events using syslog. To configure your
IronPort device to send syslog events to JSA, you must:
Step 1 Log in to your Cisco IronPort user interface.
Step 2 Select System Administration\Log Subscriptions.
Step 3 Click Add Log Subscription.
Step 4 Configure the following values:
•Log Type - Define a log subscription for both Ironport Text Mail Logs and
System Logs.
•Log Name - Type a log name.
•File Name - Use the default configuration value.
•Maximum File Size - Use the default configuration value.
•Log Level - Select Information (Default).
•Retrieval Method - Select Syslog Push.
•Hostname - Type the IP address or server name of your JSA system.
•Protocol - Select UDP.
Severity Filter
Medium
Select this check box if you want to configure the severity level
as medium.
Log sources that supports SDEE returns only the events that
match this severity level. By default, the check box is selected.
Severity Filter High Select this check box if you want to configure the severity level
as high.
Log sources that supports SDEE returns only the events that
match this severity level. By default, the check box is selected.
Table 26-10 SDEE Parameters (continued)
Parameter Description

Configuring DSMs
Cisco IronPort 175
•Facility - Use the default configuration value. This value depends on the
configured Log Type.
Step 5 Save the subscription.
You are now ready to configure the log source in JSA.
Configure a log source
To integrate Cisco IronPort with JSA, you must manually create a log source to
receive Cisco IronPort events. JSA does not automatically discover or create log
sources for syslog events from Cisco IronPort appliances.
To create a log source for Cisco IronPort events:
Step 1 Log in to JSA.
Step 2 Click the Admin tab.
Step 3 On the navigation menu, click Data Sources.
The Data Sources panel is displayed.
Step 4 Click the Log Sources icon.
The Log Sources window is displayed.
Step 5 Click Add.
The Add a log source window is displayed.
Step 6 In the Log Source Name field, type a name for your log source.
Step 7 In the Log Source Description field, type a description for the log source.
Step 8 From the Log Source Type list box, select Cisco IronPort.
Step 9 Using the Protocol Configuration list box, select Syslog.
The syslog protocol configuration is displayed.
Step 10 Configure the following values:
Step 11 Click Save.
Step 12 On the Admin tab, click Deploy Changes.
The log source is added to JSA. Events forwarded to JSA by Cisco IronPort are
displayed on the Log Activity tab.
IronPort Web Content
Filter
The Cisco IronPort DSM for JSA retrieves web content filtering events in W3C
format from a remote source using the log file protocol.
Your system must be running the latest version of log file protocol to integrate with
a Cisco IronPort device. To configure your Cisco IronPort device to push web
Table 26-11 Syslog Parameters
Parameter Description
Log Source Identifier Type the IP address or host name for the log source as an
identifier for events from your Cisco IronPort appliance.

Configuring DSMs
176 CISCO
content filter events, you must configure a log subscription for the web content filter
using the W3C format. For more information on configuring a log subscription, see
your Cisco IronPort documentation.
You are now ready to configure the log source and protocol JSA.
Step 1 From the Log Source Type drop-down list box, select Cisco IronPort.
Step 2 From the Protocol Configuration list box, select Log File protocol option.
Step 3 Select W3C as the Event Generator used to process the web content filter log
files.
Step 4 The FTP File Pattern parameter must use a regular expression that matches the
log files generated by the web content filter logs.
For more information on configuring the Log File protocol, see the Juniper Secure
Analytics Log Sources User Guide.
Cisco NAC The Cisco NAC DSM for JSA accepts events using syslog.
Supported Event
Types
JSA records all relevant audit, error, and failure events as well as quarantine and
infected system events. Before configuring a Cisco NAC device in JSA, you must
configure your device to forward syslog events.
Configuring Cisco
NAC to Forward
Events
To configure the device to forward syslog events:
Procedure
Step 1 Log in to the Cisco NAC user interface.
Step 2 In the Monitoring section, select Event Logs.
Step 3 Click the Syslog Settings tab.
Step 4 In the Syslog Server Address field, type the IP address of your JSA.
Step 5 In the Syslog Server Port field, type the syslog port. The default is 514.
Step 6 In the System Health Log Interval field, type the frequency, in minutes, for
system statistic log events.
Step 7 Click Update.
You are now ready to configure the log source in JSA.
Configuring a Log
Source
To integrate Cisco NAC events with JSA, you must manually create a log source to
receive Cisco NAC events. JSA does not automatically discover or create log
sources for syslog events from Cisco NAC appliances.
Procedure
Step 1 Log in to JSA.
Step 2 Click the Admin tab.

Configuring DSMs
Cisco Nexus 177
Step 3 On the navigation menu, click Data Sources.
Step 4 Click the Log Sources icon.
Step 5 Click Add.
Step 6 In the Log Source Name field, type a name for your log source.
Step 7 In the Log Source Description field, type a description for the log source.
Step 8 From the Log Source Type list box, select Cisco NAC Appliance.
Step 9 Using the Protocol Configuration list box, select Syslog.
Step 10 Configure the following values:
Step 11 Click Save.
Step 12 On the Admin tab, click Deploy Changes.
The log source is added to JSA. Events forwarded to JSA by Cisco NAC are
displayed on the Log Activity tab.
Cisco Nexus The Cisco Nexus DSM for JSA supports alerts from Cisco NX-OS devices.
The events are forwarded from Cisco Nexus to JSA using syslog. Before you can
integrate events with JSA, you must configure your Cisco Nexus device to forward
syslog events.
Configure Cisco
Nexus to Forward
Events
To configure syslog on your Cisco Nexus server:
Step 1 Type the following command to switch to configuration mode:
config t
Step 2 Type the following commands:
logging server <IP address> <severity>
Where:
<IP address> is the IP address of your JSA console.
<severity> is the severity level of the event messages, which range from 0-7.
For example, logging server 100.100.10.1 6 forwards information level (6)
syslog messages to 100.100.10.1.
Step 3 Type the following to configure the interface for sending syslog events:
logging source-interface loopback
Table 26-12 Syslog Protocol Parameters
Parameter Description
Log Source Identifier Type the IP address or host name for the log source as an
identifier for events from your Cisco NAC appliance.

Configuring DSMs
178 CISCO
Step 4 Type the following command to save your current configuration as the start up
configuration:
copy running-config startup-config
The configuration is complete. The log source is added to JSA as Cisco Nexus
events are automatically discovered. Events forwarded to JSA by Cisco Nexus are
displayed on the Log Activity tab of JSA.
Configure a Log
Source
JSA automatically discovers and creates a log source for syslog events from Cisco
Nexus. The following configuration steps are optional.
To manually configure a log source for Cisco Nexus:
Step 1 Log in to JSA.
Step 2 Click the Admin tab.
Step 3 On the navigation menu, click Data Sources.
The Data Sources panel is displayed.
Step 4 Click the Log Sources icon.
The Log Sources window is displayed.
Step 5 Click Add.
The Add a log source window is displayed.
Step 6 In the Log Source Name field, type a name for your log source.
Step 7 In the Log Source Description field, type a description for the log source.
Step 8 From the Log Source Type list box, select Cisco Nexus.
Step 9 Using the Protocol Configuration list box, select Syslog.
The syslog protocol configuration is displayed.
Step 10 Configure the following values:
Step 11 Click Save.
Step 12 On the Admin tab, click Deploy Changes.
The configuration is complete. For more information on configuring a Virtual
Device Context (VDC) on your Cisco Nexus device, see your vendor
documentation.
Table 26-13 Syslog Parameters
Parameter Description
Log Source Identifier Type the IP address or host name for the log source as an
identifier for events from your Cisco Nexus appliances.

Configuring DSMs
Cisco IOS 179
Cisco IOS You can integrate Cisco IOS series devices with JSA.
Supported Event
Types
The Cisco IOS DSM for JSA accepts Cisco IOS events using syslog. JSA records
all relevant events. The following Cisco Switches and Routers are automatically
discovered as Cisco IOS and have their events parsed by the Cisco IOS DSM:
•Cisco 12000 Series Routers
•Cisco 6500 Series Switches
•Cisco 7600 Series Routers
•Cisco Carrier Routing System
•Cisco Integrated Services Router.
NOTE
Note: Make sure all Access Control Lists (ACLs) are set to LOG.
Configure Cisco IOS
to Forward Events
To configure a Cisco IOS-based device to forward events:
Step 1 Log in to your Cisco IOS Server, switch, or router.
Step 2 Type the following command to log in to the router in privileged-exec.
enable
Step 3 Type the following command to switch to configuration mode:
conf t
Step 4 Type the following commands:
logging <IP address>
logging source-interface <interface>
Where:
<IP address> is the IP address hosting JSA and the SIM components.
<interface> is the name of the interface, for example, dmz, lan, ethernet0, or
ethernet1.
Step 5 Type the following to configure the priority level:
logging trap warning
logging console warning
Where warning is the priority setting for the logs.
Step 6 Configure the syslog facility:
logging facility syslog
Step 7 Save and exit the file.

Configuring DSMs
180 CISCO
Step 8 Copy running-config to startup-config:
copy running-config startup-config
You are now ready to configure the log source in JSA.
The configuration is complete. The log source is added to JSA as Cisco IOS
events are automatically discovered. Events forwarded to JSA by Cisco IOS-based
devices are displayed on the Log Activity tab of JSA.
Configure a Log
Source
JSA automatically discovers and creates a log source for syslog events from Cisco
IOS. The following configuration steps are optional.
To manually configure a log source for Cisco IOS-based devices:
Step 1 Log in to JSA.
Step 2 Click the Admin tab.
Step 3 On the navigation menu, click Data Sources.
The Data Sources panel is displayed.
Step 4 Click the Log Sources icon.
The Log Sources window is displayed.
Step 5 Click Add.
The Add a log source window is displayed.
Step 6 In the Log Source Name field, type a name for your log source.
Step 7 In the Log Source Description field, type a description for the log source.
Step 8 From the Log Source Type list box, select one of the following:
•Cisco IOS
•Cisco 12000 Series Routers
•Cisco 6500 Series Switches
•Cisco 7600 Series Routers
•Cisco Carrier Routing System
•Cisco Integrated Services Router
Step 9 Using the Protocol Configuration list box, select Syslog.
The syslog protocol configuration is displayed.
Step 10 Configure the following values:
Step 11 Click Save.
Table 26-14 Syslog Parameters
Parameter Description
Log Source Identifier Type the IP address or host name for the log source as an
identifier for events from your Cisco IOS-based device.

Configuring DSMs
Cisco Pix 181
Step 12 On the Admin tab, click Deploy Changes.
The configuration is complete.
Cisco Pix You can integrate Cisco Pix security appliances with JSA.
The Cisco Pix DSM for JSA accepts Cisco Pix events using syslog. JSA records all
relevant Cisco Pix events.
Configure Cisco Pix
to Forward Events
To Configure Cisco Pix:
Step 1 Log in to your Cisco PIX appliance using a console connection, telnet, or SSH.
Step 2 Type the following command to access Privileged mode:
enable
Step 3 Type the following command to access Configuration mode:
conf t
Step 4 Enable logging and timestamp the logs:
logging on
logging timestamp
Step 5 Set the log level:
logging trap warning
Step 6 Configure logging to JSA:
logging host <interface> <ip address>
Where:
<interface> is the name of the interface, for example, dmz, lan, ethernet0, or
ethernet1.
<ip address> is the IP address hosting JSA.
The configuration is complete. The log source is added to JSA as Cisco Pix
Firewall events are automatically discovered. Events forwarded to JSA by Cisco
Pix Firewalls are displayed on the Log Activity tab of JSA.
Configure a Log
Source
JSA automatically discovers and creates a log source for syslog events from Cisco
Pix Firewalls. The following configuration steps are optional.
To manually configure a log source for Cisco Pix:
Step 1 Log in to JSA.
Step 2 Click the Admin tab.
Step 3 On the navigation menu, click Data Sources.
The Data Sources panel is displayed.

Configuring DSMs
182 CISCO
Step 4 Click the Log Sources icon.
The Log Sources window is displayed.
Step 5 Click Add.
The Add a log source window is displayed.
Step 6 In the Log Source Name field, type a name for your log source.
Step 7 In the Log Source Description field, type a description for the log source.
Step 8 From the Log Source Type list box, select Cisco PIX Firewall.
Step 9 Using the Protocol Configuration list box, select Syslog.
The syslog protocol configuration is displayed.
Step 10 Configure the following values:
Step 11 Click Save.
Step 12 On the Admin tab, click Deploy Changes.
The configuration is complete.
Cisco VPN 3000
Concentrator
The Cisco VPN 3000 Concentrator DSM for JSA accepts
Cisco VPN Concentrator events using syslog. JSA records all relevant events.
Before you can integrate with a Cisco VPN concentrator, you must configure your
device to forward syslog events to JSA.
Configure a Cisco
VPN 3000
Concentrator
To configure your Cisco VPN 3000 Concentrator:
Step 1 Log in to the Cisco VPN 3000 Concentrator command-line interface (CLI).
Step 2 Type the following command to add a syslog server to your configuration:
set logging server <IP address>
Where <IP address> is the IP address of JSA or your Event Collector.
Step 3 Type the following command to enable system message logging to the configured
syslog servers:
set logging server enable
Step 4 Set the facility and severity level for syslog server messages:
set logging server facility server_facility_parameter
set logging server severity server_severity_level
Table 26-15 Syslog Parameters
Parameter Description
Log Source Identifier Type the IP address or host name for the log source as an
identifier for events from your Cisco Pix Firewall.

Configuring DSMs
Cisco Wireless Services Module 183
The configuration is complete. The log source is added to JSA as Cisco VPN
Concentrator events are automatically discovered. Events forwarded to JSA are
displayed on the Log Activity tab of JSA.
Configure a Log
Source
JSA automatically discovers and creates a log source for syslog events from Cisco
VPN 3000 Series Concentrators. These configuration steps are optional.
To manually configure a log source:
Step 1 Log in to JSA.
Step 2 Click the Admin tab.
Step 3 On the navigation menu, click Data Sources.
The Data Sources panel is displayed.
Step 4 Click the Log Sources icon.
The Log Sources window is displayed.
Step 5 Click Add.
The Add a log source window is displayed.
Step 6 In the Log Source Name field, type a name for your log source.
Step 7 In the Log Source Description field, type a description for the log source.
Step 8 From the Log Source Type list box, select Cisco VPN 3000 Series
Concentrator.
Step 9 Using the Protocol Configuration list box, select Syslog.
The syslog protocol configuration is displayed.
Step 10 Configure the following values:
Step 11 Click Save.
Step 12 On the Admin tab, click Deploy Changes.
The configuration is complete.
Cisco Wireless
Services Module
You can integrate a Cisco Wireless Services Module (WiSM) device with JSA.
A Cisco WiSM DSM for JSA accepts events using syslog. Before you can integrate
JSA with a Cisco WiSM device, you must configure Cisco WiSM to forward syslog
events.
Table 26-16 Syslog Parameters
Parameter Description
Log Source Identifier Type the IP address or host name for the log source as an
identifier for events from your Cisco VPN 3000 Series
Concentrators.
Configuring DSMs
184 CISCO
Configure Cisco
WiSM to Forward
Events
To configure Cisco WiSM to forward syslog events to JSA:
Step 1 Log in to the Cisco Wireless LAN Controller user interface.
Step 2 Click Management > Logs > Config.
The Syslog Configuration window is displayed.
Step 3 In the Syslog Server IP Address field type the IP address of the JSA host to
which you want to send the syslog messages. Click Add.
Step 4 Using the Syslog Level list box, set the severity level for filtering syslog messages
to the syslog servers using one of the following options:
•Emergencies - Severity level 0
•Alerts - Severity level 1 (Default)
•Critical - Severity level 2
•Errors - Severity level 3
•Warnings - Severity level 4
•Notifications - Severity level 5
•Informational - Severity level 6
•Debugging - Severity level 7
If you set a syslog level, only those messages whose severity level is equal or less
than that level are sent to the syslog servers. For example, if you set the syslog
level to Warnings (severity level 4), only those messages whose severity is
between 0 and 4 are sent to the syslog servers.
Step 5 From the Syslog Facility list box, set the facility for outgoing syslog messages to
the syslog server using one of the following options:
•Kernel - Facility level 0
•User Process - Facility level 1
•Mail - Facility level 2
•System Daemons - Facility level 3
•Authorization - Facility level 4
•Syslog - Facility level 5 (default value)
•Line Printer - Facility level 6
•USENET - Facility level 7
•Unix-to-Unix Copy - Facility level 8
•Cron - Facility level 9
•FTP Daemon - Facility level 11
•System Use 1 - Facility level 12
•System Use 2 - Facility level 13
Configuring DSMs
Cisco Wireless Services Module 185
•System Use 3 - Facility level 14
•System Use 4 - Facility level 15
•Local Use 0 - Facility level 16
•Local Use 1 - Facility level 17
•Local Use 2 - Facility level 18
•Local Use 3 - Facility level 19
•Local Use 4 - Facility level 20
•Local Use 5 - Facility level 21
•Local Use 6 - Facility level 22
•Local Use 7 - Facility level 23
Step 6 Click Apply.
Step 7 From the Buffered Log Level and the Console Log Level list boxes, select the
severity level for log messages to the controller buffer and console using one of the
following options:
Emergencies - Severity level 0
Alerts - Severity level 1
Critical - Severity level 2
Errors - Severity level 3 (default value)
Warnings - Severity level 4
Notifications - Severity level 5
Informational - Severity level 6
Debugging - Severity level 7
If you set a logging level, only those messages whose severity is equal to or less
than that level are logged by the controller. For example, if you set the logging level
to Warnings (severity level 4), only those messages whose severity is between 0
and 4 are logged.
Step 8 Select the File Info check box if you want the message logs to include information
about the source file. The default value is enabled.
Step 9 Select the Proc Info check box if you want the message logs to include process
information. The default value is disabled.
Step 10 Select the Trace Info check box if you want the message logs to include traceback
information. The default value is disabled.
Step 11 Click Apply to commit your changes.
Step 12 Click Save Configuration to save your changes.
The configuration is complete. The log source is added to JSA as Cisco WiSM
events are automatically discovered. Events forwarded by Cisco WiSM are
displayed on the Log Activity tab of JSA.

Configuring DSMs
186 CISCO
Configure a Log
Source
JSA automatically discovers and creates a log source for syslog events from Cisco
WiSM. The following configuration steps are optional.
To manually configure a log source for Cisco WiSM:
Step 1 Log in to JSA.
Step 2 Click the Admin tab.
Step 3 On the navigation menu, click Data Sources.
The Data Sources panel is displayed.
Step 4 Click the Log Sources icon.
The Log Sources window is displayed.
Step 5 Click Add.
The Add a log source window is displayed.
Step 6 In the Log Source Name field, type a name for your log source.
Step 7 In the Log Source Description field, type a description for the log source.
Step 8 From the Log Source Type list box, select Cisco Wireless Services Module
(WiSM).
Step 9 Using the Protocol Configuration list box, select Syslog.
The syslog protocol configuration is displayed.
Step 10 Configure the following values:
Step 11 Click Save.
Step 12 On the Admin tab, click Deploy Changes.
The configuration is complete.
Cisco Wireless LAN
Controllers
The Cisco Wireless LAN Controllers DSM for JSA collects events forwarded from
Cisco Wireless LAN Controller devices using syslog or SNMPv2.
This section includes the following topics:
•Configuring Syslog for Cisco Wireless LAN Controller
•Configuring SNMPv2 for Cisco Wireless LAN Controller
Before You Begin If you collect events from Cisco Wireless LAN Controllers, you should select the
best collection method for your configuration. The Cisco Wireless LAN Controller
DSM for JSA supports both syslog and SNMPv2 events. However, syslog provides
Table 26-17 Syslog Protocol Parameters
Parameter Description
Log Source Identifier Type the IP address or host name for the log source as an
identifier for events from your Cisco WiSM appliance.
Configuring DSMs
Cisco Wireless LAN Controllers 187
all available Cisco Wireless LAN Controller events, where SNMPv2 only sends a
limited set of security events to JSA.
Configuring Syslog
for Cisco Wireless
LAN Controller
You can configure Cisco Wireless LAN Controller for forward syslog events to JSA.
Procedure
Step 1 Log in to your Cisco Wireless LAN Controller interface.
Step 2 Click the Management tab.
Step 3 From the menu, select Logs > Config.
Step 4 In the Syslog Server IP Address field, type the IP address of your JSA console.
Step 5 Click Add.
Step 6 From the Syslog Level list box, select a logging level.
The Information level allows you to collect all Cisco Wireless LAN Controller
events above the debug level.
Step 7 From the Syslog Facility list box, select a facility level.
Step 8 Click Apply
Step 9 Click Save Configuration.
What to do next
You are now ready to configure a syslog log source for Cisco Wireless LAN
Controller.
Configuring a syslog log source in JSA
JSA does not automatically discover incoming syslog events from Cisco Wireless
LAN Controllers. You must create a log source for each Cisco Wireless LAN
Controller providing syslog events to JSA.
Procedure
Step 1 Log in to JSA.
Step 2 Click the Admin tab.
Step 3 On the navigation menu, click Data Sources.
Step 4 Click the Log Sources icon.
Step 5 Click Add.
Step 6 In the Log Source Name field, type a name for your log source.
Step 7 In the Log Source Description field, type a description for the log source.
Step 8 From the Log Source Type list box, select Cisco Wireless LAN Controllers.
Step 9 Using the Protocol Configuration list box, select Syslog.

Configuring DSMs
188 CISCO
Step 10 Configure the following values:
Step 11 Click Save.
Step 12 On the Admin tab, click Deploy Changes.
The configuration is complete.
Configuring SNMPv2
for Cisco Wireless
LAN Controller
SNMP event collection for Cisco Wireless LAN Controllers allows you to capture
the following events for JSA:
•SNMP Config Event
•bsn Authentication Errors
•LWAPP Key Decryption Errors
Table 26-18 Syslog Protocol Parameters
Parameter Description
Log Source Identifier Type the IP address or host name for the log source as an
identifier for events from your Cisco Wireless LAN Controller.
Enabled Select this check box to enable the log source. By default,
the check box is selected.
Credibility From the list box, select the credibility of the log source. The
range is 0 to 10. The credibility indicates the integrity of an
event or offense as determined by the credibility rating from
the source devices. Credibility increases if multiple sources
report the same event. The default is 5.
Target Event Collector From the list box, select the Event Collector to use as the
target for the log source.
Coalescing Events Select this check box to enable the log source to coalesce
(bundle) events.
Automatically discovered log sources use the default value
configured in the Coalescing Events drop-down in the JSA
Settings window on the Admin tab. However, when you
create a new log source or update the configuration for an
automatically discovered log source you can override the
default value by configuring this check box for each log
source. For more information on settings, see the Juniper
Secure Analytics Administration Guide.
Incoming Event
Payload
From the list box, select the incoming payload encoder for
parsing and storing the logs.
Store Event Payload Select this check box to enable or disable JSA from storing
the event payload.
Automatically discovered log sources use the default value
from the Store Event Payload drop-down in the JSA
Settings window on the Admin tab. However, when you
create a new log source or update the configuration for an
automatically discovered log source you can override the
default value by configuring this check box for each log
source.
Configuring DSMs
Cisco Wireless LAN Controllers 189
Procedure
Step 1 Log in to your Cisco Wireless LAN Controller interface.
Step 2 Click the Management tab.
Step 3 From the menu, select SNMP > Communities.
You can use the one of the default communities created or create a new
community.
Step 4 Click New.
Step 5 In the Community Name field, type the name of the community for your device.
Step 6 In the IP Address field, type the IP address of JSA.
The IP address and IP mask you specify is the address from which your Cisco
Wireless LAN Controller accepts SNMP requests. You can treat these values as an
access list for SNMP requests.
Step 7 In the IP Mask field, type a subnet mask.
Step 8 From the Access Mode list box, select Read Only or Read/Write.
Step 9 From the Status list box, select Enable.
Step 10 Click Save Configuration to save your changes.
What to do next
You are now ready to create a SNMPv2 trap receiver.
Configure a trap receiver for Cisco Wireless LAN Controller
Trap receivers configured for Cisco Wireless LAN Controllers define where the
device can send SNMP trap messages.
Procedure
Step 1 Click the Management tab.
Step 2 From the menu, select SNMP > Trap Receivers.
Step 3 In the Trap Receiver Name field, type a name for your trap receiver.
Step 4 In the IP Address field, type the IP address of JSA.
The IP address you specify is the address to which your Cisco Wireless LAN
Controller sends SNMP messages. If you plan to configure this log source on an
Event Collector, you want to specify the Event Collector appliance IP address.
Step 5 From the Status list box, select Enable.
Step 6 Click Apply to commit your changes.
Step 7 Click Save Configuration to save your settings.
What to do next
You are now ready to create a SNMPv2 log source in JSA.

Configuring DSMs
190 CISCO
Configure a log source for SNMPv2 for Cisco Wireless LAN Controller
JSA does not automatically discover and create log sources for SNMP event data
from Cisco Wireless LAN Controllers. You must create a log source for each Cisco
Wireless LAN Controller providing SNMPv2 events.
Procedure
Step 1 Log in to JSA.
Step 2 Click the Admin tab.
Step 3 On the navigation menu, click Data Sources.
Step 4 Click the Log Sources icon.
Step 5 Click Add.
Step 6 In the Log Source Name field, type a name for your log source.
Step 7 In the Log Source Description field, type a description for the log source.
Step 8 From the Log Source Type list box, select Cisco Wireless LAN Controllers.
Step 9 Using the Protocol Configuration list box, select SNMPv2.
Step 10 Configure the following values:
Table 26-19 SNMPv2 protocol parameters
Parameter Description
Log Source Identifier Type the IP address or host name for the log source as an
identifier for events from your Cisco Wireless LAN Controller.
Community Type the SNMP community name required to access the
system containing SNMP events. The default is Public.
Include OIDs in Event
Payload
Select the Include OIDs in Event Payload check box.
This options allows the SNMP event payload to be
constructed using name-value pairs instead of the standard
event payload format. Including OIDs in the event payload is
required for processing SNMPv2 or SNMPv3 events from
certain DSMs.
Enabled Select this check box to enable the log source. By default,
the check box is selected.
Credibility From the list box, select the credibility of the log source. The
range is 0 to 10. The credibility indicates the integrity of an
event or offense as determined by the credibility rating from
the source devices. Credibility increases if multiple sources
report the same event. The default is 5.
Target Event Collector From the list box, select the Event Collector to use as the
target for the log source.

Configuring DSMs
Cisco Identity Services Engine 191
Step 11 Click Save.
Step 12 On the Admin tab, click Deploy Changes.
The configuration is complete. Events forwarded to by Cisco Wireless LAN
Controller are displayed on the Log Activity tab of JSA.
Cisco Identity
Services Engine
The Cisco Identity Services Engine (ISE) DSM for JSA accepts syslog events from
Cisco ISE appliances with log sources configured to use the UDP Multiline
protocol.
Configuration
Overview
JSA supports syslog events forwarded by Cisco ISE versions 1.1. Before you
configure your Cisco ISE appliance, you should consider which logging categories
you want to configure on your Cisco ISE to forward to JSA. Each logging category
must be configured with a syslog severity and included as a remote target to allow
Cisco ISE to forward the event to JSA. The log source you configure in JSA
receives the event forwarded from Cisco ISE and uses a regular expression to
assemble the multiline syslog event in to an event readable by JSA.
Coalescing Events Select this check box to enable the log source to coalesce
(bundle) events.
Automatically discovered log sources use the default value
configured in the Coalescing Events drop-down in the JSA
Settings window on the Admin tab. However, when you
create a new log source or update the configuration for an
automatically discovered log source you can override the
default value by configuring this check box for each log
source. For more information on settings, see the Juniper
Secure Analytics Administration Guide.
Store Event Payload Select this check box to enable or disable JSA from storing
the event payload.
Automatically discovered log sources use the default value
from the Store Event Payload drop-down in the JSA
Settings window on the Admin tab. However, when you
create a new log source or update the configuration for an
automatically discovered log source you can override the
default value by configuring this check box for each log
source.
Table 26-19 SNMPv2 protocol parameters (continued)
Parameter Description

Configuring DSMs
192 CISCO
To integrate Cisco ISE events with JSA, you must perform the following tasks:
1 Configure a log source in JSA for your Cisco ISE appliance forwarding events to
JSA.
2 Create a remote logging target for JSA on your Cisco ISE appliance.
3 Configure the logging categories on your Cisco ISE appliance.
Supported Event
Logging Categories
The Cisco ISE DSM for JSA is capable of receiving syslog events from the
following event logging categories.
Configuring a Cisco
ISE Log Source in
JSA
To collect syslog events, you must configure a log source for Cisco ISE in JSA to
use the UDP Multiline Syslog protocol.
You must configure a log source for each individual Cisco ISE appliance that
forwards events to JSA. However, all Cisco ISE appliances can forward their
events to the same listen port on JSA that you configure.
Table 26-1 Supported Cisco ISE Event Logging Categories
Event logging category
AAA audit
Failed attempts
Passed authentication
AAA diagnostics
Administrator authentication and authorization
Authentication flow diagnostics
Identity store diagnostics
Policy diagnostics
Radius diagnostics
Guest
Accounting
Radius accounting
Administrative and operational audit
Posture and client provisioning audit
Posture and client provisioning diagnostics
Profiler
System diagnostics
Distributed management
Internal operations diagnostics
System statistics

Configuring DSMs
Cisco Identity Services Engine 193
Procedure
Step 1 Log in to JSA.
Step 2 Click the Admin tab.
Step 3 In the navigation menu, click Data Sources.
Step 4 Click the Log Sources icon.
Step 5 Click Add.
Step 6 In the Log Source Name field, type a name for your log source.
Step 7 In the Log Source Description field, type a description for your log source.
Step 8 From the Log Source Type list box, select Cisco Identity Services Engine.
Step 9 From the Protocol Configuration list box, select UDP Multiline Syslog.
Step 10 Configure the following values:
Step 11 Click Save.
Step 12 On the Admin tab, click Deploy Changes.
What to do next
You are now ready to configure your Cisco ISE appliance with a remote logging
target.
Table 26-2 Cisco ISE Log Source Parameters
Parameter Description
Log Source Identifier Type the IP address, host name, or name to identify the log
source or appliance providing UDP Multiline Syslog events to
JSA.
Listen Port Type 517 as the port number used by JSA to accept
incoming UDP Multiline Syslog events. The valid port range
is 1 to 65535.
To edit a saved configuration to use a new port number:
1In the Listen Port field, type the new port number for
receiving UDP Multiline Syslog events.
2Click Save.
3On the Admin tab, select Advanced > Deploy Full
Configuration.
After the full deploy completes, JSA is capable of receiving
events on the updated listen port.
Note: When you click Deploy Full Configuration, JSA restarts
all services, resulting in a gap in data collection for events
and flows until the deployment completes.
Message ID Pattern Type the following regular expression (regex) required to
filter the event payload messages.
CISE_\S+ (\d{10})
Configuring DSMs
194 CISCO
Creating a Remote
Logging Target in
Cisco ISE
To forward syslog events to JSA, you must configure your Cisco ISE appliance
with a remote logging target.
Procedure
Step 1 Log in to your Cisco ISE Administration Interface.
Step 2 From the navigation menu, select Administration > System > Logging >
Remote Logging Targets.
Step 3 Click Add.
Step 4 In the Name field, type a name for the remote target system.
Step 5 In the Description field, type a description.
Step 6 In the IP Address field, type a the IP address of the JSA console or Event
Collector.
Step 7 In the Port field, type 517 or use the port value you specific in your Cisco ISE log
source for JSA.
Step 8 From the Facility Code list box, select the syslog facility to use for logging events.
Step 9 In the Maximum Length field, type 1024 as the maximum packet length allowed
for the UDP syslog message.
Step 10 Click Submit.
The remote logging target is created for JSA.
What to do next
You are now ready to configure the logging categories forwarded by Cisco ISE to
JSA.
Configuring Cisco
ISE Logging
Categories
To define which events are forwarded by your Cisco ISE appliance, you must
configure each logging category with a syslog severity and the remote logging
target your configured for JSA.
For a list of pre-defined event logging categories for Cisco ISE, see Supported
Event Logging Categories.
Procedure
Step 1 From the navigation menu, select Administration > System > Logging >
Logging Categories.
Step 2 Select a logging category, and click Edit.
Step 3 From the Log Severity list box, select a severity for the logging category.
Step 4 In the Target field, add your remote logging target for JSA to the Select box.
Step 5 Click Save.
Step 6 Repeat this process for each logging category you want to forward to JSA.
The configuration is complete. Events forwarded by Cisco ISE are displayed on the
Log Activity tab in JSA.

Configuring DSMs
24 CITRIX
This section provides information on the following DSMs:
•Citrix NetScaler
•Citrix Access Gateway
Citrix NetScaler The Citrix NetScaler DSM for Juniper Secure Analytics (JSA) accepts all relevant
audit log events using syslog.
Configuring Syslog
on Citrix NetScaler
To integrate Citrix NetScaler events with JSA, you must configure Citrix NetScaler
to forward syslog events.
Procedure
Step 1 Using SSH, log in to your Citrix NetScaler device as a root user.
Step 2 Type the following command to add a remote syslog server:
add audit syslogAction <ActionName> <IP Address> -serverPort 514
-logLevel Info -dateFormat DDMMYYYY
Where:
<ActionName> is a descriptive name for the syslog server action.
<IP Address> is the IP address or hostname of your JSA console.
For example:
add audit syslogAction action-JSA 10.10.10.10 -serverPort 514
-logLevel Info -dateFormat DDMMYYYY
Step 3 Type the following command to add an audit policy:
add audit syslogPolicy <PolicyName> <Rule> <ActionName>
Where:
<PolicyName> is a descriptive name for the syslog policy.
<Rule> is the rule or expression the policy uses. The only supported value is
ns_true.
<ActionName> is a descriptive name for the syslog server action.

Configuring DSMs
196 CITRIX
For example:
add audit syslogPolicy policy-JSA ns_true action-JSA
Step 4 Type the following command to bind the policy globally:
bind system global <PolicyName> -priority <Integer>
Where:
<PolicyName> is a descriptive name for the syslog policy.
<Integer> is a numeric value used to rank message priority for multiple policies
that are communicating using syslog.
For example:
bind system global policy-JSA -priority 30
When multiple policies have priority assigned to them as a numeric value the lower
priority value is evaluated before the higher value.
Step 5 Type the following command to save the Citrix NetScaler configuration.
save config
Step 6 Type the following command to verify the policy is saved in your configuration:
sh system global
NOTE
Note: For information on configuring syslog using the Citrix NetScaler user
interface, see http://support.citrix.com/article/CTX121728 or your vendor
documentation.
The configuration is complete. The log source is added to JSA as Citrix NetScaler
events are automatically discovered. Events forwarded by Citrix NetScaler are
displayed on the Log Activity tab of JSA.
Configuring a Citrix
NetScaler Log
Source
JSA automatically discovers and creates a log source for syslog events from Citrix
NetScaler. This procedure is optional.
Procedure
Step 1 Log in to JSA.
Step 2 Click the Admin tab.
Step 3 On the navigation menu, click Data Sources.
Step 4 Click the Log Sources icon.
Step 5 Click Add.
Step 6 In the Log Source Name field, type a name for your log source.
Step 7 In the Log Source Description field, type a description for the log source.
Step 8 From the Log Source Type list box, select Citrix NetScaler.
Step 9 Using the Protocol Configuration list box, select Syslog.

Configuring DSMs
Citrix Access Gateway 197
Step 10 Configure the following values:
Step 11 Click Save.
Step 12 On the Admin tab, click Deploy Changes.
The configuration is complete.
Citrix Access
Gateway
The Citrix Access Gateway DSM accepts access, audit, and diagnostic events
forwarded from your Citrix Access Gateway appliance using syslog.
Configuring Syslog
for Citrix Access
Gateway
This procedure outlines the configure steps required to configure syslog on your
Citrix Access Gateway to forward events to the JSA console or an Event
Collectors.
Procedure
Step 1 Log in to your Citrix Access Gateway web interface.
Step 2 Click the Access Gateway Cluster tab.
Step 3 Select Logging/Settings.
Step 4 In the Server field, type the IP address of your JSA console or Event Collector.
Step 5 From the Facility list box, select a syslog facility level.
Step 6 In the Broadcast interval (mins), type 0 to continuously forward syslog events to
JSA.
Step 7 Click Submit to save your changes.
The configuration is complete. The log source is added to JSA as Citrix Access
Gateway events are automatically discovered. Events forwarded to JSA by Citrix
Access Gateway are displayed on the Log Activity tab in JSA.
Configuring a Citrix
Access Gateway Log
Source
JSA automatically discovers and creates a log source for syslog events from Citrix
Access Gateway appliances. This procedure is optional.
Procedure
Step 1 Log in to JSA.
Step 2 Click the Admin tab.
Step 3 On the navigation menu, click Data Sources.
Step 4 Click the Log Sources icon.
Step 5 Click Add.
Table 27-1 Syslog protocol parameters
Parameter Description
Log Source Identifier Type the IP address or host name for the log source as an
identifier for events from your Citrix NetScaler devices.

Configuring DSMs
198 CITRIX
Step 6 In the Log Source Name field, type a name for your log source.
Step 7 In the Log Source Description field, type a description for the log source.
Step 8 From the Log Source Type list box, select Citrix Access Gateway.
Step 9 Using the Protocol Configuration list box, select Syslog.
Step 10 Configure the following values:
Step 11 Click Save.
Step 12 On the Admin tab, click Deploy Changes.
The configuration is complete.
Table 27-2 Syslog protocol parameters
Parameter Description
Log Source Identifier Type the IP address or host name for the log source as an
identifier for events from your Citrix Access Gateway
appliance.

Configuring DSMs
25 CRYPTOCARD CRYPTO-SHIELD
The Juniper Secure Analytics (JSA) CRYPTOCard CRYPTO-Shield DSM for JSA
accepts events using syslog.
Before You Begin To integrate CRYPTOCard CRYPTO-Shield events with JSA, you must manually
create a log source to receive syslog events.
Before you can receive events in JSA, you must configure a log source, then
configure your CRYPTOCard CRYPTO-Shield to forward syslog events. Syslog
events forwarded from CRYPTOCard CRYPTO-Shield devices are not
automatically discovered. JSA can receive syslog events on port 514 for both TCP
and UDP.
Configuring a Log
Source
JSA does not automatically discover or create log sources for syslog events from
CRYPTOCard CRYPTO-Shield devices.
Procedure
Step 1 Log in to JSA.
Step 2 Click the Admin tab.
Step 3 On the navigation menu, click Data Sources.
Step 4 Click the Log Sources icon.
Step 5 Click Add.
Step 6 In the Log Source Name field, type a name for your log source.
Step 7 In the Log Source Description field, type a description for the log source.
Step 8 From the Log Source Type list box, select CRYPTOCard CRYPTOShield.
Step 9 Using the Protocol Configuration list box, select Syslog.
Step 10 Configure the following values:
Table 28-1 Syslog Parameters
Parameter Description
Log Source Identifier Type the IP address or host name for the log source as an
identifier for events from your CRYPTOCard
CRYPTO-Shield device.

Configuring DSMs
200 CRYPTOCARD CRYPTO-SHIELD
Step 11 Click Save.
Step 12 On the Admin tab, click Deploy Changes.
The log source is added to JSA.
Configure Syslog for
CRYPTOCard
CRYPTO-Shield
To configure your CRYPTOCard CRYPTO-Shield device to forward syslog events:
Step 1 Log in to your CRYPTOCard CRYPTO-Shield device.
Step 2 Configure the following System Configuration parameters:
NOTE
You must have CRYPTOCard Operator access with the assigned default
Super-Operator system role to access the System Configuration parameters.
•log4j.appender.<protocol> - Directs the logs to a syslog host where the
<protocol> is the type of log appender, which determines where you want to
send logs for storage. The options are: ACC, DBG, or LOG. For this parameter,
type the following: org.apache.log4j.net.SyslogAppender
•log4j.appender.<protocol>.SyslogHost <IP address> - Type the IP
address or hostname of the syslog server where:
-<protocol> is the type of log appender, which determines where you want
to send logs for storage. The options are: ACC, DBG, or LOG.
-<IP address> is the IP address of the JSA host to which you want to send
logs. This value can only be specified when the first parameter is configured.
This parameter can only be specified when the log4j.apender.<protocol>
parameter is configured.
The configuration is complete. Events forwarded to JSA by CRYPTOCard
CRYPTO-Shield are displayed on the Log Activity tab.
Configuring DSMs
26 CYBER-ARK VAULT
The Cyber-Ark Vault DSM for Juniper Secure Analytics (JSA) accepts events using
syslog formatted for Log Enhanced Event Format (LEEF).
Supported Event
Types
JSA records both user activities and safe activities from the Cyber-Ark Vault in the
audit log events. Cyber-Ark Vault integrates with JSA to forward audit logs using
syslog to create a complete audit picture of privileged account activities.
Event Type Format Cyber-Ark Vault must be configured to generate events in Log Enhanced Event
Protocol (LEEF) and forward these events using syslog. The LEEF format consists
of a pipe ( | ) delimited syslog header and tab separated fields in the event payload.
If the syslog events forwarded from your Cyber-Ark Vault is not formatted as
described above, you must examine your device configuration or software version
to ensure your appliance supports LEEF. Properly formatted LEEF event
messages are automatically discovered and added as a log source to JSA.
Configure Syslog for
Cyber-Ark Vault
To configure Cyber-Ark Vault to forward syslog events to JSA:
Procedure
Step 1 Log in to your Cyber-Ark device.
Step 2 Edit the DBParm.ini file.
Step 3 Configure the following parameters:
•SyslogServerIP - Type the IP address of JSA.
•SyslogServerPort - Type the UDP port used to connect to JSA. The default
value is 514.
•SyslogMessageCodeFilter - Configure which message codes are sent from
the Cyber-Ark Vault to JSA. You can define specific message numbers or a
range of numbers. By default, all message codes are sent for user activities and
safe activities.
For example, to define a message code of 1,2,3,30 and 5-10, you must type:
1,2,3,5-10,30.

Configuring DSMs
202 CYBER-ARK VAULT
•SyslogTranslatorFile - Type the file path to the LEEF.xsl translator file. The
translator file is used to parse Cyber-Ark audit records data in the syslog
protocol.
Step 4 Copy LEEF.xsl to the location specified by the SyslogTranslatorFile parameter in
the DBParm.ini file.
The configuration is complete. The log source is added to JSA as Cyber-Ark Vault
events are automatically discovered. Events forwarded by Cyber-Ark Vault are
displayed on the Log Activity tab of JSA.
Configuring a Log
Source
JSA automatically discovers and creates a log source for syslog events from
Cyber-Ark Vault. The following configuration steps are optional.
Procedure
Step 1 Log in to JSA.
Step 2 Click the Admin tab.
Step 3 On the navigation menu, click Data Sources.
Step 4 Click the Log Sources icon.
Step 5 Click Add.
Step 6 In the Log Source Name field, type a name for your log source.
Step 7 In the Log Source Description field, type a description for the log source.
Step 8 From the Log Source Type list box, select Cyber-Ark Vault.
Step 9 Using the Protocol Configuration list box, select Syslog.
Step 10 Configure the following values:
Step 11 Click Save.
Step 12 On the Admin tab, click Deploy Changes.
The configuration is complete.
Table 29-1 Syslog Parameters
Parameter Description
Log Source Identifier Type the IP address or host name for the log source as an
identifier for events from your Cyber-Ark Vault appliance.
Configuring DSMs
27 CYBERGUARD FIREWALL/VPN
APPLIANCE
The CyberGuard Firewall VPN Appliance DSM for Juniper Secure Analytics (JSA)
accepts CyberGuard events using syslog.
Supported Event
Types
JSA records all relevant CyberGuard events for CyberGuard KS series appliances
forwarded using syslog.
Configure Syslog
Events
To configure a CyberGuard device to forward syslog events:
Procedure
Step 1 Log in to the CyberGuard user interface.
Step 2 Select the Advanced page.
Step 3 Under System Log, select Enable Remote Logging.
Step 4 Type the IP address of JSA.
Step 5 Click Apply.
The configuration is complete. The log source is added to JSA as CyberGuard
events are automatically discovered. Events forwarded by CyberGuard appliances
are displayed on the Log Activity tab of JSA.
Configure a Log
Source
JSA automatically discovers and creates a log source for syslog events from
CyberGuard appliances. The following configuration steps are optional.
Procedure
Step 1 Log in to JSA.
Step 2 Click the Admin tab.
Step 3 On the navigation menu, click Data Sources.
Step 4 Click the Log Sources icon.
Step 5 Click Add.
Step 6 In the Log Source Name field, type a name for your log source.
Step 7 In the Log Source Description field, type a description for the log source.
Step 8 From the Log Source Type list box, select CyberGuard TSP Firewall/VPN.

Configuring DSMs
204 CYBERGUARD FIREWALL/VPN APPLIANCE
Step 9 Using the Protocol Configuration list box, select Syslog.
Step 10 Configure the following values:
Step 11 Click Save.
Step 12 On the Admin tab, click Deploy Changes.
The configuration is complete.
Table 30-1 Syslog parameters
Parameter Description
Log Source Identifier Type the IP address or host name for the log source as an
identifier for events from your CyberGuard appliance.
Configuring DSMs
28 DAMBALLA FAILSAFE
The Failsafe DSM for Juniper Secure Analytics (JSA) accepts syslog events using
the Log Enhanced Event Protocol (LEEF), enabling JSA to record all relevant
Damballa Failsafe events.
Event Type Format Damballa Failsafe must be configured to generate events in Log Enhanced Event
Protocol (LEEF) and forward these events using syslog. The LEEF format consists
of a pipe ( | ) delimited syslog header and tab separated fields in the event payload.
If the syslog events forwarded from your Damballa Failsafe is not formatted as
described above, you must examine your device configuration or software version
to ensure your appliance supports LEEF. Properly formatted LEEF event
messages are automatically discovered and added as a log source to JSA.
Configuring Syslog
for Damballa Failsafe
To collect events, you must configure your Damballa Failsafe device to forward
syslog events to JSA.
Procedure
Step 1 Log in to your Damballa Failsafe Management console
Step 2 From the navigation menu, select Setup > Integration Settings.
Step 3 Click the Q1 QRadar tab.
Step 4 Select Enable Publishing to Q1 QRadar.
Step 5 Configure the following options:
a Q1 Hostname - Type the IP address or Fully Qualified Name (FQN) of your
JSA console.
b Destination Port - Type 514. By default, JSA uses port 514 as the port for
receiving syslog events.
c Source Port - Optional. Type the source port your Damballa Failsafe device
uses for sending syslog events.
Step 6 Click Save.
The configuration is complete. The log source is added to JSA as Damballa
Failsafe events are automatically discovered. Events forwarded by Damballa
Failsafe are displayed on the Log Activity tab of JSA.

Configuring DSMs
206 DAMBALLA FAILSAFE
Configuring a Log
Source
JSA automatically discovers and creates a log source for syslog events from
Damballa Failsafe devices. The following configuration steps are optional.
Procedure
Step 1 Log in to JSA.
Step 2 Click the Admin tab.
Step 3 On the navigation menu, click Data Sources.
Step 4 Click the Log Sources icon.
Step 5 Click Add.
Step 6 In the Log Source Name field, type a name for your log source.
Step 7 In the Log Source Description field, type a description for the log source.
Step 8 From the Log Source Type list box, select Damballa Failsafe.
Step 9 Using the Protocol Configuration list box, select Syslog.
Step 10 Configure the following values:
Step 11 Click Save.
Step 12 On the Admin tab, click Deploy Changes.
The configuration is complete.
Table 31-1 Syslog Parameters
Parameter Description
Log Source Identifier Type the IP address or host name for the log source as an
identifier for events from your Damballa Failsafe devices.
Configuring DSMs
29 DIGITAL CHINA NETWORKS (DCN)
The Digital China Networks (DCN) DCS/DCRS Series DSM for Juniper Secure
Analytics (JSA) can accept events from Digital China Networks (DCN) switches
using syslog.
Supported Event
Types
JSA records all relevant IPv4 events forwarded from DCN switches. To integrate
your device with JSA, you must configure a log source, then configure your DCS or
DCRS switch to forward syslog events.
Supported
Appliances
The DSM supports the following DCN DCS/DCRS Series switches:
•DCS - 3650
•DCS - 3950
•DCS - 4500
•DCRS - 5750
•DCRS - 5960
•DCRS - 5980
•DCRS - 7500
•DCRS - 9800
Configuring a Log
Source
JSA does not automatically discover incoming syslog events from DCN
DCS/DCRS Series switches.
Procedure
Step 1 Log in to JSA.
Step 2 Click the Admin tab.
Step 3 On the navigation menu, click Data Sources.
Step 4 Click the Log Sources icon.
Step 5 Click Add.
Step 6 In the Log Source Name field, type a name for your log source.
Step 7 In the Log Source Description field, type a description for the log source.

Configuring DSMs
208 DIGITAL CHINA NETWORKS (DCN)
Step 8 From the Log Source Type list box, select DCN DCS/DCRS Series.
Step 9 Using the Protocol Configuration list box, select Syslog.
Step 10 Configure the following value:
Step 11 Click Save.
Step 12 On the Admin tab, click Deploy Changes.
The log source is added to JSA. You are now ready to configure your Digital China
Networks DCS or DCRS Series switch to forward events to JSA.
Configure a DCN
DCS/DCRS Series
Switch
To collect events, you must configure your DCN DCS/DCRS Series switch in JSA.
Procedure
Step 1 Log in to your DCN DCS/DCRS Series switch command-line Interface (CLI).
Step 2 Type the following command to access the administrative mode:
enable
Step 3 Type the following command to access the global configuration mode:
config
The command-line interface displays the configuration mode prompt:
Switch(Config)#
Step 4 Type the following command to configure a log host for your switch:
logging <IP address> facility <local> severity <level>
Where:
<IP address> is the IP address of the JSA console.
<local> is the syslog facility, for example, local0.
<level> is the severity of the syslog events, for example, informational. If you
specify a value of informational, you forward all information level events and
above, such as, notifications, warnings, errors, critical, alerts, and emergencies.
For example,
logging 10.10.10.1 facility local0 severity informational
Table 32-1 Syslog Parameters
Parameter Description
Log Source Identifier Type the IP address, hostname, or name for the log source
as an identifier for your DCN DCS/DCRS Series switch.
Each log source you create for your DCN DCS/DCRS Series
switch should include a unique identifier, such as an IP
address or hostname.
Configuring DSMs
209
Step 5 Type the following command to save your configuration changes:
write
The configuration is complete. You can verify events forwarded to JSA by viewing
events in the Log Activity tab.

Configuring DSMs
30 ENTERASYS
This section provides information on the following DSMs:
•Enterasys Dragon
•Enterasys HiGuard Wireless IPS
•Enterasys HiPath Wireless Controller
•Enterasys Stackable and Standalone Switches
•Enterasys XSR Security Router
•Enterasys Matrix Router
•Enterasys NetSight Automatic Security Manager
•Enterasys Matrix K/N/S Series Switch
•Enterasys NAC
•Enterasys 800-Series Switch
Enterasys Dragon The Enterasys Dragon DSM for Juniper Secure Analytics (JSA) accepts Enterasys
events using either syslog or SNMPv3 to record all relevant Enterasys Dragon
events.
To configure your JSA Enterasys Dragon DSM, you must:
1 Choose one of the following:
a Create an Alarm Tool policy using an SNMPv3 notification rule. See Create an
Alarm Tool Policy for SNMPv3.
b Create an Alarm Tool policy using a Syslog notification rule. See Create a
Policy for Syslog.
2 Configure the log source within JSA. See Configure a Log Source.
3 Configure Dragon Enterprise Management Server (EMS) to forward syslog
messages. See Configure the EMS to Forward Syslog Messages
Configuring DSMs
212 ENTERASYS
Create an Alarm Tool
Policy for SNMPv3
This procedure describes how to configure an Alarm Tool policy using an SNMPv3
notification rule. Use SNMPv3 notification rules if you need to transfer PDATA
binary data elements.
To configure Enterasys Dragon with an Alarm Tool policy using an SNMPv3
notification rule:
Step 1 Log in to the Enterasys Dragon EMS.
Step 2 Click the Alarm Tool icon.
Step 3 Configure the Alarm Tool Policy:
a In the Alarm Tool Policy View > Custom Policies menu tree, right-click and
select Add Alarm Tool Policy.
The Add Alarm Tool Policy window is displayed.
b In the Add Alarm Tool Policy field, type a policy name.
For example:
JSA
c Click OK.
d In the menu tree, select the policy name you entered from Stepb.
Step 4 To configure the event group:
a Click the Events Group tab.
b Click New.
The Event Group Editor is displayed.
c Select the event group or individual events to monitor.
d Click Add.
A prompt is displayed.
e Click Yes.
f In the right column of the Event Group Editor, type Dragon-Events.
g Click OK.
Step 5 Configure the SNMPv3 notification rules:
a Click the Notification Rules tab.
b Click New.
c In the name field, type JSA-Rule.
d Click OK.
e In the Notification Rules panel, select JSA-Rule.
f Click the SNMP V3 tab.
g Click New.

Configuring DSMs
Enterasys Dragon 213
h Update SNMP V3 values, as required:
-Server IP Address - Type the JSA IP address.
Note: Do not change the OID.
-Inform - Select the Inform check box.
-Security Name - Type the SNMPv3 username.
-Auth Password - Type the appropriate password.
-Priv Password - Type the appropriate password.
-Message - Type the following on one line:
Dragon Event:
%DATE%,,%TIME%,,%NAME%,,%SENSOR%,,%PROTO%,,%SIP%,,
%DIP%,,%SPORT%,,%DPORT%,, %DIR%,,%DATA%,,<<<%PDATA%>>>
NOTE
Note: Verify that the security passwords and protocols match data configured in
the SNMP configuration.
i Click OK.
Step 6 Verify that the notification events are logged as separate events:
a Click the Global Options tab.
b Click the Main tab.
c Make sure that Concatenate Events is not selected.
Step 7 Configure the SNMP options:
a Click the Global Options tab.
b Click the SNMP tab
c Type the IP address of the EMS server sending SNMP traps.
Step 8 Configure the alarm information:
a Click the Alarms tab.
b Click New.
c Type values for the following parameters:
-Name - Type JSA-Alarm.
-Type - Select Real Time.
-Event Group - Select Dragon-Events.
-Notification Rule - Select the JSA-Rule check box.
d Click OK.
e Click Commit.
Step 9 Navigate to the Enterprise View.
Step 10 Right-click on the Alarm Tool and select Associate Alarm Tool Policy.

Configuring DSMs
214 ENTERASYS
Step 11 Select the JSA policy. Click OK.
Step 12 From the Enterprise menu, right-click and select Deploy.
You are now ready to configure the log source SNMP protocol in JSA.
Create a Policy for
Syslog
This procedure describes how to configure an Alarm Tool policy using a syslog
notification rule in the Log Event Extended Format (LEEF) message format.
LEEF is the preferred message format for sending notifications to Dragon Network
Defense when the notification rate is very high or when IPv6 addresses are
displayed. If you prefer not to use syslog notifications in LEEF format, refer to your
Enterasys Dragon documentation for more information.
NOTE
Note: Use SNMPv3 notification rules if you need to transfer PDATA, which is a
binary data element. Do not use a syslog notification rule.
To configure Enterasys Dragon with an Alarm Tool policy using a syslog notification
rule:
Step 1 Log in to the Enterasys Dragon EMS.
Step 2 Click the Alarm Tool icon.
Step 3 Configure the Alarm Tool Policy:
a In the Alarm Tool Policy View > Custom Policies menu tree, right-click and
select Add Alarm Tool Policy.
The Add Alarm Tool Policy window is displayed.
b In the Add Alarm Tool Policy field, type a policy name.
For example:
JSA
c Click OK.
d In the menu tree, select JSA.
Step 4 To configure the event group:
a Click the Events Group tab.
b Click New.
The Event Group Editor is displayed.
c Select the event group or individual events to monitor.
d Click Add.
A prompt is displayed.
e Click Yes.
f In the right column of the Event Group Editor, type Dragon-Events.
g Click OK.

Configuring DSMs
Enterasys Dragon 215
Step 5 Configure the Syslog notification rule:
a Click the Notification Rules tab.
b Click New.
c In the name field, type JSA-RuleSys.
d Click OK.
e In the Notification Rules panel, select the newly created JSA-RuleSys item.
f Click the Syslog tab.
g Click New.
The Syslog Editor is displayed.
h Update the following values:
-Facility - Using the Facility list box, select a facility.
-Level - Using the Level list box, select notice.
-Message - Using the Type list box, select LEEF.
LEEF:Version=1.0|Vendor|Product|ProductVersion|eventID|devTime|
proto|src|sensor|dst|srcPort|dstPort|direction|eventData|
NOTE
Note: The LEEF message format delineates between fields using a pipe delimiter
between each keyword.
i Click OK.
Step 6 Verify that the notification events are logged as separate events:
a Click the Global Options tab.
b Click the Main tab.
c Make sure that Concatenate Events is not selected.
Step 7 Configure the alarm information:
a Click the Alarms tab.
b Click New.
c Type values for the parameters:
-Name - Type JSA-Alarm.
-Type - Select Real Time.
-Event Group - Select Dragon-Events.
-Notification Rule - Select the JSA-RuleSys check box.
d Click OK.
e Click Commit.
Step 8 Navigate to the Enterprise View.
Step 9 Right-click on the Alarm Tool and select Associate Alarm Tool Policy.

Configuring DSMs
216 ENTERASYS
Step 10 Select the newly created JSA policy. Click OK.
Step 11 In the Enterprise menu, right-click the policy and select Deploy.
You are now ready to configure a syslog log source in JSA.
Configure a Log
Source
You are now ready to configure the log source in JSA:
Step 1 Log in to JSA.
Step 2 Click the Admin tab.
Step 3 On the navigation menu, click Data Sources.
Step 4 Click the Log Sources icon.
Step 5 Click Add.
Step 6 In the Log Source Name field, type a name for your log source.
Step 7 In the Log Source Description field, type a description for the log source.
Step 8 From the Log Source Type list box, select Enterasys Dragon Network IPS.
Step 9 From the Protocol Configuration list box, select either the SNMPv3 or Syslog
option. For more information on configuring a specific protocol, see the Log
Sources Users Guide.
For more information about Enterasys Dragon device, see your Enterasys Dragon
documentation.
NOTE
Note: Using the event mapping tool in the Log Activity tab, you can map a
normalized or raw event to a high-level and low-level category (or QID). However,
you cannot map combination Dragon messages using the event mapping tool. For
more information, see the Juniper Secure Analytics Users Guide.
Configure the EMS to
Forward Syslog
Messages
Starting with Dragon Enterprise Management Server (EMS) v7.4.0 appliances, you
must use syslog-ng for forwarding events to a Security and Information Manager
such as JSA.
Syslogd has been replaced by syslog-ng in Dragon EMS v7.4.0 and above.
To configure EMS to forward syslog messages, you must choose one of the
following:
•If you are using syslog-ng and Enterasys Dragon EMS v7.4.0 and above, see
Configuring syslog-ng Using Enterasys Dragon EMS v7.4.0 and above.
•If you are using syslogd and Enterasys Dragon EMS v7.4.0 and below, see
Configuring syslogd Using Enterasys Dragon EMS v7.4.0 and below.

Configuring DSMs
Enterasys Dragon 217
Configuring syslog-ng Using Enterasys Dragon EMS v7.4.0 and above
This section describes the steps to configure syslog-ng in non-encrypted mode
and syslogd to forward syslog messages to JSA.
If you are using encrypted syslog-ng, refer to your Enterasys documentation.
CAUTION
CAUTION: Do not run both syslog-ng and syslogd at the same time.
To configure syslog-ng in non-encrypted mode:
Step 1 On your EMS system, open the following file:
/opt/syslog-ng/etc/syslog-ng.conf
Step 2 Configure a Facility filter for the Syslog notification rule.
For example, if you selected facility local1:
filter filt_facility_local1 {facility(local1); };
Step 3 Configure a Level filter for the Syslog notification rule.
For example, if you selected level notice:
filter filt_level_notice {level(notice); };
Step 4 Configure a destination statement for the JSA.
For example, if the IP address of the JSA is 10.10.1.1 and you want to use syslog
port of 514, type:
destination siem { tcp("10.10.1.1" port(514)); };
Step 5 Add a log statement for the notification rule:
log {
source(s_local);
filter (filt_facility_local1); filter (filt_level_notice);
destination(siem);
};
Step 6 Save the file and restart syslog-ng.
cd /etc/rc.d
./rc.syslog-ng stop
./rc.syslog-ng start
Step 7 The Enterasys Dragon EMS configuration is complete.
Configuring syslogd Using Enterasys Dragon EMS v7.4.0 and below
If your Dragon Enterprise Management Server (EMS) is using a version earlier
than v7.4.0 on the appliance, you must use syslogd for forwarding events to a
Security and Information Manager such as JSA.

Configuring DSMs
218 ENTERASYS
To configure syslogd, you must:
Step 1 On the Dragon EMS system, open the following file:
/etc/syslog.conf
Step 2 Add a line to forward the facility and level you configured in the syslog notification
rule to JSA.
For example, to define the local1 facility and notice level:
local1.notice @<IP address>
Where:
<IP address> is the IP address of the JSA system.
Step 3 Save the file and restart syslogd.
cd /etc/rc.d
./rc.syslog stop
./rc.syslog start
The Enterasys Dragon EMS configuration is complete.
Enterasys HiGuard
Wireless IPS
The Enterasys HiGuard Wireless IPS DSM for JSA records all relevant events
using syslog
Before configuring the Enterasys HiGuard Wireless IPS device in JSA, you must
configure your device to forward syslog events.
Configure Enterasys
HiGuard
To configure the device to forward syslog events:
Step 1 Log in to the HiGuard Wireless IPS user interface.
Step 2 In the left navigation pane, click Syslog, which allows the management server to
send events to designated syslog receivers.
The Syslog Configuration panel is displayed.
Step 3 In the System Integration Status section, enable syslog integration.
This allows the management server to send messages to the configured syslog
servers. By default, the management server enables syslog.
The Current Status field displays the status of the syslog server. The options are:
Running or Stopped. An error status is displayed if one of the following occurs:
•One of the configured and enabled syslog servers includes a hostname that
cannot be resolved.
•The management server is stopped.
•An internal error has occurred. If this occurs, please contact Enterasys
Technical Support.

Configuring DSMs
Enterasys HiGuard Wireless IPS 219
Step 4 From Manage Syslog Servers, click Add.
The Syslog Configuration window is displayed.
Step 5 Type values for the following parameters:
•Syslog Server (IP Address/Hostname) - Type the IP address or hostname of
the syslog server to which events should be sent.
NOTE
Note: Configured syslog servers use the DNS names and DNS suffixes configured
in the Server initialization and Setup Wizard on the HWMH Config Shell.
•Port Number - Type the port number of the syslog server to which HWMH
sends events. The default is 514.
•Message Format - Select Plain Text as the format for sending events.
•Enabled? - Select if the events are to be sent to this syslog server.
Step 6 Save your configuration.
The configuration is complete. The log source is added to JSA as HiGuard events
are automatically discovered. Events forwarded to JSA by Enterasys HiGuard are
displayed on the Log Activity tab of JSA.
Configure a Log
Source
JSA automatically discovers and creates a log source for syslog events from
Enterasys HiGuard. The following configuration steps are optional.
To manually configure a log source for Enterasys HiGuard:
Step 1 Log in to JSA.
Step 2 Click the Admin tab.
Step 3 On the navigation menu, click Data Sources.
Step 4 Click the Log Sources icon.
Step 5 Click Add.
Step 6 In the Log Source Name field, type a name for your log source.
Step 7 In the Log Source Description field, type a description for the log source.
Step 8 From the Log Source Type list box, select Enterasys HiGuard.
Step 9 Using the Protocol Configuration list box, select Syslog.
Step 10 Configure the following values:
Step 11 Click Save.
Table 33-1 Syslog Parameters
Parameter Description
Log Source Identifier Type the IP address or host name for the log source as an
identifier for events from your Enterasys HiGuard.

Configuring DSMs
220 ENTERASYS
Step 12 On the Admin tab, click Deploy Changes.
The configuration is complete.
Enterasys HiPath
Wireless Controller
The Enterasys HiPath Wireless Controller DSM for JSA records all relevant events
using syslog.
Supported Event
Types
JSA supports the following Enterasys HiPath Wireless Controller events:
•Wireless access point events
•Application log events
•Service log events
•Audit log events
Configure Your
HiPath Wireless
Controller
To integrate your Enterasys HiPath Wireless Controller events with JSA, you must
configure your device to forward syslog events.
To forward syslog events to JSA:
Step 1 Log in to the HiPath Wireless Assistant.
Step 2 Click Wireless Controller Configuration.
The HiPath Wireless Controller Configuration window is displayed.
Step 3 From the menu, click System Maintenance.
Step 4 From the Syslog section, select the Syslog Server IP check box and type the IP
address of the device receiving the syslog messages.
Step 5 Using the Wireless Controller Log Level list box, select Information.
Step 6 Using the Wireless AP Log Level list box, select Major.
Step 7 Using the Application Logs list box, select local.0.
Step 8 Using the Service Logs list box, select local.3.
Step 9 Using the Audit Logs list box, select local.6.
Step 10 Click Apply.
You are now ready to configure the log source in JSA.
Configure a Log
Source
JSA automatically discovers and creates a log source for syslog events from
Enterasys HiPath. The following configuration steps are optional.
To manually configure a log source for Enterasys HiPath:
Step 1 Log in to JSA.
Step 2 Click the Admin tab.
Step 3 On the navigation menu, click Data Sources.

Configuring DSMs
Enterasys Stackable and Standalone Switches 221
Step 4 Click the Log Sources icon.
Step 5 Click Add.
Step 6 In the Log Source Name field, type a name for your log source.
Step 7 In the Log Source Description field, type a description for the log source.
Step 8 From the Log Source Type list box, select Enterasys HiPath.
Step 9 Using the Protocol Configuration list box, select Syslog.
Step 10 Configure the following values:
Step 11 Click Save.
Step 12 On the Admin tab, click Deploy Changes.
The configuration is complete. For more information about your Enterasys HiPath
Wireless Controller device, see your vendor documentation.
Enterasys
Stackable and
Standalone
Switches
The Enterasys Stackable and Standalone Switches DSM for JSA accepts events
using syslog.
JSA records all relevant events. Before configuring an Enterasys Stackable and
Standalone Switches device in JSA, you must configure your device to forward
syslog events.
To configure the device to forward syslog events to JSA:
Step 1 Log in to the Enterasys Stackable and Standalone Switch device.
Step 2 Type the following command:
set logging server <index> [ip-addr <IP address>] [facility
<facility>] [severity <severity>] [descr <description>] [port
<port>] [state <enable | disable>]
Where:
<index> is the server table index number (1 to 8) for this server.
<ip address> is the IP address of the server you wish to send
syslog messages. This is an optional field. If you do not define an IP
address, an entry in the Syslog server table is created with the specified index
number and a message is displayed indicating that no IP address has been
assigned.
<facility> is a syslog facility. Valid values are local0 to local7. This is an
optional field. If not specified, the default value configured with the set logging
default command is applied.
Table 33-1 Syslog Parameters
Parameter Description
Log Source Identifier Type the IP address or host name for the log source as an
identifier for events from your Enterasys HiPath.

Configuring DSMs
222 ENTERASYS
<severity> is the server severity level that the server will log messages. The
valid range is 1 to 8. If not specified, the default value configured with the set
logging default command is applied. This is an optional field. Valid values include:
- 1: Emergencies (system is unusable)
- 2: Alerts (immediate action required)
- 3: Critical conditions
- 4: Error conditions
- 5: Warning conditions
- 6: Notifications (significant conditions)
- 7: Informational messages
- 8: Debugging messages
<description> is a description of the facility/server. This is an optional field.
<port> is the default UDP port that the client uses to send messages to the
server. If not specified, the default value configured with the set logging default
command is applied. This is an optional field.
<enable | disable> enables or disables this facility/server configuration. This is
an optional field. If state is not specified, the server will not be enabled or disabled.
Step 3 You are now ready to configure the log source in JSA.
To configure JSA to receive events from an Enterasys Stackable and Standalone
Switch device:
From the Log Source Type list box, select one of the following options:
Enterasys Stackable and Standalone Switches, Enterasys A-Series,
Enterasys B2-Series, Enterasys B3-Series, Enterasys C2-Series,
Enterasys C3-Series, Enterasys D-Series, Enterasys G-Series, or
Enterasys I-Series.
For more information on configuring log sources, see the Log Source Users Guide.
For more information about your Enterasys Stackable and Standalone Switches,
see your vendor documentation.
Enterasys XSR
Security Router
The Enterasys XSR Security Router DSM for JSA accepts events using syslog.
JSA records all relevant events. Before configuring an Enterasys XSR Security
Router in JSA, you must configure your device to forward syslog events.
To configure the device to send syslog events to JSA:
Step 1 Using Telnet or SSH, log in to the XSR Security Router command-line interface.

Configuring DSMs
Enterasys Matrix Router 223
Step 2 Type the following command to access config mode:
enable
config
Step 3 Type the following command:
logging <IP address> low
Where <IP address> is the IP address of your JSA.
Step 4 Exit from config mode.
Step 5 Save the configuration:
exit
copy running-config startup-config
Step 6 You are now ready to configure the log sources in JSA.
To configure JSA to receive events from an Enterasys XSR Security Router:
From the Log Source Type list box, select Enterasys XSR Security
Routers.
For more information on configuring log sources, see the Log Sources Users
Guide.
For more information about your Enterasys XSR Security Router, see your vendor
documentation.
Enterasys Matrix
Router
The Enterasys Matrix Router DSM for JSA accepts Enterasys Matrix events using
SNMPv1, SNMPv2, SNMPv3, and syslog.
You can integrate Enterasys Matrix Router version 3.5 with JSA. JSA records all
SNMP events and syslog login, logout, and login failed events. Before you
configure JSA to integrate with Enterasys Matrix, you must:
Step 1 Log in to the switch/router as a privileged user.
Step 2 Type the following command:
set logging server <server number> description <description>
facility <facility> ip_addr <ip address> port <port> severity
<severity>
Where:
<server number> is the server number 1 to 8.
<description> is a description of the server.
<facility> is a syslog facility, for example, local0.
<ip address> is the IP address of the server you wish to send syslog messages.

Configuring DSMs
224 ENTERASYS
<port> is the default UDP port that the client uses to send messages to the
server. Use port 514 unless otherwise stated.
<severity> is the server severity level 1 to 9 where 1 indicates an emergency
and 8 is debug level.
For example:
set logging server 5 description ourlogserver facility local0
ip_addr 1.2.3.4 port 514 severity 8
Step 3 You are now ready to configure the log source in JSA.
To configure JSA to receive events from an Enterasys Matrix device:
From the Log Source Type list box, select Enterasys Matrix E1 Switch.
For more information on configuring log sources, see the Log Sources Users
Guide.
Enterasys NetSight
Automatic Security
Manager
The Enterasys NetSight Automatic Security Manager DSM for JSA accepts events
using syslog.
JSA records all relevant events. Before configuring an Enterasys NetSight
Automatic Security Manager device in JSA, you must configure your device to
forward syslog events.
To configure the device to send syslog events to JSA:
Step 1 Log in to the Automatic Security Manager user interface.
Step 2 Click the Automated Security Manager icon to access the Automated Security
Manager Configuration window.
NOTE
Note: You can also access the Automated Security Manager Configuration
window from the Tool menu.
Step 3 From the left navigation menu, select Rule Definitions.
Step 4 Choose one of the following options:
a If a rule is currently configured, highlight the rule. Click Edit.
b To create a new rule, click Create.
Step 5 Select the Notifications check box.
Step 6 Click Edit.
The Edit Notifications window is displayed.
Step 7 Click Create.
The Create Notification window is displayed.

Configuring DSMs
Enterasys Matrix K/N/S Series Switch 225
Step 8 Using the Type list box, select Syslog.
Step 9 In the Syslog Server IP/Name field, type the IP address of the device that will
receive syslog traffic.
Step 10 Click Apply.
Step 11 Click Close.
Step 12 In the Notification list box, select the notification configured above.
Step 13 Click OK.
Step 14 You are now ready to configure the log source in JSA.
To configure JSA to receive events from an Enterasys NetSight Automatic Security
Manager device:
From the Log Source Type list box, select Enterasys NetsightASM.
For more information on configuring log sources, see the Log Sources Users
Guide.
For more information about your Enterasys NetSight Automatic Security Manager
device, see your vendor documentation.
Enterasys Matrix
K/N/S Series Switch
The Enterasys Matrix Series DSM for JSA accepts events using syslog. JSA
records all relevant Matrix K-Series, N-Series, or S-Series standalone device
events.
Before you configure JSA to integrate with a Matrix K-Series, N-Series, or
S-Series, you must:
Step 1 Log in to your Enterasys Matrix device command-line interface (CLI).
Step 2 Type the following commands:
set logging server 1 ip-addr <IP Address of Event Processor>
state enable
set logging application RtrAcl level 8
set logging application CLI level 8
set logging application SNMP level 8
set logging application Webview level 8
set logging application System level 8
set logging application RtrFe level 8
set logging application Trace level 8
set logging application RtrLSNat level 8
set logging application FlowLimt level 8
set logging application UPN level 8
set logging application AAA level 8

Configuring DSMs
226 ENTERASYS
set logging application Router level 8
set logging application AddrNtfy level 8
set logging application OSPF level 8
set logging application VRRP level 8
set logging application RtrArpProc level 8
set logging application LACP level 8
set logging application RtrNat level 8
set logging application RtrTwcb level 8
set logging application HostDoS level 8
set policy syslog extended-format enable
For more information on configuring the Matrix Series routers or switches, consult
your vendor documentation.
Step 3 You are now ready to configure the log sources in JSA.
To configure JSA to receive events from an Enterasys Matrix Series device:
From the Log Source Type list box, select Enterasys Matrix K/N/S Series
Switch.
For information on configuring log sources, see the Log Sources Users Guide.
Enterasys NAC The Enterasys NAC DSM for JSA accepts events using syslog. JSA records all
relevant events.
For details on configuring your Enterasys NAC appliances for syslog, consult your
vendor documentation. After the Enterasys NAC appliance is forwarding syslog
events to JSA, the configuration is complete. The log source is added to JSA as
Enterasys NAC events are automatically discovered. Events forwarded by
Enterasys NAC appliances are displayed on the Log Activity tab of JSA.
Configure a log
source
JSA automatically discovers and creates a log source for syslog events from
Enterasys NAC. The following configuration steps are optional.
To manually configure a log source for Enterasys NAC:
Step 1 Log in to JSA.
Step 2 Click the Admin tab.
Step 3 On the navigation menu, click Data Sources.
Step 4 Click the Log Sources icon.
Step 5 Click Add.
Step 6 In the Log Source Name field, type a name for your log source.

Configuring DSMs
Enterasys 800-Series Switch 227
Step 7 In the Log Source Description field, type a description for the log source.
Step 8 From the Log Source Type list box, select Enterasys NAC.
Step 9 Using the Protocol Configuration list box, select Syslog.
Step 10 Configure the following values:
Step 11 Click Save.
Step 12 On the Admin tab, click Deploy Changes.
The configuration is complete.
Enterasys
800-Series Switch
The Enterasys 800-Series Switch DSM for JSA accepts events using syslog.
JSA records all relevant audit, authentication, system, and switch events. Before
configuring your Enterasys 800-Series Switch in JSA, you must configure your
switch to forward syslog events.
Configure your
Enterasys 800-Series
Switch
To configure the device to forward syslog events:
Step 1 Log in to your Enterasys 800-Series Switch command-line interface.
You must be a system administrator or operator-level user to complete these
configuration steps.
Step 2 Type the following command to enable syslog:
enable syslog
Step 3 Type the following command to create a syslog address for forwarding events to
JSA:
create syslog host 1 <IP address> severity informational
facility local7 udp_port 514 state enable
Where <IP address> is the IP address of your JSA console or Event Collector.
Step 4 Optional. Type the following command to forward syslog events using an IP
interface address:
create syslog source_ipif <name> <IP address>
Where:
<name> is the name of your IP interface.
<IP address> is the IP address of your JSA console or Event Collector.
Table 33-2 Syslog Parameters
Parameter Description
Log Source Identifier Type the IP address or host name for the log source as an
identifier for events from your Enterasys NAC appliances.

Configuring DSMs
228 ENTERASYS
The configuration is complete. The log source is added to JSA as Enterasys
800-Series Switch events are automatically discovered. Events forwarded to JSA
by Enterasys 800-Series Switches are displayed on the Log Activity tab of JSA.
Configure a log
source
JSA automatically discovers and creates a log source for syslog events from
Enterasys 800-Series Switches. The following configuration steps are optional.
To manually configure a log source:
Step 1 Log in to JSA.
Step 2 Click the Admin tab.
Step 3 On the navigation menu, click Data Sources.
Step 4 Click the Log Sources icon.
Step 5 Click Add.
Step 6 In the Log Source Name field, type a name for your log source.
Step 7 In the Log Source Description field, type a description for the log source.
Step 8 From the Log Source Type list box, select Enterasys 800-Series Switch.
Step 9 Using the Protocol Configuration list box, select Syslog.
Step 10 Configure the following values:
Step 11 Click Save.
Step 12 On the Admin tab, click Deploy Changes.
The configuration is complete.
Table 33-1 Syslog Parameters
Parameter Description
Log Source Identifier Type the IP address or host name for the log source as an
identifier for events from your Enterasys 800-Series Switch.

Configuring DSMs
31 EXTREME NETWORKS
EXTREMEWARE
The Extreme Networks ExtremeWare DSM for Juniper Secure Analytics (JSA)
records al relevant Extreme Networks ExtremeWare and Extremeware XOS
devices events from using syslog.
To integrate JSA with an ExtremeWare device, you must configure a log source in
JSA, then configure your Extreme Networks ExtremeWare and Extremeware XOS
devices to forward syslog events. JSA does not automatically discover or create
log sources for syslog events from ExtremeWare appliances.
Configuring a Log
Source
To integrate with JSA, you must manually create a log source to receive the
incoming ExtremeWare events forwarded to JSA.
Procedure
Step 1 Log in to JSA.
Step 2 Click the Admin tab.
Step 3 On the navigation menu, click Data Sources.
Step 4 Click the Log Sources icon.
Step 5 Click Add.
Step 6 In the Log Source Name field, type a name for your log source.
Step 7 In the Log Source Description field, type a description for the log source.
Step 8 From the Log Source Type list box, select Extreme Networks ExtremeWare
Operating System (OS).
Step 9 Using the Protocol Configuration list box, select Syslog.
Step 10 Configure the following values:
Step 11 Click Save.
Table 34-1 Syslog Parameters
Parameter Description
Log Source Identifier Type the IP address or host name for the log source as an
identifier for events from your ExtremeWare appliance.
Configuring DSMs
230 EXTREME NETWORKS EXTREMEWARE
Step 12 On the Admin tab, click Deploy Changes.
The log source is added to JSA. Events forwarded to JSA by Extreme Networks
ExtremeWare appliances are displayed on the Log Activity tab.
For information on configuring syslog forwarding for your Extremeware appliances,
see your vendor documentation.

Configuring DSMs
32 F5 NETWORKS
This section provides information on the following DSMs:
•F5 Networks BIG-IP AFM
•F5 Networks BIG-IP APM
•F5 Networks BIG-IP ASM
•F5 Networks BIG-IP LTM
•F5 Networks FirePass
F5 Networks BIG-IP
AFM
The F5 Networks BIG-IP Advanced Firewall Manager (AFM) DSM for Juniper
Secure Analytics (JSA) accepts syslog events forwarded from F5 Networks BIG-IP
AFM systems in name-value pair format.
Supported Event
Types
JSA is capable of collecting the following events from F5 BIG-IP appliances with
Advanced Firewall Managers:
•Network events
•Network Denial of Service (DoS) events
•Protocol security events
•DNS events
•DNS Denial of Service (DoS) events
Before You Begin Before you can configure the Advanced Firewall Manager, you must verify that
your BIG-IP appliance is licensed and provisions to include Advanced Firewall
Manager.
Procedure
Step 1 Log in to your BIG-IP appliance Management Interface.
Step 2 From the navigation menu, select System > License.
Step 3 In the License Status column, verify the Advanced Firewall Manager is licensed
and enabled.
Configuring DSMs
232 F5 NETWORKS
Step 4 To enable the Advanced Firewall Manager, select System > Resource
Provisioning.
Step 5 From the Provisioning column, select the check box and select Nominal from the
list box.
Step 6 Click Submit to save your changes.
Configure a Logging
Pool
A logging pool allows you to define a pool of servers that receive syslog events.
The pool contains the IP address, port, and a node name that you provide.
Procedure
Step 1 From the navigation menu, select Local Traffic > Pools.
Step 2 Click Create.
Step 3 In the Name field, type a name for the logging pool.
For example, Logging_Pool.
Step 4 From the Health Monitor field, in the Available list, select TCP and click <<.
This moves the TCP option from the Available list to the Selected list.
Step 5 In the Resource pane, from the Node Name list box, select Logging_Node or the
name you defined in Step 3.
Step 6 In the Address field, type the IP address for the JSA console or Event Collector.
Step 7 In the Service Port field, type 514.
Step 8 Click Add.
Step 9 Click Finish.
Creating a
High-Speed Log
Destination
The process to configure logging for BIG-IP AFM requires that you create a
high-speed logging destination.
Procedure
Step 1 From the navigation menu, select System > Logs > Configuration > Log
Destinations.
Step 2 Click Create.
Step 3 In the Name field, type a name for the destination.
For example, Logging_HSL_dest.
Step 4 In the Description field, type a description.
Step 5 From the Type list box, select Remote High-Speed Log.
Step 6 From the Pool Name list box, select a logging pool from the list of remote log
servers.
For example, Logging_Pool.
Step 7 From the Protocol list box, select TCP.
Step 8 Click Finish.
Configuring DSMs
F5 Networks BIG-IP AFM 233
Creating a Formatted
Log Destination
The formatted log destination allows you to specify any special formatting required
on the events forwarded to the high-speed logging destination.
Procedure
Step 1 From the navigation menu, select System > Logs > Configuration > Log
Destinations.
Step 2 Click Create.
Step 3 In the Name field, type a name for the logging format destination.
For example, Logging_Format_dest.
Step 4 In the Description field, type a description.
Step 5 From the Type list box, select Remote Syslog.
Step 6 From the Syslog Format list box, select Syslog.
Step 7 From the High-Speed Log Destination list box, select your high-speed logging
destination.
For example, Logging_HSL_dest.
Step 8 Click Finished.
Creating a Log
Publisher
Creating a publisher allows the BIG-IP appliance to publish the formatted log
message to the local syslog database.
Procedure
Step 1 From the navigation menu, select System > Logs > Configuration > Log
Publishers.
Step 2 Click Create.
Step 3 In the Name field, type a name for the publisher.
For example, Logging_Pub.
Step 4 In the Description field, type a description.
Step 5 From the Destinations field, in the Available list, select the log destination name
you created in Step 3 and click << to add items to the Selected list.
This moves your logging format destination from the Available list to the Selected
list. To include local logging in your publisher configuration, you can add local-db
and local-syslog to the Selected list.
Configuring DSMs
234 F5 NETWORKS
Creating a Logging
Profile
Logging profiles allow you to configure the types of events that your Advanced
Firewall Manager is producing and associates your events with the logging
destination.
Procedure
Step 1 From the navigation menu, select Security > Event Logs > Logging Profile.
Step 2 Click Create.
Step 3 In the Name field, type a name for the log profile.
For example, Logging_Profile.
Step 4 In the Network Firewall field, select the Enabled check box.
Step 5 From the Publisher list box, select the log publisher you configured.
For example, Logging_Pub.
Step 6 In the Log Rule Matches field, select the Accept, Drop, and Reject check boxes.
Step 7 In the Log IP Errors field, select the Enabled check box.
Step 8 In the Log TCP Errors field, select the Enabled check box.
Step 9 In the Log TCP Events field, select the Enabled check box.
Step 10 In the Storage Format field, from the list box, select Field-List.
Step 11 In the Delimiter field, type , (comma) as the delimiter for events.
Step 12 In the Storage Format field, select all of the options in the Available Items list and
click <<.
This moves the all Field-List options from the Available list to the Selected list.
Step 13 In the IP Intelligence pane, from the Publisher list box, select the log publisher you
configured.
For example, Logging_Pub.
Step 14 Click Finished.
Associate the Profile
to a Virtual Server
The log profile you created must be associated with a virtual server in the Security
Policy tab. This allows the virtual server to process your network firewall events,
along with local traffic.
Procedure
Step 1 From the navigation menu, select Local Traffic > Virtual Servers.
Step 2 Click the name of a virtual server to modify.
Step 3 From the Security tab, select Policies.
Step 4 From the Log Profile list box, select Enabled.
Step 5 From the Profile field, in the Available list, select Logging_Profile or the name
you specified in Step 3 and click <<.
This moves the Logging_Profile option from the Available list to the Selected list.

Configuring DSMs
F5 Networks BIG-IP AFM 235
Step 6 Click Update to save your changes.
The configuration is complete. The log source is added to JSA as F5 Networks
BIG-IP AFM syslog events are automatically discovered. Events forwarded to JSA
by F5 Networks BIG-IP AFM are displayed on the Log Activity tab of JSA.
Configuring a Log
Source
JSA automatically discovers and creates a log source for syslog events from F5
Networks BIG-IP AFM. However, you can manually create a log source for JSA to
receive syslog events. The following configuration steps are optional.
Procedure
Step 1 Log in to JSA.
Step 2 Click the Admin tab.
Step 3 On the navigation menu, click Data Sources.
Step 4 Click the Log Sources icon.
Step 5 Click Add.
Step 6 In the Log Source Name field, type a name for your log source.
Step 7 In the Log Source Description field, type a description for the log source.
Step 8 From the Log Source Type list box, select F5 Networks BIG-IP AFM.
Step 9 Using the Protocol Configuration list box, select Syslog.
Step 10 Configure the following values:
Step 11 Click Save.
Step 12 On the Admin tab, click Deploy Changes.
The configuration is complete.
Table 35-2 Syslog Protocol Parameters
Parameter Description
Log Source Identifier Type the IP address or host name for the log source as an
identifier for events from your F5 BIG-IP AFM appliance.

Configuring DSMs
236 F5 NETWORKS
F5 Networks BIG-IP
APM
The F5 Networks BIG-IP Access Policy Manager (APM) DSM for JSA collects
access and authentication security events from a BIG-IP APM device using syslog.
Configure Remote
Syslog
To configure your BIG-IP LTM device to forward syslog events to a remote syslog
source, choose your BIG-IP APM software version:
•Configure Remote Syslog for F5 BIG-IP APM 11.x
•Configure Remote Syslog for F5 BIG-IP APM 10.x
Configure Remote Syslog for F5 BIG-IP APM 11.x
To configure syslog for F5 BIG-IP APM 11.x:
Step 1 Log in to the command-line of your F5 BIG-IP device.
Step 2 Type the following command to add a single remote syslog server:
tmsh syslog remote server {<Name> {host <IP Address>}}
Where:
<Name> is the name of the F5 BIG-IP APM syslog source.
<IP Address> is the IP address of the JSA console.
For example,
bigpipe syslog remote server {BIGIP_APM {host 10.100.100.101}}
Step 3 Type the following to save the configuration changes:
tmsh save sys config partitions all
The configuration is complete. The log source is added to JSA as F5 Networks
BIG-IP APM events are automatically discovered. Events forwarded to JSA by F5
Networks BIG-IP APM are displayed on the Log Activity tab in JSA.
Configure Remote Syslog for F5 BIG-IP APM 10.x
To configure syslog for F5 BIG-IP APM 10.x:
Step 1 Log in to the command-line of your F5 BIG-IP device.
Step 2 Type the following command to add a single remote syslog server:
bigpipe syslog remote server {<Name> {host <IP Address>}}
Where:
<Name> is the name of the F5 BIG-IP APM syslog source.
<IP Address> is the IP address of JSA console.
For example,
bigpipe syslog remote server {BIGIP_APM {host 10.100.100.101}}
Step 3 Type the following to save the configuration changes:
bigpipe save

Configuring DSMs
F5 Networks BIG-IP ASM 237
The configuration is complete. The log source is added to JSA as F5 Networks
BIG-IP APM events are automatically discovered. Events forwarded to JSA by F5
Networks BIG-IP APM are displayed on the Log Activity tab.
Configuring a Log
Source
JSA automatically discovers and creates a log source for syslog events from F5
Networks BIG-IP APM appliances. These configuration steps are optional.
Procedure
Step 1 Log in to JSA.
Step 2 Click the Admin tab.
Step 3 On the navigation menu, click Data Sources.
Step 4 Click the Log Sources icon.
Step 5 Click Add.
Step 6 In the Log Source Name field, type a name for your log source.
Step 7 In the Log Source Description field, type a description for the log source.
Step 8 From the Log Source Type list box, select F5 Networks BIG-IP APM.
Step 9 Using the Protocol Configuration list box, select Syslog.
Step 10 Configure the following values:
Step 11 Click Save.
Step 12 On the Admin tab, click Deploy Changes.
The configuration is complete.
F5 Networks BIG-IP
ASM
The F5 Networks BIG-IP Application Security Manager (ASM) DSM for JSA
collects web application security events from BIG-IP ASM appliances using syslog.
Configure F5
Networks BIG-IP ASM
To forward syslog events from an F5 Networks BIG-IP ASM appliance to JSA, you
must configure a logging profile.
A logging profile allows you to configure remote storage for syslog events, which
can be forwarded directly to JSA.
Procedure
Step 1 Log in to the F5 Networks BIG-IP ASM appliance user interface.
Step 2 On the navigation pane, select Application Security > Options.
Table 35-1 Syslog Protocol Parameters
Parameter Description
Log Source Identifier Type the IP address or host name for the log source as an
identifier for events from your F5 Networks BIG-IP APM
appliance.

Configuring DSMs
238 F5 NETWORKS
Step 3 Click Logging Profiles.
Step 4 Click Create.
Step 5 From the Configuration list box, select Advanced.
Step 6 Configure the following parameters:
a Type a Profile Name.
For example, type JSA.
b Optional. Type a Profile Description.
NOTE
Note: If you do not want data logged locally as well as remotely, you must clear the
Local Storage check box.
c Select the Remote Storage check box.
d From the Type list box, select Reporting Server.
e From the Protocol list box, select TCP.
f Configure the Server Addresses fields:
-IP address - Type the IP address of the JSA console.
-Port - Type a port value of 514.
g Select the Guarantee Logging check box.
NOTE
Note: Enabling the Guarantee Logging option ensures the system log requests
continue for the web application when the logging utility is competing for system
resources. Enabling the Guarantee Logging option can slow access to the
associated web application.
h Select the Report Detected Anomalies check box, to allow the system to log
details.
i Click Create.
The display refreshes with the new logging profile. The log source is added to JSA
as F5 Networks BIG-IP ASM events are automatically discovered. Events
forwarded by F5 Networks BIG-IP ASM are displayed on the Log Activity tab of
JSA.
Configuring a Log
Source
JSA automatically discovers and creates a log source for syslog events from F5
Networks BIG-IP ASM appliances. These configuration steps are optional.
Procedure
Step 1 Log in to JSA.
Step 2 Click the Admin tab.
Step 3 On the navigation menu, click Data Sources.
Step 4 Click the Log Sources icon.

Configuring DSMs
F5 Networks BIG-IP LTM 239
Step 5 Click Add.
Step 6 In the Log Source Name field, type a name for your log source.
Step 7 In the Log Source Description field, type a description for the log source.
Step 8 From the Log Source Type list box, select F5 Networks BIG-IP ASM.
Step 9 Using the Protocol Configuration list box, select Syslog.
Step 10 Configure the following values:
Step 11 Click Save.
Step 12 On the Admin tab, click Deploy Changes.
The configuration is complete.
F5 Networks BIG-IP
LTM
The F5 Networks BIG-IP Local Traffic Manager (LTM) DSM for JSA collects
networks security events from a BIG-IP device using syslog.
Before receiving events in JSA, you must configure a log source for JSA, then
configure your BIG-IP LTM device to forward syslog events. We recommend you
create your log source before forward events as JSA does not automatically
discover or create log sources for syslog events from F5 BIG-IP LTM appliances.
Configuring a Log
Source
To integrate F5 BIG-IP LTM with JSA, you must manually create a log source to
receive syslog events.
Procedure
Step 1 Log in to JSA.
Step 2 Click the Admin tab.
Step 3 On the navigation menu, click Data Sources.
Step 4 Click the Log Sources icon.
Step 5 Click Add.
Step 6 In the Log Source Name field, type a name for your log source.
Step 7 In the Log Source Description field, type a description for the log source.
Step 8 From the Log Source Type list box, select F5 Networks BIG-IP LTM.
Step 9 Using the Protocol Configuration list box, select Syslog.
Table 35-2 Syslog Protocol Parameters
Parameter Description
Log Source Identifier Type the IP address or host name for the log source as an
identifier for events from your F5 Networks BIG-IP ASM
appliance.

Configuring DSMs
240 F5 NETWORKS
Step 10 Configure the following values:
Step 11 Click Save.
Step 12 On the Admin tab, click Deploy Changes.
You are now ready to configure your BIG-IP LTM appliance to forward syslog
events to JSA.
Configuring Syslog
Forwarding in BIG-IP
LTM
To configure your BIG-IP LTM device to forward syslog events, select your BIG-IP
LTM software version:
•Configuring Remote Syslog for F5 BIG-IP LTM 11.x
•Configuring Remote Syslog for F5 BIG-IP LTM 10.x
•Configuring Remote Syslog for F5 BIG-IP LTM 9.4.2 to 9.4.8
Configuring Remote Syslog for F5 BIG-IP LTM 11.x
To configure syslog for F5 BIG-IP LTM 11.x:
Step 1 Log in to the command-line of your F5 BIG-IP device.
Step 2 Type the following command to add a single remote syslog server:
tmsh syslog remote server {<Name> {host <IP Address>}}
Where:
<Name> is a name you assign to identify the syslog source, for example,
BIGIPsyslog or JSA.
<IP Address> is the IP address of JSA.
For example,
tmsh syslog remote server {BIGIPsyslog {host 10.100.100.100}}
Step 3 Save the configuration changes:
tmsh save sys config partitions all
The configuration is complete. Events forwarded from your F5 Networks BIG-IP
LTM appliance are displayed on the Log Activity tab in JSA.
Configuring Remote Syslog for F5 BIG-IP LTM 10.x
To configure syslog for F5 BIG-IP LTM 10.x:
Step 1 Log in to the command-line of your F5 BIG-IP device.
Step 2 Type the following command to add a single remote syslog server:
bigpipe syslog remote server {<Name> {host <IP Address>}}
Table 35-3 Syslog Protocol Parameters
Parameter Description
Log Source Identifier Type the IP address or host name for the log source as an
identifier for events from your BIG-IP LTM appliance.

Configuring DSMs
F5 Networks FirePass 241
Where:
<Name> is the name of the F5 BIG-IP LTM syslog source.
<IP Address> is the IP address of JSA.
For example:
bigpipe syslog remote server {BIGIPsyslog {host 10.100.100.100}}
Step 3 Save the configuration changes:
bigpipe save
NOTE
Note: F5 Networks modified the syslog output format in BIG-IP v10.x to include the
use of local/ before the hostname in the syslog header. The syslog header
format containing local/ is not supported in JSA, but a workaround is available to
correct the syslog header. For more information, see
http://www.juniper.net/customers/support/.
The configuration is complete. Events forwarded from your F5 Networks BIG-IP
LTM appliance are displayed on the Log Activity tab in JSA.
Configuring Remote Syslog for F5 BIG-IP LTM 9.4.2 to 9.4.8
To configure syslog for F5 BIG-IP LTM 9.4.2 to 9.4.8:
Step 1 Log in to the command-line of your F5 BIG-IP device.
Step 2 Type the following command to add a single remote syslog server:
bigpipe syslog remote server <IP Address>
Where <IP Address> is the IP address of JSA.
For example:
bigpipe syslog remote server 10.100.100.100
Step 3 Type the following to save the configuration changes:
bigpipe save
The configuration is complete. Events forwarded from your F5 Networks BIG-IP
LTM appliance are displayed on the Log Activity tab in JSA.
F5 Networks
FirePass
The F5 Networks FirePass DSM for JSA collects system events from an F5
FirePass SSL VPN device using syslog.
By default, remote logging is disabled and must be enabled in the F5 Networks
FirePass device. Before receiving events in JSA, you must configure your F5
Networks FirePass device to forward system events to JSA as a remote syslog
server.
Configuring DSMs
242 F5 NETWORKS
Configuring Syslog
Forwarding for F5
FirePass
To forward syslog events from an F5 Networks BIG-IP FirePass SSL VPM
appliance to JSA, you must enable and configure a remote log server.
The remote log server can forward events directly to your JSA console or any
Event Collectors in your deployment.
Procedure
Step 1 Log in to the F5 Networks FirePass Admin console.
Step 2 On the navigation pane, select Device Management > Maintenance > Logs.
Step 3 From the System Logs menu, select the Enable Remote Log Server check box.
Step 4 From the System Logs menu, clear the Enable Extended System Logs check
box.
Step 5 In the Remote host parameter, type the IP address or hostname of your JSA.
Step 6 From the Log Level list box, select Information.
The Log Level parameter monitors application level system messages.
Step 7 From the Kernel Log Level list box, select Information.
The Kernel Log Level parameter monitors Linux kernel system messages.
Step 8 Click Apply System Log Changes.
The changes are applied and the configuration is complete. The log source is
added to JSA as F5 Networks FirePass events are automatically discovered.
Events forwarded to JSA by F5 Networks BIG-IP ASM are displayed on the Log
Activity tab in JSA.
Configuring a Log
Source
JSA automatically discovers and creates a log source for syslog events from F5
Networks FirePass appliances. These configuration steps are optional.
Procedure
Step 1 Log in to JSA.
Step 2 Click the Admin tab.
Step 3 On the navigation menu, click Data Sources.
Step 4 Click the Log Sources icon.
Step 5 Click Add.
Step 6 In the Log Source Name field, type a name for your log source.
Step 7 In the Log Source Description field, type a description for the log source.
Step 8 From the Log Source Type list box, select F5 Networks FirePass.
Step 9 Using the Protocol Configuration list box, select Syslog.
Step 10 Configure the following values:

Configuring DSMs
F5 Networks FirePass 243
Step 11 Click Save.
Step 12 On the Admin tab, click Deploy Changes.
The configuration is complete.
Table 35-4 Syslog Protocol Parameters
Parameter Description
Log Source Identifier Type the IP address or host name for the log source as an
identifier for events from your F5 Networks FirePass
appliance.
Configuring DSMs
F5 Networks FirePass 244
Configuring DSMs
33 FAIR WARNING
The Fair Warning DSM for Juniper Secure Analytics (JSA) retrieves event files
from a remote source using the log file protocol.
JSA records event categories from the Fair Warning log files about user activity
related to patient privacy and security threats to medical records. Before you can
retrieve log files from Fair Warning, you must verify your device is configured to
generate an event log. Instructions for generating the event log can be found in
your Fair Warning documentation.
When configuring the log file protocol, make sure the hostname or IP address
configured in the Fair Warning system is the same as configured in the Remote
Host parameter in the Log File Protocol configuration.
Configuring a Log
Source
You can configure JSA to download an event log from a Fair Warning device.
Procedure
Step 1 Log in to JSA.
Step 2 Click the Admin tab.
Step 3 On the navigation menu, click Data Sources.
Step 4 Click the Log Sources icon.
Step 5 Click Add.
Step 6 In the Log Source Name field, type a name for your log source.
Step 7 In the Log Source Description field, type a description for the log source.
Step 8 From the Log Source Type list box, select Fair Warning.
Step 9 Select the Log File option from the Protocol Configuration list box.
Step 10 In the FTP File Pattern field, type a regular expression that matches the log files
generated by the Fair Warning system.
Step 11 In the Remote Directory field, type the path to the directory containing logs from
your Fair Warning device.
Step 12 From the Event Generator list box, select Fair Warning.
Step 13 Click Save.
Configuring DSMs
246 FAIR WARNING
Step 14 On the Admin tab, click Deploy Changes.
The configuration is complete. For more information on full parameters for the Log
File protocol, see the Log Sources Users Guide.
For more information on configuring Fair Warning, consult your vendor
documentation.
Configuring DSMs
34 FIDELIS XPS
The Fidelis XPS DSM for Juniper Secure Analytics (JSA) accepts events
forwarded in Log Enhanced Event Protocol (LEEF) from Fidelis XPS appliances
using syslog.
Supported Event
Types
JSA is capable of collecting all relevant alerts triggered by policy and rule violations
configured on your Fidelis XPS appliance.
Event Type Format Fidelis XPS must be configured to generate events in Log Enhanced Event
Protocol (LEEF) and forward these events using syslog. The LEEF format consists
of a pipe ( | ) delimited syslog header and tab separated fields in the event payload.
If the syslog events forwarded from your Fidelis XPS is not formatted as described
above, you must examine your device configuration or software version to ensure
your appliance supports LEEF. Properly formatted LEEF event messages are
automatically discovered and added as a log source to JSA.
Configuring Fidelis
XPS
You can configure syslog forwarding of alerts from your Fidelis XPS appliance.
Procedure
Step 1 Log in to CommandPost to manage your Fidelis XPS appliance.
Step 2 From the navigation menu, select System > Export.
A list of available exports is displayed. If this is the first time you have used the
export function, the list is empty.
Step 3 Select one of the following options:
•Click New to create a new export for your Fidelis XPS appliance.
•Click Edit next to an export name to edit an existing export on your Fidelis XPS
appliance.
The Export Editor is displayed.
Step 4 From the Export Method list box, select Syslog LEEF.
Step 5 In the Destination field, type the IP address or host name for JSA.
For example, 10.10.10.100:::514
This field does not support non-ASCII characters.

Configuring DSMs
248 FIDELIS XPS
Step 6 From Export Alerts, select one of the following options:
•All alerts - Select this option to export all alerts to JSA. This option is resource
intensive and it can take time to export all alerts.
•Alerts by Criteria - Select this option to export specific alerts to JSA. This
option displays a new field that allows you to define your alert criteria.
Step 7 From Export Malware Events, select None.
Step 8 From Export Frequency, select Every Alert / Malware.
Step 9 In the Save As field, type a name for your export.
Step 10 Click Save.
Step 11 Optional. To verify events are forwarded to JSA, you can click Run Now.
Run Now is intended as a test tool to verify that alerts selected by criteria are
exported from your Fidelis appliance. This option is not available if you selected to
export all events in Step 6.
The configuration is complete. The log source is added to JSA as Fidelis XPS
syslog events are automatically discovered. Events forwarded to JSA by Fidelis
XPS are displayed on the Log Activity tab of JSA.
Configuring a Log
Source
JSA automatically discovers and creates a log source for syslog events from
Fidelis XPS. However, you can manually create a log source for JSA to receive
syslog events. The following configuration steps are optional.
Procedure
Step 1 Log in to JSA.
Step 2 Click the Admin tab.
Step 3 On the navigation menu, click Data Sources.
Step 4 Click the Log Sources icon.
Step 5 Click Add.
Step 6 In the Log Source Name field, type a name for your log source.
Step 7 In the Log Source Description field, type a description for the log source.
Step 8 From the Log Source Type list box, select Fidelis XPS.
Step 9 Using the Protocol Configuration list box, select Syslog.
Step 10 Configure the following values:
Table 37-5 Syslog Parameters
Parameter Description
Log Source Identifier Type the IP address or host name for the log source as an
identifier for events from your Fidelis XPS appliance.
Configuring DSMs
249
Step 11 Click Save.
Step 12 On the Admin tab, click Deploy Changes.
The configuration is complete.
Configuring DSMs
250 FIDELIS XPS

Configuring DSMs
35 FIREEYE
The FireEye DSM for Juniper Secure Analytics (JSA) accepts rsyslog events in
Log Event Extended Format (LEEF).
Supported Event
Types
This DSM applies to FireEye MPS, eMPS and MA appliances. JSA records all
relevant notification alerts sent by FireEye appliances.
Configuring a Log
Source
To integrate FireEye events with JSA, you must manually create a log source as
JSA does not automatically discover or create log sources for syslog events from
FireEye appliances.
Procedure
Step 1 Log in to JSA.
Step 2 Click the Admin tab.
Step 3 On the navigation menu, click Data Sources.
Step 4 Click the Log Sources icon.
Step 5 Click Add.
Step 6 In the Log Source Name field, type a name for your log source.
Step 7 In the Log Source Description field, type a description for the log source.
Step 8 From the Log Source Type list box, select FireEye.
Step 9 Using the Protocol Configuration list box, select Syslog.
The syslog protocol configuration is displayed.
Step 10 Configure the following values:
Step 11 Click Save.
Step 12 On the Admin tab, click Deploy Changes.
The log source is added to JSA.
Table 38-1 Syslog protocol parameters
Parameter Description
Log Source Identifier Type the IP address or host name for the log source as an
identifier for events from your FireEye appliance.
Configuring DSMs
252 FIREEYE
Configuring FireEye
to Forward Syslog
Events
You are now ready to configure your FireEye appliance to forward syslog events.
Procedure
Step 1 Log in to the FireEye appliance using the CLI.
Step 2 Type the following command to activate configuration mode:
enable
configure terminal
Step 3 Enable rsyslog notifications:
fenotify rsyslog enable
Step 4 Add JSA as an rsyslog notification consumer:
fenotify rsyslog trap-sink JSA
Step 5 Type the IP address for the JSA system receiving rsyslog trap-sink notifications:
fenotify rsyslog trap-sink JSA address <IP address>
Where <IP address> is the IP address of the JSA system.
Step 6 Type the following command to define the rsyslog event format:
fenotify rsyslog trap-sink JSA prefer message format leef
Step 7 Save the configuration changes to the FireEye appliance:
write memory
The configuration is complete. Events forwarded by FireEye are displayed on the
Log Activity tab.
Configuring DSMs
36 FORESCOUT COUNTERACT
The ForeScout CounterACT DSM for Juniper Secure Analytics (JSA) accepts Log
Extended Event Format (LEEF) events from CounterACT using syslog.
Supported Event
Types
JSA records the following ForeScout CounterACT events:
•Denial of Service (DoS)
•Authentication
•Exploit
•Suspicious
•System
Configuring a Log
Source
To integrate ForeScout CounterACT with JSA, you must manually create a log
source to receive policy-based syslog events.
JSA does not automatically discover or create log sources for syslog events from
ForeScout CounterACT appliances.
Procedure
Step 1 Log in to JSA.
Step 2 Click the Admin tab.
Step 3 On the navigation menu, click Data Sources.
Step 4 Click the Log Sources icon.
Step 5 Click Add.
Step 6 In the Log Source Name field, type a name for your log source.
Step 7 In the Log Source Description field, type a description for the log source.
Step 8 From the Log Source Type list box, select ForeScout CounterACT.
Step 9 Using the Protocol Configuration list box, select Syslog.

Configuring DSMs
254 FORESCOUT COUNTERACT
Step 10 Configure the following values:
Step 11 Click Save.
Step 12 On the Admin tab, click Deploy Changes.
The log source is added to JSA.
Configure ForeScout
CounterACT
Before configuring JSA, you must install a plug-in for your ForeScout CounterACT
appliance and configure ForeScout CounterACT to forward syslog events to JSA.
Configure the ForeScout CounterACT Plug-in
To integrate JSA with ForeScout CounterACT, you must download, install and
configure a plug-in for CounterACT. The plug-in extends ForeScout CounterACT
and provides the framework for forwarding LEEF events to JSA.
Procedure
Step 1 From the ForeScout website, download the plug-in for ForeScout CounterACT.
Step 2 Log in to your ForeScout CounterACT appliance.
Step 3 From the CounterACT console toolbar, select Options > Plugins > Install and
select the location of the plug-in file.
The plug-in is installed and displayed in the Plugins pane.
Step 4 From the Plugins pane, select the JSA plug-in and click Configure.
The Add JSA wizard is displayed.
Step 5 In the Server Address field, type IP address of JSA.
Step 6 From the Port list box, select 514.
Step 7 Click Next.
Step 8 From the Assigned CounterACT devices pane, choose one of the following
options:
•Default Server - Select this option to make all devices on this ForeScout
CounterACT forward events to JSA.
•Assign CounterACT devices - Select this option to assign which individual
devices running on ForeScout CounterACT forward events to JSA. The Assign
CounterACT devices option is only available if you have one or more ForeScout
CounterACT server.
Step 9 Click Finish.
Table 39-1 Syslog protocol parameters
Parameter Description
Log Source Identifier Type the IP address or host name for the log source as an
identifier for events from your ForeScout CounterACT
appliance.
Configuring DSMs
255
The plug-in configuration is complete. You are now ready to define the events
forwarded to JSA by ForeScout CounterACT policies.
Configuring ForeScout CounterACT Policies
ForeScout CounterACT policies test conditions to trigger management and
remediation actions on the appliance.
The plug-in provides an additional action for policies to forward the event to the
JSA using syslog. To forward events to JSA, you must define a CounterACT policy
that includes the JSA update action. The policy condition must be met at least
once to initiate an event to JSA. You must configure each policy to send updates to
JSA for events you want to record.
Procedure
Step 1 Select a policy for ForeScout CounterACT.
Step 2 From the Actions tree, select Audit > Send Updates to JSA Server.
Step 3 From the Contents tab, configure the following values:
a Select the Send host property results check box.
b Choose one of the type of events to forward for the policy:
-Send All - Select this option to include all properties discovered for the
policy to JSA.
-Send Specific - Select this option to select and send only specific properties
for the policy to JSA.
c Select the Send policy status check box.
Step 4 From the Trigger tab, select the interval ForeScout CounterACT uses for
forwarding the event to JSA:
•Send when the action starts - Select this check box to send a single event to
JSA when the conditions of your policy are met.
•Send when information is updated - Select this check box to send a report
when there is a change in the host properties specified in the Contents tab.
•Send periodically every - Select this check box to send a reoccurring event to
JSA on an interval if the policy conditions are met.
Step 5 Click OK to save the policy changes.
Step 6 Repeat this process to configure any additional policies with an action to send
updates to JSA, if required.
The configuration is complete. Events forwarded by ForeScout CounterACT are
displayed on the Log Activity tab of JSA.

Configuring DSMs
37 FORTINET FORTIGATE
The Fortinet FortiGate DSM for Juniper Secure Analytics (JSA) records all relevant
FortiGate IPS/Firewall events using syslog.
Table 40-1 identifies the specifications for the Fortinet FortiGate DSM.
Fortinet FortiGate
DSM Integration
Process
To integrate Fortinet FortiGate DSM with JSA, use the following procedures:
1 Download and install the most recent Fortinet FortiGate RPM to your JSA console.
If automatic updates are enabled, this procedure is not required. RPMs need to be
installed only one time.
2 Optional. Install the Syslog Redirect protocol RPM to collect events through
Fortigate FortiAnalyzer. When you use the Syslog Redirect protocol, JSA can
identify the specific Fortigate firewall that sent the event. You can use the
procedure to manually install a DSM to install a protocol.
Table 40-1 Fortinet FortiGate DSM Specifications
Specification Value
Manufacturer Fortinet
DSM Fortinet FortiGate
RPM file name DSM-FortinetFortiGate-7.x-xxxxxx.noarch.rpm
Supported
version
FortiOS v2.5 and later
Protocol Syslog
JSA recorded
events
All relevant events
Auto discovered Yes
Includes identity Yes
For more
information
http://www.fortinet.com

Configuring DSMs
258 FORTINET FORTIGATE
3 Configure your Fortinet FortiGate system to enable communication with JSA. This
procedure must be performed for each instance of Fortinet FortiGate. For more
information on configuring a Fortinet FortiGate device, see your vendor
documentation.
4 For each Fortinet FortiGate server you want to integrate, create a log source on
the JSA console. If JSA automatically discovers the DSM, this step is not required.
Related tasks
•Manually Installing a DSM
•Configuring a Fortinet FortiGate Log Source
Configuring a
Fortinet FortiGate
Log Source
JSA automatically discovers and creates a log source for syslog events from
Fortinet FortiGate. The following configuration steps are optional.
Procedure
To configure a Fortinet FortiGate log source:
Step 1 Log in to JSA.
Step 2 Click the Admin tab.
Step 3 On the navigation menu, click Data Sources.
Step 4 Click the Log Sources icon.
Step 5 Click Add.
Step 6 In the Log Source Name field, type a name for your log source.
Step 7 In the Log Source Description field, type a description for the log source.
Step 8 From the Log Source Type list, select Fortinet FortiGate Security Gateway.
Step 9 Using the Protocol Configuration list, select one of the following options:
•Select Syslog.
•To configure JSA to receive FortiAnalyzer events, select Syslog Redirect.
Step 10 Configure the following values:
Step 11 Configure the remaining parameters.
Step 12 Click Save.
On the Admin tab, click Deploy Changes.
Table 40-1 Syslog Parameters
Parameter Description
Log Source Identifier
RegEx
devname=([\w-]+)
Listen Port 517
Protocol UDP
Configuring DSMs
38 FOUNDRY FASTIRON
You can integrate a Foundry FastIron device with Juniper Secure Analytics (JSA)
to collect all relevant events using syslog.
Configure Syslog for
Foundry FastIron
To integrate JSA with a Foundry FastIron RX device, you must configure the
appliance to forward syslog events.
Procedure
Step 1 Log in to the Foundry FastIron device command-line interface (CLI).
Step 2 Type the following command to enable logging:
logging on
Local syslog is now enabled with the following defaults:
•Messages of all syslog levels (Emergencies - Debugging) are logged.
•Up to 50 messages are retained in the local syslog buffer.
•No syslog server is specified.
Step 3 Type the following command to define an IP address for the syslog server:
logging host <IP Address>
Where <IP Address> is the IP address of your JSA.
You are now ready to configure the log source in JSA.
Configuring a Log
Source
JSA automatically discovers and creates a log source for syslog events from
Foundry FastIron. The following configuration steps are optional.
Procedure
Step 1 Log in to JSA.
Step 2 Click the Admin tab.
Step 3 On the navigation menu, click Data Sources.
Step 4 Click the Log Sources icon.
Step 5 Click Add.
Step 6 In the Log Source Name field, type a name for your log source.

Configuring DSMs
260 FOUNDRY FASTIRON
Step 7 In the Log Source Description field, type a description for the log source.
Step 8 From the Log Source Type list box, select Foundry FastIron.
Step 9 Using the Protocol Configuration list box, select Syslog.
Step 10 Configure the following values:
Step 11 Click Save.
Step 12 On the Admin tab, click Deploy Changes.
The configuration is complete.
Table 41-1 Syslog protocol parameters
Parameter Description
Log Source Identifier Type the IP address or host name for the log source as an
identifier for events from your Foundry FastIron appliance.
Configuring DSMs
39 GENERIC FIREWALL
The generic firewall server DSM for Juniper Secure Analytics (JSA) accepts events
using syslog. JSA records all relevant events.
Configuring Event
Properties
To configure JSA to interpret the incoming generic firewall events:
Step 1 Forward all firewall logs to your JSA.
For information on forwarding firewall logs from your generic firewall to JSA, see
your firewall vendor documentation.
Step 2 Open the following file:
/opt/qradar/conf/genericFirewall.conf
Make sure you copy this file to systems hosting the Event Collector and the JSA
console.
Step 3 Restart the Tomcat server:
service tomcat restart
A message is displayed indicating that the Tomcat server has restarted.
Step 4 Enable or disable regular expressions in your patterns by setting the
regex_enabled property accordingly. By default, regular expressions are disabled.
For example:
regex_enabled=false
When you set the regex_enabled property to false, the system generates regular
expressions based on the tags you entered while attempting to retrieve the
corresponding data values from the logs.
When you set the regex_enabled property to true, you can define custom regex to
control patterns. These regex are directly applied to the logs and the first captured
group is returned. When defining custom regex patterns, you must adhere to regex
rules, as defined by the Java programming language. For more information, see
the following website: http://download.oracle.com/javase/tutorial/essential/regex/
To integrate a generic firewall with JSA, make sure you specify the classes directly
instead of using the predefined classes. For example, the digit class (/\d/)
becomes /[0-9]/. Also, instead of using numeric qualifiers, re-write the
expression to use the primitive qualifiers (/?/,/*/ and /+/).
Configuring DSMs
262 GENERIC FIREWALL
Step 5 Review the file to determine a pattern for accepted packets.
For example, if your device generates the following log messages for accepted
packets:
Aug. 5, 2005 08:30:00 Packet accepted. Source IP: 192.168.1.1
Source Port: 80 Destination IP: 192.168.1.2 Destination Port: 80
Protocol: tcp
The pattern for accepted packets is Packet accepted.
Step 6 Add the following to the file:
accept_pattern=<accept pattern>
Where <accept pattern> is the pattern determined in Step 5. For example:
accept pattern=Packet accepted
Patterns are case insensitive.
Step 7 Review the file to determine a pattern for denied packets.
For example, if your device generates the following log messages for denied
packets:
Aug. 5, 2005 08:30:00 Packet denied. Source IP: 192.168.1.1
Source Port: 21 Destination IP: 192.168.1.2 Destination Port: 21
Protocol: tcp
The pattern for denied packets is Packet denied.
Step 8 Add the following to the file:
deny_pattern=<deny pattern>
Where <deny pattern> is the pattern determined in Step 7.
Patterns are case insensitive.
Step 9 Review the file to determine a pattern, if present, for the following:
source ip
source port
destination ip
destination port
protocol
For example, if your device generates the following log message:
Aug. 5, 2005 08:30:00 Packet accepted. Source IP: 192.168.1.1
Source Port: 80 Destination IP: 192.168.1.2 Destination Port: 80
Protocol: tcp
The pattern for source IP is Source IP.
Step 10 Add the following to the file:
source_ip_pattern=<source ip pattern>
source_port_pattern=<source port pattern>
destination_ip_pattern=<destination ip pattern>

Configuring DSMs
263
destination_port_pattern=<destination port pattern>
protocol_pattern=<protocol pattern>
Where <source ip pattern>, <source port pattern>, <destination
ip pattern>, <destination port pattern>, and <protocol pattern>
are the corresponding patterns identified in Step 9.
NOTE
Note: Patterns are case insensitive and you can add multiple patterns. For multiple
patterns, separate using a # symbol.
Step 11 Save and exit the file.
You are now ready to configure the log source in JSA.
Configuring a Log
Source
To integrate generic firewalls with JSA, you must manually create a log source to
receive the events as JSA does not automatically discover or create log sources
for events from generic firewall appliances.
Procedure
Step 1 Log in to JSA.
Step 2 Click the Admin tab.
Step 3 On the navigation menu, click Data Sources.
The Data Sources panel is displayed.
Step 4 Click the Log Sources icon.
The Log Sources window is displayed.
Step 5 Click Add.
The Add a log source window is displayed.
Step 6 In the Log Source Name field, type a name for your log source.
Step 7 In the Log Source Description field, type a description for the log source.
Step 8 From the Log Source Type list box, select Configurable Firewall Filter.
Step 9 Using the Protocol Configuration list box, select Syslog.
The syslog protocol configuration is displayed.
Step 10 Configure the following values:
Table 42-1 Syslog Parameters
Parameter Description
Log Source Identifier Type the IP address or host name for the log source as an
identifier for events from your generic firewall appliance.
Configuring DSMs
264
Step 11 Click Save.
Step 12 On the Admin tab, click Deploy Changes.
The log source is added to JSA. Events forwarded to JSA by generic firewalls are
displayed on the Log Activity tab.
Configuring DSMs
40 GENERIC AUTHORIZATION SERVER
The generic authorization server DSM for Juniper Secure Analytics (JSA) records
all relevant generic authorization events using syslog.
Configuring Event
Properties
To configure JSA to interpret the incoming generic authorization events:
Step 1 Forward all authentication server logs to your JSA system.
For information on forwarding authentication server logs to JSA, see your generic
authorization server vendor documentation.
Step 2 Open the following file:
/opt/qradar/conf/genericAuthServer.conf
Make sure you copy this file to systems hosting the Event Collector and the
console.
Step 3 Restart the Tomcat server:
service tomcat restart
A message is displayed indicating that the Tomcat server has restarted.
Step 4 Enable or disable regular expressions in your patterns by setting the
regex_enabled property accordingly. By default, regular expressions are disabled.
For example:
regex_enabled=false
When you set the regex_enabled property to false, the system generates regular
expressions (regex) based on the tags you entered while attempting to retrieve the
corresponding data values from the logs.
When you set the regex_enabled property to true, you can define custom regex to
control patterns. These regex are directly applied to the logs and the first captured
group is returned. When defining custom regex patterns, you must adhere to regex
rules, as defined by the Java programming language. For more information, see
the following website: http://download.oracle.com/javase/tutorial/essential/regex/
To integrate the generic authorization server with JSA, make sure you specify the
classes directly instead of using the predefined classes. For example, the digit
class (/\d/) becomes /[0-9]/. Also, instead of using numeric qualifiers,
re-write the expression to use the primitive qualifiers (/?/,/*/ and /+/).
Configuring DSMs
266 GENERIC AUTHORIZATION SERVER
Step 5 Review the file to determine a pattern for successful login:
For example, if your authentication server generates the following log message for
accepted packets:
Jun 27 12:11:21 expo sshd[19926]: Accepted password for root
from 10.100.100.109 port 1727 ssh2
The pattern for successful login is Accepted password.
Step 6 Add the following entry to the file:
login_success_pattern=<login success pattern>
Where <login success pattern> is the pattern determined in Step 5.
For example:
login_success_pattern=Accepted password
All entries are case insensitive.
Step 7 Review the file to determine a pattern for login failures.
For example, if your authentication server generates the following log message for
login failures:
Jun 27 12:58:33 expo sshd[20627]: Failed password for root from
10.100.100.109 port 1849 ssh2
The pattern for login failures is Failed password.
Step 8 Add the following to the file:
login_failed_pattern=<login failure pattern>
Where <login failure pattern> is the pattern determined for login failure.
For example:
login_failed_pattern=Failed password
All entries are case insensitive.
Step 9 Review the file to determine a pattern for logout:
For example, if your authentication server generates the following log message for
logout:
Jun 27 13:00:01 expo su(pam_unix)[22723]: session closed for
user genuser
The pattern for lookout is session closed.
Step 10 Add the following to the genericAuthServer.conf file:
logout_pattern=<logout pattern>
Where <logout pattern> is the pattern determined for logout in Step 9.
For example:
logout_pattern=session closed
All entries are case insensitive.
Configuring DSMs
267
Step 11 Review the file to determine a pattern, if present, for source IP address and source
port.
For example, if your authentication server generates the following log message:
Jun 27 12:11:21 expo sshd[19926]: Accepted password for root
from 10.100.100.109 port 1727 ssh2
The pattern for source IP address is from and the pattern for source port is port.
Step 12 Add an entry to the file for source IP address and source port:
source_ip_pattern=<source IP pattern>
source_port_pattern=<source port pattern>
Where <source IP pattern> and <source port pattern> are the patterns
identified in Step 11 for source IP address and source port.
For example:
source_ip_pattern=from
source_port_pattern=port
Step 13 Review the file to determine if a pattern exists for username.
For example:
Jun 27 12:11:21 expo sshd[19926]: Accepted password for root
from 10.100.100.109 port 1727 ssh2
The pattern for username is for.
Step 14 Add an entry to the file for the username pattern:
For example:
user_name_pattern=for
You are now ready to configure the log source in JSA.
Configure a Log
Source
To integrate generic authorization appliance event with JSA, you must manually
create a log source to receive the events as JSA does not automatically discover
or create log sources for events from generic authorization appliances.
Procedure
Step 1 Log in to JSA.
Step 2 Click the Admin tab.
Step 3 On the navigation menu, click Data Sources.
Step 4 Click the Log Sources icon.
Step 5 Click Add.
Step 6 In the Log Source Name field, type a name for your log source.
Step 7 In the Log Source Description field, type a description for the log source.
Step 8 From the Log Source Type list box, select Configurable Authentication
message filter.

Configuring DSMs
268 GENERIC AUTHORIZATION SERVER
Step 9 Using the Protocol Configuration list box, select Syslog.
Step 10 Configure the following values:
Step 11 Click Save.
Step 12 On the Admin tab, click Deploy Changes.
The log source is added to JSA. Events forwarded to JSA by generic authorization
appliances are displayed on the Log Activity tab.
Table 43-1 Syslog Parameters
Parameter Description
Log Source Identifier Type the IP address or host name for the log source as an
identifier for events from your generic authorization
appliance.
Configuring DSMs
41 GREAT BAY BEACON
The Great Bay Beacon DSM for Juniper Secure Analytics (JSA) supports syslog
alerts from the Great Bay Beacon Endpoint Profiler.
JSA records all relevant endpoint security events. Before you can integrate with
JSA, you must configure your Great Bay Beacon Endpoint Profiler to forward
syslog event messages to JSA.
Configuring Syslog
for Great Bay Beacon
You can configure your Great Bay Beacon Endpoint Profiler to forward syslog
events.
Procedure
Step 1 Log in to your Great Bay Beacon Endpoint Profiler.
Step 2 To create an event, select Configuration > Events > Create Events.
A list of currently configured events is displayed.
Step 3 From the Event Delivery Method pane, select the Syslog check box.
Step 4 To apply your changes, select Configuration Apply Changes > Update
Modules.
Step 5 Repeat Step 2 to Step 4 to configure all of the events you want to monitor in JSA.
Step 6 Configure JSA as an external log source for your Great Bay Beacon Endpoint
Profiler.
For information on configuring JSA as an external log source, see the Great Bay
Beacon Endpoint Profiler Configuration Guide.
You are now ready to configure the log source in JSA.
Configuring a log
source
JSA automatically discovers and creates a log source for syslog events from Great
Bay Beacon. The following configuration steps are optional.
Procedure
Step 1 Log in to JSA.
Step 2 Click the Admin tab.
Step 3 On the navigation menu, click Data Sources.

Configuring DSMs
270 GREAT BAY BEACON
Step 4 Click the Log Sources icon.
Step 5 Click Add.
Step 6 In the Log Source Name field, type a name for your log source.
Step 7 In the Log Source Description field, type a description for the log source.
Step 8 From the Log Source Type list box, select Great Bay Beacon.
Step 9 Using the Protocol Configuration list box, select Syslog.
Step 10 Configure the following values:
Step 11 Click Save.
Step 12 On the Admin tab, click Deploy Changes.
The configuration is complete.
Table 44-1 Syslog Parameters
Parameter Description
Log Source Identifier Type the IP address or host name for the log source as an
identifier for events from your Great Bay Beacon appliance.
Configuring DSMs
42 HBGARY ACTIVE DEFENSE
The HBGary Active Defense DSM for Juniper Secure Analytics (JSA) accepts
several event types forwarded from HBGary Active Defense devices, such as
access, system, system configuration, and policy events.
Events from Active Defense are forwarded in the Log Event Extended Format
(LEEF) to JSA using syslog. Before you can configure JSA, you must configure a
route for your HBGary Active Defense device to forward events to a syslog
destination.
Configuring HBGary
Active Defense
You can configure a route for syslog events in Active Defense for JSA.
Procedure
Step 1 Log in to the Active Defense Management console.
Step 2 From the navigation menu, select Settings > Alerts.
Step 3 Click Add Route.
Step 4 In the Route Name field, type a name for the syslog route you are adding to Active
Defense.
Step 5 From the Route Type list box, select LEEF (Q1 Labs).
Step 6 In the Settings pane, configure the following values:
•Host - Type the IP address or hostname for your JSA console or Event
Collector.
•Port - Type 514 as the port number.
Step 7 In the Events pane, select any events you want to forward to JSA.
Step 8 Click OK to save your configuration changes.
The Active Defense device configuration is complete. You are now ready to
configure a log source in JSA. For more information on configuring a route in
Active Defense, see your HBGary Active Defense User Guide.

Configuring DSMs
272 HBGARY ACTIVE DEFENSE
Configuring a Log
Source
JSA automatically discovers and creates a log source for LEEF formatted syslog
events forwarded from Active Defense. These configuration steps are optional.
Procedure
Step 1 Log in to JSA.
Step 2 Click the Admin tab.
Step 3 In the navigation menu, click Data Sources.
Step 4 Click the Log Sources icon.
Step 5 Click Add.
Step 6 In the Log Source Name field, type a name for the log source.
Step 7 In the Log Source Description field, type a description for the log source.
Step 8 From the Log Source Type list box, select HBGary Active Defense.
Step 9 From the Protocol Configuration list box, select Syslog.
Step 10 Configure the following values:
For more information on configuring log sources, see the Log Sources Users
Guide.
Step 11 Click Save.
Step 12 On the Admin tab, click Deploy Changes.
The HBGary Active Defense configuration is complete.
Table 45-1 HBGary Active Defense Syslog Protocol Parameters
Parameter Description
Log Source Identifier Type the IP address or hostname for your HBGary Active
Defense device.
The IP address or hostname identifies your HBGary Active
Defense device as a unique event source in JSA.
Configuring DSMs
43 HONEYCOMB LEXICON FILE
INTEGRITY MONITOR (FIM)
You can use the Honeycomb Lexicon File Integrity Monitor (FIM) DSM with JSA to
collect detailed file integrity events from your network.
Configuration
Overview
JSA supports syslog events that are forwarded from Lexicon File Integrity Monitor
installations that use Lexicon mesh v3.1 and above. The syslog events that are
forwarded by Lexicon FIM are formatted as Log Extended Event Format (LEEF)
events by the Lexicon mesh service.
To integrate Lexicon FIM events with JSA, you must complete the following tasks:
1 On your Honeycomb installation, configure the Lexicon mesh service to generate
syslog events in LEEF.
2 On your Honeycomb installation, configure any Lexicon FIM policies for your
Honeycomb data collectors to forward FIM events to your JSA console or Event
Collector.
3 On your JSA console, verify that a Lexicon FIM log source is created and that
events are displayed on the Log Activity tab.
4 Optional. Ensure that no firewall rules block communication between your
Honeycomb data collectors and the JSA console or Event Collector that is
responsible for receiving events.
Supported
Honeycomb FIM
Event Types Logged
by JSA
The Honeycomb FIM DSM for JSA can collect events from several categories.
Each event category contains low-level events that describe the action that is
taken within the event category. For example, file rename events might have a
low-level categories of either file rename successful or file rename failed.
The following list defines the event categories that are collected by JSA for
Honeycomb file integrity events:
•Baseline events
•Open file events
•Create file events
•Rename file events
•Modify file events
Configuring DSMs
274 HONEYCOMB LEXICON FILE INTEGRITY MONITOR (FIM)
•Delete file events
•Move file events
•File attribute change events
•File ownership change events
JSA can also collect Windows and other log files that are forwarded from
Honeycomb Lexicon. However, any event that is not a file integrity event might
require special processing by a Universal DSM or a log source extension in JSA.
Configuring the
Lexicon Mesh
Service
To collect events in a format that is compatible with JSA, you must configure your
Lexicon mesh service to generate syslog events in LEEF.
Procedure
Step 1 Log in to the Honeycomb LexCollect system that is configured as the dbContact
system in your network deployment.
Step 2 Locate the Honeycomb installation directory for the installImage directory.
For example, c:\Program Files\Honeycomb\installImage\data.
Step 3 Open the mesh.properties file.
If your deployment does not contain Honeycomb LexCollect, you can edit
mesh.properties manually.
For example, c:\Program Files\mesh
Step 4 To export syslog events in LEEF, edit the formatter field.
For example, formatter=leef.
Step 5 Save your changes.
The mesh service is configured to output LEEF events. For information about the
Lexicon mesh service, see your Honeycomb documentation.
Configuring a
Honeycomb Lexicon
FIM Log Source in
JSA
JSA automatically discovers and creates a log source for file integrity events that
are forwarded from the Honeycomb Lexicon File Integrity Monitor. This procedure
is optional.
Procedure
Step 1 Log in to JSA.
Step 2 Click the Admin tab.
Step 3 In the navigation menu, click Data Sources.
Step 4 Click the Log Sources icon.
Step 5 Click Add.
Step 6 In the Log Source Name field, type a name for your log source.
Step 7 Optional. In the Log Source Description field, type a description for your log
source.

Configuring DSMs
275
Step 8 From the Log Source Type list box, select Honeycomb Lexicon File Integrity
Monitor.
Step 9 From the Protocol Configuration list box, select Syslog.
Step 10 Configure the following values:
Step 11 Click Save.
Step 12 On the Admin tab, click Deploy Changes.
Honeycomb Lexicon File Integrity Monitor events that are forwarded to JSA are
displayed on the Log Activity tab.
Table 46-2 Syslog Protocol Parameters
Parameter Description
Log Source Identifier Type the IP address or host name for the log source as an
identifier for events from your Honeycomb Lexicon FIM
installation.
The log source identifier must be unique value.
Enabled Select this check box to enable the log source. By default,
the check box is selected.
Credibility From the list box, select the credibility of the log source. The
range is 0 - 10.
The credibility indicates the integrity of an event or offense
as determined by the credibility rating from the source
devices. Credibility increases if multiple sources report the
same event. The default is 5.
Target Event Collector From the list box, select the Event Collector to use as the
target for the log source.
Coalescing Events Select this check box to enable the log source to coalesce
(bundle) events.
By default, automatically discovered log sources inherit the
value of the Coalescing Events list box from the System
Settings in JSA. When you create a log source or edit an
existing configuration, you can override the default value by
configuring this option for each log source.
Incoming Event
Payload
From the list box, select the incoming payload encoder for
parsing and storing the logs.
Store Event Payload Select this check box to enable the log source to store event
payload information.
By default, automatically discovered log sources inherit the
value of the Store Event Payload list box from the System
Settings in JSA. When you create a log source or edit an
existing configuration, you can override the default value by
configuring this option for each log source.

Configuring DSMs
44 HP
This section provides information on the following DSMs:
•HP ProCurve
•HP Tandem
•Hewlett Packard UNIX (HP-UX)
HP ProCurve You can integrate an HP ProCurve device with JSA to record all relevant HP
Procurve events using syslog.
Configuring Syslog
for HP ProCurve
You can configure your HP ProCurve device to forward syslog events to Juniper
Secure Analytics (JSA)
Procedure
Step 1 Log into the HP ProCurve device.
Step 2 Type the following command to make global configuration level changes.
config
If successful, the CLI will change to ProCurve(config)# as the prompt.
Step 3 Type the following command to logging <syslog-ip-addr>
Where <syslog-ip-addr> is the IP address of the JSA.
Step 4 To exit config mode, press CTRL+Z.
Step 5 Type write mem to save the current configuration to the startup configuration for
your HP ProCurve device.
You are now ready to configure the log source in JSA.
Configuring a Log
Source
JSA automatically discovers and creates a log source for LEEF formatted syslog
events forwarded from Active Defense. These configuration steps are optional.
Procedure
Step 1 Log in to JSA.
Step 2 Click the Admin tab.
Step 3 In the navigation menu, click Data Sources.

Configuring DSMs
278 HP
Step 4 Click the Log Sources icon.
Step 5 Click Add.
Step 6 In the Log Source Name field, type a name for the log source.
Step 7 In the Log Source Description field, type a description for the log source.
Step 8 From the Log Source Type list box, select HP ProCurve.
Step 9 From the Protocol Configuration list box, select Syslog.
Step 10 Configure the following values:
Step 11 Click Save.
Step 12 On the Admin tab, click Deploy Changes.
The configuration is complete.
HP Tandem You can integrate an HP Tandem device with JSA. An HP Tandem device accepts
SafeGuard Audit file events using a log file protocol source.
A log file protocol source allows JSA to retrieve archived log files from a remote
host. The HP Tandem DSM supports the bulk loading of log files using the log file
protocol source.
When configuring your HP Tandem device to use the log file protocol, make sure
the hostname or IP address configured in the HP Tandem device is the same as
configured in the Remote Host parameter in the Log File Protocol configuration.
The SafeGuard Audit file names have the following format:
Annnnnnn
The single alphabetic character A is followed by a seven-digit decimal integer
nnnnnnn, which increments by one each time a name is generated in the same
audit pool.
You are now ready to configure the log source and protocol in JSA:
Procedure
Step 1 From the Log Source Type list box, select HP Tandem.
Step 2 To configure the log file protocol, from the Protocol Configuration list box, select
Log File.
Table 47-1 HP ProCurve syslog protocol parameters
Parameter Description
Log Source Identifier Type the IP address or hostname for your HP ProCurve
device.

Configuring DSMs
Hewlett Packard UNIX (HP-UX) 279
NOTE
Note: Your system must be running the latest version of the log file protocol to
integrate with an HP Tandem device:
For the full list of Log File protocol parameters, see the Log Sources Users Guide.
For more information about HP Tandem see your vendor documentation.
Hewlett Packard
UNIX (HP-UX)
You can integrate an HP-UX device with JSA. An HP-UX DSM accepts events
using syslog.
Configuring Syslog
for HP-UX
You can configure syslog on your HP-UX device to forward events to JSA.
Procedure
Step 1 Log in to the HP-UX device command-line interface.
Step 2 Open the following file:
/etc/syslog.conf
Step 3 Add the following line:
<facility>.<level> <destination>
Where:
<facility> is auth.
<level> is info.
<destination> is the IP address of the JSA.
Step 4 Save and exit the file.
Step 5 Type the following command to ensure that syslogd enforces the changes to the
syslog.conf file.
kill -HUP ‘cat /var/run/syslog.pid‘
NOTE
Note: The above command is surrounded with back quotation marks.
You are now ready to configure the log source in JSA.
Configure a Log
Source
JSA automatically discovers and creates a log source for syslog events forwarded
from HP-UX. These configuration steps are optional.
Procedure
Step 1 Log in to JSA.
Step 2 Click the Admin tab.
Step 3 In the navigation menu, click Data Sources.
Step 4 Click the Log Sources icon.

Configuring DSMs
280 HP
Step 5 Click Add.
Step 6 In the Log Source Name field, type a name for the log source.
Step 7 In the Log Source Description field, type a description for the log source.
Step 8 From the Log Source Type list box, select Hewlett Packard UniX.
Step 9 From the Protocol Configuration list box, select Syslog.
Step 10 Configure the following values:
Step 11 Click Save.
Step 12 On the Admin tab, click Deploy Changes.
The configuration is complete.
Table 47-1 HP-UX syslog parameters
Parameter Description
Log Source Identifier Type the IP address or hostname for your Hewlett Packard
UniX device.

Configuring DSMs
45 HUAWEI
This section includes configurations for the following DSMs:
•Huawei AR Series Router
•Huawei S Series Switch
Huawei AR Series
Router
The Huawei AR Series Router DSM for Juniper Secure Analytics (JSA) can accept
events from Huawei AR Series Routers using syslog.
JSA records all relevant IPv4 events forwarded from Huawei AR Series Router. To
integrate your device with JSA, you must create a log source, then configure your
AR Series Router to forward syslog events.
Supported Routers The DSM supports events from the following Huawei AR Series Routers:
•AR150
•AR200
•AR1200
•AR2200
•AR3200
Configuring a Log
Source
JSA does not automatically discover incoming syslog events from Huawei AR
Series Routers.
If your events are not automatically discovered, you must manually create a log
source from the Admin tab in JSA.
Procedure
Step 1 Log in to JSA.
Step 2 Click the Admin tab.
Step 3 On the navigation menu, click Data Sources.
Step 4 Click the Log Sources icon.
Step 5 Click Add.

Configuring DSMs
282 HUAWEI
Step 6 In the Log Source Name field, type a name for your log source.
Step 7 In the Log Source Description field, type a description for the log source.
Step 8 From the Log Source Type list box, select Huawei AR Series Router.
Step 9 From the Protocol Configuration list box, select Syslog.
Step 10 Configure the following values:
Step 11 Click Save.
Step 12 On the Admin tab, click Deploy Changes.
The log source is added to JSA. You are now ready to configure your Huawei AR
Series Router to forward events to JSA.
Configuring Your
Huawei AR Series
Router
To forward syslog events to JSA, you must configure your Huawei AR Series
Router as an information center, then configure a log host.
The log host you create for your Huawei AR Series Router should forward events
to your JSA console or an Event Collector.
Procedure
Step 1 Log in to your Huawei AR Series Router command-line Interface (CLI).
Step 2 Type the following command to access the system view:
system-view
Step 3 Type the following command to enable the information center:
info-center enable
Step 4 Type the following command to send informational level log messages to the
default channel:
info-center source default channel loghost log level
informational debug state off trap state off
Step 5 Optional. To verify your Huawei AR Series Router source configuration, type the
command:
display channel loghost
Step 6 Type the following command to configure the IP address for JSA as the loghost for
your switch:
info-center loghost <IP address> facility <local>
Table 48-1 Syslog protocol parameters
Parameter Description
Log Source Identifier Type the IP address, host name, or name for the log source
as an identifier for your Huawei AR Series Router.
Each log source you create for your Huawei AR Series
Router should include a unique identifier, such as an IP
address or host name.

Configuring DSMs
Huawei S Series Switch 283
Where:
<IP address> is the IP address of the JSA console or Event Collector.
<local> is the syslog facility, for example, local0.
For example,
info-center loghost 10.10.10.1 facility local0
Step 7 Type the following command to exit the configuration:
quit
The configuration is complete. You can verify events forwarded to JSA by viewing
events on the Log Activity tab.
Huawei S Series
Switch
The Huawei S Series Switch DSM for JSA can accept events from Huawei S
Series Switch appliances using syslog.
JSA records all relevant IPv4 events forwarded from Huawei S Series Switches. To
integrate your device with JSA, you must configure a log source, then configure
your S Series Switch to forward syslog events.
Supported Switches The DSM supports events from the following Huawei S Series Switches:
•S5700
•S7700
•S9700
Configuring a Log
Source
JSA does not automatically discover incoming syslog events from Huawei S Series
Switches.
If your events are not automatically discovered, you must manually create a log
source from the Admin tab in JSA.
Procedure
Step 1 Log in to JSA.
Step 2 Click the Admin tab.
Step 3 On the navigation menu, click Data Sources.
Step 4 Click the Log Sources icon.
Step 5 Click Add.
Step 6 In the Log Source Name field, type a name for your log source.
Step 7 In the Log Source Description field, type a description for the log source.
Step 8 From the Log Source Type list box, select Huawei S Series Switch.
Step 9 From the Protocol Configuration list box, select Syslog.

Configuring DSMs
284 HUAWEI
Step 10 Configure the following values:
Step 11 Click Save.
Step 12 On the Admin tab, click Deploy Changes.
The log source is added to JSA. You are now ready to configure your Huawei S
Series Switch to forward events to JSA.
Configuring Your
Huawei S Series
Switch
To forward syslog events to JSA, you must configure your Huawei S Series Switch
as an information center, then configure a log host.
The log host you create for your Huawei S Series Switch should forward events to
your JSA console or an Event Collector.
Procedure
Step 1 Log in to your Huawei S Series Switch command-line Interface (CLI).
Step 2 Type the following command to access the system view:
system-view
Step 3 Type the following command to enable the information center:
info-center enable
Step 4 Type the following command to send informational level log messages to the
default channel:
info-center source default channel loghost log level
informational debug state off trap state off
Step 5 Optional. To verify your Huawei S Series Switch source configuration, type the
command:
display channel loghost
Step 6 Type the following command to configure the IP address for JSA as the loghost for
your switch:
info-center loghost <IP address> facility <local>
Where:
<IP address> is the IP address of the JSA console or Event Collector.
<local> is the syslog facility, for example, local0.
For example,
Table 48-2 Syslog protocol parameters
Parameter Description
Log Source Identifier Type the IP address, host name, or name for the log source
as an identifier for your Huawei S Series switch.
Each log source you create for your Huawei S Series switch
should include a unique identifier, such as an IP address or
host name.
Configuring DSMs
Huawei S Series Switch 285
info-center loghost 10.10.10.1 facility local0
Step 7 Type the following command to exit the configuration:
quit
The configuration is complete. You can verify events forwarded to JSA by viewing
events on the Log Activity tab.
Configuring DSMs
46 IBM
This section provides information on the following DSMs:
•IBM AIX
•IBM AS/400 iSeries
•IBM CICS
•IBM Lotus Domino
•IBM Proventia Management SiteProtector
•IBM ISS Proventia
•IBM RACF
•IBM DB2
•IBM WebSphere Application Server
•IBM Informix Audit
•IBM IMS
•IBM Guardium
•IBM Tivoli Access Manager for E-business
•IBM z/Secure Audit
•IBM Tivoli Endpoint Manager
•IBM zSecure Alert
•IBM Security Network Protection (XGS)
•IBM Security Network IPS

Configuring DSMs
288 IBM
IBM AIX IBM offers two DSMs for Juniper Secure Analytics (JSA) that can collect and parse
audit or operating system events from IBM AIX®.
Supported Versions JSA supports the following versions of IBM AIX:
•The IBM AIX Audit DSM supports IBM AIX v6.1 and IBM AIX v7.1.
•The IBM AIX Server DSM supports IBM AIX v5.x and IBM AIX v6.x.
Available DSMs JSA can collect IBM AIX events with two available DSMs:
•IBM AIX Audit DSM - The IBM AIX Audit DSM collects detailed audit
information for events that occur on your IBM AIX appliance. IBM AIX provides
approximately 130 base audit events that you can collect.
JSA can collect audit events using one of the following protocols:
-Syslog - To use syslog to collect audit events in real-time, you must redirect
the audit log output to JSA.
-Log File - To use the log file protocol, you must install the audit.pl script on
your IBM AIX appliance and schedule the script to generate an event log file
that contains JSA readable audit events. You can then configure a log
source in JSA to retrieve your IBM AIX event logs. The shortest time period
you can configure to retrieve events with the log file protocol is a 15 minute
interval. Perl 5.8 or above is required on your IBM AIX appliance to use the
audit script.
•IBM AIX Server DSM - The IBM AIX Server DSM collects operating system
and authentication events using syslog for users that interact or log in to your
IBM AIX appliance. Events can include:
- Login or logoff events
- Session opened or session closed events
- Accepted password and failed password events
- Operating system events
Configuring DSMs
IBM AIX 289
Configuration
Overview
IBM AIX supports multiple DSMs for events and methods for event collection.
Consider the following information when configuring JSA:
•To collect audit events using the IBM AIX Audit DSM, you must select one of the
following configuration options:
-Configuring Syslog for the IBM AIX Audit DSM
-Configuring the Log File Protocol for the IBM AIX Audit DSM
•To collect system authentication events using the IBM AIX Server DSM, you
must complete the system authentication syslog configuration. For more
information, see Configuring the IBM AIX Server DSM.
Configuring Syslog
for the IBM AIX Audit
DSM
To collect audit events with syslog using the IBM AIX Audit DSM, you must redirect
your audit log output from your IBM AIX appliance to JSA.
You can configure the events generated by IBM AIX appliances for JSA and
enable or disable classes in the audit configuration. The default classes configured
in IBM AIX captures a large number of audit events. To prevent performance
issues, you can tune your IBM AIX appliance and reduce the number of classes
collected per your network security policy. For more information on the audit
classes, see your IBM AIX appliance documentation.
Procedure
Step 1 Log in to your IBM AIX appliance.
Step 2 Edit the audit configuration file:
/etc/security/audit/config
Step 3 In the Start section of the audit file, edit the configuration to disable binmode and
enable streammode.
For example,
binmode = off
streammode = on
Step 4 In the Classes section of the audit file, edit the configuration to determine which
classes are audited.
Step 5 Save the configuration changes.
Step 6 Edit the streamcmds configuration file on your IBM AIX appliance:
/etc/security/audit/streamcmds
Step 7 Add the following command to your streamcmds file:
/usr/sbin/auditstream | auditpr -h eclrRdi | /usr/bin/logger -p
local0.debug &
Step 8 Save the configuration changes.
Step 9 Edit the syslog configuration file to include a debug entry and the location of JSA.

Configuring DSMs
290 IBM
For example,
*.debug @<JSA>
Where <JSA> is the IP address of your JSA console or Event Collector. A tab must
separate *.debug and the IP address of JSA.
Step 10 Save the configuration changes.
Step 11 Type the following command to reload your syslog configuration:
refresh -s syslogd
Step 12 Type the following command to start the audit script on your IBM AIX appliance:
audit start
The configuration is complete. The IBM AIX Audit DSM automatically discovers
syslog audit events that are forwarded from IBM AIX to JSA. If the events are not
automatically discovered, you can manually configure a log source.
Configuring a log source
JSA automatically discovers and creates a log source for system authentication
events forwarded from IBM AIX. This procedure is optional.
Procedure
Step 1 Click the Admin tab.
Step 2 Click the Log Sources icon.
Step 3 Click Add.
Step 4 In the Log Source Name field, type a name for your log source.
Step 5 From the Log Source Type list box, select IBM AIX Audit.
Step 6 Using the Protocol Configuration list box, select Syslog.
Step 7 Configure the following values:
Table 49-1 Syslog Parameters
Parameter Description
Log Source Identifier Type the IP address or host name for the log source as an
identifier for events from your IBM AIX.
Enabled Select this check box to enable the log source.
By default, the check box is selected.
Credibility Select the credibility of the log source. The range is 0 - 10.
The credibility indicates the integrity of an event or offense
as determined by the credibility rating from the source
devices. Credibility increases if multiple sources report the
same event. The default is 5.
Target Event Collector Select the Event Collector to use as the target for the log
source.

Configuring DSMs
IBM AIX 291
Step 8 Click Save.
Step 9 On the Admin tab, click Deploy Changes.
The configuration is complete. The Log Activity tab of JSA displays syslog audit
events are redirected to syslog by IBM AIX.
Configuring the Log
File Protocol for the
IBM AIX Audit DSM
The log file protocol retrieves the event log created by the audit.pl script.
About this task
You can schedule the audit.pl script to run each time you want to convert your IBM
AIX audit logs to a readable event log format for JSA.
The audit script determines which audit logs to read based on the configuration of
your audit configuration file in the /etc/security/audit/config directory on your IBM
AIX appliance. The audit configuration allows you to identify the event classes that
are audited and folder location for the event log file on your IBM AIX appliance.
The audit script converts binary logs on your IBM AIX appliance to single line
events that are readable by JSA. The log file protocol then retrieves the event log
from your IBM AIX appliance and imports the events to JSA.
The default classes configured in IBM AIX captures a large number of audit
events. You can configure the classes in the audit configuration on your IBM AIX
system to prevent performance issues. For information on configuring audit
classes, see your IBM AIX documentation.
Coalescing Events Select this check box to enable the log source to coalesce
(bundle) events.
By default, automatically discovered log sources inherit the
value of the Coalescing Events list box from the System
Settings in JSA. When you create a log source or edit an
existing configuration, you can override the default value by
configuring this option for each log source.
Incoming Event
Payload
From the list box, select the incoming payload encoder for
parsing and storing the logs.
Store Event Payload Select this check box to enable the log source to store event
payload information.
By default, automatically discovered log sources inherit the
value of the Store Event Payload list box from the System
Settings in JSA. When you create a log source or edit an
existing configuration, you can override the default value by
configuring this option for each log source.
Table 49-1 Syslog Parameters (continued)
Parameter Description
Configuring DSMs
292 IBM
Procedure
Step 1 Log in to your IBM AIX appliance.
Step 2 Edit the following audit configuration file:
/etc/security/audit/config
Step 3 In the Start section of the audit file, edit the configuration to enable binmode.
For example,
binmode = on
Step 4 In the Start section of the audit file, edit the configuration to determine which
directories contain the binary audit logs.
In most cases, you do not have to edit the binary file (bin1 and bin2) directories.
For example, the default configuration for IBM AIX auditing writes binary logs to
the following directories:
trail = /audit/trail
bin1 = /audit/bin1
bin2 = /audit/bin2
binsize = 10240
cmds = /etc/security/audit/bincmds
Step 5 In the Classes section of the audit file, edit the configuration to determine which
classes are audited.
For information on configuring classes, see your IBM AIX documentation.
Step 6 Save the configuration changes.
Step 7 Type the following command to start auditing on your IBM AIX system:
audit start
You are now ready to install the audit script.
Installing and starting the audit script
You are required to install a version of Perl 5.8 or above on your IBM AIX appliance
to use the audit.pl script.
About this task
The audit script uses audit.pr to convert the binary audit records to event log files
JSA can read. You must run the script each time you want to convert your audit
records to readable events. A cronjob for the audit.pl script can automate this
process. Add 0 * * * * /audit.pl to allow the audit script to run hourly. The
minimum interval the audit.pl script should run is 15 minutes, as the shortest time
interval supported by the log file protocol to retrieve the event log is 15 minutes.
Command parameters for audit.pl must be added with the cronjob you schedule on
your IBM AIX appliance. For more information, see your system documentation.

Configuring DSMs
IBM AIX 293
Procedure
Step 1 Download the following archive file from http://www.juniper.net/customers/support/:
audit.pl.gz
Step 2 Copy the audit script to a folder on your IBM AIX appliance.
Step 3 Type the following command to extract the file:
tar -zxvf audit.pl.gz
Step 4 Type the following command, and include additional command parameters to start
the audit script:
./audit.pl
The configuration is complete.
Table 49-2 Command Parameters
Parameters Description
-r The -r parameter defines the results directory where the audit script
writes event log files for JSA.
If you do not specify a results directory, the script writes the events to
the following directory:
/audit/results/
The directory you specify for your audit result files is required in the
Remote Directory field when you configure a log source using the log
file protocol.
Note: To prevent errors, verify that your results directory exists on your
IBM AIX system.
-n The -n parameter allows you to define a unique name for the event log
file generated by audit.pl. By default, audit files are processed as
AIX_AUDIT_<timestamp>.
The value you specify using the -n parameter is required by the FTP
File Pattern field to identify the event logs the log source must retrieve
in JSA
-l The -l parameter defines the name of the last record file. By default, the
last record file is named lastrecord.txt.
The audit script uses last record file to determine the last event
processed. The last record file ensures duplicate events are not added
to the results file.
-m The -m parameter defines the maximum number of audit files to retain
on your IBM AIX system. By default, the script retains 30 audit files.
When the number of audit files exceeds the value of the -m parameter,
the script deletes the audit file with the oldest timestamp.
-t The -t parameter defines the directory that contains the audit trail file.
The default is /audit/trail.
-h The -h parameter displays the help and usage information.
-v The -v parameter displays the script version information.

Configuring DSMs
294 IBM
You are now ready to configure a log source for IBM AIX in JSA.
Configure a log source
A log file protocol source allows JSA to retrieve the audit log files from your IBM
AIX appliance.
About this task
The log file protocol can retrieve and import log files in a time interval greater than
15 minutes. The log file protocol supports the SFTP, SCP, or FTP protocol to
retrieve event files. When you configure the log file protocol in JSA to retrieve IBM
AIX audit log events, you must specify the audit log in the audit/results/ directory or
the directory specified using the -r parameter. The log file protocol uses regex to
determine which files to import and can track log files that are already imported
and processed to prevent duplicate audit events in JSA.
Procedure
Step 1 Click the Admin tab.
Step 2 Click the Log Sources icon.
Step 3 Click Add.
Step 4 In the Log Source Name field, type a name for the log source.
Step 5 In the Log Source Description field, type a description for the log source.
Step 6 From the Log Source Type list box, select IBM AIX Audit.
Step 7 From the Protocol Configuration list box, select Log File.
Step 8 Configure the following values:
Table 49-3 IBM AIX Log File Protocol Parameters
Parameter Description
Log Source Identifier Type an IP address, host name, or name to identify the event
source. IP addresses or host names allow JSA to identify a
log file to a unique event source.
Service Type From the list box, select the protocol you want to use to
retrieve log files from a remote server. The default is SFTP.
•SFTP - SSH File Transfer Protocol
•FTP - File Transfer Protocol
•SCP - Secure Copy
Note: The underlying protocol used to retrieve log files for the
SCP and SFTP service type requires that the server specified
in the Remote IP or Hostname field has the SFTP subsystem
enabled.
Remote IP or
Hostname
Type the IP address or host name of the IBM AIX appliance or
remote host that contains your event log files.

Configuring DSMs
IBM AIX 295
Remote Port Type the port number for the protocol selected to retrieve the
event logs from your IBM AIX appliance. The valid range is 1
to 65535.
The options include:
•FTP - TCP Port 21
•SFTP - TCP Port 22
•SCP - TCP Port 22
Note: If the host for your event files is using a non-standard
port number for FTP, SFTP, or SCP, adjust the port value
accordingly.
Remote User Type the user name required to log in to the IBM AIX
appliance that contains your audit event logs.
The username can be up to 255 characters in length.
Remote Password Type the password to log in to your IBM AIX appliance.
Confirm Password Confirm the password to log in to your IBM AIX appliance
SSH Key File If you select SCP or SFTP as the Service Type, use this
parameter to define an SSH private key file. When you
provide an SSH Key File, the Remote Password field is
ignored.
Remote Directory Type the directory location on the remote host from which the
files are retrieved, relative to the user account you are using
to log in.
Note: For FTP only. If your log files reside in the remote user’s
home directory, you can leave the remote directory blank. This
is to support operating systems where a change in the
working directory (CWD) command is restricted.
Recursive Select this check box if you want the file pattern to search sub
folders in the remote directory. By default, the check box is
clear.
The Recursive parameter is ignored if you configure SCP as
the Service Type.
Table 49-3 IBM AIX Log File Protocol Parameters (continued)
Parameter Description

Configuring DSMs
296 IBM
FTP File Pattern If you select SFTP or FTP as the Service Type, this option
allows you to configure the regular expression (regex)
required to filter the list of files specified in the Remote
Directory. All files that match the regular expression are
retrieved and processed.
The FTP file pattern must match the name you assigned to
your AIX audit files by the -n parameter of the audit script. For
example, to collect files that start with AIX_AUDIT and end
with your timestamp value, type the following value:
AIX_Audit_*
Use of this parameter requires knowledge of regular
expressions (regex). For more information, see the following
website:
http://download.oracle.com/javase/tutorial/essential/regex/
FTP Transfer Mode This option only displays if you select FTP as the Service
Type. From the list box, select ASCII.
ASCII is required for text event logs retrieved by the log file
protocol using FTP.
SCP Remote File If you select SCP as the Service Type, type the file name of
the remote file.
Start Time Type a time value to represent the time of day you want the
log file protocol to start. Type the start time, based on a 24
hour clock, in the following format: HH:MM.
For example, type 00:00 to schedule the Log File protocol to
collect event files at midnight.
This parameter functions with the Recurrence parameter
value to establish when and how often the Remote Directory
on your IBM AIX appliance is scanned for new event log files.
Recurrence Type the frequency that you want to scan the remote directory
on your IBM AIX appliance for new event log files. Type this
value in hours (H), minutes (M), or days (D).
For example, type 2H to scan the remote directory every 2
hours from the start time. The default is 1H and the minimum
value is 15M.
Run On Save Select this check box if you want the log file protocol to run
immediately after you click Save.
After the save action completes, the log file protocol follows
your configured start time and recurrence schedule.
Selecting Run On Save clears the list of previously processed
files for the Ignore Previously Processed File parameter.
EPS Throttle Type the number of Events Per Second (EPS) that you do not
want this protocol to exceed. The valid range is 100 to 5000.
Table 49-3 IBM AIX Log File Protocol Parameters (continued)
Parameter Description

Configuring DSMs
IBM AIX 297
Step 9 Click Save.
Step 10 On the Admin tab, click Deploy Changes.
The configuration for IBM AIX audit event collection with the log file protocol is
complete. As the log file protocol retrieves events, they are displayed on the Log
Activity tab of JSA.
Configuring the IBM
AIX Server DSM
You can configure syslog on your IBM AIX appliance to forward operating system
and authentication events to JSA.
Procedure
Step 1 Log in to your IBM AIX appliance as a root user.
Step 2 Open the /etc/syslog.conf file.
Step 3 To forward the system authentication logs to JSA, add the following line to the file:
auth.info @<IP address>
Where <IP address> is the IP address of the JSA. A tab must separate auth.info
and the IP address of JSA.
Processor From the list box, select NONE.
Processors allow event file archives to be expanded and
contents processed for events. Files are only processed after
they are downloaded. JSA can process files in zip, gzip, tar, or
tar+gzip archive format.
Ignore Previously
Processed File(s)
Select this check box to track and ignore files that are already
processed.
JSA examines the log files in the remote directory to
determine if a file is already processed by the log file protocol.
If a previously processed file is detected, the log file protocol
does not download the file. Only new or unprocessed event
log files are downloaded by JSA.
This option only applies to FTP and SFTP service types.
Change Local
Directory?
Select this check box to define a local directory on JSA to
store event log files during processing.
We recommend that you leave this check box clear. When
this check box is selected, the Local Directory field is
displayed, which allows you to configure the local directory on
JSA to store event log files. After the event log is processed
and the events added to JSA, the local directory deletes the
event log files to retain disk space.
Event Generator From the Event Generator list box, select LineByLine.
The Event Generator applies additional processing to the
retrieved event files. Each line of the file is a single event. For
example, if a file has 10 lines of text, 10 separate events are
created.
Table 49-3 IBM AIX Log File Protocol Parameters (continued)
Parameter Description

Configuring DSMs
298 IBM
For example,
##### begin /etc/syslog.conf
mail.debug /var/adm/maillog
mail.none /var/adm/maillog
auth.notice /var/adm/authlog
lpr.debug /var/adm/lpd-errs
kern.debug /var/adm/messages
*.emerg;*.alert;*.crit;*.warning;*.err;*.notice;*.info
/var/adm/messages
auth.info @<10.100.100.1>
##### end /etc/syslog.conf
Step 4 Save and exit the file.
Step 5 Type the following command to restart the syslog service:
refresh -s syslogd
After the syslog server restarts, the configuration is complete as system
authentication syslog events are automatically discovered. If the events are not
automatically discovered, you can manually configure a log source.
Configuring a log source
JSA automatically discovers and creates a log source for system authentication
events forwarded from IBM AIX. This procedure is optional.
Procedure
Step 1 Click the Admin tab.
Step 2 Click the Log Sources icon.
Step 3 Click Add.
Step 4 In the Log Source Name field, type a name for your log source.
Step 5 In the Log Source Description field, type a description for the log source.
Step 6 From the Log Source Type list box, select IBM AIX Server.
Step 7 Using the Protocol Configuration list box, select Syslog.
Step 8 Configure the following values:
Table 49-4 Syslog Protocol Parameters
Parameter Description
Log Source Identifier Type the IP address or host name for the log source as an
identifier for events from your IBM AIX.
Enabled Select this check box to enable the log source.
By default, the check box is selected.

Configuring DSMs
IBM AS/400 iSeries 299
Step 9 Click Save.
Step 10 On the Admin tab, click Deploy Changes.
IBM AS/400 iSeries JSA has three options for integrating events from an IBM AS/400® (or IBM
OS/400) iSeries using one of the following software products:
•Integrating an IBM AS/400 iSeries DSM - The IBM AS/400 iSeries DSM uses
the DSPJRN command to write audit journal records to a database file that is
pushed to an FTP server for retrieval by JSA using the Log File protocol source.
For more information, see Integrating an IBM AS/400 iSeries DSM.
For more information on configuring log sources and protocols, see Pulling
Data Using Log File Protocol.
•LogAgent for System i - Accepts all Common Event Format (CEF) formatted
syslog messages. You can integrate an IBM OS/400 device and above using
the LogAgent for System i software. After you configure your LogAgent for
System i software, use the Log File protocol source to pull the syslog CEF
messages.
For more information, see your Patrick Townsend Security Solutions LogAgent
for System i documentation.
Credibility Select the credibility of the log source. The range is 0 - 10.
The credibility indicates the integrity of an event or offense
as determined by the credibility rating from the source
devices. Credibility increases if multiple sources report the
same event. The default is 5.
Target Event Collector Select the Event Collector to use as the target for the log
source.
Coalescing Events Select this check box to enable the log source to coalesce
(bundle) events.
By default, automatically discovered log sources inherit the
value of the Coalescing Events list box from the System
Settings in JSA. When you create a log source or edit an
existing configuration, you can override the default value by
configuring this option for each log source.
Incoming Event
Payload
From the list box, select the incoming payload encoder for
parsing and storing the logs.
Store Event Payload Select this check box to enable the log source to store event
payload information.
By default, automatically discovered log sources inherit the
value of the Store Event Payload list box from the System
Settings in JSA. When you create a log source or edit an
existing configuration, you can override the default value by
configuring this option for each log source.
Table 49-4 Syslog Protocol Parameters (continued)
Parameter Description
Configuring DSMs
300 IBM
For more information on configuring log sources and protocols, see Pulling
Data Using Log File Protocol.
•PowerTech Interact - Accepts all Common Event Format (CEF) formatted
syslog messages. You can integrate an IBM OS/400 device using the
PowerTech Interact software. After you configure your PowerTech Interact
software, use the Log File protocol source to pull the syslog CEF messages.
•RazLee iSecurity - This DSM configuration is provided in a separate chapter.
See Raz-Lee iSecurity.
Integrating an IBM
AS/400 iSeries DSM
The JSA IBM AS/400 iSeries DSM allows you to integrate with an IBM AS/400
iSeries to collect audit records and event information.
The IBM AS/400 iSeries DSM uses an agent running on the iSeries that manages,
gathers and transfers the event information. The program leverages the DSPJRN
command to write audit journal records to a database file. These records are
reformatted and forwarded to an FTP server where JSA can retrieve the records
using FTP.
To integrate IBM iSeries events into JSA:
Step 1 The IBM iSeries system records and writes security events in the Audit Journal
and the QHST logs. QHST logs are stored in the Audit Journal as TYPE5
messages. For more information on configuring your AS/400 iSeries DSM, see
Configure an IBM iSeries to integrate with JSA.
Step 2 During your scheduled audit collection, the AJLIB/AUDITJRN command is run by
an iSeries Job Scheduler using DSPJRN to collect, format and write the Audit
Journal records to a database file. The database file containing the audit record
information is transferred from the iSeries to an FTP server.
Step 3 Use the log file protocol source to pull the formatted audit file from the FTP server
on a scheduled basis. For more information on configuring log sources and
protocols, see Pulling Data Using Log File Protocol.
Configure an IBM iSeries to integrate with JSA
To integrate an IBM iSeries with JSA:
Step 1 From the Juniper Networks support website
(http://www.juniper.net/customers/support/), download the following files:
AJLIB.SAVF
Step 2 Copy the AJLIB.SAVF file onto a computer or terminal that has FTP access to the
IBM AS/400 iSeries.
Step 3 Create a generic online SAVF file on the iSeries using the command:
CRTSAVF QGPL/SAVF
Step 4 Using FTP on the computer or terminal, replace the iSeries generic SAVF with the
AJLIB.SAVF file downloaded from http://www.juniper.net/customers/support/
bin

Configuring DSMs
IBM AS/400 iSeries 301
cd qgpl
lcd c:\
put ajlib.savf savf
quit
If you are transferring your SAVF file from another iSeries, the file must be sent
with the required FTP subcommand mode BINARY before the GET or PUT
statement.
Step 5 Restore the AJLIB library on the IBM iSeries:
RSTLIB
Step 6 Setup the data collection start date and time for the Audit Journal Library (AJLIB):
AJLIB/SETUP
You are prompted for a username and password. If you start the Audit Journal
Collector a failure message is sent to QSYSOPR.
The setup function sets a default start date and time for data collection from the
Audit Journal to 08:00:00 of the current day.
NOTE
Note: To preserve your previous start date and time information for a previous
installation you must run AJLIB/DATETIME. Record the previous start date and
time and type those values when you run AJLIB/SETUP. The start date and time
must contain a valid date and time in the six character system date and system
time format. The end date and time must be a valid date and time or left blank.
Step 7 Run AJLIB/DATETIME.
This updates the IBM AS/400 iSeries with the data collection start date and time if
you made changes.
Step 8 Run AJLIB/AUDITJRN.
This launches the Audit Journal Collection program to gather and send the records
to your remote FTP server: If the transfer to the FTP server fails, a message is sent
to QSYSOPR. The process for launching AJLIB/AUDITJRN is typically automated
by an iSeries Job Scheduler to collect records periodically.
NOTE
Note: If the FTP transfer is successful, the current data and time information is
written into the start time for AJLIB/DATETIME to update the gather time and the
end time is set to blank. If the FTP transfer fails, the export file is erased and no
updates are made to the gather date or time.

Configuring DSMs
302 IBM
Pulling Data Using Log File Protocol
You are now ready to configure the log source and protocol in JSA:
Step 1 To configure JSA to receive events from an IBM AS/400 iSeries, you must select
the IBM AS/400 iSeries option from the Log Source Type list box.
Step 2 To configure the log file protocol for the IBM AS/400 iSeries DSM, you must select
the Log File option from the Protocol Configuration list box and define the
location of your FTP server connection settings.
NOTE
Note: If you are using the PowerTech Interact or LogAgent for System i software to
collect CEF formatted syslog messages, you must select the Syslog option from
the Protocol Configuration list box.
Step 3 We recommend when you use the Log File protocol option that you select a secure
protocol for transferring files, such as Secure File Transfer Protocol (SFTP).
For more information on configuring log sources and protocols, see the Log
Sources Users Guide.
IBM CICS The IBM CICS® DSM allows you to integrate events from IBM Custom Information
Control System (CICS®) events from an IBM z/OS® mainframe using IBM
Security zSecure.
Using a zSecure process, events from the System Management Facilities (SMF)
are recorded to an event file in the Log Enhanced Event format (LEEF). JSA
retrieves the LEEF event log files using the log file protocol and processes the
events. You can schedule JSA to retrieve events on a polling interval, which allows
JSA to retrieve the events on the schedule you have defined.
To integrate IBM CICS events:
1 Confirm your installation meets any prerequisite installation requirements. For
more information, see Before You Begin.
2 Configure your IBM z/OS image to write events in LEEF format. For more
information, see the IBM Security zSecure Suite: CARLa-Driven Components
Installation and Deployment Guide.
3 Create a log source in JSA for IBM CICS to retrieve your LEEF formatted event
logs. For more information, see Create a Log Source.
4 Optional. Create a custom event property for IBM CICS in JSA. For more
information, see the Custom Event Properties for IBM z/OS technical note.
Before You Begin Before you can configure the data collection process, you must complete the basic
zSecure installation process.
Configuring DSMs
IBM CICS 303
The following prerequisites are required:
•You must ensure parmlib member IFAPRDxx is not disabled for IBM Security
zSecure Audit on your z/OS image.
•The SCKRLOAD library must be APF-authorized.
•You must configure a process to periodically refresh your CKFREEZE and
UNLOAD data sets.
•You must configure an SFTP, FTP, or SCP server on your z/OS image for JSA
to download your LEEF event files.
•You must allow SFTP, FTP, or SCP traffic on firewalls located between JSA and
your z/OS image.
After installing the software, you must also perform the post-installation activities to
create and modify the configuration. For instructions on installing and configuring
zSecure, see the IBM Security zSecure Suite: CARLa-Driven Components
Installation and Deployment Guide.
Create a Log Source The Log File protocol allows JSA to retrieve archived log files from a remote host.
Log files are transferred, one at a time, to JSA for processing. The log file protocol
can manage plain text event logs, compressed files, or archives. Archives must
contain plain-text files that can be processed one line at a time. Multi-line event
logs are not supported by the log file protocol. IBM z/OS with zSecure writes log
files to a specified directory as gzip archives. JSA extracts the archive and
processes the events, which are written as one event per line in the file.
To retrieve these events, you must create a log source using the Log File protocol.
JSA requires credentials to log in to the system hosting your LEEF formatted event
files and a polling interval.
Procedure
Step 1 Click the Admin tab.
Step 2 Click the Log Sources icon.
Step 3 Click Add.
Step 4 In the Log Source Name field, type a name for the log source.
Step 5 In the Log Source Description field, type a description for the log source.
Step 6 From the Log Source Type list box, select IBM CICS.
Step 7 From the Protocol Configuration list box, select Log File.

Configuring DSMs
304 IBM
Step 8 Configure the following values:
Table 49-5 IBM CICS Log File Protocol Parameters
Parameter Description
Log Source Identifier Type an IP address, host name, or name to identify the event
source. IP addresses or host names are recommended as
they allow JSA to identify a log file to a unique event source.
For example, if your network contains multiple devices, such
as multiple z/OS images or a file repository containing all of
your event logs, you should specify a name, IP address, or
hostname for the image or location that uniquely identifies
events for the IBM CICS log source. This allows events to be
identified at the image or location level in your network that
your users can identify.
Service Type From the list box, select the protocol you want to use when
retrieving log files from a remote server. The default is SFTP.
•SFTP - SSH File Transfer Protocol
•FTP - File Transfer Protocol
•SCP - Secure Copy
Note: The underlying protocol used to retrieve log files for the
SCP and SFTP service type requires that the server specified
in the Remote IP or Hostname field has the SFTP subsystem
enabled.
Remote IP or
Hostname
Type the IP address or host name of the device storing your
event log files.
Remote Port Type the TCP port on the remote host that is running the
selected Service Type. The valid range is 1 to 65535.
The options include:
•FTP - TCP Port 21
•SFTP - TCP Port 22
•SCP - TCP Port 22
Note: If the host for your event files is using a non-standard
port number for FTP, SFTP, or SCP, you must adjust the port
value accordingly.
Remote User Type the user name or userid necessary to log in to the host
containing your event files.
•If your log files are located on your IBM z/OS image, type
the userid necessary to log in to your IBM z/OS. The userid
can be up to 8 characters in length.
•If your log files are located on a file repository, type the
user name necessary to log in to the file repository. The
user name can be up to 255 characters in length.
Remote Password Type the password necessary to log in to the host.
Confirm Password Confirm the password necessary to log in to the host.

Configuring DSMs
IBM CICS 305
SSH Key File If you select SCP or SFTP as the Service Type, this
parameter allows you to define an SSH private key file. When
you provide an SSH Key File, the Remote Password field is
ignored.
Remote Directory Type the directory location on the remote host from which the
files are retrieved, relative to the user account you are using
to log in.
Recursive Select this check box if you want the file pattern to search sub
folders in the remote directory. By default, the check box is
clear.
The Recursive option is ignored if you configure SCP as the
Service Type.
FTP File Pattern If you select SFTP or FTP as the Service Type, this option
allows you to configure the regular expression (regex)
required to filter the list of files specified in the Remote
Directory. All matching files are included in the processing.
IBM z/OS mainframe using IBM Security zSecure Audit writes
event files using the pattern CICS.<timestamp>.gz
The FTP file pattern you specify must match the name you
assigned to your event files. For example, to collect files
starting with zOS and ending with .gz, type the following:
CICS.*\.gz
Use of this parameter requires knowledge of regular
expressions (regex). For more information, see the following
website:
http://download.oracle.com/javase/tutorial/essential/regex/
FTP Transfer Mode This option only displays if you select FTP as the Service
Type. From the list box, select Binary.
The binary transfer mode is required for event files stored in a
binary or compressed format, such as zip, gzip, tar, or
tar+gzip archive files.
SCP Remote File If you select SCP as the Service Type you must type the file
name of the remote file.
Start Time Type the time of day you want the processing to begin. For
example, type 00:00 to schedule the Log File protocol to
collect event files at midnight.
This parameter functions with the Recurrence value to
establish when and how often the Remote Directory is
scanned for files. Type the start time, based on a 24 hour
clock, in the following format: HH:MM.
Recurrence Type the frequency, beginning at the Start Time, that you
want the remote directory to be scanned. Type this value in
hours (H), minutes (M), or days (D).
For example, type 2H if you want the remote directory to be
scanned every 2 hours from the start time. The default is 1H.
Table 49-5 IBM CICS Log File Protocol Parameters (continued)
Parameter Description

Configuring DSMs
306 IBM
Step 9 Click Save.
Step 10 On the Admin tab, click Deploy Changes.
The IBM CICS configuration is complete. If your IBM CICS requires custom event
properties, see the Custom Event Properties for IBM z/OS technical note.
IBM Lotus Domino You can integrate an IBM Lotus Domino® device with JSA. An IBM Lotus Domino
device accepts events using SNMP.
Setting Up SNMP
Services
To set up the SNMP services on the IBM Lotus Domino server:
Run On Save Select this check box if you want the log file protocol to run
immediately after you click Save.
After the Run On Save completes, the log file protocol follows
your configured start time and recurrence schedule.
Selecting Run On Save clears the list of previously processed
files for the Ignore Previously Processed File parameter.
EPS Throttle Type the number of Events Per Second (EPS) that you do not
want this protocol to exceed. The valid range is 100 to 5000.
Processor From the list box, select gzip.
Processors allow event file archives to be expanded and
contents processed for events. Files are only processed after
they are downloaded to JSA. JSA can process files in zip,
gzip, tar, or tar+gzip archive format.
Ignore Previously
Processed File(s)
Select this check box to track and ignore files that have
already been processed by the log file protocol.
JSA examines the log files in the remote directory to
determine if a file has been previously processed by the log
file protocol. If a previously processed file is detected, the log
file protocol does not download the file for processing. All files
that have not been previously processed are downloaded.
This option only applies to FTP and SFTP Service Types.
Change Local
Directory?
Select this check box to define a local directory on your JSA
for storing downloaded files during processing.
We recommend that you leave this check box clear. When
this check box is selected, the Local Directory field is
displayed, which allows you to configure the local directory to
use for storing files.
Event Generator From the Event Generator list box, select LineByLine.
The Event Generator applies additional processing to the
retrieved event files. Each line is a single event. For example,
if a file has 10 lines of text, 10 separate events are created.
Table 49-5 IBM CICS Log File Protocol Parameters (continued)
Parameter Description

Configuring DSMs
IBM Lotus Domino 307
Procedure
Step 1 Install the Lotus Domino SNMP Agent as a service. From the command prompt, go
to the Lotus\Domino directory and type the following command:
Insnmp -SC
Step 2 Confirm that the Microsoft SNMP service is installed.
Step 3 Start the SNMP and LNSNMP services. From a command prompt, type the
following commands:
net start snmp
net start lnsnmp
Step 4 Select Start > Program > Administrative Tools > Services to open the Services
MMC
Step 5 Double-click on the SNMP service and select the Traps tab.
Step 6 In the Community name field, type public and click add to list:
Step 7 In the Traps destinations section, select Add and type the IP address of your JSA.
Click Add.
Step 8 Click OK.
Step 9 Confirm that both SNMP agents are set to Automatic so they run upon server boot.
Starting the Domino
Server Add-in Tasks
After you configure the SNMP services, you must start the Domino server add-in
tasks. Repeat the below procedure for each Domino partition.
Procedure
Step 1 Log in to the Domino Server console.
Step 2 To support SNMP traps for Domino events, type the following command to start the
Event Interceptor add-in task:
load intrcpt
Step 3 To support Domino statistic threshold traps, type the following command to start
the Statistic Collector add-in task:
load collect
Step 4 Arrange for the add-in tasks to be restarted automatically the next time that
Domino is restarted. Add intrcpt and collect to the ServerTasks variable in
Domino's NOTES.INI file.
Configuring SNMP
Services
To configure SNMP services:
NOTE
Note: Configurations might vary depending on your environment. See your vendor
documentation for more information.

Configuring DSMs
308 IBM
Procedure
Step 1 Open the Domino Administrator utility and authenticate with administrative
credentials.
Step 2 Click on the Files tab, and the Monitoring Configuration (events4.nsf) document.
Step 3 Expand the DDM Configuration Tree and select DDM Probes By Type.
Step 4 Select Enable Probes, and then select Enable All Probes In View.
NOTE
Note: You might receive a warning after performing this action. This is a normal
result, as some of the probes require additional configuration.
Step 5 Select DDM Filter.
You can either create a new DDM Filter or edit the existing DDM Default Filter.
Step 6 Apply the DDM Filter to enhanced and simple events. Choose to log all event
types.
Step 7 Depending on the environment, you can choose to apply the filter to all servers in a
domain or only to specific servers.
Step 8 Click Save. Close when finished.
Step 9 Expand the Event Handlers tree and select Event Handlers By Server.
Step 10 Select New Event Handler.
Step 11 Configure the following parameters:
•Basic - Servers to monitor: Choose to monitor either all servers in the domain
or only specific servers.
•Basic - Notification trigger: Any event that matches the criteria.
•Event - Criteria to match: Events can be any type.
•Event - Criteria to match: Events must be one of these priorities (Check all the
boxes).
•Event - Criteria to match: Events can have any message.
•Action - Notification method: SNMP Trap.
•Action - Enablement: Enable this notification.
Step 12 Click Save. Close when finished.
You are now ready to configure the log source in JSA.
Configuring a Log
Source
JSA does not automatically discover incoming syslog events from Huawei AR
Series Routers.
If your events are not automatically discovered, you must manually create a log
source from the Admin tab in JSA.

Configuring DSMs
IBM Proventia Management SiteProtector 309
Procedure
Step 1 Click the Admin tab.
Step 2 Click the Log Sources icon.
Step 3 Click Add.
Step 4 In the Log Source Name field, type a name for your log source.
Step 5 From the Log Source Type list box, select IBM Lotus Domino.
Step 6 From the Protocol Configuration list box, select SNMPv2.
Step 7 Configure the following values:
Step 8 Click Save.
Step 9 On the Admin tab, click Deploy Changes.
IBM Proventia
Management
SiteProtector
The IBM Proventia® Management SiteProtector DSM for JSA accepts
SiteProtector events by polling the SiteProtector database.
The DSM allows JSA to record Intrusion Prevention System (IPS) events and audit
events directly from the IBM SiteProtector database.
NOTE
Note: The IBM Proventia Management SiteProtector DSM requires the latest
JDBC Protocol to collect audit events.
The IBM Proventia Management SiteProtector DSM for JSA can accept detailed
SiteProtector events by reading information from the primary SensorData1 table.
The SensorData1 table is generated with information from several other tables in
the IBM SiteProtector database. SensorData1 remains the primary table for
collecting events.
Table 49-6 SNMPv2 Protocol Parameters
Parameter Description
Log Source
Identifier
Type an IP address, hostname, or name to identify the SNMPv2
event source.
IP addresses or hostnames are recommended as they allow JSA
to identify a log file to a unique event source.
Community Type the SNMP community name required to access the system
containing SNMP events.
Include OIDs in
Event Payload
Clear the value from this check box.
When selected, this option constructs SNMP events with
name-value pairs instead of the standard event payload format.

Configuring DSMs
310 IBM
IDP events include information from SensorData1, along with information from the
following tables:
•SensorDataAVP1
•SensorDataReponse1
Audit events include information from the following tables:
•AuditInfo
•AuditTrail
Audit events are not collected by default and make a separate query to the
AuditInfo and AuditTrail tables when you select the Include Audit Events check
box. For more information about your SiteProtector database tables, see your
vendor documentation.
Before you configure JSA to integrate with SiteProtector, we recommend you
create a database user account and password in SiteProtector for JSA. Your JSA
user must have read permissions for the SensorData1 table, which stores
SiteProtector events. The JDBC - SiteProtector protocol allows JSA to log in and
poll for events from the database. Creating a JSA account is not required, but it is
recommended for tracking and securing your event data.
NOTE
Note: Ensure that no firewall rules are blocking the communication between the
SiteProtector console and JSA.
Configure a Log
Source
To configure JSA to poll for IBM SiteProtector events:
Procedure
Step 1 Click the Admin tab.
Step 2 Click the Log Sources icon.
Step 3 Click Add.
Step 4 In the Log Source Name field, type a name for your log source.
Step 5 From the Log Source Type list, select IBM Proventia Management
SiteProtector.
Step 6 Using the Protocol Configuration list box, select JDBC - SiteProtector.

Configuring DSMs
IBM Proventia Management SiteProtector 311
Step 7 Configure the following values:
Table 49-7 JDBC - SiteProtector Protocol Parameters
Parameter Description
Log Source
Identifier
Type the identifier for the log source. The log source identifier must
be defined in the following format:
<database>@<hostname>
Where:
<database> is the database name, as defined in the Database
Name parameter. The database name is a required parameter.
<hostname> is the hostname or IP address for the log source as
defined in the IP or Hostname parameter. The hostname is a
required parameter.
The log source identifier must be unique for the log source type.
Database Type From the list box, select MSDE as the type of database to use for
the event source.
Database Name Type the name of the database to which you want to connect. The
default database name is RealSecureDB.
IP or Hostname Type the IP address or hostname of the database server.
Port Type the port number used by the database server. The default
that is displayed depends on the selected Database Type. The
valid range is 0 to 65536. The default for MSDE is port 1433.
The JDBC configuration port must match the listener port of the
database. The database must have incoming TCP connections
enabled to communicate with JSA.
The default port number for all options include:
•MSDE - 1433
•Postgres - 5432
•MySQL - 3306
•Oracle - 1521
•Sybase - 1521
Note: If you define a Database Instance when using MSDE as the
database type, you must leave the Port parameter blank in your
configuration.
Username Type the database username. The username can be up to 255
alphanumeric characters in length. The username can also include
underscores (_).
Password Type the database password.
The password can be up to 255 characters in length.
Confirm
Password
Confirm the password to access the database.

Configuring DSMs
312 IBM
Authentication
Domain
If you select MSDE as the Database Type and the database is
configured for Windows, you must define a Windows
Authentication Domain. Otherwise, leave this field blank.
The authentication domain must contain alphanumeric characters.
The domain can include the following special characters:
underscore (_), en dash (-), and period(.).
Database
Instance
If you select MSDE as the Database Type and you have multiple
SQL server instances on one server, define the instance to which
you want to connect.
Note: If you use a non-standard port in your database
configuration, or have blocked access to port 1434 for SQL
database resolution, you must leave the Database Instance
parameter blank in your configuration.
Table Name Type the name of the view that includes the event records. The
default table name is SensorData1.
AVP View Name Type the name of the view that includes the event attributes. The
default table name is SensorDataAVP.
Response View
Name
Type the name of the view that includes the response events. The
default table name is SensorDataResponse.
Select List Type * to include all fields from the table or view.
You can use a comma-separated list to define specific fields from
tables or views, if required for your configuration. The list must
contain the field defined in the Compare Field parameter. The
comma-separated list can be up to 255 alphanumeric characters in
length. The list can include the following special characters: dollar
sign ($), number sign (#), underscore (_), en dash (-), and
period(.).
Compare Field Type SensorDataRowID to identify new events added between
queries to the table.
Polling Interval Type the polling interval, which is the amount of time between
queries to the event table. The default polling interval is 10
seconds.
You can define a longer polling interval by appending H for hours
or M for minutes to the numeric value. The maximum polling
interval is 1 week in any time format. Numeric values without an H
or M designator poll in seconds.
Use Named Pipe
Communication
If you select MSDE as the Database Type, select this check box to
use an alternative method to a TCP/IP port connection.
When using a Named Pipe connection, the username and
password must be the appropriate Windows authentication
username and password and not the database username and
password. Also, you must use the default Named Pipe.
Table 49-7 JDBC - SiteProtector Protocol Parameters (continued)
Parameter Description

Configuring DSMs
IBM ISS Proventia 313
Step 8 Click Save.
Step 9 On the Admin tab, click Deploy Changes.
The configuration is complete.
IBM ISS Proventia The IBM Integrated Systems Solutions® (ISS) Proventia DSM for JSA records all
relevant IBM Proventia® events using SNMP.
Procedure
Step 1 In the Proventia Manager user interface navigation pane, expand the System
node.
Step 2 Select System.
Step 3 Select Services.
The Service Configuration page is displayed.
Step 4 Click the SNMP tab.
Step 5 Select SNMP Traps Enabled.
Step 6 In the Trap Receiver field, type the IP address of your JSA you wish to monitor
incoming SNMP traps.
Step 7 In the Trap Community field, type the appropriate community name.
Step 8 From the Trap Version list, select the trap version.
Step 9 Click Save Changes.
Database
Cluster Name
If you select the Use Named Pipe Communication check box, the
Database Cluster Name parameter is displayed. If you are running
your SQL server in a cluster environment, define the cluster name
to ensure Named Pipe communication functions properly.
Include Audit
Events
Select this check box to collect audit events from IBM
SiteProtector.
By default, this check box is clear.
Use NTLMv2 Select the Use NTLMv2 check box to force MSDE connections to
use the NTLMv2 protocol when communicating with SQL servers
that require NTLMv2 authentication. The default value of the check
box is selected.
If the Use NTLMv2 check box is selected, it has no effect on
MSDE connections to SQL servers that do not require NTLMv2
authentication.
Use SSL Select this check box if your connection supports SSL
communication.
Log Source
Language
Select the language of the log source events.
Table 49-7 JDBC - SiteProtector Protocol Parameters (continued)
Parameter Description

Configuring DSMs
314 IBM
You are now ready to configure JSA to receive SNMP traps.
To configure JSA to receive events from an ISS Proventia device:
From the Log Source Type list box, select IBM Proventia Network Intrusion
Prevention System (IPS).
For information on configuring SNMP in the JSA, see the Log Sources Users
Guide. For more information about your ISS Proventia device, see your vendor
documentation.
IBM RACF JSA includes two options for integrating event from IBM RACF®:
•Integrating IBM RACF with JSA Using IBM Security zSecure
•Integrate IBM RACF with JSA Using Audit Scripts
Integrating IBM RACF
with JSA Using IBM
Security zSecure
The IBM RACF DSM allows you to integrate events from an IBM z/OS® mainframe
using IBM Security zSecure.
Using a zSecure process, events from the System Management Facilities (SMF)
are recorded to an event file in the Log Enhanced Event format (LEEF). JSA
retrieves the LEEF event log files using the log file protocol and processes the
events. You can schedule JSA to retrieve events on a polling interval, which allows
JSA to retrieve the events on the schedule you have defined.
To integrate IBM RACF LEEF events:
1 Confirm your installation meets any prerequisite installation requirements. For
more information, see Before You Begin.
2 Configure your IBM z/OS image to write events in LEEF format. For more
information, see the IBM Security zSecure Suite: CARLa-Driven Components
Installation and Deployment Guide.
3 Create a log source in JSA for IBM RACF to retrieve your LEEF formatted event
logs. For more information, see Creating an IBM RACF Log Source in JSA.
4 Optional. Create a custom event property for IBM RACF in JSA. For more
information, see the Custom Event Properties for IBM z/OS technical note.
Before You Begin
Before you can configure the data collection process, you must complete the basic
zSecure installation process.
The following prerequisites are required:
•You must ensure parmlib member IFAPRDxx is not disabled for IBM Security
zSecure Audit on your z/OS image.
•The SCKRLOAD library must be APF-authorized.
Configuring DSMs
IBM RACF 315
•You must configure a process to periodically refresh your CKFREEZE and
UNLOAD data sets.
•You must configure an SFTP, FTP, or SCP server on your z/OS image for JSA
to download your LEEF event files.
•You must allow SFTP, FTP, or SCP traffic on firewalls located between JSA and
your z/OS image.
After installing the software, you must also perform the post-installation activities to
create and modify the configuration. For instructions on installing and configuring
zSecure, see the IBM Security zSecure Suite: CARLa-Driven Components
Installation and Deployment Guide.
Creating an IBM RACF Log Source in JSA
The Log File protocol allows JSA to retrieve archived log files from a remote host.
Log files are transferred, one at a time, to JSA for processing. The log file protocol
can manage plain text event logs, compressed files, or archives. Archives must
contain plain-text files that can be processed one line at a time. Multi-line event
logs are not supported by the log file protocol. IBM z/OS with zSecure writes log
files to a specified directory as gzip archives. JSA extracts the archive and
processes the events, which are written as one event per line in the file.
To retrieve these events, you must create a log source using the Log File protocol.
JSA requires credentials to log in to the system hosting your LEEF formatted event
files and a polling interval.
Procedure
Step 5 Click the Admin tab.
Step 6 Click the Log Sources icon.
Step 7 Click Add.
Step 8 In the Log Source Name field, type a name for the log source.
Step 9 In the Log Source Description field, type a description for the log source.
Step 10 From the Log Source Type list box, select IBM Resource Access Control
Facility (RACF).
Step 11 From the Protocol Configuration list box, select Log File.

Configuring DSMs
316 IBM
Step 12 Configure the following values:
Table 49-8 IBM RACF Log File Protocol Parameters
Parameter Description
Log Source Identifier Type an IP address, host name, or name to identify the event
source. IP addresses or host names are recommended as
they allow JSA to identify a log file to a unique event source.
For example, if your network contains multiple devices, such
as multiple z/OS images or a file repository containing all of
your event logs, you should specify a name, IP address, or
hostname for the image or location that uniquely identifies
events for the IBM RACF log source. This allows events to be
identified at the image or location level in your network that
your users can identify.
Service Type From the list box, select the protocol you want to use when
retrieving log files from a remote server. The default is SFTP.
•SFTP - SSH File Transfer Protocol
•FTP - File Transfer Protocol
•SCP - Secure Copy
Note: The underlying protocol used to retrieve log files for the
SCP and SFTP service type requires that the server specified
in the Remote IP or Hostname field has the SFTP subsystem
enabled.
Remote IP or
Hostname
Type the IP address or host name of the device storing your
event log files.
Remote Port Type the TCP port on the remote host that is running the
selected Service Type. The valid range is 1 to 65535.
The options include:
•FTP - TCP Port 21
•SFTP - TCP Port 22
•SCP - TCP Port 22
Note: If the host for your event files is using a non-standard
port number for FTP, SFTP, or SCP, you must adjust the port
value accordingly.
Remote User Type the user name or userid necessary to log in to the host
containing your event files.
•If your log files are located on your IBM z/OS image, type
the userid necessary to log in to your IBM z/OS. The userid
can be up to 8 characters in length.
•If your log files are located on a file repository, type the
user name necessary to log in to the file repository. The
user name can be up to 255 characters in length.
Remote Password Type the password necessary to log in to the host.
Confirm Password Confirm the password necessary to log in to the host.

Configuring DSMs
IBM RACF 317
SSH Key File If you select SCP or SFTP as the Service Type, this
parameter allows you to define an SSH private key file. When
you provide an SSH Key File, the Remote Password field is
ignored.
Remote Directory Type the directory location on the remote host from which the
files are retrieved, relative to the user account you are using
to log in.
Recursive Select this check box if you want the file pattern to search sub
folders in the remote directory. By default, the check box is
clear.
The Recursive option is ignored if you configure SCP as the
Service Type.
FTP File Pattern If you select SFTP or FTP as the Service Type, this option
allows you to configure the regular expression (regex)
required to filter the list of files specified in the Remote
Directory. All matching files are included in the processing.
IBM z/OS mainframe using IBM Security zSecure Audit writes
event files using the pattern RACF.<timestamp>.gz
The FTP file pattern you specify must match the name you
assigned to your event files. For example, to collect files
starting with zOS and ending with .gz, type the following:
RACF.*\.gz
Use of this parameter requires knowledge of regular
expressions (regex). For more information, see the following
website:
http://download.oracle.com/javase/tutorial/essential/regex/
FTP Transfer Mode This option only displays if you select FTP as the Service
Type.
The binary transfer mode is required for event files stored in a
binary or compressed format, such as zip, gzip, tar, or
tar+gzip archive files.
SCP Remote File If you select SCP as the Service Type you must type the file
name of the remote file.
Start Time Type the time of day you want the processing to begin. For
example, type 00:00 to schedule the Log File protocol to
collect event files at midnight.
This parameter functions with the Recurrence value to
establish when and how often the Remote Directory is
scanned for files. Type the start time, based on a 24 hour
clock, in the following format: HH:MM.
Recurrence Type the frequency, beginning at the Start Time, that you
want the remote directory to be scanned. Type this value in
hours (H), minutes (M), or days (D).
For example, type 2H if you want the remote directory to be
scanned every 2 hours from the start time. The default is 1H.
Table 49-8 IBM RACF Log File Protocol Parameters (continued)
Parameter Description

Configuring DSMs
318 IBM
Step 13 Click Save.
Step 14 On the Admin tab, click Deploy Changes.
The IBM RACF configuration is complete. If your IBM RACF requires custom event
properties, see the Custom Event Properties for IBM z/OS technical note.
Run On Save Select this check box if you want the log file protocol to run
immediately after you click Save.
After the Run On Save completes, the log file protocol follows
your configured start time and recurrence schedule.
Selecting Run On Save clears the list of previously processed
files for the Ignore Previously Processed File parameter.
EPS Throttle Type the number of Events Per Second (EPS) that you do not
want this protocol to exceed. The valid range is 100 to 5000.
Processor From the list box, select gzip.
Processors allow event file archives to be expanded and
contents processed for events. Files are only processed after
they are downloaded to JSA. JSA can process files in zip,
gzip, tar, or tar+gzip archive format.
Ignore Previously
Processed File(s)
Select this check box to track and ignore files that have
already been processed by the log file protocol.
JSA examines the log files in the remote directory to
determine if a file has been previously processed by the log
file protocol. If a previously processed file is detected, the log
file protocol does not download the file for processing. All files
that have not been previously processed are downloaded.
This option only applies to FTP and SFTP Service Types.
Change Local
Directory?
Select this check box to define a local directory on your JSA
for storing downloaded files during processing.
We recommend that you leave this check box clear. When
this check box is selected, the Local Directory field is
displayed, which allows you to configure the local directory to
use for storing files.
Event Generator From the Event Generator list box, select LineByLine.
The Event Generator applies additional processing to the
retrieved event files. Each line of the file is a single event. For
example, if a file has 10 lines of text, 10 separate events are
created.
Table 49-8 IBM RACF Log File Protocol Parameters (continued)
Parameter Description
Configuring DSMs
IBM RACF 319
Integrate IBM RACF
with JSA Using Audit
Scripts
The IBM Resource Access Control Facility (RACF®) DSM for JSA allows you to
integrate with an IBM z/OS mainframe using IBM RACF for auditing transactions.
JSA records all relevant and available information from the event.
To integrate the IBM RACF events into JSA:
1 The IBM mainframe system records all security events as Service Management
Framework (SMF) records in a live repository.
2 At midnight, the IBM RACF data is extracted from the live repository using the SMF
dump utility. The RACFICE utility IRRADU00 (an IBM utility) creates a log file
containing all of the events and fields from the previous day in a SMF record
format.
3 The QEXRACF program pulls data from the SMF formatted file, as described
above. The program only pulls the relevant events and fields for JSA and writes
that information in a condensed format for compatibility. The information is also
saved in a location accessible by JSA.
4 JSA uses the log file protocol source to pull the QEXRACF output file and retrieves
the information on a scheduled basis. JSA then imports and process this file.
Configure IBM RACF to integrate with JSA
To integrate an IBM mainframe RACF with JSA:
Step 1 From the Juniper Networks support website
(http://www.juniper.net/customers/support/), download the following compressed
file:
qexracf_bundled.tar.gz
Step 2 On a Linux-based operating system, extract the file:
tar -zxvf qexracf_bundled.tar.gz
The following files are contained in the archive:
qexracf_jcl.txt
qexracfloadlib.trs
qexracf_trsmain_JCL.txt
Step 3 Load the files onto the IBM mainframe using any terminal emulator file transfer
method.
Upload the qexracf_trsmain_JCL.txt and qexracf_jcl.txt files using the
TEXT protocol.
Upload the QexRACF loadlib.trs file using binary mode and append to a
pre-allocated data set. The QexRACF loadlib.trs file is a tersed file containing
the executable (the mainframe program QEXRACF). When you upload the .trs file
from a workstation, pre-allocate a file on the mainframe with the following DCB
attributes: DSORG=PS, RECFM=FB, LRECL=1024, BLKSIZE=6144. The file
transfer type must be binary mode and not text.
Configuring DSMs
320 IBM
Step 4 Customize the qexracf_trsmain_JCL.txt file according to your
installation-specific requirements.
The qexracf_trsmain_JCL.txt file uses the IBM utility Trsmain to uncompress
the program stored in the QexRACF loadlib.trs file.
An example of the qexracf_trsmain_JCL.txt file includes:
//TRSMAIN JOB (yourvalidjobcard),Q1 labs,
// MSGCLASS=V
//DEL EXEC PGM=IEFBR14
//D1 DD DISP=(MOD,DELETE),DSN=<yourhlq>.QEXRACF.TRS
// UNIT=SYSDA,
// SPACE=(CYL,(10,10))
//TRSMAIN EXEC PGM=TRSMAIN,PARM='UNPACK'
//SYSPRINT DD SYSOUT=*,DCB=(LRECL=133,BLKSIZE=12901,RECFM=FBA)
//INFILE DD DISP=SHR,DSN=<yourhlq>.QEXRACF.TRS
//OUTFILE DD DISP=(NEW,CATLG,DELETE),
// DSN=<yourhlq>.LOAD,
// SPACE=(CYL,(10,10,5),RLSE),UNIT=SYSDA
//
You must update the file with your installation specific information for parameters,
such as, jobcard, data set naming conventions, output destinations, retention
periods, and space requirements.
The .trs input file is an IBM TERSE formatted library and is extracted by running
the JCL, which calls the TRSMAIN. This tersed file, when extracted, creates a PDS
linklib with the QEXRACF program as a member.
Step 5 You can STEPLIB to this library or choose to move the program to one of the
LINKLIBs that are in the LINKLST. The program does not require authorization.
Step 6 After uploading, copy the program to an existing link listed library or add a
STEPLIB DD statement with the correct dataset name of the library that will
contain the program.
Step 7 The qexracf_jcl.txt file is a text file containing a sample JCL deck to provide
you with the necessary JCL to run the IBM IRRADU00 utility. This allows JSA to
obtain the necessary IBM RACF events. Configure the job card to meet your local
standards.
An example of the qexracf_jcl.txt file includes:
//QEXRACF JOB (<your valid jobcard>),Q1 LABS,
// MSGCLASS=P,
// REGION=0M
//*
//*QEXRACF JCL version 1.0 April 2009
//*
//*************************************************************
//* Change below dataset names to sites specific datasets
names *
//*************************************************************
//SET1 SET SMFOUT='<your hlq>.CUSTNAME.IRRADU00.OUTPUT',
Configuring DSMs
IBM RACF 321
// SMFIN='<your SMF dump ouput dataset>',
// QRACFOUT='<your hlq>.QEXRACF.OUTPUT'
//*************************************************************
//* Delete old datasets *
//*************************************************************
//DEL EXEC PGM=IEFBR14
//DD2 DD DISP=(MOD,DELETE),DSN=&QRACFOUT,
// UNIT=SYSDA,
// SPACE=(TRK,(1,1)),
// DCB=(RECFM=FB,LRECL=80)
//*************************************************************
//* Allocate new dataset *
//*************************************************************
//ALLOC EXEC PGM=IEFBR14
//DD1 DD DISP=(NEW,CATLG),DSN=&QRACFOUT,
// SPACE=(CYL,(1,10)),UNIT=SYSDA,
// DCB=(RECFM=VB,LRECL=1028,BLKSIZE=6144)
//************************************************************
//* Execute IBM IRRADU00 utility to extract RACF smf records *
//*************************************************************
//IRRADU00 EXEC PGM=IFASMFDP
//SYSPRINT DD SYSOUT=*
//ADUPRINT DD SYSOUT=*
//OUTDD DD DSN=&SMFOUT,SPACE=(CYL,(100,100)),DISP=(,CATLG),
// DCB=(RECFM=FB,LRECL=8192,BLKSIZE=40960),
// UNIT=SYSALLDA
//SMFDATA DD DISP=SHR,DSN=&SMFIN
//SMFOUT DD DUMMY
//SYSIN DD *
INDD(SMFDATA,OPTIONS(DUMP))
OUTDD(SMFOUT,TYPE(30:83))
ABEND(NORETRY)
USER2(IRRADU00)
USER3(IRRADU86)
/*
//EXTRACT EXEC PGM=QEXRACF,DYNAMNBR=10,
// TIME=1440
//*STEPLIB DD DISP=SHR,DSN=<the loadlib containing the
QEXRACF program if not in LINKLST>
//SYSTSIN DD DUMMY
//SYSTSPRT DD SYSOUT=*
//SYSPRINT DD SYSOUT=*
//RACIN DD DISP=SHR,DSN=&SMFOUT
//RACOUT DD DISP=SHR,DSN=&QRACFOUT
//
//*************************************************************
//* FTP Output file from C program (Qexracf) to an FTP server *
//* QRadar will go to that FTP Server to get file *
//* Note you need to replace <user>, <password>,<serveripaddr>*
//* <THEIPOFTHEMAINFRAMEDEVICE> and <QEXRACFOUTDSN> *
Configuring DSMs
322 IBM
//*************************************************************
//*FTP EXEC PGM=FTP,REGION=3800K
//*INPUT DD *
//*<FTPSERVERIPADDR>
//*<USER>
//*<PASSWORD>
//*ASCII
//*PUT '<QEXRACFOUTDSN>'
/<THEIPOFTHEMAINFRAMEDEVICE>/<QEXRACFOUTDSN>
//*QUIT
//*OUTPUT DD SYSOUT=*
//*SYSPRINT DD SYSOUT=*
//*
//*
Step 8 After the output file is created, you must send this file to an FTP server. This
ensures that every time you run the utility, the output file is sent to a specific FTP
server for processing at the end of the above script. If the z/OS platform is
configured to serve files through FTP or SFTP, or allow SCP, then no interim server
is required and JSA can pull those files directly from the mainframe. If an interim
FTP server is needed, JSA requires a unique IP address for each IBM RACF log
source or they will be joined as one system.
Create an IBM RACF log source
The Log File protocol allows JSA to retrieve archived log files from a remote host.
Log files are transferred, one at a time, to JSA for processing. The log file protocol
can manage plain text event logs, compressed files, or archives. Archives must
contain plain-text files that can be processed one line at a time. Multi-line event
logs are not supported by the log file protocol. IBM RACF with z/OS writes log files
to a specified directory as gzip archives. JSA extracts the archive and processes
the events, which are written as one event per line in the file.
To retrieve these events, you must create a log source using the Log File protocol.
JSA requires credentials to log in to the system hosting your event files and a
polling interval.
Procedure
Step 9 Click the Admin tab.
Step 10 Click the Log Sources icon.
Step 11 Click Add.
Step 12 In the Log Source Name field, type a name for the log source.
Step 13 In the Log Source Description field, type a description for the log source.
Step 14 From the Log Source Type list box, select IBM Resource Access Control
Faclilty (RACF).
Step 15 From the Protocol Configuration list box, select Log File.

Configuring DSMs
IBM RACF 323
Step 16 Configure the following values:
Table 49-9 IBM RACF Log File Protocol Parameters
Parameter Description
Log Source Identifier Type an IP address, host name, or name to identify the event
source. IP addresses or host names are recommended as
they allow JSA to identify a log file to a unique event source.
For example, if your network contains multiple devices, such
as multiple z/OS images or a file repository containing all of
your event logs, you should specify a name, IP address, or
hostname for the image or location that uniquely identifies
events for the IBM RACF log source. This allows events to be
identified at the image or location level in your network that
your users can identify.
Service Type From the list box, select the protocol you want to use when
retrieving log files from a remote server. The default is SFTP.
•SFTP - SSH File Transfer Protocol
•FTP - File Transfer Protocol
•SCP - Secure Copy
Note: The underlying protocol used to retrieve log files for the
SCP and SFTP service type requires that the server specified
in the Remote IP or Hostname field has the SFTP subsystem
enabled.
Remote IP or
Hostname
Type the IP address or host name of the device storing your
event log files.
Remote Port Type the TCP port on the remote host that is running the
selected Service Type. The valid range is 1 to 65535.
The options include:
•FTP - TCP Port 21
•SFTP - TCP Port 22
•SCP - TCP Port 22
Note: If the host for your event files is using a non-standard
port number for FTP, SFTP, or SCP, you must adjust the port
value accordingly.
Remote User Type the user name or userid necessary to log in to the host
containing your event files.
•If your log files are located on your IBM z/OS image, type
the userid necessary to log in to your IBM z/OS. The userid
can be up to 8 characters in length.
•If your log files are located on a file repository, type the
user name necessary to log in to the file repository. The
user name can be up to 255 characters in length.
Remote Password Type the password necessary to log in to the host.
Confirm Password Confirm the password necessary to log in to the host.

Configuring DSMs
324 IBM
SSH Key File If you select SCP or SFTP as the Service Type, this
parameter allows you to define an SSH private key file. When
you provide an SSH Key File, the Remote Password field is
ignored.
Remote Directory Type the directory location on the remote host from which the
files are retrieved, relative to the user account you are using
to log in.
Note: For FTP only. If your log files reside in the remote user’s
home directory, you can leave the remote directory blank. This
is to support operating systems where a change in the
working directory (CWD) command is restricted.
Recursive Select this check box if you want the file pattern to search sub
folders in the remote directory. By default, the check box is
clear.
The Recursive option is ignored if you configure SCP as the
Service Type.
FTP File Pattern If you select SFTP or FTP as the Service Type, this option
allows you to configure the regular expression (regex)
required to filter the list of files specified in the Remote
Directory. All matching files are included in the processing.
The FTP file pattern you specify must match the name you
assigned to your event files. For example, to collect files
starting with zOS and ending with .gz, type the following:
Use of this parameter requires knowledge of regular
expressions (regex). For more information, see the following
website:
http://download.oracle.com/javase/tutorial/essential/regex/
FTP Transfer Mode This option only displays if you select FTP as the Service
Type.
From the list box, select the transfer mode you want to apply
to this log source:
•Binary - Select Binary for log sources that require binary
data files or compressed zip, gzip, tar, or tar+gzip archive
files.
•ASCII - Select ASCII for log sources that require an ASCII
FTP file transfer.
SCP Remote File If you select SCP as the Service Type you must type the file
name of the remote file.
Start Time Type the time of day you want the processing to begin. For
example, type 00:00 to schedule the Log File protocol to
collect event files at midnight.
This parameter functions with the Recurrence value to
establish when and how often the Remote Directory is
scanned for files. Type the start time, based on a 24 hour
clock, in the following format: HH:MM.
Table 49-9 IBM RACF Log File Protocol Parameters (continued)
Parameter Description

Configuring DSMs
IBM RACF 325
Step 17 Click Save.
Step 18 On the Admin tab, click Deploy Changes.
The IBM RACF configuration is complete. If your IBM RACF requires custom event
properties, see the Custom Event Properties for IBM z/OS technical note.
Recurrence Type the frequency, beginning at the Start Time, that you
want the remote directory to be scanned. Type this value in
hours (H), minutes (M), or days (D).
For example, type 2H if you want the remote directory to be
scanned every 2 hours from the start time. The default is 1H.
Run On Save Select this check box if you want the log file protocol to run
immediately after you click Save.
After the Run On Save completes, the log file protocol follows
your configured start time and recurrence schedule.
Selecting Run On Save clears the list of previously processed
files for the Ignore Previously Processed File parameter.
EPS Throttle Type the number of Events Per Second (EPS) that you do not
want this protocol to exceed. The valid range is 100 to 5000.
Processor From the list box, select gzip.
Processors allow event file archives to be expanded and
contents processed for events. Files are only processed after
they are downloaded to JSA. JSA can process files in zip,
gzip, tar, or tar+gzip archive format.
Ignore Previously
Processed File(s)
Select this check box to track and ignore files that have
already been processed by the log file protocol.
JSA examines the log files in the remote directory to
determine if a file has been previously processed by the log
file protocol. If a previously processed file is detected, the log
file protocol does not download the file for processing. All files
that have not been previously processed are downloaded.
This option only applies to FTP and SFTP Service Types.
Change Local
Directory?
Select this check box to define a local directory on your JSA
system for storing downloaded files during processing.
We recommend that you leave this check box clear. When
this check box is selected, the Local Directory field is
displayed, which allows you to configure the local directory to
use for storing files.
Event Generator From the Event Generator list box, select LineByLine.
The Event Generator applies additional processing to the
retrieved event files. Each line of the file is a single event. For
example, if a file has 10 lines of text, 10 separate events are
created.
Table 49-9 IBM RACF Log File Protocol Parameters (continued)
Parameter Description

Configuring DSMs
326 IBM
IBM DB2 JSA has two options for integrating events from IBM DB2®:
•Integrating IBM DB2 with LEEF Events
•Integrating IBM DB2 Audit Events
Integrating IBM DB2
with LEEF Events
The IBM DB2 DSM allows you to integrate DB2 events in LEEF format from an
IBM z/OS® mainframe using IBM Security zSecure®.
Using a zSecure process, events from the System Management Facilities (SMF)
are recorded to an event file in the Log Enhanced Event format (LEEF). JSA
retrieves the LEEF event log files using the log file protocol and processes the
events. You can schedule JSA to retrieve events on a polling interval, which allows
you to retrieve the events on the schedule you have defined.
To integrate IBM DB2 events:
1 Confirm your installation meets any prerequisite installation requirements. For
more information, see Before You Begin.
2 Configure your IBM DB2 image to write events in LEEF format. For more
information, see the IBM Security zSecure Suite: CARLa-Driven Components
Installation and Deployment Guide.
3 Create a log source in JSA for IBM DB2 to retrieve your LEEF formatted event
logs. For more information, see Creating a Log Source.
4 Optional. Create a custom event property for IBM DB2 in JSA. For more
information, see the Custom Event Properties for IBM z/OS technical note.
Before You Begin Before you can configure the data collection process, you must complete the basic
zSecure installation process.
The following prerequisites are required:
•You must ensure parmlib member IFAPRDxx is not disabled for IBM Security
zSecure Audit on your IBM DB2 z/OS image.
•The SCKRLOAD library must be APF-authorized.
•You must configure a process to periodically refresh your CKFREEZE and
UNLOAD data sets.
•You must configure an SFTP, FTP, or SCP server on your z/OS image for JSA
to download your LEEF event files.
•You must allow SFTP, FTP, or SCP traffic on firewalls located between JSA and
your z/OS image.
After installing the software, you must also perform the post-installation activities to
create and modify the configuration. For instructions on installing and configuring
zSecure, see the IBM Security zSecure Suite: CARLa-Driven Components
Installation and Deployment Guide.

Configuring DSMs
IBM DB2 327
Creating a Log
Source
The Log File protocol allows JSA to retrieve archived log files from a remote host.
Log files are transferred, one at a time, to JSA for processing. The log file protocol
can manage plain text event logs, compressed files, or archives. Archives must
contain plain-text files that can be processed one line at a time. Multi-line event
logs are not supported by the log file protocol. IBM z/OS with zSecure writes log
files to a specified directory as gzip archives. JSA extracts the archive and
processes the events, which are written as one event per line in the file.
To retrieve these events, you must create a log source using the Log File protocol.
JSA requires credentials to log in to the system hosting your LEEF formatted event
files and a polling interval.
Procedure
Step 5 Click the Admin tab.
Step 6 Click the Log Sources icon.
Step 7 Click Add.
Step 8 In the Log Source Name field, type a name for the log source.
Step 9 In the Log Source Description field, type a description for the log source.
Step 10 From the Log Source Type list box, select IBM DB2.
Step 11 From the Protocol Configuration list box, select Log File.
Step 12 Configure the following values:
Table 49-10 IBM DB2 Log File Protocol Parameters
Parameter Description
Log Source Identifier Type an IP address, host name, or name to identify the event
source. IP addresses or host names are recommended as
they allow JSA to identify a log file to a unique event source.
For example, if your network contains multiple devices, such
as multiple z/OS images or a file repository containing all of
your event logs, you should specify a name, IP address, or
hostname for the image or location that uniquely identifies
events for the IBM DB2 log source. This allows events to be
identified at the image or location level in your network that
your users can identify.
Service Type From the list box, select the protocol you want to use when
retrieving log files from a remote server. The default is SFTP.
•SFTP - SSH File Transfer Protocol
•FTP - File Transfer Protocol
•SCP - Secure Copy
Note: The underlying protocol used to retrieve log files for the
SCP and SFTP service type requires that the server specified
in the Remote IP or Hostname field has the SFTP subsystem
enabled.

Configuring DSMs
328 IBM
Remote IP or
Hostname
Type the IP address or host name of the device storing your
event log files.
Remote Port Type the TCP port on the remote host that is running the
selected Service Type. The valid range is 1 to 65535.
The options include:
•FTP - TCP Port 21
•SFTP - TCP Port 22
•SCP - TCP Port 22
Note: If the host for your event files is using a non-standard
port number for FTP, SFTP, or SCP, you must adjust the port
value accordingly.
Remote User Type the user name or userid necessary to log in to the host
containing your event files.
•If your log files are located on your IBM z/OS image, type
the userid necessary to log in to your IBM z/OS. The userid
can be up to 8 characters in length.
•If your log files are located on a file repository, type the
user name necessary to log in to the file repository. The
user name can be up to 255 characters in length.
Remote Password Type the password necessary to log in to the host.
Confirm Password Confirm the password necessary to log in to the host.
SSH Key File If you select SCP or SFTP as the Service Type, this
parameter allows you to define an SSH private key file. When
you provide an SSH Key File, the Remote Password field is
ignored.
Remote Directory Type the directory location on the remote host from which the
files are retrieved, relative to the user account you are using
to log in.
Recursive Select this check box if you want the file pattern to search sub
folders in the remote directory. By default, the check box is
clear.
The Recursive option is ignored if you configure SCP as the
Service Type.
Table 49-10 IBM DB2 Log File Protocol Parameters (continued)
Parameter Description

Configuring DSMs
IBM DB2 329
FTP File Pattern If you select SFTP or FTP as the Service Type, this option
allows you to configure the regular expression (regex)
required to filter the list of files specified in the Remote
Directory. All matching files are included in the processing.
IBM z/OS mainframe using IBM Security zSecure Audit writes
event files using the pattern DB2.<timestamp>.gz
The FTP file pattern you specify must match the name you
assigned to your event files. For example, to collect files
starting with zOS and ending with .gz, type the following:
DB2.*\.gz
Use of this parameter requires knowledge of regular
expressions (regex). For more information, see the following
website:
http://download.oracle.com/javase/tutorial/essential/regex/
FTP Transfer Mode This option only displays if you select FTP as the Service
Type. From the list box, select Binary.
The binary transfer mode is required for event files stored in a
binary or compressed format, such as zip, gzip, tar, or
tar+gzip archive files.
SCP Remote File If you select SCP as the Service Type you must type the file
name of the remote file.
Start Time Type the time of day you want the processing to begin. For
example, type 00:00 to schedule the Log File protocol to
collect event files at midnight.
This parameter functions with the Recurrence value to
establish when and how often the Remote Directory is
scanned for files. Type the start time, based on a 24 hour
clock, in the following format: HH:MM.
Recurrence Type the frequency, beginning at the Start Time, that you
want the remote directory to be scanned. Type this value in
hours (H), minutes (M), or days (D).
For example, type 2H if you want the remote directory to be
scanned every 2 hours from the start time. The default is 1H.
Run On Save Select this check box if you want the log file protocol to run
immediately after you click Save.
After the Run On Save completes, the log file protocol follows
your configured start time and recurrence schedule.
Selecting Run On Save clears the list of previously processed
files for the Ignore Previously Processed File parameter.
EPS Throttle Type the number of Events Per Second (EPS) that you do not
want this protocol to exceed. The valid range is 100 to 5000.
Table 49-10 IBM DB2 Log File Protocol Parameters (continued)
Parameter Description

Configuring DSMs
330 IBM
Step 13 Click Save.
Step 14 On the Admin tab, click Deploy Changes.
The IBM DB2 LEEF configuration is complete. If your configuration requires
custom event properties, see the Custom Event Properties for IBM z/OS technical
note.
Integrating IBM DB2
Audit Events
The IBM DB2 DSM allows you to integrate your DB2 audit logs into JSA for
analysis.
The db2audit command creates a set of comma-delimited text files with a .del
extension that defines the scope of audit data for JSA when auditing is configured
and enabled. Comma-delimited files created by the db2audit command include:
•audit.del
•checking.del
•context.del
•execute.del
•objmaint.del
Processor From the list box, select gzip.
Processors allow event file archives to be expanded and
contents processed for events. Files are only processed after
they are downloaded to JSA. JSA can process files in zip,
gzip, tar, or tar+gzip archive format.
Ignore Previously
Processed File(s)
Select this check box to track and ignore files that have
already been processed by the log file protocol.
JSA examines the log files in the remote directory to
determine if a file has been previously processed by the log
file protocol. If a previously processed file is detected, the log
file protocol does not download the file for processing. All files
that have not been previously processed are downloaded.
This option only applies to FTP and SFTP Service Types.
Change Local
Directory?
Select this check box to define a local directory on your JSA
for storing downloaded files during processing.
We recommend that you leave this check box clear. When
this check box is selected, the Local Directory field is
displayed, which allows you to configure the local directory to
use for storing files.
Event Generator From the Event Generator list box, select LineByLine.
The Event Generator applies additional processing to the
retrieved event files. Each line of the file is a single event. For
example, if a file has 10 lines of text, 10 separate events are
created.
Table 49-10 IBM DB2 Log File Protocol Parameters (continued)
Parameter Description

Configuring DSMs
IBM DB2 331
•secmaint.del
•sysadmin.del
•validate.del
To integrate the IBM DB2 DSM with JSA, you must:
1 Use the db2audit command to ensure the IBM DB2 records security events. See
your IBM DB2 vendor documentation for more information.
2 Extract the DB2 audit data of events contained in the instance to a log file,
depending on your version of IBM DB2:
•If you are using DB2 v9.5 and above, see Extract audit data: DB2 v9.5 and
above.
•If you are using DB2 v8.x to v9.4, see Extract audit data: DB2 v8.x to v9.4
3 Use the log file protocol source to pull the output instance log file and send that
information back to JSA on a scheduled basis. JSA then imports and processes
this file. See Creating a log source for IBM DB2.
NOTE
Note: The IBM DB2 DSM does not support the IBM z/OS mainframe operating
system.
Extract audit data: DB2 v9.5 and above
To extract audit data when you are using IBM DB2 v9.5 and above:
Step 1 Log into a DB2 account with SYSADMIN privilege.
Step 2 Move the audit records from the database instance to the audit log:
db2audit flush
For example, the flush command response might resemble the following:
AUD00001 Operation succeeded.
Step 3 Archive and move the active instance to a new location for future extraction:
db2audit archive
For example, an archive command response might resemble the following:
Node AUD Archived or Interim Log File
Message
---- --- ------------------------------
0 AUD00001 dbsaudit.instance.log.0.20091217125028
AUD00001 Operation succeeded.
NOTE
Note: In DB2 v9.5 and above, the archive command replaces the prune command.
The archive command moves the active audit log to a new location, effectively
pruning all non-active records from the log. An archive command must be
complete before an extract can be performed.

Configuring DSMs
332 IBM
Step 4 Extract the data from the archived audit log and write the data to .del files:
db2audit extract delasc from files
db2audit.instance.log.0.200912171528
For example, an archive command response might resemble the following:
AUD00001 Operation succeeded.
NOTE
Note: Double-quotation marks (“) are used as the default text delimiter in the
ASCII files, do not change the delimiter.
Step 5 Move the .del files to a storage location where JSA can pull the file. The movement
of the comma-delimited (.del) files should be synchronized with the file pull interval
in JSA.
You are now ready to configure JSA to receive DB2 log files. See Creating a log
source for IBM DB2.
Extract audit data: DB2 v8.x to v9.4
To extract audit data when you are using IBM DB2 v8.x to v9.4.
Step 1 Log into a DB2 account with SYSADMIN privilege.
Step 2 Type the following start command to audit a database instance:
db2audit start
For example, the start command response might resemble the following:
AUD00001 Operation succeeded.
Step 3 Move the audit records from the instance to the audit log:
db2audit flush
For example, the flush command response might resemble the following:
AUD00001 Operation succeeded.
Step 4 Extract the data from the archived audit log and write the data to .del files:
db2audit extract delasc
For example, an archive command response might resemble the following:
AUD00001 Operation succeeded.
NOTE
Note: Double-quotation marks (“) are used as the default text delimiter in the
ASCII files, do not change the delimiter.
Step 5 Remove non-active records:
db2audit prune all
Step 6 Move the .del files to a storage location where JSA can pull the file. The movement
of the comma-delimited (.del) files should be synchronized with the file pull interval
in JSA.

Configuring DSMs
IBM DB2 333
You are now ready to create a log source in JSA to receive DB2 log files.
Creating a log source for IBM DB2
A log file protocol source allows JSA to retrieve archived log files from a remote
host.
The IBM DB2 DSM supports the bulk loading of log files using the log file protocol
source. When configuring your IBM DB2 to use the log file protocol, make sure the
hostname or IP address configured in the IBM DB2 system is the same as
configured in the Remote Host parameter in the Log File protocol configuration.
For more information, see the Log Sources Users Guide.
Procedure
Step 1 Log in to JSA.
Step 2 Click the Admin tab.
Step 3 Click the Log Sources icon.
Step 4 Click Add.
Step 5 In the Log Source Name field, type a name for the log source.
Step 6 In the Log Source Description field, type a description for the log source.
Step 7 From the Log Source Type list box, select IBM DB2.
Step 8 From the Protocol Configuration list box, select Log File.
Step 9 Configure the following values:
Table 49-11 IBM DB2 Log File Protocol Parameters
Parameter Description
Log Source Identifier Type an IP address, host name, or name to identify the event
source. IP addresses or host names are recommended as
they allow JSA to identify a log file to a unique event source.
For example, if your network contains multiple devices, such
as multiple z/OS images or a file repository containing all of
your event logs, you should specify a name, IP address, or
hostname for the image or location that uniquely identifies
events for the IBM DB2 log source. This allows events to be
identified at the image or location level in your network that
your users can identify.

Configuring DSMs
334 IBM
Service Type From the list box, select the protocol you want to use when
retrieving log files from a remote server. The default is SFTP.
•SFTP - SSH File Transfer Protocol
•FTP - File Transfer Protocol
•SCP - Secure Copy
Note: The underlying protocol used to retrieve log files for the
SCP and SFTP service type requires that the server specified
in the Remote IP or Hostname field has the SFTP subsystem
enabled.
Remote IP or
Hostname
Type the IP address or host name of the device storing your
event log files.
Remote Port Type the TCP port on the remote host that is running the
selected Service Type. The valid range is 1 to 65535.
The options include:
•FTP - TCP Port 21
•SFTP - TCP Port 22
•SCP - TCP Port 22
Note: If the host for your event files is using a non-standard
port number for FTP, SFTP, or SCP, you must adjust the port
value accordingly.
Remote User Type the user name necessary to log in to the host containing
your event files.
The username can be up to 255 characters in length.
Remote Password Type the password necessary to log in to the host.
Confirm Password Confirm the password necessary to log in to the host.
SSH Key File If you select SCP or SFTP as the Service Type, this
parameter allows you to define an SSH private key file. When
you provide an SSH Key File, the Remote Password field is
ignored.
Remote Directory Type the directory location on the remote host from which the
files are retrieved, relative to the user account you are using
to log in.
Note: For FTP only. If your log files reside in the remote user’s
home directory, you can leave the remote directory blank. This
is to support operating systems where a change in the
working directory (CWD) command is restricted.
Recursive Select this check box if you want the file pattern to search sub
folders in the remote directory. By default, the check box is
clear.
The Recursive option is ignored if you configure SCP as the
Service Type.
Table 49-11 IBM DB2 Log File Protocol Parameters (continued)
Parameter Description

Configuring DSMs
IBM DB2 335
FTP File Pattern If you select SFTP or FTP as the Service Type, this option
allows you to configure the regular expression (regex)
required to filter the list of files specified in the Remote
Directory. All matching files are included in the processing.
The FTP file pattern you specify must match the name you
assigned to your event files. For example, to collect
comma-delimited files ending with .del, type the following:
.*.del
Use of this parameter requires knowledge of regular
expressions (regex). For more information, see the following
website:
http://download.oracle.com/javase/tutorial/essential/regex/
FTP Transfer Mode From the list box, select ASCII for comma-delimited, text, or
ASCII log sources that require an ASCII FTP file transfer
mode.
This option only displays if you select FTP as the Service
Type.
SCP Remote File If you select SCP as the Service Type you must type the file
name of the remote file.
Start Time Type the time of day you want the processing to begin. For
example, type 00:00 to schedule the Log File protocol to
collect event files at midnight.
This parameter functions with the Recurrence value to
establish when and how often the Remote Directory is
scanned for files. Type the start time, based on a 24 hour
clock, in the following format: HH:MM.
Recurrence Type the frequency, beginning at the Start Time, that you
want the remote directory to be scanned. Type this value in
hours (H), minutes (M), or days (D).
For example, type 2H if you want the remote directory to be
scanned every 2 hours from the start time. The default is 1H.
Run On Save Select this check box if you want the log file protocol to run
immediately after you click Save.
After the Run On Save completes, the log file protocol follows
your configured start time and recurrence schedule.
Selecting Run On Save clears the list of previously processed
files for the Ignore Previously Processed File parameter.
EPS Throttle Type the number of Events Per Second (EPS) that you do not
want this protocol to exceed. The valid range is 100 to 5000.
Processor From the list box, select None.
Processors allow event file archives to be expanded and
contents processed for events. Files are only processed after
they are downloaded to JSA. JSA can process files in zip,
gzip, tar, or tar+gzip archive format.
Table 49-11 IBM DB2 Log File Protocol Parameters (continued)
Parameter Description

Configuring DSMs
336 IBM
Step 10 Click Save.
Step 11 On the Admin tab, click Deploy Changes.
The configuration for IBM DB2 is complete.
IBM WebSphere
Application Server
The IBM WebSphere® Application Server DSM for JSA accepts events using the
log file protocol source.
JSA records all relevant application and security events from the WebSphere
Application Server log files.
Configuring IBM
WebSphere
You can configure IBM WebSphere Application Server events for JSA.
Procedure
Step 1 Using a web browser, log in to the IBM WebSphere administrative console.
Step 2 Click Environment > WebSphere Variables.
Step 3 Define Cell as the Scope level for the variable.
Step 4 Click New.
Step 5 Configure the following values:
•Name - Type a name for the cell variable.
•Description - Type a description for the variable (optional).
Ignore Previously
Processed File(s)
Select this check box to track and ignore files that have
already been processed by the log file protocol.
JSA examines the log files in the remote directory to
determine if a file has been previously processed by the log
file protocol. If a previously processed file is detected, the log
file protocol does not download the file for processing. All files
that have not been previously processed are downloaded.
This option only applies to FTP and SFTP Service Types.
Change Local
Directory?
Select this check box to define a local directory on your JSA
for storing downloaded files during processing.
We recommend that you leave this check box clear. When
this check box is selected, the Local Directory field is
displayed, which allows you to configure the local directory to
use for storing files.
Event Generator From the Event Generator list box, select LineByLine.
The Event Generator applies additional processing to the
retrieved event files. Each line of the file is a single event. For
example, if a file has 10 lines of text, 10 separate events are
created.
Table 49-11 IBM DB2 Log File Protocol Parameters (continued)
Parameter Description

Configuring DSMs
IBM WebSphere Application Server 337
•Value - Type a directory path for the log files.
For example:
{QRADAR_LOG_ROOT} =
/opt/IBM/WebSphere/AppServer/profiles/Custom01/logs/QRadar
You must create the target directory specified in Step 5 before proceeding.
Step 6 Click OK.
Step 7 Click Save.
Step 8 You must restart the WebSphere Application Server to save the configuration
changes.
NOTE
Note: If the variable you created affects a cell, you must restart all WebSphere
Application Servers in the cell before you continue.
You are now ready to customize the logging option for the IBM WebSphere
Application Server DSM.
Customizing the
Logging Option
You must customize the logging option for each application server WebSphere
uses and change the settings for the JVM Logs (Java Virtual Machine logs).
Procedure
Step 1 Select Servers > Application Servers.
Step 2 Select your WebSphere Application Server to load the server properties.
Step 3 Select Logging and Tracing > JVM Logs.
Step 4 Configure a name for the JVM log files.
For example:
System.Out log file name:
${QRADAR_LOG_ROOT}/${WAS_SERVER_NAME}-SystemOut.log
System.Err log file name:
${QRADAR_LOG_ROOT}/${WAS_SERVER_NAME}-SystemErr.log
Step 5 Select a time of day to save the log files to the target directory.
Step 6 Click OK.
Step 7 You must restart the WebSphere Application Server to save the configuration
changes.
NOTE
Note: If the JVM Logs changes affect the cell, you must restart all of the
WebSphere Application Servers in the cell before you continue.
You are now ready to import the file into JSA using the Log File Protocol.

Configuring DSMs
338 IBM
Create a Log Source The log file protocol allows JSA to retrieve archived log files from a remote host.
The IBM WebSphere Application Server DSM supports the bulk loading of log files
using the log file protocol source.
Procedure
Step 1 Log in to JSA.
Step 2 Click the Admin tab.
Step 3 Click the Log Sources icon.
Step 4 Click Add.
Step 5 In the Log Source Name field, type a name for the log source.
Step 6 In the Log Source Description field, type a description for the log source.
Step 7 From the Log Source Type list box, select IBM WebSphere Application Server.
Step 8 Using the Protocol Configuration list box, select Log File.
Step 9 Configure the following values:
Table 49-12 Log File Parameters
Parameter Description
Log Source Identifier Type an IP address, hostname, or name to identify your IBM
WebSphere Application Server as an event source in JSA. IP
addresses or host names are recommended as they allow
JSA to identify a log file to a unique event source.
For example, if your network contains multiple IBM
WebSphere Application Serves that provides logs to a file
repository, you should specify the IP address or hostname of
the device that created the event log. This allows events to be
identified at the device level in your network, instead of
identifying the file repository.
Service Type From the list box, select the protocol you want to use when
retrieving log files from a remove server. The default is SFTP.
•SFTP - SSH File Transfer Protocol
•FTP - File Transfer Protocol
•SCP - Secure Copy
Note: The underlying protocol used to retrieve log files for the
SCP and SFTP service type requires that the server specified
in the Remote IP or Hostname field has the SFTP subsystem
enabled.
Remote IP or
Hostname
Type the IP address or host name of your IBM WebSphere
Application Server storing your event log files.

Configuring DSMs
IBM WebSphere Application Server 339
Remote Port Type the TCP port on the remote host that is running the
selected Service Type. The valid range is 1 to 65535.
The options include:
•FTP - TCP Port 21
•SFTP - TCP Port 22
•SCP - TCP Port 22
Note: If the host for your event files is using a non-standard
port number for FTP, SFTP, or SCP, you must adjust the port
value accordingly.
Remote User Type the user name necessary to log in to the host containing
your event files.
The username can be up to 255 characters in length.
Remote Password Type the password necessary to log in to the host.
Confirm Password Confirm the password necessary to log in to the host.
SSH Key File If you select SCP or SFTP as the Service Type, this
parameter allows you to define an SSH private key file.
The Remote Password field is ignored when you provide an
SSH Key File.
Remote Directory Type the directory location on the remote host to the cell and
file path you specified in Step 5. This is the directory you
created containing your IBM WebSphere Application Server
event files.
Note: For FTP only. If your log files reside in the remote user’s
home directory, you can leave the remote directory blank. This
is to support operating systems where a change in the
working directory (CWD) command is restricted.
Recursive Select this check box if you want the file pattern to search sub
folders. By default, the check box is clear.
The Recursive option is ignored if you configure SCP as the
Service Type.
FTP File Pattern If you select SFTP or FTP as the Service Type, this option
allows you to configure the regular expression (regex)
required to filter the list of files specified in the Remote
Directory. All matching files are included in the processing.
The FTP file pattern you specify must match the name you
assigned to your JVM logs in Step 4. For example, to collect
system logs, type the following:
System.*\.log
Use of this parameter requires knowledge of regular
expressions (regex). For more information, see the following
website:
http://download.oracle.com/javase/tutorial/essential/regex/
Table 49-12 Log File Parameters (continued)
Parameter Description

Configuring DSMs
340 IBM
FTP Transfer Mode This option only appears if you select FTP as the Service
Type. The FTP Transfer Mode parameter allows you to define
the file transfer mode when retrieving log files over FTP.
From the list box, select the transfer mode you want to apply
to this log source:
•Binary - Select Binary for log sources that require binary
data files or compressed zip, gzip, tar, or tar+gzip archive
files.
•ASCII - Select ASCII for log sources that require an ASCII
FTP file transfer.
You must select NONE for the Processor parameter and
LINEBYLINE the Event Generator parameter when using
ASCII as the FTP Transfer Mode.
SCP Remote File If you select SCP as the Service Type you must type the file
name of the remote file.
Start Time Type the time of day you want the processing to begin. This
parameter functions with the Recurrence value to establish
when and how often the Remote Directory is scanned for files.
Type the start time, based on a 24 hour clock, in the following
format: HH:MM.
Recurrence Type the frequency, beginning at the Start Time, that you
want the remote directory to be scanned. Type this value in
hours (H), minutes (M), or days (D). For example, 2H if you
want the directory to be scanned every 2 hours. The default is
1H.
Note: We recommend when scheduling a Log File protocol,
you select a recurrence time for the log file protocol shorter
than the scheduled write interval of the WebSphere
Application Server log files. This ensures that WebSphere
events are collected by the Log File Protocol before a the new
log file overwrites the old event log.
Run On Save Select this check box if you want the log file protocol to run
immediately after you click Save. After the Run On Save
completes, the log file protocol follows your configured start
time and recurrence schedule.
Selecting Run On Save clears the list of previously processed
files for the Ignore Previously Processed File parameter.
EPS Throttle Type the number of Events Per Second (EPS) that you do not
want this protocol to exceed. The valid range is 100 to 5000.
Processor If the files located on the remote host are stored in a zip, gzip,
tar, or tar+gzip archive format, select the processor that
allows the archives to be expanded and contents processed.
Table 49-12 Log File Parameters (continued)
Parameter Description

Configuring DSMs
IBM Informix Audit 341
Step 10 Click Save.
Step 11 On the Admin tab, click Deploy Changes.
The configuration is complete. For more information about IBM WebServer
Application Server, see your vendor documentation.
IBM Informix Audit The IBM Informix® Audit DSM allows JSA to integrate IBM Informix audit logs into
JSA for analysis.
JSA retrieves the IBM Informix archived audit log files from a remote host using the
Log File protocol configuration. JSA records all configured IBM Informix Audit
events.
For more information about IBM Informix auditing configuration, see your IBM
Informix documentation at the following website:
http://publib.boulder.ibm.com/infocenter/idshelp/v10/index.jsp?topic=/com.ibm.tfg.
doc/tfg26.htm
When configuring your IBM Informix to use the log file protocol, make sure the
hostname or IP address configured in the IBM Informix is the same as configured
in the Remote Host parameter in the Log File protocol configuration.
You are now ready to configure the log source and protocol in JSA:
Step 1 To configure JSA to receive events from an IBM Informix device, you must select
the IBM Informix Audit option from the Log Source Type list box.
Step 2 To configure the log file protocol, you must select the Log File option from the
Protocol Configuration list box.
Ignore Previously
Processed File(s)
Select this check box to track files that have already been
processed. Files that have been previously processed are not
processed a second time.
This check box only applies to FTP and SFTP Service Types.
Change Local
Directory?
Select this check box to define the local directory on your JSA
that you want to use for storing downloaded files during
processing. We recommend that you leave the check box
clear. When the check box is selected, the Local Directory
field is displayed, which allows you to configure the local
directory to use for storing files.
Event Generator From the Event Generator list box, select WebSphere
Application Server.
The Event Generator applies additional processing, which is
specific to retrieved event files for IBM WebSphere
Application Server events.
Table 49-12 Log File Parameters (continued)
Parameter Description

Configuring DSMs
342 IBM
Step 3 We recommend that you use a secure protocol for transferring files, such as
Secure File Transfer Protocol (SFTP).
For more information on configuring log sources and protocols, see the Log
Sources Users Guide.
IBM IMS The IBM Information Management System (IMS) DSM for JSA allows you to use
an IBM mainframe to collect events and audit IMS database transactions.
Configuration
Overview
To integrate IBM IMS events with JSA, you must download scripts that allow IBM
IMS events to be written to a log file.
Overview of the event collection process:
1 The IBM mainframe records all security events as Service Management
Framework (SMF) records in a live repository.
2 The IBM IMS data is extracted from the live repository using the SMF dump utility.
The SMF file contains all of the events and fields from the previous day in raw SMF
format.
3 The qeximsloadlib.trs program pulls data from the SMF formatted file. The
qeximsloadlib.trs program only pulls the relevant events and fields for JSA
and writes that information in a condensed format for compatibility. The information
is saved in a location accessible by JSA.
4 JSA uses the log file protocol source to retrieve the output file information for JSA
on a scheduled basis. JSA then imports and processes this file.
Configure IBM IMS To integrate IBM IMS with JSA:
Procedure
Step 1 From the Juniper Networks support website
(http://www.juniper.net/customers/support/), download the following compressed
file:
QexIMS_bundled.tar.gz
Step 2 On a Linux-based operating system, extract the file:
tar -zxvf qexims_bundled.tar.gz
The following files are contained in the archive:
qexims_jcl.txt - Job Control Language file
qeximsloadlib.trs - Compressed program library (requires IBM TRSMAIN)
qexims_trsmain_JCL.txt - Job Control Language for TRSMAIN to decompress the
.trs file

Configuring DSMs
IBM IMS 343
Step 3 Load the files onto the IBM mainframe using the following methods:
a Upload the sample qexims_trsmain_JCL.txt and qexims_jcl.txt files
using the TEXT protocol.
b Upload the qeximsloadlib.trs file using BINARY mode transfer and append
to a pre-allocated data set. The qeximsloadlib.trs file is a tersed file
containing the executable (the mainframe program QexIMS). When you upload
the .trs file from a workstation, pre-allocate a file on the mainframe with the
following DCB attributes: DSORG=PS, RECFM=FB, LRECL= 1024,
BLKSIZE=6144. The file transfer type must be binary mode and not text.
NOTE
Note: QexIMS is a small C mainframe program that reads the output of the IMS
log file (EARLOUT data) line by line. QexIMS adds a header to each record
containing event information, for example, record descriptor, the date, and time.
The program places each field into the output record, suppresses trailing blank
characters, and delimits each field with the pipe character. This output file is
formatted for JSA and the blank suppression reduces network traffic to JSA. This
program does not consume CPU or I/O disk resources.
Step 4 Customize the qexims_trsmain_JCL.txt file according to your installation
specific information for parameters.
For example, jobcard, data set naming conventions, output destinations, retention
periods, and space requirements.
The qexims_trsmain_JCL.txt file uses the IBM utility TRSMAIN to extract the
program stored in the qeximsloadlib.trs file.
An example of the qexims_trsmain_JCL.txt file includes:
//TRSMAIN JOB (yourvalidjobcard),Q1 labs,
// MSGCLASS=V
//DEL EXEC PGM=IEFBR14
//D1 DD DISP=(MOD,DELETE),DSN=<yourhlq>.QEXIMS.TRS
// UNIT=SYSDA,
// SPACE=(CYL,(10,10))
//TRSMAIN EXEC PGM=TRSMAIN,PARM='UNPACK'
//SYSPRINT DD SYSOUT=*,DCB=(LRECL=133,BLKSIZE=12901,RECFM=FBA)
//INFILE DD DISP=SHR,DSN=<yourhlq>.QEXIMS.TRS
//OUTFILE DD DISP=(NEW,CATLG,DELETE),
// DSN=<yourhlq>.LOAD,
// SPACE=(CYL,(1,1,5),RLSE),UNIT=SYSDA
//
The .trs input file is an IBM TERSE formatted library and is extracted by running
the JCL, which calls the TRSMAIN. This tersed file, when extracted, creates a PDS
linklib with the qexims program as a member.
Step 5 You can STEPLIB to this library or choose to move the program to one of the
LINKLIBs that are in LINKLST. The program does not require authorization.
Configuring DSMs
344 IBM
Step 6 The qexims_jcl.txt file is a text file containing a sample JCL. You must
configure the job card to meet your configuration.
The qexims_jcl.txt sample file includes:
//QEXIMS JOB (T,JXPO,JKSD0093),DEV,NOTIFY=Q1JACK,
// MSGCLASS=P,
// REGION=0M
//*
//*QEXIMS JCL VERSION 1.0 FEBRUARY 2011
//*
//************************************************************
//* Change dataset names to site specific dataset names *
//************************************************************
//SET1 SET IMSOUT='Q1JACK.QEXIMS.OUTPUT',
// IMSIN='Q1JACK.QEXIMS.INPUT.DATA'
//************************************************************
//* Delete old datasets *
//************************************************************
//DEL EXEC PGM=IEFBR14
//DD1 DD DISP=(MOD,DELETE),DSN=&IMSOUT,
// UNIT=SYSDA,
// SPACE=(CYL,(10,10)),
// DCB=(RECFM=FB,LRECL=80)
//************************************************************
//* Allocate new dataset
//************************************************************
//ALLOC EXEC PGM=IEFBR14
//DD1 DD DISP=(NEW,CATLG),DSN=&IMSOUT,
// SPACE=(CYL,(21,2)),
// DCB=(RECFM=VB,LRECL=1028,BLKSIZE=6144)
//EXTRACT EXEC PGM=QEXIMS,DYNAMNBR=10,
// TIME=1440
//STEPLIB DD DISP=SHR,DSN=Q1JACK.C.LOAD
//SYSTSIN DD DUMMY
//SYSTSPRT DD SYSOUT=*
//SYSPRINT DD SYSOUT=*
//IMSIN DD DISP=SHR,DSN=&IMSIN
//IMSOUT DD DISP=SHR,DSN=&IMSOUT
//*FTP EXEC PGM=FTP,REGION=3800K
//*INPUT DD *
//*<target server>
//*<USER>
//*<PASSWORD>
//*ASCII
//*PUT '<IMSOUT>' /TARGET DIRECTORY>/<IMSOUT>
//*QUIT
//*OUTPUT DD SYSOUT=*
//*SYSPRINT DD SYSOUT=*
//*

Configuring DSMs
IBM IMS 345
Step 7 After the output file is created, you must choose one of the following options:
a Schedule a job to transfer the output file to an interim FTP server.
Each time the job completes, the output file is forwarded to an intermin FTP
server. You must configure the following parameters in the sample JCL to
successfully forward the output to an interim FTP server:
For example:
//*FTP EXEC PGM=FTP,REGION=3800K
//*INPUT DD *
//*<target server>
//*<USER>
//*<PASSWORD>
//*ASCII
//*PUT '<IMSOUT>' /TARGET DIRECTORY>/<IMSOUT>
//*QUIT
//*OUTPUT DD SYSOUT=*
//*SYSPRINT DD SYSOUT=*
Where:
<target server> is the IP address or host name of the interim FTP server to
receive the output file.
<USER> is the user name required to access the interim FTP server.
<PASSWORD> is the password required to access the interim FTP server.
<IMSOUT> is the name of the output file saved to the interim FTP server.
For example:
PUT 'Q1JACK.QEXIMS.OUTPUT.C320' /192.168.1.101/IMS/QEXIMS.OUT
PUT.C320
NOTE
Note: You must remove commented lines beginning with //* for the script to
properly forward the output file to the interim FTP server.
You are now ready to configure the Log File protocol.
b Schedule JSA to retrieve the output file from IBM IMS.
If the mainframe is configured to serve files through FTP, SFTP, or allow SCP,
then no interim FTP server is required and JSA can pull the output file directly
from the mainframe. The following text must be commented out using //* or
deleted from the qexims_jcl.txt file:
//*FTP EXEC PGM=FTP,REGION=3800K
//*INPUT DD *
//*<target server>
//*<USER>
//*<PASSWORD>
//*ASCII
//*PUT '<IMSOUT>' /TARGET DIRECTORY>/<IMSOUT>

Configuring DSMs
346 IBM
//*QUIT
//*OUTPUT DD SYSOUT=*
//*SYSPRINT DD SYSOUT=*
You are now ready to configure the Log File protocol.
Configure a Log
Source
A log file protocol source allows JSA to retrieve archived log files from a remote
host.
Procedure
Step 1 Log in to JSA.
Step 2 Click the Admin tab.
Step 3 Click the Log Sources icon.
Step 4 From the Log Source Type list box, select IBM IMS.
Step 5 Using the Protocol Configuration list box, select Log File.
Step 6 Configure the following parameters:
Table 49-1 Log File Protocol Parameters
Parameter Description
Log Source Identifier Type the IP address or hostname for the log source. The log
source identifier must be unique for the log source type.
Service Type From the list box, select the protocol you want to use when
retrieving log files from a remove server. The default is SFTP.
•SFTP - SSH File Transfer Protocol
•FTP - File Transfer Protocol
•SCP - Secure Copy
Note: The underlying protocol used to retrieve log files for the
SCP and SFTP service types requires that the server
specified in the Remote IP or Hostname field has the SFTP
subsystem enabled.
Remote IP or
Hostname
Type the IP address or hostname of the IBM IMS system.
Remote Port Type the TCP port on the remote host that is running the
selected Service Type. If you configure the Service Type as
FTP, the default is 21. If you configure the Service Type as
SFTP or SCP, the default is 22.
The valid range is 1 to 65535.
Remote User Type the username necessary to log in to your IBM IMS
system.
The username can be up to 255 characters in length.
Remote Password Type the password necessary to log in to your IBM IMS
system.

Configuring DSMs
IBM IMS 347
Confirm Password Confirm the Remote Password to log in to your IBM IMS
system.
SSH Key File If you select SCP or SFTP from the Service Type field you
can define a directory path to an SSH private key file. The
SSH Private Key File allows you to ignore the Remote
Password field.
Remote Directory Type the directory location on the remote host from which the
files are retrieved. By default, the newauditlog.sh script writes
the human-readable logs files to the /var/log/ directory.
Recursive Select this check box if you want the file pattern to also search
sub folders. The Recursive parameter is not used if you
configure SCP as the Service Type. By default, the check box
is clear.
FTP File Pattern If you select SFTP or FTP as the Service Type, this option
allows you to configure the regular expression (regex)
required to filter the list of files specified in the Remote
Directory. All matching files are included in the processing.
For example, if you want to retrieve all files in the
<starttime>.<endtime>.<hostname>.log format, use the
following entry: \d+\.\d+\.\w+\.log.
Use of this parameter requires knowledge of regular
expressions (regex). For more information, see the following
website:
http://download.oracle.com/javase/tutorial/essential/regex/
FTP Transfer Mode This option only appears if you select FTP as the Service
Type. The FTP Transfer Mode parameter allows you to define
the file transfer mode when retrieving log files over FTP.
From the list box, select the transfer mode you want to apply
to this log source:
•Binary - Select Binary for log sources that require binary
data files or compressed .zip, .gzip, .tar, or .tar+gzip
archive files.
•ASCII - Select ASCII for log sources that require an ASCII
FTP file transfer. You must select NONE for the Processor
field and LINEBYLINE the Event Generator field when
using ASCII as the transfer mode.
SCP Remote File If you select SCP as the Service Type, you must type the file
name of the remote file.
Start Time Type the time of day you want the processing to begin. This
parameter functions with the Recurrence value to establish
when and how often the Remote Directory is scanned for files.
Type the start time, based on a 24 hour clock, in the following
format: HH:MM.
Table 49-1 Log File Protocol Parameters (continued)
Parameter Description

Configuring DSMs
348 IBM
Step 7 Click Save.
The configuration is complete. Events that are retrieved using the log file protocol
are displayed on the Log Activity tab of JSA.
IBM Guardium IBM Guardium® is a database activity and audit tracking tool for system
administrators to retrieve detailed auditing events across database platforms.
NOTE
Note: These instructions require that you install the 8.2p45 fix for InfoSphere
Guardium. For more information on this fix, see the Fix Central website at
http://www.ibm.com/support/fixcentral/.
Supported Event
Types
JSA collects informational, error, alert, and warnings from IBM Guardium using
syslog. JSA receives IBM Guardium Policy Builder events in the Log Event
Extended Format (LEEF).
Recurrence Type the frequency, beginning at the Start Time, that you
want the remote directory to be scanned. Type this value in
hours (H), minutes (M), or days (D).
For example, type 2H if you want the directory to be scanned
every 2 hours. The default is 1H.
Run On Save Select this check box if you want the log file protocol to run
immediately after you click Save. After the Run On Save
completes, the log file protocol follows your configured start
time and recurrence schedule.
Selecting Run On Save clears the list of previously processed
files for the Ignore Previously Processed File(s) parameter.
EPS Throttle Type the number of Events Per Second (EPS) that you do not
want this protocol to exceed. The valid range is 100 to 5000.
Processor If the files located on the remote host are stored in a .zip,
.gzip, .tar, or tar+gzip archive format, select the processor that
allows the archives to be expanded and contents processed.
Ignore Previously
Processed File(s)
Select this check box to track files that have already been
processed and you do not want the files to be processed a
second time. This only applies to FTP and SFTP Service
Types.
Change Local
Directory?
Select this check box to define the local directory on your JSA
system that you want to use for storing downloaded files
during processing. We recommend that you leave the check
box clear. When the check box is selected, the Local Directory
field is displayed, which allows you to configure the local
directory to use for storing files.
Event Generator From the Event Generator list box, select LINEBYLINE.
Table 49-1 Log File Protocol Parameters (continued)
Parameter Description
Configuring DSMs
IBM Guardium 349
JSA can only automatically discover and map events the default policies that ship
with IBM Guardium. Any user configured events require are displayed as
unknowns in JSA and you must manually map the unknown events.
Configuration
Overview
The following list outlines the process required to integrate IBM Guardium with
JSA.
1 Create a syslog destination for policy violation events. For more information, see
Creating a Syslog Destination for Events.
2 Configure your existing policies to generate syslog events. For more information,
see Configuring Policies to Generate Syslog Events.
3 Install the policy on IBM Guardium. For more information, see Installing an IBM
Guardium Policy.
4 Configure the log source in JSA. For more information, see Configure a Log
Source.
5 Identify and map unknown policy events in JSA. For more information, see
Creating an Event Map for IBM Guardium Events.
Creating a Syslog
Destination for
Events
To create a syslog destination for these events on IBM Guardium, you must log in
to the command-line interface (CLI) and define the IP address for JSA.
Procedure
Step 1 Using SSH, log in to IBM Guardium as the root user.
Username: <username>
Password: <password>
Step 2 Type the following command to configure the syslog destination for informational
events:
store remote add daemon.info <IP address>:<port> <tcp|udp>
For example, store remote add daemon.info 10.10.1.1:514 tcp
Where:
<IP address> is the IP address of your JSA console or Event Collector.
<port> is the syslog port number used to communicate to the JSA console or
Event Collector.
<tcp|udp> is the protocol used to communicate to the JSA console or Event
Collector.
Step 3 Type the following command to configure the syslog destination for warning
events:
store remote add daemon.warning <IP address>:<port> <tcp|udp>
Where:
<IP address> is the IP address of your JSA console or Event Collector.
Configuring DSMs
350 IBM
<port> is the syslog port number used to communicate to the JSA console or
Event Collector.
<tcp|udp> is the protocol used to communicate to the JSA console or Event
Collector.
Step 4 Type the following command to configure the syslog destination for error events:
store remote add daemon.err <IP address>:<port> <tcp|udp>
Where:
<IP address> is the IP address of your JSA console or Event Collector.
<port> is the syslog port number used to communicate to the JSA console or
Event Collector.
<tcp|udp> is the protocol used to communicate to the JSA console or Event
Collector.
Step 5 Type the following command to configure the syslog destination for alert events:
store remote add daemon.alert <IP address>:<port> <tcp|udp>
Where:
<IP address> is the IP address of your JSA console or Event Collector.
<port> is the syslog port number used to communicate to the JSA console or
Event Collector.
<tcp|udp> is the protocol used to communicate to the JSA console or Event
Collector.
You are now ready to configure a policy for IBM InfoSphere Guardium.
Configuring Policies
to Generate Syslog
Events
Policies in IBM Guardium are responsible for reacting to events and forwarding the
event information to JSA.
Procedure
Step 1 Click the Tools tab.
Step 2 From the left-hand navigation, select Policy Builder.
Step 3 From the Policy Finder pane, select an existing policy and click Edit Rules.
Step 4 Click Edit this Rule individually.
The Access Rule Definition is displayed.
Step 5 Click Add Action.
Step 6 From the Action list box, select one of the following alert types:
•Alert Per Match - A notification is provided for every policy violation.
•Alert Daily - A notification is provided the first time a policy violation occurs that
day.
•Alert Once Per Session - A notification is provided per policy violation for
unique session.

Configuring DSMs
IBM Guardium 351
•Alert Per Time Granularity - A notification is provided per your selected time
frame.
Step 7 From the Message Template list box, select JSA.
Step 8 From Notification Type, select SYSLOG.
Step 9 Click Add, then click Apply.
Step 10 Click Save.
Step 11 Repeat Step 2 to Step 10 for all rules within the policy you want to forward to JSA.
For more information on configuring a policy, see your IBM InfoSphere Guardium
vendor documentation. After you have configured all of your policies, you are now
ready to install the policy on your IBM Guardium system.
NOTE
Note: Due to the configurable policies, JSA can only automatically discover the
default policy events. If you have customized policies that forward events to JSA,
you must manually create a log source to capture those events.
Installing an IBM
Guardium Policy
Any new or edited policy in IBM Guardium must be installed before the updated
alert actions or rule changes can occur.
Procedure
Step 1 Click the Administration Console tab.
Step 2 From the left-hand navigation, select Configuration > Policy Installation.
Step 3 From the Policy Installer pane, select a policy you modified in Step 3, Configuring
Policies to Generate Syslog Events.
Step 4 From the drop-down list, select Install and Override.
A confirmation is displayed to install the policy to all Inspection Engines.
Step 5 Click OK.
For more information on installing a policy, see your IBM InfoSphere Guardium
vendor documentation. After you have installed all of your policies, you are ready
to configure the log source in JSA.
Configure a Log
Source
JSA only automatically discovers default policy events from IBM Guardium.
Due to the configurable nature of policies, we recommend that you configure a log
source manually for IBM Guardium.
Procedure
Step 1 Log in to JSA.
Step 2 Click the Admin tab.
Step 3 Click the Log Sources icon.
Step 4 Click Add.

Configuring DSMs
352 IBM
Step 5 In the Log Source Name field, type a name for the log source.
Step 6 In the Log Source Description field, type a description for the log source.
Step 7 From the Log Source Type list box, select IBM Guardium.
Step 8 From the Protocol Configuration list box, select Syslog.
Step 9 Configure the following values:
For more information on configuring log sources, see the Log Sources Users
Guide.
Step 10 Click Save.
Step 11 On the Admin tab, click Deploy Changes.
The IBM Infosphere Guardium configuration is complete.
Creating an Event
Map for IBM
Guardium Events
Event mapping is required for a number of IBM Guardium events. Due to the
customizable nature of policy rules, most events, except the default policy events
do not contain a predefined JSA Identifier (QID) map to categorize security events.
You can individually map each event for your device to an event category in JSA.
Mapping events allows JSA to identify, coalesce, and track reoccurring events from
your network devices. Until you map an event, all events that are displayed in the
Log Activity tab for IBM Guardium are categorized as unknown. Unknown events
are easily identified as the Event Name column and Low Level Category columns
display Unknown.
Discovering unknown events
As your device forwards events to JSA, it can take time to categorize all of the
events for a device, as some events might not be generated immediately by the
event source appliance or software. It is helpful to know how to quickly search for
unknown events. When you know how to search for unknown events, we
recommend you repeat this search until you are comfortable that you have
identified the majority of your events.
Procedure
Step 1 Log in to JSA.
Step 1 Click the Log Activity tab.
Step 2 Click Add Filter.
Step 3 From the first list box, select Log Source.
Step 4 From the Log Source Group list box, select the log source group or Other.
Log sources that are not assigned to a group are categorized as Other.
Table 49-2 IBM Guardium Syslog Configuration
Parameter Description
Log Source Identifier Type the IP address or hostname for the IBM InfoSphere
Guardium appliance.

Configuring DSMs
IBM Guardium 353
Step 5 From the Log Source list box, select your IBM Guardium log source.
Step 6 Click Add Filter.
The Log Activity tab is displayed with a filter for your log source.
Step 7 From the View list box, select Last Hour.
Any events generated by the IBM Guardium DSM in the last hour are displayed.
Events displayed as unknown in the Event Name column or Low Level Category
column require event mapping in JSA.
NOTE
Note: You can save your existing search filter by clicking Save Criteria.
You are now ready to modify the event map.
Modifying the event map
Modifying an event map allows you to manually categorize events to a JSA
Identifier (QID) map. Any event categorized to a log source can be remapped to a
new JSA Identifier (QID).
NOTE
Note: Events that do not have a defined log source cannot be mapped to an event.
Events without a log source display SIM Generic Log in the Log Source column.
Procedure
Step 1 On the Event Name column, double-click an unknown event for IBM Guardium.
The detailed event information is displayed.
Step 2 Click Map Event.
Step 3 From the Browse for QID pane, select any of the following search options to
narrow the event categories for a JSA Identifier (QID):
a From the High-Level Category list box, select a high-level event
categorization.
For a full list of high-level and low-level event categories or category definitions,
see the Event Categories section of the Juniper Secure Analytics
Administration Guide.
b From the Low-Level Category list box, select a low-level event categorization.
c From the Log Source Type list box, select a log source type.
The Log Source Type list box allows you to search for QIDs from other log
sources. Searching for QIDs by log source is useful when events are similar to
another existing network device. For example, IBM Guardium provides policy
events, you might select another product that likely captures similar events.
d To search for a QID by name, type a name in the QID/Name field.
The QID/Name field allows you to filter the full list of QIDs for a specific word,
for example, policy.

Configuring DSMs
354 IBM
Step 4 Click Search.
A list of QIDs are displayed.
Step 5 Select the QID you want to associate to your unknown event.
Step 6 Click OK.
JSA maps any additional events forwarded from your device with the same QID
that matches the event payload. The event count increases each time the event is
identified by JSA.
If you update an event with a new JSA Identifier (QID) map, past events stored in
JSA are not updated. Only new events are categorized with the new QID.
IBM Security
Directory Server
The Juniper Secure Analytics (JSA) DSM for IBM Security Directory Server can
collect event logs from your IBM Security Directory Server.
Table 49-1 identifies the specifications for the IBM Security Directory Server DSM.
Table 49-1 IBM Security Directory Server DSM Specifications
Specification Value
Manufacturer IBM
DSM IBM Security Directory Server
RPM file name DSM-IBMSecurityDirectoryServer-build_number.noarch.rpm
Supported
version
6.3.1 and later
Protocol Syslog (LEEF)
JSA recorded
events
All relevant events
Automatically
discovered
Yes
Includes identity Yes
For more
information
http://publib.boulder.ibm.com/infocenter/tivihelp/v2r1/index.jsp?t
opic=%2Fcom.ibm.IBMDS.doc_6.3.1%2Fadmin_gd381.htm&pat
h=9_3_4_13_18_3
Configuring DSMs
IBM Security Directory Server 355
IBM Security
Directory Server
integration process
To integrate IBM Security Directory Server with JSA, use the following procedure:
1 If automatic updates are not enabled, download and install the most recent
versions of the following RPMs on your JSA console:
•DSMCommon RPM
•IBM Security Directory Server RPM
2 Configure each IBM Security Directory Server system in your network to enable
communication with JSA.
For more information, see Enabling communication between JSA and IBM
Security Directory Server
(http://publib.boulder.ibm.com/infocenter/tivihelp/v2r1/index.jsp?topic=%2Fcom.ib
m.IBMDS.doc_6.3.1%2Fadmin_gd381.htm&path=9_3_4_13_18_3)
3 If JSA does not automatically discover the log source, for each IBM Security
Directory Server on your network, create a log source on the JSA console.
Related tasks
Manually installing a DSM
Configuring an IBM Security Directory Server Log Source in JSA
Configuring an IBM
Security Directory
Server Log Source in
JSA
To collect IBM Security Directory Server events, configure a log source in JSA.
Before you begin
Ensure that the
DSM-IBMSecurityDirectoryServer-build_number.noarch.rpm file is
installed and deployed on your JSA host:
Procedure
To configure an IBM Security Directory Server log source in JSA:
Step 1 Log in to JSA.
Step 2 Click the Admin tab.
Step 3 In the navigation menu, click Data Sources.
Step 4 Click the Log Sources icon.
Step 5 Click Add.
Step 6 From the Log Source Type list, select IBM Security Directory Server.
Step 7 From the Protocol Configuration list, select Syslog.
Step 8 Configure the remaining parameters.
Step 9 Click Save.
Step 10 On the Admin tab, click Deploy Changes.

Configuring DSMs
356 IBM
IBM Tivoli Access
Manager for
E-business
The IBM Tivoli® Access Manager for e-business DSM for JSA accepts access,
audit, and HTTP events forwarded from IBM Tivoli Access Manager.
JSA collects audit, access, and HTTP events from IBM Tivoli Access Manager for
e-business using syslog. Before you can configure JSA, you must configure Tivoli
Access Manager for e-business to forward events to a syslog destination.
Configure Tivoli
Access Manager for
E-business
You can configure syslog on your Tivoli Access Manager for e-business to forward
events.
Procedure
To configure Tivoli Access Manager for E-business:
Step 1 Log in to Tivoli Access Manager’s IBM Security Web Gateway.
Step 2 From the navigation menu, select Secure Reverse Proxy Settings > Manage >
Reverse Proxy.
The Reverse Proxy pane is displayed.
Step 3 From the Instance column, select an instance.
Step 4 Click the Manage list box and select Configuration > Advanced.
The text of the WebSEAL configuration file is displayed.
Step 5 Locate the Authorization API Logging configuration.
The remote syslog configuration begins with logcfg. For example,
# As an example, to send authorization events to a remote syslog
server:
# logcfg = audit.azn:rsyslog server=<IP
address>,port=514,log_id=<log name>
Step 6 Copy the remote syslog configuration (logcfg) to a new line without the comment
(#) marker.
Step 7 Edit the remote syslog configuration.
For example,
logcfg = audit.azn:rsyslog server=<IP
address>,port=514,log_id=<log name>
logcfg = audit.authn:rsyslog server=<IP address>,port=514,log_id=<log name>
logcfg = http:rsyslog server=<IP address>,port=514,log_id=<log name>
Where:
<IP address> is the IP address of your JSA console or Event Collector.
<Log name> is the name assigned to the log that is forwarded to JSA. For
example, log_id=WebSEAL-log.
Step 8 Click Submit.
The Deploy button is displayed in the navigation menu.
Configuring DSMs
IBM Tivoli Access Manager for E-business 357
Step 9 From the navigation menu, click Deploy.
Step 10 Click Deploy.
You must restart the reverse proxy instance to continue.
Step 11 From the Instance column, select your instance configuration.
Step 12 Click the Manage list box and select Control > Restart.
A status message is displayed after the restart completes. For more information on
configuring a syslog destination, see your IBM Tivoli Access Manager for
e-business vendor documentation. You are now ready to configure a log source in
JSA.
Configure a Log
Source
JSA automatically discovers syslog audit and access events, but does not
automatically discover HTTP events forwarded from IBM Tivoli Access Manager
for e-business.
Since JSA automatically discovers audit and access events, you are not required
to create a log source. However, you can manually create a log source for JSA to
receive IBM Tivoli Access Manager for e-business syslog events. The following
configuration steps for creating a log source are optional.
Procedure
Step 1 Log in to JSA.
Step 2 Click the Admin tab.
Step 3 Click the Log Sources icon.
Step 4 Click Add.
Step 5 In the Log Source Name field, type a name for the log source.
Step 6 In the Log Source Description field, type a description for the log source.
Step 7 From the Log Source Type list box, select IBM Tivoli Access Manager for
e-business.
Step 8 From the Protocol Configuration list box, select Syslog.

Configuring DSMs
358 IBM
Step 9 Configure the following values:
For more information on configuring log sources, see the Log Sources Users
Guide.
Step 10 Click Save.
Step 11 On the Admin tab, click Deploy Changes.
The IBM Tivoli Access Manager for e-business configuration is complete.
IBM z/Secure Audit The IBM z/OS DSM for Juniper Secure Analytics (JSA) allows you to integrate with
an IBM z/OS mainframe using IBM Security zSecure Audit to collect security,
authorization, and audit events.
Using a zSecure process, events from the System Management Facilities (SMF)
are recorded to an event file in the Log Enhanced Event format (LEEF). JSA
retrieves the LEEF event log files using the log file protocol and processes the
events. You can schedule JSA to retrieve events on a polling interval, which allows
JSA to retrieve the events on the schedule you have defined.
To integrate IBM z/OS events from IBM Security zSecure Audit into JSA:
1 Confirm your installation meets any prerequisite installation requirements. For
more information, see Before You Begin.
2 Configure your IBM z/OS image. For more information, see the IBM Security
zSecure Suite: CARLa-Driven Components Installation and Deployment Guide.
3 Create a log source in JSA for IBM z/OS to retrieve your LEEF formatted event
logs. For more information, see Create an IBM z/OS Log Source.
4 Optional. Create a custom event property for IBM z/OS in JSA. For more
information, see the Custom Event Properties for IBM z/OS technical note.
Before You Begin Before you can configure the data collection process, you must complete the basic
zSecure installation process.
The following prerequisites are required:
•You must ensure parmlib member IFAPRDxx is not disabled for IBM Security
zSecure Audit on your z/OS image.
•The SCKRLOAD library must be APF-authorized.
Table 49-2 IBM Tivloi Access Manager for E-business Syslog Configuration
Parameter Description
Log Source Identifier Type the IP address or hostname for your IBM Tivoli Access
Manager for e-business appliance.
The IP address or hostname identifies your IBM Tivoli
Access Manager for e-business as a unique event source in
JSA.
Configuring DSMs
IBM z/Secure Audit 359
•You must configure a process to periodically refresh your CKFREEZE and
UNLOAD data sets.
•You must configure an SFTP, FTP, or SCP server on your z/OS image for JSA
to download your LEEF event files.
•You must allow SFTP, FTP, or SCP traffic on firewalls located between JSA and
your z/OS image.
After installing the software, you must also perform the post-installation activities to
create and modify the configuration. For instructions on installing and configuring
zSecure, see the IBM Security zSecure Suite: CARLa-Driven Components
Installation and Deployment Guide.
Create an IBM z/OS
Log Source
The Log File protocol allows JSA to retrieve archived log files from a remote host.
Log files are transferred, one at a time, to JSA for processing. The log file protocol
can manage plain text event logs, compressed files, or archives. Archives must
contain plain-text files that can be processed one line at a time. Multi-line event
logs are not supported by the log file protocol. IBM z/OS with zSecure writes log
files to a specified directory as gzip archives. JSA extracts the archive and
processes the events, which are written as one event per line in the file.
To retrieve these events, you must create a log source using the Log File protocol.
JSA requires credentials to log in to the system hosting your LEEF formatted event
files and a polling interval.
Procedure
Step 1 Log in to JSA.
Step 2 Click the Admin tab.
Step 3 Click the Log Sources icon.
Step 4 Click Add.
Step 5 In the Log Source Name field, type a name for the log source.
Step 6 In the Log Source Description field, type a description for the log source.
Step 7 From the Log Source Type list box, select IBM z/OS.
Step 8 From the Protocol Configuration list box, select Log File.

Configuring DSMs
360 IBM
Step 9 Configure the following values:
Table 49-3 z/OS Log File Parameters
Parameter Description
Log Source Identifier Type an IP address, host name, or name to identify the event
source. IP addresses or host names are recommended as
they allow JSA to identify a log file to a unique event source.
For example, if your network contains multiple devices, such
as multiple z/OS images or a file repository containing all of
your event logs, you should specify a name, IP address, or
hostname for the image or location that uniquely identifies
events for the IBM z/OS log source. This allows events to be
identified at the image or location level in your network that
your users can identify.
Service Type From the list box, select the protocol you want to use when
retrieving log files from a remote server. The default is SFTP.
•SFTP - SSH File Transfer Protocol
•FTP - File Transfer Protocol
•SCP - Secure Copy
Note: The underlying protocol used to retrieve log files for the
SCP and SFTP service type requires that the server specified
in the Remote IP or Hostname field has the SFTP subsystem
enabled.
Remote IP or
Hostname
Type the IP address or host name of the device storing your
event log files.
Remote Port Type the TCP port on the remote host that is running the
selected Service Type. The valid range is 1 to 65535.
The options include:
•FTP - TCP Port 21
•SFTP - TCP Port 22
•SCP - TCP Port 22
Note: If the host for your event files is using a non-standard
port number for FTP, SFTP, or SCP, you must adjust the port
value accordingly.
Remote User Type the user name or userid necessary to log in to the host
containing your event files.
•If your log files are located on your IBM z/OS image, type
the userid necessary to log in to your IBM z/OS. The userid
can be up to 8 characters in length.
•If your log files are located on a file repository, type the
user name necessary to log in to the file repository. The
user name can be up to 255 characters in length.
Remote Password Type the password necessary to log in to the host.
Confirm Password Confirm the password necessary to log in to the host.

Configuring DSMs
IBM z/Secure Audit 361
SSH Key File If you select SCP or SFTP as the Service Type, this
parameter allows you to define an SSH private key file. When
you provide an SSH Key File, the Remote Password field is
ignored.
Remote Directory Type the directory location on the remote host from which the
files are retrieved, relative to the user account you are using
to log in.
Recursive Select this check box if you want the file pattern to search sub
folders in the remote directory. By default, the check box is
clear.
The Recursive option is ignored if you configure SCP as the
Service Type.
FTP File Pattern If you select SFTP or FTP as the Service Type, this option
allows you to configure the regular expression (regex)
required to filter the list of files specified in the Remote
Directory. All matching files are included in the processing.
IBM z/OS mainframe using IBM Security zSecure Audit writes
event files using the pattern zOS.<timestamp>.gz
The FTP file pattern you specify must match the name you
assigned to your event files. For example, to collect files
starting with zOS and ending with .gz, type the following:
zOS.*\.gz
Use of this parameter requires knowledge of regular
expressions (regex). For more information, see the following
website:
http://download.oracle.com/javase/tutorial/essential/regex/
FTP Transfer Mode This option only displays if you select FTP as the Service
Type. From the list box, select Binary.
The binary transfer mode is required for event files stored in a
binary or compressed format, such as zip, gzip, tar, or
tar+gzip archive files.
SCP Remote File If you select SCP as the Service Type you must type the file
name of the remote file.
Start Time Type the time of day you want the processing to begin. For
example, type 00:00 to schedule the Log File protocol to
collect event files at midnight.
This parameter functions with the Recurrence value to
establish when and how often the Remote Directory is
scanned for files. Type the start time, based on a 24 hour
clock, in the following format: HH:MM.
Recurrence Type the frequency, beginning at the Start Time, that you
want the remote directory to be scanned. Type this value in
hours (H), minutes (M), or days (D).
For example, type 2H if you want the remote directory to be
scanned every 2 hours from the start time. The default is 1H.
Table 49-3 z/OS Log File Parameters (continued)
Parameter Description

Configuring DSMs
362 IBM
Step 10 Click Save.
Step 11 On the Admin tab, click Deploy Changes.
The IBM z/OS with IBM zSecure configuration is complete. If your IBM z/OS for
zSecure requires custom event properties, see the Custom Event Properties for
IBM z/OS technical note.
Run On Save Select this check box if you want the log file protocol to run
immediately after you click Save.
After the Run On Save completes, the log file protocol follows
your configured start time and recurrence schedule.
Selecting Run On Save clears the list of previously processed
files for the Ignore Previously Processed File parameter.
EPS Throttle Type the number of Events Per Second (EPS) that you do not
want this protocol to exceed. The valid range is 100 to 5000.
Processor From the list box, select gzip.
Processors allow event file archives to be expanded and
contents processed for events. Files are only processed after
they are downloaded to JSA. JSA can process files in zip,
gzip, tar, or tar+gzip archive format.
Ignore Previously
Processed File(s)
Select this check box to track and ignore files that have
already been processed by the log file protocol.
JSA examines the log files in the remote directory to
determine if a file has been previously processed by the log
file protocol. If a previously processed file is detected, the log
file protocol does not download the file for processing. All files
that have not been previously processed are downloaded.
This option only applies to FTP and SFTP Service Types.
Change Local
Directory?
Select this check box to define a local directory on your JSA
for storing downloaded files during processing.
We recommend that you leave this check box clear. When
this check box is selected, the Local Directory field is
displayed, which allows you to configure the local directory to
use for storing files.
Event Generator From the Event Generator list box, select LineByLine.
The Event Generator applies additional processing to the
retrieved event files. Each line of the file is a single event. For
example, if a file has 10 lines of text, 10 separate events are
created.
Table 49-3 z/OS Log File Parameters (continued)
Parameter Description

Configuring DSMs
IBM Tivoli Endpoint Manager 363
IBM Tivoli Endpoint
Manager
The IBM Tivoli Endpoint Manager DSM for JSA accepts system events in Log
Extended Event Format (LEEF) retrieved from IBM Tivoli Endpoint Manager.
JSA uses the Tivoli Endpoint Manager SOAP protocol to retrieve events on a 30
second interval. As events are retrieved the IBM Tivoli Endpoint Manager DSM
parses and categorizes the events for JSA. The SOAP API for IBM Tivoli Endpoint
Manager is only available after you have installed with the Web Reports
application. The Web Reports application for Tivoli Endpoint Manager is required
to retrieve and integrate IBM Tivoli Endpoint Manager system event data with JSA.
NOTE
Note: JSA is compatible with IBM Tivoli Endpoint Manager versions 8.2.x.
However, we recommend that you update and use the latest version of IBM Tivoli
Endpoint Manager that is available.
To integrate IBM Tivoli Endpoint Manager with JSA, you must manually configure a
log source as events from IBM Tivoli Endpoint Manager are not automatically
discovered.
Procedure
Step 1 Log in to JSA.
Step 2 Click the Admin tab.
Step 3 Click the Log Sources icon.
Step 4 Click Add.
Step 5 In the Log Source Name field, type a name for the log source.
Step 6 In the Log Source Description field, type a description for the log source.
Step 7 From the Log Source Type list box, select IBM Tivoli Endpoint Manager.
Step 8 From the Protocol Configuration list box, select IBM Tivoli Endpoint Manager
SOAP.
Step 9 Configure the following values:
Table 49-4 IBM Tivoli Endpoint Manager SOAP Protocol Configuration
Parameter Description
Log Source Identifier Type the IP address or hostname for your IBM Tivoli
Endpoint Manager appliance.
The IP address or hostname identifies your IBM Tivoli
Endpoint Manager as a unique event source in JSA.

Configuring DSMs
364 IBM
For more information on configuring JSAto import IBM Tivoli Endpoint Manager
vulnerabilities assessment information, see the Juniper Secure Analytics
Managing Vulnerability Assessment Guide.
Step 10 Click Save.
Step 11 On the Admin tab, click Deploy Changes.
The IBM Tivoli Endpoint Manager configuration is complete.
IBM zSecure Alert The IBM zSecure Alert DSM for JSA accepts alert events using syslog, allowing
JSA to receive alert events in real-time.
The alert configuration on your IBM zSecure Alert appliance determines which
alert conditions you want to monitor and forward to JSA. To collect events in JSA,
you must configure your IBM zSecure Alert appliance to forward events in a UNIX
syslog event format using the JSA IP address as the destination. For information
on configuring UNIX syslog alerts and destinations, see the IBM Security zSecure
Alert User Reference Manual.
Port Type the port number used to connect to the IBM Tivoli
Endpoint Manager using the SOAP API.
By default, port 80 is the port number for communicating with
IBM Tivoli Endpoint Manager. If you are use HTTPS, you
must update this field to the HTTPS port number for your
network. Most configurations use port 443 for HTTPS
communications.
Use HTTPS Select this check box to connect using HTTPS.
If you select this check box, the hostname or IP address you
specify uses HTTPS to connect to your IBM Tivoli Endpoint
Manager. If a certificate is required to connect using HTTPS,
you must copy any certificates required by the JSA Console
or managed host to the following directory:
/opt/qradar/conf/trusted_certificates
Note: JSA support certificates with the following file
extensions: .crt, .cert, or .der. Any required certificates
should be copied to the trusted certificates directory before
you save and deploy your changes.
Username Type the username required to access your IBM Tivoli
Endpoint Manager.
Password Type the password required to access your IBM Tivoli
Endpoint Manager.
Confirm Password Confirm the password necessary to access your IBM Tivoli
Endpoint Manager.
Table 49-4 IBM Tivoli Endpoint Manager SOAP Protocol Configuration (continued)
Parameter Description

Configuring DSMs
IBM Security Network Protection (XGS) 365
JSA automatically discovers and creates a log source for syslog events from IBM
zSecure Alert. However, you can manually create a log source for JSA to receive
syslog events. The following configuration steps are optional.
Procedure
Step 1 Log in to JSA.
Step 2 Click the Admin tab.
Step 3 Click the Log Sources icon.
Step 4 Click Add.
Step 5 In the Log Source Name field, type a name for your log source.
Step 6 In the Log Source Description field, type a description for the log source.
Step 7 From the Log Source Type list box, select IBM zSecure Alert.
Step 8 Using the Protocol Configuration list box, select Syslog.
Step 9 Configure the following values:
Step 10 Click Save.
Step 11 On the Admin tab, click Deploy Changes.
The configuration is complete.
IBM Security
Network Protection
(XGS)
The IBM Security Network Protection (XGS) DSM accepts events by using the Log
Enhanced Event Protocol (LEEF), enabling JSA to record all relevant events.
Before you configure an Network Security Protection (XGS) appliance in JSA, you
must configure remote syslog alerts for your IBM Security Network Protection
(XGS) rules or policies to forward events to JSA.
Supported Event
Types
IBM Security Network Protection (XGS) appliances provides three types of event
to JSA:
•System events
•Access events
•Security events
To integrate the device with JSA see the Network Security Protection (XGS) online
documentation:
Table 49-5 Syslog Parameters
Parameter Description
Log Source Identifier Type the IP address or host name for the log source as an
identifier for events from your IBM zSecure Alert.

Configuring DSMs
366 IBM
http://pic.dhe.ibm.com/infocenter/sprotect/v2r8m0/topic/com.ibm.alps.doc/tasks/al
ps_configuring_system_alerts.htm.
Configure IBM
Security Network
Protection (XGS)
Alerts
All event types are sent to JSA using a remote syslog alert object that is LEEF
enabled.
Remote syslog alert objects can be created, edited and deleted from each context
in which an events is generated. To configure a remote syslog alert object log in to
the Network Security Protection (XGS) local management interface as admin and
navigate to one of the following:
•Manage > System Settings > System Alerts (System events)
•Secure > Network Access Policy (Access events)
•Secure > IPS Event Filter Policy (Security events)
•Secure > Intrusion Prevention Policy (Security events)
•Secure > Network Access Policy > Inspection > Intrusion Prevention
Policy
In the IPS Objects, the Network Objects pane, or the System Alerts page,
complete the following steps.
Procedure
Step 1 Click New > Alert > Remote Syslog.
Step 2 Select an existing remote syslog alert object, and then click Edit.
Step 3 Configure the following options:
Step 4 Click Save Configuration.
The alert is added to the Available Objects list.
Step 5 Click Deploy to update your IBM Security Network Protection (XGS) appliance.
Table 49-6 Syslog Configuration Parameters
Option Description
Name Type a name for the syslog alert configuration.
Remote Syslog Collector Type the IP address of your JSA Console or Event
Collector.
Remote Syslog Collector Port Type 514 for the Remote Syslog Collector Port.
Remote LEEF Enabled Select this check box to enable LEEF formatted
events. This field is required.
Note: If you do not see this option, verify you have
software version 5.0 and fixpack 7 installed on your
IBM Security Network Protection appliance.
Comment Optional. Type a comment for the syslog
configuration.

Configuring DSMs
IBM Security Network Protection (XGS) 367
The remote syslog alert object you created is now ready to be added to your
system, access, or security policies to forward events to JSA
Step 6 To make your IBM Security Network Protection (XGS) device send an event to
JSA, you must:
•Add the LEEF alert object for JSA to one or more rules in a policy.
•Add the LEEF alert object for JSA to the Added Objects pane n the System
Alerts page.
Step 7 Click Deploy to update your IBM Security Network Protection (XGS) appliance.
Further support information about the Network Security Protection (XGS) device
can be found by clicking help in the Network Security Protection (XGS) local
management interface browser client window or by accessing the online Network
Security Protection (XGS) documentation.
The configuration is complete. The log source is added to JSA as events IBM
Security Network Protection (XGS) are automatically discovered. Events
forwarded to JSA by IBM Security Network Protection (XGS) are displayed on the
Log Activity tab of JSA.
Configuring a Log
Source in JSA
JSA automatically discovers and creates a log source for LEEF-enabled syslog
events from IBM Security Network Protection (XGS). The following configuration
steps are optional.
Procedure
Step 1 Click the Admin tab.
Step 2 Click the Log Sources icon.
Step 3 Click Add.
Step 4 In the Log Source Name field, type a name for your log source.
Step 5 From the Log Source Type list box, select IBM Security Network Protection
(XGS).
Step 6 Using the Protocol Configuration list box, select Syslog.
Step 7 Configure the following values:
Step 8 Click Save.
Step 9 On the Admin tab, click Deploy Changes.
Table 49-7 Syslog Parameters
Parameter Description
Log Source Identifier Type the IP address or host name for the log source as an
identifier for events from your IBM Security Network
Protection (XGS).

Configuring DSMs
368 IBM
IBM Security
Network IPS
The IBM Security Network IPS DSM for JSA accepts LEEF-based events from IBM
Security Network IPS appliances using syslog.
Supported Versions JSA supports syslog events from IBM Security Network IPS appliances v4.6 and
above.
Supported Events Events forwarded by the IBM Security Network IPS appliance are generated from
security alerts (including IPS and SNORT), health alerts, and system alerts. IPS
events include security, connection, user defined, and OpenSignture policy events.
NOTE
Note: Ensure no firewall rules are blocking the communication between your IBM
Security Network IPS appliance and JSA.
Configuring your IBM
Security Network IPS
Appliances
To collect events with JSA, you must configure your IBM Security Network IPS
appliance to enable syslog forwarding of LEEF events.
Procedure
Step 1 Log in to your IPS Local Management Interface.
Step 2 From the navigation menu, select Manage System Settings > Appliance > LEEF
Log Forwarding.
Step 3 Select the Enable Local Log check box.
Step 4 In the Maximum File Size field, configure the maximum file size for your LEEF log
file.
Step 5 From the Remote Syslog Server pane, select the Enable check box.
Step 6 In the Syslog Server IP/Host field, type the IP address of your JSA Console or
Event Collector.
Step 7 In the UDP Port field, type 514 as the port for forwarding LEEF log events.
Step 8 From the event type list, enable any event types that are forwarded to JSA. The
options include Security Event, System Event, and Health Event.
The syslog configuration for your IBM Security Network IPS is complete.
Configuring a Log
Source in JSA
JSA automatically discovers and creates a log source for syslog events from IBM
Security Network IPS appliances. However, you can manually create a log source
for JSA to receive syslog events. This procedure is optional.
Procedure
Step 1 Click the Admin tab.
Step 2 Click the Log Sources icon.
Step 3 Click Add.
Step 4 In the Log Source Name field, type a name for your log source.

Configuring DSMs
IBM Security Network IPS 369
Step 5 From the Log Source Type list box, select IBM Security Network IPS.
Step 6 Using the Protocol Configuration list box, select Syslog.
Step 7 Configure the following values:
Step 8 Click Save.
Step 9 On the Admin tab, click Deploy Changes.
Table 49-8 Syslog Parameters
Parameter Description
Log Source
Identifier
Type the IP address or host name for the log source as an
identifier for events from your IBM Security Network IPS appliance.
Enabled Select this check box to enable the log source.
By default, the check box is selected.
Credibility Select the credibility of the log source. The range is 0 - 10.
The credibility indicates the integrity of an event or offense as
determined by the credibility rating from the source devices.
Credibility increases if multiple sources report the same event. The
default is 5.
Target Event
Collector
Select the Event Collector to use as the target for the log source.
Coalescing
Events
Select this check box to enable the log source to coalesce (bundle)
events.
By default, automatically discovered log sources inherit the value
of the Coalescing Events list box from the System Settings in
JSA. When you create a log source or edit an existing
configuration, you can override the default value by configuring
this option for each log source.
Incoming Event
Payload
From the list box, select the incoming payload encoder for parsing
and storing the logs.
Store Event
Payload
Select this check box to enable the log source to store event
payload information.
By default, automatically discovered log sources inherit the value
of the Store Event Payload list box from the System Settings in
JSA. When you create a log source or edit an existing
configuration, you can override the default value by configuring
this option for each log source.
Configuring DSMs
370 IBM
Configuring DSMs
47 ISC BIND
You can integrate an Internet System Consortium (ISC) BIND device with Juniper
Secure Analytics (JSA). An ISC BIND device accepts events using syslog.
Configuring Syslog
for ISC BIND
You can configure syslog on your ISC BIND device to forward events to JSA.
Procedure
Step 1 Log in to the ISC BIND device.
Step 2 Open the following file to add a logging clause:
named.conf
logging {
channel <channel_name> {
syslog <syslog_facility>;
severity <critical | error | warning | notice | info |
debug [level ] | dynamic >;
print-category yes;
print-severity yes;
print-time yes;
};
category queries {
<channel_name>;
};
category notify {
<channel_name>;
};
category network {
<channel_name>;
};
category client {
<channel_name>;
};

Configuring DSMs
372 ISC BIND
};
For Example:
logging {
channel QRadar {
syslog local3;
severity info;
};
category queries {
QRadar;
};
category notify {
QRadar;
};
category network {
QRadar;
};
category client {
QRadar;
};
};
Step 3 Save and exit the file.
Step 4 Edit the syslog configuration to log to your JSA using the facility you selected in
Step 2:
<syslog_facility>.* @<IP Address>
Where <IP Address> is the IP address of your JSA.
For example:
local3.* @192.16.10.10
NOTE
Note: JSA only parses logs with a severity level of info or higher.
Step 5 Restart the following services.
service syslog restart
service named restart
You are now ready to configure the log source in JSA.

Configuring DSMs
373
Configuring a Log
Source
JSA automatically discovers and creates a log source for syslog events from ISC
BIND. The following configuration steps are optional.
Procedure
Step 1 Log in to JSA.
Step 2 Click the Admin tab.
Step 3 On the navigation menu, click Data Sources.
Step 4 Click the Log Sources icon.
Step 5 Click Add.
Step 6 In the Log Source Name field, type a name for your log source.
Step 7 In the Log Source Description field, type a description for the log source.
Step 8 From the Log Source Type list box, select ISC BIND.
Step 9 Using the Protocol Configuration list box, select Syslog.
Step 10 Configure the following values:
Step 11 Click Save.
Step 12 On the Admin tab, click Deploy Changes.
The configuration is complete.
Table 50-1 Syslog Protocol Parameters
Parameter Description
Log Source Identifier Type the IP address or host name for the log source as an
identifier for events from your ISC BIND appliance.
Configuring DSMs
48 IMPERVA SECURESPHERE
The Imperva SecureSphere DSM for Juniper Secure Analytics (JSA) records all
relevant events forwarded using syslog.
Configuration
Overview
To collect syslog events, you must configure your Imperva SecureSphere
appliance with an alert and a system event action that can be associated to a
firewall or system policy. Each time a firewall policy triggers an alert action or a
system event policy triggers an event action a syslog event is sent to JSA. JSA
supports syslog events from SecureSphere V6.2, V7.x, and V8.5.
To configure events for your SecureSphere appliance, complete the following
tasks:
1 On your Imperva SecureSphere appliance, create an alert action and associate the
alert action to your SecureSphere firewall policies.
2 your Imperva SecureSphere appliance, create a system alert action and associate
the action to your SecureSphere system event policies.
3 On your JSA system, verify that the syslog events are forwarded and that a log
source is automatically discovered.
Configuring an Alert
Action for Imperva
SecureSphere
You can configure your Imperva SecureSphere appliance to forward syslog events
for firewall policy alerts to JSA.
Procedure
Step 1 Log in to your SecureSphere device user interface using administrative privileges.
Step 2 Click the Policies tab.
Step 3 Click the Action Sets tab.
Step 4 To generate events for each alert generated by the SecureSphere device:
a Click New to create a new action set for an alert.
b Move the action to the Selected Actions list.
c Expand the System Log action group.
d In the Action Name field, type a name for your alert action.

Configuring DSMs
376 IMPERVA SECURESPHERE
e Configure the following parameters:
-Syslog host - Type the IP address of JSA to which you want to send events.
-Syslog log level - Select INFO.
-Message - Define a message string for your event type from Table 51-1.
NOTE
Note: The devTimeFormat does not include a value as the time format can be
configured on the SecureSphere appliance. Administrators must review the time
format of their SecureSphere appliance and specify the appropriate time format.
For example, dd MMM yyyy HH:mm:ss or yyyy-MM-dd HH:mm:ss.S.
f Select the Run on Every Event check box.
g Click Save.
h Repeat this process to create an alert with another message type from
Table 51-1.
Table 51-1 Imperva SecureSphere alert message strings
Type Version Message string
Database
alerts
V9.5 and
V10
LEEF:1.0|Imperva|SecureSphere|${SecureSphereVersion}|${Alert.alertType}
${Alert.immediateAction}|Alert ID=${Alert.dn}\tdevTimeFormat=[see note]
\tdevTime=${Alert.createTime}\tAlert type=${Alert.alertType}\tsrc=${Alert.sourceIp}
\tusrName=${Event.struct.user.user}\tApplication name=${Alert.applicationName}
\tdst=${Event.destInfo.serverIp}\tAlert Description=${Alert.description}
\tSeverity=${Alert.severity} \tImmediate Action=${Alert.immediateAction}
\tSecureSphere Version=${SecureSphereVersion}
File server
alerts
V9.5 and
V10
LEEF:1.0|Imperva|SecureSphere|${SecureSphereVersion}|${Alert.alertType}
${Alert.immediateAction}|Alert ID={Alert.dn}\tdevTimeFormat=[see note]
\tdevTime=${Alert.createTime}\tAlert type=${Alert.alertType}\tsrc=${Alert.sourceIp}
\tusrName=${Event.struct.user.username}\tDomain=${Event.struct.user.domain}
\tApplication name=${Alert.applicationName}\tdst=${Event.destInfo.serverIp}
\tAlert Description=${Alert.description}\tSeverity=${Alert.severity}
\tImmediate Action=${Alert.immediateAction}
\tSecureSphere Version=${SecureSphereVersion}
Web
application
firewall
alerts
V9.5 and
V10
LEEF:1.0|Imperva|SecureSphere|${SecureSphereVersion}|${Alert.alertType}
${Alert.immediateAction}|Alert ID=${Alert.dn}\tdevTimeFormat=[see note]
\tdevTime=${Alert.createTime}\tAlert type=${Alert.alertType}\tsrc=${Alert.sourceIp}
\tusrName=${Alert.username}\tApplication name=${Alert.applicationName}
\tService name=${Alert.serviceName}\tAlert Description=${Alert.description}
\tSeverity=${Alert.severity}\tSimulation Mode=${Alert.simulationMode}
\tImmediate Action=${Alert.immediateAction}
All alerts v6.2 and
v7.x
Release
Enterprise
Edition
DeviceType=ImpervaSecuresphere
Alert|an=$!{Alert.alertMetadata.alertName}|at=Securesphere
Alert|sp=$!{Event.sourceInfo.sourcePort}|s=$!{Event.sourceInfo.sourceIp}|d=$!{Event.d
estInfo.serverIp}|dp=$!{Event.destInfo.serverPort}|u=$!{Alert.username}|g=$!{Alert.serve
rGroupName}|ad=$!{Alert.description}

Configuring DSMs
377
Step 5 To trigger syslog events, you must associate your firewall policies to use your alert
actions.
a From the navigation menu, select Policies > Security > Firewall Policy.
b Select the policy you want to edit to use the alert action.
c Click the Policy tab.
d From the Followed Action list, select your new action.
e Ensure your policy is configured as enabled and is applied to the appropriate
server groups.
f Click Save.
g Repeat this step for all policies that require an alert.
Configuring a System
Event Action for
Imperva
SecureSphere
You can configure your Imperva SecureSphere appliance to forward syslog system
policy events to JSA.
Step 1 Click the Policies tab.
Step 2 Click the Action Sets tab.
Step 3 To generate events for each event generated by the SecureSphere device:
a Click New to create a new action set for an event.
b Move the action to the Selected Actions list.
c Expand the System Log action group.
d In the Action Name field, type a name for your event action.
e Configure the following parameters:
-Syslog host - Type the IP address of JSA to which you want to send events.
-Syslog log level - Select INFO.
-Message - Define a message string for your event type from Table 51-2.
Table 51-2 Imperva SecureSphere System Event Message Strings
Type Version Message string
System
events
V9.5 and
V10
LEEF:1.0|Imperva|SecureSphere|${SecureSphereVersion}|${Event.eventType}|Event
ID=${Event.dn}\tdevTimeFormat=[see note]\tdevTime=${Event.createTime}\tEvent
Type=${Event.eventType}\tMessage=${Event.message}\tSeverity=${Event.severity.disp
layName} \tusrName=${Event.username}\tSecureSphere
Version=${SecureSphereVersion}

Configuring DSMs
378 IMPERVA SECURESPHERE
NOTE
Note: The devTimeFormat does not include a value as the time format can be
configured on the SecureSphere appliance. Administrators must review the time
format of their SecureSphere appliance and specify the appropriate time format.
For example, dd MMM yyyy HH:mm:ss or yyyy-MM-dd HH:mm:ss.S.
f Select the Run on Every Event check box.
g Click Save.
h Repeat this process to create an alert with another message type from
Table 51-2.
Database
audit
records
V9.5 and
V10
LEEF:1.0|Imperva|SecureSphere|${SecureSphereVersion}|${Event.struct.eventType}|S
erver Group=${Event.serverGroup}\tService Name=${Event.serviceName}\tApplication
Name=${Event.applicationName}\tSource Type=${Event.sourceInfo.eventSourceType}
\tUser Type=${Event.struct.user.userType}\tusrName=${Event.struct.user.user}\tUser
Group=${Event.struct.userGroup}\tAuthenticated=${Event.struct.user.authenticated}
\tApp User=${Event.struct.applicationUser}\tsrc=${Event.sourceInfo.sourceIp}
\tApplication=${Event.struct.application.application}
\tOS User=${Event.struct.osUser.osUser}\tHost=${Event.struct.host.host}
\tService Type=${Event.struct.serviceType}\tdst=${Event.destInfo.serverIp}
\tEvent Type=${Event.struct.eventType} \tOperation=${Event.struct.operations.name}
\tOperation type=${Event.struct.operations.operationType}
\tObject name=${Event.struct.operations.objects.name}
\tObject type=${Event.struct.operations.objectType}
\tSubject=${Event.struct.operations.subjects.name}
\tDatabase=${Event.struct.databases.databaseName}
\tSchema=${Event.struct.databases.schemaName}
\tTable Group=${Event.struct.tableGroups.displayName}
\tSensitive=${Event.struct.tableGroups.sensitive}
\tPrivileged=${Event.struct.operations.privileged}
\tStored Proc=${Event.struct.operations.storedProcedure}
\tCompleted Successfully=${Event.struct.complete.completeSuccessful}
\tRaw Data=${Event.struct.rawData.rawData}
\tParsed Query=${Event.struct.query.parsedQuery}
\tBind Vaiables=${Event.struct.rawData.bindVariables}
\tError=${Event.struct.complete.errorValue}
\tResponse Size=${Event.struct.complete.responseSize}
\tResponse Time=${Event.struct.complete.responseTime}
\tAffected Rows=${Event.struct.query.affectedRows}\tdevTimeFormat=[see note]
\tdevTime=${Event.createTime}
All events v6.2 and
v7.x
Release
Enterprise
Edition
DeviceType=ImpervaSecuresphere Event|et=$!{Event.eventType}|dc=Securesphere
System Event|sp=$!{Event.sourceInfo.sourcePort}|s=$!{Event.sourceInfo.sourceIp}|
d=$!{Event.destInfo.serverIp}|dp=$!{Event.destInfo.serverPort}|u=$!{Event.username}|
t=$!{Event.createTime}|sev=$!{Event.severity}|m=$!{Event.message}
Table 51-2 Imperva SecureSphere System Event Message Strings (continued)
Type Version Message string

Configuring DSMs
379
Step 4 To enable the action, you must edit your system event policies to use the action.
The below procedure details the steps to configure the action for a system event
policy. Repeat this procedure for all required policies.
a Go to Policies > System Events.
b Select or create the system event policy you want to edit to use the event
action.
c Click the Followed Action tab.
d From the Followed Action list, select your system event action.
e Click Save.
f Repeat this step for all system event policies that require an action.
Configuring a log
source
JSA automatically discovers and creates a log source for syslog events from
Imperva SecureSphere. The following configuration steps are optional.
Procedure
Step 1 Log in to JSA.
Step 2 Click the Admin tab.
Step 3 Click the Log Sources icon.
Step 4 Click Add.
Step 5 In the Log Source Name field, type a name for your log source.
Step 6 From the Log Source Type list box, select Imperva SecureSphere.
Step 7 Using the Protocol Configuration list box, select Syslog.
Step 8 Configure the following values:
Table 51-3 Syslog Protocol Parameters
Parameter Description
Log Source Identifier Type the IP address or host name for the log source as an
identifier for events from your Imperva SecureSphere
appliance.
Enabled Select this check box to enable the log source.
By default, the check box is selected.
Credibility Select the credibility of the log source. The range is 0 - 10.
The credibility indicates the integrity of an event or offense
as determined by the credibility rating from the source
devices. Credibility increases if multiple sources report the
same event. The default is 5.
Target Event Collector Select the Event Collector to use as the target for the log
source.

Configuring DSMs
380
Step 9 Click Save.
Step 10 On the Admin tab, click Deploy Changes.
Coalescing Events Select this check box to enable the log source to coalesce
(bundle) events.
By default, automatically discovered log sources inherit the
value of the Coalescing Events list box from the System
Settings in JSA. When you create a log source or edit an
existing configuration, you can override the default value by
configuring this option for each log source.
Incoming Event
Payload
From the list box, select the incoming payload encoder for
parsing and storing the logs.
Store Event Payload Select this check box to enable the log source to store event
payload information.
By default, automatically discovered log sources inherit the
value of the Store Event Payload list box from the System
Settings in JSA. When you create a log source or edit an
existing configuration, you can override the default value by
configuring this option for each log source.
Table 51-3 Syslog Protocol Parameters (continued)
Parameter Description

Configuring DSMs
49 INFOBLOX NIOS
The Infoblox NIOS DSM for Juniper Secure Analytics (JSA) accepts events using
syslog, enabling JSA to record all relevant events from an Infoblox NIOS device.
Before configuring JSA, you must configure your Infoblox NIOS device to send
syslog events to JSA. For more information on configuring logs on your Infoblox
NIOS device, see your Infoblox NIOS vendor documentation.
Table 52-1 identifies the specifications for the Infoblox NIOS DSM.
Configuring a Log
Source
To integrate Infoblox NIOS appliances with JSA, you must manually create a log
source to receive Infoblox NIOS events.
JSA does not automatically discover or create log sources for syslog events from
Infoblox NIOS appliances.
Table 52-1 Infoblox NIOS DSM Specifications
Specification Value
Manufacturer Infoblox
DSM NIOS
Version v6.x
Events accepted Syslog
JSA recorded
events
•ISC Bind events
•Linux DHCP events
•Linux Server events
•Apache events
Option in QRadar Infoblox NIOS
Auto discovered No
Includes identity Yes
For more
information
http://www.infoblox.com
Configuring DSMs
382 INFOBLOX NIOS
Procedure
To integrate Infoblox NIOS appliances with JSA:
Step 1 Log in to JSA.
Step 2 Click the Admin tab.
Step 3 On the navigation menu, click Data Sources.
Step 4 Click the Log Sources icon.
Step 5 Click Add.
Step 6 In the Log Source Name field, type a name for your log source.
Step 7 In the Log Source Description field, type a description for the log source.
Step 8 From the Log Source Type list box, select Infoblox NIOS.
Step 9 Using the Protocol Configuration list box, select Syslog.
Step 10 Configure the remaining parameters.
Step 11 Click Save.
Step 12 On the Admin tab, click Deploy Changes.
The log source is added to JSA. Events forwarded to JSA by Infoblox NIOS are
displayed on the Log Activity tab.
Configuring DSMs
50 IT-CUBE AGILESI
The iT-CUBE agileSI DSM for Juniper Secure Analytics (JSA) can accept
security-based and audit SAP events from agileSI installations that are integrated
with your SAP system.
JSA uses the event data defined as security risks in your SAP environment to
generate offenses and correlate event data for your security team. SAP security
events are written in Log Event Extended Format (LEEF) to a log file produced by
agileSI. JSA retrieves the new events using the SMB Tail protocol. To retrieve
events from agileSI, you must create a log source using the SMB Tail protocol and
provide JSA credentials to log in and poll the LEEF formatted agileSI event file.
JSA is updated with new events each time the SMB Tail protocol polls the event file
for new SAP events.
Configuring AgileSI
to Forward Events
To configure agileSI, you must create a logical filename for your events and
configure the connector settings with the path to your agileSI event log.
The location of the LEEF formatted event file must be in a location viewable by
Samba and accessible with the credentials you configure for the log source in JSA.
Procedure
Step 1 In agileSI core system installation, define a logical file name for the output file
containing your SAP security events.
SAP provides a concept which enables you to use platform-independent logical file
names in your application programs. Create a logical file name and path using
transaction “FILE” (Logical File Path Definition) according to your organization’s
requirements.
Step 2 Log in to agileSI.
For example,
http://<sap-system-url:port>/sap/bc/webdynpro/itcube/
ccf?sap-client=<client>&sap-language=EN
Where:
<sap-system-url> is the IP address and port number of your SAP system, such
as 10.100.100.125:50041.
<client> is the agent in your agileSI deployment.
Step 3 From the menu, click Display/Change to enable change mode for agileSI.
Configuring DSMs
384 IT-CUBE AGILESI
Step 4 From the toolbar, select Tools > Core Consumer Connector Settings.
The Core Consumer Connector Settings are displayed.
Step 5 Configure the following values:
a From the Consumer Connector list box, select Q1 Labs.
b Select the Active check box.
c From the Connector Type list box, select File.
d From the Logical File Name field, type the path to your logical file name you
configured in Step 1.
For example, /ITCUBE/LOG_FILES.
The file created for the agileSI events is labeled LEEFYYYYDDMM.TXT where
YYYYDDMM is the year, day, and month. The event file for the current day is
appended with new events every time the extractor runs. iT-CUBE agileSI
creates a new LEEF file for SAP events daily.
Step 6 Click Save.
The configuration for your connector is saved. Before you can complete the agileSI
configuration, you must deploy the changes for agileSI using extractors.
Step 7 From the toolbar, select Tools > Extractor Management.
The Extractor Management settings are displayed.
Step 8 Click Deploy all.
The configuration for agileSI events is complete. You are now ready to configure a
log source in JSA.
Configure an AgileSI
Log Source
JSA must be configured to log in and poll the event file using the SMB Tail
protocol.
The SMB Tail protocol logs in and retrieves events logged by agileSI in the
LEEFYYYDDMM.txt file.
Procedure
Step 1 Log in to JSA.
Step 2 Click the Admin tab.
Step 3 On the navigation menu, click Data Sources.
Step 4 Click the Log Sources icon.
Step 5 Click Add.
Step 6 In the Log Source Name field, type a name for your log source.
Step 7 In the Log Source Description field, type a description for the log source.
Step 8 From the Log Source Type list box, select iT-CUBE agileSI.
Step 9 Using the Protocol Configuration list box, select SMB Tail.

Configuring DSMs
385
Step 10 Configure the following values:
Table 53-1 SMB Tail protocol parameters
Parameter Description
Log Source Identifier Type the IP address, hostname, or name for the log source
as an identifier for your iT-CUBE agileSI events.
Server Address Type the IP address of your iT-CUBE agileSI server.
Domain Type the domain for your iT-CUBE agileSI server.
This parameter is optional if your server is not located in a
domain.
Username Type the username required to access your iT-CUBE agileSI
server.
Note: The username and password you specify must be able
to read to the LEEFYYYYDDMM.txt file for your agileSI
events.
Password Type the password required to access your iT-CUBE agileSI
server.
Confirm Password Confirm the password required to access your iT-CUBE
agileSI server.
Log Folder Path Type the directory path to access the LEEFYYYYDDMM.txt
file.
Parameters that support file paths allow you to define a drive
letter with the path information. For example, you can use
c$\LogFiles\ for an administrative share, or LogFiles\
for a public share folder path, but not c:\LogFiles.
If a log folder path contains an administrative share (C$),
users with NetBIOS access on the administrative share (C$)
have the proper access required to read the log files. Local
or domain administrators have sufficient privileges to access
log files that reside on administrative shares.
File Pattern Type the regular expression (regex) required to filter the
filenames. All matching files are included for processing
when JSA polls for events.
For example, if you want to list all files ending with txt, use
the following entry: .*\.txt. Use of this parameter requires
knowledge of regular expressions (regex). For more
information, see the following website:
http://download.oracle.com/javase/tutorial/essential/regex/
Force File Read Select this check box to force the protocol to read the log file.
By default, the check box is selected.
If the check box is clear the event file is read when JSA
detects a change in the modified time or file size.
Recursive Select this check box if you want the file pattern to search
sub folders. By default, the check box is selected.

Configuring DSMs
386 IT-CUBE AGILESI
Step 11 Click Save.
Step 12 On the Admin tab, click Deploy Changes.
The configuration is complete. As your iT-CUBE agileSI log source retrieves new
events, the Log Activity tab in JSA is updated.
Polling Interval (in
seconds)
Type the polling interval, which is the number of seconds
between queries to the event file to check for new data.
The minimum polling interval is 10 seconds, with a maximum
polling interval of 3,600 seconds. The default is 10 seconds.
Throttle Events/Sec Type the maximum number of events the SMB Tail protocol
forwards per second.
The minimum value is 100 EPS and the maximum is 20,000
EPS. The default is 100 EPS.
Table 53-1 SMB Tail protocol parameters (continued)
Parameter Description

Configuring DSMs
51 ITRON SMART METER
The Itron Smart Meter DSM for Juniper Secure Analytics (JSA) collects events
from an Itron Openway Smart Meter using syslog.
The Itron Openway Smart Meter sends syslog events to JSA using Port 514. For
details of configuring your meter for syslog, see your Itron Openway Smart Meter
documentation.
JSA automatically discovers and creates a log source for syslog events from Itron
Openway Smart Meters. However, you can manually create a log source for JSA
to receive syslog events. The following configuration steps are optional.
Procedure
Step 1 Log in to JSA.
Step 2 Click the Admin tab.
Step 3 On the navigation menu, click Data Sources.
Step 4 Click the Log Sources icon.
Step 5 Click Add.
Step 6 In the Log Source Name field, type a name for your log source.
Step 7 In the Log Source Description field, type a description for the log source.
Step 8 From the Log Source Type list box, select Itron Smart Meter.
Step 9 Using the Protocol Configuration list box, select Syslog.
Step 10 Configure the following values:
Step 11 Click Save.
Step 12 On the Admin tab, click Deploy Changes.
The configuration is complete.
Table 54-1 Syslog Protocol Parameters
Parameter Description
Log Source Identifier Type the IP address or host name for the log source as an
identifier for events from your Itron Openway Smart Meter
installation.

Configuring DSMs
52 JUNIPER NETWORKS
This section provides information on the following DSMs:
•Juniper Networks AVT
•Juniper DX Application Acceleration Platform
•Juniper EX Series Ethernet Switch
•Juniper IDP
•Juniper Networks Secure Access
•Juniper Infranet Controller
•Juniper Networks Firewall and VPN
•Juniper Networks Network and Security Manager
•Juniper Junos OS
•Juniper Steel-Belted Radius
•Juniper Networks vGW Virtual Gateway
•Juniper Security Binary Log Collector
•Juniper Junos WebApp Secure
Juniper Networks
AVT
The Juniper Networks Application Volume Tracking (AVT) DSM for Juniper Secure
Analytics (JSA) accepts events using Java Database Connectivity (JDBC)
protocol.
JSA records all relevant events. To integrate with Juniper Networks NSM AVT
data, you must create a view in the database on the Juniper Networks NSM server.
You must also configure the Postgres database configuration on the Juniper
Networks NSM server to allow connections to the database since, by default, only
local connections are allowed.
NOTE
Note: This procedure is provided as a guideline. For specific instructions, see your
vendor documentation.
Configuring DSMs
390 JUNIPER NETWORKS
Procedure
Step 1 Log in to your Juniper Networks AVT device command-line interface (CLI).
Step 2 Open the following file:
/var/netscreen/DevSvr/pgsql/data/pg_hba.conf file
Step 3 Add the following line to the end of the file:
host all all <IP address>/32 trust
Where <IP address> is the IP address of your JSA console or Event Collector
you want to connect to the database.
Step 4 Reload the Postgres service:
su - nsm -c "pg_ctl reload -D /var/netscreen/DevSvr/pgsql/data"
Step 5 As the Juniper Networks NSM user, create the view:
create view strm_avt_view as SELECT a.name, a.category,
v.srcip,v.dstip,v.dstport, v."last", u.name as userinfo, v.id,
v.device, v.vlan,v.sessionid, v.bytecnt,v.pktcnt, v."first" FROM
avt_part v JOIN app a ON v.app =a.id JOIN userinfo u ON
v.userinfo = u.id;
The view is created.
You are now ready to configure the log source in JSA.
To configure JSA to receive events from a Juniper Networks AVT device:
Step 1 From the Log Source Type list box, select Juniper Networks AVT.
Step 2 You must also configure the JDBC protocol for the log source. Use the following
parameters to configure the JDBC protocol:
a Database Type - From the Database Type list box, select Postgres.
b Database Name - Type profilerDb.
c IP or Hostname - Type the IP address of the Juniper Networks NSM system.
d Port - Type 5432.
e Username - Type the username for the profilerDb database.
f Password - Type the password for profilerDB database.
g Table Name - Type strm_avt_view.
h Select List - Type * for the select list.
i Compare Field - Type id for the Compare Field.
j Use Prepared Statements -The Use Prepared Statements check box must be
clear. The Juniper Networks AVT DSM does not support prepared statements.
k Polling Interval - Type 10 for the Polling interval.
Note: The Database Name and Table Name parameters are case sensitive.

Configuring DSMs
Juniper DDoS Secure 391
NOTE
Note: For more information on configuring log sources and protocols, see the Log
Sources Users Guide.
For more information about the Juniper Networks AVT device, see your vendor
documentation.
Juniper DDoS
Secure
The Juniper DDoS Secure DSM for Juniper Secure Analytics (JSA) receives
events from Juniper DDoS Secure devices by using syslog in Log Event Extended
Format (LEEF) format. JSA records all relevant status and network condition
events.
Procedure
Step 1 Log in to Juniper DDoS Secure.
Step 2 Go to the Structured Syslog Server window.
Step 3 In the Server IP Address(es) field, type the IP address of the JSA Console.
Step 4 From the Format list, select LEEF.
Step 5 Optional. If you do not want to use the default of local0 in the Facility field, type
a facility.
Step 6 From the Priority list, select the syslog priority level that you want to include.
Events that meet or exceed the syslog priority level you select are forwarded to
JSA.
Step 7 Log in to JSA.
Step 8 Click the Admin tab.
Step 9 From the navigation menu, click Data Sources.
Step 10 Click the Log Sources icon.
Step 11 Click Add.
Step 12 From the Log Source Type list, select the Juniper DDoS Secure option.
Step 13 Configure the parameters.
Step 14 Click Save.
For more information about log source management, see the Log Sources Users
Guide.
Juniper DX
Application
Acceleration
Platform
The Juniper DX Application Acceleration Platforms off-load core networking and
I/O responsibilities from web and application servers to improve the performance
of web-based applications, increasing productivity of local, remote, and mobile
users.

Configuring DSMs
392 JUNIPER NETWORKS
The Juniper DX Application Acceleration Platform DSM for JSA accepts events
using syslog. JSA records all relevant status and network condition events. Before
configuring JSA, you must configure your Juniper device to forward syslog events.
Procedure
Step 1 Log in to the Juniper DX user interface.
Step 2 Browse to the desired cluster configuration (Services - Cluster Name), Logging
section.
Step 3 Select the Enable Logging check box.
Step 4 Select the desired Log Format.
JSA supports Juniper DX logs using the common and perf2 formats only.
Step 5 Select the desired Log Delimiter format.
JSA supports comma delimited logs only.
Step 6 In the Log Host section, type the IP address of your JSA system.
Step 7 In the Log Port section, type the UDP port on which you wish to export logs.
Step 8 You are now ready to configure the log source in JSA.
To configure JSA to receive events from a Juniper DX Application Acceleration
Platform:
From the Log Source Type list box, select the Juniper DX Application
Acceleration Platform option.
For more information on configuring log sources, see the Log Sources Users
Guide.
Juniper EX Series
Ethernet Switch
The Juniper EX Series Ethernet Switch DSM for JSA accepts events using syslog.
The Juniper EX Series Ethernet Switch DSM supports Juniper EX Series Ethernet
Switches running Junos OS. Before you can integrate JSA with a Juniper EX
Series Ethernet Switch, you must configure your Juniper EX Series Switch to
forward syslog events.
Procedure
Step 1 Log in to the Juniper EX Series Ethernet Switch command-line interface (CLI).
Step 2 Type the following command:
configure
Step 3 Type the following command:
set system syslog host <IP address> <option> <level>
Where:
<IP address> is the IP address of your JSA.

Configuring DSMs
Juniper EX Series Ethernet Switch 393
<level> is info, error, warning, or any.
<option> is one of the following options from Table 55-1.
For example:
set system syslog host 10.77.12.12 firewall info
Configures the Juniper EX Series Ethernet Switch to send info messages from
firewall filtering systems to your JSA.
Step 4 Repeat Step 3 to configure any additional syslog destinations and options. Each
additional option must be identified using a separate syslog destination
configuration.
Step 5 You are now ready to configure the Juniper EX Series Ethernet Switch in JSA.
To configure JSA to receive events from a Juniper EX Series Ethernet Switch:
From the Log Source Type list box. select Juniper EX-Series Ethernet
Switch option.
For more information on configuring log sources, see the Log Sources Users
Guide. For more information about your Juniper switch, see your vendor
documentation.
Table 55-1 Juniper Networks EX Series Switch Options
Option Description
any All facilities
authorization Authorization system
change-log Configuration change log
conflict-log Configuration conflict log
daemon Various system processes
dfc Dynamic flow capture
explicit-priority Include priority and facility in messages
external Local external applications
facility-override Alternate facility for logging to remote host
firewall Firewall filtering system
ftp FTP process
interactive-commands Commands run by the UI
kernel Kernel
log-prefix Prefix for all logging to this host
match Regular expression for lines to be logged
pfe Packet Forwarding Engine
user User processes

Configuring DSMs
394 JUNIPER NETWORKS
Juniper IDP The Juniper IDP DSM for JSA accepts events using syslog. JSA records all
relevant Juniper IDP events.
Configuring Syslog
for Juniper IDP
You can configure a sensor on your Juniper IDP to send logs to a syslog server:
Procedure
Step 1 Log in to the Juniper NSM user interface.
Step 2 In NSM, double-click on the Sensor in Device Manager.
Step 3 Select Global Settings.
Step 4 Select Enable Syslog.
Step 5 Type the Syslog Server IP address to forward events to JSA.
Step 6 Click OK.
Step 7 Use Update Device to load the new settings onto the IDP Sensor.
The format of the syslog message sent by the IDP Sensor is as follows:
<day id>, <record id>, <timeReceived>, <timeGenerated>,
<domain>, <domainVersion>, <deviceName>, <deviceIpAddress>,
<category>, <subcategory>,<src zone>, <src intface>, <src addr>,
<src port>, <nat src addr>, <nat src port>, <dstzone>,
<dst intface>, <dst addr>, <dst port>, <nat dst addr>,
<nat dst port>,<protocol>, <rule domain>, <rule domainVersion>,
<policyname>, <rulebase>, <rulenumber>, <action>, <severity>,
<is alert>, <elapsed>, <bytes in>, <bytes out>, <bytestotal>,
<packet in>, <packet out>, <packet total>, <repeatCount>,
<hasPacketData>,<varData Enum>, <misc-str>, <user str>,
<application str>, <uri str>
For example:
[syslog@juniper.net dayId="20061012" recordId="0"
timeRecv="2006/10/12 21:52:21" timeGen="2006/10/12 21:52:21"
domain="" devDomVer2="0" device_ip="10.209.83.4"
cat="Predefined" attack="TROJAN:SUBSEVEN:SCAN" srcZn="NULL"
srcIntf="NULL" srcAddr="192.168.170.20" srcPort="63396"
natSrcAddr="NULL" natSrcPort="0" dstZn="NULL" dstIntf="NULL"
dstAddr="192.168.170.10" dstPort="27374" natDstAddr="NULL"
natDstPort="0" protocol="TCP" ruleDomain="" ruleVer="5"
policy="Policy2" rulebase="IDS" ruleNo="4" action="NONE"
severity="LOW" alert="no" elaspedTime="0" inbytes="0"
outbytes="0" totBytes="0" inPak="0" outPak="0" totPak="0"
repCount="0" packetData="no" varEnum="31"
misc="<017>'interface=eth2" user="NULL" app="NULL" uri="NULL"]
Configure a Log
Source
Juniper NSM is a central management server for Juniper IDP. You can configure
JSA to collect and represent the Juniper IDP alerts as coming from a central NSM,
or JSA can collect syslog from the individual Juniper IDP device.

Configuring DSMs
Juniper Networks Secure Access 395
To configure JSA to receive events from Juniper Networks Secure Access device:
From the Log Source Type list box, select Juniper Networks Intrusion
Detection and Prevention (IDP).
For more information on configuring devices, see the Log Sources Users Guide.
For more information about Juniper IDP, see your Network and Security Manager
documentation.
Juniper Networks
Secure Access
The Juniper Networks Secure Access DSM for JSA accepts login and session
information using syslog in WebTrends Enhanced Log File (WELF) format. You
can integrate Juniper SA and Juniper IC with JSA.
NOTE
Note: If your Juniper device is running release 5.5R3-HF2 - 6.1 or above, we
recommend that you use the WELF:WELF format for logging. See your vendor
documentation to determine if your device and license support logging in
WELF:WELF format.
This document provides information for integrating a Juniper Secure Access
device using one of the following formats:
•WELF:WELF (Recommended). See Use the WELF:WELF format.
•Syslog. See Use the Syslog Format.
Use the WELF:WELF
format
To integrate a Juniper Networks Secure Access device with JSA using the
WELF:WELF format.
Procedure
Step 1 Log in to your Juniper device administration user interface:
https://10.xx.xx.xx/admin
Configuring DSMs
396 JUNIPER NETWORKS
Step 2 Configure syslog server information for events:
a If a WELF:WELF file is configured, go to Step f. Otherwise, go to Step b.
b From the left panel, select System > Log/Monitoring > Events > Filter.
c Click New Filter.
d Select WELF.
e Click Save Changes.
f From the left panel, select System > Log/Monitoring > Events > Settings.
g From the Select Events to Log pane, select the events that you wish to log.
h In the Server name/IP field, type the name or IP address of the syslog server.
i From the Facility list box, select the facility.
j From the Filter list box, select WELF:WELF.
k Click Add, then click Save Changes.
Step 3 Configure syslog server information for user access:
a If a WELF:WELF file is configured, go to Step e. Otherwise, go to Step b.
b From the left panel, select System > Log/Monitoring > User Access > Filter.
c Click New Filter.
d Select WELF. Click Save Changes.
e From the left panel, select System > Log/Monitoring > User Access >
Settings.
f From the Select Events to Log pane, select the events that you wish to log.
g In the Server name/IP field, type the name or IP address of the syslog server.
h From the Facility list box, select the facility.
i From the Filter list box, select WELF:WELF.
j Click Add and click Save Changes.
Step 4 Configure syslog server information for administrator access:
a If a WELF:WELF file is configured, go to Step f. Otherwise, go to Step b.
b From the left panel, select System > Log/Monitoring > Admin Access >
Filter.
c Click New Filter.
d Select WELF.
e Click Save Changes.
f From the left panel, select System > Log/Monitoring > Admin Access >
Settings.
g From the Select Events to Log pane, select the events that you wish to log.
h In the Server name/IP field, type the name or IP address of the syslog server.
Configuring DSMs
Juniper Networks Secure Access 397
i From the Facility list box, select the facility.
j From the Filter list box, select WELF:WELF.
k Click Add, then click Save Changes.
Step 5 Configure syslog server information for client logs:
a If a WELF:WELF file is configured, go to Step e. Otherwise, go to Step b.
b From the left panel, select System > Log/Monitoring > Client Logs > Filter.
The Filter menu is displayed.
c Click New Filter.
d Select WELF. Click Save Changes.
e From the left pane, select System > Log/Monitoring > Client Logs >
Settings.
f From the Select Events to Log pane, select the events that you wish to log.
g In the Server name/IP field, type the name or IP address of the syslog server.
h From the Facility list box, select the facility.
i From the Filter list box, select WELF:WELF.
j Click Add, then click Save Changes.
You are now ready to configure the log source in JSA.
To configure JSA to receive events from Juniper Networks Secure Access device:
From the Log Source Type list box, select Juniper Networks Secure
Access (SA) SSL VPN.
For more information on configuring log sources, see the Log Sources Users
Guide. For more information about your Juniper device, see your vendor
documentation.
Use the Syslog
Format
You can use the syslog format to integrate a Juniper Networks Secure Access
device with JSA.
Procedure
Step 1 Log in to your Juniper device administration user interface:
https://10.xx.xx.xx/admin
Step 2 Configure syslog server information for events:
a From the left pane, select System > Log/Monitoring > Events > Settings.
b From the Select Events to Log section, select the events that you wish to log.
c In the Server name/IP field, type the name or IP address of the syslog server.

Configuring DSMs
398 JUNIPER NETWORKS
Step 3 Configure syslog server information for user access:
a From the left pane, select System > Log/Monitoring > User Access >
Settings.
b From the Select Events to Log section, select the events that you wish to log.
c In the Server name/IP field, type the name or IP address of the syslog server.
Step 4 Configure syslog server information for administrator access:
a From the left pane, select System > Log/Monitoring > Admin Access >
Settings.
b From the Select Events to Log section, select the events that you wish to log.
c In the Server name/IP field, type the name or IP address of the syslog server.
Step 5 Configure syslog server information for client logs:
a From the left pane, select System > Log/Monitoring > Client Logs >
Settings.
b From the Select Events to Log section, select the events that you wish to log.
c In the Server name/IP field, type the name or IP address of the syslog server.
You are now ready to configure the log source in JSA.
To configure JSA to receive events from Juniper Networks Secure Access device:
From the Log Source Type list box, select Juniper Networks Secure
Access (SA) SSL VPN.
For more information on configuring log sources, see the Log Sources Users
Guide. For more information about your Juniper device, see your vendor
documentation.
Juniper Infranet
Controller
The Juniper Networks Infranet Controller DSM for JSA accepts DHCP events
using syslog. JSA records all relevant events from a Juniper Networks Infranet
Controller. Before you configure JSA to integrate with a Juniper Networks Infranet
Controller, you must configure syslog within the server. For more information on
configuring your Juniper Networks Infranet Controller, consult your vendor
documentation.
After you configure syslog for your Juniper Infranet Controller, you are now ready
to configure the log source in JSA.
To configure JSA to receive events from your Juniper Networks Infranet Controller:
From the Log Source Type list box, select Juniper Networks Infranet
Controller option.
For more information on configuring devices, see the Log Sources Users Guide.
Configuring DSMs
Juniper Networks Firewall and VPN 399
Juniper Networks
Firewall and VPN
The Juniper Networks Firewall and VPN DSM for JSA accepts Juniper Firewall
and VPN events using UDP syslog. JSA records all relevant firewall and VPN
events.
NOTE
Note: TCP syslog is not supported. You must use UDP syslog.
You can Juniper Networks Firewall and VPN device to export events to JSA.
Procedure
Step 1 Log in to your Juniper Networks Firewall and VPN user interface.
Step 2 Select Configuration > Report Settings > Syslog.
Step 3 Select the enable syslog messages check box.
Step 4 Type the IP address of your JSA console or Event Collector.
Step 5 Click Apply.
You are now ready to configure the log source in JSA.
To configure JSA to receive events from a Juniper Networks Firewall and VPN
device:
From the Log Source Type list box, select Juniper Networks Firewall and
VPN option.
For more information on configuring log sources, see the Log Sources Users
Guide. For more information about your Juniper Networks Firewall and VPN
device, see your Juniper documentation.
Juniper Networks
Network and
Security Manager
The Juniper Networks Network and Security Manager (NSM) DSM for JSA
accepts Juniper Networks NSM and Juniper Networks Secure Service Gateway
(SSG) logs. All Juniper SSG logs must be forwarded through Juniper NSM to JSA.
All other Juniper devices should be forwarded directory to JSA.
For more information on advanced filtering of Juniper Networks NSM logs, see
your Juniper Networks vendor documentation.
To integrate a Juniper Networks NSM device with JSA, you must:
•Configuring Juniper Networks NSM to Export Logs to Syslog
•Configuring a Log Source for Juniper Networks NSM
Configuring Juniper
Networks NSM to
Export Logs to
Syslog
Juniper Networks NSM uses the syslog server when exporting qualified log entries
to syslog. Configuring the syslog settings for the management system only defines
the syslog settings for the management system.

Configuring DSMs
400 JUNIPER NETWORKS
It does not actually export logs from the individual devices. You can enable the
management system to export logs to syslog.
Procedure
Step 1 Log in to the Juniper Networks NSM user interface.
Step 2 From the Action Manager menu, select Action Parameters.
Step 3 Type the IP address for the syslog server to which you want to send qualified logs.
Step 4 Type the syslog server facility for the syslog server to which you want to send
qualified logs.
Step 5 From the Device Log Action Criteria node, select the Actions tab.
Step 6 Select Syslog Enable for Category, Severity, and Action.
You are now ready to configure the log source in JSA.
Configuring a Log
Source for Juniper
Networks NSM
You can configure a log source in JSA for Juniper Networks NSM.
Procedure
Step 1 Log in to JSA.
Step 2 Click the Admin tab.
Step 3 On the navigation menu, click Data Sources.
Step 4 Click the Log Sources icon.
Step 5 Click Add.
Step 1 From the Log Source Type list box, select Juniper Networks Network and
Security Manager.
Step 2 From the Protocol Configuration list box, select Juniper NSM.
Step 3 Configure the following values for the Juniper NSM protocol:
Table 55-2 Juniper NSM Protocol Parameters
Parameter Description
Log Source Identifier Type the IP address or hostname for the log source.
The log source identifier must be unique for the log source
type.
IP Type the IP address or hostname of the Juniper Networks
NSM server.
Inbound Port Type the inbound port to which the Juniper Networks NSM
sends communications.The valid range is 0 to 65536. The
default is 514.
Redirection Listen
Port
Type the port to which traffic is forwarded. The valid range is
0 to 65,536. The default is 516.
Use NSM Address for
Log Source
Select this check box to use the Juniper NSM management
server IP address instead of the log source IP address. By
default, the check box is selected.

Configuring DSMs
Juniper Junos OS 401
NOTE
Note: In the JSA interface, the Juniper NSM protocol configuration enables you to
use the Juniper Networks NSM IP address by selecting the Use NSM Address for
Event Source check box. If you wish to change the configuration to use the
originating IP address (clear the check box), you must log in to your JSA console,
as a root user, and reboot the console (for an all-in-one system) or the Event
Collector hosting the log sources (in a distributed environment) using the following
command: shutdown -r now.
Juniper Junos OS The Juniper Junos OS Platform DSM for JSA accepts events using syslog,
structured-data syslog, or PCAP (SRX Series only). JSA records all valid syslog or
structured-data syslog events.
The Juniper Junos OS Platform DSM supports the following Juniper devices
running Junos OS:
•Juniper M Series Multiservice Edge Routing
•Juniper MX Series Ethernet Services Router
•Juniper T Series Core Platform
•Juniper SRX Series Services Gateway
For information on configuring PCAP data using a Juniper Networks SRX Series
appliance, see Configure the PCAP Protocol.
NOTE
Note: For more information about structured-data syslog, see RFC 5424 at the
Internet Engineering Task Force: http://www.ietf.org/
Before you configure JSA to integrate with a Juniper device, you must forward data
to JSA using syslog or structured-data syslog.
Procedure
Step 1 Log in to your Juniper platform command-line interface (CLI).
Step 2 Include the following syslog statements at the set system hierarchy level:
[set system]
syslog {
host (hostname) {
facility <severity>;
explicit-priority;
any any;
authorization any;
firewall any;
}
source-address source-address;
structured-data {

Configuring DSMs
402 JUNIPER NETWORKS
brief;
}
}
Table 55-3 lists and describes the configuration setting variables to be entered in
the syslog statement.
You are now ready to configure the log source in JSA.
The following devices are auto discovered by JSA as a Juniper Junos OS Platform
devices:
•Juniper M Series Multiservice Edge Routing
•Juniper MX Series Ethernet Services Router
•Juniper SRX Series
•Juniper EX Series Ethernet Switch
•Juniper T Series Core Platform
Table 55-3 List of Syslog Configuration Setting Variables
Parameter Description
host (hostname) Type the IP address or the fully-qualified hostname of your JSA.
Facility <severity> Define the severity of the messages that belong to the named
facility with which it is paired. Valid severity levels are:
•any
•none
•emergency
•alert
•critical
•error
•warning
•notice
•info
Messages with the specified severity level and higher are
logged. The levels from emergency through info are in order
from highest severity to lowest.
Source-address Type a valid IP address configured on one of the router
interfaces for system logging purposes.
The source-address is recorded as the source of the syslog
message send to JSA. This IP address is specified in host
hostname statement set system syslog hierarchy level; not,
however, for messages directed to the other routing engine, or
to the TX Matrix platform in a routing matrix.
structured-data Inserts structured-data syslog into the data.
Configuring DSMs
Juniper Junos OS 403
To manually configure JSA to receive events from a Juniper Junos OS Platform
device:
From the Log Source Type list box, select one of the following options:
Juniper Junos OS Platform, Juniper M Series Multiservice Edge Routing,
Juniper MX Series Ethernet Services Router, Juniper SRX Series
Services Gateway, or Juniper T Series Core Platform.
For more information on configuring log sources, see the Log Sources Users
Guide. For more information about your Juniper device, see your vendor
documentation.
Configure the PCAP
Protocol
The Juniper SRX Series appliance supports forwarding of packet capture (PCAP)
and syslog data to JSA.
Syslog data is forwarded to JSA on port 514. The IP address and outgoing PCAP
port number is configured on the Juniper Networks SRX Series appliance
interface. The Juniper Networks SRX Series appliance must be configured using
the to forward PCAP data in the format
<IP Address>:<Port>.
Where:
<IP Address> is the IP address of JSA.
<Port> is the outgoing port address for the PCAP data.
For more information on Configuring Packet Capture, see your Juniper Networks
Junos OS documentation.
You are now ready to configure the log source and protocol in JSA. For more
information see Configuring a New Juniper Networks SRX Log Source with
PCAP.
Configuring a New Juniper Networks SRX Log Source with PCAP
The Juniper Networks SRX Series appliance is auto discovered by JSA as a
Juniper Junos OS Platform.
JSA detects the syslog data and adds the log source automatically. The PCAP
data can be added to JSA as Juniper SRX Series Services Gateway log source
using the PCAP Syslog Combination protocol. Adding the PCAP Syslog
Combination protocol after JSA auto discovers the Junos OS syslog data adds an
additional log source to your existing log source limit. Deleting the existing syslog
entry, then adding the PCAP Syslog Combination protocol adds both syslog and
PCAP data as single log source.
Procedure
Step 1 Log in to JSA.
Step 2 Click the Admin tab.

Configuring DSMs
404 JUNIPER NETWORKS
Step 3 On the navigation menu, click Data Sources.
Step 4 Click the Log Sources icon.
Step 5 Click Add.
Step 6 From the Log Source Type list box, select Juniper SRX Series Services
Gateway.
Step 7 From the Protocol Configuration list box, select PCAP Syslog Combination.
Step 8 Type the Log Source Identifier.
Step 9 Type the Incoming PCAP Port.
To configure the Incoming PCAP Port parameter in the log source, enter the
outgoing port address for the PCAP data as configured on the Juniper Networks
SRX Series appliance interface. For more information on configuring log sources,
see the Log Sources Users Guide.
Step 10 Click Save.
Step 11 Select the auto discovered syslog-only Junos OS log source for your Juniper
Networks SRX Series appliance.
Step 12 Click Delete.
A delete log source confirmation window is displayed.
Step 13 Click Yes.
The Junos OS syslog log source is deleted from the log source list. You should
now have the PCAP Syslog Combination protocol in your log source list.
Step 14 On the Admin tab, click Deploy Changes.
Juniper
Steel-Belted Radius
The Juniper Steel-Belted Radius DSM for JSA accepts syslog events from a client
running the JSA Adaptive Log Exporter utility using the Windows operating
system, or on Linux using syslog.
JSA records all successful and unsuccessful login attempts. You can integrate
Juniper Networks Steel-Belted Radius with JSA using one of the following
methods:
•Configure Juniper Steel Belted-Radius to use the Adaptive Log Exporter on
Microsoft Windows operating systems. For more information, see Configuring
Juniper Steel-Belted Radius for the Adaptive Log Exporter.
•Configure Juniper Steel-Belted Radius using syslog on Linux-based operating
systems. For more information, see Configuring Juniper Steel-Belted Radius
for Syslog.

Configuring DSMs
Juniper Steel-Belted Radius 405
Configuring Juniper
Steel-Belted Radius
for the Adaptive Log
Exporter
You can integrate a Juniper Steel-Belted Radius DSM with JSA using the Adaptive
Log Exporter.
Procedure
Step 1 From the Start menu, select Start > Programs > Adaptive Log Exporter >
Configure Adapter Log Exporter.
The Adaptive Log Exporter must be installed on the same system as your Juniper
SBR system. The Adaptive Log Exporter must be updated to include the Juniper
SBR device plug-in. For more information, see your Adaptive Log Exporter Users
Guide.
Step 2 Click the Devices tab.
Step 3 Select Juniper SBR, right-click and select Add Device.
The New Juniper SBR Properties window is displayed.
Step 4 Configure the following parameters:
a Name - Type a name for the device. The name can include alphanumeric
characters and underscore (_) characters.
b Description - Type a description for this device.
c Device Address - Type the IP address or hostname that the device. The IP
address or hostname is used to identify the device in syslog messages
forwarded to JSA. This is the IP address or hostname that will appear in JSA.
d Root Log Directory - Type the location where Juniper SBR stores log files.
Report log files should be located in the Steel-Belted Radius directory
<radiusdir>\authReports. The Adaptive Log Exporter monitors the Root
Log Directory for any .CSV files having a date stamp in the file name matching
the current day.
Step 5 From the Adaptive Log Exporter toolbar, click Save.
Step 6 From the Adaptive Log Exporter toolbar, click Deploy.
NOTE
Note: You must use the default values for the log file heading in the Juniper
Steel-Belted Radius appliance. If the log file headings have been changed from the
default values and JSA is not parsing SBR events properly, please contact Juniper
Customer Support.
Step 7 You are now ready to configure the log source in JSA.
Juniper SBR events provided from the Adaptive Log Exporter are automatically
discovered by JSA. If you want to manually configure JSA to receive events from
Juniper Steel-Belted Radius:
From the Log Source Type drop-down box, select the Juniper Steel-Belted
Radius option.
For more information on configuring log sources, see the Log Sources Users
Guide.

Configuring DSMs
406 JUNIPER NETWORKS
Configuring Juniper
Steel-Belted Radius
for Syslog
You can integrate a Juniper Steel-Belted Radius DSM with JSA using syslog on a
Linux-based operating system.
Procedure
Step 1 Using SSH log in to your Juniper Steel-Belted Radius device, as a root user.
Step 2 Edit the following file:
/etc/syslog.conf
Step 3 Add the following information:
<facility>.<priority> @<IP address>
Where:
<facility> is the syslog facility, for example, local3.
<priority> is the syslog priority, for example, info.
<IP address> is the IP address of JSA.
Step 4 Save the file.
Step 5 From the command-line, type the following command to restart syslog:
service syslog restart
Step 6 You are now ready to configure the log source in JSA.
To configure JSA to receive events from Juniper Steel-Belted Radius:
From the Log Source Type list box, select the Juniper Steel-Belted Radius
option.
For more information on configuring log sources, see the Log Sources Users
Guide. For more information on configuring your Steel-Belted Radius server
consult your vendor documentation.
Juniper Networks
vGW Virtual
Gateway
The Juniper Networks vGW Virtual Gateway DSM for JSA accepts events using
syslog and NetFlow from your vGW management server or firewall. JSA records
all relevant events, such as admin, policy, IDS logs, and firewall events. Before
configuring an Juniper Networks vGW Virtual Gateway in JSA, you must configure
vGW to forward syslog events.
Procedure
Step 1 Log in to your Juniper Networks vGW user interface.
Step 2 Select Settings.
Step 3 From Security Settings, select Global.
Step 4 From External Logging, select one of the following:
•Send Syslog from vGW management server - Central logging with syslog
event provided from a management server.
Configuring DSMs
Juniper Networks vGW Virtual Gateway 407
If you select the option Send Syslog from vGW management server, all
events forwarded to JSA contain the IP address of the vGW management
server.
•Send Syslog from Firewalls - Distribute logging with each Firewall Security
VM providing syslog events.
Step 5 Type values for the following parameters:
a Syslog Server - Type the IP address of your vGW management server if you
selected to Send Syslog from vGW management server. Or, type the IP
address of JSA if you selected Send Syslog from Firewalls.
b Syslog Server Port - Type the port address for syslog. This is typically port
514.
Step 6 From the External Logging panel, click Save.
Only changes made to the External Logging section are stored when you click
Save. Any changes made to NetFlow require that you save using the button within
NetFlow Configuration section.
Step 7 From the NetFlow Configuration panel, select the enable check box.
NetFlow does not support central logging from a vGW management server. From
the External Logging section, you must select the option Send Syslog from
Firewalls.
Step 8 Type values for the following parameters:
a NetFlow collector address - Type the IP address of JSA.
b NetFlow collector port - Type a port address for NetFlow events.
Note: JSA typically uses port 2055 for NetFlow event data on Flow Processors.
You must configure a different NetFlow collector port on your Juniper Networks
vGW Series Virtual Gateway for NetFlow.
Step 9 From the NetFlow Configuration, click Save.
Step 10 You are now ready to configure the log source in JSA.
JSA automatically detects syslog forwarded from Juniper Networks vGW. If you
want to manually configure JSA to receive syslog events:
From the Log Source Type list box, select Juniper vGW.
For more information on configuring log sources, see the Log Sources Users
Guide. For more information, see your Juniper Networks vGW documentation.

Configuring DSMs
408 JUNIPER NETWORKS
Juniper Security
Binary Log
Collector
The Juniper Security Binary Log Collector DSM for JSA can accept audit, system,
firewall and intrusion prevention system (IPS) events in binary format from Juniper
SRX or Juniper Networks J Series appliances. The Juniper Networks binary log file
format is intended to increase performance when writing large amounts of data to
an event log. To integrate your device with JSA, you must configure your Juniper
appliance to stream binary formatted events, then configure a log source in JSA.
This section includes the following topics:
•Configuring the Juniper Networks Binary Log Format
•Configure a Log Source
Configuring the
Juniper Networks
Binary Log Format
The binary log format from Juniper SRX or J Series appliances are streamed to
JSA using the UDP protocol. You must specify a unique port for streaming binary
formatted events, the standard syslog port for JSA cannot understand binary
formatted events. The default port assigned to JSA for receiving streaming binary
events from Juniper appliances is port 40798.
NOTE
Note: The Juniper Binary Log Collector DSM only supports events forwarded in
Streaming mode. The Event mode is not supported.
Procedure
Step 1 Log in to your Juniper SRX or J Series using the command-line Interface (CLI).
Step 2 Type the following command to edit your device configuration:
configure
Step 3 Type the following command to configure the IP address and port number for
streaming binary formatted events:
set security log stream <Name> host <IP address> port <Port>
Where:
<Name> is the name assigned to the stream.
<IP address> is the IP address of your JSA console or Event Collector.
<Port> is a unique port number assigned for streaming binary formatted events to
JSA. By default, JSA listens for binary streaming data on port 40798. For a list of
ports used by JSA, see the Juniper Secure Analytics Common Ports List technical
note.
Step 4 Type the following command to set the security log format to binary:
set security log stream <Name> format binary
Where <Name> is the name you specified for your binary format stream in Step 3.
Step 5 Type the following command to enable security log streaming:
set security log mode stream
Configuring DSMs
Juniper Security Binary Log Collector 409
Step 6 Type the following command to set the source IP address for the event stream:
set security log source-address <IP address>
Where <IP address> is the IP address of your Juniper SRX Series or Juniper J
Series appliance.
Step 7 Type the following command to save the configuration changes:
commit
Step 8 Type the following command to exit the configuration mode:
exit
The configuration of your Juniper SRX or J Series appliance is complete. You are
now ready to configure a log source in JSA.
Configure a Log
Source
JSA does not automatically discover incoming Juniper Security Binary Log
Collector events from Juniper SRX or Juniper J Series appliances.
If your events are not automatically discovered, you must manually create a log
source using the Admin tab in JSA.
Procedure
Step 1 Log in to JSA.
Step 2 Click the Admin tab.
Step 3 On the navigation menu, click Data Sources.
Step 4 Click the Log Sources icon.
Step 5 Click Add.
Step 6 In the Log Source Name field, type a name for your log source.
Step 7 In the Log Source Description field, type a description for the log source.
Step 8 From the Log Source Type list box, select Juniper Security Binary Log
Collector.
Step 9 Using the Protocol Configuration list box, select Juniper Security Binary Log
Collector.

Configuring DSMs
410 JUNIPER NETWORKS
Step 10 Configure the following values:
Step 11 Click Save.
Step 12 On the Admin tab, click Deploy Changes.
The configuration is complete. You can verify events forwarded to JSA by viewing
events in the Log Activity tab.
Table 55-4 Juniper Security Binary Log Collector protocol parameters
Parameter Description
Log Source Identifier Type an IP address or hostname to identify the log source.
The identifier address should be the Juniper SRX or J Series
appliance generating the binary event stream.
Binary Collector Port Specify the port number used by the Juniper Networks SRX
or J Series appliance to forward incoming binary data to JSA.
The UDP port number for binary data is the same port config-
ured in Configuring the Juniper Networks Binary Log
Format, Step 3.
If you edit the outgoing port number for the binary event
stream from your Juniper Networks SRX or J Series
appliance, you must also edit your Juniper log source and
update the Binary Collector Port parameter in JSA.
To edit the port:
1In the Binary Collector Port field, type the new port
number for receiving binary event data.
2Click Save.
Event collection is stopped for the log source until you
fully deploy JSA.
3On the Admin tab, select Advanced > Deploy Full
Configuration.
The port update is complete and event collection starts on
the new port number.
Note: When you click Deploy Full Configuration, JSA restarts
all services, resulting in a gap in data collection for events
and flows until the deployment completes.
XML Template File
Location
Type the path to the XML file used to decode the binary
stream from your Juniper SRX or Juniper J Series appliance.
By default, JSA includes an XML template file for decoding
the binary stream in the following directory:
/opt/qradar/conf/security_log.xml

Configuring DSMs
Juniper Junos WebApp Secure 411
Juniper Junos
WebApp Secure
The Juniper WebApp Secure DSM for JSA accepts events forwarded from Juniper
Junos WebApp Secure appliances using syslog.
Juniper Junos WebApp Secure provides incident logging and access logging
events to JSA. Before you can receive events in JSA, you must configure event
forwarding on your Juniper Junos WebApp Secure, then define the events you
want to forward.
Configuring Syslog
Forwarding
To configure a remote syslog server for Juniper Junos WebApp Secure, you must
SSH in to a configuration interface. The configuration interface allows you to setup
or configure core settings on your Juniper Junos WebApp Secure appliance.
Procedure
Step 1 Using SSH, log in to your Juniper Junos WebApp device using port 2022.
https://<IP address>:<port>
Where:
<IP address> is the IP address of your Juniper Junos WebApp Secure
appliance.
<Port> is the port number of your Juniper Junos WebApp Secure appliance
configuration interface. The default SSH configuration port is 2022.
Step 2 From the Choose a Tool menu, select Logging.
Step 3 Click Run Tool.
Step 4 From the Log Destination menu, select Remote Syslog Server.
Step 5 In the Syslog Server field, type the IP address of your JSA console or Event
Collector.
Step 6 Click Save.
Step 7 From the Choose a Tool menu, select Quit.
Step 8 Type Exit to close your SSH session.
You are now ready to configure event logging on your Juniper Junos WebApp
Secure appliance.
Configuring Event
Logging
The Juniper Junos WebApp Secure appliance must be configured to determine
which logs are forwarded to JSA.
Procedure
Step 1 Using a web browser, log in to the Configuration Site for your Juniper Junos
WebApp Secure appliance.
https://<IP address>:<port>
Where:
<IP address> is the IP address of your Juniper Junos WebApp Secure
appliance.

Configuring DSMs
412 JUNIPER NETWORKS
<Port> is the port number of your Juniper Junos WebApp Secure appliance. The
default configuration uses a port number of 5000.
Step 2 From the navigation menu, select Configuration Manager.
Step 3 From the Configuration menu, select Basic Mode.
Step 4 Click the Global Configuration tab and select Logging.
Step 5 Click the link Show Advanced Options.
Step 6 Configure the following parameters:
Table 55-1 Juniper Junos WebApp Secure Logging Parameters
Parameter Description
Access logging: Log
Level
Click this option to configure the level of information logged
when access logging is enabled.
The options include:
•0 - Access logging is disabled.
•1 - Basic logging.
•2 - Basic logging with headers.
•3 - Basic logging with headers and body.
Note: Access logging is disabled by default. It is
recommended that you only enable access logging for
debugging purposes. For more information, see your Juniper
Junos WebApp Secure documentation.
Access logging: Log
requests before
processing
Click this option and select True to log the request before it is
processed, then forward the event to JSA.
Access logging: Log
requests to access log
after processing
Click this option and select True to log the request after it is
processed. After Juniper Junos WebApp Secure processes
the event, then it is forwarded to JSA.
Access logging: Log
responses to access
log after processing
Click this option and select True to log the response after it is
processed. After Juniper Junos WebApp Secure processes
the event, then the event is forwarded to JSA.
Access logging: Log
responses to access
log before processing
Click this option and select True to log the response before it
is processed, then forward the event to JSA.

Configuring DSMs
Juniper Junos WebApp Secure 413
The configuration is complete. The log source is added to JSA as Juniper Junos
WebApp Secure events are automatically discovered. Events forwarded to JSA by
Juniper Junos WebApp Secure are displayed on the Log Activity tab of JSA.
Configuring a Log
Source
JSA automatically discovers and creates a log source for syslog events from
Juniper Junos WebApp Secure. The following configuration steps are optional.
Procedure
Step 1 Log in to JSA.
Step 2 Click the Admin tab.
Step 3 On the navigation menu, click Data Sources.
Step 4 Click the Log Sources icon.
Step 5 Click Add.
Step 6 In the Log Source Name field, type a name for your log source.
Step 7 In the Log Source Description field, type a description for the log source.
Step 8 From the Log Source Type list box, select Juniper Junos WebApp Secure.
Step 9 Using the Protocol Configuration list box, select Syslog.
Step 10 Configure the following values:
Incident severity log
level
Click this option to define the severity of the incident events
to log. All incidents at or above the level defined are
forwarded to JSA. The options include:
The options include:
•0 - Informational level and above incident events are
logged and forwarded.
•1 - Suspicious level and above incident events are logged
and forwarded.
•2 - Low level and above incident events are logged and
forwarded.
•3 - Medium level and above incident events are logged
and forwarded.
•4 - High level and above incident events are logged and
forwarded.
Log incidents to the
syslog
Click this option and select Yes to enable syslog forwarding
to JSA.
Table 55-1 Juniper Junos WebApp Secure Logging Parameters (continued)
Parameter Description

Configuring DSMs
414 JUNIPER NETWORKS
Step 11 Click Save.
Step 12 On the Admin tab, click Deploy Changes.
Juniper Networks
WLC Series
Wireless LAN
Controller
Juniper Secure Analytics (JSA) can collect and categorize syslog events from
Juniper Networks WLC Series Wireless LAN Controllers.
Configuration
overview
To collect syslog events, you must configure your Juniper Networks Wireless LAN
Controller to forward syslog events to JSA. Administrators can use either the
RingMaster interface or the command-line interface to configure syslog forwarding
for their Juniper Networks Wireless LAN Controller appliance. JSA automatically
discovers and creates log sources for syslog events that are forwarded from
Juniper Networks WLC Series Wireless LAN Controllers. JSA supports syslog
events from Juniper WLAN devices that run on Mobility System Software (MSS)
V7.6.
To integrate Juniper WLC events with JSA, administrators can complete the
following tasks:
1 On your Juniper WLAN appliance, configure syslog server.
•To use the RingMaster user interface to configure a syslog server, see
Configuring a Syslog Server from the Juniper WLC User Interface.
•To use the command-line interface to configure a syslog server, see
Configuring a Syslog Server with the Command-line Interface for Juniper
WLC.
2 On your JSA system, verify that the forwarded events are automatically
discovered.
Configuring a Syslog
Server from the
Juniper WLC User
Interface
To collect events, you must configure a syslog server on your Juniper WLC system
to forward syslog events to JSA.
Procedure
TO configure a syslog server from the Juniper WLC user interface:
Step 1 Log in to the RingMaster software.
Step 2 From the Organizer panel, select a Wireless LAN Controller.
Step 3 From the System panel, select Log.
Table 55-1 Syslog protocol parameters
Parameter Description
Log Source Identifier Type the IP address or host name for the log source as an
identifier for events from your Juniper Junos WebApp Secure
appliance.
Configuring DSMs
Juniper Networks WLC Series Wireless LAN Controller 415
Step 4 From the Task panel, select Create Syslog Server.
Step 5 In the Syslog Server field, type the IP address of your JSA system.
Step 6 In the Port field, type 514.
Step 7 From the Severity Filter list, select a severity.
Logging debug severity events can negatively affect system performance on the
Juniper WLC appliance. As a best practice, administrators can log events at the
error or warning severity level and slowly increase the level to get the data you
need. The default severity level is error.
Step 8 From the Facility Mapping list, select a facility between Local 0 - Local 7.
Step 9 Click Finish.
Result
As events are generated by the Juniper WLC appliance, they are forwarded to the
syslog destination you specified. The log source is automatically discovered after
enough events are forwarded to JSA. It typically takes a minimum of 25 events to
automatically discover a log source.
What to do next
Administrators can log in to the JSA Console and verify that the log source is
created on the Console. The Log Activity tab displays events from the Juniper
WLC appliance.
Configuring a Syslog
Server with the
Command-line
Interface for Juniper
WLC
To collect events, you must configure a syslog server on your Juniper WLC system
to forward syslog events to JSA.
Procedure
Step 1 Log in to the command-line interface of the Juniper WLC appliance.
Step 2 To configure a syslog server, type the following command:
set log server <ip-addr> [port 514 severity <severity-level>
local-facility <facility-level>]
For example, set log server 1.1.1.1 port 514 severity error
local-facility local0.
Step 3 To save the configuration, type the following command:
save configuration
Result
As events are generated by the Juniper WLC appliance, they are forwarded to the
syslog destination you specified. The log source is automatically discovered after
enough events are forwarded to JSA. It typically takes a minimum of 25 events to
automatically discover a log source.
Configuring DSMs
416 JUNIPER NETWORKS
What to do next
Administrators can log in to the Console and verify that the log source is created.
The Log Activity tab displays events from the Juniper WLC appliance.
Configuring DSMs
Juniper Networks WLC Series Wireless LAN Controller 417
Configuring DSMs
418 JUNIPER NETWORKS
Configuring DSMs
53 KASPERSKY SECURITY CENTER
The Kaspersky Security Center DSM retrieves events directly from a database on
your Kaspersky Security Center appliance.
Supported Event
Types
JSA uses the JDBC protocol to poll a view created specifically for Juniper Secure
Analytics (JSA) to collect antivirus, server, and audit events.
Before You Begin Before you can receive events in JSA, you must create a database view for JSA to
poll using the JDBC protocol.
We also recommend that you create a user for JSA, as JSA requires a user
account to poll the database for events. After you have configured a database view
and a user account for JSA, you are ready to configure a log source in JSA for
Kaspersky Security Center.
Creating a Database
View for Kaspersky
Security Center
To collect audit event data, you must create a database view on your Kaspersky
server that is accessible to JSA.
To create a database view, you can download the klsql2.zip tool, which is available
from Kaspersky or use another program that allows you to create database views.
The instructions provided below define the steps required to create the dbo.events
view using the Kaspersky Labs tool.
Procedure
Step 1 From the Kaspersky Labs website, download the klsql2.zip file:
http://support.kaspersky.com/9284
Step 2 Copy klsql2.zip to your Kaspersky Security Center Administration Server.
Step 3 Extract klsql2.zip to a directory.
Step 4 The following files are included:
•klsql2.exe
•libmysql.dll
•src.sql
•start.cmd

Configuring DSMs
420 KASPERSKY SECURITY CENTER
Step 5 In any text editor, edit the src.sql file.
Step 6 Clear the contents of the src.sql file.
Step 7 Type the following Transact-SQL statement to create the dbo.events database
view:
create view dbo.events as select e.nId, e.strEventType as
'EventId', e.wstrDescription as 'EventDesc', e.tmRiseTime as
'DeviceTime', h.nIp as 'SourceInt', e.wstrPar1, e.wstrPar2,
e.wstrPar3, e.wstrPar4, e.wstrPar5, e.wstrPar6, e.wstrPar7,
e.wstrPar8, e.wstrPar9 from dbo.v_akpub_ev_event e,
dbo.v_akpub_host h where e.strHostname = h.strName;
Step 8 Save the src.sql file.
Step 9 From the command line, navigate to the location of the klsql2 files.
Step 10 Type the following command to create the view on your Kaspersky Security Center
appliance:
klsql2 -i src.sql -o result.xml
The dbo.events view is created. You are now ready to configure the log source in
JSA to poll the view for Kaspersky Security Center events.
NOTE
Note: Kaspersky Security Center database administrators should ensure that JSA
is allowed to poll the database for events using TCP port 1433 or the port
configured for your log source. Protocol connections are often disabled on
databases by default and additional configuration steps might be required to allow
connections for event polling. Any firewalls located between Kaspersky Security
Center and JSA should also be configured to allow traffic for event polling.
Configuring the Log
Source in JSA
JSA requires a user account with the proper credentials to access the view you
created in the Kaspersky Security Center database.
To successfully poll for audit data from the Kaspersky Security Center database,
you must create a new user or provide the log source with existing user credentials
to read from the dbo.events view. For more information on creating a user account,
see your Kaspersky Security Center documentation.
Procedure
Step 1 Click the Admin tab.
Step 2 On the navigation menu, click Data Sources.
Step 3 Click the Log Sources icon.
Step 4 In the Log Source Name field, type a name for the log source.
Step 5 In the Log Source Description field, type a description for the log source.
Step 6 From the Log Source Type list box, select Kaspersky Security Center.

Configuring DSMs
421
Step 7 From the Protocol Configuration list box, select JDBC.
Step 8 Configure the following values:
Table 56-2 JDBC protocol parameters
Parameter Description
Log Source
Identifier
Type the identifier for the log source. Type the log source identifier
in the following format:
<Kaspersky Database>@<Kaspersky Database Server
IP or Host Name>
Where:
<Kaspersky Database> is the database name, as entered in
the Database Name parameter.
<Kaspersky Database Server IP or Host Name> is the
hostname or IP address for this log source, as entered in the IP or
Hostname parameter.
Database Type From the list box, select MSDE.
Database Name Type KAV as the name of the Kaspersky Security Center
database.
IP or Hostname Type the IP address or hostname of the SQL server that hosts the
Kaspersky Security Center database.
Port Type the port number used by the database server. The default
port for MSDE is 1433. You must enable and verify you can
communicate using the port you specify in the Port field.
The JDBC configuration port must match the listener port of the
Kaspersky database. The Kaspersky database must have
incoming TCP connections enabled to communicate with JSA.
Note: If you define a Database Instance when using MSDE as the
database type, you must leave the Port parameter blank in your
configuration.
Username Type the username the log source can use to access the
Kaspersky database.
Password Type the password the log source can use to access the
Kaspersky database.
The password can be up to 255 characters in length.
Confirm
Password
Confirm the password required to access the database. The
confirmation password must be identical to the password entered
in the Password field.
Authentication
Domain
If you select MSDE as the Database Type and the database is
configured for Windows, you must define the Window
Authentication Domain. Otherwise, leave this field blank.

Configuring DSMs
422 KASPERSKY SECURITY CENTER
Database
Instance
Optional. Type the database instance, if you have multiple SQL
server instances on your database server.
Note: If you use a non-standard port in your database
configuration, or have blocked access to port 1434 for SQL
database resolution, you must leave the Database Instance
parameter blank in your configuration.
Table Name Type dbo.events as the name of the table or view that includes
the event records.
Select List Type * for all fields from the table or view.
You can use a comma-separated list to define specific fields from
tables or views, if required for your configuration. The list must
contain the field defined in the Compare Field parameter. The
comma-separated list can be up to 255 alphanumeric characters in
length. The list can include the following special characters: dollar
sign ($), number sign (#), underscore (_), en dash (-), and
period(.).
Compare Field Type nld as the compare field. The compare field is used to
identify new events added between queries to the table.
Start Date and
Time
Optional. Type the start date and time for database polling.
The Start Date and Time parameter must be formatted as
yyyy-MM-dd HH:mm with HH specified using a 24 hour clock. If the
start date or time is clear, polling begins immediately and repeats
at the specified polling interval.
Use Prepared
Statements
Select the Use Prepared Statements check box.
Prepared statements allows the JDBC protocol source to setup the
SQL statement one time, then run the SQL statement many times
with different parameters. For security and performance reasons,
we recommend that you use prepared statements.
Clearing this check box requires you to use an alternative method
of querying that does not use pre-compiled statements.
Polling Interval Type the polling interval, which is the amount of time between
queries to the view you created. The default polling interval is 10
seconds.
You can define a longer polling interval by appending H for hours
or M for minutes to the numeric value. The maximum polling
interval is 1 week in any time format. Numeric values entered
without an H or M poll in seconds.
EPS Throttle Type the number of Events Per Second (EPS) that you do not
want this protocol to exceed. The default value is 20000 EPS.
Use Named Pipe
Communication
Clear the Use Named Pipe Communications check box.
When using a Named Pipe connection, the username and
password must be the appropriate Windows authentication
username and password and not the database username and
password. Also, you must use the default Named Pipe.
Table 56-2 JDBC protocol parameters (continued)
Parameter Description

Configuring DSMs
423
NOTE
Note: Selecting a value for the Credibility parameter greater than 5 will weight your
Kaspersky Security Center log source with a higher importance compared to other
log sources in JSA.
Step 9 Click Save.
Step 10 On the Admin tab, click Deploy Changes.
The Kaspersky Security Center configuration is complete. Events collected using
the JDBC protocol are displayed on the Log Activity tab of JSA.
Database
Cluster Name
If you select the Use Named Pipe Communication check box, the
Database Cluster Name parameter is displayed. If you are running
your SQL server in a cluster environment, define the cluster name
to ensure Named Pipe communication functions properly.
Table 56-2 JDBC protocol parameters (continued)
Parameter Description
Configuring DSMs
54 LIEBERMAN RANDOM PASSWORD
MANAGER
The Lieberman Random Password Manager DSM for allows you to integrate
Juniper Secure Analytics (JSA) with Lieberman Enterprise Random Password
Manager and Lieberman Random Password Manager software using syslog
events in the Log Extended Event Format (LEEF).
The Lieberman Random Password Manager forwards syslog events to JSA using
Port 514. JSA records all relevant password management events. For information
on configuring syslog forwarding, see your vendor documentation.JSA
JSA automatically detects syslog events forwarded from Lieberman Random
Password Manager and Lieberman Enterprise Random Password Manager
devices. However, if you want to manually configure JSA to receive events from
these devices:
From the Log Source Type list box, select Lieberman Random Password
Manager.
For more information on configuring log sources, see the Log Sources Users
Guide.

Configuring DSMs
55 LINUX
This section provides information on the following DSMs:
•Linux DHCP
•Linux IPtables
•Linux OS
Linux DHCP The Linux DHCP Server DSM for Juniper Secure Analytics (JSA) accepts DHCP
events using syslog.
Configuring Syslog
for Linux DHCP
JSA records all relevant events from a Linux DHCP Server. Before you configure
JSA to integrate with a Linux DHCP Server, you must configure syslog within your
Linux DHCP Server to forward syslog events to JSA.
For more information on configuring your Linux DHCP Server, consult the man
pages or associated documentation for your DHCP daemon.
Configuring a Log
Source
JSA automatically discovers and creates log sources for syslog events forwarded
from Linux DHCP Servers. The following procedure is optional.
Procedure
Step 1 Log in to JSA.
Step 2 Click the Admin tab.
Step 3 On the navigation menu, click Data Sources.
Step 4 Click the Log Sources icon.
Step 5 Click Add.
Step 6 In the Log Source Name field, type a name for your Linux DHCP Server.
Step 7 In the Log Source Description field, type a description for the log source.
Step 8 From the Log Source Type list box, select Linux DHCP Server.
Step 9 Using the Protocol Configuration list box, select Syslog.

Configuring DSMs
428 LINUX
Step 10 Configure the following values:
Step 11 Click Save.
Step 12 On the Admin tab, click Deploy Changes.
The configuration is complete.
Linux IPtables The Linux IPtables DSM for JSA accepts firewall IPtables events using syslog.
JSA records all relevant from Linux IPtables where the syslog event contains any
of the following words: Accept, Drop, Deny, or Reject. Creating a customized log
prefix in the event payload allows JSA to easily identify IPtables behavior.
Configure IPtables IPtables is a powerful tool, which allows you to create rules on the Linux kernel
firewall for routing traffic.
To configure IPtables, you must examine the existing rules, modify the rule to log
the event, and assign a log identifier to your IPtables rule that can be identified by
JSA. This process allows you to determine which rules are logged by JSA. JSA
includes any events that are logged that include the words: accept, drop, reject, or
deny in the event payload.
Procedure
Step 1 Using SSH, log in to your Linux Server as a root user.
Step 2 Edit the IPtables file located in the following directory:
/etc/iptables.conf
NOTE
Note: The file containing IPtables rules can vary according to the specific Linux
operating system you are configuring.
Step 3 Review the file to determine the IPtables rule you want to log.
For example, if you want to log the rule defined by the entry:
-A INPUT -i eth0 --dport 31337 -j DROP
Step 4 Insert a matching rule immediately before each rule you want to log:
-A INPUT -i eth0 --dport 31337 -j DROP
-A INPUT -i eth0 --dport 31337 -j DROP
Step 5 Update the target of the new rule to LOG for each rule you want to log. For
example:
Table 58-1 Syslog Parameters
Parameter Description
Log Source Identifier Type the IP address or hostname for the log source as an
identifier for events from your Linux DHCP Server.

Configuring DSMs
Linux IPtables 429
-A INPUT -i eth0 --dport 31337 -j LOG
-A INPUT -i eth0 --dport 31337 -j DROP
Step 6 Set the log level of the LOG target to a SYSLOG priority level, such as info or
notice:
-A INPUT -i eth0 --dport 31337 -j LOG --log-level info
-A INPUT -i eth0 --dport 31337 -j DROP
Step 7 Configure a log prefix to identify the rule behavior. Set the log prefix parameter to
Q1Target=<rule>.
Where <rule> is one of fw_accept, fw_drop, fw_reject, or fw_deny.
For example, if the rule being logged by the firewall targets dropped events, the log
prefix setting should be Q1Target=fw_drop.
-A INPUT -i eth0 --dport 31337 -j LOG --log-level info
--log-prefix "Q1Target=fw_drop "
-A INPUT -i eth0 --dport 31337 -j DROP
NOTE
Note: The trailing space is required before the closing quotation mark.
Step 8 Save and exit the file.
Step 9 Restart IPtables:
/etc/init.d/iptables restart
Step 10 Open the syslog.conf file.
Step 11 Add the following line:
kern.<log level> @<IP address>
Where:
<log level> is the previously set log level.
<IP address> is the IP address of JSA.
Step 12 Save and exit the file.
Step 13 Restart the syslog daemon:
/etc/init.d/syslog restart
After the syslog daemon restarts, events are forwarded to JSA. IPtable events
forwarded from Linux Servers are automatically discovered and displayed in the
Log Activity tab of JSA.
Configuring a Log
Source
JSA automatically discovers and creates log sources for IPtables syslog events
forwarded from Linux Servers. The following steps for configuring a log source are
optional.
Procedure
Step 1 Log in to JSA.
Step 2 Click the Admin tab.

Configuring DSMs
430 LINUX
Step 3 On the navigation menu, click Data Sources.
Step 4 Click the Log Sources icon.
Step 5 Click Add.
Step 6 In the Log Source Name field, type a name for your Linux DHCP Server.
Step 7 In the Log Source Description field, type a description for the log source.
Step 8 From the Log Source Type list box, select Linux iptables Firewall.
Step 9 Using the Protocol Configuration list box, select Syslog.
Step 10 Configure the following values:
Step 11 Click Save.
Step 12 On the Admin tab, click Deploy Changes.
The configuration is complete. IPtables events forwarded from Linux Servers are
automatically discovered and displayed in the Log Activity tab of JSA.
For more information on configuring IPtables on Linux Servers, consult the man
pages or your associated Linux documentation.
Linux OS The Linux OS DSM for JSA records Linux operating system events and forwards
the events using syslog or syslog-ng.
If you are using syslog on a UNIX host, we recommends that you upgrade the
standard syslog to a more recent version, such as, syslog-ng.
CAUTION
CAUTION: Do not run both syslog and syslog-ng at the same time.
To integrate Linux OS with JSA, select one of the following syslog configurations
for event collection:
•Configuring Linux OS Using Syslog
•Configure Linux OS Using Syslog-ng
Supported Event
Types
The Linux OS DSM supports the following event types:
•cron
•HTTPS
Table 58-2 Syslog Protocol Parameters
Parameter Description
Log Source Identifier Type the IP address or hostname for the log source as an
identifier for IPtables events forwarded from your Linux
Server.
Configuring DSMs
Linux OS 431
•FTP
•NTP
•Simple Authentication Security Layer (SASL)
•SMTP
•SNMP
•SSH
•Switch User (SU)
•Pluggable Authentication Module (PAM) events.
Configuring Linux OS
Using Syslog
To configure Linux OS using the syslog protocol:
Procedure
To configure Linux OS using syslog:
Step 1 Log in to your Linux OS device, as a root user.
Step 2 Open the /etc/syslog.conf file.
Step 3 Add the following facility information:
authpriv.* @<IP address>
Where <IP address> is the IP address of the JSA.
Step 4 Save the file.
Step 5 Restart syslog using the following command:
service syslog restart
Step 6 Log in to the JSA user interface.
Step 7 Add a Linux OS log source.
For more information on configuring log sources, see the Log Sources Users
Guide.
Step 8 On the Admin tab, click Deploy Changes.
For more information on syslog, see your Linux operating system documentation.
Configure Linux OS
Using Syslog-ng
To configure Linux OS using the syslog-ng protocol:
Procedure
Step 1 Log in to your Linux OS device, as a root user.
Step 2 Open the /etc/syslog-ng/syslog-ng.conf file.
Configuring DSMs
432 LINUX
Step 3 Add the following facility information:
filter auth_filter{ facility(authpriv); };
destination auth_destination { tcp("<IP address>" port(514)); };
log{
source(<Sourcename>);
filter(auth_filter);
destination(auth_destination);
};
Where:
<IP address> is the IP address of the JSA.
<Source name> is the name of the source defined in the configuration file.
Step 4 Save the file.
Step 5 Restart syslog-ng using the following command:
service syslog-ng restart
Step 6 Log in to the JSA user interface.
Step 7 Add a Linux OS log source.
For more information on configuring log sources, see the Log Sources Users
Guide.
Step 8 On the Admin tab, click Deploy Changes.
For more information on syslog, see your Linux operating system documentation.
Configuring Linux OS
to Send Audit Logs
Configure Linux OS to send audit logs to Juniper Secure Analytics (JSA).
About this task
This task applies to Red Hat Enterprise Linux v6 operating systems. If you use
SUSE, Debian, or Ubuntu operating system, see your vendor documentation for
specific steps for your operating system.
Procedure
Step 1 Log in to your Linux OS device, as a root user.
Step 2 Type the following commands:
yum install audit
service auditd start
chkconfig auditd on
Step 3 Open the following file:
/etc/audisp/plugins.d/syslog.conf
Step 4 Ensure the parameters match the following values:
Configuring DSMs
Linux OS 433
active = yes
direction = out
path = builtin_syslog
type = builtin
args = LOG_LOCAL6
format = string
Step 5 Open the following file:
/etc/rsyslog.conf
Step 6 Add the following line to the end of the file:
local6.* @@QRadar_Collector_IP_address
Step 7 Log in to the JSA user interface.
Step 8 Add a Linux OS log source. For more information on configuring log sources, see
the Log Sources Users Guide.
Step 9 On the Admin tab, click Deploy Changes.
Step 10 Log in to JSA as the root user.
Step 11 Type the following commands:
service auditd restart
service syslog restart
Configuring DSMs
434 LINUX

Configuring DSMs
56 MCAFEE
This section provides information on the following DSMs:
•McAfee Intrushield
•McAfee ePolicy Orchestrator
•McAfee Application / Change Control
•McAfee Web Gateway
McAfee Intrushield A Juniper Secure Analytics (JSA) McAfee Intrushield DSM accepts events using
syslog. JSA records all relevant events.
Before you configure JSA to integrate with a McAfee Intrushield device, you must
select your McAfee Intrushield version.
•To integrate JSA with a version of McAfee Intrushield between v2.x and v5.x,
see Configure McAfee Intrushield Using v2.x to v5.x.
•To integrate JSA with McAfee Intrushield v6.x, see Configuring McAfee
Intrushield Using v6.x.
Configure McAfee
Intrushield Using
v2.x to v5.x
To integrate your McAfee Intrushield with JSA, you must configure a syslog
forwarder in McAfee Intrushield, then configure the log source in JSA or wait for
JSA to automatically discover your McAfee Intrushield appliance.
Configure the syslog forwarder for McAfee Intrushield v2.x to v5.x
To configure McAfee Intrushield:
Step 1 Log in to the McAfee Intrushield Manager user interface.
Step 2 In the dashboard click Configure.
Step 3 From the Resource Tree, click the root node (Admin-Domain-Name).
Step 4 Select Alert Notification > Syslog Forwarder.
Step 5 Type the Syslog Server details.
a The Enable Syslog Forwarder must be configured as Yes.
b The Port must be configured to 514.

Configuring DSMs
436 MCAFEE
Step 6 Click Edit.
Step 7 Choose one of the following:
a If you are using a version of McAfee Intrushield that does not have patches
applied, type the following to customize the message string:
|$ALERT_ID$|$ALERT_TYPE$|$ATTACK_TIME$|"$ATTACK_NAME$"|
$ATTACK_ID$|$ATTACK_SEVERITY$|$ATTACK_SIGNATURE$|$ATTACK_
CONFIDENCE$|$ADMIN_DOMAIN$|$SENSOR_NAME$|$INTERFACE$|
$SOURCE_IP$|$SOURCE_PORT$|$DESTINATION_IP$|$DESTINATION
_PORT$|
NOTE
Note: The custom message string must be entered as a single line with no
carriage returns. Versions of McAfee Intrushield that do not have patches applied
use different message strings than patched versions. McAfee Intrushield expects
the format of the custom message syslog information to contain a dollar sign ($)
delimiter before and after each element. If you are missing a dollar sign for an
element, then the event might not parse properly.
If you are unsure what event message format to use, contact McAfee Customer
Support.
b If you are using a version of McAfee Intrushield that has patches applied from
3.x to v5.x, type the following to customize the message string:
|$IV_ALERT_ID$|$IV_ALERT_TYPE$|$IV_ATTACK_TIME$|"$IV_ATTACK_
NAME$"|$IV_ATTACK_ID$|$IV_ATTACK_SEVERITY$|$IV_ATTACK_
SIGNATURE$|$IV_ATTACK_CONFIDENCE$|$IV_ADMIN_DOMAIN$|$IV_
SENSOR_NAME$|$IV_INTERFACE$|$IV_SOURCE_IP$|$IV_SOURCE_PORT$|
$IV_DESTINATION_IP$|$IV_DESTINATION_PORT$|
NOTE
Note: The custom message string must be entered as a single line with no
carriage returns. Versions of McAfee Intrushield with patches applied use custom
message strings that begin with $IV. McAfee Intrushield expects the format of the
custom message syslog information to contain a dollar sign ($) delimiter before
and after each element. If you are missing a dollar sign for an element, then the
event might not parse properly.
If you are unsure what event message format to use, contact McAfee Customer
Support.
Step 8 Click Save.
You are now ready to configure the log source in JSA.
Configure a log source
JSA automatically detects syslog events from your McAfee Intrushield appliance
and creates a log source for your McAfee Intrushield events. These configuration
steps are options.

Configuring DSMs
McAfee Intrushield 437
Procedure
Step 1 Log in to JSA.
Step 2 Click the Admin tab.
Step 3 On the navigation menu, click Data Sources.
Step 4 Click the Log Sources icon.
Step 5 Click Add.
Step 6 In the Log Source Name field, type a name for your log source.
Step 7 In the Log Source Description field, type a description for the log source.
Step 8 From the Log Source Type list box, select McAfee IntruShield Network IPS
Appliance.
Step 9 Using the Protocol Configuration list box, select Syslog.
Step 10 Configure the following values:
Step 11 Click Save.
Step 12 On the Admin tab, click Deploy Changes.
The configuration is complete.
Configuring McAfee
Intrushield Using
v6.x
To integrate your McAfee Intrushield with JSA, you must configure your McAfee
Intrushield to forward events, then configure the log source in JSA or wait for JSA
to automatically discover your McAfee Intrushield appliance.
Configure syslog events for McAfee Intrushield v6.x
To configure McAfee Intrushield:
Step 1 Log in to the McAfee Intrushield Manager user interface.
Step 2 On the Network Security Manager dashboard, click Configure.
Step 3 Expand the Resource Tree, click IPS Settings node.
The IPS Summary page is displayed.
Step 4 Click the Alert Notification tab.
The Summary page is displayed.
Step 5 In the Alert Notification menu, click the Syslog tab.
Table 59-3 Syslog protocol parameters
Parameter Description
Log Source Identifier Type the IP address or hostname for the McAfee Intrushield
console.

Configuring DSMs
438 MCAFEE
Step 6 Configure the following values:
Table 59-4 McAfee Intrushield v6.x Required Parameters
Parameter Description
Enable Syslog Notification Select Yes to enable syslog notifications for
McAfee Intrushield. You must enable this option
to forward events to JSA.
Admin Domain Select any of the following options:
•Current - Select this check box to send
syslog notifications for alerts in the current
domain. This option is selected by default.
•Children - Select this check box to send
syslog notifications for alerts in any child
domains within the current domain.
Server Name or IP Address Type the IP address of your JSA console or
Event Collector. This field supports both IPv4
and IPv6 addresses.
UDP Port Type 514 as the UDP port for syslog events.
Facility Select a syslog priority value from the list box.
Severity Mappings Select a value to map the informational, low,
medium, and high alert notification level to a
syslog severity.
The options include:
•Emergency - The system is down or
unusable.
•Alert - The system requires immediate user
input or intervention.
•Critical - The system should be corrected
for a critical condition.
•Error - The system has non-urgent failures.
•Warning - The system has a warning
message indicating an imminent error.
•Notice - The system has notifications, no
immediate action required.
•Informational - Normal operating
messages.
Send Notification If Select the following check boxes:
•The attack definition has this notification
option explicitly enabled
•The following notification filter is
matched - From the list box, select Severity
Informational and above.
Notify on IPS Quarantine Alert Select No as the notify on IPS quarantine
option.
Configuring DSMs
McAfee Intrushield 439
Step 7 Click Save.
Step 8 From the Message Preference field, click Edit to add a custom message filter.
The Custom Message page is displayed.
Step 9 Type the following to customize the message string:
|$IV_ALERT_ID$|$IV_ALERT_TYPE$|$IV_ATTACK_TIME$|"$IV_ATTACK_NAM
E$"|$IV_ATTACK_ID$|$IV_ATTACK_SEVERITY$|$IV_ATTACK_SIGNATURE$|$
IV_ATTACK_CONFIDENCE$|$IV_ADMIN_DOMAIN$|$IV_SENSOR_NAME$|$IV_IN
TERFACE$|$IV_SOURCE_IP$|$IV_SOURCE_PORT$|$IV_DESTINATION_IP$|$I
V_DESTINATION_PORT$|$IV_DIRECTION$|$IV_SUB_CATEGORY$
NOTE
Note: The custom message string must be entered as a single line with no
carriage returns. McAfee Intrushield expects the format of the custom message
syslog information to contain a dollar sign ($) delimiter before and after each
element. If you are missing a dollar sign for an element, then the event might not
parse properly.
You might require a text editor to properly format the custom message string as a
single line.
You are now ready to configure the log source in JSA or wait for JSA to
automatically discover your McAfee Intrushield appliance.
Configure a log source
JSA automatically detects syslog events from your McAfee Intrushield appliance
and creates a log source for your McAfee Intrushield events. These configuration
steps are optional.
Procedure
Step 1 Log in to JSA.
Step 2 Click the Admin tab.
Step 3 On the navigation menu, click Data Sources.
Step 4 Click the Log Sources icon.
Step 5 Click Add.
Step 6 In the Log Source Name field, type a name for your log source.
Step 7 In the Log Source Description field, type a description for the log source.
Step 8 From the Log Source Type list box, select McAfee IntruShield Network IPS
Appliance.
Step 9 Using the Protocol Configuration list box, select Syslog.
Message Preference Select the Customized option.
Table 59-4 McAfee Intrushield v6.x Required Parameters (continued)
Parameter Description

Configuring DSMs
440 MCAFEE
Step 10 Configure the following values:
Step 11 Click Save.
Step 12 On the Admin tab, click Deploy Changes.
The configuration is complete.
McAfee ePolicy
Orchestrator
The McAfee ePolicy Orchestrator (ePO) DSM for JSA accepts events using Java
Database Connectivity (JDBC) or Simple Network Management Protocol
(SNMPv2, and SNMPv3).
JSA records all relevant ePO anti-virus events from JDBC or SNMP. You can
configure McAfee ePolicy Orchestrator to integrate with JSA using one of the
following methods:
•Configuring a Log Source Using the JDBC Protocol
•Configuring ePO to Forward SNMP Events
Configuring a Log
Source Using the
JDBC Protocol
To configure JSA to access the ePO database using the JDBC protocol:
Procedure
Step 1 Click the Admin tab.
Step 2 Click the Log Sources icon.
Step 3 Click Add.
Step 4 In the Log Source Name field, type a name for your McAfee ePolicy Orchestrator
log source.
Step 5 From the Log Source Type list box, select McAfee ePolicy Orchestrator.
Step 6 Using the Protocol Configuration list box, select JDBC.
You must refer to the Configure Database Settings on your ePO Management
console to configure the McAfee ePolicy Orchestrator with JDBC.
Table 59-5 Syslog prptocol parameters
Parameter Description
Log Source Identifier Type the IP address or hostname for the McAfee Intrushield
console.

Configuring DSMs
McAfee ePolicy Orchestrator 441
Step 7 Configure the following values:
Table 59-6 McAfee ePO JDBC Protocol Parameters
Parameter Description
Log Source
Identifier
Type the identifier for the log source. The log source identifier must
be added in the following format:
<McAfee ePO Database>@<McAfee ePO Database Server
IP or Host Name>
Where:
<McAfee ePO Database> is the database name, as entered in
the Database Name parameter.
<McAfee ePO Database Server IP or Host Name> is the
hostname or IP address for this log source, as entered in the IP or
Hostname parameter.
When defining a name for your log source identifier, you must use
the values of the McAfee ePO Database and Database Server IP
address or hostname from the ePO Management console.
Database Type From the list box, select MSDE.
Database Name Type the exact name of the McAfee ePolicy Orchestrator
database.
IP or Hostname Type the IP address or host name of the McAfee ePolicy
Orchestrator SQL Server.
Port Type the port number used by the database server. The default
port for MSDE is 1433.
The JDBC configuration port must match the listener port of the
McAfee ePolicy Orchestrator database. The McAfee ePolicy
Orchestrator database must have incoming TCP connections
enabled to communicate with JSA.
Note: If you define a Database Instance when using MSDE as the
database type, you must leave the Port parameter blank in your
configuration.
Username Type the username required to access the database.
Password Type the password required to access the database.
The password can be up to 255 characters in length.
Confirm
Password
Confirm the password required to access the database. The
confirmation password must be identical to the password entered
in the Password parameter.
Authentication
Domain
If you select MSDE as the Database Type and the database is
configured for Windows, you must define the Window
Authentication Domain. Otherwise, leave this parameter blank.

Configuring DSMs
442 MCAFEE
Database
Instance
Optional. Type the database instance, if you have multiple SQL
server instances on your database server.
Note: If you use a non-standard port in your database
configuration, or have blocked access to port 1434 for SQL
database resolution, you must leave the Database Instance
parameter blank in your configuration.
Table Name Type a table or view that includes the event records as follows:
•For ePO 3.x - Type Events.
•For ePO 4.x - Type EPOEvents.
Select List Type * for all fields from the table or view.
You can use a comma-separated list to define specific fields from
tables or views, if required for your configuration. The list must
contain the field defined in the Compare Field parameter. The
comma-separated list can be up to 255 alphanumeric characters in
length. Also, the list can include the following special characters:
dollar sign ($), number sign (#), underscore (_), en dash (-), and
period(.).
Compare Field Type AutoID in the compare field. The compare field is used to
identify new events added between queries to the table.
Start Date and
Time
Optional. Type the start date and time for database polling.
The Start Date and Time parameter must be formatted as
yyyy-MM-dd HH:mm with HH specified using a 24 hour clock. If the
start date or time is clear, polling begins immediately and repeats
at the specified polling interval.
Use Prepared
Statements
Select this check box to use prepared statements.
Prepared statements allow the JDBC protocol source to setup the
SQL statement once, then run the SQL statement many times with
different parameters. For security and performance reasons, we
recommend that you use prepared statements.
Clearing this check box requires you to use an alternative method
of querying that does not use pre-compiled statements.
Polling Interval Type the polling interval, which is the amount of time between
queries to the event table. The default polling interval is 10
seconds.
You can define a longer polling interval by appending H for hours
or M for minutes to the numeric value. The maximum polling
interval is 1 week in any time format. Numeric values entered
without an H or M poll in seconds.
EPS Throttle Type the number of Events Per Second (EPS) that you do not
want this protocol to exceed. The default value is 20000 EPS.
Table 59-6 McAfee ePO JDBC Protocol Parameters (continued)
Parameter Description

Configuring DSMs
McAfee ePolicy Orchestrator 443
NOTE
Note: Selecting a value for the Credibility parameter greater than 5 will weight your
McAfee ePolicy Orchestrator log source with a higher importance compared to
other log sources in JSA.
Step 8 Click Save.
Step 9 On the Admin tab, click Deploy Changes.
The configuration for McAfee ePolicy Orchestrator for JDBC is complete.
Configuring ePO to
Forward SNMP
Events
To configure ePO to forward events using SNMP, you must complete the following
configuration steps on your McAfee ePolicy Orchestrator device:
1 Add a registered server. For more information, see Adding a Registered Server to
McAfee ePO.
2 Configure the SNMP trap notifications on your ePO device. For more information,
see Configuring SNMP Notifications.
3 Configure the log source and protocol in JSA. For more information, see
Configuring the Log Source in JSA.
4 Optional. Install the Java Cryptography Extension for high level SNMP decryption
algorithms. For more information, see Installing the Java Cryptography
Extension.
Adding a Registered Server to McAfee ePO
Step 1 Log in to your McAfee ePolicy Orchestrator console.
Step 2 Select Menu > Configuration > Registered Servers.
Step 3 Click New Server.
Step 4 From the Server Type menu, select SNMP Server.
Step 5 Type the name and any additional notes about the SNMP server, click Next.
Step 6 From the Address list box, select the type of server address you are using:
a DNS Name - Type the DNS name of JSA.
Use Named Pipe
Communication
Clear the Use Named Pipe Communications check box.
When using a Named Pipe connection, the username and
password must be the appropriate Windows authentication
username and password and not the database username and
password. Also, you must use the default Named Pipe.
Database
Cluster Name
If you select the Use Named Pipe Communication check box, the
Database Cluster Name parameter is displayed. If you are running
your SQL server in a cluster environment, define the cluster name
to ensure Named Pipe communication functions properly.
Table 59-6 McAfee ePO JDBC Protocol Parameters (continued)
Parameter Description
Configuring DSMs
444 MCAFEE
b IPv4 - Type the IPv4 address of JSA.
c IPv6 - Type the IPv6 address of JSA.
Step 7 From the SNMP Version list box, select the SNMP version to use with JSA.
a If you are using SNMPv2c, you must provide the Community name.
b If you are using SNMPv3, you must provide the SNMPv3 Security details.
Step 8 Click Send Test Trap to verify the SNMP configuration.
Step 9 Click Save.
The SNMP server you configured is added to the Registered Server page.
You are now ready to configure the SNMP notifications in McAfee ePolicy
Orchestrator.
Configuring SNMP Notifications
To configure the event type to generate SNMP trap notifications:
Step 1 Select Menu > Automation > Automatic Responses.
Step 2 Click New Responses.
Step 3 Configure the following values:
a Name - Type a name for the response.
b Description - Type a description for the response.
c Event group - From the Event group list box, select ePO Notification Events.
d Event type - From the Event type list box, select Threats.
e Status - Select Enabled.
Step 4 Click Next.
The Response Builder Filter is displayed.
Step 5 From the Value column, type a value to use for system selection, or click the
ellipsis button.
Step 6 Optional. From the Available Properties list, select any additional filters to narrow
the response results.
Step 7 Click Next.
The Response Builder Aggregation window is displayed.
Step 8 Select Trigger this response for every event and click Next.
Note: We recommend that when you configure aggregation for your McAfee ePO
responses that you do not enable throttling.
Step 9 From the Actions list box, select Send SNMP Trap.
Step 10 Configure the following values:
a From the list of SNMP servers, select the SNMP server you registered in
Adding a Registered Server to McAfee ePO, Step 5.
b From the Available Types list box, select List of All Values.

Configuring DSMs
McAfee ePolicy Orchestrator 445
c Click >> to add to the following Select Types window from Table 59-7 based on
your McAfee ePolicy Orchestrator version.
Step 11 Click Next.
A summary of the automatic response configuration is displayed.
Step 12 Click Save.
You are now ready to configure the log source and protocol in JSA.
Configuring the Log Source in JSA
To configure JSA to receive event logs from McAfee ePolicy Orchestrator using
SNMP:
Step 1 Click the Admin tab.
Step 2 Click the Log Sources icon.
Step 3 Click Add.
Step 4 In the Log Source Name field, type a name for your McAfee ePolicy Orchestrator
log source.
Step 5 From the Log Source Type list box, select McAfee ePolicy Orchestrator.
Table 59-7 Supported Parameters for Event Detection
Available Types Selected Types ePO Version
Detected UTC {listOfDetectedUTC} 4.5
Received UTC {listOfReceivedUTC} 4.5
Detecting Product IPv4 Address {listOfAnalyzerIPV4} 4.5
Detecting Product IPv6 Address {listOfAnalyzerIPV6} 4.5
Detecting Product MAC Address {listOfAnalyzerMAC} 4.5
Source IPv4 Address {listOfSourceIPV4} 4.5
Source IPv6 Address {listOfSourceIPV6} 4.5
Source MAC Address {listOfSourceMAC} 4.5
Source User Name {listOfSourceUserName} 4.5
Target IPv4 Address {listOfTargetIPV4} 4.5
Target IPv6 Address {listOfTargetIPV6} 4.5
Target MAC {listOfTargetMAC} 4.5
Target Port {listOfTargetPort} 4.5
Threat Event ID {listOfThreatEventID} 4.5
Threat Severity {listOfThreatSeverity} 4.5
SourceComputers 4.0
AffectedComputerIPs 4.0
EventIDs 4.0
TimeNotificationSent 4.0

Configuring DSMs
446 MCAFEE
Step 6 From the Protocol Configuration list box, select either SNMPv2, or SNMPv3.
NOTE
Note: SNMPv1 is listed as an option in the Protocol Configuration list box, but
SNMPv1 is not a recommended protocol when using McAfee ePolicy Orchestrator
with JSA.
Step 7 Configure the following values based on the protocol you selected in Step 6:
a To configure the SNMPv2 protocol:
b To configure the SNMPv3 protocol:
Table 59-8 SNMPv2 Configuration Parameters
Parameter Description
Log Source
Identifier
Type the IP address for the log source. The log source identifier
must be unique for the log source type.
Community Type the SNMP community string for the SNMPv2 protocol, such
as Public.
The default community string is Public.
Include OIDs in
Event Payload
Select this check box.
This options allows the McAfee ePO event payloads to be
constructed using name-value pairs instead of the standard
event payload format. Including OIDs in the event payload is
required for processing SNMPv2 or SNMPv3 events for McAfee
ePO.
Note: This option is not supported for SNMPv1 configurations of
McAfee ePO.
Table 59-9 SNMPv3 Configuration Parameters
Parameter Description
Log Source Identifier Type the IP address for the log source. The log source
identifier must be unique for the log source type.
Authentication
Protocol
From the list box, select the algorithm you want to use to
authenticate SNMP traps. This parameter is required if you
are using SNMPv3.
The options include:
•SHA - Select this option to use Secure Hash Algorithm
(SHA) as your authentication protocol.
•MD5 - Select this option to use Message Digest 5 (MD5)
as your authentication protocol.
The default is MD5.
Authentication
Password
Type the password you want to use to authenticate SNMP.
This parameter is required if you are using SNMPv3.
Note: Your authentication password must include a minimum
of 8 characters.

Configuring DSMs
McAfee ePolicy Orchestrator 447
For more information on configuring SNMP on your ePO device, see the McAfee
website at http://www.mcafee.com.
Installing the Java
Cryptography
Extension
The Java Cryptography Extension (JCE) is a Java framework that is required for
JSA to decrypt advanced cryptography algorithms for AES192 or AES256. The
following information describes how to install Oracle JCE with JSA and on your
McAfee ePO appliance.
Decryption Protocol From the list box, select the algorithm you want to use to
decrypt the SNMP traps. This parameter is required if you are
using SNMPv3.
The decryption algorithms include:
•DES
•AES128
•AES192
•AES256
The default is AES256.
Note: If you select AES192 or AES256 as your decryption
algorithm, you must install additional software for JSA. For
more information, see Installing the Java Cryptography
Extension.
Decryption Password Type the password used to decrypt SNMP traps. This
parameter is required if you are using SNMPv3.
Note: Your decryption password must include a minimum of 8
characters.
User Type the user access for this protocol. The default is
AdminUser.
The username can be up to 255 characters in length.
Include OIDs in Event
Payload
Select this check box.
This options allows the McAfee ePO event payloads to be
constructed using a name-value pairs instead of the standard
event payload format. Including OIDs in the event payload is
required for processing SNMPv2 or SNMPv3 events for
McAfee ePO.
Note: This option is not supported for SNMPv1 configurations
of McAfee ePO.
Table 59-9 SNMPv3 Configuration Parameters (continued)
Parameter Description

Configuring DSMs
448 MCAFEE
To allow AES192 or AES256 decryption on JSA, you must:
1 Install the JCE on McAfee ePolicy Orchestrator
2 Install the JCE on JSA
Install the JCE on McAfee ePolicy Orchestrator
To install the Unrestricted JCE Policy Files on JSA.
Step 1 Download the latest version of the JavaTM Cryptography Extension:
https://www14.software.ibm.com/webapp/iwm/web/preLogin.do?source=jcesdk
There may be several versions of the JCE available for download. The version you
download should match the version of the Java installed on your McAfee ePO
appliance.
Step 2 Copy the JCE zip file to the following directory on your McAfee ePO appliance:
<McAfee ePO>/jre/lib/security
Where <McAfee ePO> is the installation path for ePolicy Orchestrator.
The installation is complete.
NOTE
Note: You do not need to extract the zip files for the Java Cryptography Extension
on your McAfee ePolicy Orchestrator appliance.
Install the JCE on JSA
To install the Oracle JCE on JSA:
Step 1 Download the latest version of the Java Cryptography Extension:
https://www14.software.ibm.com/webapp/iwm/web/preLogin.do?source=jcesdk
There may be several versions of the JCE available for download. The version you
download should match the version of Java installed on JSA.
Step 2 Extract the JCE file.
The following Java archive (JAR) files are included in the JCE download:
•local_policy.jar
•US_export_policy.jar
Step 3 Using SSH, log in to your JSA console or Event Collector as a root user.
Username: root
Password: <password>

Configuring DSMs
McAfee Application / Change Control 449
Step 4 Copy the JCE jar files to the following directory on your JSA console or Event
Collector:
/usr/java/latest/jre/lib/
The JCE jar files are only copied to the system receiving the AES192 or AE256
encrypted files from McAfee ePolicy Orchestrator. Depending on your
configuration, this could be the JSA console or an Event Collector.
The installation of the Java Cryptography Extension for JSA is complete.
McAfee Application
/ Change Control
The McAfee Application / Change Control DSM for JSA accepts change control
events using Java Database Connectivity (JDBC). JSA records all relevant McAfee
Application / Change Control events. This document includes information on
configuring JSA to access the database containing events using the JDBC
protocol.
Procedure
Step 1 Log in to JSA.
Step 2 Click the Admin tab.
Step 3 Click the Log Sources icon.
Step 4 Click Add.
Step 5 Using the Log Source Type list box, select McAfee Application / Change
Control.
Step 6 Using the Protocol Configuration list box, select JDBC.
You must refer to the Configure Database Settings on your ePO Management
console to configure the McAfee Application / Change Control DSM in JSA.
Step 7 Configure the following values:
Table 59-10 McAfee Application / Change Control JDBC Protocol Parameters
Parameter Description
Log Source
Identifier
Type the identifier for the log source. Type the log source identifier
in the following format:
<McAfee Change Control Database>@<Change Control
Database Server IP or Host Name>
Where:
<McAfee Change Control Database> is the database name,
as entered in the Database Name parameter.
<Change Control Database Server IP or Host Name>
is the hostname or IP address for this log source, as entered in the
IP or Hostname parameter.
When defining a name for your log source identifier, you must use
the values of the McAfee Change Control Database and Database
Server IP address or hostname from the ePO Management
Console.

Configuring DSMs
450 MCAFEE
Database Type From the list box, select MSDE.
Database Name Type the exact name of the McAfee Application / Change Control
database.
IP or Hostname Type the IP address or host name of the McAfee Application /
Change Control SQL Server.
Port Type the port number used by the database server. The default
port for MSDE is 1433.
The JDBC configuration port must match the listener port of the
McAfee Application / Change Control database. The McAfee
Application / Change Control database must have incoming TCP
connections enabled to communicate with JSA.
Note: If you define a Database Instance when using MSDE as the
database type, you must leave the Port parameter blank in your
configuration.
Username Type the username required to access the database.
Password Type the password required to access the database. The
password can be up to 255 characters in length.
Confirm
Password
Confirm the password required to access the database. The
confirmation password must be identical to the password entered
in the Password parameter.
Authentication
Domain
If you select MSDE as the Database Type and the database is
configured for Windows, you must define the Window
Authentication Domain. Otherwise, leave this field blank.
Database
Instance
Optional. Type the database instance, if you have multiple SQL
server instances on your database server.
Note: If you use a non-standard port in your database
configuration, or have blocked access to port 1434 for SQL
database resolution, you must leave the Database Instance
parameter blank in your configuration.
Table Name Type SCOR_EVENTS as the name of the table or view that
includes the event records.
Select List Type * for all fields from the table or view.
You can use a comma-separated list to define specific fields from
tables or views, if required for your configuration. The list must
contain the field defined in the Compare Field parameter. The
comma-separated list can be up to 255 alphanumeric characters in
length. The list can include the following special characters: dollar
sign ($), number sign (#), underscore (_), en dash (-), and
period(.).
Compare Field Type AutoID as the compare field. The compare field is used to
identify new events added between queries to the table.
Table 59-10 McAfee Application / Change Control JDBC Protocol Parameters (continued)
Parameter Description

Configuring DSMs
McAfee Application / Change Control 451
NOTE
Note: Selecting a value for the Credibility parameter greater than 5 will weight your
McAfee Application / Change Control log source with a higher importance
compared to other log sources in JSA.
Step 8 Click Save.
Step 9 On the Admin tab, click Deploy Changes.
For more information on configuring log sources, see the Log Sources Users
Guide.
Start Date and
Time
Optional. Type the start date and time for database polling.
The Start Date and Time parameter must be formatted as
yyyy-MM-dd HH:mm with HH specified using a 24 hour clock. If the
start date or time is clear, polling begins immediately and repeats
at the specified polling interval.
Use Prepared
Statements
Select this check box to use prepared statements.
Prepared statements allows the JDBC protocol source to setup the
SQL statement one time, then run the SQL statement many times
with different parameters. For security and performance reasons,
we recommend that you use prepared statements.
Note: Clearing this check box requires you to use an alternative
method of querying that does not use pre-compiled statements.
Polling Interval Type the polling interval, which is the amount of time between
queries to the event table. The default polling interval is 10
seconds.
You can define a longer polling interval by appending H for hours
or M for minutes to the numeric value. The maximum polling
interval is 1 week in any time format. Numeric values entered
without an H or M poll in seconds.
EPS Throttle Type the number of Events Per Second (EPS) that you do not
want this protocol to exceed. The default value is 20000 EPS.
Use Named Pipe
Communication
Clear the Use Named Pipe Communications check box.
When using a Named Pipe connection, the username and
password must be the appropriate Windows authentication
username and password and not the database username and
password. Also, you must use the default Named Pipe.
Database
Cluster Name
If you select the Use Named Pipe Communication check box, the
Database Cluster Name parameter is displayed. If you are running
your SQL server in a cluster environment, define the cluster name
to ensure Named Pipe communication functions properly.
Table 59-10 McAfee Application / Change Control JDBC Protocol Parameters (continued)
Parameter Description

Configuring DSMs
452 MCAFEE
McAfee Web
Gateway
You can configure McAfee Web Gateway to integrate with JSA using one of the
following methods:
•Configuring McAfee Web Gateway for Syslog
•Configuring McAfee Web Gateway for the Log File Protocol
NOTE
Note: McAfee Web Gateway is formerly known as McAfee WebWasher.
Configuring McAfee
Web Gateway for
Syslog
To integrated McAfee Web Gateway with JSA:
Procedure
Step 1 Log in to your McAfee Web Gateway console.
Step 2 Using the toolbar, click Configuration.
Step 3 Click the File Editor tab.
Step 4 Expand the appliance files and select the file /etc/rsyslog.conf.
The file editor displays the rsyslog.conf file for editing.
Step 5 Modify the rsyslog.conf file to include the following information:
# send access log to qradar
*.info;daemon.!=info;mail.none;authpriv.none;cron.none
-/var/log/messages
*.info;mail.none;authpriv.none;cron.none @<IP Address>:<Port>
Where:
<IP Address> is the IP address of JSA.
<Port> is the syslog port number, for example 514.
Step 6 Click Save Changes.
You are now ready to import a policy for the syslog handler on your McAfee Web
Gateway appliance. For more information, see Importing the Syslog Log Handler.
Importing the Syslog Log Handler
To Import a policy rule set for the syslog handler:
Step 1 From the support website, download the following compressed file:
log_handlers.tar.gz
Step 2 Extract the file.
This will give you the syslog handler file required to configure your McAfee Web
Gateway appliance.
syslog_loghandler.xml
Step 3 Log in to your McAfee Web Gateway console.
Step 4 Using the menu toolbar, click Policy.

Configuring DSMs
McAfee Web Gateway 453
Step 5 Click Log Handler.
Step 6 Using the menu tree, select Default.
Step 7 From the Add list box, select Rule Set from Library.
Step 8 Click Import from File button.
Step 9 Navigate to the directory containing the syslog_handler file you downloaded in and
select syslog_loghandler.xml as the file to import.
NOTE
Note: If the McAfee Web Gateway appliance detects any conflicts with the rule set,
you must resolve the conflict. For more information, see your McAfee Web
Gateway documentation.
Step 10 Click OK.
Step 11 Click Save Changes.
Step 12 You are now ready to configure the log source in JSA.
JSA automatically discovers syslog events from a McAfee Web Gateway
appliance.
If you want to manually configure JSA to receive syslog events, select McAfee
Web Gateway from the Log Source Type list box.
For more information on configuring log sources, see the Log Sources Users
Guide.
Configuring McAfee
Web Gateway for the
Log File Protocol
The McAfee Web Gateway appliance allows you to forward event log files to an
interim file server for retrieval by JSA.
Procedure
Step 1 From the support website, download the following file:
log_handlers.tar.gz
Step 2 Extract the file.
This will give you the access handler file required to configure your McAfee Web
Gateway appliance.
access_log_file_loghandler.xml
Step 3 Log in to your McAfee Web Gateway console.
Step 4 Using the menu toolbar, click Policy.
NOTE
Note: If there is an existing access log configuration in your McAfee Web Gateway
appliance, you must delete the existing access log from the Rule Set Library
before adding access_log_file_loghandler.xml.

Configuring DSMs
454 MCAFEE
Step 5 Click Log Handler.
Step 6 Using the menu tree, select Default.
Step 7 From the Add list box, select Rule Set from Library.
Step 8 Click Import from File button.
Step 9 Navigate to the directory containing the access_log_file_loghandler.xml file you
downloaded and select syslog_loghandler.xml as the file to import.
When importing the rule set for access_log_file_loghandler.xml, a conflict occurs
stating the Access Log Configuration already exists in the current configuration
and a conflict solution is presented.
Step 10 If the McAfee Web Gateway appliance detects that the Access Log Configuration
already exists, select the Conflict Solution: Change name option presented to
resolve the rule set conflict.
For more information on resolving conflicts, see your McAfee Web Gateway
vendor documentation.
You must configure your access.log file to be pushed to an interim server on an
auto rotation. It does not matter if you push your files to the interim server based on
time or size for your access.log file. For more information on auto rotation, see
your McAfee Web Gateway vendor documentation.
NOTE
Note: Due to the size of access.log files generated, we recommend you select the
option GZIP files after rotation in your McAfee Web Gate appliance.
Step 11 Click OK.
Step 12 Click Save Changes.
NOTE
Note: By default McAfee Web Gateway is configured to write access logs to the
/opt/mwg/log/user-defined-logs/access.log/ directory.
You are now ready to configure JSA to receive access.log files from McAfee Web
Gateway. For more information, see Pulling Data Using the Log File Protocol.
Pulling Data Using the Log File Protocol
A log file protocol source allows JSA to retrieve archived log files from a remote
host. The McAfee Web Gateway DSM supports the bulk loading of access.log files
using the log file protocol source. The default directory for the McAfee Web
Gateway access logs are
You are now ready to configure the log source and protocol in JSA:
Step 1 To configure JSA to receive events from a McAfee Web Gateway appliance, select
McAfee Web Gateway from the Log Source Type list box.
Step 2 To configure the protocol, you must select the Log File option from the Protocol
Configuration list box.

Configuring DSMs
McAfee Web Gateway DSM Integration Process 455
Step 3 To configure the File Pattern parameter, you must type a regex string for the
access.log file, such as access[0-9]+\.log.
NOTE
Note: If you selected to GZIP your access.log files, you must type
access[0-9]+\.log\.gz for the FIle Pattern field and from the Processor list box,
select GZIP.
McAfee Web
Gateway DSM
Integration Process
To integrate McAfee Web Gateway DSM with Juniper Secure Analytics (JSA), use
the following procedure:
1 Download and install the most recent version of the McAfee Web Gateway DSM
RPM on your JSA console.
2 For each instance of McAfee Web Gateway, configure your McAfee Web Gateway
VPN system to enable communication with JSA.
3 If JSA does not automatically discovers the log source, for each McAfee Web
Gateway server you want to integrate, create a log source on the JSA console.
4 If you use McAfee Web Gateway v7.0.0 or later, create an event map.
Related tasks
•Manually installing a DSM
•Configuring McAfee Web Gateway for Syslog
•Configuring McAfee Web Gateway for the Log File Protocol
•Creating an event map for McAfee Web Gateway events
Configuring DSMs
456 MCAFEE
Configuring DSMs
57 METAINFO METAIP
The MetaInfo MetaIP DSM for Juniper Secure Analytics (JSA) accepts MetaIP
events using syslog.
JSA records all relevant and available information from the event. Before
configuring a MetaIP device in JSA, you must configure your device to forward
syslog events. For information on configuring your MetaInfo MetaIP appliance, see
your vendor documentation.
After you configure your MetaInfo MetaIP appliance the configuration for JSA is
complete. JSA automatically discovers and creates a log source for syslog events
forwarded from MetaInfo MetaIP appliances. However, you can manually create a
log source for JSA to receive syslog events. The following configuration steps are
optional.
To manually configure a log source for MetaInfo MetaIP:
Step 1 Log in to JSA.
Step 2 Click the Admin tab.
Step 3 On the navigation menu, click Data Sources.
The Data Sources panel is displayed.
Step 4 Click the Log Sources icon.
The Log Sources window is displayed.
Step 5 Click Add.
The Add a log source window is displayed.
Step 6 In the Log Source Name field, type a name for your log source.
Step 7 In the Log Source Description field, type a description for the log source.
Step 8 From the Log Source Type list box, select Metainfo MetaIP.
Step 9 Using the Protocol Configuration list box, select Syslog.
The syslog protocol configuration is displayed.

Configuring DSMs
458 METAINFO METAIP
Step 10 Configure the following values:
Step 11 Click Save.
Step 12 On the Admin tab, click Deploy Changes.
The configuration is complete.
Table 60-1 Syslog Parameters
Parameter Description
Log Source Identifier Type the IP address or host name for the log source as an
identifier for events from your MetaInfo MetaIP appliances.

Configuring DSMs
58 MICROSOFT
This section provides information on the following DSMs:
•Microsoft Exchange Server
•Microsoft IAS Server
•Microsoft DHCP Server
•Microsoft IIS Server
•Microsoft ISA
•Microsoft SQL Server
•Microsoft SharePoint
•Microsoft Windows Security Event Log
•Microsoft Operations Manager
•Microsoft System Center Operations Manager
•Microsoft Endpoint Protection
Microsoft
Exchange Server
The Microsoft Exchange Server DSM for Juniper Secure Analytics (JSA) accepts
Exchange events by polling for event log files.
Supported Versions JSA supports collecting events from Microsoft Exchange Servers with the following
products:
Table 61-1 Microsoft Exchange Supported Versions
Version Product
Microsoft Exchange 2003 Adaptive Log Exporter
Note: For more information, see the Juniper Secure
Analytics Adaptive Log Exporter User Guide.
Microsoft Exchange 2007 Microsoft Exchange Protocol
Microsoft Exchange 2010 Microsoft Exchange Protocol

Configuring DSMs
460 MICROSOFT
Supported Event
Types
The Microsoft Exchange Protocol for JSA supports several event types for mail
and security events. Each event type contains events in a separate log file on your
Microsoft Exchange Server. To retrieve events, you must create a log source in
JSA to poll the Exchange Server for the event log, which is downloaded by the
Microsoft Exchange Protocol.
JSA supports the following event types for Microsoft Exchange:
•Outlook Web Access events (OWA)
•Simple Mail Transfer Protocol events (SMTP)
•Message Tracking Protocol events (MSGTRK)
The log files for each event type are located in the following default directories:
The Exchange Protocol configuration supports file paths that allow you to define a
drive letter with the path information. The default file paths are typical for standard
Exchange Server installations, but if you have changed the ExchangeInstallPath
environment variable, you need to adjust the Microsoft Exchange Protocol
accordingly. The Microsoft Exchange Protocol is capable of reading subdirectories
of the OWA, SMTP, and MSGTRK folders for event logs.
Directory paths can be specified in the following formats:
•Correct - c$/LogFiles/
•Correct - LogFiles/
•Incorrect - c:/LogFiles
•Incorrect - c$\LogFiles
Table 61-2 Microsoft Exchange Server Default File Path
Version Event Type Default File Path
Microsoft
Exchange
2003
OWA c$/WINDOWS/system32/LogFiles/W3SVC1/
SMTP c$/Program Files/Microsoft/Exchange Server/TransportRoles/Logs/ProtocolLog/
MSGTRK Not supported with JSA.
Microsoft
Exchange
2007
OWA c$/WINDOWS/system32/LogFiles/W3SVC1/
SMTP c$/Program Files/Microsoft/Exchange Server/TransportRoles/Logs/ProtocolLog/
MSGTRK c$/Program Files/Microsoft/Exchange Server/TransportRoles/Logs/MessageTracking/
Microsoft
Exchange
2010
OWA c$/inetpub/logs/LogFiles/W3SVC1/
SMTP c$/Program Files/Microsoft/Exchange Server/V14/TransportRoles/Logs/ProtocolLog/
MSGTRK c$/Program Files/Microsoft/Exchange
Server/V14/TransportRoles/Logs/MessageTracking/

Configuring DSMs
Microsoft Exchange Server 461
Required Ports and
Privileges
The Microsoft Exchange Protocol polls your Exchange Server for OWA, SMTP,
and MSGTRK event logs using NetBIOS.
You must ensure any firewalls located between the Exchange Server and the
remote host being remotely polled allow traffic on the following ports:
•TCP port 135 is used by the Microsoft Endpoint Mapper.
•UDP port 137 is used for NetBIOS name service.
•UDP port 138 is used for NetBIOS datagram service.
•TCP port 139 is used for NetBIOS session service.
•TCP port 445 is required for Microsoft Directory Services to transfer files
across a Windows share.
If a log folder path contains an administrative share (C$), users with NetBIOS
access on the administrative share (C$) have the proper access required to read
the log files. Local or domain administrators have sufficient privileges to access log
files that reside on administrative shares. Clearing the file path information from
any log folder path field disables monitoring for that log type.
Configure OWA Logs Outlook Web Access event logs for Microsoft Exchange are generated by the
Microsoft Internet Information System (IIS) installed with your Windows operating
system.
IIS is capable of writing OWA event logs in several different formats. We
recommend using the W3C log file format because the W3C format contains the
highest level of configurable logging detail.
The following log formats are supported by the Microsoft Exchange Protocol:
•W3C
•NCSA
•IIS
The configuration steps to enable OWA event logs for your Microsoft Exchange
Server is dependant on the version of IIS installed.
Table 61-3 Microsoft IIS Versions
Operating system IIS version
Microsoft Server 2003 IIS 6.0
Microsoft Server 2008 IIS 7.0
Microsoft Server 2008R2 IIS 7.0
Configuring DSMs
462 MICROSOFT
Configure OWA event logs with IIS 6.0
To configure OWA event logs for Microsoft IIS 6.0:
Step 1 On the desktop, select Start > Run.
Step 2 Type the following command:
inetmgr
Step 3 Click OK.
Step 4 In the IIS 6.0 Manager menu tree, expand Local Computer.
Step 5 Expand Web Sites.
Step 6 Right-click Default Web Site and select Properties.
Step 7 From the Active Log Format list box, choose one of the following options:
•Select W3C (Go to Step 8)
•Select NCSA (Go to Step 11)
•Select IIS (Go to Step 11)
Step 8 Click Properties.
Step 9 Click the Advanced tab.
Step 10 From the list of properties, select all properties that you want to apply to the
Microsoft Exchange Server DSM. You must select the following check boxes:
•Method (cs-method)
•Protocol Version (cs-version)
Step 11 Click OK.
JSA supports OWA, SMTP, and MSGTRK event logs. After you configure the
event log types required, then you are ready to create a log source in JSA.
Configure OWA event logs with IIS 7.0
To configure OWA event logs for Microsoft IIS 7.0:
Step 1 On the desktop, select Start > Run.
Step 2 Type the following command:
inetmgr
Step 3 Click OK.
Step 4 In the IIS 7.0 Manager menu tree, expand Local Computer.
Step 5 Click Logging.
Step 6 From the Format list box, choose one of the following options:
•Select W3C (Go to Step 7)
•Select NCSA (Go to Step 9)
•Select IIS (Go to Step 9)
Step 7 Click Select Fields.
Configuring DSMs
Microsoft Exchange Server 463
Step 8 From the list of properties, select all properties that you want to apply to the
Microsoft Exchange Server DSM. You must select the following check boxes:
•Method (cs-method)
•Protocol Version (cs-version)
Step 9 Click OK.
JSA supports OWA, SMTP, and MSGTRK event logs. After you configure all of the
event log types you want to collect, then you are ready to create a log source in
JSA.
Configure SMTP
Logs
SMTP logs created by the Exchange Server write SMTP send and receive email
events that are part of the message delivery process.
SMTP protocol logging is not enabled by default on Exchange 2007 or Exchange
2010 installations. You must enable SMTP logging on both send and receive
connectors. The instructions for enabling SMTP event logs apply to both Exchange
Server 2007 and Exchange Server 2010.
To enable SMTP event logs:
Step 1 Start the Exchange Management console.
Step 2 Configure your receive connector based on the server type:
•For edge transport servers - In the console tree, select Edge Transport and
click the Receive Connectors tab.
•For hub transport servers - In the console tree, select Server Configuration >
Hub Transport, then select the server and click the Receive Connectors tab.
Step 3 Select your Receive Connector and click Properties.
Step 4 Click the General tab.
Step 5 From the Protocol logging level list box, select Verbose.
Step 6 Click Apply.
Step 7 Click OK.
You are now ready to configure your send connectors.
Step 8 Configure your send connector based on the server type:
•For edge transport servers - In the console tree, select Edge Transport and
click the Send Connectors tab.
•For hub transport servers - In the console tree, select Organization
Configuration > Hub Transport, then select the server and click the Send
Connectors tab.
Step 9 Select your Send Connector and click Properties.
Step 10 Click the General tab.
Step 11 From the Protocol logging level list box, select Verbose.
Step 12 Click Apply.
Configuring DSMs
464 MICROSOFT
Step 13 Click OK.
Logging for SMTP is now enabled.
Configure MSGTRK
Logs
Message Tracking logs created by the Exchange Server detail the message
activity that takes on your Exchange Server, including the message path
information.
MSGTRK logs are enabled by default on Exchange 2007 or Exchange 2010
installations. The following configuration steps are optional.
To enable MSGTRK event logs:
Step 1 Start the Exchange Management console.
Step 2 Configure your receive connector based on the server type:
•For edge transport servers - In the console tree, select Edge Transport and
click Properties.
•For hub transport servers - In the console tree, select Server Configuration >
Hub Transport, then select the server and click Properties.
Step 3 Click the Log Settings tab.
Step 4 Select the Enable message tracking check box.
Step 5 Click Apply.
Step 6 Click OK.
MSGTRK events are now enabled on your Exchange Server.
Configure a Log
Source
The Microsoft Windows Exchange protocol supports SMTP, OWA, and message
tracking logs for Microsoft Exchange.
To configure a log source:
Step 1 Click the Admin tab.
Step 2 On the navigation menu, click Data Sources.
Step 3 Click the Log Sources icon.
Step 4 In the Log Source Name field, type a name for the log source.
Step 5 In the Log Source Description field, type a description for the log source.
Step 6 From the Log Source Type list box, select Microsoft Exchange Server.
Step 7 From the Protocol Configuration list box, select Microsoft Exchange.

Configuring DSMs
Microsoft Exchange Server 465
Step 8 Configure the following parameters:
Table 61-4 Microsoft Exchange Parameters
Parameter Description
Log Source Identifier Type an IP address, hostname, or name to identify the
Windows Exchange event source.
IP addresses or host names are recommended as they allow
JSA to identify a log file to a unique event source.
Server Address Type the IP address of the Microsoft Exchange server.
Domain Type the domain required to access the Microsoft Exchange
server. This parameter is optional.
Username Type the username required to access the Microsoft
Exchange server.
Password Type the password required to access the Microsoft
Exchange server.
Confirm Password Confirm the password required to access the Microsoft
Exchange server.
SMTP Log Folder Path Type the directory path to access the SMTP log files.
Clearing the file path information from the SMTP Log Folder
Path field disables SMTP monitoring.
OWA Log Folder Path Type the directory path to access the OWA log files.
Clearing the file path information from the OWA Log Folder
Path field disables OWA monitoring.
MSGTRK Log Folder
Path
Type the directory path to access message tracking log files.
Message tracking is only available on Microsoft Exchange
2007 servers assigned the Hub Transport, Mailbox, or Edge
Transport server role.
File Pattern Type the regular expression (regex) required to filter the
filenames. All files matching the regex are processed.
The default is .*\.(?:log|LOG)
Force File Read Select this check box to force the protocol to read the log file.
By default, the check box is selected.
If the check box is cleared, the log file is read when the log
file modified time or file size attributes change.
Recursive Select this check box if you want the file pattern to search
sub folders. By default, the check box is selected.
Polling Interval (in
seconds)
Type the polling interval, which is the number of seconds
between queries to the log files to check for new data. The
minimum polling interval is 10 seconds, with a maximum
polling interval of 3,600 seconds.
The default is 10 seconds.

Configuring DSMs
466 MICROSOFT
Step 9 Click Save.
Step 10 On the Admin tab, click Deploy Changes.
The configuration is complete.
Microsoft IAS
Server
The Microsoft IAS Server DSM for JSA accepts RADIUS events using syslog. You
can integrate Internet Authentication Service (IAS) or Network Policy Server (NPS)
logs with JSA using the Adaptive Log Exporter. For more information, see the
Adaptive Log Exporter Users Guide.
You are now ready to configure the log source in JSA.
To configure JSA to receive events from a Microsoft Windows IAS Server:
From the Log Source Type list box, select the Microsoft IAS Server option.
For more information on configuring devices, see the Log Sources Users Guide.
For more information about your server, see your vendor documentation.
Microsoft DHCP
Server
The Microsoft DHCP Server DSM for JSA accepts DHCP events using the
Microsoft DHCP Server protocol or the Adaptive Log Exporter.
Configure your
Microsoft DHCP
Server
Before you can integrate your Microsoft DHCP Server with JSA, you must enable
audit logging.
To configure the Microsoft DHCP Server:
Step 1 Log in to the DHCP Server Administration Tool.
Step 2 From the DHCP Administration Tool, right-click on the DHCP server and select
Properties.
The Properties window is displayed.
Step 3 Click the General tab.
The General panel is displayed.
Step 4 Click Enable DHCP Audit Logging.
The audit log file is created at midnight and must contain a three-character day of
the week abbreviation.
Throttle Events/Sec Type the maximum number of events the Microsoft
Exchange protocol forwards every second. The minimum
value is 100 EPS and the maximum is 20,000 EPS.
The default value is 100 EPS.
Table 61-4 Microsoft Exchange Parameters (continued)
Parameter Description

Configuring DSMs
Microsoft IIS Server 467
By default Microsoft DHCP is configured to write audit logs to the
%WINDIR%\system32\dhcp\ directory.
Step 5 Restart the DHCP service.
You are now ready to configure the log source and protocol in JSA:
Step 1 To configure JSA to receive events from a Microsoft DHCP Server, you must select
the Microsoft DHCP Server option from the Log Source Type list box.
Step 2 To configure the protocol, you must select the Microsoft DHCP option from the
Protocol Configuration list box. For more information on configuring the
Microsoft DHCP protocol, see the Log Sources Users Guide.
NOTE
Note: To integrate Microsoft DHCP Server versions 2000/2003 with JSA using the
Adaptive Log Exporter Microsoft DHCP devices, see the Adaptive Log Exporter
Users Guide.
Microsoft IIS Server The Microsoft Internet Information Services (IIS) Server DSM for JSA accepts FTP,
HTTP, NNTP, and SMTP events using syslog.
You can integrate a Microsoft IIS Server with JSA using one of the following
methods:
•Configure JSA to connect to your Microsoft IIS Server using the IIS Protocol.
The IIS Protocol collects HTTP events from Microsoft IIS servers. For more
information, see Configure Microsoft IIS using the IIS Protocol.
•Configure a Snare Agent with your Microsoft IIS Server to forward event
information to JSA. For more information, see Configuring Microsoft IIS Using
a Snare Agent.
•Configure the Adaptive Log Exporter to forward IIS events to JSA. For more
information, see Configuring Microsoft IIS using the Adaptive Log Exporter.
For more information on the Adaptive Log Exporter, see the Adaptive Log
Exporter Users Guide.
Table 61-5 Microsoft DHCP Log File Examples
Log Type Example
IPv4 DhcpSrvLog-Mon.log
IPv6 DhcpV6SrvLog-Wed.log
Table 61-6 Microsoft IIS Supported Log Types
Version
Supported Log
Type Method of Import
Microsoft IIS 6.0 SMTP, NNTP,
FTP, HTTP
IIS Protocol

Configuring DSMs
468 MICROSOFT
Configure Microsoft
IIS using the IIS
Protocol
Before you configure JSA with the Microsoft IIS protocol, you must configure your
Microsoft IIS Server to generate the proper log format.
The Microsoft IIS Protocol only supports the W3C Extended Log File format. The
Microsoft authentication protocol NTLMv2 Session is not supported by the
Microsoft IIS protocol.
Configuring Your IIS Server
To configure the W3C event log format in Microsoft IIS:
Step 1 Log in to your Microsoft Information Services (IIS) Manager.
Step 2 In the IIS Manager menu tree, expand Local Computer.
Step 3 Select Web Sites.
Step 4 Right-click on Default Web Sites and select Properties.
The Default Web Site Properties window is displayed.
Step 5 Select the Web Site tab.
Step 6 Select the Enable logging check box.
Step 7 From the Active Log Format list box, select W3C Extended Log File Format.
Step 8 From the Enable Logging pane, click Properties.
The Logging Properties window is displayed.
Step 9 Click the Advanced tab.
Step 10 From the list of properties, select check boxes for the following W3C properties:
Microsoft IIS 6.0 SMTP, NNTP,
FTP, HTTP
Adaptive Log Exporter or Snare
Microsoft IIS 7.0 HTTP IIS Protocol
Microsoft IIS 7.0 SMTP, NNTP,
FTP, HTTP
Adaptive Log Exporter or Snare
Table 61-6 Microsoft IIS Supported Log Types (continued)
Version
Supported Log
Type Method of Import
Table 61-7 Required Properties for IIS Event Logs
IIS 6.0 Required Properties IIS 7.0 Required Properties
Date (date) Date (date)
Time (time) Time (time)
Client IP Address (c-ip) Client IP Address (c-ip)
User Name (cs-username) User Name (cs-username)
Server IP Address (s-ip) Server IP Address (s-ip)
Server Port (s-port) Server Port (s-port)

Configuring DSMs
Microsoft IIS Server 469
Step 11 Click OK.
You are now ready to configure the log source in JSA.
Configuring the Microsoft IIS Protocol in JSA
To configure the log source
Step 1 Log in to JSA.
Step 2 Click the Admin tab.
Step 3 On the navigation menu, click Data Sources.
The Data Sources panel is displayed.
Step 4 Click the Log Sources icon.
The Log Sources window is displayed.
Step 5 Click Add.
The Add a log source window is displayed.
Step 6 From the Log Source Type list box, select Microsoft IIS Server.
Step 7 From the Protocol Configuration list box, select Microsoft IIS.
Step 8 Configure the following values:
Method (cs-method) Method (cs-method)
URI Stem (cs-uri-stem) URI Stem (cs-uri-stem)
URI Query (cs-uri-query) URI Query (cs-uri-query)
Protocol Status (sc-status) Protocol Status (sc-status)
Protocol Version (cs-version) User Agent (cs(User-Agent))
User Agent (cs(User-Agent))
Table 61-7 Required Properties for IIS Event Logs
IIS 6.0 Required Properties IIS 7.0 Required Properties
Table 61-8 Microsoft IIS Protocol Parameters
Parameter Description
Log Source Identifier Type the IP address or hostname for the log source.
Server Address Type the IP address of the Microsoft IIS server.
Username Type the username required to access the Microsoft IIS
server.
Password Type the password required to access the Microsoft IIS
server.
Confirm Password Confirm the password required to access the Microsoft IIS
server.
Domain Type the domain required to access the Microsoft IIS server.

Configuring DSMs
470 MICROSOFT
Step 9 Click Save.
Step 10 The Microsoft IIS protocol configuration is complete.
Configuring
Microsoft IIS Using a
Snare Agent
If you want to use a snare agent to integrate the Microsoft IIS server with JSA, you
must configure a Snare Agent to forward events.
Configuring Microsoft IIS using a Snare Agent with JSA requires the following:
1 Configure Your Microsoft IIS Server for Snare
2 Configure the Snare Agent
3 Configure a Microsoft IIS log source
Configure Your Microsoft IIS Server for Snare
To configure a Snare Agent to integrate a Microsoft IIS server with JSA:
Step 1 Log in to your Microsoft Information Services (IIS) Manager.
Step 2 In the IIS Manager menu tree, expand Local Computer.
Step 3 Select Web Sites.
Folder Path Type the directory path to access the IIS log files. The default
is \WINDOWS\system32\LogFiles\W3SVC1\
Parameters that support file paths allow you to define a drive
letter with the path information. For example, you can use
c$\LogFiles\ for an administrative share or LogFiles\
for a public share folder path, but not c:\LogFiles.
If a log folder path contains an administrative share (C$),
users with NetBIOS access on the administrative share (C$)
have the proper access required to read the log files. Local
or domain administrators have sufficient privileges to access
log files that reside on administrative shares.
File Pattern Type the regular expression (regex) required to filter the
filenames. All matching files are included in the processing.
The default is (?:u_)?ex.*\.(?:log|LOG)
For example, to list all files starting with the word log,
followed by one or more digits and ending with tar.gz, use
the following entry: log[0-9]+\.tar\.gz. Use of this parameter
requires knowledge of regular expressions (regex). For more
information, see the following website:
http://download.oracle.com/javase/tutorial/essential/regex/
Recursive Select this check box if you want the file pattern to search
sub folders. By default, the check box is selected.
Polling Interval (s) Type the polling interval, which is the number of seconds
between queries to the log files to check for new data. The
default is 10 seconds.
Table 61-8 Microsoft IIS Protocol Parameters (continued)
Parameter Description

Configuring DSMs
Microsoft IIS Server 471
Step 4 Right-click on Default Web Sites and select Properties.
The Default Web Site Properties window is displayed.
Step 5 Select the Web Site tab.
Step 6 Select the Enable logging check box.
Step 7 From the Active Log Format list box, select W3C Extended Log File Format.
Step 8 From the Enable Logging panel, click Properties.
The Logging Properties window is displayed.
Step 9 Click the Advanced tab.
Step 10 From the list of properties, select check boxes for the following W3C properties:
Step 11 Click OK.
Step 12 You are now ready to configure the Snare Agent.
Configure the Snare Agent
To configure your Snare Agent:
Step 1 Access the InterSect Alliance website:
http://www.intersectalliance.com/projects/SnareIIS/
Step 2 Download open source Snare Agent for IIS, version 1.2:
SnareIISSetup-1.2.exe
Step 3 Install the open source Snare Agent for IIS.
Step 4 In the Snare Agent, select Audit Configuration.
The Audit Service Configuration window is displayed.
Table 61-9 Required Properties for IIS Event Logs
IIS 6.0 Required Properties IIS 7.0 Required Properties
Date (date) Date (date)
Time (time) Time (time)
Client IP Address (c-ip) Client IP Address (c-ip)
User Name (cs-username) User Name (cs-username)
Server IP Address (s-ip) Server IP Address (s-ip)
Server Port (s-port) Server Port (s-port)
Method (cs-method) Method (cs-method)
URI Stem (cs-uri-stem) URI Stem (cs-uri-stem)
URI Query (cs-uri-query) URI Query (cs-uri-query)
Protocol Status (sc-status) Protocol Status (sc-status)
Protocol Version (cs-version) User Agent (cs(User-Agent))
User Agent (cs(User-Agent))

Configuring DSMs
472 MICROSOFT
Step 5 In the Target Host field, type the IP address of your JSA.
Step 6 In the Log Directory field type the IIS file location:
\%SystemRoot%\System32\LogFiles\
By default Snare for IIS is configured to look for logs in
C:\WINNT\System32\LogFiles\.
Step 7 For Destination, select Syslog.
Step 8 For Delimiter, select TAB.
Step 9 Select the Display IIS Header Information check box.
Step 10 Click OK.
Configure a Microsoft IIS log source
JSA automatically discovers and creates a log source for syslog events from
Microsoft IIS forwarded from a Snare agent. These configuration steps are
optional.
To manually create a Microsoft IIS log source in JSA:
Step 1 Log in to JSA.
Step 2 Click the Admin tab.
Step 3 On the navigation menu, click Data Sources.
The Data Sources panel is displayed.
Step 4 Click the Log Sources icon.
The Log Sources window is displayed.
Step 5 Click Add.
The Add a log source window is displayed.
Step 6 From the Log Source Type list box, select Microsoft IIS Server.
Step 7 From the Protocol Configuration list box, select Syslog.
Step 8 Configure the following values:
Step 9 Click Save.
Step 10 On the Admin tab, click Deploy Changes.
The configuration is complete.
Table 61-10 Microsoft IIS Syslog Configuration
Parameter Description
Log Source Identifier Type the IP address or hostname for the log source.

Configuring DSMs
Microsoft ISA 473
Configuring
Microsoft IIS using
the Adaptive Log
Exporter
The Adaptive Log Exporter is a stand-alone application that allows you to integrate
device logs or application event data with JSA or Log Analytics.
The Adaptive Log Export supports NCSA, IIS, and W3C active log formats.
To integrate the Adaptive Log Exporter with Microsoft IIS:
Step 1 Log in to your Microsoft Information Services (IIS) Manager.
Step 2 In the IIS Manager menu tree, expand Local Computer.
Step 3 Select Web Sites.
Step 4 Right-click on Default Web Site and select Properties.
The Web Sites Properties window is displayed.
Step 5 From the Active Log Format list box, select one of the following:
•Select NCSA. Go to Step 9.
•Select IIS. Go to Step 9.
•Select W3C. Go to Step 6.
Step 6 Click Properties.
The Properties window is displayed.
Step 7 Click the Advanced tab.
Step 8 From the list of properties, select all event properties that you want to apply to the
Microsoft IIS event log. The selected properties must include the following:
a Select the Method (cs-method) check box.
b Select the Protocol Version (cs-version) check box.
Step 9 Click OK.
Step 10 You are now ready to configure the Adaptive Log Exporter.
For more information on installing and configuring Microsoft IIS for the Adaptive
Log Exporter, see the Adaptive Log Exporter User Guide.
Microsoft ISA The Microsoft Internet and Acceleration (ISA) DSM for JSA accepts events using
syslog. You can integrate Microsoft ISA Server with JSA using the Adaptive Log
Exporter. For more information on the Adaptive Log Exporter, see the Adaptive
Log Exporter Users Guide.
NOTE
Note: The Microsoft ISA DSM also supports events from Microsoft Threat
Management Gateway using the Adaptive Log Exporter.

Configuring DSMs
474 MICROSOFT
Microsoft Hyper-V The Juniper Secure Analytics (JSA) DSM for Microsoft Hyper-V can collect event
logs from your Microsoft Hyper-V servers.
Table 61-1 describes the specifications for the Microsoft Hyper-V Server DSM.
Microsoft Hyper-V
DSM Integration
Process
To integrate Microsoft Hyper-V DSM with JSA, use the following procedures:
1 Download and install the most recent WinCollect RPM on your JSA console.
2 Install a WinCollect agent on the Hyper-V system or on another system that has a
route to the Hyper-V system. You can also use an existing WinCollect agent. For
more information, see the WinCollect Users Guide.
3 If automatic updates are not enabled, download and install the DSM RPM for
Microsoft Hyper-V on your JSA Console. RPMs need to be installed only one time.
4 For each Microsoft Hyper-V server that you want to integrate, create a log source
on the JSA console.
Related tasks
Manually installing a DSM
Configuring a Microsoft Hyper-V Log Source in JSA
Table 61-1 Microsoft Hyper-V DSM Specifications
Specification Value
Manufacturer Microsoft
DSM Microsoft Hyper-V
RPM file name DSM-MicrosoftHyperV-build_number.rpm
Supported versions v2008 and v2012
Protocol WinCollect
JSA recorded events All relevant events
Automatically discovered No
Includes identity No
More information http://technet.microsoft.com/en-us/windowsserver/dd
448604.aspx

Configuring DSMs
Microsoft SQL Server 475
Configuring a
Microsoft Hyper-V
Log Source in JSA
To collect Microsoft Hyper-V events, configure a log source in JSA.
Before you begin
Ensure that you have the current credentials for the Microsoft Hyper-V server and
the WinCollect agent can access it.
Procedure
To configure a Microsoft Hyper-V log source in JSA:
Step 1 Log in to JSA.
Step 2 Click the Admin tab.
Step 3 In the navigation menu, click Data Sources.
Step 4 Click the Log Sources icon.
Step 5 Click Add.
Step 6 From the Log Source Type list, select Microsoft Hyper-V.
Step 7 From the Protocol Configuration list, select WinCollect.
Step 8 From the Application or Service Log Type list, select Microsoft Hyper-V.
Step 9 From the WinCollect Agent list, select the WinCollect agent that accesses the
Microsoft Hyper-V server.
Step 10 Configure the remaining parameters.
Step 11 Click Save.
Step 12 On the Admin tab, click Deploy Changes.
Microsoft SQL
Server
The Microsoft SQL Server DSM JSA accepts SQL events using syslog or JDBC.
You can integrate Microsoft SQL Server with JSA using one of the following
methods:
•JDBC - Microsoft SQL Server 2008 Enterprise allows you to capture audit
events using JDBC by generating a table view containing audit events. Audit
events are only available using Microsoft SQL Server 2008 Enterprise.
•Adaptive Log Exporter - You can integrate Microsoft SQL Server 2000 and
2005 with JSA using the Adaptive Log Exporter to collect ERRORLOG
messages from databases managed by your Microsoft SQL Server. For more
information on the Adaptive Log Exporter, see the Adaptive Log Exporter Users
Guide.
Configure Auditing
for MS SQL Server
2008 Enterprise
To configure Microsoft SQL Server 2008 Enterprise, you must create an auditing
object for audit events. The auditing object allows you log database events to a file.
Configuring DSMs
476 MICROSOFT
To create an audit object:
Step 1 Log in to your Microsoft SQL Server Management Studio.
Step 2 From the navigation menu, select Security > Audits.
Step 3 Right-click Audits and select New Audit.
The Create Audit window is displayed.
Step 4 In the Audit name field, type a name for the new audit file.
Step 5 From the Audit destination list box, select File.
Step 6 From the File path field, specify a directory path for your Microsoft SQL Server
audit file.
Step 7 Click OK.
The audit object is created for Microsoft SQL 2008 Server.
Step 8 Right-click on your audit object and select Enable Audit.
You are now ready to create your server and database audit specifications.
Creating an Audit
Specification
An audit specification allows you to define the level of auditing events that are
written to an audit file.
You can create an audit specification at the server level or at the database level.
Depending on your requirements, you might require both a server and database
audit specification.
Create a server audit specification
To create an audit specification at the server level:
Step 1 From the navigation menu, select Security > Server Audit Specifications.
Step 2 Right-click Server Audit Specifications and select New Server Audit
Specifications.
The Create Server Audit Specification window is displayed.
Step 3 In the Name field, type a name for the new audit file.
Step 4 From the Audit list box, select the audit you created for your Microsoft SQL Server.
Step 5 In the Actions pane, add any actions and objects to the server audit.
Step 6 Click OK.
The Server Audit Specification is created.
Step 7 Right-click on your server audit specification and select Enable Server Audit
Specification.
You are now ready to create an audit specification for your database.
Configuring DSMs
Microsoft SQL Server 477
Create a database audit specification
To create an audit specification at the database level:
Step 1 From the navigation menu, select <Database> > Security > Database Audit
Specifications.
Step 2 Right-click Server Audit Specifications and select New Database Audit
Specifications.
The Create Server Audit Specification window is displayed.
Step 3 In the Name field, type a name for the new audit file.
Step 4 From the Audit list box, select the audit you created for your database.
Step 5 In the Actions pane, add any actions and objects to the database audit.
Step 6 Click OK.
The Database Audit Specification is created.
Step 7 Right-click on your database audit specification and select Enable Database
Audit Specification.
You are now ready to create a view in the database for audit events.
Create a Database
View
The database view contains the audit events from your server audit specification
and database audit specification. A database view allows JSA to poll for audit
events from a database table using JDBC.
To create a database view:
Step 1 From the toolbar, click New Query.
The Query window is displayed.
Step 2 Type the following Transact-SQL statement:
create view dbo.AuditData as
SELECT * FROM sys.fn_get_audit_file
('<Audit File Path and Name>',default,default);
GO
Where <Audit File Path and Name> is the name of the file you specified for
writing audit events in Configure Auditing for MS SQL Server 2008 Enterprise,
Step 4.
For example,
create view dbo.AuditData as
SELECT * FROM sys.fn_get_audit_file
('C:\inetpub\logs\SQLAudits*’,default,default);
GO
Step 3 From the Standard toolbar, click Execute.
If successful, the Messages pane displays the following:
Command(s) completed successfully.

Configuring DSMs
478 MICROSOFT
A new database view is created named dbo.AuditData. You are now ready to
configure a log source in JSA.
Configure a Log
Source
To configure JSA to receive SQL events:
Step 1 Click the Admin tab.
Step 2 On the navigation menu, click Data Sources.
The Data Sources panel is displayed.
Step 3 Click the Log Sources icon.
The Log Sources window is displayed.
Step 4 From the Log Source Type list box, select Microsoft SQL Server.
Step 5 From the Protocol Configuration list box, select JDBC.
The JDBC protocol is displayed.
Step 6 Configure the following values:
Table 61-2 Microsoft SQL Server JDBC Parameters
Parameter Description
Log Source
Identifier
Type the identifier for the log source in the following format:
<SQL Database>@<SQL DB Server IP or Host Name>
Where:
<SQL Database> is the database name, as entered in the
Database Name parameter.
<SQL DB Server IP or Host Name> is the hostname or IP
address for this log source, as entered in the IP or Hostname
parameter.
Database Type From the list box, select MSDE.
Database Name Type Master as the name of the Microsoft SQL database.
IP or Hostname Type the IP address or host name of the Microsoft SQL Server.
Port Type the port number used by the database server. The default
port for MSDE is 1433.
The JDBC configuration port must match the listener port of the
Microsoft SQL database. The Microsoft SQL database must have
incoming TCP connections enabled to communicate with JSA.
Note: If you define a Database Instance when using MSDE as the
database type, you must leave the Port parameter blank in your
configuration.
Username Type the username required to access the SQL database.
Password Type the password required to access the SQL database.
The password can be up to 255 characters in length.
Confirm
Password
Confirm the password required to access the SQL database.

Configuring DSMs
Microsoft SQL Server 479
Authentication
Domain
If you select MSDE as the Database Type and the database is
configured for Windows, you must define a Window Authentication
Domain. Otherwise, leave this field blank.
Database
Instance
Optional. Type the database instance, if you have multiple SQL
server instances on your database server.
Note: If you use a non-standard port in your database
configuration, or have blocked access to port 1434 for SQL
database resolution, you must leave the Database Instance
parameter blank in your configuration.
Table Name Type dbo.AuditData as the name of the table or view that
includes the audit event records.
Select List Type * for all fields from the table or view.
You can use a comma-separated list to define specific fields from
tables or views, if required for your configuration. The list must
contain the field defined in the Compare Field parameter. The
comma-separated list can be up to 255 alphanumeric characters in
length. The list can include the following special characters: dollar
sign ($), number sign (#), underscore (_), en dash (-), and
period(.).
Compare Field Type event_time as the compare field. The compare field is used
to identify new events added between queries to the table.
Start Date and
Time
Optional. Type the start date and time for database polling.
The Start Date and Time parameter must be formatted as
yyyy-MM-dd HH:mm with HH specified using a 24 hour clock. If the
start date or time is clear, polling begins immediately and repeats
at the specified polling interval.
Use Prepared
Statements
Select this check box to use prepared statements.
Prepared statements allow the JDBC protocol source to setup the
SQL statement once, then run the SQL statement many times with
different parameters. For security and performance reasons, we
recommend that you use prepared statements.
Clearing this check box requires you to use an alternative method
of querying that does not use pre-compiled statements.
Polling Interval Type the polling interval, which is the amount of time between
queries to the event table. The default polling interval is 10
seconds.
You can define a longer polling interval by appending H for hours
or M for minutes to the numeric value. The maximum polling
interval is 1 week in any time format. Numeric values entered
without an H or M poll in seconds.
EPS Throttle Type the number of Events Per Second (EPS) that you do not
want this protocol to exceed. The default value is 20000 EPS.
Table 61-2 Microsoft SQL Server JDBC Parameters (continued)
Parameter Description

Configuring DSMs
480 MICROSOFT
NOTE
Note: Selecting a value for the Credibility parameter greater than 5 will weight your
Microsoft SQL log source with a higher importance compared to other log sources
in JSA.
Step 7 Click Save.
Step 8 On the Admin tab, click Deploy Changes.
For more information about configuring audit events, see your vendor
documentation.
Microsoft
SharePoint
The Microsoft SharePoint DSM for JSA collects audit events from the SharePoint
database using JDBC to poll an SQL database for audit events. Audit events allow
you to track changes made to sites, files, and content managed by Microsoft
SharePoint.
Microsoft SharePoint audit events include:
•Site name and the source from which the event originated
•Item ID, item name, and event location
•User ID associated with the event
•Event type, timestamp, and event action.
Before you can integrate Microsoft SharePoint with JSA, you must:
1 Configure the audit events you want to collect for Microsoft SharePoint.
2 Create an SQL database view for JSA in Microsoft SharePoint.
3 Configure a log source to collect audit events from Microsoft SharePoint.
NOTE
Note: Ensure that no firewall rules are blocking the communication between JSA
and the database associated with Microsoft SharePoint.
Use Named Pipe
Communication
Clear the Use Named Pipe Communications check box.
When using a Named Pipe connection, the username and
password must be the appropriate Windows authentication
username and password and not the database username and
password. Also, you must use the default Named Pipe.
Database
Cluster Name
If you select the Use Named Pipe Communication check box, the
Database Cluster Name parameter is displayed. If you are running
your SQL server in a cluster environment, define the cluster name
to ensure Named Pipe communication functions properly.
Table 61-2 Microsoft SQL Server JDBC Parameters (continued)
Parameter Description
Configuring DSMs
Microsoft SharePoint 481
Configure Microsoft
SharePoint Audit
Events
The audit settings for Microsoft SharePoint allow you to define what events are
tracked for each site managed by Microsoft SharePoint.
To configure audit events for Microsoft SharePoint:
Step 1 Log in to your Microsoft SharePoint site.
Step 2 From the Site Actions list box, select Site Settings.
Step 3 From the Site Collection Administration list, click Site collection audit settings.
Step 4 From the Documents and Items section, select a check box for each document
and item audit event you want to audit.
Step 5 From the Lists, Libraries, and Sites section, select a check box for each content
audit event you want to enable.
Step 6 Click OK.
You are now ready to create a database view for JSA to poll Microsoft SharePoint
events.
Create a database
View for Microsoft
SharePoint
Microsoft SharePoint uses SQL Server Management Studio (SSMS) to manage
the SharePoint SQL databases. To collect audit event data, you must create a
database view on your Microsoft SharePoint server that is accessible to JSA.
To create a database view using SQL Server Management Studio:
Step 1 Log in to the system hosting your Microsoft SharePoint SQL database.
Step 2 On the desktop, select Start > Run.
The Run window is displayed.
Step 3 Type the following:
ssms
Step 4 Click OK.
The Microsoft SQL Server 2008 displays the Connect to Server window.
Step 5 Log in to your Microsoft SharePoint database.
Step 6 Click Connect.
Step 7 From the Object Explorer for your SharePoint database, select Databases >
WSS_Logging > Views.
Step 8 From the navigation menu, click New Query.
Step 9 In the Query pane, type the following Transact-SQL statement to create the
AuditEvent database view:
create view dbo.AuditEvent as select a.siteID
,a.ItemId
,a.ItemType
,u.tp_Title as "User"
,a.MachineName
,a.MachineIp
Configuring DSMs
482 MICROSOFT
,a.DocLocation
,a.LocationType
,a.Occurred as "EventTime"
,a.Event as "EventID"
,a.EventName
,a.EventSource
,a.SourceName
,a.EventData
from WSS_Content.dbo.AuditData a, WSS_Content.dbo.UserInfo u
where a.UserId = u.tp_ID and a.SiteId = u.tp_SiteID;
Step 10 From the Query pane, right-click and select Execute.
If the view is created, the following message is displayed in the results pane:
Command(s) completed successfully.
The dbo.AuditEvent view is created. You are now ready to configure the log source
in JSA to poll the view for audit events.
Configure a Log
Source
JSA requires a user account with the proper credentials to access the view you
created in the Microsoft SharePoint database. To successfully poll for audit data
from the Microsoft SharePoint database, you must create a new user or provide
the log source with existing user credentials to read from the AuditEvent view. For
more information on creating a user account, see your vendor documentation.
To configure JSA to receive SharePoint events:
Step 1 Click the Admin tab.
Step 2 On the navigation menu, click Data Sources.
The Data Sources panel is displayed.
Step 3 Click the Log Sources icon.
The Log Sources window is displayed.

Configuring DSMs
Microsoft SharePoint 483
Step 4 In the Log Source Name field, type a name for the log source.
Step 5 In the Log Source Description field, type a description for the log source.
Step 6 From the Log Source Type list box, select Microsoft SharePoint.
Step 7 From the Protocol Configuration list box, select JDBC.
The JDBC protocol parameters appear.
Step 8 Configure the following values:
Table 61-3 Microsoft SharePoint JDBC Parameters
Parameter Description
Log Source
Identifier
Type the identifier for the log source. Type the log source identifier
in the following format:
<SharePoint Database>@<SharePoint Database Server
IP or Host Name>
Where:
<SharePoint Database> is the database name, as entered in
the Database Name parameter.
<SharePoint Database Server IP or Host Name> is the
hostname or IP address for this log source, as entered in the IP or
Hostname parameter.
Database Type From the list box, select MSDE.
Database Name Type WSS_Logging as the name of the Microsoft SharePoint
database.
IP or Hostname Type the IP address or host name of the Microsoft SharePoint
SQL Server.
Port Type the port number used by the database server. The default
port for MSDE is 1433.
The JDBC configuration port must match the listener port of the
Microsoft SharePoint database. The Microsoft SharePoint
database must have incoming TCP connections enabled to
communicate with JSA.
Note: If you define a Database Instance when using MSDE as the
database type, you must leave the Port parameter blank in your
configuration.
Username Type the username the log source can use to access the Microsoft
SharePoint database.
Password Type the password the log source can use to access the Microsoft
SharePoint database.
The password can be up to 255 characters in length.
Confirm
Password
Confirm the password required to access the database. The
confirmation password must be identical to the password entered
in the Password field.
Authentication
Domain
If you select MSDE as the Database Type and the database is
configured for Windows, you must define the Window
Authentication Domain. Otherwise, leave this field blank.

Configuring DSMs
484 MICROSOFT
Database
Instance
Optional. Type the database instance, if you have multiple SQL
server instances on your database server.
Note: If you use a non-standard port in your database
configuration, or have blocked access to port 1434 for SQL
database resolution, you must leave the Database Instance
parameter blank in your configuration.
Table Name Type AuditEvent as the name of the table or view that includes
the event records.
Select List Type * for all fields from the table or view.
You can use a comma-separated list to define specific fields from
tables or views, if required for your configuration. The list must
contain the field defined in the Compare Field parameter. The
comma-separated list can be up to 255 alphanumeric characters in
length. The list can include the following special characters: dollar
sign ($), number sign (#), underscore (_), en dash (-), and
period(.).
Compare Field Type EventTime as the compare field. The compare field is used
to identify new events added between queries to the table.
Start Date and
Time
Optional. Type the start date and time for database polling.
The Start Date and Time parameter must be formatted as
yyyy-MM-dd HH:mm with HH specified using a 24 hour clock. If the
start date or time is clear, polling begins immediately and repeats
at the specified polling interval.
Use Prepared
Statements
Select the Use Prepared Statements check box.
Prepared statements allows the JDBC protocol source to setup the
SQL statement one time, then run the SQL statement many times
with different parameters. For security and performance reasons,
we recommend that you use prepared statements.
Clearing this check box requires you to use an alternative method
of querying that does not use pre-compiled statements.
Polling Interval Type the polling interval, which is the amount of time between
queries to the AuditEvent view you created. The default polling
interval is 10 seconds.
You can define a longer polling interval by appending H for hours
or M for minutes to the numeric value. The maximum polling
interval is 1 week in any time format. Numeric values entered
without an H or M poll in seconds.
EPS Throttle Type the number of Events Per Second (EPS) that you do not
want this protocol to exceed. The default value is 20000 EPS.
Use Named Pipe
Communication
Clear the Use Named Pipe Communications check box.
When using a Named Pipe connection, the username and
password must be the appropriate Windows authentication
username and password and not the database username and
password. Also, you must use the default Named Pipe.
Table 61-3 Microsoft SharePoint JDBC Parameters (continued)
Parameter Description

Configuring DSMs
Microsoft Windows Security Event Log 485
NOTE
Note: Selecting a value for the Credibility parameter greater than 5 will weight your
Microsoft SharePoint log source with a higher importance compared to other log
sources in JSA.
Step 9 Click Save.
Step 10 On the Admin tab, click Deploy Changes.
The Microsoft SharePoint configuration is complete.
Microsoft Windows
Security Event Log
The Microsoft Windows Security Event Log DSM for JSA accepts Windows-based
events using syslog.
You can integrate Window Microsoft Security Event Log events with JSA using one
of the following methods:
•Use a WinCollect agent to retrieve Windows-based events from multiple
Windows systems in your network. For more information on WinCollect, see the
WinCollect User Guide.
•Use the Adaptive Log Exporter. For more information on the Adaptive Log
Exporter, see the Adaptive Log Exporter Users Guide.
•Use the Microsoft Security Event Log protocol to collect events using WMI. For
more information, see Using WMI
•Set-up the Snare Agent to forward Microsoft Windows Security Event Logs to
JSA. See Using the Snare Agent
Using WMI Before you can configure a log source using the Microsoft Windows Security Event
Log protocol, you must configure your system DCOM settings for each host you
want to monitor. Ensure the following is configured for each host:
•Make sure you have appropriate administrative permissions. For this process,
you must be a member of the Administrators group on the remote computer.
•Make sure you have Windows 2000, Windows 2003, Windows 2008, XP, or
Vista software, or Windows 7 installed. The Windows Event Log Protocol
supports 32 or 64-bit systems.
•Configure DCOM and enable the host.
•Enable Windows Management Instrumentation on the host.
•Activate the remote registry service.
Database
Cluster Name
If you select the Use Named Pipe Communication check box, the
Database Cluster Name parameter is displayed. If you are running
your SQL server in a cluster environment, define the cluster name
to ensure Named Pipe communication functions properly.
Table 61-3 Microsoft SharePoint JDBC Parameters (continued)
Parameter Description

Configuring DSMs
486 MICROSOFT
•If a firewall is installed on the host (for example, Windows firewall) or is located
between the host and JSA (such as a hardware or other intermediary firewall),
you must configure the firewall to allow DCOM communication. This includes
configuring the firewall to permit port 135 to be accessible on the host, as well
as permitting DCOM ports (generally random ports above 1024). If necessary,
you can also configure specific ports to be accessible to DCOM. This depends
on the version of Windows. For more information, see your Windows
documentation.
•Configure a system or domain account that includes security configuration
permitting access to the Window event log protocol DCOM components,
Windows event log protocol name space, and appropriate access to the remote
registry keys.
You are now ready to configure the log source in JSA:
Step 1 To configure JSA to receive events from Windows security event logs, you must
select the Microsoft Windows Security Event Log option from the Log Source
Type list box.
Step 2 To configure the Windows Event Log protocol, you must select the Microsoft
Security Event Log option from the Protocol Configuration list box. Your system
must be running the latest version of the Windows Event Log protocol to retrieve
File Replication and Directory Service events:
Using the Snare
Agent
To configure the Snare Agent to forward Windows security event logs to JSA:
Step 1 Download and install the Snare Agent.
NOTE
Note: To download a Snare Agent, see the following website:
http://www.intersectalliance.com/projects/SnareWindows/index.html
Step 2 On the navigation menu, select Network Configuration.
Step 3 Type the IP address of the JSA system in the Destination Snare Server address
field.
Step 4 Select the Enable SYSLOG Header check box.
Step 5 Click Change Configuration.
Step 6 On the navigation menu, select Objectives Configuration.
Step 7 In the Identify the event types to be captured field, select check boxes to define
the event types you want snare to forward to JSA.
The Microsoft Windows Event Log DSM supports Informational, Warning, Error,
Success Audit, and Failure Audit event types.
Step 8 In the Identify the event logs field, select check boxes to define the event logs
you want snare to forward to JSA.
The Microsoft Windows Event Log DSM supports Security, System, Application,
DNS Server, File Replication and Directory Service log types.

Configuring DSMs
Microsoft Operations Manager 487
Step 9 Click Change Configuration.
Step 10 On the navigation menu, select Apply the Latest Audit Configuration.
The value entered in the override host name detection with field must match the IP
address or hostname assigned to the device configured in the JSA setup.
You are now ready to configure the log source in JSA:
Step 1 To configure JSA to receive events from Windows security event logs, you must
select the Microsoft Windows Security Event Log option from the Log Source
Type list box.
Step 2 To configure the Windows Event Log protocol, you must select the Microsoft
Security Event Log option from the Protocol Configuration list box. Your system
must be running the latest version of the Windows Event Log protocol to retrieve
File Replication and Directory Service log types:
For more information on configuring devices, see the Log Sources Users Guide.
For more information about your server, see your vendor documentation.
Microsoft
Operations
Manager
The Microsoft Operations Manager DSM for JSA accepts Microsoft Operations
Manager (MOM) events by polling the OnePoint database allowing JSA to record
the relevant events.
Before you configure JSA to integrate with the Microsoft Operations Manager, you
must ensure a database user account is configured with appropriate permissions
to access the MOM OnePoint SQL Server database. Access to the OnePoint
database SDK views is managed through the MOM SDK View User database role.
For more information, please see your Microsoft Operations Manager
documentation.
NOTE
Note: Make sure that no firewall rules are blocking the communication between
JSA and the SQL Server database associated with MOM. For MOM installations
that use a separate, dedicated computer for the SQL Server database, the
SDKEventView view is queried on the database system, not the system running
MOM.
To configure JSA to receive MOM events:
Step 1 Click the Admin tab.
Step 2 On the navigation menu, click Data Sources.
The Data Sources panel is displayed.
Step 3 Click the Log Sources icon.
The Log Sources window is displayed.
Step 4 From the Log Source Type list box, select Microsoft Operations Manager.

Configuring DSMs
488 MICROSOFT
Step 5 From the Protocol Configuration list box, select JDBC.
The JDBC protocol parameters appear.
Step 6 Configure the following values:
Table 61-4 Microsoft Operations Manager JDBC Parameters
Parameter Description
Log Source
Identifier
Type the identifier for the log source. Type the log source identifier
in the following format:
<MOM Database>@<MOM Database Server IP or Host
Name>
Where:
<MOM Database> is the database name, as entered in the
Database Name parameter.
<MOM Database Server IP or Host Name> is the
hostname or IP address for this log source, as entered in the IP or
Hostname parameter.
Database Type From the list box, select MSDE.
Database Name Type OnePoint as the name of the Microsoft Operations Manager
database.
IP or Hostname Type the IP address or host name of the Microsoft Operations
Manager SQL Server.
Port Type the port number used by the database server. The default
port for MSDE is 1433.
The JDBC configuration port must match the listener port of the
Microsoft Operations Manager database. The Microsoft
Operations Manager database must have incoming TCP
connections enabled to communicate with JSA.
Note: If you define a Database Instance when using MSDE as the
database type, you must leave the Port parameter blank in your
configuration.
Username Type the username required to access the database.
Password Type the password required to access the database. The
password can be up to 255 characters in length.
Confirm
Password
Confirm the password required to access the database. The
confirmation password must be identical to the password entered
in the Password parameter.
Authentication
Domain
If you select MSDE as the Database Type and the database is
configured for Windows, you must define the Window
Authentication Domain. Otherwise, leave this field blank.

Configuring DSMs
Microsoft Operations Manager 489
Database
Instance
Optional. Type the database instance, if you have multiple SQL
server instances on your database server.
Note: If you use a non-standard port in your database
configuration, or have blocked access to port 1434 for SQL
database resolution, you must leave the Database Instance
parameter blank in your configuration.
Table Name Type SDKEventView as the name of the table or view that
includes the event records.
Select List Type * for all fields from the table or view.
You can use a comma-separated list to define specific fields from
tables or views, if required for your configuration. The list must
contain the field defined in the Compare Field parameter. The
comma-separated list can be up to 255 alphanumeric characters in
length. The list can include the following special characters: dollar
sign ($), number sign (#), underscore (_), en dash (-), and
period(.).
Compare Field Type TimeStored as the compare field. The compare field is used
to identify new events added between queries to the table.
Start Date and
Time
Optional. Type the start date and time for database polling.
The Start Date and Time parameter must be formatted as
yyyy-MM-dd HH:mm with HH specified using a 24 hour clock. If the
start date or time is clear, polling begins immediately and repeats
at the specified polling interval.
Use Prepared
Statements
Select this check box to use prepared statements.
Prepared statements allows the JDBC protocol source to setup the
SQL statement one time, then run the SQL statement many times
with different parameters. For security and performance reasons,
we recommend that you use prepared statements.
Clearing this check box requires you to use an alternative method
of querying that does not use pre-compiled statements.
Polling Interval Type the polling interval, which is the amount of time between
queries to the event table. The default polling interval is 10
seconds.
You can define a longer polling interval by appending H for hours
or M for minutes to the numeric value. The maximum polling
interval is 1 week in any time format. Numeric values entered
without an H or M poll in seconds.
EPS Throttle Type the number of Events Per Second (EPS) that you do not
want this protocol to exceed. The default value is 20000 EPS.
Use Named Pipe
Communication
Clear the Use Named Pipe Communications check box.
When using a Named Pipe connection, the username and
password must be the appropriate Windows authentication
username and password and not the database username and
password. Also, you must use the default Named Pipe.
Table 61-4 Microsoft Operations Manager JDBC Parameters (continued)
Parameter Description

Configuring DSMs
490 MICROSOFT
NOTE
Note: Selecting a value for the Credibility parameter greater than 5 will weight your
Microsoft Operations Manager log source with a higher importance compared to
other log sources in JSA.
Step 7 Click Save.
Step 8 On the Admin tab, click Deploy Changes.
For more information on configuring log sources, see the Log Sources Users
Guide.
Microsoft System
Center Operations
Manager
A JSA Microsoft System Center Operations Manager (SCOM) DSM accepts
SCOM events by polling the OperationsManager database allowing JSA to record
the relevant events.
Before you configure JSA to integrate with the Microsoft SCOM, you must ensure
a database user account is configured with appropriate permissions to access the
SCOM OperationsManager SQL Server database. The appropriate authentication
mode might need to be enabled in the Security settings of the SQL Server
properties. For more information, please see your Microsoft SCOM documentation.
NOTE
Note: Ensure that no firewall rules are blocking the communication between JSA
and the SQL Server database associated with SCOM. For SCOM installations that
use a separate, dedicated computer for the SQL Server database, the EventView
view is queried on the database system, not the system running SCOM.
To configure JSA to receive SCOM events:
Step 1 Click the Admin tab.
Step 2 On the navigation menu, click Data Sources.
The Data Sources panel is displayed.
Step 3 Click the Log Sources icon.
The Log Sources window is displayed.
Step 4 From the Log Source Type list box, select Microsoft SCOM.
Step 5 From the Protocol Configuration list box, select JDBC.
The JDBC protocol is displayed.
Database
Cluster Name
If you select the Use Named Pipe Communication check box, the
Database Cluster Name parameter is displayed. If you are running
your SQL server in a cluster environment, define the cluster name
to ensure Named Pipe communication functions properly.
Table 61-4 Microsoft Operations Manager JDBC Parameters (continued)
Parameter Description

Configuring DSMs
Microsoft System Center Operations Manager 491
Step 6 Configure the following values:
Table 61-5 Microsoft SCOM JDBC Parameters
Parameter Description
Log Source
Identifier
Type the identifier for the log source. Type the log source identifier
in the following format:
<SCOM Database>@<SCOM Database Server IP or Host
Name>
Where:
<SCOM Database> is the database name, as entered in the
Database Name parameter.
<SCOM Database Server IP or Host Name> is the
hostname or IP address for this log source, as entered in the IP or
Hostname parameter.
Database Type From the list box, select MSDE.
Database Name Type OperationsManager as the name of the Microsoft SCOM
database.
IP or Hostname Type the IP address or host name of the Microsoft SCOM SQL
Server.
Port Type the port number used by the database server. The default
port for MSDE is 1433.
The JDBC configuration port must match the listener port of the
Microsoft SCOM database. The Microsoft SCOM database must
have incoming TCP connections enabled to communicate with
JSA.
Note: If you define a Database Instance when using MSDE as the
database type, you must leave the Port parameter blank in your
configuration.
Username Type the username required to access the database.
Password Type the password required to access the database. The
password can be up to 255 characters in length.
Confirm
Password
Confirm the password required to access the database. The
confirmation password must be identical to the password entered
in the Password parameter.
Authentication
Domain
If you select MSDE as the Database Type and the database is
configured for Windows, you must define a Window Authentication
Domain. Otherwise, leave this field blank.
Database
Instance
Optional. Type the database instance, if you have multiple SQL
server instances on your database server.
Note: If you use a non-standard port in your database
configuration, or have blocked access to port 1434 for SQL
database resolution, you must leave the Database Instance
parameter blank in your configuration.
Table Name Type EventView as the name of the table or view that includes
the event records.

Configuring DSMs
492 MICROSOFT
Select List Type * for all fields from the table or view.
You can use a comma-separated list to define specific fields from
tables or views, if required for your configuration. The list must
contain the field defined in the Compare Field parameter. The
comma-separated list can be up to 255 alphanumeric characters in
length. The list can include the following special characters: dollar
sign ($), number sign (#), underscore (_), en dash (-), and
period(.).
Compare Field Type TimeAdded as the compare field. The compare field is used
to identify new events added between queries to the table.
Start Date and
Time
Optional. Type the start date and time for database polling.
The Start Date and Time parameter must be formatted as
yyyy-MM-dd HH:mm with HH specified using a 24 hour clock. If the
start date or time is clear, polling begins immediately and repeats
at the specified polling interval.
Use Prepared
Statements
Select this check box to use prepared statements.
Prepared statements allows the JDBC protocol source to setup the
SQL statement one time, then run the SQL statement many times
with different parameters. For security and performance reasons,
we recommend that you use prepared statements.
Clearing this check box requires you to use an alternative method
of querying that does not use pre-compiled statements.
Polling Interval Type the polling interval, which is the amount of time between
queries to the event table. The default polling interval is 10
seconds.
You can define a longer polling interval by appending H for hours
or M for minutes to the numeric value. The maximum polling
interval is 1 week in any time format. Numeric values entered
without an H or M poll in seconds.
EPS Throttle Type the number of Events Per Second (EPS) that you do not
want this protocol to exceed. The default value is 20000 EPS.
Use Named Pipe
Communication
Clear the Use Named Pipe Communications check box.
When using a Named Pipe connection, the username and
password must be the appropriate Windows authentication
username and password and not the database username and
password. Also, you must use the default Named Pipe.
Database
Cluster Name
If you select the Use Named Pipe Communication check box, the
Database Cluster Name parameter is displayed. If you are running
your SQL server in a cluster environment, define the cluster name
to ensure Named Pipe communication functions properly.
Table 61-5 Microsoft SCOM JDBC Parameters (continued)
Parameter Description

Configuring DSMs
Microsoft Endpoint Protection 493
NOTE
Note: Selecting a value for the Credibility parameter greater than 5 will weight your
Microsoft SCOM log source with a higher importance compared to other log
sources in JSA.
Step 7 Click Save.
Step 8 On the Admin tab, click Deploy Changes.
For more information on configuring log sources, see the Log Sources Users
Guide.
Microsoft Endpoint
Protection
The Microsoft Endpoint Protection DSM for JSA is capable of collecting malware
detection events.
Supported Event
Types
Malware detection events are retrieved by JSA by configuring the JDBC protocol.
Adding malware detection events to JSA allows you to monitor and detect malware
infected computers in your deployment.
Malware detection events include:
•Site name and the source from which the malware was detected
•Threat name, threat ID, and severity
•User ID associated with the threat
•Event type, timestamp, and the cleaning action taken on the malware.
Configuration
Overview
The Microsoft Endpoint Protection DSM uses JDBC to poll an SQL database for
malware detection event data. This DSM does not automatically discover. To
integrate Microsoft EndPoint Protection with JSA, you must:
1 Create an SQL database view for JSA with the malware detection event data.
2 Configure a JDBC log source to poll for events from the Microsoft EndPoint
Protection database.
3 Ensure that no firewall rules are blocking communication between JSA and the
database associated with Microsoft EndPoint Protection.
Configuring DSMs
494 MICROSOFT
Creating a Database
View
Microsoft EndPoint Protection uses SQL Server Management Studio (SSMS) to
manage the EndPoint Protection SQL databases.
Procedure
Step 1 Log in to the system hosting your Microsoft EndPoint Protection SQL database.
Step 2 On the desktop, select Start > Run.
Step 3 Type the following:
ssms
Step 4 Click OK.
Step 5 Log in to your Microsoft Endpoint Protection database.
Step 6 From the Object Explorer, select Databases.
Step 7 Select your database and click Views.
Step 8 From the navigation menu, click New Query.
Step 9 In the Query pane, type the following Transact-SQL statement to create the
database view:
create view dbo.MalwareView as
select n.Type
, n.RowID
, n.Name
, n.Description
, n.Timestamp
, n.SchemaVersion
, n.ObserverHost
, n.ObserverUser
, n.ObserverProductName
, n.ObserverProductversion
, n.ObserverProtectionType
, n.ObserverProtectionVersion
, n.ObserverProtectionSignatureVersion
, n.ObserverDetection
, n.ObserverDetectionTime
, n.ActorHost
, n.ActorUser
, n.ActorProcess
, n.ActorResource
, n.ActionType
, n.TargetHost
, n.TargetUser
, n.TargetProcess
, n.TargetResource
, n.ClassificationID
, n.ClassificationType
, n.ClassificationSeverity
, n.ClassificationCategory
Configuring DSMs
Microsoft Endpoint Protection 495
, n.RemediationType
, n.RemediationResult
, n.RemediationErrorCode
, n.RemediationPendingAction
, n.IsActiveMalware
, i.IP_Addresses0 as 'SrcAddress'
from v_AM_NormalizedDetectionHistory n, System_IP_Address_ARR i,
v_RA_System_ResourceNames s, Network_DATA d where n.ObserverHost
= s.Resource_Names0 and s.ResourceID = d.MachineID and
d.IPEnabled00 = 1 and d.MachineID = i.ItemKey and
i.IP_Addresses0 like '%.%.%.%';
Step 10 From the Query pane, right-click and select Execute.
If the view is created, the following message is displayed in the results pane:
Command(s) completed successfully.
You are now ready to configure a log source in JSA.
Configuring a Log
Source
JSA requires a user account with the proper credentials to access the view you
created in the Microsoft EndPoint Protection database.
To successfully poll for malware detection events from the Microsoft EndPoint
Protection database, you must create a new user or provide the log source with
existing user credentials to read from the database view you created. For more
information on creating a user account, see your vendor documentation.
Procedure
Step 1 Click the Admin tab.
Step 2 On the navigation menu, click Data Sources.
Step 3 Click the Log Sources icon.
Step 4 In the Log Source Name field, type a name for the log source.
Step 5 In the Log Source Description field, type a description for the log source.
Step 6 From the Log Source Type list box, select Microsoft EndPoint Protection.
Step 7 From the Protocol Configuration list box, select JDBC.

Configuring DSMs
496 MICROSOFT
Step 8 Configure the following values:
Table 61-6 Microsoft EndPoint Protection JDBC parameters
Parameter Description
Log Source
Identifier
Type the identifier for the log source. Type the log source identifier
in the following format:
<Database>@<Database Server IP or Host Name>
Where:
<Database> is the database name, as entered in the Database
Name parameter.
<Database Server IP or Host Name> is the hostname or
IP address for this log source, as entered in the IP or Hostname
parameter.
Database Type From the list box, select MSDE.
Database Name Type the name of the Microsoft EndPoint Protection database.
This name must match the database name you selected when
creating your view in Step 7.
IP or Hostname Type the IP address or host name of the Microsoft EndPoint
Protection SQL Server.
Port Type the port number used by the database server. The default
port for MSDE is 1433.
The JDBC configuration port must match the listener port of the
Microsoft EndPoint Protection database. The Microsoft EndPoint
Protection database must have incoming TCP connections
enabled to communicate with JSA.
Note: If you define a Database Instance when using MSDE as the
database type, you must leave the Port parameter blank in your
configuration.
Username Type the username the log source can use to access the Microsoft
EndPoint Protection database.
Password Type the password the log source can use to access the Microsoft
EndPoint Protection database.
The password can be up to 255 characters in length.
Confirm
Password
Confirm the password required to access the database. The
confirmation password must be identical to the password entered
in the Password field.
Authentication
Domain
If you select MSDE as the Database Type and the database is
configured for Windows, you must define the Window
Authentication Domain. Otherwise, leave this field blank.
Database
Instance
Optional. Type the database instance, if you have multiple SQL
server instances on your database server.
Note: If you use a non-standard port in your database
configuration, or have blocked access to port 1434 for SQL
database resolution, you must leave the Database Instance
parameter blank in your configuration.

Configuring DSMs
Microsoft Endpoint Protection 497
Table Name Type dbo.MalwareView as the name of the table or view that
includes the event records.
Select List Type * for all fields from the table or view.
You can use a comma-separated list to define specific fields from
tables or views, if required for your configuration. The list must
contain the field defined in the Compare Field parameter. The
comma-separated list can be up to 255 alphanumeric characters in
length. The list can include the following special characters: dollar
sign ($), number sign (#), underscore (_), en dash (-), and
period(.).
Compare Field Type Timestamp as the compare field. The compare field is used
to identify new events added between queries to the table.
Start Date and
Time
Optional. Type the start date and time for database polling.
The Start Date and Time parameter must be formatted as
yyyy-MM-dd HH:mm with HH specified using a 24 hour clock. If the
start date or time is clear, polling begins immediately and repeats
at the specified polling interval.
Use Prepared
Statements
Select the Use Prepared Statements check box.
Prepared statements allows the JDBC protocol source to setup the
SQL statement one time, then run the SQL statement many times
with different parameters. For security and performance reasons,
we recommend that you use prepared statements.
Clearing this check box requires you to use an alternative method
of querying that does not use pre-compiled statements.
Polling Interval Type the polling interval, which is the amount of time between
queries to the view you created. The default polling interval is 10
seconds.
You can define a longer polling interval by appending H for hours
or M for minutes to the numeric value. The maximum polling
interval is 1 week in any time format. Numeric values entered
without an H or M poll in seconds.
EPS Throttle Type the number of Events Per Second (EPS) that you do not
want this protocol to exceed. The default value is 20000 EPS.
Use Named Pipe
Communication
Clear the Use Named Pipe Communications check box.
When using a Named Pipe connection, the username and
password must be the appropriate Windows authentication
username and password and not the database username and
password. Also, you must use the default Named Pipe.
Database
Cluster Name
If you select the Use Named Pipe Communication check box, the
Database Cluster Name parameter is displayed. If you are running
your SQL server in a cluster environment, define the cluster name
to ensure Named Pipe communication functions properly.
Table 61-6 Microsoft EndPoint Protection JDBC parameters (continued)
Parameter Description

Configuring DSMs
498 MICROSOFT
NOTE
Note: Selecting a value for the Credibility parameter greater than 5 will weight your
Microsoft EndPoint Protection log source with a higher importance compared to
other log sources in JSA.
Step 9 Click Save.
Step 10 On the Admin tab, click Deploy Changes.
The Microsoft EndPoint Protection configuration is complete.
Use NTLMv2 Select the Use NTLMv2 check box.
This option forces MSDE connections to use the NTLMv2 protocol
when communicating with SQL servers that require NTLMv2
authentication. The default value of the check box is selected.
If the Use NTLMv2 check box is selected, it has no effect on
MSDE connections to SQL servers that do not require NTLMv2
authentication.
Table 61-6 Microsoft EndPoint Protection JDBC parameters (continued)
Parameter Description

Configuring DSMs
59 MOTOROLA SYMBOL AP
The Motorola Symbol AP DSM for Juniper Secure Analytics (JSA) records all
relevant events forwarded from Motorola Symbol AP devices using syslog.
Configure a Log
Source
To integrate Motorola SymbolAP with JSA, you must manually create a log source
to receive events.
JSA does not automatically discover or create log sources for syslog events from
Motorola SymbolAP appliances. In cases where the log source is not automatically
discovered, we recommend you create a log source before forwarding events to
JSA.
To configure a log source:
Step 1 Log in to JSA.
Step 2 Click the Admin tab.
Step 3 On the navigation menu, click Data Sources.
The Data Sources panel is displayed.
Step 4 Click the Log Sources icon.
The Log Sources window is displayed.
Step 5 Click Add.
The Add a log source window is displayed.
Step 6 In the Log Source Name field, type a name for your log source.
Step 7 In the Log Source Description field, type a description for the log source.
Step 8 From the Log Source Type list box, select Motorola SymbolAP.
Step 9 Using the Protocol Configuration list box, select Syslog.
The syslog protocol configuration is displayed.
Step 10 Configure the following values:
Table 62-1 Syslog Parameters
Parameter Description
Log Source Identifier Type the IP address or host name for the log source as an
identifier for events from your Motorola SymbolAP appliance.
Configuring DSMs
500 MOTOROLA SYMBOL AP
Step 11 Click Save.
Step 12 On the Admin tab, click Deploy Changes.
The log source is added to JSA.
Configure Syslog
Events for Motorola
Symbol AP
To configure the device to forward syslog events to JSA:
Step 1 Log in to your Symbol AP device user interface.
Step 2 From the menu, select System Configuration > Logging Configuration.
The Access Point window is displayed.
Step 3 Using the Logging Level list box, select the desired log level for tracking system
events. The options are:
0 - Emergency
1- Alert
2 - Critical
3 - Errors
4 - Warning
5 - Notice
6 - Info. This is the default.
7 - Debug
Step 4 Select the Enable logging to an external syslog server check box.
Step 5 In the Syslog Server IP Address field, type the IP address of an external syslog
server, such as JSA.
This is required to route the syslog events to JSA.
Step 6 Click Apply.
Step 7 Click Logout.
A confirmation window is displayed.
Step 8 Click OK to exit the application.
The configuration is complete. Events forwarded to JSA are displayed on the Log
Activity tab.

Configuring DSMs
60 NETAPP DATA ONTAP
Juniper Secure Analytics (JSA) accepts syslog events from a Windows agent
installed with the Adaptive Log Exporter.
The Adaptive Log Exporter is an external event collection agent. The Adaptive Log
Exporter allows you to collect events using a NetApp Data ONTAP plug-in. The
Adaptive Log Exporter can read and process event log messages generated from
Common Internet File System (CIFS) auditing on the NetApp Data ONTAP device
and forward the events.
For more information on using the Adaptive Log Exporter, see the Adaptive Log
Exporter Users Guide.
NOTE
Note: The NetApp Data ONTAP plug-in for the Adaptive Log Exporter only
supports CIFS. For information on configuring CIFS on your NetApp Data ONTAP
device, see your vendor documentation.
JSA automatically detects the NetApp Data ONTAP events from the Adaptive Log
Exporter. To manually configure JSA to receive events from NetApp Data ONTAP:
From the Log Source Type list box, select the NetApp Data ONTAP option.

Configuring DSMs
61 NAME VALUE PAIR
The Name Value Pair (NVP) DSM allows you to integrate Juniper Secure Analytics
(JSA) with devices that might not natively send logs using syslog.
JSAThe NVP DSM provides a log format that allows you to send logs to JSA. For
example, for a device that does not export logs natively with syslog, you can create
a script to export the logs from a device that JSA does not support, format the logs
in the NVP log format, and send the logs to JSA using syslog. The NVP DSM log
source configured in JSA then receives the logs and is able to parse the data since
the logs are received in the NVP log format.
NOTE
Note: Events for the NVP DSM are not automatically discovered by JSA.
The NVP DSM accepts events using syslog. JSA records all relevant events. The
log format for the NVP DSM must be a tab-separated single line list of
Name=Parameter. The NVP DSM does not require a valid syslog header.
NOTE
Note: The NVP DSM assumes an ability to create custom scripts or thorough
knowledge of your device capabilities to send logs to JSA using syslog in NVP
format.
This section provides information on the following:
•NVP Log Format
•Examples
NVP Log Format Table 64-1 includes a list of tags that the NVP DSM is able to parse:
Table 64-1 NVP Log Format Tags
Tag Description
DeviceType Type NVP as the DeviceType. This identifies the log
formats as a Name Value Pair log message.
This is a required parameter and DeviceType=NVP must
be the first pair in the list.

Configuring DSMs
504 NAME VALUE PAIR
EventName Type the event name that you want to use to identity the
event in the Events interface when using the Event
Mapping functionality. For more information on mapping
events, see the Juniper Secure Analytics Users Guide.
This is a required parameter.
EventCategory Type the event category you want to use to identify the
event in the Events interface. If this value is not included in
the log message, the value NameValuePair value is
used.
SourceIp Type the source IP address for the message.
SourcePort Type the source port for the message.
SourceIpPreNAT Type the source IP address for the message before
Network Address Translation (NAT) occurred.
SourceIpPostNAT Type the source IP address for the message after NAT
occurs.
SourceMAC Type the source MAC address for the message.
SourcePortPreNAT Type the source port for the message before NAT occurs.
SourcePortPostNAT Type the source port for the message after NAT occurs.
DestinationIp Type the destination IP address for the message.
DestinationPort Type the destination port for the message.
DestinationIpPreNAT Type the destination IP address for the message before
NAT occurs.
DestinationIpPostNAT Type the IP address for the message after NAT occurs.
DestinationPortPreNAT Type the destination port for the message before NAT
occurs.
DestinationPortPostNAT Type the destination port for the message after NAT
occurs.
DestinationMAC Type the destination MAC address for the message.
DeviceTime Type the time that the event was sent, according to the
device. The format is: YY/MM/DD hh:mm:ss. If no specific
time is provided, the syslog header or DeviceType
parameter is applied.
UserName Type the user name associated with the event.
HostName Type the host name associated with the event. Typically,
this parameter is only associated with identity events.
GroupName Type the group name associated with the event. Typically,
this parameter is only associated with identity events.
NetBIOSName Type the NetBIOS name associated with the event.
Typically, this parameter is only associated with identity
events.
Table 64-1 NVP Log Format Tags (continued)
Tag Description

Configuring DSMs
Examples 505
In addition to the parameters listed above, you can add any NVP parameters to
your log. The additional parameters are added to the payload, however, these
values are not parsed.
Step 9 You are now ready to configure the log source in JSA.
To configure JSA to receive events from an NVP DSM:
From the Log Source Type list box, select the Name Value Pair option.
For more information on configuring log sources, see the Log Sources Users
Guide.
Examples Example 1
The following example parses all fields:
DeviceType=NVP EventName=Test
DestinationIpPostNAT=172.16.45.10 DeviceTime=2007/12/14
09:53:49 SourcePort=1111 Identity=FALSE SourcePortPostNAT=3333
DestinationPortPostNAT=6666 HostName=testhost
DestinationIpPreNAT=172.16.10.10 SourcePortPreNAT=2222
DestinationPortPreNAT=5555 SourceMAC=AA:15:C5:BF:C4:9D
SourceIp=172.16.200.10 SourceIpPostNAT=172.16.40.50
NetBIOSName=testbois DestinationMAC=00:41:C5:BF:C4:9D
EventCategory=Accept DestinationPort=4444
GroupName=testgroup SourceIpPreNAT=172.16.70.87UserName=root
DestinationIp=172.16.30.30
Example 2
The following example provides identity using the destination IP address:
<133>Apr 16 12:41:00 172.16.10.10 namevaluepair:
DeviceType=NVP EventName=Test EventCategory=Accept
Identity=TRUE SourceMAC=AA:15:C5:BF:C4:9D
Identity Type TRUE or FALSE to indicate whether you wish this
event to generate an identity event. An identity event is
generated if the log message contains the SourceIp (if the
IdentityUseSrcIp parameter is set to TRUE) or
DestinationIp (if the IdentityUseSrcIp parameter is set to
FALSE) and one of the following parameters: UserName,
SourceMAC, HostName, NetBIOSName, or GroupName.
IdentityUseSrcIp Type TRUE or FALSE (default). TRUE indicates that you
wish to use the source IP address for identity. FALSE
indicates that you wish to use the destination IP address
for identity. This parameter is used only if the Identity
parameter is set to TRUE.
Table 64-1 NVP Log Format Tags (continued)
Tag Description
Configuring DSMs
506 NAME VALUE PAIR
SourceIp=172.15.210.113 DestinationIp=172.16.10.10
UserName=root
Example 3
The following example provides identity using the source IP address:
DeviceType=NVP EventName=Test EventCategory=Accept
DeviceTime=2007/12/14 09:53:49 SourcePort=5014 Identity=TRUE
IdentityUseSrcIp=TRUE SourceMAC=AA:15:C5:BF:C4:9D
SourceIp=172.15.210.113 DestinationIp=172.16.10.10
DestinationMAC=00:41:C5:BF:C4:9D UserName=root
Example 4
The following example provides an entry with no identity:
DeviceType=NVP EventName=Test EventCategory=Accept
DeviceTime=2007/12/14 09:53:49 SourcePort=5014 Identity=FALSE
SourceMAC=AA:15:C5:BF:C4:9D SourceIp=172.15.210.113
DestinationIp=172.16.10.10DestinationMAC=00:41:C5:BF:C4:9D
UserName=root
Configuring DSMs
62 NIKSUN
The Niksun DSM for Juniper Secure Analytics (JSA) records all relevant Niksun
events using syslog.
You can integrate NetDetector/NetVCR2005, version 3.2.1sp1_2 with JSA. Before
you configure JSA to integrate with a Niksun device, you must configure a log
source, then enable syslog forwarding on your Niksun appliance. For more
information on configuring Niksun, see your Niksun appliance documentation.
Configure a Log
Source
To integrate Niksun with JSA, you must manually create a log source to receive
events.
JSA does not automatically discover or create log sources for syslog events from
Niksun appliances. In cases where the log source is not automatically discovered,
we recommend you create a log source before forwarding events to JSA.
To configure a log source:
Step 1 Log in to JSA.
Step 2 Click the Admin tab.
Step 3 On the navigation menu, click Data Sources.
The Data Sources panel is displayed.
Step 4 Click the Log Sources icon.
The Log Sources window is displayed.
Step 5 Click Add.
The Add a log source window is displayed.
Step 6 In the Log Source Name field, type a name for your log source.
Step 7 In the Log Source Description field, type a description for the log source.
Step 8 From the Log Source Type list box, select Niksun 2005 v3.5.
Step 9 Using the Protocol Configuration list box, select Syslog.
The syslog protocol configuration is displayed.

Configuring DSMs
508 NIKSUN
Step 10 Configure the following values:
Step 11 Click Save.
Step 12 On the Admin tab, click Deploy Changes.
The log source is added to JSA.
Table 65-1 Syslog Parameters
Parameter Description
Log Source Identifier Type the IP address or host name for the log source as an
identifier for events from your Niksun appliance.

Configuring DSMs
63 NOKIA FIREWALL
The Check Point Firewall-1 DSM allows Juniper Secure Analytics (JSA) to accept
events Check Point-based Firewall events sent from Nokia Firewall appliances.
The syslog and OPSEC protocols allow two methods for JSA to collect Check
Point events from Nokia Firewall appliances.
This section contains the following topics:
•Integrating with a Nokia Firewall Using Syslog
•Integrating With a Nokia Firewall Using OPSEC
Integrating with a
Nokia Firewall
Using Syslog
This method allows you to configure your Nokia Firewall to accept Check Point
syslog events forwarded from your Nokia Firewall appliance.
To configure JSA to integrate with a Nokia Firewall device, you must:
1 Configure iptables on your JSA console or Event Collector to receive syslog events
from Nokia Firewall.
2 Configure your Nokia Firewall to forward syslog event data.
3 Configure the events logged by the Nokia Firewall.
4 Optional. Configure a log source in JSA.
Configuring IPtables Nokia Firewalls require a TCP reset (rst) or a TCP acknowledge (ack) from JSA on
port 256 before forwarding syslog events.
The Nokia Firewall TCP request is an online status request designed to ensure
that JSA is online and able to receive syslog events. If a valid reset or
acknowledge is received from JSA, then Nokia Firewall begins forwarding events
to JSA on UDP port 514. By default, JSA does not respond to any online status
requests from TCP port 256. You must configure IPtables on your JSA console or
any Event Collectors that receive Check Point events from a Nokia Firewall to
respond to an online status request.
Configuring DSMs
510 NOKIA FIREWALL
Procedure
Step 1 Using SSH, log in to JSA as the root user.
Login: root
Password: <password>
Step 2 Type the following command to edit the IPtables file:
vi /opt/qradar/conf/iptables.pre
The IPtables configuration file is displayed.
Step 3 Type the following command to instruct JSA to respond to your Nokia Firewall with
a TCP reset on port 256:
-A INPUT -s <IP address> -p tcp --dport 256 -j REJECT
--reject-with tcp-reset
Where <IP address> is the IP address of your Nokia Firewall. You must include a
TCP reset for each Nokia Firewall IP address that sends events to your JSA
console or Event Collector. For example,
-A INPUT -s 10.10.100.10/32 -p tcp --dport 256 -j REJECT
--reject-with tcp-reset
-A INPUT -s 10.10.110.11/32 -p tcp --dport 256 -j REJECT
--reject-with tcp-reset
-A INPUT -s 10.10.120.12/32 -p tcp --dport 256 -j REJECT
--reject-with tcp-reset
Step 4 Save your IPtables configuration.
Step 5 Type the following command to update IPtables in JSA:
./opt/qradar/bin/iptables_update.pl
Step 6 Repeat Step 1 to Step 5 to configure any additional Event Collectors in your
deployment that receive syslog events from a Nokia Firewall.
You are now ready to configure your Nokia Firewall to forward events to JSA.
Configuring Syslog To configure your Nokia Firewall to forward syslog events to JSA:
Procedure
Step 1 Log in to the Nokia Voyager.
Step 2 Click Config.
Step 3 In the System Configuration pane, click System Logging.
Step 4 In the Add new remote IP address to log to field, type the IP address of your
JSA console or Event Collector.
Step 5 Click Apply.
Step 6 Click Save.
You are now ready to configure which events are logged by your Nokia Firewall to
the logger.

Configuring DSMs
Integrating with a Nokia Firewall Using Syslog 511
Configure the
Logged Events
Custom Script
To configure which events are logged by your Nokia Firewall and forwarded to
JSA, you must configure a custom script for your Nokia Firewall.
Procedure
Step 1 Using SSH, log in to Nokia Firewall as an administrative user.
If you cannot connect to your Nokia Firewall, SSH may be disabled. You must
enable the command-line using the Nokia Voyager web interface or connect
directly using a serial connection. For more information, see your Nokia Voyager
documentation.
Step 2 Type the following command to edit your Nokia Firewall rc.local file:
vi /var/etc/rc.local
Step 3 Add the following command to your rc.local file:
$FWDIR/bin/fw log -ftn | /bin/logger -p local1.info &
Step 4 Save the changes to your rc.local file.
The terminal is displayed.
Step 5 To begin logging immediately, type the following command:
nohup $FWDIR/bin/fw log -ftn | /bin/logger -p local1.info &
You are now ready to configure the log source in JSA.
Configure a Log
Source
Events forwarded by your Nokia Firewall are automatically discovered by the
Check Point Firewall-1 DSM. The automatic discovery process creates a log
source for syslog events from Nokia Firewall appliances. The following steps are
optional.
Procedure
Step 1 Log in to JSA.
Step 2 Click the Admin tab.
Step 3 On the navigation menu, click Data Sources.
Step 4 Click the Log Sources icon.
Step 5 Click Add.
Step 6 In the Log Source Name field, type a name for your log source.
Step 7 In the Log Source Description field, type a description for the log source.
Step 8 From the Log Source Type list box, select Check Point Firewall-1.
Step 9 Using the Protocol Configuration list box, select Syslog.
Step 10 Configure the following values:
Table 66-1 Syslog Protocol Parameters
Parameter Description
Log Source Identifier Type the IP address or hostname for the log source as an
identifier for events from your Nokia Firewall appliance.

Configuring DSMs
512 NOKIA FIREWALL
Step 11 Click Save.
Step 12 On the Admin tab, click Deploy Changes.
The syslog configuration for receiving Check Point events from Nokia Firewalls
over syslog is complete. Check Point events from your Nokia Firewall are
displayed in the Log Activity tab in JSA.
Integrating With a
Nokia Firewall
Using OPSEC
JSA can accept Check Point FireWall-1 events from Nokia Firewalls using the
Check Point FireWall-1 DSM configured using the OPSEC/LEA protocol. Before
you configure JSA to integrate with a Nokia Firewall device, you must:
1 Configure Nokia Firewall using OPSEC, see Configuring a Nokia Firewall for
OPSEC.
2 Configure a log source in JSA for your Nokia Firewall using the OPSEC LEA
protocol, see Configuring an OPSEC Log Source.
Configuring a Nokia
Firewall for OPSEC
To configure Nokia Firewall using OPSEC:
Procedure
Step 1 To create a host object for your JSA, open up the Check Point SmartDashboard
GUI and select Manage > Network Objects > New > Node > Host.
Step 2 type the Name, IP Address, and optional Comment for your JSA.
Step 3 Click OK.
Step 4 Select Close.
Step 5 To create the OPSEC connection, select Manage > Servers and OPSEC
Applications > New > OPSEC Application Properties.
Step 6 Type the Name and optional Comment.
The name you type must be different than the name in Step 2.
Step 7 From the Host drop-down menu, select the JSA host object that you created.
Step 8 From Application Properties, select User Defined as the Vendor Type.
Step 9 From Client Entries, select LEA.
Step 10 Select Communication and enter an activation key to configure the Secure
Internal Communication (SIC) certificate.
Step 11 Select OK and then select Close.
Step 12 To install the policy on your firewall, select Policy > Install > OK.
For more information on policies, see your vendor documentation. You are now
ready to configure a log source for your Nokia Firewall in JSA.
Configuring an
OPSEC Log Source
OPSEC/LEA log sources do not automatically discover in JSA, you must create an
OPSEC log source to collect events.

Configuring DSMs
Integrating With a Nokia Firewall Using OPSEC 513
Procedure
Step 1 Log in to JSA.
Step 2 Click the Admin tab.
Step 3 On the navigation menu, click Data Sources.
Step 4 Click the Log Sources icon.
Step 5 Click Add.
Step 6 In the Log Source Name field, type a name for your log source.
Step 7 In the Log Source Description field, type a description for the log source.
Step 8 From the Log Source Type list box, select Check Point FireWall-1.
Step 9 Using the Protocol Configuration list box, select OPSEC/LEA.
Step 10 Configure the following values:
Table 66-2 OPSEC/LEA Protocol Parameters
Parameter Description
Log Source
Identifier
Type an IP address, hostname, or name to identify the event
source. IP addresses or host names are recommended as they
allow JSA to identify a log file to a unique event source.
Server IP Type the IP address of the server.
Server Port Type the port used for OPSEC communication. The valid range
is 0 to 65,536 and the default is 18184.
Use Server IP for
Log Source
Select this check box if you want to use the LEA server’s IP
address instead of the managed device’s IP address for a log
source. By default, the check box is selected.
Statistics Report
Interval
Type the interval, in seconds, during which the number of syslog
events are recorded in the qradar.log file.
The valid range is 4 to 2,147,483,648 and the default is 600.

Configuring DSMs
514 NOKIA FIREWALL
Step 11 Click Save.
Step 12 On the Admin tab, click Deploy Changes.
The configuration is complete. As events are received, they are displayed in the
Log Activity tab in JSA.
Authentication
Type
From the list box, select the authentication type you want to use
for this LEA configuration. The options are sslca (default),
sslca_clear, or clear. This value must match the authentication
method used by the server. The following parameters appear if
sslca or sslca_clear is selected as the authentication type.
•OPSEC Application Object SIC Attribute (SIC Name) -
Type the Secure Internal Communications (SIC) name of the
OPSEC Application Object. The SIC name is the
distinguished name (DN) of the application, for example:
CN=LEA, o=fwconsole..7psasx. The name can be up
to 255 characters in length and is case sensitive.
•Log Source SIC Attribute (Entity SIC Name) - Type the SIC
name of the server, for example:
cn=cp_mgmt,o=fwconsole..7psasx. The name can be
up to 255 characters in length and is case sensitive.
•Specify Certificate - Select this check box if you want to
define a certificate for this LEA configuration. JSA attempts to
retrieve the certificate using these parameters when the
certificate is required.
If you select the Specify Certificate check box, the Certificate
Filename parameter is displayed:
•Certificate Filename - This option only appears if Specify
Certificate is selected. Type the directory path of the
certificate you want to use for this configuration.
If you clear the Specify Certificate check box, the following
parameters appear:
•Certificate Authority IP - Type the IP address of the
SmartCenter server from which you want to pull your
certificate.
•Pull Certificate Password - Type the password you want to
use when requesting a certificate. The password can be up to
255 characters in length.
•OPSEC Application - Type the name of the application you
want to use when requesting a certificate. This value can be
up to 255 characters in length.
Table 66-2 OPSEC/LEA Protocol Parameters (continued)
Parameter Description
Configuring DSMs
64 NOMINUM VANTIO
The Nominum Vantio DSM for Juniper Secure Analytics (JSA) accepts syslog
events in Log Extended Event Format (LEEF) forwarded from Nominum Vantio
engines installed with the Nominum Vantio LEEF Adapter.
JSA accepts all relevant events forwarded from Nominum Vantio.
The Vantio LEEF Adapter creates LEEF messages based on Lightweight View
Policy (LVP) matches. In order to generate LVP matches for the Vantio LEEF
Adapter to process, you most configure Lightweight Views and the lvp-monitor for
the Vantio engine. LVP is an optionally licensed component of the Nominum Vantio
product. For more information about configuring LVP, please see the Vantio
Administrator’s Manual.
Before you can integrate Nominum Vantio events with JSA, you must install and
configure the Vantio LEEF adapter. To obtain the Vantio LEEF adapter or request
additional information, you can email Nominum at the following address:
leefadapter@nominum.com.
Configure the Vantio
LEEF Adapter
To install and configure your Vantio LEEF Adapter:
Step 1 Using SSH, log in to your Vantio engine server.
Step 2 Install the Vantio LEEF Adapter:
sudo rpm -I VantioLEEFAdapter-0.1-a.x86_64.rpm
Step 3 Edit the Vantio LEEF Adapter configuration file.
usr/local/nom/sbin/VantioLEEFAdapter
Step 4 Configure the Vantio LEEF Adapter configuration to forward LEEF events to JSA:
-qradar-dest-addr=<IP Address>
Where <IP Address> is the IP address of your JSA console or Event Collector.
Step 5 Save the Vantio LEEF configuration file.

Configuring DSMs
516 NOMINUM VANTIO
Step 6 Type the following command to start the Vantio Adapter:
usr/local/nom/sbin/VantioLEEFAdapter &
The configuration is complete. The log source is added to JSA as Nominum Vantio
events are automatically discovered. Events forwarded to JSA by the Vantio LEEF
Adapter are displayed on the Log Activity tab of JSA.
Configure a Log
Source
JSA automatically discovers and creates a log source for syslog events from the
Vantio LEEF Adapter. The following configuration steps are optional.
To manually configure a log source for Nominum Vantio:
Step 1 Log in to JSA.
Step 2 Click the Admin tab.
Step 3 On the navigation menu, click Data Sources.
The Data Sources panel is displayed.
Step 4 Click the Log Sources icon.
The Log Sources window is displayed.
Step 5 Click Add.
The Add a log source window is displayed.
Step 6 In the Log Source Name field, type a name for your log source.
Step 7 In the Log Source Description field, type a description for the log source.
Step 8 From the Log Source Type list box, select Nominum Vantio.
Step 9 Using the Protocol Configuration list box, select Syslog.
The syslog protocol configuration is displayed.
Step 10 Configure the following values:
Step 11 Click Save.
Step 12 On the Admin tab, click Deploy Changes.
The configuration is complete.
Table 67-3 Syslog Parameters
Parameter Description
Log Source Identifier Type the IP address or host name for the log source as an
identifier for events from Nominum Vantio.

Configuring DSMs
65 NORTEL NETWORKS
This section provides information on the following DSMs:
•Nortel Multiprotocol Router
•Nortel Application Switch
•Nortel Contivity
•Nortel Ethernet Routing Switch 2500/4500/5500
•Nortel Ethernet Routing Switch 8300/8600
•Nortel Secure Router
•Nortel Secure Network Access Switch
•Nortel Switched Firewall 5100
•Nortel Switched Firewall 6000
•Nortel Threat Protection System
•Nortel VPN Gateway
Nortel
Multiprotocol
Router
The Nortel Multiprotocol Router DSM for Juniper Secure Analytics (JSA) records
all relevant Nortel Multiprotocol Router events using syslog.
Before you configure JSA to integrate with a Nortel Multiprotocol Router device,
you must:
Step 1 Log in to your Nortel Multiprotocol Router device.
Step 2 At the prompt, type the following command:
bcc
The Bay Command console prompt is displayed.
Welcome to the Bay Command Console!
* To enter configuration mode, type config
* To list all system commands, type ?
* To exit the BCC, type exit
bcc>
Configuring DSMs
518 NORTEL NETWORKS
Step 3 Type the following command to access configuration mode:
config
Step 4 Type the following command to access syslog configuration:
syslog
Step 5 Type the following commands:
log-host address <IP address>
Where <IP address> is the IP address of your JSA.
Step 6 View current default settings for your JSA:
info
For example:
log-host/10.11.12.210# info
address 10.11.12.210
log-facility local0
state enabled
Step 7 If the output of the command entered in Step 6 indicates that the state is not
enabled, type the following command to enable forwarding for the syslog host:
state enable
Step 8 Configure the log facility parameter:
log-facility local0
Step 9 Create a filter for the hardware slots to enable them to forward the syslog events.
Type the following command to create a filter with the name WILDCARD:
filter name WILDCARD entity all
Step 10 Configure the slot-upper bound parameter:
slot-upper bound <number of slots>
Where <number of slots> is the number of slots available on your device. This
parameter can require different configuration depending on your version of Nortel
Multiprotocol Router device, which determines the maximum number of slots
available on the device.
Step 11 Configure the level of syslog messages you want to send to your JSA:
severity-mask all
Step 12 View the current settings for this filter:
info
For example:
filter/10.11.12.210/WILDCARD# info
debug-map debug
entity all
event-lower-bound 0

Configuring DSMs
Nortel Multiprotocol Router 519
event-upper-bound 255
fault-map critical
info-map info
name WILDCARD
severity-mask {fault warning info trace debug}
slot-lower-bound 0
slot-upper-bound 1
state enabled
trace-map debug
warning-map warning
Step 13 View the currently configured settings for the syslog filters:
show syslog filters
When the syslog and filter parameters are correctly configured, the Operational
State indicates up.
For example:
syslog# show syslog filters
show syslog filters Sep 15, 2008 18:21:25 [GMT+8]
Step 14 View the currently configured syslog host information:
show syslog log-host
The host log is displayed with the number of packets being sent to the various
syslog hosts.
For example:
syslog# show syslog log-host
show syslog log-host Sep 15, 2008 18:21:32 [GMT+8]
Step 15 Exit the command interface:
a Exit the current command-line to return to the bcc command-line:
exit
b Exit the bbc command-line:
exit
Host
IP address
Filter
Name
Entity
Name
Entity
Code
Configured
State
Operational
State
10.11.12.130 WILDCARD all 255 enabled up
10.11.12.210 WILDCARD all 255 enabled up
Host
IP address
Configured
State
Operational
State
Time
Sequencing
UDP
Port
Facility
Code
#Messages
Sent
10.11.12.130 enabled up disabled 514 local0 1402
10.11.12.210 enabled up disabled 514 local0 131

Configuring DSMs
520 NORTEL NETWORKS
c Exit the command-line session:
logout
You are now ready to configure the log source in JSA.
To configure JSA to receive events from a Nortel Multiprotocol Router device:
From the Log Source Type list box, select the Nortel Multiprotocol Router
option.
For more information on configuring log sources, see the Log Sources Users
Guide. For more information about your device, see your vendor documentation.
Nortel Application
Switch
Nortel Application Switches integrate routing and switching by forwarding traffic at
layer 2 speed using layer 4-7 information.
The Nortel Application Switch DSM for JSA accepts events using syslog. JSA
records all relevant status and network condition events. Before configuring a
Nortel Application Switch device in JSA, you must configure your device to send
syslog events to JSA.
To configure the device to send syslog events to JSA:
Step 1 Log in to the Nortel Application Switch command-line interface (CLI).
Step 2 Type the following command:
/cfg/sys/syslog/host
Step 3 At the prompt, type the IP address of your JSA:
Enter new syslog host: <IP address>
Where <IP address> is the IP address of your JSA.
Step 4 Apply the configuration:
apply
Step 5 After the new configuration is applied, save your configuration:
save
Step 6 Type y at the prompt to confirm that you wish to save the configuration to flash.
For example:
Confirm saving to FLASH [y/n]: y
New config successfully saved to FLASH
Step 7 You are now ready to configure the log source in JSA.
To configure JSA to receive events from a Nortel Application Switch:
From the Log Source Type list box, select the Nortel Application Switch
option.

Configuring DSMs
Nortel Contivity 521
For more information on configuring log sources, see the Log Sources Users
Guide. For more information about the Nortel Application Switch, see your vendor
documentation.
Nortel Contivity A JSA Nortel Contivity DSM records all relevant Nortel Contivity events using
syslog.
Before you configure JSA to integrate with a Nortel Contivity device, you must:
Step 1 Log in to the Nortel Contivity command-line interface (CLI).
Step 2 Type the following command:
enable <password>
Where <password> is the Nortel Contivity device administrative password.
Step 3 Type the following command:
config t
Step 4 Configure the logging information:
logging <IP address> facility-filter all level all
Where <IP address> is the IP address of the JSA.
Step 5 Type the following command to exit the command-line:
exit
Step 6 You are now ready to configure the log source in JSA.
To configure JSA to receive events from a Nortel Contivity device:
From the Log Source Type list box, select the Nortel Contivity VPN Switch
option.
For more information on configuring log sources, see the Log Sources Users
Guide. For more information about your Nortel Contivity device, see your vendor
documentation.
Nortel Ethernet
Routing Switch
2500/4500/5500
A JSA Nortel Ethernet Routing Switch (ERS) 2500/4500/5500 DSM records all
relevant routing switch events using syslog.
Before configuring a Nortel ERS 2500/4500/5500 device in JSA, you must
configure your device to send syslog events to JSA.
To configure the device to send syslog events to JSA:
Step 1 Log in to the Nortel ERS 2500/4500/5500 user interface.
Step 2 Type the following commands to access global configuration mode:
ena
config term

Configuring DSMs
522 NORTEL NETWORKS
Step 3 Type informational as the severity level for the logs you wish to send to the
remote server:
logging remote level {critical|informational|serious|none}
Where informational sends all logs to the syslog server.
Step 4 Enable the host:
host enable
Step 5 Type the remote logging address:
logging remote address <IP address>
Where <IP address> is the IP address of the JSA system.
Step 6 Ensure that remote logging is enabled:
logging remote enable
Step 7 You are now ready to configure the log source in JSA.
To configure JSA to receive events from a Nortel ERS 2500/4500/5500 device:
From the Log Source Type list box, select the Nortel Ethernet Routing
Switch 2500/4500/5500 option.
For more information on configuring log sources, see the Log Sources Users
Guide.
For more information about the Nortel ERS 2500/4500/5500, see
http://www.nortel.com/support.
Nortel Ethernet
Routing Switch
8300/8600
A JSA Nortel Ethernet Routing Switch (ERS) 8300/8600 DSM records all relevant
events using syslog.
Before configuring a Nortel ERS 8600 device in JSA, you must configure your
device to send syslog events to JSA.
To configure the device to send syslog events to JSA:
Step 1 Log in to the Nortel ERS 8300/8600 command-line interface (CLI).
Step 2 Type the following command:
config sys syslog host <ID>
Where <ID> is the ID of the host you wish to configure to send syslog events to
JSA.
For the syslog host ID, the valid range is 1 to 10.
Step 3 Type the IP address of your JSA system:
address <IP address>
Where <IP address> is the IP address of your JSA system.
Configuring DSMs
Nortel Ethernet Routing Switch 8300/8600 523
Step 4 Type the facility for accessing the syslog host:
host <ID> facility local0
Where <ID> is the ID specified in Step 2.
Step 5 Enable the host:
host enable
Step 6 Type the severity level for which syslog messages are sent:
host <ID> severity info
Where <ID> is the ID specified in Step 2.
Step 7 Enable the ability to send syslog messages:
state enable
Step 8 Verify the syslog configuration for the host:
sylog host <ID> info
For example, the output might resemble the following:
ERS-8606:5/config/sys/syslog/host/1# info
Sub-Context:
Current Context:
address : 10.10.10.1
create : 1
delete : N/A
facility : local6
host : enable
mapinfo : info
mapwarning : warning
maperror : error
mapfatal : emergency
severity : info|warning|error|fatal
udp-port : 514
ERS-8606:5/config/sys/syslog/host/1#
Step 9 You are now ready to configure the log source in JSA.
To configure JSA to receive events from a Nortel ERS 8300/8600 device:
From the Log Source Type list box, you must select the Nortel Ethernet
Routing Switch 8300/8600 option.
For more information on configuring log sources, see the Log Sources Users
Guide.
For more information about the Nortel ERS 8300/8600, see
http://www.nortel.com/support.

Configuring DSMs
524 NORTEL NETWORKS
Nortel Secure
Router
A JSA Nortel Secure Router DSM records all relevant router events using syslog.
Before configuring a Nortel Secure Router device in JSA, you must configure your
device to send syslog events to JSA.
To configure the device to send syslog events to JSA:
Step 1 Log in to the Nortel Secure Router command-line interface (CLI).
Step 2 Type the following to access global configuration mode:
config term
Step 3 Type the following command:
system logging syslog
Step 4 Type the IP address of the syslog server (JSA system):
host_ipaddr <IP address>
Where <IP address> is the IP address of the JSA system.
Step 5 Ensure that remote logging is enabled:
enable
Step 6 Verify that the logging levels are configured, as appropriate:
show system logging syslog
The following shows an example of the output:
------------------------------------
Syslog Setting
------------------------------------
Syslog: Enabled
Host IP Address: 10.10.10.1
Host UDP Port: 514
Facility Priority Setting:
facility priority
======== ========
auth: info
bootp: warning
daemon: warning
domainname: warning
gated: warning
kern: info
mail: warning
ntp: warning
system: info
fr: warning
ppp: warning

Configuring DSMs
Nortel Secure Network Access Switch 525
ipmux: warning
bundle: warning
qos: warning
hdlc: warning
local7: warning
vpn: warning
firewall: warning
Step 7 You are now ready to configure the log source in JSA.
To configure JSA to receive events from a Nortel Secure Router device:
From the Log Source Type list box, select the Nortel Secure Router option.
For more information on configuring log sources, see the Log Sources Users
Guide.
For more information about the Nortel Secure Router, see
http://www.nortel.com/support.
Nortel Secure
Network Access
Switch
A JSA Nortel Secure Network Access Switch (SNAS) DSM records all relevant
switch events using syslog.
Before configuring a Nortel SNAS device in JSA, you must:
Step 1 Log in to the Nortel SNAS user interface.
Step 2 Select the Config tab.
Step 3 Select Secure Access Domain and Syslog from the Navigation pane.
The Secure Access Domain window is displayed.
Step 4 From the Secure Access Domain list, select the secure access domain. Click
Refresh.
Step 5 Click Add.
The Add New Remote Server window is displayed.
Step 6 Click Update.
The server is displayed in the secure access domain table.
Step 7 Using the toolbar, click Apply to send the current changes to the Nortel SNAS.

Configuring DSMs
526 NORTEL NETWORKS
Step 8 You are now ready to configure the log source in JSA.
To configure JSA to receive events from a Nortel SNAS device:
From the Log Source Type list box, select the Nortel Secure Network
Access Switch (SNAS) option.
For more information on configuring log sources, see the Log Sources Users
Guide.
For more information about the Nortel SNA, see http://www.nortel.com/support.
Nortel Switched
Firewall 5100
A JSA Nortel Switched Firewall 5100 DSM records all relevant firewall events
using either syslog or OPSEC.
Before configuring a Nortel Switched Firewall device in JSA, you must configure
your device to send events to JSA.
This section provides information on configuring a Nortel Switched Firewall using
one the following methods:
•Integrate Nortel Switched Firewall Using syslog
•Integrate Nortel Switched Firewall Using OPSEC
Integrate Nortel
Switched Firewall
Using syslog
This method ensures the JSA Nortel Switched Firewall 5100 DSM accepts events
using syslog.
To configure your Nortel Switched Firewall 5100:
Step 1 Log into your Nortel Switched Firewall device command-line interface (CLI).
Step 2 Type the following command:
/cfg/sys/log/syslog/add
Step 3 Type the IP address of your JSA system at the following prompt:
Enter IP address of syslog server:
A prompt is displayed to configure the severity level.
Step 4 Configure info as the desired severity level. For example:
Enter minimum logging severity
(emerg | alert | crit | err | warning | notice | info | debug):
info
A prompt is displayed to configure the facility.
Step 5 Configure auto as the local facility. For example:
Enter the local facility (auto | local0-local7): auto

Configuring DSMs
Nortel Switched Firewall 5100 527
Step 6 Apply the configuration:
apply
Step 7 Repeat for each firewall in your cluster.
Step 8 You are now ready to configure the log source in JSA.
To configure JSA to receive events from a Nortel Switched Firewall 5100 device
using syslog:
From the Log Source Type list box, select the Nortel Switched Firewall
5100 option.
For more information on configuring log sources, see the Log Sources Users
Guide. For more information, see http://www.nortel.com/support.
Integrate Nortel
Switched Firewall
Using OPSEC
This method ensures the JSA Nortel Switched Firewall 5100 DSM accepts Check
Point FireWall-1 events using OPSEC.
NOTE
Note: Depending on your Operating System, the procedures for the Check Point
SmartCenter Server can vary. The following procedures are based on the Check
Point SecurePlatform Operating system.
To enable Nortel Switched Firewall and JSA integration, you must:
1 Reconfigure Check Point SmartCenter Server.
2 Configure the log source in JSA.
Reconfigure Check Point SmartCenter Server
This section describes how to reconfigure the Check Point SmartCenter Server. In
the Check Point SmartCenter Server, create a host object representing the JSA
system. The leapipe is the connection between the Check Point SmartCenter
Server and JSA.
To reconfigure the Check Point SmartCenter Server:
Step 1 To create a host object, open the Check Point SmartDashboard user interface and
select Manage > Network Objects > New > Node > Host.
Step 2 Type the Name, IP Address, and optional Comment for your host.
Step 3 Click OK.
Step 4 Select Close.
Step 5 To create the OPSEC connection, select Manage > Servers and OPSEC
applications > New > OPSEC Application Properties.
Step 6 Type the Name and optional Comment.
The name you type must be different than the name in Step 2.

Configuring DSMs
528 NORTEL NETWORKS
Step 7 From the Host drop-down menu, select the host object you have created in Step 1.
Step 8 From Application Properties, select User Defined as the vendor.
Step 9 From Client Entries, select LEA.
Step 10 Click Communication.
Step 11 Choose a password in the provide field. This password is necessary when pulling
the certificate to the Firewall Director.
Step 12 Click OK and then click Close.
Step 13 To install the Security Policy on your firewall, select Policy > Install > OK.
Configure a log source
You are now ready to configure the log source in JSA.
Step 1 To configure JSA to receive events from a Nortel Switched Firewall 5100 device
using OPSEC, you must select the Nortel Switched Firewall 5100 option from the
Log Source Type list box.
Step 2 To configure JSA to receive events from a Check Point SmartCenter Server using
OPSEC LEA, you must select the LEA option from the Protocol Configuration
list box when configuring your protocol configuration.
For more information, see the Log Sources Users Guide.
Nortel Switched
Firewall 6000
A JSA Nortel Switched Firewall 6000 DSM records all relevant firewall events
using either syslog or OPSEC.
Before configuring a Nortel Switched Firewall device in JSA, you must configure
your device to send events to JSA.
This section provides information on configuring a Nortel Switched Firewall 6000
device with JSA using one of the following methods:
•Configure syslog for Nortel Switched Firewalls
•Configure OPSEC for Nortel Switched Firewalls
Configure syslog for
Nortel Switched
Firewalls
This method ensures the JSA Nortel Switched Firewall 6000 DSM accepts events
using syslog.
To configure your Nortel Switched Firewall 6000:
Step 1 Log into your Nortel Switched Firewall device command-line interface (CLI).
Step 2 Type the following command:
/cfg/sys/log/syslog/add
Step 3 Type the IP address of your JSA system at the following prompt:
Enter IP address of syslog server:
A prompt is displayed to configure the severity level.

Configuring DSMs
Nortel Switched Firewall 6000 529
Step 4 Configure info as the desired severity level. For example:
Enter minimum logging severity
(emerg | alert | crit | err | warning | notice | info | debug):
info
A prompt is displayed to configure the facility.
Step 5 Configure auto as the local facility. For example:
Enter the local facility (auto | local0-local7): auto
Step 6 Apply the configuration:
apply
Step 7 You are now ready to configure the log source in JSA.
To configure JSA to receive events from an Nortel Switched Firewall 6000 using
syslog:
From the Log Source Type list box, select the Nortel Switched Firewall
6000 option.
For more information on configuring log sources, see the Log Sources Users
Guide. For more information, see http://www.nortel.com/support.
Configure OPSEC for
Nortel Switched
Firewalls
This method ensures the JSA Nortel Switched Firewall 6000 DSM accepts Check
Point FireWall-1 events using OPSEC.
NOTE
Note: Depending on your Operating System, the procedures for the Check Point
SmartCenter Server can vary. The following procedures are based on the Check
Point SecurePlatform Operating system.
To enable Nortel Switched Firewall and JSA integration, you must:
Step 1 Reconfigure Check Point SmartCenter Server. See Reconfigure Check Point
SmartCenter Server.
Step 2 Configure the OPSEC LEA protocol in JSA.
To configure JSA to receive events from a Check Point SmartCenter Server using
OPSEC LEA, you must select the LEA option from the Protocol Configuration
list box when configuring LEA.
For more information, see the Log Sources Users Guide.
Step 3 Configure the log source in JSA.
To configure JSA to receive events from a Nortel Switched Firewall 6000 device
using OPSEC you must select the Nortel Switched Firewall 6000 option from the
Log Source Type list box. For more information on configuring log sources, see
the Log Sources Users Guide.

Configuring DSMs
530 NORTEL NETWORKS
For more information, see http://www.nortel.com/support.
Reconfigure Check Point SmartCenter Server
This section describes how to reconfigure the Check Point SmartCenter Server. In
the Check Point SmartCenter Server, create a host object representing the JSA
system. The leapipe is the connection between the Check Point SmartCenter
Server and JSA.
To reconfigure the Check Point SmartCenter Server:
Step 1 To create a host object, open the Check Point SmartDashboard user interface and
select Manage > Network Objects > New > Node > Host.
Step 2 Type the Name, IP Address, and optional Comment for your host.
Step 3 Click OK.
Step 4 Select Close.
Step 5 To create the OPSEC connection, select Manage > Servers and OPSEC
applications > New > OPSEC Application Properties.
Step 6 Type the Name and optional Comment.
The name you type must be different than the name in Step 2.
Step 7 From the Host drop-down menu, select the host object you have created in Step 1.
Step 8 From Application Properties, select User Defined as the vendor.
Step 9 From Client Entries, select LEA.
Step 10 Click Communication to generate a Secure Internal Communication (SIC)
certificate and enter an activation key.
Step 11 Click OK and then click Close.
Step 12 To install the Security Policy on your firewall, select Policy > Install > OK.
The configuration is complete.
Nortel Threat
Protection System
A JSA Nortel Threat Protection System (TPS) DSM records all relevant threat and
system events using syslog.
Before configuring a Nortel TPS device in JSA, you must:
Step 1 Log in to the Nortel TPS user interface.
Step 2 Select Policy & Response > Intrusion Sensor > Detection & Prevention.
The Detection & Prevention window is displayed.
Step 3 Click Edit next to the intrusion policy you want to configure alerting option.
The Edit Policy window is displayed.
Step 4 Click Alerting.
The Alerting window is displayed.

Configuring DSMs
Nortel VPN Gateway 531
Step 5 Under Syslog Configuration, select on next to State to enable syslog alerting.
Step 6 From the list boxes, select the facility and priority levels.
Step 7 Optional. In the Logging Host field, type the IP address of your JSA system. This
configures your JSA system to be your logging host. Separate multiple hosts with
commas.
Step 8 Click Save.
The syslog alerting configuration is saved.
Step 9 Apply the policy to your appropriate detection engines.
Step 10 You are now ready to configure the log source in JSA.
To configure JSA to receive events from a Nortel TPS device:
From the Log Source Type list box, select the Nortel Threat Protection
System (TPS) Intrusion Sensor option.
For more information on configuring log sources, see the Log Sources Users
Guide. For more information about Nortel TPS, see http://www.nortel.com/support.
Nortel VPN
Gateway
The JSA Nortel VPN Gateway DSM accetps events using syslog.
JSA records all relevant operating system (OS), system control, traffic processing,
startup, configuration reload, AAA, and IPsec events. Before configuring a Nortel
VPN Gateway device in JSA, you must configure your device to send syslog
events to JSA.
To configure the device to send syslog events to JSA:
Step 1 Log in to the Nortel VPN Gateway command-line interface (CLI).
Step 2 Type the following command:
/cfg/sys/syslog/add
Step 3 At the prompt, type the IP address of your JSA system:
Enter new syslog host: <IP address>
Where <IP address> is the IP address of your JSA system.
Step 4 Apply the configuration:
apply
Step 5 View all syslog servers currently added to your system configuration:
/cfg/sys/syslog/list
Configuring DSMs
Nortel VPN Gateway 532
Step 6 You are now ready to configure the log source in JSA.
To configure JSA to receive events from a Nortel VPN Gateway device:
From the Log Source Type list box, select the Nortel VPN Gateway option.
For more information on configuring log sources, see the Log Sources Users
Guide. For more information about the Nortel VPN Gateway, see
http://www.nortel.com/support.
Configuring DSMs
66 NOVELL EDIRECTORY
The Novell eDirectory DSM for Juniper Secure Analytics (JSA) accepts audit
events from Novell eDirectory using syslog.
Before You Begin To use the Novell eDirectory DSM, you must have the following components
installed:
•Novell eDirectory v8.8 with service pack 6 (sp6)
•Novell iManager v2.7
•XDASv2
To configure Novell eDirectory with JSA, you must:
1 Configure the XDASv2 property file to forward events to JSA.
2 Load the XDASv2 module on your Linux or Windows Operating System.
3 Configure auditing using Novell iManager.
4 Configure JSA.
Configure XDASv2 to
Forward Events
By default, XDASv2 is configured to log events to a file. To forward events from
XDASv2 to JSA, you must edit the xdasconfig.properties and configure the file for
syslog forwarding.
Audit events must be forwarded by syslog to JSA, instead of being logged to a file.
To configure XDASv2 to forward syslog events:
Step 1 Log in to the server hosting Novell eDirectory.
Step 2 Open the following file for editing:
•Windows - C:\Novell\NDS\xdasconfig.properties
•Linux or Solaris -
etc/opt/novell/configuration/xdasconfig.properties
Step 3 To set the root logger, remove the comment marker (#) from the following line:
log4j.rootLogger=debug, S, R
Step 4 To set the appender, remove the comment marker (#) from the following line:
log4j.appender.S=org.apache.log4j.net.SyslogAppender
Configuring DSMs
534 NOVELL EDIRECTORY
Step 5 To configure the IP address for the syslog destination, remove the comment
marker (#) and edit the following lines:
log4j.appender.S.Host=<IP address>
log4j.appender.S.Port=<Port>
Where,
<IP address> is the IP address or hostname of JSA.
<Port> is the port number for the UDP or TCP protocol. The default port for syslog
communication is port 514 for JSA or Event Collectors.
Step 6 To configure the syslog protocol, remove the comment marker (#) and type the
protocol (UDP, TCP, or SSL) use in the following line:
log4j.appender.S.Protocol=TCP
The encrypted protocol SSL is not supported by JSA.
Step 7 To set the severity level for logging events, remove the comment marker (#) from
the following line:
log4j.appender.S.Threshold=INFO
The default value of INFO is the correct severity level for events.
Step 8 To set the facility for logging events, remove the comment marker (#) from the
following line:
log4j.appender.S.Facility=USER
The default value of USER is the correct facility value for events.
Step 9 To set the facility for logging events, remove the comment marker (#) from the
following line:
log4j.appender.R.MaxBackupIndex=10
Step 10 Save the xdas.properties file.
After you configure the syslog properties for XDASv2 events, you are ready to load
the XDASv2 module.
Load the XDASv2
Module
Before you can configure events in Novell iManager, you must load the changes
you made to the XDASv2 module.
To load the XDASv2 module, select your operating system.
•To load the XDASv2 in Linux, see Load the XDASv2 on a Linux Operating
System.
•To load the XDASv2 in Windows, see Load the XDASv2 on a Windows
Operating System.

Configuring DSMs
535
NOTE
Note: If your Novell eDirectory has Novell Module Authentication Service (NMAS)
installed with NMAS auditing enabled, the changes made to XDASv2 modules are
loaded automatically. If you have NMAS installed, you should configure event
auditing. For information on configuring event auditing, see Configure Event
Auditing Using Novell iManager.
Load the XDASv2 on a Linux Operating System
Step 1 Log in to your Linux server hosting Novell eDirectory, as a root user.
Step 2 Type the following command:
ndstrace -c "load xdasauditds"
You are now ready to configure event auditing in Novell eDirectory. For more
information, see Configure Event Auditing Using Novell iManager.
Load the XDASv2 on a Windows Operating System
Step 1 Log in to your Windows server hosting Novell eDirectory.
Step 2 On your desktop, click Start > Run.
The Run window is displayed.
Step 3 Type the following:
C:\Novell\NDS\ndscons.exe
This is the default installation path for the Windows Operating System. If you
installed Novell eDirectory to a different directory, then the correct path is required.
Step 4 Click OK.
The Novell Directory Service console displays a list of available modules.
Step 5 From the Services tab, select xdasauditds.
Step 6 Click Start.
The xdasauditds service is started for Novell eDirectory.
Step 7 Click Startup.
The Service window is displayed.
Step 8 In the Startup Type panel, select the Automatic check box.
Step 9 Click OK.
Step 10 Close the Novell eDirectory Services window.
You are now ready to configure event auditing in Novell eDirectory. For more
information, see Configure Event Auditing Using Novell iManager.
Configuring DSMs
536 NOVELL EDIRECTORY
Configure Event
Auditing Using
Novell iManager
To configure event auditing for XDASv2 in Novell iManager:
Step 1 Log in to your Novell iManager console user interface.
Step 2 From the navigation bar, click Roles and Tasks.
Step 3 In the left-hand navigation, click eDirectory Auditing > Audit Configuration.
The Audit Configuration panel is displayed.
Step 4 In the NPC Server name field, type the name of your NPC Server.
Step 5 Click OK.
The Audit Configuration for the NPC Server is displayed.
Step 6 Configure the following parameters:
a On the Components panel, select one or both of the following:
-DS - Select this check box to audit XDASv2 events for an eDirectory object.
-LDAP - Select this check box to audit XDASv2 events for a Lightweight
Directory Access Protocol (LDAP) object.
b On the Log Event’s Large Values panel, select one of the following:
-Log Large Values - Select this option to log events that are larger than 768
bytes.
-Don’t Log Large Values - Select this option to log events less than 768
bytes. If a value exceeds 768 bytes, then the event is truncated.
c On the XDAS Events Configuration, select the check boxes of the events you
want XDAS to capture and forward to JSA.
d Click Apply.
Step 7 On the XDAS tab, click XDASRoles.
The XDAS Roles Configuration panel is displayed.
Step 8 Configure the following role parameters:
a Select a check box for each object class to support event collection.
b From the Available Attribute(s) list, select any attributes and click the arrow to
add these to the Selected Attribute(s) list.
c Click OK after you have added the object attributes.
d Click Apply.
Step 9 On the XDAS tab, click XDASAccounts.
The XDAS Accounts Configuration panel is displayed.
Step 10 Configure the following account parameters:
a From the Available Classes list, select any classes and click the arrow to add
these to the Selected Attribute(s) list.
b Click OK after you have added the object attributes.
Configuring DSMs
537
c Click Apply.
You are now ready to configure JSA.
Configure a Log
Source
JSA automatically detects syslog events from Novell eDirectory. This configuration
step is optional.
From the Log Source Type list box, select Novell eDirectory.
For more information on configuring log sources, see the Log Sources Users
Guide. For more information about Novell eDirectory, Novell iManager, or XDASv2,
see your vendor documentation.
Configuring DSMs
67 OBSERVEIT
The ObserveIT DSM for Juniper Secure Analytics (JSA) can collect Log Enhanced
Event Format (LEEF) events from ObserveIT using the log file protocol.
About ObserveIT ObserveIT provides administrators and security professionals the ability to capture
and replay video recordings of user interactions with network systems, software, or
operating systems.
To integrate ObserveIT with JSA, you must download and install an interface
package from the ObserveIT website. The interface package contains the tools
required to monitor the ObserveIT database and write the events to a file in LEEF
format. As ObserveIT generates and writes events to a log file, JSA can poll for the
event file and retrieve your ObserveIT event data. JSA remembers the state of the
event file to ensure that duplicate events are not imported the next time JSA read
your event file.
The ObserveIT interface package for JSA requires the following:
•Active Perl installed on the ObserveIT web server.
•An osql client and access to the ObserveIT database
You can download the ObserveIT interface package (Monitor_Log_QRadar.zip)
from the ObserveIT customer support: support@observeIT.com.
Supported Versions JSA supports ObserveIT v5.6.x and above.
Configuring
ObserveIT
The following process outlines the steps required to integrate ObserveIT events
with JSA.
1 Configure the ObserveIT interface package for JSA on your ObserveIT appliance.
2 Configure a log source to use the log file protocol and download the ObserveIT
event log to JSA.
Configuring DSMs
540 OBSERVEIT
Configuring the
ObserveIT Interface
Package
To collect ObserveIT events in JSA, you must download and configure the
ObserveIT interface package.
Procedure
Step 1 Email ObserveIT customer support at support@observeIT.com to receive the
ObserveIT interface package for JSA.
Monitor_Log_QRadar.zip
Step 2 Copy the ObserveIT interface package to the web server hosting ObserveIT.
Step 3 Extract the interface package to a directory.
Step 4 From the interface package directory, edit the following file:
Data_Query_v5.bat
Step 5 In the Data_Query_v5.bat file, edit the osql connection information with the
location of the ObserveIT database.
Step 6 From the interface package directory, run the Monitor_Log.pl file.
You must be an administrator or have access to write permissions to the following
folder: C:\Program Files (x86)\ObserveIT\NotificationService\LogFiles\qradar\.
Step 7 Verify that ObserveIT events are written to the following folder:
C:\Program Files (x86)\ObserveIT\NotificationService\LogFiles\qradar\
Step 8 Optional. Add Monitor_Log.pl to the Windows Job Scheduler to ensure the script
starts automatically when the host is powered on.
Next Steps
You are now ready to configure a log source for ObserveIT in JSA.
Configuring a
Venusense Log
Source
To integrate ObserveIT events, you must manually create a log source in JSA.
Procedure
Step 1 Log in to JSA.
Step 2 Click the Admin tab.
Step 3 On the navigation menu, click Data Sources.
Step 4 Click the Log Sources icon.
Step 5 Click Add.
Step 6 In the Log Source Name field, type a name for the log source.
Step 7 In the Log Source Description field, type a description for the log source.
Step 8 From the Log Source Type list box, select ObserveIT.
Step 9 From the Protocol Configuration list box, select Log File.

Configuring DSMs
541
Step 10 Configure the following values:
Table 70-4 Log file protocol parameters
Parameter Description
Log Source Identifier Type an IP address, host name, or name to identify the event
source. IP addresses or host names allow JSA to identify a
log file to a unique event source.
Service Type From the list box, select the protocol you want to use to
retrieve log files from a remote server. The default is SFTP.
•SFTP - SSH File Transfer Protocol
•FTP - File Transfer Protocol
•SCP - Secure Copy
Note: The underlying protocol used to retrieve log files for the
SCP and SFTP service type requires that the server specified
in the Remote IP or Hostname field has the SFTP subsystem
enabled.
Remote IP or
Hostname
Type the IP address or host name of the ObserveIT web
server that contains your event log files.
Remote Port Type the port number for the protocol selected to retrieve the
event logs from your ObserveIT web server. The valid range
is 1 to 65535.
The options include:
•FTP - TCP Port 21
•SFTP - TCP Port 22
•SCP - TCP Port 22
Note: If the host for your event files is using a non-standard
port number for FTP, SFTP, or SCP, adjust the port value
accordingly.
Remote User Type the user name required to log in to the ObserveIT web
server that contains your audit event logs.
The username can be up to 255 characters in length.
Remote Password Type the password to log in to your ObserveIT web server.
Confirm Password Confirm the password to log in to your ObserveIT web server
SSH Key File If you select SCP or SFTP as the Service Type, use this
parameter to define an SSH private key file. When you
provide an SSH Key File, the Remote Password field is
ignored.

Configuring DSMs
542 OBSERVEIT
Remote Directory Type the directory location on the remote host from which the
files are retrieved, relative to the user account you are using
to log in.
Note: For FTP only. If your log files reside in the remote user’s
home directory, you can leave the remote directory blank. This
is to support operating systems where a change in the
working directory (CWD) command is restricted.
Recursive Select this check box if you want the file pattern to search sub
folders in the remote directory. By default, the check box is
clear.
The Recursive parameter is ignored if you configure SCP as
the Service Type.
FTP File Pattern If you select SFTP or FTP as the Service Type, this option
allows you to configure the regular expression (regex)
required to filter the list of files specified in the Remote
Directory. All files that match the regular expression are
retrieved and processed.
The FTP file pattern must match the name you assigned to
your ObserveIT event log. For example, to collect files that
start with ObserveIT_ and end with a timestamp, type the
following value:
ObserveIT_*
Use of this parameter requires knowledge of regular
expressions (regex). For more information, see the following
website:
http://download.oracle.com/javase/tutorial/essential/regex/
FTP Transfer Mode This option only displays if you select FTP as the Service
Type. From the list box, select ASCII.
ASCII is required for text event logs retrieved by the log file
protocol using FTP.
SCP Remote File If you select SCP as the Service Type, type the file name of
the remote file.
Start Time Type a time value to represent the time of day you want the
log file protocol to start. Type the start time, based on a 24
hour clock, in the following format: HH:MM.
For example, type 00:00 to schedule the Log File protocol to
collect event files at midnight.
This parameter functions with the Recurrence parameter
value to establish when and how often the Remote Directory
on your ObserveIT web server is scanned for new event log
files.
Table 70-4 Log file protocol parameters (continued)
Parameter Description

Configuring DSMs
543
Recurrence Type the frequency that you want to scan the remote directory
on your ObserveIT web server for new event log files. Type
this value in hours (H), minutes (M), or days (D).
For example, type 2H to scan the remote directory every 2
hours from the start time. The default is 1H and the minimum
value is 15M.
Run On Save Select this check box if you want the log file protocol to run
immediately after you click Save.
After the save action completes, the log file protocol follows
your configured start time and recurrence schedule.
Selecting Run On Save clears the list of previously processed
files for the Ignore Previously Processed File parameter.
EPS Throttle Type the number of Events Per Second (EPS) that you do not
want this protocol to exceed. The valid range is 100 to 5000.
Processor From the list box, select NONE.
Processors allow event file archives to be expanded and
contents processed for events. Files are only processed after
they are downloaded. JSA can process files in zip, gzip, tar, or
tar+gzip archive format.
Ignore Previously
Processed File(s)
Select this check box to track and ignore files that are already
processed.
JSA examines the log files in the remote directory to
determine if a file is already processed by the log file protocol.
If a previously processed file is detected, the log file protocol
does not download the file. Only new or unprocessed event
log files are downloaded by JSA.
This option only applies to FTP and SFTP service types.
Change Local
Directory?
Select this check box to define a local directory on JSA to
store event log files during processing.
We recommend that you leave this check box clear. When
this check box is selected, the Local Directory field is
displayed, which allows you to configure the local directory on
JSA to store event log files. After the event log is processed
and the events added to JSA, the local directory deletes the
event log files to retain disk space.
Event Generator From the Event Generator list box, select LineByLine.
The Event Generator applies additional processing to the
retrieved event files. Each line of the file is a single event. For
example, if a file has 10 lines of text, 10 separate events are
created.
Table 70-4 Log file protocol parameters (continued)
Parameter Description
Configuring DSMs
544
Step 11 Click Save.
Step 12 On the Admin tab, click Deploy Changes.
The configuration for ObserveIT is complete. As the log file protocol retrieves
events, they are displayed on the Log Activity tab of JSA.

Configuring DSMs
68 OPENBSD
The OpenBSD DSM for Juniper Secure Analytics (JSA) accepts events using
syslog.
Supported Event
Types
JSA records all relevant informational, authentication, and system level events
forwarded from OpenBSD operating systems.
Configure a Log
Source
To integrate OpenBSD events with JSA, you must manually create a log source.
JSA does not automatically discover or create log sources for syslog events from
OpenBSD operating systems.
To create a log source for OpenBSD:
Step 1 Log in to JSA.
Step 2 Click the Admin tab.
Step 3 On the navigation menu, click Data Sources.
The Data Sources panel is displayed.
Step 4 Click the Log Sources icon.
The Log Sources window is displayed.
Step 5 Click Add.
The Add a log source window is displayed.
Step 6 In the Log Source Name field, type a name for your log source.
Step 7 In the Log Source Description field, type a description for the log source.
Step 8 From the Log Source Type list box, select OpenBSD OS.
Step 9 Using the Protocol Configuration list box, select Syslog.
The syslog protocol configuration is displayed.
Step 10 Configure the following values:
Table 71-1 Syslog Parameters
Parameter Description
Log Source Identifier Type the IP address or host name for the log source as an
identifier for events from your OpenBSD appliance.

Configuring DSMs
546 OPENBSD
Step 11 Click Save.
Step 12 On the Admin tab, click Deploy Changes.
The log source is added to JSA. You are now ready to configure your OpenBSD
appliance to forward syslog events.
Configure Syslog for
OpenBSD
To configure OpenBSD to forward syslog events:
Step 1 Using SHH, log in to your OpenBSD device, as a root user.
Step 2 Open the /etc/syslog.conf file.
Step 3 Add the following line to the top of the file. Make sure all other lines remain intact:
*.* @<IP address>
Where <IP address> is the IP address of your JSA.
Step 4 Save and exit the file.
Step 5 Send a hang-up signal to the syslog daemon to ensure all changes are applied:
kill -HUP `cat /var/run/syslog.pid`
NOTE
Note: The command above uses the backquote character ( ‘ ), which is located to
the left of the number one on most keyboard layouts.
The configuration is complete. Events forwarded to JSA by OpenBSD are
displayed on the Log Activity tab.

Configuring DSMs
69 OPEN LDAP
The Open LDAP DSM for Juniper Secure Analytics (JSA) accepts multiline UDP
syslog events from Open LDAP installations configured to log stats events using
logging level 256.
Before You Begin Open LDAP events are forwarded to JSA using port 514, but must be redirected to
the port configured in the UDP Multiline protocol. This redirect using iptables is
required because JSA does not support multiline UDP syslog on the standard
listen port.
NOTE
Note: UDP multiline syslog events can be assigned to any port other than port
514. The default port assigned to the UDP Multiline protocol is UDP port 517. If
port 517 is used in your network, see the Juniper Secure Analytics Common Ports
Technical Note for a list of ports used by JSA.
Configure a Log
Source
JSA does not automatically discover Open LDAP events forwarded in UDP
multiline format. To complete the integration, you must manually create a log
source for the UDP Multiline Syslog protocol using the Admin tab in JSA. Creating
the log source allows JSA to establish a listen port for incoming Open LDAP
multiline events.
To configure an Open LDAP log source in JSA:
Step 1 Log in to JSA.
Step 2 Click the Admin tab.
Step 3 In the navigation menu, click Data Sources.
The Data Sources pane is displayed.
Step 4 Click the Log Sources icon.
The Log Sources window is displayed.
Step 5 Click Add.
The Add a log source window is displayed.
Step 6 In the Log Source Name field, type a name for your log source.
Step 7 In the Log Source Description field, type a description for your log source.

Configuring DSMs
548 OPEN LDAP
Step 8 From the Log Source Type list box, select Open LDAP Software.
Step 9 From the Protocol Configuration list box, select UDP Multiline Syslog.
Step 10 Configure the following values:
Step 11 Click Save.
Step 12 On the Admin tab, click Deploy Changes.
The log source is created for Open LDAP events. You are now ready to configure
IPtables for JSA to redirect Open LDAP events to the proper UDP multiline syslog
port on your JSA console or Event Collector.
Table 72-1 UDP Multiline Protocol Configuration
Parameter Description
Log Source Identifier Type the IP address or host name for the log source as an
identifier for events from your Open LDAP server.
Listen Port Type the port number used by JSA to accept incoming UDP
Multiline Syslog events. The valid port range is 1 to 65536.
The default UDP Multiline Syslog listen port is 517.
Note: If you do not see the Listen Port field, you must restart
Tomcat on JSA. For more information on installing a protocol
manually, see the Log Sources Users Guide.
To edit the Listen Port number:
1Update IPtables on your JSA console or Event Collector
with the new UDP Multiline Syslog port number. For more
information, see Configure IPtables for Multiline UDP
Syslog Events.
2In the Listen Port field, type the new port number for
receiving UDP Multiline Syslog events.
3Click Save.
4On the Admin tab, select Advanced > Deploy Full
Configuration.
Note: When you click Deploy Full Configuration, JSA
restarts all services, resulting in a gap in data collection for
events and flows until the deployment completes.
Message ID Pattern Type the regular expression (regex) required to filter the
event payload messages. All matching events are included
when processing Open LDAP events.
The following regular expression is recommended for Open
LDAP events:
conn=(\d+)
For example, Open LDAP starts connection messages with
the word conn, followed by the rest of the event payload. Use
of this parameter requires knowledge of regular expressions
(regex). For more information, see the following website:
http://download.oracle.com/javase/tutorial/essential/regex/
Configuring DSMs
549
Configure IPtables
for Multiline UDP
Syslog Events
Open LDAP requires that you redirect events from your Open LDAP servers from
port 514 to another JSA port for the UDP multiline protocol. You must configure
IPtables on your JSA console or for each Event Collectors that receives multiline
UDP syslog events from an Open LDAP server.
To configure JSA to redirect multiline UDP syslog events:
Step 1 Using SSH, log in to JSA as the root user.
Login: root
Password: <password>
Step 2 Type the following command to edit the IPtables file:
vi /opt/qradar/conf/iptables-nat.post
The IPtables NAT configuration file is displayed.
Step 3 Type the following command to instruct JSA to redirect syslog events from UDP
port 514 to UDP port 517:
-A PREROUTING -p udp --dport 514 -j REDIRECT --to-port
<new-port> -s <IP address>
Where:
<IP address> is the IP address of your Open LDAP server.
<New port> is the port number configured in the UDP Multiline protocol for Open
LDAP.
You must include a redirect for each Open LDAP IP address that sends events to
your JSA console or Event Collector. For example, if you had three Open LDAP
servers communicating to an Event Collect, you would type the following:
-A PREROUTING -p udp --dport 514 -j REDIRECT --to-port 517 -s
10.10.10.10
-A PREROUTING -p udp --dport 514 -j REDIRECT --to-port 517 -s
10.10.10.11
-A PREROUTING -p udp --dport 514 -j REDIRECT --to-port 517 -s
10.10.10.12
Step 4 Save your IPtables NAT configuration.
You are now ready to configure IPtables on your JSA console or Event Collector to
accept events from your Open LDAP servers.
Step 5 Type the following command to edit the IPtables file:
vi /opt/qradar/conf/iptables.post
The IPtables configuration file is displayed.
Step 6 Type the following command to instruct JSA to allow communication from your
Open LDAP servers:
-I QChain 1 -m udp -p udp --src <IP address> --dport <New port>
-j ACCEPT

Configuring DSMs
550 OPEN LDAP
Where:
<IP address> is the IP address of your Open LDAP server.
<New port> is the port number configured in the UDP Multiline protocol for Open
LDAP.
You must include a redirect for each Open LDAP IP address that sends events to
your JSA console or Event Collector. For example, if you had three Open LDAP
servers communicating to an Event Collect, you would type the following:
-I QChain 1 -m udp -p udp --src 10.10.10.10 --dport 517 -j
ACCEPT
-I QChain 1 -m udp -p udp --src 10.10.10.11 --dport 517 -j
ACCEPT
-I QChain 1 -m udp -p udp --src 10.10.10.12 --dport 517 -j
ACCEPT
Step 7 Type the following command to update IPtables in JSA:
./opt/qradar/bin/iptables_update.pl
Step 8 Repeat Step 1 toStep 7 to configure any additional JSA consoles or Event
Collectors in your deployment that receive syslog events from an Open LDAP
server.
You are now ready to configure your Open LDAP server to forward events to JSA.
Configure Event
Forwarding for Open
LDAP
To configure syslog forwarding for Open LDAP:
Step 1 Log in to the command-line interface for your Open LDAP server.
Step 2 Edit the following file:
/etc/syslog.conf
Step 3 Add the following information to the syslog configuration file:
<facility> @<IP address>
Where:
<facility> is the syslog facility, for example local4.
<IP address> is the IP address of your JSA console or Event Collector.
For example,
#Logging for SLAPD
local4.debug /var/log/messages
local4.debug @10.10.10.1
NOTE
Note: If your Open LDAP server stores event messages in a directory other than
/var/log/messages, you must edit the directory path accordingly.
Configuring DSMs
551
Step 4 Save the syslog configuration file.
Step 5 Type the following command to restart the syslog service:
/etc/init.d/syslog restart
The configuration for Open LDAP is complete. UDP multiline events forwarded to
JSA are displayed on the Log Activity tab.
Configuring DSMs
552 OPEN LDAP
Configuring DSMs
70 OPEN SOURCE SNORT
The Open Source SNORT DSM for Juniper Secure Analytics (JSA) records all
relevant SNORT events using syslog.
Supported Event
Types
The SourceFire VRT certified rules for registered SNORT users are supported.
Rule sets for Bleeding Edge, Emerging Threat, and other vendor rule sets might
not be fully supported by the Open Source SNORT DSM.
Before You Begin The below procedure applies to a system operating Red Hat Enterprise. The
procedures below can vary for other operating systems.
Configure Open
Source SNORT
To configure syslog on an Open Source SNORT device:
Step 1 Configure SNORT on a remote system.
Step 2 Open the snort.conf file.
Step 3 Uncomment the following line:
output alert_syslog:LOG_AUTH LOG_INFO
Step 4 Save and exit the file.
Step 5 Open the following file:
/etc/init.d/snortd
Step 6 Add an -s to the following lines, as shown in the example below:
daemon /usr/sbin/snort $ALERTMODE $BINARY_LOG $NO PACKET_LOG
$DUMP_APP -D $PRINT_INTERFACE -i $i -s -u $USER -g $GROUP $CONF
-i $LOGIR/$i $PASS_FIRST
daemon /usr/sbin/snort $ALERTMODE $BINARY_LOG $NO_PACKET_LOG
$DUMP_APP -D $PRINT_INTERFACE $INTERFACE -s -u $USER -g $GROUP
$CONF -i $LOGDIR
Step 7 Save and exit the file.
Step 8 Restart SNORT:
/etc/init.d/snortd restart
Step 9 Open the syslog.conf file.

Configuring DSMs
554 OPEN SOURCE SNORT
Step 10 Update the file to reflect the following:
auth.info @<IP Address>
Where <IP Address> is the system to which you want logs sent.
Step 11 Save and exit the file.
Step 12 Restart syslog:
/etc/init.d/syslog restart
You are now ready to configure the log source in JSA.
Configure a Log
Source
JSA automatically discovers and creates log sources for Open Source SNORT
syslog events. The following configuration steps are optional.
To create a log source in JSA:
Step 1 Log in to JSA.
Step 2 Click the Admin tab.
Step 3 On the navigation menu, click Data Sources.
The Data Sources panel is displayed.
Step 4 Click the Log Sources icon.
The Log Sources window is displayed.
Step 5 Click Add.
The Add a log source window is displayed.
Step 6 In the Log Source Name field, type a name for your log source.
Step 7 In the Log Source Description field, type a description for the log source.
Step 8 From the Log Source Type list box, select Open Source IDS.
Step 9 Using the Protocol Configuration list box, select Syslog.
The syslog protocol configuration is displayed.
Step 10 Configure the following values:
Step 11 Click Save.
Step 12 On the Admin tab, click Deploy Changes.
The configuration is complete.
For more information about SNORT, see the SNORT documentation at
http://www.snort.org/docs/.
Table 73-2 Syslog Parameters
Parameter Description
Log Source Identifier Type the IP address or hostname for the log source as an
identifier for your Open Source SNORT events.

Configuring DSMs
71 ORACLE
This section provides information on configuring the following DSMs:
•Oracle Audit Records
•Oracle DB Listener
•Oracle Audit Vault
•Oracle OS Audit
•Oracle BEA WebLogic
•Oracle Acme Packet Session Border Controller
Oracle Audit
Records
Oracle databases track auditing events, such as, user login and logouts,
permission changes, table creation, and deletion and database inserts.
Juniper Secure Analytics (JSA) can collect these events for correlation and
reporting purposes through the use of the Oracle Audit DSM. For more
information, see your Oracle documentation.
NOTE
Note: Oracle provides two modes of audit logs. JSA does not support fine grained
auditing.
Before You Begin Oracle RDBMS is supported on Linux only when using syslog. Microsoft Windows
hosts and Linux are supported when using JDBC to view database audit tables.
When using a Microsoft Windows host, verify database audit tables are enabled.
These procedures should be considered guidelines only. We recommend that you
have experience with Oracle DBA before performing the procedures in this
document. For more information, see your vendor documentation.
Before JSA can collect Oracle Audit events from an Oracle RDBMS instance, that
instance must be configured to write audit records to either syslog or the database
audit tables. For complete details and instructions for configuring auditing, see
your vendor documentation.

Configuring DSMs
556 ORACLE
NOTE
Note: Not all versions of Oracle can send audit events using syslog. Oracle v9i
and 10g Release 1 can only send audit events to the database. Oracle v10g
Release 2 and Oracle v11g can write audit events to the database or to syslog. If
you are using v10g Release 1 or v9i, you must use JDBC-based events. If you are
using Oracle v10g Release 2, you can use syslog or JDBC-based events.
To configure an Oracle Audit device to write audit logs to JSA, see Configure
Oracle Audit Logs. If your system includes a large Oracle audit table (greater than
1 GB), see Improve Performance with Large Audit Tables.
Configure Oracle
Audit Logs
To configure the device to write audit logs:
Step 1 Log in to the Oracle host as an Oracle user (This user was used to install Oracle,
for example oracle).
Step 2 Make sure the ORACLE_HOME and ORACLE_SID environment variables are
configured properly for your deployment.
Step 3 Open the following file:
${ORACLE_HOME}/dbs/init${ORACLE_SID}.ora
Step 4 Choose one of the following options:
a For database audit trails, type the following command:
*.audit_trail=’DB’
b For syslog, type the following command:
*.audit_trail=’os’
*.audit_syslog_level=’local0.info’
You must make sure the syslog daemon on the Oracle host is configured to
forward the audit log to JSA.
Step 5 Save and exit the file.
Step 6 To restart the database:
a Connect to SQLplus and log in as sysdba:
For example,
Enter user-name: sys as sysdba

Configuring DSMs
Oracle Audit Records 557
b Shut down the database:
shutdown immediate
c Restart the database:
startup
Step 7 If you are using Oracle v9i or Oracle v10g Release 1, you must create a view,
using SQLplus to enable the JSA integration. If you are using Oracle 10g Release
2 or later, you can skip this step:
CREATE VIEW qradar_audit_view AS SELECT
CAST(dba_audit_trail.timestamp AS TIMESTAMP) AS qradar_time,
dba_audit_trail.* FROM dba_audit_trail;
If you are using the JDBC protocol, see the Log Sources Users Guide for more
information on configuring the JDBC protocol. When configuring the JDBC protocol
within JSA, use the following specific parameters:
NOTE
Note: Make sure that database user that JSA uses to query events from the audit
log table has the appropriate permissions for the Table Name object.
Step 8 You are now ready to configure the log source in JSA.
To configure JSA to receive events from an Oracle Database:
From the Log Source Type list box, select the Oracle RDBMS Audit Record
option.
For more information on configuring log sources, see the Log Sources Users
Guide.
Improve Performance
with Large Audit
Tables
The size of the Oracle audit table affects the amount of time that JSA requires to
process the DBA_AUDIT_TRAIL view. If your sys.sud$ table is large (close or
exceeding 1 GB), extended processing time is required. To ensure JSA processes
the large sys.sud$ table quickly, you must create an index and a new view.
Table 74-1 Configuring Log Source Parameters
Parameter Name
Oracle v9i or 10g Release 1
Values
Oracle v10g Release 2 and
v11g Values
Table Name qradar_audit_view dba_audit_trail
Select List * *
Compare Field qradar_time extended_timestamp
Database Name For all supported versions of Oracle, the Database Name
must be the exact service name used by the Oracle listener.
You can view the available service names by running the
following command on the Oracle host: lsnrctl status

Configuring DSMs
558 ORACLE
NOTE
Note: If auditing is extensive or the database server is very active, you might need
to shut down the database to perform the below procedure.
To create an index and a new view:
Step 1 Access the following website to download the required files:
http://www.juniper.net/customers/support/
Step 2 From the Software tab, select Scripts.
Step 3 Download the appropriate file for your version of Oracle:
a If you are using Oracle 9i or 10g Release 1, download the following file:
oracle_9i_dba_audit_view.sql
b If you are using Oracle v10g Release 2 and v11g, download the following file:
oracle_alt_dba_audit_view.sql
Step 4 Copy the downloaded file to a local directory.
Step 5 Change the directory to the location where you copied the file in Step 4.
Step 6 Log in to SQLplus and log in as sysdba:
sqlplus / as sysdba
Step 7 At the SQL prompt, type one of the following commands, depending on your
version of Oracle Audit:
To create an index, the file might already be in use and must have exclusive
access.
a If you are using Oracle 9i or 10g Release 1, type the following command:
@oracle_9i_dba_audit_view.sql
b If you are using Oracle v10g Release 2 and v11g, type the following command:
@oracle_alt_dba_audit_view.sql
Step 8 Make sure the database user configured in JSA has SELECT permissions on the
view.
For example if the user is USER1:
grant select on sys.alt_dba_audit_view to USER1;
Step 9 Log out of SQLplus.
Step 10 Log in to JSA.
Step 11 Update the JDBC protocol configuration for this entry to include the following:
•Table Name - Update the table name from DBA_AUDIT_TRAIL to
sys.alt_dba_audit_view.
•Compare Field - Update the field from entended_timestamp to ntimestamp.
For more information, see the Log Sources Users Guide.

Configuring DSMs
Oracle DB Listener 559
Step 12 Click Save.
The configuration is complete.
Oracle DB Listener The Oracle Database Listener application stores logs on the database server.
To integrate JSA with Oracle DB Listener, select one of the following methods for
event collection:
•Collect Events Using the Oracle Database Listener Protocol
•Collect Oracle Database Events Using Perl
Collect Events Using
the Oracle Database
Listener Protocol
The Oracle Database Listener protocol source allows JSA to monitor log files
generated from an Oracle Listener database. Before you configure the Oracle
Database Listener protocol to monitor log files for processing, you must obtain the
directory path to the Oracle Listener database log files.
To configure JSA to monitor log files from Oracle Database Listener:
Step 1 Log in to JSA.
Step 2 Click the Admin tab.
Step 3 On the navigation menu, click Data Sources.
The Data Sources panel is displayed.
Step 4 Click the Log Sources icon.
The Log Sources window is displayed.
Step 5 From the Log Source Type list box, select Oracle Database Listener.
Step 6 Using the Protocol Configuration list box, select Oracle Database Listener.
Step 7 Configure the following parameters:
Table 74-2 Oracle Database Listener Parameters
Parameter Description
Log Source Identifier Type the IP address or hostname for the log source.
Server Address Type the IP address of the Oracle Database Listener.
Domain Type the domain required to access the Oracle Database
Listener. This parameter is optional.
Username Type the username required to access the host running the
Oracle Database Listener.
Password Type the password required to access the host running the
Oracle Database Listener.
Confirm Password Confirm the password required to access the Oracle
Database Listener.
Log Folder Path Type the directory path to access the Oracle Database
Listener log files.

Configuring DSMs
560 ORACLE
Step 8 Click Save.
Step 9 On the Admin tab, click Deploy Changes.
The configuration of the Oracle Database Listener protocol is complete. For more
information, see the Log Sources Users Guide.
Collect Oracle
Database Events
Using Perl
The Oracle Database Listener application stores logs on the database server. To
forward these logs from the Oracle server to JSA, you must configure a Perl script
on the Oracle server. The Perl script monitors the listener log file, combines any
multi-line log entries into a single log entry, and sends the logs, using syslog
(UDP), to JSA.
Before being sent to JSA, the logs are processed and re-formatted to ensure the
logs are not forwarded line-by-line, as is found in the log file. All of the relevant
information is retained.
File Pattern Type the regular expression (regex) required to filter the
filenames. All matching files are included in the processing.
The default is listener\.log
This parameter does not accept wildcard or globbing
patterns in the regular expression. For example, if you want
to list all files starting with the word log, followed by one or
more digits and ending with tar.gz, use the following entry:
log[0-9]+\.tar\.gz. Use of this parameter requires knowledge
of regular expressions (regex). For more information, see the
following website:
http://download.oracle.com/javase/tutorial/essential/regex/
Force File Read Select this check box to force the protocol to read the log file
when the timing of the polling interval specifies.
When the check box is selected, the log file source is always
examined when the polling interval specifies, regardless of
the last modified time or file size attribute.
When the check box is not selected, the log file source is
examined at the polling interval if the last modified time or file
size attributes have changed.
Recursive Select this check box if you want the file pattern to also
search sub folders. By default, the check box is selected.
Polling Interval (in
seconds)
Type the polling interval, which is the number of seconds
between queries to the log files to check for new data. The
minimum polling interval is 10 seconds, with a maximum
polling interval of 3,600 seconds. The default is 10 seconds.
Throttle Events/Sec Type the maximum number of events the Oracle Database
Listener protocol forwards per second. The minimum value is
100 EPS and the maximum is 20,000 EPS. The default is
100 EPS.
Table 74-2 Oracle Database Listener Parameters (continued)
Parameter Description

Configuring DSMs
Oracle DB Listener 561
NOTE
Note: Perl scripts written for Oracle DB listener work on Linux/UNIX servers only.
Windows Perl script is not supported.
To install and configure the Perl script:
Step 1 Access the following websites to download the required files:
http://www.juniper.net/customers/support/
Step 2 From the Software tab, select Scripts.
Step 3 Download the script to forward Oracle DB Listener events.
oracle_dblistener_fwdr.pl.gz
Step 4 Extract the file:
gzip -d oracle_dblistener_fwdr.pl.gz
Step 5 Copy the Perl script to the server that hosts the Oracle server.
NOTE
Note: Perl 5.8 must be installed on the device that hosts the Oracle server.
Step 6 Log in to the Oracle server using an account that has read/write permissions for
the listener.log file and the /var/run directory.
Step 7 Type the following command and include any additional command parameters to
start the Oracle DB Listener script:
oracle_dblistener_fwdr.pl -h <IP address> -t “tail -F
listener.log”
Where <IP address> is the IP address of your JSA console or Event Collector.
Table 74-3 Command Parameters
Parameters Description
-D The -D parameter defines that the script is to run in the foreground.
Default is to run as a daemon and log all internal messages to the local
syslog service.
-t The -t parameter defines that the command-line is used to tail the log
file (monitors any new output from the listener). The log file might be
different across versions of the Oracle database; some examples are
provided below:
Oracle 9i:
<install_directory>/product/9.2/network/log
/listener.log
Oracle 10g:
<install_directory>/product/10.2.0/db_1/network/log
/listener.log
Oracle 11g:
<install_directory>/diag/tnslsnr/qaoracle11/listener
/trace/listener.log

Configuring DSMs
562 ORACLE
For example, to monitor the listener log on an Oracle 9i server with an IP address
of 182.168.12.44 and forward events to JSA with the IP address of 192.168.1.100,
type the following:
oracle_dblistener_fwdr.pl –t “tail –f
<install_directory>/product/9.2/network/log/listener.log”
–f user.info –H 192.168.12.44 –h 192.168.1.100 –p 514
A sample log from this setup would appear as follows:
<14>Apr 14 13:23:37 192.168.12.44 AgentDevice=OracleDBListener
Command=SERVICE_UPDATE DeviceTime=18-AUG-2006
16:51:43 Status=0 SID=qora9
NOTE
Note: The kill command can be used to terminate the script if you need to
reconfigure a script parameter or stop the script from sending events to JSA. For
example, kill -QUIT ‘cat /var/run/oracle_dblistener_fwdr.pl.pid‘.
The example command uses the backquote character (‘), which is located to the
left of the number one on most keyboard layouts.
You are now ready to configure the Oracle Database Listener within JSA.
Step 1 From the Log Source Type list box, select Oracle Database Listener.
Step 2 From the Protocol Configuration list box, select syslog.
Step 3 In the Log Source Identifier field, type the IP address of the Oracle Database you
specified using the -H option in Step 7.
The configuration of the Oracle Database Listener protocol is complete. For more
information on Oracle Database Listener, see your vendor documentation.
-f The -f parameter defines the syslog facility.priority to be included at the
beginning of the log.
If nothing is specified, user.info is used.
-H The -H parameter defines the host name or IP address for the syslog
header. It is recommended that this be the IP address of the Oracle
server on which the script is running.
-h The -h parameter defines the receiving syslog host (the Event Collector
host name or IP address being used to receive the logs).
-p The -p parameter defines the receiving UDP syslog port.
If a port is not specified, 514 is used.
-r The -r parameter defines the directory name where you wish to create
the .pid file. The default is /var/run. This parameter is ignored if -D is
specified.
-l The -I parameter defines the directory name where you wish to create
the lock file. The default is /var/lock. This parameter is ignored if -D is
specified.
Table 74-3 Command Parameters (continued)
Parameters Description

Configuring DSMs
Oracle Audit Vault 563
Oracle Audit Vault The Oracle Audit Vault DSM for JSA accepts events on Oracle v10.2.3.2 and
above using Java Database Connectivity (JDBC) to accesses alerts on the JDBC
protocol.
JSA records Oracle Audit Vault alerts from the source database and captures
events as configured by the Oracle Audit Policy Setting. When events occur, the
alerts are stored in avsys.av$alert_store table. Customized events are created in
Oracle Audit Vault by a user with AV_AUDITOR permissions.
See your vendor documentation about configuration of Audit Policy Settings in
Oracle Audit Vault.
In Oracle Audit Vault, alert names are not mapped to a JSA Identifier (QID). Using
the Map Event function in the JSA Events interface a normalized or raw event can
be mapped to a high-level and low-level category (or QID). Using the Oracle Audit
Vault DSM, category mapping can be done by mapping your high or low category
alerts directly to an alert name (ALERT_NAME field) in the payload. For
information about the Events interface, see the Juniper Secure Analytics Users
Guide.
Configure a Log
Source
To configure a JSA log source to access the Oracle Audit Vault database using the
JDBC protocol:
Step 1 Log in to JSA.
Step 2 Click the Admin tab.
Step 3 On the navigation menu, click Data Sources.
The Data Sources panel is displayed.
Step 4 Click the Log Sources icon.
The Log Sources window is displayed.
Step 5 Click Add.
Step 6 Using the Log Source Type list box, select Oracle Audit Vault.
Step 7 Using the Protocol Configuration list box, select JDBC.
Step 8 Configure the following values:
a Database Type: Oracle
b Database Name: <Audit Vault Database Name>
c Table Name: avsys.av$alert_store
d Select List: *
e Compare Field: ALERT_SEQUENCE
f IP or Hostname: <Location of Oracle Audit Vault Server>
g Port: <Default Port>
h Username: <Database Access Username having AV_AUDITOR role>

Configuring DSMs
564 ORACLE
i Password: <Password>
j Polling Interval: <Default Interval>
NOTE
Note: Verify the AV_AUDITOR password has been entered correctly before saving
the JDBC protocol configuration. Oracle Audit Vault might lock the user account
due to repeated failed login attempts. When the AV_AUDITOR account is locked,
data in the avsys.av$alert_store cannot be accessed. In order to unlock this user
account, it is necessary to first correct the password entry in the protocol
configuration. Then log in to Oracle Audit Vault through the Oracle sqlplus prompt
as the avadmindva user to perform an alter user <AV_AUDITOR USER> account
unlock command.
Step 9 Click Save.
Step 10 On the Admin tab, click Deploy Changes.
NOTE
Note: The local time zone conversion-dependent Oracle timestamps are not
supported in earlier versions of the JDBC protocol for JSA so fields
AV_ALERT_TIME, ACTUAL_ALERT_TIME, and TIME_CLEARED in the payload
only display object identifiers until your JDBC protocol is updated.
Oracle OS Audit The Oracle OS Audit DSM for JSA allows monitoring of the audit records that are
stored in the local operating system file.
When audit event files are created or updated in the local operating system
directory, a Perl script detects the change, and forwards the data to JSA. The Perl
script monitors the Audit log file, combines any multi-line log entries into a single
log entry to ensure the logs are not forwarded line-by-line, as is found in the log
file, then sends the logs using syslog to JSA. Perl scripts written for Oracle OS
Audit work on Linux/UNIX servers only. Windows-based Perl installations are not
supported.
To integrate the Oracle OS Audit DSM with JSA:
Step 1 Access the following websites to download the required files:
http://www.juniper.net/customers/support/
Step 2 From the Software tab, select Scripts.
Step 3 Download the Oracle OS Audit script:
oracle_osauditlog_fwdr_5.3.tar.gz
Step 4 Type the following command to extract the file:
tar -zxvf oracle_osauditlog_fwdr_5.3.tar.gz
Step 5 Copy the Perl script to the server that hosts the Oracle server.

Configuring DSMs
Oracle OS Audit 565
NOTE
Note: Perl 5.8 must be installed on the device that hosts the Oracle server. If you
do not have Perl 5.8 installed, you might be prompted that library files are missing
when you attempt to start the Oracle OS Audit script. We recommend you verify
you have installed Perl 5.8 before you continue.
Step 6 Log in to the Oracle host as an Oracle user that has SYS or root privilege.
Step 7 Make sure the ORACLE_HOME and ORACLE_SID environment variables are
configured properly for your deployment.
Step 8 Open the following file:
${ORACLE_HOME}/dbs/init${ORACLE_SID}.ora
Step 9 For syslog, add the following lines to the file:
*.audit_trail=’os’
*.audit_syslog_level=’local0.info’
Step 10 Verify account has read/write permissions for the following directories:
/var/lock/
/var/run/
Step 11 Restart the Oracle database instance.
Step 12 Start the OS Audit DSM script:
oracle_osauditlog_fwdr_5.3.pl -t target_host -d logs_directory
Table 74-4 Oracle OS Audit Command Parameters
Parameters Description
-t The -t parameter defines the remote host that receives the audit log
files.
-d The -d parameter defines directory location of the DDL and DML log
files.
Note: The directory location you specify should be the absolute path
from the root directory.
-H The -H parameter defines the host name or IP address for the syslog
header. We recommend that this be the IP address of the Oracle server
on which the script is running.
-D The -D parameter defines that the script is to run in the foreground.
Default is to run as a daemon (in the background) and log all internal
messages to the local syslog service.
-n The -n parameter processes new logs, and monitors existing log files for
changes to be processed.
If the -n option string is absent all existing log files are processed during
script execution.
-u The -u parameter defines UDP.

Configuring DSMs
566 ORACLE
If you restart your Oracle server you must restart the script:
oracle_osauditlog_fwdr.pl -t target_host -d logs_directory
You are now ready to configure the log sources within JSA.
Step 1 From the Log Source Type list box, select Oracle RDBMS OS Audit Record.
Step 2 From the Protocol Configuration list box. select syslog.
Step 3 From the Log Source Identifier field type the address specified using the –H
option in Step 12. For more information on configuring log sources, see the Log
Sources Users Guide.
For more information about your Oracle Audit Record, see your vendor
documentation.
Oracle BEA
WebLogic
The Oracle BEA WebLogic DSM allows JSA to retrieve archived server logs and
audit logs from any remote host, such as your Oracle BEA WebLogic server.
JSA uses the log file protocol to retrieve events from your Oracle BEA WebLogic
server and provide information on application events that occur in your domain or
on a single server.
To integrate Oracle BEA WebLogic events, you must:
1 Enable auditing on your Oracle BEA WebLogic server.
2 Configure domain logging on your Oracle BEA WebLogic server.
3 Configure application logging on your Oracle BEA WebLogic server.
4 Configure an audit provider for Oracle BEA WebLogic.
5 Configure JSA to retrieve log files from Oracle BEA WebLogic.
-f The -f parameter defines the syslog facility.priority to be included at the
beginning of the log.
If you do not type a value, user.info is used.
-r The -r parameter defines the directory name where you want to create
the .pid file. The default is /var/run. This parameter is ignored if -D is
specified.
-l The -I parameter defines the directory name where you want to create
the lock file. The default is /var/lock. This parameter is ignored if -D is
specified.
-h The -t parameter displays the help message.
-v The -v parameter displays the version information for the script.
Table 74-4 Oracle OS Audit Command Parameters (continued)
Parameters Description
Configuring DSMs
Oracle BEA WebLogic 567
Enable Event Logs By default, Oracle BEA WebLogic does not enable event logging.
To enable event logging on your Oracle WebLogic console:
Step 1 Log in to your Oracle WebLogic console user interface.
Step 2 Select Domain > Configuration > General.
Step 3 Click Advanced.
Step 4 From the Configuration Audit Type list box, select Change Log and Audit.
Step 5 Click Save.
You are now ready to configure the collection of domain logs for Oracle BEA
WebLogic.
Configure Domain
Logging
Oracle BEA WebLogic supports multiple instances. Event messages from
instances are collected in a single domain-wide log for the Oracle BEA WebLogic
server.
To configure the log file for the domain:
Step 1 From your Oracle WebLogic console, select Domain > Configuration > Logging.
Step 2 From the Log file name parameter, type the directory path and file name for the
domain log. For example, OracleDomain.log.
Step 3 Optional. Configure any additional domain log file rotation parameters.
Step 4 Click Save.
You are now ready to configure application logging for the server.
Configure
Application Logging
To configure application logging for Oracle BEA WebLogic:
Step 1 From your Oracle WebLogic console, select Server > Logging > General.
Step 2 From the Log file name parameter, type the directory path and file name for the
application log. For example, OracleDomain.log.
Step 3 Optional. Configure any additional application log file rotation parameters.
Step 4 Click Save.
You are now ready to configure an audit provider for Oracle BEA WebLogic.
Configure an Audit
Provider
To configure an audit provider:
Step 1 Select Security Realms > Realm Name > Providers > Auditing.
Step 2 Click New.
Step 3 Configure an audit provider:
a Type a name for the audit provider you are creating.

Configuring DSMs
568 ORACLE
b From the Type list box, select DefaultAuditor.
c Click OK.
The Settings window is displayed.
Step 4 Click the auditing provider you created in Step 3.
Step 5 Click the Provider Specific tab.
Step 6 Configure the following parameters:
a Add any Active Context Handler Enteries required.
b From the Severity list box, select INFORMATION.
c Click Save.
You are now ready to configure JSA to pull log files from Oracle BEA WebLogic.
Configure a Log
Source
To configure JSA to retrieve log files from Oracle BEA WebLogic:
Step 1 Log in to JSA.
Step 2 Click the Admin tab.
Step 3 On the navigation menu, click Data Sources.
The Data Sources panel is displayed.
Step 4 Click the Log Sources icon.
The Log Sources window is displayed.
Step 5 From the Log Source Type list box, select Oracle BEA WebLogic.
Step 6 Using the Protocol Configuration list box, select Log File.
Step 7 Configure the following parameters:
Table 74-5 Log File Parameters
Parameter Description
Log Source Identifier Type the IP address or hostname for the log source. This
value must match the value configured in the Remote Host IP
or Hostname parameter.
The log source identifier must be unique for the log source
type.
Service Type From the list box, select the File Transfer Protocol (FTP) you
want to use for retrieving files. The options are: SSH File
Transfer Protocol (SFTP), File Transfer Protocol (FTP), or
Secure Copy (SCP). The default is SFTP.
Remote IP or
Hostname
Type the IP address or hostname of the host from which you
want to receive files.

Configuring DSMs
Oracle BEA WebLogic 569
Remote Port Type the TCP port on the remote host that is running the
selected Service Type. If you configure the Service Type as
FTP, the default is 21. If you configure the Service Type as
SFTP or SCP, the default is 22.
The valid range is 1 to 65535.
Remote User Type the username necessary to log in to the host running the
selected Service Type.
The username can be up to 255 characters in length.
Remote Password Type the password necessary to log in to the host running the
selected Service Type.
Confirm Password Confirm the Remote Password to log in to the host running
the selected Service Type.
SSH Key File If you select SCP or SFTP as the Service Type, this
parameter allows you to define an SSH private key file. Also,
when you provide an SSH Key File, the Remote Password
option is ignored.
Remote Directory Type the directory location on the remote host from which the
files are retrieved.
Recursive Select this check box if you want the file pattern to also search
sub folders. The Recursive parameter is not used if you
configure SCP as the Service Type. By default, the check box
is clear.
FTP File Pattern If you select SFTP or FTP as the Service Type, this option
allows you to configure the regular expression (regex)
required to filter the list of files specified in the Remote
Directory. All matching files are included in the processing.
For example, if you want to list all files starting with the word
server, followed by one or more digits and ending with .log,
use the following entry: server[0-9]+\.log. Use of this
parameter requires knowledge of regular expressions (regex).
For more information, see the following website:
http://download.oracle.com/javase/tutorial/essential/regex/
FTP Transfer Mode This option only appears if you select FTP as the Service
Type. The FTP Transfer Mode parameter allows you to define
the file transfer mode when retrieving log files over FTP.
From the list box, select the transfer mode you want to apply
to this log source:
•Binary - Select a binary FTP transfer mode for log sources
that require binary data files or compressed .zip, .gzip, .tar,
or .tar.gz archive files.
•ASCII - Select ASCII for log sources that require an ASCII
FTP file transfer. You must select NONE for the Processor
parameter and LINEBYLINE the Event Generator
parameter when using ASCII as the FTP Transfer Mode.
Table 74-5 Log File Parameters (continued)
Parameter Description

Configuring DSMs
570 ORACLE
Step 8 Click Save.
Step 9 On the Admin tab, click Deploy Changes.
The configuration is complete.
SCP Remote File If you select SCP as the Service Type you must type the file
name of the remote file.
Start Time Type the time of day you want the processing to begin. This
parameter functions with the Recurrence value to establish
when and how often the Remote Directory is scanned for files.
Type the start time, based on a 24 hour clock, in the following
format: HH:MM.
Recurrence Type the frequency, beginning at the Start Time, that you
want the remote directory to be scanned. Type this value in
hours (H), minutes (M), or days (D).
For example, type 2H if you want the directory to be scanned
every 2 hours. The default is 1H.
Run On Save Select this check box if you want the log file protocol to run
immediately after you click Save. After the Run On Save
completes, the log file protocol follows your configured start
time and recurrence schedule.
Selecting Run On Save clears the list of previously processed
files for the Ignore Previously Processed File(s) parameter.
EPS Throttle Type the number of Events Per Second (EPS) that you do not
want this protocol to exceed. The valid range is 100 to 5000.
Processor If the files located on the remote host are stored in a .zip,
.gzip, .tar, or .tar.gz archive format, select the processor that
allows the archives to be expanded and contents processed.
Ignore Previously
Processed File(s)
Select this check box to track files that have already been
processed and you do not want the files to be processed a
second time. This only applies to FTP and SFTP Service
Types.
Change Local
Directory?
Select this check box to define the local directory on your JSA
system that you want to use for storing downloaded files
during processing. We recommend that you leave the check
box clear. When the check box is selected, the Local Directory
field is displayed, which allows you to configure the local
directory to use for storing files.
Event Generator From the Event Generator list box, select Oracle BEA
WebLogic.
Table 74-5 Log File Parameters (continued)
Parameter Description

Configuring DSMs
Oracle Acme Packet Session Border Controller 571
Oracle Acme
Packet Session
Border Controller
You can use JSA to collect events from Oracle Acme Packet Session Border
Controller (SBC) installations in your network.
Configuration
Overview
The Oracle Acme Packet SBC installations generate events from syslog and
SNMP traps. SNMP trap events are converted to syslog and all events are
forwarded to to JSA over syslog. JSA does not automatically discover syslog
events that are forwarded from Oracle Communications SBC. JSA supports syslog
events from Oracle Acme Packet SBC V6.2 and above.
To collect Oracle Acme Packet SBC events, you must complete the following
tasks:
1 On your JSA system, configure a log source with the Oracle Acme Packet Session
Border Controller DSM.
2 On your Oracle Acme Packet SBC installation, enable SNMP and configure the
destination IP address for syslog events.
3 On your Oracle Acme Packet SBC installation, enable syslog settings on the
media-manager object.
4 Restart your Oracle Acme Packet SBC installation.
5 Optional. Ensure that no firewall rules block syslog communication between your
Oracle Acme Packet SBC installation and the JSA console or managed host that
collects syslog events.
Supported Oracle
Acme Packet Event
Types that are
Logged by JSA
The Oracle Acme Packet SBC DSM for JSA can collect syslog events from
authorization and the system monitor event categories.
Each event category can contain low-level events that describe the action that is
taken within the event category. For example, authorization events can have
low-level categories of a login success or login failed.
Configuring an
Oracle Acme Packet
SBC Log Source
To collect syslog events from Oracle Acme Packet SBC, you must configure a log
source in JSA. Oracle Acme Packet SBC syslog events do not automatically
discover in JSA.
Procedure
Step 1 Log in to JSA.
Step 2 Click the Admin tab.
Step 3 In the navigation menu, click Data Sources.
Step 4 Click the Log Sources icon.
Step 5 Click Add.
Step 6 In the Log Source Name field, type a name for your log source.

Configuring DSMs
572 ORACLE
Step 7 Optional. In the Log Source Description field, type a description for your log
source.
Step 8 From the Log Source Type list box, select Oracle Acme Packet SBC.
Step 9 From the Protocol Configuration list box, select Syslog.
Step 10 Configure the following values:
Step 11 Click Save.
Step 12 On the Admin tab, click Deploy Changes.
What’s next
You are now ready to configure your Oracle Acme Packet SBC installation.
Table 74-6 Syslog Protocol Parameters
Parameter Description
Log Source Identifier Type the IP address or host name as an identifier for events
from your Oracle Acme Packet SBC installation.
The log source identifier must be unique value.
Enabled Select this check box to enable the log source. By default,
the check box is selected.
Credibility Select the credibility of the log source. The range is 0 - 10.
The credibility indicates the integrity of an event or offense
as determined by the credibility rating from the source
devices. Credibility increases if multiple sources report the
same event. The default is 5.
Target Event Collector Select the Event Collector to use as the target for the log
source.
Coalescing Events Select this check box to enable the log source to coalesce
(bundle) events.
By default, automatically discovered log sources inherit the
value of the Coalescing Events list box from the System
Settings in JSA. When you create a log source or edit an
existing configuration, you can override the default value by
configuring this option for each log source.
Incoming Event
Payload
From the list box, select the incoming payload encoder for
parsing and storing the logs.
Store Event Payload Select this check box to enable the log source to store event
payload information.
By default, automatically discovered log sources inherit the
value of the Store Event Payload list box from the System
Settings in JSA. When you create a log source or edit an
existing configuration, you can override the default value by
configuring this option for each log source.

Configuring DSMs
Oracle Acme Packet Session Border Controller 573
Configuring SNMP to
Syslog Conversion
on Oracle Acme
Packet SBC
To collect events in a format compatible with JSA, you must enable SNMP to
syslog conversion and configure a syslog destination.
Procedure
Step 1 Using SSH, log in to the command-line interface of your Oracle Acme Packet SBC
installation as an administrator.
Step 2 Type the following command to start the configuration mode:
config t
Step 3 Type the following commands to start the system configuration:
(configure)# system
(system)#
(system)# system-config
(system-config)# sel
The sel command is required to select a single-instance of the system
configuration object.
Step 4 Type the following commands to configure your JSA system as a syslog
destination:
(system-config)# syslog-servers
(syslog-config)# address <JSA IP address>
(syslog-config)# done
Step 5 Type the following commands to enable SNMP traps and syslog conversion for
SNMP trap notifications:
(system-config)# enable-snmp-auth-traps enabled
(system-config)# enable-snmp-syslog-notify enabled
(system-config)# enable-snmp-monitor-traps enabled
(system-config)# ids-syslog-facility 4
(system-config)# done
Step 6 Type the following commands to return to configuration mode:
(system-config)# exit
(system)# exit
(configure)#
Enabling Syslog
Settings on the Media
Manager Object
The media-manager object configuration enables syslog notifications when the
Intrusion Detection System (IDS) completes an action on an IP address. The
available action for the event might be dependent on your firmware version.
Procedure
Step 1 Type the following command to list the firmware version for your Oracle Acme
Packet SBC installation:
(configure)# show ver
ACME Net-Net OSVM Firmware SCZ 6.3.9 MR-2 Patch 2 (Build 465)
Build Date=03/13/13
The underlined text is the major and minor version number for the firmware.

Configuring DSMs
574 ORACLE
Step 2 Type the following commands to configure the media-manager object:
(configure)# media-manager
(media-manager)#
(media-manager)# media-manager
(media-manager)# sel
(media-manager-config)#
The sel command is required to select a single-instance of the media-manager
object.
Step 3 Type the following command to enable syslog messages when an IP is demoted
by the IDS system to the denied queue.
(media-manager-config)# syslog-on-demote-to-deny enabled
Step 4 For firmware version C6.3.0 and above, type the following command to enable
syslog message when sessions are rejected.
(media-manager-config)# syslog-on-call-reject enabled
Step 5 For firmware version C6.4.0 and above, type the following command to enable
syslog messages when an IP is demoted to the untrusted queue
(media-manager-config)# syslog-on-demote-to-untrusted enabled
Step 6 Type the following commands to return to configuration mode:
(media-manager-config)# done
(media-manager-config)# exit
(media-manager)# exit
(configure)# exit
Step 7 Type the following commands to save and activate the configuration:
# save
Save complete
# activate
Step 8 Type reboot to restart your Oracle Acme Packet SBC installation.
After the system restarts, events are forwarded to JSA and displayed on the Log
Activity tab.
Oracle Fine
Grained Auditing
The Oracle Fine Grained Auditing DSM can poll for database audit events from
Oracle 9i and later by using the Java Database Connectivity (JDBC) protocol.
Configuration
overview
To collect events, administrators must enable fine grained auditing on their Oracle
databases. Fine grained auditing provides events on select, update, delete, and
insert actions that occur in the source database and the records the data changed.
The database table dba_fga_audit_trail is updated with a new row each time a
change occurs on a database table where the administrator enabled an audit
policy.

Configuring DSMs
Oracle Fine Grained Auditing 575
To configure Oracle fine grained auditing, administators can complete the following
tasks:
1 Configure on audit on any tables that require policy monitoring in the Oracle
database.
2 Configure a log source for the Oracle Fine Grained Auditing DSM to poll the Oracle
database for events.
3 Verify that the events polled are collected and displayed on the Log Activity tab of
JSA.
Configure a log
source
After the database administrator has configured database policies, a log source
can be configured to access the Oracle database with the JDBC protocol.
Procedure
To configure a log source to access the Oracle database with the JDBC protocol:
Step 1 Log in to JSA.
Step 2 Click the Admin tab.
Step 3 On the navigation menu, click Data Sources.
Step 4 Click the Log Sources icon.
Step 5 Click Add.
Step 6 Using the Log Source Type list, select Oracle Fine Grained Auditing.
Step 7 Using the Protocol Configuration list, select JDBC.
Step 8 Configure the following values:
Table 74-7 Oracle Fine Grained Auditing JDBC Parameters
Parameter Description
Log Source
Identifier
Type the log source identifier in the following format:
<database>@<hostname> or
<table name>|<database>@<hostname>
Where:
<table name> is the name of the table or view of the database
containing the event records. This parameter is optional. If you
include the table name, you must include a pipe (|) character and
the table name must match the Table Name parameter.
<database> is the database name, as defined in the Database
Name parameter. The database name is a required parameter.
<hostname> is the hostname or IP address for this log source, as
defined in the IP or Hostname parameter. The hostname is a
required parameter.
The log source identifier must be unique for the log source type.
Database Type Select MSDE as the database type.

Configuring DSMs
576 ORACLE
Database Name Type the name of the database to which you want to connect.
The table name can be up to 255 alphanumeric characters in
length. The table name can include the following special
characters: dollar sign ($), number sign (#), underscore (_), en
dash (-), and period(.).
IP or Hostname Type the IP address or hostname of the database.
Port Type the port number used by the database server. The default
that is displayed depends on the selected Database Type. The
valid range is 0 to 65536.
The JDBC configuration port must match the listener port of the
database. The database must have incoming TCP connections
enabled to communicate with JSA.
The default port number for all options include:
•DB2 - 50000
•MSDE - 1433
•Oracle - 1521
Note: If you define a Database Instance when using MSDE as the
database type, you must leave the Port parameter blank in your
configuration.
Username Type the database username.
The username can be up to 255 alphanumeric characters in
length. The username can also include underscores (_).
Password Type the database password.
The password can be up to 255 characters in length.
Confirm
Password
Confirm the password to access the database.
Authentication
Domain
If you select MSDE as the Database Type, the Authentication
Domain field is displayed. If your network is configured to validate
users with domain credentials, you must define a Windows
Authentication Domain. Otherwise, leave this field blank.
The authentication domain must contain alphanumeric characters.
The domain can include the following special characters:
underscore (_), en dash (-), and period(.).
Database
Instance
If you select MSDE as the Database Type, the Database Instance
field is displayed.
Type the type the instance to which you want to connect, if you
have multiple SQL server instances on one server.
Note: If you use a non-standard port in your database
configuration, or have blocked access to port 1434 for SQL
database resolution, you must leave the Database Instance
parameter blank in your configuration.
Table 74-7 Oracle Fine Grained Auditing JDBC Parameters (continued)
Parameter Description

Configuring DSMs
Oracle Fine Grained Auditing 577
Predefined
Query
From the list, select None.
Table Name Type dba_fga_audit_trail as the name of the table that
includes the event records. If you change the value of this field
from the default, events cannot be properly collected by the JDBC
protocol.
Select List Type * to include all fields from the table or view.
You can use a comma-separated list to define specific fields from
tables or views, if required for your configuration. The list must
contain the field defined in the Compare Field parameter. The
comma-separated list can be up to 255 alphanumeric characters in
length. The list can include the following special characters: dollar
sign ($), number sign (#), underscore (_), en dash (-), and
period(.).
Compare Field Type extended_timestamp to identify new events added
between queries to the table by their timestamp.
Use Prepared
Statements
Select the Use Prepared Statements check box.
Prepared statements allows the JDBC protocol source to setup the
SQL statement one time, then run the SQL statement many times
with different parameters. For security and performance reasons,
we recommend that you use prepared statements.
Clearing this check box requires you to use an alternative method
of querying that does not use pre-compiled statements.
Start Date and
Time
Optional. Configure the start date and time for database polling.
Polling Interval Type the polling interval in seconds, which is the amount of time
between queries to the database table. The default polling interval
is 30 seconds.
You can define a longer polling interval by appending H for hours
or M for minutes to the numeric value. The maximum polling
interval is 1 week in any time format. Numeric values without an H
or M designator poll in seconds.
EPS Throttle Type the number of Events Per Second (EPS) that you do not
want this protocol to exceed. The default value is 20000 EPS.
Use Named Pipe
Communication
If you select MSDE as the Database Type, the Use Named Pipe
Communications check box is displayed. By default, this check
box is clear.
Select this check box to use an alternative method to a TCP/IP
port connection.
When using a Named Pipe connection, the username and
password must be the appropriate Windows authentication
username and password and not the database username and
password. Also, you must use the default Named Pipe.
Table 74-7 Oracle Fine Grained Auditing JDBC Parameters (continued)
Parameter Description

Configuring DSMs
578 ORACLE
Step 9 Click Save.
On the Admin tab, click Deploy Changes
Use NTLMv2 If you select MSDE as the Database Type, the Use NTLMv2
check box is displayed.
Select the Use NTLMv2 check box to force MSDE connections to
use the NTLMv2 protocol when communicating with SQL servers
that require NTLMv2 authentication. The default value of the check
box is selected.
If the Use NTLMv2 check box is selected, it has no effect on
MSDE connections to SQL servers that do not require NTLMv2
authentication.
Use SSL Select this check box if your connection supports SSL
communication. This option requires additional configuration on
your SharePoint database and also requires administrators to
configure certificates on both appliances.
Database
Cluster Name
If you select the Use Named Pipe Communication check box,
the Database Cluster Name parameter is displayed. If you are
running your SQL server in a cluster environment, define the
cluster name to ensure Named Pipe communication functions
properly.
Table 74-7 Oracle Fine Grained Auditing JDBC Parameters (continued)
Parameter Description
Configuring DSMs
72 OSSEC
The OSSEC DSM for Juniper Secure Analytics (JSA) accepts events forwarded
from OSSEC installations using syslog.
OSSEC is an open source Host-based Intrusion Detection System (HIDS) that can
provide intrusion events to JSA. If you have OSSEC agents installed, you must
configure syslog on the OSSEC management server. If you have local or
stand-alone installations of OSSEC, then you must configure syslog on each
stand-alone OSSEC to forward syslog events to JSA.
Configure OSSEC To configure syslog for OSSEC on a stand-alone installation or management
server:
Step 1 Using SSH, log in to your OSSEC device.
Step 2 Edit the OSSEC configuration file ossec.conf.
<installation directory>/ossec/etc/ossec.conf
Step 3 Add the following syslog configuration.
The syslog configuration should be added after the alerts entry and before the
localfile entry.
</alerts>
<syslog_output>
<server>(JSA IP Address)</server>
<port>514</port>
</syslog_output>
<localfile>
For example,
<syslog_output>
<server>10.100.100.2</server>
<port>514</port>
</syslog_output>
Step 4 Save the OSSEC configuration file.
Step 5 Type the following command to enable the syslog daemon:
<installation directory>/ossec/bin/ossec-control enable
client-syslog

Configuring DSMs
580 OSSEC
Step 6 Type the following command to restart the syslog daemon:
<installation directory>/ossec/bin/ossec-control restart
The configuration is complete. The log source is added to JSA as OSSEC events
are automatically discovered. Events forwarded to JSA by OSSEC are displayed
on the Log Activity tab of JSA.
Configure a Log
Source
JSA automatically discovers and creates a log source for syslog events from
OSSEC. The following configuration steps are optional.
To manually configure a log source for OSSEC:
Step 1 Log in to JSA.
Step 2 Click the Admin tab.
Step 3 On the navigation menu, click Data Sources.
The Data Sources panel is displayed.
Step 4 Click the Log Sources icon.
The Log Sources window is displayed.
Step 5 Click Add.
The Add a log source window is displayed.
Step 6 In the Log Source Name field, type a name for your log source.
Step 7 In the Log Source Description field, type a description for the log source.
Step 8 From the Log Source Type list box, select OSSEC.
Step 9 Using the Protocol Configuration list box, select Syslog.
The syslog protocol configuration is displayed.
Step 10 Configure the following values:
Step 11 Click Save.
Step 12 On the Admin tab, click Deploy Changes.
The configuration is complete.
Table 75-8 Syslog Parameters
Parameter Description
Log Source Identifier Type the IP address or host name for the log source as an
identifier for events from your OSSEC installation.

Configuring DSMs
73 PALO ALTO NETWORKS
The Palo Alto PA Series DSM for Juniper Secure Analytics (JSA) accepts events
using syslog.
Supported Event
Types
JSA records syslog threat events forwarded from Palo Alto PA Series firewalls that
have been classified into critical, high, medium, low and informational event
categories.
Before You Begin Configuring a Palo Alto PA Series device with JSA requires the following:
1 Create a syslog destination for your Palo Alto PA Series device.
2 Create a forwarding policy, which allows the Palo Alto PA Series device to
communicate with JSA.
3 Configure the log source in JSA.
NOTE
Note: If you did not type a host name when configuring your Palo Alto PA Series
device, the syslog header might not contain the IP address or host name of the
Palo Alto device. For more information, see your vendor documentation.
Create a Syslog
Destination
Before you can integrate a Palo Alto PA Series firewall with JSA, you must create a
syslog destination
Step 1 Log in to the Palo Alto Networks interface.
Step 2 Click the Device tab.
The Device options menu is displayed.
Step 3 Select Log Destinations > Syslog.
The log settings configuration menu is displayed.
Step 4 Click New.
The New Syslog Setting menu is displayed.
Step 5 Configure the New Syslog Settings options:
•Name - Type the name of the syslog server.
•Server - Type the IP address of your JSA system.
Configuring DSMs
582 PALO ALTO NETWORKS
•Port - Type the port number the JSA system to receive syslog events. The
default port number is 514.
•Facility - From the drop-down list box, select the facility level from the available
options.
Step 6 Click OK.
You have now entered the syslog destination, but you must also define the severity
of events that are contained in the syslog messages.
Step 7 Select Log Setting > System.
The System Log Settings window is displayed, which allow you to define the
contents of the syslog messages for JSA.
Step 8 Click Edit.
Step 9 Select the check box for each event severity level you want contained in the syslog
message.
Step 10 Type the name of the syslog destination you created in Step 5.
Step 11 Click OK.
This saves the candidate configuration, but you must commit your changes to the
active configuration.
Step 12 Click the Device tab.
The Device options menu is displayed.
Step 13 Click Commit from the top of the page to update your Palo Alto PA Series firewall
with the active configuration.
Step 14 You are now ready to create a forwarding policy to allow communications between
your Palo Alto Networks device and JSA.
Create a Forwarding
Policy
Network traffic between Palo Alto PA Series devices and JSA can be blocked if
your JSA console or Event Collector is in a different security zone than your Palo
Alto PA Series device. A forwarding policy rule is required to forward traffic from
your Palo Alto PA Series device providing events to JSA.
To create a new forwarding policy, perform the following steps:
Step 1 On your Palo Alto device dashboard, click the Policies tab.
The Policies options menu is displayed.
Step 2 Select Policies > Policy Based Forwarding.
Step 3 Click New.
Step 4 Configure the following values:
•Name
•Source Zone
•Destination Zone
•Source Address

Configuring DSMs
583
•Destination Address
•Source User
•Application
•Service
•Action
•Forwarding
•Monitoring
•Schedule
For descriptions of the policy based forwarding values, see your Palo Alto
Networks Administrator’s Guide.
You are now ready to configure the log source in JSA.
Configure a Log
Source
JSA automatically discovers and creates a log source for syslog events from Palo
Alto PA Series devices. The following configuration steps are optional.
To manually configure a log source:
Step 1 Log in to JSA.
Step 2 Click the Admin tab.
Step 3 In the navigation menu, click Data Sources.
The Data Sources panel is displayed.
Step 4 Click the Log Sources icon.
The Log Sources window is displayed.
Step 5 Click Add.
The Add a log source window is displayed.
Step 6 From the Log Source Type drop-down list box, select Palo Alto PA Series.
Step 7 From the Protocol Configuration drop-down list box, select Syslog.
Step 8 Configure the following values:
For more information on configuring log sources, see the Log Sources Users
Guide. The Palo Alto PA Series configuration is complete.
Table 76-1 Palo Alto PA Series Syslog Configuration
Parameter Description
Log Source Identifier Type the IP address or hostname for the log source.

Configuring DSMs
74 PIREAN ACCESS: ONE
The Pirean Access: One DSM for Juniper Secure Analytics (JSA) collects events
by polling the DB2 audit database for access management and authentication
events.
Supported Versions JSA supports Pirean Access: One software installations at v2.2 that use a DB2
v9.7 database to store access management and authentication events.
Before You Begin Before you configure JSA to integrate with Pirean Access: One, you can create a
database user account and password for JSA. Creating a JSA account is not
required, but is beneficial as it allows you to secure your access management and
authentication event table data for the JSA user. Your JSA user must have read
permissions for the database table that contains your events. The JDBC protocol
allows JSA to log in and poll for events from the database based on the timestamp
to ensure the latest data is retrieved.
NOTE
Note: Ensure that no firewall rules block communication between your Pirean
Access: One installation and the JSA console or managed host responsible for
event polling with JDBC.
Configuring a Log
Source
To collect events, you must configure a log source in JSA to poll your Access: One
installation database with the JDBC protocol.
Procedure
Step 1 Click the Admin tab.
Step 2 On the navigation menu, click Data Sources.
Step 3 Click the Log Sources icon.
Step 4 Click Add.
Step 5 In the Log Source Name field, type a name for your log source.
Step 6 In the Log Source Description field, type a description for the log source.
Step 7 From the Log Source Type list box, select Pirean Access: One.
Step 8 Using the Protocol Configuration list box, select JDBC.

Configuring DSMs
586 PIREAN ACCESS: ONE
Step 9 Configure the following values:
Table 77-2 Pirean Access: One log source parameters
Parameter Description
Log Source
Identifier
Type the identifier for the log source. The log source identifier must
be defined in the following format:
<database>@<hostname>
Where:
<database> is the database name, as defined in the Database
Name parameter. The database name is a required parameter.
<hostname> is the hostname or IP address for the log source as
defined in the IP or Hostname parameter. The hostname is a
required parameter.
The log source identifier must be unique for the log source type.
Database Type From the list box, select DB2 as the type of database to use for the
event source.
Database Name Type the name of the database to which you want to connect. The
default database name is LOGINAUD.
IP or Hostname Type the IP address or hostname of the database server.
Port Type the TCP port number used by the audit database DB2
instance.
Your DB2 administrator can provide you with the TCP port
required for this field.
Username Type a username that has access to the DB2 database server and
audit table.
The username can be up to 255 alphanumeric characters in
length. The username can also include underscores (_).
Password Type the database password.
The password can be up to 255 characters in length.
Confirm
Password
Confirm the password to access the database.
Table Name Type AUDITDATA as the name of the table or view that includes
the event records.
The table name can be up to 255 alphanumeric characters in
length. The table name can include the following special
characters: dollar sign ($), number sign (#), underscore (_), en
dash (-), and period(.).
Select List Type * to include all fields from the table or view.
You can use a comma-separated list to define specific fields from
tables or views, if required for your configuration. The list must
contain the field defined in the Compare Field parameter. The
comma-separated list can be up to 255 alphanumeric characters in
length. The list can include the following special characters: dollar
sign ($), number sign (#), underscore (_), en dash (-), and
period(.).

Configuring DSMs
587
Step 10 Click Save.
Step 11 On the Admin tab, click Deploy Changes.
The configuration is complete. Access management and authentication events for
Pirean Access: One are displayed on the Log Activity tab of JSA.
Compare Field Type TIMESTAMP to identify new events added between queries
to the table.
The compare field can be up to 255 alphanumeric characters in
length. The list can include the special characters: dollar sign ($),
number sign (#), underscore (_), en dash (-), and period(.).
Use Prepared
Statements
Select this check box to use prepared statements, which allows
the JDBC protocol source to setup the SQL statement one time,
then run the SQL statement many times with different parameters.
For security and performance reasons, we recommend that you
use prepared statements.
Clear this check box to use an alternative method of querying that
does not use pre-compiled statements.
Start Date and
Time
Optional. Configure the start date and time for database polling.
The Start Date and Time parameter must be formatted as
yyyy-MM-dd HH:mm with HH specified using a 24 hour clock. If the
start date or time is clear, polling begins immediately and repeats
at the specified polling interval.
Polling Interval Type the polling interval, which is the amount of time between
queries to the event table. The default polling interval is 10
seconds.
You can define a longer polling interval by appending H for hours
or M for minutes to the numeric value. The maximum polling
interval is 1 week in any time format. Numeric values without an H
or M designator poll in seconds.
EPS Throttle Type the number of Events Per Second (EPS) that you do not
want this protocol to exceed. The default value is 20000 EPS.
Enabled Select this check box to enable the Pirean Access: One log
source.
Table 77-2 Pirean Access: One log source parameters (continued)
Parameter Description
Configuring DSMs
75 POSTFIX MAIL TRANSFER AGENT
Juniper Secure Analytics (JSA) can collect and categorize syslog mail events from
PostFix Mail Transfer Agents (MTA) installed in your network.
Configuration
Overview
To collect syslog events, you must configure PostFix MTA installation to forward
syslog events to JSA. JSA does not automatically discover syslog events that are
forwarded from PostFix MTA installations as they are multiline events. JSA
supports syslog events from PostFix MTA V2.6.6.
To configure PostFix MTA, complete the following tasks:
1 On your PostFix MTA system, configure syslog.conf to forward mail events to JSA.
2 On your JSA system, create a log source for PostFix MTA to use the UDP multiline
syslog protocol.
3 On your JSA system, configure iptables to redirect events to the port defined for
UDP multiline syslog events.
4 On your JSA system, verify that your PostFix MTA events are displayed on the Log
Activity tab.
If you have multiple PostFix MTA installations where events go to different JSA
systems, you must configure a log source and IPtables for each JSA system that
receives PostFix MTA multiline UDP syslog events.
Configuring Syslog
for PostFix Mail
Transfer Agent
To collect events, you must configure syslog on your PostFix MTA installation to
forward mail events to JSA.
Procedure
Step 1 Using SSH, log in to your PostFix MTA installation as a root user.
Step 2 Edit the following file:
/etc/syslog.conf
Step 3 To forward all mail events, type the following command to change
-/var/log/maillog/ to an IP address. Make sure all other lines remain intact:
mail.* @<IP address>
Where <IP address> is the IP address of the JSA console, Event Processor, or
Event Collecor, or all-in-one system.

Configuring DSMs
590 POSTFIX MAIL TRANSFER AGENT
Step 4 Save and exit the file.
Step 5 Restart your syslog daemon to save the changes.
Configuring a
PostFix MTA Log
Source
To collect syslog events, you must configure a log source for PostFix MTA to use
the UDP Multiline Syslog protocol.
Procedure
Step 1 Click the Admin tab.
Step 2 Click the Log Sources icon.
Step 3 Click Add.
Step 4 In the Log Source Name field, type a name for your log source.
Step 5 From the Log Source Type list box, select PostFix Mail Transfer Agent.
Step 6 From the Protocol Configuration list box, select UDP Multiline Syslog.
Step 7 Configure the following values:
Table 78-3 PostFix MTA Log Source Parameters
Parameter Description
Log Source Identifier Type the IP address, host name, or name to identify your
PostFix MTA installation.
Listen Port Type 517 as the port number used by JSA to accept
incoming UDP Multiline Syslog events. The valid port range
is 1 to 65535.
To edit a saved configuration to use a new port number:
1In the Listen Port field, type the new port number for
receiving UDP Multiline Syslog events.
2Click Save.
3On the Admin tab, select Advanced > Deploy Full
Configuration.
After the full deploy completes, JSA is capable of receiving
events on the updated listen port.
Note: When you click Deploy Full Configuration, JSA
restarts all services, which results in a gap in data collection
for events and flows until the deployment completes.
Message ID Pattern Type the following regular expression (regex) required to
filter the event payload messages.
postfix/.*?[ \[]\\d+[ \]](?:- - |: )([A-Z0-9]{8,10})
Enabled Select this check box to enable or disable the log source.
Credibility Select the credibility of the log source. The range is 0 - 10.
The credibility indicates the integrity of an event or offense
as determined by the credibility rating from the source
devices. Credibility increases if multiple sources report the
same event. The default is 5.

Configuring DSMs
591
Step 8 Click Save.
Step 9 On the Admin tab, click Deploy Changes.
Configure IPtables
for Multiline UDP
Syslog Events
To collect events, you must redirect events from the standard PostFix MTA port to
port 517 for the UDP multiline protocol.
Procedure
Step 1 Using SSH, log in to JSA as the root user.
Step 2 To edit the IPtables file, type the following command:
vi /opt/qradar/conf/iptables-nat.post
Step 3 To instruct JSA to redirect syslog events from UDP port 514 to UDP port 517, type
the following command:
-A PREROUTING -p udp --dport 514 -j REDIRECT --to-port
<new-port> -s <IP address>
Where:
<IP address> is the IP address of your PostFix MTA installation.
<New port> is the port number configured in the UDP Multiline protocol for
PostFix MTA.
Target Event Collector Select the Event Collector to use as the target for the log
source.
Coalescing Events Select this check box to enable the log source to coalesce
(bundle) events.
By default, automatically discovered log sources inherit the
value of the Coalescing Events list box from the System
Settings in JSA. When you create a log source or edit an
existing configuration, you can override the default value by
configuring this option for each log source.
Incoming Payload
Encoding
Select the character encoding required to parse the event
logs.
Store Event Payload Select this check box to enable the log source to store event
payload information.
By default, automatically discovered log sources inherit the
value of the Store Event Payload list box from the System
Settings in JSA. When you create a log source or edit an
existing configuration, you can override the default value by
configuring this option for each log source.
Log Source Language Select the language of the events generated by PostFix
MTA.
Table 78-3 PostFix MTA Log Source Parameters (continued)
Parameter Description
Configuring DSMs
592 POSTFIX MAIL TRANSFER AGENT
For example, if you had three PostFix MTA installations that communicate to JSA,
you can type the following:
-A PREROUTING -p udp --dport 514 -j REDIRECT --to-port 517 -s
10.10.10.10
-A PREROUTING -p udp --dport 514 -j REDIRECT --to-port 517 -s
10.10.10.11
-A PREROUTING -p udp --dport 514 -j REDIRECT --to-port 517 -s
10.10.10.12
Step 4 Save your IPtables NAT configuration.
You are now ready to configure IPtables on your JSA console or Event Collector to
accept events from your PostFix MTA installation.
Step 5 Type the following command to edit the IPtables file:
vi /opt/qradar/conf/iptables.post
Step 6 Type the following command to instruct JSA to allow communication from your
PostFix MTA installations:
-I QChain 1 -m udp -p udp --src <IP address> --dport <New port>
-j ACCEPT
Where:
<IP address> is the IP address of your PostFix MTA installation.
<New port> is the port number configured in the UDP Multiline protocol.
For example, if you had three PostFix MTA installations communicating to an
Event Collector, you can type the following:
-I QChain 1 -m udp -p udp --src 10.10.10.10 --dport 517 -j
ACCEPT
-I QChain 1 -m udp -p udp --src 10.10.10.11 --dport 517 -j
ACCEPT
-I QChain 1 -m udp -p udp --src 10.10.10.12 --dport 517 -j
ACCEPT
Step 7 To save the changes and update IPtables, type the following command:
./opt/qradar/bin/iptables_update.pl
Configuring DSMs
76 PROFTPd
Juniper Secure Analytics (JSA) can collect events from a ProFTP server through
syslog.
By default, ProFTPd logs authentication related messages to the local syslog
using the auth (or authpriv) facility. All other logging is done using the daemon
facility. To log ProFTPd messages to JSA, use the SyslogFacility directive to
change the default facility.
Configure ProFTPd To configure syslog on a ProFTPd device:
Step 1 Open the /etc/proftd.conf file.
Step 2 Below the LogFormat directives add the following:
SyslogFacility <facility>
Where <facility> is one of the following options: AUTH (or AUTHPRIV), CRON,
DAEMON, KERN, LPR, MAIL, NEWS, USER, UUCP, LOCAL0, LOCAL1,
LOCAL2, LOCAL3, LOCAL4, LOCAL5, LOCAL6, or LOCAL7.
Step 3 Save the file and exit.
Step 4 Open the /etc/syslog.conf file
Step 5 Add the following line at the end of the file:
<facility> @<JSA host>
Where:
<facility> matches the facility chosen in Step 2. The facility must be typed in
lower case.
<JSA host> is the IP address of your JSA console or Event Collector.
Step 6 Restart syslog and ProFTPd:
/etc/init.d/syslog restart
/etc/init.d/proftpd restart
You are now ready to configure the log source in JSA.

Configuring DSMs
594 PROFTPD
Configure a Log
Source
JSA automatically discovers and creates a log source for syslog events from
ProFTPd. The following configuration steps are optional.
To manually configure a log source for ProFTPd:
Step 1 Log in to JSA.
Step 2 Click the Admin tab.
Step 3 On the navigation menu, click Data Sources.
The Data Sources panel is displayed.
Step 4 Click the Log Sources icon.
The Log Sources window is displayed.
Step 5 Click Add.
The Add a log source window is displayed.
Step 6 In the Log Source Name field, type a name for your log source.
Step 7 In the Log Source Description field, type a description for the log source.
Step 8 From the Log Source Type list box, select ProFTPd Server.
Step 9 Using the Protocol Configuration list box, select Syslog.
The syslog protocol configuration is displayed.
Step 10 Configure the following values:
Step 11 Click Save.
Step 12 On the Admin tab, click Deploy Changes.
The configuration is complete.
Table 79-4 Syslog Parameters
Parameter Description
Log Source Identifier Type the IP address or host name for the log source as an
identifier for events from your ProFTPd installation.
Configuring DSMs
77 PROOFPOINT ENTERPRISE
PROTECTION AND ENTERPRISE
PRIVACY
Juniper Secure Analytics (JSA) can collect and categorize syslog events from
Proofpoint Enterprise Protection and Enterprise Privacy systems that are installed
within your network.
The following events types are supported for Proofpoint installations:
•System events for Proofpoint Enterprise Protection
•Email security threat classification events for Proofpoint Enterprise Protection
•System events for Proofpoint Enterprise Privacy
•Email audit and encryption events for Proofpoint Enterprise Privacy
Configuration
Overview
To collect syslog events, administrators must configure the Proofpoint appliance to
forward syslog events. JSA does not automatically discover syslog events that are
forwarded from Proofpoint installations. JSA supports syslog events from
Proofpoint Enterprise Protection or Proofpoint Enterprise Privacy installations that
use software version 2014.1 or later.
To collect events from Proofpoint Enterprise, administrators must complete the
following tasks:
1 On your Proofpoint system, configure the log settings to forward syslog events.
2 On your JSA system, create a log source for Proofpoint Enterprise.
Configuring Syslog
for Proofpoint
Enterprise
To collect events, you must configure syslog on your Proofpoint installation to
forward syslog events.
Procedure
To configure syslog for Proofpoint enterprise:
Step 1 Log in to the Proofpoint Enterprise interface.
Step 2 Click Logs and Reports.
Step 3 Click Log Settings.
Step 4 From the Remote Log Settings pane, configure the following options to enable
syslog communication:
a Select Syslog as the communication protocol.

Configuring DSMs
596 PROOFPOINT ENTERPRISE PROTECTION AND ENTERPRISE PRIVACY
b Type the IP address of the JSA console or Event Collector.
c In the Port field, type 514 as the port number for syslog communication.
d From the Syslog Filter Enable list, select On.
e From the Facility list, select local1.
f From the Level list, select Information.
g From the Syslog MTA Enable list, select On.
Step 5 Click Save.
Configuring a
Proofpoint Log
Source
To collect syslog events, you must configure a log source for Proofpoint Enterprise
because the DSM does not support automatic discovery.
Procedure
Step 1 Click the Admin tab.
Step 2 Click the Log Sources icon.
Step 3 Click Add.
Step 4 In the Log Source Name field, type a name for your log source.
Step 5 In the Log Source Description field, type a description for your log source.
Step 6 From the Log Source Type list, select Proofpoint Enterprise
Protection/Enterprise Privacy.
Step 7 From the Protocol Configuration list, select Syslog.
Step 8 Configure the following values:
Table 80-5 Proofpoint Enterprise Log Source Parameters
Parameter Description
Log Source Identifier Type the IP address, host name, or name to identify your
Proofpoint Enterprise appliance.
Enabled Select this check box to enable the log source.
Credibility Select the credibility of the log source. The range is 0 - 10.
The credibility indicates the integrity of an event or offense
as determined by the credibility rating from the source
devices. Credibility increases if multiple sources report the
same event. The default is 5.
Target Event Collector Select the Event Collector to use as the target for the log
source.
Coalescing Events Select this check box to enable the log source to coalesce
(bundle) events.
By default, automatically discovered log sources inherit the
value of the Coalescing Events list from the System
Settings in JSA. When you create a log source or edit an
existing configuration, you can override the default value by
configuring this option for each log source.

Configuring DSMs
597
Step 9 Click Save.
Step 10 On the Admin tab, click Deploy Changes.
Incoming Payload
Encoding
Select the character encoding that is required to parse the
event logs.
Store Event Payload Select this check box to enable the log source to store event
payload information.
By default, automatically discovered log sources inherit the
value of the Store Event Payload list from the System
Settings in JSA. When you create a log source or edit an
existing configuration, you can override the default value by
configuring this option for each log source.
Log Source Language Select the language of the events that are generated by the
Proofpoint Enterprise appliance.
Table 80-5 Proofpoint Enterprise Log Source Parameters (continued)
Parameter Description
Configuring DSMs
78 RADWARE DEFENSEPRO
The Radware DefensePro DSM for Juniper Secure Analytics (JSA) accepts events
using syslog. Event traps can also be mirrored to a syslog server.
Before you configure JSA to integrate with a Radware DefensePro device, you
must configure your Radware DefensePro device to forward syslog events to JSA.
You must configure the appropriate information using the Device > Trap and
SMTP option.
Any traps generated by the Radware device are mirrored to the specified syslog
server. The current Radware Syslog server enables you to define the status and
the event log server address.
You can also define additional notification criteria, such as Facility and Severity,
which are expressed by numerical values:
•Facility is a user-defined value indicating the type of device used by the sender.
This criteria is applied when the device sends syslog messages. The default
value is 21, meaning Local Use 6.
•Severity indicates the importance or impact of the reported event. The Severity
is determined dynamically by the device for each message sent.
In the Security Settings window, you must enable security reporting using the
connect and protect/security settings. You must enable security reports to syslog
and configure the severity (syslog risk).
You are now ready to configure the log source in JSA.
Configure a Log
Source
JSA automatically discovers and creates a log source for syslog events from
Radware DefensePro. The following configuration steps are optional.
To manually configure a log source for Radware DefensePro:
Step 1 Log in to JSA.
Step 2 Click the Admin tab.
Step 3 On the navigation menu, click Data Sources.
The Data Sources panel is displayed.

Configuring DSMs
600 RADWARE DEFENSEPRO
Step 4 Click the Log Sources icon.
The Log Sources window is displayed.
Step 5 Click Add.
The Add a log source window is displayed.
Step 6 In the Log Source Name field, type a name for your log source.
Step 7 In the Log Source Description field, type a description for the log source.
Step 8 From the Log Source Type list box, select Radware DefensePro.
Step 9 Using the Protocol Configuration list box, select Syslog.
The syslog protocol configuration is displayed.
Step 10 Configure the following values:
Step 11 Click Save.
Step 12 On the Admin tab, click Deploy Changes.
The configuration is complete.
Table 81-6 Syslog Parameters
Parameter Description
Log Source Identifier Type the IP address or host name for the log source as an
identifier for events from your Radware DefensePro
installation.
Configuring DSMs
79 RAZ-LEE ISECURITY
Juniper Secure Analytics (JSA) that can collect and parse syslog events forwarded
from Raz-Lee iSecurity installations on IBM iSeries® infrastructure.
Supported Versions JSA supports events from Raz-Lee iSecurity installations with Firewall v15.7 and
Audit v11.7.
Supported Event
Types
Raz-Lee iSecurity installations on IBM AS/400 iSeries are can forward syslog
events for security, compliance, and auditing to JSA.
All syslog events forwarded by Raz-Lee iSecurity automatically discover and the
events are parsed and categorized with the IBM AS/400 iSeries DSM.
Configuring Raz-Lee
iSecurity
To collect security and audit events, you must configure your Raz-Lee iSecurity
installation to forward syslog events to JSA.
Procedure
Step 1 Log in to the IBM System i command-line interface.
Step 2 Type the following command to access the audit menu options:
STRAUD
Step 3 From the Audit menu, select 81. System Configuration.
Step 4 From the iSecurity/Base System Configuration menu, select 31. SYSLOG
Definitions.
Step 5 Configure the following parameters:
a Send SYSLOG message - Select Yes.
b Destination address - Type the IP address of JSA.
c “Facility” to use - Type a facility level.
d “Severity” range to auto send - Type a severity level.
e Message structure - Type any additional message structure parameters
required for your syslog messages.

Configuring DSMs
602 RAZ-LEE ISECURITY
Next steps
Syslog events forwarded by Raz-Lee iSecurity are automatically discovered by
JSA by the IBM AS/400 iSeries DSM. In most cases, the log source is
automatically created in JSA after a small number of events are detected. If the
event rate is extremely low, then you might be required to manually create a log
source for Raz-Lee iSecurity in JSA. Until the log source is automatically
discovered and identified, the event type displays as Unknown on the Log Activity
tab of JSA. Automatically discovered log sources can be viewed on the Admin tab
of JSA by clicking the Log Sources icon.
Configuring a Log
Source
JSA automatically discovers and creates a log source for syslog events forwarded
from Raz-Lee i Security. This procedure is optional.
Procedure
Step 1 Click the Admin tab.
Step 2 Click the Log Sources icon.
Step 3 Click Add.
Step 4 In the Log Source Name field, type a name for your log source.
Step 5 In the Log Source Description field, type a description for the log source.
Step 6 From the Log Source Type list box, select IBM AS/400 iSeries.
Step 7 Using the Protocol Configuration list box, select Syslog.
Step 8 Configure the following values:
Table 82-7 Syslog Parameters
Parameter Description
Log Source Identifier Type the IP address or host name for the log source as an
identifier for events from your IBM AS/400 iSeries device
with Raz-Lee iSecurity.
Enabled Select this check box to enable the log source.
By default, the check box is selected.
Credibility Select the credibility of the log source. The range is 0 - 10.
The credibility indicates the integrity of an event or offense
as determined by the credibility rating from the source
devices. Credibility increases if multiple sources report the
same event. The default is 5.
Target Event Collector Select the Event Collector to use as the target for the log
source.

Configuring DSMs
603
Step 9 Click Save.
Step 10 On the Admin tab, click Deploy Changes.
Coalescing Events Select this check box to enable the log source to coalesce
(bundle) events.
By default, automatically discovered log sources inherit the
value of the Coalescing Events list box from the System
Settings in JSA. When you create a log source or edit an
existing configuration, you can override the default value by
configuring this option for each log source.
Incoming Event
Payload
From the list box, select the incoming payload encoder for
parsing and storing the logs.
Store Event Payload Select this check box to enable the log source to store event
payload information.
By default, automatically discovered log sources inherit the
value of the Store Event Payload list box from the System
Settings in JSA. When you create a log source or edit an
existing configuration, you can override the default value by
configuring this option for each log source.
Table 82-7 Syslog Parameters (continued)
Parameter Description
Configuring DSMs
604 RAZ-LEE ISECURITY
Configuring DSMs
80 REDBACK ASE
The Redback ASE DSM for Juniper Secure Analytics (JSA) accepts events using
syslog.
The Redback ASE device can send log messages to the Redback device console
or to a log server that is integrated with JSA to generate deployment specific
reports. Before configuring a Redback ASE device in JSA, you must configure your
device to forward syslog events.
Configure Redback
ASE
To configure the device to send syslog events to JSA:
Step 1 Log in to your Redback ASE device user interface.
Step 2 Start the CLI configuration mode.
Step 3 In global configuration mode, configure the default settings for the security service:
asp security default
Step 4 In ASP security default configuration mode, configure the IP address of the log
server and the optional transport protocol:
log server <IP address> transport udp port 9345
Where <IP address> is the IP address of the JSA.
Step 5 Configure the IP address that you want to use as the source IP address in the log
messages:
log source <source IP address>
Where <source IP address> is the IP address of the loopback interface in
context local.
Step 6 Commit the transaction.
For more information about Redback ASE device configuration, see your vendor
documentation.
For example, if you want to configure:
•Log source server IP address 10.172.55.55
•Default transport protocol: UDP
•Default server port: 514

Configuring DSMs
606 REDBACK ASE
The source IP address used for log messages is 10.192.22.24. This address must
be an IP address of a loopback interface in context local.
asp security default
log server 10.172.55.55
log source 10.192.22.24
You are now ready to configure the log sources JSA.
Configure a Log
Source
JSA automatically discovers and creates a log source for syslog events from
Redback ASE. The following configuration steps are optional.
To manually configure a log source for Redback ASE:
Step 1 Log in to JSA.
Step 2 Click the Admin tab.
Step 3 On the navigation menu, click Data Sources.
The Data Sources panel is displayed.
Step 4 Click the Log Sources icon.
The Log Sources window is displayed.
Step 5 Click Add.
The Add a log source window is displayed.
Step 6 In the Log Source Name field, type a name for your log source.
Step 7 In the Log Source Description field, type a description for the log source.
Step 8 From the Log Source Type list box, select Redback ASE.
Step 9 Using the Protocol Configuration list box, select Syslog.
The syslog protocol configuration is displayed.
Step 10 Configure the following values:
Step 11 Click Save.
Step 12 On the Admin tab, click Deploy Changes.
The configuration is complete.
Table 83-8 Syslog Parameters
Parameter Description
Log Source Identifier Type the IP address or host name for the log source as an
identifier for events from your Redback ASE appliance.

Configuring DSMs
81 RSA AUTHENTICATION MANAGER
An RSA Authentication Manager DSM allows you to integrate Juniper Secure
Analytics (JSA) with an RSA Authentication Manager using syslog or the log file
protocol.
Before you configure JSA to integrate with RSA Authentication Manager, select
your configuration preference:
•Configuring Syslog for RSA
•Configuring the Log File Protocol for RSA
NOTE
Note: You must apply the most recent hot fix on RSA Authentication Manager 7.1
primary, replica, node, database and radius installations before configuring syslog.
Configuring Syslog
for RSA
The procedure to configure your RSA Authentication Manager using syslog
depends on the operating system version for your RSA Authentication Manager or
SecureID 3.0 appliance:
•If you are using RSA Authentication Manager on Linux, see Configuring Linux.
•If you are using RSA Authentication Manager on Windows, see Configuring
Windows.
Configuring Linux To configure RSA Authentication Manager for syslog on Linux-based operating
systems:
Step 1 Log in to the RSA Security console command-line interface (CLI).
Step 2 Open the following file for editing based on your operating system:
/usr/local/RSASecurity/RSAAuthenticationManager/utils/resources
/ims.properties
Step 3 Add the following enteries to the ims.properties file:
ims.logging.audit.admin.syslog_host = <IP address>
ims.logging.audit.admin.use_os_logger = true
ims.logging.audit.runtime.syslog_host = <IP address>
ims.logging.audit.runtime.use_os_logger = true
Configuring DSMs
608 RSA AUTHENTICATION MANAGER
ims.logging.system.syslog_host = <IP address>
ims.logging.system.use_os_logger = true
Where <IP address> is the IP address or hostname of JSA.
Step 4 Save the ims.properties files.
Step 5 Open the following file for editing:
/etc/syslog.conf
Step 6 Type the following command to add JSA as a syslog entry:
*.* @<IP address>
Where <IP address> is the IP address or hostname of JSA.
Step 7 Type the following command to restart the syslog services for Linux.
service syslog restart
You are now ready to configure the log sources and protocol in JSA: To configure
JSA to receive events from your RSA Authentication Manager:
From the Log Source Type list box, select the RSA Authentication Manager
option.
For more information, see the Log Sources Users Guide. For more information on
configuring syslog forwarding, see your RSA Authentication Manager
documentation.
Configuring
Windows
To configure RSA Authentication Manager for syslog using Microsoft Windows:
Step 1 Log in to the system hosting your RSA Security console.
Step 2 Open the following file for editing based on your operating system:
/Program Files/RSASecurity/RSAAuthenticationManager/utils/
resources/ims.properties
Step 3 Add the following enteries to the ims.properties file:
ims.logging.audit.admin.syslog_host = <IP address>
ims.logging.audit.admin.use_os_logger = true
ims.logging.audit.runtime.syslog_host = <IP address>
ims.logging.audit.runtime.use_os_logger = true
ims.logging.system.syslog_host = <IP address>
ims.logging.system.use_os_logger = true
Where <IP address> is the IP address or hostname of JSA.
Step 4 Save the ims.properties files.
Step 5 Restart RSA services.
You are now ready to configure the log source in JSA.

Configuring DSMs
Configuring the Log File Protocol for RSA 609
To configure JSA to receive events from your RSA Authentication Manager:
From the Log Source Type list box, select the RSA Authentication Manager
option.
For more information, see the Log Sources Users Guide. For more information on
configuring syslog forwarding, see your RSA Authentication Manager
documentation.
Configuring the
Log File Protocol
for RSA
The log file protocol allows JSA to retrieve archived log files from a remote host.
The RSA Authentication Manager DSM supports the bulk loading of log files using
the log file protocol source.
The procedure to configure your RSA Authentication Manager using the log file
protocol depends on the version of RSA Authentication Manager:
•If you are using RSA Authentication Manager v7.x, see Configuring RSA
Authentication Manager 7.x.
•If you are using RSA Authentication Manager v6.x, see Configuring RSA
Authentication Manager 6.x.
Configuring RSA Authentication Manager 7.x
To configure your RSA Authentication Manager v7.x device:
Step 1 Log in to the RSA Security console.
Step 2 Click Administration > Log Management > Recurring Log Archive Jobs.
Step 3 In the Schedule section, configure values for the Job Starts, Frequency, Run
Time, and Job Expires parameters.
Step 4 For the Operations field, select Export Only or Export and Purge for the
following settings: Administration Log Settings, Runtime Log Settings, and
System Log Settings.
NOTE
Note: The Export and Purge operation exports log records from the database to
the archive and then purges the logs form the database. The Export Only
operation exports log records from the database to the archive and the records
remain in the database.
Step 5 For Administration, Runtime, and System, configure an Export Directory to
which you want to export your archive files.
We recommend you make sure you can access the Administration Log, Runtime
Log, and System Log using FTP before you continue.
Step 6 For Administration, Runtime, and System parameters, set the Days Kept
Online parameter to 1. Logs older than 1 day are exported. If you selected Export
and Purge, the logs are also purged from the database.
Configuring DSMs
610 RSA AUTHENTICATION MANAGER
Step 7 Click Save.
You are now ready to configure the log sources and protocol within JSA:
Step 1 To configure JSA to receive events from a RSA device, you must select the RSA
Authentication Manager option from the Log Source Type list box.
Step 2 To configure the log file protocol, you must select the Log File option from the
Protocol Configuration list box.
For more information on configuring log sources and protocols, see the Log
Sources Users Guide.
Configuring RSA Authentication Manager 6.x
To configure your RSA Authentication Manager v6.x device:
Step 1 Log in to the RSA Security console.
Step 2 Log in to the RSA Database Administration tool:
a Click the Advanced tool.
The system prompts you to login again.
b Click Database Administration.
For complete information on using SecurID, see your vendor documentation.
Step 3 From the Log list box, select Automate Log Maintenance.
The Automatic Log Maintenance window is displayed.
Step 4 Select the Enable Automatic Audit Log Maintenance check box.
Step 5 Select Delete and Archive.
Step 6 Select Replace files.
Step 7 Type an archive filename.
Step 8 In the Cycle Through Version(s) field, type a value.
For example, 1.
Step 9 Select Select all Logs.
Step 10 Select a frequency.
Step 11 Click OK.
You are now ready to configure the log sources and protocol in JSA:
Step 1 To configure JSA to receive events from a RSA device, you must select the RSA
Authentication Manager option from the Log Source Type list box.
Step 2 To configure the log file protocol, you must select the Log File option from the
Protocol Configuration list box.
For more information on configuring log sources and protocols, see the Log
Sources Users Guide.
configuring DSMs
82 SAFENET DATASECURE
The SafeNet DataSecure DSM for Juniper Secure Analytics (JSA) receives syslog
events from your SafeNet DataSecure device. DataSecure maintains activity logs,
such as record administrative actions, network activity, and cryptography requests.
JSA supports SafeNet DataSecure v6.3.0 and later.
Supported Event
Types
SafeNet DataSecure creates the following event logs:
Activity log
Contains a record of each request that is received by the key server.
Audit log
Contains a record of all configuration changes and user input errors that are made
to KeySecure, whether through the management console or the command line
interface.
Client event log
Contains a record of all client requests that have the <RecordEventRequest>
element.
System log
Contains a record of all system events, such as the following events:
•Service starts, stops, and restarts
•SNMP traps
•Hardware failures
•Successful or failed cluster replication and synchronization
•Failed log transfers
•License errors
configuring DSMs
612 SAFENET DATASECURE
Configuration
Overview
To integrate SafeNet DataSecure with JSA, you must perform the following tasks:
1 Enable syslog on the SafeNet DataSecure device.
2 Configure a SafeNet DataSecure log source on your JSA console.

configuring DSMs
613
Enabling Syslog on
SafeNet DataSecure
Before you add the DSM for SafeNet DataSecure, enable syslog on your SafeNet
DataSecure device.
Procedure
To enable syslog on Safenet DataSecure:
Step 1 Log in to the SafeNet DataSecure management console as an administrator with
logging access control.
Step 2 Select Device > Log Configuration.
Step 3 Select the Rotation & Syslog tab.
Step 4 Select a log in the Syslog Settings section and click Edit.
Step 5 Select Enable Syslog.
Step 6 Configure the parameters:
Table 85-1 Parameters to Enable Systol on SafeNet DataSecure
Step 7 Optional. Type an IP address, port, and protocol for a Syslog Server #2. When two
servers are configured, SafeNet DataSecure sends messages to both servers.
Step 8 Type the Syslog Facility or accept the default value of local1.
Step 9 Click Save.
Add a log source JSA automatically detects syslog events forwarded by SafeNet DataSecure. In
most cases, JSA automatically adds the log source after a small number of events
are detected. If required, you can manually add the log source.
Procedure
Step 1 Log in to JSA.
Step 2 Click the Admin tab.
Step 3 On the navigation menu, click Data Sources.
Step 4 Click the Log Sources icon.
Step 5 Click Add.
Step 6 Select the SafeNet DataSecure option from the Log Source Type list box.
Step 7 From the Protocol Configuration list box, select Syslog.
Step 8 Configure the remaining parameters.
Parameter Description
Syslog Server #1 IP The IP address or host name of
the target JSA Event Collector.
Syslog Server #1 Port The listening port for JSA. Use
Port 514.
Syslog Server #1 Proto JSA can receive syslog
messages by using either UDP
or TCP.

Table 85-2 describes some SafeNet DataSecure log source parameters:
Step 9 Optional. Clear the Enable check box if you want to disable the log source.
Step 10 Select any groups that you want this log source to be a member of.
Step 11 Click Save.
Table 85-2 SafeNet DataSecure parameters
Parameter Description
Log Source Identifier The IP address or hostname to identify the log source. The
value must be unique to the log source type.
Credibility Indicates the integrity of an event or offense as determined by
the credibility rating from the log source. Credibility increases
if multiple log sources report the same event.
Incoming Payload
Encoding
The character encoding that is required to parse the event
logs.
Store Event Payload Enables the log source to store event payload information.
Automatically discovered log sources inherit the value in the
Store Event Payload list from your system settings. When
you manually create or edit a log source, you can override the
default value by configuring this option.

Configuring DSMs
83 SAMHAIN LABS
The Samhain Labs Host-Based Intrusion Detection System (HIDS) monitors
changes to files on the system.
The Samhain HIDS DSM for Juniper Secure Analytics (JSA) supports Samhain
version 2.4 when used for File Integrity Monitoring (FIM).
You can configure the Samhain HIDS DSM to accept one of the following log
types:
•Configuring Syslog to Collect Samhain Events
•Configuring JDBC to Collect Samhain Events
Configuring Syslog
to Collect Samhain
Events
Before you configure JSA to integrate with Samhain HIDS using syslog, you must
configure the Samhain HIDS system to forward logs to your JSA system.
NOTE
Note: The following procedure is based on the default samhainrc file. If the
samhainrc file has been modified, some values might be different, such as the
syslog facility,
Procedure
Step 1 Log in to Samhain HIDS from the command-line interface.
Step 2 Open the following file:
/etc/samhainrc
Step 3 Remove the comment marker (#) from the following line:
SetLogServer=info
Step 4 Save and exit the file.
Alerts are sent to the local system using syslog.
Step 5 Open the following file:
/etc/syslog.conf

Configuring DSMs
616 SAMHAIN LABS
Step 6 Add the following line:
local2.* @<IP Address>
Where <IP Address> is the IP address of your JSA.
Step 7 Save and exit the file.
Step 8 Restart syslog:
/etc/init.d/syslog restart
Samhain sends logs using syslog to JSA. You are now ready to configure Samhain
HIDS DSM in JSA.
To configure JSA to receive events from Samhain:
From the Log Source Type list box, select the Samhain HIDS option.
For more information on configuring log sources, see the Log Sources Users
Guide.
Configuring JDBC
to Collect Samhain
Events
You can configure Samhain HIDS to send log alerts to a database. Oracle,
PostgreSQL, and MySQL are natively supported by Samhain. You can also
configure JSA to collect events from these databases using the JDBC protocol.
NOTE
Note: JSA does not include a MySQL driver for JDBC. If you are using a DSM or
protocol that requires a MySQL JDBC driver, you must download and install the
platform independent MySQL Connector/J from
http://dev.mysql.com/downloads/connector/j/. For instruction on installing MySQL
Connector/J for the JDBC protocol, see the Log Sources Users Guide.
Procedure
Step 1 Log into JSA.
Step 2 Click the Admin tab.
Step 3 On the navigation menu, click Data Sources.
Step 4 Click the Log Sources icon.
Step 5 Click Add.
Step 6 From the Log Source Type list box, select the Samhain HIDS option.
Step 7 Using the Protocol Configuration list box, select JDBC.
Step 8 Update the JDBC configuration to include the following values:
a Database Type: <Samhain Database Type>
b Database Name: <Samhain SetDBName>
c Table Name: <Samhain SetDBTable>
d Select List: *
Configuring DSMs
Configuring JDBC to Collect Samhain Events 617
e Compare Field: log_index
f IP or Hostname: <Samhain SetDBHost>
g Port: <Default Port>
h Username: <Samhain SetDBUser>
i Password: <Samhain SetDBPassword>
j Polling Interval: <Default Interval>
Where:
<Samhain Database Type> is the database type used by Samhain (see your
Samhain system administrator).
<Samhain SetDBName> is the database name specified in the samhainrc file.
<Samhain SetDBTable> is the database table specified in the samhainrc file.
<Samhain SetDBHost> is the database host specified in the samhainrc file.
<Samhain SetDBUser> is the database user specified in the samhainrc file.
<Samhain SetDBPassword> is the database password specified in the samhainrc
file.
You are now ready to configure the log source in JSA.
To configure JSA to receive events from Samhain:
From the Log Source Type list box, select the Samhain HIDS option.
For more information on configuring log sources, see the Log Sources Users
Guide. For more information about Samhain, see
http://www.la-samhna.de/samhain/manual.


Configuring DSMs
84 SENTRIGO HEDGEHOG
You can integrate a Sentrigo Hedgehog device with Juniper Secure Analytics
(JSA).
A Sentrigo Hedgehog device accepts LEEF events using syslog. Before you
configure JSA to integrate with a Sentrigo Hedgehog device, you must:
Step 1 Log in to the Sentrigo Hedgehog command-line interface (CLI).
Step 2 Open the following file for editing:
<Installation directory>/conf/sentrigo-custom.properties
Where <Installation directory> is the directory containing your Sentrigo
Hedgehog installation.
Step 3 Add the following log.format entries to the custom properties file:
NOTE
Note: Depending on your Sentrigo Hedgehog configuration or installation, you
might be required to replace or overwrite the existing log.format entry.
sentrigo.comm.ListenAddress=1996
log.format.body.custom=usrName=$osUser:20$|duser=$execUser:20$|
severity=$severity$|identHostName=$sourceHost$|src=$sourceIP$|
dst=$agent.ip$|devTime=$logonTime$|devTimeFormat=EEE MMM dd
HH:mm:ss z yyyy|cmdType=$cmdType$|externalId=$id$|
execTime=$executionTime.time$|dstServiceName=$database.name:20$
|srcHost=$sourceHost:30$|execProgram=$execProgram:20$|
cmdType=$cmdType:15$|oper=$operation:225$|
accessedObj=$accessedObjects.name:200$
log.format.header.custom=LEEF:1.0|Sentrigo|Hedgehog|$serverVers
ion$|$rules.name:150$|
log.format.header.escaping.custom=\\|
log.format.header.seperator.custom=,
log.format.header.escape.char.custom=\\
log.format.body.escaping.custom=\=
log.format.body.escape.char.custom=\\
log.format.body.seperator.custom=|
log.format.empty.value.custom=NULL
log.format.length.value.custom=10000
log.format.convert.newline.custom=true
Configuring DSMs
620 SENTRIGO HEDGEHOG
Step 4 Save the custom properties file.
Step 5 Stop and restart your Sentrigo Hedgehog service to implement the log.format
changes.
You are now ready to configure the log source in JSA.
To configure JSA to receive events from a Sentrigo Hedgehog device:
From the Log Source Type list box, select the Sentrigo Hedgehog option.
For more information on configuring log sources, see the Log Sources Users
Guide. For more information about Sentrigo Hedgehog see your vendor
documentation.
Configuring DSMs
85 SECURE COMPUTING SIDEWINDER
The Sidewinder DSM for Juniper Secure Analytics (JSA) records all relevant
Sidewinder events using syslog.
Before you configure JSA to integrate with a Sidewinder device, you must
configure syslog within your Sidewinder device. When configuring the Sidewinder
device to forward syslog to JSA, make sure that the logs are exported in
Sidewinder Export format (SEF).
For more information on configuring Sidewinder, see your vendor documentation.
After you configure syslog to forward events to JSA, you are ready to configure the
log source in JSA.
To configure JSA to receive events from a Sidewinder device:
From the Log Source Type list box, select Sidewinder G2 Security
Appliance option.
For more information on configuring log sources, see the Log Sources Users
Guide.
Configuring DSMs
86 SOLARWINDS ORION
The SolarWinds Orion DSM for Juniper Secure Analytics (JSA) supports SNMPv2
and SNMPv3 configured alerts from the SolarWinds Alert Manager.
The events are sent to JSA using syslog. Before you can integrate JSA, you must
configure the SolarWinds Alert Manager to create SNMP traps and forward syslog
events.
To configure SNMP traps in the SolarWinds Orion Alert Manager:
Step 1 Select Start > All Programs > SolarWinds Orion > Alerting, Reporting, and
Mapping > Advanced Alert Manager.
The Alert Manager Quick Start is displayed.
Step 2 Click Configure Alerts.
The Manage Alerts window is displayed.
Step 3 Select an existing alert and click Edit.
Step 4 Select the Triggered Actions tab.
Step 5 Click Add New Action.
The Select an Action window is displayed.
Step 6 Select Send an SNMP Trap and click OK.
Step 7 Configure the following values:
a SNMP Trap Definitions - Type the IP address of the JSA Console or Event
Collector.
b Trap Template - Select ForwardSyslog.
c SNMP Version - Select the SNMP Version to use to forward the event. JSA
supports SNMPv2c or SNMPv3.
-SNMPv2c - Type the SNMP Community String to use for SNMPv2c
authentication. The default Community String value is public.
-SNMPv3 - Type the Username and select the Authentication Method to
use for SNMPv3.
JSA supports MD5 or SH1 as methods of authentication and DES56 or
AES128 bit encryption.

Configuring DSMs
624 SOLARWINDS ORION
Step 8 Click OK to save the SNMP trigger action.
The Manage Alerts window is displayed.
NOTE
Note: To verify that your SNMP trap is configured properly, select an alert you
have edited and click Test. The action should trigger and forward the syslog event
to JSA.
Step 9 Repeat Step 3 to Step 8 to configure the Alert Manager with all of the SNMP trap
alerts you want to monitor in JSA.
You are now ready to configure the log source in JSA.
JSA automatically detects syslog events from properly configured SNMP trap alert
triggers. However, if you want to manually configure JSA to receive events from
SolarWinds Orion:
From the Log Source Type list box, select SolarWinds Orion.
For more information on configuring log sources, see the Log Sources Users
Guide.
Configuring DSMs
87 SONICWALL
The SonicWALL SonicOS DSM accepts events using syslog.
Juniper Secure Analytics (JSA) records all relevant syslog events forwarded from
SonicWALL appliances using SonicOS firmware. Before you can integrate with a
SonicWALL SonicOS device, you must configure syslog forwarding on your
SonicWALL SonicOS appliance.
Configure
SonicWALL to
Forward Syslog
Events
SonicWALL captures all SonicOS event activity. The events can be forwarded to
JSA using SonicWALL’s default event format.
To configure SonicWALL to forward syslog events:
Step 1 Log in to your SonicWALL web interface.
Step 2 From the navigation menu, select Log > Automation.
The Automation window is displayed.
Step 3 From the Syslog Servers pane, click Add.
The Add Syslog Server window is displayed.
Step 4 In the Name or IP Address field, type the IP address of your JSA console or Event
Collector.
Step 5 In the Port field, type 514.
SonicWALL syslog forwarders send events to JSA using UDP port 514.
Step 6 Click OK.
The Automation window is displayed.
Step 7 From the Syslog Format list box, select Default.
Step 8 Click Apply.
Syslog events are forwarded to JSA. SonicWALL events forwarded to JSA are
automatically discovered and log sources are created automatically. For more
information on configuring your SonicWALL appliance or for information on specific
events, see your vendor documentation.

Configuring DSMs
626 SONICWALL
Configure a Log
Source
JSA automatically discovers and creates a log source for syslog events from
SonicWALL appliances. The following configuration steps are optional.
To manually configure a log source for SonicWALL syslog events:
Step 1 Log in to JSA.
Step 2 Click the Admin tab.
Step 3 On the navigation menu, click Data Sources.
The Data Sources panel is displayed.
Step 4 Click the Log Sources icon.
The Log Sources window is displayed.
Step 5 Click Add.
The Add a log source window is displayed.
Step 6 In the Log Source Name field, type a name for your log source.
Step 7 In the Log Source Description field, type a description for the log source.
Step 8 From the Log Source Type list box, select SonicWALL SonicOS.
Step 9 Using the Protocol Configuration list box, select Syslog.
The syslog protocol configuration is displayed.
Step 10 Configure the following values:
Step 11 Click Save.
Step 12 On the Admin tab, click Deploy Changes.
The log source is added to JSA. Events forwarded to JSA by SonicWALL SonicOS
appliances are displayed on the Log Activity tab. For more information, see the
Juniper Secure Analytics Users Guide.
Table 90-3 Syslog Parameters
Parameter Description
Log Source Identifier Type the IP address or hostname for the log source as an
identifier for events from SonicWALL appliances.
Each log source you create for your SonicWALL SonicOS
appliance should include a unique identifier, such as an IP
address or host name.

Configuring DSMs
88 SOPHOS
This section provides information on the following:
•Sophos Enterprise Console
•Sophos PureMessage
•Sophos Astaro Security Gateway
•Sophos Web Security Appliance
Sophos Enterprise
Console
Juniper Secure Analytics (JSA) has two options for gathering events from a
Sophos Enterprise console using JDBC.
Select the method that best applies to your Sophos Enterprise console installation:
•Configure JSA Using the Sophos Enterprise Console Protocol
•Configure JSA Using the JDBC Protocol
NOTE
Note: To use the Sophos Enterprise console protocol, you must ensure that the
Sophos Reporting Interface is installed with your Sophos Enterprise console. If you
do not have the Sophos Reporting Interface, you must configure JSA using the
JDBC protocol. For information on installing the Sophos Reporting Interface, see
your Sophos Enterprise console documentation.
Configure JSA Using
the Sophos
Enterprise Console
Protocol
The Sophos Enterprise console DSM for JSA accepts events using Java Database
Connectivity (JDBC).
The Sophos Enterprise console DSM works in coordination with the Sophos
Enterprise console protocol to combine payload information from anti-virus,
application control, device control, data control, tamper protection, and firewall logs
in the vEventsCommonData table and provide these events to JSA. You must
install the Sophos Enterprise console protocol before configuring JSA.
To configure JSA to access the Sophos database using the JDBC protocol:
Step 1 Log in to JSA.
Step 2 Click the Admin tab.

Configuring DSMs
628 SOPHOS
Step 3 On the navigation menu, click Data Sources.
The Data Sources panel is displayed.
Step 4 Click the Log Sources icon.
The Log Sources window is displayed.
Step 5 Click Add.
The Add a log source window is displayed.
Step 6 From the Log Source Type list box, select Sophos Enterprise Console.
Step 7 From the Protocol Configuration list box, select Sophos Enterprise Console
JDBC.
NOTE
Note: You must refer to the Configure Database Settings on your Sophos
Enterprise console to define the parameters required to configure the Sophos
Enterprise console JDBC protocol in JSA.
Step 8 Configure the following values:
Table 91-1 Sophos Enterprise Console JDBC Parameters
Parameter Description
Log Source
Identifier
Type the identifier for the log source. Type the log source identifier
in the following format:
<Sophos Database>@<Sophos Database Server IP or
Host Name>
Where:
<Sophos Database> is the database name, as entered in the
Database Name parameter.
<Sophos Database Server IP or Host Name> is the
hostname or IP address for this log source, as entered in the IP or
Hostname parameter.
Note: When defining a name for your log source identifier, you
must use the values of the Sophos Database and Database Server
IP address or hostname from the Management Enterprise console.
Database Type From the list box, select MSDE.
Database Name Type the exact name of the Sophos database.
IP or Hostname Type the IP address or host name of the Sophos SQL Server.
Port Type the port number used by the database server. The default
port for MSDE in Sophos Enterprise console is 1168.
The JDBC configuration port must match the listener port of the
Sophos database. The Sophos database must have incoming TCP
connections enabled to communicate with JSA.
Note: If you define a Database Instance when using MSDE as the
database type, you must leave the Port parameter blank in your
configuration.

Configuring DSMs
Sophos Enterprise Console 629
Username Type the username required to access the database.
Password Type the password required to access the database. The
password can be up to 255 characters in length.
Confirm
Password
Confirm the password required to access the database. The
confirmation password must be identical to the password entered
in the Password parameter.
Authentication
Domain
If you select MSDE as the Database Type and the database is
configured for Windows, you must define a Window Authentication
Domain. Otherwise, leave this field blank.
Database
Instance
Optional. Type the database instance, if you have multiple SQL
server instances on your database server.
Note: If you use a non-standard port in your database
configuration, or have blocked access to port 1434 for SQL
database resolution, you must leave the Database Instance
parameter blank in your configuration.
Table Name Type vEventsCommonData as the name of the table or view that
includes the event records.
Select List Type * for all fields from the table or view.
You can use a comma-separated list to define specific fields from
tables or views, if required for your configuration. The list must
contain the field defined in the Compare Field parameter. The
comma-separated list can be up to 255 alphanumeric characters in
length. The list can include the following special characters: dollar
sign ($), number sign (#), underscore (_), en dash (-), and
period(.).
Compare Field Type InsertedAt as the compare field. The compare field is used
to identify new events added between queries to the table.
Start Date and
Time
Optional. Type the start date and time for database polling.
The Start Date and Time parameter must be formatted as
yyyy-MM-dd HH:mm with HH specified using a 24 hour clock. If the
start date or time is clear, polling begins immediately and repeats
at the specified polling interval.
Polling Interval Type the polling interval, which is the amount of time between
queries to the event table. The default polling interval is 10
seconds.
You can define a longer polling interval by appending H for hours
or M for minutes to the numeric value. The maximum polling
interval is 1 week in any time format. Numeric values entered
without an H or M poll in seconds.
EPS Throttle Type the number of Events Per Second (EPS) that you do not
want this protocol to exceed. The default value is 20000 EPS.
Table 91-1 Sophos Enterprise Console JDBC Parameters (continued)
Parameter Description

Configuring DSMs
630 SOPHOS
NOTE
Note: Selecting a value for the Credibility parameter greater than 5 will weight your
Sophos log source with a higher importance compared to other log sources in JSA.
Step 9 Click Save.
Step 10 On the Admin tab, click Deploy Changes.
The configuration is complete.
Configure JSA Using
the JDBC Protocol
The Sophos Enterprise console DSM for JSA accepts events using Java Database
Connectivity (JDBC).
JSA records all relevant anti-virus events. This document provides information on
configuring JSA to access the Sophos Enterprise console database using the
JDBC protocol.
Configure the database view
To integrate JSA with Sophos Enterprise console:
Step 1 Log in to your Sophos Enterprise console device command-line interface (CLI).
Step 2 Type the following command to create a custom view in your Sophos database to
support JSA:
CREATE VIEW threats_view AS SELECT t.ThreatInstanceID,
t.ThreatType, t.FirstDetectedAt, c.Name, c.LastLoggedOnUser,
c.IPAddress, c.DomainName, c.OperatingSystem, c.ServicePack,
t.ThreatSubType, t.Priority, t.ThreatLocalID,
Use Named Pipe
Communication
Clear the Use Named Pipe Communications check box.
When using a Named Pipe connection, the username and
password must be the appropriate Windows authentication
username and password and not the database username and
password. Also, you must use the default Named Pipe.
Database
Cluster Name
If you select the Use Named Pipe Communication check box, the
Database Cluster Name parameter is displayed. If you are running
your SQL server in a cluster environment, define the cluster name
to ensure Named Pipe communication functions properly.
Use NTLMv2 If you select MSDE as the Database Type, the Use NTLMv2
check box is displayed.
Select the Use NTLMv2 check box to force MSDE connections to
use the NTLMv2 protocol when communicating with SQL servers
that require NTLMv2 authentication. The default value of the check
box is selected.
If the Use NTLMv2 check box is selected, it has no effect on
MSDE connections to SQL servers that do not require NTLMv2
authentication.
Table 91-1 Sophos Enterprise Console JDBC Parameters (continued)
Parameter Description

Configuring DSMs
Sophos Enterprise Console 631
t.ThreatLocalIDSource, t.ThreatName, t.FullFilePathCheckSum,
t.FullFilePath, t.FileNameOffset, t.FileVersion, t.CheckSum,
t.ActionSubmittedAt, t.DealtWithAt, t.CleanUpable,
t.IsFragment, t.IsRebootRequired, t.Outstanding, t.Status,
InsertedAt FROM <Database Name>.dbo.ThreatInstancesAll t,
<Database Name>.dbo.Computers c WHERE t.ComputerID = c.ID;
Where <Database Name> is the name of the Sophos database.
NOTE
Note: The database name must not contain any spaces.
After you have created your custom view, you must configure JSA to receive event
information using the JDBC protocol.
To configure the Sophos Enterprise console DSM with JSA, see Configure a JDBC
log source in JSA.
Configure a JDBC log source in JSA
To configure JSA to access the Sophos database using the JDBC protocol:
Step 1 Log in to JSA.
Step 2 Click the Admin tab.
Step 3 On the navigation menu, click Data Sources.
The Data Sources panel is displayed.
Step 4 Click the Log Sources icon.
The Log Sources window is displayed.
Step 5 Click Add.
The Add a log source window is displayed.
Step 6 Using the Log Source Type list box, select Sophos Enterprise Console.
Step 7 Using the Protocol Configuration list box, select JDBC.
NOTE
Note: You must refer to the Configure Database Settings on your Sophos
Enterprise console to define the parameters required to configure the Sophos
Enterprise console DSM in JSA.

Configuring DSMs
632 SOPHOS
Step 8 Configure the following values:
Table 91-2 Sophos Enterprise Console JDBC Parameters
Parameter Description
Log Source
Identifier
Type the identifier for the log source. Type the log source identifier
in the following format:
<Sophos Database>@<Sophos Database Server IP or
Host Name>
Where:
<Sophos Database> is the database name, as entered in the
Database Name parameter.
<Sophos Database Server IP or Host Name> is the
hostname or IP address for this log source, as entered in the IP or
Hostname parameter.
Note: When defining a name for your log source identifier, you
must use the values of the Sophos Database and Database Server
IP address or hostname from the Management Enterprise console.
Database Type From the list box, select MSDE.
Database Name Type the exact name of the Sophos database.
IP or Hostname Type the IP address or host name of the Sophos SQL Server.
Port Type the port number used by the database server. The default
port for MSDE is 1433.
The JDBC configuration port must match the listener port of the
Sophos database. The Sophos database must have incoming TCP
connections enabled to communicate with JSA.
Note: If you define a Database Instance when using MSDE as the
database type, you must leave the Port parameter blank in your
configuration.
Username Type the username required to access the database.
Password Type the password required to access the database. The
password can be up to 255 characters in length.
Confirm
Password
Confirm the password required to access the database. The
confirmation password must be identical to the password entered
in the Password parameter.
Authentication
Domain
If you select MSDE as the Database Type and the database is
configured for Windows, you must define a Window Authentication
Domain. Otherwise, leave this field blank.
Database
Instance
Optional. Type the database instance, if you have multiple SQL
server instances on your database server.
Note: If you use a non-standard port in your database
configuration, or have blocked access to port 1434 for SQL
database resolution, you must leave the Database Instance
parameter blank in your configuration.
Table Name Type threats_view as the name of the table or view that includes
the event records.

Configuring DSMs
Sophos Enterprise Console 633
NOTE
Note: Selecting a value for the Credibility parameter greater than 5 will weight your
Sophos log source with a higher importance compared to other log sources in JSA.
Select List Type * for all fields from the table or view.
You can use a comma-separated list to define specific fields from
tables or views, if required for your configuration. The list must
contain the field defined in the Compare Field parameter. The
comma-separated list can be up to 255 alphanumeric characters in
length. The list can include the following special characters: dollar
sign ($), number sign (#), underscore (_), en dash (-), and
period(.).
Compare Field Type ThreatInstanceID as the compare field. The compare field is
used to identify new events added between queries to the table.
Start Date and
Time
Optional. Type the start date and time for database polling.
The Start Date and Time parameter must be formatted as
yyyy-MM-dd HH:mm with HH specified using a 24 hour clock. If the
start date or time is clear, polling begins immediately and repeats
at the specified polling interval.
Use Prepared
Statements
Select this check box to use prepared statements.
Prepared statements allows the JDBC protocol source to setup the
SQL statement one time, then run the SQL statement many times
with different parameters. For security and performance reasons,
we recommend that you use prepared statements.
Clearing this check box requires you to use an alternative method
of querying that does not use pre-compiled statements.
Polling Interval Type the polling interval, which is the amount of time between
queries to the event table. The default polling interval is 10
seconds.
You can define a longer polling interval by appending H for hours
or M for minutes to the numeric value. The maximum polling
interval is 1 week in any time format. Numeric values entered
without an H or M poll in seconds.
EPS Throttle Type the number of Events Per Second (EPS) that you do not
want this protocol to exceed. The default value is 20000 EPS.
Use Named Pipe
Communication
Clear the Use Named Pipe Communications check box.
When using a Named Pipe connection, the username and
password must be the appropriate Windows authentication
username and password and not the database username and
password. Also, you must use the default Named Pipe.
Database
Cluster Name
If you select the Use Named Pipe Communication check box, the
Database Cluster Name parameter is displayed. If you are running
your SQL server in a cluster environment, define the cluster name
to ensure Named Pipe communication functions properly.
Table 91-2 Sophos Enterprise Console JDBC Parameters (continued)
Parameter Description

Configuring DSMs
634 SOPHOS
Step 9 Click Save.
Step 10 On the Admin tab, click Deploy Changes.
The configuration is complete.
For more information on configuring log sources, see the Log Sources Users
Guide.
Sophos
PureMessage
The Sophos PureMessage DSM for JSA accepts events using Java Database
Connectivity (JDBC).
JSA records all relevant quarantined email events. This document provides
information on configuring JSA to access the Sophos PureMessage database
using the JDBC protocol.
JSA supports the following Sophos PureMessage versions:
•Sophos PureMessage for Microsoft Exchange - Stores events in a Microsoft
SQL Server database specified as savexquar.
•Sophos PureMessage for Linux - Stores events in a PostgreSQL database
specified as pmx_quarantine.
This section provides information on the following:
•Integrate JSA with Sophos PureMessage for Microsoft Exchange
•Integrate JSA with Sophos PureMessage for Linux
Integrate JSA with
Sophos
PureMessage for
Microsoft Exchange
To integrate JSA with Sophos PureMessage for Microsoft Exchange:
Step 1 Log in to the Microsoft SQL Server command-line interface (CLI):
osql -E -S localhost\sophos
Step 2 Type which database you want to integrate with JSA:
use savexquar;
go
Step 3 Type the following command to create a SIEM view in your Sophos database to
support JSA:
create view siem_view as select 'Windows PureMessage' as
application, id, reason, timecreated, emailonly as sender,
filesize, subject, messageid, filename from dbo.quaritems,
dbo.quaraddresses where ItemID = ID and Field = 76;
Go
After you create your SIEM view, you must configure JSA to receive event
information using the JDBC protocol.

Configuring DSMs
Sophos PureMessage 635
To configure the Sophos PureMessage DSM with JSA, see Configure a JDBC log
source for Sophos PureMessage.
Configure a JDBC log source for Sophos PureMessage
To configure JSA to access the Sophos PureMessage for Microsoft Exchange
database using the JDBC protocol:
Step 1 Log in to JSA.
Step 2 Click the Admin tab.
Step 3 On the navigation menu, click Data Sources.
The Data Sources panel is displayed.
Step 4 Click the Log Sources icon.
The Log Sources window is displayed.
Step 5 Click Add.
The Add a log source window is displayed.
Step 6 From the Log Source Type list box, select Sophos PureMessage.
Step 7 From the Protocol Configuration list box, select JDBC.
NOTE
Note: You must refer to the database configuration settings on your Sophos
PureMessage device to define the parameters required to configure the Sophos
PureMessage DSM in JSA.
Step 8 Configure the following values:
Table 91-3 Sophos PureMessage JDBC Parameters
Parameter Description
Log Source
Identifier
Type the identifier for the log source. Type the log source identifier
in the following format:
<Sophos PureMessage Database>@<Sophos PureMessage
Database Server IP or Host Name>
Where:
<Sophos PureMessage Database> is the database name, as
entered in the Database Name parameter.
<Sophos PureMessage Database Server IP or Host
Name> is the hostname or IP address for this log source, as
entered in the IP or Hostname parameter.
When defining a name for your log source identifier, you must use
the values of the Database and Database Server IP address or
hostname of the Sophos PureMessage device.
Database Type From the list box, select MSDE.
Database Name Type savexquar.

Configuring DSMs
636 SOPHOS
IP or Hostname Type the IP address or host name of the Sophos PureMessage
server.
Port Type the port number used by the database server. The default
port for MSDE is 1433. Sophos installations typically use 24033.
You can confirm port usage using the SQL Server Configuration
Manager utility. For more information, see your vendor
documentation.
The JDBC configuration port must match the listener port of the
Sophos database. The Sophos database must have incoming TCP
connections enabled to communicate with JSA.
Note: If you define a database instance in the Database Instance
parameter, you must leave the Port parameter blank. You can only
define a database instance if the database server uses the default
port of 1433. This is not the standard Sophos configuration.
Username Type the username required to access the database.
Password Type the password required to access the database. The
password can be up to 255 characters in length.
Confirm
Password
Confirm the password required to access the database. The
confirmation password must be identical to the password entered
in the Password parameter.
Authentication
Domain
If you select MSDE as the Database Type and the database is
configured for Windows, you must define a Window Authentication
Domain. Otherwise, leave this field blank.
Database
Instance
Optional. Type the database instance, if you have multiple SQL
server instances on your database server.
Note: If you define a port number other than the default in the Port
parameter, or have blocked access to port 1434 for SQL database
resolution, you must leave the Database Instance parameter
blank.
Table Name Type siem_view as the name of the table or view that includes
the event records.
Select List Type * for all fields from the table or view.
You can use a comma-separated list to define specific fields from
tables or views, if required for your configuration. The list must
contain the field defined in the Compare Field parameter. The
comma-separated list can be up to 255 alphanumeric characters in
length. The list can include the following special characters: dollar
sign ($), number sign (#), underscore (_), en dash (-), and
period(.).
Compare Field Type ID. The Compare Field parameter is used to identify new
events added between queries to the table.
Table 91-3 Sophos PureMessage JDBC Parameters (continued)
Parameter Description

Configuring DSMs
Sophos PureMessage 637
NOTE
Note: Selecting a value for the Credibility parameter greater than 5 will weight your
Sophos PureMessage log source with a higher importance compared to other log
sources in JSA.
Step 9 Click Save.
Step 10 On the Admin tab, click Deploy Changes.
For more information on configuring log sources, see the Log Sources Users
Guide.
Use Prepared
Statements
Select this check box to use prepared statements.
Prepared statements allows the JDBC protocol source to set up
the SQL statement one time, then run the SQL statement many
times with different parameters. For security and performance
reasons, we recommend that you use prepared statements.
Clearing this check box requires you to use an alternative method
of querying that does not use pre-compiled statements.
Start Date and
Time
Optional. Type the start date and time for database polling.
The Start Date and Time parameter must be formatted as
yyyy-MM-dd HH:mm with HH specified using a 24-hour clock. If
the Start Date and Time parameter is clear, polling begins
immediately and repeats at the specified polling interval.
Polling Interval Type the polling interval, which is the amount of time between
queries to the event table. The default polling interval is 10
seconds.
You can define a longer polling interval by appending H for hours
or M for minutes to the numeric value. The maximum polling
interval is 1 week in any time format. Numeric values entered
without an H or M poll in seconds.
Use Named Pipe
Communication
Clear the Use Named Pipe Communications check box.
When using a Named Pipe connection, the username and
password must be the appropriate Windows authentication
username and password and not the database username and
password. Also, you must use the default Named Pipe.
Database
Cluster Name
If you select the Use Named Pipe Communication check box, the
Database Cluster Name parameter is displayed. If you are running
your SQL server in a cluster environment, define the cluster name
to ensure Named Pipe communication functions properly.
Table 91-3 Sophos PureMessage JDBC Parameters (continued)
Parameter Description

Configuring DSMs
638 SOPHOS
Integrate JSA with
Sophos
PureMessage for
Linux
To integrate JSA with Sophos PureMessage for Linux:
Step 1 Navigate to your Sophos PureMessage PostgreSQL database directory:
cd /opt/pmx/postgres-8.3.3/bin
Step 2 Access the pmx_quarantine database SQL prompt:
./psql -d pmx_quarantine
Step 3 Type the following command to create a SIEM view in your Sophos database to
support JSA:
create view siem_view as select 'Linux PureMessage' as
application, id, b.name, m_date, h_from_local, h_from_domain,
m_global_id, m_message_size, outbound, h_to, c_subject_utf8 from
message a, m_reason b where a.reason_id = b.reason_id;
After you create your database view, you must configure JSA to receive event
information using the JDBC protocol.
Configure a log source for Sophos PureMessage for Microsoft Exchange
To configure JSA to access the Sophos PureMessage database using the JDBC
protocol:
Step 1 Log in to JSA.
Step 2 Click the Admin tab.
Step 3 On the navigation menu, click Data Sources.
The Data Sources panel is displayed.
Step 4 Click the Log Sources icon.
The Log Sources window is displayed.
Step 5 Click Add.
The Add a log source window is displayed.
Step 6 From the Log Source Type list box, select Sophos PureMessage.
Step 7 From the Protocol Configuration list box, select JDBC.
NOTE
Note: You must refer to the Configure Database Settings on your Sophos
PureMessage to define the parameters required to configure the Sophos
PureMessage DSM in JSA.

Configuring DSMs
Sophos PureMessage 639
Step 8 Configure the following values:
Table 91-4 Sophos PureMessage JDBC Parameters
Parameter Description
Log Source
Identifier
Type the identifier for the log source. Type the log source identifier
in the following format:
<Sophos PureMessage Database>@<Sophos PureMessage
Database Server IP or Host Name>
Where:
<Sophos PureMessage Database> is the database name, as
entered in the Database Name parameter.
<Sophos PureMessage Database Server IP or Host
Name> is the hostname or IP address for this log source, as
entered in the IP or Hostname parameter.
When defining a name for your log source identifier, you must use
the values of the Database and Database Server IP address or
hostname of the Sophos PureMessage device.
Database Type From the list box, select Postgres.
Database Name Type pmx_quarantine.
IP or Hostname Type the IP address or host name of the Sophos PureMessage
server.
Port Type the port number used by the database server. The default
port is 1532.
The JDBC configuration port must match the listener port of the
Sophos database. The Sophos database must have incoming TCP
connections enabled to communicate with JSA.
Username Type the username required to access the database.
Password Type the password required to access the database. The
password can be up to 255 characters in length.
Confirm
Password
Confirm the password required to access the database. The
confirmation password must be identical to the password entered
in the Password parameter.
Database
Instance
Optional. Type the database instance, if you have multiple SQL
server instances on your database server.
Note: If you use a non-standard port in your database
configuration, or have blocked access to port 1434 for SQL
database resolution, you must leave the Database Instance
parameter blank in your configuration.
Table Name Type siem_view as the name of the table or view that includes
the event records.

Configuring DSMs
640 SOPHOS
NOTE
Note: Selecting a value for the Credibility parameter greater than 5 will weight your
Sophos PureMessage log source with a higher importance compared to other log
sources in JSA.
Step 9 Click Save.
Step 10 On the Admin tab, click Deploy Changes.
For more information on configuring log sources, see the Log Sources Users
Guide.
Select List Type * for all fields from the table or view.
You can use a comma-separated list to define specific fields from
tables or views, if required for your configuration. The list must
contain the field defined in the Compare Field parameter. The
comma-separated list can be up to 255 alphanumeric characters in
length. The list can include the following special characters: dollar
sign ($), number sign (#), underscore (_), en dash (-), and
period(.).
Compare Field Type ID.
The Compare Field parameter is used to identify new events
added between queries to the table.
Use Prepared
Statements
Select this check box to use prepared statements.
Prepared statements allows the JDBC protocol source to set up
the SQL statement one time, then run the SQL statement many
times with different parameters. For security and performance
reasons, we recommend that you use prepared statements.
Clearing this check box requires you to use an alternative method
of querying that does not use pre-compiled statements.
Start Date and
Time
Optional. Type the start date and time for database polling.
The Start Date and Time parameter must be formatted as
yyyy-MM-dd HH:mm with HH specified using a 24-hour clock. If
the Start Date and Time parameter is clear, polling begins
immediately and repeats at the specified polling interval.
Polling Interval Type the polling interval, which is the amount of time between
queries to the event table. The default polling interval is 10
seconds.
You can define a longer polling interval by appending H for hours
or M for minutes to the numeric value. The maximum polling
interval is 1 week in any time format. Numeric values entered
without an H or M poll in seconds.
Table 91-4 Sophos PureMessage JDBC Parameters (continued)
Parameter Description

Configuring DSMs
Sophos Astaro Security Gateway 641
Sophos Astaro
Security Gateway
The Sophos Astaro Security Gateway DSM for JSA accepts events using syslog,
enabling JSA to record all relevant events.
Configure Syslog for
Sophos Astaro
To configure syslog for Sophos Astaro Security Gateway:
Step 1 Log in to the Sophos Astaro Security Gateway console.
Step 2 From the navigation menu, select Logging > Settings.
Step 3 Click the Remote Syslog Server tab.
The Remote Syslog Status window is displayed.
Step 4 From Syslog Servers panel, click the + icon.
The Add Syslog Server window is displayed.
Step 5 Configure the following parameters:
a Name - Type a name for the syslog server.
b Server - Click the folder icon to add a pre-defined host, or click + and type in
new network definition.
c Port - Click the folder icon to add a pre-defined port, or click + and type in a new
service definition.
By default, JSA communicates using the syslog protocol on UDP/TCP port 514.
Step 6 Click Save.
Step 7 From the Remote syslog log selection field, you must select check boxes for the
following logs:
a POP3 Proxy - Select this check box.
b Packet Filter - Select this check box.
c Intrusion Prevention System - Select this check box.
d Content Filter(HTTPS) - Select this check box.
e High availability - Select this check box.
f FTP Proxy - Select this check box.
g SSL VPN - Select this check box.
h PPTP daemon- Select this check box.
i IPSEC VPN - Select this check box.
j HTTP daemon - Select this check box.
k User authentication daemon - Select this check box.
l SMTP proxy - Select this check box.
Step 8 Click Apply.
Step 9 From Remote syslog status section, click Enable.

Configuring DSMs
642 SOPHOS
Step 10 You are now ready to configure the log source in JSA.
To configure JSA to receive events from your Sophos Astaro Security Gateway
device:
From the Log Source Type list box, select Sophos Astaro Security
Gateway.
For more information on configuring log sources, see the Log Sources Users
Guide.
Sophos Web
Security Appliance
The Sophos Web Security Appliance (WSA) DSM for JSA accepts events using
syslog.
JSA records all relevant events forwarded from the transaction log of the Sophos
Web Security Appliance. Before configuring JSA, you must configure your Sophos
WSA appliance to forward syslog events.
Configure Syslog for
Sophos Web Security
Appliance
To configure your Sophos Web Security Appliance to forward syslog events:
Step 1 Log in to your Sophos Web Security Appliance.
Step 2 From the menu, select Configuration > System > Alerts & Monitoring.
Step 3 Select the Syslog tab.
Step 4 Select the Enable syslog transfer of web traffic check box.
Step 5 In the Hostname/IP text box, type the IP address or hostname of JSA.
Step 6 In the Port text box, type 514.
Step 7 From the Protocol list box, select a protocol. The options are:
•TCP - The TCP protocol is supported with JSA on port 514.
•UDP - The UDP protocol is supported with JSA on port 514.
•TCP - Encrypted - TCP Encrypted is an unsupported protocol for JSA.
Step 8 Click Apply.
You are now ready to configure the Sophos Web Security Appliance DSM in JSA.
JSA automatically detects syslog data from a Sophos Web Security Appliance. To
manually configure JSA to receive events from Sophos Web Security Appliance:
From the Log Source Type list box, select Sophos Web Security
Appliance.
For more information on configuring log sources, see the Log Sources Users
Guide.

Configuring DSMs
89 SOURCEFIRE
This section provides information on the following DSMs:
•Sourcefire Defense Center (DC)
•Sourcefire Intrusion Sensor
Sourcefire Defense
Center (DC)
The Sourcefire Defense Center DSM for Juniper Secure Analytics (JSA) accepts
Sourcefire Defense Center events using the eStreamer API service.
Supported Versions JSA supports the following versions of Sourcefire Defense Center:
•Sourcefire Defense Center v4.8.2.x and above
•Sourcefire Defense Center v5.x
You must download and install one of the following hotfixes from the Sourcefire
website to collect Sourcefire Defense Center 5.x events in JSA:
- Sourcfire_hotfix-v5.1.0-0-build_1.tar
- Sourcfire_hotfix-v5.1.1-0-build_1.tar
For more information on hotfixes for your Sourcefire appliance, see the
Sourcefire website.
Configuration
Overview
Integrating with Sourcefire Defense Center requires that you create certificates in
the Sourcefire Defense Center interface, then add the certificates to JSA
appliances that receive eStreamer event data.
If your deployment includes multiple Sourcefire Defense Center appliances, you
must copy the certificate for each appliance that receives eStreamer events. The
certificate allows the Sourcefire Defense Center appliance and the JSA console or
Event Collector communicate using the eStreamer API to collect events.
Configuring DSMs
644 SOURCEFIRE
The following steps are required to integrate JSA with Sourcefire Defense Center:
1 Create the eStreamer certificate on your Sourcefire Defense Center appliance.
2 Add the Sourcefire Defense Center certificate files to JSA.
3 Configure a log source in JSA for your Sourcefire Defense Center appliances.
Supported Event
Types
JSA supports the following event types from Sourcefire Defense Center:
•Intrusion events and extra data
Intrusion events categorized by the Sourcefire Defense Center DSM in JSA use
the same JSA Identifiers (QIDs) as the Snort DSM. To ensure that all intrusion
events are categorized properly, you can download and install the latest Snort
DSM from http://www.juniper.net/customers/support/.
Intrusion events in the 1,000,000 to 2,000,000 range are user-defined rules in
Sourcefire Defense Center. User-defined rules that generate events are added
as an Unknown event in JSA, but include additional information describing the
event type. For example, a user-defined event can identify as Unknown:Buffer
Overflow for Sourcefire Defense Center.
•Correlation events
•Metadata events
•Discovery events
•Host events
•User events
Creating Sourcefire
4.x Certificates
Certificates are created by Sourcefire Defense Center appliances in your
deployment.
JSA requires a certificate for every Sourcefire Defense Center appliance in your
deployment. Certificates are generated in pkcs12 format and must be converted to
a keystore and truststore file, which are usable by JSA appliances.
Procedure
Step 1 Log in to your Sourcefire Defense Center interface.
Step 2 Select Operations > Configuration > eStreamer.
Step 3 Click the eStreamer tab.
Step 4 Click Create Client.
Step 5 Select check boxes for the event types Sourcefire Defense Center provides to
JSA.
Step 6 Click + Create Client located in the upper right-side of the interface.
Step 7 In the Hostname field, type the IP address or hostname.
Configuring DSMs
Sourcefire Defense Center (DC) 645
•If you are collect all events on your JSA console or using an All-in-one
appliance to collect sStreamer events, type the IP address or hostname of your
JSA console.
•If you are using a remote Event Collector to collect eStreamer events, type the
IP address or hostname for the remote Event Collector.
•If you are using High Availability (HA), type the virtual IP address.
Step 8 In the Password field, leave the password field blank or type a password for your
certificate.
Step 9 Click Save.
The new client is added to the Streamer Client list and the host is allowed to
communicate with the eStreamer API on port 8302.
Step 10 From the Certificate Location column, click the client you created to save the
pkcs12 certificate to a file location and click OK.
You are now ready to import your Sourcefire Defense Center certificate to your
JSA appliance.
Creating Sourcefire
5.x Certificates
Certificates are created by Sourcefire Defense Center appliances in your
deployment.
JSA requires a certificate for every Sourcefire Defense Center appliance in your
deployment. Certificates are generated in pkcs12 format and must be converted to
a keystore and truststore file, which are usable by JSA appliances.
Procedure
Step 1 Log in to your Sourcefire Defense Center interface.
Step 2 Select System > Local > Registration.
Step 3 Click the eStreamer tab.
Step 4 Select check boxes for the event types Sourcefire Defense Center provides to
JSA.
WARNING
WARNING: For Sourcefire Defense Center 5.x, you must clear the Impact Flag
Alerts check box.
Step 5 Click Save.
Step 6 Click + Create Client located in the upper right-side of the interface.
Step 7 In the Hostname field, type the IP address or hostname.
•If you are collect all events on your JSA console or using an All-in-one
appliance to collect sStreamer events, type the IP address or hostname of your
JSA console.
Configuring DSMs
646 SOURCEFIRE
•If you are using an Event Collector to collect eStreamer events, type the IP
address or hostname for the Event Collector.
•If you are using High Availability (HA), type the virtual IP address.
Step 8 In the Password field, leave the password field blank or type a password for your
certificate.
Step 9 Click Save.
The new client is added to the Streamer Client list and the host is allowed to
communicate with the eStreamer API on port 8302.
Step 10 Click the download arrow for your host to save the pkcs12 certificate to a file
location.
Step 11 Click OK to download the file.
You are now ready to import your Sourcefire Defense Center certificate to your
JSA appliance.
Importing a
Certificate to JSA
The estreamer-cert-import.pl script for JSA is responsible for converting your
pkcs12 certificate file to a keystore and truststore file and placing certificates in the
proper directory on your JSA appliance.
About the import script
The estreamer-cert-import.pl script is bundled with the Sourcefire Defense Center
protocol and is available on your JSA appliance when the protocol is installed.
The script can only convert and import one pkcs12 file at a time, as bulk certificate
importing is not supported. You can repeat this procedure for each Sourcefire
Defense Center pcks12 certificate you need to import to your JSA console or
Event Collector. It is not necessary to import a certificate to both the JSA console
and an Event Collector. You are only required to import a certificate for the JSA
appliance that manages the Sourcefire Defense Center log source. After the
Sourcfire event is categorized and normalized by an Event Collector in a JSA
distributed deployment, it is forwarded to the JSA console. The certificate is only
required at the point of entry of the Sourcefire event.
Any existing Sourcefire Defense Center certificates on the JSA appliance is
renamed so they do not interfere with existing keystore and truststore files.
Existing files are rename to estreamer.keystore.old and estreamer.truststore.old.
Before you begin
You must have root or su - root privileges to run the estreamer-cert-import.pl import
script.
Procedure
Step 1 Using SSH, log in to your JSA console or Event Collector as the root user.
User name: root
Password: <password>

Configuring DSMs
Sourcefire Defense Center (DC) 647
Step 2 Copy the pkcs12 certificate from your Sourcefire Defense Center appliance to the
following directory in JSA:
/opt/qradar/bin/
Step 3 Type the following command and any additional option parameters to import your
pkcs12 file:
/opt/qradar/bin/estreamer-cert-import.pl -f <file name>
<options>
Where:
<file name> is the file name of the pkcs12 file created by your Sourcefire
Defense Center appliance.
<options> are any additional import script parameters from Table 92-1.
For example,
/opt/qradar/bin/estreamer-cert-import.pl -f 192.168.0.1.pkcs12
Table 92-1 Sourcefire Defense Center Import Script Parameters
Parameter Description
-f The -f parameter identifies the file name of the pkcs12 files to
import. This parameter is required to import certificates.
-o The -o parameter allows you to overrides the default
estreamer name for the keystore and truststore files. The -o
parameter is required when using multiple Sourcefire
Defense Center devices, as unique key file names are
required.
For example,
/opt/qradar/bin/estreamer-cert-import.pl -f
<file name> -o 192.168.1.100
The import script creates the following files:
/opt/qradar/conf/192.168.0.100.keystore
/opt/qradar/conf/192.168.0.100.truststore
-d The -d parameter enables verbose mode when using the
import script.
Verbose mode is intended to display error messages for
troubleshooting purposes when pkcs12 files fail to import
properly.
-p The -p parameter allows you to specify a password if a
password was accidently provided when generating the
pkcs12 file.
-v The -v parameter displays the version information for the
import script.
-h The -h parameter displays a help message on using the
import script.

Configuring DSMs
648 SOURCEFIRE
The import script creates a keystore and truststore file in the following location:
/opt/qradar/conf/estreamer.keystore
/opt/qradar/conf/estreamer.truststore
You are now ready to configure the log source in JSA.
Configure a Log
Source
You must configure a log source in JSA as Sourcefire Defense Center events do
not automatically discover.
Procedure
Step 1 Log in to JSA.
Step 2 Click the Admin tab.
Step 3 On the navigation menu, click Data Sources.
Step 4 Click the Log Sources icon.
Step 5 Click Add.
Step 6 Select the Sourcefire Defense Center option from the Log Source Type list box.
Step 7 From the Protocol Configuration list box, select Sourcefire Defense Center
Estreamer.
Step 8 Configure the following parameters:
Table 92-2 Sourcefire Defense Center Estreamer Parameters
Parameter Description
Log Source Identifier Type the IP address or hostname to identify the log source.
The information in the Log Source Identifier field must be
unique to the log source type.
Server Address Type the IP address or hostname of the Sourcefire Defense
Center device.
Server Port Type the port number JSA uses to receive Sourcefire
Defense Center Estreamer events.
The default is 8302.
Keystore Filename Type the directory path and file name for the keystore private
key and associated certificate.
By default, the import script creates the keystore file in the
following directory:
/opt/qradar/conf/estreamer.keystore
Truststore Filename Type the directory path and file name for the truststore files.
The truststore file contain the certificates trusted by the client.
By default, the import script creates the truststore file in the
following directory:
/opt/qradar/conf/estreamer.truststore

Configuring DSMs
Sourcefire Intrusion Sensor 649
Step 9 Optional. Repeat this process to create log sources to receive eStreamer events
from additional Sourcefire Defense Center appliances in your deployment.
For more information about Sourcefire, see the Sourcefire documentation, see
http://www.sourcefire.com
Sourcefire
Intrusion Sensor
The Sourcefire Intrusion Sensor DSM for JSA accepts Snort based intrusion and
prevention syslog events from Sourcefire devices.
Configuring
Sourcefire Intrusion
Sensor
To configure your Sourcefire Intrusion Sensor, you must enable policy alerts and
configure your appliance to forward the event to JSA.
Procedure
Step 1 Log in to your Sourcefire user interface.
Step 2 On the navigation menu, select Intrusion Sensor > Detection Policy > Edit.
Step 3 Select an active policy and click Edit.
Step 4 Click Alerting.
Step 5 In the State field, select on to enable the syslog alert for your policy.
Step 6 From the Facility list box, select Alert.
Step 7 From the Priority list box, select Alert.
Step 8 In the Logging Host field, type the IP address of the JSA console or Event
Collector.
Step 9 Click Save.
Step 10 On the navigation menu, select Intrusion Sensor > Detection Policy > Apply.
Step 11 Click Apply.
You are now ready to configure the log source in JSA.
Configuring a Log
Source in JSA
JSA automatically discovers and creates a log source for syslog events from
Sourcefire Intrusion Sensor. However, you can manually create a log source for
JSA to receive syslog events. The following procedure is optional.
Procedure
Step 1 Log in to JSA.
Step 2 Click the Admin tab.
Step 3 On the navigation menu, click Data Sources.
Step 4 Click the Log Sources icon.
Step 5 Click Add.

Configuring DSMs
650 SOURCEFIRE
Step 6 In the Log Source Name field, type a name for your log source.
Step 7 In the Log Source Description field, type a description for the log source.
Step 8 From the Log Source Type list box, select Snort Open Source IDS.
Step 9 Using the Protocol Configuration list box, select Syslog.
Step 10 Configure the following values:
Step 11 Click Save.
Step 12 On the Admin tab, click Deploy Changes.
The configuration is complete.
Table 92-3 Syslog Parameters
Parameter Description
Log Source Identifier Type the IP address or host name for the log source as an
identifier for events from your Sourcefire Intrusion Sensor
appliance.

Configuring DSMs
90 SPLUNK
Juniper Secure Analytics (JSA) accepts and parses multiple event types forwarded
from Splunk appliances.
Collect Windows
Events Forwarded
from Splunk
Appliances
To collect events, you can configure your Windows end points to forward events to
your JSA console and your Splunk indexer.
Forwarding Windows events from aggregation nodes in your Splunk deployment is
not suggested. Splunk indexers that forward events from multiple Windows end
points to JSA can obscure the true source of the events with the IP address of the
Splunk indexer. To prevent a situation where an incorrect IP address association
might occur in the log source, you can update your Windows end point systems to
forward to both the indexer and your JSA console.
Splunk events are parsed by using the Microsoft Windows Security Event Log
DSM with the TCP multiline syslog protocol. The regular expression configured in
the protocol defines where a Splunk event starts or ends in the event payload. The
event pattern allows JSA to assemble the raw Windows event payload as a
single-line event that is readable by JSA. The regular expression required to
collect Windows events is outlined in the log source configuration.

Configuring DSMs
652 SPLUNK
To configure event collection for Splunk syslog events, you must complete the
following tasks:
1 On your JSA appliance, configure a log source to use the Microsoft Windows
Security Event Log DSM.
NOTE
Note: You must configure one log source for Splunk events. JSA can use the first
log source to autodiscover additional Windows end points.
2 On your Splunk appliance, configure each Splunk Forwarder on the Windows
instance to send Windows event data to your JSA console or Event Collector.
To configure a Splunk Forwarder, you must edit the props, transforms, and output
configuration files. For more information on event forwarding, see your Splunk
documentation.
3 Ensure that no firewall rules block communication between your Splunk appliance
and the JSA console or managed host that is responsible for retrieving events.
4 On your JSA appliance, verify the Log Activity tab to ensure that the Splunk events
are forwarded to JSA.
Configuring a Log
Source for Splunk
Forwarded Events
To collect raw events forwarded from Splunk, you must configure a log source in
JSA.
Procedure
Step 1 Log in to JSA.
Step 2 Click the Admin tab.
Step 3 In the navigation menu, click Data Sources.
Step 4 Click the Log Sources icon.
Step 5 Click Add.
Step 6 In the Log Source Name field, type a name for your log source.
Step 7 Optional. In the Log Source Description field, type a description for your log
source.
Step 8 From the Log Source Type list box, select Microsoft Windows Security Event
Log.
Step 9 From the Protocol Configuration list box, select TCP Multiline Syslog.
Step 10 Configure the following values:
Table 93-4 Protocol Parameters for TCP Multiline Syslog
Parameter Description
Log Source Identifier Type the IP address or host name for the log source as an
identifier for events from your Splunk appliance.
The log source identifier must be unique value.

Configuring DSMs
Collect Windows Events Forwarded from Splunk Appliances 653
Listen Port Type the port number used by JSA to accept incoming TCP
multiline syslog events from Splunk.
The default listen port is 12468.
The port number you configure must match the port that you
configured on your Splunk Forwarder. You can use the listen
port to collect events from up to 50 event sources that have a
common event pattern. You cannot specify port 514 in this
field.
Event Formatter From the list box, select Windows Multiline.
The event formatter ensures the format of the TCP multiline
event matches the event pattern for the event type you
selected.
Event Start Pattern Type the following regular expression (regex) to identify the
start of your Splunk windows event:
(?:<(\d+)>\s?(\w{3} \d{2} \d{2}:\d{2}:\d{2})
(\S+) )?(\d{2}/\d{2}/\d{4} \d{2}:\d{2}:\d{2}
[AP]M)
The TCP multiline syslog protocol captures all the information
between each occurrence of the defined regex pattern to
create single-line syslog events.
Event End Pattern This field can be cleared of any regex patterns.
Enabled Select this check box to enable the log source. By default, the
check box is selected.
Credibility From the list box, select the credibility of the log source. The
range is 0 - 10.
The credibility indicates the integrity of an event or offense as
determined by the credibility rating from the source devices.
Credibility increases if multiple sources report the same event.
The default is 5.
Target Event
Collector
From the list box, select the Event Collector to use as the
target for the log source.
Coalescing Events Select this check box to enable the log source to coalesce
(bundle) events.
By default, automatically discovered log sources inherit the
value of the Coalescing Events list box from the System
Settings in JSA. When you create a log source or edit an
existing configuration, you can override the default value by
configuring this option for each log source.
Incoming Event
Payload
From the list box, select the incoming payload encoder for
parsing and storing the logs.
Table 93-4 Protocol Parameters for TCP Multiline Syslog (continued)
Parameter Description

Configuring DSMs
654 SPLUNK
Step 11 Click Save.
Step 12 On the Admin tab, click Deploy Changes.
Step 13 Optional. If you have 50 or more Windows sources, you must repeat this process
to create another log source.
Events provided by the Splunk Forwarder to JSA are displayed on the Log Activity
tab.
Store Event Payload Select this check box to enable the log source to store event
payload information.
By default, automatically discovered log sources inherit the
value of the Store Event Payload list box from the System
Settings in JSA. When you create a log source or edit an
existing configuration, you can override the default value by
configuring this option for each log source.
Table 93-4 Protocol Parameters for TCP Multiline Syslog (continued)
Parameter Description
Configuring DSMs
91 SQUID WEB PROXY
The Squid Web Proxy DSM for Juniper Secure Analytics (JSA) records all cache
and access log events using syslog.
To integrate JSA with Squid Web Proxy, you must configure your Squid Web Proxy
to forward your cache and access logs using syslog.
Configure Syslog
Forwarding
To configure Squid Web Proxy to forward your access and cache events using
syslog:
Step 1 Using SSH, log in to the Squid device command-line interface (CLI).
Step 2 Open the following file:
/etc/rc3.d/S99local
Step 3 Add the following line:
tail -f /var/log/squid/access.log | logger -p
<facility>.<priority> &
Where:
<facility> is any valid syslog facility (such as, authpriv, daemon, local0 to
local7, or user) written in lowercase.
<priority> is any valid priority (such as, err, warning, notice, info, debug) written
in lowercase.
Step 4 Save and close the file.
Logging begins the next time the system is rebooted.
Step 5 To begin logging immediately, type the following command:
nohup tail -f /var/log/squid/access.log | logger -p
<facility>.<priority> &
Where <facility> and <priority> are the same values entered in Step 3.
Step 6 Open the following file:
/etc/squid/squid.conf
Configuring DSMs
656 SQUID WEB PROXY
Step 7 Add the following line to send the logs to the JSA:
<prioirty>.<facility> @<JSA_IP_address>
Where:
<priority> is the priority of your Squid messages
<facility> is the facility of your Squid messages
<JSA_IP_address> is the IP address or hostname of your JSA.
For example:
info.local4 @172.16.210.50
Step 8 Add the following line to squid.conf to turn off Squid httpd log emulation:
emulate_httpd_log off
Step 9 Save and close the file.
Step 10 Type the following command to restart the syslog daemon:
/etc/init.d/syslog restart
For more information on configuring Squid Web Proxy, consult your vendor
documentation. After you configure syslog forwarding your cache and access logs,
the configuration is complete. JSA can automatically discover syslog events
forwarded from Squid Web Proxy.
Create a Log Source JSA automatically discovers and creates a log source for syslog events forwarded
from Squid Web Proxy appliances. These configuration steps for creating a log
source are optional.
To manually configure a log source for Squid Web Proxy:
Step 1 Log in to JSA.
Step 2 Click the Admin tab.
Step 3 On the navigation menu, click Data Sources.
The Data Sources panel is displayed.
Step 4 Click the Log Sources icon.
The Log Sources window is displayed.
Step 5 Click Add.
The Add a log source window is displayed.
Step 6 In the Log Source Name field, type a name for the log source.
Step 7 In the Log Source Description field, type a description for the log source.
Step 8 From the Log Source Type list box, select Squid Web Proxy.
Step 9 From the Protocol Configuration list box, select Syslog.
The syslog protocol configuration is displayed.

Configuring DSMs
657
Step 10 Configure the following values:
Step 11 Click Save.
Step 12 On the Admin tab, click Deploy Changes.
The configuration is complete.
Table 94-1 Syslog Parameters
Parameter Description
Log Source Identifier Type the IP address or hostname for the log source as an
identifier for events from the Squid Web Proxy.

Configuring DSMs
92 STARENT NETWORKS
The Starent Networks DSM for Juniper Secure Analytics (JSA) accepts Event,
Trace, Active, and Monitor events.
Before configuring a Starent Networks device in JSA, you must configure your
Starent Networks device to forward syslog events to JSA.
To configure the device to send syslog events to JSA:
Step 1 Log in to your Starent Networks device.
Step 2 Configure the syslog server:
logging syslog <IP address> [facility <facilities>] [<rate
value>] [pdu-verbosity <pdu_level>] [pdu-data <format>]
[event-verbosity <event_level>]
The following table provides the necessary parameters:
Table 95-1 Syslog Server Parameters
Parameter Description
syslog <IP address> Type the IP address of your JSA
facility <facilities> Type the local facility for which the logging options shall be
applied. The options are:
•local0
•local1
•local2
•local3
•local4
•local5
•local6
•local7
The default is local7.
rate value Type the rate that you want log entries to be sent to the system
log server. This value must be an integer from 0 to 100000.
The default is 1000 events per second.

Configuring DSMs
660 STARENT NETWORKS
Step 3 From the root prompt for the Exec mode, identify the session for which the trace
log is to be generated:
logging trace {callid <call_id> | ipaddr <IP address> | msid
<ms_id> | name <username>}
The following table provides the necessary parameters:
Step 4 To write active logs to the active memory buffer, in the config mode:
logging runtime buffer store all-events
pdu-verbosity
<pdu-level>
Type the level of verboseness you want to use in logging the
Protocol Data Units (PDUs). The range is 1 to 5 where 5 is the
most detailed. This parameter only affects protocol logs.
pdu-data <format> Type the output format for the PDU when logged as one of
following formats:
•none - Displays results in raw or unformatted text.
•hex - Displays results in hexadecimal format.
•hex-ascii - Displays results in hexadecimal and ASCII
format similar to a main frame dump.
event-verbosity
<event_level>
Type the level of detail you want to use in logging of events,
including:
•min - Provides minimal information about the event, such
as, event name, facility, event ID, severity level, data, and
time.
•concise - Provides detailed information about the event, but
does not provide the event source.
•full - Provides detailed information about the event including
the source information identifying the task or subsystem that
generated the event.
Table 95-1 Syslog Server Parameters (continued)
Parameter Description
Table 95-2 Trace Log Parameters
Parameter Description
callid <call_id> Indicates a trace log is generated for a session identified by the
call identification number. This value is a 4-byte hexadecimal
number.
ipaddr <IP address> Indicates a trace log is generated for a session identified by the
specified IP address.
msid <ms_id> Indicates a trace log is generated for a session identified by the
mobile station identification (MSID) number. This value must
be from 7 to 16 digits, specified as an IMSI, MIN, or RMI.
name <username> Indicates a trace log is generated for a session identified by the
username. This value is the name of the subscriber that was
previously configured.

Configuring DSMs
661
Step 5 Configure a filter for the active logs:
logging filter active facility <facility> level <report_level>
[critical-info | no-critical-info]
The following table provides the necessary parameters:
Table 95-3 Active Log Parameters
Parameter Description
facility <facility> Type the facility message level. A facility is a protocol or task
that is in use by the system. The local facility defines which
logging options shall be applied for processes running locally.
The options are:
•local0
•local1
•local2
•local3
•local4
•local5
•local6
•local7
The default is local7.
level <report_level> Type the log severity level, including:
•critical - Logs only those events indicating a serious error
has occurred that is causing the system or a system
component to cease functioning. This is the highest level
severity.
•error - Logs events that indicate an error has occurred that
is causing the system or a system component to operate in
a degraded date. This level also logs events with a higher
severity level.
•warning - Logs events that can indicate a potential problem.
This level also logs events with a higher severity level.
•unusual - Logs events that are very unusual and might
need to be investigated. This level also logs events with a
higher severity level.
•info - Logs informational events and events with a higher
severity level.
•debug - Logs all events regardless of the severity.
We recommend that a level of error or critical can be
configured to maximize the value of the logged information
while minimizing the quantity of logs generated.
critical-info The critical-info parameter identifies and displays events with a
category attribute of critical information. Examples of these
types of events can be seen at bootup when system processes
or tasks are being initiated.

Configuring DSMs
662 STARENT NETWORKS
Step 6 Configure the monitor log targets:
logging monitor {msid <ms_id>|username <username>}
The following table provides the necessary parameters:
You are now ready to configure the log source in JSA.
To configure JSA to receive events from a Starent device:
From the Log Source Type list box, select the Starent Networks Home
Agent (HA) option.
For more information on configuring log sources, see the Log Sources Users
Guide. For more information about the device, see your vendor documentation.
no-critical-info The no-critical-info parameter specifies that events with a
category attribute of critical information are not displayed.
Table 95-3 Active Log Parameters (continued)
Parameter Description
Table 95-4 Monitor Log Parameters
Parameter Description
msid <md_id> Type an msid to define that a monitor log is generated for a
session identified using the Mobile Station Identification
(MDID) number. This value must be between 7 and 16 digits
specified as a IMSI, MIN, or RMI.
username
<username>
Type username to identify a monitor log generated for a
session by the username. The username is the name of the
subscriber that was previously configured.

Configuring DSMs
93 STEALTHBITS
STEALTHINTERCEPT
The Juniper Secure Analytics (JSA) DSM for STEALTHbits StealthINTERCEPT
can collect event logs from your STEALTHbits StealthINTERCEPT servers.
Table 96-1 identifies the specifications for the STEALTHbits StealthINTERCEPT
DSM.
STEALTHbits
StealthINTERCEPT
DSM Integration
Process
To integrate STEALTHbits StealthINTERCEPT DSM with JSA, use the following
procedure:
Table 96-1 STEALTHbits StealthINTERCEPT DSM Specifications
Specification Value
Manufacturer STEALTHbits Technologies
DSM STEALTHbits StealthINTERCEPT
RPM file name DSM-STEALTHbitsStealthINTERCEPT-build_number
.noarch.rpm
Supported versions
Protocol Syslog LEEF
JSA recorded events Active Directory Audit Events
Automatically discovered Yes
Includes identity No
More information http://www.stealthbits.com/resources
Configuring DSMs
664 STEALTHBITS STEALTHINTERCEPT
1 If automatic updates are not enabled, download and install the most recent RPM
files on your JSA console. RPMs need to be installed only one time. The most
recent version of the following RPM files are required:
•DSMCommon RPM
•STEALTHbits StealthINTERCEPT RPM
2 For each instance of STEALTHbits StealthINTERCEPT, configure you
STEALTHbits StealthINTERCEPT system to enable communication with JSA.
3 If JSA does not automatically discover the log source, for each STEALTHbits
StealthINTERCEPT server that you want to integrate, create a log source on the
JSA console.
Related tasks
•Manually Installing a DSM
•Configuring your STEALTHbits StealthINTERCEPT System for
Communication with JSA
•Configuring a STEALTHbits StealthINTERCEPT Log Source in JSA
Configuring your
STEALTHbits
StealthINTERCEPT
System for
Communication
with JSA
To collect all audit logs and system events from STEALTHbits StealthINTERCEPT,
you must specify JSA as the syslog server and configure the message format.
Procedure
To configure your STEALTHbits StealthINTERCEPT system for communication
with JSA:
Step 1 Log in to your STEALTHbits StealthINTERCEPT server.
Step 2 Start the Administration console.
Step 3 Click Configuration > Syslog Server.
Step 4 Configure the following parameters:
Table 96-2 Parameters to Configure your STEALTHbits StealthINTERCEPT System
Step 5 Click Import mapping file.
Step 6 Select the SyslogLeefTemplate.txt file and press Enter.
Step 7 Click Save.
Step 8 On the Administration Console, click Actions.
Step 9 Select the mapping file that you imported, and then select the Send to Syslog
check box.
Parameter Description
Host Address The IP address of the JSA
console
Port 514

Configuring DSMs
Configuring a STEALTHbits StealthINTERCEPT Log Source in JSA 665
Tip: Leave the Send to Events DB check box selected. StealthINTERCEPT uses
the events database to generate reports.
Step 10 Click Add.
Configuring a
STEALTHbits
StealthINTERCEPT
Log Source in JSA
To collect STEALTHbits StealthINTERCEPT events, configure a log source in
Juniper Secure Analytics (JSA).
Procedure
Step 1 Log in to JSA.
Step 2 Click the Admin tab.
Step 3 In the navigation menu, click Data Sources.
Step 4 Click the Log Sources icon.
Step 5 Click Add.
Step 6 From the Log Source Type list, select STEALTHbits StealthINTERCEPT.
Step 7 From the Protocol Configuration list, select Syslog.
Step 8 Configure the remaining parameters.
Step 9 Click Save.
Step 10 On the Admin tab, click Deploy Changes.

Configuring DSMs
94 STONESOFT MANAGEMENT CENTER
The Stonesoft Management Center DSM for Juniper Secure Analytics (JSA)
accepts events using syslog.
JSA records all relevant LEEF formatted syslog events. Before configuring JSA,
you must configure your Stonesoft Management Center to export LEEF formatted
syslog events.
This document includes the steps required to edit LogServerConfiguration.txt file.
Configuring the text file allows Stonesoft Management Center to export event data
in LEEF format using syslog to JSA. For detailed configuration instructions, see the
StoneGate Management Center Administrator’s Guide.
Configuring
Stonesoft
Management Center
To configure Stonesoft Management Center:
Procedure
Step 1 Log in to the appliance hosting your Stonesoft Management Center.
Step 2 Stop the Stonesoft Management Center Log Server:
•Windows - Select one of the following methods to stop the Log Server:
- Stop the Log Server in the Windows Services list.
- Run the batch file <installation path>/bin/sgStopLogSrv.bat.
•Linux - To stop the Log Server in Linux, run the script <installation
path>/bin/sgStopLogSrv.sh.
Step 3 Edit the LogServerConfiguration.txt file. The configuration file is located in the
following directory:
<installation path>/data/LogServerConfiguration.txt
Step 4 Configure the following parameters in the LogServerConfiguration.txt file:
Table 97-1 Log Server Configuration Options
Parameter Value Description
SYSLOG_EXPORT_FORMAT LEEF Type LEEF as the export format to use for syslog.

Configuring DSMs
668 STONESOFT MANAGEMENT CENTER
Step 5 Save the LogServerConfiguration.txt file.
Step 6 Start the Log Server:
•Windows - Type <installation path>/bin/sgStartLogSrv.bat.
•Linux - Type <installation path>/bin/sgStartLogSrv.sh.
You are now ready to configure a traffic rule for syslog.
Note: A firewall rule is only required if your JSA console or Event Collector is
separated by a firewall from the Stonesoft Management Server. If no firewall exists
between the Management Server and JSA, you need to configure the log source in
JSA.
Configure a Syslog
Traffic Rule
If the Stonesoft Management Center and JSA are separated by a firewall in your
network, you must modify your firewall or IPS policy to allow traffic between the
Stonesoft Management Center and JSA.
Procedure
Step 1 From the Stonesoft Management Center, select one of the following methods for
modifying a traffic rule:
•Firewall policies - Select Configuration > Configuration > Firewall.
•IPS policies - Select Configuration > Configuration > IPS.
Step 2 Select the type of policy to modify:
•Firewall - Select Firewall Policies > Edit Firewall Policy.
•IPS - Select IPS Policies > Edit Firewall Policy.
SYSLOG_EXPORT_ALERT YES | NO Type one of the following values:
•Yes - Exports alert entries to JSA using syslog.
•No - Alert entries are not exported using syslog.
SYSLOG_EXPORT_FW YES | NO Type one of the following values:
•Yes - Exports firewall and VPN entries to JSA using
syslog.
•No - Firewall and VPN entries are not exported using
syslog.
SYSLOG_EXPORT_IPS YES | NO Type one of the following values:
•Yes - Exports IPS log file entries to JSA using syslog.
•No - IPS entries are not exported using syslog.
SYSLOG_PORT 514 Type 514 as the UDP port for forwarding syslog events
to JSA.
SYSLOG_SERVER_ADDRESS JSA IPv4 Address Type the IPv4 address of your JSA console or Event
Collector.
Table 97-1 Log Server Configuration Options (continued)
Parameter Value Description

Configuring DSMs
669
Step 3 Add an IPv4 Access rule with the following values to the firewall policy:
a Source - Type the IPv4 address of your Stonesoft Management Center Log
Server.
b Destination - Type the IPv4 address of your JSA console or Event Collector.
c Service - Select Syslog (UDP).
d Action - Select Allow.
e Logging - Select None.
Note: In most cases, we recommend setting the logging value to None. Logging
syslog connections without configuring a syslog filter can create a loop. For more
information, see the StoneGate Management Center Administrator’s Guide.
Step 4 Save your changes and refresh the policy on the firewall or IPS.
You are now ready to configure the log source in JSA.
Configuring a Log
Source
JSA automatically discovers and creates a log source for syslog events from
Stonesoft Management Center. The following configuration steps are optional.
Procedure
Step 1 Log in to JSA.
Step 2 Click the Admin tab.
Step 3 On the navigation menu, click Data Sources.
Step 4 Click the Log Sources icon.
Step 5 Click Add.
Step 6 In the Log Source Name field, type a name for your log source.
Step 7 In the Log Source Description field, type a description for the log source.
Step 8 From the Log Source Type list box, select Stonesoft Management Center.
Step 9 Using the Protocol Configuration list box, select Syslog.
Step 10 Configure the following values:
Step 11 Click Save.
Step 12 On the Admin tab, click Deploy Changes.
The configuration is complete.
Table 97-2 Syslog Parameters
Parameter Description
Log Source Identifier Type the IP address or host name for the log source as an
identifier for events from your Stonesoft Management Center
appliance.

Configuring DSMs
95 SUN SOLARIS
This section provides DSM configuration information on the following:
•Sun Solaris
•Sun Solaris DHCP
•Sun Solaris Sendmail
•Sun Solaris Basic Security Mode (BSM)
Sun Solaris The Sun Solaris DSM for records all relevant Solaris authentication events using
syslog.
Configuring Sun
Solaris
To collect authentication events from Sun Solaris, you must configure syslog to
forward events to Juniper Secure Analytics (JSA).
Procedure
Step 1 Log in to the Sun Solaris command-line interface.
Step 2 Open the /etc/syslog.conf file.
Step 3 To forward system authentication logs to JSA, add the following line to the file:
*.err;auth.notice;auth.info @<IP address>
Where <IP address> is the IP address of your JSA. Use tabs instead of spaces
to format the line.
NOTE
Note: Depending on the version of Solaris you are running, you might need to add
additional log types to the file. Contact your system administrator for more
information.
Step 4 Save and exit the file.
Step 5 Type the following command:
kill -HUP ‘cat /etc/syslog.pid‘
You are now ready to configure the log source JSA.

Configuring DSMs
672 SUN SOLARIS
Configuring a Sun
Solaris DHCP Log
Source
JSA automatically discovers and creates a log source for syslog events from Sun
Solaris DHCP installations. The following configuration steps are optional.
Procedure
Step 1 Log in to JSA.
Step 2 Click the Admin tab.
Step 3 On the navigation menu, click Data Sources.
Step 4 Click the Log Sources icon.
Step 5 Click Add.
Step 6 In the Log Source Name field, type a name for your log source.
Step 7 In the Log Source Description field, type a description for the log source.
Step 8 From the Log Source Type list box, select Solaris Operating System
Authentication Messages.
Step 9 Using the Protocol Configuration list box, select Syslog.
Step 10 Configure the following values:
Step 11 Click Save.
Step 12 On the Admin tab, click Deploy Changes.
The log source is added to JSA. Events forwarded to JSA by Solaris Sendmail is
displayed on the Log Activity tab.
Sun Solaris DHCP The Sun Solaris DHCP DSM for JSA records all relevant DHCP events using
syslog.
Configuring Sun
Solaris DHCP
To collect events from Sun Solaris DHCP, you must configure syslog to forward
events to JSA.
Procedure
Step 1 Log in to the Sun Solaris command-line interface.
Step 2 Edit the /etc/default/dhcp file.
Step 3 Enable logging of DHCP transactions to syslog by adding the following line:
LOGGING_FACILITY=X
Table 98-3 Syslog Parameters
Parameter Description
Log Source Identifier Type the IP address or hostname for the log source as an
identifier for events from Sun Solaris installations.
Each additional log source you create when you have
multiple installations should include a unique identifier, such
as an IP address or host name.

Configuring DSMs
Sun Solaris DHCP 673
Where X is the number corresponding to a local syslog facility, for example, a
number from 0 to 7.
Step 4 Save and exit the file.
Step 5 Edit the /etc/syslog.conf file.
Step 6 To forward system authentication logs to JSA, add the following line to the file:
localX.notice @<IP address>
Where:
X is the logging facility number you specified in Step 3.
<IP address> is the IP address of your JSA. Use tabs instead of spaces to
format the line.
Step 7 Save and exit the file.
Step 8 Type the following command:
kill -HUP ‘cat /etc/syslog.pid‘
You are now ready to configure the log source in JSA.
Configuring a Sun
Solaris DHCP Log
Source
JSA automatically discovers and creates a log source for syslog events from Sun
Solaris DHCP installations. The following configuration steps are optional.
Procedure
Step 1 Log in to JSA.
Step 2 Click the Admin tab.
Step 3 On the navigation menu, click Data Sources.
Step 4 Click the Log Sources icon.
Step 5 Click Add.
Step 6 In the Log Source Name field, type a name for your log source.
Step 7 In the Log Source Description field, type a description for the log source.
Step 8 From the Log Source Type list box, select Solaris Operating System DHCP
Logs.
Step 9 Using the Protocol Configuration list box, select Syslog.
Step 10 Configure the following values:
Table 98-4 Syslog parameters
Parameter Description
Log Source Identifier Type the IP address or hostname for the log source as an
identifier for events from Sun Solaris DHCP installations.
Each additional log source you create when you have
multiple installations should include a unique identifier, such
as an IP address or host name.

Configuring DSMs
674 SUN SOLARIS
Step 11 Click Save.
Step 12 On the Admin tab, click Deploy Changes.
The log source is added to JSA. Events forwarded to JSA by Solaris Sendmail is
displayed on the Log Activity tab.
Sun Solaris
Sendmail
The Sun Solaris Sendmail DSM for JSA accepts Solaris authentication events
using syslog and records all relevant sendmail events.
Configuring Syslog
for Sun Solaris
Sendmail
To collect events from Sun Solaris Sendmail, you must configure syslog to forward
events to JSA.
Procedure
Step 1 Log in to the Sun Solaris command-line interface.
Step 2 Open the /etc/syslog.conf file.
Step 3 To forward system authentication logs to JSA, add the following line to the file:
mail.*; @<IP address>
Where <IP address> is the IP address of your JSA. Use tabs instead of spaces
to format the line.
NOTE
Note: Depending on the version of Solaris you are running, you might need to add
additional log types to the file. Contact your system administrator for more
information.
Step 4 Save and exit the file.
Step 5 Type the following command:
kill -HUP ‘cat /etc/syslog.pid‘
You are now ready to configure the log source JSA.
Configuring a Sun
Solaris Sendmail Log
Source
JSA automatically discovers and creates a log source for syslog events from Sun
Solaris Sendmail appliances. The following configuration steps are optional.
Procedure
Step 1 Log in to JSA.
Step 2 Click the Admin tab.
Step 3 On the navigation menu, click Data Sources.
Step 4 Click the Log Sources icon.
Step 5 Click Add.
Step 6 In the Log Source Name field, type a name for your log source.
Step 7 In the Log Source Description field, type a description for the log source.

Configuring DSMs
Sun Solaris Basic Security Mode (BSM) 675
Step 8 From the Log Source Type list box, select Solaris Operating System Sendmail
Logs.
Step 9 Using the Protocol Configuration list box, select Syslog.
Step 10 Configure the following values:
Step 11 Click Save.
Step 12 On the Admin tab, click Deploy Changes.
The log source is added to JSA. Events forwarded to JSA by Solaris Sendmail is
displayed on the Log Activity tab.
Sun Solaris Basic
Security Mode
(BSM)
Sun Solaris Basic Security Mode (BSM) is an audit tracking tool for system
administrator to retrieve detailed auditing events from Sun Solaris systems.
JSA retrieves Sun Solaris BSM events using the Log File protocol. To you
configure JSA to integrate with Solaris Basic Security Mode, you must:
1 Enable Solaris Basic Security Mode.
2 Convert audit logs from binary to a human-readable format.
3 Schedule a cron job to run the conversion script on a schedule.
4 Collect Sun Solaris events in JSA using the Log File protocol.
Enabling Basic
Security Mode
To configure Sun Solaris BSM, you must enable Solaris Basic Security Mode and
configure the classes of events the system logs to an audit log file.
Procedure
Step 1 Log in to your Solaris console as a superuser or root user.
Step 2 Enable single-user mode on your Solaris console.
Step 3 Type the following command to run the bsmconv script and enable auditing:
/etc/security/bsmconv
The bsmconv script enables Solaris Basic Security Mode and starts the auditing
service auditd.
Step 4 Type the following command to open the audit control log for editing:
vi /etc/security/audit_control
Table 98-5 Syslog parameters
Parameter Description
Log Source Identifier Type the IP address or hostname for the log source as an
identifier for events from Sun Solaris Sendmail installations.
Each additional log source you create when you have
multiple installations should include a unique identifier, such
as an IP address or host name.
Configuring DSMs
676 SUN SOLARIS
Step 5 Edit the audit control file to contain the following information:
dir:/var/audit
flags:lo,ad,ex,-fw,-fc,-fd,-fr
naflags:lo,ad
Step 6 Save the changes to the audit_control file, then reboot the Solaris console to start
auditd.
Step 7 Type the following command to verify auditd has started:
/user/sbin/auditconfig -getcond
If the auditd process is started, the following string is returned:
audit condition = auditing
You are now ready to convert the binary Solaris Basic Security Mode logs to a
human-readable log format.
Converting Sun
Solaris BSM Audit
Logs
JSA cannot process binary files directly from Sun Solaris BSM. You must convert
the audit log from the existing binary format to a human-readable log format using
praudit before the audit log data can be retrieved by JSA.
Procedure
Step 1 Type the following command to create a new script on your Sun Solaris console:
vi /etc/security/newauditlog.sh
Step 2 Add the following information to the newauditlog.sh script:
#!/bin/bash
#
# newauditlog.sh - Start a new audit file and expire the old
logs
#
AUDIT_EXPIRE=30
AUDIT_DIR="/var/audit"
LOG_DIR="/var/log/"
/usr/sbin/audit -n
cd $AUDIT_DIR # in case it is a link
# Get a listing of the files based on creation date that are not
current in use
FILES=$(ls -lrt | tr -s " " | cut -d" " -f9 | grep -v
"not_terminated")
# We just created a new audit log by doing 'audit -n', so we can
# be sure that the last file in the list will be the latest
# archived binary log file.
Configuring DSMs
Sun Solaris Basic Security Mode (BSM) 677
lastFile=""
for file in $FILES; do
lastFile=$file
done
# Extract a human-readable file from the binary log file
echo "Beginning praudit of $lastFile"
praudit -l $lastFile > "$LOG_DIR$lastFile.log"
echo "Done praudit, creating log file at: $LOG_DIR$lastFile.log"
/usr/bin/find . $AUDIT_DIR -type f -mtime +$AUDIT_EXPIRE \
-exec rm {} > /dev/null 2>&1 \;
# End script
The script outputs log files in the <starttime>.<endtime>.<hostname>.log format.
For example, the log directory in /var/log would contain a file with the following
name:
20111026030000.20111027030000.qasparc10.log
Step 3 Optional. Edit the script to change the default directory for the log files.
a AUDIT_DIR="/var/audit" - The Audit directory must match the location
specified by the audit control file you configured in Step 5.
b LOG_DIR="/var/log/" - The log directory is the location of the human-readable
log files of your Sun Solaris system that are ready to be retrieved by JSA.
Step 4 Save your changes to the newauditlog.sh script.
You are now ready to automate the this script using CRON to convert the Sun
Solaris Basic Security Mode log to human-readable format.
Creating a Cron Job Cron is a Solaris daemon utility that automates scripts and commands to run
system-wide on a scheduled basis.
The following steps provide an example for automating newauditlog.sh to run daily
at midnight. If you need to retrieve log files multiple times a day from your Solaris
system, you must alter your cron schedule accordingly.
Procedure
Step 1 Type the following command to create a copy of your cron file:
crontab -l > cronfile
Step 2 Type the following command to edit the cronfile:
vi cronfile
Step 3 Add the following information to your cronfile:
0 0 * * * /etc/security/newauditlog.sh

Configuring DSMs
678 SUN SOLARIS
Step 4 Save the change to the cronfile.
Step 5 Type the following command to add the cronfile to crontab:
crontab cronfile
Step 6 You are now ready to configure the log source in JSA to retrieve the Sun Solaris
BSM audit log files.
What to do next
You are now ready to configure a log source in JSA.
Configuring a Log
Source for Sun
Solaris BSM
A log file protocol source allows JSA to retrieve archived log files from a remote
host. Sun Solaris BSM supports the bulk loading of audit log files using the log file
protocol.
Procedure
Step 1 Log in to JSA.
Step 2 Click the Admin tab.
Step 3 On the navigation menu, click Data Sources.
Step 4 Click the Log Sources icon.
Step 5 From the Log Source Type list box, select Solaris BSM.
Step 6 Using the Protocol Configuration list box, select Log File.
Step 7 Configure the following parameters:
Table 98-1 Log File Parameters
Parameter Description
Log Source Identifier Type the IP address or hostname for the log source. The log
source identifier must be unique for the log source type.
Service Type From the list box, select the protocol you want to use when
retrieving log files from a remove server. The default is SFTP.
•SFTP - SSH File Transfer Protocol
•FTP - File Transfer Protocol
•SCP - Secure Copy
Note: The underlying protocol used to retrieve log files for the
SCP and SFTP service types requires that the server
specified in the Remote IP or Hostname field has the SFTP
subsystem enabled.
Remote IP or
Hostname
Type the IP address or hostname of the Sun Solaris BSM
system.
Remote Port Type the TCP port on the remote host that is running the
selected Service Type. If you configure the Service Type as
FTP, the default is 21. If you configure the Service Type as
SFTP or SCP, the default is 22.
The valid range is 1 to 65535.

Configuring DSMs
Sun Solaris Basic Security Mode (BSM) 679
Remote User Type the username necessary to log in to your Sun Solaris
system.
The username can be up to 255 characters in length.
Remote Password Type the password necessary to log in to your Sun Solaris
system.
Confirm Password Confirm the Remote Password to log in to your Sun Solaris
system.
SSH Key File If you select SCP or SFTP from the Service Type field you
can define a directory path to an SSH private key file. The
SSH Private Key File allows you to ignore the Remote
Password field.
Remote Directory Type the directory location on the remote host from which the
files are retrieved. By default, the newauditlog.sh script writes
the human-readable logs files to the /var/log/ directory.
Recursive Select this check box if you want the file pattern to also search
sub folders. The Recursive parameter is not used if you
configure SCP as the Service Type. By default, the check box
is clear.
FTP File Pattern If you select SFTP or FTP as the Service Type, this option
allows you to configure the regular expression (regex)
required to filter the list of files specified in the Remote
Directory. All matching files are included in the processing.
For example, if you want to retrieve all files in the
<starttime>.<endtime>.<hostname>.log format, use the
following entry: \d+\.\d+\.\w+\.log.
Use of this parameter requires knowledge of regular
expressions (regex). For more information, see the following
website:
http://download.oracle.com/javase/tutorial/essential/regex/
FTP Transfer Mode This option only appears if you select FTP as the Service
Type. The FTP Transfer Mode parameter allows you to define
the file transfer mode when retrieving log files over FTP.
From the list box, select the transfer mode you want to apply
to this log source:
•Binary - Select Binary for log sources that require binary
data files or compressed .zip, .gzip, .tar, or .tar+gzip
archive files.
•ASCII - Select ASCII for log sources that require an ASCII
FTP file transfer. You must select NONE for the Processor
field and LINEBYLINE the Event Generator field when
using ASCII as the transfer mode.
SCP Remote File If you select SCP as the Service Type, you must type the file
name of the remote file.
Table 98-1 Log File Parameters (continued)
Parameter Description

Configuring DSMs
680 SUN SOLARIS
Step 8 Click Save.
The configuration is complete. Events that are retrieved using the log file protocol
are displayed on the Log Activity tab of JSA.
Sun ONE LDAP The Sun ONE LDAP DSM for JSA accepts multiline UDP access and LDAP events
from Sun ONE Directory Servers with the log file protocol.
Configuration
Overview
JSA retrieves access and LDAP events from Sun ONE Directory Servers by
connecting to each server to download the event log. The event file must be
written to a location accessible by the log file protocol of JSA with FTP, SFTP, or
SCP. The event log is written in a multiline event format, which requires a special
Start Time Type the time of day you want the processing to begin. This
parameter functions with the Recurrence value to establish
when and how often the Remote Directory is scanned for files.
Type the start time, based on a 24 hour clock, in the following
format: HH:MM.
Recurrence Type the frequency, beginning at the Start Time, that you
want the remote directory to be scanned. Type this value in
hours (H), minutes (M), or days (D).
For example, type 2H if you want the directory to be scanned
every 2 hours. The default is 1H.
Run On Save Select this check box if you want the log file protocol to run
immediately after you click Save. After the Run On Save
completes, the log file protocol follows your configured start
time and recurrence schedule.
Selecting Run On Save clears the list of previously processed
files for the Ignore Previously Processed File(s) parameter.
EPS Throttle Type the number of Events Per Second (EPS) that you do not
want this protocol to exceed. The valid range is 100 to 5000.
Processor If the files located on the remote host are stored in a .zip,
.gzip, .tar, or tar+gzip archive format, select the processor that
allows the archives to be expanded and contents processed.
Ignore Previously
Processed File(s)
Select this check box to track files that have already been
processed and you do not want the files to be processed a
second time. This only applies to FTP and SFTP Service
Types.
Change Local
Directory?
Select this check box to define the local directory on your JSA
system that you want to use for storing downloaded files
during processing. We recommend that you leave the check
box clear. When the check box is selected, the Local Directory
field is displayed, which allows you to configure the local
directory to use for storing files.
Event Generator From the Event Generator list box, select LINEBYLINE.
Table 98-1 Log File Parameters (continued)
Parameter Description
Configuring DSMs
Sun ONE LDAP 681
event generator in the log file protocol to properly parse the event. The ID-Linked
Multiline event generator is capable of using regex to assemble multiline events for
JSA when each line of a multiline event shares a common starting value.
The Sun ONE LDAP DSM also can accept events streamed using the UDP
Multiline Syslog protocol. However, in most situations your system requires a 3rd
party syslog forwarder to forward the event log to JSA. This can require you to
redirect traffic on your JSA appliance to use the port defined by the UDP Multiline
protocol. For more information, see the Log Sources Users Guide.
Enabling the Event
log for Sun ONE
Directory Server
To collect events from Sun ONE Directory Server, you must enable the event log to
write events to a file.
Procedure
Step 1 Log in to your Sun ONE Directory Server console.
Step 2 Click the Configuration tab.
Step 3 From the navigation menu, select Logs.
Step 4 Click the Access Log tab.
Step 5 Select the Enable Logging check box.
Step 6 Type or click Browse to identify the directory path for your Sun ONE Directory
Server access logs.
Step 7 Click Save.
Step 8 The configuration of the access log for Sun ONE Directory Server is complete.
What to do next
You are now ready to configure a log source in JSA.
Configuring a Log
Source for Sun ONE
LDAP
To receive events, you must manually create a log source for your Sun ONE
Directory Server as JSA does not automatically discover log file protocol events.
Procedure
Step 1 Log in to JSA.
Step 2 Click the Admin tab.
Step 3 In the navigation menu, click Data Sources.
Step 4 Click the Log Sources icon.
Step 5 Click Add.
Step 6 In the Log Source Name field, type a name for your log source.
Step 7 In the Log Source Description field, type a description for your log source.
Step 8 From the Log Source Type list box, select Sun ONE LDAP.

Configuring DSMs
682 SUN SOLARIS
Step 9 From the Protocol Configuration list box, select Log File.
Step 10 From the Event Generator list box, select ID-Linked Multiline.
Step 11 In the Message ID Pattern field, type conn=(\d+) as the regular expression that
defines your multiline events.
Step 12 Configure the following values:
Table 98-2 Log File Protocol Parameters
Parameter Description
Log Source Identifier Type an IP address, hostname, or name to identify the event
source. IP addresses or hostnames are recommended as
they allow JSA to identify a log file to a unique event source.
For example, if your network contains multiple devices, such
as a management console or a file repository, you should
specify the IP address or hostname of the device that created
the event. This allows events to be identified at the device
level in your network, instead of identifying the event for the
management console or file repository.
Service Type From the list box, select the protocol you want to use when
retrieving log files from a remove server. The default is SFTP.
•SFTP - SSH File Transfer Protocol
•FTP - File Transfer Protocol
•SCP - Secure Copy
Note: The underlying protocol used to retrieve log files for the
SCP and SFTP service type requires that the server specified
in the Remote IP or Hostname field has the SFTP subsystem
enabled.
Remote IP or
Hostname
Type the IP address or hostname of the device storing your
event log files.
Remote Port Type the TCP port on the remote host that is running the
selected Service Type. The valid range is 1 to 65535.
The options include:
•FTP - TCP Port 21
•SFTP - TCP Port 22
•SCP - TCP Port 22
Note: If the host for your event files is using a non-standard
port number for FTP, SFTP, or SCP, you must adjust the port
value accordingly.
Remote User Type the user name necessary to log in to the host containing
your event files.
The username can be up to 255 characters in length.
Remote Password Type the password necessary to log in to the host.
Confirm Password Confirm the password necessary to log in to the host.

Configuring DSMs
Sun ONE LDAP 683
SSH Key File If you select SCP or SFTP as the Service Type, this
parameter allows you to define an SSH private key file. When
you provide an SSH Key File, the Remote Password field is
ignored.
Remote Directory Type the directory location on the remote host from which the
files are retrieved, relative to the user account you are using
to log in.
Note: For FTP only. If your log files reside in the remote user’s
home directory, you can leave the remote directory blank. This
is to support operating systems where a change in the
working directory (CWD) command is restricted.
Recursive Select this check box if you want the file pattern to search sub
folders. By default, the check box is clear.
The Recursive option is ignored if you configure SCP as the
Service Type.
FTP File Pattern If you select SFTP or FTP as the Service Type, this option
allows you to configure the regular expression (regex)
required to filter the list of files specified in the Remote
Directory. All matching files are included in the processing.
For example, if you want to list all files starting with the word
log, followed by one or more digits and ending with tar.gz,
use the following entry: log[0-9]+\.tar\.gz. Use of this
parameter requires knowledge of regular expressions (regex).
For more information, see the following website:
http://download.oracle.com/javase/tutorial/essential/regex/
FTP Transfer Mode This option only appears if you select FTP as the Service
Type. The FTP Transfer Mode parameter allows you to define
the file transfer mode when retrieving log files over FTP.
From the list box, select the transfer mode you want to apply
to this log source:
•Binary - Select Binary for log sources that require binary
data files or compressed zip, gzip, tar, or tar+gzip archive
files.
•ASCII - Select ASCII for log sources that require an ASCII
FTP file transfer.
You must select NONE for the Processor parameter and
LINEBYLINE the Event Generator parameter when using
ASCII as the FTP Transfer Mode.
SCP Remote File If you select SCP as the Service Type you must type the file
name of the remote file.
Start Time Type the time of day you want the processing to begin. This
parameter functions with the Recurrence value to establish
when and how often the Remote Directory is scanned for files.
Type the start time, based on a 24 hour clock, in the following
format: HH:MM.
Table 98-2 Log File Protocol Parameters (continued)
Parameter Description

Configuring DSMs
684 SUN SOLARIS
Step 13 Click Save.
Step 14 On the Admin tab, click Deploy Changes.
The configuration is complete.
Recurrence Type the frequency, beginning at the Start Time, that you
want the remote directory to be scanned. Type this value in
hours (H), minutes (M), or days (D). For example, 2H if you
want the directory to be scanned every 2 hours. The default is
1H.
Run On Save Select this check box if you want the log file protocol to run
immediately after you click Save. After the Run On Save
completes, the log file protocol follows your configured start
time and recurrence schedule.
Selecting Run On Save clears the list of previously processed
files for the Ignore Previously Processed File parameter.
EPS Throttle Type the number of Events Per Second (EPS) that you do not
want this protocol to exceed. The valid range is 100 to 5000.
Processor If the files located on the remote host are stored in a zip, gzip,
tar, or tar+gzip archive format, select the processor that
allows the archives to be expanded and contents processed.
Ignore Previously
Processed File(s)
Select this check box to track files that have already been
processed and you do not want the files to be processed a
second time.
This only applies to FTP and SFTP Service Types.
Change Local
Directory?
Select this check box to define the local directory on your JSA
that you want to use for storing downloaded files during
processing.
Most configurations can leave this check box clear. When you
select the check box, the Local Directory field is displayed,
which allows you to configure a local directory to use for
temporarily storing files.
Event Generator Select ID-Linked Multiline to process to the retrieved event
log as multiline events.
The ID-Linked Multiline format processes multiline event logs
that contain a common value at the start of each line in a
multiline event message. This option displays the Message ID
Pattern field that uses regex to identify and reassemble the
multiline event in to single event payload.
Folder Separator Type the character used to separate folders for your operating
system. The default value is /.
Most configurations can use the default value in Folder
Separator field. This field is only used by operating systems
that use an alternate character to define separate folders. For
example, periods that separate folders on mainframe
systems.
Table 98-2 Log File Protocol Parameters (continued)
Parameter Description
Configuring DSMs
96 SYBASE ASE
You can integrate a Sybase Adaptive Server Enterprise (ASE) device with Juniper
Secure Analytics (JSA) to record all relevant events using JDBC.
To configure a Sybase ASE device:
Step 1 Configure Sybase auditing.
For information about configuring Sybase auditing, see your Sybase
documentation.
Step 2 Log in to the Sybase database as an sa user:
isql -Usa -P<password>
Where <password> is the password necessary to access the database.
Step 3 Switch to the security database:
use sybsecurity
go
Step 4 Create a view for JSA.
create view audit_view
as
select audit_event_name(event) as event_name, * from
<audit_table_1>
union
select audit_event_name(event) as event_name, * from
<audit_table_2>
go
Step 5 For each additional audit table in the audit configuration, make sure the union
select parameter is repeated for each additional audit table.
For example, if you want to configure auditing with four audit tables (sysaudits_01,
sysaudits_02,sysaudits_03, sysaudits_04), type the following:
create view audit_view as select audit_event_name(event) as
event_name, * from sysaudits_01
union select audit_event_name(event) as event_name, * from
sysaudits_02,
Configuring DSMs
686 SYBASE ASE
union select audit_event_name(event) as event_name, * from
sysaudits_03,
union select audit_event_name(event) as event_name, * from
sysaudits_04
You are now ready to configure the log source JSA.
To configure JSA to receive events from a Sybase ASE device:
Step 1 Log in to JSA.
Step 2 Click the Admin tab.
Step 3 On the navigation menu, click Data Sources.
The Data Sources panel is displayed.
Step 4 Click the Log Sources icon.
The Log Sources window is displayed.
Step 5 Click Add.
The Add a log source window is displayed.
Step 1 From the Log Source Type list box, select the Sybase ASE option.
Step 2 Using the Protocol Configuration list box, select JDBC.
The JDBC protocol configuration is displayed.
Step 3 Update the JDBC configuration to include the following values:
a Database Name: sybsecurity
b Port: 5000 (Default)
c Username: sa
d Table Name: audit_view
e Compare Field: eventtime
The Database Name and Table Name parameters are case sensitive.
For more information on configuring log sources and protocols, see the Log
Sources Users Guide. For more information about the Sybase ASE device, see
your vendor documentation.

Configuring DSMs
97 SYMANTEC
This section provides information on the following DSMs:
•Symantec Endpoint Protection
•Symantec SGS
•Symantec System Center
•Symantec Data Loss Prevention (DLP)
•Symantec PGP Universal Server
Symantec Endpoint
Protection
The Symantec Endpoint Protection DSM for Juniper Secure Analytics (JSA)
accepts events using syslog.
JSA records all Audit and Security log events. Before configuring a Symantec
Endpoint Protection device in JSA, you must configure your device to forward
syslog events.
Procedure
Step 1 Log in to the Symantec Endpoint Protection Manager
Step 2 On the left panel, click the Admin icon.
The View Servers option is displayed.
Step 3 From the bottom of the View Servers panel, click Servers.
Step 4 From the View Servers panel, click Local Site.
Step 5 From the Tasks panel, click Configure External Logging.
Step 6 On the Generals tab:
a Select the Enable Transmission of Logs to a Syslog Server check box.
b In the Syslog Server field, type the IP address of your JSA you want to parse
the logs.
c In the UDP Destination Port field, type 514.
d In the Log Facility field, type 6.
Step 7 In the Log Filter tab:
a Under the Management Server Logs, select the Audit Logs check box.

Configuring DSMs
688 SYMANTEC
b Under the Client Log panel, select the Security Logs check box.
c Under the Client Log panel, select the Risks check box.
Step 8 Click OK.
You are now ready to configure the log source in JSA.
To configure JSA to receive events from a Symantec Endpoint Protection device:
From the Log Source Type list box, select the Symantec Endpoint
Protection option.
For more information on configuring log sources, see the Log Sources Users
Guide.
Symantec SGS The Symantec Gateway Security (SGS) Appliance DSM for JSA accepts SGS
events using syslog.
JSA records all relevant events from SGS. Before you configure JSA to integrate
with an SGS, you must configure syslog within your SGS appliance. For more
information on Symantec SGS, see your vendor documentation.
After you configure syslog to forward events to JSA, the configuration is complete.
Events forward from Symantec SGS to JSA using syslog are automatically
discovered. However, if you want to manually create a log source for Symantec
SGS:
From the Log Source Type list box, select the Symantec Gateway Security
(SGS) Appliance option.
For more information on configuring devices, see the Log Sources Users Guide.
Symantec System
Center
The Symantec System Center (SSC) DSM for JSA retrieves events from an SSC
database using a custom view created for JSA.
JSA records all SSC events. You must configure the SSC database with a user
that has read and write privileges for the custom JSA view to be able to poll the
view for information. Symantec System Center (SSC) only supports the JDBC
protocol.
Configuring a
Database View for
Symantec System
Center
A database view is required by the JDBC protocol to poll for SSC events.
Procedure
Step 1 In the Microsoft SQL Server database used by the SSC device, configure a custom
default view to support JSA:
The database name must not contain any spaces.
Configuring DSMs
Symantec System Center 689
CREATE VIEW dbo.vw_qradar AS SELECT
dbo.alerts.Idx AS idx,
dbo.inventory.IP_Address AS ip,
dbo.inventory.Computer AS computer_name,
dbo.virus.Virusname AS virus_name,
dbo.alerts.Filepath AS filepath,
dbo.alerts.NoOfViruses AS no_of_virus,
dbo.actualaction.Actualaction AS [action],
dbo.alerts.Alertdatetime AS [date],
dbo.clientuser.Clientuser AS user_name FROM
dbo.alerts INNER JOIN
dbo.virus ON dbo.alerts.Virusname_Idx =
dbo.virus.Virusname_Idx INNER JOIN
dbo.inventory ON dbo.alerts.Computer_Idx =
dbo.inventory.Computer_Idx INNER JOIN
dbo.actualaction ON dbo.alerts.Actualaction_Idx =
dbo.actualaction.Actualaction_Idx INNER JOIN
dbo.clientuser ON dbo.alerts.Clientuser_Idx =
dbo.clientuser.Clientuser_Idx
After you create your custom view, you must configure JSA to receive event
information using the JDBC protocol.
Configuring a Log
Source
To configure JSA to access the SSC database using the JDBC protocol.
Procedure
Step 1 Log in to JSA.
Step 2 Click the Admin tab.
Step 3 On the navigation menu, click Data Sources.
Step 4 Click the Log Sources icon.
Step 5 Click Add.
Step 6 Using the Log Source Type list box, select Symantec System Center.
Step 7 Using the Protocol Configuration list box, select JDBC.

Configuring DSMs
690 SYMANTEC
Step 8 Configure the following:
Table 100-1 Symantec System Center JDBC Parameters
Parameter Description
Log Source
Identifier
Type the identifier for the log source. Type the log source identifier
in the following format:
<SSC Database>@<SSC Database Server IP or Host
Name>
Where:
<SSC Database> is the database name, as entered in the
Database Name parameter.
<SSC Database Server IP or Host Name> is the
hostname or IP address for this log source, as entered in the IP or
Hostname parameter.
Database Type From the list box, select MSDE.
Database Name Type Reporting as the name of the Symantec System Center
database.
IP or Hostname Type the IP address or host name of the Symantec System Center
SQL Server.
Port Type the port number used by the database server. The default
port for MSDE is 1433.
The JDBC configuration port must match the listener port of the
Symantec System Center database. The Symantec System
Center database must have incoming TCP connections enabled to
communicate with JSA.
Note: If you define a Database Instance when using MSDE as the
database type, you must leave the Port parameter blank in your
configuration.
Username Type the username required to access the database.
Password Type the password required to access the database. The
password can be up to 255 characters in length.
Confirm
Password
Confirm the password required to access the database. The
confirmation password must be identical to the password entered
in the Password parameter.
Authentication
Domain
If you select MSDE as the Database Type and the database is
configured for Windows, you must define a Windows
Authentication Domain. Otherwise, leave this field blank.
Database
Instance
Optional. Type the database instance, if you have multiple SQL
server instances on your database server.
Note: If you use a non-standard port in your database
configuration, or have blocked access to port 1434 for SQL
database resolution, you must leave the Database Instance
parameter blank in your configuration.
Table Name Type vw_qradar as the name of the table or view that includes
the event records.

Configuring DSMs
Symantec System Center 691
NOTE
Note: Selecting a value for the Credibility parameter greater than 5 will weight your
Symantec System Center log source with a higher importance compared to other
log sources in JSA.
Step 9 Click Save.
Select List Type * for all fields from the table or view.
You can use a comma separated list to define specific tables or
views, if required for your configuration. The comma separated list
can be up to 255 alphanumeric characters in length. The list can
include the following special characters: dollar sign ($), number
sign (#), underscore (_), en dash (-), and period(.).
Compare Field Type idx as the compare field. The compare field is used to
identify new events added between queries to the table.
Start Date and
Time
Optional. Type the start date and time for database polling.
The Start Date and Time parameter must be formatted as
yyyy-MM-dd HH:mm with HH specified using a 24 hour clock. If the
start date or time is clear, polling begins immediately and repeats
at the specified polling interval.
Use Prepared
Statements
Select this check box to use prepared statements.
Prepared statements allows the JDBC protocol source to setup the
SQL statement one time, then run the SQL statement many times
with different parameters. For security and performance reasons,
we recommend that you use prepared statements.
Clearing this check box requires you to use an alternative method
of querying that does not use pre-compiled statements.
Polling Interval Type the polling interval, which is the amount of time between
queries to the event table. The default polling interval is 10
seconds.
You can define a longer polling interval by appending H for hours
or M for minutes to the numeric value. The maximum polling
interval is 1 week in any time format. Numeric values entered
without an H or M poll in seconds.
EPS Throttle Type the number of Events Per Second (EPS) that you do not
want this protocol to exceed. The default value is 20000 EPS.
Use Named Pipe
Communication
Clear the Use Named Pipe Communications check box.
When using a Named Pipe connection, the username and
password must be the appropriate Windows authentication
username and password and not the database username and
password. Also, you must use the default Named Pipe.
Database
Cluster Name
If you select the Use Named Pipe Communication check box, the
Database Cluster Name parameter is displayed. If you are running
your SQL server in a cluster environment, define the cluster name
to ensure Named Pipe communication functions properly.
Table 100-1 Symantec System Center JDBC Parameters (continued)
Parameter Description

Configuring DSMs
692 SYMANTEC
Step 10 On the Admin tab, click Deploy Changes.
The configuration is complete.
Symantec Data
Loss Prevention
(DLP)
The Symantec Data Loss Protection (DLP) DSM for JSA accepts events from a
Symantec DLP appliance using syslog.
Before configuring JSA, you must configure response rules on your Symantec
DLP. The response rule allows the Symantec DLP appliance to forward syslog
events to JSA when a data loss policy violation occurs. Integrating Symantec DLP
requires you to create two protocol response rules (SMTP and None of SMTP) for
JSA. These protocol response rules create an action to forward the event
information, using syslog, when an incident is triggered.
To configure Symantec DLP with JSA, you must:
1 Create an SMTP response rule.
2 Create a None of SMTP response rule.
3 Configure a log source in JSA.
4 Map Symantec DLP events in JSA.
Creating an SMTP
Response Rule
To configure an SMTP response rule in Symantec DLP:
Procedure
Step 1 Log in to your Symantec DLP user interface.
Step 2 From the menu, select the Manage > Policies > Response Rules.
Step 3 Click Add Response Rule.
Step 4 Select one of the following response rule types:
•Automated Response - Automated response rules are triggered automatically
as incidents occur. This is the default value.
•Smart Response - Smart response rules are added to the Incident Command
screen and handled by an authorized Symantec DLP user.
Step 5 Click Next.
Step 6 Configure the following values:
a Rule Name - Type a name for the rule you are creating. This name should be
descriptive enough for policy authors to identify the rule. For example, JSA
Syslog SMTP.
b Description - Optional. Type a description for the rule you are creating.
Step 7 Click Add Condition.
Step 8 On the Conditions panel, select the following conditions:
•From the first list box, select Protocol or Endpoint Monitoring.
•From the second list box, select Is Any Of.
Configuring DSMs
Symantec Data Loss Prevention (DLP) 693
•From the third list box, select SMTP.
Step 9 On the Actions panel, click Add Action.
Step 10 From the Actions list box, select All: Log to a Syslog Server.
Step 11 Configure the following options:
a Host - Type the IP address of your JSA.
b Port - Type 514 as the syslog port.
c Message -Type the following string to add a message for SMTP events.
LEEF:1.0|Symantec|DLP|2:medium|$POLICY$|suser=$SENDER$|duser=
$RECIPIENTS$|rules=$RULES$|matchCount=$MATCH_COUNT$|blocked=$
BLOCKED$|incidentID=$INCIDENT_ID$|incidentSnapshot=$INCIDENT_
SNAPSHOT$|subject=$SUBJECT$|fileName=$FILE_NAME$|parentPath=$
PARENT_PATH$|path=$PATH$|quarantineParentPath=$QUARANTINE_PAR
ENT_PATH$|scan=$SCAN$|target=$TARGET$
d Level - From this list box, select 6 - Informational.
Step 12 Click Save.
You are now ready to configure your None Of SMTP response rule.
Creating a None of
SMTP Response Rule
To configure a None Of SMTP response rule in Symantec DLP:
Procedure
Step 1 From the menu, select the Manage > Policies > Response Rules.
Step 2 Click Add Response Rule.
Step 3 Select one of the following response rule types:
•Automated Response - Automated response rules are triggered automatically
as incidents occur. This is the default value.
•Smart Response - Smart response rules are added to the Incident Command
screen and handled by an authorized Symantec DLP user.
Step 4 Click Next.
Step 5 Configure the following values:
a Rule Name - Type a name for the rule you are creating. This name should be
descriptive enough for policy authors to identify the rule. For example, JSA
Syslog None Of SMTP.
b Description - Optional. Type a description for the rule you are creating.
Step 6 Click Add Condition.
Step 7 On the Conditions panel, select the following conditions:
•From the first list box, select Protocol or Endpoint Monitoring.
•From the second list box, select Is Any Of.
•From the third list box, select None Of SMTP.
Configuring DSMs
694 SYMANTEC
Step 8 On the Actions panel, click Add Action.
Step 9 From the Actions list box, select All: Log to a Syslog Server.
Step 10 Configure the following options:
a Host - Type the IP address of your JSA.
b Port - Type 514 as the syslog port.
c Message -Type the following string to add a message for None Of SMTP
events.
LEEF:1.0|Symantec|DLP|2:medium|$POLICY$|src=$SENDER$|dst=$REC
IPIENTS$|rules=$RULES$|matchCount=$MATCH_COUNT$|blocked=$BLOC
KED$|incidentID=$INCIDENT_ID$|incidentSnapshot=$INCIDENT_SNAP
SHOT$|subject=$SUBJECT$|fileName=$FILE_NAME$|parentPath=$PARE
NT_PATH$|path=$PATH$|quarantineParentPath=$QUARANTINE_PARENT_
PATH$|scan=$SCAN$|target=$TARGET$
d Level - From this list box, select 6 - Informational.
Step 11 Click Save.
You are now ready to configure JSA.
Configuring a Log
Source
You are now ready to configure the log source in JSA.
JSA automatically detects syslog events for the SMTP and None of SMTP
response rules you created. However, if you want to manually configure JSA to
receive events from a Symantec DLP appliance:
From the Log Source Type list box, select the Symantec DLP option.
For more information on configuring log sources, see the Log Sources Users
Guide. For more information about Symantec DLP, see your vendor
documentation.
Creating an Event
Map for Symantec
DLP Events
Event mapping is required for a number of Symantec DLP events. Due to the
customizable nature of policy rules, most events, except the default policy events
do not contain a predefined JSA Identifier (QID) map to categorize security events.
You can individually map each event for your device to an event category in JSA.
Mapping events allows JSA to identify, coalesce, and track reoccurring events from
your network devices. Until you map an event, all events that are displayed in the
Log Activity tab for Symantec DLP are categorized as unknown. Unknown events
are easily identified as the Event Name column and Low Level Category columns
display Unknown.
Discovering
Unknown Events
As your device forwards events to JSA, it can take time to categorize all of the
events for a device, as some events might not be generated immediately by the
event source appliance or software. It is helpful to know how to quickly search for
unknown events. When you know how to search for unknown events, we

Configuring DSMs
Symantec Data Loss Prevention (DLP) 695
recommend you repeat this search until you are comfortable that you have
identified the majority of your events.
Procedure
Step 1 Log in to JSA.
Step 1 Click the Log Activity tab.
Step 2 Click Add Filter.
Step 3 From the first list box, select Log Source.
Step 4 From the Log Source Group list box, select the log source group or Other.
Log sources that are not assigned to a group are categorized as Other.
Step 5 From the Log Source list box, select your Symantec DLP log source.
Step 6 Click Add Filter.
The Log Activity tab is displayed with a filter for your log source.
Step 7 From the View list box, select Last Hour.
Any events generated by the Symantec DLP DSM in the last hour are displayed.
Events displayed as unknown in the Event Name column or Low Level Category
column require event mapping in JSA.
NOTE
Note: You can save your existing search filter by clicking Save Criteria.
You are now ready to modify the event map.
Modifying the event map
Modifying an event map allows you to manually categorize events to a JSA
Identifier (QID) map. Any event categorized to a log source can be remapped to a
new JSA Identifier (QID).
NOTE
Note: Events that do not have a defined log source cannot be mapped to an event.
Events without a log source display SIM Generic Log in the Log Source column.
Procedure
Step 1 On the Event Name column, double-click an unknown event for Symantec DLP.
The detailed event information is displayed.
Step 2 Click Map Event.
Step 3 From the Browse for QID pane, select any of the following search options to
narrow the event categories for a JSA Identifier (QID):
a From the High-Level Category list box, select a high-level event
categorization.

Configuring DSMs
696 SYMANTEC
For a full list of high-level and low-level event categories or category definitions,
see the Event Categories section of the Juniper Secure Analytics
Administration Guide.
b From the Low-Level Category list box, select a low-level event categorization.
c From the Log Source Type list box, select a log source type.
The Log Source Type list box allows you to search for QIDs from other log
sources. Searching for QIDs by log source is useful when events are similar to
another existing network device. For example, Symantec provides policy and
data loss prevention events, you might select another product that likely
captures similar events.
d To search for a QID by name, type a name in the QID/Name field.
The QID/Name field allows you to filter the full list of QIDs for a specific word,
for example, policy.
Step 4 Click Search.
A list of QIDs are displayed.
Step 5 Select the QID you want to associate to your unknown event.
Step 6 Click OK.
JSA maps any additional events forwarded from your device with the same QID
that matches the event payload. The event count increases each time the event is
identified by JSA.
If you update an event with a new JSA Identifier (QID) map, past events stored in
JSA are not updated. Only new events are categorized with the new QID.
Symantec PGP
Universal Server
The PGP Universal Server DSM for JSA accepts syslog events from PGP
Universal Servers.
Supported Event
Types
JSA accepts all relevant events from the following categories:
•Administration
•Software updates
•Clustering
•Backups
•Web Messenger
•Verified Directory
•Postfix
•Client logs
•Mail

Configuring DSMs
Symantec PGP Universal Server 697
Before you can integrate PGP Universal Server events with JSA, you must enable
and configure PGP Universal Server to forward syslog events to JSA.
Configure Syslog for
PGP Universal Server
To enable external logging to forward syslog events to JSA:
Procedure
Step 1 In a web browser, log in to your PGP server’s administrative interface.
https://<PGP Server IP address>:9000
Step 2 Click Settings.
Step 3 Select the Enable External Syslog check box.
Step 4 From the Protocol list box, select the either UDP or TCP.
By default, JSA uses port 514 to receive UDP syslog or TCP syslog event
messages.
Step 5 In the Hostname field, type the IP address of your JSA console or Event Collector.
Step 6 In the Port field, type 514.
Step 7 Click Save.
The configuration is complete. The log source is added to JSA as PGP Universal
Server events are automatically discovered. Events forwarded to JSA by the PGP
Universal Servers are displayed on the Log Activity tab of JSA.
Configure a Log
Source
JSA automatically discovers and creates a log source for syslog events from PGP
Universal Servers. The following configuration steps are optional.
Procedure
Step 1 Log in to JSA.
Step 2 Click the Admin tab.
Step 3 On the navigation menu, click Data Sources.
Step 4 Click the Log Sources icon.
Step 5 Click Add.
Step 6 In the Log Source Name field, type a name for your log source.
Step 7 In the Log Source Description field, type a description for the log source.
Step 8 From the Log Source Type list box, select PGP Universal Server.
Step 9 Using the Protocol Configuration list box, select Syslog.
Step 10 Configure the following values:
Table 100-2 Syslog Protocol Parameters
Parameter Description
Log Source Identifier Type the IP address or host name for the log source as an
identifier for events from your PGP Universal Server.
Configuring DSMs
698 SYMANTEC
Step 11 Click Save.
Step 12 On the Admin tab, click Deploy Changes.
The configuration is complete.

Configuring DSMs
98 SYMARK
Symark PowerBroker logs all events to a multi-line format in a single event log file,
which is viewed using Symark's pblog utility.
PowerBroker pblogs must be re-formatted using a script and forwarded to Juniper
Secure Analytics (JSA). This configuration requires you download and configure a
script for your Symark PowerBroker appliance before you can forward events to
JSA.
Configure Symark
PowerBroker
To configure a Symark PowerBroker device to forward syslog to JSA:
Step 1 On the Juniper Networks support website, download the following file:
pbforwarder.pl.gz
The script can be downloaded from the following website:
http://www.juniper.net/customers/support/
Step 2 Copy the file to the device that hosts Symark PowerBroker.
NOTE
Note: Perl 5.8 must be installed on the device that hosts Symark PowerBroker.
Step 3 Type the following command to extract the file:
gzip -d pbforwarder.pl.gz
Step 4 Type the following command to set the script file permissions:
chmod +x pbforwarder.pl
Step 5 Using SSH, log in to the device that hosts Symark PowerBroker.
The credentials used to log in must have read, write, and execute permissions for
the log file.
Step 6 Type the appropriate parameters:
Table 101-1 Command Parameters
Parameters Description
-h The -h parameter defines the syslog host receiving the events from
Symark PowerBroker. This is the IP address of your JSA or Event
Collector.

Step 7 Type the following command to start the pbforwarder.pl script.
pbforwarder.pl -h <IP address> -t "pblog -l -t"
Where <IP address> is the IP address of your JSA or Event Collector.
Step 8 Type the following command to stop the pbforwarder.pl script:
kill -QUIT `cat /var/run/pbforwarder.pl.pid`
Step 9 Type the following command to reconnect the pbforwarder.pl script:
kill -HUP `cat /var/run/pbforwarder.pl.pid`
JSA automatically detects and creates a log source from the syslog events
forwarded from a Symark PowerBroker.
-t The -t parameter defines that the command-line is used to tail the log
file and monitor for new output from the listener.
For PowerBroker this must be specified as ”pblog -l -t”.
-p The -p parameter defines the TCP port to be used when forwarding
events.
If nothing is specified, the default is port 514.
-H The -H parameter defines the hostname or IP address for the syslog
header of all sent events. It is recommended that this be the IP
address of the Symark PowerBroker.
-r The -r parameter defines the directory name where you want to create
the process ID (.pid) file. The default is /var/run.
This parameter is ignored if -D is specified.
-l The -I parameter defines the directory name where you want to create
the lock file. The default is /var/lock.
This parameter is ignored if -D is specified.
-D The -D parameter defines that the script should run in the foreground.
The default setting is to run as a daemon and log all internal messages
to the local syslog service.
-f The -f parameter defines the syslog facility and (optionally) the severity
for messages sent to the Event Collector.
If no value is specified, user.info is used.
-a The -a parameter enables an AIX compatible ps method.
This command is only required when using Symark PowerBroker on
AIX systems.
-d The -d parameter enables debug logging.
-v The -v parameter displays the script version information.
Table 101-1 Command Parameters (continued)
Parameters Description

Configuring DSMs
701
Configure a Log
Source
JSA automatically discovers and identifies most incoming syslog events from
external sources. The following configuration steps are optional.
To create a log source:
Step 1 Click the Admin tab.
Step 2 On the navigation menu, click Data Sources.
The Data Sources panel is displayed.
Step 3 Click the Log Sources icon.
The Log Sources window is displayed.
Step 4 In the Log Source Name field, type a name for your Symark PowerBroker log
source.
Step 5 In the Log Source Description field, type a description for the log source.
Step 6 From the Log Source Type list box, select Symark PowerBroker.
Step 7 From the Protocol Configuration list box, select Syslog.
The syslog protocol parameters are displayed.
Step 8 Configure the following values:
Table 101-2 Adding a Syslog Log Source
Parameter Description
Log Source Identifier Type the IP address or hostname for your Symark
PowerBroker appliance.
Enabled Select this check box to enable the log source. By default,
this check box is selected.
Credibility From the list box, select the credibility of the log source. The
range is 0 to 10. The credibility indicates the integrity of an
event or offense as determined by the credibility rating from
the source devices. Credibility increases if multiple sources
report the same event. The default is 5.
Target Event Collector From the list box, select the Event Collector to use as the
target for the log source.
Coalescing Events Select this check box to enable the log source to coalesce
(bundle) events.
Automatically discovered log sources use the default value
configured in the Coalescing Events list box in the System
Settings window, which is accessible on the Admin tab.
However, when you create a new log source or update the
configuration for an automatically discovered log source you
can override the default value by configuring this check box
for each log source. For more information on Settings, see
the Juniper Secure Analytics Administration Guide.

Configuring DSMs
702 SYMARK
Step 9 Click Save.
Step 10 On the Admin tab, click Deploy Changes.
The configuration is complete.
Store Event Payload Select this check box to enable or disable JSA from storing
the event payload.
Automatically discovered log sources use the default value
from the Store Event Payload list box in the System
Settings window, which is accessible on the Admin tab.
However, when you create a new log source or update the
configuration for an automatically discovered log source you
can override the default value by configuring this check box
for each log source. For more information on Settings, see
the Juniper Secure Analytics Administration Guide.
Table 101-2 Adding a Syslog Log Source (continued)
Parameter Description
Configuring DSMs
99 THREATGRID MALWARE THREAT
INTELLIGENCE PLATFORM
The ThreatGRID Malware Threat Intelligence Platform DSM for Juniper Secure
Analytics (JSA) collects malware events by using the log file protocol or syslog.
Supported versions
of ThreatGRID
Malware Threat
Intelligence
JSA supports ThreatGRID Malware Threat Intelligence Platform appliances with
v2.0 software that use the JSA Log Enhanced Event Format (LEEF) Creation
script.
Supported Event
Collection Protocols
for ThreatGRID
Malware Threat
Intelligence
ThreatGRID Malware Threat Intelligence Platform writes malware events that are
readable by JSA.
The LEEF creation script is configured on the ThreatGRID appliance and queries
the ThreatGRID API to write LEEF events that are readable by JSA. The event
collection protocol your log source uses to collect malware events is based on the
script you install on your ThreatGRID appliance.
Two script options are available for collecting LEEF formatted events:
•Syslog - The syslog version of the LEEF creation script allows your
ThreatGRID appliance to forward events directly to JSA. Events that are
forwarded by the syslog script are automatically discovered by JSA.
•Log File - The Log File protocol version of the LEEF creation script allows the
ThreatGRID appliance to write malware events to a file. JSA uses the Log File
protocol to communicate with the event log host to retrieve and parse malware
events.
The LEEF creation script is available from ThreatGRID customer support. For
more information, see the ThreatGRID website (http://www.threatgrid.com) or
email ThreatGRID support at support@threatgrid.com.

Configuring DSMs
704 THREATGRID MALWARE THREAT INTELLIGENCE PLATFORM
ThreatGRID Malware
Threat Intelligence
Configuration
Overview
To integrate ThreatGRID Malware Threat Intelligence events with JSA, you must
complete the following tasks:
1 Download the JSA Log Enhanced Event Format Creation script for your collection
type from the ThreatGRID support website to your appliance.
2 On your ThreatGRID appliance, install and configure the script to poll the
ThreatGRID API for events.
3 On your JSA appliance, configure a log source to collect events based on the
script you installed on your ThreatGRID appliance.
4 Ensure that no firewall rules block communication between your ThreatGRID
installation and the JSA console or managed host that is responsible for retrieving
events.
Configuring a
ThreatGRID Syslog
Log Source
JSA automatically discovers and creates a log source for malware events that are
forwarded from the ThreatGRID Malware Threat Intelligence Platform. This
procedure is optional.
Procedure
Step 1 Log in to JSA.
Step 2 Click the Admin tab.
Step 3 On the navigation menu, click Data Sources.
Step 4 Click the Log Sources icon.
Step 5 Click Add.
Step 6 In the Log Source Name field, type a name for your log source.
Step 7 In the Log Source Description field, type a description for the log source.
Step 8 From the Log Source Type list box, select ThreatGRID Malware Intelligence
Platform.
Step 9 From the Protocol Configuration list box, select Syslog.
Step 10 Configure the following values:
Table 102-3 Syslog Protocol Parameters
Parameter Description
Log Source Identifier Type the IP address or host name for the log source as an
identifier for events from your ThreatGRID Malware
Intelligence Platform.
The log source identifier must be unique for the log source
type.
Enabled Select this check box to enable the log source. By default,
the check box is selected.

Configuring DSMs
705
Step 11 Click Save.
Step 12 On the Admin tab, click Deploy Changes.
Malware events that are forwarded to JSAce are displayed on the Log Activity tab
of JSA.
Configuring a
ThreatGRID Log File
Protocol Log Source
To use the log file protocol to collect events, you must configure a log source in
JSA to poll for the event log that contains your malware events.
Procedure
Step 13 Click the Admin tab.
Step 14 On the navigation menu, click Data Sources.
Step 15 Click the Log Sources icon.
Step 16 Click Add.
Step 17 In the Log Source Name field, type a name for the log source.
Step 18 In the Log Source Description field, type a description for the log source.
Step 19 From the Log Source Type list box, select ThreatGRID Malware Threat
Intelligence Platform.
Credibility From the list box, select the credibility of the log source. The
range is 0 - 10.
The credibility indicates the integrity of an event or offense
as determined by the credibility rating from the source
devices. Credibility increases if multiple sources report the
same event. The default is 5.
Target Event Collector From the list box, select the Event Collector to use as the
target for the log source.
Coalescing Events Select this check box to enable the log source to coalesce
(bundle) events.
By default, automatically discovered log sources inherit the
value of the Coalescing Events list box from the System
Settings in JSA. When you create a log source or edit an
existing configuration, you can override the default value by
configuring this option for each log source.
Incoming Event
Payload
From the list box, select the incoming payload encoder for
parsing and storing the logs.
Store Event Payload Select this check box to enable the log source to store event
payload information.
By default, automatically discovered log sources inherit the
value of the Store Event Payload list box from the System
Settings in JSA. When you create a log source or edit an
existing configuration, you can override the default value by
configuring this option for each log source.
Table 102-3 Syslog Protocol Parameters (continued)
Parameter Description

Configuring DSMs
706 THREATGRID MALWARE THREAT INTELLIGENCE PLATFORM
Step 20 From the Protocol Configuration list box, select Log File.
Step 21 Configure the following values:
Table 102-4 Log file Protocol Parameters
Parameter Description
Log Source Identifier Type an IP address, host name, or name to identify the event
source.
The log source identifier must be unique for the log source
type.
Service Type From the list box, select the protocol that you want to use to
retrieve log files from a remote server. The default is SFTP.
•SFTP - SSH File Transfer Protocol
•FTP - File Transfer Protocol
•SCP - Secure Copy Protocol
The SCP and SFTP service type requires that the host server
in the Remote IP or Hostname field has the SFTP subsystem
enabled.
Remote IP or
Hostname
Type the IP address or host name of the ThreatGRID server
that contains your event log files.
Remote Port Type the port number for the protocol that is selected to
retrieve the event logs from your ThreatGRID server. The
valid range is 1 - 65535.
The list of default service type port numbers:
•FTP - TCP Port 21
•SFTP - TCP Port 22
•SCP - TCP Port 22
Remote User Type the user name that is required to log in to the
ThreatGRID web server that contains your audit event logs.
The user name can be up to 255 characters in length.
Remote Password Type the password to log in to your ThreatGRID server.
Confirm Password Confirm the password to log in to your ThreatGRID server
SSH Key File If you select SCP or SFTP as the Service Type, use this
parameter to define an SSH private key file. When you
provide an SSH Key File, the Remote Password field is
ignored.
Remote Directory Type the directory location on the remote host from which the
files are retrieved, relative to the user account you are using
to log in.
Note: For FTP only. If your log files are in the remote user’s
home directory, you can leave the remote directory blank.
Blank values in the Remote Directory field support operating
systems where a change in the working directory (CWD)
command is restricted.

Configuring DSMs
707
Recursive Select this check box if you want the file pattern to search sub
folders in the remote directory. By default, the check box is
clear.
The Recursive parameter is ignored if you configure SCP as
the Service Type.
FTP File Pattern Type the regular expression (regex) required to filter the list of
files that are specified in the Remote Directory. All files that
match the regular expression are retrieved and processed.
The FTP file pattern must match the name that you assigned
to your ThreatGRID event log. For example, to collect files
that start with leef or LEEF and ends with a text file extension,
type the following value:
(leef|LEEF)+.*\.txt
Use of this parameter requires knowledge of regular
expressions (regex). This parameter applies to log sources
that are configured to use FTP or SFTP.
FTP Transfer Mode If you select FTP as the Service Type, from the list box,
select ASCII.
ASCII is required for text-based event logs.
SCP Remote File If you select SCP as the Service Type, type the file name of
the remote file.
Start Time Type a time value to represent the time of day you want the
log file protocol to start. The start time is based on a 24 hour
clock and uses the following format: HH:MM.
For example, type 00:00 to schedule the Log File protocol to
collect event files at midnight.
This parameter functions with the Recurrence field value to
establish when your ThreatGRID server is polled for new
event log files.
Recurrence Type the frequency that you want to scan the remote directory
on your ThreatGRID server for new event log files. Type this
value in hours (H), minutes (M), or days (D).
For example, type 2H to scan the remote directory every 2
hours from the start time. The default recurrence value is 1H.
The minimum time interval is 15M.
Run On Save Select this check box if you want the log file protocol to run
immediately after you click Save.
After the save action completes, the log file protocol follows
your configured start time and recurrence schedule.
Selecting Run On Save clears the list of previously processed
files for the Ignore Previously Processed File parameter.
EPS Throttle Type the number of events per second (EPS) that you do not
want this protocol to exceed. The valid range is 100 - 5000.
Table 102-4 Log file Protocol Parameters (continued)
Parameter Description

Configuring DSMs
708 THREATGRID MALWARE THREAT INTELLIGENCE PLATFORM
Step 22 Click Save.
Step 23 On the Admin tab, click Deploy Changes.
Malware events that are retrieved by the log source are displayed on the Log
Activity tab of JSA.
Processor From the list box, select NONE.
Processors allow event file archives to be expanded and
processed for their events. Files are processed after they are
downloaded. JSA can process files in zip, gzip, tar, or tar+gzip
archive format.
Ignore Previously
Processed File(s)
Select this check box to track and ignore files that are already
processed.
JSA examines the log files in the remote directory to
determine whether the event log was processed by the log
source. If a previously processed file is detected, the log
source does not download the file. Only new or unprocessed
event log files are downloaded by JSA.
This option applies to FTP and SFTP service types.
Change Local
Directory?
Select this check box to define a local directory on your JSA
appliance to store event log files during processing.
In most scenarios, you can leave this check box not selected.
When this check box is selected, the Local Directory field is
displayed. You can configure a local directory to temporarily
store event log files. After the event log is processed, the
events added to JSA and event logs in the local directory are
deleted.
Event Generator From the Event Generator list box, select LineByLine.
The Event Generator applies extra processing to the retrieved
event files. Each line of the file is a single event. For example,
if a file has 10 lines of text, 10 separate events are created.
Table 102-4 Log file Protocol Parameters (continued)
Parameter Description

Configuring DSMs
100 TIPPING POINT
This section provides information on the following DSMs:
•Tipping Point Intrusion Prevention System
•Tipping Point X505/X506 Device
Tipping Point
Intrusion
Prevention System
The Tipping Point Intrusion Prevention System (IPS) DSM for Juniper Secure
Analytics (JSA) accepts Tipping Point events using syslog.
JSA records all relevant events from either a Local Security Management (LMS)
device or multiple devices with a Security Management System (SMS).
Before you configure JSA to integrate with Tipping Point, you must configure your
device based on type:
•If you are using an SMS, see Configure Remote Syslog for SMS.
•If you are using an LSM, see Configure Notification Contacts for LSM.
Configure Remote
Syslog for SMS
To configure Tipping Point for SMS, you must enable and configure your appliance
to forward events to a remote host using syslog.
To configure your Tipping Point SMS:
Step 1 Log in to the Tipping Point system.
Step 2 On the Admin Navigation menu, select Server Properties.
Step 3 Select the Management tab.
Step 4 Click Add.
The Edit Syslog Notification window is displayed.
Step 5 Select the Enable check box.
Step 6 Configure the following values:
a Syslog Server - Type the IP address of the JSA to receive syslog event
messages.
b Port - Type 514 as the port address.
c Log Type - Select SMS 2.0 / 2.1 Syslog format from the list box.
Configuring DSMs
710 TIPPING POINT
d Facility - Select Log Audit from the list box.
e Severity - Select Severity in Event from the list box.
f Delimiter - Select TAB as the delimiter for the generated logs.
g Include Timestamp in Header - Select Use original event timestamp.
Step 7 Select the Include SMS Hostname in Header check box.
Step 8 Click OK.
You are now ready to configure the log source in JSA.
To configure JSA to receive events from a Tipping Point device:
From the Log Source Type list box, select the Tipping Point Intrusion
Prevention System (IPS) option.
For more information on configuring log sources, see the Log Sources Users
Guide. For more information about your Tipping Point device, see your vendor
documentation.
Configure
Notification Contacts
for LSM
To configure LSM notification contacts:
Step 1 Log in to the Tipping Point system.
Step 2 From the LSM menu, select IPS > Action Sets.
The IPS Profile - Action Sets window is displayed.
Step 3 Click the Notification Contacts tab.
Step 4 In the Contacts List, click Remote System Log.
The Edit Notification Contact page is displayed.
Step 5 Configure the following values:
a Syslog Server - Type the IP address of the JSA to receive syslog event
messages.
b Port - Type 514 as the port address.
c Alert Facility - Select none or a numeric value 0-31 from the list box. Syslog
uses these numbers to identify the message source.
d Block Facility - Select none or a numeric value 0-31 from the list box. Syslog
uses these numbers to identify the message source.
e Delimiter - Select TAB from the list box.
Step 6 Click Add to table below.
Step 7 Configure a Remote system log aggregation period in minutes.

Configuring DSMs
Tipping Point Intrusion Prevention System 711
NOTE
Note: If your JSA resides in a different subnet than your Tipping Point device, you
might have to add static routes. For more information, see your vendor
documentation.
Step 8 Click Save.
You are now ready to configure the action set for your LSM, see Configuring an
Action Set for LSM.
Configuring an
Action Set for LSM
To configure an action set for your LSM:
Step 1 Log in to the Tipping Point system.
Step 2 From the LSM menu, select IPS > Action Sets.
The IPS Profile - Action Sets window is displayed.
Step 3 Click Create Action Set.
The Create/Edit Action Set window is displayed.
Step 4 Type the Action Set Name.
Step 5 For Actions, select a flow control action setting:
•Permit - Allows traffic.
•Rate Limit - Limits the speed of traffic. If you select Rate Limit, you must also
select the desired rate.
•Block - Does not permit traffic.
•TCP Reset - When used with the Block action, resets the source, destination,
or both IP addresses of an attack. This option resets blocked TCP flows.
•Quarantine - When used with the Block action, blocks an IP address (source or
destination) that triggers the filter.
Step 6 Select the Remote System Log check box for each action you have selected.
Step 7 Click Create.
Step 8 You are now ready to configure the log source in JSA.
To configure JSA to receive events from a Tipping Point device.
From the Log Source Type list box, select the Tipping Point Intrusion
Prevention System (IPS) option.
For more information on configuring log sources, see the Log Sources Users
Guide. For more information about your Tipping Point device, see your vendor
documentation.

Configuring DSMs
712 TIPPING POINT
Tipping Point
X505/X506 Device
The Tipping Point X505/X506 DSM for JSA accepts events using syslog.
Supported Event
Types
JSA records all relevant system, audit, VPN, and firewall session events.
Configure Syslog To configure your device to forward events to JSA:
Step 1 Log in to the Tipping Point X505/X506 device.
Step 2 From the LSM menu, select System > Configuration > Syslog Servers.
The Syslog Servers window is displayed.
Step 3 For each log type you want to forward, select a check box and type the IP address
of your JSA.
NOTE
Note: If your JSA resides in a different subnet than your Tipping Point device, you
might have to add static routes. For more information, see your vendor
documentation.
Step 4 You are now ready to configure the log source in JSA.
To configure JSA to receive events from a Tipping Point X505/X506 device:
From the Log Source Type list box, select the Tipping Point X Series
Appliances option.
For more information on configuring log sources, see the Log Sources Users
Guide.
NOTE
Note: If you have a previously configured Tipping Point X505/X506 DSM installed
and configured on your JSA, the Tipping Point X Series Appliances option is still
displayed in the Log Source Type list box. However, any new Tipping Point
X505/X506 DSM you configure, you must select the Tipping Point Intrusion
Prevention System (IPS) option.
Configuring DSMs
101 TOP LAYER IPS
The Top Layer IPS DSM for Juniper Secure Analytics (JSA) accepts Top Layer IPS
events using syslog.
JSA records and processes Top Layer events. Before you configure JSA to
integrate with a Top Layer device, you must configure syslog within your Top Layer
IPS device. For more information on configuring Top Layer, see your Top Layer
documentation.
The configuration is complete. The log source is added to JSA as Top Layer IPS
events are automatically discovered. Events forwarded to JSA by Top Layer IPS
are displayed on the Log Activity tab of JSA.
To configure JSA to receive events from a Top Layer IPS device:
From the Log Source Type list box, select the Top Layer Intrusion
Prevention System (IPS) option.
For more information on configuring log sources, see the Log Sources Users
Guide. For more information about your Top Layer device, see your vendor
documentation.

Configuring DSMs
102 TREND MICRO
This section provides information on the following DSMs:
•Trend Micro InterScan VirusWall
•Trend Micro Control Manager
•Trend Micro Office Scan
•Trend Micro Deep Discovery
Trend Micro
InterScan VirusWall
The Trend Micro InterScan VirusWall DSM for Juniper Secure Analytics (JSA)
accepts events using syslog.
You can integrate InterScan VirusWall logs with JSA using the Adaptive Log
Exporter. For more information on the Adaptive Log Exporter, see the Adaptive
Log Exporter Users Guide.
After you configure the Adaptive Log Exporter, the configuration is complete. The
log source is added to JSA as Trend Micro InterScan VirusWall events are
automatically discovered. Events forwarded to JSA by Trend Micro InterScan
VirusWall are displayed on the Log Activity tab of JSA.
To manually configure JSA to receive events from an InterScan VirusWall device:
From the Log Source Type list box, select the Trend InterScan VirusWall
option.
For more information on configuring devices, see the Log Sources Users Guide.
For more information about your Trend Micro InterScan VirusWall device, see your
vendor documentation.

Configuring DSMs
716 TREND MICRO
Trend Micro
Control Manager
You can integrate a Trend Micro Control Manager device with JSA.
A Trend Micro Control Manager accepts events using SNMPv1 or SNMPv2.
Before you configure JSA to integrate with a Trend Micro Control Manager device,
you must configure a log source, then configure SNMP trap settings for your Trend
Micro Control Manager.
Configure a Log
Source
JSA does not automatically discover SNMP events from Trend Micro Control
Manager.
You must configure an SNMP log source for your Trend Micro Control Manager to
use the SNMPv1 or SNMPv2 protocol. SNMPv3 is not supported by Trend Micro
Control Manager.
Procedure
Step 1 Log in to JSA.
Step 2 Click the Admin tab.
Step 3 On the navigation menu, click Data Sources.
Step 4 Click the Log Sources icon.
Step 5 Click Add.
Step 6 In the Log Source Name field, type a name for your log source.
Step 7 In the Log Source Description field, type a description for the log source.
Step 8 From the Log Source Type list box, select Trend Micro Control Manager.
Step 9 Using the Protocol Configuration list box, select SNMPv2.
SNMPv3 is not supported by Trend Micro Control Manager.
Step 10 Configure the following values:
Step 11 Click Save.
Table 105-1 SNMPv2 Protocol Parameters
Parameter Description
Log Source Identifier Type the IP address or host name for the log source as an
identifier for events from your Trend Micro Control Manager
appliance.
Community Type the SNMP community name required to access the
system containing SNMP events. The default is Public.
Include OIDs in Event
Payload
Clear the Include OIDs in Event Payload check box, if
selected.
This options allows the SNMP event payload to be
constructed using name-value pairs instead of the standard
event payload format. Including OIDs in the event payload is
required for processing SNMPv2 or SNMPv3 events from
certain DSMs.

Configuring DSMs
Trend Micro Office Scan 717
Step 12 On the Admin tab, click Deploy Changes.
The configuration is complete.
Configure SNMP
Traps
To configure SNMP traps for Trend Micro Control Manager:
NOTE
Note: Trend Micro Control Manager v5.5 requires hotfix 1697 or hotfix 1713 after
Service Pack 1 Patch 1 to provide correctly formatted SNMPv2c events. For more
information, see your vendor documentation.
Procedure
Step 1 Log in to the Trend Micro Control Manager device.
Step 2 Select Administration > Settings > Event Center Settings.
Step 3 Set the SNMP trap notifications:
a In the SNMP Trap Settings field, type the Community Name.
b Type the JSA server IP address.
Step 4 Click Save.
You are now ready to configure events in the Event Center.
Step 1 Select Administration > Event Center.
Step 2 From the Event Category list, expand Alert.
Step 3 Click Recipients for an alert.
Step 4 In Notification methods, select the SNMP Trap Notification check box.
Step 5 Click Save.
The Edit Recipients Result window is displayed.
Step 6 Click OK.
Step 7 Repeat Step 2 to Step 6 for every alert that requires an SNMP Trap Notification.
The configuration is complete. Events from Trend Micro Control Manager are
displayed on the Log Activity tab of JSA. For more information on Trend Micro
Control Manager, see your vendor documentation.
Trend Micro Office
Scan
A Trend Micro Office Scan DSM for JSA accepts events using SNMPv2.
JSA records events relevant to virus and spyware events. Before configuring a
Trend Micro device in JSA, you must configure your device to forward SNMPv2
events.
Configuring DSMs
718 TREND MICRO
JSA has two options for integrating with a Trend Micro device depending on your
device version:
•Integrating with Trend Micro Office Scan 8.x
•Integrating with Trend Micro Office Scan 10.x
Integrating with
Trend Micro Office
Scan 8.x
To integrate a Trend Micro Office Scan 8.x device with JSA:
Procedure
Step 1 Log in to the Office Scan Administration interface.
Step 2 Select Notifications.
Step 3 Configure the General Settings for SNMP Traps:
a In the Server IP Address field, type the IP address of the JSA.
Note: Do not change the community trap information.
b Click Save.
Step 4 Configure the Standard Alert Notification:
a Select Standard Notifications.
b Click the SNMP Trap tab.
c Select the Enable notification via SNMP Trap for Virus/Malware Detections
check box.
d Type the following message in the field (this should be the default):
Virus/Malware: %v
Computer: %s
Domain: %m
File: %p
Date/Time: %y
Result: %a
e Select the Enable notification via SNMP Trap for Spyware/Grayware
Detections check box.
f Type the following message in the field (this should be the default):
Spyware/Grayware: %v
Computer: %s
Domain: %m
Date/Time: %y
Result: %a
Step 5 Click Save.
Step 6 Configure Outbreak Alert Notifications:
a Select Out Notifications.
b Click the SNMP Trap tab.
c Select the Enable notification via SNMP Trap for Virus/Malware Outbreaks
check box.
Configuring DSMs
Trend Micro Office Scan 719
d Type the following message in the field (this should be the default):
Number of viruses/malware: %CV
Number of computers: %CC
Log Type Exceeded: %A
Number of firewall violation logs: %C
Number of shared folder sessions: %S
Time Period: %T
e Select the Enable notification via SNMP Trap for Spyware/Grayware
Outbreaks check box.
f Type the following message in the field (this should be the default):
Number of spyware/grayware: %CV
Number of computers: %CC
Log Type Exceeded: %A
Number of firewall violation logs: %C
Number of shared folder sessions: %S
Time Period: %T
g Click Save.
Step 7 You are now ready to configure the log sources in JSA.
To configure the Trend Micro Office Scan device:
Step 1 From the Log Source Type list box, select the Trend Micro Office Scan option.
Step 2 From the Protocol Configuration list box, select the SNMPv2 option.
For more information on configuring log sources, see the Log Sources Users
Guide.
Integrating with
Trend Micro Office
Scan 10.x
Before you configure JSA to integrate with a Trend Micro Office Scan 10.x device,
you must:
1 Configure the SNMP settings for Trend Micro Office Scan 10.x.
2 Configure standard notifications.
3 Configure outbreak criteria and alert notifications.
Configure General Settings
To integrate a Trend Micro Office Scan 10.x device with JSA:
Step 1 Log in to the Office Scan Administration interface.
Step 2 Select Notifications > Administrator Notifications > General Settings.
Step 3 Configure the General Settings for SNMP Traps:
a In the Server IP Address field, type the IP address of your JSA.
b Type a community name for your Trend Micro Office Scan device.
c Click Save.

Configuring DSMs
720 TREND MICRO
You must now configure the Standard Notifications for Office Scan.
Configure Standard Notifications
To configure standard notifications:
Step 1 Select Notifications > Administrator Notifications > Standard Notifications.
Step 2 Define the Criteria settings.
a Click the Criteria tab.
b Select the option to alert administrators on the detection of virus/malware and
spyware/grayware, or when the action on these security risks is unsuccessful.
Step 3 To enable notifications:
a Configure the SNMP Trap tab.
b Select the Enable notification via SNMP Trap check box.
c Type the following message in the field:
Virus/Malware: %v
Spyware/Grayware: %T
Computer: %s
IP address: %i
Domain: %m
File: %p
Date/Time: %y
Result: %a
User name: %n
Step 4 Click Save.
You must now configure Outbreak Notifications.
Configure Outbreak Criteria and Alert Notifications
To configure outbreak criteria and alert notifications:
Step 1 Select Notifications > Administrator Notifications > Outbreak Notifications.
Step 2 Click the Criteria tab.
Step 3 Type the number of detections and detection period for each security risk.
Notification messages are sent to an administrator when the criteria exceeds the
specified detection limit.
NOTE
Note: Trend Micro recommends using the default values for the detection number
and detection period.
Step 4 Select Shared Folder Session Link and enable Office Scan to monitor for firewall
violations and shared folder sessions.
NOTE
Note: To view computers on the network with shared folders or computers
currently browsing shared folders you can select the number link in the interface.

Configuring DSMs
Trend Micro Deep Discovery 721
Step 5 Click the SNMP Trap tab.
a Select the Enable notification via SNMP Trap check box.
b Type the following message in the field:
Number of viruses/malware: %CV
Number of computers: %CC
Log Type Exceeded: %A
Number of firewall violation logs: %C
Number of shared folder sessions: %S
Time Period: %T
Step 6 Click Save.
Step 7 You are now ready to configure the log source in JSA.
To configure the Trend Micro Office Scan device:
Step 1 From the Log Source Type list box, select the Trend Micro Office Scan option.
Step 2 From the Protocol Configuration list box, select the SNMPv2 option.
For more information on configuring log sources, see the Log Sources Users
Guide.
Trend Micro Deep
Discovery
The Trend Micro Deep Discovery DSM for JSA accepts syslog events using the
Log Enhanced Event Format (LEEF).
Before you can collect events in JSA, you must configure your Trend Micro Deep
Discovery appliance to forward syslog events in LEEF format.
To configure Trend Micro Deep Discovery, you must:
1 Configure syslog events for Trend Micro Deep Discovery.
2 Optional. Configure a Trend Micro Deep Discovery log source in JSA.
Supported Event
Types
JSA is capable of collecting events from the following categories in Trend Micro
Deep Discovery:
•Malicious content events
•Malicious behavior events
•Suspicious behavior events
•Exploit events
•Grayware events
•Web reputation events
•Disruptive application events
•Sandbox events
•Correlation events

Configuring DSMs
722 TREND MICRO
•System events
•Update events
Configuring Syslog
for Trend Micro Deep
Discovery
You must configure Trend Micro Deep Discovery to forward syslog events to
integration with JSA.
Procedure
Step 1 Log in to your Trend Micro Deep Discovery console.
Step 2 From the navigation menu, select Logs > Syslog Server Settings.
The Syslog Server Settings pane is displayed.
Step 3 Select the Enable Syslog Server check box.
Step 4 In the IP address field, type the IP address of your JSA.
Step 5 In the Port number field, type 514.
Port 514 is the default port for all syslog events forwarded to JSA.
Step 6 From the Syslog facility list box, select a local facility.
For example, local3.
Step 7 From the Syslog severity list box, select a severity level.
For example, Info. The severity level you select includes messages for the
selected severity, plus any messages that are higher in severity.
Step 8 In the Syslog format field, select the LEEF option.
Step 9 In the Detections pane, select any check boxes for the events you want to forward
to JSA.
NOTE
Note: To forward all possible detections to JSA, click the Select all check box.
Step 10 Click Save.
You are now ready to configure the log source in JSA.
Configuring a Log
Source
JSA automatically discovers and creates a log source for LEEF formatted syslog
events from Trend Micro Deep Discovery. The configuration steps for creating a
log source are optional.
Procedure
Step 1 Log in to JSA.
Step 2 Click the Admin tab.
Step 3 On the navigation menu, click Data Sources.
Step 4 Click the Log Sources icon.
Step 5 Click Add.

Configuring DSMs
Trend Micro Deep Discovery 723
Step 6 In the Log Source Name field, type a name for the log source.
Step 7 In the Log Source Description field, type a description for the log source.
Step 8 From the Log Source Type list box, select Trend Micro Deep Discovery.
Step 9 Using the Protocol Configuration list box, select Syslog.
Step 10 Configure the following values:
Step 11 Click Save.
Step 12 On the Admin tab, click Deploy Changes.
The configuration is complete.
Table 105-2 Syslog Protocol Parameters
Parameter Description
Log Source Identifier Type an IP address, hostname, or name to identify the event
source.
IP addresses or host names are recommended as they allow
JSA to identify your device as a unique event source.
Configuring DSMs
103 TRIPWIRE
The Tripwire DSM for Juniper Secure Analytics (JSA) accepts resource additions,
removal, and modification events using syslog.
Procedure
Step 1 Log in to the Tripwire interface.
Step 2 On the left-hand navigation, click Actions.
Step 3 Click New Action.
Step 4 Configure the new action.
Step 5 Select Rules and click on the desired rule you wish to monitor.
Step 6 Select the Actions tab.
Step 7 Make sure the new action is selected.
Step 8 Click OK.
Step 9 Repeat Step 5 to Step 8 for each rule you want to monitor.
You are now ready to configure the log source in JSA.
To configure JSA to receive events from a Tripwire device:
From the Log Source Type list box, select the Tripwire Enterprise option.
For more information on configuring log sources, see the Log Sources Users
Guide. For more information about your Tripwire device, see your vendor
documentation.
Configuring DSMs
104 TROPOS CONTROL
The Tropos Control DSM for Juniper Secure Analytics (JSA) accepts events using
syslog.
JSA is capable of recording all fault management, login and logout events,
provisioning events, and device image upload events. Before configuring JSA, you
must configure your Tropos Control to forward syslog events.
You can configure Tropos Control to forward logs using syslog to JSA.
Procedure
Step 1 Using SSH, log in to your Tropos Control device as a root user.
Step 2 Open the following file for editing:
/opt/ControlServer/ems/conf/logging.properties
Step 3 To enable syslog, remove the comment marker (#) from the following line:
#log4j.category.syslog = INFO, syslog
Step 4 To configure the IP address for the syslog destination, edit the following line:
log4j.appender.syslog.SyslogHost = <IP address>
Where <IP address> is the IP address or hostname of JSA.
By default, Tropos Control uses a facility of USER and a default log level of INFO.
These default settings are correct for syslog event collection from a Tropos Control
device.
Step 5 Save and exit the file.
You are now ready to configure the Tropos Control DSM in JSA.
To configure JSA to receive events from Tropos Control:
From the Log Source Type list box, select Tropos Control.
For more information on configuring log sources, see the Log Sources Users
Guide.
Configuring DSMs
105 TRUSTEER APEX LOCAL EVENT
AGGREGATOR
Juniper Secure Analytics (JSA) can collect and categorize malware, exploit, and
data exfiltration detection events from Trusteer Apex Local Event Aggregator.
Configuration
Overview
To collect syslog events, you must configure your Trusteer Apex Local Event
Aggregator to forward syslog events to JSA. Administrators can use the Apex
L.E.A. management console interface to configure a syslog target for events. JSA
automatically discovers and creates log sources for syslog events that are
forwarded from Trusteer Apex Local Event Aggregator appliances. JSA supports
syslog events from Trusteer Apex Local Event Aggregator V1304.x and later.
To integrate events with JSA, administrators can complete the following tasks:
1 On your Trusteer Apex Local Event Aggregator appliance, configure syslog server.
2 On your JSA system, verify that the forwarded events are automatically
discovered.
Configuring Syslog
for Trusteer Apex
Local Event
Aggregator
To collect events, you must configure a syslog server on your Trusteer Apex Local
Event Aggregator to forward syslog events.
Procedure
To configure syslog for Trusteer Apex Local Event Aggregator:
Step 1 Log in to the Trusteer Apex L.E.A. management console.
Step 2 From the navigation menu, select Configuration.
Step 3 To export the current Trusteer Apex Local Event Aggregator configuration, click
Export and save the file.
Step 4 Open the configuration file with a text editor.
Step 5 From the syslog.event_targets section, add the following information:
{
“host”: “<QRadar IP address>”,
“port”: “514”,
“proto”: “tcp”
}
Step 6 Save the configuration file.
Configuring DSMs
730 TRUSTEER APEX LOCAL EVENT AGGREGATOR
Step 7 From the navigation menu, select Configuration.
Step 8 Click Choose file and select the new configuration file that contains the event
target IP address.
Step 9 Click Import.
Result
As syslog events are generated by the Trusteer Apex Local Event Aggregator, they
are forwarded to the target specified in the configuration file. The log source is
automatically discovered after enough events are forwarded to JSA. It typically
takes a minimum of 25 events to automatically discover a log source.
What to do next
Administrators can log in to the JSA console and verify that the log source is
created. The Log Activity tab displays events from Trusteer Apex Local Event
Aggregator.
Configuring DSMs
106 UNIVERSAL DSM
Juniper Secure Analytics (JSA) can collect and correlates events from any network
infrastructure or security device using the Universal DSM.
After the events are collected and before the correlation can begin. The individual
events from your devices must be properly parsed to determine the event name, IP
addresses, protocol, and ports. For common network devices, such as Cisco
Firewalls, predefined DSMs have been engineered for JSA to properly parse and
classify the event messages from the respective devices. After the events from a
device have been parsed by the DSM, JSA can continue to correlate events into
offenses.
If an enterprise network has one or more network or security devices that are not
officially supported, where no specific DSM for the device exists, you can use the
Universal DSM. The Universal DSM allows you to forward events and messages
from unsupported devices and use the Universal DSM to categorize the events for
JSA. JSA can integrate with virtually any device or any common protocol source
using the Universal DSM. For more information on the available protocols for
retrieving events or logs from devices, see the Log Sources Users Guide.
To configure the Universal DSM, you must use device extensions to associate a
Universal DSM to devices. Before you define device extension information using
the log sources window in the Admin tab, you must create an extensions
document for the log source.
For more information on writing and testing a Universal DSM, see our support
forum at http://www.juniper.net/customers/support/.

Configuring DSMs
107 UNIVERSAL LEEF
The Universal LEEF DSM for Juniper Secure Analytics (JSA) can accept events
from devices that produce events using the Log Event Extended Format (LEEF).
The LEEF event format is a proprietary event format, which allows hardware
manufacturers and software product manufacturers to read and map device events
specifically designed for JSA integration.
LEEF formatted events sent to JSA outside of the partnership program require you
to have installed the Universal LEEF DSM and manually identify each event
forwarded to JSA by mapping unknown events. The Universal LEEF DSM can
parse events forwarded from syslog or files containing events in the LEEF format
polled from a device or directory using the Log File protocol.
To configure events in JSA using Universal LEEF, you must:
1 Configure a Universal LEEF log source in JSA.
2 Send LEEF formatted events from your device to JSA. For more information on
forwarding events, see your vendor documentation.
3 Map unknown events to JSA Identifiers (QIDs).
Configuring a
Universal LEEF Log
Source
Before you configure your device to send events to JSA, you must add a log
source for the device providing LEEF events.
JSA can receive events from a real-time source using syslog or files stored on a
device or in a repository using the Log File protocol.
Configuring Syslog
to Collect Universal
LEEF Events
To configure a log source for Universal LEEF using syslog:
Procedure
Step 1 Log in to JSA.
Step 2 Click the Admin tab.
Step 3 On the navigation menu, click Data Sources.
Step 4 Click the Log Sources icon.
Step 5 Click Add.

Configuring DSMs
734 UNIVERSAL LEEF
Step 6 In the Log Source Name field, type a name for your log source.
Step 7 In the Log Source Description field, type a description for the log source.
Step 8 From the Log Source Type list box, select Universal LEEF.
Step 9 Using the Protocol Configuration list box, select Syslog.
Step 10 Configure the following values:
Step 11 Click Save.
Step 12 On the Admin tab, click Deploy Changes.
The log source is added to JSA. You are now ready to forward LEEF events to
JSA.
Configuring the Log
File Protocol to
Collect Universal
LEEF Events
The Log File protocol allows JSA to retrieve archived event or log files from a
remote host or file repository.
The files are transferred, one at a time, to JSA for processing. JSA reads the event
files and updates the log source with new events. Due to the Log File protocol
polling for archive files, the events are not provided in real-time, but added in bulk.
The log file protocol can manage plain text, compressed files, or archives.
Procedure
Step 1 Log in to JSA.
Step 2 Click the Admin tab.
Step 3 On the navigation menu, click Data Sources.
Step 4 Click the Log Sources icon.
Step 5 In the Log Source Name field, type a name for the Universal LEEF log source.
Step 6 In the Log Source Description field, type a description for the Universal LEEF log
source.
Step 7 From the Log Source Type list box, select Universal LEEF.
Step 8 Using the Protocol Configuration list box, select Log File.
Table 110-3 Syslog Protocol Parameters
Parameter Description
Log Source Identifier Type the IP address or hostname for the log source as an
identifier for Universal LEEF events.

Configuring DSMs
Configuring a Universal LEEF Log Source 735
Step 9 Configure the following parameters:
Table 110-1 Log File Protocol Parameters
Parameter Description
Log Source Identifier Type the IP address or hostname for your Universal LEEF log
source. This value must match the value configured in the
Remote Host IP or Hostname parameter.
The log source identifier must be unique for the log source
type.
Service Type From the list box, select the protocol you want to use when
retrieving log files from a remove server. The default is SFTP.
•SFTP - SSH File Transfer Protocol
•FTP - File Transfer Protocol
•SCP - Secure Copy
Note: The underlying protocol used to retrieve log files for the
SCP and SFTP service type requires that the server specified
in the Remote IP or Hostname field has the SFTP subsystem
enabled.
Remote IP or
Hostname
Type the IP address or hostname of the host from which you
want to receive files.
Remote Port Type the TCP port on the remote host that is running the
selected Service Type. If you configure the Service Type as
FTP, the default is 21. If you configure the Service Type as
SFTP or SCP, the default is 22. The valid range is 1 to 65535.
Remote User Type the username necessary to log in to the host running the
selected Service Type. The username can be up to 255
characters in length.
Remote Password Type the password necessary to log in to the host containing
the LEEF event files.
Confirm Password Confirm the Remote Password to log in to the host containing
the LEEF event files.
SSH Key File If you select SCP or SFTP as the Service Type, this
parameter allows you to define an SSH private key file. When
you provide an SSH Key File, the Remote Password option is
ignored.
Remote Directory Type the directory location on the remote host from which the
files are retrieved.
Note: For FTP only. If your log files reside in the remote user’s
home directory, you can leave the remote directory blank. This
is to support operating systems where a change in the
working directory (CWD) command is restricted.
Recursive Select this check box if you want the file pattern to search sub
folders. By default, the check box is clear.
The Recursive parameter is not used if you configure SCP as
the Service Type.

Configuring DSMs
736 UNIVERSAL LEEF
FTP File Pattern If you select SFTP or FTP as the Service Type, this option
allows you to configure the regular expression (regex)
required to filter the list of files specified in the Remote
Directory. All matching files are included in the processing.
For example, if you want to list all files starting with the word
log, followed by one or more digits and ending with tar.gz,
use the following entry: log[0-9]+\.tar\.gz. Use of this
parameter requires knowledge of regular expressions (regex).
For more information, see the following website:
http://download.oracle.com/javase/tutorial/essential/regex/
FTP Transfer Mode This option is only displayed if you select FTP as the Service
Type. The FTP Transfer Mode parameter allows you to define
the file transfer mode when retrieving log files over FTP.
From the list box, select the transfer mode you want to apply
to this log source:
•Binary - Select Binary for log sources that require binary
data files or compressed zip, gzip, tar, or tar+gzip archive
files.
•ASCII - Select ASCII for log sources that require an ASCII
FTP file transfer.
You must select NONE as the Processor and LINEBYLINE
as the Event Generator when using ASCII as the FTP
Transfer Mode.
SCP Remote File If you select SCP as the Service Type you must type the file
name of the remote file.
Start Time Type the time of day you want processing to begin. This
parameter functions with the Recurrence value to establish
when and how often the Remote Directory is scanned for files.
Type the start time, based on a 24 hour clock, in the following
format: HH:MM.
Recurrence Type the frequency, beginning at the Start Time, that you
want the remote directory to be scanned. Type this value in
hours (H), minutes (M), or days (D).
For example, type 2H if you want the directory to be scanned
every 2 hours. The default is 1H.
Run On Save Select this check box if you want the log file protocol to run
immediately after you click Save. After the Run On Save
completes, the log file protocol follows your configured start
time and recurrence schedule.
Selecting Run On Save clears the list of previously processed
files for the Ignore Previously Processed File parameter.
EPS Throttle Type the number of Events Per Second (EPS) that you do not
want this protocol to exceed. The valid range is 100 to 5000.
Table 110-1 Log File Protocol Parameters (continued)
Parameter Description

Configuring DSMs
Forwarding Events to JSA 737
Step 10 Click Save.
Step 11 On the Admin tab, click Deploy Changes.
The log source is added to JSA. You are now ready to write LEEF events that can
be retrieved using the Log File protocol.
Forwarding Events
to JSA
After you have created your log source, you are ready to forward or retrieve events
for JSA. Forwarding events using syslog might require additional configuration
from your network device.
As events are discovered by JSA, either using syslog or polling for log files, events
are displayed in the Log Activity tab. The events for your device forwarding LEEF
events are identified by the name you typed in the Log Source Name field. The
events for your log source are not categorized by default in JSA and require
categorization. For more information on categorizing your Universal LEEF events,
see Creating a Universal LEEF Event Map.
Creating a
Universal LEEF
Event Map
Event mapping is required for the Universal LEEF DSM, as Universal LEEF events
do not contain a predefined JSA Identifier (QID) map to categorize security events.
Members of the SIPP partner program have QID maps designed for their network
devices, the configuration documented, and the QID maps tested by Juniper
Networks
Processor If the files located on the remote host are stored in a zip, gzip,
tar, or tar+gzip archive format, select the processor that
allows the archives to be expanded and contents processed.
Ignore Previously
Processed File(s)
Select this check box to track files that have already been
processed that you do not want to be processed a second
time. This only applies to FTP and SFTP Service Types.
Change Local
Directory?
Select this check box to define the local directory on your JSA
system that you want to use for storing downloaded files
during processing.
We recommend that you leave this check box clear. When the
check box is selected, the Local Directory field is displayed,
allowing you to configure the local directory to use for storing
files.
Event Generator From the Event Generator list box, select LineByLine.
The Event Generator applies additional processing to the
retrieved event files. The LineByLine option reads each line of
the file as single event. For example, if a file has 10 lines of
text, 10 separate events are created.
Table 110-1 Log File Protocol Parameters (continued)
Parameter Description

Configuring DSMs
738 UNIVERSAL LEEF
The Universal LEEF DSM requires that you individually map each event for your
device to an event category in JSA. Mapping events allows JSA to identify,
coalesce, and track reoccurring events from your network devices. Until you map
an event, all events that are displayed in the Log Activity tab for the Universal
LEEF DSM are categorized as unknown. Unknown events are easily identified as
the Event Name column and Low Level Category columns display Unknown.
Discovering
Unknown Events
As your device forwards events to JSA, it can take time to categorize all of the
events for a device, as some events might not be generated immediately by the
event source appliance or software. It is helpful to know how to quickly search for
unknown events. When you know how to search for unknown events, we
recommend you repeat this search until you are comfortable that you have
identified the majority of your Universal LEEF events.
Procedure
Step 1 Log in to JSA.
Step 1 Click the Log Activity tab.
Step 2 Click Add Filter.
Step 3 From the first list box, select Log Source.
Step 4 From the Log Source Group list box, select the log source group or Other.
Log sources that are not assigned to a group are categorized as Other.
Step 5 From the Log Source list box, select your Universal LEEF log source.
Step 6 Click Add Filter.
The Log Activity tab is displayed with a filter for your Universal LEEF DSM.
Step 7 From the View list box, select Last Hour.
Any events generated by your Universal LEEF DSM in the last hour are displayed.
Events displayed as unknown in the Event Name column or Low Level Category
column require event mapping in JSA.
NOTE
Note: You can save your existing search filter by clicking Save Criteria.
You are now ready to modify the event map for your Universal LEEF DSM.
Modifying an Event
Map
Modifying an event map allows you to manually categorize events to a JSA
Identifier (QID) map. Any event categorized to a log source can be remapped to a
new JSA Identifier (QID). By default, the Universal LEEF DSM categorizes all
events as unknown.
NOTE
Note: Events that do not have a defined log source cannot be mapped to an event.
Events without a log source display SIM Generic Log in the Log Source column.

Configuring DSMs
Creating a Universal LEEF Event Map 739
Procedure
Step 1 On the Event Name column, double-click an unknown event for your Universal
LEEF DSM.
The detailed event information is displayed.
Step 2 Click Map Event.
Step 3 From the Browse for QID pane, select any of the following search options to
narrow the event categories for a JSA Identifier (QID):
a From the High-Level Category list box, select a high-level event
categorization.
For a full list of high-level and low-level event categories or category definitions,
see the Event Categories section of the Juniper Secure Analytics
Administration Guide.
b From the Low-Level Category list box, select a low-level event categorization.
c From the Log Source Type list box, select a log source type.
The Log Source Type list box allows you to search for QIDs from other
individual log sources. Searching for QIDs by log source is useful when the
events from your Universal LEEF DSM are similar to another existing network
device. For example, if your Universal DSM provides firewall events, you might
select Cisco ASA, as another firewall product that likely captures similar events.
d To search for a QID by name, type a name in the QID/Name field.
The QID/Name field allows you to filter the full list of QIDs for a specific word,
for example, MySQL.
Step 4 Click Search.
A list of QIDs are displayed.
Step 5 Select the QID you want to associate to your unknown Universal LEEF DSM
event.
Step 6 Click OK.
JSA maps any additional events forwarded from your device with the same QID
that matches the event payload. The event count increases each time the event is
identified by JSA.
NOTE
Note: If you update an event with a new JSA Identifier (QID) map, past events
stored in JSA are not updated. Only new events are categorized with the new QID.
Configuring DSMs
108 VENUSTECH VENUSENSE
The Venustech Venusense DSM for Juniper Secure Analytics (JSA) can collect
events from Venusense appliances using syslog.
Supported
Venusense Events
and Appliances
JSA records all relevant unified threat, firewall, or network intrusion prevention
events forwarded using syslog on port 514.
The following Venustech appliances are supported by JSA:
•Venustech Venusense Security Platform
•Venusense Unified Threat Management (UTM)
•Venusense Firewall
•Venusense Network Intrusion Prevention System (NIPS)
Venusense
Configuration
Overview
JSA can collect events from Venustech appliances that are configured to forward
filtered event logs in syslog format to JSA.
The following process outlines the steps required to collect events from a
Venustech Venusense appliance:
1 Configure the syslog server on your Venusense appliance.
2 Configure a log filter on your Venusense appliance to forward specific event logs.
3 Configure a log source in JSA to correspond to the filtered log events.
Configuring a
Venusense Syslog
Server
To forward events to JSA, you must configure and enable a syslog server on your
Venusense appliance with the IP address of your JSA console or Event Collector.
Procedure
Step 1 Log in to the configuration interface for your Venusense appliance.
Step 2 From the navigation menu, select Logs > Log Configuration > Log Servers.
Step 3 In the IP Address field, type the IP address of your JSA console or Event
Collector.
Step 4 In the Port field, type 514.
Step 5 Select the Enable check box.
Step 6 Click OK.
Configuring DSMs
742 VENUSTECH VENUSENSE
Next Steps
You are ready to configure your Venusense appliance to filter which events are
forwarded to JSA.
Configuring
Venusense Event
Filtering
Event filtering allows you to determine which events your Venusense appliance
forwards to JSA.
Procedure
Step 1 From the navigation menu, select Logs > Log Configuration > Log Filtering.
Step 2 In the Syslog Log column, select a check box for each event log you want to
forward to JSA.
Step 3 From the list box, select a syslog facility for the event log you enabled.
Step 4 Repeat Step 2 and Step 3 to configure any additional syslog event filters.
Step 5 Click OK.
Next Steps
You are now ready to configure a log source for your Venusense appliance in JSA.
JSA does not automatically discover or create log sources for syslog events from
Venusense appliances.
Configuring a
Venusense Log
Source
To integrate Venusense syslog events, you must manually create a log source in
JSA as Venusense events to not automatically discover.
Procedure
Step 1 Log in to JSA.
Step 2 Click the Admin tab.
Step 3 On the navigation menu, click Data Sources.
Step 4 Click the Log Sources icon.
Step 5 Click Add.
Step 6 In the Log Source Name field, type a name for your log source.
Step 7 In the Log Source Description field, type a description for the log source.
Configuring DSMs
743
Step 8 From the Log Source Type list box, select your Venustech Venusense appliance.
The type of log source you select is determined by the event filtering configured on
your Venusense appliance. The options include:
•Venustech Venusense Security Platform - Select this option if you enabled
all event filtering options.
•Venustech Venusense UTM - Select this option if you enabled unified filtering
events.
•Venustech Venusense Firewall - Select this option if you enabled filtering for
firewall events.
•Venustech Venusense NIPS - Select this option if you enabled filtering for
firewall events.
Step 9 From the Protocol Configuration list box, select Syslog.
Step 10 In the Log Source Identifier field, type the IP address or host name for the log
source as an identifier for your Venusense appliance.
Step 11 Click Save.
Step 12 On the Admin tab, click Deploy Changes.
The configuration is complete. Events forwarded to JSA by your Venusense
appliance are displayed on the Log Activity tab.
Configuring DSMs
109 VERDASYS DIGITAL GUARDIAN
The Verdasys Digital Guardian DSM for Juniper Secure Analytics (JSA) accepts
and categorizes all alert events from Verdasys Digital Guardian appliances.
About Verdasys
Digital Guardian
Verdasys Digital Guardian is a comprehensive Enterprise Information Protection
(EIP) platform. Digital Guardian serves as a cornerstone of policy driven,
data-centric security by enabling organizations to solve the information risk
challenges that exist in today's highly collaborative and mobile business
environment. Digital Guardian's endpoint agent architecture makes it possible to
implement a data-centric security framework.
Verdasys Digital Guardian allows business and IT managers to:
•Discover and classify sensitive data by context and content
•Monitor data access and usage by user or process
•Automatically implement policy driven information protection
•Alert, block, and record high risk behavior to prevent costly and damaging data
loss incidents.
Digital Guardian’s integration with JSA provides context from the endpoint and
enables a new level of detection and mitigation for Insider Threat and Cyber Threat
(Advanced Persistent Threat).
Digital Guardian provides JSA with a rich data stream from the end-point which
includes; visibility of every data access by users or processes including the file
name, file classification, application used to access the data and other contextual
variables.
Supported Event
Types
JSA supports all JSA LEEF or syslog formatted alert events you configure in your
data export from Verdasys Digital Guardian.
Supported Versions JSA supports Verdasys Digital Guardian versions:
•v6.1.1 and above with the JSA LEEF event format
•v6.0.x with the Syslog event format
Configuring DSMs
746 VERDASYS DIGITAL GUARDIAN
Configuring IPtables Before configuring your Verdasys Digital Guardian to forward events, you must
configure IPtables in JSA to allow ICMP requests from Verdasys Digital Guardian.
Procedure
Step 1 Using SSH, log in to JSA as the root user.
Login: root
Password: <password>
Step 2 Type the following command to edit the IPtables file:
vi /opt/qradar/conf/iptables.post
The IPtables configuration file is displayed.
Step 3 Type the following command to allow JSA to accept ICMP requests from Verdasys
Digital Guardian:
-I QChain 1 -m icmp -p icmp --src <IP address> -j ACCEPT
Where <IP address> is the IP address of your Verdasys Digital Guardian
appliance. For example,
-I QChain 1 -m icmp -p icmp --src 10.100.100.101 -j ACCEPT
Step 4 Save your IPtables configuration.
Step 5 Type the following command to update IPtables in JSA:
./opt/qradar/bin/iptables_update.pl
Step 6 To verify JSA accepts ICMP traffic from your Verdasys Digital Guardian, type the
following command:
iptables --list --line-numbers
The following output is displayed:
[root@JSA bin]# iptables --list --line-numbers
Chain QChain (1 references)
num target prot opt source destination
1 ACCEPT icmp -- 10.100.100.101 anywhere icmp
any
2 ACCEPT tcp -- anywhere anywhere state
NEW tcp dpt:https
3 ACCEPT tcp -- anywhere anywhere state
NEW tcp dpt:http
The IPtables configuration for JSA is complete.
Configuring a Data
Export
Data exports allow you to configure the events Verdasys Digital Guardian forwards
to JSA.
Procedure
Step 1 Log in to the Digital Guardian Management console.
Step 2 Select Workspace > Data Export > Create Export.
Step 3 From the Data Sources list box, select Alerts or Events as the data source.
Configuring DSMs
747
Step 4 From the Export type list box, select JSA LEEF.
If your Verdasys Digital Guardian is v6.0.x, you can select Syslog as the Export
Type. JSA LEEF is the preferred export type format for all Verdasys Digital
Guardian appliances with v6.1.1 and above.
Step 5 From the Type list box, select UDP or TCP as the transport protocol.
JSA can accept syslog events from either transport protocol. If the length of your
alert events typically exceed 1024 bytes, then you should select TCP to prevent
the events from being truncated.
Step 6 In the Server field, type the IP address of your JSA console or Event Collector.
Step 7 In the Port field, type 514.
Step 8 From the Severity Level list box, select a severity level.
Step 9 Select the Is Active check box.
Step 10 Click Next.
Step 11 From the list of available fields, add the following Alert or Event fields for your data
export:
•Agent Local Time
•Application
•Computer Name
•Detail File Size
•IP Address
•Local Port
•Operation (required)
•Policy
•Remote Port
•Rule
•Severity
•Source IP Address
•User Name
•Was Blocked
•Was Classified
Step 12 Select a Criteria for the fields in your data export and click Next.
By default, the Criteria is blank.
Step 13 Select a group for the criteria and click Next.
By default, the Group is blank.

Configuring DSMs
748 VERDASYS DIGITAL GUARDIAN
Step 14 Click Test Query.
A Test Query ensures the database runs properly.
Step 15 Click Next.
Step 16 Save the data export.
The configuration is complete.
Next steps
The data export from Verdasys Digital Guardian occurs on a 5 minute interval. You
can adjust this timing with the job scheduler in Verdasys Digital Guardian, if
required. Events exported to JSA by Verdasys Digital Guardian are displayed on
the Log Activity tab.
Configuring a Log
Source
JSA automatically discovers and creates a log source for data exports from
Verdasys Digital Guardian appliances. The following procedure is optional.
Procedure
Step 1 Log in to JSA.
Step 2 Click the Admin tab.
Step 3 On the navigation menu, click Data Sources.
Step 4 Click the Log Sources icon.
Step 5 Click Add.
Step 6 In the Log Source Name field, type a name for your log source.
Step 7 In the Log Source Description field, type a description for the log source.
Step 8 From the Log Source Type list box, select Verdasys Digital Guardian.
Step 9 Using the Protocol Configuration list box, select Syslog.
Step 10 Configure the following values:
Step 11 Click Save.
Step 12 On the Admin tab, click Deploy Changes.
The log source is added to JSA.
Table 112-1 Syslog Parameters
Parameter Description
Log Source Identifier Type the IP address or hostname for the log source as an
identifier for events from Verdasys Digital Guardian
appliance.
Configuring DSMs
110 VERICEPT CONTENT 360 DSM
The Vericept Content 360 DSM for Juniper Secure Analytics (JSA) accepts
Vericept events using syslog.
JSA records all relevant and available information from the event. Before
configuring a Vericept device in JSA, you must configure your device to forward
syslog. For more information on configuring your Vericept device, consult your
vendor documentation.
After you configure syslog to forward events to JSA the configuration is complete.
The log source is added to JSA as Vericept Content 360 events are automatically
discovered. Events forwarded to JSA by your Vericept Content 360 appliance are
displayed on the Log Activity tab.
To manually configure a log source for JSA to receive events from a Vericept
device:
From the Log Source Type list box, select the Vericept Content 360 option.
For more information on configuring devices, see the Log Sources Users Guide.

Configuring DSMs
111 VMWARE
The VMWare DSM for Juniper Secure Analytics (JSA) can collect events from
VMWare ESX and ESXi, vCenter, and vCloud Director servers.
•VMware ESX and ESXi
•VMware vCenter
•VMware vCloud Director
VMware ESX and
ESXi
The EMC VMware DSM for JSA collects ESX and ESXi server events by using the
VMware protocol or syslog. The EMC VMware DSM supports events from VMware
ESX or ESXi 3.x, 4.x, or 5.x servers.
To collect VMware ESX or ESXi events, you can select one of the following event
collection methods:
•Configuring Syslog on VMWare ESX and ESXi Servers
•Configuring the VMWare Protocol for ESX or ESXi Servers
Configuring Syslog
on VMWare ESX and
ESXi Servers
To collect syslog events for VMWare, you must configure the server to forward
events by using syslogd from your ESXi server to JSA.
Procedure
Step 1 Log in to your VMWare vSphere Client.
Step 2 Select the host that manages your VMWare inventory.
Step 3 Click the Configuration tab.
Step 4 From the Software panel, click Advanced Settings.
Step 5 In the navigation menu, click Syslog.

Configuring DSMs
752 VMWARE
Step 6 Configure values for the following parameters:
Step 7 Click OK to save the configuration.
Firewall settings for VMWare products
The default firewall configuration on VMWare ESXi v5.x servers disable outgoing
connections by default. Disabled outgoing syslog connections restrict the internal
syslog forwarder from sending security and access events to JSA
CAUTION
CAUTION: By default, the syslog firewall configuration for VMWare products allow
only outgoing syslog communications. To prevent security risks, do not edit the
default syslog firewall rule to enable incoming syslog connections.
Enabling syslog firewall settings on vSphere Clients
To forward syslog events from ESXi v5.x server, you must edit your security policy
to enable outgoing syslog connections for events.
Procedure
Step 1 Log in to your ESXi v5.x Server from a vSphere client.
Step 2 From the inventory list, select your ESXi Server.
Step 3 Click the Manage tab and select Security Profile.
Step 4 In the Firewall section, click Properties.
Step 5 In the Firewall Properties window, select the syslog check box.
Step 6 Click OK.
Table 114-1 VMWare Syslog Protocol Parameters
Parameter ESX version Description
Syslog.Local.DatastorePath ESX or ESXi 3.5.x or
4.x
Type the directory path for the local syslog messages
on your ESXi server.
The default directory path is []
/scratch/log/messages.
Syslog.Remote.Hostname ESX or ESXi 3.5.x or
4.x
Type the IP address or host name of JSA.
Syslog.Remote.Port ESX or ESXi 3.5.x or
4.x
Type the port number the ESXi server uses to forward
syslog data.
The default is port 514.
Syslog.global.logHost ESXi v5.x Type the URL and port number that the ESXi server
uses to forward syslog data.
Examples:
udp://<JSA IP address>:514
tcp://<JSA IP address>:514

Configuring DSMs
VMware ESX and ESXi 753
Configuring a syslog log source for VMware ESX or ESXi
JSA automatically discovers and creates a log source for syslog events from
VMWare. The following configuration steps are optional.
Procedure
Step 1 Click the Admin tab.
Step 2 Click the Log Sources icon.
Step 3 Click Add.
Step 4 In the Log Source Name field, type a name for your log source.
Step 5 From the Log Source Type list box, select EMC VMWare.
Step 6 Using the Protocol Configuration list box, select Syslog.
Step 7 Configure the following values:
Step 8 Click Save.
Table 114-2 Syslog Protocol Parameters
Parameter Description
Log Source Identifier Type the IP address or host name for the log source as an
identifier for events from your EMC VMWare server.
Enabled Select this check box to enable the log source. By default,
the check box is selected.
Credibility From the list box, select the credibility of the log source. The
range is 0 - 10.
The credibility indicates the integrity of an event or offense
as determined by the credibility rating from the source
devices. Credibility increases if multiple sources report the
same event. The default is 5.
Target Event Collector From the list box, select the Event Collector to use as the
target for the log source.
Coalescing Events Select this check box to enable the log source to coalesce
(bundle) events.
By default, automatically discovered log sources inherit the
value of the Coalescing Events list box from the System
Settings in JSA. When you create a log source or edit an
existing configuration, you can override the default value by
configuring this option for each log source.
Incoming Event
Payload
From the list box, select the incoming payload encoder for
parsing and storing the logs.
Store Event Payload Select this check box to enable the log source to store event
payload information.
By default, automatically discovered log sources inherit the
value of the Store Event Payload list box from the System
Settings in JSA. When you create a log source or edit an
existing configuration, you can override the default value by
configuring this option for each log source.

Configuring DSMs
754 VMWARE
Step 9 On the Admin tab, click Deploy Changes.
Configuring the
VMWare Protocol for
ESX or ESXi Servers
You can configure the VMWare protocol to read events from your VMWare ESXi
server. The VMware protocol uses HTTPS to poll for ESX and ESXi servers for
events.
Before you configure your log source to use the VMWare protocol, we suggest you
create a unique user to poll for events. This user can be created as a member of
the root or administrative group, but you must provide the user with an assigned
role of read-only permission. This ensures that JSA can collect the maximum
number of events and retain a level of security for your virtual servers. For more
information on user roles, see your VMWare documentation.
To integrate EMC VMWare with JSA, you must complete the following tasks:
1 Create an ESX account for JSA.
2 Configure account permissions for the JSA user.
3 Configure the VMWare protocol in JSA.
CAUTION
CAUTION: Creating a user who is not part of the root or an administrative group
might lead to some events not being collected by JSA. We suggest that you create
your JSA user to include administrative privileges, but assign this custom user a
read-only role.
Creating an account for JSA in ESX
You can create a JSA user account for EMC VMWare to allow the protocol to
properly poll for events.
Procedure
Step 1 Log in to your ESX host by using the vSphere Client.
Step 2 Click the Local Users & Groups tab.
Step 3 Click Users.
Step 4 Right-click and select Add.
Step 5 Configure the following parameters:
a Login - Type a login name for the new user.
b UID - Optional. Type a user ID.
c User Name - Optional. Type a user name for the account.
d Password - Type a password for the account.
e Confirm Password - Type the password again as confirmation.
f Group - From the Group list box, select root.

Configuring DSMs
VMware ESX and ESXi 755
Step 6 Click Add.
Step 7 Click OK.
Configuring read-only account permissions
For security reasons, we suggest you configure your JSA user account as a
member of your root or admin group, but select an assigned role of read-only
permissions.
Read-only permission allows the JSA user account to view and collect events by
using the VMWare protocol.
Procedure
Step 1 Click the Permissions tab.
Step 2 Right-click and select Add Permissions.
Step 3 On the Users and Groups window, click Add.
Step 4 Select your JSA user and click Add.
Step 5 Click OK.
Step 6 From the Assigned Role list box, select Read-only.
Step 7 Click OK.
Configuring a log source for the VMWare Protocol
You can configure a log source with the VMWare protocol to poll for EMC VMWare
events.
Procedure
Step 1 Click the Admin tab.
Step 2 Click the Log Sources icon.
Step 3 Click Add.
Step 4 In the Log Source Name field, type a name for your log source.
Step 5 From the Log Source Type list box, select EMC VMWare.
Step 6 Using the Protocol Configuration list box, select EMC VMWare.
Step 7 Configure the following values:
Table 114-3 VMWare Protocol Parameters
Parameter Description
Log Source Identifier Type the IP address or hostname for the log source. This
value must match the value configured in the ESX IP field.

Configuring DSMs
756 VMWARE
Step 8 Click Save.
Step 9 On the Admin tab, click Deploy Changes.
VMware vCenter The VMware vCenter DSM for JSA collects vCenter server events by using the
VMware protocol.
The VMware protocol uses HTTPS to poll for vCenter appliances for events. You
must configure a log source in JSA to collect VMware vCenter events.
Before you configure your log source to use the VMWare protocol, we suggest you
create a unique user to poll for events. This user can be created as a member of
the root or administrative group, but you must provide the user with an assigned
role of read-only permission. This ensures that JSA can collect the maximum
number of events and retain a level of security for your virtual servers. For more
information on user roles, see your VMWare documentation.
Configuring a Log
Source for the
VMWare vCenter
To collect vCenter events with the VMware protocol, you must configure a log
source in JSA.
Procedure
Step 1 Click the Admin tab.
Step 2 Click the Log Sources icon.
Step 3 Click Add.
Step 4 In the Log Source Name field, type a name for your log source.
Step 5 From the Log Source Type list box, select VMWare vCenter.
Step 6 Using the Protocol Configuration list box, select EMC VMWare.
Step 7 The syslog protocol is listed in the
ESX IP Type the IP address of the VMWare ESX or ESXi server.
For example, 1.1.1.1.
The VMware protocol prepends the IP address of your
VMware ESX or ESXi server with HTTPS before the protocol
requests event data.
User Name Type the username required to access the VMWare server.
Password Type the password required to access the VMWare server.
Table 114-3 VMWare Protocol Parameters (continued)
Parameter Description

Configuring DSMs
VMware vCloud Director 757
Step 8 Configure the following values:
Step 9 Click Save.
Step 10 On the Admin tab, click Deploy Changes.
VMware vCloud
Director
You can use the VMware vCloud Director DSM and the vCloud protocol for JSA to
poll the vCloud REST API for events.
Configuration
Overview
JSA supports polling for VMware vCloud Director events from vCloud Directory 5.1
appliances. Events collected by using the vCloud REST API are assembled as Log
Extended Event Format (LEEF) events.
To integrate vCloud events with JSA, you must complete the following tasks:
1 On your vCloud appliance, configure a public address for the vCloud REST API.
2 On your JSA appliance, configure a log source to poll for vCloud events.
3 Ensure that no firewall rules block communication between your vCloud appliance
and the JSA console or the managed host that is responsible for polling the vCloud
REST API.
Supported vClound
Event Types Logged
by JSA
The VMware vCloud DSM for JSA can collect events from several categories.
Each event category contains low level events that describe the action taken within
the event category. For example, user events can have user created or user
deleted as low level event.
The following list are the default event categories collected by JSA from vCloud
Director:
•User events
•Group events
Table 114-4 VMware protocol parameters
Parameter Description
Log Source Identifier Type the IP address or hostname for the log source. This
value must match the value configured in the ESX IP field.
ESX IP Type the IP address of the VMWare vCenter server.
For example, 1.1.1.1.
The VMware protocol prepends the IP address of your
VMware vCenter server with HTTPS before the protocol
requests event data.
User Name Type the username required to access the VMWare vCenter
server.
Password Type the password required to access the VMWare vCenter
server.
Configuring DSMs
758 VMWARE
•User role events
•Session events
•Organization events
•Network events
•Catalog events
•Virtual data center (VDC) events
•Virtual application (vApp) events
•Virtual machine (VM) events
•Media events
•Task operation events
Configuring the
vCloud REST API
Public Address
JSA collects security data from the vCloud API by polling the REST API of the
vCloud appliance for events. Before JSA can collect any data, you must configure
the public REST API base URL.
Procedure
Step 1 Log in to your vCloud appliance as an administrator.
Step 2 Click the Administration tab.
Step 3 From the Administration menu, select System Settings > Public Addresses.
Step 4 In the VCD public REST API base URL field, type an IP address or host name.
The address that you specify becomes a publically available address outside of the
firewall or NAT on your vCloud appliance. For example, https://1.1.1.1/.
Step 5 Click Apply.
The public API URL is created on the vCloud appliance.
What to do next
You are now ready to configure a log source in JSA.
Configuring a vCloud
Log Source in JSA
To collect vCloud events, you must configure a log source in JSA with the location
and credentials that are required to poll the vCloud API.
Procedure
Step 1 Log in to JSA.
Step 2 Click the Admin tab.
Step 3 In the navigation menu, click Data Sources.
Step 4 Click the Log Sources icon.
Step 5 Click Add.
Step 6 In the Log Source Name field, type a name for your log source.

Configuring DSMs
VMware vCloud Director 759
Step 7 Optional. In the Log Source Description field, type a description for your log
source.
Step 8 From the Log Source Type list box, select VMware vCloud Director.
Step 9 From the Protocol Configuration list box, select VMware vCloud Director.
Step 10 Configure the following values:
Table 114-5 VMware vCloud Director Log Source Parameters
Parameter Description
Log Source Identifier Type the IP address, host name, or name that identifies the
vCloud appliance events to JSA.
vCloud URL Type the URL configured on your vCloud appliance to
access the REST API.
The URL you type must match the address you configured in
the VCD public REST API base URL field on your vCloud
Server.
For example, https://10.10.10.1.
User Name Type the user name that is required to remotely access the
vCloud Server.
For example, console/user@organization.
If you want to configure a read-only account to use with JSA,
you can create a vCloud user in your organization who has
the Console Access Only permission.
Password Type the password that is required to remotely access the
vCloud Server.
Confirm Password Confirm the password that is required to remotely access the
vCloud Server.
Polling Interval Type a polling interval, which is the amount of time between
queries to the vCloud Server for new events.
The default polling interval is 10 seconds.
Enabled Select this check box to enable the log source. By default,
the check box is selected.
Credibility From the list box, select the credibility of the log source. The
range is 0 - 10.
The credibility indicates the integrity of an event or offense
as determined by the credibility rating from the source
devices. Credibility increases if multiple sources report the
same event. The default is 5.
Target Event Collector From the list box, select the Event Collector to use as the
target for the log source.

Configuring DSMs
760 VMWARE
Step 11 Click Save.
Step 12 On the Admin tab, click Deploy Changes.
vCloud events that are forwarded to JSAce are displayed on the Log Activity tab of
JSA.
VMware vShield The Juniper Secure Analytics (JSA) DSM for VMware vShield can collect event
logs from your VMware vShield servers.
Table 114-1 identifies the specifications for the VMware vShield Server DSM.
Coalescing Events Select this check box to enable the log source to coalesce
(bundle) events.
By default, automatically discovered log sources inherit the
value of the Coalescing Events list box from the System
Settings in JSA. When you create a log source or edit an
existing configuration, you can override the default value by
configuring this option for each log source.
Incoming Event
Payload
From the list box, select the incoming payload encoder for
parsing and storing the logs.
Store Event Payload Select this check box to enable the log source to store event
payload information.
By default, automatically discovered log sources inherit the
value of the Store Event Payload list box from the System
Settings in JSA. When you create a log source or edit an
existing configuration, you can override the default value by
configuring this option for each log source.
Table 114-5 VMware vCloud Director Log Source Parameters (continued)
Parameter Description
Table 114-1 VMware vShield DSM Specifications
Specification Value
Manufacturer VMware
DSM vShield
RPM file name DSM-VMwarevShield-build_number.noarch.rpm
Supported versions
Protocol Syslog
JSA recorded events All events
Automatically discovered Yes
Includes identity No
More information http://www.vmware.com/
Configuring DSMs
VMware vShield 761
VMware vShield DSM
Integration Process
To integrate VMware vShield DSM with JSA, use the following procedures:
1 If automatic updates are not enabled, download and install the most recent version
of the VMware vShield RPM on your JSA Console.
2 For each instance of VMware vShield, configure your VMware vShield system to
enable communication with JSA. This procedure must be performed for each
instance of VMware vShield.
3 If JSA does not automatically discover the log source, for each VMware vShield
server that you want to integrate, create a log source on the JSA Console.
Related tasks
Manually installing a DSM
Configuring your VMware vShield System for Communication with JSA
Configuring a VMware vShield Log Source in JSA
Configuring your
VMware vShield
System for
Communication with
JSA
To collect all audit logs and system events from VMware vShield, you must
configure the vShield Manager. When you configure VMware vShield, you must
specify JSA as the syslog server.
Procedure
To configure your VMware vShied system for communication with JSA:
Step 1 Access your vShield Manager inventory panel.
Step 2 Click Settings & Reports.
Step 3 Click Configuration > General.
Step 4 Click Edit next to the Syslog Server option.
Step 5 Type the IP address of your JSA console.
Step 6 Optional. Type the port for your JSA console. If you do not specify a port, the
default UDP port for the IP address/host name of your JSA console is used.
Step 7 Click OK.
Configuring a
VMware vShield Log
Source in JSA
To collect VMware vShield events, configure a log source in JSA.
Procedure
Step 1 Log in to JSA.
Step 2 Click the Admin tab.
Step 3 In the navigation menu, click Data Sources.
Step 4 Click the Log Sources icon.
Step 5 Click Add.
Step 6 From the Log Source Type list, select VMware vShield.
Configuring DSMs
762 VMWARE
Step 7 From the Protocol Configuration list, select Syslog.
Step 8 Configure the remaining parameters.
Step 9 Click Save.
Step 10 On the Admin tab, click Deploy Changes.

Configuring DSMs
112 VORMETRIC DATA SECURITY
The Vormetric Data Security DSM for Juniper Secure Analytics (JSA) can collect
event logs from your Vormetric Data Security servers.
Table 115-1 identifies the specifications for the Vormetric Data Security DSM.
Vormetric Data
Security DSM
Integration Process
To integrate Vormetric Data Security DSM with JSA, use the following procedures:
1 If automatic updates are not enabled, download and install the most recent version
of the following RPMs on your JSA console:
•Syslog protocol RPM
•DSMCommon RPM
The minimum version of the DSMCommon RPM that you can use are the
DSM-DSMCommon-7.1-530016.noarch.rpm or
DSM-DSMCommon-7.2-572972.noarch.rpm
Table 115-1 Vormetric Data Security DSM Specifications
Specification Value
Manufacturer Vormetric, Inc.
DSM Vormetric Data Security
RPM file name DSM-VormetricDataSecurity-7.1-804377.noarch.rpm
DSM-VormetricDataSecurity-7.2-804381.noarch.rpm
Supported
versions
Vormetric Data Security Manager v5.1.3 and later
Vormetric Data Firewall FS Agent v5.2 and later
Protocol Syslog (LEEF)
JSA recorded
events
Audit, Alarm, Warn, Learn Mode, System
Auto discovered Yes
Includes identity No
More information Vormetric website (http://www.vormetric.com)

Configuring DSMs
764 VORMETRIC DATA SECURITY
•Vormetric Data Security RPM
2 For each instance of Vormetric Data Security, configure your Vormetric Data
Security system to enable communication with JSA.
3 If JSA does not automatically discover the DSM, for each Vormetric Data Security
server you want to integrate, create a log source on the JSA console.
Related tasks
•Manually Installing a DSM
•Configuring your Vormetric Data Security Systems for Communication with
JSA
•Configuring a Vormetric Data Security Log Source in JSA
Configuring your
Vormetric Data
Security Systems
for Communication
with JSA
To collect all audit logs and system events from Vormetric Data Security, you must
configure your Vormetric Data Security Manager to enable communication with
JSA.
Before you begin
Your Vormetric Data Security Manager user account must have System
Administrator permissions.
Procedure
To configure your Vormetric Data Security system for communication with JSA:
Step 1 Log in to your Vormetric Data Security Manager as an administrator that is
assigned System Administrator permissions.
Step 2 On the navigation menu, click Log > Syslog.
Step 3 Click Add.
Step 4 In the Server Name field, type the IP address or host name of your JSA system.
Step 5 From the Transport Protocol list, select TCP or a value that matches the log
source protocol configuration on your JSA system.
Step 6 In the Port Number field, type 514 or a value that matches the log source protocol
configuration on your JSA system.
Step 7 From the Message Format list, select LEEF.
Step 8 Click OK.
Step 9 On the Syslog Server summary screen, verify the details you have entered for your
JSA system. If the Logging to SysLog value is OFF, complete the following steps.
a On the navigation menu, click System > General Preferences.
b Click the System tab.
c In the Syslog Settings pane, select the Syslog Enabled check box.
Configuring DSMs
Configuring your Vormetric Data Security Systems for Communication with JSA 765
What to do next
Configuring Vormetric Data Firewall FS Agents to Bypass Vormetric Data
Security Manager
Configuring
Vormetric Data
Firewall FS Agents to
Bypass Vormetric
Data Security
Manager
When the Vormetric Data Security Manager is enabled to communicate with JSA,
all events from the Vormetric Data Firewall FS Agents are also forwarded to the
JSA system through the Vormetric Data Security Manager. To bypass the
Vormetric Data Security Manager, you can configure Vormetric Data Firewall FS
Agents to send LEEF events directly to the JSA system.
Before you begin
Your Vormetric Data Security Manager user account must have System
Administrator permissions.
Procedure
Step 1 Log in to your Vormetric Data Security Manager.
Step 2 On the navigation menu, click System > Log Preferences.
Step 3 Click the FS Agent Log tab.
Step 4 In the Policy Evaluation row, configure the following parameters:
a Select the Log to Syslog/Event Log check box.
b Clear the Upload to Server check box.
c From the Level list, select INFO.
This set up enables a full audit trail from the policy evaluation module to be sent
directly to a syslog server, and not to the Security Manager. Leaving both
destinations enabled may result in duplication of events to the JSA system.
Step 5 Under the Syslog Settings section, configure the following parameters.
a In the Server field, use the following syntax to type the IP address or host name
and port number of your JSA system.
qradar_IP address_or_host:port
b From the Protocol list, select TCP or a value that will match the log source
configuration on your JSA system.
c From the Message Format list, select LEEF.
What to do next
This configuration is applied to all hosts or host groups subsequently added to the
Vormetric Data Security Manager. For each existing host or host group, select the
required host or host group from the Hosts list and repeat the procedure.

Configuring DSMs
766 VORMETRIC DATA SECURITY
Configuring a
Vormetric Data
Security Log
Source in JSA
To collect Vormetric Data Security events, configure a log source in JSA.
Procedure
Step 1 Log in to JSA.
Step 2 Click the Admin tab.
Step 3 In the navigation menu, click Data Sources.
Step 4 Click the Log Sources icon.
Step 5 Click Add.
Step 6 From the Log Source Type list, select Vormetric Data Security.
Step 7 From the Protocol Configuration list, select Syslog.
Step 8 Configure the remaining parameters.
Step 9 Click Save.
Step 10 On the Admin tab, click Deploy Changes.

Configuring DSMs
113 WEBSENSE V-SERIES
This section provides information on the following DSMs:
•Websense TRITON
•Websense V-Series Data Security Suite
•Websense V-Series Content Gateway
Websense TRITON The Websense V-Series Content Gateway DSM for Juniper Secure Analytics
(JSA) supports events for web content from several Websense TRITON solutions,
including Web Security, Web Security Gateway, Web Security Gateway Anywhere,
and V-Series appliances.
Websense TRITON collects and streams event information to JSA using the
Websense Multiplexer component. Before configuring JSA, you must configure the
Websense TRITON solution to provide LEEF formatted syslog events.
Before You Begin Before you can configure Websense TRITON Web Security solutions to forward
events to JSA, you must ensure your deployment contains a Websense
Multiplexer.
The Websense Multiplexer is supported on Windows, Linux, and on Websense
V-Series appliances.
To configure a Websense Multiplexer on a Websense Triton or V-Series appliance:
Step 1 Install an instance of Websense Multiplexer for each Websense Policy Server
component in your network.
•For Microsoft Windows - To install the Websense Multiplexer on Windows,
use the TRITON Unified Installer. The Triton Unified Installer is available for
download at http://www.mywebsense.com.
•For Linux - To install the Websense Multiplexer on Linux, use the Web Security
Linux Installer. The Web Security Linux Installer is available for download at
http://www.mywebsense.com.
For information on adding a Websense Multiplexer to software installations, see
your Websense Security Information Management (SIEM) Solutions
documentation.
Configuring DSMs
768 WEBSENSE V-SERIES
Step 2 Enable the Websense Multiplexer on a V-Series appliance configured as a full
policy source or user directory and filtering appliance:
a Log in to your Websense TRITON Web Security console or V-Series appliance.
b From the Appliance Manager, select Administration > Toolbox > Command
Line Utility.
c Click the Websense Web Security tab.
d From the Command list box, select multiplexer, then use the enable
command.
Step 3 Repeat Step 1 and Step 2 to enable one Multiplexer instance for each Policy
Server instance in your network.
If more than one Multiplexer is installed for a Policy Server, only the last installed
instance of the Websense Multiplexer is used. The configuration for each
Websense Multiplexer instance is stored by its Policy Server.
You are now ready to configure your Websense TRITON appliance to forward
syslog events in LEEF format to JSA.
Configuring Syslog
for Websense
TRITON
To collect events, you must configure syslog forwarding for Websense TRITON.
Procedure
Step 1 Log in to your Websense TRITON Web Security console.
Step 2 On the Settings tab, select General > SIEM Integration.
Step 3 Select the Enable SIEM integration for this Policy Server check box.
Step 4 In the IP address or hostname field, type the IP address of your JSA.
Step 5 In the Port field, type 514.
Step 6 From the Transport protocol list box, select either the TCP or UDP protocol
option.
JSA supports syslog events for TCP and UDP protocols on port 514.
Step 7 From the SIEM format list box, select syslog/LEEF (JSA).
Step 8 Click OK to cache any changes.
Step 9 Click Deploy to update your Websense Triton security components or V-Series
appliances.
The Websense Multiplexer connects to Websense Filtering Service and ensures
that event log information is provided to JSA.
Configure a Log
Source
JSA automatically discovers and creates a log source for syslog events in LEEF
format from Websense TRITON and V-Series appliances. The
configuration steps for creating a log source are optional.

Configuring DSMs
Websense V-Series Data Security Suite 769
Procedure
Step 1 Log in to JSA.
Step 2 Click the Admin tab.
Step 3 On the navigation menu, click Data Sources.
Step 4 Click the Log Sources icon.
Step 5 Click Add.
Step 6 In the Log Source Name field, type a name for your log source.
Step 7 In the Log Source Description field, type a description for the log source.
Step 8 From the Log Source Type list box, select Websense V Series Content
Gateway.
Note: Websense TRITON uses the Websense V Series Content Gateway DSM for
parsing events. When you manually add a log source to JSA for Websense
TRITON, you should select the Websense V Series Content Gateway.
Step 9 Using the Protocol Configuration list box, select Syslog.
Step 10 Configure the following values:
Step 11 Click Save.
Step 12 On the Admin tab, click Deploy Changes.
The log source is added to JSA.
Websense V-Series
Data Security Suite
The Websense V-Series Data Security Suite DSM for JSA supports Websense
V-Series appliances and the Data Security Suite (DSS) software.
Configuring syslog
for Websense
V-Series DSS
The Websense V-Series Data Security Suite DSM accepts events using syslog.
Before you can integrate JSA you, must enable the Websense V-Series appliance
to forward syslog events in the Data Security Suite (DSS) Management console.
Procedure
Step 1 Select Policies > Policy Components > Notification Templates.
Step 2 Select an existing Notification Template or create a new template.
Step 3 Click the General tab.
Step 4 Click Send Syslog Message.
Table 116-1 Syslog Parameters
Parameter Description
Log Source Identifier Type the IP address or hostname for the log source as an
identifier for events from Websense TRITON or V-Series
appliance.

Configuring DSMs
770 WEBSENSE V-SERIES
Step 5 Select Options > Settings > Syslog to access the Syslog window.
The syslog window enables administrators to define the IP address/hostname and
port number of the syslog in their organization. The defined syslog receives
incident messages from the Websense Data Security Suite DSS Manager.
Step 6 The syslog is composed of the following fields:
DSS Incident|ID={value}|action={display value - max}|urgency=
{coded}|policy categories={values,,,}|source={value-display
name}|destinations={values...}|channel={display name}|matches=
{value}|detaills={value}
•Max length for policy categories is 200 characters.
•Max length for destinations is 200 characters.
•Details and source are reduced to 30 characters.
Step 7 Click Test Connection to verify that your syslog is accessible.
You are now ready to configure the log source in JSA.
The configuration is complete. The log source is added to JSA as OSSEC events
are automatically discovered. Events forwarded to JSA by OSSEC are displayed
on the Log Activity tab of JSA.
Configuring a Log
Source
JSA automatically discovers and creates a log source for syslog events from
Websense V-Series Data Security Suite. The following configuration steps are
optional.
Procedure
Step 1 Log in to JSA.
Step 2 Click the Admin tab.
Step 3 On the navigation menu, click Data Sources.
Step 4 Click the Log Sources icon.
Step 5 Click Add.
Step 6 In the Log Source Name field, type a name for your log source.
Step 7 In the Log Source Description field, type a description for the log source.
Step 8 From the Log Source Type list box, select Websense V Series.
Step 9 Using the Protocol Configuration list box, select Syslog.
Step 10 Configure the following values:
Step 11 Click Save.
Table 116-2 Syslog Parameters
Parameter Description
Log Source Identifier Type the IP address or host name for the log source as an
identifier for events from your Websense V-Series Data
Security Suite DSM

Configuring DSMs
Websense V-Series Content Gateway 771
Step 12 On the Admin tab, click Deploy Changes.
The configuration is complete.
Websense V-Series
Content Gateway
The Websense V-Series Content Gateway DSM for JSA supports events for web
content on Websense V-Series appliances with the Content Gateway software.
The Websense V-Series Content Gateway DSM accepts events using syslog to
stream events or using the Log File protocol to provide events to JSA. Before you
can integrate your appliance with JSA, you must select one of the following
configuration methods:
•To configure syslog for your Websense V-Series, see Configure Syslog for
Websense V-Series Content Gateway.
•To configure the log file protocol for your Websense V-Series, see Configuring
a Log File Protocol for Websense V-Series Content Gateway.
Configure Syslog for
Websense V-Series
Content Gateway
The Websense V-Series DSM supports Websense V-Series appliances running
the Websense Content Gateway on Linux software installations.
Before configuring JSA, you must configure the Websense Content Gateway to
provide LEEF formatted syslog events.
Configure the Management Console
To configure event logging in the Content Gateway Manager:
Step 1 Log into your Websense Content Gateway Manager.
Step 1 Click the Configure tab.
Step 2 Select Subsystems > Logging.
The General Logging Configuration window is displayed.
Step 3 Select Log Transactions and Errors.
Step 4 Select Log Directory to specify the directory path of the stored event log files.
The directory you define must already exist and the Websense user must have
read and write permissions for the specified directory. The default directory is
/opt/WGC/logs
Step 5 Click Apply.
Step 6 Click the Custom tab.

Configuring DSMs
772 WEBSENSE V-SERIES
Step 7 In the Custom Log File Definitions window, type the following text for the LEEF
format.
<LogFormat>
<Name = "leef"/>
<Format =
"LEEF:1.0|Websense|WCG|7.6|%<wsds>|cat=%<wc> src=%<chi> devTime=
%<cqtn> devTimeFormat=dd/MMM/yyyy:HH:mm:ss
Z http-username=%<caun> url=%<cquc>
method=%<cqhm> httpversion=%<cqhv> cachecode=%<crc> dstBytes
=%<sscl> dst=%<pqsi>
srcBytes=%<pscl> proxy-status-code=%<pssc> server-status-code=%<ss
sc> usrName=%<wui> duration=%<ttms>"/>
</LogFormat>
<LogObject>
<Format = "leef"/>
<Filename = "leef"/>
</LogObject>
NOTE
Note: The fields in the LEEF format string are tab separated. You might be
required to type the LEEF format in a text editor and then cut and paste it into your
web browser to retain the tab separations.The definitions file ignores extra white
space, blank lines, and all comments.
Step 8 Select Enabled to enable the custom logging definition.
Step 9 Click Apply.
You are now ready to enable event logging for your Websense Content Gateway.
Enable Event Logging
If you are using a Websense V-Series appliance, you need to contact Websense
Technical Support to enable this feature.
Procedure
Step 1 Log in to the command-line Interface (CLI) of the server running Websense
Content Gateway.
Step 2 Add the following lines to the end of the /etc/rc.local file:
( while [ 1 ] ; do
tail -n1000 -F /opt/WCG/logs/leef.log | nc <IP Address> 514
sleep 1
done ) &
Where <IP Address> is the IP address for JSA.
Step 3 To start logging immediately, type the following command:
nohup /bin/bash –c “while [ 1 ] ; do tail -F
/opt/WCG/logs/leef.log | nc <IP Address> 514; sleep 1; done” &

Configuring DSMs
Websense V-Series Content Gateway 773
NOTE
Note: You might need to type the logging command in Step 3 or copy the
command to a text editor to interpret the quotation marks.
The configuration is complete. The log source is added to JSA as syslog events
from Websense V-Series Content Gateway are automatically discovered. Events
forwarded by Websense V-Series Content Gateway are displayed on the Log
Activity tab of JSA.
Configuring a Log
Source
JSA automatically discovers and creates a log source for syslog events from
Websense V-Series Content Gateway. The following configuration steps are
optional.
Procedure
Step 1 Log in to JSA.
Step 2 Click the Admin tab.
Step 3 On the navigation menu, click Data Sources.
Step 4 Click the Log Sources icon.
Step 5 Click Add.
Step 6 In the Log Source Name field, type a name for your log source.
Step 7 In the Log Source Description field, type a description for the log source.
Step 8 From the Log Source Type list box, select Websense V Series.
Step 9 Using the Protocol Configuration list box, select Syslog.
Step 10 Configure the following values:
Step 11 Click Save.
Step 12 On the Admin tab, click Deploy Changes.
The configuration is complete.
Configuring a Log
File Protocol for
Websense V-Series
Content Gateway
The log file protocol allows JSA to retrieve archived log files from a remote host.
The Websense V-Series DSM supports the bulk loading of log files from your
Websense V-Series Content Gateway using the log file protocol to provide events
on a scheduled interval. The log files contain transaction and error events for your
Websense V-Series Content Gateway:
Table 116-3 Syslog Parameters
Parameter Description
Log Source Identifier Type the IP address or host name for the log source as an
identifier for events from your Websense V-Series Content
Gateway appliance.
Configuring DSMs
774 WEBSENSE V-SERIES
Configure the management console
To configure event logging in the Content Management console:
Step 1 Log into your Websense Content Gateway interface.
Step 1 Click the Configure tab.
Step 2 Select Subsystems > Logging.
Step 3 Select Log Transactions and Errors.
Step 4 Select Log Directory to specify the directory path of the stored event log files.
The directory you define must already exist and the Websense user must have
read and write permissions for the specified directory. The default directory is
/opt/WGC/logs.
Step 5 Click Apply.
Step 6 Click the Formats tab.
Step 7 Select Netscape Extended Format as your format type.
Step 8 Click Apply.
You are now ready to enable event logging for your Websense V-Series Content
Gateway.
Configuring a log file protocol log source
When configuring your Websense V-Series DSM to use the log file protocol, make
sure the hostname or IP address configured in the Websense V-Series is the same
as configured in the Remote Host parameter in the Log File protocol configuration.
Procedure
Step 1 Log in to JSA.
Step 2 Click the Admin tab.
Step 3 On the navigation menu, click Data Sources.
Step 4 Click the Log Sources icon.
Step 5 Click Add.
Step 6 In the Log Source Name field, type a name for your log source.
Step 7 In the Log Source Description field, type a description for the log source.
Step 8 From the Log Source Type list box, select the Websense V Series.
Step 9 From the Protocol Configuration list box, select the Log File.
Step 10 From the Service Type list box, select the Secure File Transfer Protocol (SFTP)
option.
Step 11 In the FTP File Pattern field, type extended.log_.*.old.
Configuring DSMs
Websense V-Series Content Gateway 775
Step 12 In the Remote Directory field, type /opt/WCG/logs.
This is the default directory for storing the Websense V-Series log files you
specified in Step 4.
Step 13 From the Event Generator list box, select LINEBYLINE.
Step 14 Click Save.
Step 15 On the Admin tab, click Deploy Changes.
The log source is added to JSA. For the entire list of Log File protocol parameters,
see the Log Sources Users Guide.
Configuring DSMs
776 WEBSENSE V-SERIES
Configuring DSMs
114 ZSCALER NANOLOG STREAMING
SERVICE
Juniper Secure Analytics (JSA) can collect and categorize events from Zscaler
Nanolog Streaming Service (NSS) log feeds that forward syslog event to JSA.
Configuration
Overview
To collect syslog events, you must configure your Zscaler NSS with an NSS feed to
forward TCP syslog events to JSA. JSA automatically discovers and creates log
sources for syslog events that are forwarded from Zscaler NSS log feeds. JSA
supports syslog events from Zscaler NSS V4.1.
To configure Zscaler NSS, complete the following tasks:
1 On your Zscaler NSS appliance, create a log feed for JSA.
2 On your JSA system, verify that the forwarded events are automatically
discovered.
Supported Event
types for Zscaler NSS
The ZScaler NSS DSM for JSA collects information about web browsing events
from Zscaler NSS installations.
Each Zscaler NSS event contains information on the action that is taken on the
web browsing in the event category. For example, web browsing events can have
a category that is allowed or blocked website traffic. Each event defines the
website that was allowed or blocked and includes all of the event details in the
event payload.
Configuring a Syslog
feed in Zscaler NSS
To collect events, you must configure a log feed on your Zscaler NSS to forward
syslog events to JSA.
Procedure
Step 1 Log in to the administration portal for Zscaler NSS.
Step 2 In the navigation menu, select Policy > Administration > Configure Nanolog
Streaming Service.
Step 3 Click Add Feed.
Step 4 In the Feed Name field, type a name for the NSS feed.
Step 5 From the NSS Name list, select the ZScaler NSS system.
Step 6 From the Status list, select Enabled.
Configuring DSMs
778 ZSCALER NANOLOG STREAMING SERVICE
Step 7 In the SIEM IP field, type the IP address of your JSA system.
Step 8 In the TCP Port field, type the 514.
Step 9 From the Log Type list, select Web Log.
Step 10 From the Feed Output Type list, select Custom.
Step 11 In the Feed Output Format field, type the following custom format:
%s{mon} %02d{dd} %02d{hh}:%02d{mm}:%02d{ss} zscaler-nss:
LEEF:1.0|Zscaler|NSS|4.1|%s{reason}|cat=%s{action}\tdevTime=
%s{mon} %02d{dd} %d{yy}
%02d{hh}:%02d{mm}:%02d{ss}%s{tz}\tdevTimeFormat=MMM dd yyyy
HH:mm:ss z\tsrc=%s{cip}\tdst=%s{sip}
\tsrcPostNAT=%s{cintip}\trealm=%s{location}\tusrName=%s{login}\
tsrcBytes=%d{reqsize}\tdstBytes=%d{respsize}\trole=%s{dept}\tpo
licy=%s{reason}\turl=%s{url}\trecordid=%d{recordid}\tbwthrottle
=%s{bwthrottle}\tuseragent=%s{ua}\treferer=%s{referer}\thostnam
e=%s{host}\tappproto=%s{proto}\turlcategory=%s{urlcat}\turlsupe
rcategory=%s{urlsupercat}\turlclass=%s{urlclass}\tappclass=%s{a
ppclass}\tappname=%s{appname}\tmalwaretype=%s{malwarecat}\tmalw
areclass=%s{malwareclass}\tthreatname=%s{threatname}\triskscore
=%d{riskscore}\tdlpdict=%s{dlpdict}\tdlpeng=%s{dlpeng}\tfilecla
ss=%s{fileclass}\tfiletype=%s{filetype}\treqmethod=%s{reqmethod
}\trespcode=%s{respcode}\n
Step 12 Click Done.
JSA automatically discovers and creates a log source for Zscaler NSS appliances.
Events that are forwarded to JSA are viewable on the Log Activity tab.
Configuring a Zscaler
NSS Log Source
JSA automatically discovers and creates a log source for syslog events that are
forwarded from Zscaler NSS. These configuration steps are optional.
Procedure
Step 1 Log in to JSA.
Step 2 Click the Admin tab.
Step 3 Click the Log Sources icon.
Step 4 Click Add.
Step 5 In the Log Source Name field, type a name for your log source.
Step 6 Optional. In the Log Source Description field, type a description for your log
source.
Step 7 From the Log Source Type list box, select Zscaler NSS.
Step 8 From the Protocol Configuration list box, select Syslog.

Configuring DSMs
779
Step 9 Configure the following values:
Step 10 Click Save.
Step 11 On the Admin tab, click Deploy Changes.
Table 117-4 Syslog protocol parameters
Parameter Description
Log Source Identifier Type the IP address as an identifier for events from your
Zscaler NSS installation.
The log source identifier must be unique value.
Enabled Select this check box to enable the log source.
By default, the check box is selected.
Credibility Select the credibility of the log source. The range is 0 - 10.
The credibility indicates the integrity of an event or offense
as determined by the credibility rating from the source
devices. Credibility increases if multiple sources report the
same event. The default is 5.
Target Event Collector Select the Event Collector to use as the target for the log
source.
Coalescing Events Select this check box to enable the log source to coalesce
(bundle) events.
By default, automatically discovered log sources inherit the
value of the Coalescing Events list box from the System
Settings in JSA. When you create a log source or edit an
existing configuration, you can override the default value by
configuring this option for each log source.
Incoming Event
Payload
From the list box, select the incoming payload encoder for
parsing and storing the logs.
Store Event Payload Select this check box to enable the log source to store event
payload information.
By default, automatically discovered log sources inherit the
value of the Store Event Payload list box from the System
Settings in JSA. When you create a log source or edit an
existing configuration, you can override the default value by
configuring this option for each log source.
Log Source Language Select the language of the events generated by zScaler
NSS.

Configuring DSMs
115 SUPPORTED DSMS
Table 118-1 provides information on the DSMs supported for Juniper Secure Analytics (JSA).
JSA integrates with many manufacturers and vendors of security products. Our list of supported DSMs and documentation
is constantly increasing. If your device or appliance is not listed in this document, contact your sales representative.
Table 118-1 Supported DSMs
Manufacturer DSM Version
Events
Accepted
JSA Recorded
Events Option in JSA
Auto
Discovered
Includes
Identity For More Information
3Com 8800 Series
Switch
v3.01.30 Syslog All relevant status
and network
condition
3Com 8800 Series Switch Yes No http://www.3com.com
Ambiron TrustWave
ipAngel
v4.0 Syslog Snort-based
events
Ambiron TrustWave
ipAngel Intrusion
Prevention System (IPS)
No No http://www.atwcorp.com
Apache HTTP Server v1.3 and
above
Syslog HTTP status Apache HTTP Server Yes No http://www.apache.org
APC UPS Syslog All relevant
Smart-UPS series
events
APC UPS No No http://www.apc.com
Apple Mac OS X (10) Syslog All relevant
firewall, web
server (access/
error), privilege,
and information
events
Mac OS X No Yes http://www.apple.com
Application
Security, Inc.
DbProtect v6.2, v6.3,
v6.3sp1,
v6.3.1,
and v6.4
Syslog All relevant events Application Security
DbProtect
Yes No http://www.appsecinc.com/

Configuring DSMs
782 SUPPORTED DSMS
Arpeggio
Software
SIFT-IT v3.1 and
above
Syslog All events
configured in the
SIFT-IT rule set
Arpeggio SIFT-IT Yes No http://www.arpeggiosoftwa
re.com
Array
Networks
SSL VPN ArraySP
v7.3
Syslog All relevant events Array Networks SSL VPN
Access Gateways
No Yes http://www.arraynetworks.
net
Aruba
Networks
Mobility
Controllers
v2.5 and
above
Syslog All relevant events Aruba Mobility Controller Yes No http://www.arubanetworks.
com
BalaBit IT
Security
Microsoft
Windows
Security Event
Log
v4.x Syslog All relevant
Microsoft Event
Log Events
Microsoft Windows
Security Event Log
Yes Yes http://www.balabit.com
BalaBit IT
Security
Microsoft ISA v4.x Syslog All relevant
Microsoft Event
Log Events
Microsoft Windows
Security Event Log
Yes Yes http://www.balabit.com
Barracuda
Networks
Spam & Virus
Firewall
v5.x and
above
Syslog All relevant events Barracuda Spam & Virus
Firewall
Yes No https://www.barracudanet
works.com
Barracuda
Networks
Web
Application
Firewall
v7.0.x Syslog All relevant
system, web
firewall, access,
and audit events
Barracuda Web
Application Firewall
No No https://www.barracudanet
works.com
Barracuda
Networks
Web Filter 6.0.x and
above
Syslog All relevant web
traffic and web
interface events
Barracuda Web Filter Yes No https://www.barracudanet
works.com
Bit9 Parity v6.0.2 and
above
Syslog All relevant events Bit9 Parity Yes Yes http://www.bit9.com
BlueCat
Networks
Adonis v6.7.1-P2
and above
Syslog All relevant DNS
and DHCP events
BlueCat Networks Adonis Yes No http://www.bluecatnetwork
s.com
Blue Coat SG v4.x and
above
Syslog
Log File
Protocol
All relevant events Bluecoat SG Appliance No No http://www.bluecoat.com
Bridgewater
Systems
AAA v8.2c1 Syslog All relevant events Bridgewater Systems
AAA Service Controller
Yes Yes http://www.bridgewater
systems.com
Table 118-1 Supported DSMs (continued)
Manufacturer DSM Version
Events
Accepted
JSA Recorded
Events Option in JSA
Auto
Discovered
Includes
Identity For More Information

Configuring DSMs
783
CA Access
Control
Facility
v12 to v15 Log File
Protocol
All relevant events CA ACF2 No No http://www.ca.com
CA SiteMinder Syslog All relevant events CA SiteMinder No No http://www.ca.com
CA Top Secret v12 to v15 Log File
Protocol
All relevant events CA Top Secret No No http://www.ca.com
Check Point FireWall-1 NG, FP1,
FP2, FP3,
AI R54, AI
R55, R65,
R70,
NGX, and
R75
Syslog or
OPSEC
LEA
All relevant events Check Point FireWall-1 Yes Yes http://www.checkpoint.com
Check Point VPN-1 NG, FP1,
FP2, FP3,
AI R54, AI
R55, R65,
R70, NGX
Syslog or
OPSEC
LEA
All relevant events Check Point FireWall-1 Yes Yes http://www.checkpoint.com
Check Point Provider-1 NG, FP1,
FP2, FP3,
AI R54, AI
R55, R65,
R70, NGX
Syslog or
OPSEC
LEA
All relevant events Check Point FireWall-1 Yes Yes http://www.checkpoint.com
Cilasoft Cilasoft
QJRN/400
V5.14.K
and above
Syslog All relevent IBM i
audit events
Cilasoft QJRN/400 Yes No http://www.cilasoft.com
Cisco 4400 Series
Wireless LAN
Controller
v7.2 Syslog or
SNMPv2
All relevant events Cisco Wireless LAN
Controllers
No No http://www.cisco.com
Cisco CallManager v8.x Syslog All relevant
application events
Cisco CallManager Yes No http://www.cisco.com
Table 118-1 Supported DSMs (continued)
Manufacturer DSM Version
Events
Accepted
JSA Recorded
Events Option in JSA
Auto
Discovered
Includes
Identity For More Information

Configuring DSMs
784 SUPPORTED DSMS
Cisco ACS v4.1 and
above if
directly
from ACS
v3.x and
above if
using ALE
Syslog Failed Access
Attempts
Cisco ACS Yes Yes http://www.cisco.com
Cisco Aironet v4.x and
above
Syslog Cisco Emblem
Format
Cisco Aironet Yes No http://www.cisco.com
Cisco ACE Firewall v12.2 Syslog All relevant events Cisco ACE Firewall Yes Yes http://www.cisco.com
Cisco ASA v7.x and
above
Syslog All relevant events Cisco Adaptive Security
Appliance (ASA)
Yes Yes http://www.cisco.com
Cisco ASA v7.x and
above
NSEL
Protocol
All relevant events Cisco Adaptive Security
Appliance (ASA)
No No http://www.cisco.com
Cisco CSA v4.x, v5.x
and v6.x
Syslog
SNMPv1
SNMPv2
All relevant events Cisco CSA Yes Yes http://www.cisco.com
Cisco CatOS for
catalyst
systems
v7.3 and
above
Syslog All relevant events Cisco CatOS for Catalyst
Switches
Yes Yes http://www.cisco.com
Cisco IDS/IPS v5.x and
v6.x
SDEE All relevant events Cisco Intrusion Prevention
System (IPS)
No No http://www.cisco.com
Cisco IronPort v5.5, v6.5,
and v7.1
Syslog,
Log File
Protocol
All relevant events Cisco IronPort No No http://www.cisco.com
Cisco Firewall
Service
Module
(FWSM)
v2.1 and
above
Syslog All relevant events Cisco Firewall Services
Module (FWSM)
Yes Yes http://www.cisco.com
Cisco Catalyst
Switch
IOS, 12.2,
12.5, and
above
Syslog All relevant events Cisco IOS Yes Yes http://www.cisco.com
Table 118-1 Supported DSMs (continued)
Manufacturer DSM Version
Events
Accepted
JSA Recorded
Events Option in JSA
Auto
Discovered
Includes
Identity For More Information

Configuring DSMs
785
Cisco NAC
Appliance
v4.x and
above
Syslog All relevant audit,
error, failure,
quarantine, and
infected events
Cisco NAC Appliance No No http://www.cisco.com
Cisco Nexus v6.x Syslog All relevant
Nexus-OS events
Cisco Nexus Yes No http://www.cisco.com
Cisco PIX Firewall v5.x, v6.3,
and above
Syslog All relevant Cisco
PIX events
Cisco PIX Firewall Yes Yes http://www.cisco.com
Cisco IOS IOS, 12.2,
12.5, and
above
Syslog All relevant events Cisco IOS or select your
specific device type:
•Cisco 12000 Series
Routers
•Cisco 6500 Series
Switches
•Cisco 7600 Series
Routers
•Cisco Carrier Routing
System
•Cisco Integrated
Services Router
Yes* Yes http://www.cisco.com
Cisco VPN 3000
Concentrator
VPN
3005,
4.1.7.H
Syslog All relevant events Cisco VPN 3000 Series
Concentrator
Yes Yes http://www.cisco.com
Cisco Wireless
Services
Modules
(WiSM)
v 5.1 and
above
Syslog All relevant events Cisco Wireless Services
Module (WiSM)
Yes No http://www.cisco.com
Cisco Identity
Services
Engine
v1.1 UDP
Multiline
Syslog
Protocol
All device events Cisco Identity Services
Engine
No Yes http://www.cisco.com
Table 118-1 Supported DSMs (continued)
Manufacturer DSM Version
Events
Accepted
JSA Recorded
Events Option in JSA
Auto
Discovered
Includes
Identity For More Information

Configuring DSMs
786 SUPPORTED DSMS
Citrix NetScaler v9.3 to
v10.0
Syslog All relevant events Citrix NetScaler Yes Yes http://www.citrix.com
Citrix Access
Gateway
v4.5 Syslog All relevant
access, audit, and
diagnostic events
Citrix Access Gateway Yes No http://www.citrix.com
CRYPTOCard CRYPTO-
Shield
v6.3 Syslog All relevant events CRYPTOCard
CRYPTO-Shield
No No http://www.cryptocard.com
Cyber-Ark Vault v6.x Syslog All relevant events Cyber-Ark Vault Yes Yes http://www.cyber-ark.com
CyberGuard Firewall/VPN KS1000
v5.1
Syslog All relevant
CyberGuard
events
CyberGuard TSP
Firewall/VPN
Yes No http://www.cyberguard.co
m
Damballa Failsafe v5.0.2 and
above
Syslog All relevant events Damballa Failsafe Yes No http://www.damballa.com
Digital China
Networks
DCS and
DCRS Series
switches
v1.8.7 and
above
Syslog All relevant DCS
and DCRS IPv4
events
Digital China DCRS
Series
No No http://www.dcnglobal.com/
Enterasys 800-Series
Switch
All Syslog All relevant events Enterasys 800-Series
Switch
Yes No http://www.enterasys.com
Enterasys Dragon v5.0, 6.x,
v7.1, v7.2,
v7.3, and
v7.4
Syslog
SNMPv1
SNMPv3
All relevant
Enterasys Dragon
events
Enterasys Dragon
Network IPS
Yes No http://www.enterasys.com
Enterasys Matrix Router v3.5 Syslog
SNMPv1
SNMPv2
SNMPv3
SNMP and syslog
login, logout, and
login failed events
Enterasys Matrix E1
Switch
Yes No http://www.enterasys.com
Enterasys NetSight
Automatic
Security
Manager
v3.1.2 Syslog All relevant events Enterasys NetsightASM Yes No http://www.enterasys.com
Table 118-1 Supported DSMs (continued)
Manufacturer DSM Version
Events
Accepted
JSA Recorded
Events Option in JSA
Auto
Discovered
Includes
Identity For More Information

Configuring DSMs
787
Enterasys Matrix N/K/S
Series Switch
v6.x, v7.x Syslog All relevant Matrix
K-Series,
N-Series and
S-Series device
events
Enterasys K/N/S Series
Switch
Yes No http://www.enterasys.com
Enterasys Stackable and
Standalone
Switches
Syslog All relevant events Enterasys Stackable and
Standalone Switches or
select your specific device
type:
•Enterasys A-Series
•Enterasys B2-Series
•Enterasys B3-Series
•Enterasys C2-Series
•Enterasys C3-Series
•Enterasys D-Series
•Enterasys G-Series
•Enterasys I-Series
Yes Yes http://www.enterasys.com
Enterasys XSR Security
Router
v7.6.14.00
02
Syslog All relevant events Enterasys XSR Security
Routers
Yes No http://www.enterasys.com
Enterasys HiGuard
Wireless IPS
V2R2.0.30 Syslog All relevant events Enterasys HiGuard Yes No http://www.enterasys.com
Enterasys HiPath
Wireless
Controller
V2R2.0.30 Syslog All relevant events Enterasys HiPath Yes No http://www.enterasys.com
Enterasys NAC v3.2 and
v3.3
Syslog All relevant events Enterasys NAC Yes No http://www.enterasys.com
Extreme
Networks
Extreme
Ware
v7.7 and
XOS
v12.4.1.x
Syslog All relevant events Extreme Networks
ExtremeWare Operating
System (OS)
No Yes http://www.extremenetwor
ks.com
Table 118-1 Supported DSMs (continued)
Manufacturer DSM Version
Events
Accepted
JSA Recorded
Events Option in JSA
Auto
Discovered
Includes
Identity For More Information

Configuring DSMs
788 SUPPORTED DSMS
F5 Networks BIG-IP AFM v11.3 Syslog All relevant
network, network
DoS, protocol
security, DNS,
and DNS DoS
events
F5 BIG-IP AFM Yes No http://www.f5.com
F5 Networks BIG-IP LTM v4.5, v9.x
to v11.x
Syslog All relevant events F5 Networks BIG-IP LTM No Yes http://www.f5.com
F5 Networks BIG-IP ASM v10.2 Syslog All relevant events F5 Networks BIG-IP ASM Yes No http://www.f5.com
F5 Networks BIG-IP APM v10.x, and
v11.x
Syslog All relevant events F5 Networks APM Yes No http://www.f5.com
F5 Networks FirePass v7.0 Syslog All relevant events F5 Networks FirePass Yes Yes http://www.f5.com
Fair Warning Fair Warning v2.9.2 Log File
Protocol
All relevant events Fair Warning No No http://www.fairwarningaudi
t.com
Fidelis
Security
Systems
Fidelis XPS 7.3.x Syslog All relevant alert
events
Fidelis XPS Yes No http://www.fidelissecurity.c
om
FireEye MPS, eMPS
and MA
v5.1 patch
level 5
Syslog All relevant events FireEye No No http://www.fireeye.com
ForeScout CounterACT v7.x and
above
Syslog All relevant Denial
of Service,
system, exploit,
authentication,
and suspicious
events
ForeScout CounterACT No No http://www.forescout.com
Fortinet FortiGate FortiOS
v2.5 and
above
Syslog All relevant events Fortinet FortiGate
Security Gateway
Yes No http://www.fortinet.com
Foundry FastIron Syslog All relevant events Foundry FastIron Yes Yes http://www.brocade.com
Great Bay Beacon v3.x.x and
v4.x.x
Syslog All relevant events Great Bay Beacon Yes No http://www.greatbaysoftwa
re.com
Table 118-1 Supported DSMs (continued)
Manufacturer DSM Version
Events
Accepted
JSA Recorded
Events Option in JSA
Auto
Discovered
Includes
Identity For More Information

Configuring DSMs
789
HBGary Active
Defense
v1.2 and
above
Syslog All relevant events HBGary Active Defense Yes No http://www.hbgary.com
HP Tandem Log File
Protocol
Safe Guard Audit
file events
HP Tandem No No http://www.HP.com
HP ProCurve K.14.52 Syslog All relevant events HP ProCurve Yes No http://www.HP.com
HP UX v11.x and
above
Syslog All relevant events Hewlett Packard UniX No Yes http://www.HP.com
Honeycomb
Technologies
Lexicon File
Integrity
Monitor
mesh
service
v3.1 and
above
Syslog All relevent file
integrity events
Honeycomb Lexicon File
Integrity Monitor
Yes No http://www.honeycomb.co.
uk
Huawei S Series
Switch
S5700,
S7700,
and
S9700
using
V200R001
C00
Syslog All relevant IPv4
events from
S5700, S7700,
and S9700
Switches
Huawei S Series Switch No No http://www.huawei.com
Huawei AR Series
Router
AR150,
AR200,
AR1200,
AR2200,
and
AR3200
routers
using
V200R002
C00
Syslog All relevant IPv4
events
Huawei AR Series Router No No http://www.huawei.com
IBM AIX v6.1 &
v7.1
Syslog,
Log File
Protocol
All configured
audit events
IBM AIX Audit Yes No http://www.ibm.com
Table 118-1 Supported DSMs (continued)
Manufacturer DSM Version
Events
Accepted
JSA Recorded
Events Option in JSA
Auto
Discovered
Includes
Identity For More Information

Configuring DSMs
790 SUPPORTED DSMS
IBM AIX 5.x and
6.x
Syslog All relevant
authentication and
operating system
events
IBM AIX Server Yes Yes http://www.ibm.com
IBM AS/400 iSeries
DSM
V5R3 and
above
Log File
Protocol
All relevant events IBM AS/400 iSeries No Yes http://www.ibm.com
IBM AS/400 iSeries
- Robert
Townsend
Security
Solutions
V5R1 and
above
Syslog All CEF formatted
messages
IBM AS/400 iSeries Yes Yes http://www.ibm.com
http://www.patownsend.co
m
IBM AS/400 iSeries
- Powertech
Interact
V5R1 and
above
Syslog All CEF formatted
messages
IBM AS/400 iSeries Yes Yes http://www.ibm.com
http://www.powertech.com
IBM InfoSphere
Guardium
8.2p45 Syslog All relevant policy
builder events
IBM Guardium No No http://www.ibm.com
IBM ISS Proventia M10
v2.1_2004
.1122_15.
13.53
SNMP All relevant events IBM Proventia Network
Intrusion Prevention
System (IPS)
No No http://www.ibm.com
IBM Lotus Domino v8.5 SNMP All relevant events IBM Lotus Domino No No http://www.ibm.com
IBM Proventia
Management
SiteProtector
v2.0 and
v2.9
JDBC All relevant IPS
and audit events
IBM Proventia
Management
SiteProtector
No No http://www.ibm.com
IBM RACF v1.9 to
v1.13
Log File
Protocol
All relevant events IBM RACF No No http://www.ibm.com
IBM CICS v3.1 to
v4.2
Log File
Protocol
All relevant events IBM CICS No No http://www.ibm.com
IBM DB2 v8.1 to
v10.1
Log File
Protocol
All relevant events IBM DB2 No No http://www.ibm.com
IBM z/OS v1.9 to
v1.13
Log File
Protocol
All relevant events IBM z/OS No No http://www.ibm.com
Table 118-1 Supported DSMs (continued)
Manufacturer DSM Version
Events
Accepted
JSA Recorded
Events Option in JSA
Auto
Discovered
Includes
Identity For More Information

Configuring DSMs
791
IBM Informix v11 Log File
Protocol
All relevant events IBM Informix Audit No No http://www.ibm.com
IBM IMS Log File
Protocol
All relevant events IBM IMS No No http://www.ibm.com
IBM Security
Network
Protection
(XGS)
v5.0 with
fixpack 7
Syslog All relevant
system, access,
and security
events
IBM Security Network
Protection (XGS)
Yes No http://www.ibm.com
IBM Security
Network IPS
v4.6 and
above
Syslog All relevant
security, health,
and system
events
IBM Security Network IPS Yes No http://www.ibm.com
IBM Tivoli Access
Manager
IBM Web
Security
Gateway
v7.x
Syslog All relevant audit,
access, and HTTP
events.
IBM Tivoli Access
Manager
Yes Yes http://www.ibm.com
IBM Tivoli Endpoint
Manager
Tivoli
Endpoint
Manager
v8.2.x and
above
IBM Tivoli
Endpoint
Manager
SOAP
Protocol
All relevant server
events
IBM Tivoli Endpoint
Manager
No Yes http://www.ibm.com
IBM WebSphere
Application
Server
5.0.x to
6.1
Log File
Protocol
All relevant events IBM WebSphere
Application Server
No Yes http://www.ibm.com
IBM zSecure Alert 1.13.x and
above
UNIX
syslog
All relevant alert
events
IBM Security zSecure
Alert
Yes Yes http://www.ibm.com
Table 118-1 Supported DSMs (continued)
Manufacturer DSM Version
Events
Accepted
JSA Recorded
Events Option in JSA
Auto
Discovered
Includes
Identity For More Information

Configuring DSMs
792 SUPPORTED DSMS
Imperva SecureSphere v6.2 and
v7.x or 9.5
and 10.0
(LEEF)
Syslog All relevant events Imperva SecureSphere Yes No http://www.imperva.com
Infoblox NIOS v6.x Syslog All relevant events Infoblox NIOS No Yes http://www.infoblox.com
Internet
Systems
Consortium
(ISC)
BIND v9.9 Syslog All relevant events ISC BIND Yes No http://www.isc.org
iT-CUBE agileSI v1.x SMB Tail All relevant
agileSI SAP
events
iT-CUBE agileSI No Yes http://www.it-cube.net
Itron Openway
Smart Meter
Syslog All relevant events Itron Smart Meter Yes No http://www.itron.com
Juniper
Networks
AVT JDBC All relevant events Juniper AVT No No http://www.juniper.net
Juniper
Networks
DX Syslog All relevant status
and network
condition events
Juniper DX Application
Acceleration Platform
Yes No http://www.juniper.net
Juniper
Networks
Infranet
Controller
v2.1, v3.1
& v4.0
Syslog All relevant events Juniper Networks Infranet
Controller
No Yes http://www.juniper.net
Juniper
Networks
Firewall and
VPN
v5.5r3 and
later
Syslog All relevant
Juniper Firewall
events
Juniper Networks Firewall
and VPN
Yes Yes http://www.juniper.net
Juniper
Networks
Junos
WebApp
Secure
4.2.x Syslog All relevant
incident and
access events
Juniper Junos WebApp
Secure
Yes No http://www.juniper.net
Juniper
Networks
IDP v4.0, v4.1
& v5.0
Syslog All relevant
Juniper IDP
events
Juniper Networks
Intrusion Detection and
Prevention (IDP)
Yes No http://www.juniper.net
Table 118-1 Supported DSMs (continued)
Manufacturer DSM Version
Events
Accepted
JSA Recorded
Events Option in JSA
Auto
Discovered
Includes
Identity For More Information

Configuring DSMs
793
Juniper
Networks
Network and
Security
Manager
(NSM) and
Juniper SSG
2007.1r2
to
2007.2r2,
2008.r1,
2009.1r1,
2010.x
Syslog All relevant NSM
events
Juniper Networks Network
and Security Manager
Yes No http://www.juniper.net
Juniper
Networks
Junos OS v7.x to
v10.x
Ex Series
Ethernet
Switch
DSM only
supports
v9.0 to
v10.x
Syslog or
PCAP
Syslog***
All relevant events Juniper Junos OS
Platform or select your
specific device type:
•Juniper M Series
Multiservice Edge
Routing**
•Juniper MX Series
Ethernet Services
Router**
•Juniper T Series Core
Platform**
•Juniper EX Series
Ethernet Switch**
•Juniper SRX Series**
Yes** Yes http://www.juniper.net
Juniper
Networks
Secure
Access RA
Juniper
SA
version
6.1R2 and
Juniper IC
version
2.1
Syslog All relevant events Juniper Networks Secure
Access (SA) SSL VPN
Yes Yes http://www.juniper.net
Juniper
Networks
Juniper
Security
Binary Log
Collector
SRX or J
Series
appliances
at v12.1 or
above.
Binary All relevant audit,
system, firewall,
and IPS events.
Juniper Security Binary
Log Collector
No No http://www.juniper.net
Juniper
Networks
Steel-Belted
Radius
v5.x and
above
Syslog All relevant events Juniper Steel Belted
Radius
Yes Yes http://www.juniper.net
Table 118-1 Supported DSMs (continued)
Manufacturer DSM Version
Events
Accepted
JSA Recorded
Events Option in JSA
Auto
Discovered
Includes
Identity For More Information

Configuring DSMs
794 SUPPORTED DSMS
Juniper
Networks
vGW Virtual
Gateway
v4.5 Syslog All relevant
firewall, admin,
policy and IDS
Log events
Juniper vGW Yes No http://www.juniper.net
Kaspersky Security
Center
v9.2 JDBC All relevant anti
virus, server, and
audit events
Kaspersky Security
Center
No Yes http://www.kaspersky.com
Lieberman Random
Password
Manager
v4.8x Syslog All relevant events Lieberman Random
Password Manager
Yes No http://www.liebsoft.com
Linux Open Source
Linux OS
v2.4 and
above
Syslog All relevant
operating system
events
Linux OS Yes Yes
Linux DHCP Server v2.4 and
above
Syslog All relevant events
from a DHCP
server
Linux DHCP Server Yes Yes
Linux IPtables kernel v2.4 and
above
Syslog All relevant
Accept, Drop, or
Reject events
Linux iptables Firewall Yes No
McAfee Intrushield v2.1.x and
above
Syslog All relevant events McAfee IntruShield
Network IPS Appliance
Yes No http://www.mcafee.com
McAfee ePolicy
Orchestrator
v3.5 to
v4.6
JDBC
SNMPv2
SNMPv3
All relevant
AntiVirus events
McAfee ePolicy
Orchestrator
No No http://www.mcafee.com
McAfee Application /
Change
Control
v4.5.x JDBC All relevant
change
management
events
McAfee Application /
Change Control
No Yes http://www.mcafee.com
McAfee Web Gateway v7.0.0 Syslog,
Log File
Protocol
All relevant events McAfee Web Gateway Yes No http://www.mcafee.com
Table 118-1 Supported DSMs (continued)
Manufacturer DSM Version
Events
Accepted
JSA Recorded
Events Option in JSA
Auto
Discovered
Includes
Identity For More Information

Configuring DSMs
795
MetaInfo MetaIP v5.7.00-60
59 and
above
Syslog All relevant events Metainfo MetaIP Yes Yes http://www.metainfo.com
Microsoft IIS 6.0 and
7.0
Syslog HTTP status code
events
Microsoft IIS Webserver
Logs
Yes No http://www.microsoft.com
Microsoft Internet and
Acceleration
(ISA) Server
or Threat
Management
Gateway
ISA 2006 Syslog All relevant ISA or
TMG events
Microsoft ISA
Note: Microsoft TMG
2010 is supported using
the Adaptive Log
Exporter.
Yes No http://www.microsoft.com
Microsoft Exchange
Server
2007, and
2010
Windows
Exchange
Protocol
Exchange mail
and security
events
Microsoft Exchange
Server
No No http://www.microsoft.com
Microsoft Endpoint
Protection
2012 JDBC Malware detection
events
Microsoft Endpoint
Protection
No No http://www.microsoft.com
Microsoft IAS Server Windows
2000,
2003, and
2008
Syslog All relevant events Microsoft IAS Server Yes No http://www.microsoft.com
Microsoft Microsoft
Windows
Event Security
Log
2000,
2003,
2008, XP,
Vista, and
Windows
7 (32 or
64-bit
systems
supported)
Syslog or
Microsoft
Windows
Event Log
Protocol
Source
All relevant events Microsoft Windows
Security Event Log
Yes Yes http://www.microsoft.com
Microsoft SQL Server 2008 JDBC SQL Audit events Microsoft SQL Server No No http://www.microsoft.com
Microsoft SharePoint 2010 JDBC SharePoint audit,
site, and file
events
Microsoft SharePoint No No http://www.microsoft.com
Microsoft DHCP Server 2000/2003 Syslog All relevant events Microsoft DHCP Server Yes Yes http://www.microsoft.com
Table 118-1 Supported DSMs (continued)
Manufacturer DSM Version
Events
Accepted
JSA Recorded
Events Option in JSA
Auto
Discovered
Includes
Identity For More Information

Configuring DSMs
796 SUPPORTED DSMS
Microsoft Operations
Manager
2005 JDBC All relevant events Microsoft Operations
Manager
No No http://www.microsoft.com
Microsoft System Center
Operations
Manager
2007 JDBC All relevant events Microsoft SCOM No No http://www.microsoft.com
Motorola Symbol AP firmware
v1.1 to 2.1
Syslog All relevant events Motorola SymbolAP No No http://www.motorola.com
NetApp Data ONTAP Syslog All relevant CIFS
events
NetApp Data ONTAP Yes Yes http://www.netapp.com
Niksun NetVCR 2005 v3.x Syslog All relevant
Niksun events
Niksun 2005 v3.5 No No http://www.niksun.com
Nokia Firewall NG FP1,
FP2, FP3,
AI R54, AI
R55, NGX
on IPSO
v3.8 and
above
Syslog or
OPSEC
LEA
All relevant events Check Point Firewall-1 Yes Yes http://www.nokia.com
Nokia VPN-1 NG FP1,
FP2, FP3,
AI R54, AI
R55, NGX
on IPSO
v3.8 and
above
Syslog or
OPSEC
LEA
All relevant events Check Point Firewall-1 Yes Yes http://www.nokia.com
Nominum Vantio v5.3 Syslog All relevant events Nominum Vantio Yes No http://www.nominum.com
Nortel Contivity Syslog All relevant events Nortel Contivity V2 VPN
Switch
Yes No http://www.nortel.com
Nortel Application
Switch
v3.2 and
above
Syslog All relevant status
and network
condition events
Nortel Application Switch No Yes http://www.nortel.com
Nortel ARN v15.5 Syslog All relevant events Nortel Multiprotocol
Router
Yes No http://www.nortel.com
Table 118-1 Supported DSMs (continued)
Manufacturer DSM Version
Events
Accepted
JSA Recorded
Events Option in JSA
Auto
Discovered
Includes
Identity For More Information

Configuring DSMs
797
Nortel Ethernet
Routing
Switch 2500
v4.1 Syslog All relevant events Nortel Ethernet Routing
Switch 2500/4500/5500
No Yes http://www.nortel.com
Nortel Ethernet
Routing
Switch 4500
v5.1 Syslog All relevant events Nortel Ethernet Routing
Switch 2500/4500/5500
No Yes http://www.nortel.com
Nortel Ethernet
Routing
Switch 5500
v5.1 Syslog All relevant events Nortel Ethernet Routing
Switch 2500/4500/5500
No Yes http://www.nortel.com
Nortel Ethernet
Routing
Switch 8300
v4.1 Syslog All relevant events Nortel Ethernet Routing
Switch 8300/8600
No Yes http://www.nortel.com
Nortel Ethernet
Routing
Switch 8600
v5.0 Syslog All relevant events Nortel Ethernet Routing
Switch 8300/8600
No Yes http://www.nortel.com
Nortel VPN Gateway v6.0, 7.0.1
and
above,
v8.x
Syslog All relevant events Nortel VPN Gateway Yes Yes http://www.nortel.com
Nortel Secure Router v9.3,
v10.1
Syslog All relevant events Nortel Secure Router Yes Yes http://www.nortel.com
Nortel Secure
Network
Access Switch
v1.6 and
v2.0
Syslog All relevant events Nortel Secure Network
Access Switch (SNAS)
Yes Yes http://www.nortel.com
Nortel Switched
Firewall 5100
v2.4 Syslog or
OPSEC
All relevant events Nortel Switched Firewall
5100
Yes Yes http://www.nortel.com
Nortel Switched
Firewall 6000
v4.2 Syslog or
OPSEC
All relevant events Nortel Switched Firewall
6000
Yes Yes http://www.nortel.com
Nortel Threat
Protection
System
v4.6 and
v4.7
Syslog All relevant events Nortel Threat Protection
System (TPS) Intrusion
Sensor (IS)
No No http://www.nortel.com
Novell eDirectory v2.7 Syslog All relevant events Novell eDirectory Yes No http://www.novell.com/
Table 118-1 Supported DSMs (continued)
Manufacturer DSM Version
Events
Accepted
JSA Recorded
Events Option in JSA
Auto
Discovered
Includes
Identity For More Information

Configuring DSMs
798 SUPPORTED DSMS
ObserveIT ObserveIT 5.6.x and
above
Log File
Protocol
All relevant user
activity events
ObserveIT No No http://www.observeit-sys.c
om
OpenBSD
Project
OpenBSD v4.2 and
above
Syslog All relevant events OpenBSD OS No Yes http://www.openbsd.org
Open LDAP
Foundation
Open LDAP 2.4.x UDP
Multiline
Syslog
All relevant events Open LDAP No No http://www.openldap.org/
Open Source SNORT v2.x Syslog All relevant events Snort Open Source IDS Yes No http://www.snort.org
Oracle Audit Records v9i, v10g,
and v11g
Syslog
JDBC
All relevant Oracle
events
Oracle RDBMS Audit
Record
Yes Yes http://www.oracle.com
Oracle Database
Listener
v9i, v10g,
and v11g
Syslog All relevant Oracle
events
Oracle Database Listener Yes No http://www.oracle.com
Oracle Audit Vault v10.2.3.2
and above
JDBC All relevant Oracle
events
Oracle Audit Vault No No http://www.oracle.com
Oracle OS Audit v9i, v10g,
and v11g
Syslog All relevant Oracle
events
Oracle RDBMS OS Audit
Record
Yes Yes http://www.oracle.com
Oracle BEA
WebLogic
v10.3.x Log File
Protocol
All relevant Oracle
events
Oracle BEA WebLogic No No http://www.oracle.com
OSSEC OSSEC v2.6 and
above
Syslog All relevant OSSEC Yes No http://www.ossec.net
Palo Alto
Networks
PanOS v3.0 and
above
Syslog All relevant events Palo Alto PA Series Yes Yes http://www.paloaltonetwor
ks.com
Pirean Access: One v2.2 with
DB2 v9.7
JDBC All relevant
access
management and
authentication
events
Pirean Access: One No No http://www.pirean.com
PostFix Mail Transfer
Agent
V2.6.6
and above
UDP
Multiline
Protocol
or Syslog
All relevant mail
events
Postfix Mail Transfer
Agent
No No http://www.postfix.org
Table 118-1 Supported DSMs (continued)
Manufacturer DSM Version
Events
Accepted
JSA Recorded
Events Option in JSA
Auto
Discovered
Includes
Identity For More Information

Configuring DSMs
799
ProFTPd v1.2.x,
v1.3.x
Syslog All relevant events ProFTPD Server Yes Yes http://www.proftpd.org
Radware DefensePro v4.23 and
5.01
Syslog All relevant events Radware DefensePro Yes No http://www.radware.com
Raz-Lee
iSecurity
AS/400 iSeries Firewall
15.7 and
Audit 11.7
Syslog All relevant
security and audit
events
IBM AS/400 iSeries Yes Yes http://www.razlee.com
Redback
Networks
ASE v6.1.5 Syslog All relevant events Redback ASE Yes No http://www.redback.com
RSA Authentication
Manager
v7.1, v6.x Syslog or
Log File
Protocol
All relevant events RSA Authentication
Manager
No No http://www.rsa.com
Samhain Labs HIDS v2.4 Syslog
JDBC
All relevant events Samhain HIDS Yes No http://www.la-samhna.de/s
amhain
Secure
Computing
Sidewinder G2 v61 Syslog All Sidewinder
events
Sidewinder G2 Security
Appliance
Yes No http://www.securecomputi
ng.com
Sentrigo Hedgehog v2.5.3 Syslog All relevant events Sentrigo Hedgehog Yes No http://www.sentrigo.com
SolarWinds Orion v2011.2 Syslog All relevant events SolarWinds Orion Yes No http://www.solarwinds.com
SonicWALL UTM/Firewall/
VPN
Appliance
v3.x and
above
Syslog All relevant events SonicWALL SonicOS Yes No http://www.sonicwall.com
Sophos Astaro v8.x Syslog All relevant events Sophos Astaro Security
Gateway
Yes No http://www.sophos.com
Sophos Enterprise
console
v4.5.1 and
v5.1
Sophos
Enterprise
console
protocol
or JDBC
All relevant events Sophos Enterprise
console
No No http://www.sophos.com
Table 118-1 Supported DSMs (continued)
Manufacturer DSM Version
Events
Accepted
JSA Recorded
Events Option in JSA
Auto
Discovered
Includes
Identity For More Information

Configuring DSMs
800 SUPPORTED DSMS
Sophos PureMessage v3.1.0.0
and above
for
Microsoft
Exchange
v5.6.0 for
Linux
JDBC All relevant
quarantined email
events
Sophos PureMessage No No http://www.sophos.com
Sophos Web Security
Appliance
v3.x Syslog All relevant
transaction log
events
Sophos Web Security
Appliance
Yes No http://www.sophos.com
Sourcefire Intrusion
Sensor
IS 500,
v2.x, 3.x,
4.x
Syslog All relevant
Sourcefire events
Snort Open Source IDS Yes No http://www.sourcefire.com
Sourcefire Defense
Center
v4.8.0.2
and above
Sourcefire
Defense
Center
All relevant
Sourcefire events
Sourcefire Defense
Center
No No http://www.sourcefire.com
Splunk Microsoft
Windows
Security Event
Log
TCP
Multiline
Syslog
Windows-based
event provided by
Splunk
Forwarders
Microsoft Windows
Security Event Log
No Yes http://www.splunk.com
Squid Web Proxy v2.5 and
above
Syslog All cache and
access log events
Squid Web Proxy Yes No http://www.squid-cache.or
g
Startent
Networks
Syslog All relevant events Starent Networks Home
Agent (HA)
Yes No http://www.starentnetwork
s.com
Stonesoft Management
Center
v5.4 Syslog All relevant
Management
Center, IPS,
Firewall, and VPN
Events
Stonesoft Management
Center
Yes No http://www.stonesoft.com
Sun Solaris v5.8, v5.9,
Sun OS
v5.8, v5.9
Syslog All relevant events Solaris Operating System
Authentication Messages
Yes Yes http://www.sun.com
Table 118-1 Supported DSMs (continued)
Manufacturer DSM Version
Events
Accepted
JSA Recorded
Events Option in JSA
Auto
Discovered
Includes
Identity For More Information

Configuring DSMs
801
Sun Solaris DHCP v2.8 Syslog All relevant events Solaris Operating System
DHCP Logs
Yes Yes http://www.sun.com
Sun Solaris
Sendmail
v2.x Syslog All relevant events Solaris Operating System
Sendmail Logs
Yes No http://www.sun.com
Sun Solaris Basic
Security Mode
(BSM)
v5.10 and
above
Log File
Protocol
All relevant events Solaris BSM No Yes http://www.sun.com
Sun ONE LDAP v11.1 Log File
Protocol
All relevant
access and LDAP
events
Sun ONE LDAP No No http://www.sun.com
Sybase ASE v15.0 and
above
JDBC All relevant events Sybase ASE No No http://www.sybase.com
Symantec Endpoint
Protection
v11 and
v12
Syslog All Audit and
Security Logs
Symantec Endpoint
Protection
Yes No http://www.symantec.com
Symantec SGS
Appliance
v3.x and
above
Syslog All relevant events Symantec Gateway
Security (SGS) Appliance
Yes No http://www.symantec.com
Symantec SSC v10.1 JDBC All relevant events Symantec System Center Yes No http://www.symantec.com
Symantec Data Loss
Prevention
(DLP)
v8.x and
above
Syslog All relevant events Symantec Data Loss
Prevention (DLP)
No No http://www.symantec.com
Symantec PGP Universal
Server
3.0.x Syslog All relevant events PGP Universal Server Yes No http://www.symantec.com
Symark PowerBroker 4.0 Syslog All relevant events Symark Yes No http://www.symark.com
ThreatGRID Malware
Threat
Intelligence
Platform
v2.0 Log file or
syslog
All relevant
malware events
ThreatGRID Malware
Threat Intelligence
Platform
No No http://www.threatgrid.com
TippingPoint Intrusion
Prevention
System (IPS)
v1.4.2 to
v3.2.x
Syslog All relevant events TippingPoint Intrusion
Prevention System (IPS)
No No http://www.tippingpoint.co
m
X505/X506 v2.5 and
above
Syslog All relevant events TippingPoint X Series
Appliances
Yes Yes http://www.tippingpoint.co
m
Table 118-1 Supported DSMs (continued)
Manufacturer DSM Version
Events
Accepted
JSA Recorded
Events Option in JSA
Auto
Discovered
Includes
Identity For More Information

Configuring DSMs
802 SUPPORTED DSMS
Top Layer IPS 5500 v4.1 and
above
Syslog All relevant events Top Layer Intrusion
Prevention System (IPS)
Yes No http://www.toplayer.com
Trend Micro Control
Manager
v5.0 or
v5.5 with
hotfix
1697 or
hotfix
1713 after
SP1 Patch
1
SNMPv1,
SNMPv2,
SNMPv3
All relevant events Trend Micro Control
Manager
Yes No http://www.trendmicro.com
Trend Micro Deep
Discovery
v3.x Syslog All relevant events Trend Micro Deep
Discovery
Yes No http://www.trendmicro.com
Trend Micro InterScan
VirusWall
v6.0 and
above
Syslog All relevant events Trend InterScan VirusWall Yes No http://www.trendmicro.com
Trend Micro Office Scan v8.x and
v10.x
SNMPv2 All relevant events Trend Micro Office Scan No No http://www.trendmicro.com
Tripwire Enterprise
Manager
v5.2 and
above
Syslog Resource
additions,
removal, and
modification
events
Tripwire Enterprise Yes No http://www.tripwire.com
Tropos
Networks
Tropos Control v7.7 Syslog All relevant fault
management,
login/logout,
provision, and
device image
upload events
Tropos Control No No http://www.tropos.com
Universal Syslog and
SNMP
Syslog,
SNMP, or
SDEE
All relevant events Universal DSM No Yes
Universal Syslog Syslog or
Log File
Protocol
All relevant events Universal LEEF No Yes
Table 118-1 Supported DSMs (continued)
Manufacturer DSM Version
Events
Accepted
JSA Recorded
Events Option in JSA
Auto
Discovered
Includes
Identity For More Information

Configuring DSMs
803
* These devices are auto discovered as Cisco IOS devices.
** These devices are auto discovered as a Juniper Junos OS Platform devices.
*** PCAP Syslog Combination protocol is only available on the Juniper Networks SRX Series appliance.
Universal Authentication
Server
Syslog All relevant events Configurable
Authentication message
filter
No Yes
Universal Firewall Syslog All relevant events Configurable Firewall
Filter
No No
Verdasys Digital
Guardian
6.0.x Syslog All relevant events Verdasys Digital Guardian Yes No http://www.verdasys.com
Vericept Content 360 Up to v8.0 Syslog All relevant events Vericept Content 360 Yes No http://www.vericept.com
VMware VMware ESX or
ESXi
3.5.x, 4.x,
and 5.x
Syslog All relevant events EMC VMware Yes No http://www.vmware.com
VMWare
protocol
All relevant events EMC VMware No No http://www.vmware.com
VMware vCenter v5.x VMWare
protocol
All relevant events VMware vCenter No No http://www.vmware.com
VMware vCloud v5.1 vCloud
protocol
All relevant events VMware vCloud No Yes http://www.vmware.com
Websense TRITON v7.7 Syslog All relevant events Websense V Series Yes No http://www.websense.com
Websense V Series Data
Security Suite
(DSS)
v7.1.x and
above
Syslog All relevant events Websense V Series Yes No http://www.websense.com
Websense V Series
Content
Gateway
v7.1.x and
above
Log File
Protocol
All relevant events Websense V Series No No http://www.websense.com
Zscaler Zscaler NSS V4.1 Syslog All relevent web
log events
Zscaler NSS Yes No http://www.zscaler.com
Table 118-1 Supported DSMs (continued)
Manufacturer DSM Version
Events
Accepted
JSA Recorded
Events Option in JSA
Auto
Discovered
Includes
Identity For More Information

Configuring DSMs
INDEX
Numerics
3Com 8800 Series Switch 27, 781
A
Ambiron TrustWave ipAngel 29, 781
Apache HTTP Server 31, 781
APC UPS 37, 781
Apple Mac OS 43, 781
Application Security DbProtect 45, 781
Arbor Networks Peakflow SP 49
Arpeggio SIFT-IT 57, 782
Array Networks SSL VPN 61, 387, 782
Aruba Mobility Controllers 63, 782
audience 15
automatic updates 21
B
BalaBit IT Security for Microsoft ISA and TMG Events 73,
782
BalaBit IT Security for Microsoft Windows Events 69, 782
Barracuda Spam & Virus Firewall 79, 782
Barracuda Web Application Firewall 80, 782
Barracuda Web Filter 82
Bit9 Parity 85, 782
Blue Coat SG 91, 782
BlueCat Networks Adonis 87, 782
Bridgewater Systems 101, 782
Brocade Fabric OS 103
C
CA ACF2 105, 110, 783
CA SiteMinder 118, 783
CA Top Secret 121, 783
Check Point FireWall-1 135, 783
Check Point Provider-1 143, 783
Cilasoft QJRN/400 149, 783
Cisco ACE Firewall 153, 784
Cisco ACS 157, 784
Cisco Aironet 155, 784
Cisco ASA 161, 784
Cisco CallManager 166, 783
Cisco Catalyst Switch 167, 784
Cisco CatOS for Catalyst Switches 167, 784
Cisco CSA 169, 784
Cisco FWSM 170, 784
Cisco Identity Services Engine 191, 785
Cisco IDS/IPS 172, 784
Cisco IOS 179, 785
Cisco IronPort 174, 784
Cisco NAC appliance 176, 785
Cisco Nexus 177, 785
Cisco PIX Firewall 181, 785
Cisco VPN 3000 Concentrator 182, 785
Cisco Wireless LAN Controllers 186, 783
Cisco Wireless Services Module (WiSM) 183, 785
Citrix Access Gateway 197, 786
Citrix NetScaler 195, 786
conventions 15
CRYPTOCard CRYPTO-Shield 199, 786
Cyber-Ark Vault 201, 786
CyberGuard Firewall/VPN 203, 786
D
Damballa Failsafe 205, 786
Digital China Networks DCS/DCRS Series Switch 207, 786
E
EMC vCloud Director 803
EMC VMware 803
EMC VMware vCenter 803
Enterasys 800-Series Switch 227, 786
Enterasys Dragon 211, 786
Enterasys HiGuard Wireless IPS 218, 787
Enterasys HiPath Wireless Controller 220, 787
Enterasys Matrix K/N/S Series Switch 225, 787
Enterasys Matrix Router 223, 786
Enterasys Matrix Series 225
Enterasys NAC 226, 787
Enterasys NetSight Automatic Security Manager 224, 786
Enterasys Stackable and Standalone Switches 221, 787
Enterasys XSR Security Router 222, 787
Extreme Networks ExtremeWare 229, 787
F
F5 Networks BIG-IP AFM 231, 788
F5 Networks BIG-IP APM 236, 788
F5 Networks BIG-IP ASM 237, 788
F5 Networks BIG-IP LTM 239, 788
F5 Networks FirePass 241, 788
Fair Warning 245, 788
Fidelis XPS 247, 788
FireEye 251, 788
ForeScout CounterACT 253, 788
Fortinet FortiGate 257, 788
Foundry FastIron 259, 788
G
Generic Authentication Server 265, 803
Generic Firewall 261, 803

806 INDEX
Configuring DSMs
Great Bay Beacon 269, 788
H
HBGary Active Defense 271, 789
Hewlett Packard UniX 279, 789
high availability 21
Honeycomb Lexicon File Integrity Monitor 273, 789
HP ProCurve 277, 789
HP Tandem 789
http
//www.juniper.net/customers/support/ 165, 241, 293,
300, 319, 644, 699, 731
Huawei AR Series Router 281, 789
Huawei S Series Switch 283, 789
I
IBM AIX 288, 789, 790
IBM AS/400 iSeries 299, 790
IBM CICS 302, 790
IBM DB2 326, 790
IBM Guardium 348, 790
IBM IMS 342, 791
IBM Informix Audit 341, 791
IBM ISS Proventia 313, 790
IBM Lotus Domino 306, 790
IBM Proventia Management SiteProtector 309, 790
IBM RACF 314, 790
IBM Security Network IPS 368, 791
IBM Security Network Protection (XGS) 365, 791
IBM Tivoli Access Manager for e-business 356, 791
IBM Tivoli Endpoint Manager 363, 791
IBM WebSphere Application Server 336, 791 IBM z/
OS 790
IBM zSecure Alert 364, 791
Imperva SecureSphere 375, 792
Infoblox NIOS 381, 792
installing DSM bundle 25
installing DSMs 21
Internet System Consortium (ISC) Bind 371, 792
ISC Bind 371, 792
iT-CUBE agileSI 383, 792
Itron Smart Meter 387, 792
J
Juniper DDoS Secure 391
Juniper DX Application Acceleration Platform 391, 792
Juniper EX Series Ethernet Switch 392, 793
Juniper IDP 394, 792
Juniper Infranet Controller 398, 792
Juniper Junos OS 401, 793
Juniper Junos WebApp Secure 411, 792
Juniper Networks AVT 389, 792
Juniper Networks Firewall and VPN 399, 792
Juniper Networks NSM 399, 793
Juniper Networks Secure Access 395, 793
Juniper Networks vGW 406, 794
Juniper Secure Services Gateway (SSG) 399, 793
Juniper Security Binary Log Collector 408, 793
Juniper Steel-Belted Radius 404, 793
K
Kaspersky Security Center 419, 794
L
Lieberman Random Password Generator 425, 794
Linux DHCP Servers 427, 794
Linux IPtables 428, 794
Linux OS 430, 794
M
manually installing DSMs 24
McAfee Application / Change Control 449, 794
McAfee ePolicy Orchestrator 794
McAfee Intrushield 435, 794
McAfee Web Gateway 452, 794
MetaInfo MetaIP 457, 795
Microsoft DHCP Server 466, 795
Microsoft Endpoint Protection 493, 795
Microsoft Exchange Server 459, 795
Microsoft IAS 466, 795
Microsoft IIS Server 467, 795
Microsoft Internet and Acceleration Server 473, 795
Microsoft ISA 473, 795
Microsoft Operations Manager (MOM) 487, 796
Microsoft SharePoint 480, 795
Microsoft SQL Server 475, 795
Microsoft System Center Operations Manager (SCOM) 490,
796
Microsoft Windows Security Event Log 485, 795
Motorola Symbol AP 499, 796
N
Name Value Pair 425, 503
NetApp Data ONTAP 501, 796
Niksun NetVCR 2005 507, 796
Nokia Firewall 509, 796
Nokia VPN-1 796
Nominum Vantio 515, 796
Nortel Application Switch 520, 796
Nortel ARN 27, 796
Nortel Contivity 521, 796
Nortel Ethernet Routing Switch 2500/4500/5500 521, 797
Nortel Ethernet Routing Switch 8300/8600 522, 797
Nortel Multiprotocol Router 517, 796
Nortel Secure Network Access Switch 525, 797
Nortel Secure Router 524, 797
Nortel Switched Firewall 5100 526, 797
Nortel Switched Firewall 6000 528, 797
Nortel Threat Protection System 797
Nortel VPN Gateway 531, 797

Configuring DSMs
INDEX 807
Novell eDirectory 533, 797
O
Open LDAP Software 547, 798
Open Source SNORT 553, 798
OpenBSD 545, 798
Oracle Acme Packet Session Border Control 571
Oracle Audit Records 555, 798
Oracle Audit Vault 563, 798
Oracle BEA WebLogic 566, 798
Oracle DB Listener 559, 798
Oracle Fine Grained Auditing 574
Oracle OS Audit 564, 798
OSSEC 579, 798
overview 19
P
Palo Alto Networks 581, 798
PGP Universal Server 696, 801
Pirean Access One 585, 798
PostFix Mail Transfer Agent 589, 798
ProFTPd 593, 799
Proofpoint Enterprise Privacy 595
Proofpoint Enterprise Protection 595
R
Radware DefensePro 599, 799
Raz-Lee iSecurity for IBM i 799
Redback Networks ASE 605, 799
Requesting Technical Support 16
RSA Authentication Manager 607, 799
S
Samhain 615, 799
Secure Computing Sidewinder 621, 799
Sentrigo Hedgehog 619, 799
SolarWinds Orion 623, 799
SonicWALL 625, 799
Sophos Astaro Security Gateway 641, 799
Sophos Enterprise Console 627, 630, 799
Sophos PureMessage 634, 800
Sophos Web Security Appliance 642, 800
Sourcefire Defense Center 643, 800
SourceFire Intrusion 800
Sourcefire Intrusion 649
Splunk 651, 800
Squid Web Proxy 655, 800
Starent Networks 659, 800
Stonesoft Management Center 667, 800
stored events 22
Sun ONE LDAP 680, 801
Sun Solaris 671, 800
Sun Solaris Basic Security Mode (BSM) 675, 801
Sun Solaris DHCP 672, 801
Sun Solaris Sendmail 674, 801
Supported DSMs 781
Sybase ASE 685, 801
Symantec Data Loss Prevention (DLP) 692, 801
Symantec Endpoint Protection 687, 801
Symantec PGP Universal Server 696, 801
Symantec SGS 688, 801
Symantec SSC 688, 801
Symark PowerBroker 699, 801
T
ThreatGRID Malware Threat Intelligence Platform 703, 801
TippingPoint Intrusion Prevention System 709, 801
TippingPoint X Series Appliances 712, 801
Top Layer IPS 713, 802
Trend Micro Control Manager 716, 802
Trend Micro Deep Discovery 721, 802
Trend Micro InterScan VirusWall 715, 802
Trend Micro Office Scan 717, 802
Tripwire 725, 802
Tropos Control 727, 802
Trusteer Apex Local Event Aggregator 729
U
Universal
Configurable Authentication Server 265, 803
Device Support Module (DSM) 731, 802
Generic Firewall 261, 803
LEEF 733, 802
V
vCenter 803
Venustech Venusense 741
Verdasys Digital Guardian 745, 803
Vericept Content 360 749, 803
VMWare 751
VMware 803
VMware vCloud 757
VMware vCloud Directory 803
W
Websense Content Gateway 771, 803
Websense Data Security Suite 769, 803
Websense TRITON 767, 803
Z
Zscaler NSS 414, 777, 803
