Manual
User Manual:
Open the PDF directly: View PDF ![]() .
.
Page Count: 38

Sienna Locomotive
User Manual
October 4th, 2018

TABLE OF CONTENTS
Introduction
High Level Overview
The Purpose of Fuzzing
Vulnerability discovery
Limitations
How to Make Use of SL
Compared to a traditional fuzzer
Installation
Quickstart
Starting Sienna Locomotive
Running the “DEMO” profile
Creating and running a new profile
Components
Harness
Additional Tools
Wizard
Targeting Strategies
High Precision
Medium Precision
Low Precision (Fuzzy)
Fuzzer
Mutation Techniques
Triager
Scoring Algorithms
GUI
Target Pane
Protections
Crashes Pane
Time
Run ID
Reason
Exploitability
Engines
Winchecksec
Breakpadex
!exploitablex
SL Tracer
Ranks
Crashash
Crash Address
IP
Stack Pointer

Register Values
Crash Browser
Statistics Pane
Triage
Triage Workflow
FAQ
Q: What is a “Sanity check failure”?
Q: Why can’t the wizard find any functions to target?
Q: Why are my fuzzing runs so slow?
Q: Why am I getting errors after running the fuzzer for a while?
Q: How do I configure the fuzz server’s coverage feedback system?
Q: I’m not getting output or crashes. How do I debug?
Q: I updated Windows, and now the GUI refuses to run! What do I do?
Best Practices
Small inputs
Clever targeting
Minimizing child processes
Source Code Documentation
About Trail of Bits

Introduction
Sienna Locomotive is a fuzzing and crash triage system with usability features that are intended to attract
a wider user base than conventional fuzzing tools. Sienna Locomotive aims to bring all the power that
expert software fuzzing and triage systems have to offer into the hands of less-experienced users. Sienna
Locomotive’s bug triage system deduplicates multiple true-positive results and provides a single
quantitative score to a bug making it easy to determine its severity.
High Level Overview
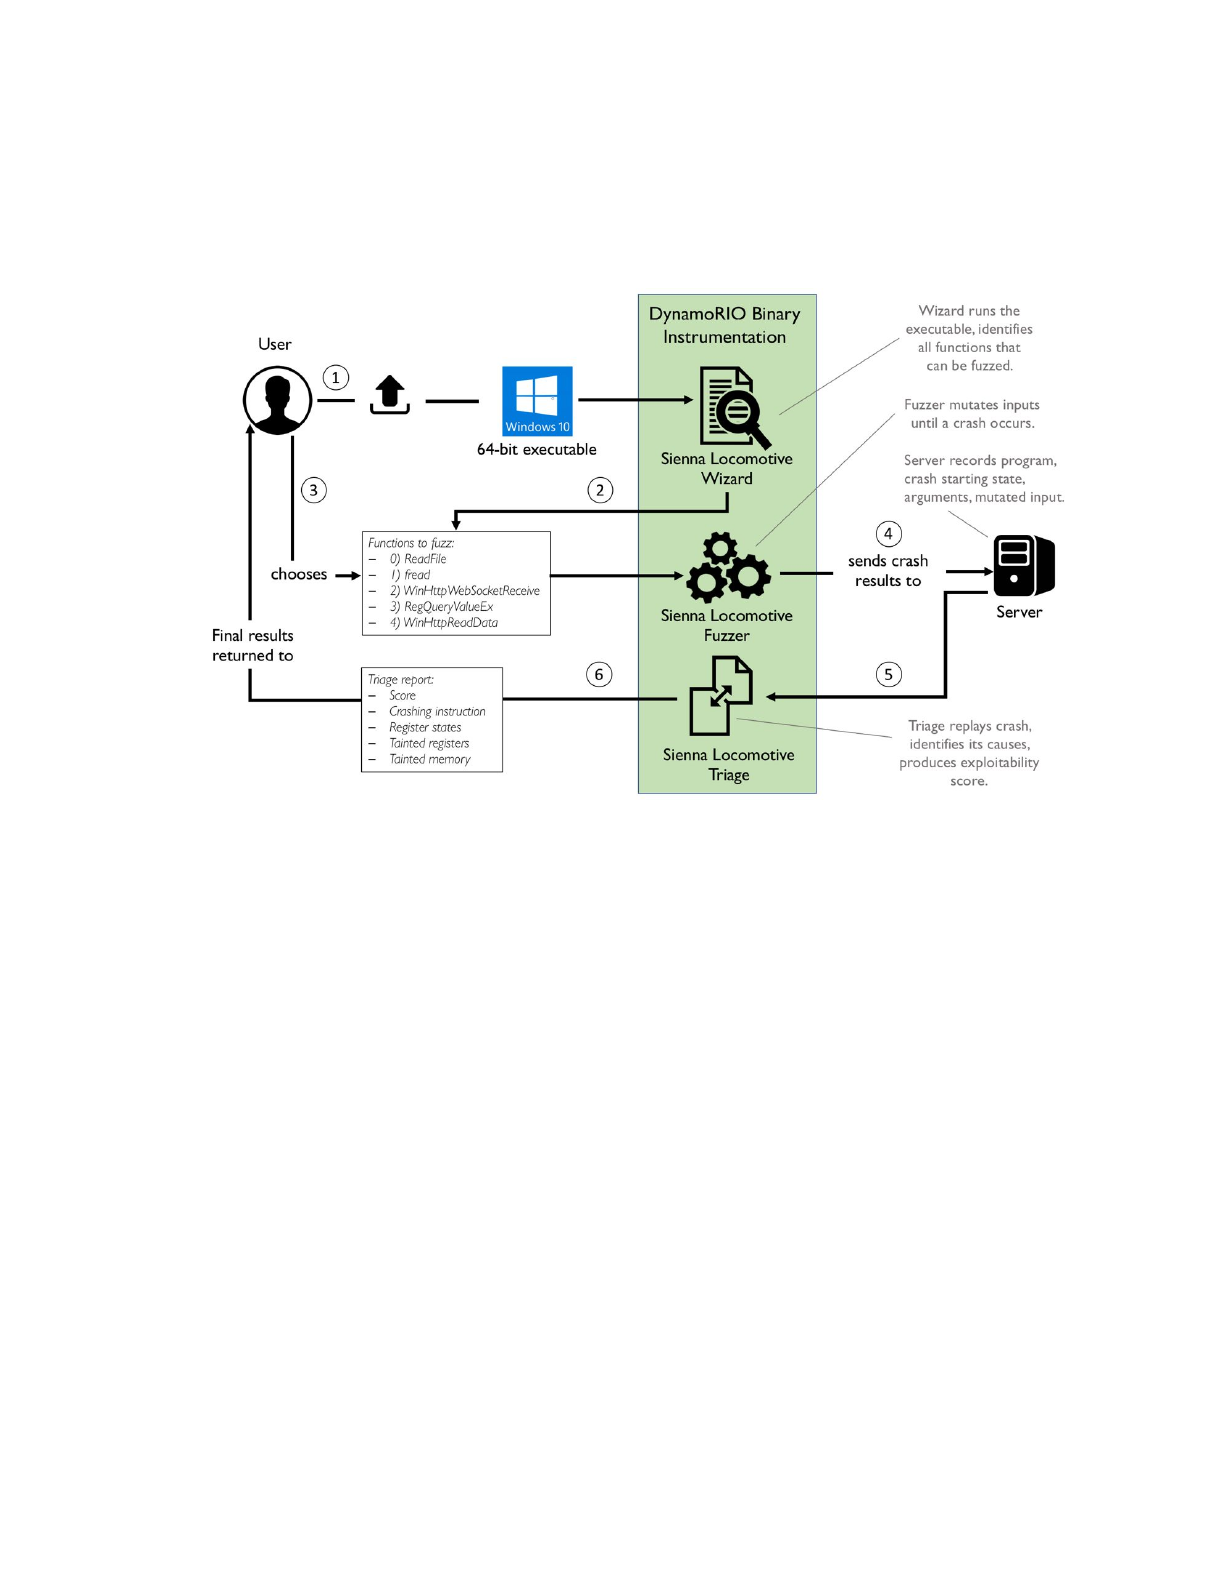
Sienna Locomotive consists of a collection of tools designed to:
●Identify fuzzable portions in target applications
●Fuzz target applications and record their crashes
●Triage those crashes and score them
Users interact with Sienna Locomotive via either the graphical user interface (GUI) or the command-line
harness. The GUI supplies less technical end users with an easy way to create and manage the lifecycle of
a target application, while the command-line harness supplies advanced users with a comprehensive
suite of options for fine-tuning each aspect of the system.
The Purpose of Fuzzing
Fuzzing is a software analysis technique that involves providing random inputs to a program in order to
cause the program to break or behave in an unexpected manner.
Vulnerability discovery
Fuzzing is commonly used as an offensive technique for the purpose of finding vulnerabilities in existing
software. Random inputs often fail to express enough of a program’s feature set to find meaningful bugs.
For example, providing random input to a JPEG parser library would be largely a waste of time, since the
library would quickly throw out any inputs that did not feature a valid JPEG header. As a result, modern
fuzzers try to provide inputs that maximize code coverage, which is the execution of new logical paths
through the program. Sienna Locomotive is a greybox fuzzer, which means that it uses binary
instrumentation to measure code coverage and prioritize inputs that seem likely to generate interesting
results. This allows mutated inputs to expose behaviors deep within a target program’s code that would
be probabilistically unreachable from random inputs, which are often where bugs and vulnerabilities lie.
Limitations
The biggest limitation of fuzzing is that it is a random process. It provides no security guarantees, nor
conclusive results of any kind. Even after evaluating millions of test cases, one can never be certain that
the fuzzer will not discover dozens of security-critical bugs if allowed to run for just a few more minutes.
This is not to say that the results are useless - one can reasonably place more trust in a program that has
been extensively fuzzed than one that has never been tested - but one must nonetheless be careful not
to treat a fuzzing campaign that yields relatively few bugs as a guaranteed indication that a piece of
software is secure.

How to Make Use of SL
SL is intended for security non-experts. It should not be necessary for a user to have a deep
understanding of software security in order to achieve useful results from fuzzing. SL can be used as a
security tool for assessing third-party software, or as a development tool for finding and fixing bugs in
one’s own software.
The basic SL fuzzing workflow consists of four steps. First, the user must configure a new target program
profile. When the user runs the SL GUI, a profile selection window will pop up that allows the user to
create a profile. Next, the user must run the function targeting wizard, which will run the target program
configuration and produce a file containing all the functions available for fuzzing that it found in the
target program. The GUI will parse this file, allowing the user to select a function to target. Third, the user
clicks the button to begin fuzzing, which causes SL to repeatedly run the target program with mutated
inputs. If the mutated inputs cause a crash, SL will record the crash and automatically analyze it to
determine its severity. Finally, the user can export a report containing statistics about the results of the
fuzzing run.
Compared to a traditional fuzzer
SL differs from other fuzzers in that it emphasizes usability over performance. While fuzzers like AFL
1
(and its siblings) aim to evaluate millions of test cases per hour, SL aims to be easy to install and
configure. This is in some ways a necessity, owing to differences between the behavior of the Windows
NtCreateProcess API and the Linux fork(2) system call that allows AFL to achieve such impressive
performance numbers. WinAFL (the Windows version of AFL) can only achieve comparable performance
2
by enforcing much stricter constraints than SL can impose without sacrificing usability. SL still strives to
achieve the highest test case throughput wherever possible, but it is limited by the unfortunate fact that
some advanced techniques are not compatible with the goal of fuzzing arbitrary black-box binaries on
Windows.
1 http://lcamtuf.coredump.cx/afl/
2 https://github.com/googleprojectzero/winafl
Installation
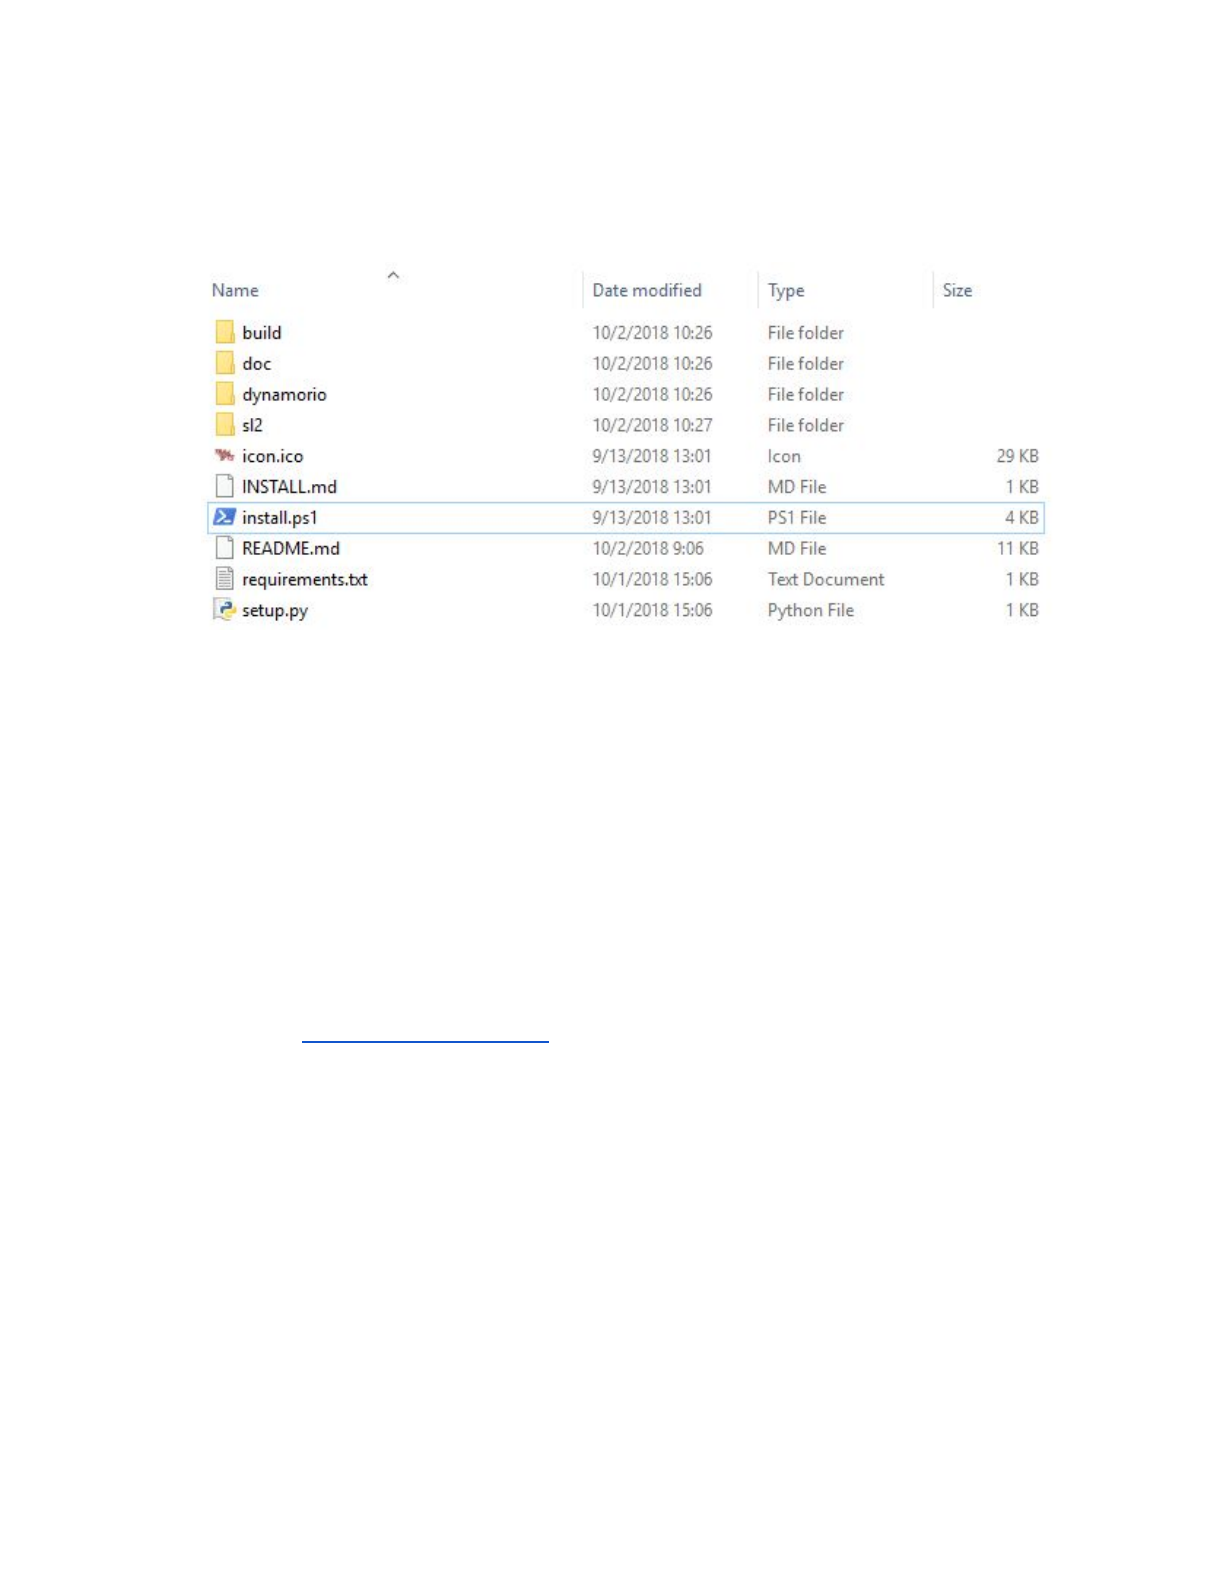
You will receive the SL installer in the form of a ZIP file containing the installation files and the compiled
binaries. The contents of the installation folder will look like this:
There are two steps necessary to be able to run the installer. We strongly recommend doing this on a
dedicated computer that has not been used for anything else, as other Python installations may interfere
with SL, and disabling Windows Error Reporting may make other pieces of software difficult to debug.
Step 1: Disable Windows Error Reporting — This is necessary to prevent the Windows Error Reporting
process from interfering with SL’s mechanisms for catching crashes.
1. Run regedit.exe
2. Navigate to HKEY_LOCAL_MACHINE\SOFTWARE\Microsoft\Windows\Windows Error
Reporting
3. Create a new DWORD (32-bit) called "Disabled" and set the value to 1
a. If the “Disabled” key already exists and is not already 1, set it to 1.
Step 2: Install Python — The installer script will prompt you to install Python if it cannot find a
compatible existing installation, but we recommend manually installing it first.
1. Download the “Windows x86-64 executable installer” for the “Latest Python 3 Release” link on
the Python Releases for Windows page. Do not install Python 2.
2. Run the installer and click through the prompts. Be sure to select "Add Python 3.7 to PATH"
Once you have disabled Windows Error Reporting and installed Python, it’s a good idea to restart your
computer in order to apply any pending registry changes. After that, you need only right-click
install.ps1 and click “Run with Powershell.” If this option does not appear, you can instead go to
“Open With →Windows Powershell.” If a prompt appears asking you to allow the script to be run, enter
‘Y’.
Once the installer successfully completes, an icon should appear on the desktop. Double click on this
icon to open the SL GUI.
Quickstart
The quickstart covers using the Sienna Locomotive GUI to profile, fuzz, and triage a demo application. It
demonstrates the high-level features included in Sienna Locomotive, plus the steps required to utilize
them for your own applications.
Starting Sienna Locomotive
Sienna Locomotive can be started via the “SL GUI” icon placed on the desktop by the SL installer.
Running the “DEMO” profile
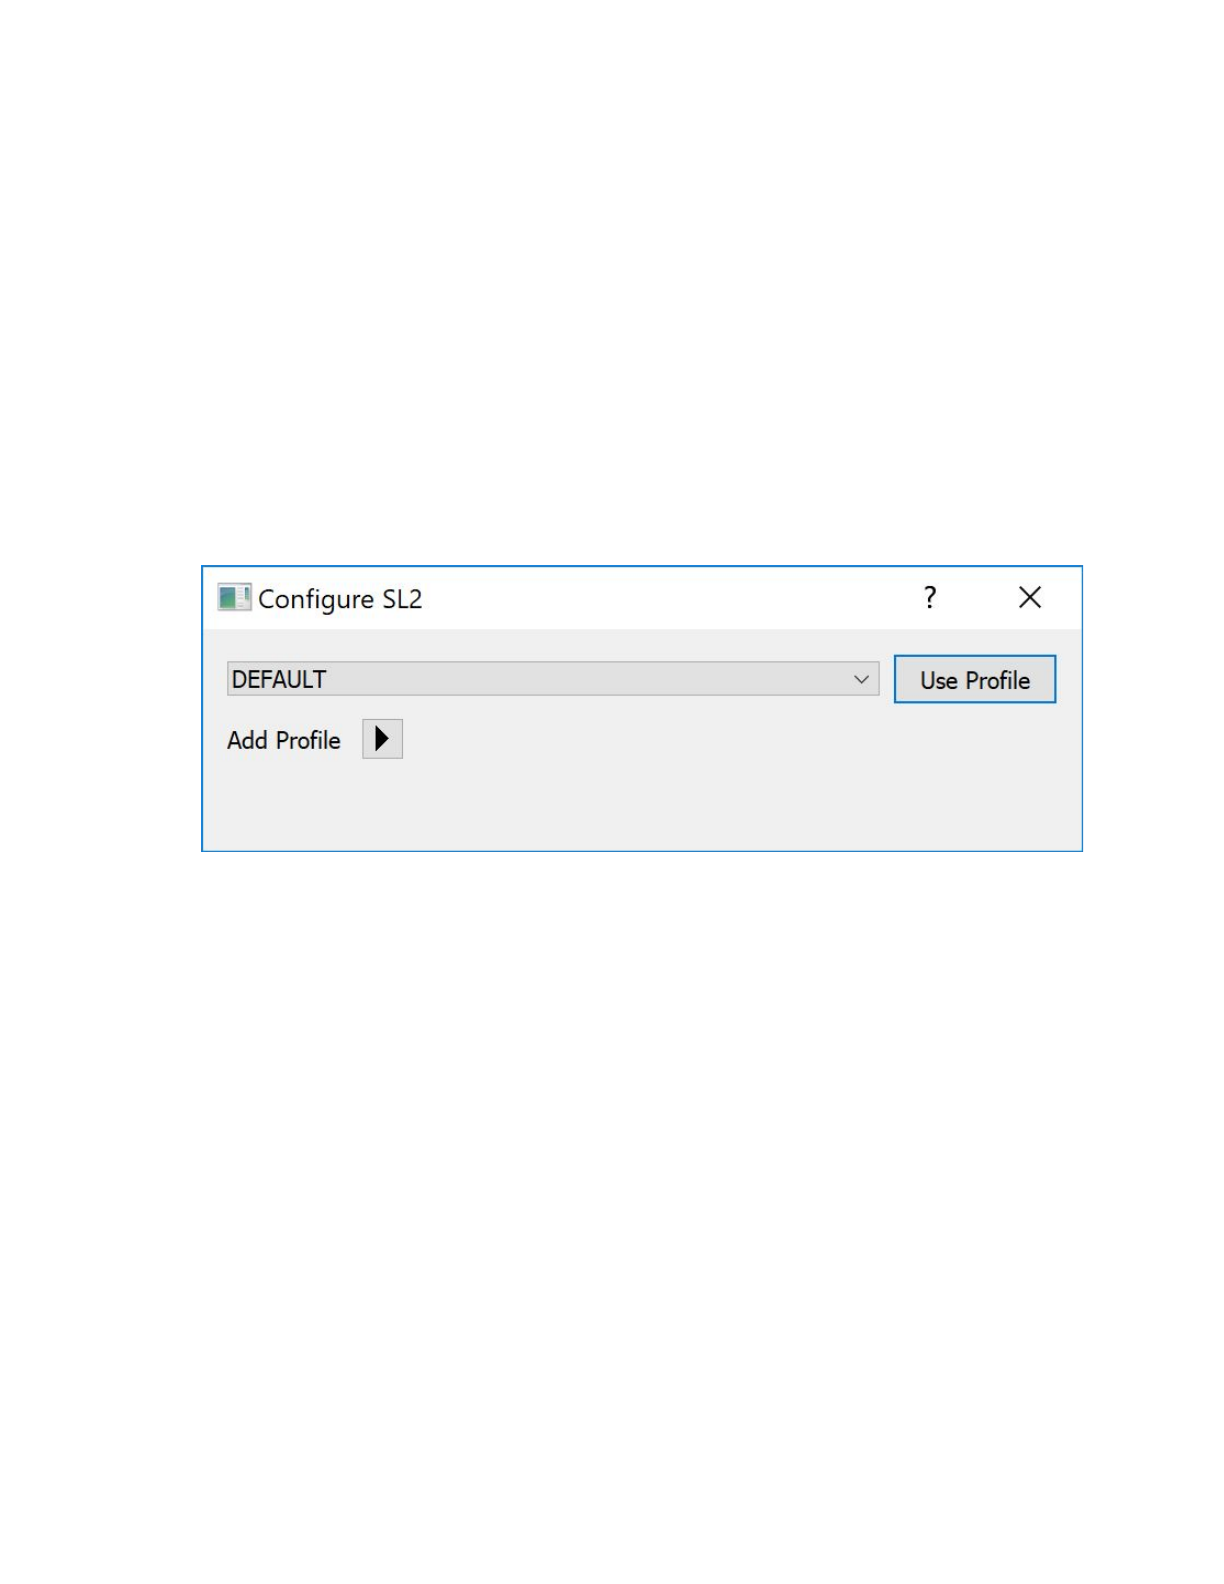
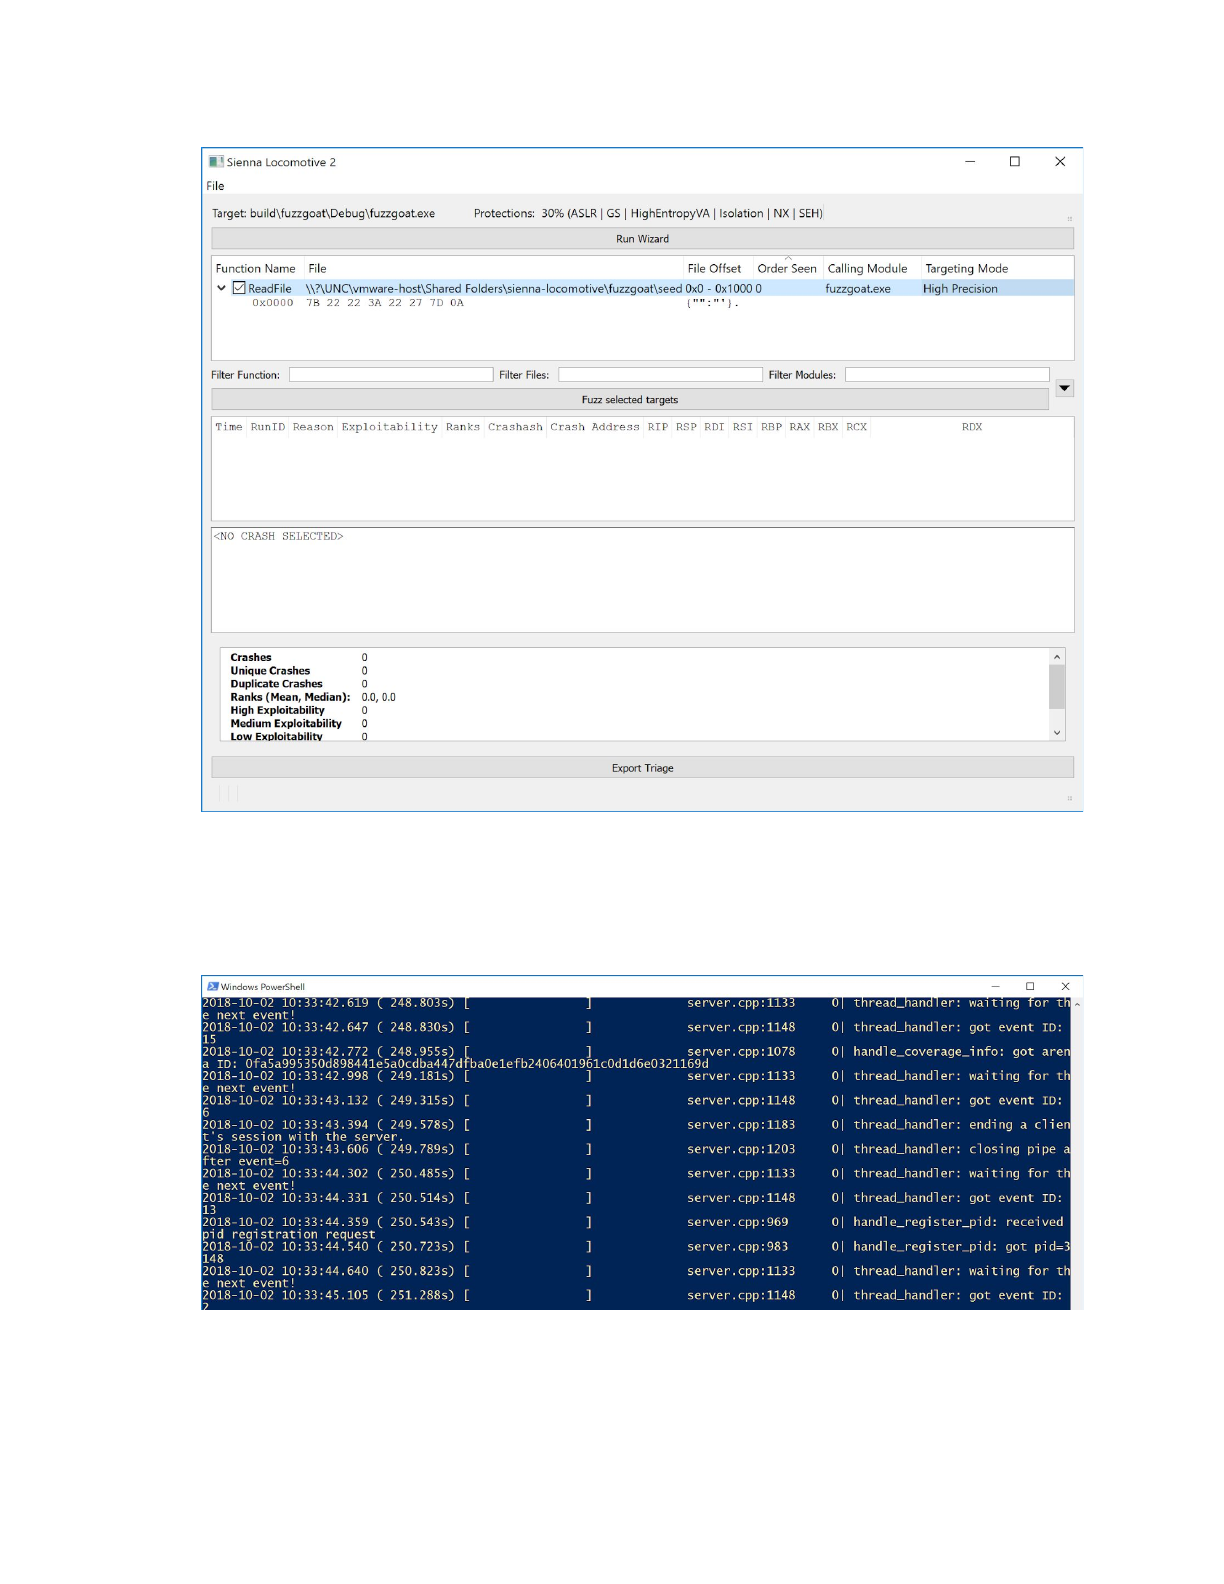
Once started, Sienna Locomotive will provide a profile selection dialog:
For this quickstart, select the “DEMO” profile from the dropdown and click “Use Profile”. This will yield the
main Sienna Locomotive window (features annotated in margins):
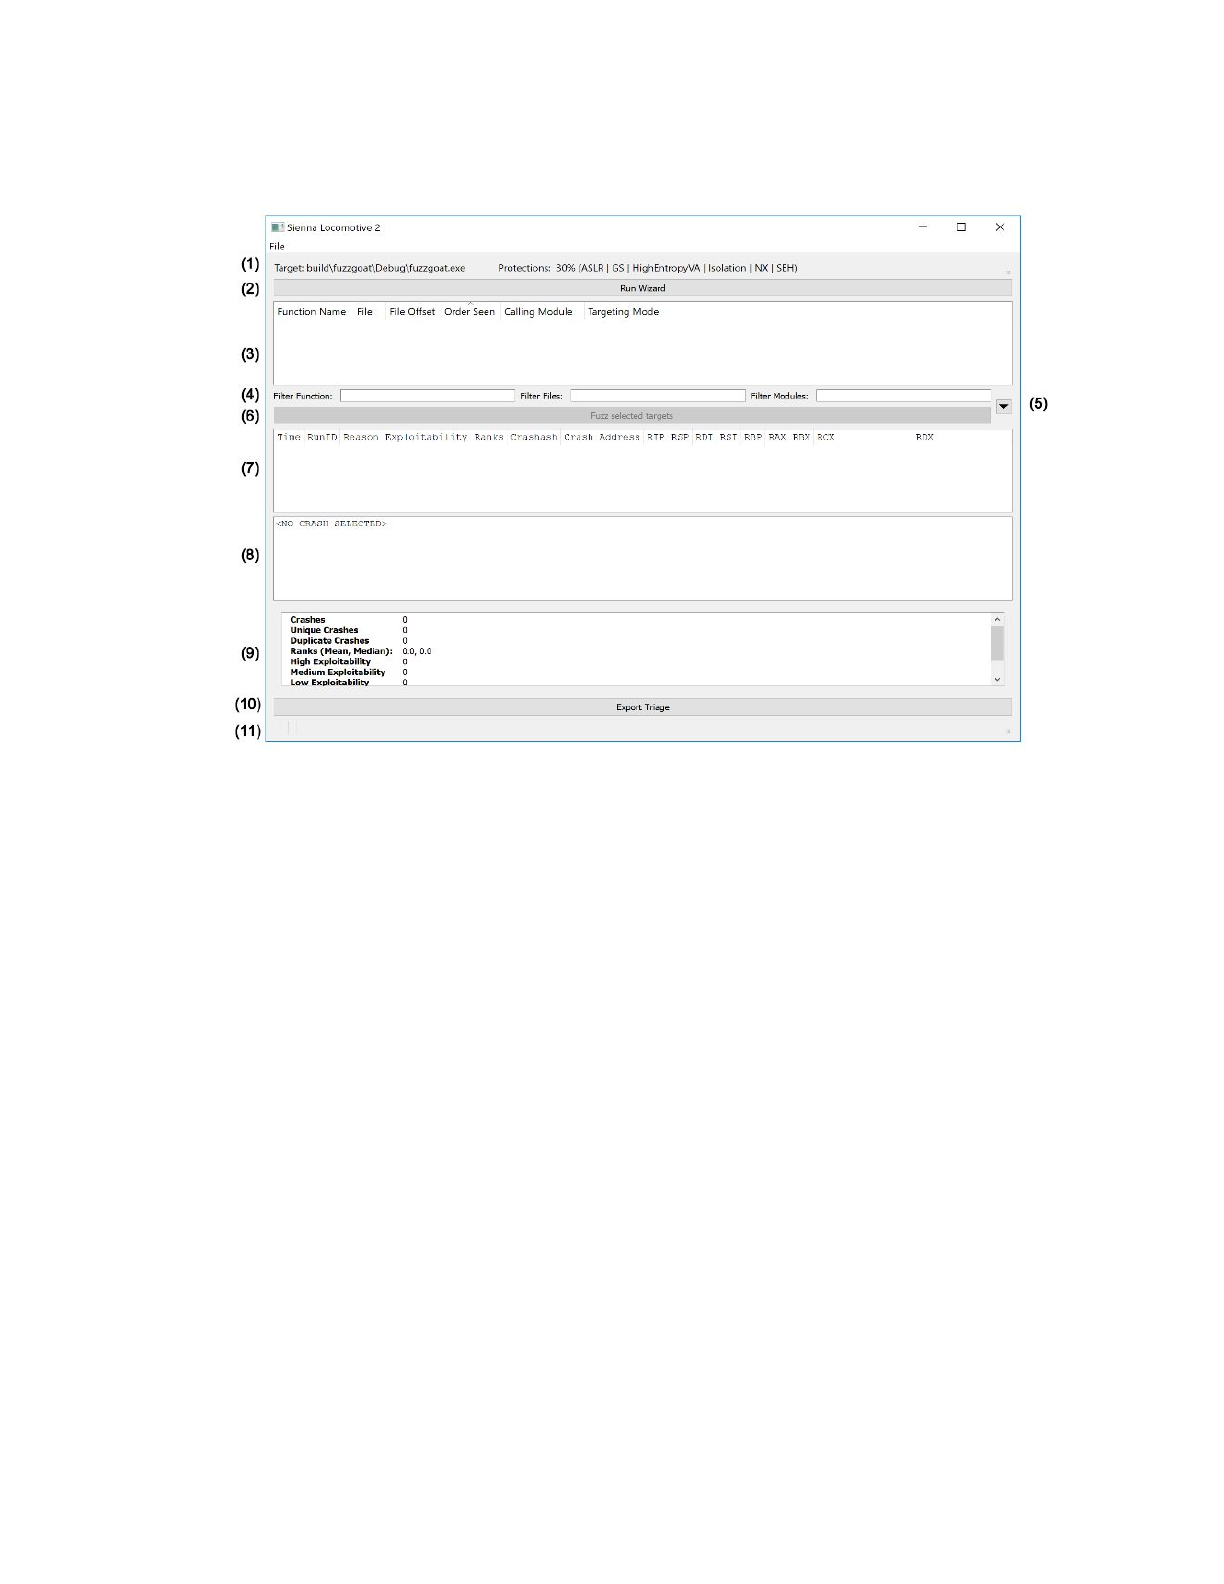
Annotated features:
1. Target application information (target path, detected protections)
2. “Run Wizard” button
3. Targetable function readout
4. Targetable function filters
5. Fuzzer and triager configuration dropdown
6. “Fuzz selected targets” button
7. Selectable crash listing
8. Individual crash readout
9. Crash statistics readout
10. “Export triage” button
11. Status indicator (empty in screenshot)
Per the target application information (annotation 1), we can see that our target has a number of
protections in place: ASLR, stack cookies (GS), DEP (NX), and so forth. These protections are factored into
the exploitability scores for any subsequently discovered crashes.
Per the empty “targetable function readout” pane (annotation 3), no fuzzable functions have been
associated with the profile yet. To perform function detection, click the “Run Wizard” button. Function
detection results are preserved, so starting Sienna Locomotive again with the same profile will not
require another wizard run. Modifying the profile in a way that changes the target application’s execution
(e.g., changing the parameters passed to the target) will invalidate the saved targets and require a re-run
of the wizard.
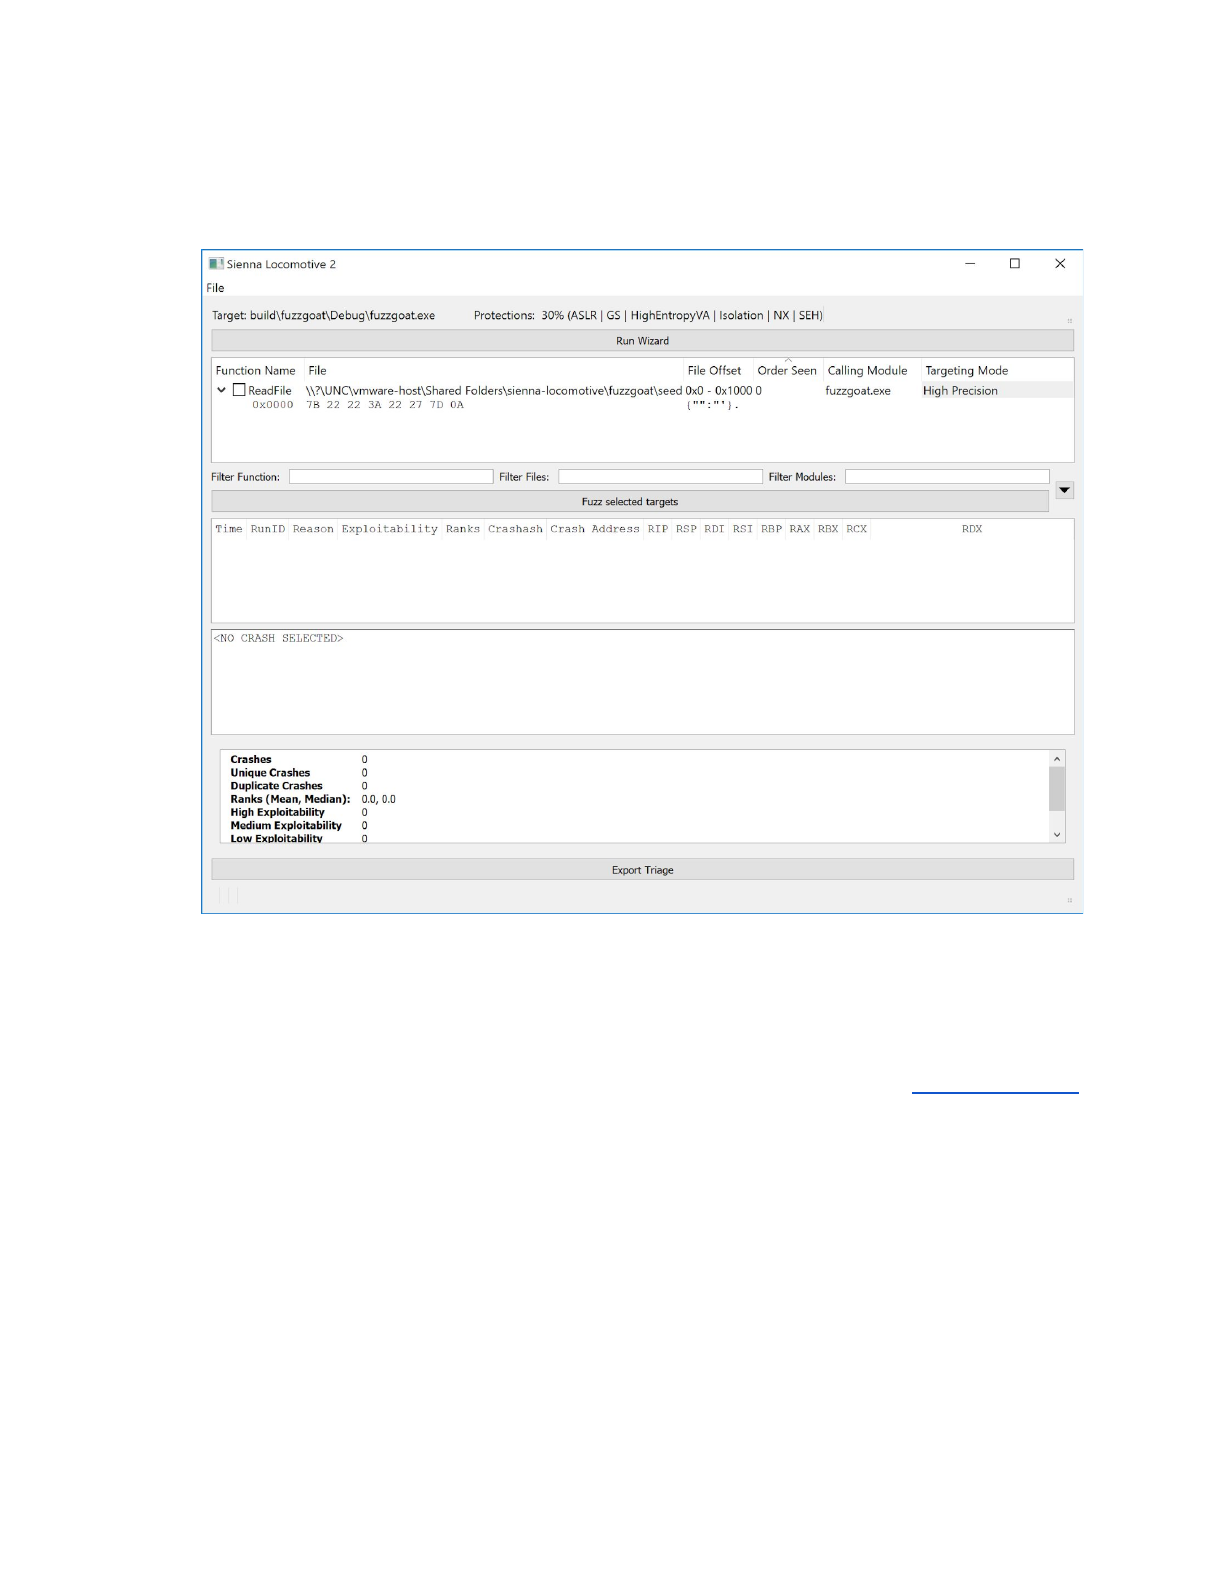
Once the wizard completes, the pane is populated with the results and the “Fuzz selected targets” button
is enabled:
Above, we can see that the wizard has found a single fuzzable function in our profile: a ReadFile call
that performs an 8 byte read of all 0x41 (ASCII ‘A’). Sienna Locomotive has identified the module within
the target application that performed the call to the function. The wizard has selected the default “High
Precision” targeting mode to use in order to reliably re-identify calls to this function that occur in the
fuzzer or tracer. You can switch this to a less precise method of targeting by double clicking in the shaded
area and selecting a new strategy. For more information on these strategies, see the Targeting Strategies
section.
In a non-trivial target application, there would be more than one targetable function to select from. For
large applications, the number of targetable functions can become too large to sort and filter manually.
When this occurs, the user may filter the list of targetable functions via three facets: the function name
(e.g., ReadFile or fread), the file or other I/O resource being managed by the function (e.g.,
input.txt, cat.png), and/or the module that contains the function call (e.g., test_application.exe,
msvcrt.dll). Each of these is controllable via the targetable function filters (annotation 4).
Since that ReadFile is the only targetable function in the “DEMO” profile, continue by selecting it:
At this point, Sienna Locomotive is ready to begin fuzzing and triaging. Click “Fuzz selected targets”
(annotation 6) to begin the process. Sienna Locomotive will start its fuzzing server in the background via
a separate console window; do not close it. You should not need to directly interact with the fuzzing
server at all, but it may provide useful debug messages in the event of a problem.
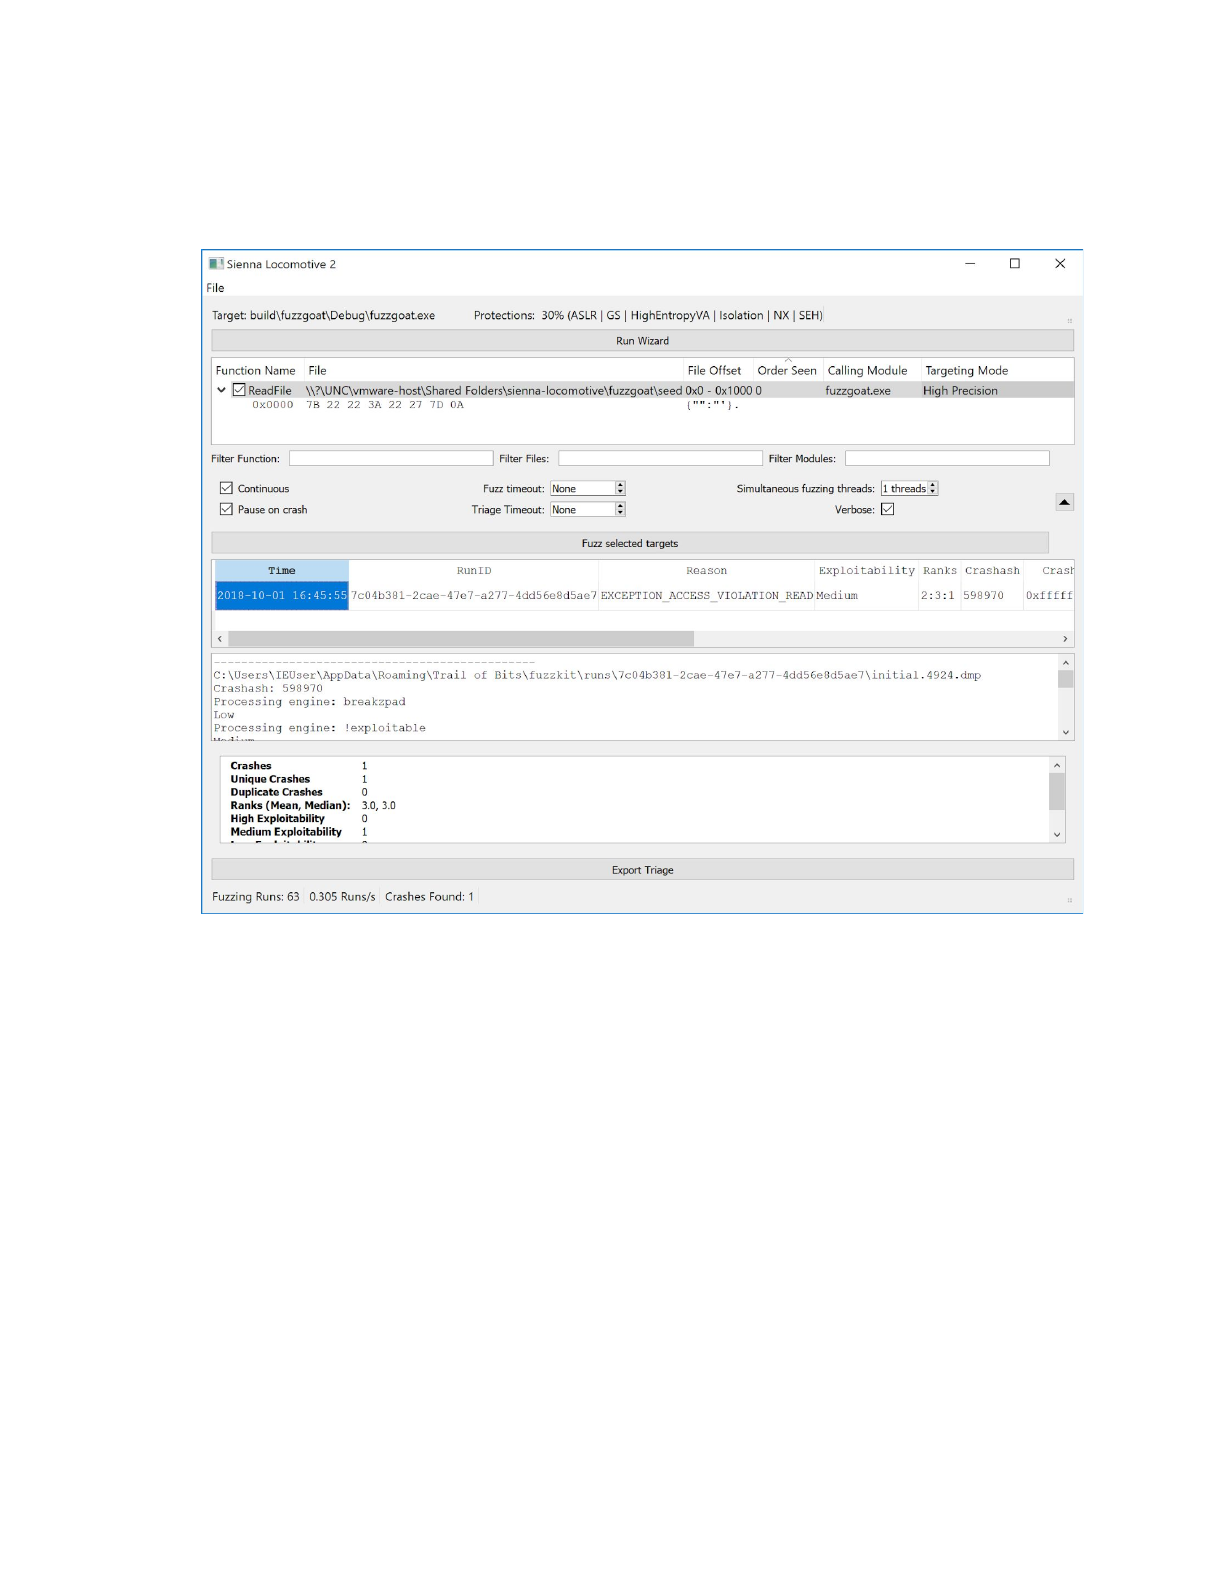
Once Sienna Locomotive discovers and triages a crash, the results will appear in the selectable crash
listing (annotation 7), individual crash readout (annotation 8), and crash statistics readout (annotation 9).
Sienna Locomotive will present crash information in the crash readout for any crash selected in the
listing:
Per the crash listing, Sienna Locomotive has found a crash in the profile’s target application. The listing
records the cause of the crash (EXCEPTION_ACCESS_VIOLATION), an initial human friendly exploitability
ranking (“Medium”), and a set of vulnerability rankings from the triage suite (“2:3:3”). Moving the
scrollbar, the addresses of the crash, last instruction pointer, and last stack pointer are also recorded for
quick reference.
Because we clicked on the listing, the crash readout contains the output of the various triage phases.
Each phase is documented in detail below.
The crash statistics readout has also been updated, and now registers the total number of crashes, the
number of unique crashes and duplicates, and a breakout of crashes by exploitability rank.
Finally, the status indicator (annotation 11) has also been updated, telling us the entire number of runs
so far (63), the number of runs per second (0.305), and the number of total crashes (1).
All three listing/readout panes, plus the status indicator, are updated once again when Sienna
Locomotive is told to begin fuzzing again and finds another crash:
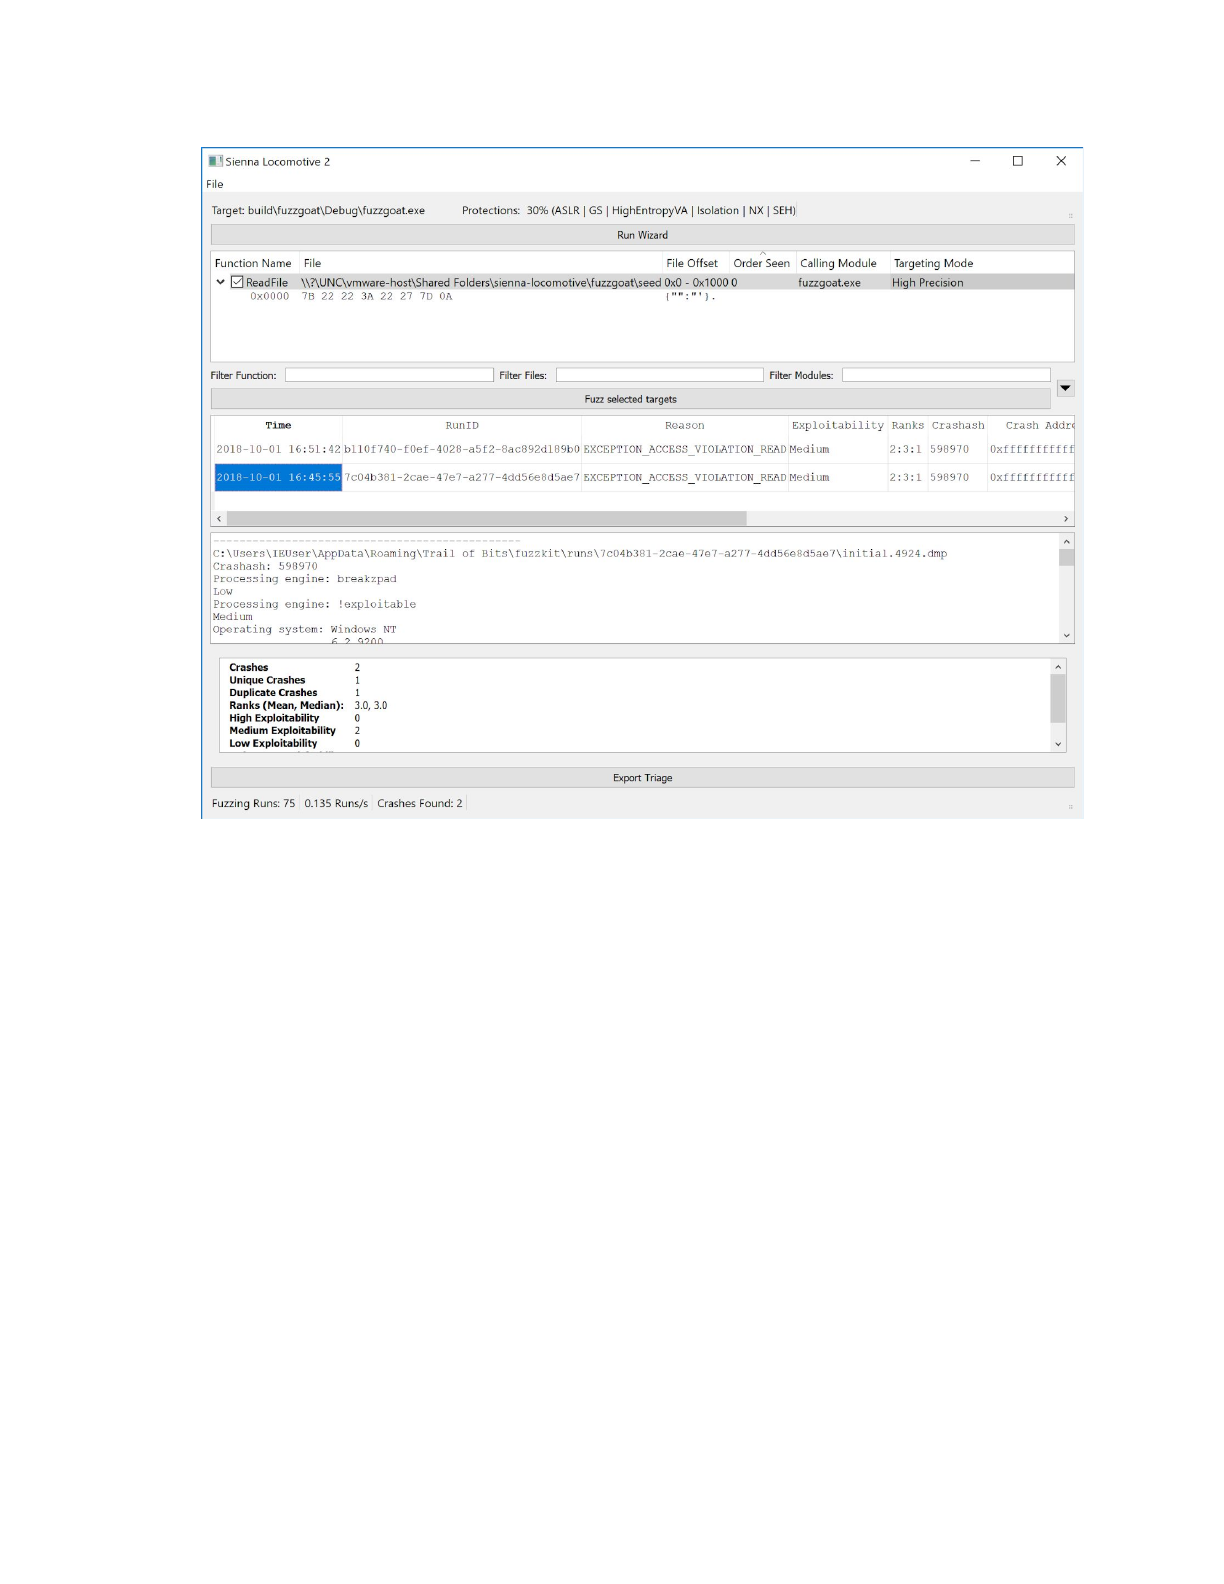
Observe that Sienna Locomotive has correctly detected that the latest crash was the same as the
previous one, and has updated the “Duplicated Crashes” field to reflect this.
To automate the tedious task of manually initiating fuzzer runs, Sienna Locomotive provides a
continuous fuzzing mode. To enable continuous mode, enter the fuzzer and triager configuration
dropdown (annotation 5, circled below):
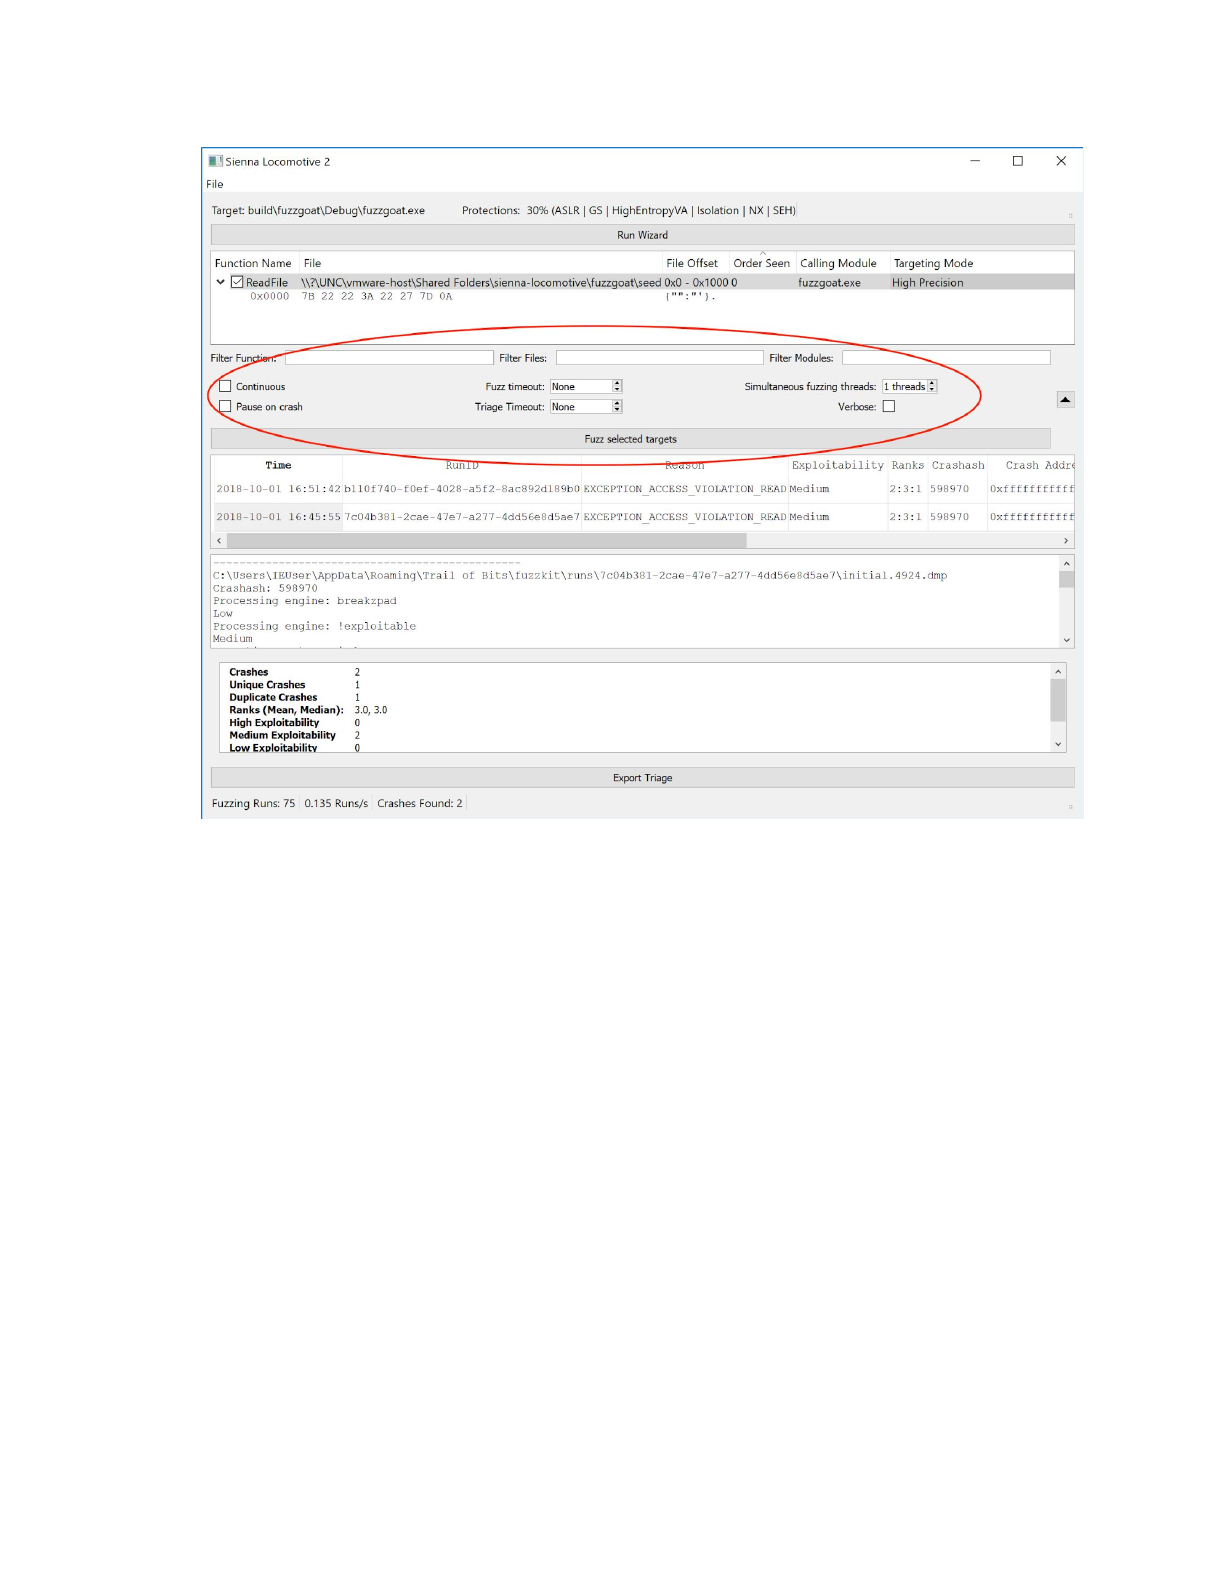
Of interest are the Continuous and Pause on crash options. Continuous may be selected to instruct Sienna
Locomotive to fuzz indefinitely, while Pause on crash instructs Sienna Locomotive to stop fuzzing as soon
as it it encounters a crash.
For more complex targets (e.g., those with a GUI or other event loop), the Fuzz timeout and Triage timeout
settings provide a guard against application hangs. Each, specified in seconds, tells Sienna Locomotive
how long to wait before terminating a fuzzing or triaging run that hasn’t exited on its own. Left
unspecified, Sienna Locomotive will wait indefinitely for the target application to exit.
Users may also specify the number of fuzzing processes to run simultaneously via the Simultaneous
fuzzing threads counter. Simultaneous fuzzing offers performance benefits, but may cause hangs or other
unexpected behavior in applications that do not expect to be run several times at once. Users are
strongly encouraged to set conservative fuzzing and triaging timeouts should they increase the number
of threads.
Finally, users may export the crash and triage results collected by SL for the current profile via the Export
Triage button (annotation 10). This will cause a folder selection dialog to open, which the user should use
to select their preferred output folder. That folder will be populated with a collection of files and
subfolders, including:
●triage.csv: a CSV-formatted log of crashes, including their tracer results.

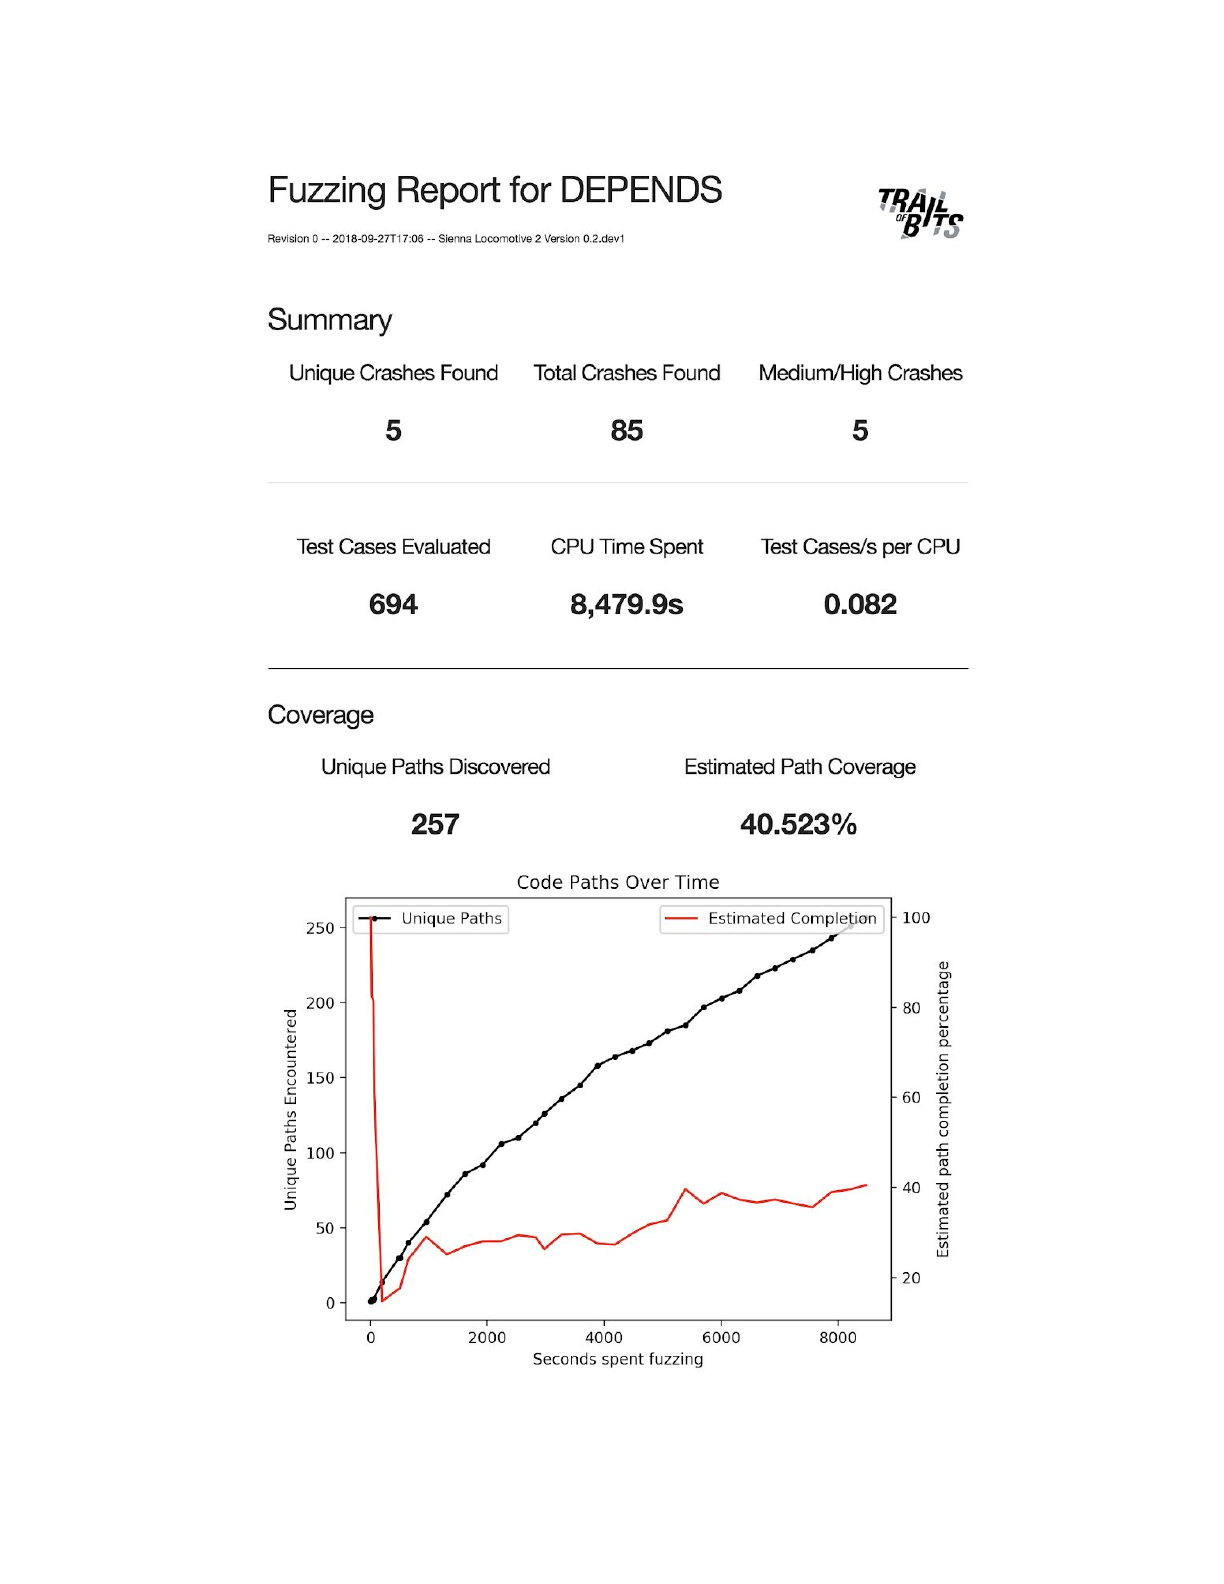
●report_vNUM.html: an HTML-formatted visualization of the fuzzer’s progress across all runs,
including discovered code paths, estimated percentage of program surface covered, and unique
crash counts. NUM refers to the number of times that the report has been exported, so the first
report for a profile would be report_v0.html, the second would be report_v1.html, and so
forth.
●A subfolder tree of crashes grouped by severity, then exception type, then unique crash ID,
followed by unique run ID. For example, the two identical crashes caused above would be found
under
Medium\EXCEPTION_ACCESS_VIOLATION_READ\598970\7c04b381-2cae-47e7-a277-4dd5
6e8d5ae7 and
Medium\EXCEPTION_ACCESS_VIOLATION_READ\598970\b110f740-f0ef-4028-a5f2-8ac8
92d189b0. Each run ID folder contains the standard output and error streams of the program
(including instrumentation output), process dumps induced under the fuzzing stage, the PIDs of
processes created under both stages, as well as the mutated buffer that actually caused the
crash. The directory structure and files are documented in greater detail under Triage.
By default, the export process will also cause Sienna Locomotive to open HTML report in the user’s
browser. This can disabled by unchecking the File > Open exported report in browser menu item.
Creating and running a new profile
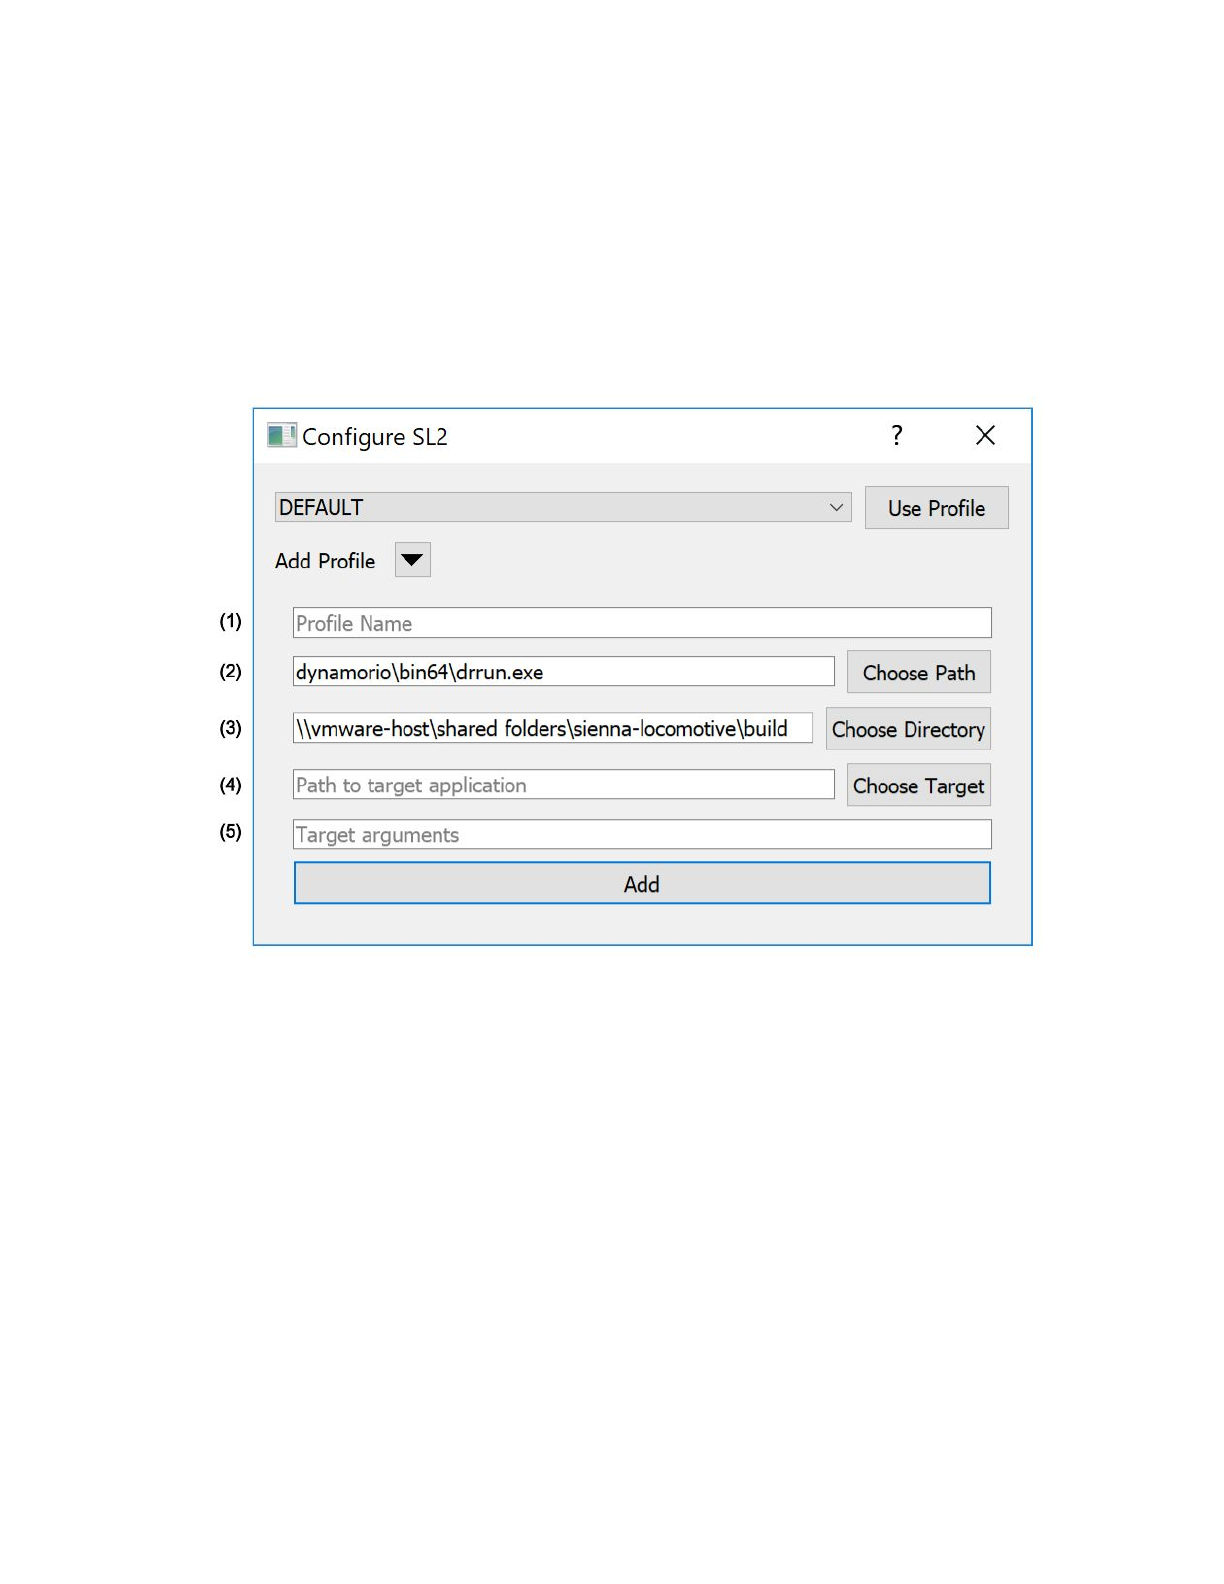
To create a new Sienna Locomotive profile, click on the “Add Profile” dropdown button in the profile
selection dialog (annotated):
Annotated features:
1. The name of the profile. This can be any alphanumeric string up to 32 characters long and
should be easy to identify and remember, e.g., “DUMPBIN” for a profile that targets
dumpbin.exe.
2. The path to drrun.exe, which may be different from the path shown above. Sienna Locomotive
will autofill this for you. End users should not need to change this.
3. The path to Sienna Locomotive’s build directory, which may be different from the path shown
above. Sienna Locomotive will autofill this for you. End users should not need to change this.
4. The path to the target application, fully qualified. notepad.exe, for example, would be
C:\Windows\notepad.exe. Users may use the “Choose Target” button to browse for an
executable.
5. The arguments, if any, to pass to the target application. For example, to open notepad.exe with
a file, the argument would be just C:\path\to\the\input.txt.

Once filled, click “Add” to register the profile. Then, use the profile selection dropdown to use your new
profile.
The paths specified in the “New Profile” window are inserted into the config.ini file in the SL Working Files
directory. Arguments in the config file will be stored just as they would be if passed in via the command
line. SL uses the Windows API to split a single argument string into tokens, so an argument string in
config.ini should be parsed exactly as it would in powershell. If this is not the case, please file a bug
report.
Users may also switch between profiles via the File > Change Profile menubar item.
Components
The following individual Sienna Locomotive components are documented for completeness, but
knowledge of their individual functions is not required to operate the Sienna Locomotive GUI.
Harness
In addition to supplying advanced users with a command-line interface, the Sienna Locomotive harness
manages the interactions between all other Sienna Locomotive components. All other components may
be run either individually or collectively via the harness.
The harness accepts a large number of configuration options. To see them, run:
$ sl2-cli -h
Which will yield:
usage: sl2-cli [-h] [-v] [-d] [-n] [-p PROFILE] [-c] [-x] [-f FUZZ_TIMEOUT]
[-fn FUNCTION_NUMBER] [-g] [-i TRACER_TIMEOUT] [-r RUNS]
[-s SIMULTANEOUS] [-t TARGET_APPLICATION_PATH]
[-e {WIZARD,FUZZER,TRACER}] [-a ...] [-l] [-P]
[--run_id RUN_ID]
Run the DynamoRIO fuzzing harness. You can pass arguments to the command line
to override the defaults in config.ini
optional arguments:
-h, --help show this help message and exit

-v, --verbose Tell drrun to run in verbose mode
-d, --debug Tell drrun to run in debug mode
-n, --nopersist Tell drrun not to use persistent code caches (slower)
-p PROFILE, --profile PROFILE
Load the given profile (from config.ini). Defaults to
DEFAULT
-c, --continuous Continuously fuzz the target application
-x, --exit Exit the application once it finds and triages a
single crash
-f FUZZ_TIMEOUT, --fuzztimeout FUZZ_TIMEOUT
Timeout (seconds) after which fuzzing runs should be
killed. By default, runs are not killed.
-fn FUNCTION_NUMBER, --functionnumber FUNCTION_NUMBER
Function call number to run
-g, --registry Enable tracking registry calls like RegQuery()
-i TRACER_TIMEOUT, --triagetimeout TRACER_TIMEOUT
Timeout (seconds) after which triage runs should be
killed. By default, runs are not killed.
-r RUNS, --runs RUNS Number of times to run the target application
-s SIMULTANEOUS, --simultaneous SIMULTANEOUS
Number of simultaneous instances of the target
application to run
-t TARGET_APPLICATION_PATH, --target TARGET_APPLICATION_PATH
Path to the target application. Note: Ignores
arguments in the config file
-e {WIZARD,FUZZER,TRACER}, --stage {WIZARD,FUZZER,TRACER}
Synchronously re-run a single stage (for debugging
purposes)
-a ..., --arguments ...
Arguments for the target application. Multiple
arguments are supported, but must come last.
-l, --inline_stdout Inline stdout of program under test to console stdout
-P, --preserve_runs Preserve all fuzzer runs, even when they don't cause
crashes
--run_id RUN_ID Set the Run ID for a given run to a specific value
instead of using an auto-generated value. Useful for
replaying triage runs.
By way of example, one might run just the wizard phase on the profile “DUMPBIN” in verbose mode via:
$ sl2-cli -v -p DUMPBIN -e WIZARD
Or, to run the profile “FOOBAR” in continuous mode, exiting on the first crash:
$ sl2-cli -c -x -p FOOBAR
Or, to run the fuzzer on the “XEYES” profile in verbose mode once, preserving all files even without a
crash:
$ sl2-cli -v -P -p XEYES -e FUZZER
The CLI does not provide an interface for creating new profiles — you must either use the GUI’s profile
creation dialog or add them to the config.ini via a text editor.

Additional Tools
The Sl2 install script creates several run configurations in addition to the SL GUI. These can be run by
entering the following commands into powershell:
●sl2-cli - Runs the SL command-line client, which can be used for headless fuzzing.
●sl2-test - Runs the SL unit tests to confirm that it works correctly.
●sl2-stats - Displays graphs of the run throughput and path coverage for a given target. The
target can be specified via the -p flag.
●sl2-report - Generates a new version of the HTML report describing the fuzzer findings. The
target can be specified via the -p flag.
Note that all the run configurations use the same config parser as the harness, so they may accept flags
that don’t make sense for a given configuration.
Wizard
The Sienna Locomotive wizard takes a target application and identifies fuzzable functions within it. It
emits these functions in a machine-readable format for presentation in the GUI. The wizard also
determines what targeting strategy to use for individually fuzzable functions, minimizing the amount of
user choice required. Users may, however, choose to override the automatically chosen targeting
strategy.
Targeting Strategies
Reliably re-identifying a function call discovered by the wizard is a surprisingly difficult problem. Some of
the inherent problems include:
●Functions may be called in a non-deterministic order
●A function that is called from only one point in the code might be called multiple times with
different files as arguments
●A single function might be called at different offsets of the same file
●The program might perform different function calls (after a previous function call had its input
mutated) than it did when we ran the wizard
●The Windows API sometimes nests functions. For example, internally, fread might call fread_s,
which calls _read, which calls ReadFile. We’ve filtered out a few of the most common cases,
but these may still cause problems.
●A target application may fork off child processes that don’t share any memory with the parent
SL provides multiple function targeting strategies in order to mitigate these problems. For almost all
workflows, the default High Precision strategy should perform appropriately. However, if you notice that
mutations do not seem to be getting applied to the targeted input, you may want to choose one of the
more “fuzzy” strategies.
High Precision
The high precision algorithm checks two values against the ones recorded by the wizard: the hash of the
arguments of the function, and the number of times this function was called with the current return
address. The high precision algorithm will only ever target a single function call once, even if it is
repeated exactly.

Medium Precision
The medium precision algorithm works largely the same as the high precision algorithm, but opts to
check only the return address instead of the number of times the function was called with that return
address. In effect, this means that if a function call is perfectly duplicated, the medium precision
algorithm will target it again. This might occur, if, for example, a program is trying to read from a device
or file that might sometimes provide bad inputs, and thus continually tries to re-read until it receives a
valid input.
Low Precision (Fuzzy)
The low precision algorithm aims to target all reads arising from the same file. If the filename for a read
is available, it will simply compare the filename with the one recorded by the wizard. If the name of the
file is not available, it will compare the return address of the function and the first 16 bytes of the file as a
substitute.
Fuzzer
The Sienna Locomotive fuzzer performs two core operations:
1. Given a set of targeted functions, the fuzzer will instrument the target application to redirect the
input to each function. These redirected inputs are then mutated (potentially based on the
results of previous runs) and fed into the instrumented functions.
2. If the mutations performed during a run cause the target application to crash, the fuzzer will
record that crash and mark the run for triaging. Otherwise, the fuzzer will mark the run for later
disposal.
The fuzzer is capable of targeting the following functions:
●ReadFile
●fread
●fread_s
●_read
●MapViewOfFile
●recv*
●WinHTTPReadData*
●InternetReadFile*
●WinHttpWebSocketReceive*
●RegQueryValueEx
*While the fuzzer allows the user to target internet functions like WinHTTPReadData, support for doing
so is not as robust as targeting functions that read from the local disk. We have successfully tested these
functions in our own sample applications, but have run into difficulty scaling these tests to real-world
software due to limitations in DynamoRIO — the binary instrumentation framework underlying SL. They
may work well with some pieces of software, but be advised that your results may vary.
Mutation Techniques
Sienna Locomotive uses a number of simple primitives for mutating data. We have found these
strategies to be effective at producing novel inputs when compounded over multiple runs.

●Overwrite with AAAA
○Typically only used for debugging, this strategy completely fills the target buffer with
0x41.
●Add/Subtract Known Values
○This strategy selects one of a few known-problematic values (For example, zero,
MAX_INT - 1, etc.) and adds or subtracts it to a random value in the target buffer.
●Overwrite with Known Values
○Replace a continuous span of bytes with known-problematic values.
●Overwrite with Random Values
○Replace a continuous span of bytes in the target buffer with random values.
●Delete Bytes
○This strategy nulls out a continuous span of bytes in the target buffer.
●Delete Bytes (ASCII)
○This strategy replaces a continuous span of bytes in the target buffer with 0x30 (0).
●Endianness Swap
○This strategy flips the endianness of a random integer in the target buffer.
●Bit Flip
○This strategy flips a random bit in the target buffer.
●Repeat Bytes
○Copy a continuous span of bytes and repeat it later in the target buffer.
●Repeat Bytes Backwards
○Reverse the bytewise order of a continuous span of bytes somewhere in the target
buffer.
Triager
The Sienna Locomotive triager is composed of two stages: a DynamoRIO-based taint tracker
(tracer.dll) that gets loaded into the target application as a library, and a separate executable
(triager.exe) that gets run by the harness. The taint tracker tracks the propagation of state affected by
the mutated buffer and generates a more complete dump of the program’s state at crash-time, while the
triager takes care of exploitability ranking, uniqueness, and the binning of crashes by type and severity.
Scoring Algorithms
Scoring the exploitability of a crash requires deep knowledge of exploitation techniques. We use heuristic
analysis enabled by information gathered from several sources to provide an approximate ranking. The
exact measurements informed by each source are detailed in their respective sections below:
Breakpadex
!exploitablex
SL Tracer
Additionally, the results from these analyses are adjusted via the results from Winchecksec to make the
rankings relatively target-independent. This means that crashes in binaries that are missing common
security features will be scored higher, and crashes in binaries that have additional, uncommon security
features will be scored lower.
GUI
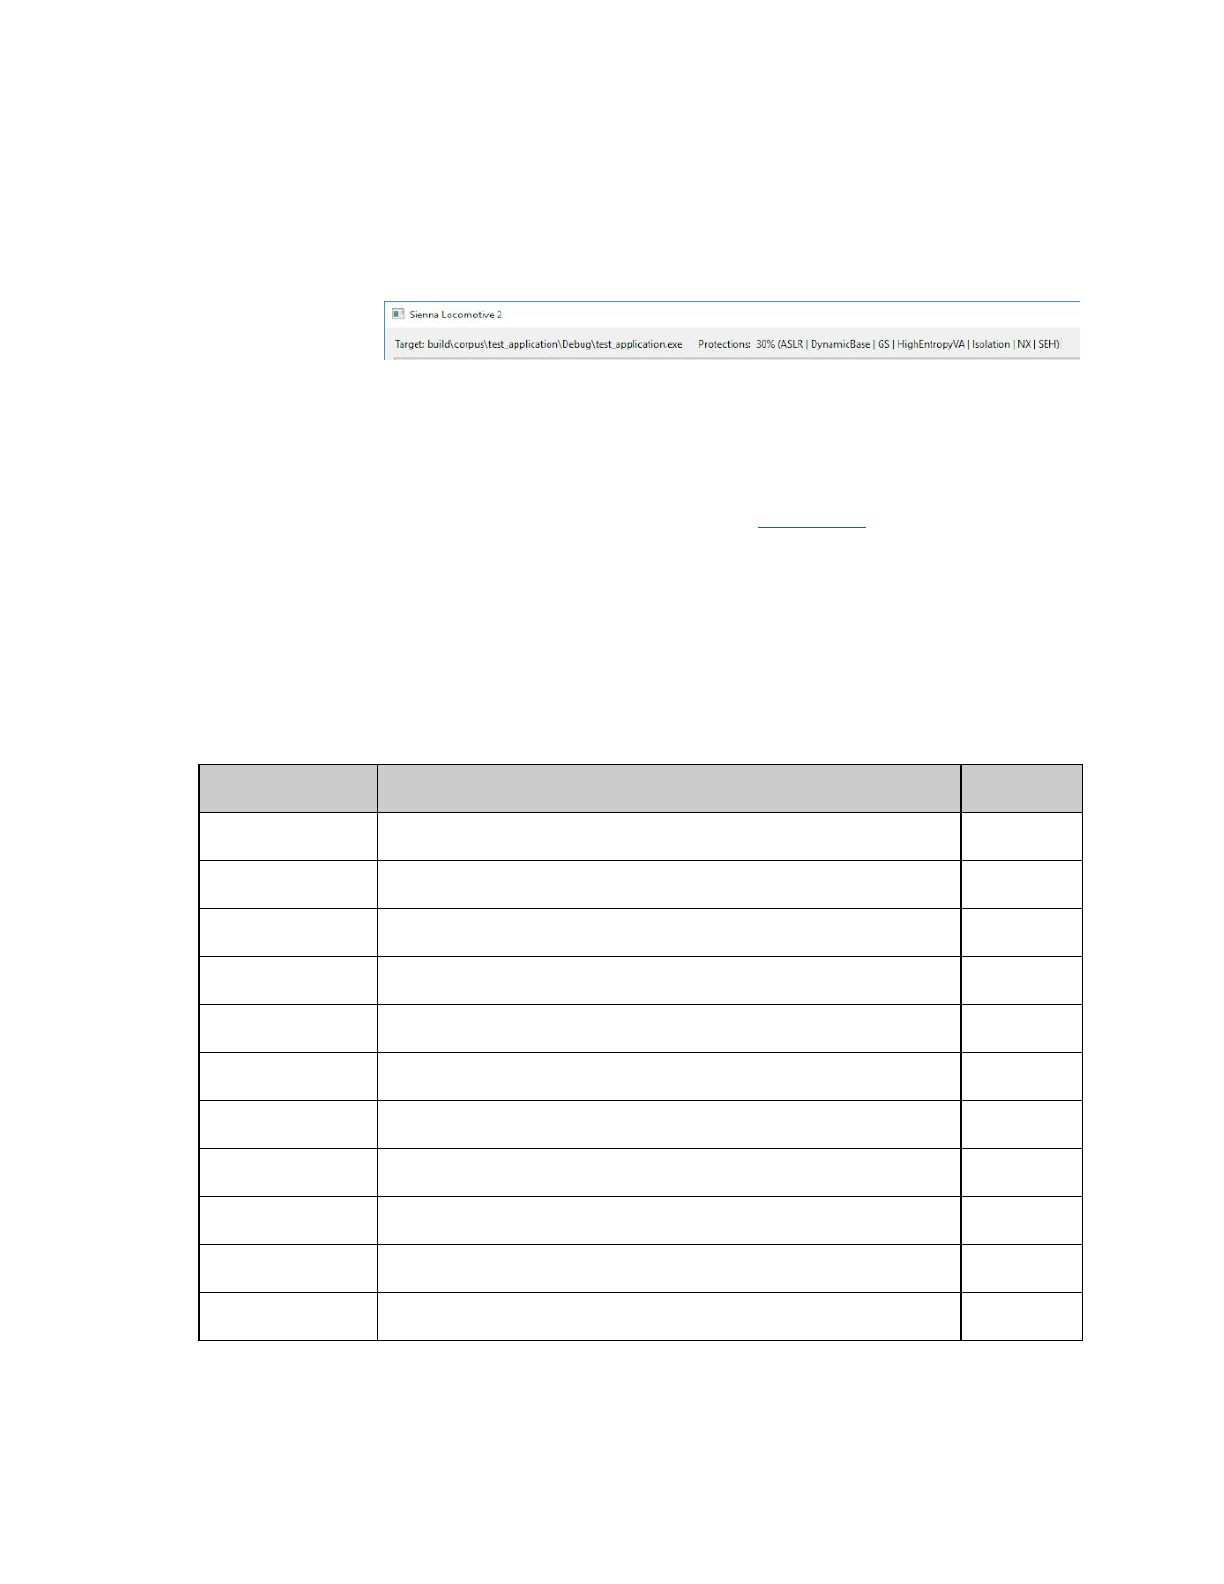
Target Pane
The target pane
shows information
about the Target
Application and its
protections. The Target line shows the path (either absolute or relative to the current directory).
Protections
The protections line of the Target Pane describes a number of flags for the binary protections on
Windows. This is generated from the output of Winchecksec; see Winchecksec for more information on
how detected security features are used to augment the exploitability scoring system.
Protections Percentages give further context on a target binary’s protection posture. Not intended as a
replacement for expert consideration, but a general score relative to statistics on a corpus of Windows
binaries. The Protections Percentage ranges from 0-100% and is derived from the relative rarity of each
flag. Binaries that contain rare flags, like RFG, more quickly gain percentage. A binary with all of the flags
set will score 100%; with none, 0%. The following table shows a brief summary of the flags along with the
probability of being set in a Windows application.
Flag
Description
Probability
ASLR
Address Space Layout Randomization
79%
Authenticode
Executable is signed with a valid (trusted and active) certificate
37%
CFG
Control Flow Guard
49%
Force Integrity
Requires the Digital Signature must be checked
3%
GS
Stack Cookies
65%
High Entropy VA
ASLR with a larger randomized address space (64 bit)
43%
Isolation
Loads Manifest
100%
NX
No eXecute
79%
RFG
Return Flow Guard
6%
Safe SEH
Safe Structured Exception Handling
25%
SEH
Structured Exception Handling
91%
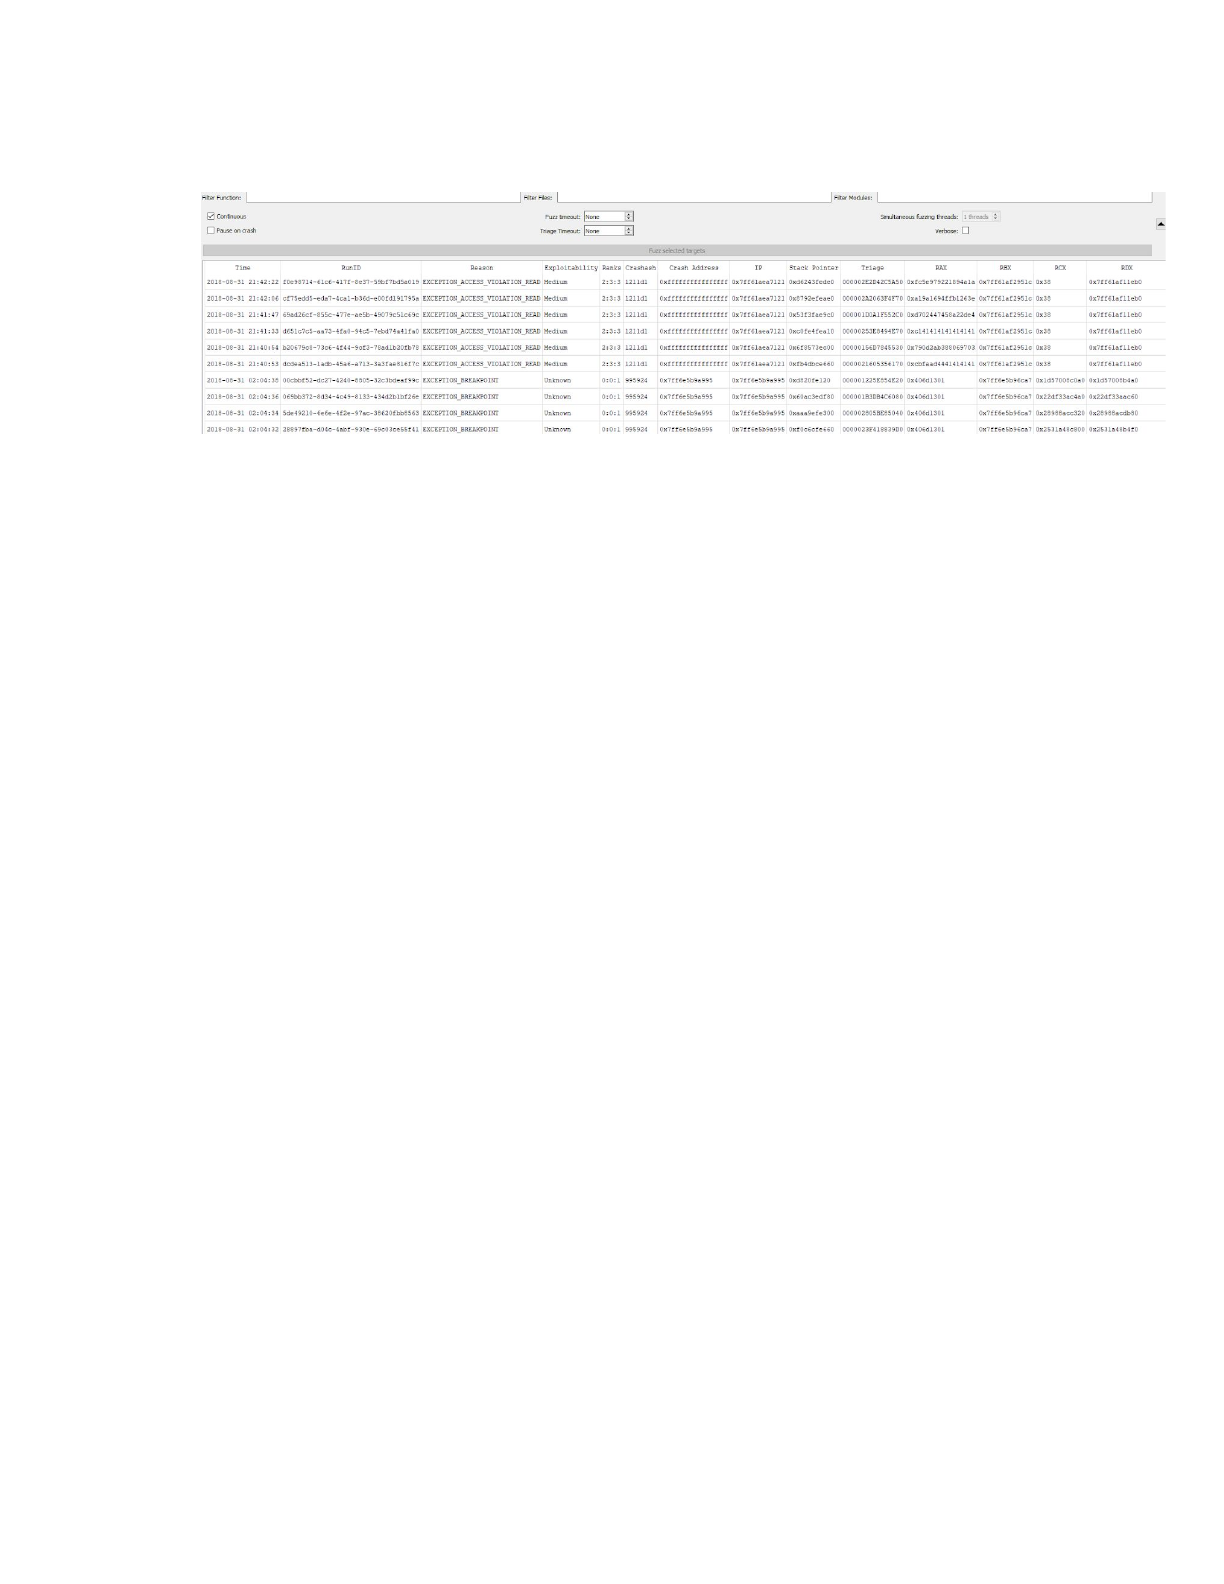
Crashes Pane
The crashes pane is tabular form information about each crash. It gives the time of the crash, the unique
run id, crash reason, exploitability, a list of 3 exploitability ranks, the crashash for binning, crash address,
instruction pointer, stack pointer and other register values of the crashing thread.
Time
This is the timestamp of when the crash occurred in the current timezone of the machine.
Run ID
The Run ID is a unique identifier assigned to every fuzzer run (and its accompanying triage run, if triage
occurs). Only runs that result in a crash appear here. The Run ID is also used as the directory name in
triage exports. They appear as version 4 UUIDs, for example:
2e264fa1-fd58-4612-ba73-4eff198bf096.
Reason
The Reason column maps to a reason for the crash and can be from the following list:
DBG_CONTROL_C
EXC_FLT_INEXACT
EXC_I386_ALIGNFLT
EXC_I386_BOUND
EXC_I386_BPT
EXC_I386_DIV
EXC_I386_EMERR
EXC_I386_EXTERR
EXC_I386_EXTOVR
EXC_I386_GPFLT
EXC_I386_INTO
EXC_I386_INVOP
EXC_I386_INVTSSFLT
EXC_I386_NOEXT
EXC_I386_SEGNPFLT
EXC_I386_SGL
EXC_I386_SSEEXTERR
EXC_I386_STKFLT
EXCEPTION_ACCESS_VIOLATION
EXCEPTION_ACCESS_VIOLATION_EXEC
EXCEPTION_ACCESS_VIOLATION_READ
EXCEPTION_ACCESS_VIOLATION_WRITE
EXCEPTION_BAD_FUNCTION_TABLE
EXCEPTION_BOUNDS_EXCEEDED
EXCEPTION_BREAKPOINT
EXCEPTION_DATATYPE_MISALIGNMENT
EXCEPTION_FLT_DENORMAL_OPERAND
EXCEPTION_FLT_DIVIDE_BY_ZERO
EXCEPTION_FLT_INEXACT_RESULT
EXCEPTION_FLT_INVALID_OPERATION
EXCEPTION_FLT_OVERFLOW
EXCEPTION_FLT_STACK_CHECK
EXCEPTION_FLT_UNDERFLOW
EXCEPTION_GUARD_PAGE
EXCEPTION_HEAP_CORRUPTION
EXCEPTION_ILLEGAL_INSTRUCTION
EXCEPTION_IN_PAGE_ERROR
EXCEPTION_IN_PAGE_ERROR_EXEC

EXCEPTION_IN_PAGE_ERROR_READ
EXCEPTION_IN_PAGE_ERROR_WRITE
EXCEPTION_INT_DIVIDE_BY_ZERO
EXCEPTION_INT_OVERFLOW
EXCEPTION_INVALID_DISPOSITION
EXCEPTION_INVALID_HANDLE
EXCEPTION_NONCONTINUABLE_EXCEPTION
EXCEPTION_POSSIBLE_DEADLOCK
EXCEPTION_PRIV_INSTRUCTION
EXCEPTION_SINGLE_STEP
EXCEPTION_STACK_BUFFER_OVERRUN
EXCEPTION_STACK_OVERFLOW
SIGABRT
UNCAUGHT_NS_EXCEPTION
Exploitability
The exploitability ranking is a score for the potential to exploit a crash based on 3 engines. The ranks
range from High (4) to None (0). The highest score of the engines is used as the exploitability.
Rank
Exploitability
Description
4
High
The mostly likely case of a crash being exploitable.
3
Medium
Between High and Low.
2
Low
At or above the cutoff for low exploitability.
1
Unknown
Unknown cases are below the cutoff for low, but still have the potential to be of
interest.
0
None
Very unlikely the crash is exploitable.
Engines
Sienna Locomotive’s triager uses four engines to score the potential exploitability of a crash: one
preprocessing engine (Winchecksec), and three postprocessing engines (Breakpadex, !exploitablex, and
the SL Tracer). The engines interact with the target application either statically (by analyzing the binary
without instrumenting it), dynamically (by instrumenting the binary and observing its behavior at
crash-time), or post-mortem (by analyzing the minidump generated by the target after a crash).
Winchecksec
Winchecksec is the only preprocessing engine in Sienna Locomotive. Given a target binary, it statically
detects the presence of security features that either mitigate or substantially reduce the exploitability of
various vulnerabilities. Detected features include ASLR and DEP (which counter memory corruption
vulnerabilities like heap and stack-based overflows), SafeSEH (hardens the exception handling
instrumentation against exception-chain exploits), and Authenticode (indicates whether the binary is
cryptographically signed by a trusted party, making on-disk modification detectable).
Breakpadex

This engine uses a modified Google Breakpad library, which parses minidump files and return an
exploitability between High and None. Breakpadex’s system, although oversimplified, works generally as
follows:
●Stack Execution: Is the crashing thread executing on the stack? If so, increase exploitability by a
huge factor.
●Stack Overflow: If the crash involves a stack overflow, increment the exploitability by a small
amount.
●Floating Point: Floating point exceptions can generally be ignored.
●Illegal Instruction: Illegal, invalid, and privileged instructions usually implicate a jump to an area
of data, or code. This results in a large increase in exploitability.
●Exception Handler: Bugs involving exceptions handlers, such as Invalid Disposition and Non
Continuable Exceptions, result in a small bump.
●Memory Corruption: Heap corruption and stack buffer overflows contribute to a huge potential
boost in score.
●Guard Page: Issues involving a Guard Page violation cause a large hike in the metric.
●Access Violation: Determining a weight for an Access Violation is a complicated task. There are
many factors involved in the calculation, such as:
○Is the access near the null page?
○Is the offending access a read, write, or execution?
○What does the memory around the crash address appear like? Is it code?
●Disassembler: Breakpadex includes an X86/X64 disassembler. This is used to disassemble
instructions in memory and intelligently assess how they affect exploitability.
○Is the instruction involved in a bad read? write?
○What type or group of instructions are involved?
○Is there a bad branch target, argument, block write, or comparison involved?
●ASCII: If an address is ASCII and it is not near null, a medium rise in exploitability is awarded.
!exploitablex
This engine is a reimplementation and approximation of Microsoft’s !exploitable command for
windbg. !exploitablex is significantly different than Breakpadex in form, but not function. Instead of
relying on the debugger windbg, !exploitablex is built upon the minidump parsing functionality of
breakpad. It is architected on a rules engine, constructed on 46 rules, that test everything from Access
Violations to Divide-by-Zero errors. A key difference between !exploitablex and !exploitable is the former
does not involve taint analysis. This aspect is left up to the SL Tracer exploitability engine. A summary of
the categories and what factors are involved:
●High Exploitability (4)
○A privileged instruction exception indicates that the attacker controls execution flow..
○Access violations at the instruction pointer are exploitable if not near NULL.
○Access violations not near null in control flow instructions are considered exploitable.
○An illegal instruction exception indicates that the attacker controls execution flow.
○An overrun of a protected stack buffer has been detected. This is considered
exploitable. and must be fixed.
○Any exception occurring in kernel mode where the code is in Userland is considered
exploitable.
○Code execution from the stack is considered exploitable.
○Corruption of the exception handler chain is considered exploitable.
○Data Execution Prevention Violation.
○Exception Handler Chain Corrupted.
○Exception generated by code running in the Stack.

○Guard Page Violation.
○Heap Corruption.
○Illegal Instruction Violation.
○Privileged Instruction Violation.
○Read Access Violation at the Instruction Pointer.
○Read Access Violation on Control Flow.
○Stack Buffer Overrun (/GS Exception).
○User Mode Write AV.
○User mode DEP access violations are exploitable..
○User mode write access violations that are not near NULL are exploitable.
●Medium Exploitability (3)
○Access violations at the instruction pointer are probably exploitable if near NULL.
○Access violations near null in control flow instructions are considered probably
exploitable.
○Cannot disassemble instruction
○Data Execution Prevention Violation near NUL
○Data from Faulting Address controls Code Flow
○Data from Faulting Address controls subsequent Write Address
○Kernel Memory Read Access Violation on Block Data Move
○Memory Read Access Violation on Block Data Move
○Read Access Violation Near Null at the Instruction Pointer
○Read Access Violation on Block Data Move
○Read Access Violation on Control Flow
○The data from the faulting address is later used as the target for a branch.
○The data from the faulting address is later used as the target for a later write.
○There is no memory backing the instruction pointer. Disassembly of instruction failed.
○This is a read access violation in a block data move and is therefore classified as
probably exploitable.
○This is a read access violation in a kernel memory block data move and is therefore
classified as probably exploitable.
○This is a second chance read access violation in a kernel mode block data move and is
therefore classified as probably exploitable.
○User mode DEP access violations are probably exploitable if near NULL.
●Low Exploitability (2)
○Float Divide By Zero.
○Integer Divide By Zero.
○Read Access Violation near NULL.
○Stack Exhaustion is considered to be probably not exploitable
○This is a divide by zero, and is probably not exploitable.
○This is a user mode read access violation near null, and is probably not exploitable.
●Unknown Exploitability (1)
○A BugCheck was detected. but no further information about the severity could be
determined.
○Application Verifier Stop.
○Breakpoint.
○Data from Faulting Address controls Branch Selection.
○Data from Faulting Address is used as one or more arguments in a subsequent Function
Call.
○Data from Faulting Address is used in a subsequent Block Data Move.
○Data from Faulting Address may be used as a return value.

○Memory Read Access Violation on Block Data Move.
○Possible Stack Corruption.
○The application has requested a Debugger Wake event. This should not happen during
normal operations. and should be investigated.
○The data from the faulting address is later used as one or more of the arguments to a
function call.
○The data from the faulting address is later used as the input for a later block data move.
○The data from the faulting address is later used to determine whether or not a branch is
taken.
○The data from the faulting address may later be used as a return value from this
function.
○The stack trace contains one or more locations for which no symbol or module could be
found. This may be a sign of stack corruption.
○This is a first chance read access violation in a kernel mode block data move. If the
attacker controls the size of the move. this may represent a security issue.
○This is a kernel mode read access violation near null.
○User Mode Write AV near NUL.
○User mode write access violations that are near NULL are unknown.
○While a breakpoint itself is probably not exploitable. it may also be an indication that an
attacker is testing a target. In either case breakpoints should not exist in production
code.
●None (0)
○Events that are not exceptions are not considered exploitable.
SL Tracer
The SL Tracer is an entirely original dynamic analysis tool which takes taint information into
consideration. Built to replay the behavior of a fuzzer run, the tracer serves as a basic sanity test for
fuzzer-detected crashes (i.e., whether they’re reproducible) and as a taint-tracking platform. Given a run
to replay, the SL Tracer will track the taint state of all registers and memory addresses that end up
affected by the mutation, using the ultimate state to produce an exploitability score similar to that of the
Breakpadex and !exploitablex engines:
●High exploitability (4):
○Invalid exception address plus tainted program counter (RIP)
○Invalid instruction execution plus tainted program counter
○Tainted return address (indicates ROP susceptibility)
●Medium exploitability (3):
○Tainted program counter, but on a branching instruction
○Tainted return address, but without tainted program counter
○Invalid memory write with potentially controllable pointers
○Invalid memory read
●Low exploitability (2):
○Invalid exception address, but without a tainted program counter
○Invalid instruction execution, but without a tainted program counter
○Division by zero or floating point error
○Tainted memory write, but probably without controllable pointers
●Very low exploitability (1):
○Breakpoint exceptions
○Tainted branch point, but without a tainted program counter
○Invalid memory read, but without a tainted source address
Ranks
The Ranks column is a colon delimited list of the exploitability engines: Breakpadex, !exploitablex,
and SL Tracer, in their respective order. The ranks 0:1:2 correlate to None from Breakpadex, Unknown
from !exploitablex, and Low from the SL Tracer.
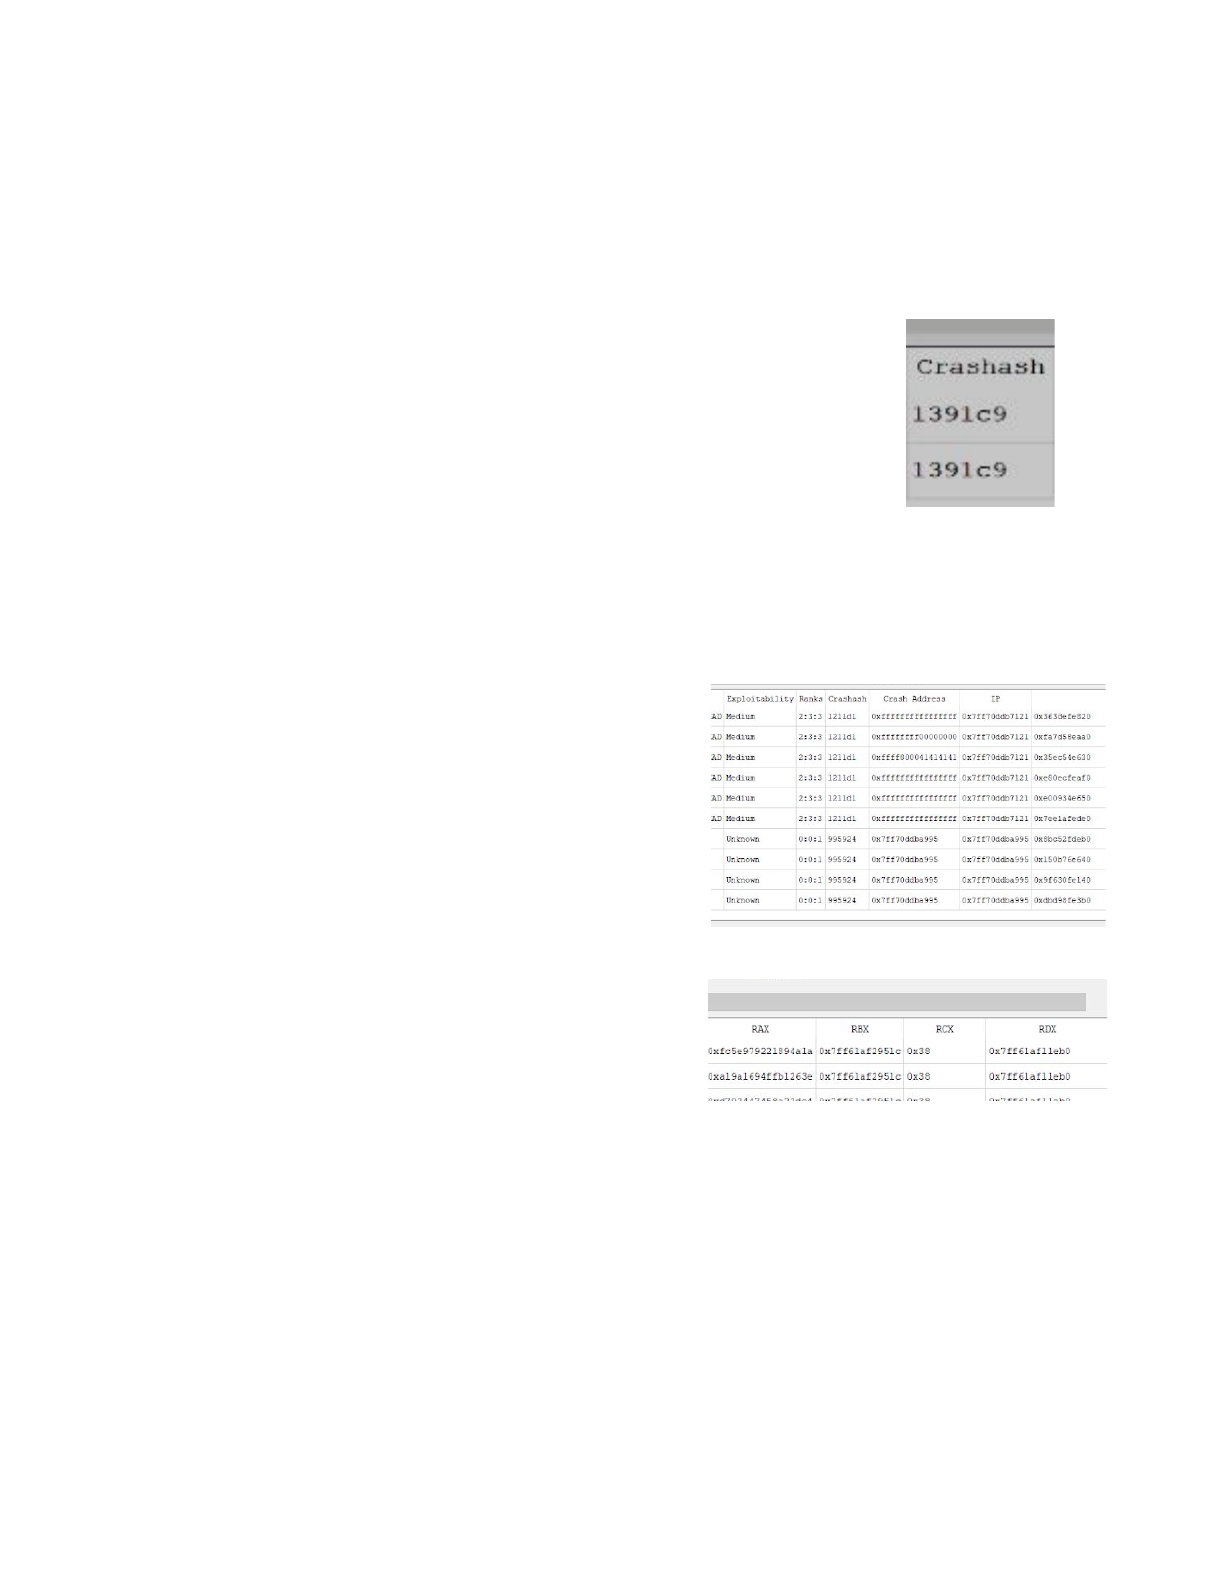
Crashash
Crashash, or Crash Hash, is a 3 byte / 6 nibble hash for uniquely grouping (or
binning) multiple crashes around a single cause. It is a practical heuristic based
on real-world empirical work on binning large amounts of crashes into related
buckets. It is resistant to the effects of Address Space Layout Randomization.
The representation in SL is a 6 character hex string. The first 3 characters are the
major hash, and bottom 3 are the minor hash. The top 3 characters are related to
the crash address and the lower involve the call stack. This string is also used in the directory structure
of Triage Export (described later). This results in multiple crashes with the same potential cause to
accumulate in the same directory.
Crash Address
Memory address which is involved in the crash.
IP
The Instruction Pointer or RIP for 64-bit Windows.
Stack Pointer
The Stack Pointer at the time of the crash, which is RSP for
64-bit Windows..
Register Values
A series of register values of the crashing thread, including
RAX, RBX, RCX, and RDX are provided.
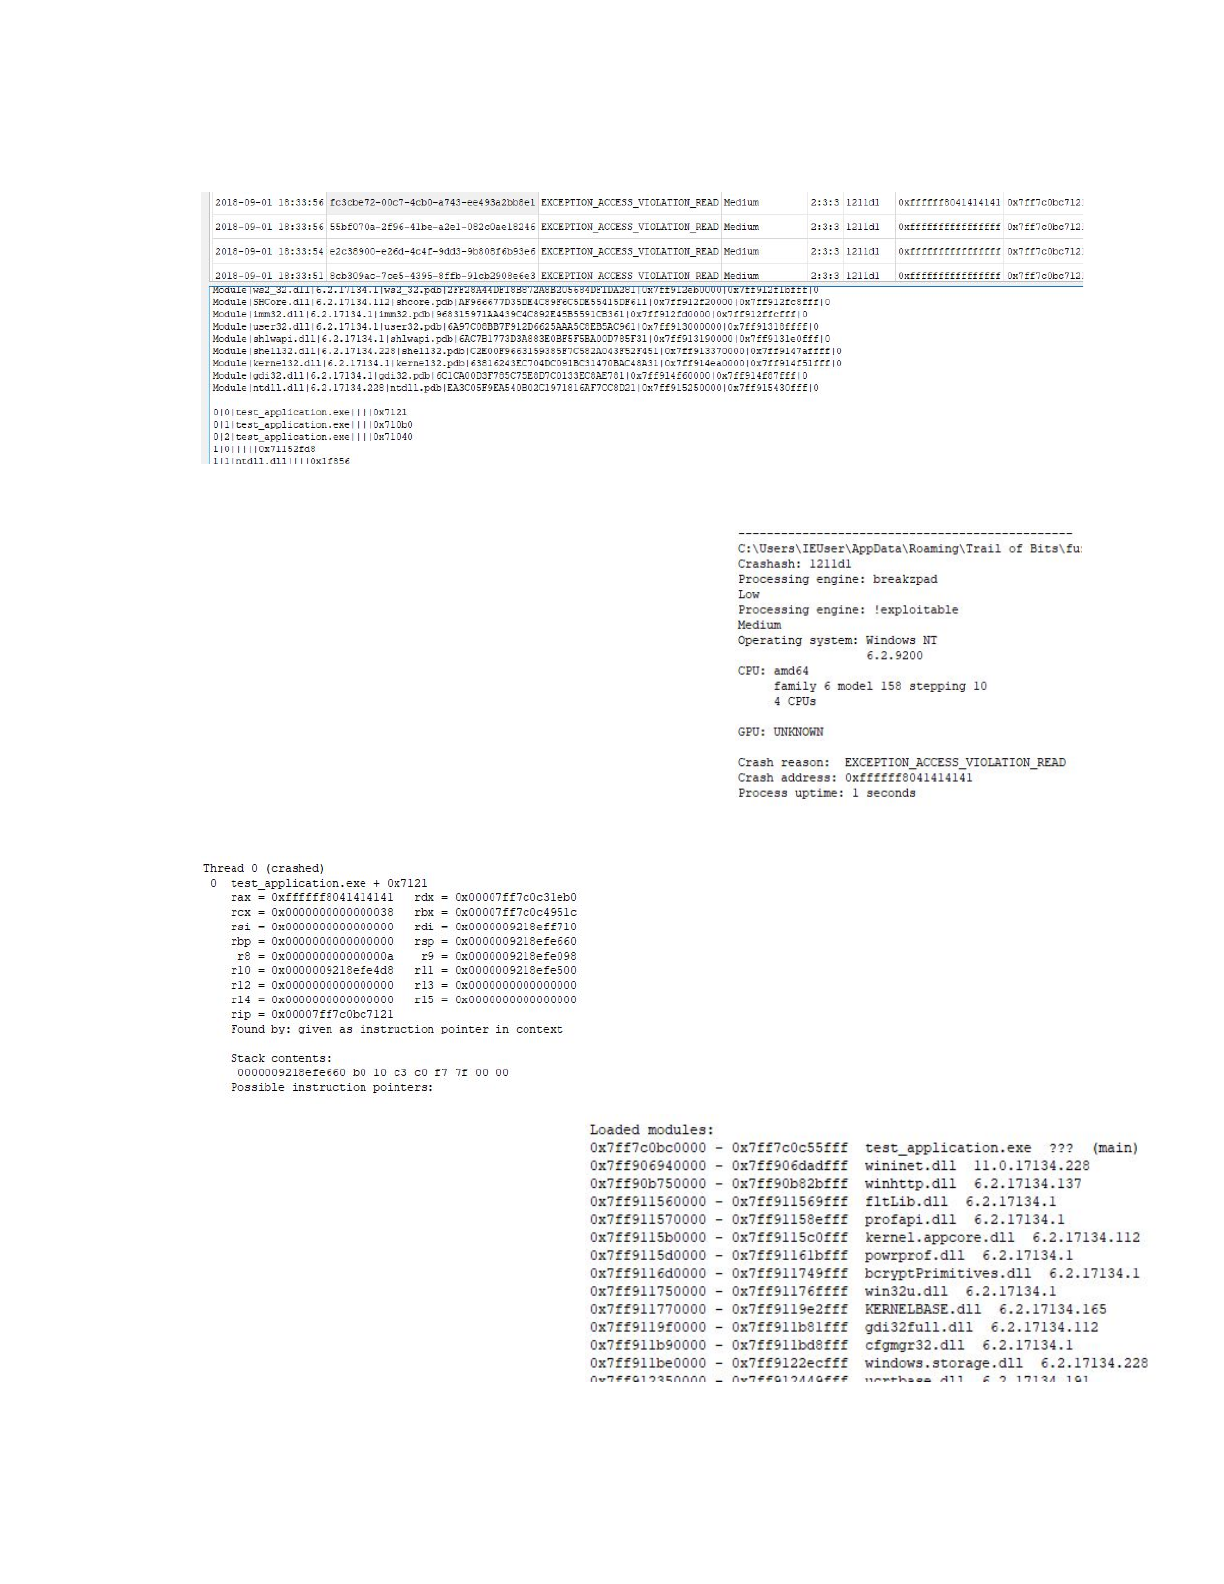
Crash Browser
Clicking on a row in the crashes table updates the Crash
Browser, which has a detailed textual breakdown of the
crash. For convenience, this information is also stored on the
filesystem as triage.txt.
There are several sections to the output. The first is a general
summary of the minidump for the crash, the crashash,
exploitability results from the breakpadx and !exploitablex
engines, and hardware and software information. The
operating system version, cpu and gpu types are included.
The reason for the crash and address are given just as they
are in the table.
This is the thread crash info. It contains relevant register
states, function and offset,, how the crash state was
determined, and the contents.
Following the state of all the threads is a list
of loaded modules. This includes versions
and load addresses.
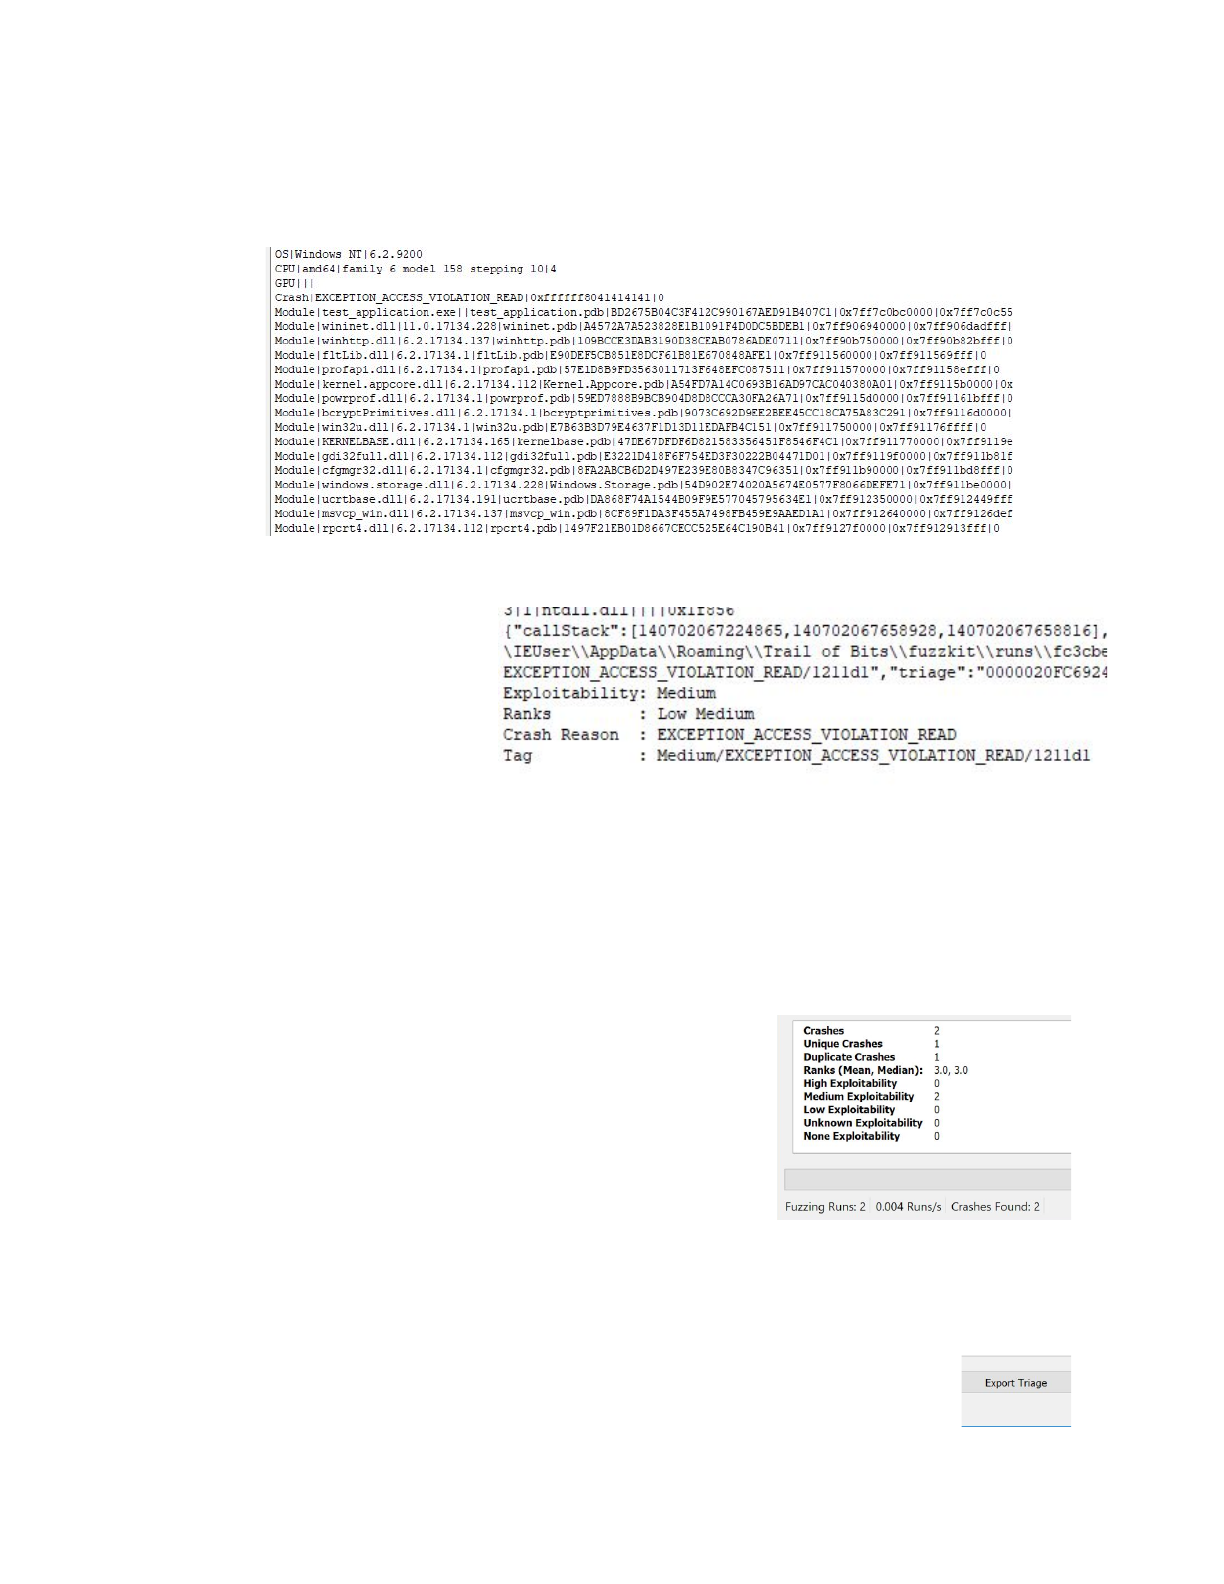
Next is a ‘|’ delimited, machine readable version of information above.
Last is a trailer including a json
version of the crash and overall
exploitability and rank.
Statistics Pane
The statistics pane has information about the crashes and their exploitability. The “Crashes” line is the
total number of crashes. Unique and Duplicate Crashes relate to the crashash binning. Ranks Mean and
Median are the Mean and Median of the winning exploitability rank for each crash. The rank is the
highest rank of the 3 for the exploitability engines. High
Exploitability, Medium Exploitability, Low Exploitability, Unknown
Exploitability, and None Exploitability are all totals of each crash
(non unique) across the 5 ranks of exploitability.
The final line, “Fuzzing Runs” and “Crashes Found”, relate to the
current GUI session and not historical crashes.
Triage
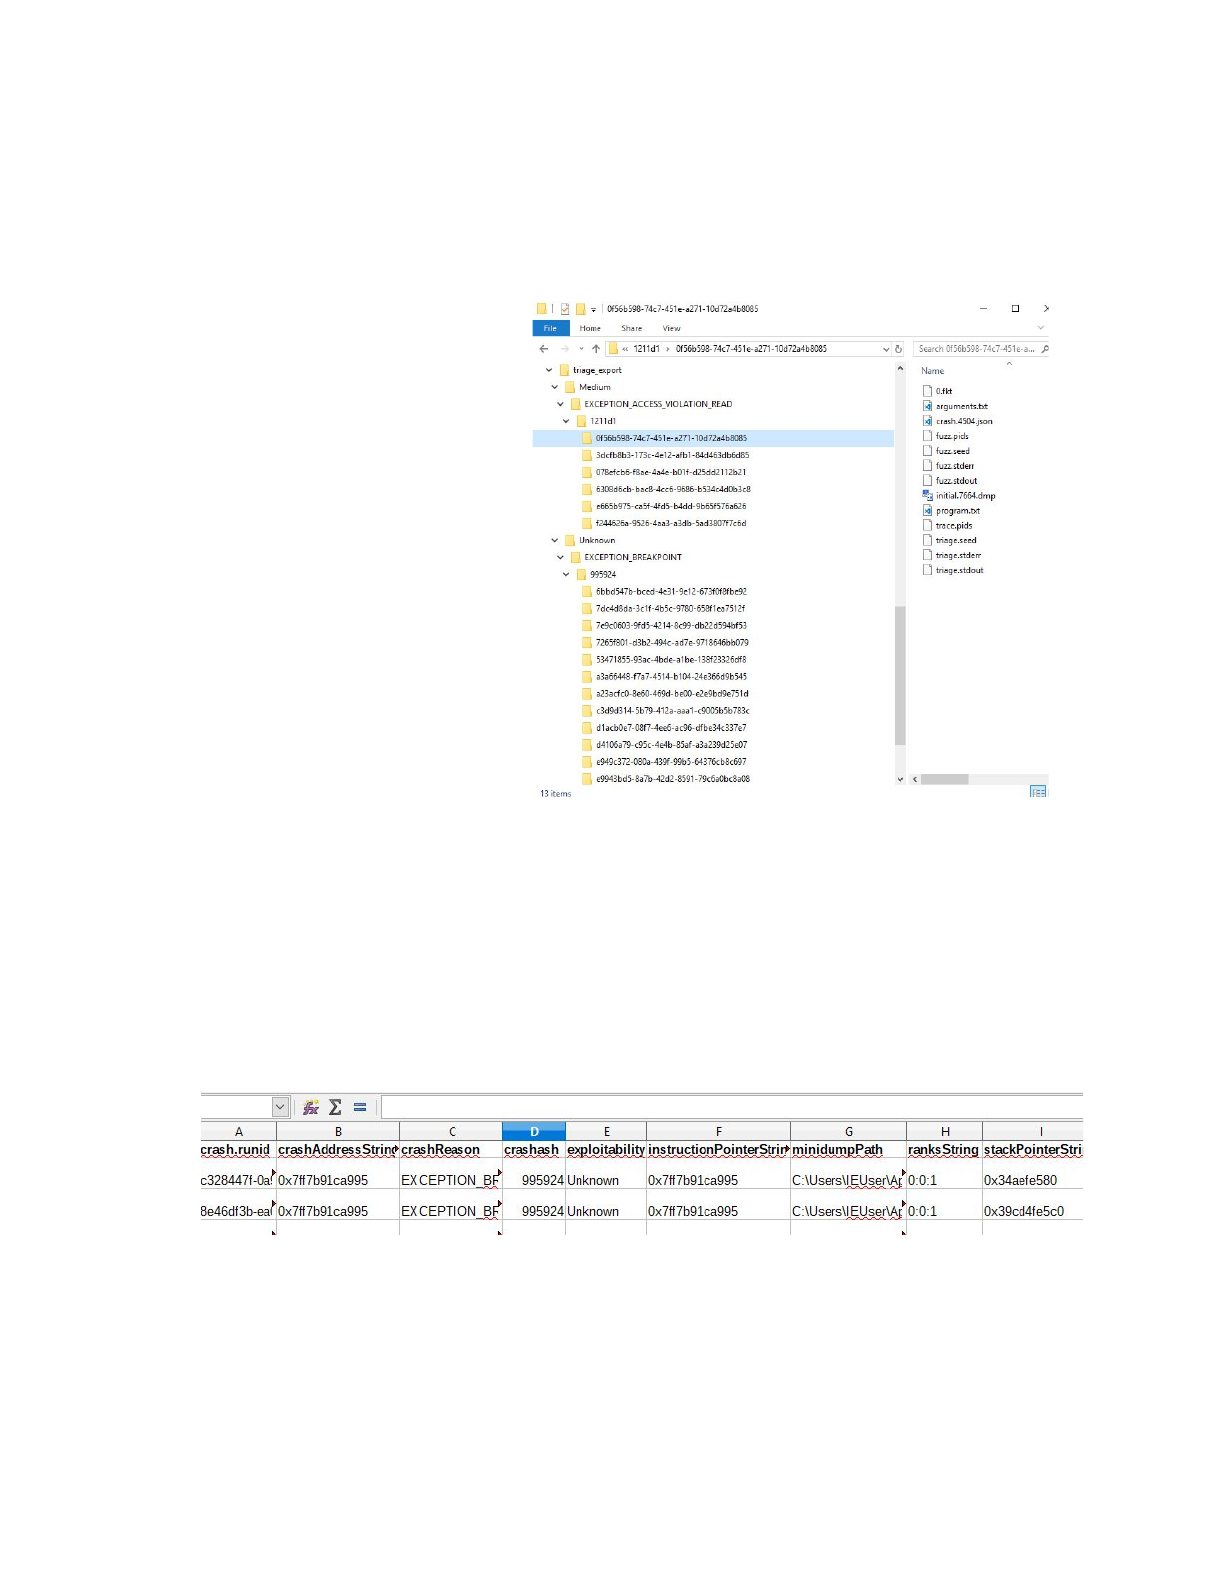
The triage system exports results of fuzzing rounds to a directory structure layout for analysis. To begin
click on the Export Triage button on the button of the GUI. This will prompt a dialog window to pick an
existing directory to export crashes.
Once selected, all crashes are copied
to a directory arranged by
exploitability, crash reason, and
crashash.
Syntax
A:\X\Rank
\Reason
\Crashash
\
Example
f:\x\Medium\EXCEPTION_AV\1211d1
Triage Workflow
A typical workflow would start at the
top directory, or the Exploitability
Rank. These directories will be
named High, Medium, Low,
Unknown, and None.
Under the exploitability directory are
directories of the crash reason. Researchers prioritize crash reasons which are most favorable given the
protections and exploitation context of the target application.
Underneath the crash reason directory is the crashash. This groups crashes that are likely caused by the
same bug. In each reason directory exists the actual crash information in folders named after the runid.
Finally, the run ID folders contain files pertinent to each crash. A quick selection of some of the more
important files:
●triage.csv
In the root of the export directory is a spreadsheet summarizing all the crashes, called triage.csv. It
includes columns such as:
runid
crashAddressString
crashReason
crashash
exploitability
instructionPointerString
minidumpPath
ranksString
stackPointerString
tag

formatted
targetPath
aslr
authenticode
cfg
dynamicBase
forceIntegrity
gs
highEntropyVA
isolation
nx
rfg
safeSEH
seh
●triage.txt
triage.txt contains detailed information about the crash in a textual human readable form. It
contains information about the crashash, exploitability engines, OS, CPU, crash reason, address, process
time, register state, and stack information. Here is an example:
-----------------------------------------------
C:\Users\IEUser\AppData\Roaming\Trail of
Bits\fuzzkit\runs\866d4908-099d-4a6d-bb22-723847771e67\initial.19128.dmp
Crashash: 1211d1
Processing engine: breakzpad
Low
Processing engine: !exploitable
Medium
Operating system: Windows NT
6.2.9200
CPU: amd64
family 6 model 158 stepping 10
4 CPUs
GPU: UNKNOWN
Crash reason: EXCEPTION_ACCESS_VIOLATION_READ
Crash address: 0xffffffffffffffff
Process uptime: 1 seconds
Thread 0 (crashed)
0 test_application.exe + 0x7121
rax = 0x8041414141414141 rdx = 0x00007ff7d1ee1eb0
rcx = 0x0000000000000038 rbx = 0x00007ff7d1ef951c
rsi = 0x0000000000000000 rdi = 0x000000f01c2ffb50
rbp = 0x0000000000000000 rsp = 0x000000f01c2feaa0
r8 = 0x000000000000000a r9 = 0x000000f01c2fe4d8
r10 = 0x000000f01c2fe918 r11 = 0x000000f01c2fe940
r12 = 0x0000000000000000 r13 = 0x0000000000000000
r14 = 0x0000000000000000 r15 = 0x0000000000000000
rip = 0x00007ff7d1e77121
Found by: given as instruction pointer in context
Stack contents:
000000f01c2feaa0 b0 10 ee d1 f7 7f 00 00 ........
Possible instruction pointers:
….

….
4|1|ntdll.dll||||0x1f856
{"callStack":[140702355255585,140702355689648,140702355689536],"crashAddress":1844674407370
9551615,"crashReason":"EXCEPTION_ACCESS_VIOLATION_READ","crashash":"1211d1","exploitability
":"Medium","instructionPointer":140702355255585,"minidumpPath":"C:\\Users\\IEUser\\AppData\
\Roaming\\Trail of
Bits\\fuzzkit\\runs\\866d4908-099d-4a6d-bb22-723847771e67\\initial.19128.dmp","rank":3,"ran
ks":[2,3],"rax":9241739658864443713,"rbx":140702355789084,"rcx":56,"rdx":140702355693232,"s
tackPointer":1031265053344,"tag":"Medium/EXCEPTION_ACCESS_VIOLATION_READ/1211d1","triage":"
000001EF381E4ED0"}
Exploitability: Medium
Ranks : Low Medium
Crash Reason : EXCEPTION_ACCESS_VIOLATION_READ
Tag : Medium/EXCEPTION_ACCESS_VIOLATION_READ/1211d1
●initial.PID.dmp
Each run directory may contain multiple of these minidumps, one for each PID that
crashed in the target application during the fuzzing phase. For example, if the target application
foo.exe (PID 1111) spawned bar.exe (PID 1112) and baz.exe (PID 1113) and both foo.exe
and baz.exe crashed during fuzzing, then both initial.1111.dmp and initial.1113.dmp
would be present.
●crash.PID.json
Like initial.PID.dmp, each run directory may contain multiple of these files, one for
each PID that crashed in the target application during the triaging phase. Each contains a
JSON-formatted dump of the process state at the time of crash, including register states, a
disassembly of the region around the crashing address, as well as taint information for registers
and memory addresses.
●arguments.txt
The target application and its command line arguments, for example:
build/corpus/test_application/Debug/test_application.exe 10 -f
●fuzz.pids, trace.pids
The PIDs of all processes created by the target application (and subsequently
instrumented by Sienna Locomotive) during fuzzing and tracing, respectively. This file is
primarily useful for debugging purposes.
●fuzz.stderr, fuzz.stdout, trace.stderr, trace.stdout
Logs of the target application’s standard error and output streams, including output
from the instrumentation layers of the fuzzer and tracer. This can be analyzed to debug issues
during fuzzing and tracing, or to search for error messages that correspond to an observed
crash. If no output occurs on a stream during a particular phase (fuzzing or triaging), that output
file is not saved.

FAQ
Q: What is a “Sanity check failure”?
When started, Sienna Locomotive performs a series of checks against system settings that are known to
interfere with the fuzzing and/or triaging process. If it detects one or more of these settings, it will
present the user with a “Sanity check failure” error message that includes information on how to fix the
problem. In most cases, the fix will be as simple as removing the offending registry key or modifying it as
Sienna Locomotive tells you to.
Q: Why can’t the wizard find any functions to target?
Sienna Locomotive’s wizard may fail to find any targetable functions for several reasons:
●A non 64-bit application was targeted. Sienna Locomotive currently only supports 64-bit
targets; attempting to run the wizard on a 32-bit target should cause an error message and
result in an empty target list. This is the most common reason for wizard failures.
●The application doesn’t contain any targetable functions. The application may not perform direct
I/O (it may delegate it to another process, which it communicates with via IPC), may use an
unsupported I/O routine (such as WriteConsole), or may link to an extremely old or unusual
version of the system or C/C++ runtime that Sienna Locomotive does not know how to detect.
Make sure that the application being targeted is indeed the one that performs I/O.
●The application is statically linked. Sienna Locomotive is unable to detect I/O routines that have
been statically linked into the target application, as there are no “module load” events for the
instrumentation layer to hook into and intercept. If you have access to the application’s
source, rebuild it to use dynamic linkage.
Q: Why are my fuzzing runs so slow?
●Your target application’s input may be too large. Aim for inputs that balance size with
reasonable initial coverage of the target application’s features. See Small inputs.
●You may be targeting too many functions at once. Sienna Locomotive allows you to select as
many functions in the target as you’d like, but doing so incurs substantial instrumentation
overhead. Target functions based on their proximity to the input, and specifically
interesting parts of the input. See Clever targeting.
●You may not be invoking the target application in the most efficient way. Many applications
provide both a GUI and a CLI — try to avoid starting the target’s GUI when possible. Many
applications also spawn child processes that do the real work — try to target those directly,
instead of the user-facing “shell” application. See Minimizing child processes.
Q: Why am I getting errors after running the fuzzer for a while?
●Sienna Locomotive requires space for the crash artifacts that it creates, as well as for the
database that it uses to track runs. Make sure that your system partition has ample free
space.
●Not all applications exit cleanly — some may leave behind artifacts, or mutate the operating
system’s state in a way that interferes with the long-term stability of both Sienna Locomotive
and the application itself. Configure the target application to minimize artifacts on exit, and
consider running Sienna Locomotive on a virtual machine that can be periodically
rebooted or flushed to restore a clean state.
Q: How do I configure the fuzz server’s coverage feedback
system?
●The fuzz server uses a collection of reasonable default parameters for controlling the coverage
feedback system, but advanced users may wish to substitute their own parameters for specific
targets. The coverage feedback system is configured via flags passed to the server in the
server_args key for a given profile (in config.ini). Here are the configurable flags:
-s <NUM> The strategy “stickiness”, or how many attempts
to give to a strategy that hasn’t increased the
coverage score before switching to a new
strategy.
-b Whether or not to use coverage “bucketing,”
which geometrically decreases the value of a
coverage tuple as it is continuously seen
across runs.
Most target applications should not need to change the server’s coverage feedback parameters.
Changing the feedback parameters without a specific goal in mind may result in dramatically
worse fuzzing results.
Q: I’m not getting output or crashes. How do I debug?
●Sienna Locomotive can be run in a verbose mode, which may reveal error or warning messages.
To enable the verbose mode, click the “Verbose” checkbox under the advanced fuzzer and
triager configuration dropdown.
●To capture even more messages, start the Sienna Locomotive GUI from a terminal: run sl2 -v
to provide additional debugging information or sl2 -vv for the full output. You can also check
the “Verbose” box in the GUI, which is equivalent to the -vv flag
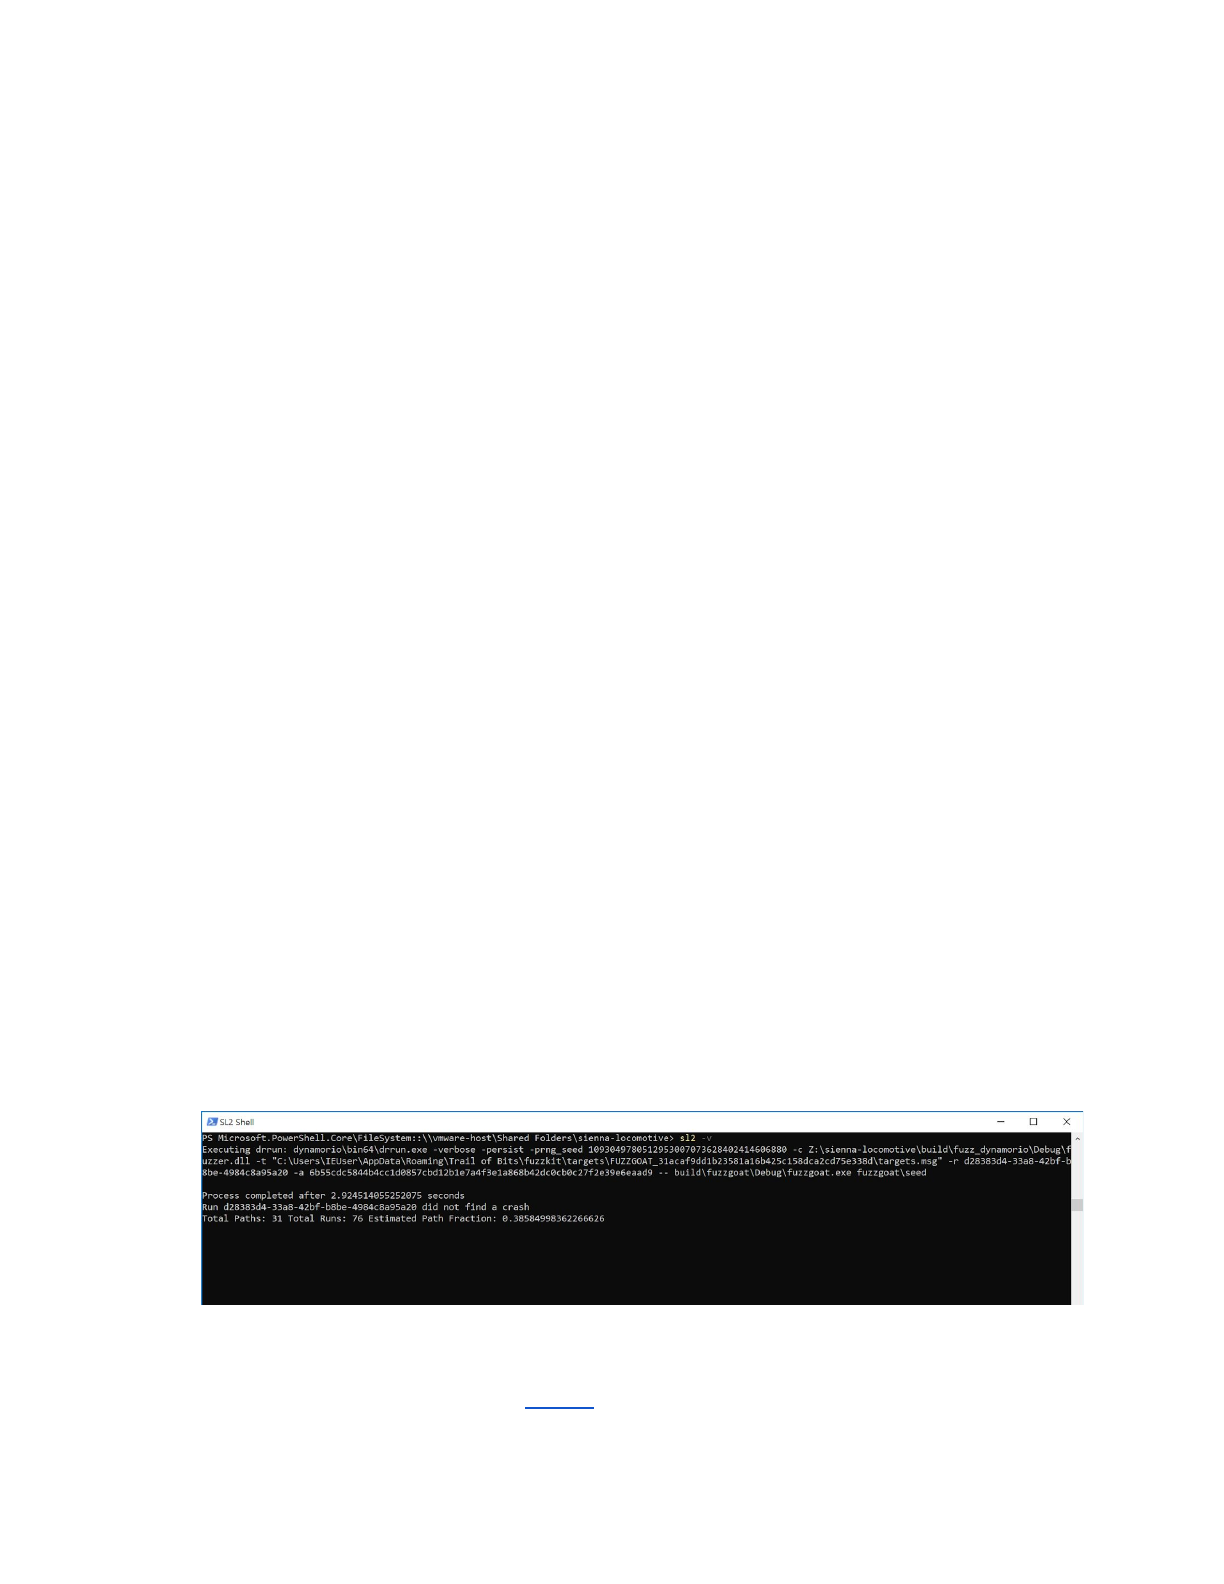
●To debug an individual stage (wizard, fuzzer, or tracer), you can repeat one of the drrun
invocations output by Sienna Locomotive when attached to a console. Here, for example, is a
fuzzer’s invocation (output after beginning a fuzzing run):
●Consult the fuzz.stdout, fuzz.stderr, trace.stdout, and trace.stderr files in the run
directory. If the run didn’t cause a crash, you’ll need to use the -P flag with either the GUI or CLI
to preserve the run’s files (see Harness).

Q: I updated Windows, and now the GUI refuses to run! What
do I do?
●DynamoRIO, the dynamic instrumentation framework underlying Sienna Locomotive, relies on
having an up-to-date table of the Windows system calls. To combat malware, Microsoft reorders
this table roughly every nine months, which will cause DynamoRIO to break. If this happens, the
only available recourse is unfortunately to roll back Windows to a supported version (or wait
until DynamoRIO is updated).
○Note: At time of writing, Trail of Bits was working on a patch to DynamoRIO to support
the most recent update to the table, which took place on October 3rd, 2018. Since
DynamoRIO’s official builds are released on a weekly basis, it may take several days for
these changes to make their way into a release.
Best Practices
Small inputs
Sienna Locomotive will fuzz large buffers and/or large groups of targeted functions, but will perform best
when given small buffers and/or a relatively small group of functions to fuzz on each individual run.
Clever targeting
In addition to small inputs and small groups of targeted functions, users should attempt to target
functions that read interesting parts of their inputs. For example, an executable parser might have three
groups of reads:
1. Magic and other sanity checks (length prefixes, checksums, etc.)
2. Indirect lookups (symbol tables, resource entries)
3. Large regions of data (executable code)
Here, the user would do best to target group 2: changing the values that the parser reads to perform
additional reads will reveal flaws in group 1. By contrast, targeting group 1 directly would probably be
largely ineffective (checksums are difficult to fuzz through), and targeting group 3 would probably do
relatively little (since the parser isn’t loading data/executable code or evaluating it at all).
Minimizing child processes
Sienna Locomotive will detect and instrument child processes for fuzzing and triaging, but not without
performance overhead. To minimize this overhead, users should attempt to directly target the
executable they’d like to discover crashes in, rather than the “toplevel” or user-facing executable that
calls it. For example, if foo.exe calls bar.exe and bar.exe calls the actual target baz.exe, then the
user should attempt to target baz.exe directly rather than either foo.exe or bar.exe.
Source Code Documentation
The SL installation folder contains a folder called “doc” that contains Trail of Bits’ internal developer
documentation for the project. You may find this information useful for troubleshooting. To access the
documentation, open the “html” folder under “doc” and open “index.html” in your web browser of choice.

About Trail of Bits
Since 2012, Trail of Bits has helped secure some of the world's most targeted organizations and devices.
We combine high-end security research with a real-world attacker mentality to reduce risk and fortify
code.
Our clientele - ranging from Facebook to DARPA - lead their industries. Their dedicated security teams
come to us for our foundational tools and deep expertise in reverse engineering, cryptography,
virtualization, malware behavior and software exploits. We help them assess their products or networks,
and determine the modifications necessary for a secure deployment. We're especially well suited for the
technology, finance and defense industries.
After solving the problem at hand, we continue to refine our work in service to the deeper issues. The
knowledge we gain from each engagement and research project further hones our tools and processes,
helping us extend software engineers' abilities. We believe the most meaningful security gains hide at the
intersection of human intellect and computational power.
