PsrPopPy Ation Manual
User Manual:
Open the PDF directly: View PDF ![]() .
.
Page Count: 24

PsrPopPy Documentation
Release 1
S Bates
April 17, 2013

CONTENTS
1 Introduction 3
1.1 What is PsrPopPy? ............................................ 3
1.2 Why is PsrPopPy? ............................................ 3
1.3 Who can contribute? ........................................... 3
1.4 Acknowledgements ........................................... 3
2 Installation 5
2.1 Download the package .......................................... 5
2.2 Compile the FORTRAN ......................................... 5
3 Command-line scripts 7
3.1 populate.py ................................................ 7
3.2 dosurvey.py ................................................ 8
3.3 view.py .................................................. 8
3.4 visualize.py ................................................ 8
4 Tutorial - Basic Usage 9
4.1 Generate Population Model ....................................... 9
4.2 Simulate a Pulsar Survey ......................................... 9
4.3 Visualising a Pulsar Model ........................................ 10
5 Module-level Documentation 13
5.1 pulsar – Creates/stores a pulsar object ................................ 13
5.2 population – Creates/stores a population .............................. 13
5.3 survey – Read a survey file into a survey object ............................ 14
5.4 populate – Create a population object ................................ 14
5.5 radialmodels – Container for radial distn models ......................... 14
5.6 galacticops – Container for functions relating to the Galaxy .................... 15
6 Indices and tables 17
Index 19
i

ii

PsrPopPy Documentation, Release 1
Contents:
CONTENTS 1

PsrPopPy Documentation, Release 1
2 CONTENTS

CHAPTER
ONE
INTRODUCTION
1.1 What is PsrPopPy?
PsrPopPy is a Python (for the most part) implementation of Duncan Lorimer’s PSRPOP code. All of the user-facing (in
normal circumstances) code is written in Python, with some remaining FORTRAN functions (e.g. NE2001, coordinate
conversion) for speed.
1.2 Why is PsrPopPy?
For the development of a research project, I was modifying the PSRPOP code, but found it somewhat tricky. I decided
to re-write the code with much heavier reliance on functions and with added OO design. This makes modifying the
code and addition of new features much more simple, with little speed loss since the difficult number crunching is still
done in FORTRAN. The added bonus of re-writing the code is the detection of a number of bugs in the original code,
which have hopefully been eliminated.
1.3 Who can contribute?
In short - anybody. The code is up on github and I’ll be happy to accept suggestions for future modifications and
improvements.
1.4 Acknowledgements
Many thanks to Duncan Lorimer for giving his blessing to this project and of course for generating the codebase which
has inspired this project.
3

PsrPopPy Documentation, Release 1
4 Chapter 1. Introduction

CHAPTER
TWO
INSTALLATION
To get started with PsrPopPy there are a few steps you’ll need to go through.
PsrPopPy is currently supported on Linux and Mac OS X, and for full feature support, it is recommended to install the
Matplotlib package and either use Python versions >2.6, or install the argparse module.
2.1 Download the package
The source for PsrPopPy can be downloaded from GitHub from the PsrPopPy page. The source will contain the
Python modules and scripts needed both for basic and advanced use.
2.2 Compile the FORTRAN
Although PsrPopPy is a Python-based package, some of the algorithms have been kept in their native FORTRAN for
speed and ease of programming (e.g. the NE2001 electron model, coordinate conversion...). Therefore, it is necessary
to compile the FORTRAN.
Two scripts are provided for just this purpose (though I hope to find someone willing to contribute configure scripts).
From the base directory:
> cd lib/fortran
To use make, edit makefile.<OSTYPE> and ensure that the gf variable points to the location of your gfortran
compiler. Then simply type make. All being well, four .so files will be generated.
Failing this, edit either make_mac.csh or make_linux.csh, depending upon your system, so that the gf variable
points to your local gfortran/f77 compiler. Running the script:
> tcsh make_<os>.csh
should then compile a series of .so files in the fortran directory. Assuming this went to plan, the installation
process is completed.
5

PsrPopPy Documentation, Release 1
6 Chapter 2. Installation

CHAPTER
THREE
COMMAND-LINE SCRIPTS
3.1 populate.py
-n <number of pulsars>
Required: Number of pulsars to generate; or to detect in a survey
-o <output>
Output file name for population model (def=populate.model)
-surveys <SURVEY NAME(S)>
List of surveys to use when trying to detect pulsars (default=None)
-z <scale height>
Scale height of pulsars about Galactic plane, in kpc (default=0.33)
-w <width>
Pulse width to use when generating pulsars (default=0, use beaming model)
-si <SImean SIsigma>
Spectral index mean and standard deviation (default=-1.6, 0.35)
-sc <scatter index>
Spectral index of scattering law to use (default=-3.86, Bhat et al model)
-pdist <distribution name>
Distribution type for pulse periods (default=lnorm)
Supported: ‘lnorm’, ‘norm’, ‘cc97’
-p <mean stddev>
Mean and standard deviation to use in period dist ‘lnorm’ or ‘norm’ (def=-2.7, 0.34)
-rdist <radial model>
Model to use for Galactic radial distribution of pulsars
Supported: ‘lfl06’, ‘yk04’, ‘isotropic’, ‘slab’, ‘disk’
-dm <Electron model>
Model to describe the Galactic electron distribution
Supported: ‘ne2001’, ‘lm98’
-gps <fraction ’a’>
Add <fraction> pulsars with GHz-frequency turnovers with index a
-doublespec <fraction alpha1>
Add <fraction> pulsars with low-frequency (below 1GHz) spectral index of alpha1
7

PsrPopPy Documentation, Release 1
-nostdout
Turn off writing to stdout. Useful for many iterations eg. in large simulations
3.2 dosurvey.py
-f <filename>
Input population model to use (default=populate.model)
-surveys <SURVEY NAME(S)>
Required: Name(s) of surveys to simulate on the population model
-noresults
By default, a .results file is written, containing a model of the population detected in the survey. This option
switches off the writing of this file.
-asc
Write the survey model in plain ascii (psrpop old style). Not recommended, since the cPickle ‘.results’ file is
easier to work with.
-summary
Write a short .summary file (per survey) describing number of detections, number of pulsars outside survey area,
number smeared, and number not beaming
-nostdout
Turn off writing to stdout. Useful for many iterations eg. in large simulations
3.3 view.py
-f <input model>
Select the population model to view (default=populate.model)
-p <param name>
Select the population parameter to plot
Supported: ‘period’, ‘dm’, ‘gl’, ‘gb’, ‘lum’, ‘alpha’, ‘r0’, ‘rho’, ‘width’, ‘spindex’, ‘scindex’, ‘dist’
-logx
Plot log10 of the values
3.4 visualize.py
-f <model>
Select a population model to plot (default = populate.model)
-frac <F>
Plot a fraction <F> of the population for speed gains
8 Chapter 3. Command-line scripts

CHAPTER
FOUR
TUTORIAL - BASIC USAGE
This page will outline a very simple pipeline for basic population simulations with PsrPopPy.
4.1 Generate Population Model
Population models are generated using the populate.py script. A common use would be to generate a population
of normal pulsars using the Parkes Multibeam Pulsar Survey as a basis. This survey detected 1038 pulsars (at last
count). Using default radial distribution, period and luminosity models, we can generate such a population using the
command:
python populate.py -n 1038 -surveys PMSURV
This will then run for a few minutes, until the model PMSURV survey has detected 1038 pulsars. The file
populate.model will be produced by default, which is a pickled population object.
If, instead, you wanted to use the Lyne & Manchester (1998) electron distribution, and for whatever reason wanted to
store the output in the file pop_lm98.model, then we could run:
python populate.py -n 1038 -surveys PMSURV -dm lm98 -o pop_lm98.model
A different output file will then be produced, where the population uses the new simulation parameters.
4.2 Simulate a Pulsar Survey
Once you’ve generated a pulsar population model, the dosurvey.py script can be used to run the model through a
past, present or future, pulsar survey (as specified in files in the survey directory — see _model-survey-files).
For example, say we want to take the population model we just created, pop_lm98.model, and estimate from this
how many pulsars would be detected in a putative LOFAR pulsar survey. This can be simply done using:
python dosurvey.py -f pop_lm98.model -surveys LOFAR
Which will print out the results of the survey, and write a results file called LOFAR.results, which again is in the
Pickle format. To write an ascii summary file, and an ascii file containing the parameters of all detected pulsars, simply
add some extra flags:
python dosurvey.py -f pop_lm98.model -surveys LOFAR --asc --summary
Note that multiple model surveys may be run at once. To do so, just list as many as required after the -surveys flag.
The results file can also be turned off:
9

PsrPopPy Documentation, Release 1
python dosurvey.py -f pop_lm98.model -surveys LOFAR GMRT GBNCC --noresults
4.3 Visualising a Pulsar Model
There are two ways to visualise the populations generated by either populate.py (.model) or dosurvey.py
(.results). To plot basic histograms of various parameters, use the view.py script:
python view.py -f <model> -p <parameter>
Here <parameter> could be period,dm, or several other options, as outlined in _view_doc. Assuming the
Matplotlib package is installed, this will generate a histogram which can then be saved or printed as necessary.
To create a histogram of the logarithm of the selected parameter, use:
python view.py -f <model> -p <parameter> --logx
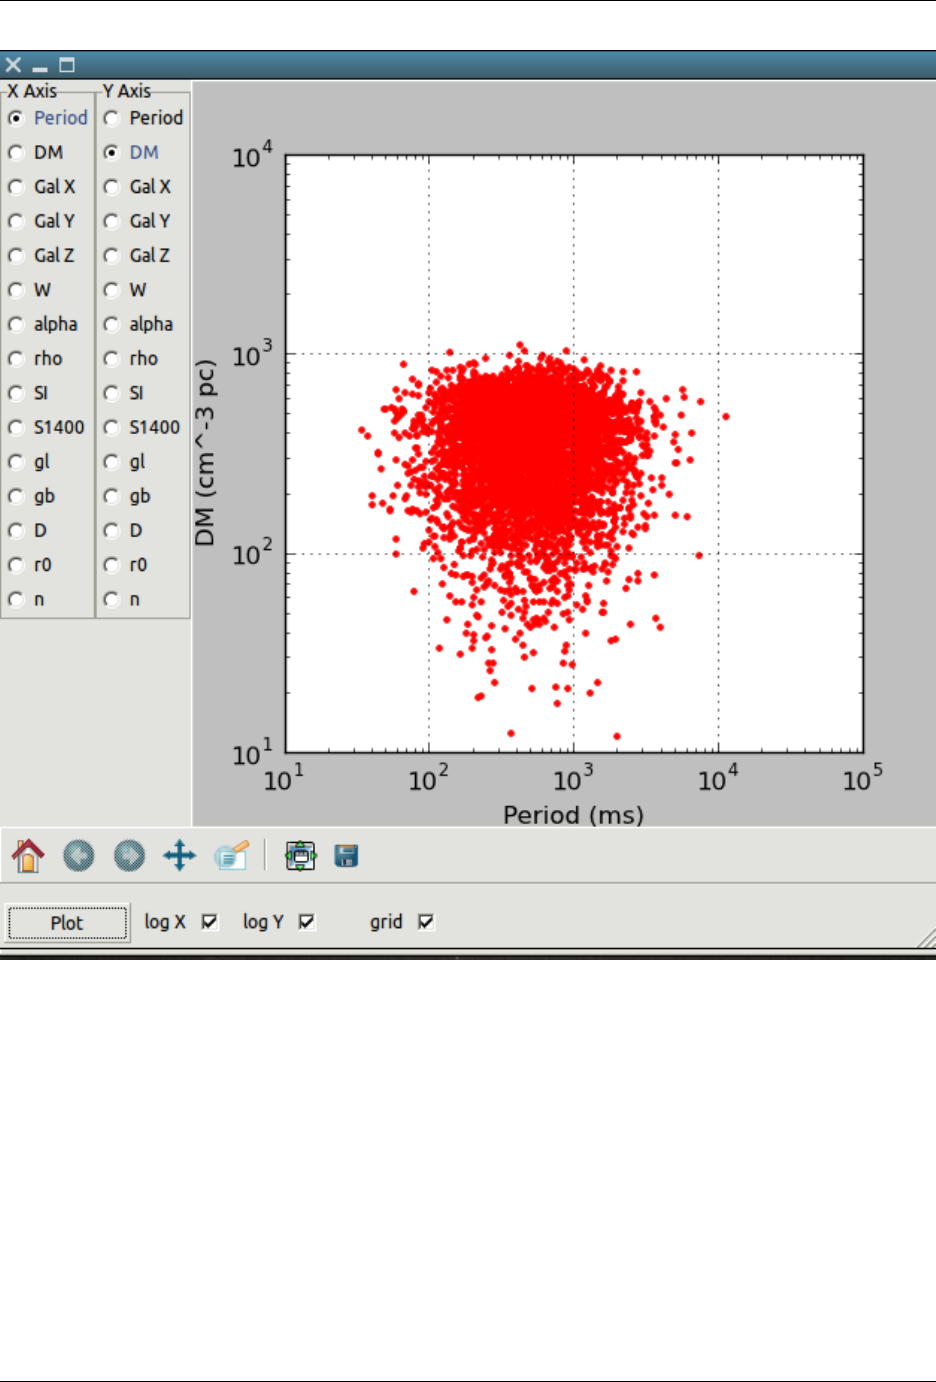
If you have the wxPython plugin working (seems on newer macs this is a non-trivial piece of software to install —
using macports is recommended) then use wxView.py to create scatter plots of various parameters (see screenshot
below).
10 Chapter 4. Tutorial - Basic Usage
PsrPopPy Documentation, Release 1
4.3. Visualising a Pulsar Model 11

PsrPopPy Documentation, Release 1
12 Chapter 4. Tutorial - Basic Usage

CHAPTER
FIVE
MODULE-LEVEL DOCUMENTATION
5.1 pulsar – Creates/stores a pulsar object
class pulsar.Pulsar
Pulsar.__init__([period,dm,gl,gb,galCoords,r0,dtrue,lum_1400,spindex,alpha,rho,width_degree,
snr,beaming,scindex,gpsFlag,gpsA,brokenFlag,brokenSI ])
Initialise the pulsar object
Pulsar.s_1400()
Returns the flux at 1400 MHz, calculated as
S1400 =L1400
D2
true
Pulsar.width_ms()
Returns the pulse width in milliseconds, calculated as
Wms =Pms ×Wdegree/360
5.2 population – Creates/stores a population
class population.Population
Population.__init__([pDistType,radialDistType,lumDistType,pmean,psigma,simean,sisigma,lum-
mean,lumsigma,zscale,electronModel,gpsFrac,gpsA,brokenFrac,brokenSI,
ref_freq ])
Initialise the population object
Population.__str__()
Defines how the operation print Population is performed
Population.size()
Returns the number of pulsars in the population object
Population.join(poplist)
Joins each of the populations in list poplist to the current population
Population.write(outf )
Uses cPickle to dump the population to file outf
Population.write_asc(outf )
Writes the population to an ascii file in the old psrpop way
13

PsrPopPy Documentation, Release 1
5.3 survey – Read a survey file into a survey object
class survey.Survey
Survey.__init__(surveyName)
Read in a (correctly formatted!) survey file
Survey.__str__()
Define how to perform print Survey
Survey.nchans()
Returns the number of channels, calculated as
nchans =BWtotal
BMchan
Survey.inRegion(pulsar)
Determines if Pulsar is inside survey region. Returns True or False accordingly
Survey.inPointing(pulsar)
Determines if Pulsar is inside one of the survey’s pointings. Returns the offset from beam centre to the
pulsar.
Survey.SNRcalc(pulsar,pop)
Calculates the SNR of a Pulsar from Population pop in the survey. Returns -1 if pulse is smeared, and -2
if pulsar is outside survey region. SNR is calculated (with familiar terms) as
SNR = S1400 G√npol BW τ
βTtot q1−δ
δη
where
η= exp(−2.7727 ×offset2/fwhm2)
class survey.Pointing
Pointing.__init__(coord1,coord2,coordtype)
Converts (coord1, coord2) into correctly formatted (l, b). Coordtype must be either eq or gal. If eq, the RA
and Dec are converted internally
5.4 populate – Create a population object
class populate.Populate
Populate.generate(ngen[,surveyList,pDistType,radialDistType,electronModel,pDistPars,siDistPars,
lumDistType,lumDistPars,zscale,duty,scindex,gpsArgs,doubleSpec,nostdout ])
The method called by the populate.py command-line-script
Populate.write(outf=populate.model)
Writes the Population model into file outf as a cPickle dump
5.5 radialmodels – Container for radial distn models
class radialmodels.RadialModels
radialmodels.seed()
Call the FORTRAN routine to make a seed
radialmodels.slabdist()
Pick a point from a “slab” distribution around the Galactic plane
14 Chapter 5. Module-level Documentation

PsrPopPy Documentation, Release 1
radialmodels.diskdist()
Pick a point from a distribution purely along the Galactic plane
radialmodels.lfl06()
Pick a point from the Lorimer et al (2006) Galactic distribution
radialmodels.ykr()
Pick a point from the Yusifov & Kucuk Galactic distribution
5.6 galacticops – Container for functions relating to the Galaxy
class radialmodels.GalacticOps
radialmodels.calc_dtrue((x,y,z))
Calculate the distance from the Sun to Galactic coords (x, y, z) (NB. tuple)
radialmodels.calcXY(r0)
Given a Galactic radius r0, choose an (x, y) position at random θ
radialmodels.ne2001_dist_to_dm(dist,gl,gb)
Given a distance and Galactic coordinates, calculate DM according to NE2001
radialmodels.lm98_dist_to_dm(dist,gl,gb)
Given a distance and Galactic coordinates, calculate DM according to lm98
radialmodels.lb_to_radec(gl,gb)
Convert Galactic coordinates to equatorial
radialmodels.ra_dec_to_lb(ra,dec)
Convert equatorial coordinates to Galactic
radialmodels.tsky(gl,gb,freq)
Calculate sky temperature at observing frequency freq and at Galactic coordinates gl, gb according to Haslam
et al
radialmodels.xyz_to_lb((x,y,z))
Convert the tuple (x, y, z) to Galactic sky coordinates.
Returns l, b in degrees
radialmodels.lb_to_xyz(l,b,dist)
Convert Galactic sky coordinates at a distance dist to x,y,z coordinates.
Returns position as a tuple
radialmodels.scatter_bhat(dm,scatterindex,freq_mhz)
Calculate the scatter time according to Bhat et al at. Frequency in MHz, pulsar with dispersion measure dm, and
using a scattering spectral index of scatterindex.
Calculated as
τ=−6.46 + 0.154 log10(dm) + 1.07 log10(dm)2+ scatterindex ×log10(freq_mhz
1000 )
and typically scatterindex = −3.86 (but there is an option to vary it!)
5.6. galacticops – Container for functions relating to the Galaxy 15

PsrPopPy Documentation, Release 1
16 Chapter 5. Module-level Documentation

CHAPTER
SIX
INDICES AND TABLES
•genindex
•modindex
•search
17

PsrPopPy Documentation, Release 1
18 Chapter 6. Indices and tables

INDEX
Symbols
–asc
dosurvey.py command line option, 8
–logx
view.py command line option, 8
–noresults
dosurvey.py command line option, 8
–nostdout
dosurvey.py command line option, 8
populate.py command line option, 7
–summary
dosurvey.py command line option, 8
-dm <Electron model>
populate.py command line option, 7
-doublespec <fraction alpha1>
populate.py command line option, 7
-f <filename>
dosurvey.py command line option, 8
-f <input model>
view.py command line option, 8
-f <model>
visualize.py command line option, 8
-frac <F>
visualize.py command line option, 8
-gps <fraction ’a’>
populate.py command line option, 7
-n <number of pulsars>
populate.py command line option, 7
-o <output>
populate.py command line option, 7
-p <mean stddev>
populate.py command line option, 7
-p <param name>
view.py command line option, 8
-pdist <distribution name>
populate.py command line option, 7
-rdist <radial model>
populate.py command line option, 7
-sc <scatter index>
populate.py command line option, 7
-si <SImean SIsigma>
populate.py command line option, 7
-surveys <SURVEY NAME(S)>
dosurvey.py command line option, 8
populate.py command line option, 7
-w <width>
populate.py command line option, 7
-z <scale height>
populate.py command line option, 7
__init__() (population.Population method), 13
__init__() (pulsar.Pulsar method), 13
__init__() (survey.Pointing method), 14
__init__() (survey.Survey method), 14
__str__() (population.Population method), 13
__str__() (survey.Survey method), 14
C
calc_dtrue() (in module radialmodels), 15
calcXY() (in module radialmodels), 15
D
diskdist() (in module radialmodels), 15
dosurvey.py command line option
–asc, 8
–noresults, 8
–nostdout, 8
–summary, 8
-f <filename>, 8
-surveys <SURVEY NAME(S)>, 8
G
GalacticOps (class in radialmodels), 15
generate() (populate.Populate method), 14
I
inPointing() (survey.Survey method), 14
inRegion() (survey.Survey method), 14
J
join() (population.Population method), 13
19

PsrPopPy Documentation, Release 1
L
lb_to_radec() (in module radialmodels), 15
lb_to_xyz() (in module radialmodels), 15
lfl06() (in module radialmodels), 15
lm98_dist_to_dm() (in module radialmodels), 15
N
nchans() (survey.Survey method), 14
ne2001_dist_to_dm() (in module radialmodels), 15
P
Pointing (class in survey), 14
Populate (class in populate), 14
populate (module), 14
populate.py command line option
–nostdout, 7
-dm <Electron model>, 7
-doublespec <fraction alpha1>, 7
-gps <fraction ’a’>, 7
-n <number of pulsars>, 7
-o <output>, 7
-p <mean stddev>, 7
-pdist <distribution name>, 7
-rdist <radial model>, 7
-sc <scatter index>, 7
-si <SImean SIsigma>, 7
-surveys <SURVEY NAME(S)>, 7
-w <width>, 7
-z <scale height>, 7
Population (class in population), 13
population (module), 13
Pulsar (class in pulsar), 13
pulsar (module), 13
R
ra_dec_to_lb() (in module radialmodels), 15
RadialModels (class in radialmodels), 14
radialmodels (module), 14
S
s_1400() (pulsar.Pulsar method), 13
scatter_bhat() (in module radialmodels), 15
seed() (in module radialmodels), 14
size() (population.Population method), 13
slabdist() (in module radialmodels), 14
SNRcalc() (survey.Survey method), 14
Survey (class in survey), 14
survey (module), 14
T
tsky() (in module radialmodels), 15
V
view.py command line option
–logx, 8
-f <input model>, 8
-p <param name>, 8
visualize.py command line option
-f <model>, 8
-frac <F>, 8
W
width_ms() (pulsar.Pulsar method), 13
write() (populate.Populate method), 14
write() (population.Population method), 13
write_asc() (population.Population method), 13
X
xyz_to_lb() (in module radialmodels), 15
Y
ykr() (in module radialmodels), 15
20 Index
