Manual
User Manual:
Open the PDF directly: View PDF ![]() .
.
Page Count: 26
Contents
1 Introduction 6
2 Installation of R 7
2.1 Brief introduction to R . . . . . . . . . . . . . . . . . . . . . . . . 7
2.2 InstallingR.............................. 7
2.3 RunningR .............................. 7
3 Installation of RClimDex 8
4 RClimDex 8
4.1 Getting started on RClimDex . . . . . . . . . . . . . . . . . . . . 8
4.2 Quality control . . . . . . . . . . . . . . . . . . . . . . . . . . . . 9
4.2.1 Description of RClimDex quality control procedures . . . 9
4.2.2 Loading datasets for quality control . . . . . . . . . . . . 10
4.2.3 Quality control main menu and parameters . . . . . . . . 10
4.2.4 Quality control results and plots . . . . . . . . . . . . . . 12
4.3 Indices calculation . . . . . . . . . . . . . . . . . . . . . . . . . . 13
4.3.1 Loading data files for indices calculation . . . . . . . . . . 13
4.3.2 Indices calculation main menu and parameters . . . . . . 14
Appendix A List of ETCCDI core Climate Indices 17
Appendix B Data format 19
Appendix C Indices definition 20
Appendix D Threshold estimation and base period temperature
indices calculation 25
D.1 Empirical quantile estimation . . . . . . . . . . . . . . . . . . . . 25
D.2 Bootstrap procedure for the estimation of exceedance rate for the
baseperiod .............................. 25
2
Acknowledgements to version 1
The initial version of RClimDex was developed by Xuebin Zhang and Yang
Feng at the Climate Research Branch of Meteorological Service of Canada. Its
initial development was funded by the Canadian International Development
Agency through the Canada China Climate Change Cooperation (C5) Project.
Lisa Alexander, Francis Zwiers, Byron Gleason, David Stephenson, Albert Klan
Tank, Mark New, Lucie Vincent, and Tom Peterson made important contribu-
tions to the development and testing of the package. Jose Luis Santos at CIIFEN
helped to translate this document into Spanish. Earlier versions of RClimDex
have been used during CCl/CLIVAR ETCCDI workshops in Cape Town, South
Africa, May 31-June 4, 2004, and in Maceio, Brazil, August 9-14, 2004. The
lectures and attendees of the workshops provided very valuable suggestions for
the improvement of RClimDex.
Acknowledgements to version 2
The version 2 of RClimDex was developed by Xuebin Zhang, Yang Feng and
Rodney Chan at the Climate Research Division of Environment Canada. The
new version of RClimDex is made possible by Pacific Climate Impacts Consor-
tium and their climdex.pcic package. All indices calculation now depends on the
fast and well tested implemention of ClimDex from the climdex.pcic package.
3
Release notes
Major changes in version 2:
1. Indices calculation replaced by climdex.pcic from RClimDex
2. Batch processing support
3. UX overhaul
Changelog
2.0:
Release version.
Updated manual.
Removed outlier checking for precipition upper limit in quality control.
1.9-1:
Fix bug where indices calculation crashed when only one variable is present.
(the others are all NAs)
1.9:
If base period contains years at the start or end with all missing values, the base
period will be shorten accordingly.
Longitude and Latitude are replaced by Northern Hemisphere and Southern
Hemisphere to better reflect the parameter.
Fix bug where selecting a different output directory than the input data file will
sometimes result in an error. (’/’ syntax issue)
Fix bug where outliers are set against tmax or tmin even if they are purposely
not provided. (all missing values)
NA mask rules are implemented in climdex.pcic instead of RClimDex.
Updated manual to reflect UX change for station selection.
1.8-2:
Edits to FD0,SU25,TR20,ID0 to FD,SU,TR,ID to be more consistent.
1.8-1:
Made some minor edits to vignettes in terms of spelling, grammer and structure.
1.8:
Change the version numbering from 0.1-8 ->1.8.
Remove support for LS trend and plots for indices calculation.
Updated dependency from climdex.pcic version 1.1-1 to 1.1-6
Updated function calls from RClimDex to climdex.pcic for version 1.1-6 from
version 0.7-2
Fix bug where repeated indices calculation with multiple files will skip the first
file.
Fix bug where ”indcal” will appear in the names of output files from the first
dataset when processing multiple files.
4
0.1-7:
Vignettes is added to package.
Manual has been updated with more details.
Startup message has been added for clearer instruction.
Check for precipitation exceeding upper limit.
Output indices plot as pdf instead of jpg.
Change quality control rules to allow some datasets to be flagged but not dis-
rupted from processing.
Log messages are updated to be more natural.
Fix bug in multiple dataset where parameters are changed due to data quality,
the changed will revert back after that file instead of remaining for the rest of
the files.
Fix bug in leap days being NA instead of being repeated of 28th February.
0.1-6:
Datasets are padded with NA to ensure the datasets filled up a whole year.
0.1-5:
Change NA mask rules to 15 NA threshold for annual and 3 NA threshold for
monthly.
Fix bug where any NA in values resulted in invalid dates.
Fix bug where NA mask was not apply to TMAXmean and TMINmean.
Updated RX5day, RX1day. There were issues in old RClimdex NA mask.
Updated missing marker to accept character values.
Updated thresholds such that some indices calculation are skiped when there
are too many NA.
0.1-4:
Initial pacakage version - UX overhaul, batch processing support, indices calcu-
lation replaced by climdex.pcic from RClimDex.
Updated GSL. There were issues in counting one less day in old RClimdex.
(missing +1)
Updated TNn. There were issues with January, even one NA will trigger NA
for that month. (missing na.rm=T)
5
1 Introduction
ClimDex is a Microsoft Excel based program that provides an easy-to-use soft-
ware package for the calculation of indices of climate extremes for monitor-
ing and detecting climate change. It was developed by Byron Gleason at
the National Climate Data Centre (NCDC) of NOAA, and has been used in
CCl/CLIVAR workshops on climate indices from 2001.
The original objective was to port ClimDex into an environment that does not
depend on a particular operating system. It was very natural to use Ras our
platform, since Ris a free and yet very robust and powerful software for statisti-
cal analysis and graphics. It runs under both Windows and Unix environments.
In 2003 it was discovered that the method used for computing percentile-based
temperature indices in ClimDex and other programs resulted in inhomogeneity
in the indices series. A fix to the problem requires a bootstrap procedure that
makes it almost impossible to implement in an Excel environment. This has
made it more urgent to develop the Rbased package.
RClimDex is designed to provide a user friendly interface to compute indices
of climate extremes. It computes all 27 core indices recommended by the
CCl/CLIVAR Expert Team for Climate Change Detection Monitoring and In-
dices (ETCCDI) as well as some other temperature and precipitation indices
with user defined thresholds. The 27 core indices include almost all the in-
dices calculated by ClimDex (Version 1.3). This version of RClimDex has been
developed under R2.15.2. It also depends on the Rlibrary of climdex.pcic
(Version 1.1-6) and PCICt (Version 0.5-4) for computing the 27 core indices as
well as the Rlibrary of Tcl/Tk (Version 2.15.2) for the graphical user inter-
face. This RClimDex package should run with R2.15.2 or a later version. The
depended Rlibraries are available from the official CRAN website and needs
to be downloaded and installed before the installation of the RClimDex package.
A main objective of constructing climate extremes indices is to use for climate
change monitoring and detection studies. This requires that the indices be
homogenized. Data homogenization has been planned but is not implemented
in this release. Current RClimDex only includes a simple data quality control
procedure that was provided in ClimDex. As in ClimDex, we require that data
are quality controlled before the indices can be computed. This manual provides
step-by-step instructions on the following.
1. The installation of Rand setting up the user environment
2. Quality control of daily climate data
3. Calculation of the 27 core indices
6
2 Installation of R
2.1 Brief introduction to R
Ris a language and environment for statistical computing and graphics. It is
a GNU implementation of the S language developed by John Chambers and
colleagues at Bell Laboratories (formerly AT&T, now Lucent Technologies). S-
plus provides a commercial implementation of the S language.
2.2 Installing R
RClimDex requires the base package of R(Version 2.15.2 or later). The instal-
lation of Rinvolves a very simple procedure. First, connect to the Rproject
website at www.r-project.org, then follow the links to download the most recent
version of Rfor your computer operating system from any mirror site of CRAN.
For Microsoft Windows XP and later, download the base RWindows installer.
Run that installer and Rwill be automatically installed on your computer, with
a shortcut to Ron your desktop. The Tcl/Tk library is included in the default
installation of R.
For Linux, download the proper precompiled binaries and follow the instruction
to install R. For other UNIX systems, you may need to download the source
code and compile it yourself.
For Mac OSX 10.9 (Mavericks) and above, download the latest version of the
Rsigned package. Validate the signature using pkgutil for example –check-
signature R-3.2.1.pkg in the Terminal. Run the Rsigned package to install.
Select custom install during installtion to enable Tcl/Tk library. Connect to
XQuartz website at xquartz.macosforge.org to use X11 which is required for the
graphical user interface of RClimDex. Download the latest XQuartz image and
install. There is now an R app in Lauchpad.
For Mac OSX 10.5 (Leopard) to 10.8 (Mountain Lion), download the last sup-
ported legacy version of the Rsigned package of the corresponding Mac OSX
version. Validate the signature by checking the MD5 checksum with the website.
For example to check the MD5 checksum type in md5 R-3.2.1.pkg in the Ter-
minal application. Run the Rsigned package to install and during installation
select custom install to enable Tcl/Tk library. Ris now installed and in the
Application folder. For Mac OSX 10.8 (Mountain Lion), connect to XQuartz
website at xquartz.macosforge.org to use X11 which is required for the graphical
user interface of RClimDex. Download the latest XQuartz image and install.
2.3 Running R
For Windows, double click the Ricon on your desktop, or launch it through
Windows Start Menu. This usually gets you into the Ruser interface. R64bit
will also be installed if your system supports 64bit. It is recommended to use
R64bit if your system is 64bit. You may quit the program by clicking on the
7
top menu under File then Exit.
Under Linux, just run the command Rto give you the Rconsole. You may quit
by typing in the command q().
Under OSX, click on the Rapp in Lauchpad, or double click the Ricon in your
Application folder. This usually gets you into the Ruser interface. You may
quit the program by clicking on the top menu under Rthen Quit R.
3 Installation of RClimDex
RClimDex is now an Rpackage. Most recent version of RClimDex is avaliable
from the ETCCDI website at http://etccdi.pacificclimate.org/software.shtml,
where registration is required. Please install RClimDex as a local package in
R. RClimDex now depends on the climdex.pcic. With an internet connection,
launch Rin the same directory as the RClimDex package. Then run the follow-
ing commands:
install.packages("climdex.pcic")
install.packages("RClimDex_1.9-1.tar.gz", repos=NULL, type="source")
Select a CRAN mirror to install or update the Rpackage of climdex.pcic then
run the other command to install RClimDex.
RClimDex has been developed under R2.15.2. This version of RClimDex de-
pends on the Rlibrary of climdex.pcic (Version 1.1-6) and PCICt (Version
0.5-4) for computing the 27 core indices as well as the Rlibrary of Tcl/Tk (Ver-
sion 2.15.2) for the graphical user interface. The depended Rlibraries will be
downloaded and installed automatically during the installation of the RClimDex
package.
For Windows, you may change the current Rworking directory by clicking on
the top menu under File then Change dir..., afterwards select the directory
where you store the RClimDex package before installing.
Under OSX, please click on the top menu under Misc then Change Working Di-
rectory... to change the current Rworking directory. Please select the directory
where RClimDex package is stored before installing.
4 RClimDex
4.1 Getting started on RClimDex
RClimDex can be loaded like any other Rpackages. All dependent libraries will
also be loaded. Please type in the following into the Rconsole:
library("RClimDex")
8
In order to launch RClimDex user interface and to begin using RClimdex, simply
type in the following into the Rconsole.
rclimdex.start()
You may type in the command into the Rconsole again to relaunch the user
interface. RClimDex is not programmed to support concurrent sessions within
the same Rconsole, therefore please launch one user interface at a time.
Alternatively you may launch another seperate Rconsole in another window for
an additional session of RClimDex. Please note that RClimDex only supports
one current session per Rconsole.
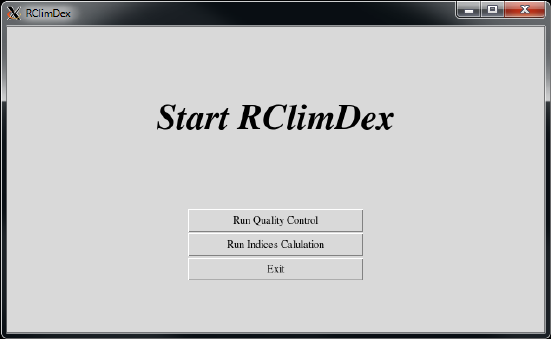
Figure 1: RClimDex main menu.
4.2 Quality control
4.2.1 Description of RClimDex quality control procedures
We highly recommend to executing the quality control step of RClimDex before
proceeding to indices calculation. Simply press the Run Quality Control button
to begin as shown in Figure 1. Data quality control consists of the following
procedures.
1. Replace all user-defined missing values, with default as -99.9, into NA
(internal R missing value).
2. Replace all unreasonable values into NA. If any of the following cases
occurs, it usuaully means there is a significant issue in the dataset and
require user to review. Please review the log subdirectory after quality
control is completed.
(a) Daily precipitation value less than zero millimeter.
(b) Daily maximum temperature less than daily minimum temperature.
9
(c) Daily temperature values greater than 70 degree Celsius or less than
-70 degree Celsius.
(d) Leap days. (i.e. 29th February)
(e) All values corresponding to an impossible date. (i.e. 32nd March
2013, 12th June 20AA, etc.)
(f) Any non-numeric values.
3. Identifies outliers of daily temperature values outside of user-defined re-
gion, with default as values further than 3 times standard deviation from
the mean value for that calendar day. Users can define other multiples of
standard deviation away from mean. Note that the outliers are most often
valid values.
4.2.2 Loading datasets for quality control
In the File Open Window, you may select the dataset to execute the quality
control of RClimDex. You may need to change directory to where the dataset
is stored. RClimDex expects file extension of either .csv or .txt however you
may display files of all types by selecting ALL files in the Files of type drop-
down menu (See Figure 2). Please note that the dataset must be formatted as
described in Appendix B.
Windows and Linux users may press and hold shift key or crtl key (OSX users
may use cmd key) to select multiple datasets. When multiple datasets are
selected, RClimDex would perform quality control based on the same parameters
selected on the quality control menu to all datasets in sequence. The output
filenames of multiple datasets correspond with their filenames respectively and
cannot be changed.
4.2.3 Quality control main menu and parameters
The following is a brief descripition to each parameter as shown in Figure 3.
1. Output file location: The local directory where RClimDex will store the
output files from quality control.
2. Station name or code: Output filename prefix. (Only available when
processing only one dataset)
3. Number of standard deviation for temperature: The threshold for outliers
from daily record. Any daily temperature values away from mean in terms
of standard deviation for that particular calendar day above threshold will
be flagged as outlier in the log file.
4. Missing marker: Character string as the indicator for missing values in
input dataset.
The output file location is where all outputs from RClimDex will be stored.
After a successful quality control execution, you will find a csv file ending with
a suffix of .indcal.csv, which is the post quality controlled dataset. Please select
this dataset instead of your original dataset for the indices calculation. In addi-
tion, there is a log file in txt format with details about the quality control a log
10
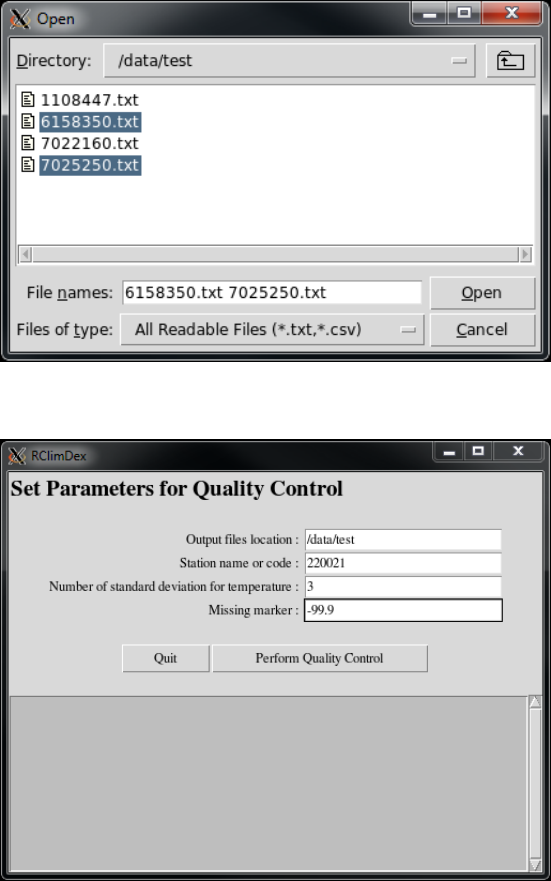
Figure 2: File selection for quality control.
Figure 3: Quality control menu of RClimDex.
11
subdirectory that contains plots and statistics about the quality control. Lastly,
there are the indices subdirectory which would be where the indices calculation
outputs be stored. If you are only executing quality control on one dataset, you
may rename the output filename.
The other parameters relates to the actual quality control. They are the outlier
settings in terms of standard devation away from mean value, an upper limit
for precipitation values in millimeters and the missing marker. Please note that
the default missing marker of -99.9 will always be used in addition to your user-
defined missing marker.
Press the Perform Quality Control button to begin quality control and press
the Quit button to exit to main menu. Also note that quality control will not
automatically quit after completion. If you desire to perform indices calculation
on the post quality controlled dataset, simply press the Quit button to go back
to the main menu then press the Run Indices Calculation button on the main
menu.
Under the buttons, there are log messages in which RClimDex communicates
with the user. It will provide details for current status, including but not limited
to which file is loaded, what process is being executed, was the quality control
successfully performed and number of files remaining to processs.
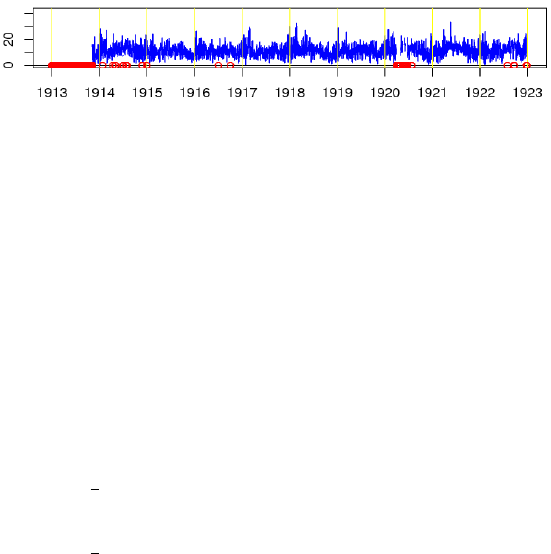
4.2.4 Quality control results and plots
Figure 4: A sample plot from quality control. Red circle indicates values were
flagged by quality control.
Please note that while unreasonable values are removed, other problematic data
like outliers are simply flagged in a log file and are not changed. They simply
alert the user to pay more attention and make correction only if needed.
Besides the main results of post quality controlled dataset, there are a few more
outputs from quality control of RClimDex. All of these outputs are in the log
subdirectory. Please review these log files for a better understanding of the
changes quality control made to the dataset.
(a) filename.indcal.csv; The post quality control data file.
(b) log.datestamp.timestamp.txt; Detail log from RClimDex.
(c) log/filename prcpPLOT.pdf; Plot of daily precipitation values and his-
togram of precipitation values.
(d) log/filename tmaxPLOT.pdf; Plot of daily maximum temperature values.
12

(e) log/filename tminPLOT.pdf; Plot of daily minimum temperature values.
(f) log/filename dtrPLOT.pdf; Plot of daily diurnal temperature range val-
ues.
(g) log/filename prcpQC.csv; Table of all daily precipitation values that were
flagged and removed.
(h) log/filename tmaxQC.csv; Table of all daily maximum temperature values
that were flagged and removed.
(i) log/filename tminQC.csv; Table of all daily minimum temperature values
that were flagged and removed.
(j) log/filename tepstdQC.csv; Table of all outlier temperature values that
were only flagged.
(k) log/filename nastatistic.csv; Summary table of the annual and monthly
sums of values flagged and removed.
For the outlier tables, there are twelve columns. Three columns each for date,
daily maximum temperature, daily minimum temperature and diurnal tempera-
ture range. For all temperature columns, there are the lower bound of accepted
values, the temperature value of that day and the upper bound of accepted
values. The boundaries for outliers are user-defined by the number of standard
deviation away from mean. A record is added to the outlier table if any outlier
temperature values are flagged for that day.
All plots in quality control provide a quick visual understanding of where values
are flagged. As seen in Figure 4, the red circles in the plots are where values
are flagged. For daily precipitation values, a histogram is provided as well.
4.3 Indices calculation
4.3.1 Loading data files for indices calculation
In the File Open Window, you may select the dataset from which indices are
calculated. You may need to change directory to where the quality controlled
dataset is stored. RClimDex expects file extension of .indcal.csv, which a post
RClimDex quality controlled dataset. You may also display files of all types by
selecting ALL files in the Files of type dropdown menu and select files that are in
the format as described in Appendix B. Please note that we highly recommend
users to first go through quality control of RClimDex prior to indices calculation.
User may want to check and review the values flagged by the RClimDex quality
control prior to indices calculation. You may make changes to the post qual-
ity controlled dataset (.indcal.csv file) by a spreadsheet editor such as Excel or
Numbers in Windows and OSX or any text editor in Linux.
Windows and Linux users may press and hold shift key or crtl key (OSX users
may use cmd key) to select multiple files. When multiple data files are selected,
RClimDex would perform indices calculation based on the same parameters
13
and indices selected on the indices calculation menu to all selected datasets in
sequence. The output filenames of multiple files corresponds with their original
filenames respectively and can not be changed.
4.3.2 Indices calculation main menu and parameters
The following is a brief descripition to each parameter as shown in Figure 6.
1. Output file location: The local directory where RClimDex will store the
output files from indices calculation.
2. Station name or code: Output filename prefix. (Only available when
processing only one dataset)
3. Missing marker: Character string as the indicator for missing values in
input dataset.
4. Base period: The base period usually is a long enough period preferably
more than 10 years in which climatology do not change much for a given
station.
(a) First year: Starting year of base period. (Always begin on 1st of
January)
(b) Last year: Ending year of base period. (Always end on 31st of De-
cember)
5. Station location: It will affect indices such as CSDI and GSL based on the
hemisphere the station is located. Please select datasets from the same
hemisphere when processing multiple dateset. Station location only have
options to select between Northern Hemisphere or Southern Hemisphere.
6. Threshold of daily maximum temperature:
(a) Upper: User defined threshold for summer days, similar to SU.
(b) Lower: User defined threshold for ice days, similar to ID.
7. Threshold of daily minimum temperature:
(a) Upper: User defined threshold for tropical nights, similar to TR.
(b) Lower: User defined threshold for frost days, similar to FD.
8. Threshold of precipitation (mm): User defined total counts of daily pre-
cipitation above the user defined threshold, similar to R10 and R20.
9. Indices selections: Please refer to Appendix A for more information and
full definition can be found in Appendix C.
The output files location is where all outputs from RClimDex will be stored.
There is a log file in txt format about the indices calculation. There are also
the indices subdirectory which would be where the indices calculation outputs
be stored. You may only rename the output filename if you are not processing
multiple dataset. The current version of RClimDex does not support different
indices calculation selection for each individual dataset when processing multi-
ple dataset. In other words, only the indices selected are calculated for multiple
14
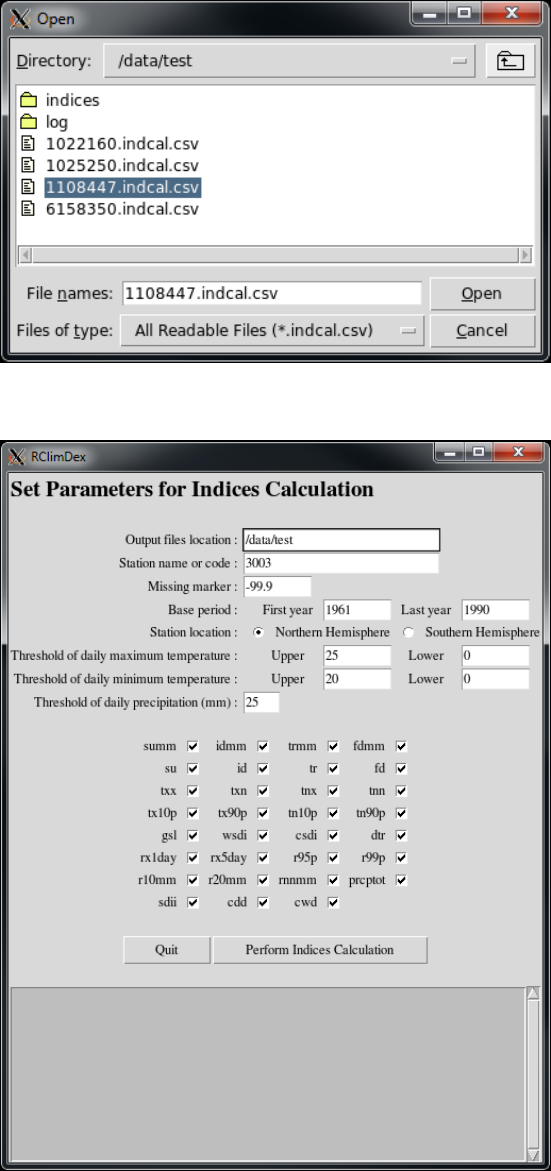
Figure 5: File selection for indices calculation.
Figure 6: Indices calculation menu of RClimDex.
15
dataset. Please note that the default missing marker of -99.9 will always be
used in addition to your user-defined missing marker.
The base period always begin from the 1st of January and ends on the 31st of De-
cember of the user defined period. RClimDex determines the hemisphere from
the station location with radio button for Northern or Southern Hemisphere.
Keep in mind to have all datasets from the same hemisphere when processing
multiple datasets because RClimDex assumes same parameters when process-
ing multiple datasets which includes the hemisphere. The threshold values for
temperature are for user-defined frost days, summer days, ice days and tropical
nights, where precipitation threshold is for user defined number of days with
daily precipitation values above threshold.
Each index can be individually selected to be or not to be calculated for the
datasets. More information about the indices can be found in Appendix A and
full definition can be found in Appendix C. Press the Perform Indices Calcu-
lation button to begin and press the Quit button to exit to main menu. Also
note that indices calcualtion will not automatically quit after completion.
RClimDex communicates with the user in the log message box below the but-
tons. This is where details about the current status, such as which dataset is
loaded, what process is being performed, number of datasets remaining, etc. are
displayed.
16
A List of ETCCDI core Climate Indices
ID Indicator name Definitions Units
FD Frost days Annual count when TN(daily minimum) <
0 C
days
SU Summer days Annual count when TX(daily maximum)
>25 C
days
ID Ice days Annual count when TX(daily maximum)
<0 C
days
TR Tropical nights Annual count when TN(daily minimum) >
20 C
days
GSL Growing season
length
Annual (1st Jan to 31st Dec in NH, 1st
July to 30th June in SH) count between
first span of at least 6 days with TG >5 C
and first span after 1st July (1st January
in SH) of 6 days with TG <5 C
days
TXx Max Tmax Monthly maximum value of daily maxi-
mum temp
C
TNx Max Tmin Monthly maximum value of daily minimum
temp
C
TXn Min Tmax Monthly minimum value of daily maximum
temp
C
TNn Min Tmin Monthly minimum value of daily minimum
temp
C
TN10p Cool nights Percentage of days when TN <10th per-
centile
%
TX10p Cool days Percentage of days when TX <10th per-
centile
%
TN90p Warm nights Percentage of days when TN >90th per-
centile
%
TX90p Warm days Percentage of days when TX >90th per-
centile
%
17

ID Indicator name Definitions Units
WSDI Warm spell dura-
tion indicator
Annual count of days with at least 6 con-
secutive days when TX>90th percentile
days
CSDI Cold spell duration
indicator
Annual count of days with at least 6 con-
secutive days when TN<10th percentile
days
DTR Diurnal tempera-
ture range
Monthly mean difference between TX and
TN
C
RX1day Max 1-day precipi-
tation amount
Monthly maximum 1-day precipitation mm
RX5day Max 5-day precipi-
tation amount
Monthly maximum consecutive 5-day pre-
cipitation
mm
SDII Simple daily inten-
sity index
Annual total precipitation divided by the
number of wet days (defined as PRCP >=
1.0mm) in the year
mm/day
R10 Number of heavy
precipitation days
Annual count of days when PRCP >=
10mm
days
R20 Number of very
heavy precipitation
days
Annual count of days when PRCP >=
20mm
days
Rnn Number of days
above nn mm
Annual count of days when PRCP >= nn
mm, nn is user defined threshold
days
CDD Consecutive dry
days
Maximum number of consecutive days with
RR <1mm
days
CWD Consecutive wet
days
Maximum number of consecutive days with
RR >= 1mm
days
R95p Very wet days Annual total PRCP when RR >95th per-
centile
mm
R99p Extremely wet days Annual total PRCP when RR >99th per-
centile
mm
PRCPTOT Annual total wet-
day precipitation
Annual total PRCP in wet days (RR >=
1mm)
mm
18

B Data format
All indices calculation are outputted as comma-separated values (CSV) files for
tables and portable document format (PDF) files for all plots. RClimDex like-
wise accepts CSV files as input data. RClimDex also accepts space-delimited
ASCII text file as input data. Space-delimited format has each element sep-
arated by one or more spaces. The input dataset must satisfy the following
requirements.
1. The input dataset must have the file extension .csv or .txt
2. Columns must be YEAR MONTH DAY PRCP TMAX TMIN in that
order
3. The records must be in calendar date order. Missing dates are allowed.
This is an example of an input dataset as a space-delimited ASCII file.
1950 2 3 -99.9 -3.1 -6.8
1950 2 4 0 -1.3 -3.6
1950 2 5 0 -0.5 -7.9
1950 2 6 11.4 -1 -9.1
1950 2 9 0 -1.8 -8.4
This is an example of an input dataset as a CSV file.
1950,2,3,-99.9,-3.1,-6.8
1950,2,4,0,-1.3,-3.6
1950,2,5,0,-0.5,-7.9
1950,2,6,11.4,-1,-9.1
1950,2,9,0,-1.8,-8.4
19

C Indices definition
Definitions for indicators are listed in Appendix A. For practical reasons, in
this version of the software, not all indices are calculated on a monthly basis.
Monthly indices are calculated if no more than 3 days are missing in a month,
while annual values are calculated if no more than 15 days are missing in a year.
No annual values will be calculated if any one month’s data are missing. For
threshold indices, a threshold is calculated if at least 75% of data are present.
For spell duration indicators (marked with a *), a spell can continue into the
next year and is counted against the year in which the spell ends.
A cold spell (CSDI) for example in the Northern Hemisphere beginning on 31st
December 2000 and ending on 6th January 2001 is counted towards the total
number of cold spells in 2001.
1. FD
Let T nij be the daily minimum temperature on day iin period j. Count
the number of days where:
T nij <0 C
2. SU
Let T xij be the daily maximum temperature on day iin period j. Count
the number of days where:
T xij >25 C
3. ID
Let T xij be the daily maximum temperature on day iin period j. Count
the number of days where:
T xij <0 C
4. TR
Let T nij be the daily minimum temperature on day iin period j. Count
the number of days where:
T nij >20 C
5. GSL
Let Tij be the daily mean temperature on day iin period j. Count the
number of days between the first occurence of at least 6 consecutive days
with:
Tij >5 C
20

and the first occurence after 1st July (1st January in SH) of at least 6
consecutive days with:
Tij <5 C
6. TXx
Let T xij be the daily maximum temperature in month i, period j. The
maximum daily maximum temperature each month is then:
T Xij =max(T xij )
7. TNx
Let T nij be the daily minimum temperature in month i, period j. The
maximum daily minimum temperature each month is then:
T Nij =max(T nij )
8. TXn
Let T xij be the daily maximum temperature in month i, period j. The
minimum daily maximum temperature each month is then:
T Xij =min(T xij )
9. TNn
Let T nij be the daily minimum temperature in month i, period j. The
minimum daily minimum temperature each month is then:
T Nij =min(T nij )
10. Tn10p
Let T nij be the daily minimum temperature on day i, period jand let
T nin10 be the calendar day 10th percentile centered on a 5-day window
(calculated using method in Appendix D). The percentage of time is de-
termined where:
T nij < T nin10
11. Tx10p
Let T xij be the daily maximum temperature on day i, period jand let
T xin10 be the calendar day 10th percentile centered on a 5-day window
(calculated using method in Appendix D). The percentage of time is de-
termined where:
T xij < T xin10
21

12. Tn90p
Let T nij be the daily minimum temperature on day i, period jand let
T nin90 be the calendar day 90th percentile centered on a 5-day window
(calculated using method in Appendix D). The percentage of time is de-
termined where:
T nij > T nin90
13. Tx90p
Let T xij be the daily maximum temperature on day i, period jand let
T xin90 be the calendar day 90th percentile centered on a 5-day window
(calculated using method in Appendix D). The percentage of time is de-
termined where:
T xij > T xin90
14. WSDI*
Let T xij be the daily maximum temperature on day i, period jand let
T xin90 be the calendar day 90th percentile centered on a 5-day window
(calculated using method in Appendix D). Then the number of days per
period is summed where, in interval, of at least 6 consecutive days:
T xij > T xin90
15. CSDI*
Let T nij be the daily minimum temperature on day i, period jand let
T nin10 be the calendar day 10th percentile centered on a 5-day window
(calculated using method in Appendix D). Then the number of days per
period is summed where, in interval, of at least 6 consecutive days:
T xij > T xin90
16. DTR
Let T xij and T nij be the daily maximum and minimum temperature re-
spectively on day i, period j. If Irepresents the number of days in j, then:
DT R =
I
X
i=1
(T xij −T nij )
I
17. RX1day
Let RRij be the daily precipitation amount on day iin period j. Then
maximum 1-day values for period jare:
22

RX1dayj=max(RRij )
18. RX5day
Let RRkj be the daily precipitation amount for the 5-day interval ending
on day kin period j. Then maximum 5-day values for period jare:
RX5dayj=max(RRkj )
19. SDII
Let RRwj daily precipitation amount on wet days, w(RR ≥1mm), in
period j. If Wrepresents the number of wet days in j, then:
SDIIj=
W
X
w=1
RRwj
W
20. R10
Let RRij be the daily precipitation amount on day iin period j. Count
the number of days where:
RRij ≥10mm
21. R20
Let RRij be the daily precipitation amount on day iin period j. Count
the number of days where:
RRij ≥20mm
22. Rnn
Let RRij be the daily precipitation amount on day iin period j. If nn
represents any reasonable daily precipitation value in millimeters then,
count the number of days where:
RRij ≥nn
23. CDD*
Let RRij be the daily precipitation amount on day iin period j. Count
the largest number of consecutive days where:
RRij <1mm
23
24. CWD*
Let RRij be the daily precipitation amount on day iin period j. Count
the largest number of consecutive days where:
RRij ≥1mm
25. R95p
Let RRwj daily precipitation amount on wet days, w(RR ≥1mm), in
period jand let RRwn95 be the 95th percentile on wet days in the base
period. If Wrepresents the number of wet days in the period, then:
R95pj=
W
X
w=1
RRwj , where RRwj > RRwn95
26. R99p
Let RRwj daily precipitation amount on wet days, w(RR ≥1mm), in
period jand let RRwn99 be the 99th percentile on wet days in the base
period. If Wrepresents the number of wet days in the period, then:
R99pj=
W
X
w=1
RRwj , where RRwj > RRwn99
27. PRCPTOT
Let be the RRij daily precipitation amount on day iin period j. If I
represents the number of wet-days in j, then:
P RCP T OTj=
I
X
i=1
RRij
24
D Threshold estimation and base period tem-
perature indices calculation
D.1 Empirical quantile estimation
The quantile of a distribution is defined as
Q(p) = F−1(p) = inf{x:F(x)≥p},0<p<1
where F(x) is the distribution function. Let {X(a), ..., X(n)}denote the order
statistics of {X1, ..., Xn}(i.e. sorted values of {X}), and let ˆ
Qi(p) denote the
ith sample quantile definition. The sample quantiles can be generally written
as
ˆ
Qi(p) = (1 −γ)X(j)+γX(j+1)
Hyndman and Fan (1996) suggest a formula to obtain medium un-biased es-
timate of the quantile by letting j=int(p×n+ (1 + p)/3) and letting γ=
p×n+ (1 + p)/3−j, where int(u) is the largest integer not greater than u.
The empirical quantile is set to the smallest or largest value in the sample
when j < 1 or j > n respectively. That is, quantile estimates corresponding to
p < 1/(n+1) are set to the smallest value in the sample, and those corresponding
to p > n/(n+ 1) are set to the largest value in the sample.
D.2 Bootstrap procedure for the estimation of exceedance
rate for the base period
It is not possible to make an exact estimate of the thresholds due to sam-
pling uncertainty. To provide temporally consistent estimate of exceedance rate
throughout the base period and out-of-base period, we adapt the following pro-
cedure (Zhang et al. 2004) to estimate exceedance rate for the base period.
(a) The base period is divided into one out-of-base year, the year for which
exceedance is to be estimated, and a base-period consisting the remaining
years from which the thresholds would be estimated.
(b) A n-year block of data is constructed by using the n−1 year base-period
data set and adding an additional year of data from the base-period (i.e.
one of the years in the base-period is repeated). This constructed n-year
block is used to estimate thresholds.
(c) The out-of-base year is then compared with these thresholds and the ex-
ceedance rate for the out-of-base year is obtained.
(d) Steps (b) and (c) are repeated for additional n−2 times, by repeating
each of the remaining n−2 in-base years in turn to construct the n-year
block.
(e) The final index for the out-of-base year is obtained by averaging the n−1
estimates obtained from steps (b), (c) and (d).
25
References
[1] Hyndman, R.J., and Y. Fan, 1996: Sample quantiles in statistical packages.
The American Statistician,50, 361-367.
[2] Zhang, X., G. Hegerl, F.W. Zwiers, and J. Kenyon, 2005: Avoiding inhomo-
geneity in percentile-based indices of temperature extremes. J. Climate,18,
1647-1648.
26
