P5 Manual For Zillow
User Manual:
Open the PDF directly: View PDF ![]() .
.
Page Count: 12


2 | P a g e
INDEX
Topic
Page number
Abstract
3
Usage Manual
4
Requirements
4
Results
5
Plots
7
Note: Suitable links have been provided for additional information wherever necessary in RULES AND
DESCRIPTION.

3 | P a g e
ABSTRACT
Zillow’s Zestimate home valuation has shaken up the U.S. real estate industry since first released 11 years
ago.
A home is often the largest and most expensive purchase a person makes in his or her lifetime. Ensuring
homeowners have a trusted way to monitor this asset is incredibly important. The Zestimate was created
to give consumers as much information as possible about homes and the housing market, marking the
first time consumers had access to this type of home value information at no cost.
“Zestimates” are estimated home values based on 7.5 million statistical and machine learning models that
analyze hundreds of data points on each property. And, by continually improving the median margin of
error (from 14% at the onset to 5% today), Zillow has since become established as one of the largest, most
trusted marketplaces for real estate information in the U.S. and a leading example of impactful machine
learning.
Zillow Prize, a competition with a one million dollar grand prize, is challenging the data science community
to help push the accuracy of the Zestimate even further. Winning algorithms stand to impact the home
values of 110M homes across the U.S.
In this million-dollar competition, participants will develop an algorithm that makes predictions about the
future sale prices of homes. The contest is structured into two rounds, the qualifying round which opens
May 24, 2017 and the private round for the 100 top qualifying teams that opens on Feb 1st, 2018. In the
qualifying round, you’ll be building a model to improve the Zestimate residual error. In the final round,
you’ll build a home valuation algorithm from the ground up, using external data sources to help engineer
new features that give your model an edge over the competition.
Because real estate transaction data is public information, there will be a three-month sales tracking
period after each competition round closes where your predictions will be evaluated against the actual
sale prices of the homes. The final leaderboard won’t be revealed until the close of the sales tracking
period.

4 | P a g e
USAGE MANUAL
INSTRUCTIONS:
Download the code from https://www.kaggle.com/cpvirani/draft-random/notebook or from the zip
folder attached. Unzip it and run the notebook code.
Requirements:
To run the source code, you must have the below software installed in your machine.
Software
Download link
Python 3.5
https://www.python.org/downloads/
sklearn
http://scikit-learn.org/stable/install.html
matplotlib
http://matplotlib.org/downloads.html
numpy
http://www.scipy.org/scipylib/download.html
Pandas
Xgboost
Lightbgm
gc
random
datetime
seaborn

5 | P a g e
Results
XGBoost
Predicting with XGBoost ...
First XGBoost predictions:
0
0 -0.029928
1 -0.021941
2 0.025714
3 0.072211
4 0.010145
Setting up data for XGBoost ...
num_boost_rounds=150
Training XGBoost again ...
Predicting with XGBoost again ...
Second XGBoost predictions:
0
0 -0.084468
1 -0.033246
2 0.017929
3 0.067383
4 0.034122
Combined XGBoost predictions:
0
0 -0.040384
1 -0.024108
2 0.024222
3 0.071285
4 0.014741
63157

6 | P a g e
LightBGM
Start LightGBM prediction ...
Unadjusted LightGBM predictions:
0
0 0.029938
1 0.032608
2 0.010775
3 0.009892
4 0.009784
Combined
Combining XGBoost, LightGBM, and baseline predicitons ...
Combined XGB/LGB/baseline predictions:
0
0 -0.016695
1 -0.004245
2 0.021221
3 0.053898
4 0.014187
Predicting with OLS and combining with XGB/LGB/baseline predicitons: ...
predict... 0
predict... 1
predict... 2
predict... 3
predict... 4
predict... 5
Combined XGB/LGB/baseline/OLS predictions:
ParcelId 201610 201611 201612 201710 201711 201712
0 10754147 -0.0181 -0.0181 -0.0181 -0.0181 -0.0181 -0.0181
1 10759547 -0.0072 -0.0072 -0.0073 -0.0072 -0.0072 -0.0073
2 10843547 0.0749 0.0749 0.0749 0.0749 0.0749 0.0749
3 10859147 0.0526 0.0526 0.0526 0.0526 0.0526 0.0526
4 10879947 0.0156 0.0156 0.0155 0.0156 0.0156 0.0155

7 | P a g e
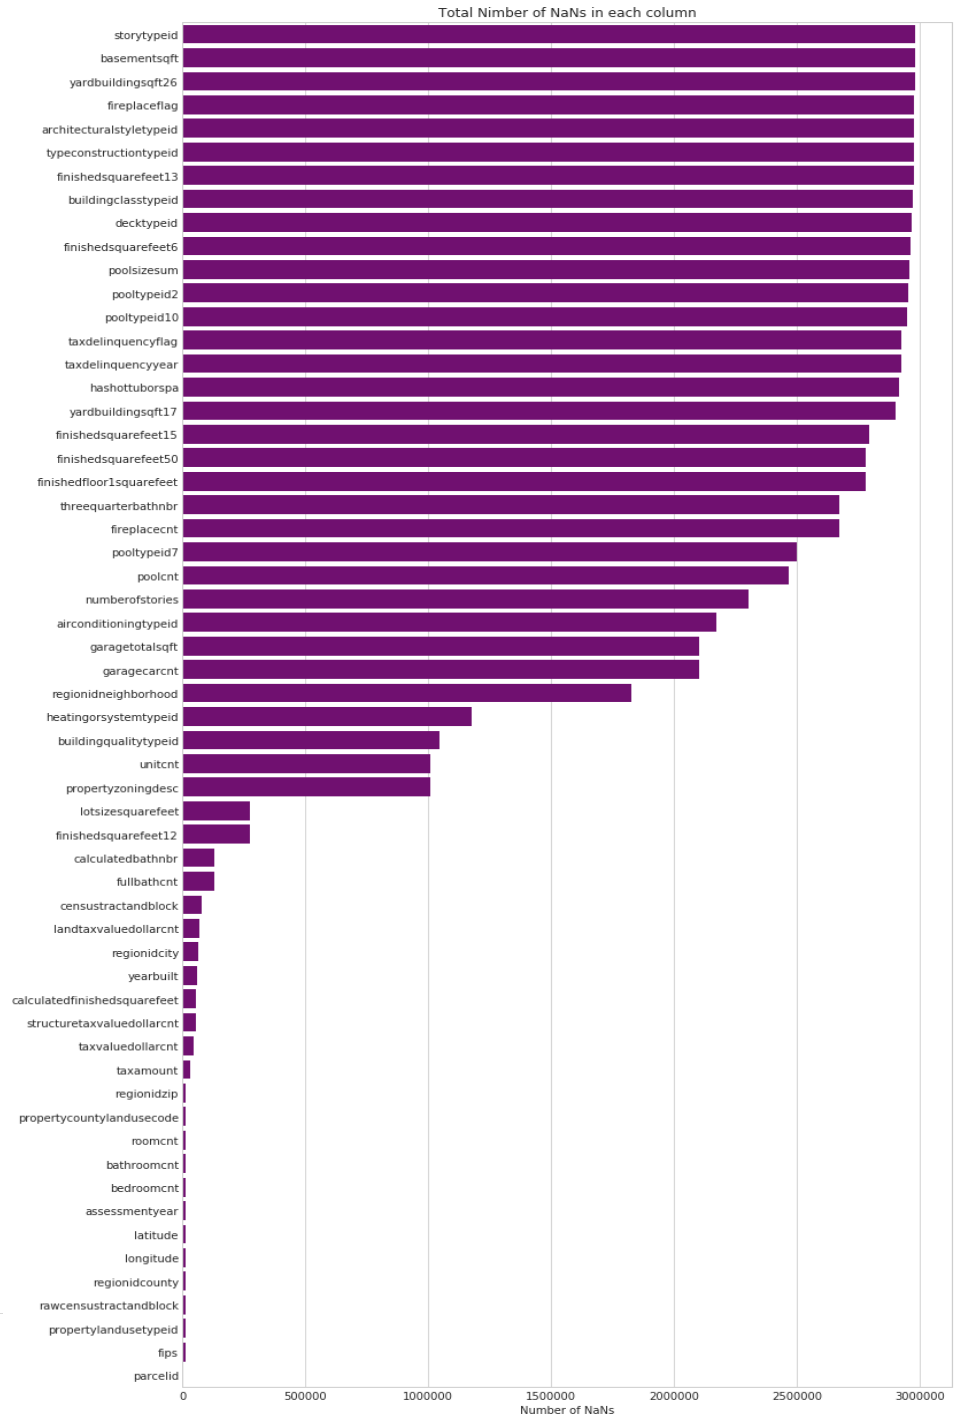
Plot # 1: Total Number of NaN’s in each column
parcelid airconditioningtypeid architecturalstyletypeid basementsqft \
0 10754147 NaN NaN NaN
1 10759547 NaN NaN NaN
2 10843547 NaN NaN NaN
3 10859147 NaN NaN NaN
4 10879947 NaN NaN NaN
bathroomcnt bedroomcnt buildingclasstypeid buildingqualitytypeid \
0 0.0 0.0 NaN NaN
1 0.0 0.0 NaN NaN
2 0.0 0.0 NaN NaN
3 0.0 0.0 3 7
4 0.0 0.0 4 NaN
calculatedbathnbr decktypeid ... numberofstories \
0 NaN NaN ... NaN
1 NaN NaN ... NaN
2 NaN NaN ... NaN
3 NaN NaN ... 1.0
4 NaN NaN ... NaN
fireplaceflag structuretaxvaluedollarcnt taxvaluedollarcnt \
0 NaN NaN 9.0
1 NaN NaN 27516.0
2 NaN 650756.0 1413387.0
3 NaN 571346.0 1156834.0
4 NaN 193796.0 433491.0
assessmentyear landtaxvaluedollarcnt taxamount taxdelinquencyflag \
0 2015.0 9.0 NaN NaN
1 2015.0 27516.0 NaN NaN
2 2015.0 762631.0 20800.37 NaN
3 2015.0 585488.0 14557.57 NaN
4 2015.0 239695.0 5725.17 NaN
taxdelinquencyyear censustractandblock
0 NaN NaN
1 NaN NaN
2 NaN NaN
3 NaN NaN
4 NaN NaN
[5 rows x 58 columns]
8 | P a g e

9 | P a g e
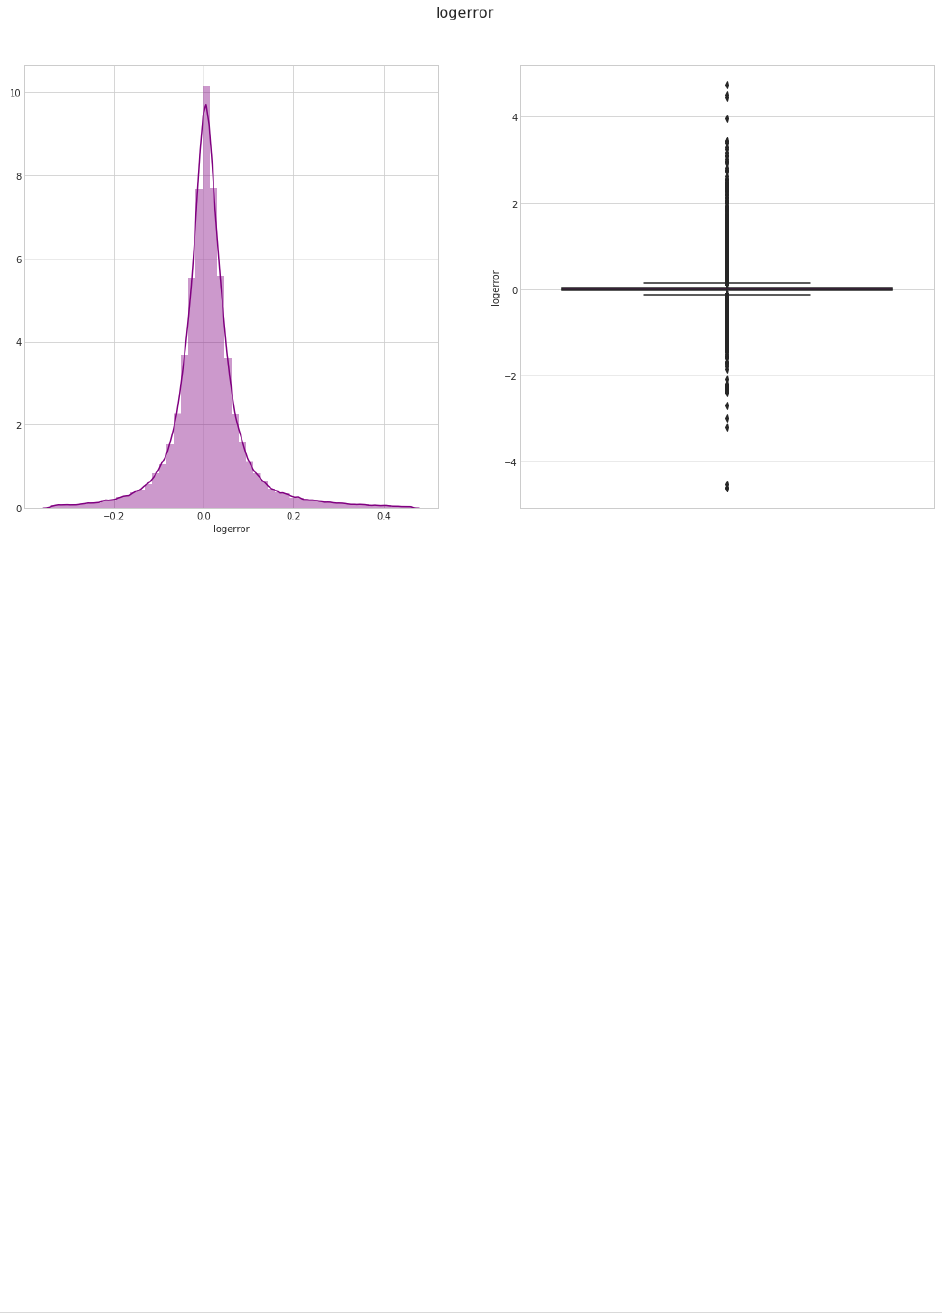
Plot # 2: logerror
Checking logerror
parcelid airconditioningtypeid architecturalstyletypeid basementsqft \
0 17073783 NaN NaN NaN
1 17088994 NaN NaN NaN
2 17100444 NaN NaN NaN
3 17102429 NaN NaN NaN
4 17109604 NaN NaN NaN
bathroomcnt bedroomcnt buildingclasstypeid buildingqualitytypeid \
0 2.5 3.0 NaN NaN
1 1.0 2.0 NaN NaN
2 2.0 3.0 NaN NaN
3 1.5 2.0 NaN NaN
4 2.5 4.0 NaN NaN
calculatedbathnbr decktypeid ... landtaxvaluedollarcnt \
0 2.5 NaN ... 76724.0
1 1.0 NaN ... 95870.0
2 2.0 NaN ... 14234.0
3 1.5 NaN ... 17305.0
4 2.5 NaN ... 277000.0
taxamount taxdelinquencyflag taxdelinquencyyear censustractandblock \
0 2015.06 NaN NaN 61110022003007
1 2581.30 NaN NaN 61110015031002
2 591.64 NaN NaN 61110007011007
3 682.78 NaN NaN 61110008002013
4 5886.92 NaN NaN 61110014021007
logerror transactiondate month day_of_week week_number
0 0.0953 2016-01-27 1 Wednesday 4
1 0.0198 2016-03-30 3 Wednesday 13
2 0.0060 2016-05-27 5 Friday 21
3 -0.0566 2016-06-07 6 Tuesday 23
4 0.0573 2016-08-08 8 Monday 32
[5 rows x 63 columns]
- Boxplot
- distplot
10 | P a g e
11 | P a g e
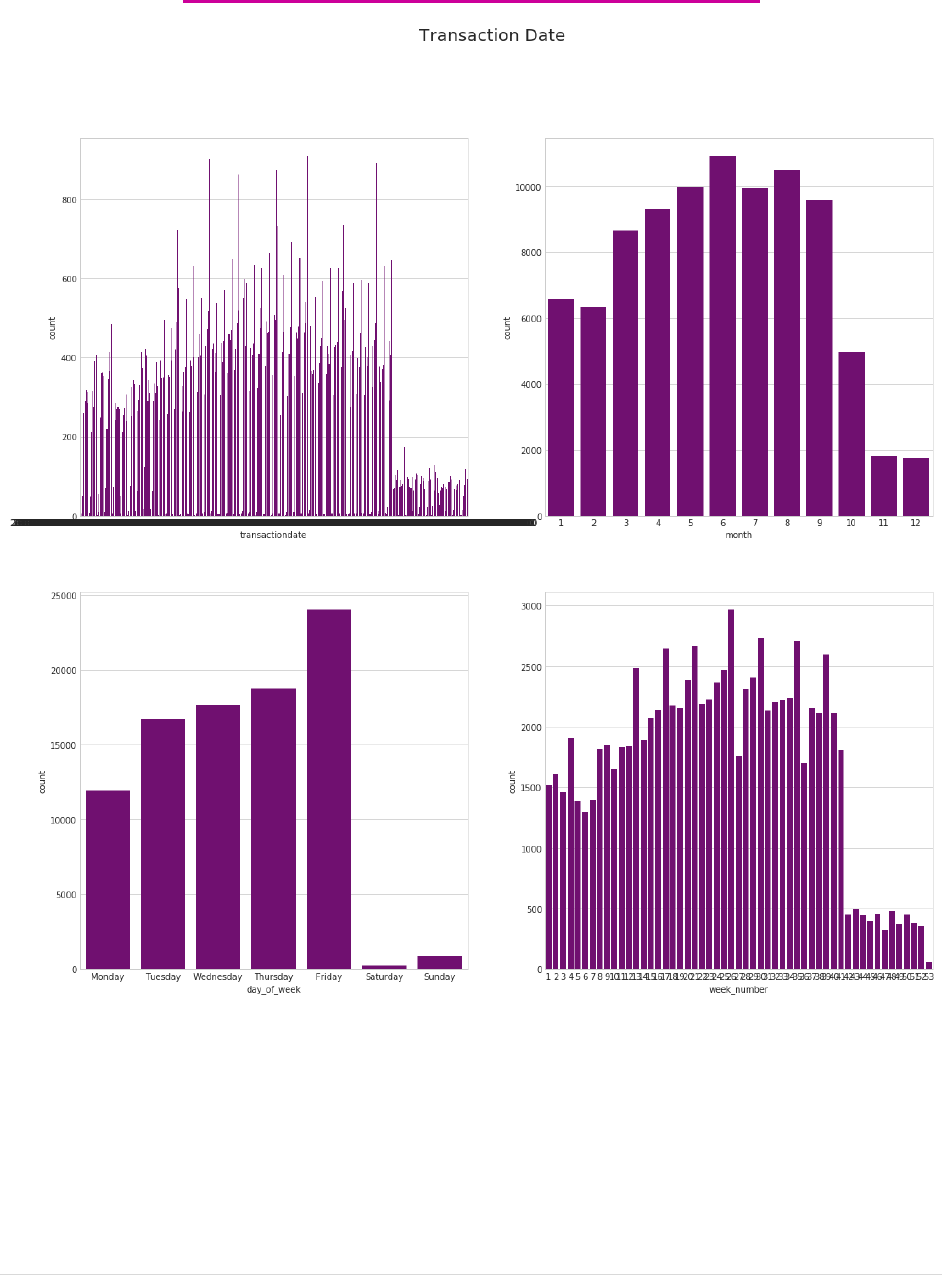
Plot # 3: scrutinizing transaction date
12 | P a g e
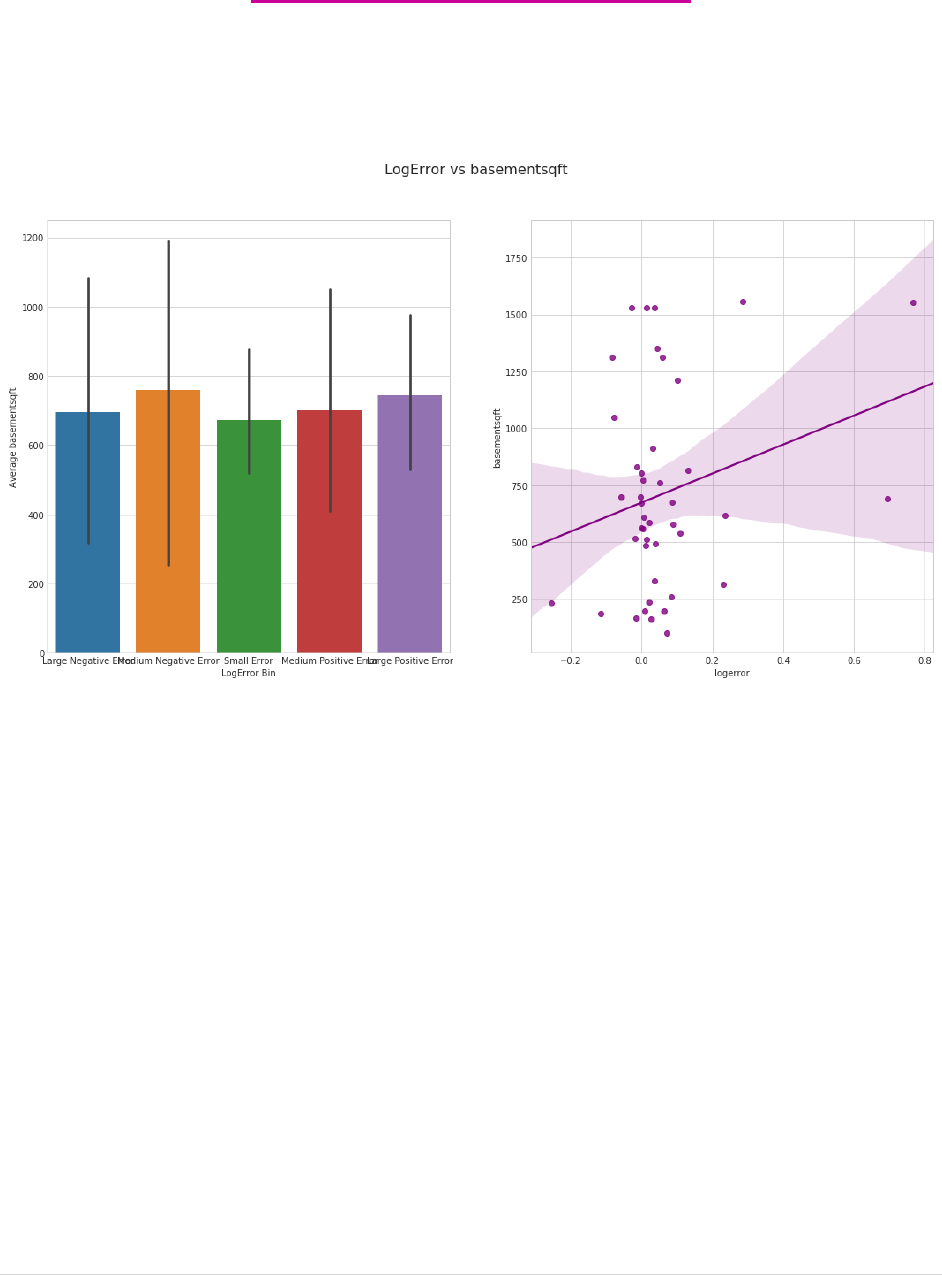
Plot # 4: logerror vs variable
- barplot
- regplot
- There are similar graphs for various variables
