MSP Debuggers User's Guide (Rev. L) Slau647l
User Manual:
Open the PDF directly: View PDF ![]() .
.
Page Count: 53
- MSP Debuggers
- 1 Introduction
- 2 MSP Debug Probe Overview
- 3 Hardware Identification
- 3.1 How to Determine If Your Hardware is Based on eZ-FET or eZ-FET Lite
- 3.2 How to Determine If Your Hardware is Based on eZ430
- 3.3 Signal Connections for In-System Programming and Debugging
- 3.4 Using the Power Supply Feature of the eZ-FET and eZ-FET Lite
- 3.5 Using the Power Supply Feature of the MSP-FET430UIF and MSP-FET
- 4 Hardware Installation
- 5 Debug Probes Hardware and Software
- 5.1 MSPDebugStack
- 5.2 Ultra-Low-Power (ULP) Debug Support
- 5.3 EnergyTrace™ Technology
- 5.4 Unlimited Software Breakpoints in Flash, FRAM, and RAM
- 5.5 JTAG Access Protection (Fuse Blow)
- 5.6 MSP-FET Stand-Alone Debug Probe
- 5.7 MSP-FET430UIF Stand-Alone Debugger
- 5.8 eZ-FET and eZ-FET Lite Onboard Emulation
- 5.9 eZ430 Onboard Emulation
- 5.10 MSP-FET430PIF
- Revision History
- Important Notice

1
SLAU647L–July 2015–Revised February 2018
Submit Documentation Feedback Copyright © 2015–2018, Texas Instruments Incorporated
MSP Debuggers
User's Guide
SLAU647L–July 2015–Revised February 2018
MSP Debuggers
This manual describes the use and the features of the debug probes for MSP430™ and SimpleLink™
MSP432™ microcontrollers (MCUs). It includes information about the debugger probe hardware and
software. It documents frequently asked questions on how to enable and disable certain features. It shows
the differences between the debug probes and offers a guide on how to identify the specific version of the
debug probe hardware.
Contents
1 Introduction ................................................................................................................... 3
2 MSP Debug Probe Overview............................................................................................... 4
3 Hardware Identification...................................................................................................... 6
4 Hardware Installation........................................................................................................ 8
5 Debug Probes Hardware and Software ................................................................................. 12
List of Figures
1 eZ-FET Windows Enumeration ............................................................................................ 6
2 eZ-FET Emulation IP........................................................................................................ 6
3 eZ-FET Lite Emulation IP................................................................................................... 6
4 eZ430 Emulation IP ......................................................................................................... 7
5 eZ430 Windows Enumeration.............................................................................................. 7
6 MSP Flasher Driver Install Notification .................................................................................. 10
7 CCS Cloud Agent Installation............................................................................................. 11
8 Successful CCS Cloud Agent Installation............................................................................... 11
9 MSP Ecosystem............................................................................................................ 12
10 MSP-FET Top View........................................................................................................ 15
11 MSP-FET Bottom View.................................................................................................... 15
12 MSP-FET 14-Pin JTAG Connector ...................................................................................... 19
13 Open MSP-FET Cover .................................................................................................... 20
14 Jumper J5 ................................................................................................................... 20
15 Recovery Confirmation .................................................................................................... 21
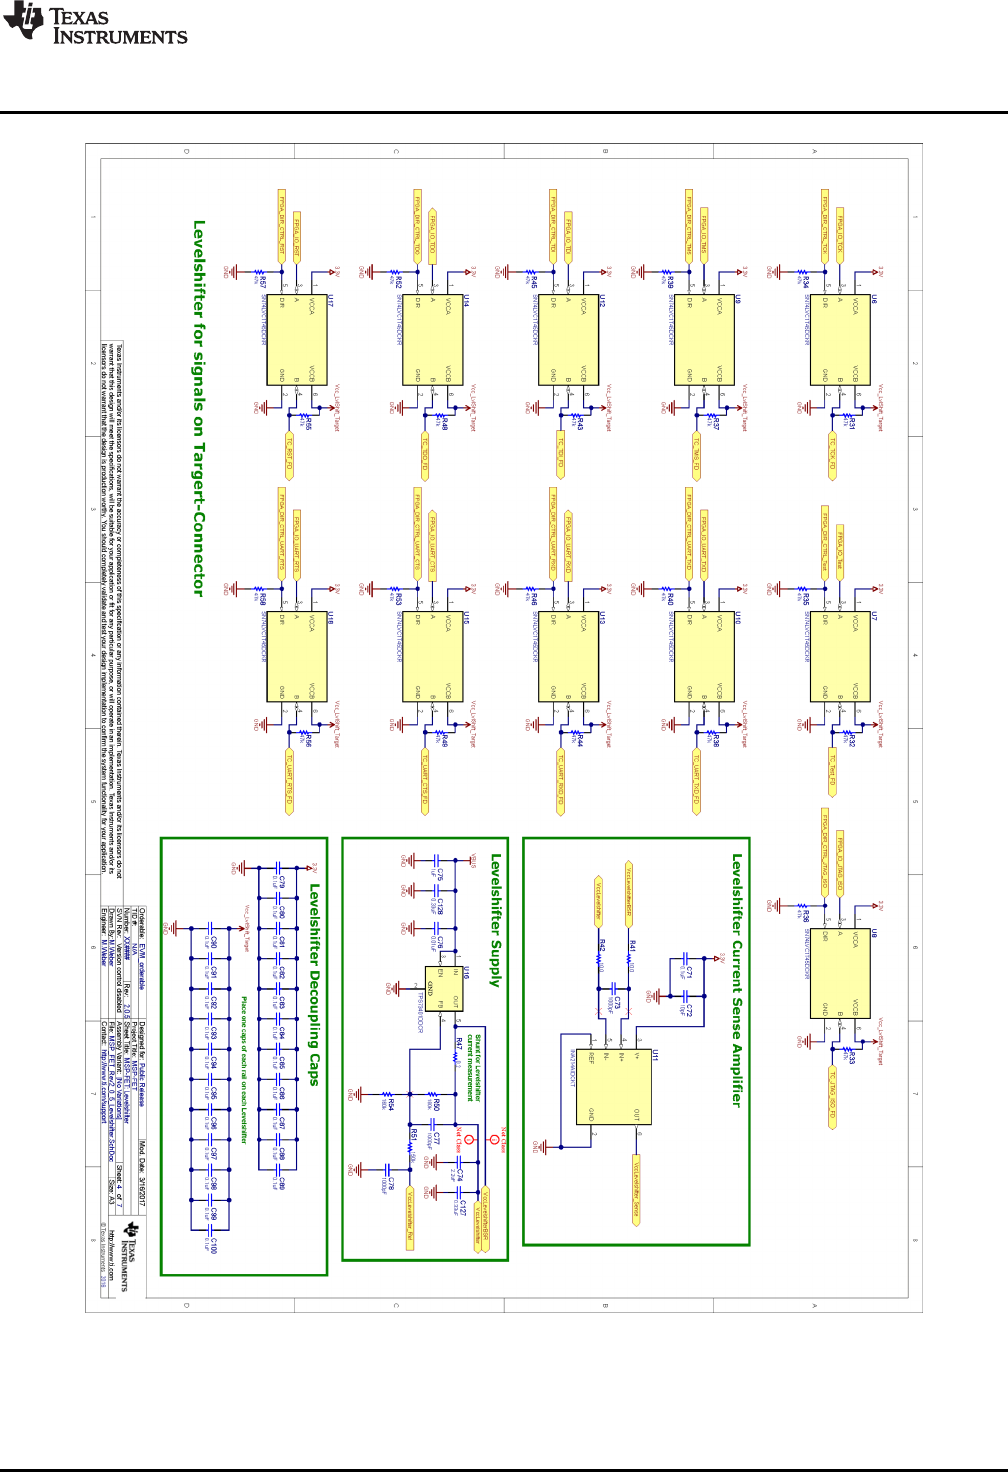
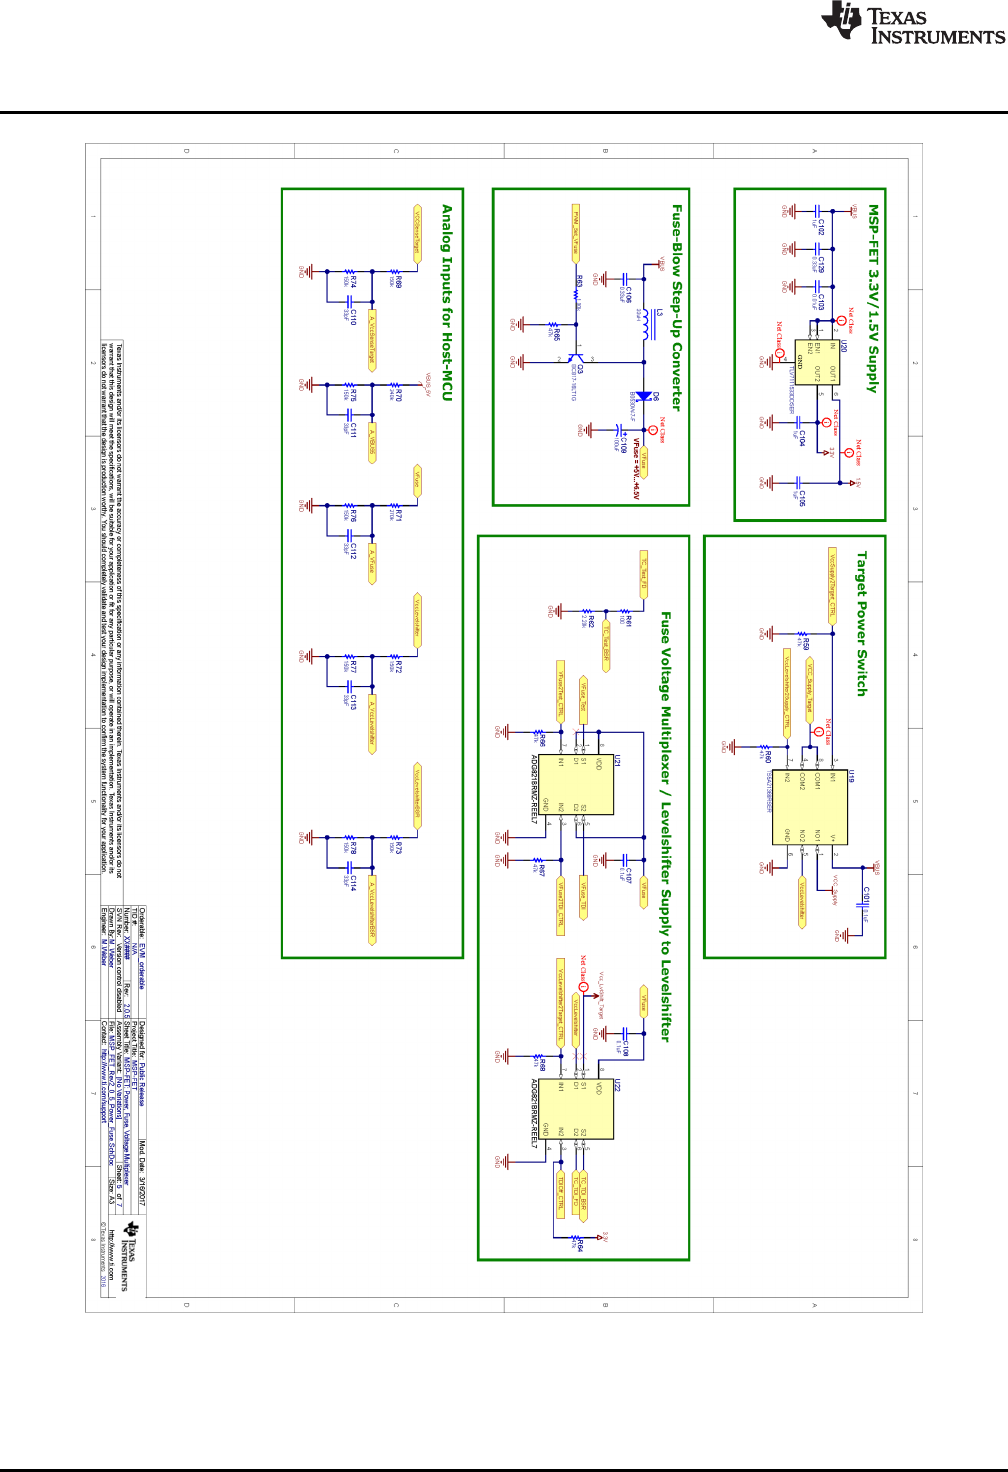
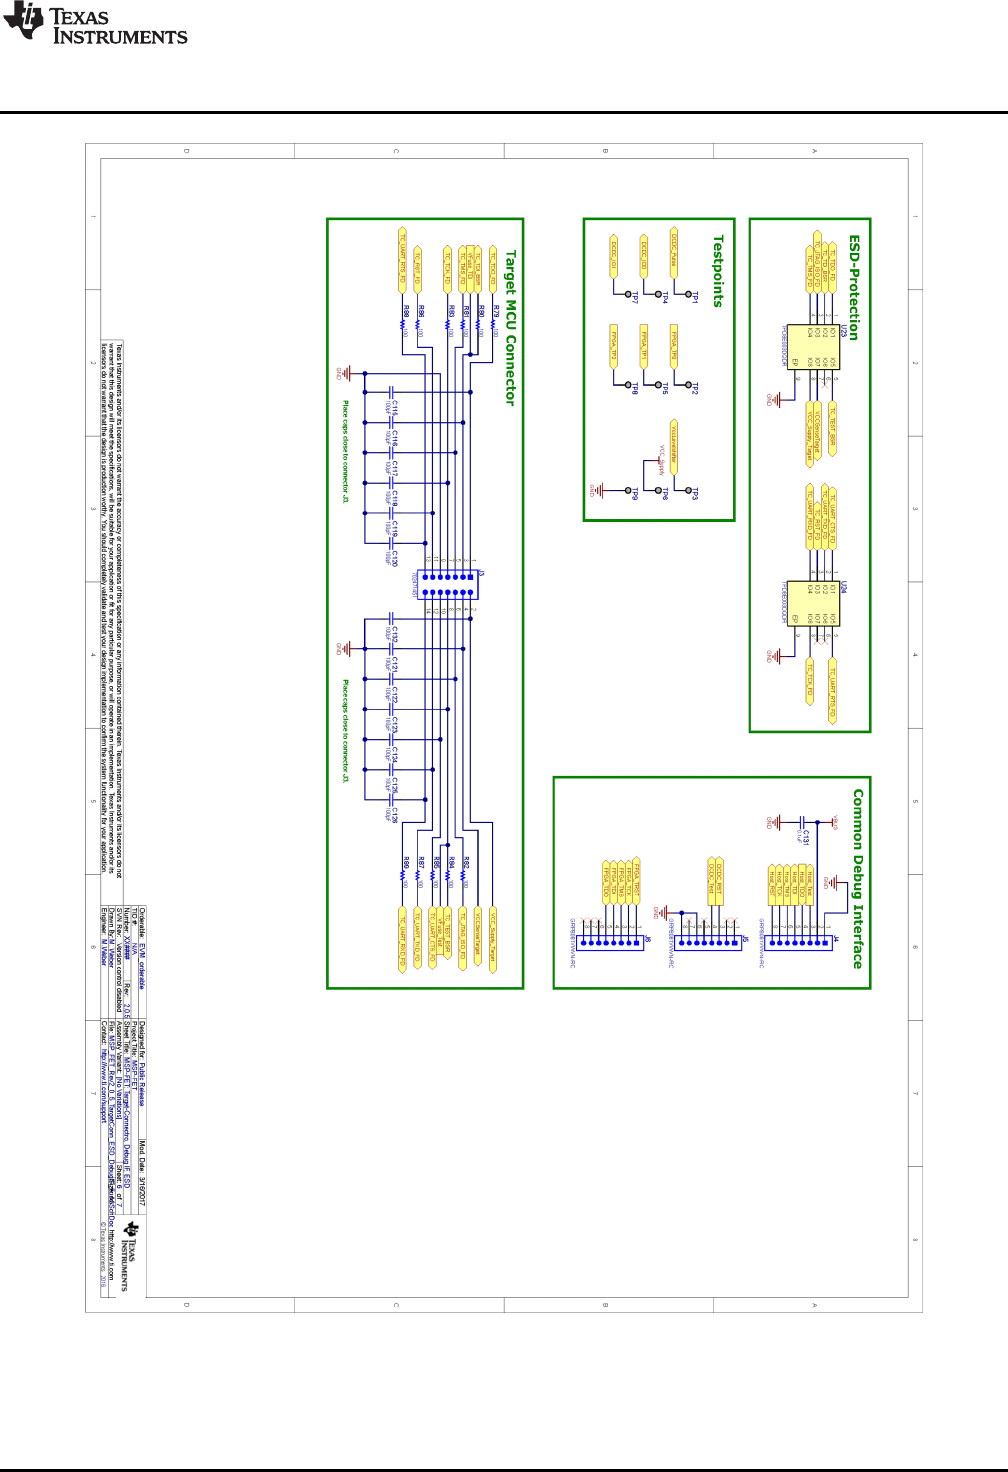
16 MSP-FET USB Debugger, Schematic (1 of 6) ......................................................................... 22
17 MSP-FET USB Debugger, Schematic (2 of 6) ......................................................................... 23
18 MSP-FET USB Debugger, Schematic (3 of 6) ......................................................................... 24
19 MSP-FET USB Debugger, Schematic (4 of 6) ......................................................................... 25
20 MSP-FET USB Debugger, Schematic (5 of 6) ......................................................................... 26
21 MSP-FET USB Debugger, Schematic (6 of 6) ......................................................................... 27
22 MSP-FET430UIF Version 1.4a Top and Bottom Views............................................................... 30
23 MSP-FET430UIF Version 1.3 Top and Bottom Views ................................................................ 30
24 MSP-FET430UIF 14-Pin JTAG Connector ............................................................................. 31
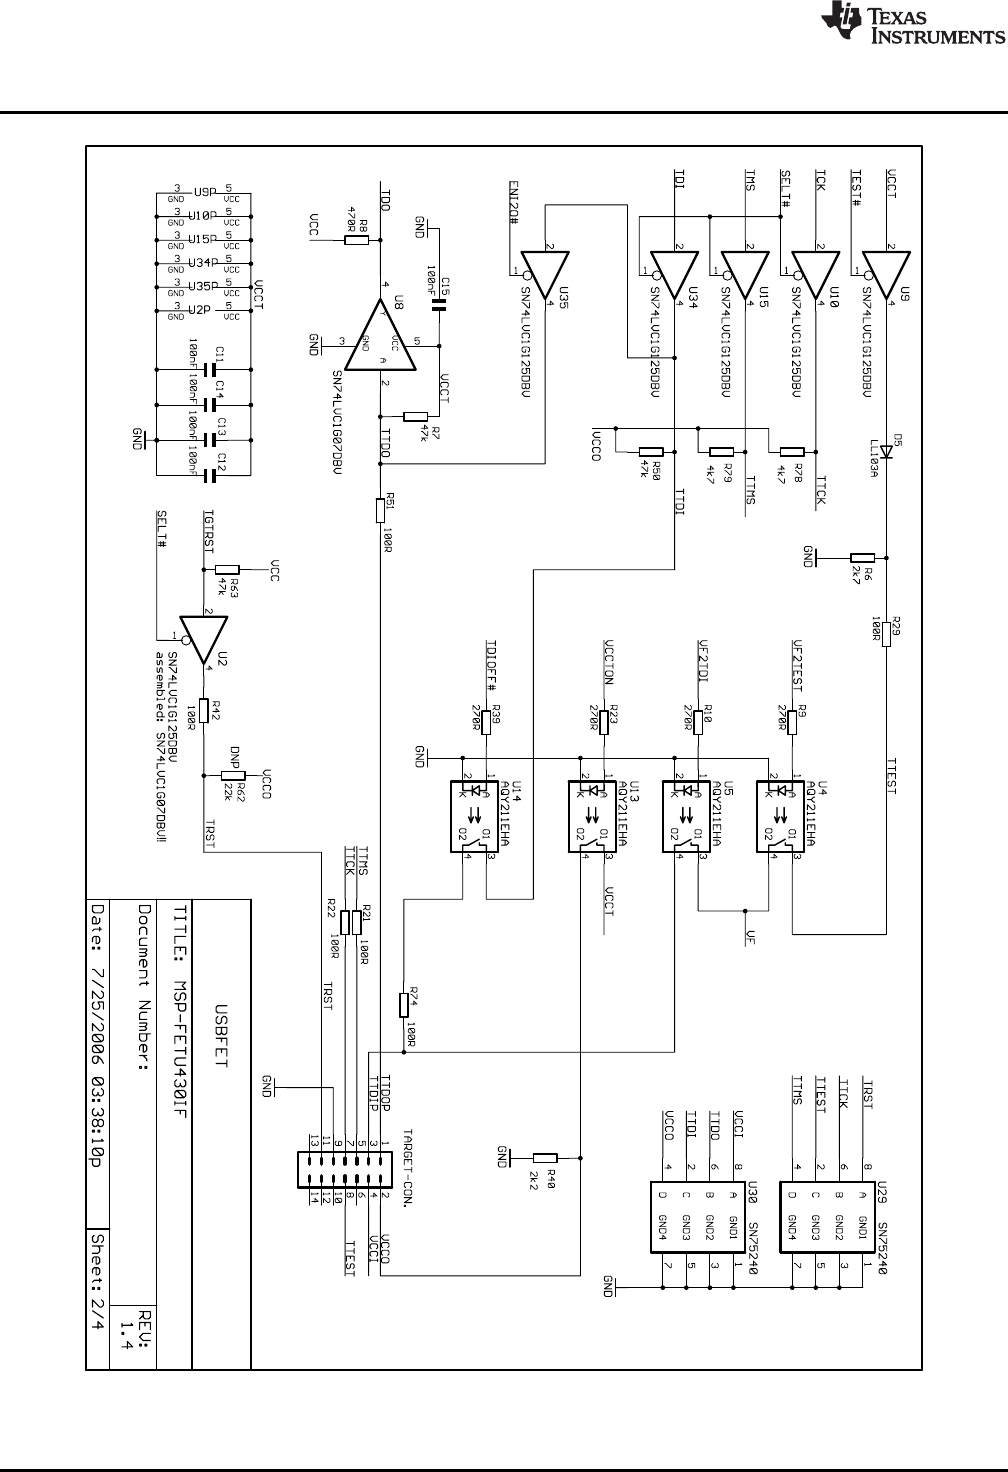
25 MSP-FET430UIF USB Interface, Schematic (1 of 4).................................................................. 33
26 MSP-FET430UIF USB Interface, Schematic (2 of 4).................................................................. 34
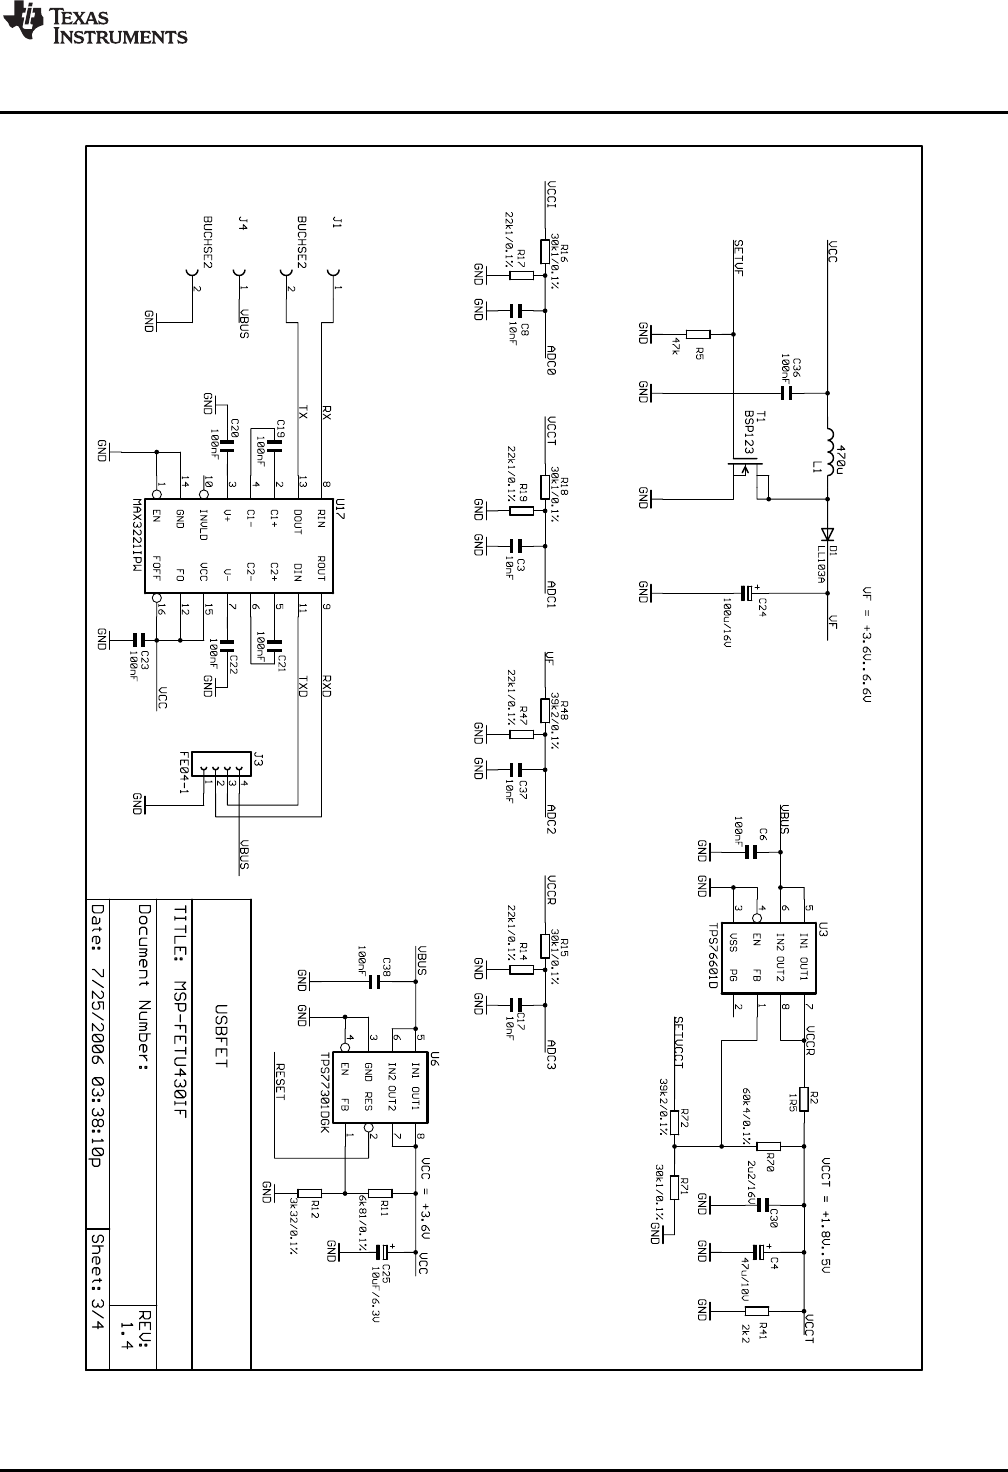
27 MSP-FET430UIF USB Interface, Schematic (3 of 4).................................................................. 35
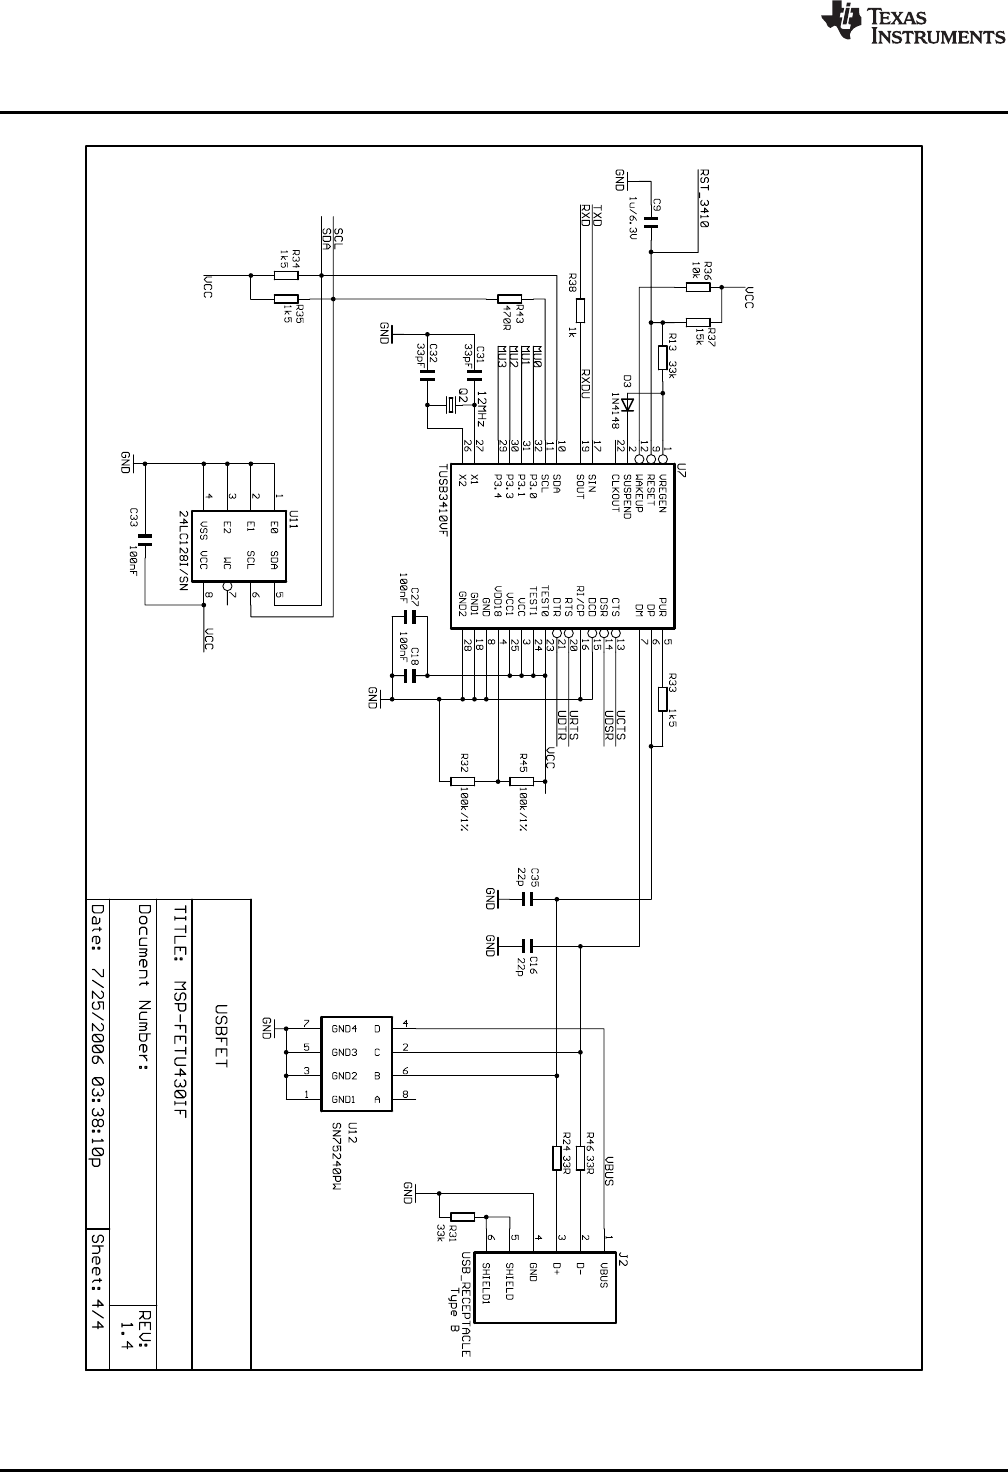
28 MSP-FET430UIF USB Interface, Schematic (4 of 4).................................................................. 36

www.ti.com
2SLAU647L–July 2015–Revised February 2018
Submit Documentation Feedback
Copyright © 2015–2018, Texas Instruments Incorporated
MSP Debuggers
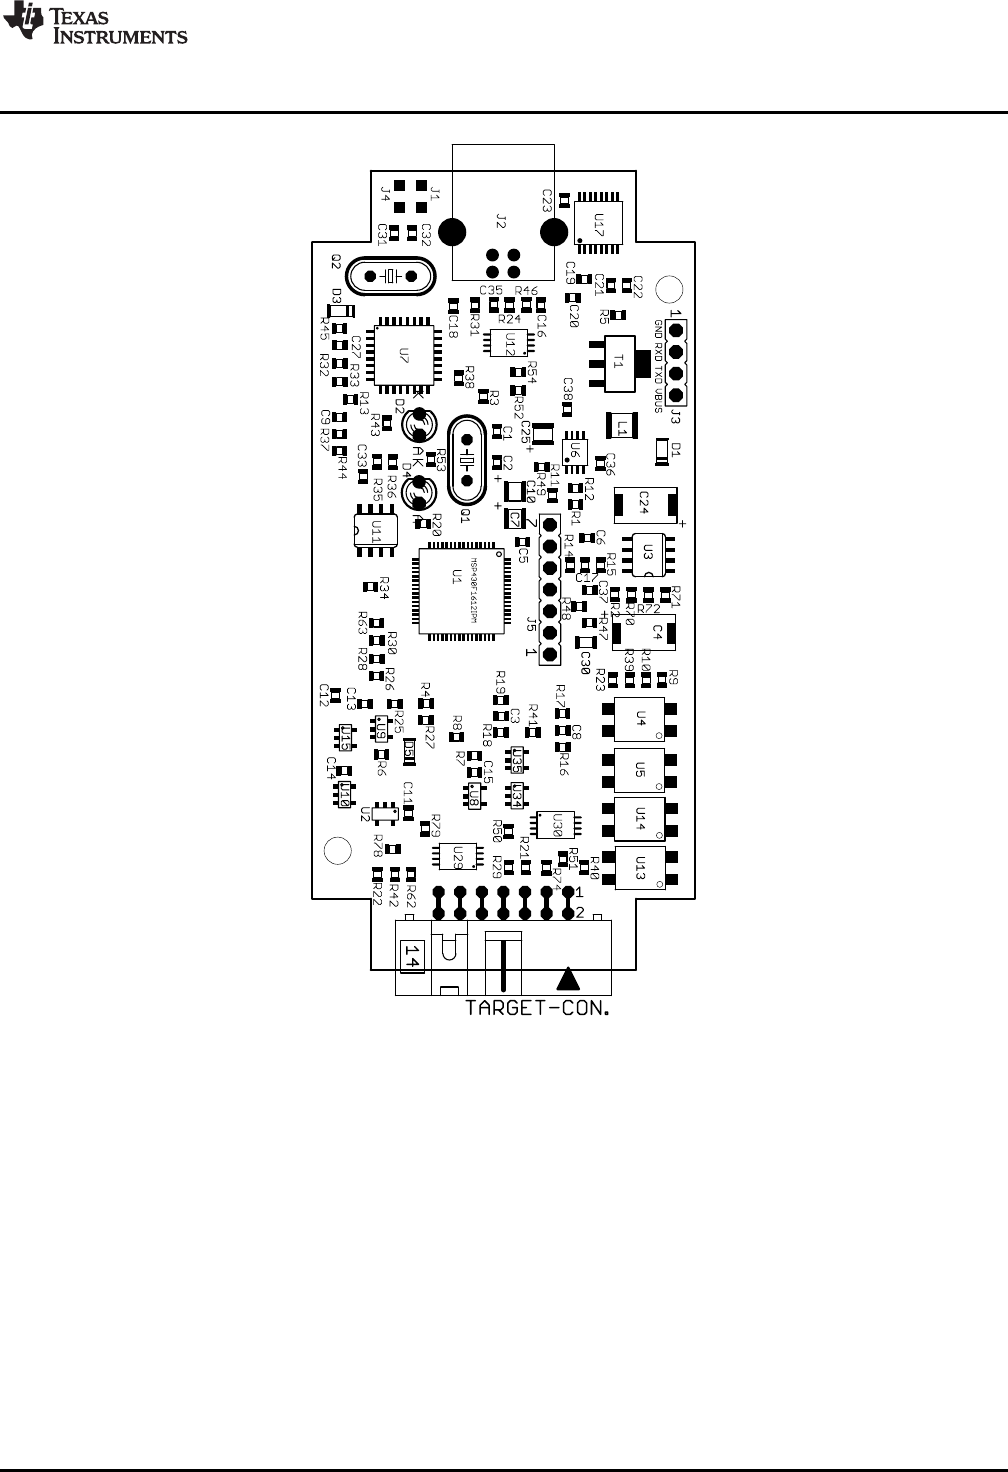
29 MSP-FET430UIF USB Interface, PCB .................................................................................. 37
30 eZ-FET and eZ-FET Lite (Top View) .................................................................................... 38
31 eZ-FET Rev1.3 (Top View) ............................................................................................... 38
32 eZ-FET or eZ-FET Lite Debug Connector .............................................................................. 40
33 MSP-FET to LaunchPad Development Kit Pin Assignments......................................................... 41
34 MSP-FET to LaunchPad Wiring Diagram............................................................................... 41
35 eZ-FET Schematic (USB Connection)................................................................................... 42
36 eZ-FET Schematic (Emulation MCU).................................................................................... 43
37 eZ-FET Schematic DCDC (No eZ-FET Lite) ........................................................................... 44
38 eZ430 Emulation ........................................................................................................... 45
39 eZ430 Debug Connector on MSP-EXP430G2 LaunchPad........................................................... 46
40 eZ430 Schematic (Emulation MCU) ..................................................................................... 47
41 eZ430 Schematic (USB Connection) .................................................................................... 48
42 MSP-FET430PIF ........................................................................................................... 49
43 MSP-FET430PIF FET Interface Module, Schematic .................................................................. 50
44 MSP-FET430PIF FET Interface Module, PCB ......................................................................... 51
List of Tables
1 Debug Probes Features and Device Compatibility...................................................................... 4
2 MSP-FET Backchannel UART Implementation ........................................................................ 16
3 MSP-FET Backchannel UART Activation Commands ................................................................ 17
4 MSP-FET MSP Target BSL Activation Commands.................................................................... 18
5 MSP-FET LED Signals .................................................................................................... 18
6 MSP-FET Pin States....................................................................................................... 19
7 Mechanical and Interface Specifications ................................................................................ 28
8 JTAG and Spy-Bi-Wire Interface Specifications........................................................................ 28
9 JTAG and SWD Interface Specifications................................................................................ 29
10 MSP-FET430UIF LED Signals ........................................................................................... 31
11 MSP-FET430UIF Pin States.............................................................................................. 32
12 eZ-FET and eZ-FET Lite Backchannel UART Implementation ...................................................... 39
13 eZ-FET and eZ-FET Lite Backchannel UART Activation Commands............................................... 40
14 eZ-FET LED Signals....................................................................................................... 40
15 eZ-FET and eZ-FET Lite Pin States ..................................................................................... 41
16 eZ430 Backchannel UART Implementation ............................................................................ 46
17 eZ430 Pin States ........................................................................................................... 46
Trademarks
MSP430, SimpleLink, MSP432, Code Composer Studio, E2E, EnergyTrace are trademarks of Texas
Instruments.
OS X is a registered trademark of Apple, Inc.
Arm is a registered trademark of Arm Limited.
Ubuntu is a trademark of Canonical Group Ltd.
IAR Embedded Workbench is a registered trademark of IAR Systems.
Linux is a registered trademark of Linus Torvalds.
Windows is a registered trademark of Micosoft Corporation.
CentOS is a trademark of Red Hat, Inc.
All other trademarks are the property of their respective owners.

www.ti.com
Introduction
3
SLAU647L–July 2015–Revised February 2018
Submit Documentation Feedback Copyright © 2015–2018, Texas Instruments Incorporated
MSP Debuggers
1 Introduction
1.1 Related Documentation From Texas Instruments
MSP430™ Hardware Tools User's Guide
IAR Embedded Workbench Version v7+ for MSP430 User's Guide
Advanced Debugging Using the Enhanced Emulation Module (EEM) With Code Composer Studio™
Version 6
MSP430™ Flash Device Bootloader (BSL) User's Guide
MSP430™ Programming With the JTAG Interface
1.2 Terms and Abbreviations
Term Definition
BSL Bootloader
CCS Code Composer Studio™ development tool for MSP430
CDC Communications device class
CPU Central processing unit
CRC Cyclic redundancy check
CTS Clear to send
FET Flash emulation tool
I2C Inter-Integrated Circuit 2-wire communication bus
IAR EW430 IAR Embedded Workbench®development tool for MSP430
JTAG Joint Test Action Group
JTAG 4-wire 4-wire JTAG protocol communication
MCLK Master clock
MSP Mixed signal processor
MSP-FET MSP debug probe
MSP-FET430 UIF MSP debug probe
MSPDebugStack Dynamic library (Windows®), shared object (Linux®), or dy library (OS X®) that offers functions to access and
debug MSP430 devices using an MSP debug probe
PC Personal computer
RTS Request to send
RX Receive data
SBW Spy-Bi-Wire (2-wire JTAG protocol) communication
TX Transmit data
UART Universal asynchronous receiver/transmitter
UIF USB interface to debug and access MSP derivatives
USB Universal serial bus
1.3 If You Need Assistance
Support for the MSP microcontrollers and the development tools is provided by the TI Product Information
Center (PIC). Contact information for the PIC can be found on the TI website. The TI E2E™ Community
support forums for the MSP microcontrollers also provide open interaction and support from a community
of peer engineers, TI engineers, and other experts. Additional device-specific information can be found on
the MSP website.
MSP Debug Probe Overview
www.ti.com
4SLAU647L–July 2015–Revised February 2018
Submit Documentation Feedback
Copyright © 2015–2018, Texas Instruments Incorporated
MSP Debuggers
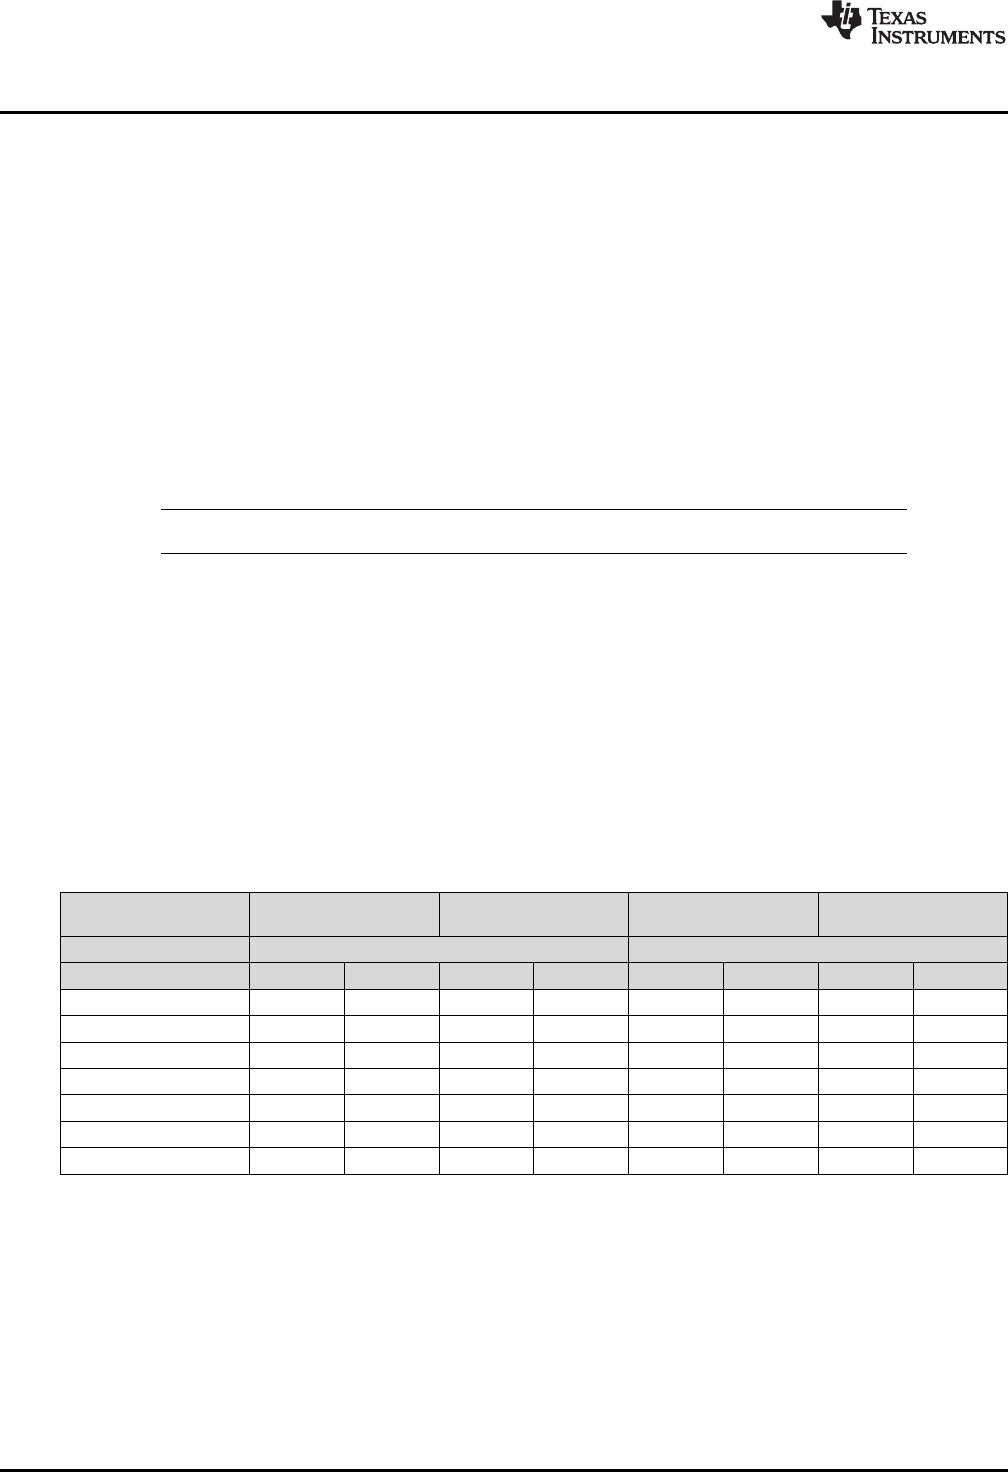
2 MSP Debug Probe Overview
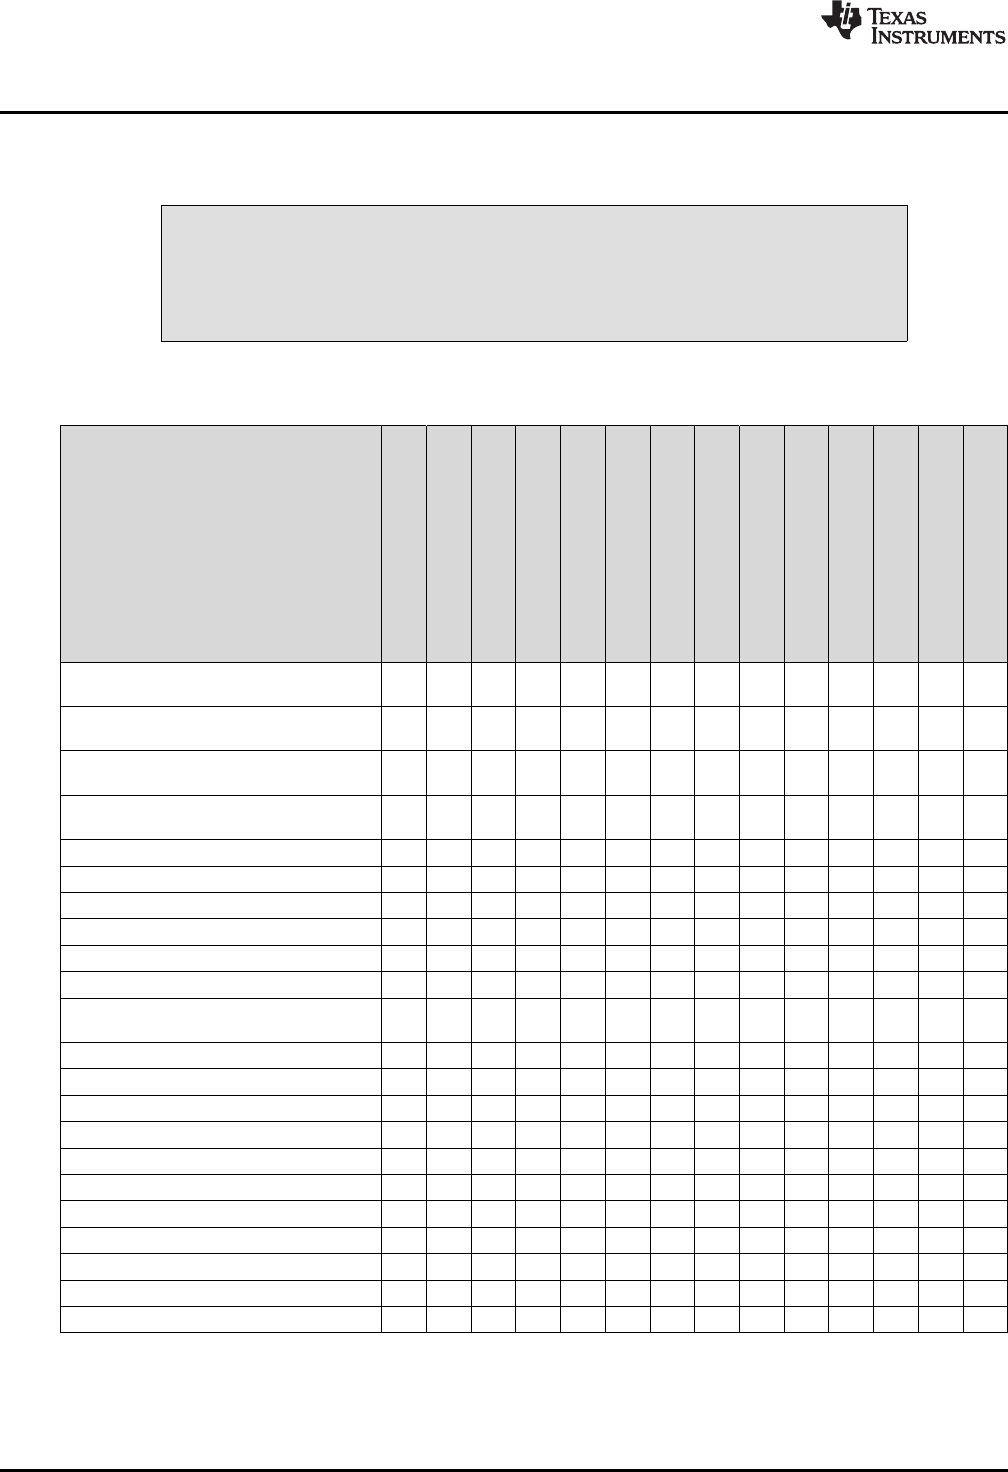
Table 1 is an overview of the capabilities and features for the available MSP debug probes.
CAUTION
Never disconnect the JTAG or emulator USB cable during an active debug
session. Always terminate a running debug session properly, by clicking on the
"Terminate" icon, before disconnecting the target device.
(1) The MSP-FET430PIF is for legacy device support only. This emulation tool does not support any devices released after 2011.
(2) See Section 3.1 to identify the hardware.
(3) The eZ-FET Emulation IP and eZ-FET Lite Emulation IP are used as the onboard emulation for the MSP LaunchPad tools.
(4) See Section 5.5 for more information.
(5) The 2-wire JTAG debug interface is also referred to as Spy-Bi-Wire (SBW) interface.
Table 1. Debug Probes Features and Device Compatibility(1)(2)(3)
Feature and MSP430 Device Support
eZ430-F2013
eZ430-RF2500
eZ430-RF2480
eZ430-RF2560
MSP-WDSxx Metawatch
eZ430-Chronos
LaunchPad (MSP-EXP430G2)
MSP-EXP430FR5739
MSP-EXP430F5529
MSP-FET430PIF
MSP-FET430UIF
MSP-FET
eZ-FET Emulation IP
eZ-FET Lite Emulation IP
Supports all programmable MSP430 and
CC430 devices ✓ ✓ ✓ ✓ ✓
Supports only F20xx, G2x01, G2x11,
G2x21, G2x31 ✓
Supports F20xx, F21x2, F22xx, G2x01,
G2x11, G2x21, G2x31, G2x53 ✓
Supports F20xx, F21x2, F22xx, G2x01,
G2x11, G2x21, G2x31 ✓ ✓
Supports F5438, F5438A ✓
Supports BT5190, F5438A ✓ ✓
Supports only F552x ✓
Supports FR57xx, F5638, F6638 ✓
Supports only CC430F613x ✓
Supports MSP432Pxx ✓
Allows JTAG access protection
(Fuse Blow)(4) ✓ ✓
Adjustable target supply voltage ✓ ✓
Fixed 2.8-V target supply voltage ✓
Fixed 3.3-V target supply voltage ✓ ✓
Fixed 3.6-V target supply voltage ✓✓✓✓✓✓✓✓✓
4-wire JTAG ✓ ✓ ✓
2-wire JTAG(5) ✓✓✓✓✓✓✓✓✓ ✓✓✓✓
BSL tool or mode ✓
Backchannel UART ✓ ✓ ✓ ✓ ✓ ✓ ✓ ✓ ✓ ✓ ✓
Supported by CCS for Windows ✓✓✓✓✓✓✓✓✓✓✓✓✓✓
Supported by CCS for Linux ✓ ✓ ✓ ✓
Supported by CCS for OS X ✓ ✓ ✓ ✓

www.ti.com
MSP Debug Probe Overview
5
SLAU647L–July 2015–Revised February 2018
Submit Documentation Feedback Copyright © 2015–2018, Texas Instruments Incorporated
MSP Debuggers
Table 1. Debug Probes Features and Device Compatibility(1)(2)(3) (continued)
Feature and MSP430 Device Support
eZ430-F2013
eZ430-RF2500
eZ430-RF2480
eZ430-RF2560
MSP-WDSxx Metawatch
eZ430-Chronos
LaunchPad (MSP-EXP430G2)
MSP-EXP430FR5739
MSP-EXP430F5529
MSP-FET430PIF
MSP-FET430UIF
MSP-FET
eZ-FET Emulation IP
eZ-FET Lite Emulation IP
Supported by IAR ✓✓✓✓✓✓✓✓✓✓✓✓✓✓
EnergyTrace™, EnergyTrace++ ✓ ✓
2.1 Known Limitations
A firmware update may fail when using a USB hub. Therefore, do not connect through a USB hub while
updating the firmware on the debug tools.
Hardware Identification
www.ti.com
6SLAU647L–July 2015–Revised February 2018
Submit Documentation Feedback
Copyright © 2015–2018, Texas Instruments Incorporated
MSP Debuggers
3 Hardware Identification
3.1 How to Determine If Your Hardware is Based on eZ-FET or eZ-FET Lite
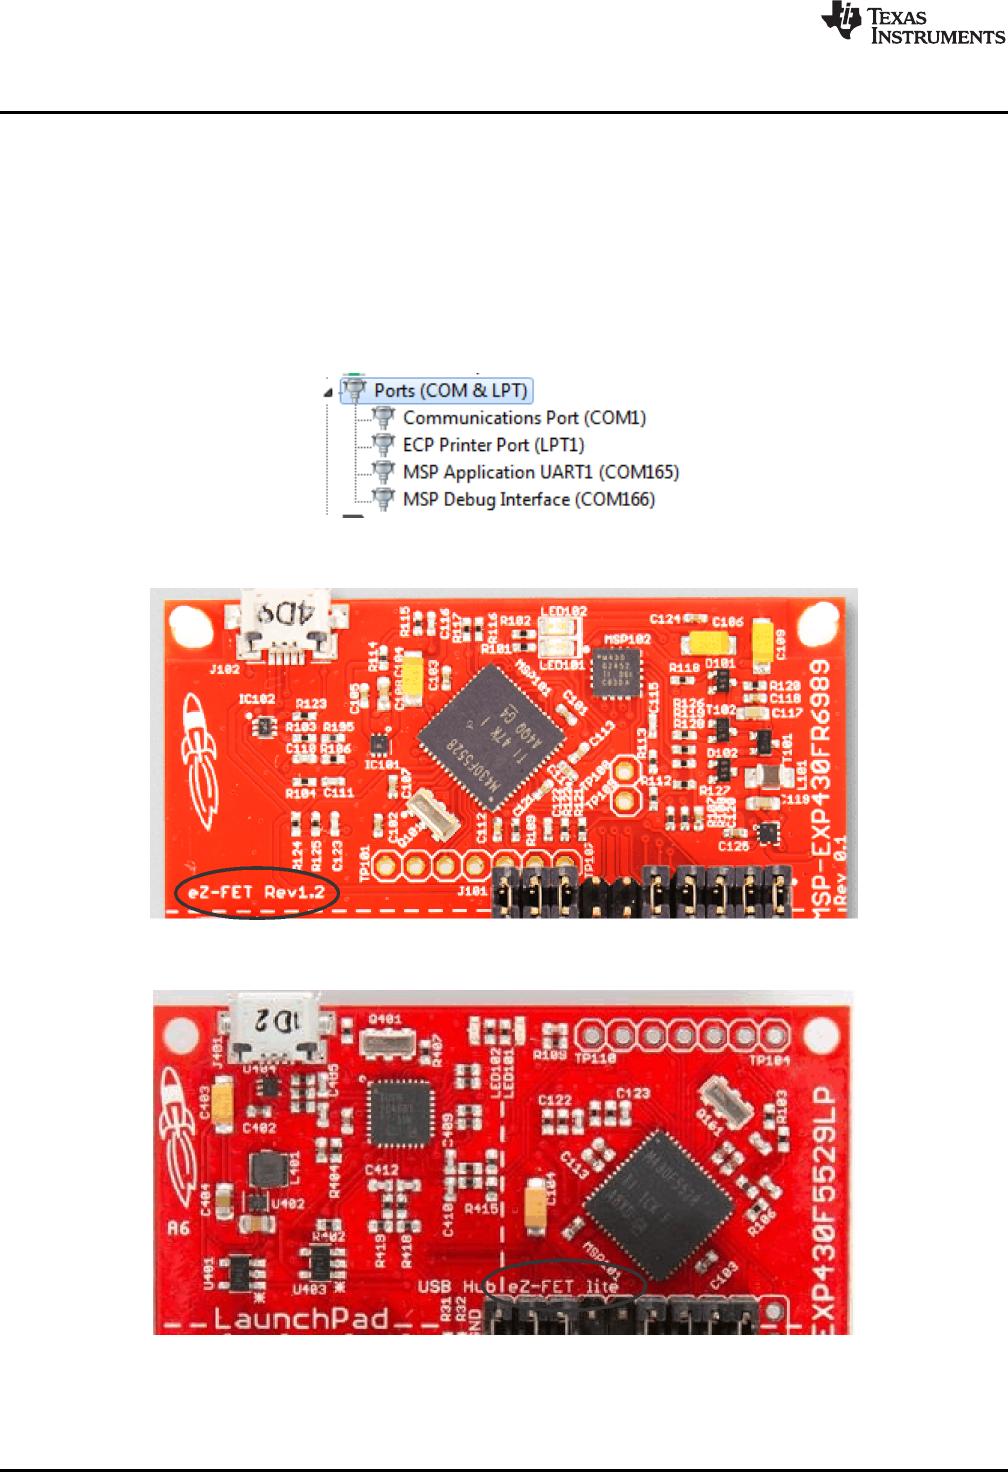
• Check the installed tool drivers by using the Windows Device Manager. eZ-FET tools enumerate as
CDC "MSP Debug Interface" and CDC "MSP Application UART1" devices (see Figure 1).
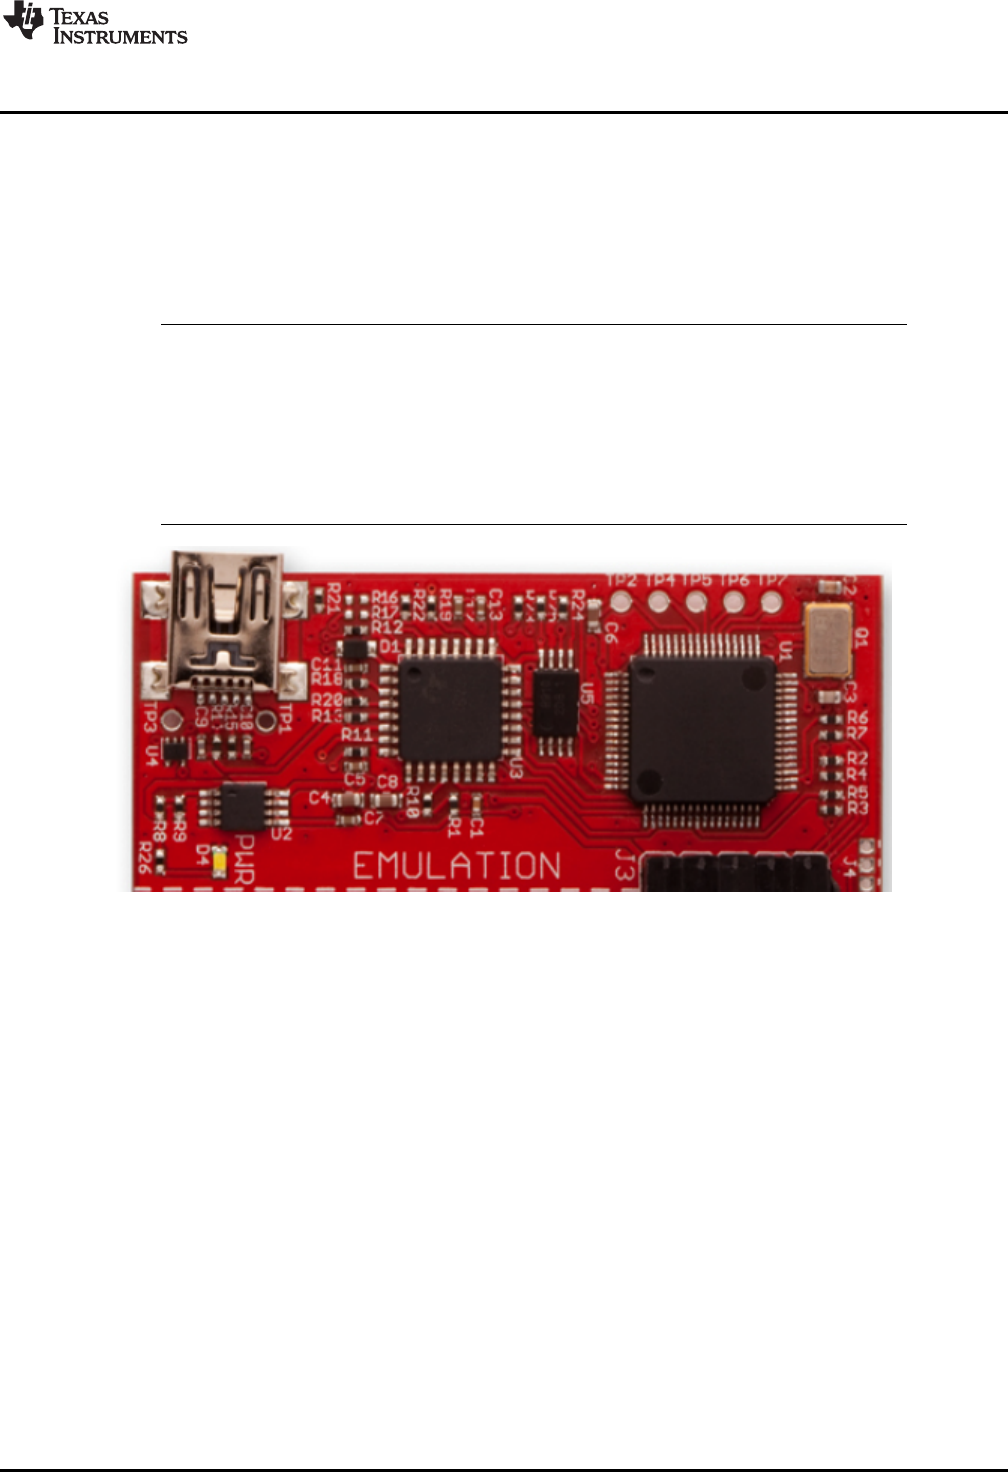
• Check the Experimenter Board or LaunchPad emulation section to find out if it is based on an eZ-FET
tool. If it is based on an MSP430F5528 device, it is an eZ-FET tool.
• There is a small print on the silkscreen that indicates eZ-FET or eZ-FET Lite (see Figure 2 and
Figure 3).
Figure 1. eZ-FET Windows Enumeration
Figure 2. eZ-FET Emulation IP
Figure 3. eZ-FET Lite Emulation IP
www.ti.com
Hardware Identification
7
SLAU647L–July 2015–Revised February 2018
Submit Documentation Feedback Copyright © 2015–2018, Texas Instruments Incorporated
MSP Debuggers
3.2 How to Determine If Your Hardware is Based on eZ430
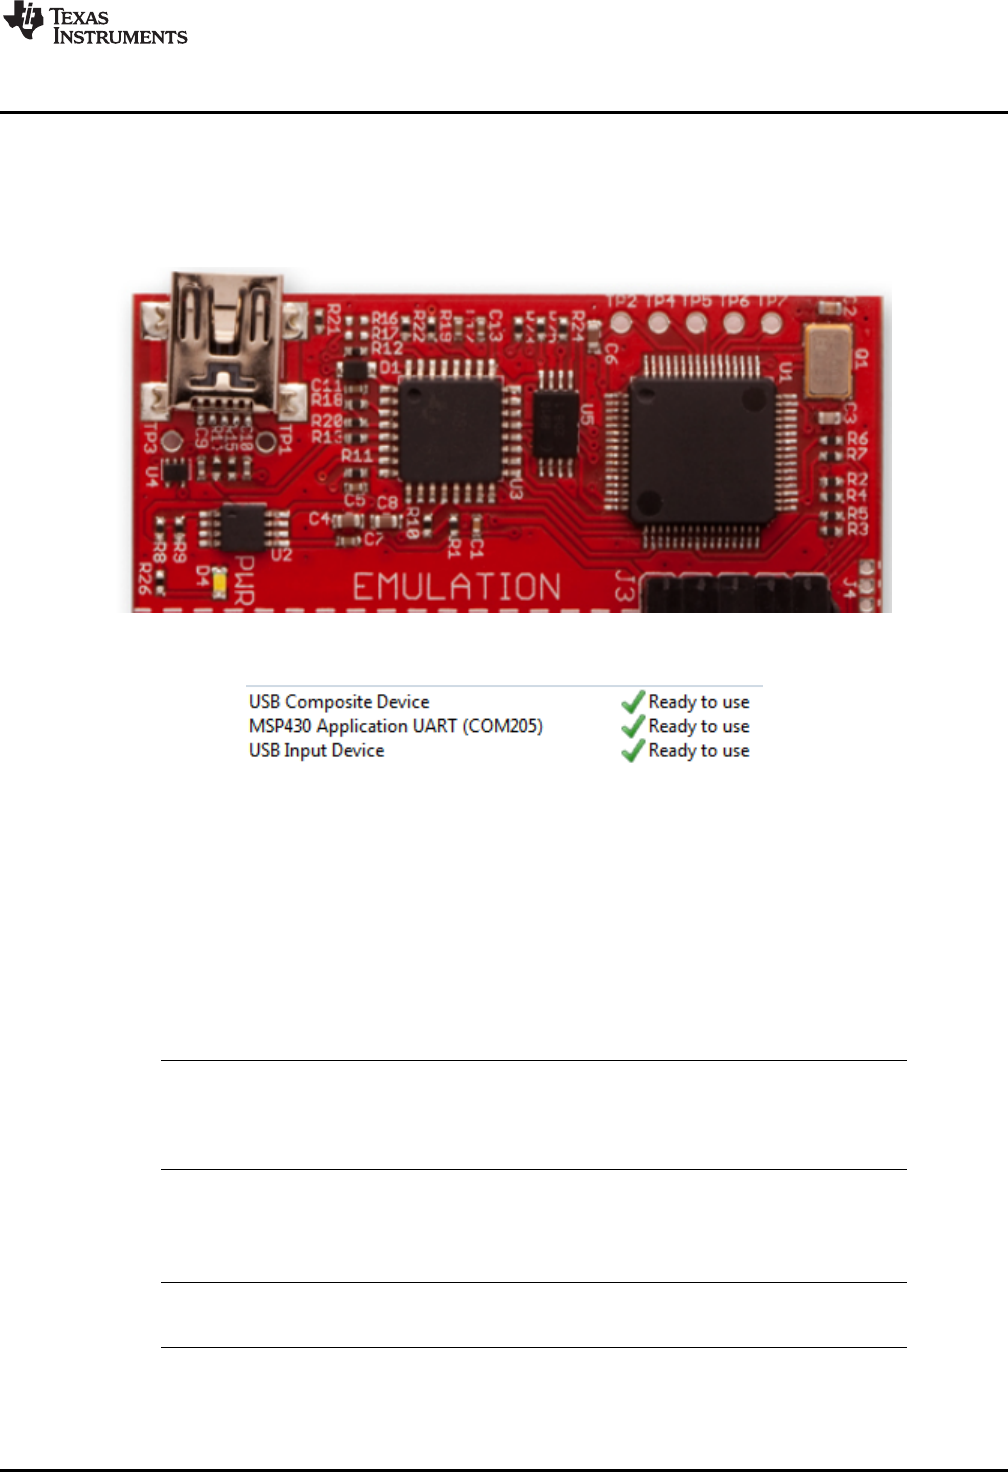
• Check the installed tool drivers by using the Windows Device Manager (see Figure 5). eZ430 tools
enumerate as HID (Debugger port) and CDC (Backchannel UART) devices.
• Check the Experimenter Board to find out if it is based on an eZ430 tool (see Figure 4). If it is based
on an MSP430F1612 and a TUSB3410, it is an eZ430 tool.
Figure 4. eZ430 Emulation IP
Figure 5. eZ430 Windows Enumeration
3.3 Signal Connections for In-System Programming and Debugging
For details about the hardware connections of all debug probes see the "Signal Connections for In-System
Programming and Debugging" section of the MSP430 Hardware Tools User's Guide.
3.4 Using the Power Supply Feature of the eZ-FET and eZ-FET Lite
The eZ-FET and the eZ-FET Lite only support a fixed voltage power supply. The maximum supply current
is 75 mA. For more details, see the specific LaunchPad or experimenter board user's guide.
NOTE: These debug probes do not support externally powering of the device while debugging – if
an external voltage is needed for stand-alone testing, the eZ-FET emulation section should
not be connected through USB. If both external power and the USB power are connected,
there could be a conflict that can damage the device.
3.5 Using the Power Supply Feature of the MSP-FET430UIF and MSP-FET
All MSP debug probes can supply targets with up to 100 mA through pin 2 of the 14-pin JTAG connector.
NOTE: The target should not consume more than 60 mA at peak current, as it may violate the USB
specification. Details can found on www.USB.org.
Example: If the target board has a capacitor on the VCC line with a capacity of more than 10 µF, it may
cause an inrush current during capacitor charging that may exceed 60 mA. In this case, the current should
be limited by the design of the target board, or an external power supply should be used.

Hardware Installation
www.ti.com
8SLAU647L–July 2015–Revised February 2018
Submit Documentation Feedback
Copyright © 2015–2018, Texas Instruments Incorporated
MSP Debuggers
Target VCC is selectable in a range between 1.8 V and 3.6 V in steps of 0.1 V.
Alternatively, the target can be supplied externally. In this case, the external voltage should be connected
to pin 4 of the 14-pin JTAG connector. MSP-FET tools adjusts the level of the JTAG signals to
automatically match the external VCC.
NOTE: Only pin 2 (MSP-FET tool supplies target) or pin 4 (target is externally supplied) must be
connected. Both connections are not supported at the same time.
Even if an external supply powers the target device on the target socket module and any
user circuitry connected to the target socket module, the MSP-FET tool continues to be
powered from the PC through the USB interface.
NOTE: MSP-FET430PIF only
The PC parallel ports with a connected MSP-FET430PIF can source a maximum current of
25 mA. Because of the ultra-low-power requirement of the MSP430, a stand-alone MSP430
does not exceed the provided current. However, if additional circuits are added, the current
limit could be exceeded. In this case, the MSP430 must be supplied externally.
4 Hardware Installation
This section describes how to install the drivers for all MSP debug probes. The drivers are needed to
enable the IDE (integrated development environment) to use the debug probe that is connected to the
system. There are four different ways to install the drivers.
1. CCS desktop: During the CCS setup, all MSP debug probe drivers are installed for all supported
operation systems.
2. CCS cloud: The automatic driver installer is included in the TI Cloud Agent application, which must be
downloaded when connecting a local MSP debug probe to CCS cloud.
3. Stand-alone driver installer: The stand-alone driver installer is available only for Windows. It installs all
MSP debug probe drivers.
4. Using another supported IDE such as IAR EW430 or the MSP-Flasher: During the setup, all MSP
debug probe drivers are installed.
4.1 MSP-FET430PIF
The MSP-FET430PIF has the following system requirements:
It supports only Windows XP with IAR EW430 version 5.xx.x and Code Composer Studio version 5.x.x. No
new development is scheduled to support MSP-FET430PIF.
Follow these steps to install the hardware for the MSP-FET430PIF tool:
1. Use the 25-pin ribbon cable to connect the debugger interface module to the parallel port of the PC.
The necessary driver for accessing the PC parallel port is installed automatically during CCS or IAR
Embedded Workbench installation. Note that a restart is required after the CCS or IAR Embedded
Workbench installation.
2. Use the 14-pin ribbon cable to connect the parallel-port debug interface to a target board which
contains the target MSP430 device.
4.2 MSP-FET430UIF, MSP-FET, eZ-FET, and eZ-FET Lite
NOTE: The built-in DC-DC converter of the MSP-FET and eZ-FET emulators causes a load-
dependent amount of ripple on the output voltage (fripple = 1 kHz to 50 kHz, Vrms_ripple = 5 mV to
50 mV), which might affect sensitive analog and RF circuits that are supplied by the
emulator. For such sensitive circuits, TI recommends temporarily increasing the amount of
power supply decoupling used during development, using an emulator with an integrated
linear regulator (MSP-FET430UIF or eZ-FET430), or using a separate bench supply.

www.ti.com
Hardware Installation
9
SLAU647L–July 2015–Revised February 2018
Submit Documentation Feedback Copyright © 2015–2018, Texas Instruments Incorporated
MSP Debuggers
Installation steps for the MSP-FET430UIF, MSP-FET, eZ-FET or eZ-FET Lite:
1. Install the IDE (TI CCS or IAR EW430) before connecting the debug probe to the PC. During IDE
installation, the USB drivers for the debug probes are installed automatically. Make sure to use the
latest IDE version; older versions might install USB drivers that do not recognize the connected debug
probe.
2. Connect the debug probe to a USB port on the PC using the provided USB cable.
3. The following procedure applies to operation under Windows:
1. After connecting to the PC, the debug probe should be recognized automatically, as the USB
device driver has been already installed together with the IDE.
2. However, if the driver is not automatically detected, the "Found New Hardware wizard" starts.
Follow the instructions and point the wizard to the driver files.
The default location for CCS is: c:\ti\ccsv6\ccs_base\emulation\drivers\msp430\USB_CDC.
The default location for IAR Embedded Workbench is: <Installation Root>\Embedded Workbench
x.x\430\drivers\<Win_OS>.
4. The following procedure applies to operation under Linux:
• Installation as root
1. If installing TI CCS as root, make sure that the debug probe is not connected to the computer
during installation.
2. If you start installation with the debug probe connected to the computer, disconnect the probe
and reconnect after installation finishes.
• Installation as user
1. If installing TI CCS without root access, install the debug probe UDEV rules manually after the
CCS TI installation has finished.
2. Make sure that the debug probe is disconnected from the computer during this step.
3. Open the shell and go to: <CSS installation directory>/ccsv7/install_scripts.sh
4. Execute msp430uif_install.sh as sudo.
5. Connect the debug probe and make sure that the debug probe is detected as other than
"modem". Use the dmseg command to check the system log.
6. The debug probe is ready for use.
5. After connecting the debug probe to a PC, the probe performs a self-test. If the self-test passes, the
green LED stays on. For a complete list of LED signals, see the LED Signals section of each debug
probe in Section 5.6 through Section 5.8.
6. Connect the debug probe with the target board using the 14-pin ribbon cable.
7. When using a target socket board, make sure that the MSP430 device is properly inserted in the
socket and that pin 1 of the device (indicated with a circular indentation on the top surface) aligns with
the "1" mark on the PCB.
NOTE: To use the debug probe without an IDE, install the stand-alone driver package. The stand-
alone driver installer can be found at www.ti.com/mspds under the heading MSPDS-USB-
DRIVERS.
4.3 eZ430-Based Experimenter Boards and LaunchPad Kits
For driver installation on a Windows operating system, follow the steps in Section 4.2.
NOTE: eZ430-tools are not supported on USB3.0 ports. eZ430 tools are supported on Windows
operating systems only—Linux and OS X are not supported.
Hardware Installation
www.ti.com
10 SLAU647L–July 2015–Revised February 2018
Submit Documentation Feedback
Copyright © 2015–2018, Texas Instruments Incorporated
MSP Debuggers
4.4 Hardware Installation Using the MSP Flasher
MSP Flasher is an open-source shell-based interface for programming any MSP430 device through a
MSP Debug Stack and provides the most common functions on the command line. MSP Flasher can be
used to download binary files (.txt or .hex) directly to the MSP430 memory without the need for an IDE like
CCS or IAR. It can also be used to extract firmware directly from a device, set hardware breakpoints, and
lock JTAG access permanently.
MSP Flasher supports the following operating systems:
• Windows 10 32-bit or 64-bit
• Windows 8 32-bit or 64-bit
• Windows 7 32-bit or 64-bit
• Windows XP 32-bit or 64-bit
• Ubuntu™ 32-bit or 64-bit
• OS X 64-bit
Installation steps for the MSP-FET430UIF, MSP-FET, eZ-FET or eZ-FET Lite:
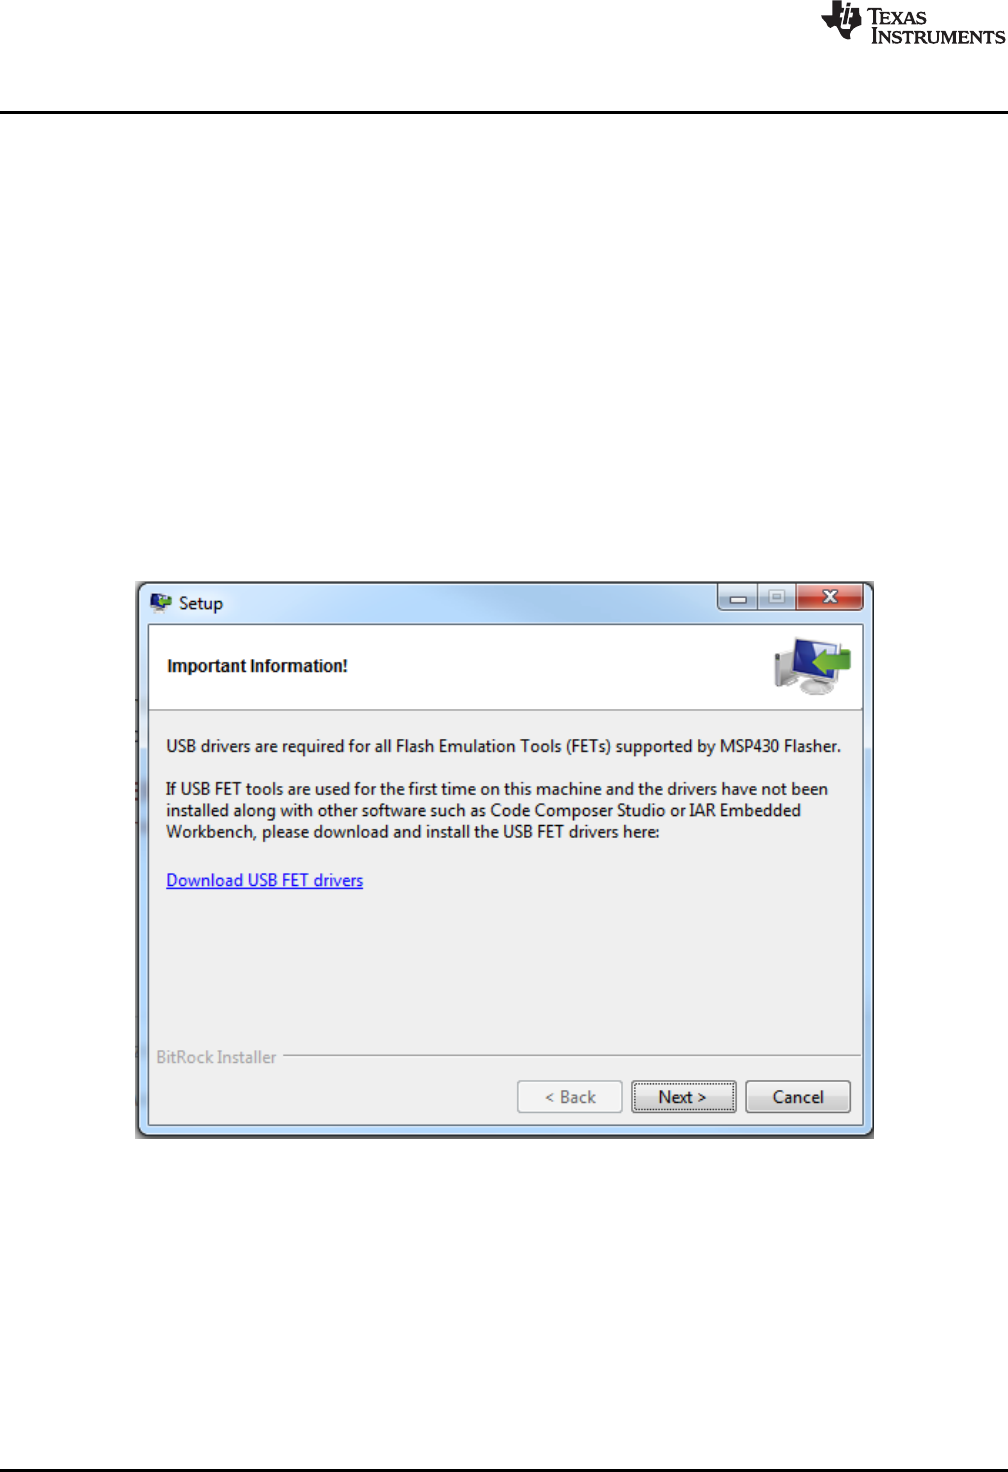
1. After successfully downloading and executing the MSP Flasher installer, it prompts you to execute the
stand-alone driver installer for the MSP debug probes.
Figure 6. MSP Flasher Driver Install Notification
2. Follow the steps given by the stand-alone driver installer for debug probe driver installation.
3. After successful driver installation, connect the debug probe to a USB port on the PC using the
provided USB cable.
4. After connecting the debug probe to a PC, it performs a self-test. If the self-test passes, the green LED
stays on. For a complete list of LED signals, see the LED Signals section of every debug probe in
Section 5.6 through Section 5.8.
5. Connect the debug probe with the target board using the 14-pin ribbon cable.
6. When using a target socket board, make sure that the MSP430 device is properly inserted in the
socket and that its pin 1 (indicated with a circular indentation on the top surface) aligns with the "1"
mark on the PCB.
www.ti.com
Hardware Installation
11
SLAU647L–July 2015–Revised February 2018
Submit Documentation Feedback Copyright © 2015–2018, Texas Instruments Incorporated
MSP Debuggers
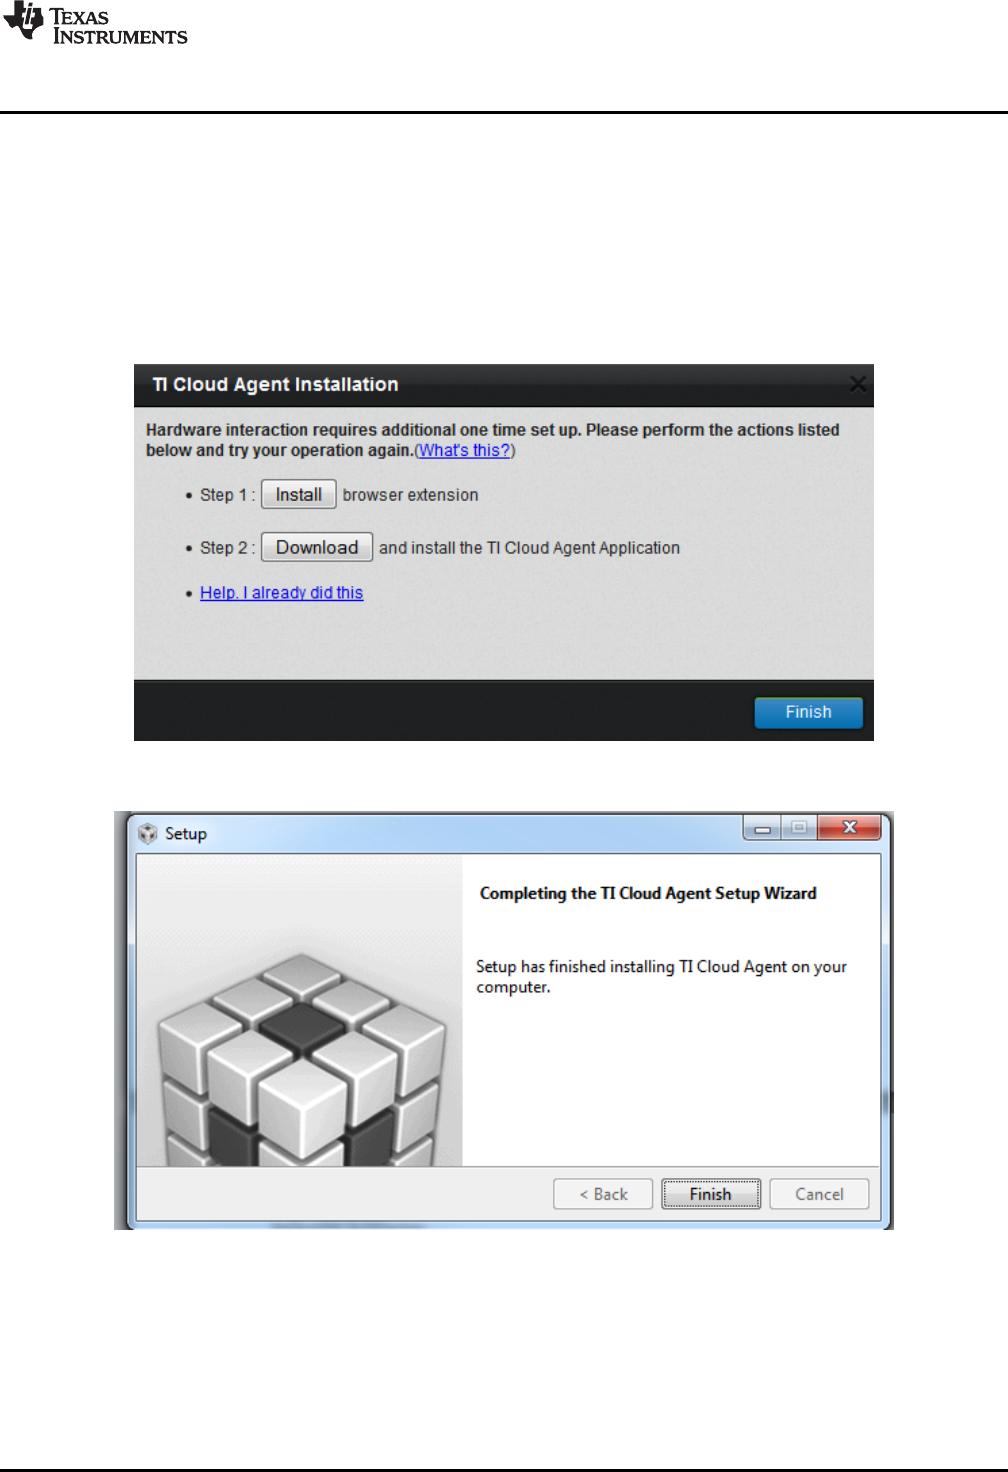
4.5 Hardware Installation Using CCS Cloud
CCS Cloud is web-based IDE that allows you to create, edit, and build CCS and Energia projects. After a
project is successfully built, it can be downloaded and run on the connected LaunchPad or any other
debug probe. Basic debugging features, like setting breakpoints or viewing values of target variables are
now supported.
CCS Cloud can be used with the local debug probe connected to the PC through USB. To support this
configuration, install the "CCS Cloud browser extension", and download and install the "TI Cloud Agent
Application". For more details, see the CCS cloud documentation at
processors.wiki.ti.com/index.php/TI_Cloud_Agent.
Figure 7. CCS Cloud Agent Installation
Figure 8. Successful CCS Cloud Agent Installation
After the successful Agent installation, download the application by clicking the Flash or Debug button in
CCS Cloud.
Debug Probes Hardware and Software
www.ti.com
12 SLAU647L–July 2015–Revised February 2018
Submit Documentation Feedback
Copyright © 2015–2018, Texas Instruments Incorporated
MSP Debuggers
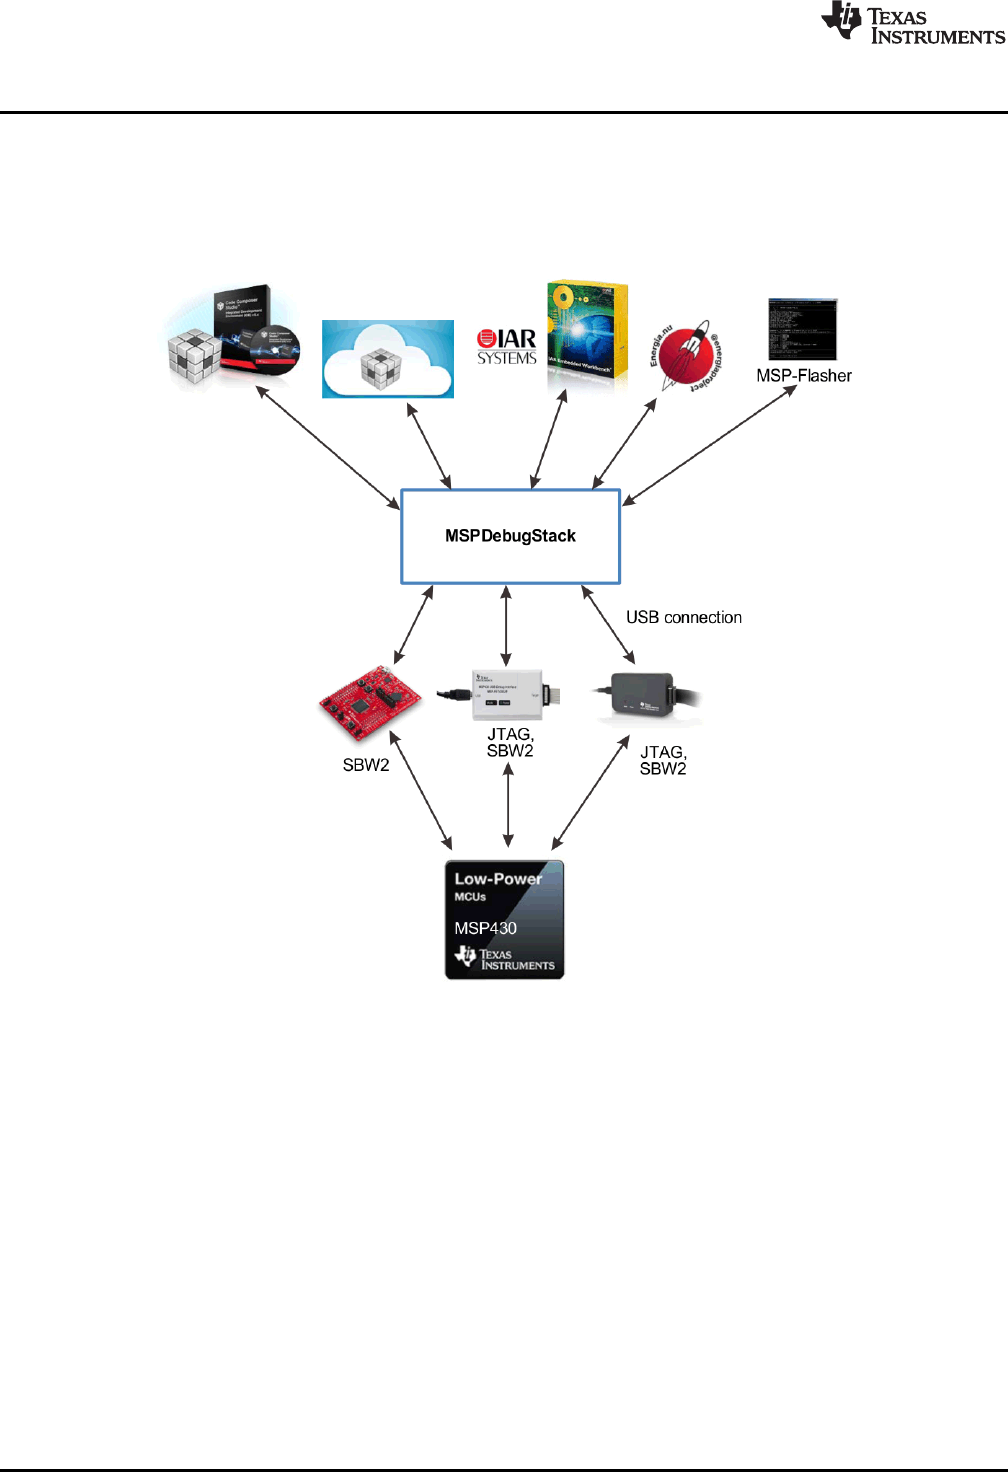
5 Debug Probes Hardware and Software
This section includes all specifications and features of all MSP debug probes. The debug probe hardware
and different debug mode configuration and setting are descried.
Figure 9 is an overview of the MSP ecosystem showing the relations between IDE and debug probe and
the MSP device itself.
Figure 9. MSP Ecosystem

www.ti.com
Debug Probes Hardware and Software
13
SLAU647L–July 2015–Revised February 2018
Submit Documentation Feedback Copyright © 2015–2018, Texas Instruments Incorporated
MSP Debuggers
5.1 MSPDebugStack
The MSPDebugStack is the host side interface to all MSP debug probes. It is a library for controlling and
debugging Texas Instruments MSP ultra-low power microcontrollers during software development phase.
For this purpose the MSP microcontroller is controlled by the MSPDebugStack using the MSP device's
JTAG interface. The MSPDebugStack provides device control (for example, run and stop), memory
programming and debugging functionality (for example, breakpoints).
The MSPDebugStack supports these operating systems:
• Windows 10 32-bit or 64-bit
• Windows 8 32-bit or 64-bit
• Windows 7 32-bit or 64-bit
• Ubuntu 32-bit or 64-bit
• CentOS™ 6 64-bit
• CentOS 7 64-bit
• OS X 64-bit
The debug probe firmware for all field updatable tools is included in the MSPDebugStack. It automatically
detects if an update of the debug probe is required.
For more details and information see www.ti.com/mspds.
5.2 Ultra-Low-Power (ULP) Debug Support
ULP debug support enables users to debug in the low-power modes that are used in their application
software.
If this option is enabled during an active debug session in IAR EW430 or Code Composer studio, the
target MSP430 device enters the low-power modes. Wake-up times can be measured on F5xx, F6xx,
FR5xx, and FR6xx devices. For some MSP430 devices, special debug features are disabled in this mode;
for example, setting breakpoints (hardware and software) while device is running in ULP mode.
NOTE: When debugging with EnergyTrace++ active, this mode must be used.
NOTE: Measured currents might be slightly higher than in stand-alone mode (EnergyTrace) due to
the active debugger connection.
For more details and information, see the MSP430 Ultra-Low-Power LPMx.5 Mode section of
the IAR Embedded Workbench Version v7+ for MSP430 User's Guide and Code Composer
Studio v7.x for MSP430 User's Guide.
5.3 EnergyTrace™ Technology
EnergyTrace technology is an energy-based code analysis tool that measures and displays the energy
profile of an application, which helps to optimize it for ultra-low power consumption.
MSP devices with built-in EnergyTrace+[CPU State]+[Peripheral States] (or in short EnergyTrace++)
technology allow real-time monitoring of many internal device states while user program code executes.
EnergyTrace++ technology is supported on selected MSP devices and debuggers (see Table 1).
EnergyTrace mode (without the "++") is a fundamental part of EnergyTrace technology and enables
analog energy measurement to determine the energy consumption of an application but does not correlate
it to internal device information. The EnergyTrace mode is available for all MSP devices with selected
debuggers, including CCS (see Table 1).
For more details about EnergyTrace technology, visit www.ti.com/tool/energytrace.

Debug Probes Hardware and Software
www.ti.com
14 SLAU647L–July 2015–Revised February 2018
Submit Documentation Feedback
Copyright © 2015–2018, Texas Instruments Incorporated
MSP Debuggers
5.4 Unlimited Software Breakpoints in Flash, FRAM, and RAM
All MSP430 debug tools support the use of software breakpoints in Flash, FRAM, and RAM. Software
breakpoints let the user set an unlimited number of breakpoints during an active debug session.
Without software breakpoints enabled, the number of breakpoints that can be set is limited to the number
of hardware breakpoints available by the specific MSP MCU. All MSP debug tools prefer the use of
hardware breakpoints as much as possible. However, if the MSP breakpoint logic runs out of hardware
breakpoints, software breakpoints are used automatically (if enabled in the IDE).
NOTE: When the debug session is closed, all software breakpoints are erased and the original
memory content is restored.
For more details about the software breakpoints and their IDE-specific use, see the
Breakpoint Types section in IAR Embedded Workbench Version v7+ for MSP430 User's
Guide and Code Composer Studio v7.x for MSP430 User's Guide.
For a practical example of different breakpoint types, see Advanced Debugging Using the
Enhanced Emulation Module (EEM) With Code Composer Studio Version 6.
5.5 JTAG Access Protection (Fuse Blow)
Different MSP430 devices implement different methods to prevent JTAG debug access to the MSP430
target device.
NOTE: Only the MSP-FET and the MSP-FET430UIF support JTAG access protection to disable
JTAG access.
For more details how the JTAG access protection mechanism is implemented see the "JTAG
Access Protection" section in MSP430 Programming With the JTAG Interface.
JTAG fuse
• Available on 1xx, 2xx, and 4xx families (except FRxx and I20xx devices)
• Applying a high voltage to test the TEST pin of the MSP430 target device blows an actual physical
polyfuse and disables the JTAG interface.
JTAG lock without password (eFuse/"soft" fuse)
• Available on 5xx, 6xx, and FRxx families
• A certain lock pattern is written into the MSP430 target memory to disable the JTAG interface.
JTAG lock with password
• Available only FRxx families
• A user-defined password can disable JTAG access to the MSP430 target device.
• Using CCS, EW430, or the MSP Flasher, applying the configured password to the MSP430 target
restores JTAG access
Memory protection by custom startup code (SUC)
• Available on only the i20xx family (for example, the MSP430i2040 device)
• Custom startup code can enable or disable JTAG access to the MSP430i20xx target device.
DAP (Debug Access Port) lock
• Available on MSP432P401x family – Locks JTAG/SWD connection to MSP432P401x device
• Execute a Factory Reset to unlock the Debug Access port.
www.ti.com
Debug Probes Hardware and Software
15
SLAU647L–July 2015–Revised February 2018
Submit Documentation Feedback Copyright © 2015–2018, Texas Instruments Incorporated
MSP Debuggers
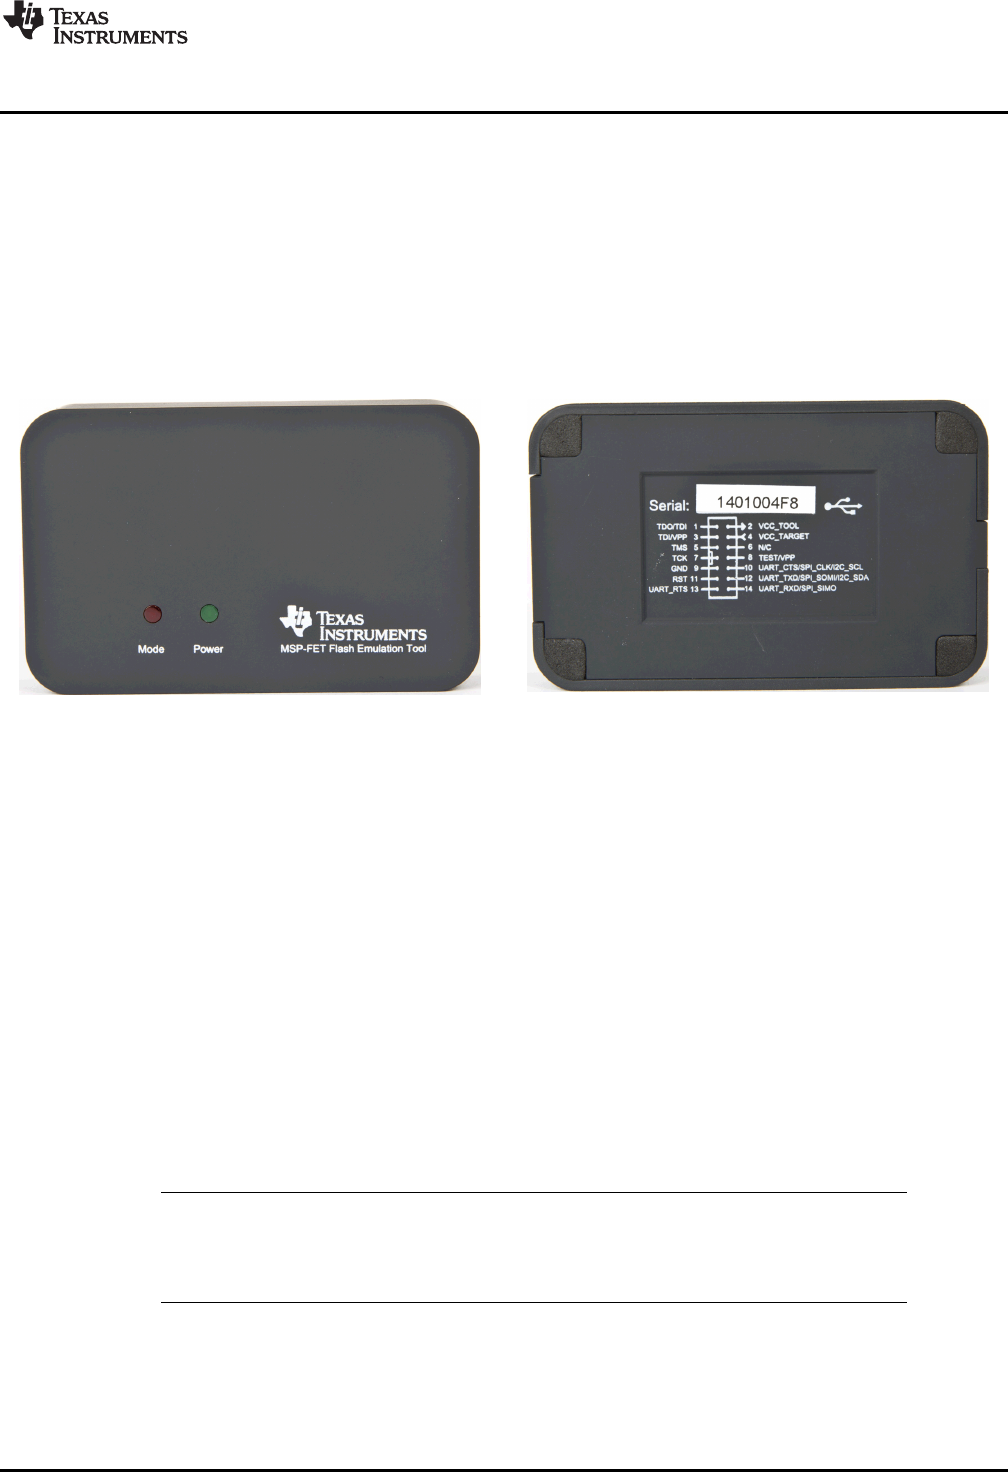
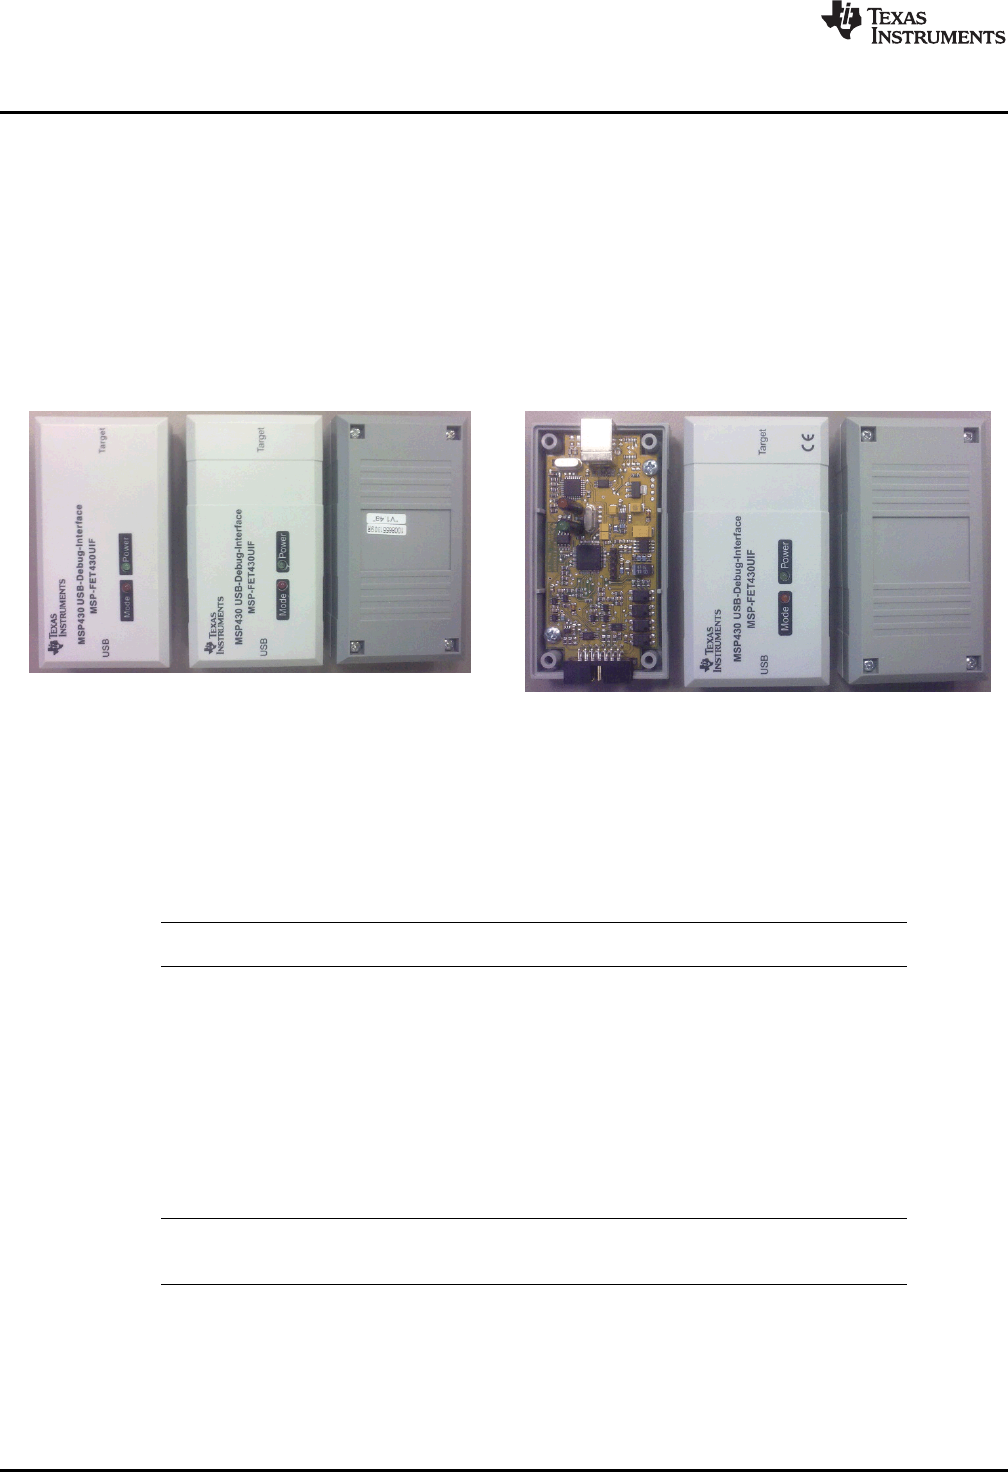
5.6 MSP-FET Stand-Alone Debug Probe
The MSP-FET (see Figure 10 and Figure 11) is a powerful debug probe for application development
supporting all MSP430 microcontrollers.
The MSP-FET provides a USB interface to program and debug the MSP430 devices in-system through
the JTAG interface or the pin-saving Spy-Bi-Wire (2-wire JTAG) protocol. Furthermore, the USB interface
can be used for Backchannel UART and MSP target BSL communication. UART BSL and I2C BSL
communication modes are supported.
The MSP-FET development tool supports development with all MSP430 devices and is designed for use
with PCBs that contain MSP430 devices; for example, the MSP430 target socket boards.
Figure 10. MSP-FET Top View Figure 11. MSP-FET Bottom View
5.6.1 General Features
The MSP-FET debug probe includes the following features:
• MSP-FET first generation (v1.2):
– Has no CE sticker or label on the case, and no W at the end of the version number
– Is supported since:
• CCS v6.0.0
• IAR EW430 v5.60.7 and IAR EWARM v6.10.1
• MSP-FET second generation (v2.04, v2.05, and v2.06):
– Has a CE sticker or label on the case, or a W at the end of the version number
– Is supported since:
• CCS v7.0
• IAR EW430 7.1 and IAR EWARM 8.10
• Operating systems: OS X, Linux, Windows
• Software configurable supply voltage between 1.8 V and 3.6 V at 100 mA
NOTE: The MSP-FET supply voltage is generated by an DC/DC converter, which creates a voltage
ripple on the target supply line. This ripple can affect the performance of the analog modules
of the MSP device (for example, the ADC and the DAC). If necessary, connect an low-ripple
external power supply to the target application.
• External voltage detection
• Supports JTAG security fuse blow to disable debugging
• Supports all MSP430 boards with JTAG header
• Supports both JTAG and Spy-Bi-Wire (2-wire JTAG) debug protocols
Debug Probes Hardware and Software
www.ti.com
16 SLAU647L–July 2015–Revised February 2018
Submit Documentation Feedback
Copyright © 2015–2018, Texas Instruments Incorporated
MSP Debuggers
(1) Enable new device support by in field firmware updates
• EnergyTrace Technology (MSP430 and MSP432 devices), EnergyTrace+ (MSP432 devices only), and
EnergyTrace++ (MSP430 devices only) support
• EnergyTrace technology accuracy
– Current < 25 µA: Error range is typically ±500 nA.
– Current ≥25 µA: Error range is typically ±2% to ±4%.
• Software breakpoints in flash, FRAM, and RAM
• MSPDS application backchannel UART included
• Target BSL communication mode available
• Flash and FRAM programming support
• Debug probe firmware field update is supported (1)
• Supports all MSP432P401x boards with Arm®20-pin and 10-pin connectors using the MSP432
Adapter for MSP-FET
• Supports JTAG and SWD MSP432 debug protocols
NOTE: The MSP-FET does not support the MSP432E4 family of devices.
5.6.2 Backchannel UART
The MSP-FET supports the Backchannel UART functionality only when using an MSPDebugStack
v3.4.1.0 or higher for the MSP-FET connection.
The baud rates that are supported depend on the target configuration and the debug settings. Table 2
shows which baud rates are supported with certain configuration combinations.
✓means that the corresponding baud rate is supported without any data loss with the specified
combination of settings.
✗means that the corresponding baud rate is not supported (data loss is expected) with the specified
combination of settings.
Table 2. MSP-FET Backchannel UART Implementation
Target MCLK
Frequency: 1 MHz 8 MHz 1 MHz 8 MHz
Debugger: Active Inactive
Flow Control: No Yes No Yes No Yes No Yes
4800 baud ✓✓✓✓✓✓✓✓
9600 baud ✓✓✓✓✓✓✓✓
19200 baud ✓✓✓✓✓✓✓✓
28800 baud ✗✓✓✓✓✓✓✓
38400 baud ✗✓✗✓✗✓✗✓
57600 baud ✗✓✗✓✗✓✗✓
115200 baud ✗✗✗✓✗✗✗✓
www.ti.com
Debug Probes Hardware and Software
17
SLAU647L–July 2015–Revised February 2018
Submit Documentation Feedback
Copyright © 2015–2018, Texas Instruments Incorporated
MSP Debuggers
5.6.2.1 UART Backchannel Activation Commands
The MSP-FET supports two different Backchannel UART modes, one with flow control and one without.
The different modes can be selected by opening the corresponding COM port with a dedicated baud rate.
See Table 3 for the specific baud rates for each command.
NOTE: The baud rates used by these activation commands cannot be used for communication.
NOTE: The Backchannel UART is disabled until the COM port is opened with a valid baud rate.
If none of the specified commands are transferred before setting the communication baud rate,
communication starts with the default settings: 3.3-V target VCC, no flow control mechanism, no parity.
Table 3. MSP-FET Backchannel UART Activation Commands
Baud Rate Command
9620 Set all backchannel UART pins to high impedance – no current flow into target device
9621 Configure backchannel UART communication without handshake (default start behavior)
9622 Configure backchannel UART communication with handshake
9623 Voltage configuration command. When this command is received, target VCC is set to 3.3 V. After target VCC
is configured, it is switched through to the target device.
9625 Configure backchannel UART communication without handshake and even parity (available starting with
MSPDebugStack version 3.8.0.2)
5.6.3 Target BSL Connection and BSL-Scripter Support
The MSP-FET can be used for communication with the target device bootloader (BSL) through the I2C and
UART protocols. The activation of the different protocols is equivalent to the MSP-FET backchannel
UART. See Table 4 for command details.
The BSL-Scripter software implements support for these activation commands and performs the correct
sequence according to the communication interface (UART, I2C) that is specified in the script.
In MSP-FET BSL communication mode, flow control is not available, because this is not supported by the
MSP target device BSL.
UART BSL: The MSP-FET BSL UART mode supports the following baud rates: 9600, 14400, 19200,
28800, 38400, 56000, 57600, and 115200. For the BSL UART, 8 + 1 + even parity is used.
I2C BSL: The MSP-FET is always the I2C master, and the target device BSL is always the I2C slave. 7-bit
I2C addressing mode is used with a fixed I2C slave address of 0x48.
NOTE: If the MSP-FET is configured to support BSL communication, debugger functionality is
disabled. To switch to debugger mode, either perform a power cycle (unplug the USB cable)
or configure the baud rate to 8001. The BSL mode is disabled until sending a BSL entry
baud rate command.
NOTE: MSP-FET BSL I2C pullup resistors must not exceed 2-kΩresistance.
The maximum I2C clock rate is 55 kHz.
Debug Probes Hardware and Software
www.ti.com
18 SLAU647L–July 2015–Revised February 2018
Submit Documentation Feedback
Copyright © 2015–2018, Texas Instruments Incorporated
MSP Debuggers
Table 4. MSP-FET MSP Target BSL Activation Commands
Baud Rate Command
9620 Set all UART or I2C pins to high impedance – no current flow into target device
9601 BSL entry sequence and power up 3.3 V (UART BSL) – debugger is disabled
100000 or 100001 BSL entry sequence and power up 3.3 V (I2C BSL) – debugger is disabled
400000 or 400001 BSL entry sequence and power up 3.3 V (I2C BSL) – debugger is disabled
9623 Power up 3.3 V
8001 Activate debugger
100002 or 400002 Configure communication and power up 3.3 V (MSP432 I2C BSL) – debugger is disabled, no BSL entry sequence
9602 Configure communication and power up 3.3 V (MSP432 UART BSL) – debugger is disabled, no BSL entry
sequence
NOTE: The MSP-FET I2C interface is a software I2C implementation, which always runs with a
speed of approximately 55 kHz. The four different speed configurations are supported for
compatibility purposes with BSL-Scripter and the BSL-Rocket.
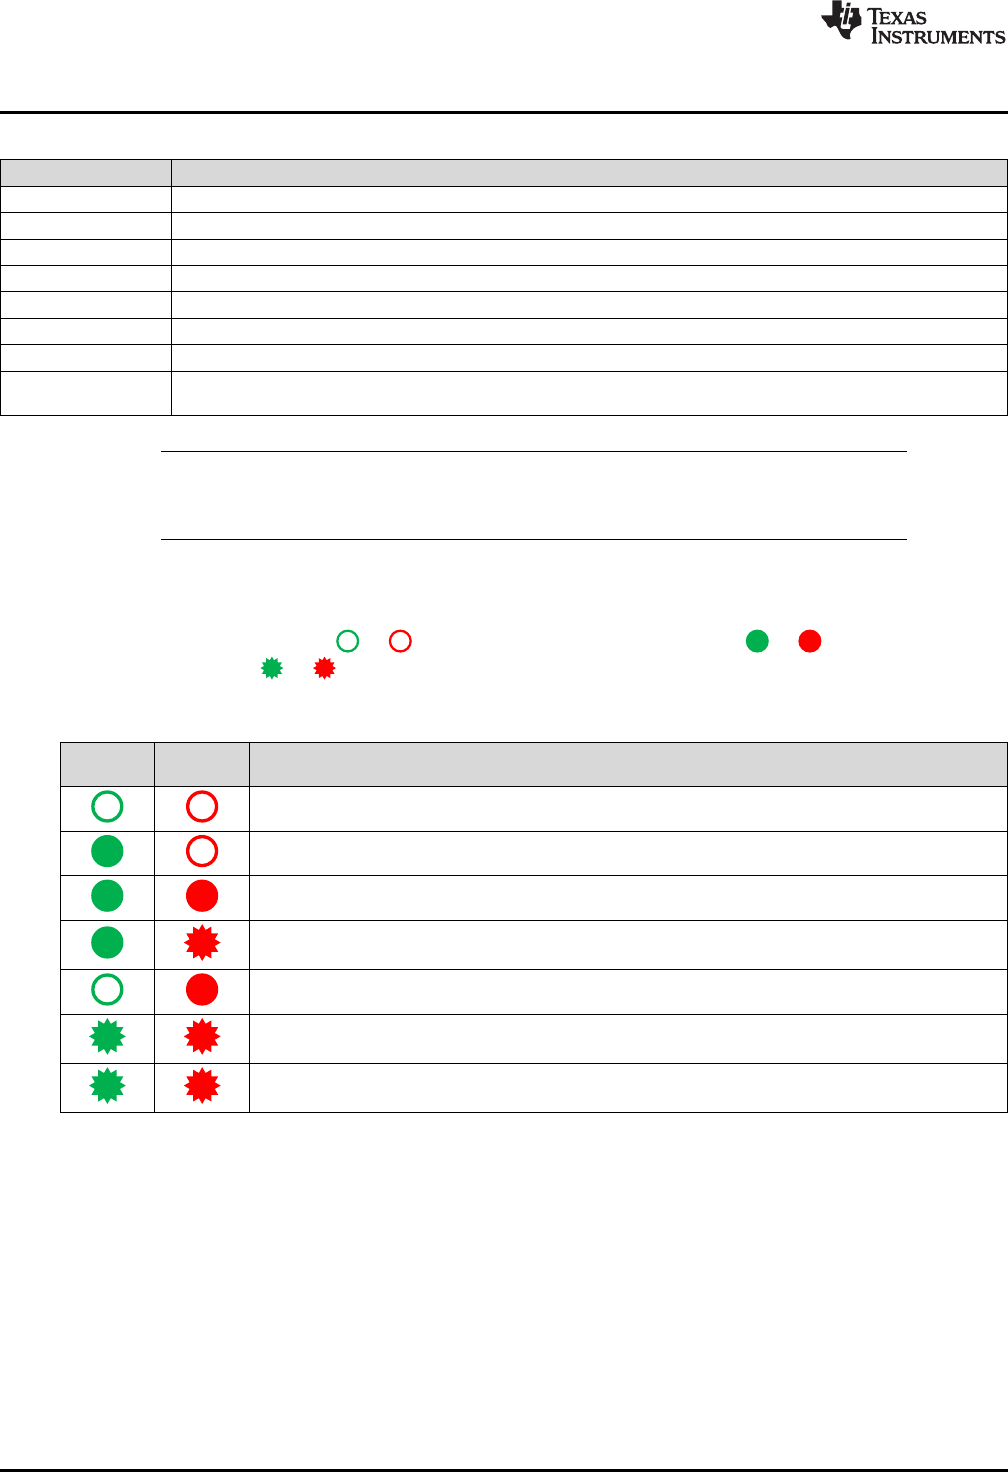
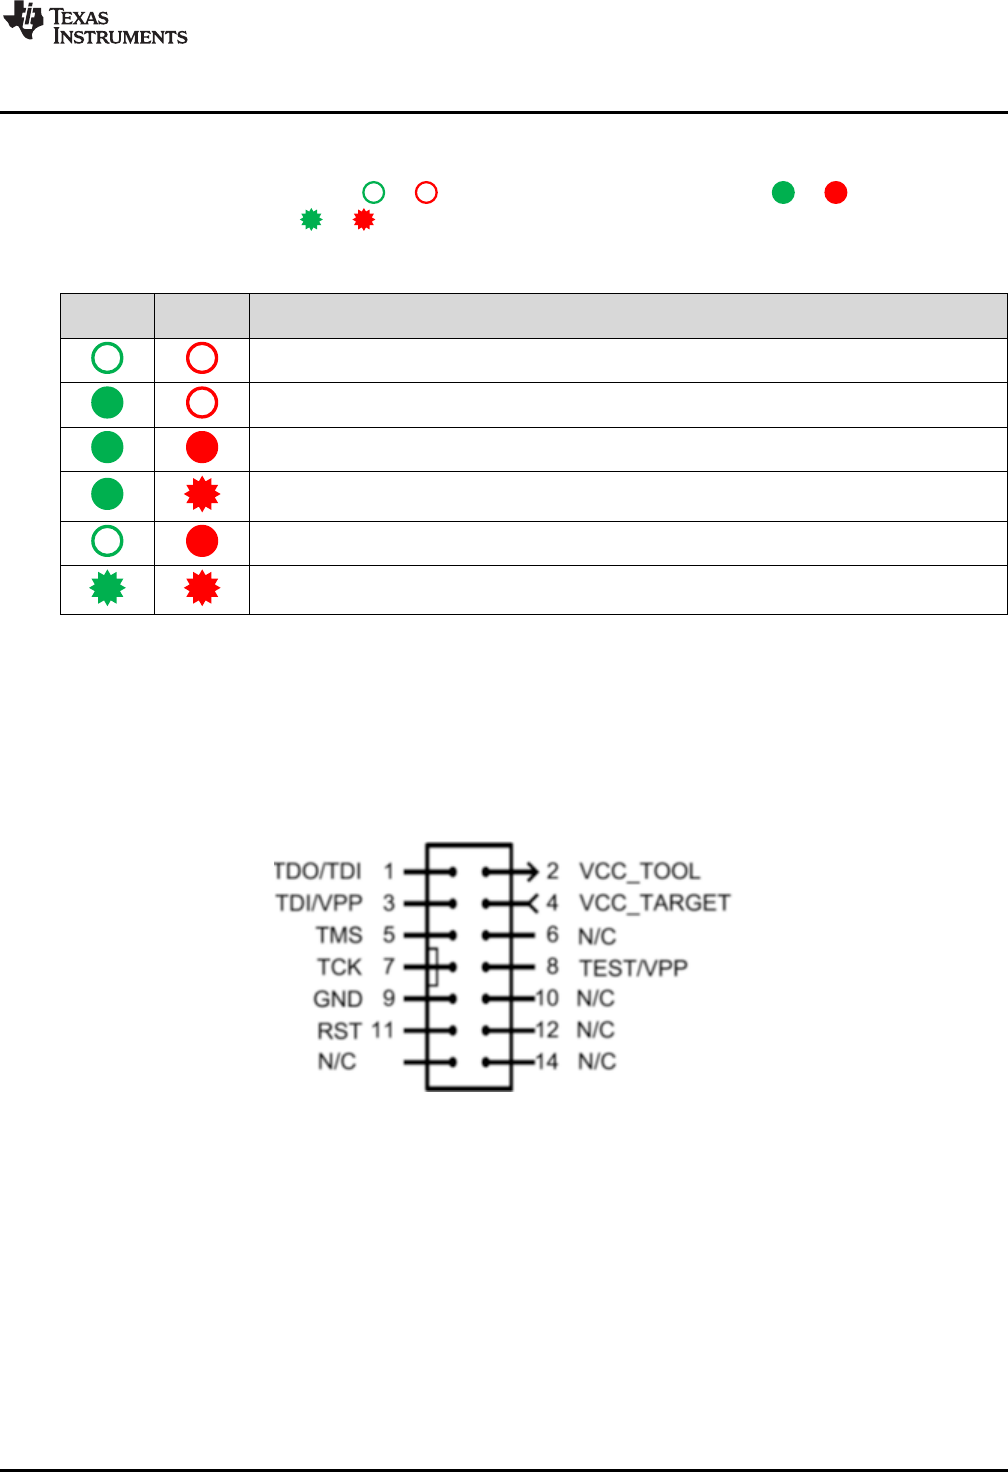
5.6.4 LED Signals
The MSP-FET shows its operating states using two LEDs, one green and one red. Table 5 lists all
available operation modes. An or icon indicates that the LED is off, an or icon indicates that
the LED is on, and an or icon indicates that the LED flashes.
Table 5. MSP-FET LED Signals
Power
LED Mode LED Function
MSP-FET not connected to PC or MSP-FET not ready; for example, after a major firmware update.
Connect or reconnect MSP-FET to PC.
MSP-FET connected and ready
MSP-FET waiting for data transfer
Ongoing data transfer – during active debug session
An error has occurred; for example, target VCC over current. Unplug MSP-FET from target, and cycle the
power off and on. Check target connection, and reconnect MSP-FET.
Firmware update in progress. Do not disconnect MSP-FET while both LEDs are blinking slowly.
FPGA update in progress. Do not disconnect MSP-FET while both LEDs are blinking rapidly.
www.ti.com
Debug Probes Hardware and Software
19
SLAU647L–July 2015–Revised February 2018
Submit Documentation Feedback Copyright © 2015–2018, Texas Instruments Incorporated
MSP Debuggers
5.6.5 Hardware
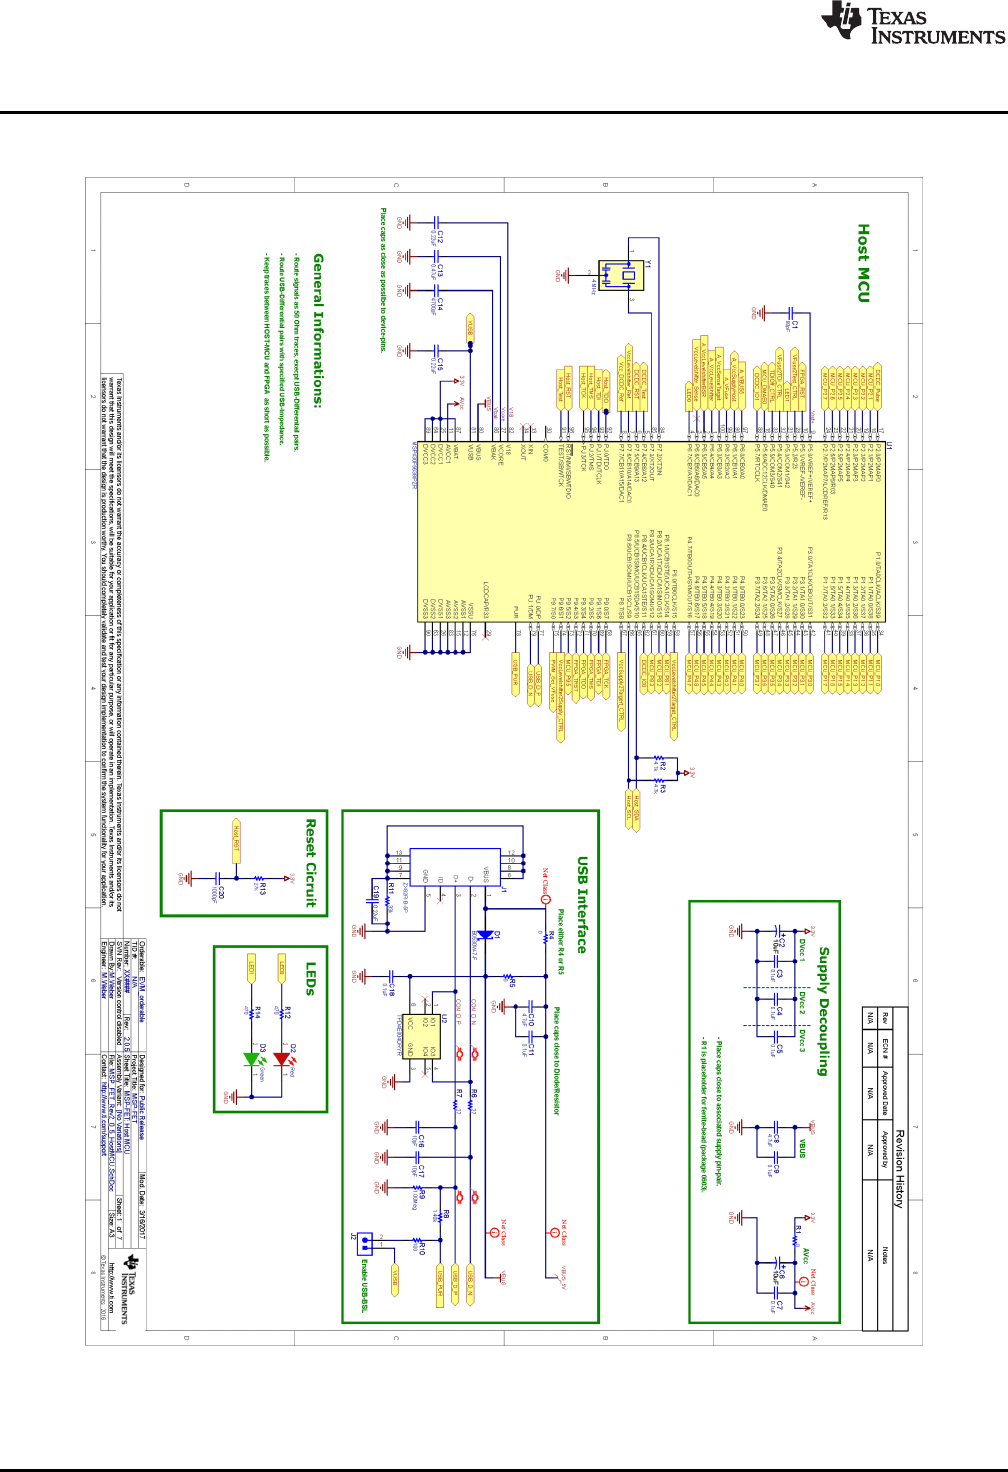
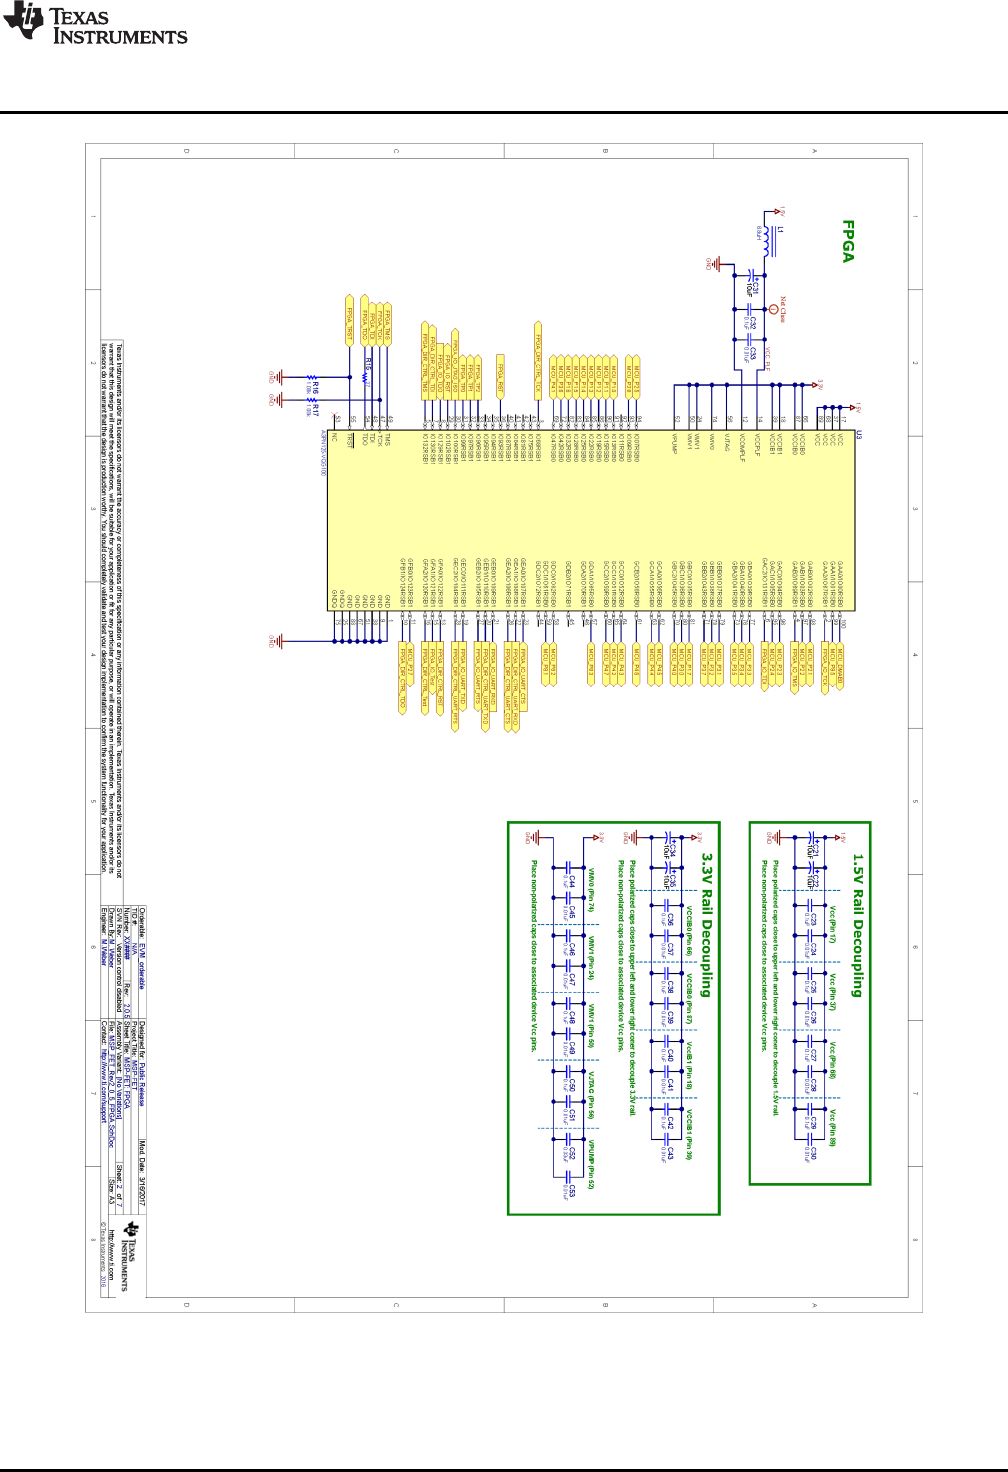
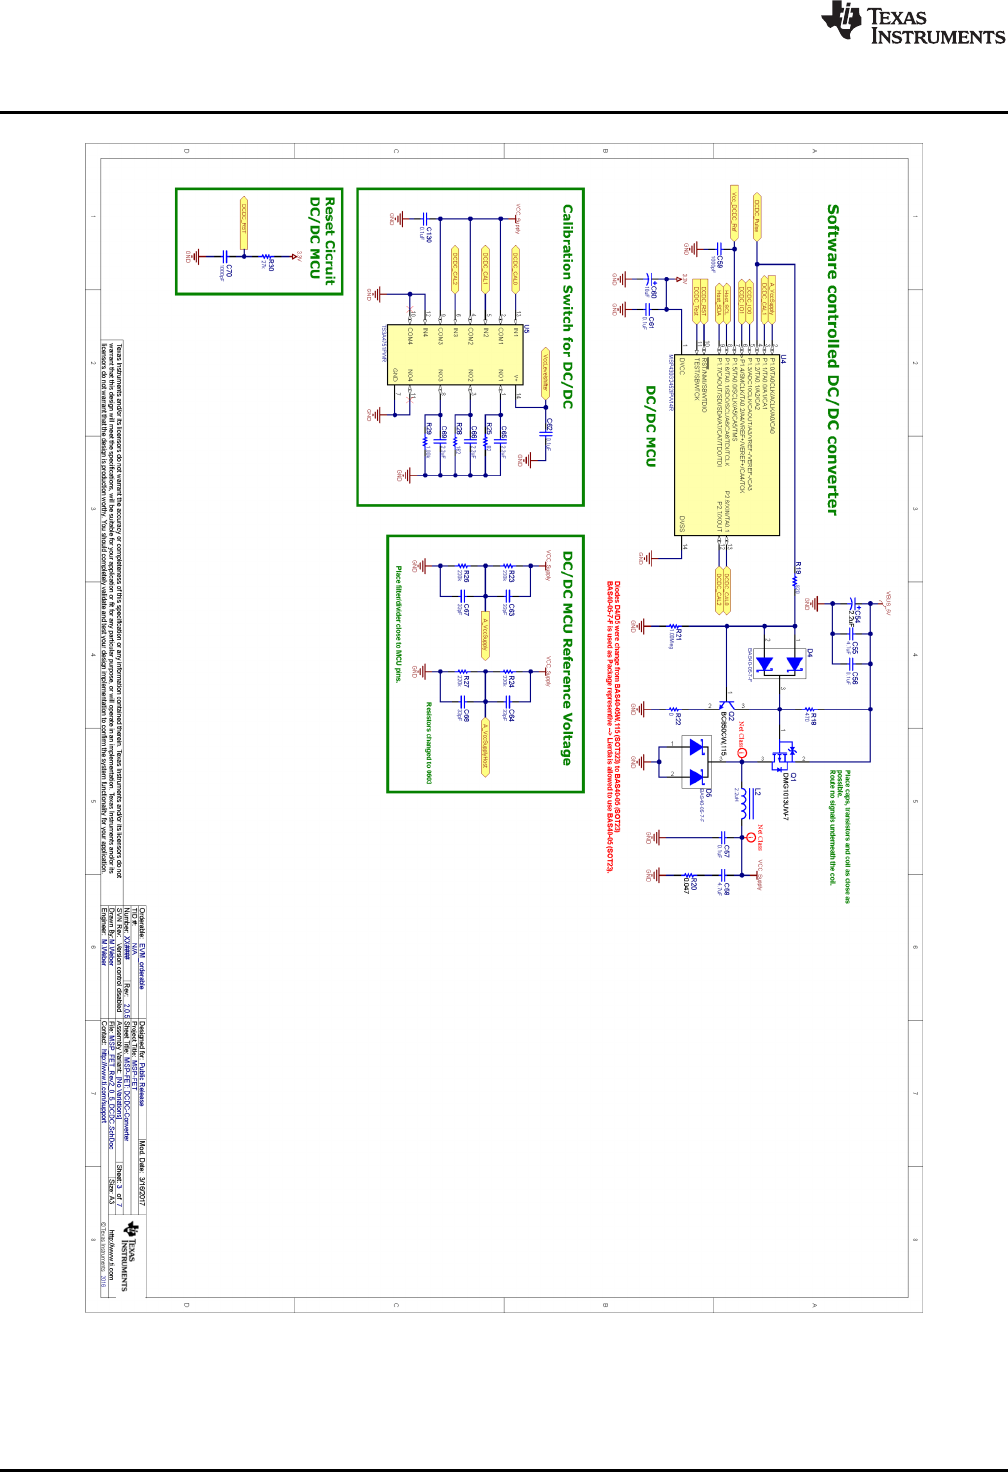
This section includes MSP-FET hardware descriptions like the JTAG connector, schematics, and power-
up states of the MSP-FET JTAG pins.
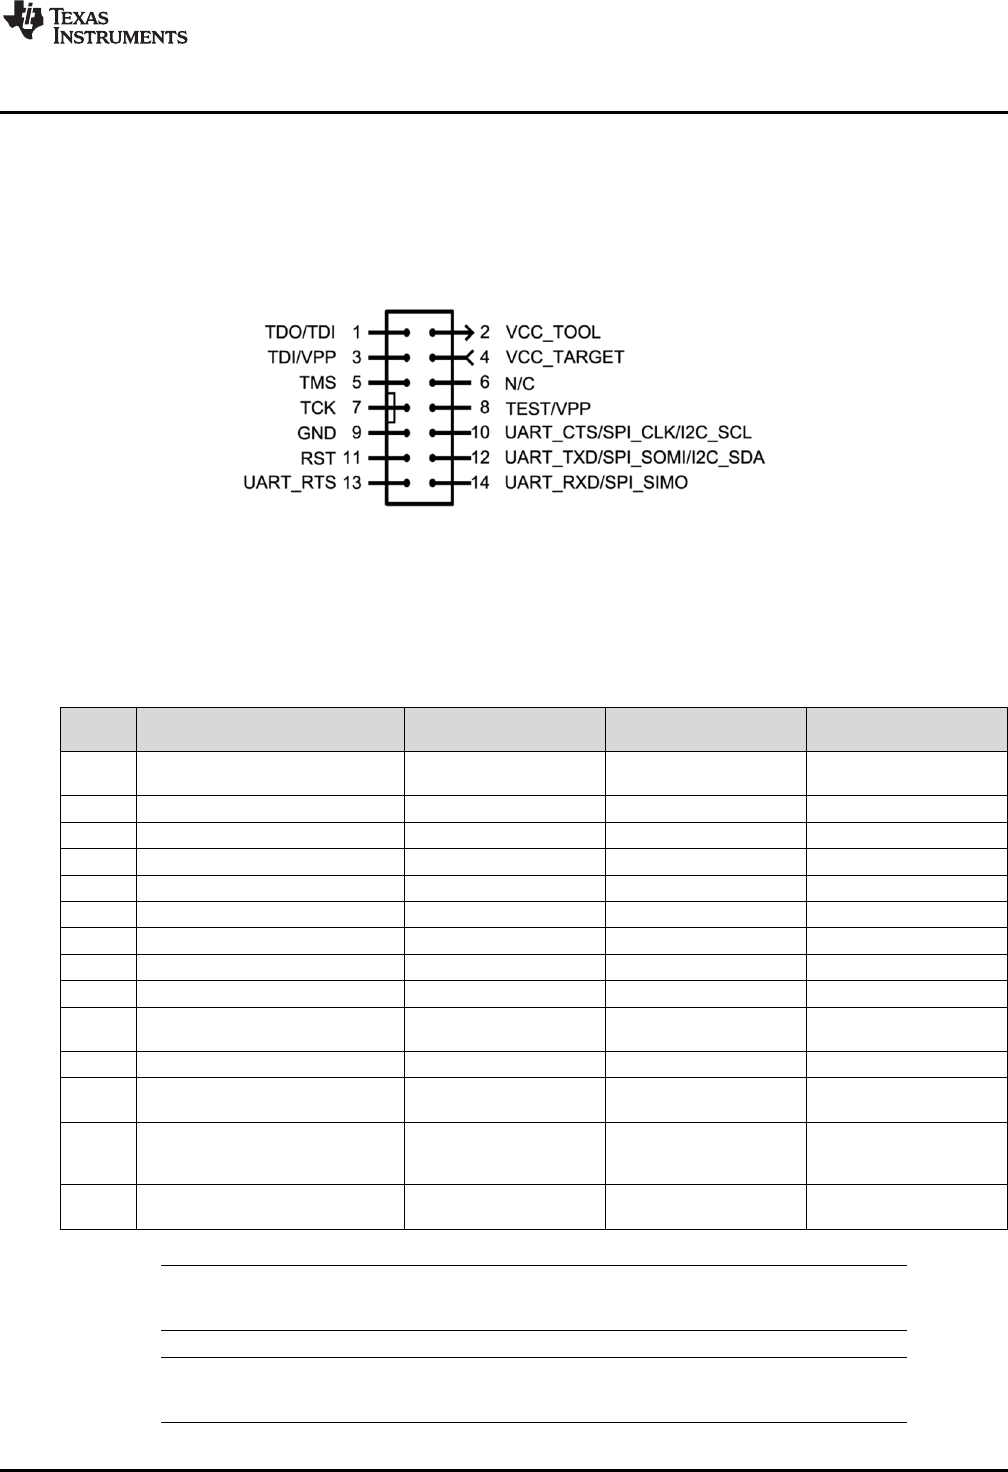
5.6.5.1 JTAG Target Connector
Figure 12 shows the pinout of the MSP-FET JTAG connector.
Figure 12. MSP-FET 14-Pin JTAG Connector
5.6.5.2 MSP-FET Pin States After Power Up
Table 6 describes the electrical state of every JTAG pin after debug probe power up.
Table 6. MSP-FET Pin States
Pin Name After Power up When JTAG Protocol is
Active When Spy-Bi-Wire
Protocol is Active
1 TDO/TDI Hi-Z, pulled up to 3.3 V In, TDO In and Out, SBWTDIO
(RST pin)
2 VCC_TOOL 3.3 V Target VCC Target VCC
3 TDI/VPP Hi-Z, pulled up to 3.3 V Out, TDI Hi-Z, pulled up to VCC
4 VCC_TARGET In, external VCC sense In, external VCC sense In, external VCC sense
5 TMS Hi-Z, pulled up to 3.3 V Out, TMS Hi-Z, pulled up to VCC
6 N/C N/C N/C N/C
7 TCK Hi-Z, pulled up to 3.3 V Out, TCK Out, SBWTCK
8 TEST/VPP Out, Ground Out, TEST Hi-Z, pulled up to VCC
9 GND Ground Ground Ground
10 UART_CTS/SPI_CLK/I2C_SCL Hi-Z, pulled up to 3.3 V Out, Target UART Clear-
To-Send Handshake input Out, Target UART Clear-
To-Send Handshake input
11 RST Out, VCC Out, RST Ground
12 UART_TXD/SPI_SOMI/I2C_SDA Hi-Z, pulled up to 3.3 V In, Target UART TXD
output In, Target UART TXD
output
13 UART_RTS Hi-Z, pulled up to 3.3 V In, Target UART Ready-
to-Send Handshake
output
In, Target UART Ready-
to-Send Handshake
output
14 UART_RXD/SPI_SIMO Hi-Z, pulled up to 3.3 V Out, Target UART RXD
input Out, Target UART RXD
input
NOTE: To enable the UART, I2C, or SPI pins, the correct invalid baud rate activation command
must be sent (see Table 3 and Table 4). After this, the pins switch to the states in Table 6.
NOTE: MSP430BSL-SPI support is currently not available using the MSP-FET. The pin names used
in Table 6 are the same as the names that are printed on the back of the MSP-FET.
Debug Probes Hardware and Software
www.ti.com
20 SLAU647L–July 2015–Revised February 2018
Submit Documentation Feedback
Copyright © 2015–2018, Texas Instruments Incorporated
MSP Debuggers
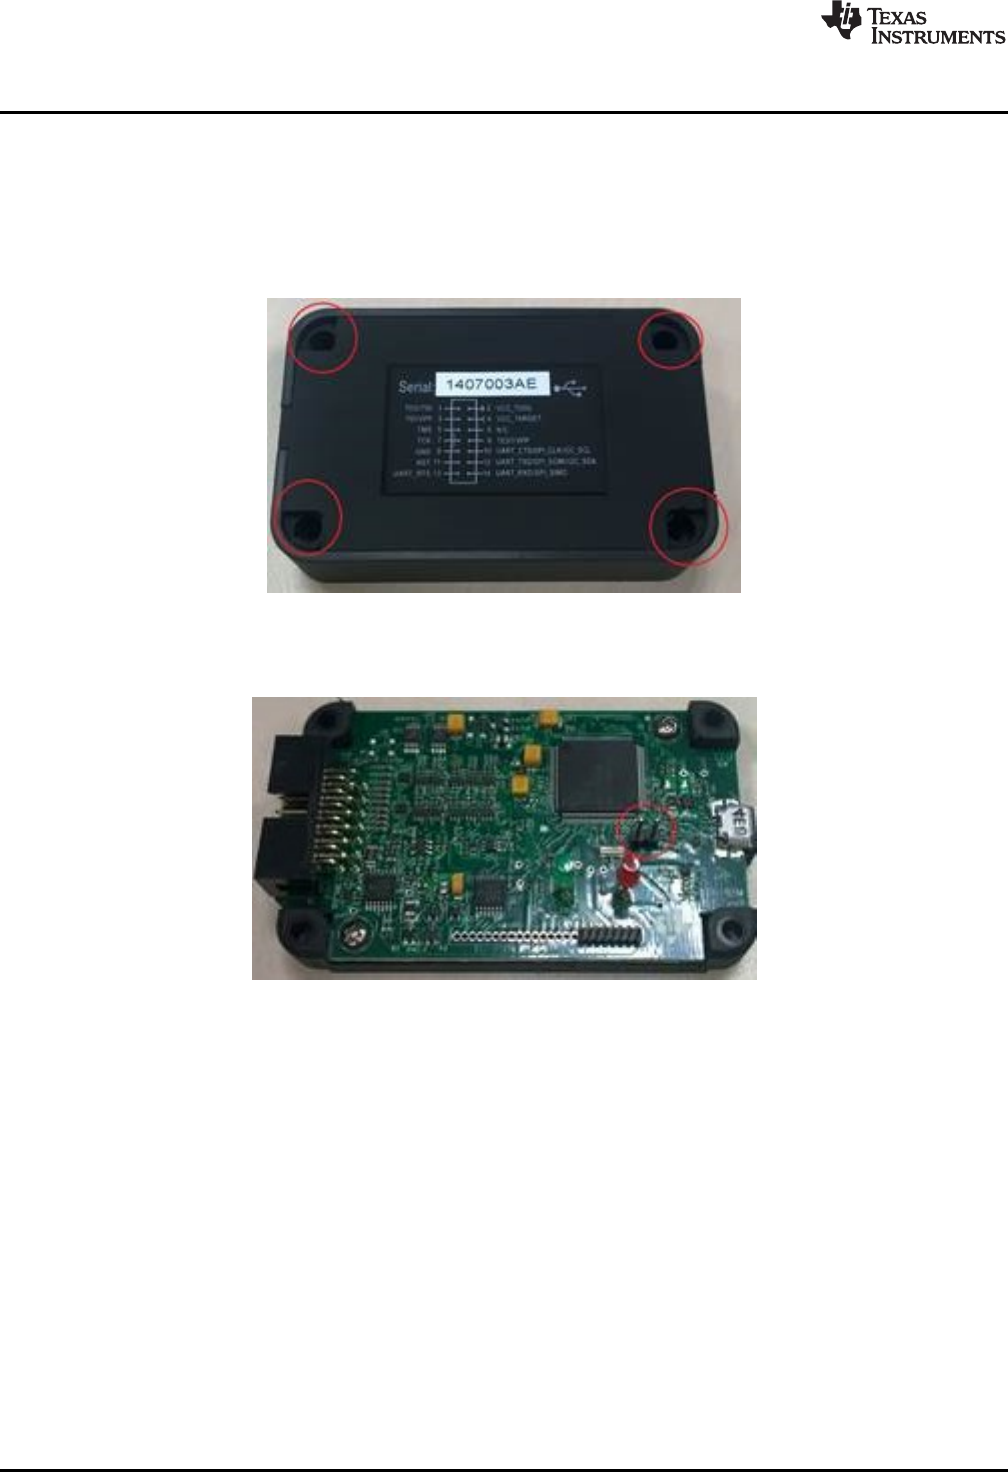
5.6.5.3 MSP-FET HID Cold Boot
If the MSP-FET does not respond to software commands or firmware updates, a cold boot is the last
option to bring it back to operation. A cold boot is performed by connecting VBUS to the PUR signal of the
MSP-FET host device (MSP430F6638) with a serial resistor.
To execute this procedure, the MSP-FET cover must be opened by unscrewing the four screws on its
back (see Figure 13). Make sure that the USB cable is disconnected from the computer.
Figure 13. Open MSP-FET Cover
Next connect a cable or jumper to J5 (see Figure 14).
Figure 14. Jumper J5
Plug in the USB cable while the jumper is on J5. After boot, remove the jumper from J5. The MSP-FET is
recognized by the device manager of the OS as an HID-compliant device. The green LED should be on.
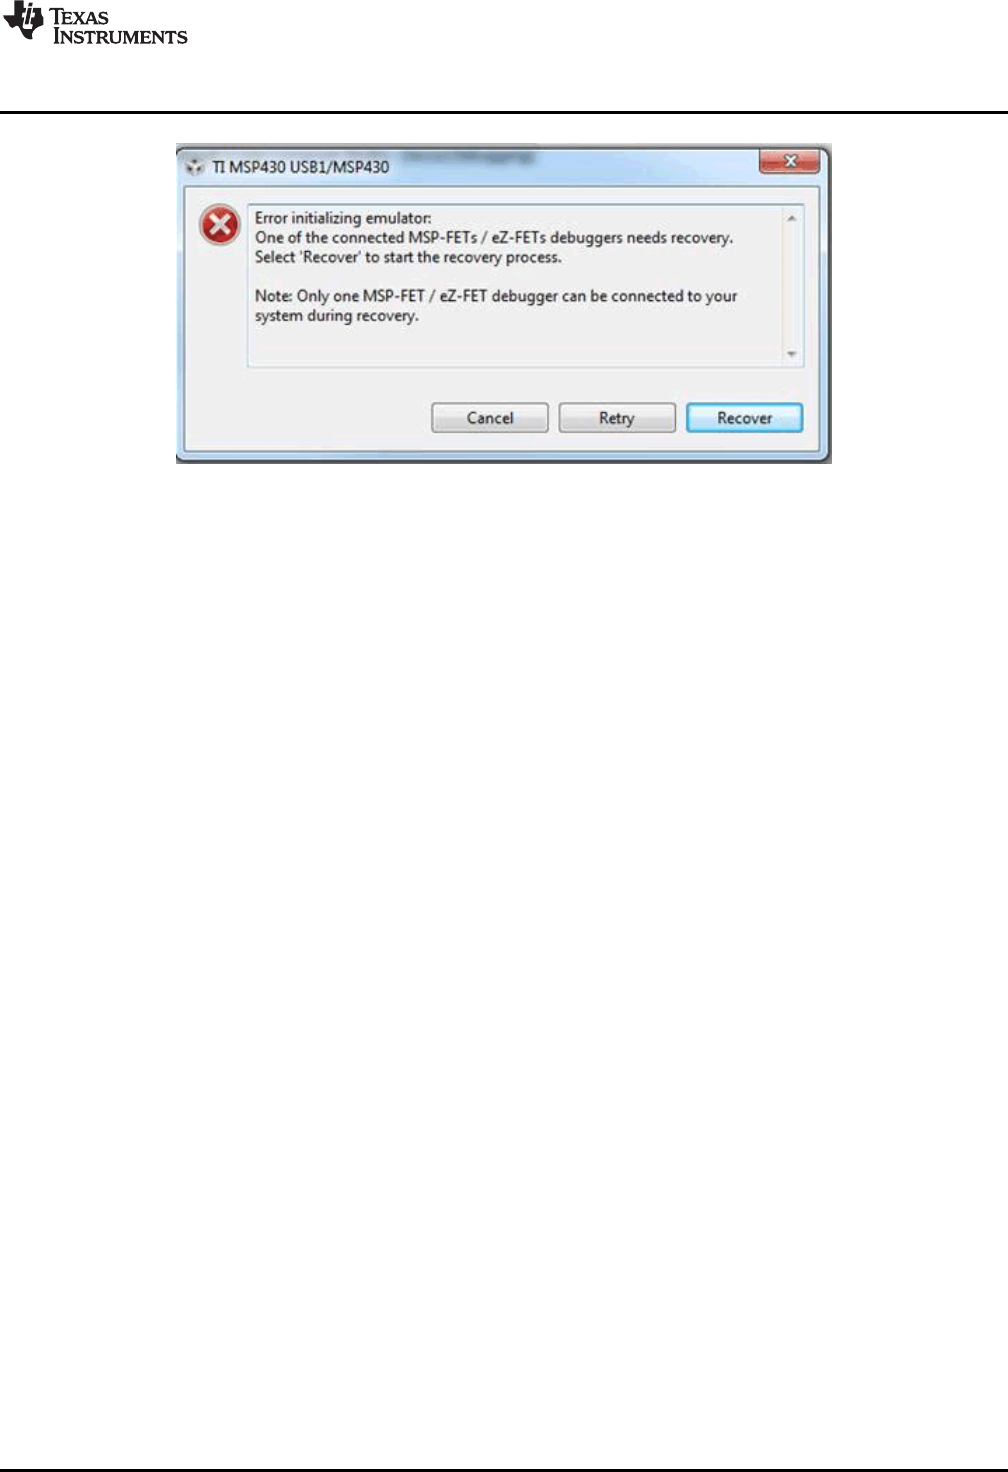
Start the IDE while the MSP-FET is in recovery (HID) mode. When prompted (see Figure 15), confirm the
request to recover the firmware and all following firmware update requests.
Debug Probes Hardware and Software
www.ti.com
28 SLAU647L–July 2015–Revised February 2018
Submit Documentation Feedback
Copyright © 2015–2018, Texas Instruments Incorporated
MSP Debuggers
5.6.6 Specifications
This section includes the MSP-FET specifications.
5.6.6.1 Hardware
Table 7 lists the mechanical and interface specifications for the MSP-FET.
Table 7. Mechanical and Interface Specifications
Mechanical
Size (without cables) 80 mm x 50 mm x 20 mm
Interfaces
USB interface USB 2.0, full speed
Target interface JTAG 14-pin See Figure 12 for pinout
JTAG cable length 20 cm (max)
5.6.6.2 MSP430 MCUs
Table 8 lists the specifications for the MSP-FET interface to MSP430 microcontrollers.
Table 8. JTAG and Spy-Bi-Wire Interface Specifications
JTAG and Spy-Bi-Wire Interface, Electrical
Power supply USB powered,
200 mA (max)
Target output voltage
VCC_TOOL 1.8 V to 3.6 V Selectable in 0.1-V steps. VCC_TOOL available from JTAG pin 2.
Target output current 100 mA (max) Current supplied through JTAG pin 2
Target output overcurrent
detection level 160 mA (max)
JTAG signal overcurrent
detection level 30 mA (max) Total current supplied through JTAG pins 1, 3, 5, 7, 8, 10, 11, 12, 13, 14
External target supply Supported
(1.8 V to 3.6 V) Connect external target voltage VCC_TARGET to JTAG pin 4. JTAG and
SBW signals are regulated to external target voltage ±100 mV.
Fuse blow Supported For devices with poly-fuse
JTAG and Spy-Bi-Wire Interface, Timing
JTAG clock speed 8 MHz (max) Protocol speed selectable by software
SBW clock speed 8 MHz (max) Protocol speed selectable by software. System limitations due to external RC
components on reset pin might apply.
JTAG and Spy-Bi-Wire Interface, Speed
Flash write speed (JTAG) Up to 20 kB/s
Flash write speed (SWB) Up to 7 kB/s
FRAM write speed (JTAG) Up to 50 kB/s
FRAM write speed (SWB) Up to 14 kB/s
www.ti.com
Debug Probes Hardware and Software
29
SLAU647L–July 2015–Revised February 2018
Submit Documentation Feedback Copyright © 2015–2018, Texas Instruments Incorporated
MSP Debuggers
5.6.6.3 SimpleLink MSP432 MCUs
Table 9 lists the specifications for the MSP-FET interface to MSP432 microcontrollers.
Table 9. JTAG and SWD Interface Specifications
JTAG and SWD Interface, Electrical
Power supply USB powered,
200 mA (max)
Target output voltage
VCC_TOOL 1.8 V to 3.6 V Selectable in 0.1-V steps. VCC_TOOL available from JTAG pin 2.
Target output current 100 mA (max) Current supplied through JTAG pin 2
Target output overcurrent
detection level 160 mA (max)
JTAG signal overcurrent
detection level 30 mA (max) Total current supplied through JTAG pins 1, 3, 5, 7, 8, 10, 11, 12, 13, 14
External target supply Supported
(1.8 V to 3.6 V) Connect external target voltage VCC_TARGET to JTAG pin 4. JTAG and
SBW signals are regulated to external target voltage ±100 mV.
JTAG and SWD Interface, Timing
JTAG clock speed 10 MHz (max) Protocol speed selectable by software
SWD clock speed 3 MHz (max) Protocol speed selectable by software. System limitations due to external RC
components on reset pin might apply.
JTAG and SWD Interface, Speed
Flash write speed (JTAG) Up to 70 kB/s
Flash write speed (SWD) Up to 22 kB/s
Debug Probes Hardware and Software
www.ti.com
30 SLAU647L–July 2015–Revised February 2018
Submit Documentation Feedback
Copyright © 2015–2018, Texas Instruments Incorporated
MSP Debuggers
5.7 MSP-FET430UIF Stand-Alone Debugger
The MSP-FET430UIF is a powerful debug probe for application development on MSP430 microcontrollers.
This is a legacy debugger being replaced by MSP-FET.
The MSP-FET430UIF provides a USB interface to program and debug the MSP430 devices in-system
through the JTAG interface or the pin-saving Spy-Bi-Wire (2-wire JTAG) protocol.
The MSP-FET430UIF development tool supports development with all MSP430 devices and is designed
for use with PCBs that contain MSP430 devices; for example, the MSP430 target socket boards.
Two different version of the MSP-FET430UIF are available, version 1.3 and version 1.4a. There are
limitations when using version 1.3. See Section 5.7.1 for more details.
Figure 22. MSP-FET430UIF Version 1.4a Top and Bottom
Views Figure 23. MSP-FET430UIF Version 1.3 Top and Bottom
Views
5.7.1 General Features
The following features are provided by the MSP-FET430UIF debug probe.
Features:
• Operating systems: OS X, Linux, Windows
NOTE: OS X El Capitan is not supported using the MSP-FET430UIF.
• Software configurable supply voltage between 1.8 V and 3.6 V at 100 mA
• External voltage detection
• Supports JTAG security fuse blow to protect code
• Supports all MSP430 boards with JTAG header
• Supports both JTAG and Spy-Bi-Wire (2-wire JTAG) debug protocols
• Software breakpoints in flash, FRAM, and RAM support
• Flash and FRAM programming support
• Software field update is possible (enable new device support by in field firmware updates)
NOTE: The MSP-FET430UIF version 1.3 does not support Spy-Bi-Wire connection for MSP430
devices with 1-µF capacitance on the reset line.
www.ti.com
Debug Probes Hardware and Software
31
SLAU647L–July 2015–Revised February 2018
Submit Documentation Feedback Copyright © 2015–2018, Texas Instruments Incorporated
MSP Debuggers
5.7.2 LED Signals
The MSP-FET430UIF shows its operating states using two LEDs, one green and one red. Table 10 lists
all available operation modes. An or icon indicates that the LED is off, an or icon indicates
that the LED is on, and an or icon indicates that the LED flashes.
Table 10. MSP-FET430UIF LED Signals
Power
LED Mode LED Function
MSP-FET430UIF not connected to PC, or MSP-FET430UIF not ready; for example, after a major
firmware update. Connect or reconnect MSP-FET430UIF to PC.
MSP-FET430UIF connected and ready
MSP-FET430UIF waiting for data transfer
Ongoing data transfer – during active debug session
An error has occurred; for example, target VCC over current. Unplug MSP-FET430UIF from target, and
cycle the power off and on. Check target connection, and reconnect MSP-FET430UIF.
Firmware update in progress. Do not disconnect MSP-FET430UIF while both LEDs are blinking.
5.7.3 Hardware
This section includes MSP-FET430UIF hardware descriptions like the JTAG connector, schematic, and
power up states of the JTAG pins.
5.7.3.1 JTAG Target Connector
Figure 24 shows the pinout of the MSP-FET430UIF JTAG connector.
Figure 24. MSP-FET430UIF 14-Pin JTAG Connector

Debug Probes Hardware and Software
www.ti.com
32 SLAU647L–July 2015–Revised February 2018
Submit Documentation Feedback
Copyright © 2015–2018, Texas Instruments Incorporated
MSP Debuggers
5.7.3.2 Pin States After Power Up
Table 11 describes the electrical state of every JTAG pin after debug probe power up.
Table 11. MSP-FET430UIF Pin States
Pin Name After Power-Up When JTAG Protocol is
Active When Spy-Bi-Wire
Protocol is Active
1 TDO/TDI Hi-Z, pulled up to 3.3 V In, TDO In and Out, SBWTDIO
2 VCC_TOOL 3.3 V Target VCC Target VCC
3 TDI/VPP Hi-Z, pulled up to 3.3 V Out, TDI Hi-Z, pulled up to VCC
4 VCC_TARGET In, external VCC sense In, external VCC sense In, external VCC sense
5 TMS Hi-Z, pulled up to 3.3 V Out, TMS Hi-Z, pulled up to VCC
6 N/C N/C N/C N/C
7 TCK Hi-Z, pulled up to 3.3 V Out, TCK Out, SBWTCK
8 TEST/VPP Out, Ground Out, TEST Hi-Z, pulled up to VCC
9 GND Ground Ground Ground
10 N/C N/C N/C N/C
11 RST Out, VCC Out, RST Ground
12 N/C N/C N/C N/C
13 N/C N/C N/C N/C
14 N/C N/C N/C N/C
Debug Probes Hardware and Software
www.ti.com
38 SLAU647L–July 2015–Revised February 2018
Submit Documentation Feedback
Copyright © 2015–2018, Texas Instruments Incorporated
MSP Debuggers
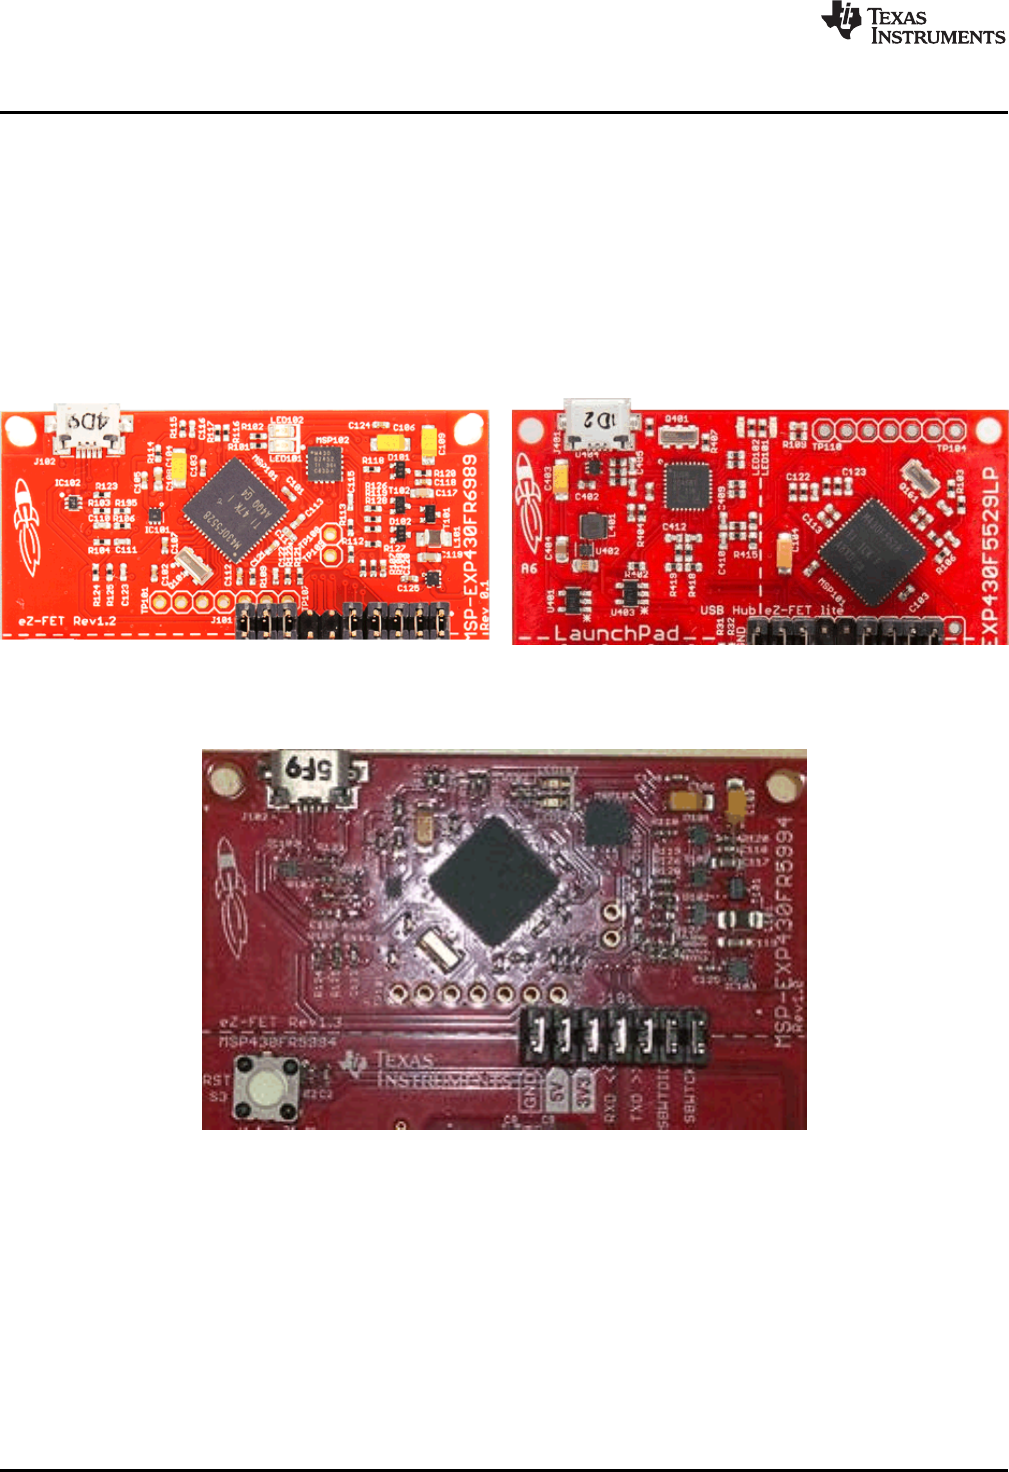
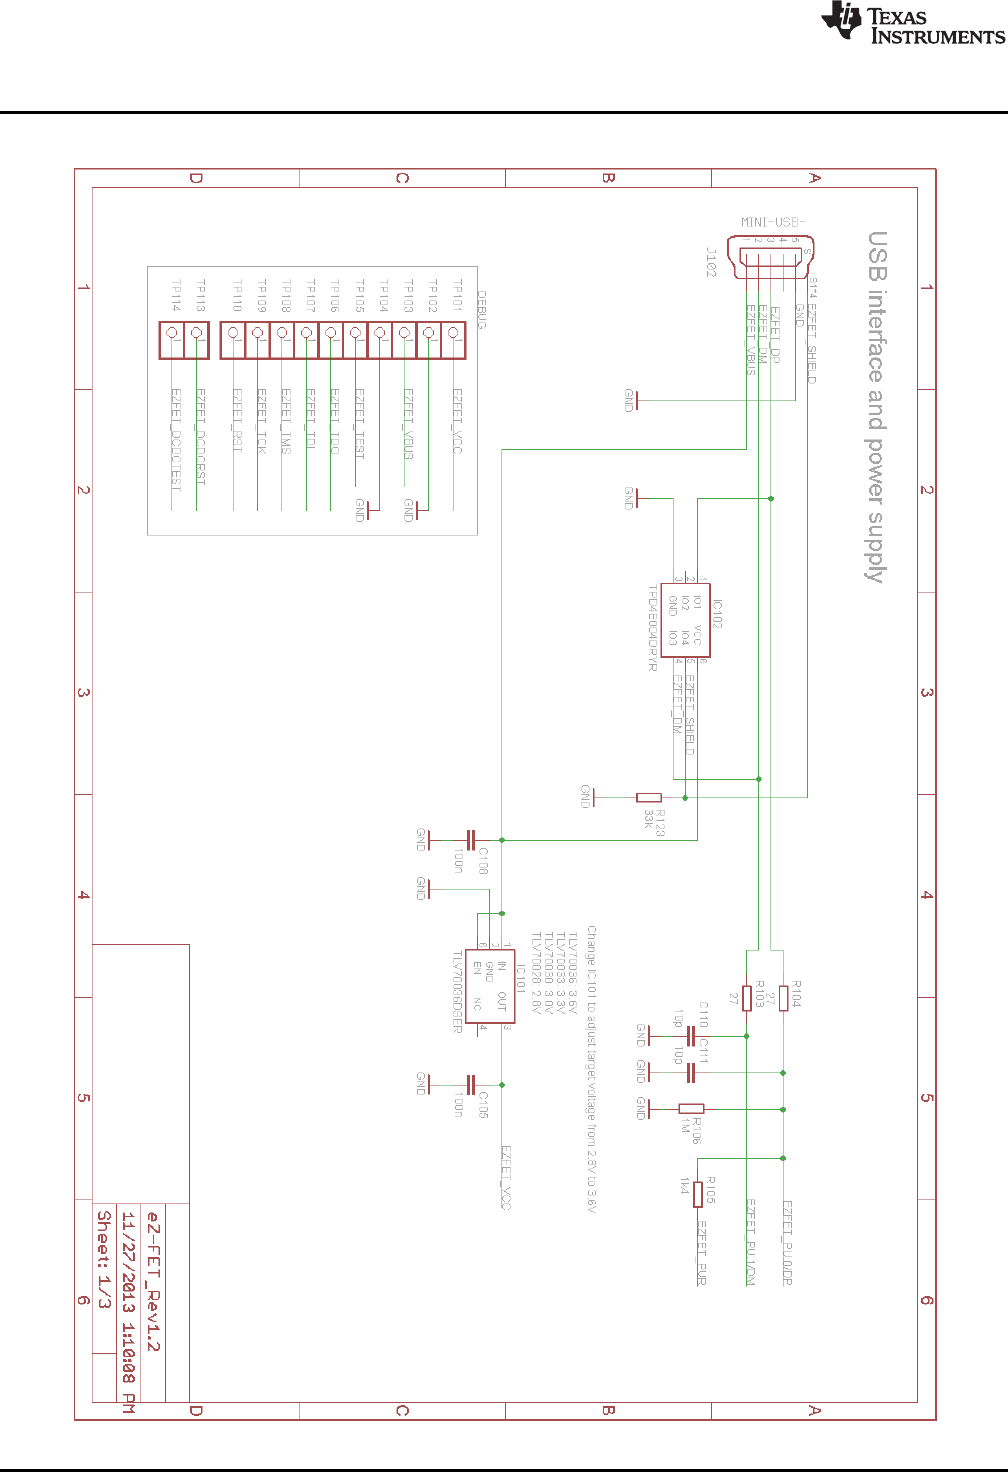
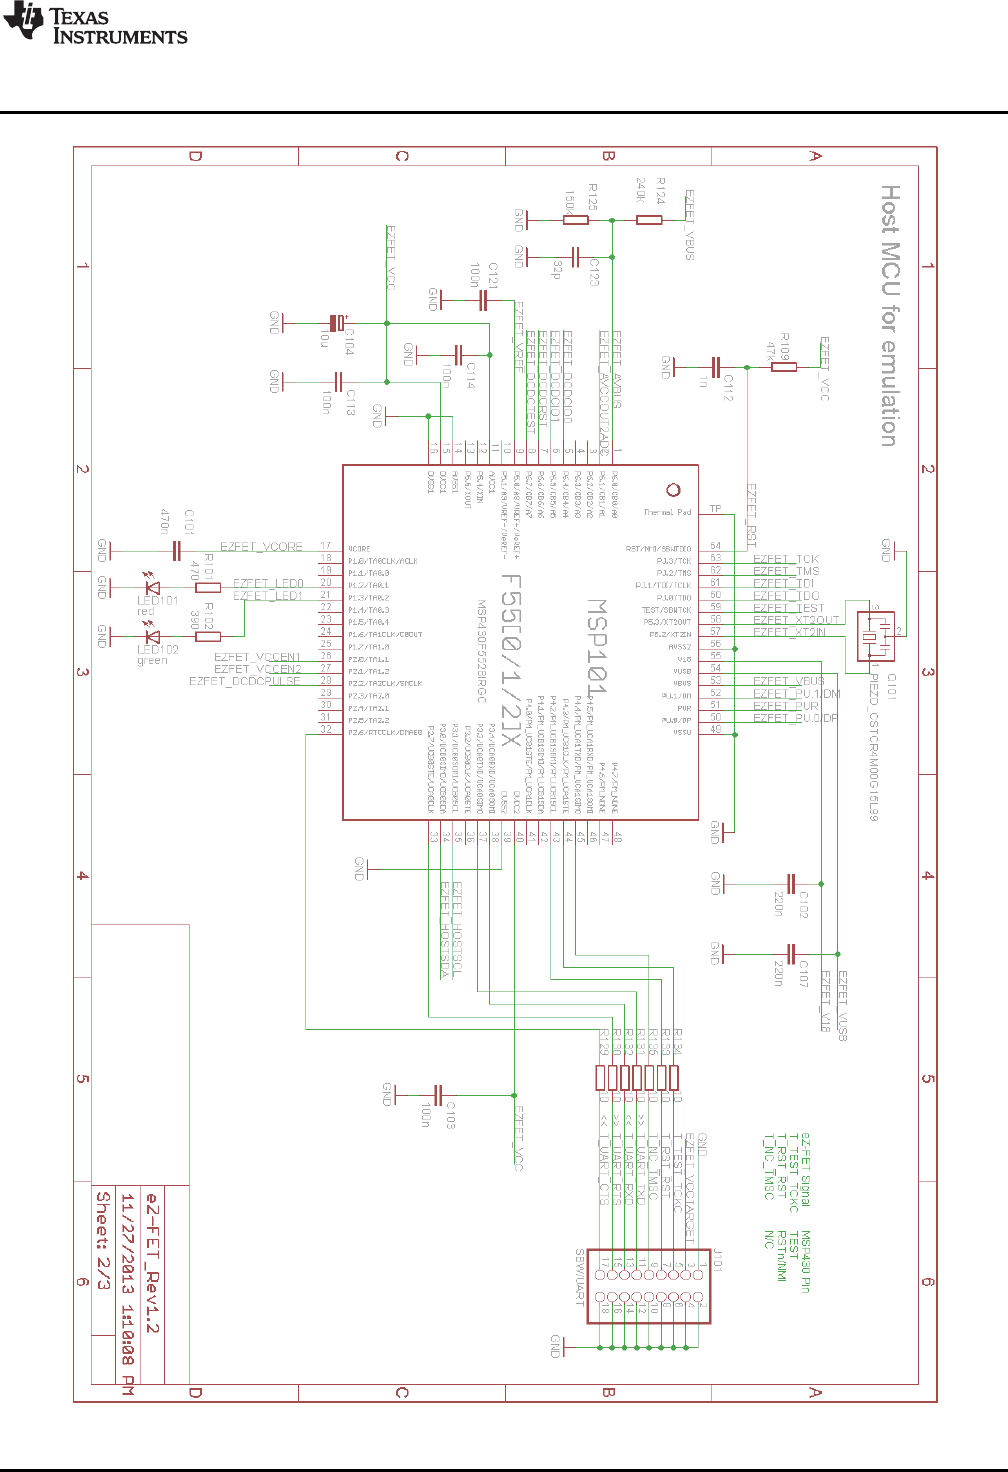
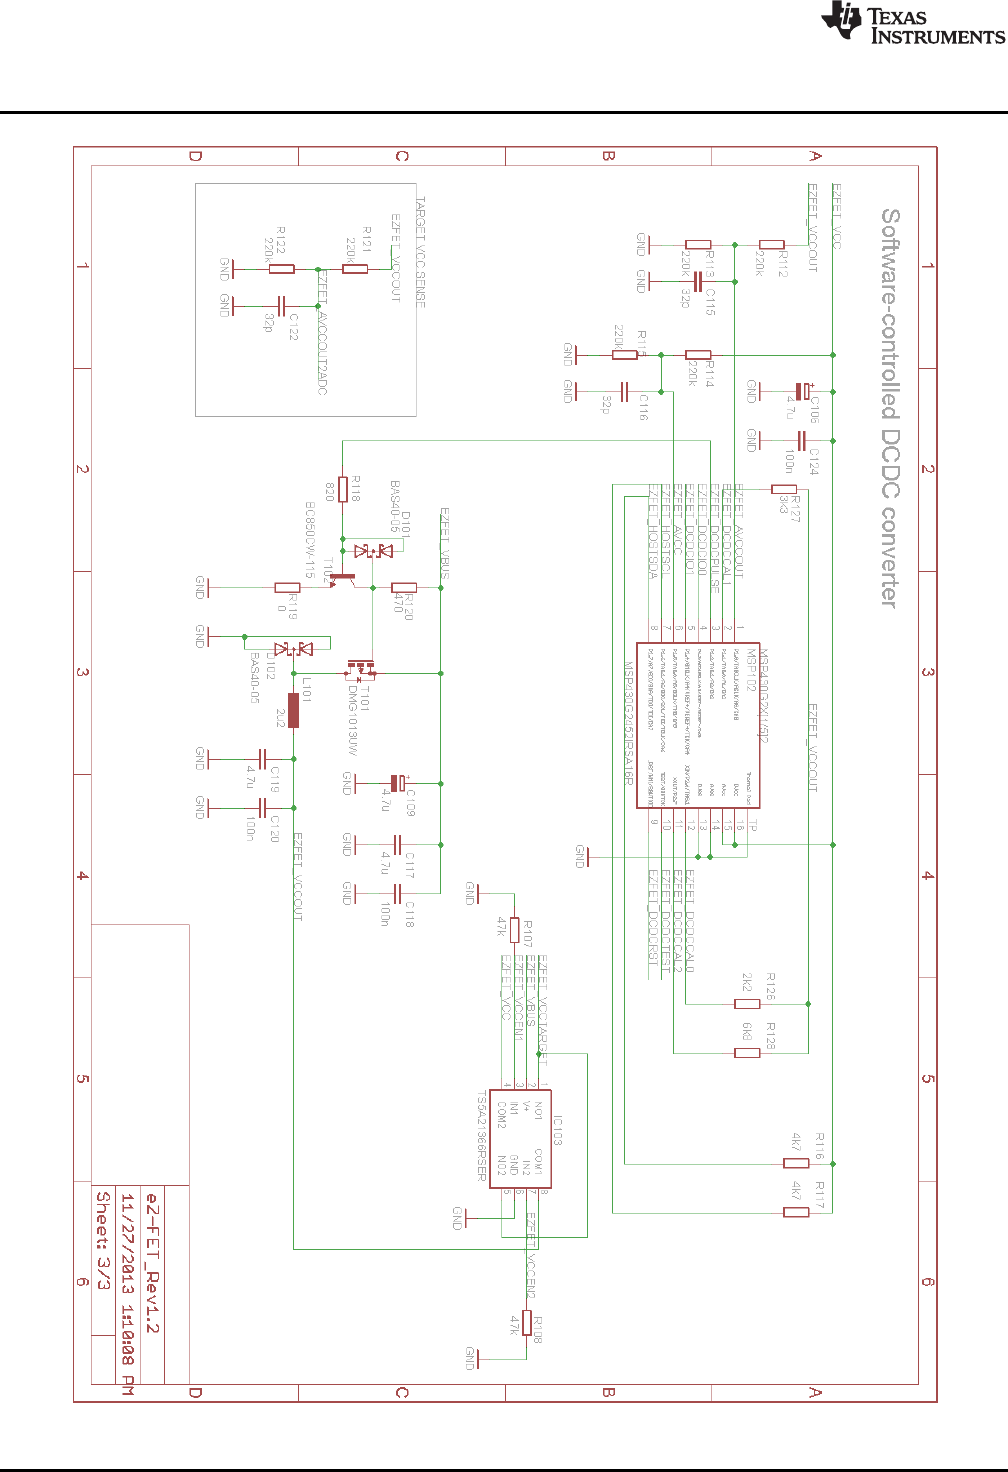
5.8 eZ-FET and eZ-FET Lite Onboard Emulation
The eZ-FET and eZ-FET Lite are powerful onboard flash emulation debug probes for application
development on MSP430 microcontrollers (see Figure 30). The eZ-FET and eZ-FET Lite onboard
emulation are the successors of the legacy eZ430.
Both eZ-FETs provide a USB interface to program and debug the MSP430 devices in-system through the
pin-saving Spy-Bi-Wire (2-wire JTAG) protocol. Furthermore, the USB interface can be used for
backchannel UART communication.
Both development tools support development with all MSP430 devices. They are designed as onboard
emulation that is available on several LaunchPad kits. (Only MSP430 devices that implement the SBW2
protocol are supported.)
Figure 30. eZ-FET and eZ-FET Lite (Top View)
Figure 31 shows revision 1.3 of the eZ-FET.
Figure 31. eZ-FET Rev1.3 (Top View)
www.ti.com
Debug Probes Hardware and Software
39
SLAU647L–July 2015–Revised February 2018
Submit Documentation Feedback Copyright © 2015–2018, Texas Instruments Incorporated
MSP Debuggers
5.8.1 General Features
The following features are provided by the eZ-FET and eZ-FET Lite debug probes.
Features:
• eZ-FET and eZ-FET Lite supported since:
– CCS v5.4.0
– IAR EW430 v5.52.1 and v5.51.6
• Operating systems: OS X, Linux, Windows
• Fixed supply voltage between 3.3 or 3.6 V at 75 mA
• Support Spy-Bi-Wire (2-wire JTAG) debug protocol
• Software breakpoint in flash, FRAM, and RAM support
• Flash and FRAM programming support
• Backchannel UART
• eZ-FET only – EnergyTrace and EnergyTrace++ support
• EnergyTrace technology accuracy
– Current < 25 µA: Error range = ±500 nA
– Current ≥25 µA and ≤75 mA: Error range = ±5%
• Software field update is possible
5.8.2 Backchannel UART
Supported baud rates depend on the target configuration and the debug settings. Table 12 shows which
baud rates are supported with certain configuration combinations.
✓means that the corresponding baud rate is supported without any data loss with the specified
combination of settings.
✗means that the corresponding baud rate is not supported (data loss is expected) with the specified
combination of settings.
Table 12. eZ-FET and eZ-FET Lite Backchannel UART Implementation
Target MCLK
Frequency: 1 MHz 8 MHz 1 MHz 8 MHz
Debugger: Active Inactive
Flow Control: No Yes No Yes No Yes No Yes
4800 baud ✓✓✓✓✓✓✓✓
9600 baud ✓✓✓✓✓✓✓✓
19200 baud ✓✓✓✓✓✓✓✓
28800 baud ✗✓✓✓✓✓✓✓
38400 baud ✗✓✗✓✗✓✗✓
57600 baud ✗✓✗✓✗✓✗✓
115200 baud ✗✗✗✓✗ ✗ ✗ ✓
5.8.2.1 eZ-FET and eZ-FET Lite UART Backchannel Activation Commands
The eZ-FET supports two different backchannel UART modes, one with flow control and one without. The
different modes can be selected by opening the corresponding COM port with a dedicated baud rate. See
Table 13 for the specific baud rates for each command.
NOTE: The baud rates used by these commands cannot be used for communication.
If none of the specified commands are transferred before setting the communication baud rate,
communication starts with these default settings: VCC on, no flow control mechanism, no parity.
Debug Probes Hardware and Software
www.ti.com
40 SLAU647L–July 2015–Revised February 2018
Submit Documentation Feedback
Copyright © 2015–2018, Texas Instruments Incorporated
MSP Debuggers
Table 13. eZ-FET and eZ-FET Lite Backchannel UART Activation Commands
Baud Rate Command
9620 Set all backchannel UART pins to high impedance – no current flow into target device
9621 Configure backchannel UART communication without handshake (default start behavior)
9622 Configure backchannel UART communication with handshake
NOTE: Available on Rev. 1.2 only.
9623 Voltage configuration command. When this command is received, target VCC switched on.
9625 Configure backchannel UART communication without handshake and even parity (available starting with
MSPDebugStack version 3.8.0.2)
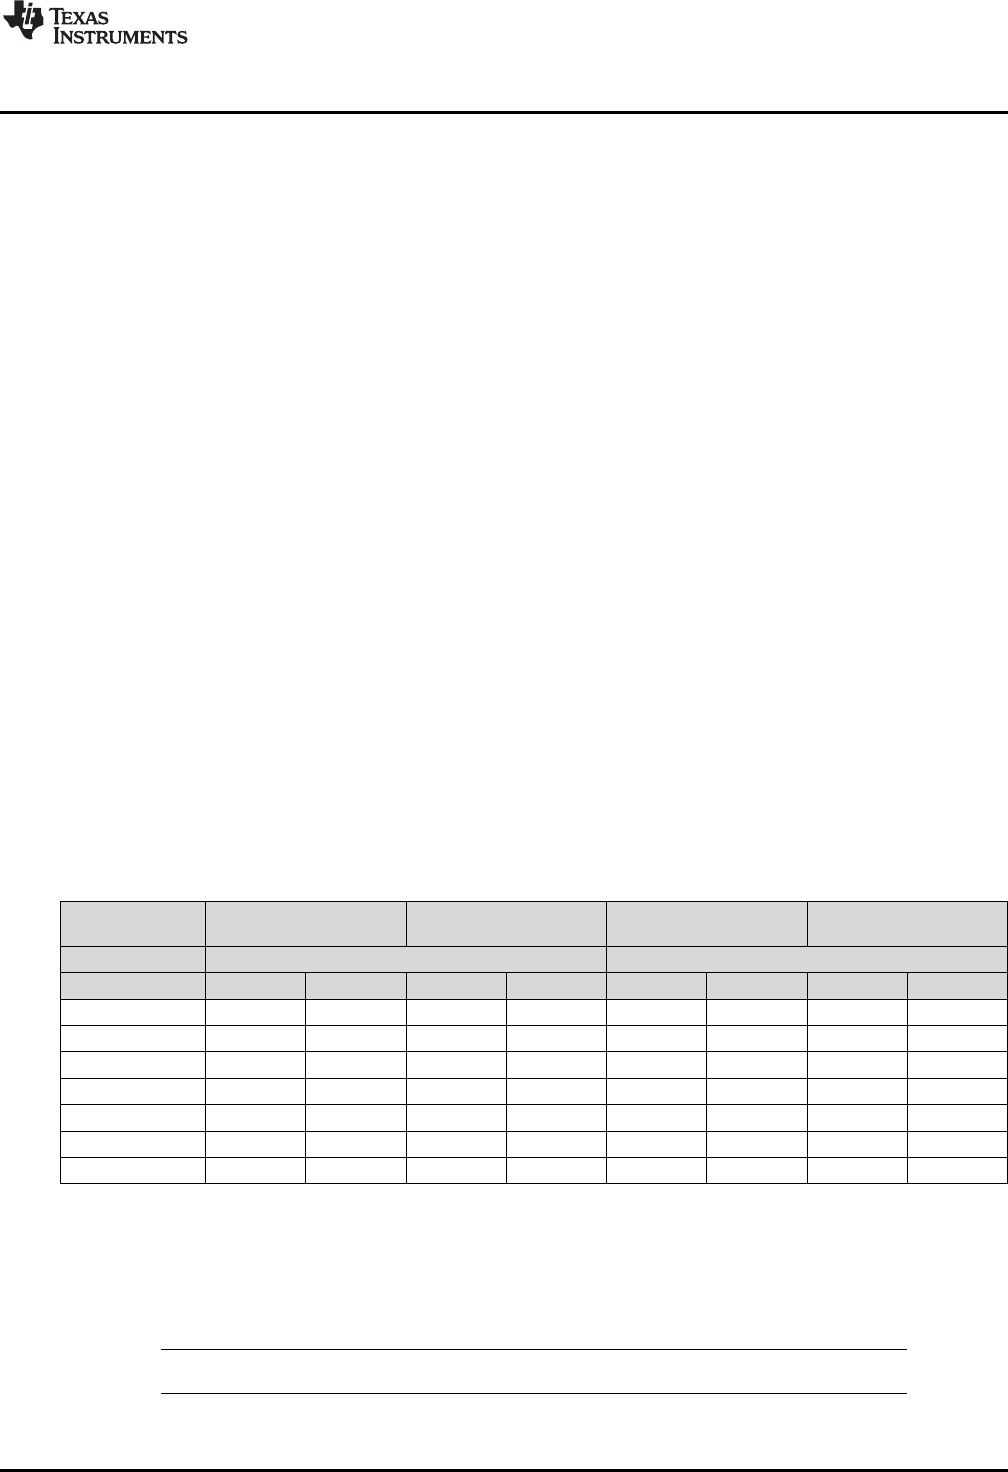
5.8.3 LED Signals
eZ-FET emulators show their operating states using two LEDs, one green and one red. Table 14 lists all
available operation modes. An or icon indicates that the LED is off, an or icon indicates that
the LED is on, and an or icon indicates that the LED flashes.
Table 14. eZ-FET LED Signals
Power
LED Mode LED Function
eZ-FET not connected to PC, or eZ-FET not ready; for example, after a major firmware update. Connect
or reconnect eZ-FET to PC.
eZ-FET connected and ready
eZ-FET waiting for data transfer
Ongoing data transfer – during active debug session
An error has occurred; for example, target VCC over current. Unplug eZ-FET from target, and cycle the
power off and on. Check target connection, and reconnect eZ-FET.
Firmware update in progress. Do not disconnect eZ-FET while both LEDs are blinking.
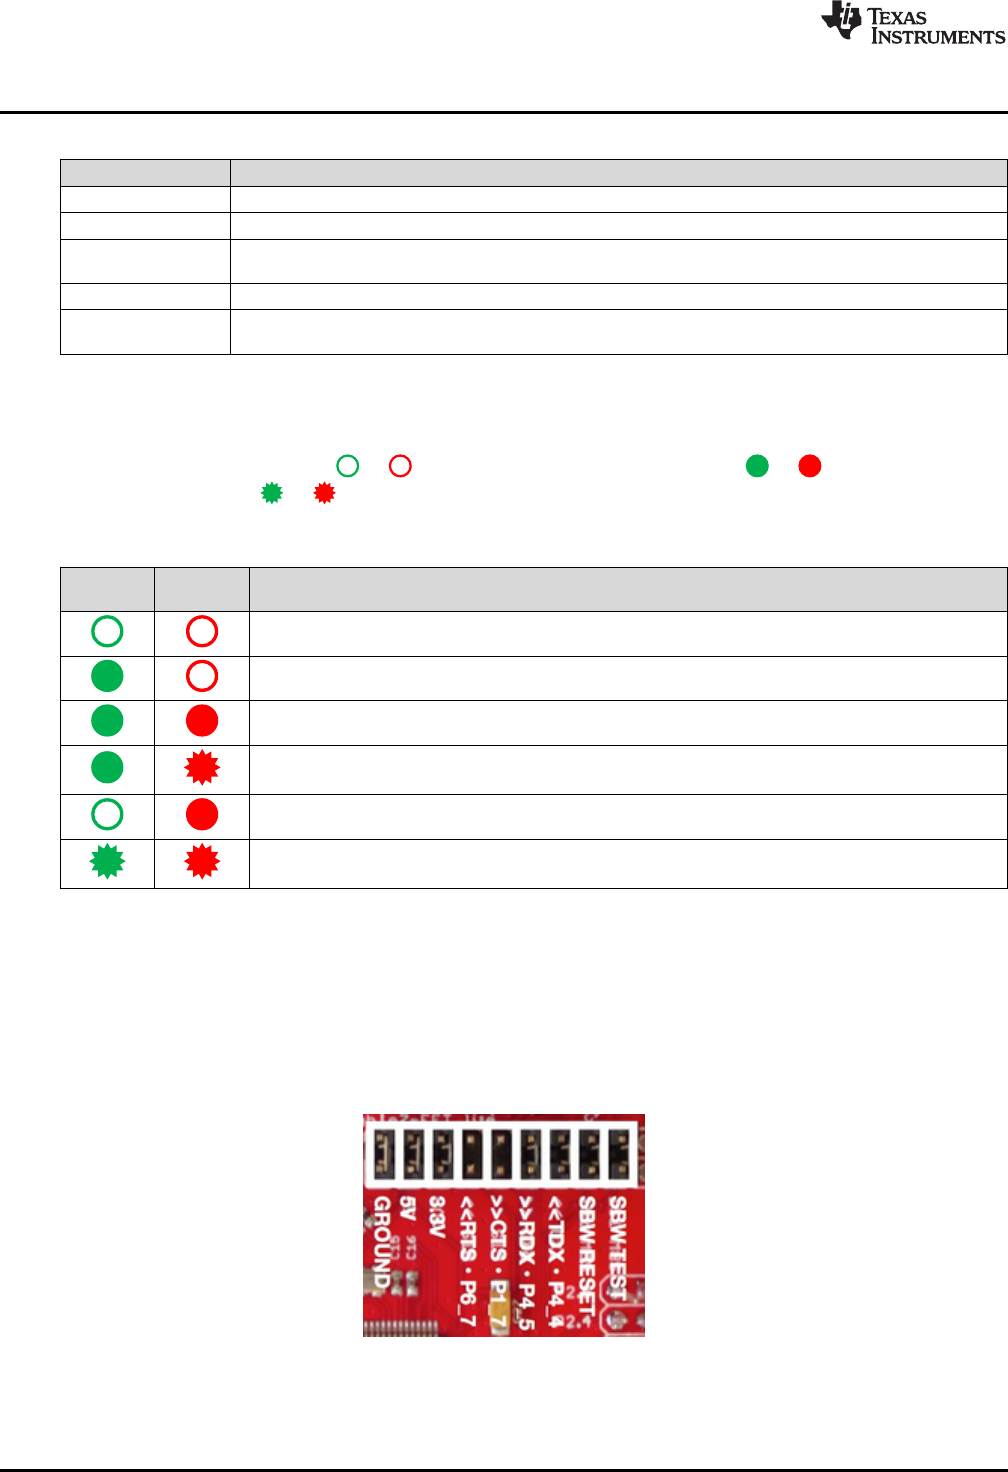
5.8.4 Hardware
This section describes the pinout of the eZ-FET and eZ-FET Lite debug connector. It includes a list of all
debugger pin states after power up and the eZ-FET and eZ-FET Lite schematics.
5.8.4.1 JTAG Target Connector
Figure 32 shows the pinout of the eZ-FET debug connector.
Figure 32. eZ-FET or eZ-FET Lite Debug Connector
www.ti.com
Debug Probes Hardware and Software
41
SLAU647L–July 2015–Revised February 2018
Submit Documentation Feedback Copyright © 2015–2018, Texas Instruments Incorporated
MSP Debuggers
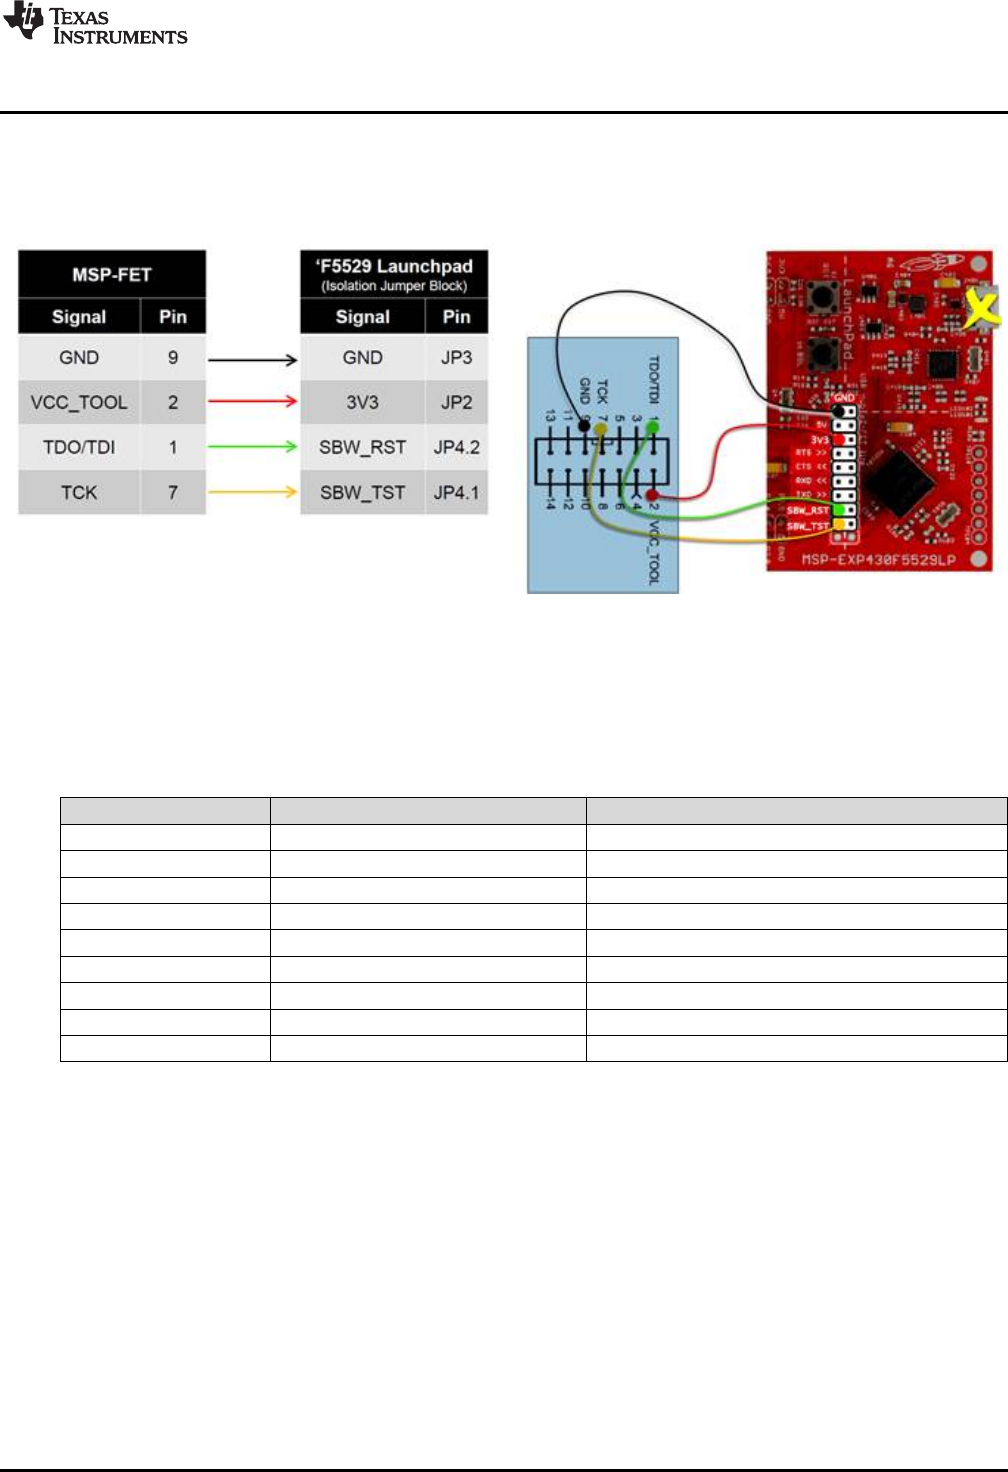
5.8.4.2 Connecting MSP-FET to LaunchPad Development Kit
Figure 33 and Figure 34 show how to connect an MSP-FET to the target MSP430 device that is solders
onto the LaunchPad, using an F5529 LaunchPad as an example.
Figure 33. MSP-FET to LaunchPad Development Kit Pin
Assignments Figure 34. MSP-FET to LaunchPad Wiring Diagram
5.8.4.3 Pin States After Power Up
Table 15 describes the electrical state of every JTAG pin after debug probe power up.
Table 15. eZ-FET and eZ-FET Lite Pin States
Signal Name After Power up When Spy-Bi-Wire Protocol is Active
SBWTDIO Hi-Z, pulled up to 3.3 V In and Out, SBWTDIO
SBWTCK Hi-Z, pulled up to 3.3 V Out, SBWTCK
TXD Hi-Z, pulled up to 3.3 V In, Target UART TXD output
RXD Hi-Z, pulled up to 3.3 V Out, Target UART RXD input
CTS Hi-Z, pulled up to 3.3 V Out, Target UART Clear-To- Send Handshake input
RTS Hi-Z, pulled up to 3.3 V In, Target UART Ready-to Send Handshake output
3V3 Target VCC Target VCC
5V USB VCC USB VCC
GND Ground Ground
www.ti.com
Debug Probes Hardware and Software
45
SLAU647L–July 2015–Revised February 2018
Submit Documentation Feedback Copyright © 2015–2018, Texas Instruments Incorporated
MSP Debuggers
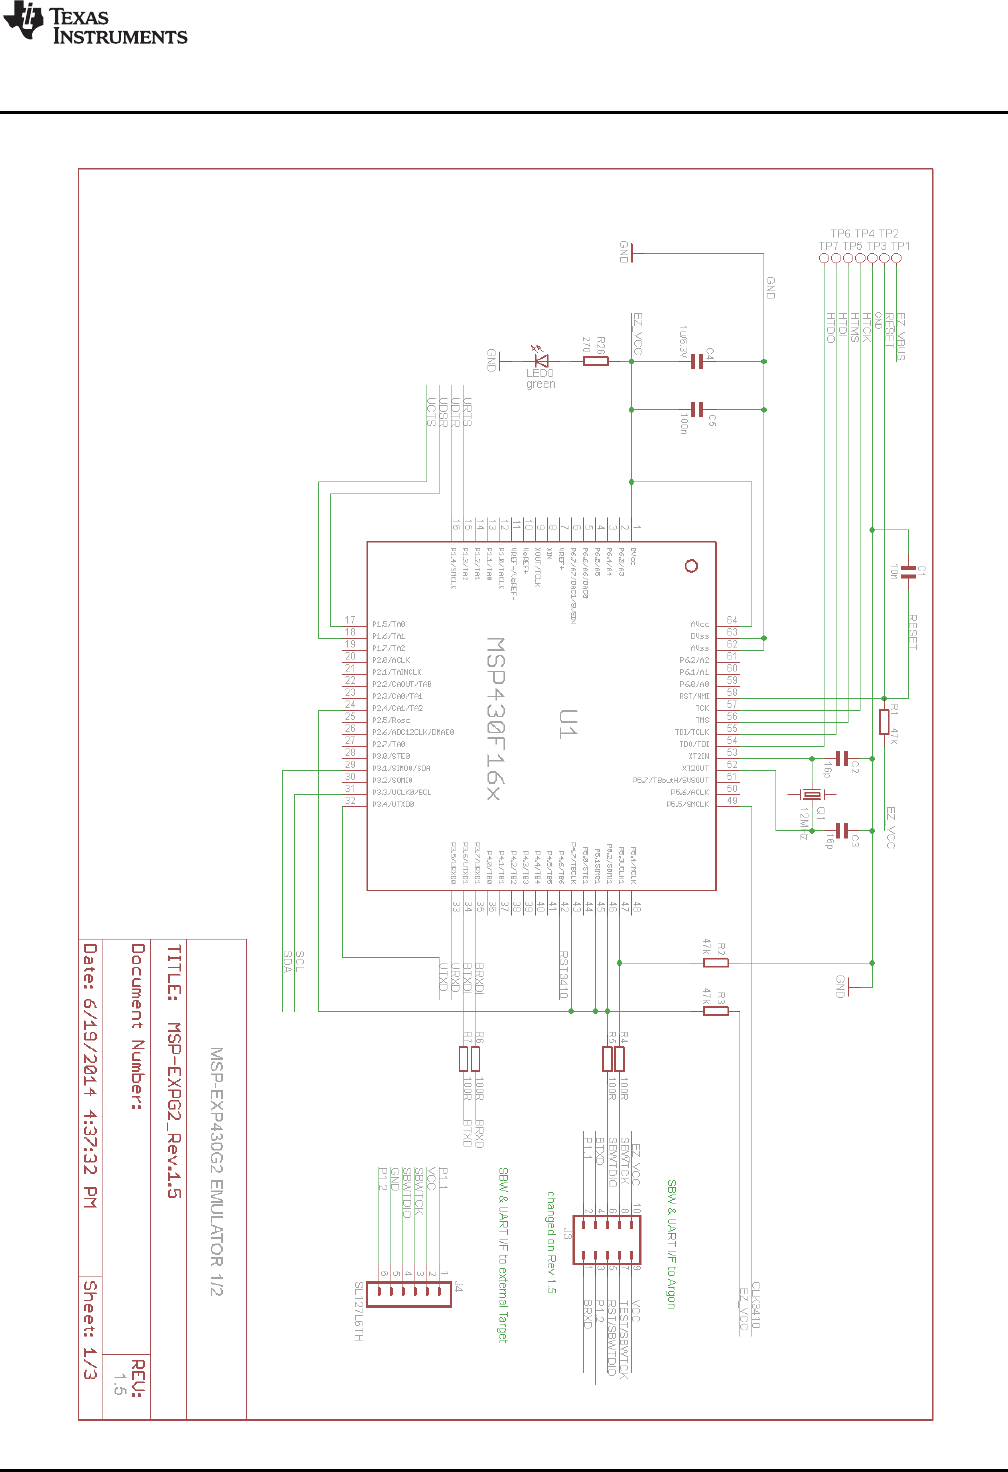
5.9 eZ430 Onboard Emulation
The eZ430 onboard emulation is the legacy onboard flash emulation for application development on
MSP430 microcontrollers. The eZ-FET and eZ-FET Lite onboard emulation are the successors of the
legacy eZ430.
The eZ430 provides a USB interface to program and debug the MSP430 devices in-system through the
pin-saving Spy-Bi-Wire (2-wire JTAG) protocol. Furthermore, the USB interface can be used for
Backchannel UART communication.
NOTE: The eZ430 does not support all MSP430 device families. See Table 1 for more details about
device support.
The eZ430 onboard emulation and its backchannel UART might fail to enumerate on USB
3.0 computer ports. If enumeration fails, reconfigure the USB 3.0 port to USB 2.0 mode in
your computer BIOS.
If the eZ430 onboard emulation is used with active software breakpoints, the RUN to MAIN
function might fail. Disable software breakpoints to enable RUN to MAIN.
Figure 38. eZ430 Emulation
5.9.1 General Features
USB debug interface to connect a MSP430 MCU to a PC for real-time in-system programming and
debugging.
Features:
• Operating systems: Windows
• Fixed supply voltage between 3.6 V at 75 mA
• Support Spy-Bi-Wire (2-wire JTAG) debug protocol
• Software Breakpoint in Flash, FRAM, and RAM support
• Flash and FRAM programming support
• Backchannel UART
• Software field update is not possible (see Table 1 for device support details)
• Limited device support
Debug Probes Hardware and Software
www.ti.com
46 SLAU647L–July 2015–Revised February 2018
Submit Documentation Feedback
Copyright © 2015–2018, Texas Instruments Incorporated
MSP Debuggers
5.9.2 Backchannel UART
The baud rates that are supported depend on the target configuration and the debug settings. Table 16
shows which baud rates are supported with certain configuration combinations.
✓means that the corresponding baud rate is supported without any data loss with the specified
combination of settings.
✗means that the corresponding baud rate is not supported (data loss is expected) with the specified
combination of settings.
Table 16. eZ430 Backchannel UART Implementation
Target MCLK Frequency: 1 MHz 8 MHz
Debugger: Active Active
4800 baud ✓ ✓
9600 baud ✓ ✓
19200 baud ✗ ✗
28800 baud ✗ ✗
38400 baud ✗ ✗
57200 baud ✗ ✗
115200 baud ✗ ✗
5.9.3 Hardware
This section describes the pinout of the eZ430 debug connector. It includes a list of all debugger pin
states after power up and the ez430 schematics.
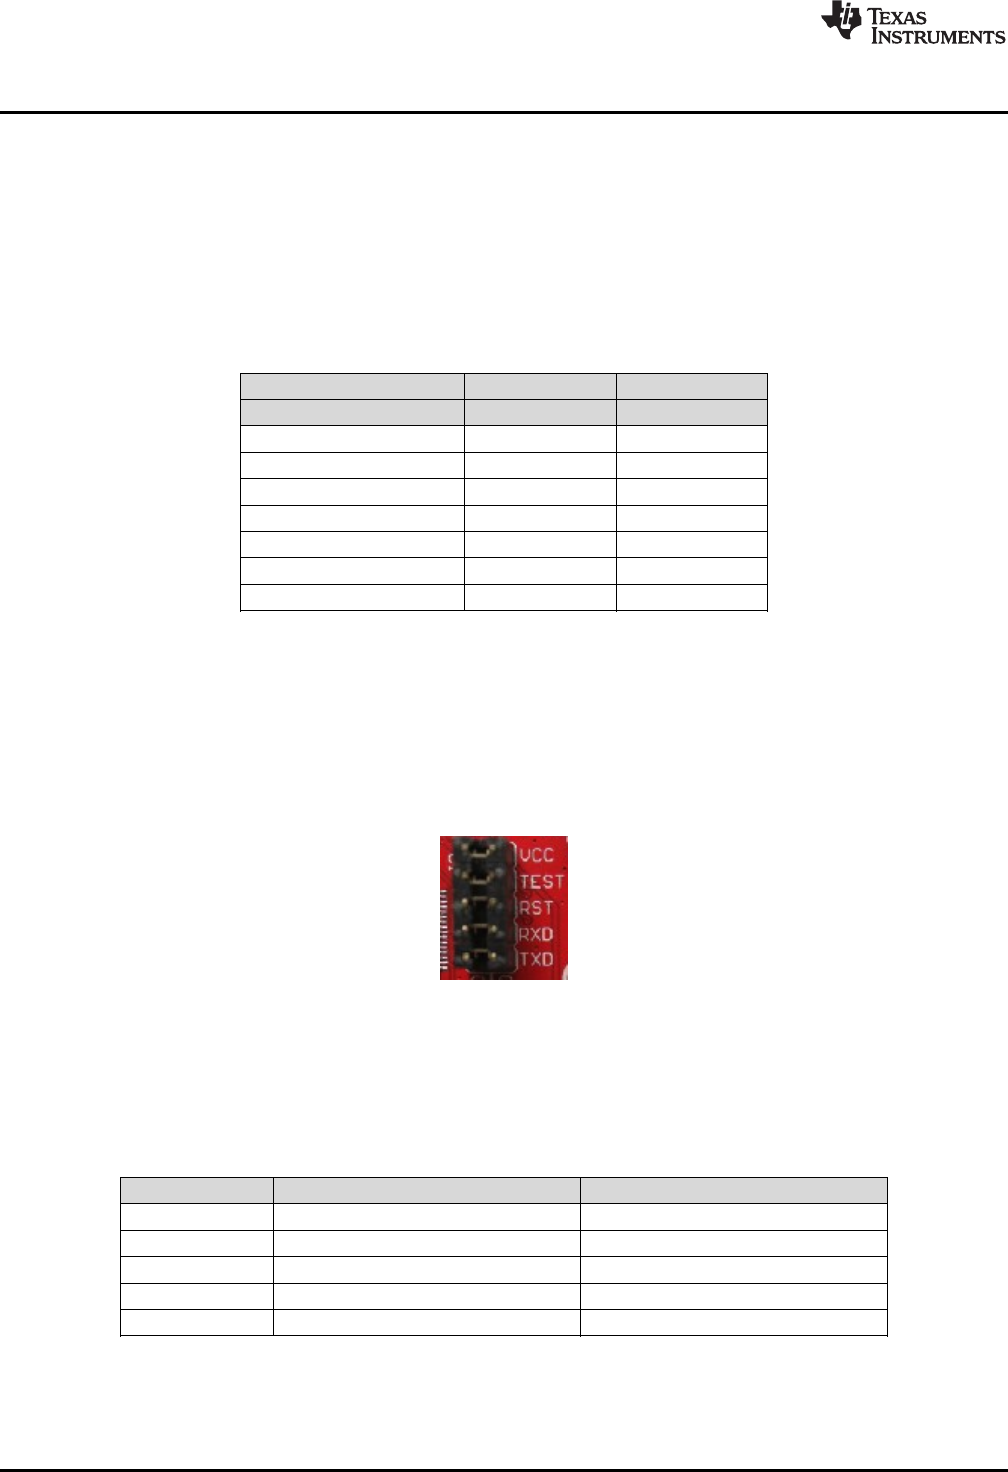
5.9.3.1 JTAG Target Connector
Figure 39 shows the pinout of the eZ430 debug connector.
Figure 39. eZ430 Debug Connector on MSP-EXP430G2 LaunchPad
5.9.3.2 Pin States After Power Up
Table 17 describes the electrical state of every JTAG pin after debug probe power up.
Table 17. eZ430 Pin States
Signal Name After Power-Up When Spy-Bi-Wire Protocol is Active
VCC Target VCC Target VCC
RST In and Out, SBWTDIO In and Out, SBWTDIO
TST Out, SBWTCK Out, SBWTCK
TXD In, Target UART TXD output In, Target UART TXD output
RXD Out, Target UART RXD input Out, Target UART RXD input
www.ti.com
Debug Probes Hardware and Software
49
SLAU647L–July 2015–Revised February 2018
Submit Documentation Feedback Copyright © 2015–2018, Texas Instruments Incorporated
MSP Debuggers
(1) Spy-Bi-Wire (2-wire JTAG) is supported
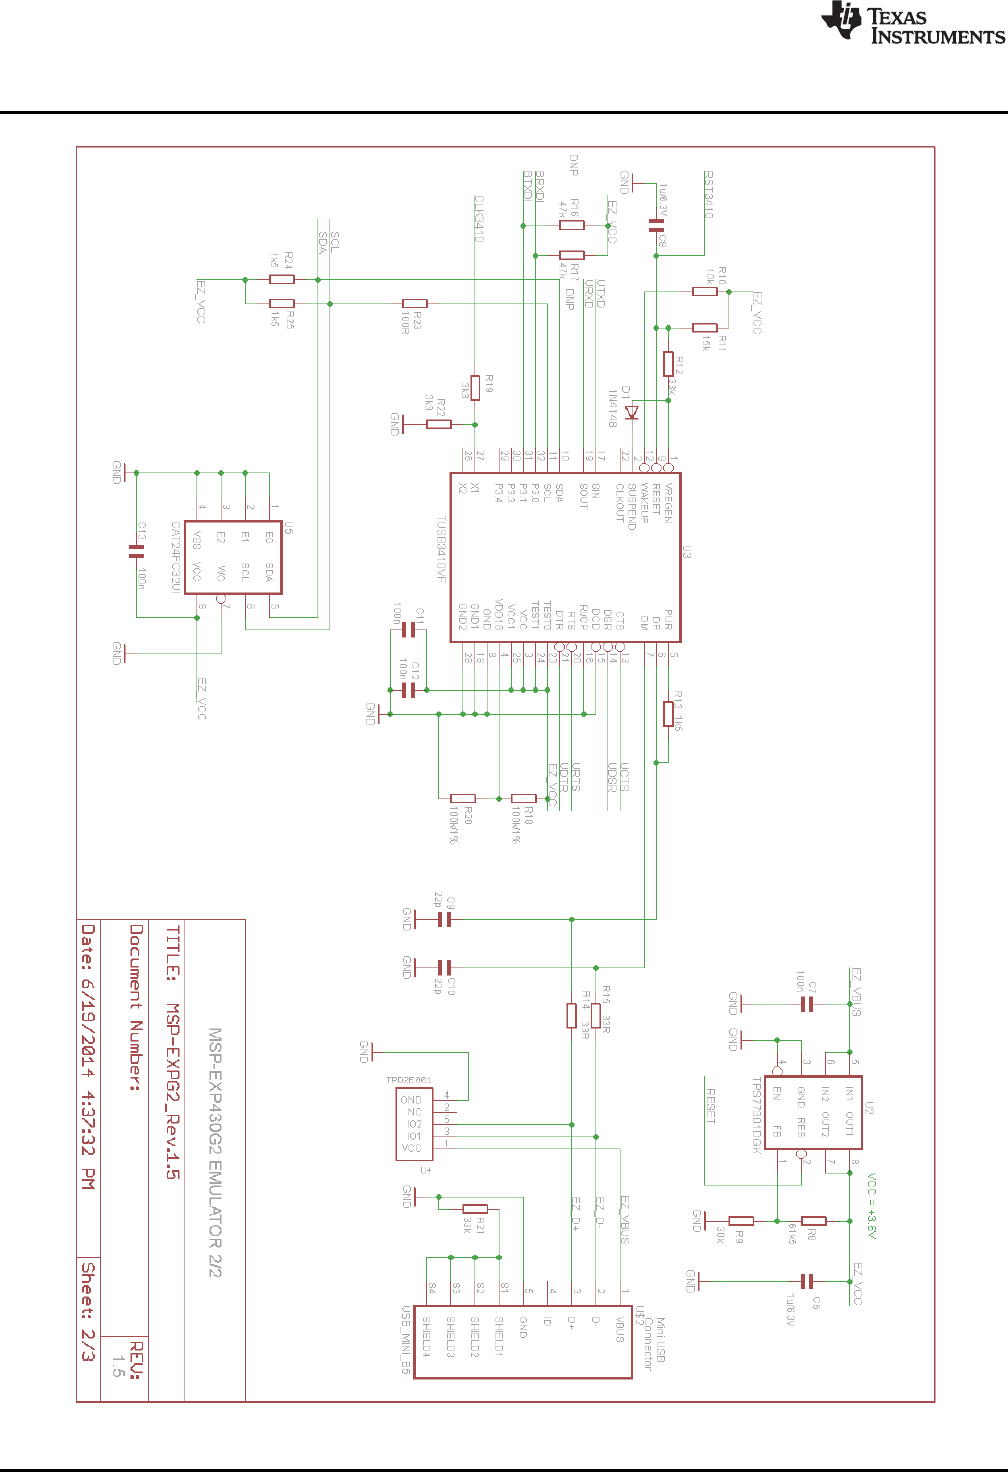
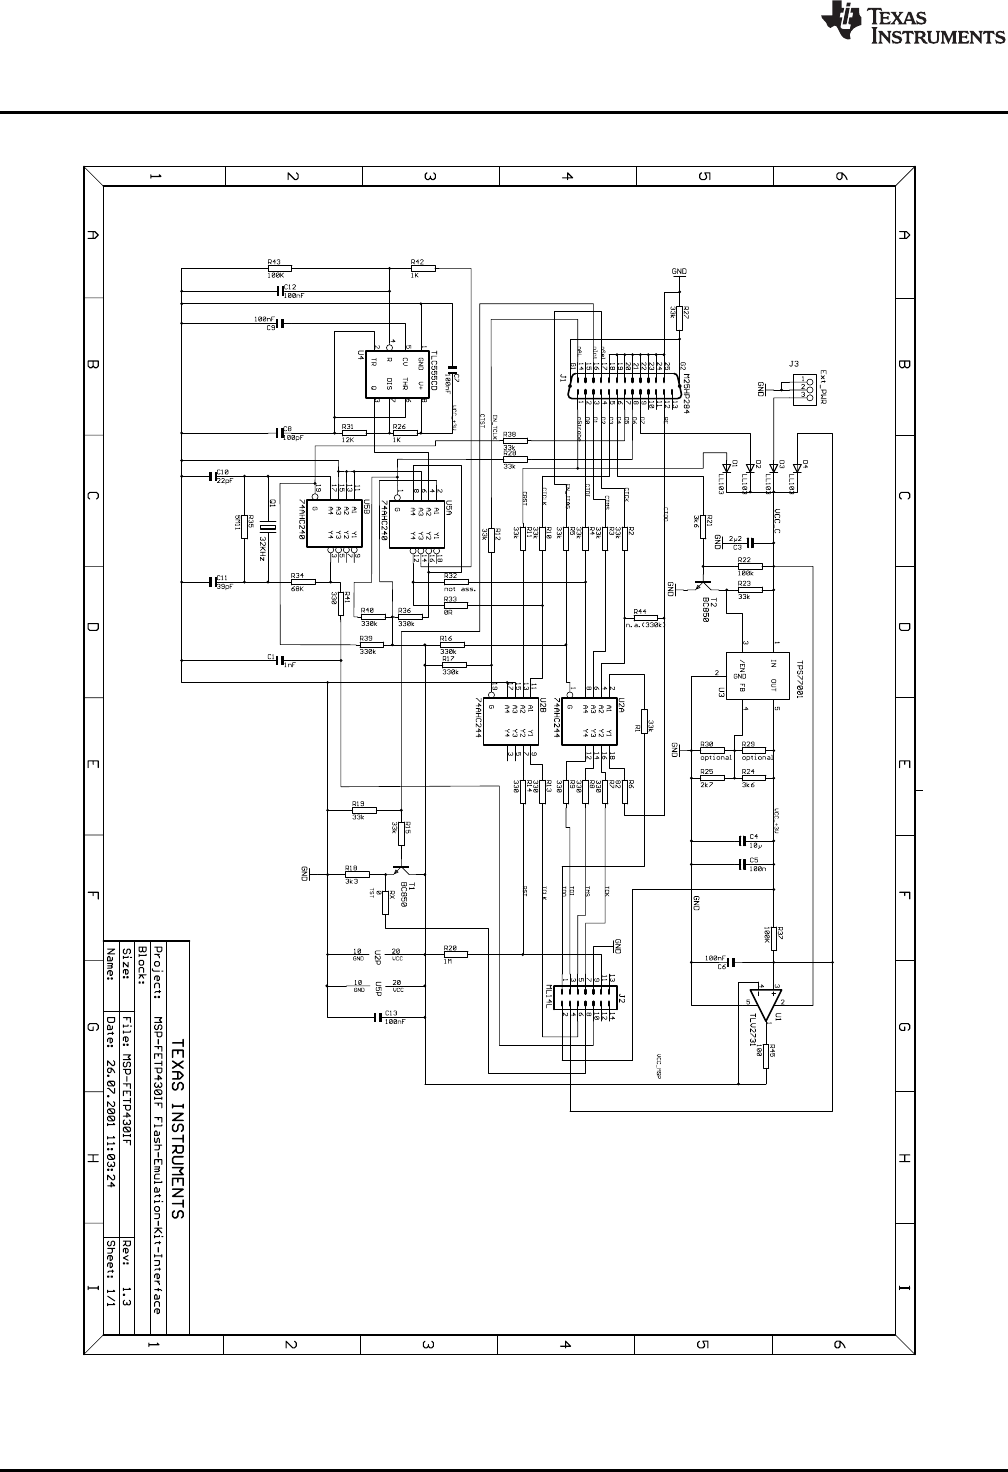
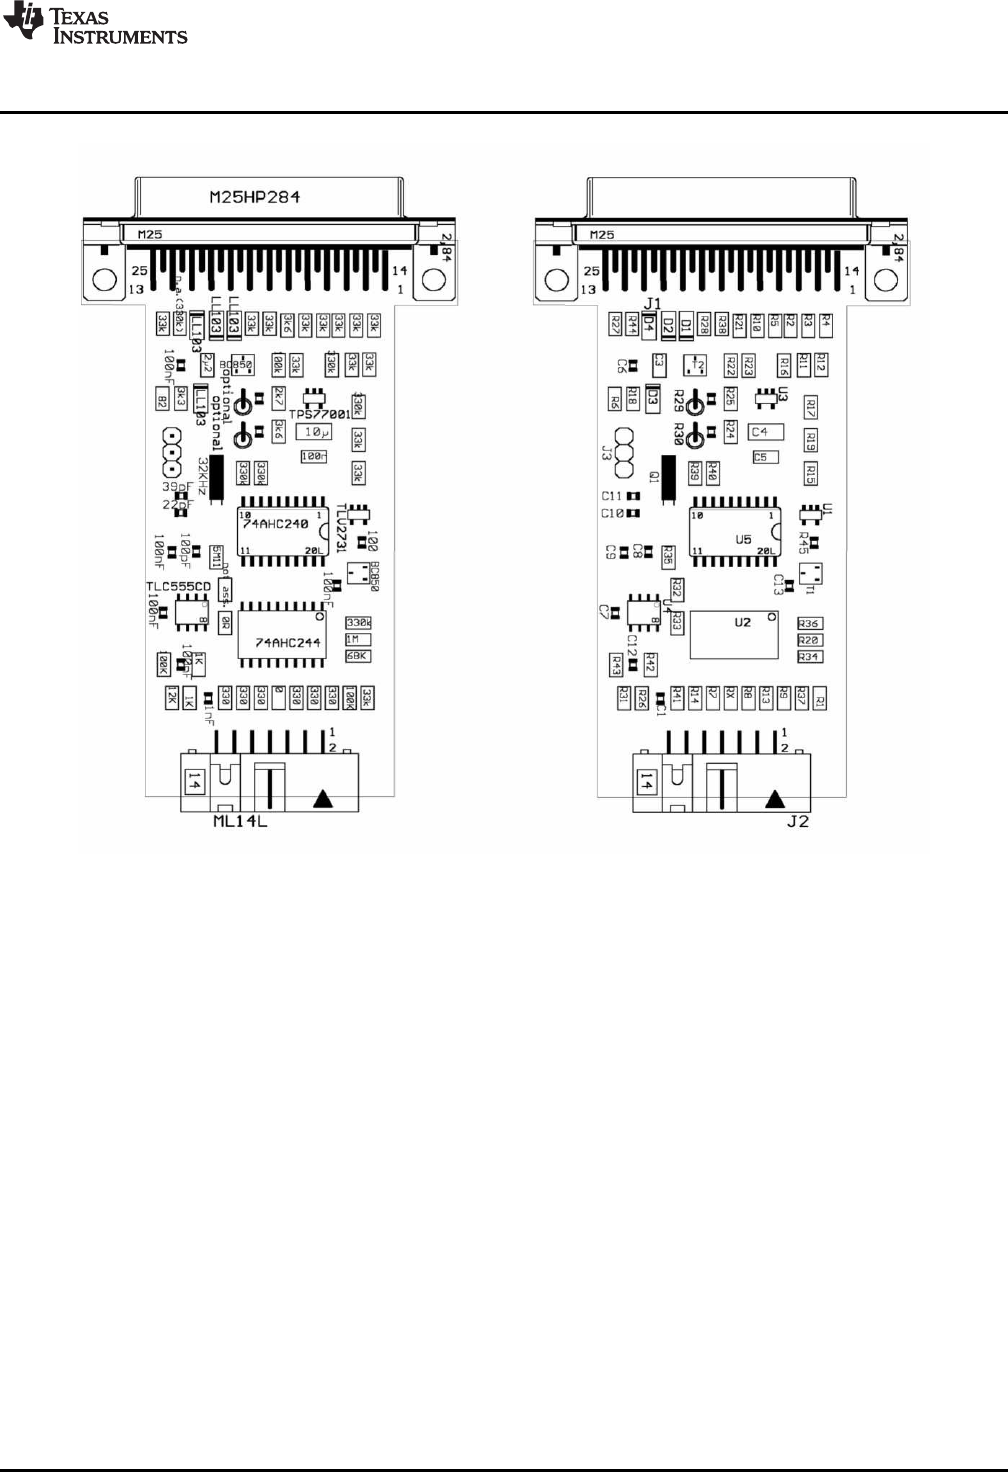
5.10 MSP-FET430PIF
The MSP-FET430PIF is a parallel port interface that is used to program and debug MSP430 boards
through the JTAG interface. This interface uses a parallel PC port to communicate with the IDE (CCS,
EW430, or the MSP Flasher) running on the PC. The interface uses the standard 14-pin JTAG header to
communicate with the MSP430 device using the standard JTAG protocol.
The flash memory can be erased and programmed in seconds with only a few keystrokes, and because
the MSP430 flash is extremely low power, no external power supply is required. The tool has an
integrated software environment and connects directly to the PC which greatly simplifies the setup and
use of the tool.
Figure 42. MSP-FET430PIF
5.10.1 General Features
• Operating systems: Windows XP
• Fixed supply voltage between 3.3 V at 25 mA
• Software Breakpoint in Flash, FRAM, and RAM support
• Flash and FRAM programming support
• Supports JTAG protocol only (1)
NOTE: The MSP-FET430PIF is for legacy device support only. This emulation tool does not support
any devices released after 2011.

Revision History
www.ti.com
52 SLAU647L–July 2015–Revised February 2018
Submit Documentation Feedback
Copyright © 2015–2018, Texas Instruments Incorporated
Revision History
Revision History
NOTE: Page numbers for previous revisions may differ from page numbers in the current version.
Changes from December 7, 2017 to February 23, 2018 ................................................................................................. Page
• Added Section 2.1,Known Limitations ................................................................................................. 5
• Changed the list item "EnergyTrace technology accuracy" in Section 5.6.1,General Features .............................. 16

IMPORTANT NOTICE FOR TI DESIGN INFORMATION AND RESOURCES
Texas Instruments Incorporated (‘TI”) technical, application or other design advice, services or information, including, but not limited to,
reference designs and materials relating to evaluation modules, (collectively, “TI Resources”) are intended to assist designers who are
developing applications that incorporate TI products; by downloading, accessing or using any particular TI Resource in any way, you
(individually or, if you are acting on behalf of a company, your company) agree to use it solely for this purpose and subject to the terms of
this Notice.
TI’s provision of TI Resources does not expand or otherwise alter TI’s applicable published warranties or warranty disclaimers for TI
products, and no additional obligations or liabilities arise from TI providing such TI Resources. TI reserves the right to make corrections,
enhancements, improvements and other changes to its TI Resources.
You understand and agree that you remain responsible for using your independent analysis, evaluation and judgment in designing your
applications and that you have full and exclusive responsibility to assure the safety of your applications and compliance of your applications
(and of all TI products used in or for your applications) with all applicable regulations, laws and other applicable requirements. You
represent that, with respect to your applications, you have all the necessary expertise to create and implement safeguards that (1)
anticipate dangerous consequences of failures, (2) monitor failures and their consequences, and (3) lessen the likelihood of failures that
might cause harm and take appropriate actions. You agree that prior to using or distributing any applications that include TI products, you
will thoroughly test such applications and the functionality of such TI products as used in such applications. TI has not conducted any
testing other than that specifically described in the published documentation for a particular TI Resource.
You are authorized to use, copy and modify any individual TI Resource only in connection with the development of applications that include
the TI product(s) identified in such TI Resource. NO OTHER LICENSE, EXPRESS OR IMPLIED, BY ESTOPPEL OR OTHERWISE TO
ANY OTHER TI INTELLECTUAL PROPERTY RIGHT, AND NO LICENSE TO ANY TECHNOLOGY OR INTELLECTUAL PROPERTY
RIGHT OF TI OR ANY THIRD PARTY IS GRANTED HEREIN, including but not limited to any patent right, copyright, mask work right, or
other intellectual property right relating to any combination, machine, or process in which TI products or services are used. Information
regarding or referencing third-party products or services does not constitute a license to use such products or services, or a warranty or
endorsement thereof. Use of TI Resources may require a license from a third party under the patents or other intellectual property of the
third party, or a license from TI under the patents or other intellectual property of TI.
TI RESOURCES ARE PROVIDED “AS IS” AND WITH ALL FAULTS. TI DISCLAIMS ALL OTHER WARRANTIES OR
REPRESENTATIONS, EXPRESS OR IMPLIED, REGARDING TI RESOURCES OR USE THEREOF, INCLUDING BUT NOT LIMITED TO
ACCURACY OR COMPLETENESS, TITLE, ANY EPIDEMIC FAILURE WARRANTY AND ANY IMPLIED WARRANTIES OF
MERCHANTABILITY, FITNESS FOR A PARTICULAR PURPOSE, AND NON-INFRINGEMENT OF ANY THIRD PARTY INTELLECTUAL
PROPERTY RIGHTS.
TI SHALL NOT BE LIABLE FOR AND SHALL NOT DEFEND OR INDEMNIFY YOU AGAINST ANY CLAIM, INCLUDING BUT NOT
LIMITED TO ANY INFRINGEMENT CLAIM THAT RELATES TO OR IS BASED ON ANY COMBINATION OF PRODUCTS EVEN IF
DESCRIBED IN TI RESOURCES OR OTHERWISE. IN NO EVENT SHALL TI BE LIABLE FOR ANY ACTUAL, DIRECT, SPECIAL,
COLLATERAL, INDIRECT, PUNITIVE, INCIDENTAL, CONSEQUENTIAL OR EXEMPLARY DAMAGES IN CONNECTION WITH OR
ARISING OUT OF TI RESOURCES OR USE THEREOF, AND REGARDLESS OF WHETHER TI HAS BEEN ADVISED OF THE
POSSIBILITY OF SUCH DAMAGES.
You agree to fully indemnify TI and its representatives against any damages, costs, losses, and/or liabilities arising out of your non-
compliance with the terms and provisions of this Notice.
This Notice applies to TI Resources. Additional terms apply to the use and purchase of certain types of materials, TI products and services.
These include; without limitation, TI’s standard terms for semiconductor products http://www.ti.com/sc/docs/stdterms.htm), evaluation
modules, and samples (http://www.ti.com/sc/docs/sampterms.htm).
Mailing Address: Texas Instruments, Post Office Box 655303, Dallas, Texas 75265
Copyright © 2018, Texas Instruments Incorporated
