Intel® SoC Watch For Google Android* OS, Chrome* And Linux* OS Socwatch Linux Android Users Guide V2.6.1
User Manual:
Open the PDF directly: View PDF ![]() .
.
Page Count: 27

Intel® SoC Watch for Google Android* OS,
Google Chrome* OS, Linux* OS, and QNX*
RTOS
User's Guide (for use under NDA Only)
Copyright © 2013–2018 Intel Corporation
All Rights Reserved
Version: 2.6.1
Intel Confidential
Legal Information
No license (express or implied, by estoppel or otherwise) to any intellectual property rights is granted by this document.
Intel disclaims all express and implied warranties, including without limitation, the implied warranties of merchantability, fitness for a particular
purpose, and non-infringement, as well as any warranty arising from course of performance, course of dealing, or usage in trade.
This document contains information on products, services and/or processes in development. All information provided here is subject to change
without notice. Contact your Intel representative to obtain the latest forecast, schedule, specifications and roadmaps.
The products and services described may contain defects or errors known as errata which may cause deviations from published specifications.
Current characterized errata are available on request.
Intel, Intel Core, Intel Atom, the Intel logo, and VTune are trademarks of Intel Corporation in the U.S. and/or other countries.
Optimization Notice: Intel’s compilers may or may not optimize to the same degree for non-Intel microprocessors for optimizations that are not
unique to Intel microprocessors. These optimizations include SSE2, SSE3, and SSSE3 instruction sets and other optimizations. Intel does not
guarantee the availability, functionality, or effectiveness of any optimization on microprocessors not manufactured by Intel. Microprocessor-
dependent optimizations in this product are intended for use with Intel microprocessors. Certain optimizations not specific to Intel
microarchitecture are reserved for Intel microprocessors. Please refer to the applicable product User and Reference Guides for more information
regarding the specific instruction sets covered by this notice.
Notice Revision #20110804
*Other names and brands may be claimed as the property of others.
Copyright 2013 - 2018 Intel Corporation.
This software and the related documents are Intel copyrighted materials, and your use of them is governed by the express license under which they
were provided to you (License). Unless the License provides otherwise, you may not use, modify, copy, publish, distribute, disclose or transmit this
software or the related documents without Intel's prior written permission.
This software and the related documents are provided as is, with no express or implied warranties, other than those that are expressly stated in the
License.

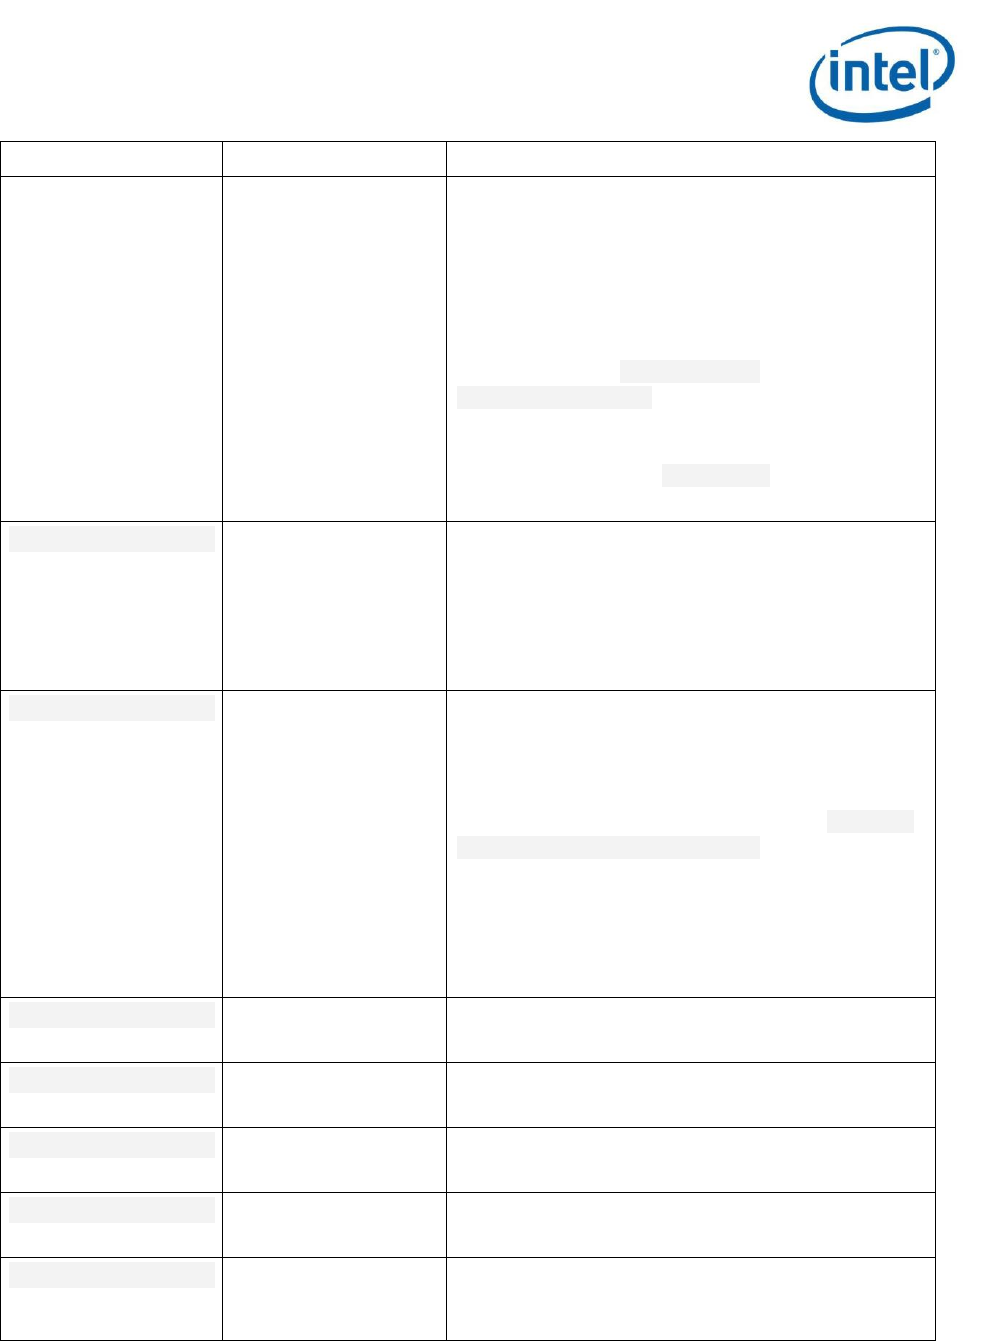
Revision History
Revision
Number
Description
Revision Date
2.0
Initial release for 2.0 product.
August 2015
2.1
Updated Building the Kernel Modules section
November 2015
2.1.1
Updated for 2.1.1 product release
December 2015
2.2
Updated for 2.2 product release and to combine Android*,
Chrome*, Linux*, and OS X* User’s Guides
June 2016
2.2.1
Updated for 2.2.1 product release
Added NDA support for OSX
Update from socperf1_2.ko to socperf2_0.ko
Bug fixes
June 2016
2.3.0
Updated for 2.3.0 product release
October 2016
2.3.1
Updated for 2.3.1 product release
April 2017
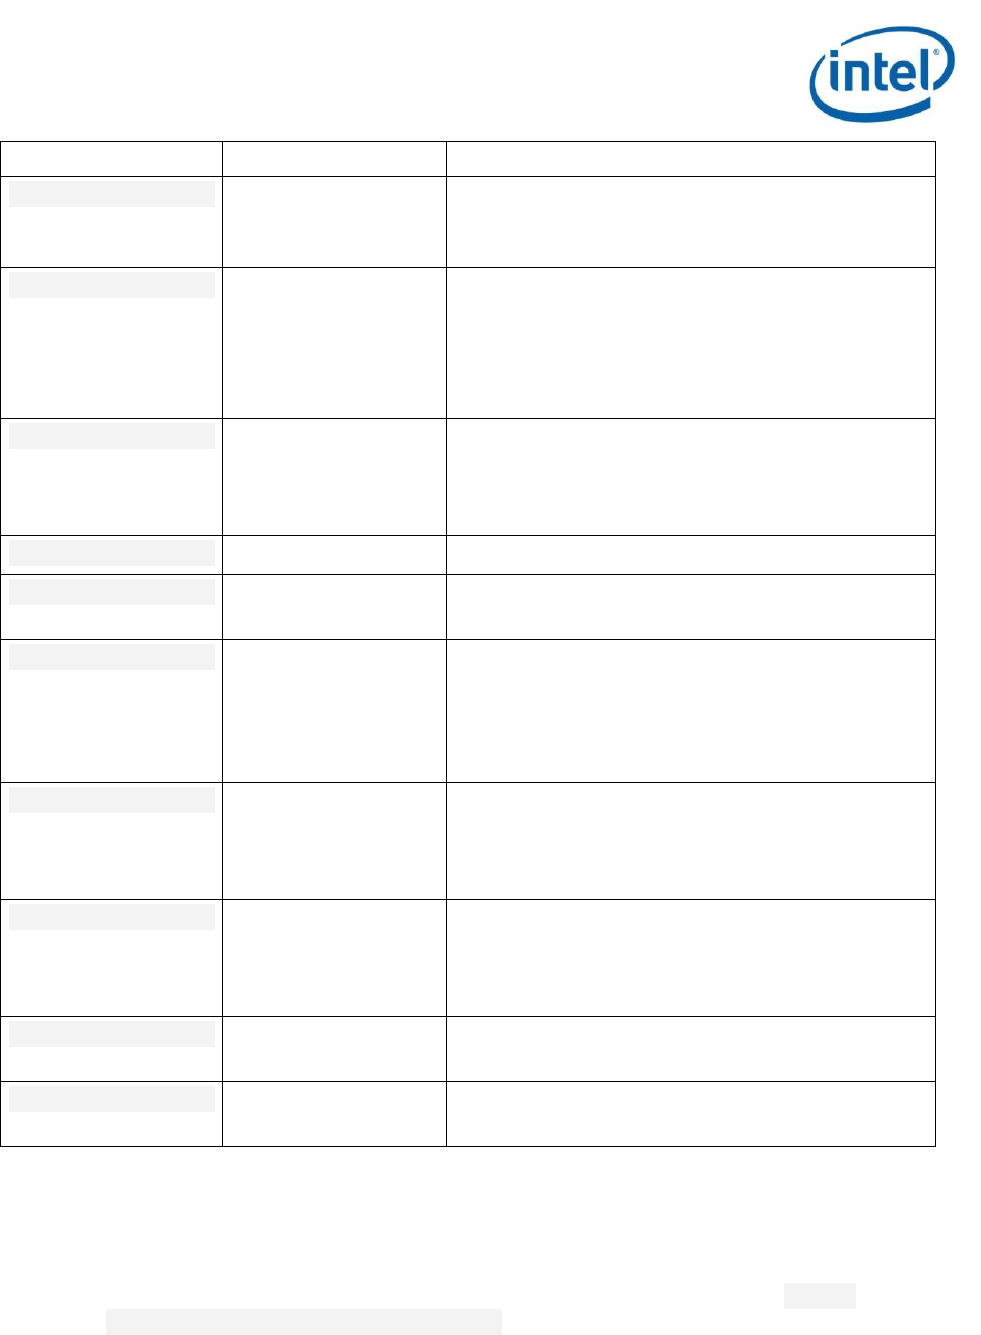
2.4
Update aligning available metrics and common reporting
across all operating systems, including Windows OS for the
first time. Includes many new metrics for Intel® Core™
platforms.
November 2017
2.4.1
Bug fix release. No change in this document.
November 2017
2.5
Added support for QNX*, added feature pch-ip-lat-limit and
added Intel VTune Amplifier import support for most PCH
metrics.
February 2018
2.6
Enhancements include initial support for Intel platform code
named Ice Lake, added new s0i3-sstate-dbg metric, and
improved PCIe LPM and PCH reporting.
April 2018
2.6.1
Adds feature xhci-lpm. Also adds warning if too many
telemetry-based metrics requested, corrects minimum LTR
reporting for platform LTR.
May 2018

Intel® SoC Watch for Google Android* OS, Google Chrome* OS, Linux* OS, and QNX* RTOS
4 User's Guide (for use under NDA only) Intel Confidential
Contents
1 About Intel® SoC Watch ........................................................................................... 5
1.1 Intended Audience ............................................................................................................... 5
1.2 Conventions and Symbols ..................................................................................................... 5
1.3 Related Information .............................................................................................................. 6
2 Installation .............................................................................................................. 7
3 Getting Started with Intel SoC Watch .......................................................................... 8
3.1 Preparing the Target on Chrome OS ..................................................................................... 8
3.2 Preparing the Target on QNX RTOS ...................................................................................... 8
3.3 Collect on Linux or Chrome OS ............................................................................................. 9
3.3.1 Set Up Collection on Linux ............................................................................ 9
3.3.2 Set Up Collection on Chrome OS.................................................................... 9
3.3.3 Collection on Linux or Chrome OS .................................................................. 9
3.4 Collect on Android OS ......................................................................................................... 10
3.5 Collect on QNX RTOS .......................................................................................................... 11
4 Options Quick Reference .......................................................................................... 12
4.1 General Options .................................................................................................................. 12
4.2 Post-processing Options ..................................................................................................... 13
4.3 Collection Options .............................................................................................................. 14
4.3.1 Feature Names (Individual) ......................................................................... 16
4.3.2 Feature Group Names ................................................................................. 25
5 Viewing Intel SoC Watch Results with Intel® VTune™ Amplifier .................................... 27
About Intel® SoC Watch
User's Guide (for use under NDA only) Intel Confidential 5
1 About Intel® SoC Watch
Intel® SoC Watch is a command line tool for monitoring and debugging system behaviors related to
power consumption on Intel® architecture-based platforms. It reports active and low power states for
the system/CPU/GPU/devices, processor frequencies and throttling reasons, IO subsystem low power
states and latency tolerance, PCH activity, memory and display refresh states, wakeups, and other
metrics that provide insight into the system’s energy efficiency. The tool includes utility functions that
include delaying the start of collection and launching an application prior to starting collection.
Data is collected from both hardware and OS sources. When using the default mode of collection, the
tool collects data at normally occurring OS context-switch points so that the tool itself is not perturbing
the system sleep states. Tool overhead when collecting during idle scenarios can be < 1%, however
active workloads with a high-rate of context switching will increase the overhead. A minimum collection
interval is used to control the rate of collection.
Intel SoC Watch writes a summary report file (.csv) at the end of collection on the system under analysis
(target system), allowing immediate access to results. Additional result files can be specified including:
an import file (.pwr) for Intel® VTune™ Amplifier that can be used for visualization of correlated
timelines for all the collected metrics with powerful zoom and filtering functions, and a time trace file
(.csv) that can be viewed as a timelines in tools like Microsoft* Excel*.
1.1 Intended Audience
Use this document if you use Intel SoC Watch to analyze power consumption on a Linux, Android,
Chrome, or QNX system.
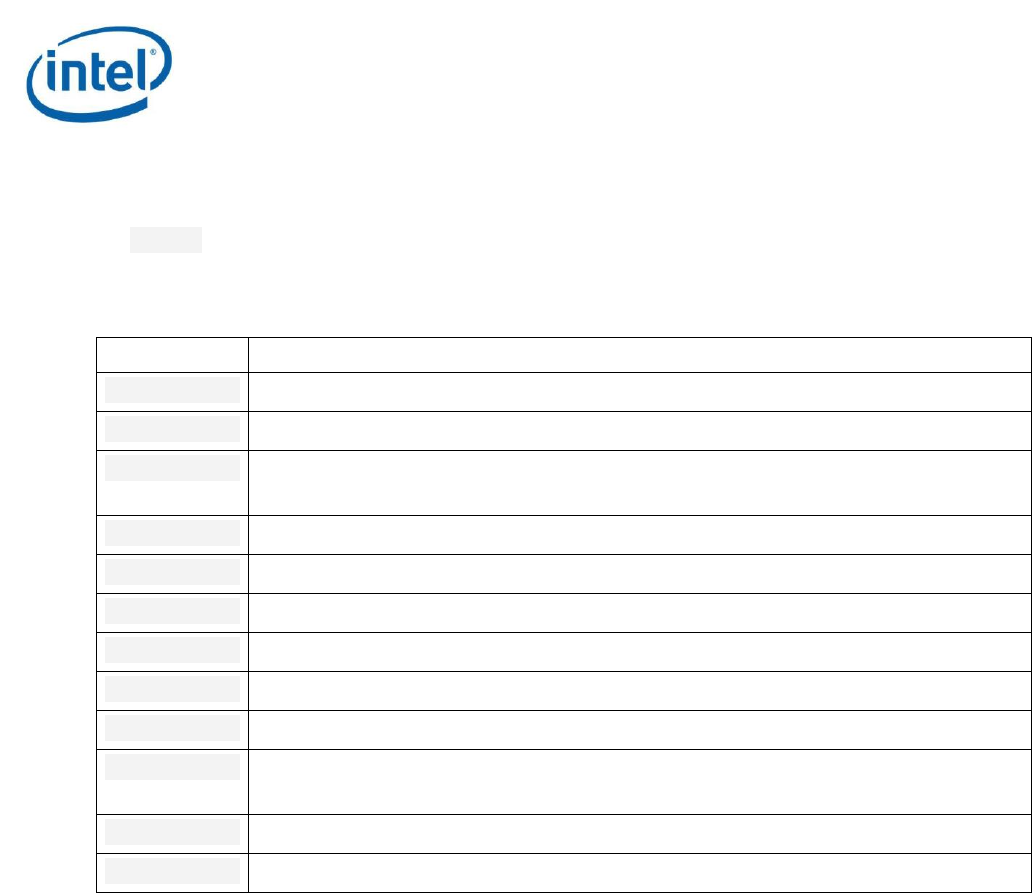
1.2 Conventions and Symbols
The following conventions are used in this document.
Table 1 Conventions and Symbols used in this Document
This type style
Indicates an element of syntax, reserved word, keyword, filename, computer
output, or part of a program example. The text appears in lowercase unless
uppercase is significant.
This type style
Indicates the exact characters you type as input. Also used to highlight the
elements of a graphical user interface such as buttons and menu names.
This type style
Indicates a placeholder for an identifier, an expression, a string, a symbol, or a
value. Substitute one of these items for the placeholder.
[ items ]
Indicates that the items enclosed in brackets are optional.
Intel® SoC Watch for Google Android* OS, Google Chrome* OS, Linux* OS, and QNX* RTOS
6 User's Guide (for use under NDA only) Intel Confidential
{ item | item }
Indicates to select only one of the items listed between braces. A vertical bar ( | )
separates the items.
... (ellipses)
Indicates that you can repeat the preceding item.
1.3 Related Information
See the Intel SoC Watch Release Notes for information on known issues and last minute changes that
were not covered in this document.
Online help, including information about importing results into Intel VTune Amplifier and collecting
results with Intel® System Studio, is available at https://software.intel.com/en-us/socwatch-help.

Installation
User's Guide (for use under NDA only) Intel Confidential 7
2 Installation
See the Intel SoC Watch Release Notes for supported platforms and installation instructions.

Intel® SoC Watch for Google Android* OS, Google Chrome* OS, Linux* OS, and QNX* RTOS
8 User's Guide (for use under NDA only) Intel Confidential
3 Getting Started with Intel SoC Watch
For Android* OS, Google Chrome* OS, and Linux* OS, the following steps assume that the Intel SoC
Watch drivers and executables are installed. For QNX* Real Time Operating System (RTOS), the
following steps assume that the Intel SoC Watch executables are installed. See the Intel SoC Watch
Release Notes for instructions on how to install Intel SoC Watch.
Use the following steps to quickly collect processor C-state and P-state data for 60 seconds and import
it into Intel VTune Amplifier for analysis.
3.1 Preparing the Target on Chrome OS
The following section applies only to target devices running Google Chrome OS. After rebooting the
system, complete the following steps on the target device once before running Intel SoC Watch
collections;
1. Target: cd /
2. Target: find . –name module_locking
3. Target: sudo echo 0 > </path_to_module_locking_file found in previous step>
// if module_locking is set to 1, this step is required to disable module_locking
4. Target: sudo mount –o remount,rw /home
// change read only bit to read write on /home partition
5. Target: sudo mount –o remount,exec /home
// change noexec bit to exec on /home partition
3.2 Preparing the Target on QNX RTOS
The following section applies only to target devices running QNX RTOS. After rebooting the system,
complete the following steps on the target device once before running Intel SoC Watch collections;
1. Host: Find a host machine in the same subnet as the target system running QNX RTOS
1. Host: Set up an NFS share.
a) Install the required packages:
> sudo apt-get install nfs-kernel-server
> sudo apt-get install rpcbind nfs-common
b) Create a shared folder:
> sudo mkdir /var/nfs
> sudo chown user:user /var/nfs
Getting Started with Intel SoC Watch
User's Guide (for use under NDA only) Intel Confidential 9
c) Add the target configuration to the “exports" file:
> vim /etc/exports
>/var/nfs xx.xx.xx.xx(rw,sync,no_subtree_check,insecure,all_squash,anonuid
=1000,anongid=1000)
d) Restart the nfs service
> sudo exportfs –ra
> sudo /etc/init.d/nfs-kernel-server restart
e) Check the shared folder configuration
> showmount -e <host-ip-address>
This should show /var/nfs <target-ip-address>.
2. Target: Map the NFS share to the root folder or a location of your choice
> fs-nfs3 xx.xx.xx.xx:/var/nfs /
3. Host: Copy the Intel SoC Watch package to the NFS share to make it available on the target.
> cp -r <SoCWatch untarred package> /var/nfs
3.3 Collect on Linux or Chrome OS
3.3.1 Set Up Collection on Linux
To collect directly on a Linux target, login as ‘root’. To collect remotely on a target device running Linux,
use ssh to login to your target device as root.
3.3.2 Set Up Collection on Chrome OS
To collect directly on the target, follow the instructions at http://www.chromium.org/chromium-
os/poking-around-your-chrome-os-device. In general, place your device in Developer Mode, start a
command prompt, and login as 'root' using the password you established when Intel SoC Watch was
installed. Finally, mount the filesystem as described in the install directions.
To collect remotely on a target device running Google Chrome OS, use ssh to login to your target device
as root using the password established in the install instructions. Finally, mount the filesystem as
described in the install instructions.
3.3.3 Collection on Linux or Chrome OS
1. Load the device drivers. If the system is based on an Intel Atom® SoC, load the socperf2_0.ko driver.
Finally, load the socwatch2_6.ko driver on all platforms. Note that the socperf2_0.ko driver must be
loaded before the socwatch2_6.ko driver.
Intel® SoC Watch for Google Android* OS, Google Chrome* OS, Linux* OS, and QNX* RTOS
10 User's Guide (for use under NDA only) Intel Confidential
Previous versions of the socwatch2_x.ko driver (e.g. socwatch2_0.ko) will also work but new
collector support and/or bug fixes may be missing in the older drivers. If an older socwatch2_x.ko
driver is used, some metrics may not be collected.
On systems running Chrome, if the socwatch_chrome_CUSTOM.tar.gz package was installed, issue
the following commands:
> insmod <path>/socwatch/socwatch_chrome_CUSTOM/driver/socperf2_0.ko
> insmod <path>/socwatch/socwatch_chrome_CUSTOM/driver/socwatch2_6.ko
On systems running Linux, issue the following commands:
> insmod
<path>/socwatch/socwatch_chrome_linux_NDA_[version]/soc_perf_driver/src/socpe
rf2_0.ko
> insmod
<path>/socwatch/socwatch_chrome_linux_NDA_[version]/socwatch_driver/socwatch2
_6.ko
2. Navigate to the Intel SoC Watch directory.
> cd <path>/socwatch/socwatch_chrome_[CUSTOM | linux_NDA_[version]]
3. Setup the collection environment:
> source ./setup_socwatch_env.sh
4. Create a results directory:
> mkdir results
5. Collect data. The following command generates the test.csv, test.sw2 and test.pwr files in the
results directory.
>./socwatch –r vtune –m -f cpu-cstate -f cpu-pstate -t 60 -o ./results/test
6. View the summary results.
> cat ./results/test.csv
7. If you wish to view results in Intel VTune Amplifier on your host system, copy the test.pwr file from
the target to the host using scp. The following steps assume a Windows host.
> scp root@<your_target_IP>:<path>/socwatch/<path>/results/test.pwr
c:\results\.
3.4 Collect on Android OS
1. On the host system, establish a root adb shell on the target:
> adb root
> adb shell
2. Load the appropriate socperf driver.
If the target system has an Intel Atom processor, load the socperf driver. The socperf driver must be
loaded before the Intel SoC Watch driver:
> insmod <path_to_socperf_driver>/socperf2_0.ko
Getting Started with Intel SoC Watch
User's Guide (for use under NDA only) Intel Confidential 11
NOTE: Make sure to use the latest version of the socperf driver.
3. Load the Intel SoC Watch driver:
> insmod <path_to_socwatch_driver>/socwatch2_6.ko
4. Confirm the drivers are loaded:
> lsmod
Confirm the loaded drivers are included in the list of installed modules.
5. Setup the collection environment. This step assumes the default install directory was used.
> cd /data/socwatch
> source ./setup_socwatch_env.sh
6. Collect data and generate the test.csv, test.sw2, and test.pwr files in the results directory. This step
assumes the /data/socwatch/results directory exists.
>./socwatch -r vtune –m –f cpu-cstate –f cpu-pstate –t 60 –o ./results/test
7. Exit the adb shell:
> exit
8. Use adb to pull the result files to the host:
> adb pull /data/socwatch/results/test.csv c:\results
> adb pull /data/socwatch/results/test.sw2 c:\results
> adb pull /data/socwatch/results/test.pwr c:\results
3.5 Collect on QNX RTOS
The QNX RTOS is a read-only file system. It is essential to run the Intel SoC Watch collection directly in
a mounted NFS share.
NOTE: Mount an NFS share following instructions in 3.2Preparing the Target on QNX RTOS.
1. Change the directory to the SoC Watch package folder on the NFS share
2. Set up the collection environment. This step assumes the / directory is where the NFS share is
mounted.
> cd /<soc watch_package>
> source ./setup_socwatch_env.sh
3. Collect data and generate the test.csv, test.sw2, and test.pwr files in the results directory.
>./socwatch -r vtune –m –f cpu-cstate –f cpu-pstate –t 60 –o ./results/test
The results are automatically written on the NFS share and are available on the host. For example,
/var/nfs on the host.
Intel® SoC Watch for Google Android* OS, Google Chrome* OS, Linux* OS, and QNX* RTOS
12 User's Guide (for use under NDA only) Intel Confidential
4 Options Quick Reference
Invoke Intel SoC Watch with root privilege, using the following syntax:
socwatch <general options> <post-processing options> <collection options>
Order of options does not matter unless specifically noted.
Help is displayed if no option is specified.
All features are not available on all systems, so the help text is dynamic, meaning it displays
only the collection options that are supported by the system on which it is run. The metrics
available differ because of changes in the system’s hardware architecture support. This User’s
Guide contains a list of all metrics across all systems.
You can specify feature names that are not available or not enabled on a particular system.
When the tool starts, it will display console messages regarding features that cannot be
collected, but collection will proceed if at least one feature is valid on that system.
Intel SoC Watch terminates data collection for one of three reasons (whichever occurs first):
1. the --time option was specified and the timer elapsed,
2. the --program option was used and the specified program exited,
3. a Ctrl-C interrupt was entered in the command window.
The location and name of the results files is displayed at the end of a collection. The summary report
will be there with that name and a .csv extension. Raw data files and additional files based on post-
processing options specified on the command line are located there as well, all with the same base
name (default name is SoCWatchOutput).
NOTE: Result files are replaced if the same name is used for multiple collections.
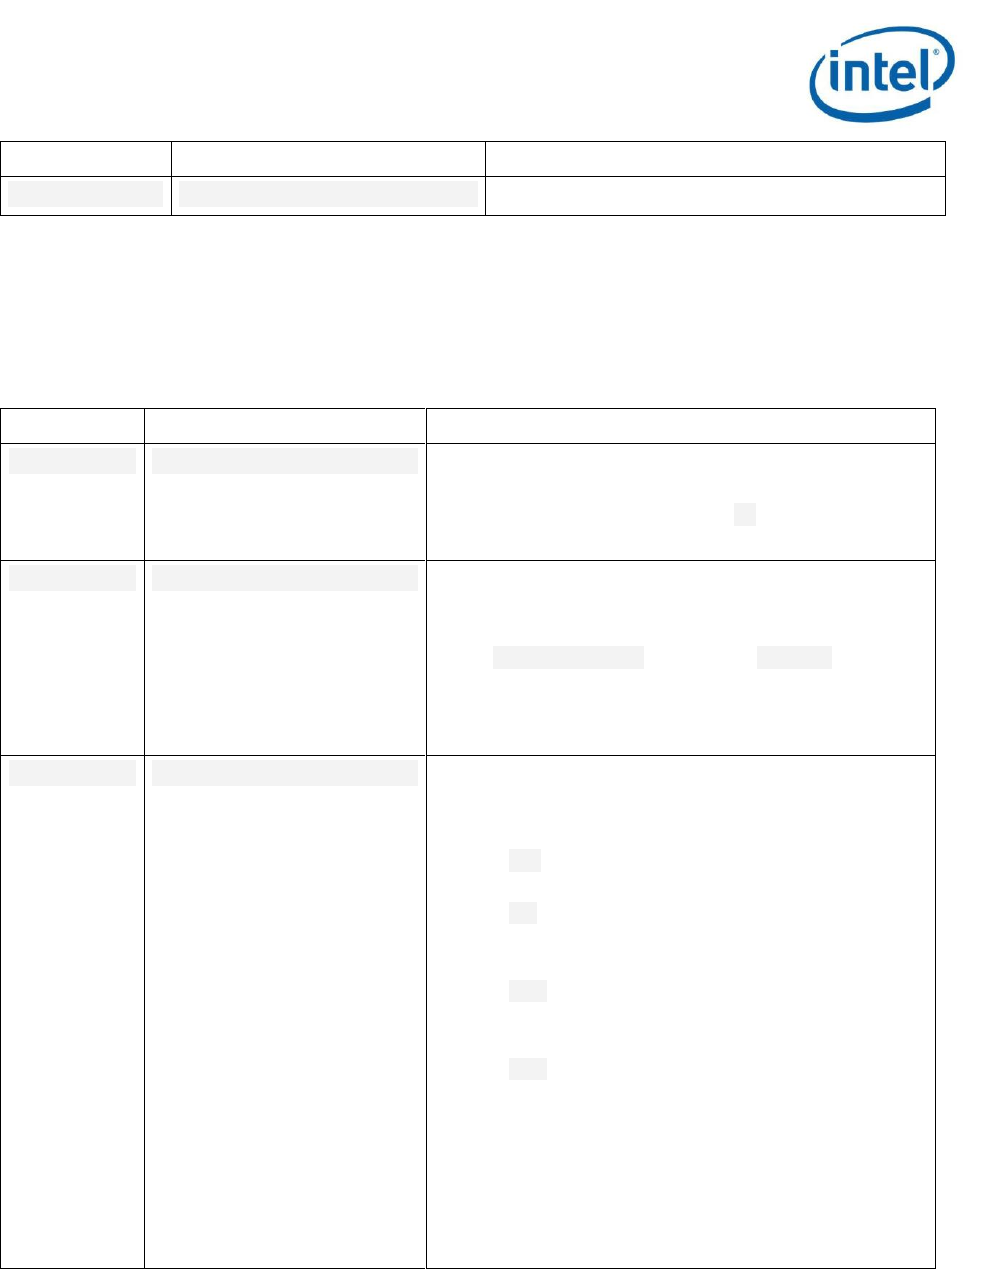
4.1 General Options
The following options display information about the tool or system on which it is run.
Table 2 General Options
Abbreviation
Option Name
Description
-h
--help
Display tool usage information and exit. The
help shown is specific to the system on which it
is run. Only metrics supported by the system
architecture will be listed.
--print-fms
Display CPU ID as Family.Model.Stepping and
exit.
-l
--log <filename>
Redirect all console output, including errors, to
specified file.
Options Quick Reference
User's Guide (for use under NDA only) Intel Confidential 13
Abbreviation
Option Name
Description
-v
--version
Display tool version information and exit.
4.2 Post-processing Options
The following options affect how results are reported and where they are stored.
Table 3 Reporting Options
Abbreviation
Option Name
Description
-i
--input <filename>
Specify the path and base filename (without
extension) of an existing collection to generate
additional reports. Use with the –r option to specify
which types of reports.
-o
--output <filename>
Specify the base name for the output files from this
collection. If this option is not specified, the files are
written to the current working directory with base
name SoCWatchOutput. Specifying console as the
filename will cause the summary results to also write
to stdout. If a name already exists, the previous
results will be replaced.
-r
--result <result_type>
Specify the type of result to generate. This option
can be repeated to get multiple types of reports.
Following are the result types that can be specified:
sum Write summary reports to .csv file.
[default]
int Write over-time data to _trace.csv file.
vtune Generate .pwr file for import to Intel
VTune Amplifier.
json Generate .swjson file for visualization
using HTLM5 viewer such as Intel System
Studio Energy Analysis plugin.
auto Write summary results as a single line
to file Automation_Summary.csv in current
directory. Appends results, does not
overwrite. If column headers for the new
result changed, new headers will be inserted.
Use to generate sets of data in a single file
for comparison.

Intel® SoC Watch for Google Android* OS, Google Chrome* OS, Linux* OS, and QNX* RTOS
14 User's Guide (for use under NDA only) Intel Confidential
4.3 Collection Options
These options affect what is collected and how it is collected.
Table 4 Collection Options
Abbreviation
Option Name
Description
-f
--feature <name>
Specify which metric to collect, choose from
the group names or individual names listed in
the tables below. This option can be repeated
to collect multiple metrics in a single run.
Most features can be collected simultaneously,
exceptions noted in the table of feature
names.
-m
--max-detail
Collect all data available for each feature
specified. This will cause snapshot metrics to
be sampled. Use of this option can increase
tool overhead, so best used only when
timeline of the data is needed or when
collecting across system entry to hibernation.
Without this option, the tool collects data at
the minimum required by the data source for
best accuracy.
On Android OS, Google Chrome OS, and Linux
OS, data may be traced, sampled, or
snapshot. On QNX RTOS, data may only be
sampled or snapshot:
Traced data is obtained at state transition points
resulting in accurate summary and timeline
results. Traced data is not available on QNX
RTOS.
Sampled data is read at OS context switch
points (or at timed intervals if polling option is
used). This is less accurate as changes that take
place between samples will not be measured.
Metrics that come from hardware status/state
data must be sampled.
Snapshot data can be read at the beginning and
end of the collection and the difference gives an
accurate result with lowest overhead, but no
timeline. Only metrics that come from hardware
accumulators can be snapshot.

Options Quick Reference
User's Guide (for use under NDA only) Intel Confidential 15
Abbreviation
Option Name
Description
The algorithm used to determine the collection
method for each data type is as follows:
If –m is specified;
if the data can be traced, trace it;
else sample it.
If –m is not specified;
if the data can be snapshot, snapshot it;
else if the data can be traced, trace it;
else sample it.
-n
--interval <milliseconds>
Specify the time in milliseconds that should
pass before reading next hardware data
sample (default 100 ms). For default collection
mode, this is the minimum time between
sampling at context switch points. When --
polling option is used, this is actual time
between samples.
The minimum polling interval is 1ms.
However, using low polling intervals will result
in higher overhead and may fail to measure
some metrics (e.g. bandwidths) with intervals
shorter than the default.
--option <opt-name=value>
Specify additional info for a metric. See pch-
ip-active and pch-ip-lat-limit for valid
option names and values.
--polling
Make data collection occur at regular intervals
rather than at context switch points. Use the -
-interval option to set the interval period
(default: 100ms). Use of this option
significantly increases perturbation of sleep
states because it employs a timer which will
interrupt sleep states, increase wakeup
counts, and change timer resolution.
-p
--program
<application><parameters>
Specify the name of an executable to be
started automatically prior to collection. The
name can be followed by zero or more
arguments that will be passed to the program.
NOTE: This option must occur at the end of the
command line, everything following the executable name
will be given to it as arguments.

Intel® SoC Watch for Google Android* OS, Google Chrome* OS, Linux* OS, and QNX* RTOS
16 User's Guide (for use under NDA only) Intel Confidential
Abbreviation
Option Name
Description
-s
--startdelay <seconds>
Specify number of seconds to wait before
starting collection of data.
If used with --program, it delays execution of
that program (collection begins immediately
upon starting the program).
-t
--time <seconds>
Specify collection duration in seconds.
Collection will stop when this time has elapsed
unless Ctrl-C is entered or an executable
specified with --program option exits prior to
the specified duration.
4.3.1 Feature Names (Individual)
The available feature names for the --feature option and their collection methods are listed below.
You can specify multiple feature names individually or using group names described in the Feature
Group Names section.
Note that every feature listed is not available on every platform supported by Intel SoC Watch. The --
help option is dynamic, only showing features available for the platform on which it is run. Use it to
determine which features are supported. You can specify unsupported features on the command line
and the tool will simply display a message for those that cannot be collected, but continue with
collection if there is at least one that is supported.
Collection methods are indicative of a metric’s level of accuracy and overhead. Traced collection
provides high accuracy along with precise transition points between states. Sampled collection is least
accurate since transitions can occur which are never noted. Sampled data needs to be read at intervals
throughout the collection period which increases tool overhead. Increasing the sampling rate (reading
at closer intervals) will improve accuracy but increase overhead. Snapshot collection means the data
comes from an accumulator so it can be collected only at the start and end of the collection period and
give perfect accuracy. This gives accuracy and the lowest overhead. If the --max-detail (-m) option
is given, the Snapshot metrics will instead be read at the same intervals as the Sampled metrics
throughout the collection, so that you can generate a trace file to see how it changed overtime.
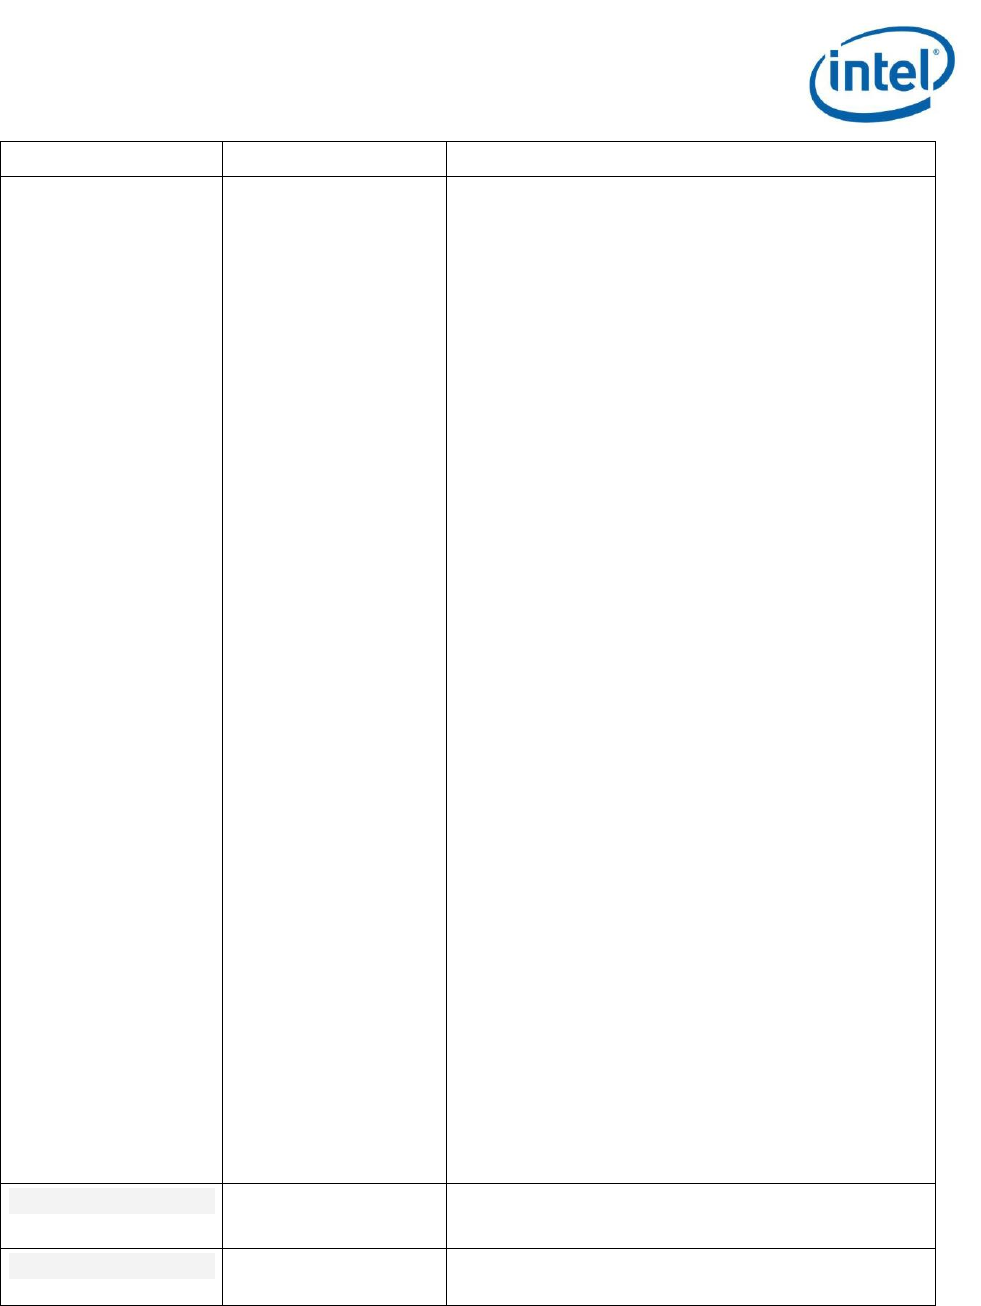
Table 5 Features
Name
Collection Methods
Description
all-approx-bw
Sampled
Estimated memory bandwidth for multiple SoC
agents (concurrently), from hardware signal
accumulators. Precise bandwidth can be collected
for one agent at a time using other bandwidth
features. Only one bandwidth or DRAM self-refresh
metric can be specified at a time.
Options Quick Reference
User's Guide (for use under NDA only) Intel Confidential 17
Name
Collection Methods
Description
Hardware counter overflow can occur if -m is not
used for signal-based metrics.
SoC transactions are counted and multiplied by 64
to form the estimates, which will be equal to or
higher than the actual bandwidths. The estimate is
high if partial or 32-byte transfers actually
occurred.
On 22nm Intel Atom Processor-based SoC for
Tablets and 2-in-1s (formerly code named Bay
Trail), this feature provides the following estimated
bandwidths:
Module 0 and Module 1: the bandwidth from CPU
Module 0 and Module 1 to the DDR
GFX: the bandwidth from the graphics component to
the DDR
Display: the bandwidth from the display controller to
the DDR
ISP: the bandwidth from the camera image processor
to the DDR
VED: the bandwidth from the video encode and
decode components to the DDR
IO: the bandwidth between the north and south
clusters
On systems code named Cherry Trail, and Intel
Atom Processor Z35XX (formerly code named
Moorefield), this feature provides the following
estimated bandwidths:
Module 0 and Module 1: the bandwidth from CPU
Module 0 and Module 1 to the DDR
GFX: the bandwidth from the graphics component to
the DDR
Display: the bandwidth from the display controller to
the DDR
ISP: the bandwidth from the camera image processor
to the DDR
IO: the bandwidth between the north and south
clusters
core-temp
Sampled
IA core temperature statistics, from hardware
status data.
core-volt
Sampled
Calculate core voltage, from hardware status data.
This data can only be collected on Intel Atom

Intel® SoC Watch for Google Android* OS, Google Chrome* OS, Linux* OS, and QNX* RTOS
18 User's Guide (for use under NDA only) Intel Confidential
Name
Collection Methods
Description
Processor-based SoCs for systems code named
Apollo Lake.
cpu-ddr-mod0-bw
cpu-ddr-mod1-bw
Sampled
Precise CPU to DDR module 0 or 1 bandwidth, from
hardware signal accumulators. Only one bandwidth
or DRAM self-refresh metric can be specified at a
time.
Hardware counter overflow can occur if -m is not
used for signal-based metrics.
NOTE: Not available on QNX RTOS.
cpu-gpu-concurrency
Snapshot
Concurrent active time of CPU and GPU, from
hardware accumulators.
cpu-pkgc-dbg
Snapshot
Reasons blocking entry to lower-power C-states
and wakeup from C-states for CPU Package, from
hardware accumulators.
ddr-bw
Snapshot
Total DDR memory bandwidth, from hardware
accumulators or from signal accumulators. On
platforms where signals are used, only one
bandwidth or DRAM self-refresh metric can be
specified at a time.
Hardware counter overflow can occur if -m is not
used for signal-based metrics.
deep-sstate
Sampled
Deep S0iX residencies, from hardware
accumulators. This data can only be collected on
Intel Atom Processor-based SoCs for systems code
named Apollo Lake.
die-temp
Sampled
Die temperatures, from hardware status data. This
data can only be collected on Intel Atom Processor-
based SoCs for systems code named Apollo Lake.
disp-ddr-bw
Sampled
Precise display controller to DDR memory
bandwidth, from hardware signal accumulators.
Only one bandwidth or DRAM self-refresh metric
can be specified at a time.
Hardware counter overflow can occur if -m is not
used for signal-based metrics.
dram-bw
Snapshot
Total DDR bandwidth with memory slice
breakdown, from hardware accumulators. Available
in place of ddr-bw on platforms where hardware
signals not available.

Options Quick Reference
User's Guide (for use under NDA only) Intel Confidential 19
Name
Collection Methods
Description
dram-pwr
Sampled
Calculate DRAM power consumption, from
hardware accumulators. This data can only be
collected on Intel Atom Processor-based SoCs for
systems code named Apollo Lake.
dram-srr
Sampled
DRAM residency in self-refresh mode, from
hardware signals. Only one bandwidth or DRAM
self-refresh metric can be specified at a time.
Hardware counter overflow can occur if -m is not
used for signal-based metrics.
Do not specify a polling interval greater than 14
seconds when measuring DRAM self-refresh.
edp-throt-cnt
Sampled
Throttling counts due to EDP (electrical design
power) limits, from hardware status data. This data
can only be collected on Intel Atom Processor-
based SoCs for systems code named Apollo Lake
and Gemini Lake.
edp-throt-res
Sampled
Throttling residencies due to EDP (electrical design
power) limits, from hardware accumulators. This
data can only be collected on Intel Atom Processor-
based SoCs for systems code named Apollo Lake
and Gemini Lake.
gfx-ddr-bw
Sampled
Graphics component to DDR bandwidth, from
hardware signal accumulators. Only one bandwidth
or DRAM self-refresh metric can be specified at a
time.
NOTE: Some bandwidth measurements include ReadPartial
or WritePartial traffic. The payload (how many bytes were
transferred) of a partial transaction can range from 1 to 64 bytes.
Therefore, the exact bandwidth cannot be accurately measured.
In these cases, the Intel SoC Watch bandwidth results will
provide a Total Bandwidth Range. The Total Bandwidth Range
describes the minimum and maximum bandwidth that was
measured. The actual bandwidth falls within the Total
Bandwidth Range.
Hardware counter overflow can occur if -m is not
used for signal-based metrics.
gfx-throt-rsn
Sampled
Reasons for throttling the GPU frequency, from
hardware status data.
gt-pwr
Sampled
Calculate GT power consumption, from hardware
accumulators. This data can only be collected on

Intel® SoC Watch for Google Android* OS, Google Chrome* OS, Linux* OS, and QNX* RTOS
20 User's Guide (for use under NDA only) Intel Confidential
Name
Collection Methods
Description
Intel Atom Processor-based SoCs for systems code
named Apollo Lake.
gt-temp
Sampled
GT graphics temperature, from hardware status
data. This data can only be collected on Intel Atom
Processor-based SoCs for systems code named
Broxton and Apollo Lake.
hw-cpu-cstate
Android OS, Chrome
OS, and Linux
OS:Snapshot, Traced
QNX RTOS: Snapshot,
Sampled
CPU C-state (sleep) residencies, from hardware
accumulators, and summary of wakeups that cause
IA cores to exit a C-state from trace data.
Wakeups are available only on Android* OS,
Chrome* OS, and Linux* OS and only collected if
the –m or --max-detail switch is specified.
hw-cpu-hwp
Sampled
HWP capabilities, from hardware status data.
hw-cpu-pstate
Sampled
CPU P-state (frequency) residencies, from trace
data.
hw-gfx-cstate
Snapshot
GPU C-state residency, from hardware
accumulators.
hw-gfx-pstate
Sampled
GT graphics P-state (processor frequency)
residencies, from hardware status data.
ia-pwr
Sampled
Calculate IA power consumption, from hardware
accumulators. This data can only be collected on
Intel Atom Processor-based SoCs for systems code
named Apollo Lake.
ia-temp
Sampled
IA core temperature, from hardware status data.
This data can only be collected on Intel Atom
Processor-based SoCs for systems code named
Broxton and Apollo Lake.
ia-throt-rsn
Sampled
Reasons for throttling the CPU frequency, from
hardware status data.
io-bw
Sampled
IO bandwidth between the North Cluster (NC) and
South Cluster (SC), from hardware signal
accumulators. Only one bandwidth or DRAM self-
refresh metric can be specified at a time.
Hardware counter overflow can occur if -m is not
used for signal-based metrics.
isp-ddr-bw
Sampled
ISP (camera image processor) to DDR bandwidth,
from hardware signal accumulators. Only one

Options Quick Reference
User's Guide (for use under NDA only) Intel Confidential 21
Name
Collection Methods
Description
bandwidth or DRAM self-refresh metric can be
specified at a time.
Hardware counter overflow can occur if -m is not
used for signal-based metrics.
isp-pwr
Sampled
Calculate ISP power consumption, from hardware
accumulators. This data can only be collected on
Intel Atom Processor-based SoCs for systems code
named Apollo Lake.
isp-temp
Sampled
ISP (camera image processor) temperature, from
hardware status data. This data can only be
collected on Intel Atom Processor-based SoCs for
systems code named Broxton and Apollo Lake.
iunit-temp
Sampled
IUNIT temperature, from hardware status data.
This data can only be collected on Intel Atom
Processor-based SoCs for systems code named
Apollo Lake.
lpss-ltr
Sampled
Low Power Subsystem (LPSS) Latency tolerance
reporting (LTR) for hardware and software
mechanisms, from hardware status data.
mod-temp
Sampled
Module temperature, from hardware status data.
This data can only be collected on Intel Atom
Processor-based SoCs for systems code named
Apollo Lake.
nc-dstate
Sampled
North Complex (NC) component D0ix approximated
state residency, from hardware status data.
netip-bw
Sampled
Networking IP block to DDR bandwidth, from
hardware signal accumulators. Only transfers of 32
or 64 bytes are measured. Use both the netip-bw
and netip-partials-bw features to measure the
full networking IP block to DDR bandwidth. Only
one bandwidth or DRAM self-refresh metric can be
specified at a time.
Hardware counter overflow can occur if -m is not
used for signal-based metrics.
netip-partials-bw
Sampled
Networking IP block to DDR bandwidth, from
hardware signal accumulators. Only partial
transfers are measured (partial transfers are non-
32byte or non-64byte transactions). Use both the
netip-bw and netip-partials-bw features to
measure the full networking IP block to DDR

Intel® SoC Watch for Google Android* OS, Google Chrome* OS, Linux* OS, and QNX* RTOS
22 User's Guide (for use under NDA only) Intel Confidential
Name
Collection Methods
Description
bandwidth. Only one bandwidth or DRAM self-
refresh metric can be specified at a time.
Hardware counter overflow can occur if -m is not
used for signal-based metrics.
other-throt-cnt
Sampled
Throttling counts due to causes other than power,
thermal, or EDP (electrical design power) limits,
from hardware accumulators. This data can only be
collected on Intel Atom Processor-based SoCs for
systems code named Apollo Lake and Gemini Lake.
other-throt-res
Sampled
Throttling residencies due to causes other than
power, thermal, or EDP (electrical design power)
limits, from hardware accumulators. This data can
only be collected on Intel Atom Processor-based
SoCs for systems code named Apollo Lake and
Gemini Lake.
panel-srr
Sampled
Panel self-refresh residency report, from hardware
status data.
pch-ip-active
Snapshot
PCH active residencies for each IP, from hardware
accumulators. To avoid interference in attaining
deeper sleep states on older PCH, the PCH activity
data is split into multiple groups referred to as
levels (lvl) and data is collected at a much lower
rate. By default, lvl1 is reported and the collection
interval is 5 seconds. Additional levels are shown
below, as is the option to change the collection
interval.
To specify a level, include --option pch-
lvl=<lvl, lvl, …>. Listing multiple levels is not
allowed for older PCH due to impact of overhead.
All levels are not supported for all PCH and will be
ignored if specified. IP data included in each level
can vary for each PCH. Valid values for lvl are:
1: Includes PMC, PLL activity for OPI, SATA, Audio,
USB, MIPI, and CNVi, and more
2: Audio high speed fabric, SCS, Thermal Sensor,
and ISH, and more
3a: ModPhy lanes 0-3
3b: ModPhy lanes 4-7
3c: ModPhy lanes 8-11
Options Quick Reference
User's Guide (for use under NDA only) Intel Confidential 23
Name
Collection Methods
Description
3d: ModPhy lanes 12-15
4: Power-gated domains, ungated SRAMS, camera,
and more
5: LPSS, CNVi components, CRO, XTAL, CLKOUT,
and more
To change the frequency at which this data is
collected, include --option pch-
int=<milliseconds>. Use of intervals below the
default 5 seconds for PCH active metrics has higher
impact on overhead and may reduce time in low
power states. Use the --interval option for all
other metrics.
pch-ip-active-all
Snapshot
All levels of PCH active residencies for each IP,
from hardware accumulators. Not available on
platforms with high-overhead mechanism for
collecting this data, use the pch-ip-active feature
with its pch-lvl option to specify one group at a
time.
pch-ip-lat-limit
Snapshot
PCH IP latency limit residencies, from hardware
accumulators. Exactly three IPs can be monitored
at the same time. By default SPA, SPB, and SPC
will be monitored.
To change which IPs to monitor, include --option
lat-limit-ip=<IP1, IP2, IP3>, where each IP is
one of the following: SPA, SPB, SPC, SATA, GBE,
XHCI, ME, EVA, HD-AUDIO, ESPI, LPSS, CAM, SCC,
ISH. The exact list of IPs can vary for different
PCH. Use the --help option to see which IP are
available on your target platform.
pch-ip-status
Sampled
PCH IP blocks power gated statistics, from
hardware status data.
pch-platform-ltr
Sampled
PCH IP Latency Tolerance Requirement (LTR) for
snoop and no snoop, from hardware status data.
pch-slps0
Snapshot
PCH SLP_S0 residency, from hardware
accumulator.
pch-slps0-dbg
Sampled
Blocking reasons for SLP_S0, from hardware status
data.
pcie-lpm
Sampled
PCIe Link Power Management (LPM) Lx state
residencies, from hardware status data. Includes
root port and end point device capabilities. L1 sub-

Intel® SoC Watch for Google Android* OS, Google Chrome* OS, Linux* OS, and QNX* RTOS
24 User's Guide (for use under NDA only) Intel Confidential
Name
Collection Methods
Description
states are included if supported by the device (Gen
1, Gen 2, Gen 3).
pcie-ltr
Sampled
PCIe Latency Tolerance Reporting (LTR) for snoop
and no-snoop requests, from hardware status.
Includes root port and end point device
capabilities.
pkg-power
Sampled
Calculate the entire SOC/Package power
consumption, from hardware accumulators.
pkg-temp
Sampled
Package temperature, from hardware status data.
This data can only be collected on Intel Atom
Processor-based SoCs for systems code named
Broxton and Apollo Lake.
pmic-imon
Sampled
Average current on multiple PMIC voltage rails,
from hardware status data.
pmic-pwr
Sampled
Calculate PMIC rails power values, from hardware
accumulators. This data can only be collected on
Intel Atom Processor-based SoCs for systems code
named Apollo Lake.
pmic-temp
Sampled
MSIC/PMIC temperature, from sysfs reads.
pwr-throt-cnt
Sampled
Throttling counts due to power limits, from
hardware accumulators. This data can only be
collected on Intel Atom Processor-based SoCs for
systems code named Apollo Lake and Gemini Lake.
pwr-throt-res
Snapshot
Throttling residencies due to power limits, from
hardware accumulators. This data can only be
collected on Intel Atom Processor-based SoCs for
systems code named Apollo Lake and Gemini Lake.
ring-throt-rsn
Sampled
Reasons for throttling the ring clock frequency,
from hardware status data.
s0i3-sstate
Snapshot
S0i3 system state residencies, from hardware
accumulators.
s0i3-sstate-dbg
Snapshot
Blocking reasons for entry to system state S0i3
(wakeup reasons for exit from S0i3 are included on
some platforms), from hardware accumulators.
sa-temp
Sampled
System Agent temperature, from hardware status
data. This data can only be collected on Intel Atom
Processor-based SoCs for systems code named
Broxton and Apollo Lake.
Options Quick Reference
User's Guide (for use under NDA only) Intel Confidential 25
Name
Collection Methods
Description
sata-lpm
Sampled
SATA Link Power Management (LPM) states
residencies, from hardware status data. Includes
device capabilities.
sc-dstate
Snapshot or Sampled
(depends on target
system)
South Complex (SC) component D0ix state
residencies. If sampled, the residency is only an
approximation.
Intel microarchitecture code named Anniedale and
Clover Trail only.
shallow-sstate
Sampled
Measure shallow S0ix residencies, from hardware
accumulators. This data can only be collected on
Intel Atom Processor-based SoCs for systems code
named Apollo Lake.
skin-temp
Sampled
Skin temperature data, from sysfs reads.
soc-temp
Sampled
SoC temperature data, from hardware status data
or PMC telemetry.
sstate
Snapshot (for S0ix)
Trace (for ACPI S3)
S0ix and ACPI Suspend-To-RAM (S3) residency. S3
data is traced using kernel hooks to trace the
system’s S3 behavior. S0ix data is snapshot at the
start of the collection, at the end of the collection,
and during S0->S3 and S3->S0 transitions.
temp-throt-cnt
Sampled
Throttling counts due to thermal limits, from
hardware accumulators. This data can only be
collected on Intel Atom Processor-based SoCs for
systems code named Apollo Lake and Gemini Lake.
temp-throt-res
Sampled
Throttling residencies due to thermal limits, from
hardware accumulators. This data can only be
collected on Intel Atom Processor-based SoCs for
systems code named Apollo Lake and Gemini Lake.
wakelock
Trace
User and kernel wakelock data, from kernel
tracepoints and aplog. Android only.
xhci-lpm
Sampled
XHCI Link Power Management state (Ux)
residencies, from hardware status data.
4.3.2 Feature Group Names
The following features are groupings of the previously described features. These group names can be
used to simplify command lines to collect multiple features concurrently. For example, –f cpu can
replace the –f hw-cpu-cstate –f hw-cpu-pstate in a command line.
Intel® SoC Watch for Google Android* OS, Google Chrome* OS, Linux* OS, and QNX* RTOS
26 User's Guide (for use under NDA only) Intel Confidential
If a group includes a feature that is not enabled on the target platform, that feature will be ignored and
collection continue, as long as there is one feature that can be collected.
All features are not supported on all platforms, a group will only include the supported features. Use
the --help option on the target platform to see the list of group names and specific features included
each group.
Table 6 Feature Groups
Name
Description
cpu
CPU metrics such as C-states and P-state residencies, and IA throttling reasons.
device
Device state residency metrics such as NC and SC D-states.
gfx
Graphics metrics such as C-state and P-state residencies, GT throttling reasons,
and panel self-refresh residency.
pcie
PCIe metrics such as link state residencies and latency tolerance requirements.
pch
Most PCH related metrics.
pch-all
All PCH related metrics (all PCH active groups).
power
Power related metrics.
sata
SATA related metrics.
sstate
System Sx/S0ix state metrics
sys
Broad spectrum of metrics commonly used to get general information about
platform power behavior.
temp
Temperature metrics.
throt
Frequency throttling reason metrics.

Viewing Intel SoC Watch Results with Intel® VTune™ Amplifier
User's Guide (for use under NDA only) Intel Confidential 27
5 Viewing Intel SoC Watch Results with
Intel® VTune™ Amplifier
You can analyze Intel SoC Watch data graphically using the Intel VTune Amplifier GUI. VTune Amplifier
provides a dynamic timeline view for interacting with Intel SoC Watch data and provides powerful
filtering of data for in-depth analysis of a platform’s power management behavior.
For detailed instructions, refer to the Analyze Energy Usage section of the Intel VTune Amplifier Help.
