Presentation IQ 10/15 Sp Capitaliq Fixed Income North America Q2 2015
User Manual: IQ 10/15
Open the PDF directly: View PDF ![]() .
.
Page Count: 25
- Slide Number 1
- TABLE OF CONTENTS North America
- EDITORS’ NOTE
- MARKET TRENDS
- Relative Performance of Fixed Income Indices
- 10 Year BBB Sector Z-Spreads
- Z-Spread Ratings Term Structure (Quarter over Quarter)
- Slide Number 8
- Sovereign CDS Heat Map
- Sovereign CDS Regional Focus: United States
- CREDIT TRENDS
- S&P Ratings Trends
- Slide Number 13
- CDS Market Outliers
- Slide Number 15
- Slide Number 16
- Quantitatively Viewed Ratings Outliers
- FINANCIAL RATIO TRENDS
- Financial Ratio Trends
- ISSUANCE TRENDS
- Issuance Trends By Rating Category
- Covenants for High Yield Issuance
- Contact Us
- Disclosures
- Slide Number 25
FIXED INCOME IQ
Credit Markets
Quarterly Fixed Income Trends
North America
July 2015│ Issue 6

2
TABLE OF CONTENTS
North America
Market Trends……..………………………………………………………..5
Market Indices
Corporate Yield Curves
Investment Grade vs. High Yield Market Activity
Sovereign CDS Heat Map
Sovereign CDS Deep Dive: United States
Credit Trends...……………………………………………………………..12
Ratings Trends
CDS Market Sentiment
CDS Market Outliers
Fundamental and Market Implied Default Risk
̶PD Market Signals and PD Fundamentals
Quantitatively Viewed Ratings Outliers
Financial Ratio Trends..……………………………………………….…..19
Issuance Trends..…………………………………………………………...21
Ratings Issuance
Security Issuance
High Yield Covenant Trends
Please click on the links below to access research on other regions or visit http://www.spcapitaliq.com/our-
thinking/research.html?category=market:
Latin America
Europe
3
EDITORS’ NOTE
High yield performed well in Q2 2015, while investment grade posted losses as the market began to anticipate rate increases in the
second half of 2015. Spreads increased but other risk signals remained varied.
Q2 2015 Overview:
-Overall, credit markets were mixed – Anticipation of rate increases caused investors to shed investment grade debt while high yield
posted positive returns for second quarter in a row.
-U.S. sovereign risk decreased as global market volatility in China and Europe strengthened the U.S. as a safe haven.
-Spreads increased for most sectors and investment grade – Markets re-priced risk upwards this quarter for all sectors and for
investment grade debt. Only high yield debt saw spreads tighten from last quarter.
-Risk signals mixed this quarter - Median equity market-based probabilities of default improved on a quarterly basis while fundamental
probabilities of default showed deterioration in all but one sector.
-Issuance continues to be healthy – Issuance increased in most ratings categories on a year-over-year basis with the biggest increase
coming from the BBB spectrum, following a similar trend from last quarter.
Jay Bhankharia, CFA
Senior Manager
Investment Management
S&P Capital IQ
AUTHORS:
James Elder
Director
Corporates and Financial Institutions
S&P Capital IQ

MARKET TRENDS

5
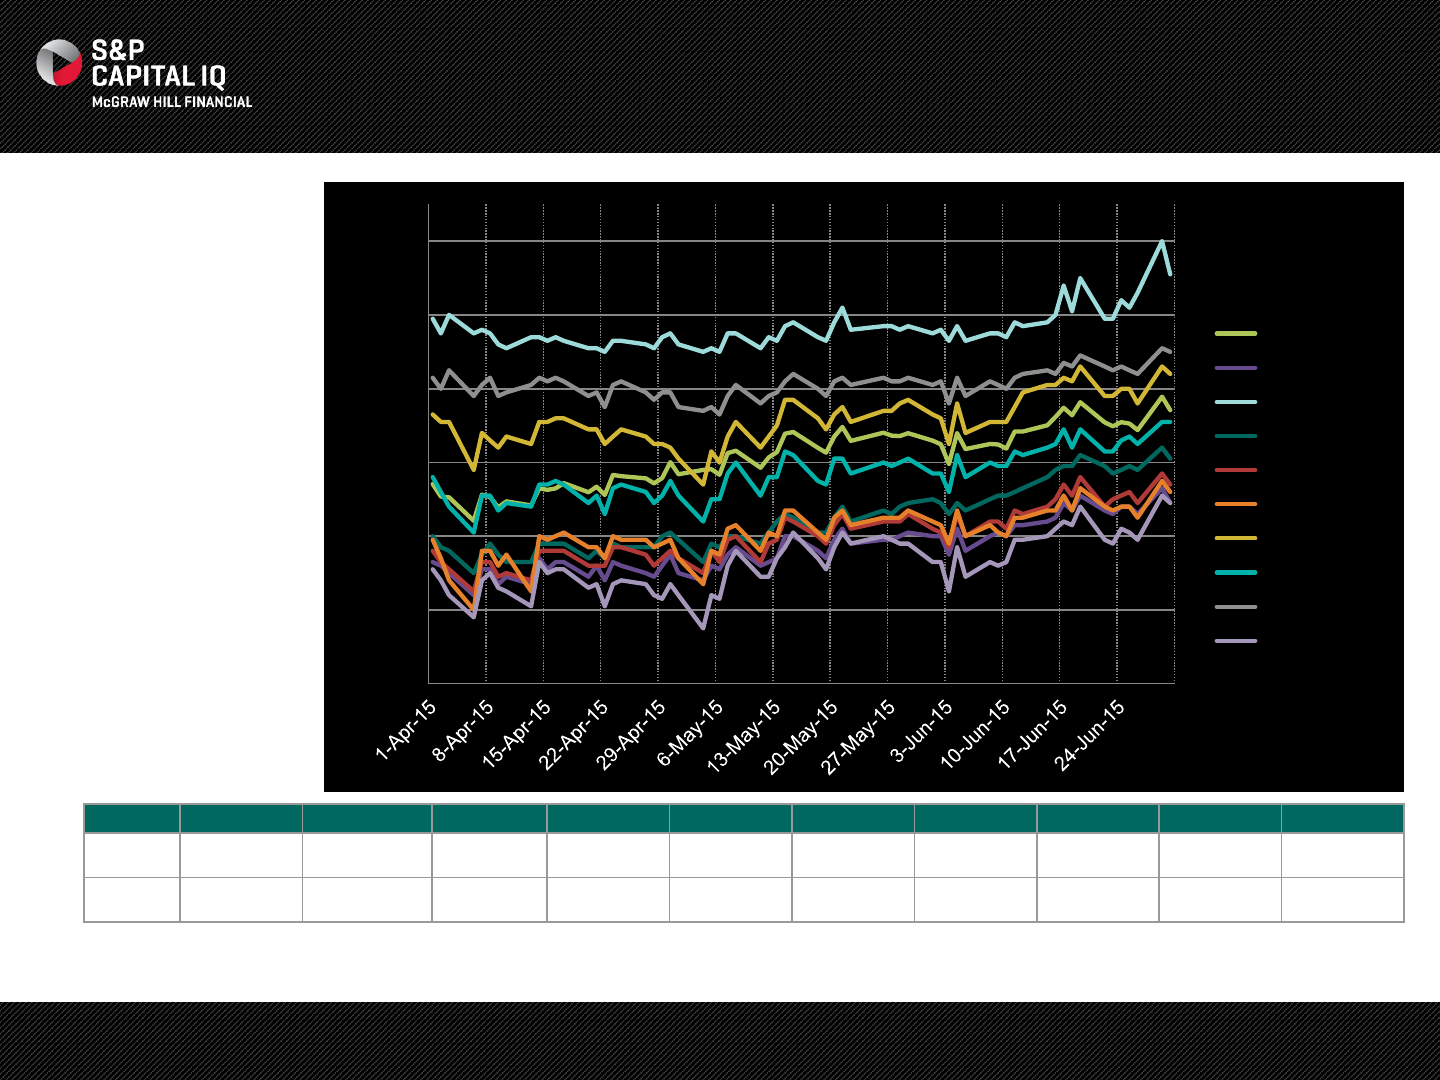
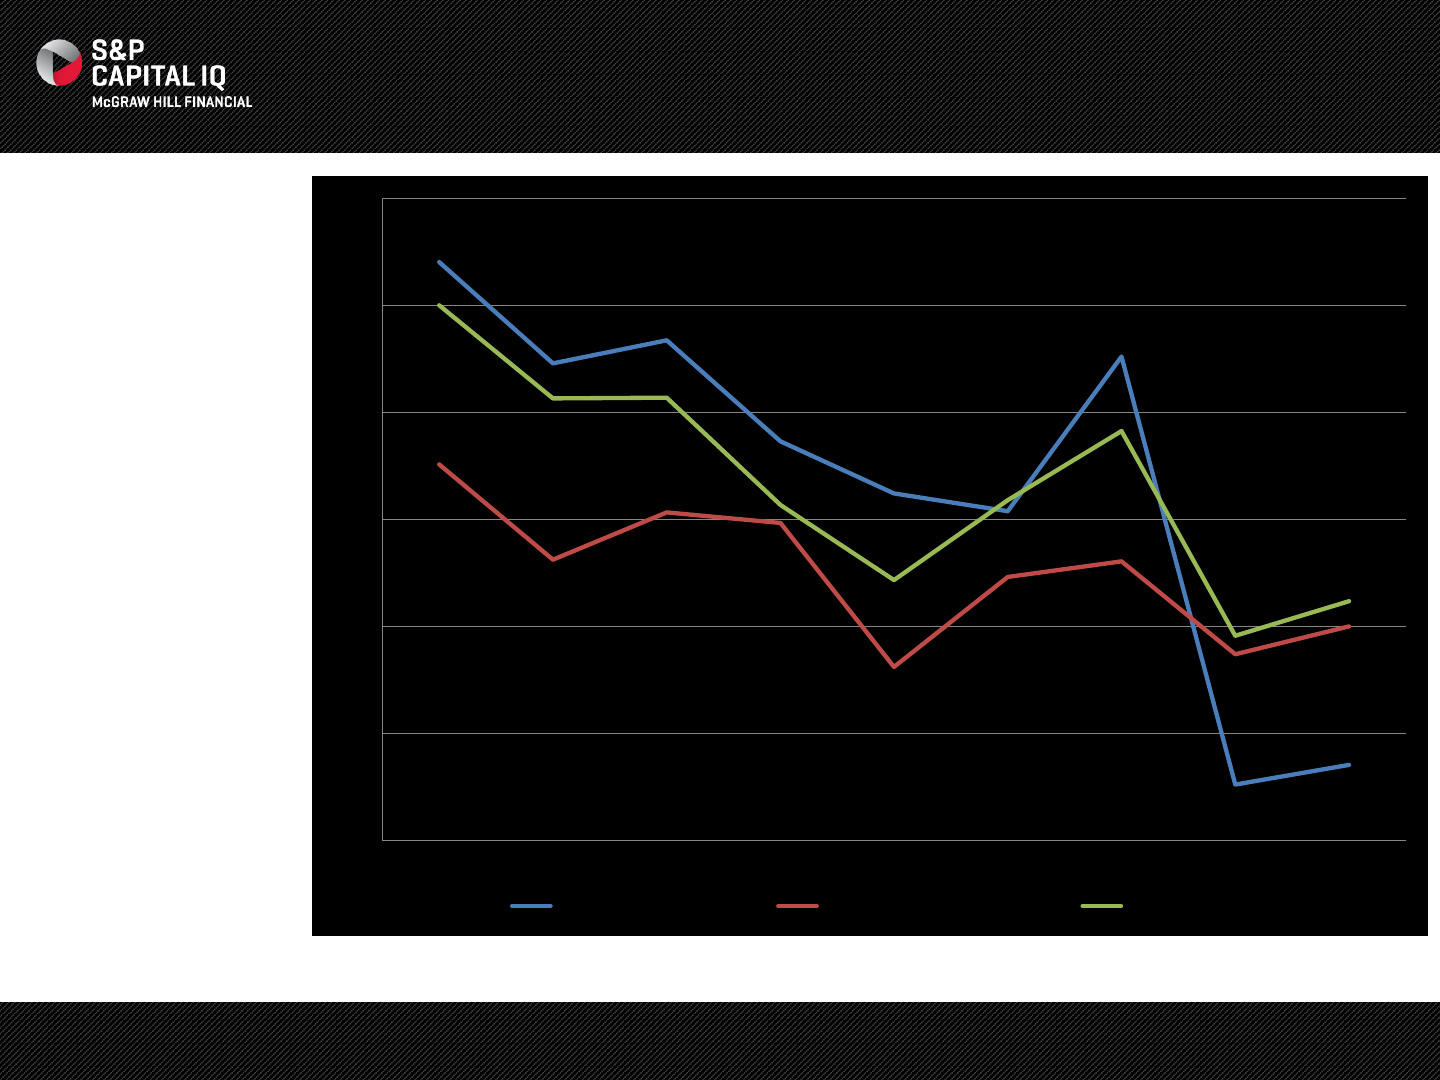
Relative Performance of Fixed Income Indices
NOTES:
•As of June 30th, the S&P
U.S. Investment Grade and
High Yield Corporate Bond
Indices generated -2.52%
and .66% in total returns,
respectively during the last
three months. During that
same period, the S&P 500®
finished the quarter with a
.28% gain.
•As the economy slowly
continued to strengthen
with labor markets
maintaining momentum,
investors were looking for
rates to increase which
caused investment grade
bonds to drop in Q2 2015.
High yield was the top
performer in Q2 as equity
prices were volatile due to
global market issues
stemming from Greece and
China.
Source: S&P Capital IQ as of July 1, 2015.
-4%
-2%
0%
2%
4%
S&P U.S. Investment Grade Corporate Bond Index QTD TRR %
S&P U.S. High Yield Corporate Bond Index QTD TRR %
S&P 500 (TR) QTD TRR %
6
NOTES:
•All sector z-spreads
widened this quarter,
coinciding with similar
movement in Treasury
rates.
•The largest widening on a
percentage basis in Q2
was in financials, which
moved from 160bps to
181bps.
•Telecom and IT ended the
quarter with the smallest
widening on an absolute
basis.
All spreads and yield curves are proprietary data developed from buy-side indicative quotes. All bonds are USD denominated.
Source: S&P Capital IQ as of July 1, 2015.
Cons. Discr. Cons. Staples
Energy Financials Healthcare Industrials IT Materials Telecom. Utilities
BPS
Change 20
16
12
21
18
13
11
15
7
18
Total %
Change 11.49%
10.46%
5.48%
13.13%
11.54%
8.18%
5.70%
8.52%
3.45%
11.92%
10 Year BBB Sector Z-Spreads
120
140
160
180
200
220
240
Bps
Cons. Discr.
Cons. Staples
Energy
Financials
Healthcare
Industrials
IT
Materials
Telecom.
Utilities
7
bps Change QoQ
1Y 5Y 10Y 15Y 20Y 30Y
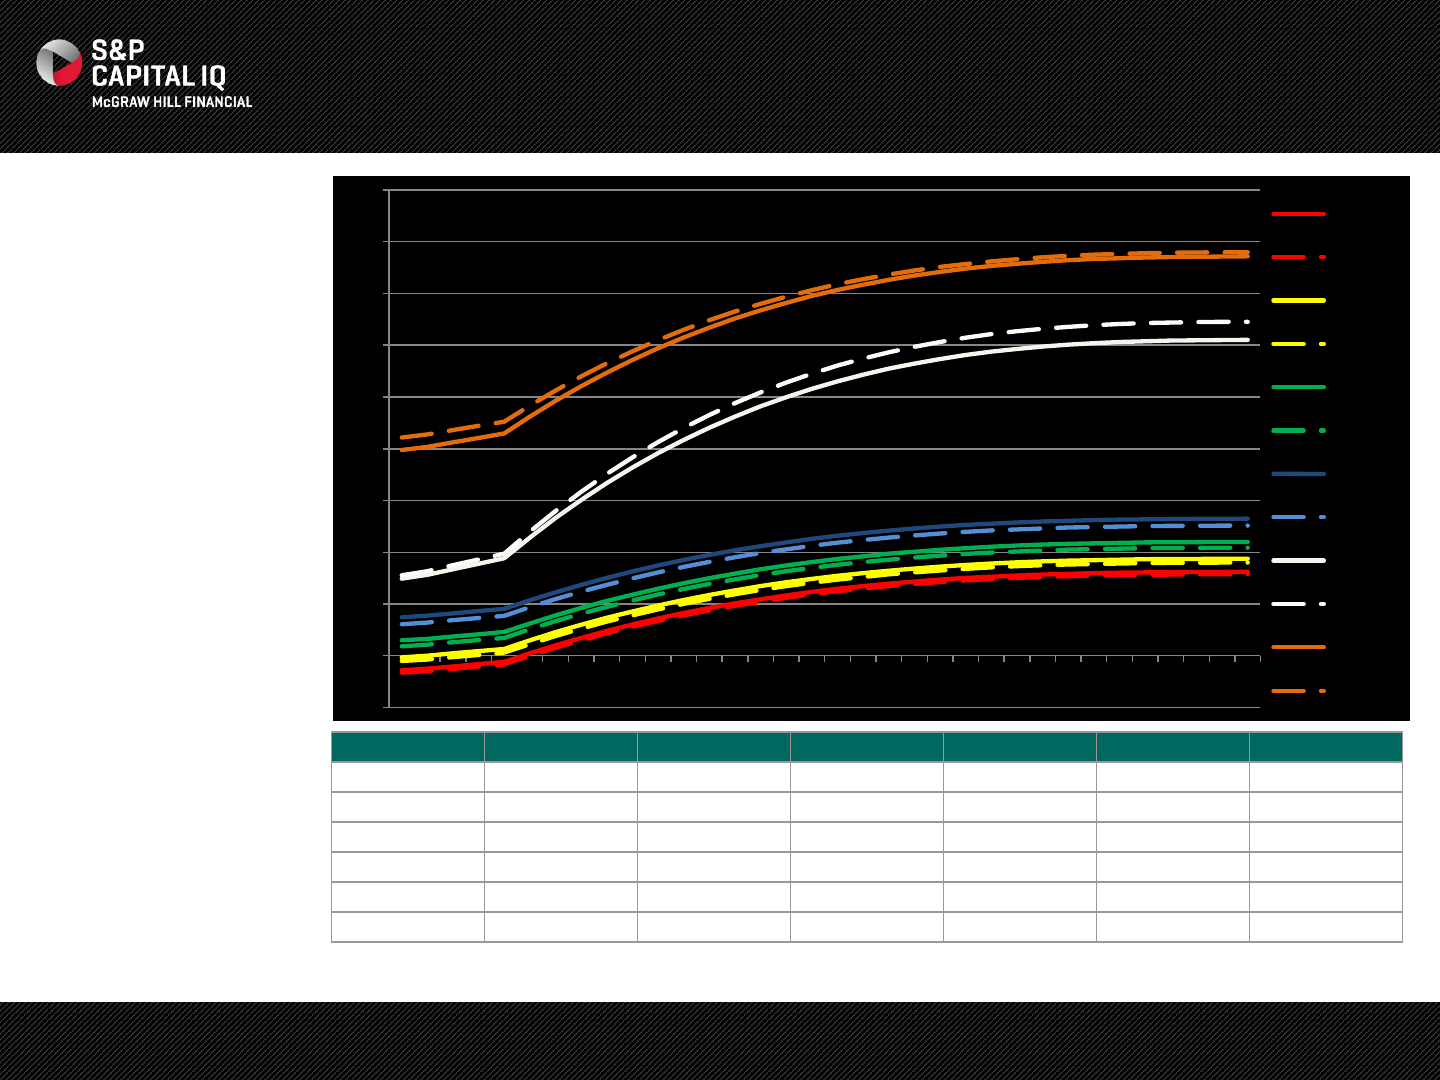
AAA 4.67 4.67 4.67 4.67 4.67 4.67
AA 7.40 7.40 7.40 7.40 7.40 7.40
A 11.17 11.17 11.17 11.17 11.17 11.17
BBB 13.35 13.35 13.35 13.35 13.35 13.35
BB -8.82 -17.90 -25.96 -25.96 -33.81 -35.23
B -22.85 -17.82 -13.35 -13.35 -9.01 -8.22
All spreads and yield curves are proprietary data developed from buy-side indicative quotes. All bonds are USD denominated.
Source: S&P Capital IQ as of July 1, 2015.
NOTES:
•Investment grade z-
spreads widened over the
quarter, across the term
structure.
•Within the investment
grade space, we observed
a parallel shift upward
throughout the term
structure.
•Similar to last quarter in
high yield, we noticed the
BB curve tightened much
more on the long end while
the B curve experienced
greater tightening on the
short end. The tightening
of the BB spreads was
much stronger this quarter
than Q1 2015.
Z-Spread Ratings Term Structure (Quarter over Quarter)
-1%
0%
1%
2%
3%
4%
5%
6%
7%
8%
9%
1M
3M
6M
9M
1Y
2Y
3Y
4Y
5Y
6Y
7Y
8Y
9Y
10Y
11Y
12Y
13Y
14Y
15Y
16Y
17Y
18Y
19Y
20Y
21Y
22Y
23Y
24Y
25Y
26Y
27Y
28Y
29Y
30Y
AAA15 Q2
AAA15 Q1
AA15 Q2
AA15 Q1
A15 Q2
A15 Q1
BBB15 Q2
BBB15 Q1
BB15 Q2
BB15 Q1
B15 Q2
B15 Q1
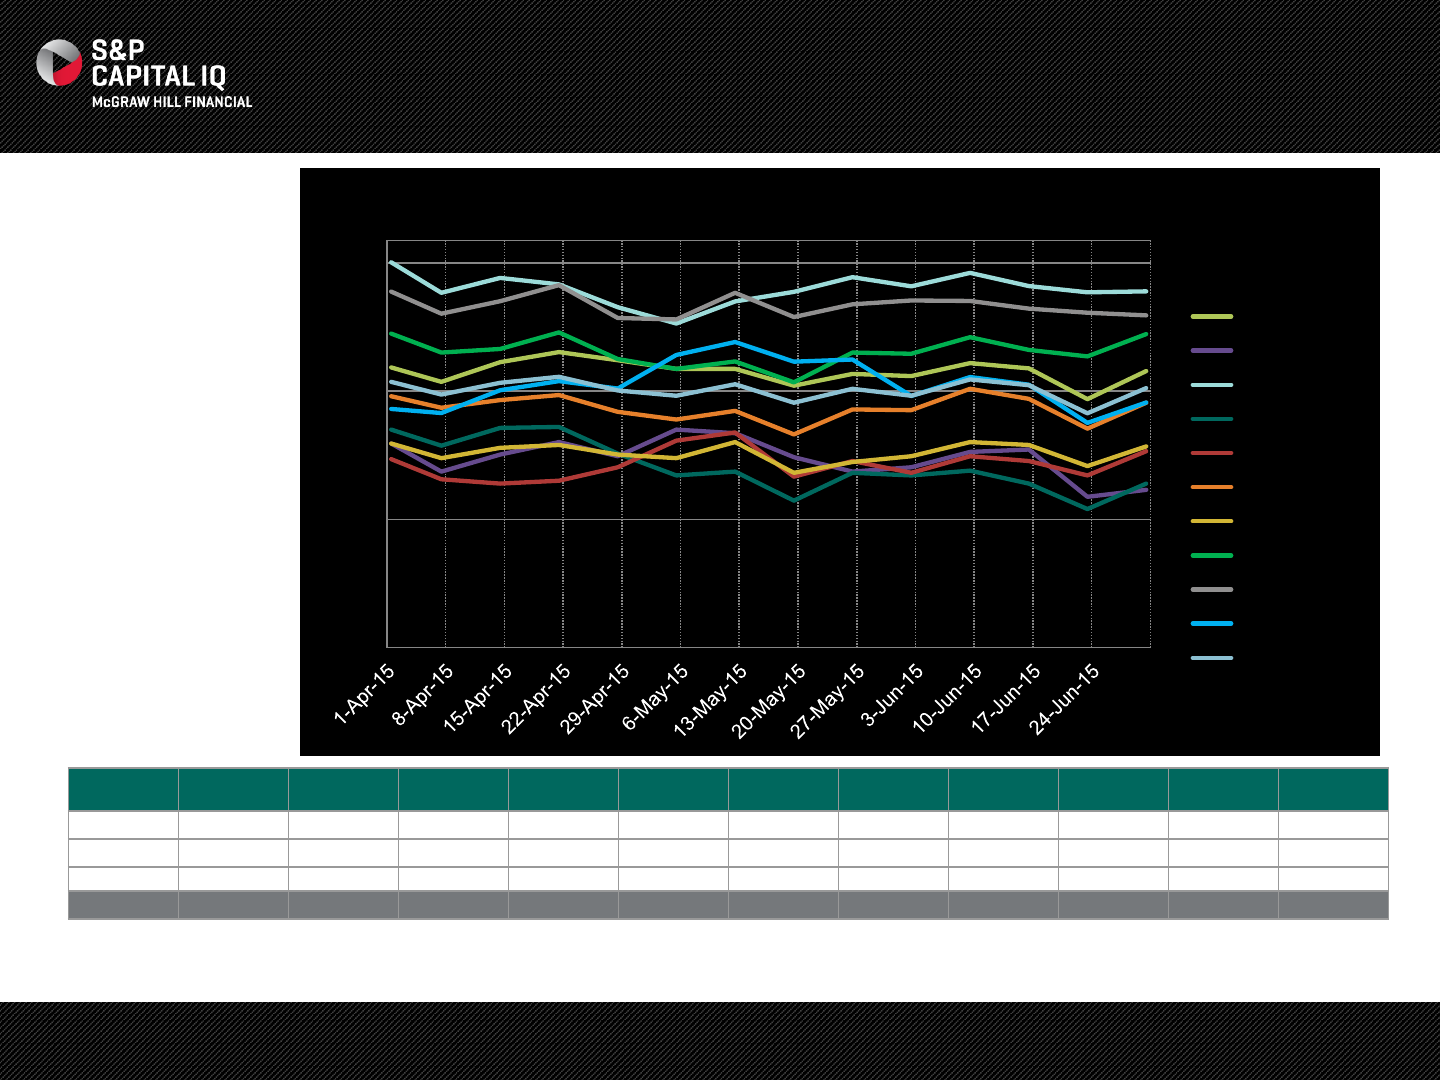
8
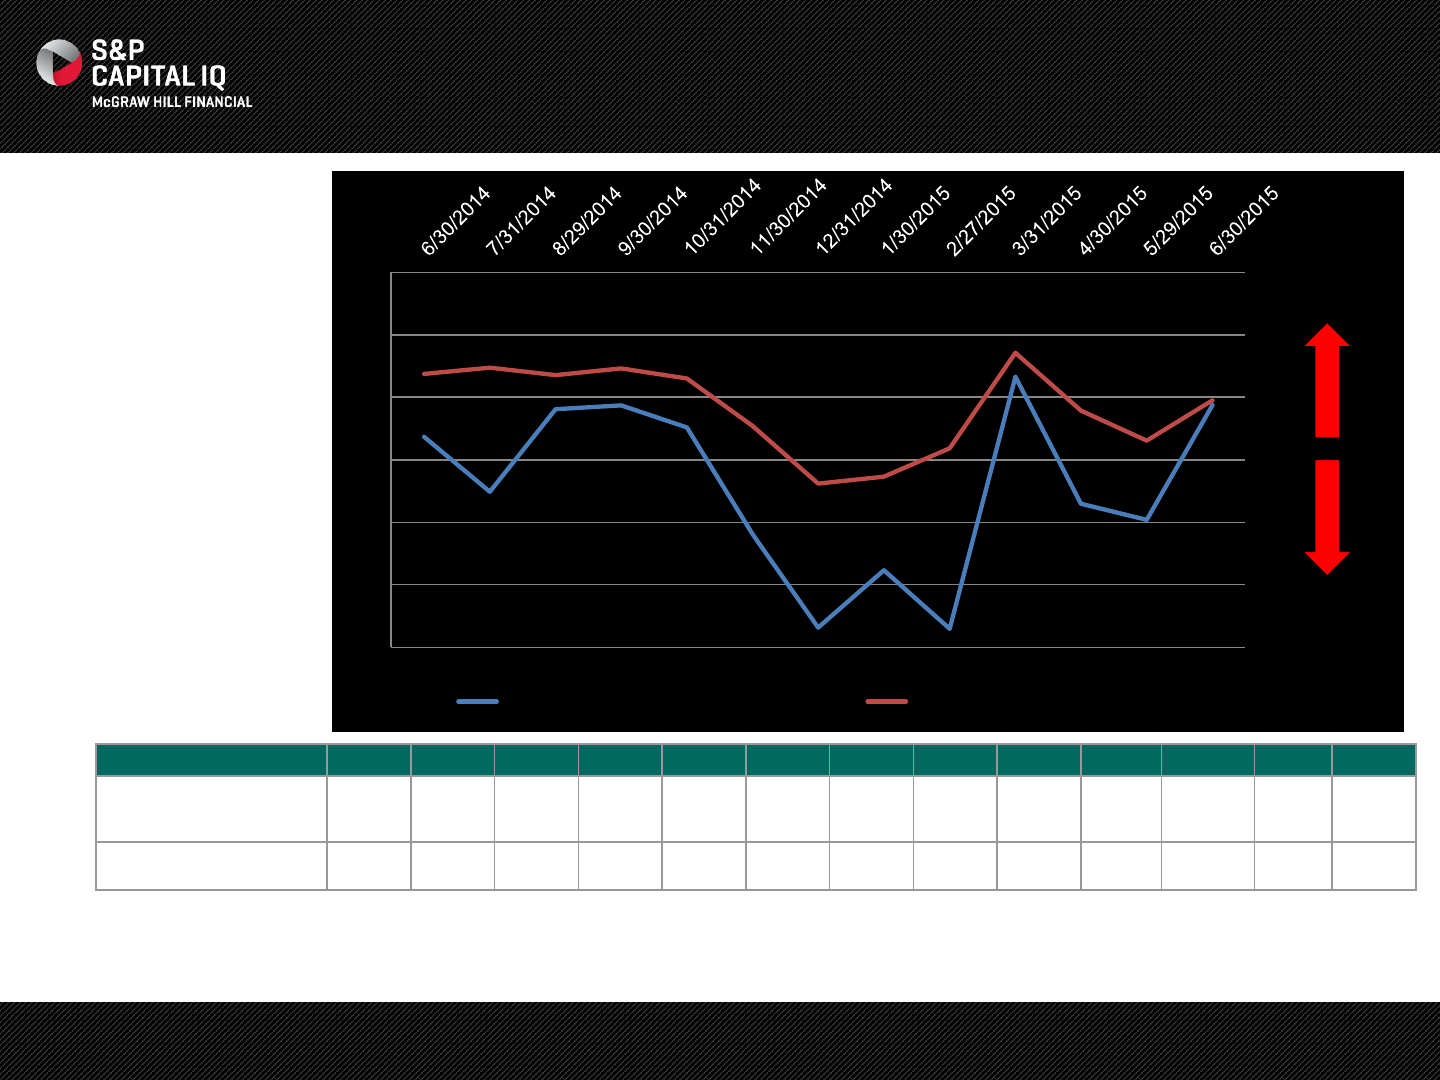
NOTES:
•Market activity fell from its
a 12-month high in March
for both investment grade
and high yield. In the
second quarter, activity hit
lows in May but rebounded
in June.
•Within high yield, telecom
and energy had the most
activity. Within investment
grade, telecom and IT led
the way with the most
activity.
Investment Grade vs. High Yield Market Activity
Source: S&P Capital IQ as of July 1, 2015. Market Activity Score (MAS) is a derived analytic created to provide an indication of the level of trade and market activity
associated with a given security. It is developed from a review of all available trades and quotes based on price staleness, number of quotes/market makers and trade
data. It is scaled from 1 (high MAS) to 5 (low MAS).
MAS 6/30/14
7/31/14
8/29/14
9/30/14
10/31/14
11/30/14
12/31/14
1/30/15 2/27/15 3/31/15 4/30/15
5/29/15
6/30/15
S&P High Yield Corporate
Index 1.71
1.80
1.67
1.66
1.70
1.87
2.02
1.93
2.02
1.62
1.82
1.85
1.66
S&P Investment Grade
Corporate Index 1.61
1.60
1.61
1.60
1.62
1.70
1.79
1.78
1.73
1.58
1.67
1.72
1.66
1.45
1.55
1.65
1.75
1.85
1.95
2.05
S&P High Yield Corporate Index (MAS) S&P Investment Grade Corporate Index (MAS)
More
Market
Activity
Less
Market
Activity
9
Source: S&P Capital IQ as of July 1, 2015.
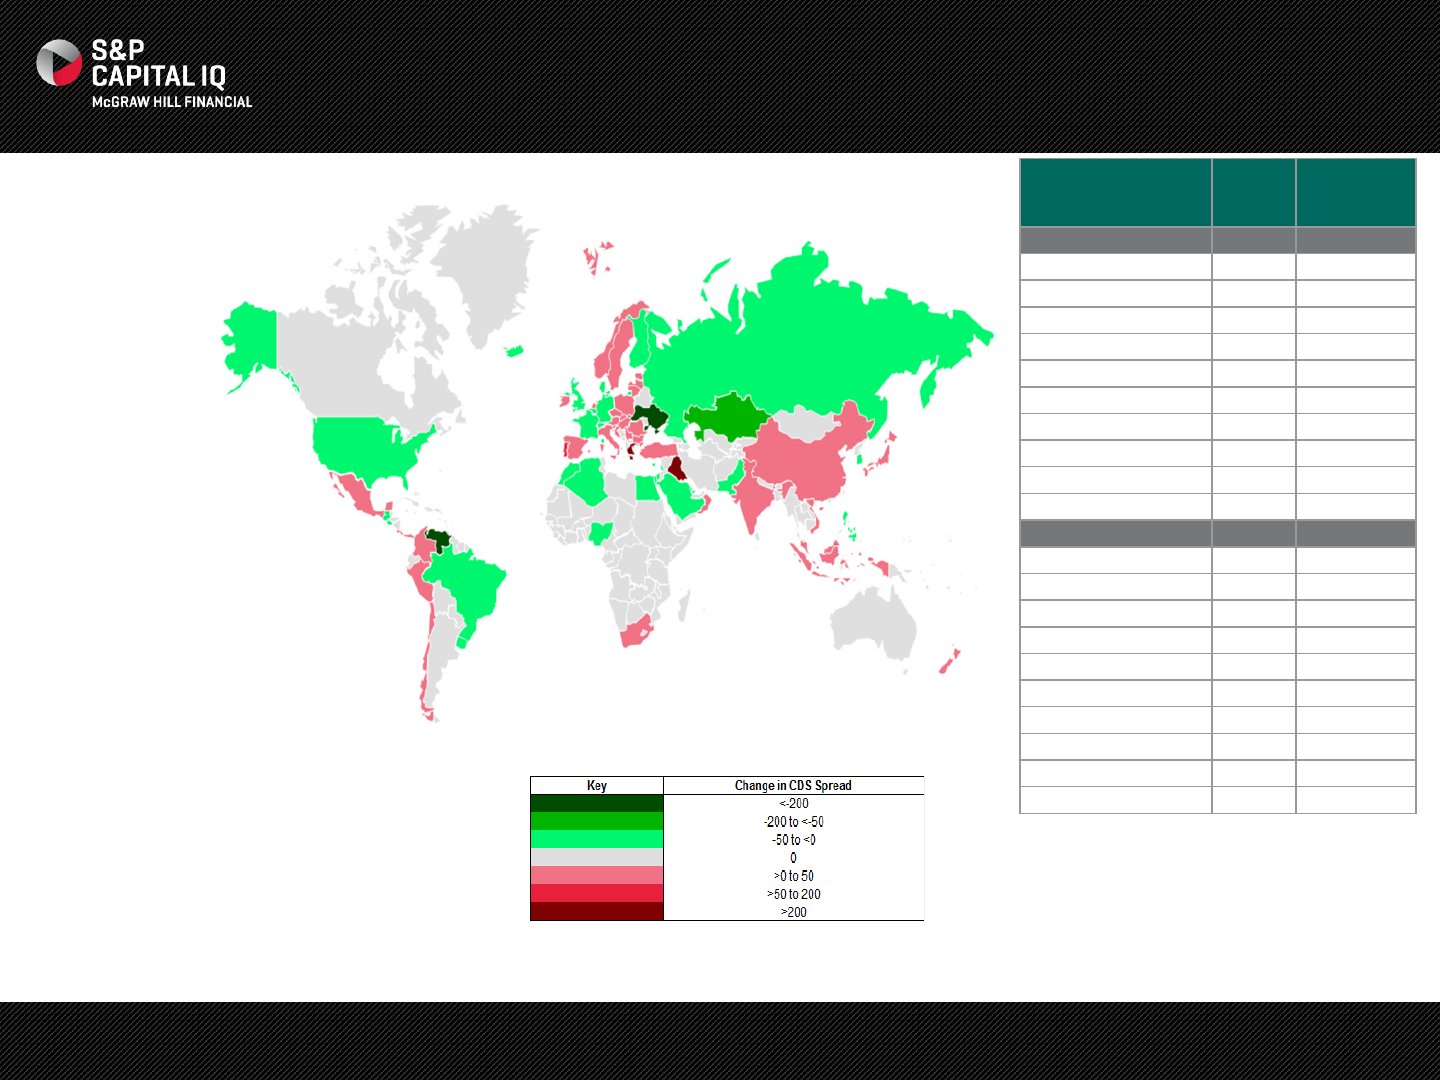
Sovereign CDS Heat Map
Country
6/30/2015
CDS
Spread
Avg # Quotes
per Day
CDS Most Risky
Greece
6739
200 to 10
Venezuela
4691
>200
Ukraine
4096
200 to 10
Cyprus
437
<10
Nigeria
425
<10
El
Salvador
416
<10
Pakistan
410
<10
Lebanon
358
<10
Russia
341
>200
Egypt
313
<10
CDS Least Risky
Swiss Confederation
14
<10
Norway
15
200 to 10
Sweden
15
200 to 10
United States of America
16
200 to 10
Germany
16
>200
Denmark
20
200 to 10
United
Kingdom
20
>200
Netherlands
20
>200
Finland
21
200 to 10
New Zealand
31
<10
NOTES:
•The heat map
provides a quarter-
over-quarter view
of the bps change
in sovereign CDS
spreads.
•The country with
the largest
increase in CDS
spreads was
Greece, as debt
repayment issues
lingered. Its
spreads widened
by 3,974 bps
throughout the
quarter.
•The countries with
the largest
improvement in
CDS spread were
Ukraine and
Venezuela. Their
spreads tightened
by 3,521 and 300
bps, respectively.
10
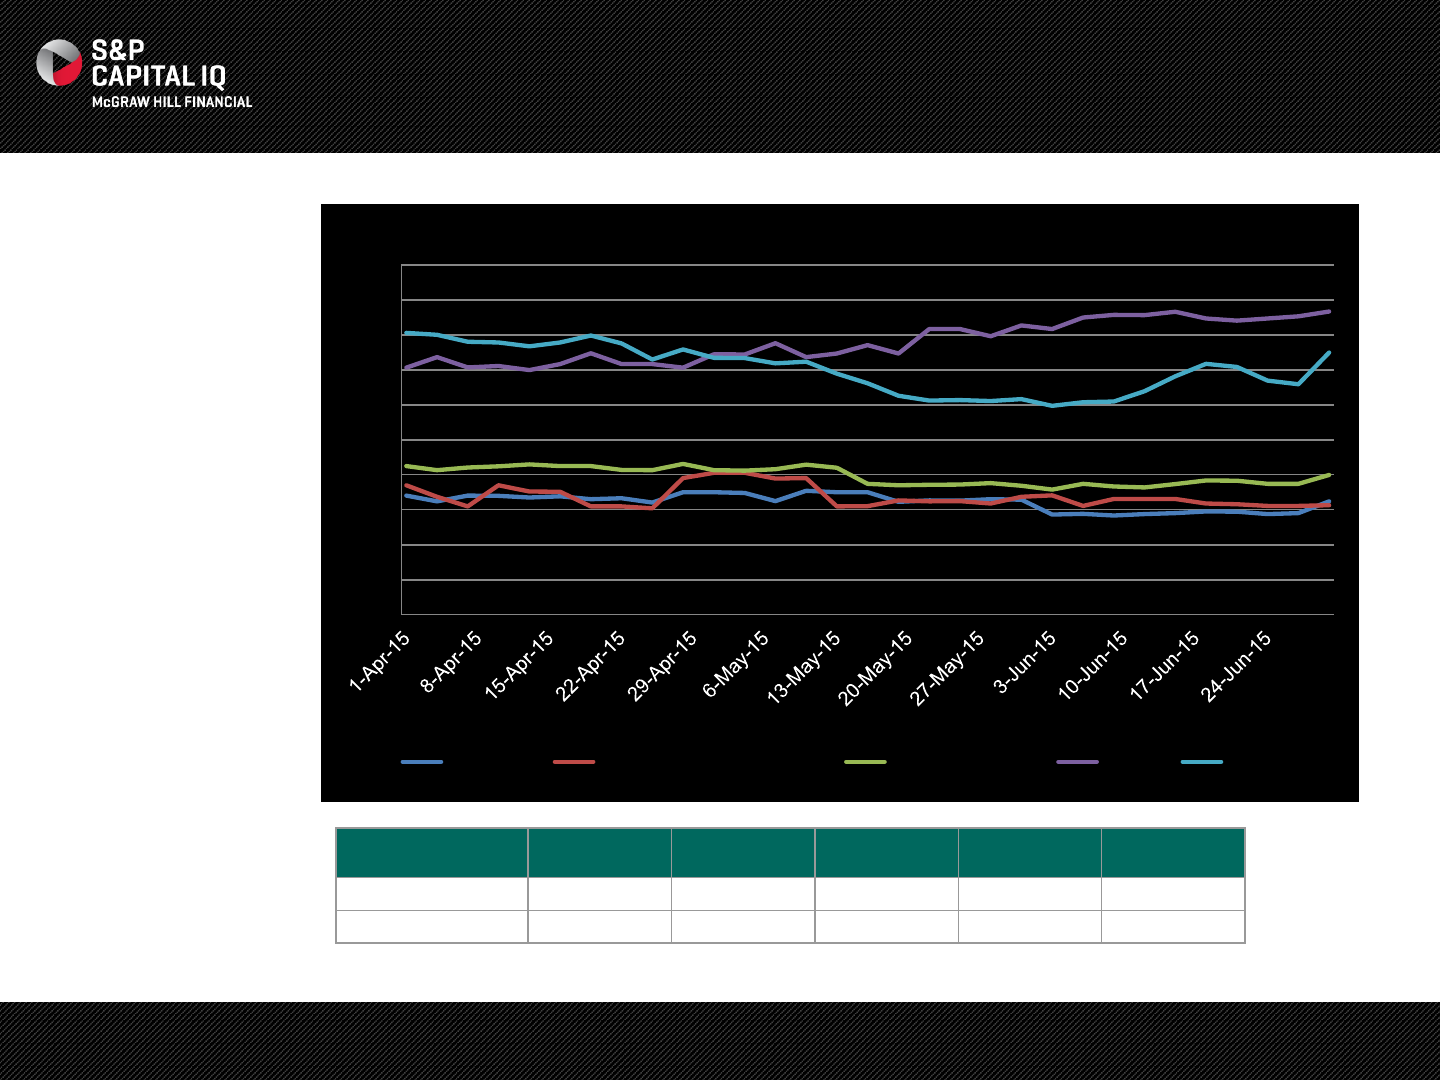
NOTES:
•The U.S. CDS spread
compared to G5 nations.
•The U.S. saw a tightening
in its CDS spread
throughout the quarter
moving from 18.5 to 15.6
bps.
•The U.S. is now the
country with the tightest
CDS spread closely
followed by Germany and
the U.K.
•Japan was the biggest
mover again this quarter,
with its spread widening by
22.7% to 43.3 bps.
Source: S&P Capital IQ as of July 1, 2015.
United States
United
Kingdom Japan France Germany
BPS Change -2.84
-1.27
8.03
-
2.79
-0.82
Total % Change -15.3%
-6.0%
22.7%
-6.9%
-4.8%
Sovereign CDS Regional Focus: United States
0
5
10
15
20
25
30
35
40
45
50
Bps
Germany United States of America United Kingdom Japan France

CREDIT TRENDS
12
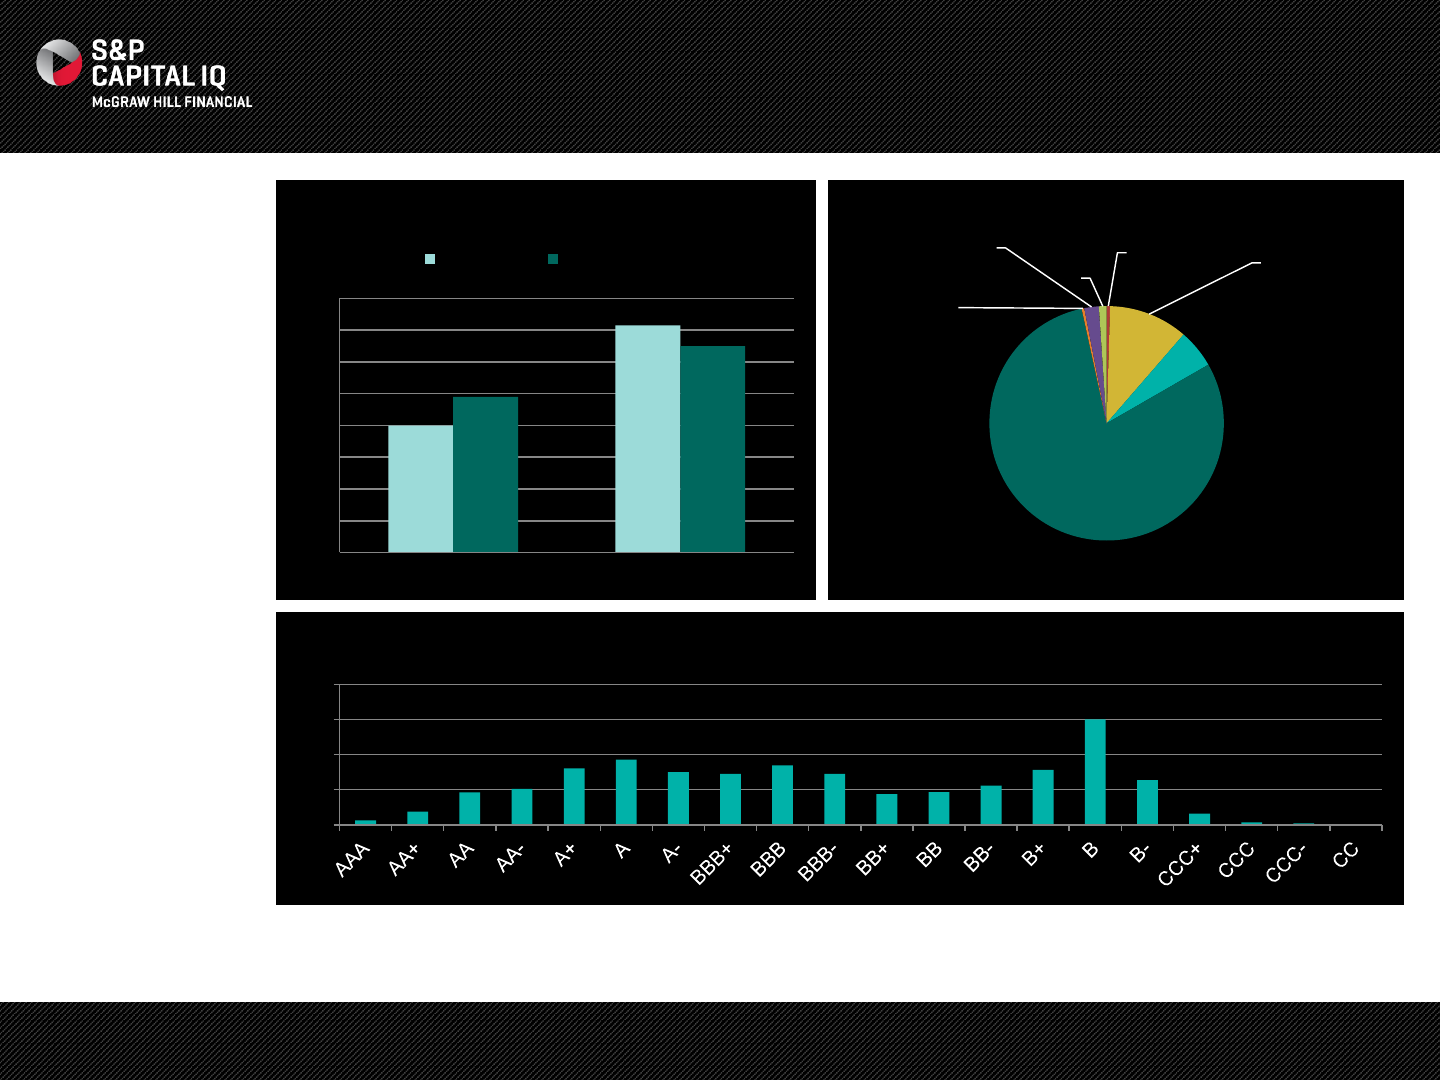
NOTES:
•There was much more
activity as the count of
upgrades and downgrades
surpassed last quarter. Q2
2015 saw a reversal in the
upgrade to downgrade
trend for the 3rd straight
quarter. The number of
companies with positive
outlook decreased this
quarter to 5% from 8% last
quarter.
S&P Ratings Services
Outlook:
•Risk aversion could be
amplified by Greece's exit
from the Eurozone, or from
credit contagion associated
with decelerating Chinese
GDP growth, but we see
these as manageable near-
term risks.
•The need for monetary
stimulus in the U.S. is
fading, but disrupted credit
markets or disappointing
economic news could slow
the pace of Fed policy
normalization.
Constituents include all rated companies with a Local Currency Long Term Rating and S&P Capital IQ sector classification in the U.S. and Canada.
Source: S&P Capital IQ as of July 1, 2015 and Global Credit Portal ‘Credit Conditions: A Resilient U.S. Economy Shields North America Credit Conditions
From Increasing Risks’ published on July 14, 2015.
S&P Ratings Trends
0
20
40
60
80
100
120
140
160
2015 Q1 2015 Q2
Rating Actions
Upgrades Downgrades Developing
1% Negative
11%
Positive
5%
Stable
80%
Watch Dev
0%
Watch Neg
2% Watch Pos
1%
Outlook/Credit Watch
0
200
400
600
800
Rating Distribution
13
The Market Derived Signal (MDS) is a quantitative analytic that uses Credit Default Swaps (CDS) to facilitate the interpretation of how the CDS markets generally view the credit quality of
well-known firms and sovereigns. It aims to capture the market’s sentiment regarding an entity’s perceived credit risk. One of the objectives of the MDS is to identify where market sentiment
may differ from the issuer credit rating. CDS spreads are used to compute the difference between an entity’s actual spread and expected spread for a given rating. Universe is all
companies that have an S&P Long-Term Local Rating, primary headquarters in the U.S. or Canada, and an S&P Capital IQ sector classification. Source: S&P Capital IQ as of July 1, 2015.
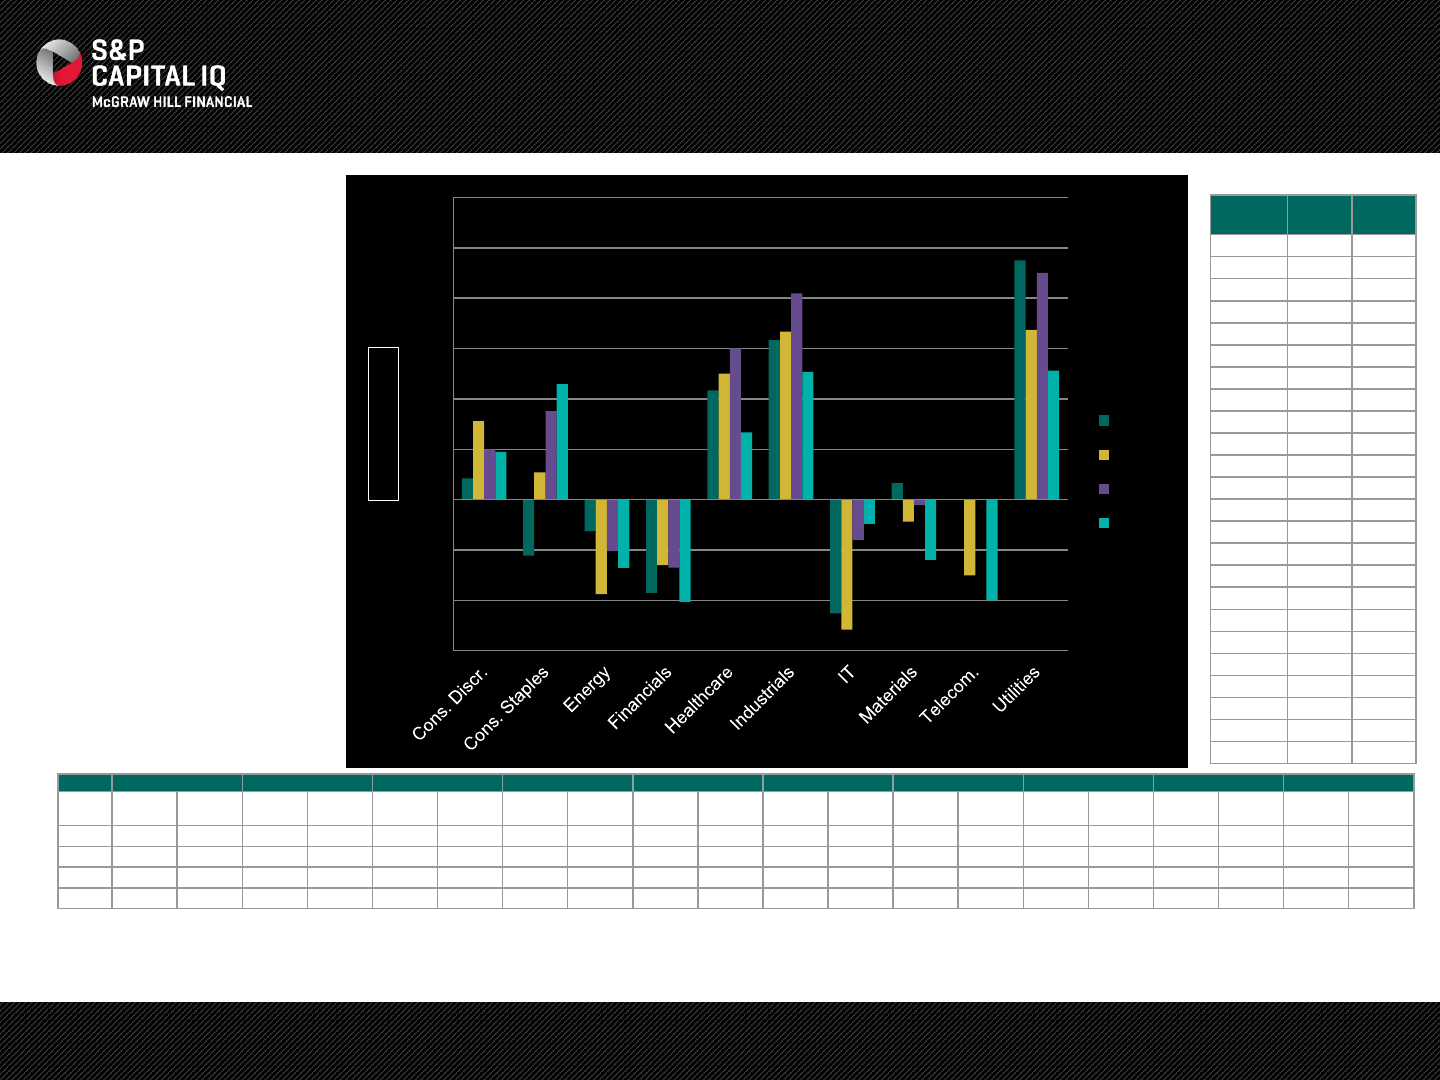
NOTES:
•Overall, the CDS market
indicated better perceived
credit quality in 5 of the 10
sectors than did their
corresponding S&P Ratings.
The reversal came in the
telecom sector. The highest
positive notch differences
came from industrials.
•Financials and telecom had
the strongest negative
sentiment in CDS vs. S&P
Ratings in Q2 2015.
S&P
Rating
CDS
MDS Value
AAA
aaa 23
AA+
aa+ 22
AA
aa 21
AA
- aa- 20
A+
a+ 19
A
a 18
A
- a- 17
BBB+
bbb+ 16
BBB
bbb 15
BBB
- bbb- 14
BB+
bb+ 13
BB
bb 12
BB
- bb- 11
B+
b+ 10
B
b 9
B
- b- 8
CCC+
ccc+ 7
CCC
ccc 6
CCC
- ccc- 5
CC
cc 4
C
c 3
D
d 2
SD
sd 1
NR
nr 0
CDS Market Sentiment By Sector
Cons. Discr. Cons. Staples Energy Financials Healthcare Industrials IT Materials Telecom. Utilities
CDS
MDS
S&P
Rating
CDS
MDS
S&P
Rating
CDS
MDS
S&P
Rating
CDS
MDS
S&P
Rating
CDS
MDS
S&P
Rating
CDS
MDS
S&P
Rating
CDS
MDS
S&P
Rating
CDS
MDS
S&P
Rating
CDS
MDS
S&P
Rating
CDS
MDS
S&P
Rating
14 Q3 13.01
12.93
15.25
15.47
15.17
15.29
15.51
15.88
16.53
16.10
15.65
15.02
14.84
15.29
14.52
14.46
13.80
13.80
16.18
15.23
14 Q4 13.18
12.89
15.54
15.43
14.98
15.35
15.64
15.90
16.57
16.07
15.78
15.12
14.84
15.35
14.37
14.46
13.50
13.80
15.90
15.23
15 Q1 13.16
12.98
15.62
15.27
14.92
15.12
15.63
15.90
16.70
16.10
15.89
15.07
15.19
15.35
14.33
14.35
13.60
13.60
16.13
15.23
15 Q2 13.15
12.98
15.68
15.22
14.61
14.92
15.50
15.90
16.40
16.13
15.64
15.13
15.26
15.35
14.11
14.35
13.20
13.60
15.73
15.22
VALUE CONVERSION:
-0.6
-0.4
-0.2
0.0
0.2
0.4
0.6
0.8
1.0
1.2
Notch Difference
14 Q3
14 Q4
15 Q1
15 Q2
14
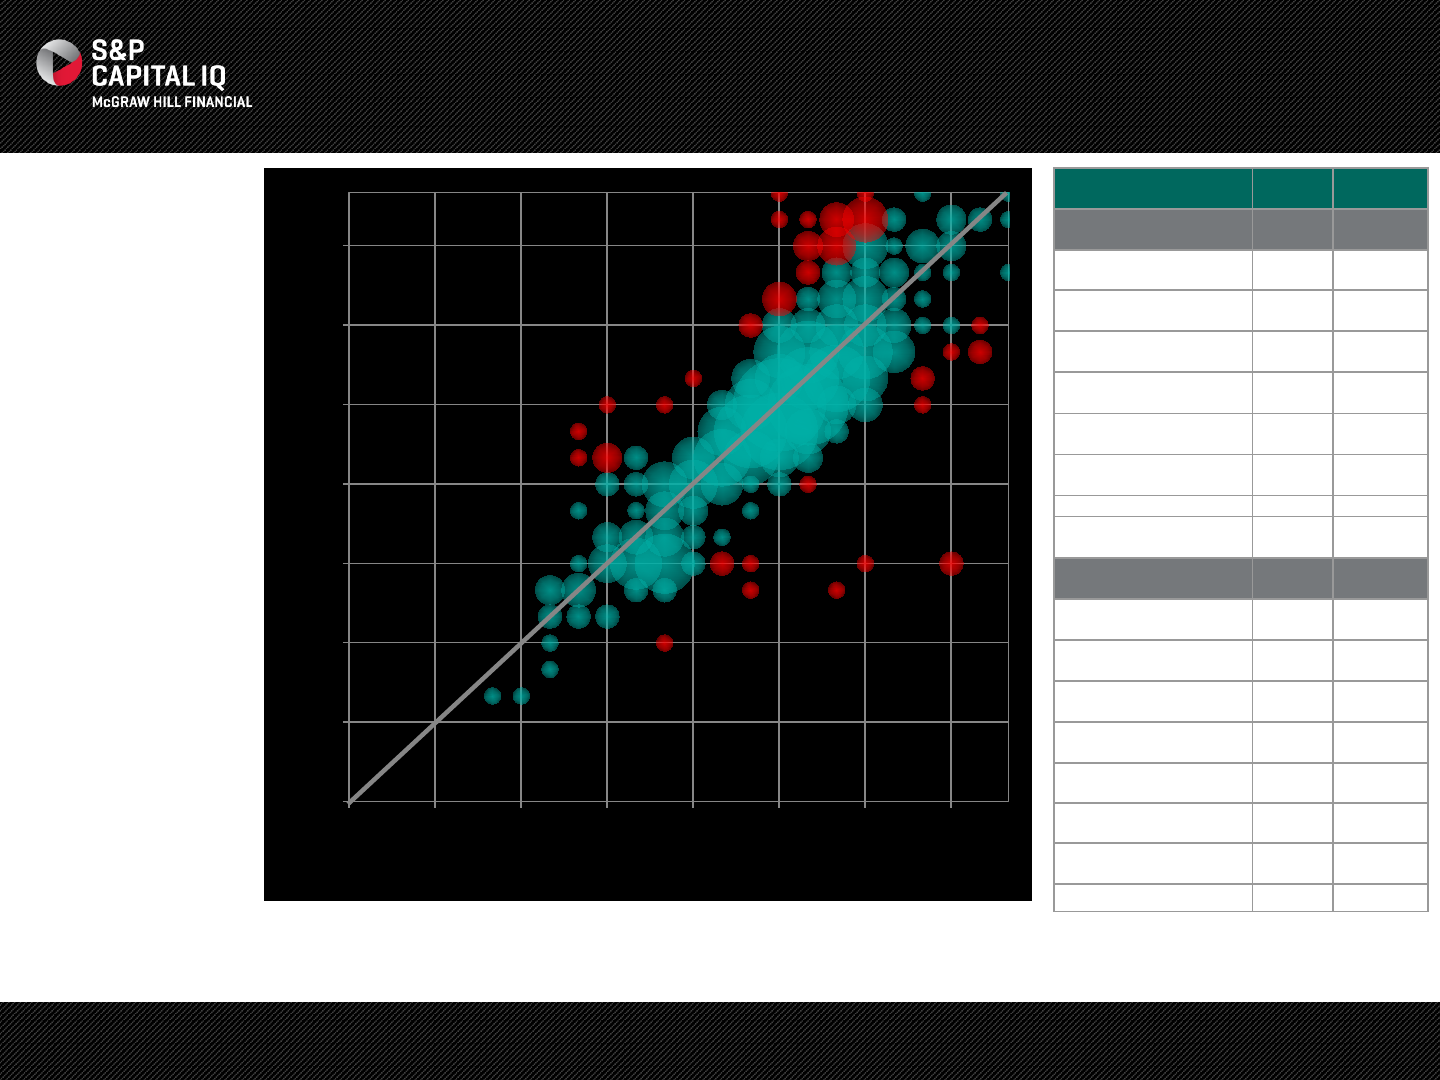
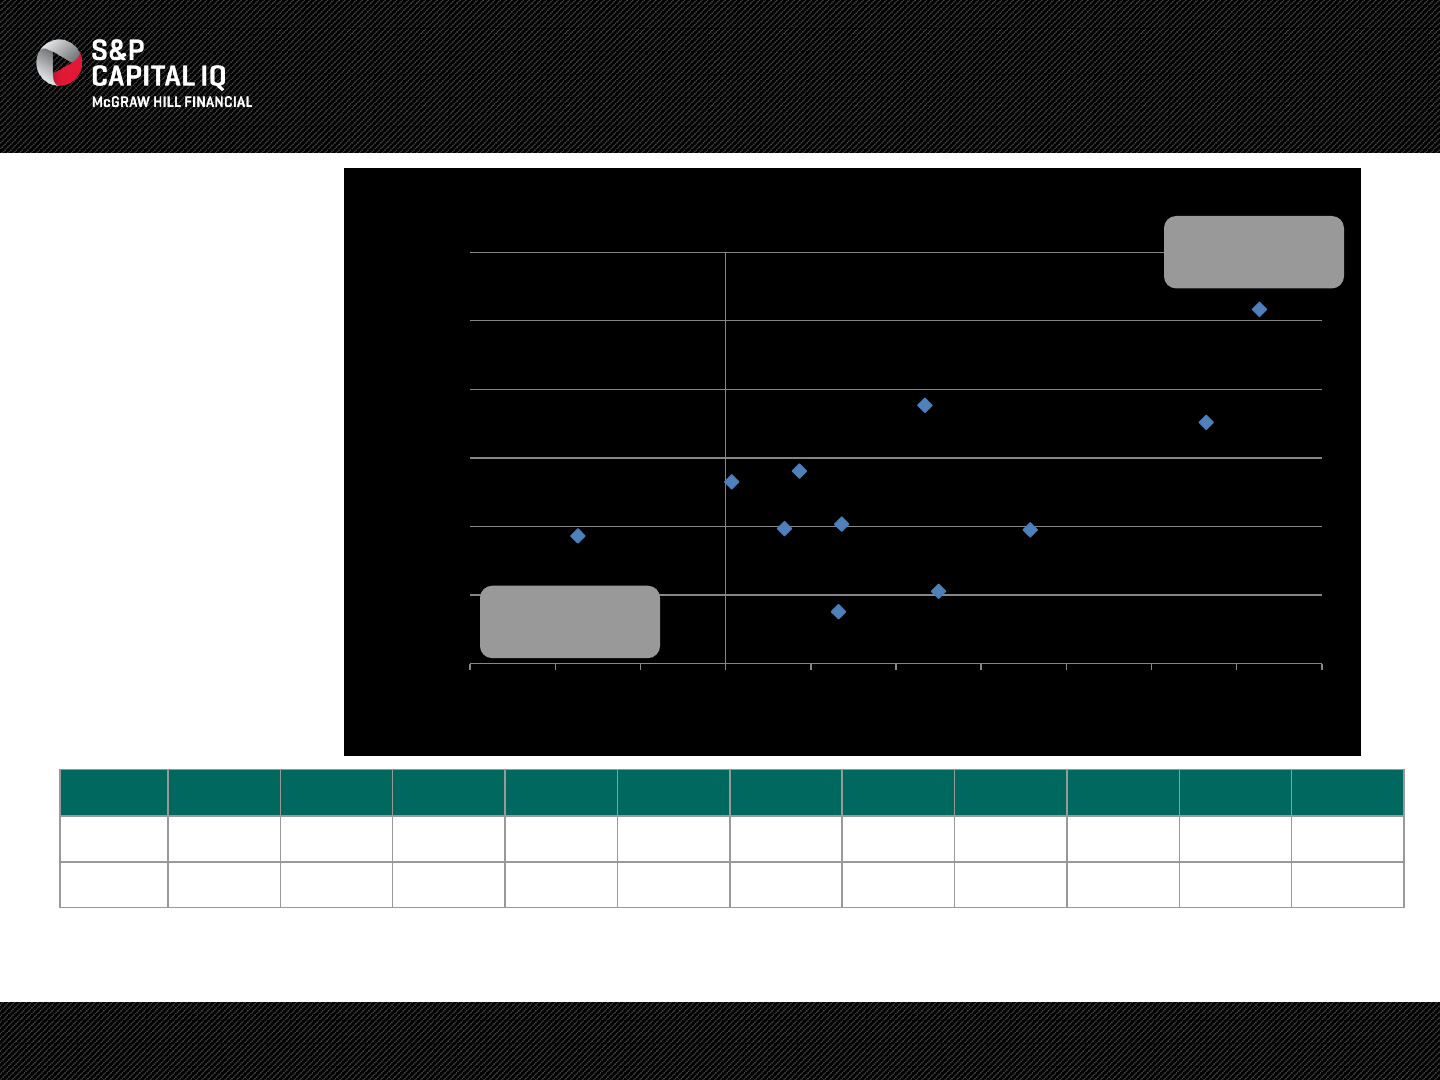
NOTES:
•We have highlighted
companies with some of
the biggest divergences
between their S&P Rating
and their CDS Market
Derived Signal in red. This
provides us with a list of
firms whose market
sentiment is significantly
different than its Rating.
As shown by the blue
circles, the vast majority of
firms were scored +/- 3
notches from their Credit
Rating.
•We notice that the CDS
market has more bullish
outliers than bearish,
especially in the lower end
of the investment grade
spectrum. In addition, as
compared to last quarter
we observe more outliers in
the B rated spectrum that
have CDS spreads trading
at higher levels. Both
trends are similar to last
quarter.
Company
CDS MDS
S&P Rating
CDS
MDS Positive
Divergence
American Electric Power
Co., Inc.
a+
BBB
MeadWestvaco
Corporation
a+
BBB
Rohm and Haas Company
a+
BBB
Hospira Inc.
a
BBB-
Kinder Morgan Energy
Partners, L.P.
a
BBB-
The E. W. Scripps
Company
bbb+
BB
H. J. Heinz Company
bbb
BB-
Alcatel
-Lucent USA, Inc.
bb+
B
CDS
MDS Negative
Divergence
General Electric Capital
Corporation
a
AA+
Berkshire Hathaway Inc.
a
- AA
Amazon.com Inc.
bbb+
AA-
The Toronto
-Dominion
Bank
bbb+
AA-
Diamond Offshore Drilling,
Inc.
bb
BBB+
Chesapeake Energy
Corporation
b
BB+
Transocean Inc.
b
BB+
General Electric Company
a
- AA+
CDS Market Outliers
The Market Derived Signal (MDS) is a quantitative analytic that uses Credit Default Swaps (CDS) to facilitate the interpretation of how the CDS markets generally view the credit quality of
well-known firms and sovereigns. It aims to capture the market’s sentiment regarding an entity’s perceived credit risk. One of the objectives of the MDS is to identify where market sentiment
may differ from the issuer credit rating. CDS spreads are used to compute the difference between an entity’s actual spread and expected spread for a given rating. Universe is all
companies that have an S&P Long-Term Local Rating, primary headquarters in the U.S. or Canada, and an S&P Capital IQ sector classification. Source: S&P Capital IQ as of July 1, 2015
CDS MDS Score
Rating
bb
aaa
a
bbb
bb
b
ccc
c
d
aa
D/NR C CCC B BB BBB A AA AAA
15
S&P Capital IQ’s proprietary probability of default (PD) model, ‘Market Signals’, is a unique analytical model which provides daily changing, 1-year forward looking PDs of publicly listed
companies based on a cutting-edge econometric framework. Universe is all companies that have an S&P Long-Term Local Rating, primary headquarters in the U.S. or Canada, and an
S&P Capital IQ sector classification. Source: S&P Capital IQ as of July 1, 2015.
NOTES:
•In Q2 2015, 8 of the 10
sectors had improving PD
Market Signals. Telecom,
consumer staples, and
financials changed to
tightening from widening
PDs this quarter.
•Overall median PDs
decreased by 11% in Q2
continuing its trend from
Q1.
•Financials had the largest
improvement in PD in
addition to being one of the
safer sectors. Additionally,
energy continued to see its
credit improve as oil prices
stabilized.
Equity Market Sentiment Implied Default Risk By Sector
Cons. Discr.
Cons.
Staples Energy Financials Healthcare Industrials IT Materials Telecom. Utilities Grand Total
4/1/2015
0.15%
0.04%
1.01%
0.05%
0.03%
0.09%
0.04%
0.28%
0.60%
0.07%
0.12%
6/30/2015
0.14%
0.02%
0.60%
0.02%
0.03%
0.08%
0.04%
0.28%
0.39%
0.08%
0.11%
% Change
-6.23%
-56.41%
-40.54%
-62.00%
15.25%
-10.99%
-5.13%
-0.71%
-34.73%
12.41%
-10.59%
0.00%
0.01%
0.10%
1.00%
PD Market Signals (Median)
Cons. Discr.
Cons. Staples
Energy
Financials
Healthcare
Industrials
IT
Materials
Telecom.
Utilities
Grand Total
16
S&P Capital IQ’s proprietary probability of default (PD) model, ‘PD Model Fundamentals’, provides an innovative approach to assessing potential default that separates credit risk into two
components—financial risk and business risk. The PDs are applicable for any public or private company and provide a short- to mid-term view of credit risk. They are based purely on
fundamental data—financial ratios and macro factors – and are updated when new financials are released or there is some change in the macro factors. Universe is all companies that
have an S&P Long-Term Local Rating, primary headquarters in the U.S. or Canada, and an S&P Capital IQ sector classification. Source: S&P Capital IQ as of July 1, 2015.
NOTES:
•Fundamentals deteriorated
during the second quarter as
median PDs increased by 3%
year-over-year.
•9 of the 10 sectors show
worsening PDs on a year-over-
year basis as compared to only 4
out of 10 last quarter.
•The healthcare sector had two
consecutive quarters of median
credit improvement.
•Telecom sector fundamentals
continue to worsen by the largest
percentage, similar to last
quarter.
Fundamental Implied Default Risk By Sector
Cons.
Discr.
Cons.
Staples Energy Financials Healthcare Industrials IT Materials Telecom. Utilities Grand Total
% Change
(YoY) 5%
7%
1%
3%
-
3%
2%
0%
11%
13%
5%
3%
PD Level
(Median) 0.75%
0.39%
0.39%
0.15%
0.37%
0.56%
0.53%
0.70%
1.03%
0.21%
0.41%
Cons. Discr.
Cons. Staples
Energy
Financials
Healthcare
Industrials
IT
Materials
Telecom
Utilities
Grand Total
0.00%
0.20%
0.40%
0.60%
0.80%
1.00%
1.20%
-6% -4% -2% 0% 2% 4% 6% 8% 10% 12% 14%
Probabiity of Default Level
% Change in PD Level (YoY)
PD Fundamentals
Most Risky and
Worsening
Least Risky and
Improving
17
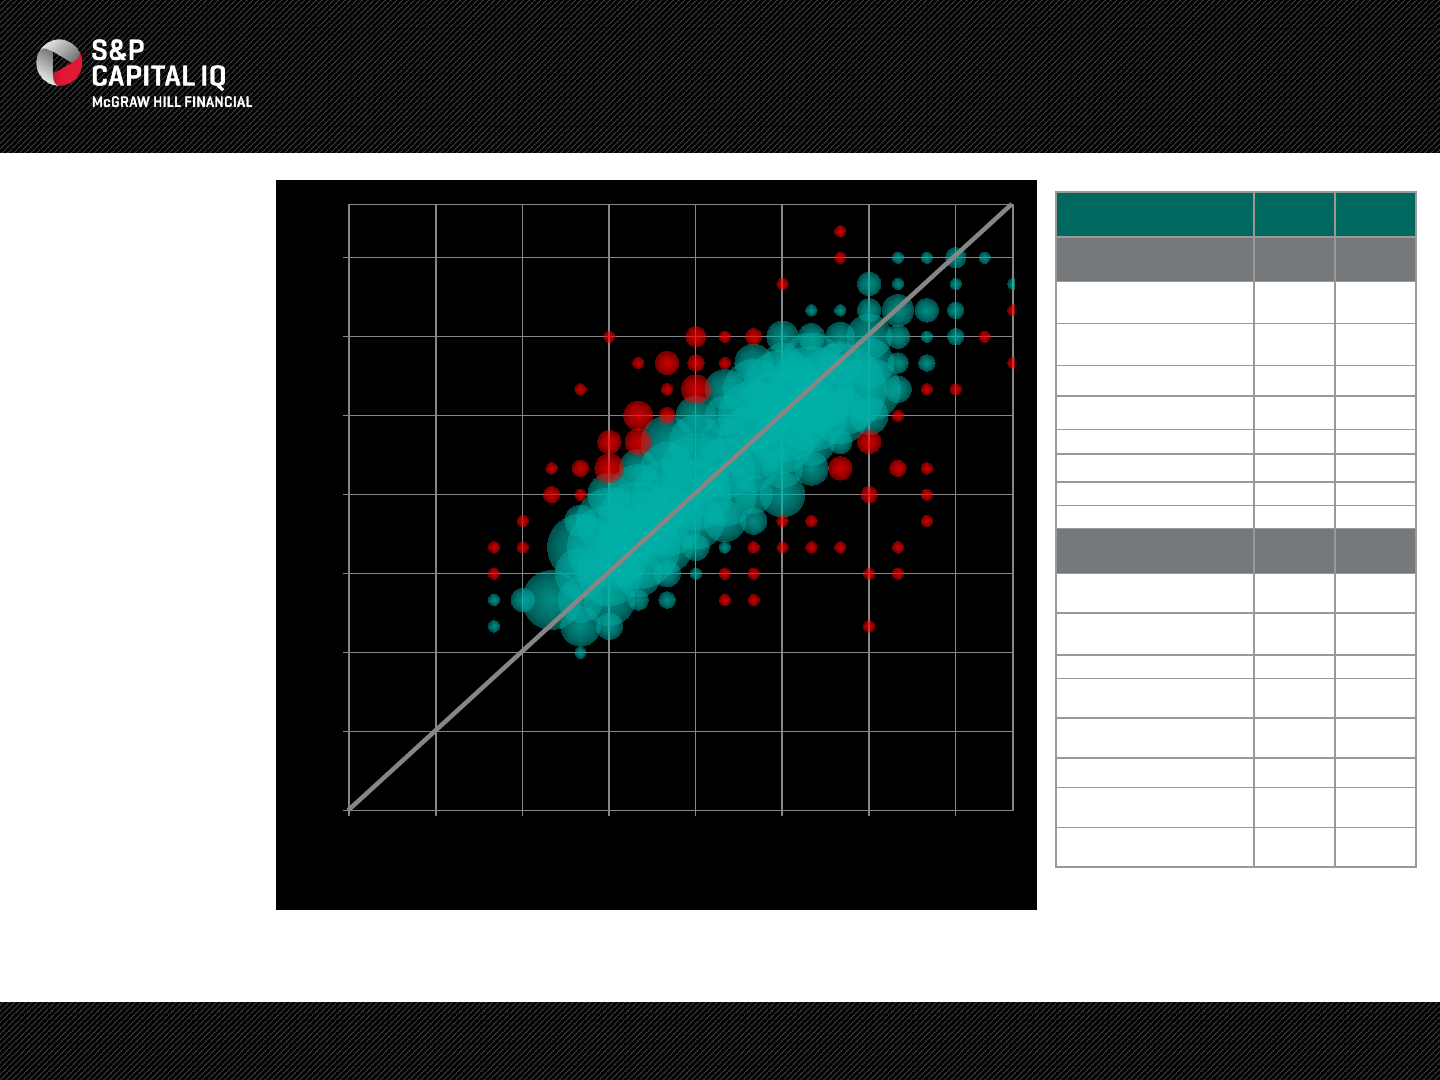
NOTES:
•We have highlighted
companies with some of
the biggest divergences
between their S&P
Rating and their purely
quantitative
CreditModel (CM)
Score in red. This
provides us with a list of
firms with fundamental
attributes that make
them positive or
negative outliers. As
shown by the blue
circles, the vast majority
of firms were scored +/-
3 notches from their
Credit Rating.
•Within the universe we
observed a higher
distribution of
companies with higher
CM Scores than
Ratings, continuing
from last quarter.
Company
CM Score
S&P Rating
CreditModel Positive
Divergence
CVR Refining, LP
bbb
- B+
IAMGOLD Corp.
bbb
- B+
Visteon Corporation
bbb
- B+
Gulfport Energy Corp.
bb+
B
Life Time Fitness, Inc.
bb+
B
Paragon Offshore plc
bb+
B
The Wendy's Company
bb+
B
Office Depot, Inc.
bb
B-
CreditModel
Negative
Divergence
Madison Gas and Electric
Company
bbb
+ AA-
Northwest Natural Gas
Company
bbb
A+
Gaz Métro inc
bbb
- A
The Sherwin
-Williams
Company
bbb
- A
Adobe Systems
Incorporated
bb+
A-
Altera Corp.
bb+
A-
Northern Natural Gas
Company
bb+
A-
Nova Gas Transmission
Ltd.
bb+
A-
Lower-case nomenclature is used to differentiate S&P Capital IQ’s PD CreditModel Scores from credit ratings issued by Standard & Poor’s Rating Services. CreditModel
Score is trained on ratings, rather than on default data, which helps CreditModel generate a long-term stable view of credit risk that is aligned with a ratings process.
Source: S&P Capital IQ as of July 1, 2015.
Quantitatively Viewed Ratings Outliers
CM Score
Rating
aaa
a
bbb
bb
b
ccc
c
d
aa
D/NR C CCC B BB BBB A AA AAA

FINANCIAL RATIO TRENDS
19
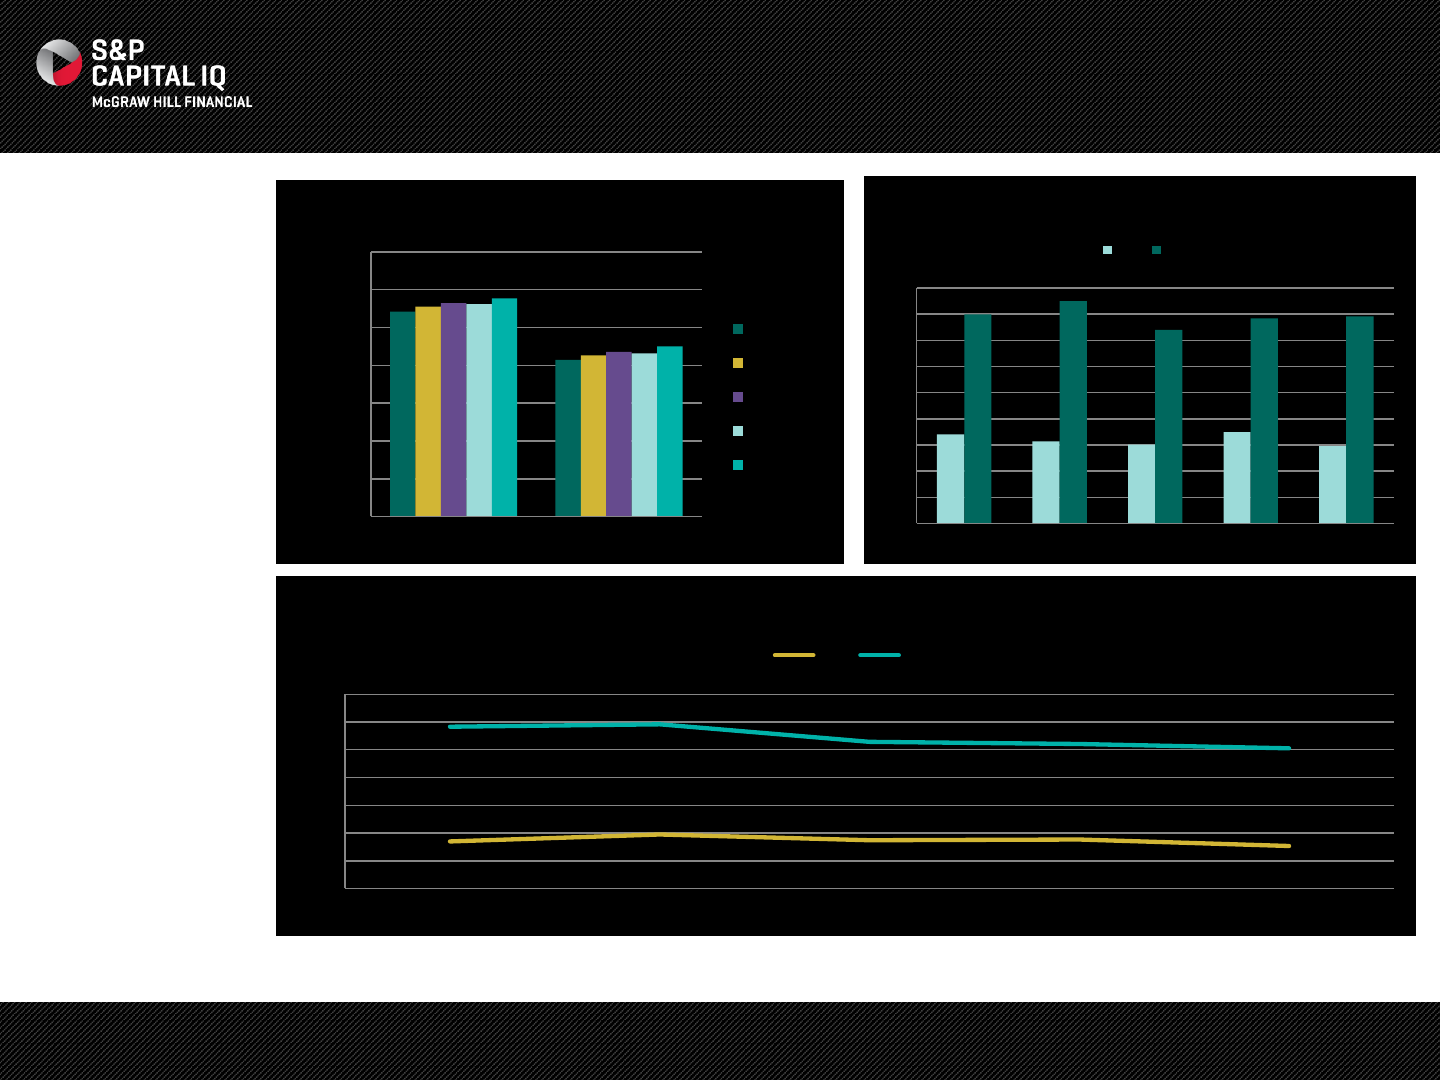
NOTES:
•Debt/Total Capital
levels continued to
rise year-over-year
for both universes.
On a quarter-over-
quarter basis,
investment grade
companies have
seen debt/total
capital levels rise to
45% from 44%.
•EBITDA/Interest
Coverage levels
were down
significantly for high
yield companies
going from 6.9 to 5.9
over the last year.
Investment grade
remains relatively
flat for the past year.
•Cash Flows/Debt
levels declined as
companies
continued to issue
more debt due to
low interest rates.
Universe is all non-financial companies that have an S&P Long-Term Local Rating, primary headquarters in the U.S. or Canada, and an S&P
Capital IQ sector classification. Source: S&P Capital IQ as of July 1, 2015.
Financial Ratio Trends
0
10
20
30
40
50
60
70
HY IG
(%)
Debt/Total Capital
2011 Q1
2012 Q1
2013 Q1
2014 Q1
2015 Q1
0
2
4
6
8
10
12
14
16
18
2011 Q1 2012 Q1 2013 Q1 2014 Q1 2015 Q1
EBITDA/Interest Coverage
HY IG
0.00
0.02
0.04
0.06
0.08
0.10
0.12
0.14
2011 Q1 2012 Q1 2013 Q1 2014 Q1 2015 Q1
Cash Flow From Ops/Debt
HY IG

ISSUANCE TRENDS
21
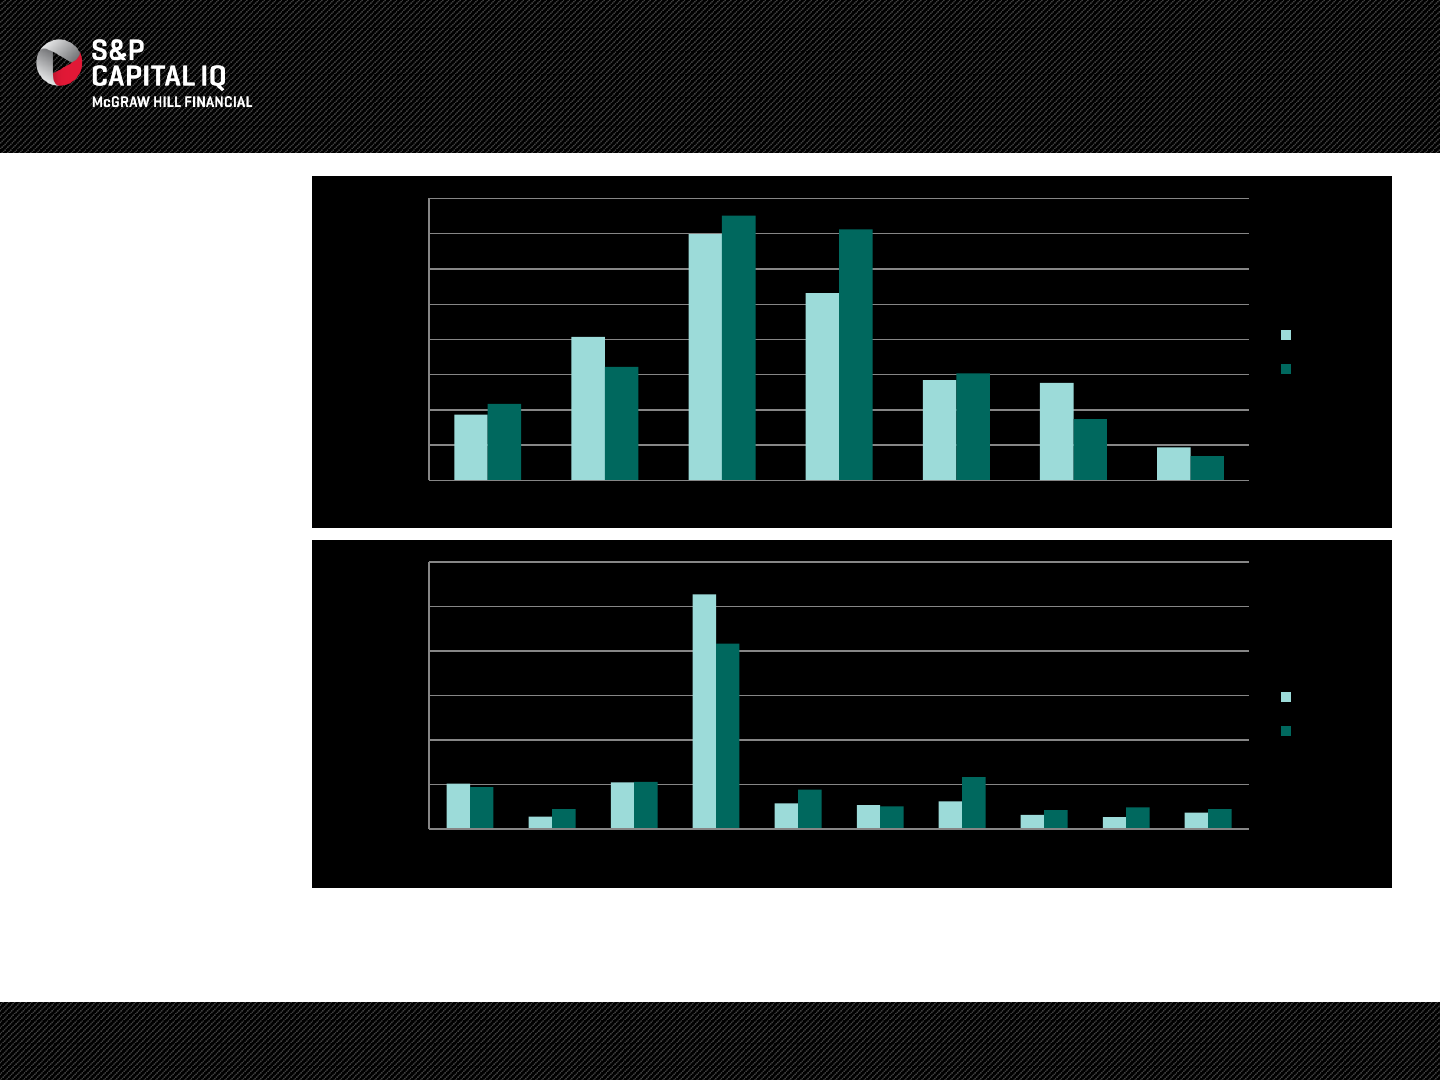
Issuance Trends By Rating Category
NOTES:
•Issuance was higher at
the lower end of
investment grade
issuers. BBB saw the
largest increase in new
volume.
•Only BB issuers
increased issuance
within high yield, while
the riskiest areas in
high yield saw declines
in issuance.
•7 of the 10 sectors
increased issuance
year-over-year with IT
having the largest
increase.
•Some of the biggest
issuers this quarter
include AT&T and
Abbvie.
Issuers are public and private companies globally that issue USD debt in U.S. bond markets. Securities include bonds, convertibles, notes and
MTNs. Amounts are aggregated by Date of Issuance. All values in USD $ billions. Source: S&P Capital IQ as of July 1, 2015.
$0
$50
$100
$150
$200
$250
$300
Cons.
Discr.
Cons.
Staples
Energy Financials Healthcare Industrials IT Materials Telecom. Utilities
($($Bil))
Q2 2014
Q2 2015
$0
$20
$40
$60
$80
$100
$120
$140
$160
AAA AA ABBB BB BCCC
($($Bil))
Q2 2014
Q2 2015
22
Covenants for High Yield Issuance
NOTES:
•The graph represents
the percentage of
companies with each
type of covenant within
new high yield
issuance.
•We observed a slight
increase in Q2 2015
covenants from low
levels in Q1 amid
weaker high yield
issuance markets.
•The fixed charge
covenant continues to
stay at lower levels
compared to 2014.
Universe incudes all high yield corporate debt issuance that is denominated in USD.
Source: S&P Capital IQ as of July 1, 2015.
0%
5%
10%
15%
20%
25%
30%
2013 Q2 2013 Q3 2013 Q4 2014 Q1 2014 Q2 2014 Q3 2014 Q4 2015 Q1 2015 Q2
Fixed Charge Coverage Dividend Related Payments Indebtedness

23
Contact Us
The Americas
+1 212 438 8701
+1 888 806 5541
Asia-Pacific
+852 2533 3588
Europe, Middle East or Africa
+44 (0) 20 7176 1233
How to Subscribe to Fixed Income IQ
Fixed Income IQ is published for S&P Capital IQ clients and select professionals. To receive a copy of the report, please register
online or send an email to fixedincomeiq@spcapitaliq.com and request inclusion in our distribution.
Submit Feedback to the Editor
Please contact us at fixedincomeiq@spcapitaliq.com with feedback and editorial suggestions.
Media Inquiries
Please contact Michael Privitera at michael.privitera@spcapitaliq.com.
www.spcapitaliq.com/trial

24
Disclosures
S&P Capital IQ is analytically and editorially independent from S&P Ratings Services. CreditModel and PD Market Signals (and various Market Derived Signals) are analytical tools but are not credit
ratings. Neither CreditModel, PD Market Signals nor credit ratings should be considered to be investment advice. A credit rating from Standard & Poor's Ratings Services is an opinion of the rated
organization's creditworthiness and involves both qualitative and quantitative characteristics. CreditModel and PD Scores are based on but differ significantly from Standard & Poor's Ratings
Services criteria and do not include a qualitative assessment or opinion. CreditModel and PD Market Signal scores are represented by lowercase nomenclature to differentiate them from S&P
Ratings Services credit ratings.
Charts, graphs and screenshots are provided for illustrative purposes only.
Copyright © 2015 by Standard & Poor’s Financial Services LLC (S&P), a part of McGraw Hill Financial. All rights reserved. STANDARD & POOR’S and S&P are registered trademarks of Standard
& Poor’s Financial Services LLC. CAPITAL IQ is a registered trademark of Capital IQ, Inc. iPad is a trademark of Apple Inc., registered in the U.S. and other countries. Microsoft, Excel, PowerPoint,
and Outlook are registered trademarks of Microsoft Corporation in the United States and/or other countries.
No content (including ratings, credit-related analyses and data, valuations model, software or other application or output therefrom) or any part thereof (Content) may be modified, reverse
engineered, reproduced or distributed in any form by any means, or stored in a database or retrieval system, without the prior written permission of Standard & Poor’s Financial Services LLC or its
affiliates (collectively, S&P). The Content shall not be used for any unlawful or unauthorized purposes. S&P and any third-party providers, as well as their directors, officers, shareholders,
employees or agents (collectively S&P Parties) do not guarantee the accuracy, completeness, timeliness or availability of the Content. S&P Parties are not responsible for any errors or omissions
(negligent or otherwise), regardless of the cause, for the results obtained from the use of the Content, or for the security or maintenance of any data input by the user. The Content is provided on an
“as is” basis. S&P PARTIES DISCLAIM ANY AND ALL EXPRESS OR IMPLIED WARRANTIES, INCLUDING, BUT NOT LIMITED TO, ANY WARRANTIES OF MERCHANTABILITY OR FITNESS
FOR A PARTICULAR PURPOSE OR USE, FREEDOM FROM BUGS, SOFTWARE ERRORS OR DEFECTS, THAT THE CONTENT’S FUNCTIONING WILL BE UNINTERRUPTED OR THAT
THE CONTENT WILL OPERATE WITH ANY SOFTWARE OR HARDWARE CONFIGURATION. In no event shall S&P Parties be liable to any party for any direct, indirect, incidental, exemplary,
compensatory, punitive, special or consequential damages, costs, expenses, legal fees, or losses (including, without limitation, lost income or lost profits and opportunity costs or losses caused by
negligence) in connection with any use of the Content even if advised of the possibility of such damages. Credit-related and other analyses, including ratings, and statements in the Content are
statements of opinion as of the date they are expressed and not statements of fact. S&P’s opinions, analyses and rating acknowledgment decisions (described below) are not recommendations to
purchase, hold, or sell any securities or to make any investment decisions, and do not address the suitability of any security. S&P assumes no obligation to update the Content following publication
in any form or format. The Content should not be relied on and is not a substitute for the skill, judgment and experience of the user, its management, employees, advisors and/or clients when
making investment and other business decisions. S&P does not act as a fiduciary or an investment advisor except where registered as such. While S&P has obtained information from sources it
believes to be reliable, S&P does not perform an audit and undertakes no duty of due diligence or independent verification of any information it receives. To the extent that regulatory authorities
allow a rating agency to acknowledge in one jurisdiction a rating issued in another jurisdiction for certain regulatory purposes, S&P reserves the right to assign, withdraw or suspend such
acknowledgement at any time and in its sole discretion. S&P Parties disclaim any duty whatsoever arising out of the assignment, withdrawal or suspension of an acknowledgment as well as any
liability for any damage alleged to have been suffered on account thereof.
S&P keeps certain activities of its business units separate from each other in order to preserve the independence and objectivity of their respective activities. As a result, certain business units of
S&P may have information that is not available to other S&P business units. S&P has established policies and procedures to maintain the confidentiality of certain non-public information received in
connection with each analytical process.
S&P may receive compensation for its ratings and certain analyses, normally from issuers or underwriters of securities or from obligors. S&P reserves the right to disseminate its opinions and
analyses. S&P’s public ratings and analyses are made available on its Web sites, www.standardandpoors.com (free of charge), and www.ratingsdirect.com and www.globalcreditportal.com
(subscription), and may be distributed through other means, including via S&P publications and third-party redistributors. Additional information about our ratings fees is available at
www.standardandpoors.com/usratingsfees.