The Crypto Fibonacci Master Guide
User Manual:
Open the PDF directly: View PDF ![]() .
.
Page Count: 250 [warning: Documents this large are best viewed by clicking the View PDF Link!]

The Crypto Master Guide to Fibonacci Trading
Bennett Stein
________________________________________________________________________
1. Origins
a. The Fibonacci Sequence | pg. 9
b. In Nature | pg. 10
c. Fear and Greed | pg. 12
2. Market Stages
a. Three Types of Market Stages | pg. 13
b. Market Stage Transitions | pg. 16
1

c. Major and Minor Market Stages | pg. 18
d. Market Stage Strength and Weakness | pg. 22
3. Fibonacci Retracements
a. Patterns of Contraction | pg. 26
b. The 61.8% Retracement | pg. 27
c. The Other Retracement Levels | pg. 31
i. The 23.6%
ii. The 38.2%
iii. The 50%
iv. The 78.6%
d. Drawing Fibonacci Retracements | pg. 45
e. Practice | pg. 50
4. Fibonacci Extensions
a. Patterns of Expansion | pg. 56
b. The Golden Ratio 161.8% | pg. 57
c. The Other Extension Levels | pg. 63
i. The 127.2%
ii. The 261.8%
d. Drawing Fibonacci Extensions | pg. 74
e. Practice | pg. 81
5. Fibonaccis in Context
2

a. Support and Resistance Confluence | pg. 88
b. Volume | pg. 97
c. Technical Indicators | pg. 109
d. Overlapping Fibonacci Analysis | pg. 117
e. Fibonacci Planning | pg. 124
6. Fibonacci Market Structure
a. The 5 Shapes of Respected Fibonacci Levels | pg. 134
i. V-Shape
ii. Wild Tail
iii. Multi-Tail Rejection
iv. Stop Loss Hunt
v. Consolidation Spring
b. The 3 Shapes of Disrespected Fibonacci Levels | pg. 153
i. Consolidation at Important Fibonacci Level
ii. Strong Retracing Momentum
iii. Consecutive Lows
c. Practice | pg. 168
7. Finale
a. How to Actively Trade Fibonaccis | pg. 175
b. Large Market Cap Coins versus Altcoins | pg. 192
c. Practice Makes Perfect | pg. 194
3

i. Market Stage Practice
ii. Confluence Zone Practice
iii. Entry Practice
iv. Exit Practice
v. Stop Loss Placement Practice
vi. Final Tips
About the Author: Bennett Stein
I am a cryptocurrency educator who has been actively trading since 2011.
For years I devoured as many books on psychology and market dynamics
that I could before I even started to trade the markets. In early 2017, I
started my own youtube channel, Bitcoin Trading Challenge to mentor
traders on how to trade cryptocurrencies. I have just completed my 140th
video and plan to continue as long as there is information to share.
4
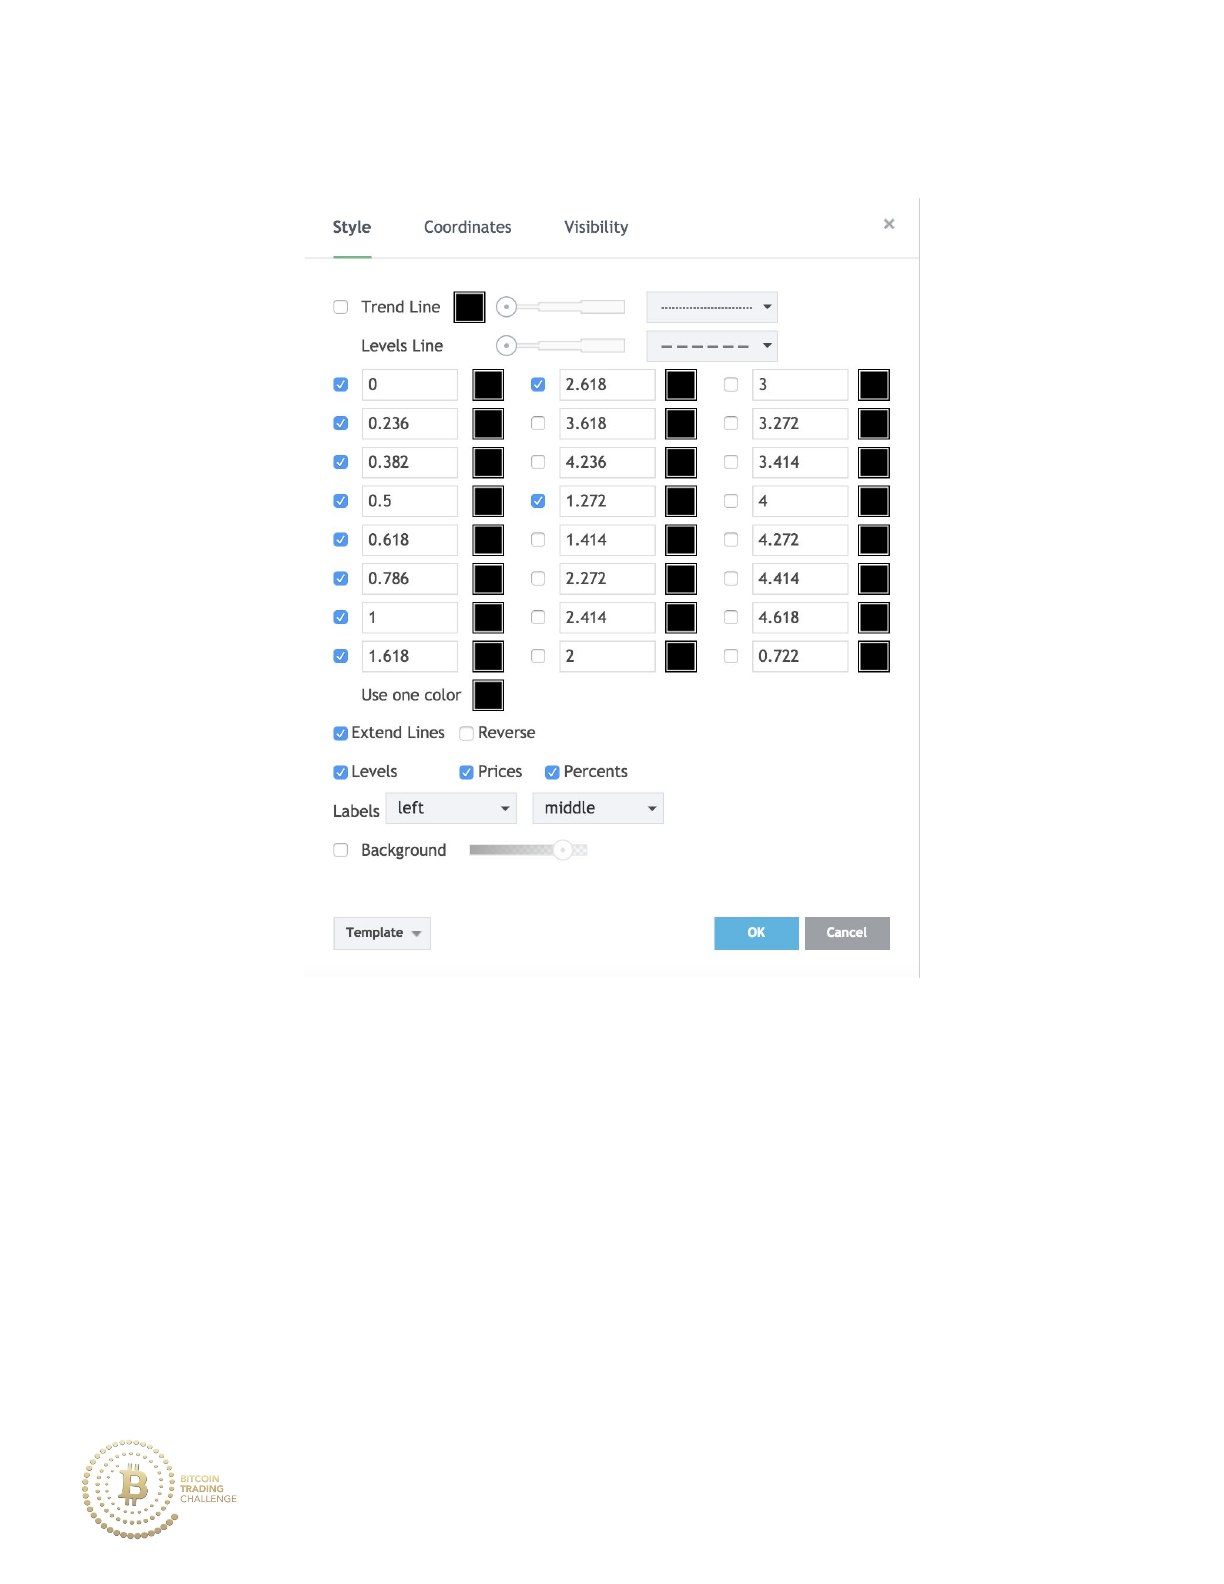
My Fibonacci Settings on Tradingview
It is also recommended that you use magnet mode when drawing Fibonaccis
on Tradingview.
5

Trading Term List
Bull is one who expects the price to rise.
Bear is one who expects the price to fall.
Bullish Retracement is a bearish (downward) pullback against an uptrend-
drawn from low to high of uptrend.
Bearish Retracement is a bullish (upward) pullback against a downtrend-
drawn from high to low of a downtrend.
Strong Momentum in a trend is characterized by infrequent and weak
retracements (retracements below 38.2%) with trend continuations on high
ease of movement. Think BTCUSD from mid November to early December
2017.
Average Momentum in a trend is characterized by regular and average
retracements (retracements below 61.8%) with trend continuations on
average ease of movement. Think BTCUSD from early May to mid
November 2017.
Weak Momentum in a trend is characterized by frequent and strong
retracements (retracements above 61.8%) with trend continuations on low
ease of movement.
Long Position is one who bought to establish a market position.
Short Position is one who sold to establish a market position.
High Tail is a candlestick formation that forms when price closes
drastically below its candlestick high. Typically a bearish signal.
6

Low Tail is a candlestick formation that forms when price closes drastically
above its candlestick low. Typically a bullish signal.
Retail Trader is a trader who trades independently through a broker or an
exchange; typically trades with low volume and has limited access to
advanced market information.
Institutional Trader is a trader who either trades with direct access to a
market (no intermediary broker/exchange), or sends trades to an exchange
independently in order to ensure the best execution price possible; typically
trades with high volume and has access to advanced market information.
Stop Loss is a market order to buy or sell when the market reaches a
specific point with the intention of limiting losses. A stop loss order to buy
(used if a trader entered a short position) becomes a market order when
price reaches the most available ask price at or above the stop price. A
stop order to sell (used if a trader entered a long position) becomes a
market order when price reaches the most available bid price at or below
the stop price.
Market Stage refers to a market phase of consolidation, an uptrend or a
downtrend.
Contraction occurs when price moves against the overall trend (also known
as ‘pullback’ or ‘retracement’).
Expansion occurs when price moves with the overall trend.
Confluence is when multiple indicators overlap at a price level. When this
occurs, that level has a greater likelihood of becoming a support/resistance
level.
7

Altcoin, or ‘Alternative Coin’, is a coin that is not listed as one of the major
cryptocurrency coins by market cap, typically traded to BTC or to another
coin.
Bid is a request to buy at a specified price.
Ask is an offer to sell at a specified price (also known as an ‘Offer’).
Liquidity refers to the ability to convert an asset into cash (fiat currency) or
vice versa. In the crypto world this is the ability to convert between a coin
and cash. Institutional traders need high liquidity so that their trading
activity will not impact the market price.
High liquidity refers to large transactions that do not cause a substantial
change in price.
Low liquidity refers to large transactions that do cause a substantial
change in price.
Support refers to a price level where price has historically had difficulty
falling past.
Resistance refers to a price level where price has historically had difficulty
rising past.
___________________________________________________________________________
All examples within the guide will be on 5-Minute or 1-Hour charts. However, material
from this guide can be used on other timeframes as well due to the fractal-like nature of
Fibonacci patterns.
__________________________________________________________________________
8

1. Origins
A. The Fibonacci Sequence
Everything in the universe is in a constant state of movement. From flowers
to the price movements of a cryptocurrency, the universe is consistently
contracting and expanding. Now, if you didn’t know anything about
Fibonacci Theory and I told you that a book written in 1202 AD could
predict the movements of the expansions and contractions within the
cryptocurrency market, you would likely call me a fool. I might as well have
told you that the phases of the moon could predict the price changes of the
global markets.
But what if there were precise mathematical patterns that dictated nature’s
method of contraction and expansion, repeated over time? There are, and it
is called the Fibonacci sequence.
The first alleged revelation of the “Fibonacci sequence” came from
Leonardo of Pisa in 1202, who uncovered it in his famous book Liber Abaci
(although many believe that ancient Indian mathematicians may have
discovered it first). The sequence was created by taking a number and then
adding it to the previous number, wherein the sum of the two numbers
creates the next value in the Fibonacci number series. This pattern of
numerical expansion continues on to infinity.
9

The Fibonacci sequence is 0, 1, 1, 2, 3, 5, 8, 13, 21, 34, 55, 89, 144, 233, 377…
The pattern that 18th century mathematicians discovered after the
founder’s original finding of the sequence was that if you divide a number
in the sequence by the number that comes after it (like 5/8 or 21/34) you
eventually approach the ratio of 61.8%. He also found that if you reverse
this and divide a number in the sequence by the number that comes before
it (like 55/34 or 144/89) you eventually approach the ratio of 161.8%. It is
no coincidence that these two ratios, the 61.8% and the 161.8%, are the
most important ratios in Fibonacci market analysis.
B. In Nature
It’s interesting how this mathematical sequence can be derived from, or
explain, a series of numbers. It substantiates the theory that the natural
universe around us also conforms to this pattern as elements of nature
expand and contract. There is a large amount of evidence that indicates
that many growing entities incorporate some elements of the Fibonacci
pattern, even including the human body.
Measure the length of your hand from the crease at the beginning of your
hand to the tip of your longest finger, and then measure the length of your
forearm from that same initial crease down to the bend in your elbow. Then
gauge the length. You will find that your forearm is around 161.8% the
10

length of your hand. This is the Fibonacci ratio system at work within your
body.
Now take a look at the nearest tree. In most trees, the main trunk extends
out to create two large branches. Then, one of those two branches will stay
dormant, while the other branch extends to create two more smaller
branches. This system of branching will continue until the tree completes
its expansion and begins to decay. This branching “pattern” mirrors the
Fibonacci sequence of 1, 1, 2, 3, 5, 8…
If you take a look at anything from the intricate spirals within a rose to the
formation of a hurricane, the Fibonacci sequence reveals itself. No matter
the size of the organism in question, the sequence largely remains, as it
plays out in a fractal-like nature. Think of a “fractal” as a pattern that
repeats itself infinitely regardless of its scale.
One example of this is the snowflake. As you zoom in, the same shape of a
snowflake is visible. This will keep occurring no matter how intensely you
zoom in. Since the natural universe clearly acts in concert with the
Fibonacci sequence, is it surprising that other patterns of human life,
including economic decisions, follow the sequence as well?
11

C. Fear and Greed
Fibonacci price levels reflect the effects of extreme fear and greed at work
in the market. Fibonacci-based traders recognize the mathematical nature
to the patterns of fear and greed and set their orders accordingly to
Fibonacci ratios.
Fear manifests itself in a “sell-off” as traders panic under the belief that the
market can only go lower. Greed manifests itself in a rush of buyers who
impulsively buy into an uptrend in order to not miss out on potential profits.
When market sentiment turns into either extreme fear or extreme greed, a
Fibonacci trader typically wants to take the other side of the trade. That
means that we want to buy when everyone is panicking and sell when
everyone is getting greedy.
But why? Why should we buy after everyone else sells and why should we
sell after everyone else buys?
Consider this analogy: there are 100 traders in a trading room with
unlimited liquidity in the market. They are all trading the same asset, with
no outside parties participating. Price begins to rise and suddenly all of the
100 traders buy the asset with their full capital as they are afraid of missing
out on profits on the uptrend. Can the price go any higher at this point?
12

No, it can’t. There are no more buyers to push the price any higher making
this the perfect opportunity to sell against the crowd that had all just
bought.
Fibonacci ratios, especially the 61.8% and 161.8%, provide price points
where the crowd is likely acting on emotions of extreme fear or greed.
Therefore, Fibonacci retracements and extensions act as important
psychological zones with major fear creating “support” levels and major
greed creating “resistance” levels.
__________________________________________________________________________
2. Market Stages
A. Three Types of Market Stages
A market stage refers to price’s dominant patterns of movements within
the timeframe that you are analyzing. There are three main types of market
stages:
1. Consolidation
a. Price is moving sideways.
b. Price cycles from a support area to a resistance area and back
again.
c. Price eventually stops this cycle when it breaks out and turns
into an uptrend or a downtrend.
13

2. Uptrend
a. Price is making higher highs and higher lows.
b. Previous resistance levels become future support.
c. Price eventually turns consolidation or a downtrend.
3. Downtrend
a. Price is making lower highs and lower lows.
b. Previous support levels become future resistance.
c. Price eventually turns into consolidation or an uptrend.
How is market stage identification relevant when plotting Fibonaccis? The
traders who can label and understand the current market stage have the
ability to plot the correct Fibonacci points and thus, gain the benefits of
doing so.
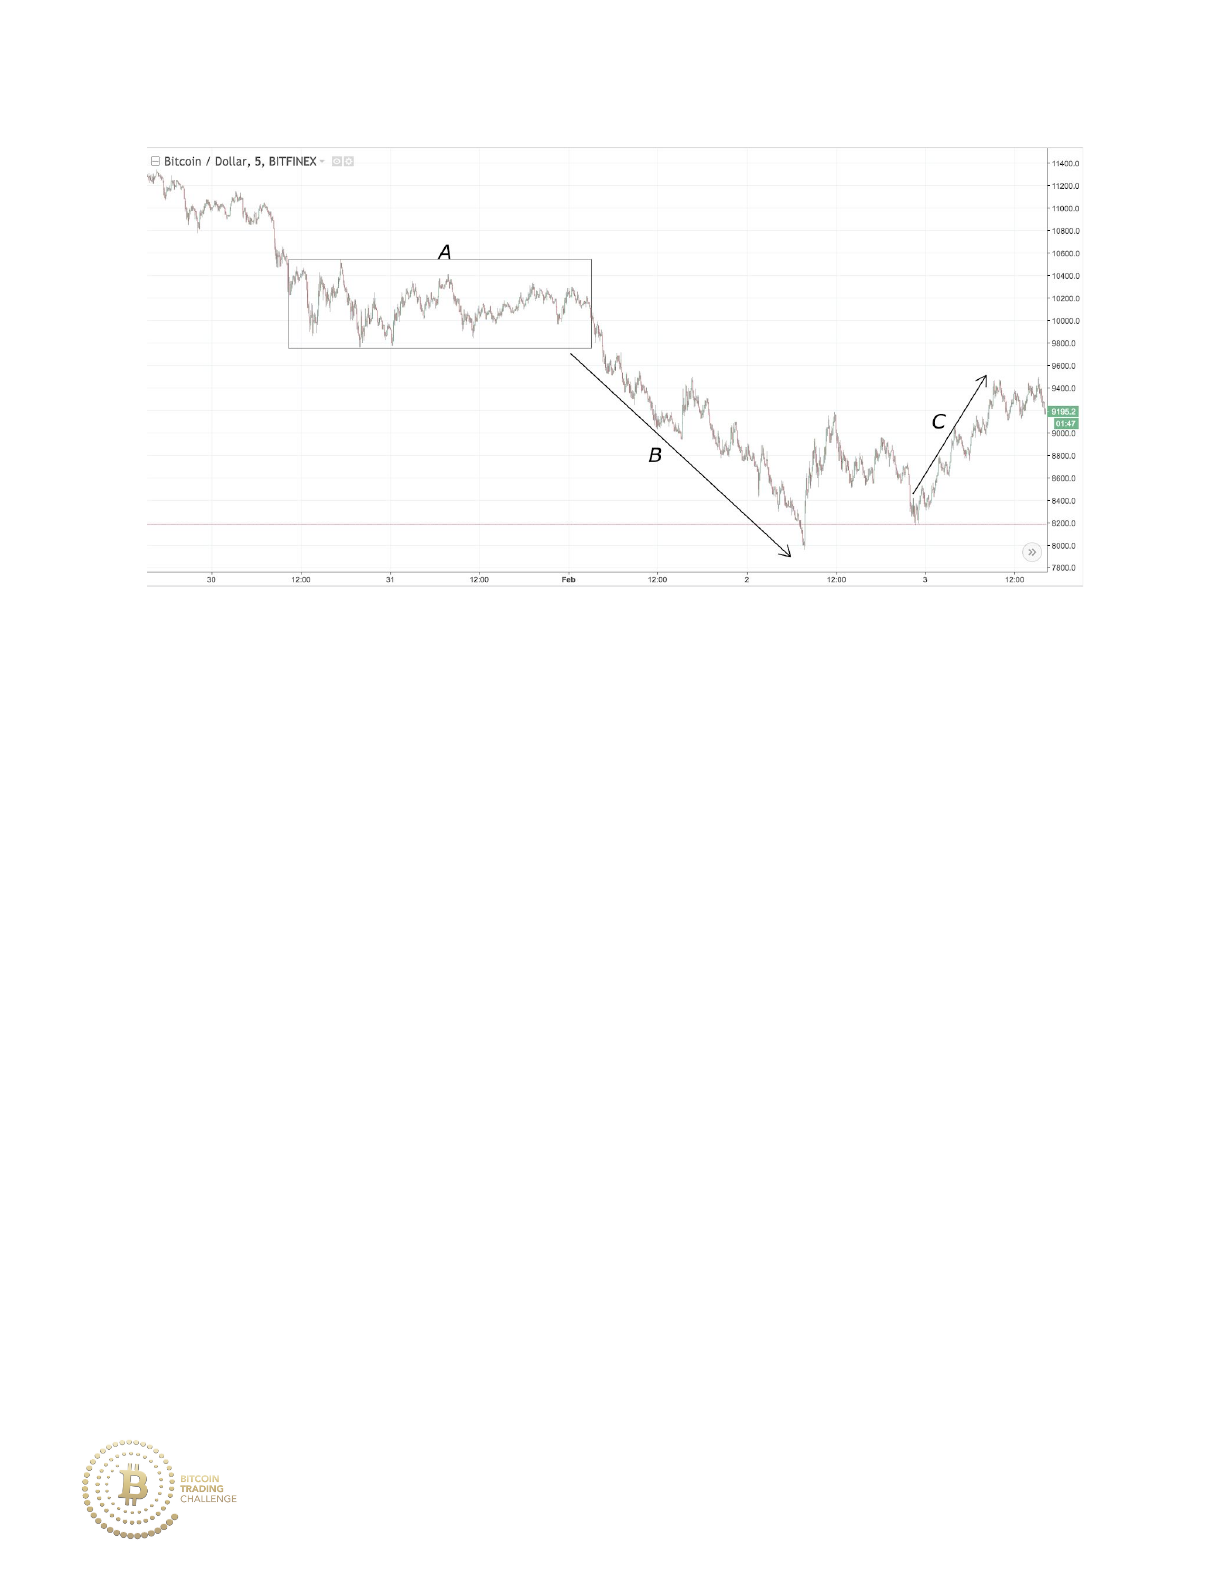
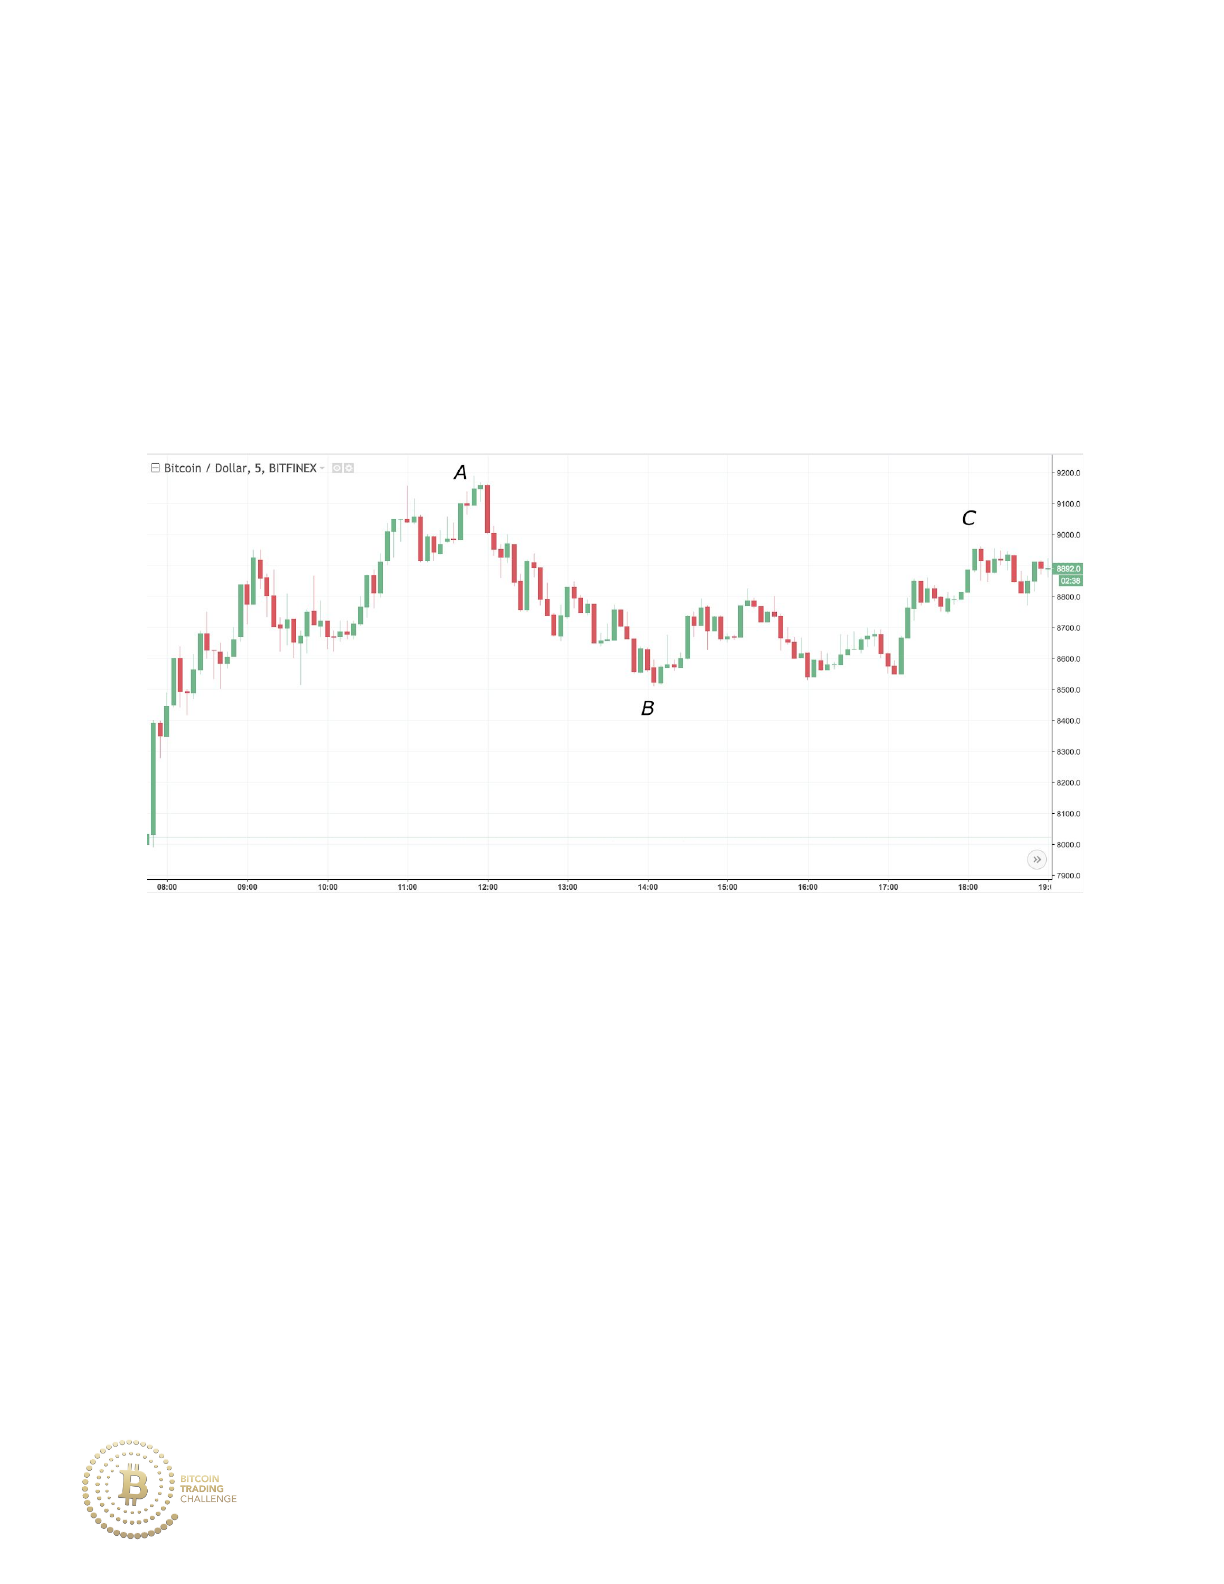
Let’s identify some basic market stages:
14
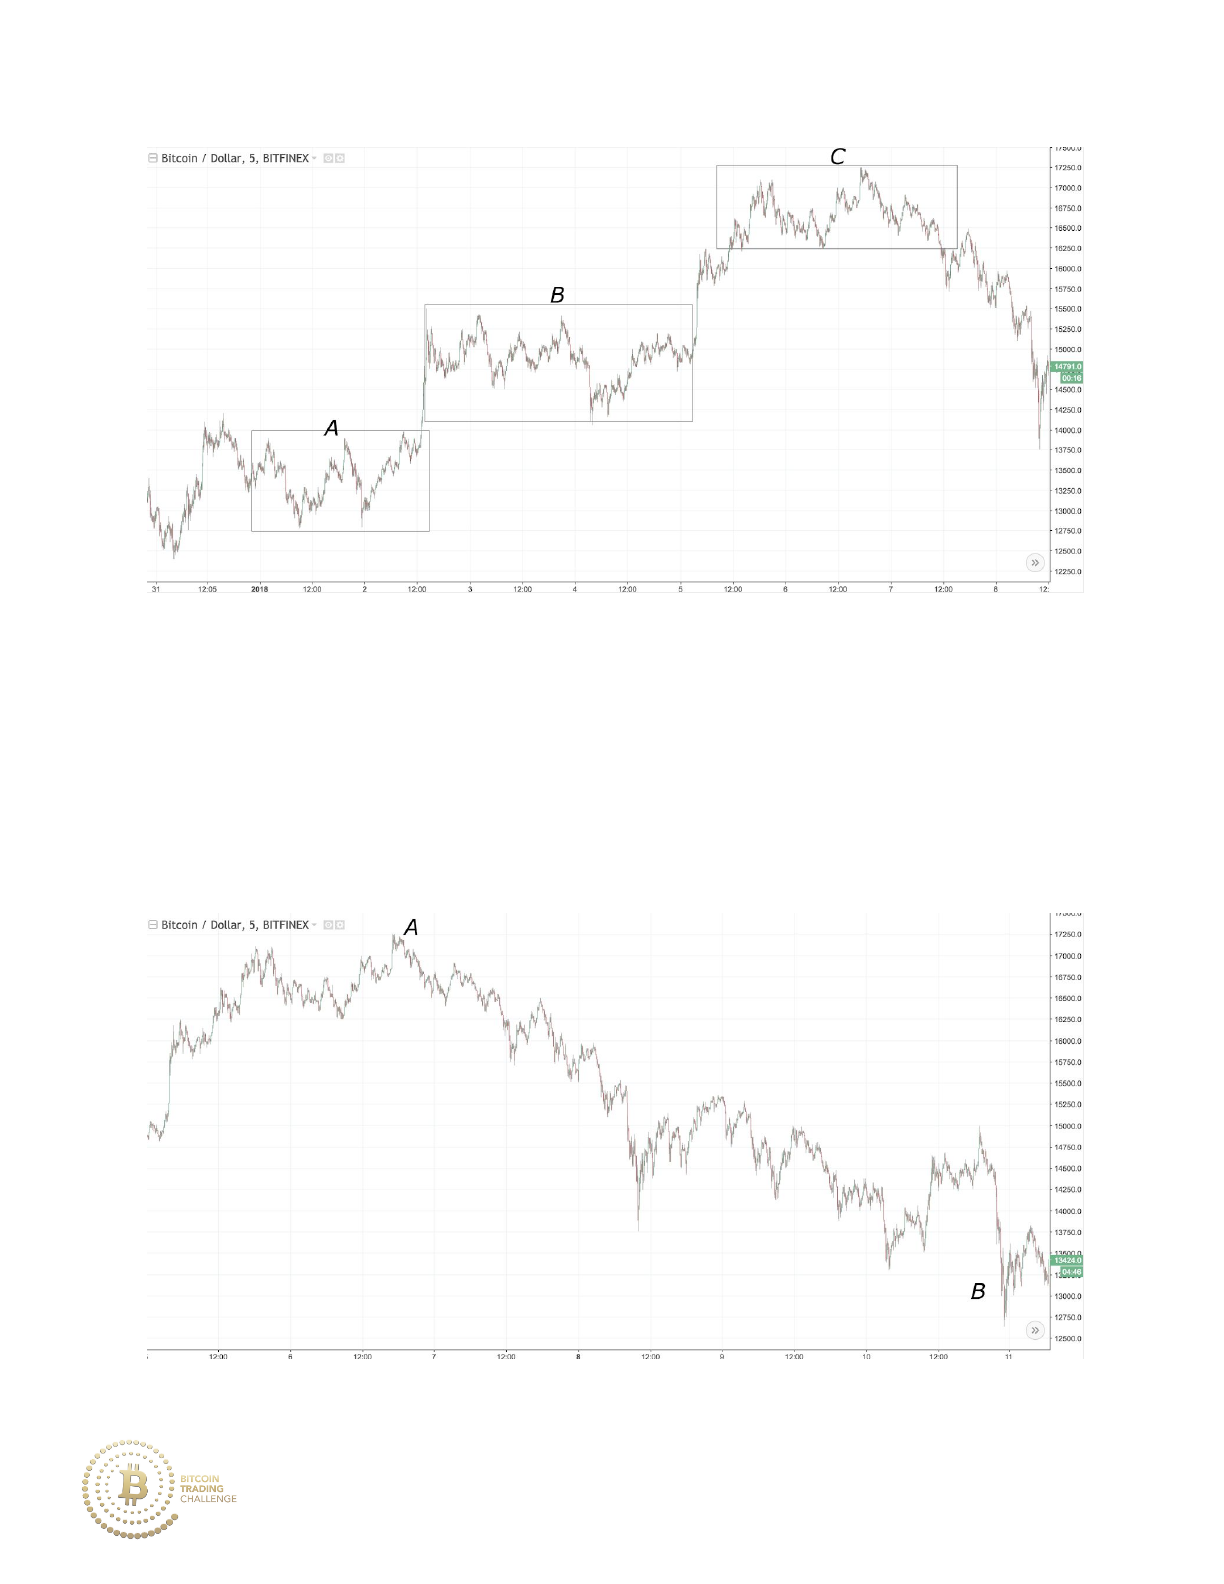
The boxes labeled A, B and C are price zones where the price was in a
stage of consolidation within the overall market stage of an uptrend.
The market moving from A to B is a clear example of a downtrend.
15
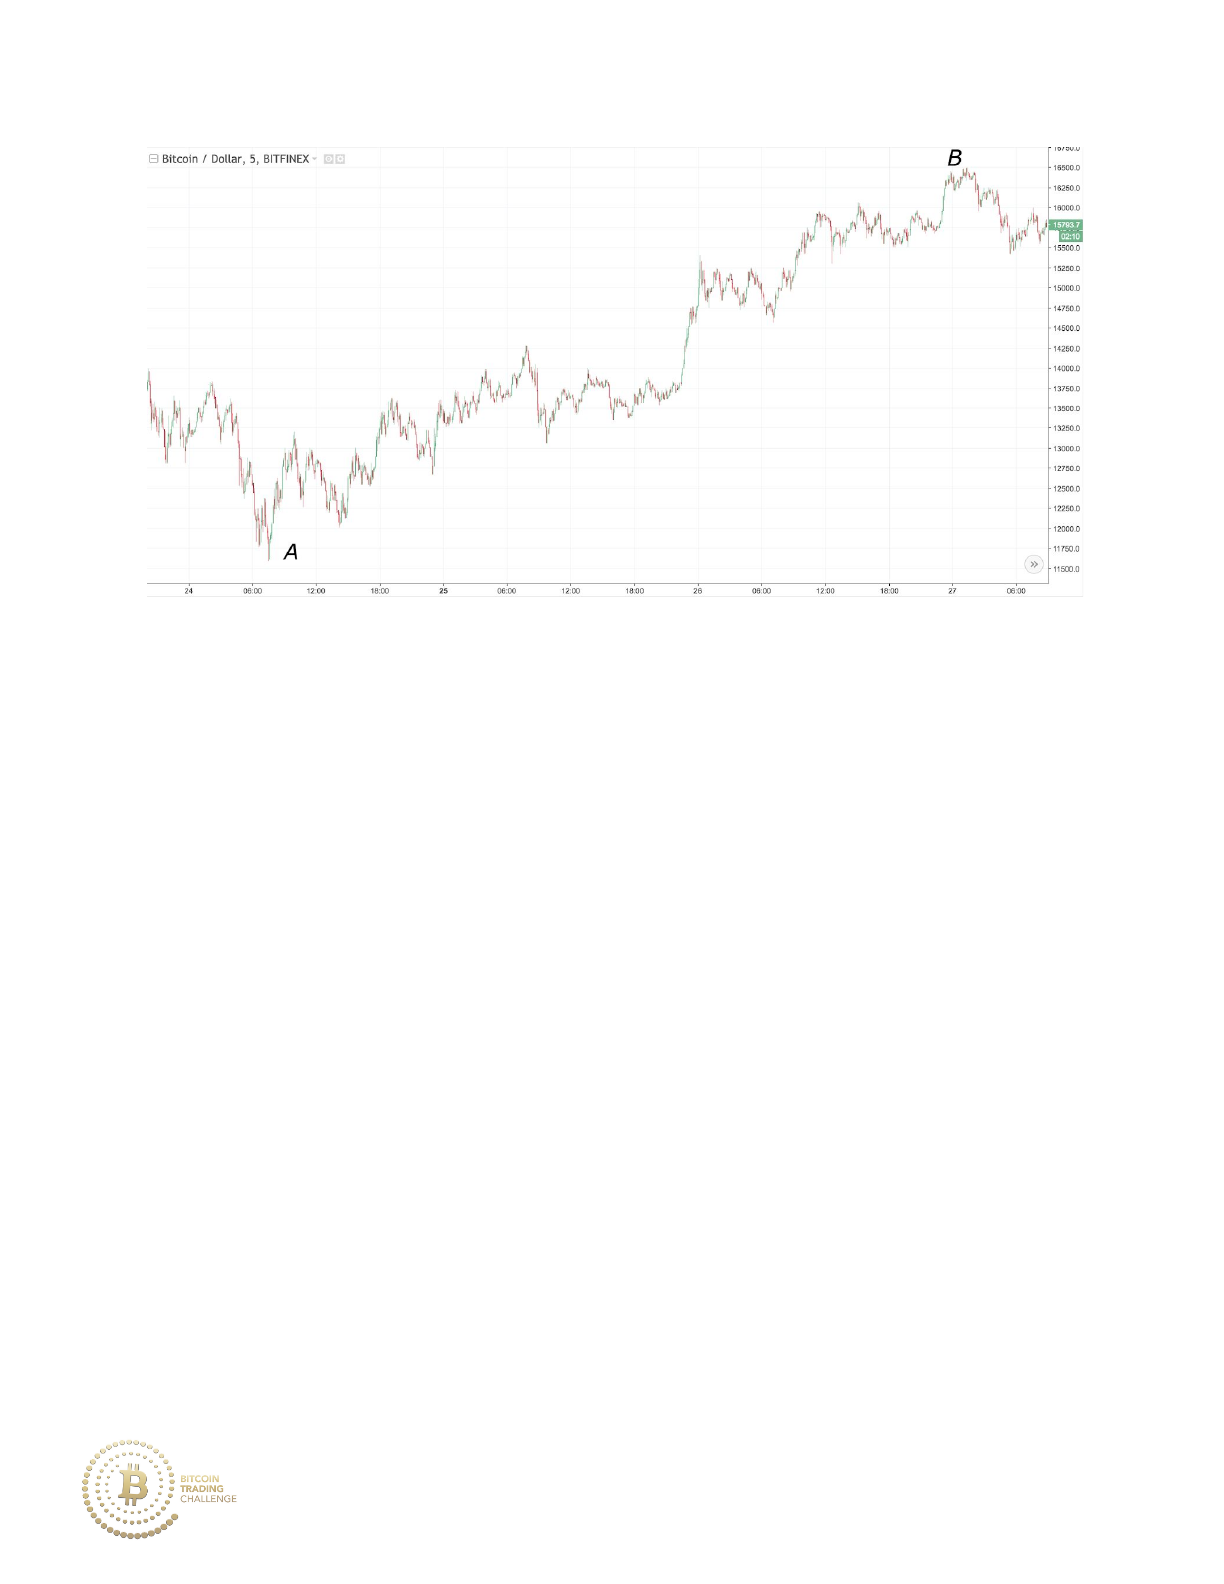
The market moving from A to B is a clear example of an uptrend.
Remember that price will always be in one of these three stages, depending
on the scale of your chart. One of the hardest parts about plotting
Fibonacci points lies in identifying these market stages. Once identified,
deciding which endpoints to draw is far easier.
B. Market Stage Transitions
The market is constantly shifting from market stage to market stage as
price cycles through time.
An uptrend can turn into a downtrend or consolidation and will naturally do
so eventually. Consolidation can turn into an uptrend or a downtrend and
16
will do so eventually. A downtrend can turn into an uptrend or consolidation
and will do so eventually. How can you identify when the market stage is
changed? An example of a market stage transition with all three market
stages involved would look like this:
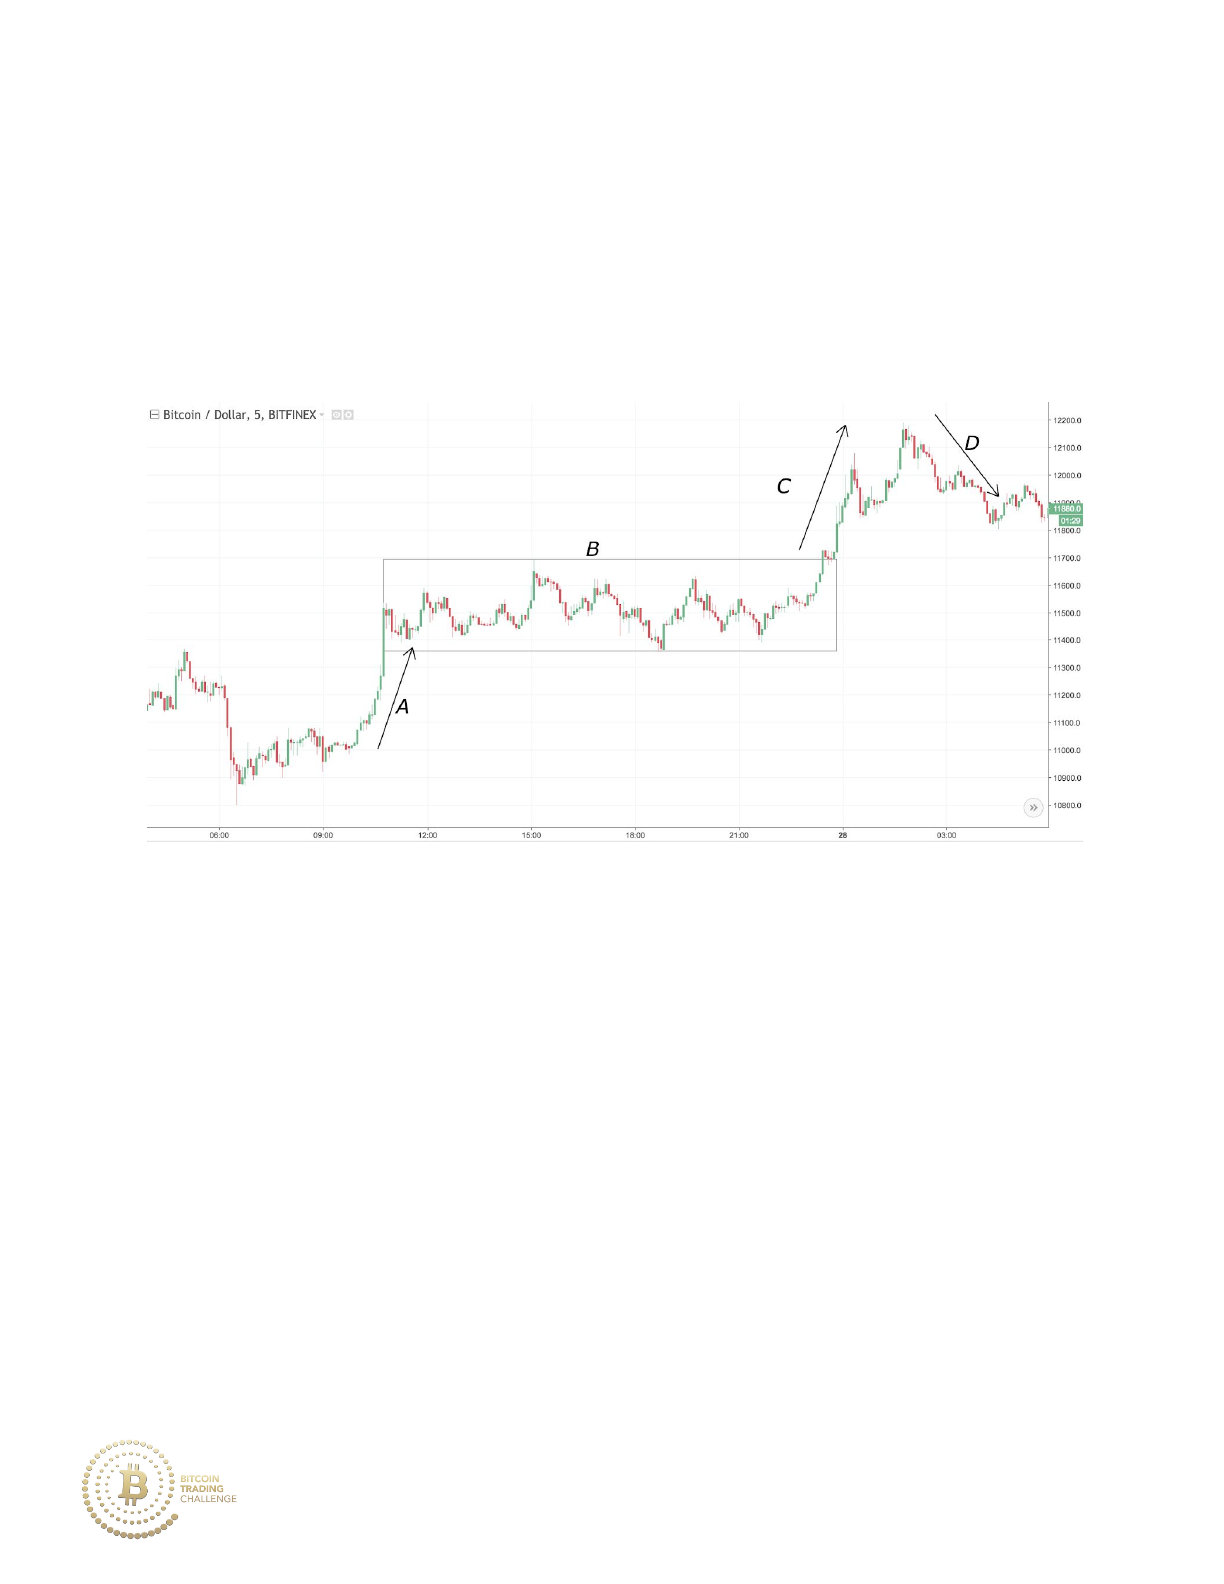
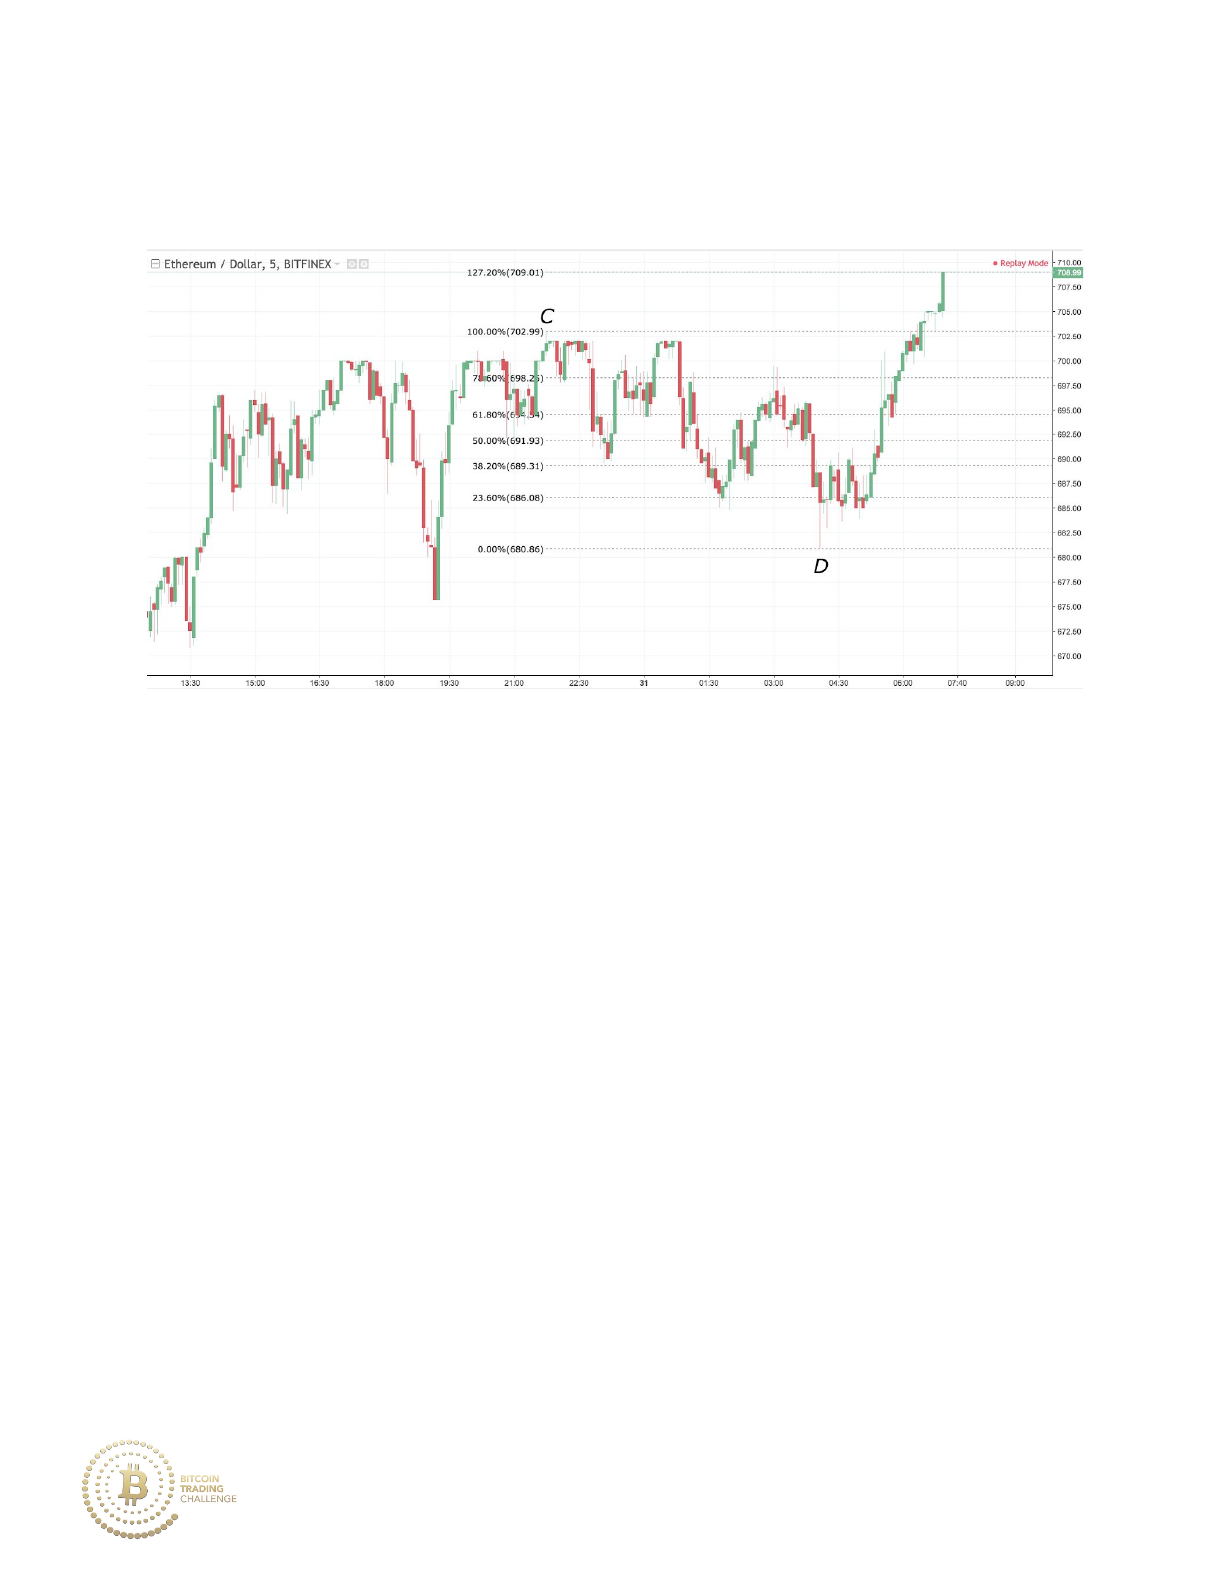
Notice how the first market stage is an uptrend at A, followed by a market
stage of consolidation at B. This leads to a continuation of the uptrend at C
which finally ends in a downtrend at D.
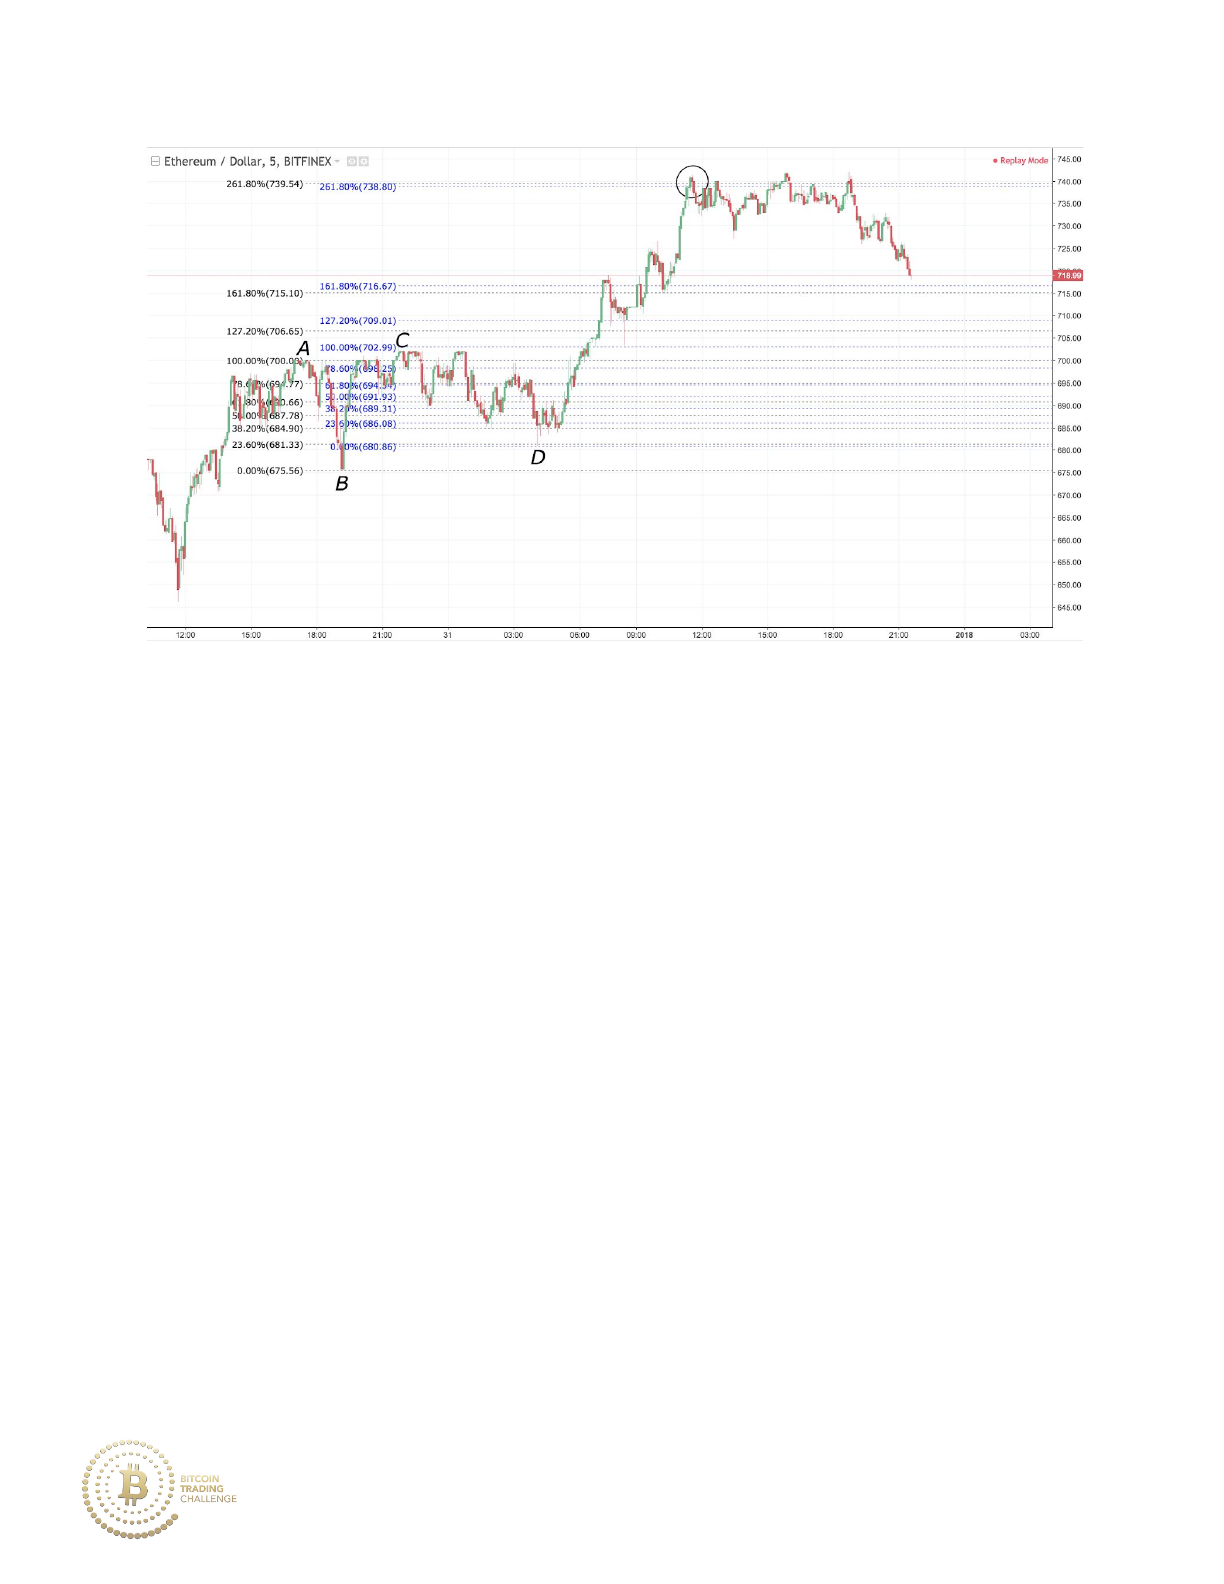
When price breaks out above consolidation (i.e. consolidation turning into
an uptrend), we call this a breakout. This is exemplified in the market
transition from B to C. We use the term breakdown to describe price going
from consolidation into a downtrend. When price turns from an uptrend
into a downtrend, we call this a bearish reversal. When price turns from a
downtrend into an uptrend, we call this a bullish reversal.
17
The transition from Box A to Line B is a price breakdown. The transition
from Line B to Line C is a bullish reversal.
C. Major and Minor Market Stages
There are both major and minor market stages, as some market stages
have significantly higher price movement (major) relative to recent price
changes, while other market stages have significantly lower price
movement (minor) relative to recent price changes.
A market stage that turns from an uptrend into a downtrend is called a
reversal if both the uptrend and downtrend are major market stages.
18
However, if the uptrend was major while the downtrend is minor, we call
this a retracement. A retracement is defined as a temporary reversal in the
direction of a market’s (or coin’s) price that goes against the overall
trend. However, this does not signify a change in the larger trend, but rather
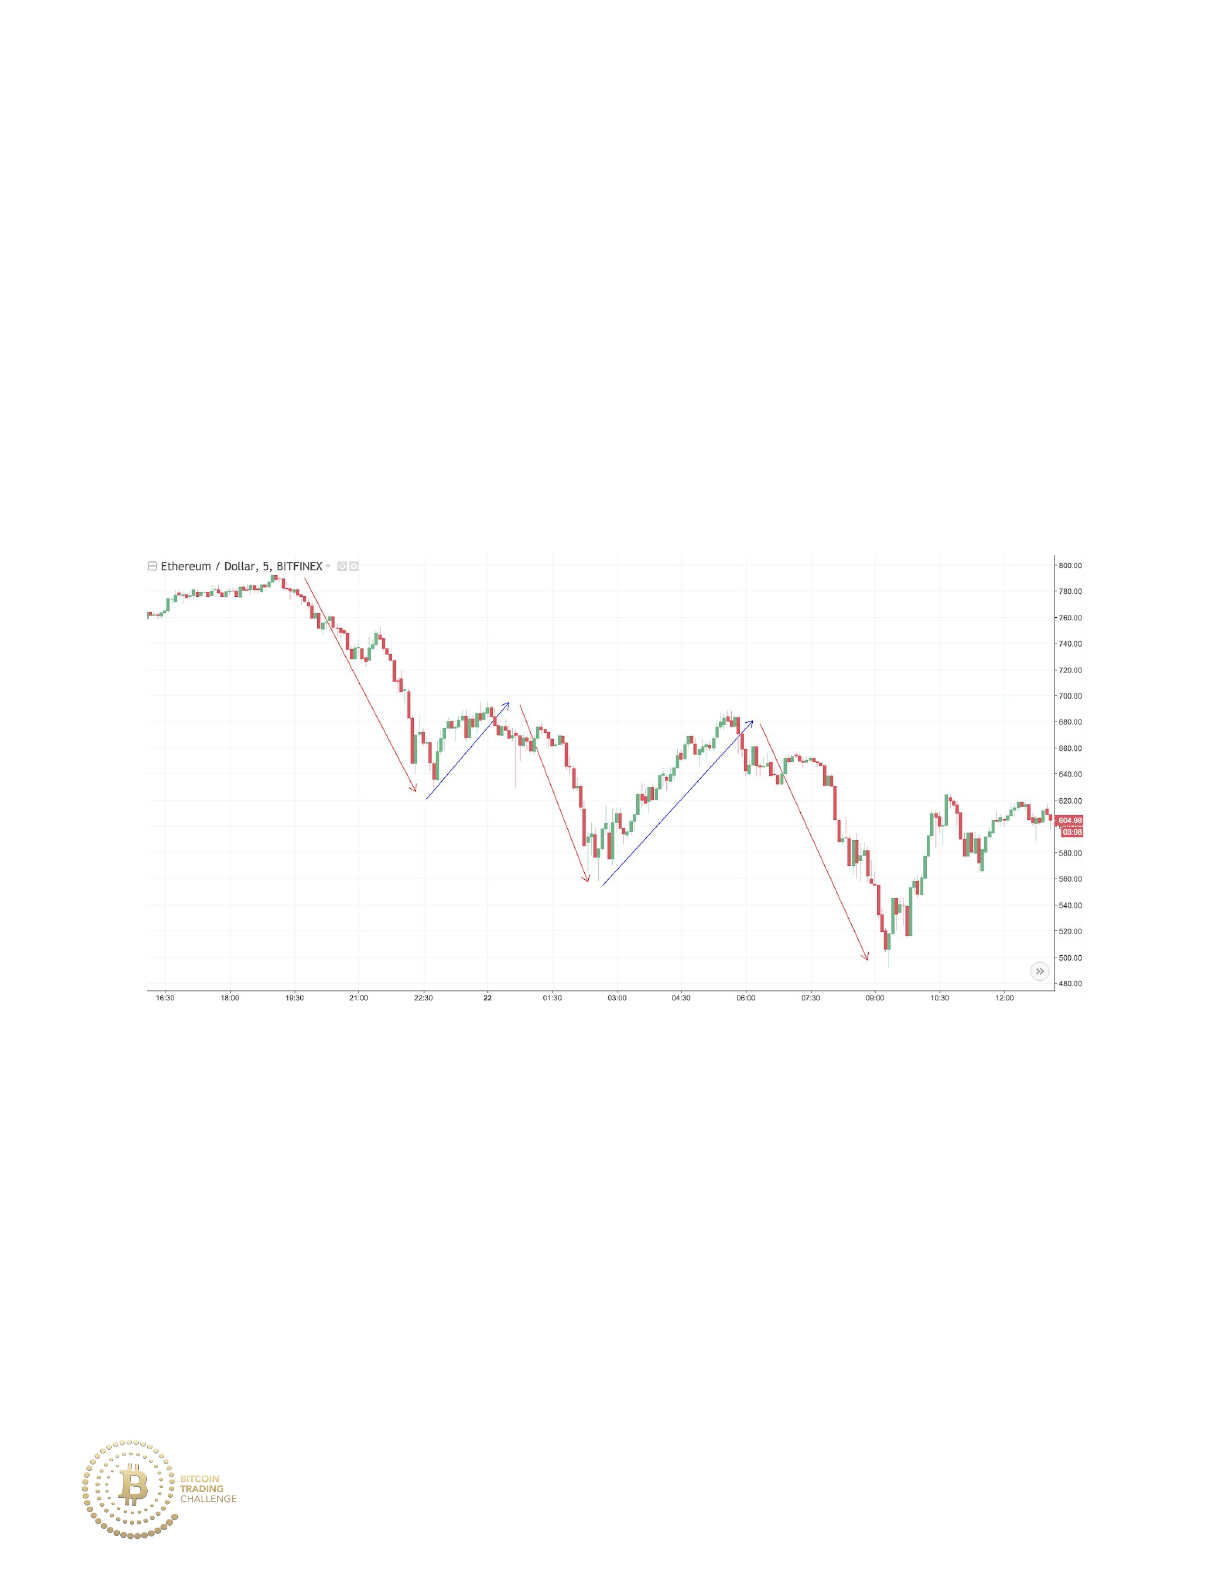
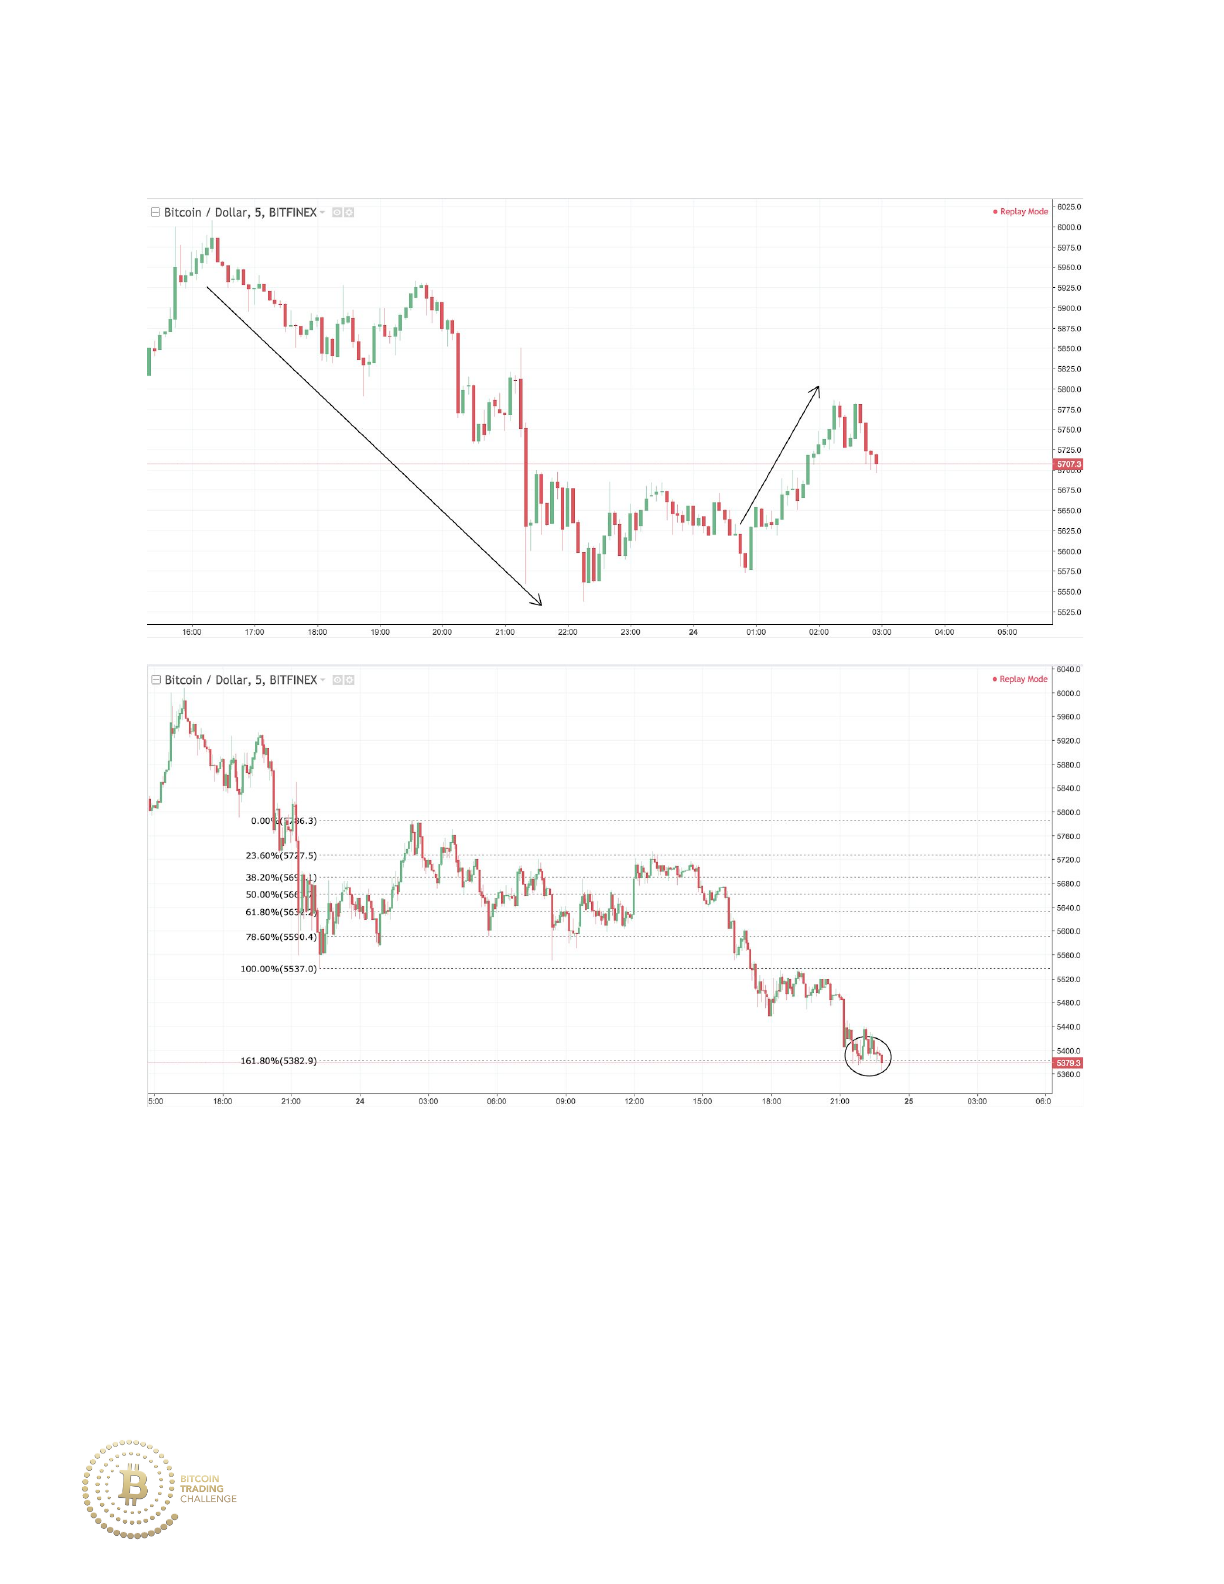
constitutes a minor correction. Here is an example of the market retracing
during a downtrend:
The red arrows signify when the market moves with the overall trend
(downward) and the blue arrows signify when the market retraces (moves
against the overall trend with the market moving upward).
19
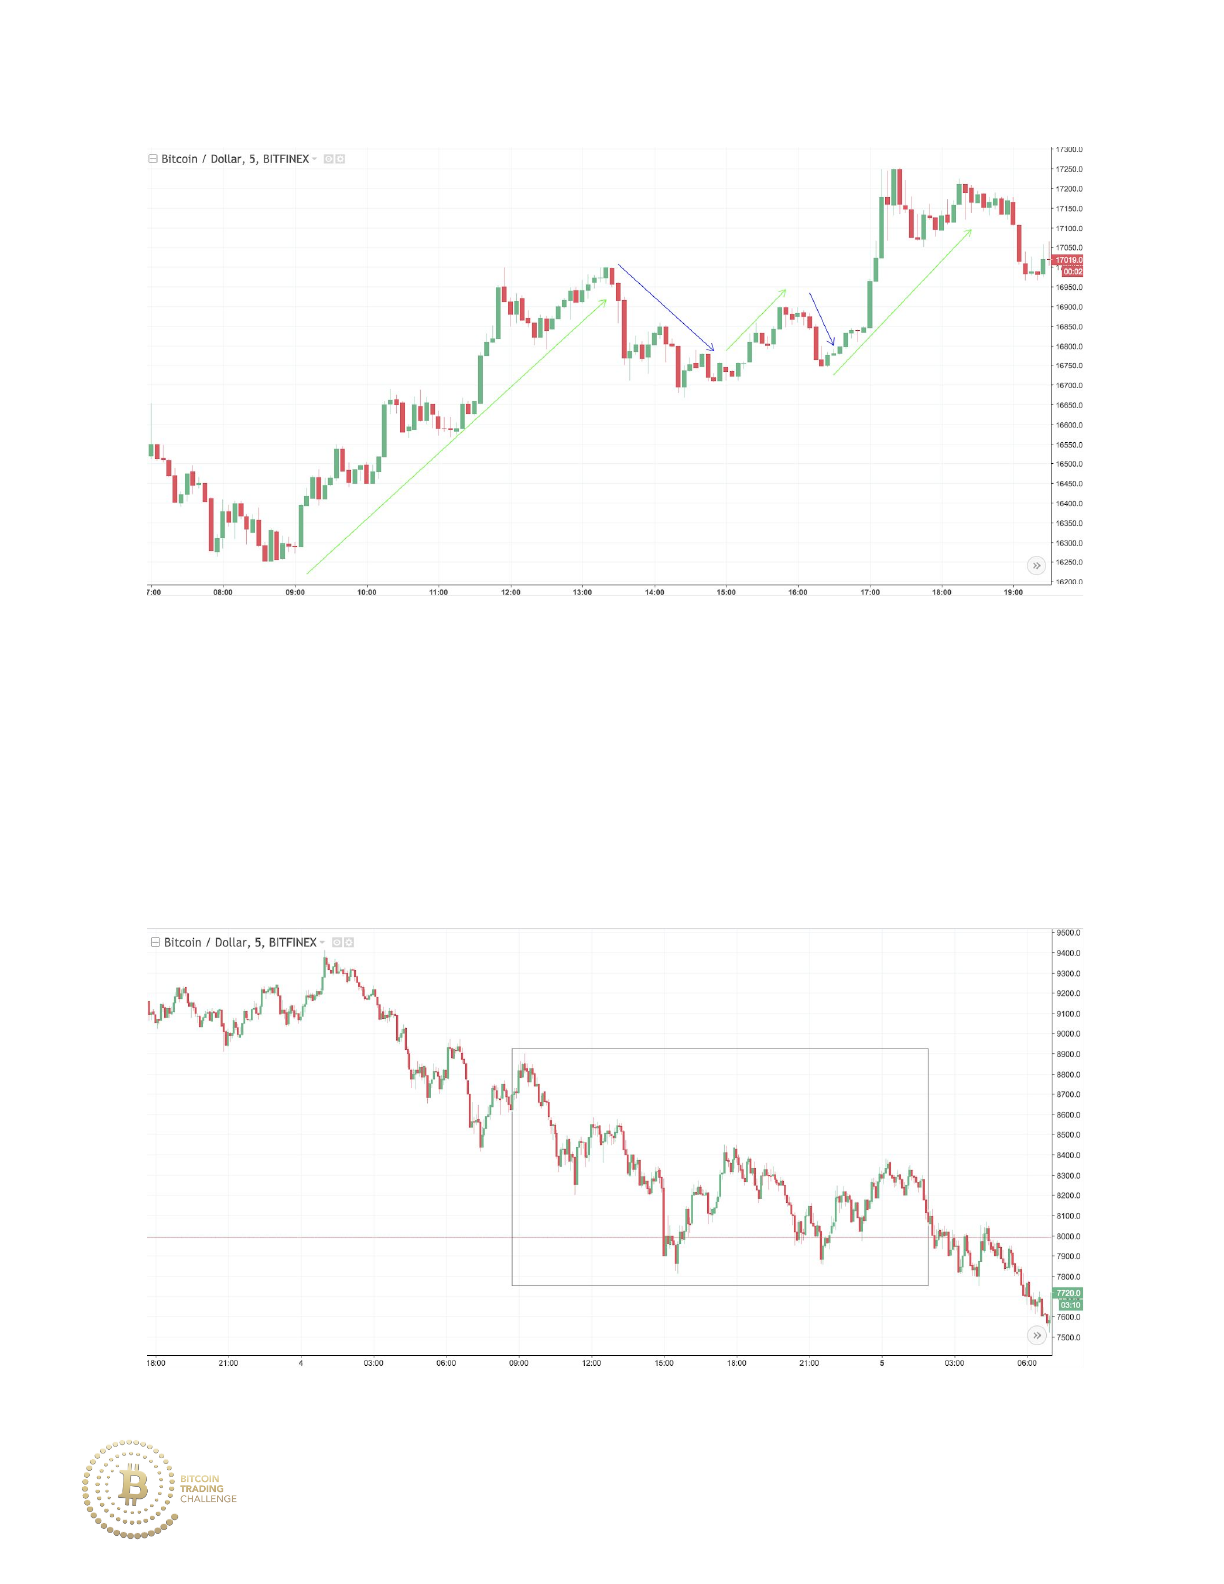
Example above illustrates price in an uptrend. The green arrows signify
when the market moves with the overall trend (upward) and the blue arrows
signify when the market retraces.
Focusing on the boxed area below, this market has many minor market
stages occurring within it, in which the market retraces to the upside.
20
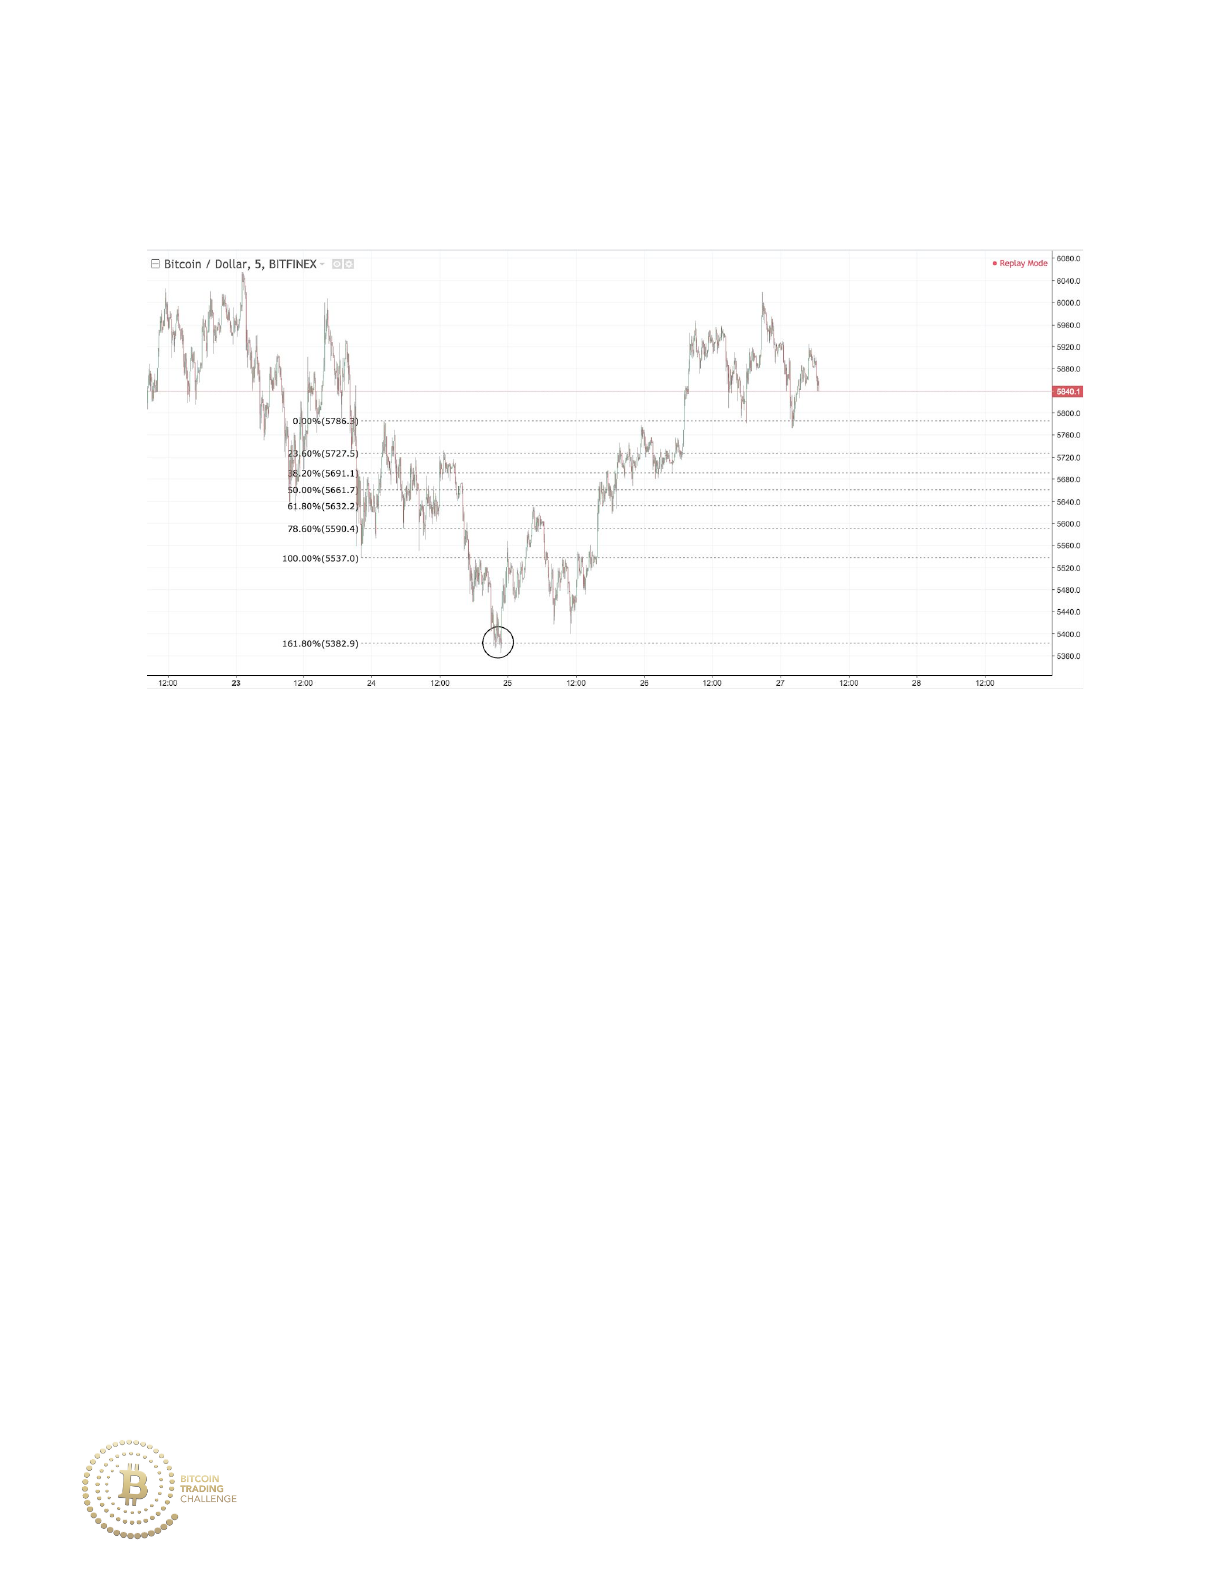
Whereas the following market price looks to comprise a single major
market stage as there is solely minor consolidation and pullback against
the bearish trend.
Drawing Fibonaccis is easier applied to markets that are composed of a
single major market stage. If multiple stages are present, either draw the
Fibonacci endpoints on the most recent major subdivision (for the minor
market stage), or on the overall market stage (for major market stage
values). More on exactly how to do this in Chapter 3.
Drawing Fibonaccis on both minor and major market stages can reveal key
levels of confluence, but may clutter a chart. To declutter a chart, try
attaching different colors to different Fibonacci drawings or simply mark
important levels of confluence and then remove the Fibonacci drawings.
21

D. Market Stage Strength and Weakness
Both uptrending and downtrending market stages can be categorized as a
weak trend, an average trend, or a strong trend. Do not confuse “weak” with
“minor” as these mean different things (a minor trend is a retracement or a
continuation of the larger trend).
These categories can apply to trends in both major and minor market
stages. Knowing the strength of a trend is vital to the placement of orders
when using Fibonacci analysis.
A strong market stage consists of strong momentum and high volume in
the direction of the trend with weak pullback against the underlying trend.
An average market stage consists of middling momentum and volume in
the direction of the trend with mediocre pullback against the underlying
trend.
A weak market stage consists of trend continuation moves on weak
momentum and low volume in the direction of the trend along with many
market moves against the underlying trend.
For example, we would expect that a strong bull market would undergo a
weaker retracement than a retracement of a weak bull market as
consistently high demand will make it harder for price to make a deep
retracement. On the flip side, we would expect that a weak bull market
22
would retrace heavily or potentially reverse as strong demand is not
present and sellers may win the fight to push the price down.
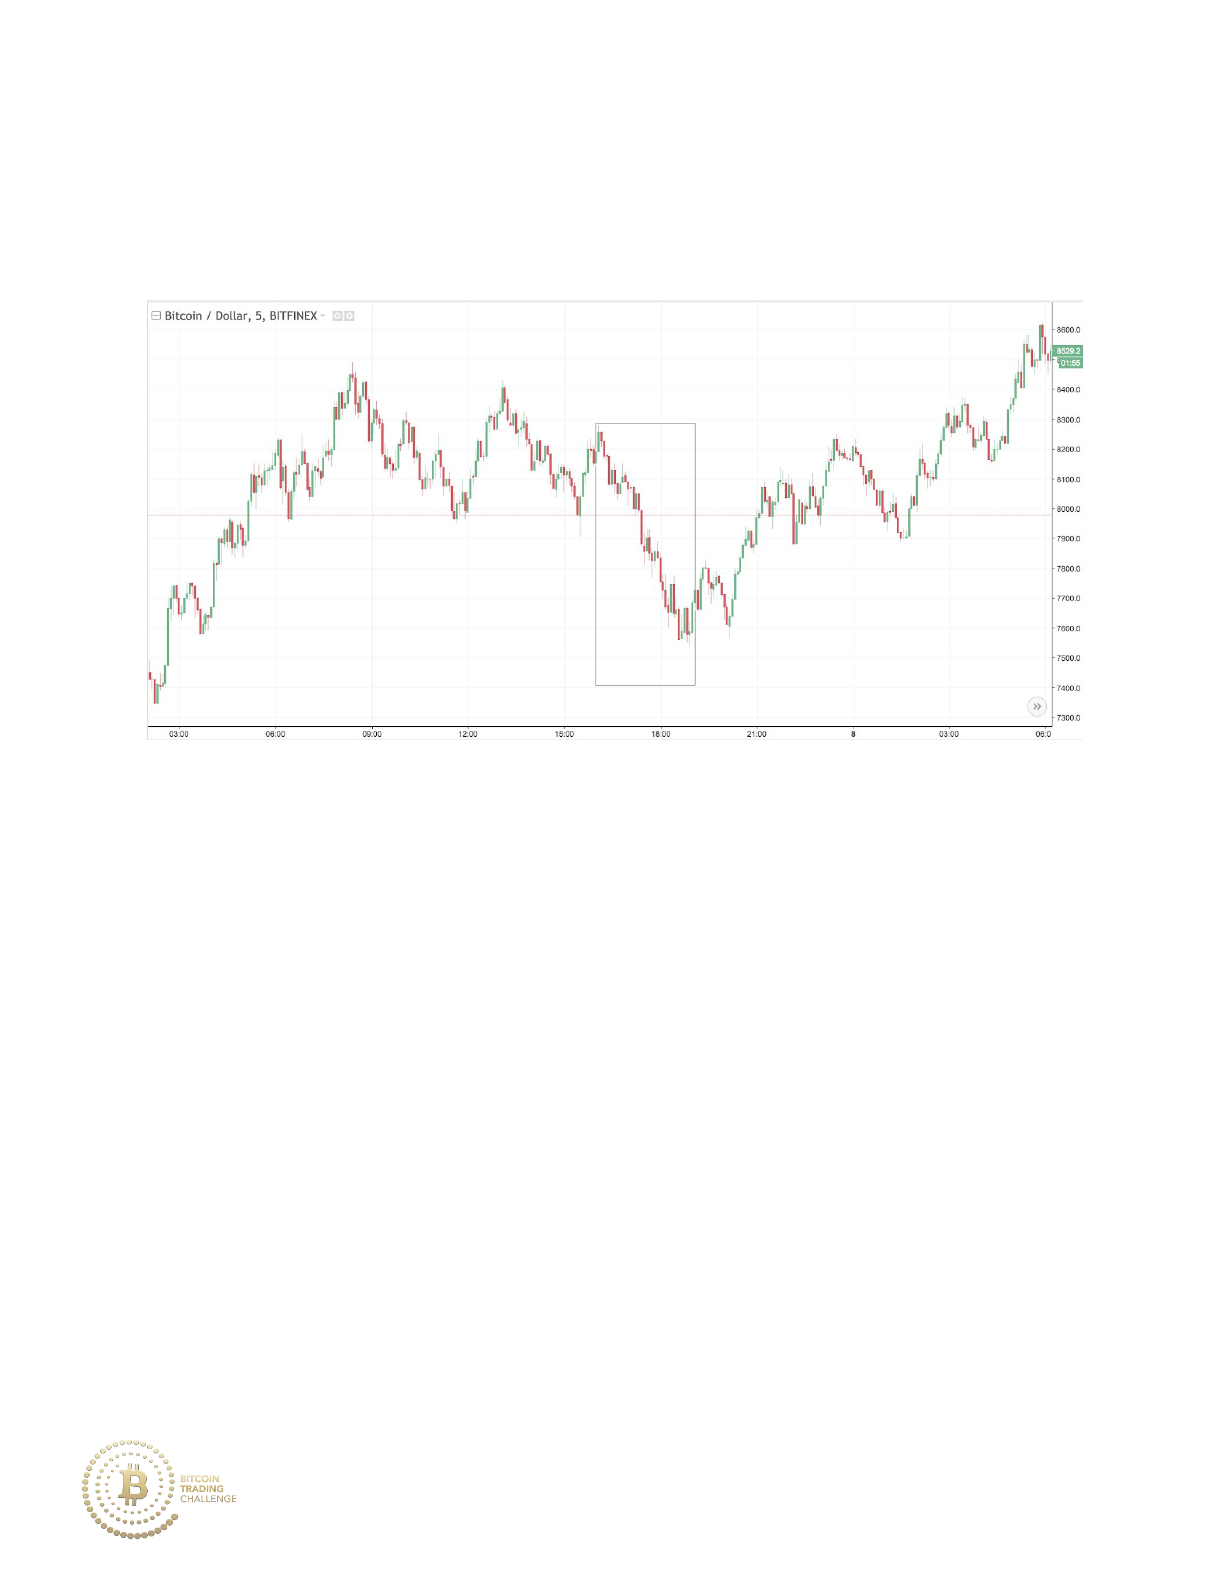
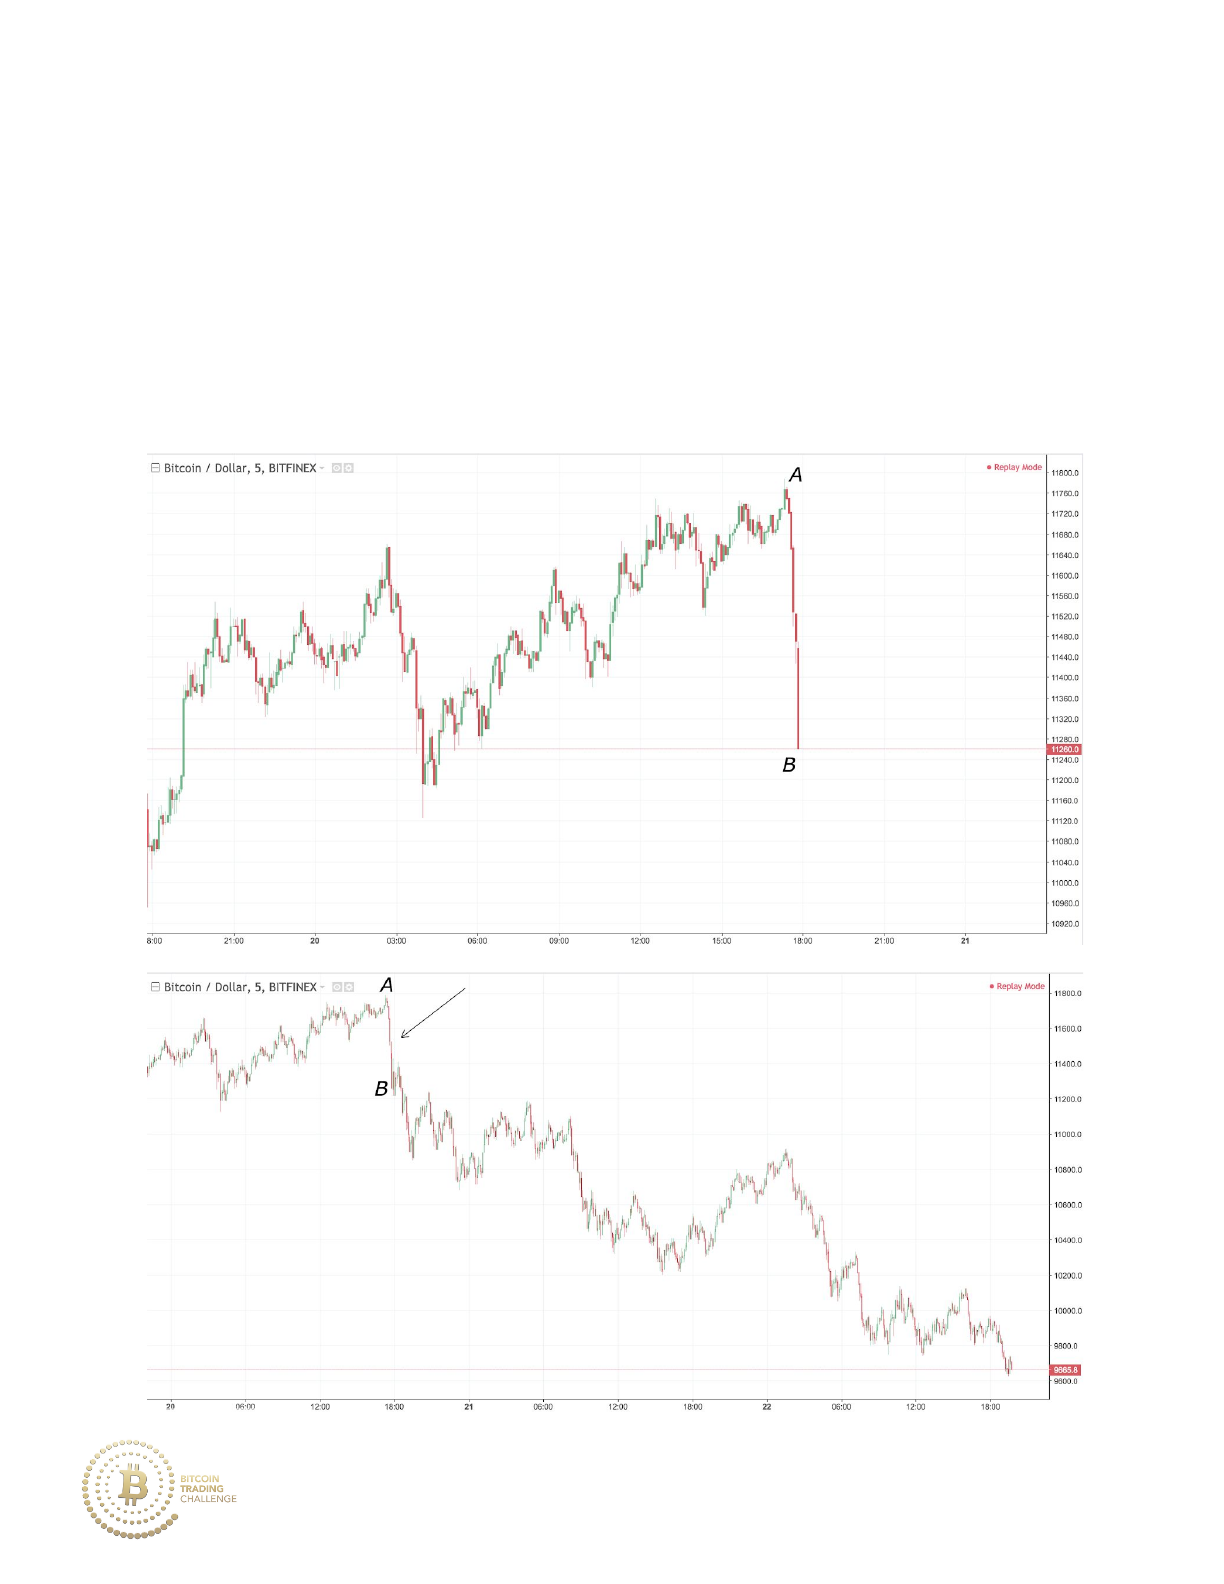
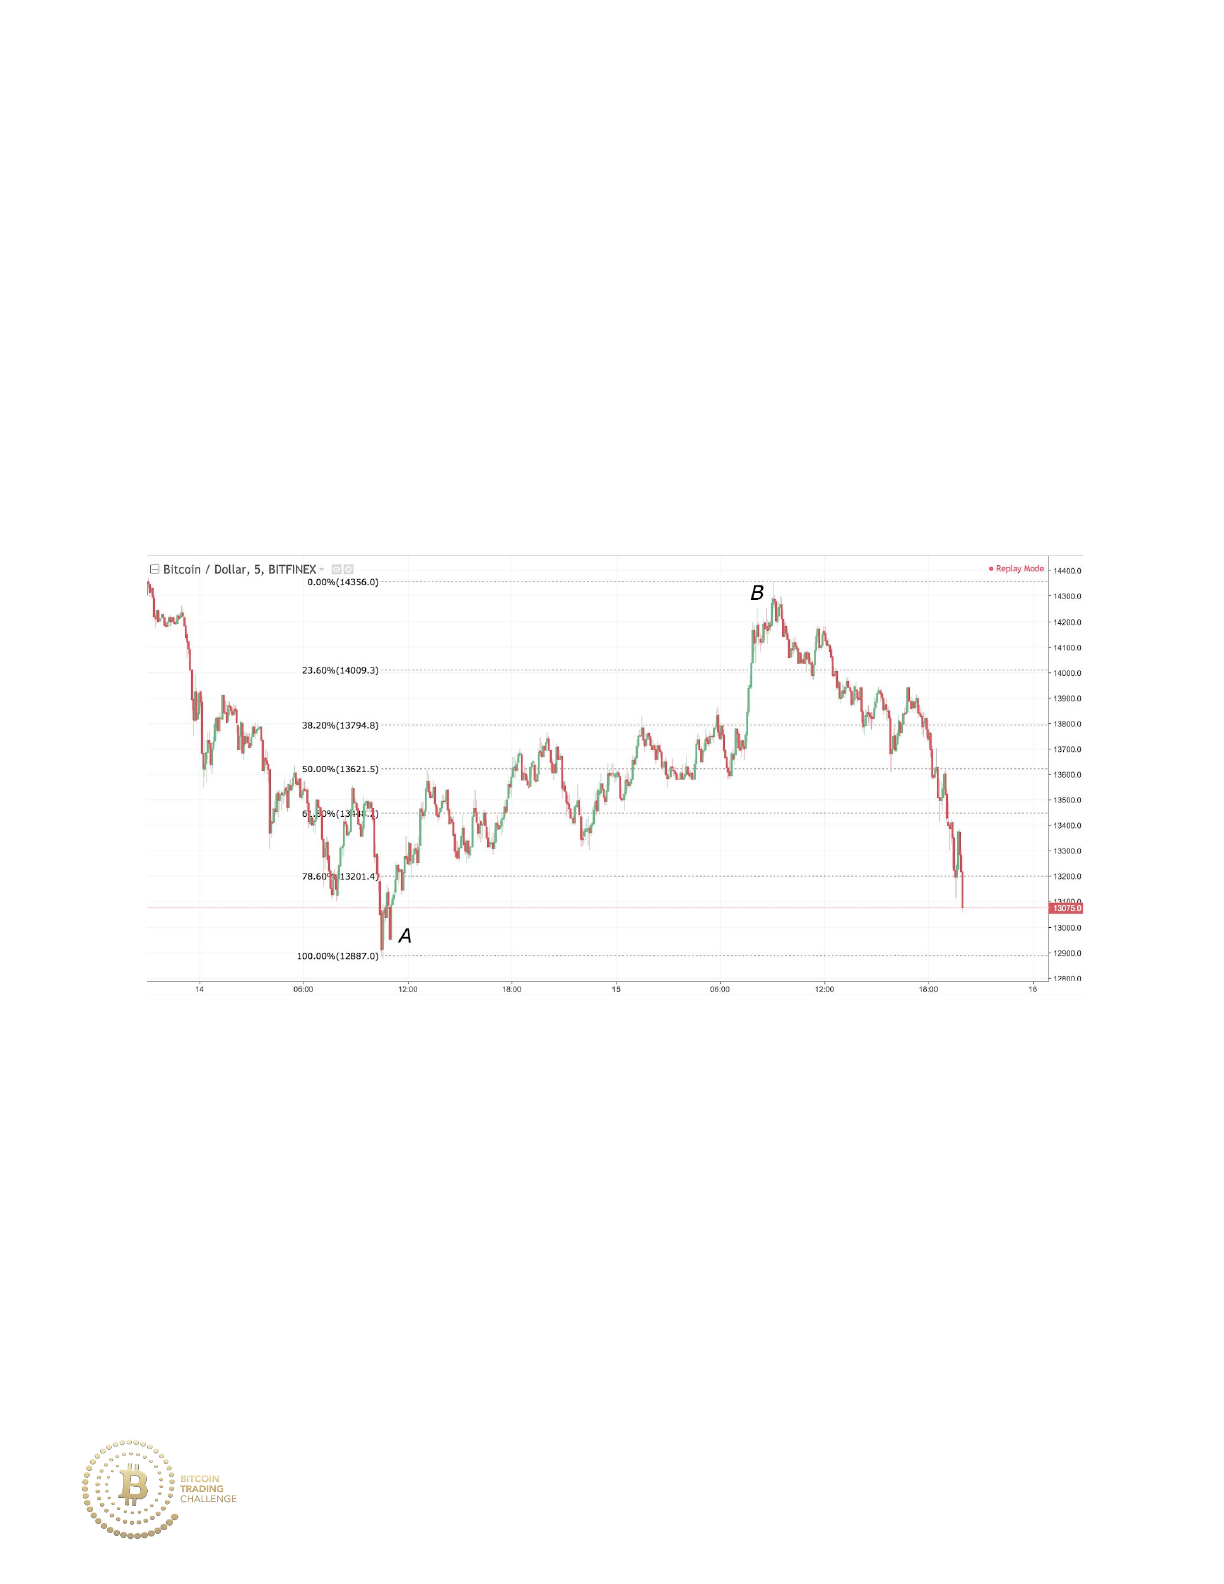
Point A to Point B shows a strong downtrending market with little to no
bullish movement and strong bearish momentum. This instigates the
downtrend.
23
Point A to Point B on the chart below is an example of a downtrend on
middling momentum. Notice the two strong retracements that occur within
the downtrend and the constant fight between the buyers and sellers.
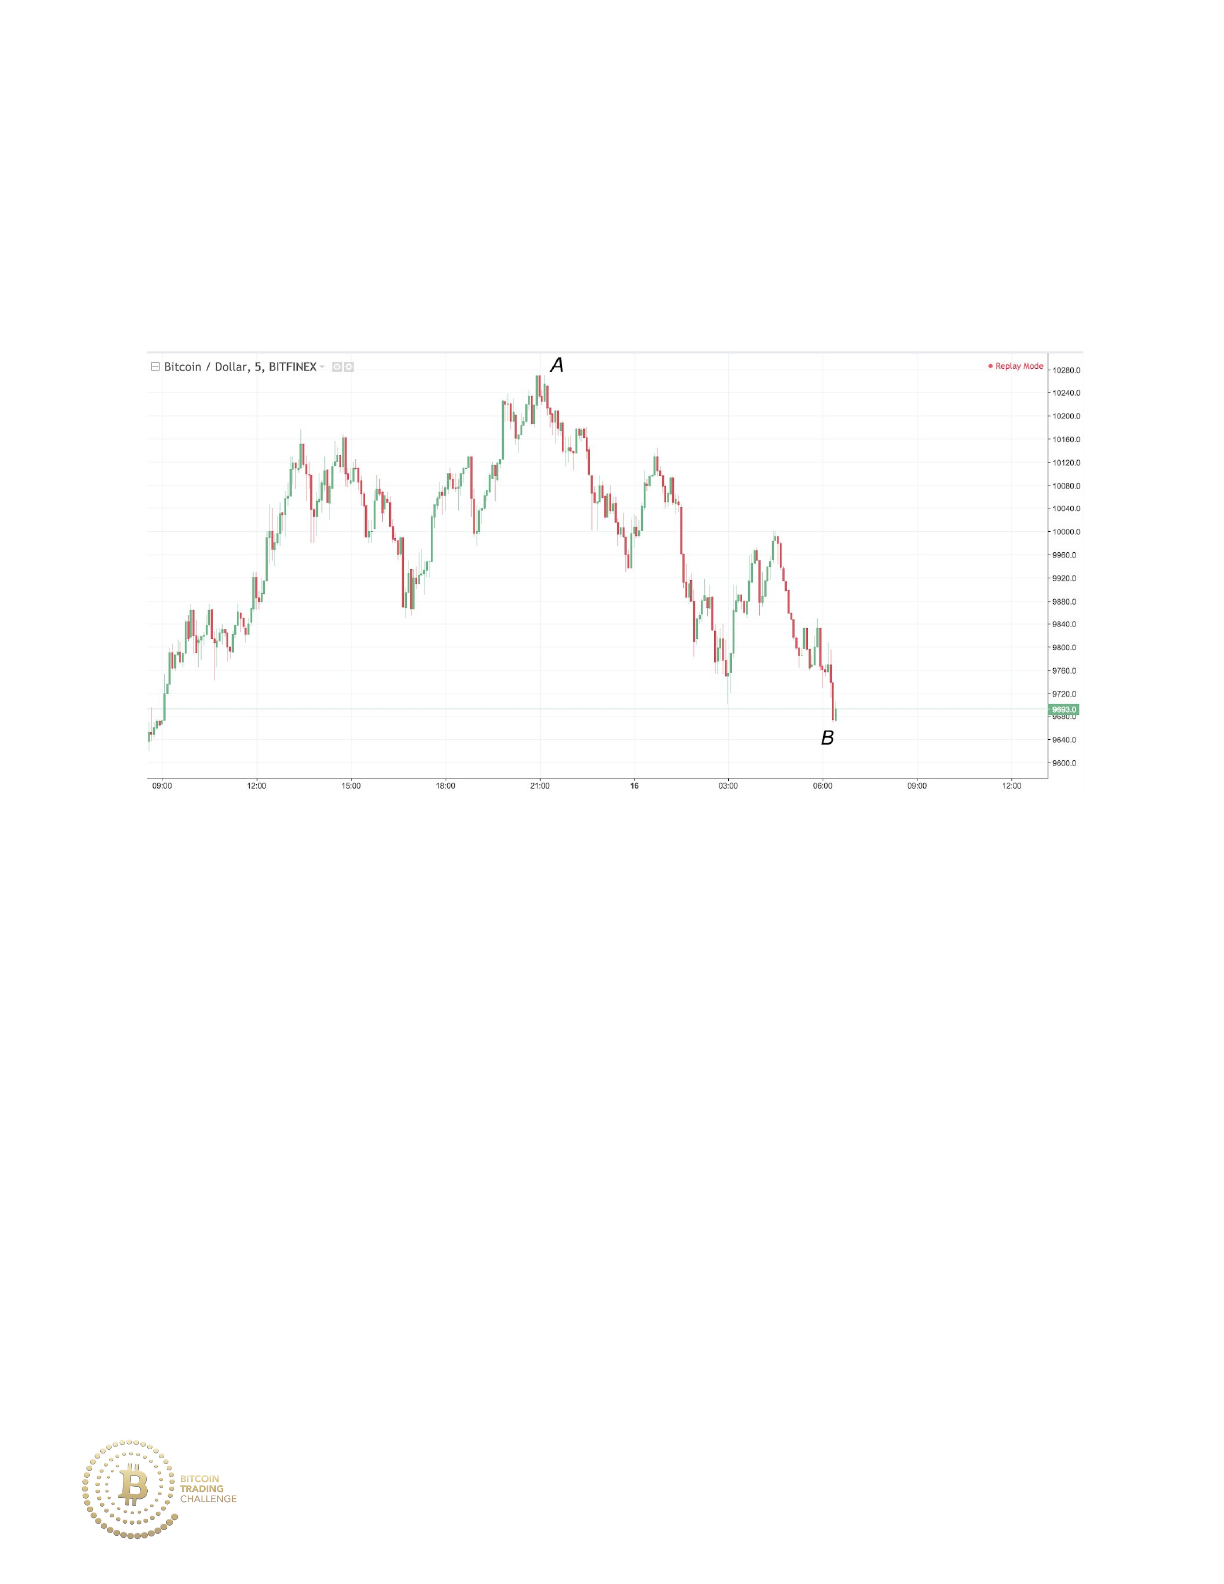
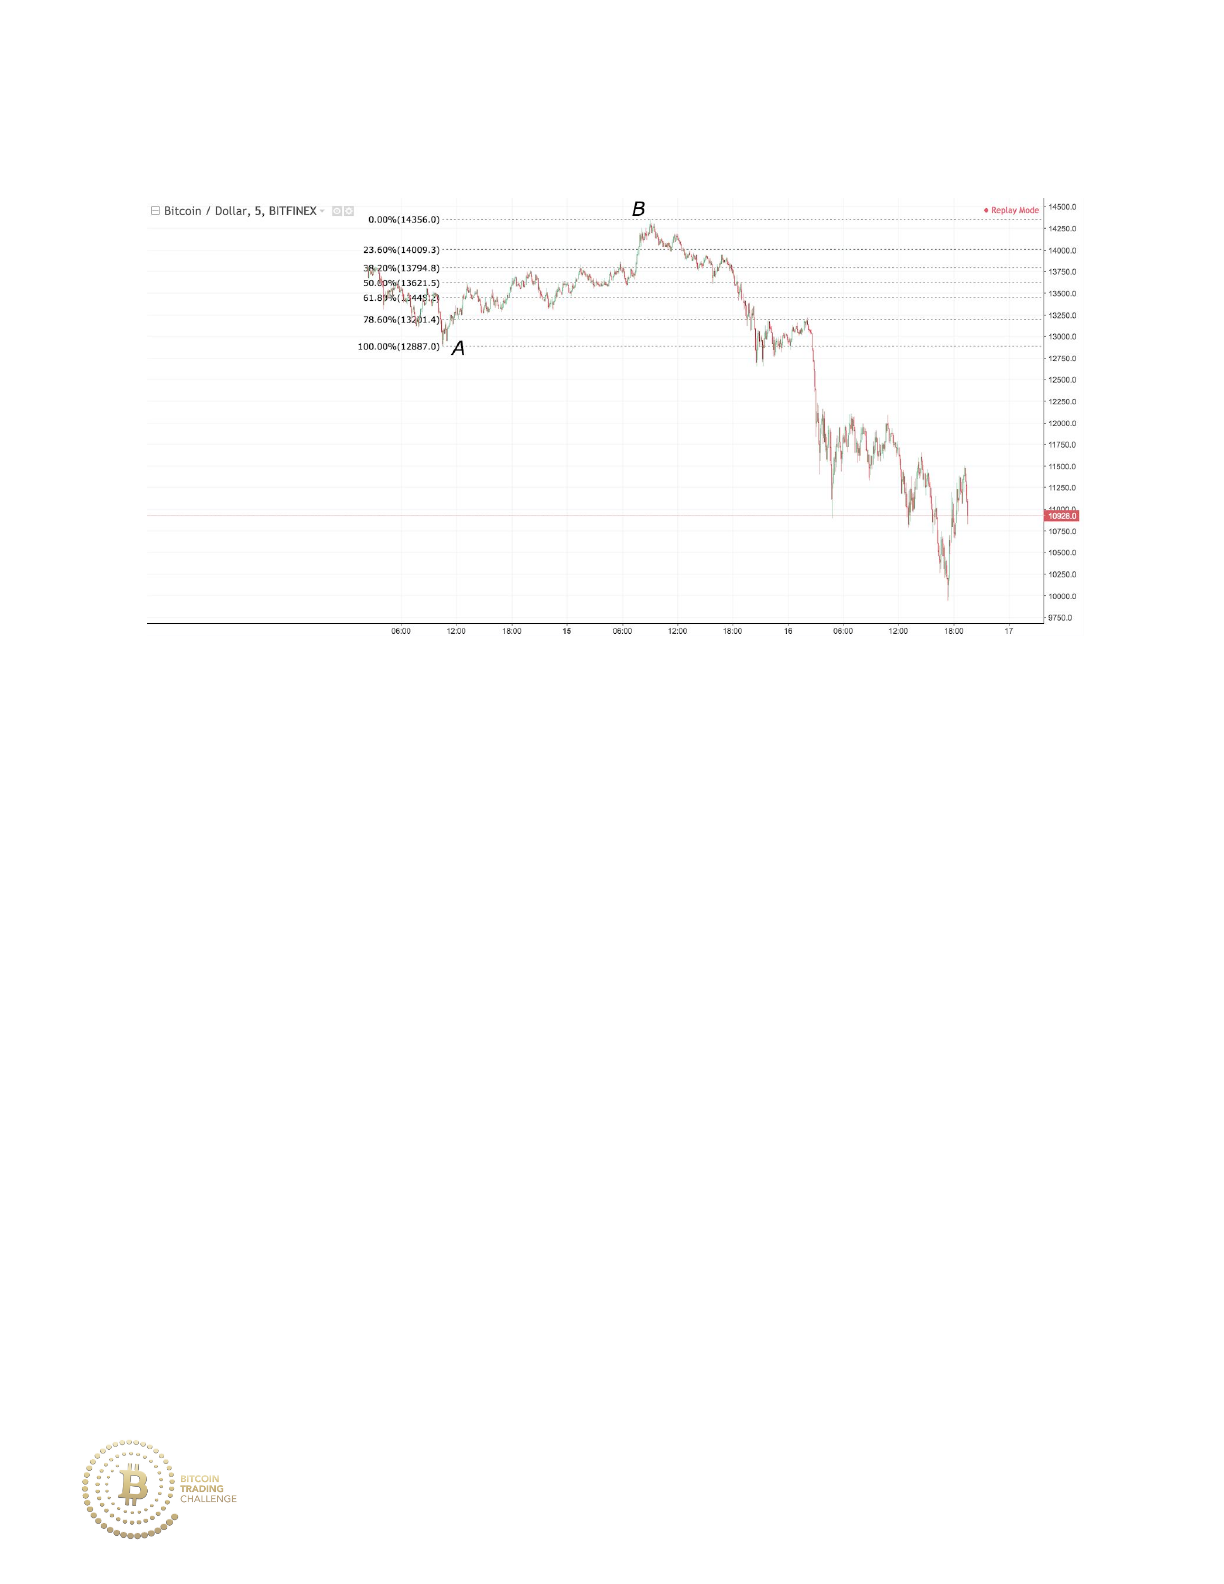
Point A to Point B on the chart below is an example of a weak downtrend.
The sellers struggle to press price lower as price fails to make a deep
retracement after ending at B.
24
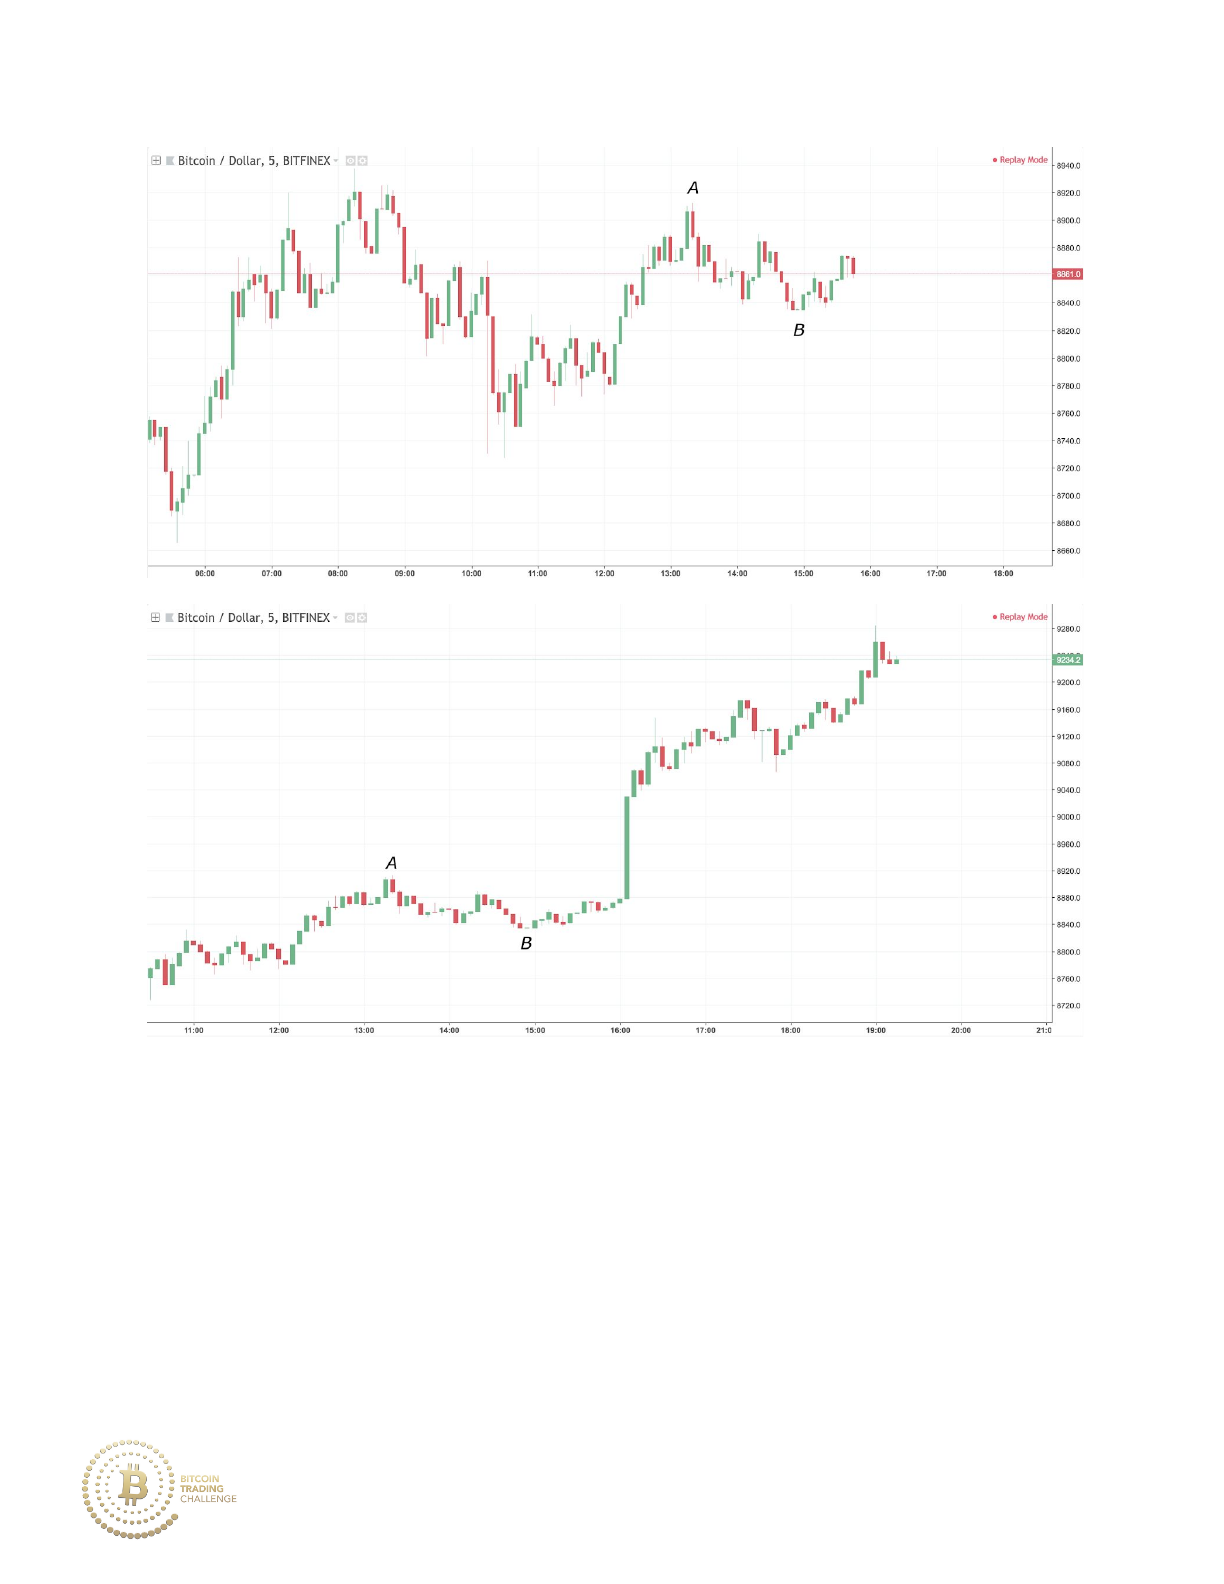
A strong trend consists of strong momentum continuations of the trend
and small and infrequent pullbacks against the trend. A weak trend
consists of low momentum continuations of the trend and frequent
pullbacks against the trend.
25

__________________________________________________________________________
3. Fibonacci Retracements
A. Patterns of Contraction
Like all ever-growing beings within the universe, the market goes through
periods of both contraction and expansion. Fibonacci retracements allow
you to identify the likely levels of contraction from the movements of the
previous trend.
It is important to note that expansion DOES NOT refer to the price of a coin
increasing and contraction DOES NOT refer to the price of a coin
decreasing. Rather, expansion refers to the market’s continuation of a
previous trend, while contraction refers to the market moving against the
underlying trend.
Quick question: Which price trend will retrace the most in price quantity
(not percentage-wise)?
Practice 3-1
A. When price increases from 1000 to 1200
B. When price increases from 1000 to 1600
C. When price increases from 1000 to 2000
26

Practice 3-1 Answer
A. Price increases from 1000 to 1200
B. Price increases from 1000 to 1600
C. Price increases from 1000 to 2000
The greater the rise, the swifter the fall. The trend that increased the most
in magnitude will have the heaviest price retracement, all else equal. That is
not to say that the percent of contraction will be higher for option C (the
percentage retracement hypothetically would be the same), but that in
option C, the market doubled. This made the retracement in price much
larger in actual price change.
However, the exact nature of the market’s rise dictates the extent to how
much it will likely contract. If price increases from 1000 to 2000, as in the
example above, with price seeing little resistance on its rise, than the
contraction of the uptrend will likely be weaker than if price struggled to
increase from 1000 to 2000.
B. The 61.8% Retracement
The most important Fibonacci retracement level is 61.8%. This ratio is the
most common level of market contraction. Recall that this level is derived
from the ratio between two adjacent numbers within the Fibonacci
27
sequence (ie. 144/233). Now that our training wheels are off, let’s analyze
our first Fibonacci chart:
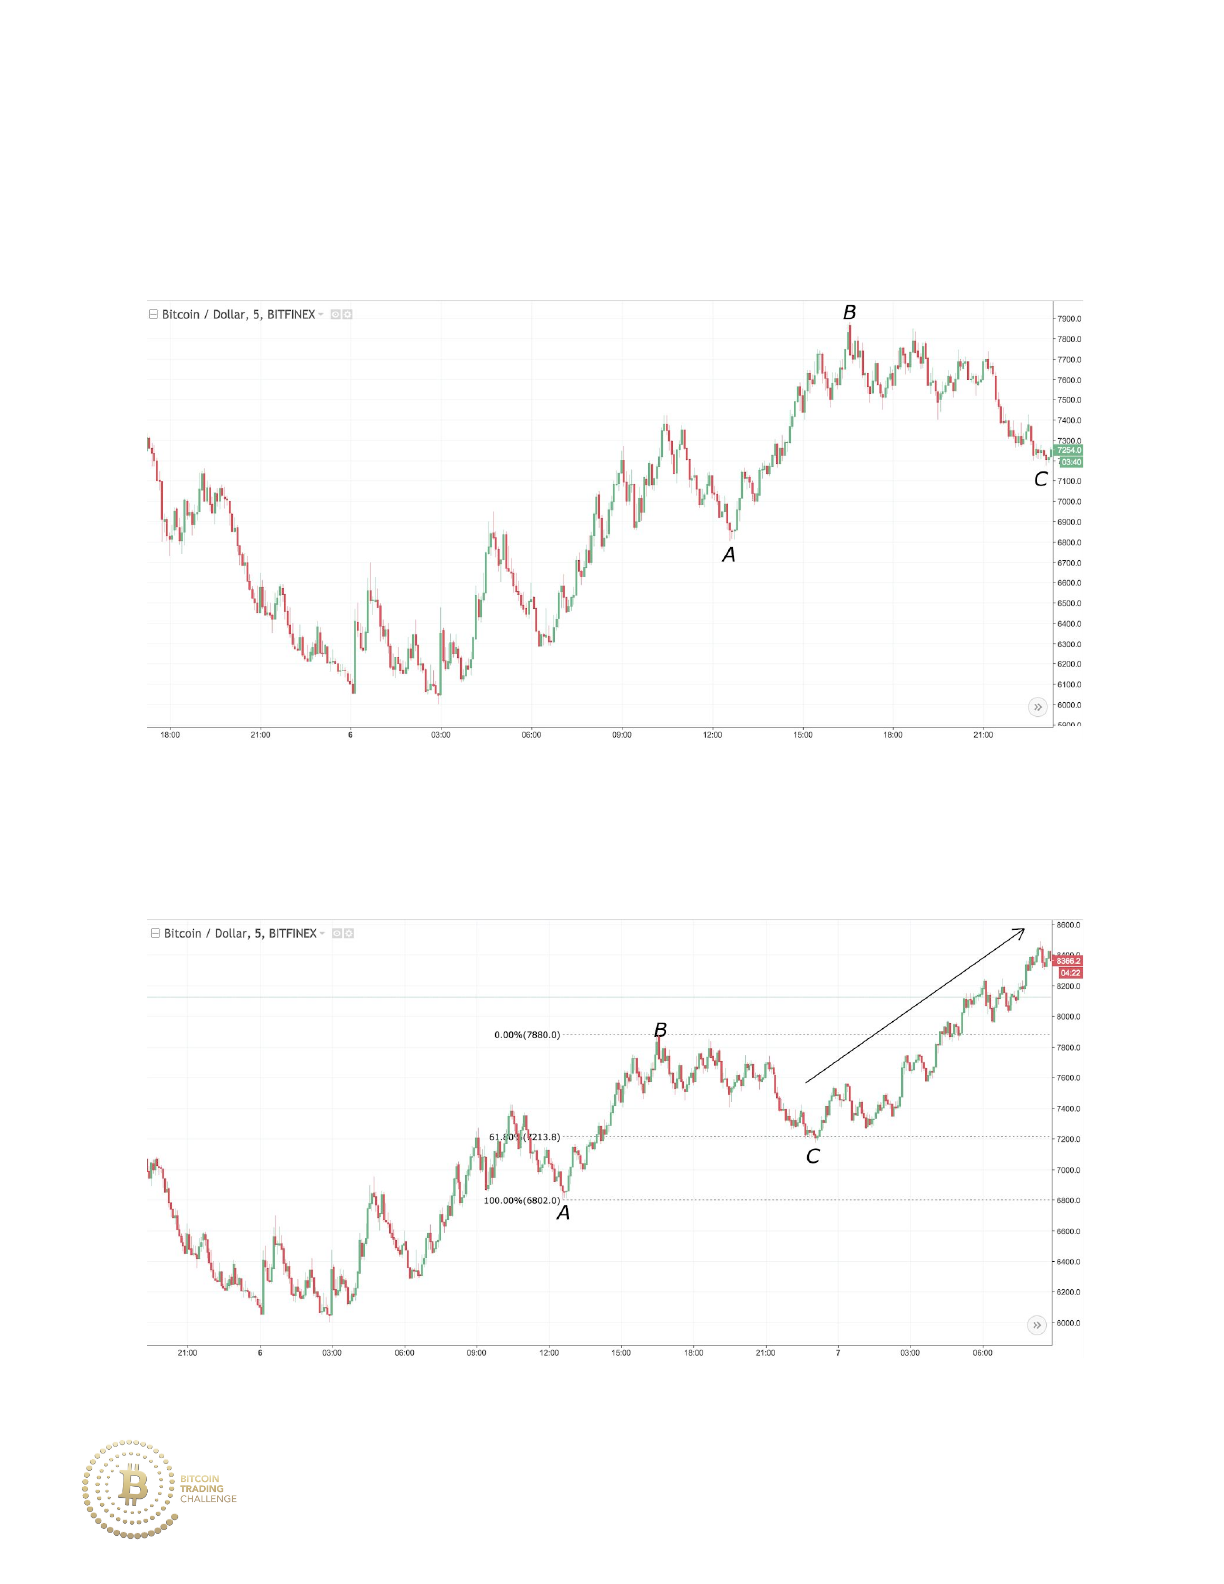
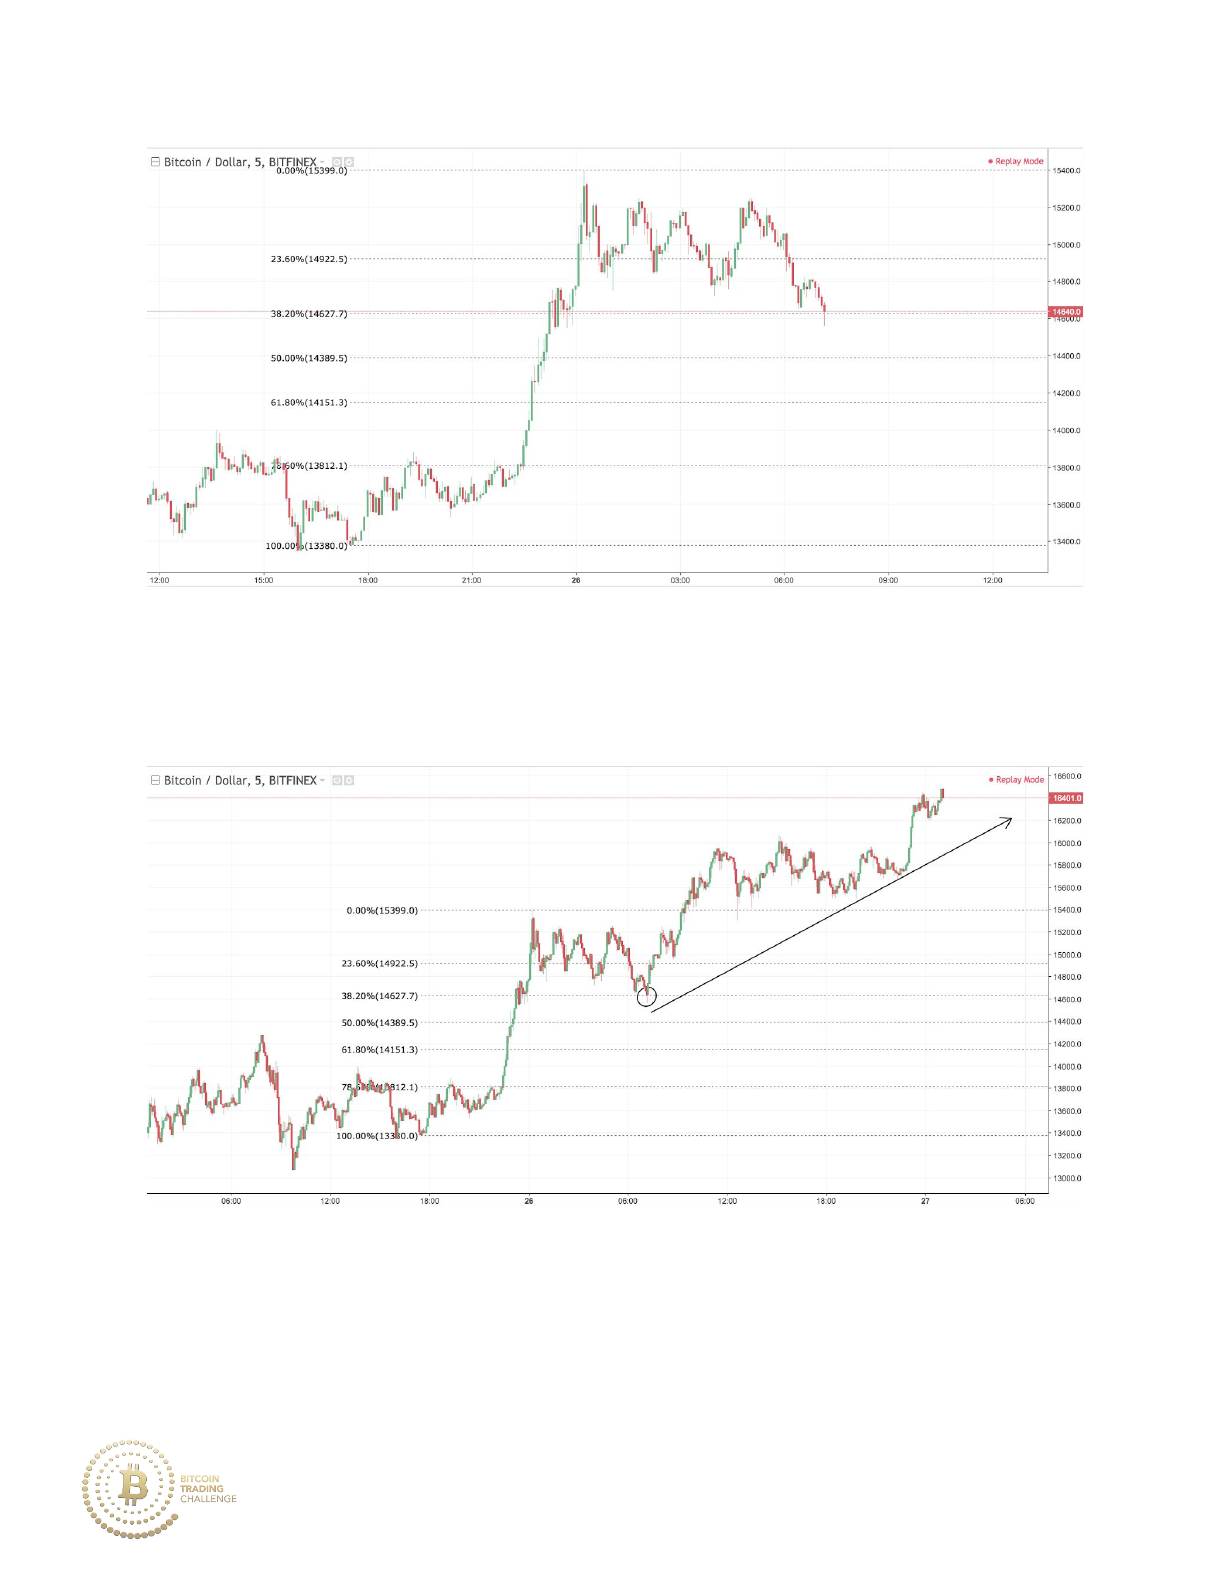
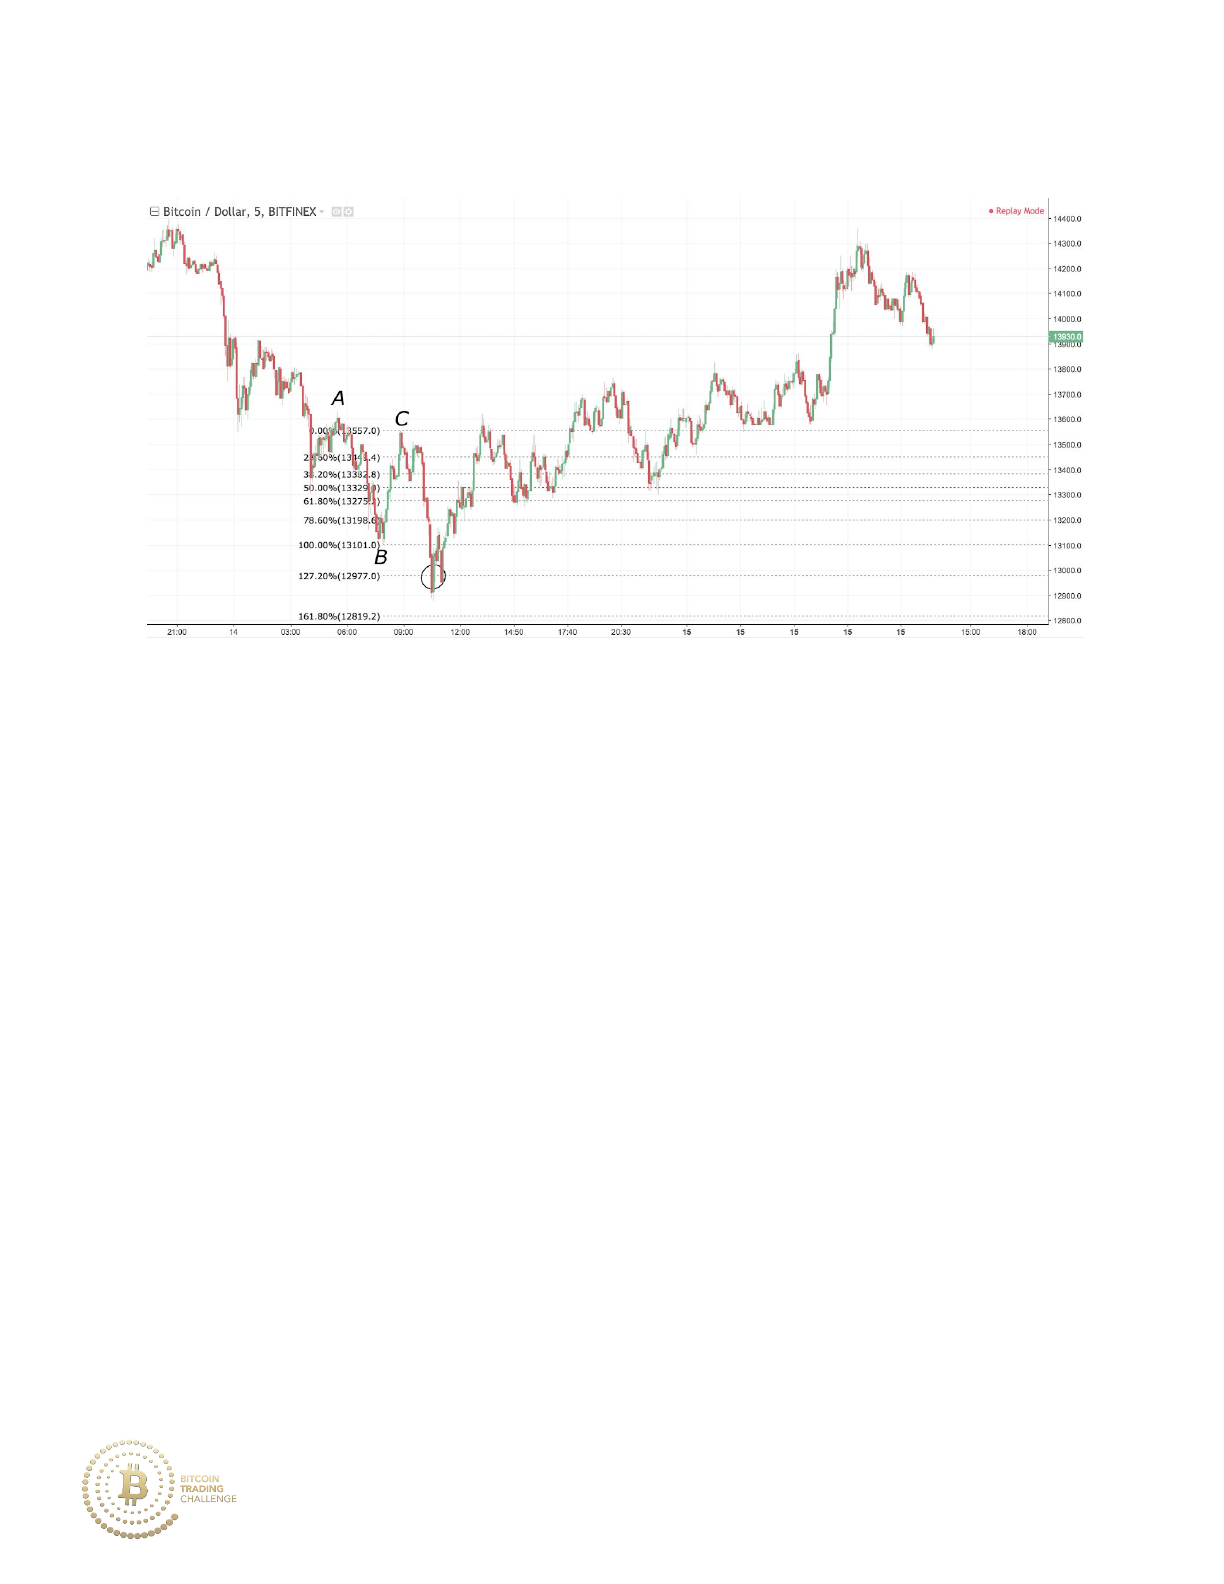
It may be hard to spot at first, but there is a certain ratio to the price move
from Point A to Point B in relation to Point C.
28
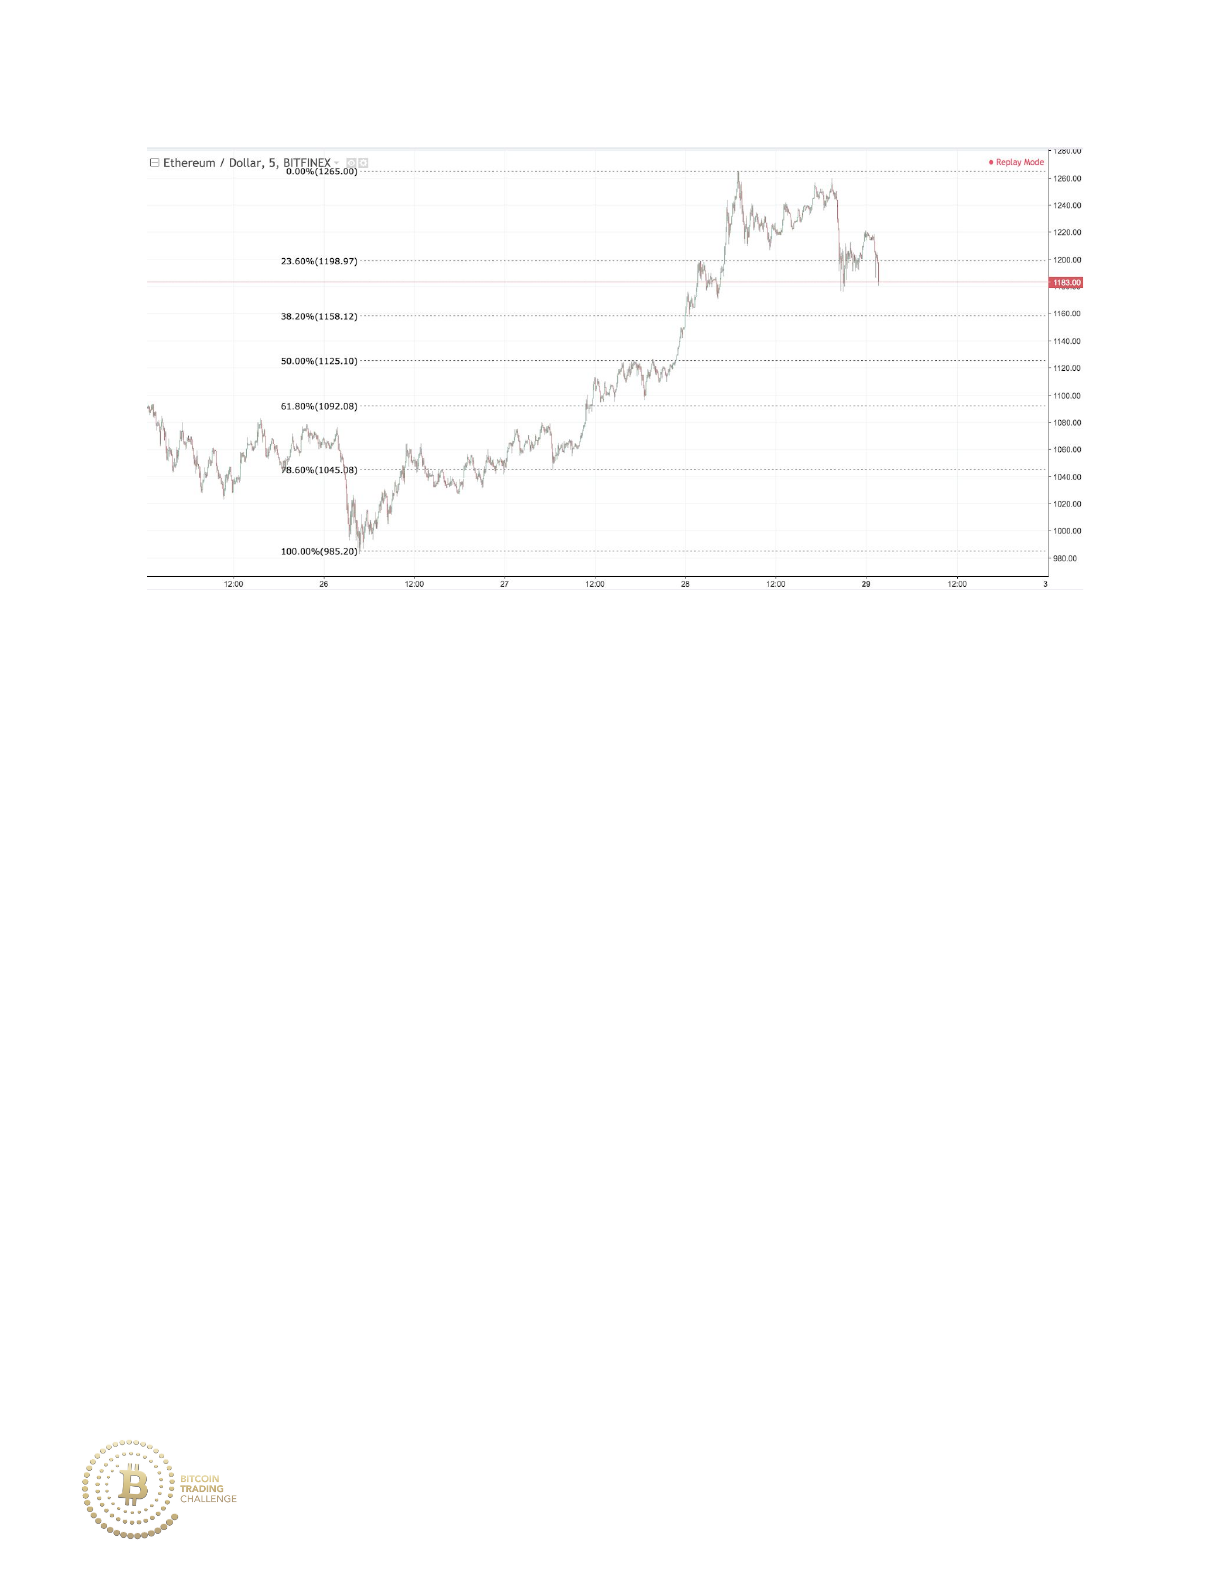
Point C is located at the 61.8% retracement of the price move from Point A
to Point B. To draw this Fibonacci retracement, I isolated the market move
that began at 6802 and ended at 7880, as those two points made up the
extreme low and extreme high respectively of the market stage.
Here is an example of the market in a downtrend:
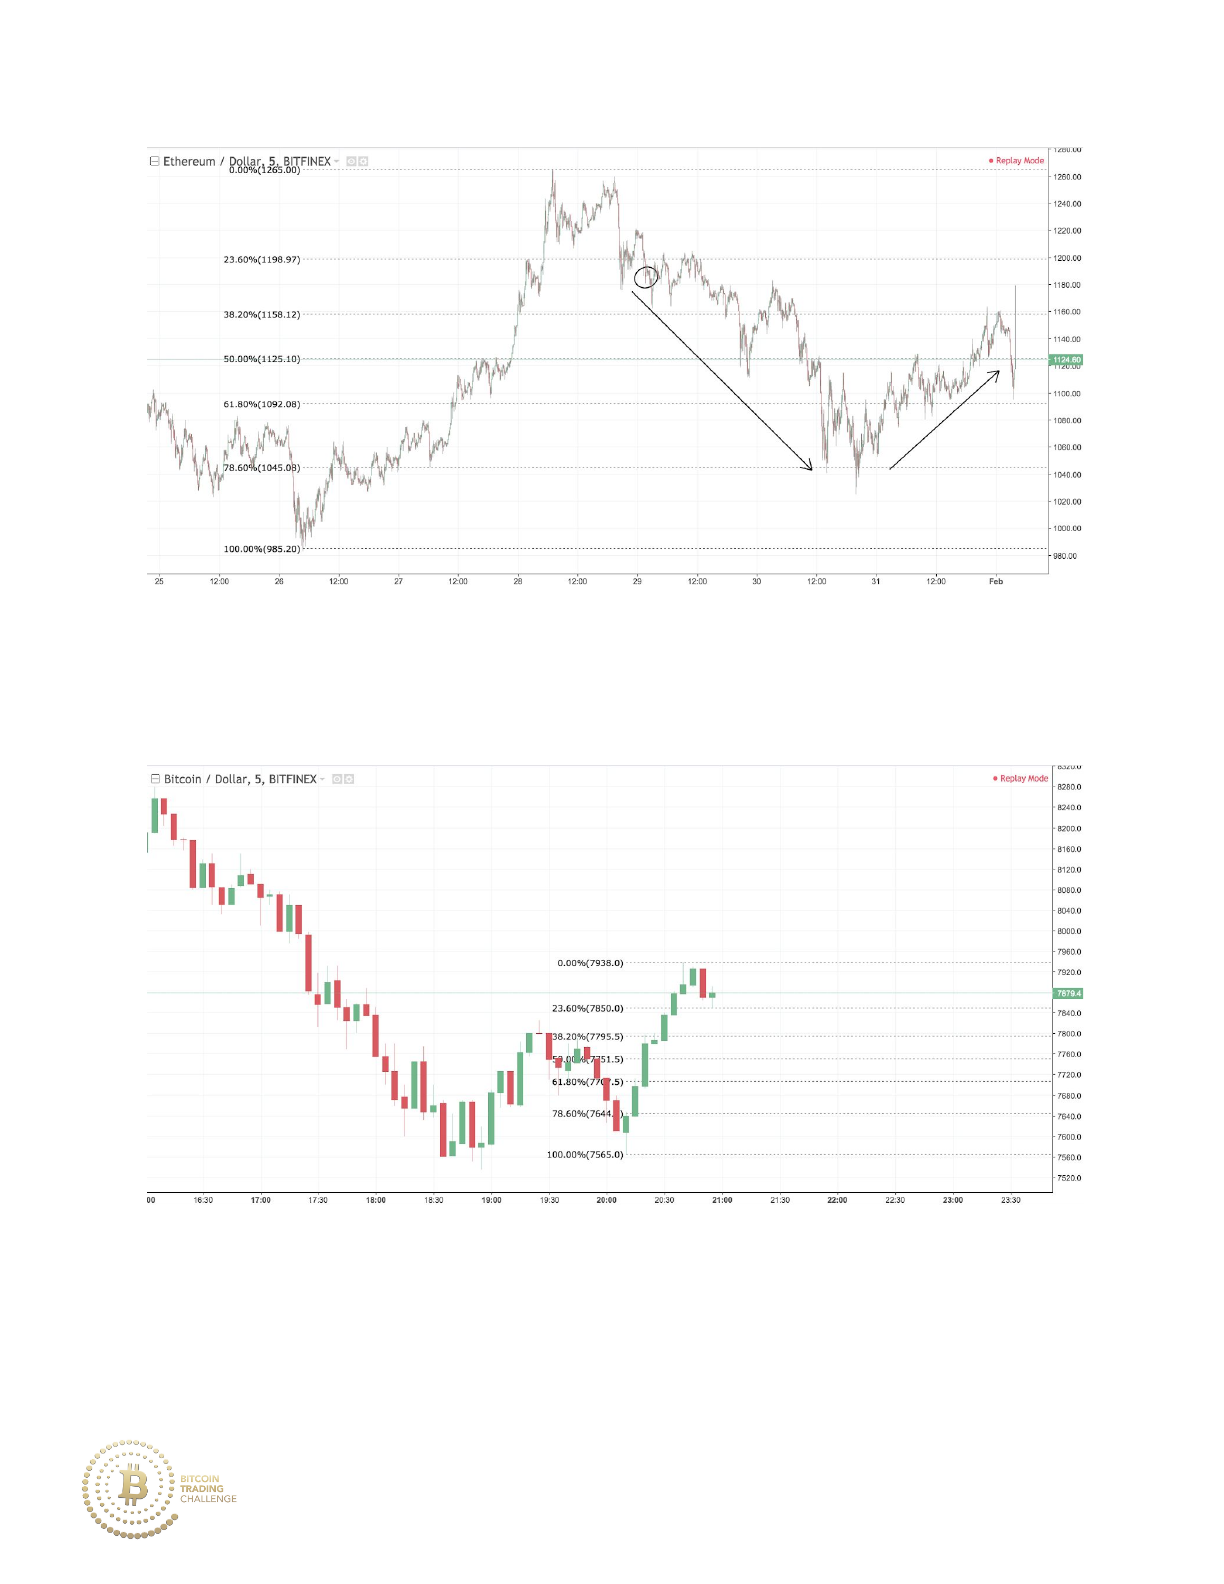
Now let’s draw the Fibonacci from the high located at Point A to the low
located at Point B. This represents the major market stage of a downtrend.
29
This is what a price retracement in a downtrend would look like, with price
heading to the 61.8% at Point C.
The 61.8% Fibonacci retracement has many uses when analyzing market
retracements, including but not limited to:
1. Most likely retracement area. The 61.8% to 78.6% price zone of a trend
is the most likely area of reversal and a great entry trade area, this area
is known as the strong retracement zone.
2. Momentum zone. When the previous trend is not moving on strong
momentum, it is the 61.8% that will likely become support/resistance
(strong momentum trends typically retrace to the 38.2% retracement
zone).
3. Initial pullback. A strong price rejection of the 61.8% Fibonacci
retracement level (single tail touching the level or V-Shaped reversal)
reveals the strength of the underlying trend and the weakness of the
contracting move, typically leading to a trend continuation.
30
C. The Other Retracement Levels
Beyond the 61.8%, there are four other notable Fibonacci retracement
levels. These include the 23.6%, the 38.2%, the 50% and the 78.6%. Imagine
these Fibonacci retracement levels as tools in a toolbelt, with each
retracement level fitting a different purpose and allowing for different
methods to trade.
The Fibonacci retracement levels also work well together when Fibonaccis
are drawn on different market stages and multiple levels overlap. More on
this in Chapter 5.
31

The Fibonacci level of 23.6% comes from dividing a number in the
sequence by the number that is located three numbers in front of it (e.g.
34/144).
The Fibonacci level of 38.2% comes from dividing a number in the
sequence by the number that is located two numbers in front of it (e.g.
34/89). The ratio of 38.2% also comes from (or 1 - 0.618 = 0.382.).6182
The Fibonacci level of 50% is not a level by calculation in relation to the
Fibonacci sequence, however, it is included in the Fibonacci retracement
list due to an asset’s tendency to retrace by a half.
The Fibonacci level of 78.6% is derived from .
√.618
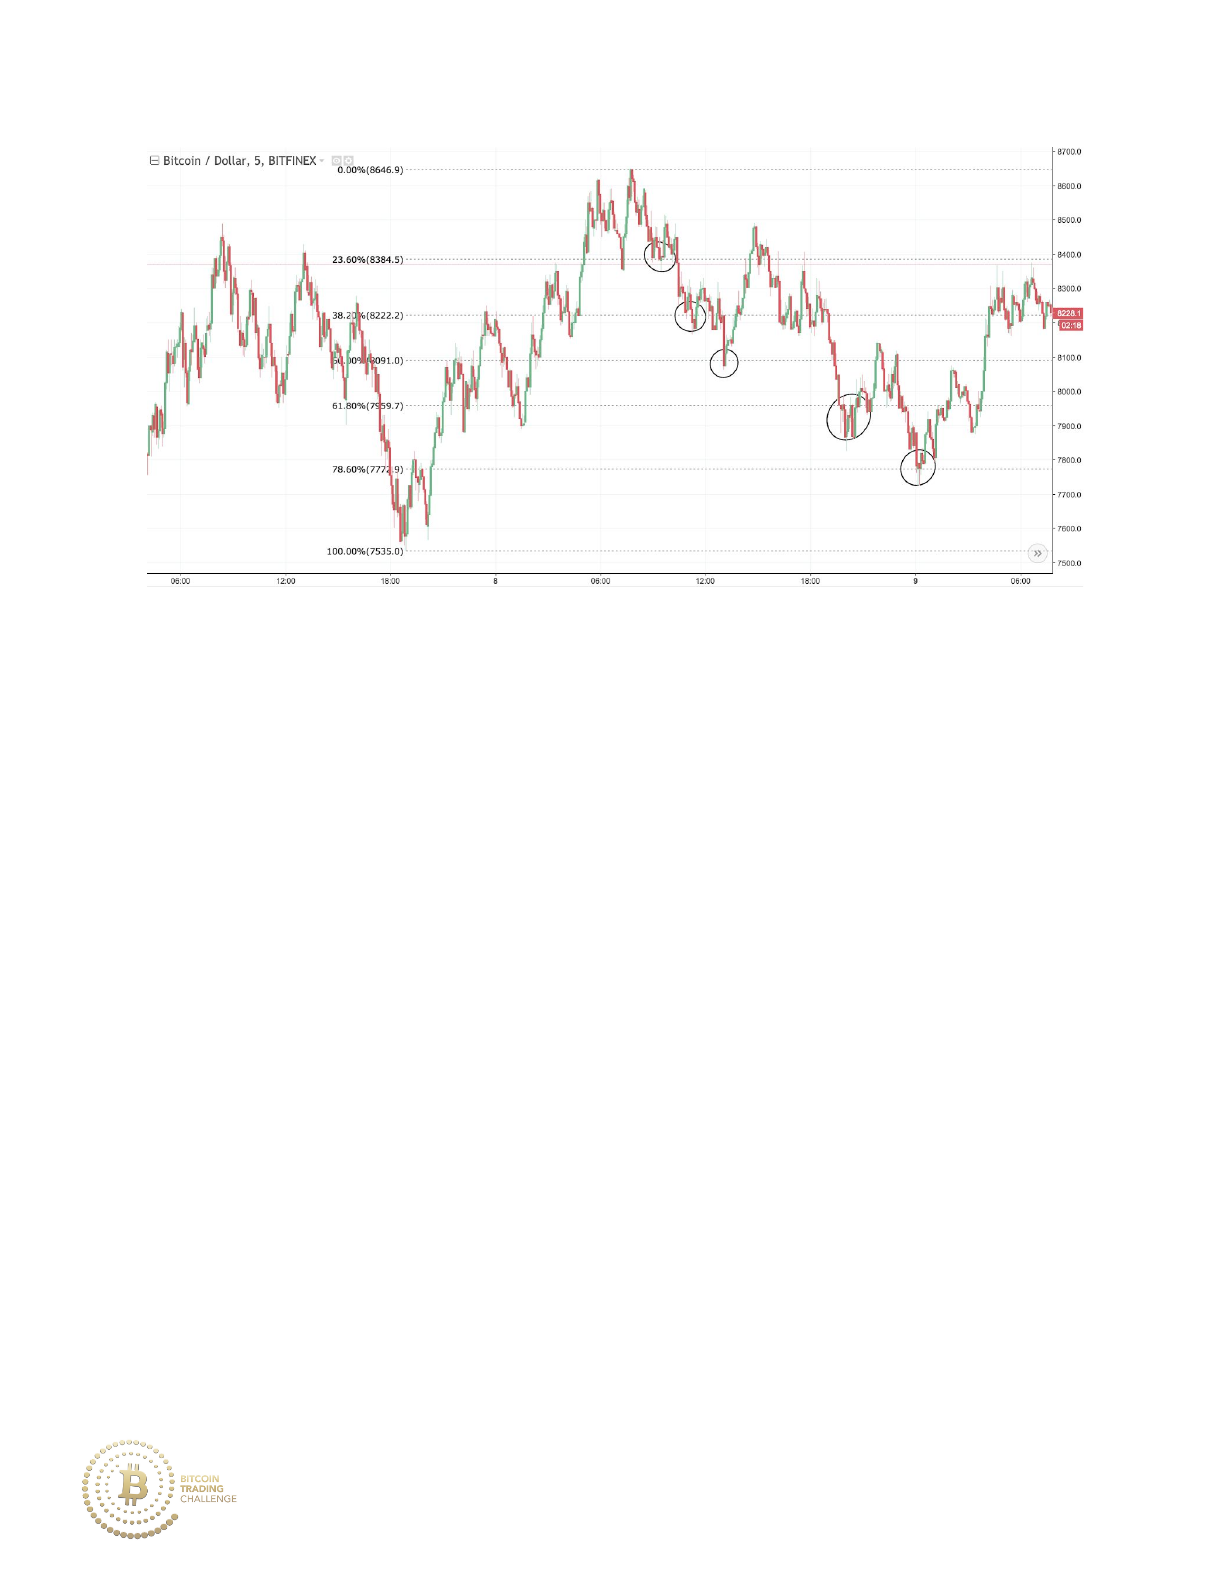
Notice in the example below how price finds support at each of the
Fibonacci levels below before bottoming out at the 78.6% level.
32
As previously stated, each Fibonacci retracement level has its own specific
use in identifying the market’s movements. Let’s delve deeper into how
exactly each Fibonacci level tells a different story.
i. The 23.6%
The 23.6% retracement level has two main uses:
1. Acts as a barometer to price retracement: a break of the 23.6% level
signals a change in the momentum of the market, making it more likely
that price will head towards deeper retracement levels.
33

2. Acts as the maximum amount of price pullback in a strong trend
without the market stage itself changing: if price is contained within
the 23.6% level whilst trending, the trend is likely to continue without a
deeper retracement.
Thus, if positioned long in an uptrend, selling on a strong bearish break of
the 23.6% retracement level with the intention of buying when the market
retraces to either the 38.2% or the 61.8% would be a solid strategy in
increasing your capital over the course of a trend.
Using Fibonacci drawings, this strategy would work better on a major
market stage than on a minor market stage because the price difference
between levels of a minor market stage can be quite small in comparison
to the large price difference in retracement levels of a major market stage.
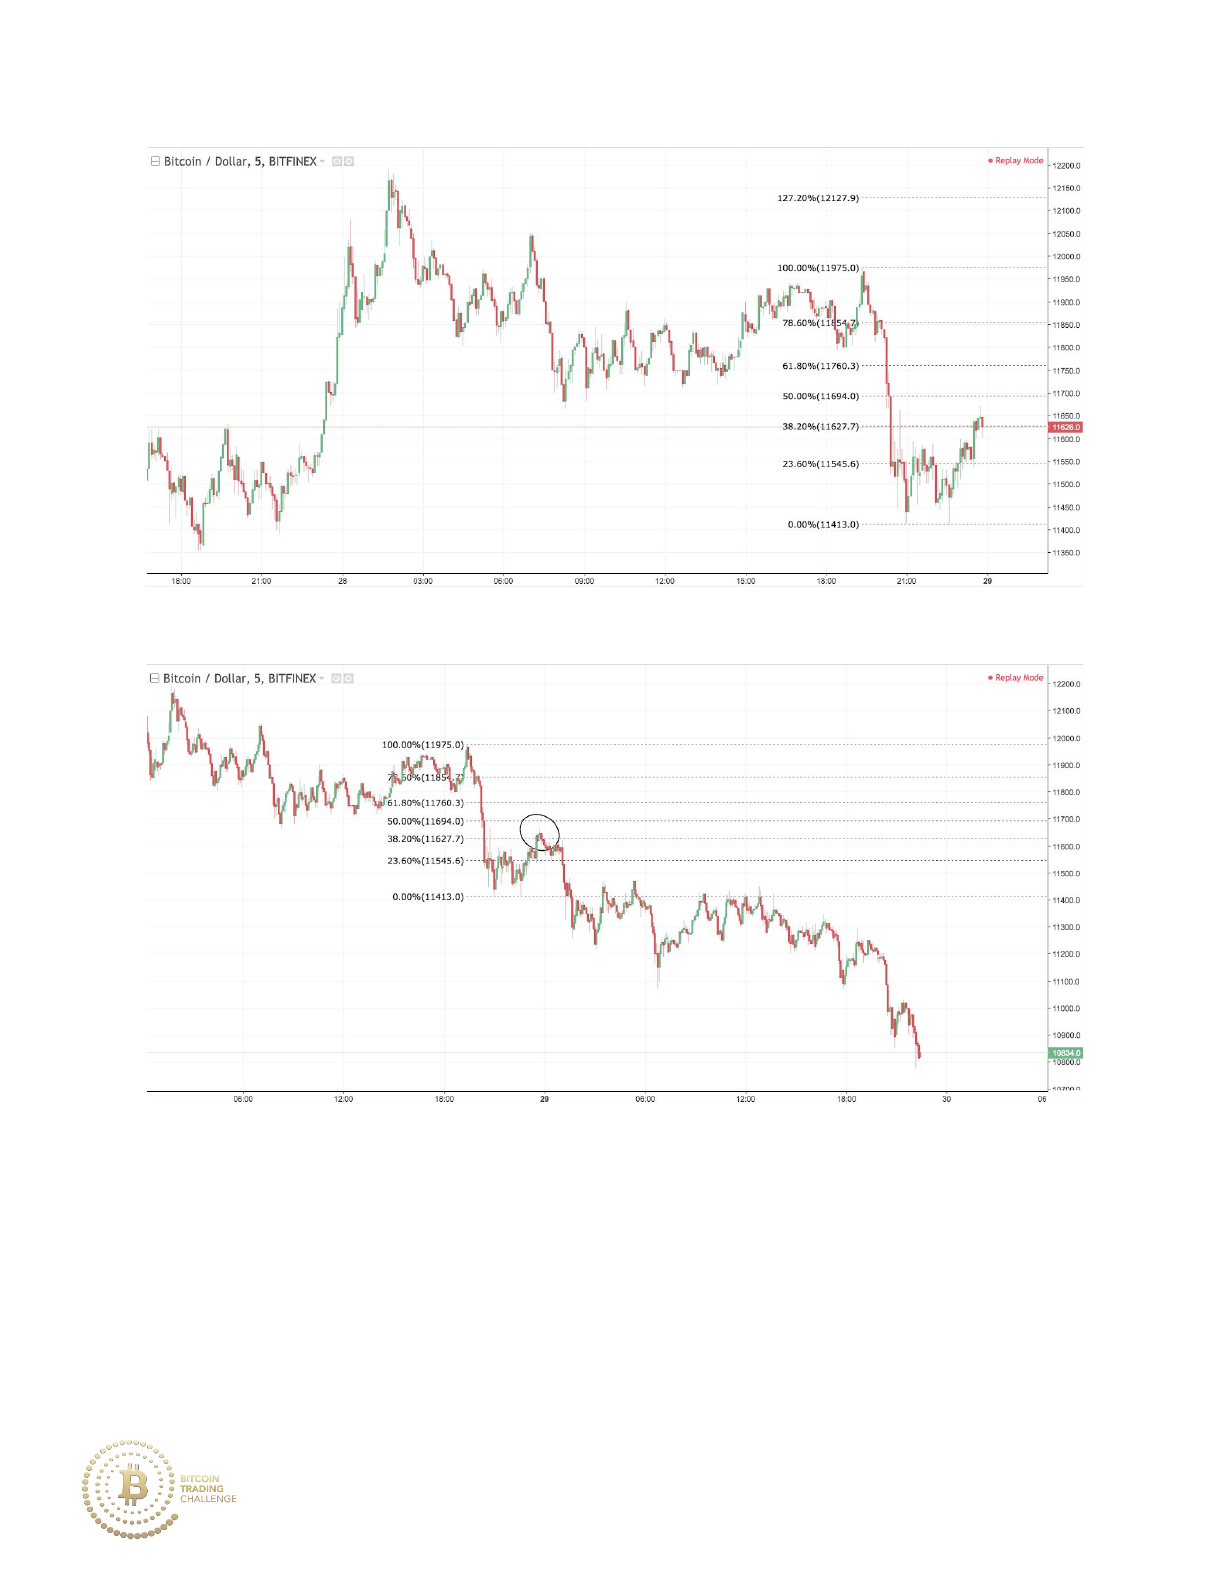
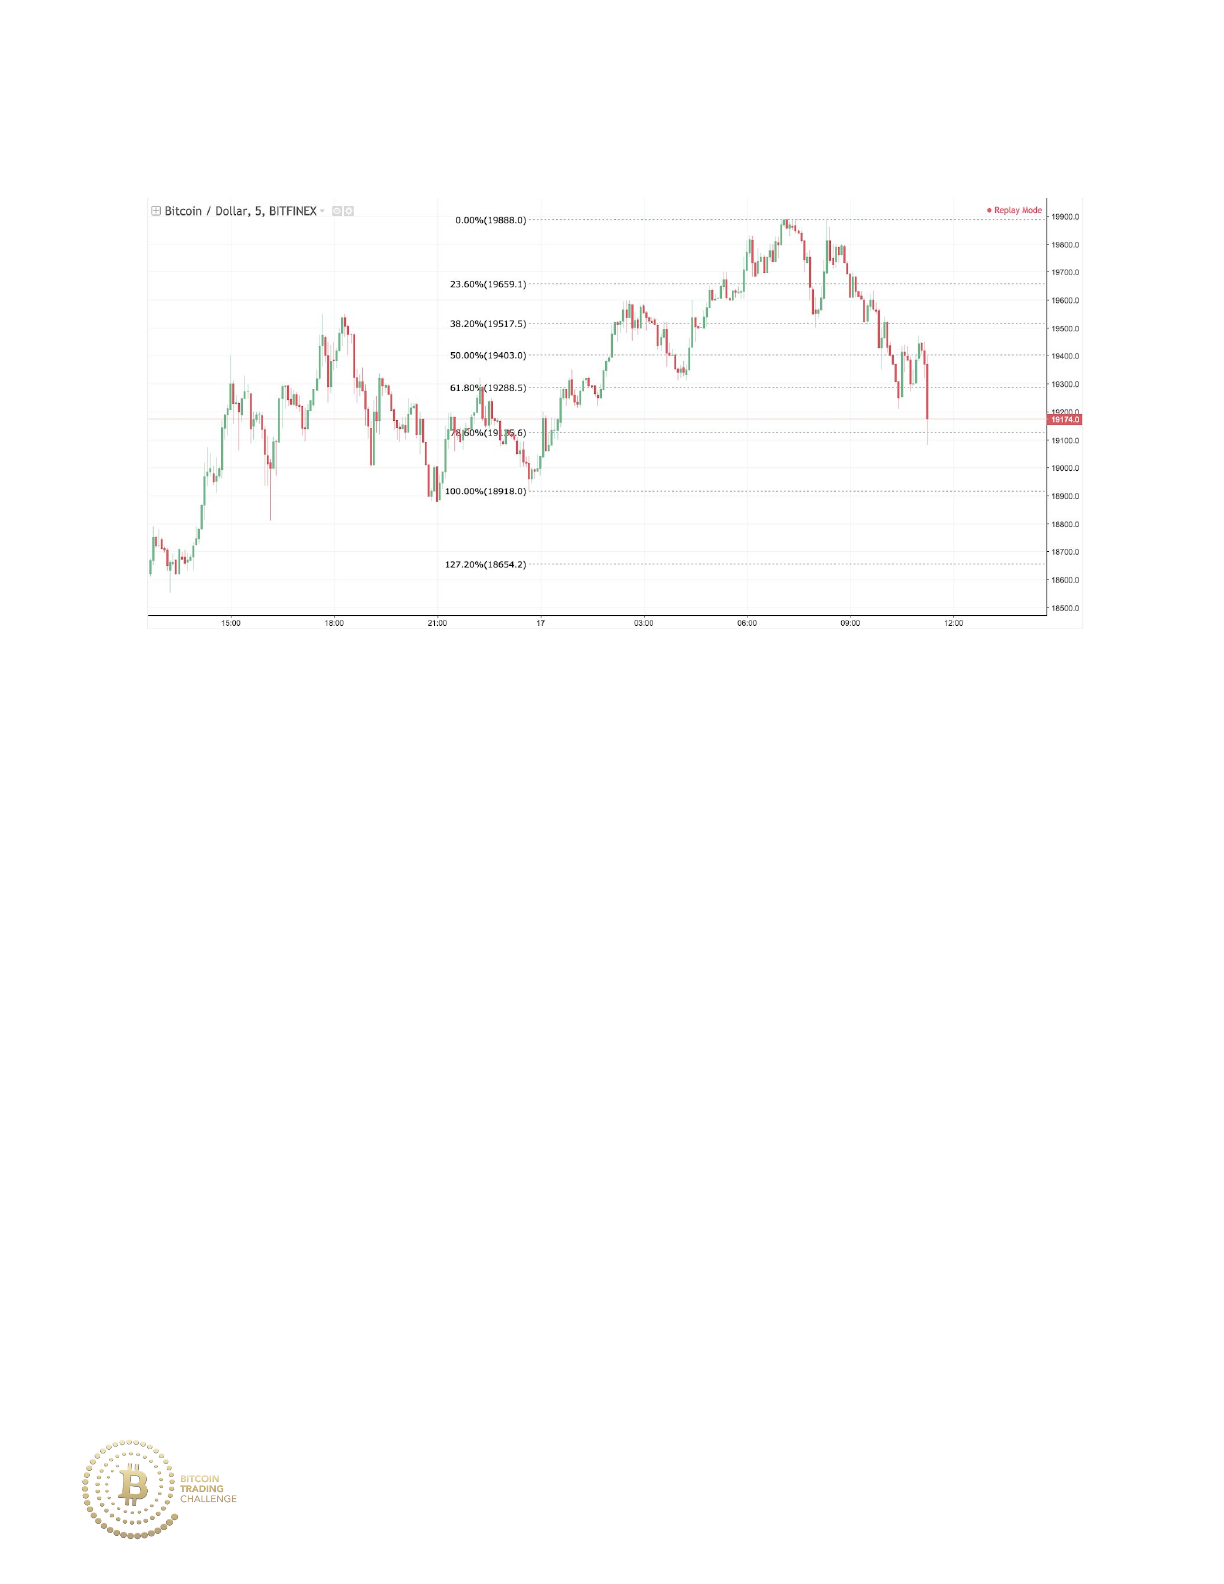
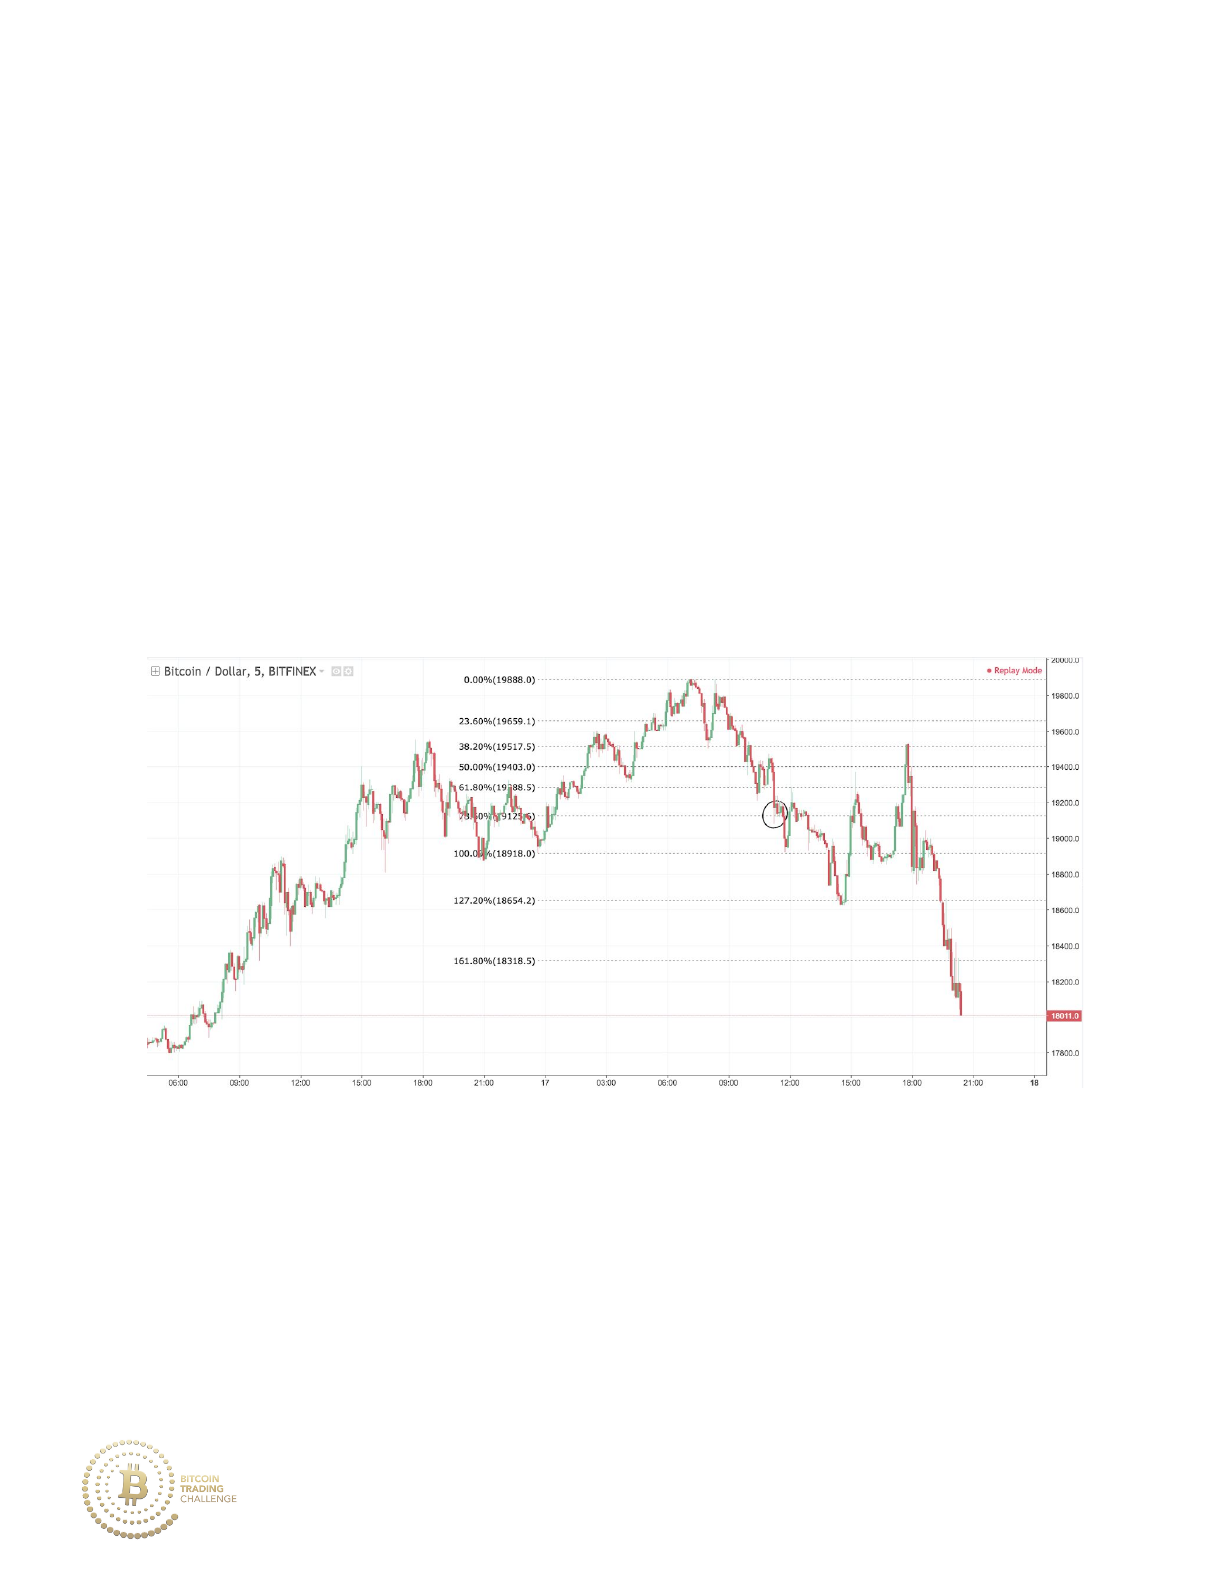
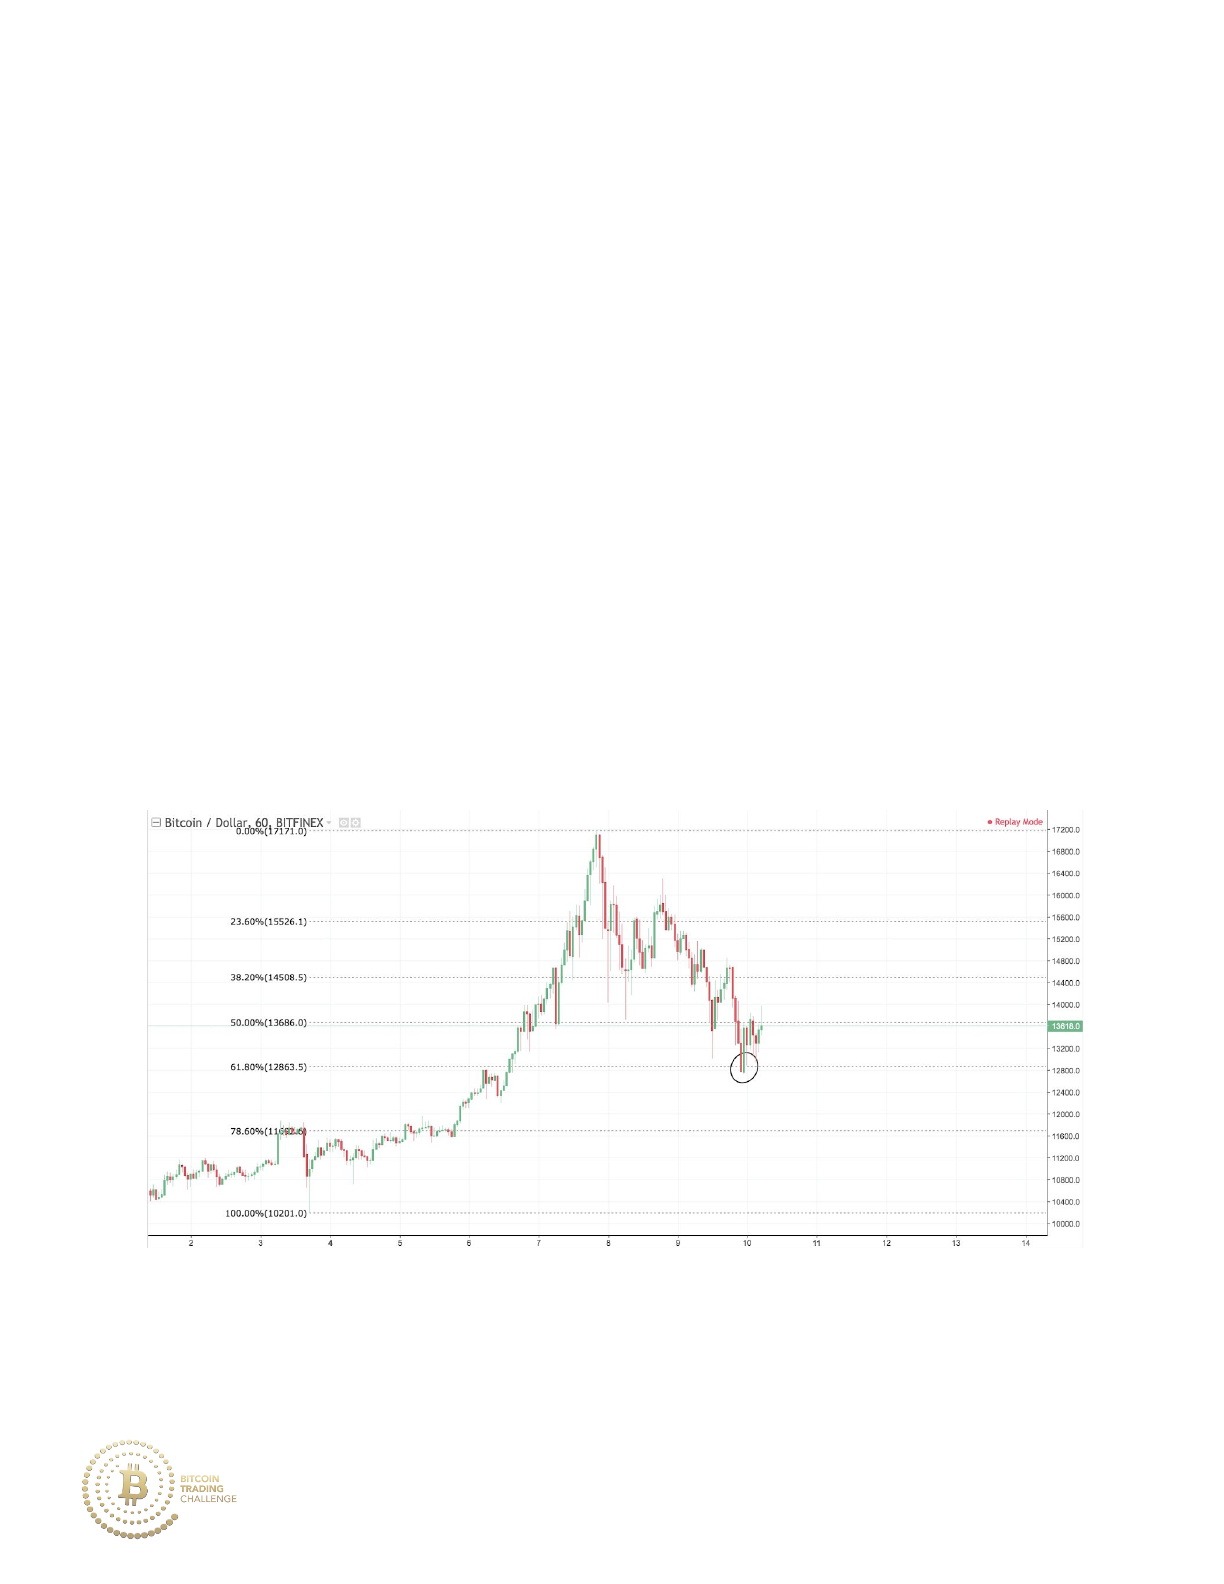
Major Uptrend Market Stage = sell at a strong break of the 23.6%
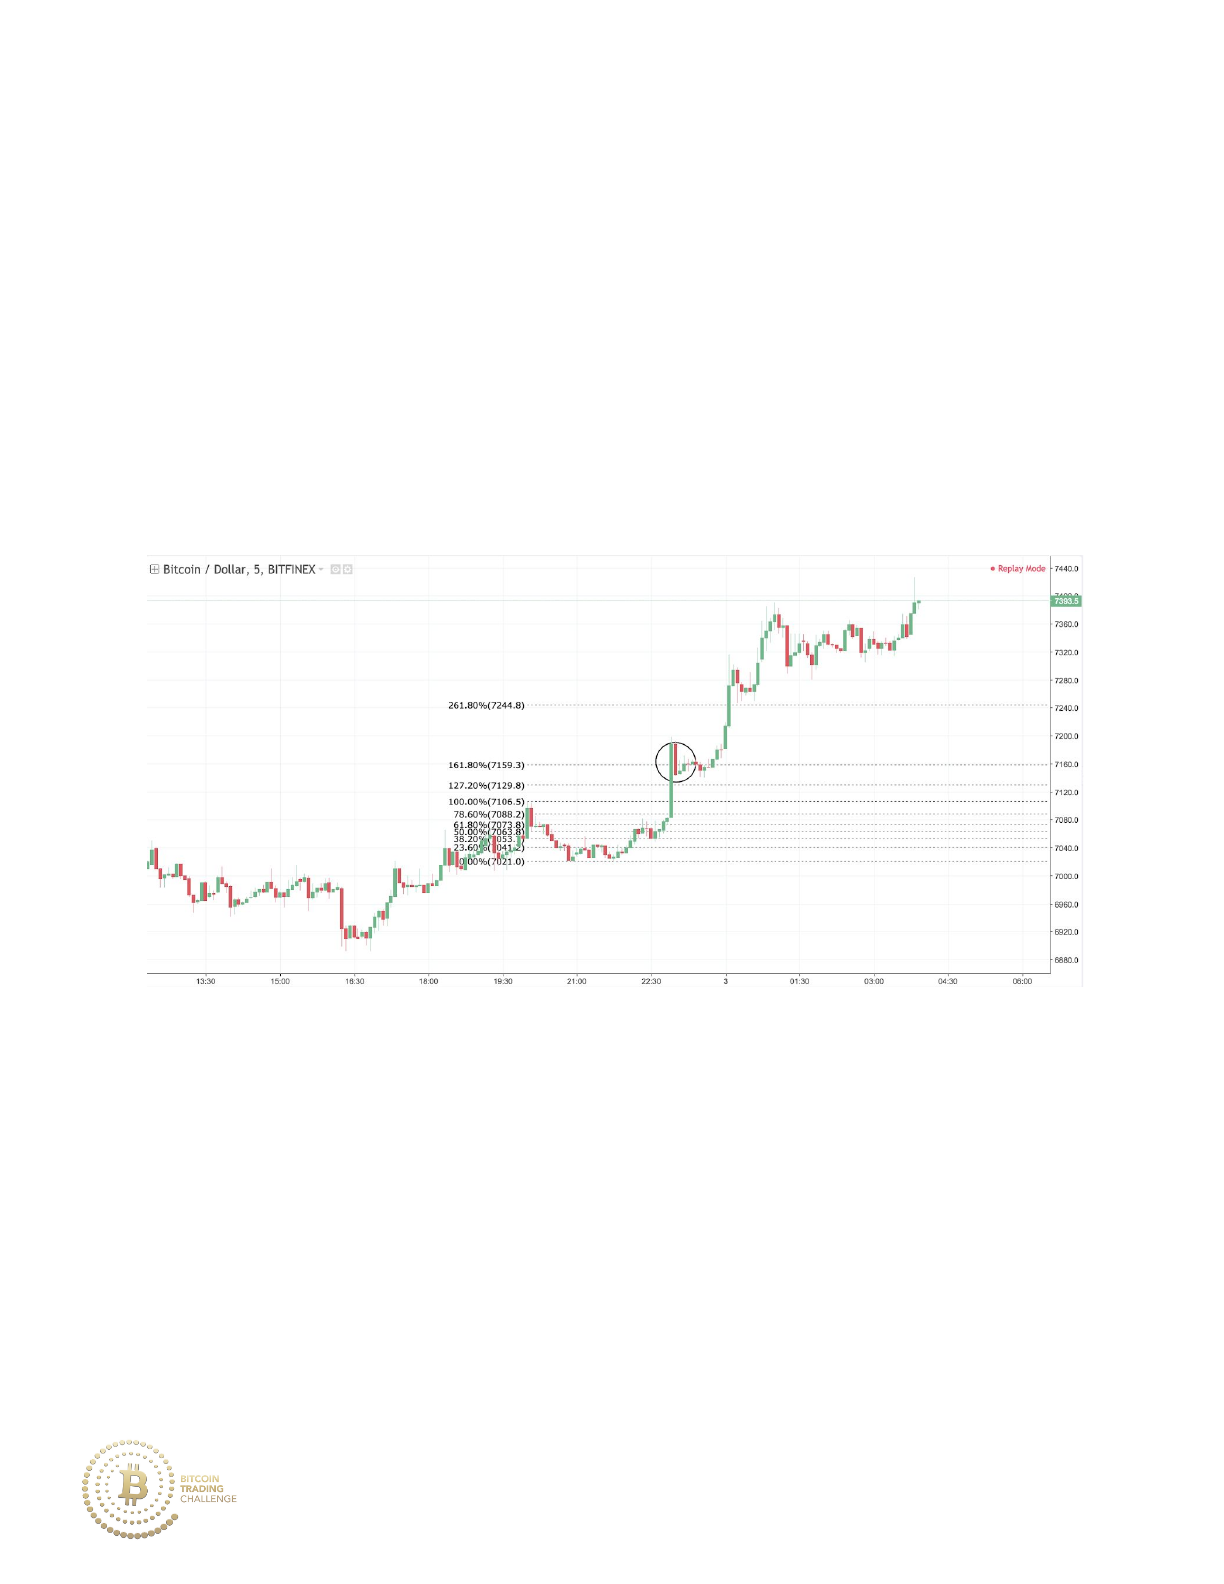
retracement level with the possible intention of entering at a deeper price
retracement.
34
If you sell when price breaks through this level (circled portion of the
graph), you will protect yourself from a major loss. An added bonus to
buying at the 78.6% or the 61.8% level is that you can rebuy at a much
better price.
35
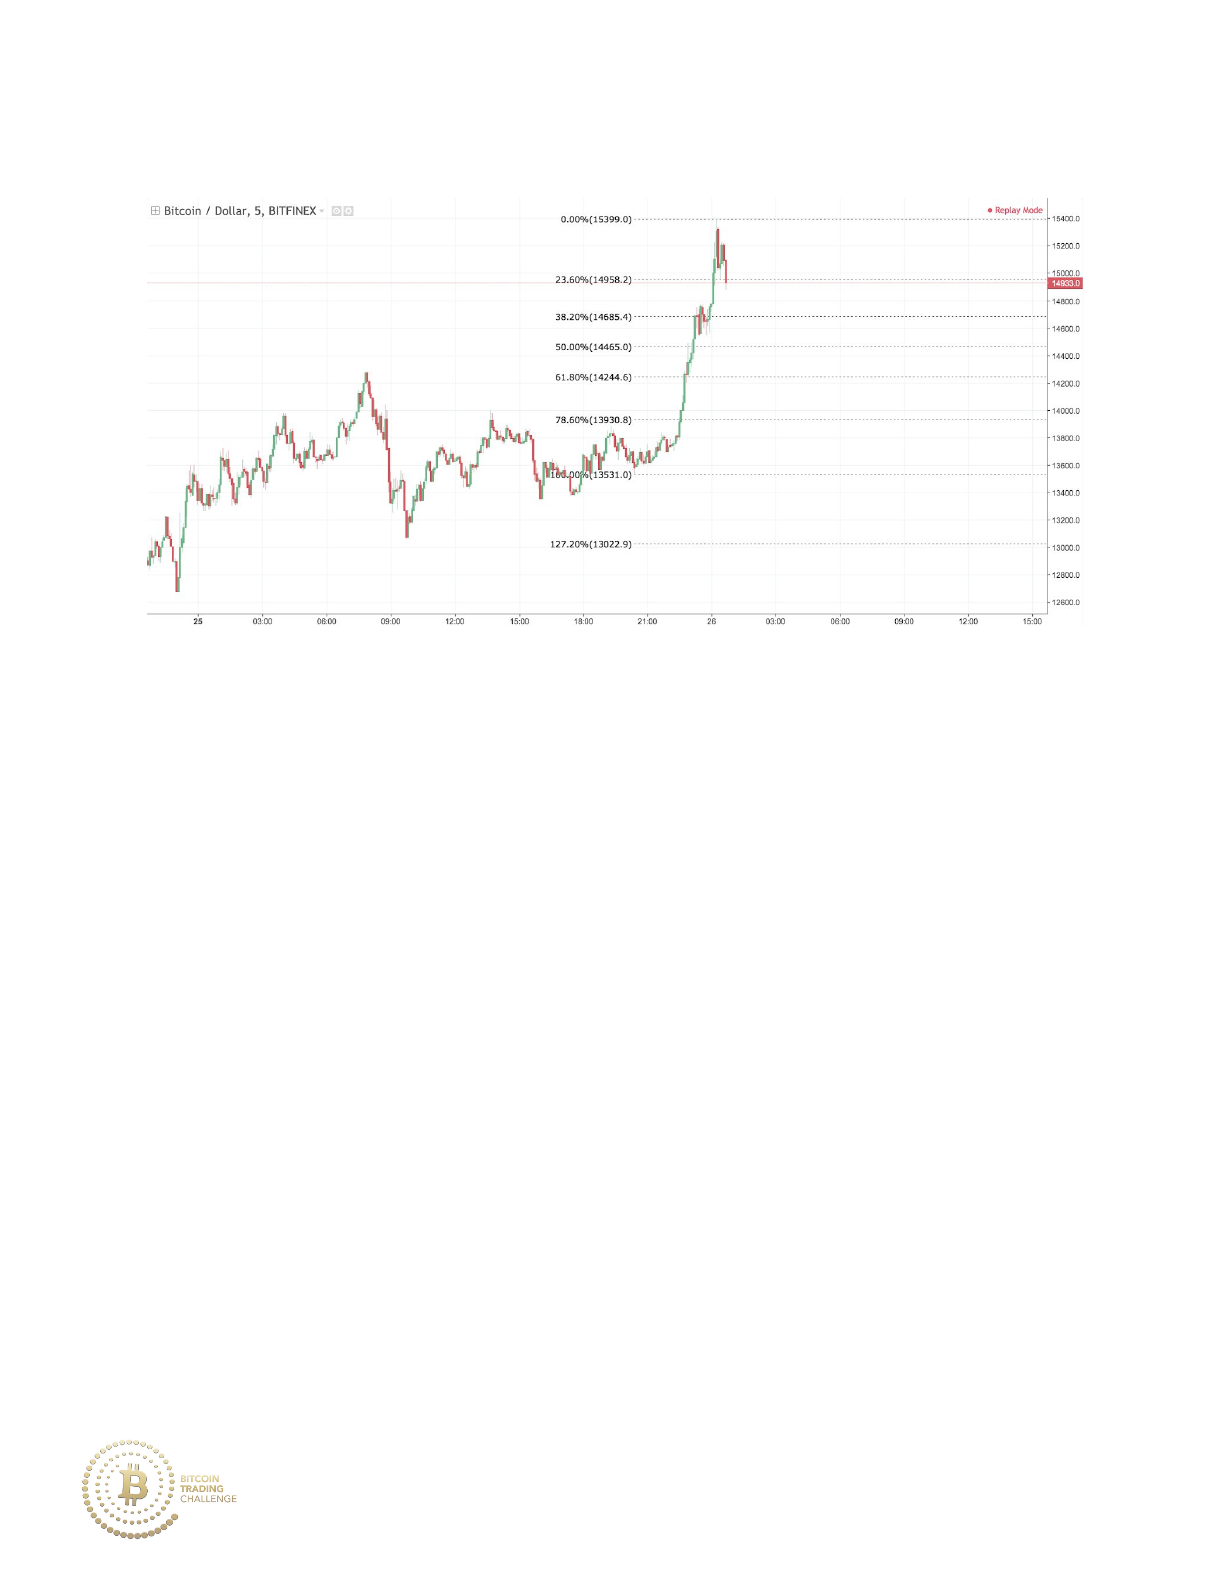
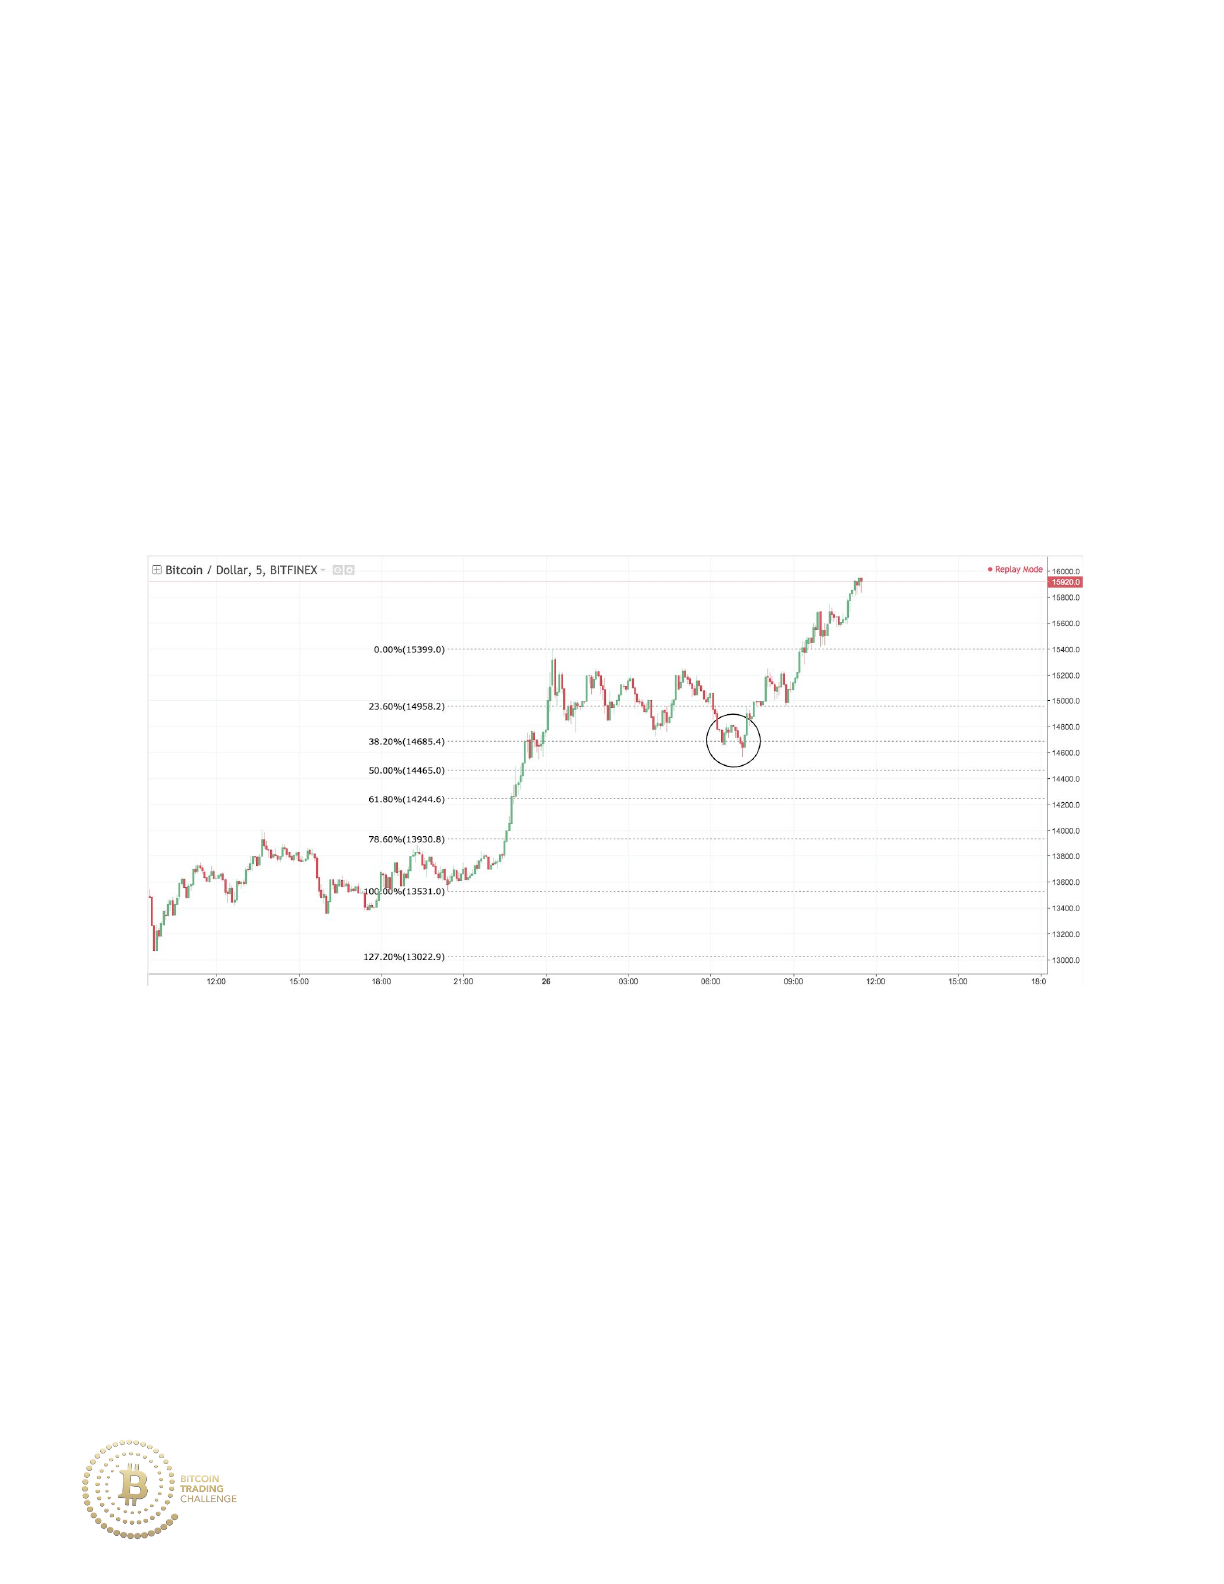
As seen below, the uptrend market stage up to the most recent price point
on the chart has strong momentum, and is only able to retrace 23.6%.
As a result, the uptrend continues to move upward as the 23.6%
retracement was respected.
36
ii. The 38.2%
The 38.2% retracement level has one important use:
1. The 38.2% ratio is typically respected when the market moves on a
trend with strong momentum, such as a price breakout.
This tool in our toolbelt is reserved for the strong market stages.
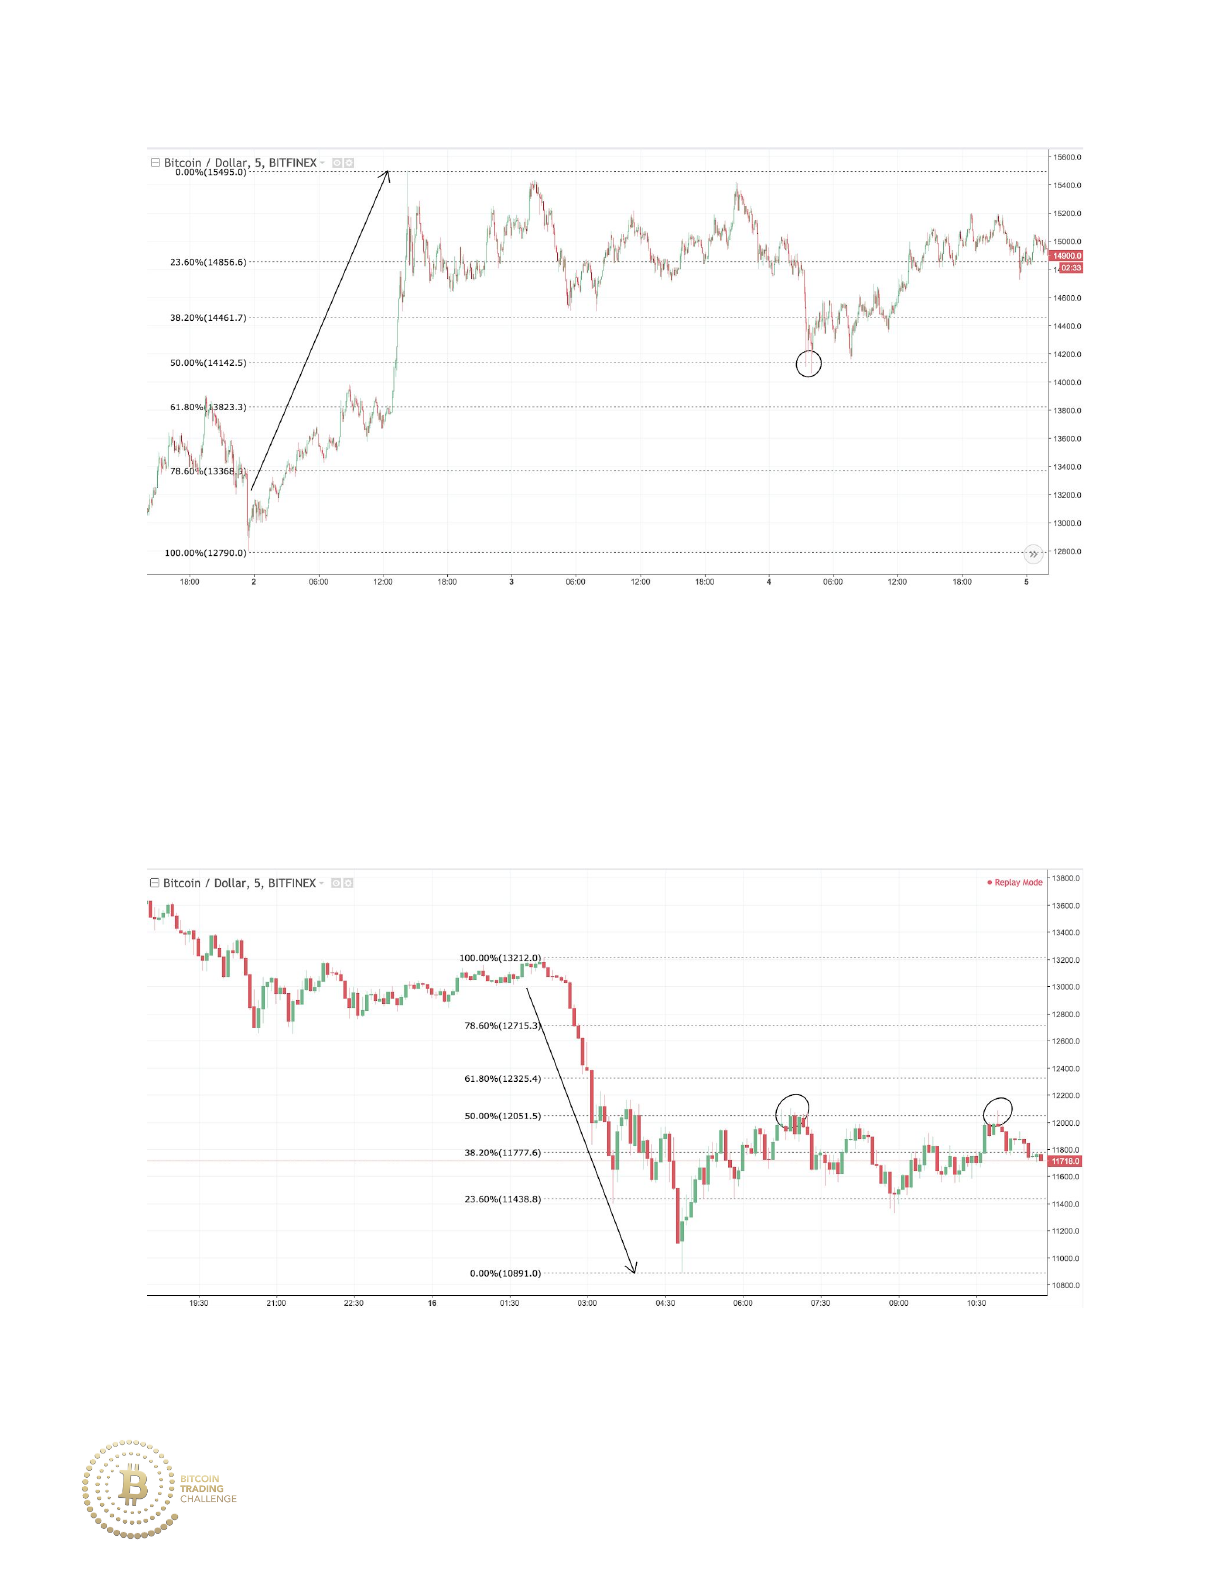
Price breaks out above resistance on strong momentum and then briefly
touches the 38.2% level.
37
The 38.2% level acts as support and price consequently continues the
uptrend.
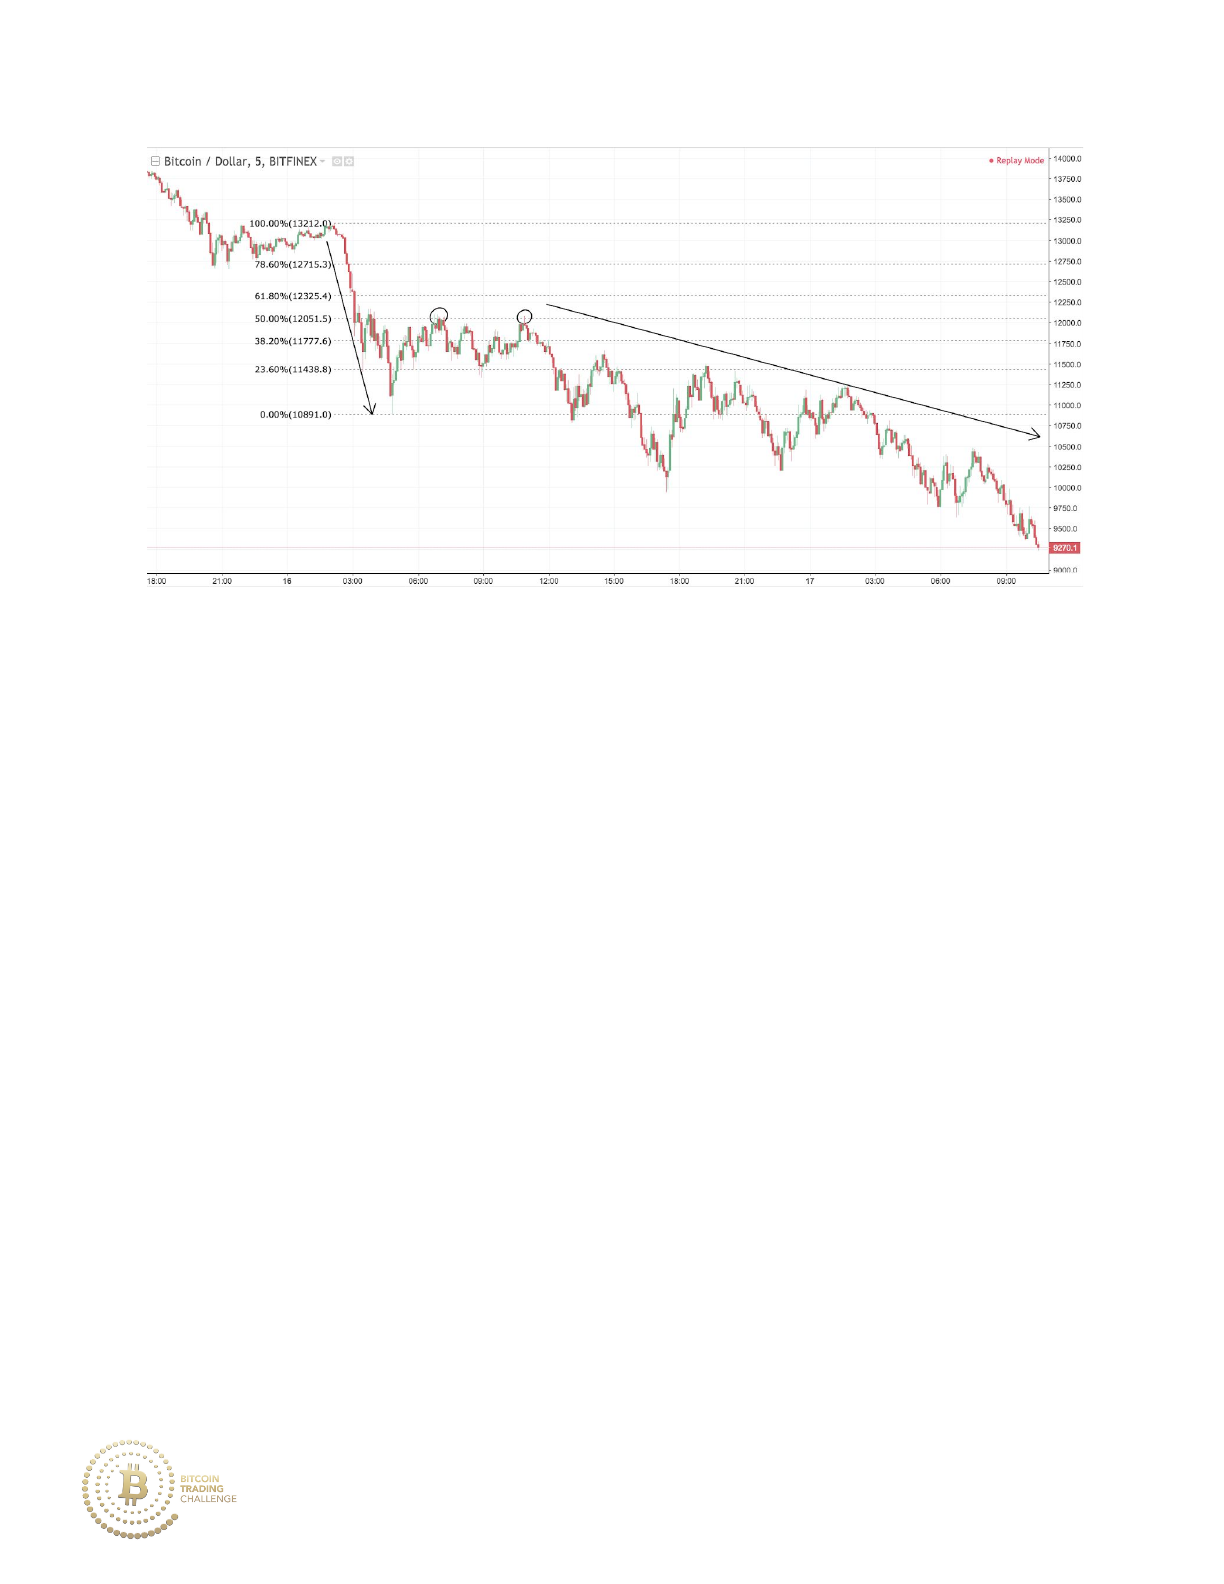
Powerful downtrend that acts on strong momentum retraces to the 38.2%
of the recent downmove…
38
Price then continues moving downward after the initial retracement.
iii. The 50%
39

The 50% retracement can be used in two ways:
1. Acts as an important barrier for the 38.2% retracement level; the 38.2%
to 50% retracement zone is known as the weak retracement zone.
2. Acts as another Fibonacci level of support/resistance, as well as
added confluence with other levels.
Price does not move in perfect directions down to specific retracement
levels. Rather, there are Fibonacci price zones that signal likely areas of
trend reversal depending upon the strength of the trend. The 50% acts as
the maximum barrier for strong price trends.
We can note that price is in a strong trend when it moves upward in the
chart below (as indicated by the arrow). Price then consolidates at the
38.2% level, with candlestick tails down to the 50% level which acts as final
support (as indicated by the circled portion).
40
In this example, price makes a strong downward move below support, and
then retraces 50% before price continues moving downward.
41
iv. The 78.6%
The 78.6% retracement can be used in two ways:
1. Acts as a gauge to whether price is retracing or reversing.
2. Acts as a price extreme for retracements of weak underlying trends.
The 78.6% retracement is the most extreme retracement that a trend can
have without changing its market stage. If price retraces to the 78.6% level,
it is likely that price is in a weak trend, either in a state of consolidation or
gearing up to move beyond the 100% retracement (the support or
resistance level, depending on the Fibonacci drawn).
42
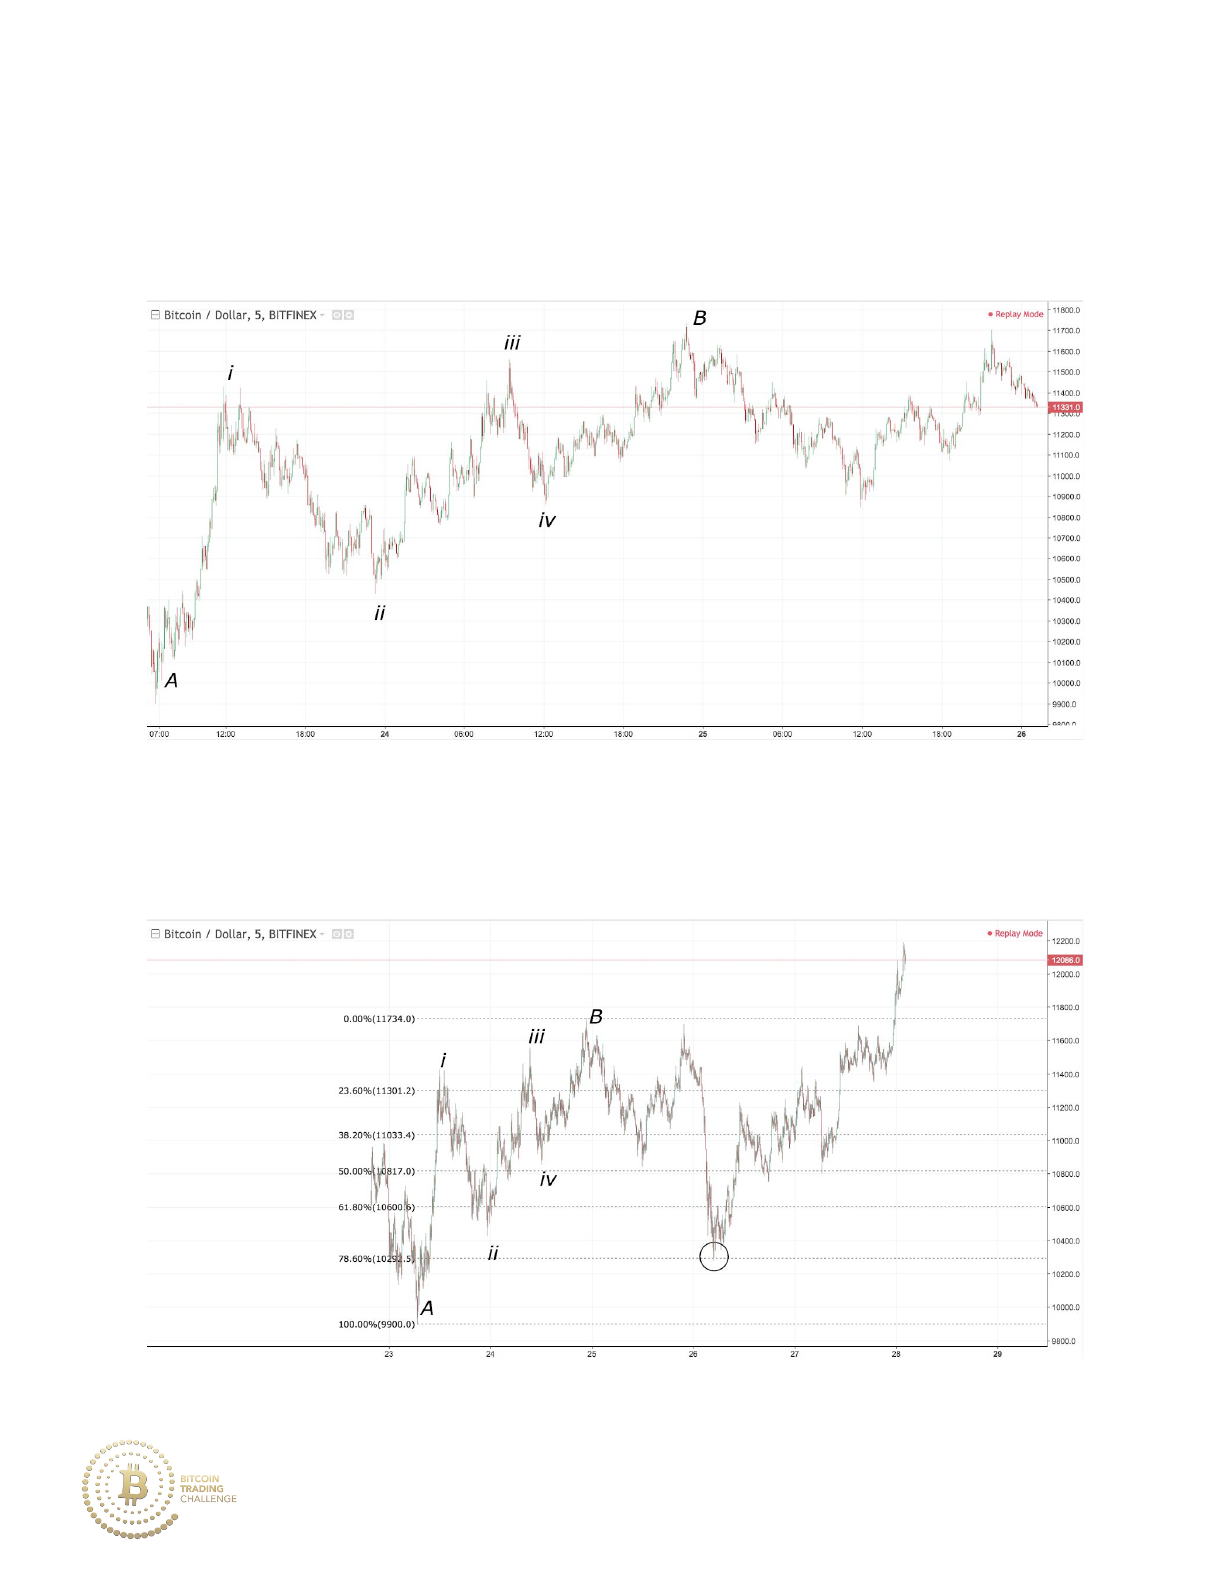
Using the example below, from Point A to Point B, price is in a weak
uptrend.This is a weak uptrend due to the heavy retracements (i to ii and iii
to iv) made as price struggled to make new highs.
As a result of the weak uptrend from point A to B, price finds significant
support at the 78.6% level after a rapid retracement.
43
The 78.6% retracement can also be used to gauge whether price is
retracing or reversing which can be useful when protecting yourself against
a loss.
From Point A to Point B, price is in a weak uptrend as the majority of the
uptrend continuations struggle to make significantly higher highs until price
moves rapidly at the end of the uptrend. We then see high price momentum
downward as price breaks through the 78.6% retracement level.
44
Price moves lower:
D. Drawing Fibonacci Retracements
The toughest part of Fibonacci analysis is knowing how to draw them.
Drawing Fibonacci endpoints are not an exact science; they require the
difficult practised skill of pattern recognition.
So, how exactly should you pick your highs and lows of the market stage in
order to draw your Fibonacci retracement?
Here are some guidelines:
Drawing Fibonacci retracements...
●on any trend gives likely levels of market contraction
45
●high to low on a downtrend gives us retracement levels
●low to high on an uptrend gives us retracement levels
●reveals the underlying strength or weakness of a trend
●yields high probability reversal opportunities indicating when to buy
or sell into a trend at near-optimal prices
Drawing Fibonacci endpoints...
●on a minor market stage gives future minor support/resistance levels
●on a major market stage gives future major support/resistance levels
Practice 3-2
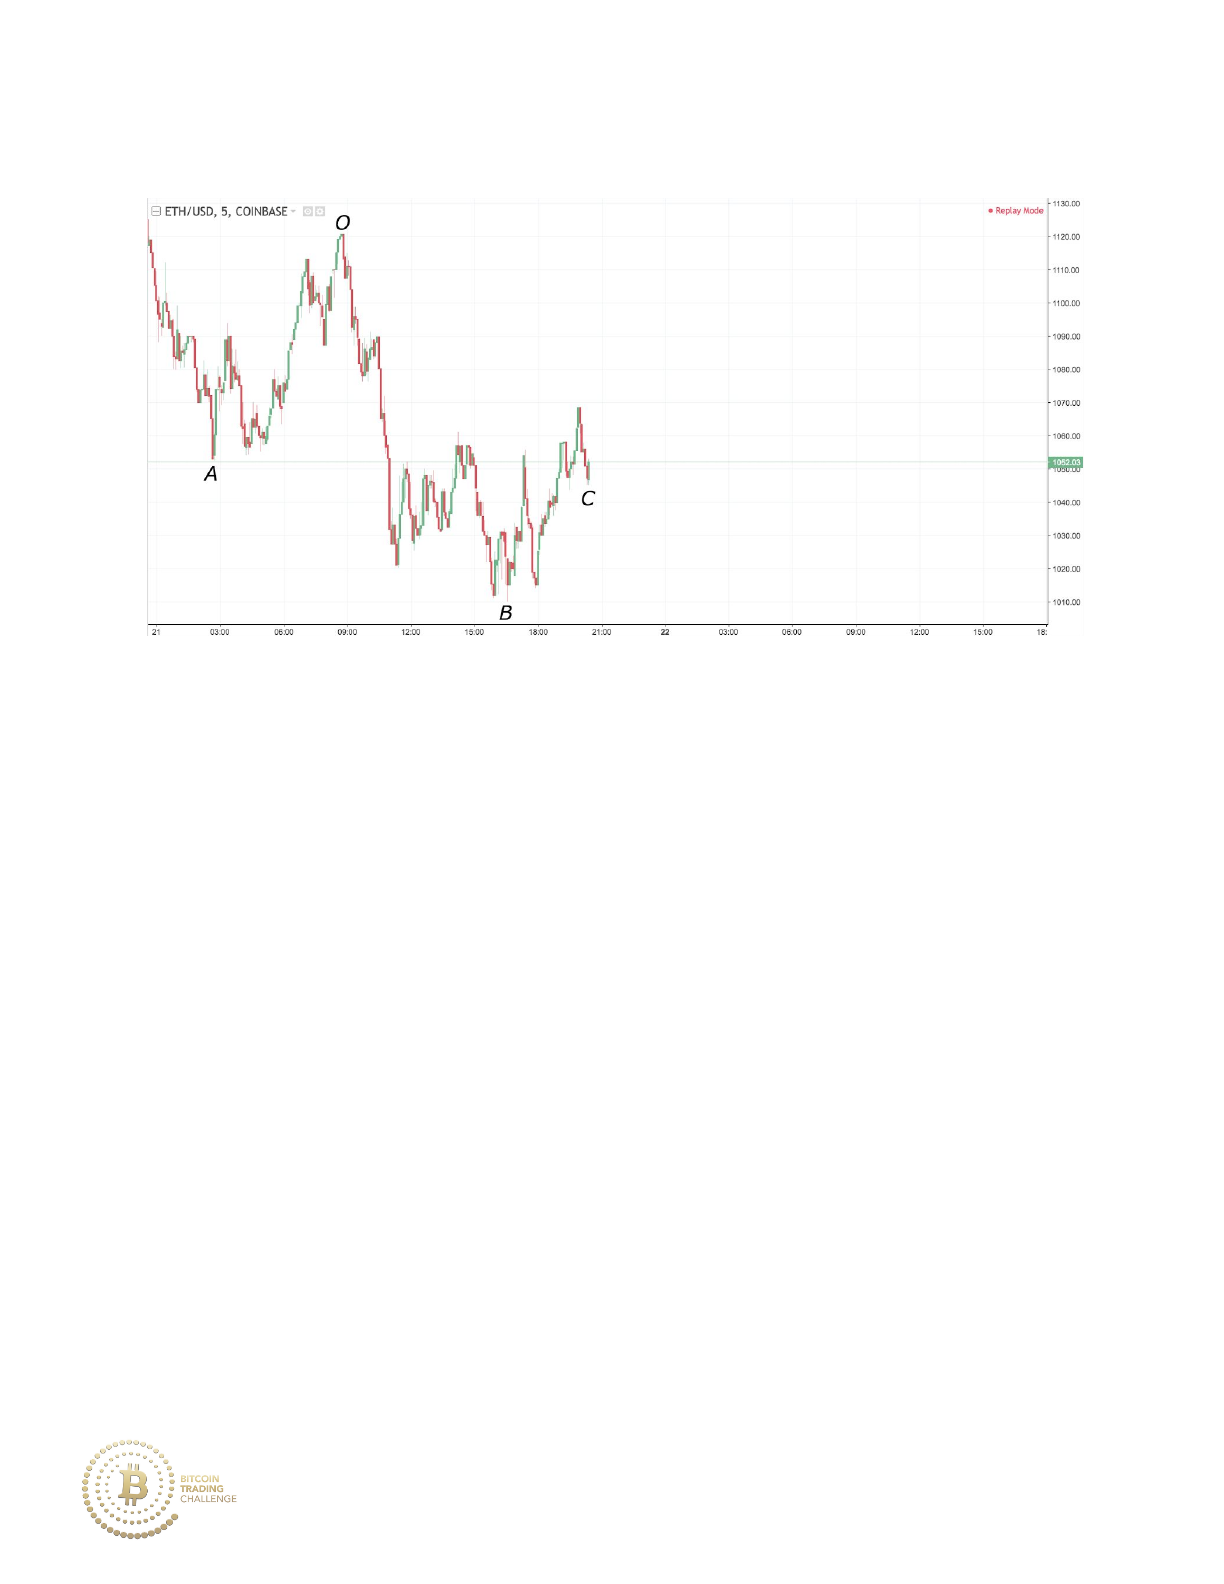
To start off, how would you draw Fibonaccis on this market stage?
A. Point O to Point A
B. Point O to Point B
C. Point O to Point C
46
Practice 3-2 Answer
A. Point O to Point A
B. Point O to Point B
C. Point O to Point C
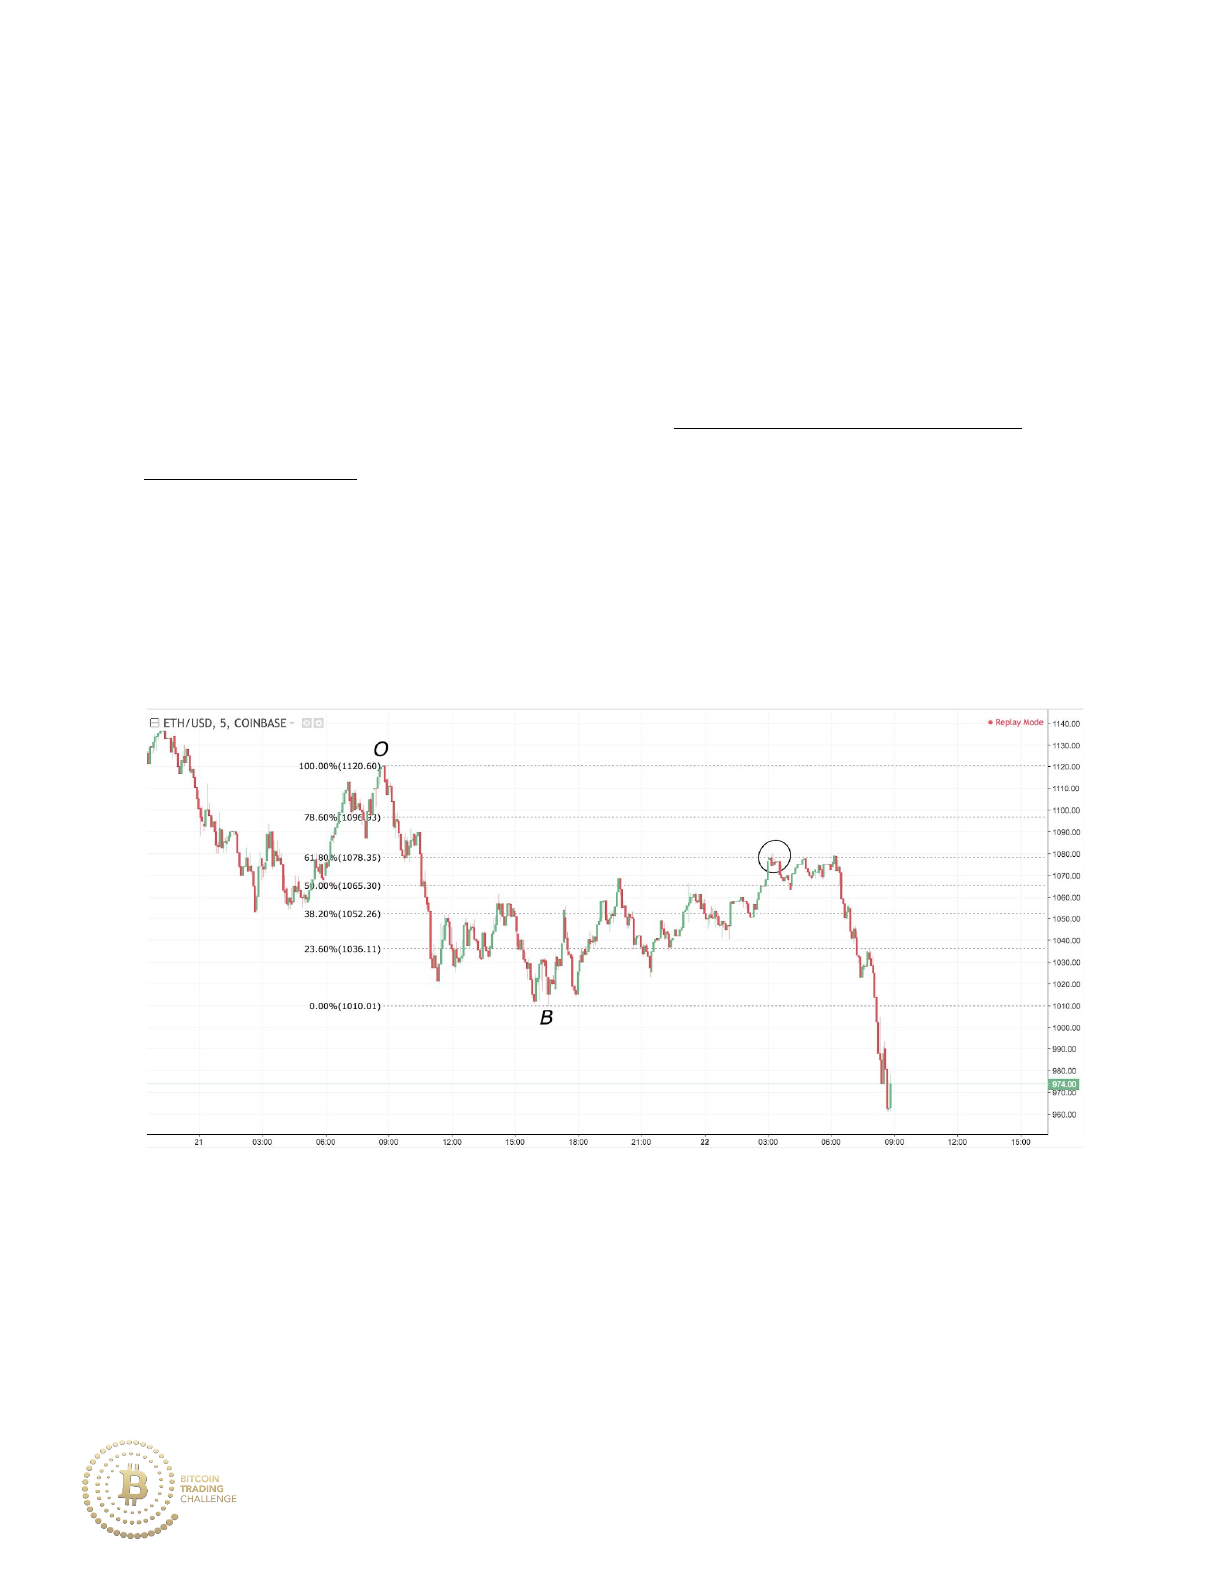
Drawing from the low at Point O to the high at Point C gives you the ability
to buy at the optimal price point at the normally targeted 61.8%
retracement.
47
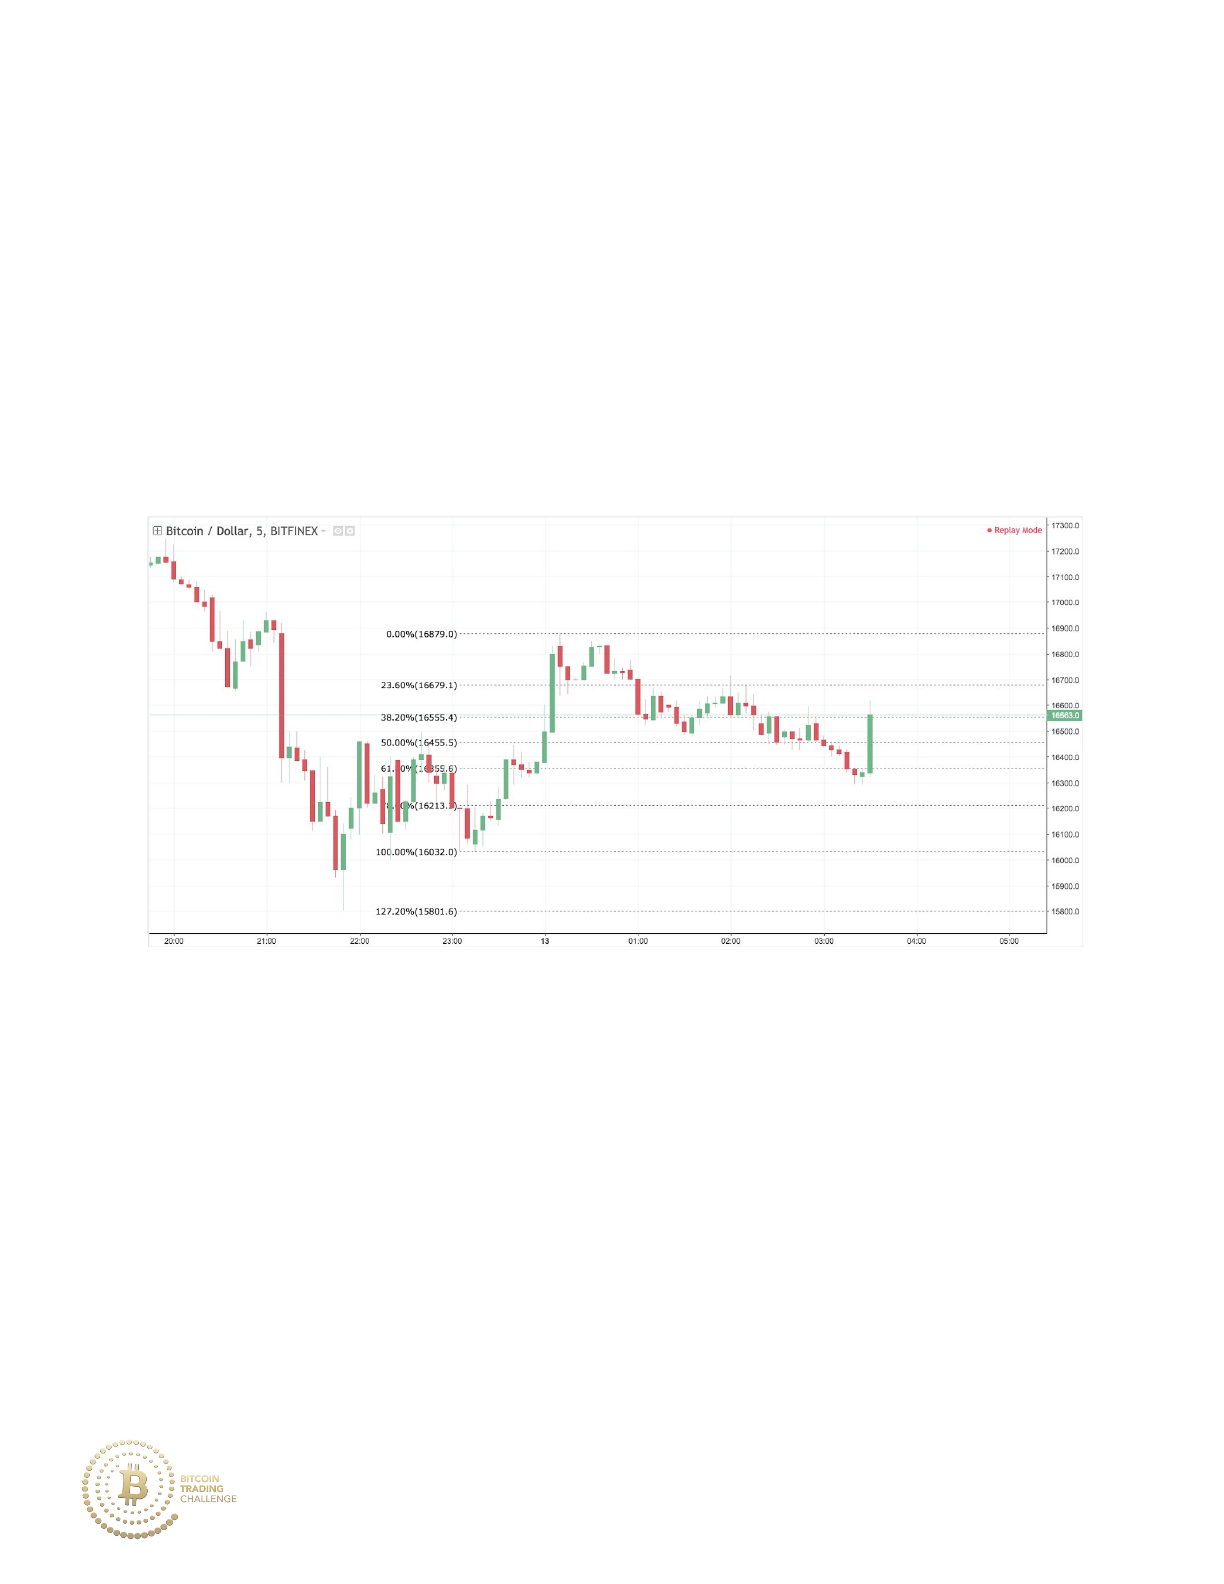
Practice 3-3
How would you draw this Fibonacci retracement on the market stage of a
downtrend?
A. Point O to Point A
B. Point O to Point B
C. Point O to Point C
48
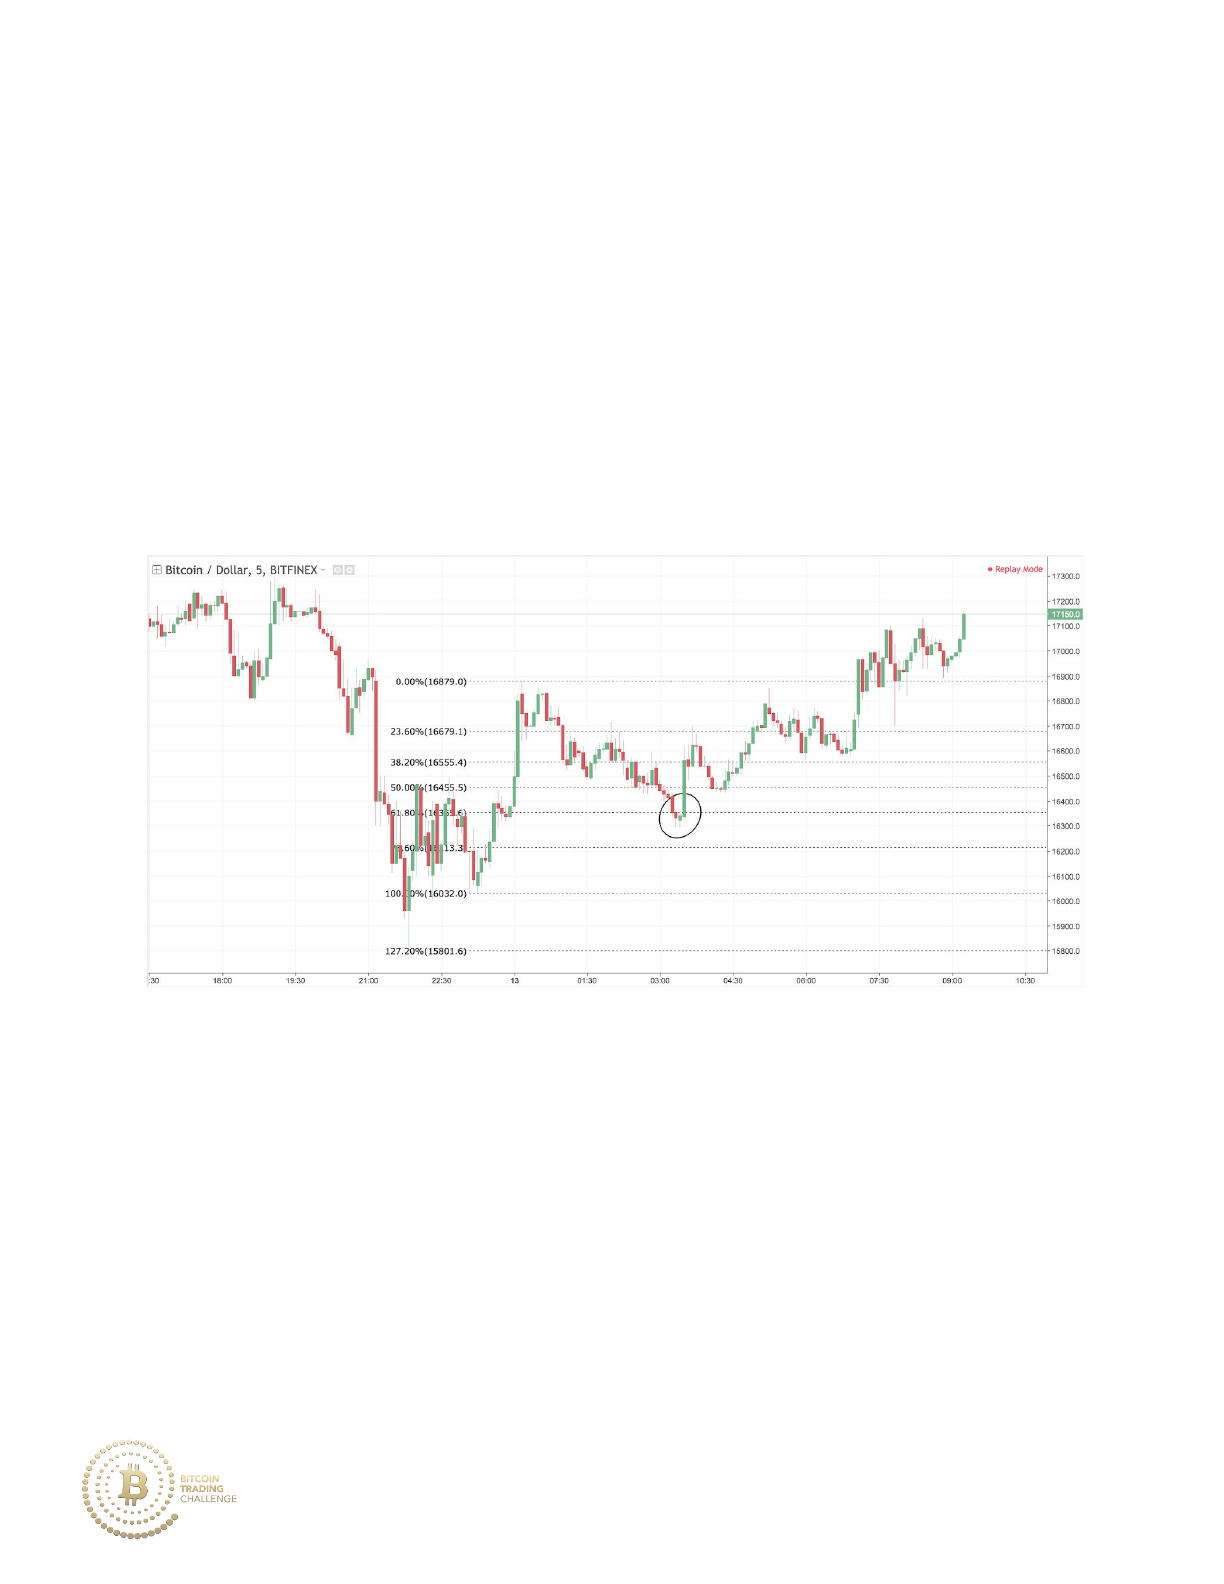
Practice 3-3 Answer
A. Point O to Point A
B. Point O to Point B
C. Point O to Point C
Drawing Point O to Point A is a mistake as you cannot draw Fibonaccis
backward in time (always draw from the left to the right). Drawing Point O
to Point C does not make sense either because Point C is not the absolute
market bottom.
Practice 3-3 Answer
49
E. Practice
Here are three examples of market momentum dynamics and their
interaction with Fibonacci levels. There are more related examples in the
final chapter.
Practice 3-4
1. Does momentum favor buyers or sellers in this example ?
2. Is there a strong market reaction at an important Fibonacci
retracement level?
3. Should you buy, sell or avoid trading this market?
50
Practice 3-4 Answers
1. Buyers. Notice the strong price momentum that instigates the first
move of the uptrend as well as the weak move downward as price
retraces to the 61.8%.
2. Yes. Two tailed candlesticks with small candle bodies followed by a
strong bullish move at the 61.8%.
3. Buy.
51
Practice 3-5
1. Does momentum favor the buyers or the sellers in this example here?
2. Is there a strong market reaction at an important Fibonacci
retracement level?
3. Should you buy, sell or avoid trading this market?
52
Practice 3-5 Answers
1. Sellers. Momentum to the downside has been strong with weak
bullish pullback alongside rapid bearish price movement.
2. All Fibonacci levels have been hit and the 78.6% retracement fails to
hold price. This is not a good sign for a bullish market reversal, and
price will likely continue to move downward.
3. Sell or avoid trading this market until evidence of bullish momentum
re-emerges at an important Fibonacci level.
53
Practice 3-6
1. Does momentum favor the buyers or the sellers in this example?
2. Which Fibonacci retracement level is most likely to become future
support?
54
Practice 3-6 Answers
1. Buyers. Price broke out upward in a strong bullish manner with weak
bearish pullback.
2. The 38.2% is most likely as a strong trend typically retraces to the
price area between the 38.2% and 50% Fibonacci retracements.
Practice 3-6 Answer
55

__________________________________________________________________________
4. Fibonacci Extensions
A. Patterns of Expansion
Newton’s third law of motion states that when one body exerts a force on a
second body, the second body simultaneously exerts a force equal in
magnitude and opposite in direction of the first body.
Fibonacci extensions are no exception to this rule. They yield likely levels of
future support/resistance based off of the price movements of the
previous retracement or consolidation range, acting as the “body” exerting
a force equal in magnitude and function.
To understand how a period of contraction typically follows expansion,
imagine squeezing a spring. The more you contract, the more it eventually
expands on release in equal strength.
Imagine that a market retraced from 5000 to 2000. Assuming it began a
rally, using Fibonaccis, at what price level would could we expect to see
significant resistance?
Answer: 6854. This value comes from the 1.618 extension of the
retracement from 5000 to 2000.
56

In this example, the Fibonacci retracement principles discussed in earlier
sections are not helpful to project trend continuation values. The
retracement rules only provide values in between 5000 and 2000. Rather
we need a tool that will project future resistance values, in the event that
price moves outside this range.
B. The Golden Ratio 161.8%
Phi is the mathematical term for the Fibonacci ratio of 161.8%. Recall that
phi is calculated by dividing a number in the Fibonacci sequence by the
number that came before it. This ratio is naturally found in the
mathematical wave-like movements of the market. Think of each specific
market stage as if it were a number within the sequence with Fibonacci
extensions dictating the next likely stopping level of that market stage.
Phi is the most respected Fibonacci extension level. The importance of phi
over other levels may come from the fact that phi is predominantly found in
nature, whereas the other extension levels are just mathematical
derivatives of phi.
The 161.8% Fibonacci extension has many uses when analyzing market
expansions:
57
1. Projects likely future support/resistance area. Typically, price moves
slightly past the 161.8% level before reversing in the other direction.
2. Projects all-time highs by allowing you to plot new highs that a
market makes (Fibonacci retracements cannot plot all-time highs).
3. Projects continuations of weak and average trends typically end at
the 161.8% extension of the previous retracement.
4. Trend rejections. A strong price rejection of the 161.8% Fibonacci
extension level (single tail touching the level or V-Shaped reversal)
reveals the weakness of the underlying trend and a likely reversal.
Below is a market stage of an uptrend where price retraces down to the
61.8% retracement level. We’ve seen this many times before.
58
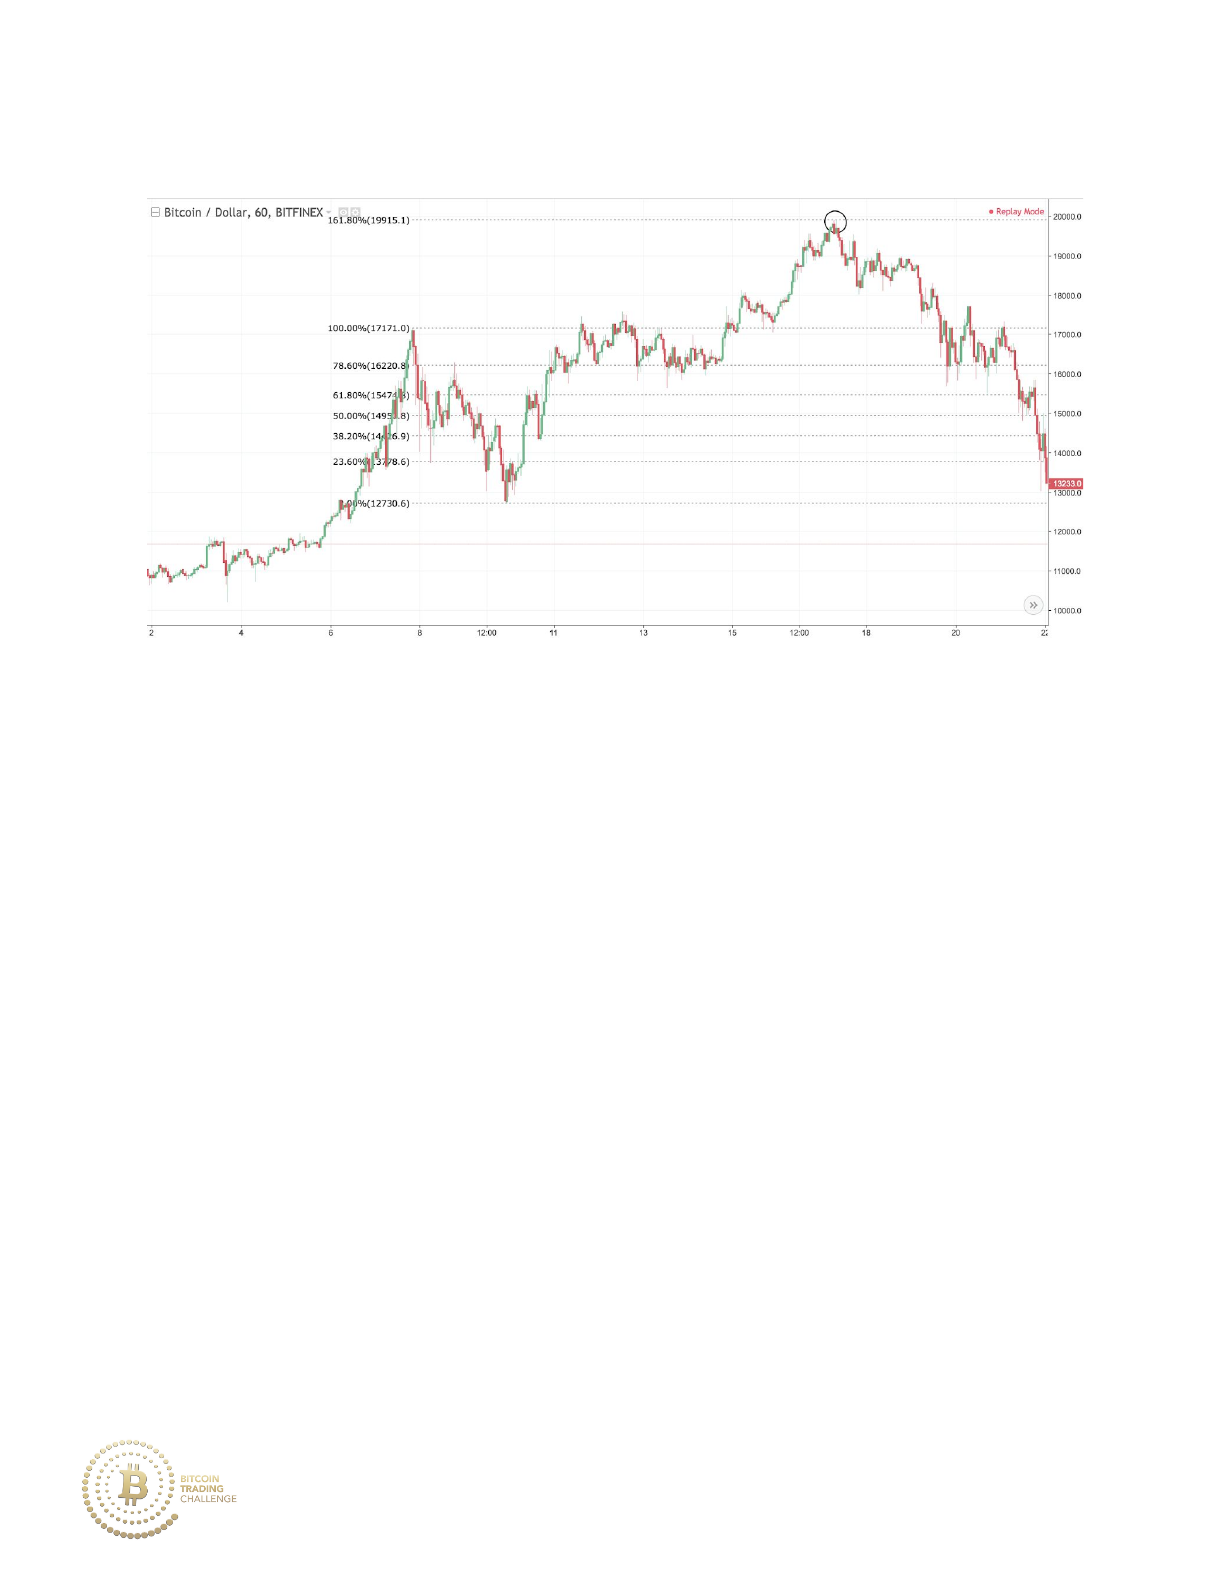
The 161.8% extension in action:
How do you project the level of resistance indicated above by the circle?
You take the previous retracement that occurred (from the first picture
above, drawn from the top of the retracement to the bottom of the
retracement), then draw the Fibonacci endpoints forward in time of that
retracement, thus projecting an extension level.
One major difference between Fibonacci retracements and Fibonacci
extensions: Extensions can be drawn on periods of consolidation as well as
trending moves, whereas retracements are drawn solely on a trending
move.
59
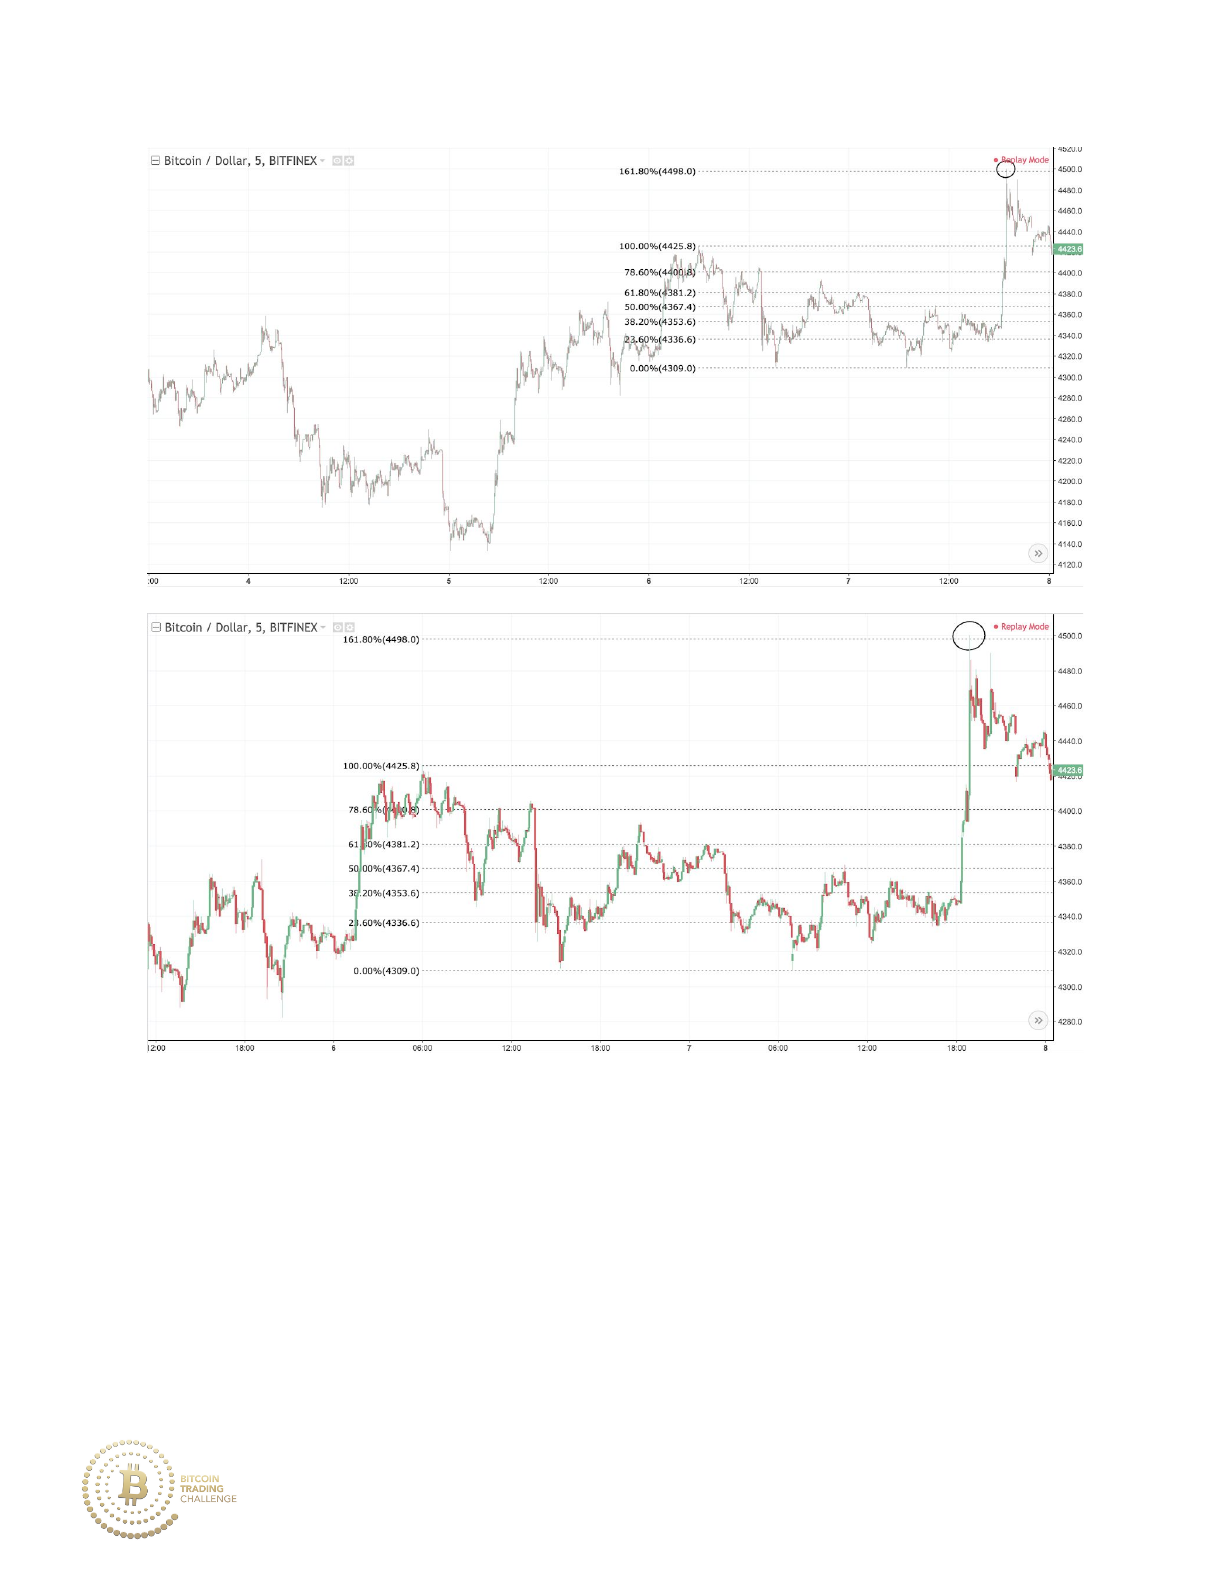
Notice above that the Fibonacci extension is drawn on the market stage of
consolidation (although some may see the market stage as a retracement).
The Fibonacci is drawn from the high to the low of consolidation.
You may be wondering why the Fibonacci extension was not drawn using
the high from 4425.8 to the low of 4282.2. Wouldn’t that high and low
60
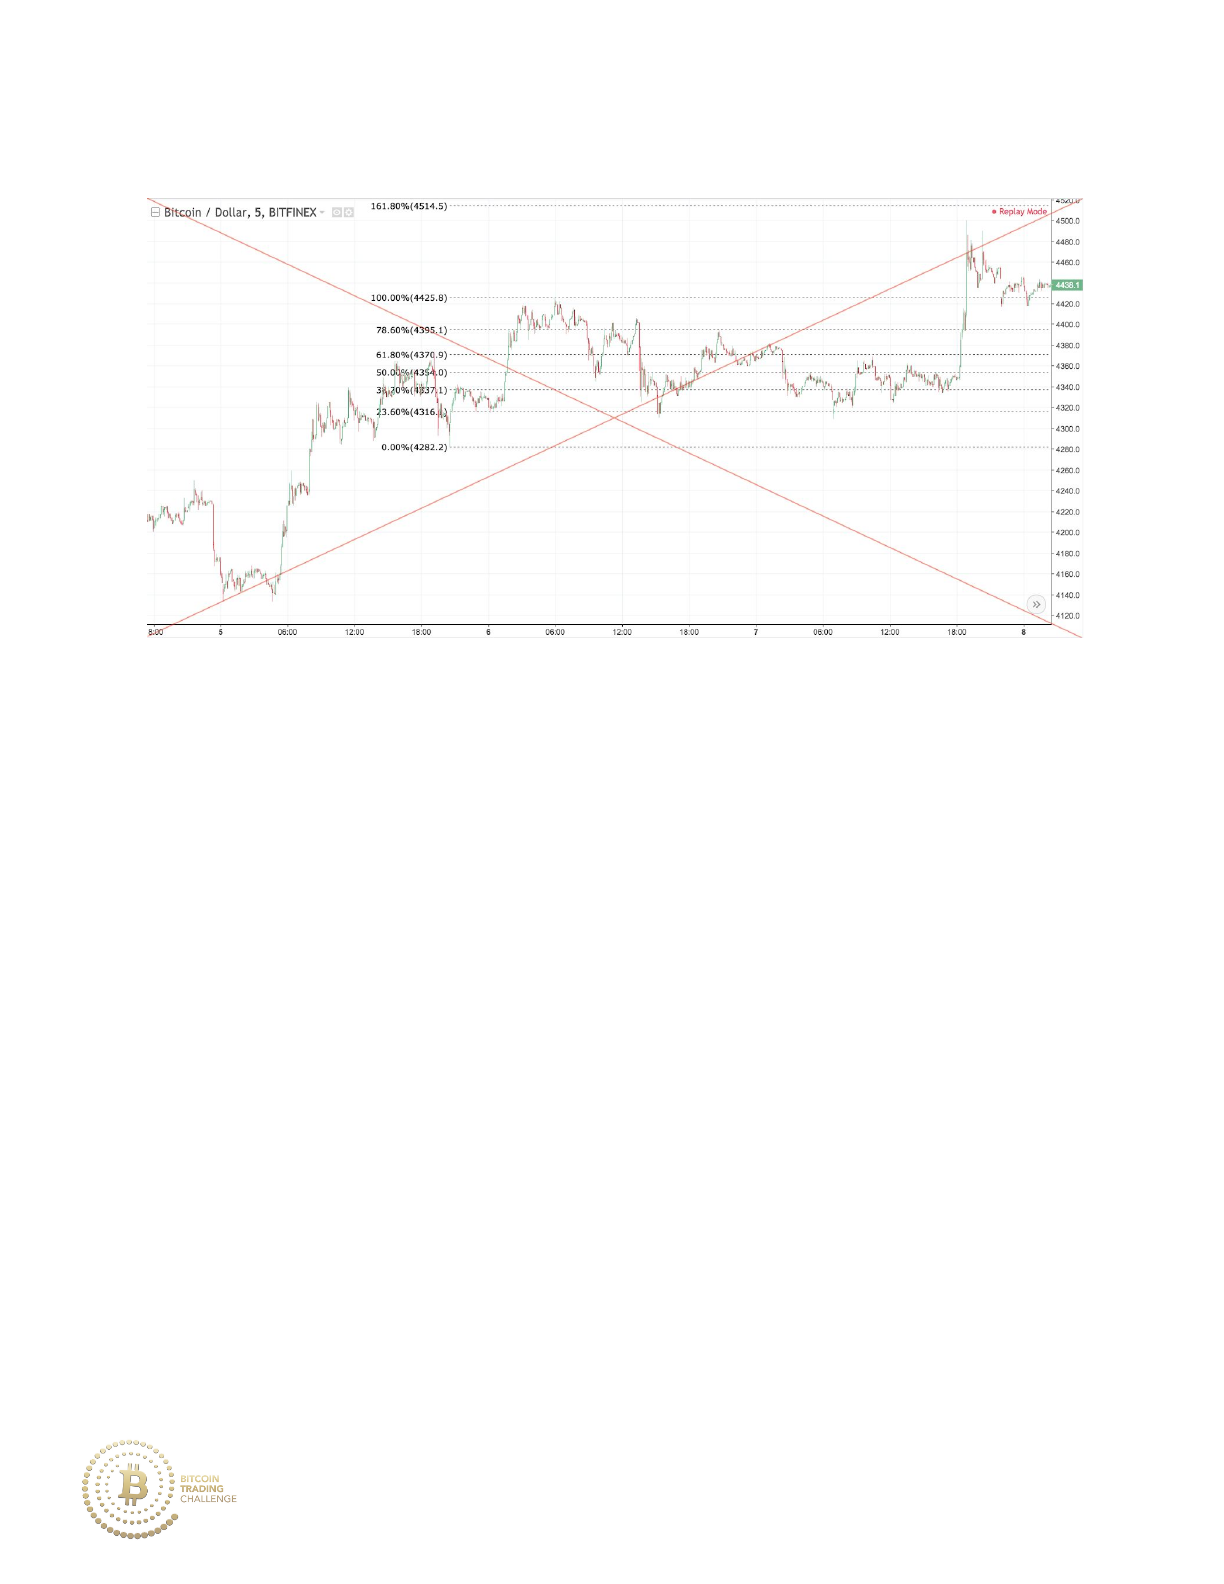
represent the consolidation range? No!
Recall that Fibonaccis can never be drawn backward in time, they must be
drawn left to right.
61
Practice 4-1
Will price rebound back upward after hitting the 161.8% extension?
62
Practice 4-1 Answer
Price rebounds off of the 161.8% and begins a powerful uptrend.
C. The Other Extension Levels
Beyond the 161.8%, there are a few other Fibonacci retracement levels that
are notable. The most important levels include the 127.2% and the 261.8%.
63
i. The 127.2%
The 127.2% extension level comes from the square root of phi: . It
√1.618
has three main uses:
1. An extension used for weak trends: when a trend retraces 78.6%, the
market tends to extend to around the 127.2% of that retracement if
price has a strong bounce off of the 78.6% level.
2. As a confluence level to be used with other extensions: overlap of the
127.2% and the 161.8% can yield high probability points of reversal.
3. As a barometer to further price extension: a strong break of the
127.2% extension signals that the market may find
support/resistance at further extension levels such as the 161.8% or
the 261.8%.
64
Price tends to extend 127.2% off of a 78.6% retracement due to the
bull/bear control of the market. If the market is in an uptrend, but the
market retraces downward to the 78.6%, it is safe to say that the bulls are
not in full control of the market and demand may only carry price so far,
thus the 127.2% extension may govern as a barrier to price.
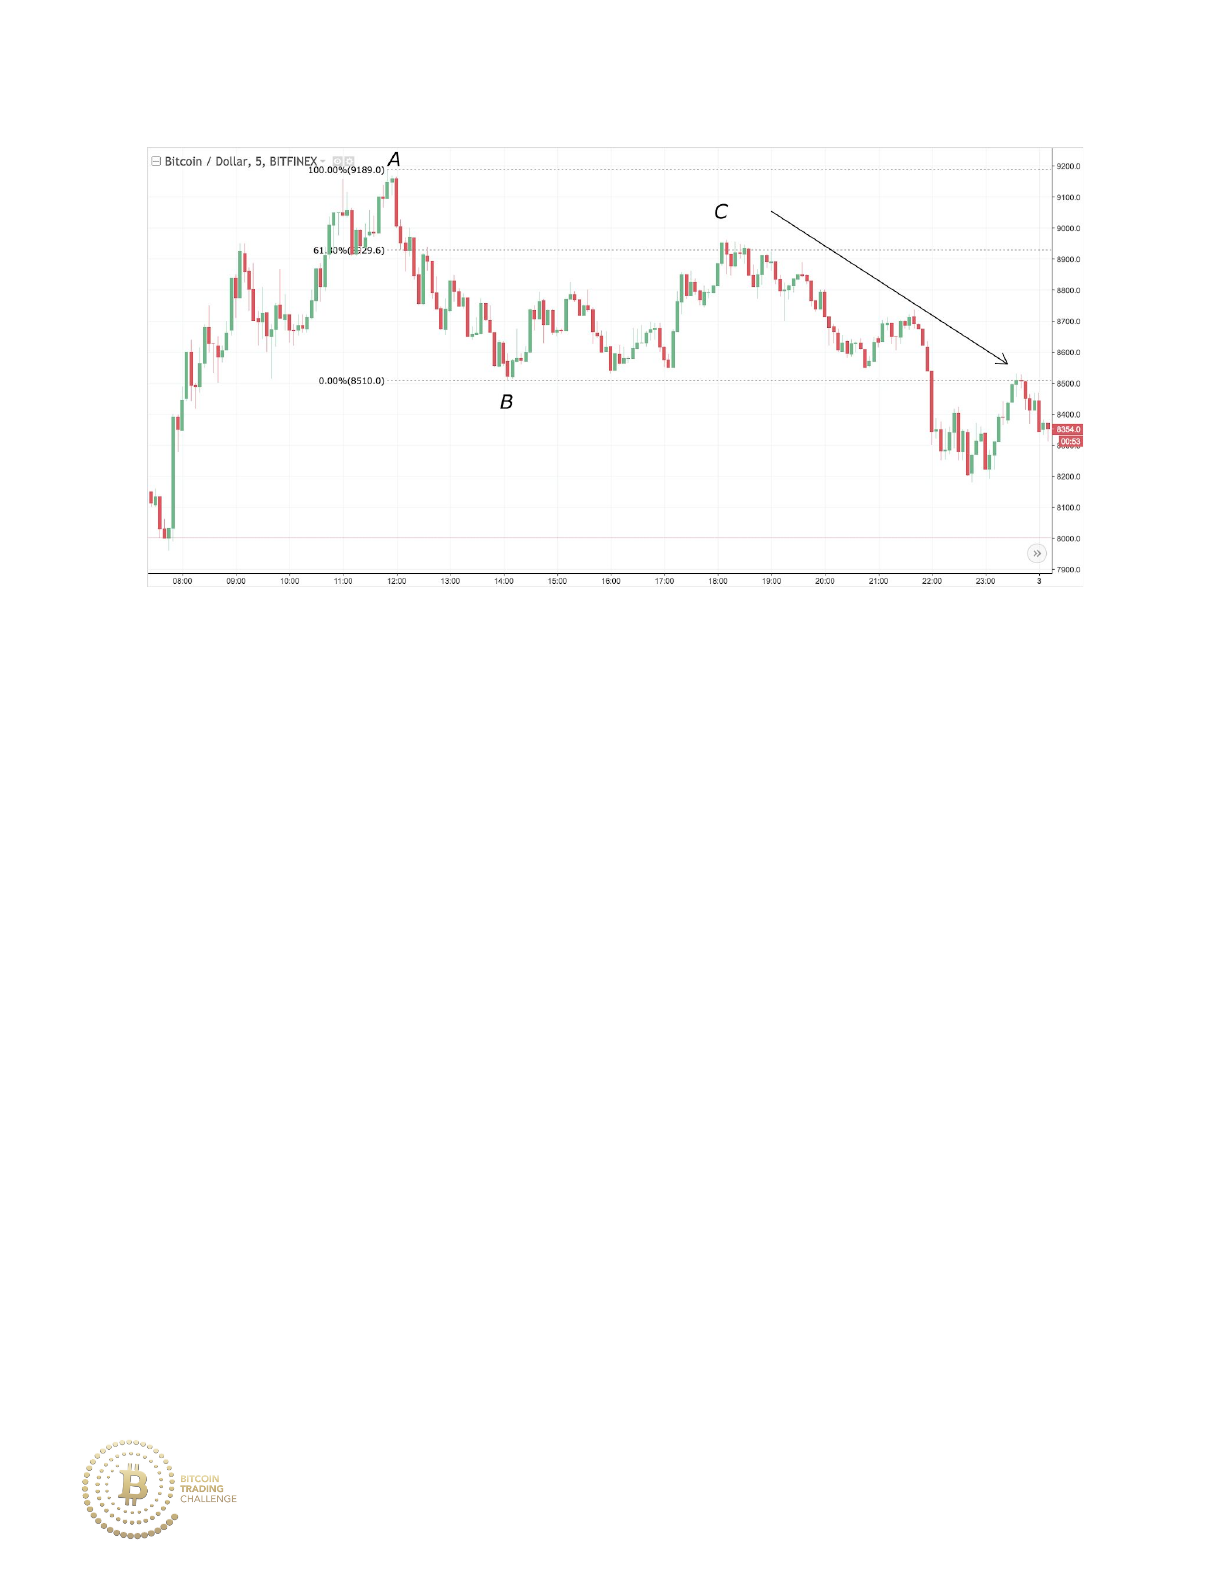
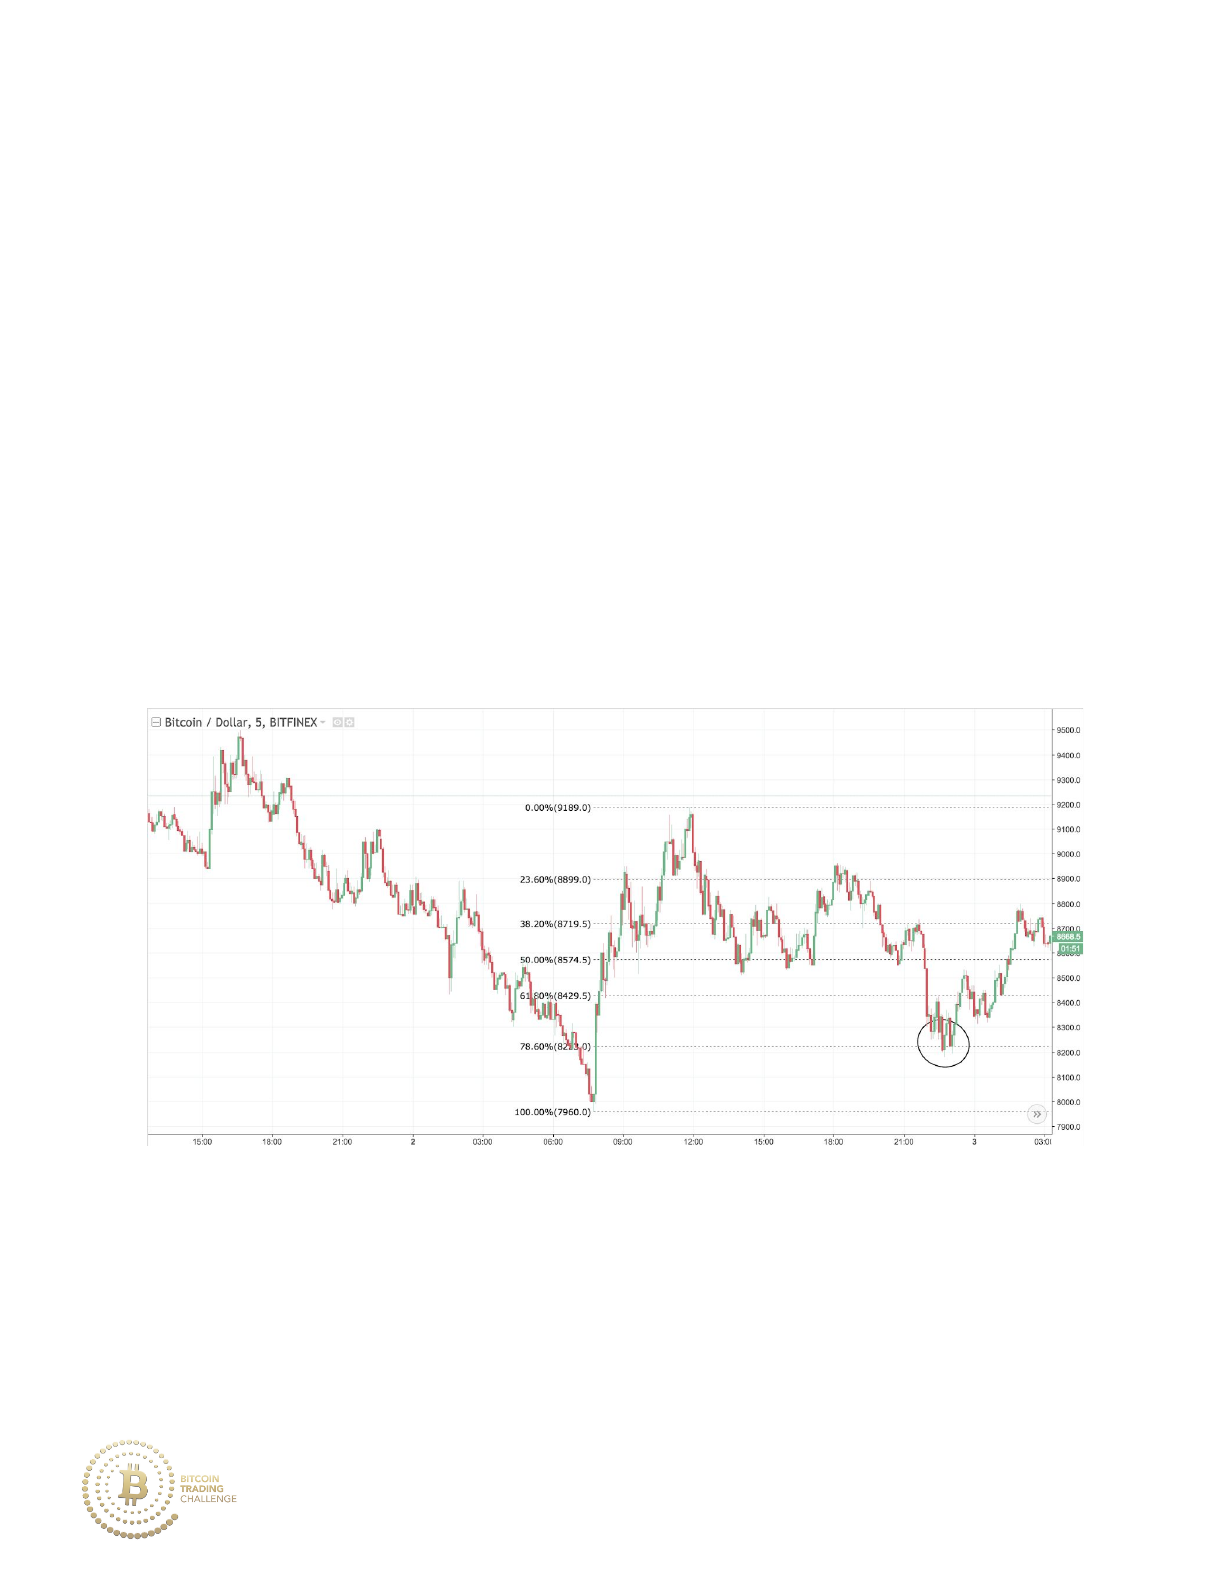
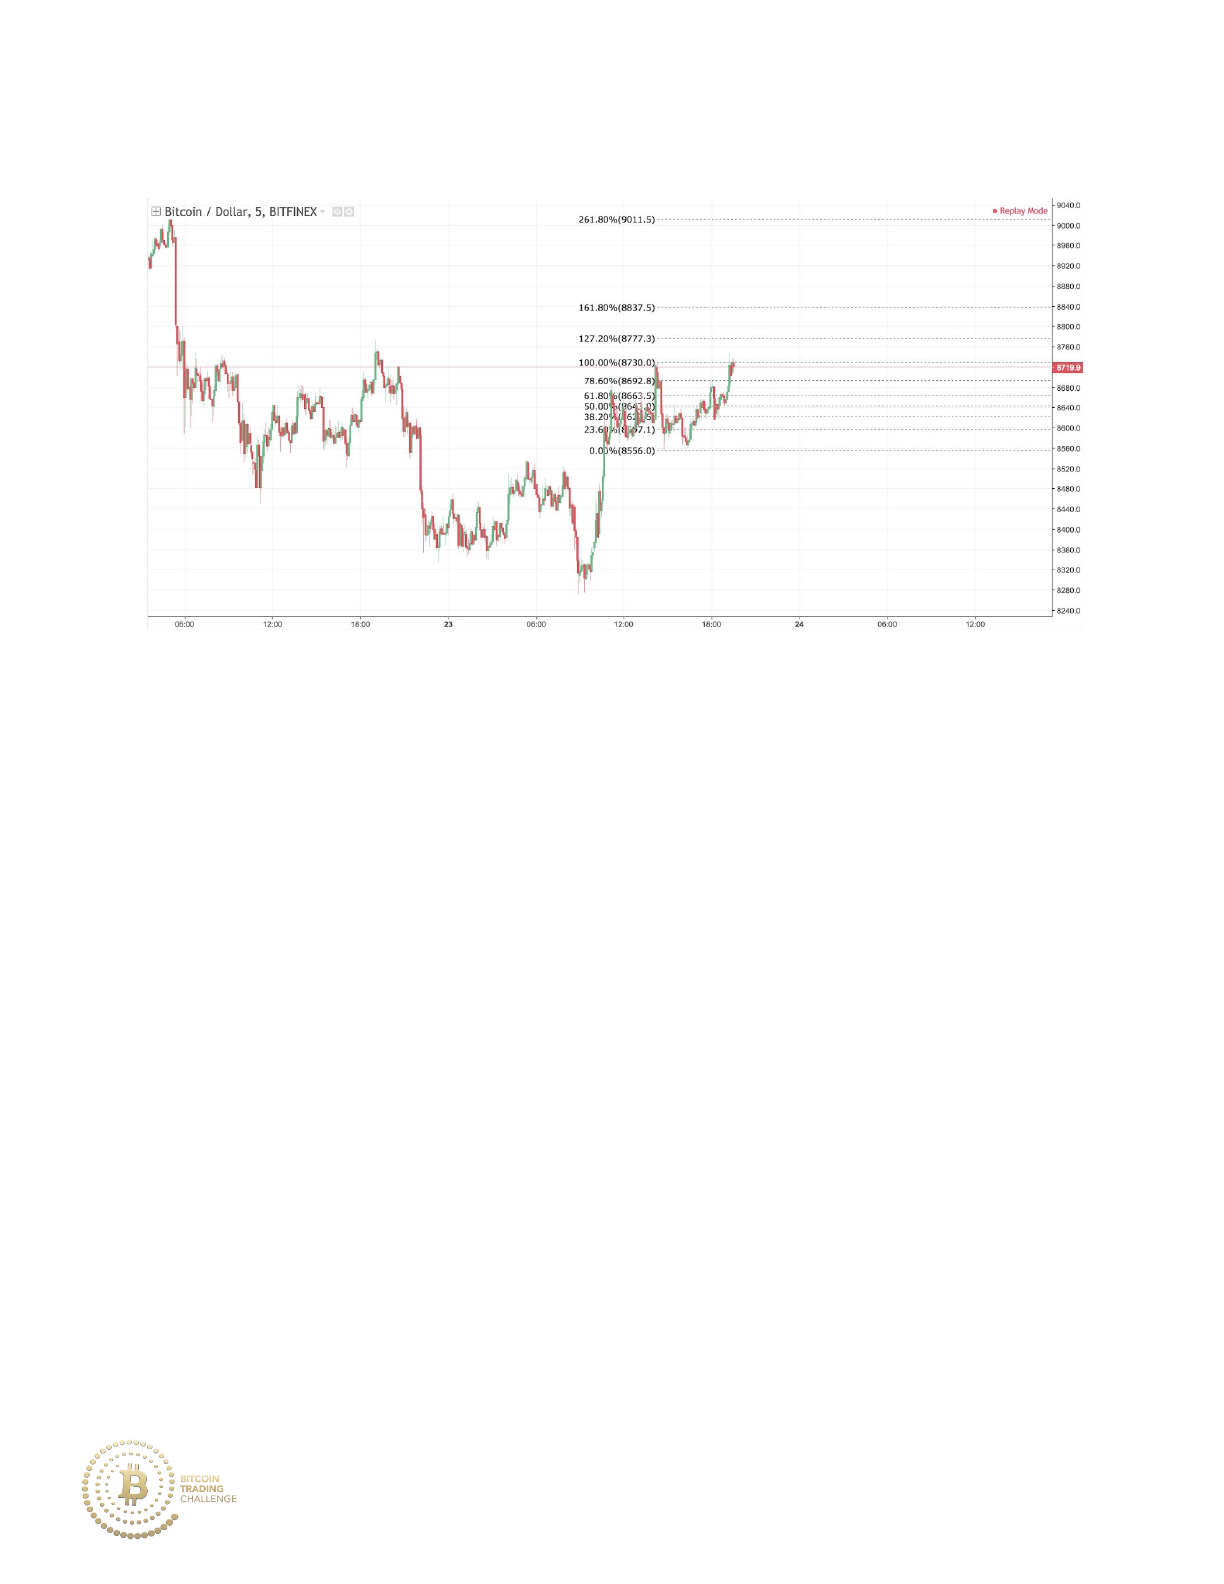
As seen below, the market retraces 78.6% of the previous trend, indicating
that the uptrend is likely weak. If price breaks the high of the Fibonacci
(9189), then the 127.2% extension of the retracing move from 9189 to 8180
is likely to become resistance.
65
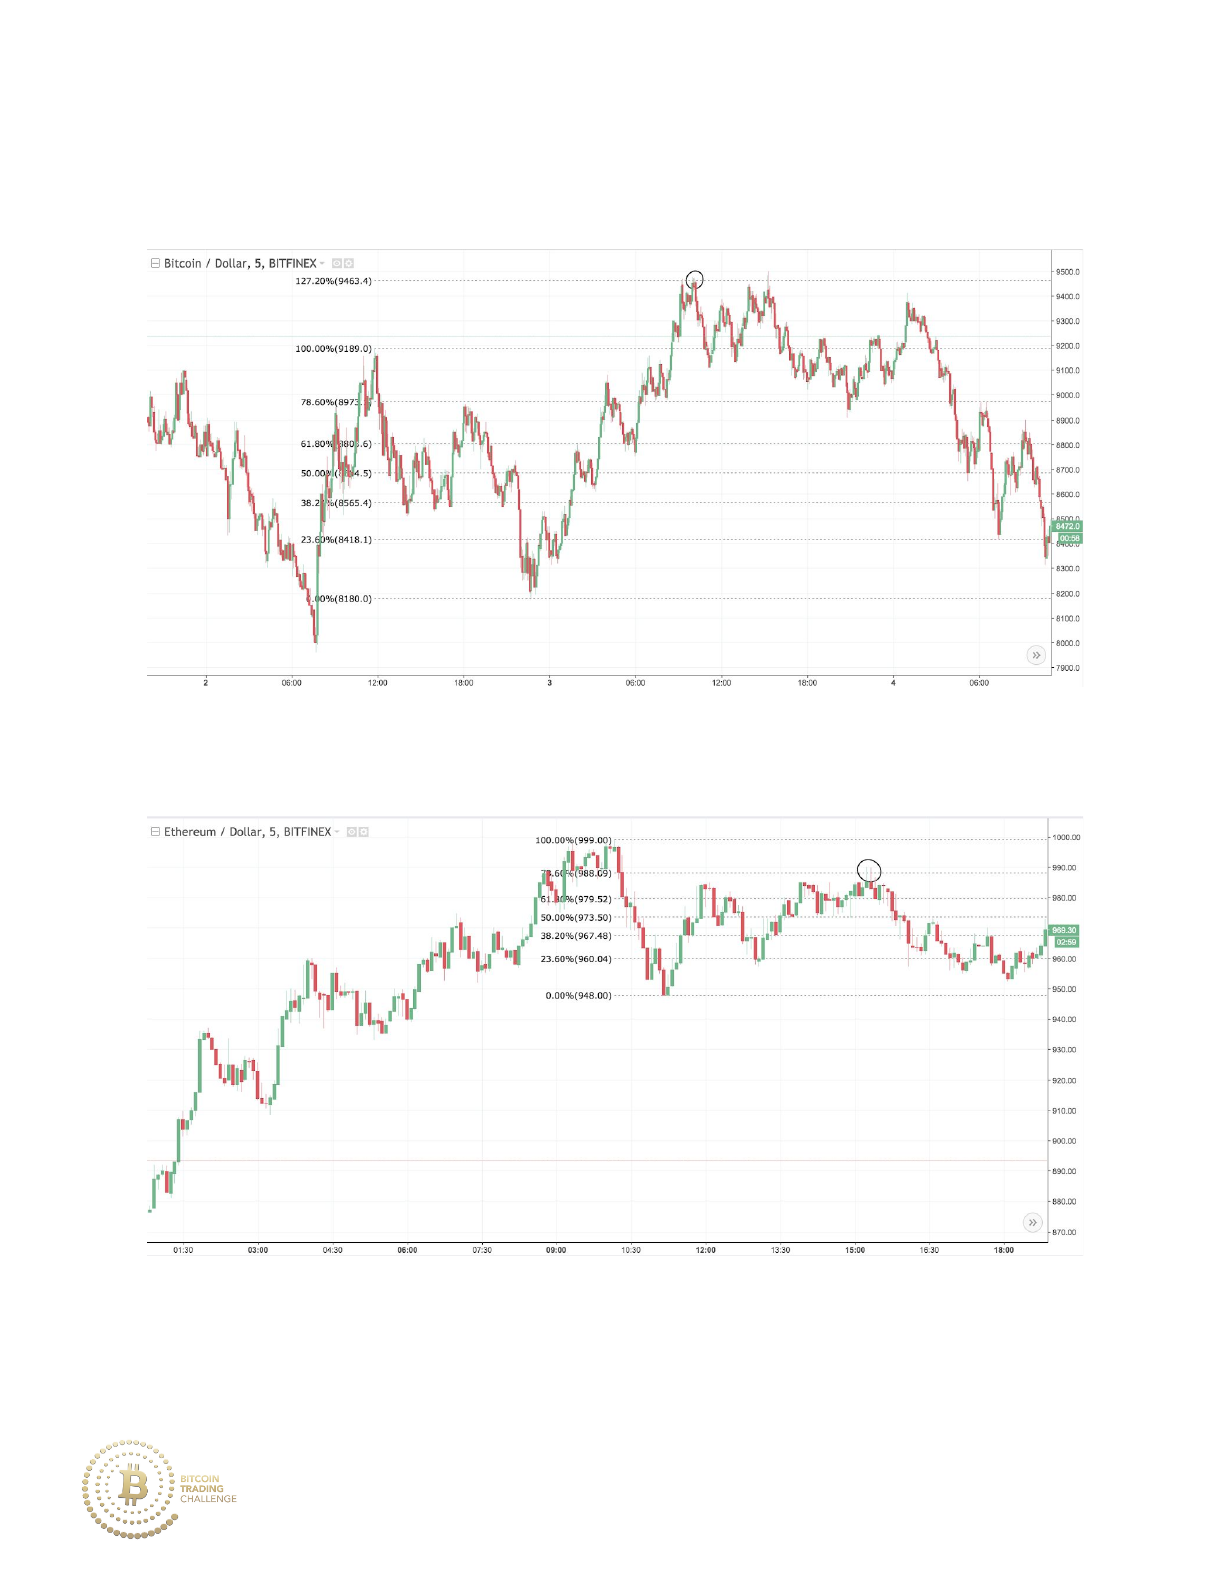
The market extends 127.2% of the previous retracement before beginning a
downtrend.
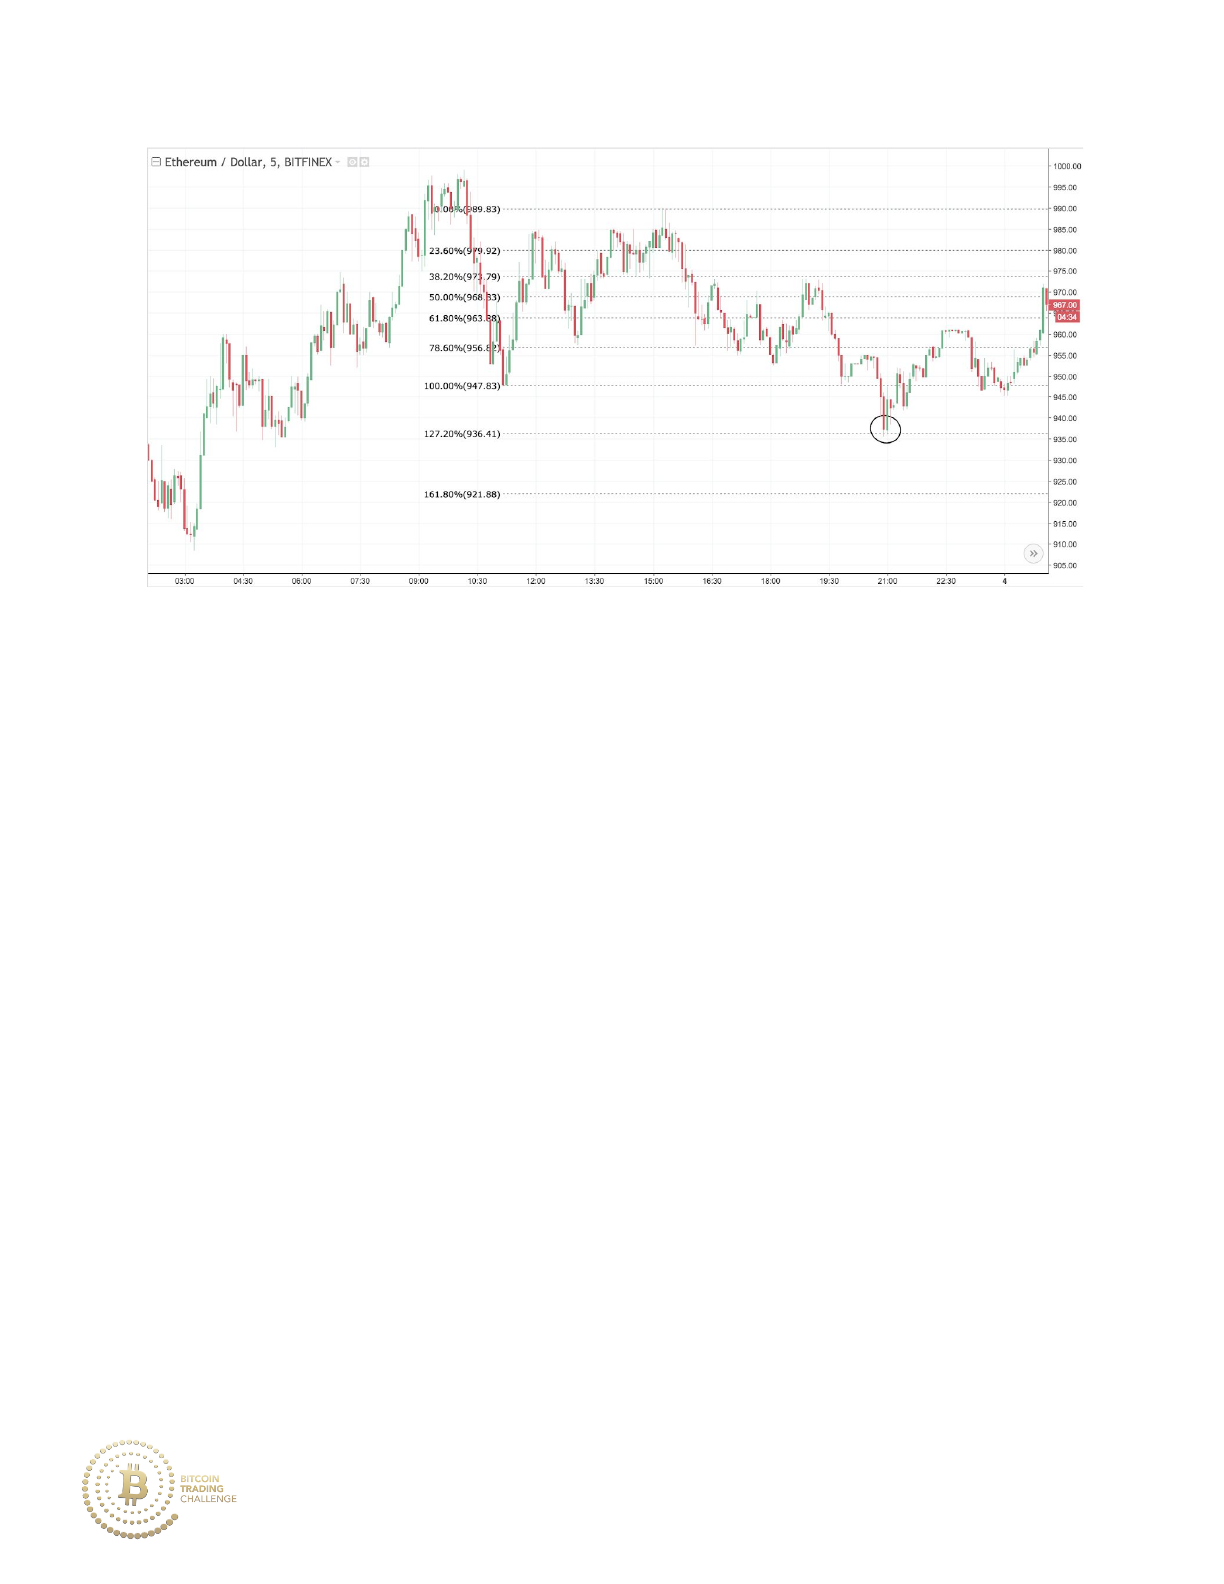
Below is an example of price in a downtrend retracing 78.6% upward.
Price then extends down to the 127.2% before moving back upward.
66
Confluence between extensions is a powerful method for generating high
probability reversal points.
Let’s take a look at how to use this confluence by use of multiple market
stages and overlapping Fibonacci extensions.
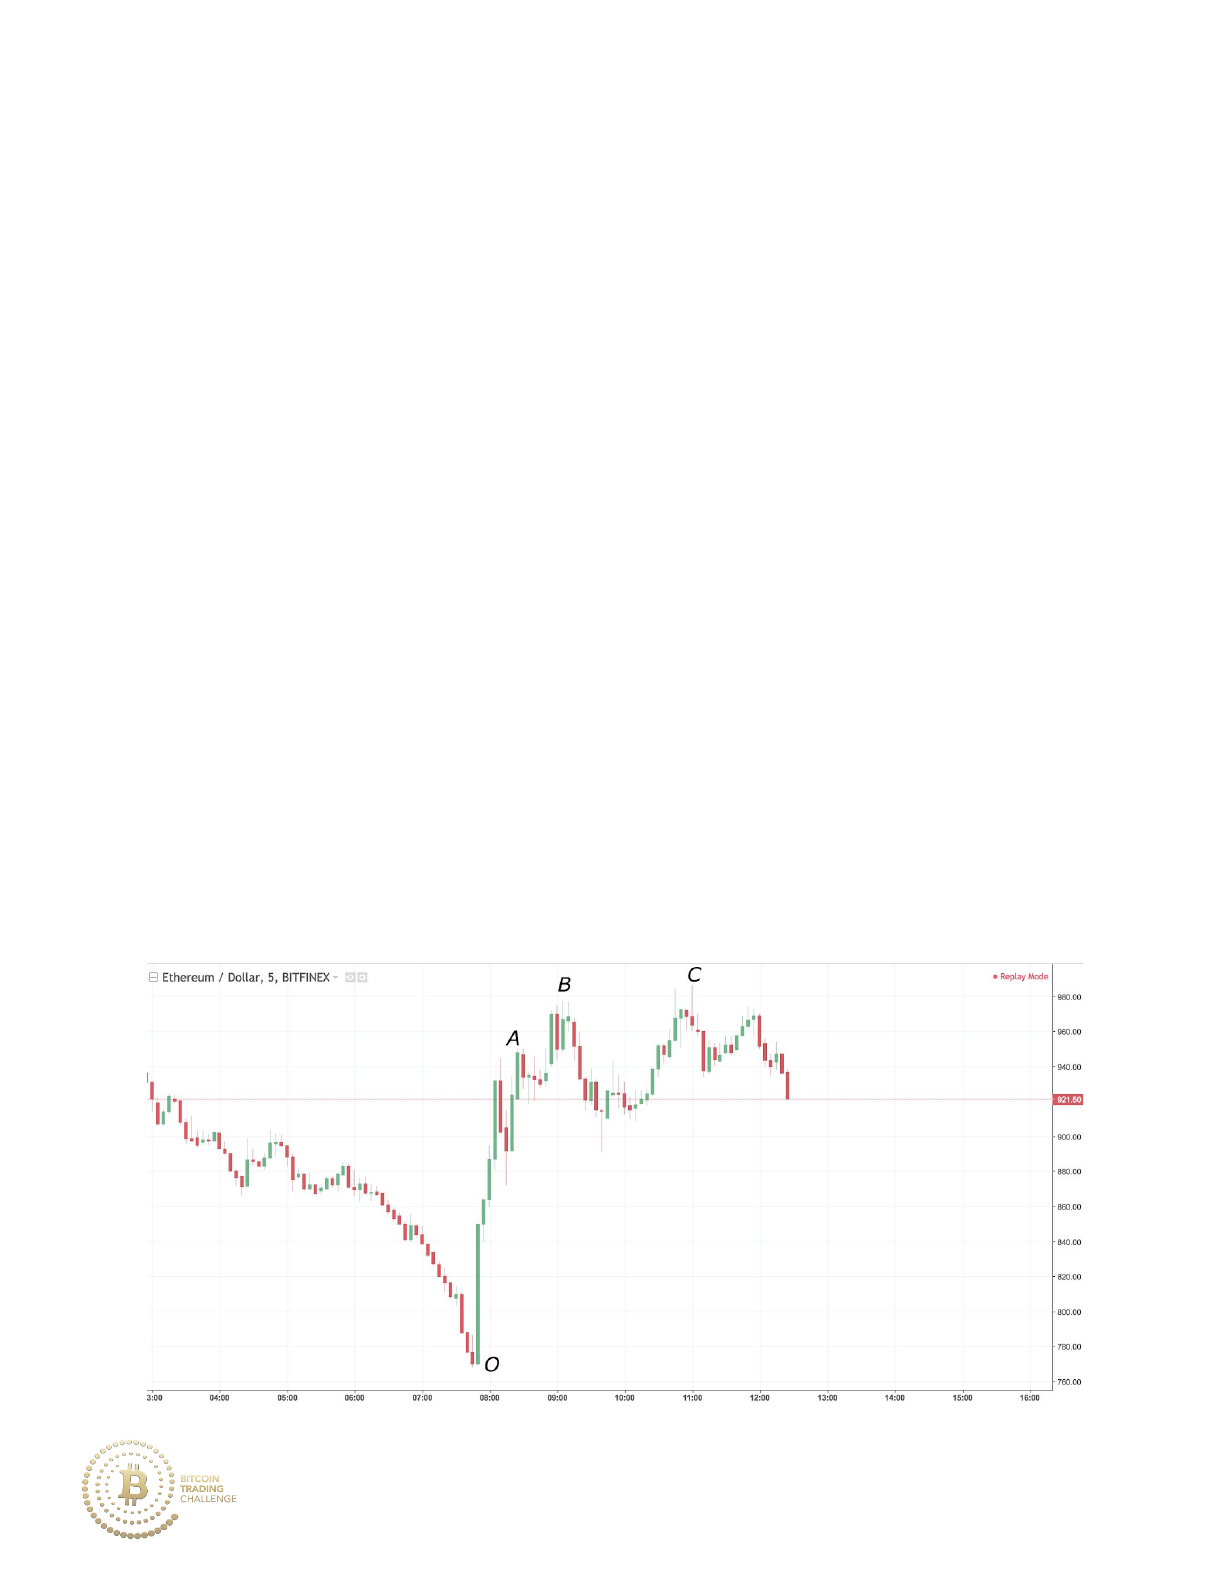
Focus on the two retracements against the downtrend: A to B and C to D.
How did I pick those two retracement levels? Those are the two major
retracements that price made against the downtrend.
67
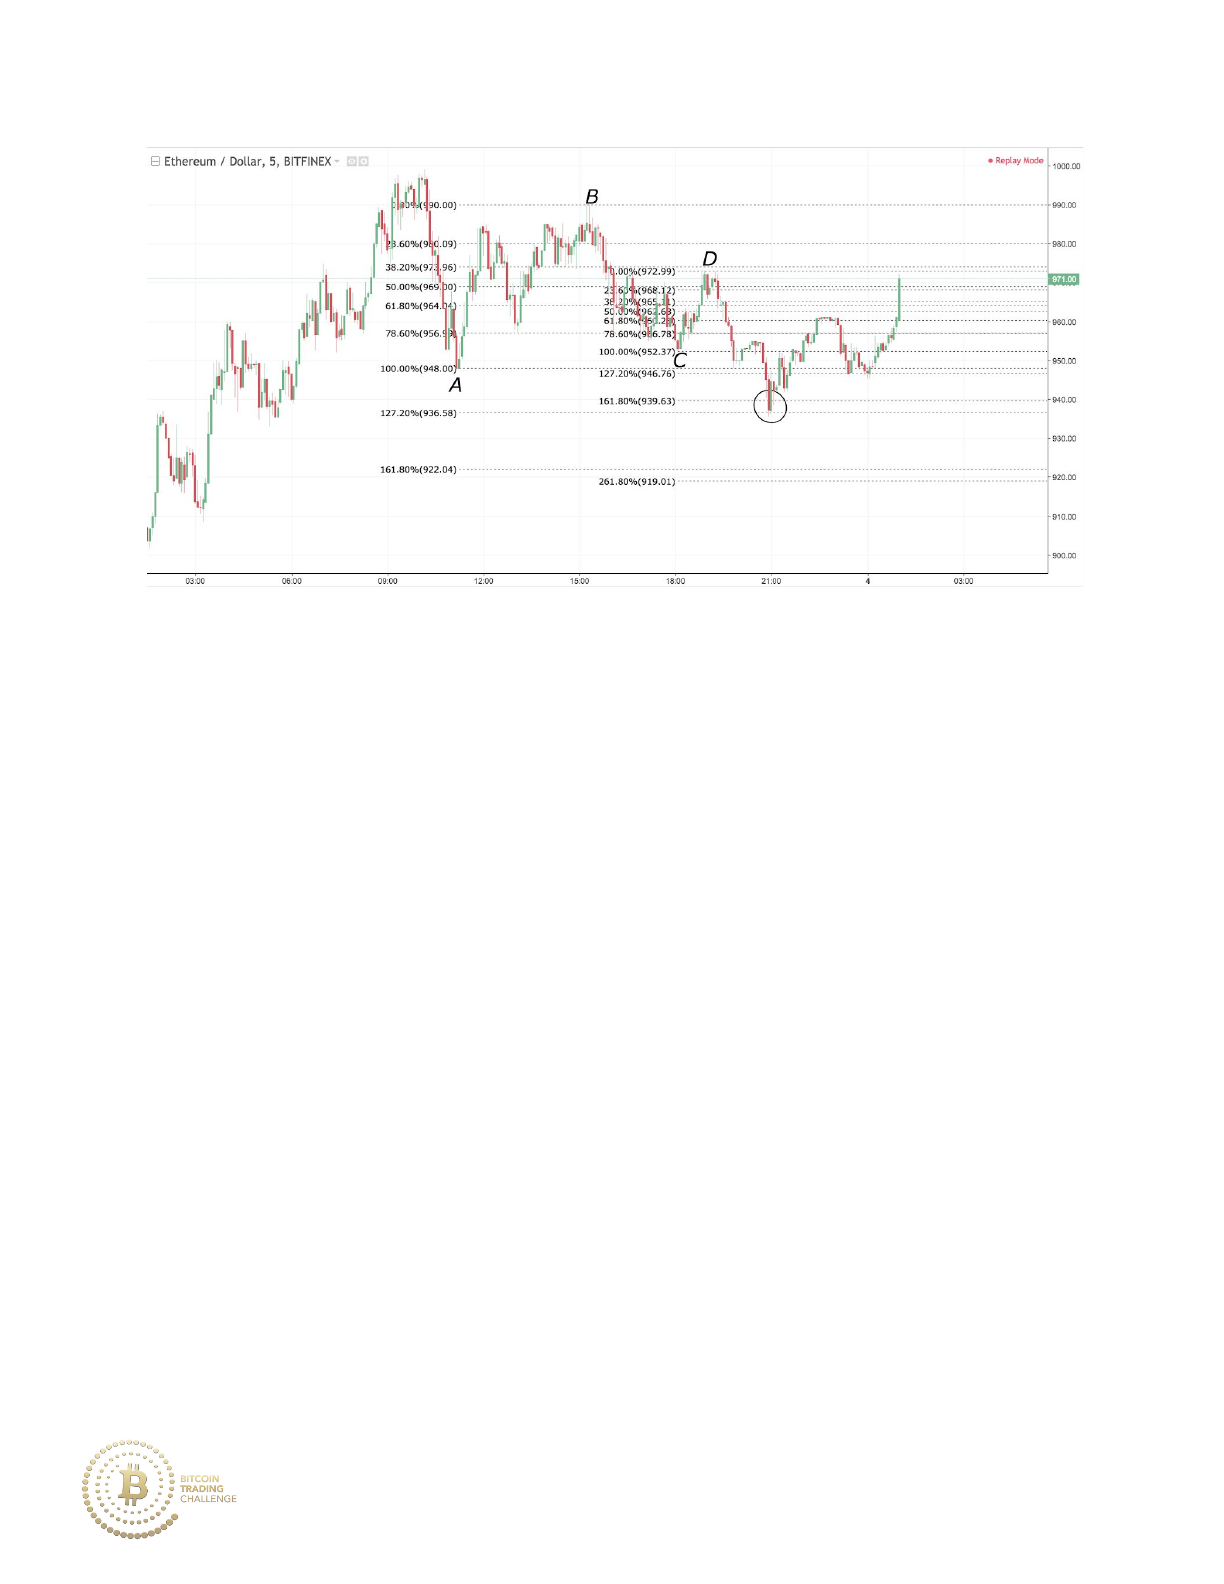
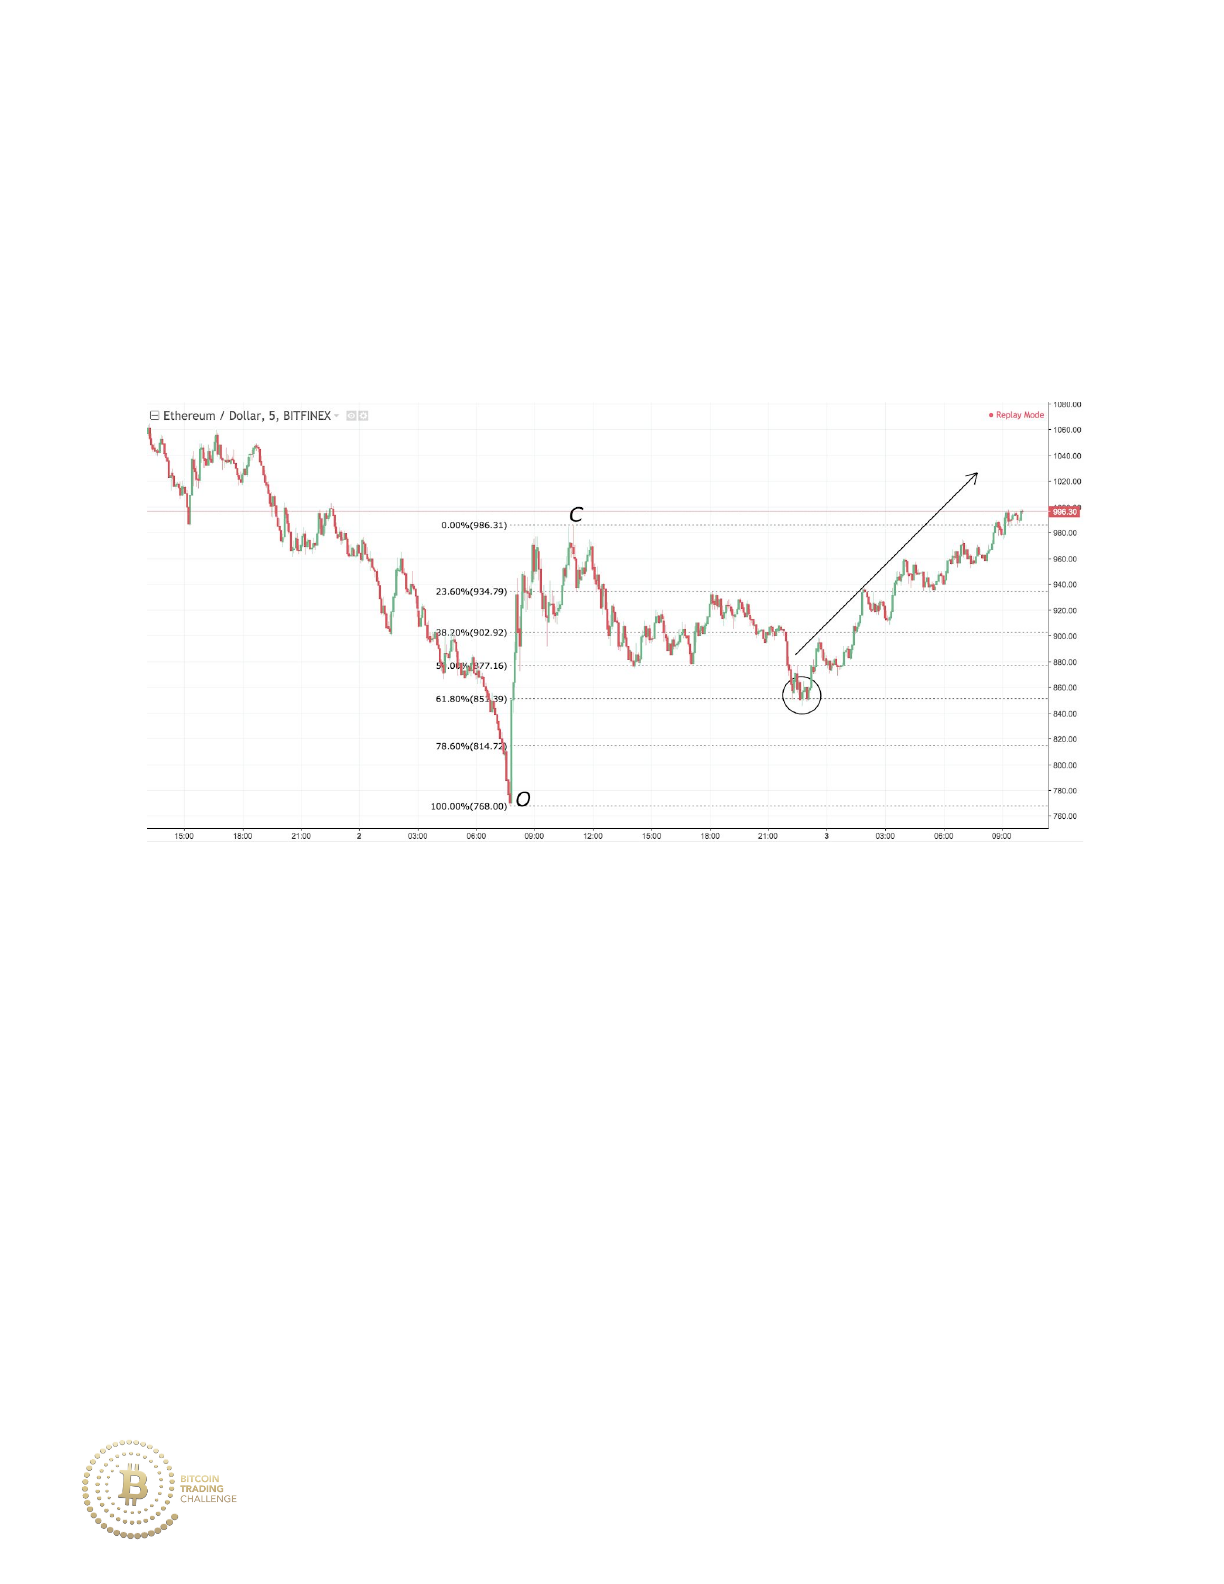
Both extensions of A to B and C to D find confluence at a zone from the
936 to the 939 support level. The market responds by immediately
touching, then rejecting that level and heading back upward to 971.
ii. The 261.8%
The 261.8% extension level is calculated by squaring phi: It has.1.6182
three main uses:
1. As a reversal level for very strong trends: when the market stage is in
a strong trend, the 261.8% extension drawn off of the previous market
stage of a retracement or consolidation will yield a likely reversal
point.
68
2. When price is consolidating in a very tight range and the underlying
trend is moving on strong momentum, a breakout will typically end at
the 261.8%.
3. As a confluence level with other extensions, especially when drawn
on a minor market stage.
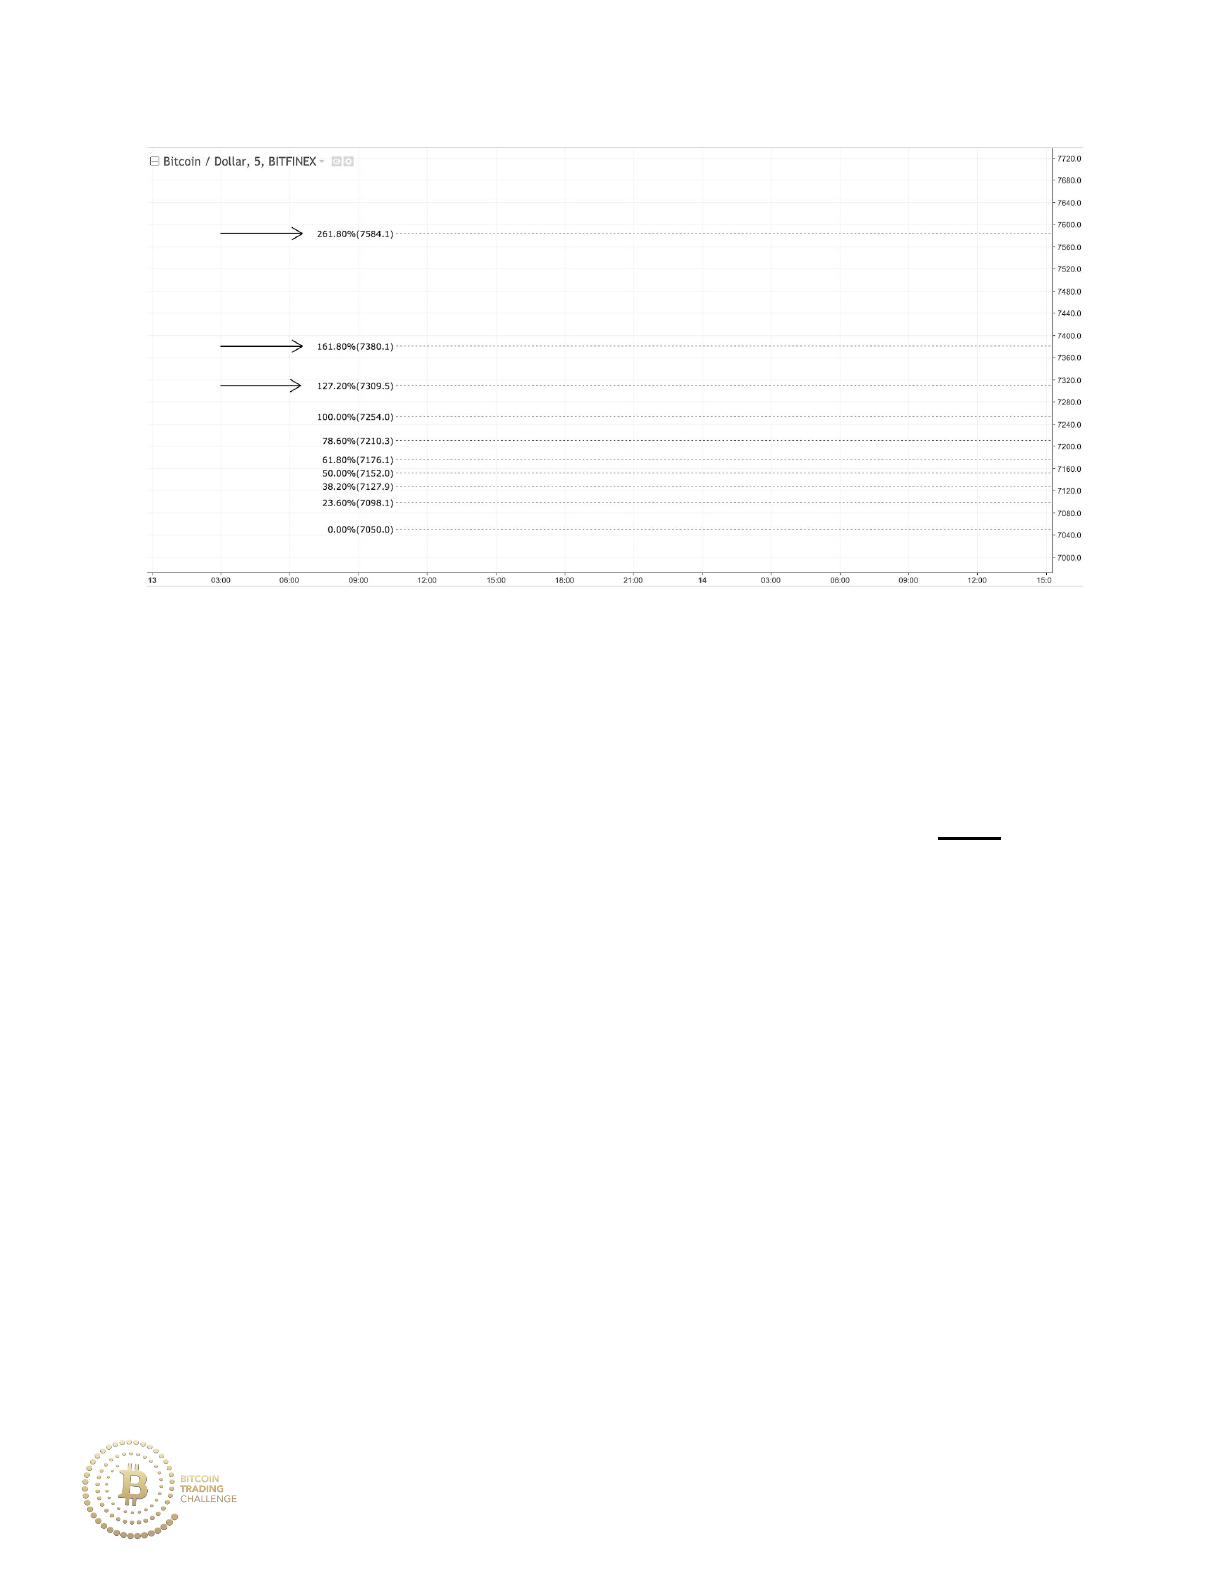
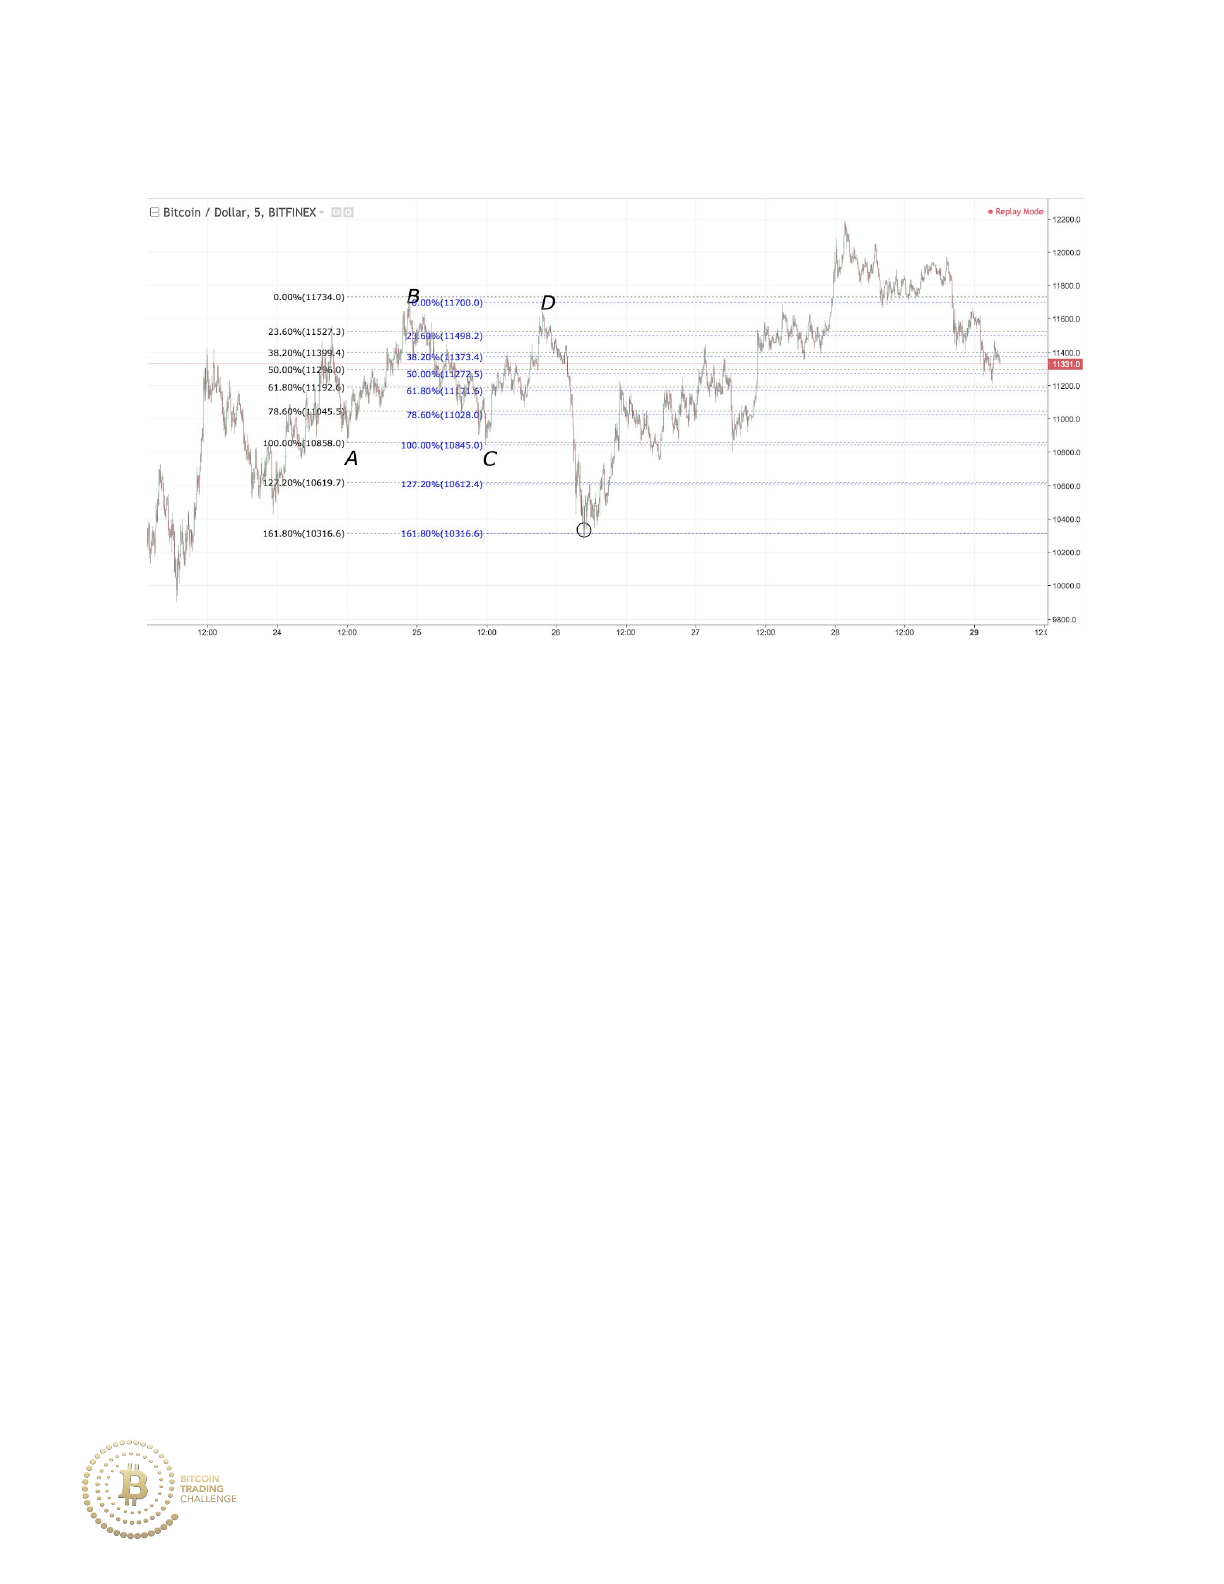
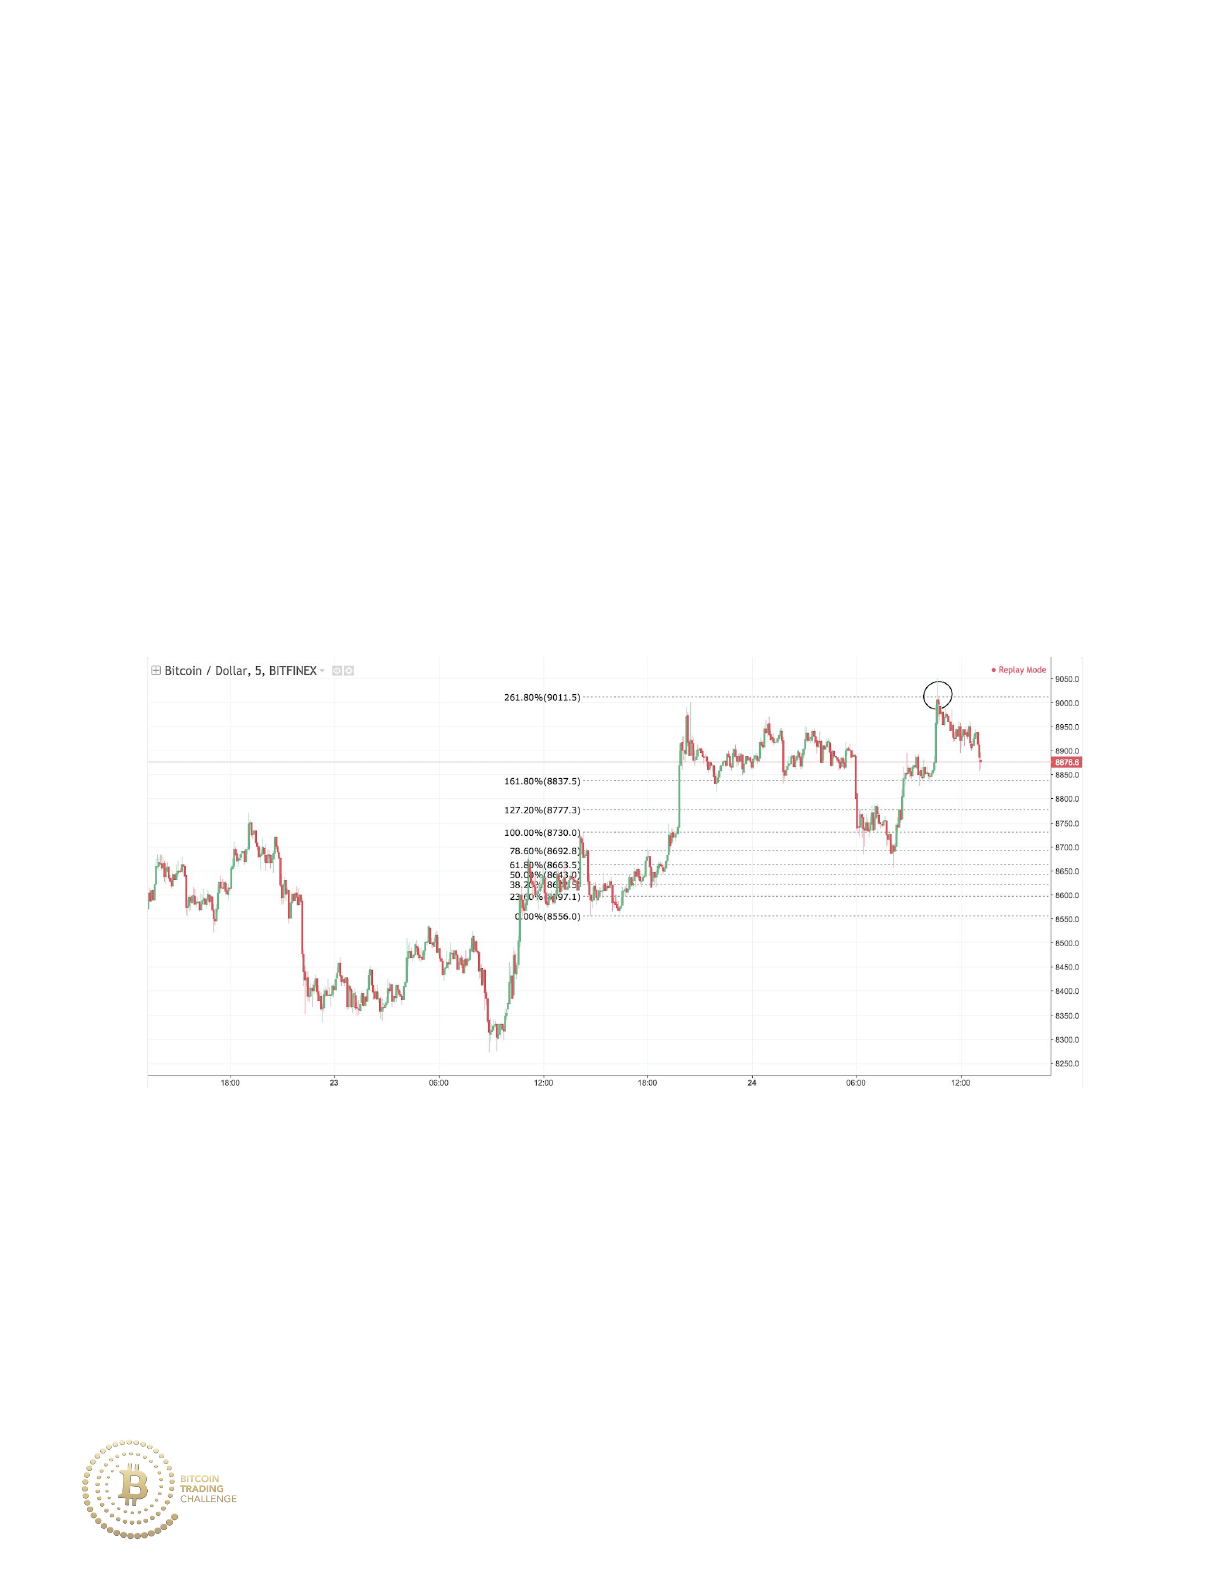
If we draw the Fibonacci endpoints from the high to the low forward in time
of the consolidation, we project potential higher levels that may act as
reversal areas. The 161.8% as well as the 261.8% extension levels are
expected to become important areas of resistance.
69
Drawing from the high of C to the low of D forward in time for the high to
low of consolidation is another way to draw the Fibonacci endpoints.
As you can see in the chart - both methods for drawing Fibonacci
extensions yield about the same resistance level for the 261.8% (it is not
typical that two separately drawn high to low Fibonacci endpoints will yield
the same extension, but when this occurs it strengthens the level of
support/resistance).
70
Also notice that the 161.8% extension(s) level yields minor resistance.
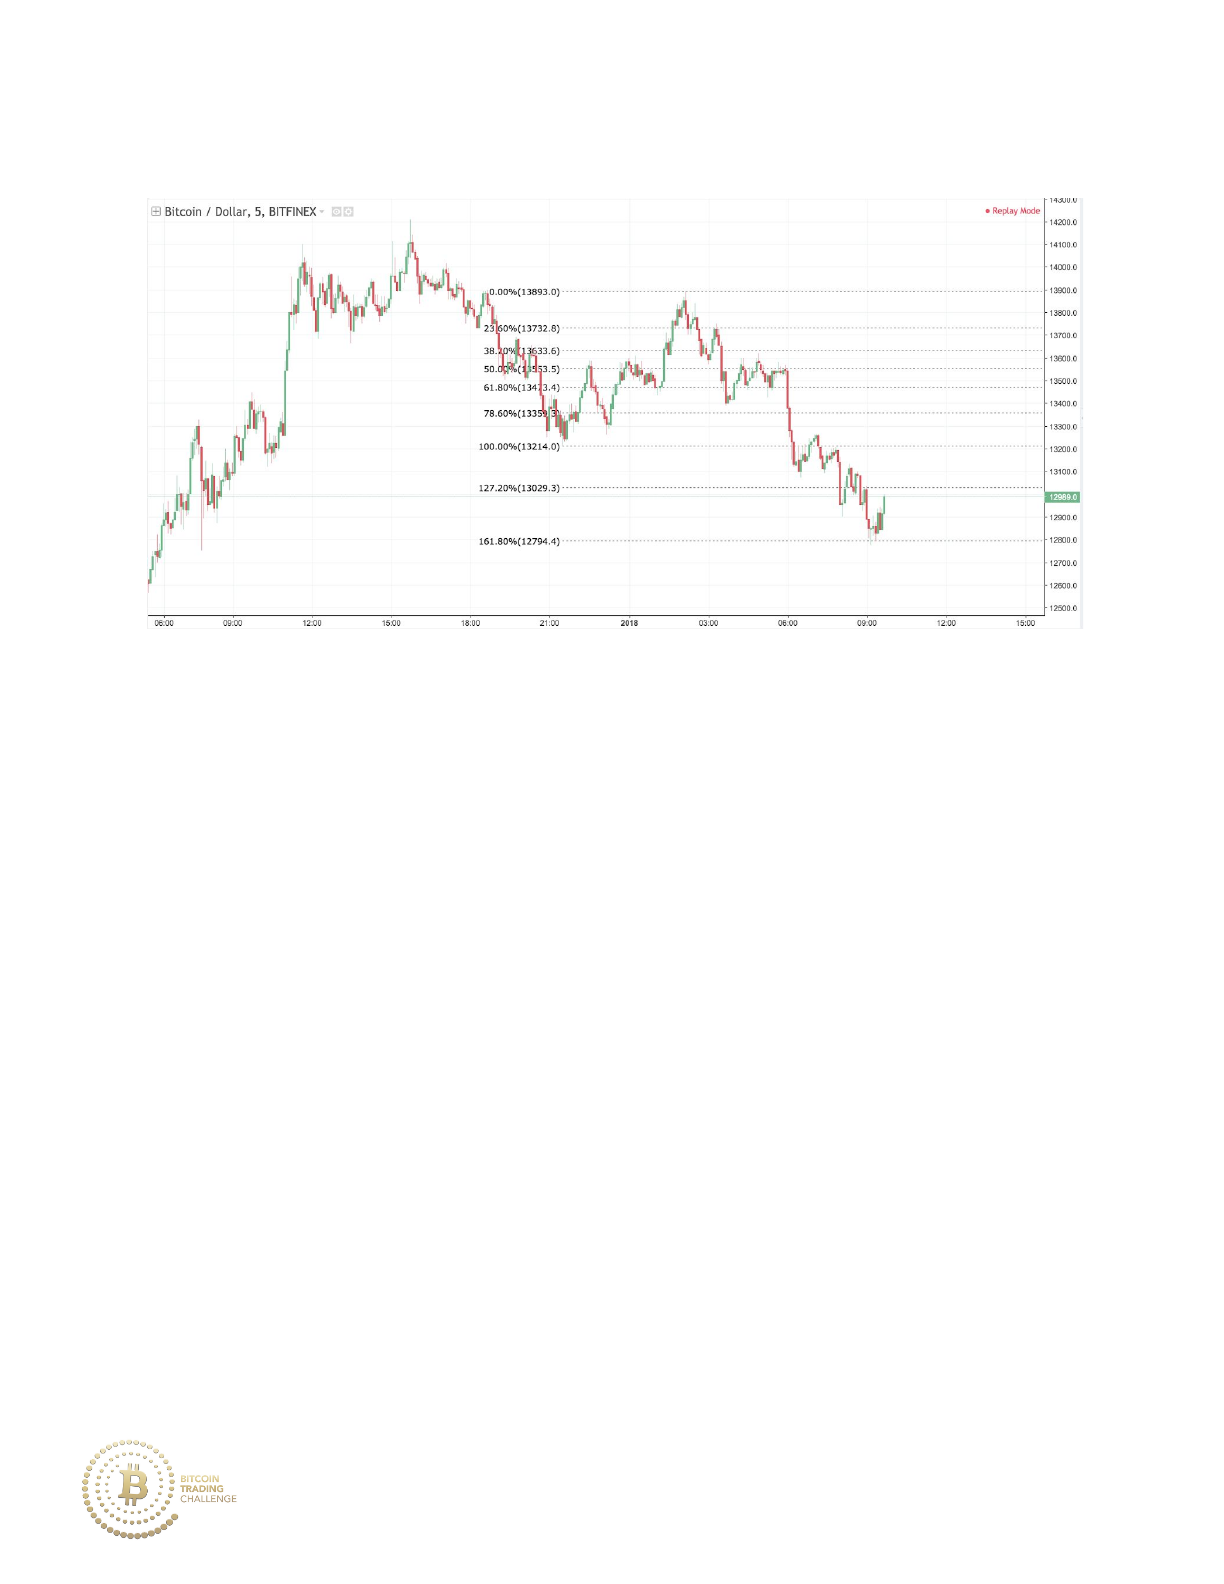
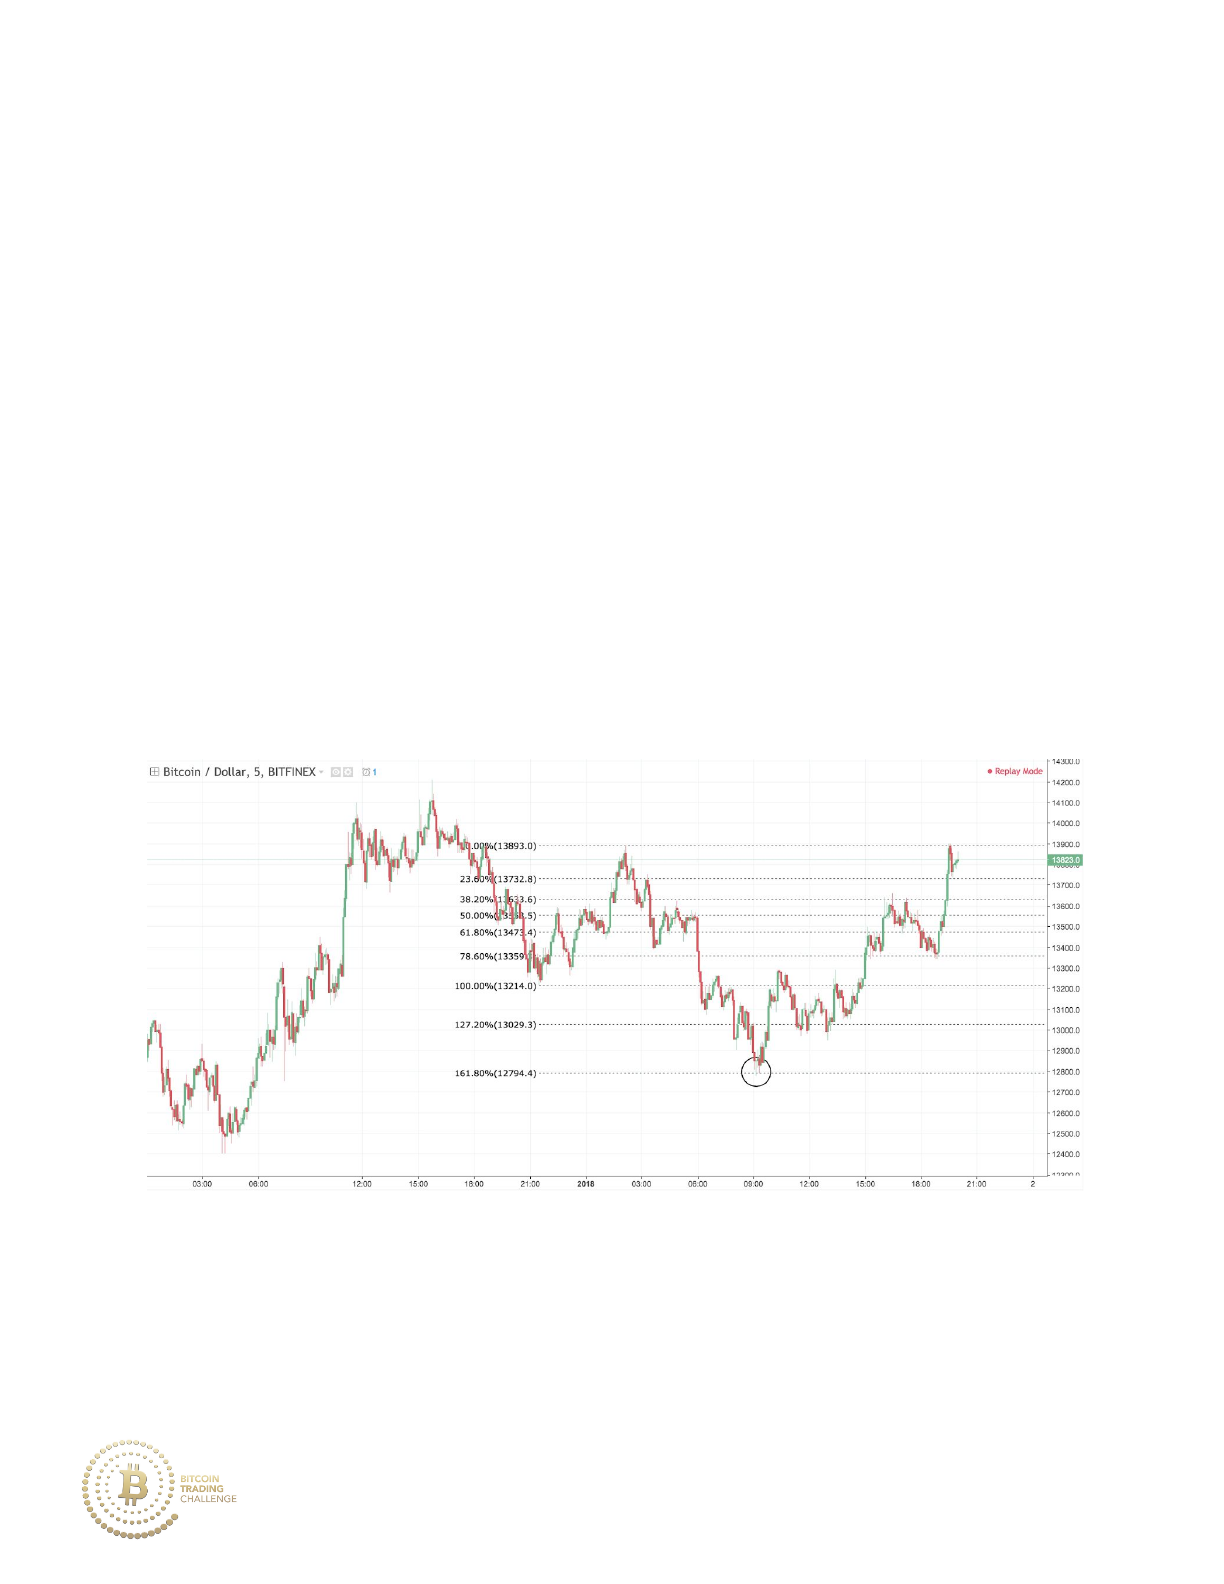
Price is in a strong downtrend from Point A to Point B. We then see a weak
retracement from Point B to Point C. Due to the strong momentum
71
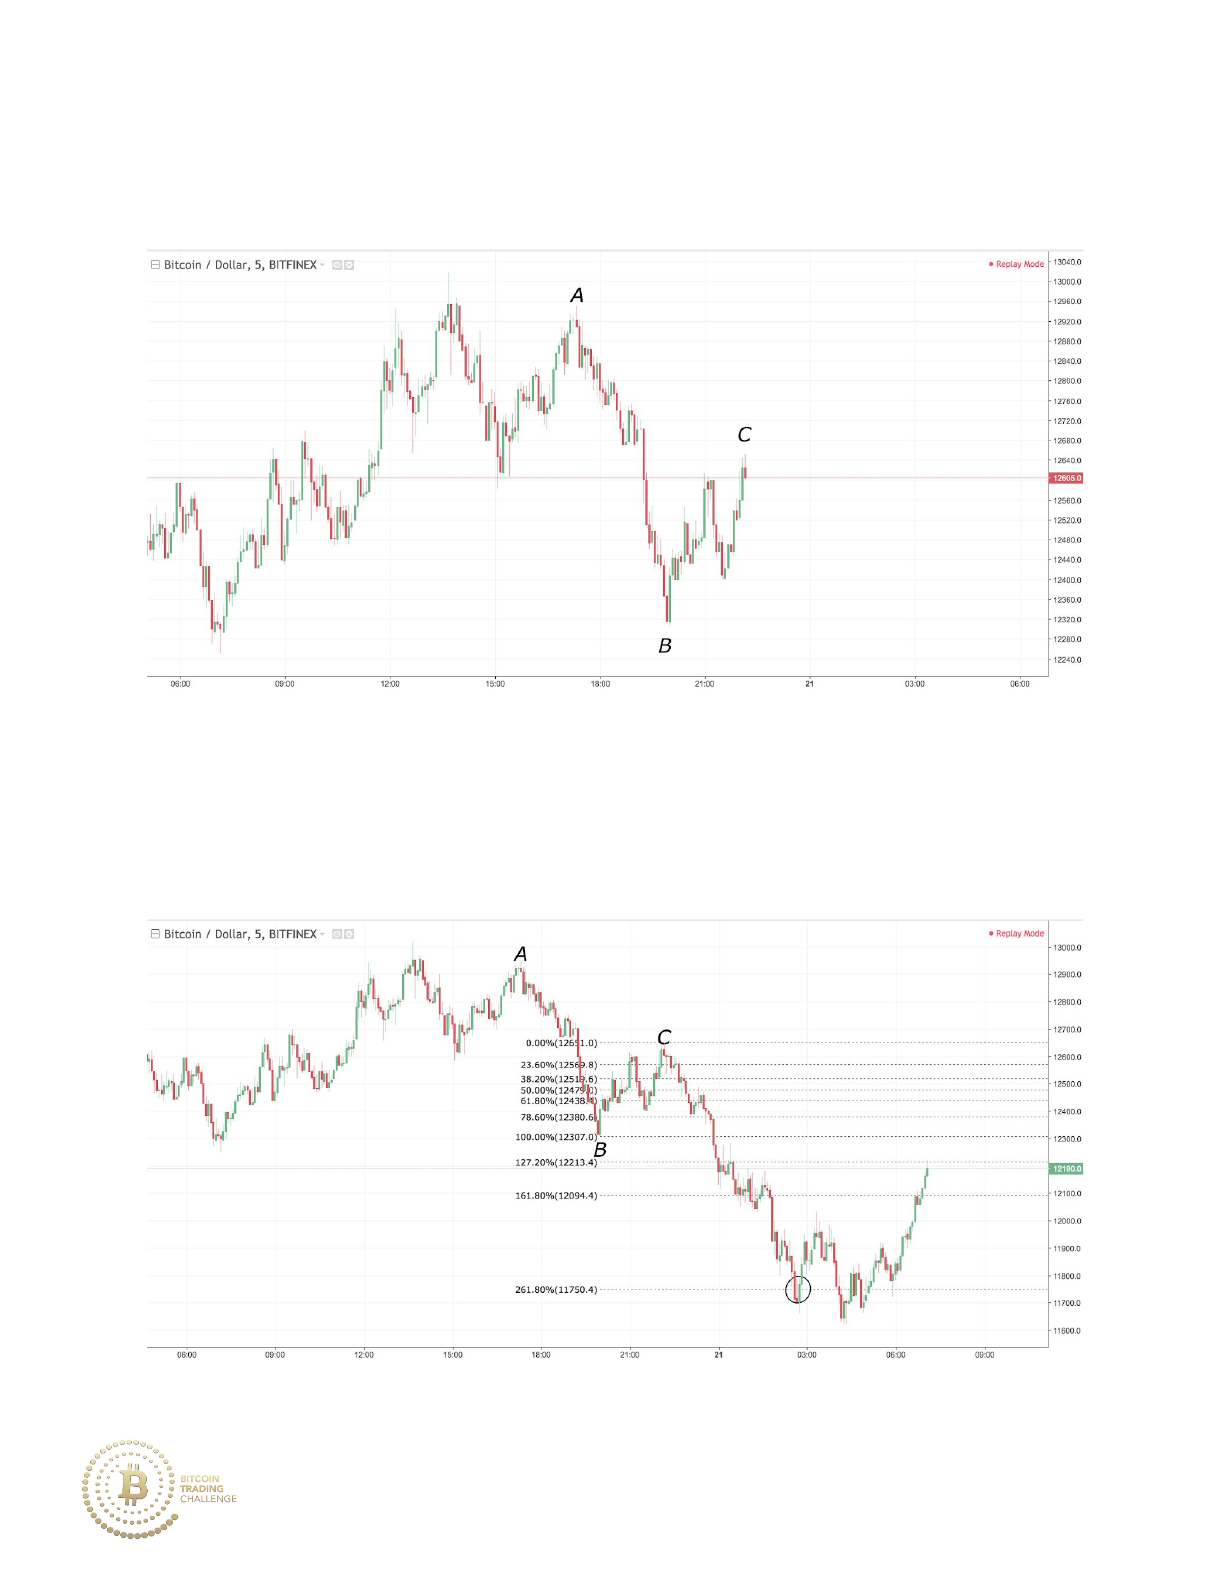
downtrend, we would expect the 261.8% extension of the B to C move to
become the next level of support.
The downtrend produces a support level from the 261.8% extension at
11750.
72
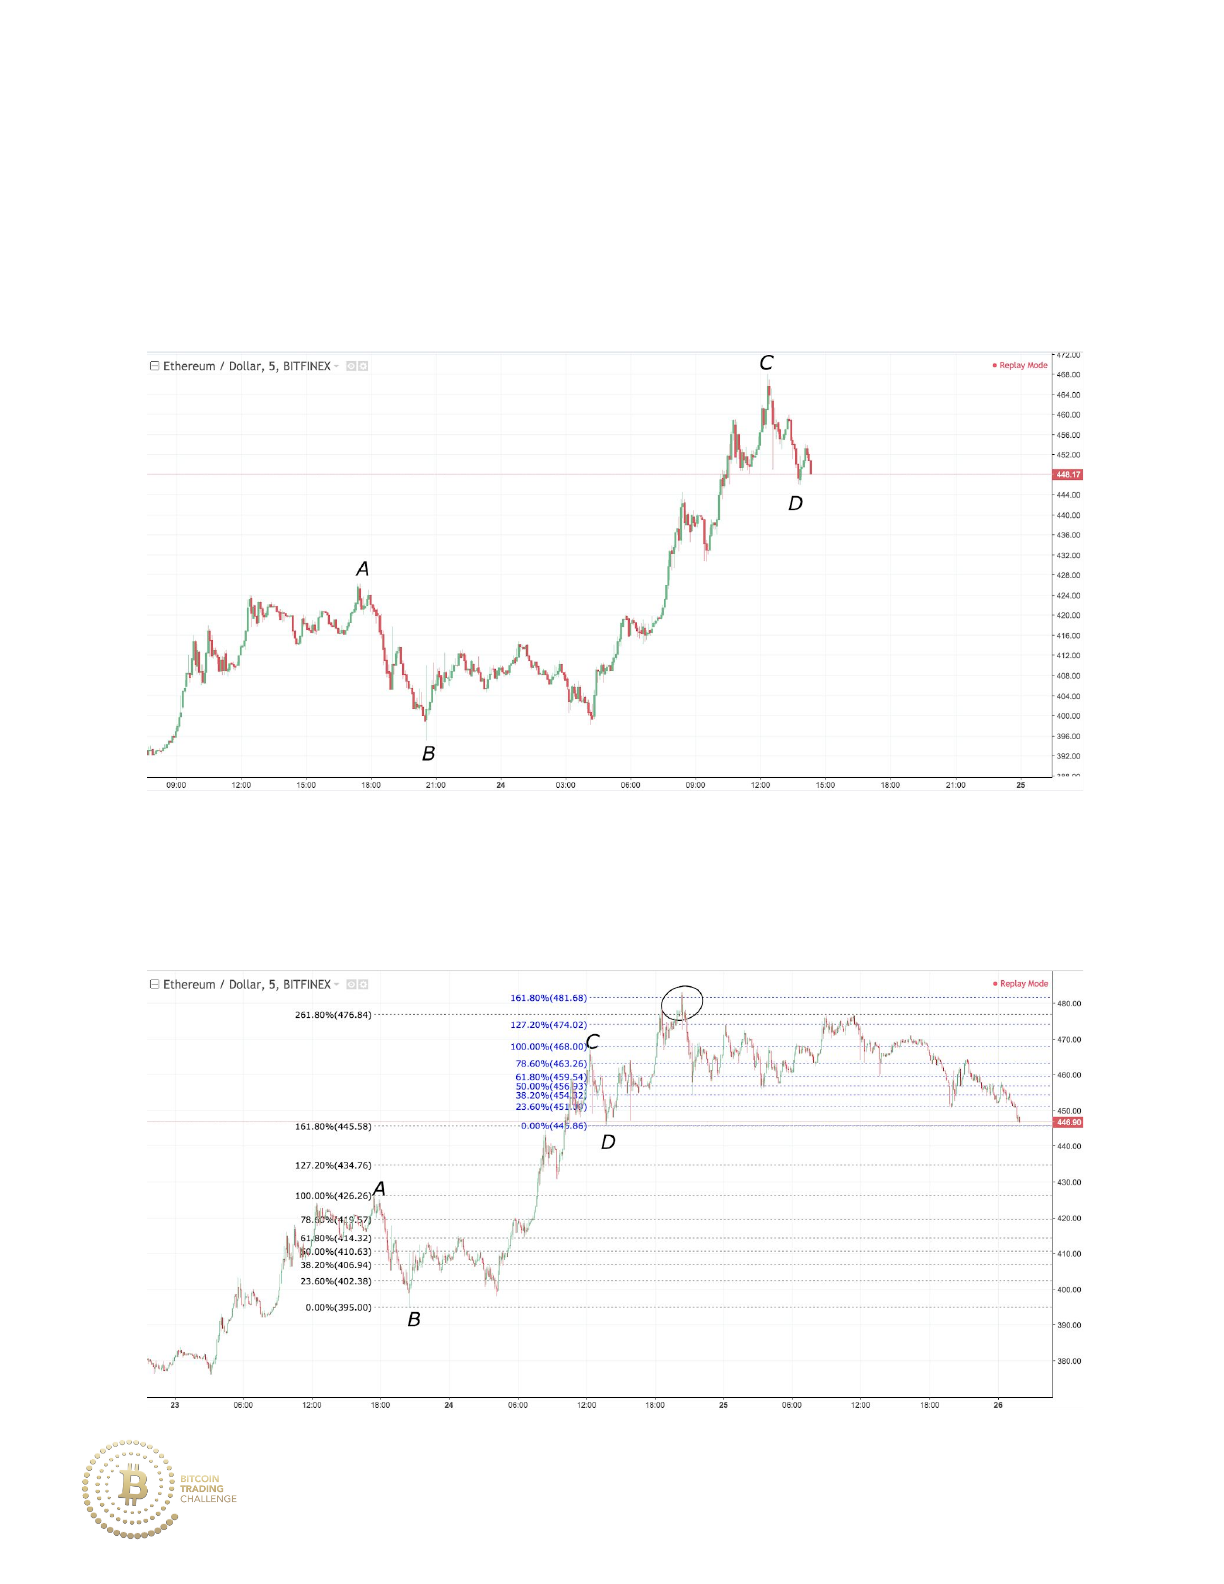
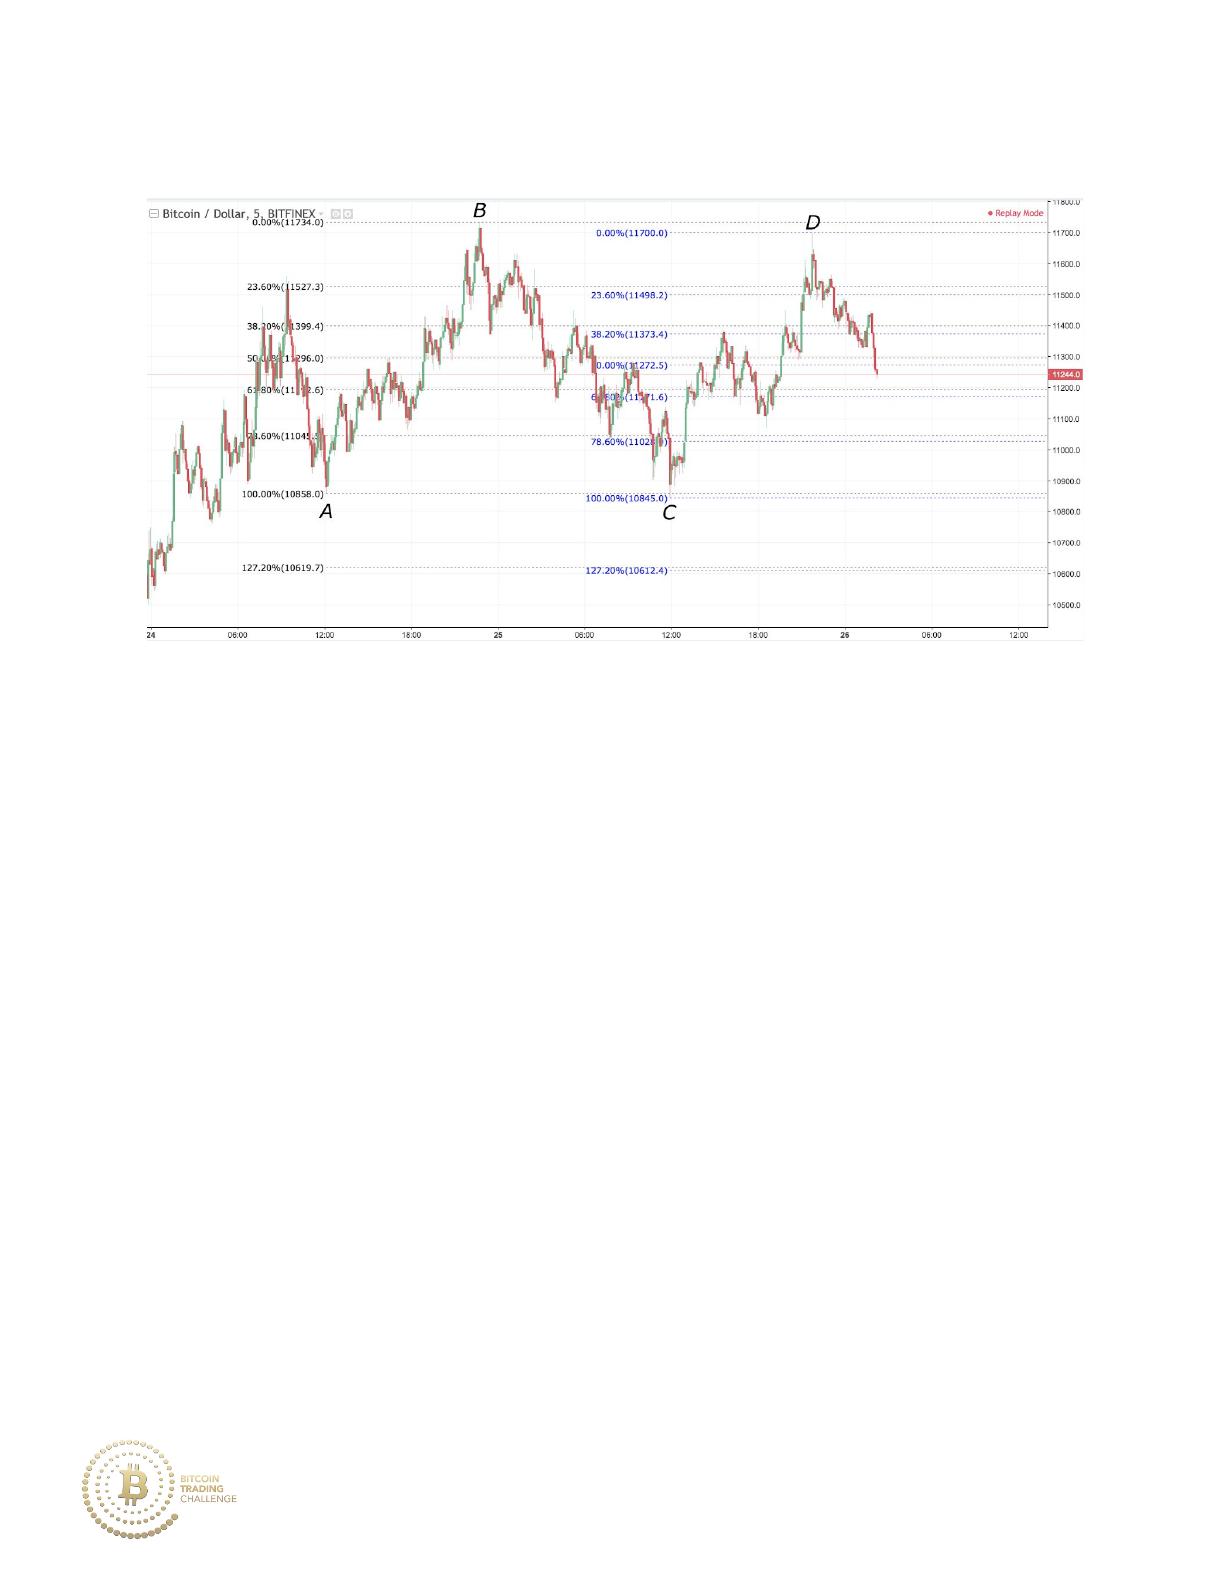
Let’s first mark the major pullbacks against the uptrend. We see a sharp
retracement from the high at Point A to the low at Point B, and we also see
a retracement from Point C to Point D. Confluence between the extensions
of those two levels yields a potential resistance level.
We then see the 476 to the 482 price zone acting as a major resistance
area as it has confluence from two different Fibonacci extensions drawn
off of retracements.
73

D. Drawing Fibonacci Extensions
The Fibonacci extension tool is incredibly versatile, allowing for many
overlapping methods that can be used to draw Fibonacci extensions.
Fibonacci Extensions:
1. Can be drawn on any market stage
2. Are drawn high to low to project a Fibonacci extension upward
3. Are drawn low to high to project a Fibonacci extension downward
4. Are drawn on the final move of a downtrend for initial resistance
levels
5. Are drawn on the final move of an uptrend for initial support levels
6. Are a powerful tool for giving selling opportunities when price breaks
above resistance (or makes an all-time high)
7. Are a powerful tool for giving buying opportunities when price breaks
below support
8. Reveal the underlying strength/weakness of a trend
74
Practice 4-1
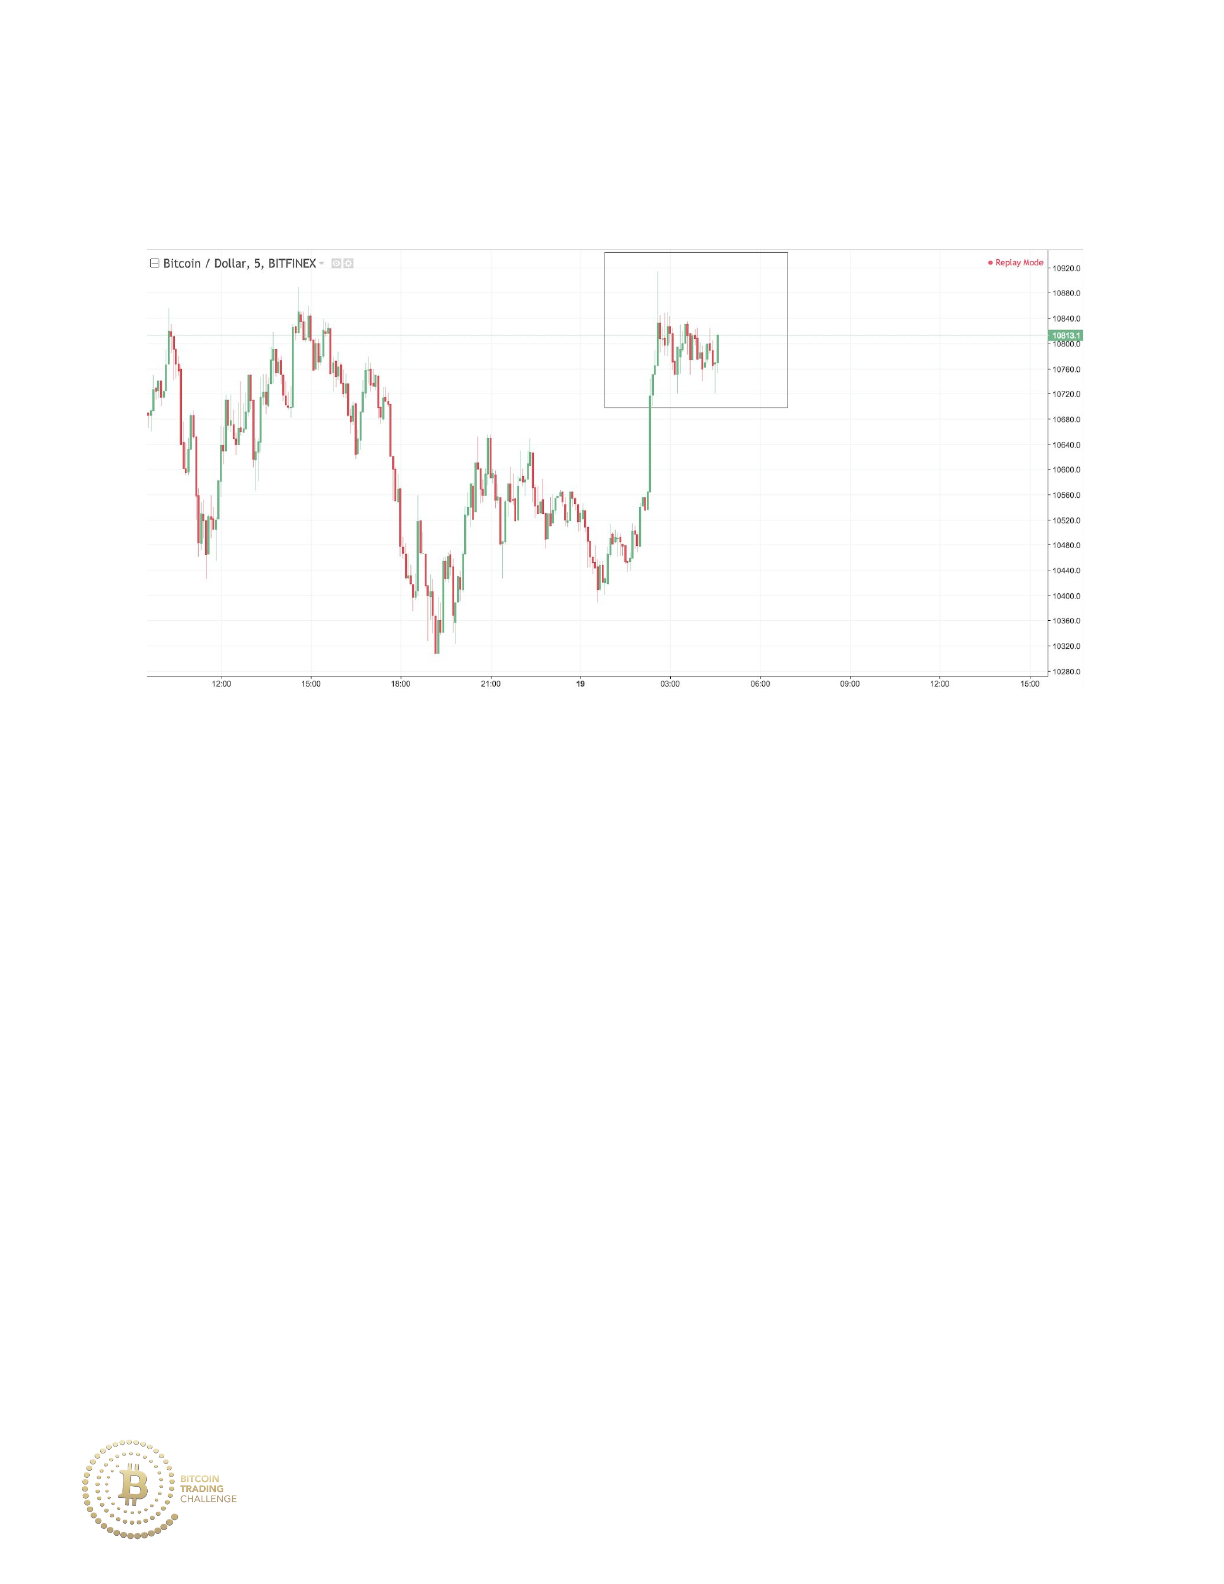
We can see that the market is currently consolidating above. If you were to
project a downward extension level, from where would you draw the
Fibonacci endpoints? (Hint: Recall that a downward extension level would be
projected by drawing from a low to a high going forward in time).
75
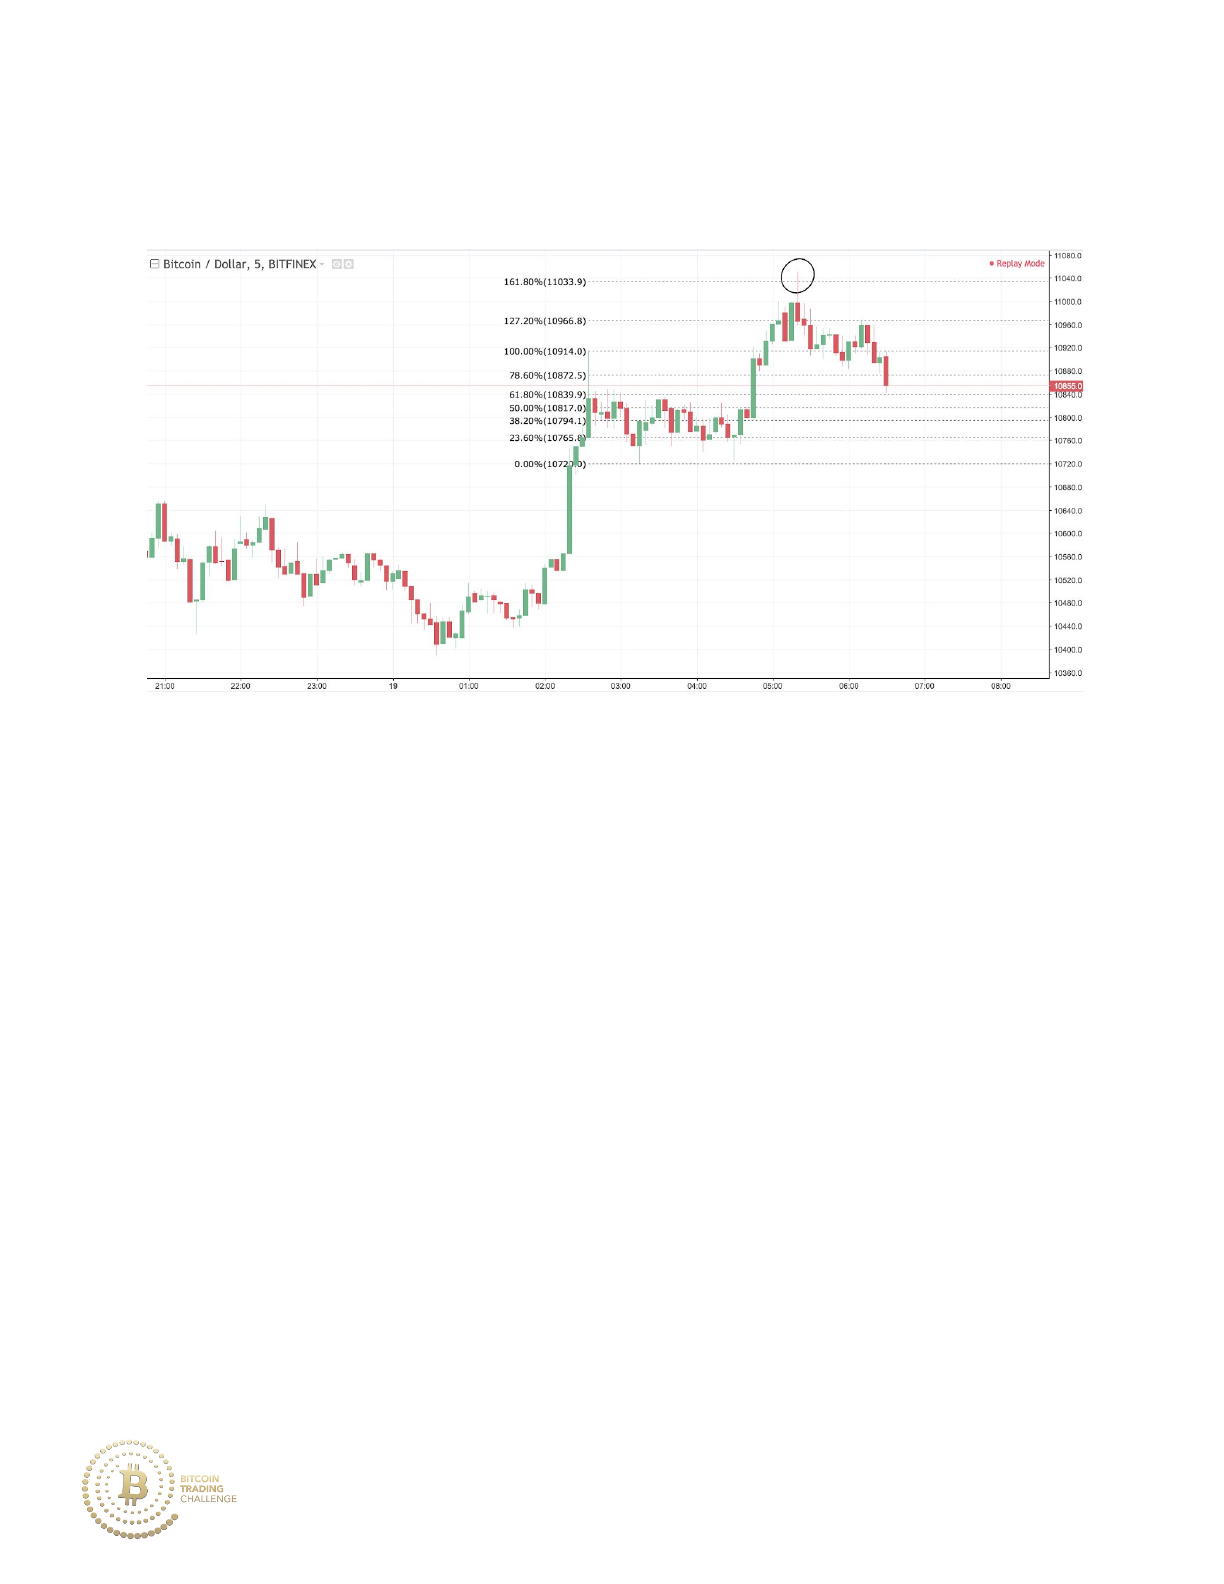
Practice 4-1 Answer
There are two correct answers here. Drawing from A to B or from C to D
yield nearly identical Fibonacci extension points.
Practice 4-1
Now the question remains, at what extension level would you place your
buy order?
A. 127.2%
B. 161.8%
C. 216.8%
76
Practice 4-1 Answer
A. 127.2%
B. 161.8%
C. 216.8%
The 161.8% extension level drawn from either A to B or from C to D would
have yielded a fantastic buying level at 10300. This may have been because
the market move from A to B moved on weak momentum and the move
from C to D moved on average momentum. The market responded by
respecting the 161.8% Fibonacci level and further created new highs within
the uptrend.
77
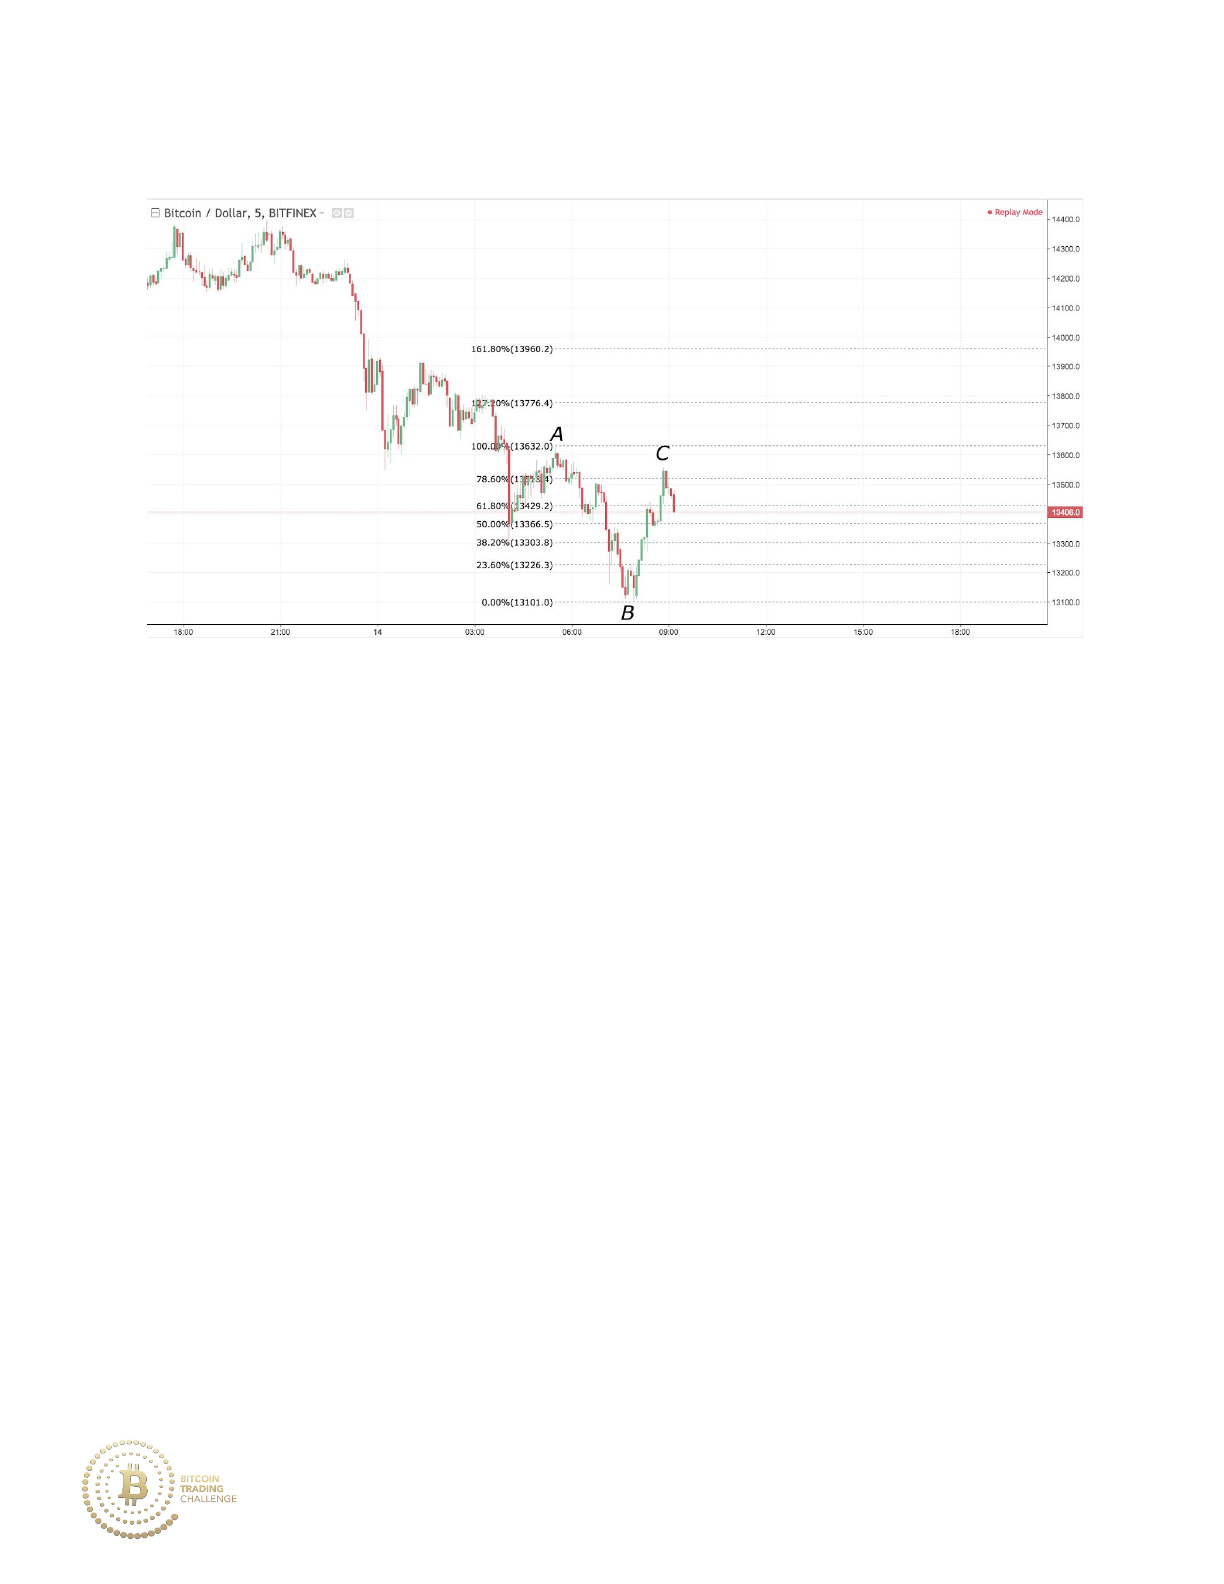
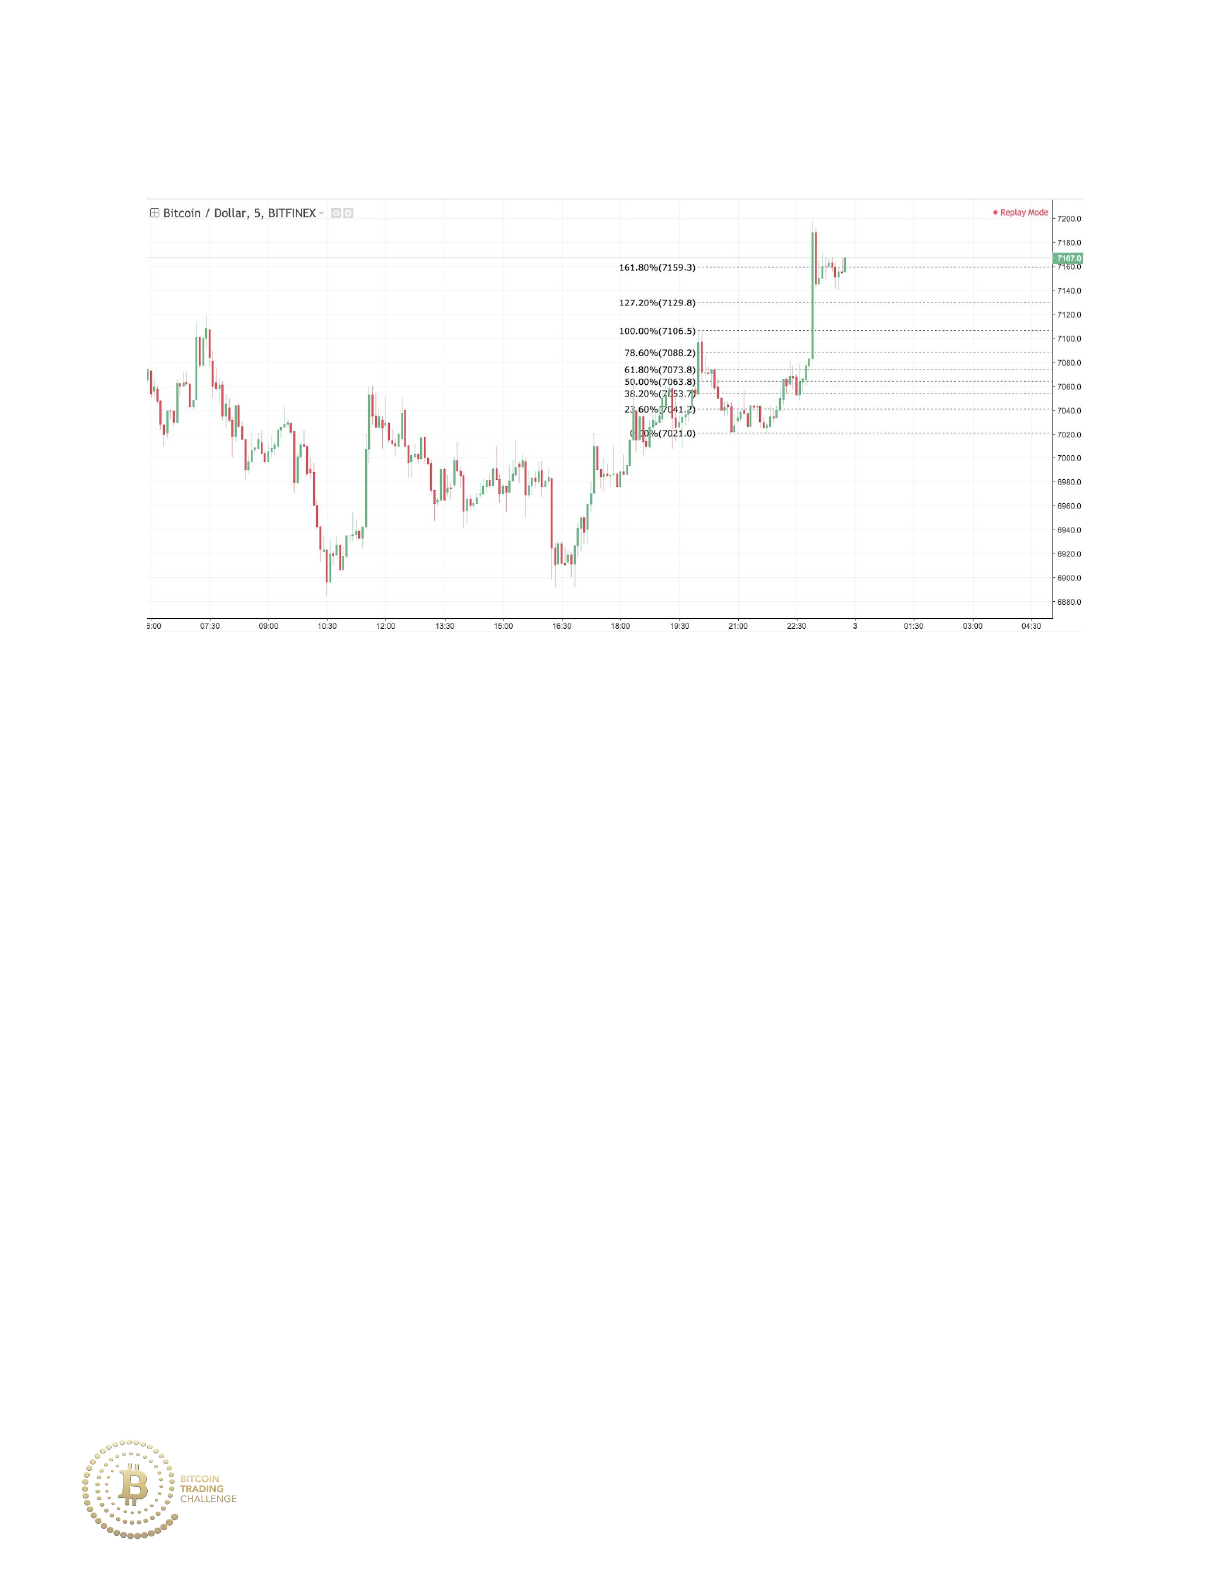
Practice 4-2
Price moves in a downtrend from Point A to Point B and then retraces up to
Point C. After this 78.6% retracement, how would one draw the Fibonacci
extension + which extension level would be a good price level for a buy
order?
78
Practice 4-2 Answer
Drawing the Fibonacci endpoints from Point B to Point C would have given
the correct extension level. Additionally, the market retraces 78.6% of the A
to B move with the B to C move, making the 127.2% extension a high
probability level of reversal to place a buy order at.
79
How would you draw a Fibonacci upward extension within this market
stage (located in the rectangle)?
80
If drawn from the high to low of that consolidation range, the 161.8%
extension alongside a high tail offered a fantastic selling opportunity.
E. Practice
The three examples below are on market momentum dynamics and its
interaction with Fibonacci levels. They feature Fibonacci extensions drawn
by using the endpoints on retracing moves within a trend. There are many
more related examples in the final chapter.
81
Practice 4-3
1. Does the momentum favor the buyers or sellers?
2. How does price react to the Fibonacci extension level?
3. Buy, sell, or avoid trading this market?
82
Practice 4-3 Answer
1. The momentum of the market favors the buyers.
2. Price burst past the 161.8% before consolidation. This bullish
reaction means that demand is likely to remain greater than supply,
hence price moves upward.
3. Buy or hold current long position.
Practice 4-3 Answer
83
Practice 4-4
1. Does the momentum favor the buyers or sellers?
2. How does price react to the Fibonacci extension level?
3. Buy, sell, or avoid trading this market?
84
Practice 4-4 Answer
1. The momentum is relatively balanced - strong bearish movement
during the downtrend with weaker bearish movement on the
approach of the 161.8% extension.
2. Price has a bullish reaction to the 161.8% extension. Price makes low
tails before moving back upward.
3. Both buying or avoiding (or possibly waiting to gather more
information and allowing the trend to partially develop first) would be
optimal.
Practice 4-4 Answer
85
Practice 4-5
1. Does the momentum favor the buyers or sellers?
2. Which Fibonacci extension level is likely to see major resistance?
3. Buy, sell, or avoid trading this market?
86
Practice 4-5 Answer
1. Recent momentum is quite bullish because sellers are unable to push
the coin’s price significantly lower; uptrend continuation is likely.
2. The 261.8%. Price moves in a strong bullish manner which is then
followed by a period of consolidation/weak bearish pullback. The
261.8% Fibonacci extension is more likely to see resistance than the
161.8% in this example.
3. Buy.
87

__________________________________________________________________________
5. Fibonaccis in Context
A. Support + Resistance Confluence
Fibonacci retracements/extensions provide great opportunities for buying
and selling based on the patterns of nature’s growth and decay patterns.
However, Fibonaccis do not offer exact levels of support and resistance. To
best improve your trading efficiency, you must also place your buy/sell
orders in accordance with support/resistance levels.
The advantage of using support and resistance levels in conjunction with
Fibonacci analysis is that order placement can be more well-defined within
Fibonacci price zones.
Support and Resistance Dynamics
1. In a consolidating (sideways) market, price typically bounces from
support to resistance and back again until a change in the market
stage occurs.
88
2. In an uptrend, price typically retraces downward to a previous
resistance level that then becomes future support.
3. In a downtrend, price typically retraces upward to a previous support
level that then becomes future resistance.
Let’s first examine what support and resistance look like within a few
different market stages.
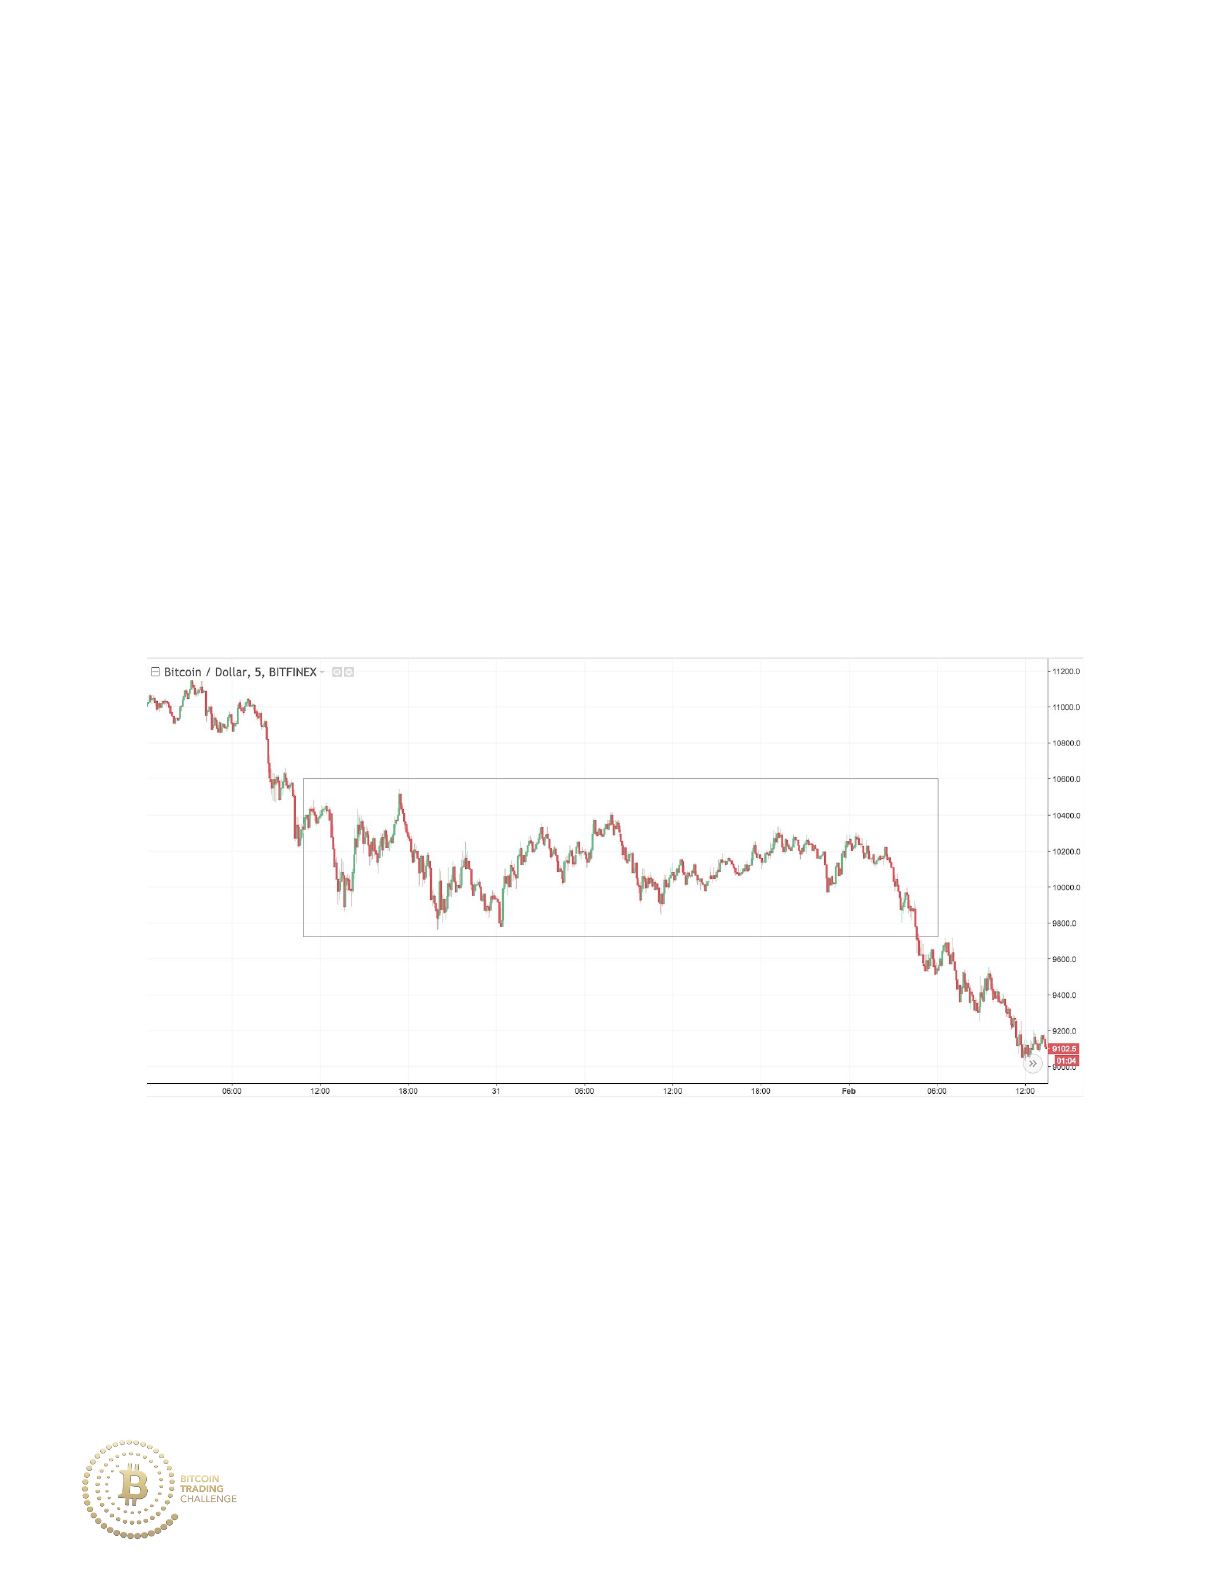
Practice 5-1
At which price level within the rectangle would you label as major support?
89
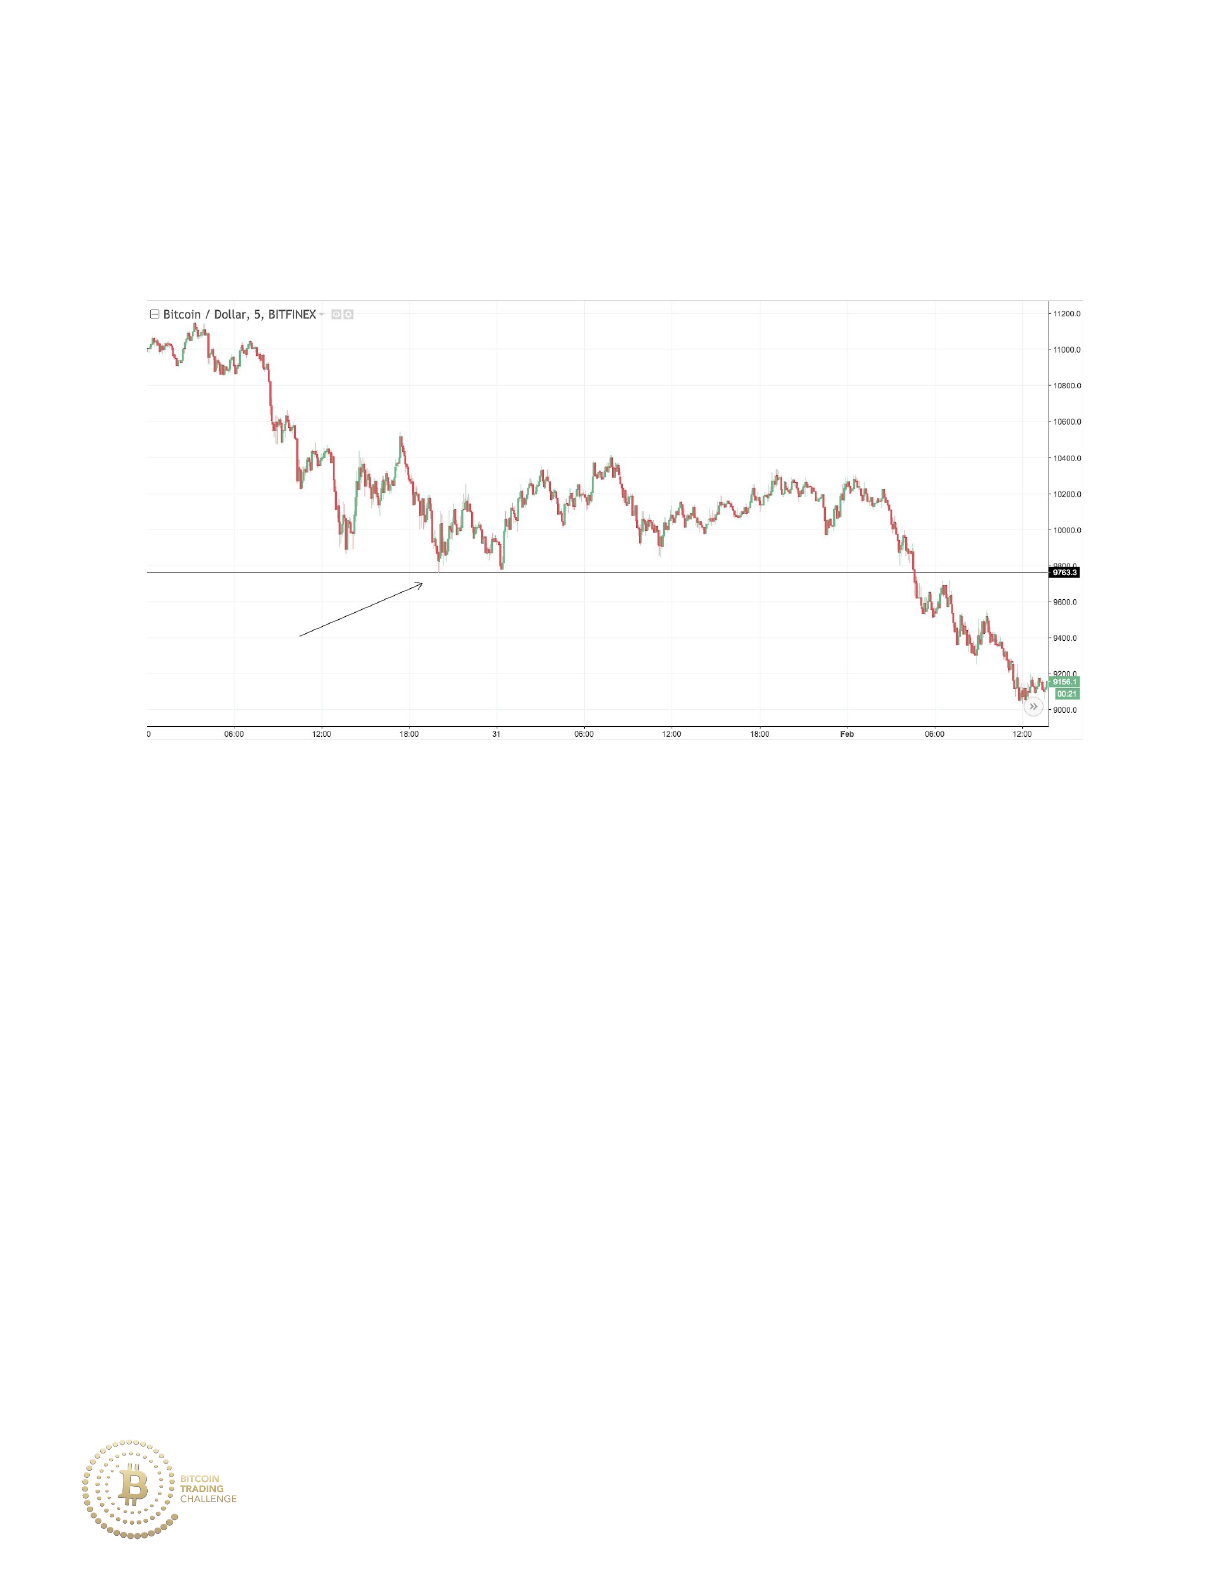
Practice 5-1 Answer
The price level of 9764 acts as major support during price’s consolidation
because it is the lowest point that price reaches within the trading range,
before price breaks downward.
90
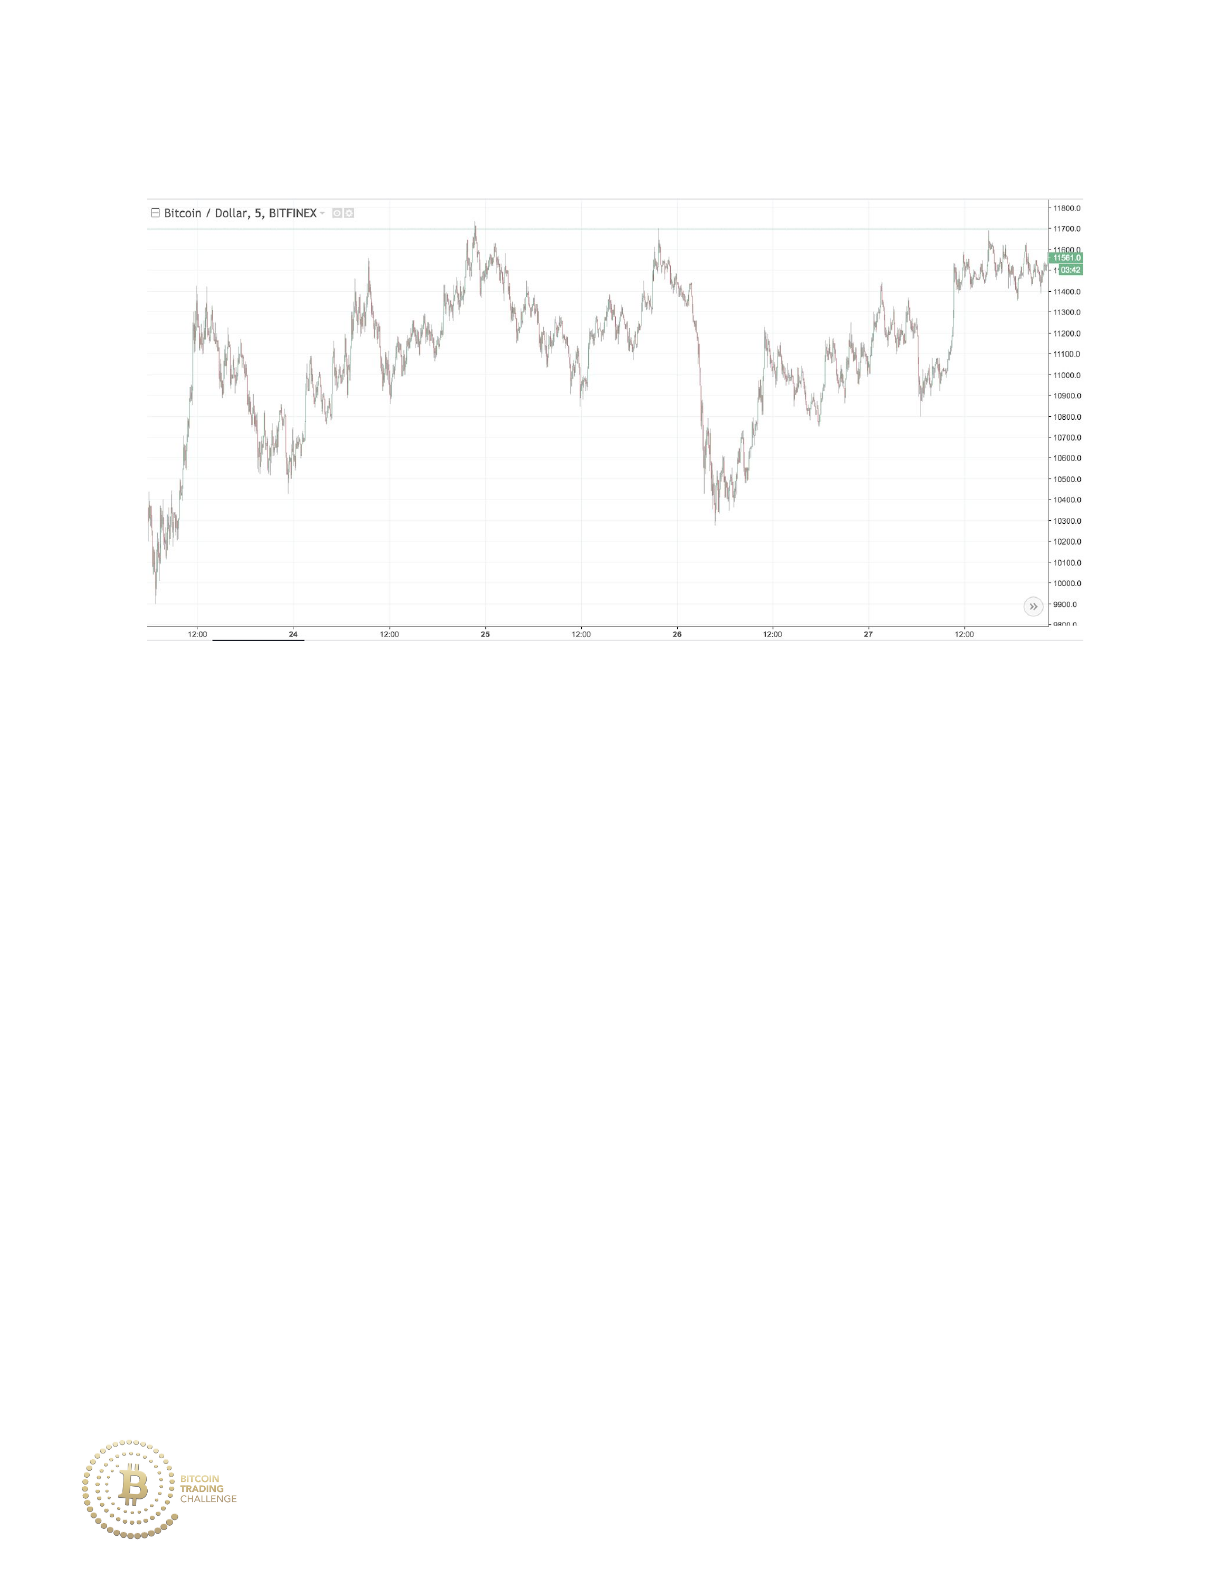
Practice 5-2
At which price level would you label as major resistance?
91
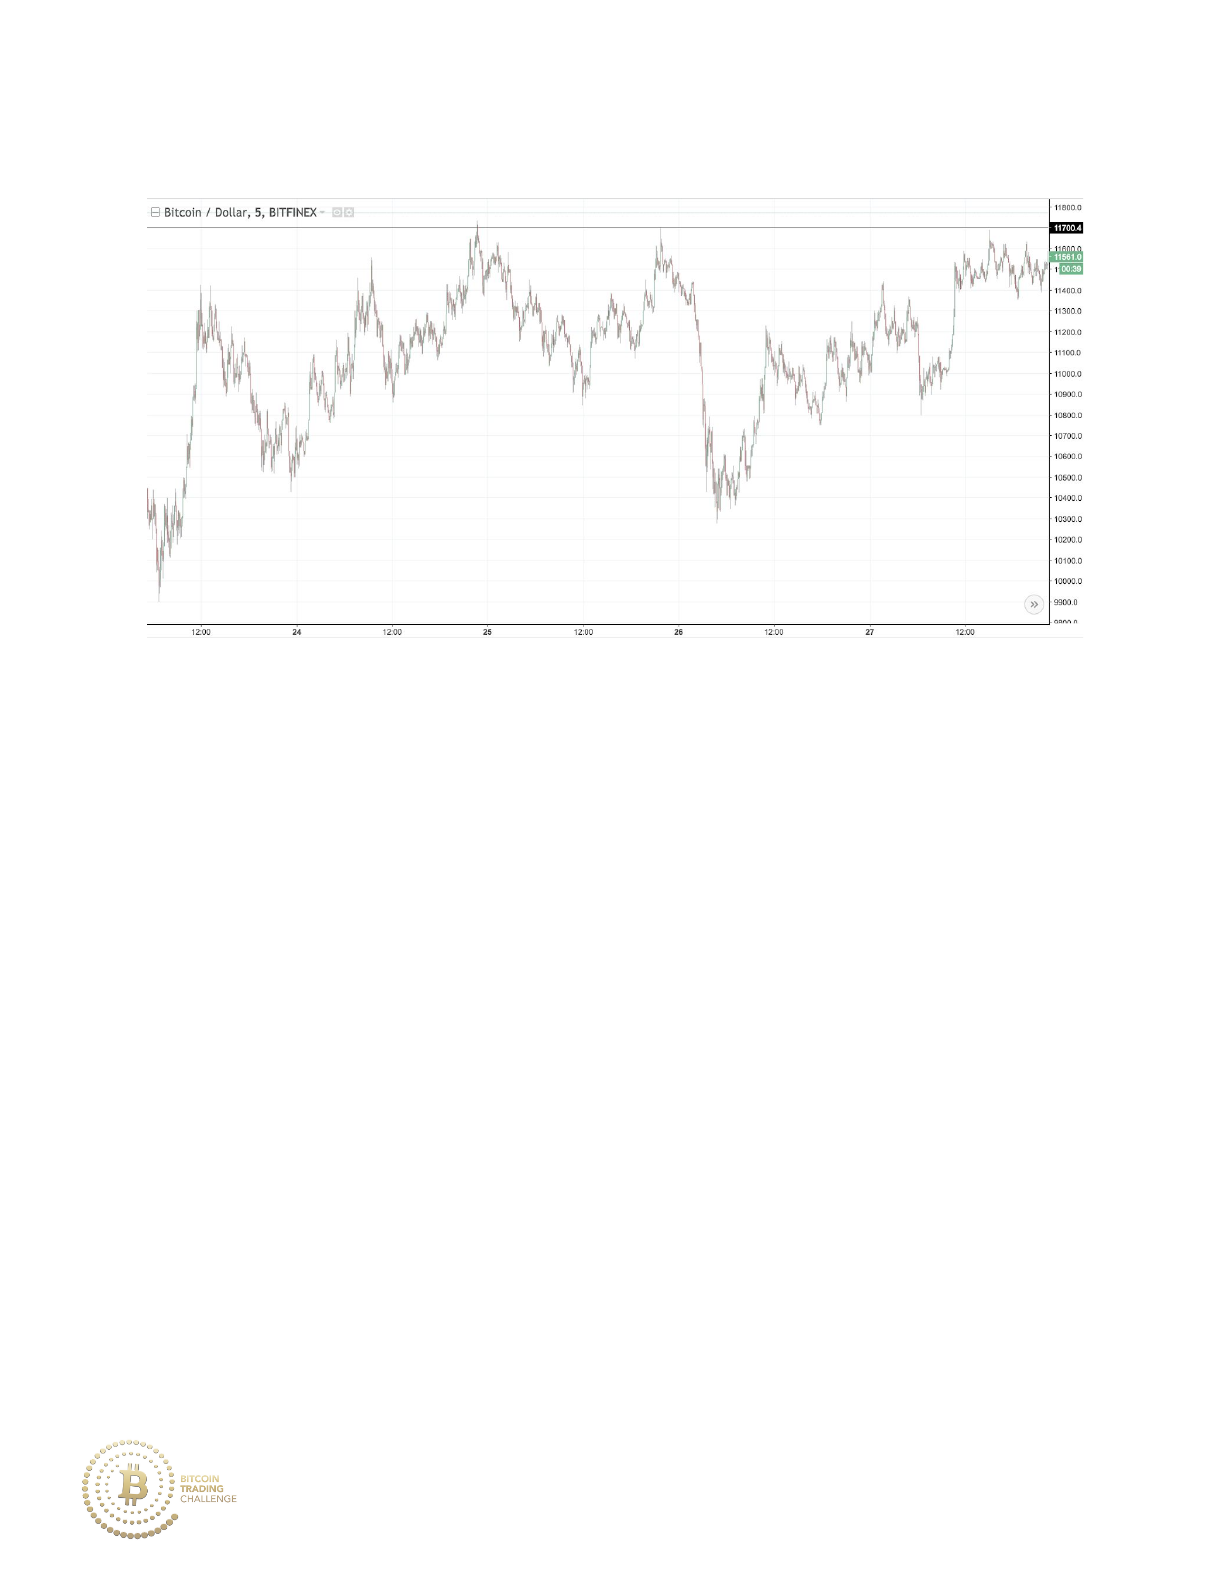
Practice 5-2 Answer
The 11700 price area has major resistance as price consolidates. We
expect that if price breaks through that resistance level, a retest of 11700
may act as future support. Price breaks through the resistance level at
11700, so we can then draw a Fibonacci retracement from the origin of this
92
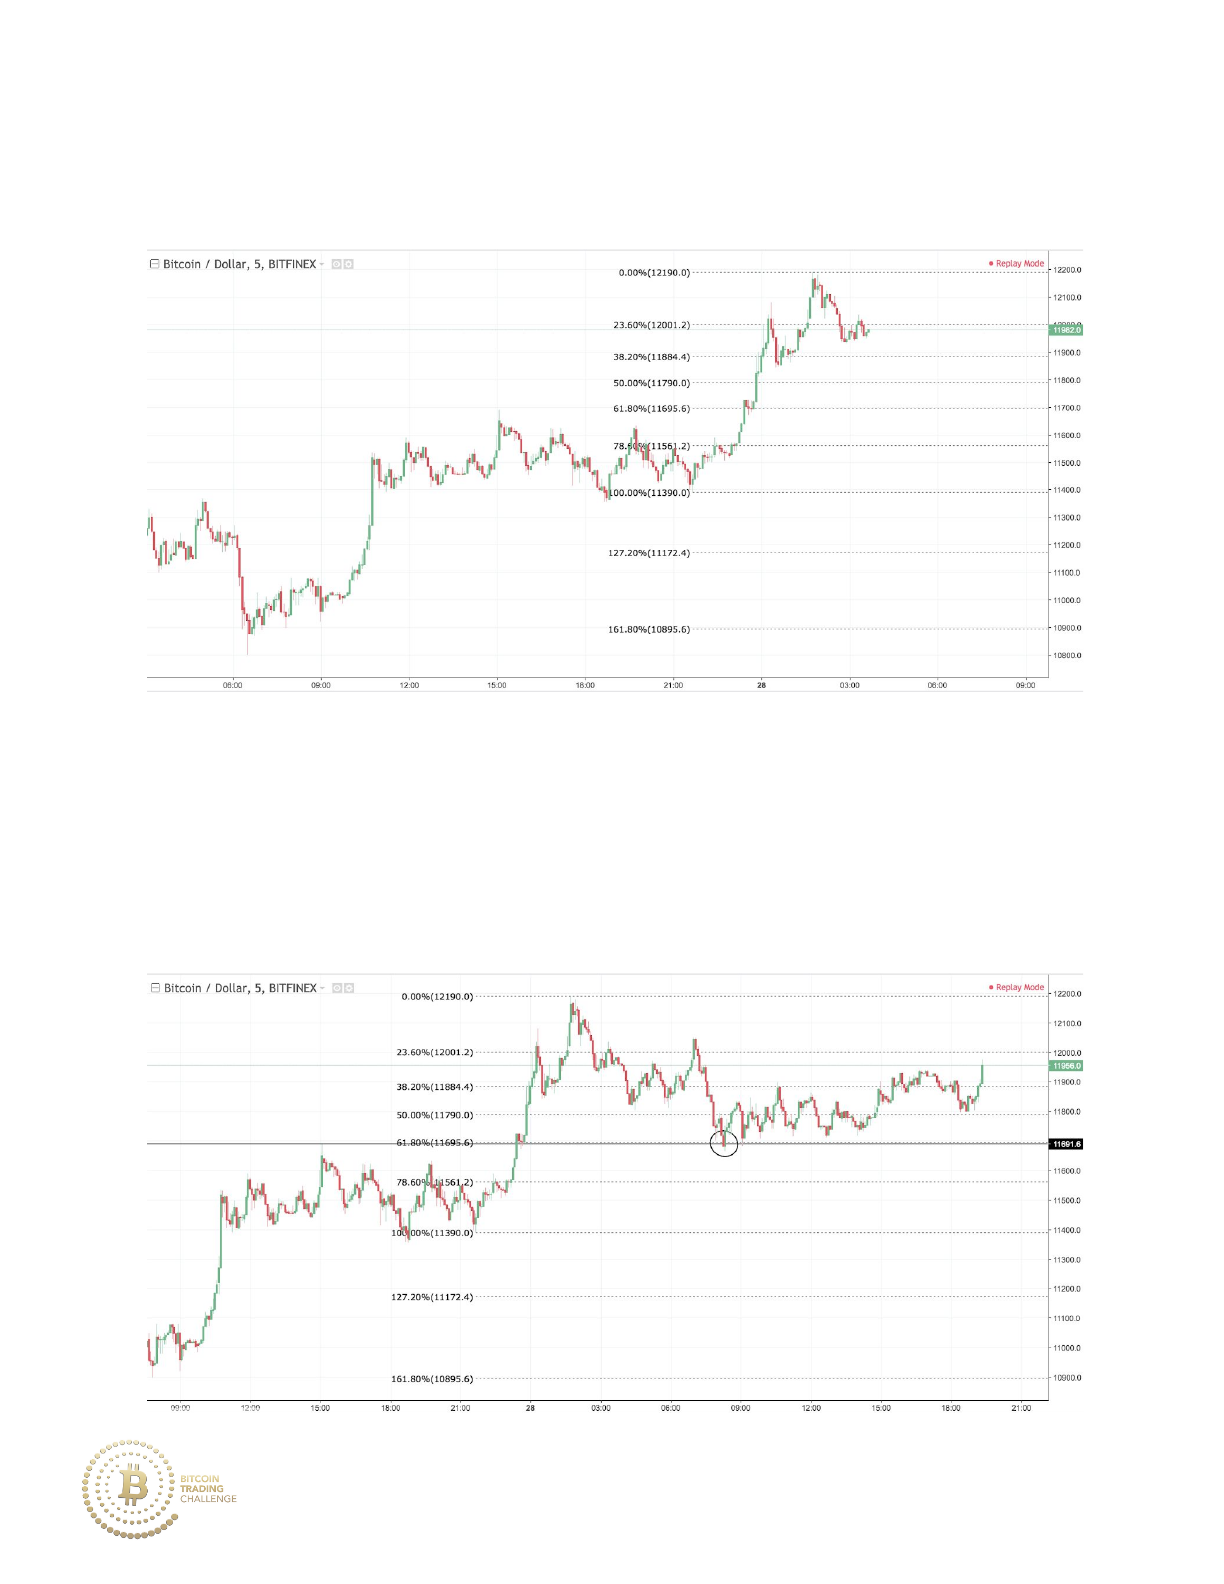
recent uptrend (11390) to the very top of this recent uptrend (12190) as
shown below.
The 61.8% retracement of that retracement gives us a value of 11695.
Recall that the previous resistance high (within the consolidation phase)
was exactly 11691, so we place our buy order at 11691.
93
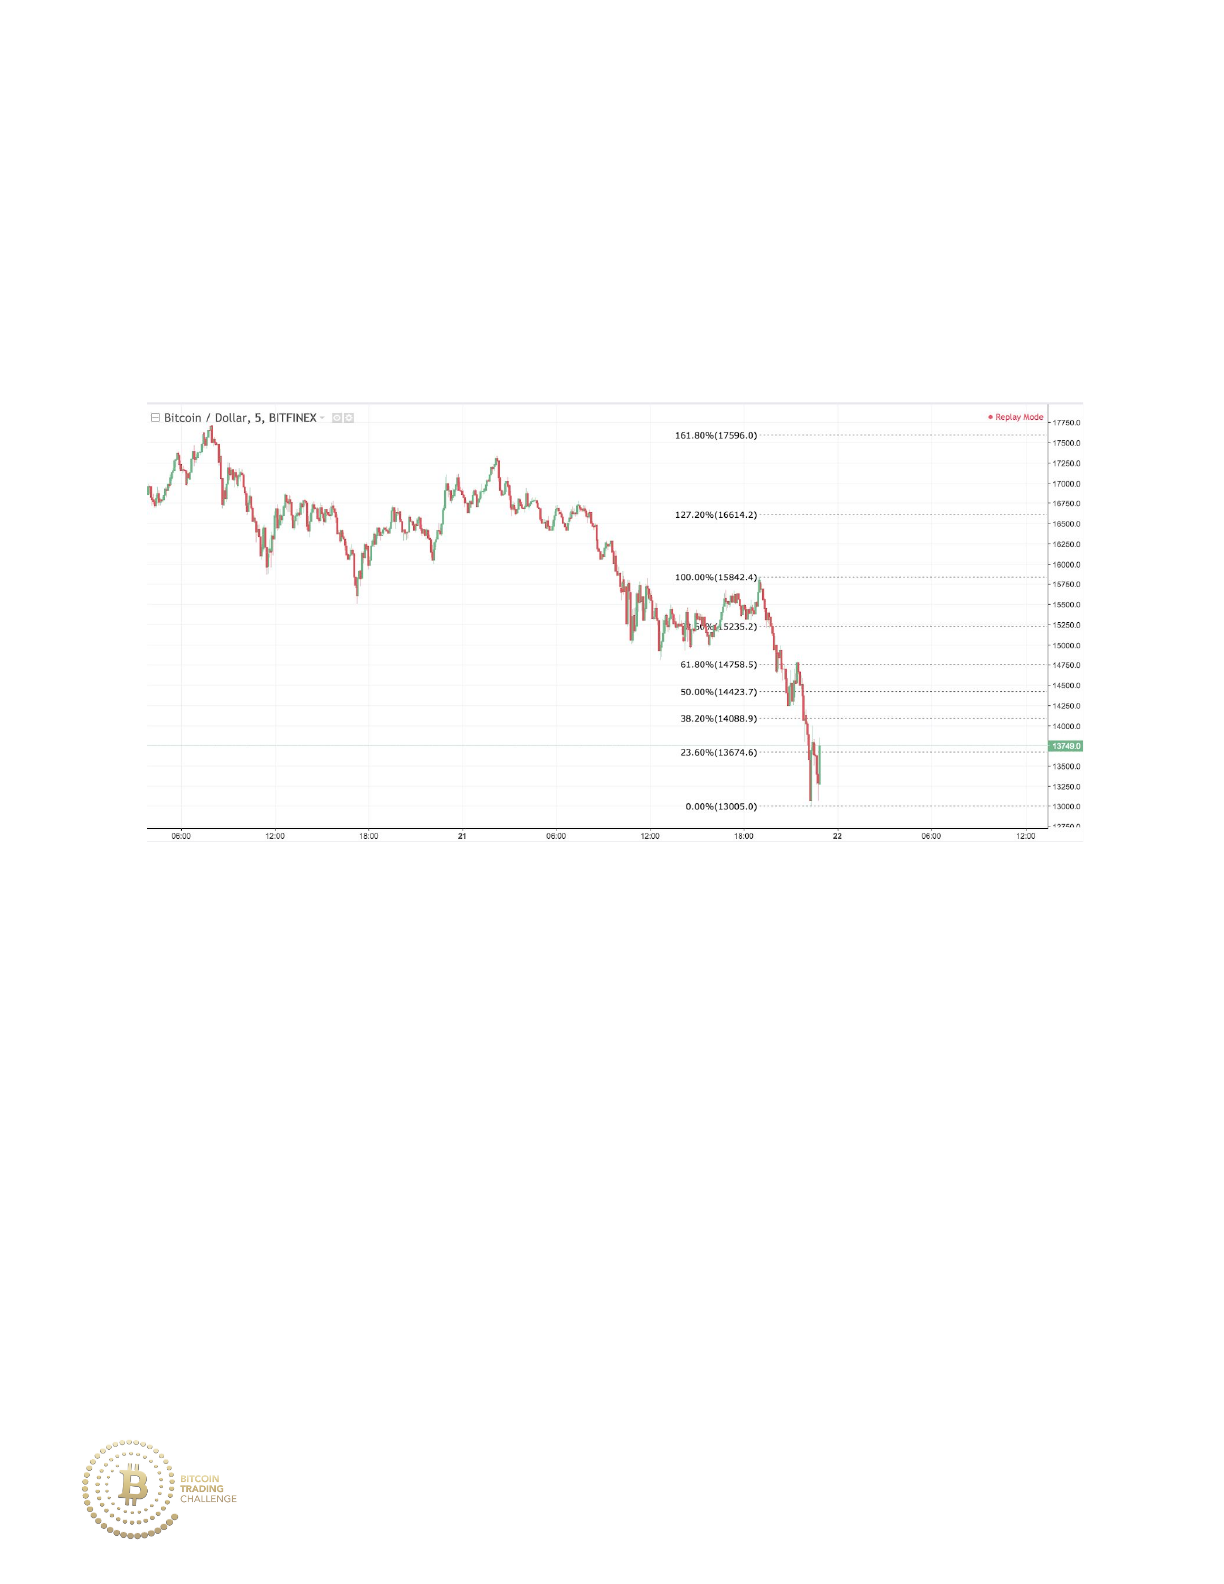
Practice 5-3
At what price level do you note previous support (that will likely turn into
future resistance)? Hint: There are two major previous support levels, pick
the lower of the two major support levels.
94
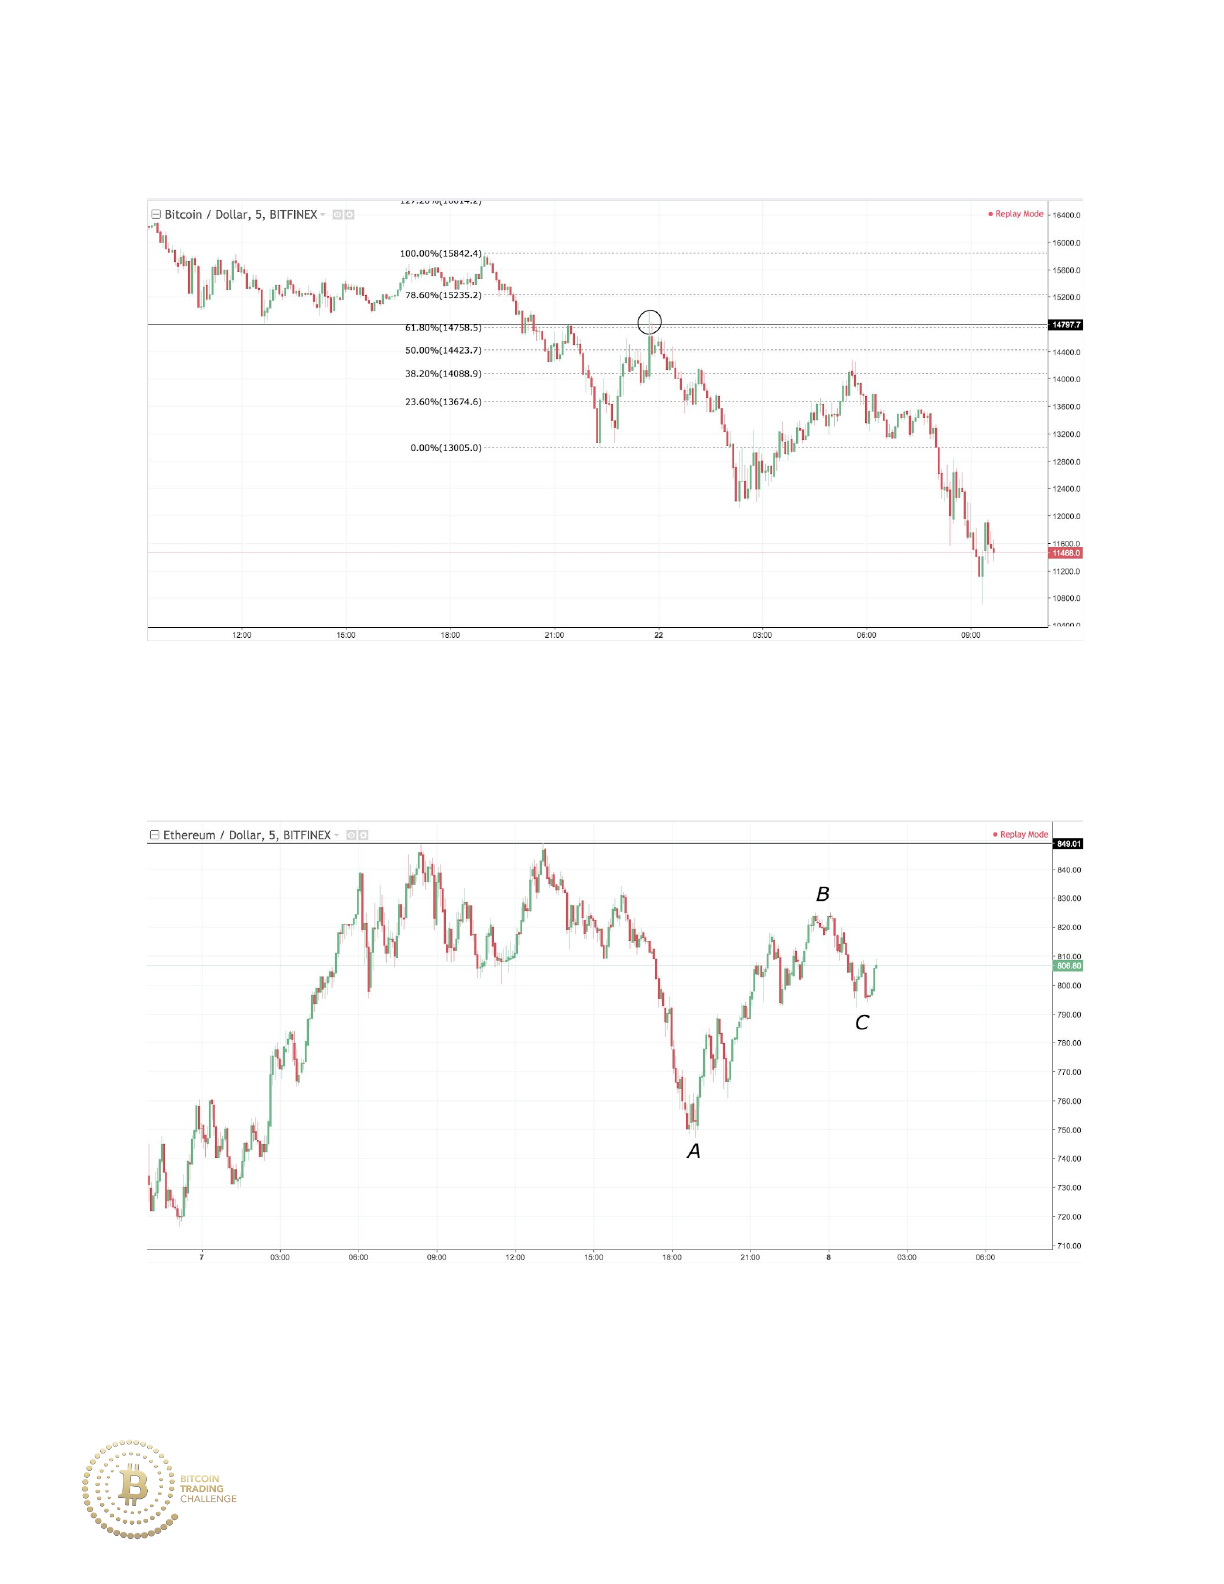
Practice 5-3 Answer
Price moves upward to the previous support level at 14798 that becomes a
61.8% resistance level and then rapidly moves back downward.
Price looks to be consolidating after an uptrend. We see a move from A to
B and then a retracement down from B to C. We also see major resistance
at 849.
95
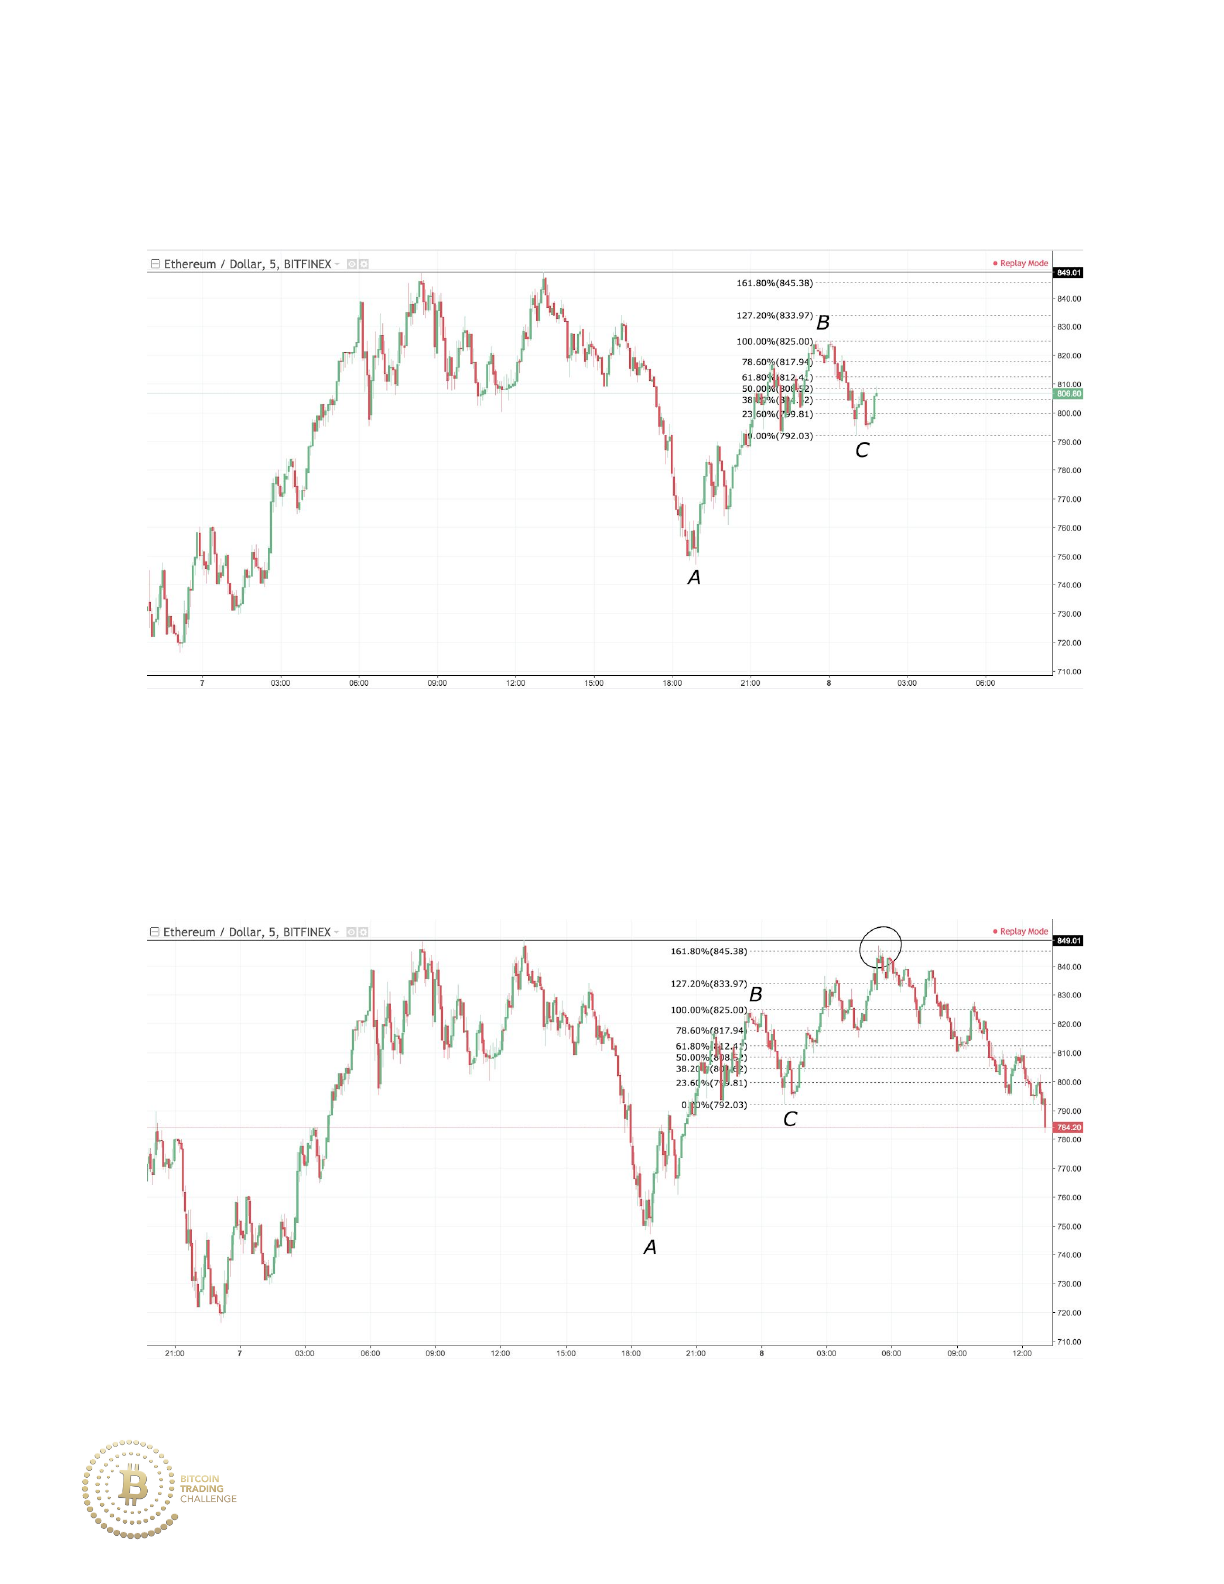
Projecting the Fibonacci extension yields the price level of 845 as
resistance.
The 845 price level coincides with the top resistance level at 849, so you
should place your sell order at that level.
96

Order Placement within Fibonacci price zones
1. When price is in an uptrend, buy orders are best placed at the
absolute top of a previous resistance level (as resistance typically
becomes support in an uptrend). Pay close attention to the Fibonacci
retracement levels that overlap with previous resistance levels.
2. When price is in a downtrend, sell orders are best placed at the
absolute bottom of a previous support level (as support typically
becomes resistance in a downtrend). Pay close attention to the
Fibonacci retracement levels that overlap with previous support
levels.
3. Fibonacci extensions can be used to strengthen the confluence of
active support/resistance levels.
B. Volume
Behind every price movement is a series of transactions, known as volume.
Volume acts as both the fuel as well as the eventual stopping force of
trends.
Volume increasing as price is trending is a sign of a healthy trend that is
likely to continue because it shows that there is high demand for the
current trend. Volume decreasing or remaining low as price is trending is a
97
sign of an unhealthy trend that is not likely to continue because it shows
that there is low demand for the current trend.
This applies to both uptrends and downtrends, meaning that if volume is
increasing as price is trending downward, we expect price to continue
moving downward. If volume is increasing as price is trending upward =
expect price to continue moving upward.
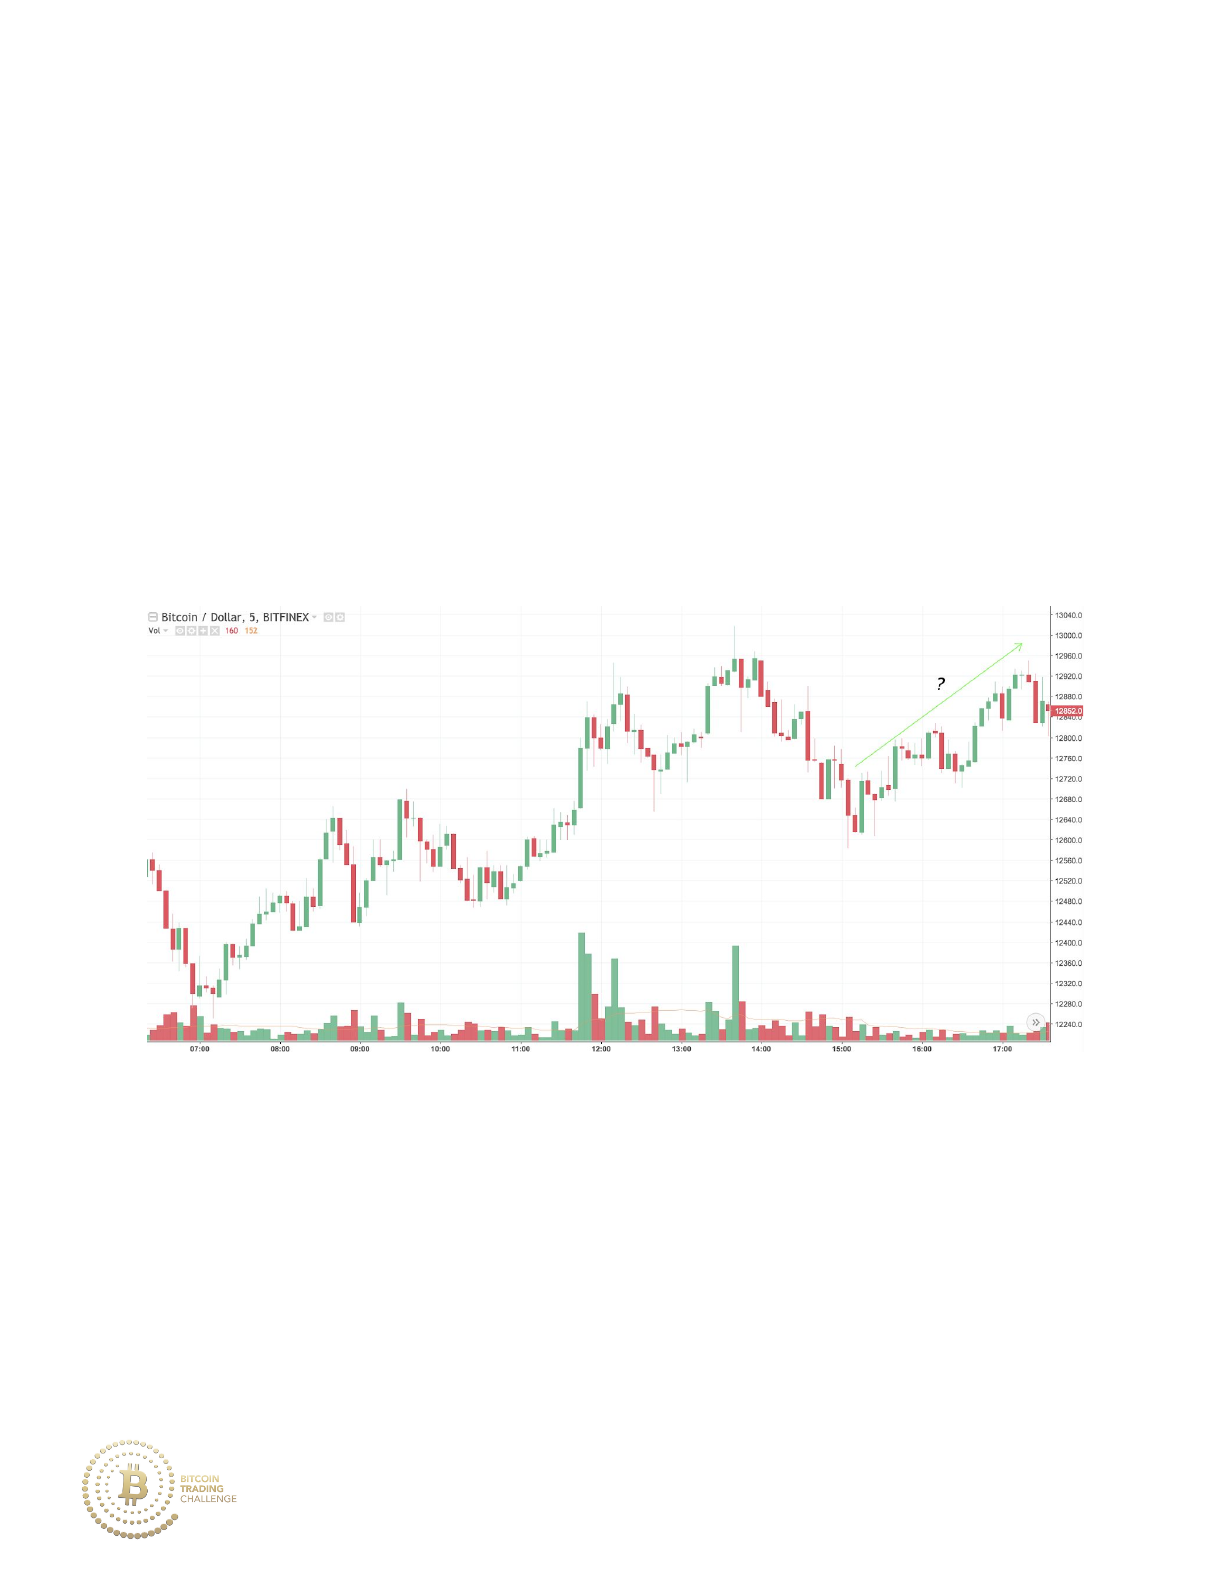
Practice 5-4
From what you read above, do you think price will move down or continue
moving upward based on the most recent continuation of the uptrend
(denoted by the green arrow)?
98
Practice 5-4 Answer
Price moves downward as volume falls just as the trend is moving upward.
This represents a loss of interest and lack of demand from the buyers in
the market.
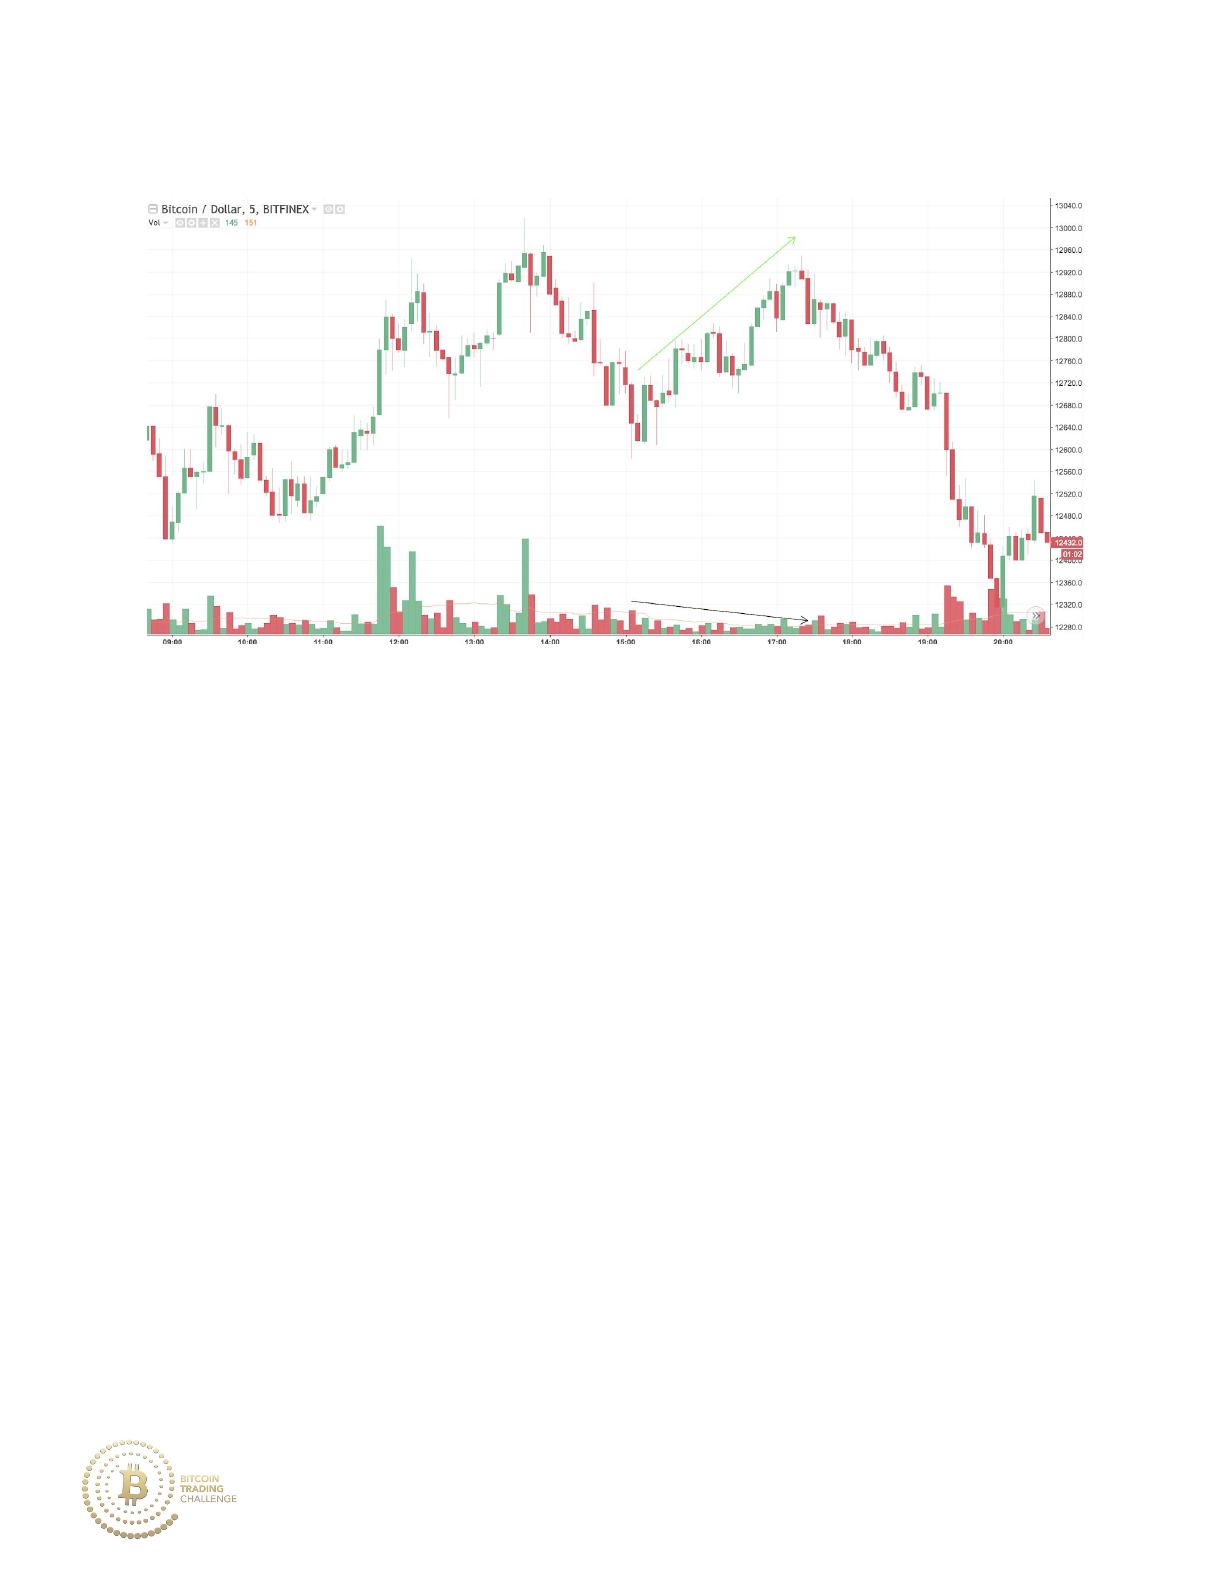
Going one step further, what volume trends do you expect in a trend
making a retracing move? We would expect volume to increase as price
moves with the overall trend and volume to decrease when price moves
against the overall trend (i.e. retracement).
Okay…but what about consolidation? Volume will typically be falling as
interest in the trend decreases when price moves sideways.
Take a look at the graph below. Move 1 shows the market moving in a
downtrend, and we see increasing volume. Move 2 shows a weakly
retracing market (also may be called consolidation) and we see falling
99
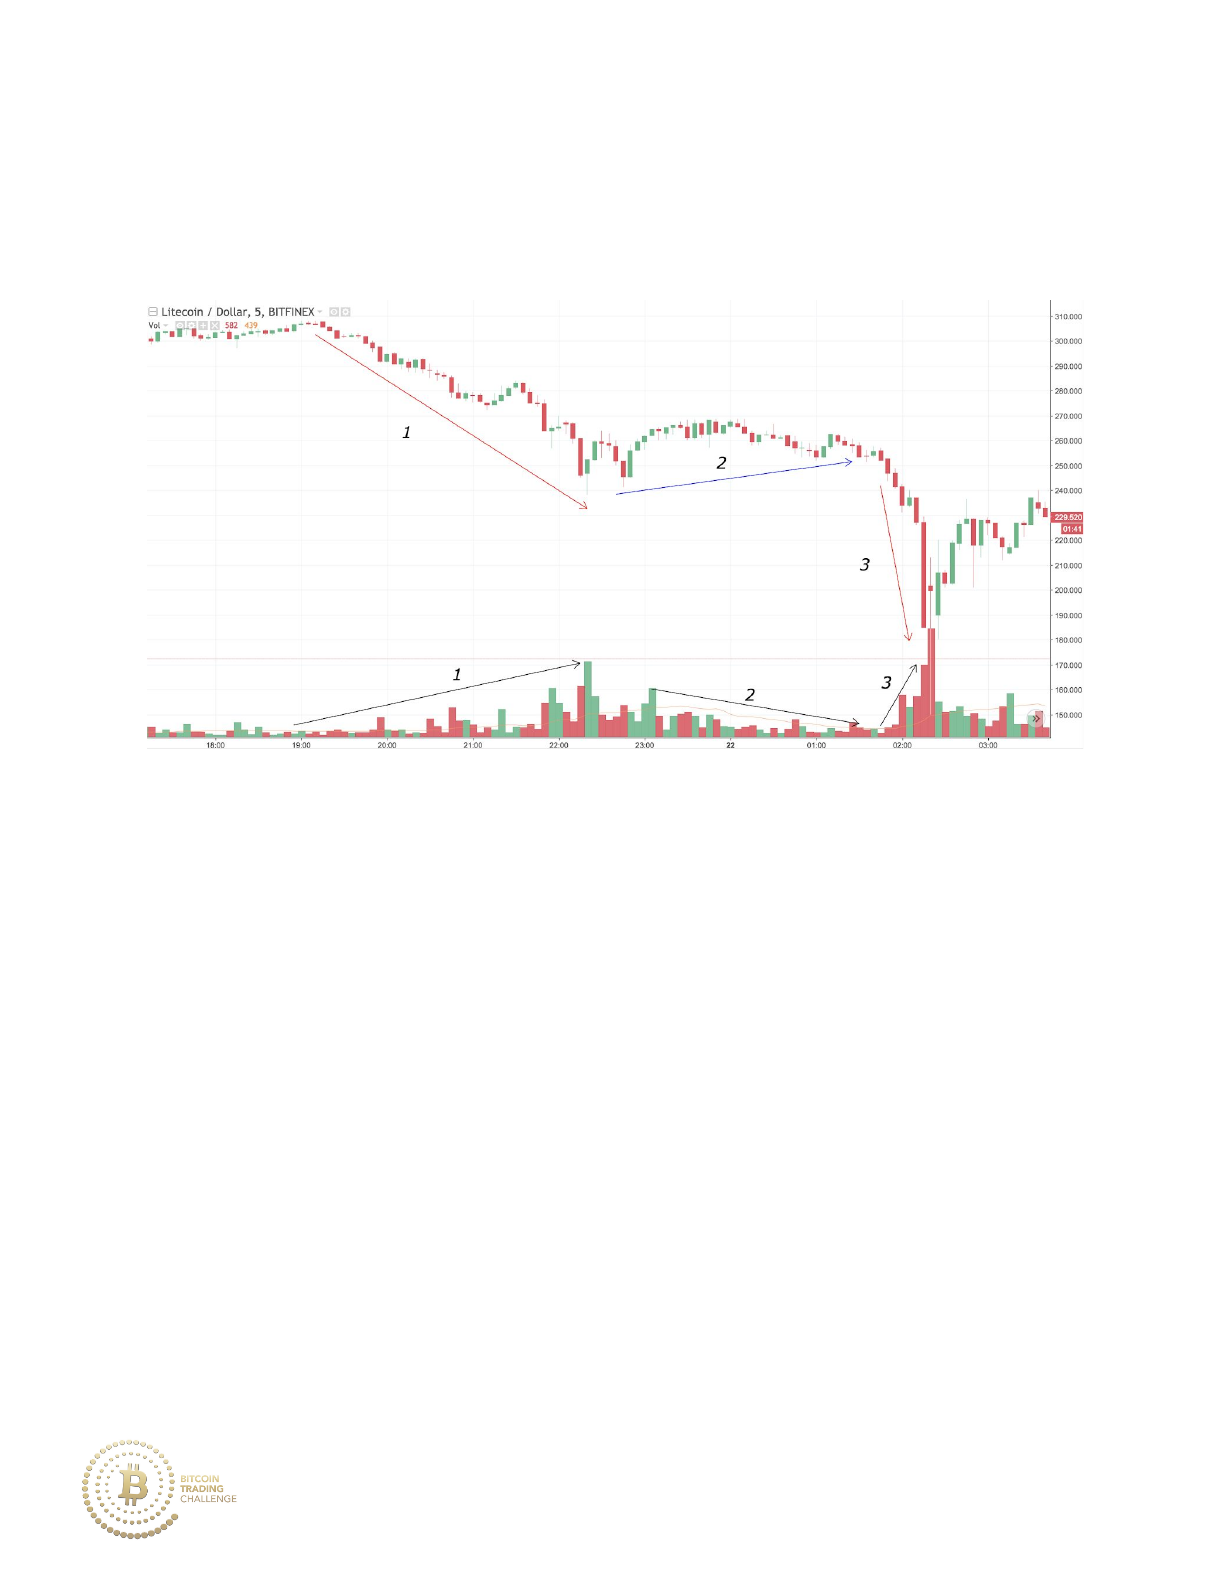
volume. Move 3 shows a rapidly declining market with a rapid increase in
volume.
However, there are instances in which the forces of supply/demand
become too strong. When this occurs, the market is oversold/overbought
and likely to reverse. These price extremes are typically formed when
volume surges many times higher than the moving average value.
Overbought/Oversold Volume Spikes:
Overbought: When a volume spike occurs in an uptrend. You would then
expect the market to struggle moving upward.
Oversold: When a volume spike occurs in a downtrend. You would then
expect the market to struggle moving downward.
100

Not many new traders are aware of the simple fact that trends typically end
when many traders rush to buy into an established uptrend, or when many
traders rush to sell in an established downtrend.
Going back to the 100 traders in a room analogy, why do traders continue
to make the same mistakes time and time again? The reasoning behind
this is due to the herd-like moves that occur as many traders tend to feel
the same emotions (of fear and greed) when looking at the same price
chart. They see the price crash and many sell (fear), or they see the price
skyrocket upward and they buy because they don’t want to miss out on
potential profits (greed). Because many traders act on their emotions at the
exact same time, we end up seeing that many retail traders end up buying
market tops (resistance) and selling market bottoms (support). We plot
Fibonaccis in advance of these points to find these likely areas of mass
greed or fear.
Thus, after many traders buy into an established uptrend, the market
struggles to move upward as it is over-bloated with buyers (traders who
have already bought) and there may not be enough capable buyers (traders
who would like to buy in the short-term, but have yet to do so) to continue
to press the price continually upward. A reverse situation occurs after a
massive sell off in a downtrend to which price is over-bloated with sellers.
When these tops and bottoms occur, a volume spike will typically occur on
a candlestick or on multiple candlesticks. Recall that a volume spike simply
101

refers to volume soaring much higher than its corresponding moving
average value.
However, a volume spike can also signify the beginning of an uptrend or a
downtrend, as in a breakout. Thus, volume spikes must always be
compared back to price’s location within the current market stage.
Breakout Volume Spikes:
Breakout: When the market is breaking upward out of consolidation on
strong momentum and a volume spike occurs at the point of the breakout,
we expect the market to continue to trend upward.
Breakdown: When the market is breaking downward out of consolidation
on strong momentum and a volume spike occurs at the point of the
breakdown, we expect the market to continue to trend downward.
A minor volume spike has a value around three to four times as large as the
corresponding moving average value, while a major volume spike has four
times or more volume than the moving average.
Let’s do an example. This time we will use only volume to locate the likely
major changes in the market stage.
102

Practice 5-5
Which points on the chart likely show a major change in the market stage?
103
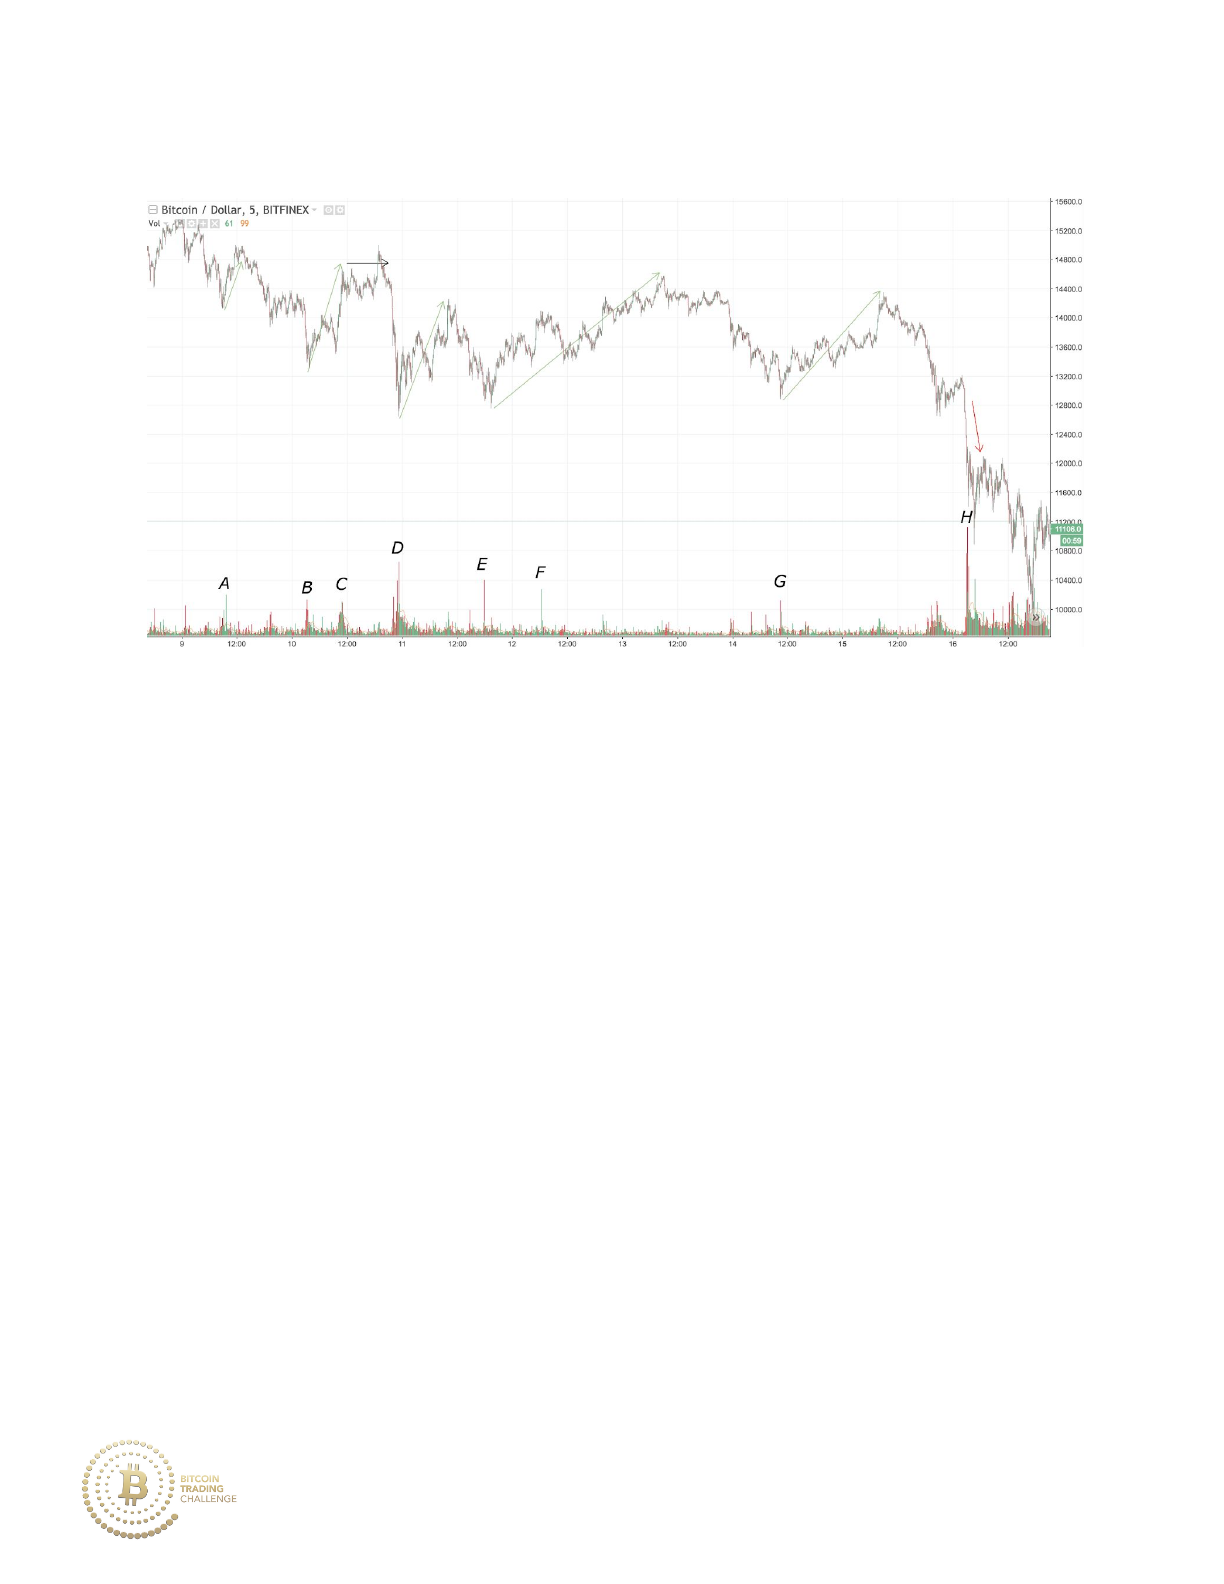
Practice 5-5 Answer
Even by looking at volume without price, we can observe minor and major
changes in the market stage:
Point A shows a minor change in the market as it retraces upward, but the
downtrend is still intact. Point A is oversold.
Point B shows a stronger retracement upward, but the corresponding
downtrend is also still intact. Point B is oversold.
Point C shows similar volume to Point B. The market reacts by
consolidating and then weakly moving upward before crashing downward.
Point C is overbought.
104

Point D shows a series of violent volume spikes as many traders panic and
exit. Point D is oversold.
Point E shows a major volume spike that is almost as large as Point D’s
volume spike, and it also establishes a support level at the price of 12800.
Point E is oversold.
Point F can be classified as in-between a minor and a major volume spike.
When it occurs the market consolidates before retracing downward. Point F
is overbought.
Point G shows a minor volume spike relative to the other volume spikes.
However, there is a large amount of time that passed since the last volume
spike which is likely why the market has a major reaction as price travels
upward to resistance. Point G is oversold.
Point H shows a major volume spike that dwarfs all volume spikes before
it. Price breaks below a major support level and then crashes. Point H is a
breakdown.
As mentioned in Point G above: if price hasn’t had a volume spike after a
significant amount of time, it is reasonable to expect that the next volume
spike will have a major effect on price.
105
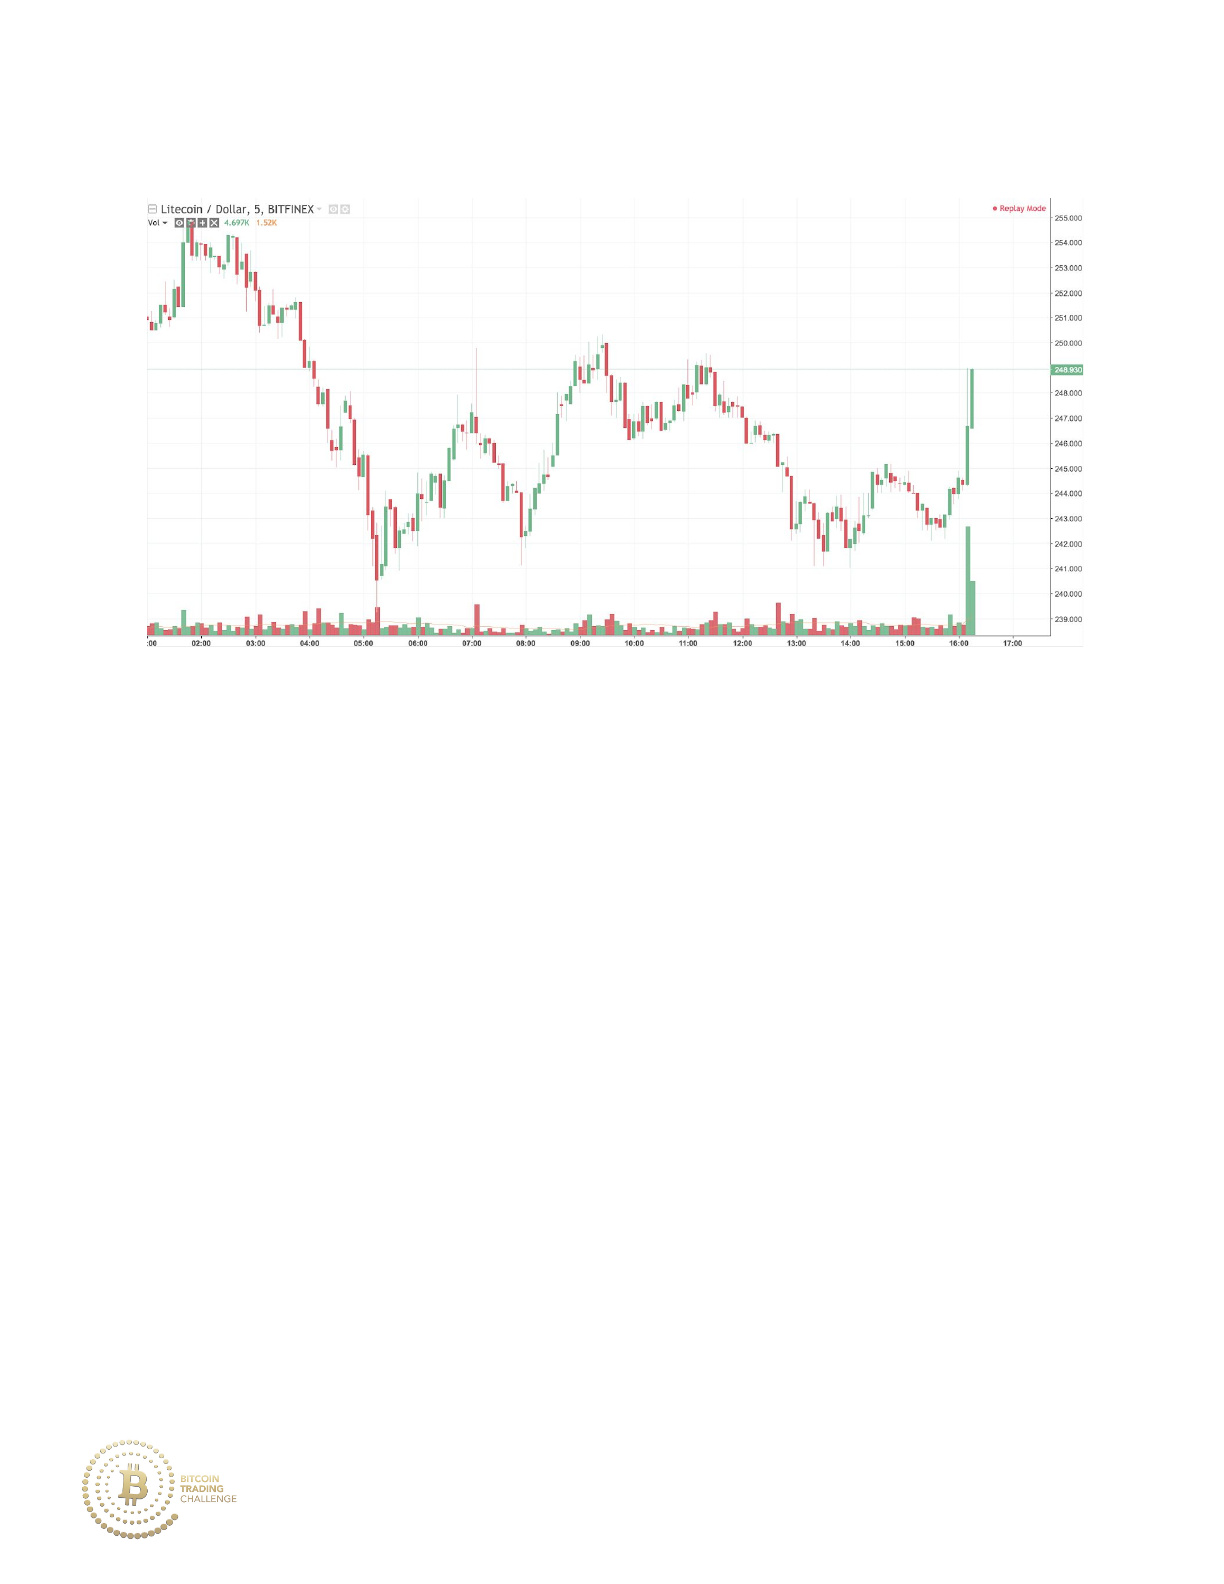
Practice 5-6
One more volume example: Is price breaking out upward, or is it overbought
based on the most recent volume spike(s)?
106
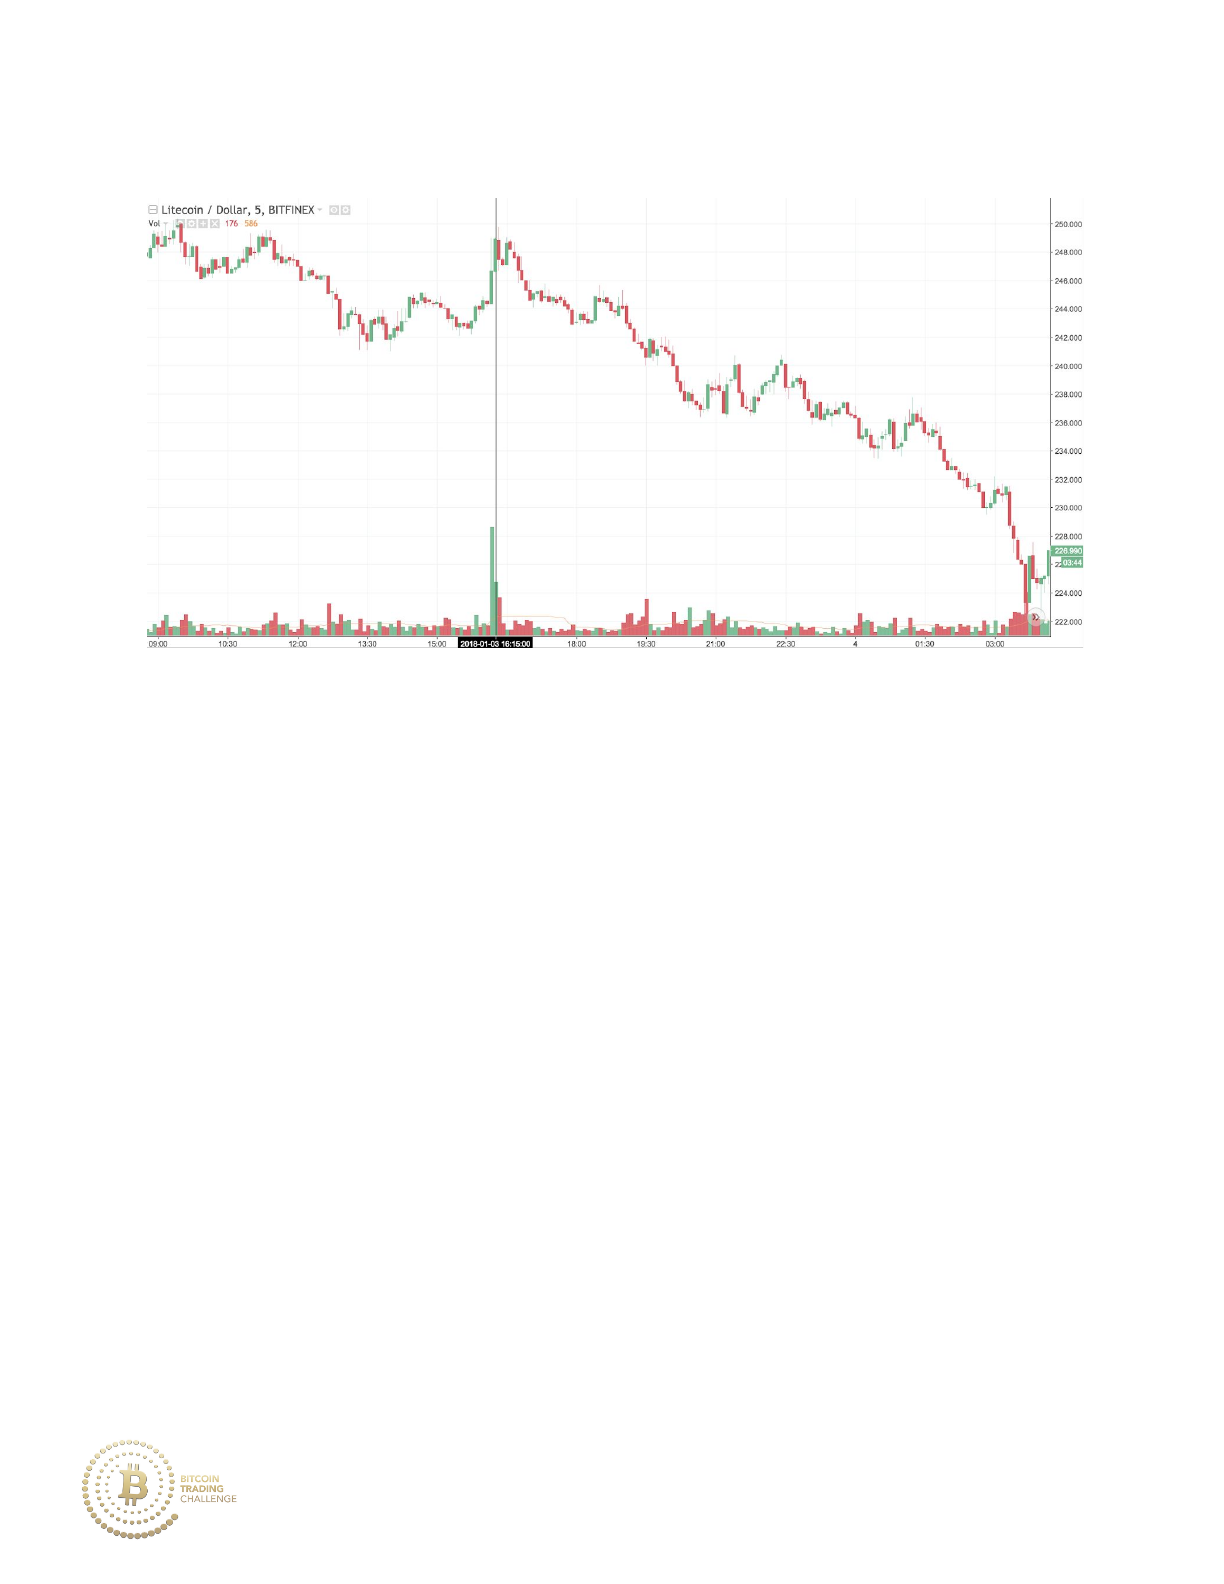
Practice 5-6 Answer
Price immediately moves down as price is overbought. If you thought it
was a breakout, then take a look back at the original chart. Price never
breaks through a major resistance level, so we cannot classify it as a
breakout.
Now let’s combine volume analysis with the Fibonacci levels.
107
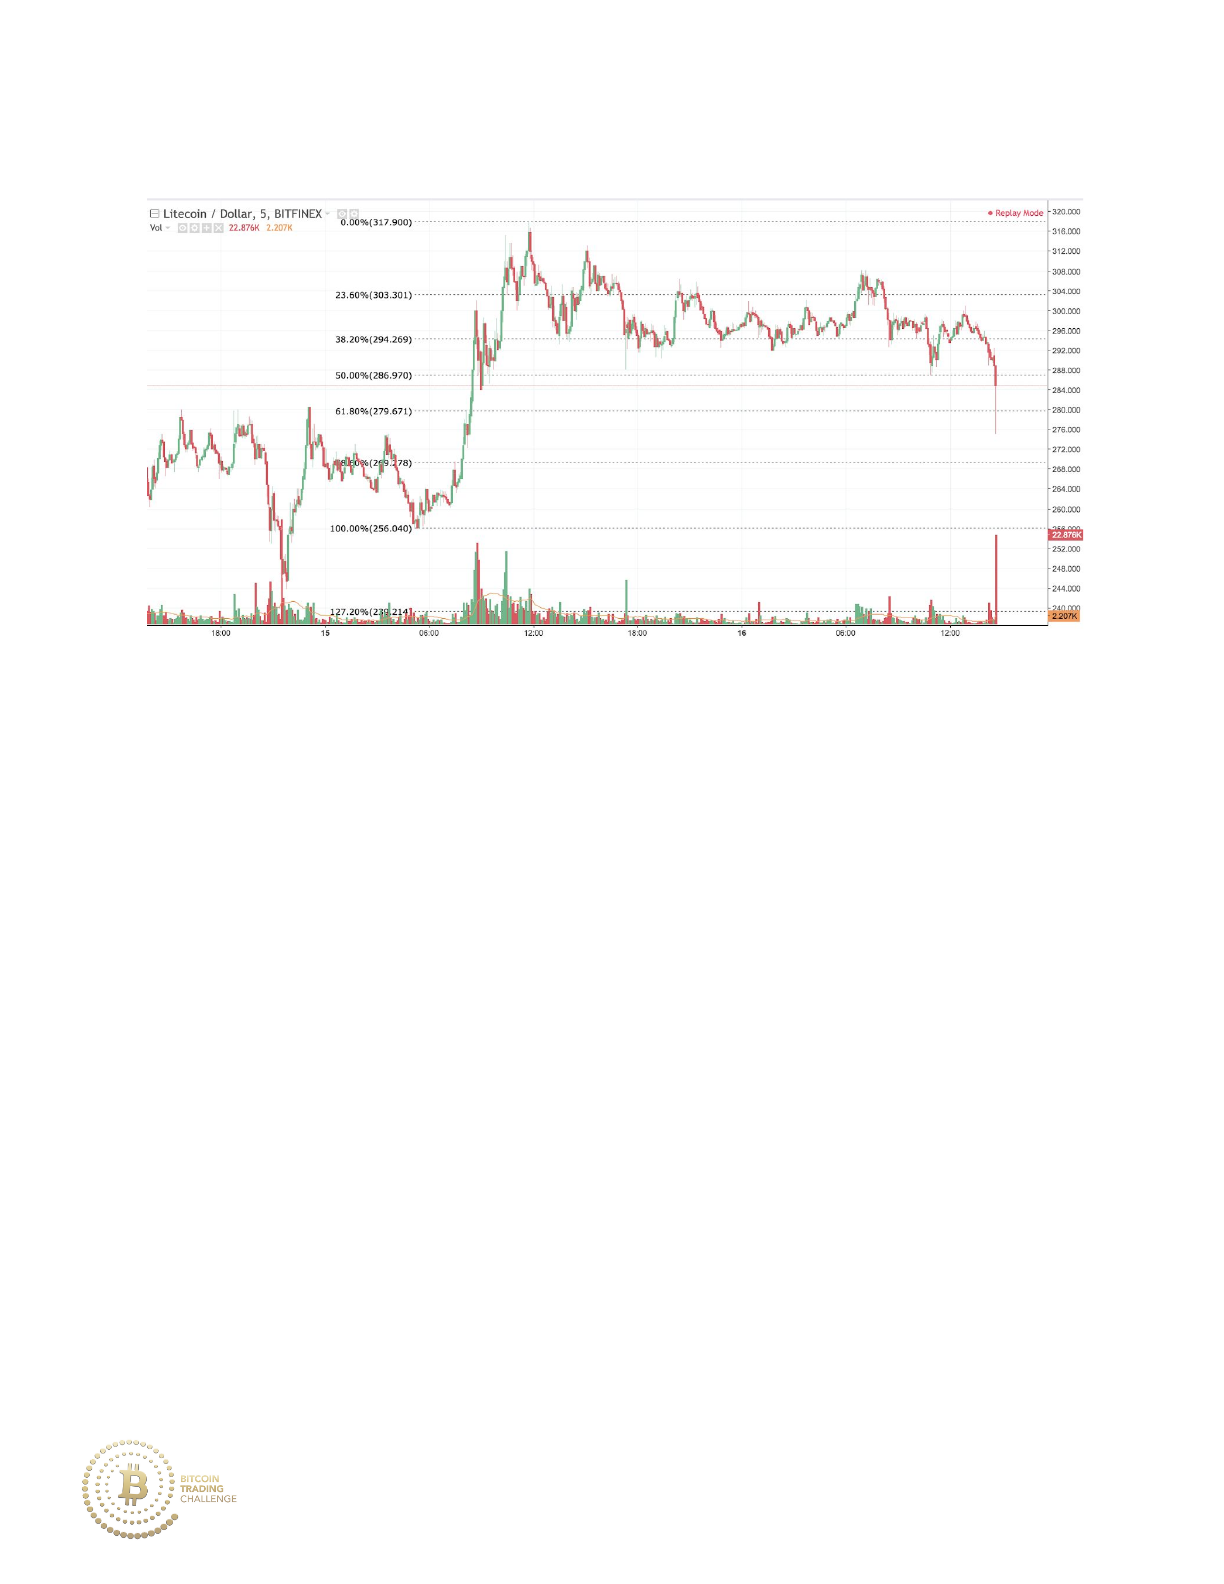
The two values located on the bottom right portion of the chart are the
most recent candlestick’s volume moving average value and the volume
value itself (can also be found on the top left portion of the chart).
Drawing from the high to the low of this recent uptrend gives a 61.8%
retracement value at 279.67. We see a volume spike of 22.876k (k means
1000, so 22876 BTC transacted) with a volume moving average value of
2.207k, about 10 times the moving average. Notice that the most recent
price tail touches down at the previous resistance level at 276.
All of these factors of confluence allow for a high probability trade setup
with a buy order at the 61.8% value.
108
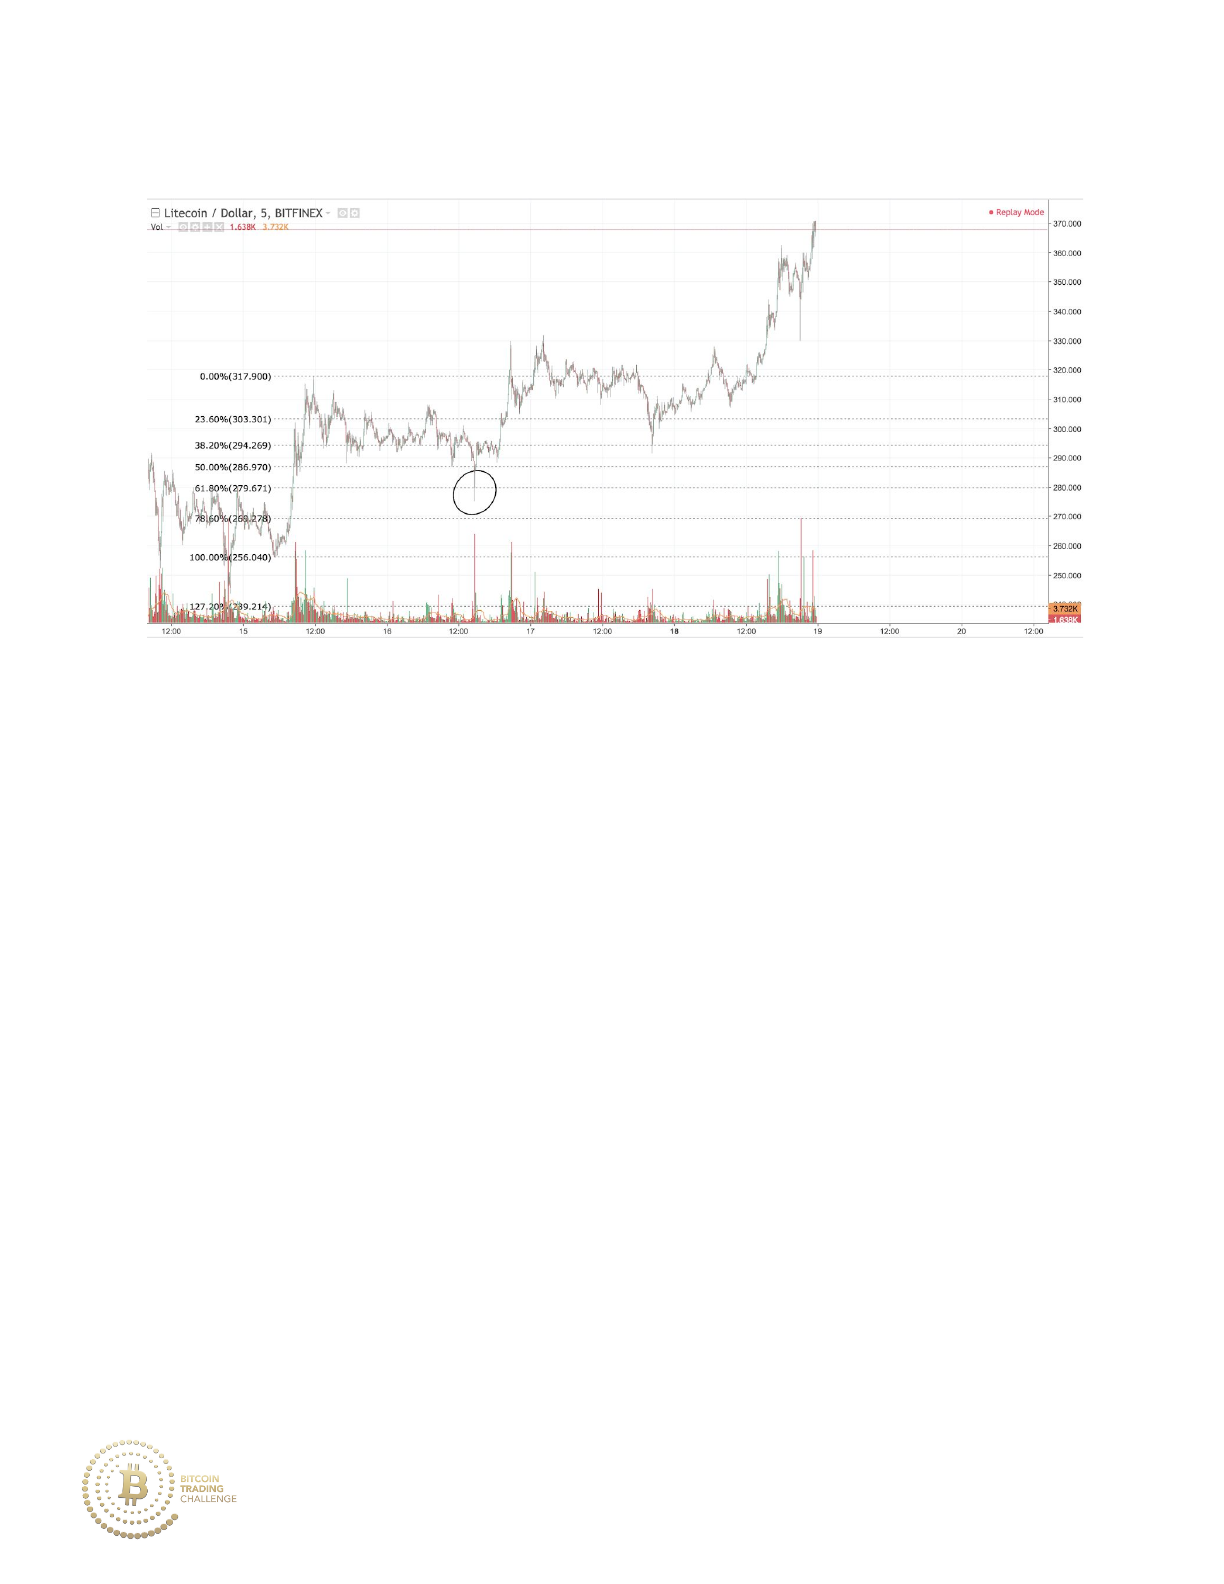
Volume spikes located directly at a Fibonacci level typically lead to a
reversal.
C. Technical Indicators
There are four main types of technical indicators: trend, momentum,
volatility and volume.
1. Trend indicators give you the ability to enter into an established
trend. These indicators include EMA’s, SMA’s, MACD, among many
more.
Pro: Allows you to buy into a new trend after the trend shows
significant strength as it reverses from a Fibonacci level.
109

Con: The trader using these indicators may be buying/selling into the
trend after it has already run its course.
2. Momentum indicators give you the ability to trade reversals and
retracements. These indicators are typically oscillators such as RSI,
Stochastics, CCI, and so on. They can provide powerful confluence to
both Fibonacci retracements and extensions.
Pro: Signals when the market has reached an overbought/oversold
point allowing for the trader to potentially trade a reversal.
Con: When price breaks out upward of consolidation, momentum
indicators will likely give overbought readings which act as an
indication to sell (vice versa for downtrends and oversold readings).
Selling genuine price breakouts is typically not a good idea because
the strong bullish momentum is not overbought, but rather an
emerging uptrend.
3. Volatility indicators give you information about price’s rate of change
over time to allow you to capitalize on rapid price movement. This
includes indicators such as the ATR, Bollinger Bands, ADX, etc. High
volatility readings typically lead to a change in the market stage.
Pro: Can offer confluence when used with Fibonaccis to signal
market tops and bottoms.
Con: May give false signals that price is reaching a market top or
bottom due to natural fluctuating volatility. To prevent this, you could
110

use major Fibonacci retracements and extensions instead of minor
Fibonacci levels.
4. Volume indicators give you information about the historical nature of
the market’s participants. They include historical volume (the
standard volume on a price chart), OBV, CMF and many other
volume-based indicators. These indicators work well with Fibonacci
levels as they provide the transaction data that can signify when the
market is entering a stage of extreme fear/greed.
Pro: Can be used in many ways in conjunction with Fibonacci levels.
For example, OBV price divergence could be used to identify weak
and strong trends. Volume spikes could be used to signal the
end/start of an uptrend or downtrend.
Con: No indicator in trading will work 100% of the time and volume
indicators are no exception. Even though volume spikes may occur,
price may keep moving with the trend. A trend may also have weak
volume, but still continue moving in that direction. Remember to
always take note of the location of major Fibonacci levels, and then
analyze how volume is reacting to that specific level.
1. Fibonacci levels in conjunction with trend indicators.
111
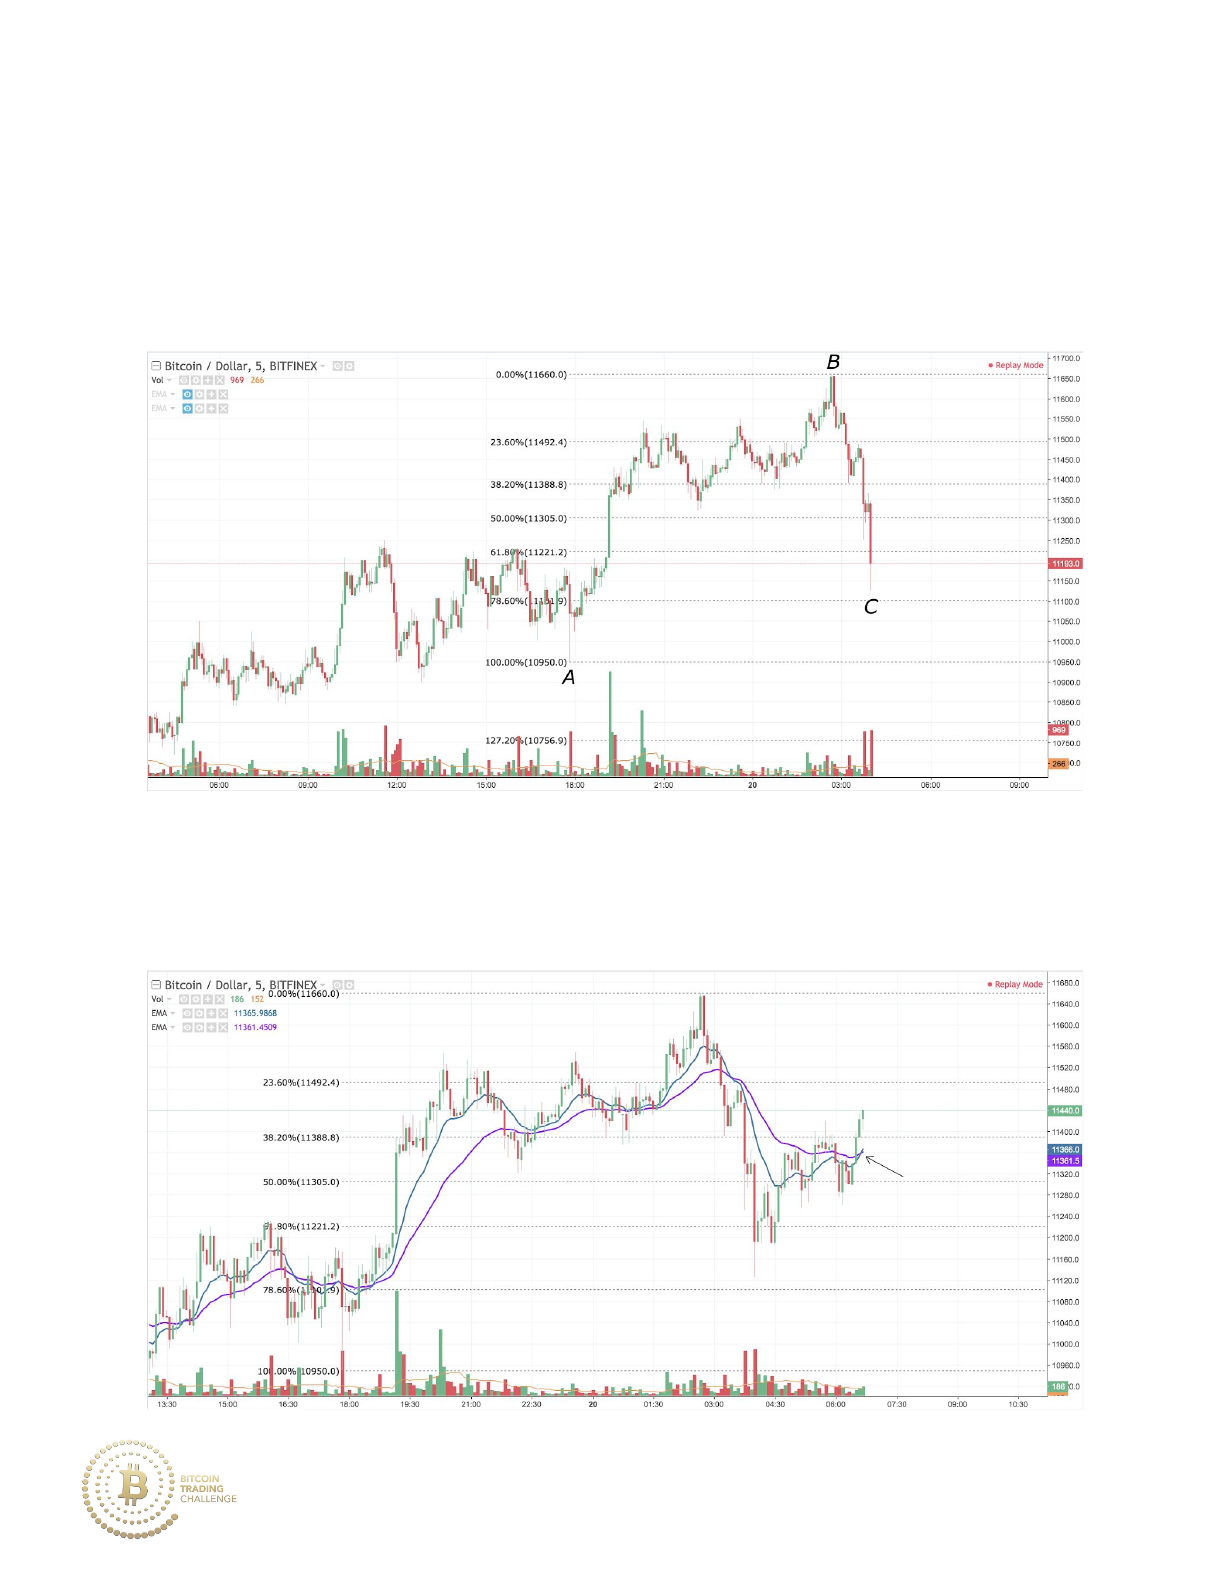
We have a standard move down to the 61.8% retracement from A to B. We
also see a volume spike with a low tail that occurs around that
retracement. Currently, the B to C move is on high bearish momentum, so
we are awaiting a bullish confirmation.
We can use two EMA’s (Exponential Moving Average) in order to buy into
this market. We see an EMA crossover, so we buy.
112
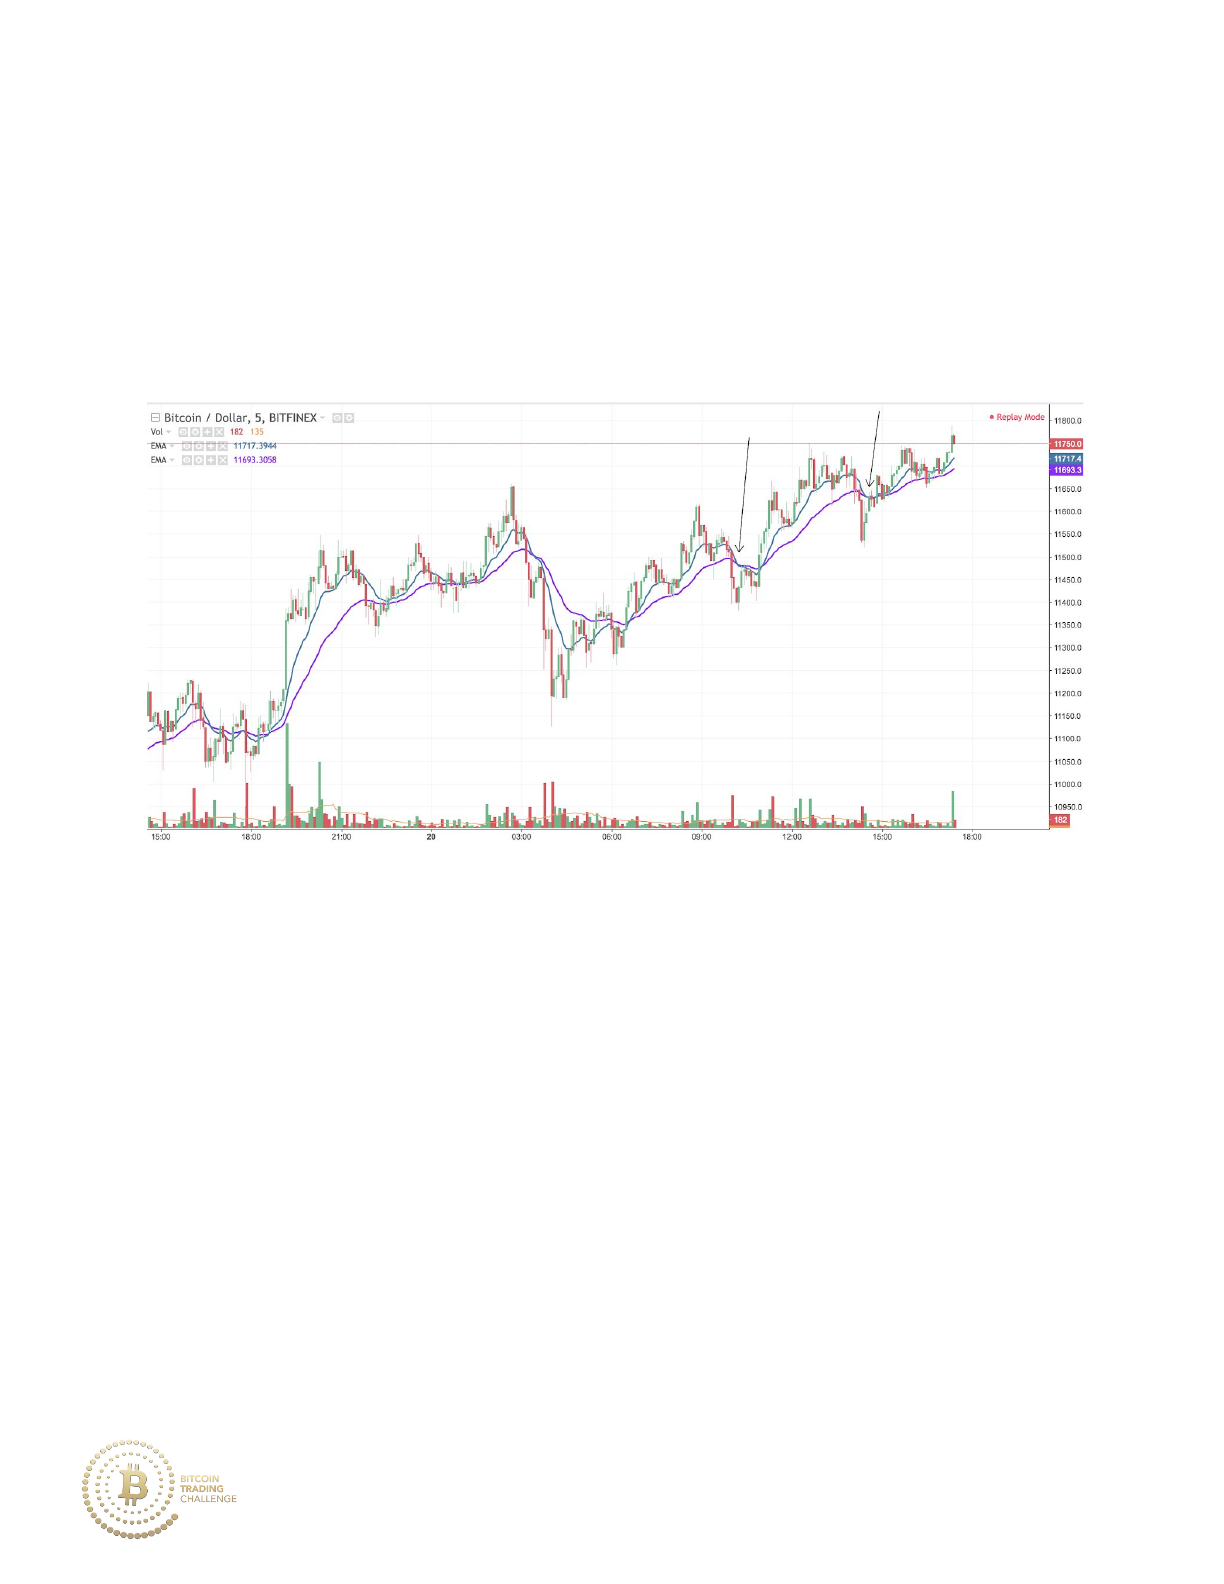
Then you can exit the trade on one of the two future EMA cross-unders as
indicated by the arrow:
2. Fibonacci levels in conjunction with momentum indicators.
We have a strong uptrend from A to B that retraces to the 38.2% support
level as strong trends typically do. RSI (Relative Strength Index) will allow a
trader to buy at the 38.2% support level as RSI was oversold each time the
market tested that level of support.
113
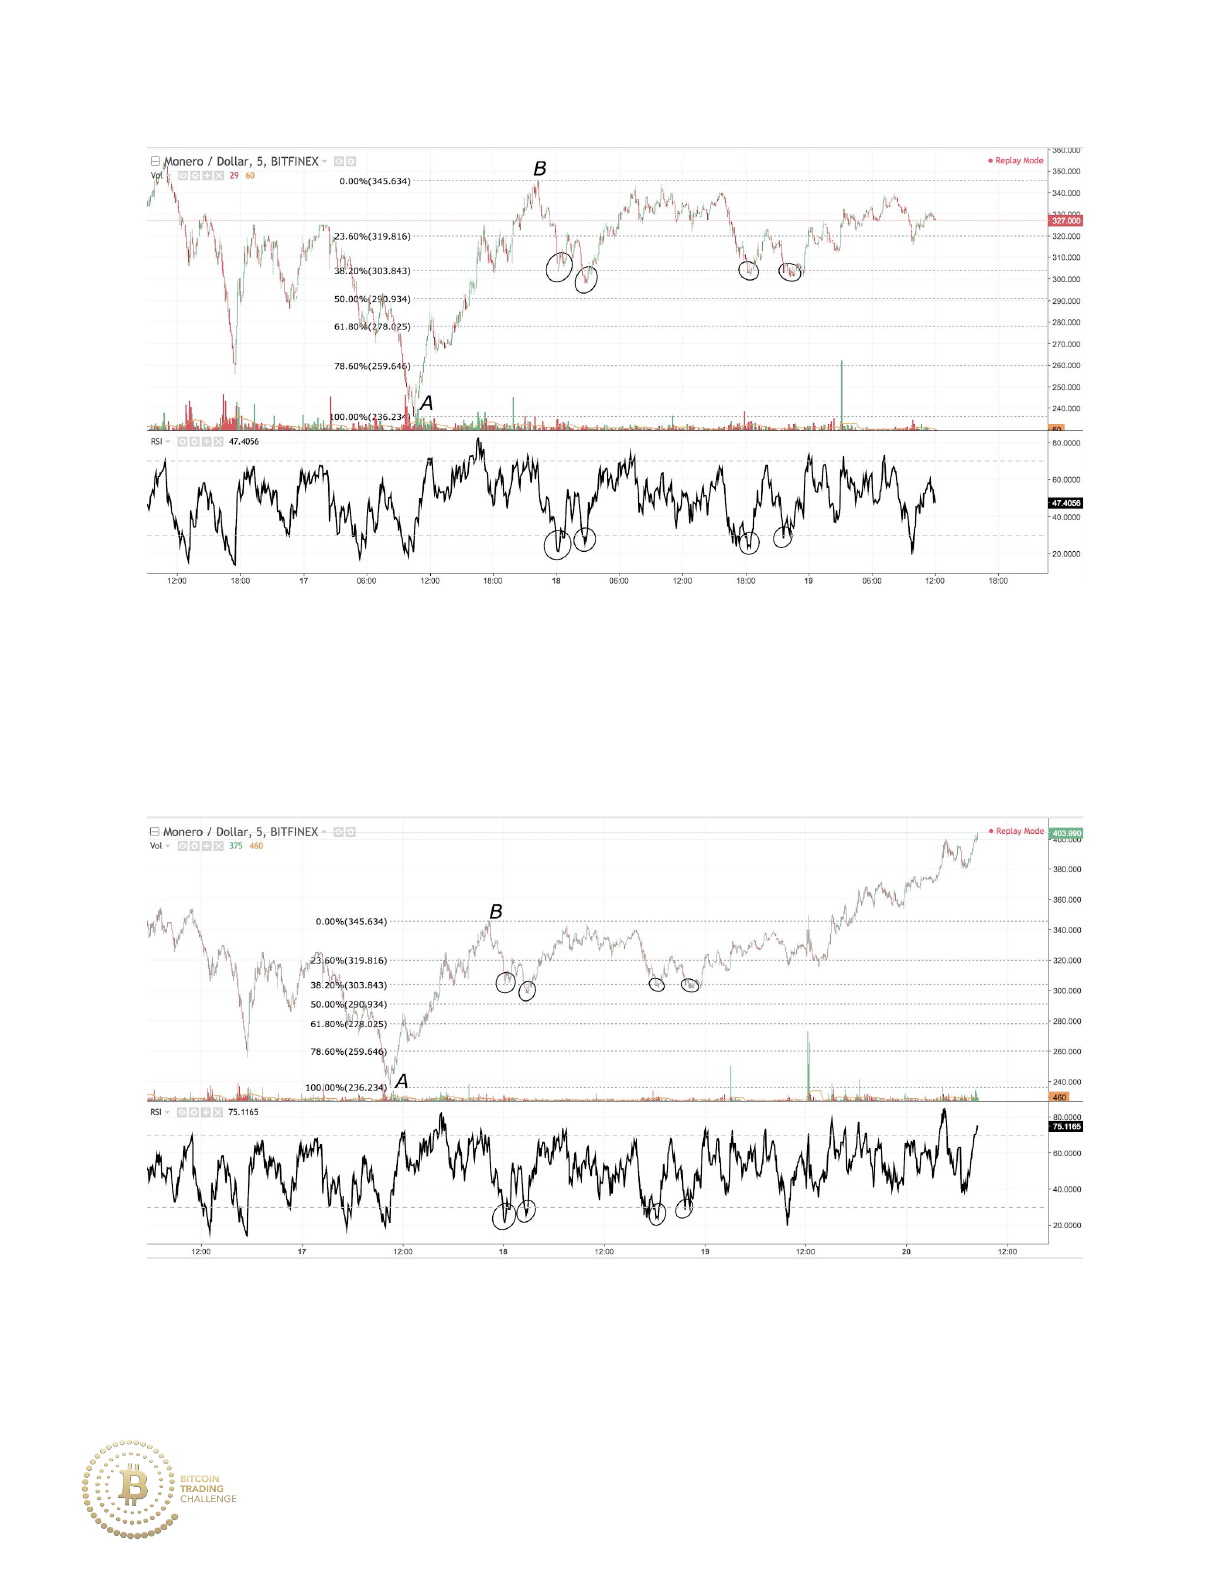
You could have further exited the trade by either selling when RSI went
overbought, or selling at the 161.8% extension drawn from 345.6 down to
298.
114
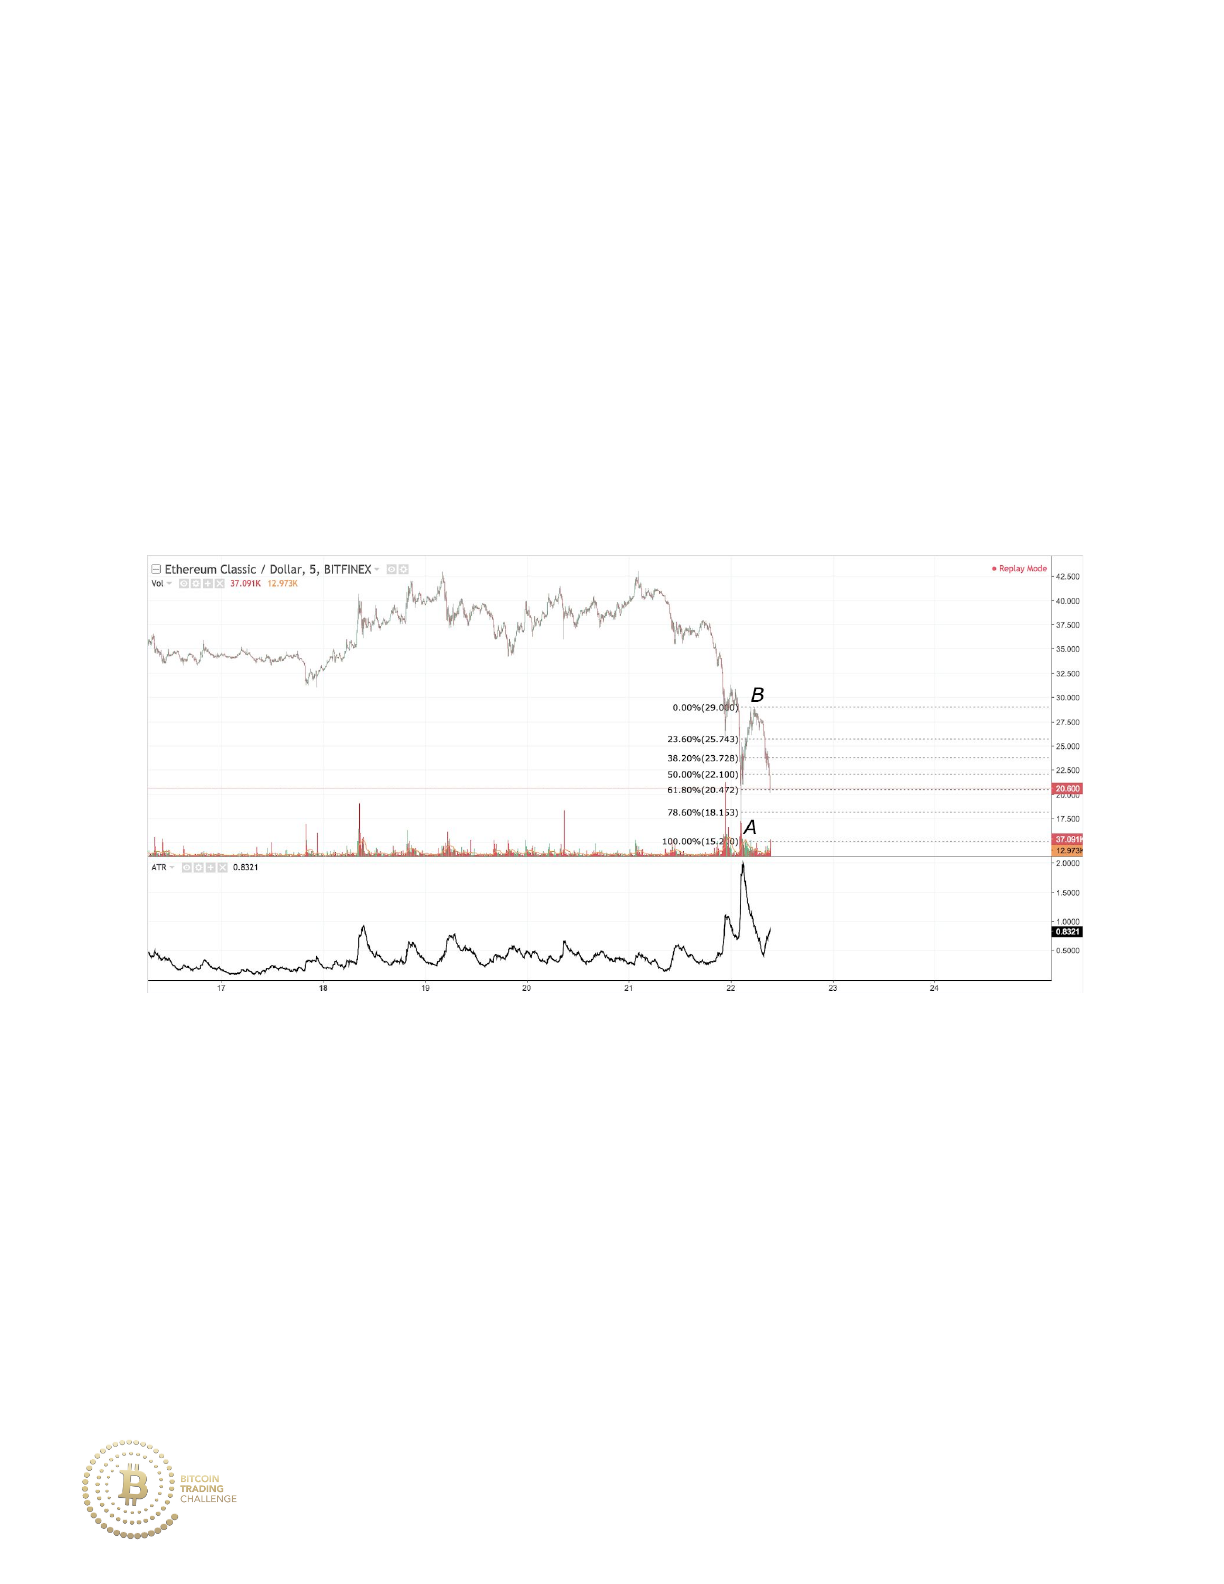
3. Fibonacci levels in conjunction with volatility indicators
In the example below, we see that price is in a strong downtrend and the
ATR (Average True Range) remains relatively low until a large spike on the
22nd of the month. This is a strong indication of a market stage reversal.
We then see that price recently retraced down to the 61.8% retracement
from A to B with declining volume and an additional ATR spike at the 61.8%
level.
Price bounces off of the 61.8% retracement at 20.472 and moves slightly
above resistance marked at Point B. Using this strategy, one could take
profit on either a spike of the ATR, or from a major Fibonacci
retracement/extension.
115
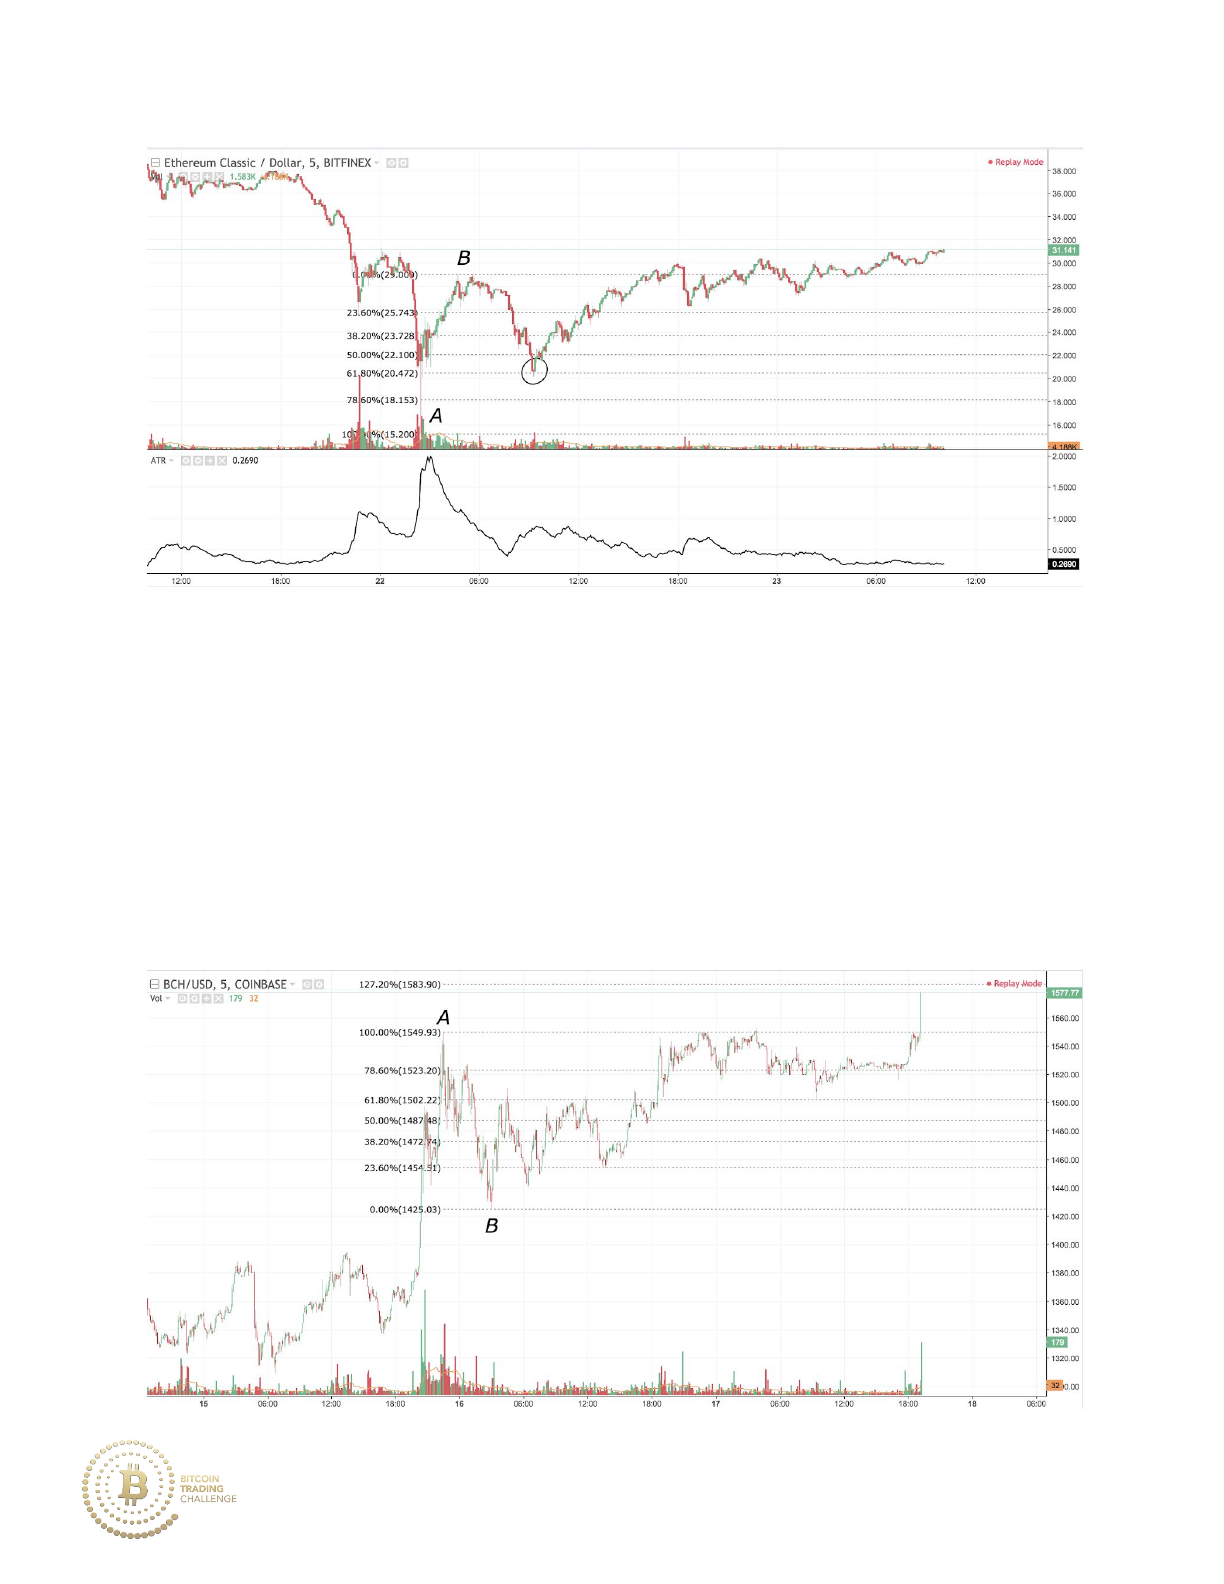
4. Fibonacci levels in conjunction with volume indicators
Here we see that price is in a strong uptrend and makes a retracement
from A to B. As a result, we would expect major resistance at the 161.8%
extension of that level.
116
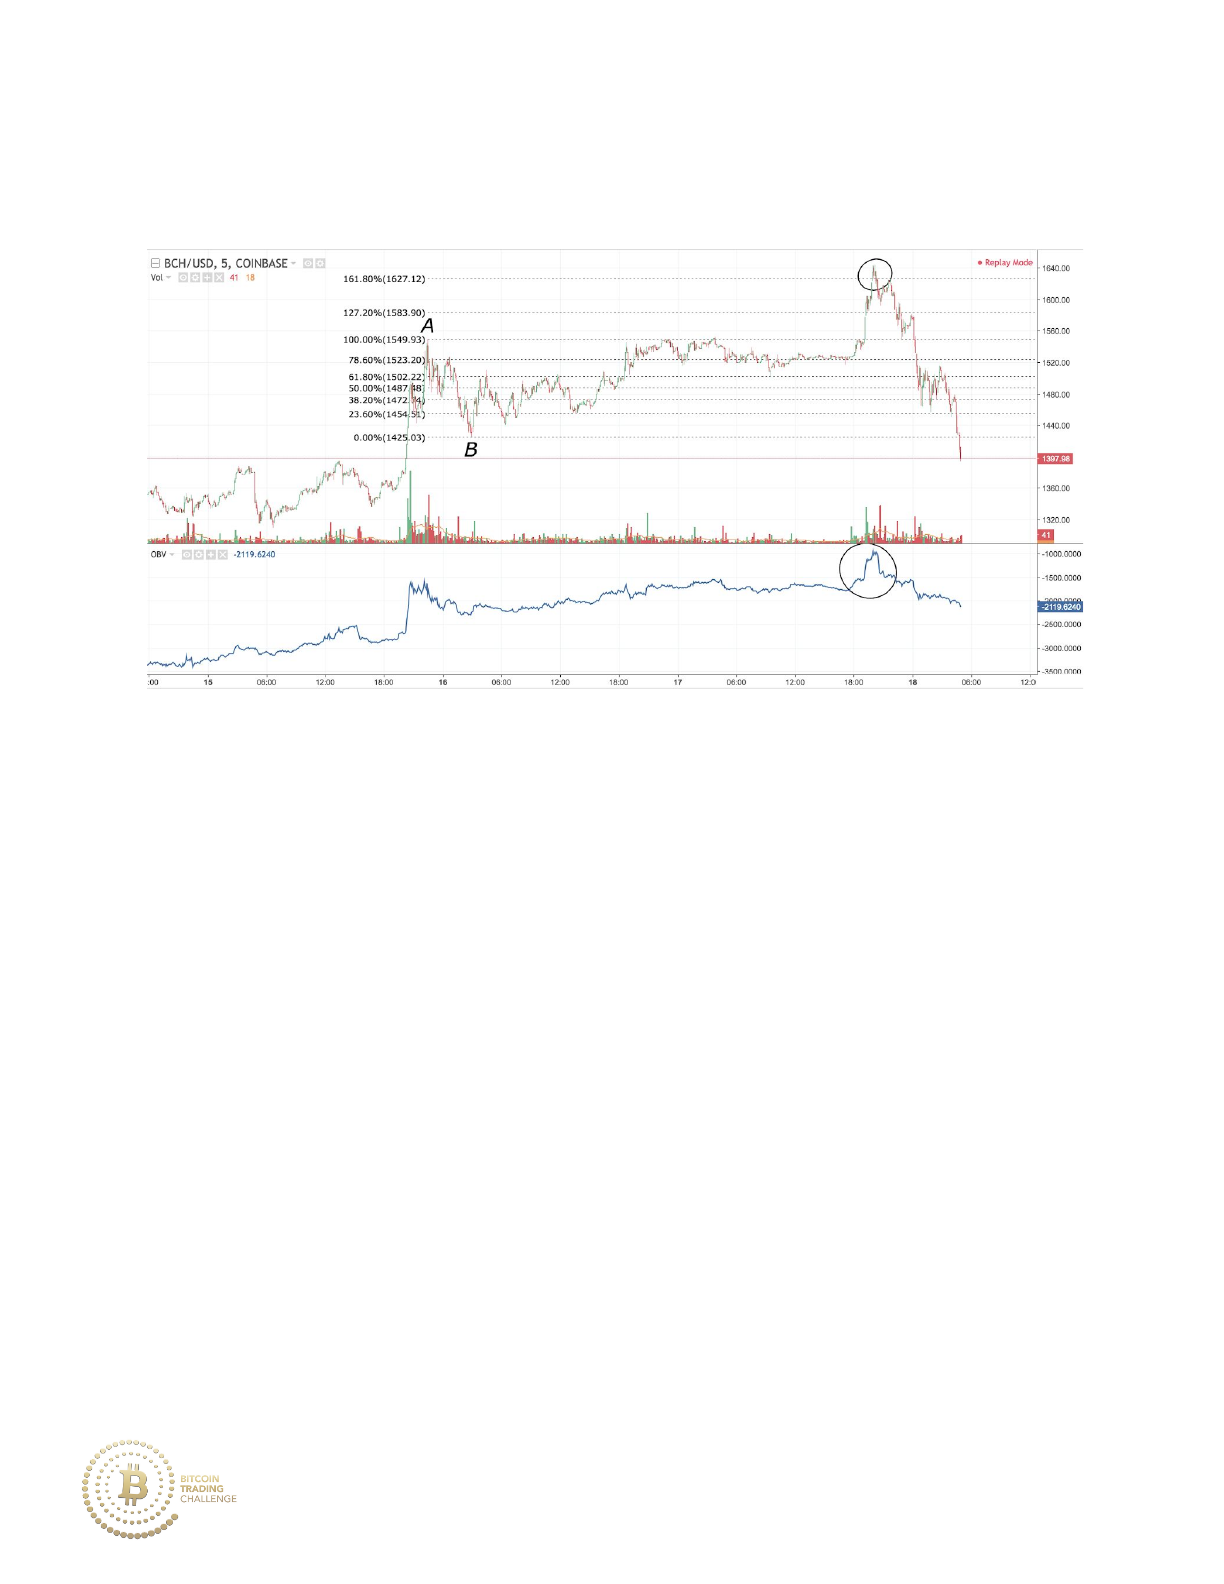
As price moves into the 161.8% extension, we see a spike in OBV
(On-Balance Volume). This is a fantastic opportunity to sell.
D. Overlapping Fibonacci Analysis
A trader who trades Fibonaccis professionally would likely be drawing
Fibonaccis on many market movements to look for both level overlap and
confluence within key areas of support and resistance. Identifying and
ultimately drawing relevant Fibonaccis is a skill that takes practice. This
step-by-step guide is meant to give a solid basis for how a Fibonacci trader
would approach the market. After having a basis for how to use Fibonacci
analysis, you can develop your own method to marking up a chart with
Fibonacci levels and finally setting orders according to those levels.
117
Step-by-Step Guide for Analyzing Multiple Fibonacci levels
1. Draw Fibonaccis from the current overall trend
2. Draw Fibonaccis on the more recent major market stage.
3. Identify consolidation and retracements within both the overall trend
and in the more recent trend. Draw Fibonacci extensions off of both
of these types of minor market stages.
When all Fibonacci drawings are complete, identify important levels and
overlapping areas within each trend.
Here is an example:
1. Draw Fibonaccis on the current overall trend (typically drawn on a
higher timeframe such as the 1H and 4H for medium/long term
trading styles).
2. Draw Fibonaccis on the more recent major market stage available.
118
The Fibonaccis drawn here can also be used for the 161.8% extension of the
last leg of this uptrend.
3. Identify consolidation and retracements within both the overall trend and
in the more recent trend. Draw Fibonacci extensions off of both of these
types of market stages. Target the 161.8% extension as future
support/resistance.
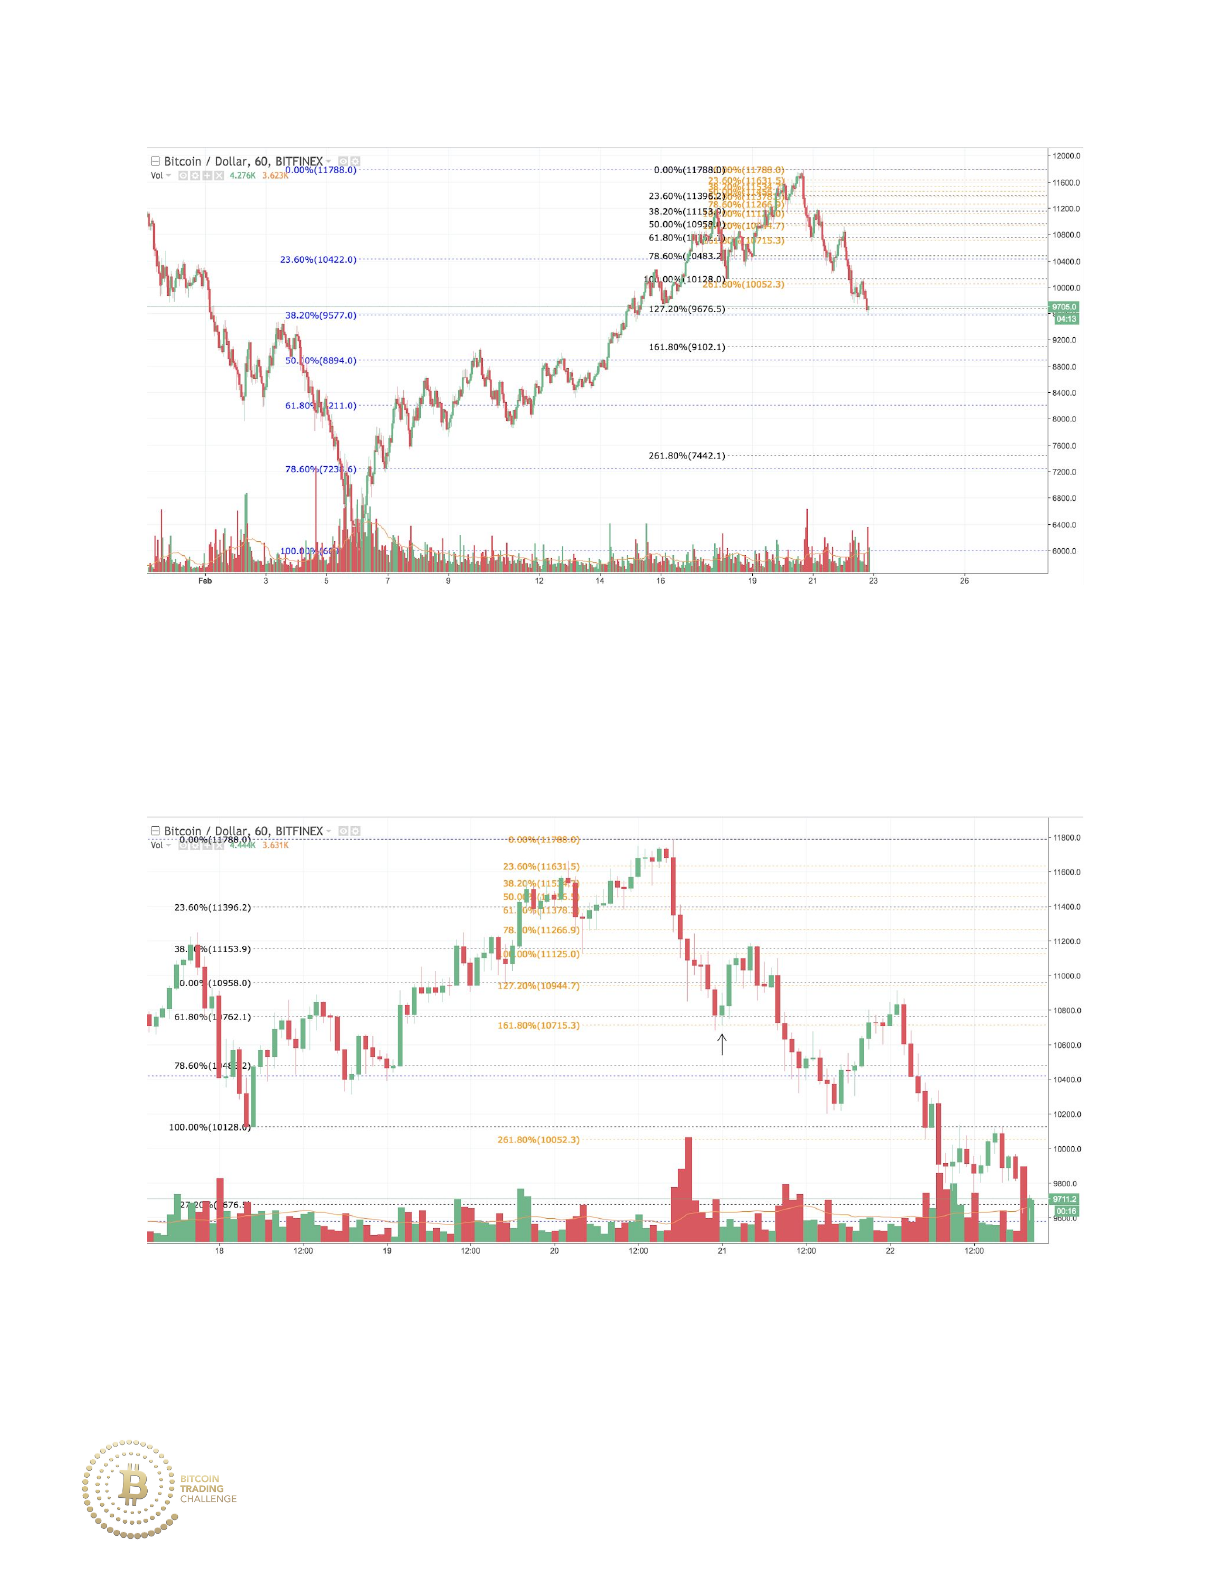
In the example below, notice that the major Fibonacci is drawn from the
low to the high of the overall uptrend in blue. The Fibonacci drawn from the
major last upmove that occurred within the uptrend is colored black. The
Fibonacci drawn from the minor final upmove is in orange.
119
The levels and price reaction to those levels can be hard to see so lets
zoom in...
We can see that the last major leg of the uptrend 61.8% (black) was
respected as price moved down to the 161.8% (orange) extension of the
120
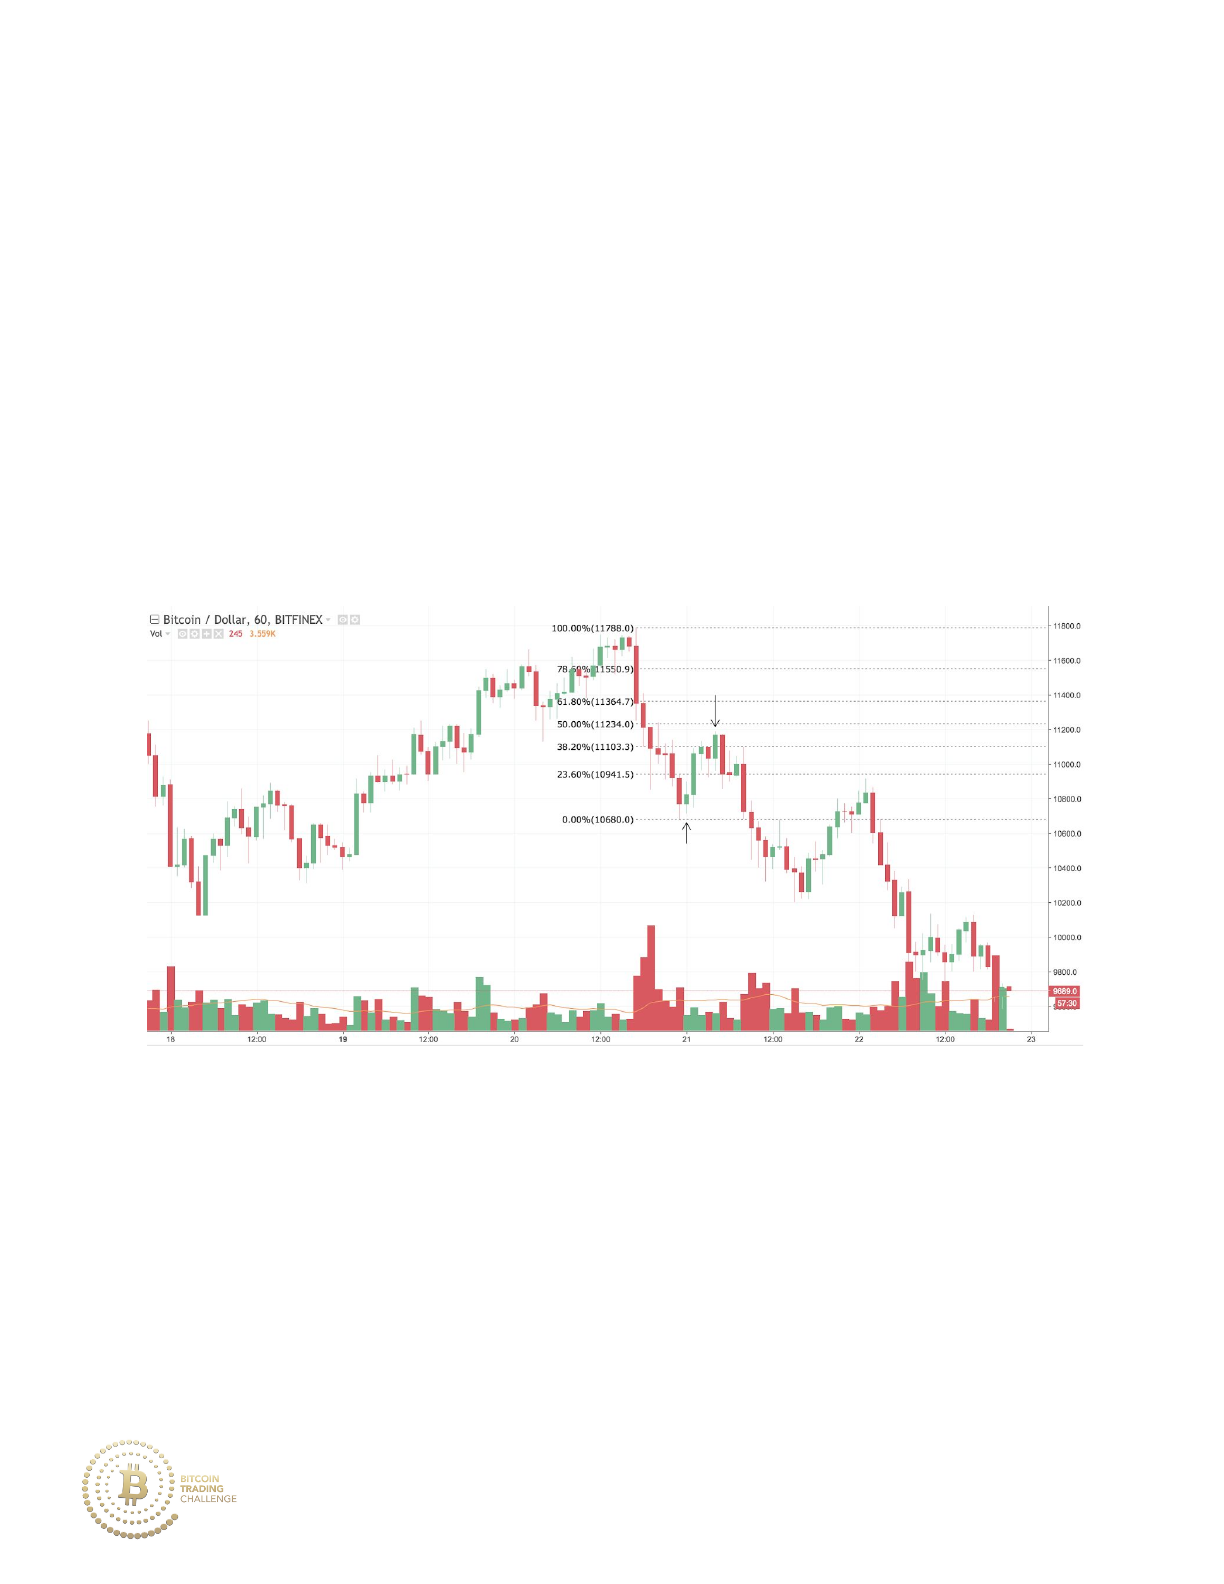
minor last leg of the uptrend. Setting a buy order at this level of confluence
can result in a profitable bounce trade. Additionally, this area of confluence
in between the 61.8% and the 161.8% is known as a confluence zone. A
confluence zone can be drawn when there are important Fibonacci levels in
close proximity.
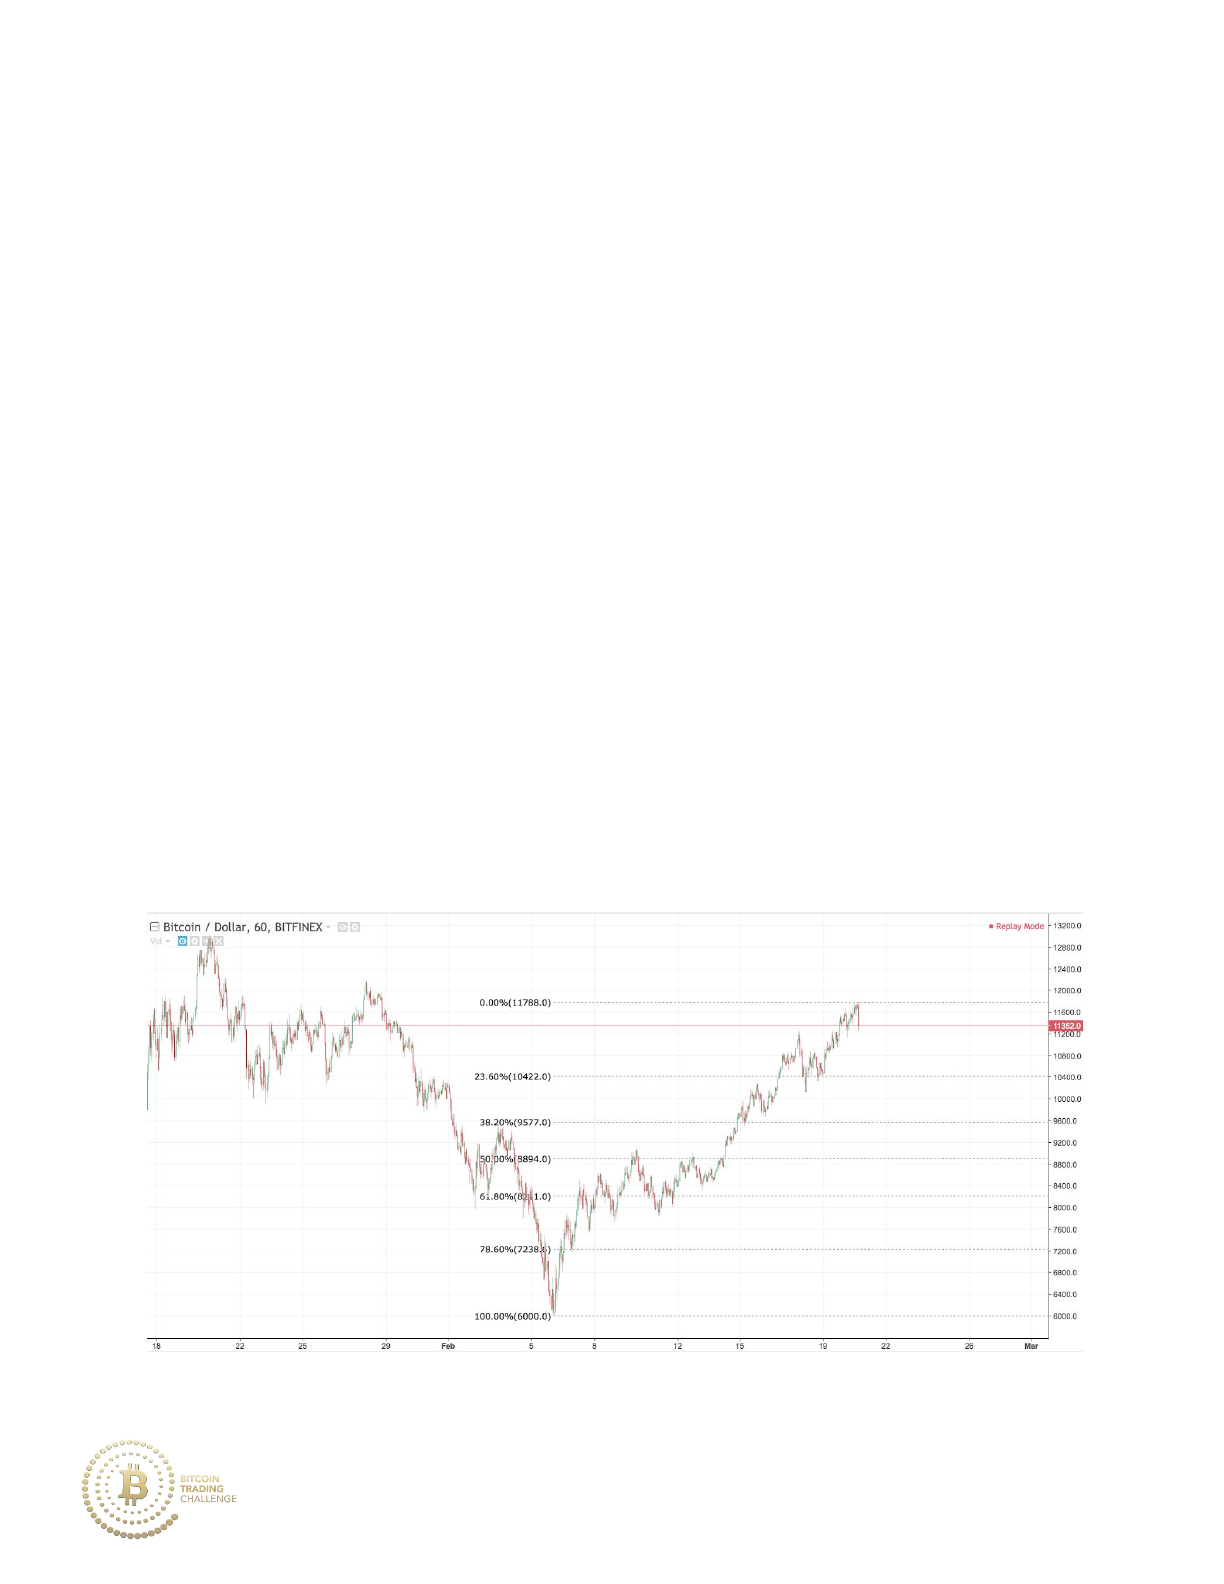
Price then retraced upward ~ 38.2% of the recent downtrend before
continuing to move lower. Price retraced 38.2% likely due to the fact that
the previous market stage (downtrend from 11788 to 10680) was strong.
121
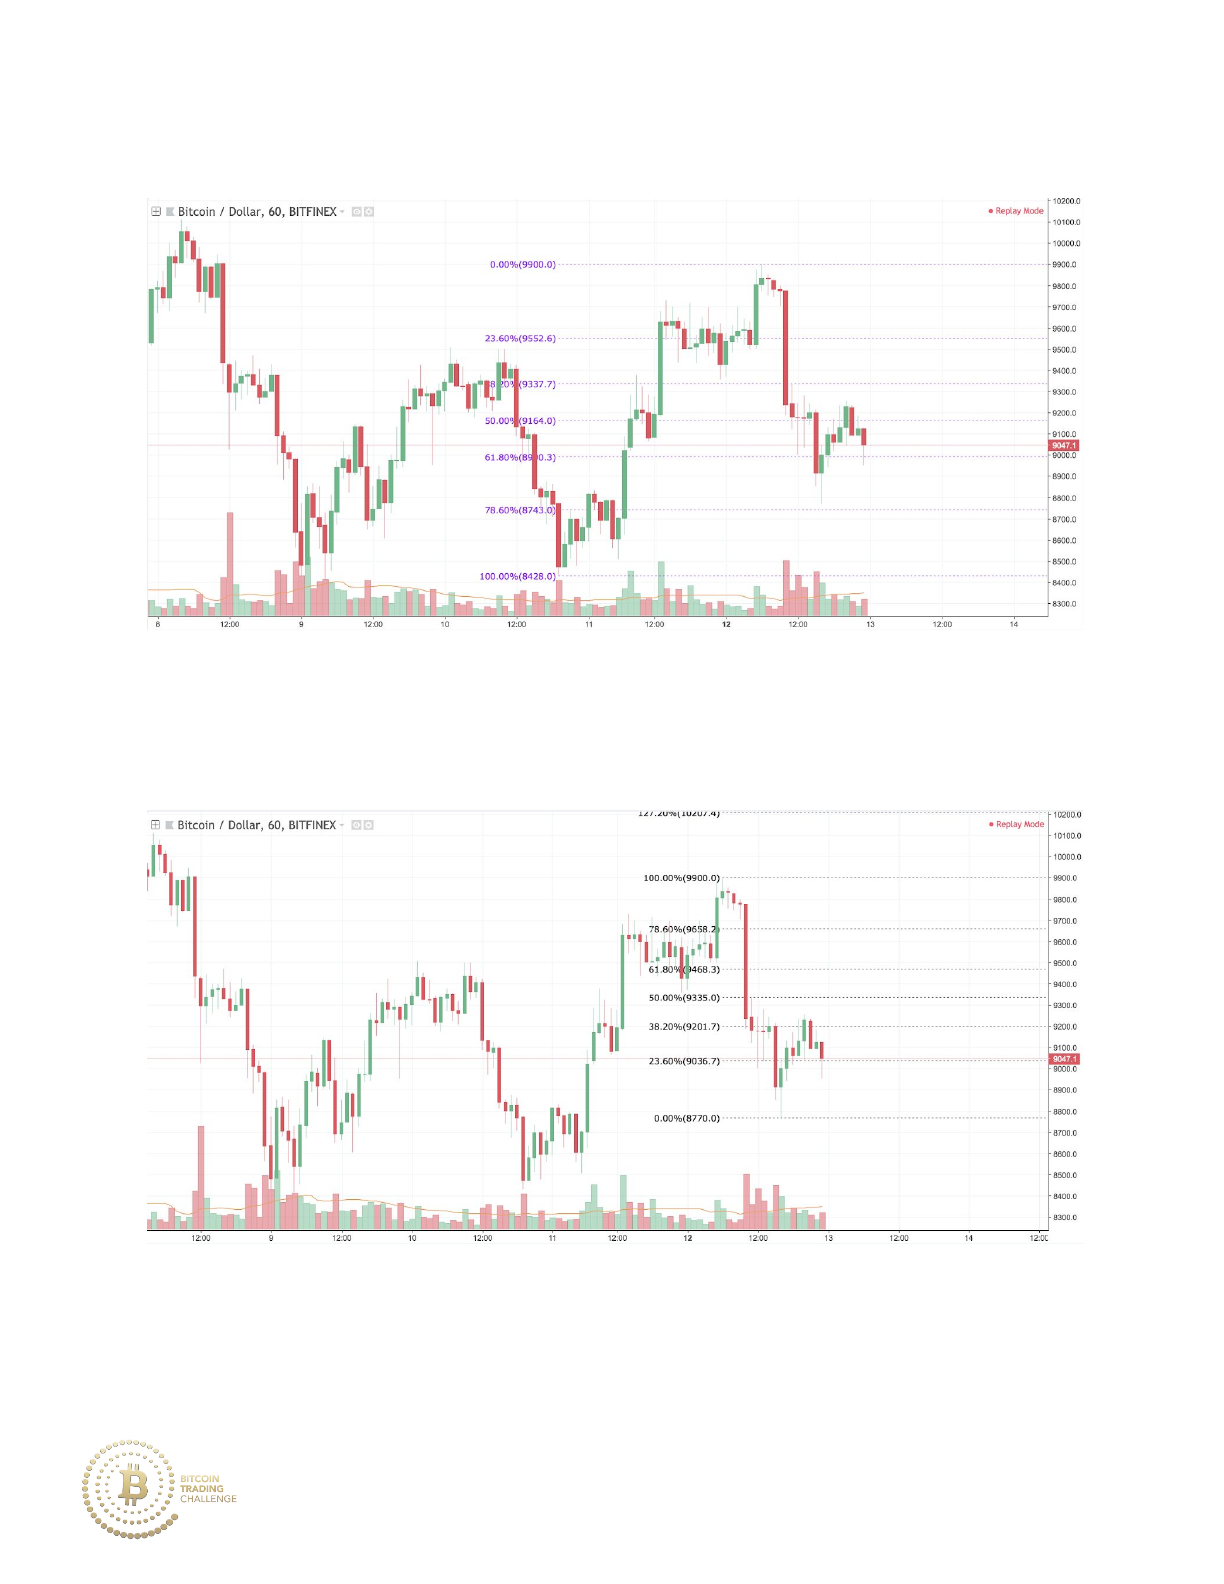
Here’s another example of overlapping Fibonacci analysis:
We see price move into the sharp retracement zone (61.8% to 78.6%)
before moving back upward.
If we draw a new Fibonacci from the high to the present low, we would find
that price moved and rejected the 38.2% retracement level. Additionally, if
122
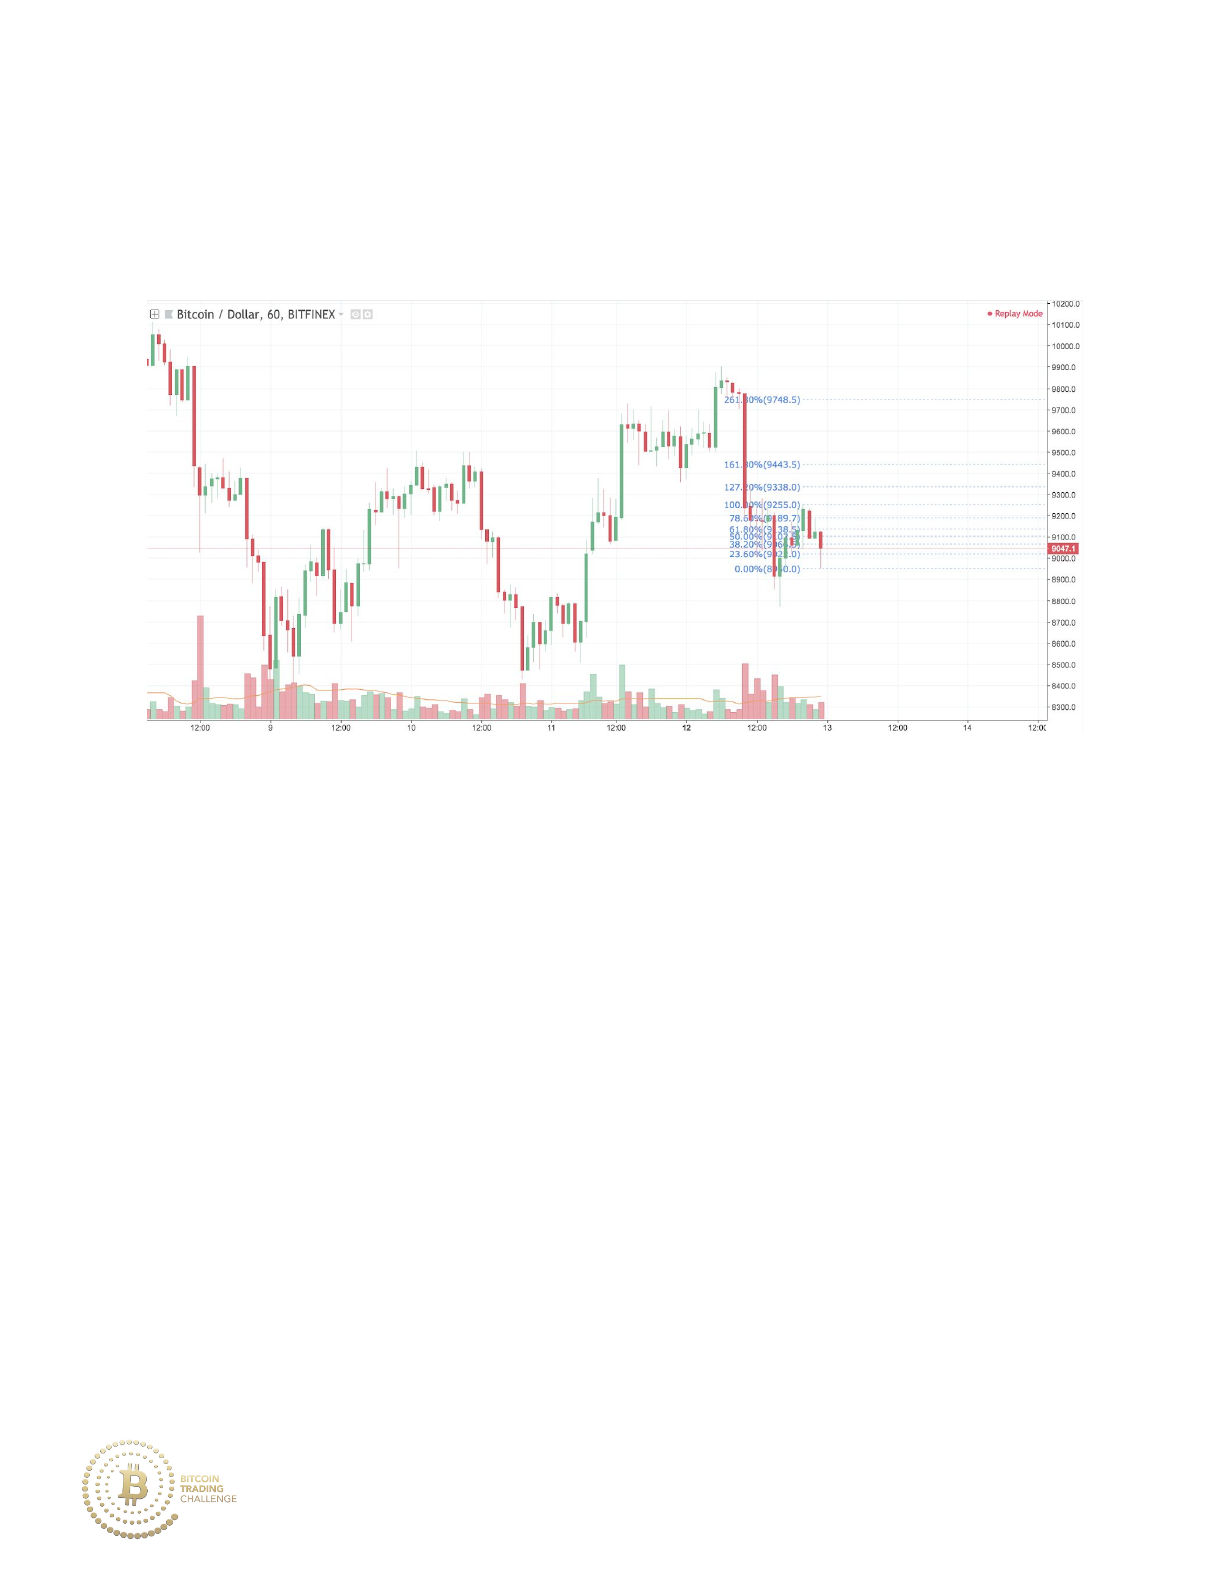
price continues upward, the 61.8% retracement is the next likely area of
resistance.
Additionally, If you were to isolate the market stage of the retracement
from 9255 down to 8950, the 161.8% Fibonacci extension emerges at what
looks to be a previous support level (could become future resistance) at
9443.5.
123
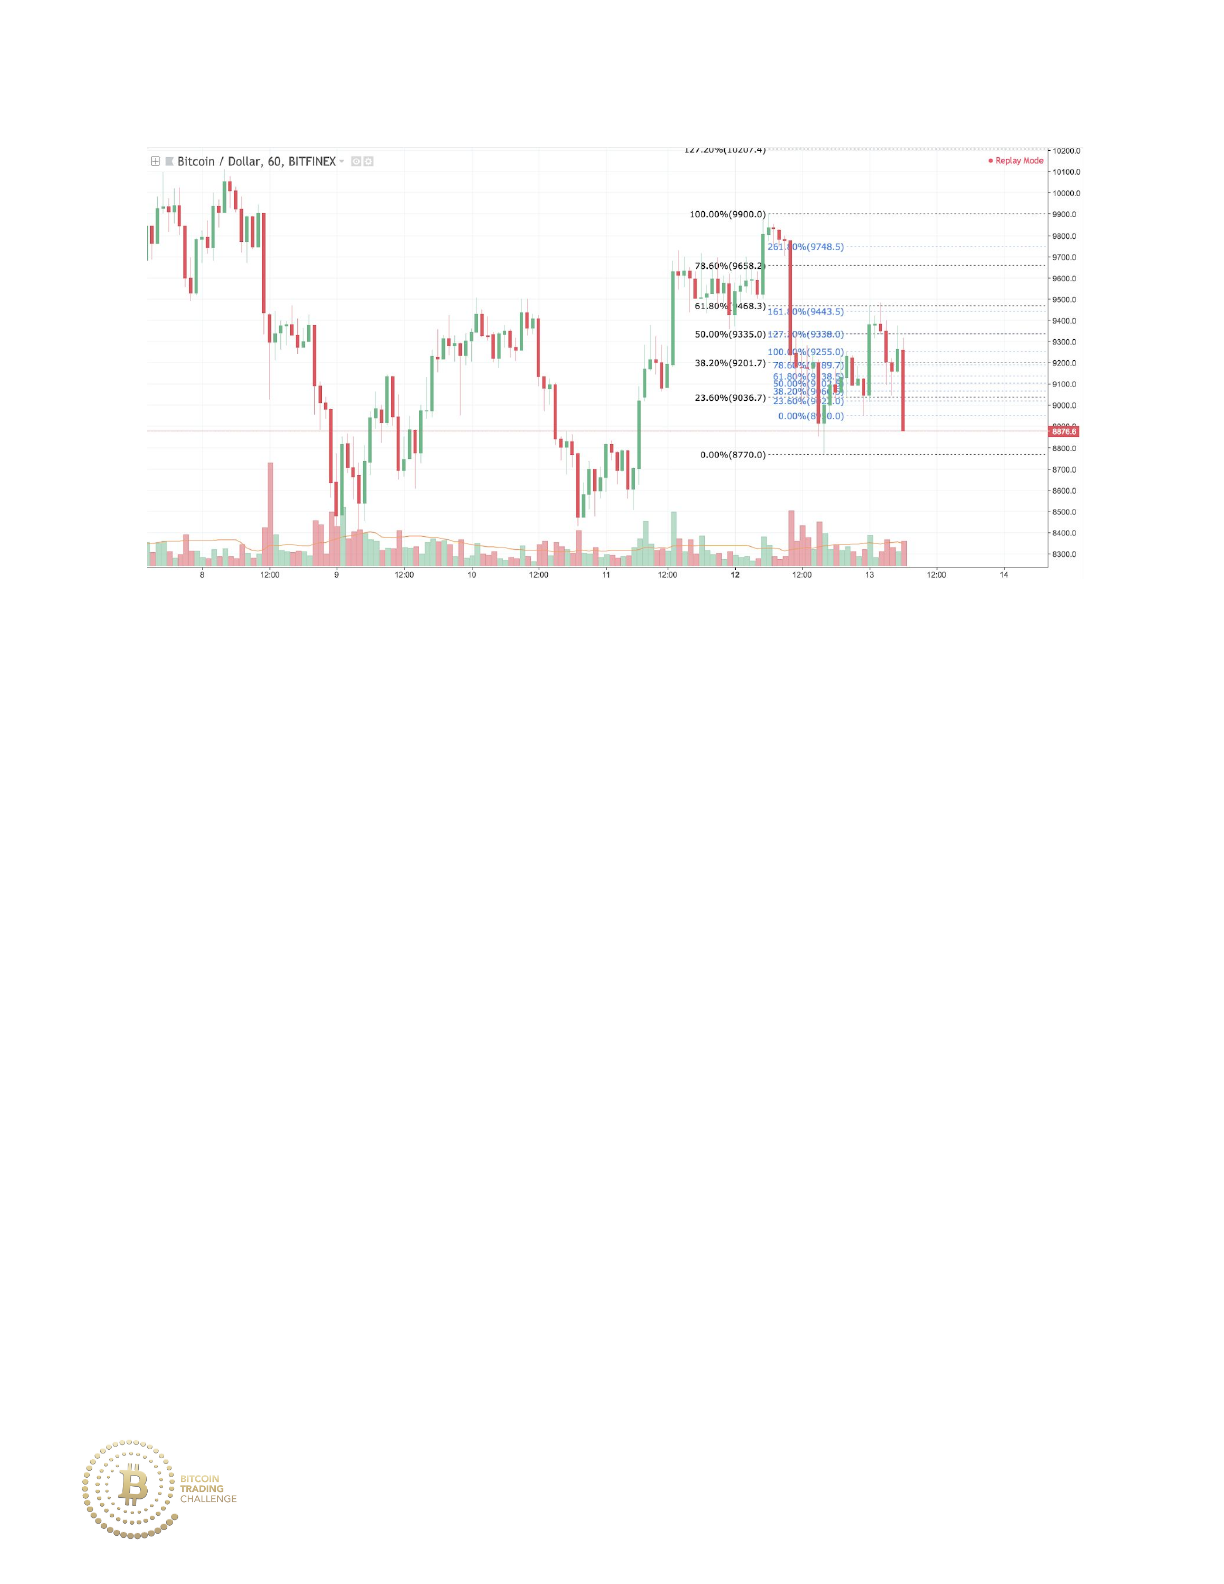
The 61.8% retracement (black) in conjunction with the 161.8% Fibonacci
extension provides a tight zone of overlapping Fibonacci confluence to
which price briefly touches before moving lower.
E. Fibonacci Planning
A Fibonacci trader can plan for multiple scenarios by plotting both bullish
and bearish Fibonaccis. This allows you to take advantage of the
non-biased nature of the Fibonacci system. In order to plot both future
support and resistance areas, you must identify the present market stage
and draw Fibonacci endpoints accordingly.
In consolidation:
1. Draw Fibonacci extensions to prepare if price moves to the upside or
to the downside.
124
2. Resistance/Support is likely to be found at the 161.8% extension - and
in strong trends that then consolidate, the 261.8% extension.
In an uptrend:
1. Draw Fibonacci endpoints from the high at the top of an uptrend to
the retracing move lower. If price continues to move downward,
redraw the low of your previous endpoint to that newly produced low.
2. If price moves past the 61.8% to 78.6% Fibonacci zone, then
resistance will likely be found at the 161.8% extension.
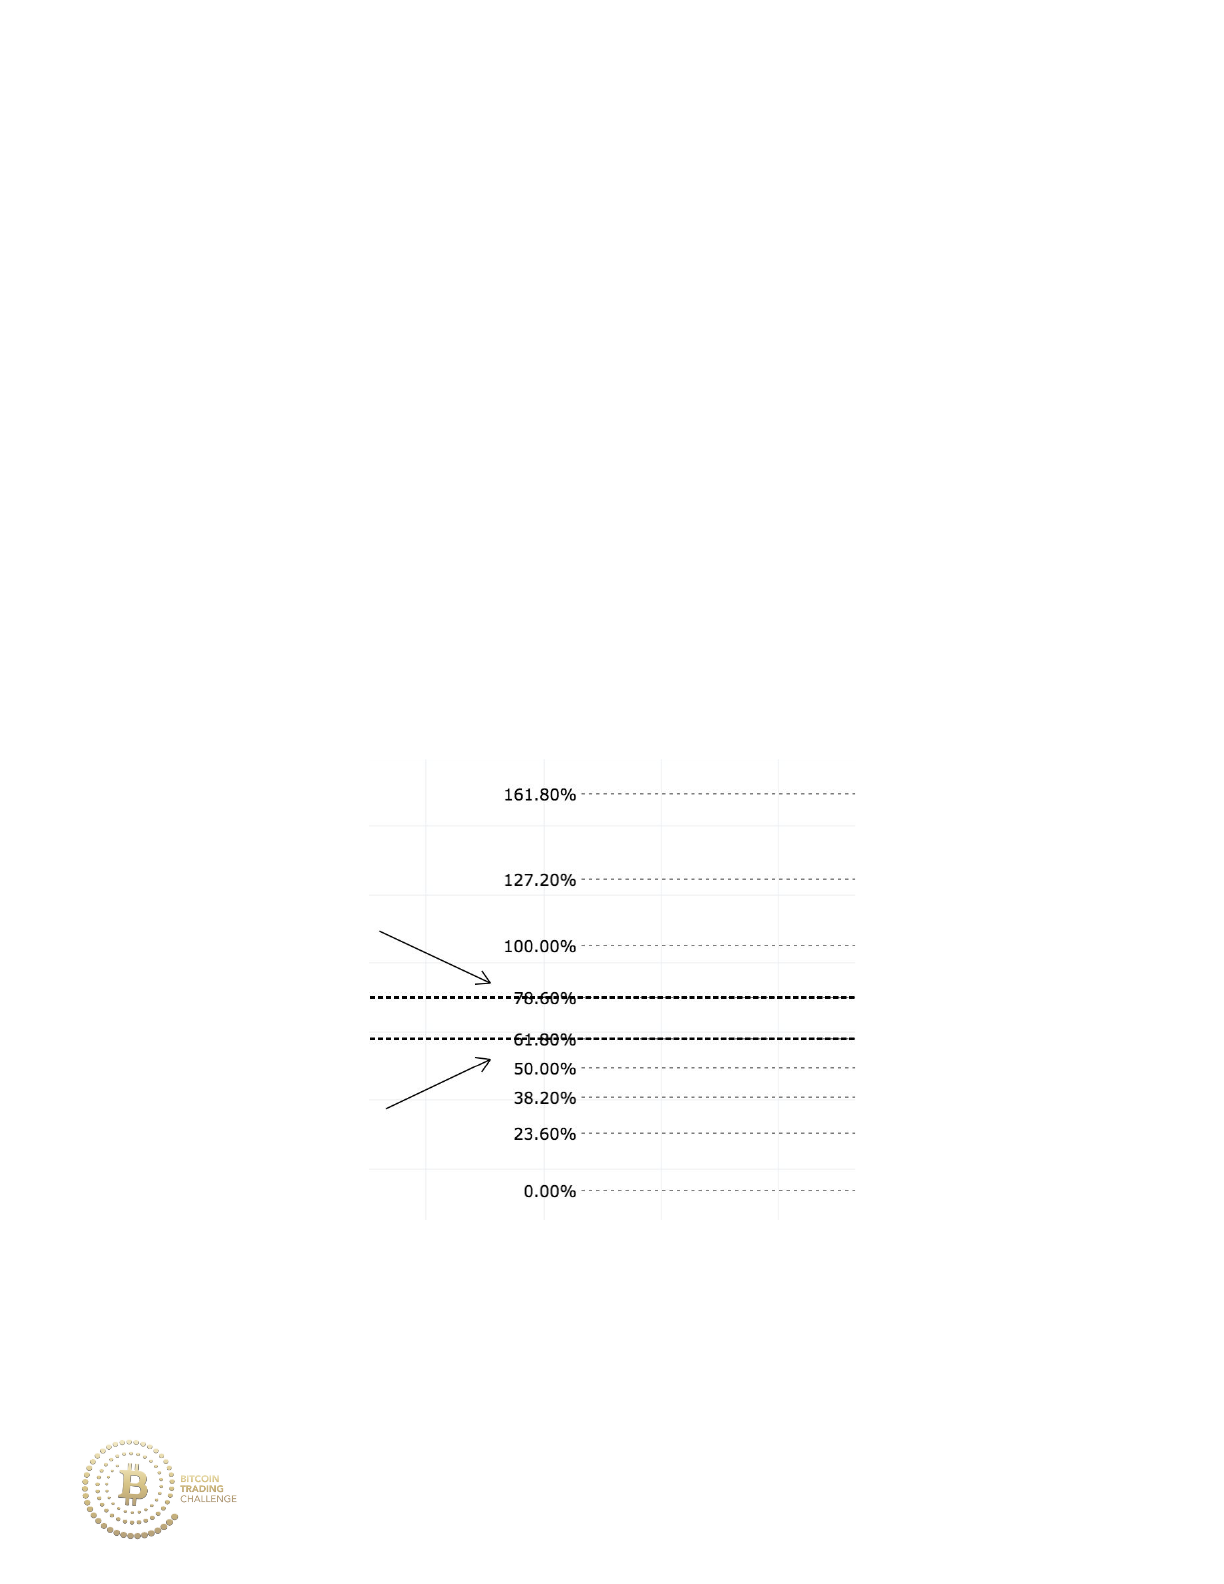
The 61.8% to 78.6% Fibonacci Resistance Zone:
In a downtrend:
125
1. Draw Fibonacci endpoints from the low at the bottom of downtrend
to the retracing move higher. If price continues to move upward,
redraw the high of your previous endpoint to that newly produced
high.
2. If price moves past the 61.8% to 78.6% Fibonacci zone then support
will likely be found at the 161.8% extension.
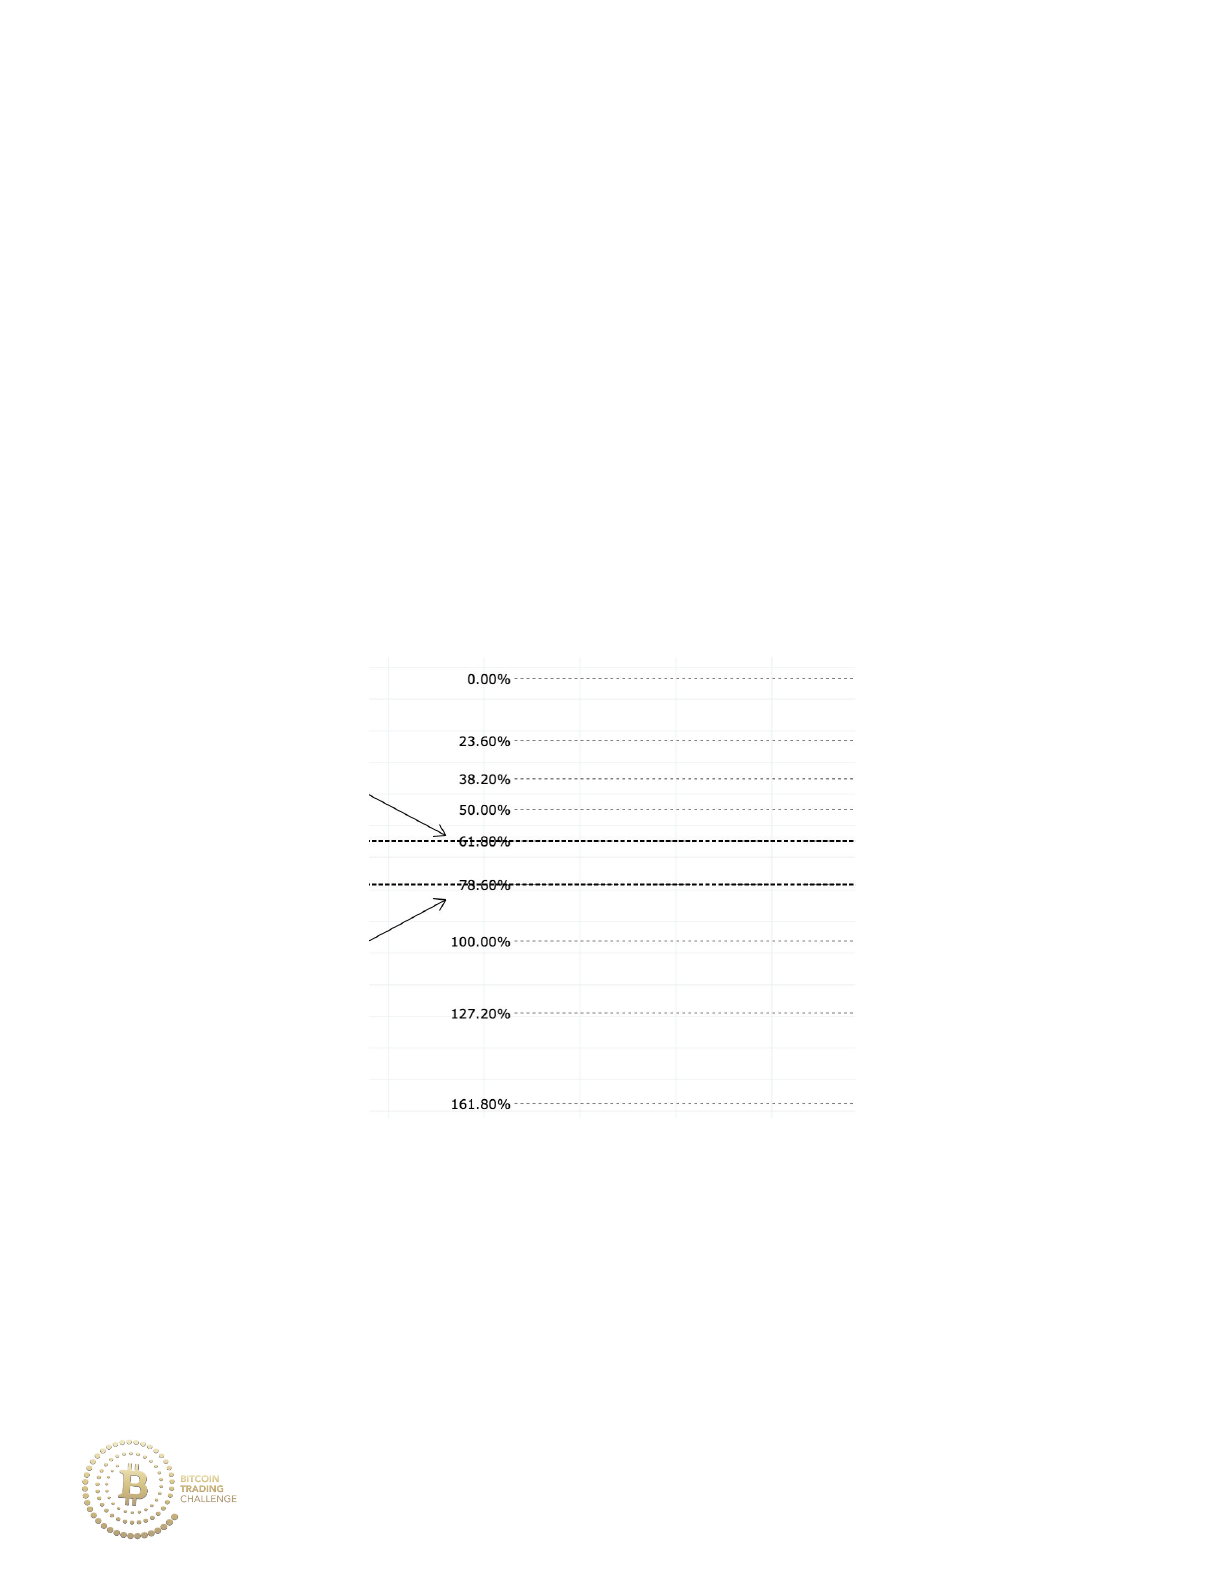
The 61.8% to 78.6% Fibonacci Support Zone:
126
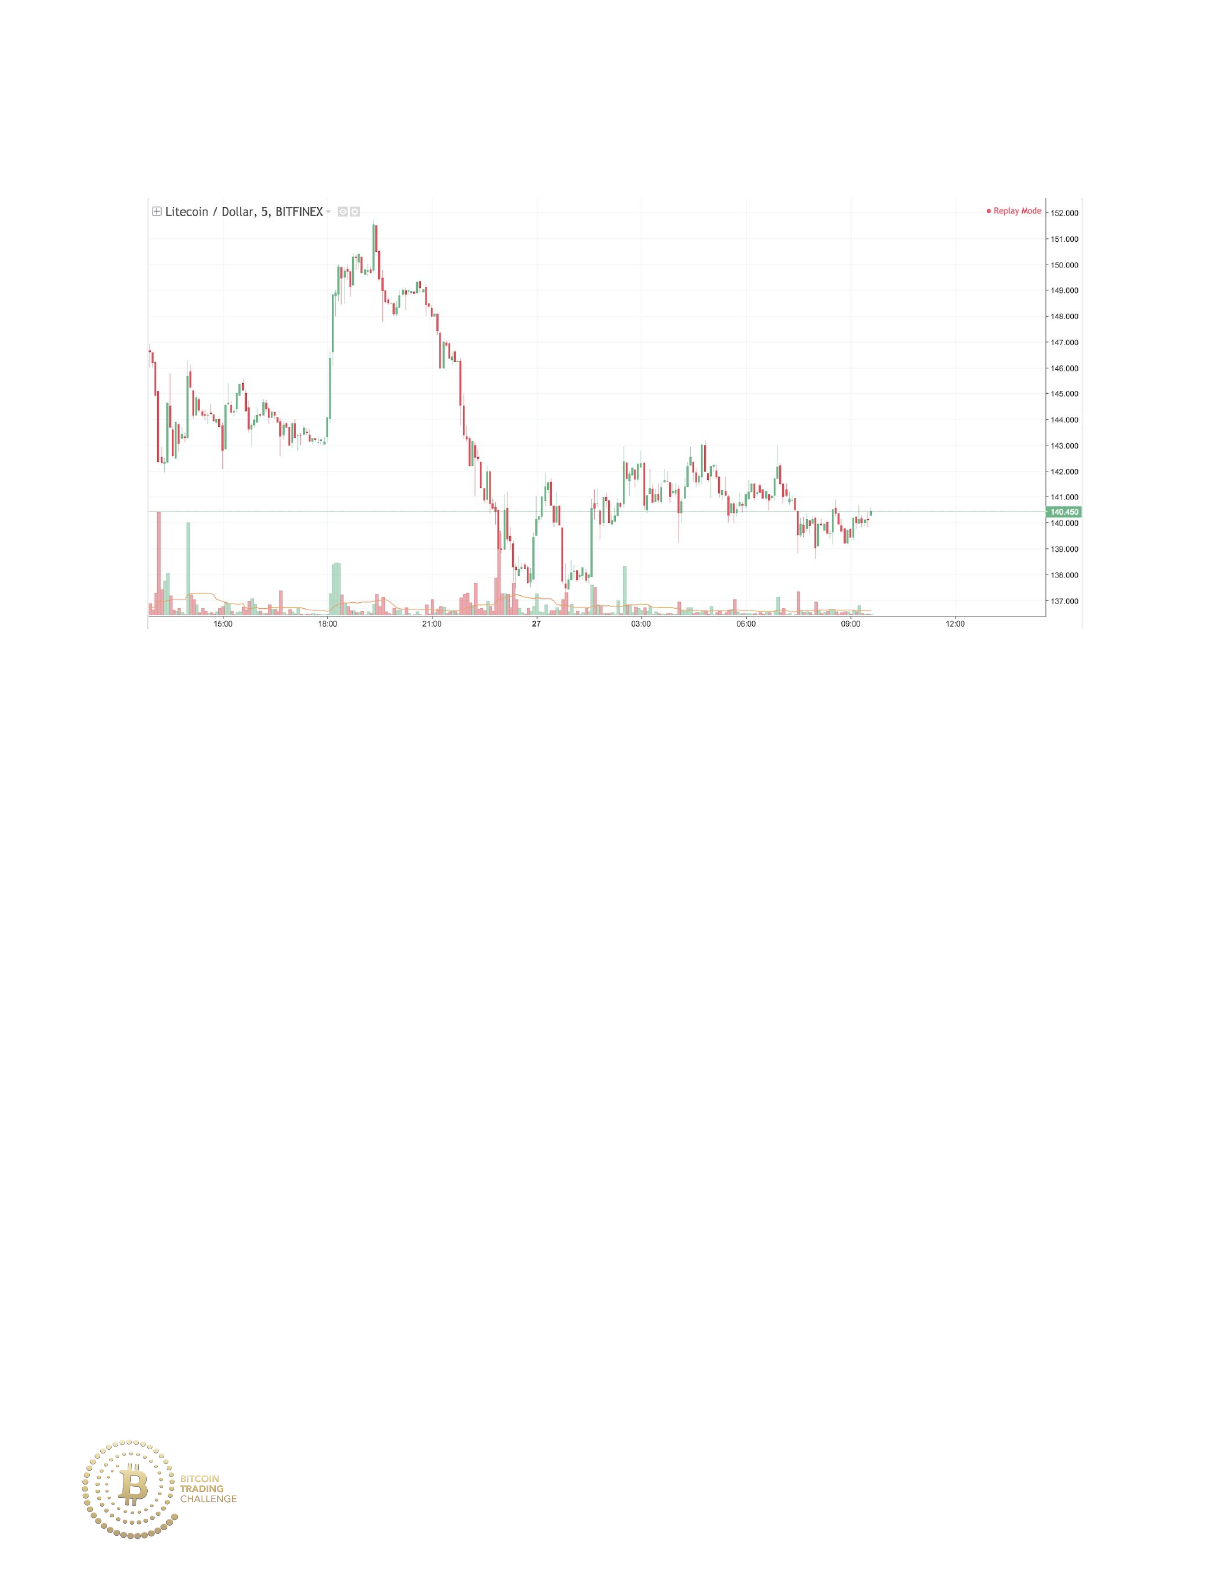
Practice 5-7
Price is consolidating after a strong downtrend. As Fibonacci traders
prepare for any market move that can occur post-consolidation, drawing
both a bullish and bearish Fibonacci extension off of the consolidation
pattern would be optimal.
Within the consolidation pattern ranging from 137.25 to 143.15,
What high and low would one use for a bullish Fibonacci extension?
(Recall that a bullish Fibonacci extension drawn within consolidation has
Fibonacci endpoints at the absolute high of consolidation to the absolute
low of consolidation)
What high and low would one use for a bearish Fibonacci extension?
(Recall that a bearish Fibonacci extension drawn within consolidation has
Fibonacci endpoints at the absolute low of consolidation to the absolute
high of consolidation)
127
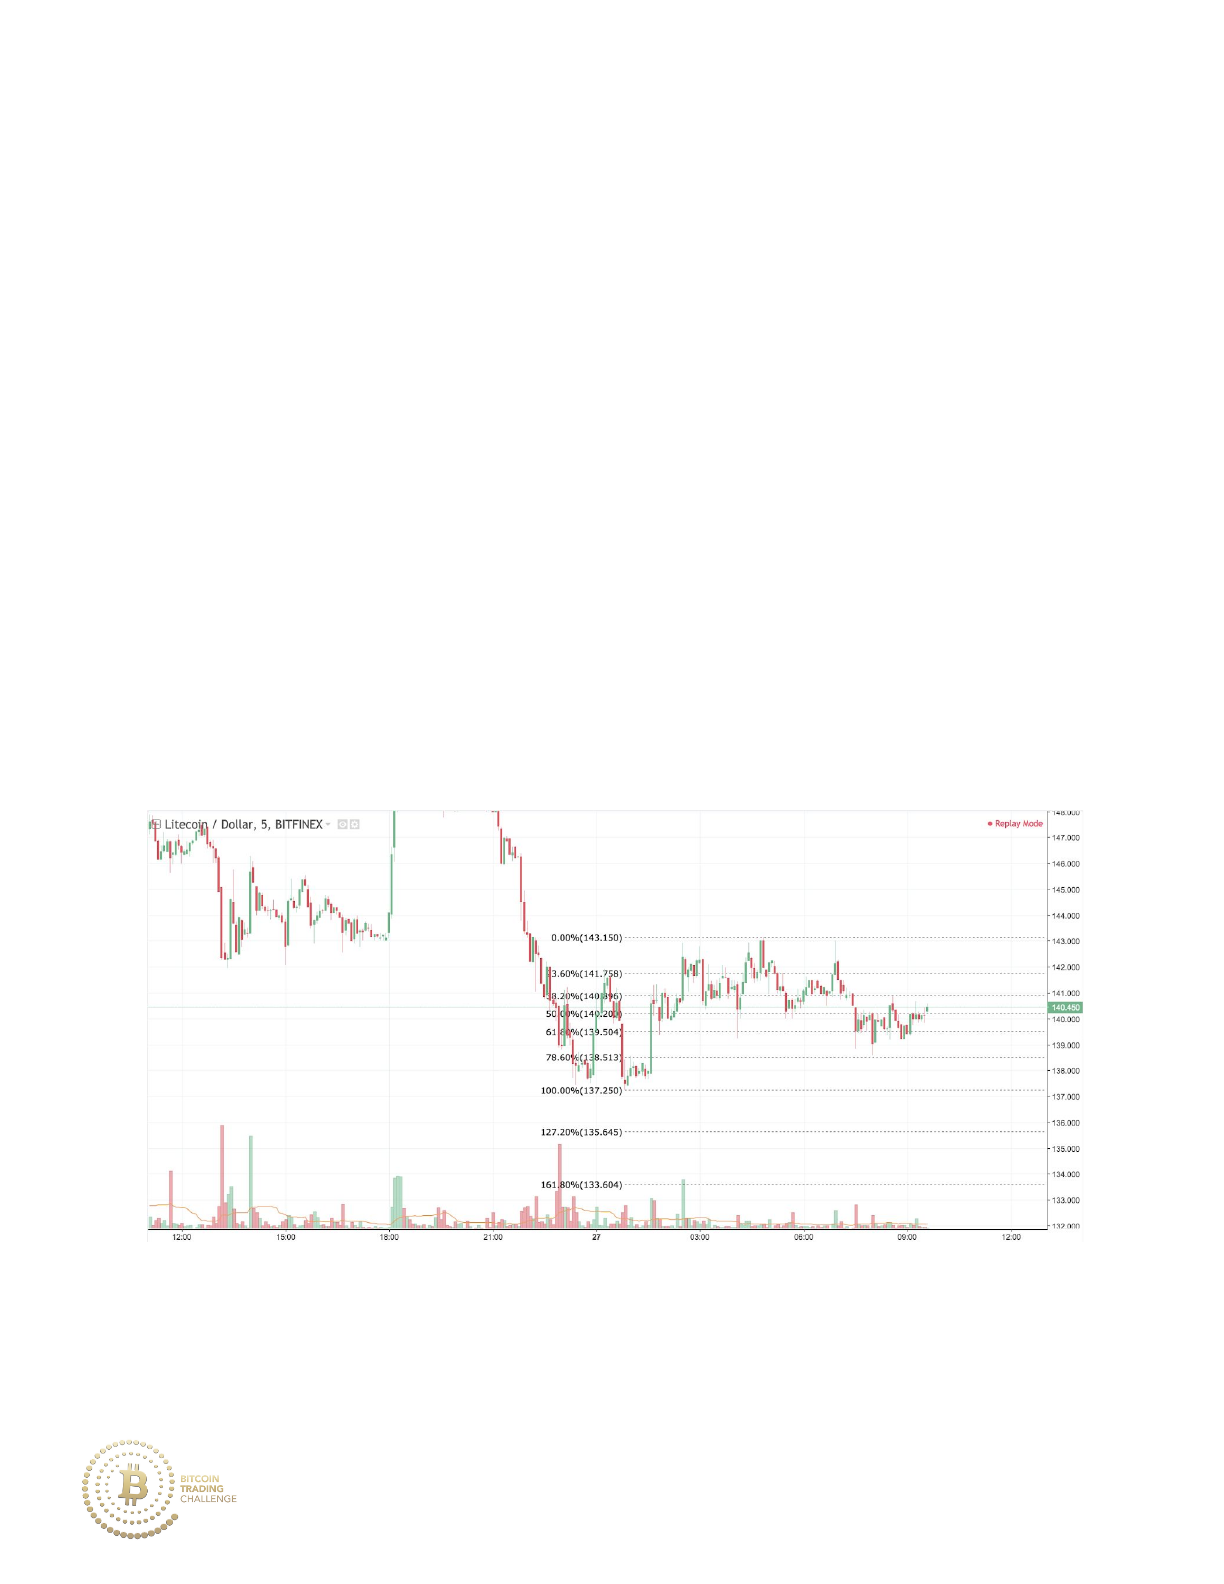
Practice 5-7 Answer
The bearish Fibonacci extension.
Practice 5-7 Answer
128
The bullish Fibonacci extension.
Practice 5-7 Outcome
Price moves to the 161.8% extension of the bullish Fibonacci extension
before continuing the overall downtrend.
129
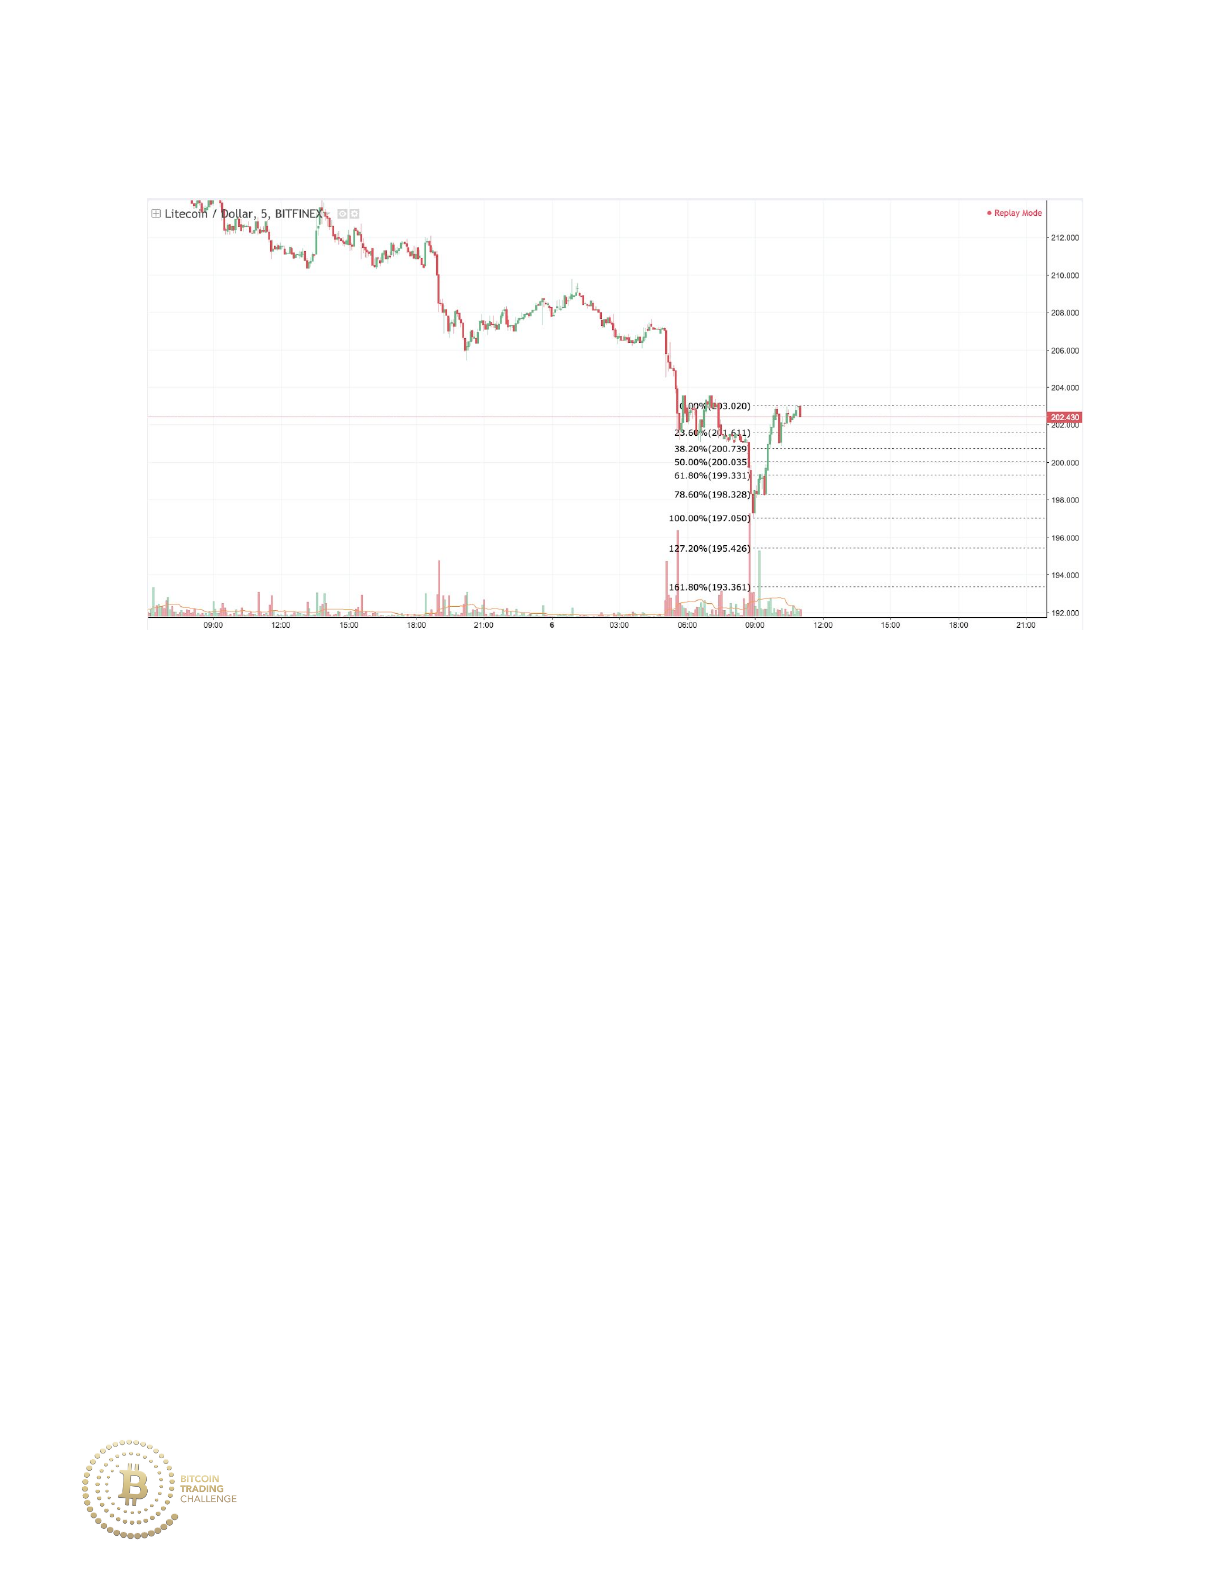
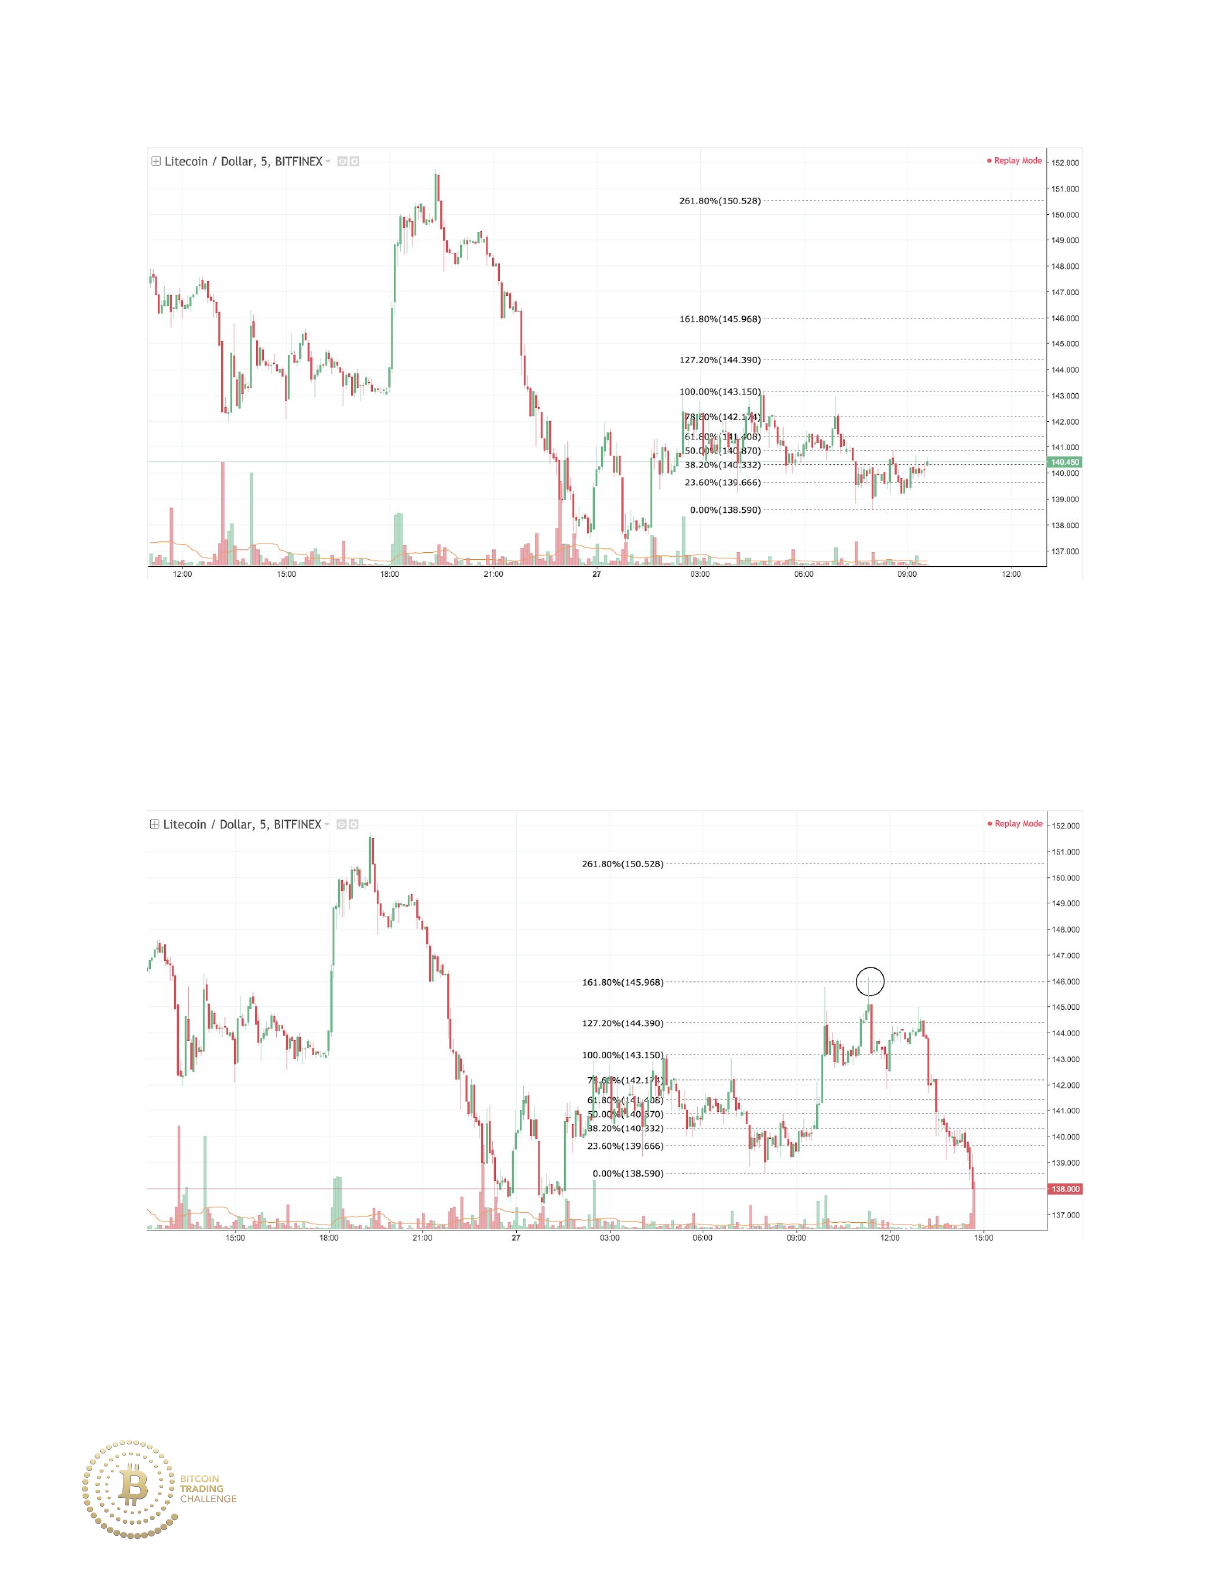
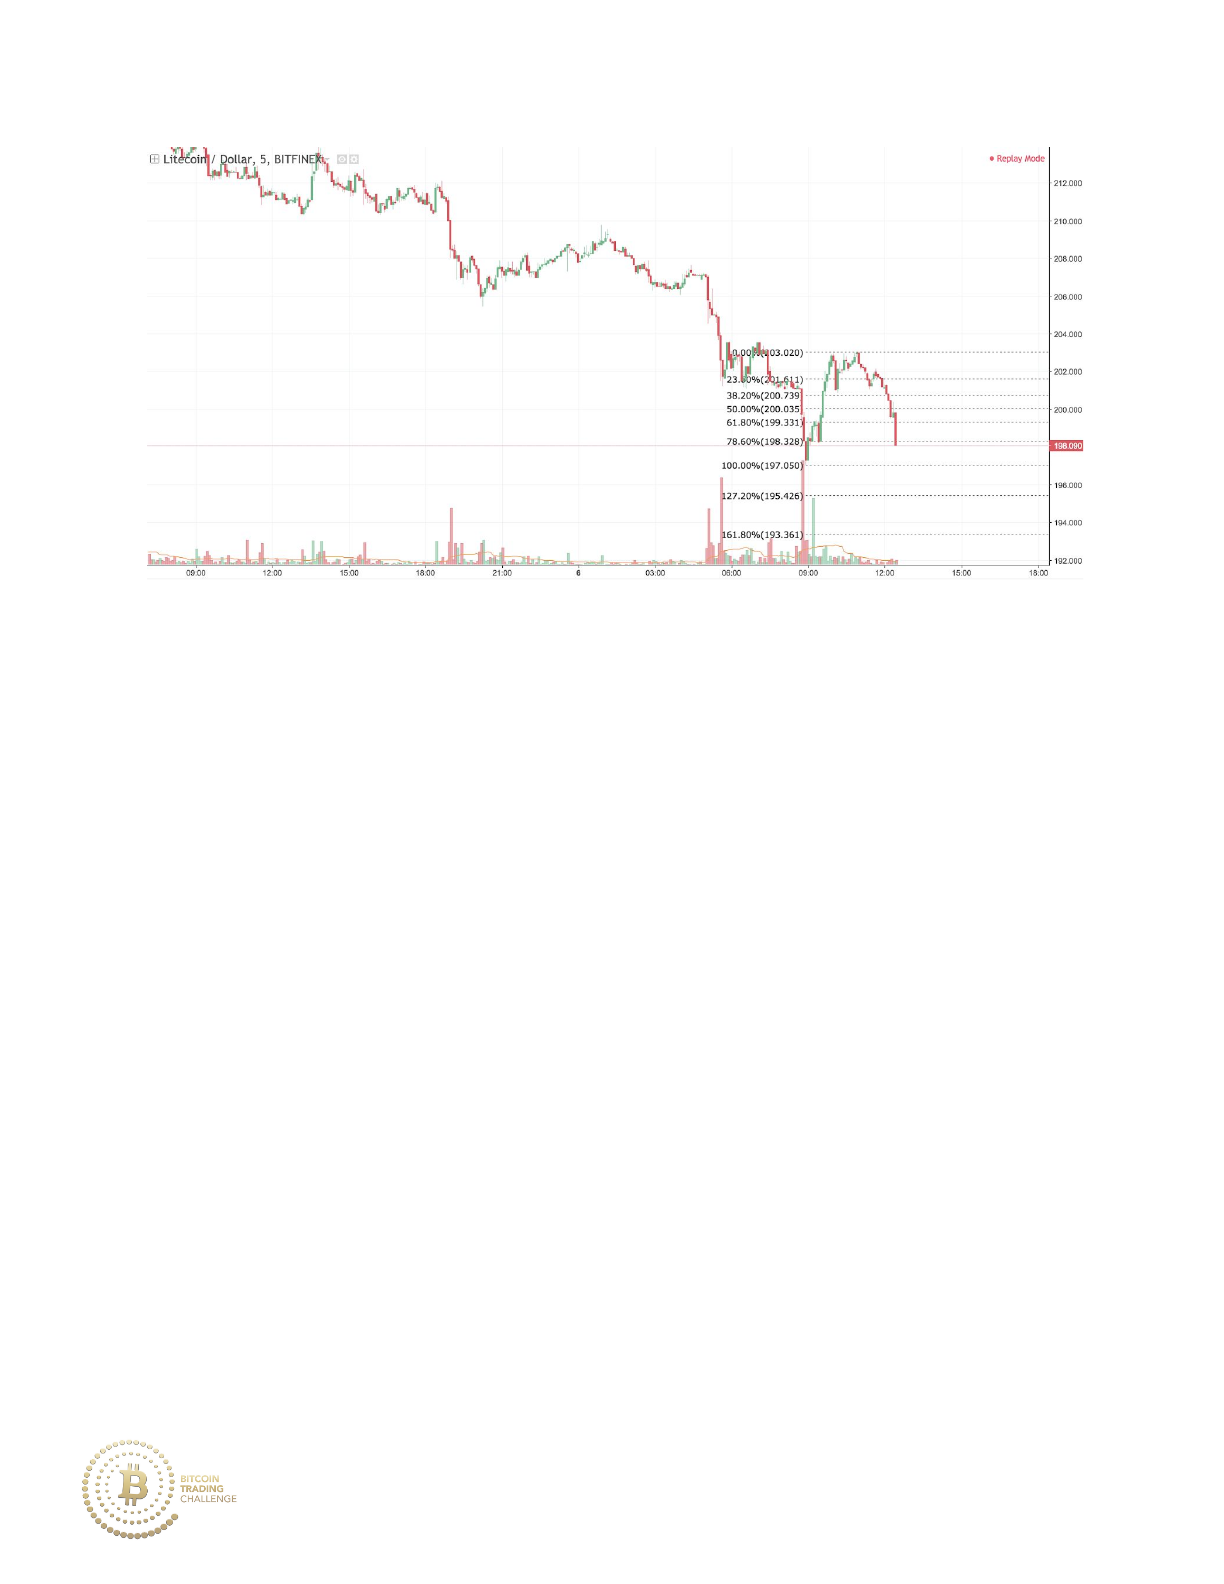
Practice 5-8 Downtrend
Price moves downward on strong momentum with weak bullish pullback.
Price then moves upward on strong momentum. Drawing the Fibonacci
endpoint from the bottom of the move (197.05) to the top of the move
(203.02) reveals both possible continuations of the downtrend at the
161.8% extension and possible retracement areas at the 38.2% and 61.8%
for support.
Practice 5-8
130
Price moves rapidly downward with little signs of bullish pullback. Both the
38.2% and 61.8% possible retracement levels have been disrespected.
From this, one would expect the 161.8% to be a potential level of support.
Practice 5-8 Answer
131
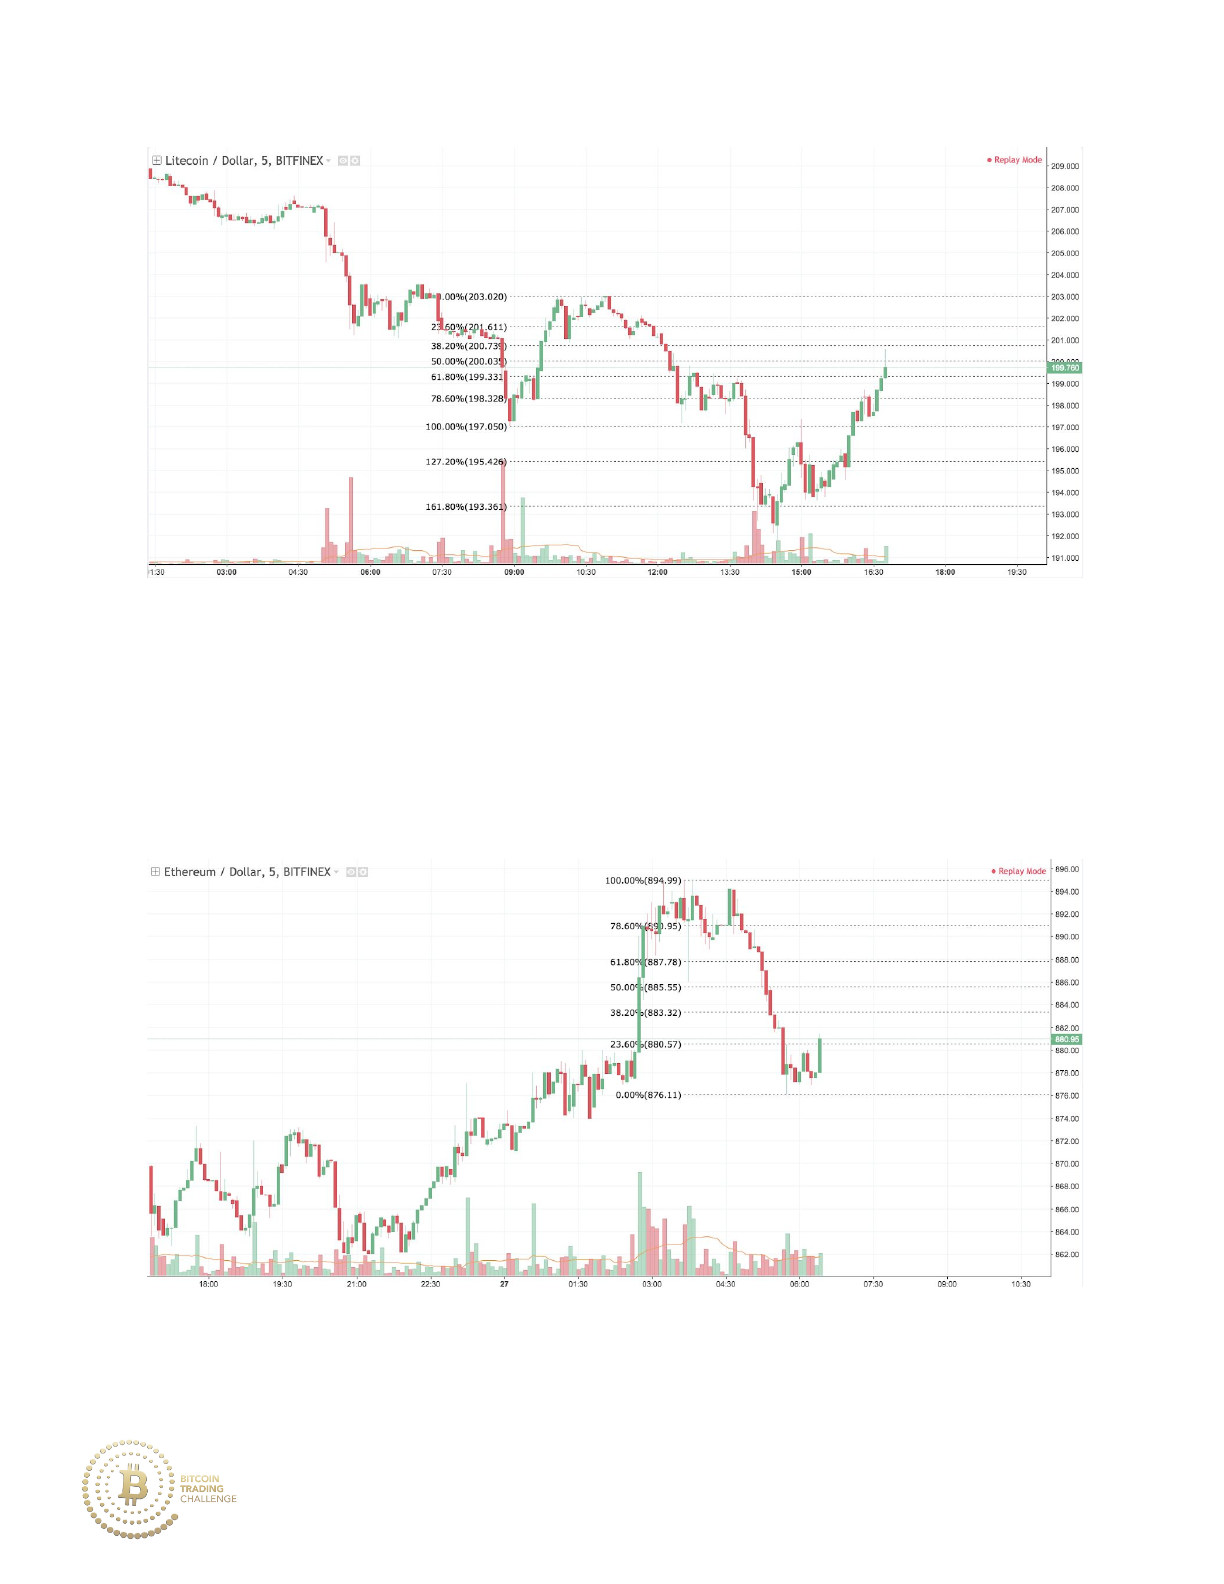
Price moves downward to the 161.8% extension and finds support after a
few volume spikes that occurred ahead of the level. Price then moves
upward on above average momentum.
Practice 5-9 Uptrend
Price moves upward with weak bearish pullback from 862 to 894.99. Price
then moves downward on strong momentum, which indicates a possible
132
reversal. If the bearish move from 894.99 to 876.11 is a strong downmove
(price continues moving lower than 876.11), then a strong market reaction
of price resistance at the 38.2% or the 61.8% of the bearish move is likely.
Practice 5-9
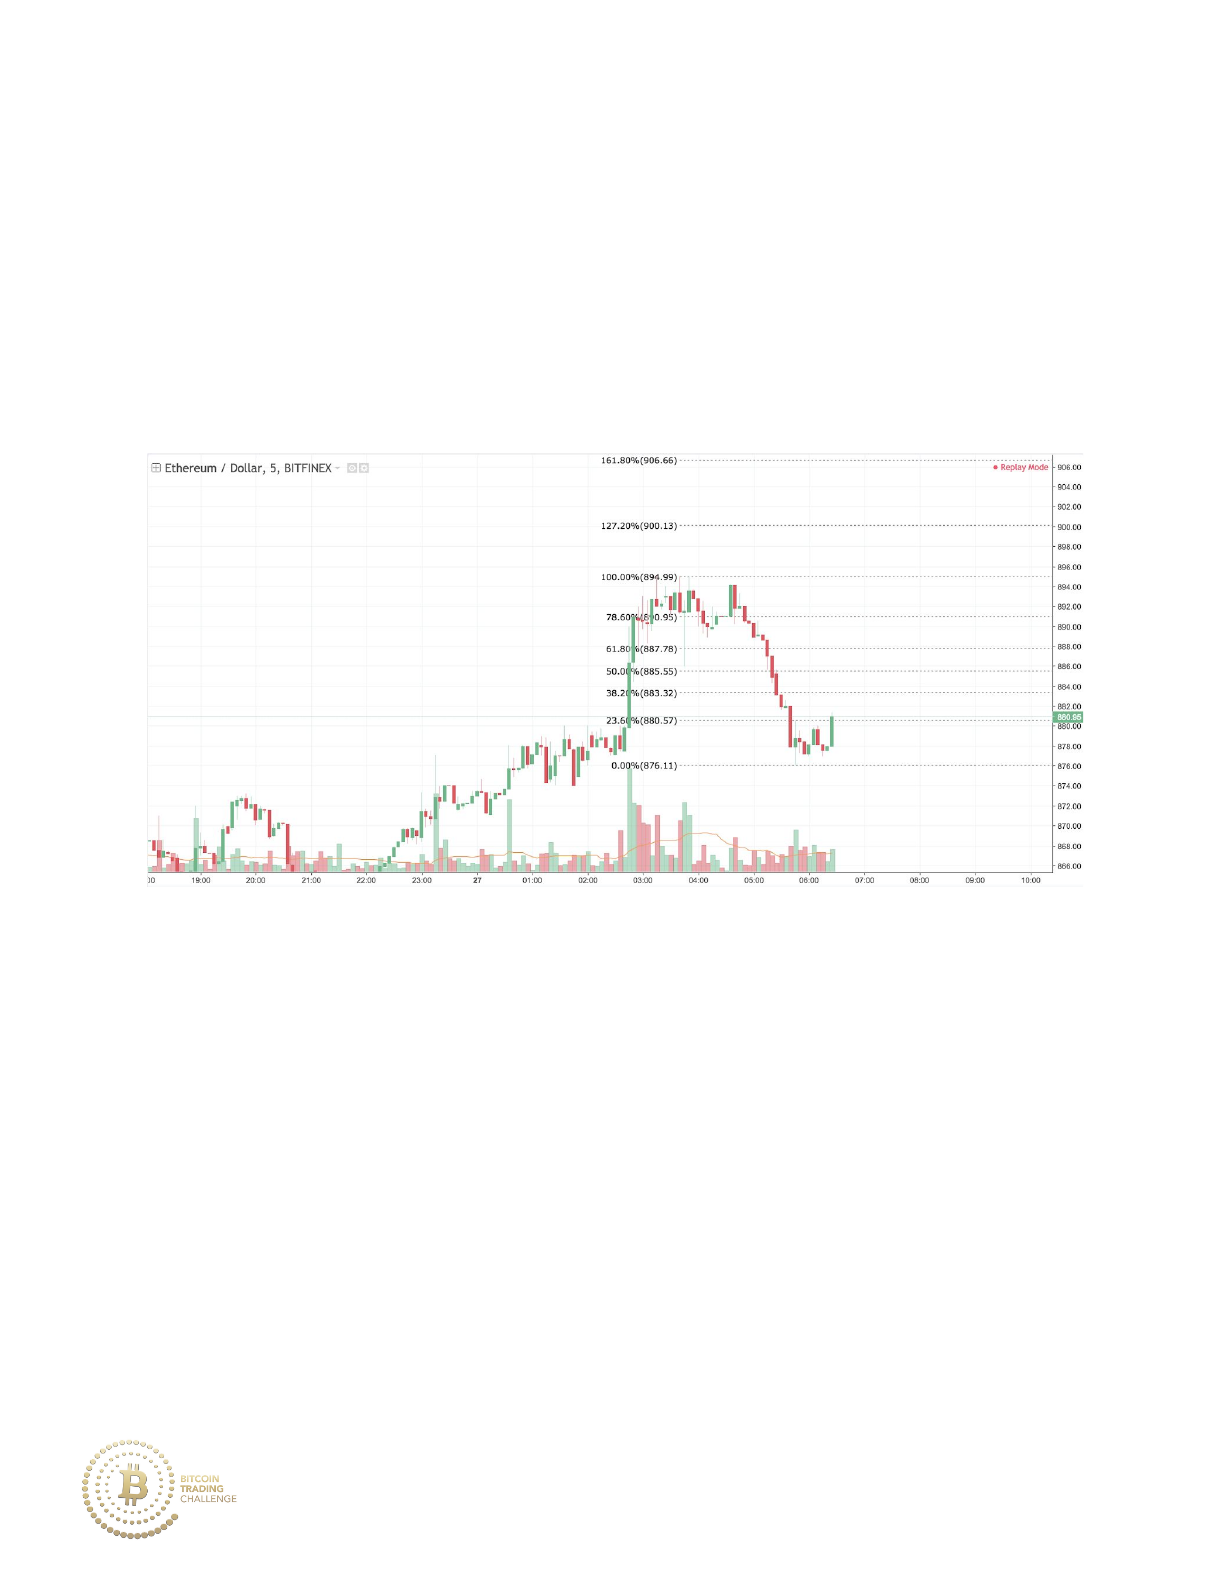
If instead of a retracement and a move further downward, the market
continues the uptrend, price may find resistance at the bullish 161.8%
Fibonacci extension.
Practice 5-9 Answer
133
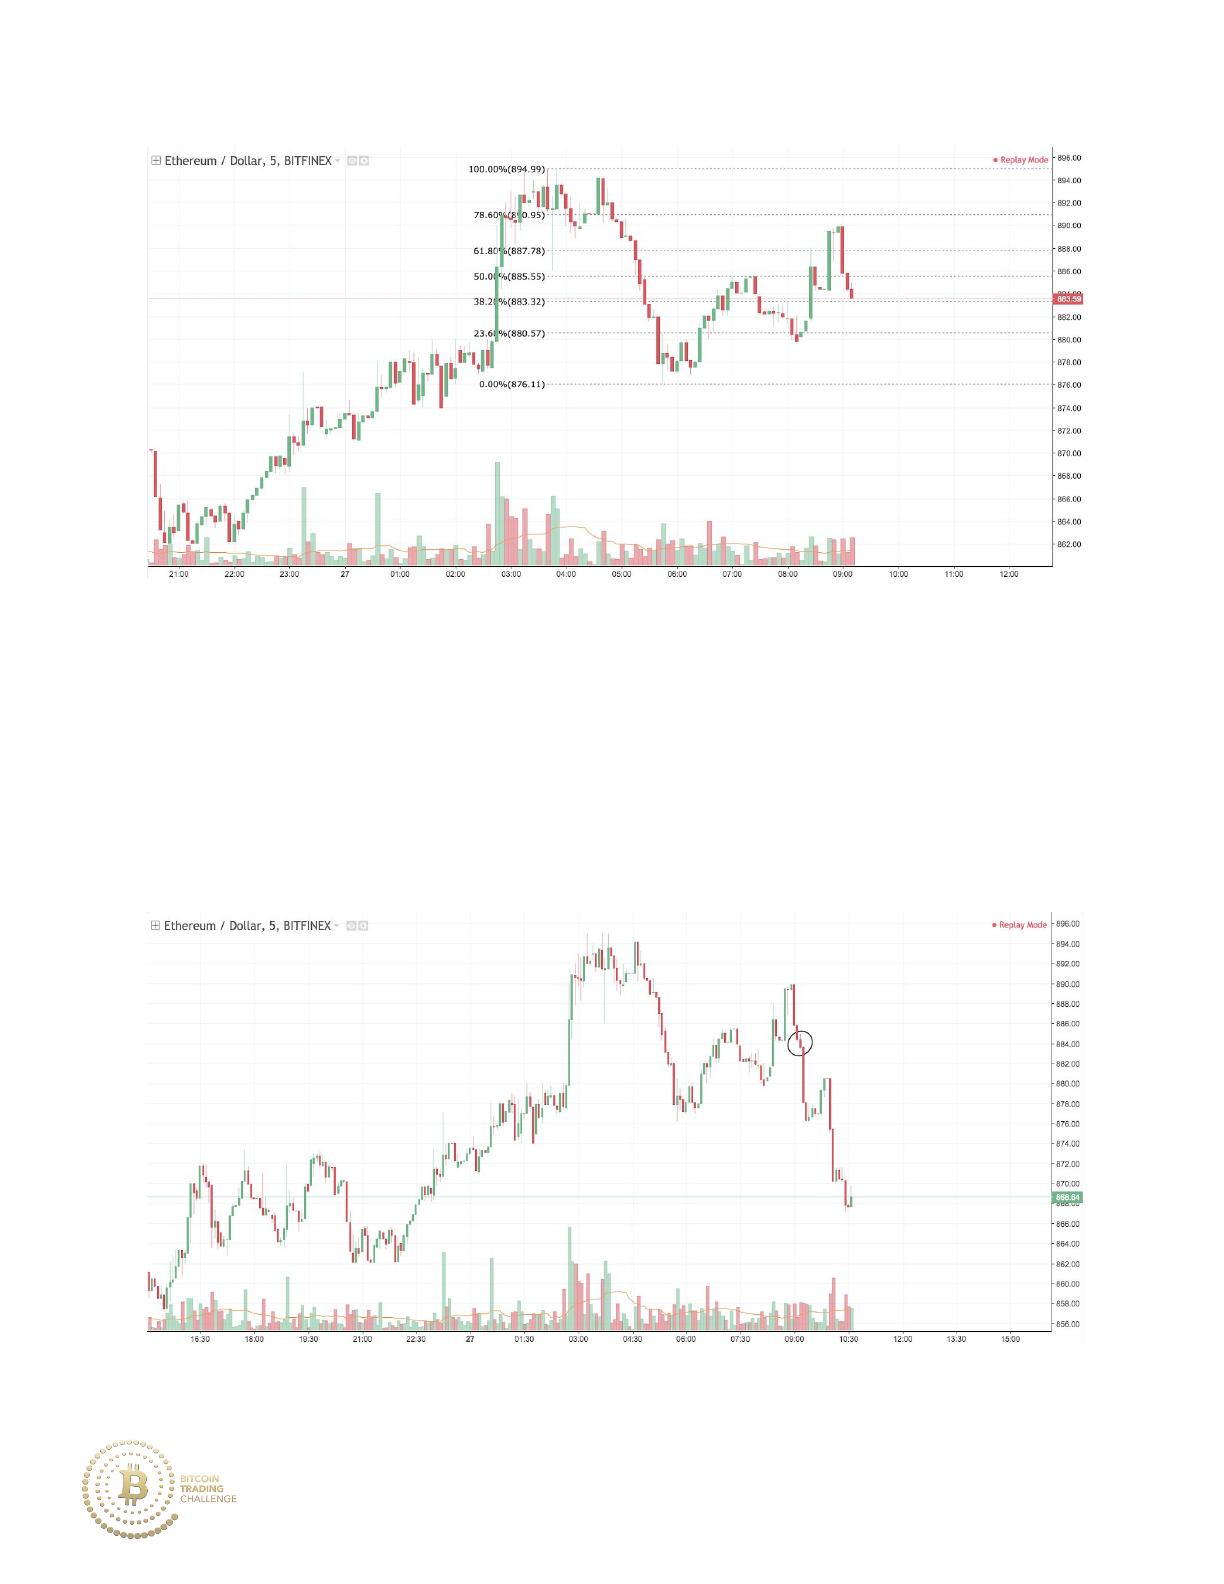
Price moves upward to the 61.8% to 78.6% zone before a major bearish
market reaction occurs. In conjunction with the previously strong downtrend,
price will continue to move in a bearish manner to break below the low at
876.11.
Practice 5-9 Outcome
Practice 5-9 Extra
134
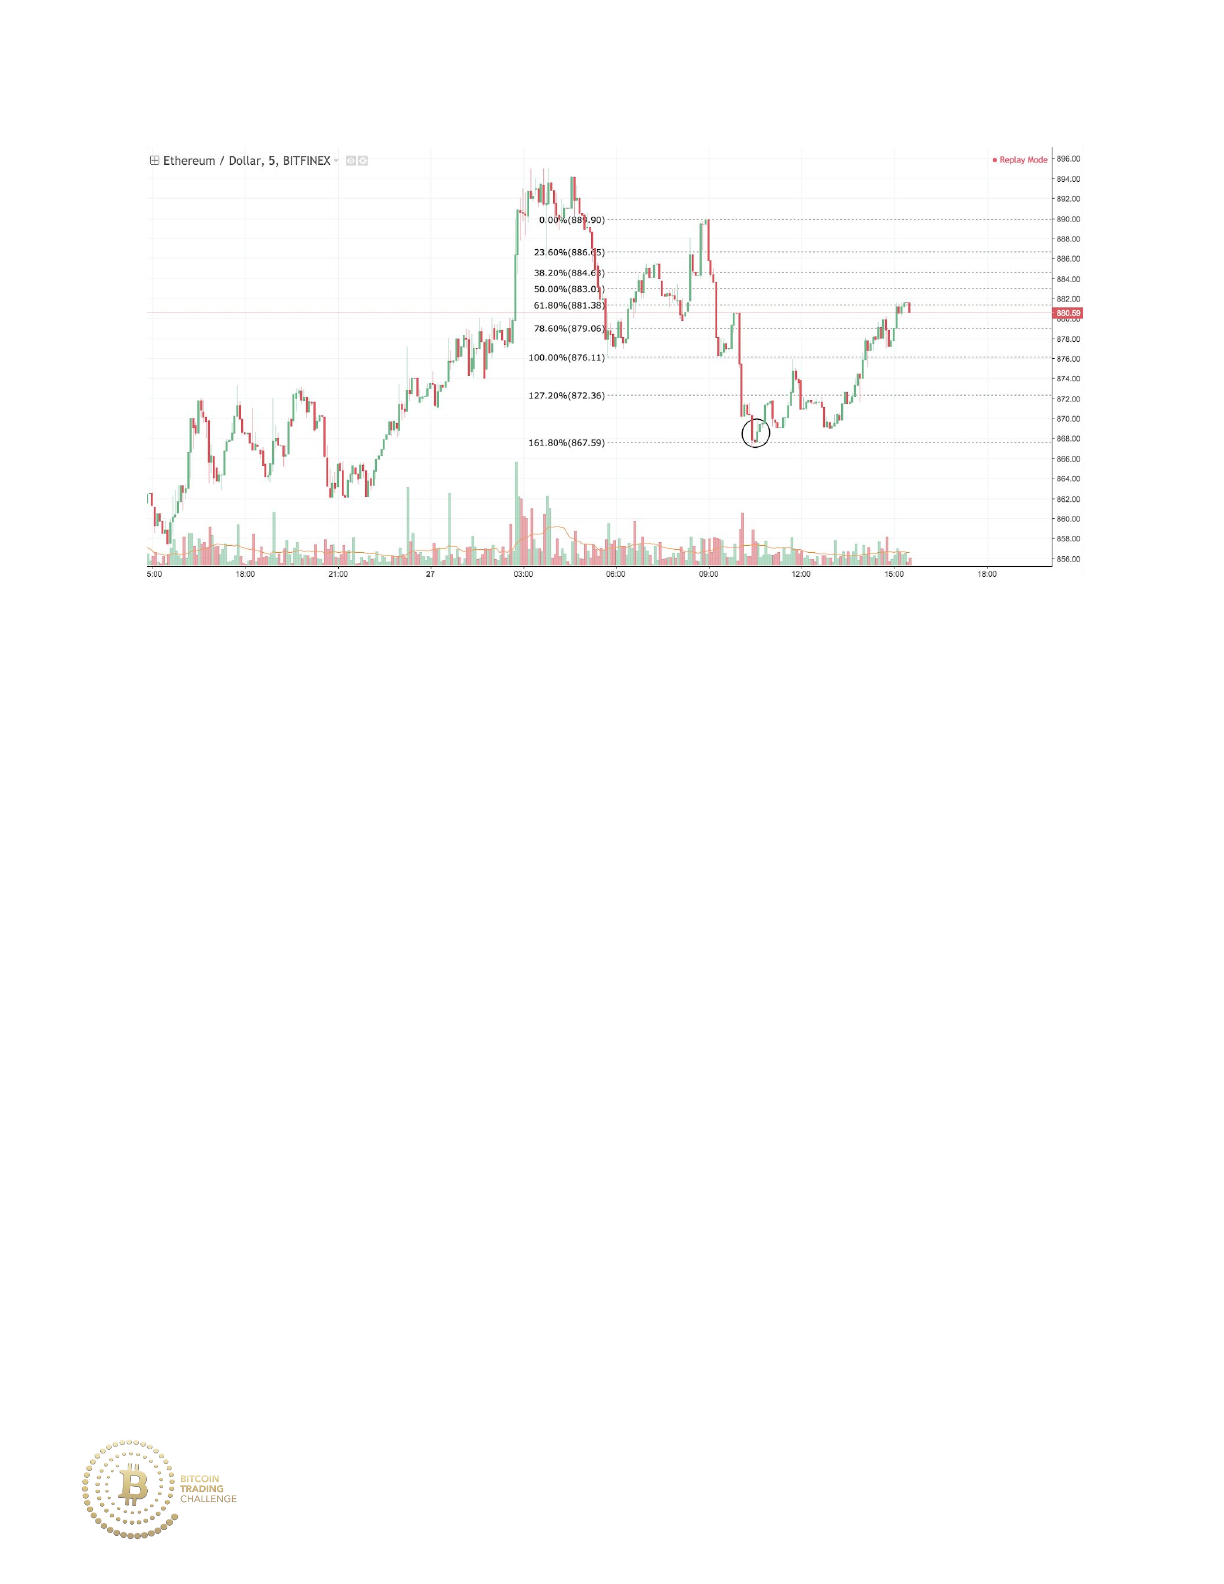
If you were to draw Fibonacci endpoints on the bullmove from 876.11 to
889.9, the 161.8% extension yields an important level of support.
Planning for both bullish Fibonacci and bearish Fibonacci scenarios avoids
confirmation bias, as well as allows for flexibility within multiple strategies
for entry/exit order placement.
____________________________________________________________________
6. Fibonacci Market Structure
A. The 5 Shapes of Respected Fibonacci Levels
The market reaction to a major Fibonacci price level provides an important
indication of the likelihood of a reversal. These various market reactions
135

are called Fibonacci Market Structures, in which price establishes
support/resistance at a Fibonacci level. It does so in 5 major shapes.
Remember, these Fibonacci market structures can form in either a
downtrend or in a uptrend. The examples below feature solely Fibonacci
shapes within an uptrend, however in a downtrend the Fibonacci market
structure would look like the inverted shape.
These include:
I. The V-Shaped Fibonacci Reversal
II. The Wild Tail
III. The Stop Loss Hunt
IV. Consolidation Spring
V. Multi-Tail Rejection
I. The V-Shaped Fibonacci Reversal
When price reaches a 61.8% retracement or a 161.8% extension, one of the
most powerful market reactions that can occur is the V-Shaped reversal.
This type of reversal off of a Fibonacci level occurs when heavy buying
rapidly turns into heavy selling (or vice versa), creating the ‘V’ shape. This
type of market reaction at a Fibonacci retracement level demonstrates that
a powerful new trend may be emerging.
136
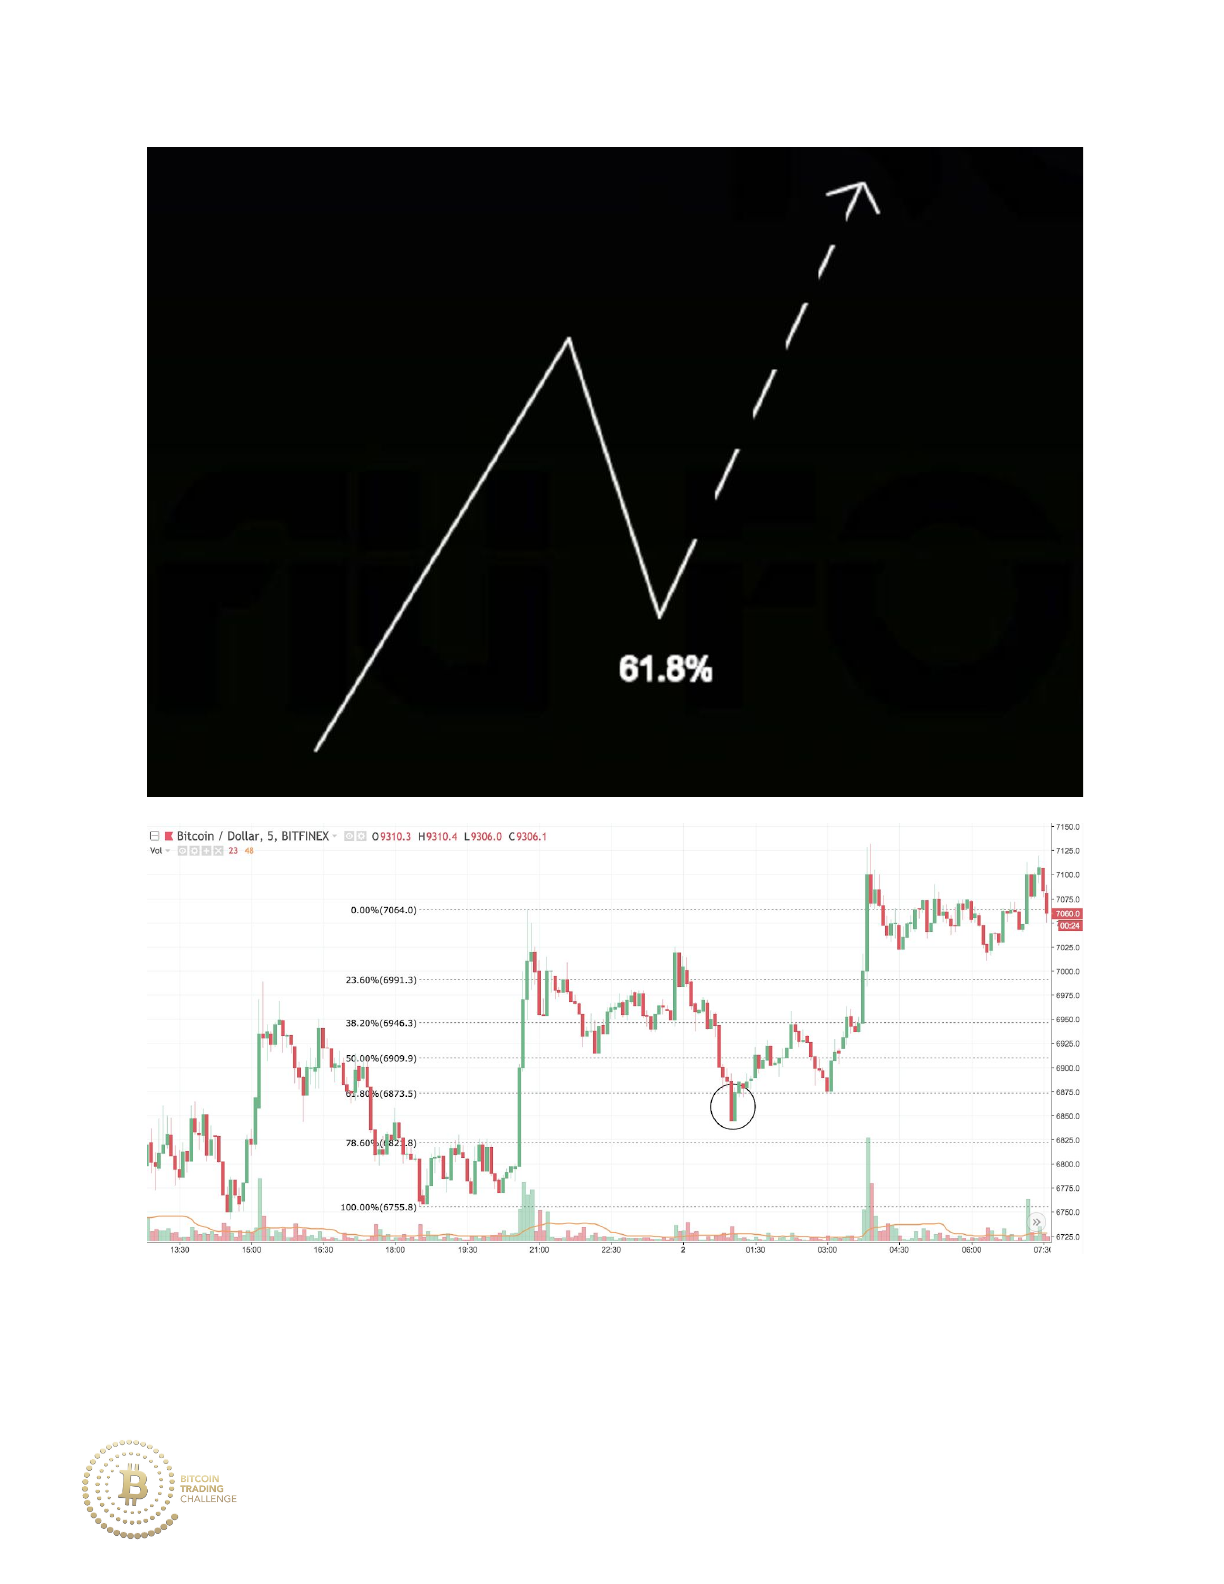
Price makes a V-Shaped reversal at the initial 61.8% Fibonacci retracement
and then makes another V-Shaped reversal in a smaller scale Fibonacci
retracement at 6875.
137
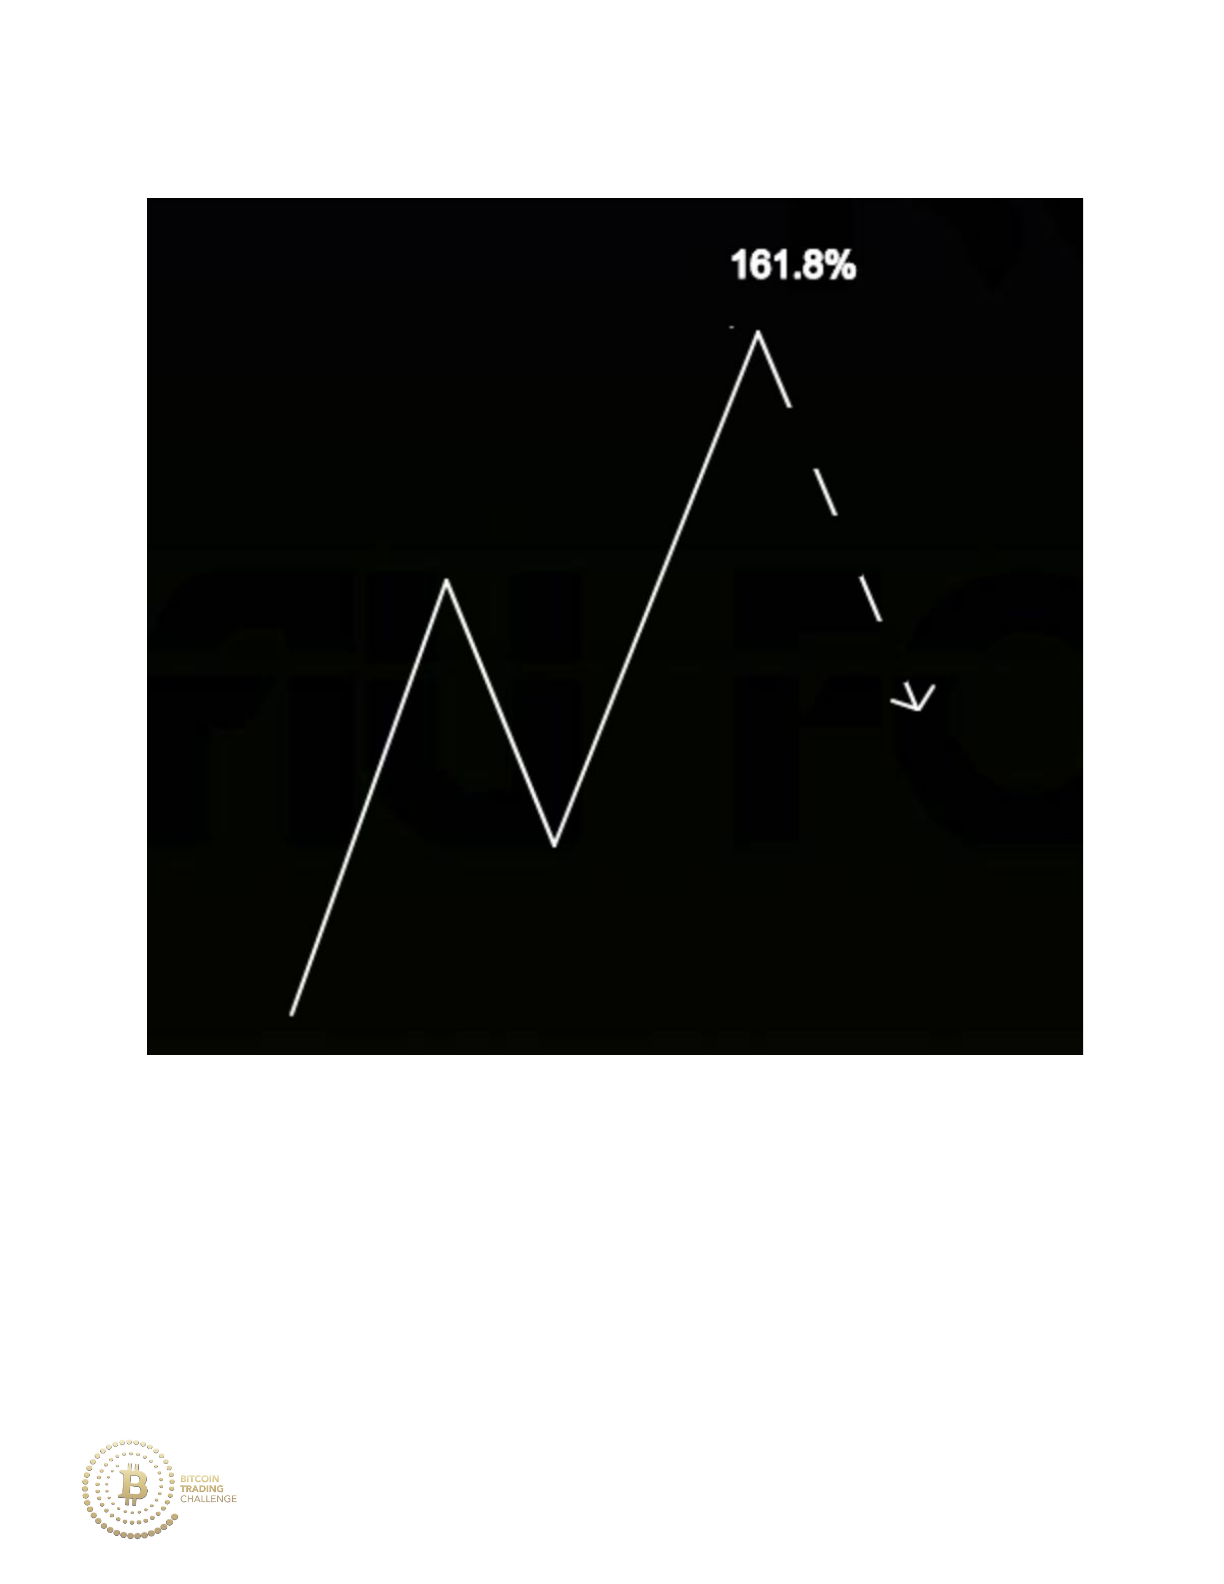
Here’s what a V-Shaped reversal looks like at a 161.8% extension:
138
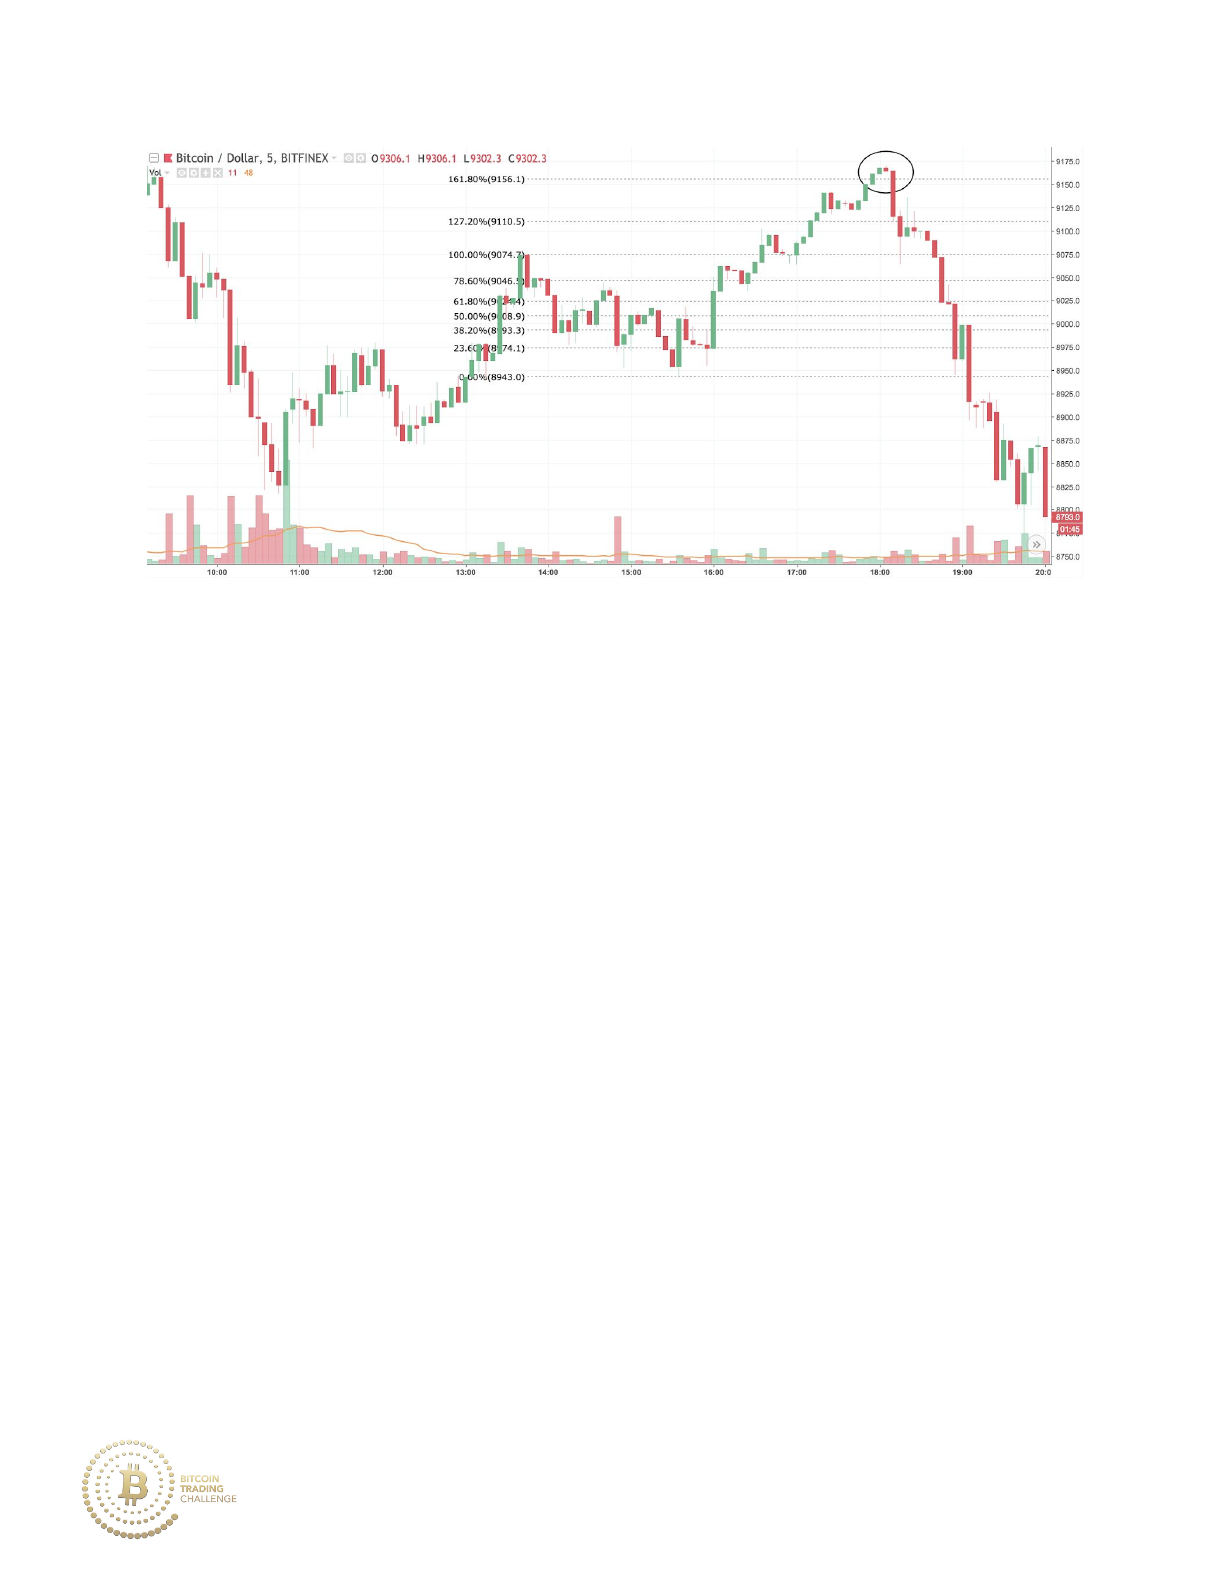
Price hits the 161.8% extension at 9156 (Fibonacci endpoints drawn off of
the retracement), and then precedes to make a V-Shaped reversal.
II. The Wild Tail
Tails typically form when a large market order fills a large string of bids or
offers, and then price reverses in the other direction as demand meets
supply (or as supply meets demand). Self-fulfilling prophecy or not, major
Fibonacci levels are known to contain clusters of large limit orders, which is
why you may notice price tails ending at Fibonacci levels.
139
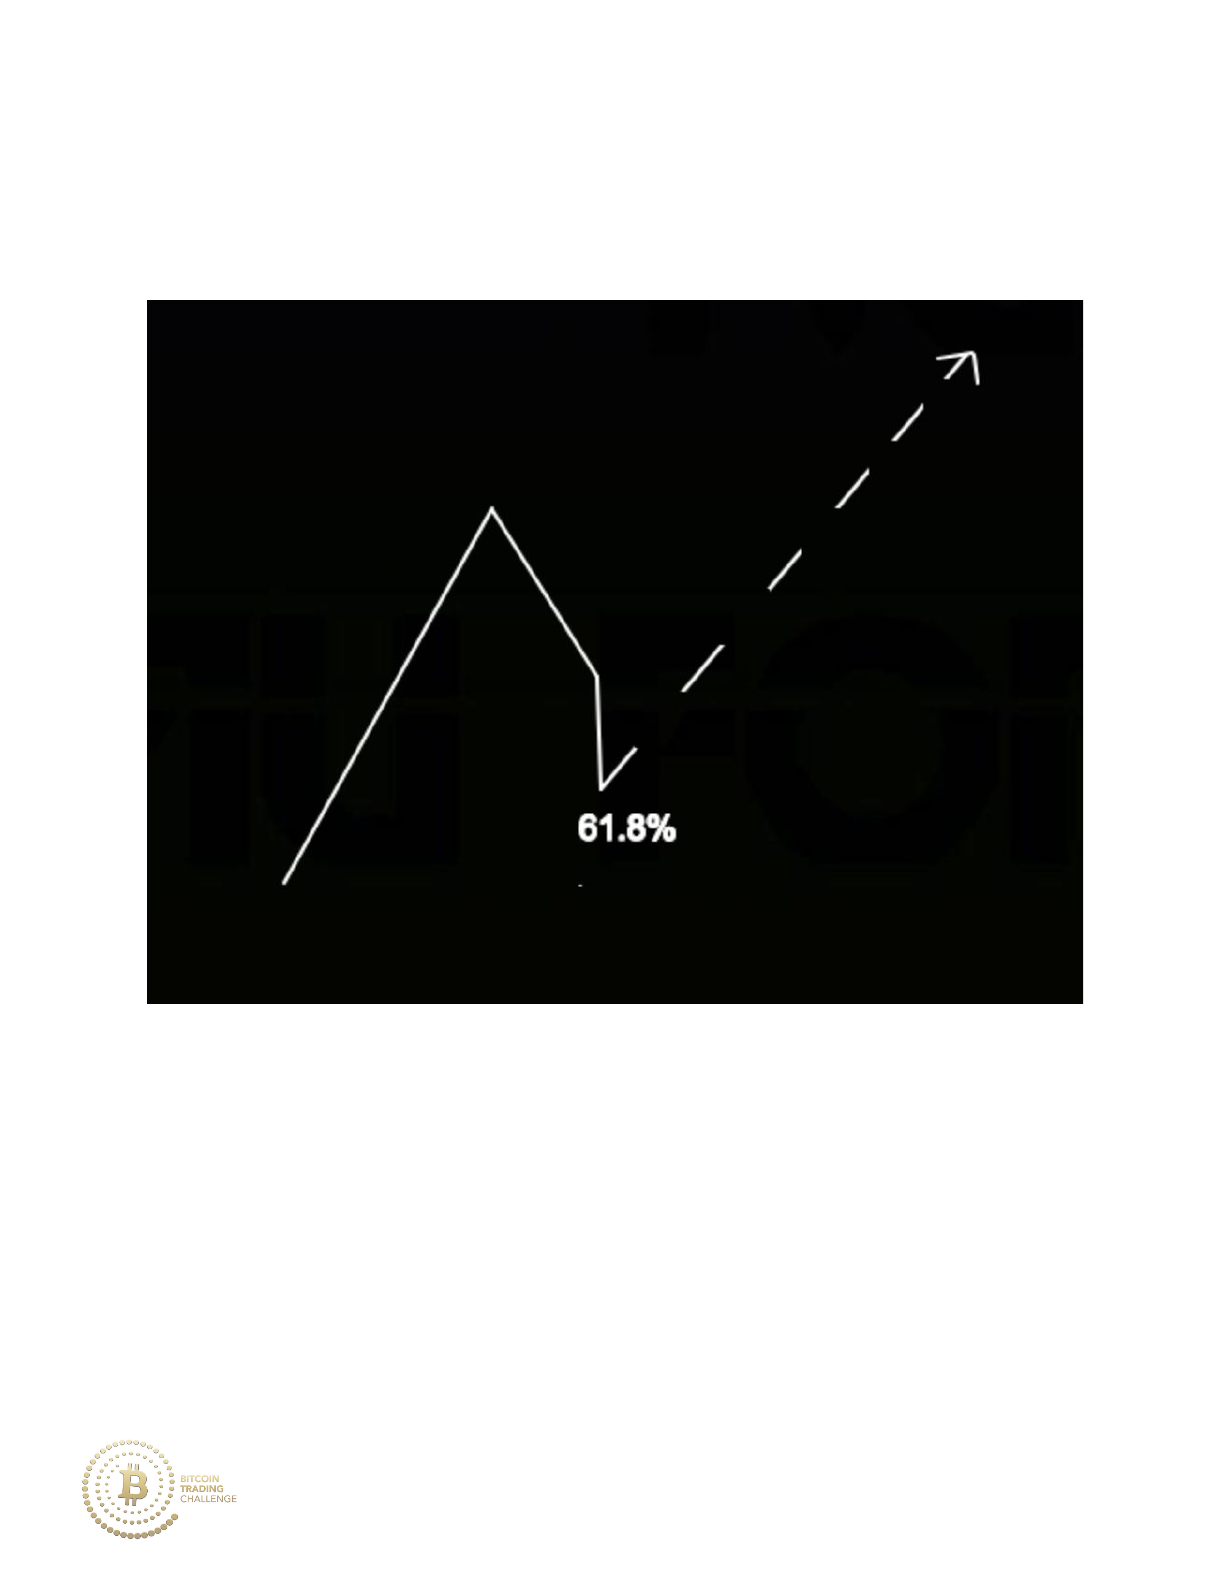
After the uptrend, price retraces downward to the 61.8% Fibonacci
retracement level, and then immediately moves back upward. This creates
the ‘wild tail’ price formation.
140
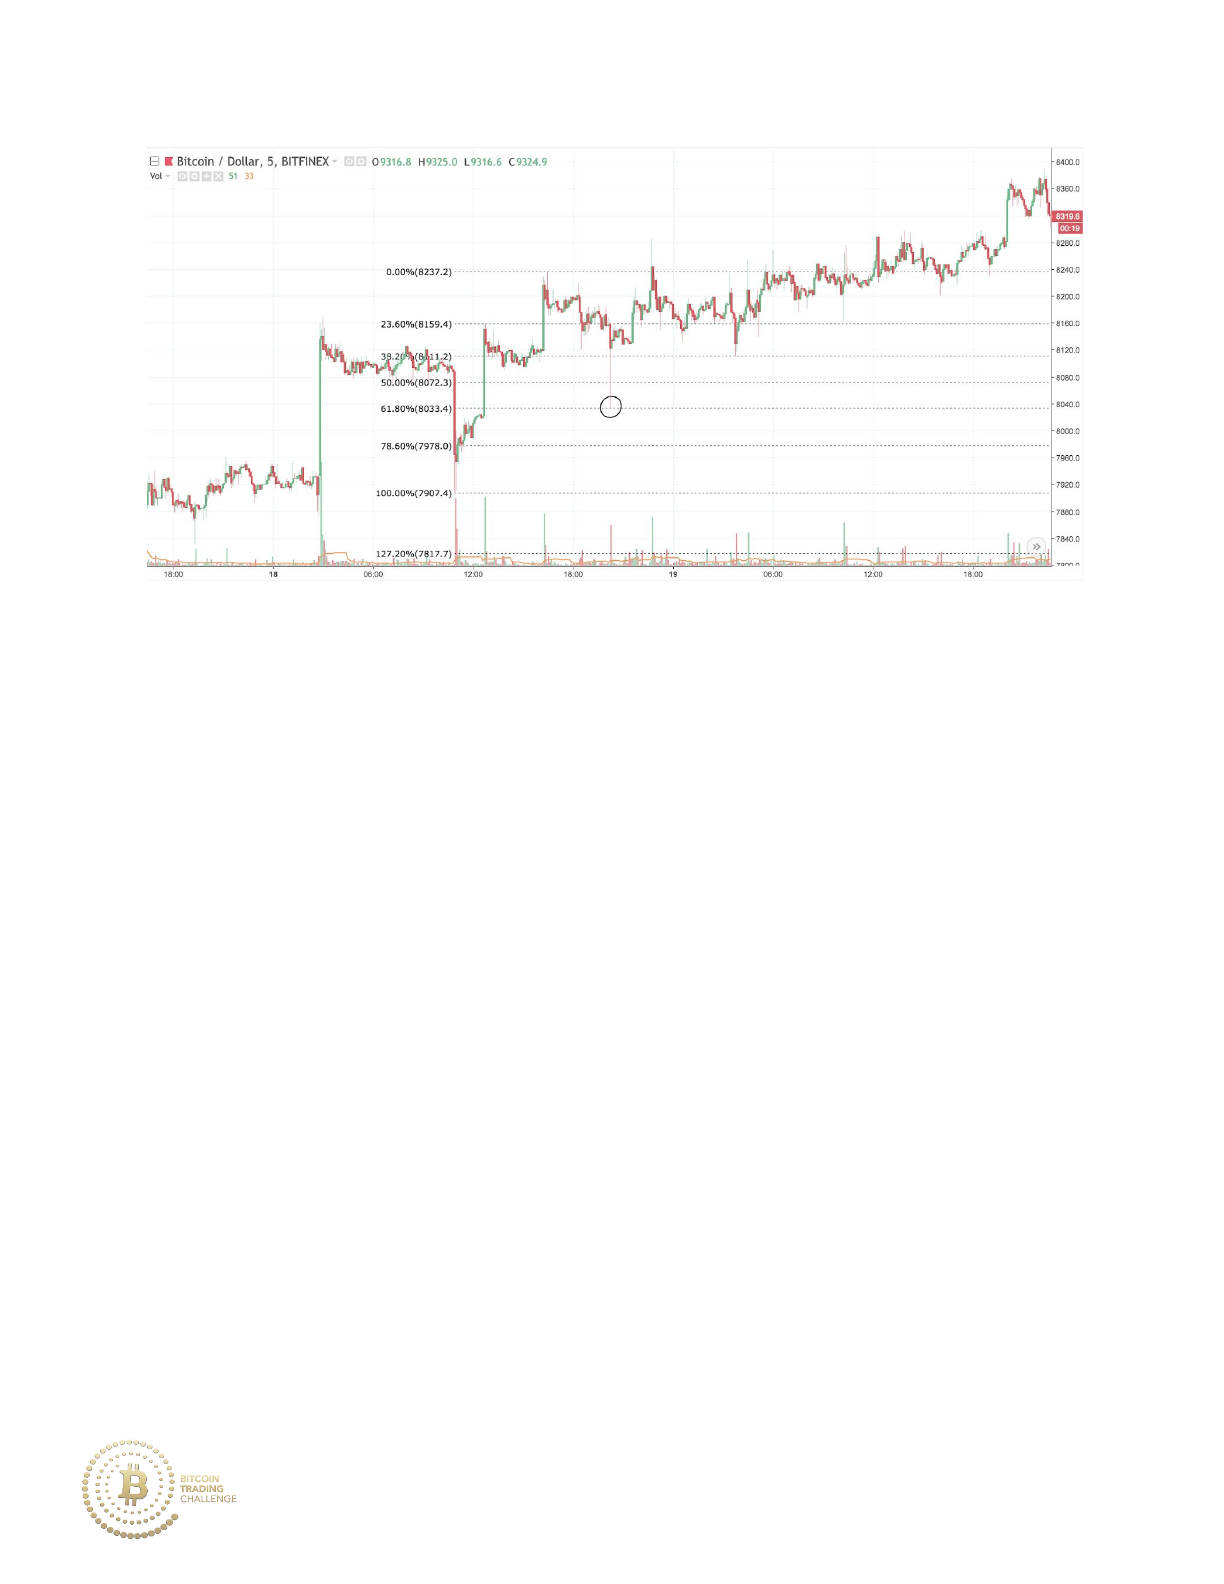
Prior to the retracement, price is moving in a strong momentum uptrend. It
then begins to retrace followed by a rapid downmove to 8032, only $1 below
the 61.8% Fibonacci retracement.
141
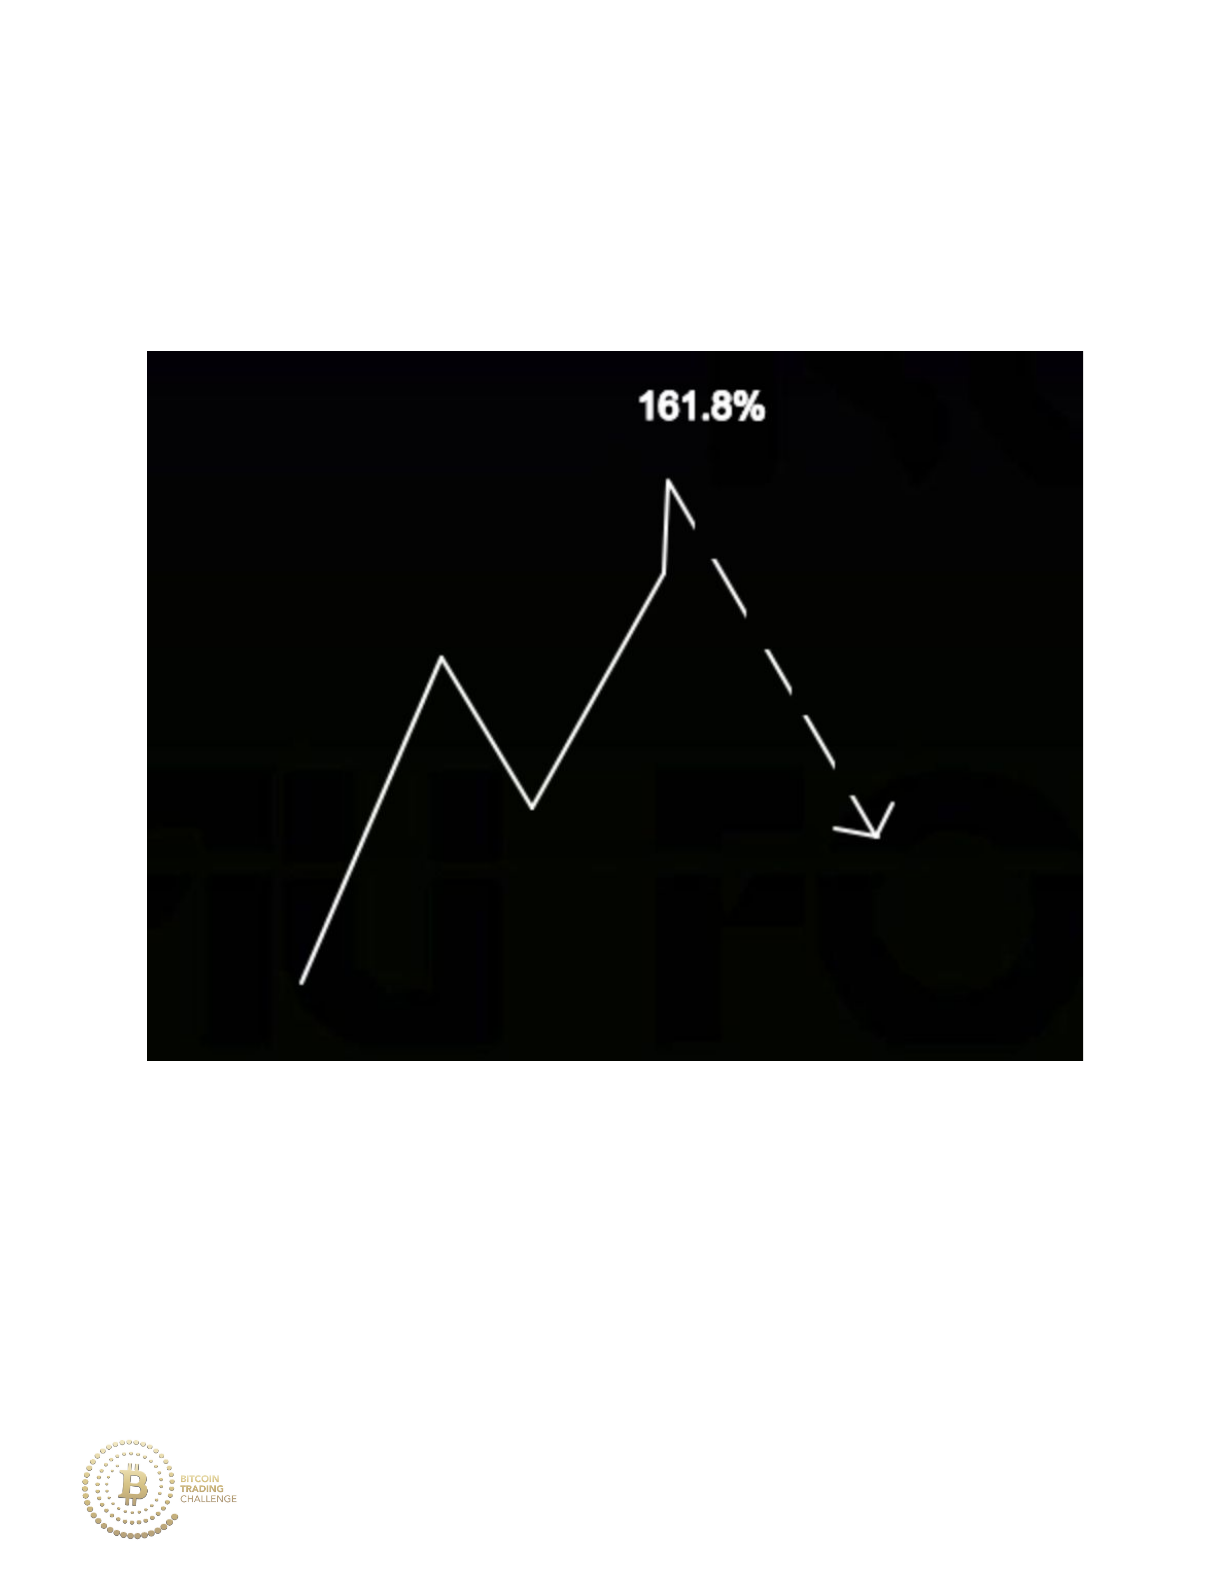
As price expands past previous resistance and up to the 161.8% extension
of the previous retracement, price enters a period of high demand. It
propels past the 161.8% and then quickly moves back downward, creating
the wild tail price formation below.
142
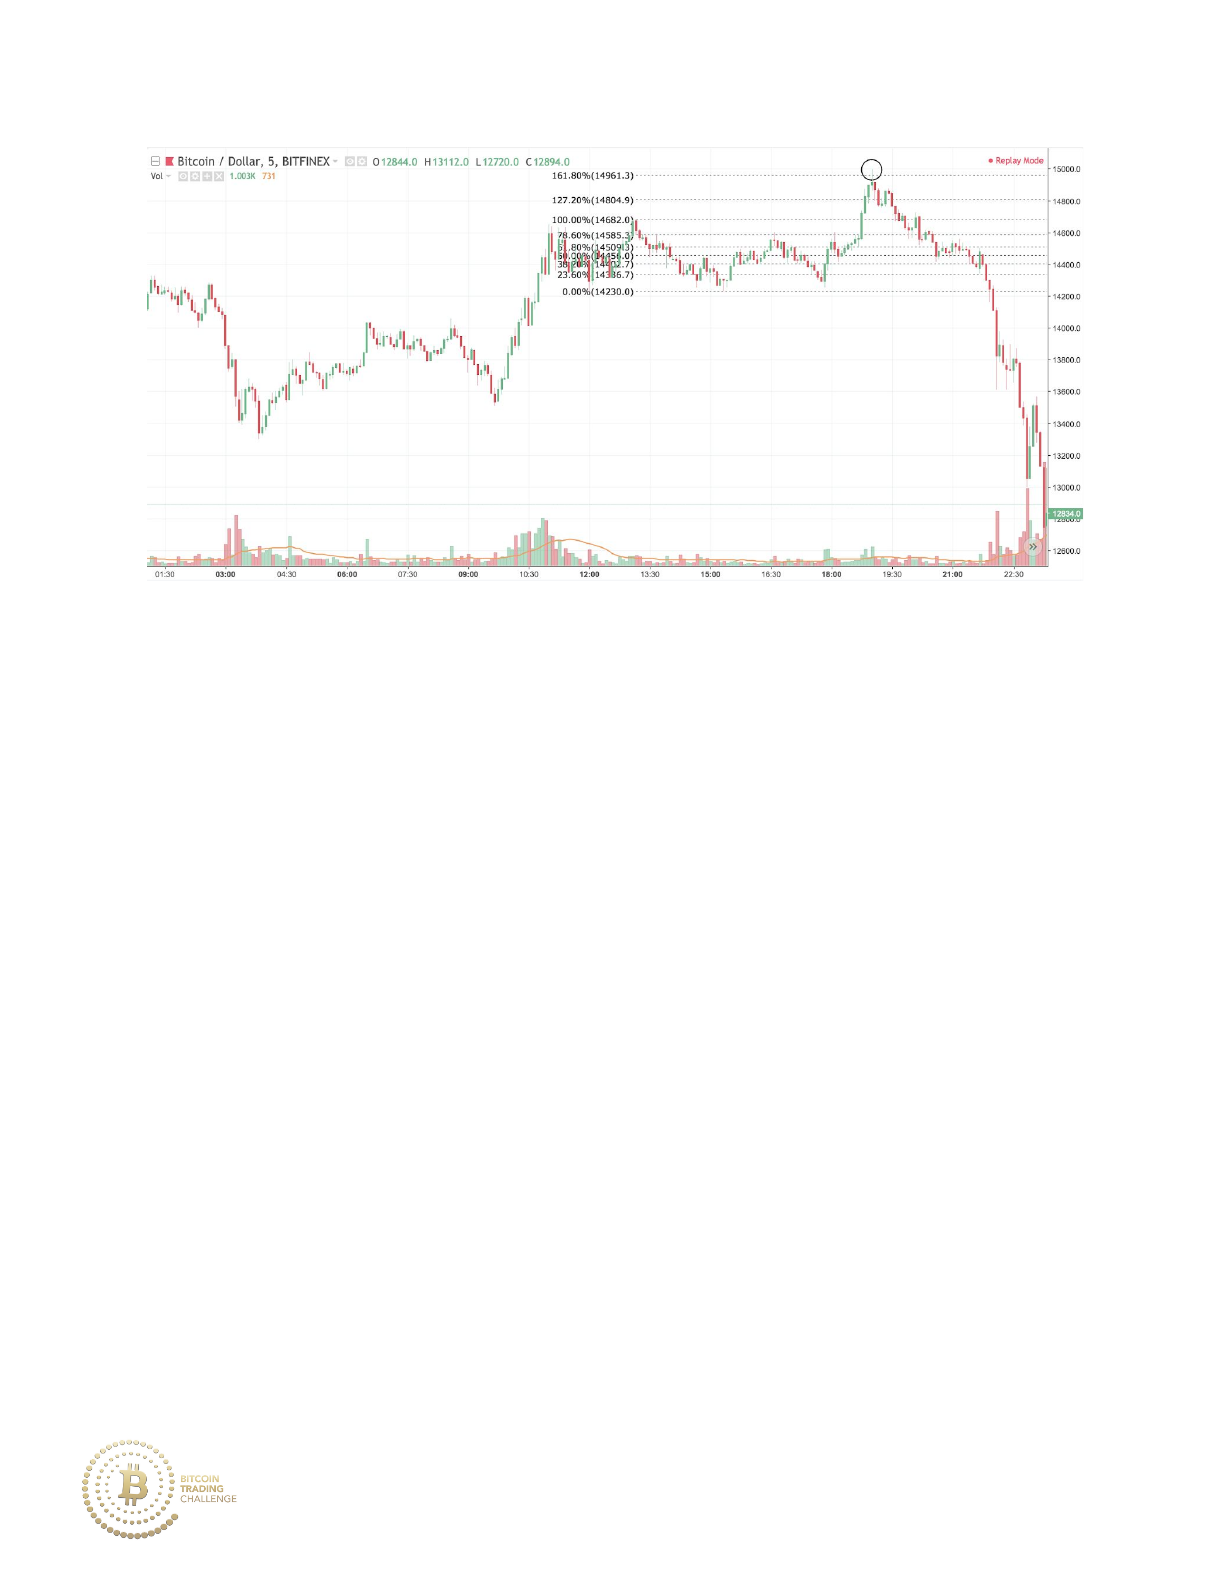
Price is moving in an uptrend from around 13500 to 14700 and then has a
period of consolidation/weak bearish pullback. Drawing the Fibonacci off of
the high and low of this consolidation creates the high tail that later forms
before price moves downward.
III. Multi-Tail Rejection
Sometimes multiple tails will sell downward/buy upward to a Fibonacci
level. This may occur due to the lack of bids/offers around the Fibonacci
price level, resulting in many limit orders around these Fibonacci levels to
hold price from continuing its retracement/extension. However, if price is
able to significantly close above high tails (or below low tails), then the
Fibonacci level will likely not hold and price may move further in that
direction.
143
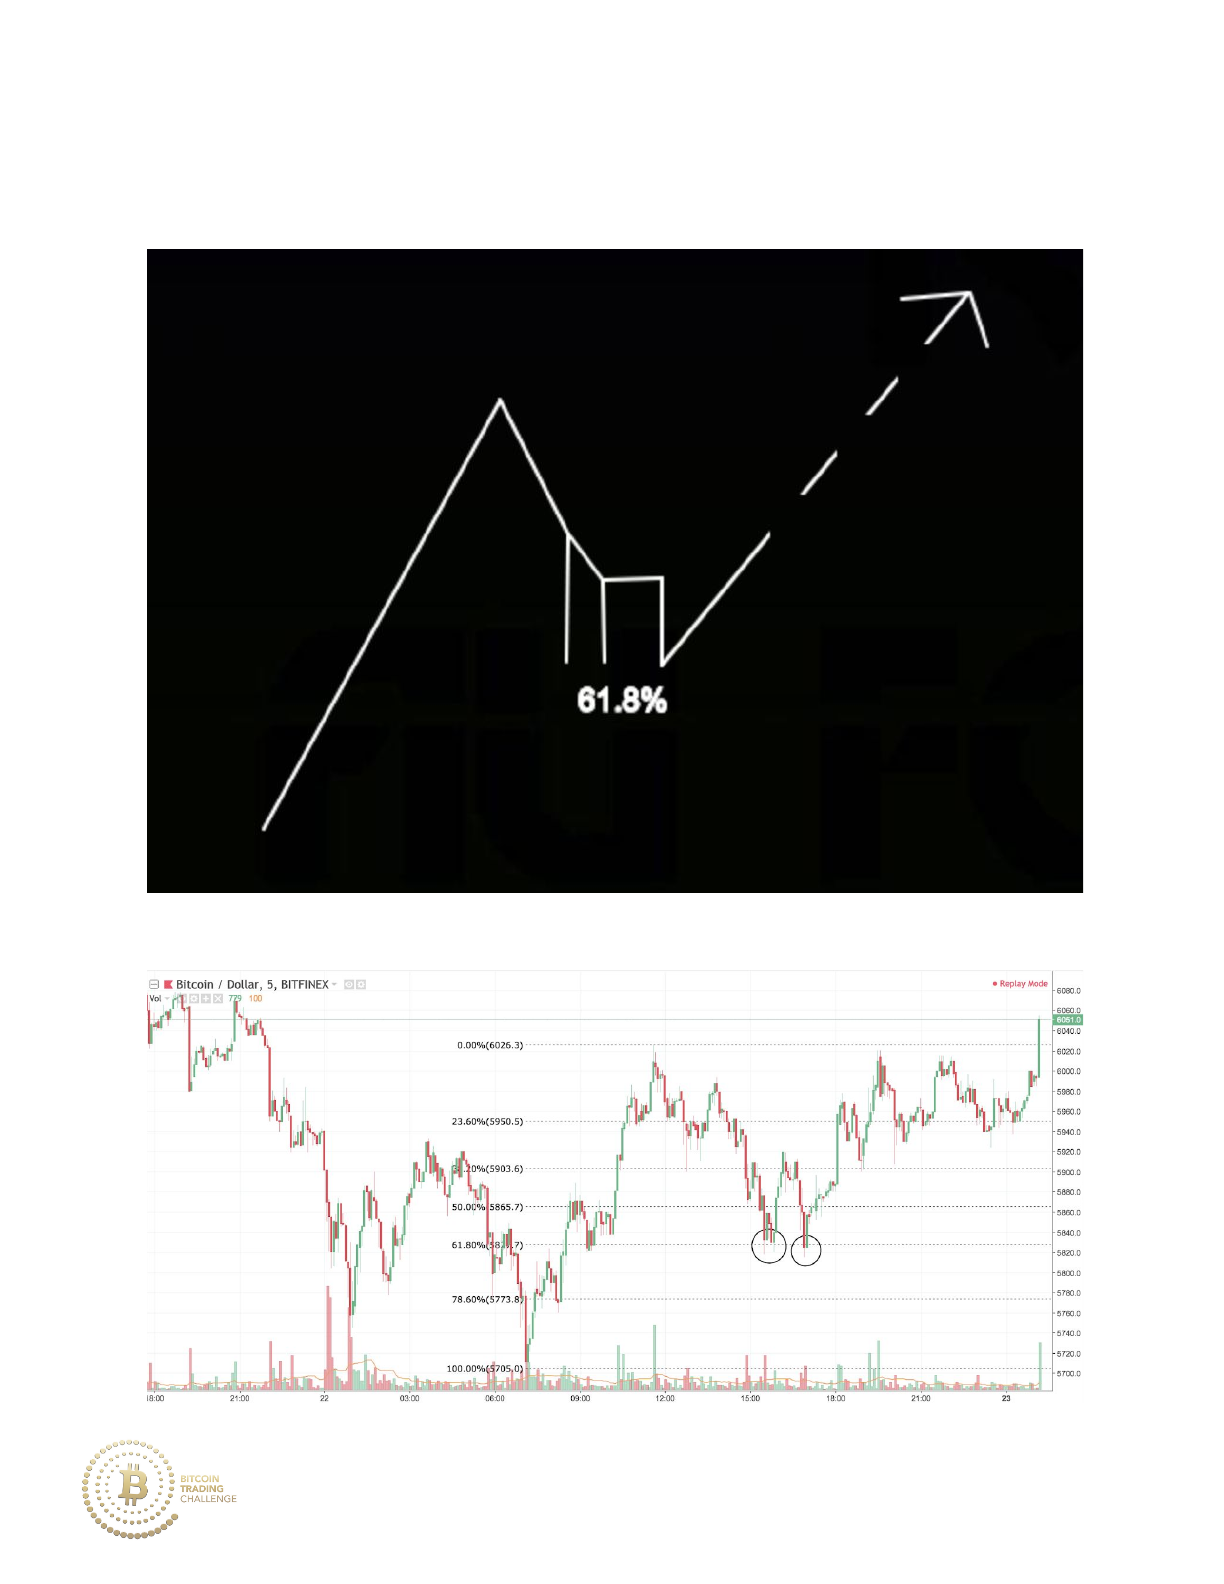
As price retraces, it makes multiple tails to the 61.8% Fibonacci
retracement level before continuing the uptrend.
144
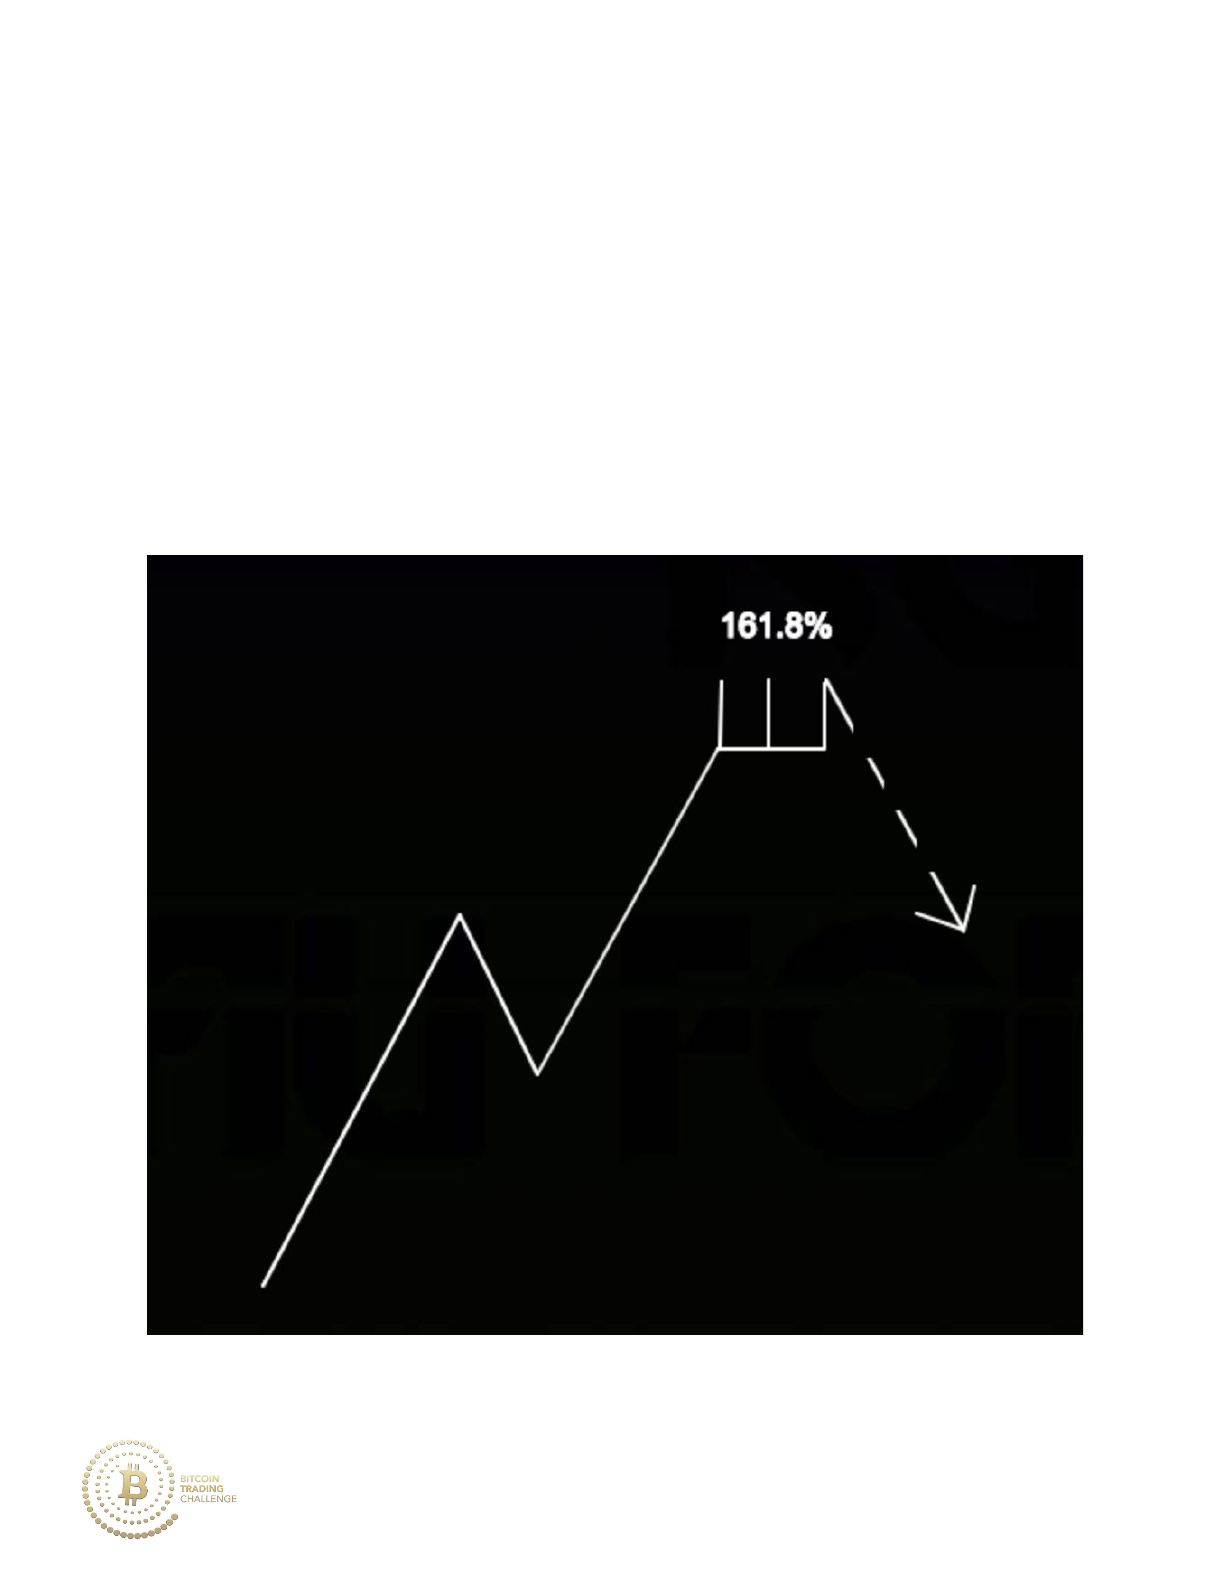
Price is moving in an overall uptrend until it retraces down to the 61.8%
retracement level with multiple tails. The tails that move below the 61.8%
level have volume spikes as well which indicates a higher likelihood of a
reversal off of the 61.8% retracement level.
Price moves beyond the 161.8% extension of the previous retracement, yet
struggles to move past this level as multiple tails form strong resistance.
145
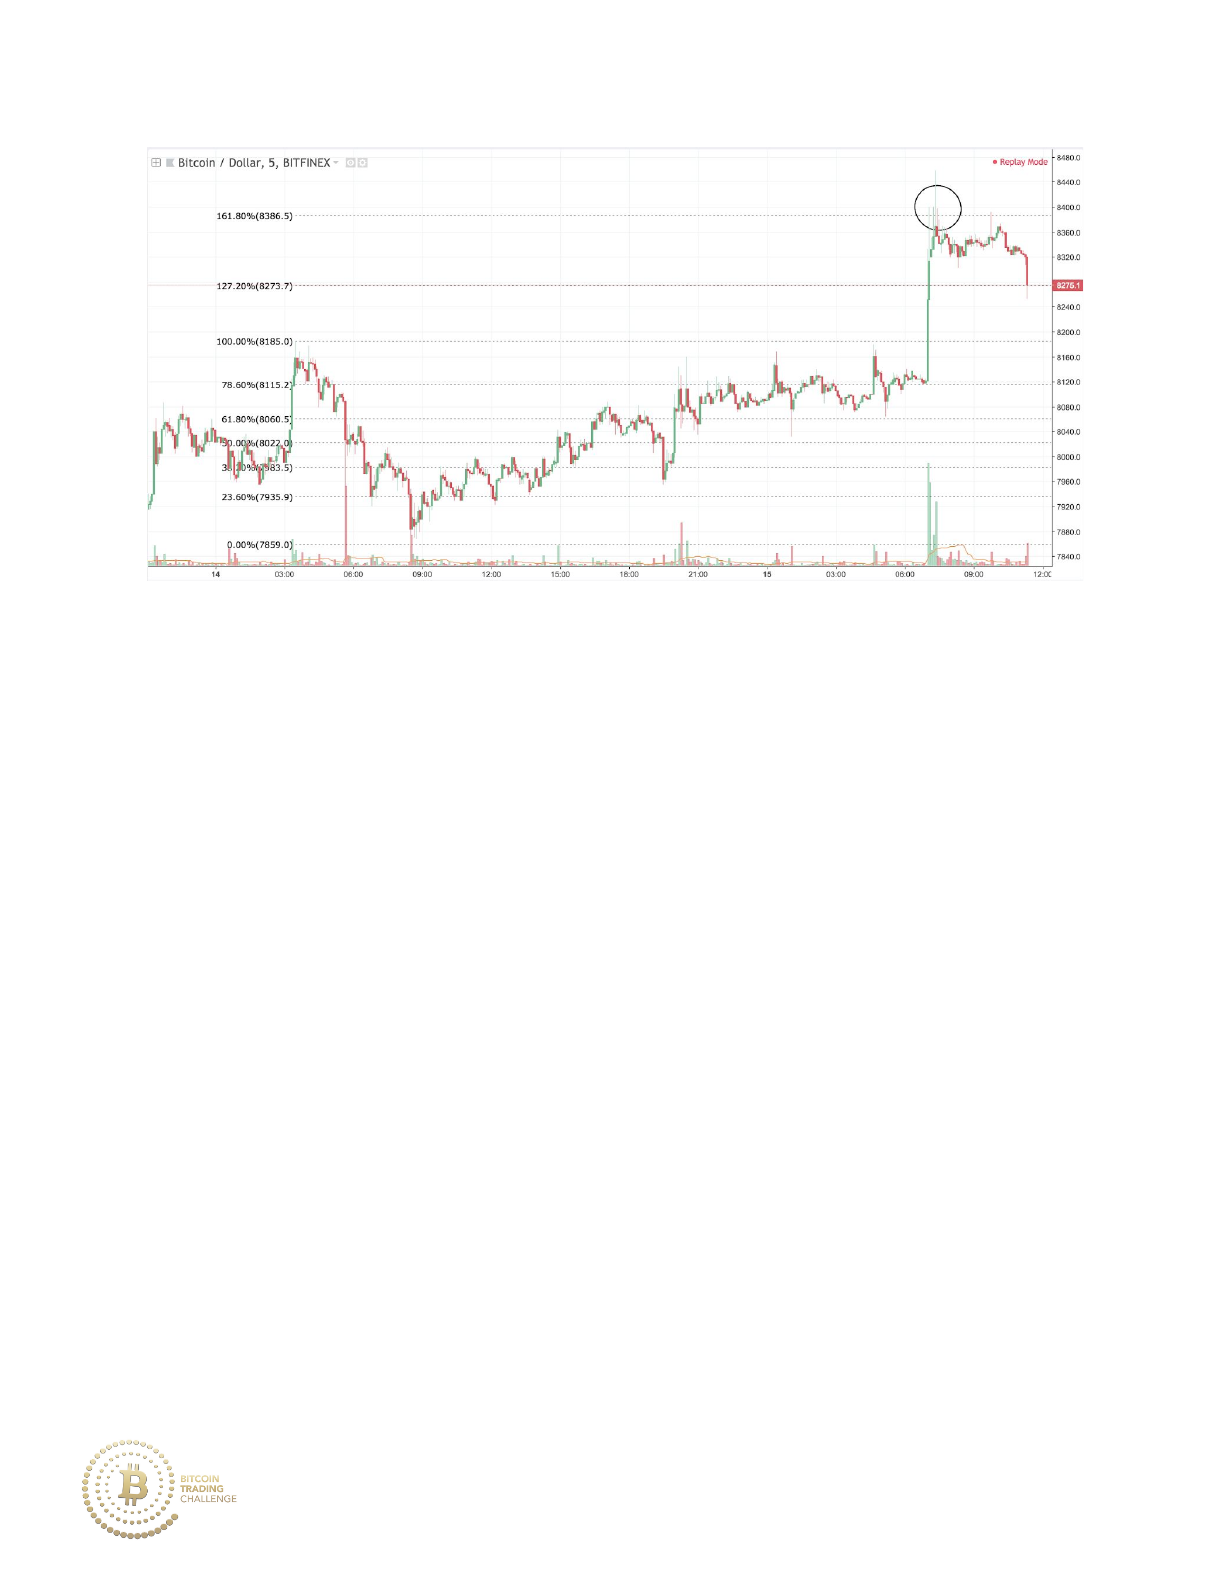
Price is moving in an overall uptrend and sees a retracement from 8185 to
7859 before continuing on strong momentum and high volume. However, as
price reaches the 161.8% extension of the previous retracement, multiple
tails move above the level with volume spikes. As a result, the market moves
back downward.
IV. The Stop Loss Hunt
When large players/institutions need to accumulate or distribute high levels
of volume, they need an equally large pool of liquidity to take the other side
of the trade. These pools of high liquidity are typically found slightly above
resistance/below support as these price areas contain many stop losses.
When reached, the stop losses will act as market orders, executing at the
most available bid/offer.
146
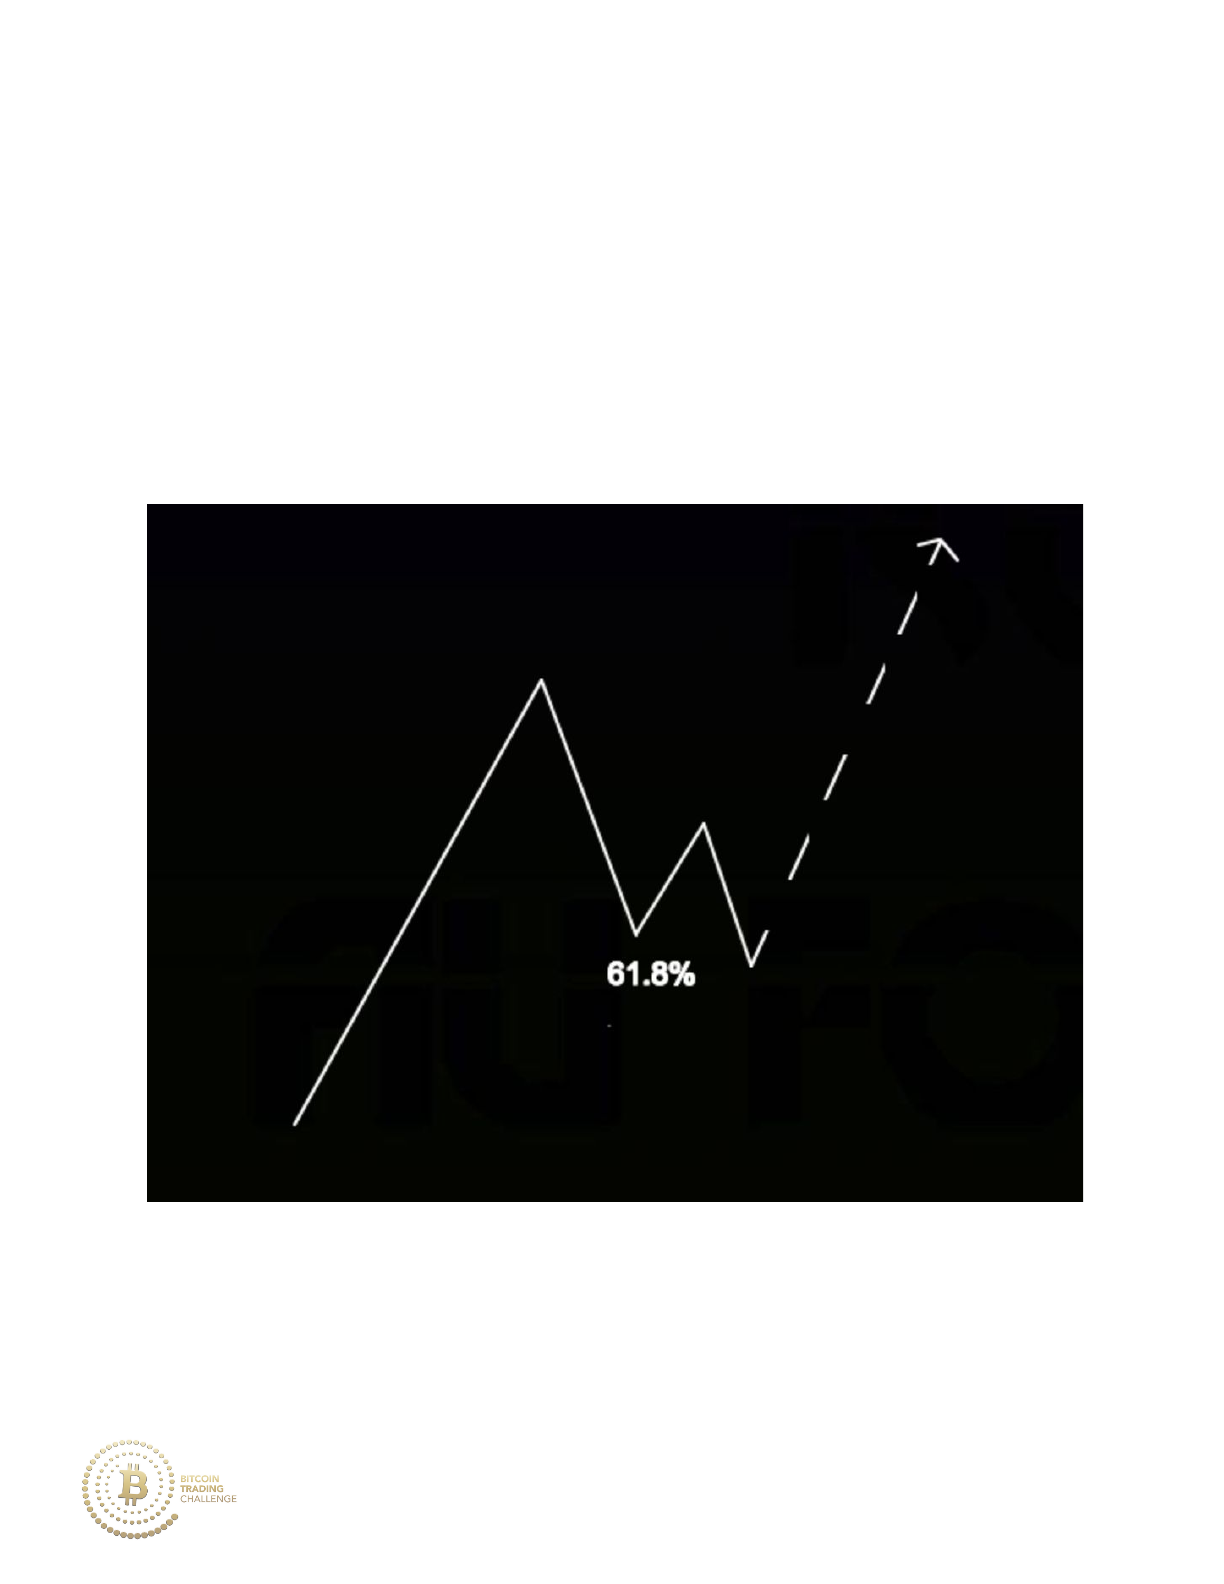
So, if retail begins buying/selling into a major Fibonacci level, price may
move deeper into the Fibonacci retracement/extension to trigger their stop
losses.
Notice how price touches the 61.8% Fibonacci retracement level and
makes a bullish move. Price then moves beneath the previously
established low of the 61.8% before moving upward again.
147
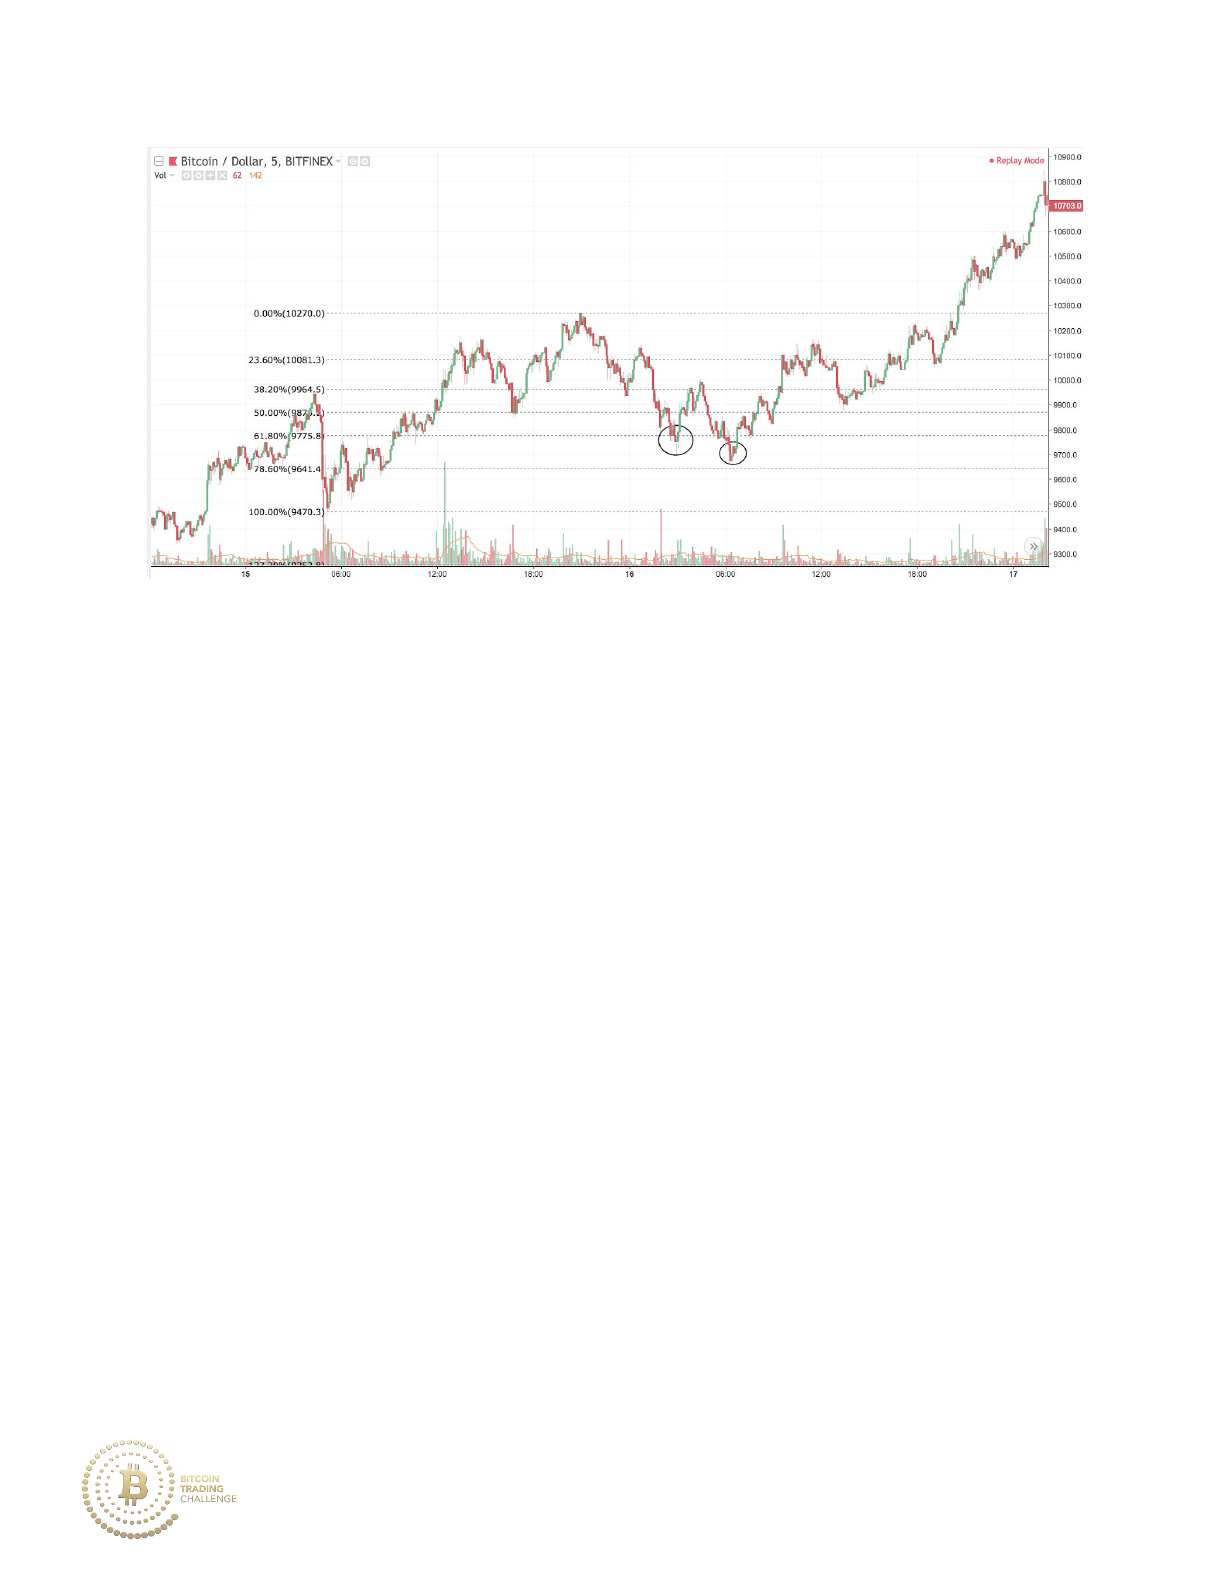
Price is in an uptrend and makes a retracement down to the 61.8% before
making a failed move back upward. Price then moves below the previously
established low before continuing the uptrend.
Price initially moves to the 161.8% Fibonacci extension of the previous
retracement within the uptrend. After price makes a preliminary move
148
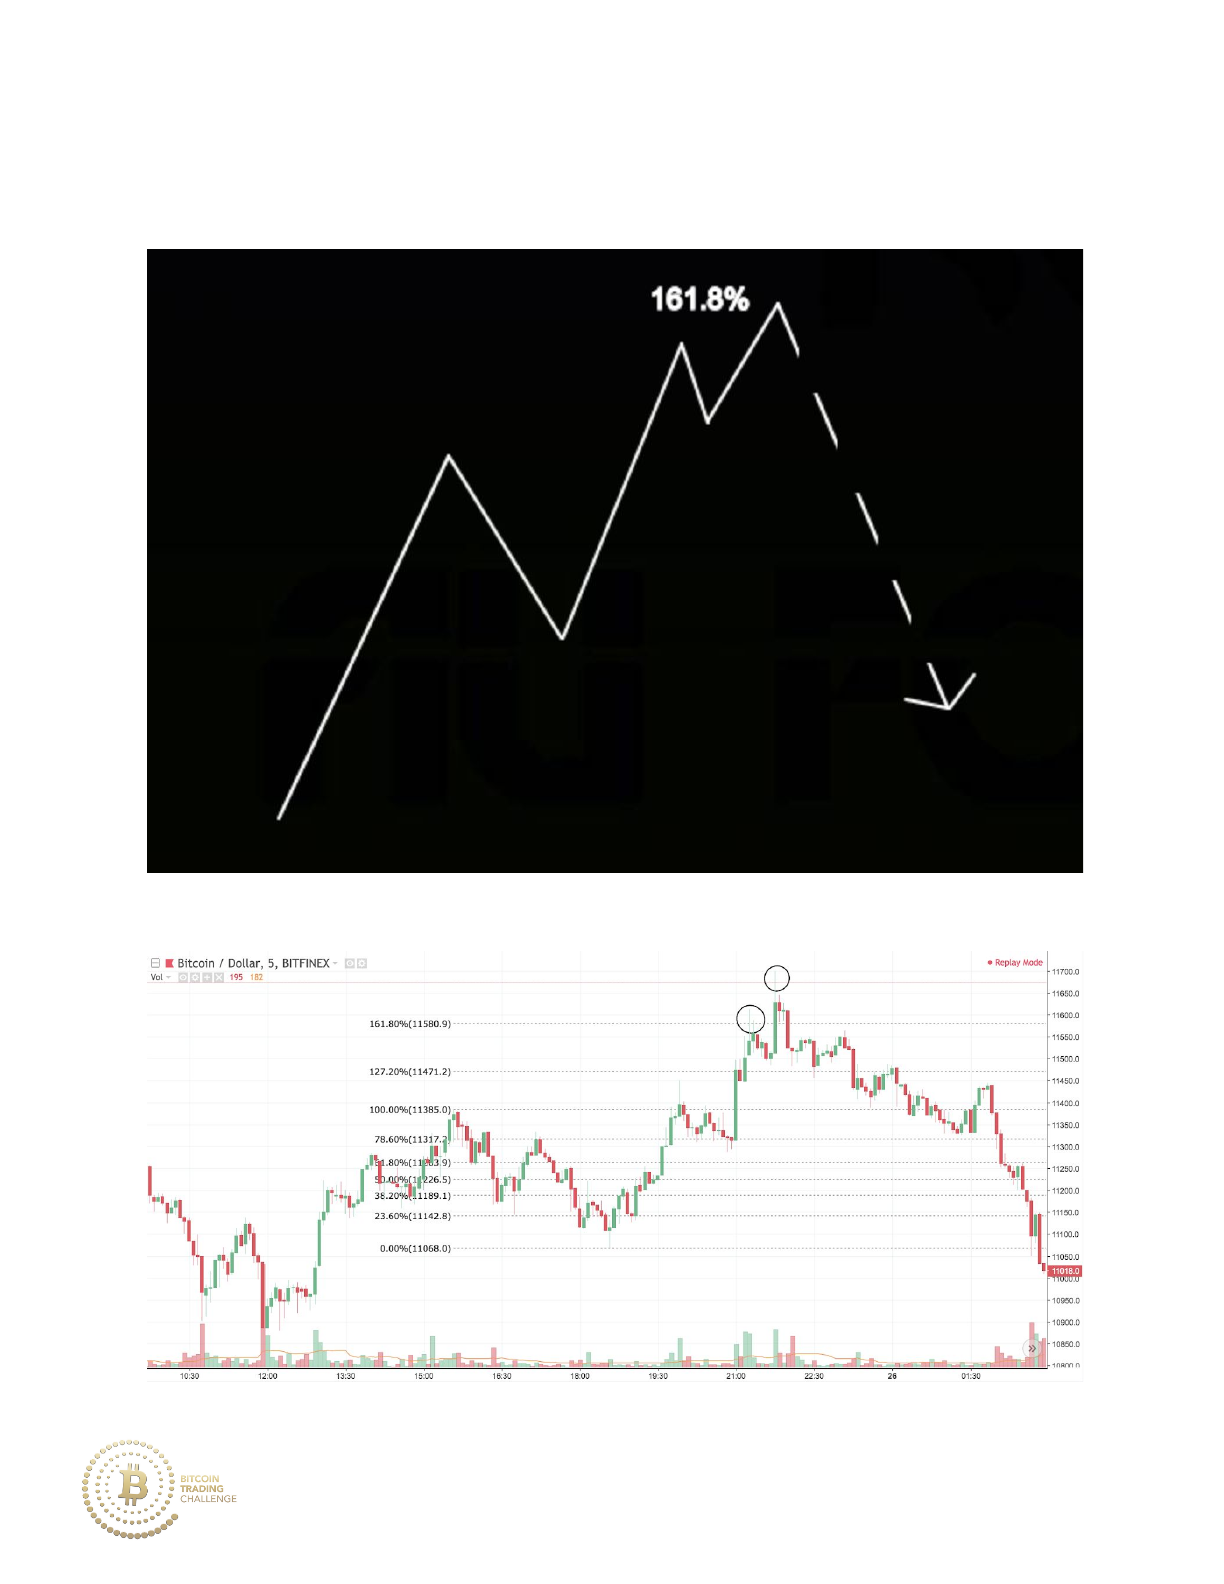
downward, it heads back upward above the previously established high
before beginning the downtrend.
149

Price is in an uptrend and makes a high tail at the 161.8% extension of the
previous retracement. Price then weakly dips down before springing above
the previous high. After a market fakeout to the upside, price moves lower.
V. Consolidation Spring
A pattern similar in theory to the stop loss hunt, the consolidation spring
allows institutions to accumulate positions at the expense of retail traders
having their stop losses hit at a major Fibonacci level. Typically, the
consolidation period will occur at the end of a market retracement, right
before price dips down to the 61.8%.
Price consolidates ahead of the 61.8% level as neither the bulls nor the
bears are in control. Any retail traders who may attempt to enter long
150
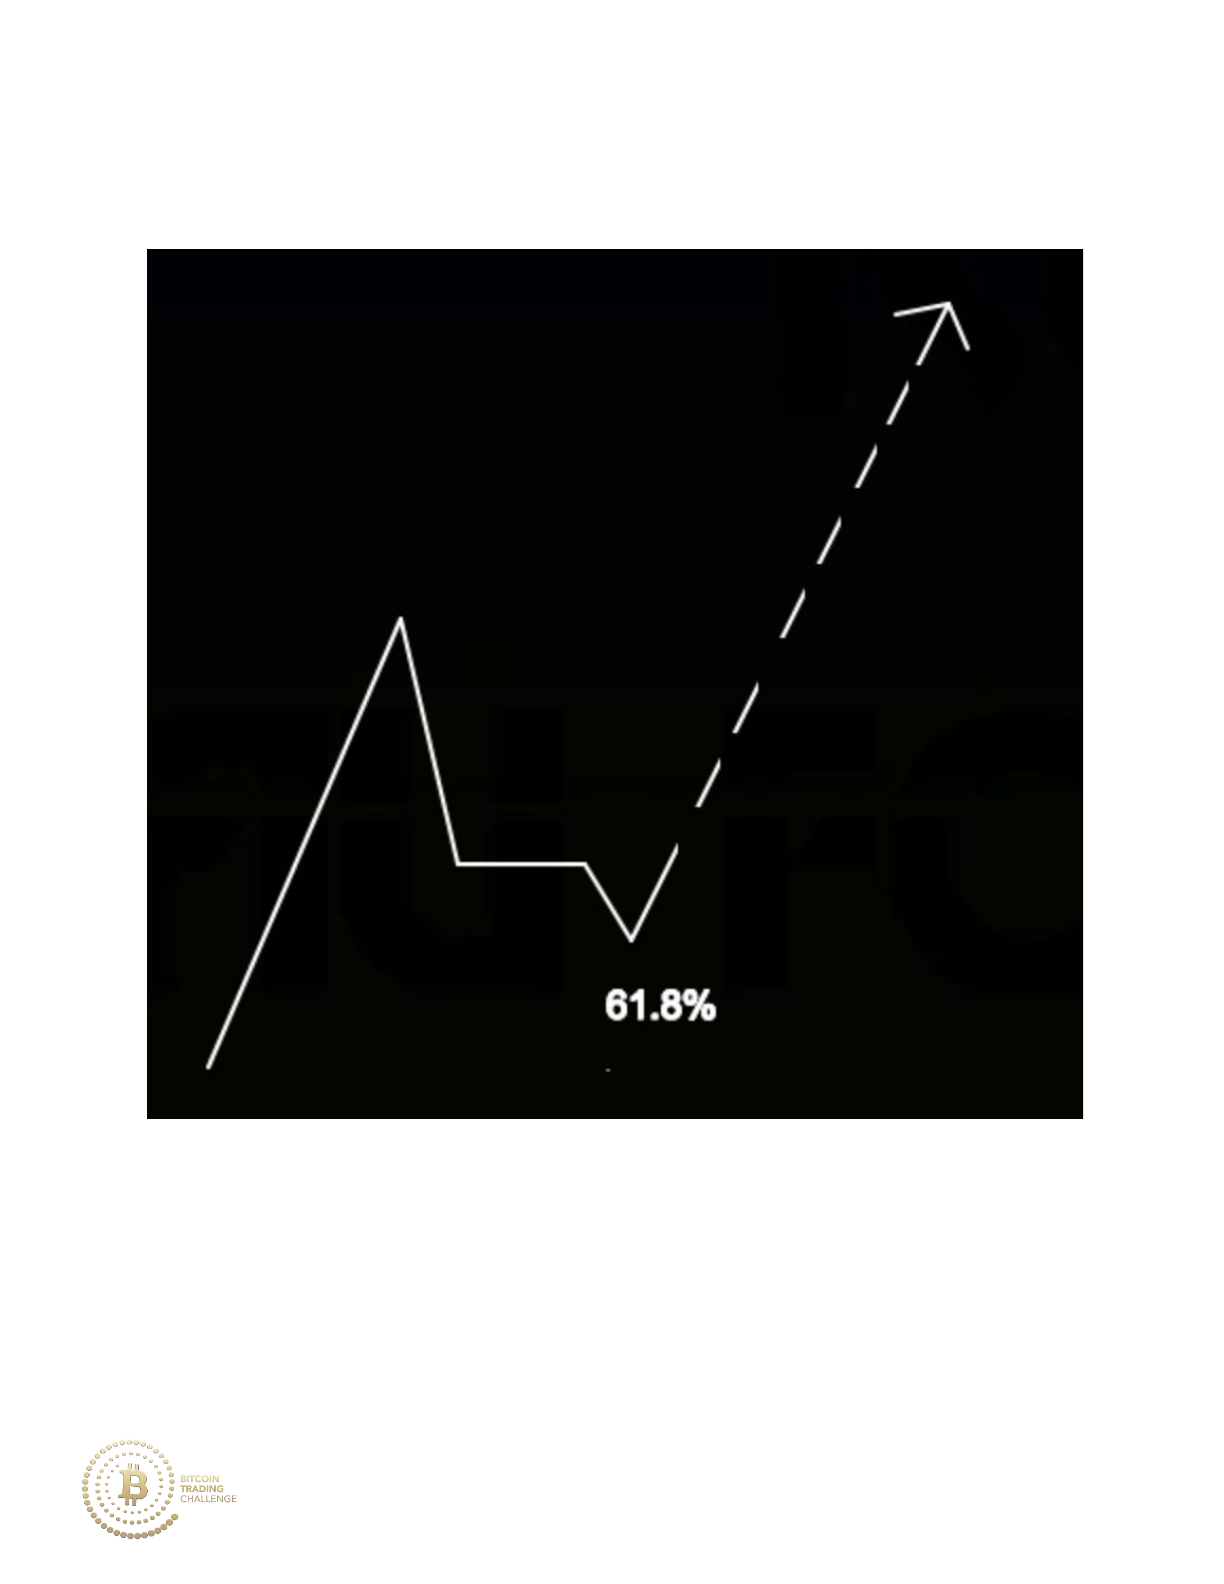
positions may have been shaken out with the continued move down to the
61.8%.
151
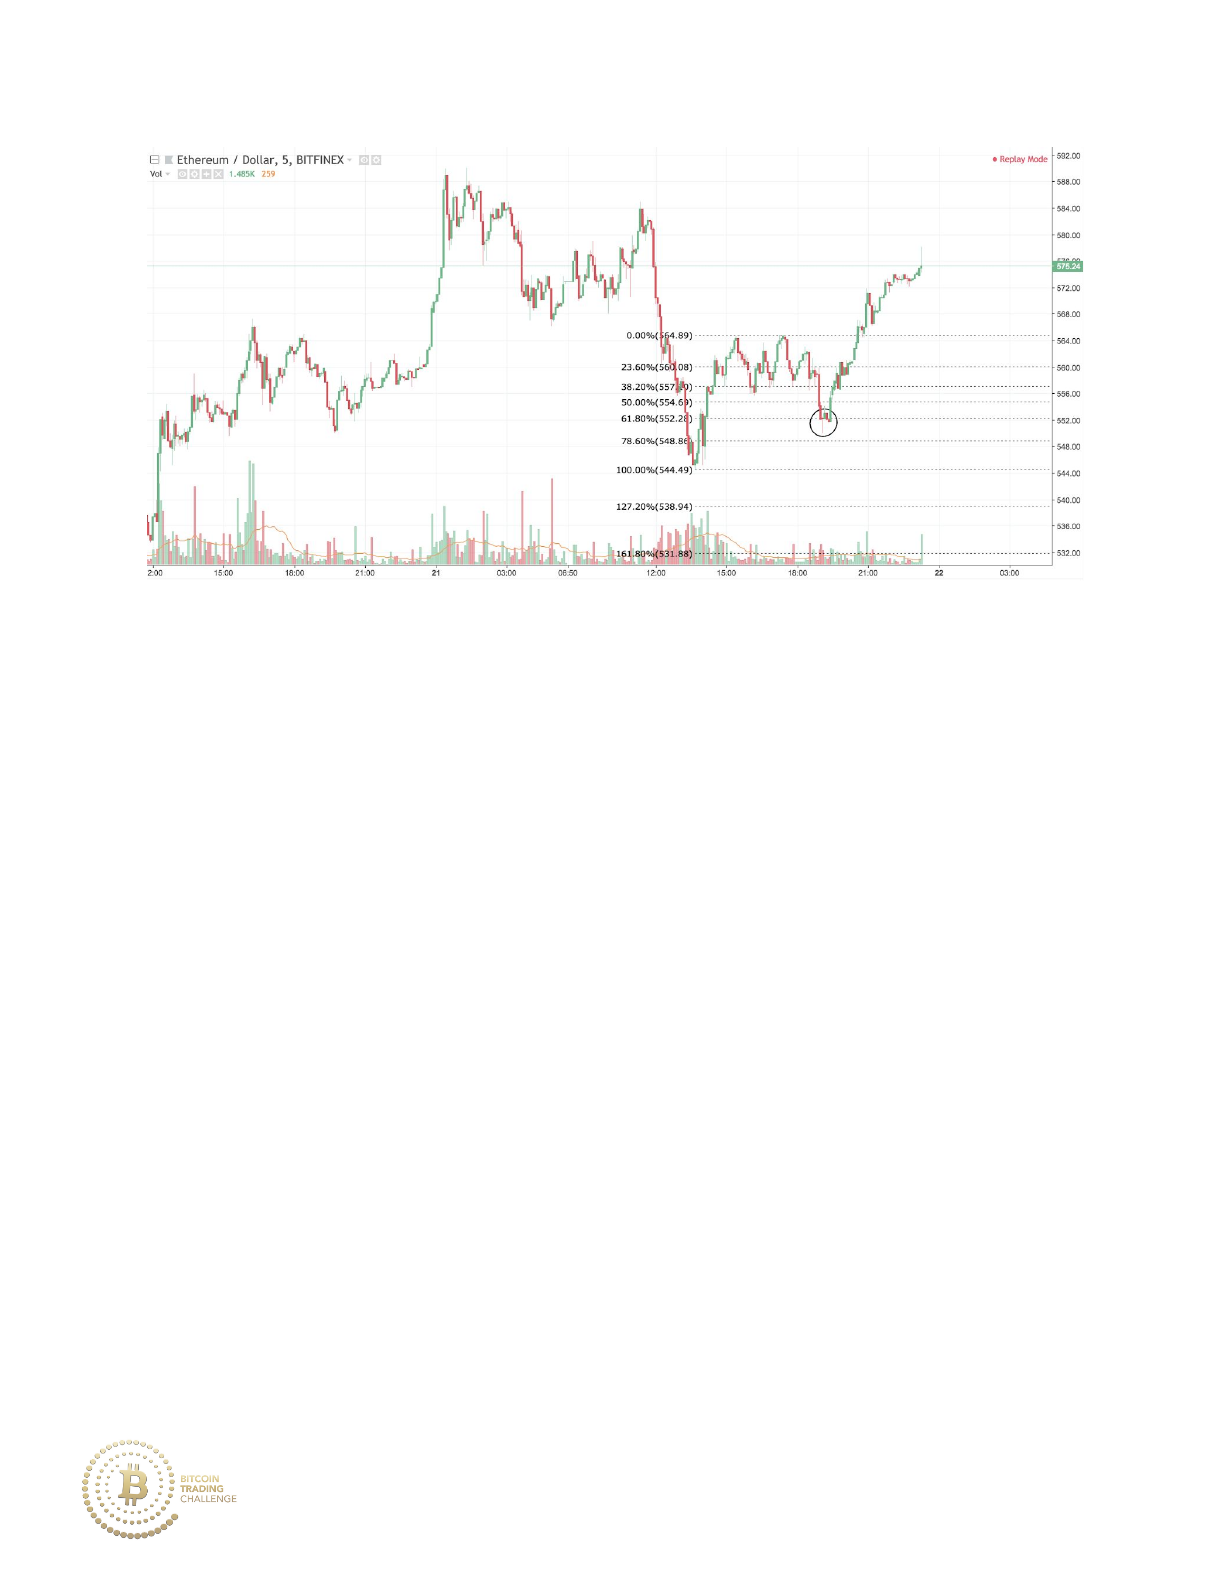
Price consolidates after the bullmove then moves downward, convincing
many retail traders that the market will continue on the overall downtrend as
price reaches the 61.8%. However, after a low tail, price reverses back
upward to continue the minor market stage uptrend.
152
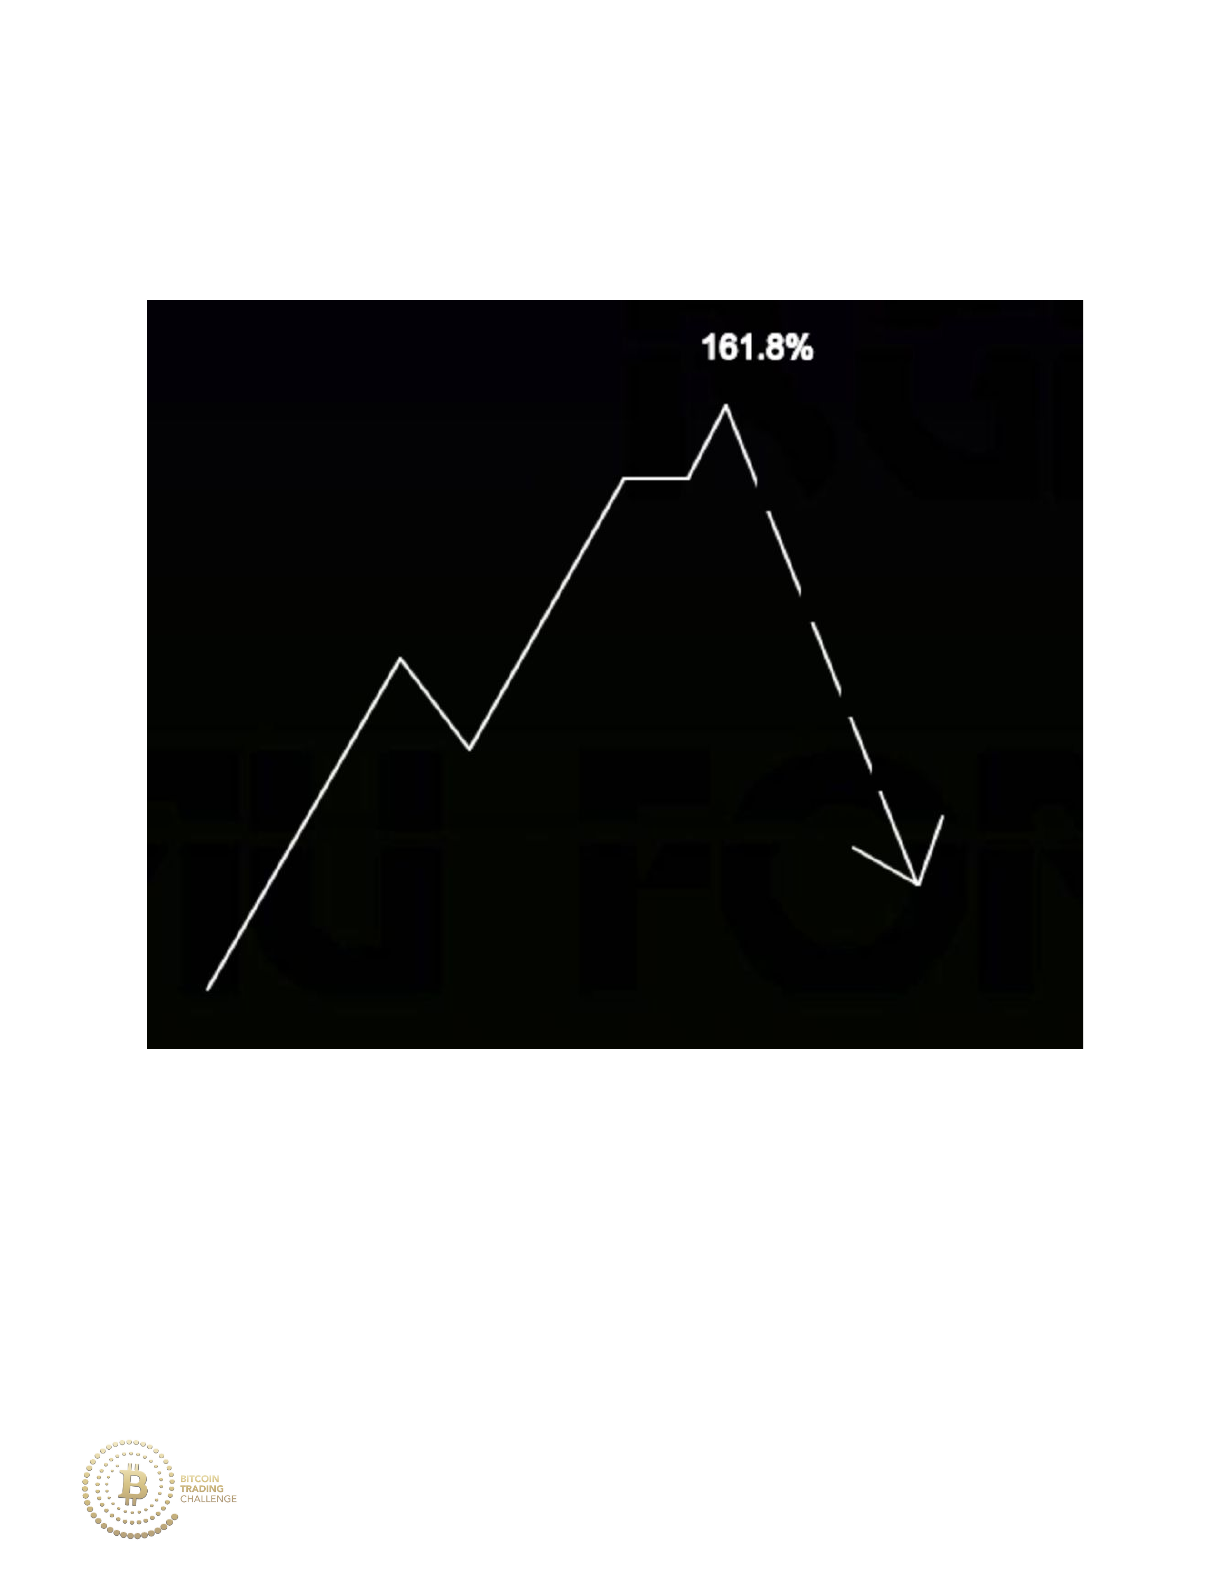
Price consolidates after an uptrend as traders begin to take profit. Price
then springs upward to fill the limit sell orders located at the Fibonacci level
as retail traders likely buy in.
153
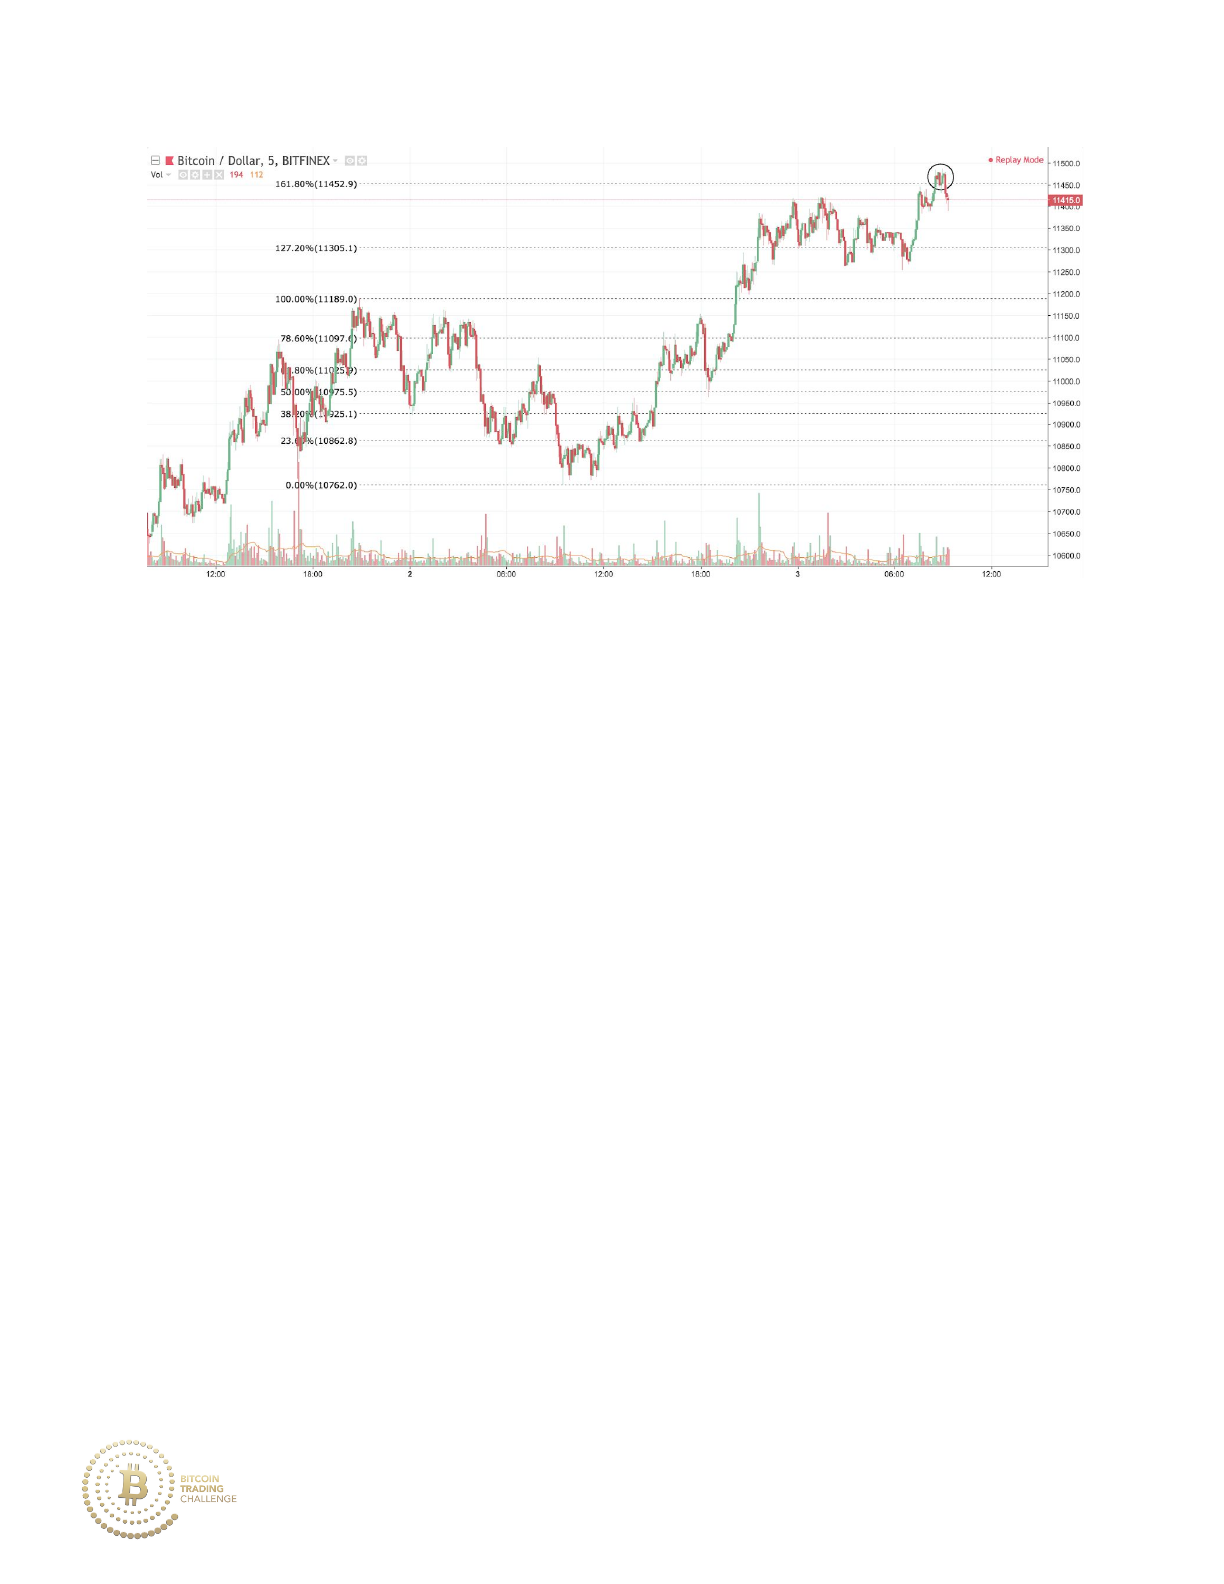
Price moves upward and makes a retracement before breaking the high of
that retracement. Price then consolidates ahead of the major 161.8%
Fibonacci extension. When price reaches this extension, price reacts in a
bearish manner and begins a downtrend.
B. The 3 Shapes of Disrespected Fibonacci Levels
These three types of market reactions (or non-reactions) to a major
Fibonacci level create market structures that give warning that Fibonacci
levels will likely not hold.
All examples below feature examples of uptrends. The same dynamics
apply to a downtrend, just in the reverse.
I. Consolidation at Important Fibonacci Levels
154
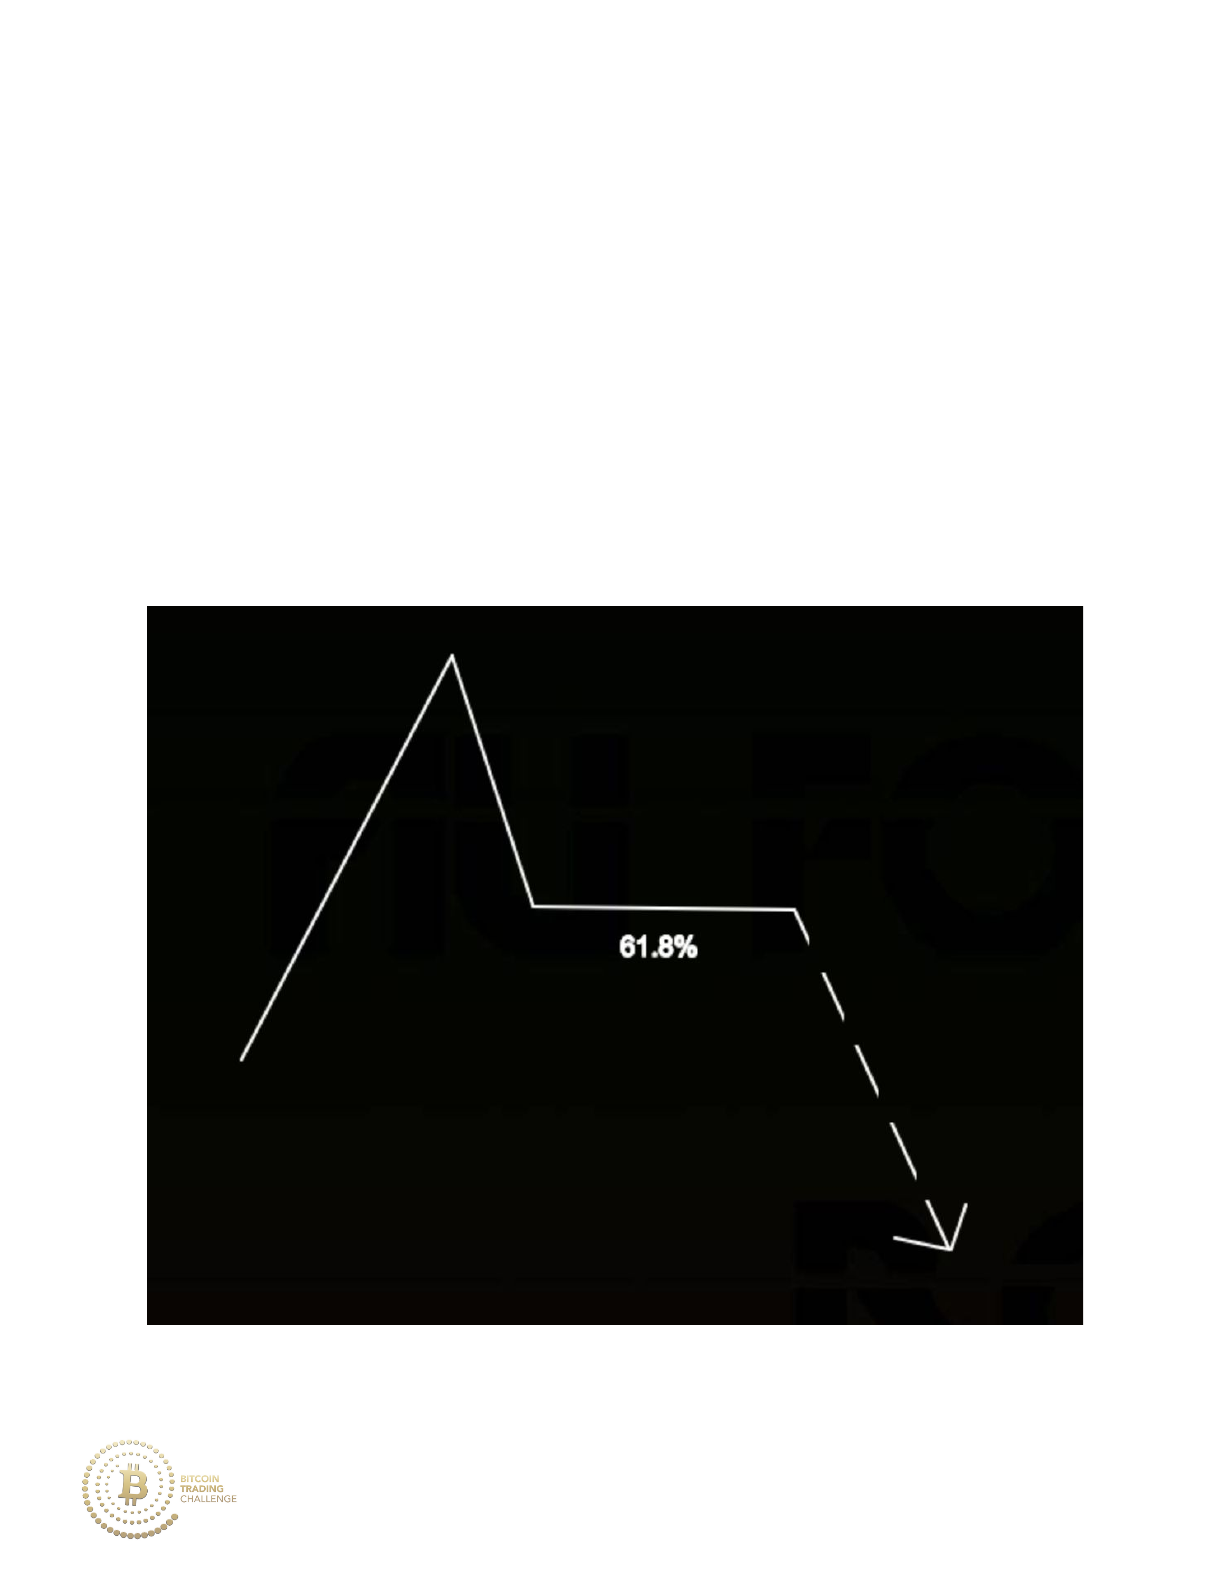
Consolidation ahead of a Fibonacci level followed by a drop to that level
signifies that the level will most likely hold. However, a rapid move followed
by consolidation directly at a major Fibonacci level is a sign that a reversal
is not likely.
Price is moving in an uptrend and then retraces rapidly down to the 61.8%.
Once there, price consolidates as retail traders buy into the retracement
and institutions sell. Price then breaks the consolidation structure and
propels the market into a downtrend.
155
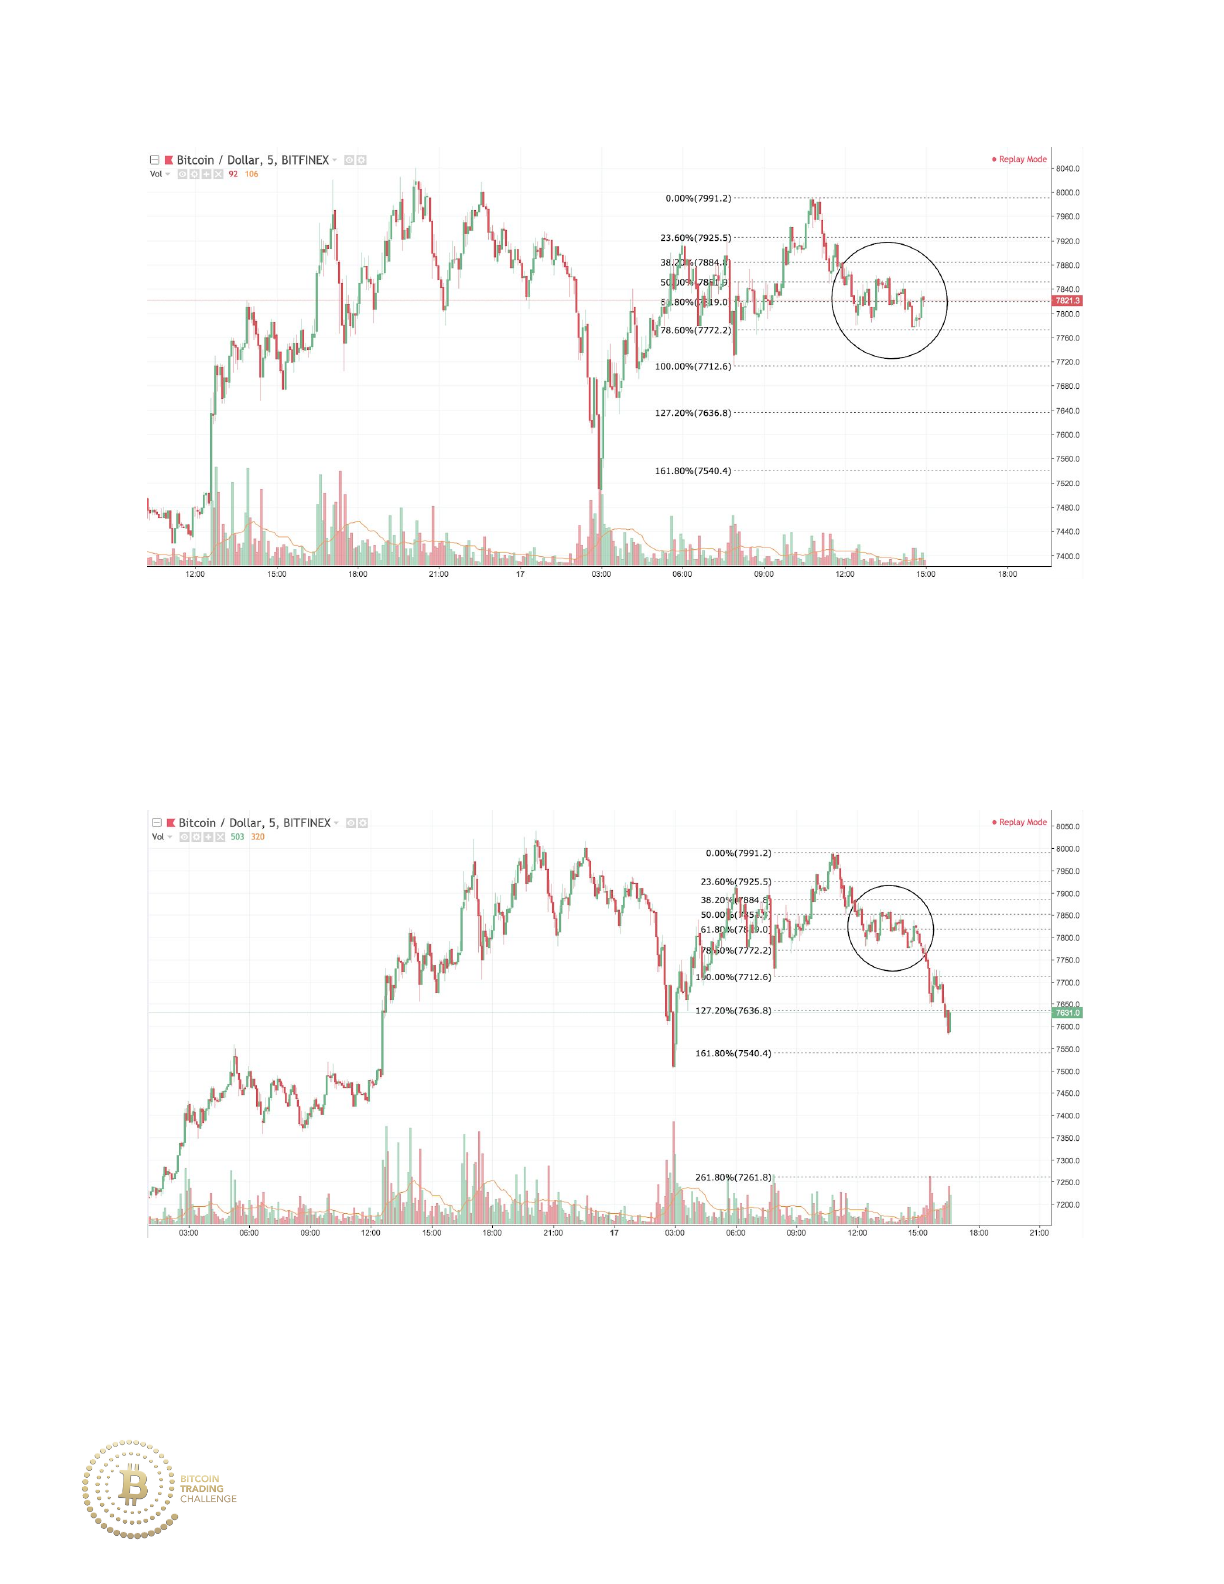
In the chart above, price is consolidating around the 61.8% price area; this
type of consolidation exhibits weakness of the uptrend and the strength of
the sellers to keep the price down.
Price moves downward past the consolidation zone.
156
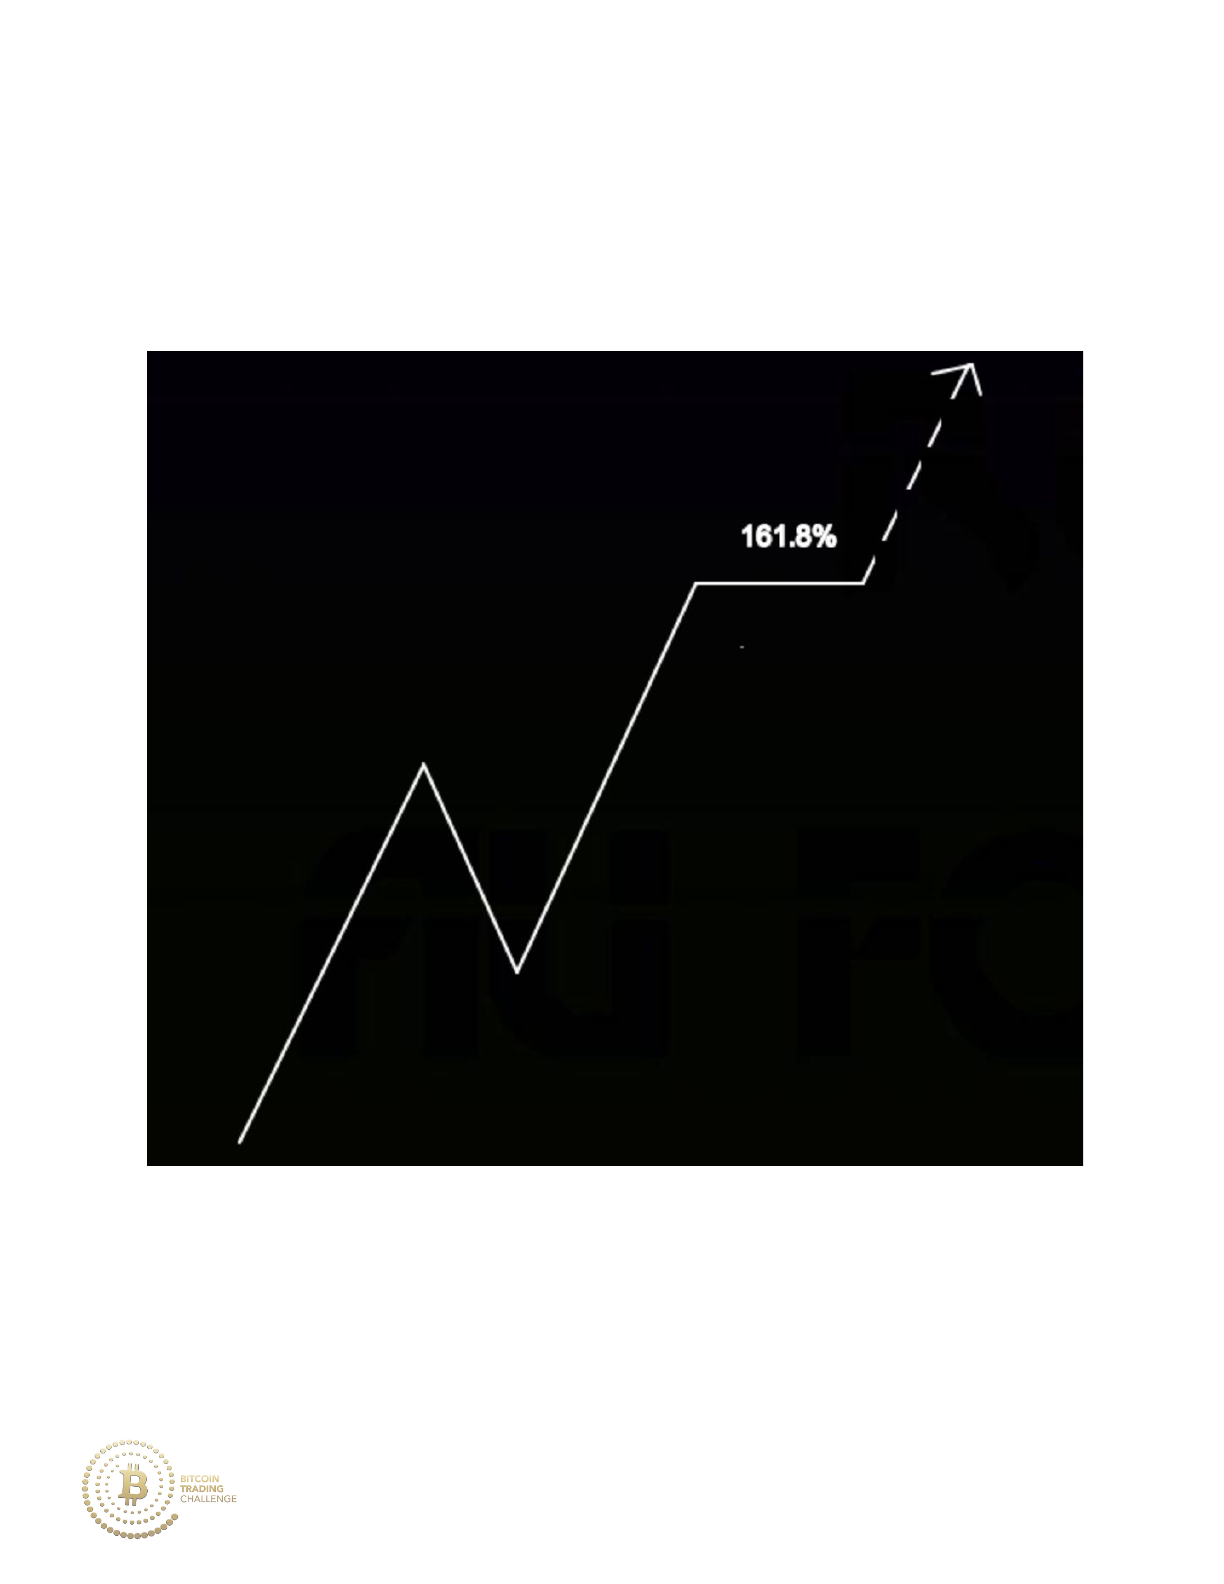
Price moves upward to the 161.8% Fibonacci extension and then
consolidates without moving to the downside, representing bullish
strength. If you were in a long position, you would want to hold and take
profit at a higher price level.
157
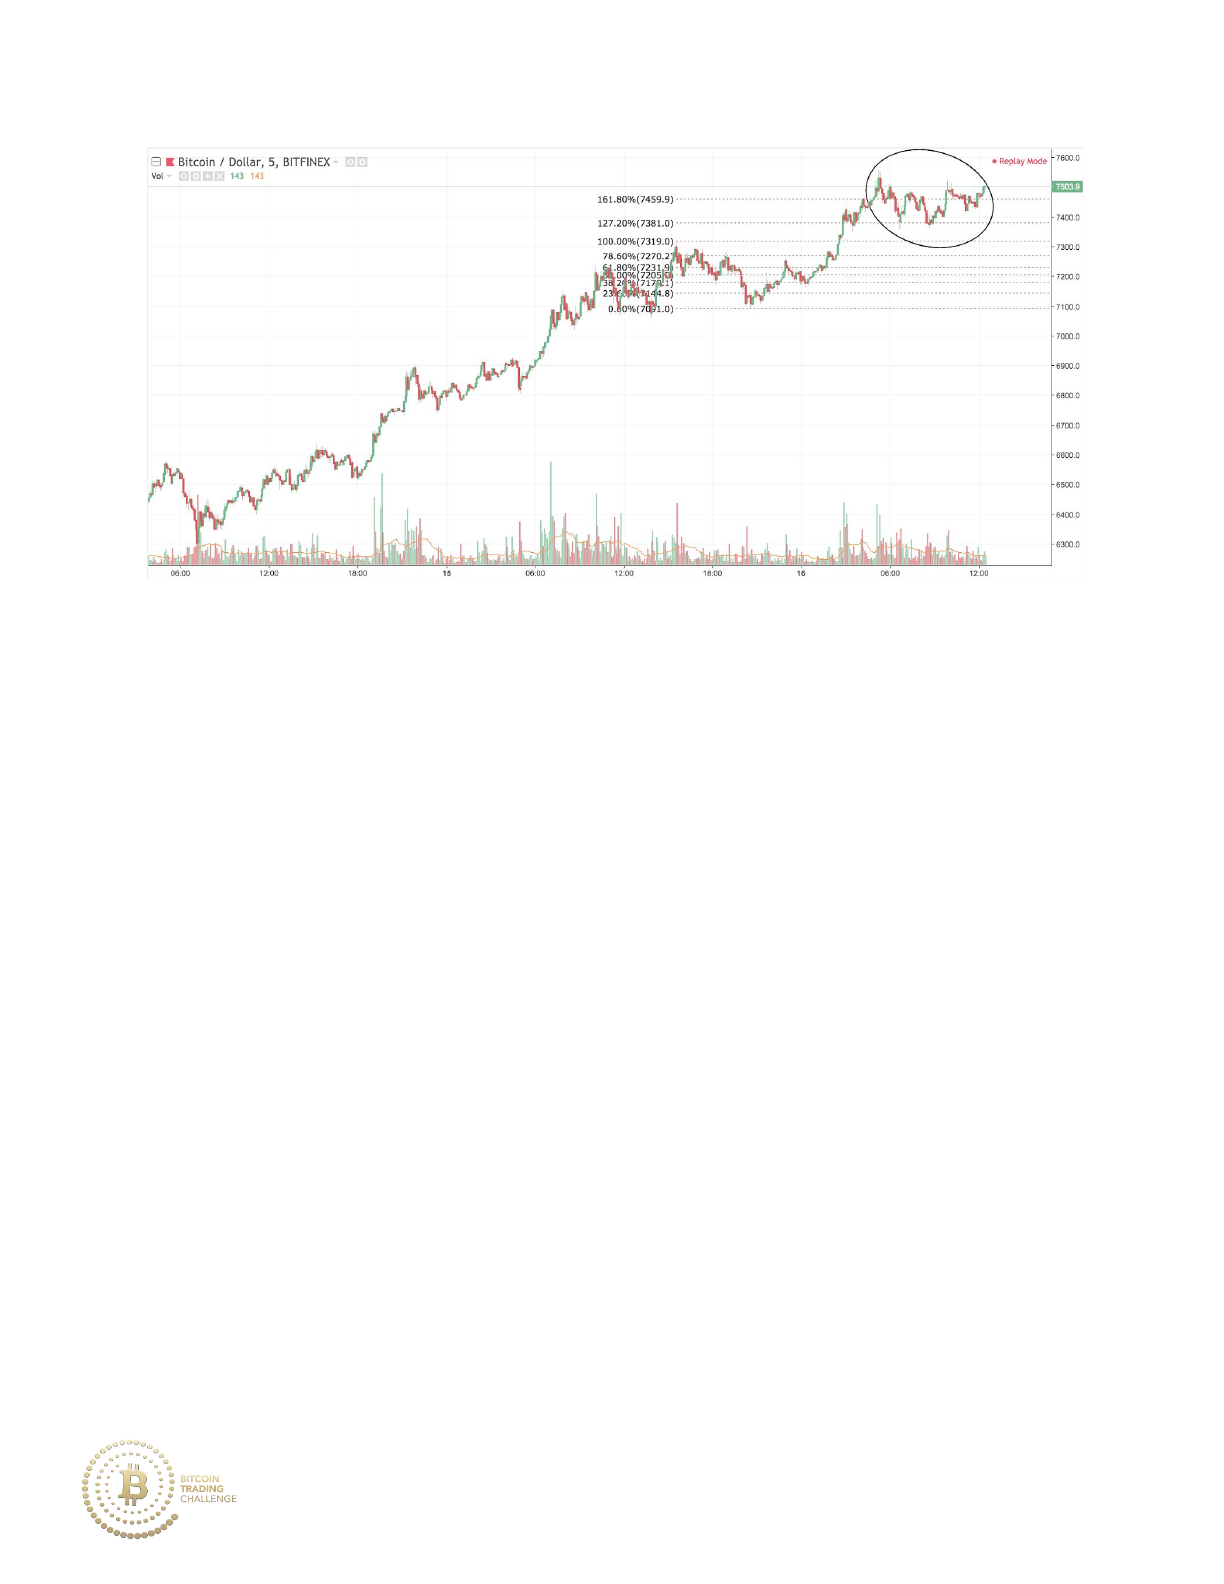
Price is in a sustained uptrend, and after a weak retracement, price moves to
the 161.8% extension of that retracement. Price then consolidates around
the level, representing the inability of the sellers to push the price lower as
well as the high present demand.
158
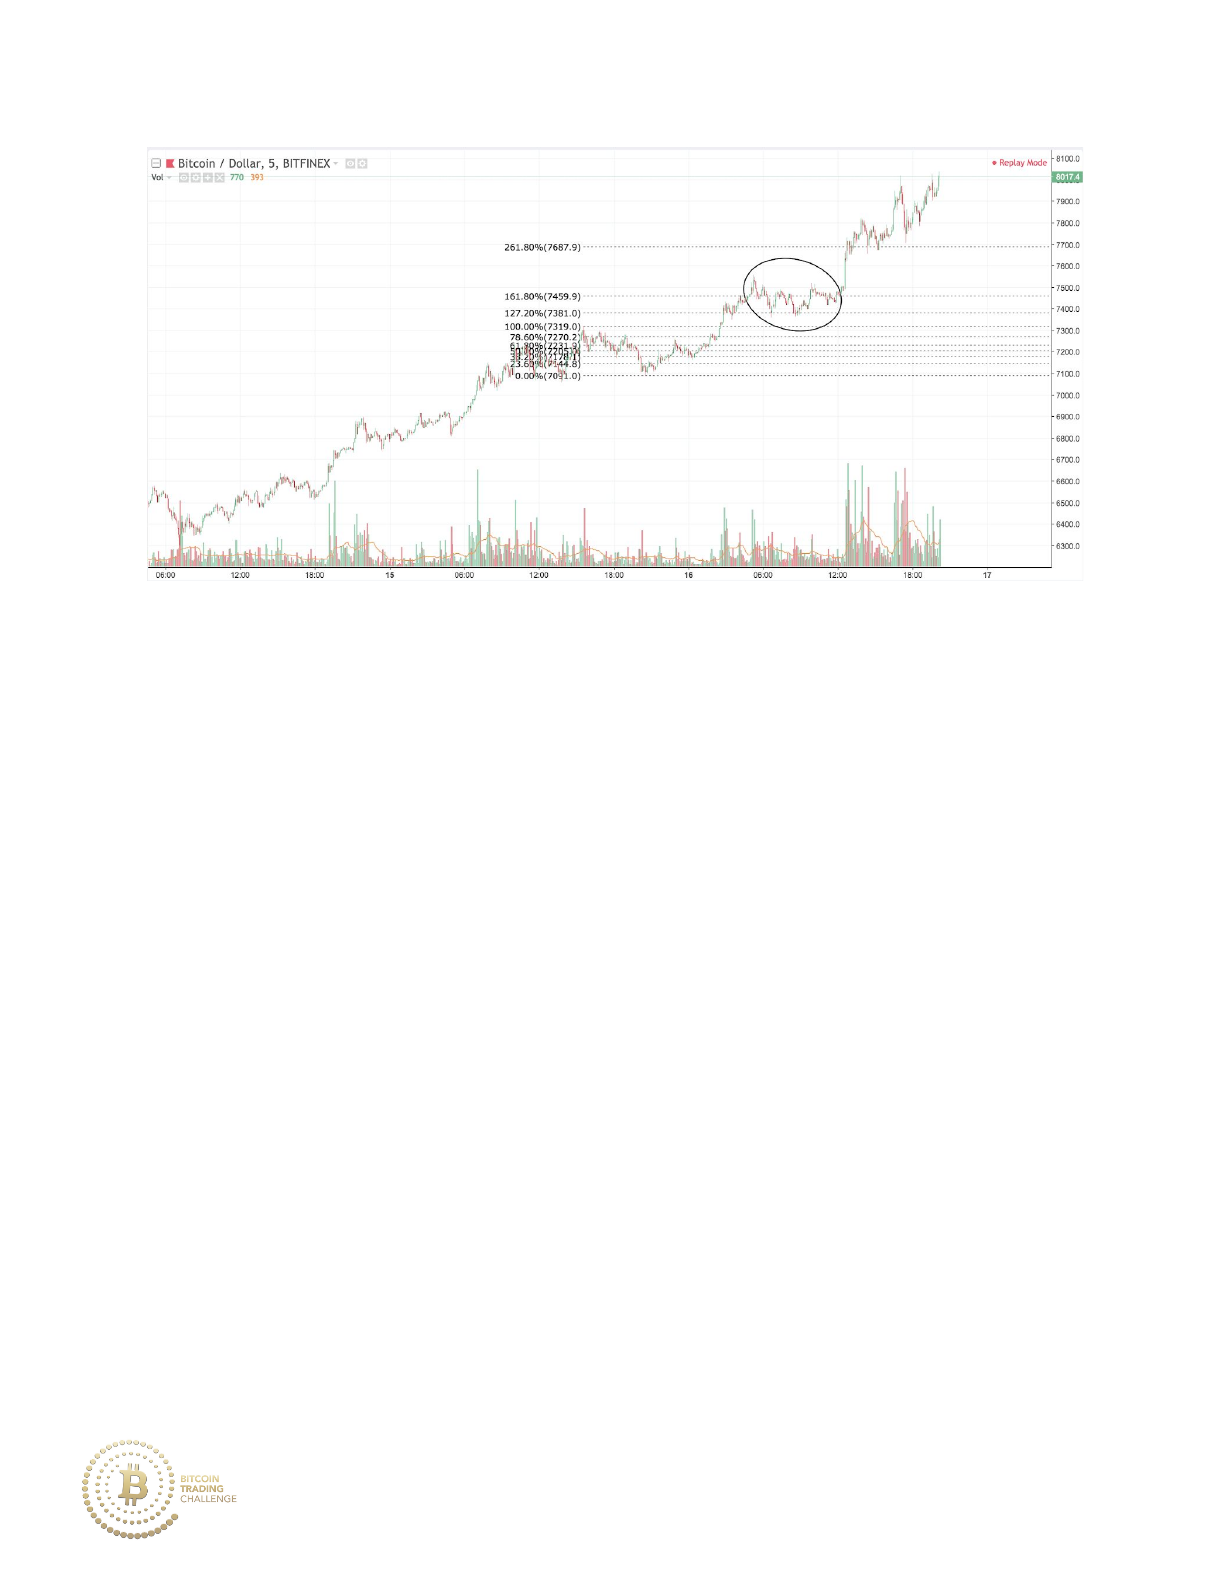
Price continues the uptrend.
II. Strong Retracing Momentum
Strong price momentum alongside above average volume hurtling towards
a major Fibonacci level will usually disrespect the Fibonacci level, as price
continues in that direction. Additionally, when price moves in a single wave
down to a major Fibonacci level (meaning no major retracements within the
original retracement, i.e. in a bearish retracement, little to no bullish
pullback), it is labeled as strong momentum.
Price moves downward to the 61.8% retracement level, disregards it, and
moves past current support. Attempting to buy into the market in this
situation would yield a negative result.
159
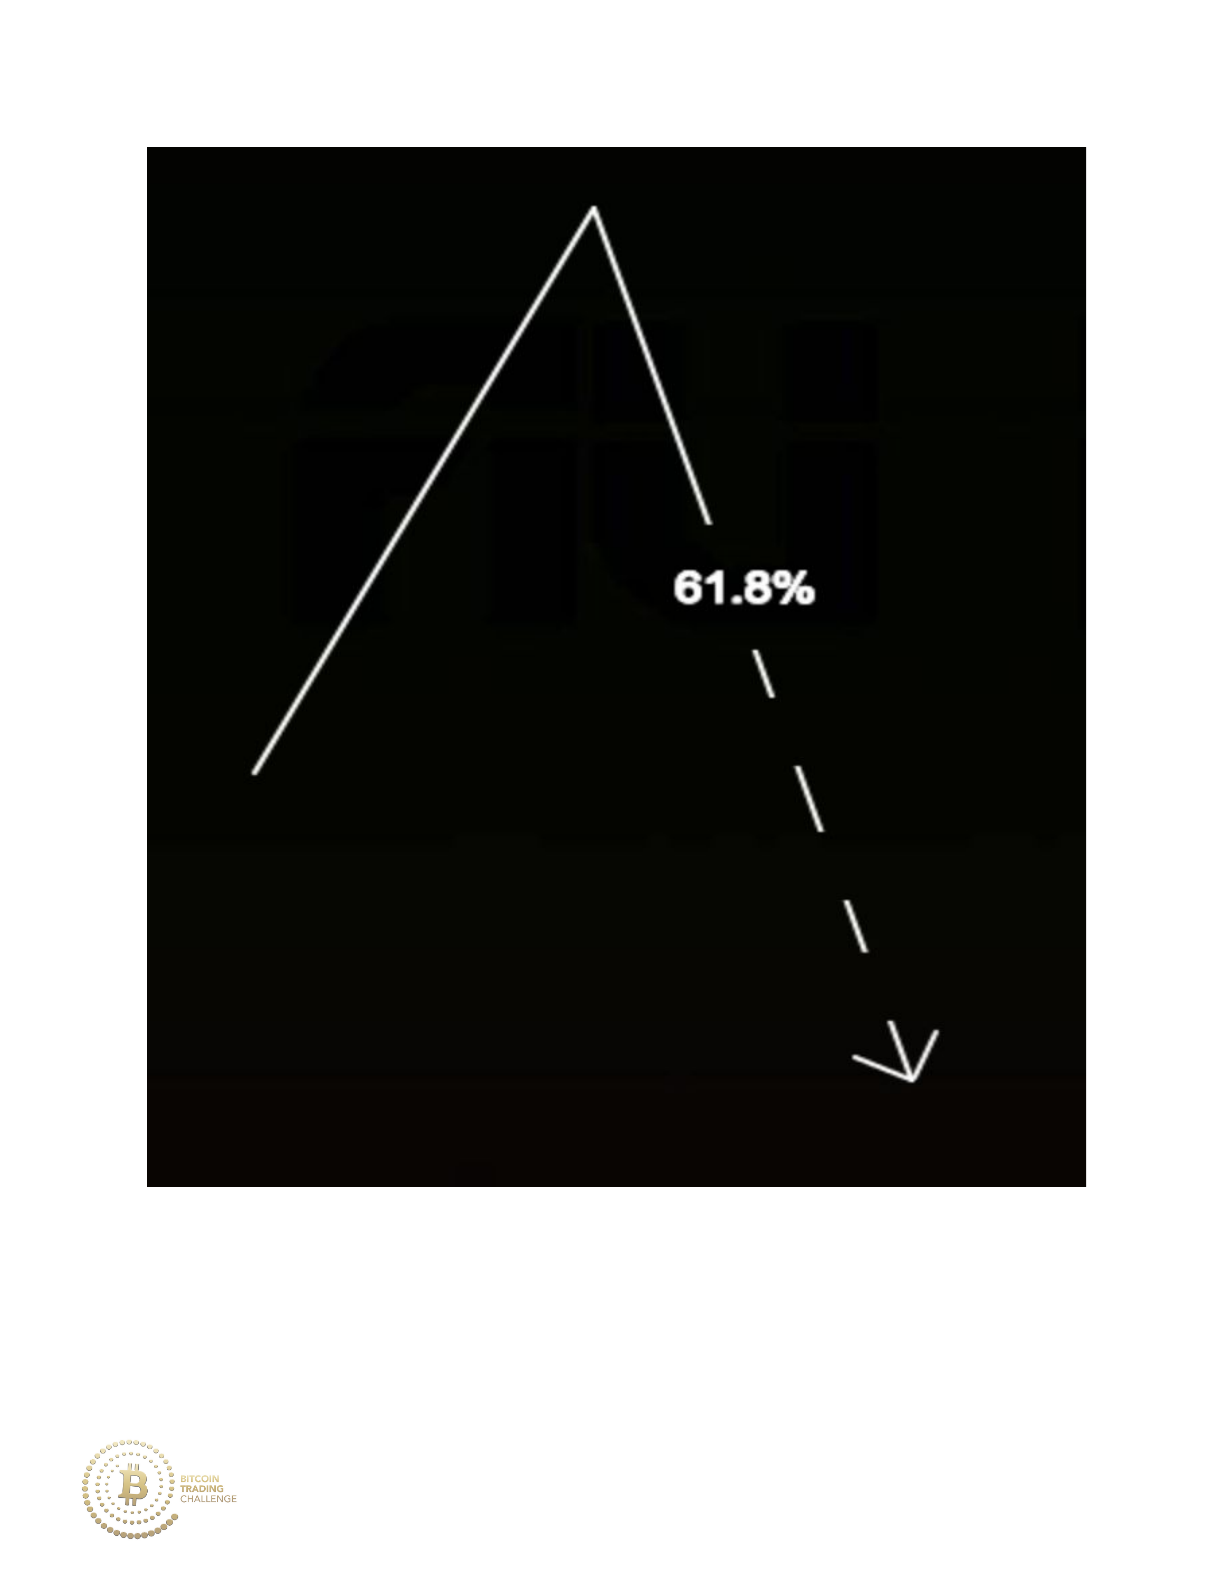
160
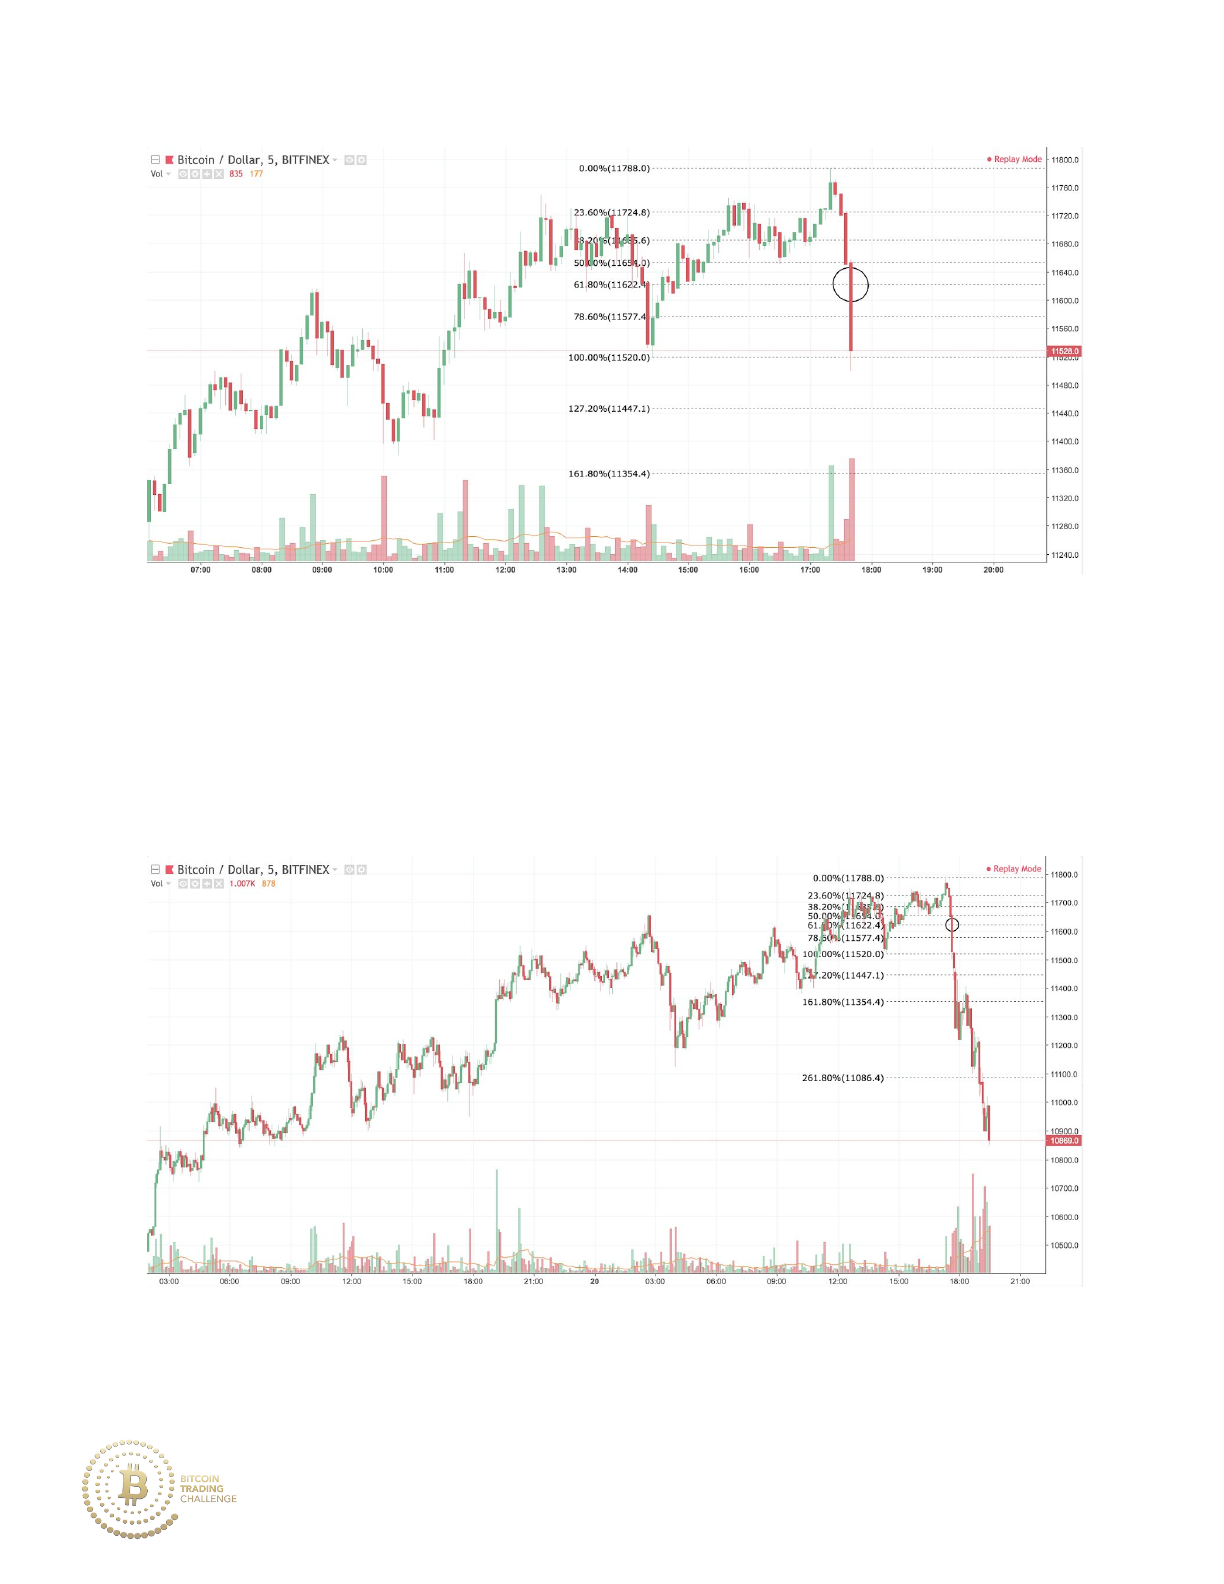
In the chart above, price moves on strong momentum and high volume to the
downside below the 61.8% retracement and breaks through support. Buying
into this would likely fail, and any currently held long position should be
exited.
Price continues the downtrend.
161
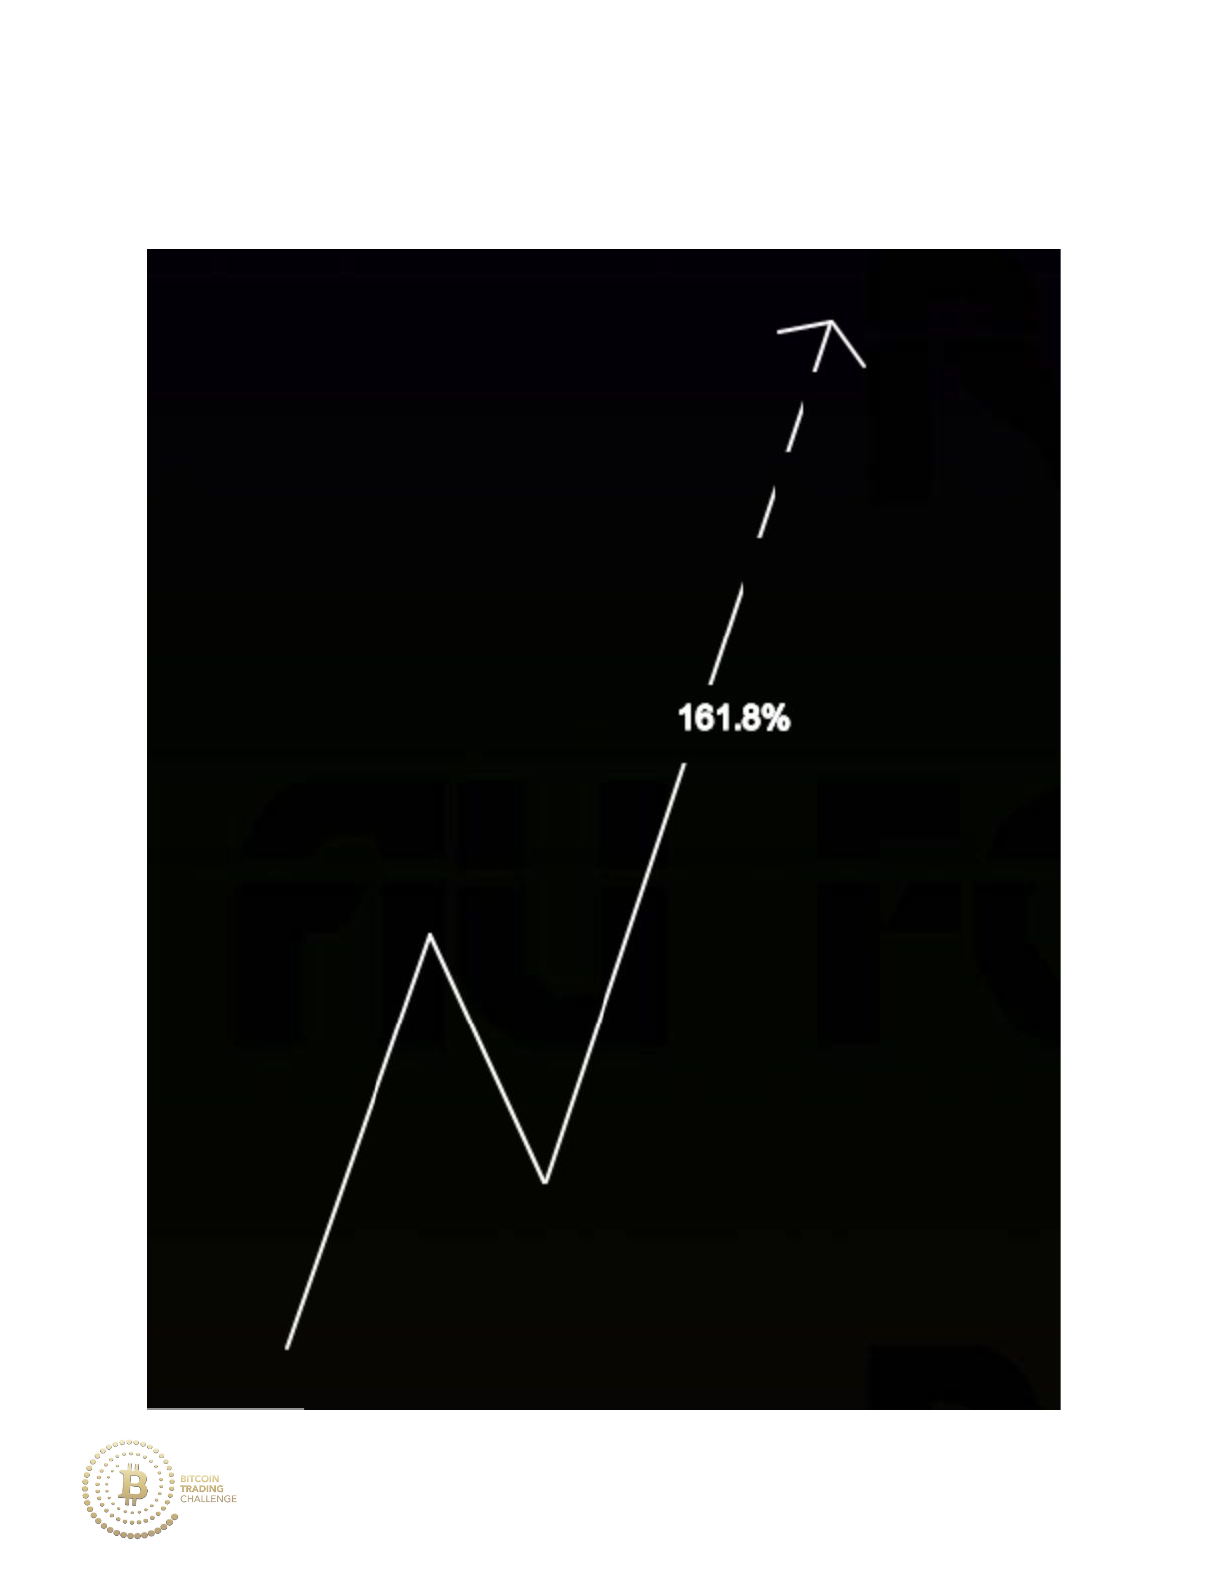
Price moves upward to the 161.8% extension of the previous retracement
on strong momentum and above average volume.
162
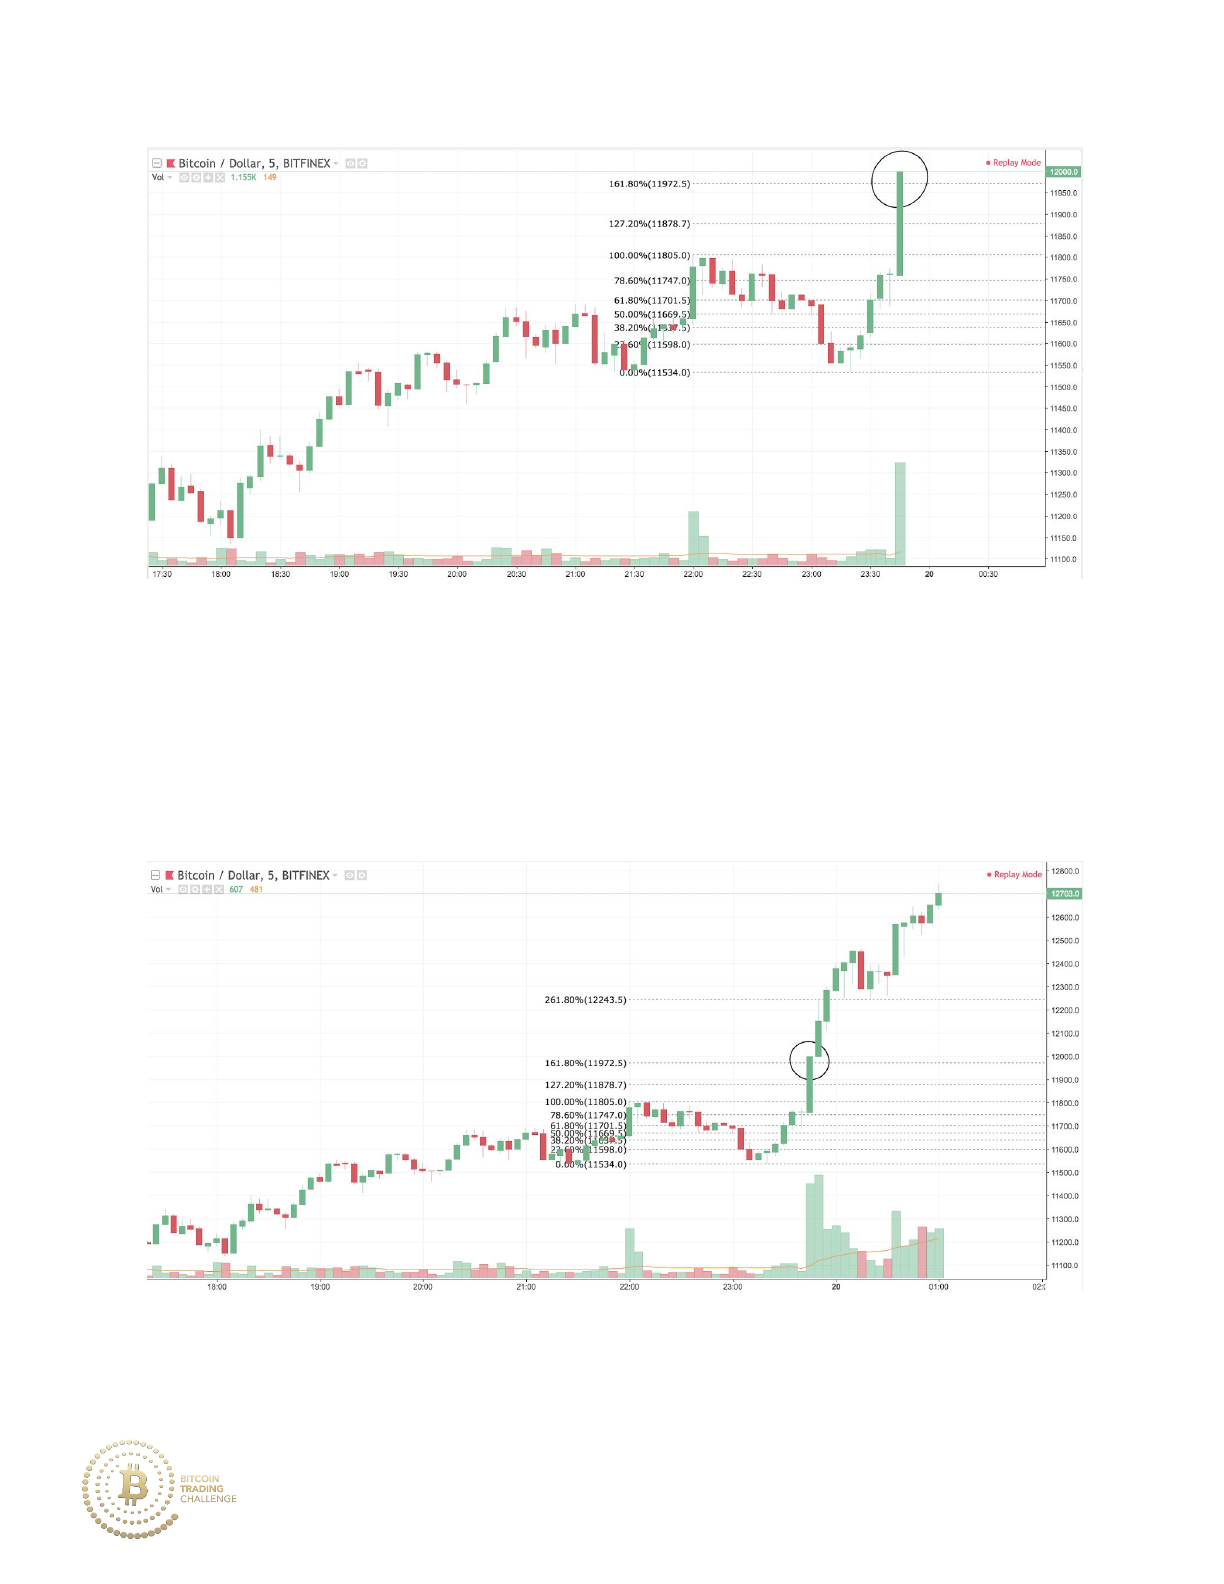
Price moves upward on high volume and strong momentum after
approaching the 161.8% Fibonacci extension. Selling here is likely not a good
idea. It would be better to wait for a bearish confirmation or to just hold your
long trade.
163

III. Consecutive Lows
When price makes a new low, it is usually said to be in a bearish state and
will likely continue to move lower. When price moves into a major Fibonacci
level and then proceeds to create consecutive lows (at least three), that
level will likely be disrespected and price will likely not reverse to the
upside. Again, the inverse is true for a bearish retracement with the
creation of new highs or in a bullish 161.8% extension.
164
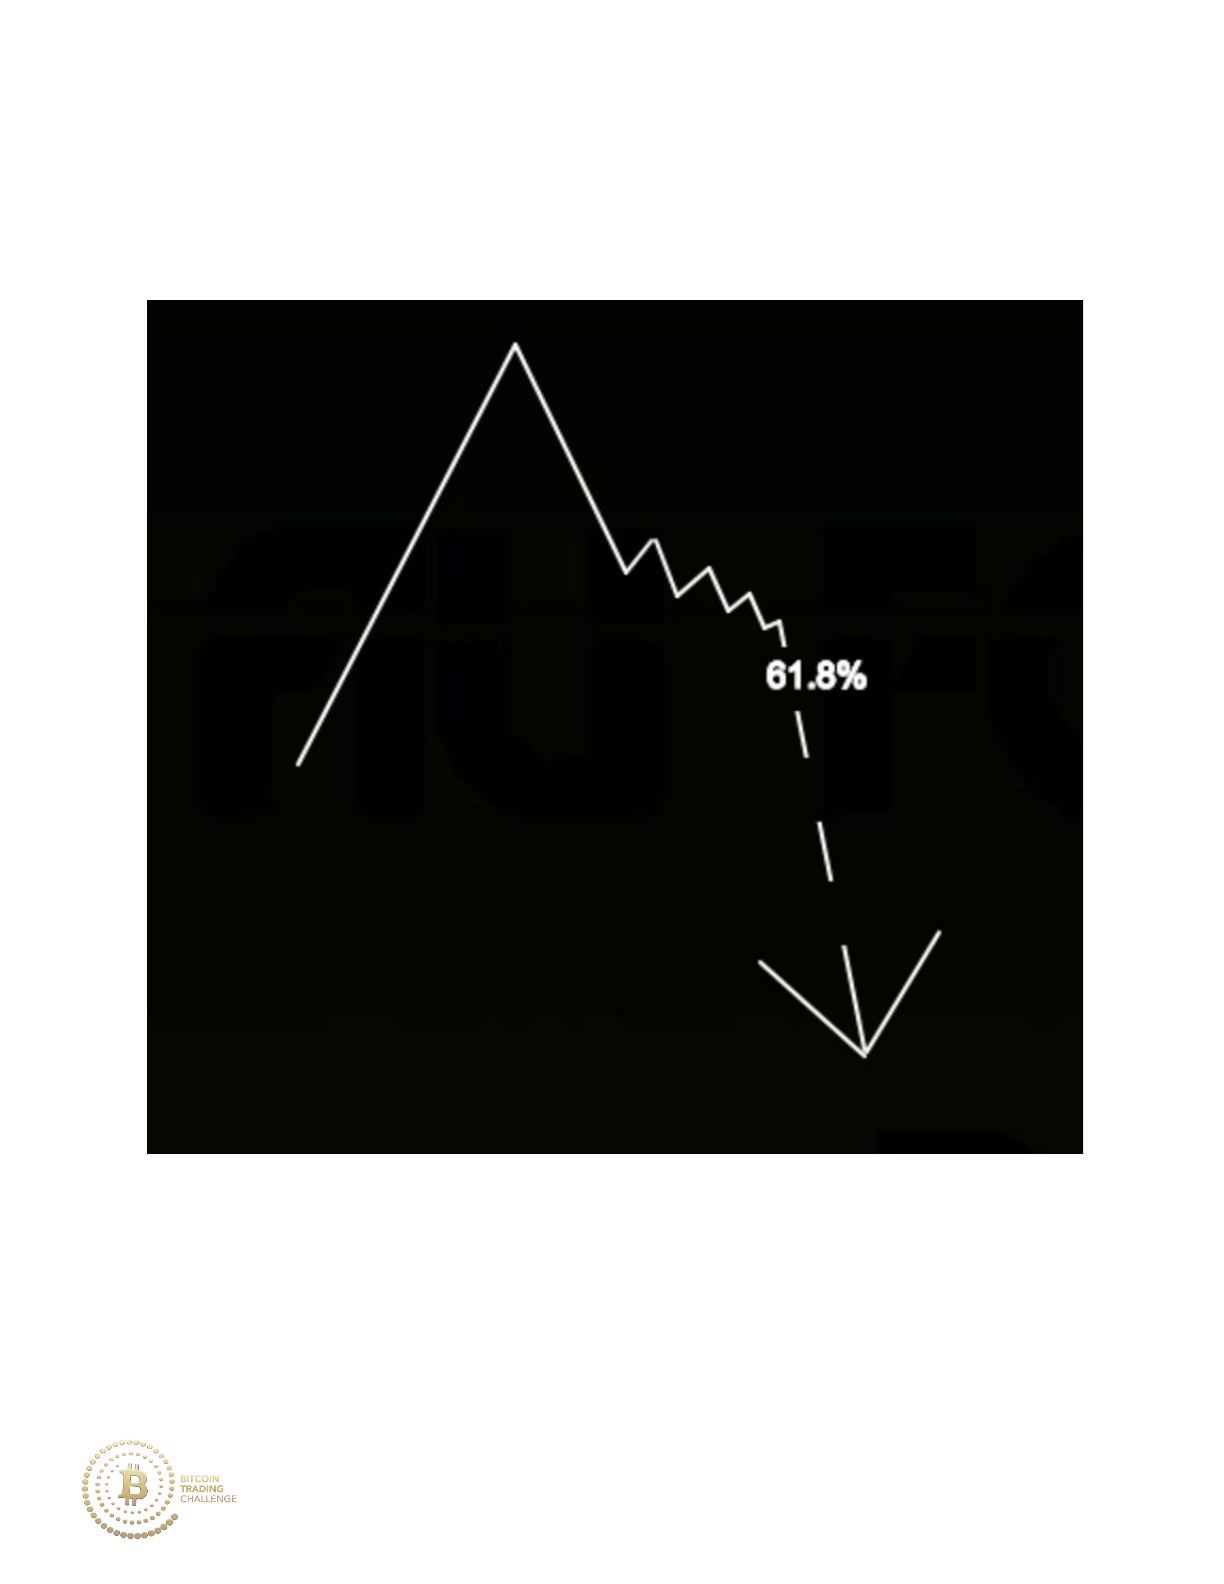
Price makes a retracement down to the 61.8%. Then, sellers repeatedly test
the lower limits of the Fibonacci level, thus creating new lows. After
multiple lows have been created, price moves downward violently.
165
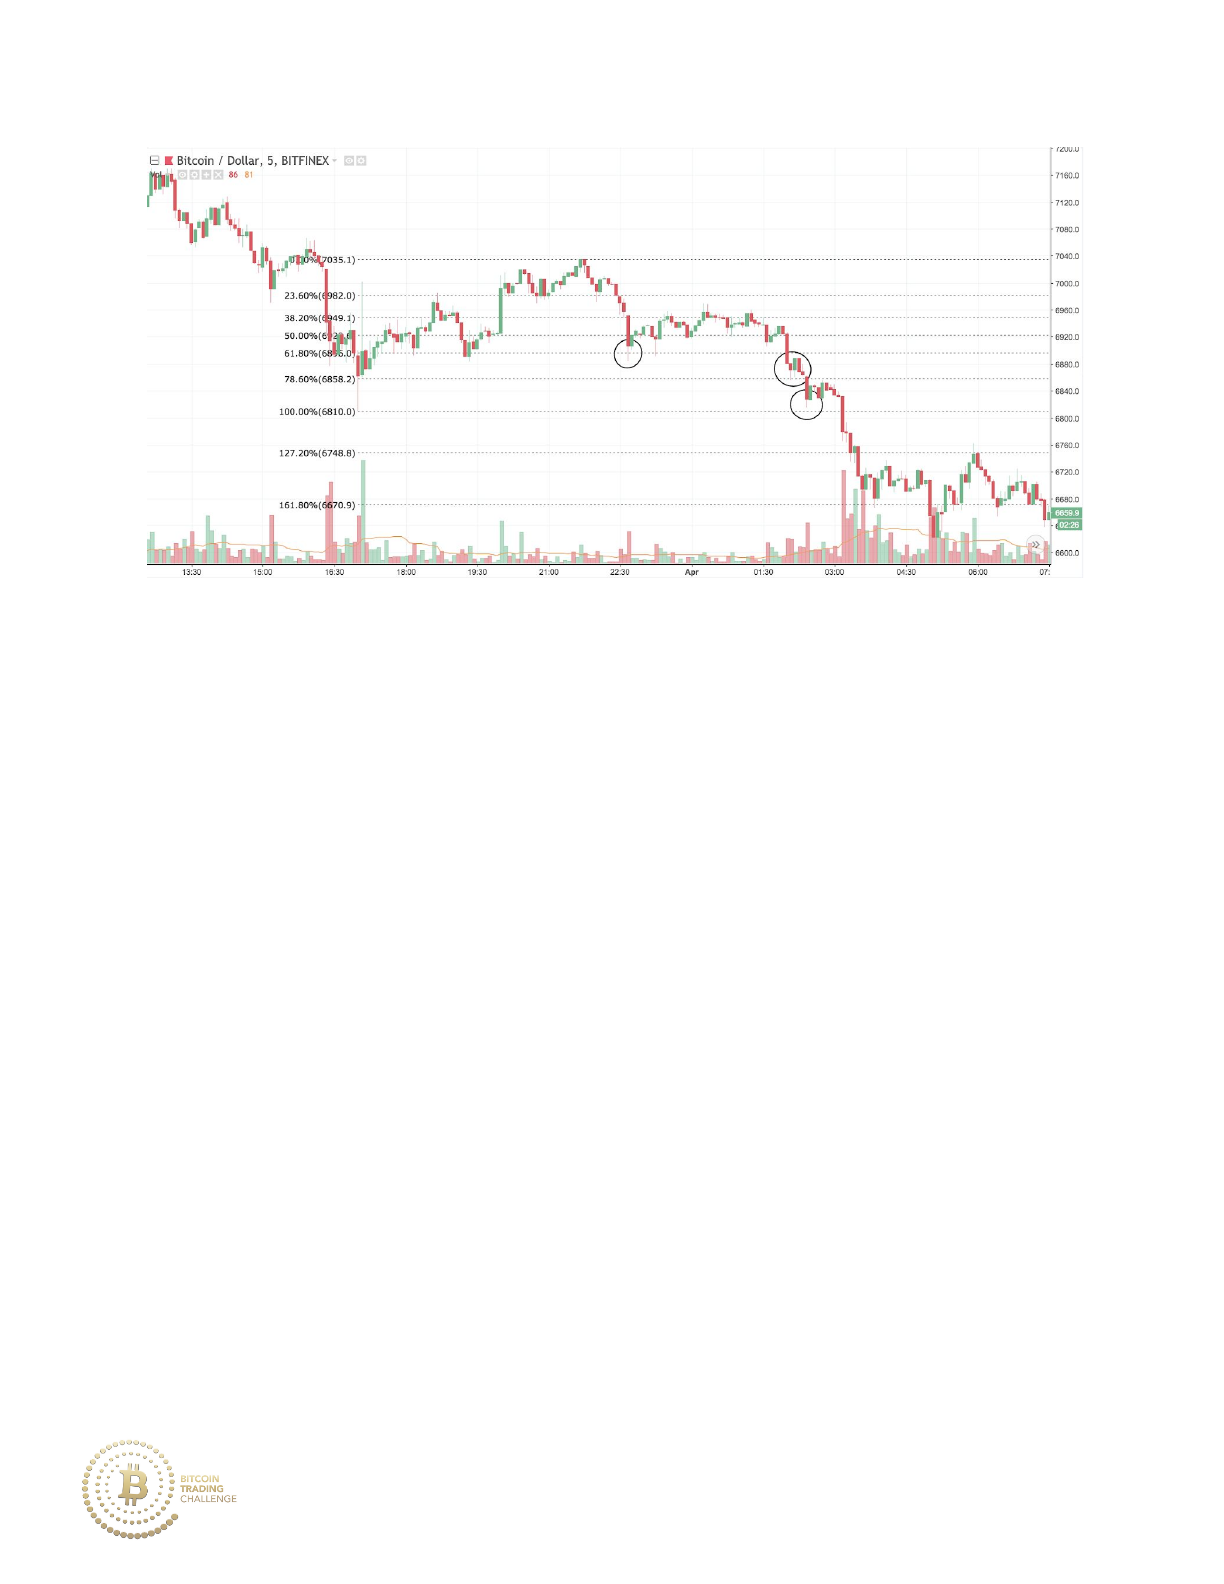
Here price makes the initial low at the 61.8% retracement. After a weak
bullish move upward, price continues to make new lows before it breaks
below support.
166
Price continues the uptrend and finds weak resistance at the 161.8%. As a
result, the buyers push price up higher.
167
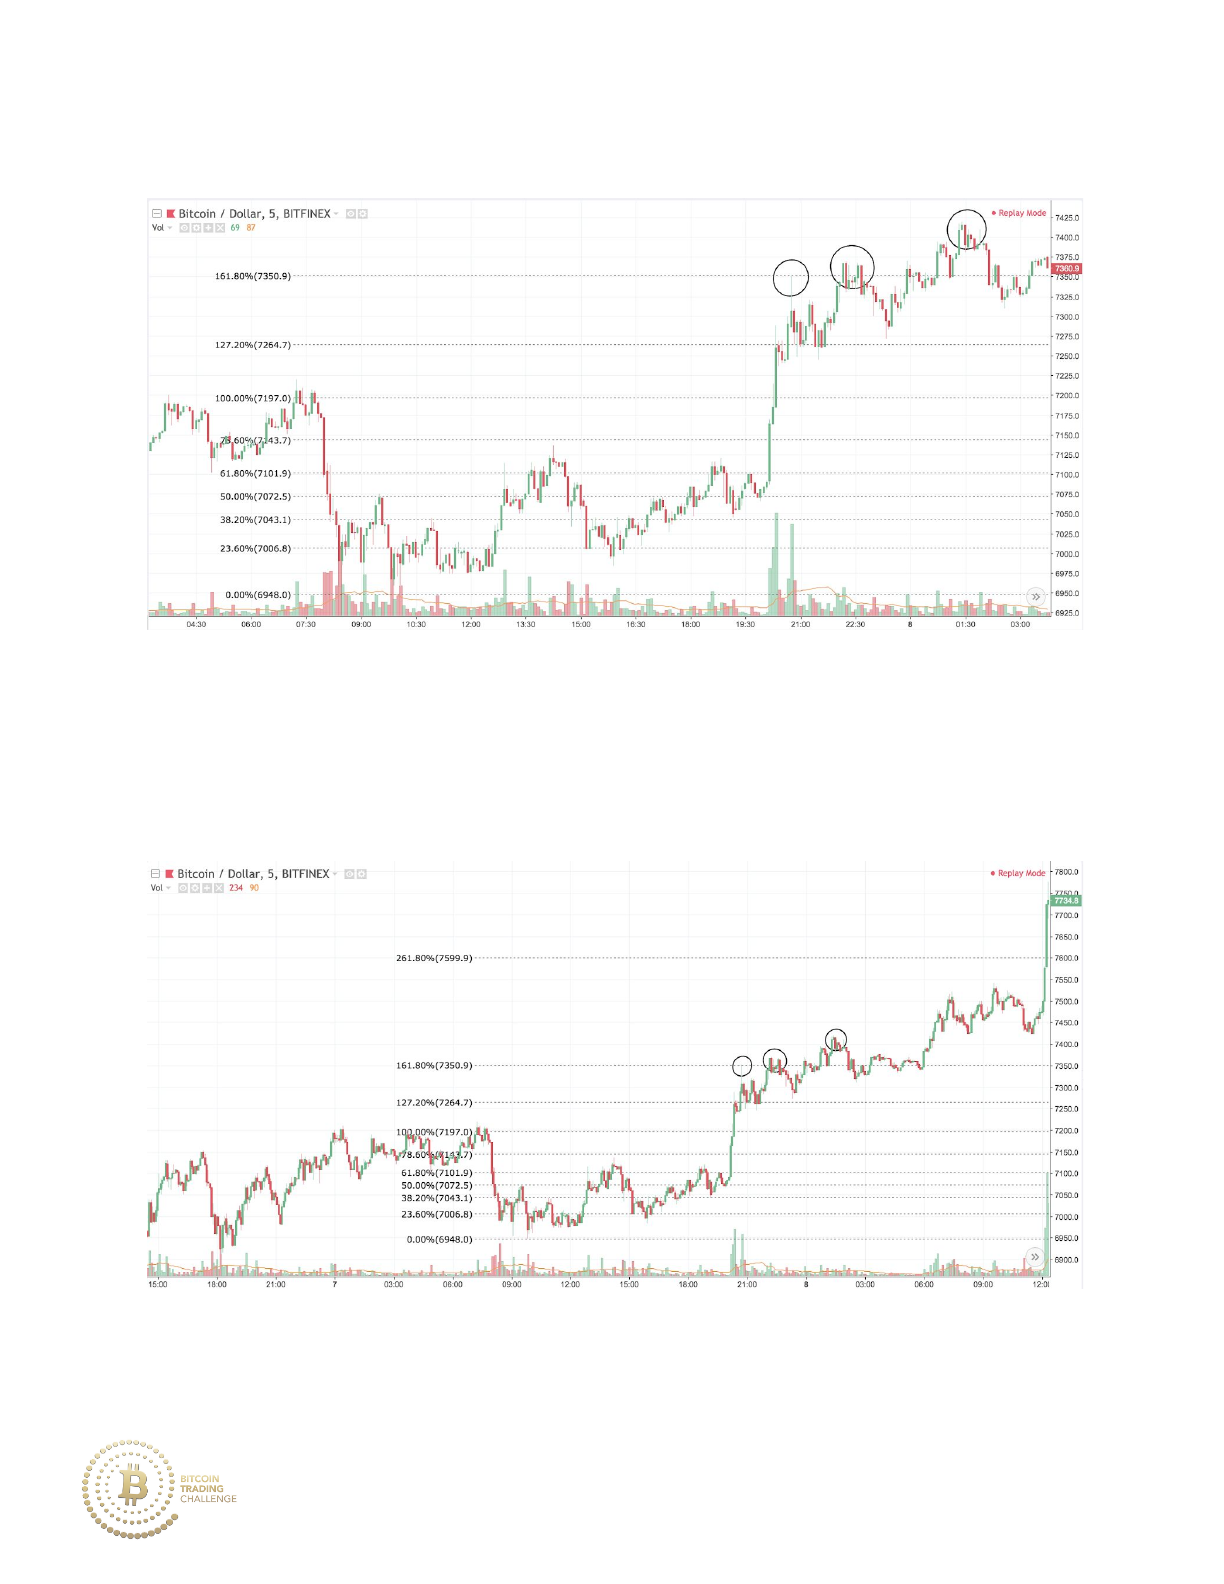
Here, price makes multiple highs after testing the 161.8% Fibonacci
extension drawn off of a bearish retracement. Bullishness is likely to
continue, so holding onto a long position is advised.
Bullishness ensues.
168
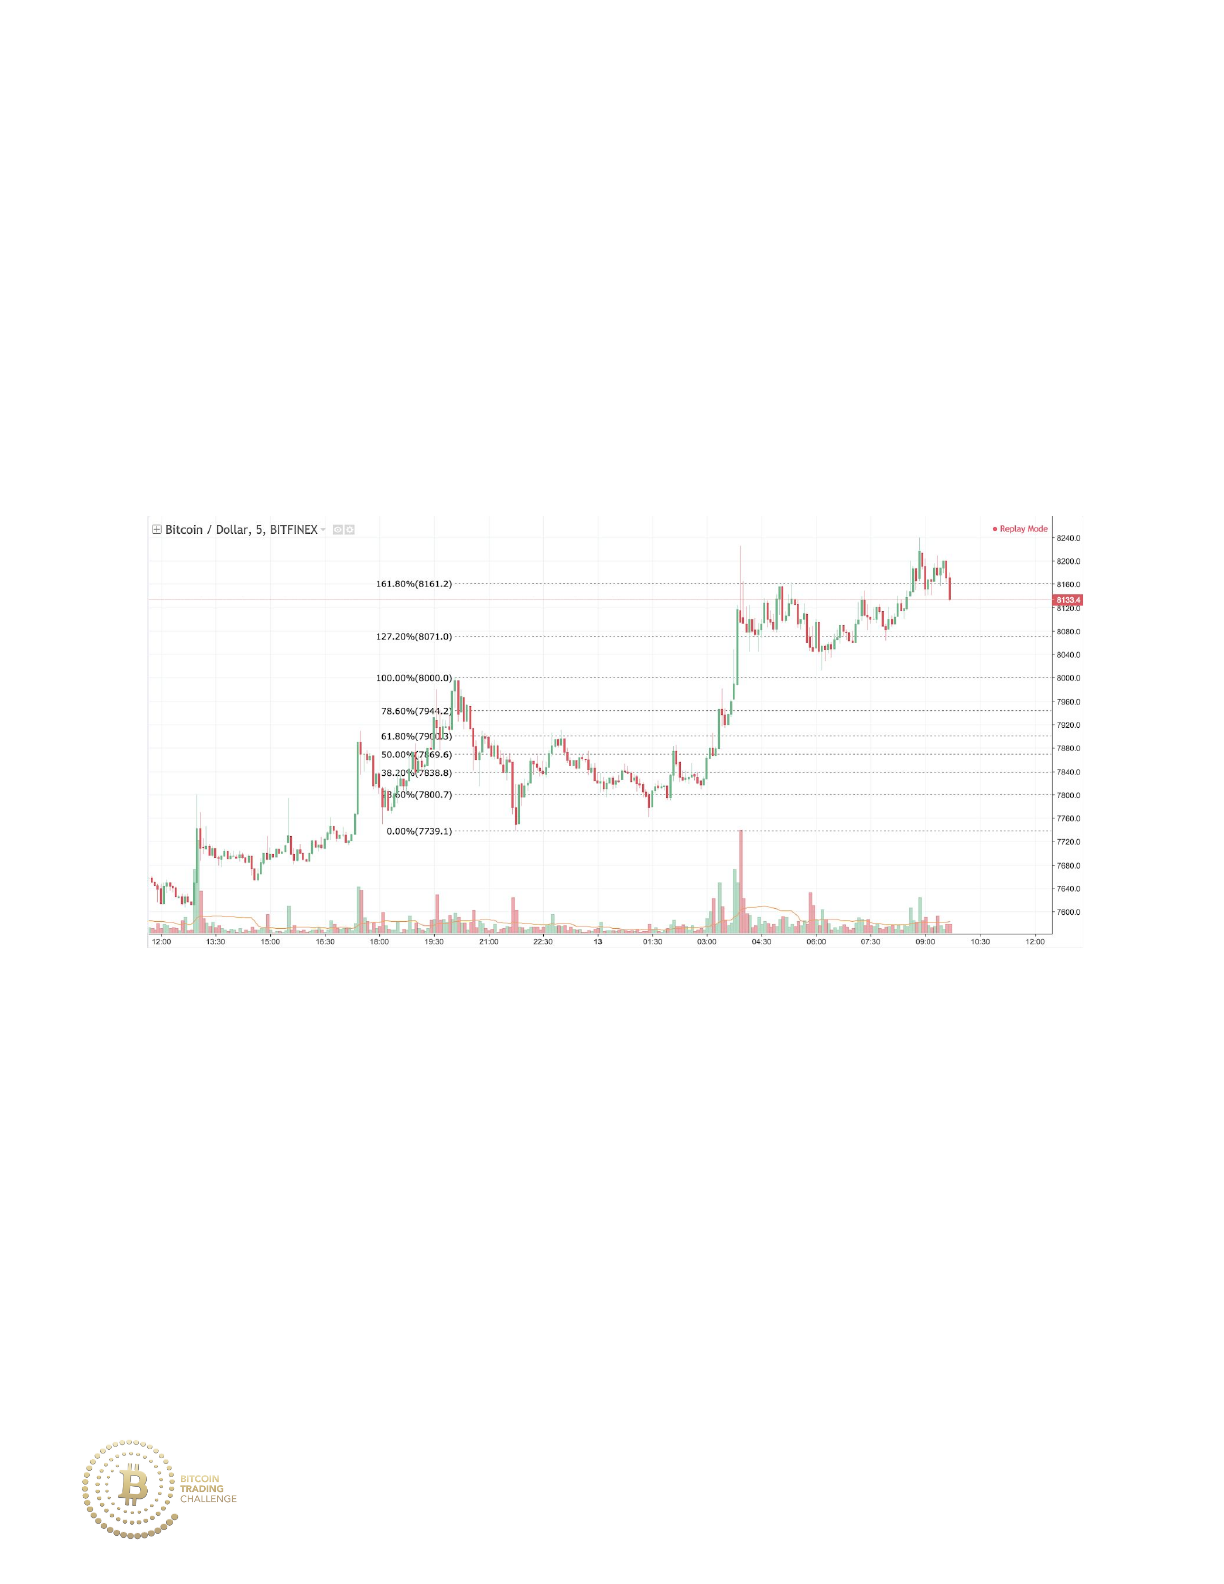
C. Practice
Identify the Fibonacci market structure and decide whether to buy, sell or
avoid the trade.
Practice 6-1
169
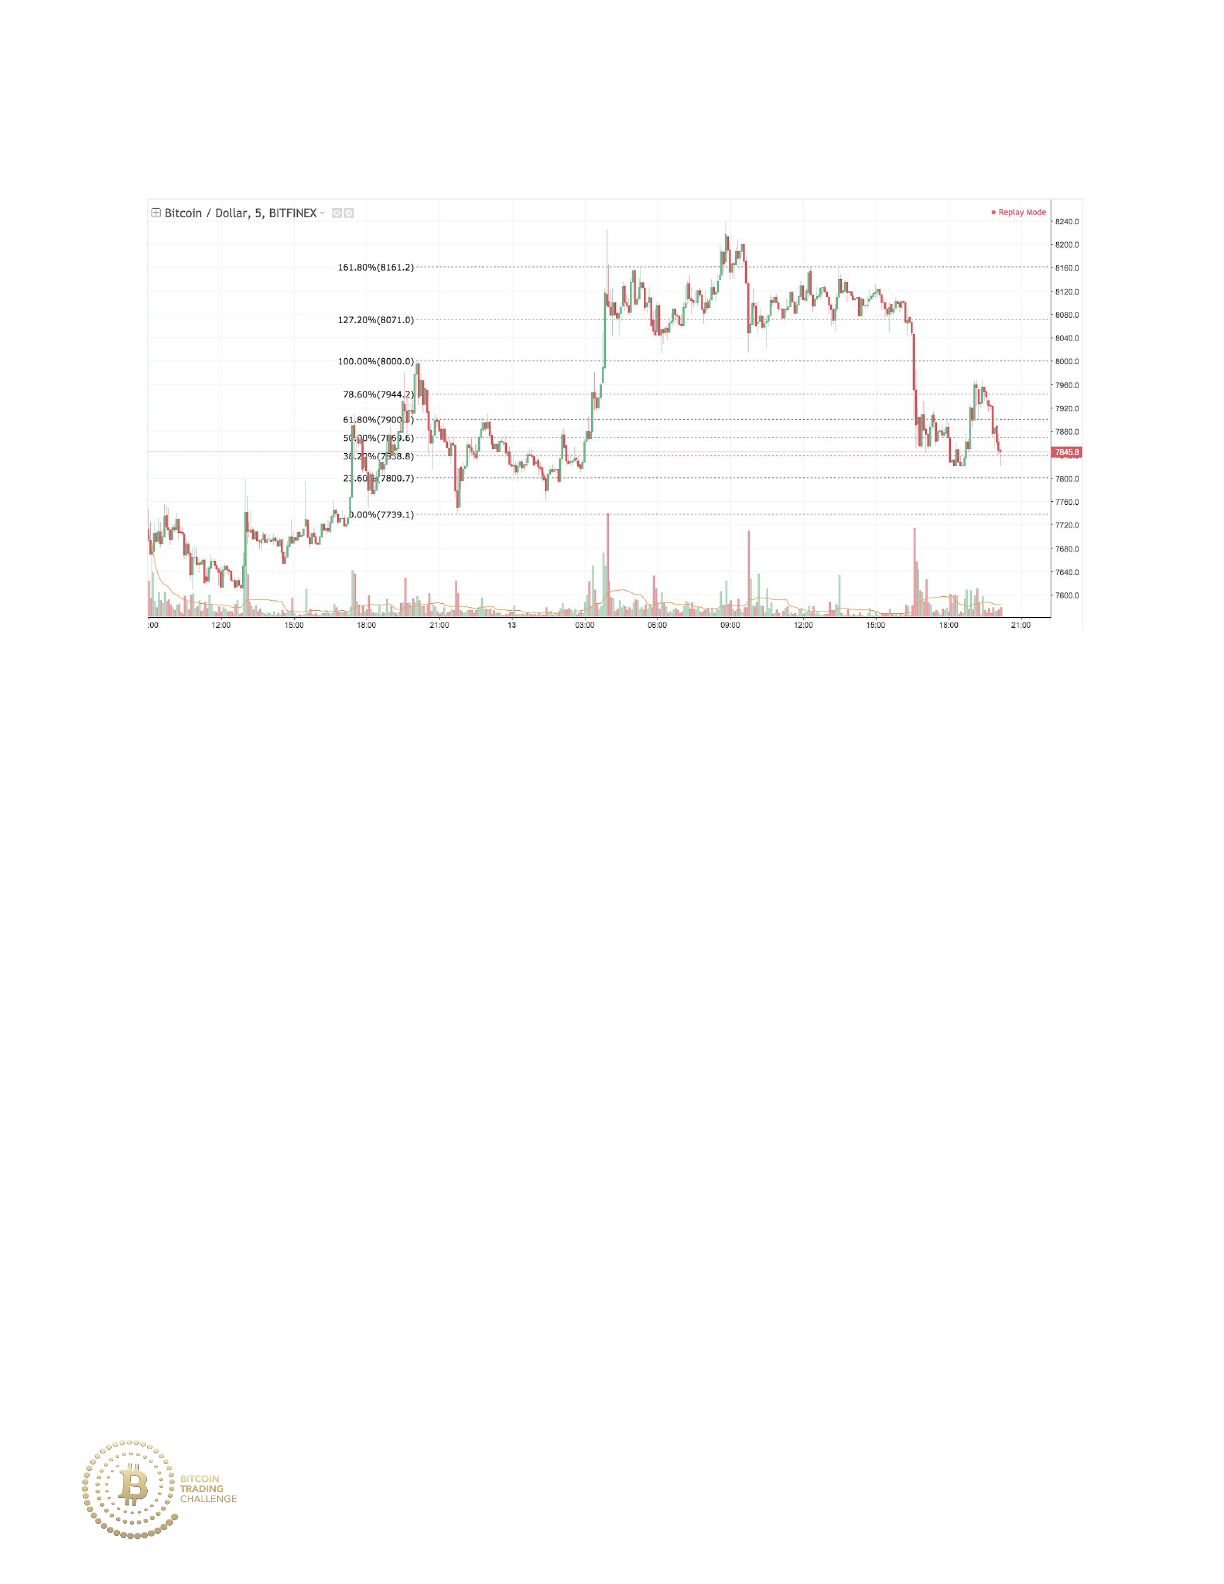
Practice 6-1 Answer
Stop loss hunt (as the shorts are squeezed, having their stop losses hit and
retail buys the new high). One may mislabel this pattern as consecutive
highs, but only two highs are made with a failure to reach a third.
Additionally, price has a strong bearish reaction after establishing the initial
high at the 161.8% with a wild tail and a volume spike. You should sell the
161.8%.
170
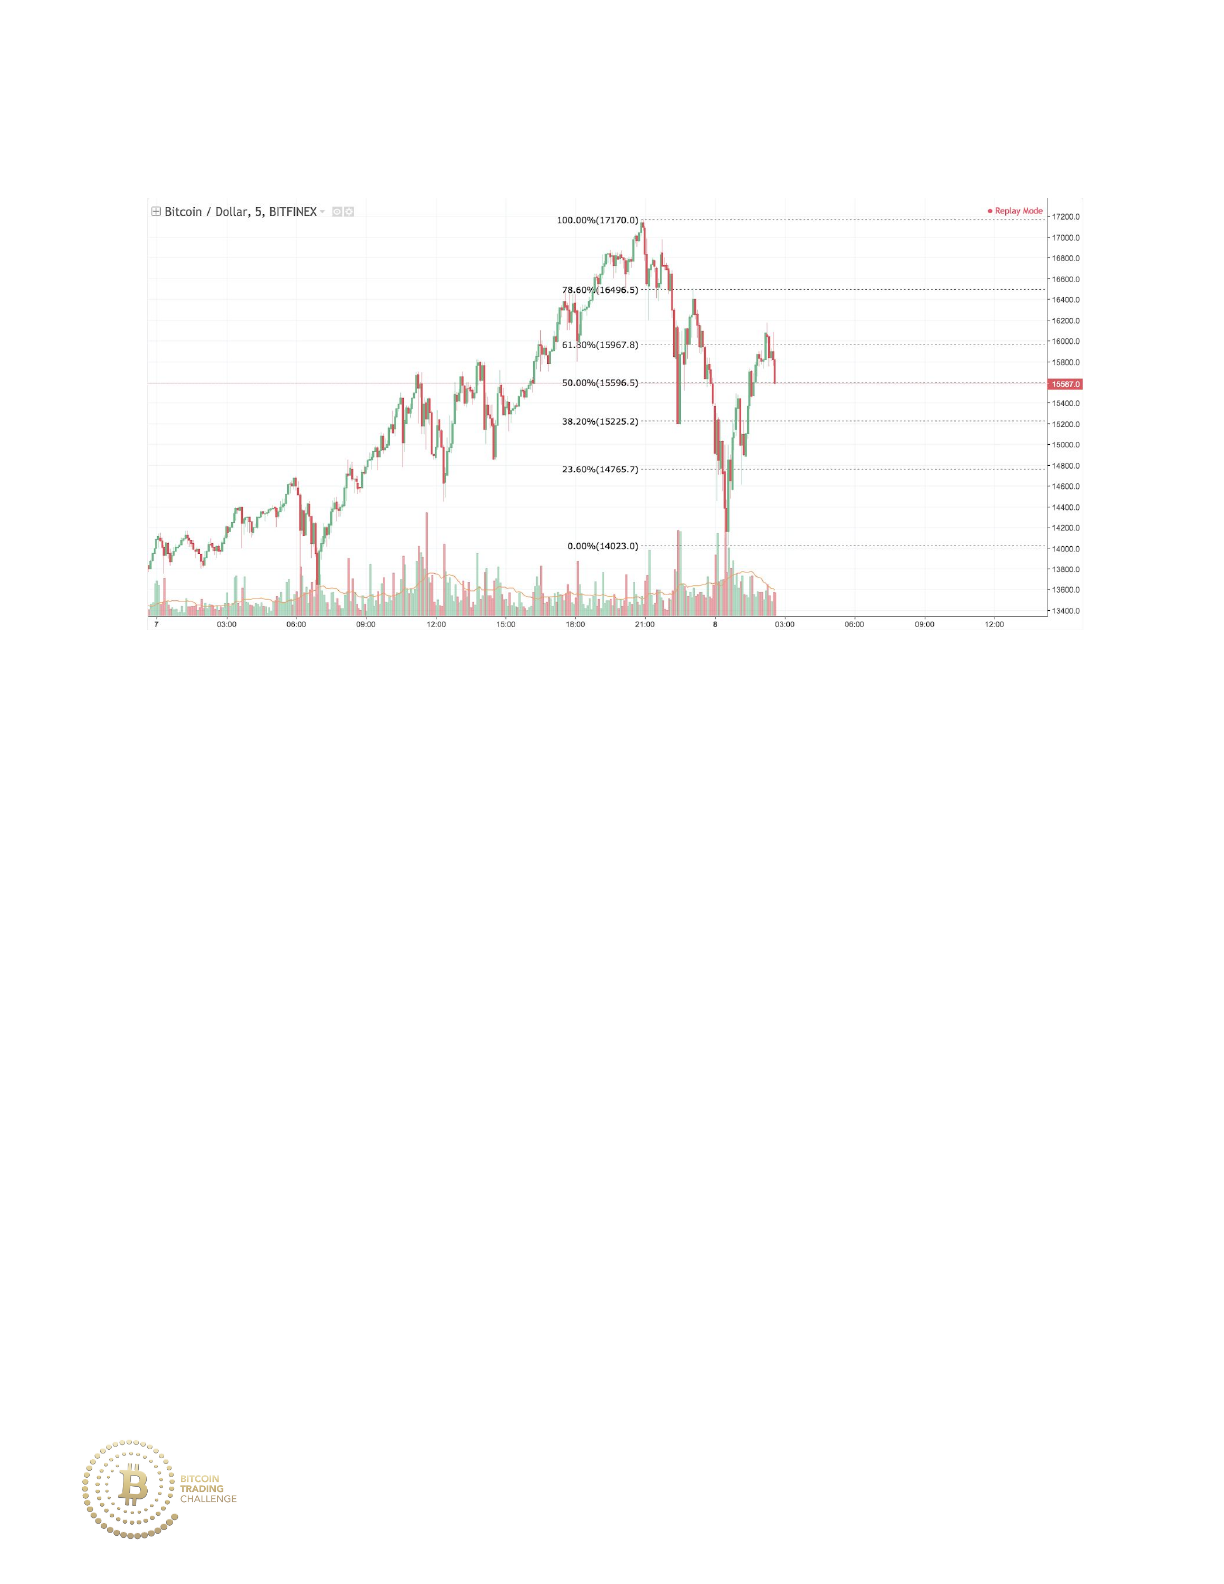
Practice 6-2
171
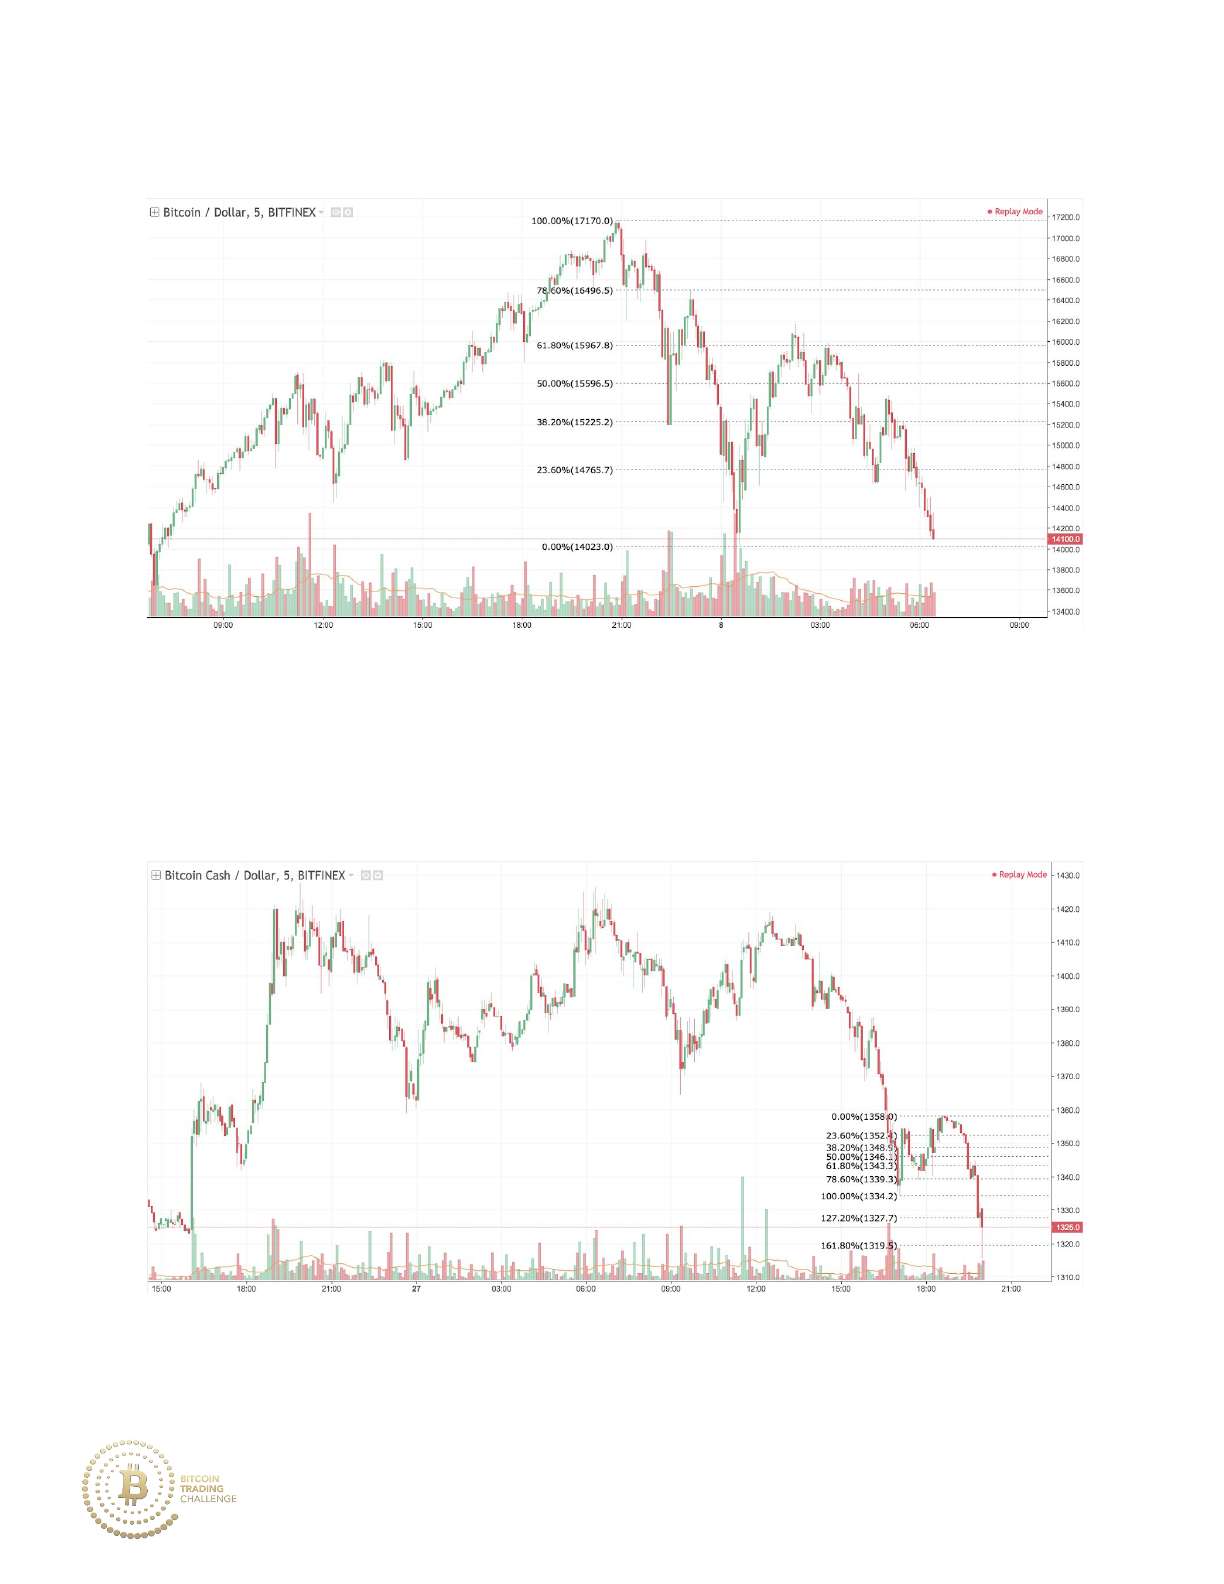
Practice 6-2 Answer
V-Shaped Reversal: price reacts in an immediate bearish manner after price
hits the high around the 61.8% retracement. You should sell the 61.8%.
Practice 6-3
Practice 6-3 Answer
172
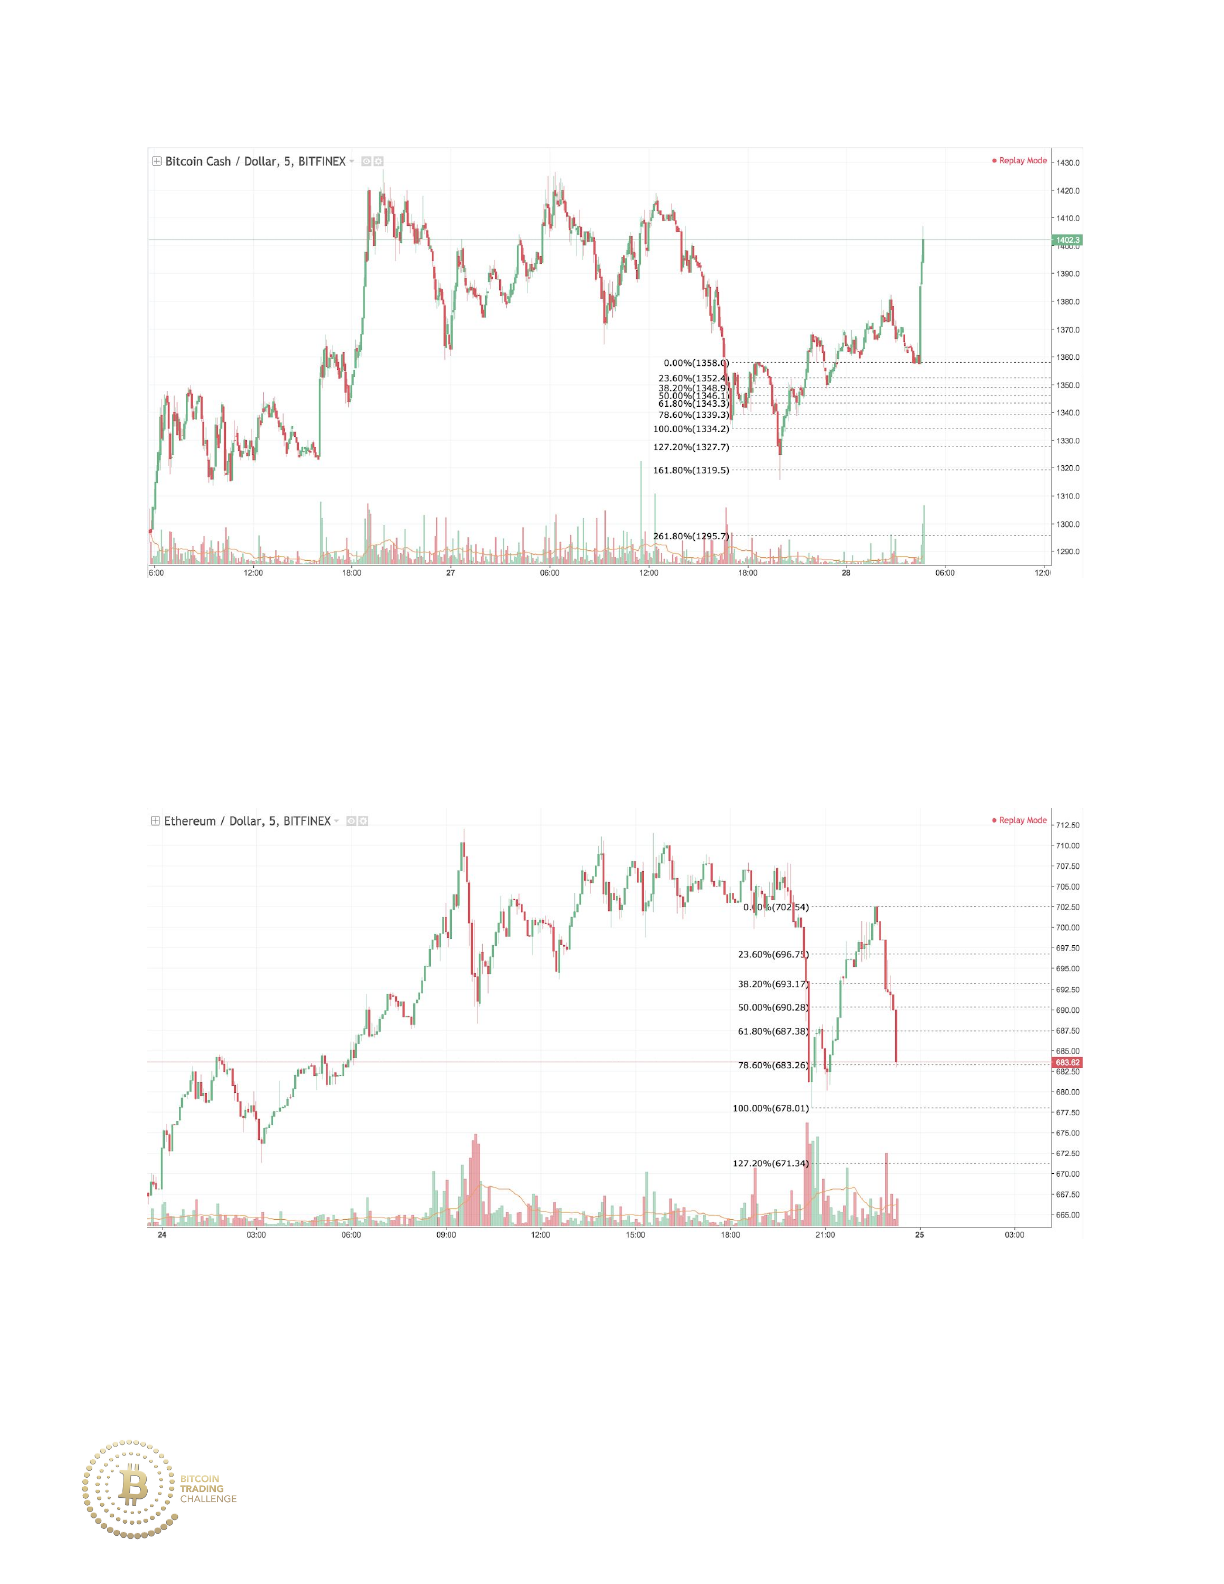
Wild Tail: price makes a low tail down to the 161.8% extension of the
previous retracement within the downtrend. You should buy the 161.8%.
Practice 6-4
173
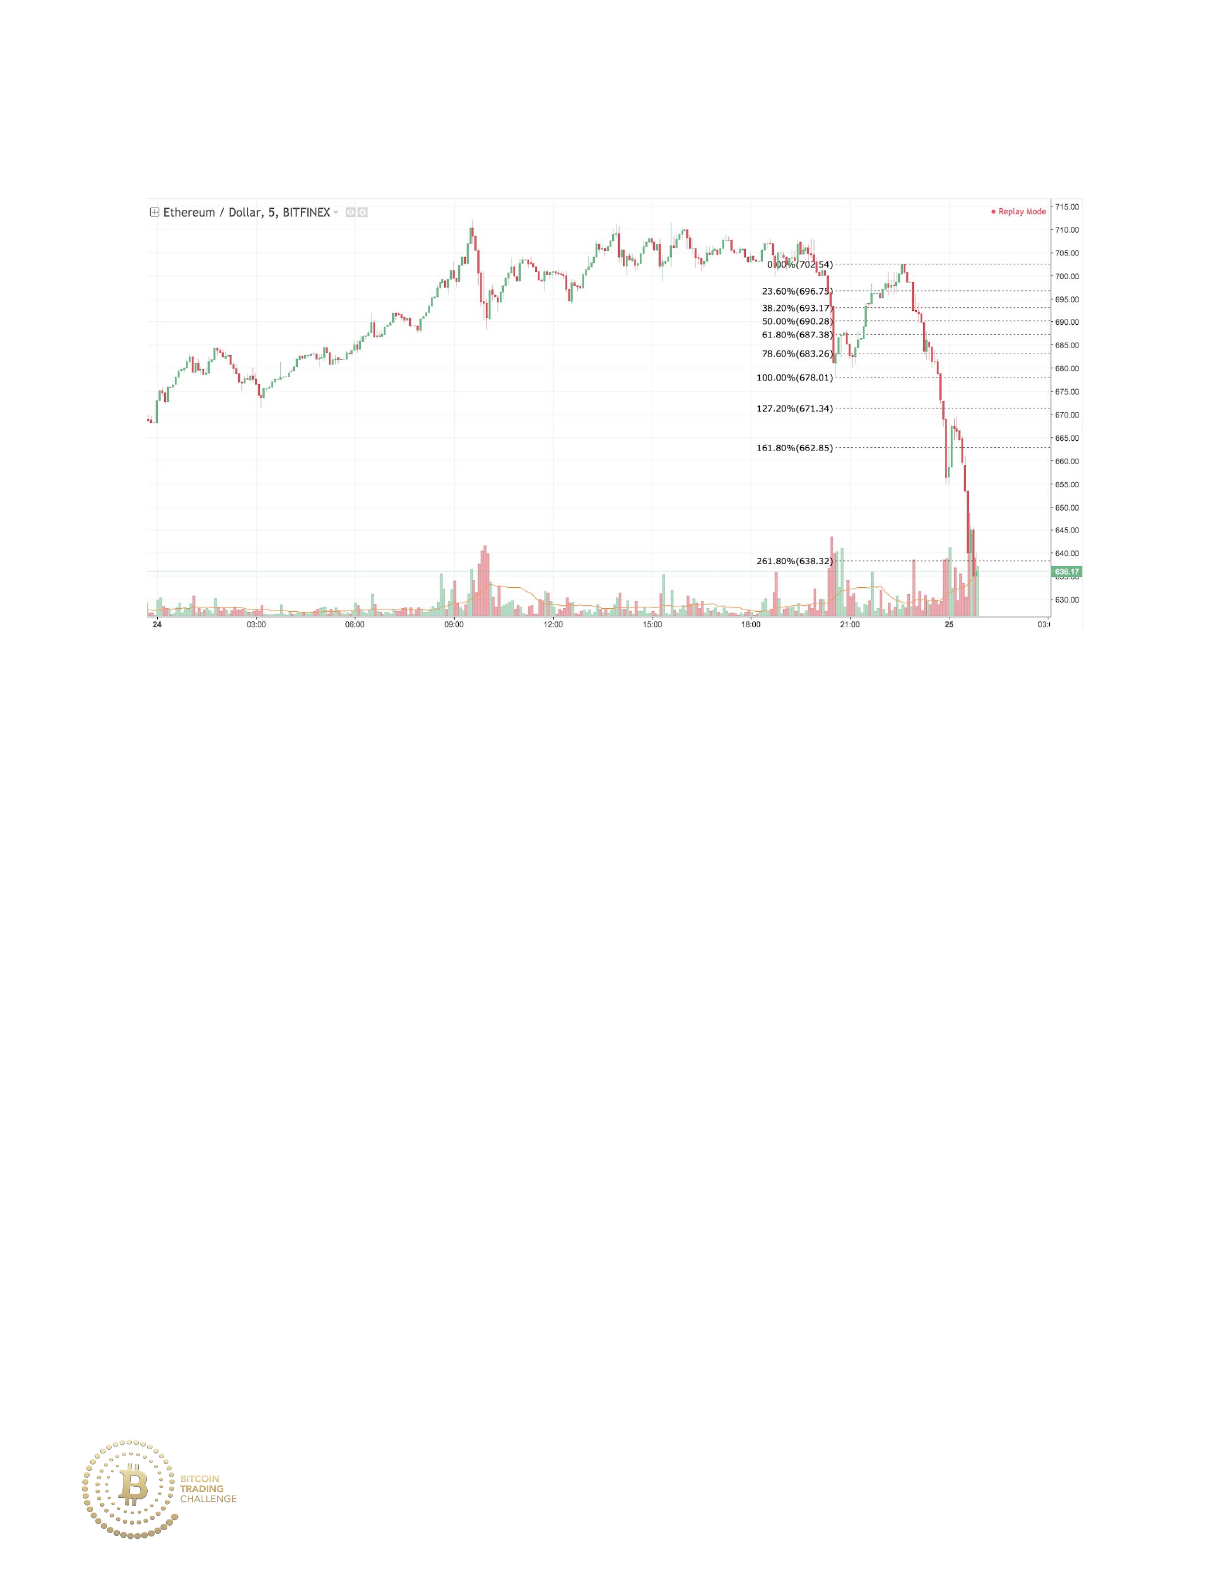
Practice 6-4 Answer
Strong momentum retracement: there is strong momentum and above
average volume as price moves down toward the 61.8%. This is
characteristic of a bearish reversal, not a retracement with a subsequent
move to the upside. You should avoid the trade or sell off on a retracement.
Price finds eventual major support at the 261.8% extension at 638.22.
174
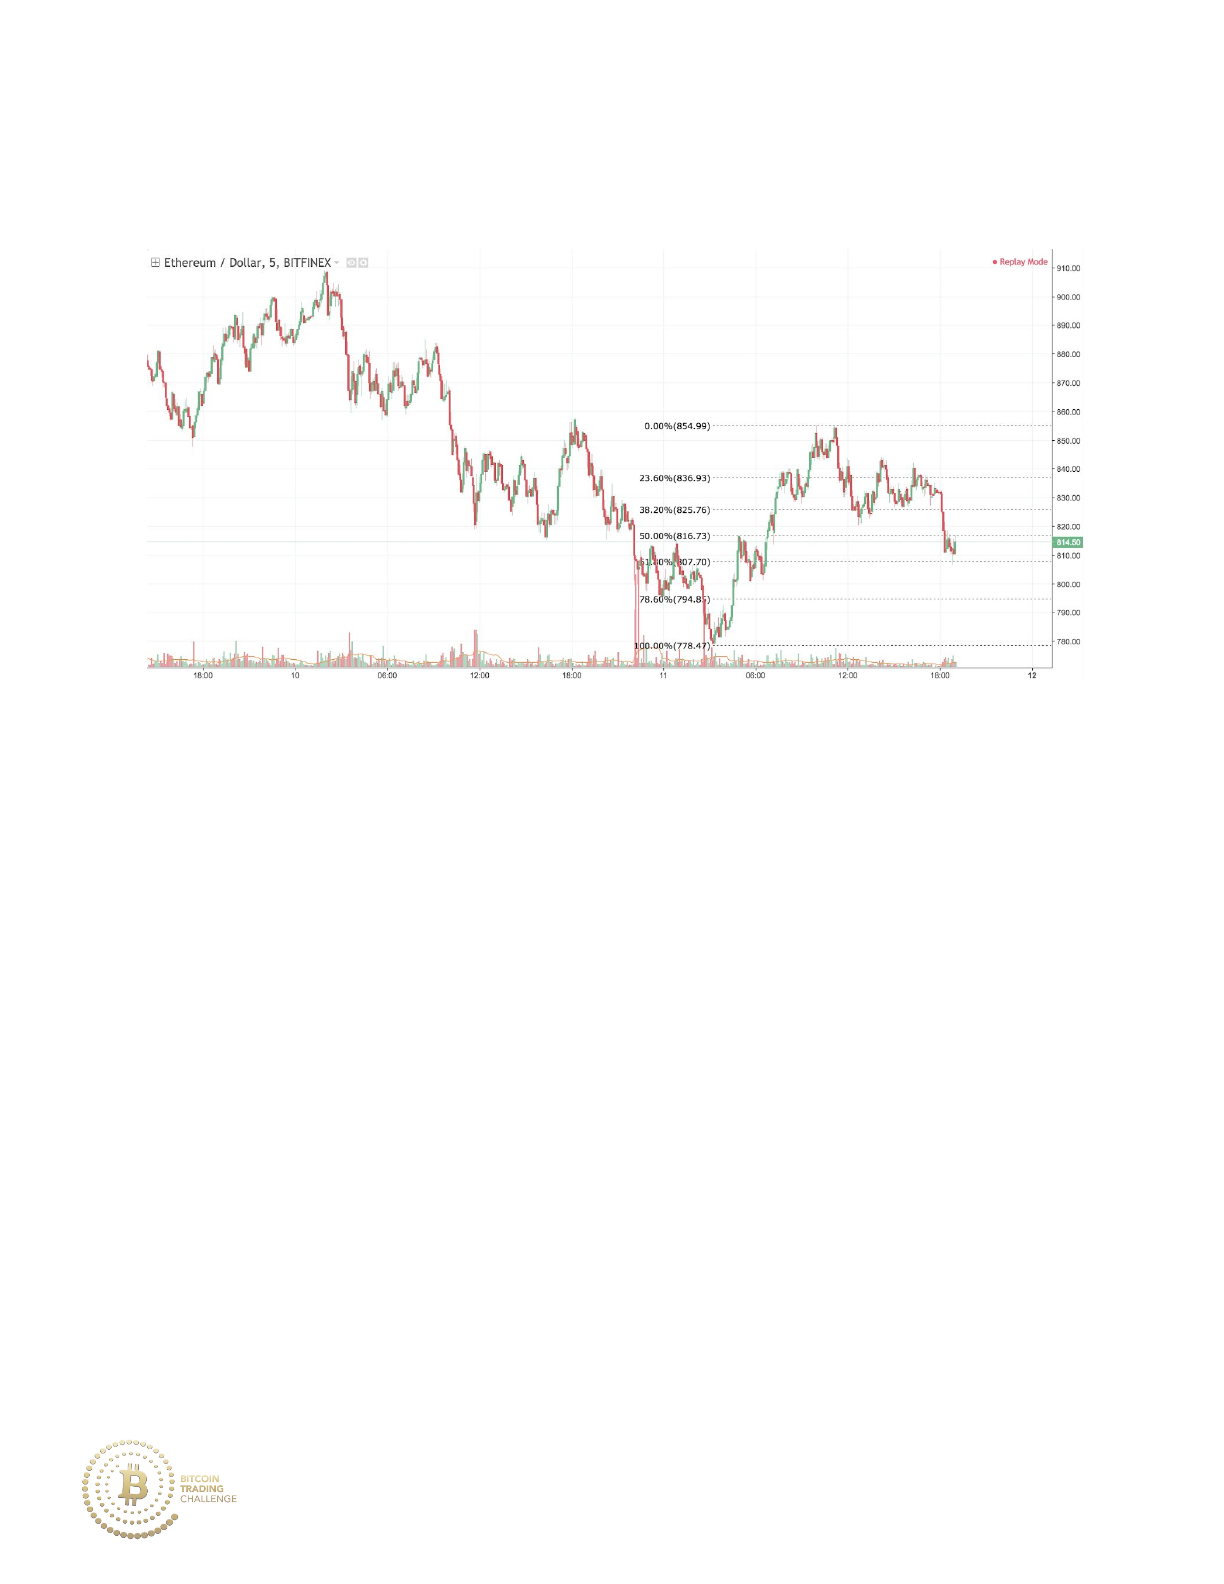
Practice 6-5
175
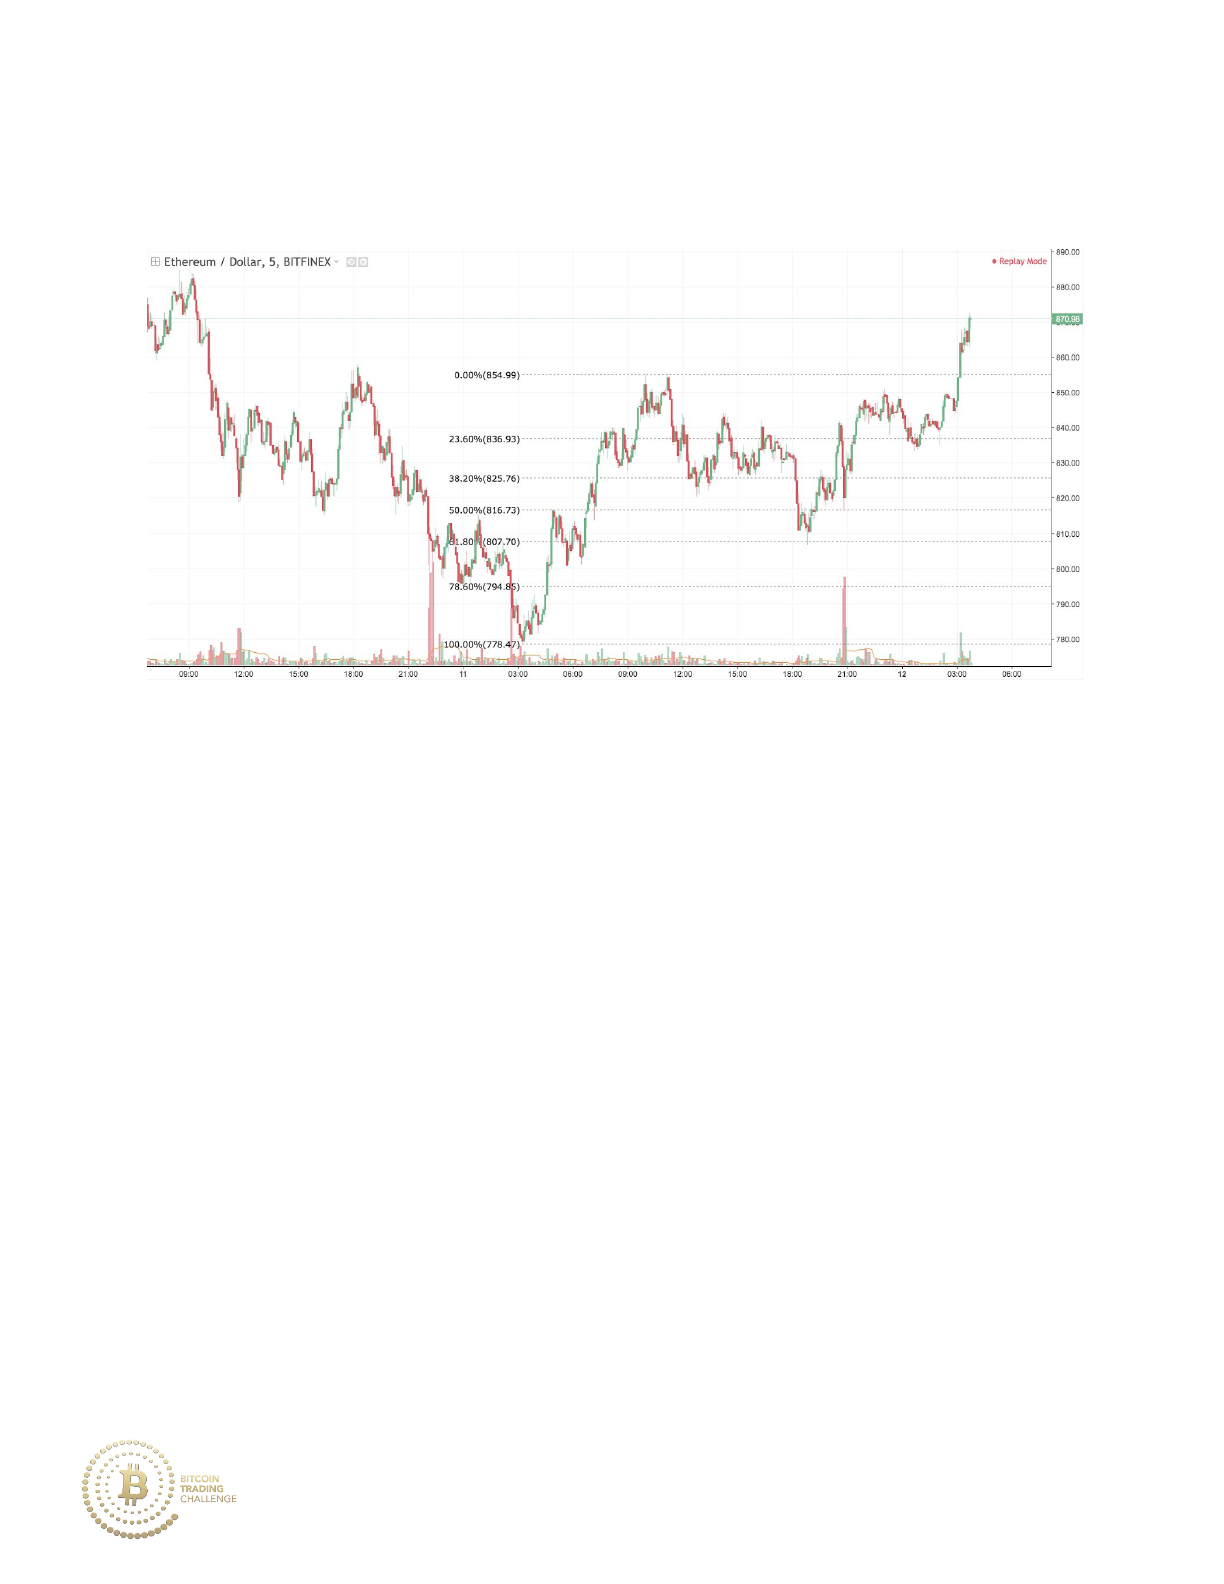
Practice 6-5 Answer
Consolidation Spring: price consolidates after touching the 38.2%
retracement before springing downward to the 61.8% for a quick bullish
reversal with a low tail. You should buy the 61.8%.
7. Finalè
A. How to Actively Trade Fibonaccis
So how can you use Fibonacci analysis to suit your trading personality?
Let’s take a look at the three different styles of trading possible:
176

Day Trading: Trades can last anywhere from 30 minutes to four
hours.
Pro: More trading opportunities, smaller losses, easier to cash out
profits
Con: Smaller gains, higher fees (due to more trades), short amount of
time to plan trades, faster-paced trading which could lead to poor
emotional trading
Swing Trading: Trades can last anywhere from four hours to a few
days.
Pro: Larger profits, gives ample time to prepare for important levels
ahead of time
Con: Larger losses, harder to cash out profits , higher variance due to
fewer trading opportunities
Position Trading: Trades can last anywhere from one week to three
months
Pro: Massive profit potential, easier to recognize confluence factors
at play in the market, more than enough time available to prepare for
important levels ahead of time
Con: Trades are rare to come by, difficult to cash out profits, massive
losses possible
I. Day Trading
177
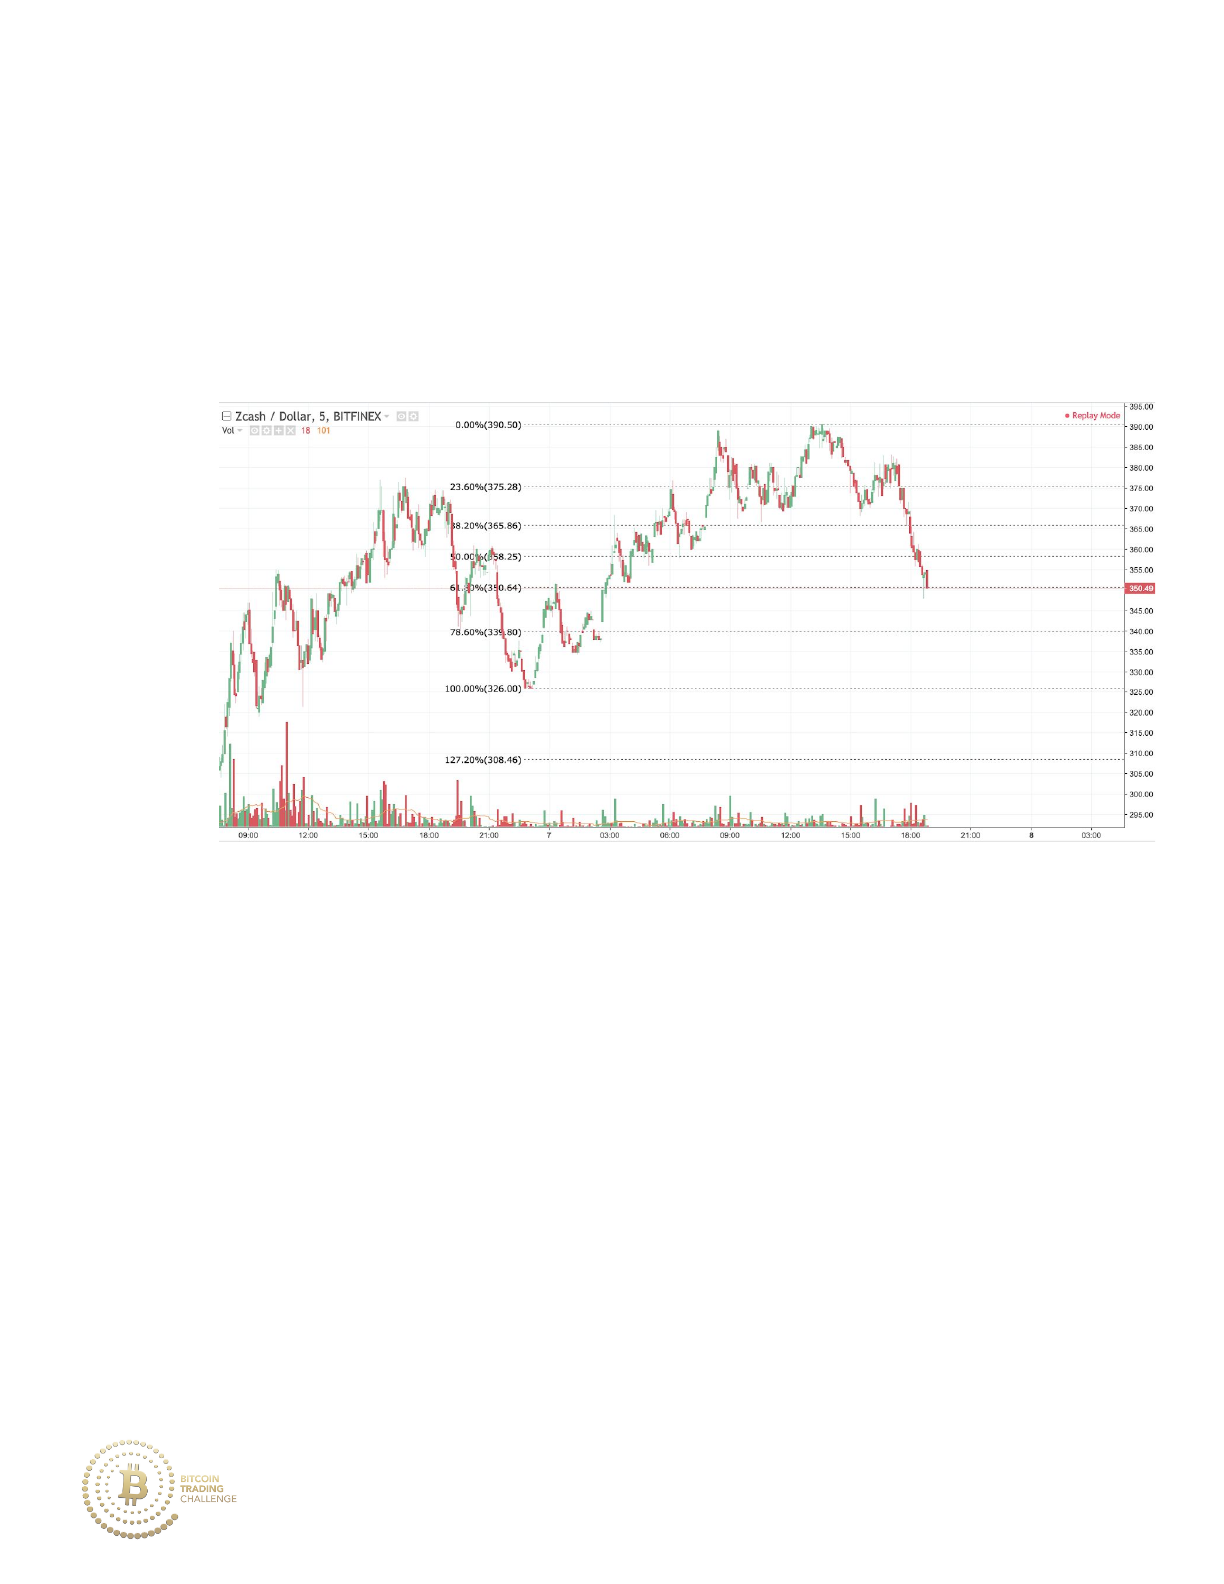
Pre-Trading:
1. Draw a Fibonacci retracement on the recent minor market stage (on
an uptrend if you are looking to enter into a long position).
2. Draw Fibonacci extensions on the recent market stages of
consolidation and retracements to find levels of confluence. (Chart
below has the 161.8% extension drawn from the bottom to the top of
consolidation at the minor market top.)
178
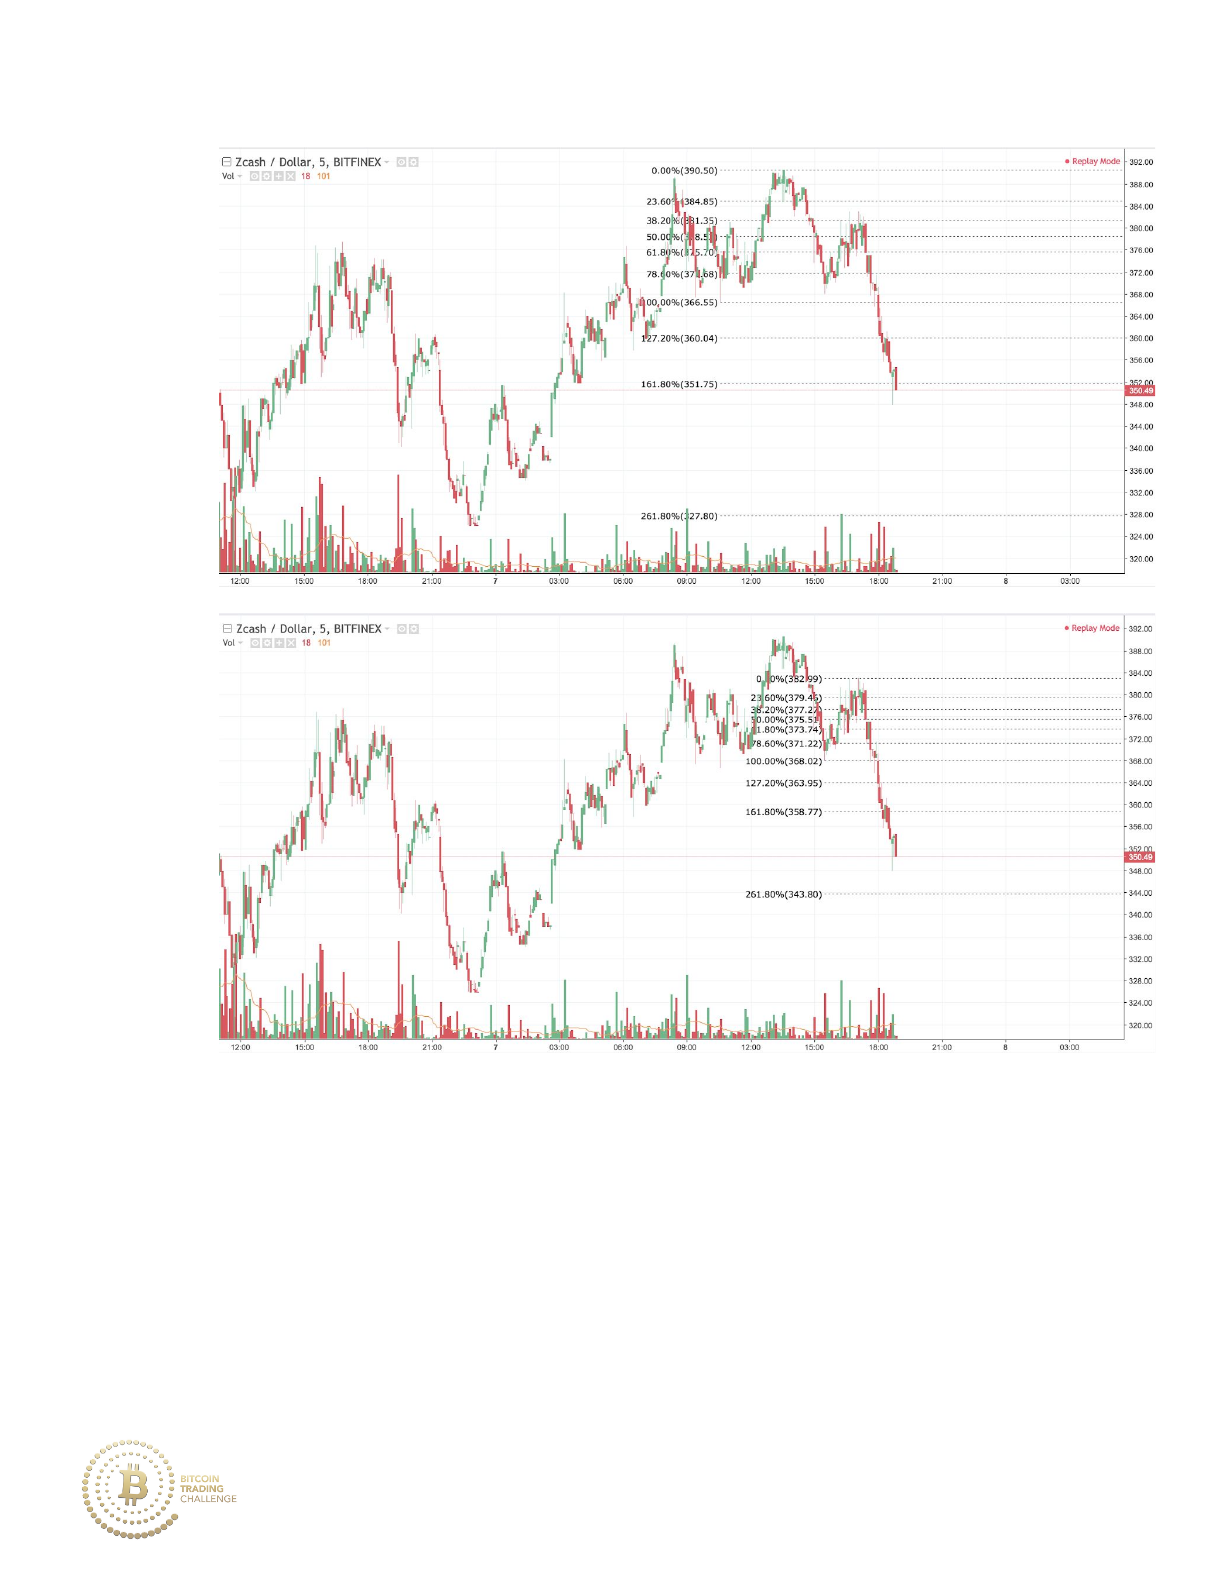
(In the chart above, price does not fully respect the 161.8% extension.
However, it does provide confluence for other levels that did hold).
179
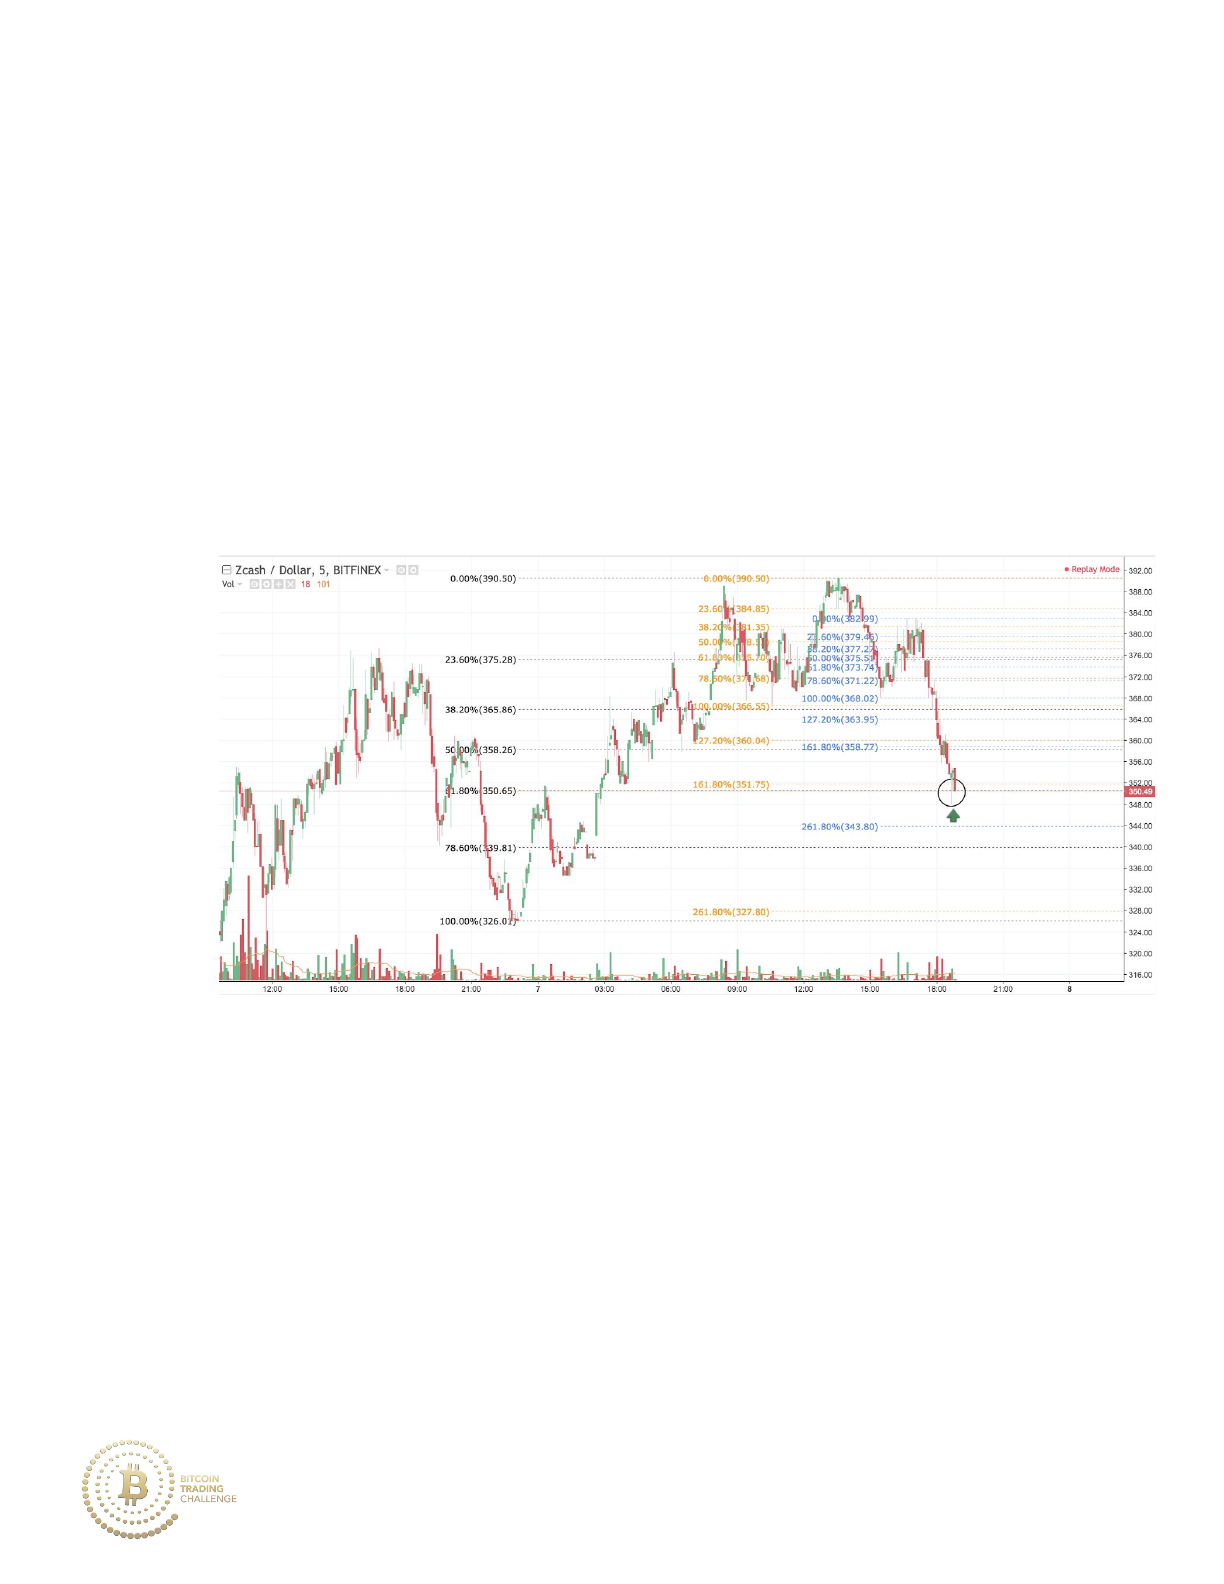
Active Trading:
1. Set buy orders to major zones of either Fibonacci confluence or
major Fibonacci levels. Remember that price tends to overshoot
Fibonacci levels more often than undershoot, leading us to place our
buy orders at the deepest retracement/extension level of confluence
(the 61.8% Fib retracement is colored black below).
2. If buying into a retracement at a major market stage 61.8% level,
place your stop loss just below the 78.6% retracement. If buying into
a retracement at the major market stage 38.2% level, place your stop
loss just below the 50% retracement. (Stop loss below is the red line
at 337.73.)
3. Set your take profit to the 161.8% extension of the recent market
stage or to the Fibonacci retracement from a higher timeframe.
180
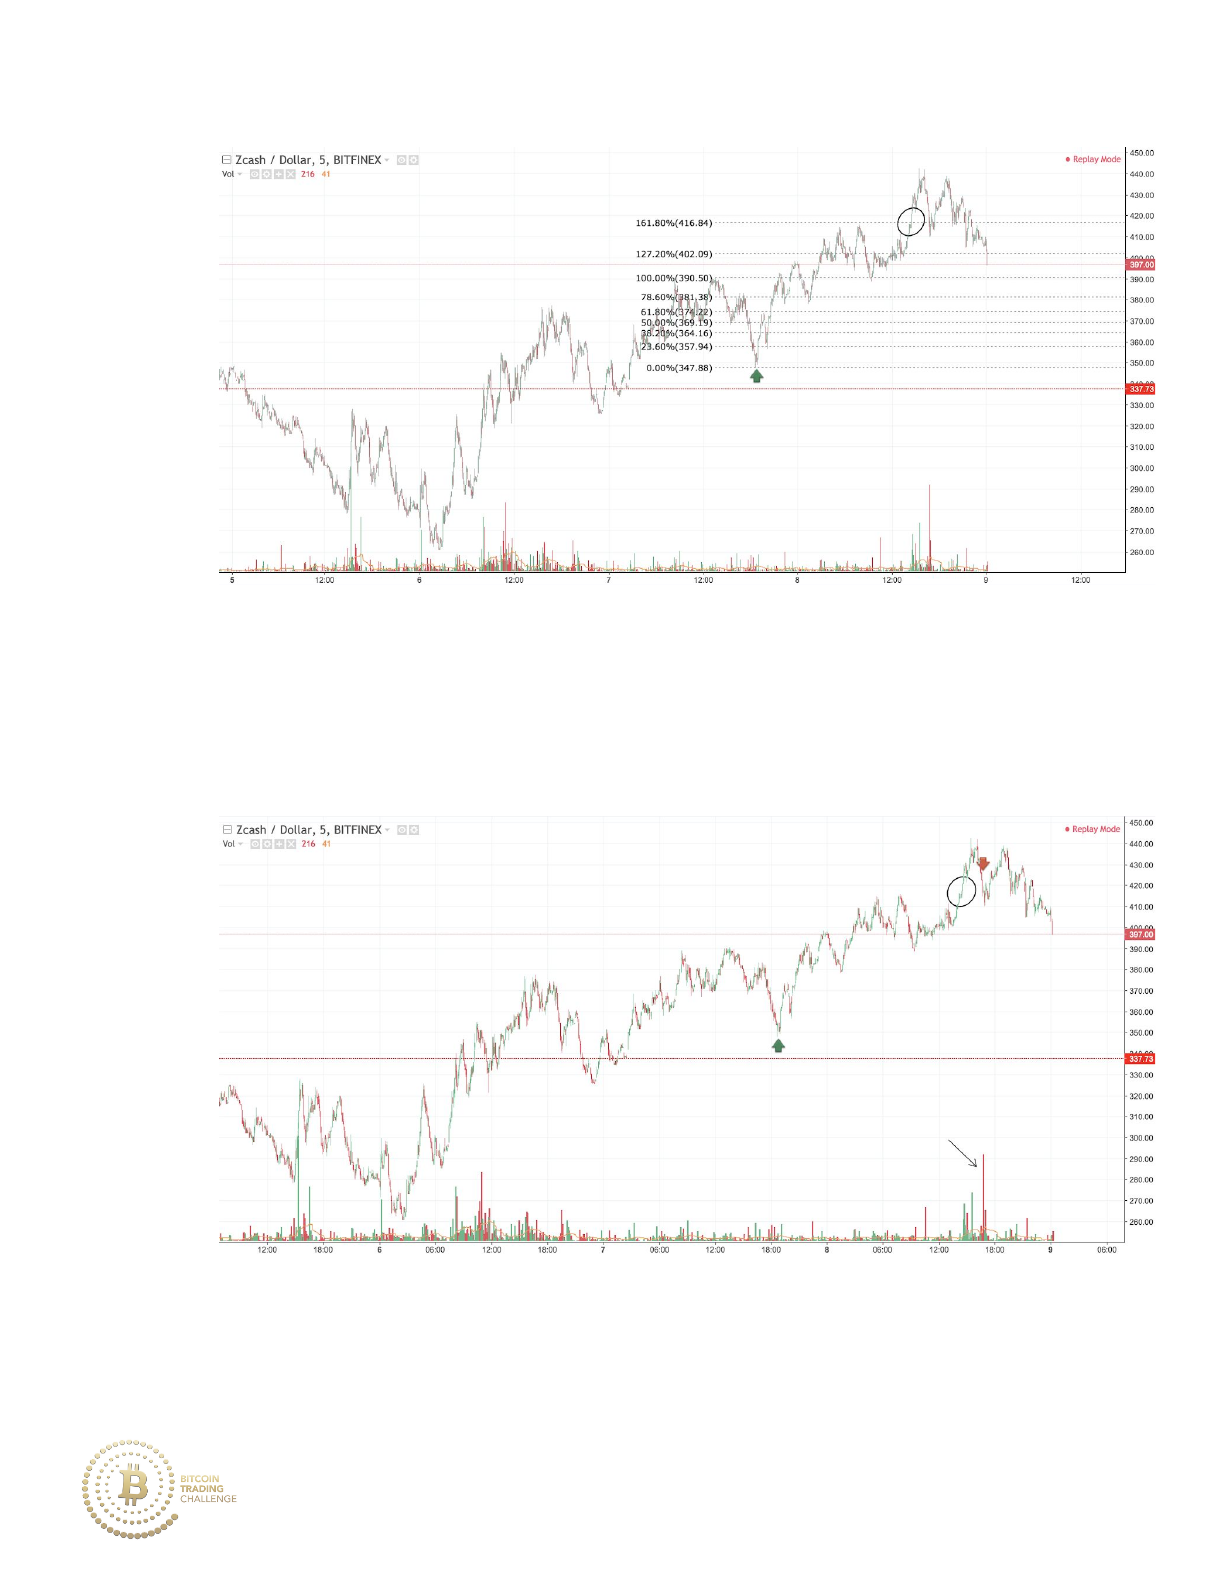
4. Pay close attention to volume or other indicators that compliment
Fibonacci analysis. For example, arrow points toward the major
volume spike present an alternate exit point.
II. Swing Trading
181
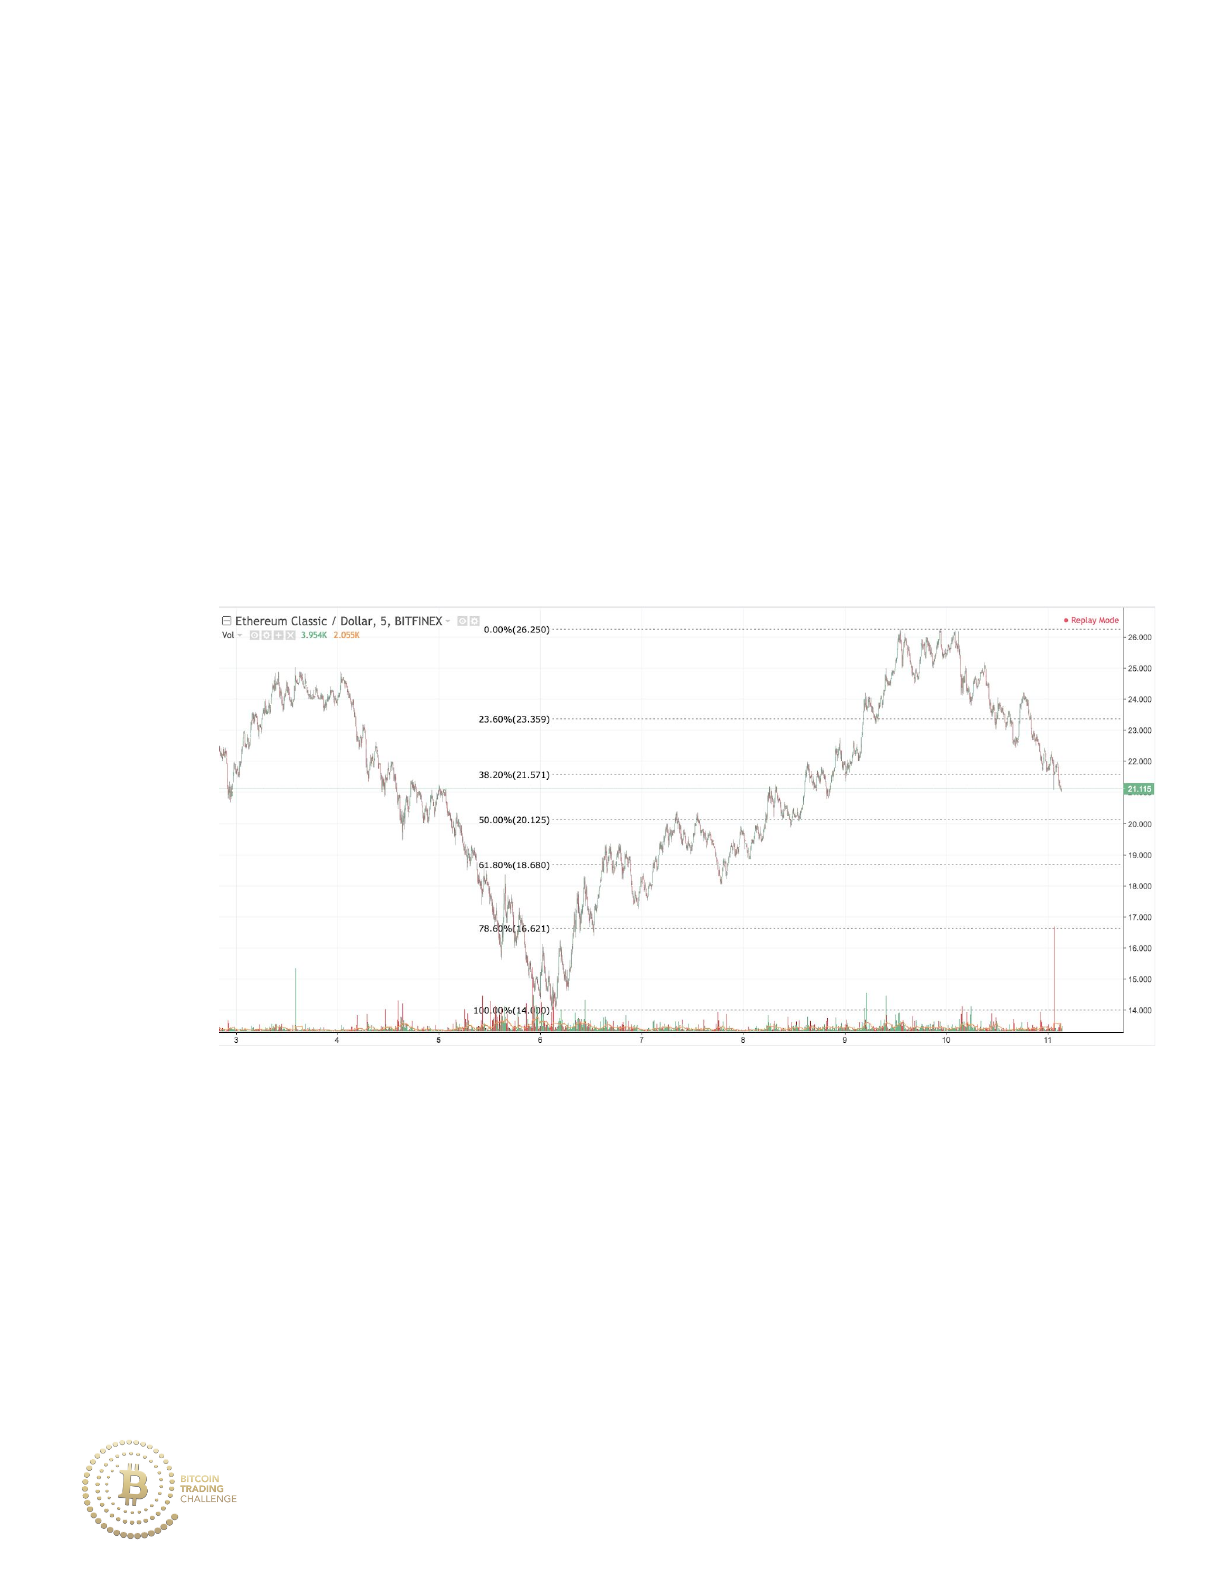
The timeframe used for swing trading in the example below is the 5M, the
same timeframe used in the day trading charts. The only notable difference
is that a swing trader will likely have a zoomed-out chart and will plan to hold
their respective trades for a longer amount of time.
Pre-Trading:
1. Draw a Fibonacci retracement on the overall major market stage (on
an uptrend if you would like to buy).
182
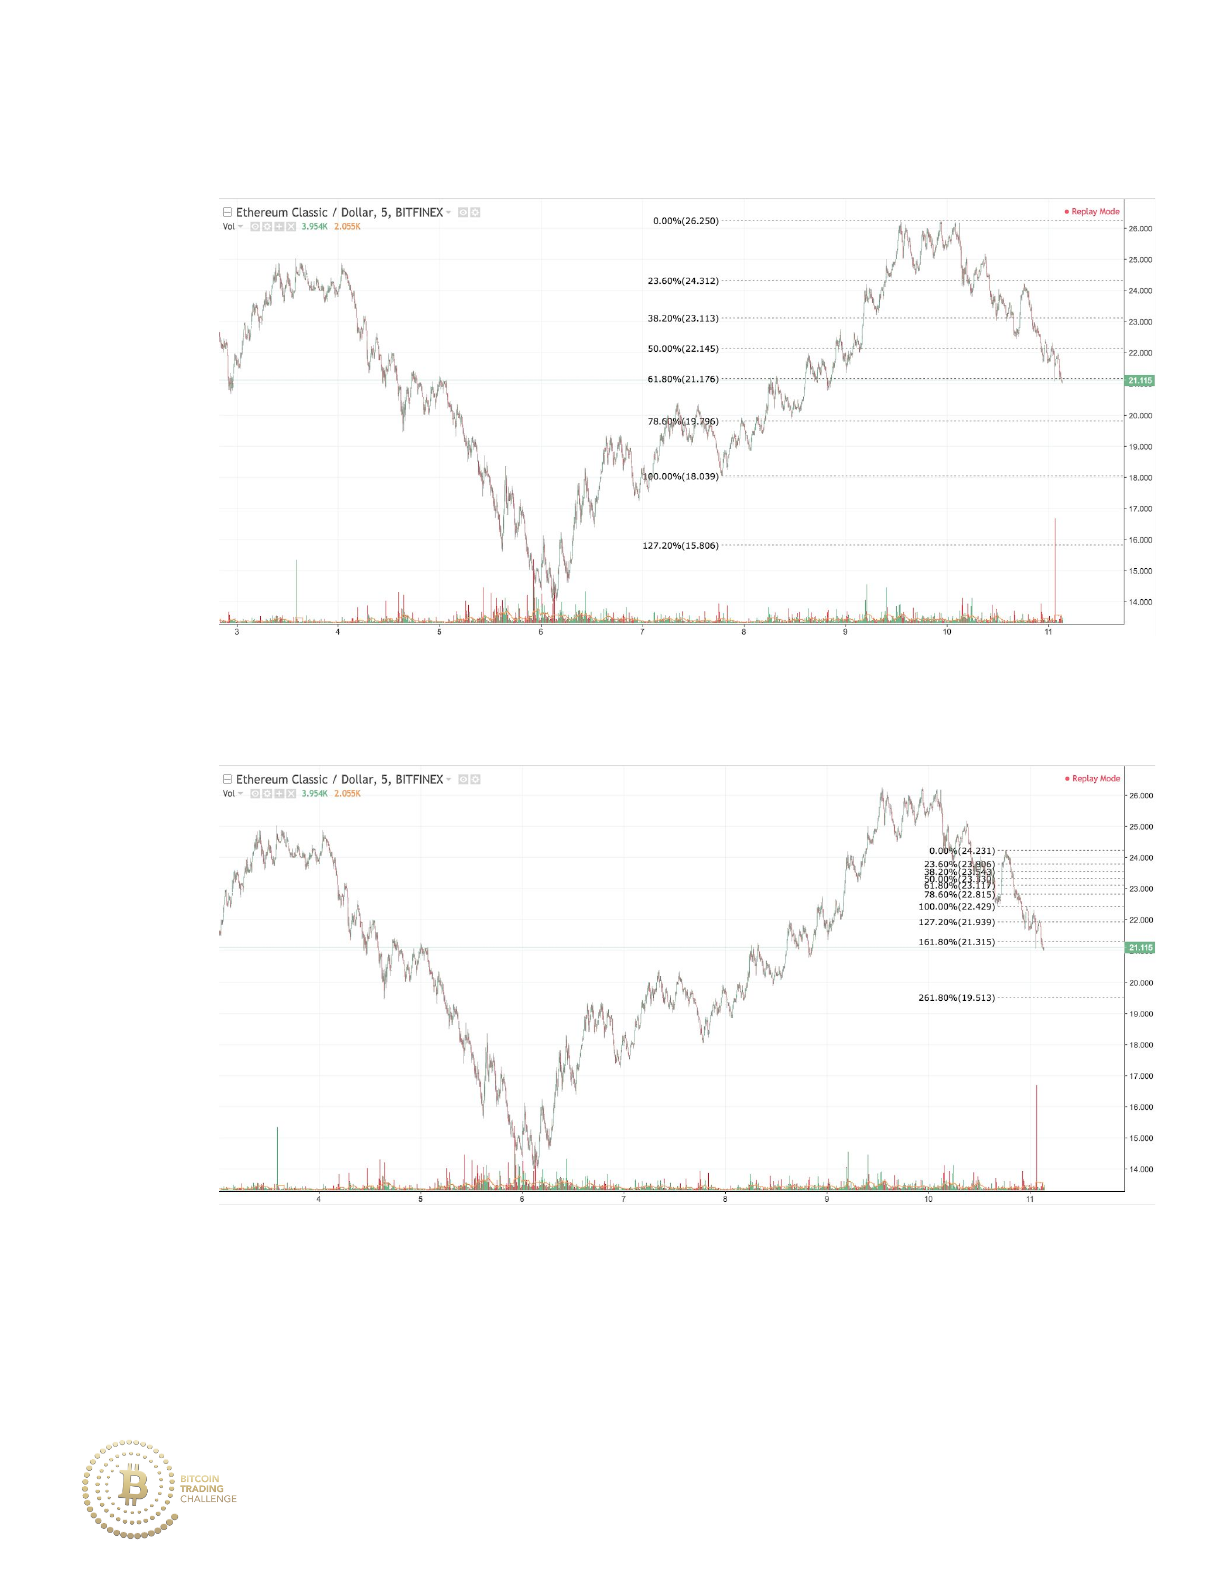
2. Draw a Fibonacci retracement on the recent minor market stage.
3. Draw Fibonacci extensions on recent market stages of consolidation
and retracements to find levels of confluence.
183
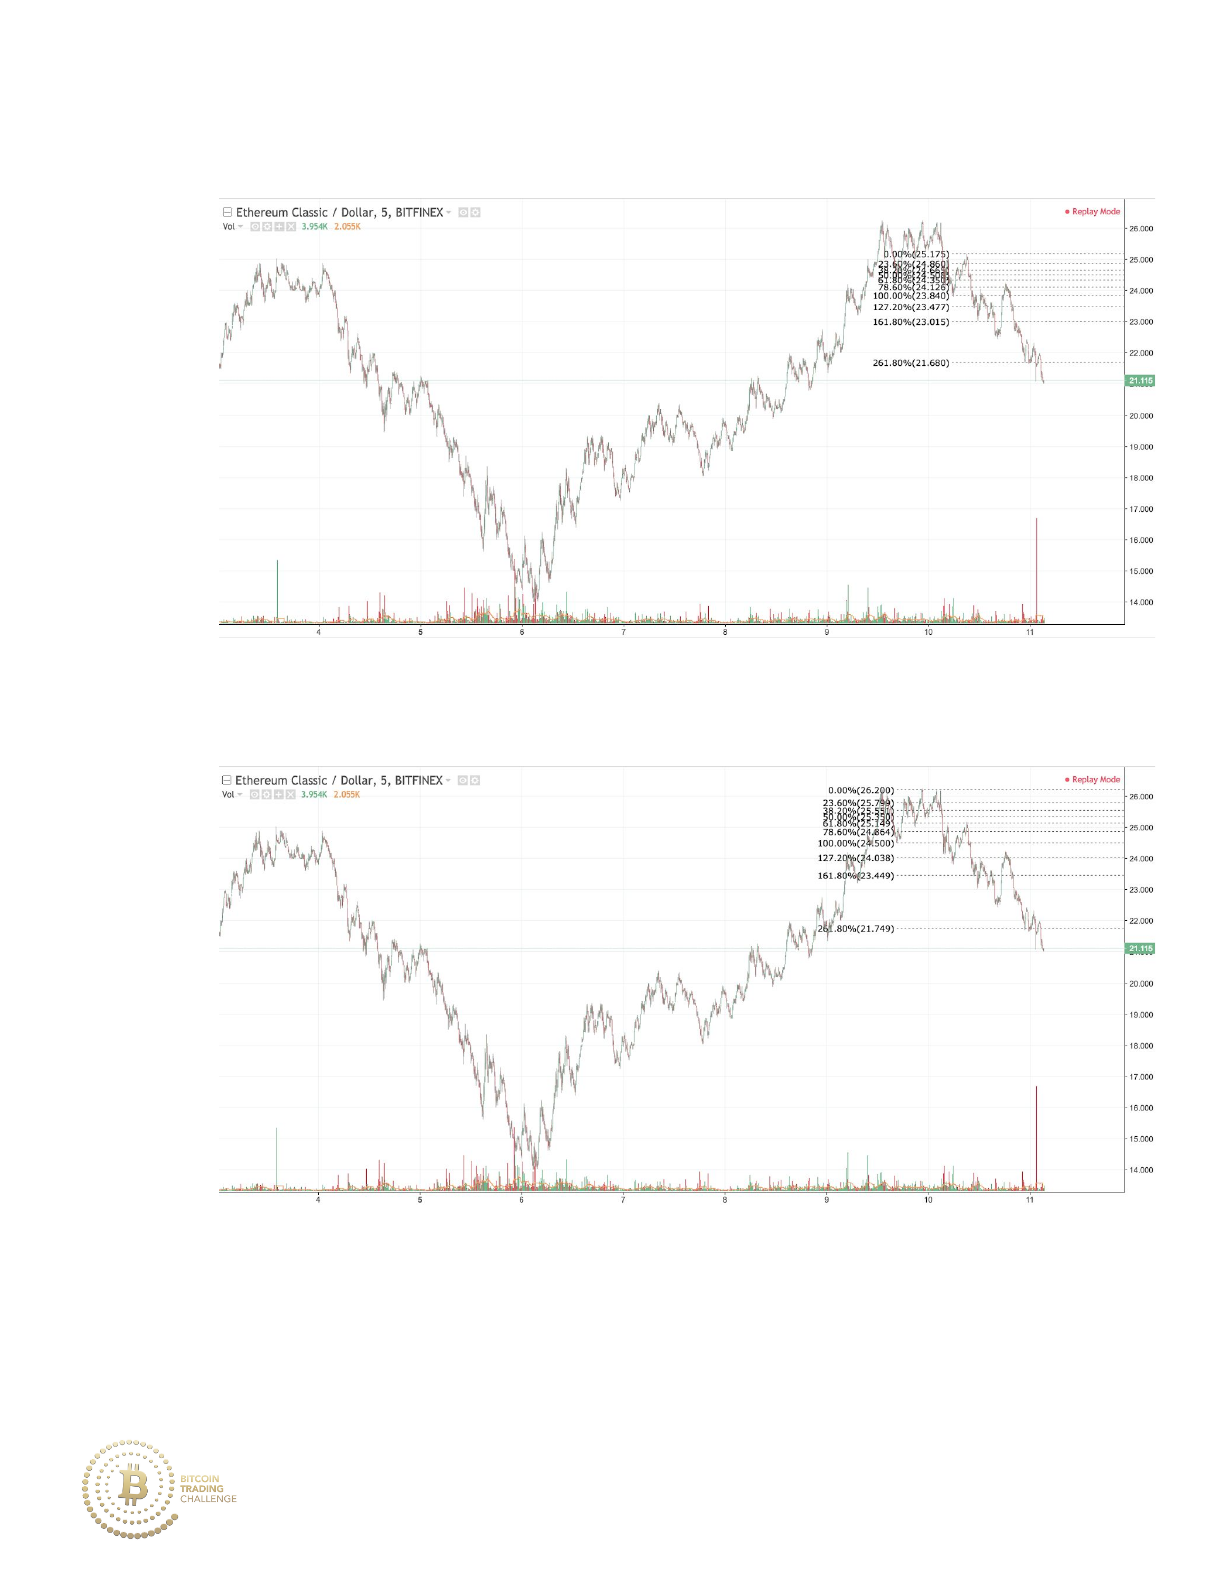
Notice the amount of confluence that is revealed when following the
step-by-step method of plotting both Fibonacci retracements and
extensions.
184
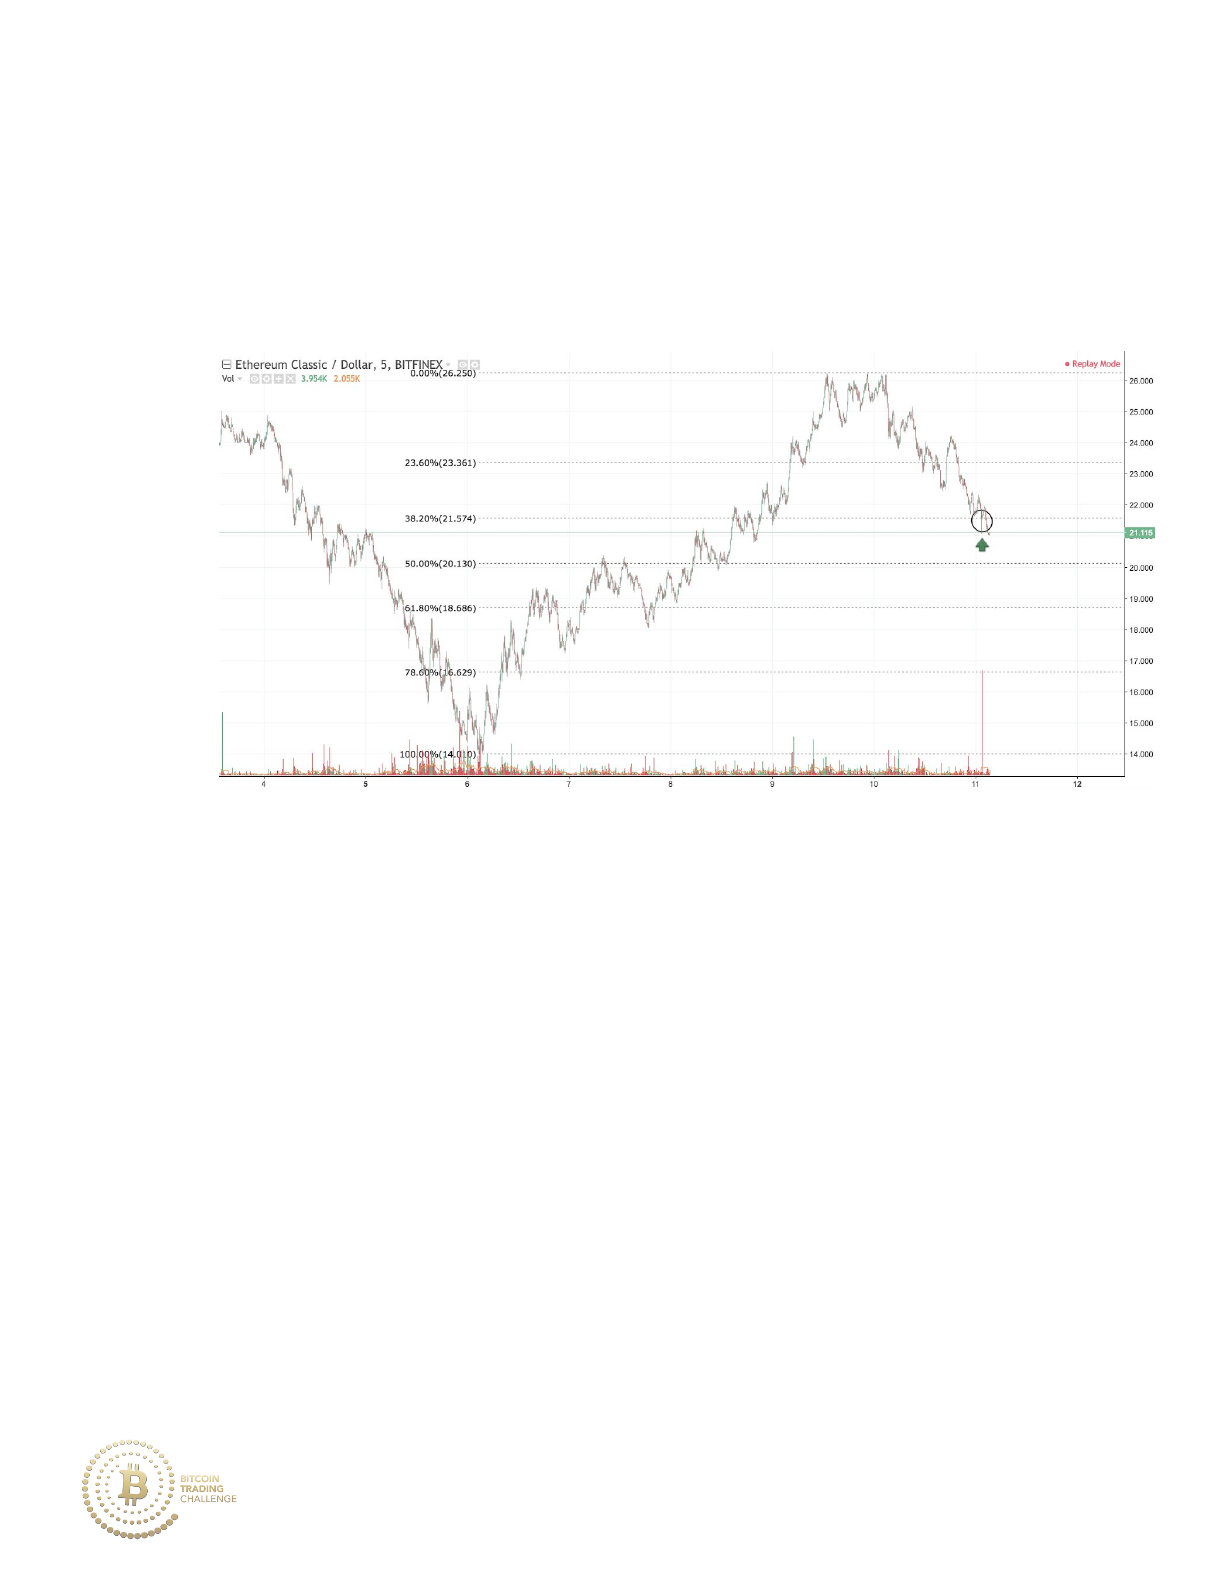
Active Trading:
1. Set buy orders to important zones of either Fibonacci confluence or
major Fibonacci levels (such as the 61.8%).
2. If buying into a retracement at a major market stage 61.8% level,
place your stop loss just below the 78.6% retracement. If buying into
a retracement at the 38.2% level, place your stop loss just below the
50% retracement. (Stop loss below is indicated by the red line below.)
185
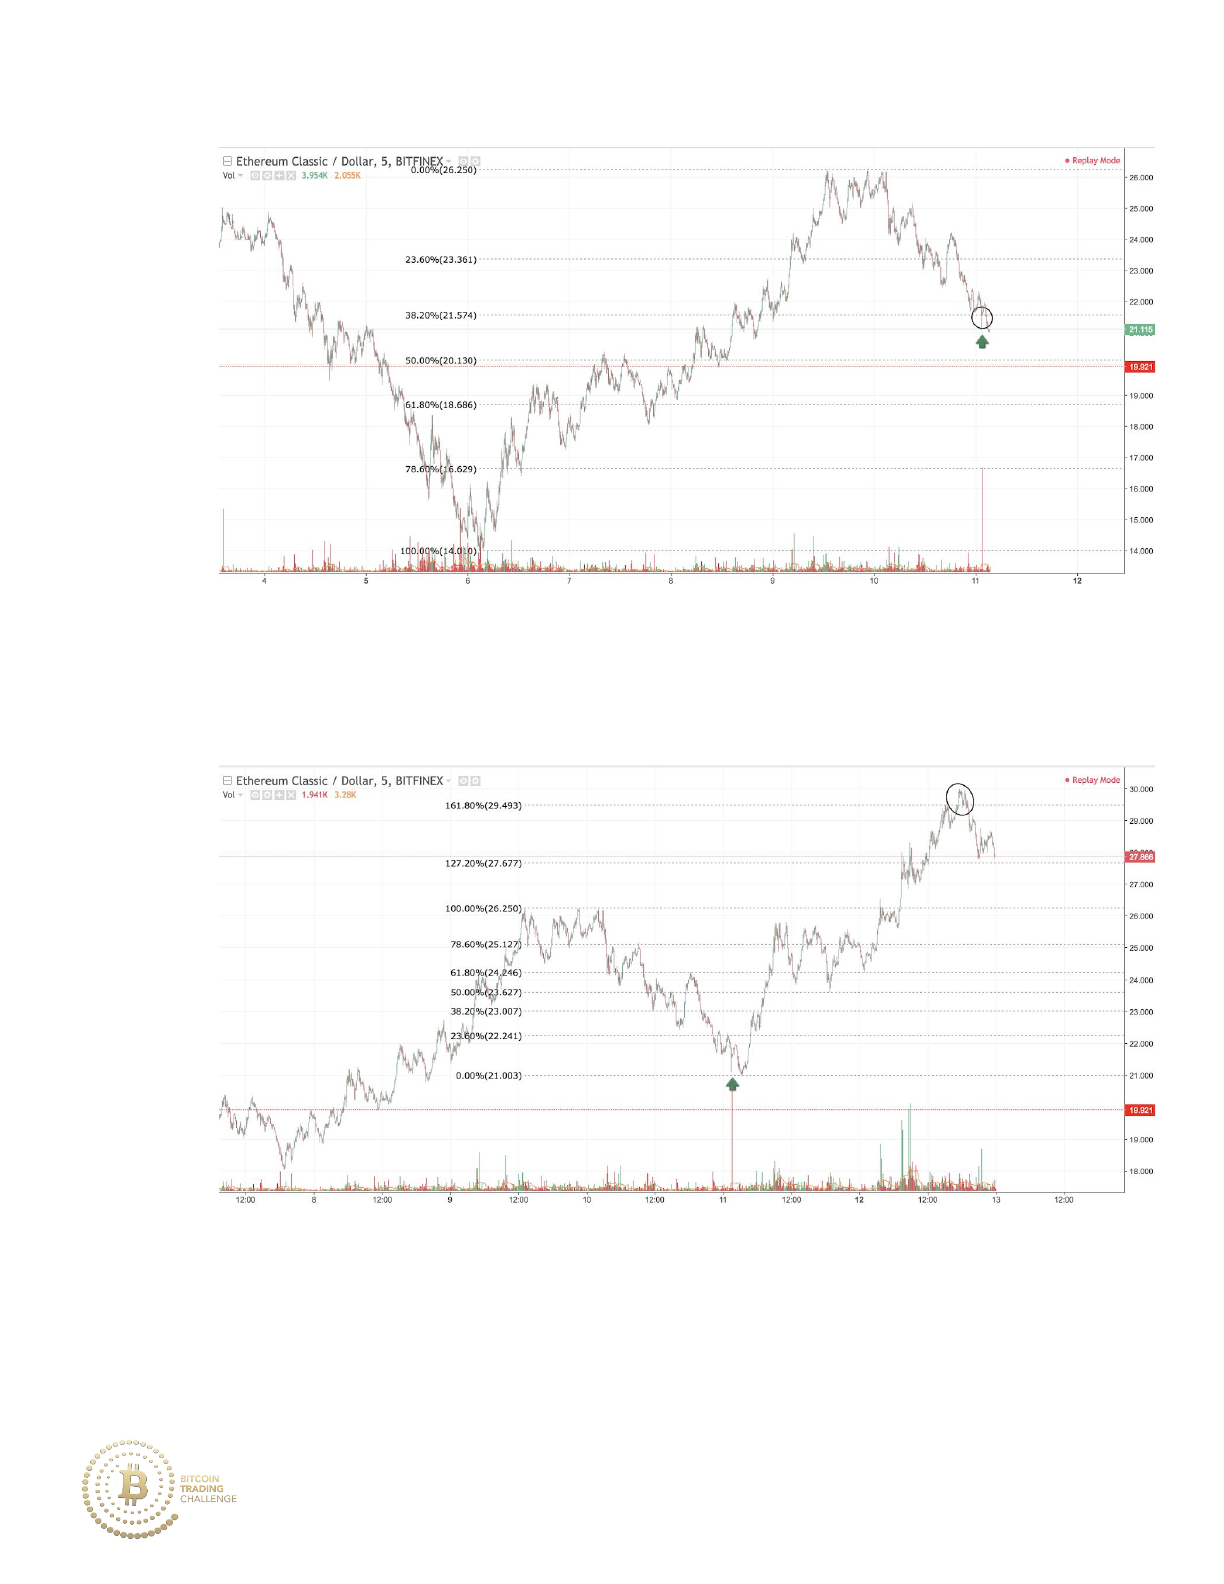
3. Set your take profit to the 161.8% extension of the recent market
stage or to a Fibonacci retracement from a higher timeframe.
4. Pay close attention to volume or other indicators that compliment
Fibonacci analysis. For example, the arrow points toward the major
volume spike that occurred with a low tail and hits both the major
186
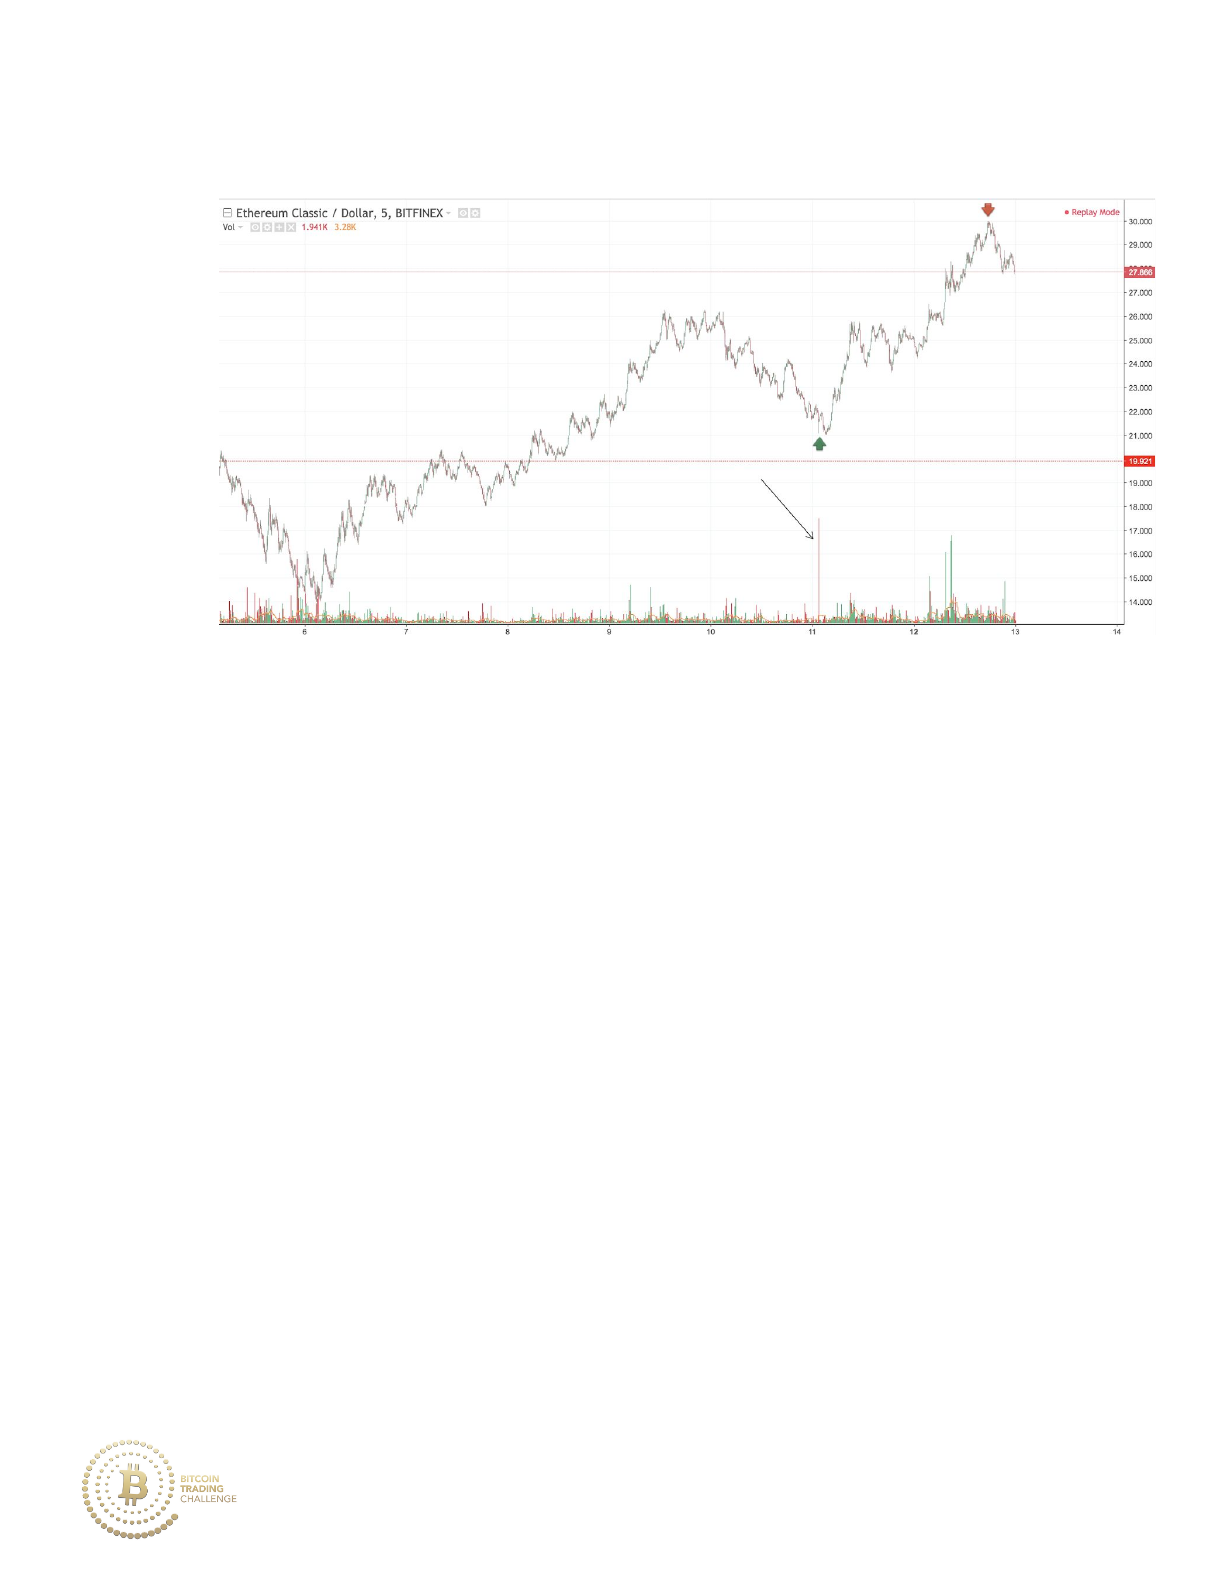
market stage 38.2% and the minor market stage 61.8%.
187
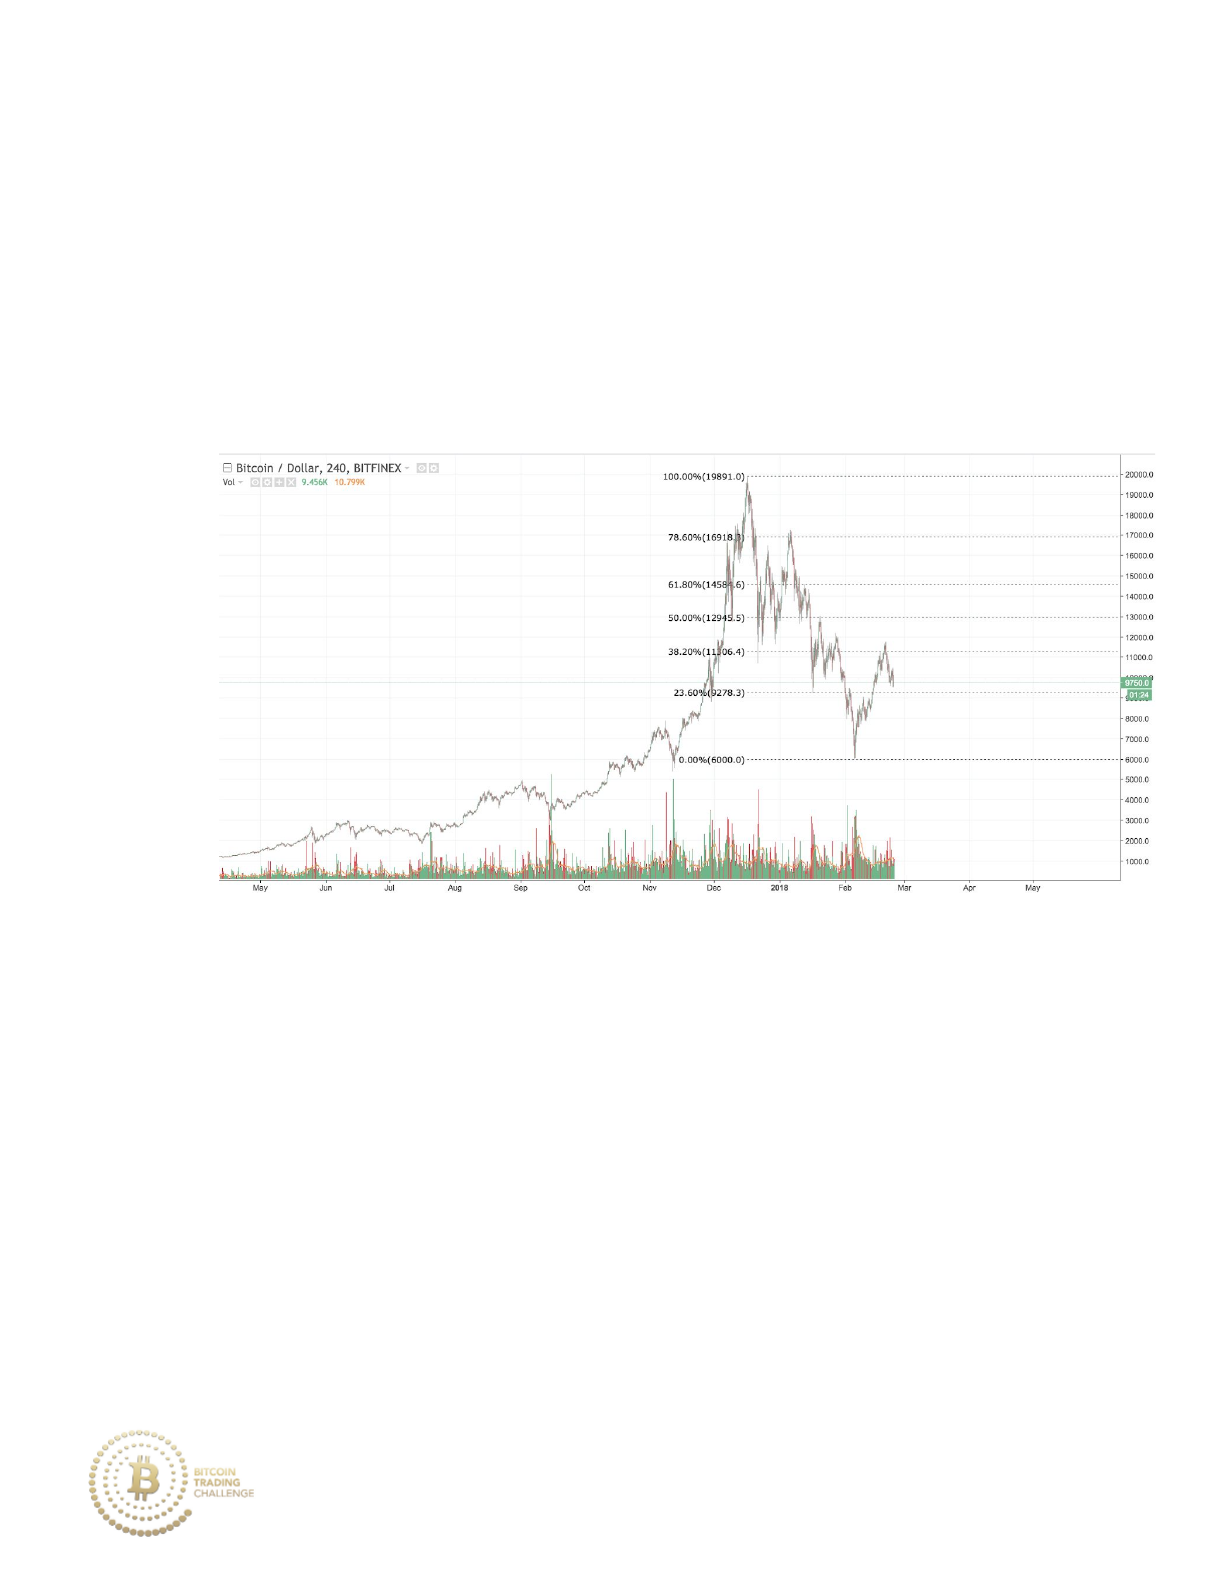
III. Position Trading
Pre-Trading:
1. Draw a Fibonacci retracement on the current major market stage.
188
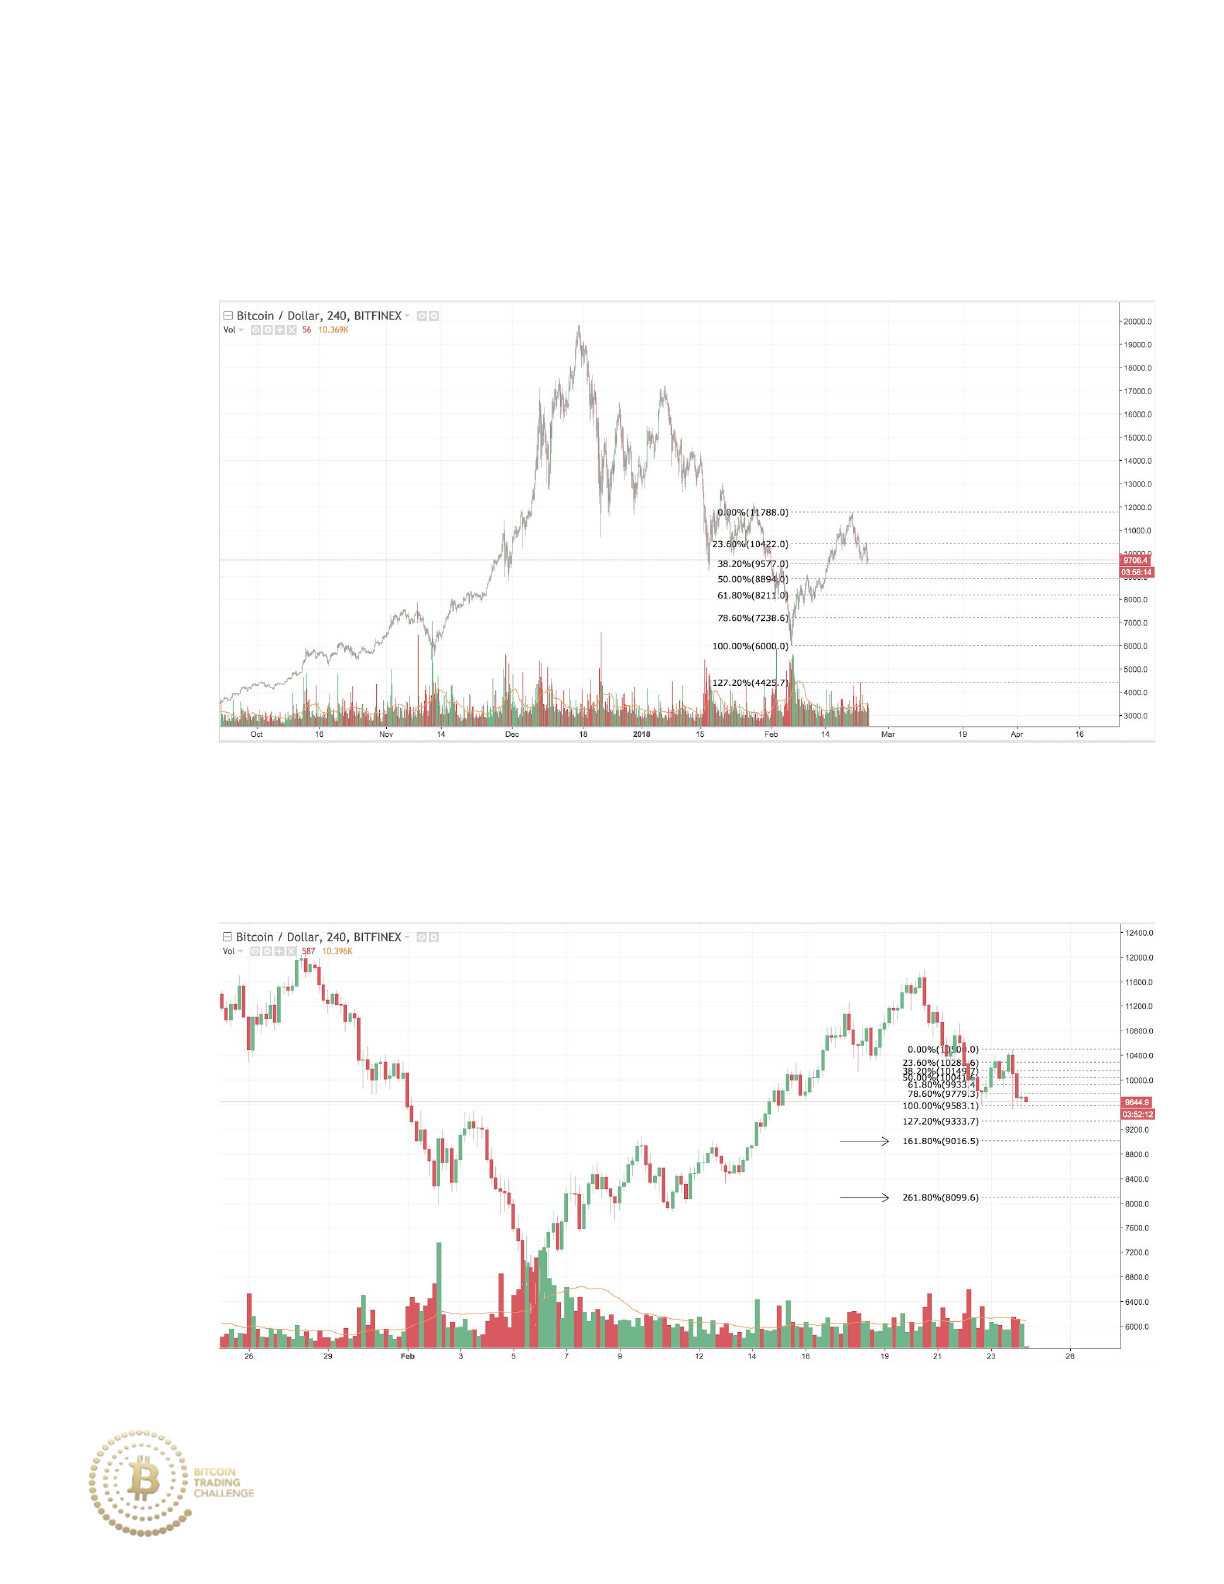
2. Draw a Fibonacci retracement on the recent market stage within the
larger market stage above. Identify the likely reversal point (usually
the 61.8%).
3. Draw Fibonacci extensions on recent market stages of consolidation
and retracements to find levels of potential confluence.
189
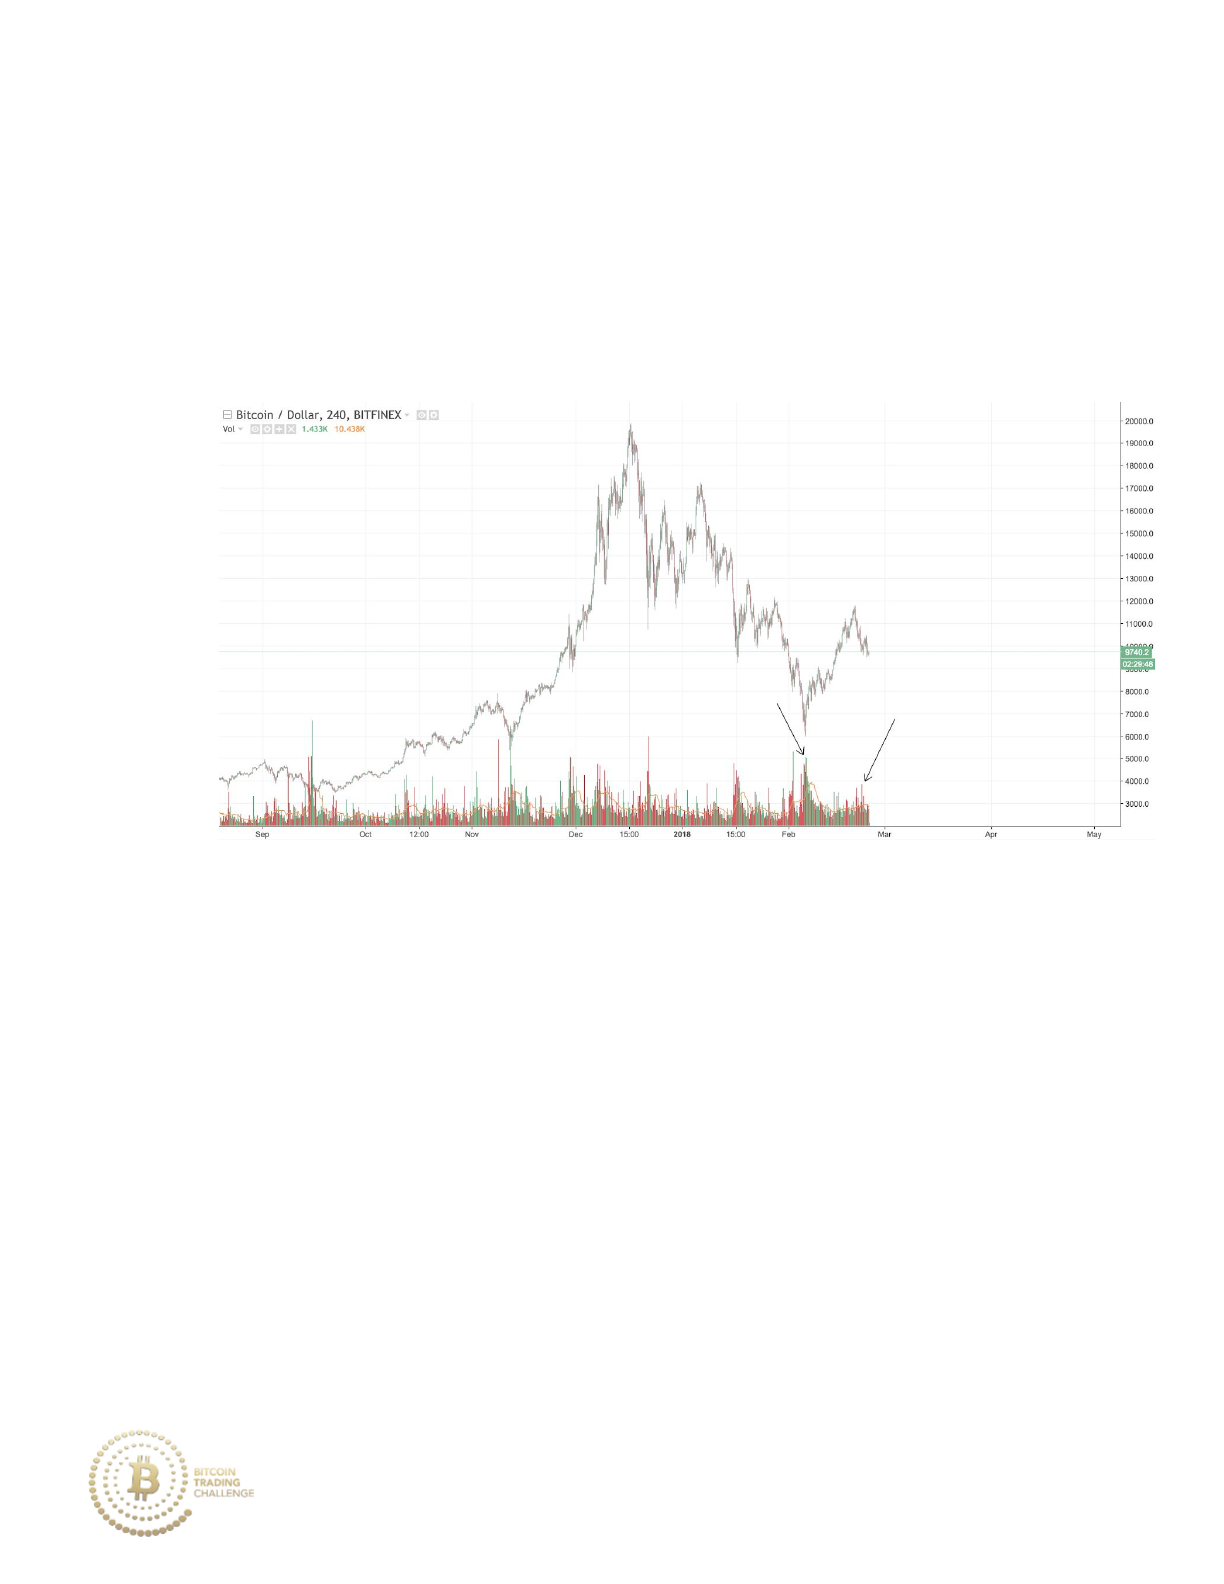
4. Pay close attention to volume or other indicators that compliment
Fibonacci analysis. The first volume spike is indicated by the left
arrow that changes the market stage from a downtrend to an
uptrend. The second, smaller, volume spike on the right of the chart
marks the beginning of the retracement off of the high around 12000.
190
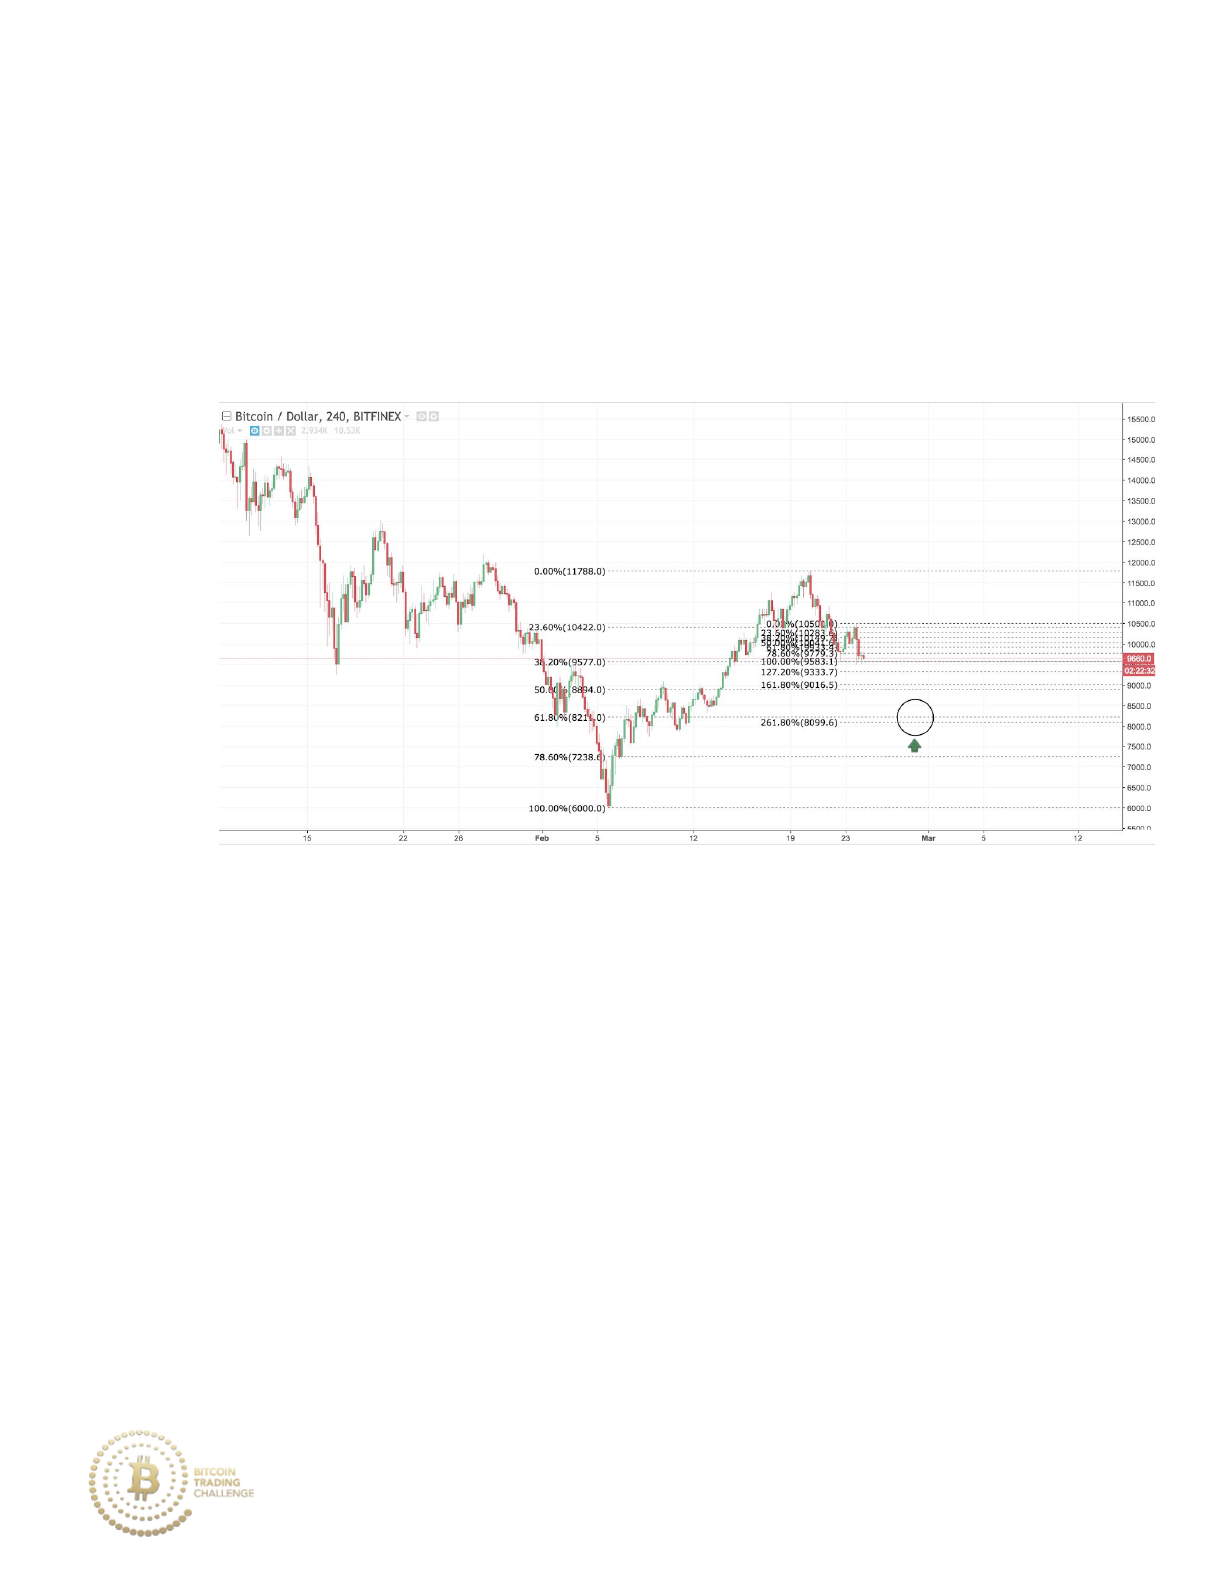
Active Trading:
1. Set buy orders to important zones of either Fibonacci confluence or
important Fibonacci levels on a major market stage (such as the
61.8%).
2. If buying into a retracement at a major market stage 61.8% level, place
your stop loss just below the 78.6% retracement. (Stop loss below is
indicated by the red line.) However, if price continues to move
downward on strong momentum and volume, then entering into a
long position is not advised.
191
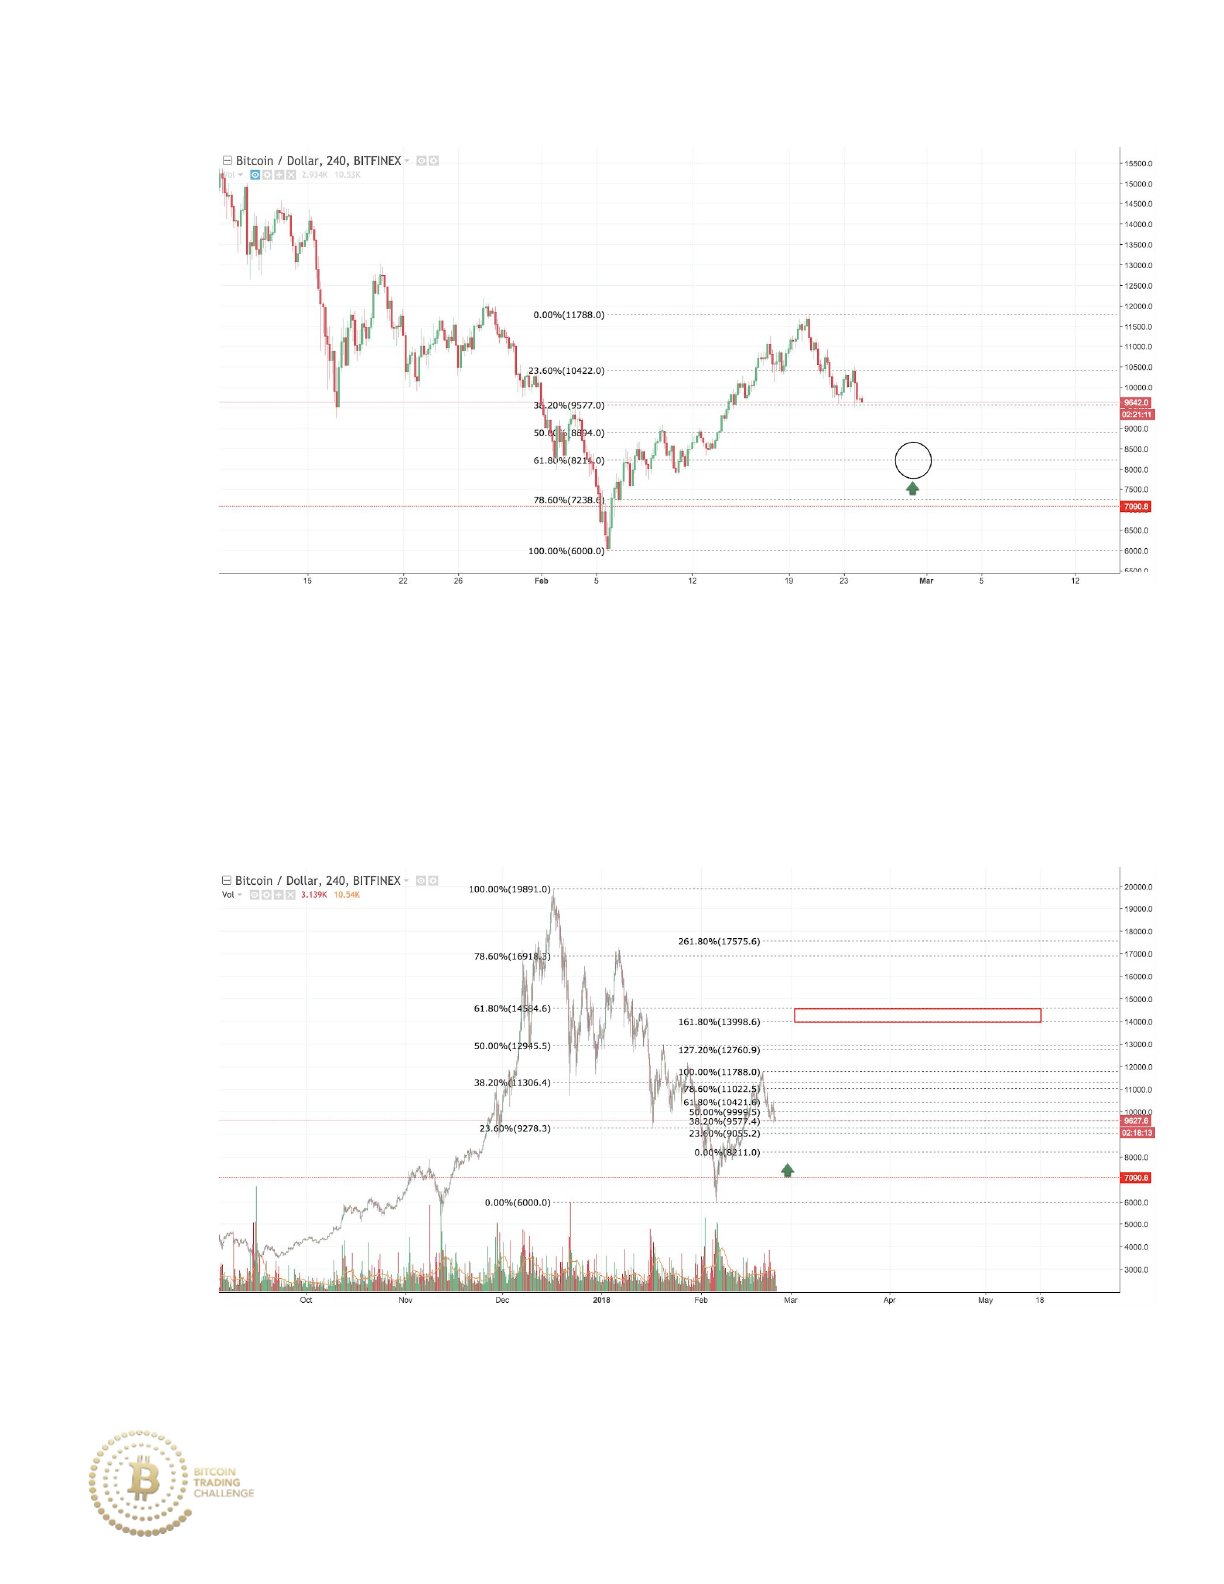
3. Set your take profit to the 161.8% extension of the recent market
stage or to a Fibonacci retracement from a higher timeframe. Both
the major market Fibonacci 61.8% and the minor Fibonacci 161.8%
extensions are shown below. The red rectangle represents the
position sell area.
192
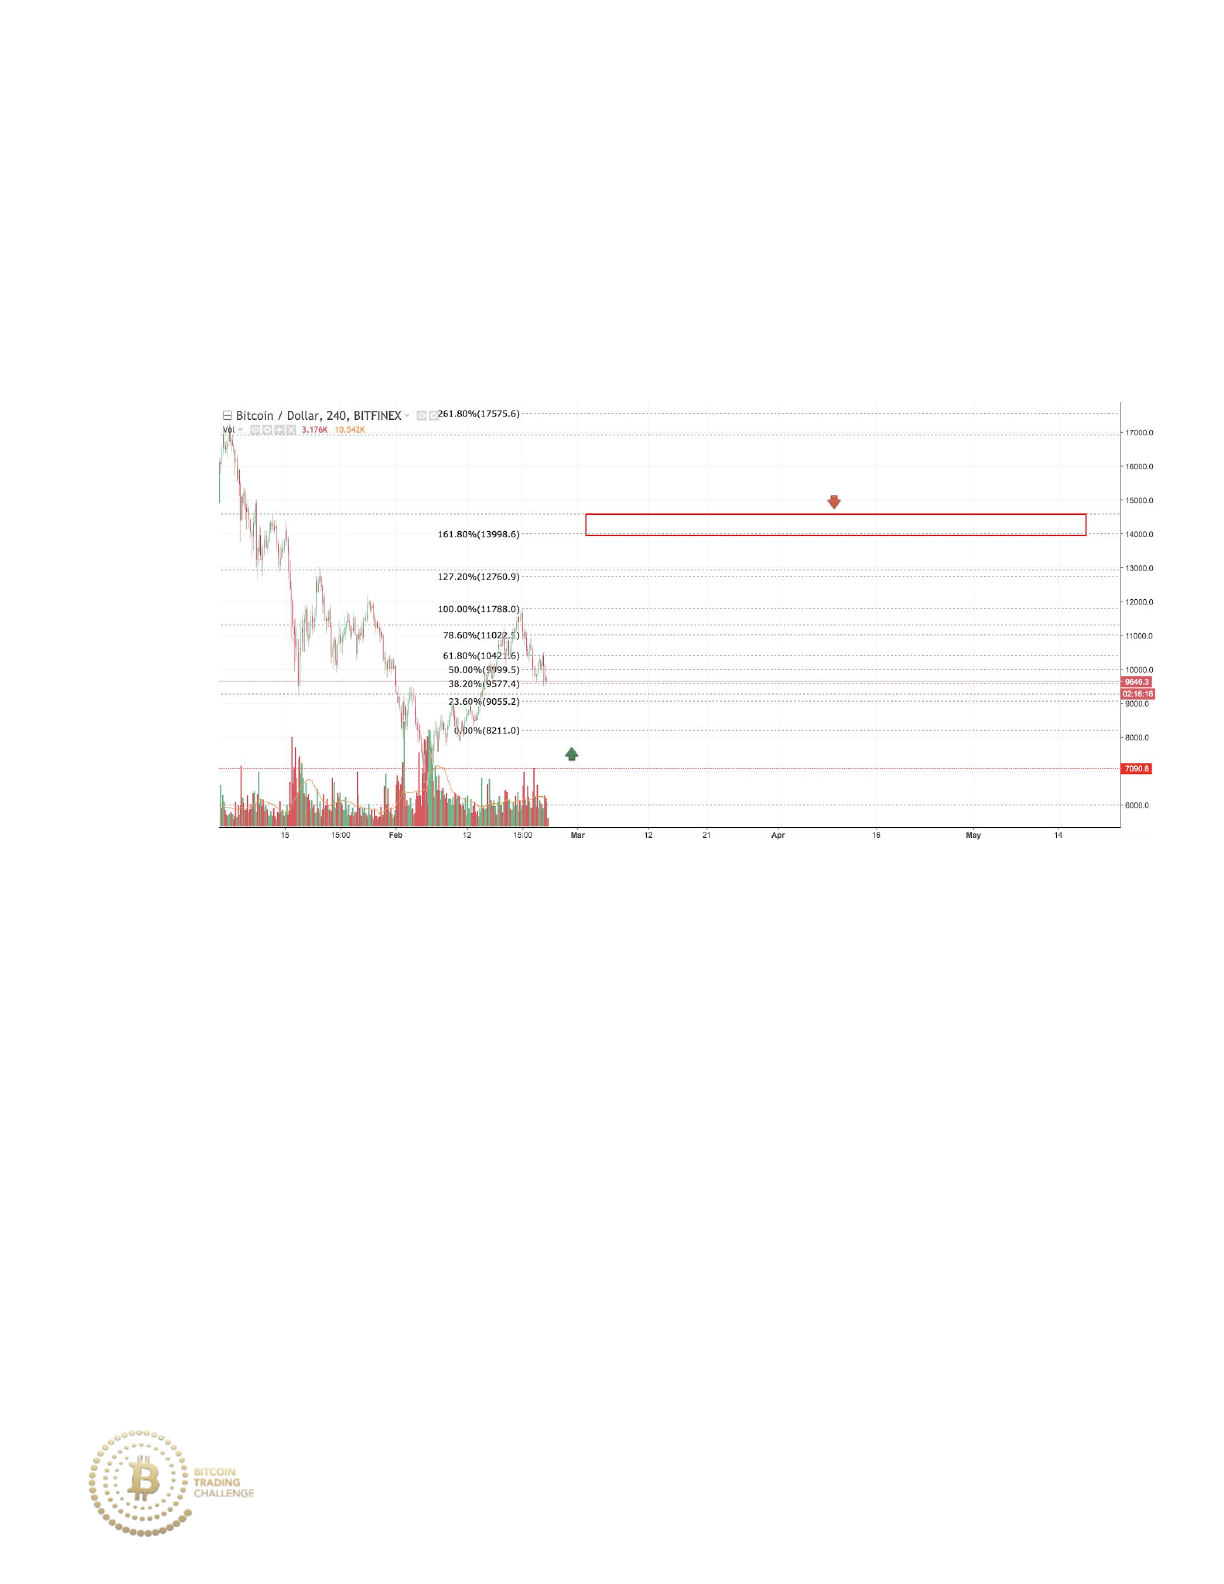
Here’s a zoomed-in look: The Fibonacci extension is drawn from the
recent high at 11788 down to the projected low of 8211 because
8211 is the 61.8% of the Fibonacci drawn from 6k to 11788. If price
makes a low below 8211 for the 161.8% Fibonacci extension levels,
then the Fibonacci low value would be drawn on that value instead.
B. Large Market Cap Coins vs Altcoins
Fibonacci analysis can be used on nearly all coins within the crypto space.
Fibonacci ratios can be used on both USD pairs (such as BTC/USD,
LTC/USD, XRP/USD) and BTC pairs (such as ETH/BTC, XRP/BTC,
XMR/BTC). Fibonaccis follow different patterns depending on the coin.
The more liquidity and volume that a coin has, the larger of an impact that
“crowd psychology” plays, leading to Fibonaccis acting as more powerful
193

reversal areas of fear and greed. When a coin has little liquidity and absent
volume, individual market players will have a larger sway on the coin’s price
movements rendering Fibonacci analysis less successful.
Keep in mind that the high volatility of bitcoin can lead to massive price
fluctuations of the BTC pairs (XRPBTC and ETHBTC) which may interfere
with traditional Fibonacci price patterns.
Additionally, BTC pairs’ actual price movements are not dictated by supply
and demand dynamics (like BTCUSD is). Rather, their price movements are
dictated against Bitcoin. For example, this means that XRPBTC will move
upward if XRPUSD is more bullish than BTCUSD in a given timeframe
(However a coin like ADABTC would act differently - as there is no ADAUSD,
because ADA is only traded to BTC).
If you want to trade altcoins to BTC using Fibonaccis, it would be best to
apply Fibonaccis to three different rates:
(BASE Currency/QUOTE Currency)
1. The base currency (xxxUSD)
2. The quote currency (BTCUSD)
3. The traded rate (xxxBTC)
Example using LTCBTC:
1. LTCUSD
194

2. BTCUSD
3. LTCBTC
It would be most optimal to use the same exchange for all three currencies,
as rates will likely vary significantly across other exchanges. If you are new
to trading Fibonaccis or new to day trading altogether, it would be best to
solely markup and trade high market cap coins traded to USD.
With USD pairs (such as BTCUSD and XRPUSD), draw Fibonaccis on the
most liquid exchange for market analysis, instead of the exchange you use.
As of 2018, that exchange is Bitfinex. If you wish to trade on GDAX, for
example, you would enter a trade when the Bitfinex BTCUSD rate moves
into a major Fibonacci level and then enter a trade on GDAX.
C. Practice makes Perfect
Each of the following examples will test individual elements of trading
Fibonaccis. These practices will improve your recognition of strong/weak
markets and Fibonacci price patterns, as well as advise you on how to
select an execution price for a trading opportunity.
1. Market Stage Practice
2. Confluence Zone Practice
195
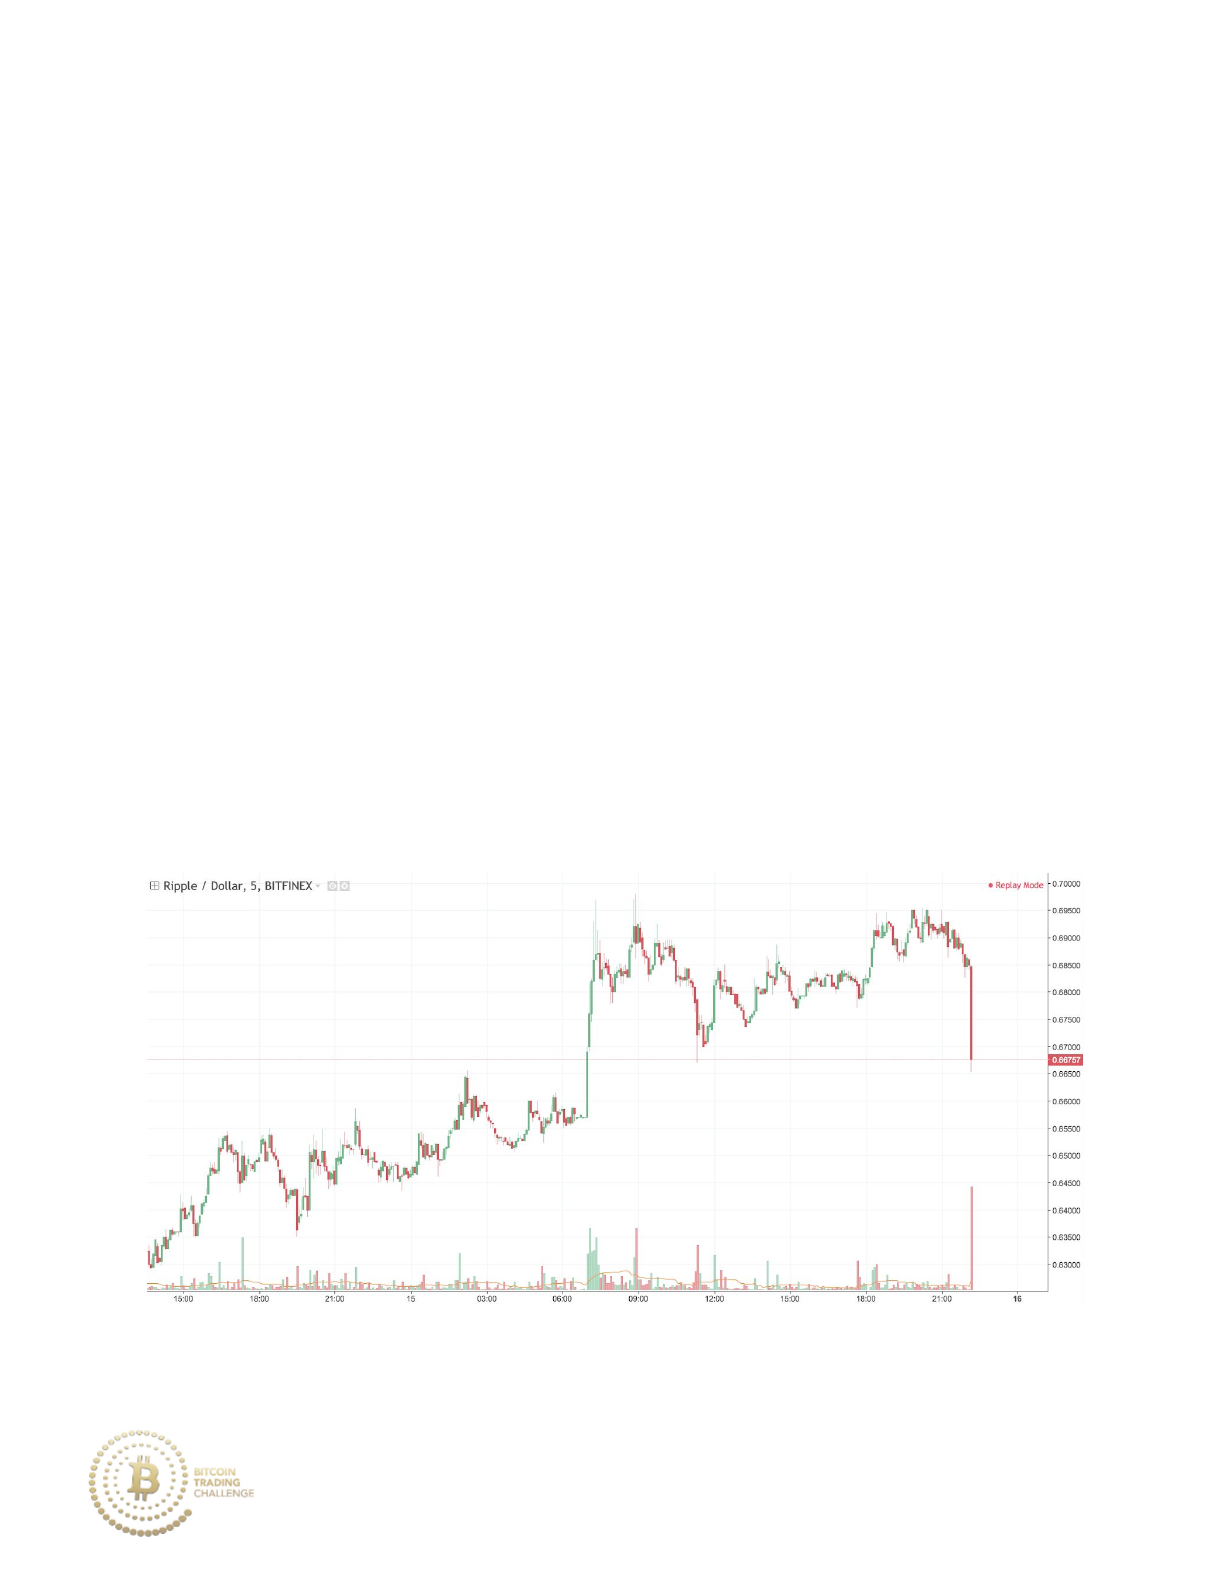
3. Entry Practice
4. Exit Practice
5. Stop Loss Placement Practice
6. Final Tips
1. Market Stage Practice
Within the five examples in this section, gauge whether the emerging
market stage is strong or weak. After determining this, estimate which
direction the market will likely move in the near future. This specific training
serves as a warmup for filtering out potential trading opportunities.
Practice 7-1
196
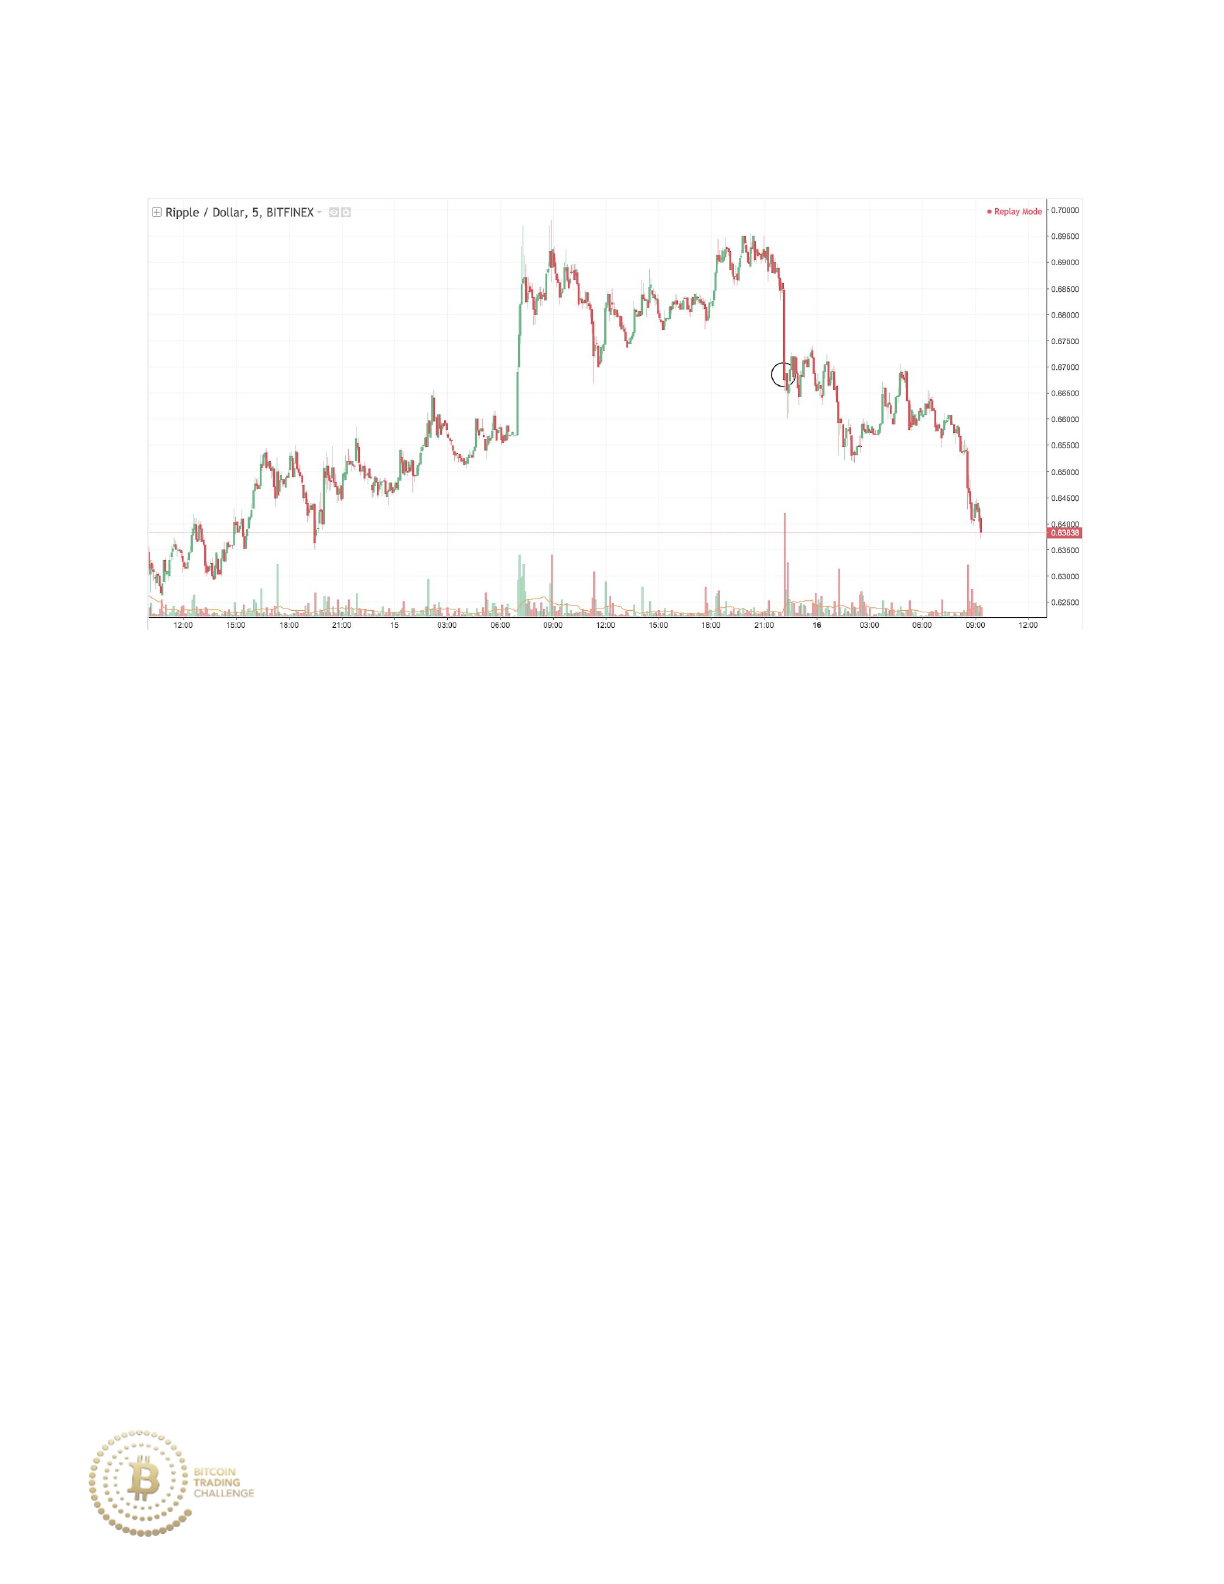
Practice 7-1 Answer
The high bearish momentum and high volume candlestick signifies that the
bears are in control and that price will likely continue its bearish market
stage. It is worth mentioning that the previous market stage of an uptrend
moved on high volume and strong momentum, but that bullish market stage
ended once price began making high tails and was unable to produce new
highs and eventually broke below support.
197
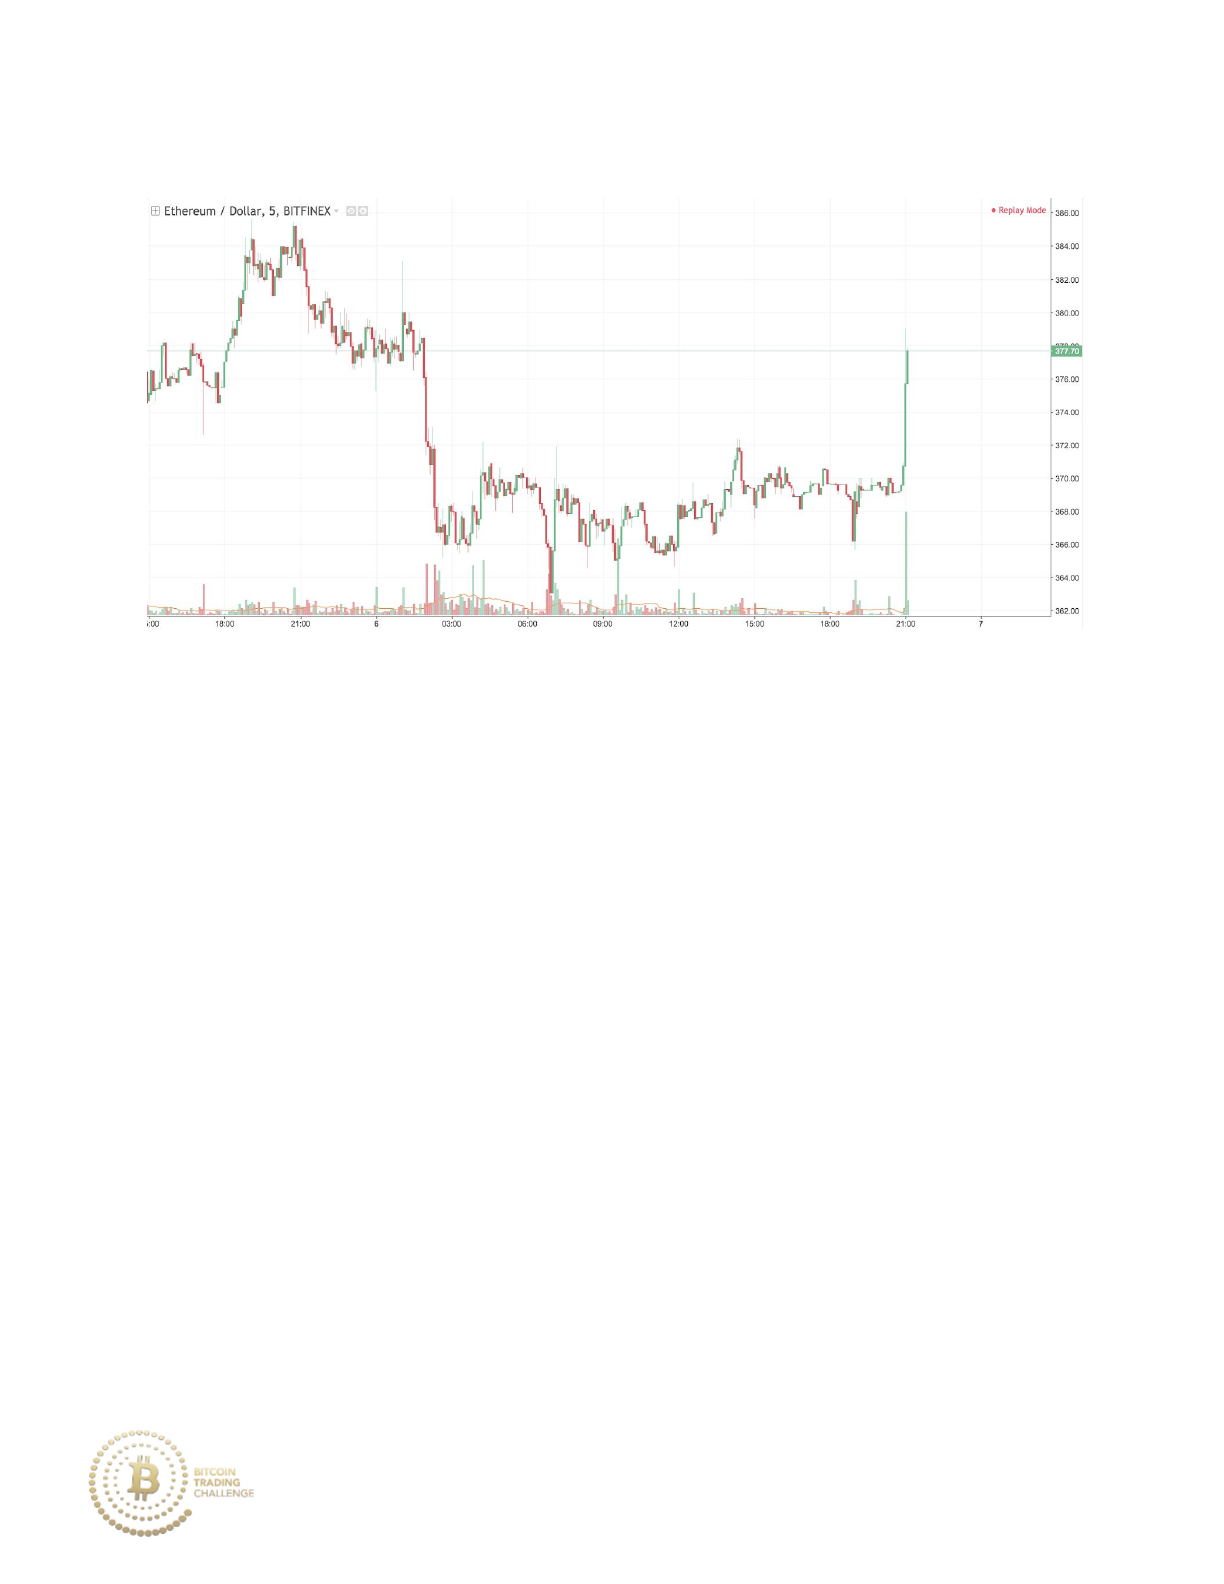
Practice 7-2
198
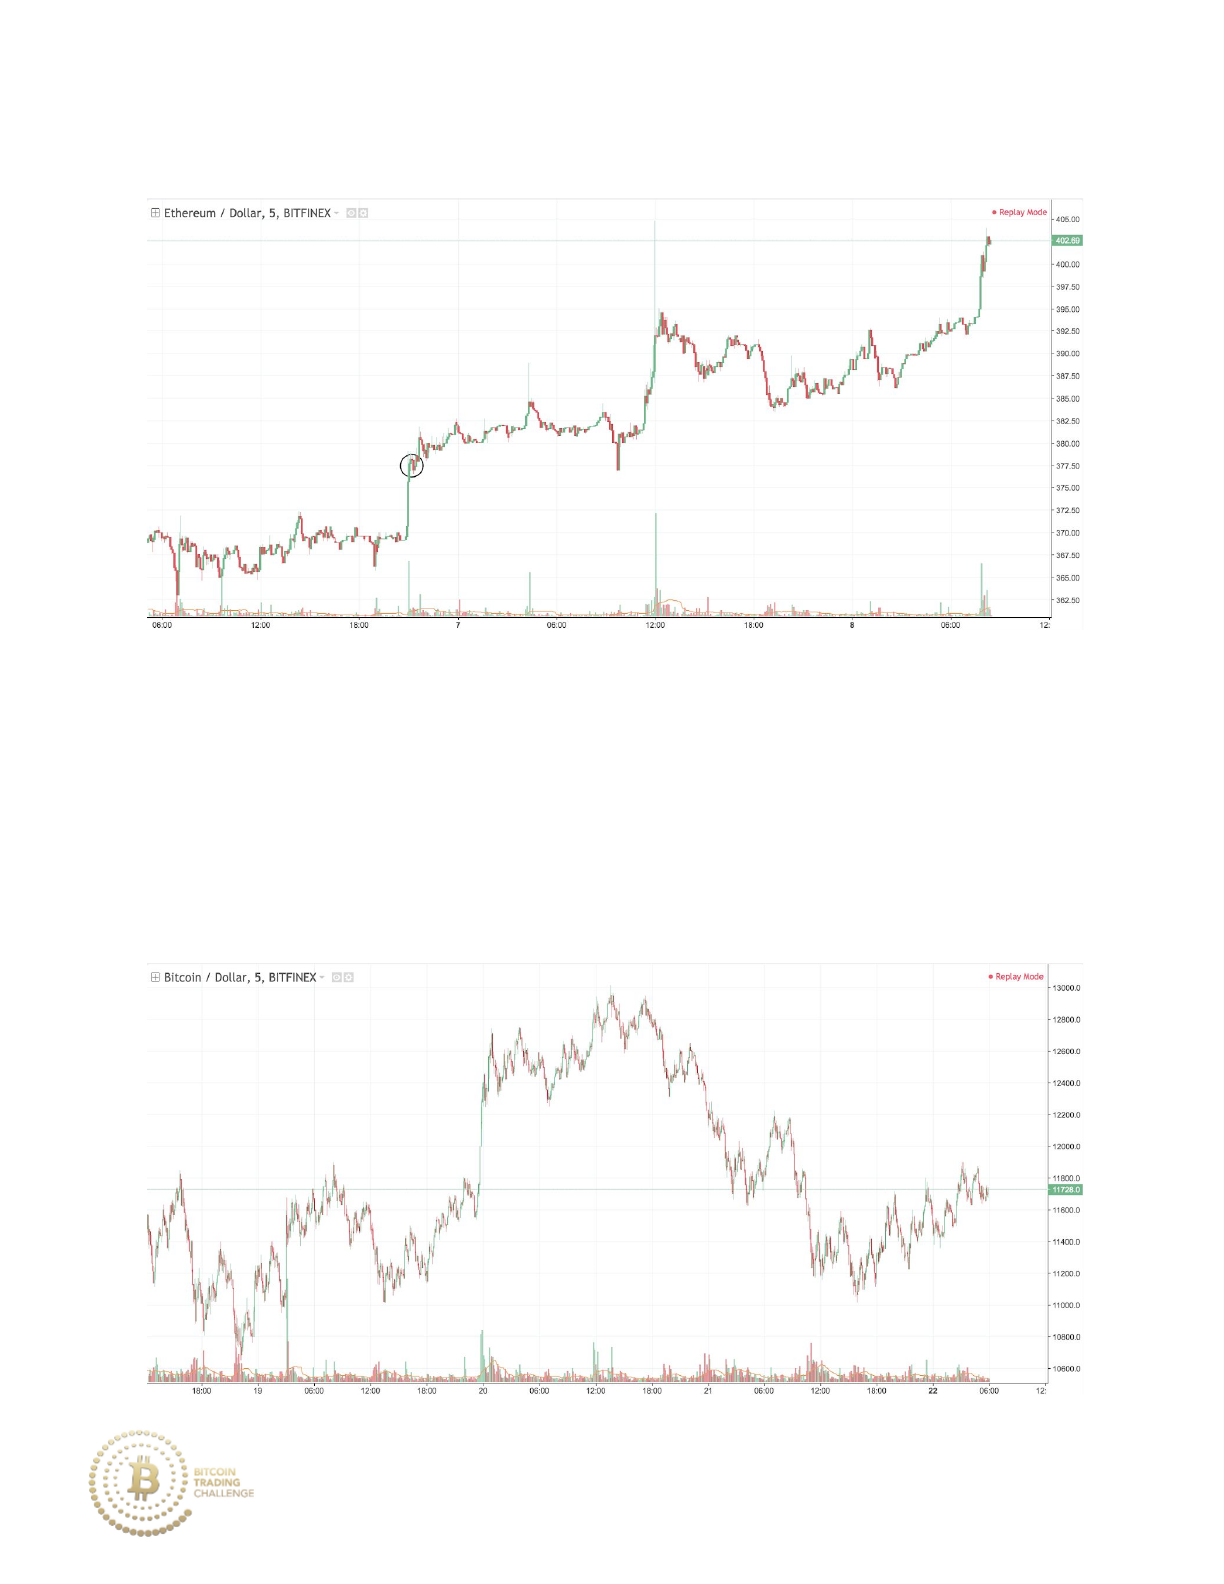
Practice 7-2 Answer
The bullish market stage emerges out of a prolonged stage of consolidation
(far left portion of the chart). When a period of low volatility is followed by a
period of high volatility, this typically means that price will continue in the
direction of high volatility.
Practice 7-3
199
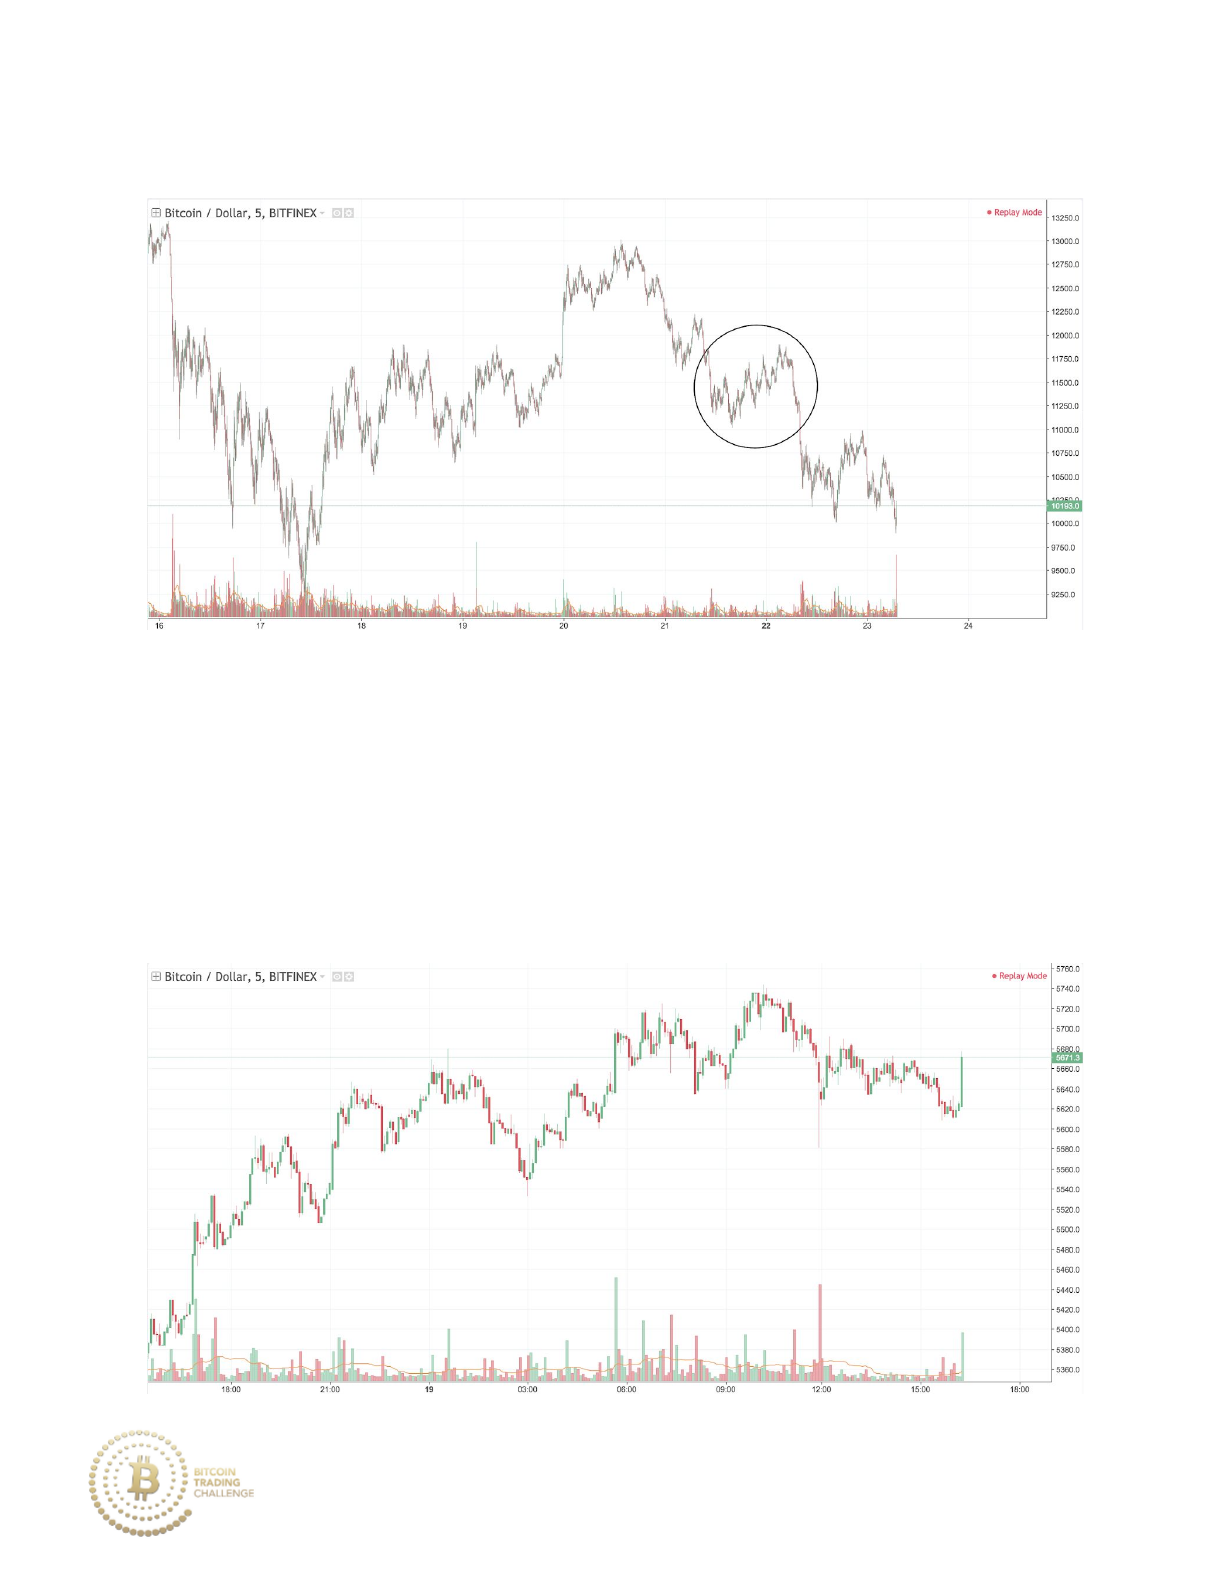
Practice 7-3 Answer
Price moves downward on strong momentum and we see a weak market
stage of a retracement. After price moves on low momentum and low
volume upward, price rapidly moves downward before breaking support on
high volume.
Practice 7-4
200
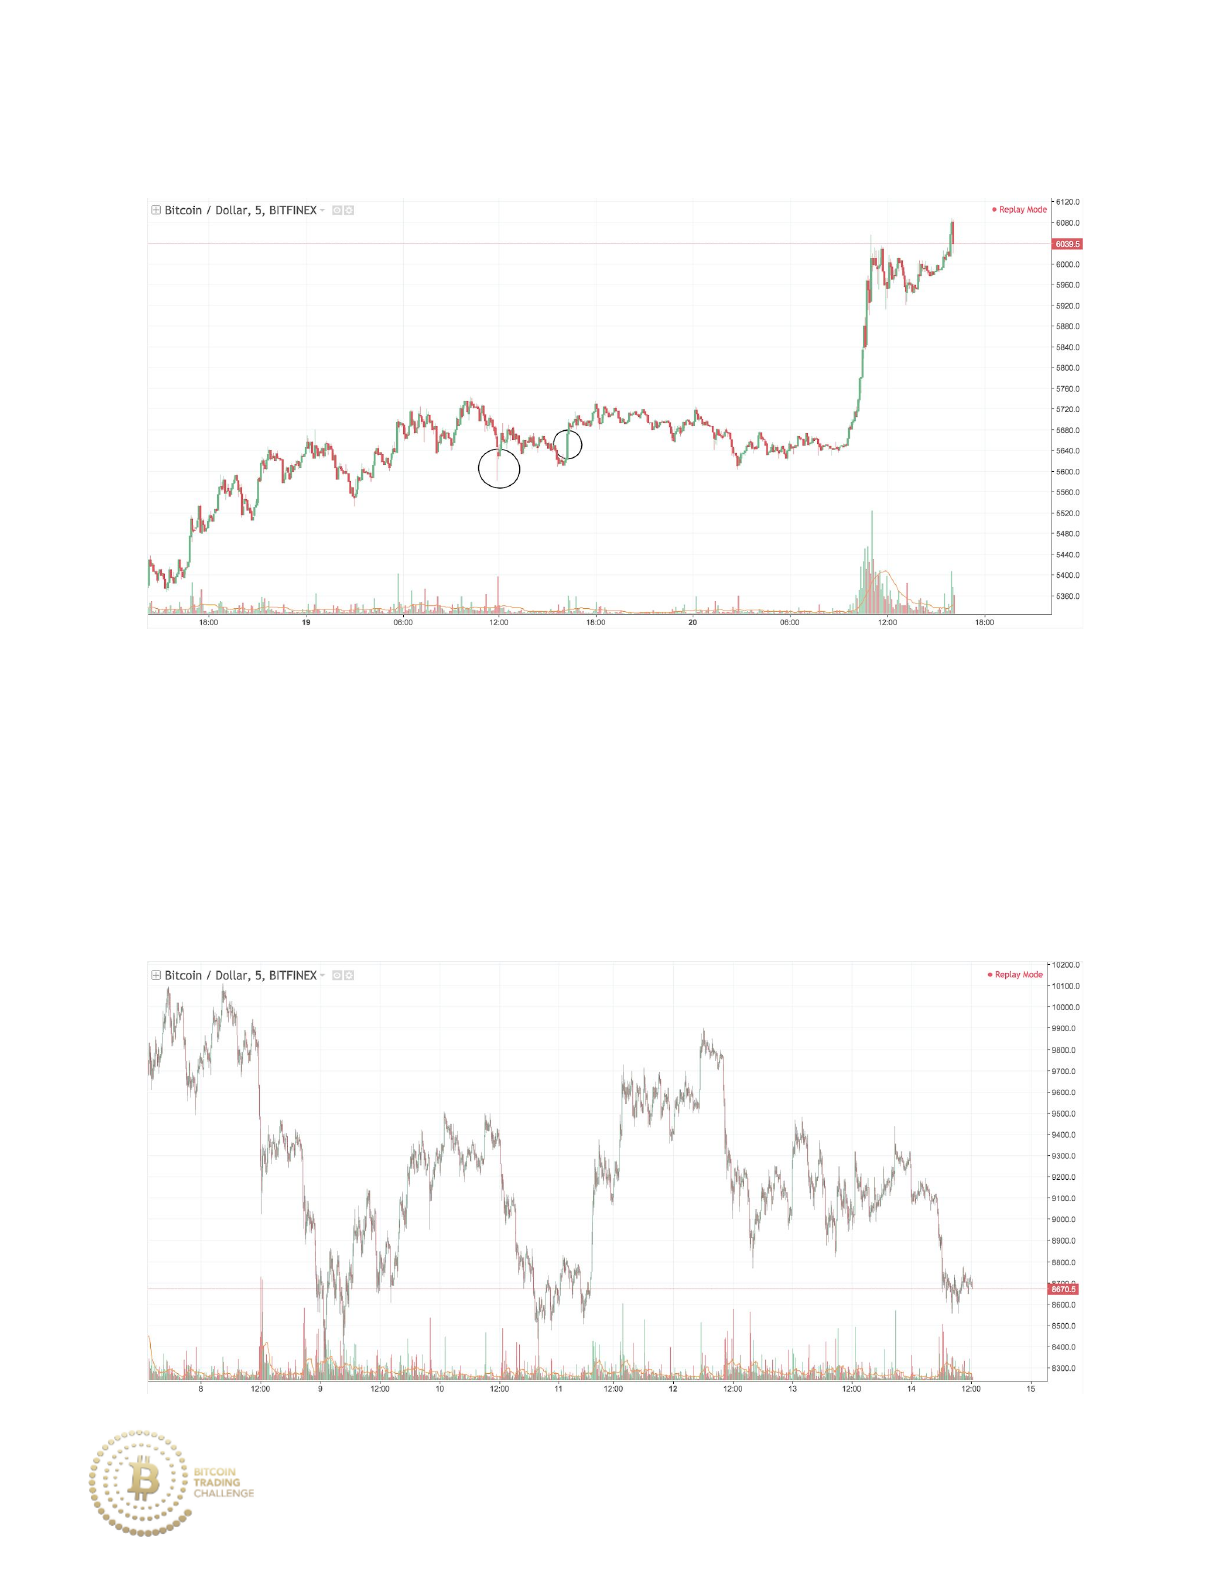
Practice 7-4 Answer
Price feints a move downward and creates a low tail before later responding
with a strong bullish momentum candlestick (the two circles respectively).
This is an example of a high volume tail acting as a reversal followed by
strong bullish follow-up, a popular pattern among Fibonacci price reversals.
Practice 7-5
201
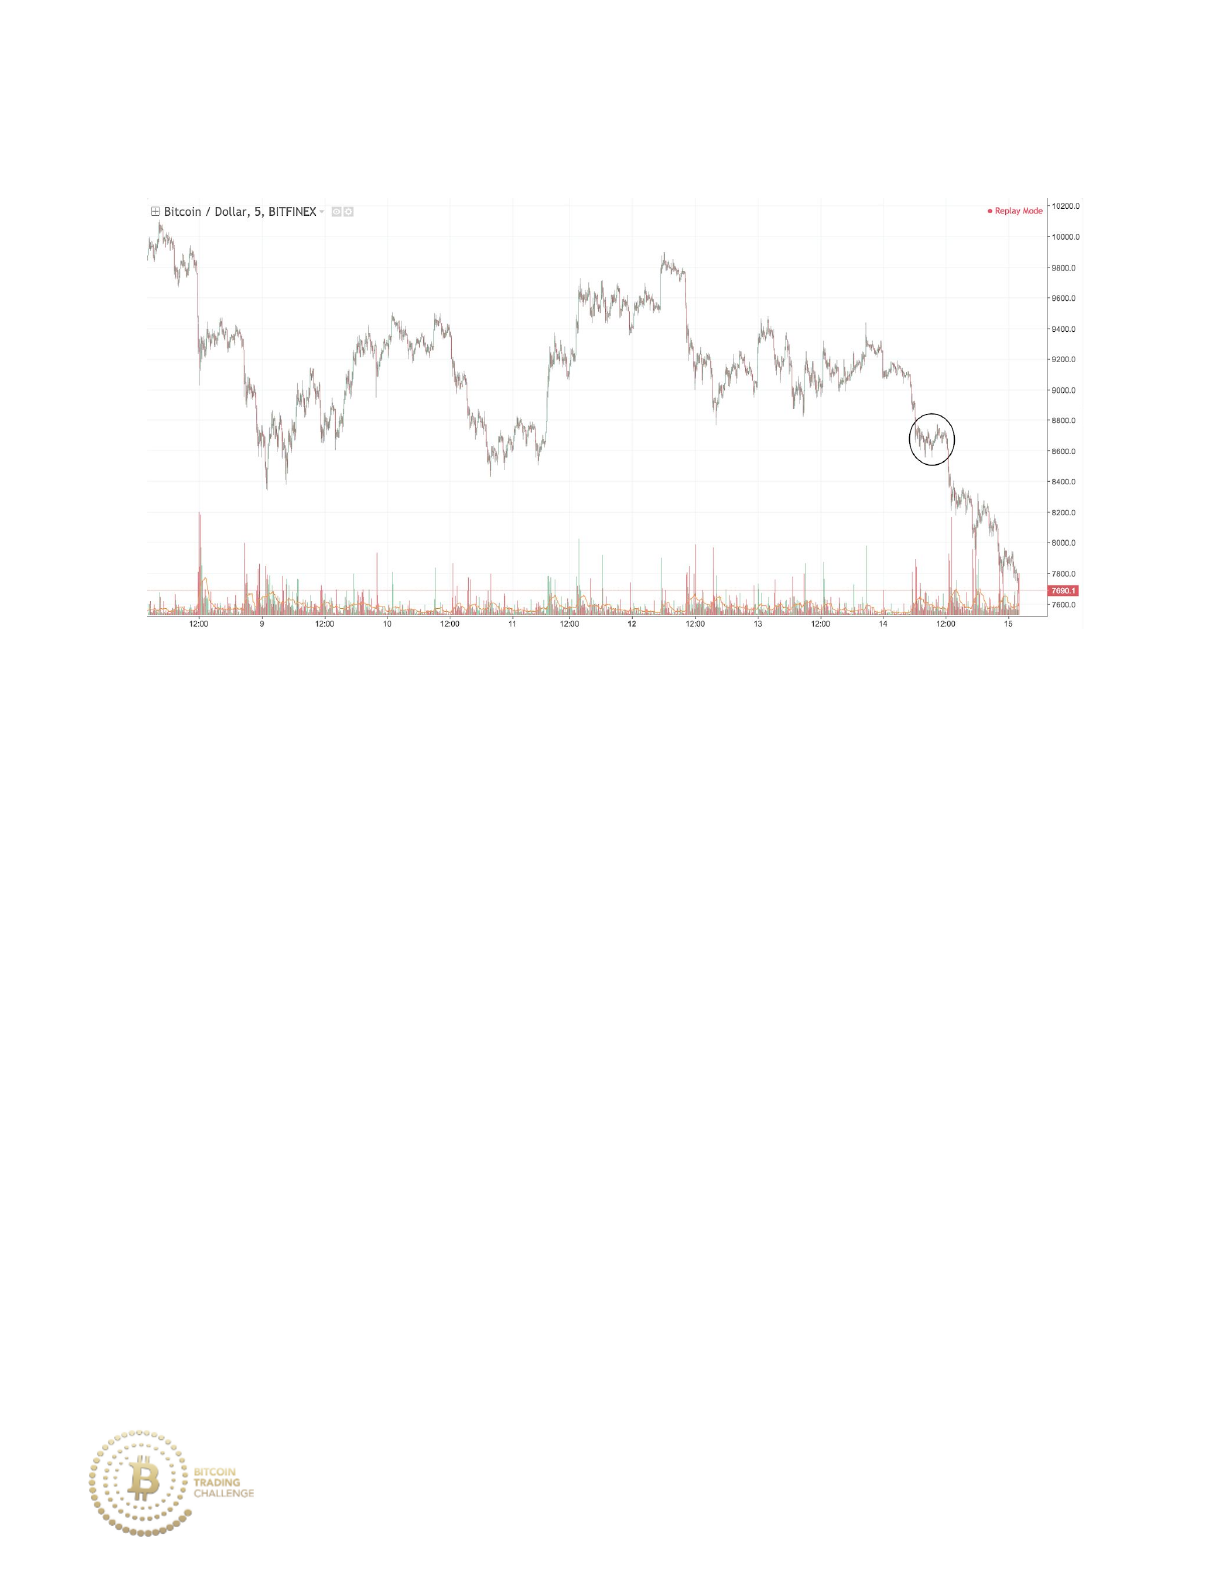
Practice 7-5 Answer
Price consolidates at a support level after a strong market stage of a
downtrend. During the downtrend, we see strong momentum and above
average volume as price continues to move lower. The market consolidating
at support after strong bearish momentum represents a sign of weakness
for that market, signaling that continued lows are likely.
Typically, tight consolidation patterns at support/resistance occur before
price moves beyond that support/resistance level.
1. Confluence Zone Practice
Within the five examples in this section, identify likely zones of high
confluence via the use of Fibonacci retracements and extensions. There
are multiple correct answers for this section that may go beyond the
202
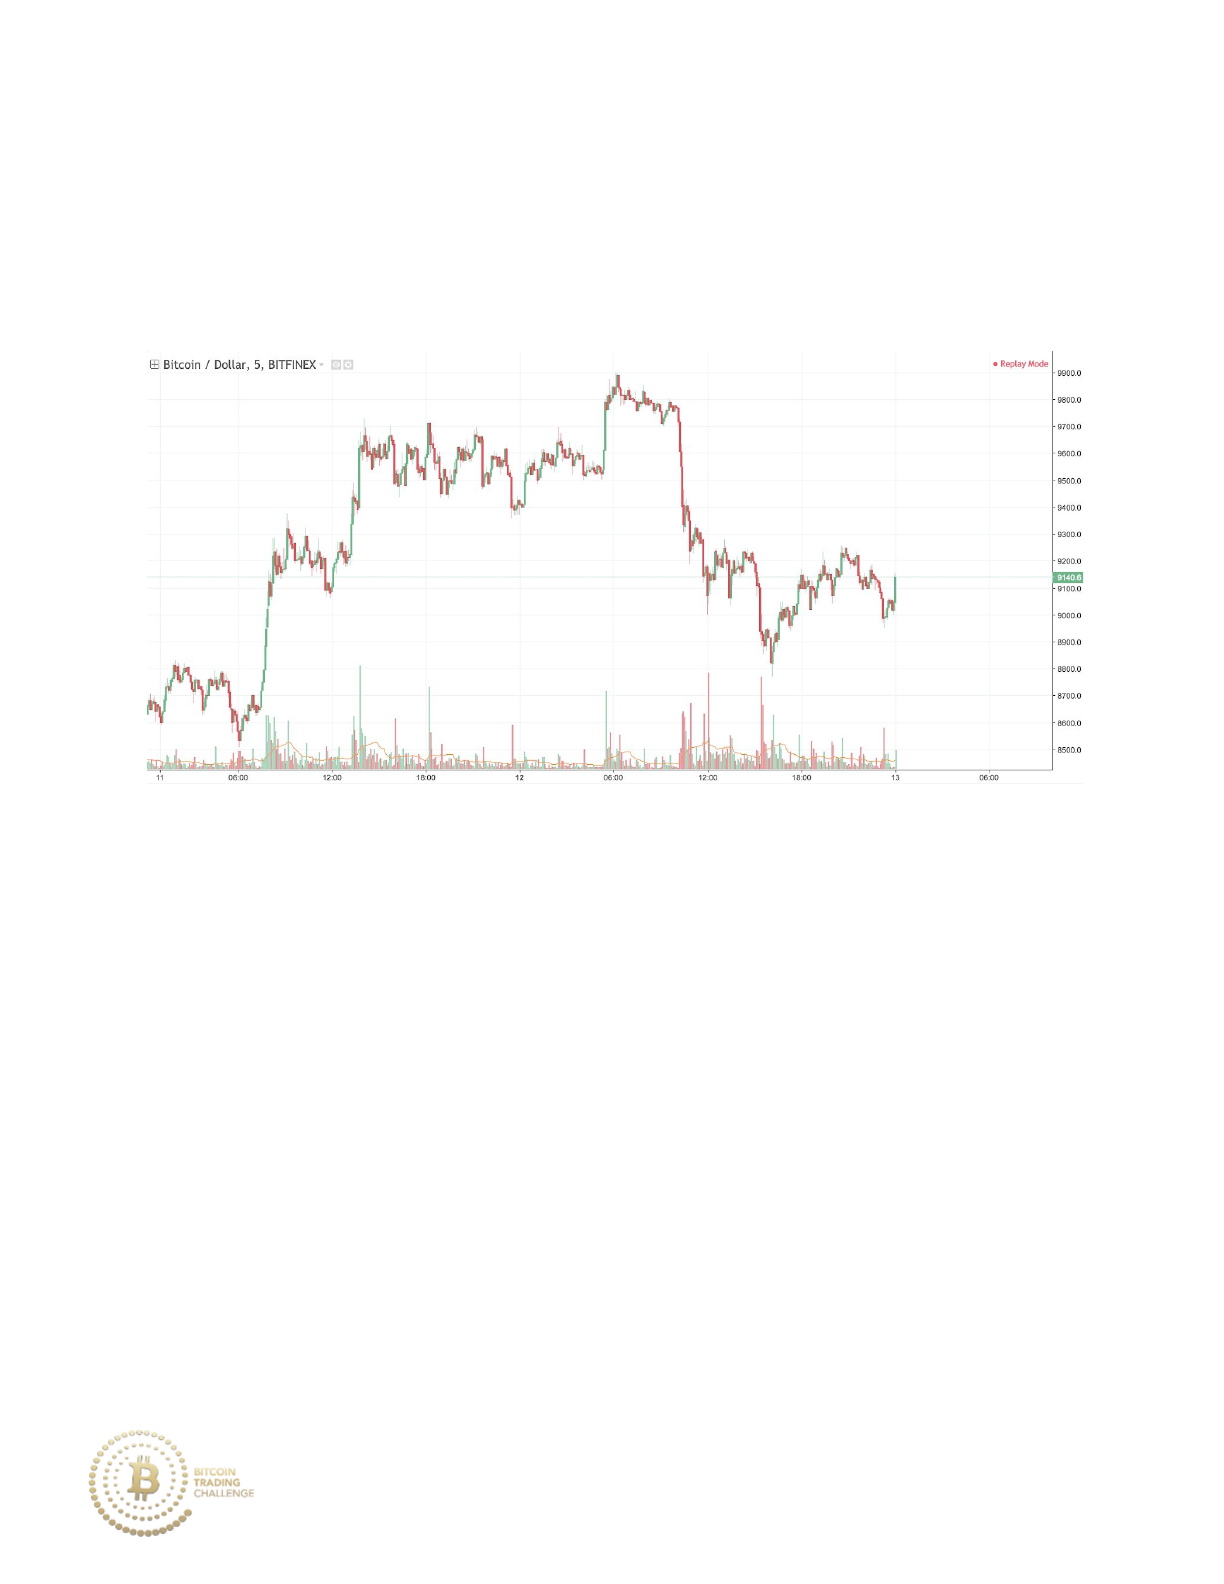
possible confluence zones listed. Identify the endpoints for which you
would use to draw your confluence zone(s).
Practice 7-6
Which endpoints would you use to draw a resistance confluence zone?
Identify a possible Fibonacci retracement and a bullish Fibonacci extension
(drawn from a high to a low).
203
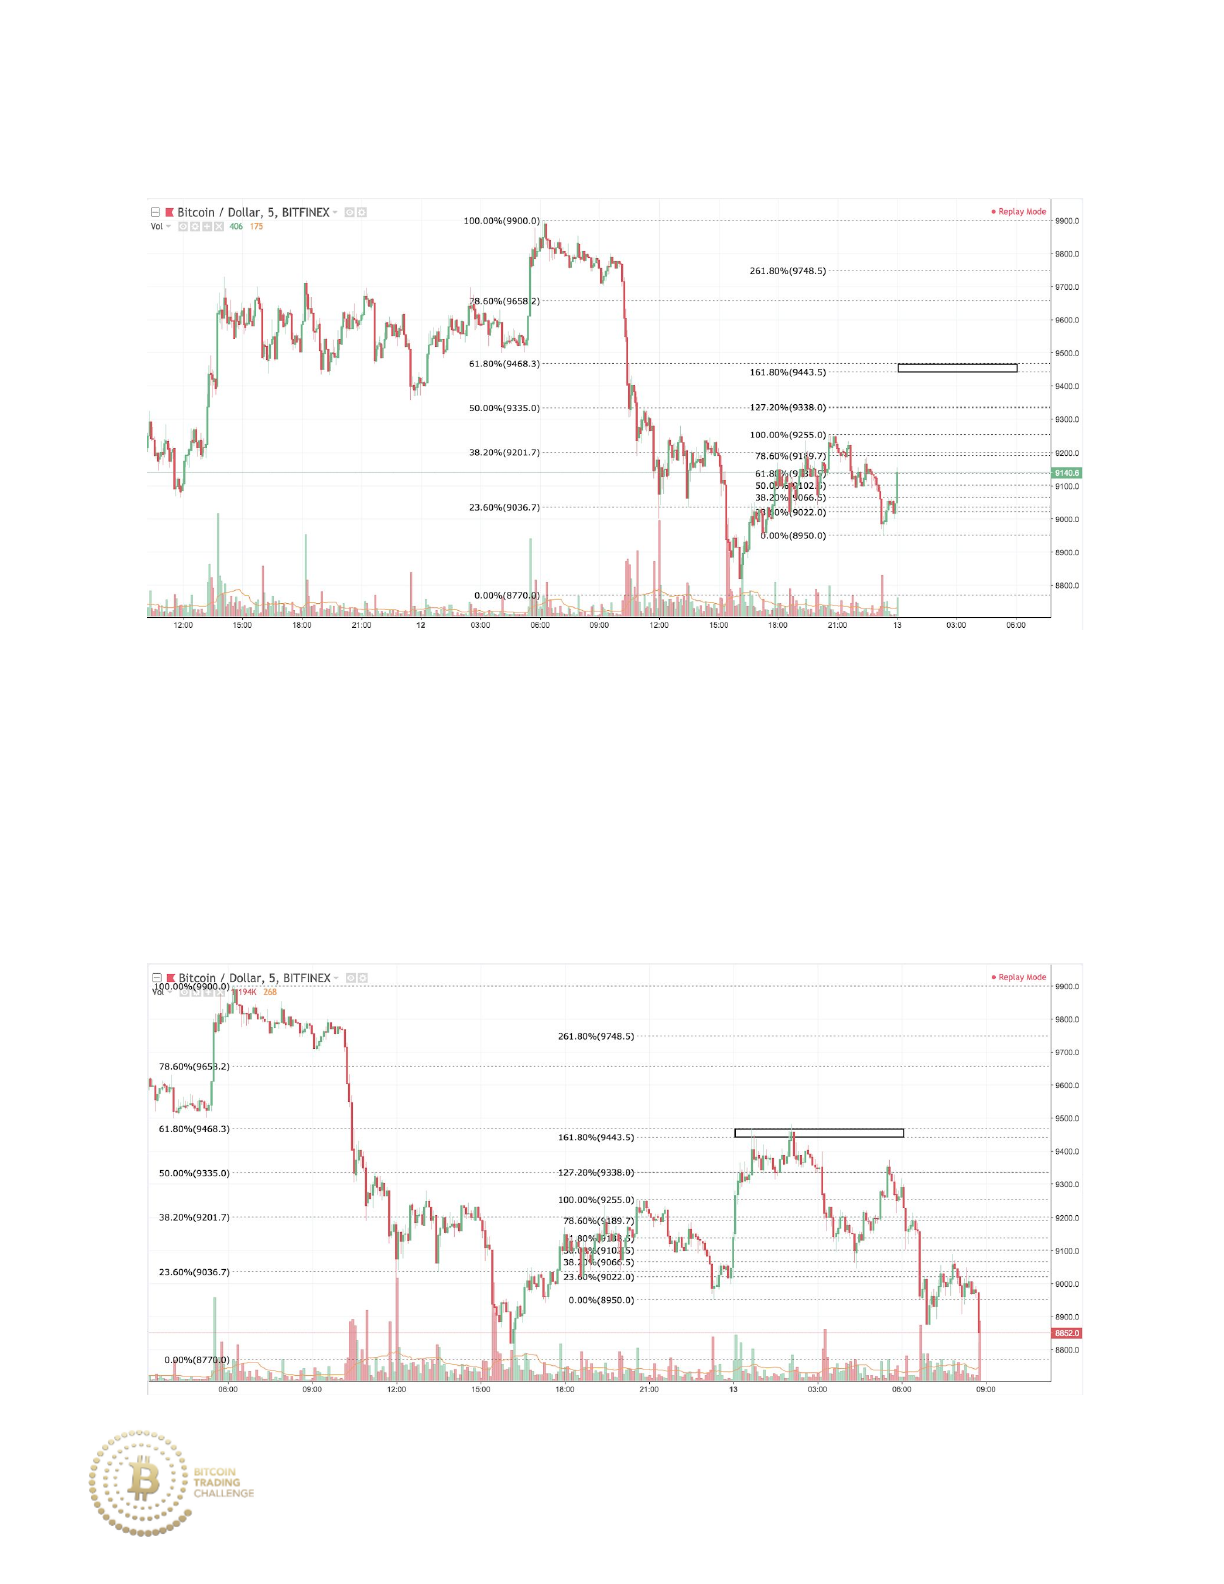
Practice 7-6 Answer
The confluence zone was drawn using the endpoints from the recent high
down to the low of the downtrend, as well as a Fibonacci extension from the
recent retracement from 9255 to 8950.
Practice 7-6 Outcome
204
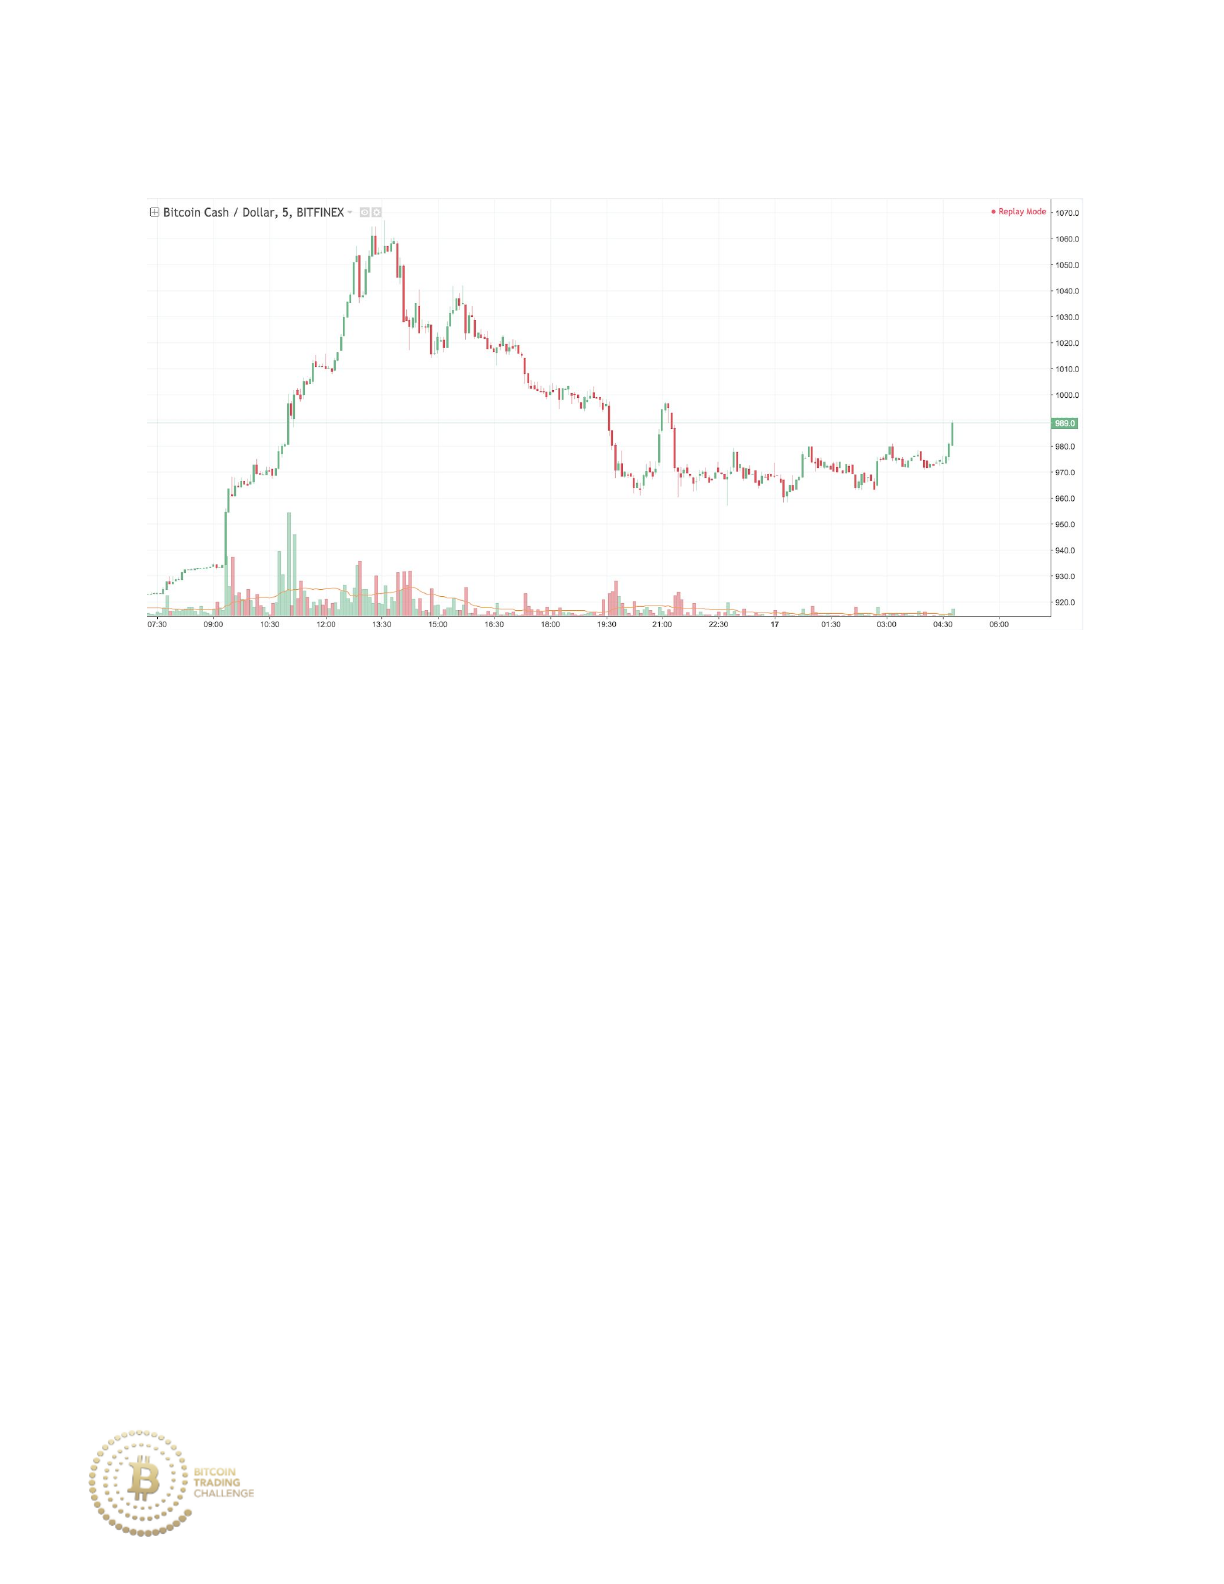
Practice 7-7
Which endpoints would you use to draw a resistance confluence zone?
Identify a possible Fibonacci retracement and a bullish Fibonacci
extension. (Identifying the endpoints for the Fibonacci extension may be
tough here).
205
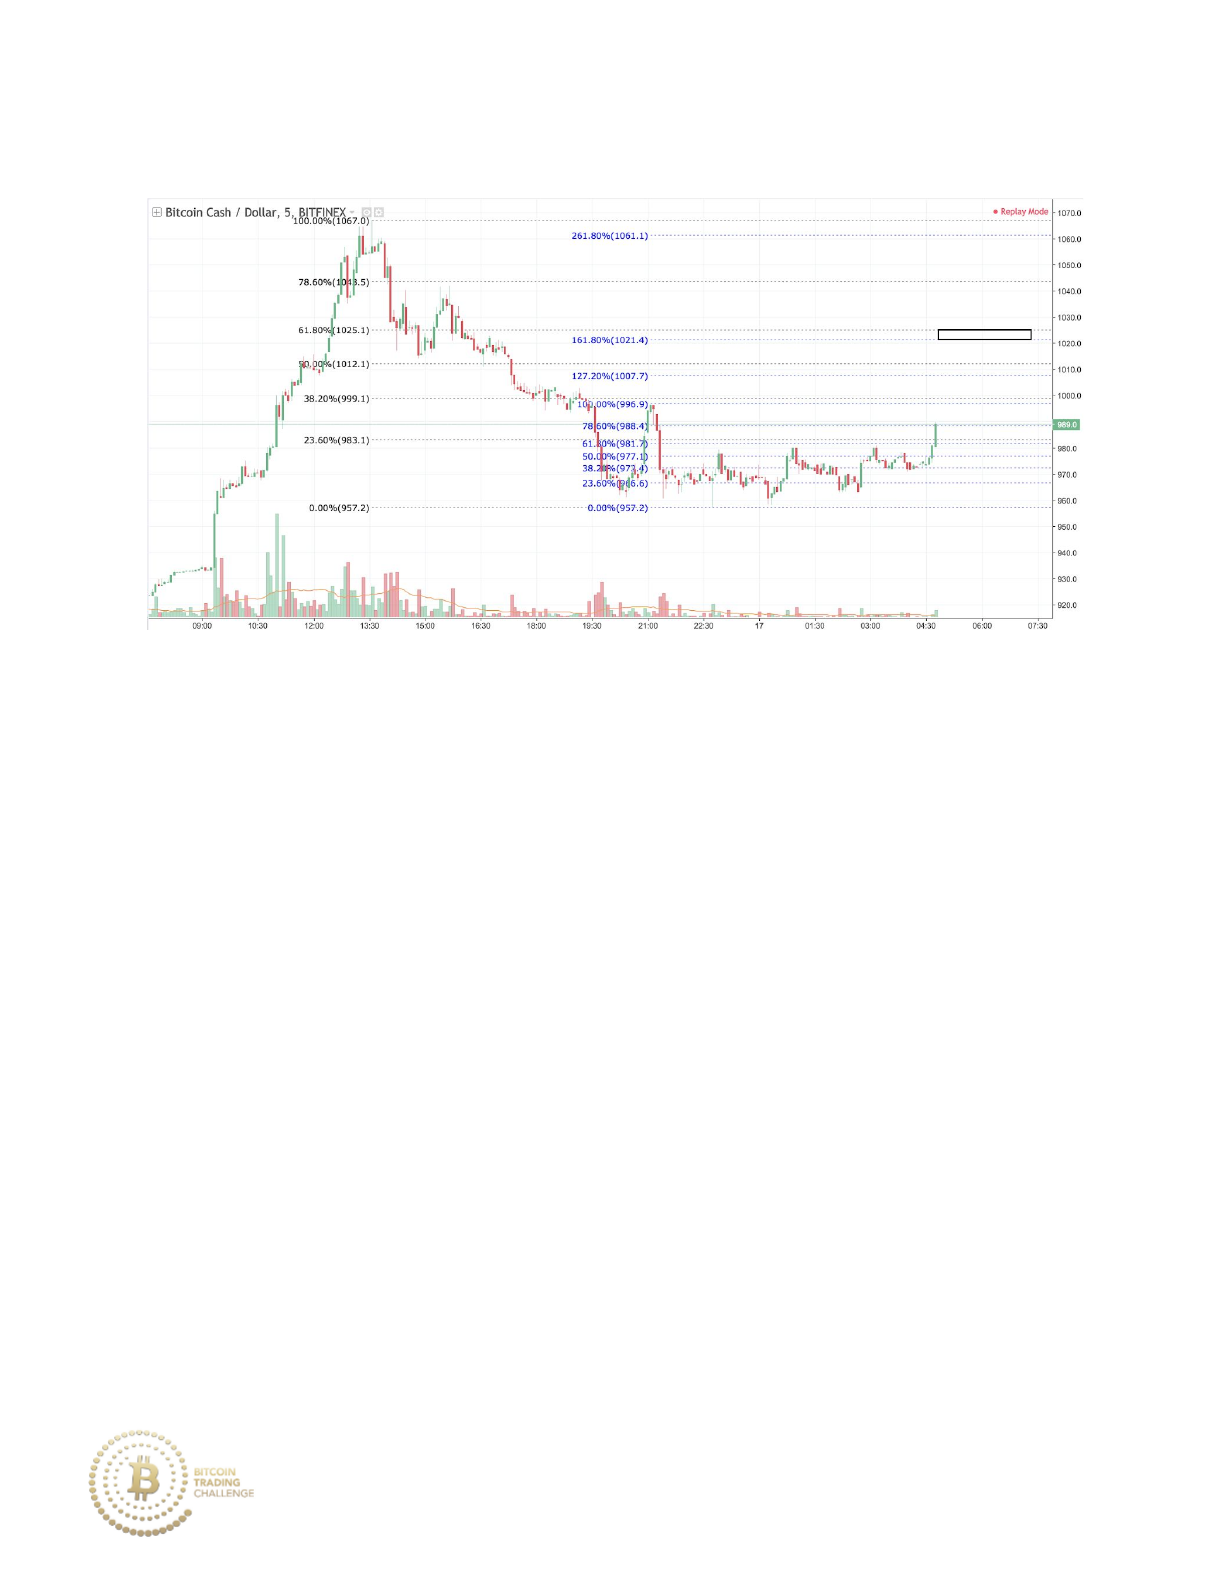
Practice 7-7 Answer
The confluence zone was drawn by identifying the recent high at 1067 drawn
down to the absolute low at 957.2 in a Fibonacci retracement (black
Fibonacci). The Fibonacci extension (blue Fibonacci) was drawn by using the
spike upward to 996.9 drawn downward to the same absolute low at 957.2.
The 61.8% and 161.8% overlap in a similar area, suggesting a potential
strong resistance zone.
206
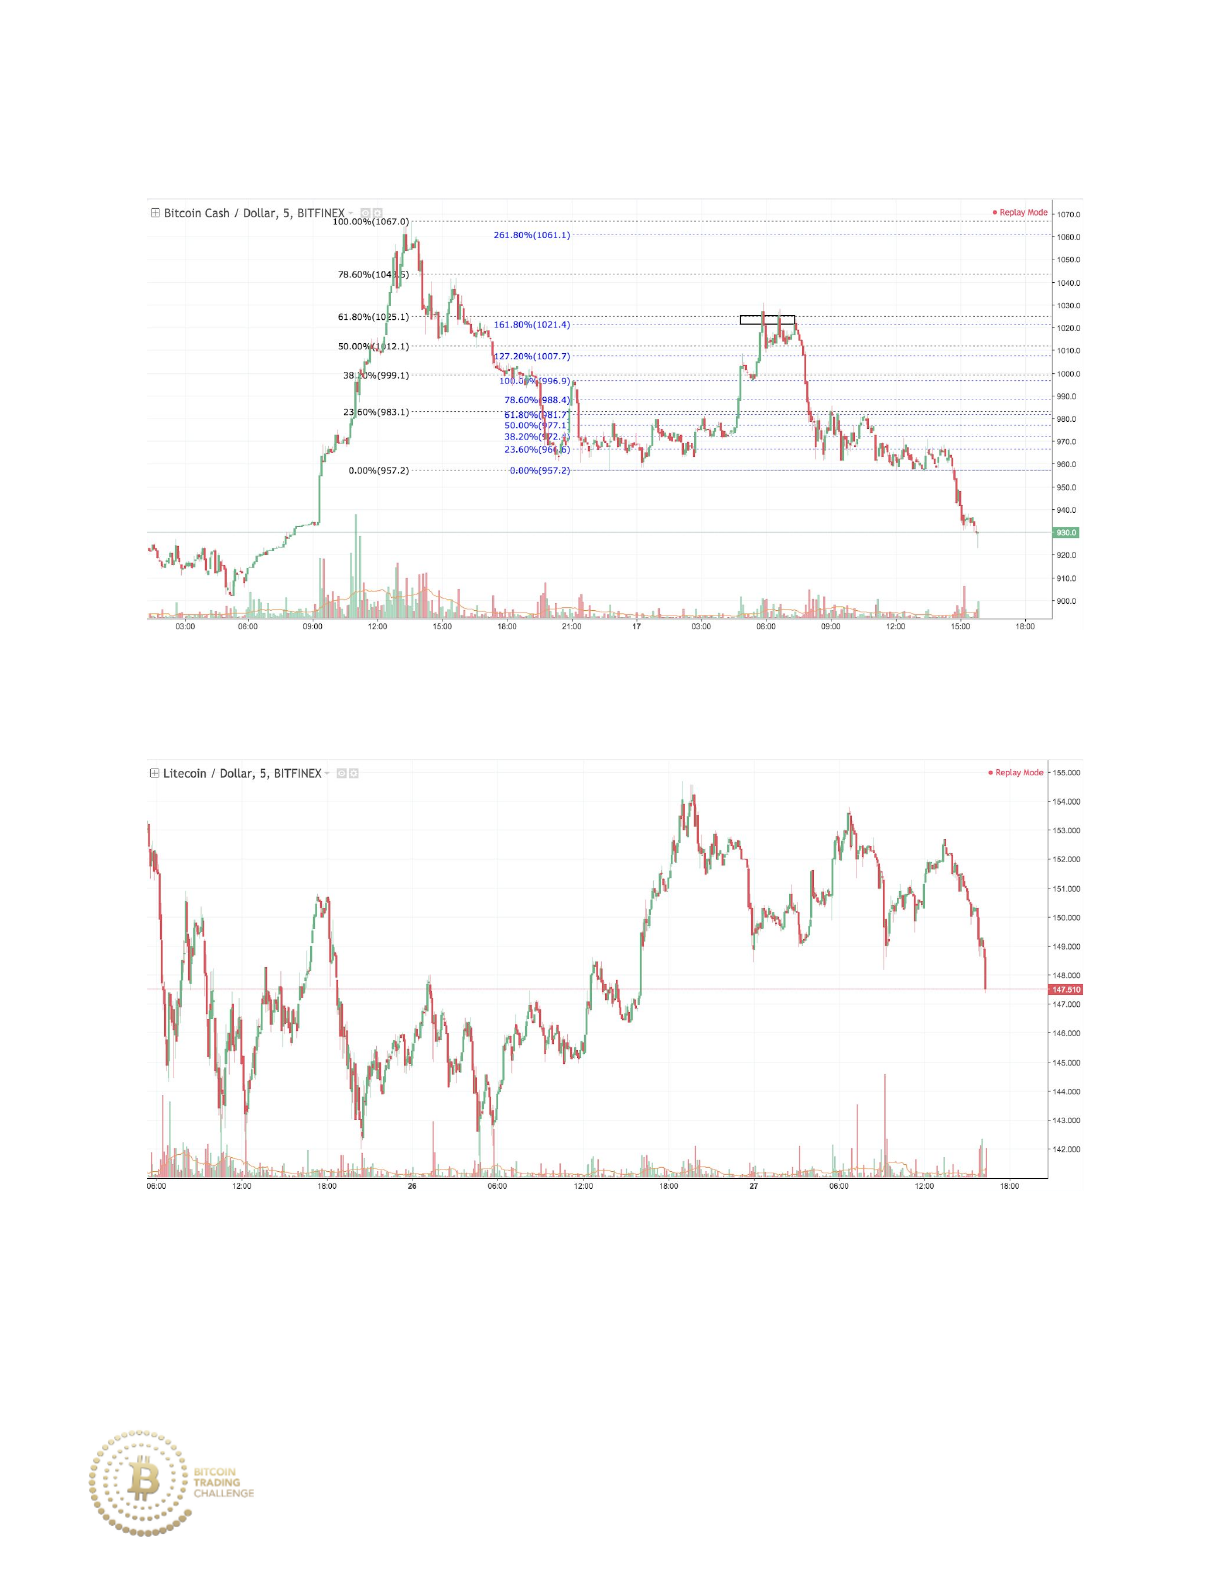
Practice 7-7 Outcome
Practice 7-8
Which endpoints would you use to draw a support confluence zone? Select
a possible Fibonacci retracement and two bearish Fibonacci extensions.
Hint: Identify the two major bullish moves against the current downtrend to
draw the Fibonacci extensions.
207
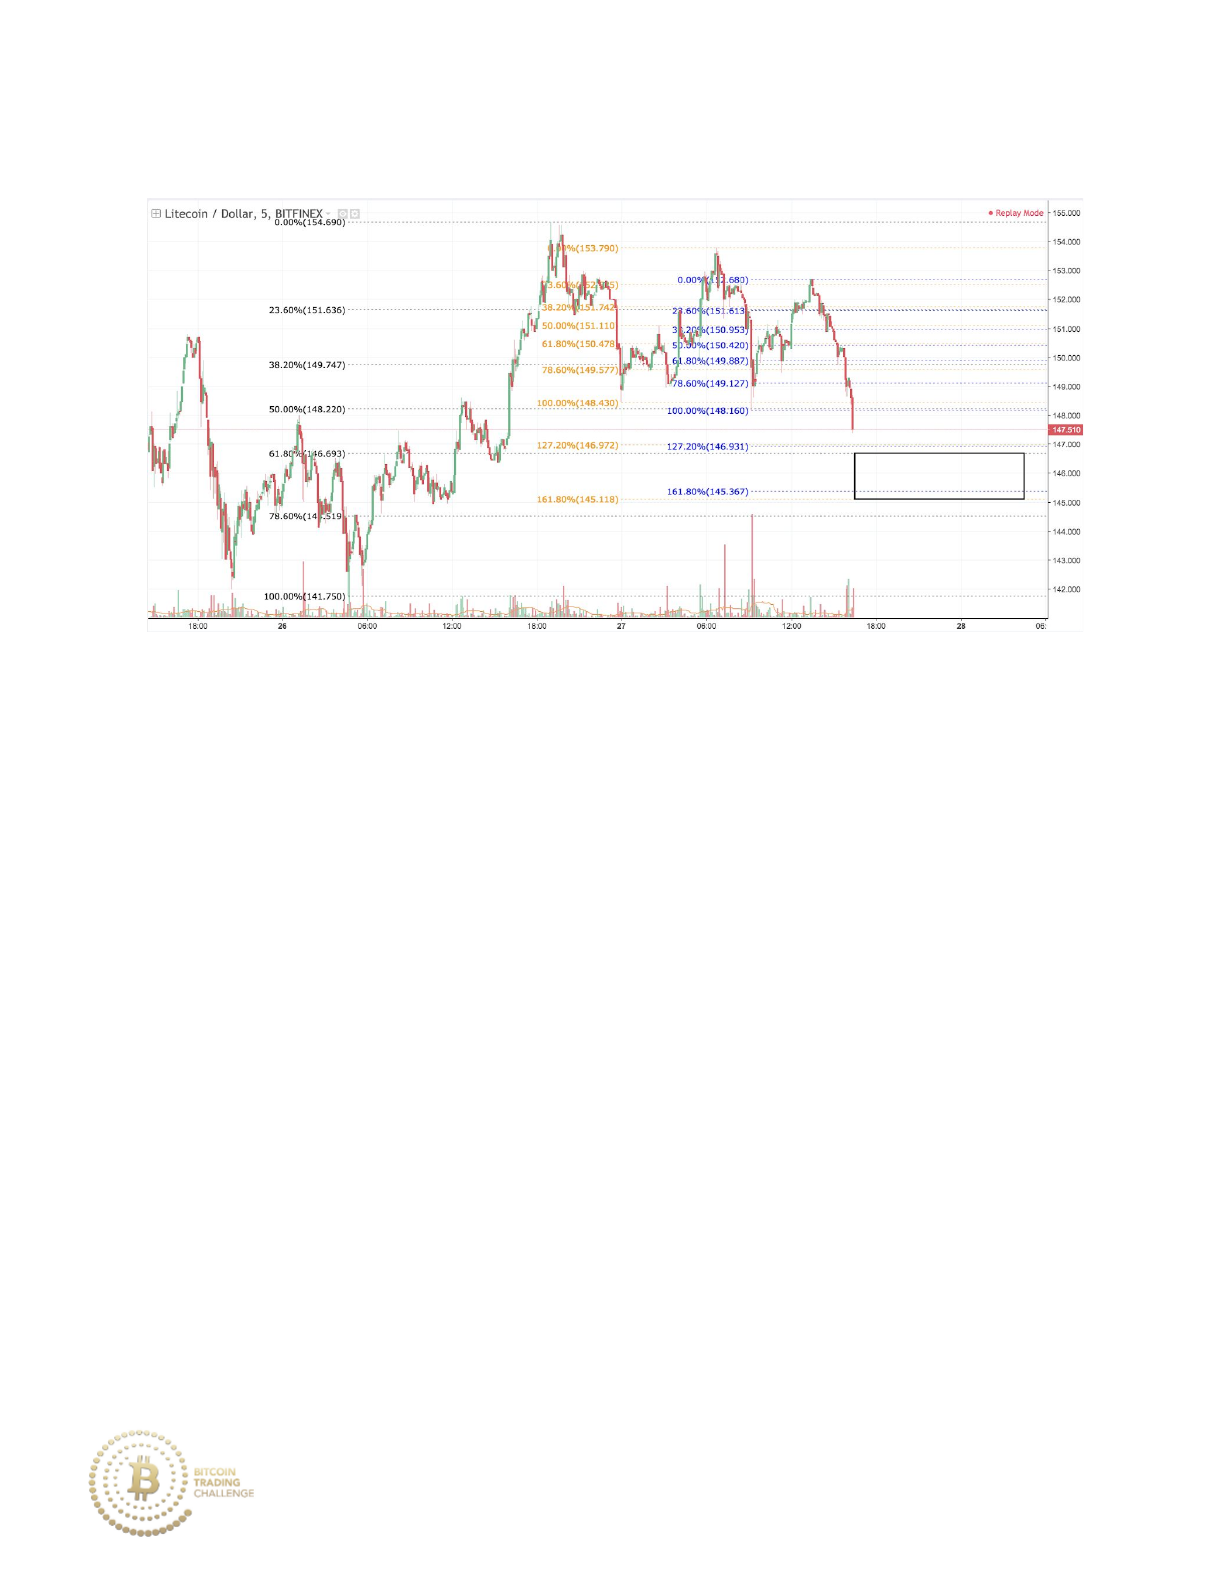
Practice 7-8 Answer
The confluence zone was drawn with a combination of a Fibonacci
retracement and two Fibonacci extensions, drawn off of the retracements.
The black Fibonacci retracement was drawn using the recent low at 141.75
up to the high at 154.69 to encapsulate the start to finish of the uptrend.
Price then weakly retraces (weak bearish movement as there is consistent
bullish pullback throughout the retracement) with two major bull moves
against the trend. Drawing Fibonacci extensions off of these two bull moves
yields a tight zone of confluence between the two 161.8% extensions, which
is in the price territory of the 61.8% to 78.6% retracement zone.
Practice 7-8 Outcome
208
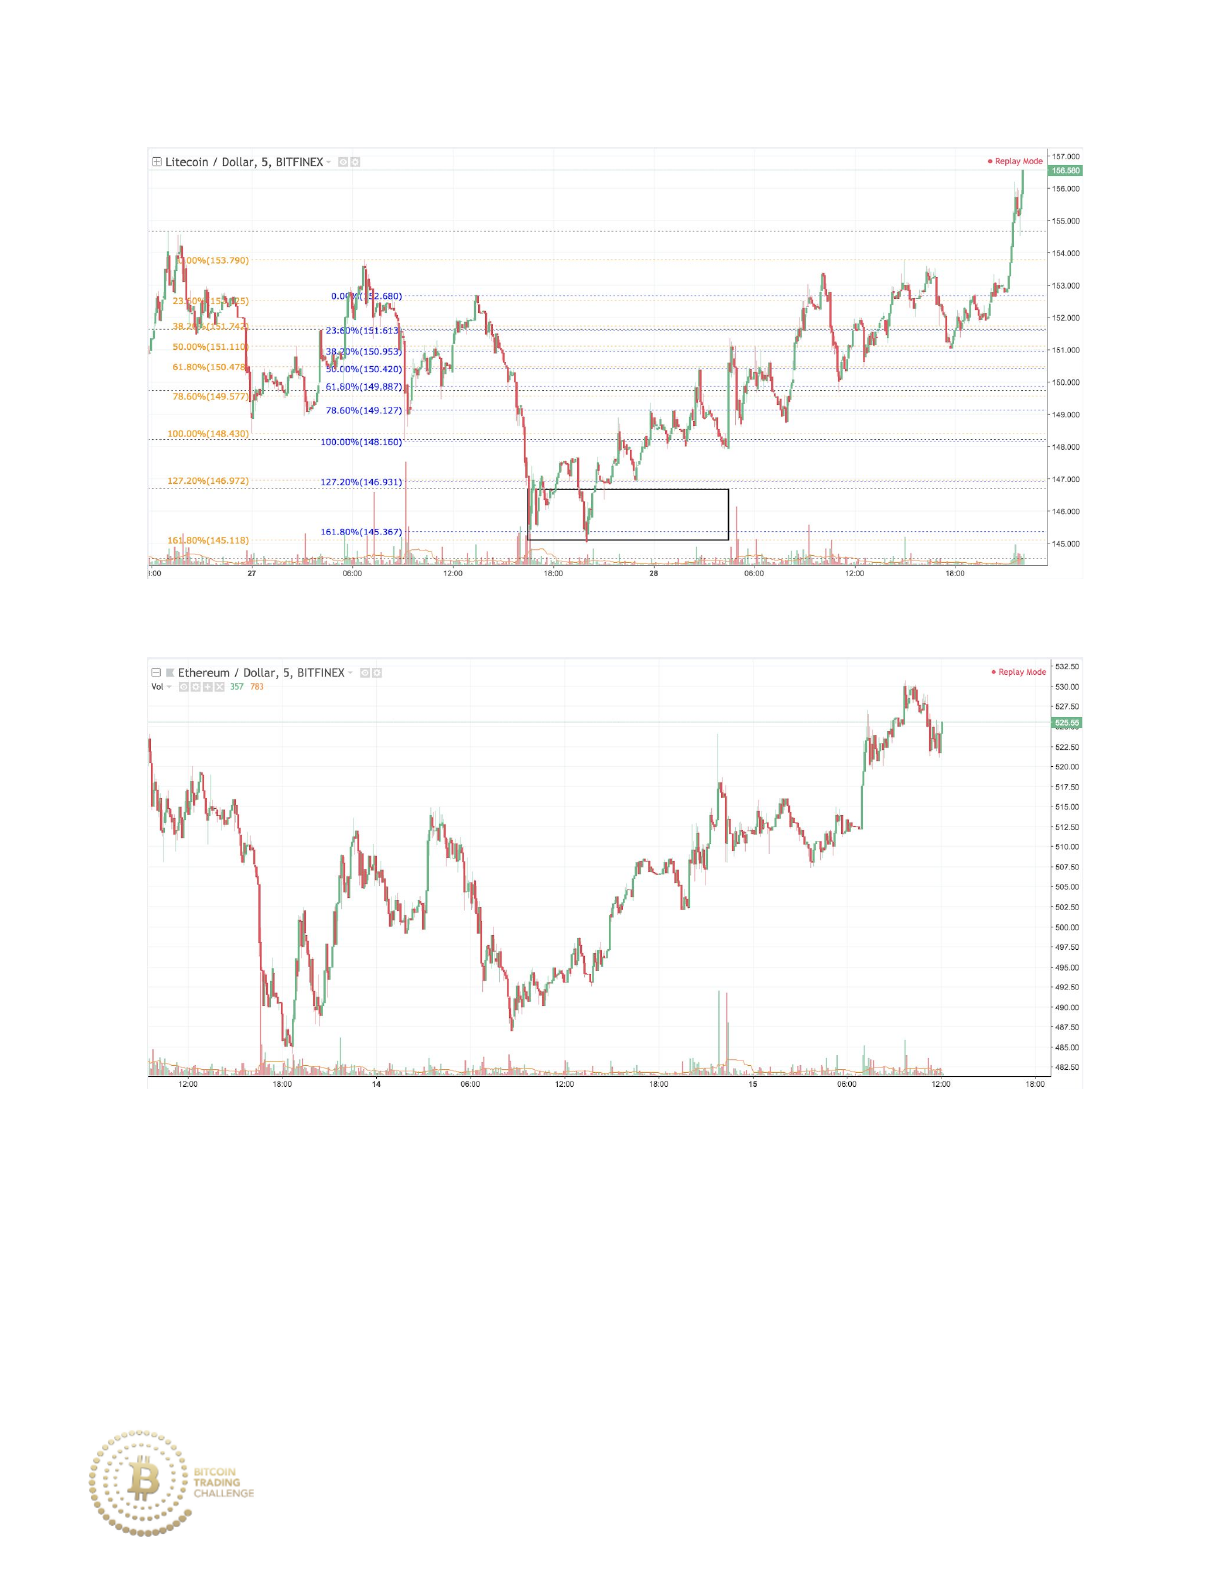
Practice 7-9
Which endpoints would you use to draw a resistance confluence zone?
There is no possibility in this chart to draw a Fibonacci retracement (as we
are projecting future areas to sell), rather, there are 3 bullish Fibonacci
extensions that you can draw to generate a confluence zone for a major
resistance area. Hint: Identify the retracements against the current uptrend
in the chart.
209
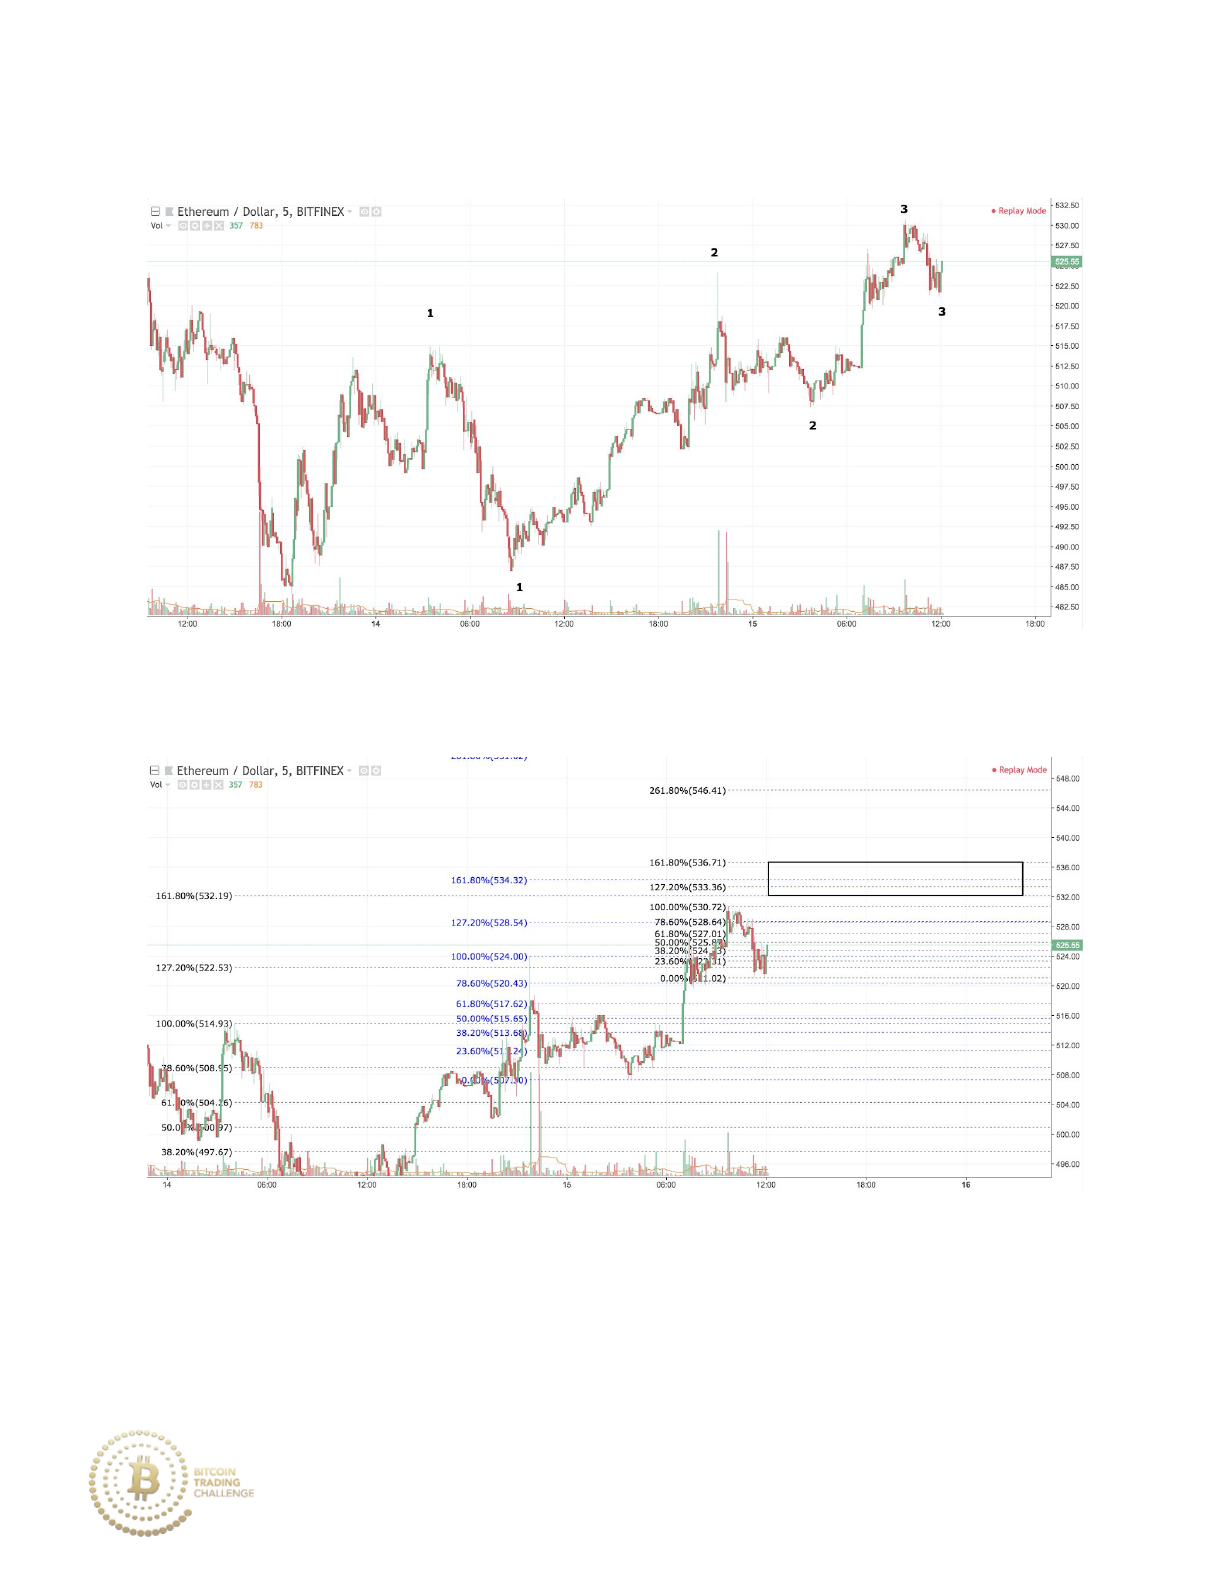
Practice 7-9 Answer
Shown above are the three major retracements against the bullish trend.
Shown above is the confluence zone, drawn from 532 - 537, created by the
overlap of the 161.8% Fibonacci extensions.
210
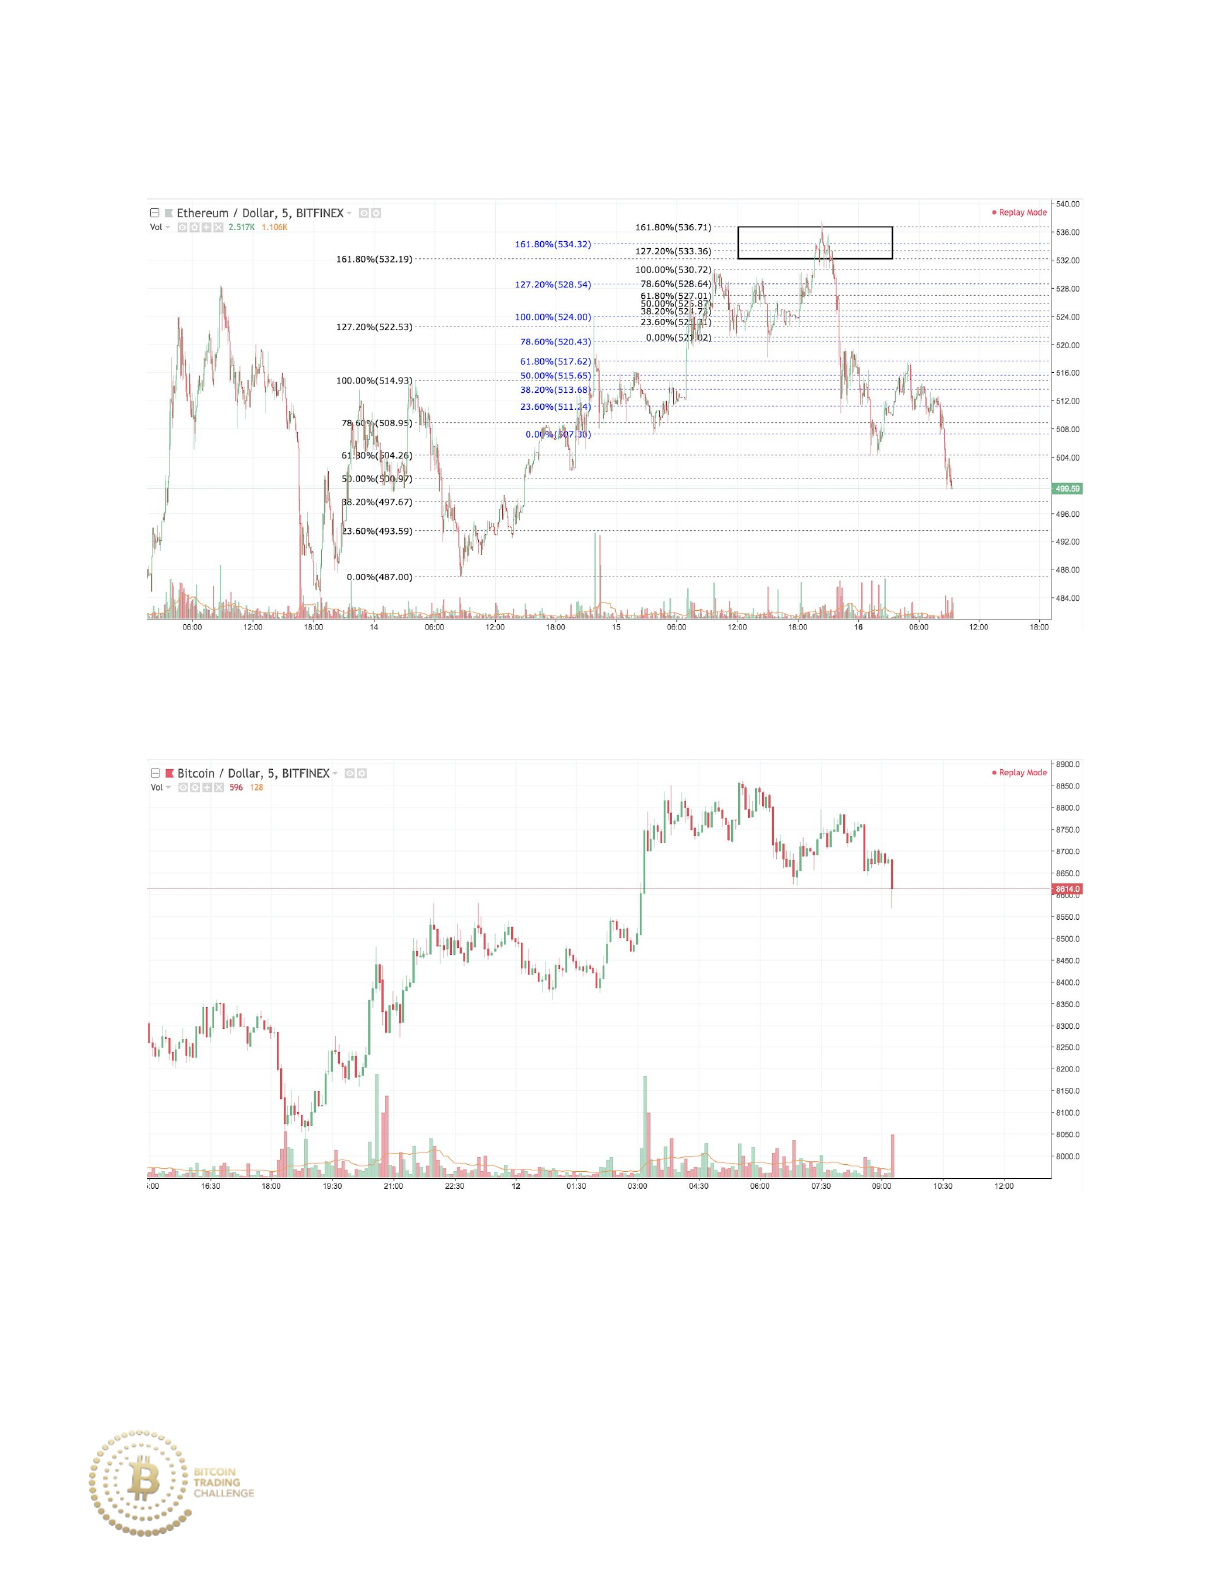
Practice 7-9 Outcome
Practice 7-10
Which endpoints would you use to draw a support confluence zone?
Identify two possible Fibonacci retracements that could be drawn and one
possible bearish Fibonacci extension.
211
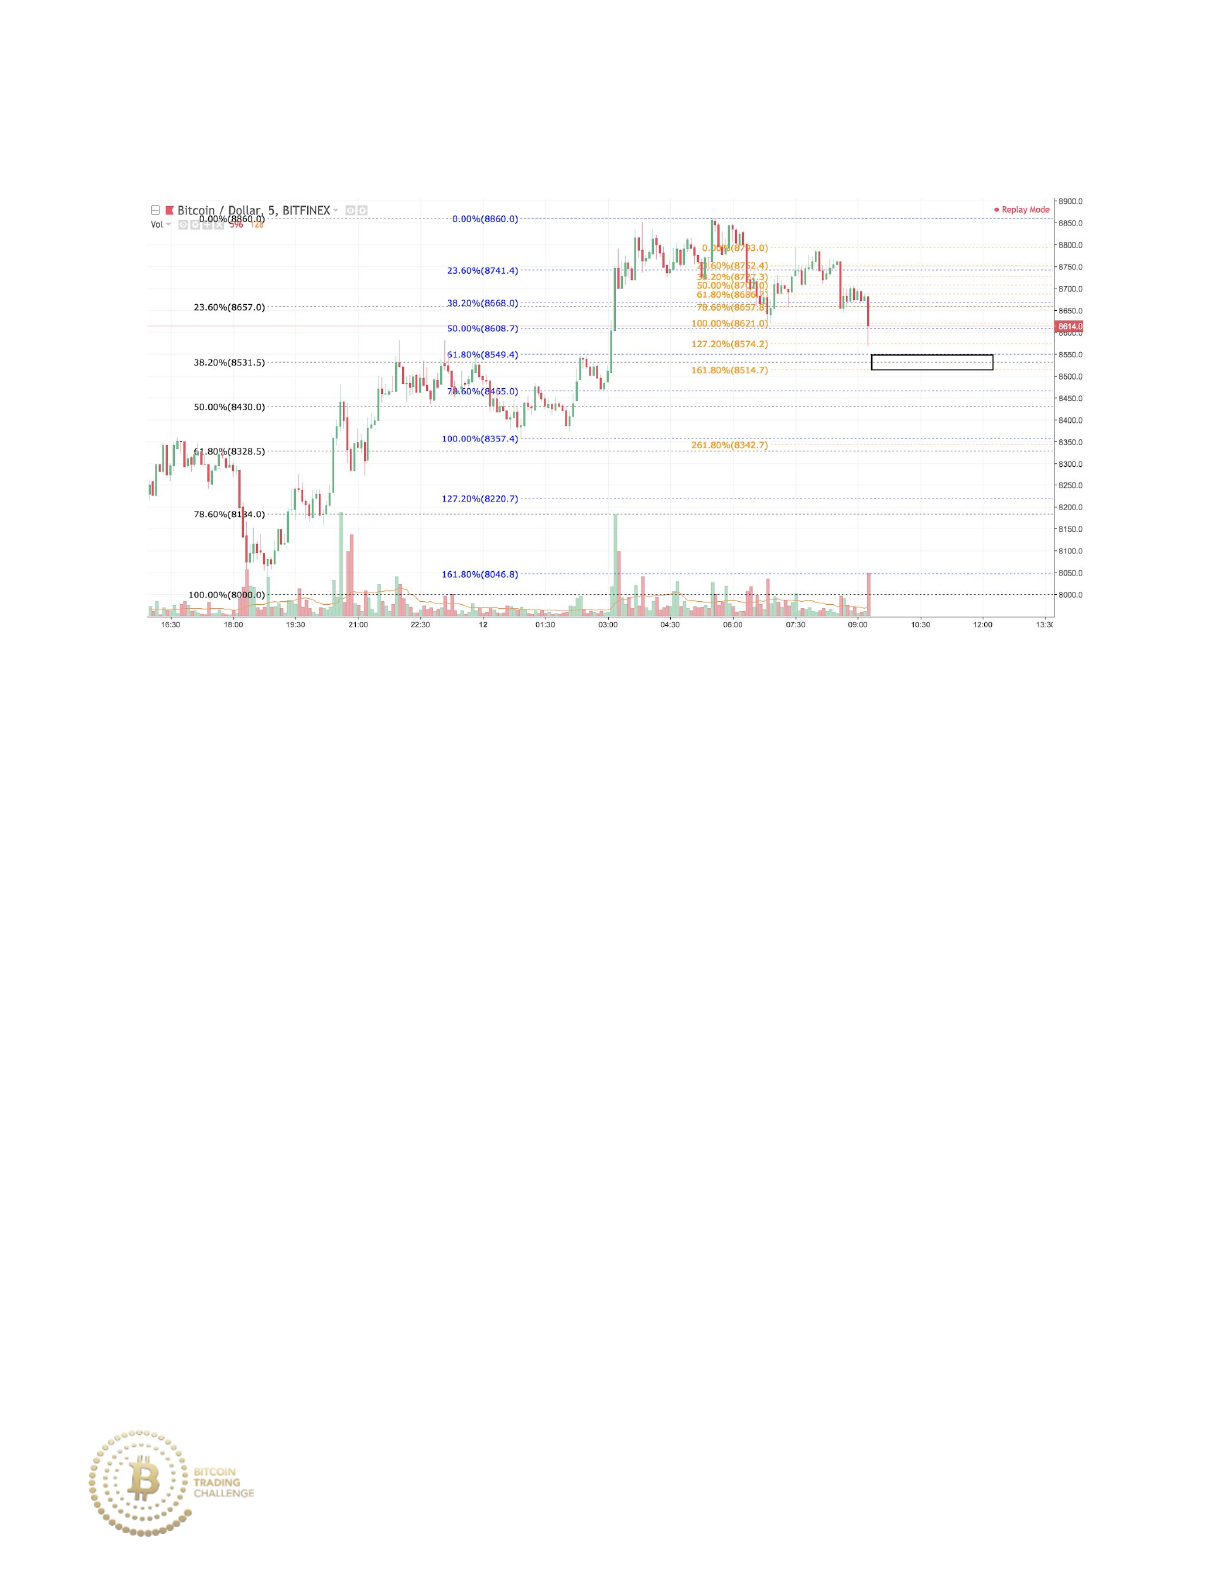
Practice 7-10 Answer
The two Fibonacci retracements drawn in the chart share the same endpoint
for the high, but use two different endpoints for the low. The base of the
uptrend at 8000 (black Fibonacci) gives the first endpoint for the overall
uptrend. The endpoint at 8357.4 (blue Fibonacci) gives the endpoint for the
low. The Fibonacci extension (orange Fibonacci) yields the 161.8% extension
for a possible support area, and was drawn off of the retracement from 8621
to 8793. Altogether, the confluence zone itself is drawn from the 61.8% of
the minor uptrend down to the 161.8% Fibonacci extension drawn off of the
bearish retracement with added confluence of the 38.2% retracement of the
major uptrend.
212
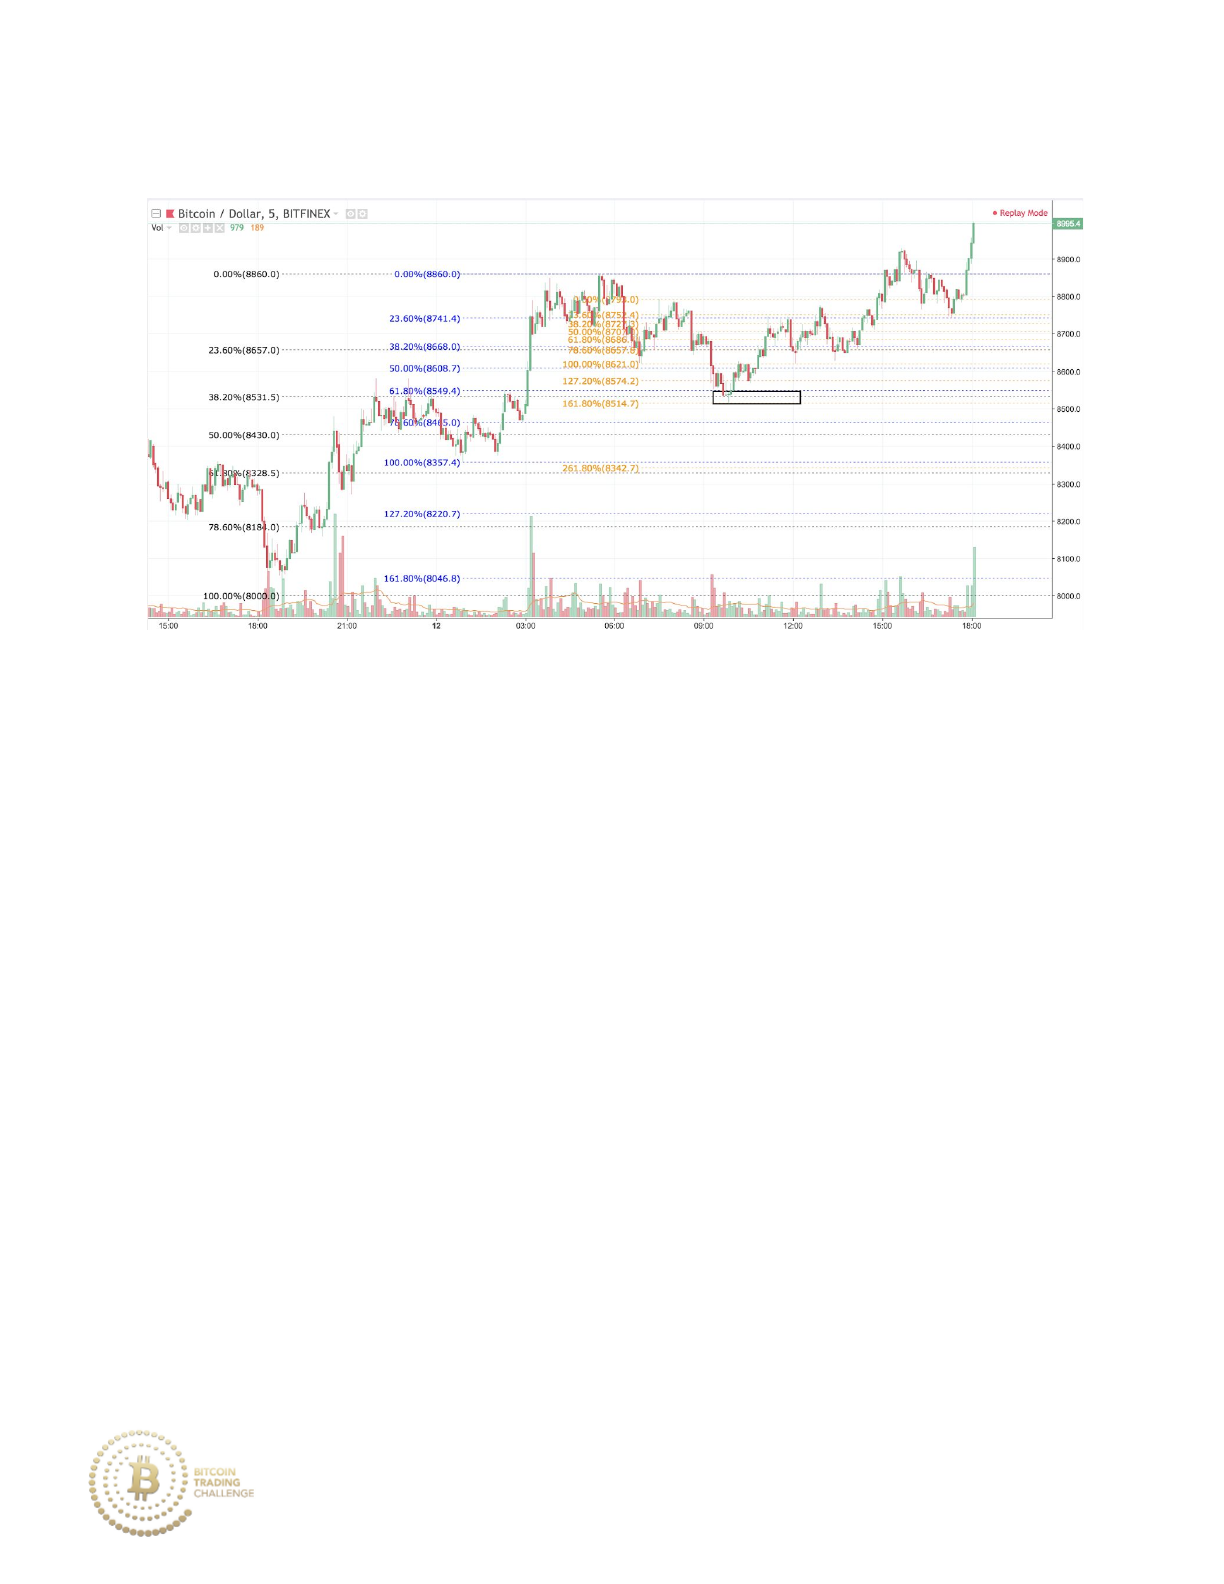
Practice 7-10 Outcome
2. Trade Entry Practice
Within the five examples in this section, identify the price that you would
place your entry buy/sell order at (or, alternatively, decide to not take the
trade at all). Take into account market momentum, volume patterns, and
Fibonacci retracements/extensions.
213
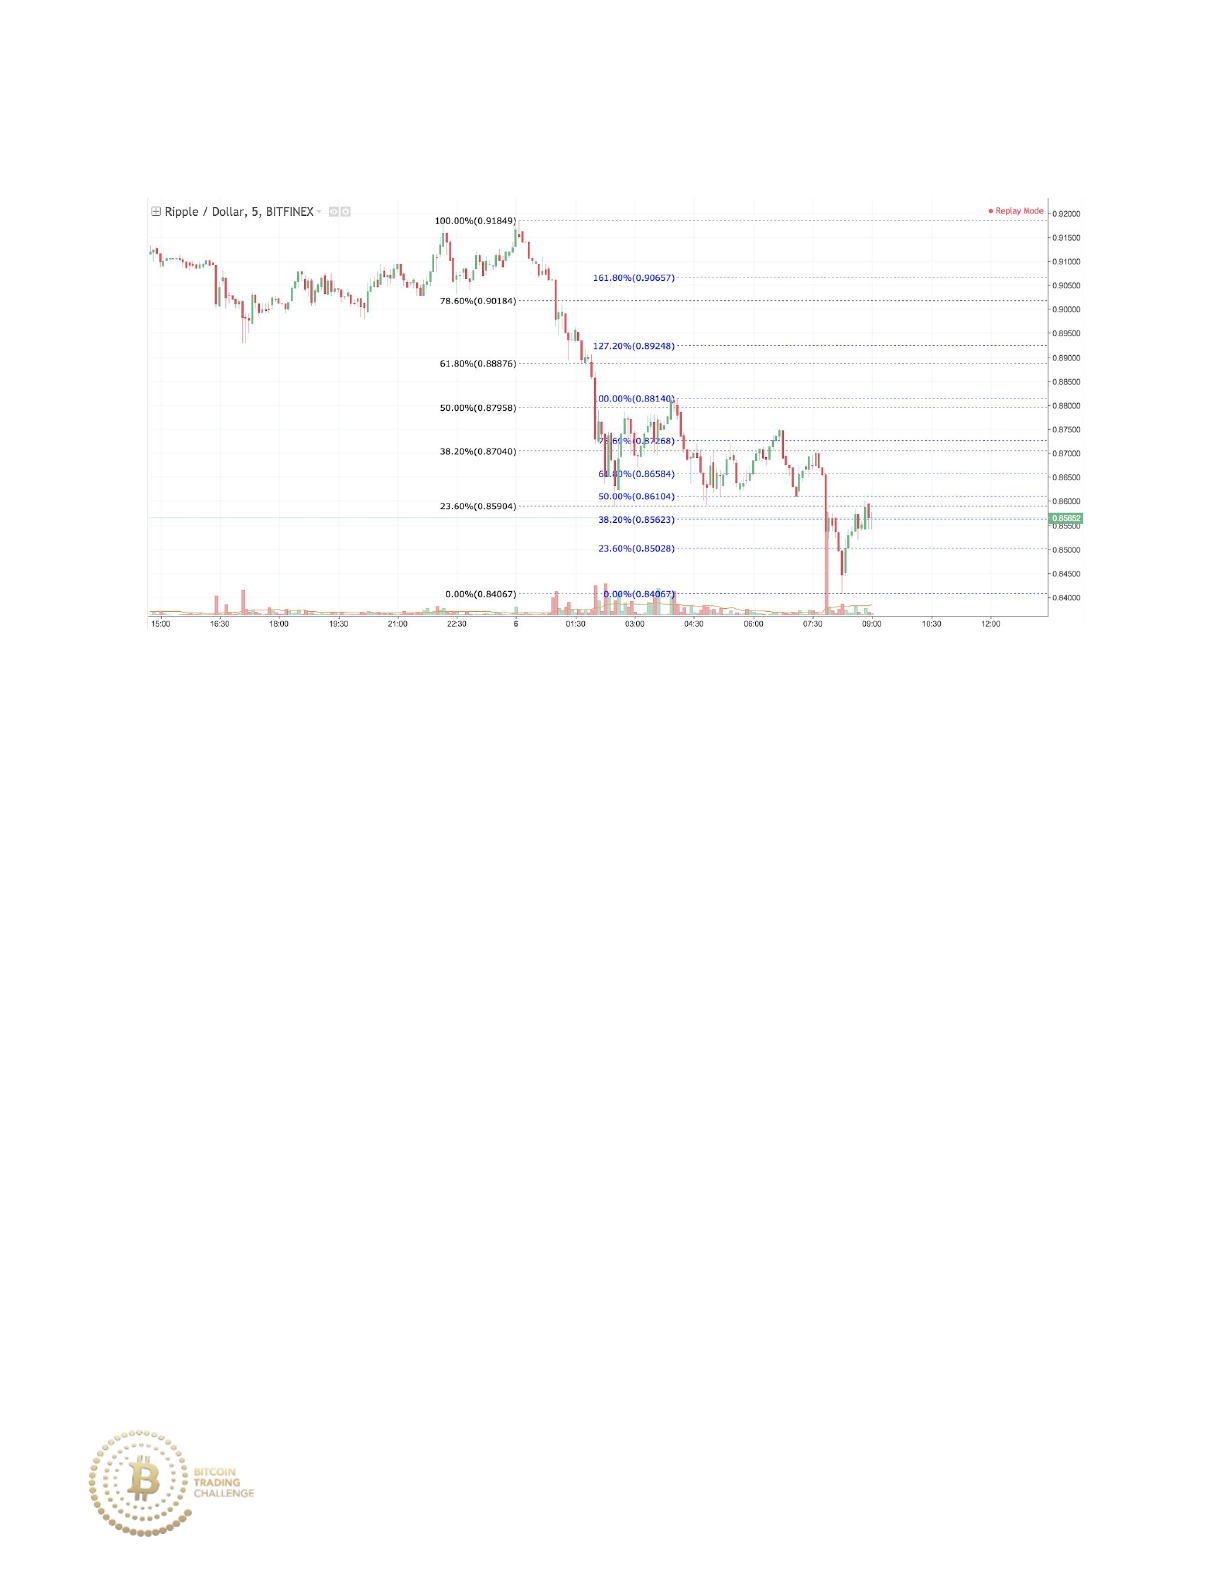
Practice 7-11 Potential Short
Which price would you place your entry order to short?
214
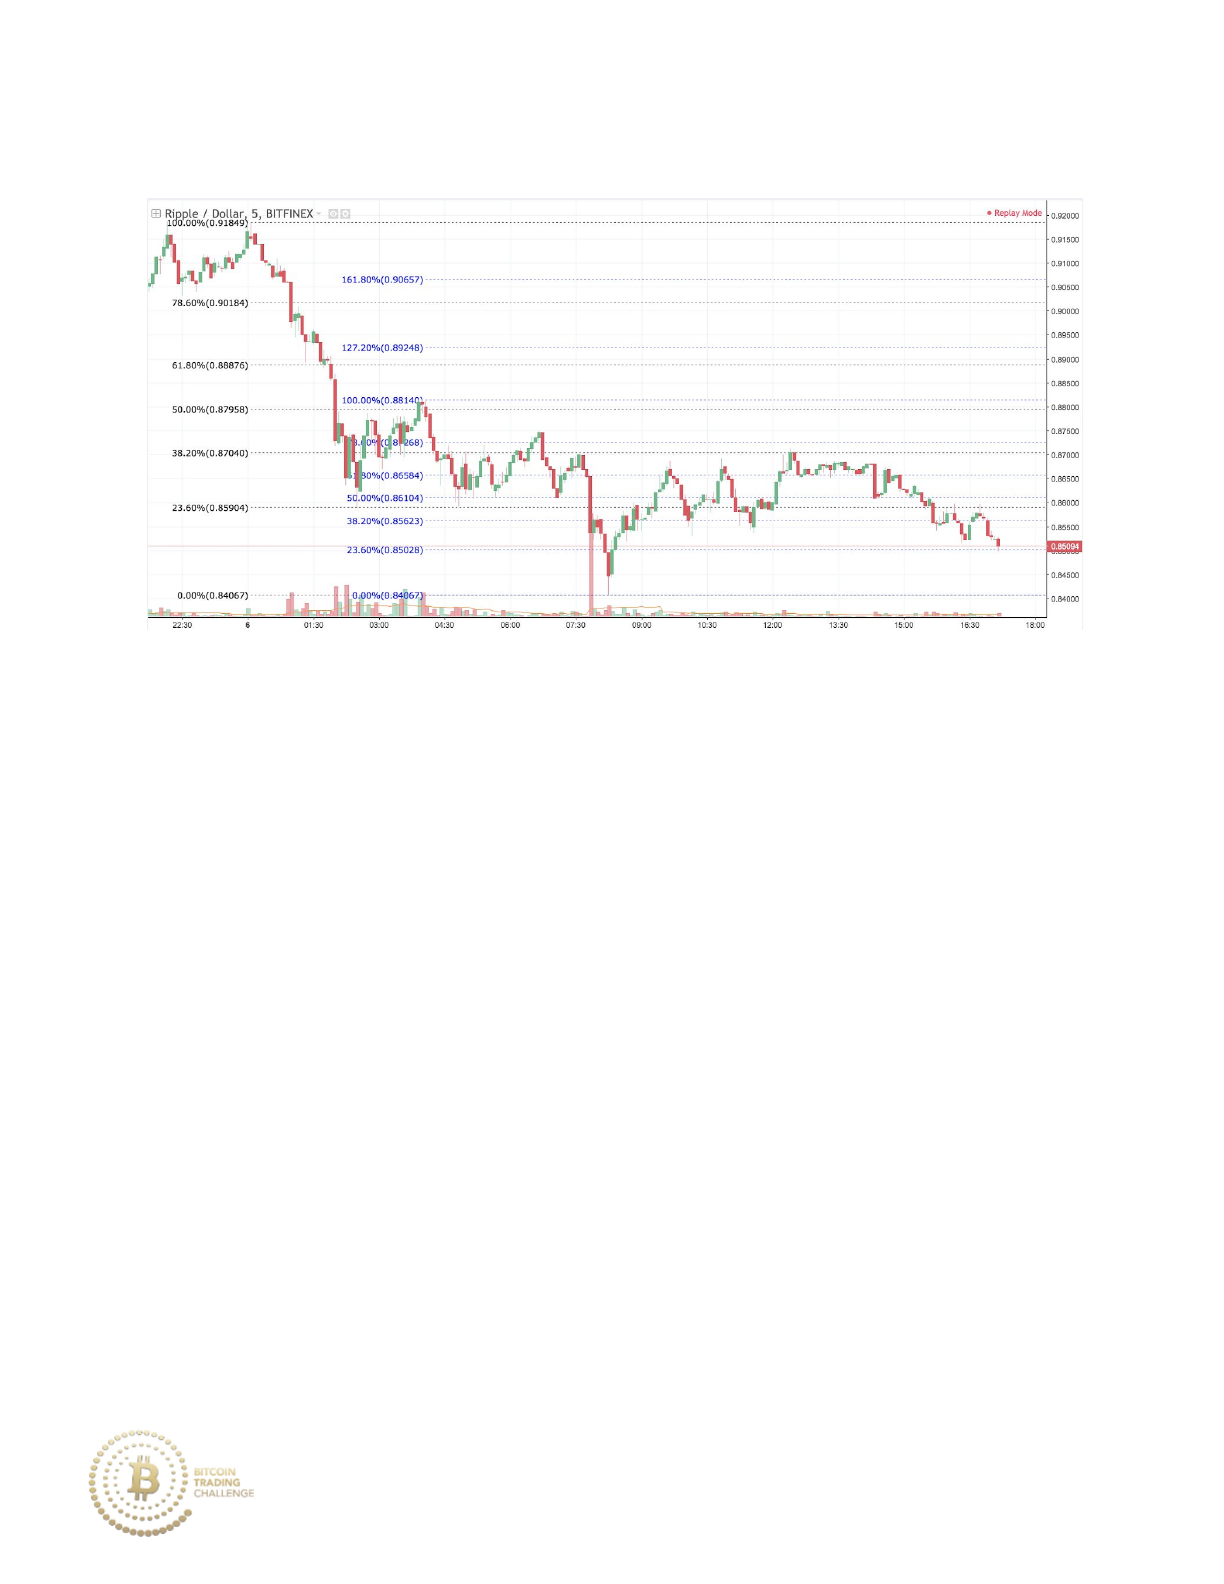
Practice 7-11 Answer
Price respects the confluence around the minor market stage downtrend
61.8% retracement and the major market stage downtrend 38.2%
retracement. The strong bearish momentum on the major market stage of
the downtrend reveals that it is the 38.2% retracement that is most likely to
be respected before price continues to move down lower. The highest price
that XRP/USD reaches is .87134, slightly above the 38.2% retracement. If
your order was any value below that, it would have gotten filled.
215
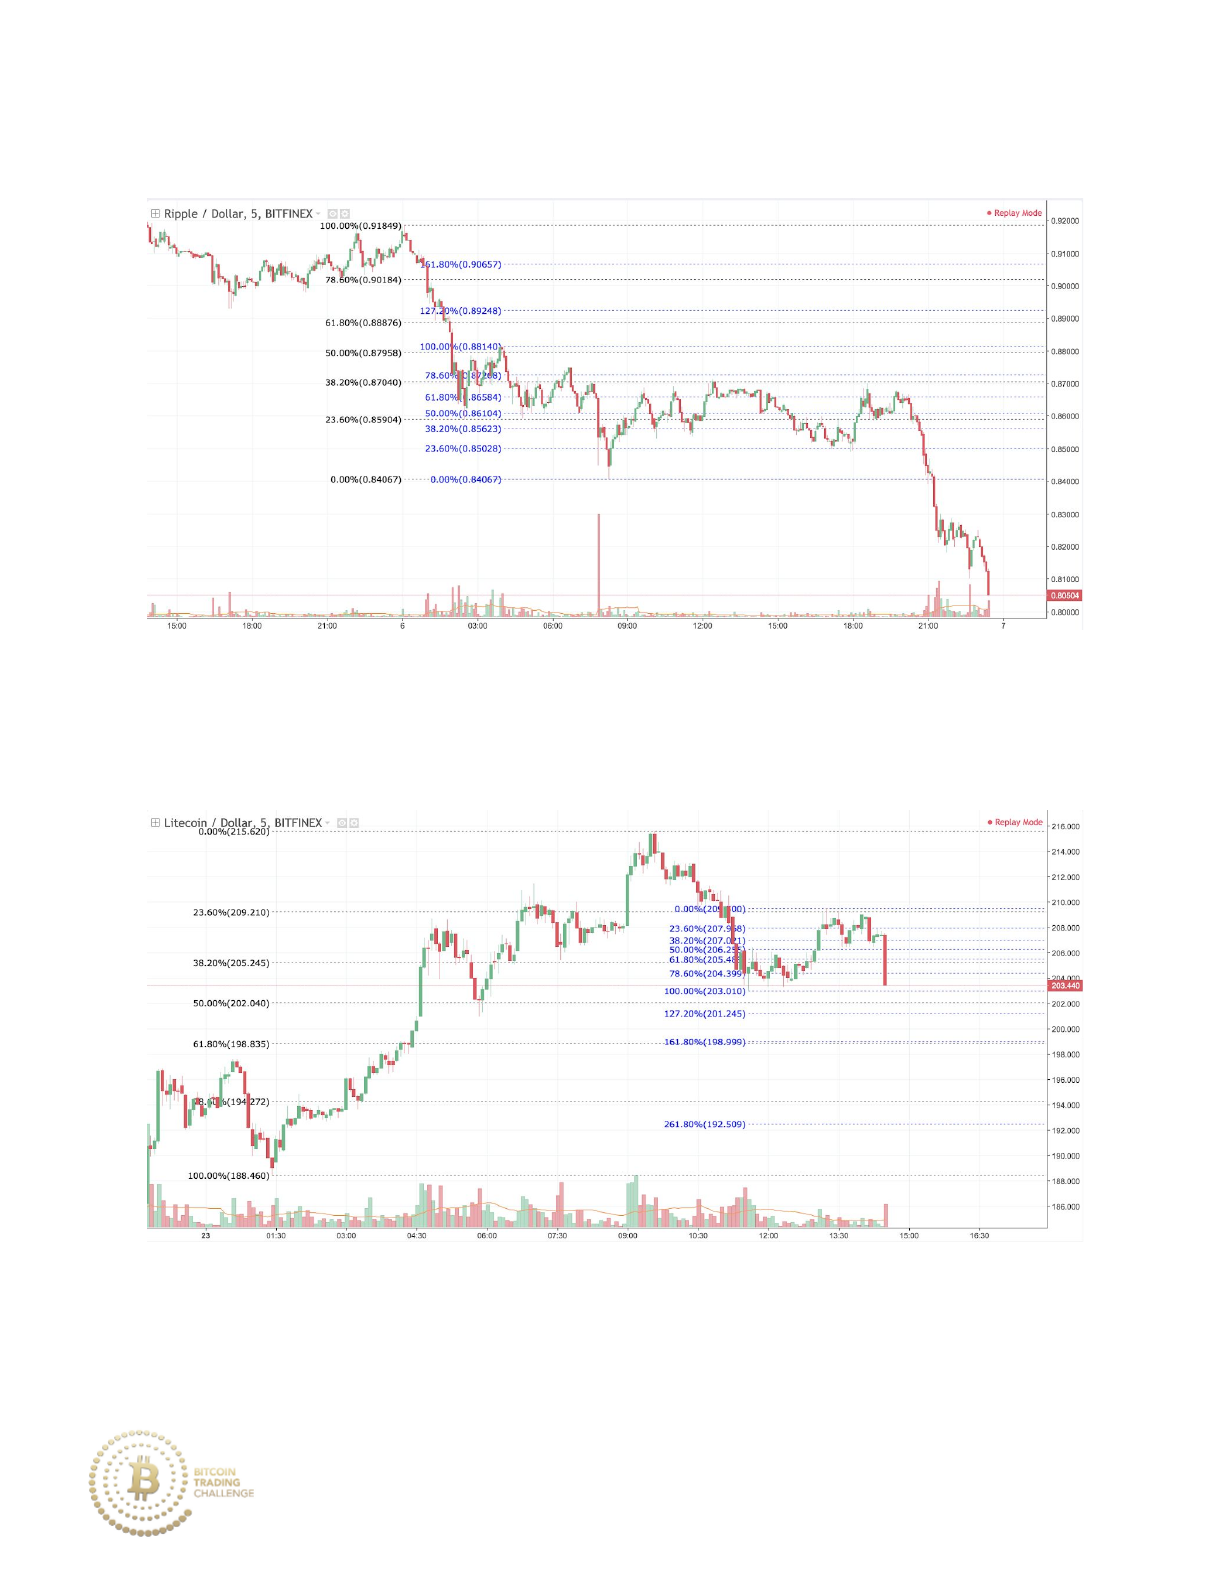
Practice 7-11 Outcome
Price continues to move on strong bearish momentum to the downside.
Practice 7-12 Potential Long
Which price would you place your entry order to buy?
216
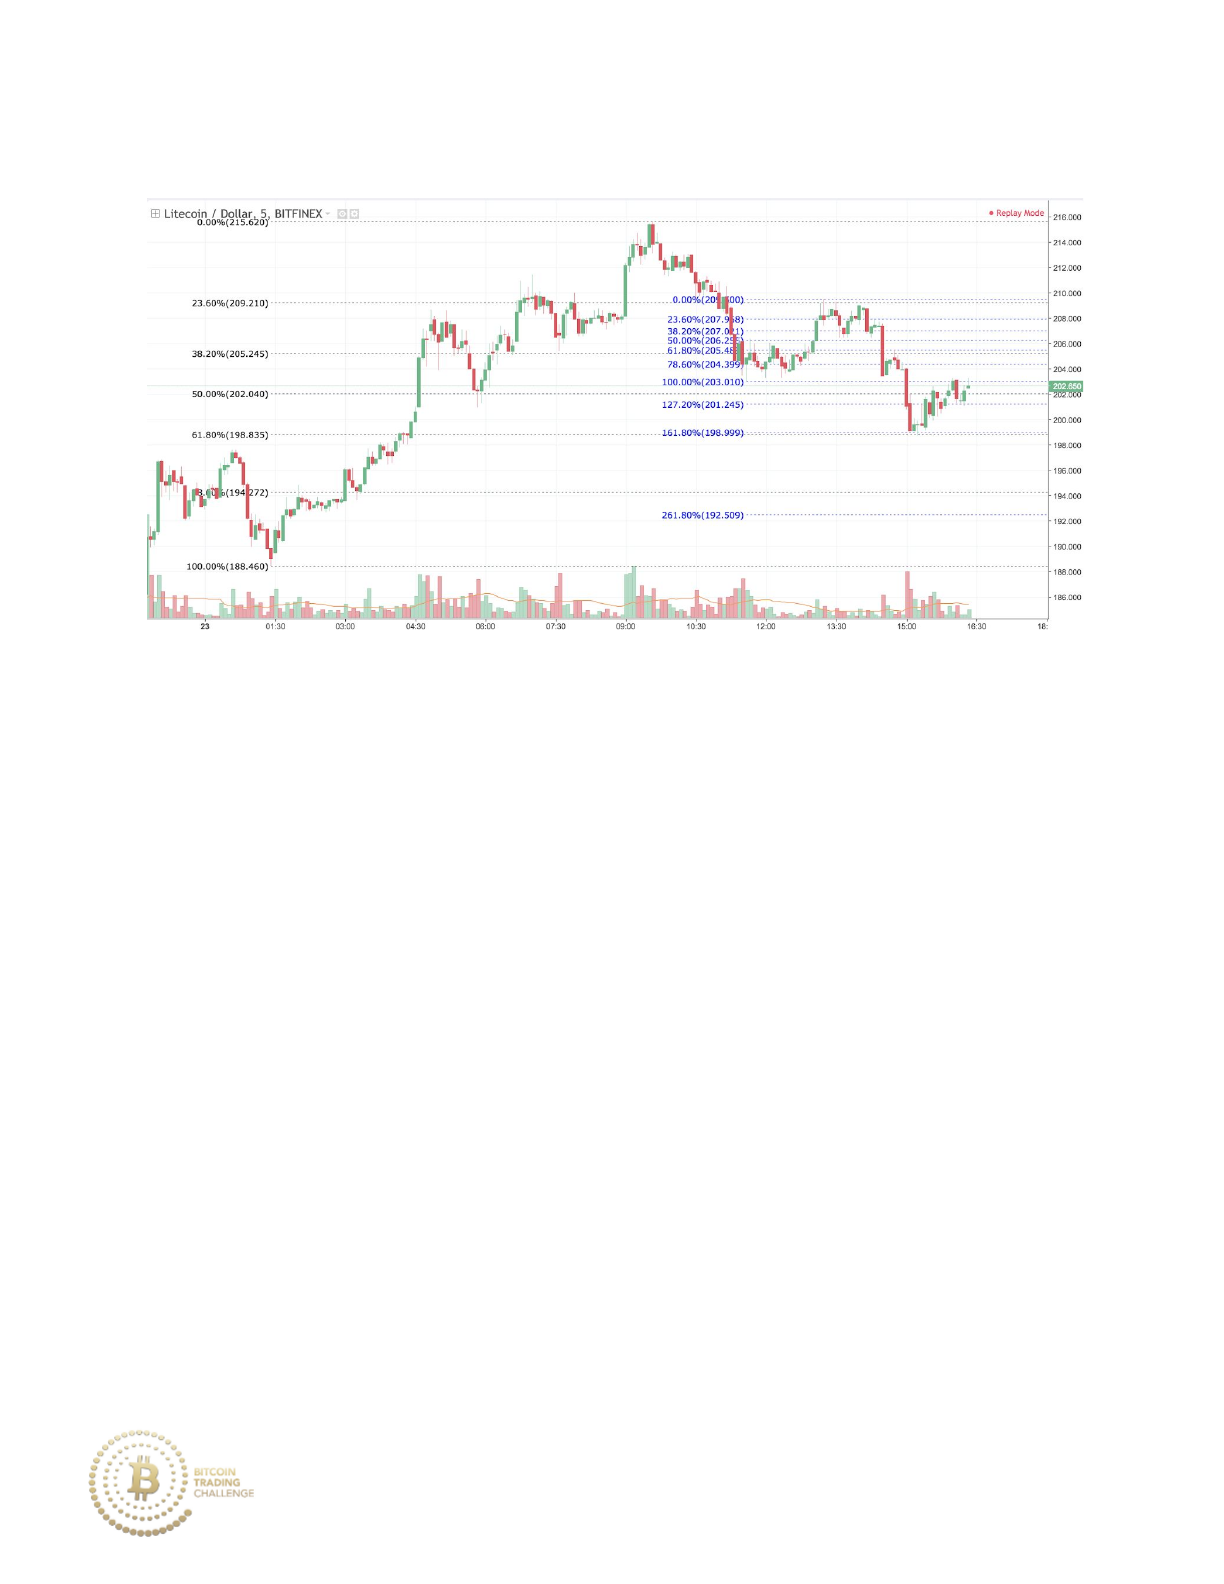
Practice 7-12 Answer
Price respects the confluence around the uptrend market stage 61.8%
retracement and the bearish 161.8% extension. A volume spike occurs in the
candlestick before price reaches the key level of confluence, showing a
potential oversold price area emerging. The lowest price that LTC/USD
reaches is 198.72, just slightly below both the 61.8% retracement and the
161.8% extension.
217
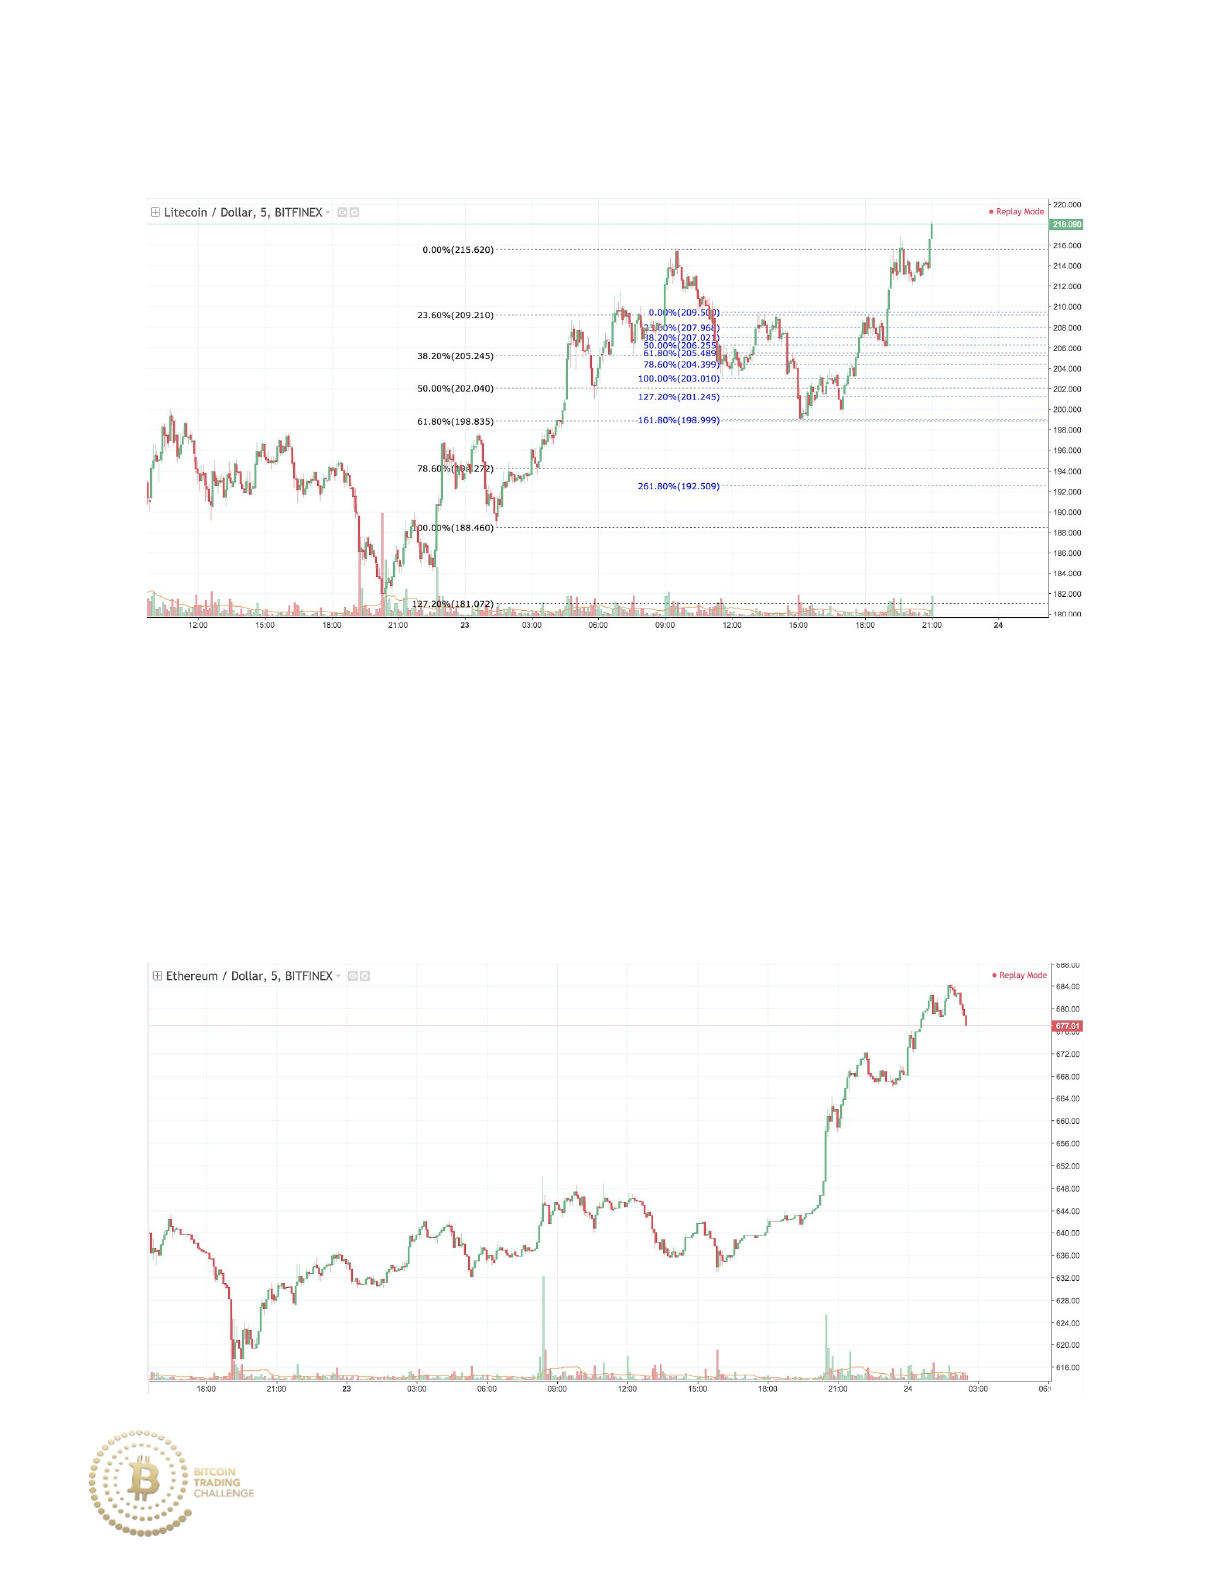
Practice 7-12 Outcome
Price continues to move on strong bullish momentum to the upside.
Practice 7-13 Potential Long
218
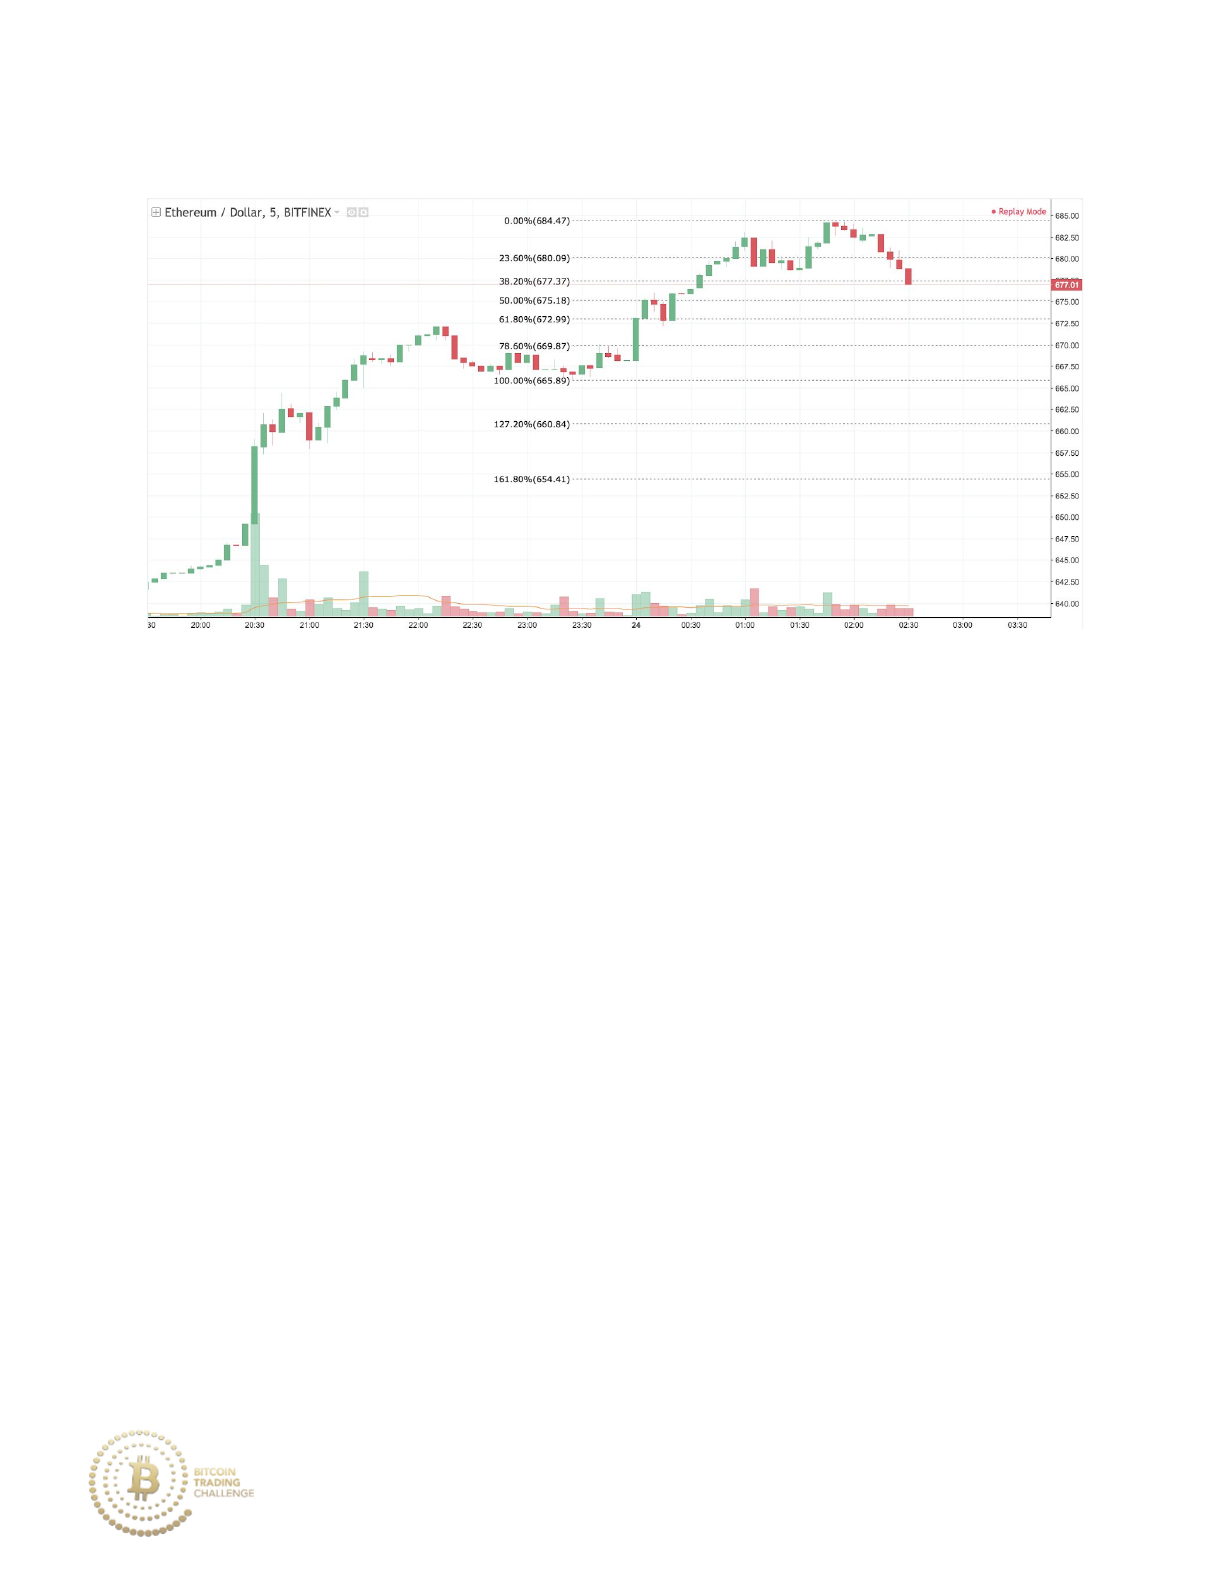
Practice 7-13 Zoomed In
Which price would you place your entry order to buy?
219
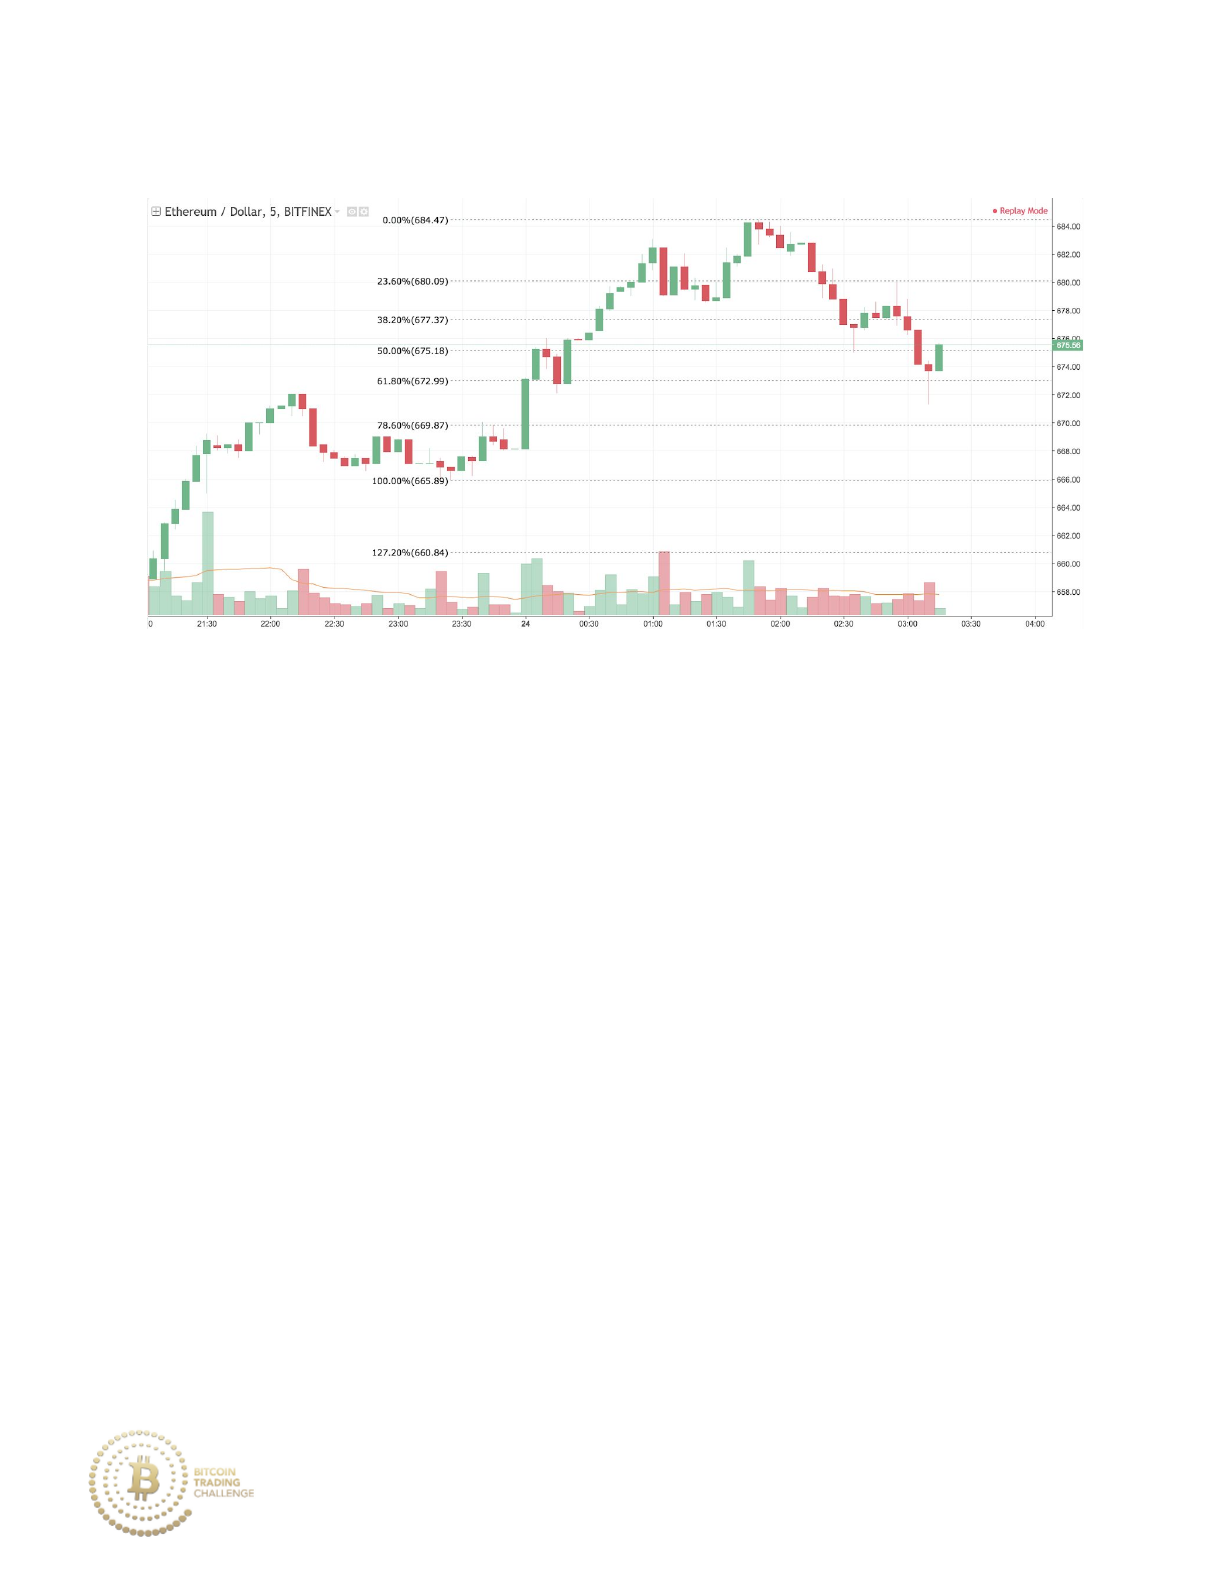
Practice 7-13 Answer
Price is currently in a strong overall uptrend and retraces downward to the
61.8% retracement with a low tail. Additionally, the candlestick with the low
tail is the highest volume candlestick within the retracement from 684.47
downward. Within the current bullish price action, there is no sign of climatic
volatility, indicating that the overall uptrend is still intact. The lowest price
that ETH/USD reaches is 671.32 as price establishes support at the previous
resistance level (at 672).
220
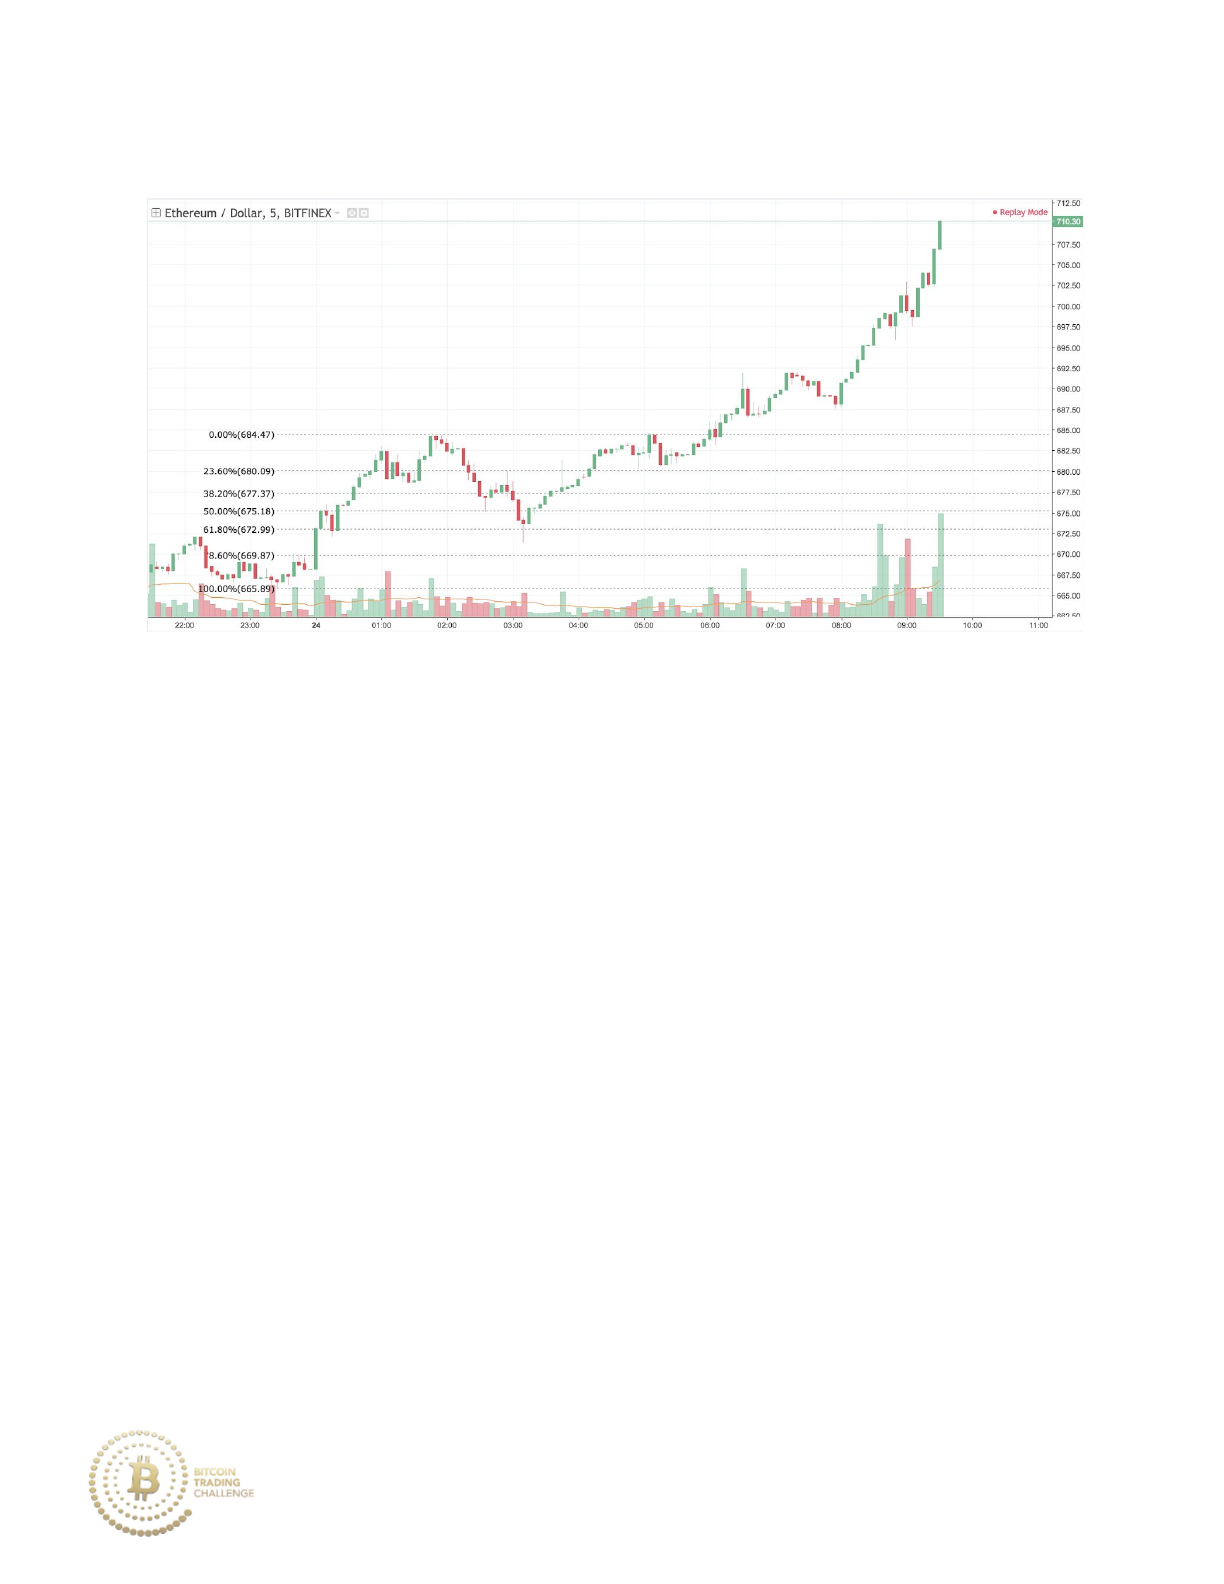
Practice 7-13 Outcome
Price continues to move on strong bullish momentum to the upside after
respecting the 61.8% retracement.
221
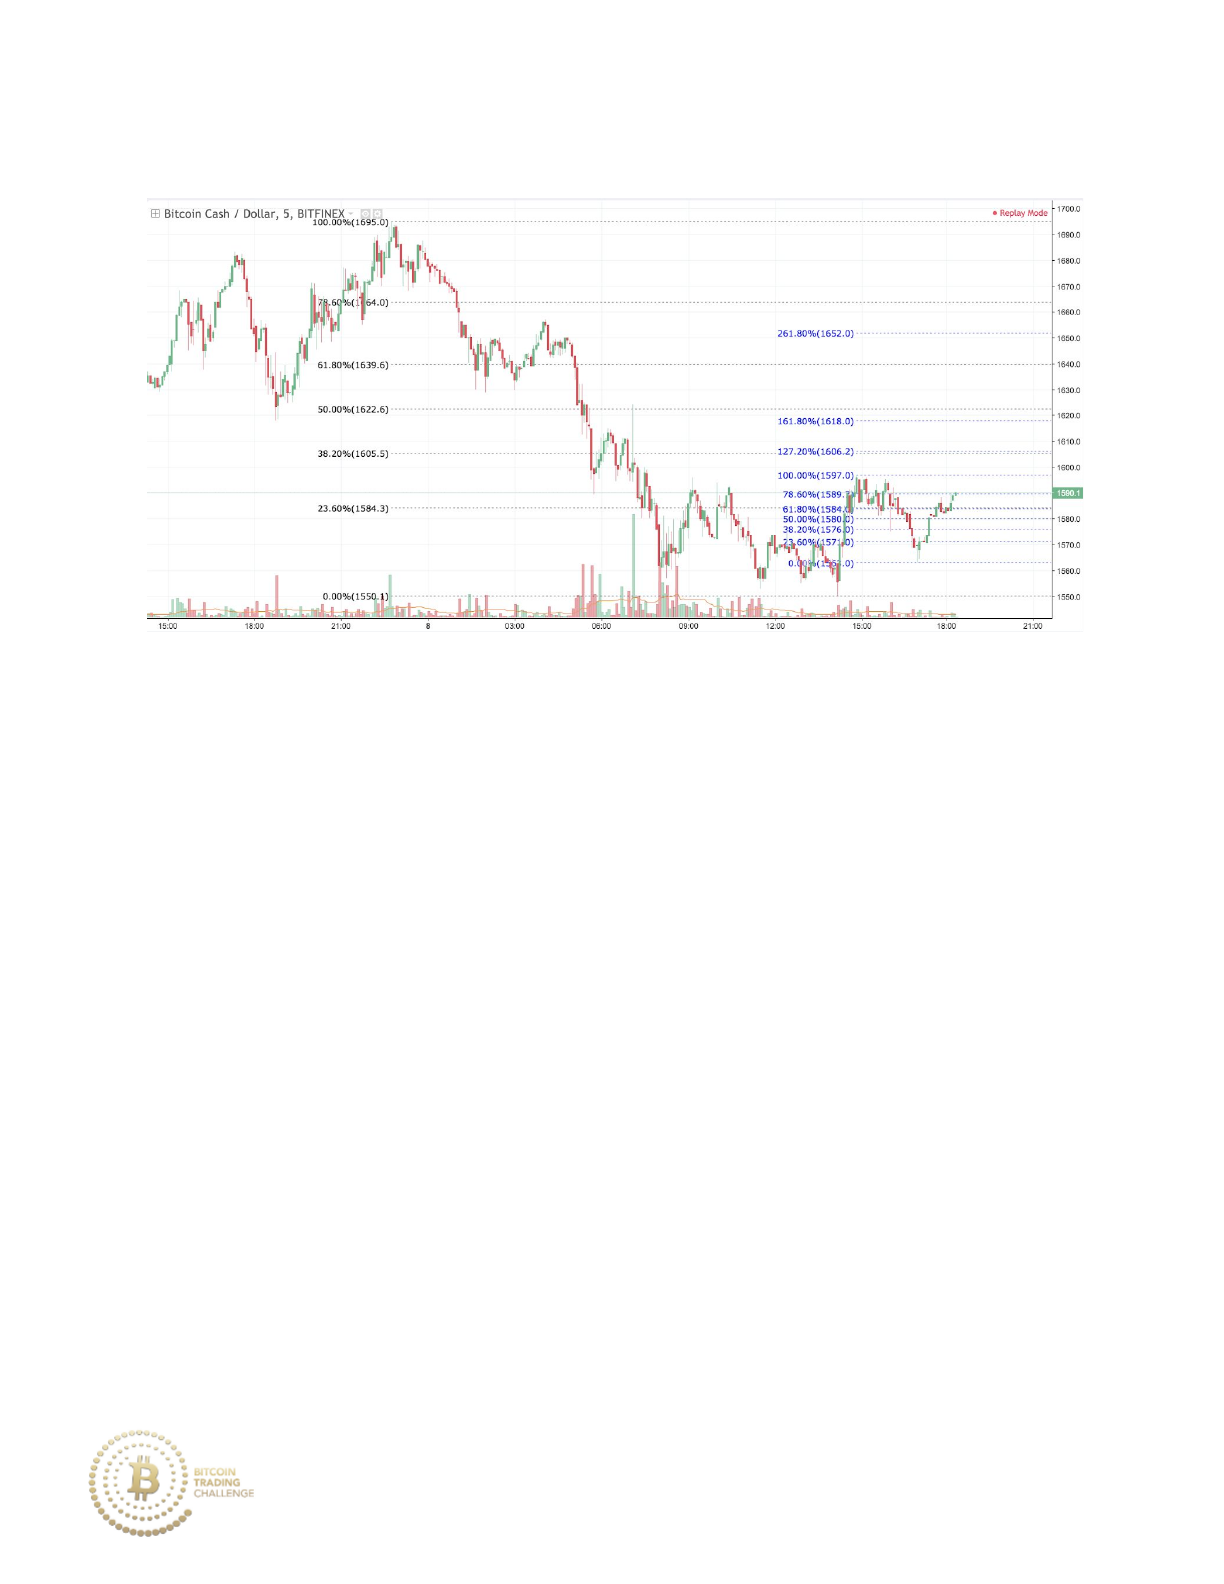
Practice 7-14 Potential Short
Which price would you place your entry order to short?
222
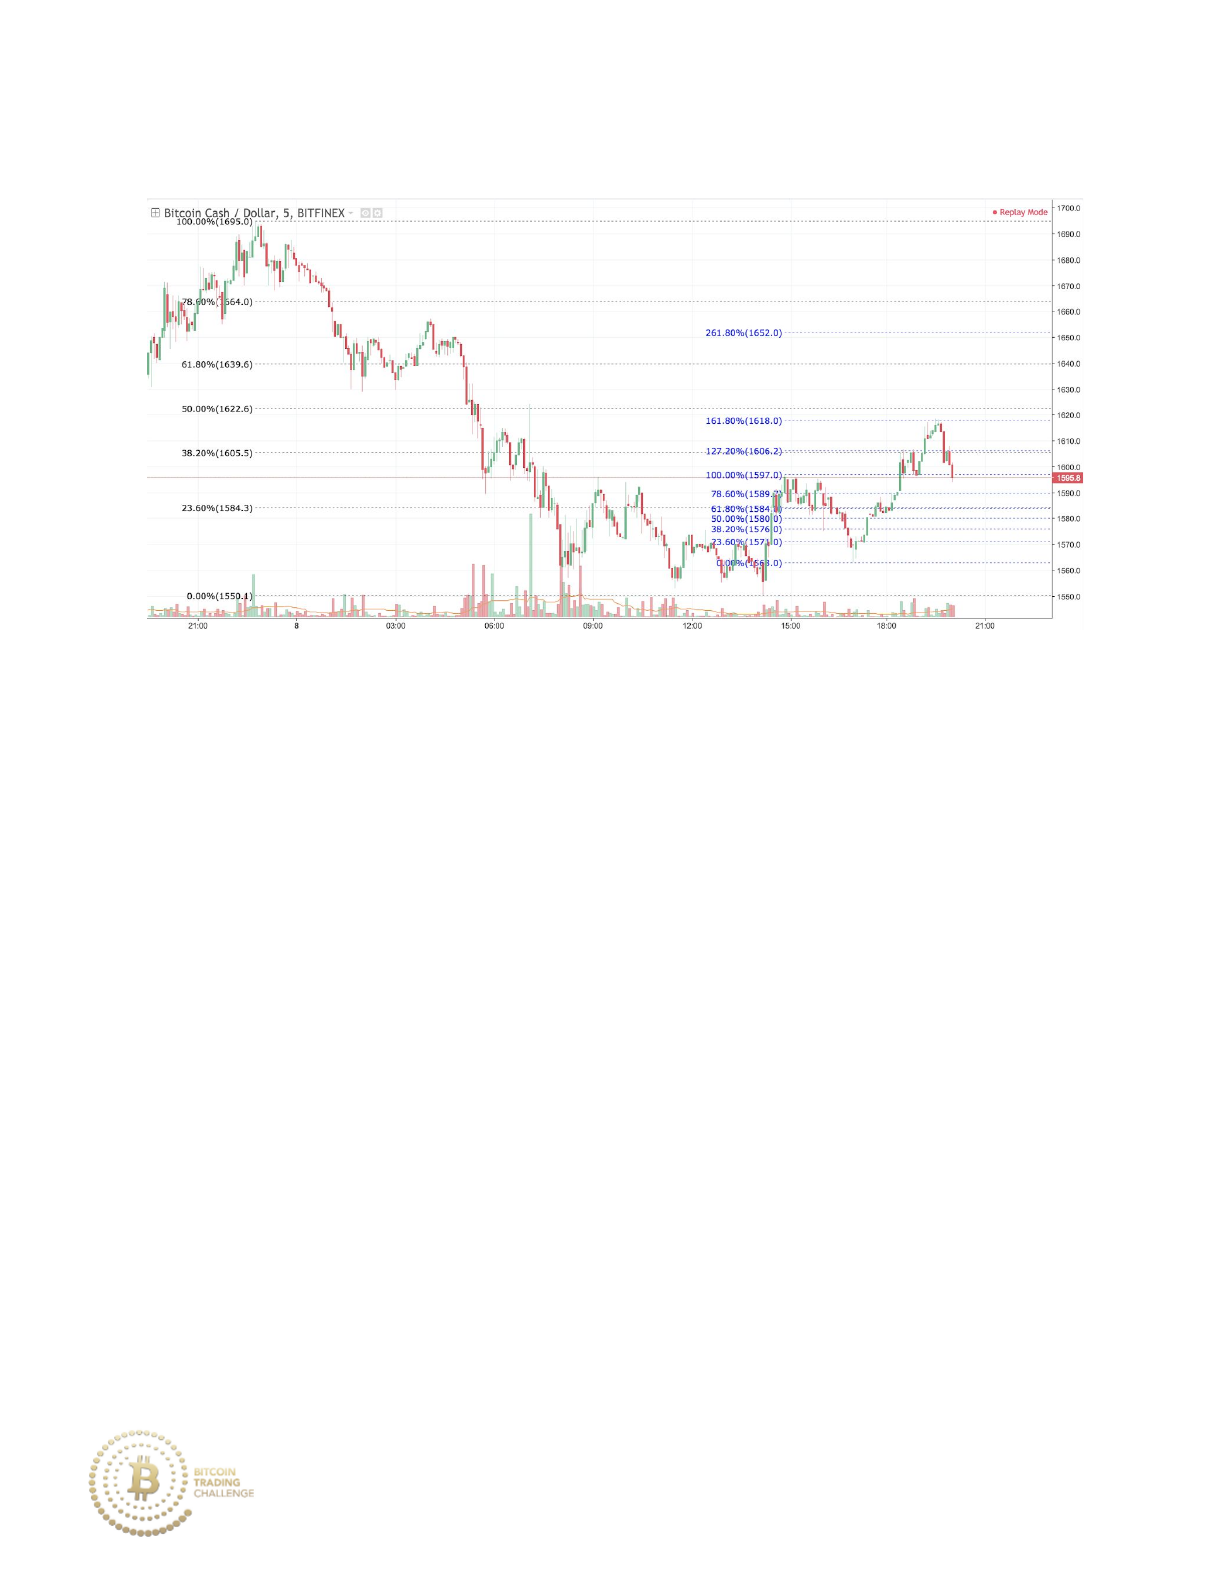
Practice 7-14 Answer
Price is currently in a downtrend that is moving with strong momentum and
volume. Recall that strong trends typically have retracements that end in the
38.2% to 50% price area. Price then weakly moves upward and possible
shorting opportunities begin to emerge. By drawing a Fibonacci extension on
the recent retracement, it is clear that the 161.8% extension had just been
touched with a high tail. The highest price that BCH/USD reaches is 1618.6,
slightly above the 161.8% extension.
223
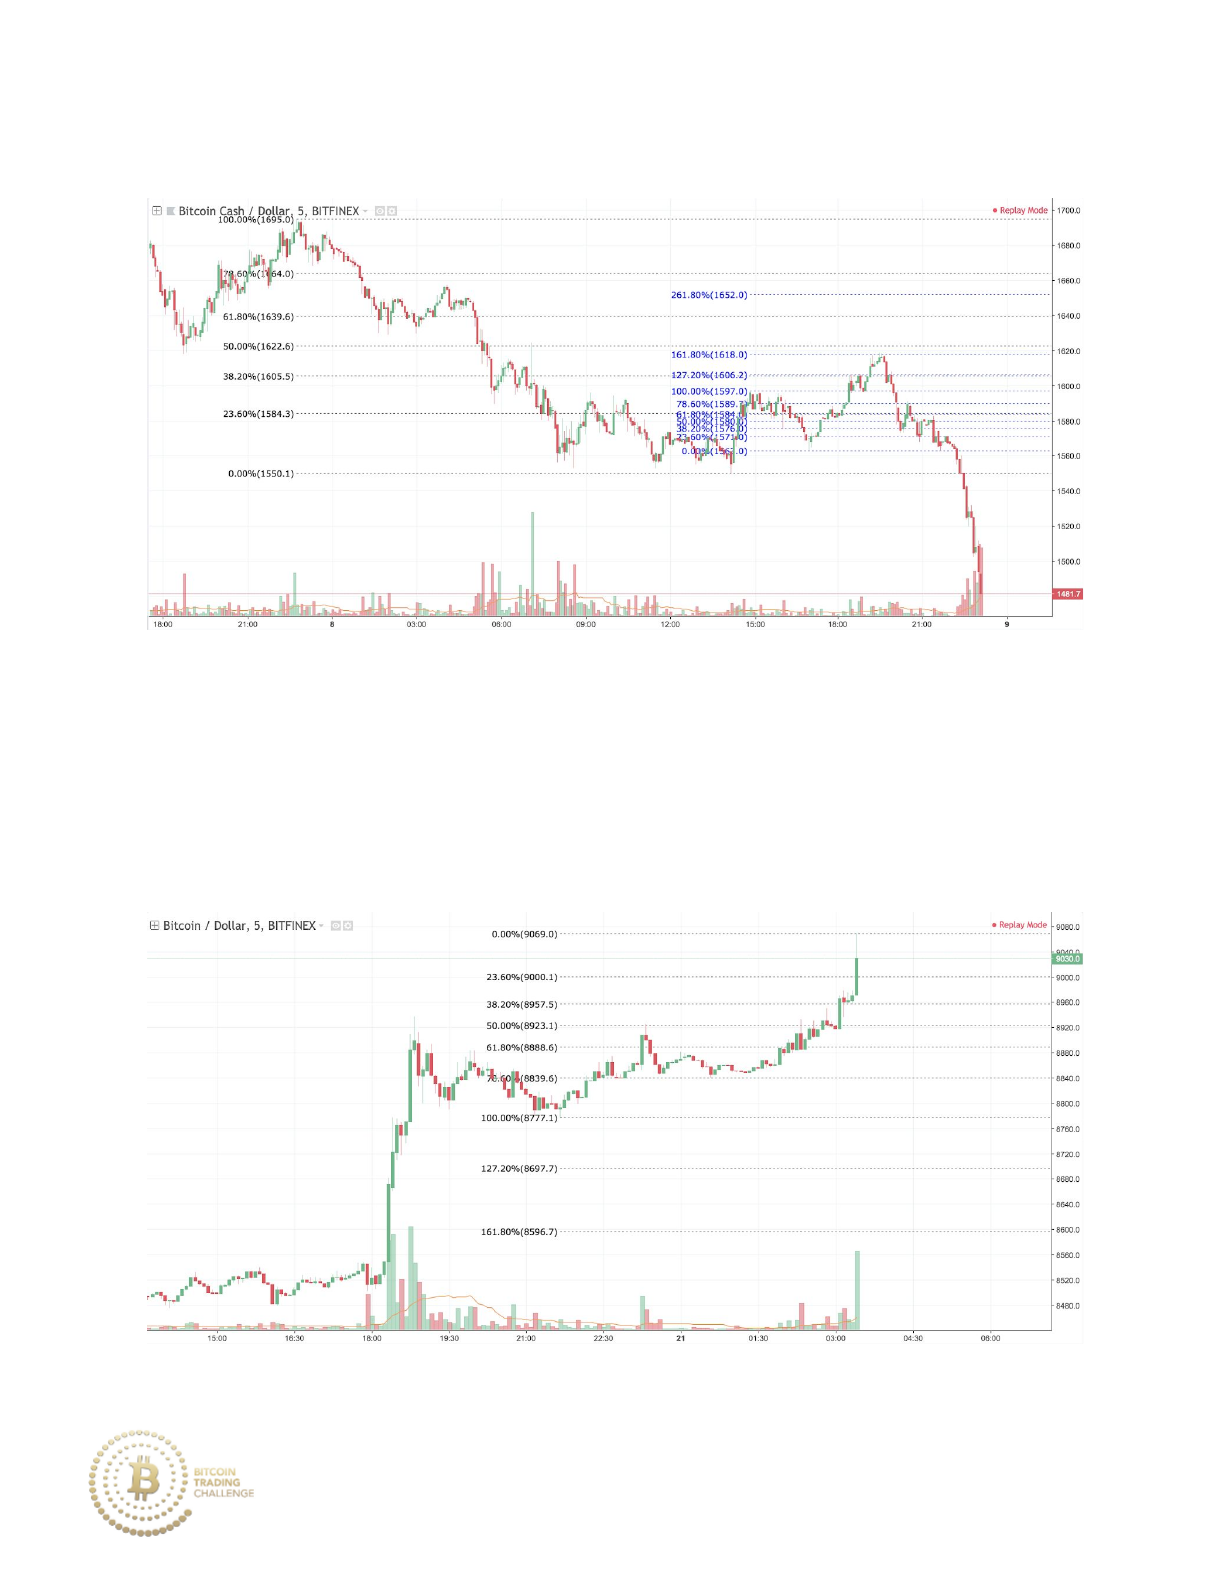
Practice 7-14 Outcome
Price continues to move on strong bearish momentum to the upside.
Practice 7-15
Which price would you place your entry order to buy?
224
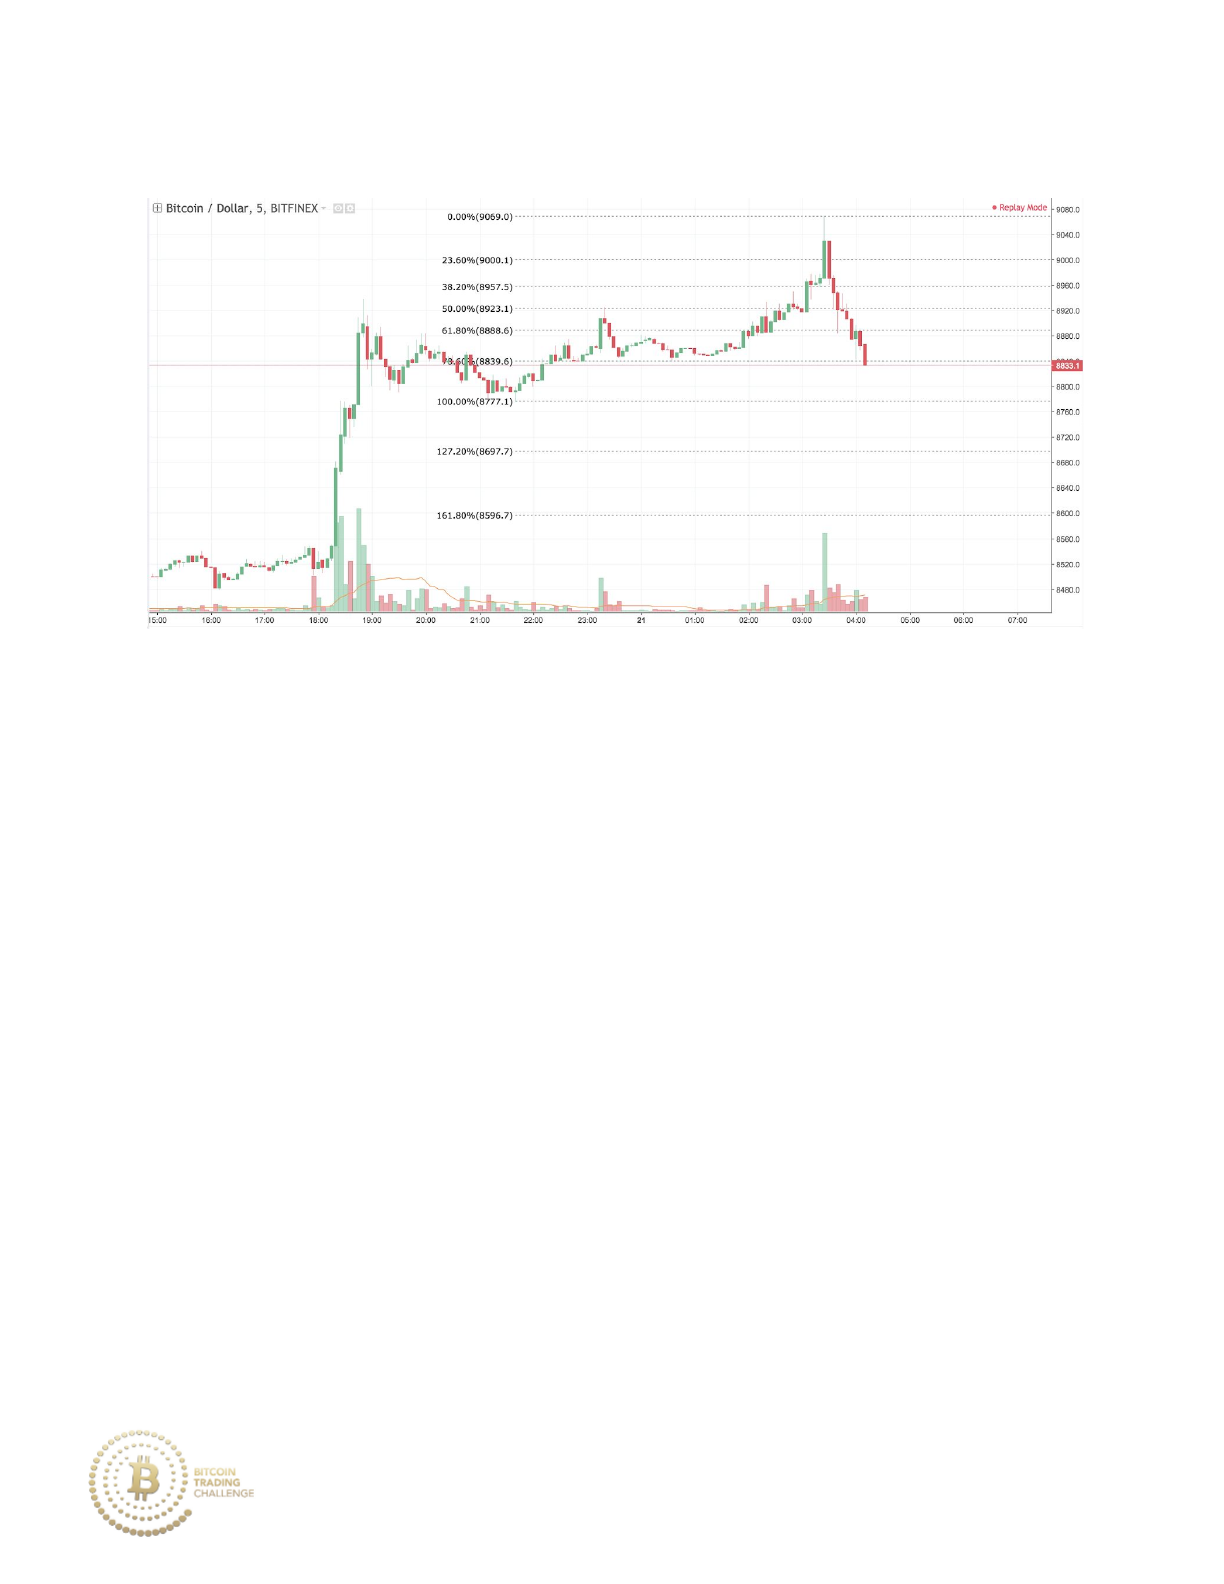
Practice 7-15 Answer
You do not want to buy into this market as it is overbought. The major
volume spike has a high tail that is typical near the end of an uptrend;
however, if that exact type of candlestick occurs in a downtrend, the reverse
is true as the high volume may signal a bullish reversal. Additionally, the
move down to the 61.8% level (of the Fibonacci retracement drawn from the
low at 8777.1 to the high at 9069) has little to no bullish pullback as the
sellers are clearly in control.
225
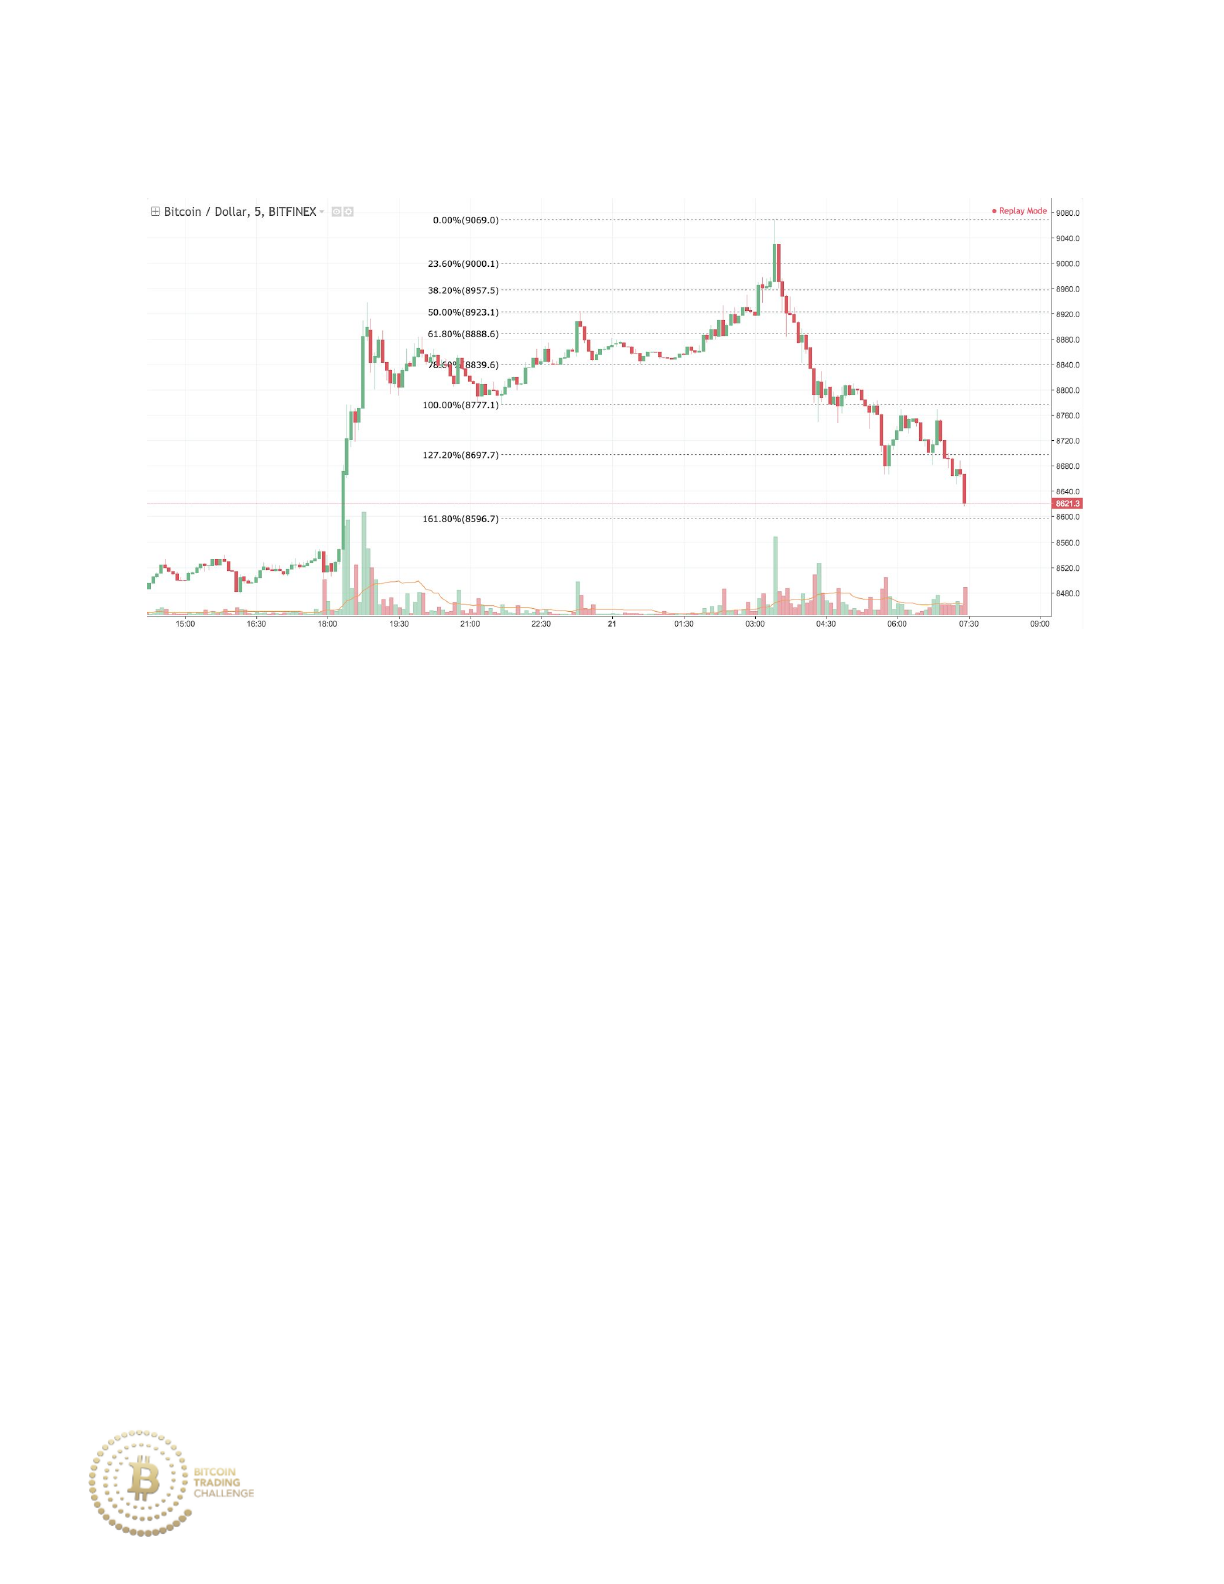
Practice 7-15 Outcome
The sellers continue to push price lower after the overbought top.
3. Trade Exit Practice
Within the five examples in this section, identify the price that you would
place your exit buy/sell order at (or decide to not exit the trade altogether).
Take into account market momentum, volume patterns and Fibonacci
retracements/extensions.
226
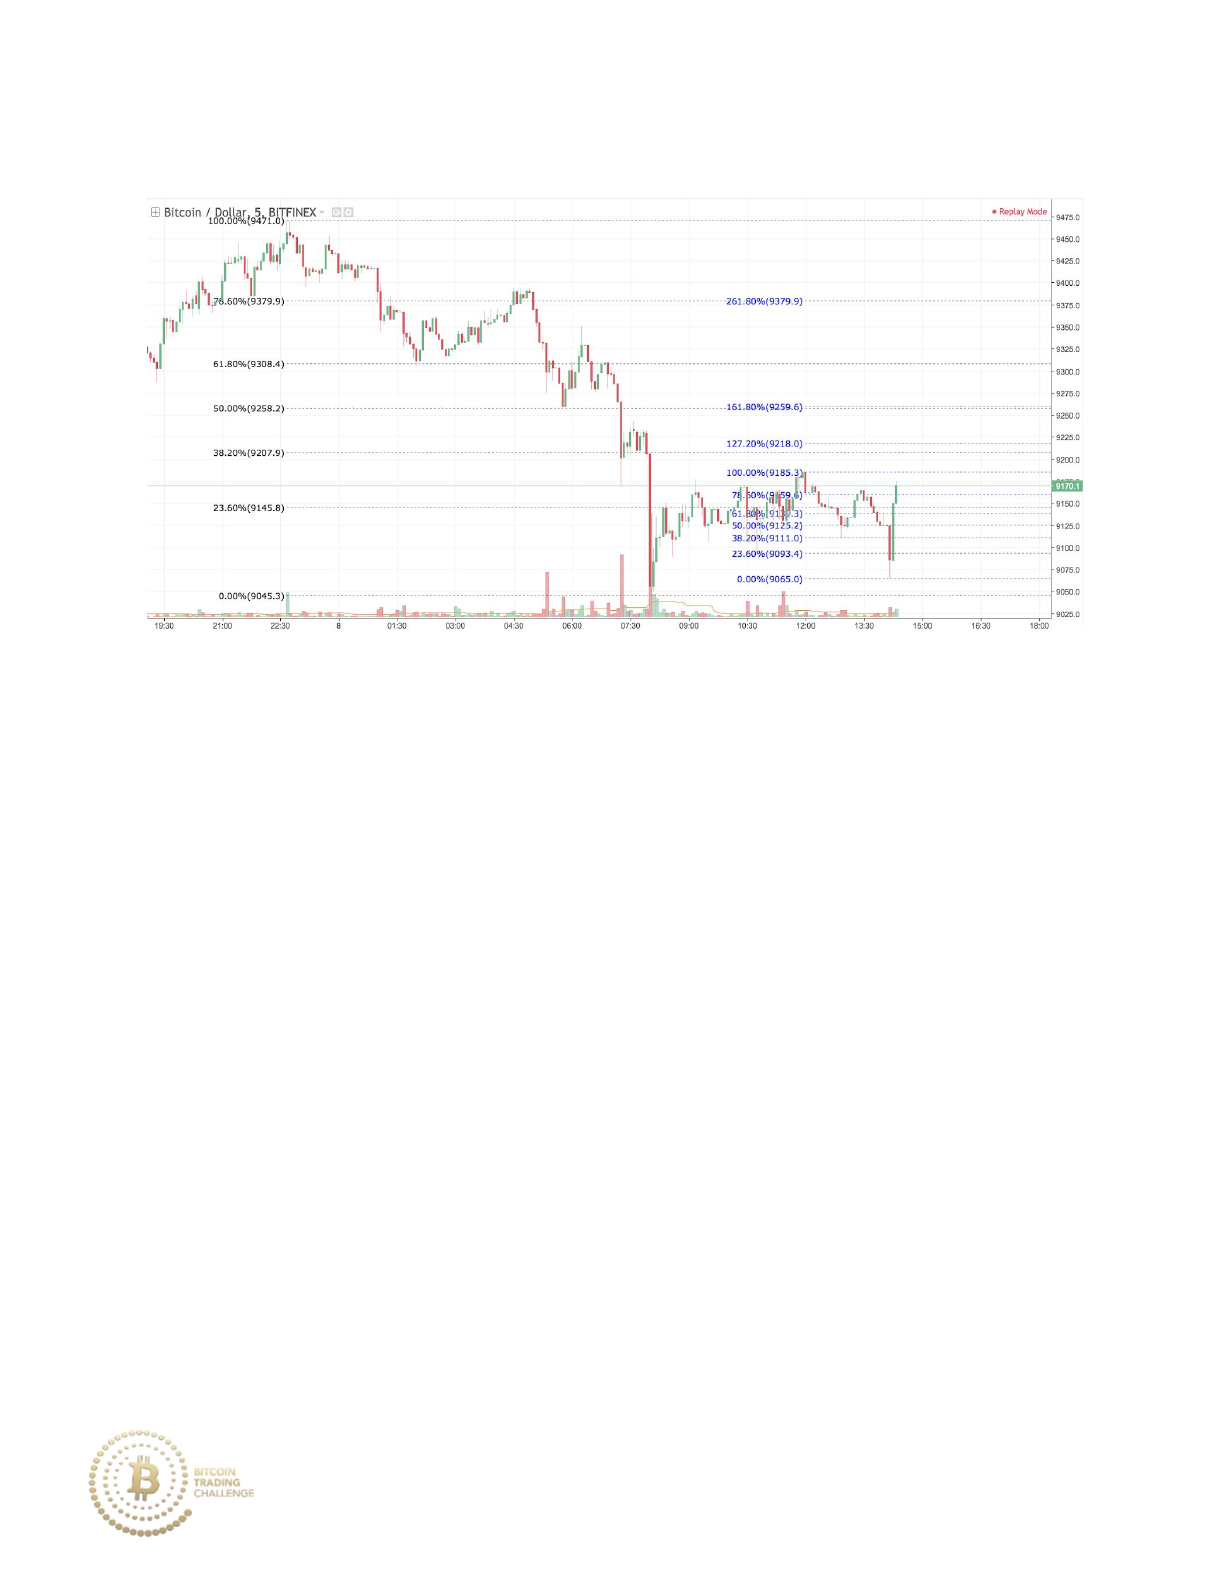
Practice 7-16
If you were currently in a long position, at which price would you place your
exit sell order (take profit)?
227
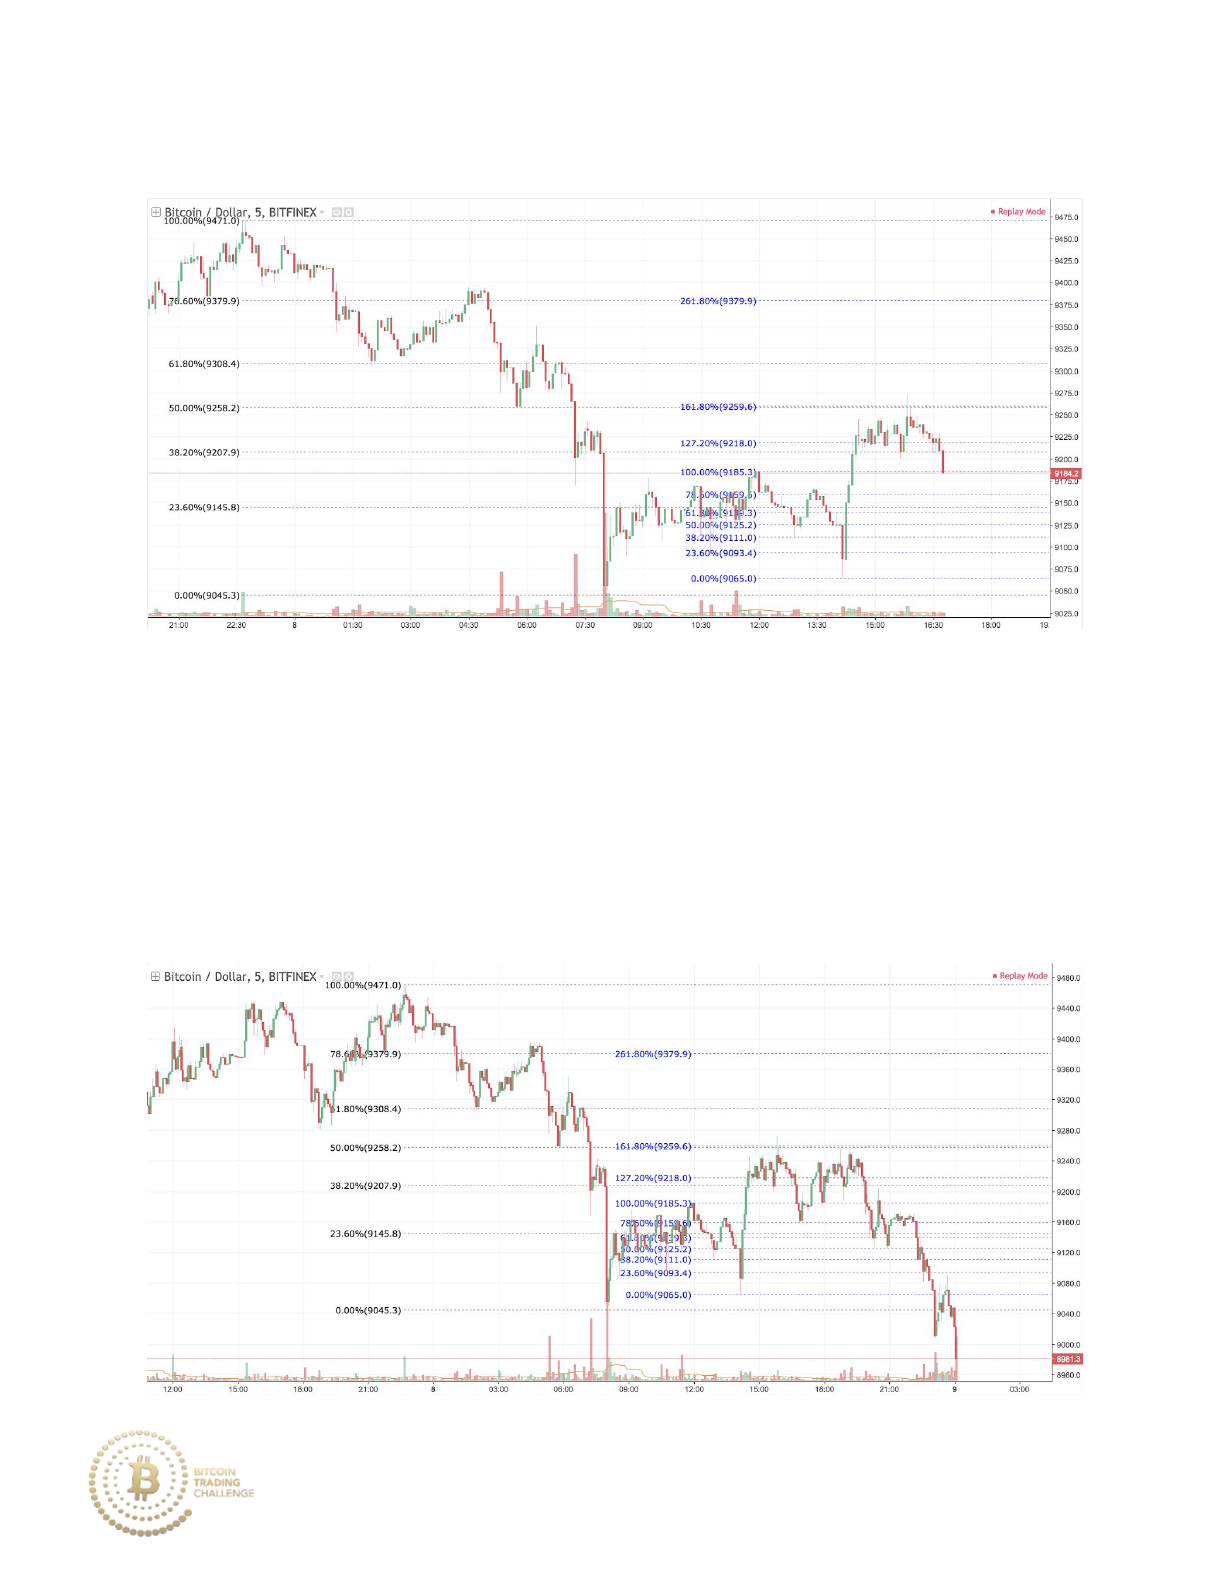
Practice 7-16 Answer
Price moves upward on strong momentum to the confluence area of the 50%
retracement, as well as the bullish 161.8% Fibonacci extension of the
previous consolidation stage. Additionally, the lack of volume within the
uptrend shows a lack of demand, another reason to exit a long position.
Practice 7-16 Outcome
228
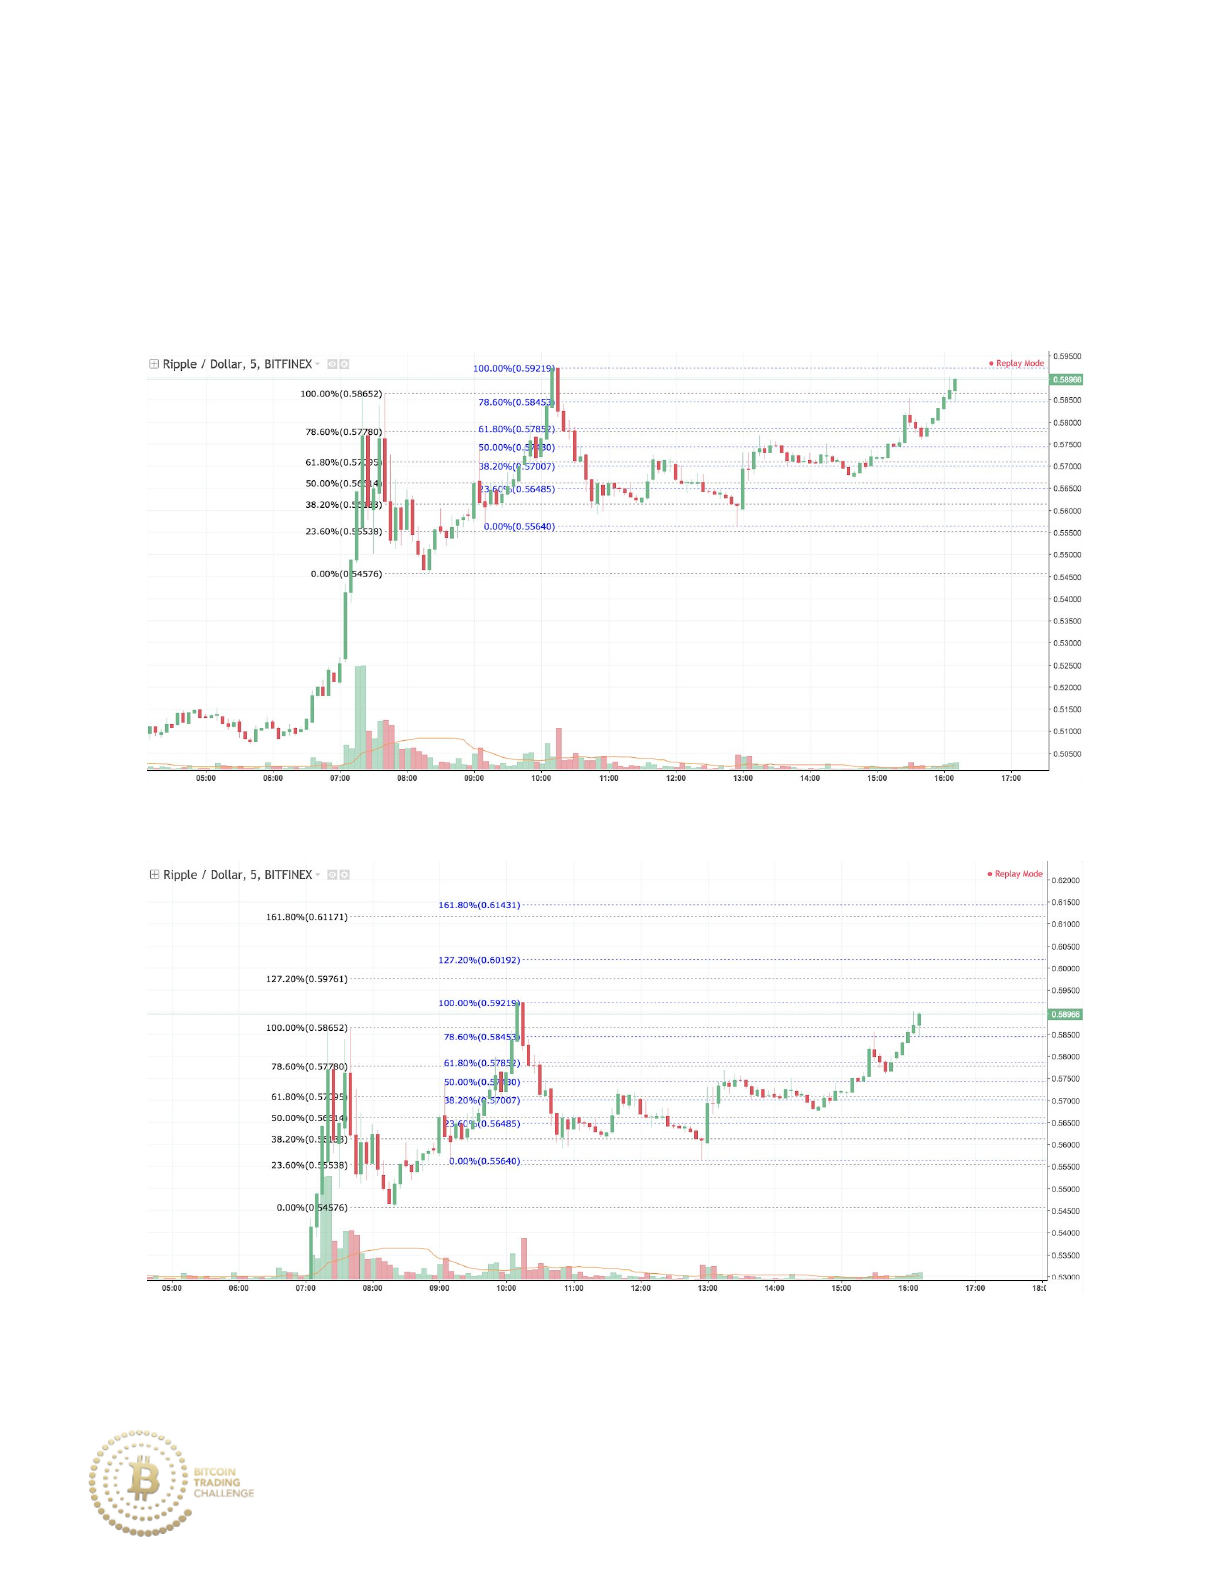
Price moves downward after encountering strong resistance at the
confluence level. The highest price that BTC/USD reaches is 9272.2.
Practice 7-17
Practice 7-17 Upward Tilt
If you were currently in a long position, at which price would you place your
exit sell order (take profit)?
229
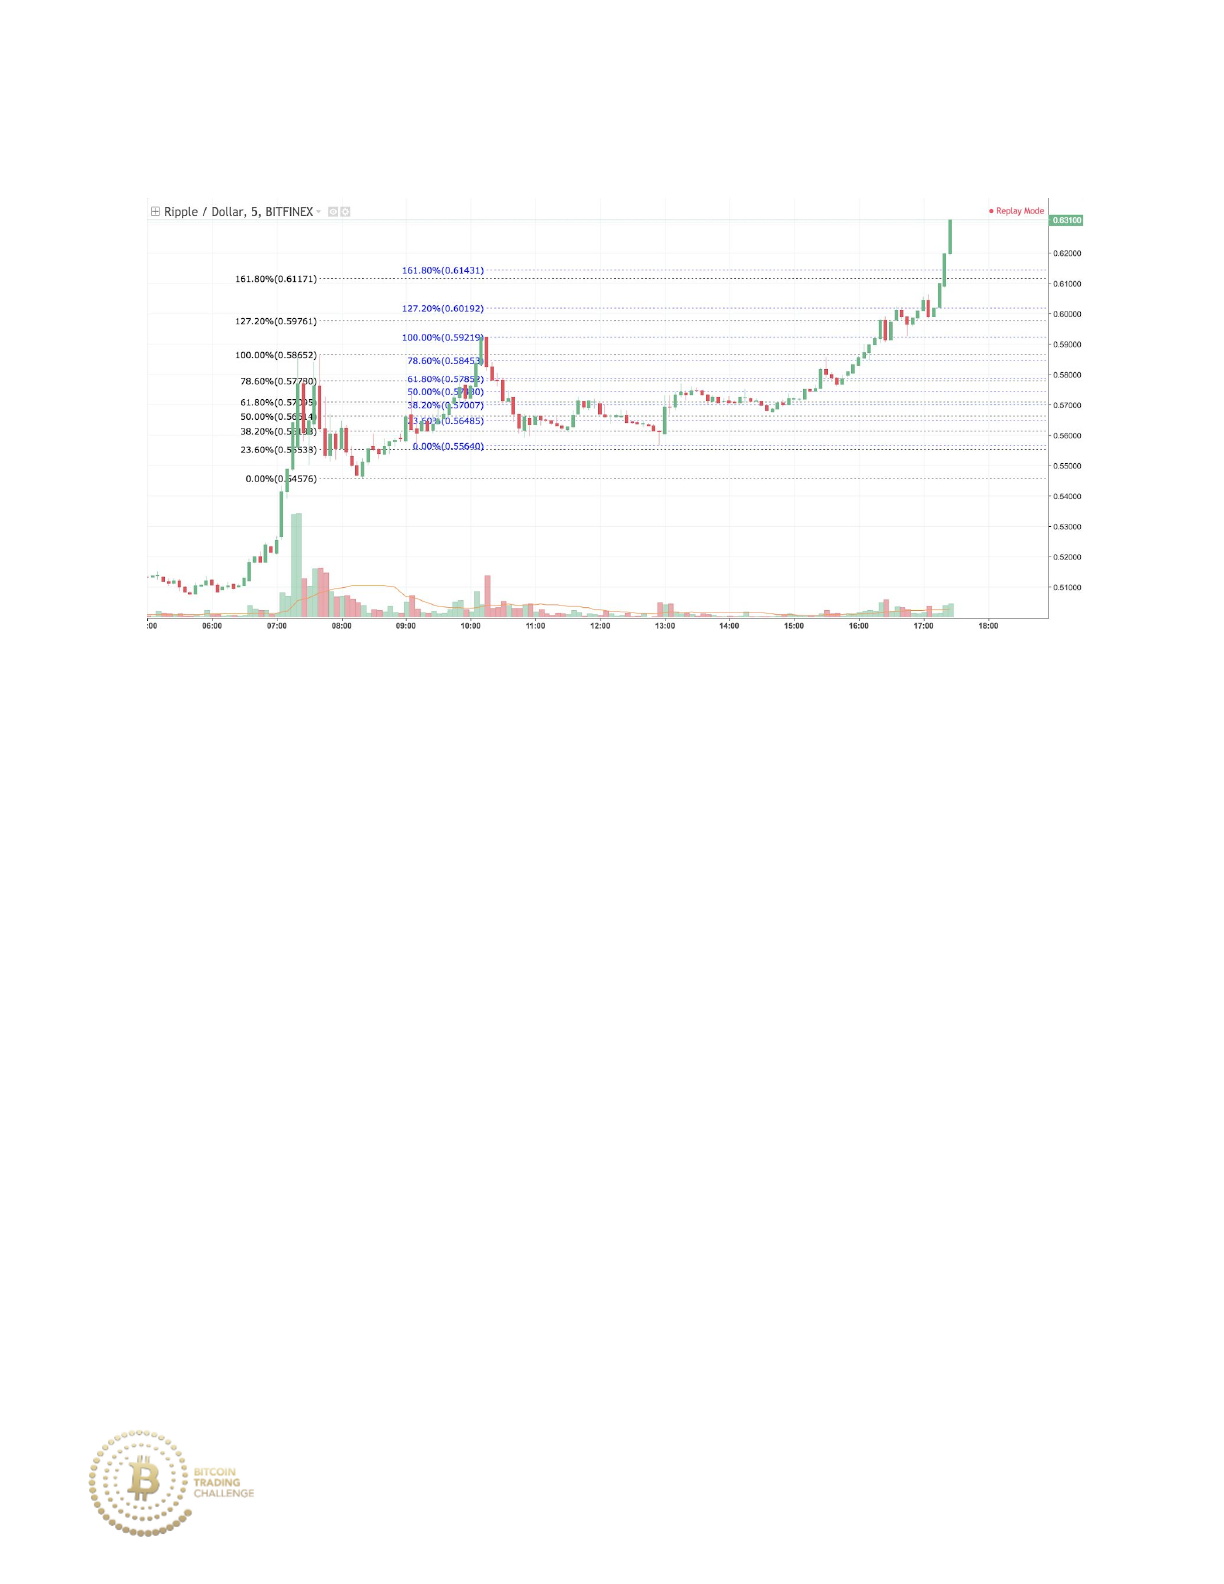
Practice 7-17 Answer
Price moves upward on strong momentum, and, then, enters a period of
consolidation/weak retracement. The bullish volume spike that occurs on
the left side of the chart is met with a weak bearish reaction on falling
volume as price responds with upward and, later, sideways market
movement. The 161.8% Fibonacci extensions have confluence, however, the
strong upward movement reveals that the uptrend may still be intact,
meaning that taking profit would not be optimal at the current price point.
230
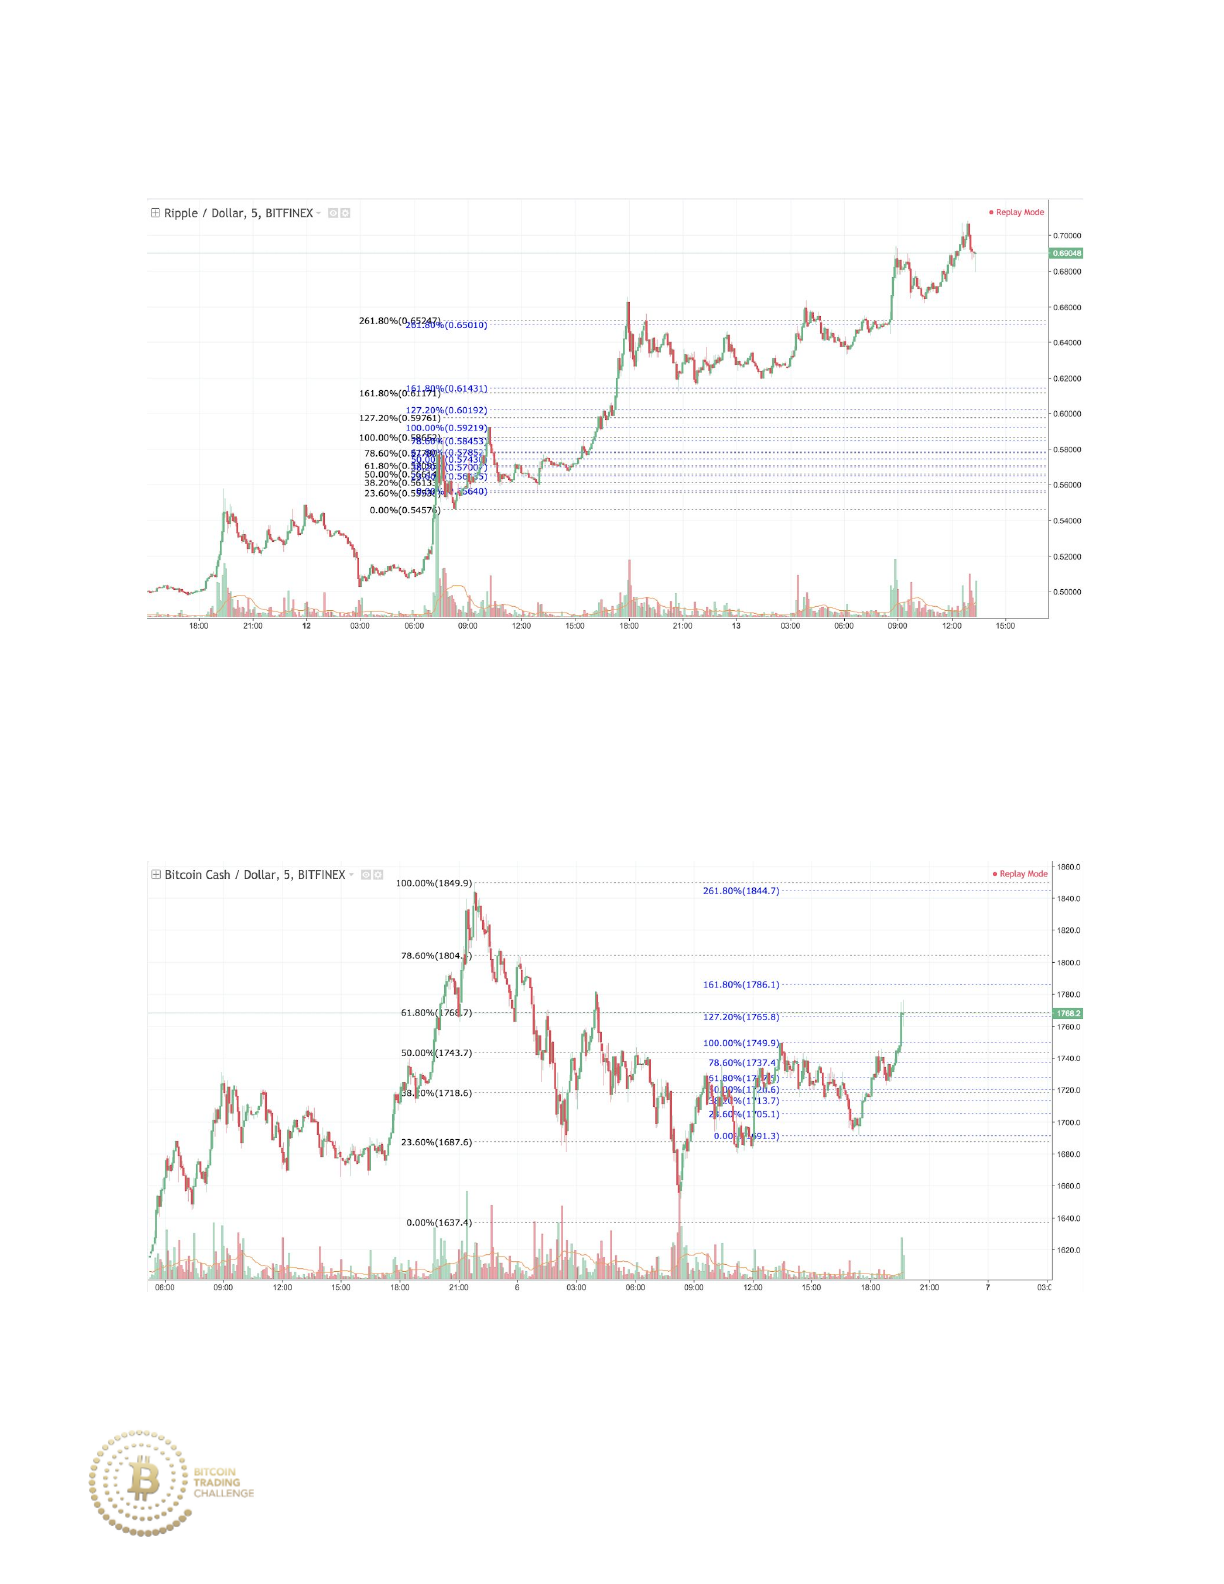
Practice 7-17 Outcome
Price meets resistance at the 261.8% confluence zone before continuing to
move higher.
Practice 7-18
If you were currently in a long position, at which price would you place your
exit sell order (take profit)?
231
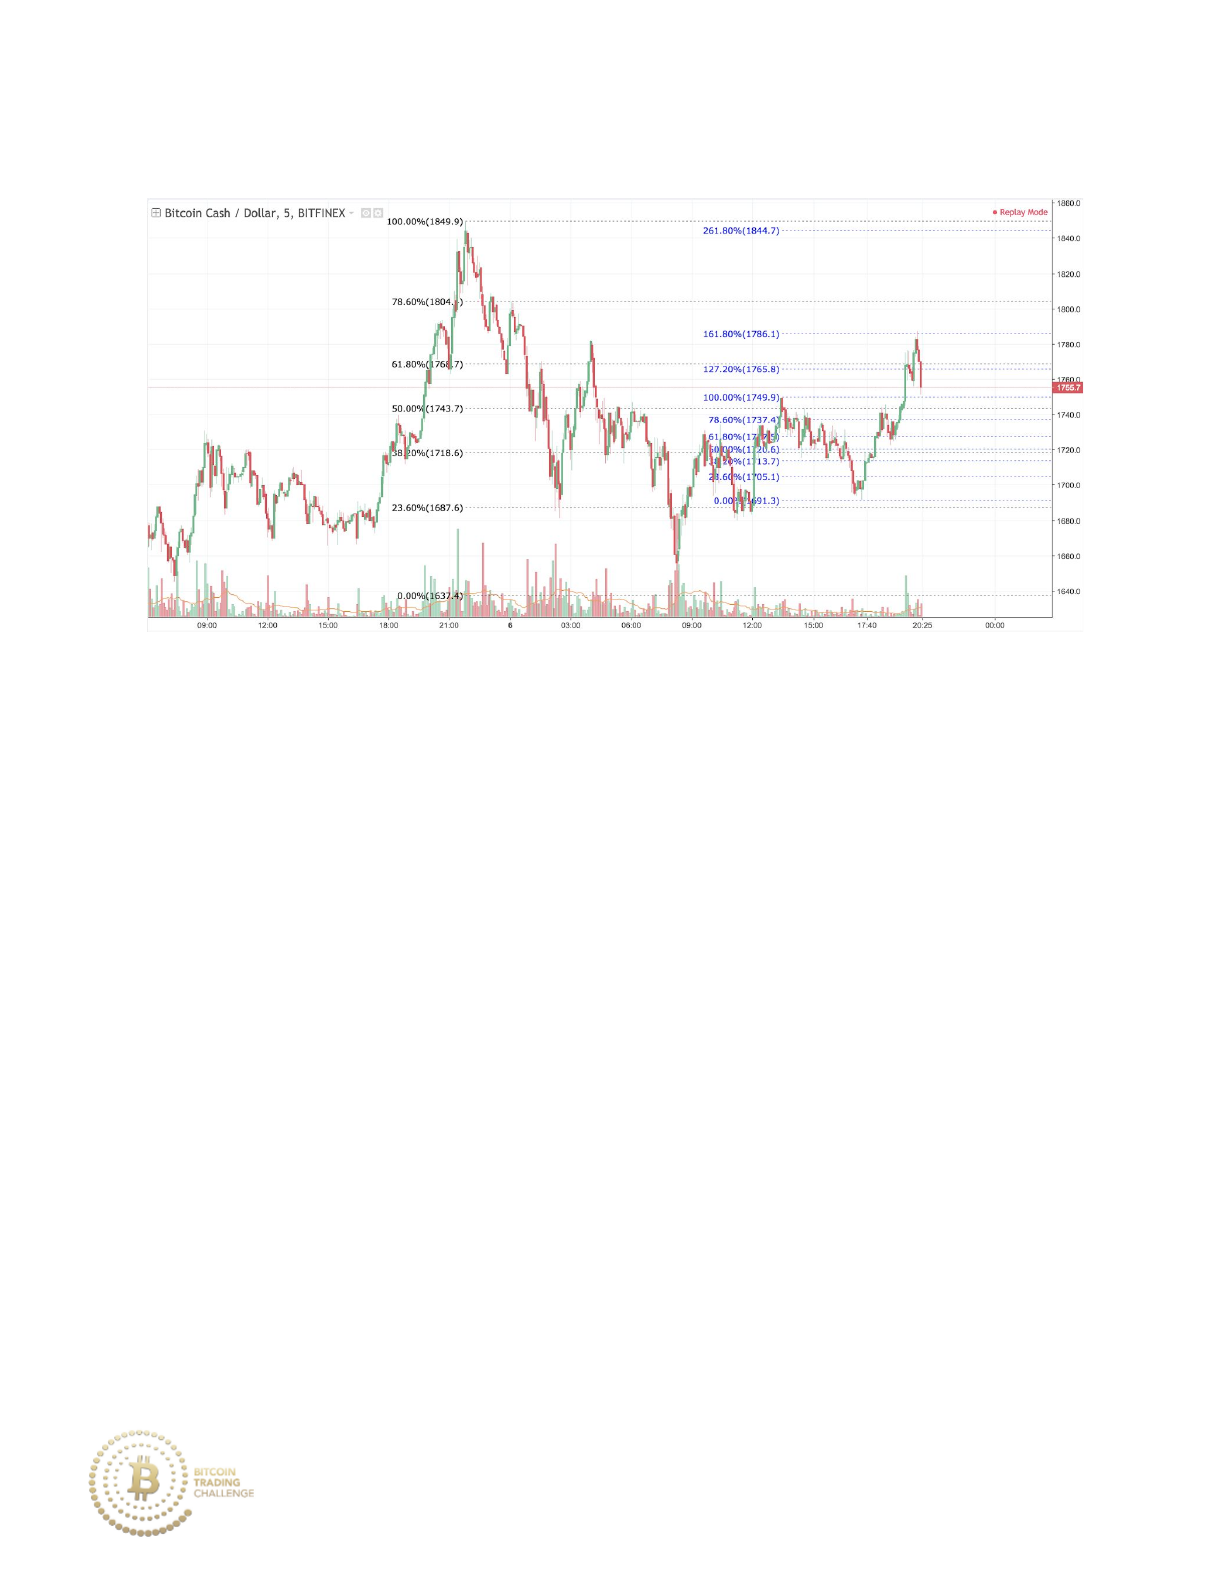
Practice 7-18 Answer
Price moves downward from 1849.9 on relatively average momentum as the
bulls fight back with multiple pullbacks. Price then moves upward from the
low tail at 1637.4 on strong momentum. There is confluence between the
61.8% Fibonacci retracement (black Fibonacci) and the 127.2%, however, the
strong uptrend continues to move to the 161.8% extension at 1786.1. The
highest price that BCH/USD reaches is 1787.
232
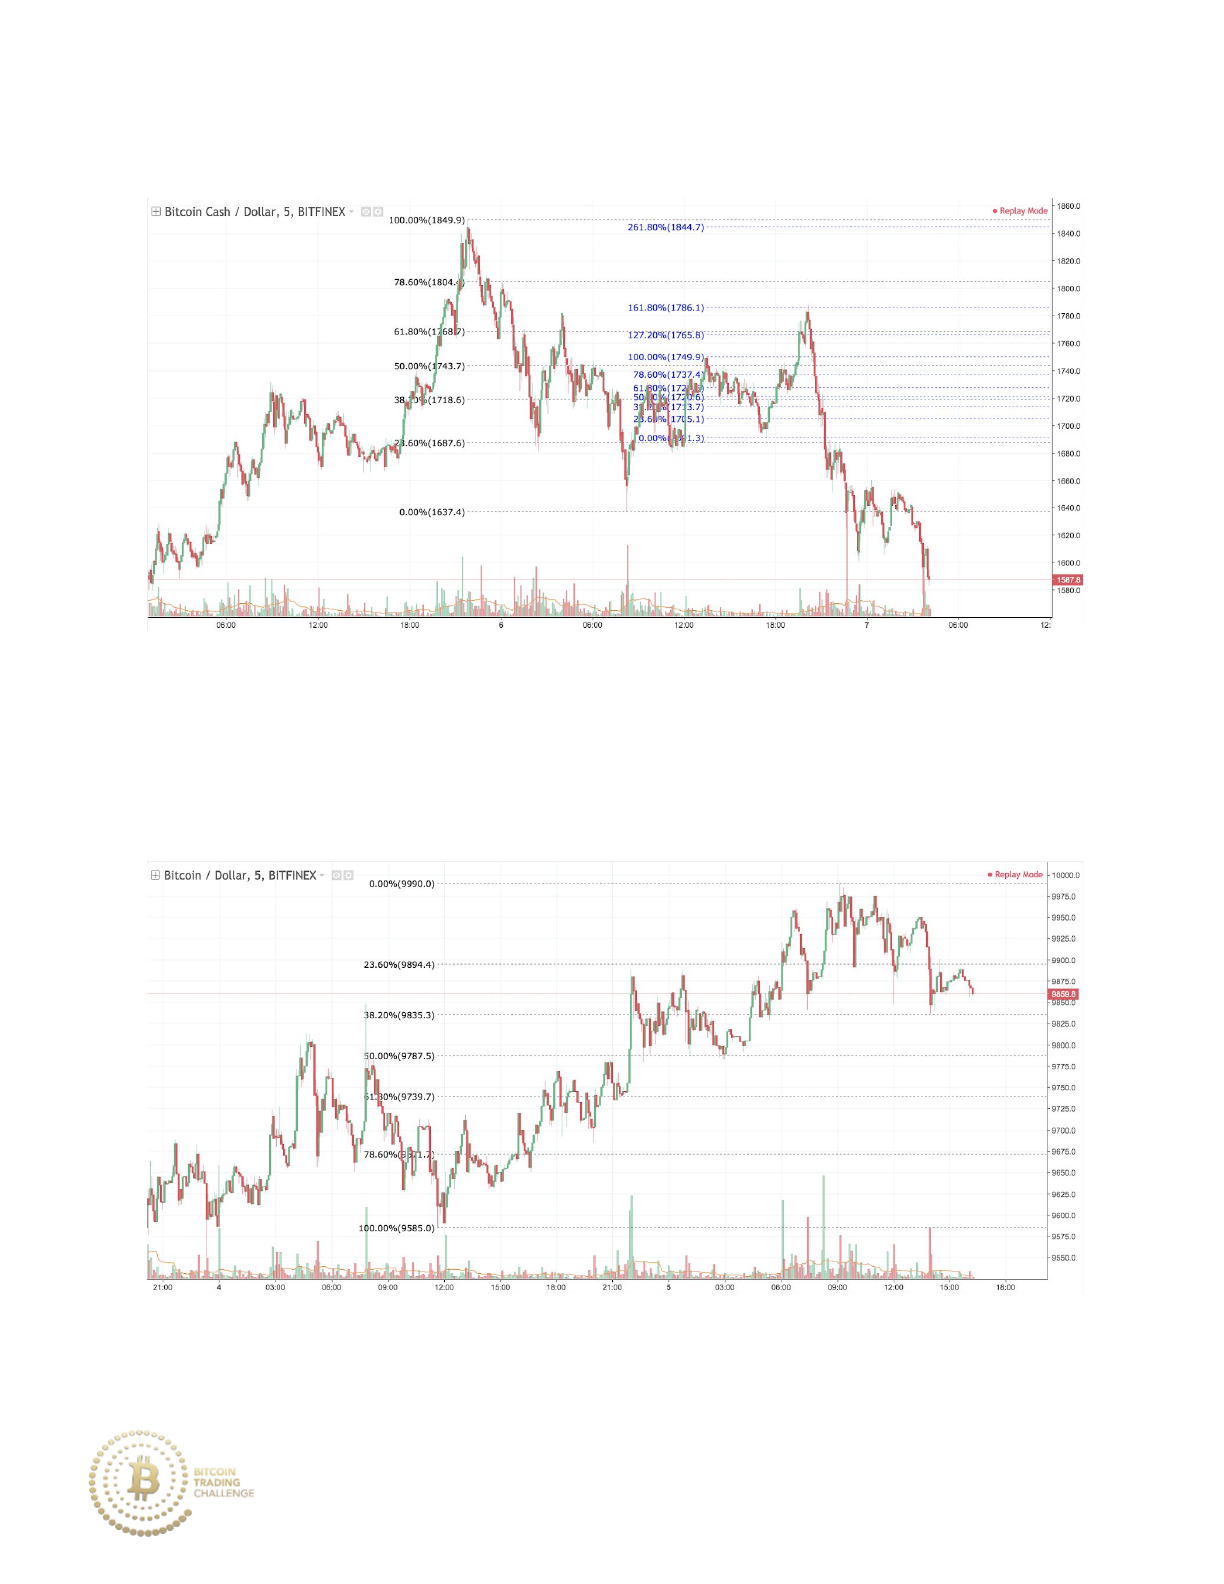
Practice 7-18 Outcome
Price moves downward after a V-Shaped Reversal at the confluence zone.
The highest price that BCH/USD reaches is 1787.
Practice 7-19
If you were currently in a short position, at which price would you place your
exit buy order (take profit)?
233
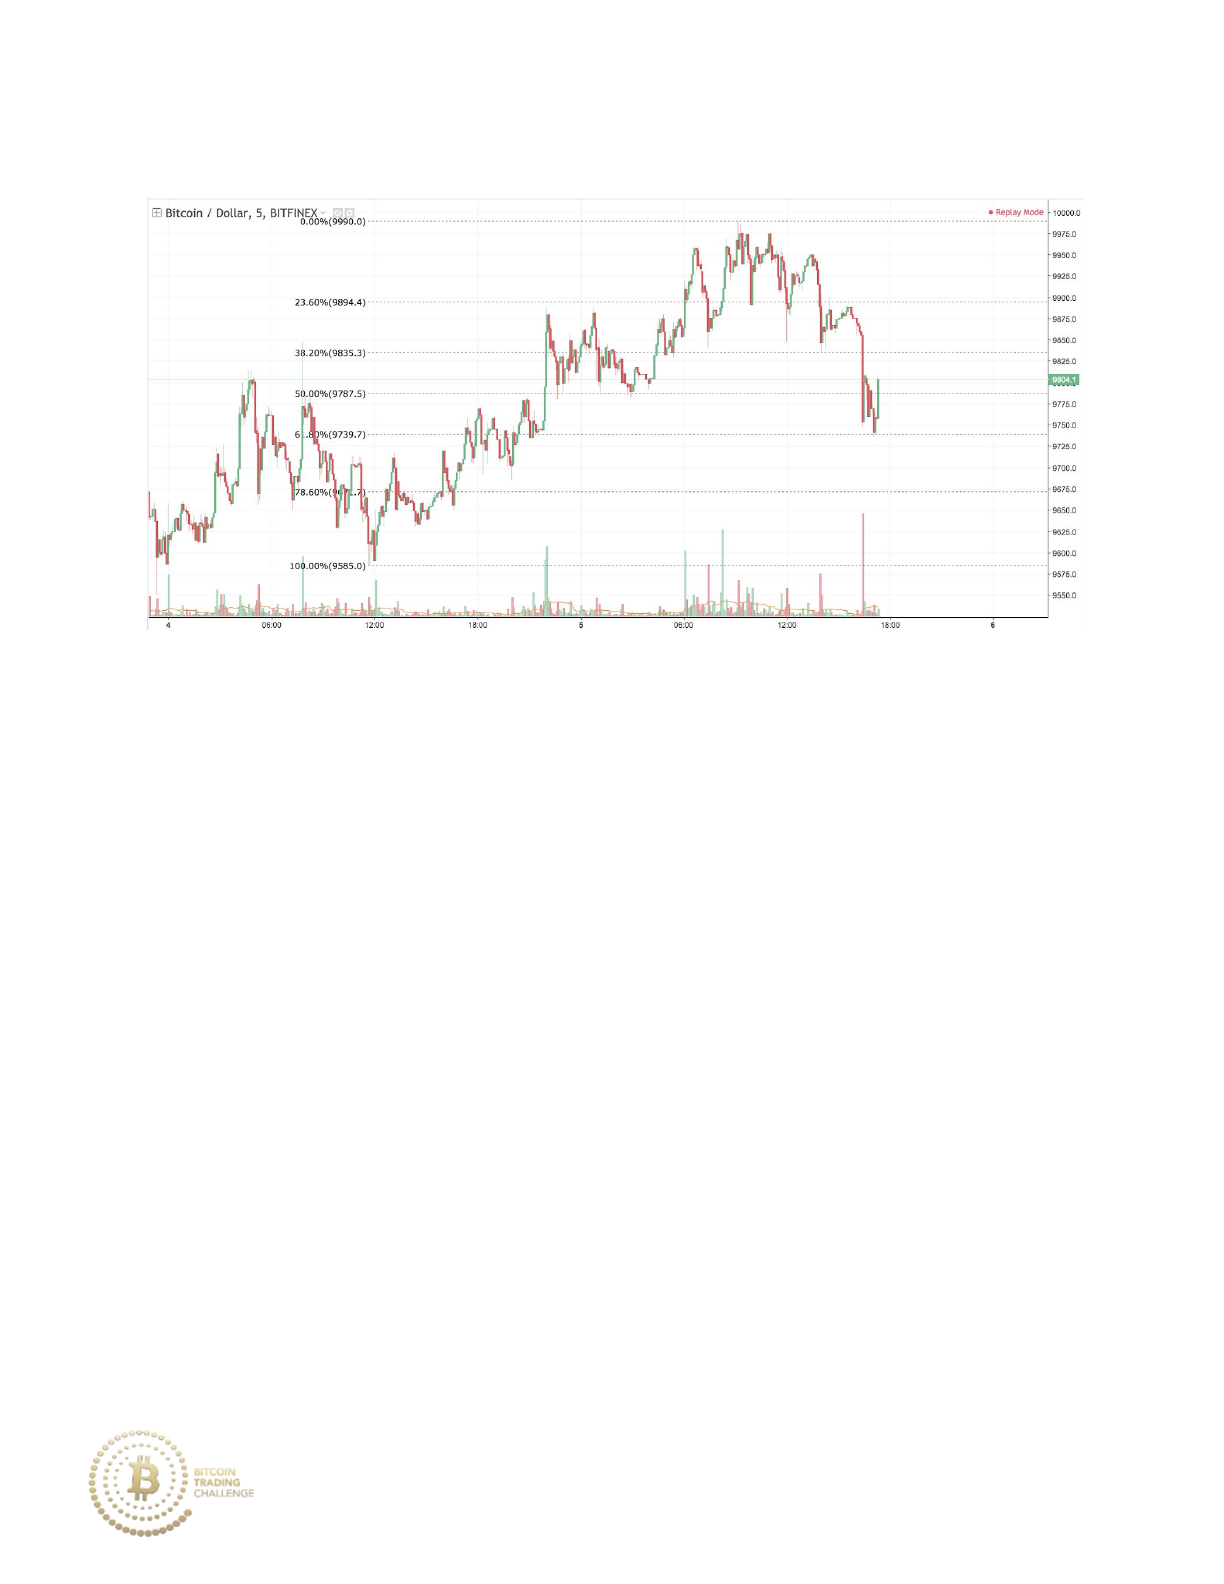
Practice 7-19 Answer
Price moves upward on weak momentum, with repetitive bearish pullback.
This weak market stage of an uptrend is expected to retrace down at least to
the 61.8% Fibonacci level. When price does retrace to the level, volume
surges, followed by a brief touch of the 61.8% level and then strong bullish
momentum upward. Taking profit off of a short position around this level is
optimal.
234
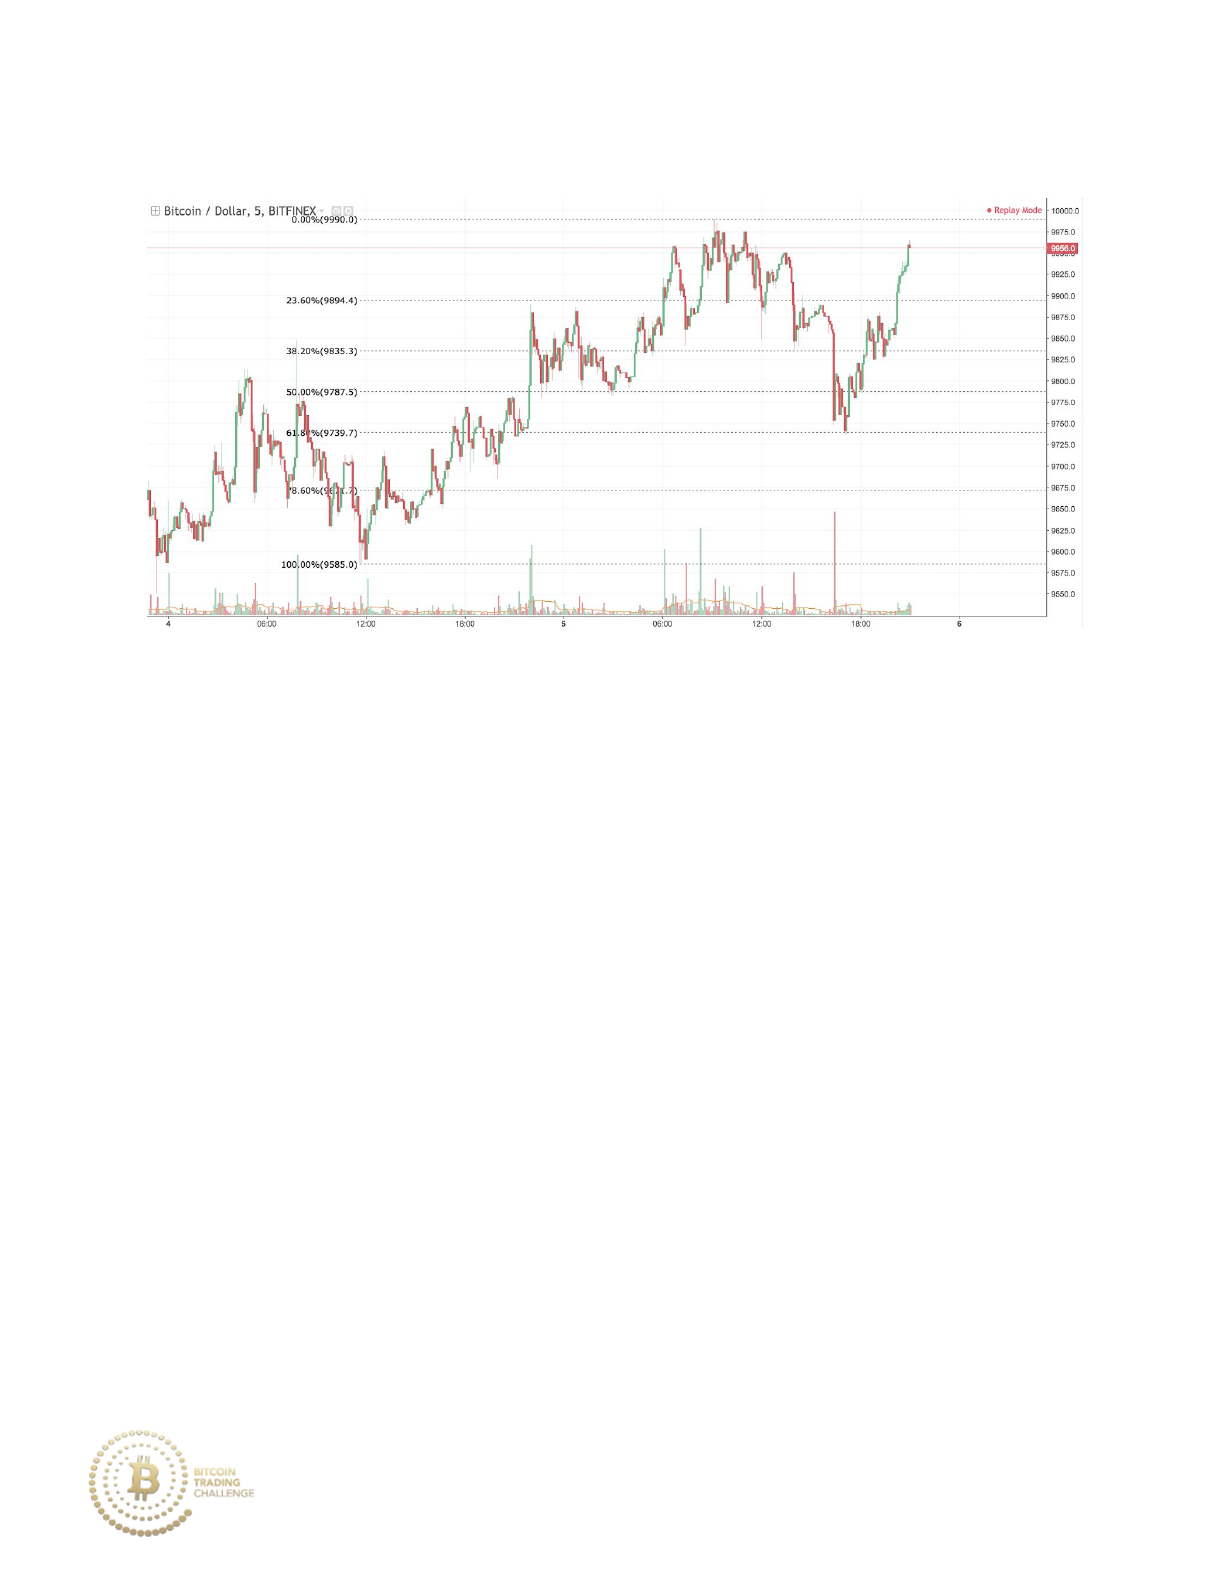
Practice 7-19 Outcome
Price moves back upward after a V-Shaped Reversal at the 61.8%
retracement. The lowest price that BTC/USD reaches is 9736.
235
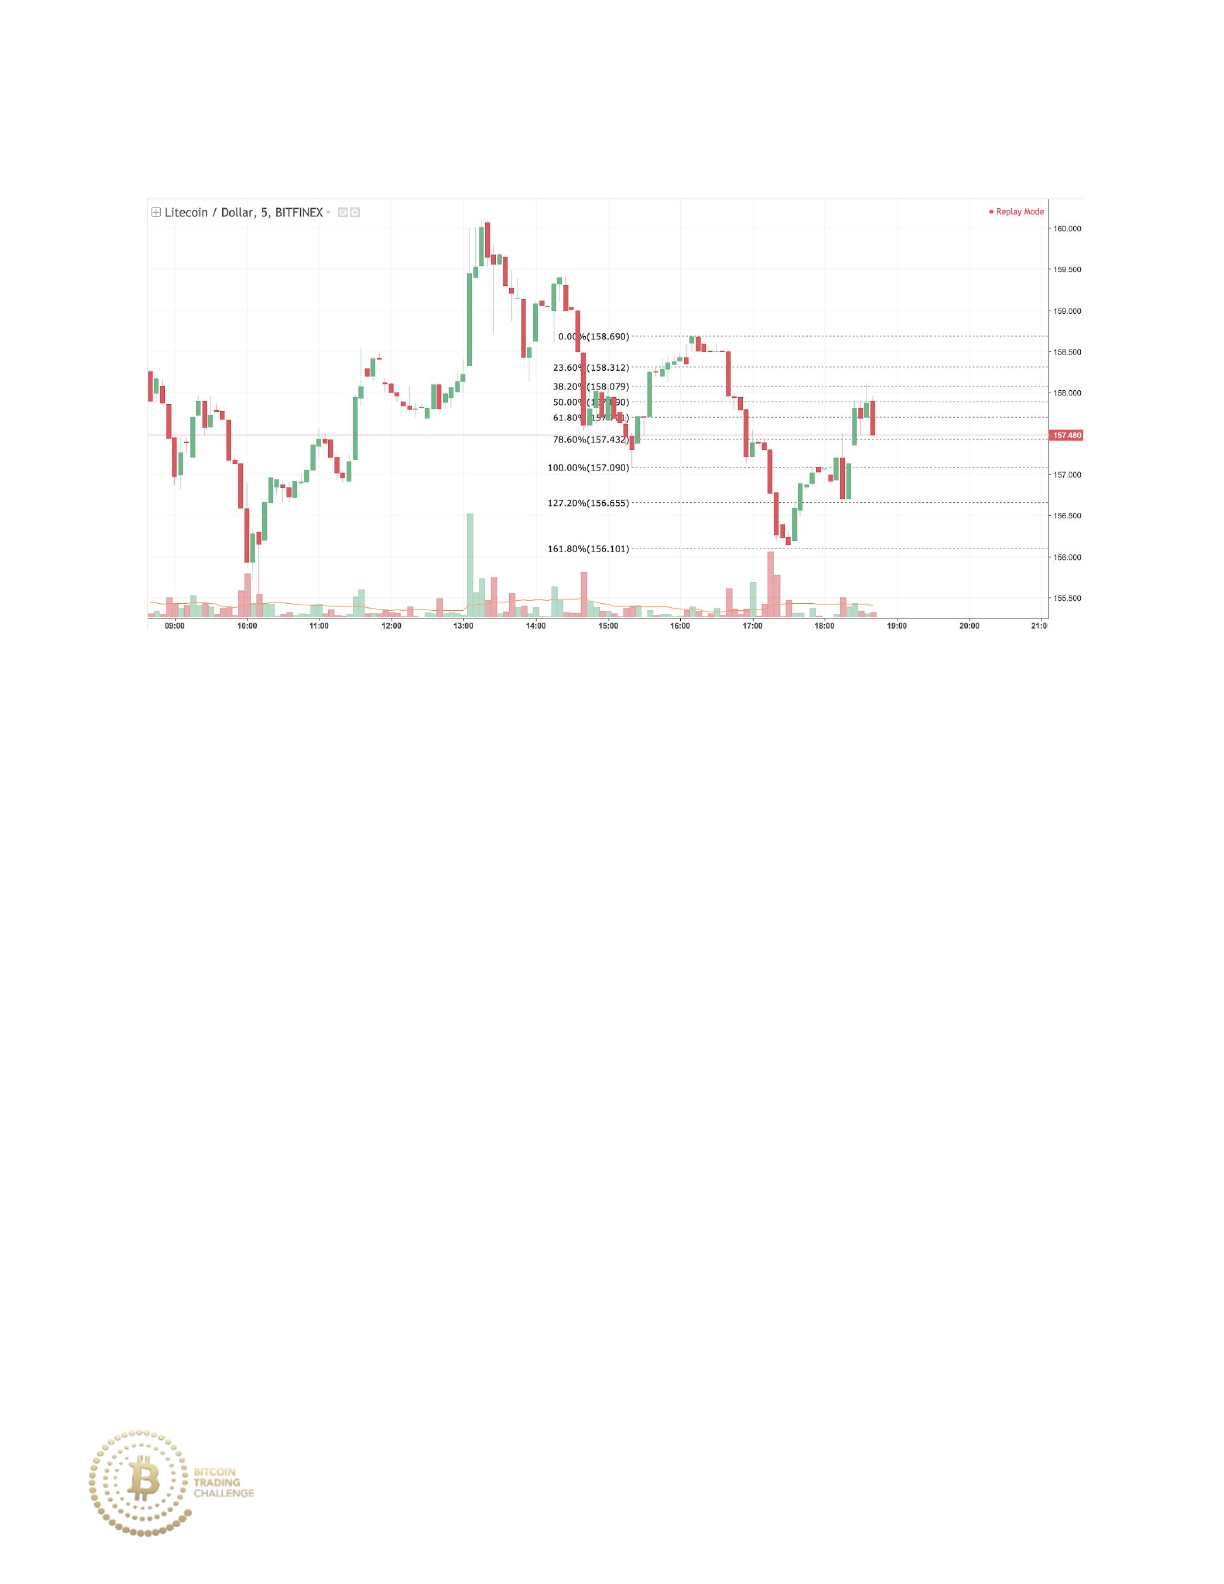
Practice 7-20
If you were currently in a short position, at which price would you place your
exit buy order (take profit)?
In this example, price is not able to touch the 161.8% Fibonacci extension
level before moving back upward. Would you sell immediately or still place
an exit order at the 161.8% extension (156.101)?
236
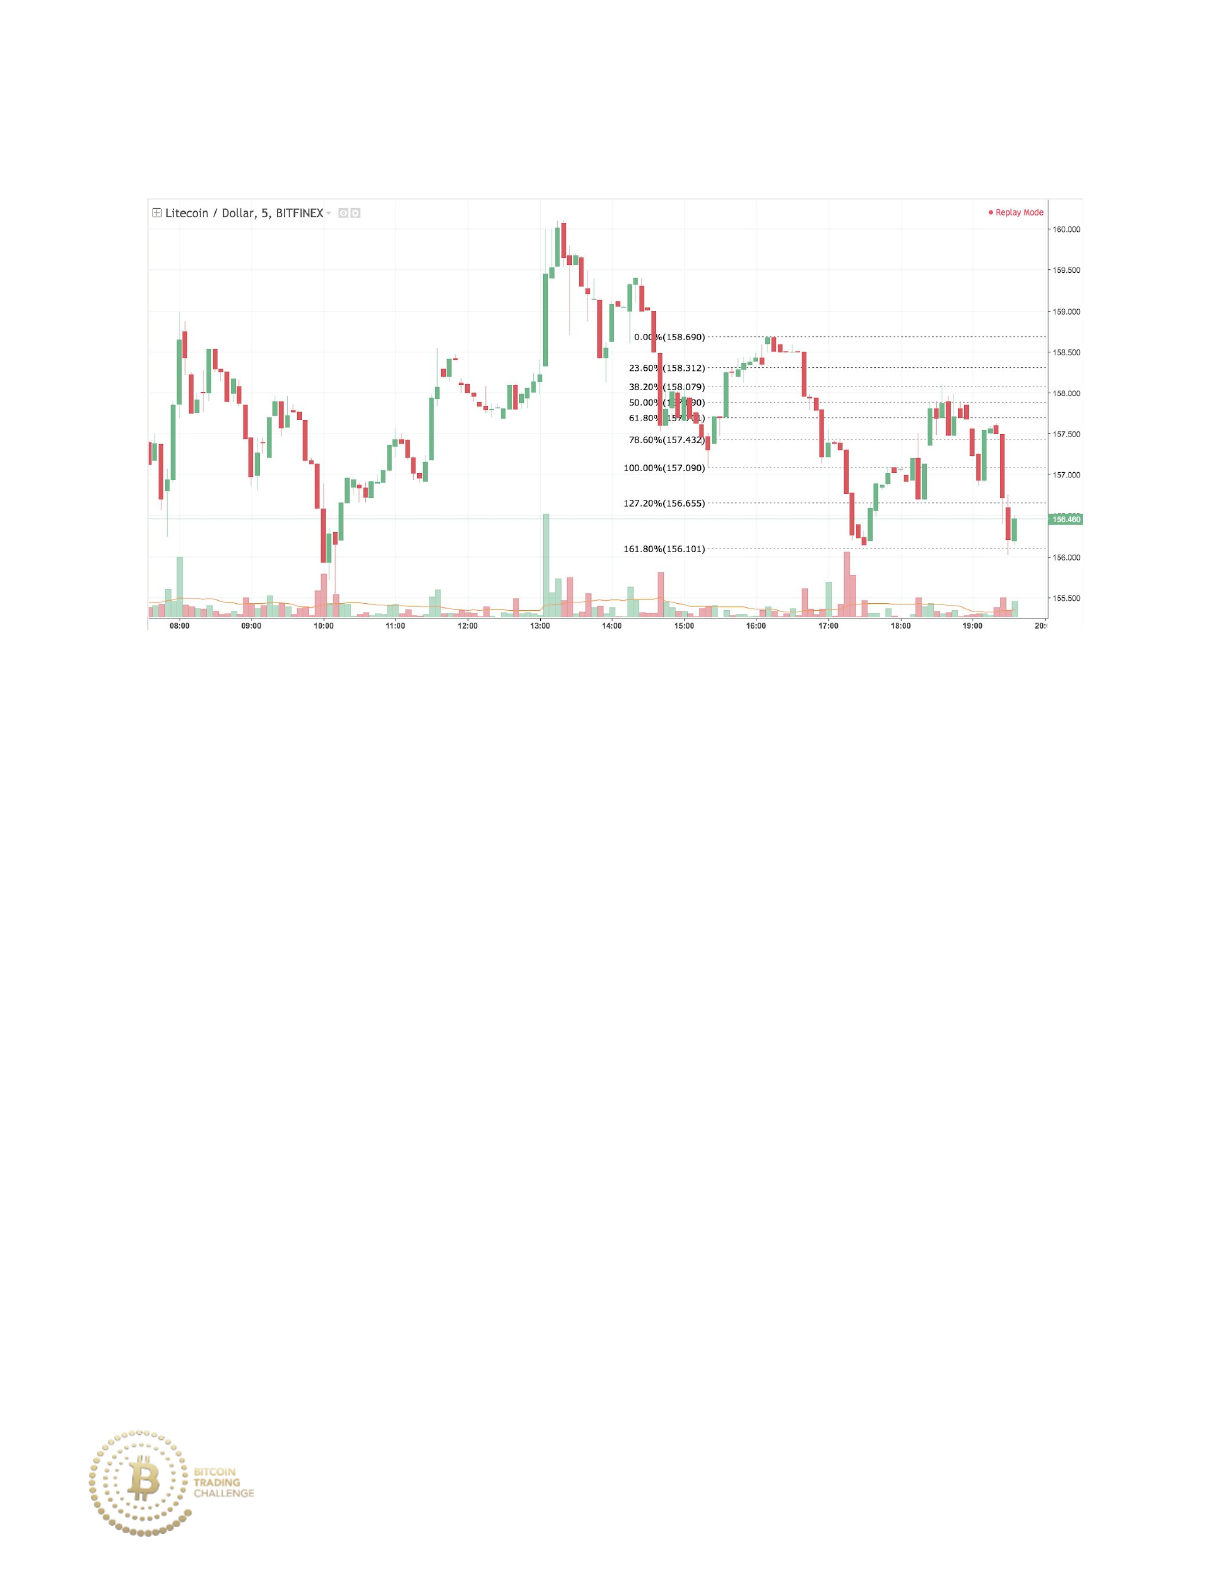
Practice 7-20 Answer
Price moves downward to touch the 161.8% Fibonacci extension of the
previous retracement before moving back upward again. Taking profit at that
level is optimal as price has a bullish rejection of (upmove from 156.14 to
158.1) after establishing initial support with the first low.
237
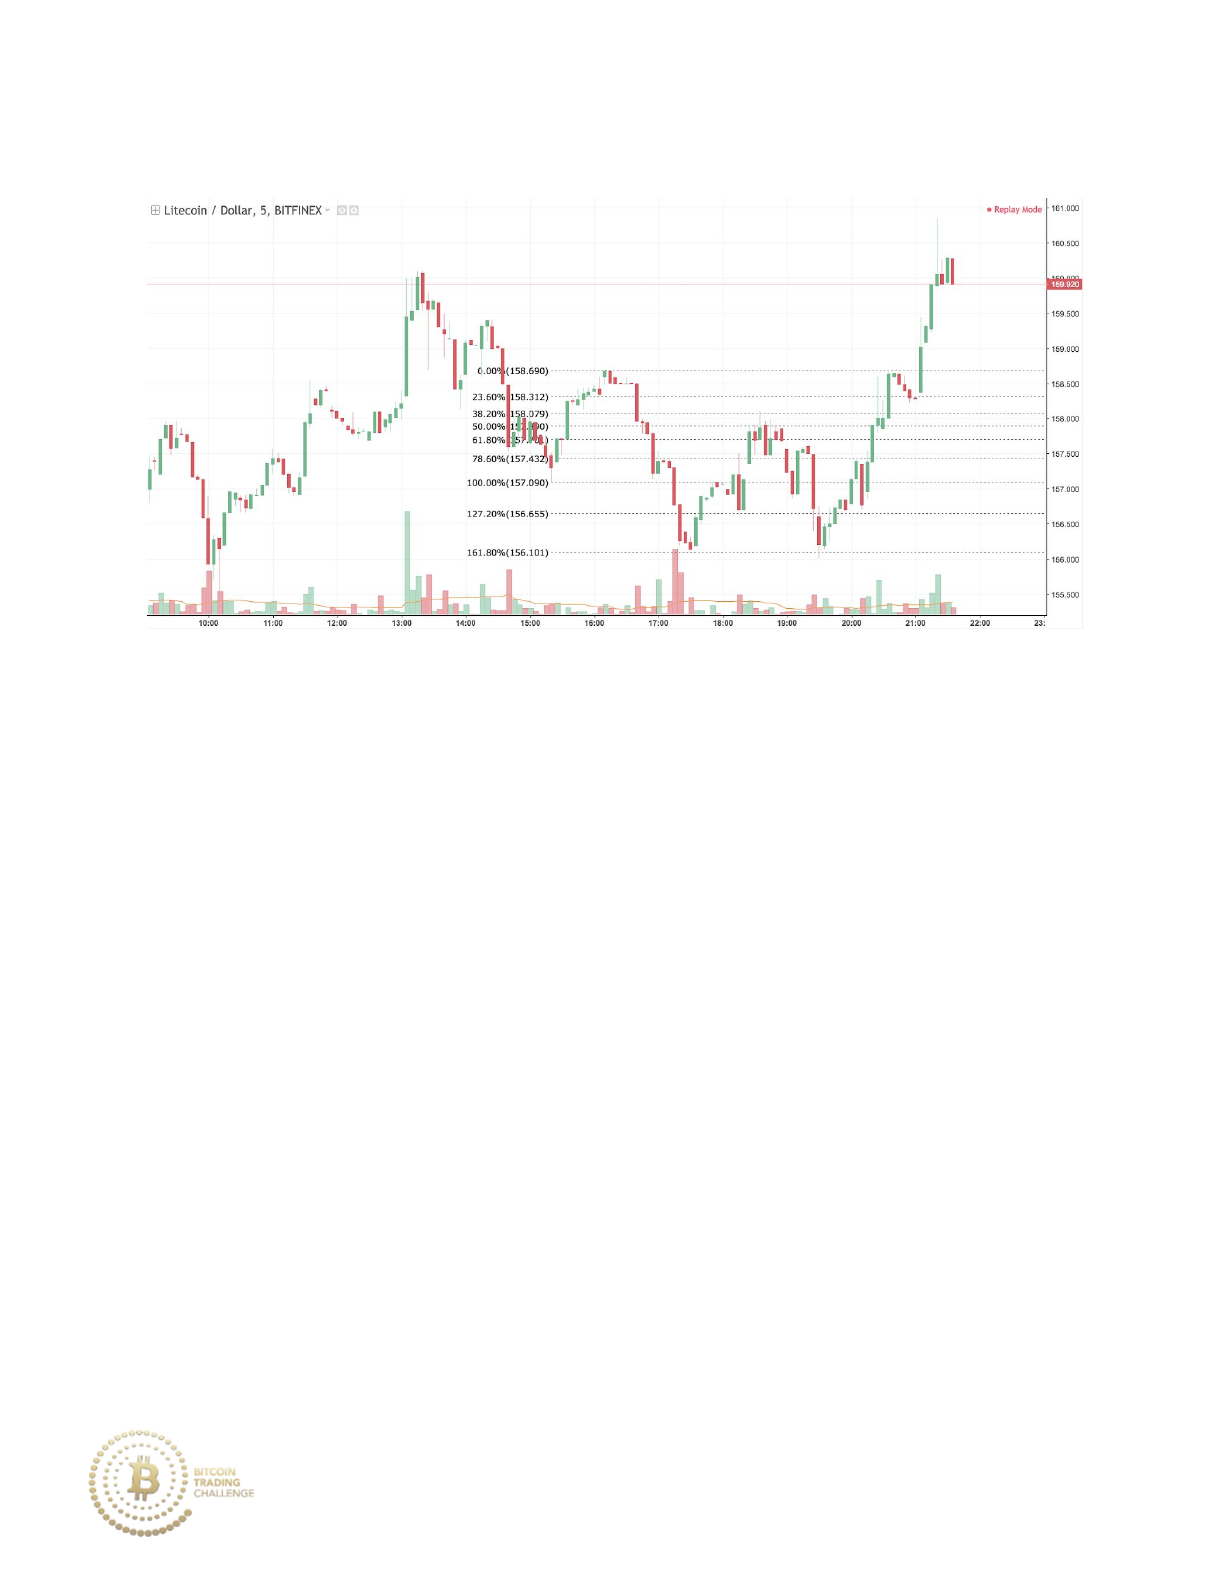
Practice 7-20 Outcome
Price moves back upward after a Stop Loss Hunt at the 161.8% extension.
The lowest price that BTC/USD reaches is 156.01.
5. Stop Loss Placement Practice
Within the five examples in this section, identify the exact price that you
would place your stop loss order at. Take into account Fibonacci
retracement/extension dynamics, support/resistance levels and volume.
238
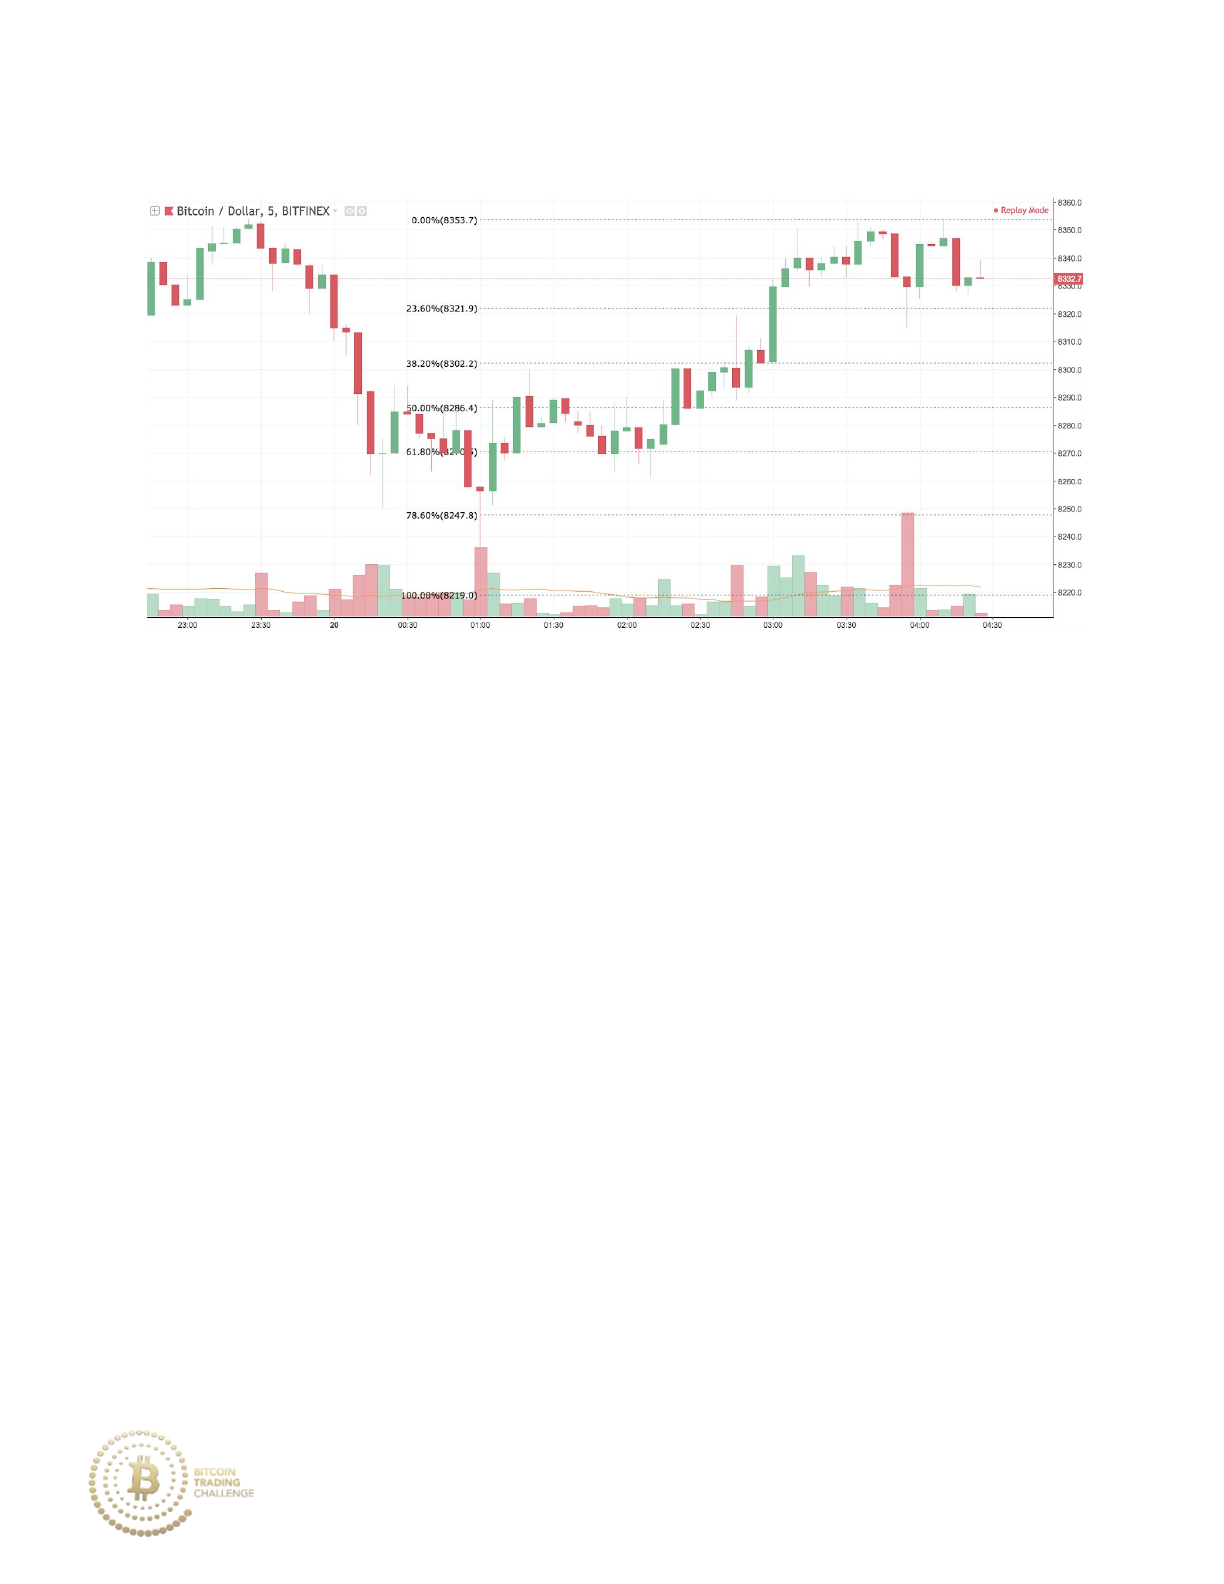
Practice 7-21
If you were currently in a long position, at which price would you place your
stop loss order?
239
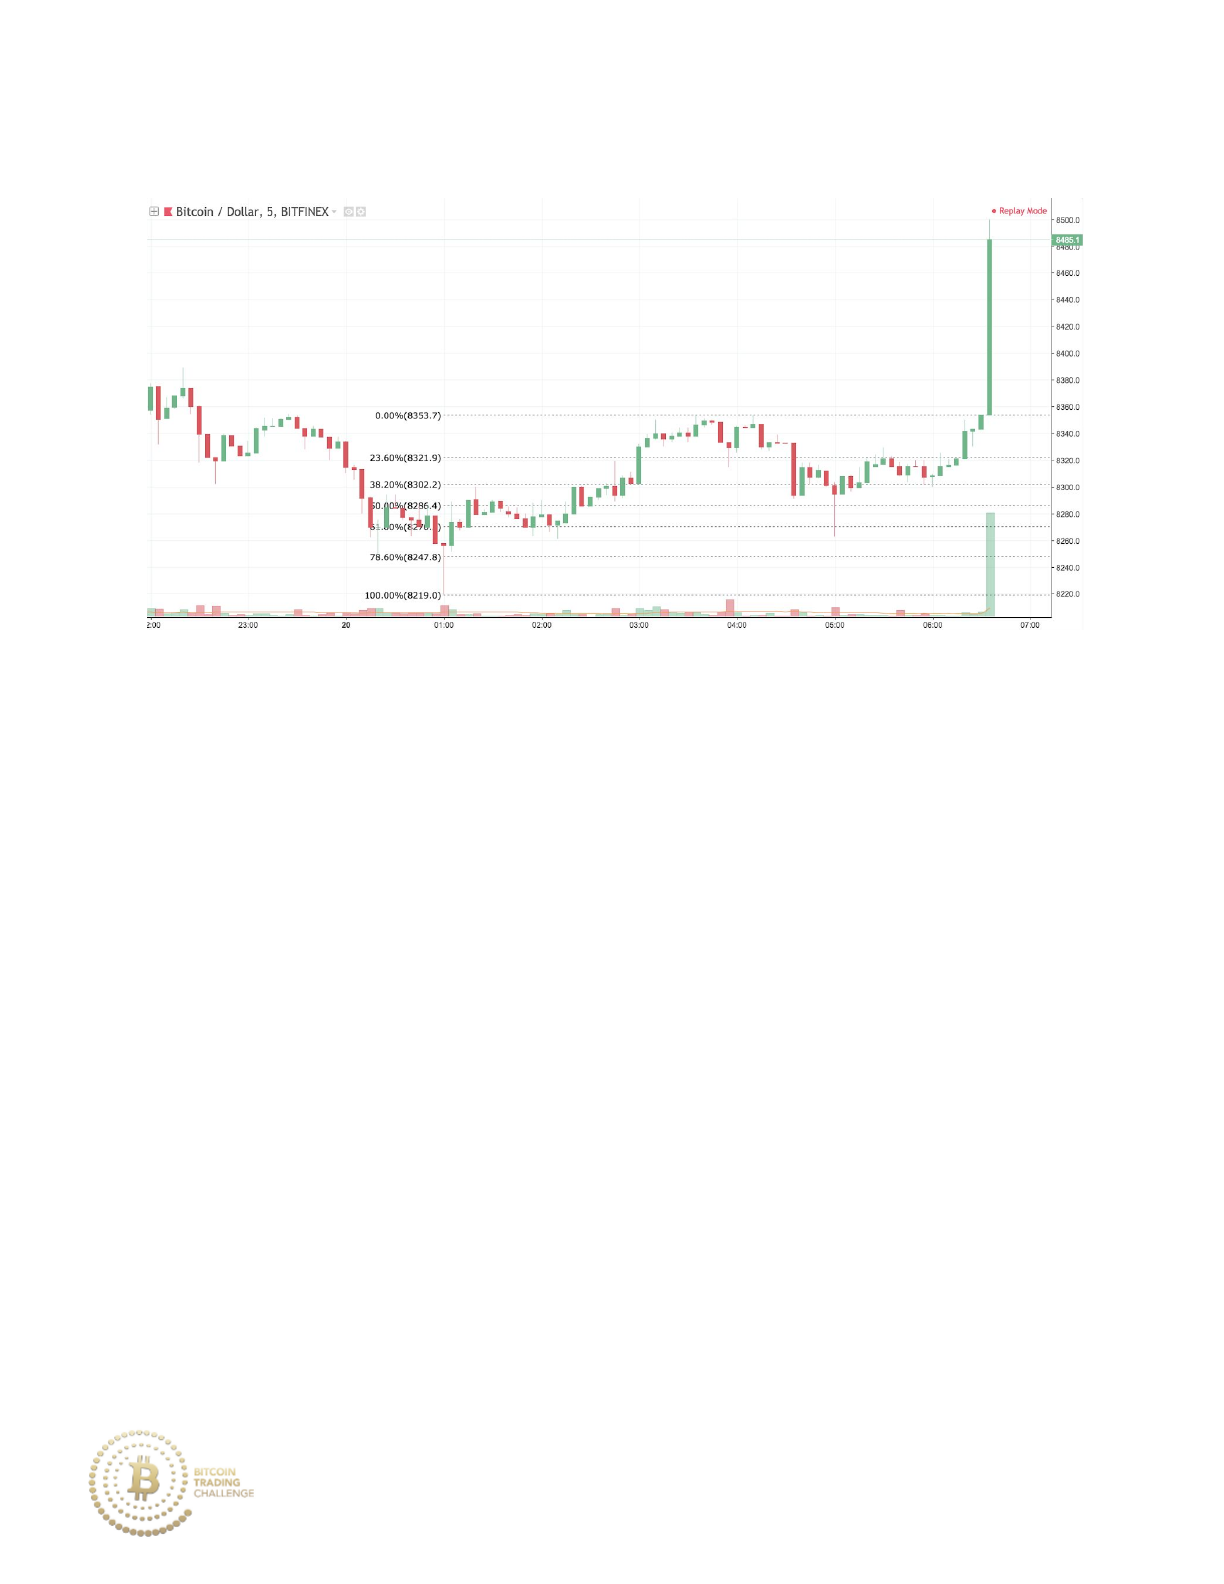
Practice 7-21 Answer
Price moves downward to touch the 61.8% Fibonacci retracement with a low
tail. The optimal placement for a stop loss is just beneath the 78.6%
retracement. The uptrend from 8219 to 8353.7 runs on average bullish
momentum and a sharp retracement is likely (the 61.8% to 78.6% area).
240
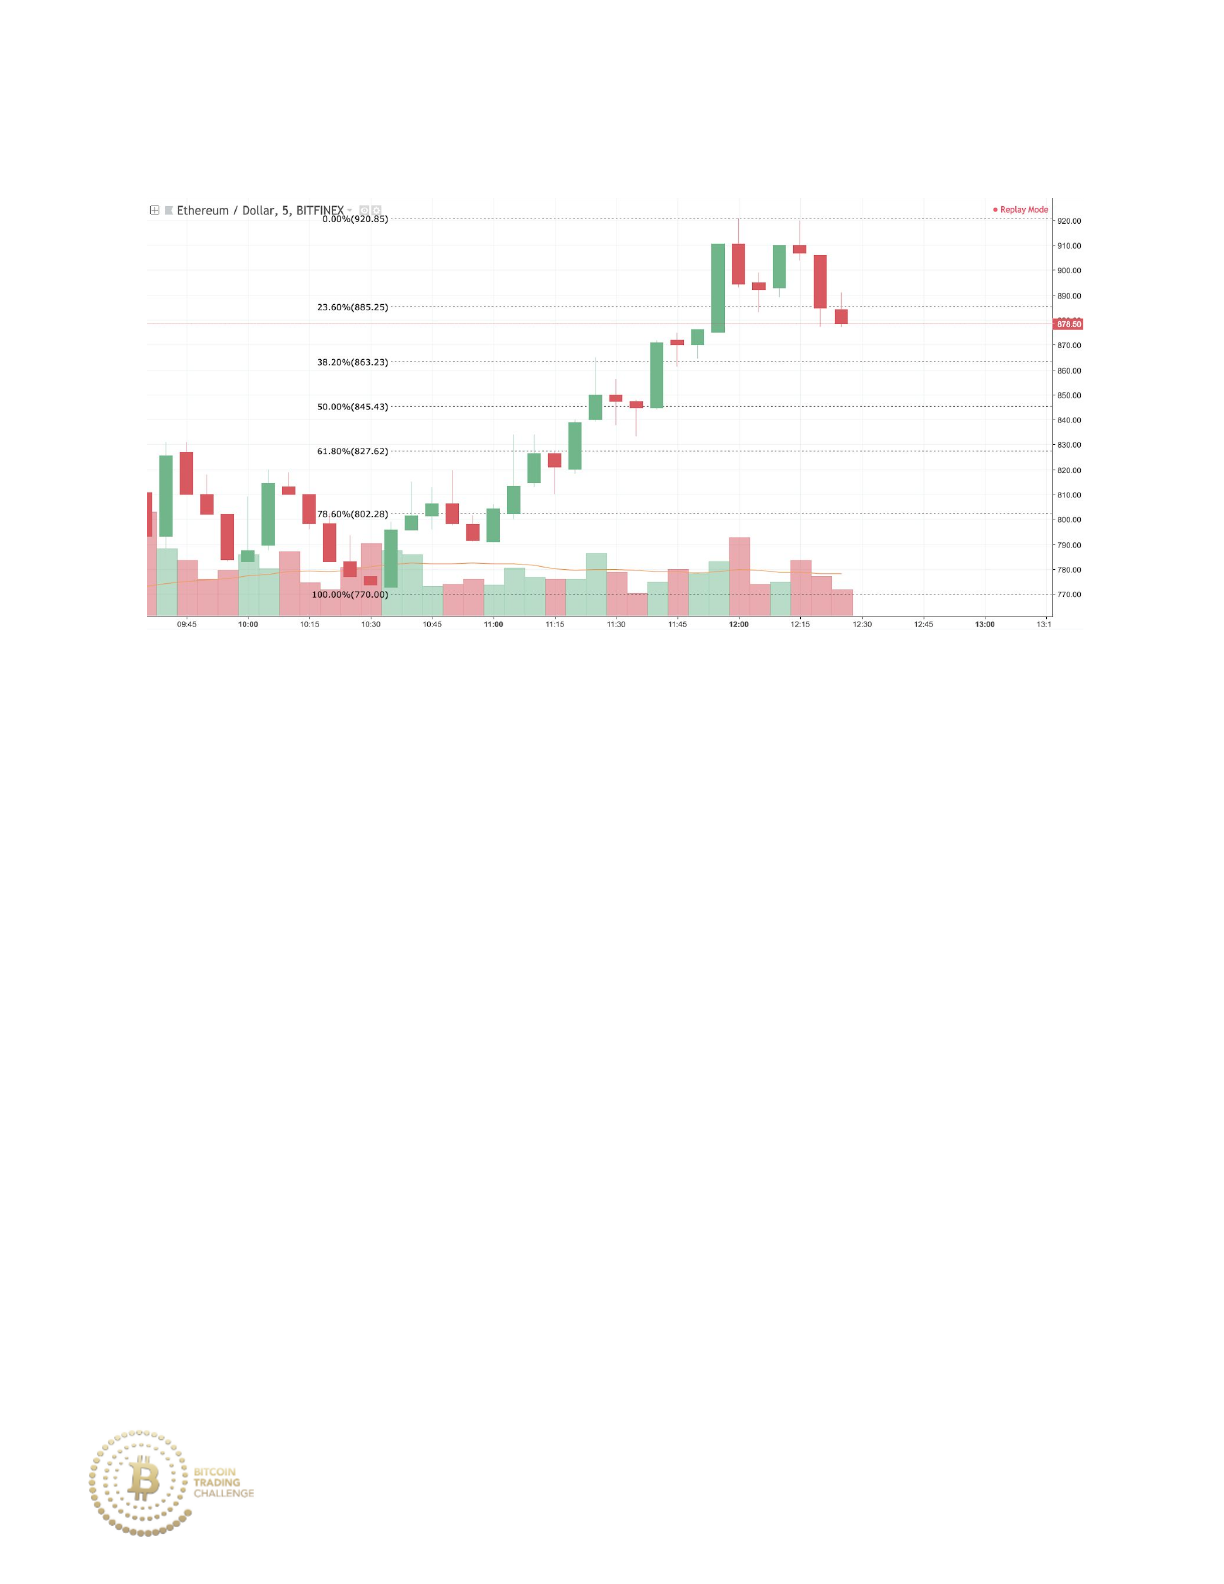
Practice 7-22
If you were currently in a long position, at which price would you place your
stop loss order?
241
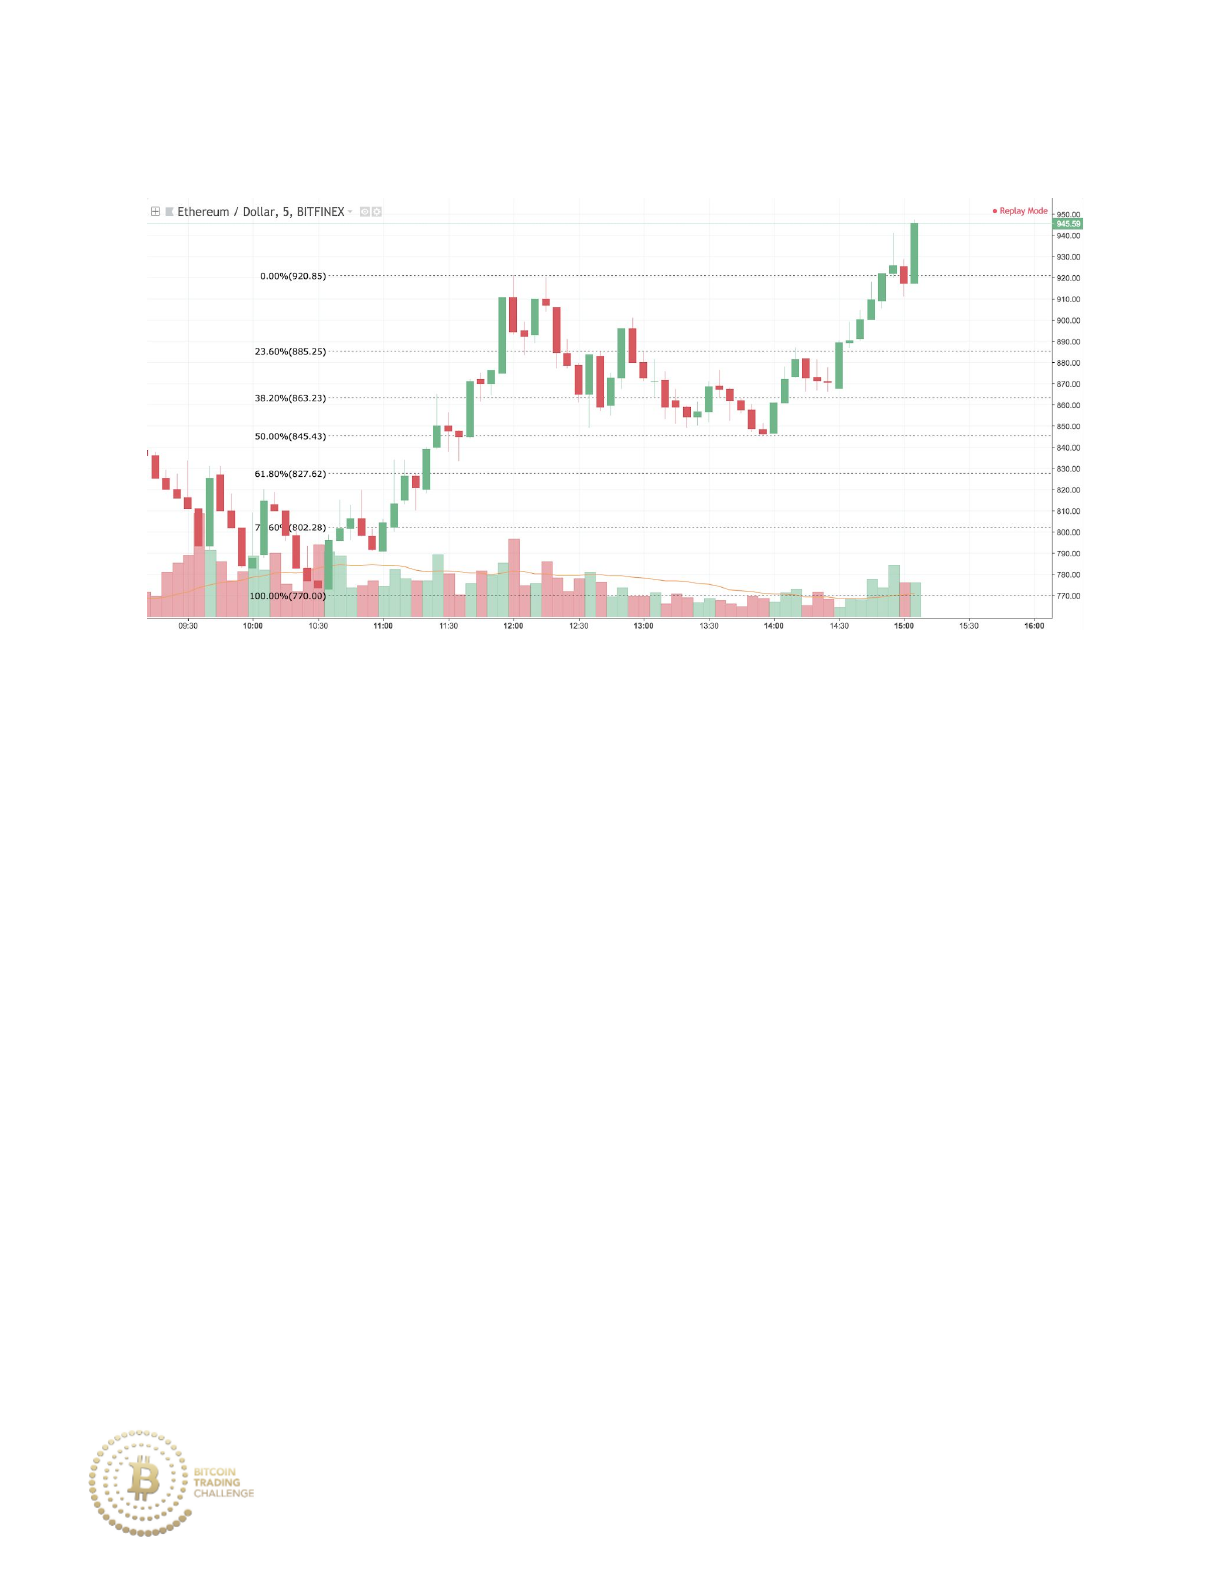
Practice 7-22 Answer
Price moves downward to touch the 50% Fibonacci retracement. The optimal
placement for a stop loss is beneath the 50% retracement as the uptrend
from 770 to 920.85 runs on strong bullish momentum with weak bearish
pullback. A weak retracement is expected after a trend on strong momentum
(the 38.2% to the 50% retracement area).
242
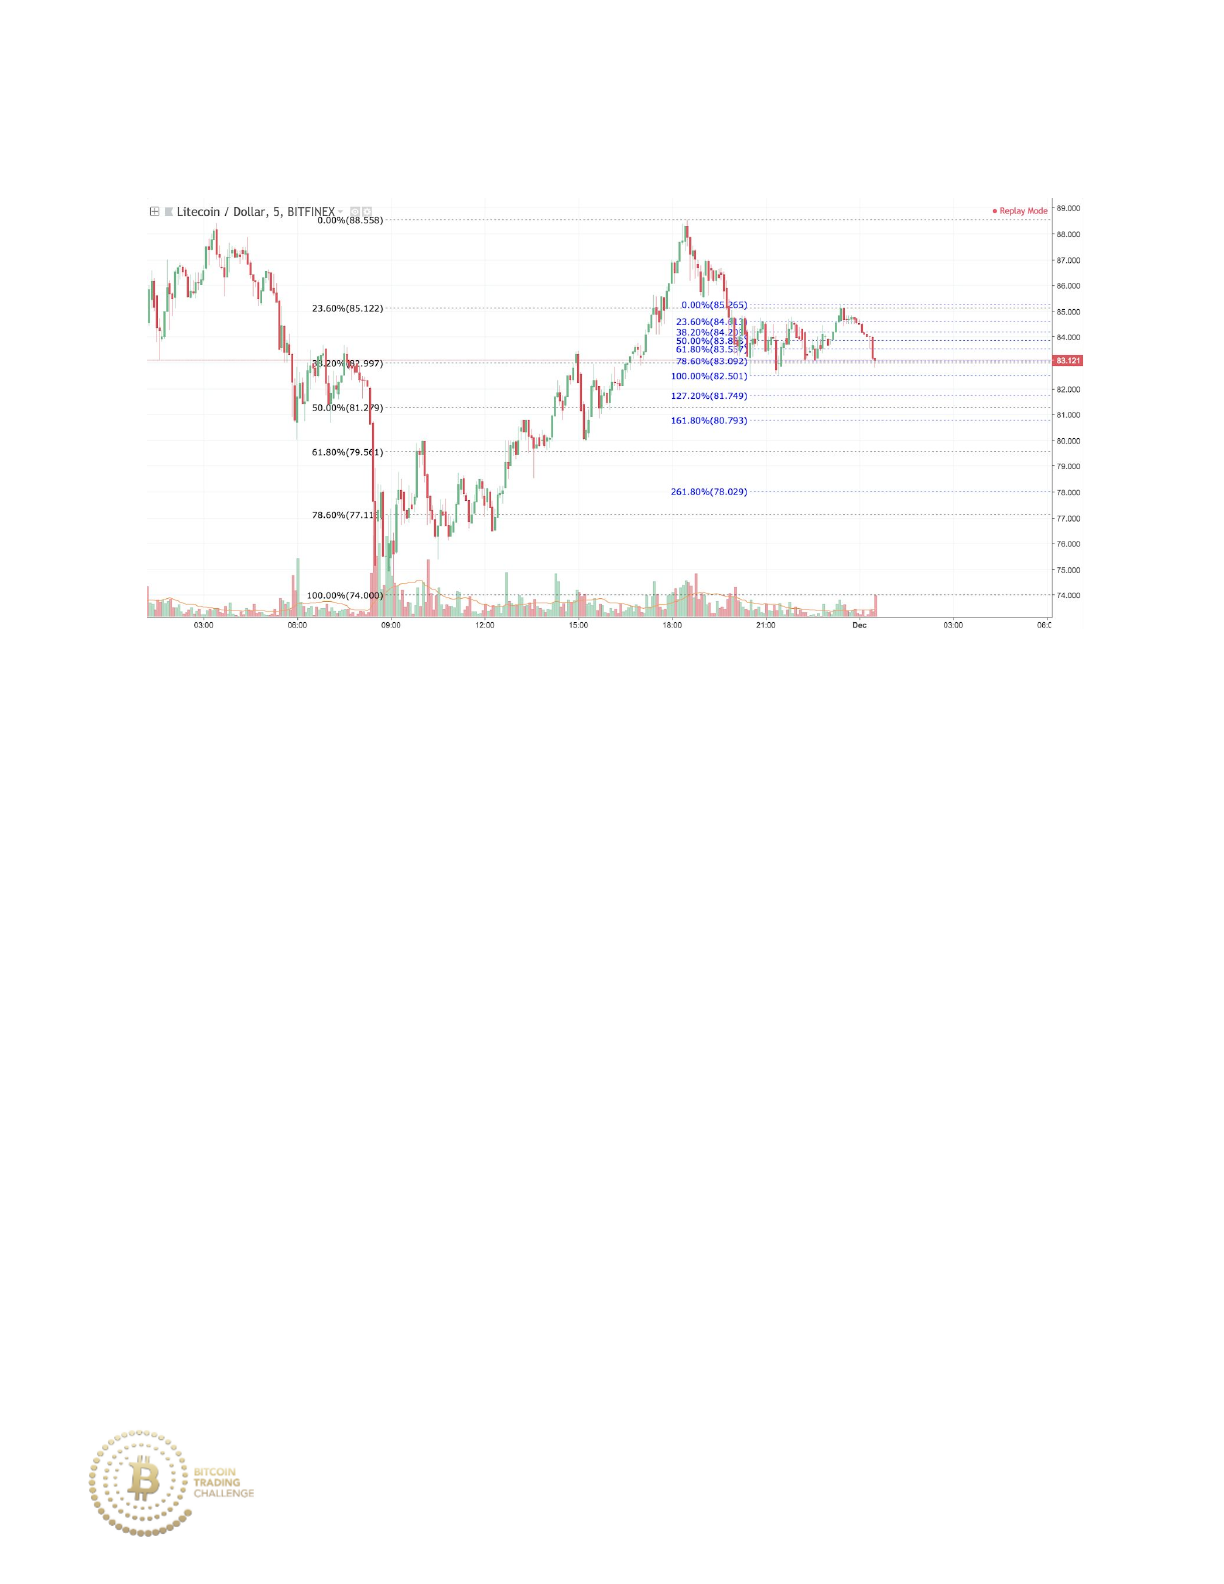
Practice 7-23
If you were currently in a long position, at which price would you place your
stop loss order?
243
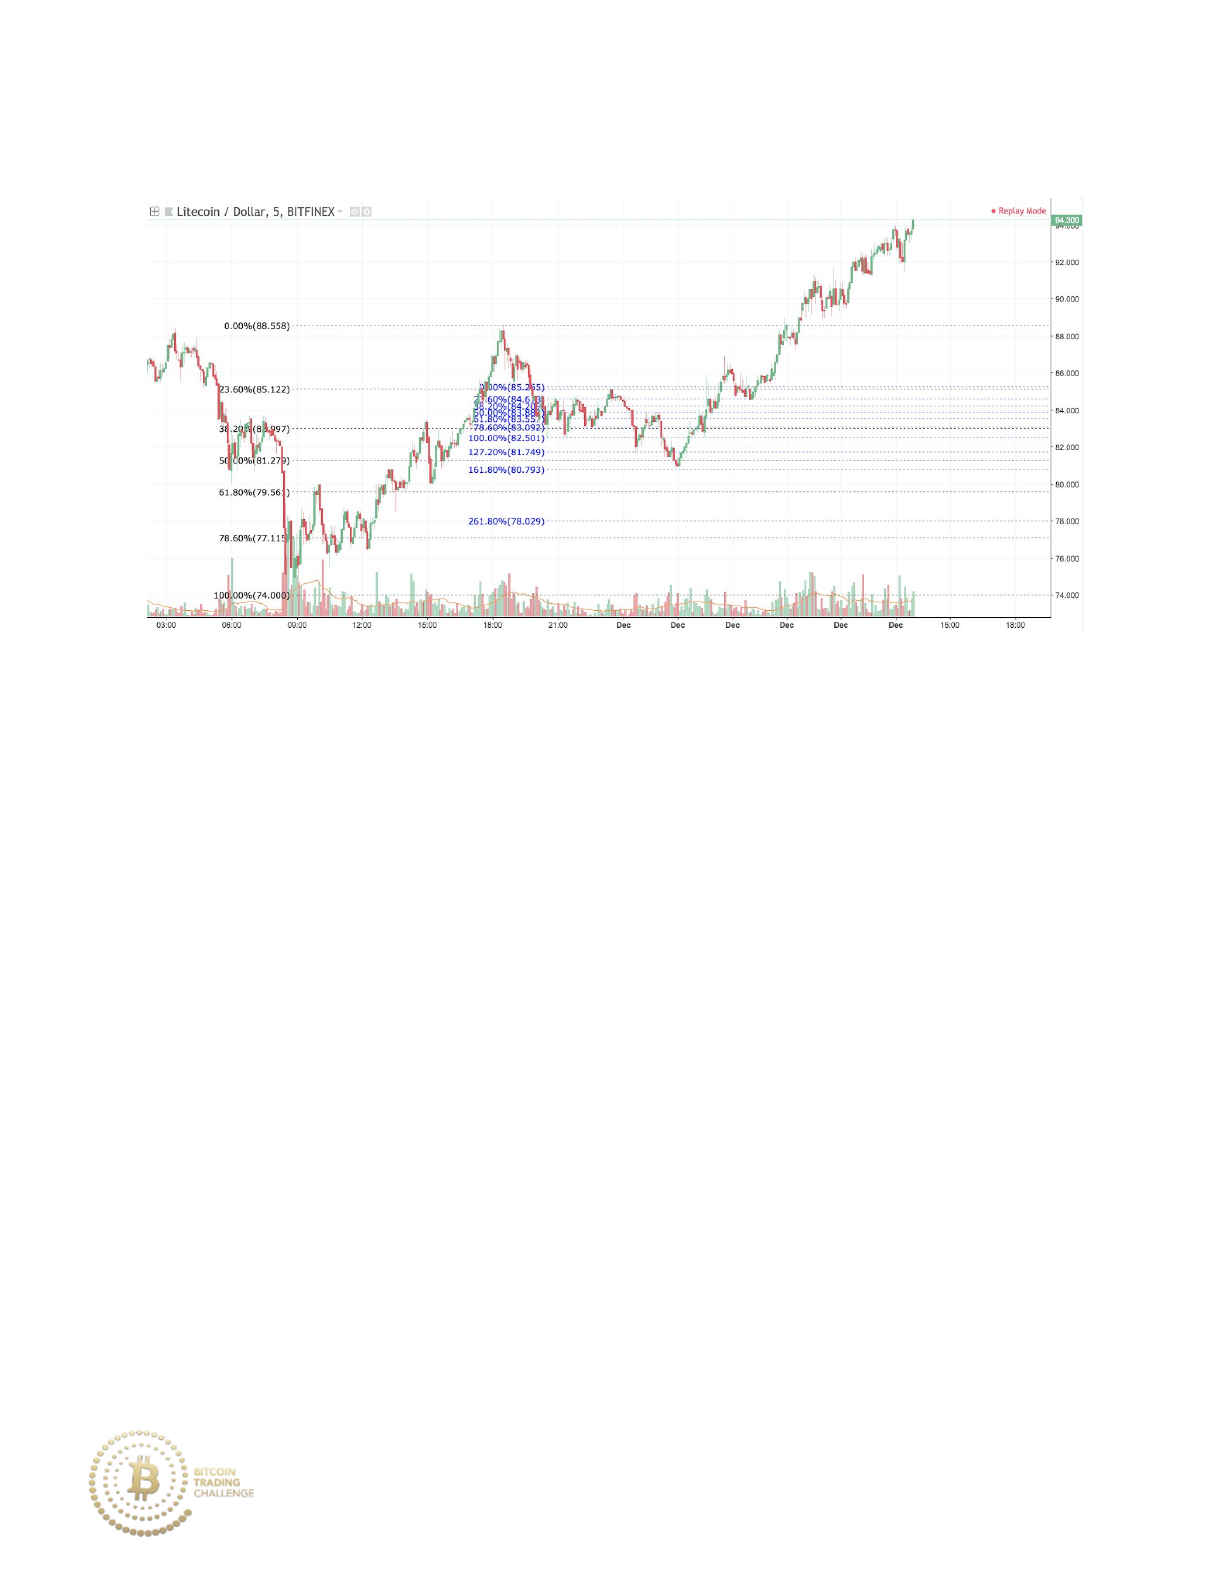
Practice 7-23 Answer
Price moves downward towards the confluence zone of the 50% as well as
the 161.8% extension of the previous retracement. The optimal placement
for a stop loss is either below the 161.8% extension (conservative) or below
the 78.6% (higher risk). To the latter placement, a case could be made to
place the stop loss just below the 78.6% because there is confluence within
the 161.8% to 61.8% Fibonacci zone and price may have traveled to that
area.
244
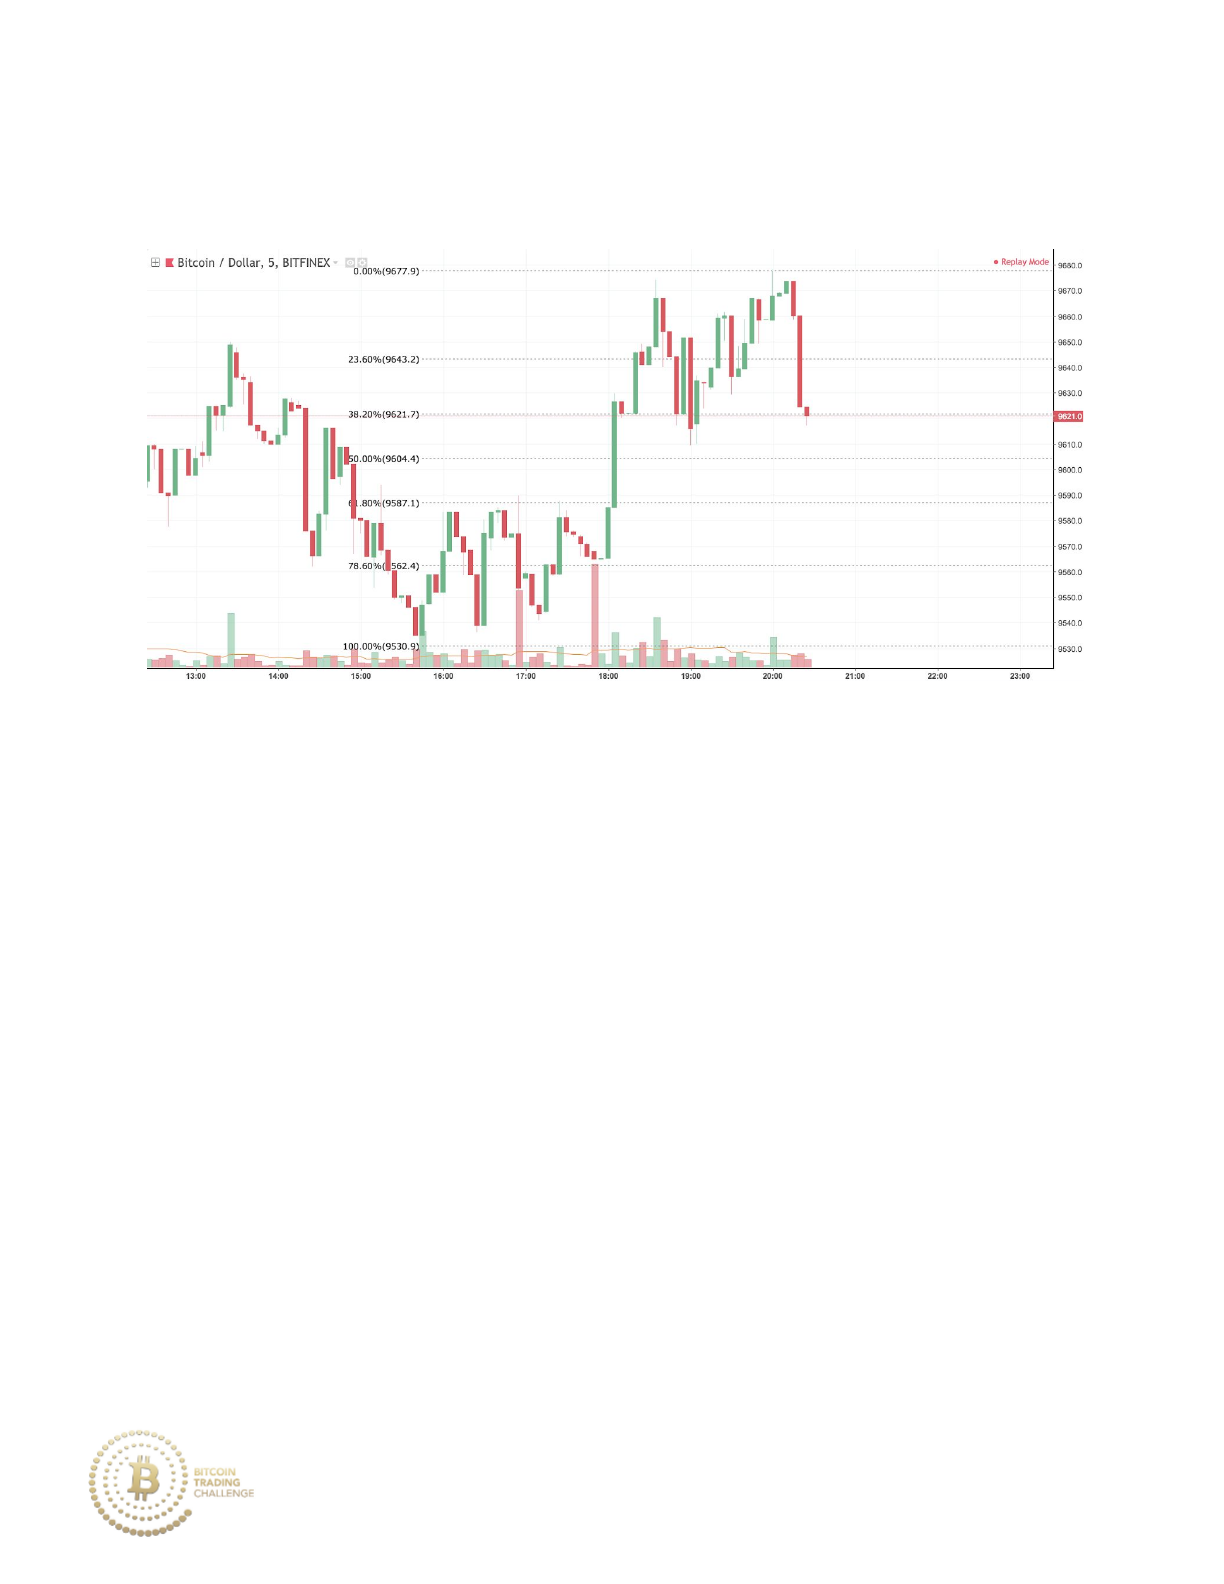
Practice 7-24
If you were currently in a long position, at which price would you place your
stop loss order?
245
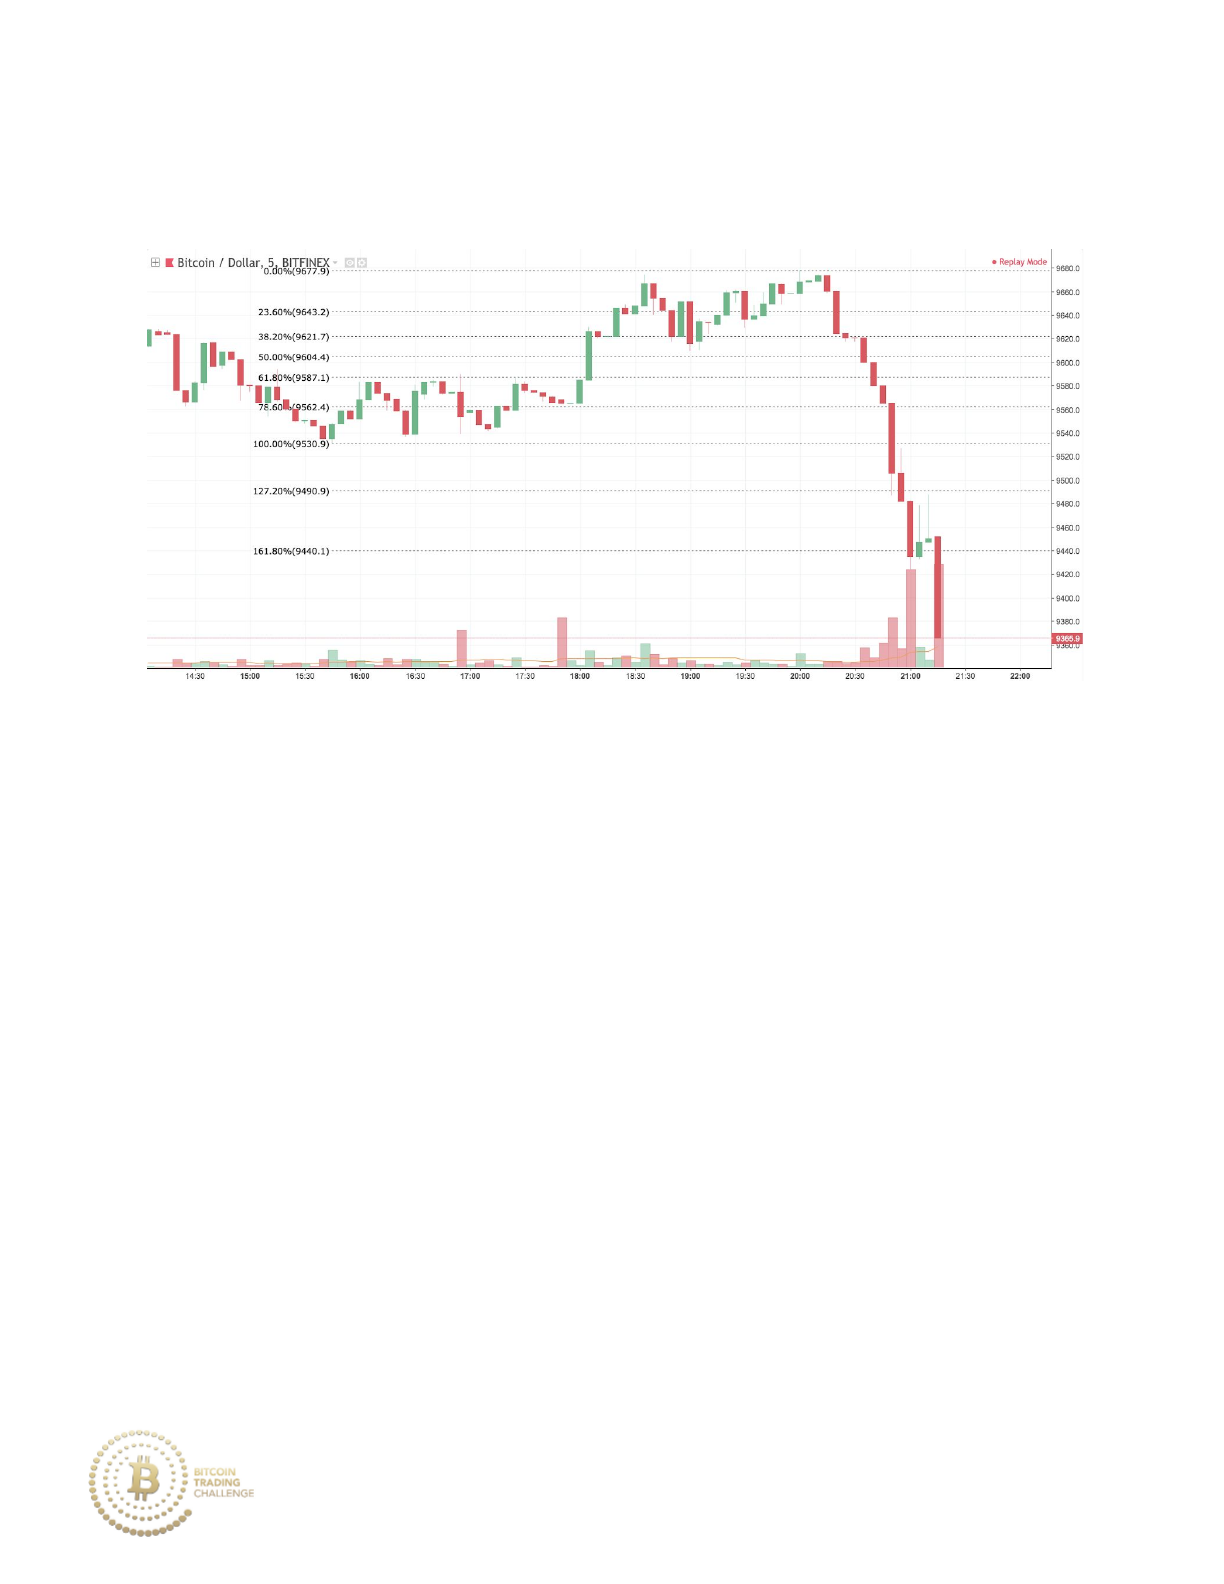
Practice 7-24 Answer
Before the rapid downmove, placing a stop loss just below the 78.6% would
have made the most sense as the previous uptrend moved on weak
momentum. Additionally, the single wave downtrend that started at 9677.9 is
quite unlikely to move back into the bullish direction as price moves
downward on strong momentum and escalating volume after the previous
uptrend fails to make significantly higher highs.
246
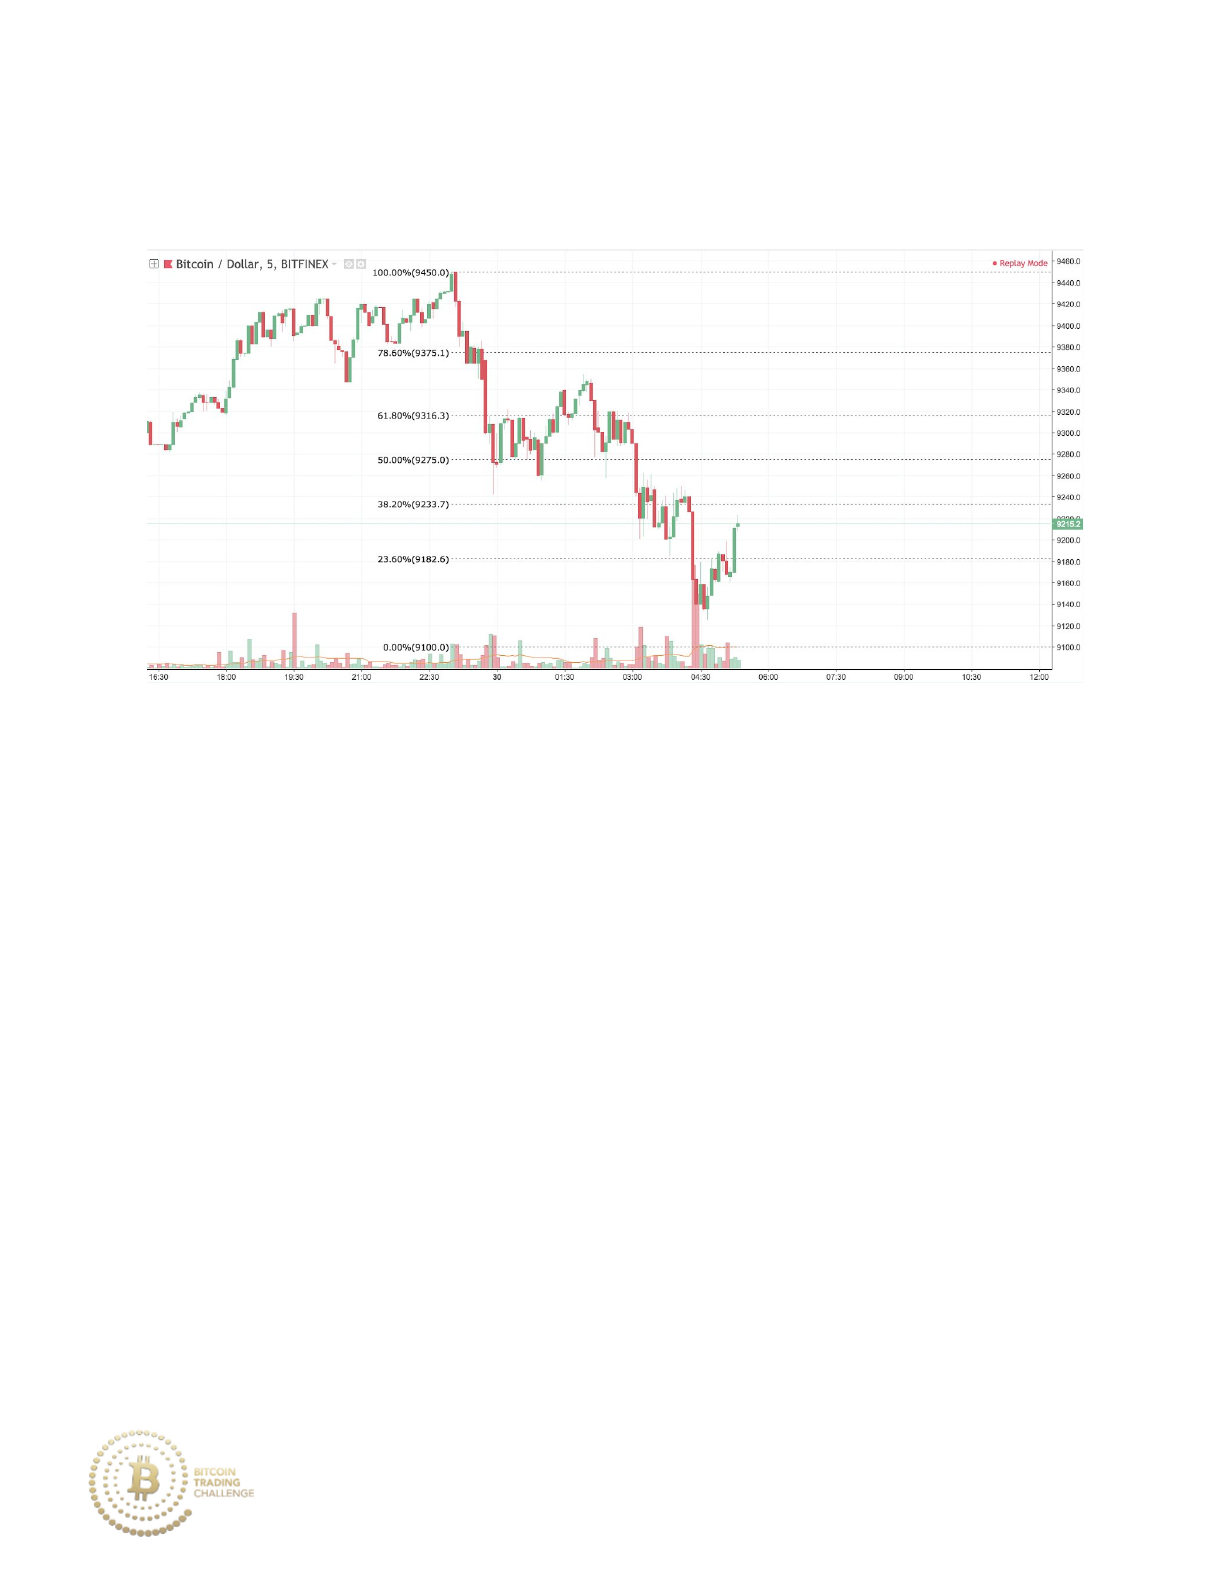
Practice 7-25
If you were currently in a short position, at which price would you place your
stop loss order?
247
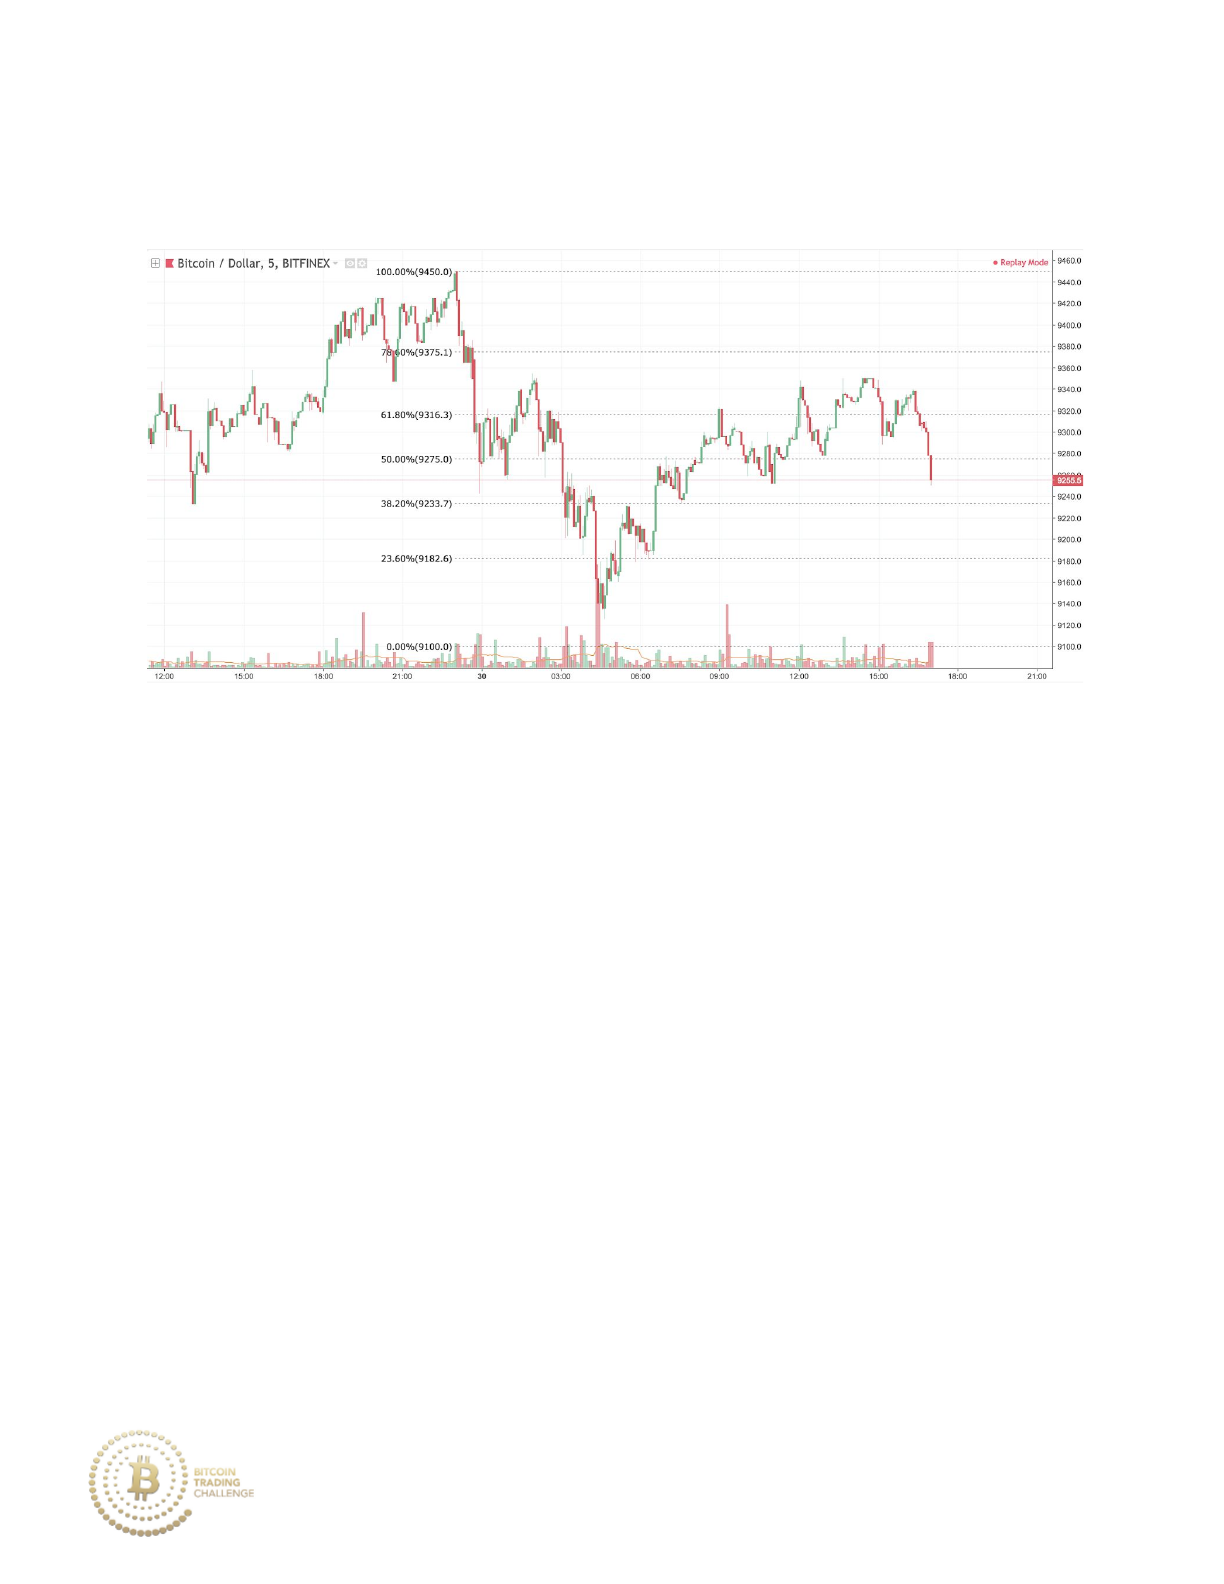
Practice 7-25 Answer
The market stage of a downtrend from 9450 down to 9100 moves on strong
bearish momentum, although there is notable bullish pullback. This type of
market is more likely to retrace into the 61.8% to 78.6% retracement zone,
thus placing a stop loss just beyond the 78.6% (above 9375.1) is optimal.
After retracing to the 61.8%, price moves downward in a continuation of the
overall downtrend.
248

Final Tips
1. Always place a stop loss.
2. Always have a take profit plan.
3. Mark-up a chart before initiating any trade.
4. Prior to making a trading decision, analyze factors such as
momentum, volume and the market stage(s).
5. Analyze Fibonnacis on the highest volume exchanges, even
if that exchange is not the one that you trade with.
6. Coins that are traded to a fiat currency (USD, EUR, etc.) tend
to respond more accurately to Fibonaccis than coins traded
to another coin (BTC, ETH, etc.). For example, BTCUSD will
likely conform to Fibonacci analysis better than a coin pair
like LTCBTC.
7. Practice Fibonacci analysis by using both the ‘Bar Replay’ tab
on Tradingview and by making short-term Fibonacci
predictions to find if price follows your analysis.
8. Prepare for both bullish and bearish price scenarios by
plotting multiple sets of Fibonaccis.
9. Remember that price is more likely to overshoot a major
Fibonacci level than to undershoot it.
249