TOUGH LESSON 176
User Manual: TOUGH 176
Open the PDF directly: View PDF ![]() .
.
Page Count: 2

ost discussions about gov-
ernment policies on educa-
tion presume by and large
that increasing public funding of
schools will improve education
quality. But research in economics
provides strong evidence that poli-
cies focused on increasing schools’
resources have little or no effect on
academic achievement.
Under the current system, the
interests of teachers and school dis-
trict administrators are often inconsis-
tent with an efficient use of school
funds to improve performance.
Individual teachers’salaries and the
security of administrators’jobs are not
usually linked to students’academic
performance. This lack of accounta-
bility stems from a lack of competition
among public schools.
This article reviews some of the
main ideas of the economics of public
schools, including the apparent lack of
a relationship between spending poli-
cies and education quality as meas-
ured by standardized test scores. To
illustrate these points, a snapshot of
the characteristics of a few school dis-
tricts in the St. Louis area is presented.
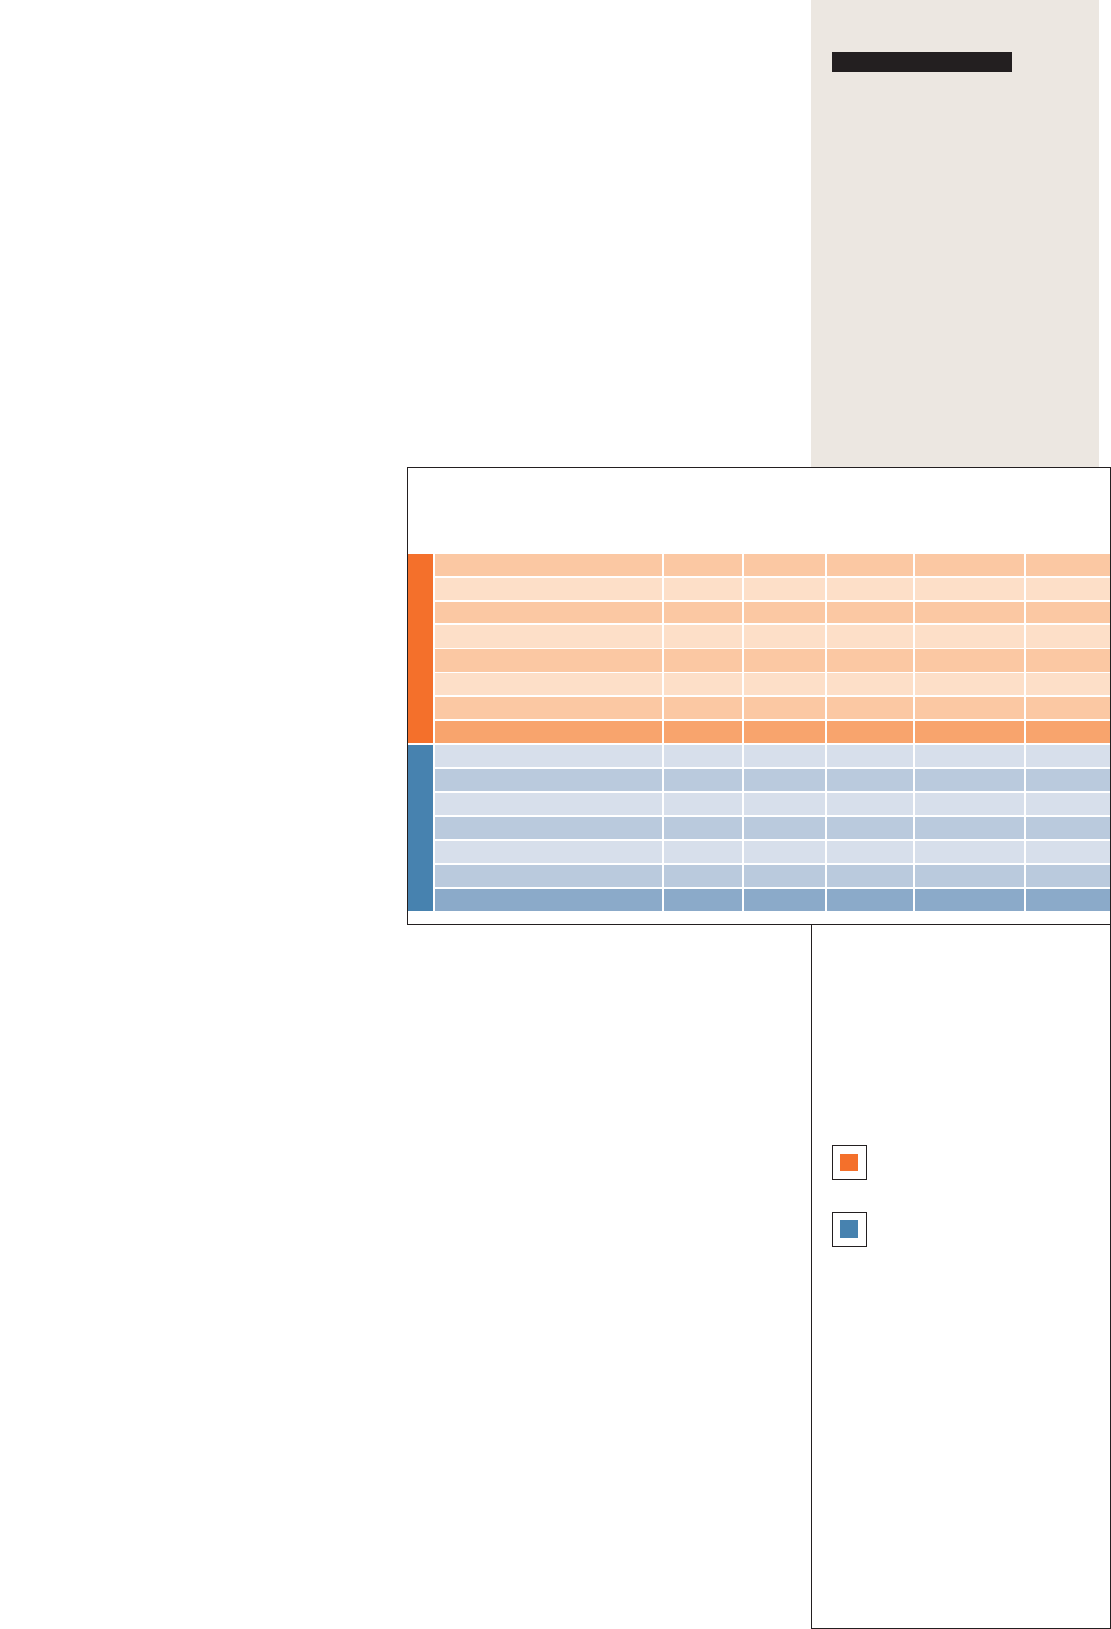
School Districts in St. Louis
Tables 1 and 2 present several
input and outcome variables for
school districts in the St. Louis area.
Education quality is measured with
the mathematics index test score for
elementary schools (fourth grade)
from the Missouri Assessment
Program (MAP). All variables are for
the academic year 1999-2000. Table 1
presents the characteristics of school
districts with test scores that are well
below the state average, and Table 2
presents the characteristics of school
districts with scores that are well
above the state average. Even though
the two sets of school districts repre-
sent opposite extremes of academic
performance, they have comparable
measures of expenditures per pupil
and student-teacher ratios. (Note that
although Clayton and Ladue have
much larger expenditures than other
high-score districts, they have only
slightly better test scores than Webster
Groves, another district in the same
group that has much lower expendi-
tures and a much higher student-
teacher ratio.) Where they really
differ is that the high-score districts
have much larger shares of house-
holds with a bachelor’s or higher
degree (a proxy for the parents’
education attainment) and much
larger median incomes for house-
holds with children. This suggests
that student achievement depends
more on family characteristics than
on spending policies.
Public Spending on Education
If there were no public schools—
if education were provided by a com-
pletely free market with no subsidies
to households or schools—investment
in schooling would fail to attain
socially optimal levels. This is because
of what economists refer to as market
failures. Government intervention in
the provision of education services is
largely motivated by an attempt to
alleviate the effects of these market
failures. Economist Caroline Hoxby
highlights two important kinds of
market failures. The first kind arises
because individuals consider only
their own benefits and costs when
deciding how much to invest in their
children’s education. From a social
standpoint, however, an individual’s
education may generate positive ben-
efits to other persons; for example,
less-educated people learn from inter-
acting with more-educated people.
Individuals do not account for these
benefits to others and, therefore,
invest less in education than what
would be socially optimal. The second
kind of market failure is liquidity con-
straints. These constraints occur
because people are unable to borrow
against their children’s future income
to pay for their education today. As a
result of this, constrained parents also
invest less in their children’s education
than they would want to spend.
In general, underinvestment in
education because of market failures
can be addressed in one of two ways
(or a combination of the two). The
government can provide subsidies—
either to parents or to schools—while
[
12]
M
By Rubén Hernández-Murillo and Deborah Roisman
Tough Lesson: More Money Doesn’t
Help Schools; Accountability Does
Tough Lesson: More Money Doesn’t
Help Schools; Accountability Does
the actual provision of education is
left to the private sector. Alternatively,
the government can provide education
itself and charge little or no tuition.
With rare exceptions, the latter solution
has prevailed. The government provi-
sion of education, however, introduces
additional distortions. Economist Eric
Hanushek argues that under the cur-
rent organizational structure of many
public school districts, teachers and
administrators often do not have the
same incentives as private schools
have to use resources effectively.
Primarily, he says, this is because the
decisions of how to allocate funds in
public schools are not tied to the per-
formance of students and because
school districts fail to respond to com-
petitive pressures from other public
school districts or from the private
school system.
Education Reforms
For these reasons, many econo-
mists believe that policies tied to stu-
dents’outcomes (test scores) might be
more useful than policies based on
input variables (such as student-
teacher ratios and spending per pupil)
at improving competition among
schools, in spite of the claims that
standardized test scores do not accu-
rately reflect academic achievement.
The No Child Left Behind Act,
signed by President George Bush in
2002, is an example of a policy that
explicitly recognizes the failure of past
spending efforts to improve students’
academic performance. The act
amends the Elementary and Second-
ary Education Act of 1965 and is now
the most important federal law regard-
ing public education. The new law is
designed to improve the incentives for
school officials, teachers and parents
by holding schools accountable for the
performance of students.
The No Child Left Behind Act calls
for federal funds, particularly those
targeted at improving the test scores
of the disadvantaged (Title I), to be
subjected to an accountability mecha-
nism by which schools’progress will
be measured every year. The goal is
for all children in the public school
system to be proficient in reading and
math by 2014. Students’performance
will be measured primarily with test
scores: Schools will be rewarded or
sanctioned, depending on the tests’
results. Schools that continually fail
to achieve progress could be forced to
provide students with supplemental
programs, such as tutoring, or, if
needed, options to transfer out of fail-
ing schools. On the positive side,
teachers who receive academic
awards will be eligible to obtain finan-
cial rewards, too.
In Missouri, the accountability
system will continue to be based on
the existing assessment program, but
it will be complemented in the next
few years to conform to the federal
requirements. The state already
makes available to the public report
cards detailing the continuous
progress of schools, but the No Child
Left Behind Act contemplates support-
ing additional involvement of parents
in the school districts’efforts to meet
the accountability requirements.
Conclusion
The accountability mechanism
implemented by the No Child Left
Behind Act highlights the use of stan-
dardized test scores to measure edu-
cation quality. Although such scores
may be imperfect measures of educa-
tion quality, their use is meant to shift
attention to outcomes and to avoid
reliance on input measures, such as
student-teacher ratios or spending
per pupil. Some economists believe
this is important because an account-
ability system opens the door for
additional reforms that would help
provide parents and school officials
with the right incentives to make
socially optimal choices on education
investment. Incentives based on stu-
dents’outcomes are more likely to be
effective and to have a long-term
impact on academic achievement
than the incentives provided by merely
increasing spending in education.
Rubén Hernández-Murillo is an economist,
and Deborah Roisman is a research associate,
both at the Federal Reserve Bank of St. Louis.
REFERENCES
Hanushek, Eric A. “Measuring
Investment in Education.” The Journal
of Economic Perspectives, Fall 1996,
Vol. 10, No. 4, pp. 9-30.
Hanushek, Eric A. “The Failure of Input-
Based Schooling Policies.” National
Bureau of Economic Research, Working
Paper No. 9040, July 2002.
Hanushek, Eric A. and Rivkin, Steven G.
“Does Public School Competition
Affect Teacher Quality?”in Caroline M.
Hoxby, ed., The Economics of School
Choice, pp. 23-47, Chicago: The
University of Chicago Press, 2003.
Hoxby, Caroline M. “Are Efficiency and
Equity in School Finance Substitutes
or Complements?” The Journal of
Economic Perspectives, Fall 1996,
Vol. 10, No. 4, pp. 51-72.
www.stlouisfed.org
The Regional Economist ■April 2004
[
13]
14,158
31,041
21,925
33,053
35,891
29,353
34,353
24,897
56,872
50,018
41,711
50,028
71,448
84,324
58,174
Median
household
income
(1999)
152.4
176.3
182.9
187.5
187.6
188.9
189.8
183.3
227.9
228.5
232.3
235.2
237.5
238.7
230.5
MAP
index
7,981.2
7,563.3
9,543.9
6,546.7
8,909.2
6,723.8
8,065.9
8,967.3
7,430.5
7,171.5
9,711.2
7,160.2
14,787.4
11,536.1
8,270.4
Spending
per pupil
13.1
16.2
14.0
16.3
13.0
16.0
17.1
14.7
17.2
15.4
12.6
15.7
11.5
12.5
15.9
Student-
teacher ratio
0.7
14.8
16.7
4.8
27.1
7.3
10.7
15.1
41.0
30.6
51.3
45.4
67.1
62.3
43.9
Percentage
of households
with bachelor or
higher degree
Wellston
Normandy
St. Louis City
Hancock Place
Maplewood-Richmond Heights
Jennings
Riverview Gardens
Averages
Rockwood R-VI
Lindbergh R-VIII
Brentwood
Webster Groves
Clayton
Ladue
Averages
District
Table 2 Table 1
Comparable Inputs, Different Results
Most of these school districts in the St. Louis
area have comparable inputs—spending per
pupil and student-teacher ratios. But the
academic performance of their students
varies dramatically, as measured by a test
from the Missouri Assessment Program (MAP).
School districts with scores on the MAP
test below the state average of 209.9.
School districts with scores on the MAP
test above the state average of 209.9.
NOTES:
1. Test score data are from the Missouri
Department of Elementary and Secondary
Education; other variables are from the
Common Core of Data available from the
National Center for Education Statistics.
2. Averages were computed using the number
of students in each district as weights.
The state average MAP Index computed
for 521 school districts was 209.9.
3. Spending per pupil represents total expen-
ditures for instruction divided by the total
number of students.
4. Median household income refers to house-
holds with children.
