User Guide
User Manual:
Open the PDF directly: View PDF ![]() .
.
Page Count: 103 [warning: Documents this large are best viewed by clicking the View PDF Link!]
- Contents
- List of Figures
- List of Tables
- Quick start guide
- Introduction
- Configuration, build and installation
- Extrae XML configuration file
- XML Section: Trace configuration
- XML Section: MPI
- XML Section: pthread
- XML Section: OpenMP
- XML Section: Callers
- XML Section: User functions
- XML Section: Performance counters
- XML Section: Storage management
- XML Section: Buffer management
- XML Section: Trace control
- XML Section: Bursts
- XML Section: Others
- XML Section: Sampling
- XML Section: CUDA
- XML Section: OpenCL
- XML Section: Input/Output
- XML Section: Dynamic memory
- XML Section: Memory references through Intel PEBS sampling
- XML Section: Merge
- Using environment variables within the XML file
- Extrae API
- Merging process
- Extrae On-line User Guide
- Examples
- An example of Extrae XML configuration file
- Environment variables
- Running Extrae on top of PnMPI
- Regression tests
- Overhead
- Frequently Asked Questions
- Submitting a bug report
- Instrumented run-times
Extrae
User guide manual
for version 3.3.0
tools@bsc.es
April 7, 2016
ii
Contents
Contents iii
List of Figures v
List of Tables vii
1 Quick start guide 1
1.1 The instrumentation package . . . . . . . . . . . . . . . . . . . . . . . . . . . . . . . 1
1.1.1 Uncompressing the package . . . . . . . . . . . . . . . . . . . . . . . . . . . . 1
1.2 Quick running . . . . . . . . . . . . . . . . . . . . . . . . . . . . . . . . . . . . . . . . 1
1.2.1 Quick running Extrae - based on DynInst . . . . . . . . . . . . . . . . . . . . 2
1.2.2 Quick running Extrae - NOT based on DynInst . . . . . . . . . . . . . . . . . 2
1.3 Quick merging the intermediate traces . . . . . . . . . . . . . . . . . . . . . . . . . . 3
2 Introduction 5
3 Configuration, build and installation 7
3.1 Configuration of the instrumentation package . . . . . . . . . . . . . . . . . . . . . . 7
3.2 Build . . . . . . . . . . . . . . . . . . . . . . . . . . . . . . . . . . . . . . . . . . . . . 10
3.3 Installation . . . . . . . . . . . . . . . . . . . . . . . . . . . . . . . . . . . . . . . . . 10
3.4 Check . . . . . . . . . . . . . . . . . . . . . . . . . . . . . . . . . . . . . . . . . . . . 11
3.5 Examples of configuration on different machines . . . . . . . . . . . . . . . . . . . . . 11
3.5.1 Cray XC 40 - Extrae 3.2.1 . . . . . . . . . . . . . . . . . . . . . . . . . . . . . 11
3.5.2 Bluegene (L and P variants) . . . . . . . . . . . . . . . . . . . . . . . . . . . . 11
3.5.3 BlueGene/Q . . . . . . . . . . . . . . . . . . . . . . . . . . . . . . . . . . . . 12
3.5.4 AIX ......................................... 12
3.5.5 Linux ........................................ 13
3.6 Knowing how a package was configured . . . . . . . . . . . . . . . . . . . . . . . . . 17
4Extrae XML configuration file 19
4.1 XML Section: Trace configuration . . . . . . . . . . . . . . . . . . . . . . . . . . . . 19
4.2 XML Section: MPI . . . . . . . . . . . . . . . . . . . . . . . . . . . . . . . . . . . . . 20
4.3 XML Section: pthread . . . . . . . . . . . . . . . . . . . . . . . . . . . . . . . . . . . 21
4.4 XML Section: OpenMP . . . . . . . . . . . . . . . . . . . . . . . . . . . . . . . . . . 21
4.5 XML Section: Callers . . . . . . . . . . . . . . . . . . . . . . . . . . . . . . . . . . . 21
4.6 XML Section: User functions . . . . . . . . . . . . . . . . . . . . . . . . . . . . . . . 22
iii
4.7 XML Section: Performance counters . . . . . . . . . . . . . . . . . . . . . . . . . . . 23
4.7.1 Processor performance counters . . . . . . . . . . . . . . . . . . . . . . . . . . 24
4.7.2 Network performance counters . . . . . . . . . . . . . . . . . . . . . . . . . . 25
4.7.3 Operating system accounting . . . . . . . . . . . . . . . . . . . . . . . . . . . 26
4.8 XML Section: Storage management . . . . . . . . . . . . . . . . . . . . . . . . . . . 26
4.9 XML Section: Buffer management . . . . . . . . . . . . . . . . . . . . . . . . . . . . 26
4.10 XML Section: Trace control . . . . . . . . . . . . . . . . . . . . . . . . . . . . . . . . 27
4.11 XML Section: Bursts . . . . . . . . . . . . . . . . . . . . . . . . . . . . . . . . . . . . 28
4.12 XML Section: Others . . . . . . . . . . . . . . . . . . . . . . . . . . . . . . . . . . . 28
4.13 XML Section: Sampling . . . . . . . . . . . . . . . . . . . . . . . . . . . . . . . . . . 29
4.14 XML Section: CUDA . . . . . . . . . . . . . . . . . . . . . . . . . . . . . . . . . . . 29
4.15 XML Section: OpenCL . . . . . . . . . . . . . . . . . . . . . . . . . . . . . . . . . . 30
4.16 XML Section: Input/Output . . . . . . . . . . . . . . . . . . . . . . . . . . . . . . . 30
4.17 XML Section: Dynamic memory . . . . . . . . . . . . . . . . . . . . . . . . . . . . . 30
4.18 XML Section: Memory references through Intel PEBS sampling . . . . . . . . . . . . 30
4.19 XML Section: Merge . . . . . . . . . . . . . . . . . . . . . . . . . . . . . . . . . . . . 31
4.20 Using environment variables within the XML file . . . . . . . . . . . . . . . . . . . . 32
5Extrae API 33
5.1 Basic API . . . . . . . . . . . . . . . . . . . . . . . . . . . . . . . . . . . . . . . . . . 33
5.2 Extended API . . . . . . . . . . . . . . . . . . . . . . . . . . . . . . . . . . . . . . . . 37
5.3 Java bindings . . . . . . . . . . . . . . . . . . . . . . . . . . . . . . . . . . . . . . . . 39
5.3.1 Advanced Java bindings . . . . . . . . . . . . . . . . . . . . . . . . . . . . . . 40
5.4 Command-line version . . . . . . . . . . . . . . . . . . . . . . . . . . . . . . . . . . . 41
6 Merging process 43
6.1 Paraver merger . . . . . . . . . . . . . . . . . . . . . . . . . . . . . . . . . . . . . . . 44
6.1.1 Sequential Paraver merger . . . . . . . . . . . . . . . . . . . . . . . . . . . . . 44
6.1.2 Parallel Paraver merger . . . . . . . . . . . . . . . . . . . . . . . . . . . . . . 46
6.2 Dimemas merger . . . . . . . . . . . . . . . . . . . . . . . . . . . . . . . . . . . . . . 47
6.3 Environment variables . . . . . . . . . . . . . . . . . . . . . . . . . . . . . . . . . . . 47
6.3.1 Environment variables suitable to Paraver merger . . . . . . . . . . . . . . . 48
6.3.2 Environment variables suitable to Dimemas merger . . . . . . . . . . . . . . . 48
7 Extrae On-line User Guide 49
7.1 Introduction . . . . . . . . . . . . . . . . . . . . . . . . . . . . . . . . . . . . . . . . . 49
7.2 Automatic analyses . . . . . . . . . . . . . . . . . . . . . . . . . . . . . . . . . . . . . 49
7.2.1 Structure detection . . . . . . . . . . . . . . . . . . . . . . . . . . . . . . . . . 49
7.2.2 Periodicity detection . . . . . . . . . . . . . . . . . . . . . . . . . . . . . . . . 50
7.2.3 Multi-experiment analysis . . . . . . . . . . . . . . . . . . . . . . . . . . . . . 50
7.3 Configuration . . . . . . . . . . . . . . . . . . . . . . . . . . . . . . . . . . . . . . . . 50
7.3.1 Clustering analysis options . . . . . . . . . . . . . . . . . . . . . . . . . . . . 51
7.3.2 Spectral analysis options . . . . . . . . . . . . . . . . . . . . . . . . . . . . . . 51
7.3.3 Gremlins analysis options . . . . . . . . . . . . . . . . . . . . . . . . . . . . . 52
iv

8 Examples 53
8.1 DynInst based examples . . . . . . . . . . . . . . . . . . . . . . . . . . . . . . . . . . 53
8.1.1 Generating intermediate files for serial or OpenMP applications . . . . . . . . 53
8.1.2 Generating intermediate files for MPI applications . . . . . . . . . . . . . . . 54
8.2 LD PRELOAD based examples . . . . . . . . . . . . . . . . . . . . . . . . . . . . . . 55
8.2.1 Linux ........................................ 55
8.2.2 CUDA........................................ 57
8.2.3 AIX ......................................... 57
8.3 Statically linked based examples . . . . . . . . . . . . . . . . . . . . . . . . . . . . . 58
8.3.1 Linking the application . . . . . . . . . . . . . . . . . . . . . . . . . . . . . . 58
8.3.2 Generating the intermediate files . . . . . . . . . . . . . . . . . . . . . . . . . 59
8.4 Generating the final tracefile . . . . . . . . . . . . . . . . . . . . . . . . . . . . . . . 59
A An example of Extrae XML configuration file 61
B Environment variables 65
C Running Extrae on top of PnMPI 69
C.1 Introduction . . . . . . . . . . . . . . . . . . . . . . . . . . . . . . . . . . . . . . . . . 69
C.2 Instructions to run with PnMPI . . . . . . . . . . . . . . . . . . . . . . . . . . . . . . 69
D Regression tests 71
E Overhead 73
F Frequently Asked Questions 77
F.1 Configure, compile and link FAQ . . . . . . . . . . . . . . . . . . . . . . . . . . . . . 77
F.2 Execution FAQ . . . . . . . . . . . . . . . . . . . . . . . . . . . . . . . . . . . . . . . 79
F.3 Performance monitoring counters FAQ . . . . . . . . . . . . . . . . . . . . . . . . . . 80
F.4 Merging traces FAQ . . . . . . . . . . . . . . . . . . . . . . . . . . . . . . . . . . . . 81
G Submitting a bug report 83
G.1 Reporting a compilation issue . . . . . . . . . . . . . . . . . . . . . . . . . . . . . . . 83
G.2 Reporting an execution issue . . . . . . . . . . . . . . . . . . . . . . . . . . . . . . . 83
H Instrumented run-times 85
H.1 MPI ............................................. 85
H.2 OpenMP . . . . . . . . . . . . . . . . . . . . . . . . . . . . . . . . . . . . . . . . . . . 88
H.2.1 Intel compilers - icc, iCC, ifort . . . . . . . . . . . . . . . . . . . . . . . . . . 88
H.2.2 IBM compilers - xlc, xlC, xlf . . . . . . . . . . . . . . . . . . . . . . . . . . . 89
H.2.3 GNU compilers - gcc, g++, gfortran . . . . . . . . . . . . . . . . . . . . . . . 90
H.3 pthread . . . . . . . . . . . . . . . . . . . . . . . . . . . . . . . . . . . . . . . . . . . 91
H.4 CUDA............................................ 92
H.5 OpenCL . . . . . . . . . . . . . . . . . . . . . . . . . . . . . . . . . . . . . . . . . . . 92
v
vi
viii
List of Tables
1.1 Package contents description . . . . . . . . . . . . . . . . . . . . . . . . . . . . . . . 1
1.2 Available libraries in Extrae. Their availability depends upon the configure process. 3
6.1 Description of the available mergers in the Extrae package. . . . . . . . . . . . . . . . 43
B.1 Set of environment variables available to configure Extrae ............... 66
B.2 Set of environment variables available to configure Extrae (continued) . . . . . . . . . 67
ix
x

Chapter 1
Quick start guide
1.1 The instrumentation package
1.1.1 Uncompressing the package
Extrae is a dynamic instrumentation package to trace programs compiled and run with the shared
memory model (like OpenMP and pthreads), the message passing (MPI) programming model or
both programming models (different MPI processes using OpenMP or pthrads within each MPI
process). Extrae generates trace files that can be latter visualized with Paraver .
The package is distributed in compressed tar format (e.g., extrae.tar.gz). To unpack it, execute
from the desired target directory the following command line :
gunzip -c extrae.tar.gz | tar -xvf -
The unpacking process will create different directories on the current directory (see table 1.1).
Directory Contents
bin Contains the binary files of the Extrae tool.
etc Contains some scripts to set up environment variables and the
Extrae internal files.
lib Contains the Extrae tool libraries.
share/man Contains the Extrae manual entries.
share/doc Contains the Extrae manuals (pdf, ps and html versions).
share/example Contains examples to illustrate the Extrae instrumentation.
Table 1.1: Package contents description
1.2 Quick running
There are several included examples in the installation package. These examples are in-
stalled in ${EXTRAE HOME}/share/example and cover different application types (including
serial/MPI/OpenMP/CUDA/etc). We suggest the user to look at them to get an idea on how
to instrument their application.
1

Once the package has been unpacked, set the EXTRAE HOME environment variable to the directory
where the package was installed. Use the export or setenv commands to set it up depending on
the shell you use. If you use sh-based shell (like sh, bash, ksh, zsh, ...), issue this command
export EXTRAE_HOME=dir
however, if you use csh-based shell (like csh, tcsh), execute the following command
setenv EXTRAE_HOME dir
where dir refers where the Extrae was installed. Henceforth, all references to the usage of the
environment variables will be used following the sh format unless specified.
Extrae is offered in two different flavors: as a DynInst-based application, or stand-alone appli-
cation. DynInst is a dynamic instrumentation library that allows the injection of code in a running
application without the need to recompile the target application. If the DynInst instrumentation
library is not installed, Extrae also offers different mechanisms to trace applications.
1.2.1 Quick running Extrae - based on DynInst
Extrae needs some environment variables to be setup on each session. Issuing the command
source ${EXTRAE_HOME}/etc/extrae.sh
on a sh-based shell, or
source ${EXTRAE_HOME}/etc/extrae.csh
on a csh-based shell will do the work. Then copy the default XML configuration file1into the
working directory by executing
cp ${EXTRAE_HOME}/share/example/MPI/extrae.xml .
If needed, set the application environment variables as usual (like OMP NUM THREADS, for ex-
ample), and finally launch the application using the ${EXTRAE HOME}/bin/extrae instrumenter
like:
${EXTRAE_HOME}/bin/extrae -config extrae.xml <program>
where <program> is the application binary.
1.2.2 Quick running Extrae - NOT based on DynInst
Extrae needs some environment variables to be setup on each session. Issuing the command
source ${EXTRAE_HOME}/etc/extrae.sh
on a sh-based shell, or
1See section 4 for further details regarding this file
2

source ${EXTRAE_HOME}/etc/extrae.csh
on a csh-based shell will do the work. Then copy the default XML configuration file1into the
working directory by executing
cp ${EXTRAE_HOME}/share/example/MPI/extrae.xml .
and export the EXTRAE CONFIG FILE as
export EXTRAE_CONFIG_FILE=extrae.xml
If needed, set the application environment variables as usual (like OMP NUM THREADS, for exam-
ple). Just before executing the target application, issue the following command:
export LD_PRELOAD=${EXTRAE_HOME}/lib/<lib>
where <lib> is one of those listed in Table 1.2.
Library Application type
Serial MPI OpenMP pthread SMPss nanos/OMPss CUDA OpenCL Java
libseqtrace Yes X
libmpitrace2Yes X
libomptrace Yes X
libpttrace Yes X
libsmpsstrace Yes X
libnanostrace Yes X
libcudatrace Yes X
libocltrace Yes X
javaseqtrace.jar Yes X
libompitrace2Yes XYes X
libptmpitrace2Yes XYes X
libsmpssmpitrace2Yes XYes X
libnanosmpitrace2Yes XYes X
libcudampitrace2Yes XYes X
libcudaompitrace2Yes XYes XYes X
liboclmpitrace2Yes XYes X
Table 1.2: Available libraries in Extrae. Their availability depends upon the configure process.
1.3 Quick merging the intermediate traces
Once the intermediate trace files (*.mpit files) have been created, they have to be merged (using
the mpi2prv command) in order to generate the final Paraver trace file. Execute the following
command to proceed with the merge:
${EXTRAE_HOME}/bin/mpi2prv -f TRACE.mpits -o output.prv
The result of the merge process is a Paraver tracefile called output.prv. If the -o option is not
given, the resulting tracefile is called EXTRAE Paraver Trace.prv.
2If the application is Fortran append an f to the library. For example, if you want to instrument a Fortran
application that is using MPI, use libmpitracef instead of libmpitrace.
3
4
Chapter 2
Introduction
Extrae is a dynamic instrumentation package to trace programs compiled and run with the shared
memory model (like OpenMP and pthreads), the message passing (MPI) programming model or
both programming models (different MPI processes using OpenMP or pthreads within each MPI
process). Extrae generates trace files that can be visualized with Paraver .
Extrae is currently available on different platforms and operating systems: IBM PowerPC run-
ning Linux or AIX, and x86 and x86-64 running Linux. It also has been ported to OpenSolaris and
FreeBSD.
The combined use of Extrae and Paraver offers an enormous analysis potential, both qualitative
and quantitative. With these tools the actual performance bottlenecks of parallel applications can
be identified. The microscopic view of the program behavior that the tools provide is very useful
to optimize the parallel program performance.
This document tries to give the basic knowledge to use the Extrae tool. Chapter 3 explains how
the package can be configured and installed. Chapter 8 explains how to monitor an application to
obtain its trace file. At the end of this document there are appendices that include: a Frequent
Asked Questions appendix and a list of routines instrumented in the package.
What is the Paraver tool?
Paraver is a flexible parallel program visualization and analysis tool based on an easy-to-use Motif
GUI. Paraver was developed responding to the need of hacing a qualitative global perception of the
application behavior by visual inspection and then to be able to focus on the detailed quantitative
analysis of the problems. Paraver provides a large amount of information useful to decide the points
on which to invest the programming effort to optimize an application.
Expressive power, flexibility and the capability of efficiently handling large traces are key fea-
tures addressed in the design of Paraver . The clear and modular structure of Paraver plays a
significant role towers achieving these targets.
Some Paraver features are the support for:
•Detailed quantitative analysis of program performance,
•concurrent comparative analysis of several traces,
•fast analysis of very large traces,
•support for mixed message passing and shared memory (network of SMPs), and,
5
•customizable semantics of the visualized information.
One of the main features of Paraver is the flexibility to represent traces coming from different
environments. Traces are composed of state records, events and communications with associated
timestamp. These three elements can be used to build traces that capture the behavior along time
of very different kind of systems. The Paraver distribution includes, either in its own distribution
or as additional packages, the following instrumentation modules:
1. Sequential application tracing: it is included in the Paraver distribution. It can be used to
trace the value of certain variables, procedure invocations, ... in a sequential program.
2. Parallel application tracing: a set of modules are optionally available to capture the activity
of parallel applications using shared-memory, message-passing paradigms, or a combination
of them.
3. System activity tracing in a multiprogrammed environment: an application to trace processor
allocations and process migrations is optionally available in the Paraver distribution.
4. Hardware counters tracing: an application to trace the hardware counter values is optionally
available in the Paraver distribution.
Where the Paraver tool can be found?
The Paraver distribution can be found at URL:
http://www.bsc.es/paraver
Paraver binaries are available for Linux/x86, Linux/x86-64 and Linux/ia64, Windows.
In the Documentation Tool section of the aforementioned URL you can find the Paraver Ref-
erence Manual and Paraver Tutorial in addition to the documentation for other instrumentation
packages.
Extrae and Paraver tools e-mail support is tools@bsc.es.
6

Chapter 3
Configuration, build and installation
3.1 Configuration of the instrumentation package
There are many options to be applied at configuration time for the instrumentation package. We
point out here some of the relevant options, sorted alphabetically. To get the whole list run
configure --help. Options can be enabled or disabled. To enable them use –enable-X or –with-
X= (depending on which option is available), to disable them use –disable-X or –without-X.
•--enable-instrument-dynamic-memory
Allows instrumentation of dynamic memory related calls (such as malloc, free, realloc).
•--enable-merge-in-trace
Embed the merging process in the tracing library so the final tracefile can be generated
automatically from the application run.
•--enable-parallel-merge
Build the parallel mergers (mpimpi2prv/mpimpi2dim) based on MPI.
•--enable-posix-clock
Use POSIX clock (clock gettime call) instead of low level timing routines. Use this option
if the system where you install the instrumentation package modifies the frequency of its
processors at runtime.
•--enable-single-mpi-lib
Produces a single instrumentation library for MPI that contains both Fortran and C wrappers.
Applications that call the MPI library from both C and Fortran languages need this flag to
be enabled.
•--enable-sampling
Enable PAPI sampling support.
•--enable-pmapi
Enable PMAPI library to gather CPU performance counters. PMAPI is a base package
installed in AIX systems since version 5.2.
7
•--enable-openmp
Enable support for tracing OpenMP on IBM, GNU and Intel runtimes. The IBM runtime
instrumentation is only available for Linux/PowerPC systems.
•--enable-openmp-gnu
Enable support for tracing OpenMP on GNU runtime.
•--enable-openmp-intel
Enable support for tracing OpenMP on Intel runtime.
•--enable-openmp-ibm
Enable support for tracing OpenMP IBM runtime. The IBM runtime instrumentation is only
available for Linux/PowerPC systems.
•--enable-openmp-ompt
Enables support for tracing OpenMP runtimes through the OMPT specification. NOTE: en-
abling this option disables the regular instrumentation system available through --enable-openmp-ibm,
--enable-openmp-intel and --enable-openmp-gnu.
•--enable-smpss
Enable support for tracing SMP-superscalar.
•--enable-nanos
Enable support for tracing Nanos run-time.
•--enable-online
Enables the on-line analysis module.
•--enable-pthread
Enable support for tracing pthread library calls.
•--enable-xml
Enable support for XML configuration (not available on BG/L, BG/P and BG/Q systems).
•--enable-xmltest
Do not try to compile and run a test LIBXML program.
•--enable-doc
Generates this documentation.
•--prefix=DIR
Location where the installation will be placed. After issuing make install you will find
under DIR the entries lib/,include/,share/ and bin/ containing everything needed to
run the instrumentation package.
•--with-bfd=DIR
Specify where to find the Binary File Descriptor package. In conjunction with libiberty, it is
used to translate addresses into source code locations.
•--with-binary-type=OPTION
Available options are: 32, 64 and default. Specifies the type of memory address model when
compiling (32bit or 64bit).
8

•--with-boost=DIR
Specify the location of the BOOST package. This package is required when using the DynInst
instrumentation with versions newer than 7.0.1.
•--with-binutils=DIR
Specify the location for the binutils package. The binutils package is necessary to translate
addresses into source code references.
•--with-clustering
If the on-line analysis module is enabled (see –enable-online), specify where to find Cluster-
ingSuite libraries and includes. This package enables support for on-line clustering analysis.
•--with-cuda=DIR
Enable support for tracing CUDA calls on nVidia hardware and needs to point to the CUDA
SDK installation path. This instrumentation is only valid in binaries that use the shared ver-
sion of the CUDA library. Interposition has to be done through the LD PRELOAD mechanism.
It is superseded by --with-cupti=DIR which also supports instrmentation for static binaries.
•--with-cupti=DIR
Specify the location of the CUPTI libraries. CUPTI is used to instrument CUDA calls, and
supersedes the --with-cuda, although it still requires --with-cuda.
•--with-dyninst=DIR
Specify the installation location for the DynInst package. Extrae also requires the DWARF
package --with-dwarf=DIR when using DynInst. Also, newer versions of DynInst (versions
after 7.0.1) require the BOOST package --with-boost. This flag is mandatory. Requires a
working installation of a C++ compiler.
•--with-fft
If the spectral analysis module is enabled (see –with-spectral), specify where to find FFT
libraries and includes. This library is a dependency of the Spectral libraries.
•--with-java-jdk=DIR
Specify the location of JAVA development kit (JDK). This is necessary to create the connec-
tors between Extrae and Java applications.
•--with-java-aspectj=DIR
Specify the location of the AspectJ infrastructure. AspectJ is used to give support to dynam-
ically instrumented Java applications.
•--with-java-aspectj-weaver=<path/to/aspectjweaver.jar>
AspectJ includes the aspectweaver.jar file that is responsible for the execution of dynam-
ically instrumented Java applications. If --with-java-aspectj cannot locate this file, use
this option to tell Extrae where to find it.
•--with-liberty=DIR
Specify where to find the libiberty package. In conjunction with Binary File Descriptor, it is
used to translate addresses into source code locations.
9
•--with-libgomp={4.2,4.9,auto}
Determines which version of libgomp (4.2 or 4.9) is supported by the installation of Extrae.
Since these versions of libgomp are incompatible, to support both versions Extrae needs to
be installed twice in separate directories. The user can provide the auto value which will use
the C compiler to determine which version of libgomp is more adequate.
•--with-mpi=DIR
Specify the location of an MPI installation to be used for the instrumentation package. This
flag is mandatory.
•--with-mpi-name-mangling=OPTION
Available options are: 0u, 1u, 2u, upcase and auto. Choose the Fortran name decoration (0,
1 or 2 underscores) for MPI symbols. Let OPTION be auto to automatically detect the name
mangling.
•--with-synapse
If the on-line analysis module is enabled (see –enable-online), specify where to find Synapse
libraries and includes. This library is a front-end of the MRNet library.
•--with-opencl=DIR
Specify the location for the OpenCL package, including library and include directories.
•--with-openshmem
Specify the location of the OpenSHMEM installation to be used for the instrumentation
package.
•--with-papi=DIR
Specify where to find PAPI libraries and includes. PAPI is used to gather performance
counters. This flag is mandatory.
•--with-spectral
If the on-line analysis module is enabled (see –enable-online), specify where to find Spectral
libraries and includes. This package enables support for on-line spectral analysis.
•--with-unwind=DIR
Specify where to find Unwind libraries and includes. This library is used to get callstack
information on several architectures (including IA64 and Intel x86-64). This flag is mandatory.
3.2 Build
To build the instrumentation package, just issue make after the configuration.
3.3 Installation
To install the instrumentation package in the directory chosen at configure step (through --prefix
option), issue make install.
10

3.4 Check
The Extrae package contains some consistency checks. The aim of such checks is to determine
whether a functionality is operative in the target (installation) environment and/or check whether
the development of Extrae has introduced any misbehavior. To run the checks, just issue make
check after the installation. Please, notice that checks are meant to be run in the machine that the
configure script was run, thus the results of the checks on machines with back-end nodes different
to front-end nodes (like BG/* systems) are not representative at all.
3.5 Examples of configuration on different machines
All commands given here are given as an example to configure and install the package, you may
need to tune them properly (i.e., choose the appropriate directories for packages and so). These
examples assume that you are using a sh/bash shell, you must adequate them if you use other shells
(like csh/tcsh).
3.5.1 Cray XC 40 - Extrae 3.2.1
Before issuing the configure command, the following modules were loaded:
•PrgEnv-gnu/5.2.40
•cray-mpich/7.2.2
•cudatoolkit6.5/6.5.14-1.0502.9613.6.1
•libunwind/1.1-CrayGNU-5.2.4
Configuration command:
./configure --with-papi=/opt/cray/papi/5.4.1.1
--with-mpi=/opt/cray/mpt/7.2.2/gni/mpich2-gnu/48
--with-unwind=/apps/daint/5.2.UP02/easybuild/software/libunwind/1.1-CrayGNU-5.2.40
--with-cuda=/opt/nvidia/cudatoolkit6.5/6.5.14-1.0502.9613.6.1
--enable-sampling --without-dyninst --with-binary-type=64 CC=gcc CXX=g++
MPICC=cc
Build and installation commands:
make
make install
3.5.2 Bluegene (L and P variants)
Configuration command:
./configure --prefix=/homec/jzam11/jzam1128/aplic/extrae/2.2.0
--with-papi=/homec/jzam11/jzam1128/aplic/papi/4.1.2.1
--with-bfd=/bgsys/local/gcc/gnu-linux 4.3.2/powerpc-linux-gnu/powerpc-bgp-linux
--with-liberty=/bgsys/local/gcc/gnu-linux 4.3.2/powerpc-bgp-linux
--with-mpi=/bgsys/drivers/ppcfloor/comm --without-unwind --without-dyninst
11

Build and installation commands:
make
make install
3.5.3 BlueGene/Q
To enable parsing the XML configuration file, the libxml2 must be installed. As of the time of
writing this user guide, we have been only able to install the static version of the library in a
BG/Q machine, so take this into consideration if you install the libxml2 in the system. Simi-
larly, the binutils package (responsible for translating application addresses into source code loca-
tions) that is available in the system may not be properly installed and we suggest installing the
binutils from the source code using the BG/Q cross-compiler. Regarding the cross-compilers, we
have found that using the IBM XL compilers may require using the XL libraries when generat-
ing the final application binary with Extrae, so we would suggest using the GNU cross-compilers
(/bgsys/drivers/ppcfloor/gnu-linux/bin/powerpc64-bgq-linux-*).
If you want to add libxml2 and binutils support into Extrae, your configuration command may
resemble to:
./configure --prefix=/homec/jzam11/jzam1128/aplic/juqueen/extrae/2.2.1
--with-mpi=/bgsys/drivers/ppcfloor/comm/gcc --without-unwind
--without-dyninst --disable-openmp --disable-pthread
--with-libz=/bgsys/local/zlib/v1.2.5
--with-papi=/usr/local/UNITE/packages/papi/5.0.1
--with-xml-prefix=/homec/jzam11/jzam1128/aplic/juqueen/libxml2-gcc
--with-binutils=/homec/jzam11/jzam1128/aplic/juqueen/binutils-gcc
--enable-merge-in-trace
Otherwise, if you do not want to add support for the libxml2 library, your configuration may
look like this:
./configure --prefix=/homec/jzam11/jzam1128/aplic/juqueen/extrae/2.2.1
--with-mpi=/bgsys/drivers/ppcfloor/comm/gcc --without-unwind
--without-dyninst --disable-openmp --disable-pthread
--with-libz=/bgsys/local/zlib/v1.2.5
--with-papi=/usr/local/UNITE/packages/papi/5.0.1 --disable-xml
In any situation, the build and installation commands are:
make
make install
3.5.4 AIX
Some extensions of Extrae do not work properly (nanos, SMPss and OpenMP) on AIX. In addition,
if using IBM MPI (aka POE) the make will complain when generating the parallel merge if the
main compiler is not xlc/xlC. So, you can either change the compiler or disable the parallel merge
at compile step. Also, command ar can complain if 64bit binaries are generated. It’s a good idea
to run make with OBJECT MODE=64 set to avoid this.
12

Compiling the 32bit package using the IBM compilers
Configuration command:
CC=xlc CXX=xlC ./configure --prefix=PREFIX --disable-nanos --disable-smpss
--disable-openmp --with-binary-type=32 --without-unwind --enable-pmapi
--without-dyninst --with-mpi=/usr/lpp/ppe.poe
Build and installation commands:
make
make install
Compiling the 64bit package without the parallel merge
Configuration command:
./configure --prefix=PREFIX --disable-nanos --disable-smpss --disable-openmp
--disable-parallel-merge --with-binary-type=64 --without-unwind
--enable-pmapi --without-dyninst --with-mpi=/usr/lpp/ppe.poe
Build and installation commands:
OBJECT MODE=64 make
make install
3.5.5 Linux
Compiling using default binary type using MPICH, OpenMP and PAPI
Configuration command:
./configure --prefix=PREFIX --with-mpi=/home/harald/aplic/mpich/1.2.7
--with-papi=/usr/local/papi --enable-openmp --without-dyninst
--without-unwind
Build and installation commands:
make
make install
Compiling 32bit package in a 32/64bit mixed environment
Configuration command:
./configure --prefix=PREFIX --with-mpi=/opt/osshpc/mpich-mx
--with-papi=/gpfs/apps/PAPI/3.6.2-970mp --with-binary-type=32
--with-unwind=$HOME/aplic/unwind/1.0.1/32 --with-elf=/usr --with-dwarf=/usr
--with-dyninst=$HOME/aplic/dyninst/7.0.1/32
Build and installation commands:
make
make install
13

Compiling 64bit package in a 32/64bit mixed environment
Configuration command:
./configure --prefix=PREFIX --with-mpi=/opt/osshpc/mpich-mx
--with-papi=/gpfs/apps/PAPI/3.6.2-970mp --with-binary-type=64
--with-unwind=$HOME/aplic/unwind/1.0.1/64 --with-elf=/usr --with-dwarf=/usr
--with-dyninst=$HOME/aplic/dyninst/7.0.1/64
Build and installation commands:
make
make install
Compiling using default binary type, using OpenMPI, DynInst and libunwind
Configuration command:
./configure --prefix=PREFIX --with-mpi=/home/harald/aplic/openmpi/1.3.1
--with-dyninst=/home/harald/dyninst/7.0.1 --with-dwarf=/usr
--with-elf=/usr --with-unwind=/home/harald/aplic/unwind/1.0.1
--without-papi
Build and installation commands:
make
make install
Compiling on CRAY XT5 for 64bit package and adding sampling
Notice the ”–disable-xmltest”. As backends programs cannot be run in the frontend, we skip
running the XML test. Also using a local installation of libunwind.
Configuration command:
CC=cc CFLAGS=’-O3 -g’ LDFLAGS=’-O3 -g’ CXX=CC CXXFLAGS=’-O3 -g’ ./configure
--with-mpi=/opt/cray/mpt/4.0.0/xt/seastar/mpich2-gnu --with-binary-type=64
--with-xml-prefix=/sw/xt5/libxml2/2.7.6/sles10.1 gnu4.1.2
--disable-xmltest --with-bfd=/opt/cray/cce/7.1.5/cray-binutils
--with-liberty=/opt/cray/cce/7.1.5/cray-binutils --enable-sampling
--enable-shared=no --prefix=PREFIX --with-papi=/opt/xt-tools/papi/3.7.2/v23
--with-unwind=/ccs/home/user/lib --without-dyninst
Build and installation commands:
make
make install
Compiling for the Intel MIC accelerator / Xeon Phi
The Intel MIC accelerators (also codenamed KnightsFerry - KNF and KnightsCorner - KNC) or
Xeon Phi processors are not binary compatible with the host (even if it is an Intel x86 or x86/64
14

chip), thus the Extrae package must be compiled specially for the accelerator (twice if you want
Extrae for the host). While the host configuration and installation has been shown before, in order
to compile Extrae for the accelerator you must configure Extrae like:
./configure --with-mpi=/opt/intel/impi/4.1.0.024/mic --without-dyninst
--without-papi --without-unwind --disable-xml --disable-posix-clock
--with-libz=/opt/extrae/zlib-mic --host=x86 64-suse-linux-gnu
--prefix=/home/Computational/harald/extrae-mic --enable-mic
CFLAGS="-O -mmic -I/usr/include" CC=icc CXX=icpc
MPICC=/opt/intel/impi/4.1.0.024/mic/bin/mpiicc
To compile it, just issue:
make
make install
Compiling on a ARM based processor machine using Linux
If using the GNU toolchain to compile the library, we suggest at least using version 4.6.2 because
of its enhaced in this architecture.
Configuration command:
CC=/gpfs/APPS/BIN/GCC-4.6.2/bin/gcc-4.6.2 ./configure
--prefix=/gpfs/CEPBATOOLS/extrae/2.2.0
--with-unwind=/gpfs/CEPBATOOLS/libunwind/1.0.1-git
--with-papi=/gpfs/CEPBATOOLS/papi/4.2.0 --with-mpi=/usr --enable-posix-clock
--without-dyninst
Build and installation commands:
make
make install
Compiling in a Slurm/MOAB environment with support for MPICH2
Configuration command:
export MP IMPL=anl2 ./configure --prefix=PREFIX
--with-mpi=/gpfs/apps/MPICH2/mx/1.0.8p1..3/32
--with-papi=/gpfs/apps/PAPI/3.6.2-970mp --with-binary-type=64
--without-dyninst --without-unwind
Build and installation commands:
make
make install
Compiling in a environment with IBM compilers and POE
Configuration command:
15

CC=xlc CXX=xlC ./configure --prefix=PREFIX --with-mpi=/opt/ibmhpc/ppe.poe
--without-dyninst --without--unwind --without-papi
Build and installation commands:
make
make install
Compiling in a environment with GNU compilers and POE
Configuration command:
./configure --prefix=PREFIX --with-mpi=/opt/ibmhpc/ppe.poe --without-dyninst
--without--unwind --without-papi
Build and installation commands:
MP COMPILER=gcc make
make install
Compiling Extrae 3.0 in Hornet / Cray XC40 system
Configuration command, enabling MPI, PAPI and online analysis over MRNet.
./configure --prefix=/zhome/academic/HLRS/xhp/xhpgl/tools/extrae/intel
--with-mpi=/opt/cray/mpt/7.1.2/gni/mpich2-intel/140
--with-unwind=/zhome/academic/HLRS/xhp/xhpgl/tools/libunwind
--without-dyninst --with-papi=/opt/cray/papi/5.3.2.1 --enable-online
--with-mrnet=/zhome/academic/HLRS/xhp/xhpgl/tools/mrnet/4.1.0
--with-spectral=/zhome/academic/HLRS/xhp/xhpgl/tools/spectral/3.1
--with-synapse=/zhome/academic/HLRS/xhp/xhpgl/tools/synapse/2.0
Build and installation commands:
make
make install
Compiling Extrae 3.0 in Shaheen II / Cray XC40 system
With the following modules loaded
module swap PrgEnv-XXX/YYY PrgEnv-cray/5.2.40
module load cray-mpich
Configuration command, enabling MPI, PAPI with the following modules loaded
./configure --prefix=${PREFIX}--with-mpi=/opt/cray/mpt/7.1.1/gni/mpich2-cray/83
--with-binary-type=64 --with-unwind=/home/markomg/lib--without-dyninst
--disable-xmltest --with-bfd=/opt/cray/cce/default/cray-binutils
--with-liberty=/opt/cray/cce/default/cray-binutils --enable-sampling
--enable-shared=no --with-papi=/opt/cray/papi/5.3.2.1
Build and installation commands:
16

make
make install
3.6 Knowing how a package was configured
If you are interested on knowing how an Extrae package was configured execute the following
command after setting EXTRAE HOME to the base location of an installation
${EXTRAE HOME}/etc/configured.sh
this command will show the configure command itself and the location of some dependencies of
the instrumentation package.
17
18

Chapter 4
Extrae XML configuration file
Extrae is configured through a XML file that is set through the EXTRAE CONFIG FILE environment
variable. The included examples provide several XML files to serve as a basis for the end user. For
instance, the MPI examples provide four XML configuration files:
•extrae.xml Exemplifies all the options available to set up in the configuration file. We will
discuss below all the sections and options available. It is also available on this document on
appendix A.
•extrae explained.xml The same as the above with some comments on each section.
•summarized trace basic.xml A small example for gathering information of MPI and OpenMP
information with some performace counters and calling information at each MPI call.
•detailed trace basic.xml A small example for gathering a summarized information of MPI
and OpenMP parallel paradigms.
•extrae bursts 1ms.xml An XML configuration example to setup the bursts tracing mode.
This XML file will only capture the regions in between MPI calls that last more than the
given threshold (1ms in this example).
Please note that most of the nodes present in the XML file have an enabled attribute that
allows turning on and off some parts of the instrumentation mechanism. For example, <mpi
enabled="yes"> means MPI instrumentation is enabled and process all the contained XML subn-
odes, if any; whether <mpi enabled="no"> means to skip gathering MPI information and do not
process XML subnodes.
Each section points which environment variables could be used if the tracing package lacks XML
support. See appendix B for the entire list.
Sometimes the XML tags are used for time selection (duration, for instance). In such tags, the
following postfixes can be used: n or ns for nanoseconds, u or us for microseconds, m or ms for
milliseconds, s for seconds, M for minutes, H for hours and D for days.
4.1 XML Section: Trace configuration
The basic trace behavior is determined in the first part of the XML and contains all of the
remaining options. It looks like:
19

<?xml version=’1.0’?>
<trace enabled="yes"
home="@sed_MYPREFIXDIR@"
initial-mode="detail"
type="paraver"
xml-parser-id="@sed_XMLID@"
>
< ... other XML nodes ... >
</trace>
The <?xml version=’1.0’?> is mandatory for all XML files. Don’t touch this. The available
tunable options are under the <trace> node:
•enabled Set to "yes" if you want to generate tracefiles.
•home Set to where the instrumentation package is installed. Usually it points to the same
location that EXTRAE HOME environment variable.
•initial-mode Available options
–detail Provides detailed information of the tracing.
–bursts Provides summarized information of the tracing. This mode removes most of the
information present in the detailed traces (like OpenMP and MPI calls among others)
and only produces information for computation bursts.
•type Available options
–paraver The intermediate files are meant to generate Paraver tracefiles.
–dimemas The intermediate files are meant to generate Dimemas tracefiles.
•xml-parser-id This is used to check whether the XML parsing scheme and the file scheme
match or not.
See EXTRAE ON,EXTRAE HOME,EXTRAE INITIAL MODE and EX-
TRAE TRACE TYPE environment variables in appendix B.
4.2 XML Section: MPI
The MPI configuration part is nested in the config file (see section 4.1) and its nodes are the
following:
<mpi enabled="yes">
<counters enabled="yes" />
</mpi>
20

MPI calls can gather performance information at the begin and end of MPI calls. To activate
this behavior, just set to yes the attribute of the nested <counters> node.
See EXTRAE DISABLE MPI and EXTRAE MPI COUNTERS ON environment
variables in appendix B.
4.3 XML Section: pthread
The pthread configuration part is nested in the config file (see section 4.1) and its nodes are the
following:
<pthread enabled="yes">
<locks enabled="no" />
<counters enabled="yes" />
</pthread>
The tracing package allows to gather information of some pthread routines. In addition to that,
the user can also enable gathering information of locks and also gathering performance counters
in all of these routines. This is achieved by modifying the enabled attribute of the <locks> and
<counters>, respectively.
See EXTRAE DISABLE PTHREAD,EXTRAE PTHREAD LOCKS and EX-
TRAE PTHREAD COUNTERS ON environment variables in appendix B.
4.4 XML Section: OpenMP
The OpenMP configuration part is nested in the config file (see section 4.1) and its nodes are the
following:
<openmp enabled="yes">
<locks enabled="no" />
<counters enabled="yes" />
</openmp>
The tracing package allows to gather information of some OpenMP runtimes and outlined
routines. In addition to that, the user can also enable gathering information of locks and also
gathering performance counters in all of these routines. This is achieved by modifying the enabled
attribute of the <locks> and <counters>, respectively.
See EXTRAE DISABLE OMP,EXTRAE OMP LOCKS and EX-
TRAE OMP COUNTERS ON environment variables in appendix B.
4.5 XML Section: Callers
<callers enabled="yes">
<mpi enabled="yes">1-3</mpi>
21

<sampling enabled="no">1-5</sampling>
<dynamic-memory enabled="no">1-5</dynamic-memory>
</callers>
Callers are the routine addresses present in the process stack at any given moment during the
application run. Callers can be used to link the tracefile with the source code of the application.
The instrumentation library can collect a partial view of those addresses during the instru-
mentation. Such collected addresses are translated by the merging process if the correspondent
parameter is given and the application has been compiled and linked with debug information.
There are three points where the instrumentation can gather this information:
•Entry of MPI calls
•Sampling points (if sampling is available in the tracing package)
•Dynamic memory calls (malloc, free, realloc)
The user can choose which addresses to save in the trace (starting from 1, which is the closest
point to the MPI call or sampling point) specifying several stack levels by separating them by
commas or using the hyphen symbol.
See EXTRAE MPI CALLER environment variable in appendix B.
4.6 XML Section: User functions
<user-functions enabled="no"
list="/home/bsc41/bsc41273/user-functions.dat"
exclude-automatic-functions="no">
<counters enabled="yes" />
</user-functions>
The file contains a list of functions to be instrumented by Extrae . There are different alternatives
to instrument application functions, and some alternatives provides additional flexibility, as a result,
the format of the list varies depending of the instrumentation mechanism used:
•DynInst
Supports instrumentation of user functions, outer loops, loops and basic blocks. The given
list contains the desired function names to be instrumented. After each function name, op-
tionally you can define different basic blocks or loops inside the desired function always by
providing different suffixes that are provided after the +character. For instance:
–To instrument the entry and exit points of foo function just provide the function name
(foo).
–To instrument the entry and exit points of foo function plus the entry and exit points
of its outer loop, suffix the function name with outerloops (i.e. foo+outerloops).
22

–To instrument the entry and exit points of foo function plus the entry and exit points
of its N-th loop function you have to suffix it as loop N, for instance foo+loop 3.
–To instrument the entry and exit points of foo function plus the entry and exit points
of its N-th basic block inside the function you have to use the suffix bb N, for instqance
foo+bb 5. In this case, it is also possible to specifically ask for the entry or exit point
of the basic block by additionally suffixing sor e, respectively.
Additionally, these options can be added by using comas, as in:
foo+outerloops,loop 3,bb 3 e,bb 4 s,bb 5.
To discover the instrumentable loops and basic blocks of a certain function you can execute the
command $EXTRAE HOME/bin/extrae -config extrae.xml -decodeBB, where extrae.xml
is an Extrae configuration file that provides a list on the user functions attribute that you
want to get the information.
•GCC and ICC (through -finstrument-functions)
GNU and Intel compiler provides a compile and link flag named -finstrument-functions
that instruments the routines of a source code file that Extrae can use. To take advantage
of this functionality the list of routines must point to a list with the format: hexadecimal
address#function name where hexadecimal address refers to the hexadecimal address of the
function in the binary file (obtained throug the nm binary and function name is the name of
the function to be instrumented. For instance to instrument the routine pi kernel from the
pi binary we execute nm as follows:
# nm -a pi | grep pi_kernel
00000000004005ed T pi_kernel
and add 00000000004005ed # pi kernel into the function list.
The exclude-automatic-functions attribute is used only by the DynInst instrumenter. By
setting this attribute to yes the instrumenter will avoid automatically instrumenting the routines
that either call OpenMP outlined routines (i.e. routines with OpenMP pragmas) or call CUDA
kernels.
Finally, in order to gather performance counters in these functions and also in those instru-
mented using the extrae user function API call, the node counters has to be enabled.
Warning! Note that you need to compile your application binary with debugging information
(typically the -g compiler flag) in order to translate the captured addresses into valuable information
such as: function name, file name and line number.
See EXTRAE FUNCTIONS environment variable in appendix B.
4.7 XML Section: Performance counters
The instrumentation library can be compiled with support for collecting performance metrics of
different components available on the system. These components include:
23

•Processor performance counters. Such access is granted by PAPI1or PMAPI2
•Network performance counters. (Only available in systems with Myrinet GM/MX networks).
•Operating system accounts.
Here is an example of the counters section in the XML configuration file:
<counters enabled="yes">
<cpu enabled="yes" starting-set-distribution="1">
<set enabled="yes" domain="all" changeat-time="5s">
PAPI_TOT_INS,PAPI_TOT_CYC,PAPI_L1_DCM
<sampling enabled="yes" period="100000000">PAPI_TOT_CYC</sampling>
</set>
<set enabled="yes" domain="user" changeat-globalops="5">
PAPI_TOT_INS,PAPI_TOT_CYC,PAPI_FP_INS
</set>
</cpu>
<network enabled="yes" />
<resource-usage enabled="yes" />
</counters>
See EXTRAE COUNTERS,EXTRAE NETWORK COUNTERS and EX-
TRAE RUSAGE environment variables in appendix B.
4.7.1 Processor performance counters
Processor performance counters are configured in the <cpu> nodes. The user can configure many
sets in the <cpu> node using the <set> node, but just one set will be used at any given time in
a specific task. The <cpu> node supports the starting-set-distribution attribute with the
following accepted values:
•number (in range 1..N, where N is the number of configured sets) All tasks will start using
the set specified by number.
•block Each task will start using the given sets distributed in blocks (i.e., if two sets are
defined and there are four running tasks: tasks 1 and 2 will use set 1, and tasks 3 and 4 will
use set 2).
•cyclic Each task will start using the given sets distributed cyclically (i.e., if two sets are
defined and there are four running tasks: tasks 1 and 3 will use, and tasks 2 and 4 will use
set 2).
•random Each task will start using a random set, and also calls either to Extrae next hwc set
or Extrae previous hwc set will change to a random set.
1More information available on their website http://icl.cs.utk.edu/papi.Extrae requires PAPI 3.x at least.
2PMAPI is only available for AIX operating system, and it is on the base operating system since AIX5.3. Extrae
requires AIX 5.3 at least.
24

Each set contain a list of performance counters to be gathered at different instrumentation points
(see sections 4.2, 4.4 and 4.6). If the tracing library is compiled to support PAPI, performance
counters must be given using the canonical name (like PAPI TOT CYC and PAPI L1 DCM), or
the PAPI code in hexadecimal format (like 8000003b and 80000000, respectively)3. If the tracing
library is compiled to support PMAPI, only one group identifier can be given per set4and can
be either the group name (like pm basic and pm hpmcount1) or the group number (like 6 and 22,
respectively).
In the given example (which refers to PAPI support in the tracing library) two sets are de-
fined. First set will read PAPI TOT INS (total instructions), PAPI TOT CYC (total cycles) and
PAPI L1 DCM (1st level cache misses). Second set is configured to obtain PAPI TOT INS (total
instructions), PAPI TOT CYC (total cycles) and PAPI FP INS (floating point instructions).
Additionally, if the underlying performance library supports sampling mechanisms, each set
can be configured to gather information (see section 4.5) each time the specified counter reaches
a specific value. The counter that is used for sampling must be present in the set. In the given
example, the first set is enabled to gather sampling information every 100M cycles.
Furthermore, performance counters can be configured to report accounting on different basis
depending on the domain attribute specified on each set. Available options are
•kernel Only counts events ocurred when the application is running in kernel mode.
•user Only counts events ocurred when the application is running in user-space mode.
•all Counts events independently of the application running mode.
In the given example, first set is configured to count all the events ocurred, while the second
one only counts those events ocurred when the application is running in user-space mode.
Finally, the instrumentation can change the active set in a manual and an automatic fashion. To
change the active set manually see Extrae previous hwc set and Extrae next hwc set API calls
in 5.1. To change automatically the active set two options are allowed: based on time and based on
application code. The former mechanism requires adding the attribute changeat-time and specify
the minimum time to hold the set. The latter requires adding the attribute changeat-globalops
with a value. The tracing library will automatically change the active set when the application has
executed as many MPI global operations as selected in that attribute. When In any case, if either
attribute is set to zero, then the set will not me changed automatically.
4.7.2 Network performance counters
Network performance counters are only available on systems with Myrinet GM/MX networks and
they are fixed depending on the firmware used. Other systems, like BG/* may provide some network
performance counters, but they are accessed through the PAPI interface (see section 4.7 and PAPI
documentation).
If <network> is enabled the network performance counters appear at the end of the application
run, giving a summary for the whole run.
3Some architectures do not allow grouping some performance counters in the same set.
4Each group contains several performance counters
25

4.7.3 Operating system accounting
Operating system accounting is obtained through the getrusage(2) system call when <resource-usage>
is enabled. As network performance counters, they appear at the end of the application run, giving
a summary for the whole run.
4.8 XML Section: Storage management
The instrumentation packages can be instructed on what/where/how produce the intermediate
trace files. These are the available options:
<storage enabled="no">
<trace-prefix enabled="yes">TRACE</trace-prefix>
<size enabled="no">5</size>
<temporal-directory enabled="yes">/scratch</temporal-directory>
<final-directory enabled="yes">/gpfs/scratch/bsc41/bsc41273</final-directory>
</storage>
Such options refer to:
•trace-prefix Sets the intermediate trace file prefix. Its default value is TRACE.
•size Let the user restrict the maximum size (in megabytes) of each resulting intermediate
trace file5.
•temporal-directory Where the intermediate trace files will be stored during the execution
of the application. By default they are stored in the current directory. If the directory does
not exist, the instrumentation will try to make it.
•final-directory Where the intermediate trace files will be stored once the execution has
been finished. By default they are stored in the current directory. If the directory does not
exist, the instrumentation will try to make it.
See EXTRAE PROGRAM NAME,EXTRAE FILE SIZE,EXTRAE DIR,EX-
TRAE FINAL DIR and EXTRAE GATHER MPITS environment variables in ap-
pendix B.
4.9 XML Section: Buffer management
Modify the buffer management entry to tune the tracing buffer behavior.
5This check is done each time the buffer is flushed, so the resulting size of the intermediate trace file depends also
on the number of elements contained in the tracing buffer (see section 4.9).
26

<buffer enabled="yes">
<size enabled="yes">150000</size>
<circular enabled="no" />
</buffer>
By, default (even if the enabled attribute is ”no”) the tracing buffer is set to 500k events. If
<size> is enabled the tracing buffer will be set to the number of events indicated by this node. If
the circular option is enabled, the buffer will be created as a circular buffer and the buffer will be
dumped only once with the last events generated by the tracing package.
See EXTRAE BUFFER SIZE environment variable in appendix B.
4.10 XML Section: Trace control
<trace-control enabled="yes">
<file enabled="no" frequency="5M">/gpfs/scratch/bsc41/bsc41273/control</file>
<global-ops enabled="no">10</global-ops>
<remote-control enabled="yes">
<mrnet enabled="yes" target="150" analysis="spectral" start-after="30">
<clustering max_tasks="26" max_points="8000"/>
<spectral min_seen="1" max_periods="0" num_iters="3" signals="DurBurst,InMPI"/>
</mrnet>
</remote-control>
</trace-control>
This section groups together a set of options to limit/reduce the final trace size. There are
three mechanisms which are based on file existance, global operations executed and external remote
control procedures.
Regarding the file, the application starts with the tracing disabled, and it is turned on when
a control file is created. Use the property frequency to choose at which frequency this check must
be done. If not supplied, it will be checked every 100 global operations on MPI COMM WORLD.
If the global-ops tag is enabled, the instrumentation package begins disabled and starts the
tracing when the given number of global operations on MPI COMM WORLD has been executed.
The remote-control tag section allows to configure some external mechanisms to automatically
control the tracing. Currently, there is only one option which is built on top of MRNet and it is
based on clustering and spectral analysis to generate a small yet representative trace.
These are the options in the mrnet tag:
•target: the approximate requested size for the final trace (in Mb).
•analysis: one between clustering and spectral.
•start-after: number of seconds before the first analysis starts.
The clustering tag configures the clustering analysis parameters:
•max tasks: maximum number of tasks to get samples from.
27

•max points: maximum number of points to cluster.
The spectral tag section configures the spectral analysis parameters:
•min seen: minimum times a given type of period has to be seen to trace a sample
•max periods: maximum number of representative periods to trace. 0 equals to unlimited.
•num iters: number of iterations to trace for every representative period found.
•signals: performance signals used to analyze the application. If not specified, DurBurst is
used by default.
See EXTRAE CONTROL FILE,EXTRAE CONTROL GLOPS,EX-
TRAE CONTROL TIME environment variables in appendix B.
4.11 XML Section: Bursts
<bursts enabled="no">
<threshold enabled="yes">500u</threshold>
<mpi-statistics enabled="yes" />
</bursts>
If the user enables this option, the instrumentation library will just emit information of com-
putation bursts (i.e., not does not trace MPI calls, OpenMP runtime, and so on) when the current
mode (through initial-mode in 4.1) is set to bursts. The library will discard all those computation
bursts that last less than the selected threshold.
In addition to that, when the tracing library is running in burst mode, it computes some statis-
tics of MPI activity. Such statistics can be dumped in the tracefile by enabling mpi-statistics.
See EXTRAE INITIAL MODE,EXTRAE BURST THRESHOLD and EX-
TRAE MPI STATISTICS environment variables in appendix B.
4.12 XML Section: Others
<others enabled="yes">
<minimum-time enabled="no">10M</minimum-time>
<finalize-on-signal enabled="yes"
SIGUSR1="no" SIGUSR2="no" SIGINT="yes"
SIGQUIT="yes" SIGTERM="yes" SIGXCPU="yes"
SIGFPE="yes" SIGSEGV="yes" SIGABRT="yes"
/>
<flush-sampling-buffer-at-instrumentation-point enabled="yes" />
</others>
This section contains other configuration details that do not fit in the previous sections. At the
moment, there are three options to be configured.
28

•The minimum-time option indicates the instrumentation package the minimum instrumen-
tation time. To enable it, set enabled to ”yes” and set the minimum time within the
minimum-time tag.
•The option labeled as finalize-on-signal instructs the instrumentation package to listen
for different types of signals6and dump and finalize the execution whenever they occur. If
a signal occurs but it is not configured, then the execution may finish without generating
the trace-file. Caveat: Some MPI implementations use SIGUSR1 and/or SIGUSR2, so if you
want to capture those signals check first that enabling them do not alter with the application
execution.
•The flush-sampling-buffer-at-instrumentation-point lets the user decide whether the
sampling buffer should be checked for flushing at instrumentation points. If this option is not
enabled, then the buffer will only be dumped once at the end of the application execution.
4.13 XML Section: Sampling
<sampling enabled="no" type="default" period="50m" variability="10m"/>
This section configures the time-based sampling capabilities. Every sample contains processor
performance counters (if enabled in section 4.7.1 and either PAPI or PMAPI are referred at con-
figure time) and callstack information (if enabled in section 4.5 and proper dependencies are set at
configure time).
This section contains two attributes besides enabled. These are
•type: determines which timer domain is used (see man 2 setitimer or man 3p setitimer
for further information on time domains). Available options are: real (which is also the
default value, virtual and prof (which use the SIGALRM, SIGVTALRM and SIGPROF
respectively). The default timing accumulates real time, but only issues samples at master
thread. To let all the threads to collect samples, the type must be virtual or prof.
•period: specifies the sampling periodicity. In the example above, samples are gathered every
50ms.
•variability: specifies the variability to the sampling periodicity. Such variability is calculated
through the random() system call and then is added to the periodicity. In the given example,
the variability is set to 10ms, thus the final sampling period ranges from 45 to 55ms.
See EXTRAE SAMPLING PERIOD,EXTRAE SAMPLING VARIABILITY,
EXTRAE SAMPLING CLOCKTYPE and EXTRAE SAMPLING CALLER
environment variables in appendix B.
4.14 XML Section: CUDA
<cuda enabled="yes" />
6See man 2 signal and man 7 signal for more details.
29
This section indicates whether the CUDA calls should be instrumented or not. If enabled is
set to yes, CUDA calls will be instrumented, otherwise they will not be instrumented.
4.15 XML Section: OpenCL
<opencl enabled="yes" />
This section indicates whether the OpenCL calls should be instrumented or not. If enabled is
set to yes, Opencl calls will be instrumented, otherwise they will not be instrumented.
4.16 XML Section: Input/Output
<input-output enabled="no" />
This section indicates whether I/O calls (read and write) are meant to be instrumented. If
enabled is set to yes, the aforementioned calls will be instrumented, otherwise they will not be
instrumented.
Note: This is an experimental feature, and needs to be enabled at configure time using the
--enable-instrument-io option.
Warning! This option seems to intefere with the instrumentation of the GNU and Intel
OpenMP runtimes, and the issues haven’t been solved yet.
4.17 XML Section: Dynamic memory
<dynamic-memory enabled="no">
<alloc enabled="yes" threshold="32768" />
<free enabled="yes" />
</dynamic-memory>
This section indicates whether dynamic memory calls (malloc,free,realloc) are meant to
be instrumented. If enabled is set to yes, the aforementioned calls will be instrumented, otherwise
they will not be instrumented. This section allows deciding whether allocation and free-related
memory calls shall be instrumented. Additionally, the configuration can also indicate whether
allocation calls should be instrumented if the requested memory size surpasses a given threshold
(32768 bytes, in the example).
Note: This is an experimental feature, and needs to be enabled at configure time using the
--enable-instrument-dynamic-memory option.
Warning! This option seems to intefere with the instrumentation of the Intel OpenMP runtime,
and the issues haven’t been solved yet.
4.18 XML Section: Memory references through Intel PEBS sam-
pling
<pebs-sampling enabled="yes">
<loads enabled="yes" period="1000000" minimum-latency="10" />
30

<stores enabled="no" period="1000000" />
</pebs-sampling>
This section tells Extrae to use the PEBS feature from recent Intel processors7to sample memory
references. These memory references capture the linear address referenced, the component of the
memory hierarchy that solved the reference and the number of cycles to solve the reference. In
the example above, PEBS monitors one out of every million load instructions and only grabs those
that require at least 10 cycles to be solved.
Note: This is an experimental feature, and needs to be enabled at configure time using the
--enable-pebs-sampling option.
4.19 XML Section: Merge
<merge enabled="yes"
synchronization="default"
binary="mpi_ping"
tree-fan-out="16"
max-memory="512"
joint-states="yes"
keep-mpits="yes"
sort-addresses="yes"
overwrite="yes"
>
mpi_ping.prv
</merge>
If this section is enabled and the instrumentation packaged is configured to support this, the
merge process will be automatically invoked after the application run. The merge process will use
all the resources devoted to run the application.
In the example given, the leaf of this node will be used as the tracefile name (mpi ping.prv
in this example). Current available options for the merge process are given as attribute of the
<merge> node and they are:
•synchronization: which can be set to default,node,task,no. This determines how task
clocks will be synchronized (default is node).
•binary: points to the binary that is being executed. It will be used to translate gathered
addresses (MPI callers, sampling points and user functions) into source code references.
•tree-fan-out:only for MPI executions sets the tree-based topology to run the merger in a
parallel fashion.
•max-memory: limits the intermediate merging process to run up to the specified limit (in
MBytes).
7Check for availability on your system by looking for pebs in /proc/cpuinfo.
31

•joint-states: which can be set to yes,no. Determines if the resulting Paraver tracefile will
split or join equal consecutive states (default is yes).
•keep-mpits: whether to keep the intermediate tracefiles after performing the merge.
•sort-addresses: whether to sort all addresses that refer to the source code (enabled by
default).
•overwrite: set to yes if the new tracefile can overwrite an existing tracefile with the same
name. If set to no, then the tracefile will be given a new name using a consecutive id.
In Linux systems, the tracing package can take advantage of certain functionalities from the
system and can guess the binary name, and from it the tracefile name. In such systems, you can
use the following reduced XML section replacing the earlier section.
<merge enabled="yes"
synchronization="default"
tree-fan-out="16"
max-memory="512"
joint-states="yes"
keep-mpits="yes"
sort-addresses="yes"
overwrite="yes"
/>
For further references, see chapter 6.
4.20 Using environment variables within the XML file
XML tags and attributes can refer to environment variables that are defined in the environment
during the application run. If you want to refer to an environment variable within the XML file,
just enclose the name of the variable using the dollar symbol ($), for example: $FOO$.
Note that the user has to put an specific value or a reference to an environment variable which
means that expanding environment variables in text is not allowed as in a regular shell (i.e., the
instrumentation package will not convert the follwing text bar$FOO$bar).
32

Chapter 5
Extrae API
There are two levels of the API in the Extrae instrumentation package. Basic API refers to the basic
functionality provided and includes emitting events, source code tracking, changing instrumentation
mode and so. Extended API is an experimental addition to provide several of the basic API within
single and powerful calls using specific data structures.
5.1 Basic API
The following routines are defined in the ${EXTRAE HOME}/include/extrae.h. These routines are
intended to be called by C/C++ programs. The instrumentation package also provides bindings
for Fortran applications. The Fortran API bindings have the same name as the C API but honoring
the Fortran compiler function name mangling scheme. To use the API in Fortran applications you
must use the module provided in $EXTRAE HOME/include/extrae module.f by using the language
clause use. This module which provides the appropriate function and constant declarations for
Extrae .
•void Extrae get version (unsigned *major, unsigned *minor, unsigned *revision)
Returns the version of the underlying Extrae package. Although an application may be com-
piled to a specific Extrae library, by using the appropriate shared library commands, the
application may use a different Extrae library.
•void Extrae init (void)
Initializes the tracing library.
NOTE: This routine is called automatically in different circumstances, which include:
–Call to MPI Init when the appropriate instrumentation library is linked or preload with
the application.
–Usage of the DynInst launcher.
–If either the libseqtrace.so,libomptrace.so or libpttrace.so are linked dynami-
cally or preloaded with the application.
No major problems should occur if the library is initialized twice, only a warning appears in
the terminal output noticing the intent of double initialization.
33

•extrae init type t Extrae is initialized (void)
This routine tells whether the instrumentation has been initialized, and if so, also which
mechanism was the first to initialize it (regular API or MPI initialization).
•void Extrae fini (void)
Finalizes the tracing library and dumps the intermediate tracing buffers onto disk.
NOTE: As it happened by using Extrae init, this routine is automatically called in the
same circumstances (but on call to MPI Finalize in the first case).
•void Extrae event (extrae type t type, extrae value t value)
The Extrae event adds a single timestamped event into the tracefile. The event has two
arguments: type and value.
Some common use of events are:
–Identify loop iterations (or any code block): Given a loop, the user can set a unique type
for the loop and a value related to the iterator value of the loop. For example:
for (i = 1; i <= MAX_ITERS; i++)
{
Extrae_event (1000, i);
[original loop code]
}
Extrae_event (1000, 0);
The last added call to Extrae event marks the end of the loop setting the event value to
0, which facilitates the analysis with Paraver.
–Identify user routines: Choosing a constant type (6000019 in this example) and different
values for different routines (set to 0 to mark a ”leave” event)
void routine1 (void)
{
Extrae_event (6000019, 1);
[routine 1 code]
Extrae_event (6000019, 0);
}
void routine2 (void)
{
Extrae_event (6000019, 2);
[routine 2 code]
Extrae_event (6000019, 0);
}
–Identify any point in the application using a unique combination of type and value.
•void Extrae nevent (unsigned count, extrae type t *types, extrae value t *values)
Allows the user to place count events with the same timestamp at the given position.
34

•void Extrae counters (void)
Emits the value of the active hardware counters set. See chapter 4 for further information.
•void Extrae eventandcounters (extrae type t event, extrae value t value)
This routine lets the user add an event and obtain the performance counters with one call
and a single timestamp.
•void Extrae neventandcounters (unsigned count, extrae type t *types, extrae value t
*values)
This routine lets the user add several events and obtain the performance counters with one
call and a single timestamp.
•void Extrae define event type (extrae type t *type, char *description, unsigned
*nvalues, extrae value t *values, char **description values)
This routine adds to the Paraver Configuration File human readable information regarding
type type and its values values. If no values needs to be decribed set nvalues to 0 and also
set values and description values to NULL.
•void Extrae shutdown (void)
Turns off the instrumentation.
•void Extrae restart (void)
Turns on the instrumentation.
•void Extrae previous hwc set (void)
Makes the previous hardware counter set defined in the XML file to be the active set (see
section 4.2 for further information).
•void Extrae next hwc set (void)
Makes the following hardware counter set defined in the XML file to be the active set (see
section 4.2 for further information).
•void Extrae set tracing tasks (int from, int to)
Allows the user to choose from which tasks (not threads!) store informartion in the tracefile
•void Extrae set options (int options)
Permits configuring several tracing options at runtime. The options parameter has to be a
bitwise or combination of the following options, depending on the user’s needs:
–EXTRAE CALLER OPTION
Dumps caller information at each entry or exit point of the MPI routines. Caller levels
need to be configured at XML (see chapter 4).
–EXTRAE HWC OPTION
Activates hardware counter gathering.
–EXTRAE MPI OPTION
Activates tracing of MPI calls.
–EXTRAE MPI HWC OPTION
Activates hardware counter gathering in MPI routines.
35

–EXTRAE OMP OPTION
Activates tracing of OpenMP runtime or outlined routines.
–EXTRAE OMP HWC OPTION
Activates hardware counter gathering in OpenMP runtime or outlined routines.
–EXTRAE UF HWC OPTION
Activates hardware counter gathering in the user functions.
•void Extrae network counters (void)
Emits the value of the network counters if the system has this capability. (Only available for
systems with Myrinet GM/MX networks).
•void Extrae network routes (int task)
Emits the network routes for an specific task.(Only available for systems with Myrinet
GM/MX networks).
•unsigned long long Extrae user function (unsigned enter)
Emits an event into the tracefile which references the source code (data includes: source
line number, file name and function name). If enter is 0 it marks an end (i.e., leaving the
function), otherwise it marks the beginning of the routine. The user must be careful to place
the call of this routine in places where the code is always executed, being careful not to place
them inside if and return statements. The function returns the address of the reference.
void routine1 (void)
{
Extrae_user_function (1);
[routine 1 code]
Extrae_user_function (0);
}
void routine2 (void)
{
Extrae_user_function (1);
[routine 2 code]
Extrae_user_function (0);
}
In order to gather performance counters during the execution of these calls, the user-functions
tag in the XML configuration and its counters have to be both enabled.
Warning! Note that you need to compile your application binary with debugging information
(typically the -g compiler flag) in order to translate the captured addresses into valuable
information such as: function name, file name and line number.
•void Extrae flush (void)
Forces the calling thread to write the events stored in the tracing buffers to disk.
36

5.2 Extended API
NOTE: This API is in experimental stage and it is only available in C. Use it at your own risk!
The extended API makes use of two special structures located in ${PREFIX}/include/extrae types.h.
The structures are extrae UserCommunication and extrae CombinedEvents. The former is in-
tended to encode an event that will be converted into a Paraver communication when its partner
equivalent event has found. The latter is used to generate events containing multiple kinds of
information at the same time.
struct extrae_UserCommunication
{
extrae_user_communication_types_t type;
extrae_comm_tag_t tag;
unsigned size; /* size_t? */
extrae_comm_partner_t partner;
extrae_comm_id_t id;
};
The structure extrae UserCommunication contains the following fields:
•type
Available options are:
–EXTRAE USER SEND, if this event represents a send point.
–EXTRAE USER RECV, if this event represents a receive point.
•tag
The tag information in the communication record.
•size
The size information in the communication record.
•partner
The partner of this communication (receive if this is a send or send if this is a receive).
Partners (ranging from 0 to N-1) are considered across tasks whereas all threads share a
single communication queue.
•id
An identifier that is used to match communications between partners.
struct extrae_CombinedEvents
{
/* These are used as boolean values */
int HardwareCounters;
int Callers;
int UserFunction;
/* These are intended for N events */
unsigned nEvents;
37

extrae_type_t *Types;
extrae_value_t *Values;
/* These are intended for user communication records */
unsigned nCommunications;
extrae_user_communication_t *Communications;
};
The structure extrae CombinedEvents contains the following fields:
•HardwareCounters
Set to non-zero if this event has to gather hardware performance counters.
•Callers
Set to non-zero if this event has to emit callstack information.
•UserFunction
Available options are:
–EXTRAE USER FUNCTION NONE, if this event should not provide information about user
routines.
–EXTRAE USER FUNCTION ENTER, if this event represents the starting point of a user rou-
tine.
–EXTRAE USER FUNCTION LEAVE, if this event represents the ending point of a user routine.
•nEvents
Set the number of events given in the Types and Values fields.
•Types
A pointer containing nEvents type that will be stored in the trace.
•Values
A pointer containing nEvents values that will be stored in the trace.
•nCommunications
Set the number of communications given in the Communications field.
•Communications
A pointer to extrae UserCommunication structures containing nCommunications elements
that represent the involved communications.
The extended API contains the following routines:
•void Extrae init UserCommunication (struct extrae UserCommunication *)
Use this routine to initialize an extrae UserCommunication structure.
•void Extrae init CombinedEvents (struct extrae CombinedEvents *)
Use this routine to initialize an extrae CombinedEvents structure.
•void Extrae emit CombinedEvents (struct extrae CombinedEvents *)
Use this routine to emit to the tracefile the events set in the extrae CombinedEvents given.
38

•void Extrae resume virtual thread (unsigned vthread)
This routine changes the thread identifier so as to be vthread in the final tracefile. Improper
use of this routine may result in corrupt tracefiles.
•void Extrae suspend virtual thread (void)
This routine recovers the original thread identifier (given by routines like pthread self or
omp get thread num, for instance).
•void Extrae register codelocation type (extrae type t t1, extrae type t t2, const
char* s1, const char *s2)
Registers type t2 to reference user source code location by using its address. During the
merge phase the mpi2prv command will assign type t1 to the event type that references the
user function and to the event t2 to the event that references the file name and line location.
The strings s1 and s2 refers, respectively, to the description of t1 and t2
•void Extrae register function address (void *ptr, const char *funcname, const char
*modname, unsigned line);
By default, the mpi2prv process uses the binary debugging information to translate program
addresses into information that contains function name, the module name and line. The Ex-
trae register function address allows providing such information by hand during the execution
of the instrumented application. This function must provide the function name (funcname),
module name (modname) and line number for a given address.
•void Extrae register stacked type (extrae type t type)
Registers which event types are required to be managed in a stack way whenever void
Extrae resume virtual thread or void Extrae suspend virtual thread are called.
•void Extrae set threadid function (unsigned (*threadid function)(void))
Defines the routine that will be used as a thread identifier inside the tracing facility.
•void Extrae set numthreads function (unsigned (*numthreads function)(void))
Defines the routine that will count all the executing threads inside the tracing facility.
•void Extrae set taskid function (unsigned (*taskid function)(void))
Defines the routine that will be used as a task identifier inside the tracing facility.
•void Extrae set numtasks function (unsigned (*numtasks function)(void))
Defines the routine that will count all the executing tasks inside the tracing facility.
•void Extrae set barrier tasks function (void (*barriertasks function)(void))
Establishes the barrier routine among tasks. It is needed for synchronization purposes.
5.3 Java bindings
If Java is enabled at configure time, a basic instrumentation library for serial application based on
JNI bindings to Extrae will be installed. The current bindings are within the package es.bsc.cepbatools.extrae
and the following bindings are provided:
39
•void Init ();
Initializes the instrumentation package.
•void Fini ();
Finalizes the instrumentation package.
•void Event (int type, long value);
Emits one event into the trace-file with the given pair type-value.
•void Eventandcounters (int type, long value);
Emits one event into the trace-file with the given pair type-value as well as read the perfor-
mance counters.
•void nEvent (int types[], long values[]);
Emits a set of pair type-value at the same timestamp. Note that both arrays must be the
same length to proceed correctly, otherwise the call ignores the call.
•void nEventandcounters (int types[], long values[]);
Emits a set of pair type-value at the same timestamp as well as read the performance counters.
Note that both arrays must be the same length to proceed correctly, otherwise the call ignores
the call.
•void defineEventType (int type, String description, long[] values, String[] descriptionValues);
Adds a description for a given event type (through type and description parameters). If the
array values is non-null, then the array descriptionValues should be the an array of the
same length and each entry should be a string describing each of the values given in values.
•void SetOptions (int options);
This API call changes the behavior of the instrumentation package but none of the options
currently apply to the Java instrumentation.
•void Shutdown();
Disables the instrumentation until the next call to Restart().
•void Restart();
Resumes the instrumentation from the previous Shutdown() call.
5.3.1 Advanced Java bindings
Since Extrae does not have features to automatically discover the thread identifier of the threads
that run within the virtual machine, there are some calls that allows to do this manually. These
calls are, however, intended for expert users and should be avoided whenever possible because their
behavior may be highly modified, or even removed, in future releases.
•SetTaskID (int id);
Tells Extrae that this process should be considered as task with identifier id. Use this call
before invoking Init().
•SetNumTasks (int num);
Instructs Extrae to allocate the structures for num processes. Use this call before invoking
Init().
40

•SetThreadID (int id);
Instructs Extrae that this thread should be considered as thread with identifier id.
•SetNumThreads (int num);
Tells Extrae that there are num threads active within this process. Use this call before invoking
Init().
•Comm (boolean send, int tag, int size, int partner, long id);
Allows generating communications between two processes. The call emits one of the two-point
communication part, so it is necessary to invoke it from both the sender and the receiver part.
The send parameter determines whether this call will act as send or receive message. The
tag and size parameters are used to match the communication and their parameters can be
displayed in Paraver. The partner refers to the communication partner and it is identified
by its TaskID. The id is meant for matching purposes but cannot be recovered during the
analysis with Paraver.
5.4 Command-line version
Extrae incorporates a mechanism to generate trace-files from the command-line in a very na¨ıve way
in order to instrument executions driven by shell-scripted applications. The command-line binary
is installed in $EXTRAE HOME/bin/extrae-cmd and supports the following commands:
•init TASKID THREADS
This command initializes the tracing on the node that executed the command. The initializa-
tion command receives two parameters (TASKID, THREADS). The TASKID parameter gives
an task identifier to the following forthcoming events. The THREADS parameter indicates
how many threads should the task contain.
•emit THREAD-SLOT TYPE VALUE
This command emits an event with the pair TYPE, VALUE into the the thread THREAD
at the timestamp when the command is invoked.
•fini
This command finalizes the instrumentation using the command-line version. Note that this
finalization does not automatically call the merge process (mpi2prv).
Warning: In order to use these commands, do not export neither EXTRAE ON nor EXTRAE CONFIG FILE,
otherwise the behavior of these commands is undefined. The initialization can be executed only
once per node, so if you want to represent multiple tasks you need different tasks.
41
42
Chapter 6
Merging process
Once the application has finished, and if the automatic merge process is not setup, the merge must
be executed manually. Here we detail how to run the merge process manually.
The inserted probes in the instrumented binary are responsible for gathering performance met-
rics of each task/thread and for each of them several files are created where the XML configuration
file specified (see section 4.8). Such files are:
•As many .mpit files as tasks and threads where running the target application. Each file
contains information gathered by the specified task/thread in raw binary format.
•A single .mpits file that contain a list of related .mpit files.
•If the DynInst based instrumentation package was used, an addition .sym file that contains
some symbolic information gathered by the DynInst library.
In order to use Paraver, those intermediate files (i.e.,.mpit files) must be merged and translated
into Paraver trace file format. The same applies if the user wants to use the Dimemas simulator.
To proceed with any of these translation all the intermediate trace files must be merged into a
single trace file using one of the available mergers in the bin directory (see table 6.1).
The target trace type is defined in the XML configuration file used at the instrumentation step
(see section 4.1), and it has match with the merger used (mpi2prv and mpimpi2prv for Paraver and
mpi2dim and mpimpi2dim for Dimemas). However, it is possible to force the format nevertheless
the selection done in the XML file using the parameters -paraver or -dimemas1.
Binary Description
mpi2prv Sequential version of the Paraver merger.
mpi2dim Sequential version of the Dimemas merger.
mpimpi2prv Parallel version of the Paraver merger.
mpimpi2dim Parallel version of the Dimemas merger.
Table 6.1: Description of the available mergers in the Extrae package.
1The timing mechanism differ in Paraver/Dimemas at the instrumentation level. If the output trace format does
not correspond with that selected in the XML some timing inaccuracies may be present in the final tracefile. Such
inaccuracies are known to be higher due to clock granularity if the XML is set to obtain Dimemas tracefiles but the
resulting tracefile is forced to be in Paraver format.
43
6.1 Paraver merger
As stated before, there are two Paraver mergers: mpi2prv and mpimpi2prv. The former is for use
in a single processor mode while the latter is meant to be used with multiple processors using MPI
(and cannot be run using one MPI task).
Paraver merger receives a set of intermediate trace files and generates three files with the same
name (which is set with the -o option) but differ in the extension. The Paraver trace itself (.prv file)
that contains timestamped records that represent the information gathered during the execution
of the instrumented application. It also generates the Paraver Configuration File (.pcf file), which
is responsible for translating values contained in the Paraver trace into a more human readable
values. Finally, it also generates a file containing the distribution of the application across the
cluster computation resources (.row file).
The following sections describe the available options for the Paraver mergers. Typically, options
available for single processor mode are also available in the parallel version, unless specified.
6.1.1 Sequential Paraver merger
These are the available options for the sequential Paraver merger:
•-d or -dump
Dumps the information stored in the intermediate trace files.
•-dump-without-time
The information dumped with -d (or -dump) does not show the timestamp.
•-e BINARY
Uses the given BINARY to translate addresses that are stored in the intermediate trace files
into useful information (including function name, source file and line). The application has
to be compiled with -g flag so as to obtain valuable information.
NOTE: Since Extrae version 2.4.0 this flag is superseded in Linux systems where /proc/self/maps
is readable. The instrumentation part will annotate the binaries and shared libraries in use
and will try to use them before using BINARY. This flag is still available in Linux systems
as a default case just in case the binaries and libraries pointed by /proc/self/maps are not
available.
•-emit-library-events
Emit additional events for the source code references that belong to a separate shared library
that cannot be translated. Only add information with respect to the shared library name.
This option is disabled by default.
•-evtnum N
Partially processes (up to N events) the intermediate trace files to generate the Dimemas
tracefile.
•-f FILE.mpits (where FILE.mpits file is generated by the instrumentation)
The merger uses the given file (which contains a list of intermediate trace files of a single
executions) instead of giving set of intermediate trace files.
This option looks first for each file listed in the parameter file. Each contained file is searched
in the absolute given path, if it does not exist, then it’s searched in the current directory.
44

•-f-relative FILE.mpits (where FILE.mpits file is generated by the instrumentation)
This options behaves like the -f options but looks for the intermediate files in the current
directory.
•-f-absolute FILE.mpits (where FILE.mpits file is generated by the instrumentation)
This options behaves like the -f options but uses the full path of every intermediate file so as
to locate them.
•-h
Provides minimal help about merger options.
•-keep-mpits (or inversely, -no-keep-mpits)
Tells the merger to keep (or remove) the intermediate tracefiles after the trace generation.
•-maxmem M
The last step of the merging process will be limited to use Mmegabytes of memory. By
default, M is 512.
•-s FILE.sym (where FILE.sym file is generated with the DynInst instrumentator)
Passes information regarding instrumented symbols into the merger to aid the Paraver anal-
ysis. If -f,-f-relative or -f-absolute paramters are given, the merge process will try to
automatically load the symbol file associated to that FILE.mpits file.
•-no-syn
If set, the merger will not attempt to synchronize the different tasks. This is useful when
merging intermediate files obtained from a single node (and thus, share a single clock).
•-o FILE.prv
Choose the name of the target Paraver tracefile. If -o is not given, the merging process will
automatically name the tracefile using the application binary name, if possible.
•-o FILE.prv.gz
Choose the name of the target Paraver tracefile compressed using the libz library.
•-remove-files
The merging process removes the intermediate tracefiles when succesfully generating the
Paraver tracefile.
•-skip-sendrecv
Do not match point to point communications issued by MPI Sendrecv or MPI Sendrecv replace.
•-sort-addresses
Sort event values that reference source code locations so as the values are sorted by file name
first and then line number (enabled by default).
•-split-states
Do not join consecutive states that are the same into a single one.
•-syn
If different nodes are used in the execution of a tracing run, there can exist some clock
45

differences on all the nodes. This option makes mpi2prv to recalculate all the timings based
on the end of the MPI Init call. This will usually lead to ”synchronized” tasks, but it will
depend on how the clocks advance in time.
•-syn-node
If different nodes are used in the execution of a tracing run, there can exist some clock
differences on all the nodes. This option makes mpi2prv to recalculate all the timings based
on the end of the MPI Init call and the node where they ran. This will usually lead to better
synchronized tasks than using -syn, but, again, it will depend on how the clocks advance in
time.
•-translate-addresses (or inversely, -no-translate-addresses)
The merger process tries to translate the code reference addresses into source code references
(including routine name, file name, line number, and if outside the main module, the shared
library where the reference belongs). This option is enabled by default.
•-trace-overwrite (or inversely, -no-trace-overwrite)
Tells the merger to overwrite (or not) the final tracefile if it already exists. If the tracefile exists
and -no-trace-overwrite is given, the tracefile name will have an increasing numbering in
addition to the name given by the user.
•-unique-caller-id
Choose whether use a unique value identifier for different callers locations (MPI calling rou-
tines, user routines, OpenMP outlined routines andpthread routines).
6.1.2 Parallel Paraver merger
These options are specific to the parallel version of the Paraver merger:
•-block
Intermediate trace files will be distributed in a block fashion instead of a cyclic fashion to the
merger.
•-cyclic
Intermediate trace files will be distributed in a cyclic fashion instead of a block fashion to the
merger.
•-size
The intermediate trace files will be sorted by size and then assigned to processors in a such
manner that each processor receives approximately the same size.
•-consecutive-size
Intermediate trace files will be distributed consecutively to processors but trying to distribute
the overall size equally among processors.
•-use-disk-for-comms
Use this option if your memory resources are limited. This option uses an alternative matching
communication algorithm that saves memory but uses intensively the disk.
46
•-tree-fan-out N
Use this option to instruct the merger to generate the tracefile using a tree-based topology.
This should improve the performance when using a large number of processes at the merge
step. Depending on the combination of processes and the width of the tree, the merger will
need to run several stages to generate the final tracefile.
The number of processes used in the merge process must be equal or greater than the N
parameter. If it is not, the merger itself will automatically set the width of the tree to the
number of processes used.
6.2 Dimemas merger
As stated before, there are two Dimemas mergers: mpi2dim and mpimpi2dim. The former is for
use in a single processor mode while the latter is meant to be used with multiple processors using
MPI.
In contrast with Paraver merger, Dimemas mergers generate a single output file with the .dim
extension that is suitable for the Dimemas simulator from the given intermediate trace files..
These are the available options for both Dimemas mergers:
•-evtnum N
Partially processes (up to N events) the intermediate trace files to generate the Dimemas
tracefile.
•-f FILE.mpits (where FILE.mpits file is generated by the instrumentation)
The merger uses the given file (which contains a list of intermediate trace files of a single
executions) instead of giving set of intermediate trace files.
This option takes only the file name of every intermediate file so as to locate them.
•-f-relative FILE.mpits (where FILE.mpits file is generated by the instrumentation)
This options works exactly as the -f option.
•-f-absolute FILE.mpits (where FILE.mpits file is generated by the instrumentation)
This options behaves like the -f options but uses the full path of every intermediate file so as
to locate them.
•-h
Provides minimal help about merger options.
•-maxmem M
The last step of the merging process will be limited to use Mmegabytes of memory. By
default, M is 512.
•-o FILE.dim
Choose the name of the target Dimemas tracefile.
6.3 Environment variables
There are some environment variables that are related Two environment variables
47

6.3.1 Environment variables suitable to Paraver merger
EXTRAE LABELS
This environment variable lets the user add custom information to the generated Paraver Configu-
ration File (.pcf). Just set this variable to point to a file containing labels for the unknown (user)
events.
The format for the file is:
EVENT_TYPE
0 [type1] [label1]
0 [type2] [label2]
...
0 [typeK] [labelK]
Where [typeN] is the event value and [labelN] is the description for the event with value
[typeN]. It is also possible to link both type and value of an event:
EVENT_TYPE
0 [type] [label]
VALUES
[value1] [label1]
[value2] [label2]
...
[valueN] [labelN]
With this information, Paraver can deal with both type and value when giving textual infor-
mation to the end user. If Paraver does not find any information for an event/type it will shown it
in numerical form.
MPI2PRV TMP DIR
Points to a directory where all intermediate temporary files will be stored. These files will be
removed as soon the application ends.
6.3.2 Environment variables suitable to Dimemas merger
MPI2DIM TMP DIR
Points to a directory where all intermediate temporary files will be stored. These files will be
removed as soon the application ends.
48

Chapter 7
Extrae On-line User Guide
7.1 Introduction
Extrae On-line is a new module developed for the Extrae tracing toolkit, available from version 3.0,
that incorporates intelligent monitoring, analysis and selection of the traced data. This tracing
setup is tailored towards long executions that are producing large traces. Applying automatic
analysis techniques based on clustering, signal processing and active monitoring, Extrae gains the
ability to inspect and filter the data while it is being collected to minimize the amount of data
emitted into the trace, while maximizing the amount of relevant information presented.
Extrae On-line has been developed on top of Synapse, a framework that facilitates the deploy-
ment of applications that follow the master/slave architecture based on the MRNet software overlay
network. Thanks to its modular design, new types of automatic analyses can be added very easily
as new plug-ins into the on-line tracing system, just by defining new Synapse protocols.
This document briefly describes the main features of the Extrae On-line module, and shows
how it has to be configured and the different options available.
7.2 Automatic analyses
Extrae On-line currently supports three types of automatic analyses: fine-grain structure detection
based on clustering techniques, periodicity detection based on signal processing techniques, and
multi-experiment analysis based on active monitoring techniques. Extrae On-line has to be config-
ured to apply one of these types of analyses, and then the analysis will be performed periodically
as new data is being traced.
7.2.1 Structure detection
This mechanism aims at identifying the fine-grain structure of the computing regions of the program.
Applying density-based clustering, this method is able to expose the main performance trends in
the computations, and this information is useful to focus the analysis on the zones of real interest.
To perform the cluster analysis, Extrae On-line relies on the ClusteringSuite tool1.
At each phase of analysis, several outputs are produced:
1You can download it from http://www.bsc.es/computer-sciences/performance-tools/downloads.
49
•A scatter-plot representation that illustrates the behavior of the main computing regions of
the program, that enables a quick evaluation of potential imbalances.
•A summary of several performance metrics per cluster.
•On supported machines, a CPI stack model that attributes stall cycles to specific hardware
components.
•And a trace that is augmented with the clusters information, that allows to identify patterns
of performance and variabilites.
Subsequent clustering results can be used to study the evolution of the application over time.
In order to study how the clusters are evolving, the xtrack tool can be used.
7.2.2 Periodicity detection
This mechanism allows to detect iterative patterns over a wide region of time, and precisely de-
limit where the iterations start. Once a period has been found, those iterations presenting less
perturbations are selected to produce a representative trace, and the rest of the data is basically
discarded. The result of applying this mechanism is a compact trace where only the representa-
tive iterations are traced in full detail, and for the rest of the execution we can optionally keep
summarized information in the form of phase profiles or a “low resolution” trace.
Please note that applying this technique to a very short execution, or if no periodicity can be
detected in the application, may result in an empty trace depending on the configuration options
selected (see Section 7.3).
7.2.3 Multi-experiment analysis
This mechanism employs active measurement techniques in order to simulate different execution
scenarios under the same execution. Extrae On-line is able to add controlled interference into the
program to simulate different computation loads, network bandwidth, memory congestion and even
tuning some configurations of the parallel runtime (currently supports MPI Dynamic Load Balance
(DLB) runtime). Then, the application behavior can be studied under different circumstances, and
tracking can be used to analyze the impact of these configurations on the program performance.
This technique aims at reducing the number of executions necessary to evaluate different parameters
and characteristics of your program.
7.3 Configuration
In order to activate the On-line tracing mode, the user has to enable the corresponding configuration
section in the Extrae XML configuration file. This section is found under trace-control ¿ remote-
control ¿ online. The default configuration is already ready to use:
<online enabled="yes"
analysis="clustering"
frequency="auto"
topology="auto">
50

The available options for the ¡online¿ section are the following:
•enabled: Set to “yes” to activate the On-line tracing mode.
•analysis: Choose from “clustering”, “spectral” and “gremlins”.
•frequency: Set the time in seconds after which a new phase of analysis will be triggered, or
“auto” to let Extrae decide this automatically.
•topology: Set the desired tree process tree topology, or “auto” to let Extrae decide this
automatically.
Depending on the analysis selected, the following specific options become available.
7.3.1 Clustering analysis options
<clustering config="cl.I.IPC.xml"/>
•config: Specify the path to the ClusteringSuite XML configuration file.
7.3.2 Spectral analysis options
<spectral max_periods="0" num_iters="3" min_seen="0" min_likeness="85">
<spectral_advanced enabled="no" burst_threshold="80">
<periodic_zone detail_level="profile"/>
<non_periodic_zone detail_level="bursts" min_duration="3s"/>
</spectral_advanced>
</spectral>
The basic configuration options for the spectral analysis are the following:
•max periods: Set to the maximum number of periods to trace, or “all” to explore the whole
run.
•num iters: Set to the number of iterations to trace per period.
•min seen: Minimum repetitions of a period before tracing it (0 to trace the first time that
you encounter it)
•min likeness: Minimum percentage of similarity to compare two periods equivalent.
•min likeness: Minimum percentage of similarity to compare two periods equivalent.
Also, some advanced settings are tunable in the ¡spectral advanced¿ section:
•enabled: Set to “yes” to activate the spectral analysis advanced options.
•burst threshold: Filter threshold to keep all CPU bursts that add up to the given total
time percentage.
51

•detail level: Specify the granularity of the data stored for the non-representative iterations
of the periodic region, and in the non-periodic regions. Choose from none (everything is
discarded), profile (phase profile at the start of each iteration/region) or bursts (trace in
bursts mode).
•min duration: Minimum duration in seconds of the non-periodic regions for emitting any
information regarding that region into the trace.
7.3.3 Gremlins analysis options
<gremlins start="0" increment="2" roundtrip="no" loop="no"/>
•start: Number of gremlins at the beginning of the execution.
•increment: Number of extra gremlins at each analysis phase. Can also be a negative value
to indicate that you want to remove gremlins.
•roundtrip: Set to “yes” if you want to start adding gremlins after you decrease to 0, or
vice-versa, start removing gremlins after you reach the maximum.
•loop: Set to “yes” if you want to go back to the initial number of gremlins and repeat the
sequence of adding/removing gremlins after you have finished a complete sequence.
52

Chapter 8
Examples
We present here three different examples of generating a Paraver tracefile. First example re-
quires the package to be compiled with DynInst libraries. Second example uses the LD PRELOAD or
LDR PRELOAD[64] mechanism to interpose code in the application. Such mechanism is available in
Linux and FreeBSD operating systems and only works when the application uses dynamic libraries.
Finally, there is an example using the static library of the instrumentation package.
8.1 DynInst based examples
DynInst is a third-party instrumentation library developed at UW Madison which can instrument
in-memory binaries. It adds flexibility to add instrumentation to the application without modi-
fying the source code. DynInst is ported to different systems (Linux, FreeBSD) and to different
architectures1(x86, x86/64, PPC32, PPC64) but the functionality is common to all of them.
8.1.1 Generating intermediate files for serial or OpenMP applications
run dyninst.sh
1#!/bin/sh
2
3export EXTRAE_HOME=WRITE-HERE-THE-PACKAGE-LOCATION
4export LD_LIBRARY_PATH=${EXTRAE_HOME}/lib
5source ${EXTRAE_HOME}/etc/extrae.sh
6
7## Run the desired program
8${EXTRAE_HOME}/bin/extrae -config extrae.xml $*
A similar script can be found in the share/example/SEQ directory in your tracing package
directory. Just tune the EXTRAE HOME environment variable and make the script executable (using
chmod u+x). You can either pass the XML configuration file through the EXTRAE CONFIG FILE if
you prefer instead. Line no. 5 is responsible for loading all the environment variables needed for
the DynInst launcher (called extrae) that is invoked in line 8.
In fact, there are two examples provided in share/example/SEQ, one for static (or manual)
instrumentation and another for the DynInst-based instrumentation. When using the DynInst
1The IA-64 architecture support was dropped by DynInst 7.0
53

instrumentation, the user may add new routines to instrument using the existing function-list
file that is already pointed by the extrae.xml configuration file. The way to specify the routines
to instrument is add as many lines with the name of every routine to be instrumented.
Running OpenMP applications using DynInst is rather similar to serial codes. Just compile the
application with the appropiate OpenMP flags and run as before. You can find an example in the
share/example/OMP directory.
8.1.2 Generating intermediate files for MPI applications
MPI applications can also be instrumented using the DynInst instrumentator. The instrumentation
is done independently to each spawned MPI process, so in order to execute the DynInst-based
instrumentation package on a MPI application, you must be sure that your MPI launcher supports
running shell-scripts. The following scripts show how to run the DynInst instrumentator from the
MOAB/Slurm queue system. The first script just sets the environment for the job whereas the
second is responsible for instrumenting every spawned task.
slurm trace.sh
1#!/bin/bash
2# @ initialdir = .
3# @ output = trace.out
4# @ error = trace.err
5# @ total_tasks = 4
6# @ cpus_per_task = 1
7# @ tasks_per_node = 4
8# @ wall_clock_limit = 00:10:00
9# @ tracing = 1
10
11 srun ./run.sh ./mpi_ping
The most important thing in the previous script is the line number 11, which is responsible for
spawning the MPI tasks (using the srun command). The spawn method is told to execute ./run.sh
./mpi ping which in fact refers to instrument the mpi ping binary using the run.sh script. You
must adapt this file to your queue-system (if any) and to your MPI submission mechanism (i.e.,
change srun to mpirun, mpiexec, poe, etc...). Note that changing the line 11 to read like ./run.sh
srun ./mpi ping would result in instrumenting the srun application not mpi ping.
run.sh
1#!/bin/bash
2
3export EXTRAE_HOME=@sub_PREFIXDIR@
4source ${EXTRAE_HOME}/etc/extrae.sh
5
6# Only show output for task 0, others task send output to /dev/null
7if test "${SLURM_PROCID}" == "0" ; then
8${EXTRAE_HOME}/bin/extrae -config ../extrae.xml $@ > job.out 2> job.err
9else
10 ${EXTRAE_HOME}/bin/extrae -config ../extrae.xml $@ > /dev/null 2> /dev/null
11 fi
54

This is the script responsible for instrumenting a single MPI task. In line number 4 we set-up the
instrumentation environment by executing the commands from extrae.sh. Then we execute the
binary passed to the run.sh script in lines 8 and 10. Both lines are executing the same command
except that line 8 sends all the output to two different files (one for standard output and another
for standard error) and line 10 sends all the output to /dev/null.
Please note, this script is particularly adapted to the MOAB/Slurm queue systems. You may
need to adapt the script to other systems by using the appropiate environment variables. Partic-
ularly, SLURM PROCID identifies the MPI task id (i.e., the task rank) and may be changed to the
proper environemnt variable (PMI RANK in ParaStation/Torque/MOAB system or MXMPI ID
in systems having Myrinet MX devices, for example).
8.2 LD PRELOAD based examples
LD PRELOAD (or LDR PRELOAD[64] in AIX) interposition mechanism only works for binaries
that are linked against shared libraries. This interposition is done by the runtime loader by sub-
stituting the original symbols by those provided by the instrumentation package. This mechanism
is known to work on Linux, FreeBSD and AIX operating systems, although it may be available on
other operating systems (even using different names2) they are not tested.
We show how this mechanism works on Linux (or similar environments) in subsection 8.2.1 and
on AIX in subsection 8.2.3.
8.2.1 Linux
The following script preloads the libmpitrace library to instrument MPI calls of the application
passed as an argument (tune EXTRAE HOME according to your installation).
trace.sh
1#!/bin/sh
2
3export EXTRAE_HOME=WRITE-HERE-THE-PACKAGE-LOCATION
4export EXTRAE_CONFIG_FILE=extrae.xml
5export LD_PRELOAD=${EXTRAE_HOME}/lib/libmpitrace.so
6
7## Run the desired program
8$*
The previous script can be found in the share/example/MPI/ld-preload directory in your tracing
package directory. Copy the script to one of your directories, tune the EXTRAE HOME environment
variable and make the script executable (using chmod u+x). Also copy the XML configuration
extrae.xml file from the share/example/MPI directory instrumentation package to the current di-
rectory. This file is used to configure the whole behavior of the instrumentation package (there is
more information about the XML file on chapter 4). The last line in the script, $∗, executes the
arguments given to the script, so as you can run the instrumentation by simply adding the script
in between your execution command.
2Look at http://www.fortran-2000.com/ArnaudRecipes/sharedlib.html for further information.
55

Regarding the execution, if you run MPI applications from the command-line, you can issue
the typical mpirun command as:
${MPI HOME}/bin/mpirun -np N ./trace.sh mpi-app
where, ${MPI HOME}is the directory for your MPI installation, Nis the number of MPI tasks
you want to run and mpi-app is the binary of the MPI application you want to run.
However, if you execute your MPI applications through a queue system you may need to write
a submission script. The following script is an example of a submission script for MOAB/Slurm
queuing system using the aforementioned trace.sh script for an execution of the mpi-app on two
processors.
slurm-trace.sh
1#! /bin/bash
2#@ job_name = trace_run
3#@ output = trace_run%j.out
4#@ error = trace_run%j.out
5#@ initialdir = .
6#@ class = bsc_cs
7#@ total_tasks = 2
8#@ wall_clock_limit = 00:30:00
9
10 srun ./trace.sh mpi_app
If your system uses LoadLeveler your job script may look like:
ll.sh
1#! /bin/bash
2#@ job_type = parallel
3#@ output = trace_run.ouput
4#@ error = trace_run.error
5#@ blocking = unlimited
6#@ total_tasks = 2
7#@ class = debug
8#@ wall_clock_limit = 00:10:00
9#@ restart = no
10 #@ group = bsc41
11 #@ queue
12
13 export MLIST=/tmp/machine_list ${$}
14 /opt/ibmll/LoadL/full/bin/ll_get_machine_list > ${MLIST}
15 set NP = ‘cat ${MLIST} | wc -l‘
16
17 ${MPI_HOME}/mpirun -np ${NP} -machinefile ${MLIST} ./trace.sh ./mpi-app
18
19 rm ${MLIST}
Besides the job specification given in lines 1-11, there are commands of particular interest.
Lines 13-15 are used to know which and how many nodes are involved in the computation. Such
56

information information is given to the mpirun command to proceed with the execution. Once the
execution finished, the temporal file created on line 14 is removed on line 19.
8.2.2 CUDA
There are two ways to instrument CUDA applications, depending on how the package was config-
ured. If the package was configure with --enable-cuda only interposition on binaries using shared
libraries are available. If the package was configured with --with-cupti any kind of binary can be
instrumented because the instrumentation relies on the CUPTI library to instrument CUDA calls.
The example shown below is intended for the former case.
run.sh
1#!/bin/bash
2
3export EXTRAE_HOME=/home/harald/extrae
4export PAPI_HOME=/home/harald/aplic/papi/4.1.4
5
6EXTRAE_CONFIG_FILE=extrae.xml LD_LIBRARY_PATH=${EXTRAE_HOME}/lib:${PAPI_HOME}/lib:${LD_LIBRARY_PA
7${EXTRAE_HOME}/bin/mpi2prv -f TRACE.mpits -e ./hello
In this example, the hello application is compiled using the nvcc compiler and linked against
the -lcudatrace library. The binary contains calls to Extrae init and Extrae fini and then
executes a CUDA kernel. Line number 6 refers to the execution of the application itself. The
Extrae configuration file and the location of the shared libraries are set in this line. Line number 7
invokes the merge process to generate the final tracefile.
8.2.3 AIX
AIX typically ships with POE and LoadLeveler as MPI implementation and queue system respec-
tively. An example for a system with these software packages is given below. Please, note that the
example is intended for 64 bit applications, if using 32 bit applications then LDR PRELOAD64 needs
to be changed in favour of LDR PRELOAD.
ll-aix64.sh
1#@ job_name = basic_test
2#@ output = basic_stdout
3#@ error = basic_stderr
4#@ shell = /bin/bash
5#@ job_type = parallel
6#@ total_tasks = 8
7#@ wall_clock_limit = 00:15:00
8#@ queue
9
10 export EXTRAE_HOME=WRITE-HERE-THE-PACKAGE-LOCATION
11 export EXTRAE_CONFIG_FILE=extrae.xml
12 export LDR_PRELOAD64=${EXTRAE_HOME}/lib/libmpitrace.so
13
14 ./mpi-app
57

Lines 1-8 contain a basic LoadLeveler job definition. Line 10 sets the Extrae package directory
in EXTRAE HOME environment variable. Follows setting the XML configuration file that will
be used to set up the tracing. Then follows setting LDR PRELOAD64 which is responsible for in-
strumentation using the shared library libmpitrace.so. Finally, line 14 executes the application
binary.
8.3 Statically linked based examples
This is the basic instrumentation method suited for those installations that neither support DynInst
nor LD PRELOAD, or require adding some manual calls to the Extrae API.
8.3.1 Linking the application
To get the instrumentation working on your code, first you have to link your application with the
Extrae libraries. There are installed examples in your package distribution under share/examples
directory. There you can find MPI, OpenMP, pthread and sequential examples depending on the
support at configure time.
Consider the example Makefile found in share/examples/MPI/static:
Makefile
1MPI_HOME = /gpfs/apps/MPICH2/mx/1.0.7..2/64
2EXTRAE_HOME = /home/bsc41/bsc41273/foreign-pkgs/extrae-11oct-mpich2/64
3PAPI_HOME = /gpfs/apps/PAPI/3.6.2-970mp-patched/64
4XML2_LDFLAGS = -L/usr/lib64
5XML2_LIBS = -lxml2
6
7F77 = $(MPI_HOME)/bin/mpif77
8FFLAGS = -O2
9FLIBS = $(EXTRAE_HOME)/lib/libmpitracef.a \
10 -L$(PAPI_HOME)/lib -lpapi -lperfctr \
11 $(XML2_LDFLAGS) $(XML2_LIBS)
12
13 all: mpi_ping
14
15 mpi_ping: mpi_ping.f
16 $(F77) $(FFLAGS) mpi_ping.f $(FLIBS) -o mpi_ping
17
18 clean:
19 rm -f mpi_ping *.o pingtmp? TRACE.*
Lines 2-5 are definitions of some Makefile variables to set up the location of different packages
needed by the instrumentation. In particular, EXTRAE HOME sets where the Extrae package directory
is located. In order to link your application with Extrae you have to add its libraries in the link
stage (see lines 9-11 and 16). Besides libmpitracef.a we also add some PAPI libraries (-lpapi,
and its dependency (which you may or not need -lperfctr), the libxml2 parsing library (-lxml2),
and finally, the bfd and liberty libraries (-lbfd and -liberty), if the instrumentation package was
compiled to support merge after trace (see chapter 3 for further information).
58

8.3.2 Generating the intermediate files
Executing an application with the statically linked version of the instrumentation package is
very similar as the method shown in Section 8.2. There is, however, a difference: do not set
LD PRELOAD in trace.sh.
trace.sh
1#!/bin/sh
2
3export EXTRAE_HOME=WRITE-HERE-THE-PACKAGE-LOCATION
4export EXTRAE_CONFIG_FILE=extrae.xml
5export LD_LIBRARY_PATH=${EXTRAE_HOME}/lib:\
6/gpfs/apps/MPICH2/mx/1.0.7..2/64/lib:\
7/gpfs/apps/PAPI/3.6.2-970mp-patched/64/lib
8
9## Run the desired program
10 $*
See section 8.2 to know how to run this script either through command line or queue systems.
8.4 Generating the final tracefile
Independently from the tracing method chosen, it is necessary to translate the intermediate trace-
files into a Paraver tracefile. The Paraver tracefile can be generated automatically (if the tracing
package and the XML configuration file were set up accordingly, see chapters 3 and 4) or manu-
ally. In case of using the automatic merging process, it will use all the resources allocated for the
application to perform the merge once the application ends.
To manually generate the final Paraver tracefile issue the following command:
${EXTRAE HOME}/bin/mpi2prv -f TRACE.mpits -e mpi-app -o trace.prv
This command will convert the intermediate files generated in the previous step into a single
Paraver tracefile. The TRACE.mpits is a file generated automatically by the instrumentation and
contains a reference to all the intermediate files generated during the execution run. The -e
parameter receives the application binary mpi-app in order to perform translations from addresses
to source code. To use this feature, the binary must have been compiled with debugging information.
Finally, the -o flag tells the merger how the Paraver tracefile will be named (trace.prv in this case).
59
60
Appendix A
An example of Extrae XML
configuration file
<?xml version=’1.0’?>
<trace enabled="yes"
home="@sed_MYPREFIXDIR@"
initial-mode="detail"
type="paraver"
xml-parser-id="@sed_XMLID@"
>
<mpi enabled="yes">
<counters enabled="yes" />
</mpi>
<pthread enabled="yes">
<locks enabled="no" />
<counters enabled="yes" />
</pthread>
<openmp enabled="yes">
<locks enabled="no" />
<counters enabled="yes" />
</openmp>
<callers enabled="yes">
<mpi enabled="yes">1-3</mpi>
<sampling enabled="no">1-5</sampling>
</callers>
<user-functions enabled="no"
list="/home/bsc41/bsc41273/user-functions.dat"
exclude-automatic-functions="no">
61
<counters enabled="yes" />
</user-functions>
<counters enabled="yes">
<cpu enabled="yes" starting-set-distribution="1">
<set enabled="yes" domain="all" changeat-globalops="5">
PAPI_TOT_INS,PAPI_TOT_CYC,PAPI_L1_DCM
<sampling enabled="no" period="100000000">PAPI_TOT_CYC</sampling>
</set>
<set enabled="yes" domain="user" changeat-globalops="5">
PAPI_TOT_INS,PAPI_FP_INS,PAPI_TOT_CYC
</set>
</cpu>
<network enabled="yes" />
<resource-usage enabled="yes" />
</counters>
<storage enabled="no">
<trace-prefix enabled="yes">TRACE</trace-prefix>
<size enabled="no">5</size>
<temporal-directory enabled="yes">/scratch</temporal-directory>
<final-directory enabled="yes">/gpfs/scratch/bsc41/bsc41273</final-directory>
</storage>
<buffer enabled="yes">
<size enabled="yes">150000</size>
<circular enabled="no" />
</buffer>
<trace-control enabled="yes">
<file enabled="no" frequency="5M">/gpfs/scratch/bsc41/bsc41273/control</file>
<global-ops enabled="no">10</global-ops>
<remote-control enabled="yes">
<mrnet enabled="yes" target="150" analysis="spectral" start-after="30">
<clustering max_tasks="26" max_points="8000"/>
<spectral min_seen="1" max_periods="0" num_iters="3" signals="DurBurst,InMPI"/>
</mrnet>
</remote-control>
</trace-control>
<others enabled="yes">
<minimum-time enabled="no">10M</minimum-time>
<finalize-on-signal enabled="yes"
SIGUSR1="no" SIGUSR2="no" SIGINT="yes"
SIGQUIT="yes" SIGTERM="yes" SIGXCPU="yes"
62
SIGFPE="yes" SIGSEGV="yes" SIGABRT="yes"
/>
<flush-sampling-buffer-at-instrumentation-point enabled="yes" />
</others>
<bursts enabled="no">
<threshold enabled="yes">500u</threshold>
<mpi-statistics enabled="yes" />
</bursts>
<sampling enabled="no" type="default" period="50m" variability="10m"/>
<opencl enabled="no" />
<cuda enabled="no" />
<merge enabled="yes"
synchronization="default"
binary="mpi_ping"
tree-fan-out="16"
max-memory="512"
joint-states="yes"
keep-mpits="yes"
sort-addresses="yes"
overwrite="yes"
>
mpi_ping.prv
</merge>
</trace>
63
64

Appendix B
Environment variables
Although Extrae is configured through an XML file (which is pointed by the EXTRAE CONFIG FILE),
it also supports minimal configuration to be done via environment variables for those systems that
do not have the library responsible for parsing the XML files (i.e., libxml2).
This appendix presents the environment variables the Extrae package uses if EXTRAE CONFIG FILE
is not set and a description. For those environment variable that refer to XML ’enabled’ attributes
(i.e., that can be set to ”yes” or ”no”) are considered to be enabled if their value are defined to 1.
65
Environment variable Description
Set the number of records that the instrumentation buffer can
EXTRAE BUFFER SIZE hold before flushing them.
See section 4.7.1. Just one set can be defined. Counters (in PAPI)
EXTRAE COUNTERS groups (in PMAPI) are given separated by commas.
EXTRAE CONTROL FILE The instrumentation will be enabled only when the file pointed exists.
Starts the instrumentation when the specified number of global collectives
EXTRAE CONTROL GLOPS have been executed.
EXTRAE CONTROL TIME Checks the file pointed by EXTRAE CONTROL FILE at this period.
Specifies where temporal files will be created during
EXTRAE DIR instrumentation.
EXTRAE DISABLE MPI Disable MPI instrumentation.
EXTRAE DISABLE OMP Disable OpenMP instrumentation.
EXTRAE DISABLE PTHREAD Disable pthread instrumentation.
EXTRAE FILE SIZE Set the maximum size (in Mbytes) for the intermediate trace file.
List of routine to be instrumented, as described in 4.6 using the
EXTRAE FUNCTIONS GNU C -finstrument-functions or the IBM XL -qdebug=function trace
option at compile and link time.
Specify if the performance counters should be collected when a
EXTRAE FUNCTIONS COUNTERS ON user function event is emitted.
EXTRAE FINAL DIR Specifies where files will be stored when the application ends.
Gather intermediate trace files into a single directory
EXTRAE GATHER MPITS (this is only available when instrumenting MPI applications).
EXTRAE HOME Points where the Extrae is installed.
Choose whether the instrumentation runs in in detail or
EXTRAE INITIAL MODE in bursts mode.
EXTRAE BURST THRESHOLD Specify the threshold time to filter running bursts.
EXTRAE MINIMUM TIME Specify the minimum amount of instrumentation time.
Table B.1: Set of environment variables available to configure Extrae
66
Environment variable Description
EXTRAE MPI CALLER Choose which MPI calling routines should be dumped into the tracefile.
EXTRAE MPI COUNTERS ON Set to 1 if MPI must report performace counter values.
Set to 1 if basic MPI statistics must be collected in burst mode
EXTRAE MPI STATISTICS (Only available in systems with Myrinet GM/MX networks).
EXTRAE NETWORK COUNTERS Set to 1 to dump network performance counters at flush points.
EXTRAE PTHREAD COUNTERS ON Set to 1 if pthread must report performance counters values.
EXTRAE OMP COUNTERS ON Set to 1 if OpenMP must report performance counters values.
EXTRAE PTHREAD LOCKS Set to 1 if pthread locks have to be instrumented.
EXTRAE OMP LOCKS Set to 1 if OpenMP locks have to be instrumented.
EXTRAE ON Enables instrumentation
EXTRAE PROGRAM NAME Specify the prefix of the resulting intermediate trace files.
EXTRAE SAMPLING CALLER Determines the callstack segment stored through time-sampling capabilities.
Determines domain for sampling clock.
EXTRAE SAMPLING CLOCKTYPE Options are: DEFAULT, REAL, VIRTUAL and PROF.
EXTRAE SAMPLING PERIOD Enable time-sampling capabilities with the indicated period.
EXTRAE SAMPLING VARIABILITY Adds some variability to the sampling period.
EXTRAE RUSAGE Instrumentation emits resource usage at flush points if set to 1.
EXTRAE SKIP AUTO LIBRARY INITIALIZE Do not automatically init instrumentation in the main symbol.
EXTRAE TRACE TYPE Choose whether the resulting tracefiles are intended for Paraver or Dimemas.
Table B.2: Set of environment variables available to configure Extrae (continued)
67
68

Appendix C
Running Extrae on top of PnMPI
C.1 Introduction
Most tools targeting MPI rely on the MPI Profiling Interface (PMPI), which allows tools to trans-
parently intercept invocations to MPI routines and with that to establish wrappers around MPI
calls to gather execution information. However, the usage of this interface is limited to a single tool.
PnMPI eliminates the restriction of a single PMPI tool layer per execution. It can dynamically
load and chain multiple PMPI tools into a single tool stack and then interject this complete stack
between the target application and the library without changing the view for each individual tool.
It enables the user to combine arbitrary MPI tools without having to reimplement them. When
Extrae is operating through LD PRELOAD interposition it also supports to run on top of PnMPI.
C.2 Instructions to run with PnMPI
The Extrae’s tracing libraries have to be processed with the ¨patch¨
tool that comes included with
PnMPI. Just run this utility, passing as argument the tracing library that you want to load under
the PnMPI environment and the output name for the patched library.
$PNMPI_HOME/patch/patch libmpitrace.so libmpitrace-pnmpi.so
At execution time the PNMPI CONF environment variable has to be defined, pointing to a file
that specifies all the tools that will be loaded with PnMPI.
export PNMPI_CONF=$PNMPI_HOME/demo/.pnmpi-conf
In this file we have to add the patched tracing library at the beginning of the list.
module libmpitrace-pnmpi
module another-tool
...
69
70

Appendix D
Regression tests
Extrae includes a battery of regression tests to evaluate whether recent versions of the instrumenta-
tion package keep their compatibility and that new changes on it have not introduced new faults.
These tests are meant to be executed in the same machine that compiled Extrae and they are not
intended to support its execution through batch-queuing systems nor cross-compilation processes.
To invoke the tests, simply run from the terminal the following command:
make check
after the configuration and building process. It will automatically invoke all the tests one after
another and will produce several summaries.
These tests are divided into different categories that stress different parts of Extrae . The current
categories tested include, but are not limited to:
•Clock routines
•Instrumentation support
–Event definition in the PCF from the Extrae API
–pthread instrumentation
–MPI instrumentation
–Java instrumentation
•Merging process (i.e. mpi2prv)
•Callstack unwinding (either using libunwind library or backtrace)
•Performance hardware counters through PAPI library
•XML parsing through libxml2
These tests will change during the development of Extrae . If the reader has a particular
suggestion on a particular test, please consider to send it to tools@bsc.es for its consideration.
71
72

Appendix E
Overhead
Extrae includes a set of tests to evaluate the overhead imposed to the application by different
components. These tests are installed in ${EXTRAE HOME}/share/tests/overhead and can be
run by executing the run overhead tests.sh script within this directory. Note that this script
compiles and executes the generated binaries on the same system, so this script will require some
tuning to run in a system that uses a batch-queuing system and/or needs cross-compiling.
Currently there are the following tests the evaluate the necessary time to perform certain op-
erations:
•posix clock grab the current time using the posix clock. Even the simpler emitted event
requires gathering a timestamp.
•extrae event emit one event (without performance counters) into the tracing buffer using the
Extrae event API call.
•extrae nevent4 emit four events (without performance counters) into the tracing buffer using
the Extrae nevent API call.
•extrae eventandcounters emit one event (and reading 4 peformance counters) into the tracing
buffer through the Extrae eventandcounters call.
•papi read1 capture the value of one performance counter through PAPI.
•papi read4 capture the value of four performance counters through PAPI.
•extrae user function involves traversing the processor call-stack while searching the frame
that points to the current routine (as the Extrae user function API call).
•extrae get caller1 traverses one level of the processor call-stack.
•extrae get caller6 traverses six levels of the processor call-stack.
•extrae trace callers collects three frames from the processor call-stack.
•extrae event/Java measures the time required to emit one event (without performance coun-
ters) from Java through the JNI connector.
73

•extrae nevent4/Java needed time to emit four events (without performance counters) from
Java through the JNI connector.
Figure E depicts the overhead of the Extrae 3.3.0 in the following systems:
•System based on Intel Xeon E5649 (Nehalem) processors. Extrae was compiled with support
for libunwind 1.1 and PAPI 5.0.1.
•System based on Intel Xeon E5-2670 (SanyBridge) processors. Extrae was compiled with
support for libunwind 1.1, PAPI 5.4.1 and IBM’s Java7.
•System based on Intel Xeon E5-2680 (Haswell) processors. Extrae was compiled with support
for libunwind 1.1 and PAPI 5.4.1 and OpenJDK’s Java 1.8.
•System based on IBM Power8.Extrae was compiled with support for libunwind (downloaded
from GIT) and PAPI 5.4.1.
•System based on Cortex-A15 (Samsung Exynos 5 ). Extrae was compiled with support for
libunwind (downloaded from GIT) and PAPI 5.4.1.
The reader may notice that the ARM processor requires more time to execute the tests than the
rest, even for the simpler cases (posix clock and extrae event). The Power8-based system takes
a similar amount of time than Intel-based systems except for the call-stack traversal. Within
Intel-based systems, the SandyBridge processor reduced the time significantly from the Nehalem
processor but the Haswell does not show a great reduction from SandyBridge.
74
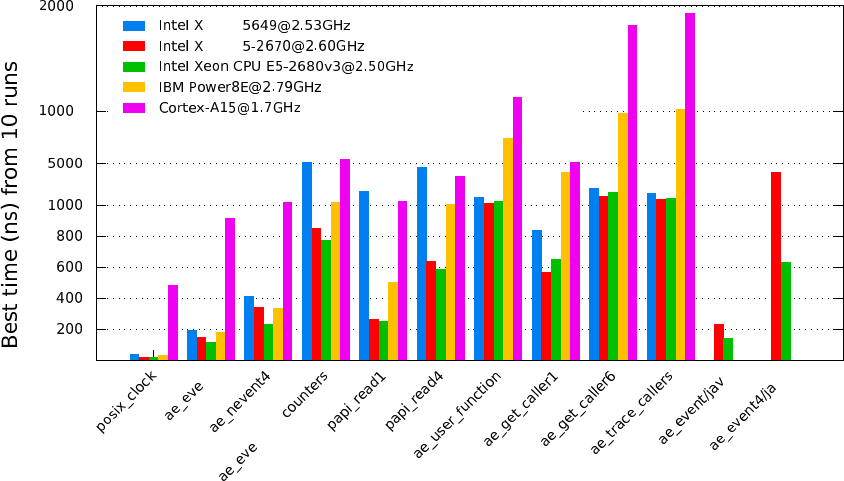
Extrae/3.3.0 overhead
0
extr nt
extr
extr ntand
extr
extr
extr
extr
extr a
extr va
0
0
eon E
eon E
Figure E.1: Overhead result in a variety of systems for Extrae 3.3.0
75
76

Appendix F
Frequently Asked Questions
F.1 Configure, compile and link FAQ
•Question: The bootstrap script claims libtool errors like:
src/common/Makefile.am:9: Libtool library used but ‘LIBTOOL’ is undefined
src/common/Makefile.am:9: The usual way to define ‘LIBTOOL’ is to add ‘AC PROG LIBTOOL’
src/common/Makefile.am:9: to ‘configure.ac’ and run ‘aclocal’ and ‘autoconf’
again.
src/common/Makefile.am:9: If ‘AC PROG LIBTOOL’ is in ‘configure.ac’, make sure
src/common/Makefile.am:9: its definition is in aclocal’s search path.
Answer: Add to the aclocal (which is called in bootstrap) the directory where it can
find the M4-macro files from libtool. Use the -I option to add it.
•Question: The bootstrap script claims that some macros are not found in the library, like:
aclocal:configure.ac:338: warning: macro ‘AM PATH XML2’ not found in library
Answer: Some M4 macros are not found. In this specific example, the libxml2 is not in-
stalled or cannot be found in the typical installation directory. To solve this issue, check
whether the libxml2 is installed and modify the line in the bootstrap script that reads
&& aclocal -I config
into
&& aclocal -I config -I/path/to/xml/m4/macros
where /path/to/xml/m4/macros is the directory where the libxml2 M4 got installed (for
example /usr/local/share/aclocal).
•Question: The application cannot be linked succesfully. The link stage complains about (or
something similar like)
ld: 0711-317 ERROR: Undefined symbol: . udivdi3.
ld: 0711-317 ERROR: Undefined symbol: . mulvsi3.
Answer: The instrumentation libraries have been compiled with GNU compilers whereas
the application is compiled using IBM XL compilers. Add the libgcc s library to the link
stage of the application. This library can be found under the installation directory of the
GNU compiler.
•Question: The application cannot be linked. The linker misses some routines like
src/common/utils.c:122: undefined reference to ‘ intel sse2 strlen’
77

src/common/utils.c:125: undefined reference to ‘ intel sse2 strdup’
src/common/utils.c:132: undefined reference to ‘ intel sse2 strtok’
src/common/utils.c:100: undefined reference to ‘ intel sse2 strncpy’
src/common/timesync.c:211: undefined reference to ‘ intel fast memset’
Answer: The instrumentation libraries have been compiled using Intel compilers (i.e. icc,
icpc) whereas the application is being linked through non-Intel compilers or ld directly.
You can proceed in three directions, you can either compile your application using the Intel
compilers, or add a Intel library that provides these routines (libintlc.so and libirc.so,
for instance), or even recompile Extrae using the GNU compilers. Note, moreover, that using
Intel MPI compiler does not guarantee using the Intel compiler backends, just run the MPI
compiler (mpicc,mpiCC,mpif77,mpif90, .. ) with the -v flag to get information on what
compiler backend relies.
•Question: The make command dies when building libraries belonging Extrae in an AIX ma-
chine with messages like:
libtool: link: ar cru libcommon.a libcommon la-utils.o libcommon la-events.o
ar: 0707-126 libcommon la-utils.o is not valid with the current object file mode.
Use the -X option to specify the desired object mode.
ar: 0707-126 libcommon la-events.o is not valid with the current object file mode.
Use the -X option to specify the desired object mode.
Answer: Libtool uses ar command to build static libraries. However, ar does need special
flags (-X64) to deal with 64 bit objects. To workaround this problem, just set the environ-
ment variable OBJECT MODE to 64 before executing gmake. The ar command honors this
variable to properly handle the object files in 64 bit mode.
•Question: The configure script dies saying
configure: error: Unable to determine pthread library support.
Answer: Some systems (like BG/L) does not provide a pthread library and configure
claims that cannot find it. Launch the configure script with the -disable-pthread param-
eter.
•Question: NOT! gmake command fails when compiling the instrumentation package in a
machine running AIX operating system, using 64 bit mode and IBM XL compilers complaining
about Profile MPI (PMPI) symbols.
Answer: NOT! Use the reentrant version of IBM compilers (xlc r and xlC r). Non
reentrant versions of MPI library does not include 64 bit MPI symbols, whereas reentrant
versions do. To use these compilers, set the CC (C compiler) and CXX (C++ compiler)
environment variables before running the configure script.
•Question: The compiler fails complaining that some parameters can not be understand when
compiling the parallel merge. Answer: If the environment has more than one compiler (for
example, IBM and GNU compilers), is it possible that the parallel merge compiler is not the
same as the rest of the package. There are two ways to solve this:
–Force the package compilation with the same backend as the parallel compiler. For
example, for IBM compiler, set CC=xlc and CXX=xlC at the configure step.
–Tell the parallel compiler to use the same compiler as the rest of the package. For
example, for IBM compiler mpcc, set MP COMPILER=gcc when issuing the make command.
78

•Question: The instrumentation package does not generate the shared instrumentation li-
braries but generates the satatic instrumentation libraries.
Answer 1: Check that the configure step was compiled without --disable-shared or force
it to be enabled through --enable-shared.
Answer 2: Some MPI libraries (like MPICH 1.2.x) do not generate the shared libraries by
default. The instrumentation package rely on them to generate its shared libraries, so make
sure that the shared libraries of the MPI library are generated.
•Question: In BlueGene systems where the libxml2 (or any optional library for extrae) the
linker shows error messages like when compiling the final application with the Extrae library:
../libxml2/lib/libxml2.a(xmlschemastypes.o): In function ‘ xmlSchemaDateAdd’:
../libxml2-2.7.2/xmlschemastypes.c:3771: undefined reference to ‘ uitrunc’
../libxml2-2.7.2/xmlschemastypes.c:3796: undefined reference to ‘ uitrunc’
../libxml2-2.7.2/xmlschemastypes.c:3801: undefined reference to ‘ uitrunc’
../libxml2-2.7.2/xmlschemastypes.c:3842: undefined reference to ‘ uitrunc’
../libxml2-2.7.2/xmlschemastypes.c:3843: undefined reference to ‘ uitrunc’
../libxml2/lib/libxml2.a(xmlschemastypes.o): In function ‘xmlSchemaGetCanonValue’:
../libxml2-2.7.2/xmlschemastypes.c:5840: undefined reference to ‘ f64tou64rz’
../libxml2-2.7.2/xmlschemastypes.c:5843: undefined reference to ‘ f64tou64rz’
../libxml2-2.7.2/xmlschemastypes.c:5846: undefined reference to ‘ f64tou64rz’
../libxml2-2.7.2/xmlschemastypes.c:5849: undefined reference to ‘ f64tou64rz’
../libxml2/lib/libxml2.a(debugXML.o): In function ‘xmlShell’:
../libxml2-2.7.2/debugXML.c:2802: undefined reference to ‘ fill’
collect2: ld returned 1 exit status
Answer: The libxml2 library (or any other optional library) has been compiled using the
IBM XL compiler. There are two alternatives to circumvent the problem: add the XL li-
braries into the link stage when building your application, or recompile the libxml2 library
using the GNU gcc cross compiler for BlueGene.
•Question: Where do I get the procedure and constant declarations for Fortran?
Answer: You can find a module (ready to be compiled) in $EXTRAE HOME/include/extrae module.f.
To use the module, just compile it (do not link it), and then use it in your compiling / linking
step. If you do not use the module, the trace generation (specially for those routines that
expect parameters which are not INTEGER*4) can result in type errors and thus generate a
tracefile that does not honor the Extrae calls.
F.2 Execution FAQ
•Question: I executed my application instrumenting with Extrae, even though it appears that
Extrae is not intrumenting anything. There is neither any Extrae message nor any Extrae
output files (set-X/*.mpit)
Answer 1: Check that environment variables are correctly passed to the application.
Answer 2: If the code is Fortran, check that the number of underscores used to decorate
routines in the instrumentation library matches the number of underscores added by the For-
tran compiler you used to compile and link the application. You can use the nm and grep
commands to check it.
79

Answer 3: If the code is MPI and Fortran, check that you’re using the proper Fortran library
for the instrumentation.
Answer 4: If the code is MPI and you are using LD PRELOAD, check that the binary is
linked against a shared MPI library (you can use the ldd command).
•Question: Why do the environment variables are not exported?
Answer: MPI applications are launched using special programs (like mpirun, poe, mprun,
srun...) that spawn the application for the selected resources. Some of these programs do
not export all the environment variables to the spawned processes. Check if the the launching
program does have special parameters to do that, or use the approach used on section 8 based
on launching scripts instead of MPI applications.
•Question: The instrumentation begins for a single process instead for several processes?
Answer 1: Check that you place the appropriate parameter to indicate the number of tasks
(typically -np).
Answer 2: Some MPI implementation require the application to receive special MPI pa-
rameters to run correctly. For example, MPICH based on CH-P4 device require the binary
to receive som paramters. The following example is an sh-script that solves this issue:
#!/bin/sh
EXTRAE CONFIG FILE=extrae.xml ./mpi program $@ real params
•Question: The application blocks at the beginning?
Answer : The application may be waiting for all tasks to startup but only some of them are
running. Check for the previous question.
•Question: The resulting traces does not contain the routines that have been instrumented.
Answer 1: Check that the routines have been actually executed.
Answer 2: Some compilers do automatic inlining of functions at some optimization levels
(e.g., Intel Compiler at -O2). When functions are inlined, they do not have entry and exit
blocks and cannot be instrumented. Turn off inlining or decrease the optimization level.
•Question: Number of threads = 1?
Answer : Some MPI launchers (i.e. mpirun, poe, mprun...) do not export all the envi-
ronment variables to all tasks. Look at chapter 8 to workaround this and/or contact your
support staff to know how to do it.
•Question: When running the instrumented application, the loader complains about:
undefined symbol: clock gettime
Answer : The instrumentation package was configured using --enable-posix-clock and
on many systems this implies the inclusion of additional libraries (namely, -lrt).
F.3 Performance monitoring counters FAQ
•Question: How do I know the available performance counters on the system?
Answer 1: If using PAPI, check the papi avail or papi native avail commands found in
the PAPI installation directory.
80

Answer 2: If using PMAPI (on AIX systems), check for the pmlist command. Specifically,
check for the available groups running pmlist -g -1.
•Question: How do I know how many performance counters can I use?
Answer: The Extrae package can gather up to eight (8) performance counters at the same
time. This also depends on the underlying library used to gather them.
•Question: When using PAPI, I cannot read eight performance counters or the specified in
papi avail output.
Answer 1: There are some performance counters (those listed in papi avail) that are
classified as derived. Such performance counters depend on more than one counter increasing
the number of real performance counters used. Check for the derived column within the list
to check whether a performance counter is derived or not.
Answer 2: On some architectures, like the PowerPC, the performance counters are grouped
in a such way that choosing a performance counter precludes others from being elected in the
same set. A feasible work-around is to create as many sets in the XML file to gather all the
required hardware counters and make sure that the sets change from time to time.
F.4 Merging traces FAQ
•Question: The mpi2prv command shows the following messages at the start-up:
PANIC! Trace file TRACE.0000011148000001000000.mpit is 16 bytes too big!
PANIC! Trace file TRACE.0000011147000002000000.mpit is 32 bytes too big!
PANIC! Trace file TRACE.0000011146000003000000.mpit is 16 bytes too big!
and it dies when parsing the intermediate files.
Answer 1: The aforementioned messages are typically related with incomplete writes in
disk. Check for enough disk space using the quota and df commands. Answer 2: If your
system supports multiple ABIs (for example, linux x86-64 supports 32 and 64 bits ABIs),
check that the ABI of the target application and the ABI of the merger match.
•Question: The resulting Paraver tracefile contains invalid references to the source code.
Answer: This usually happens when the code has not been compiled and linked with the
-g flag. Moreover, some high level optimizations (which includes inlining, interprocedural
analysis, and so on) can lead to generate bad references.
•Question: The resulting trace contains information regarding the stack (like callers) but
their value does not coincide with the source code.
Answer: Check that the same binary is used to generate the trace and referenced with the
the -e parameter when generating the Paraver tracefile.
81
82
Appendix G
Submitting a bug report
Whenever encountering that Extrae fails while instrumenting an application or generating a trace-
file, you may consider to submit a bug report to tools@bsc.es. Before submitting a bug report,
consider looking at the Frequently Asked Questions in Appendix F because it may contain valuable
information to address the failure you observe.
In any case, if you find that Extrae fails and you want to submit a bug report, please collect
as much as information possible to ease the bug-hunting process. The information required depen
whether the bug refers to a compilation or an execution issue.
G.1 Reporting a compilation issue
The following list of items are valuable when reporting a compilation problem:
•Extrae version (this information appears in the first messages of the execution).
•Extrae configuration information, such as:
–the configure output and the generated config.log file,
–versions of any additional libraries (PAPI, libunwind, DynInst, CUDA, OpenCL, libxml2,
libdwarf, libelf, ...)
•The compilation error itself as reported by invoking make V=1
G.2 Reporting an execution issue
The following list of items are valuable when reporting an execution problem:
•Extrae version (this information appears in the first messages of the execution).
•Extrae configuration information, such as:
–the configure output and the generated config.log file,
–versions of any additional libraries (PAPI, libunwind, DynInst, CUDA, OpenCL, libxml2,
libdwarf, libelf, ...), and/or
83

–the $EXTRAE HOME/etc/configured.sh output.
•The result of the make check command after the Extrae compilation process.
•Does the application successfully executes with and without Extrae ?
•Any valuable information from the system (type of processor, network, ...).
•Which type of parallel programming paradigm does the application use: MPI, OpenMP,
OmpSs, pthreads, ..., hybrid?
•How do you execute the application? Which instrumentation library do you use?
•The Extrae configuration file used.
•Any output generated by the application execution (in either the output or error channels).
•If the execution generates a core dump, a backtrace of the dump using the where command
of the gdb debugger.
84

Appendix H
Instrumented run-times
H.1 MPI
These are the instrumented MPI routines in the Extrae package:
•MPI Init
•MPI Init thread1
•MPI Finalize
•MPI Bsend
•MPI Ssend
•MPI Rsend
•MPI Send
•MPI Bsend init
•MPI Ssend init
•MPI Rsend init
•MPI Send init
•MPI Ibsend
•MPI Issend
•MPI Irsend
•MPI Isend
•MPI Recv
•MPI Irecv
•MPI Recv init
85

•MPI Reduce
•MPI Ireduce
•MPI Reduce scatter
•MPI Ireduce scatter
•MPI Allreduce
•MPI Iallreduce
•MPI Barrier
•MPI Ibarrier
•MPI Cancel
•MPI Test
•MPI Wait
•MPI Waitall
•MPI Waitany
•MPI Waitsome
•MPI Bcast
•MPI Ibcast
•MPI Alltoall
•MPI Ialltoall
•MPI Alltoallv
•MPI Ialltoallv
•MPI Allgather
•MPI Iallgather
•MPI Allgatherv
•MPI Iallgatherv
•MPI Gather
•MPI Igather
•MPI Gatherv
•MPI Igatherv
86

•MPI Scatter
•MPI Iscatter
•MPI Scatterv
•MPI Iscatterv
•MPI Comm rank
•MPI Comm size
•MPI Comm create
•MPI Comm free
•MPI Comm dup
•MPI Comm split
•MPI Comm spawn
•MPI Comm spawn multiple
•MPI Cart create
•MPI Cart sub
•MPI Start
•MPI Startall
•MPI Request free
•MPI Scan
•MPI Iscan
•MPI Sendrecv
•MPI Sendrecv replace
•MPI File open2
•MPI File close2
•MPI File read2
•MPI File read all2
•MPI File write2
•MPI File write all2
•MPI File read at2
87

•MPI File read at all2
•MPI File write at2
•MPI File write at all2
•MPI Get3
•MPI Put3
•MPI Win complete3
•MPI Win create3
•MPI Win fence3
•MPI Win free3
•MPI Win post3
•MPI Win start3
•MPI Win wait3
H.2 OpenMP
H.2.1 Intel compilers - icc, iCC, ifort
The instrumentation of the Intel OpenMP runtime for versions 8.1 to 10.1 is only available using
the Extrae package based on DynInst library.
These are the instrument routines of the Intel OpenMP runtime functions using DynInst:
•kmpc fork call
•kmpc barrier
•kmpc invoke task func
•kmpc set lock4
•kmpc unset lock4
The instrumentation of the Intel OpenMP runtime for version 11.0 to 12.0 is available using
the Extrae package based on the LD PRELOAD and also the DynInst mechanisms. The instrumented
routines include:
•kmpc fork call
1The MPI library must support this routine
2The MPI library must support MPI/IO routines
3The MPI library must support 1-sided (or RMA -remote memory address-) routines
4The instrumentation of OpenMP locks can be enabled/disabled
88

•kmpc barrier
•kmpc dispatch init 4
•kmpc dispatch init 8
•kmpc dispatch next 4
•kmpc dispatch next 8
•kmpc dispatch fini 4
•kmpc dispatch fini 8
•kmpc single
•kmpc end single
•kmpc critical4
•kmpc end critical4
•omp set lock4
•omp unset lock4
•kmpc omp task alloc
•kmpc omp task begin if0
•kmpc omp task complete if0
•kmpc omp taskwait
H.2.2 IBM compilers - xlc, xlC, xlf
Extrae supports IBM OpenMP runtime 1.6.
These are the instrumented routines of the IBM OpenMP runtime:
•xlsmpParallelDoSetup TPO
•xlsmpParRegionSetup TPO
•xlsmpWSDoSetup TPO
•xlsmpBarrier TPO
•xlsmpSingleSetup TPO
•xlsmpWSSectSetup TPO
•xlsmpRelDefaultSLock4
•xlsmpGetDefaultSLock4
89

H.2.3 GNU compilers - gcc, g++, gfortran
Extrae supports GNU OpenMP runtime 4.2.
These are the instrumented routines of the GNU OpenMP runtime:
•GOMP parallel start
•GOMP parallel sections start
•GOMP parallel end
•GOMP sections start
•GOMP sections next
•GOMP sections end
•GOMP sections end nowait
•GOMP loop end
•GOMP loop end nowait
•GOMP loop static start
•GOMP loop dynamic start
•GOMP loop guided start
•GOMP loop runtime start
•GOMP loop ordered static start
•GOMP loop ordered dynamic start
•GOMP loop ordered guided start
•GOMP loop ordered runtime start
•GOMP parallel loop static start
•GOMP parallel loop dynamic start
•GOMP parallel loop guided start
•GOMP parallel loop runtime start
•GOMP loop static next
•GOMP loop dynamic next
•GOMP loop guided next
•GOMP loop runtime next
90

•GOMP barrier
•GOMP critical name enter4
•GOMP critical name exit4
•GOMP critical enter4
•GOMP critical exit4
•GOMP atomic enter4
•GOMP atomic exit4
•GOMP task
•GOMP taskwait
H.3 pthread
These are the instrumented routines of the pthread runtime:
•pthread create
•pthread detach
•pthread join
•pthread barrier wait
•pthread mutex lock
•pthread mutex trylock
•pthread mutex timedlock
•pthread mutex unlock
•pthread rwlock rdlock
•pthread rwlock tryrdlock
•pthread rwlock timedrdlock
•pthread rwlock wrlock
•pthread rwlock trywrlock
•pthread rwlock timedwrlock
•pthread rwlock unlock
91
H.4 CUDA
These are the instrumented CUDA routines in the Extrae package:
•cudaLaunch
•cudaConfigureCall
•cudaThreadSynchronize
•cudaStreamCreate
•cudaStreamSynchronize
•cudaMemcpy
•cudaMemcpyAsync
•cudaDeviceReset
The CUDA accelerators do not have memory for the tracing buffers, so the tracing buffer
resides in the host side. Typically, the CUDA tracing buffer is flushed at cudaThreadSynchronize,
cudaStreamSynchronize and cudaMemcpy calls, so it is possible that the tracing buffer for the
device gets filled if no calls to this routines are executed.
H.5 OpenCL
These are the instrumented OpenCL routines in the Extrae package:
•clBuildProgram
•clCompileProgram
•clCreateBuffer
•clCreateCommandQueue
•clCreateContext
•clCreateContextFromType
•clCreateKernel
•clCreateKernelsInProgram
•clCreateProgramWithBinary
•clCreateProgramWithBuiltInKernels
•clCreateProgramWithSource
•clCreateSubBuffer
92

•clEnqueueBarrierWithWaitList
•clEnqueueCopyBuffer
•clEnqueueCopyBufferRect
•clEnqueueFillBuffer
•clEnqueueMarkerWithWaitList
•clEnqueueMapBuffer
•clEnqueueMigrateMemObjects
•clEnqueueNativeKernel
•clEnqueueNDRangeKernel
•clEnqueueReadBuffer
•clEnqueueReadBufferRect
•clEnqueueTask
•clEnqueueUnmapMemObject
•clEnqueueWriteBuffer
•clEnqueueWriteBufferRect
•clFinish
•clFlush
•clLinkProgram
•clSetKernelArg
•clWaitForEvents
The OpenCL accelerators have small amounts of memory, so the tracing buffer resides in the host
side. Typically, the accelerator tracing buffer is flushed at each cl Finish call, so it is possible that
the tracing buffer for the accelerator gets filled if no calls to this routine are executed. However
if the operated OpenCL command queue is tagged as not Out-of-Order, then flushes will also
happen at clEnqueueReadBuffer,clEnqueueReadBufferRect and clEnqueueMapBuffer if their
corresponding blocking parameter is set to true.
93
