User Manual
user_manual
User Manual:
Open the PDF directly: View PDF ![]() .
.
Page Count: 2
Insurance annuity calculator in R
User Manual
Brian Hooper, Heather McKinnon, Divya Kalla Chandrika
Central Washington University
January 29th, 2019
1 Introduction
This document describes the use and function of the Annuity calculator written in R. The
program is intended to simulate 10,000 independent customers purchasing an annuities using
a mortality table. An input file provided to the program will give a initial age range that
will be used to randomly select a starting age, or the age that the person will purchase an
annuity product. Then, the mortality table will be used to randomly select a death age
based on the distribution provided by the mortality table. This can be used to calculate the
amount of profit or loss for the insurance company for an individual annuity product.
2 Input
Three auxiliary comma-separated-value files are required to use the script: input.csv,ROI input.csv,
and mortality.csv. The input.csv contains the following input parameters that should be pro-
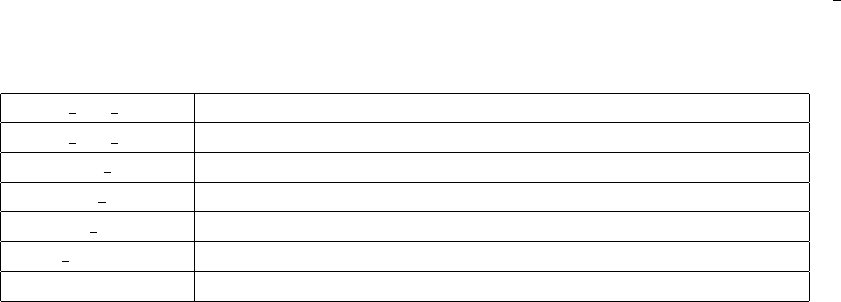
vided to the script, shown in Table 1:
input age start The lower bound of the age range for purchasing annuity
input age end The upper bound of the age range for purchasing annuity
maturity age The age at which the annuity matures
monthly annuity The desired monthly annuity benefit
interest rate The interest rate
term length The number of terms for N-year annuities
iterations The number of simulations to run
Table 1: Input parameter descriptions
1
Note that column headers input start age, input age end, etc are required for the script to
function correctly. Each row of the input column will represent a single simulation. An
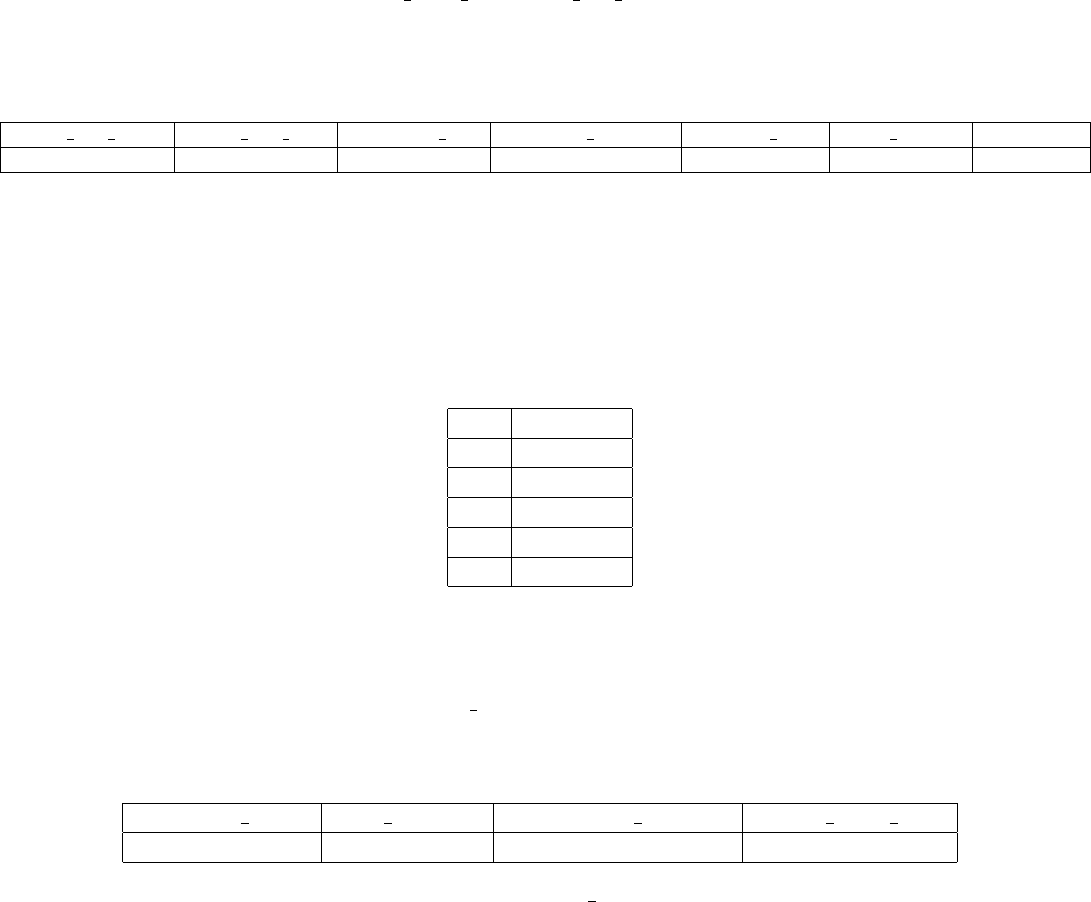
example input.csv file is shown in Table 2. In this case, the program will simulate a group of
100 individuals, aged 25 to 40, purchasing a $1000 annuity benefit that matures at age 60.
input age start input age end maturity age monthly annuity interest rate term length iterations
25 40 60 1000 0.05 20 100
Table 2: Example input.csv file
The mortality.csv file should contain two columns: an age column containing a list of integer
ages, and a mortality column containing the probability of death at each age. An example
mortality.csv file is given in Table 3.
Age Mortality
0 0.02042
1 0.00133
2 0.00122
... ...
98 0.67499
Table 3: Example mortality.csv file
Finally, Table 4 shows an example ROI input.csv file. The number of rows in this file should
not exceed the number of rows in the input.csv file. However, if the number of rows is less
than the input.csv file, the last row of the ROI file will be used for all subsequent simulations.
company years ROI interest investment percent policy sales goal
75 0.05 0.25 100
Table 4: Example ROI input.csv file
3 Use
To run the program, simply use the source command from within RStudio, or another R
interface running R version 3.5.1 or greater. It may be necessary to first set the working
directory to the directory containing the input.csv files using either the setwd() command or
using Session →Set working directory →to source file location. The program will output
a report and a set of tables containing the expected profit or loss to the company based on
the simulated business block. Plots and output will be placed in the output folder, with a
single subfolder for each row in the input file.
2
