2796_ KFC 1023C Yum P27 P32
User Manual: KFC-1023C
Open the PDF directly: View PDF ![]() .
.
Page Count: 5

As we approach our 10th anniversary as a company, we want our shareholders
to know that over 1,000,000 Customer Maniacs around the globe have made
a commitment — together as one system, company and franchise alike — to
building an operating culture that revolves solely around our passion for serv-
ing customers. We have a vision for greatness that is founded on our belief in
building the capability of our people first and driven by our desire to achieve
dynasty-like performance. We’re proud of the fact that our Customer Mania mind-
set and behavior is coming to life in every aspect of our business, from recruiting
and training to our operations. Our goal is to make sure that every customer
experiences the type of branded service for which our brands want to be famous.
As Customer Maniacs we are committed to executing the basics — CHAMPS —
our core program for training, measuring and rewarding employee perfor-
mance against key customer metrics. We know that when we’re running great
restaurants and are 100% focused on satisfying our customers, we’re driving
consistent performance year after year. And we won’t be satisfied until we have
100% CHAMPS execution and Same Store Sales Growth in every restaurant!
Turn the page to meet some of the best Customer Maniacs from around the
world who are putting smiles on customers’ faces and are consistently executing
the basics with a daily intensity that is driving the business.
A&W ALL AMERICAN FOOD has
been serving “hometown” favorites
for over 88 years. With real jukebox
music and a frosty mug of our
signature A&W Root Beer Floats,
our customers love the nostalgia as
much as our delicious 100% U.S.
beef burgers, Coney dogs, french
fries and Sweets & Treats menu.
C’mon in and have some fun!
LONG JOHN SILVER’S Since 1969,
Long John Silver’s has been bringing
families together with our delicious,
signature battered fish and shrimp.
As the leader of the Quick Service
Restaurant Seafood category, we
continue to satisfy customers with
great, new quality products like our
delicious Buttered Lobster Bites,
reinventing seafood for the way
people eat today.
starts with
great
people!
great culture
A
Peter Hearl
Chief Operating and Development
Officer, Yum! Brands
2726
hamps
Accuracy
Accuracy for this outstanding
RGM means serving delicious
food the right way every
time, and that’s just what the
team at KFC RGM Liu Bing
Zhi’s restaurant does regularly.
“The key focus is putting a
smile on our customers’ faces
and making sure their orders
are correct,” he says. “We
treat our customers like old
friends because they are most
important to us.” In-store
surveys help the team stay
focused on their customers’
needs and keep their CHAMPS
scores in the 90% plus
range— while growing sales!
Liu Bing Zhi, KFC
Beijing, China
Maintenance
Displaying a high-energy atti-
tude, Pizza Hut RGM Don Bryant
keeps his eye on all parts of the
business— and making sure
customers don’t have a bad
experience because something
isn’t working right is very impor-
tant. This 20-year veteran and
his team drove sales up 25%
last year, making his restaurant
number one in sales and profits
for all of franchisee RAGE’s
restaurants. Add to that an over-
all CHAMPS score of 95% and
a CHAMPS Excellence Review
of 99.5% and you can see that
Don is a true Customer Maniac.
Don Bryant, Pizza Hut
Middlesboro, Kentucky
Product Quality
Perfect tacos every time. That’s what
Taco Bell company RGM of the Year
Ramona Urena delivers in her restau-
rant. “We weigh every item and follow
all of Taco Bell’s procedures,” she says.
Ramona has been with Taco Bell for
14 years and she knows that custom-
ers expect their orders to be perfect
and the quality of the product to be as
high as possible. She and her team
deliver both. “They’re not coming in
just because the value is right,” she
says. “That may be a consideration,
but they’re coming in because they
know they’ll get great food.” Customers
must be well satisfied at Ramona’s
restaurant because she and her team
drove her overall CHAMPS scores to
97% in 2006.
Ramona Urena, Taco Bell
Oceanside, New York
Speed with Service
Things move fast in the five
restaurants that Mejid Mamdouh
oversees in Paris — so much so
that one of them is the highest
grossing KFC restaurant in the
world! But Mejid always stays calm
in the storm of activity. This vet-
eran started as a crew member in
1993 and his outstanding coaching
skills and CHAMPS performance
over the years demonstrate that he
is a unique leader. Big businesses
are built on people like Mejid. And
this Customer Maniac has one
simple credo: put people capability
first, then satisfied customers and
profitability will follow!
Mejid Mamdouh, KFC
Paris, France
Hospitality
Letting the customer know that they
come first. That’s how LJS/A&W RGM
Kris Jaccard defines hospitality. And
that’s how she and her team practice
it, too. It pays off. Her CHAMPS
scores averaged around 90% in 2006.
“We have fun,” Kris says, “and I think
when the team is happy, the customers
are happy. It shows.” Kris has been
keeping the customer top of mind for
15 years with franchisee BNC Food
Group. Hers is designated a “train-
ing restaurant,” and she is also a
Training Coach.
Kris Jaccard, LJS/A&W
Austin, Texas
c
Cleanliness
Make it shine! That’s what KFC
RGM Manish Patel tells his team.
“I take personal accountability
for keeping the restaurant clean
and bright for my customers,”
he says. He uses the company’s
“Cleaning Captain” program
and that person spends the first
two hours of each day keeping
his restaurant sparkling. That
dedication is paying off too! In
2006, Manish was named KFC’s
RGM of the Year for his strong
CHAMPS scores and his solid
sales growth!
Manish Patel, KFC
Aurora, Illinois
28 29

WORLDWIDE SYSTEM UNITS
% B/(W)
Year-end 2006 2005 Change
Company 7,736 7,587 2%
Unconsolidated affiliates 1,206 1,648 (27%)
Franchisees 23,516 22,666 4%
Licensees 2,137 2,376 (10%)
Total 34,595 34,277 1%
5-Year
Year-end 2006 2005 2004 2003 2002 Growth(a) (b)
UNITED STATES
KFC 5,394 5,443 5,525 5,524 5,472 –
Pizza Hut 7,532 7,566 7,500 7,523 7,599 –
Taco Bell 5,608 5,845 5,900 5,989 6,165 (3%)
Long John Silver’s 1,121 1,169 1,200 1,204 1,221 NM
A&W 406 449 485 576 665 NM
Total U.S. (c) 20,061 20,472 20,610 20,822 21,126 (1%)
INTERNATIONAL
KFC 6,606 6,307 6,084 5,944 5,698 4%
Pizza Hut 4,788 4,701 4,528 4,357 4,249 3%
Taco Bell 236 243 237 247 261 –
Long John Silver’s 35 34 34 31 28 NM
A&W 238 229 210 183 182 NM
Total International 11,903 11,514 11,093 10,762 10,418 3%
CHINA
KFC 2,258 1,981 1,657 1,410 1,192 19%
Pizza Hut 365 305 246 204 182 20%
Taco Bell 2 2 1 1 – NM
A&W – – – – 6 NM
Total China (d) 2,631 2,291 1,905 1,615 1,380 19%
Total (c)(d) 34,595 34,277 33,608 33,199 32,924 1%
(a) Compounded annual growth rate; total U.S., International and Worldwide excludes the impact of Long John Silver’s and A&W.
(b) Compounded annual growth rate excludes the impact of transferring 30 units from Taco Bell U.S. to Taco Bell International in 2002.
(c) Includes 6 and 4 Yan Can units in 2003 and 2002, respectively.
(d) Includes 6 units, 3 units and 1 unit in 2006, 2005 and 2004, respectively, for an Asian food concept in China.
BREAKDOWN OF WORLDWIDE SYSTEM UNITS
Unconsolidated
Year-end 2006 Company Affiliate Franchised Licensed Total
UNITED STATES
KFC 1,023 – 4,287 84 5,394
Pizza Hut 1,453 – 4,757 1,322 7,532
Taco Bell 1,267 – 3,803 538 5,608
Long John Silver’s 460 – 661 – 1,121
A&W 9 – 397 – 406
Total U.S. 4,212 – 13,905 1,944 20,061
INTERNATIONAL
KFC 750 354 5,446 56 6,606
Pizza Hut 1,011 207 3,476 94 4,788
Taco Bell – – 194 42 236
Long John Silver’s 1 – 33 1 35
A&W – – 238 – 238
Total International 1,762 561 9,387 193 11,903
CHINA
KFC 1,414 645 199 – 2,258
Pizza Hut 340 – 25 – 365
Taco Bell 2 – – – 2
Total China (a) 1,762 645 224 – 2,631
Total (a) 7,736 1,206 23,516 2,137 34,595
(a) Includes 6 units in 2006 for an Asian food concept in China.
WORLDWIDE SALES
5-Year
(in billions) 2006 2005 2004 2003 2002 Growth(a)
UNITED STATES
KFC
Company sales $ 1.4 $ 1.4 $ 1.4 $ 1.4 $ 1.4 –
Franchisee sales (b) 3.9 3.8 3.6 3.5 3.4 4%
PH
Company sales $ 1.4 $ 1.6 $ 1.6 $ 1.6 $ 1.5 (1%)
Franchisee sales (b) 3.8 3.7 3.6 3.5 3.6 1%
TACO BELL
Company sales $ 1.8 $ 1.8 $ 1.7 $ 1.6 $ 1.6 5%
Franchisee sales (b) 4.5 4.4 4.0 3.8 3.6 5%
LONG JOHN SILVER’S (c)
Company sales $ 0.4 $ 0.5 $ 0.5 $ 0.5 $ 0.3 NM
Franchisee sales (b) 0.4 0.3 0.3 0.3 0.2 NM
A&W (c)
Company sales $– $– $– $ – $ – NM
Franchisee sales (b) 0.2 0.2 0.2 0.2 0.2 NM
TOTAL U.S.
Company sales $ 5.0 $ 5.3 $ 5.2 $ 5.1 $ 4.8 1%
Franchisee sales (b) 12.8 12.4 11.7 11.3 11.0 3%
INTERNATIONAL
KFC
Company sales $ 1.1 $ 1.1 $ 1.0 $ 0.9 $ 0.9 8%
Franchisee sales (b) 5.7 5.2 4.7 4.1 3.6 10%
PIZZA HUT
Company sales $ 0.7 $ 0.6 $ 0.7 $ 0.5 $ 0.5 7%
Franchisee sales (b) 3.1 3.0 2.6 2.4 2.2 9%
TACO BELL
Company sales $– $– $– $ – $ – NM
Franchisee sales (b) 0.2 0.2 0.2 0.1 0.2 16%
LONG JOHN SILVER’S (c)
Company sales –––––NM
Franchisee sales (b) –– – – – NM
A&W (c)
Company sales –– – – – NM
Franchisee sales (b) 0.1 0.1 0.1 0.1 – NM
TOTAL INTERNATIONAL
Company sales $ 1.8 $ 1.7 $ 1.7 $ 1.4 $ 1.4 7%
Franchisee sales (b) 9.1 8.5 7.6 6.7 6.0 10%
CHINA
KFC
Company sales $ 1.3 $ 1.0 $ 0.9 $ 0.8 $ 0.6 20%
Franchisee sales (b) 0.8 0.7 0.6 0.5 0.3 22%
PIZZA HUT
Company sales $ 0.3 $ 0.2 $ 0.2 $ 0.1 $ 0.1 NM
Franchisee sales (b) –– – – – NM
TOTAL CHINA
Company sales $ 1.6 $ 1.2 $ 1.1 $ 0.9 $ 0.7 23%
Franchisee sales (b) 0.8 0.7 0.6 0.5 0.3 21%
TOTAL WORLDWIDE
Company sales $ 8.4 $ 8.2 $ 8.0 $ 7.4 $ 6.9 5%
Franchisee sales (b) 22.7 21.6 19.9 18.5 17.3 6%
(a) Compounded annual growth rate; totals for U.S., International and Worldwide exclude the impact of Long John Silver’s and A&W.
(b) Franchisee sales represents the combined estimated sales of unconsolidated affiliate and franchise and license restaurants. Franchisee sales, which are not included in our Company
sales, generate franchise and license fees (typically at rates between 4% and 6%) that are included in our revenues.
(c) Beginning May 7, 2002, includes Long John Silver’s and A&W, which were added when we acquired Yorkshire Global Restaurants, Inc.
Consistency of Performance, Global Growth, and Cash Generation. In 2006, Yum! further built
upon its track record in these three important areas. In 2006, EPS grew 14%, the fifth straight year
we exceeded our target of double-digit growth. Our track record for global growth continued as we
opened nearly 1,200 new international restaurants, exceeding the 1,000 milestone for the sixth
consecutive year. Over the past three years, Yum! has added more restaurants outside the U.S. than
any other company — more than McDonald’s and more than Starbucks. In 2006, we also generated
a lot of cash. In fact, Yum! again generated over $1 billion that we returned to shareholders through
share buybacks and dividends. We will strive to make consistent financial performance, strong
global growth, and impressive cash generation key trademarks for Yum! while we “Go for Greatness
Around the Globe.” Rick Carucci, Chief Financial Officer, Yum! Brands, Inc.
great
results!
Global Facts
31
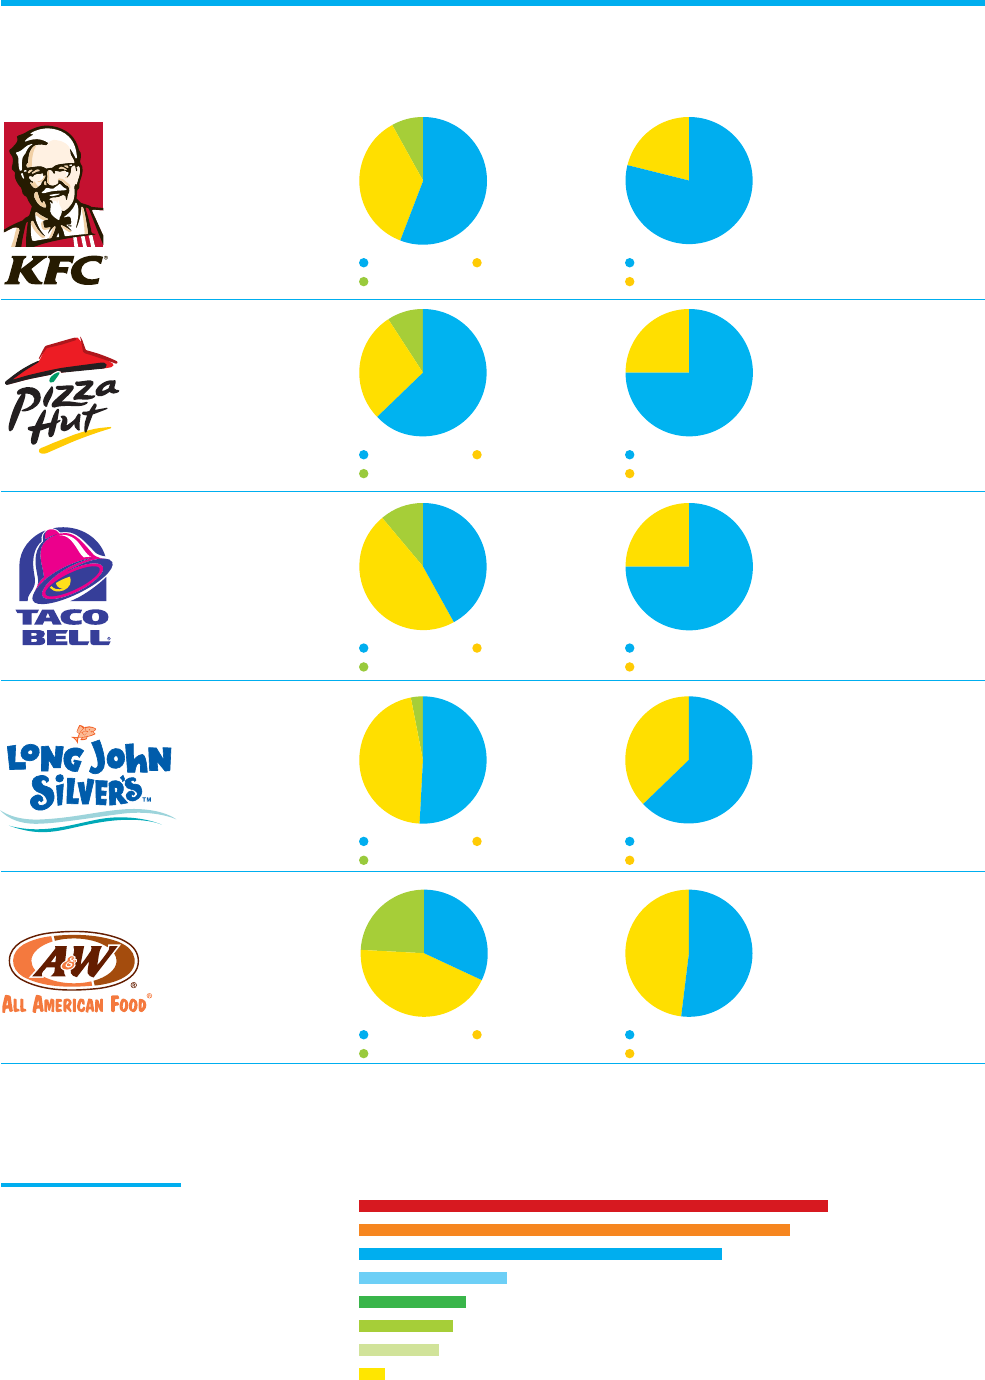
Dinner 56% Lunch 36%
Snacks/Breakfast 8%
Dine Out 79%
Dine In 21%
Dinner 63% Lunch 28%
Snacks/Breakfast 9%
Dine Out 75%
Dine In 25%
Dinner 42% Lunch 47%
Snacks/Breakfast 11%
Dine Out 75%
Dine In 25%
Dinner 51% Lunch 46%
Snacks/Breakfast 3%
Dine Out 63%
Dine In 37%
Dinner 32% Lunch 44%
Snacks/Breakfast 24%
Dine Out 52%
Dine In 48%
U.S. SALES BY BRAND BY DAYPART BY DISTRIBUTION CHANNEL
WORLDWIDE UNITS
2006 (in thousands)
Yum! Brands at-a-glance
Yum! Brands
McDonald’s
Subway
Burger King
Domino’s Pizza
Wendy’s
Dairy Queen
Popeyes
35
32
27
11
8
7
6
2
Source: The NPD Group, Inc.; NPD Foodworld; CREST
32
33
Introduction and Overview
DESCRIPTION OF BUSINESS YUM! Brands, Inc. (“YUM” or
the “Company”) is the world’s largest restaurant company in
terms of system restaurants with over 34,000 restaurants
in more than 100 countries and territories operating under
the KFC, Pizza Hut, Taco Bell, Long John Silver’s or A&W All-
American Food Restaurants brands. Four of the Company’s
restaurant brands — KFC, Pizza Hut, Taco Bell and Long John
Silver’s— are the global leaders in the chicken, pizza, Mexican-
style food and quick-service seafood categories, respectively.
Of the over 34,000 restaurants, 22% are operated by the Com-
pany, 72% are operated by franchisees and unconsolidated
affiliates and 6% are operated by licensees.
YUM’s business consists of three reporting segments:
United States, the International Division and the China Divi-
sion. The China Division includes mainland China, Thailand
and KFC Taiwan and the International Division includes the
remainder of our international operations. The China and Inter-
national Divisions have been experiencing dramatic growth and
now represent approximately half of the Company’s operating
profits. The U.S. business operates in a highly competitive
marketplace resulting in slower profit growth, but continues
to produce strong cash flows.
STRATEGIES The Company continues to focus on four key
strategies:
Build Dominant China Brands The Company has developed
the KFC and Pizza Hut brands into the leading quick service
and casual dining restaurants, respectively, in mainland China.
Additionally, the Company owns and operates the distribution
system for its restaurants in mainland China which we believe
provides a significant competitive advantage. Given this strong
competitive position, a rapidly growing economy and a popula-
tion of 1.3 billion in mainland China, the Company is rapidly
adding KFC and Pizza Hut Casual Dining restaurants and test-
ing the additional restaurant concepts of Pizza Hut Home
Service (pizza delivery) and East Dawning (Chinese food).
Drive Profitable International Division Expansion The Com-
pany and its franchisees opened over 700 new restaurants
in 2006 in the Company’s International Division, representing
seven straight years of opening over 700 restaurants. The
International Division generated over $400 million in operating
profit in 2006 up from $186 million in 1998. The Company
expects to continue to experience strong growth by building
out existing markets and growing in new markets including
India, France and Russia.
Improve U.S. Brands Positions and Returns The Company
continues to focus on improving its U.S. position through
differentiated products and marketing and an improved
customer experience. The Company also strives to pro-
vide industry leading new product innovation which
adds sales layers and expands day parts. We are the leader in
multibranding, with over 3,000 restaurants providing custom-
ers two or more of our brands at a single location. We continue
to evaluate our returns and ownership positions with an earn
the right to own philosophy on Company owned restaurants.
Drive High Return on Invested Capital & Strong Shareholder
Payout The Company is focused on delivering high returns
and returning substantial cash flows to its shareholders via
share repurchases and dividends. The Company has one of
the highest returns on invested capital in the Quick Service
Restaurants (“QSR”) industry. Additionally, 2006 was the sec-
ond consecutive year in which the Company returned over
$1.1 billion to its shareholders via share repurchases and
dividends. The Company recently announced that it was dou-
bling its quarterly dividend rate for the second quarter, 2007
dividend payment, and now expects to generate an approxi-
mate 2% dividend yield.
2006 HIGHLIGHTS
Worldwide system sales grew by 5% excluding the
benefit of the 53rd week in 2005
Diluted earnings per share increased 14%
Company restaurant margins increased 1.2 percentage
points worldwide and grew in all three reporting
segments
China Division operating profit up a strong 37%
Mainland China restaurant growth of 18%
International Division operating profit up 11% excluding
the benefit of the 53rd week in 2005
International Division opened 785 new restaurants
U.S. Division grew operating profit 3% excluding the
benefit of the 53rd week in 2005
U.S. operating margin increased by 80 basis points
to 13.6%
Throughout the Management’s Discussion and Analysis
(“MD&A”), the Company provides the percentage change
excluding the impact of currency translation. These amounts
are derived by translating current year results at prior year
average exchange rates. We also provide the percentage
change excluding the extra week certain of our businesses
had in fiscal 2005. We believe the elimination of the currency
translation impact and the 53rd week impact provides better
year-to-year comparability without the distortion of foreign cur-
rency fluctuations or an extra week in fiscal 2005.
This MD&A should be read in conjunction with our Con-
solidated Financial Statements on pages 54 through 57 and
the Cautionary Statements on pages 48 and 49. All Note
references herein refer to the Notes to the Consolidated
Financial Statements on pages 58 through 80. Tabular
amounts are displayed in millions except per share
and unit count amounts, or as otherwise specifi-
cally identified.
Management’s Discussion and Analysis of Financial Condition and
Results of Operations.
