Echelon 79010-01 IEEE 802.15.4 HAN Card with ANSI 2S 3.1 Meter Antenna User Manual DRAFT
Echelon Corporation IEEE 802.15.4 HAN Card with ANSI 2S 3.1 Meter Antenna DRAFT
Echelon >
Contents
- 1. IP Meter Supplement
- 2. User Manual DRAFT
User Manual DRAFT


![56 Meter Operation Disconnect Switch Error Event Argument Formats The Disconnect Switch Error event has several different arguments that contain information about why the event was logged and the state of the meter at that time. In summary, an argument value of 0x0054 or 0x005C means that load side generation was detected, and any other argument is indicative of an unexpected fault related to the load disconnect contactor. Below is more detail on the argument encoding. Note: Your meter may be configured to use the Load Side Voltage Detected error to indicate when load side voltage is present, in which case all arguments relevant to load side voltage as described below are unused. The argument type is identified by the lowest 3 bits of the argument itself. Argument Format 2: If Bits [2..0] are binary xx1 (where x can be either 0 or 1), then bits 1..3 represent the current status of the load disconnect contactor and the remaining bits are reserved for internal use. This argument is included every time the Disconnect Switch Error event is logged: Bits1..2: Internal State o 1 = closed o 2 = opened o 3 = locked open Bit 3: External State o 0 = open o 1 = closed Argument Format 3: If Bits [2..0] are set to binary x10, then it is a new occurrence of the condition. The rest of the argument information is reserved for internal use, but the Disconnect Switch Error event with argument format 2 will also be logged in this case and should provide some information as to the current state of the load disconnect contactor. Argument Format 4: If Bits [2..0] are set to 4 (binary 100), then the event has been logged because the disconnect feedback is unreliable or because the meter has detected load side generation when the disconnect is open. In this case, bits 3-6 indicate the following status, and the remaining bits are reserved for internal use. Bits 3..4: Internal State o 1 = closed o 2 = opened o 3 = locked open Bit 5: External State o 0 = open (NES version 3.1 meter) or not applicable (NES version 3.0 meter) o 1 = closed](https://usermanual.wiki/Echelon/79010-01.User-Manual-DRAFT/User-Guide-1083218-Page-62.png)

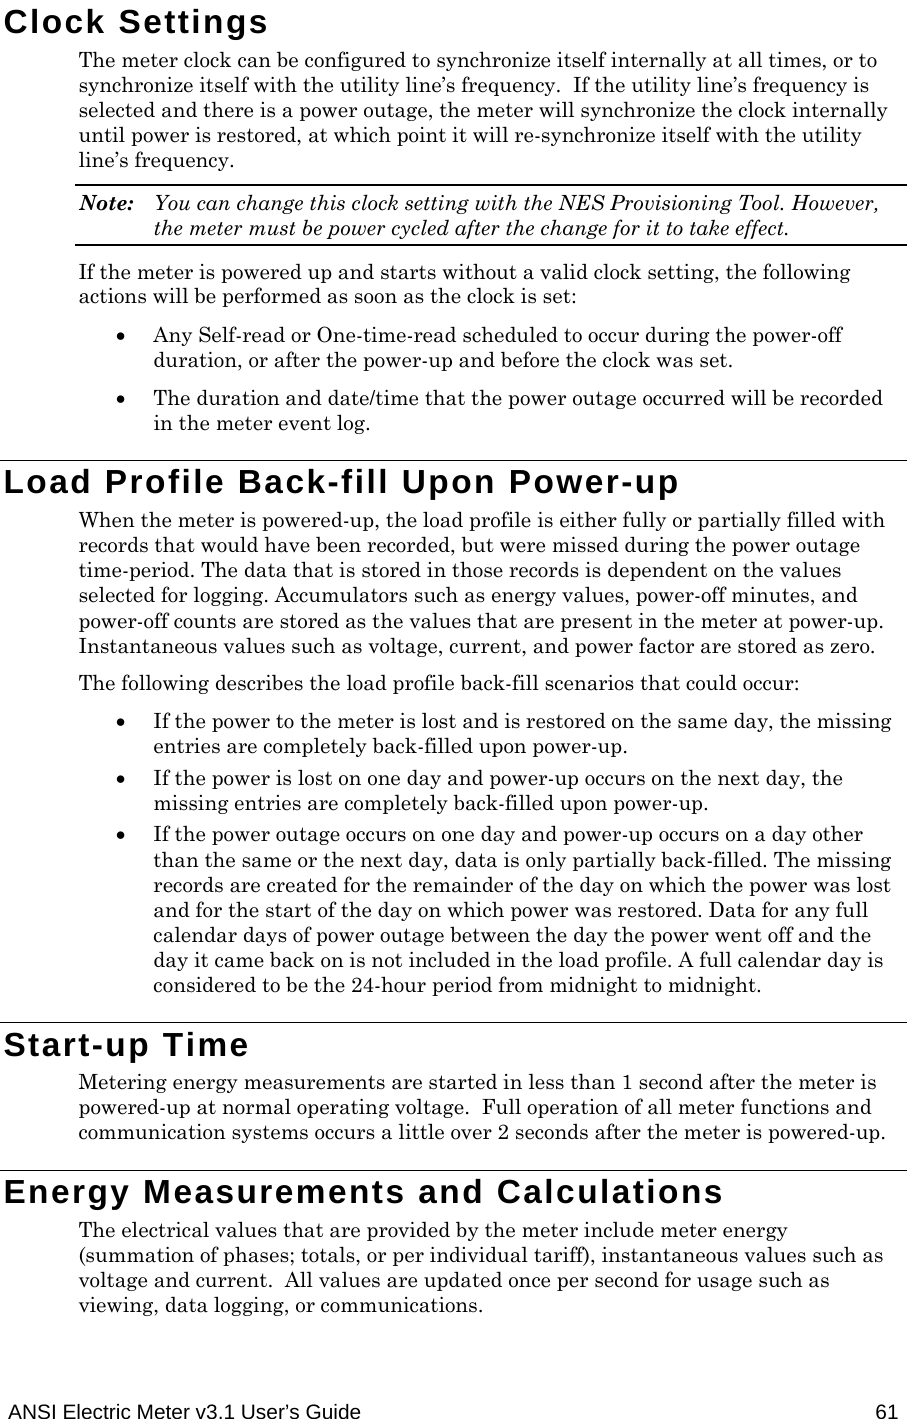

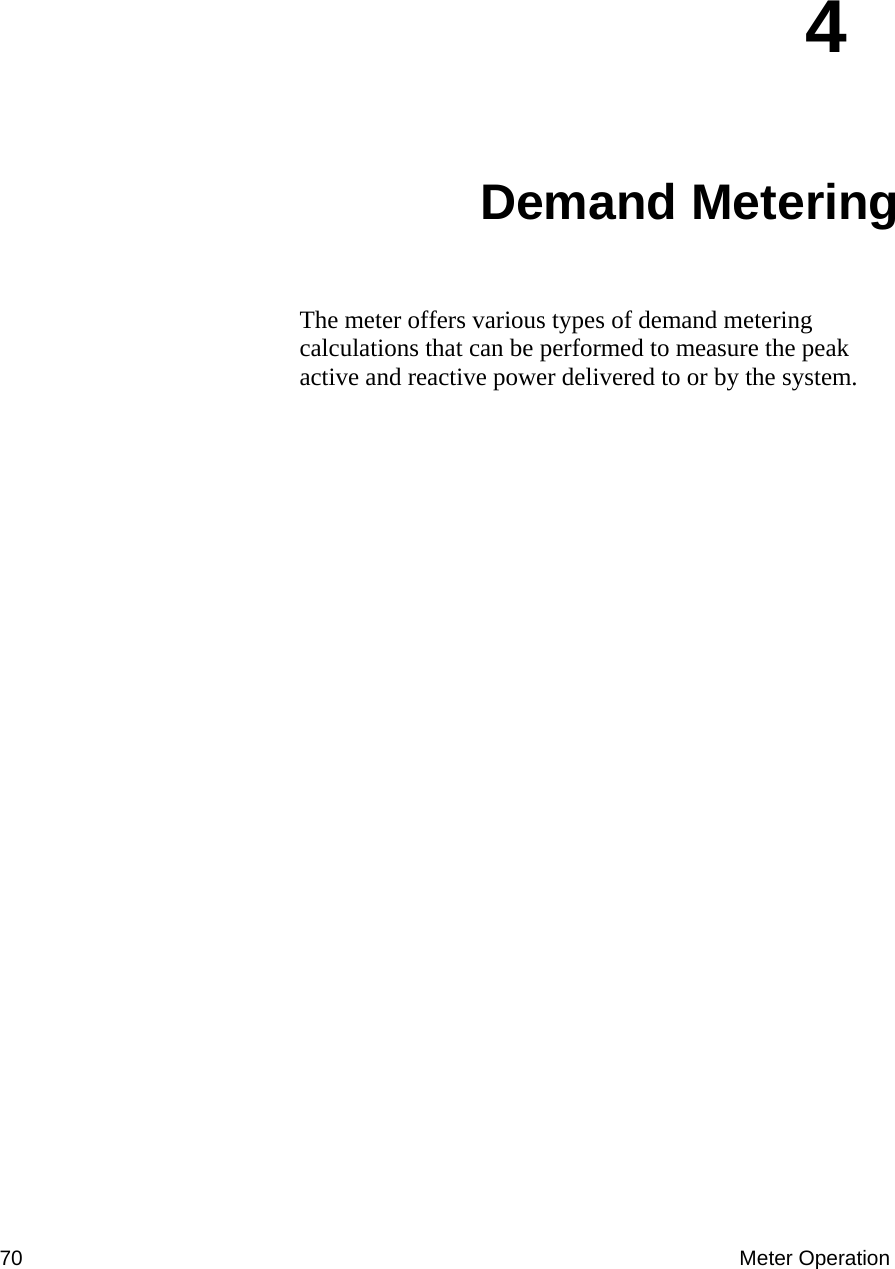
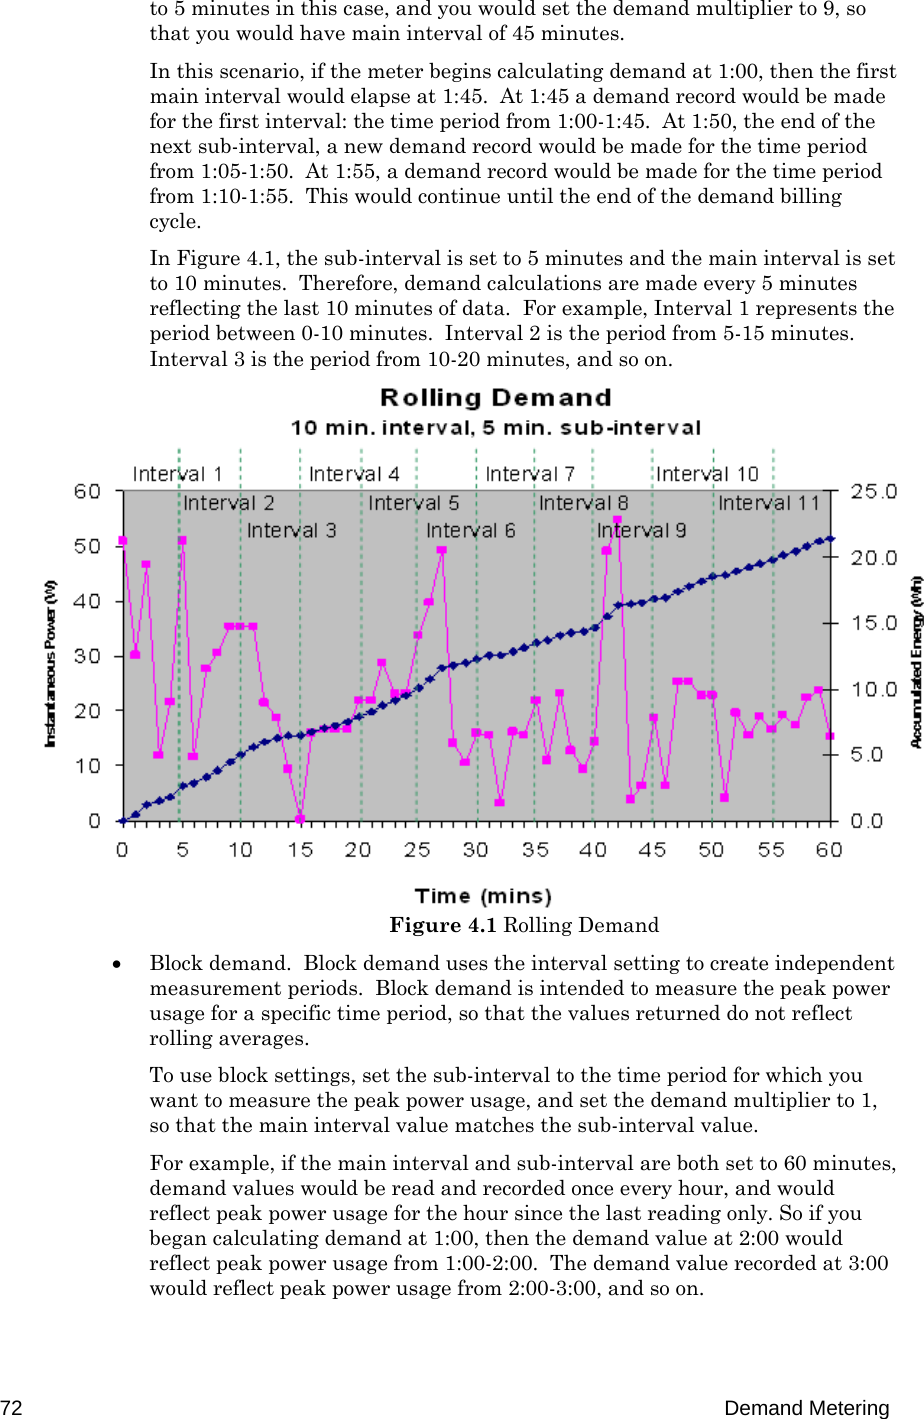
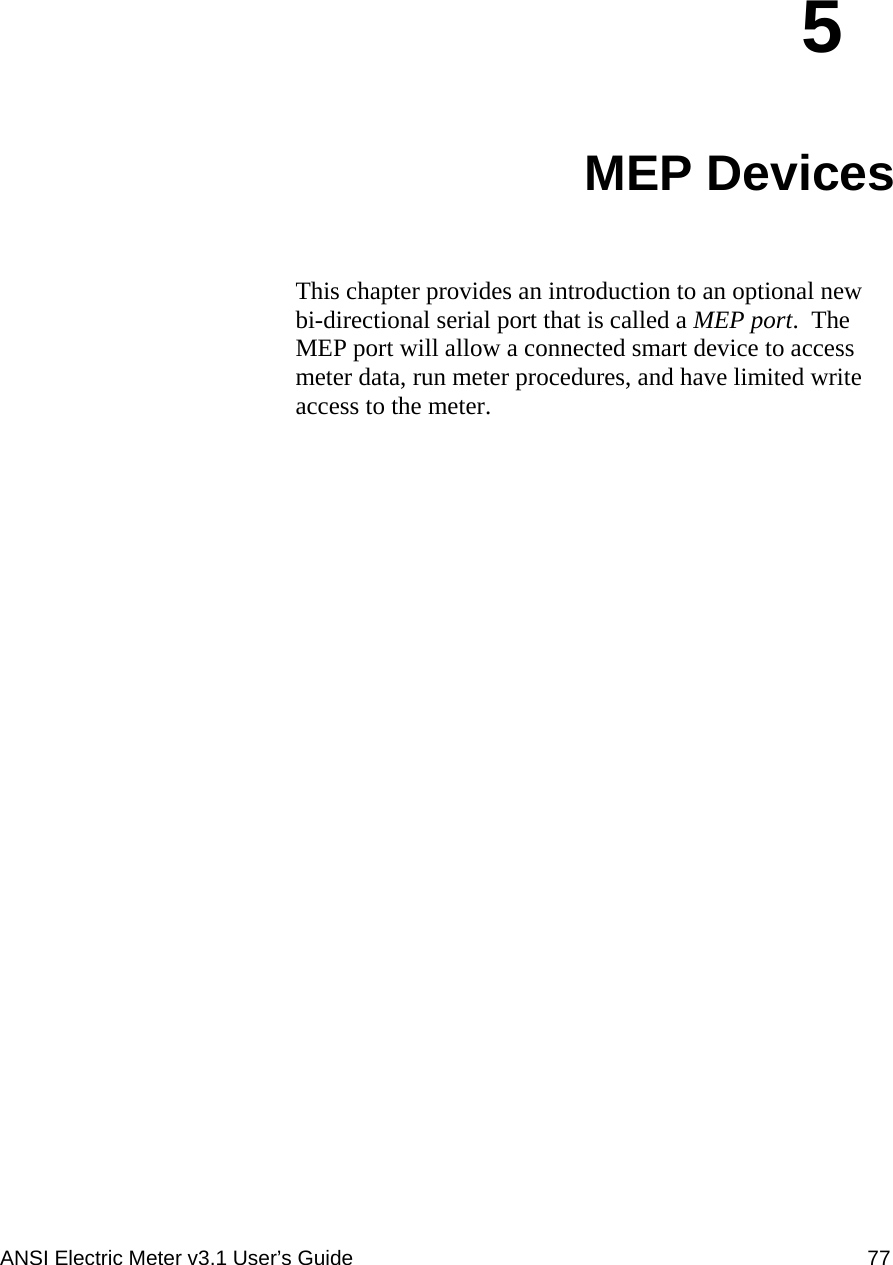
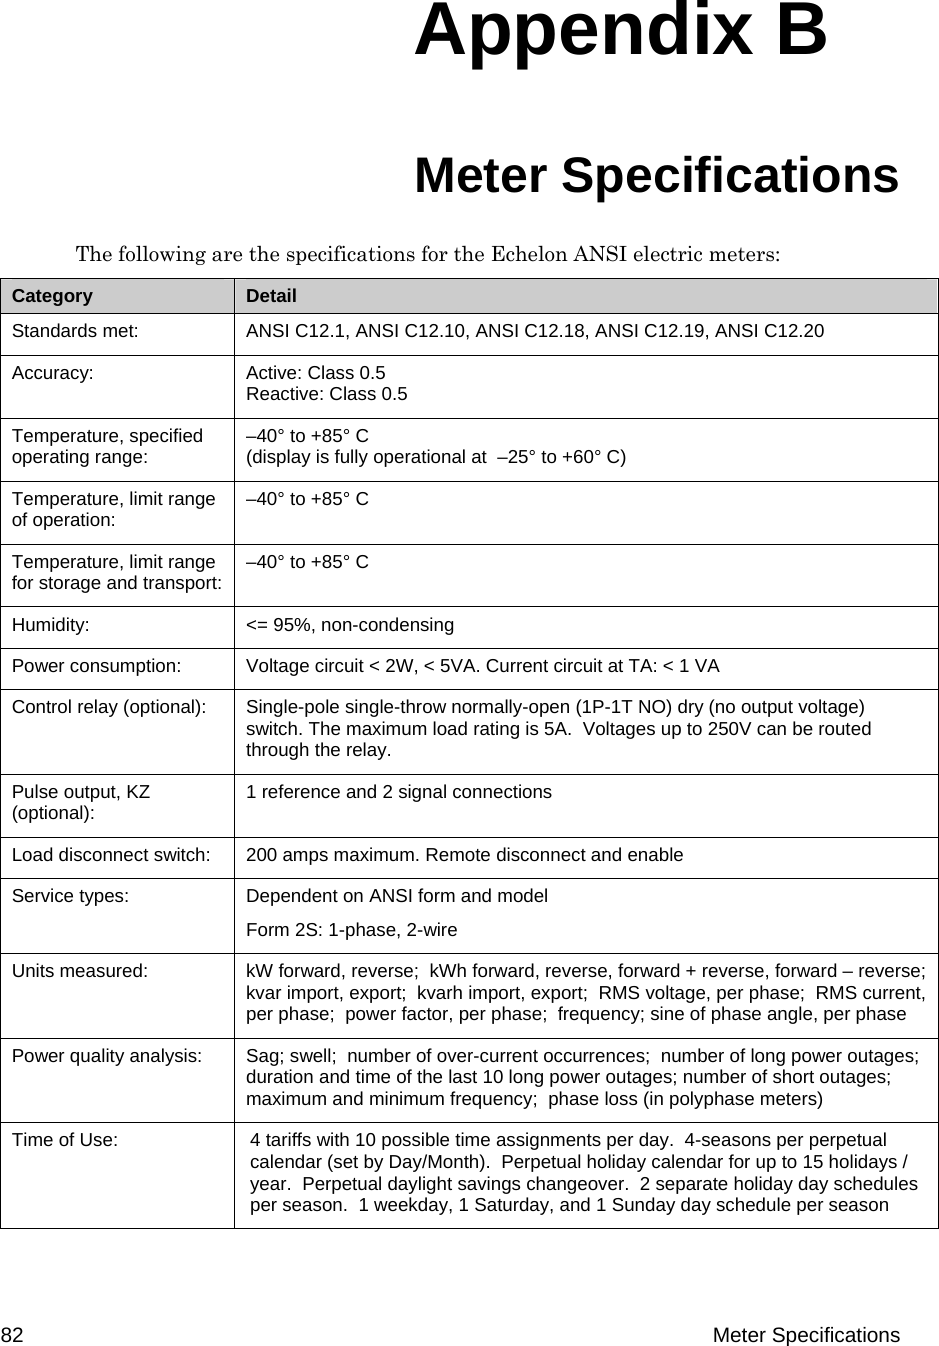
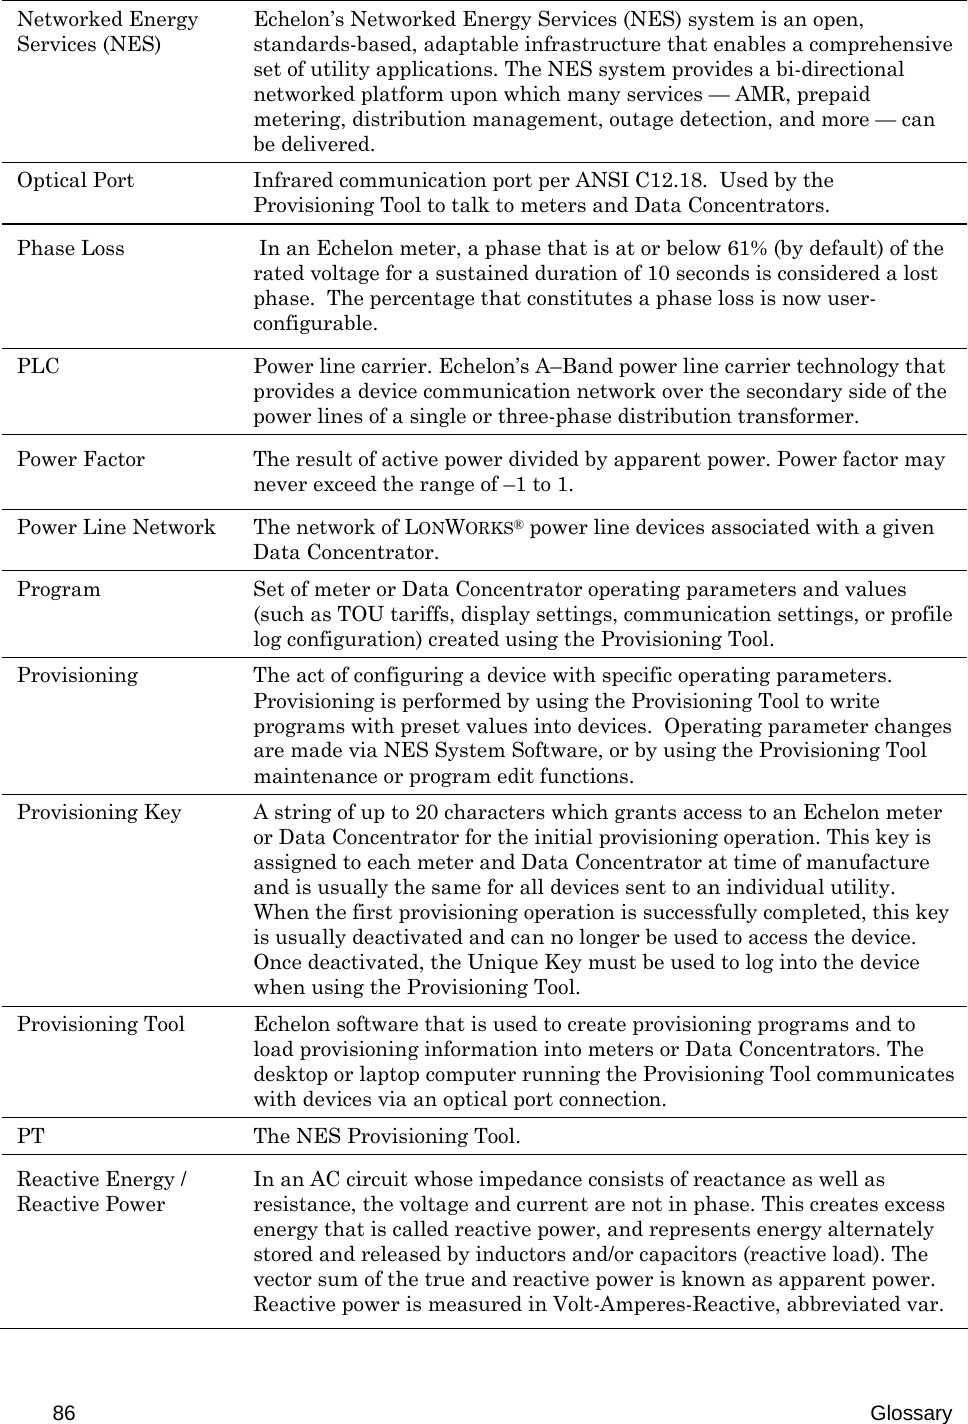
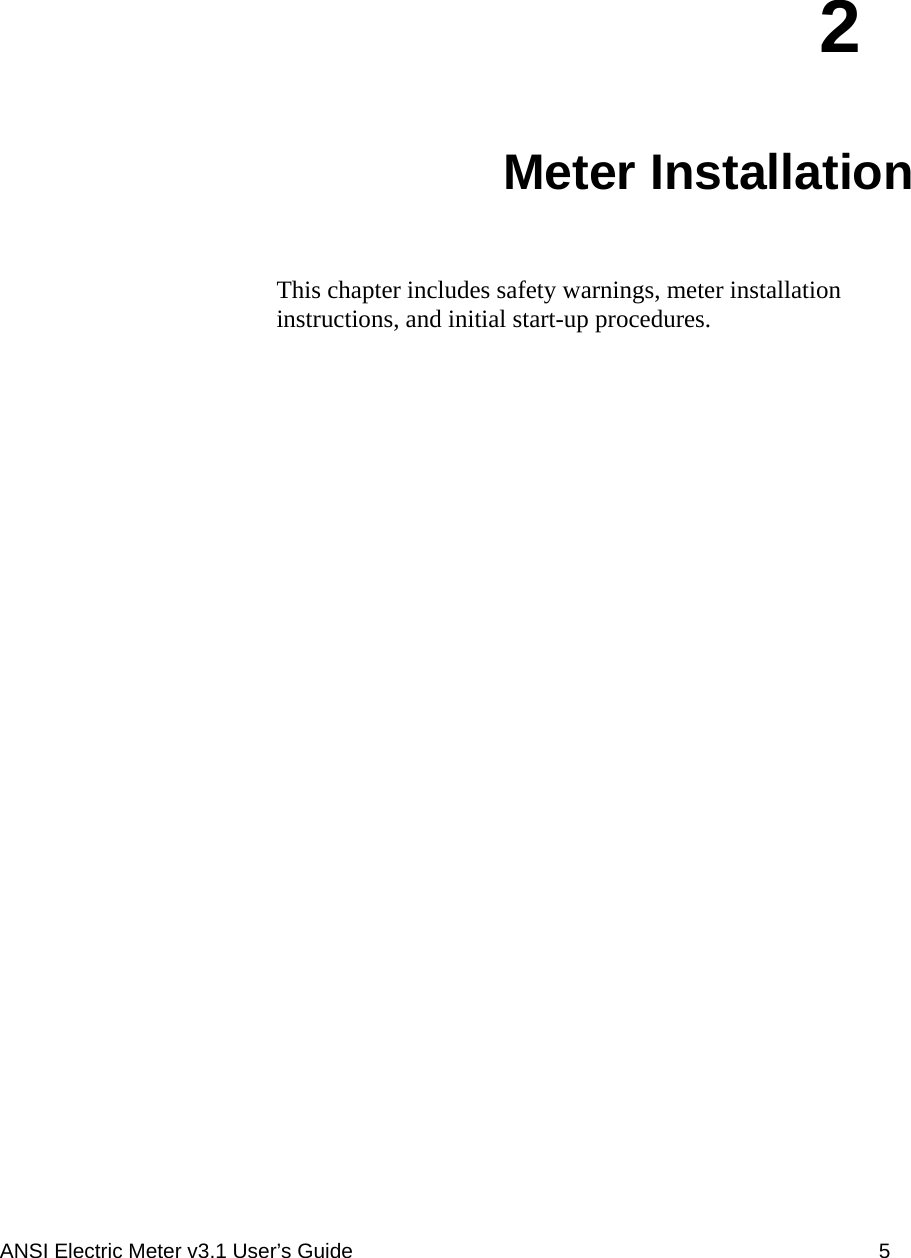
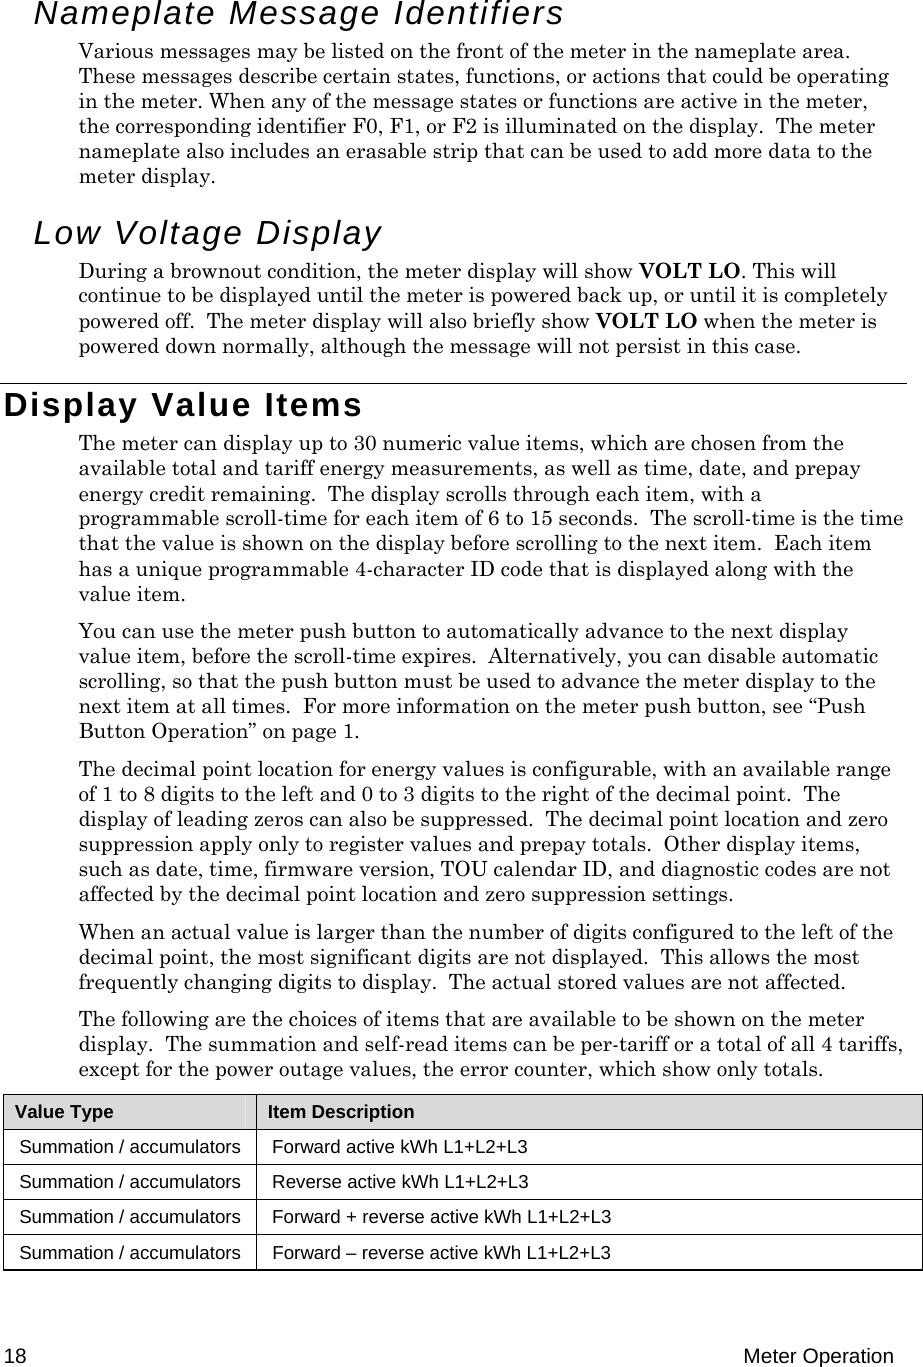
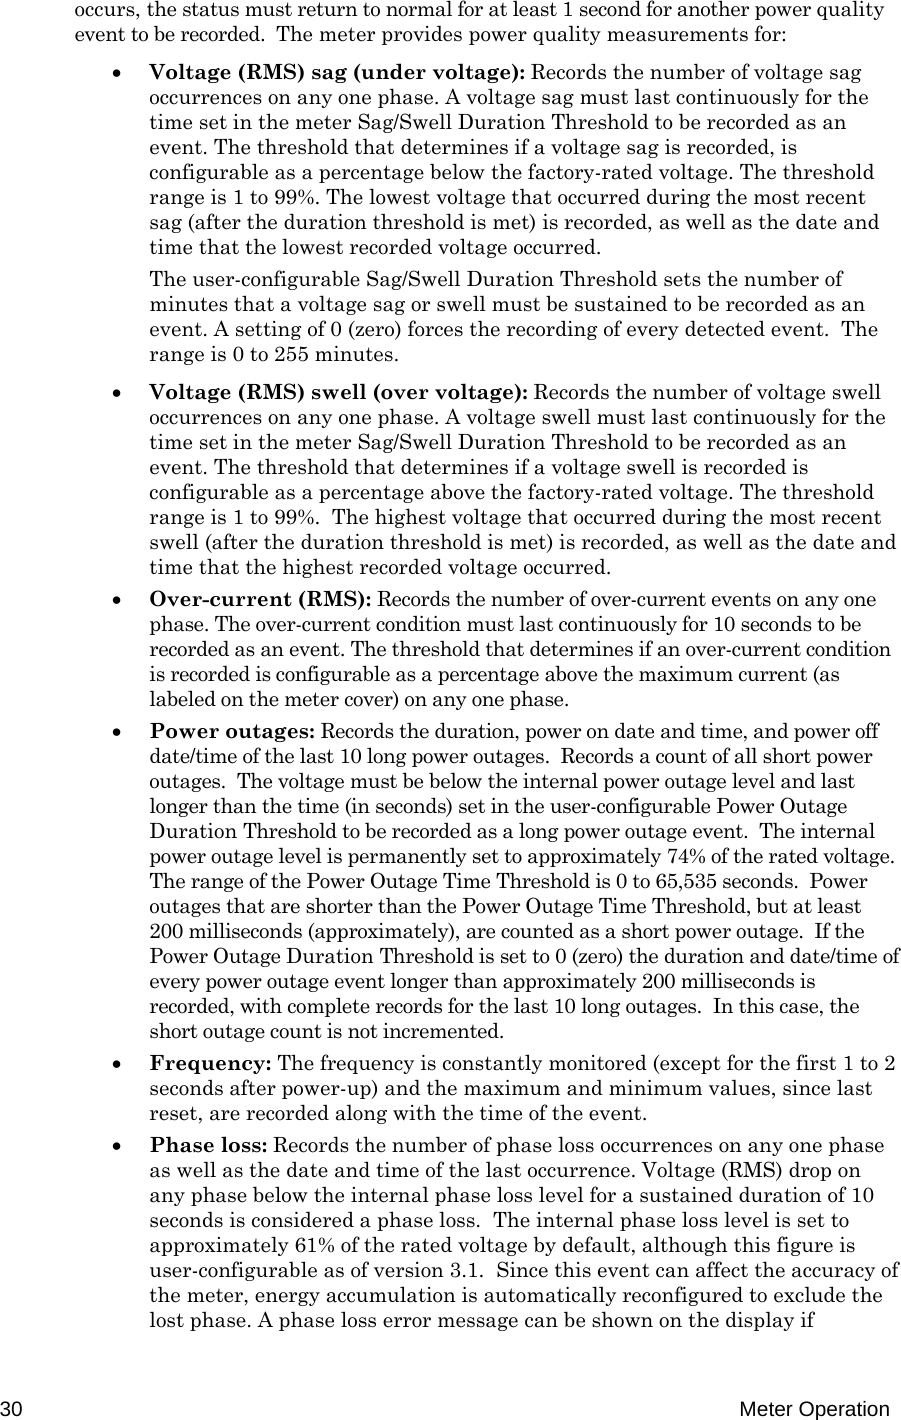
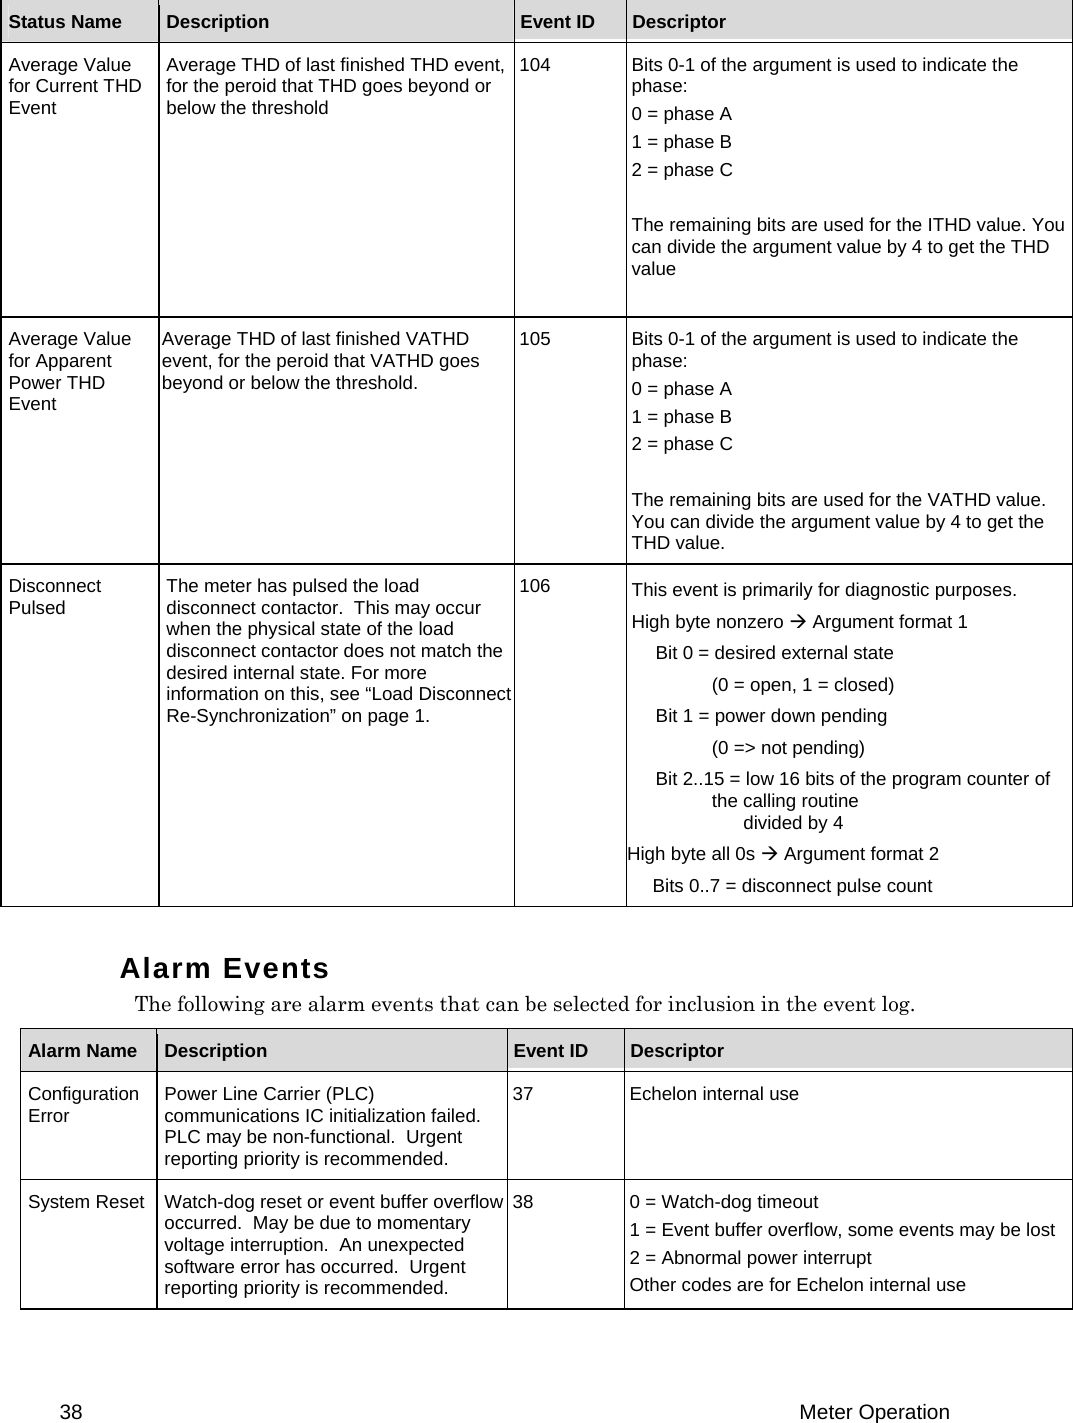
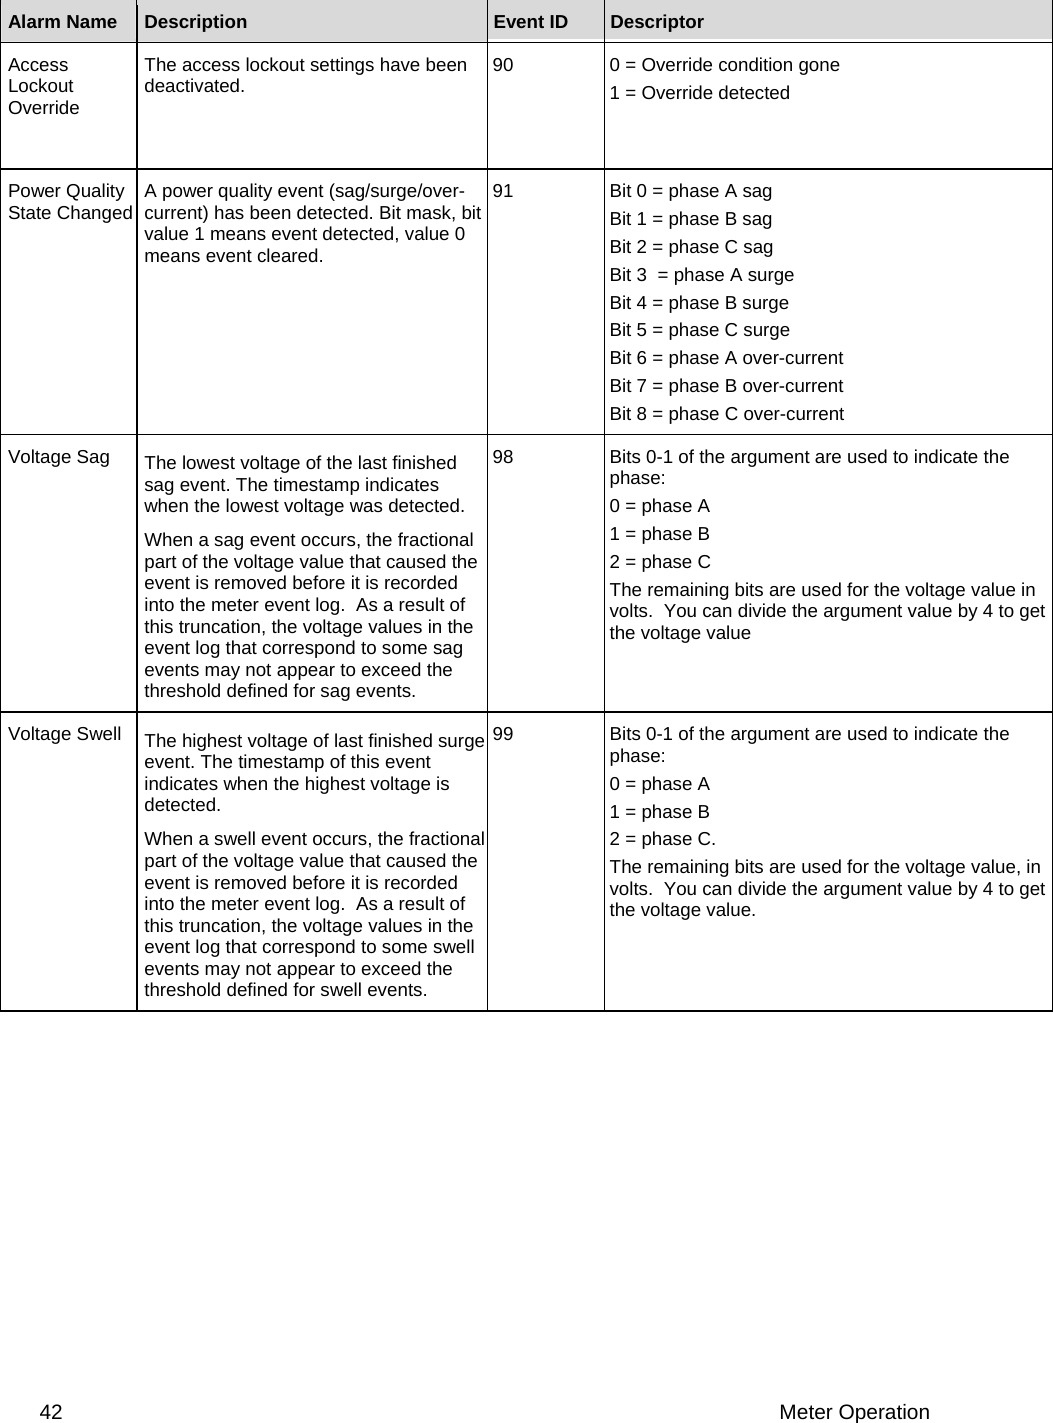
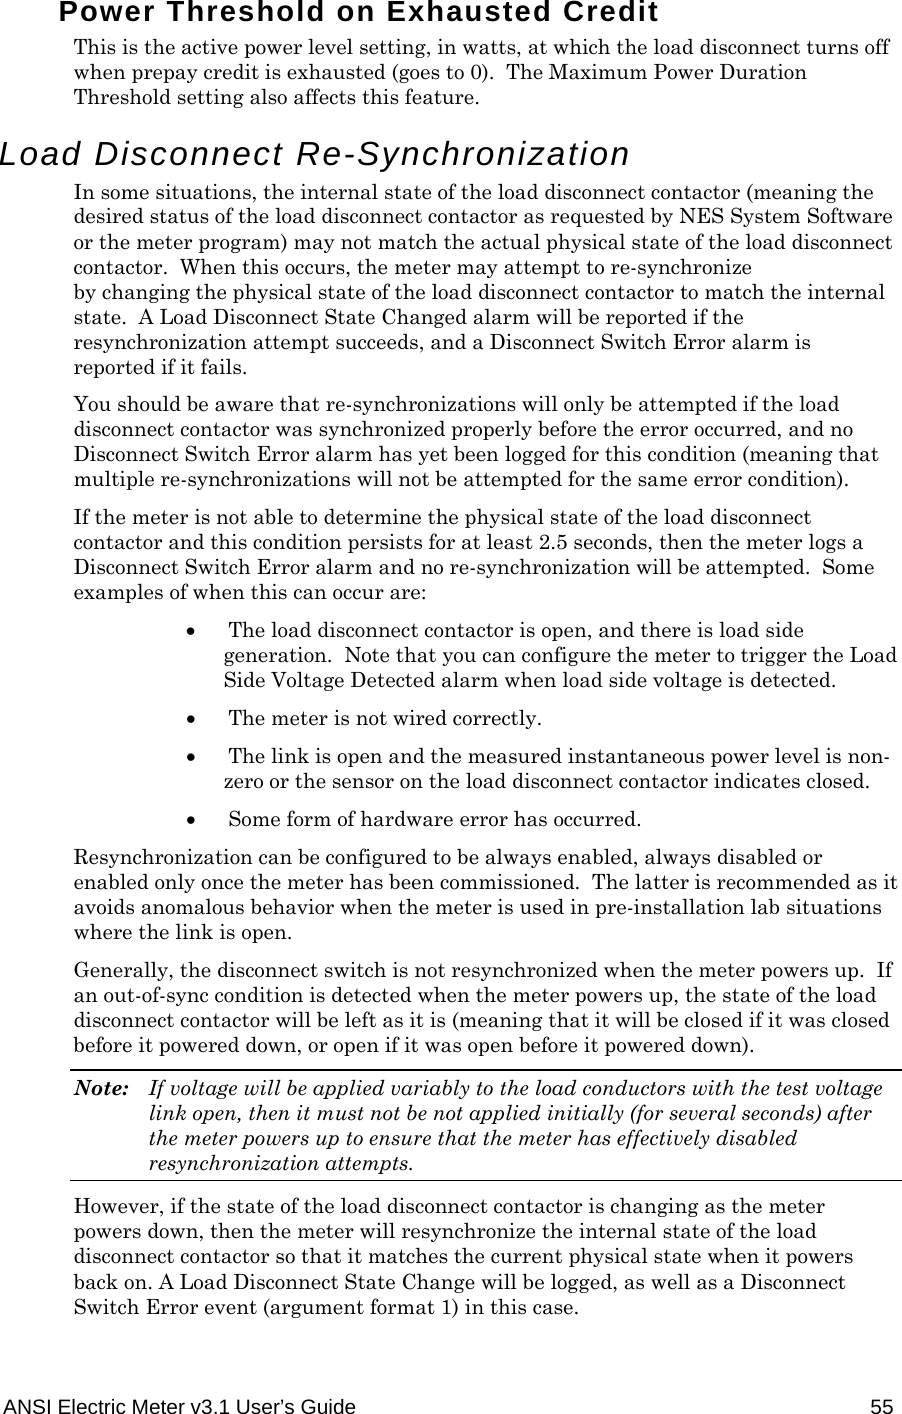
![ANSI Electric Meter v3.1 User’s Guide 73 Figure 4.2 shows a line graph charting two demand values. In this scenario, the main interval is set to 10 minutes, so values for each of the 6 intervals are recorded at 10, 20, 30, 40, 50, and 60 minutes. Figure 4.2 Block Demand Demand Calculations The previous section describes how the meter can calculate and record demand measurements. This section describes which energy measurements can be made using demand. The meter is capable of calculating the following energy measurements for any of the 8 configurable demand sources. The 8 demand sources are: Forward energy (Fwd Active [kWh] L1+L2+L3) Reverse energy (Rev Active [kWh] L1+L2+L3) Forward + reverse energy (Fwd+Rev Active [kWh] L1+L2+L3) Forward - reverse active energy (Fwd-Rev Active [kWh] L1+L2+L3) Reactive energy for all 4 quadrants (Reactive [kvarh] Q[1..4]) The meter can measure the following measurements for any of the 8 demand sources: Present Demand. Present demand is the demand value of the interval currently in progress. It is updated every second. There are two ways to calculate present demand, depending on the time value that is used to normalize the energy used in the interval. The first measures the accumulated energy since interval start based on the time expired since last end-of-interval, meaning that the demand value is calculated by dividing the accumulated energy by the amount of time that has passed since the current interval began. The second measures the accumulated energy since interval start based on the total interval time, meaning that the demand value is calculated by dividing the accumulated energy by the total length of the current interval (regardless of how much of that time has expired).](https://usermanual.wiki/Echelon/79010-01.User-Manual-DRAFT/User-Guide-1083218-Page-79.png)