Emerson Fisher Valvelink Software Data Sheet
2015-03-30
: Emerson Emerson-Fisher-Valvelink-Software-Data-Sheet-681806 emerson-fisher-valvelink-software-data-sheet-681806 emerson pdf
Open the PDF directly: View PDF ![]() .
.
Page Count: 4
www.Fisher.com
Dead Band Plus Hysteresis Estimation with
ValveLinkt Diagnostics
Background
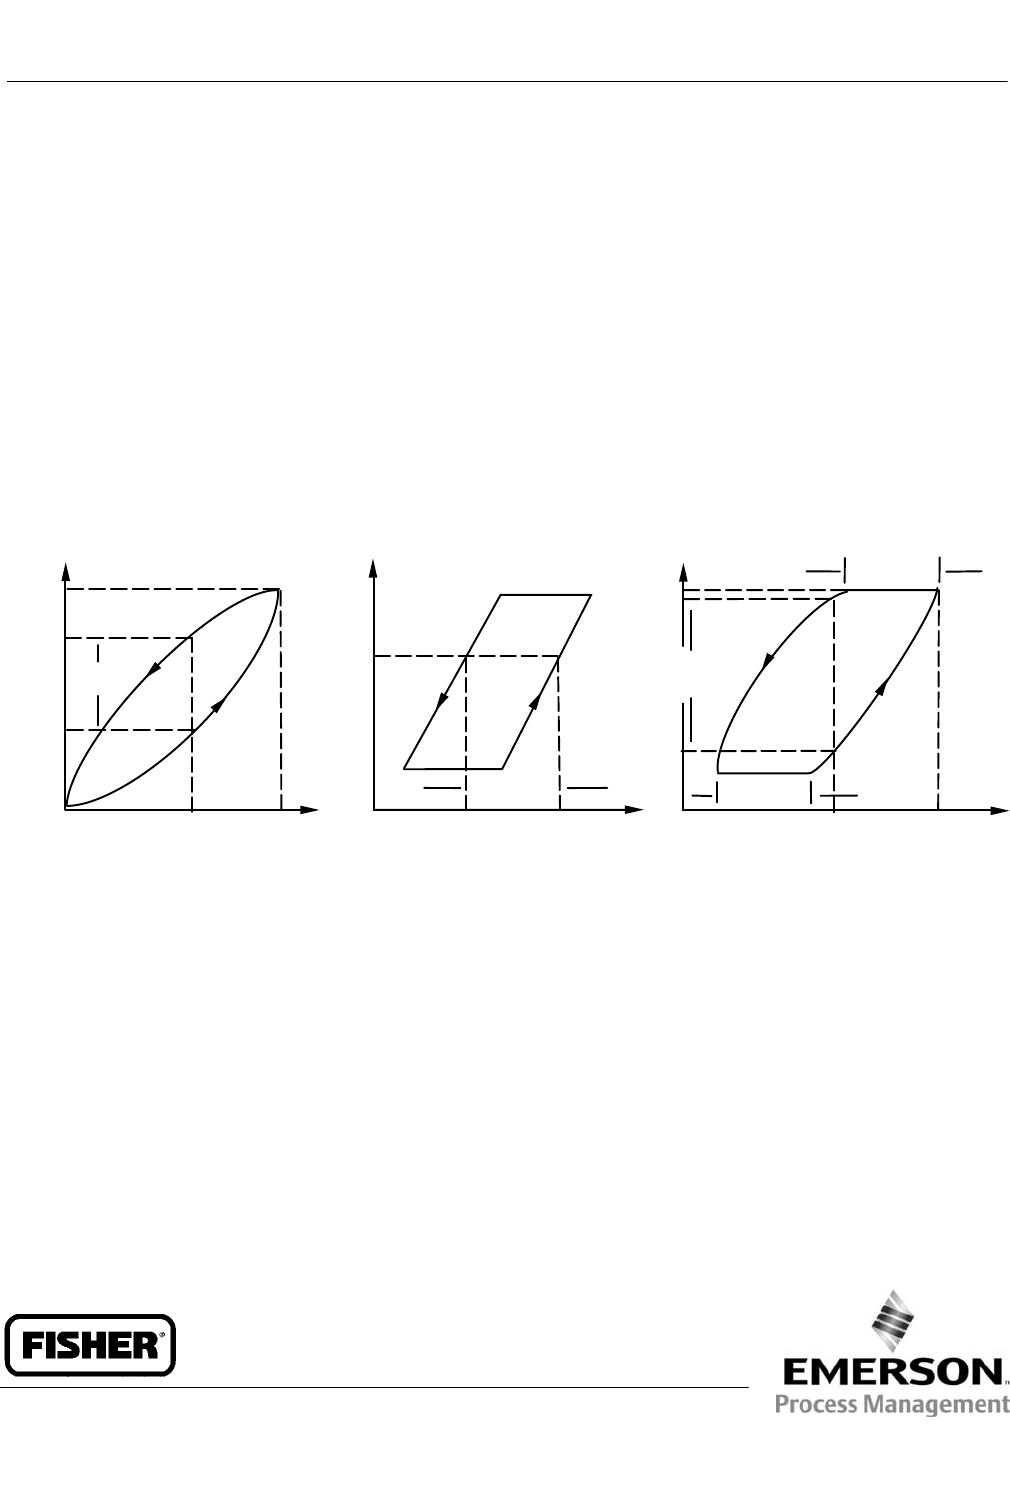
Dead band and hysteresis are important nonlinearities that can adversely affect process control. Figure 1 shows input
and output graphs for hysteresis, dead band, and dead band plus hysteresis. Hysteresis is a path dependent
characteristic that can be attributed to materials not being able to return to their original shape and size after being
stretched or deformed. Dead band represents the amount of signal change required to reverse direction and is
characterized by a zero slope region where the input signal reverses. Dead band can usually be attributed to valve
friction (packing, actuator seal rings, and valve seal rings) and pneumatic dead zones in the instrumentation.
Figure 1. Hysteresis, Dead Band, and Dead Band plus Hysteresis Curves
Y
B
HYSTERESIS
ERROR
100%
OUTPUT
100% INPUT
A"
INPUT
OUTPUT
DEAD BAND
y2
y1
y
xx1x2
"A
"A
HYSTERESIS
ERROR WITH
DEAD BAND
DEAD BAND
ERROR ERROR
100%INPUT
100%
y2
y1
OUTPUT DEAD BAND
x
B
Y
For control valves, dead band is the dominant nonlinearity whereas hysteresis is a secondary effect. Hysteresis can be
estimated by subtracting dead band from the dead band plus hysteresis data. However, since hysteresis is generally
negligable and difficult to discern from experimental error, dead band and hysteresis are not separated and test results
are reported as the sum of these nonlinearities.
Allowable dead band plus hysteresis is process dependent but is typically specified to be ≤ 1% for the entire valve
assembly, which comprises the valve, actuator, and positioner.
Dead Band plus Hysteresis Test Definition
Dead band plus hysteresis can be estimated at the factory using a Series 3 Factory ValveLink test. Although dead band
plus hysteresis is a factory test, results can be imported and viewed in all versions of ValveLink software. Dead band
plus hysteresis tests can be run at nominal travels of 5%, 25%, 50%, 75%, and 95%. If a test point is not specified, dead
band plus hysteresis will be evaluated at a nominal travel of 50%.
ValveLink Software
D103549X012
Product Bulletin
62.1:ValveLink Software(S3)
October 2012
ValveLink Software
D103549X012
Product Bulletin
62.1:ValveLink Software(S3)
October 2012
2
Test Procedures
Dead band plus hysteresis is a static measurement that can be estimated using a quasi steady‐state test signal. All
tests are performed using standard digital valve controller diagnostic procedures with the cutoffs and characterization
disabled and with the travel integrator disabled. This is done to prevent limit cycles, overshoots, or other transients
that would invalidate the dead band plus hysteresis estimate.
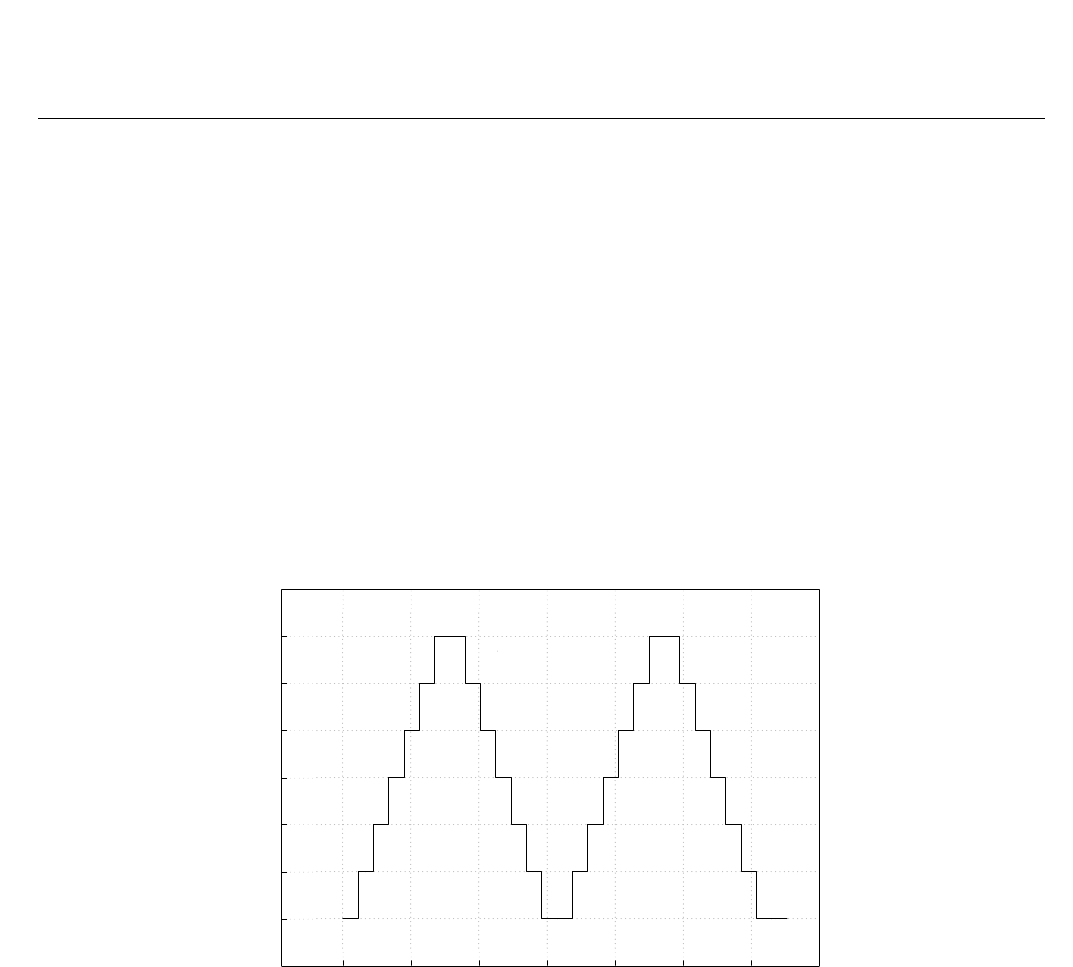
The dead band plus hysteresis test is a 29 point step test that consists of series of 0.25% steps that slowly move the
valve in the opening and closing directions. Figure 2 shows a test signal centered around 50%. Test signal span is 1.5%
and each step is held for 45 seconds, although this can be set to 60 or 90 seconds in the factory to ensure that quasi
steady‐state conditions are met.
The dead band plus hysteresis test consists of two sequences. The first sequence is a break‐in cycle that moves the
valve through its dead band and establishes a valid starting point for the second sequence. Data from the break‐in
cycle are not analyzed. The second sequence is the test cycle and data from this sequence are used to estimate dead
band plus hysteresis.
Figure 2. Dead Band plus Hysteresis Test about a Nominal Set Point of 50%
Time (sec)
0 200 400 600 800 1000 1200 1400
Travel Set Point (%)
49.00
49.25
49.50
49.75
50.00
50.25
50.50
50.75
51.00
Test Results
Four graphs are used to display test results: step response time series, step response with supply pressure, step
response with drive, and dead band plus hysteresis X-Y plot.
The step response graph displays travel set point and travel time series data. A typical time series plot of travel set
point and travel is presented in figure 3. This graph is used to make sure that steady‐state conditions have been
reached before the next step is implemented. If this is not the case, the dead band plus hysteresis test can be rerun
with a longer step hold time. This graph can also be used to roughly estimate dead band by counting the number of
0.25% steps required to reverse direction.
Step response time series data with supply pressure and drive signal are also available and are recorded for
completeness.
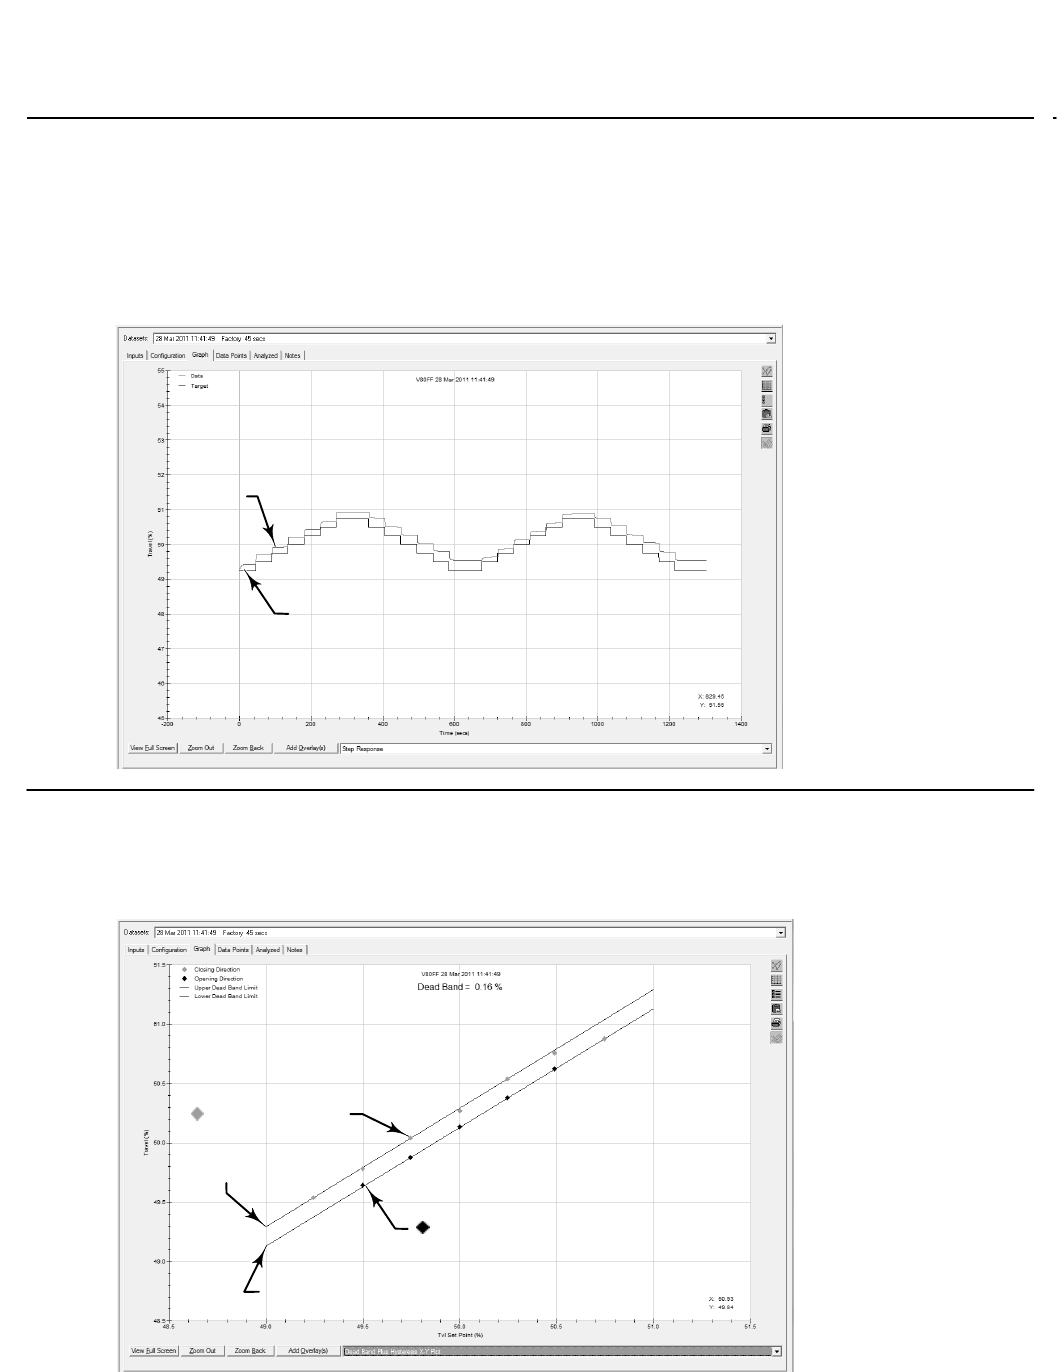
Finally, steady‐state data can be displayed on an X-Y plot where set point is plotted on the x‐axis (input signal) and
travel is plotted on the y‐axis (output signal). A sample X-Y dead band plus hysteresis is shown in figure 4.
ValveLink Software
D103549X012
Product Bulletin
62.1:ValveLink Software(S3)
September 2012
3
The ideal response of a control valve is a straight line with unity slope. Dead band plus hysteresis can be estimated by
drawing lines parallel to the ideal response that band the data. The width between the bands provides the best
estimate of dead band plus hysteresis.
Figure 3. Typical Travel Set Point and Travel Time Series Plots
TARGET
DATA
Note: The first cycle is a break-in cycle. The second is a test cycle.
Figure 4. Dead Band plus Hysteresis X‐Y Plot with Unity Slope Bands
OPENING DIRECTION
UPPER DEAD
BAND LIMIT
LOWER DEAD BAND LIMIT
CLOSING DIRECTION

ValveLink Software
D103549X012
Product Bulletin
62.1:ValveLink Software(S3)
October 2012
4
Data Export
Dead band plus hysteresis data from factory ValveLink can be exported as a standard step study test. When imported
into ValveLink 11.5 or higher, time series and dead band plus hysteresis X-Y plots can be displayed. For earlier versions
of ValveLink, only time series data will be displayed.
References
[1] ANSI/ISA75.05.012000 (R2005), “Control Valve Terminology.”
[2] ANSI/ISA75.13.011996 (2007), “Method of Evaluating the Performance of Positioners with Analog Input Signals
and Pneumatic Output.”
[3] ANSI/ISA75.25.012000, “Test Procedures for Control Valve Response Measurement from Step Inputs.”
[4] ANSI/ISATR75.25.022002, “Control Valve Response Measurements from Step Inputs.”
[5] IEC 605341, “Industrialprocess control valves Part 1: Control valve terminology and general considerations.”
[6] IEC 605344, “Industrialprocess control valves Part 4: Inspection and routine testing.”
[7] “Control Valve Dynamic Specification,” Version 3.0, EnTech, 1998.
[8] ANSI/ISA-51.1-1979 (R1993), “Process Instrumentation Terminology.”
Emerson Process Management
Marshalltown, Iowa 50158 USA
Sorocaba, 18087 Brazil
Chatham, Kent ME4 4QZ UK
Dubai, United Arab Emirates
Singapore 128461 Singapore
www.Fisher.com
The contents of this publication are presented for informational purposes only, and while every effort has been made to ensure their accuracy, they are not
to be construed as warranties or guarantees, express or implied, regarding the products or services described herein or their use or applicability. All sales are
governed by our terms and conditions, which are available upon request. We reserve the right to modify or improve the designs or specifications of such
products at any time without notice.
E 2011, 2012 Fisher Controls International LLC. All rights reserved.
Fisher and ValveLink are marks owned by one of the companies in the Emerson Process Management business unit of Emerson Electric Co. Emerson Process
Management, Emerson, and the Emerson logo are trademarks and service marks of Emerson Electric Co. All other marks are the property of their respective
owners.
Neither Emerson, Emerson Process Management, nor any of their affiliated entities assumes responsibility for the selection, use or maintenance
of any product. Responsibility for proper selection, use, and maintenance of any product remains solely with the purchaser and end user.
