Fluke 1750 Data Sheet
2015-09-09
: Fluke Fluke-1750-Data-Sheet-809050 fluke-1750-data-sheet-809050 fluke pdf
Open the PDF directly: View PDF ![]() .
.
Page Count: 35

Power Analysis Summary
Introduction
This is a summary of the power conditions measured with these setup parameters:
C:\Users\fhealy\Documents\Fluke\Power Analyze\Core 2 Recording.odn
Measurement File:
12/12/2010 00:00:00
Start Time:
12/19/2010 00:00:00
End Time:
7 - 00:00:00
Duration:
3-ph Delta
Power Configuration:
480V
Nominal Voltage:
60Hz
Nominal Frequency:
Instrument
The measurement was performed with a FLUKE 1750 with these characteristics:
1750 <9488005>
Instrument:
Voltage Inputs
A-A, 1.00:1
A:
B-B, 1.00:1
B:
C-C, 1.00:1
C:
N-N, 1.00:1
N:
Current Inputs
A-A, 1.00:1
A:
B-B, 1.00:1
B:
C-C, 1.00:1
C:
N-N, 1.00:1
N:
G-G, 1.00:1
G:
Current Probes
2-100A Flexi-CT Model 3110 or 3112
A:
2-100A Flexi-CT Model 3110 or 3112
B:
2-100A Flexi-CT Model 3110 or 3112
C:
Unidentified CT Defaults to 5A
N:
Unidentified CT Defaults to 5A
G:
1 / 35
1/6/2011

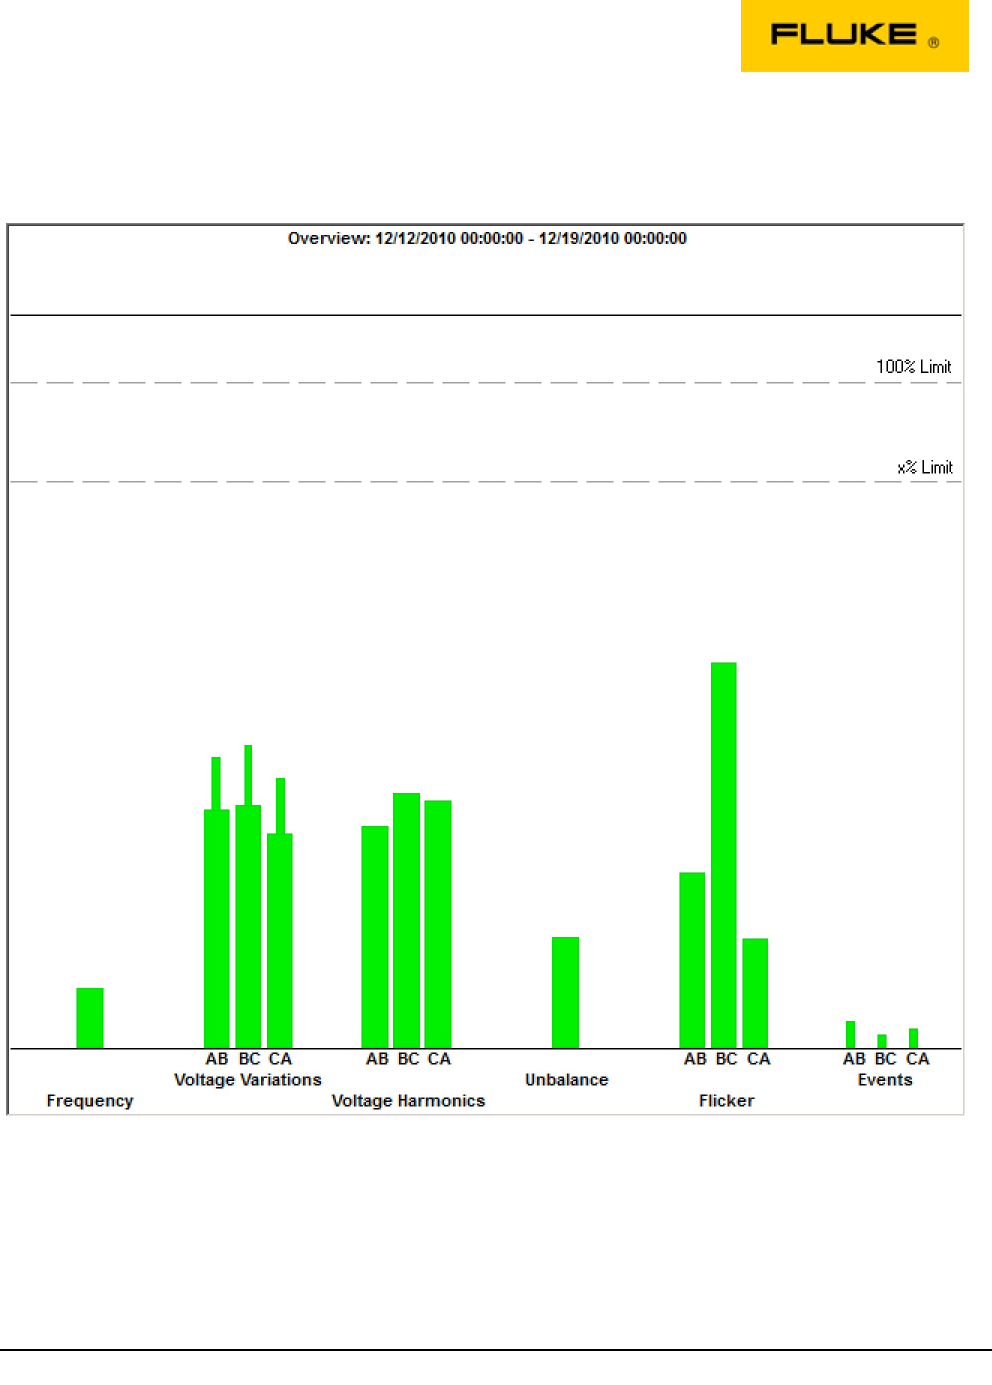
Summary
The Summary section compares the key power quality parameters to pre-defined levels.
It consists of three elements: Overview, Events and Harmonics.
The overview summarizes the overall power quality for the chosen reporting period in six
classes: frequency, voltage variations, voltage harmonics, unbalance, flicker and events.
The total number of readings for each of these variables is compared to the 100% limits. A
different percentage of the total number of readings (typically 95%) is also compared to specific
limits. This allows a power quality survey according to international or local standards (e.g.
EN50160).
The summary indicates the number of values within the limit and the extreme value measured
during the selected period.
2 / 35
1/6/2011
Summary
Overview Graph
3 / 35
1/6/2011
Summary
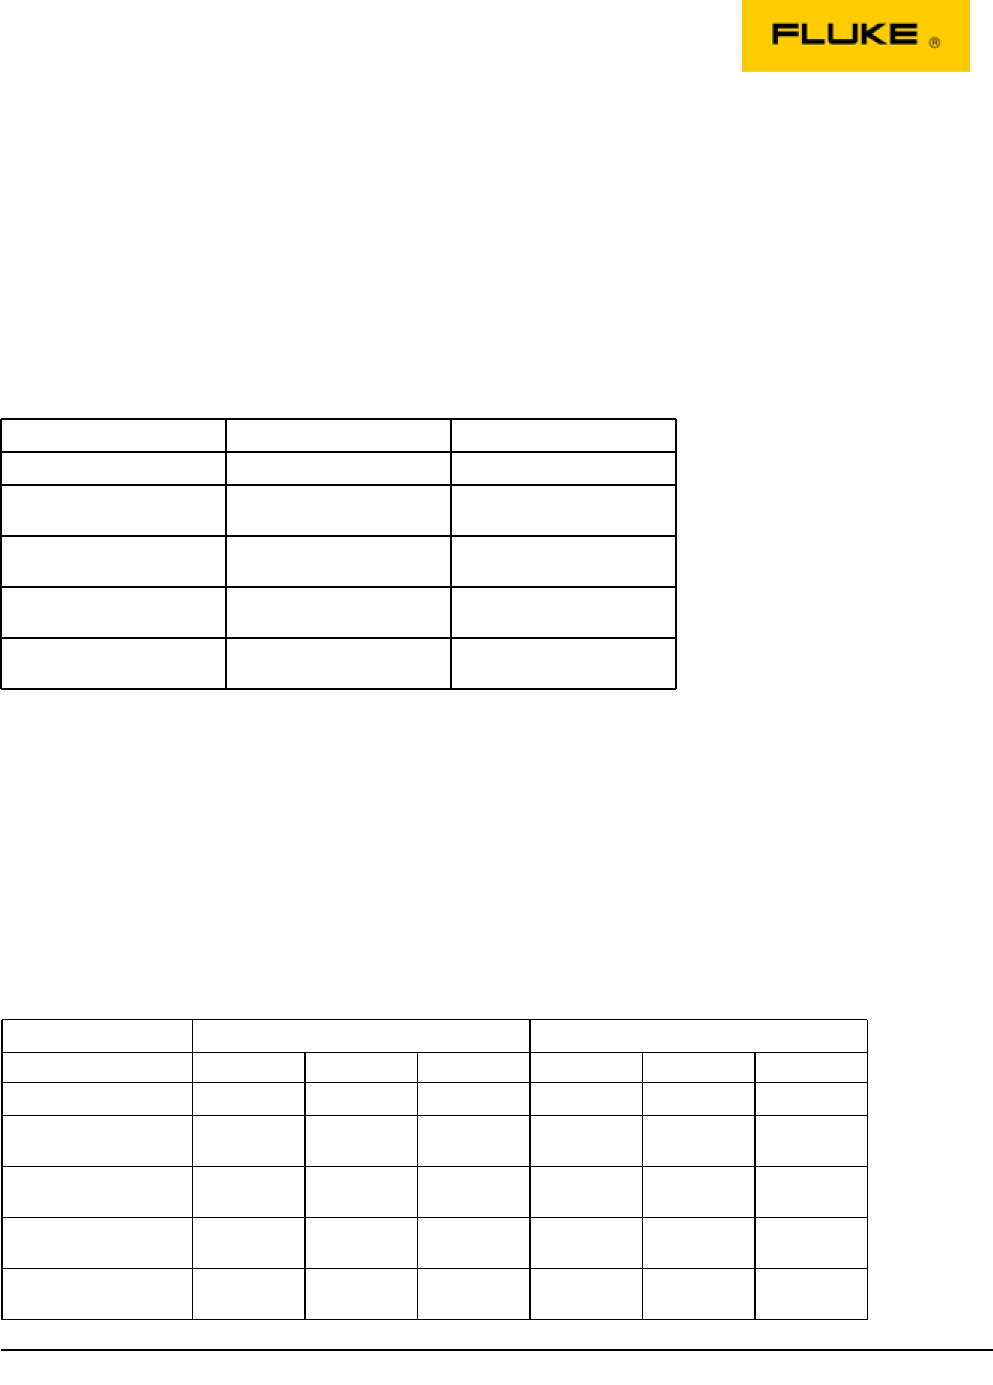
Frequency
Settings
Required values within limit
99.5% of the time
Maximum 99.5% / 100%
+1/+4
Minimum 99.5% / 100%
-1/-6
Results
99.5% Value
Extreme Value
% Within Limit
100.00%
100.00%
Maximum 99.5% / 100%
60.06Hz
(0.10%)
60.08Hz
(0.13%)
Time
12/17/2010
05:57:50
Minimum 99.5% / 100%
59.94Hz
(-0.11%)
59.91Hz
(-0.15%)
Time
12/13/2010
06:13:10
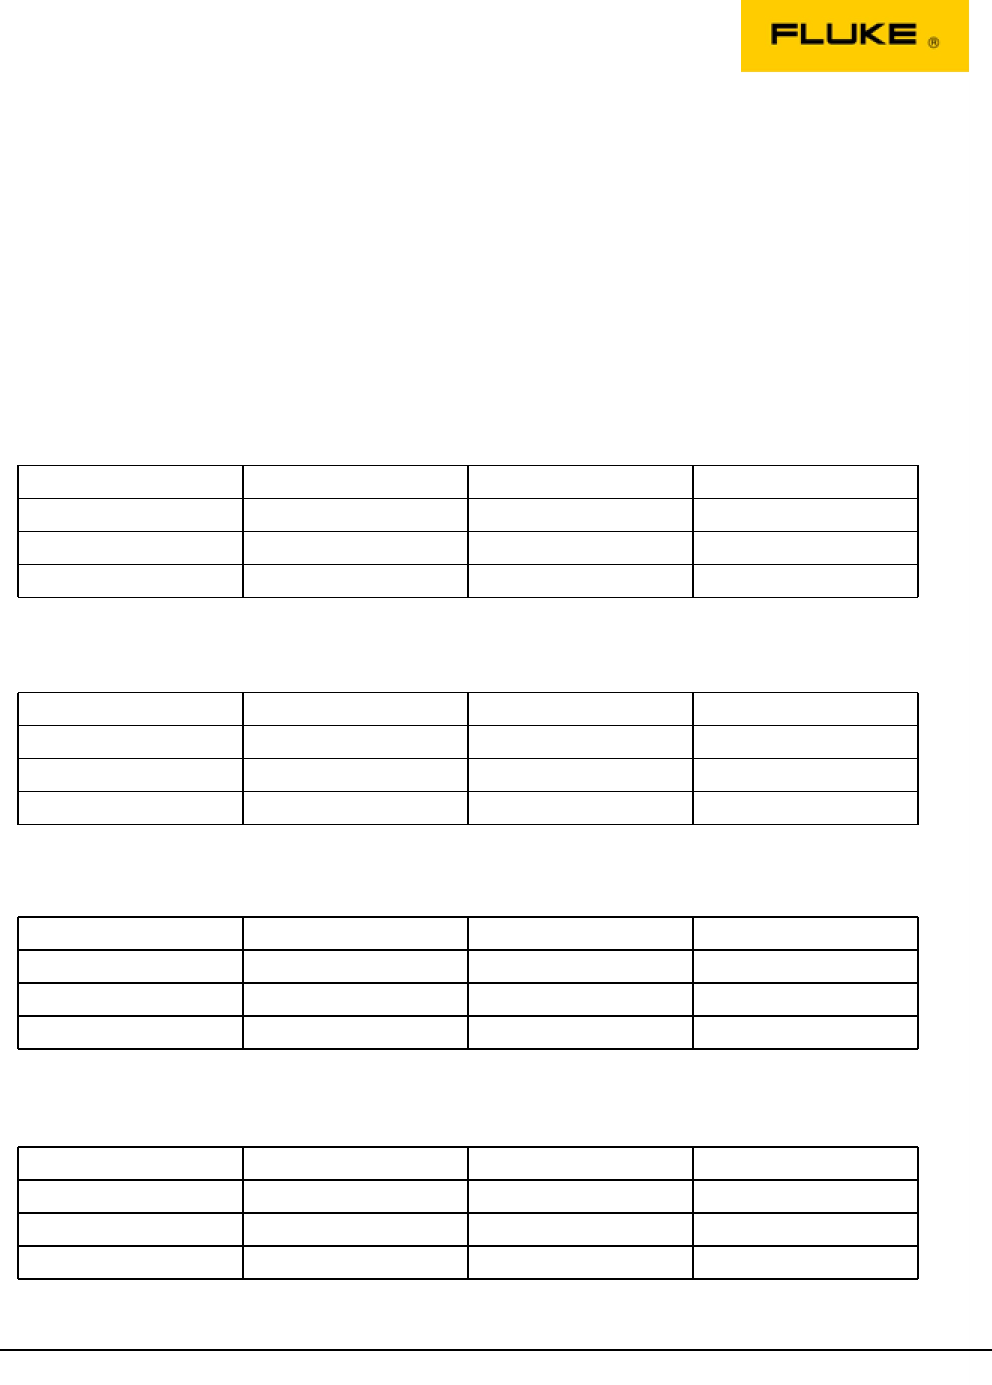
Slow Voltage Variations
Settings
Required values within limit
95% of the time
Maximum 95% / 100%
+10/+10
Minimum 95% / 100%
-10/-15
Results
95% Value
AB
BC
CA
Extreme Value
AB
BC
CA
% Within Limit
100.00%
100.00%
100.00%
100.00%
100.00%
100.00%
Maximum 95% / 100%
500.17V
(4.20%)
500.58V
(4.29%)
498.20V
(3.79%)
500.92V
(4.36%)
501.79V
(4.54%)
499.43V
(4.05%)
Time
12/13/2010
14:20:00
12/14/2010
00:50:00
12/13/2010
14:20:00
Minimum 95% / 100%
494.17V
(2.95%)
494.46V
(3.01%)
492.28V
(2.56%)
493.03V
(2.71%)
492.96V
(2.70%)
490.53V
(2.19%)
Time
12/13/2010
06:10:00
12/13/2010
07:20:00
12/13/2010
06:10:00
4 / 35
1/6/2011
Summary
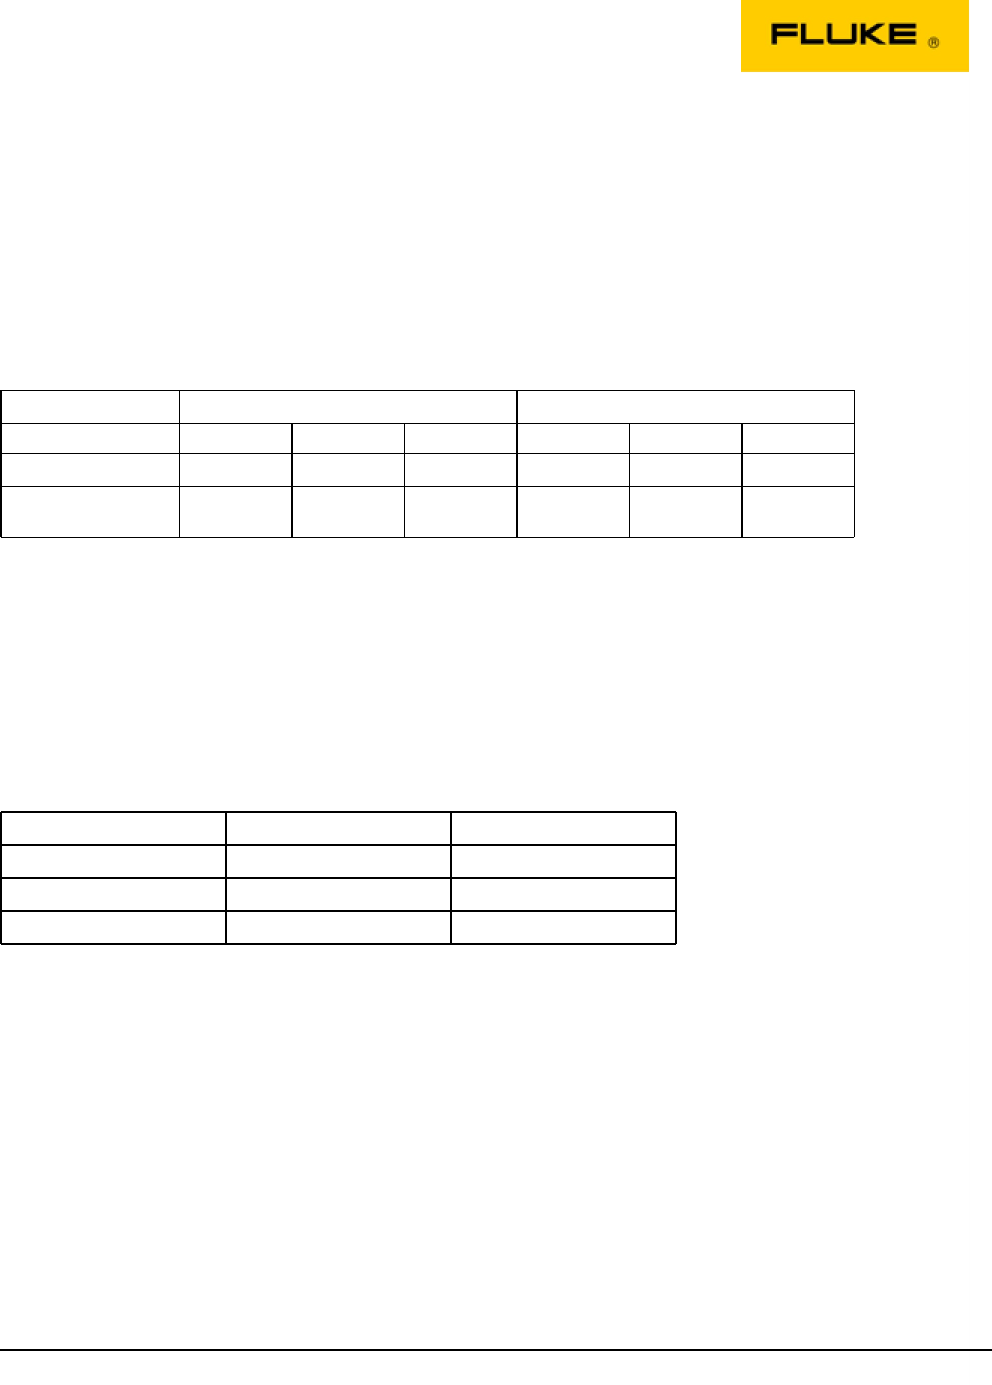
Voltage Harmonics
Settings
Required values within limit
95% of the time
5. Order 95% / 100%
6/-
Results
95% Value
AB
BC
CA
Extreme Value
AB
BC
CA
5. Order 95% / 100%
2.35%
2.71%
2.62%
(2.47%)
(2.85%)
(2.78%)
Time
12/13/2010
14:10:00
12/13/2010
14:10:00
12/13/2010
14:10:00
Unbalance
Settings
Required values within limit
95% of the time
Maximum 95% / 100%
2/-
Results
95% Value
Extreme Value
% Within Limit
100.00%
-
Maximum 95% / 100%
0.39%
(0.45%)
Time
12/12/2010 21:00:00
5 / 35
1/6/2011
Summary
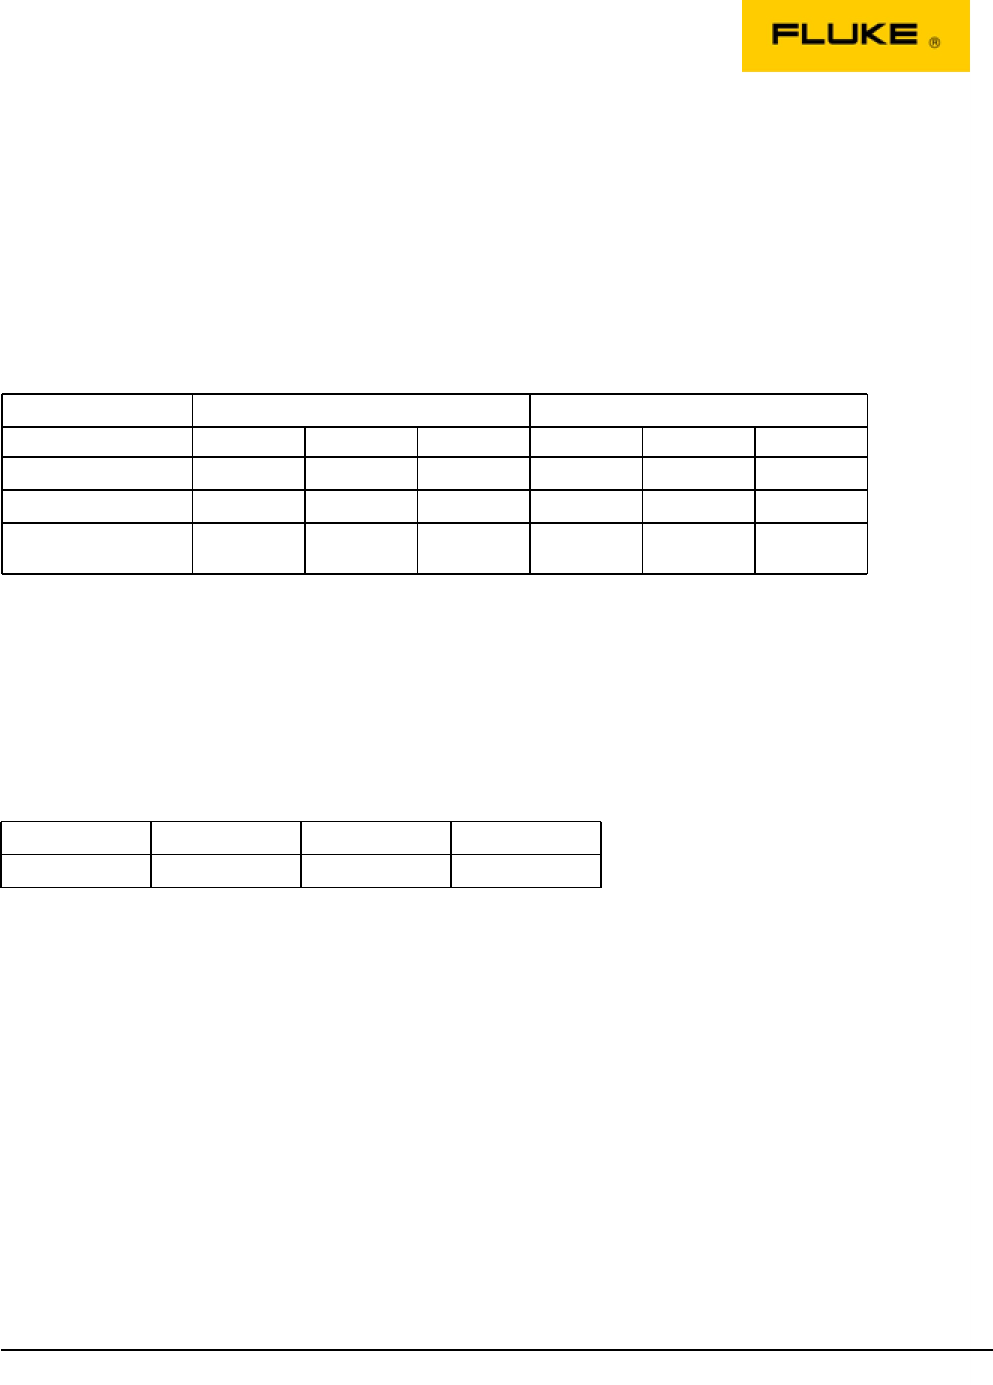
Flicker (Plt)
Settings
Required values within limit
95% of the time
Maximum 95% / 100%
1/-
Results
95% Value
AB
BC
CA
Extreme Value
AB
BC
CA
% Within Limit
98.81%
98.81%
97.62%
-
-
-
Maximum 95% / 100%
0.31
0.68
0.19
(2.23)
(2.04)
(1.87)
Time
12/14/2010
00:20:00
12/14/2010
00:20:00
12/18/2010
02:20:00
Events Summary
Settings
Number of allowed events
100
Results
AB
BC
CA
Number of
4
2
3
6 / 35
1/6/2011
Summary
Events
Settings
Swell threshold
110% of nominal voltage
Dip threshold
90% of nominal voltage
Short Interruption
< 1% of nominal voltage
Long Interruption
< 1% of nominal voltage, > 180s
Results
Swell
AB
BC
CA
Quantity
0
0
0
Max. Value
Max. Duration
Dip
AB
BC
CA
Quantity
4
2
3
Max. Value
406.86V (-15.24%)
412.21V (-14.12%)
395.06V (-17.70%)
Max. Duration
0 - 00:00:00,058
0 - 00:00:00,066
0 - 00:00:00,058
Short Interruption
AB
BC
CA
Quantity
0
0
0
Max. Value
Max. Duration
Long Interruption
AB
BC
CA
Quantity
0
0
0
Max. Value
Max. Duration
7 / 35
1/6/2011
Summary
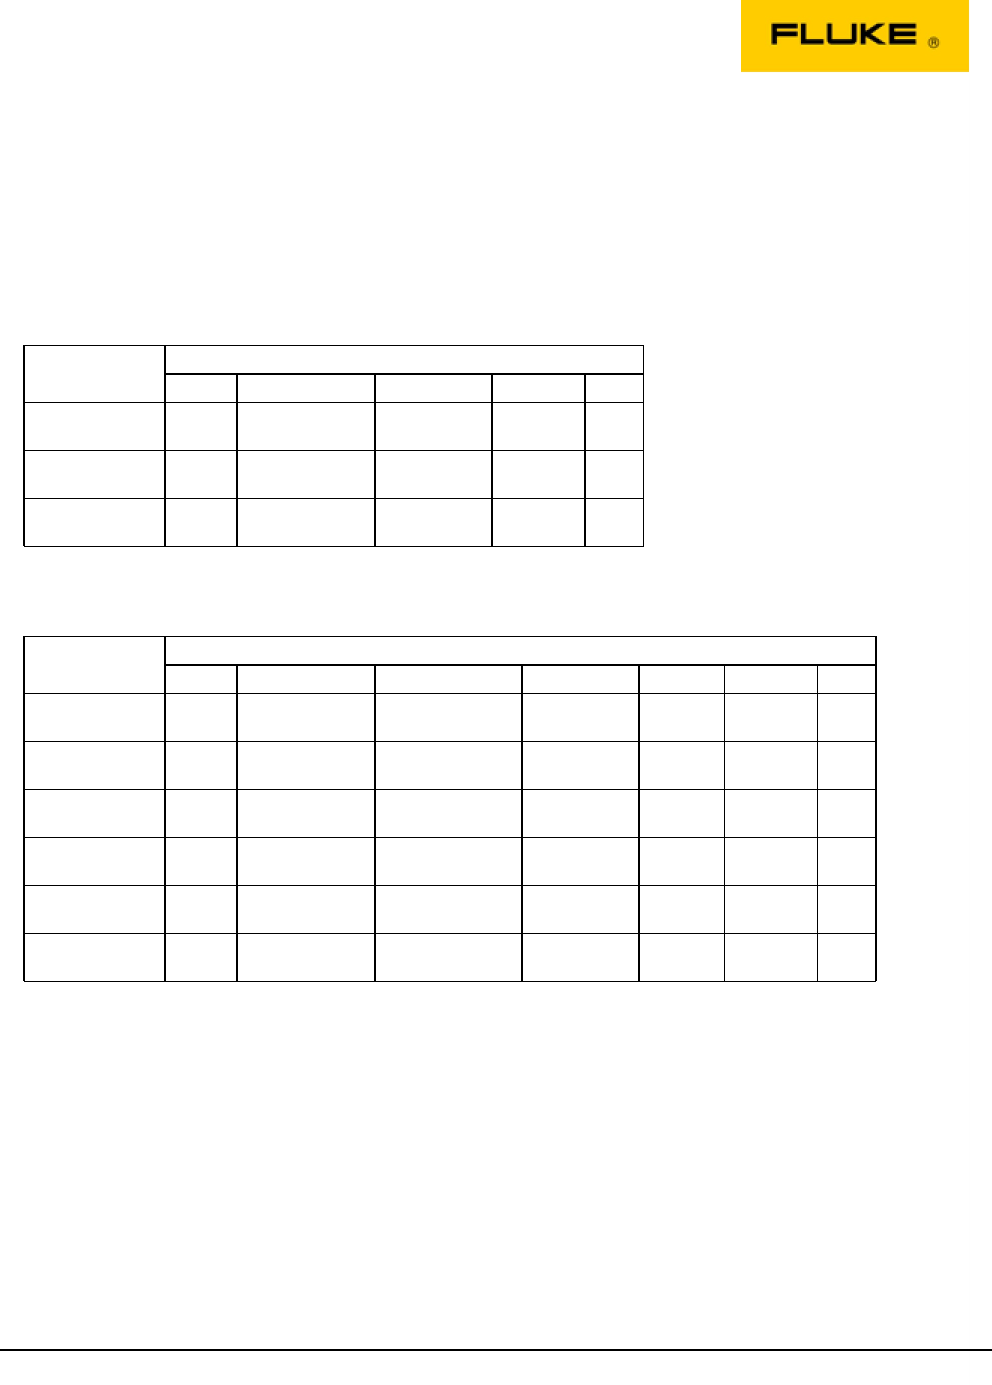
DisDIP Table
Results
Swell
Duration
t < 10ms
10ms ≤ t ≤ 500ms
500ms < t ≤ 5s
5s < t ≤ 60s
60s < t
u ≥ 120%
(u ≥ 576V)
120% > u > 110%
(576V > u > 528V)
110% ≥ u
(528V ≥ u)
Dip
Duration
t < 10ms
10ms ≤ t ≤ 200ms
200ms < t ≤ 500ms
500ms < t ≤ 1s
1s < t ≤ 5s
5s < t ≤ 60s
60s < t
u ≥ 90%
(u ≥ 432V)
90% > u ≥ 80%
(432V > u ≥ 384V)
80% > u ≥ 70%
(384V > u ≥ 336V)
70% > u ≥ 40%
(336V > u ≥ 192V)
40% > u ≥ 5%
(192V > u ≥ 24V)
5% > u
(24V > u)
9
8 / 35
1/6/2011
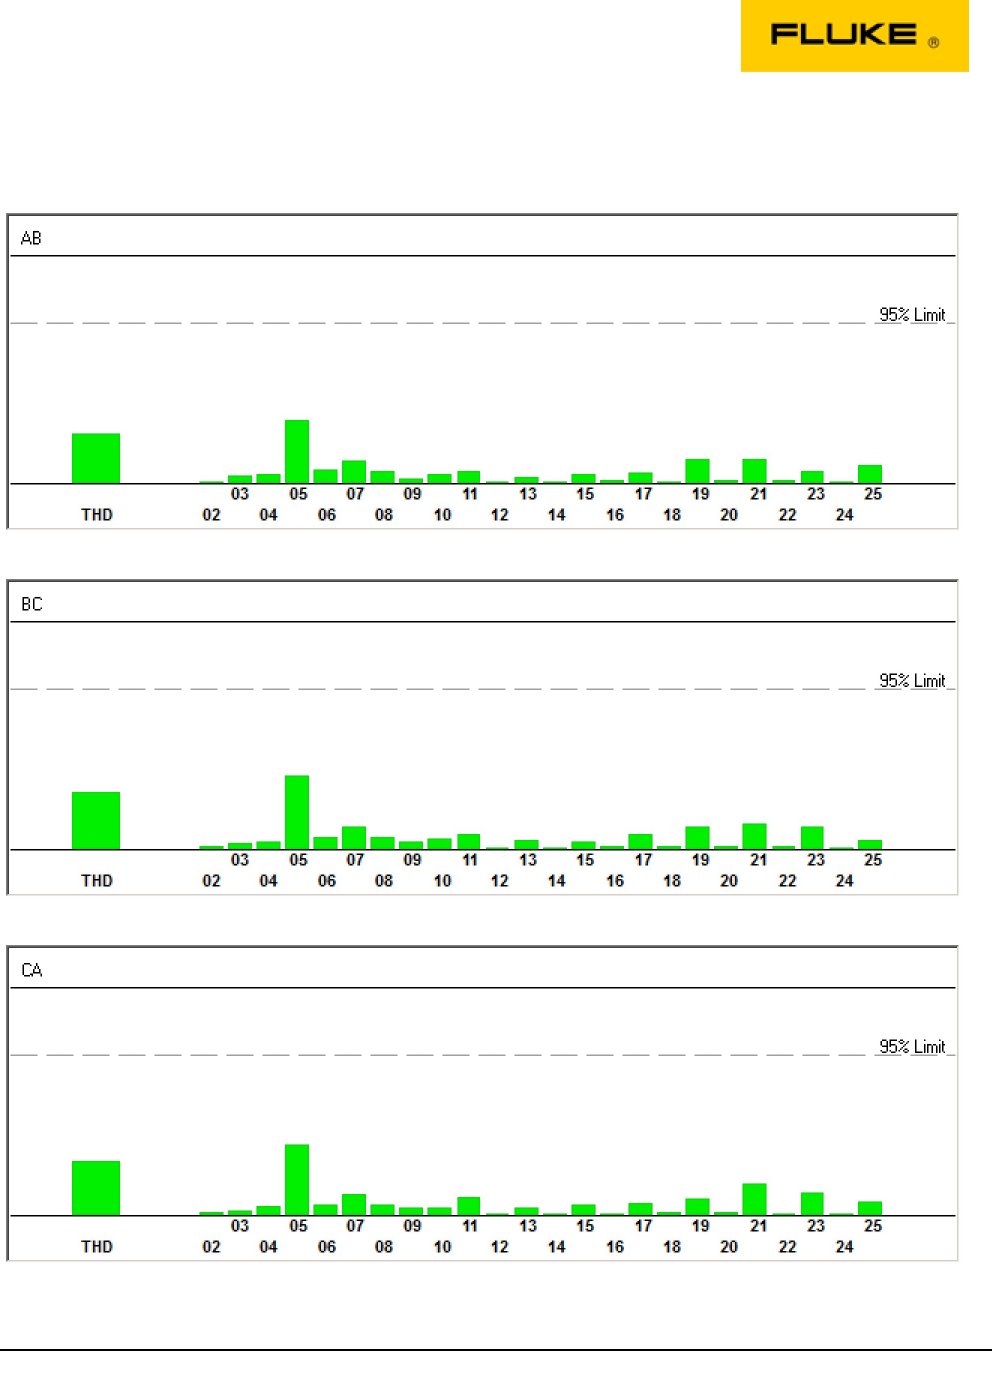
Summary
Voltage Harmonics Graphs
9 / 35
1/6/2011
Summary
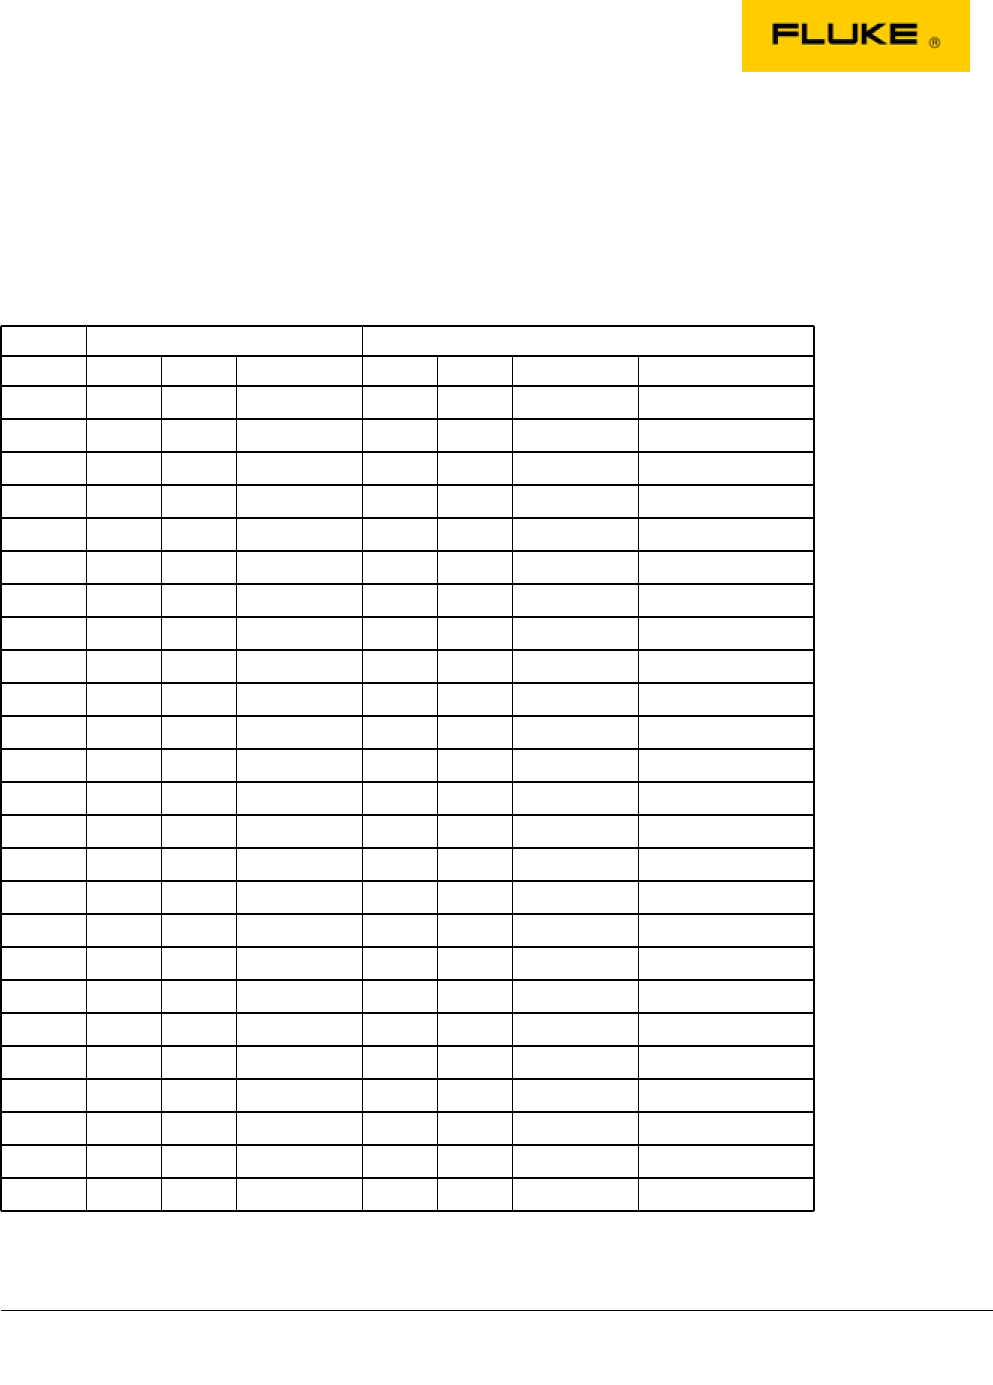
Voltage Harmonics Tables
Settings
Required values within limit
95% of the time
Phase AB
95% Value
Limit
Value
% Within Limit
Extreme Value
Limit
Value
% Within Limit
Time
THD
8%
2.46%
100.00%
-
2.61%
-
12/13/2010 14:10:00
2. Order
2%
0.03%
100.00%
-
0.04%
-
12/15/2010 10:10:00
3. Order
5%
0.25%
100.00%
-
0.28%
-
12/17/2010 07:00:00
4. Order
1%
0.05%
100.00%
-
0.07%
-
12/14/2010 09:10:00
5. Order
6%
2.35%
100.00%
-
2.47%
-
12/13/2010 14:10:00
6. Order
0.5%
0.04%
100.00%
-
0.10%
-
12/17/2010 02:10:00
7. Order
5%
0.71%
100.00%
-
0.82%
-
12/13/2010 14:00:00
8. Order
0.5%
0.04%
100.00%
-
0.07%
-
12/17/2010 02:10:00
9. Order
1.5%
0.04%
100.00%
-
0.06%
-
12/18/2010 05:10:00
10. Order
0.5%
0.03%
100.00%
-
0.05%
-
12/15/2010 11:20:00
11. Order
3.5%
0.27%
100.00%
-
0.30%
-
12/12/2010 03:10:00
12. Order
0.5%
0.01%
100.00%
-
0.02%
-
12/15/2010 11:20:00
13. Order
3%
0.12%
100.00%
-
0.15%
-
12/13/2010 03:20:00
14. Order
0.5%
0.00%
100.00%
-
0.01%
-
12/13/2010 04:30:00
15. Order
0.5%
0.03%
100.00%
-
0.05%
-
12/13/2010 03:20:00
16. Order
0.5%
0.01%
100.00%
-
0.01%
-
12/14/2010 09:10:00
17. Order
2%
0.14%
100.00%
-
0.28%
-
12/13/2010 03:30:00
18. Order
0.5%
0.01%
100.00%
-
0.02%
-
12/13/2010 04:30:00
19. Order
1.5%
0.23%
100.00%
-
0.43%
-
12/13/2010 03:20:00
20. Order
0.5%
0.01%
100.00%
-
0.02%
-
12/13/2010 04:30:00
21. Order
0.5%
0.07%
100.00%
-
0.12%
-
12/13/2010 03:20:00
22. Order
0.5%
0.01%
100.00%
-
0.01%
-
12/13/2010 04:30:00
23. Order
1.5%
0.12%
100.00%
-
0.27%
-
12/13/2010 03:30:00
24. Order
0.5%
0.01%
100.00%
-
0.02%
-
12/13/2010 04:30:00
25. Order
1.5%
0.16%
100.00%
-
0.30%
-
12/13/2010 03:20:00
10 / 35
1/6/2011
Summary
Phase BC
95% Value
Limit
Value
% Within Limit
Extreme Value
Limit
Value
% Within Limit
Time
THD
8%
2.80%
100.00%
-
2.95%
-
12/13/2010 14:10:00
2. Order
2%
0.03%
100.00%
-
0.05%
-
12/14/2010 01:00:00
3. Order
5%
0.19%
100.00%
-
0.23%
-
12/17/2010 20:40:00
4. Order
1%
0.05%
100.00%
-
0.08%
-
12/17/2010 02:10:00
5. Order
6%
2.71%
100.00%
-
2.85%
-
12/13/2010 14:10:00
6. Order
0.5%
0.04%
100.00%
-
0.11%
-
12/17/2010 02:10:00
7. Order
5%
0.68%
100.00%
-
0.78%
-
12/15/2010 17:40:00
8. Order
0.5%
0.04%
100.00%
-
0.07%
-
12/16/2010 19:20:00
9. Order
1.5%
0.06%
100.00%
-
0.07%
-
12/16/2010 04:50:00
10. Order
0.5%
0.03%
100.00%
-
0.05%
-
12/13/2010 13:20:00
11. Order
3.5%
0.34%
100.00%
-
0.37%
-
12/17/2010 23:50:00
12. Order
0.5%
0.00%
100.00%
-
0.01%
-
12/13/2010 04:30:00
13. Order
3%
0.17%
100.00%
-
0.19%
-
12/18/2010 19:00:00
14. Order
0.5%
0.00%
100.00%
-
0.01%
-
12/13/2010 04:30:00
15. Order
0.5%
0.02%
100.00%
-
0.03%
-
12/12/2010 09:30:00
16. Order
0.5%
0.01%
100.00%
-
0.01%
-
12/13/2010 04:30:00
17. Order
2%
0.18%
100.00%
-
0.36%
-
12/13/2010 03:20:00
18. Order
0.5%
0.01%
100.00%
-
0.02%
-
12/13/2010 04:30:00
19. Order
1.5%
0.21%
100.00%
-
0.40%
-
12/13/2010 03:20:00
20. Order
0.5%
0.01%
100.00%
-
0.02%
-
12/13/2010 04:30:00
21. Order
0.5%
0.08%
100.00%
-
0.13%
-
12/13/2010 04:00:00
22. Order
0.5%
0.01%
100.00%
-
0.01%
-
12/13/2010 04:30:00
23. Order
1.5%
0.21%
100.00%
-
0.39%
-
12/13/2010 03:30:00
24. Order
0.5%
0.01%
100.00%
-
0.01%
-
12/13/2010 04:30:00
25. Order
1.5%
0.09%
100.00%
-
0.20%
-
12/13/2010 03:20:00
11 / 35
1/6/2011

Summary
Phase CA
95% Value
Limit
Value
% Within Limit
Extreme Value
Limit
Value
% Within Limit
Time
THD
8%
2.71%
100.00%
-
2.89%
-
12/13/2010 14:10:00
2. Order
2%
0.03%
100.00%
-
0.04%
-
12/14/2010 01:00:00
3. Order
5%
0.12%
100.00%
-
0.16%
-
12/13/2010 17:20:00
4. Order
1%
0.05%
100.00%
-
0.07%
-
12/13/2010 23:50:00
5. Order
6%
2.62%
100.00%
-
2.78%
-
12/13/2010 14:10:00
6. Order
0.5%
0.03%
100.00%
-
0.11%
-
12/15/2010 11:50:00
7. Order
5%
0.66%
100.00%
-
0.76%
-
12/16/2010 08:10:00
8. Order
0.5%
0.03%
100.00%
-
0.06%
-
12/15/2010 11:50:00
9. Order
1.5%
0.07%
100.00%
-
0.09%
-
12/16/2010 02:40:00
10. Order
0.5%
0.02%
100.00%
-
0.04%
-
12/15/2010 11:20:00
11. Order
3.5%
0.38%
100.00%
-
0.41%
-
12/12/2010 03:00:00
12. Order
0.5%
0.01%
100.00%
-
0.02%
-
12/15/2010 11:20:00
13. Order
3%
0.15%
100.00%
-
0.17%
-
12/18/2010 19:00:00
14. Order
0.5%
0.00%
100.00%
-
0.01%
-
12/13/2010 04:30:00
15. Order
0.5%
0.03%
100.00%
-
0.05%
-
12/13/2010 03:50:00
16. Order
0.5%
0.00%
100.00%
-
0.01%
-
12/13/2010 04:30:00
17. Order
2%
0.16%
100.00%
-
0.33%
-
12/13/2010 03:20:00
18. Order
0.5%
0.01%
100.00%
-
0.02%
-
12/13/2010 04:30:00
19. Order
1.5%
0.15%
100.00%
-
0.26%
-
12/13/2010 03:30:00
20. Order
0.5%
0.01%
100.00%
-
0.01%
-
12/13/2010 03:30:00
21. Order
0.5%
0.10%
100.00%
-
0.15%
-
12/13/2010 03:20:00
22. Order
0.5%
0.01%
100.00%
-
0.01%
-
12/13/2010 04:30:00
23. Order
1.5%
0.21%
100.00%
-
0.43%
-
12/13/2010 03:30:00
24. Order
0.5%
0.01%
100.00%
-
0.01%
-
12/13/2010 04:30:00
25. Order
1.5%
0.12%
100.00%
-
0.23%
-
12/13/2010 03:30:00
12 / 35
1/6/2011

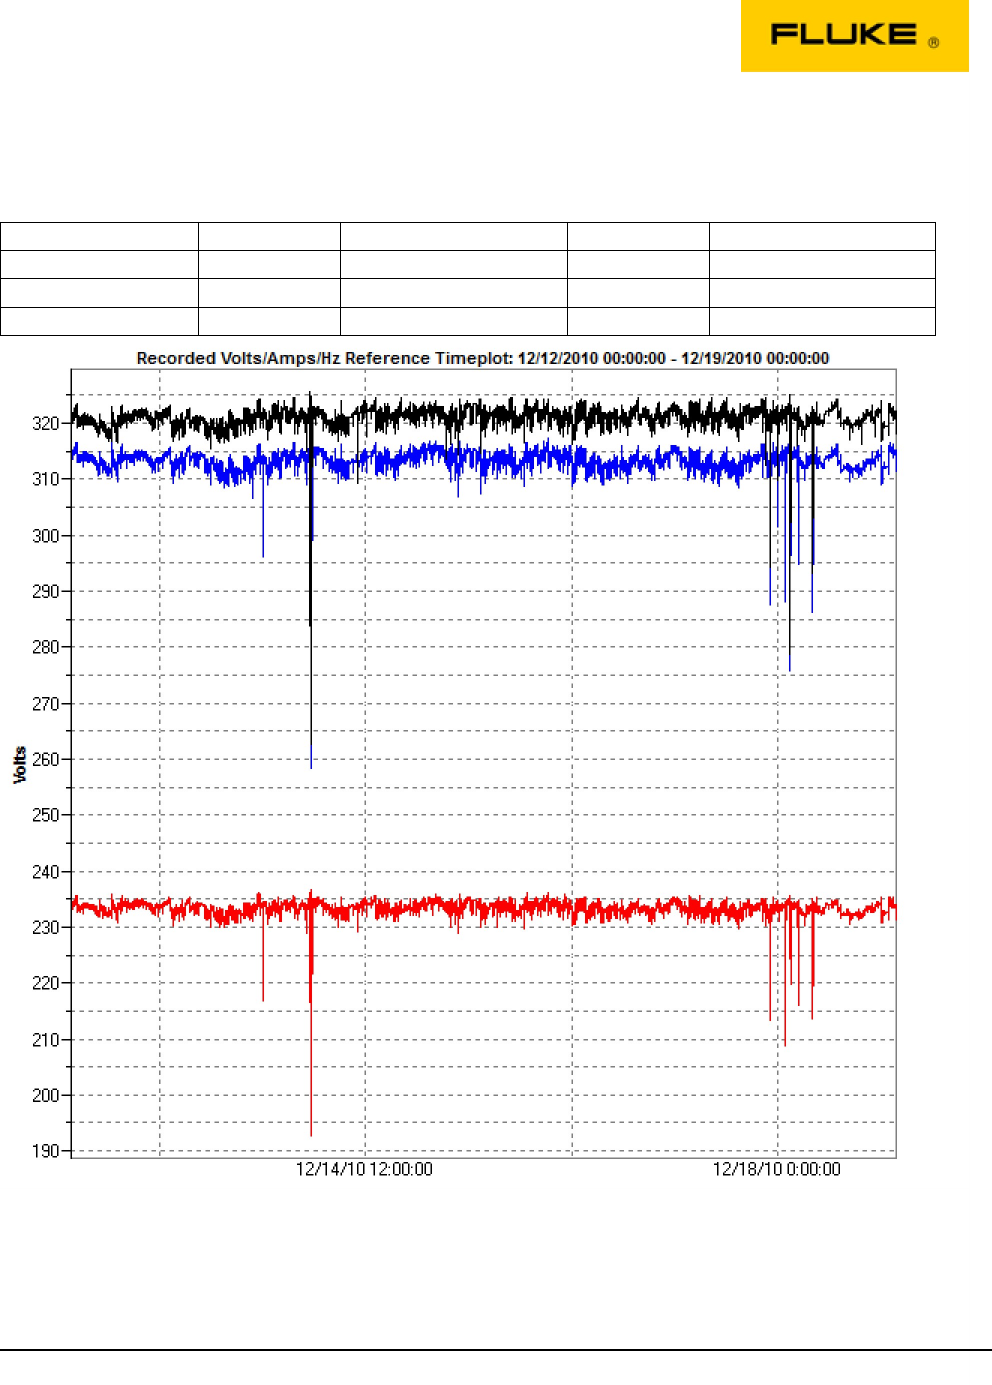
Volts/Amps/Hz
This section contains graphical summaries for each of the selected parameters during the
monitor period.
13 / 35
1/6/2011
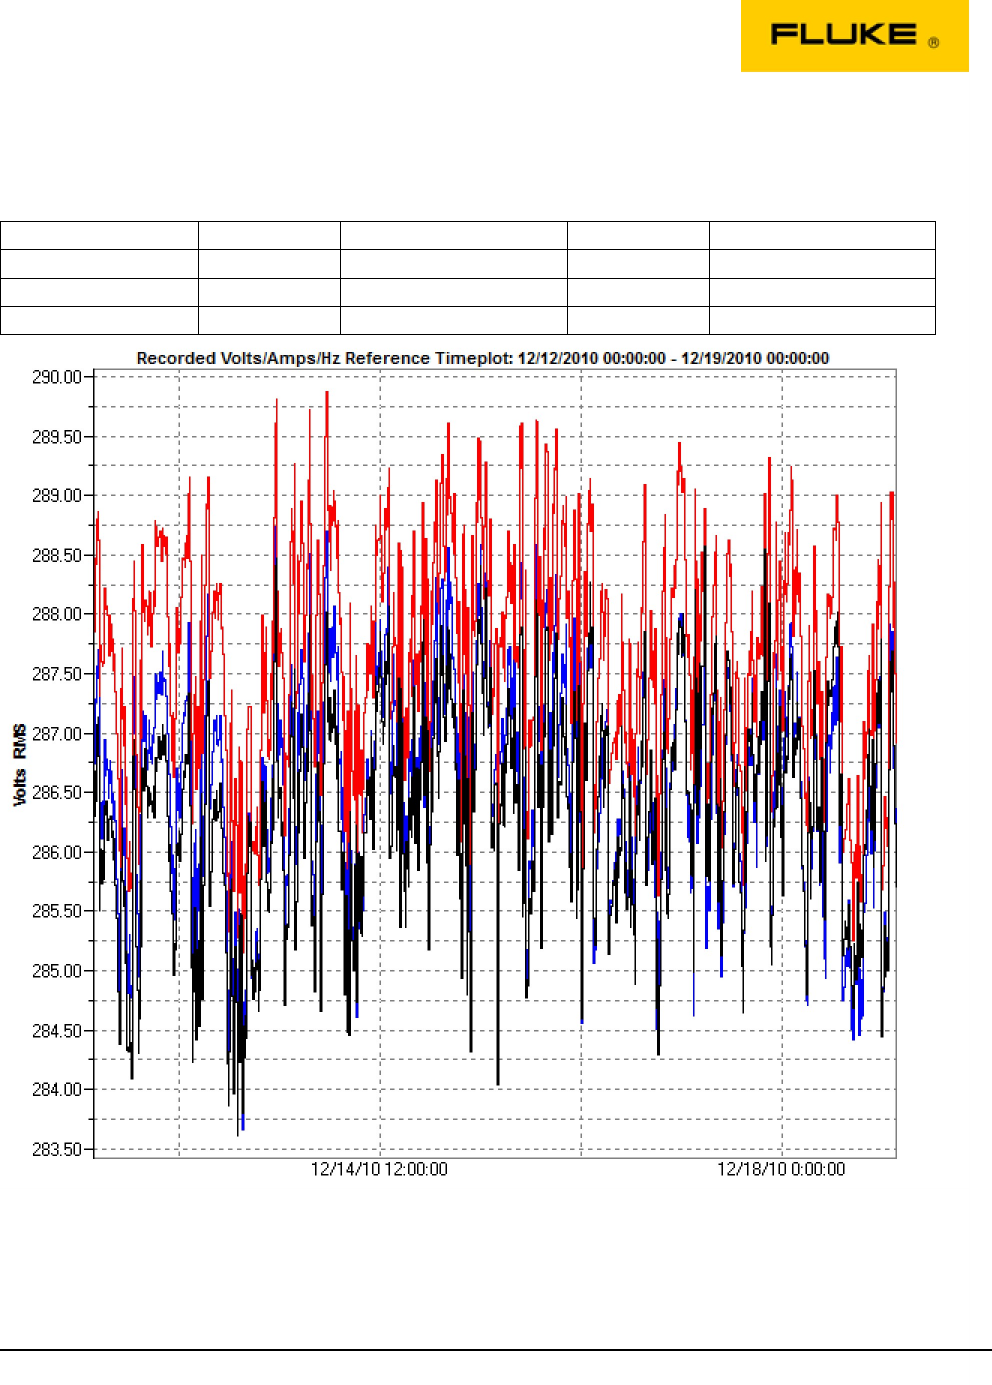
Volts/Amps/Hz
10 Minutes Trend Data
Phase
Max
Time
Min
Time
12/17/2010 08:00:00
288.57 V RMS
283.62 V RMS
12/13/2010 06:10:00
V RMS Avg AN
12/14/2010 00:50:00
289.87 V RMS
285.15 V RMS
12/13/2010 07:20:00
V RMS Avg BN
12/13/2010 14:20:00
288.95 V RMS
283.67 V RMS
12/13/2010 07:20:00
V RMS Avg CN
14 / 35
1/6/2011
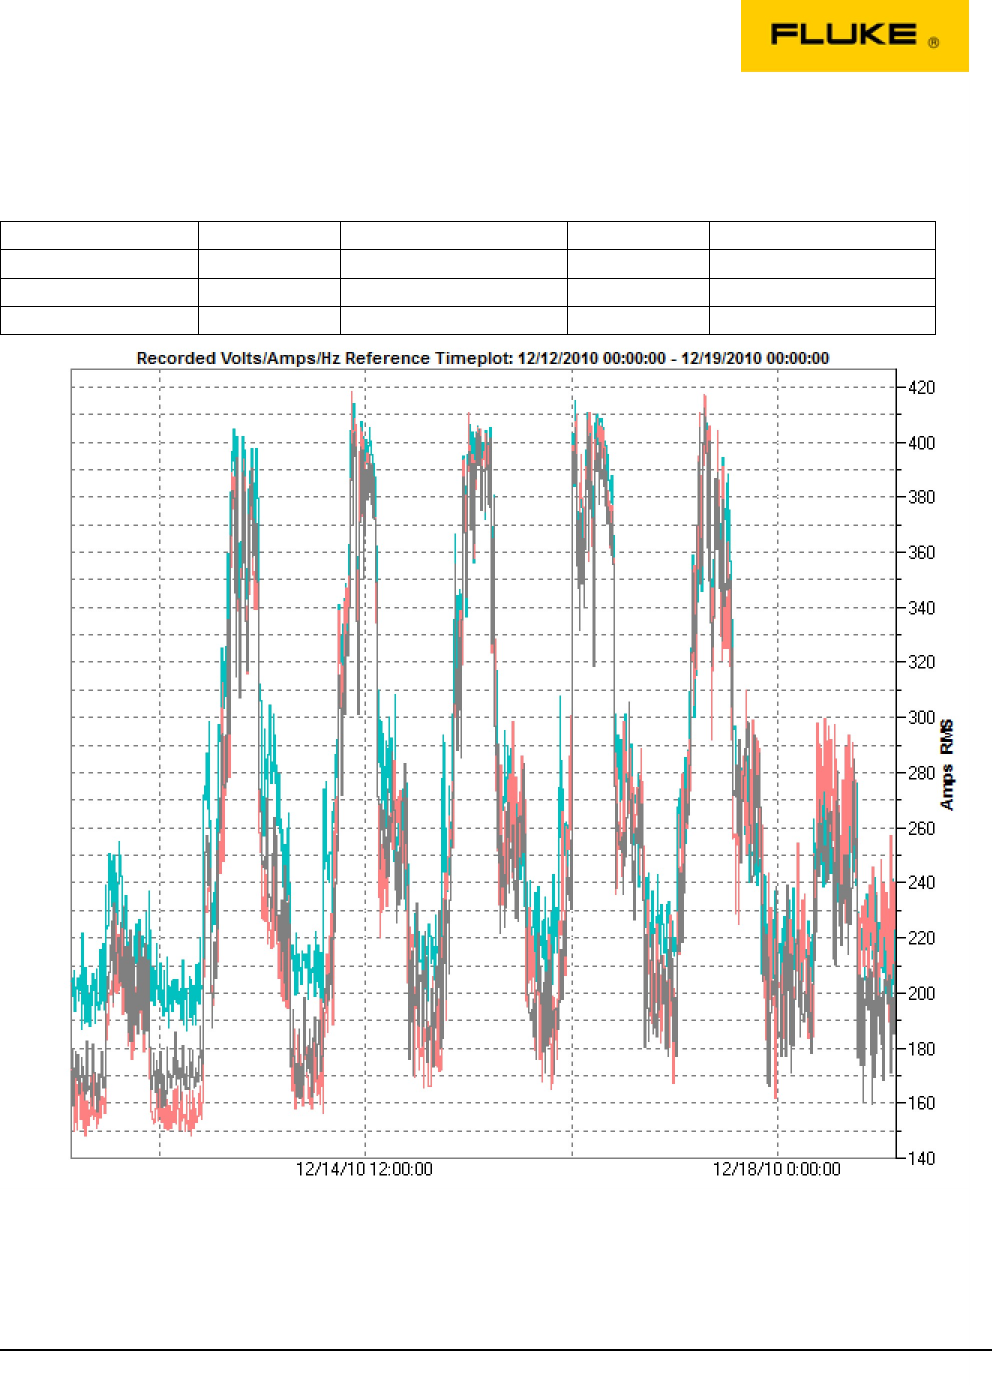
Volts/Amps/Hz
10 Minutes Trend Data
Phase
Max
Time
Min
Time
12/17/2010 09:00:00
412.41 A RMS
156.89 A RMS
12/12/2010 05:30:00
A RMS Avg A
12/14/2010 09:10:00
418.32 A RMS
148.43 A RMS
12/13/2010 00:30:00
A RMS Avg B
12/16/2010 06:40:00
415.03 A RMS
186.27 A RMS
12/12/2010 23:40:00
A RMS Avg C
15 / 35
1/6/2011
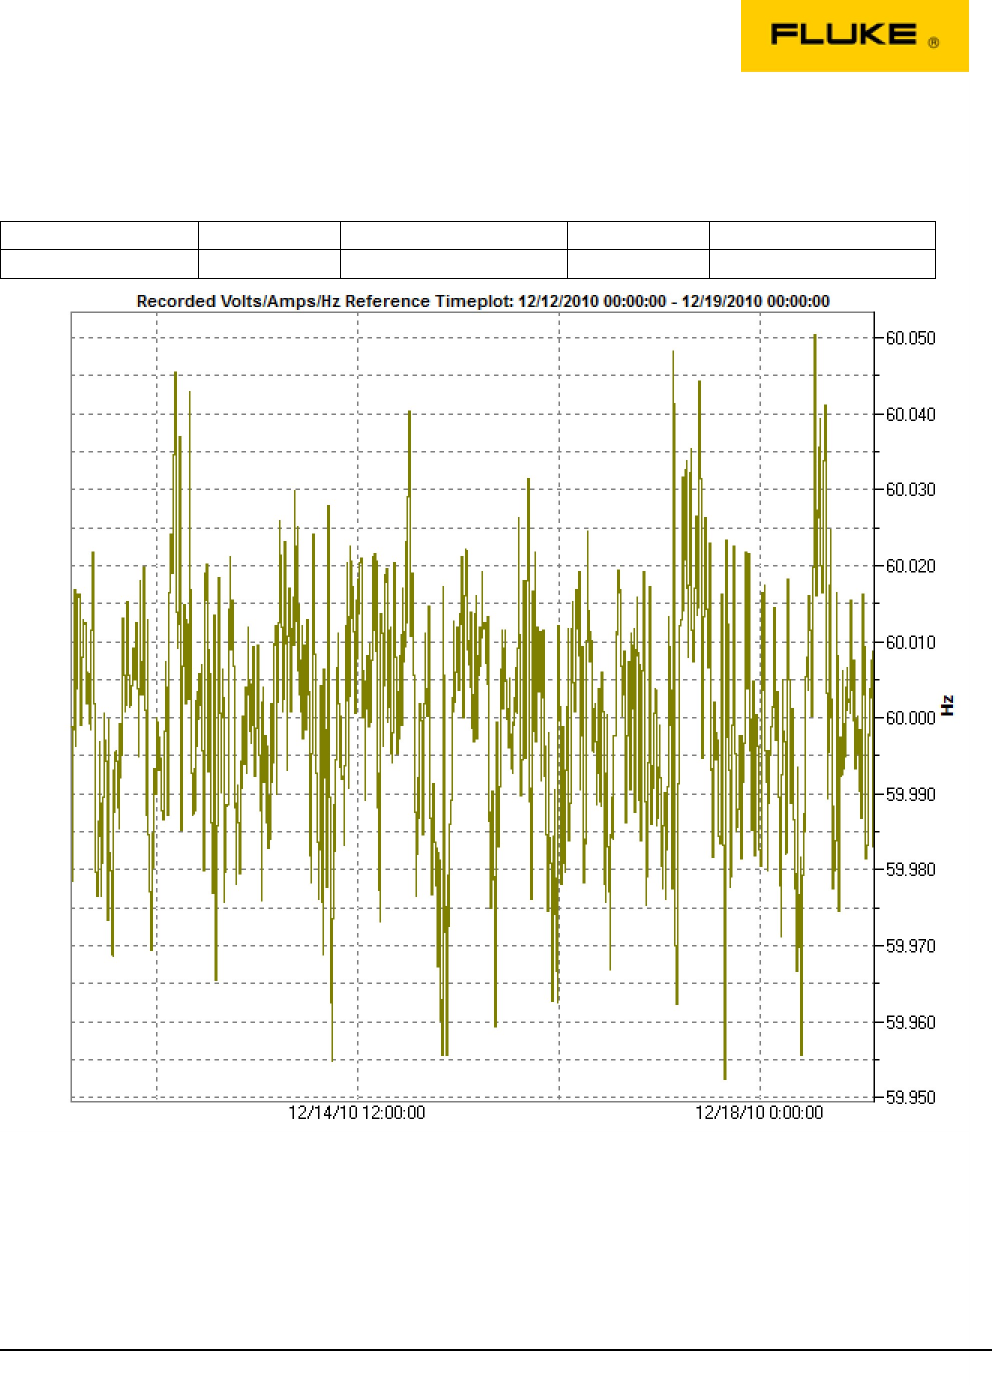
Volts/Amps/Hz
10 Minutes Trend Data
Phase
Max
Time
Min
Time
12/18/2010 11:40:00
60.05 Hz
59.95 Hz
12/17/2010 16:50:00
Freq Avg
16 / 35
1/6/2011
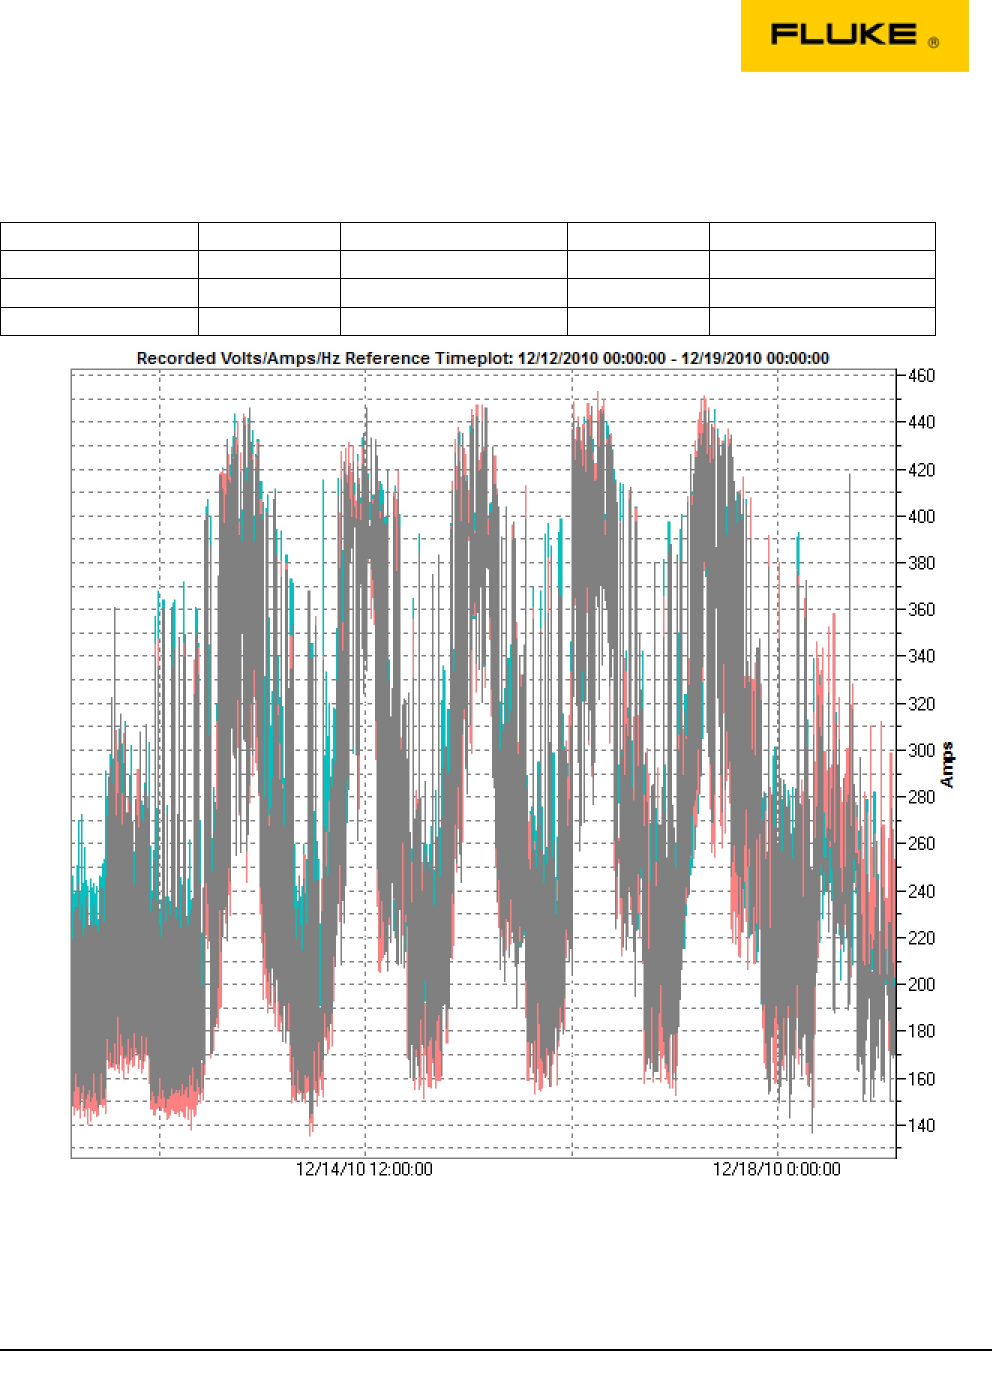
Volts/Amps/Hz
Detailed View
Phase
Max
Time
Min
Time
12/14/2010 00:36:24
325.69 V RMS
262.59 V RMS
12/14/2010 00:53:58
V RMS Avg AN
12/14/2010 00:55:54
236.62 V RMS
192.80 V RMS
12/14/2010 00:53:58
V RMS Avg BN
12/14/2010 00:55:54
318.17 V RMS
258.51 V RMS
12/14/2010 00:53:58
V RMS Avg CN
17 / 35
1/6/2011
Volts/Amps/Hz
Detailed View
Phase
Max
Time
Min
Time
12/16/2010 09:59:13
446.42 A RMS
136.75 A RMS
12/18/2010 06:45:51
A RMS Avg A
12/16/2010 11:15:51
453.06 A RMS
135.64 A RMS
12/14/2010 00:42:18
A RMS Avg B
12/16/2010 11:15:51
445.65 A RMS
164.91 A RMS
12/18/2010 06:45:51
A RMS Avg C
18 / 35
1/6/2011
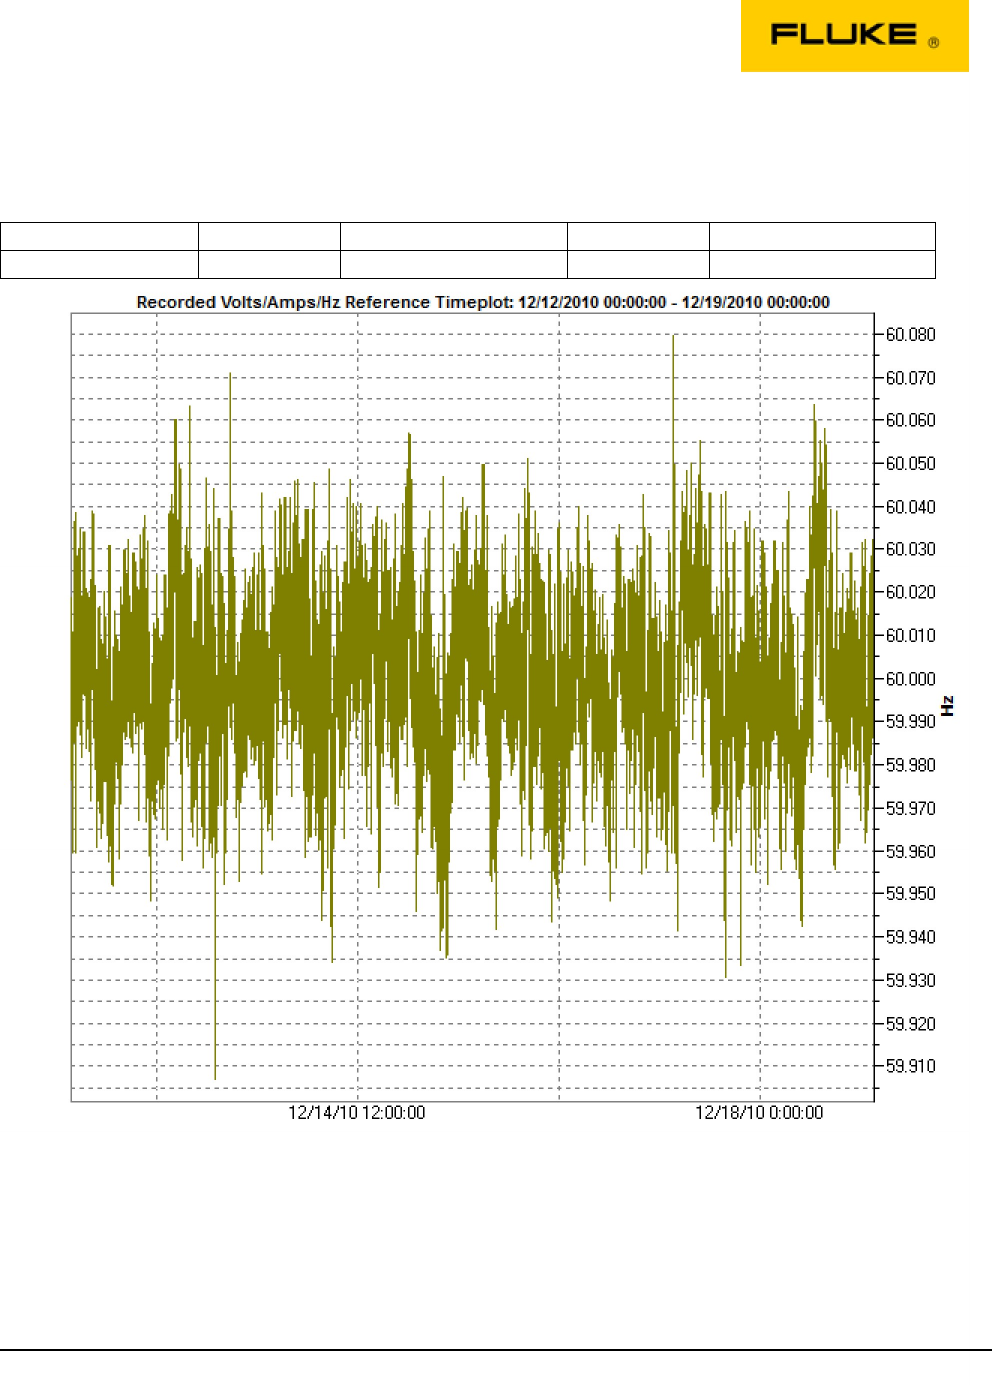
Volts/Amps/Hz
Detailed View
Phase
Max
Time
Min
Time
12/17/2010 05:57:40
60.08 Hz
59.91 Hz
12/13/2010 06:12:10
Freq Avg
19 / 35
1/6/2011

Events
The Events section is a summary of the voltage and current events that occurred at this
location during the monitor period.
Events are defined as changes in the monitored voltage or current. These changes may be
subtle or severe.
Tolerance curves provide a graphical representation of the likelihood of an event to disrupt
equipment operations. Tolerance curves classify the event by magnitude and duration;
there are standardized tolerance curves for voltage such as CBEMA or ITIC and for current,
circuit breaker manufacturers supply curves of their equipments operation.
20 / 35
1/6/2011
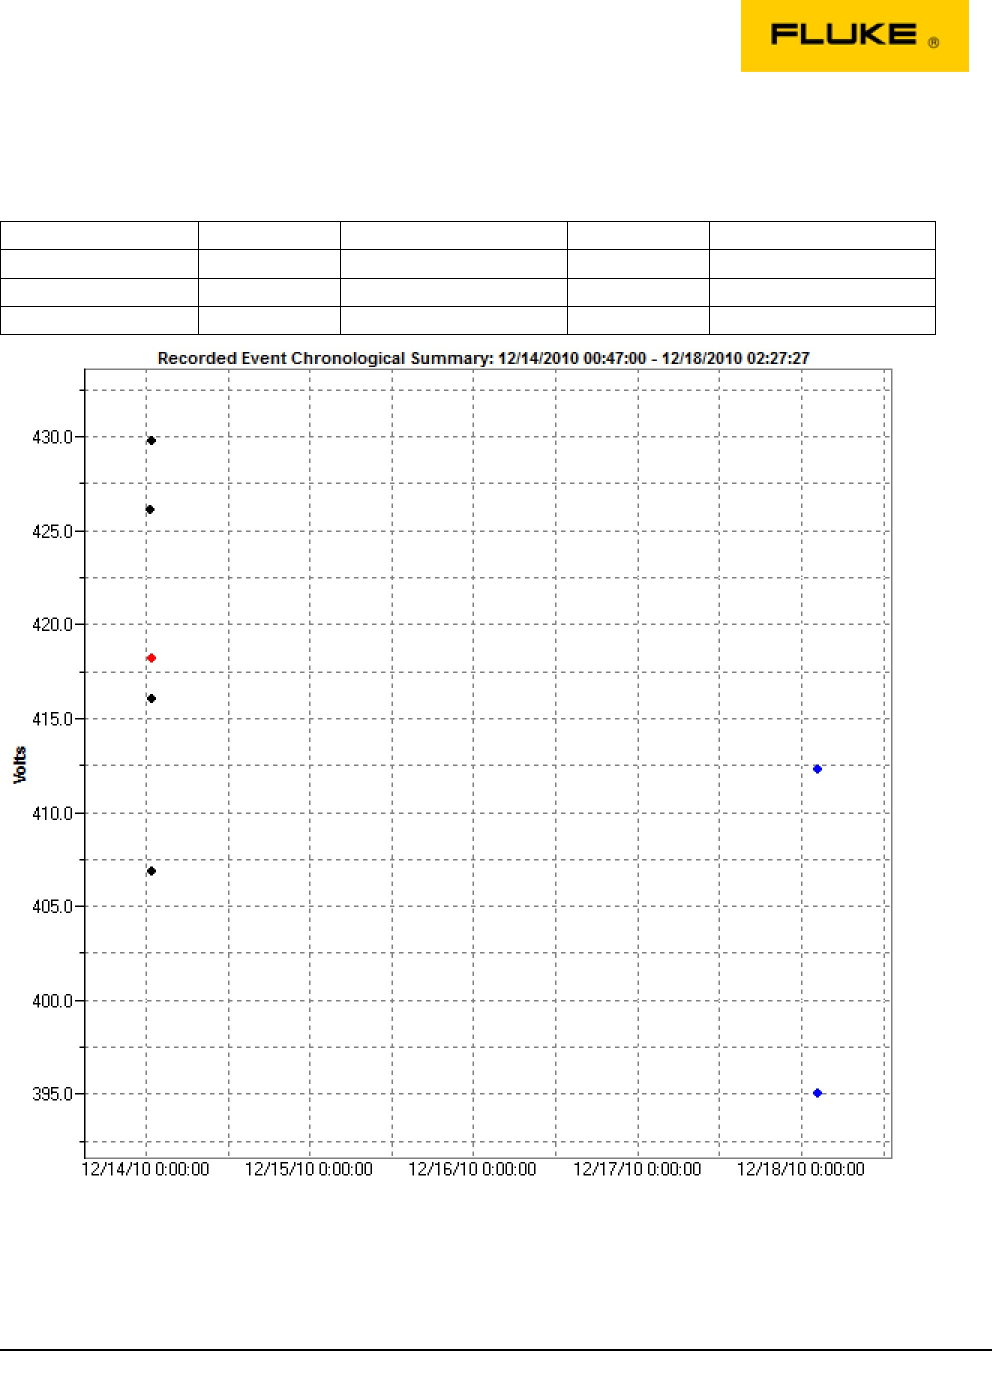
Events
Phase
Max
Time
Min
Time
12/14/2010 00:54:02
429.79 V
406.86 V
12/14/2010 00:54:43
V RMS Avg AB
12/14/2010 00:54:51
418.16 V
418.16 V
12/14/2010 00:54:51
V RMS Avg BC
12/18/2010 02:27:27
412.25 V
395.06 V
12/18/2010 02:27:16
V RMS Avg CA
21 / 35
1/6/2011
Events
7 of 7 shown (max 50 worst per type)
#
Type
Date/Time
Duration (d-h:mm:ss)
Absolute
% of Nominal
Phase
Dip
12/18/2010 02:27:16.483.995
0 - 00:00:00.058096300
82.30%
1
395.06 V
CA
Dip
12/14/2010 00:54:42.834.938
0 - 00:00:00.050029700
84.76%
2
406.86 V
AB
Dip
12/18/2010 02:27:26.573.486
0 - 00:00:00.041521300
85.88%
3
412.25 V
CA
Dip
12/14/2010 00:53:57.020.506
0 - 00:00:00.050005200
86.67%
4
416.01 V
AB
Dip
12/14/2010 00:54:51.230.315
0 - 00:00:00.058511800
87.12%
5
418.16 V
BC
Dip
12/14/2010 00:46:59.745.900
0 - 00:00:00.025038700
88.77%
6
426.09 V
AB
Dip
12/14/2010 00:54:02.161.249
0 - 00:00:00.033316900
89.54%
7
429.79 V
AB
22 / 35
1/6/2011
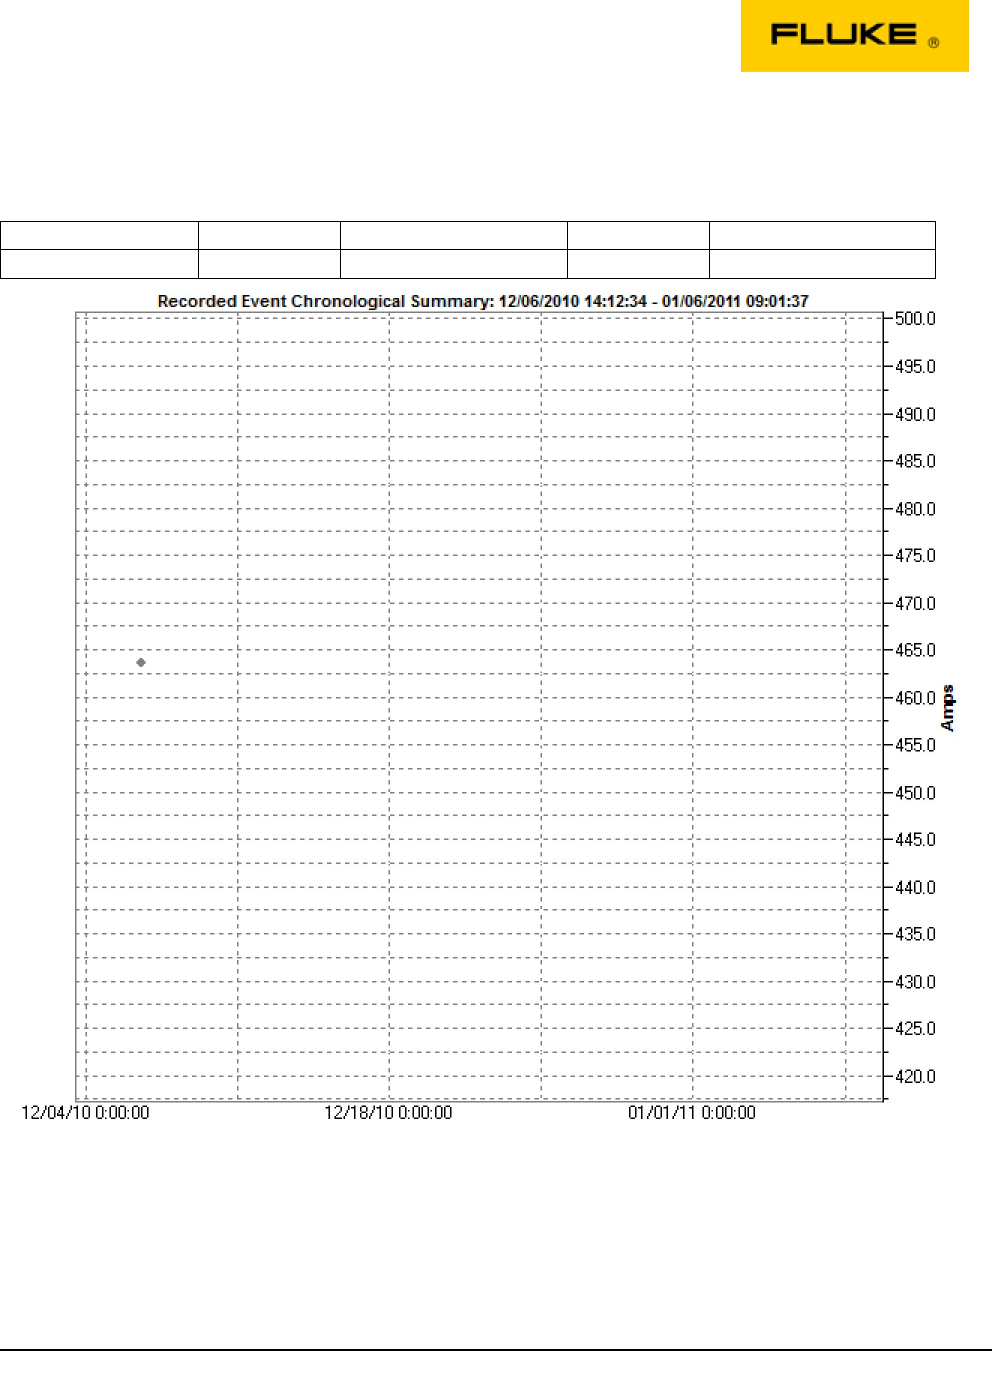
Events
Phase
Max
Time
Min
Time
12/06/2010 14:12:34
463.62 A
463.62 A
12/06/2010 14:12:34
A RMS Avg A
23 / 35
1/6/2011

Events
1 of 1 shown (max 50 worst per type)
#
Type
Date/Time
Duration (d-h:mm:ss)
Absolute
% of Nominal
Phase
Current
12/06/2010 14:12:34.195.428
30 - 18:49:03.189677900
96.59%
1
463.62 A
A
24 / 35
1/6/2011

Harmonics/
Interharmonics
This section contains the voltage and current harmonics acquired during the monitor period.
Harmonics may be represented in summary showing the overall harmonics in a spectral format
or individual harmonics may be graphed over time to indicate the effects of harmonics and
particular loads switching on.
Harmonics are typically caused by switching electronic loads. The distortion caused by
harmonics can cause overheating in conductors and equipment and may cause equipment
malfunctions.
25 / 35
1/6/2011
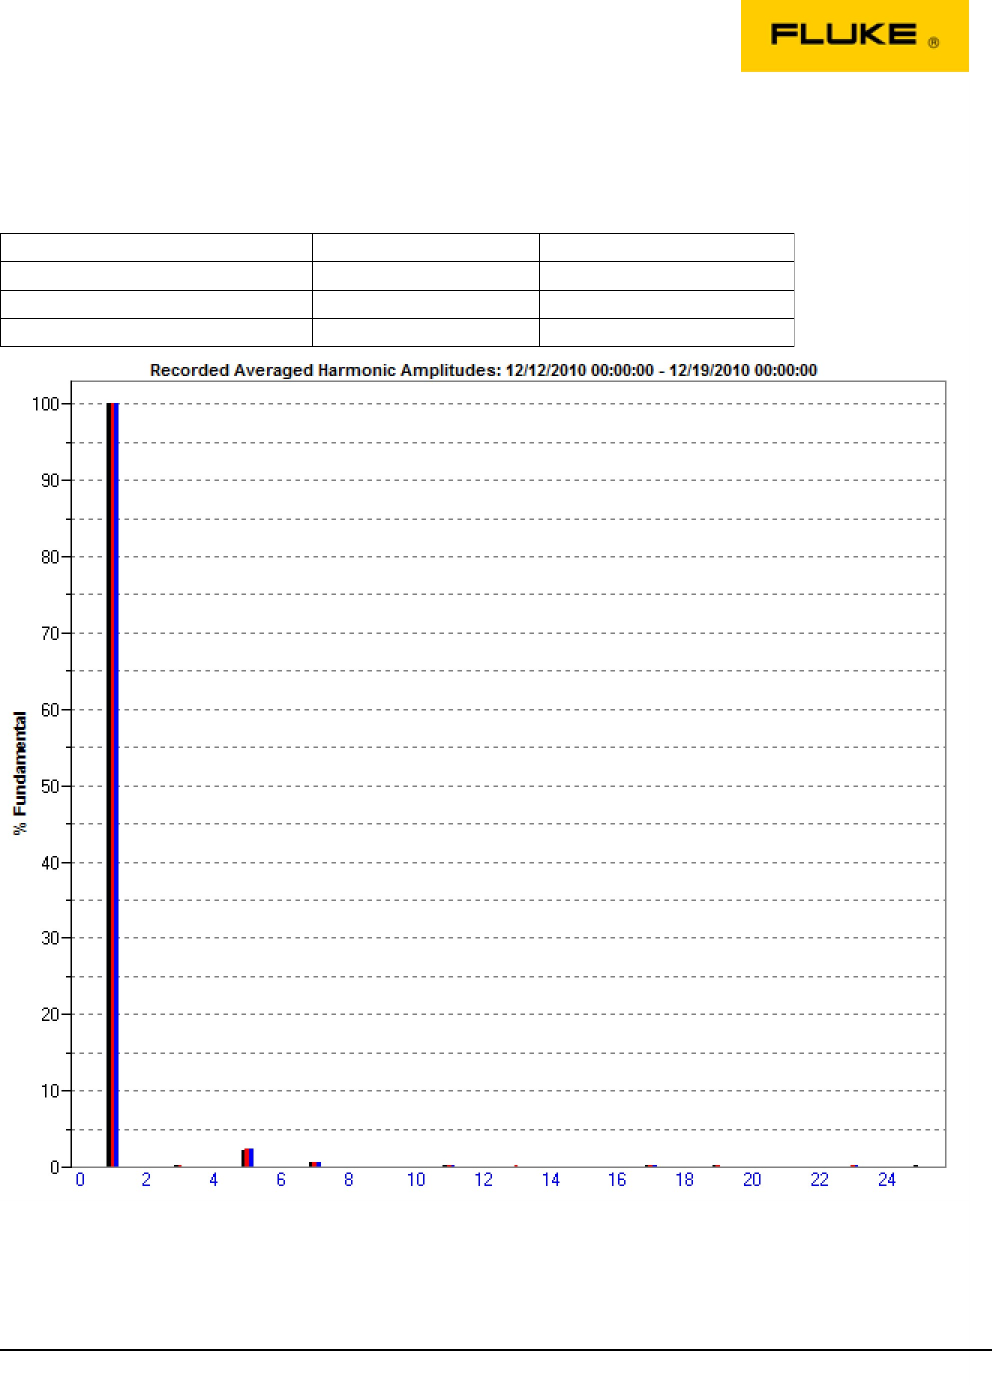
Harmonics/
Interharmonics
Phase
Max
Harmonic Order
1
100.00 %
V Harmonics Avg AB
1
100.00 %
V Harmonics Avg BC
1
100.00 %
V Harmonics Avg CA
26 / 35
1/6/2011
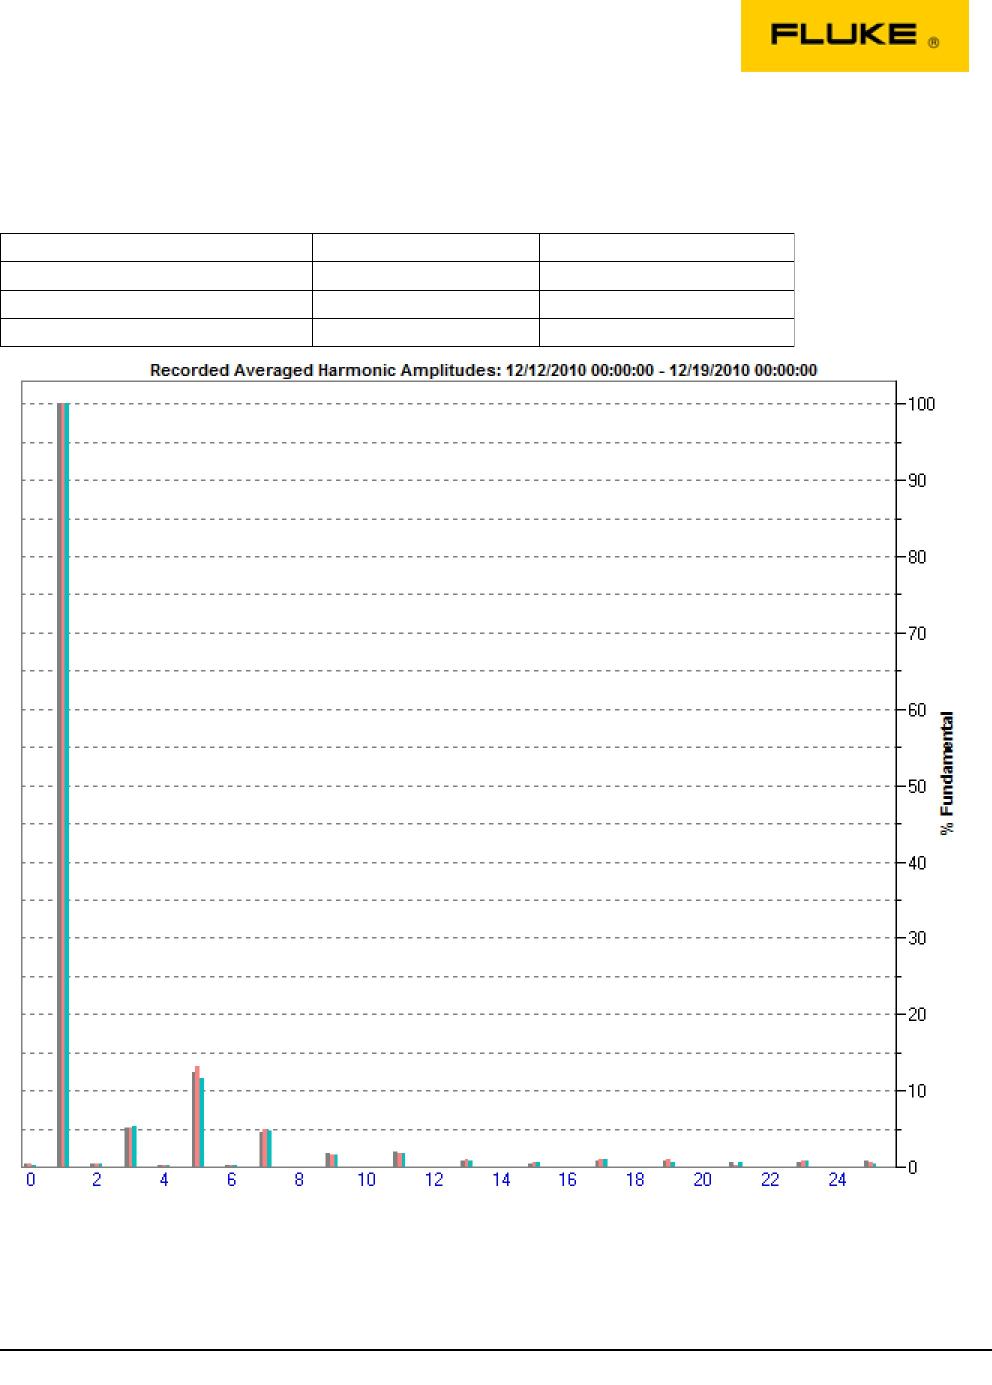
Harmonics/
Interharmonics
Phase
Max
Harmonic Order
1
100.00 %
A Harmonics Avg A
1
100.00 %
A Harmonics Avg B
1
100.00 %
A Harmonics Avg C
27 / 35
1/6/2011

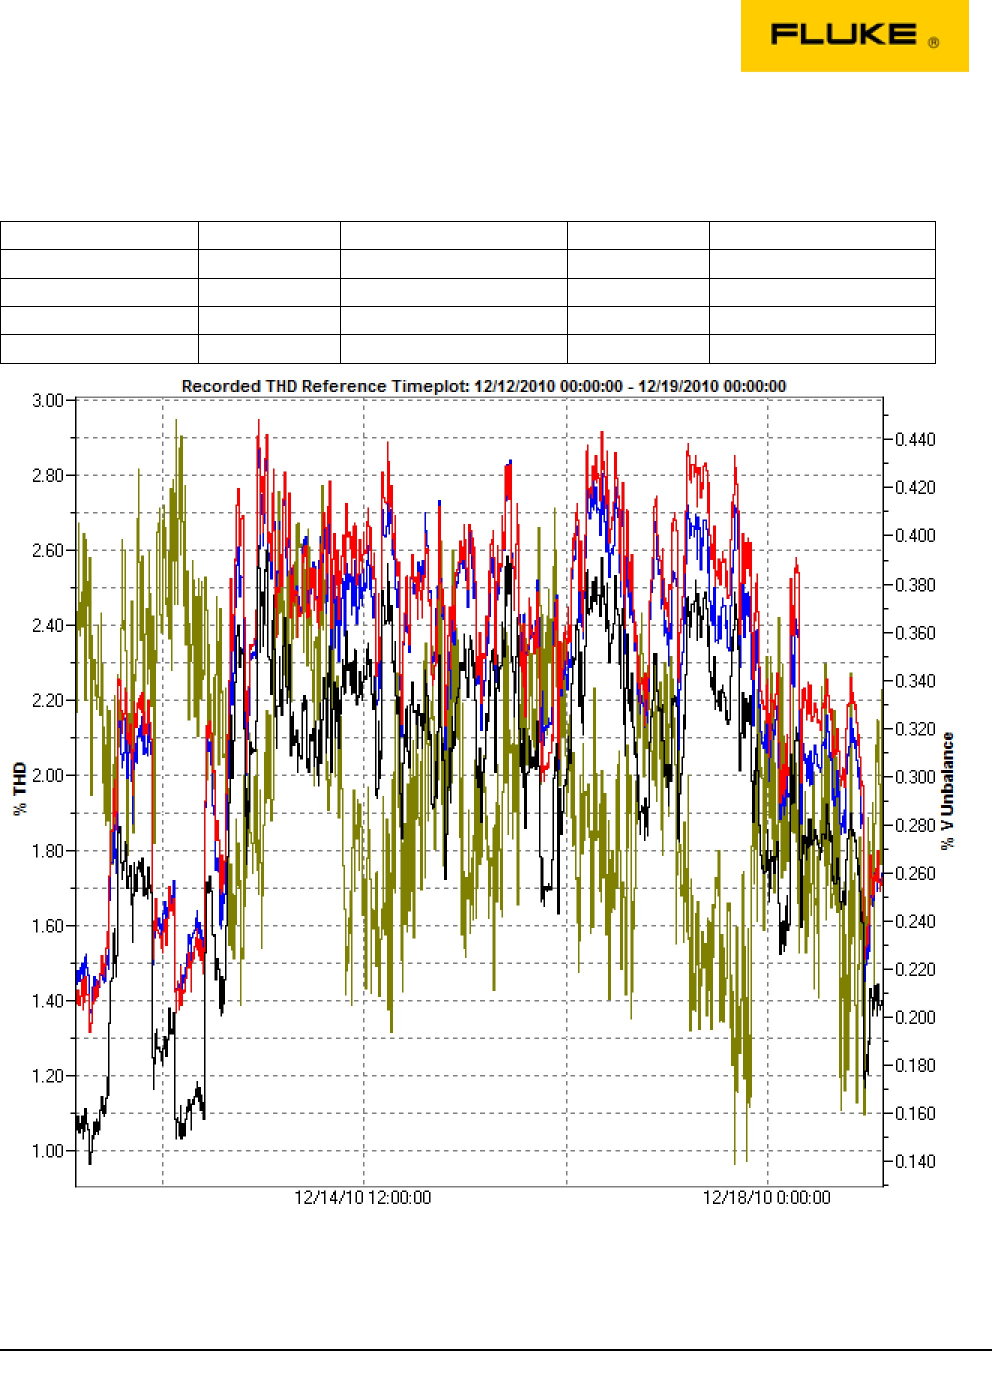
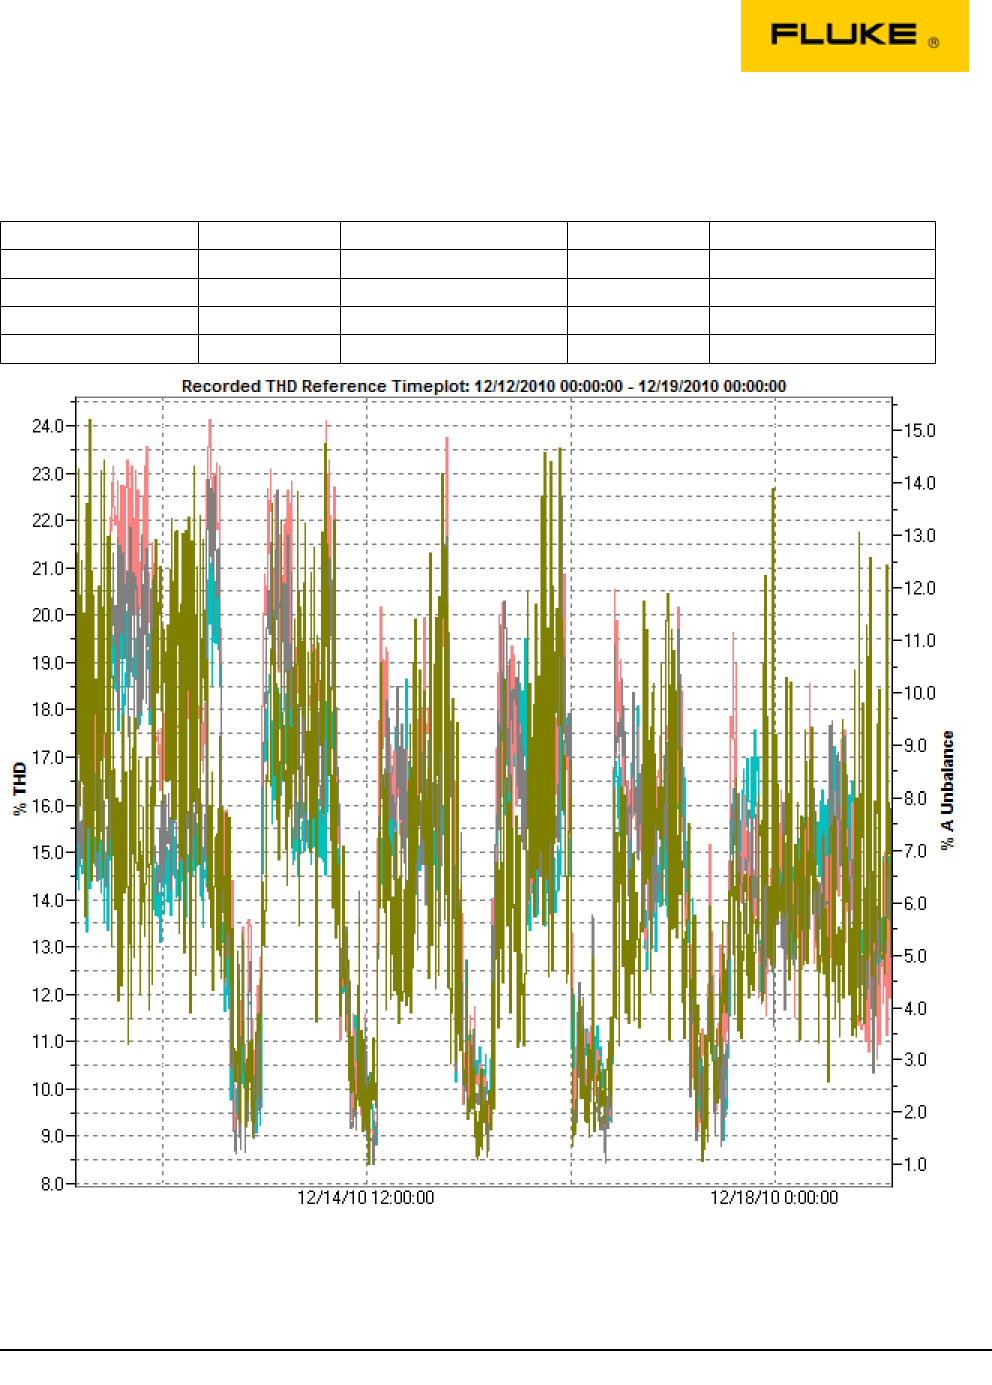
Total Harmonic Distortion (THD) /
Unbalance
This section contains summaries of THD for voltage and current.
Additionally graphical summaries of voltage and current unbalanced are displayed during the
monitor interval.
There are international standards recommending the allowable level of harmonic distortion, the
levels vary depending on the operating voltage level, it is recommended that you consult the
local prevailing standard for comparison with the levels found in this report.
Excessive voltage unbalance is an indication that one or two phases may be overloaded. A
redistribution of the loads on one or more of the phases may be in order.
Excessive current unbalance also indicates a poor distribution of loads. Although there may be
no corresponding voltage unbalance, excessive current unbalance may result in tripped circuit
breakers or transformer overheating.
28 / 35
1/6/2011
Total Harmonic Distortion (THD) /
Unbalance
Phase
Max
Time
Min
Time
12/13/2010 14:10:00
2.61 % THD
0.97 % THD
12/12/2010 03:00:00
V THD Avg AB
12/13/2010 14:10:00
2.95 % THD
1.31 % THD
12/12/2010 03:00:00
V THD Avg BC
12/13/2010 14:10:00
2.89 % THD
1.37 % THD
12/12/2010 03:10:00
V THD Avg CA
12/12/2010 21:00:00
0.45
0.14
12/17/2010 17:10:00
% V Unbalance
29 / 35
1/6/2011
Total Harmonic Distortion (THD) /
Unbalance
Phase
Max
Time
Min
Time
12/12/2010 03:00:00
15.21
1.02
12/14/2010 12:30:00
% A Unbalance
12/13/2010 04:50:00
22.93 % THD
8.42 % THD
12/14/2010 13:20:00
A THD Avg A
12/13/2010 03:40:00
24.13 % THD
8.82 % THD
12/16/2010 13:10:00
A THD Avg B
12/13/2010 03:30:00
21.20 % THD
8.81 % THD
12/14/2010 14:00:00
A THD Avg C
30 / 35
1/6/2011

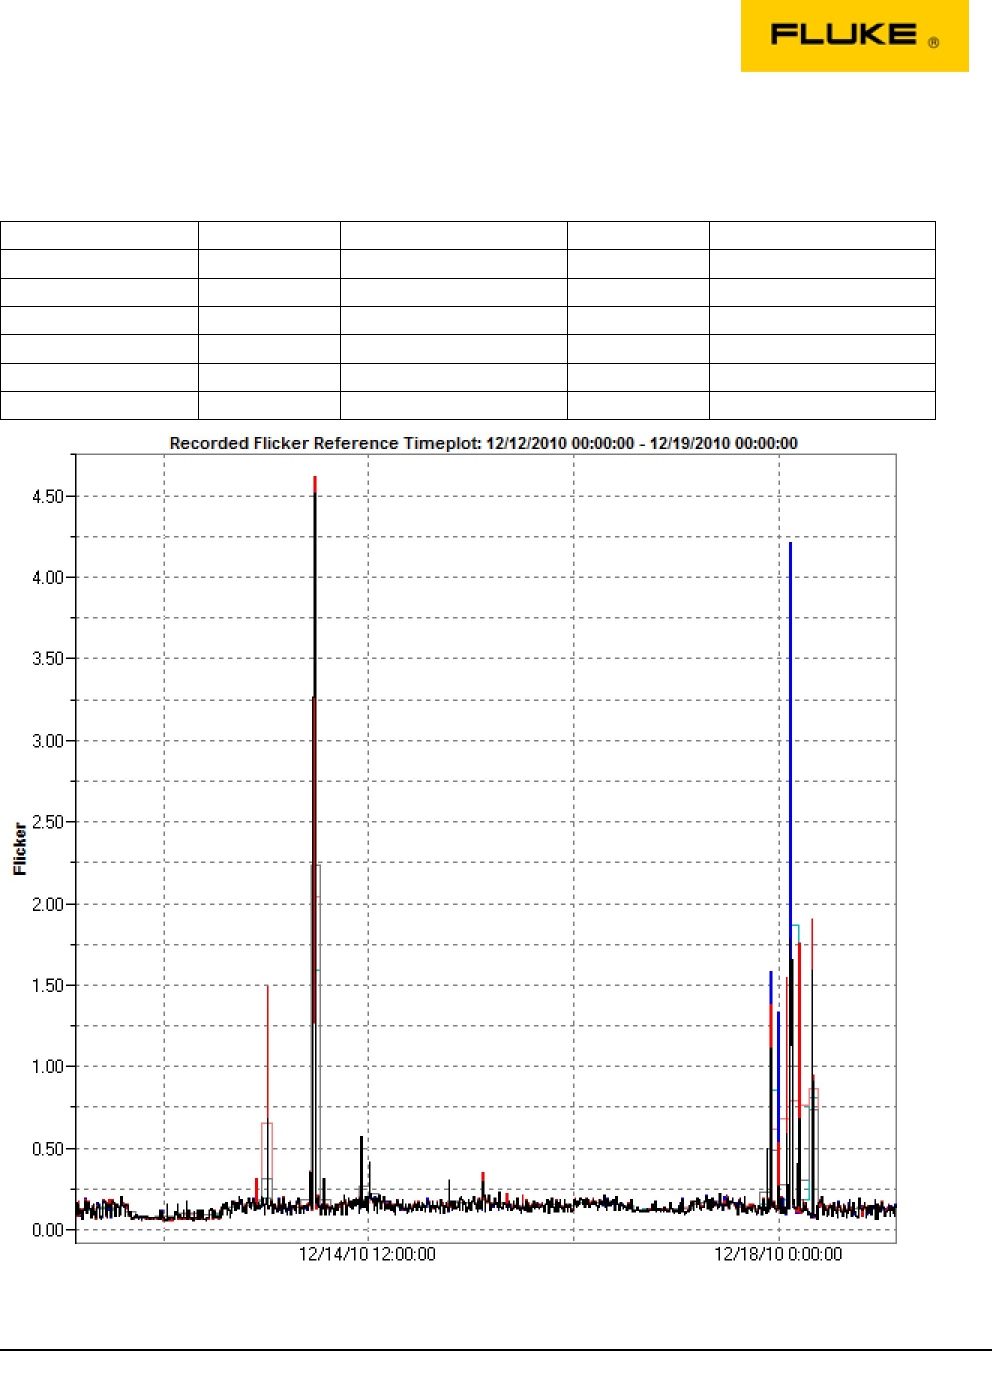
Flicker
The Flicker section shows the effects of large fluctuating loads.
The standard flicker variables PST (short term, 10 minute value) and PLT (long term, 120
minute value) are graphed.
Flicker is a statistical measurement relating to the effect of fluctuating loads on lighting and
other sensitive equipment.
The typical sources of flicker are steel mills using large electric motors or arc furnaces on a
distribution network, or frequent starting of an elevator motor in an office building, or if a rural
residence has a large water pump starting regularly on a long feeder system.
31 / 35
1/6/2011
Flicker
Phase
Max
Time
Min
Time
12/14/2010 01:00:00
4.51
0.06
12/13/2010 00:10:00
Flicker Pst Avg AB
12/14/2010 01:00:00
4.62
0.06
12/12/2010 19:20:00
Flicker Pst Avg BC
12/18/2010 02:30:00
4.22
0.06
12/12/2010 22:30:00
Flicker Pst Avg CA
12/14/2010 00:20:00
2.23
0.07
12/12/2010 14:20:00
Flicker Plt Avg AB
12/14/2010 00:20:00
2.04
0.07
12/12/2010 14:20:00
Flicker Plt Avg BC
12/18/2010 02:20:00
1.87
0.07
12/12/2010 14:20:00
Flicker Plt Avg CA
32 / 35
1/6/2011

Power/Energy
The VA, var, Watts, power factor and energy by phase and totals acquired during the monitor
period are graphed or totals shown in tabular form.
33 / 35
1/6/2011
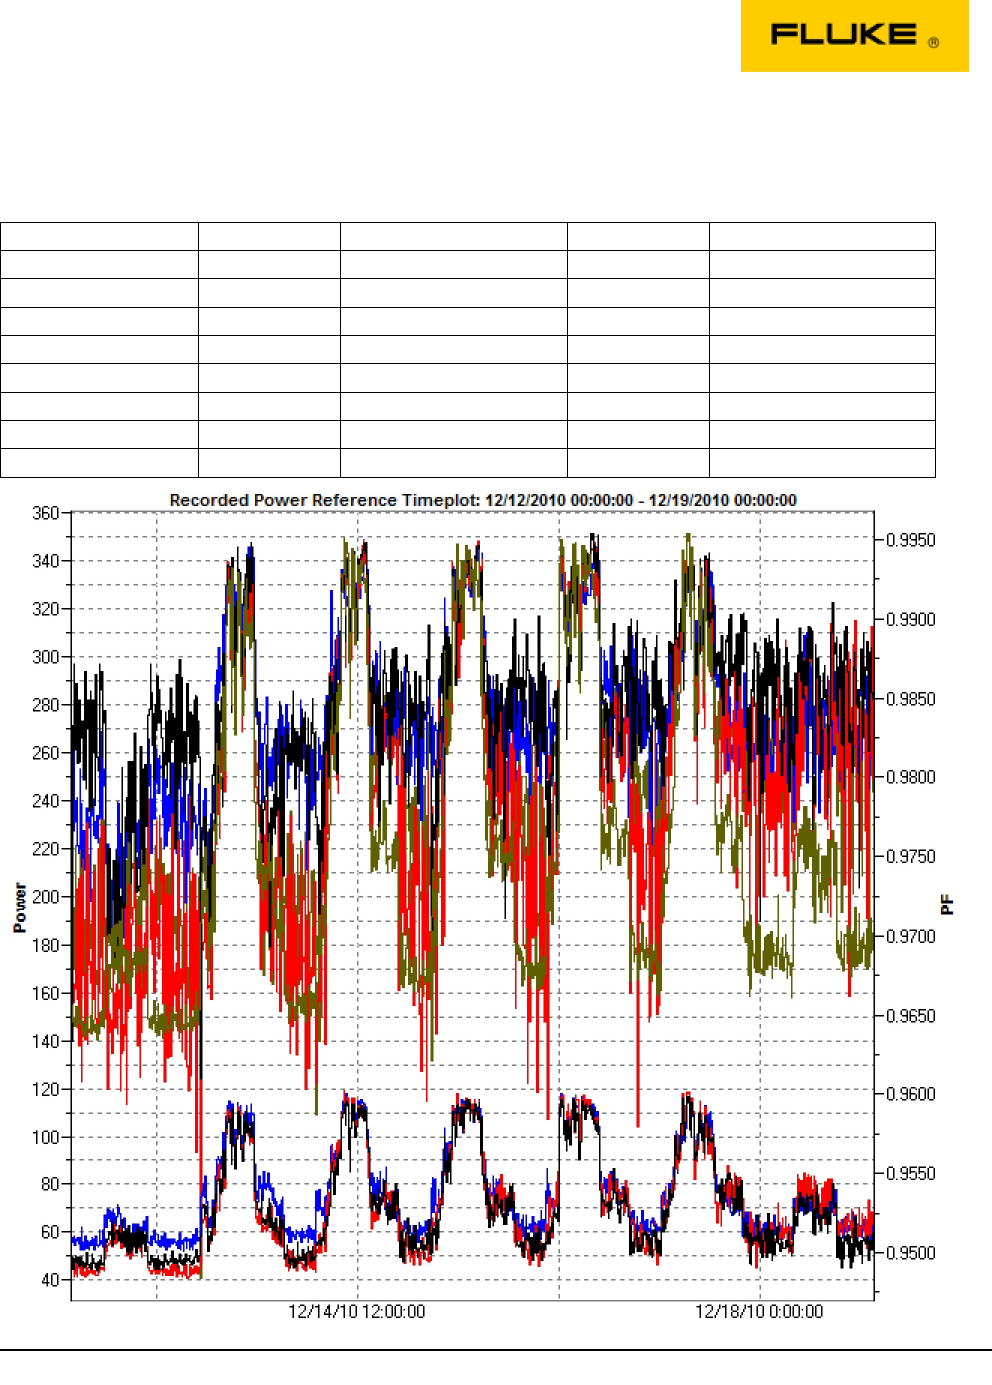
Power
Demand Period: 10 min
Phase
Max
Time
Min
Time
12/17/2010 09:00:00
116.89 kW
43.78 kW
12/12/2010 05:30:00
kW Avg A
12/14/2010 09:10:00
119.33 kW
41.04 kW
12/13/2010 00:30:00
kW Avg B
12/16/2010 06:40:00
117.69 kW
52.35 kW
12/12/2010 23:40:00
kW Avg C
12/17/2010 09:00:00
351.51 kW
140.62 kW
12/12/2010 05:30:00
kW Avg Total
12/16/2010 12:50:00
1.00 PF
0.96 PF
12/13/2010 03:10:00
PF Avg A
12/16/2010 13:10:00
1.00 PF
0.95 PF
12/13/2010 03:10:00
PF Avg B
12/15/2010 13:20:00
0.99 PF
0.96 PF
12/13/2010 03:10:00
PF Avg C
12/15/2010 13:20:00
0.99 PF
0.95 PF
12/13/2010 03:10:00
PF Avg Total
34 / 35
1/6/2011
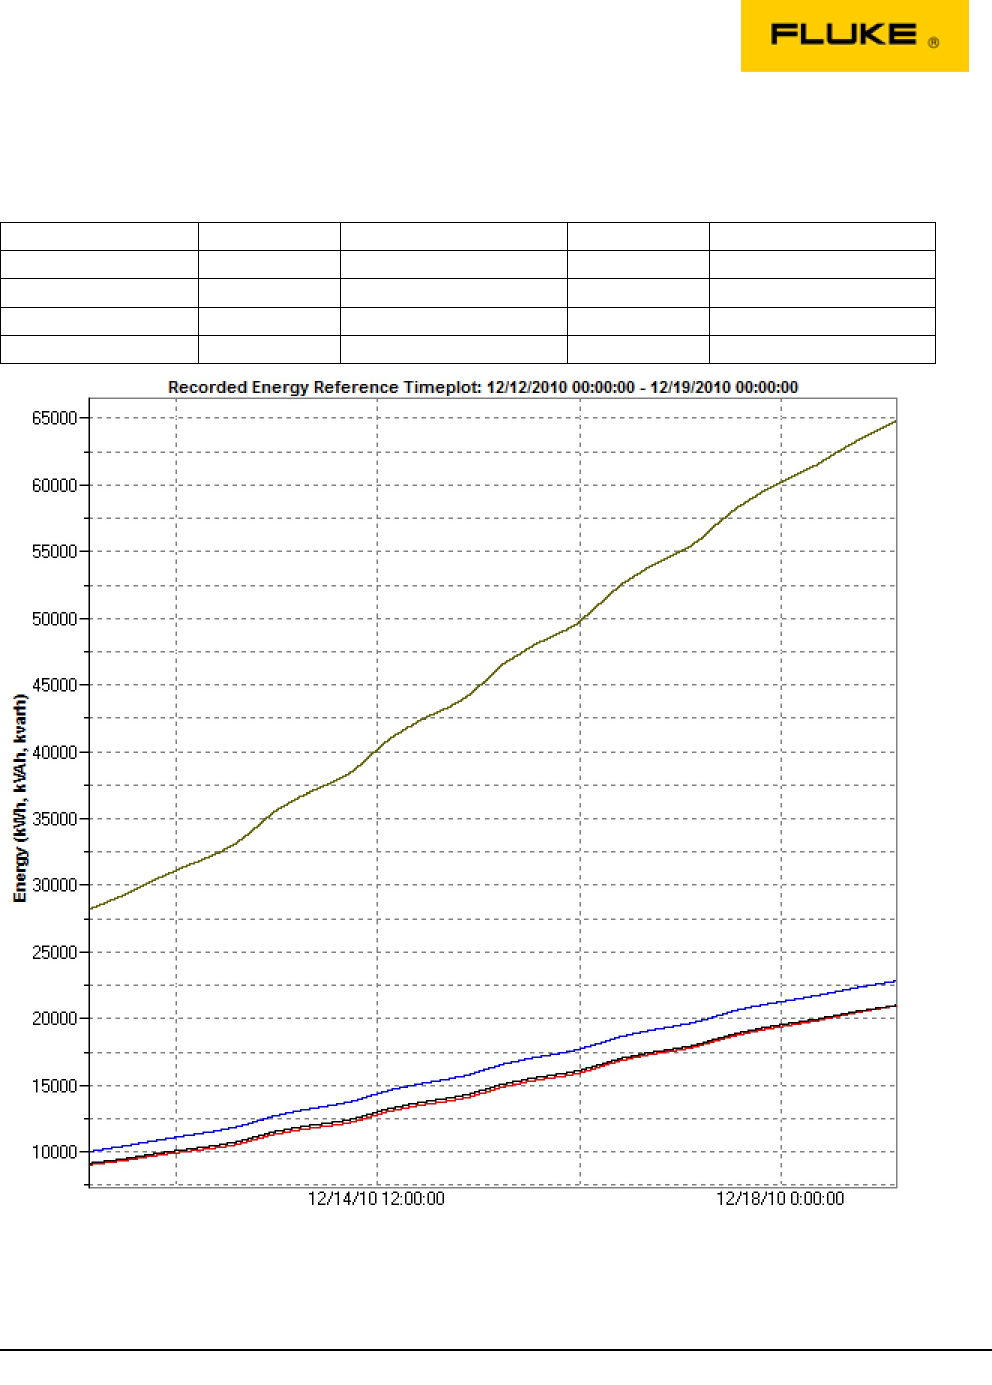
Energy
Demand Period: 10 min
Phase
Max
Time
Min
Time
12/19/2010 00:10:00
21008.14 kWh
9137.47 kWh
12/12/2010 00:00:00
kWh Avg A
12/19/2010 00:10:00
20993.67 kWh
9034.73 kWh
12/12/2010 00:00:00
kWh Avg B
12/19/2010 00:10:00
22842.27 kWh
10022.89 kWh
12/12/2010 00:00:00
kWh Avg C
12/19/2010 00:10:00
64844.08 kWh
28195.09 kWh
12/12/2010 00:00:00
kWh Avg Total
35 / 35
1/6/2011
