Fluke 971 Application Note 2519671
2015-09-09
: Fluke Fluke-971-Application-Note-808536 fluke-971-application-note-808536 fluke pdf
Open the PDF directly: View PDF ![]() .
.
Page Count: 5

Application Note
Ask many school administrators
about the air quality inside their
buildings, and the frank answer is
liable to be “Well, we don’t know.”
They should. School air quality
and student performance go
together as naturally as breathing
in and breathing out.
In the words of the U.S. Envi-
ronmental Protection Agency
(EPA), “Good indoor air quality
contributes to a favorable learning
environment for students, per-
formance of teachers and staff,
and a sense of comfort, health,
and well-being. These elements
combine to assist a school in its
core mission educating children.”1
This article provides key facts
about why school air quality is so
important, plus the building blocks
to start developing an air quality
management plan to help your
schools provide a healthy and
comfortable indoor environment
and minimize risk and liability.
A threat to the school’s
educational mission
Poor IAQ can compromise the
learning environment, trigger
health problems among students
and staff, and snowball into
major issues of remediation and
liability.
•A 2004 review by the U.S.
Department of Education
identified adverse health
effects related to the presence
of chemical pollutants, lead,
biological pollutants such as
mold, allergens and airborne
particles.
Indoor air quality:
Can your schools
pass the test?
From the Fluke Digital Library @ www.fluke.com/library
•The same study concluded
that “it is also likely that inad-
equate IEQ (indoor environ-
mental quality) conditions are
common in U.S. schools and
lead to adverse effects on stu-
dents and teachers.”2
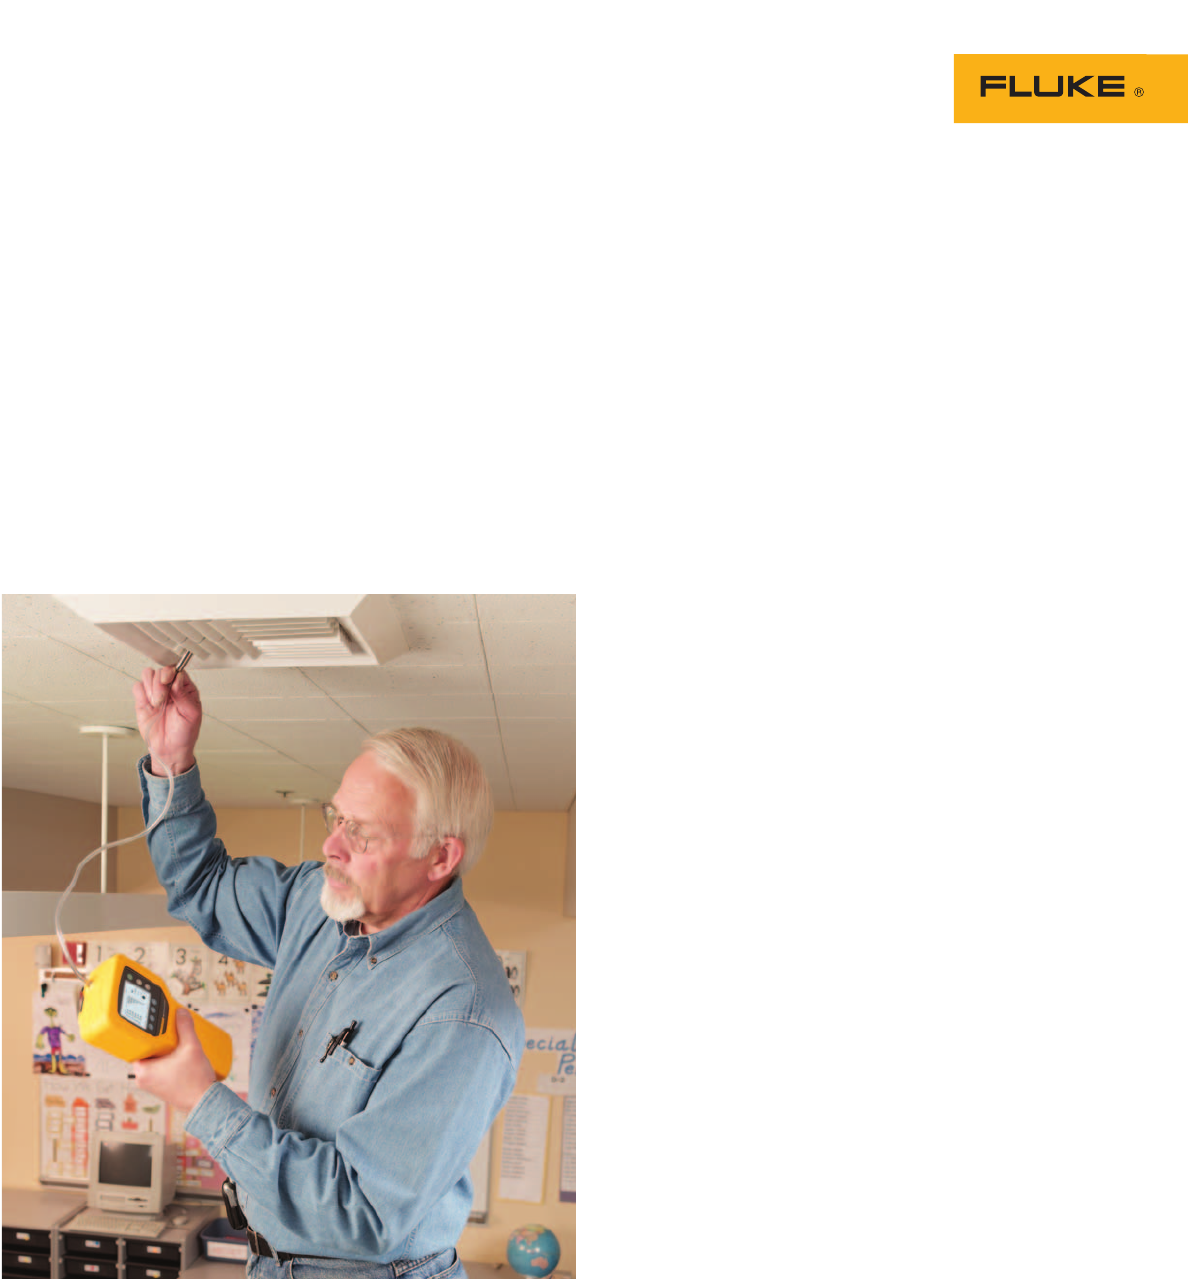
Measuring ambient temperature and relative humidity to evaluate air comfort.
•The EPA reports that asthma,
often triggered by airborne
agents, causes more school
absenteeism than any other
chronic childhood condition,
and costs students 14.7 million
missed days a year.3
1U.S. Environmental Protection Agency (EPA) IAQ Tools for Schools Kit, IAQ Coordinator’s Guide.
2A Summary of Scientific Findings on Adverse Effects of Indoor Environments on Students’ Health,
Academic Performance and Attendance, page 10, U.S. Department of Education, 2004.
3Asthma Facts, U.S. EPA, May 2005.

2 Fluke Corporation Indoor air quality: Can your schools pass the test?
•In Seattle, one of many sys-
tems dealing with mold prob-
lems in schools, four schools
are under repair and adminis-
trators are surveying IAQ dis-
trict wide. One board member,
citing the district’s slow
response to mold complaints,
called for the district to pay the
medical bills of all affected stu-
dents and staff. At the same
time the district faces a $20
million budget shortfall, and
was considering a proposal to
close ten schools.
“(IAQ) is definitely a signifi-
cant issue for schools, but so is
money, and so is time,” says
Rich Prill, building science & IAQ
specialist with the Washington
State University Extension
Energy Program. “So unless
(school administrators) have an
immediate IAQ problem, it is typ-
ically a back burner thing.”
Under a federally-supported
program, Prill and his associates
take a satchel of measurement
instruments to about 100 North-
west schools each year and
assess the air quality in occupied
classrooms, measuring such IAQ
factors as temperature, relative
humidity and moisture, air flow,
carbon dioxide (CO2) and levels
of airborne particles.
But when a resource such as
Rich Prill is not available, how
does an administrator or facility
manager know an IAQ problem
exists? Better yet, how can
school staff identify changing
conditions and prevent problems
from ever cropping up?
With a well-planned IAQ monitoring and control program,
using the right instruments, the facility director, maintenance
technician, or head custodian can:
•Help identify indoor air quality issues before they become major problems
•Improve comfort and increase teacher performance and student achievement
•Reduce health risks and exposure to asthma triggers
•Pinpoint causes and avoid costly and/or unnecessary and ineffective repairs
•Clearly demonstrate the district’s commitment to providing adequate indoor air quality
•Avoid negative publicity, loss of community trust, litigation and financial liability
Creating an IAQ
management plan
Begin your planning by review-
ing the existing indoor air quality
standards. The American Society
of Heating, Refrigeration and Air
Conditioning Engineers (ASHRAE)
publishes guidelines for ventila-
tion, air filtration and tempera-
ture and humidity management.
The National Air Duct Cleaners
Association (NADCA) has specifi-
cations for duct cleaning.
Keep in mind that even when
standards are still under devel-
opment (such as for airborne
particles or mold spores), your
IAQ management program can
establish benchmarks that
enable you to deal with emerg-
ing problems before they turn
into an expensive liability.
Perhaps the most widely
known IAQ resource for schools
is the EPA Indoor Air Quality
Tools for Schools Kit.4The kit
contains a wealth of information
and many useful checklists that
help guide administrators and
others through the indoor air
quality management task.
The WSU Extension Energy
Program has also developed this
“3-Step IAQ Program” for schools
in Washington, Oregon, Idaho
and Alaska.
Step One—Identify a coordinator
for IAQ in each building, typically
the head custodian, the facility
director, or an HVAC (heating,
ventilation and air conditioning)
technician.
Step Two—Do a thorough top to
bottom, inside and out IAQ walk-
around of the facility and assess
the specific IAQ challenges for
each building—whether it’s
particles, moisture, ventilation,
pollutants or comfort.
Step Three—Create an IAQ pro-
gram to address the challenges.
The program starts by taking
credit for what is already being
done, and then adopting some
additional good practices to
address existing deficiencies.
Prevention is the goal.
The key to prevention is to
first understand the building
from an IAQ perspective: the Step
Two assessment provides a doc-
umented “baseline” of conditions.
Now the conditions in the build-
ings can be routinely monitored
for such critical IAQ factors as
temperature, humidity, CO2, and
particle levels. Not only do these
routine measurements provide
early warning if the numbers
deviate from the norm, but the
record provides evidence of
proper operation and attention to
good practice.
4http://www.epa.gov/iaq/schools/
tools4s2.html
3 Fluke Corporation Indoor air quality: Can your schools pass the test?
investigation shows the
unvented attic space above is
140 degrees. In winter, cold
walls and window surfaces
can have just the opposite
effect—occupants feel cold in
spite of air temperatures in the
comfort zone.
•Cleanliness. “Typically in
schools the cleaning is based
on appearance, not on health,”
Prill says. “If it looks clean,
good enough. But we find that
carpets that look clean can
contain huge amounts of parti-
cles. Many of these particles
are allergy and asthma trig-
gers. So how do the custodi-
ans or janitorial staff keep
abreast of quality control? Are
you spending the time, money
and equipment where you
need to?
“By having some kind of a
particle measurement you can
look at various areas and say,
“Gee, how come this wing of
the building has ten times
more particles than the other
wing?” It could be that one
custodian is not doing as good
a job, or his/her vacuum equip-
ment isn’t working. Maybe the
kids are tracking in too much
dirt from the playground. Mea-
surement is just a way to get a
handle on reality.”
Prill uses a laser particle
counter to get real time counts
of the number and size of
particles present and track
down their source. Instead of
assuming high particle counts
are caused by dirty ductwork,
and spending thousands on
cleaning, Prill advises schools
Benchmarks
Both the walk-around inspection
and the subsequent IAQ manage-
ment program are focused on
five basic benchmarks of indoor
environmental quality.
•Moisture. In addition to open-
ing the way for mold growth,
excess moisture can cause
unsightly stains and even
structural damage. “Add water
and you’ve got mold,” Prill
says. “If you’ve got any water
leaks, which most buildings
do, you need to address that
immediately. The “best” water
leak is one that is small
enough it doesn’t cause exten-
sive damage and big enough
that you find it in time. So we
suggest moisture meters to
locate wet materials. Bigger
districts can probably benefit
from a thermal imaging device
that’s sensitive enough to
show the temperature differ-
ence between wet materials
and dry materials. That’s a
good way to find hidden mois-
ture, and track down the
source of a leak.”
•Comfort. The right combina-
tion of temperature and rela-
tive humidity is essential, but
comfort is what people feel,
not what a thermometer or
humidity tester say it is. Prill
uses an infrared thermometer
to measure surface tempera-
tures and spot problems. A
room thermostat might read
72 degrees Fahrenheit, but
occupants feel hot. The
infrared thermometer reveals
that the ceiling surface may be
is 85 degrees, and further
to count the particles in air
from supply ducts. If the supply
air is cleaner than room air,
the HVAC system is likely not
the problem.
•Ventilation. A key job for the
HVAC system is removing stale
or polluted inside air and
replacing it with cleaner out-
side air. ANSI/ASHRAE Stan-
dard 62-2001, Ventilation for
Acceptable Indoor Air Quality,
calls for 15 cubic feet per
minute of outside air supply for
each student. Inadequate sup-
ply can allow levels of carbon
dioxide to climb above the
ASHRAE guideline of 1,000
parts per million (ppm). Excess
CO2 also suggests that other
pollutants and particulates are
also accumulating. The CO2
meter makes it easy to rou-
tinely tour the various zones
and note whether the proper
amount of outside air is being
supplied. CO2 measurement
also identifies over-ventilation
of zones. Over-ventilation can
waste energy, increase wear
and tear on equipment, and
create comfort problems.
Another significant benefit is
that the occupants can see for
themselves that they are get-
ting the fresh air they deserve.
The CO2 meter, particle
counter and infrared ther-
mometer help keep a check on
the cleanliness and tempera-
ture of air coming into the
room. An airflow capture hood
determines supply air volume.
•Pollutant control. Point
sources of pollutants must be
identified and controlled and
in general, air should flow
from clean to dirty. That means
air moves from the hallway
into and through the restroom
to be vented outside. Air
moves into the chemistry lab
and storage areas 24/7 to
protect occupants in adjacent
spaces in case of a mistake,
leak or spill. Prill uses a chem-
ical tracer smoke to track the
direction of airflow, and carries
a carbon monoxide tester to
check for the presence of
dangerous combustion gases.
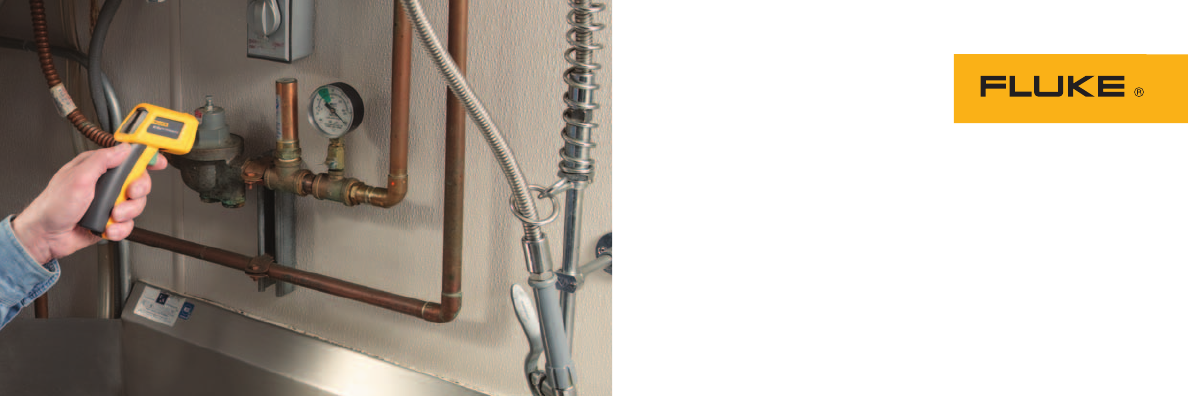
Infrared thermometers are a convenient way to check for temperature differences
along pipes that could indicate a moisture leak.
4 Fluke Corporation Indoor air quality: Can your schools pass the test?
Information takes
center stage
The success of a school IAQ pro-
gram ultimately lies with secur-
ing the understanding, buy in
and support of students, staff,
and community.
“Education and communica-
tion are absolutely key,” Prill
says. “The schools need to be
proactive. If people come to you
asking questions, it’s too late - -
it looks like you’re being reac-
tive instead of proactive. You
need to provide information
before they ask.
Careful maintenance also pre-
vents the HVAC system itself
from turning into a pollutant
source. Heating and cooling
coils, drip pans and ducts must
be kept dry and clean, filters
changed and properly sealed,
motors and drive systems
checked for correct mechanical
and electrical performance.
Proper air flow through filters
and coils means energy effi-
ciency, too. Prill finds that pay-
ing attention to IAQ often
uncovers energy saving oppor-
tunities—in fact, these energy
savings can easily pay for your
IAQ equipment and efforts.
“We suggest they adopt an
IAQ program and market that.
Advertise it. Talk it up. Once you
start talking about it, people’s
fears or anxieties are relieved
because they know someone’s in
charge, someone’s paying atten-
tion. And a little bit of knowl-
edge goes a long way, especially
with numbers. You can say ‘Look,
no particles coming out of the
ducts, relative humidity is okay,
the CO2 numbers show fresh air
being delivered, and air is mov-
ing into restrooms, locker rooms,
storage, mechanical rooms—the
right way . . . “clean to dirty.”
This approach clearly demon-
strates you’re paying attention
and doing what you can in a
very real and practical fashion.’
That makes a big difference in
giving people confidence.”
Documentation can also build
a strong defense against legal
claims. Air quality test equipment
can pay for itself over time, by
documenting that the building is
operated in a healthy and safe
fashion, according to Prill. “It’s
going to be pretty hard to come
after you if the building is clean
and dry and comfortable. A lot of
districts, especially the bigger
ones, are finding that having
documentation, and having num-
bers, really pays,” he adds.
“If schools have documenta-
tion, then it’s hard to suggest
that they’re negligent. That’s
what schools are trying to do:
follow good practice.”
Using a particle counter to evaluate air quality at the supply vent.

5 Fluke Corporation Indoor air quality: Can your schools pass the test?
Particle count examples
Here are three sample readings from a
Fluke 983 Particle Counter, taken in and
around an elementary school.
This sample was taken outdoors.
It’s the baseline for comparing indoor
measurements to.
This sample was taken from ambient
classroom air. From this sample alone
we can’t tell where the pollutants are
coming from, but note that they are
significantly less than the baseline out-
side readings. Use the particle counter
near the supply ducts, doors, windows,
and other areas of possible contamina-
tion, to determine whether a repair is
necessary.
Fluke Corporation
PO Box 9090, Everett, WA USA 98206
Fluke Europe B.V.
PO Box 1186, 5602 BD
Eindhoven, The Netherlands
For more information call:
In the U.S.A. (800) 443-5853 or
Fax (425) 446-51
16
In Europe/M-East/Africa (31 40) 2 675 200 or
Fax (31 40) 2 675 222
In Canada (800) 36-FLUKE or
Fax (905) 890-6866
From other countries +1 (425) 446-5500 or
Fax +1 (425) 446-5116
Web access: http://www.fluke.com
©2005 Fluke Corporation. All rights reserved.
Printed in U.S.A. 7/2005 2519671 A-EN-N Rev A
Fluke. Keeping your world
up and running.
This sample was taken near the car-
pet, right after people had walked by, to
simulate the effect of particles kicked up
by student activity. Compare the particle
counts to the baseline. This could sug-
gest the need to vacuum more fre-
quently, ideally with a HEPA-installed
vacuum, to reduce the risk of asthma.
Note especially the elevated levels of
particulates between 1 and 10 microns,
when compared to the ambient readings.
