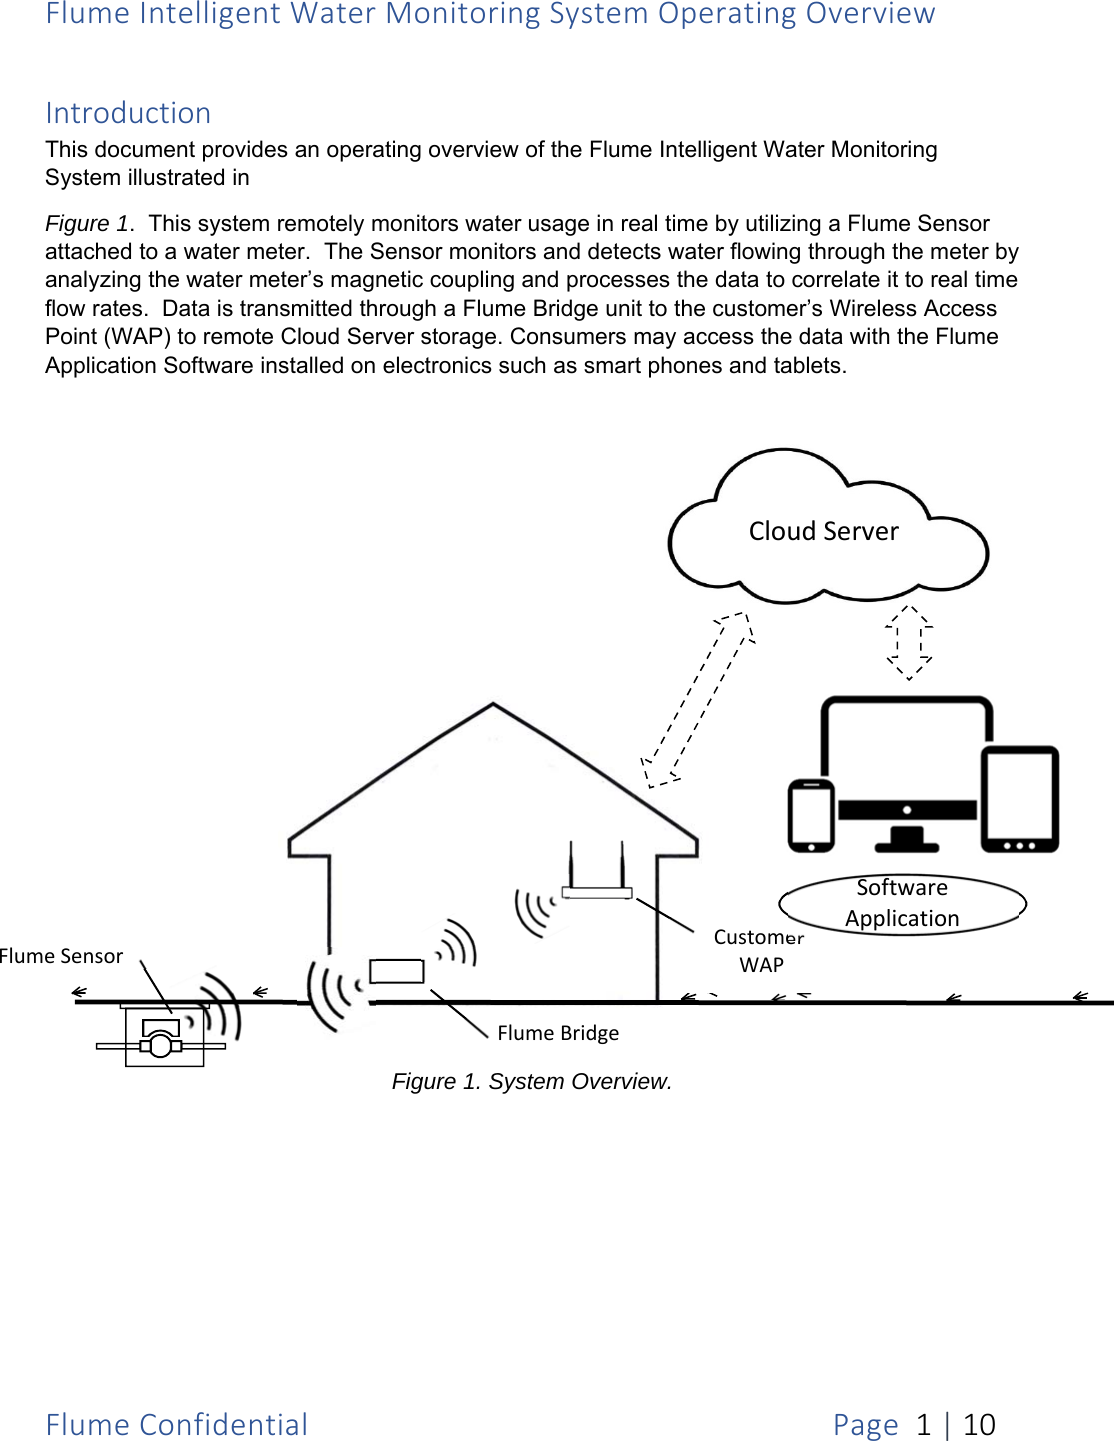
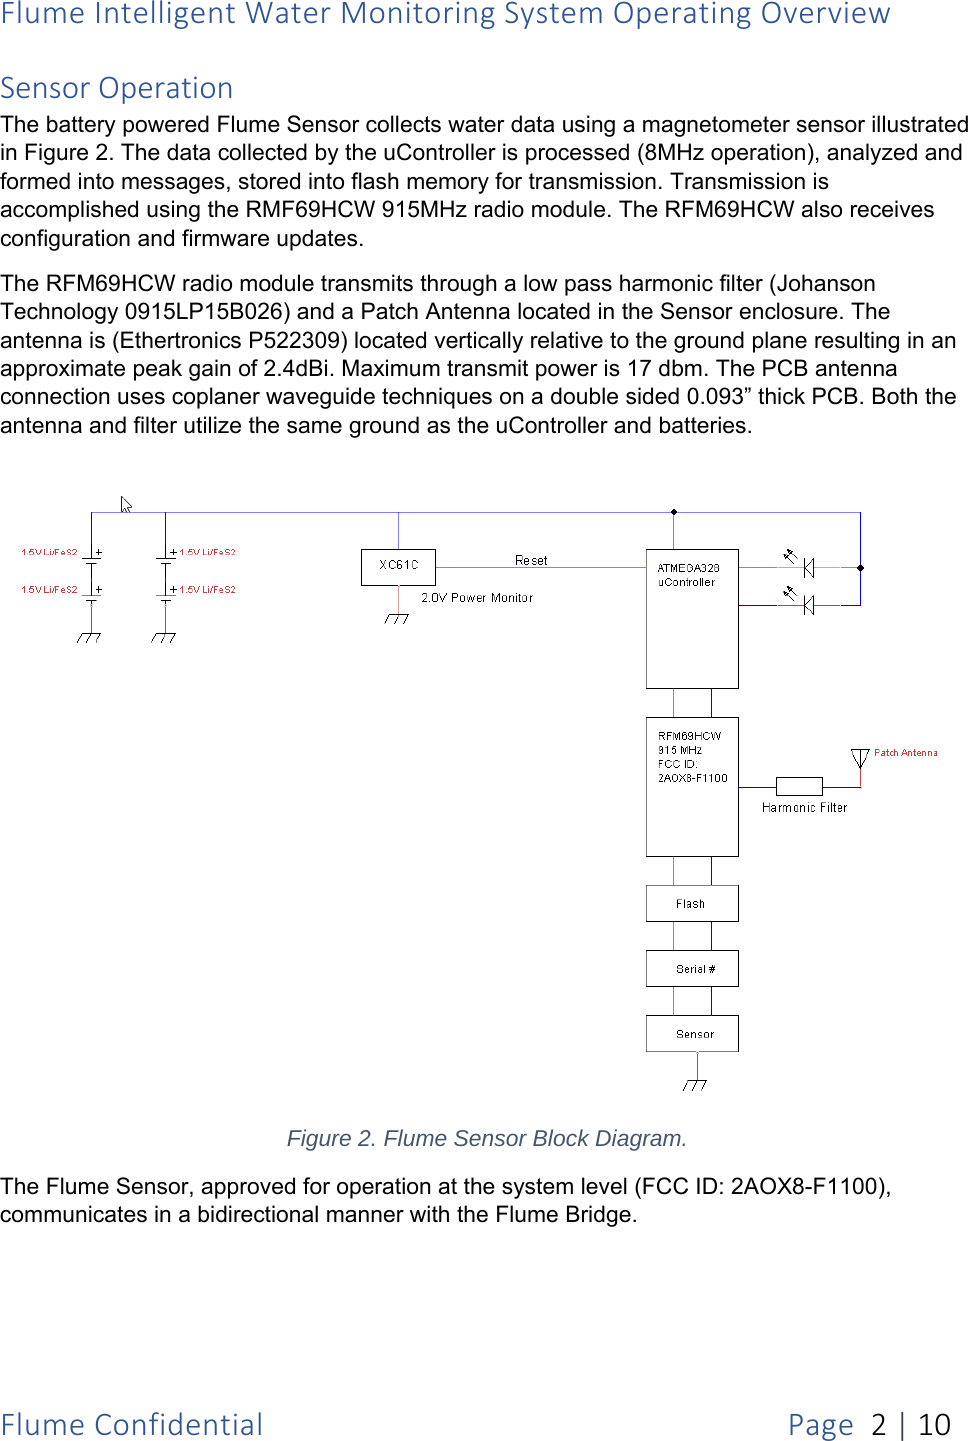
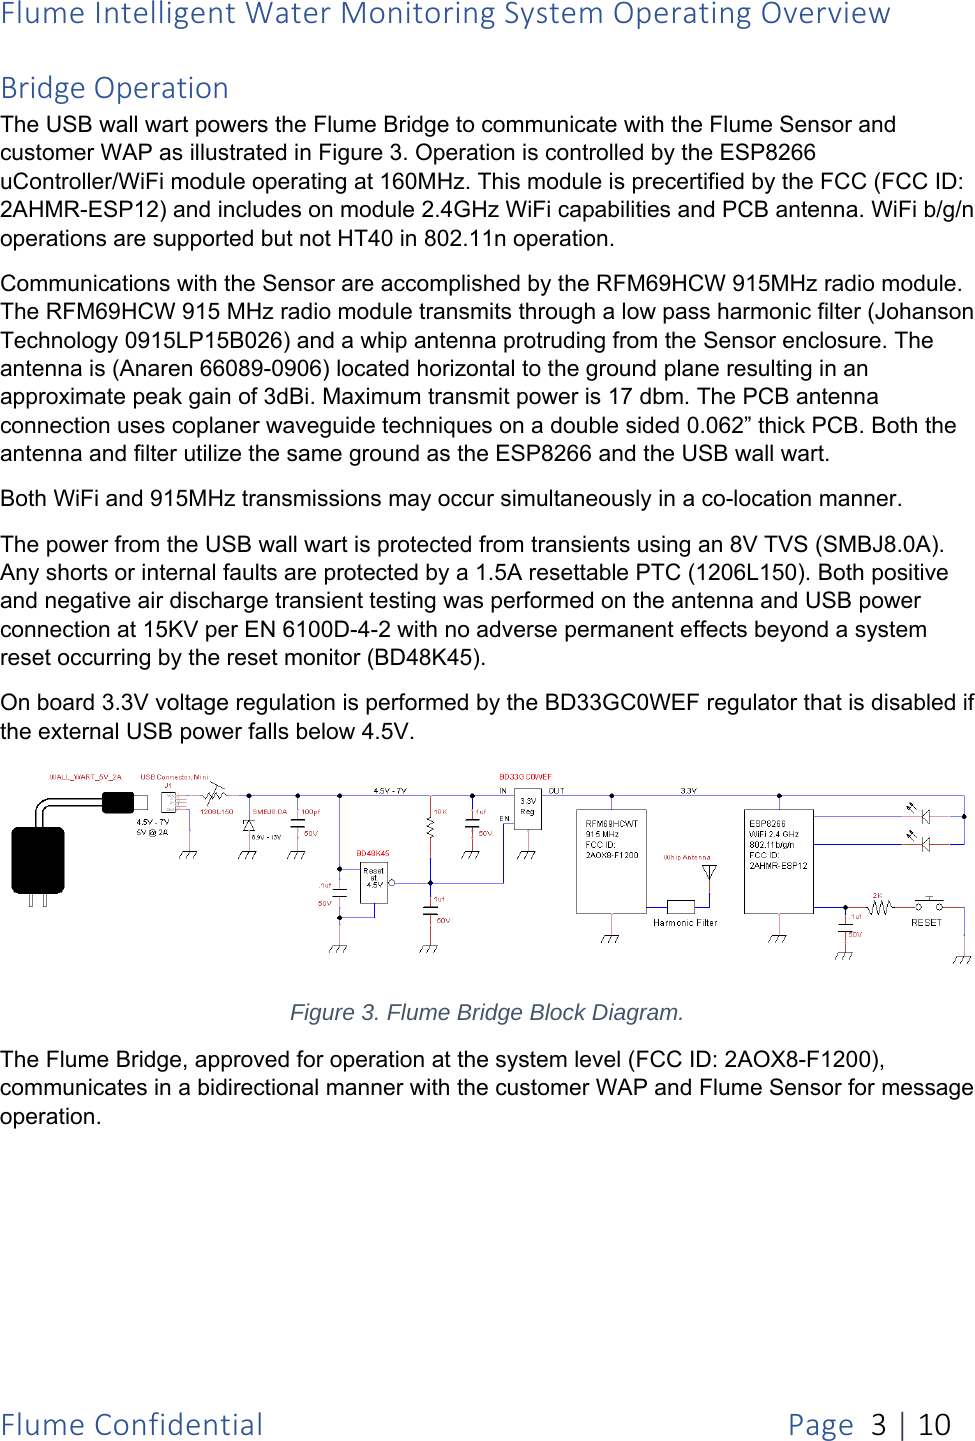
Flume F1100 Flume Intelligent Water Monitoring System (Sensor) User Manual

Flume Inc. Flume Intelligent Water Monitoring System (Sensor)

Contents

User Manual

FlumeIntelligentWaterMonitoringSystemOperatingOverviewFlumeConfidentialPage1|10IntroductionThis document provides an operating overview of the Flume Intelligent Water Monitoring System illustrated in Figure 1.  This system remotely monitors water usage in real time by utilizing a Flume Sensor attached to a water meter.  The Sensor monitors and detects water flowing through the meter by analyzing the water meter’s magnetic coupling and processes the data to correlate it to real time flow rates.  Data is transmitted through a Flume Bridge unit to the customer’s Wireless Access Point (WAP) to remote Cloud Server storage. Consumers may access the data with the Flume Application Software installed on electronics such as smart phones and tablets.  Figure 1. System Overview. CloudServerFlumeBridgeCustomerWAPSoftwareApplicationFlumeSensor
FlumeIntelligentWaterMonitoringSystemOperatingOverviewFlumeConfidential Page2|10SensorOperationThe battery powered Flume Sensor collects water data using a magnetometer sensor illustrated in Figure 2. The data collected by the uController is processed (8MHz operation), analyzed and formed into messages, stored into flash memory for transmission. Transmission is accomplished using the RMF69HCW 915MHz radio module. The RFM69HCW also receives configuration and firmware updates.The RFM69HCW radio module transmits through a low pass harmonic filter (Johanson Technology 0915LP15B026) and a Patch Antenna located in the Sensor enclosure. The antenna is (Ethertronics P522309) located vertically relative to the ground plane resulting in an approximate peak gain of 2.4dBi. Maximum transmit power is 17 dbm. The PCB antenna connection uses coplaner waveguide techniques on a double sided 0.093” thick PCB. Both the antenna and filter utilize the same ground as the uController and batteries. Figure 2. Flume Sensor Block Diagram. The Flume Sensor, approved for operation at the system level (FCC ID: 2AOX8-F1100), communicates in a bidirectional manner with the Flume Bridge. 
FlumeIntelligentWaterMonitoringSystemOperatingOverviewFlumeConfidential Page3|10BridgeOperationThe USB wall wart powers the Flume Bridge to communicate with the Flume Sensor and customer WAP as illustrated in Figure 3. Operation is controlled by the ESP8266 uController/WiFi module operating at 160MHz. This module is precertified by the FCC (FCC ID: 2AHMR-ESP12) and includes on module 2.4GHz WiFi capabilities and PCB antenna. WiFi b/g/n operations are supported but not HT40 in 802.11n operation.Communications with the Sensor are accomplished by the RFM69HCW 915MHz radio module. The RFM69HCW 915 MHz radio module transmits through a low pass harmonic filter (Johanson Technology 0915LP15B026) and a whip antenna protruding from the Sensor enclosure. The antenna is (Anaren 66089-0906) located horizontal to the ground plane resulting in an approximate peak gain of 3dBi. Maximum transmit power is 17 dbm. The PCB antenna connection uses coplaner waveguide techniques on a double sided 0.062” thick PCB. Both the antenna and filter utilize the same ground as the ESP8266 and the USB wall wart.Both WiFi and 915MHz transmissions may occur simultaneously in a co-location manner.  The power from the USB wall wart is protected from transients using an 8V TVS (SMBJ8.0A). Any shorts or internal faults are protected by a 1.5A resettable PTC (1206L150). Both positive and negative air discharge transient testing was performed on the antenna and USB power connection at 15KV per EN 6100D-4-2 with no adverse permanent effects beyond a system reset occurring by the reset monitor (BD48K45). On board 3.3V voltage regulation is performed by the BD33GC0WEF regulator that is disabled if the external USB power falls below 4.5V. Figure 3. Flume Bridge Block Diagram. The Flume Bridge, approved for operation at the system level (FCC ID: 2AOX8-F1200), communicates in a bidirectional manner with the customer WAP and Flume Sensor for message operation.
FlumeIntelligentWaterMonitoringSystemOperatingOverviewFlumeConfidential Page4|10MessageOperationMessages from/to the Sensor are transmitted using 915MHz with the Bridge which also communicates with the customer WiFi network using 2.4GHz. An overview of the Sensor and Bridge message communication appears below. Sensor/BridgeCommunicationA frequency hopping method is utilized across 50 channels where the channel dwell time is 150ms. For example, in a 20 second transmission there are 20/150ms=133.33 channels. Given the sequence repeats every 50 channels each channel will on average be occupied by 1333.33/50*150ms=400ms. Bridge/WAPCommunicationIndustry standard 2.4MHz WiFi communications are utilized between the Flume Bridge and customer supplied WAP. The ubiquitous 802.11 b/g/n operation is supported with WPA/WPA2 and WEP/TKIP/AES in station mode.Messages transmitted through the customer WiFi network are routed to the Flume Cloud Storage where the messages are parsed, and data stored into a data base for further reporting by the Flume Software Application. 
FlumeIntelligentWaterMonitoringSystemOperatingOverviewFlumeConfidentialPage5|10SoftwareApplicationThe Flume Software Application provides intelligent leak detection and water management for the residential home. This application work in conjunction with the Flume Sensor and Flume Bridge notifies of water leaks and provides water usage in near real-time. DashboardMonitor, in near real-time, water usage by a house and irrigation. Figure 4 illustrates a Dashboard displaying Today’s water use against a daily budget and water Status.Budgets may be displayed for daily, monthly or yearly time frames. Drilling down provides more detail. Figure 4. Application Dashboard.
FlumeIntelligentWaterMonitoringSystemOperatingOverviewFlumeConfidentialPage6|10DetailedUsage              Figure 5 illustrates detailed usages over hourly, daily, weekly, monthly and yearly resolutions.Compare water usage to others that have similar households. Set budgets to help control how much water is used and receive notification when approaching limits.               Figure 5. Detailed Usage and Comparison. 
FlumeIntelligentWaterMonitoringSystemOperatingOverviewFlumeConfidentialPage7|10NotificationsSee Figure 6 for example notifications. Notifications provide waning of possible leak detection and usage against a budget threshold. Near real-time notifications are provided via text messaging.Figure 6. Notifications. 
FlumeIntelligentWaterMonitoringSystemOperatingOverviewFlumeConfidentialPage8|10InstallationSummaryThe Flume Intelligent Water Monitoring System requires no special installer, installation techniques or tools. The average home owner can install the solution in 10-15 minutes. A summary of installation is covered below. PairtheDevices1.  Install iOS or Android application from Flume 2.  Crate a User Account 3.  Scan QR codes from Bridge and Sensor 4.  Pair the Bridge with the WAP 5.  Pair the Bridge with the Sensor 
FlumeIntelligentWaterMonitoringSystemOperatingOverviewFlumeConfidentialPage9|10Installation6.  Locate the water meter 7.  Install the Sensor on the meter      
FlumeIntelligentWaterMonitoringSystemOperatingOverviewFlumeConfidentialPage10|108.  Run water 9.  Run orient command for the Sensor Verify10. Log-in to the Flume Application Software 11. Observe water usage  

Navigation menu