Frye Fonix 7000 Users Manual Book+.indb
2015-02-09
: Frye Frye-Fonix-7000-Users-Manual-552258 frye-fonix-7000-users-manual-552258 frye pdf
Open the PDF directly: View PDF ![]() .
.
Page Count: 216 [warning: Documents this large are best viewed by clicking the View PDF Link!]

Hearing Aid Test System
Operator’s Manual
Version 1.51
©2006, Frye Electronics, Inc.
All rights reserved
Oct. 23, 2006
FONIX® 7000
Contents
Chapter 1: Introduction & Setup
1.1 History. . . . . . . . . . . . . . . . . . . . . . . . . . . . . . . . . . . . . . . . . . . . . . . . . . . . . . . . . . . . . . . . . . . . . . . . . . . . . . . . . . . . . . . . . . . . . . . . . 1
1.2 Basic Test Functions . . . . . . . . . . . . . . . . . . . . . . . . . . . . . . . . . . . . . . . . . . . . . . . . . . . . . . . . . . . . . . . . . . . . . . . . . . . . . . . . . . . 2
1.3 Options . . . . . . . . . . . . . . . . . . . . . . . . . . . . . . . . . . . . . . . . . . . . . . . . . . . . . . . . . . . . . . . . . . . . . . . . . . . . . . . . . . . . . . . . . . . . . . . 2
1.4 Accessories. . . . . . . . . . . . . . . . . . . . . . . . . . . . . . . . . . . . . . . . . . . . . . . . . . . . . . . . . . . . . . . . . . . . . . . . . . . . . . . . . . . . . . . . . . . . 4
1.4.1 Standard Accessories . . . . . . . . . . . . . . . . . . . . . . . . . . . . . . . . . . . . . . . . . . . . . . . . . . . . . . . . . . . . . . . . . . . . . . . . . . . . 4
1.4.2 Real-Ear Accessories. . . . . . . . . . . . . . . . . . . . . . . . . . . . . . . . . . . . . . . . . . . . . . . . . . . . . . . . . . . . . . . . . . . . . . . . . . . . . 6
1.4.3 Optional Accessories . . . . . . . . . . . . . . . . . . . . . . . . . . . . . . . . . . . . . . . . . . . . . . . . . . . . . . . . . . . . . . . . . . . . . . . . . . . . 8
1.5 Layout, Controls, and Safety . . . . . . . . . . . . . . . . . . . . . . . . . . . . . . . . . . . . . . . . . . . . . . . . . . . . . . . . . . . . . . . . . . . . . . . . . . 11
1.5.1 Front Panel Layout . . . . . . . . . . . . . . . . . . . . . . . . . . . . . . . . . . . . . . . . . . . . . . . . . . . . . . . . . . . . . . . . . . . . . . . . . . . . . . 11
1.5.2 Rear Panel Layout . . . . . . . . . . . . . . . . . . . . . . . . . . . . . . . . . . . . . . . . . . . . . . . . . . . . . . . . . . . . . . . . . . . . . . . . . . . . . . 13
1.5.3 Safety. . . . . . . . . . . . . . . . . . . . . . . . . . . . . . . . . . . . . . . . . . . . . . . . . . . . . . . . . . . . . . . . . . . . . . . . . . . . . . . . . . . . . . . . . . . 14
1.6 Setup . . . . . . . . . . . . . . . . . . . . . . . . . . . . . . . . . . . . . . . . . . . . . . . . . . . . . . . . . . . . . . . . . . . . . . . . . . . . . . . . . . . . . . . . . . . . . . . . . 16
1.6.1 Unpacking the FONIX 7000 . . . . . . . . . . . . . . . . . . . . . . . . . . . . . . . . . . . . . . . . . . . . . . . . . . . . . . . . . . . . . . . . . . . . . 16
1.6.2 Locating and arranging the 7000 test system. . . . . . . . . . . . . . . . . . . . . . . . . . . . . . . . . . . . . . . . . . . . . . . . . . . . 17
1.6.3 Connecting the Main Module & Components. . . . . . . . . . . . . . . . . . . . . . . . . . . . . . . . . . . . . . . . . . . . . . . . . . . 17
1.6.4 Connecting the Real-Ear Equipment . . . . . . . . . . . . . . . . . . . . . . . . . . . . . . . . . . . . . . . . . . . . . . . . . . . . . . . . . . . . 18
1.6.5 Powering up the 7000 test system . . . . . . . . . . . . . . . . . . . . . . . . . . . . . . . . . . . . . . . . . . . . . . . . . . . . . . . . . . . . . . 19
1.7 Maintenance . . . . . . . . . . . . . . . . . . . . . . . . . . . . . . . . . . . . . . . . . . . . . . . . . . . . . . . . . . . . . . . . . . . . . . . . . . . . . . . . . . . . . . . . . 19
1.7.1 Cleaning . . . . . . . . . . . . . . . . . . . . . . . . . . . . . . . . . . . . . . . . . . . . . . . . . . . . . . . . . . . . . . . . . . . . . . . . . . . . . . . . . . . . . . . . 19
1.7.2 Care & Maintenance of your M1950E Coupler Microphone . . . . . . . . . . . . . . . . . . . . . . . . . . . . . . . . . . . . . 20
1.7.3 Locating the serial number and software version . . . . . . . . . . . . . . . . . . . . . . . . . . . . . . . . . . . . . . . . . . . . . . . 20
1.7.4 Contacting the Factory . . . . . . . . . . . . . . . . . . . . . . . . . . . . . . . . . . . . . . . . . . . . . . . . . . . . . . . . . . . . . . . . . . . . . . . . . . 22
1.7.5 Warranty. . . . . . . . . . . . . . . . . . . . . . . . . . . . . . . . . . . . . . . . . . . . . . . . . . . . . . . . . . . . . . . . . . . . . . . . . . . . . . . . . . . . . . . . 22
Chapter 2: General Operation
2.1 Operation of buttons . . . . . . . . . . . . . . . . . . . . . . . . . . . . . . . . . . . . . . . . . . . . . . . . . . . . . . . . . . . . . . . . . . . . . . . . . . . . . . . . . 23
2.1.1 Using the function keys. . . . . . . . . . . . . . . . . . . . . . . . . . . . . . . . . . . . . . . . . . . . . . . . . . . . . . . . . . . . . . . . . . . . . . . . . 23
2.1.2 Navigating through the screens. . . . . . . . . . . . . . . . . . . . . . . . . . . . . . . . . . . . . . . . . . . . . . . . . . . . . . . . . . . . . . . . . 25
2.1.3 Using the pop-up help windows. . . . . . . . . . . . . . . . . . . . . . . . . . . . . . . . . . . . . . . . . . . . . . . . . . . . . . . . . . . . . . . . 26
2.1.4 Using the local menus . . . . . . . . . . . . . . . . . . . . . . . . . . . . . . . . . . . . . . . . . . . . . . . . . . . . . . . . . . . . . . . . . . . . . . . . . . 27
2.1.5 Using the EXIT and RESET buttons. . . . . . . . . . . . . . . . . . . . . . . . . . . . . . . . . . . . . . . . . . . . . . . . . . . . . . . . . . . . . . 28
2.1.6 Using the remaining buttons. . . . . . . . . . . . . . . . . . . . . . . . . . . . . . . . . . . . . . . . . . . . . . . . . . . . . . . . . . . . . . . . . . . . 28
2.2 Setup Menu . . . . . . . . . . . . . . . . . . . . . . . . . . . . . . . . . . . . . . . . . . . . . . . . . . . . . . . . . . . . . . . . . . . . . . . . . . . . . . . . . . . . . . . . . . 28
2.2.1 Saving and loading default settings. . . . . . . . . . . . . . . . . . . . . . . . . . . . . . . . . . . . . . . . . . . . . . . . . . . . . . . . . . . . . 29
2.2.2 Setting the date and time . . . . . . . . . . . . . . . . . . . . . . . . . . . . . . . . . . . . . . . . . . . . . . . . . . . . . . . . . . . . . . . . . . . . . . . 29
2.2.3 Setting the user mode . . . . . . . . . . . . . . . . . . . . . . . . . . . . . . . . . . . . . . . . . . . . . . . . . . . . . . . . . . . . . . . . . . . . . . . . . . 30
2.2.4 Explaining the settings. . . . . . . . . . . . . . . . . . . . . . . . . . . . . . . . . . . . . . . . . . . . . . . . . . . . . . . . . . . . . . . . . . . . . . . . . . 30
2.3 Source Types . . . . . . . . . . . . . . . . . . . . . . . . . . . . . . . . . . . . . . . . . . . . . . . . . . . . . . . . . . . . . . . . . . . . . . . . . . . . . . . . . . . . . . . . . 33
2.3.1 Understanding Pure-tone Signals . . . . . . . . . . . . . . . . . . . . . . . . . . . . . . . . . . . . . . . . . . . . . . . . . . . . . . . . . . . . . . . 33
2.3.1.1 Pure-tone settings . . . . . . . . . . . . . . . . . . . . . . . . . . . . . . . . . . . . . . . . . . . . . . . . . . . . . . . . . . . . . . . . . . . . . . 34
2.3.1.2 Noise reduction . . . . . . . . . . . . . . . . . . . . . . . . . . . . . . . . . . . . . . . . . . . . . . . . . . . . . . . . . . . . . . . . . . . . . . . . . 35
2.3.1.3 Delay times. . . . . . . . . . . . . . . . . . . . . . . . . . . . . . . . . . . . . . . . . . . . . . . . . . . . . . . . . . . . . . . . . . . . . . . . . . . . . . 35
2.3.1.4 Harmonic distortion . . . . . . . . . . . . . . . . . . . . . . . . . . . . . . . . . . . . . . . . . . . . . . . . . . . . . . . . . . . . . . . . . . . . . 36
2.3.1.5 Pure-tone Filter. . . . . . . . . . . . . . . . . . . . . . . . . . . . . . . . . . . . . . . . . . . . . . . . . . . . . . . . . . . . . . . . . . . . . . . . . . 36
2.3.2 Understanding Composite Signals. . . . . . . . . . . . . . . . . . . . . . . . . . . . . . . . . . . . . . . . . . . . . . . . . . . . . . . . . . . . . . 37
2.3.2.1 Noise reduction . . . . . . . . . . . . . . . . . . . . . . . . . . . . . . . . . . . . . . . . . . . . . . . . . . . . . . . . . . . . . . . . . . . . . . . . . 38
2.3.2.2 Intermodulation distortion. . . . . . . . . . . . . . . . . . . . . . . . . . . . . . . . . . . . . . . . . . . . . . . . . . . . . . . . . . . . . . 38
2.3.2.3 Composite filter . . . . . . . . . . . . . . . . . . . . . . . . . . . . . . . . . . . . . . . . . . . . . . . . . . . . . . . . . . . . . . . . . . . . . . . . . 39
2.3.2.4 Composite type . . . . . . . . . . . . . . . . . . . . . . . . . . . . . . . . . . . . . . . . . . . . . . . . . . . . . . . . . . . . . . . . . . . . . . . . . 40
2.3.2.5 Composite source levels . . . . . . . . . . . . . . . . . . . . . . . . . . . . . . . . . . . . . . . . . . . . . . . . . . . . . . . . . . . . . . . . 41
2.3.2.6 Digital Speech technical details . . . . . . . . . . . . . . . . . . . . . . . . . . . . . . . . . . . . . . . . . . . . . . . . . . . . . . . . . 42
2.4 Printing. . . . . . . . . . . . . . . . . . . . . . . . . . . . . . . . . . . . . . . . . . . . . . . . . . . . . . . . . . . . . . . . . . . . . . . . . . . . . . . . . . . . . . . . . . . . . . . 42
2.4.1 Choosing a printer. . . . . . . . . . . . . . . . . . . . . . . . . . . . . . . . . . . . . . . . . . . . . . . . . . . . . . . . . . . . . . . . . . . . . . . . . . . . . . 42
2.4.2 Adding a label . . . . . . . . . . . . . . . . . . . . . . . . . . . . . . . . . . . . . . . . . . . . . . . . . . . . . . . . . . . . . . . . . . . . . . . . . . . . . . . . . . 43
2.4.3 Using the internal printer. . . . . . . . . . . . . . . . . . . . . . . . . . . . . . . . . . . . . . . . . . . . . . . . . . . . . . . . . . . . . . . . . . . . . . . 44
2.4.4 Loading the thermal paper . . . . . . . . . . . . . . . . . . . . . . . . . . . . . . . . . . . . . . . . . . . . . . . . . . . . . . . . . . . . . . . . . . . . . 45
2.4.5 Unloading a partial roll of paper . . . . . . . . . . . . . . . . . . . . . . . . . . . . . . . . . . . . . . . . . . . . . . . . . . . . . . . . . . . . . . . 48
2.4.6 Using an external printer . . . . . . . . . . . . . . . . . . . . . . . . . . . . . . . . . . . . . . . . . . . . . . . . . . . . . . . . . . . . . . . . . . . . . . . 48
2.4.7 Putting multiple screens on a page . . . . . . . . . . . . . . . . . . . . . . . . . . . . . . . . . . . . . . . . . . . . . . . . . . . . . . . . . . . . . 49
2.5 Display & Data . . . . . . . . . . . . . . . . . . . . . . . . . . . . . . . . . . . . . . . . . . . . . . . . . . . . . . . . . . . . . . . . . . . . . . . . . . . . . . . . . . . . . . . 49
2.5.1 Viewing the Curve Characteristics Box. . . . . . . . . . . . . . . . . . . . . . . . . . . . . . . . . . . . . . . . . . . . . . . . . . . . . . . . . . 49
2.5.2 Viewing numerical data . . . . . . . . . . . . . . . . . . . . . . . . . . . . . . . . . . . . . . . . . . . . . . . . . . . . . . . . . . . . . . . . . . . . . . . . 51
2.6 Computer Connection. . . . . . . . . . . . . . . . . . . . . . . . . . . . . . . . . . . . . . . . . . . . . . . . . . . . . . . . . . . . . . . . . . . . . . . . . . . . . . . . 52
2.7 Remote Module . . . . . . . . . . . . . . . . . . . . . . . . . . . . . . . . . . . . . . . . . . . . . . . . . . . . . . . . . . . . . . . . . . . . . . . . . . . . . . . . . . . . . . 52
2.8 Leveling . . . . . . . . . . . . . . . . . . . . . . . . . . . . . . . . . . . . . . . . . . . . . . . . . . . . . . . . . . . . . . . . . . . . . . . . . . . . . . . . . . . . . . . . . . . . . . 53
Chapter 3: Basic Sound Chamber Tests
3.1 The Coupler Screen Display . . . . . . . . . . . . . . . . . . . . . . . . . . . . . . . . . . . . . . . . . . . . . . . . . . . . . . . . . . . . . . . . . . . . . . . . . . 55
3.1.1 Viewing a Pure-tone Display . . . . . . . . . . . . . . . . . . . . . . . . . . . . . . . . . . . . . . . . . . . . . . . . . . . . . . . . . . . . . . . . . . . . 55
3.1.2 Viewing a Composite Display . . . . . . . . . . . . . . . . . . . . . . . . . . . . . . . . . . . . . . . . . . . . . . . . . . . . . . . . . . . . . . . . . . . 56
3.2 The Leveling Process . . . . . . . . . . . . . . . . . . . . . . . . . . . . . . . . . . . . . . . . . . . . . . . . . . . . . . . . . . . . . . . . . . . . . . . . . . . . . . . . . 57
3.2.1 Leveling the sound chamber . . . . . . . . . . . . . . . . . . . . . . . . . . . . . . . . . . . . . . . . . . . . . . . . . . . . . . . . . . . . . . . . . . . 57
3.2.2 Removing the leveling of the sound chamber: . . . . . . . . . . . . . . . . . . . . . . . . . . . . . . . . . . . . . . . . . . . . . . . . . 58
3.2.3 Saving the leveling information . . . . . . . . . . . . . . . . . . . . . . . . . . . . . . . . . . . . . . . . . . . . . . . . . . . . . . . . . . . . . . . . 58
3.3 Hearing Aid Setup. . . . . . . . . . . . . . . . . . . . . . . . . . . . . . . . . . . . . . . . . . . . . . . . . . . . . . . . . . . . . . . . . . . . . . . . . . . . . . . . . . . . 58
3.3.1 Explaining the Coupler Types . . . . . . . . . . . . . . . . . . . . . . . . . . . . . . . . . . . . . . . . . . . . . . . . . . . . . . . . . . . . . . . . . . 59
3.3.2 In-The-Ear (ITE) and Canal Aids . . . . . . . . . . . . . . . . . . . . . . . . . . . . . . . . . . . . . . . . . . . . . . . . . . . . . . . . . . . . . . . . 60
3.3.3 Behind-The-Ear (BTE) Aids . . . . . . . . . . . . . . . . . . . . . . . . . . . . . . . . . . . . . . . . . . . . . . . . . . . . . . . . . . . . . . . . . . . . . 62
3.3.4 Open-Ear Hearing Aids . . . . . . . . . . . . . . . . . . . . . . . . . . . . . . . . . . . . . . . . . . . . . . . . . . . . . . . . . . . . . . . . . . . . . . . . . 62
3.3.5 Body Aids . . . . . . . . . . . . . . . . . . . . . . . . . . . . . . . . . . . . . . . . . . . . . . . . . . . . . . . . . . . . . . . . . . . . . . . . . . . . . . . . . . . . . . 64
3.3.6 Eyeglass Aids . . . . . . . . . . . . . . . . . . . . . . . . . . . . . . . . . . . . . . . . . . . . . . . . . . . . . . . . . . . . . . . . . . . . . . . . . . . . . . . . . . . 65
3.3.7 Wireless CROS and BICROS Aids . . . . . . . . . . . . . . . . . . . . . . . . . . . . . . . . . . . . . . . . . . . . . . . . . . . . . . . . . . . . . . . 66
3.3.8 Wire-Type CROS and BICROS aids. . . . . . . . . . . . . . . . . . . . . . . . . . . . . . . . . . . . . . . . . . . . . . . . . . . . . . . . . . . . . . 68
3.4 Basic Measurements. . . . . . . . . . . . . . . . . . . . . . . . . . . . . . . . . . . . . . . . . . . . . . . . . . . . . . . . . . . . . . . . . . . . . . . . . . . . . . . . . . 68
3.4.1 Signal Types . . . . . . . . . . . . . . . . . . . . . . . . . . . . . . . . . . . . . . . . . . . . . . . . . . . . . . . . . . . . . . . . . . . . . . . . . . . . . . . . . . . . 69
3.4.2 Running a Test Curve . . . . . . . . . . . . . . . . . . . . . . . . . . . . . . . . . . . . . . . . . . . . . . . . . . . . . . . . . . . . . . . . . . . . . . . . . . . 69
3.4.3 Example . . . . . . . . . . . . . . . . . . . . . . . . . . . . . . . . . . . . . . . . . . . . . . . . . . . . . . . . . . . . . . . . . . . . . . . . . . . . . . . . . . . . . . . . 70
3.4.4 Deleting measurements and settings . . . . . . . . . . . . . . . . . . . . . . . . . . . . . . . . . . . . . . . . . . . . . . . . . . . . . . . . . . . 72
3.4.5 Running a Single Frequency Measurement . . . . . . . . . . . . . . . . . . . . . . . . . . . . . . . . . . . . . . . . . . . . . . . . . . . . . 73
3.4.6 Running a Three-Frequency Average . . . . . . . . . . . . . . . . . . . . . . . . . . . . . . . . . . . . . . . . . . . . . . . . . . . . . . . . . . . 73
3.4.7 Measuring Harmonic Distortion. . . . . . . . . . . . . . . . . . . . . . . . . . . . . . . . . . . . . . . . . . . . . . . . . . . . . . . . . . . . . . . . . 74
3.4.8 Intermodulation Distortion . . . . . . . . . . . . . . . . . . . . . . . . . . . . . . . . . . . . . . . . . . . . . . . . . . . . . . . . . . . . . . . . . . . . . 76
3.4.9 Battery Current Drain . . . . . . . . . . . . . . . . . . . . . . . . . . . . . . . . . . . . . . . . . . . . . . . . . . . . . . . . . . . . . . . . . . . . . . . . . . . 77
3.4.10 Telecoil . . . . . . . . . . . . . . . . . . . . . . . . . . . . . . . . . . . . . . . . . . . . . . . . . . . . . . . . . . . . . . . . . . . . . . . . . . . . . . . . . . . . . . . . 78
3.4.11 Measuring directionality. . . . . . . . . . . . . . . . . . . . . . . . . . . . . . . . . . . . . . . . . . . . . . . . . . . . . . . . . . . . . . . . . . . . . . . 80
3.5 Digital hearing aids. . . . . . . . . . . . . . . . . . . . . . . . . . . . . . . . . . . . . . . . . . . . . . . . . . . . . . . . . . . . . . . . . . . . . . . . . . . . . . . . . . . 84
3.5.1 Using Digital Speech. . . . . . . . . . . . . . . . . . . . . . . . . . . . . . . . . . . . . . . . . . . . . . . . . . . . . . . . . . . . . . . . . . . . . . . . . . . . 84
3.5.2 Changing the Speech Shape . . . . . . . . . . . . . . . . . . . . . . . . . . . . . . . . . . . . . . . . . . . . . . . . . . . . . . . . . . . . . . . . . . . . 84
3.5.3 Testing with Bias Signals . . . . . . . . . . . . . . . . . . . . . . . . . . . . . . . . . . . . . . . . . . . . . . . . . . . . . . . . . . . . . . . . . . . . . . . . 85
3.5.4 Checking Noise Suppression . . . . . . . . . . . . . . . . . . . . . . . . . . . . . . . . . . . . . . . . . . . . . . . . . . . . . . . . . . . . . . . . . . . 86
3.5.5 Understanding Terminology. . . . . . . . . . . . . . . . . . . . . . . . . . . . . . . . . . . . . . . . . . . . . . . . . . . . . . . . . . . . . . . . . . . . 88
3.6 CIC Feature. . . . . . . . . . . . . . . . . . . . . . . . . . . . . . . . . . . . . . . . . . . . . . . . . . . . . . . . . . . . . . . . . . . . . . . . . . . . . . . . . . . . . . . . . . . 88
3.7 Occluded Ear Simulator Option . . . . . . . . . . . . . . . . . . . . . . . . . . . . . . . . . . . . . . . . . . . . . . . . . . . . . . . . . . . . . . . . . . . . . . 89
3.8 Automatic Testing—Loading & Saving Groups . . . . . . . . . . . . . . . . . . . . . . . . . . . . . . . . . . . . . . . . . . . . . . . . . . . . . . . 91
3.8.1 Setting up a test sequence . . . . . . . . . . . . . . . . . . . . . . . . . . . . . . . . . . . . . . . . . . . . . . . . . . . . . . . . . . . . . . . . . . . . . . 92
3.8.2 Loading a Saved Test Sequence . . . . . . . . . . . . . . . . . . . . . . . . . . . . . . . . . . . . . . . . . . . . . . . . . . . . . . . . . . . . . . . . 93
3.8.3 Testing in Fully-Automatic Mode . . . . . . . . . . . . . . . . . . . . . . . . . . . . . . . . . . . . . . . . . . . . . . . . . . . . . . . . . . . . . . . 93
3.8.4 Testing in Semi-Automatic Mode . . . . . . . . . . . . . . . . . . . . . . . . . . . . . . . . . . . . . . . . . . . . . . . . . . . . . . . . . . . . . . . 93
3.9 Complete List of Menu Items . . . . . . . . . . . . . . . . . . . . . . . . . . . . . . . . . . . . . . . . . . . . . . . . . . . . . . . . . . . . . . . . . . . . . . . . . 94
Chapter 4: Advanced Coupler Tests
4.1 Enhanced DSP . . . . . . . . . . . . . . . . . . . . . . . . . . . . . . . . . . . . . . . . . . . . . . . . . . . . . . . . . . . . . . . . . . . . . . . . . . . . . . . . . . . . . . . . 97
4.1.1 Digital Processing Delay. . . . . . . . . . . . . . . . . . . . . . . . . . . . . . . . . . . . . . . . . . . . . . . . . . . . . . . . . . . . . . . . . . . . . . . . . 97
4.1.2 Signal Phase . . . . . . . . . . . . . . . . . . . . . . . . . . . . . . . . . . . . . . . . . . . . . . . . . . . . . . . . . . . . . . . . . . . . . . . . . . . . . . . . . . . . 98
4.1.3 Procedure . . . . . . . . . . . . . . . . . . . . . . . . . . . . . . . . . . . . . . . . . . . . . . . . . . . . . . . . . . . . . . . . . . . . . . . . . . . . . . . . . . . . . . 99
4.2 Battery Current Test . . . . . . . . . . . . . . . . . . . . . . . . . . . . . . . . . . . . . . . . . . . . . . . . . . . . . . . . . . . . . . . . . . . . . . . . . . . . . . . . .100
4.2.1 Static Test (Estimated Battery Life) . . . . . . . . . . . . . . . . . . . . . . . . . . . . . . . . . . . . . . . . . . . . . . . . . . . . . . . . . . . . . 101
4.2.2 mA/Freq. . . . . . . . . . . . . . . . . . . . . . . . . . . . . . . . . . . . . . . . . . . . . . . . . . . . . . . . . . . . . . . . . . . . . . . . . . . . . . . . . . . . . . . 102
4.2.3 mA/Ampl. . . . . . . . . . . . . . . . . . . . . . . . . . . . . . . . . . . . . . . . . . . . . . . . . . . . . . . . . . . . . . . . . . . . . . . . . . . . . . . . . . . . . . 102
4.3 Coupler I/O . . . . . . . . . . . . . . . . . . . . . . . . . . . . . . . . . . . . . . . . . . . . . . . . . . . . . . . . . . . . . . . . . . . . . . . . . . . . . . . . . . . . . . . . . 103
4.4 Attack & Release. . . . . . . . . . . . . . . . . . . . . . . . . . . . . . . . . . . . . . . . . . . . . . . . . . . . . . . . . . . . . . . . . . . . . . . . . . . . . . . . . . . . .104
Chapter 5: Automated Test Sequences
5.1 ANSI S3.22. . . . . . . . . . . . . . . . . . . . . . . . . . . . . . . . . . . . . . . . . . . . . . . . . . . . . . . . . . . . . . . . . . . . . . . . . . . . . . . . . . . . . . . . . . . 107
5.1.1 Leveling for ANSI . . . . . . . . . . . . . . . . . . . . . . . . . . . . . . . . . . . . . . . . . . . . . . . . . . . . . . . . . . . . . . . . . . . . . . . . . . . . . . 108
5.1.2 Setting up the hearing aid for ANSI . . . . . . . . . . . . . . . . . . . . . . . . . . . . . . . . . . . . . . . . . . . . . . . . . . . . . . . . . . . . 109
5.1.3 Setting up the analyzer for ANSI. . . . . . . . . . . . . . . . . . . . . . . . . . . . . . . . . . . . . . . . . . . . . . . . . . . . . . . . . . . . . . . 110
5.1.4 Running an ANSI 96 or an ANSI 03 Test . . . . . . . . . . . . . . . . . . . . . . . . . . . . . . . . . . . . . . . . . . . . . . . . . . . . . . . . 110
5.1.5 Running an ANSI 87 Test . . . . . . . . . . . . . . . . . . . . . . . . . . . . . . . . . . . . . . . . . . . . . . . . . . . . . . . . . . . . . . . . . . . . . . . 112
5.1.6 Viewing ANSI Results . . . . . . . . . . . . . . . . . . . . . . . . . . . . . . . . . . . . . . . . . . . . . . . . . . . . . . . . . . . . . . . . . . . . . . . . . . 112
5.1.7 Testing Digital Hearing Aids. . . . . . . . . . . . . . . . . . . . . . . . . . . . . . . . . . . . . . . . . . . . . . . . . . . . . . . . . . . . . . . . . . . . 114
5.1.8 Viewing ANSI measurements in the Coupler screen . . . . . . . . . . . . . . . . . . . . . . . . . . . . . . . . . . . . . . . . . . . 114
5.1.9 Explaining the Menu Settings . . . . . . . . . . . . . . . . . . . . . . . . . . . . . . . . . . . . . . . . . . . . . . . . . . . . . . . . . . . . . . . . . . 115
5.2 ANSI S3.42-1992 (ANSI 92). . . . . . . . . . . . . . . . . . . . . . . . . . . . . . . . . . . . . . . . . . . . . . . . . . . . . . . . . . . . . . . . . . . . . . . . . . . 117
5.2.1 Understanding ANSI 92. . . . . . . . . . . . . . . . . . . . . . . . . . . . . . . . . . . . . . . . . . . . . . . . . . . . . . . . . . . . . . . . . . . . . . . . 117
5.2.2 Running ANSI 92. . . . . . . . . . . . . . . . . . . . . . . . . . . . . . . . . . . . . . . . . . . . . . . . . . . . . . . . . . . . . . . . . . . . . . . . . . . . . . . 117
5.2.3 Viewing ANSI 92 Results. . . . . . . . . . . . . . . . . . . . . . . . . . . . . . . . . . . . . . . . . . . . . . . . . . . . . . . . . . . . . . . . . . . . . . . 118
5.2.4 Viewing ANSI measurements in the Coupler screen . . . . . . . . . . . . . . . . . . . . . . . . . . . . . . . . . . . . . . . . . . . 119
5.2.5 Explaining the Menu Settings. . . . . . . . . . . . . . . . . . . . . . . . . . . . . . . . . . . . . . . . . . . . . . . . . . . . . . . . . . . . . . . . . . 120
5.3 IEC . . . . . . . . . . . . . . . . . . . . . . . . . . . . . . . . . . . . . . . . . . . . . . . . . . . . . . . . . . . . . . . . . . . . . . . . . . . . . . . . . . . . . . . . . . . . . . . . . . 120
5.3.1 Setting up for IEC . . . . . . . . . . . . . . . . . . . . . . . . . . . . . . . . . . . . . . . . . . . . . . . . . . . . . . . . . . . . . . . . . . . . . . . . . . . . . . 120
5.3.2 Running IEC . . . . . . . . . . . . . . . . . . . . . . . . . . . . . . . . . . . . . . . . . . . . . . . . . . . . . . . . . . . . . . . . . . . . . . . . . . . . . . . . . . . 121
5.3.3 Viewing IEC Results . . . . . . . . . . . . . . . . . . . . . . . . . . . . . . . . . . . . . . . . . . . . . . . . . . . . . . . . . . . . . . . . . . . . . . . . . . . 121
5.3.4 Viewing IEC measurements in the Coupler screen. . . . . . . . . . . . . . . . . . . . . . . . . . . . . . . . . . . . . . . . . . . . . 122
5.3.5 Understanding the Menu Settings . . . . . . . . . . . . . . . . . . . . . . . . . . . . . . . . . . . . . . . . . . . . . . . . . . . . . . . . . . . . . 122
5.4 JIS . . . . . . . . . . . . . . . . . . . . . . . . . . . . . . . . . . . . . . . . . . . . . . . . . . . . . . . . . . . . . . . . . . . . . . . . . . . . . . . . . . . . . . . . . . . . . . . . . . . 123
5.4.1 Running JIS . . . . . . . . . . . . . . . . . . . . . . . . . . . . . . . . . . . . . . . . . . . . . . . . . . . . . . . . . . . . . . . . . . . . . . . . . . . . . . . . . . . . 123
5.4.2 Viewing JIS Results . . . . . . . . . . . . . . . . . . . . . . . . . . . . . . . . . . . . . . . . . . . . . . . . . . . . . . . . . . . . . . . . . . . . . . . . . . . . 124
5.4.3 Viewing JIS measurements in the Coupler screen . . . . . . . . . . . . . . . . . . . . . . . . . . . . . . . . . . . . . . . . . . . . . 125
5.4.4 Understanding the menu settings . . . . . . . . . . . . . . . . . . . . . . . . . . . . . . . . . . . . . . . . . . . . . . . . . . . . . . . . . . . . . 125
Chapter 6: Real-Ear Measurements
6.1 Introduction. . . . . . . . . . . . . . . . . . . . . . . . . . . . . . . . . . . . . . . . . . . . . . . . . . . . . . . . . . . . . . . . . . . . . . . . . . . . . . . . . . . . . . . . . 127
6.1.1 Understanding the Real-Ear Screens. . . . . . . . . . . . . . . . . . . . . . . . . . . . . . . . . . . . . . . . . . . . . . . . . . . . . . . . . . . 127
6.1.2 Navigating through the Real-Ear Screens . . . . . . . . . . . . . . . . . . . . . . . . . . . . . . . . . . . . . . . . . . . . . . . . . . . . . . 128
6.2 Real-Ear Setup . . . . . . . . . . . . . . . . . . . . . . . . . . . . . . . . . . . . . . . . . . . . . . . . . . . . . . . . . . . . . . . . . . . . . . . . . . . . . . . . . . . . . . 128
6.2.1 Placing the Sound Field Speaker . . . . . . . . . . . . . . . . . . . . . . . . . . . . . . . . . . . . . . . . . . . . . . . . . . . . . . . . . . . . . .128
6.2.2 Placing the earhook and reference microphone . . . . . . . . . . . . . . . . . . . . . . . . . . . . . . . . . . . . . . . . . . . . . . . 129
6.2.3 Inserting the probe tube. . . . . . . . . . . . . . . . . . . . . . . . . . . . . . . . . . . . . . . . . . . . . . . . . . . . . . . . . . . . . . . . . . . . . . . 130
6.2.4 Leveling the Sound Field Speaker . . . . . . . . . . . . . . . . . . . . . . . . . . . . . . . . . . . . . . . . . . . . . . . . . . . . . . . . . . . . . 133
6.2.5 Setting up Body Aids . . . . . . . . . . . . . . . . . . . . . . . . . . . . . . . . . . . . . . . . . . . . . . . . . . . . . . . . . . . . . . . . . . . . . . . . . . 135
6.3 Real-Ear Targets . . . . . . . . . . . . . . . . . . . . . . . . . . . . . . . . . . . . . . . . . . . . . . . . . . . . . . . . . . . . . . . . . . . . . . . . . . . . . . . . . . . . . 135
6.3.1 Entering an Audiogram . . . . . . . . . . . . . . . . . . . . . . . . . . . . . . . . . . . . . . . . . . . . . . . . . . . . . . . . . . . . . . . . . . . . . . . . 135
6.3.2 Deleting Audiometric Information. . . . . . . . . . . . . . . . . . . . . . . . . . . . . . . . . . . . . . . . . . . . . . . . . . . . . . . . . . . . . 137
6.3.3 Creating a Target. . . . . . . . . . . . . . . . . . . . . . . . . . . . . . . . . . . . . . . . . . . . . . . . . . . . . . . . . . . . . . . . . . . . . . . . . . . . . . . 137
6.3.4 Entering Bone Data . . . . . . . . . . . . . . . . . . . . . . . . . . . . . . . . . . . . . . . . . . . . . . . . . . . . . . . . . . . . . . . . . . . . . . . . . . . .138
6.3.5 Performing an RECD measurement . . . . . . . . . . . . . . . . . . . . . . . . . . . . . . . . . . . . . . . . . . . . . . . . . . . . . . . . . . . . 138
6.3.6 Modifying a Target. . . . . . . . . . . . . . . . . . . . . . . . . . . . . . . . . . . . . . . . . . . . . . . . . . . . . . . . . . . . . . . . . . . . . . . . . . . . . 141
6.3.7 Entering an REDD transform . . . . . . . . . . . . . . . . . . . . . . . . . . . . . . . . . . . . . . . . . . . . . . . . . . . . . . . . . . . . . . . . . . . 143
6.4 Real-Ear Measurements . . . . . . . . . . . . . . . . . . . . . . . . . . . . . . . . . . . . . . . . . . . . . . . . . . . . . . . . . . . . . . . . . . . . . . . . . . . . . 143
6.4.1 Measuring in the Insertion Gain screen. . . . . . . . . . . . . . . . . . . . . . . . . . . . . . . . . . . . . . . . . . . . . . . . . . . . . . . . 143
6.4.2 Measuring in the Real-ear SPL screen . . . . . . . . . . . . . . . . . . . . . . . . . . . . . . . . . . . . . . . . . . . . . . . . . . . . . . . . .145
6.4.3 Measuring the Unaided Response (REUG/REUR). . . . . . . . . . . . . . . . . . . . . . . . . . . . . . . . . . . . . . . . . . . . . .146
6.4.4 Measuring the Aided Response (REAG/REAR) . . . . . . . . . . . . . . . . . . . . . . . . . . . . . . . . . . . . . . . . . . . . . . . . . 148
6.4.5 Working with prescription targets . . . . . . . . . . . . . . . . . . . . . . . . . . . . . . . . . . . . . . . . . . . . . . . . . . . . . . . . . . . . . 150
6.4.6 Using Semi-Auto and Fully-Auto Mode . . . . . . . . . . . . . . . . . . . . . . . . . . . . . . . . . . . . . . . . . . . . . . . . . . . . . . . . 151
6.4.7 Testing with a single tone or three frequency average . . . . . . . . . . . . . . . . . . . . . . . . . . . . . . . . . . . . . . . . . 151
6.4.8 Using the reference microphone . . . . . . . . . . . . . . . . . . . . . . . . . . . . . . . . . . . . . . . . . . . . . . . . . . . . . . . . . . . . . . 152
6.4.9 Viewing numerical curve data . . . . . . . . . . . . . . . . . . . . . . . . . . . . . . . . . . . . . . . . . . . . . . . . . . . . . . . . . . . . . . . . . 152
6.4.10 Deleting and un-displaying measurements . . . . . . . . . . . . . . . . . . . . . . . . . . . . . . . . . . . . . . . . . . . . . . . . . . . 154
6.4.11 Using Smoothing in measurement curves . . . . . . . . . . . . . . . . . . . . . . . . . . . . . . . . . . . . . . . . . . . . . . . . . . . . 154
6.4.12 Using Output Limiting . . . . . . . . . . . . . . . . . . . . . . . . . . . . . . . . . . . . . . . . . . . . . . . . . . . . . . . . . . . . . . . . . . . . . . . . 156
6.4.13 Measuring the occlusion effect . . . . . . . . . . . . . . . . . . . . . . . . . . . . . . . . . . . . . . . . . . . . . . . . . . . . . . . . . . . . . . . 156
6.5 Digital Hearing Aids . . . . . . . . . . . . . . . . . . . . . . . . . . . . . . . . . . . . . . . . . . . . . . . . . . . . . . . . . . . . . . . . . . . . . . . . . . . . . . . . . 157
6.5.1 Using Digital Speech. . . . . . . . . . . . . . . . . . . . . . . . . . . . . . . . . . . . . . . . . . . . . . . . . . . . . . . . . . . . . . . . . . . . . . . . . . . 157
6.5.2 Choosing a speech weighting. . . . . . . . . . . . . . . . . . . . . . . . . . . . . . . . . . . . . . . . . . . . . . . . . . . . . . . . . . . . . . . . . . 158
6.5.3 Testing the digital filters . . . . . . . . . . . . . . . . . . . . . . . . . . . . . . . . . . . . . . . . . . . . . . . . . . . . . . . . . . . . . . . . . . . . . . . 158
6.5.4 Testing digital noise suppression . . . . . . . . . . . . . . . . . . . . . . . . . . . . . . . . . . . . . . . . . . . . . . . . . . . . . . . . . . . . . . 159
6.6 Directional Hearing Aids . . . . . . . . . . . . . . . . . . . . . . . . . . . . . . . . . . . . . . . . . . . . . . . . . . . . . . . . . . . . . . . . . . . . . . . . . . . . 160
6.6.1 Using the insertion gain technique . . . . . . . . . . . . . . . . . . . . . . . . . . . . . . . . . . . . . . . . . . . . . . . . . . . . . . . . . . . .160
6.6.2 Determining the “null” . . . . . . . . . . . . . . . . . . . . . . . . . . . . . . . . . . . . . . . . . . . . . . . . . . . . . . . . . . . . . . . . . . . . . . . .162
6.7 Open Ear Hearing Aids . . . . . . . . . . . . . . . . . . . . . . . . . . . . . . . . . . . . . . . . . . . . . . . . . . . . . . . . . . . . . . . . . . . . . . . . . . . . . .162
6.8 Visible Speech . . . . . . . . . . . . . . . . . . . . . . . . . . . . . . . . . . . . . . . . . . . . . . . . . . . . . . . . . . . . . . . . . . . . . . . . . . . . . . . . . . . . . .163
6.8.1 Performing Visible Speech measurement. . . . . . . . . . . . . . . . . . . . . . . . . . . . . . . . . . . . . . . . . . . . . . . . . . . . . .164
6.8.2 Viewing the Real-time Visible Speech Display. . . . . . . . . . . . . . . . . . . . . . . . . . . . . . . . . . . . . . . . . . . . . . . . . 165
6.8.3 Viewing Completed Test Results. . . . . . . . . . . . . . . . . . . . . . . . . . . . . . . . . . . . . . . . . . . . . . . . . . . . . . . . . . . . . . .165
6.8.4 Measuring multiple envelopes . . . . . . . . . . . . . . . . . . . . . . . . . . . . . . . . . . . . . . . . . . . . . . . . . . . . . . . . . . . . . . . . 166
6.9 CROS/BICROS Aids. . . . . . . . . . . . . . . . . . . . . . . . . . . . . . . . . . . . . . . . . . . . . . . . . . . . . . . . . . . . . . . . . . . . . . . . . . . . . . . . . . 167
6.9.1 Measuring the Head-Baffle Effect. . . . . . . . . . . . . . . . . . . . . . . . . . . . . . . . . . . . . . . . . . . . . . . . . . . . . . . . . . . . . . 168
6.9.2 Measuring the Overcoming of the Head-Baffle Effect . . . . . . . . . . . . . . . . . . . . . . . . . . . . . . . . . . . . . . . . . . 169
6.9.2.1 CROS. . . . . . . . . . . . . . . . . . . . . . . . . . . . . . . . . . . . . . . . . . . . . . . . . . . . . . . . . . . . . . . . . . . . . . . . . . . . . . . . . . . 169
6.9.2.2 BI-CROS. . . . . . . . . . . . . . . . . . . . . . . . . . . . . . . . . . . . . . . . . . . . . . . . . . . . . . . . . . . . . . . . . . . . . . . . . . . . . . . . 170
6.9.3 Measuring Overall Insertion Gain . . . . . . . . . . . . . . . . . . . . . . . . . . . . . . . . . . . . . . . . . . . . . . . . . . . . . . . . . . . . . 170
6.9.3.1 CROS. . . . . . . . . . . . . . . . . . . . . . . . . . . . . . . . . . . . . . . . . . . . . . . . . . . . . . . . . . . . . . . . . . . . . . . . . . . . . . . . . . . 171
6.9.3.2 BI-CROS. . . . . . . . . . . . . . . . . . . . . . . . . . . . . . . . . . . . . . . . . . . . . . . . . . . . . . . . . . . . . . . . . . . . . . . . . . . . . . . . 171
6.9.4 Measuring Insertion Loss to the “Good” Ear (CROS) . . . . . . . . . . . . . . . . . . . . . . . . . . . . . . . . . . . . . . . . . . . 172
Appendix A: Specifications. . . . . . . . . . . . . . . . . . . . . . . . . . . . . . . . . . . . . . . . . . . . . . . . . . . . . . . . . . . . . . . . . . . . . . . . . . . . . . 173
Appendix B: Calibration . . . . . . . . . . . . . . . . . . . . . . . . . . . . . . . . . . . . . . . . . . . . . . . . . . . . . . . . . . . . . . . . . . . . . . . . . . . . . . . . . 177
Appendix C: Troubleshooting Guide . . . . . . . . . . . . . . . . . . . . . . . . . . . . . . . . . . . . . . . . . . . . . . . . . . . . . . . . . . . . . . . . . . . .183
Appendix D: The FONIX CIC Feature. . . . . . . . . . . . . . . . . . . . . . . . . . . . . . . . . . . . . . . . . . . . . . . . . . . . . . . . . . . . . . . . . . . . .185
Appendix E: Fitting Formula Tables . . . . . . . . . . . . . . . . . . . . . . . . . . . . . . . . . . . . . . . . . . . . . . . . . . . . . . . . . . . . . . . . . . . . . . 189
Appendix F: Probe SPL Mode Description . . . . . . . . . . . . . . . . . . . . . . . . . . . . . . . . . . . . . . . . . . . . . . . . . . . . . . . . . . . . . . . 193
Appendix G: Glossary of Terms . . . . . . . . . . . . . . . . . . . . . . . . . . . . . . . . . . . . . . . . . . . . . . . . . . . . . . . . . . . . . . . . . . . . . . . . . . 197

Chapter 1 1
Introduction & Setup
Welcome to the newest innovation in hearing aid testing! The 7000 Test System
is the long-awaited successor to the 6500-CX, the analyzer that arguably has
become the standard by which all other hearing aid test equipment is measured.
The 7000 Test System has many design improvements, including a high-resolu-
tion color display, a flexible and easy-to-use interface, and built-in help screens.
Throughout the design process of the 7000 Test System, the engineers at Frye
Electronics have followed two important mantras: Flexibility and Usability. We
wanted all the features of the existing 6500-CX system in a new package that was
easier to use and easier to upgrade. We are confident that the 7000 Test System is a
success on both counts
1.1 History
The 6500-CX has been one of the fastest and most accurate hearing aid analyz-
ers in the industry. Since its introduction in 1985 at the International Audiology
Congress in Prague, Czechoslovakia, it has evolved through three model num-
bers: the original 6500, the 6500-C with color, and the 6500-CX with a faster
CPU. These hardware upgrades, and the software upgrades that went with them,
kept the 6500 analyzer current as hearing aid technology evolved.
The original 6500 operator interface was originally designed around a set of
tests that were needed at the time of its introduction. Linear and AGC hearing
aids were tested for ANSI coupler performance, and real ear tests were done to
check on insertion gain performance. Its Composite signal gave the industry the
first real time, interactive frequency response measurement for both coupler
and real ear tests. This enabled an order of magnitude increase in the collec-
tion speed of response data. This feature has been particularly useful in real ear
tests, where artifacts caused by ambient noise in the acoustical environment are
a factor.
The 6500 evolved to keep pace with the technology of the hearing aid industry.
The 6500-C with color video came in 1992. The CX version with its faster CPU
was introduced in 1994. Functions such as Multi-curve, Target 2-cc, ANSI 92,
CIC, Digital-Speech-in-Noise, the real-ear SPL screen, and Enhanced DSP were
gradually introduced, making the 6500-CX analyzer more powerful with each
release.
The number of tests on the 6500-CX grew, but the operator interface remained
much the same. To accommodate new functions, 6500 front panel buttons were
programmed with functions different from their original purpose and labeling.
While the help messages on the screen allowed the first time user to operate the
instrument, it was obvious that improvements could be made. Some of these

2 FONIX 7000 Hearing Aid Analyzer
were implemented and tested on other Frye instruments. The FP40 analyzer
introduced “function buttons” that adapt to handle the specific needs of each
test screen and sequence. The FP35 analyzer added help screens and local
menus to make the analyzer more intuitive and easier to use.
The lessons learned in the FP40 and FP35 analyzers have been incorporated into the
7000 Test System. It is hoped that these improvements will make the 7000 flexible
enough to adapt to any new test procedures as they become needed with the chang-
ing testing requirements of the hearing aid industry
1.2 Basic Test Functions
The basic 7000 can perform the following coupler tests:
• Pure-tone signal measurements
• Composite and Digital Speech signal measurements
• Phase measures for binaural hearing aid pairs
• Group delay (processing delay) measurement of digital hearing aids
• Battery Current as a function of amplitude and frequency
• I/O Curves
• Attack and Release
For both composite and pure tone measurements, the following are possible:
• Special CIC hearing aid coupler measurements
• Behind the ear (BTE), In the ear (ITE), in the canal (ITC), Open ear, and
body hearing aid measurements
• Choice of either IEC 60118-7 or ANSI S3.22-2003/96/87/92 standard tests
(All tests can be installed as options)
An additional function that comes standard with the 7000 is RS232 communication
with an external personal computer. This allows remote operation of the analyzer
from the computer, and lets you save test results onto your computer’s hard drive.
Firmware upgrades to the 7000 Test System can also be performed though the com-
puter.
1.3 Options
The 7000 test system has the following software (and hardware) options avail-
able:
Real-Ear Option
The 7000 test system can be ordered with the Real-Ear Option so that tests can
be done on the hearing aid while it is in the client’s ear. These measurements
are also commonly called “probe measurements” because they are performed

Introduction and Setup 3
with a probe microphone. Using real-ear measurements makes it possible to
individualize the fitting of a hearing aid since a coupler measurement can sel-
dom tell the operator exactly how what sound is received by the client. Many
factors affect the sound on its way to the ear drum. When measuring with a
probe microphone, you will know what is happening in the “real-ear.”
ANSI Option
The ANSI Option gives the user access to the ANSI 03, ANSI 96, ANSI 87, and
ANSI 92 test sequences. These perform measurements according to the ANSI
S3.22 2003, ANSI S3.22 1996, ANSI S3.22-1987, and ANSI S3.42-1992 stan-
dards, respectively.
This option also includes the Telewand, which is used for performing ANSI 96
telecoil measurements.
IEC Option
The IEC Option gives the user access to the IEC test sequence, which performs
measurements in accordance with the IEC 118-7, the performance part of the
IEC standard.
OES Option
The Occluded Ear Simulator (OES) Option includes the MZ-1, MZ-2, and MZ-3
couplers and corresponding correction factors meant to simulate the results of a
real-ear simulator (Zwislocki) coupler when simulating occluded ear measure-
ments in the sound chamber. The results produced with the OES Option will
not be an exact duplication of the results produced with a Zwislocki coupler.
VA CORFIG
The VA-CORFIG Option supplies a frequency response in the ANSI test
sequence that includes correction factors that make the measurement closer to a
real-ear response. These correction factors were developed by the United States
Veterans Administration.
4 FONIX 7000 Hearing Aid Analyzer
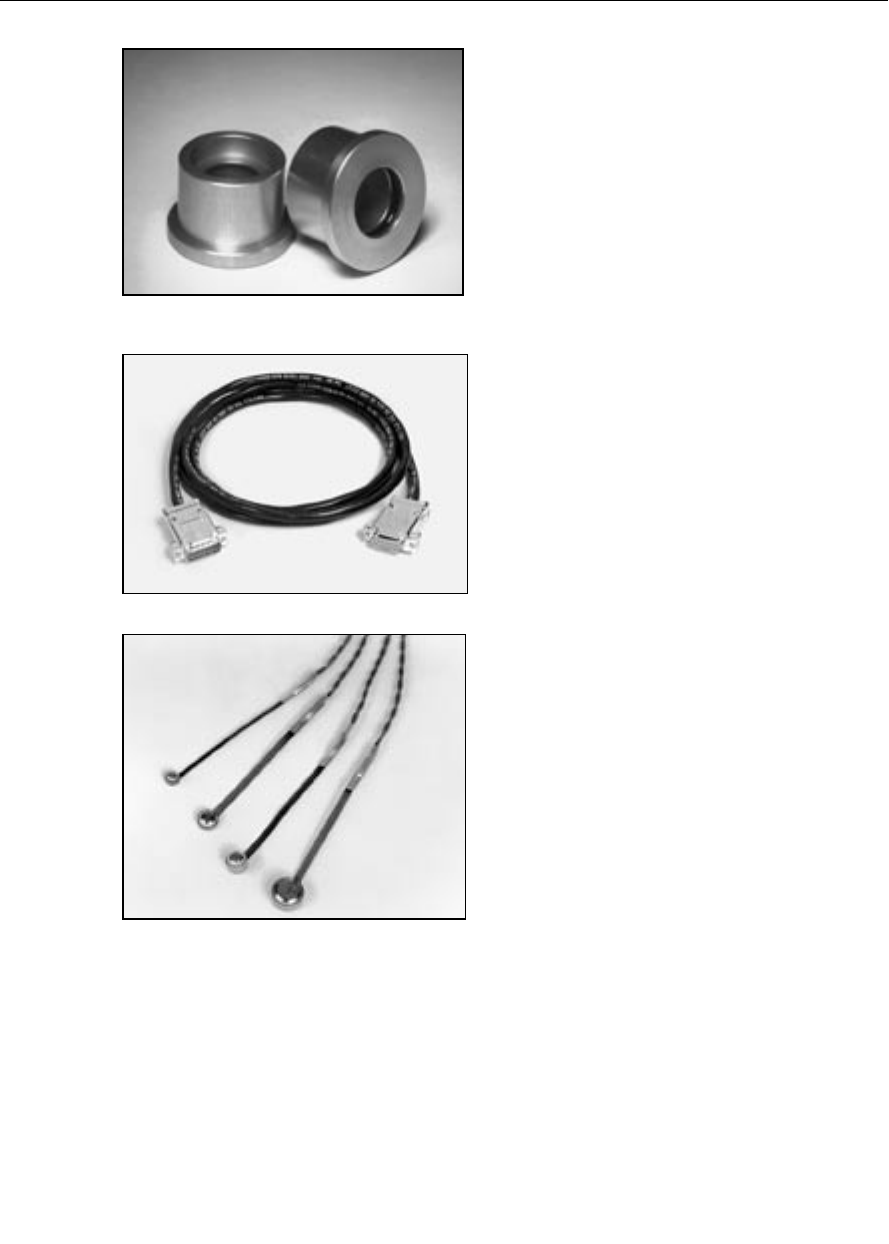
HA-2, 2-cc Coupler
Dimensions per ANSI S3.7 for testing
behind-the-ear aids, eyeglass aids, and
body aids.
Coupler Microphone—M1950E
14 mm pressure-type electret instru-
mentation microphone.
Note: Older 7000 analyzers may use
the M1750E microphone.
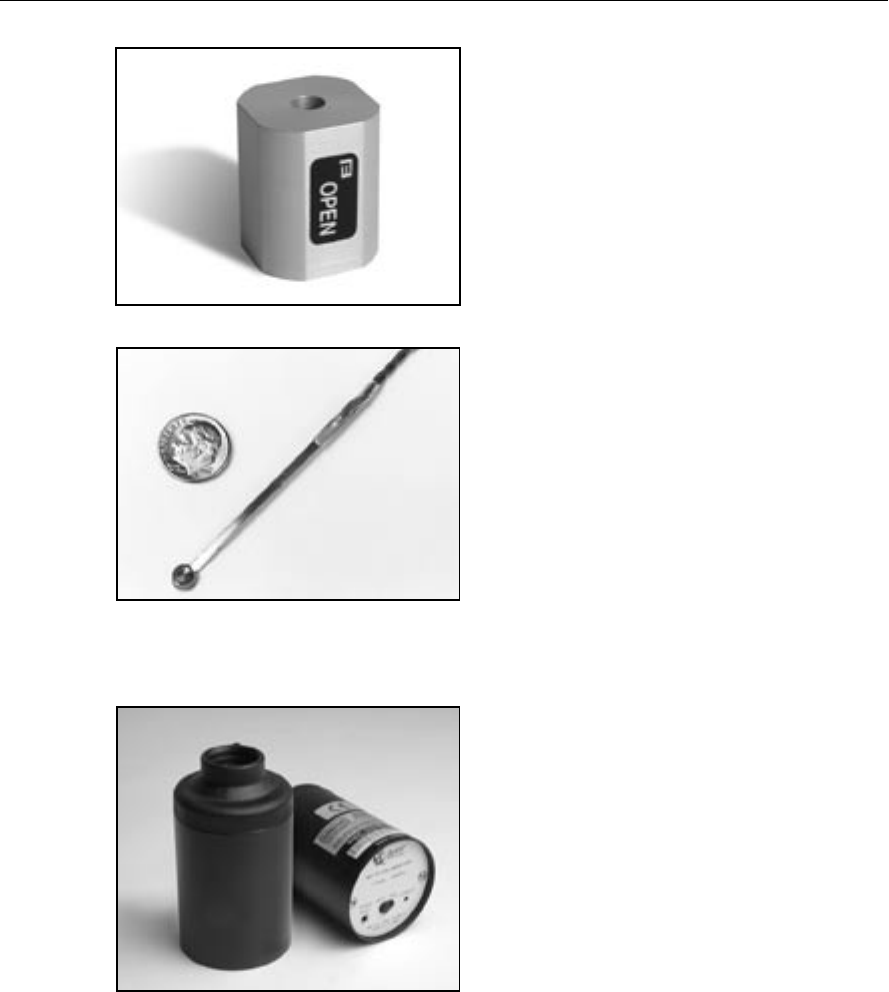
HA-1 2-cc Coupler
Dimensions per ANSI S3.7 for testing
in-the-ear aids, canal aids, and aids fit-
ted with earmolds.
1.4 Accessories
The following are accessories that are standard and optional on your FONIX
7000 hearing aid analyzer.
1.4.1 Standard Accessories
The following accessories come standard with each 7000 test system.
Ear-Level Adapter (BTE)
Snaps into the 1/4" (6.35 mm) diameter
cavity of the HA-2 and MZ-2 couplers.
Equipped with a 0.6" (15 mm) length
of 0.076" (1.93 mm) ID tubing, the
adapter allows ANSI S3.22 specified
connection of an ear-level aid to the
coupler.
Introduction and Setup 5
Microphone Adapter
14 mm to 1" (25.4) mm adapter for
coupling the M1950E microphone
and reference microphone to a 1-inch
device such as a sound level calibra-
tor.
Test Chamber Cable
Connects the main module to the test
chamber.
Battery Substitution Pills
Used to power hearing aids, measure
battery drain, and estimate battery life.
Standard sizes:
675/76
13
312
10A/230
Other Standard Accessories:
Thermal Paper
Fun-Tak
RS232 Cable
Dummy Microphone (for testing to ANSI specifications)
Sound Chamber Replacement Feet
Operator’s Manual
Maintenance Manual (upon request at time of purchase)
6 FONIX 7000 Hearing Aid Analyzer
Loudspeaker Swing Arm
This swing arm may be substituted for
the speaker floor stand & shelf. It is a
convenient device that can be mounted
to a wall or desktop. The four-piece
arm swivels and extends along five
different dimensions to allow precise
placement and aiming of the loud-
speaker. Spring tension and friction
keep the loudspeaker exactly where
you put it.
1.4.2 Real-Ear Accessories
When the Real-Ear Option is ordered, the following accessories are
included.
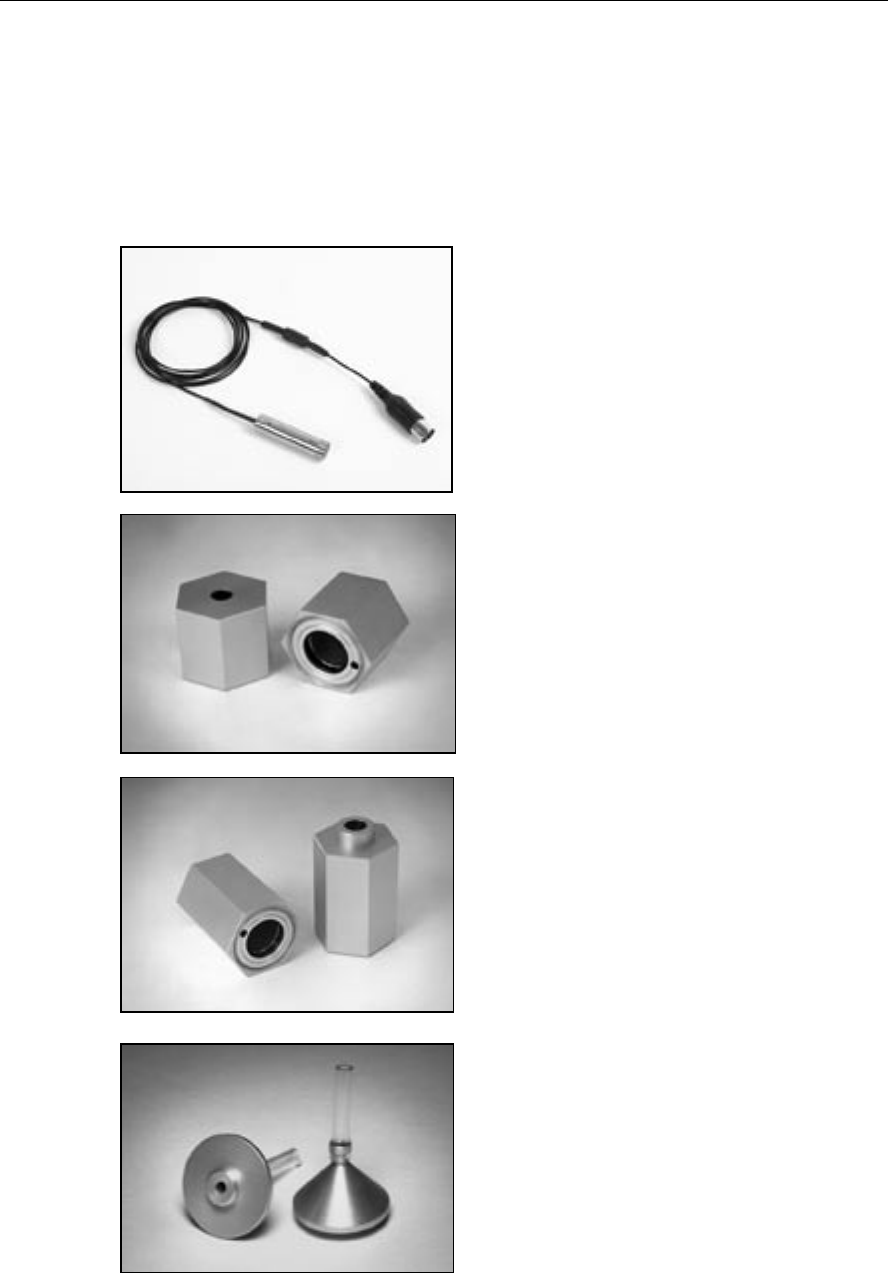
Remote Module and Microphones
The remote module allows the user to
control the analyzer while remaining
close to the patient. The probe and ref-
erence microphones, used for perform-
ing real-ear measurements, are plugged
into this module.
Sound Field Speaker
Produces the output for most real-ear
measurements. The Real-Ear Option
can be ordered with a floor stand,
remote module shelf, or with a swing
arm.
Loudspeaker Floor Stand
The lightweight, sturdy floor stand is
adjustable and has a low-profile tripod
base.
Remote Module Shelf
The shelf fits directly on the floor
stand, providing a stable, convenient
platform for operating and storing the
remote module. This is the default
configuration.
Introduction and Setup 7
Monitor Headset
Plugs into the remote module, and
allows the user to listen to the signal
being measured by the probe micro-
phone. Model of headset may differ
from one shown.
Wedge-style Ear Hook
Standard Size. Holds probe and refer-
ence microphone during real-ear test-
ing.
Probe Tubes
Used for performing real-ear measure-
ments. Probe tubes are not reusable.
8 FONIX 7000 Hearing Aid Analyzer
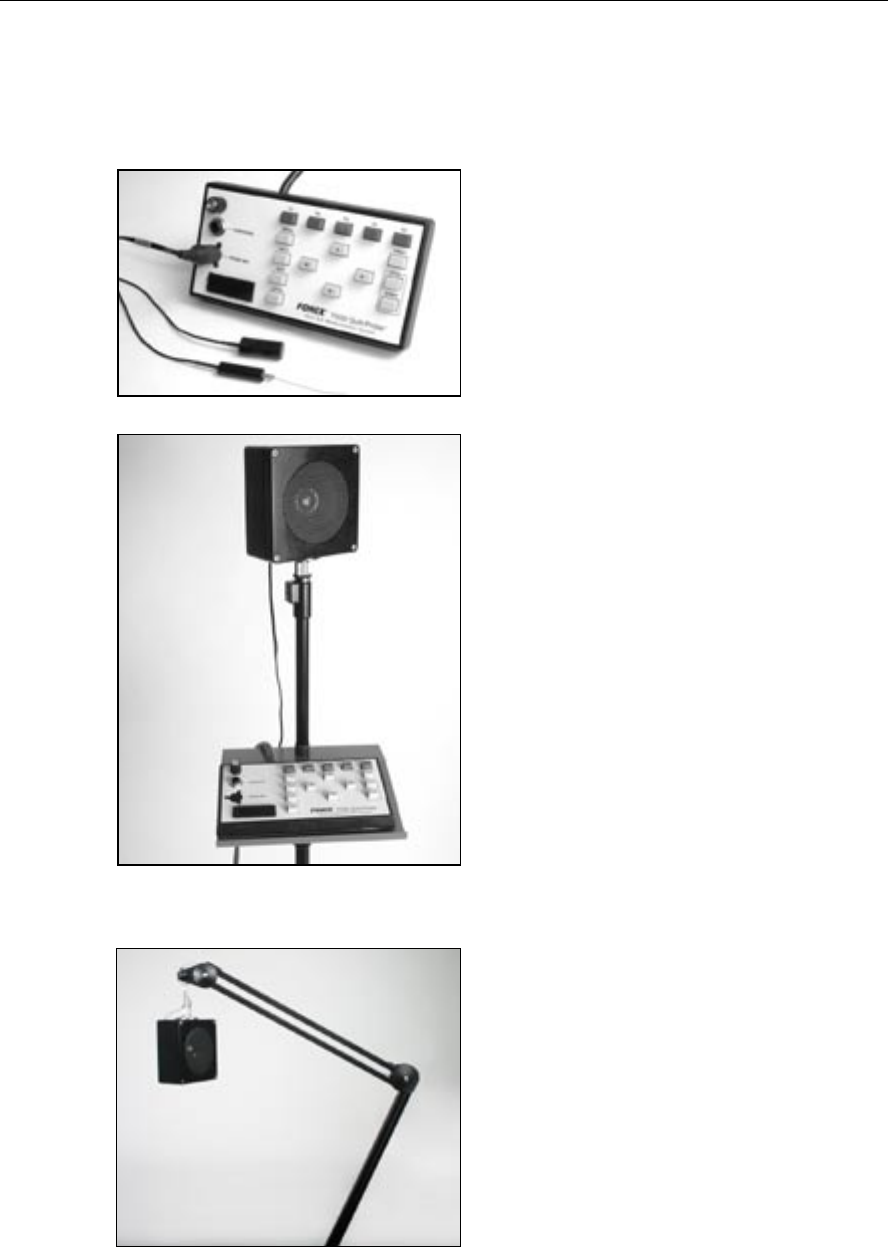
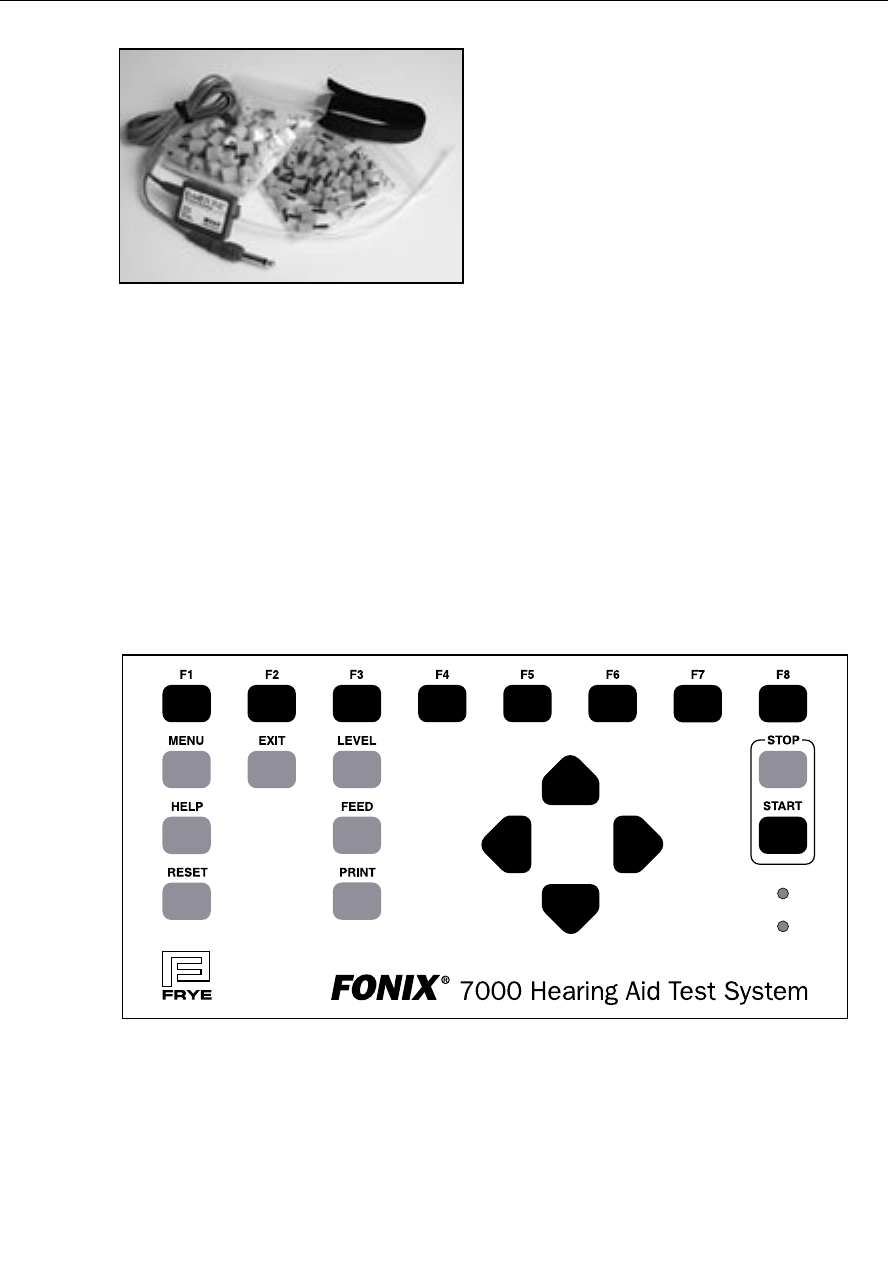
CIC Coupler
Non-standard (0.4 cc) coupler used for
realistic testing of CIC hearing aids.
This coupler is always used in con-
junction with the CIC software correc-
tion factors
6-cc Coupler
Enables checking the response of stan-
dard audiometer headphones. It is
designed around the NBS 9A coupler
specifications.
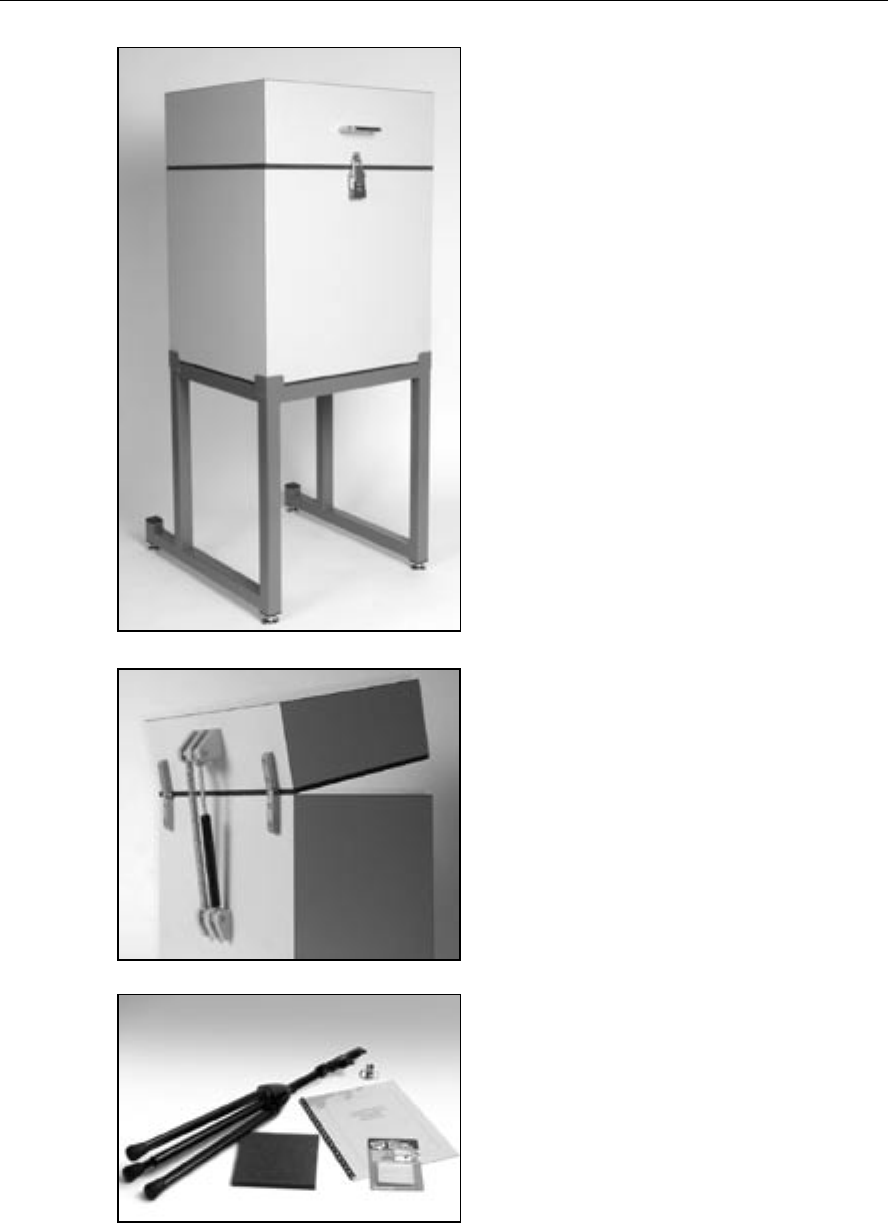
MZ Couplers
MZ-3, MZ-2, and MZ-1 couplers are
supplied with the OES Option.
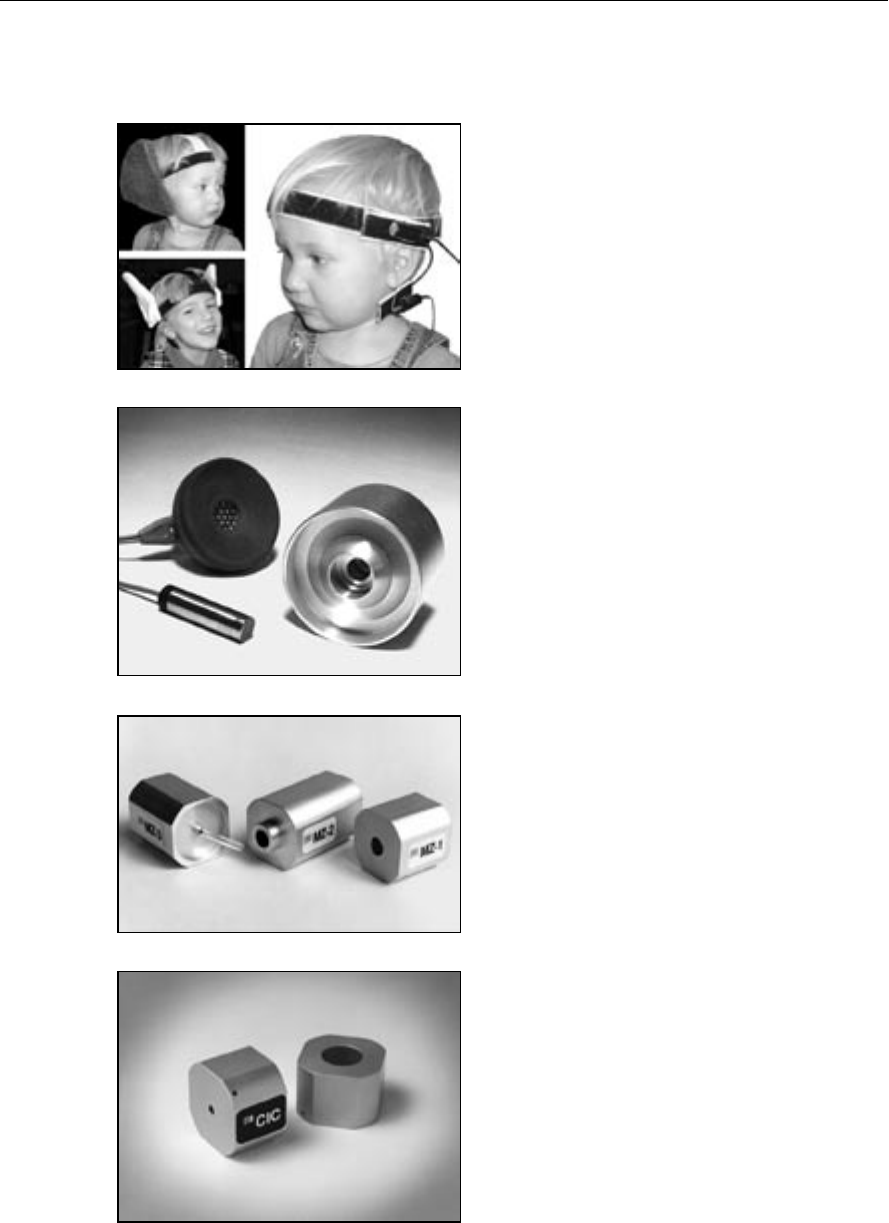
1.4.3 Optional Accessories
Infant/Child Headband
Includes infant, child, and adult head-
bands, six bendable earhooks, and two
sets of “animal ears.”
Introduction and Setup 9
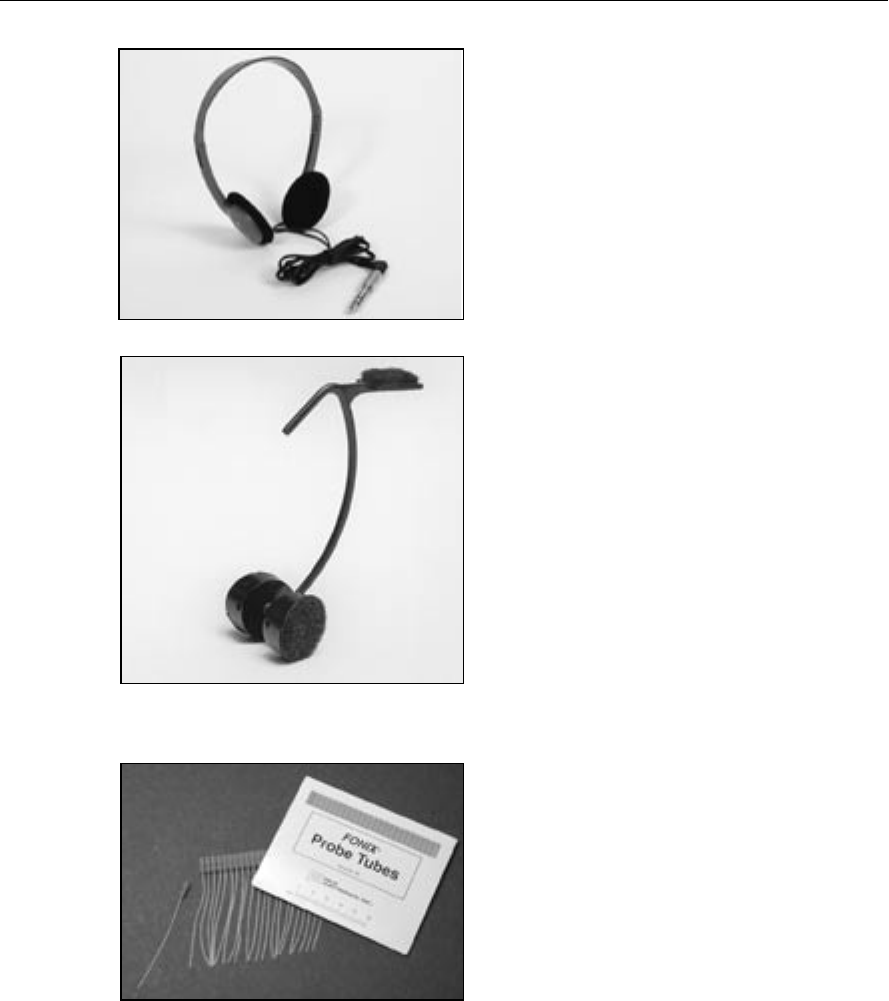
Open Ear Coupler
Non-standard coupler used for realistic
testing of open ear hearing aids.
#5 battery pill
Provides battery current measurements
for many CIC hearing aids.
Also available:
#41 battery pill
AA
Sound Level Calibrator A portable,
self-contained, field-type calibrator for
calibrating the microphone amplifier.
It operates on one nine-volt transistor
battery. Use with 14 mm-to-1" adapter.
Calibration is traceable to the U.S.
National Institute of Standards and
Technology. Conforms to ANSI @1.40-
1984 and IEC 942: 1988.
10 FONIX 7000 Hearing Aid Analyzer
Sound Chamber Spring Damper
Factory-installed.or Assembly Kit.
This spring assembly fits onto the back
of the sound chamber, making it easier
to open the sound chamber lid. Once
the sound chamber is open past a cer-
tain point, the user can release the lid
and let the spring open it the rest of the
way. Great when performing repetitive
coupler measurements.
FM Kit
Facilitates coupler and real-ear tests
of FM systems. The kit includes a
telescoping floor stand with a test plat-
form and plenty of extra Fun-Tak and
a 6-inch (15 cm) square foam pad for
using the 2-cc coupler outside the test
chamber.
Sound Chamber Stand
A secure, steel-tube stand that
improves sound isolation and brings
the testing area of the test chamber to
convenient table height. Color matches
the electronics module.
Introduction and Setup 11
1.5 Layout, Controls, and Safety
This section describes the basic layout of the front and rear panel of the 7000
test system, and special information pertaining to safety regulations.
1.5.1 Front Panel Layout
The front panel of the 7000 test system consists of 8 function keys, 4 arrow
keys, and 9 other keys with varying operations. Together, all of these keys are
used to control all the operations of the 7000 test system. A wide internal ther-
mal printer is located to the right of the front panel. See Figure 1.5.1.
POWER
STANDBY
Figure 1.5.1—Front panel
FUNCTION KEYS:
The top row of buttons on the 7000 front panel consists of “function keys”
labeled [F1] through [F8]. The function of these keys change from screen to
screen, according to the need of the screen. There are three basic uses of the
function keys:
RECD Earphone Package
Consists of one ER3A earphone with
a 1⁄4 inch plug, a 72 inch cable, an
assortment of ear tips, a calibration
certificate, and a lapel clip. This pack-
age is suitable for performing an RECD
measurement with the 7000 Test
System.

12 FONIX 7000 Hearing Aid Analyzer
• To navigate from screen to screen
• To toggle a selection
• To pop-up up a selection menu
For a more complete description of the operation of the function keys, see
Section 2.1.1.
[RESET]: Resets the analyzer and returns you to the opening screen.
Many settings, measurements, and test conditions are erased
or returned to their default conditions with the push of this
button. Use [EXIT] instead of [RESET] to avoid the loss of
data.
[HELP]: Brings up a pop-up help window, which tells you what func-
tions can be performed in the current screen.
[MENU]: Opens a local menu, or the Default Settings menu.
[EXIT]: Exits from the current screen, leaving all settings, measure-
ments, and test conditions as is.
[LEVEL]: Levels the sound chamber or sound field speaker.
[FEED]: Advances the internal thermal paper feed.
[PRINT]: Prints current screen.
[STOP]: Stops testing.
[START]: Starts testing.
ARROW KEYS: The arrow keys perform different functions depending upon
the screen and previous buttons pushed. In a test situation,
they adjust the source amplitude and frequency. If you press
one of the function buttons to bring up a pop-up menu, they
are used to scroll through the available options and make
selections.
LEDs: Power: When green, this LED indicates that the 7000 Test
System is powered on.
Standby: When green, this LED indicates that the screensaver
mode is engaged (screensaver not available at this time)
Introduction and Setup 13
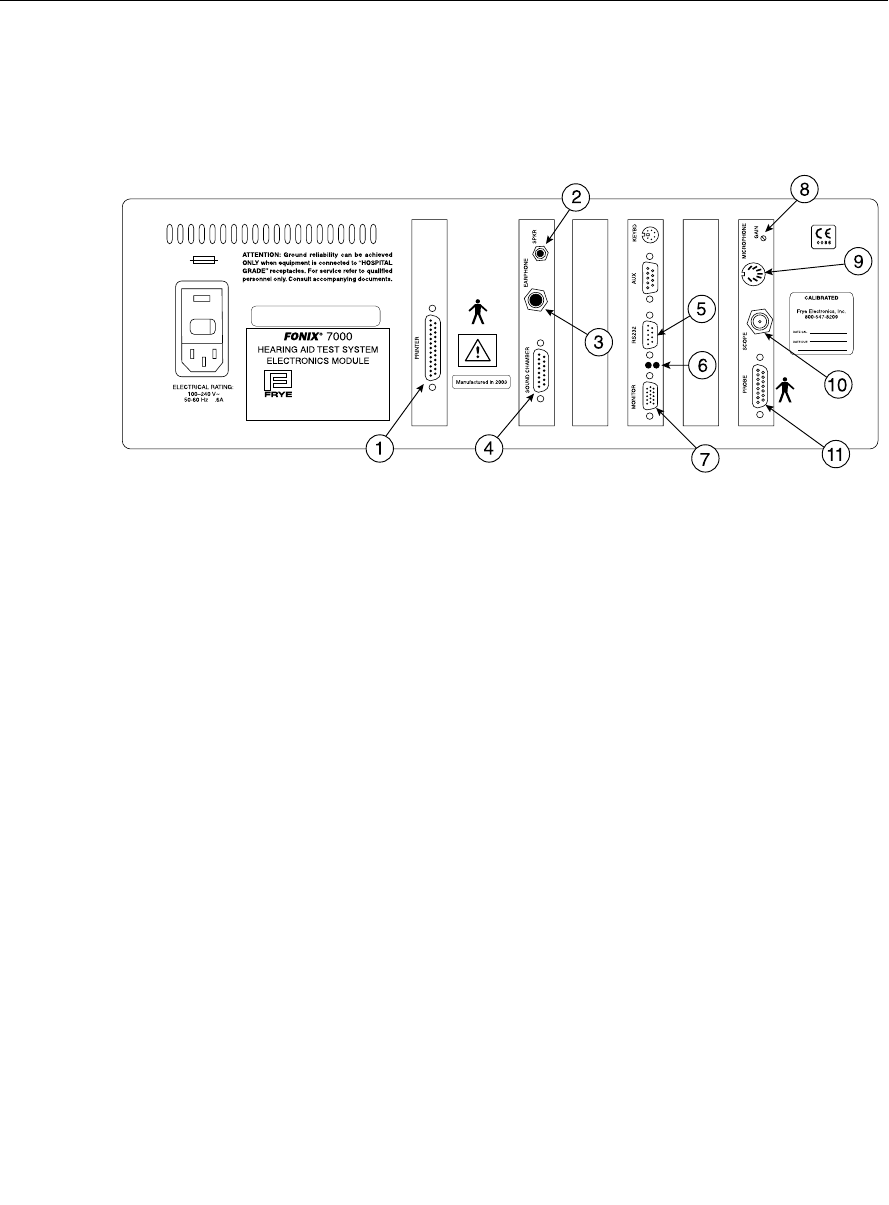
1.5.2 Rear Panel Layout
The rear panel of the 7000 test system contains most of the external connec-
tions for the analyzer. See Figure 1.5.2 for a diagram of the back panel.
FONIX 7000 Serial No. 1234
Made in Tigard, Oregon, USA
by Frye Electronics, Inc.
Frye Electronics products are protected by U.S.
and/or foreign patents and/or patents pending
T630 mAL
Figure 1.5.2—Back panel
1. PRINTER: Connects an external printer to the 7000 test system.
2. SPKR: Connects the sound field speaker for real-ear measure-
ments.
3. EARPHONE: Connect a insert earphone to the analyzer for RECD mea-
surements. A 50 ohm earphone should always be used, to
avoid harm to the earphone.
4. SOUND
CHAMBER: Connects the main module to the sound chamber.
5. RS232: Connects the 7000 test system to a personal computer.
6. RS232 LEDs: The red LED indicates the analyzer is sending a poll. This
will flash whether or not a computer is connected. The
green LED indicates the analyzer is receiving a command
from a connected computer.
7. MONITOR: Connects the main module to a video monitor.
8. GAIN: Adjusts the calibration of the M1950E microphone.
9. MICROPHONE: Connects the M1950E microphone.
10. SCOPE: Connects to an external scope for external measuring pur-
poses.
14 FONIX 7000 Hearing Aid Analyzer
11. PROBE: Connects the main module to the remote module (used for
real-ear measurements).
KEYBD: Not currently active.
AUX: Not currently active.
The following safety symbols can be found on the back of the 7000 hearing aid
analyzer:
Type B Equipment. The probe microphone and insert ear-
phone are type B applied parts, according to IEC 60601-1.
Read the accompanying documents. Please read this manual
before operating the 7000 test system. A separate maintenance
manual exists for the 7000 test system. If you wish to obtain a
maintenance manual, please contact Frye Electronics, Inc. or
your Frye representative.
This symbol indicates that Frye Electronics, Inc. conforms to
the Medical Device Directive 93/42/EEC. Any attached video
monitor, external printer, or external computer should also
have a CE mark in order for the 7000 test system to remain
compliant.
Replace fuses only with the same type and rating.
1.5.3 Safety
Safety Classification for IEC 60601-1
Type of protection against electric shock: Class I
Degree of protection against electric shock: Type B
Protection against harmful ingress of water: Ordinary
Mode of operation: Continuous
The 7000 does not require sterilization or disinfection.
Warning: This equipment is not suitable for use in the presence of flammable
anaesthetic mixture with air or with oxygen or nitrous oxide.

Introduction and Setup 15
Connection of peripheral equipment to the 7000
Compliance with IEC 60601-1-1 Safety requirements for medical electrical sys-
tems must be determined on a case-by-case basis.
All electrical equipment attached to the 7000, such as video monitors, computer
equipment, etc. must, at a minimum, meet one of the following conditions:
a. The equipment complies with IEC 60601-1
b. The equipment complies with relevant IEC and ISO safety standards and is
supplied from a medical grade isolation transformer.
c. The equipment complies with relevant IEC and ISO safety standards and is
kept at least 1.5 meters from the patient.
The allowable leakage currents of IEC 60601-1-1 must not be exceeded. IEC
60601-1-1 should be consulted when assembling such a system.
Electromagnetic compatibility
The 7000 complies with IEC 60601-1-2.
The 7000 generates and uses radio frequency energy. In some cases the 7000
could cause interference to radio or television reception. You can determine if
the 7000 is the source of such interference by turning the unit off and on.
If you are experiencing interference caused by the 7000, you may be able to cor-
rect it by one or more of the following measures:
1. Relocate or reorient the receiving antenna.
2. Increase the distance between the 7000 and the receiver.
3. Connect the 7000 to a different outlet than the receiver.
In some cases radio transmitting devices, such as cellular telephones, may cause
interference to the 7000. In this case try increasing the distance between the
transmitter and the 7000.
Disposal of the 7000 and accessories
The 7000 and some of its accessories contain lead. At the end of its useful life,
please recycle or dispose of the 7000 according to local regulations.
If you are located in the European Union, please report all safety-related con-
cerns to our authorized representative:
Siemens Hearing Instruments Ltd.
Alexandra House
Newton Road
Manor Royal
Crawley
West Sussex RH109TT
ENGLAND
16 FONIX 7000 Hearing Aid Analyzer
Otherwise, please report all safety related concerns to the Frye factory:
Frye Electronics, Inc.
9826 SW Tigard St.
Tigard, OR 97223
Ph: (503) 620-2722 or (800) 547-8209
Fax: (503) 639-0128
email: support @frye.com
sales@frye.com
Frye Electronics, Inc. is a Registered Firm of British Standards
Institution, and we conform to the ISO 13485 standard.
1.6 Setup
This section describes the unpacking and setup of the 7000 test system. A
description of the front and back panels is also included.
1.6.1 Unpacking the FONIX 7000
Remove the FONIX 7000 test system from the shipping cartons. Store the ship-
ping cartons in a dry place so that they can be used again in the event that the
unit must be returned to the factory for repair or upgrade.
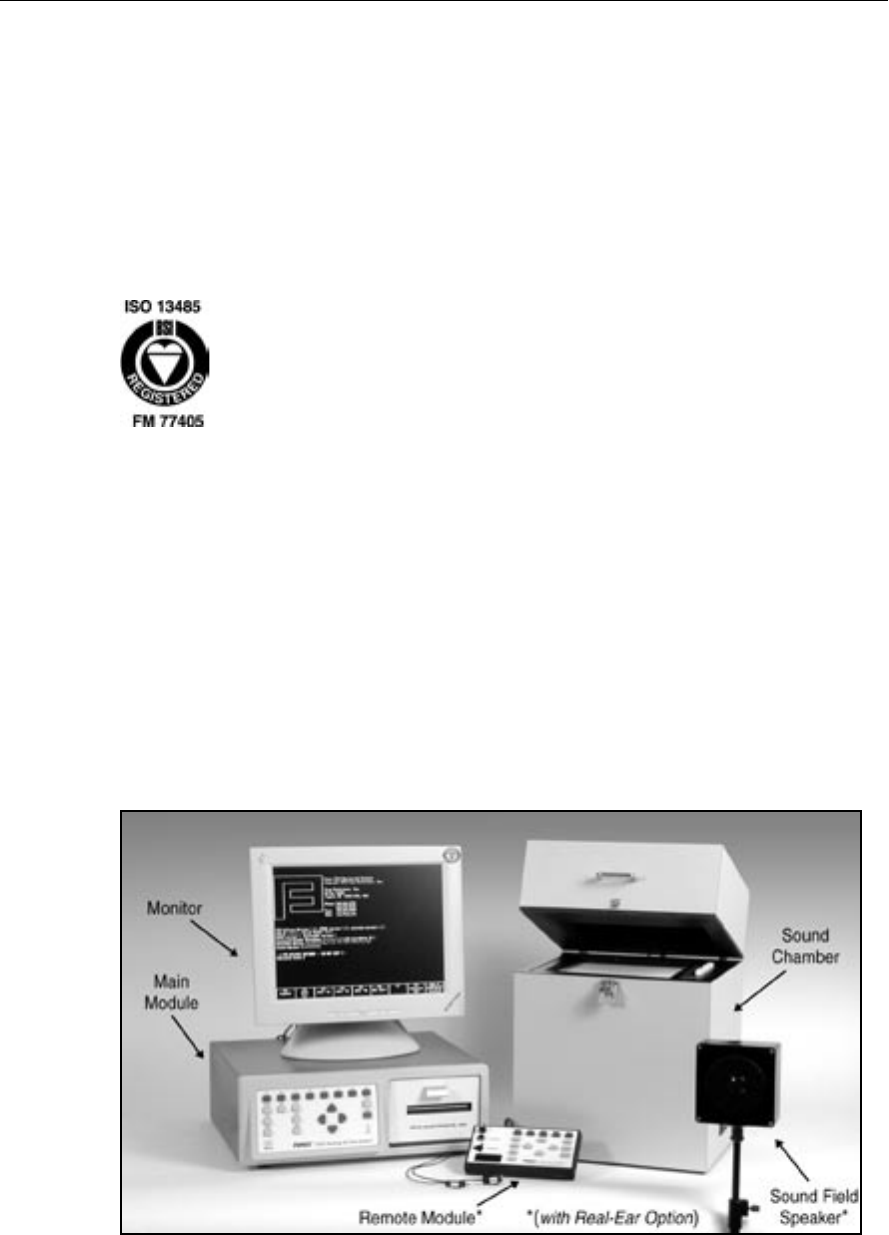
See Figure 1.6.1 for a picture of the 7000 test system and a labeling of its basic
components.
Figure 1.6.1. Caption: The 7000 Test system.

Introduction and Setup 17
1.6.2 Locating and arranging the 7000 test system
Locate the 7000 test system in a moderately quiet area, such as a private office
or laboratory. In order for test results to reliably conform to specifications, the
ambient noise, mechanical vibrations, electrical or magnetic fields must not
affect test results by more than 0.5 dB (ANSI S3.22). Low-noise acoustic condi-
tions, as found in sound treated rooms and booths, are recommended but not
necessary.
Locate the main module near the sound chamber. The video monitor may be
placed on top of the main module.
If your 7000 has the Real-ear Option, further consideration needs to be given
to the placement of the sound field speaker. The speaker should be placed in
a manner in which the sound will not reflect off walls, chairs, tables, or other
objects. Such sound reflections could negatively affect test results.
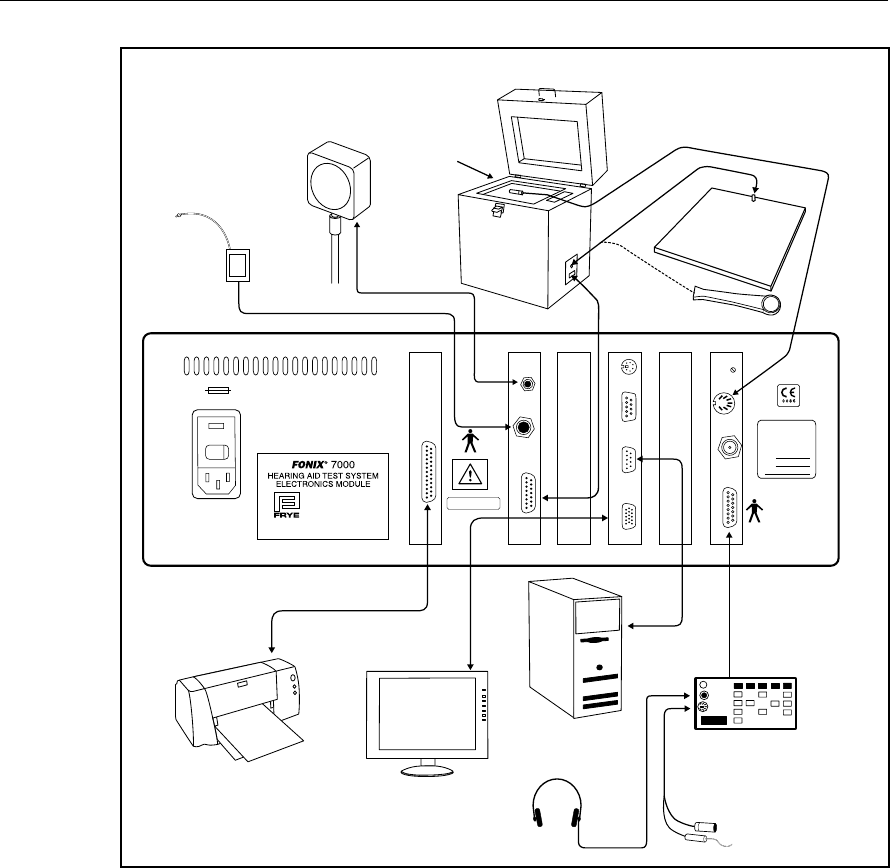
1.6.3 Connecting the Main Module & Components
Connect the main module to the system components as follows (see Figure
1.6.3):
1. Connect the video monitor to the jack marked “Monitor” on the back of the
main module. Tighten the screws on the connector to secure the connection.
2. Plug the M1950E microphone into the connector marked “Microphone”
located on the back of the main module.
3. Connect the sound chamber cable into the plug marked “sound chamber” on
the back of the main module. Plug the other end of the cable into the sound
chamber. This cable provides all the connections necessary for operating the
internal loudspeaker, telecoil, and battery voltage supply of the 7020 test
chamber. Tighten the screws of the plug at each end of the cable to secure
the connection.
4. Plug the power cord into the three-pronged jack on the rear panel of the
main module. Plug the power cords of both the main module and the video
monitor into an AC outlet. We recommend using a switchable multiple out-
let power strip. Any voltage between 100 and 240 VAC is acceptable, 50 or
60 Hz line frequency.
18 FONIX 7000 Hearing Aid Analyzer
PRINTER
SOUND CHAMBER
EARPHONE
SPKR
MONITOR RS232 AUXKEYBD
MICROPHONE
GAIN
SCOPEPROBE
FONIX 7000 Serial No. 1234
Manufactured in 2003
CALIBRATED
Frye Electronics, Inc.
800-547-8209
www.frye.com
DATE CAL
DATE DUE
ATTENTION: Ground reliability can be achieved
ONLY when equipment is connected to “HOSPITAL
GRADE” receptacles. For service refer to qualified
personnel only. Consult accompanying documents.
ELECTRICAL RATING:
100–240 V
~
50-60 Hz .6A
Made in Tigard, Oregon, USA
by Frye Electronics, Inc.
Frye Electronics products are protected by U.S.
and/or foreign patents and/or patents pending
T630 mAL
Earphone
Speaker
External printer
(not provided) Monitor
Headphones
Computer
(not provided)
Telecoil board
(optional)
Telewand (optional)
7020 Sound Chamber
Quik-Probe
remote module
M1950E
Microphone
Probe/Reference mics
Figure 1.6.3 —7000 test system setup
1.6.4 Connecting the Real-Ear Equipment
If you ordered the Real-Ear Option, connect the real-ear equipment as follows.
See Figure 1.6.3.
1. Plug the remote module cable into the jack labeled “Probe” on the back of
the main module. Tighten the connector screw to secure the connection.
2. Plug the round, 8-pin connector of the dual microphone cable into the top
surface of the remote module where it is marked “PROBE MIC.”
3. Plug the monitor headset into the remote module by attaching the ¼” adapt-
er and plugging it into the jack marked “earphone,” if desired.

Introduction and Setup 19
4. Depending on whether you have a floor stand or a swing arm, either (1)
Unfold and extend the floor stand to the desired height, about the level of a
seated client’s ear, or (2) Mount the wall/desk bracket of the swing arm in a
convenient location. Attach the loudspeaker to the stand or arm, using the
threaded connection.
5. Plug the dual banana plug into the rear jacks of the loudspeaker. Then plug
the other end of the cable into the main module where it is marked “SPKR.”
1.6.5 Powering up the 7000 test system
1. Turn on the electronics module by reaching back on the right side of the
main module (while you are facing the front of the unit), and pressing
the POWER switch. The green LED on the front panel, above the words
“POWER” will turn on after a couple seconds.
2. Turn on the video monitor. See the video operator’s manual for instructions,
if necessary.
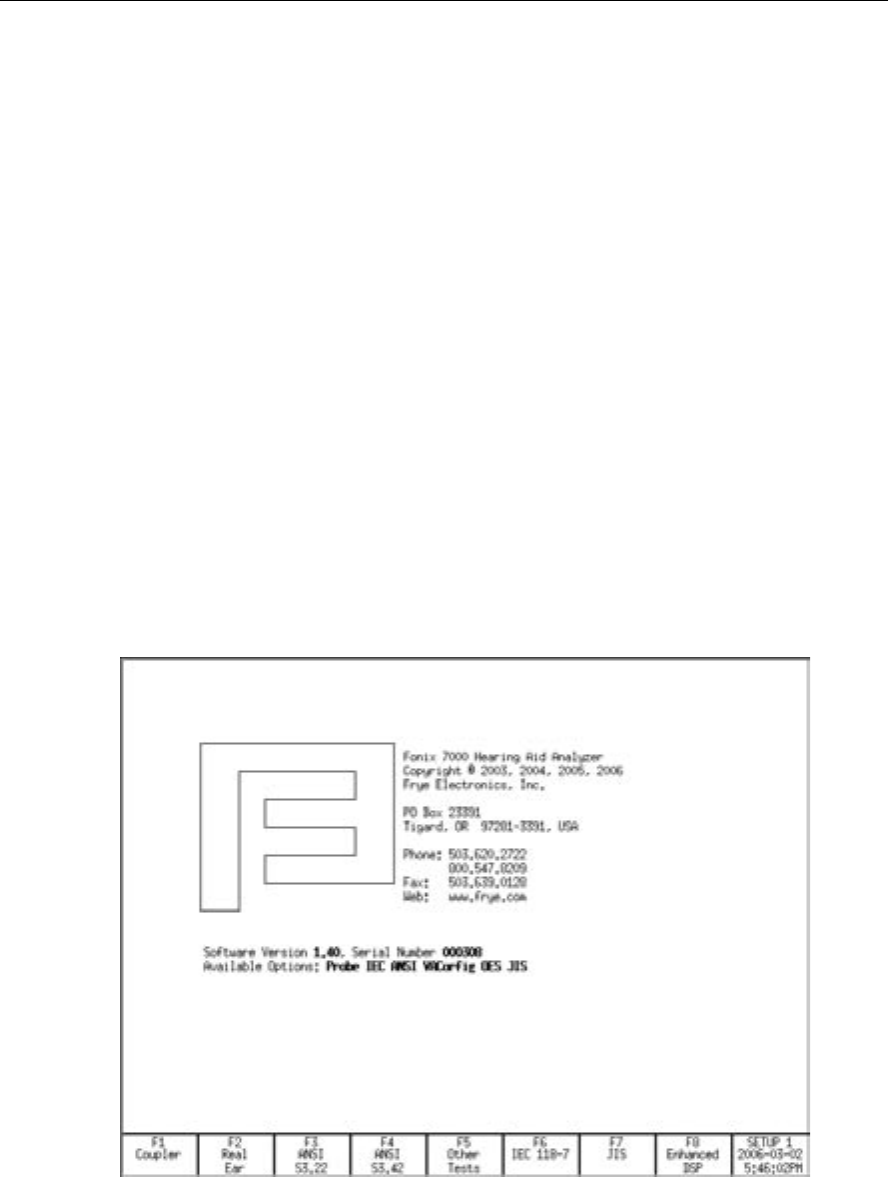
The Opening screen of the 7000 test system will be displayed. It contains the
FONIX logo, along with the software version, the serial number, and the avail-
able options. This information is important in identifying your equipment when
you communicate with the company about your FONIX 7000 test system.
1.7 Maintenance
In order to ensure accurate testing, we recommend yearly calibrations of your
coupler microphone. For those units with the Real-ear Option, we also recom-
mend yearly calibration of the probe & reference microphones and the sound
field speaker. These calibrations can be performed by any Frye distributor or by
yourself with the aid of a sound level calibrator such as a Quest QC-10. Please
see Appendix B for calibration instructions.
1.7.1 Cleaning
For your safety, disconnect the 7000 from mains power while cleaning. Wipe the
7000 with a slightly moist but not dripping cloth. Use plain water or water with
mild dish washing detergent. Wipe away any detergent with a slightly moist
cloth. Finally, use a soft dry cloth to eliminate any lingering moisture.
Never allow fluid to enter the 7000:
• enclosure
• power switch
• power connector
• electrical connectors
• front panel buttons

20 FONIX 7000 Hearing Aid Analyzer
The 7000 microphones should be wiped with a dry cloth. Excess moisture may
damage the microphones.
Solvents and abrasives will cause permanent damage to the 7000.
1.7.2 Care & Maintenance of your M1950E Coupler Microphone
Microphones are perhaps the most delicate of FONIX products. They require
care and concern when handled. At the risk of sounding negative, the following
is a list of the five microphone DON’Ts.
1. Don’t bend the microphone cord at the connection of the cord and the body!
This is perhaps the most common cause of microphone damage. The place
where the cord and the body of the microphone meet is the most fragile part
of their connection. The less strain you put on this area, the longer your
microphone will last.
2. Don’t hit the microphone against the sound chamber or any other object!
The microphone head is delicate and easily damaged. Hitting the micro-
phone against anything will do you no good and the microphone much
harm. Similarly, be careful not the drop the microphone on the floor.
3. Don’t pull the microphone from the coupler by the cord!
When removing the microphone from the coupler, grip the microphone
body, not the cord. Pulling on the cord damages the connection.
4. Don’t get Fun-Tak on the grill of the microphone!
Fun-tak that accumulates on the grill will fall into the microphone body and
onto the diaphragm which will damage the microphone.
5. Don’t touch the diaphragm of the microphone!
The diaphragm is located inside the grill of the microphone and is extremely
sensitive. If you need to take the grill off the microphone, please do so with
extreme care, and be especially careful not to touch the diaphragm, as this
will cause damage!
Overall, just be aware that your coupler microphone is a delicate instrument
that needs to be treated with care and respect. If you do so, the two of you will
be rewarded with a long, happy relationship.
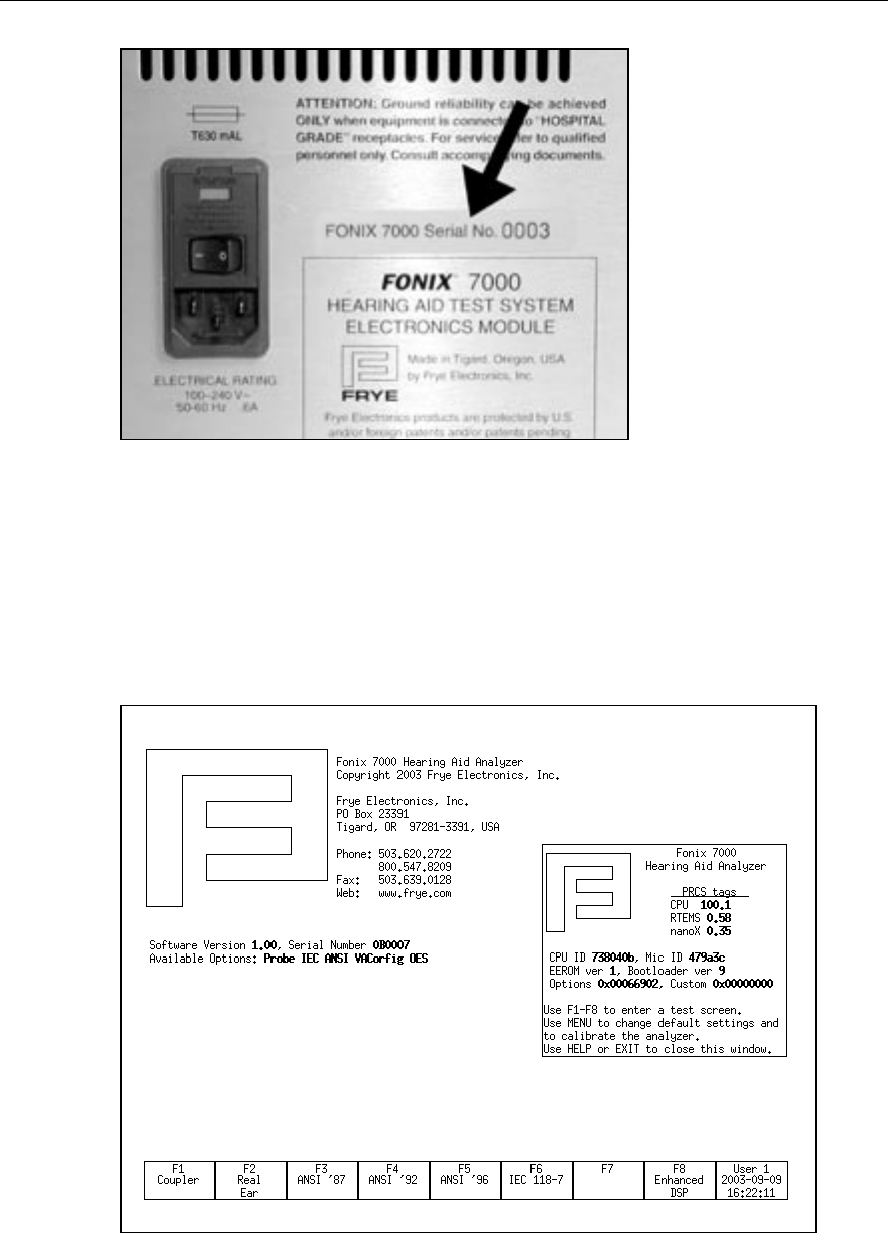
1.7.3 Locating the serial number and software version
When contacting the factory, it is very useful if you have your serial number
and software version handy. This information will help us help you regarding
repair, upgrade, and technical questions.
The serial number of your 7000 test system can be found on the back of the
main module, just to the right of the power switch. See Figure 1.7.3A.
Introduction and Setup 21
Figure 1.7.3A—Serial number location
The software version of your 7000 test system can be found on the Opening
screen. See Figure 1.7.3B.
Press [HELP] to open a help window with more detailed service information.
This data may be requested if you call in with a repair-related question. Press
[HELP] again to close the help window.
Figure 1.7.3B—Software version location

22 FONIX 7000 Hearing Aid Analyzer
1.7.4 Contacting the Factory
If you have any questions regarding your instrument, have your serial number
and software version ready (see Section 1.5.3), and contact us at:
Mailing address: Shipping address:
Frye Electronics, Inc. Frye Electronics
PO Box 23391 9826 SW Tigard St.
Tigard OR 97281-3391 Tigard, OR 97223
USA USA
Phone: (800) 547-8209 or (503) 620-2722
Fax: (503) 639-0128
Email: sales@frye.com (sales questions)
Support@frye.com (technical questions)
Service@frye.com (repair questions)
1.7.5 Warranty
The 7000 test system and its accessories are guaranteed to be free of manufac-
turing defects that would prevent the product from meeting its specifications
(given in Appendix A of this manual) for a period of one year from the date of
purchase.
Chapter 2 23
General Operation
This chapter describes the general operation of the 7000 test system, including
basic operation of the buttons, screen navigation, default settings, source types,
printing, and other information.
2.1 Operation of buttons
The general operation of the various buttons on the 7000 test system are
described in this section. This includes a description of the function buttons,
the arrow buttons, and the Menu, Help, Reset, Exit, Level, Feed, Print, Stop, and
Start buttons.
2.1.1 Using the function keys
The top row of buttons on the 7000 test system front panel consists of “function
keys” labeled [F1] through [F8]. The function of these keys changes from screen
to screen, according to the need of the screen. The screen itself always shows
the function of each of these buttons in a row of boxes along the bottom of the
display. This row is meant to represent the physical buttons on the front panel.
See Figure 2.1.
Figure 2.1—Function key display

24 FONIX 7000 Hearing Aid Analyzer
There are three basic uses of the function keys:
• To navigate from screen to screen
• To toggle a selection
• To pop-up a selection menu
Navigation
In the Opening screen, the function keys are used to navigate between the vari-
ous measurement screens. For example, pushing [F1] in the Opening screen will
take you to the Coupler screen.
Toggle
In a measurement screen, when a selection for a function key has only two pos-
sible options, pressing the function key will toggle between those options. For
example, a function key setting the ear tested will toggle between “left” and
“right.” A red box will appear briefly around the function key box on the dis-
play. This box means that the selection is in the process of being toggled.
Pop-up Menu
In a measurement screen, when there are several possible selections to be made
with a function key, pressing the function key will bring up a pop-up menu.
When this happens, use the [∨, ∧] keys to select the desired setting, and then
use [>] to perform the actual selection.
For example, in the Coupler screen, pressing [F5] will bring up a selection of
source types. To select the desired source, you would use [∨, ∧]. To complete the
selection, you would press [>].
General Operation 25
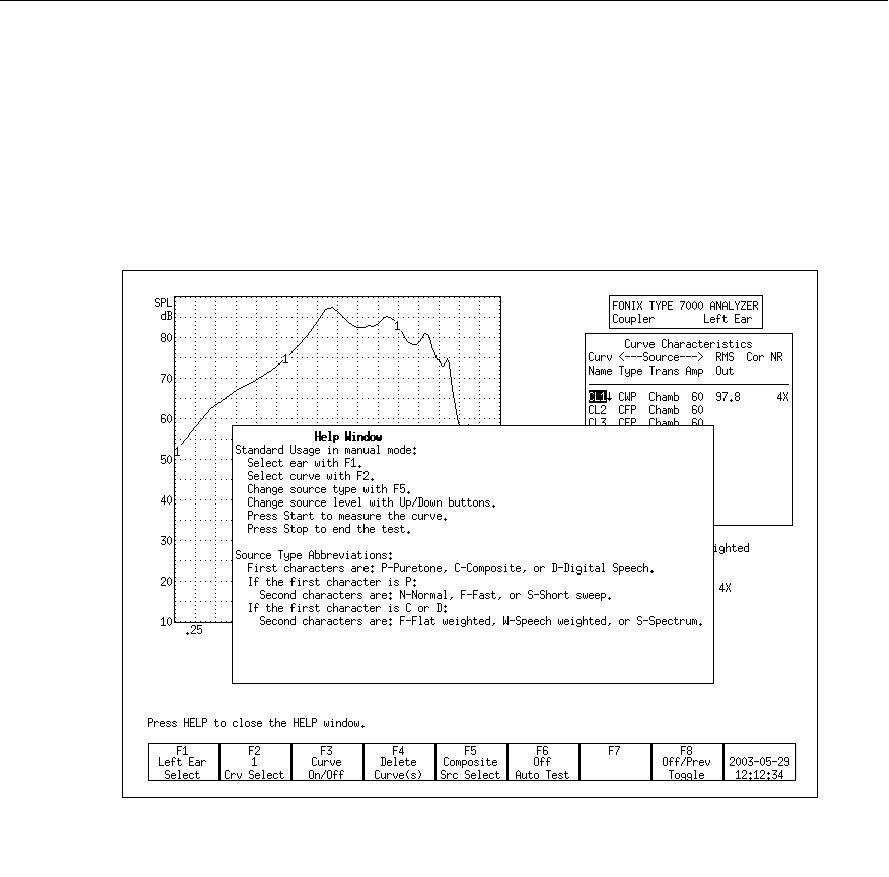
2.1.2 Navigating through the screens
The function keys are used to move from screen to screen. Here is a flow chart
of all the available screens and the buttons used to open each screen. Some of
the screens will only be available to you if you’ve ordered a certain option.
F1 F2 F3 F4 F5 F6 F7 F8
JIS Enhanced
DSP
F1 F2 F3 F4 F5
Audiogram Target Insertion
Entry Edit Gain SPL
ANSI 87 ANSI 96 ANSI 03
Battery Coupler Attack &
Test I/O Release
OPENING SCREEN
ANSI
S3.42
Other
Tests IEC
ANSI
S3.22
Coupler Real-Ear
Screen Menu
F1 F2 F3
F1 F2 F3
Visible
Speech
Figure 2.1.2—Navigation Flow Chart
26 FONIX 7000 Hearing Aid Analyzer
2.1.3 Using the pop-up help windows
Each operational screen on the 7000 test system has a local help window
designed to give you a basic operational overview of the current screen. In gen-
eral, these help windows tell you what each button does in the current screen.
See Figure 2.1.3 for an example.
To clear the help window, press [HELP] again or the [EXIT] button.
Figure 2.1.3—Pop-up help window
General Operation 27
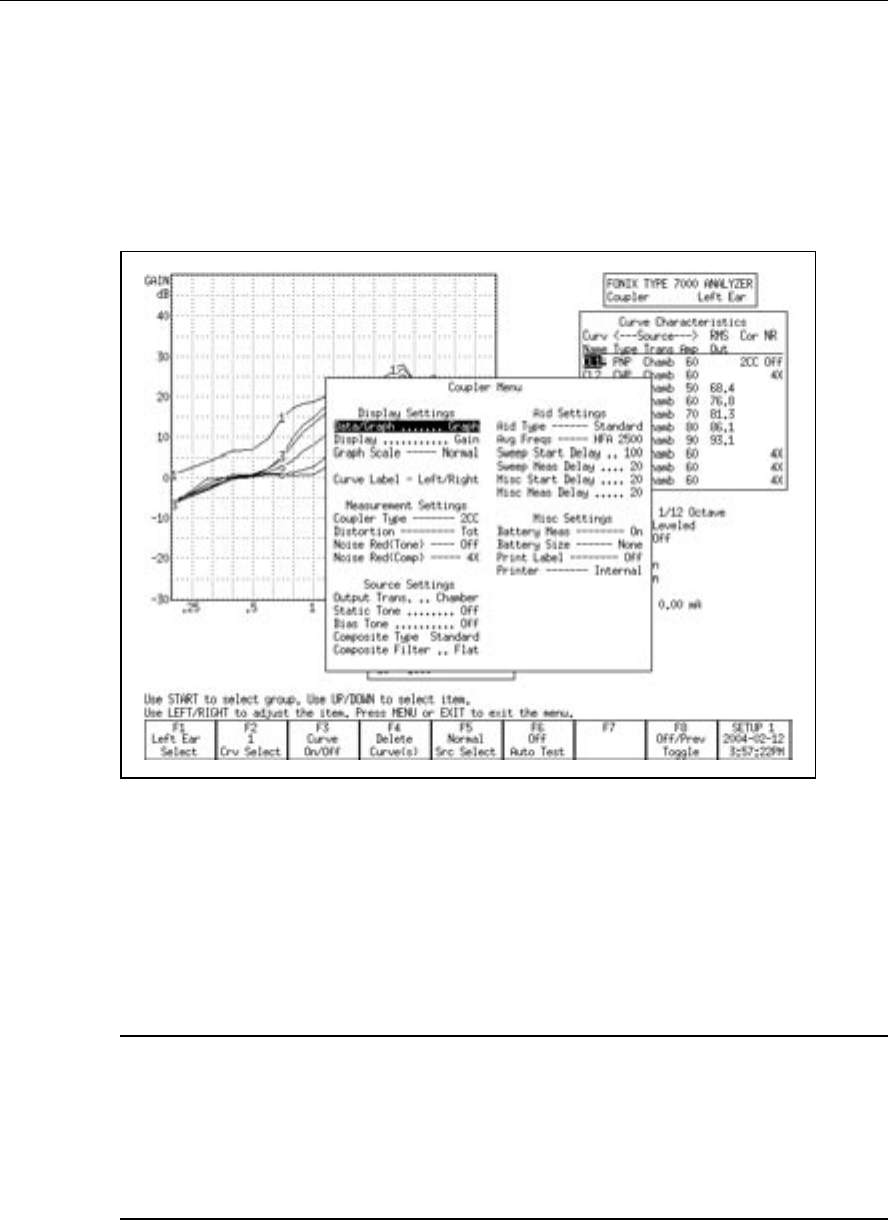
2.1.4 Using the local menus
Pressing the [MENU] button will pop up a local menu that, like the help win-
dow, will be overlaid on your current screen. Each local menu contains selec-
tions specific to your current screen. For instance, when you are in the Coupler
screen, the local menu will contain only selections specific to coupler measure-
ments. See Figure 2.1.4 for an example of a local menu.
Figure 2.1.4—Local menu
Some local menu selections are common across screens. When this is the case,
selections made in one local menu will usually carry across any other local
menu containing that selection. For instance, AID TYPE is a common selection
in the local menus of the Coupler and Insertion Gain screens. If you were to set
the AID TYPE to AGC in the local menu of the Coupler screen, it will automati-
cally be set in local menu of the Insertion Gain screen.
HINT: Located between each option and its selection in the local menu is a
series of dots or dashes. For instance, there are a series of dashes between
AID TYPE and AGC in the local menu of the Coupler screen. Dashes indi-
cate the selection can be saved as a default setting in the Default Settings
screen. Dots indicate that the selection cannot be saved as a default selec-
tion. See Section 2.2 for details.

28 FONIX 7000 Hearing Aid Analyzer
2.1.5 Using the EXIT and RESET buttons
The [EXIT] and [RESET] buttons can be used to exit from any screen, menu, or
window.
The [RESET] button resets the analyzer and returns it to the start screen. By
default, this start screen is the Opening screen with the Frye logo. However, the
user can change the start screen to be the Coupler Multicurve screen by chang-
ing the settings in the Default Settings (see Section 2.2.1). All measurements are
erased, and the settings are returned to their default values. It is recommended
to use [EXIT] instead of [RESET] when moving between screens to avoid the
loss of data.
The [EXIT] button closes a popup or local menu. When all such menus are
closed, the [EXIT] button exits the current screen without altering the settings,
measurements, and test conditions of the analyzer.
2.1.6 Using the remaining buttons
Here is a description of the remaining buttons on the front panel of the analyzer
and their use.
[LEVEL]: Levels the sound chamber or sound field speaker. See Sections 3.2 and
6.2.4 for details.
[FEED]: Advances the internal thermal printer paper.
[PRINT]: Prints the current screen. See Section 2.4 for details.
[STOP]: Stops a currently running test.
[START]: Starts a test.
ARROW KEYS: The arrow keys perform different functions depending upon the
screen and previous buttons pushed. In a test situation, they adjust the source
amplitude and frequency. If you press one of the function buttons to bring up
a pop-up menu, they are used to scroll through the available options and make
selections. In the Audiogram Entry and Target Edit screens, they are used to edit
the audiogram and targets.
2.2 Setup Menu
The Setup menu contains a number of different functions that set up your ana-
lyzer for testing. These functions include saving and loading default settings,
setting the date and time, setting the comfort level of the user, and calibration
functions. This section contains instructions for several of these functions. For
calibration instructions, see Appendix B. For instructions on leveling and saving
leveling, see Section 3.2.
To open the Setup menu, press [MENU] from the Opening screen.

General Operation 29
2.2.1 Saving and loading default settings
All of the settings in the Setup menu (described in Section 2.2.4) can be saved
as default settings. There are five possible setups, so you can have five different
configurations saved into the analyzer’s permanent memory.
To save a user configuration:
1. Open the Setup menu by pressing [MENU] from the Opening screen.
2. Set up the Setup menu as desired. All displayed settings will be saved, so
make sure that you check all fields. See Section 2.2.4 for an explanation of
each of them.
3. Press [F8] to open the Save Setup Defaults pop-up menu.
4. Use [∨, ∧] to select the desired setup number. If you are only going to have
one saved configuration, use Setup 1.
5. Use [>] to complete the selection and close the pop-up menu. It will take a
few seconds for the 7000 Test System to save the configuration. The saved
setup number will automatically be selected as the current user.
To load a setup configuration:
1. Open the Setup menu by pressing [MENU] from the Opening screen.
2. Press [F7] to open the Load Setup Defaults pop-up window.
3. Use [∨, ∧] to select the desired setup number.
4. Use [>] to complete the selection and close the pop-up menu.
Whenever a user configuration is saved or loaded, that user will also be auto-
matically saved as the new default user.
2.2.2 Setting the date and time
The date and time that are displayed on every measurement screen can be
changed in the Setup menu.
1. Open the Setup menu by pressing [MENU] from the Opening screen.
2. Use [∨, ∧] to select Year under Date/Time. You may want to use [START] to
skip ahead sections in the menu.
3. Use the arrow keys to change the Year, Month, Day, Hour, and Minute. The
[∨, ∧] keys choose the category and the [<, >] keys make the selection.
4. Use the arrow keys to decide if you want to use AM/PM time or a 24-hour
style clock. This is changed in the AM/PM/24 setting.
5. Press [EXIT] to return to the Opening screen when done.

30 FONIX 7000 Hearing Aid Analyzer
2.2.3 Setting the user mode
There are two different user modes available on the 7000 test system: Beginner
and Expert. In the Beginner mode, extra help windows pop up automatically
when function keys are pressed in order to give the user more direction in using
the instrument. In Expert mode, those help windows are eliminated.
To change the user mode:
1. Press [MENU] in the Opening screen to open the Setup menu.
2. Use [∨, ∧] to select User under Other.
3. Use [<, >] to choose EXPERT or BEGINNER.
4. Press [EXIT] to return to the Opening screen. The new user mode will be in
effect.
2.2.4 Explaining the settings
The following is an explanation of all the various settings in the Setup menu.
General
PRINT LABEL: Status of the printing label. Choose ON or OFF.
PRINTER: Printer used for printouts. Choose INTERNAL or EXTERNAL. See
Section 2.4.
EXT PRNT COLOR: Color used when an external printer is selected. Choose
BLACK & WHITE or COLOR.
EXT PRNT LANGUAGE: Language used when the external printer is selected.
Choose HPCL or EPSON.
EXT PRNT #SCRNS/PAGE: The number of screens printed on a page using an
external printer. See Section 2.4.7.
RS232 BAUDRATE: Baud rate of the RS232 connection. This is the speed of the
connection of the analyzer with a personal computer. The Windows-based pro-
gram used on the computer end will need to have the same baud rate selection.
Other
AID TYPE: Type of hearing aid being measured. Choose between STANDARD
(linear), AGC, and ADAPTIVE AGC. This will affect the delays of pure-tone
sweeps as well as some other measurements. See Section 2.3.1.3 for details.
GRAPH SCALING: Scaling used when making measurements. NORMAL scales
to the upper-most curve displayed. AUTO scales to the current selected curve.
USER: The selected user mode. See Section 2.2.3 for details.

General Operation 31
START SCREEN: The screen shown when the analyzer is powered on or the
[RESET] button is pressed. COUPLER sets this screen to the Coupler Multicurve
screen. OPENING sets this screen to the Opening screen with the Frye logo.
Date/Time
YEAR/MONTH/DAY/HOUR/MINUTE: Current date and time. See Section 2.2.2.
AM/PM/24: Clock setting. Choose between using AM and PM settings or the 24-
hour clock.
Coupler
RESET SOURCE: The signal type selected in the Coupler screen when the
[RESET] button is pushed.
NOISE RED (TONE): Amount of pure-tone noise reduction used in coupler mea-
surements. See Section 2.3.1.2.
NOISE RED (COMP): Amount of composite noise reduction used in coupler
measurements. See Section 2.3.2.1.
CURVE LABEL: Label used for the two available “ears.” Choose between LEFT/
RIGHT, and A/B.
BATTERY SIZE: Size of battery used with the hearing aid being tested. Used in
battery current measurements.
COUPLER TYPE: The type of coupler being used in making sound chamber
measurements. Selections of CIC and MZ turn on corresponding software cor-
rection factors (see Sections 3.6 and 3.7). A selection of NONE or 2cc does not
apply correction factors to the curve.
DISPLAY: Display of the Coupler Multicurve screen. Choose between Gain and
SPL.
Real-Ear (Only available with the Real-Ear Option)
RESET SOURCE: The signal type selected in the real-ear measurement screens
when the [RESET] button is pushed.
RESET EAR: The ear selected in the real-ear measurement screens when the
[RESET] button is pushed.
FIT RULE: The selected real-ear fitting rule, also known as a real-ear target.
REF MIC: Status of the reference microphone during real-ear measurements.
OUTPUT LIMIT: The maximum dB SPL value that the analyzer will allow
when taking real-ear measurements. When this value is exceeded, the measure-
ment will automatically stop and the source will turn off in order to protect the
patient.

32 FONIX 7000 Hearing Aid Analyzer
NOISE RED (TONE): Pure-tone noise reduction for real-ear measurements. See
Section 2.3.1.2.
NOISE RED (COMP): Composite noise reduction for real-ear measurements. See
Section 2.3.2.1.
SMOOTHING: Status of smoothing, which rounds off real-ear curves and
removes minor peaks. Turn it ON or OFF.
RECD MODE: Real-ear to coupler difference used in real-ear conversions such
as HL to SPL. When set to OFF, the RECD graph and table are removed from the
Audiogram Entry Screen, and the average RECD is used. CUSTOM ENTERED
will let you enter RECD values previously measured, and CUSTOM MEASURED
will let you measure the RECD.
APPROACH: The approach set in the local menu of the Real-Ear Target screen.
When set to Gain, the source type of REAR 5 in both the Real-Ear Insertion Gain
and Real-Ear SPL screens will be set to the RESET SOURCE type. When set to
SPL, the source type of this curve will be set to SHORT. This is done for per-
forming a real-ear saturation measurement at 90 dB SPL.
UNAIDED: The type of unaided curve used in real-ear measurements. A selec-
tion of AVG will set the KEMAR average. A selection of CUSTOM will use the
patient’s measured unaided response.
IG DISPLAY: Type of display used in the Insertion Gain screen. Choose between
having the lower graph display in gain or SPL (output).
TONE FILTER: The weighting used for pure-tone sweeps in real-ear measure-
ments. FLAT produces tones at each frequency with the same amount of ampli-
fication. ANSI and ICRA produce tones with higher amplification at lower fre-
quencies and lower amplification at higher frequencies, according to the ANSI
and ICRA speech weighting, respectively. AUTO uses the ANSI weighting for
pure-tone sweeps below 85 dB SPL and the FLAT weighting for sweeps at 85 dB
SPL and above. Coupler measurements with pure-tone sweeps are always FLAT
weighted.
COMPOSITE FILTER: Wide-band speech weighting used in the Composite and
Digital Speech signals. See Section 2.3.2.3.
Tone
See Section 2.3.1.1 for an explanation of all the pure-tone settings.
Tone Test Sequences
ANSI 12 dB DIST: The ANSI standard states that when measuring harmonic dis-
tortion, if the amplitude of the response curve at the second harmonic is 12 dB
greater than the amplitude of the response curve at the distortion frequency, the

General Operation 33
harmonic distortion measurement should be ignored. Choose ON to apply this
rule. Choose OFF to ignore this rule.
ANSI OPTION: Modifications to the ANSI test sequences. VA-CORFIG adds the
modification requested by the Veterans Administration of the United States.
CIC adds CIC correction factors and is meant to be used with the CIC coupler.
BATTERY MEAS: Status of the battery current measurement. Turn it ON or OFF.
EQUIV NOISE TEST: Status of the equivalent input noise measurement. Turn it
ON or OFF.
TELECOIL: Status of the Telecoil measurement. Turn it ON or OFF.
2.3 Source Types
There are two main types of sources available on the 7000 test system: pure-
tone and composite. Four types of pure-tone sweeps are available: long, normal,
fast, and short. Two types of composite signals are available: Composite and
Digital Speech. The composite signal can have your choice of speech weight-
ings, including ANSI and ICRA.
The type of signal you should choose for a particular test or type of hearing aid
depends upon the situation. Here is a description of each of the source types
and when you would want to use them.
2.3.1 Understanding Pure-tone Signals
A pure-tone sweep is a test involving a progression of pure tone signals pre-
sented at a specified level. When the sweep is complete, the aid’s frequency
response at those frequencies is displayed on the graph (or data column).
There are four types of pure-tone signals: long, normal, fast, and short.
• LONG: Contains 64 different frequencies and only does one sweep before
ending the test.
• NORMAL: Contains 43 different frequencies and only does one sweep
before ending the test.
• FAST: Contains 16 different frequencies and continually sweeps through
them until you stop the test. The fast sweep is meant to be used as a
real-time continuous signal convenient for use while adjusting hearing
aids. It is an alternative to the composite signals.
• SHORT: Contains 10 different frequencies and only does one sweep. It is
primarily used for testing loud levels in real-ear measurements.

34 FONIX 7000 Hearing Aid Analyzer
2.3.1.1 Pure-tone settings
There are several different settings available for pure-tone sweeps. You can
change all of them in the Setup menu (see Section 2.2). Some of these settings
are also available in local menus. Here is an explanation of the pure-tone set-
tings.
NOISE RED (TONE): The amount of noise reduction used in pure-tone mea-
surements. This is set independently for real-ear and coupler measurements.
See Section 2.3.1.2.
SWEEP START DELAY: The amount of time the 7000 test system presents the
first tone in a pure-tone sweep. See Section 2.3.1.3.
SWEEP MEAS DELAY: The amount of time each subsequent tone is presented
before the measurement is made in a pure-tone sweep. See Section 2.3.1.3.
MISC START DELAY: The amount of time the 7000 test system presents the
first tone in one of the following measurements: reference test gain measure-
ments (in automated test sequences), averaging, harmonic distortion measure-
ments, equivalent input noise, and single-frequency telecoil measurements. See
Section 2.3.1.3.
MISC MEAS DELAY: The amount of time each subsequent tone is presented
before the measurements is made in one of the measurements listed above. See
Section 2.3.1.3.
I/O START DELAY: The amount of time the first tone in an I/O sweep is pre-
sented before the measurement is made. See Section 2.3.1.3.
I/O MEAS DELAY: The amount of time each subsequent tone in an I/O sweep is
presented before the measurement is made. See Section 2.3.1.3.
DISTORTION: The type of harmonic distortion measurement made during a
pure-tone sweep. See Section 2.3.1.4.
STATIC TONE: A continuous tone (or series of tones) presented in the Coupler
screen when a pure-tone sweep, Composite, or Digital Speech signal isn’t run-
ning. This can be set to SINGLE for a pure-tone signal and AVG for a running
three frequency average.
RESET FREQ: The frequency the analyzer returns to when RESET is pressed.
AVG FREQS: The frequencies used for averaging in pure-tone measurements.
Each frequency set is represented on the screen by the highest frequency in the
set. The sets are:

General Operation 35
HFA (High Frequency Average) 1000, 1600, 2500
SPA (Special Purpose Average) 800, 1250, 2000
SPA 1250, 2000, 3150
SPA 1600, 2500, 4000
SPA 2000, 3150, 5000
IEC–(HAIC) 500, 1000, 2000
2.3.1.2 Noise reduction
Noise reduction is used in noisy testing environments. Pure-tone noise reduc-
tion takes several measurements at each frequency and averages those measure-
ments together. Larger noise reduction numbers lead to smoother curves but
increase the amount of time it takes to complete a pure-tone sweep.
For example, if you select “4” as the pure-tone noise reduction setting, 172 mea-
surements (43 x 4) will be taken with every normal pure-tone sweep.
2.3.1.3 Delay times
The 7000 test system allows you to refine your pure-tone measurements with
many different adjustments for delay times. This choice is allowed because
some hearing aid circuits take a longer time than others to adjust to changes in
amplitude or frequency. If the measurement is made too quickly, an artifact in
testing will be created. If the measurement takes too long, the test is longer than
necessary.
In determining the length of time needed for a proper measurement, a good rule
is to use twice the published attack time of the hearing aid. If you are unsure
of the attack time, you can experiment with longer times and shorter times and
see if there is any difference in the test results. Linear aids can be tested very
quickly, so a delay of 20 msec is usually fine. Other aids are quite variable. See
Section 2.3.1.1 for a description of the available delay settings.
The 7000 test system has standard delay times that are determined by the aid
type selection. When you set the delay settings to Default, the following delay
times will be used:
Measurement Standard AGC Adaptive
SWEEP START 100 ms 500 ms 2000 ms
SWEEP MEAS 20 ms 50 ms 100 ms
MISC START 100 ms 500 ms 2000 ms
MISC MEAS 20 ms 100 ms 200 ms
I/O START 100 ms 500 ms 2000 ms
I/O MEAS 20 ms 100 ms 200 ms

36 FONIX 7000 Hearing Aid Analyzer
In addition to the delays, the aid type will also have an effect on the way
some measurements are made. With a selection of ADAPTIVE, the analyzer
will throw away the first three measurements of all averaging (including refer-
ence test gain) and harmonic distortion measurements. This will increase the
amount of time it takes for the test, but it should increase the accuracy of the
test for adaptive AGC aids.
Note: The “Adaptive” aid type category was created for a specific type of adap-
tive-AGC aid, such as the model created by Telex.
2.3.1.4 Harmonic distortion
Harmonic distortion occurs when a hearing aid clips the peak of a pure-tone
input signal, resulting in artifacts at harmonics (integer multiples) of that input
signal. For example, if you present a 500 Hz tone to the hearing aid, distortion
artifacts could occur at 1000 Hz and 1500 Hz.
The harmonic distortion measurement is expressed as the percentage of the
power of these distortion artifacts to the power of the input signal. All hearing
aids will have some amount of distortion.
Usually, the strongest artifacts occur at the second and third harmonics of the
frequency. With the 7000 Test System, you can test the amount of distortion
available in the second harmonics, the third harmonics, or both harmonics
(considered “total harmonic distortion”).
Definitions
2nd Harmonic: Energy of the second harmonic or twice the presented frequency.
3rd Harmonic: Energy of the third harmonic or three times the presented fre-
quency.
TOTAL: Combined 2nd and 3rd harmonic distortion.
See Section 3.4.7 for instructions on performing the harmonic distortion mea-
surement.
2.3.1.5 Pure-tone Filter
Pure-tone signals are usually flat-weighted. That is, in a pure-tone sweep, each
tone usually has the same amplitude as every other tone in the sweep. In con-
trast, the wideband Composite and Digital Speech signals are usually speech-
weighted. That is, the lower frequencies of the wideband signals have higher
amplitudes than the higher frequencies, simulating the long-term average of
speech.
When viewing measurements in output (dB SPL), the weighting of the signal
is very important because the signal input is included with the measurement
results of the output. This could cause some problems when comparing pure-

General Operation 37
tone sweeps with speech-weighted Composite or Digital Speech signals. For this
reason, we have made it possible to “weight” the real-ear pure-tone sweeps on
the 7000 hearing aid test system.
The TONE FILTER selection is available in the Setup Menu under Real-ear set-
tings and in the local menus of the Real-Ear Insertion Gain and Real-Ear SPL
measurements screens. It has the following settings:
• FLAT: Uses a flat weighted signal with equal amplitudes of all the tones
in the sweep
• ANSI: Uses the ANSI weighting in the pure-tone sweep
• ICRA: Uses the ICRA weighting in the pure-tone sweep
• AUTO: Uses the ANSI weighting for measurements below 85 dB SPL and
the FLAT weighting for measurements at 85 dB SPL and above.
Pure-tone measurements made in the coupler measurement screens are always
flat weighted.
2.3.2 Understanding Composite Signals
There are two types of composite signals: Composite and Digital Speech. The
Composite signal is a continuous broadband signal containing 79 different fre-
quencies presented simultaneously. This signal is usually “speech weighted,”
which means that the lower frequencies have a higher emphasis than the high-
er frequencies.
The Composite signal is both a faster and a more realistic signal than a pure-
tone sweep because there is no waiting for a progression of tones to complete,
and, like speech, a broad spectrum of frequencies is used simultaneously. The
Composite signal updates several times a second.
Digital Speech is an interrupted version of the Composite signal used for test-
ing high-end digital hearing aids. Many high-end digital aids (though not all)
use a technology called “speech enhancement” or “noise reduction.” These aids
respond to any continuous signal as if it were noise, and lower the gain at the
offending frequencies. Unfortunately, these aids regard the Composite signal or
pure-tone sweeps as noise, making them difficult to test using traditional meth-
ods.
Digital Speech was developed as a way to test these high-end hearing aids.
Instead of presenting a continuous signal, it presents an interrupted signal that
the aid regards as speech instead of noise.
The Composite and Digital Speech signals can be used with several different
types of speech weightings: ANSI, ICRA, and FLAT. Flat is generally only used
for specific research purposes—it contains no speech weighting and is difficult
for most hearing aid circuits to process. See Section 2.3.2.3 for a discussion of
the ANSI and ICRA speech weightings.

38 FONIX 7000 Hearing Aid Analyzer
A significant advantage of using a composite signal is that each frequency pres-
ent in the signal can be individually controlled in amplitude and phase. As
the analyzer goes through the leveling process, each component is adjusted to
produce a signal that is optimally accurate at the reference point where the lev-
eling microphone is located. The 7000 test system is able to equalize the ampli-
tudes to within 0.25 dB for coupler measurements made with the Composite
signal. The spectrum limits are broadened to within 2 dB for real-ear measure-
ments.
2.3.2.1 Noise reduction
Composite noise reduction is a little different than pure-tone noise reduction
(discussed in Section 2.3.1.2), even though both are used for noisy testing envi-
ronments.
When a composite signal is running, the analyzer takes several different mea-
surements a second and displays them on the screen. Composite noise reduc-
tion performs a “running average” of these composite measurements. This
means it averages together several of the previous measurements with the cur-
rent measurement to produce the next curve. If you select “2X” noise reduc-
tion, it will average the last two measurements together. A selection of “4X”
averages the last four measurements together. When performing composite mea-
surements, it will take several seconds for the actual noise reduction used to
reach the set value. This is due to the nature of the running average.
Larger noise reduction numbers lead to smoother curves but increase the
amount of time it takes the analyzer to update its composite measurements.
2.3.2.2 Intermodulation distortion
The composite signals are helpful for identifying intermodulation distortion
(IM). IM distortion occurs when amplitudes at more than one frequency in a
signal combine to create an amplitude at a frequency not present in the original
signal. When viewing a graph run with a composite signal, look for points along
the graph where the line “breaks up.” Such an appearance indicates the pres-
ence of IM distortion. See Figure 2.3.2.2 for an example of IM distortion.
This type of distortion is only apparent when a composite signal source is used
because pure-tone sweeps do not present more than one frequency at a time.

General Operation 39
Figure 2.3.2.2—Example of IM distortion
2.3.2.3 Composite filter
There are two main types of composite filters (also known as “speech weight-
ing”): ICRA and ANSI. They differ in the speech spectrum they use.
The ANSI filter, taken from the ANSI S3.42 standard, rolls off the high frequen-
cies at a rate of 6 dB per octave, starting with a 3 dB drop at 900 Hz. The ICRA
filter uses the ICRA speech spectrum developed by the International Collegium
of Rehabilitative Audiology. The ICRA spectrum is based on the Long Term
Average Speech Spectrum (LTASS) and rolls off the high frequencies more rap-
idly than the ANSI spectrum. Figure 2.3.2.3 shows a comparison of the spectra.
In general, we recommend using the ANSI speech weighting for Composite and
Digital Speech measurements.
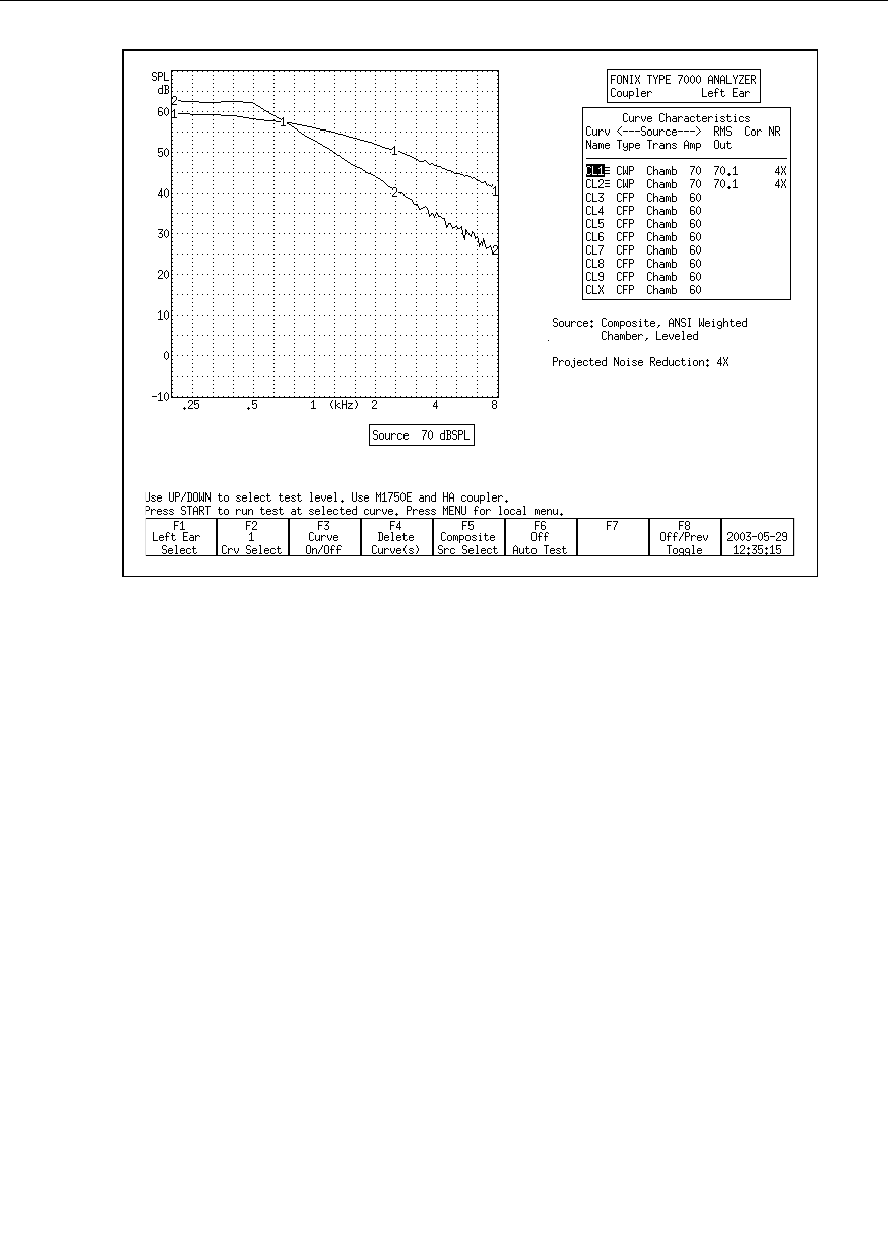
40 FONIX 7000 Hearing Aid Analyzer
Figure 2.3.2.3—Comparison of the ICRA shape and the ANSI shape
2.3.2.4 Composite type
There are two types of the traditional Composite signal available on the 7000
test system. They are known as “Standard” and “Chirp.” The two signals differ
in the manner that their phase is generated, and this difference has an impact
on the crest factor of the signals. The crest factor of a waveform is the ratio of its
highest amplitude to its RMS amplitude. Human speech is often referred to as
having a 12 dB crest factor.
For the needs of most clinicians, the Standard and Chirp Composite signal are
virtually identical.
The Standard Composite signal is composed of 79 different individual frequen-
cies that are each generated with a random phase pattern that results in the
signal having a crest factor of 10 dB, close to the crest factor of human speech.
(If the phase components were not randomized or otherwise changed, and if
all the signal components were in phase, the crest factor of the signal would
increase to over 19 dB.) The Standard Composite signal is the standard signal
used on the 6500-CX test system, the predecessor to the 7000.
The Chirp Composite signal is another type of composite signal with a low
crest factor. The phase of the individual frequency components of the Chirp
Composite signal is determined in a way that makes the signal appear to be pre-
sented as a “chirp,” or very fast sweep. The Chirp has a crest factor of 6 dB. The
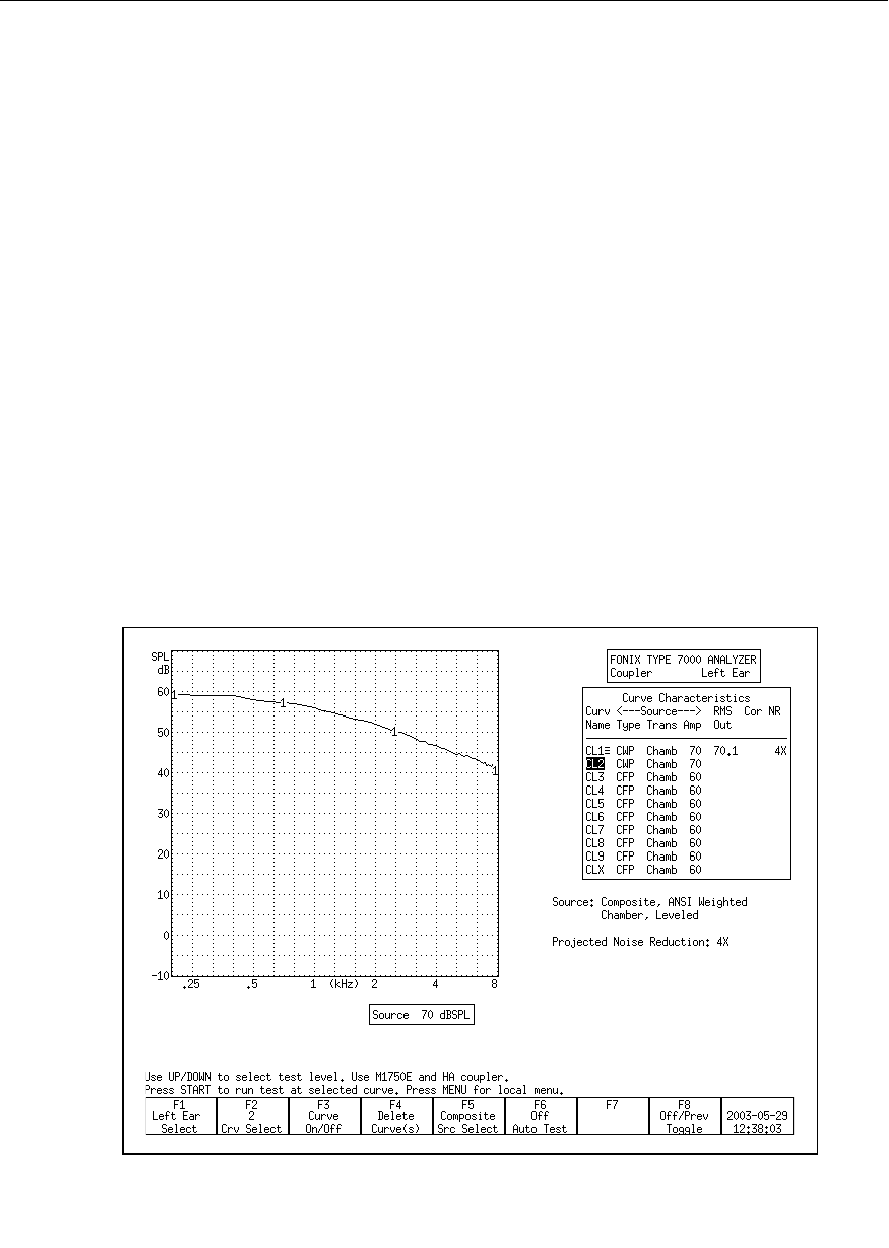
General Operation 41
Chirp Composite signal is the standard composite signal used on the FP40 and
FP35 portable hearing aid test systems.
Although the Standard and Chirp Composite signals sound the same to most
people, an analysis tool such as Tempus3D will show the difference between
them. Both the Standard and the Chirp Composite signals are further speech-
weighted to agree with the user-selected composite filter (described in Section
2.3.2.3.)
2.3.2.5 Composite source levels
The Composite signal (and its Digital Speech counterpart) is a complex signal
consisting of 79 different frequency components. When you set the source level
of a composite signal (50 dB, 60 dB, etc), you are actually setting its overall
energy, known as the RMS (root-mean-square) of the signal; you are NOT set-
ting the amplitude of the individual frequency components.
The actual amplitude of each of frequency of the Composite signal is less than
the overall RMS of the signal. See Figure 2.3.2.5 for an example of the ampli-
tudes of each frequency of the Composite signal with an RMS of 70 dB. Be
aware of this difference, especially when viewing frequency response results in
overall amplitude of dB SPL.
Figure 2.3.2.5

42 FONIX 7000 Hearing Aid Analyzer
2.3.2.6 Digital Speech technical details
The digital speech signal works by turning the composite signal on for a set
period of time, taking a measurement, turning the signal off for a random
period of time, and turning the signal back on again. This sequence is repeated
until the test ends.
The signal “on” time takes a minimum of 60 milliseconds. This includes the
time to turn the signal on, take the measurement, and turn the signal off. Some
aids may require an additional delay before the measurement is taken in order
to allow their circuits to settle. This additional delay time can be changed in
the MISC MEAS delay setting that is available in the local menu of the mea-
surement screens and in the Setup Menu. The MISC MEAS setting is automati-
cally adjusted according to the aid type selected. This setting is added to the 60
ms minimum measurement time.
The default settings are:
STANDARD (linear): 20 ms
AGC: 100 ms
ADAPTIVE: 2000 ms
The signal “off” time is random between 100 and 300 milliseconds. This time is
not controllable by the user.
2.4 Printing
The 7000 test system comes equipped with an internal thermal printer. The
thermal printer prints a clear, easy-to-read image of the display. You can also
hook up an external printer to print your results on normal office paper. You
can use any external printer that supports HP PCL (Hewlett Packard Printer
Computer Language) version 3.0 or the Epson ESC/P2 printer language.
2.4.1 Choosing a printer
You can set which printer to use in any local menu. (If you want to set the
printer language or whether to print in color or black & white, you will need
to use the Setup menu, shown in the next set of instructions.) To choose the
printer in the local menu:
1. Press [MENU] from any measurement screen to open a local menu.
2. Use [∨, ∧] to select Printer under Misc Settings. (You can use the [START]
button to skip ahead sections in the local menu.)
3. Use [>] to make your printer selection (INTERNAL or EXTERNAL).
4. Press [EXIT] to return to the measurement screen.
General Operation 43
To set the default printer, and/or to set the external printer language and color
choice, use the Setup menu:
1. Press [MENU] from the Opening screen to open the Setup menu.
2. Use [∨, ∧] to select Printer under General.
3. Use [>] to make your printer selection (INTERNAL or EXTERNAL).
4. Use the arrow keys to make the desired selections for EXT PRNT COLOR
and EXT PRNT LANGUAGE, if you are using an external printer.
5. Press [MENU] to close the menu.
6. Press [F8] to save the setting as the user default. This will also save all the
other selections in the Setup menu.
7. Press [EXIT] to return to the Opening screen.
2.4.2 Adding a label
A label with your printout allows you to record useful information about the
client and hearing aid to go along with the test results. See Figure 2.4.2.
If you are in the middle of a test, and you want to add a label for the printout in
the local screen, without changing the default setting:
1. Press [MENU] from the measurement screen to open a local menu.
2. Use [∨, ∧] to select Print Label under Misc Settings. You may want to use
the [START] button to skip ahead sections in the local menu.
3. Use [>] to turn the label ON.
4. Press [EXIT] to return to the measurement screen. Any printout will now
include a label until your turn off the analyzer.
Figure 2.4.2—Label with printed result

44 FONIX 7000 Hearing Aid Analyzer
If you want to include a label on all printouts by default:
1. Press [MENU] from the Opening screen to enter the Setup menu.
2. Use [∨, ∧] to select Print Label.
3. Use [>] to select ON.
4. Press [MENU] to close the Setup menu.
5. Press [F8] to save the user defaults. This will also save all the other selec-
tions in the Setup menu.
6. Press [EXIT] to return to the Opening screen.
2.4.3 Using the internal printer
The internal printer of the 7000 test system is straight-forward to use. Make
sure the internal printer is selected by following the instructions in the section
above. Press [PRINT] to print any displayed screen. Press the [FEED] button to
feed the thermal paper through the printer without printing.
General Information
The following is useful information:
• Raise “Head-Up” lever to the up position when paper is not loaded, or
when the internal printer is not in use for extended periods of time.
• Frequently inspect the printer for any residue or foreign matter, and clean
as required. Paper residue or foreign matter may shorten the life of the
thermal printer head or platen.
• The 7000 printer mechanism is equipped with a paper back tension
device. This feature is used to eliminate paper migration from side-to-
side. If paper migrates too far to one side, the edge or the paper will
“krinkle” and cause a paper jam. The white plastic spring-loaded back
tension rod located at the back of the printer mechanism provides the
required tension onto the outside of the paper roll. No adjustment is
required for proper operation.
Error Messages:
In the event that an error occurs when printing with the 7000 analyzer, we’ve
included some error codes in the lower right corner of the screen that should
help a FONIX technician troubleshoot the problem. This section describes
those error codes.
There are two categories of errors that can occur with the 7000 printer: initial-
ization errors and printing errors. Initialization errors occur only when the 7000
analyzer is first powered up; this also initializes the printer. Here are the printer
initialization error codes:

General Operation 45
• Init failed 0: No memory available for the converted screen buffer
• Init failed 1: No memory available for the label bitmap
• Init failed 2: Printer driver unresponsive
• Init failed 3: Version number from printer board is unreadable
Errors that occur when actually printing have the following error codes:
• Print failed 0: Switching from internal to external printer failed
• Print failed 1: Copying the label bitmap to the printer board has failed
• Print failed 2: Converting of the screen to printable version has failed
• Print failed 3: Copying the converted screen bitmap to the printer
board has failed
• Print failed 4: Preparing to print; printer board is busy
• Disconnected: External printer is disconnected.
• No power: Internal or external printer is not powered.
• Offline External printer is offline.
• Head up: Internal printer has head raised.
If you are having a problem with the 7000 printer, contact the factory (Section
1.7.4) and be ready to provide the Frye technician with the error code. The
printer software version, available in the help menu of the Opening screen, will
also be helpful.
2.4.4 Loading the thermal paper
Please read the entire instructions before loading paper. Refer to Fig. 2.4.4A for
printer features.
Step I: Installing the paper into the printer assembly
1. Open the printer door.
2. Remove the white plastic paper roller from the printer mechanism. If you
are replacing an empty paper roll, remove and discard the paper spool from
the printer mechanism, but do not discard the plastic roller. The spring-
loaded (white plastic) back tension rod, located directly behind the paper
roller is not a removable part.
3. Insert the plastic roller into a new paper roll.
4. Install the plastic roller and paper roll into the printer mechanism, with
paper feeding from the top of the roll. The paper roller will fit into the slots
on the left and right side of the printer mechanism. The paper roller should
drop into position without additional adjustment.
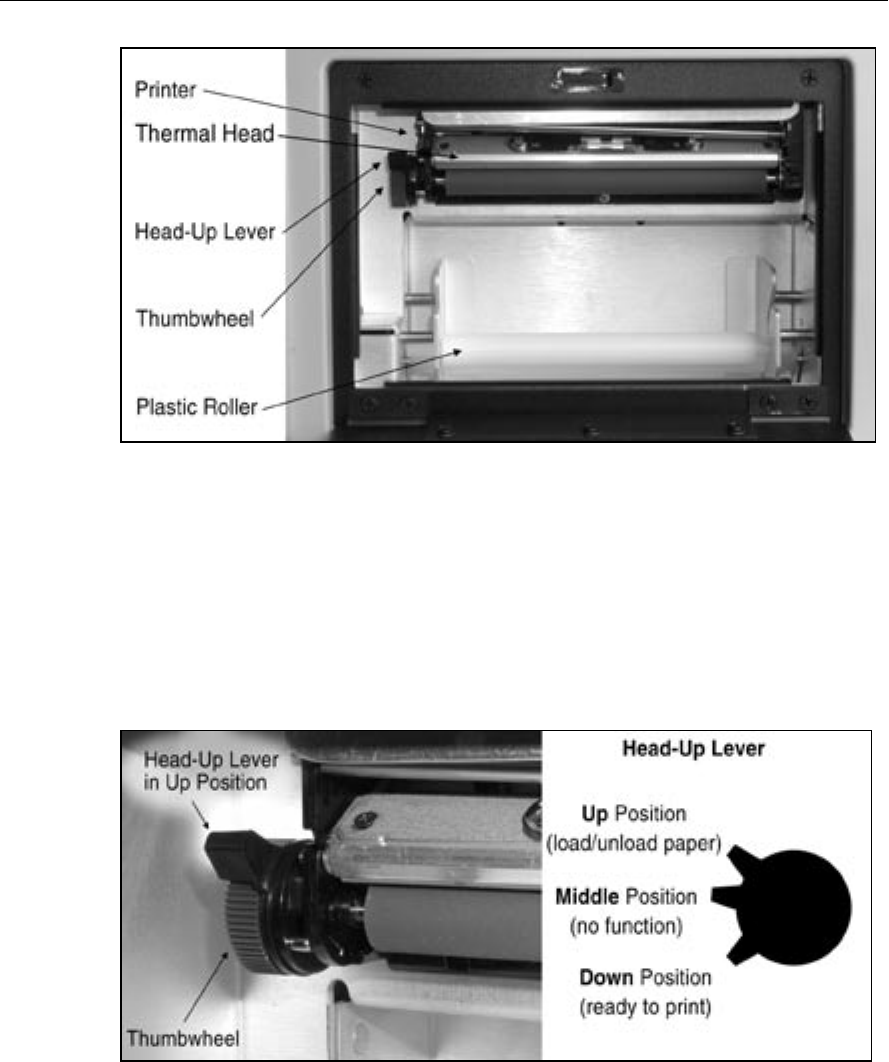
46 FONIX 7000 Hearing Aid Analyzer
Figure 2.4.4A—The internal printer
Step II: Loading paper into the printer
1. Turn on the instrument.
2. Place the Head-Up lever into the up position. See Fig. 2.4.4B.
3. Unroll approximately six inches of paper from the roll, and insert the
paper’s leading edge into the bottom of the printer, directly behind the rub-
ber roller. See Fig. 2.4.4C.
Figure 2.4.4B—Head-Up lever in up position.
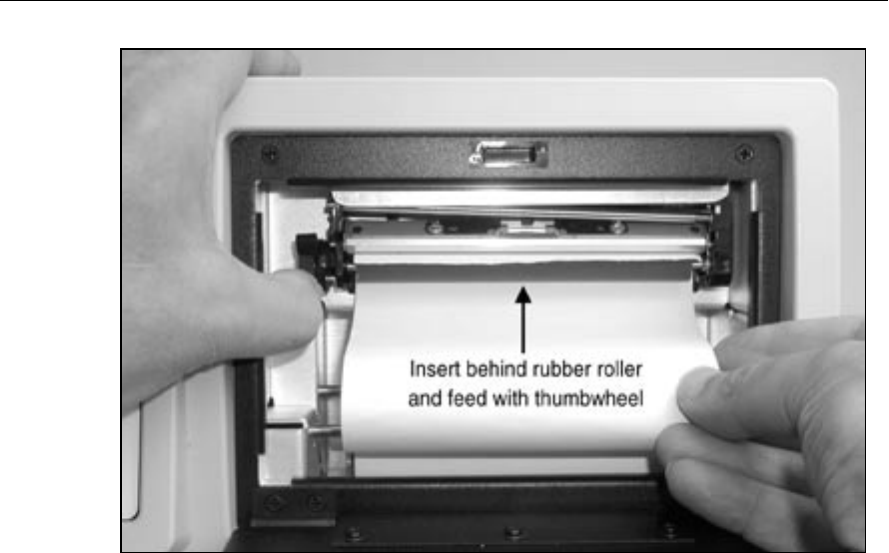
General Operation 47
Figure 2.4.4C—Loading paper into the printer
4. While holding the paper in place behind the rubber roller, manually turn
the thumbwheel to advance the paper approximately one inch. Never press
the [FEED] button while the Head-Up lever is in the up position. See Note 2
at the end of this section.
5. Center the paper on the rubber roller. Visually inspect the paper path to
ensure that the paper advances smoothly without hitting the edges of the
printer. If necessary, manually pull on the end of the paper until the paper is
centered and does not hit the edges of the printer.
6. Place the Head-Up lever into the down position.
7. Please read the caution note below before proceeding.
Press the [FEED] button to advance the paper. Continue pressing it until the
paper advances smoothly. The back tension device should automatically
correct a misaligned paper feed.
If the paper is not aligned properly, it may “krinkle” on one edge. If the
paper continues to krinkle after feeding 12 inches, place the Head-Up lever
into the up position and repeat steps 5 thought 6.
CAUTION—Do not allow the paper to feed back into the rubber roller. It
may be necessary to use your fingers to guide paper out and away from the
rubber roller. If the paper has a severe curl, it may have a tendency to roll
back under the rubber roller and cause a paper jam. If this occurs, stop feed-
ing the paper immediately, remove it from the roller, and reload the paper.

48 FONIX 7000 Hearing Aid Analyzer
8. Tear off excess paper by pulling the paper against the thermal head at
approximately a 45º angle.
9. Close the printer door. Press the [FEED] button to advance the paper through
the printer door slot. You can tear off excess paper by pulling it upward
against the tear strip (on top of the pritner door opening) at approximately a
45º angle. You are now ready to print.
Note 1: Whenever the printer door is opened, you will need to repeat steps 8
and 9. Closing the printer door without tearing the paper at the thermal head
can cause a paper jam, which can damage the printer.
Note 2: If the [FEED] or [PRINT] button is pressed while the Head-Up lever is
in up or middle position, the printer may fail to respond to all subsequent key
commands, even when the lever is returned to down position. If this happens, it
will be necessary to power off the instrument and restart.
2.4.5 Unloading a partial roll of paper
1. Place the Head-Up lever in the up positon.
2. Use the thumbwheel to unwind the paper from behind the rubber roller.
3. Push the roll of paper back and up, then lift out.
2.4.6 Using an external printer
You can hook up an external printer to your 7000 test system to print your
results on normal office paper. This eliminates the problem of fading associated
with thermal printouts, and often makes it easier to store your test results.
You can use any external printer that supports HP PCL (Hewlett Packard Printer
Control Language) version 3.0 or the Epson printer language ESC/P2. The print-
er should have a parallel interface. We keep a list of printers that work with our
analyzer on our website:
http://www.frye.com/products/analyzers/exprinter.html.
1. Unplug the 7000 test system and the external printer from any power
source.
2. Connect a standard printer cable to the external printer.
3. Connect the other end of the cable to the connector labeled PRINTER on the
back of the main module of the 7000 test system.
4. Plug the 7000 test system and the external printer into their respective
power sources.
5. Follow the directions found in Section 2.4.1 to select the external printer
in the 7000 software. If you want to set the printer language or whether to
print in color or black & white, you will need to use the Setup menu.

General Operation 49
2.4.7 Putting multiple screens on a page
When printing with an external printer, it is possible to save paper by putting
two screen prints on one piece of paper. This is done by printing the first screen
on one half of the paper and leaving the paper halfway through the external
printer until you choose to print the second screen. To do this:
1. Press [MENU] in the Opening screen to open the Setup menu.
2. Change Ext Prnt #Scrns/Page under General to 2. Make sure Printer is set to
External.
3. Press [EXIT] to return to the Opening screen.
4. Go to the screen you want to print on the first half of the page.
5. Press [PRINT] to print the screen onto the first half of the paper. The paper
will remain halfway through the external printer.
6. Go to the screen you want to print on the second half of the paper, or run
another test.
7. Press [PRINT] to print the second screen and feed the paper the rest of the
way through the printer.
Note: if you decide you don’t want to take a second screen shot, press
[FEED] to feed the second half of the paper through the external pritner
without printing.
2.5 Display & Data
This section describes the Curve Characteristics Box that is common to every
measurement screen, and the data display that shows the numerical data of the
response curves in the Coupler screen and the real-ear measurement screens.
2.5.1 Viewing the Curve Characteristics Box
Each measurement screen has a Curve Characteristics Box that tells you differ-
ent information about each measured curve. It has several different columns of
data: Curve Name, Curve Title (real-ear only), Source Type, Source Transducer,
Source Amplitude, RMS Out, Correction Factors (COR, coupler only), and NR
(Noise Reduction). Figure 2.5.1 shows an example.
Figure 2.5.1—Curve Characteristics Box

50 FONIX 7000 Hearing Aid Analyzer
Curve Name: This identifies the name of each curve. The first letter is derived
from its measurement type—coupler (C) or probe (P). The second letter is
derived from its ear—left (L) or right (R). (Coupler curves can also be labeled
A and B.) The third letter is the number of the curve. CR1 is the first coupler
curve for the right ear. PL2 is the second probe curve for the left ear.
Curve Title: This identifies the title of the real-ear curve. It is only available in
the real-ear measurement screens. Here are the possible titles: REUR (real-ear
unaided response), REAR (real-ear aided response), REIG (real-ear insertion
gain), TARG (real-ear target), HTL (hearing threshold level), UCL (uncomfortable
level).
Source Type: This identifies the type of source used to make the curve. Each
curve is identified by three letters.
First letter:
C = Composite
P = Pure-tone
D = Digital Speech
Second letter:
For pure-tone:
N = Normal pure-tone
F = Fast pure-tone
S = Short pure-tone
For Composite or Digital Speech:
W = Weighted composite
F = Flat weighted
S = Spectrum
Third letter:
P = SPL measurement (power)
G = Gain measurement
Note: When it’s possible to toggle between Gain and SPL in the local menu, the
7000 test system will convert most curves back and forth between the two for-
mats.
Source Transducer: This identifies the transducer used to make the measure-
ment. “Chamb” means sound chamber. “S.F.” means sound field. “Tcoil” refers
to a telecoil board or telewand transducer.
Source Amplitude: This identifies the amplitude of the signal used to make the
curve.

General Operation 51
RMS Out: The root-mean-square of the measured curve.
Correction Factors (COR): The coupler correction factors used to make the mea-
surement. Coupler screen only.
Noise Reduction: The noise reduction used to make the measurement. See
Sections 2.3.1.2 and 2.3.2.1.
Lastly, just to the right of the Curve Name column, the 7000 test system uses
symbols to describe the display status of the curves. Here is the legend for those
symbols:
≡ Curve is completely on the graph
• Curve is measured but turned off
↓ Curve is partially off the bottom of the graph
↑ Curve is partially off the top of the graph
▲ Curve is on, but is out of view above the graph
▼ Curve is on but is out of view below the graph
Curve is partially off the graph in both directions
2.5.2 Viewing numerical data
You can display the numerical data of the response curves made in the Coupler
screen and the real-ear measurement screens.
To display numerical data:
1. Press [MENU] from the Coupler screen or real-ear measurement screen.
2. Select Data/Graph using [∨, ∧].
3. Use [<, >] to select DATA.*
4. Press [EXIT] to return to the measurement screen.
5. Use [F2] to select the curve that you want to show. See Figure 2.5.2 for an
example of the data display of a composite curve.
* Unlike the other measurement screens, the Insertion Gain screen offers the
following selections: AIDED DATA and IG DATA. A selection of AIDED DATA
will display the data from the aided curves that are normally displayed on the
lower graph of the screen. A selection of IG DATA will display the data from
the insertion gain curves that are normally displayed on the upper graph of the
screen.
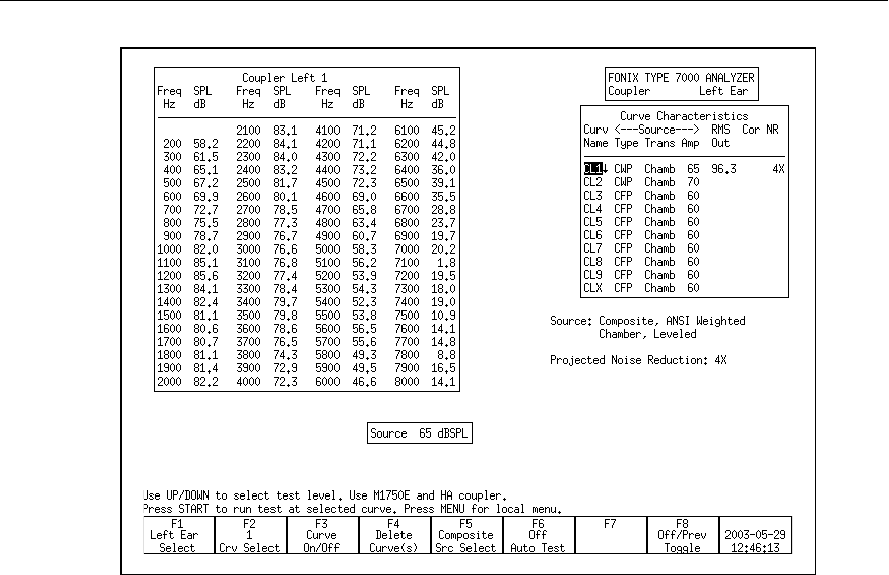
52 FONIX 7000 Hearing Aid Analyzer
Figure 2.5.2—Data display of a composite measurement
2.6 Computer Connection
The 7000 test system is equipped with an RS232 connection that will allow
you to connect to a personal computer and exchange data. You will also need a
software program, such as WinCHAP, on your Windows computer that can com-
municate with the analyzer. It is possible to make your own program using the
FRYERS protocol.
2.7 Remote Module
The remote module is a way of operating the 7000 away from the main module
itself. This is especially helpful for performing real-ear measurements.
The keys of the remote module are a sub-set of the keys of the front panel of the
main module. This means all functions performed with the remote module can
also be performed in the same way with the front panel.
Since there are only five function keys on the remote module and eight function
keys on the main module, there will be some operations, particularly in coupler
mode, that will only be able to be performed with the front panel and its extra
three function keys. However, we have made a special effort to ensure all real-
ear functions can be performed with the remote module, allowing you to step
away from the main module during the measurement process and make any
necessary adjustments to your client and testing situation.
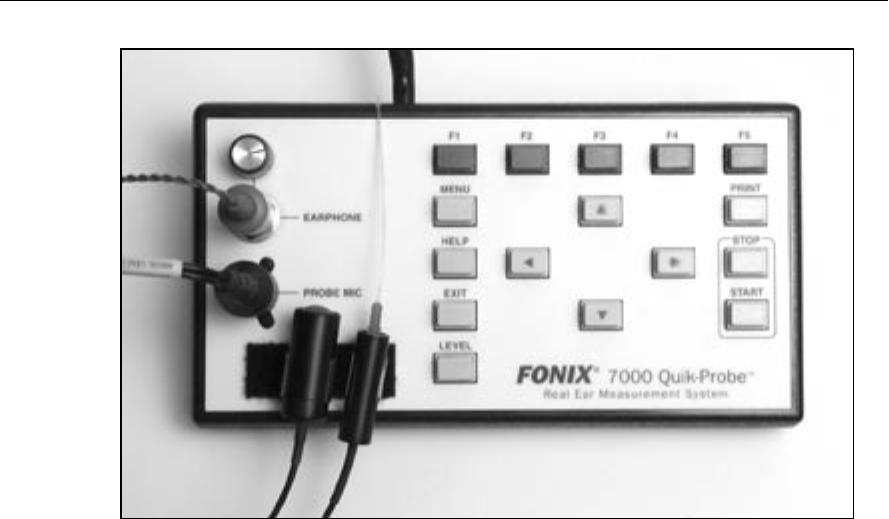
General Operation 53
Figure 2.7—Remote Module
2.8 Leveling
Leveling is the process by which the response of the sound chamber or sound
field is measured and computer-corrected so that a flat sound field is achieved.
Sound chamber leveling can be saved into permanent memory, but sound field
leveling for real-ear measurements must be done for every patient and every ear.
See Section 3.2.1 and Section 6.2.4 for instructions on how to perform coupler
and real-ear leveling, respectively.
Here are some technical details on the leveling status messages.
• UNLEVELED: Leveling has not been attempted and sound is uncorrected.
• LEVEL_ERROR or LEVEL_FAILED: An error happened during leveling
and source is uncorrected.
• LEVELED: Leveling has been achieved within ± 0.25 dB between 260–
6000 Hz and ± 0.5 outside that frequency range for sound chamber level-
ing or within ± 1 dB between 260–6000 Hz and ± 2 dB outside that fre-
quency range for real-ear leveling.
• SEMI_LEVELED: Leveling has been achieved between ± 0.25 dB and ±
0.5 dB between 260–6000 Hz and between ± 0.5 and ± 1.5 dB outside
that frequency range for sound chamber leveling or between ± 1 dB and
± 2 dB between 260–6000 Hz and between ± 2 dB and ± 6 dB outside
that frequency range for real-ear leveling.

54 FONIX 7000 Hearing Aid Analyzer
• WEAK_LEVELED: Tolerances are the same as SEMI-LEVELED but the max-
imum output for the speaker is less than 100 dB for coupler measurements
or 80 dB for real-ear measurements. To achieve a louder signal, the speaker
needs to be moved closer to the analyzer microphone and re-leveled.
If a leveling error occurs during sound chamber leveling, check the connections
of the sound chamber and the microphone, and make sure that you are getting
noise out of your sound chamber. If those connections are good, your microphone
is probably in need of calibration or it is damaged. It is also possible that your
sound chamber speaker is damaged, but this is a much less common problem.
If you are having problems leveling the sound field speaker for real-ear measure-
ments, check the connections of the microphones, remote module, and sound
field speaker. If you have been able to successfully level the sound field speaker
in the past, the most likely problem is the reference microphone needs calibration
or is damaged, although sound field speakers have also been known to go bad.
Sound field leveling, however, is more prone to user error than sound chamber
leveling. Make sure the sound field speaker isn’t pointed at a wall or other sur-
face that may cause the sound field to bounce and interfere with the leveling
process (and measurements). The client should be 12-15 inches from the speak-
er; try moving him closer and see if that helps. For troubleshooting purposes, try
leveling the sound field speaker by holding the microphone 6 inches from the
speaker. If the sound field levels with this technique, then you probably have
a positioning problem instead of a hardware problem. (This technique should
NOT be used for leveling for actual real-ear measurements.)
Contact the factory or your local FONIX distributor if you continue to have prob-
lems with leveling.
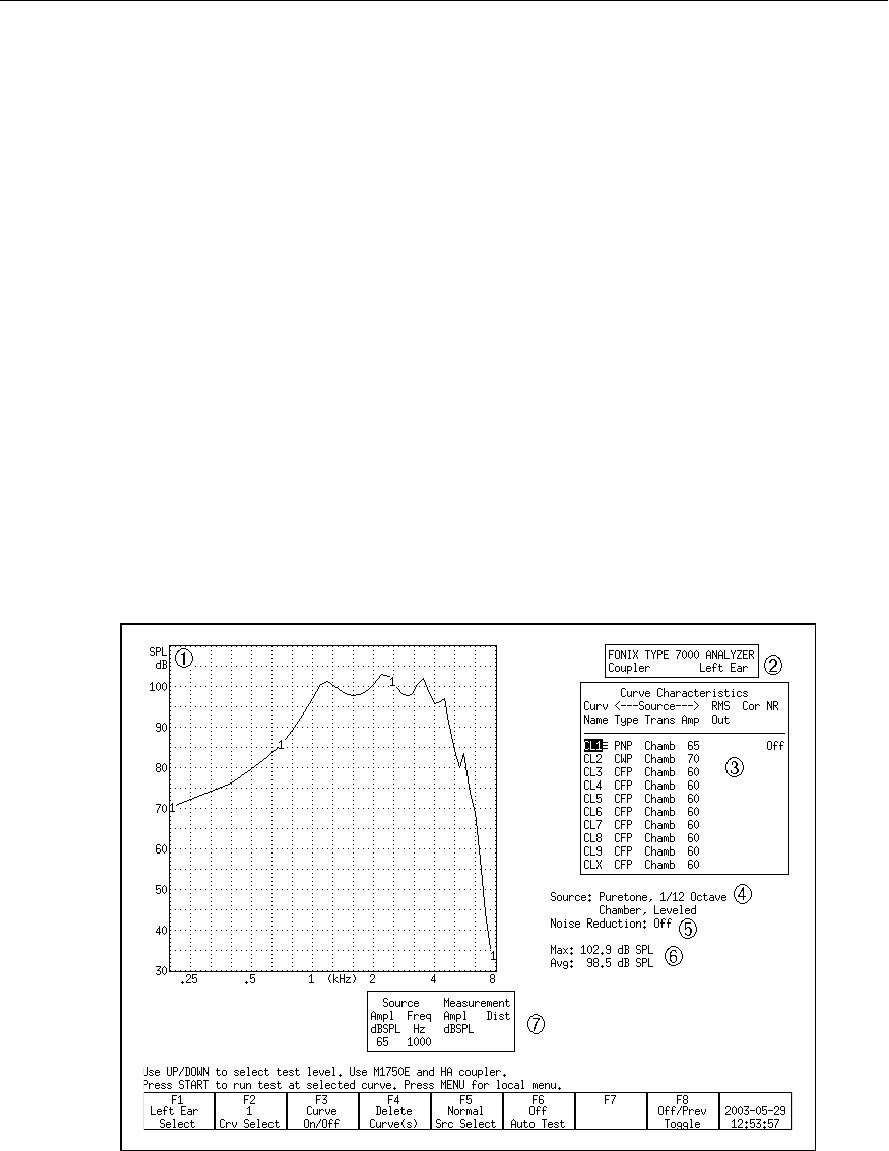
Chapter 3 55
Basic Sound Chamber Tests
In the Coupler screen, you can view measurement curves in dB SPL or dB Gain,
and run them with Composite, Digital Speech, or pure-tone signals. You can dis-
play up to 10 curves on the Coupler screen at the same time.
From the Opening screen of the 7000 test system, enter the Coupler screen by
pressing [F1].
The Coupler Multicurve screen can be set as the screen that appears when the
7000 test system is powered or the [RESET] button is pressed. See Section 2.2.1
and 2.2.4 (Other sub-section) for details.
3.1 The Coupler Screen Display
The display of the Main Coupler Screen varies depending upon whether you
have chosen a pure-tone source or a composite (including Digital Speech)
source.
3.1.1 Viewing a Pure-tone Display
Figure 3.1.1—Coupler Screen with pure-tone source
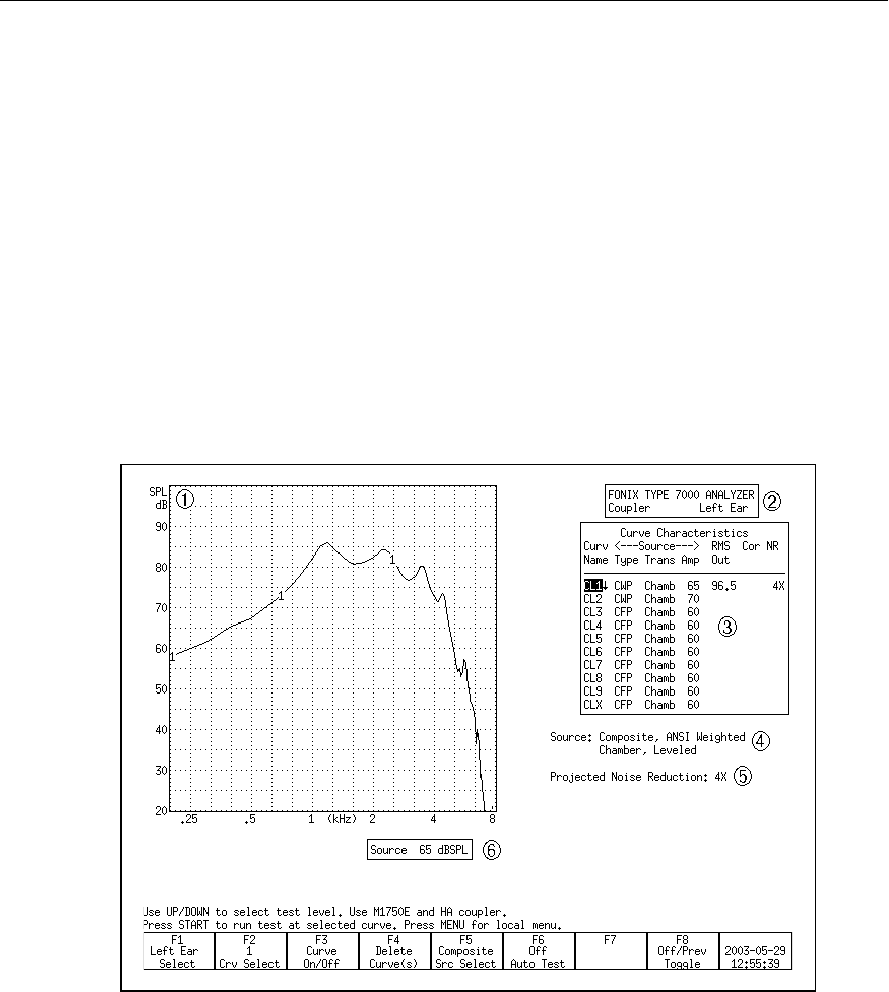
56 FONIX 7000 Hearing Aid Analyzer
Refer to Figure 3.1.1 for the following explanation of the graphical display:
1. Type of display. This will be either dB SPL (coupler output) or dB Gain (cou-
pler gain).
2. Selected ear.
3. Curve Characteristics box. See Section 2.5.1 for more details.
4. Signal type and leveling status.
5. Selected noise reduction.
6. Maximum output and three-frequency average of the selected curve.
7. Source Signal Statistics Box. Displays the source amplitude, frequency, dis-
tortion, and output/gain.
3.1.2 Viewing a Composite Display
Figure 3.1.2—Coupler screen with a Composite source
Refer to Figure 3.1.2 for the following explanation of the graphical display:
1. Type of display. This will be either dB SPL (coupler output) or dB Gain (cou-
pler gain).
2. Selected ear.
3. Curve Characteristics box. See Section 2.5.1 for more details.

Basic Sound Chamber Tests 57
4. Signal type, speech weighting, leveling status, and bias status (Digital
Speech only).
5. Selected noise reduction.
6. Source Signal Statistics Box. Displays the source amplitude.
3.2 The Leveling Process
Leveling is the process by which the response of the sound chamber is mea-
sured and computer-corrected so that a “flat” sound field is achieved. The level-
ing status can be saved into the 7000 test system’s permanent memory so that
you don’t have to level the analyzer every time you turn it on. However, if you
get your analyzer calibrated, or if you get a software upgrade, you should always
level the chamber again (and save the leveling).
To double-check the leveling status of the analyzer, place the microphone in the
sound chamber at the reference point by itself and run a composite frequency
response (see Section 3.4.2). You should get a smooth, flat curve.
If you are getting bad coupler frequency responses that you suspect are the fault
of the analyzer, rather than the fault of the hearing aid, the first step of trouble-
shooting is to level the sound chamber. Even if the screen says LEVELED, the
response of the measurement microphone may have altered since the analyzer
was last leveled, invalidating the leveling. When in doubt, level the sound
chamber again.
See Section 2.8 for details on the leveling status and troubleshooting the level-
ing process.
3.2.1 Leveling the sound chamber
To level the sound chamber:
1. IMPORTANT: Be sure nothing is plugged into the battery voltage supply.
2. Place the microphone on the left side of the sound chamber, with the micro-
phone grill over the reference point (Figure 3.2.1). Close and latch the sound
chamber lid.
Warning: Leveling is valid only when the microphone position is not
changed after leveling. Each significant change in microphone location
requires new leveling.
3. Press [F1] to enter the Coupler screen.
4. Press [LEVEL] to start the leveling sequence. The system responds by pre-
senting a complex composite signal consisting of tones from 100 to 8000 Hz.
It measures the signal and stores correction factors, so that the sound field is
flat for testing.
5. Look at the display. After a few seconds, the video monitor should display a
“Leveled” message under the Curve Characteristics box. If the 7000 doesn’t
level, it could be an indication that your microphone needs to be calibrated
or replaced.
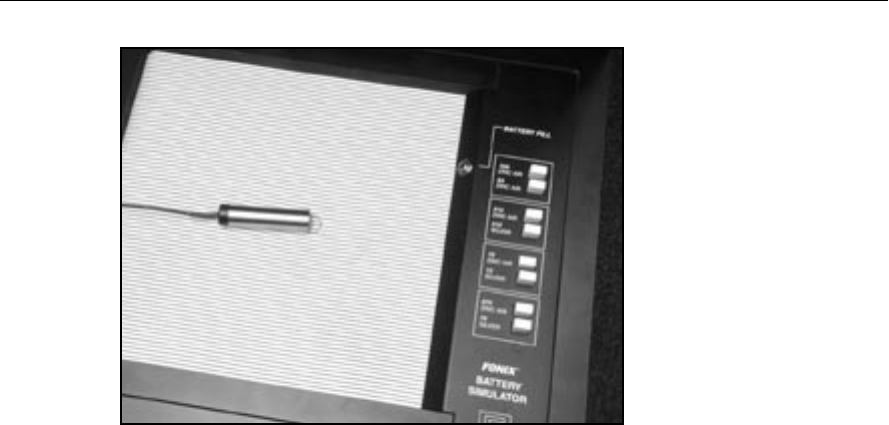
58 FONIX 7000 Hearing Aid Analyzer
Figure 3.2.1—Leveling the sound chamber
Note: See Section 5.1.1 for the ANSI standardized leveling procedures.
3.2.2 Removing the leveling of the sound chamber:
In some instances, you may want to look at the response of the sound chamber
without the benefit of leveling. In order to do this, you will need to remove the
leveling of the sound chamber. To do this:
1. Disconnect the microphone or the sound chamber.
2. Push the [LEVEL] button. The leveling will be removed. If you don’t save
this new unleveled status, the analyzer will revert to its leveled status after
it has been turned off and on again.
3.2.3 Saving the leveling information
To save the sound chamber leveling so that you won’t have to re-level the sound
chamber the next time the analyzer is turned on:
1. Follow the instructions in Section 3.2.1 to level the sound chamber.
2. Press [MENU] from the Opening screen. This will open the Setup menu.
3. Press [F5] to save the chamber leveling.
4. Press [EXIT] to return to the Opening screen.
3.3 Hearing Aid Setup
Coupler types and methods for attaching them to hearing aids are described in
this chapter. This includes a description of the HA-1 coupler, HA-2 coupler, and
the ear-level adapter (used with the HA-2 coupler).
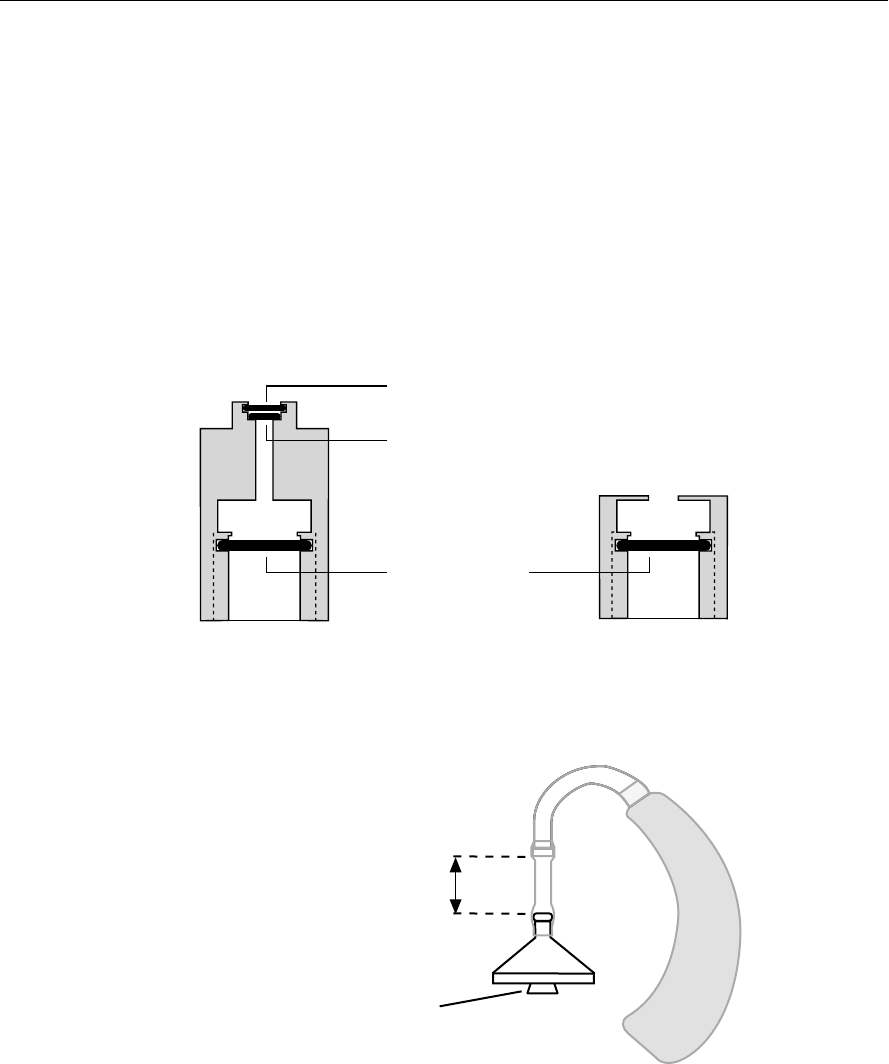
Basic Sound Chamber Tests 59
3.3.1 Explaining the Coupler Types
The HA-1 direct access coupler is used to test in-the-ear and canal aids, and
aids with molds connected. Figure 3.3.1B shows the direct access coupler. The
sound bore of the aid is sealed directly to the 2-cc cavity of this coupler with
Fun-Tak putty, provided with the instrument.
The HA-2 coupler approximates the human ear with an earmold attached. See
Figure 3.3.1A. Note the tube that simulates the earmold. Button-type receivers
connect directly to this coupler. Behind-the-Ear (BTE) hearing aids connect to
this coupler by means of an ear-level adapter, as shown in Figures 3.3.1C.
OUTER O-RING
INNER O-RING
MICROPHONE
O-RING
Figure 3.3.1A Figure 3.3.1B
Standard 2-cc Coupler (HA-2) Direct access coupler (HA-1)
0.4" (10 mm)
NUB CONNECTS TO
TOP OF HA-2 COUPLER
Figure 3.3.1C—Ear-level Adapter (used with HA-2)
The length and thickness of the tubing of the ear-level adapter can have a sig-
nificant effect on the frequency response of an aid. If an aid is being compared
against the manufacturer’s specifications, the tubing should be carefully chosen
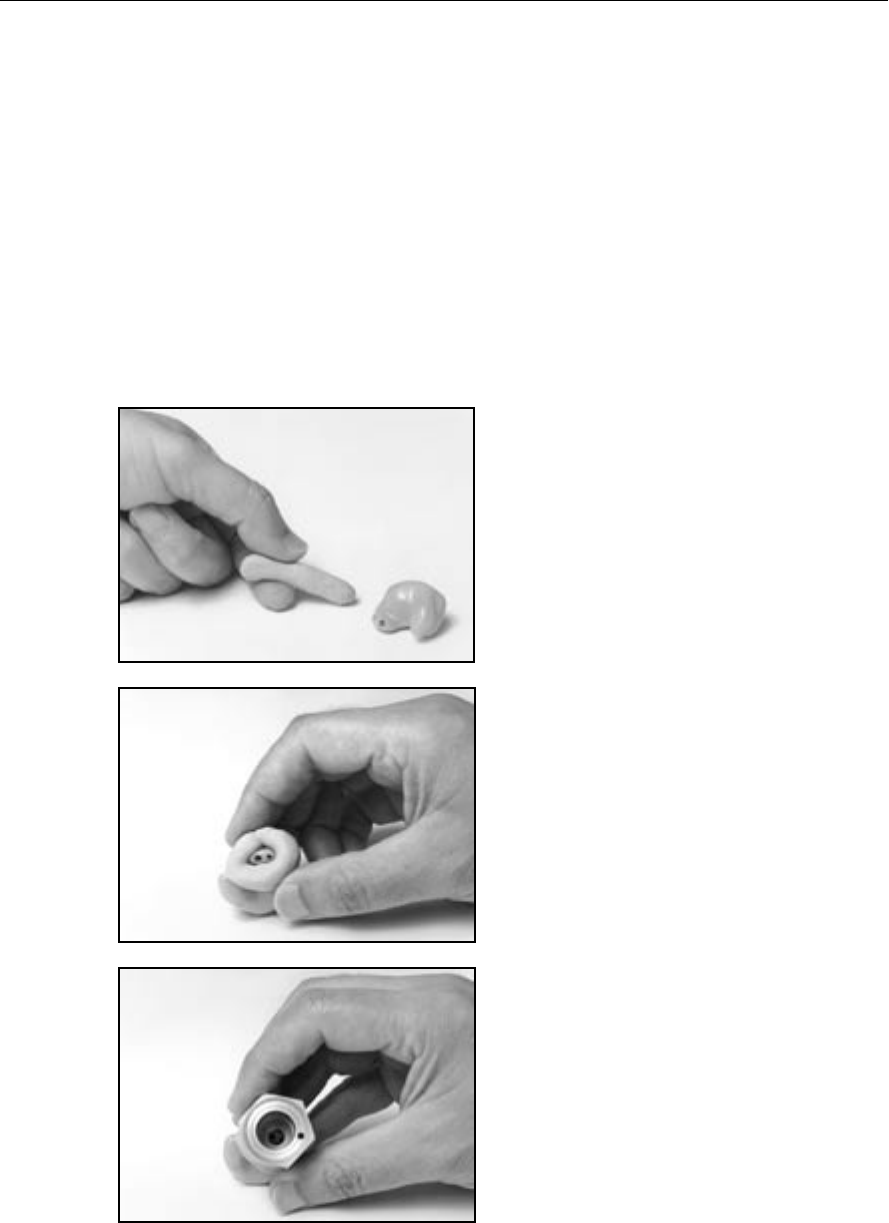
60 FONIX 7000 Hearing Aid Analyzer
to duplicate that used by the manufacturer to obtain the original data. For ANSI
tests, use #13 thick-walled tubing with a length of 0.4 inches (10 mm). When
cutting tubing to length, leave extra space at each end to go around the nubs of
the ear-level adapter and the hearing aid hook.
Both the HA-1 and the HA-2 couplers have an O-ring located deep within them
that reduces pressure on the inserted microphone, thereby reducing damage to
the microphone. When inserting the microphone into the coupler, you will feel
a point of resistance when the microphone reaches the O-ring. You must contin-
ue to push the microphone into the coupler past that first resistance or incorrect
data will be collected.
3.3.2 In-The-Ear (ITE) and Canal Aids
1. Roll the Fun-Tak, provided with each
instrument, into a rod long enough
to go around the transmitting end
of the aid (approximately 2 inches).
(Modeling clay can also be used, but
it doesn’t work as well.)
2. Bend the Fun-Tak rod around the
canal of the aid, making the result-
ing “donut” flush with the end of the
aid. (Some users choose to seal the
vent opening at this end with a small
amount of Fun-Tak.)
3. Align the sound opening of the aid
to the hole at the conical end of the
coupler. Look through the open end
of the coupler to be sure the sound
opening of the aid is clear of obstruc-
tions and correctly placed.
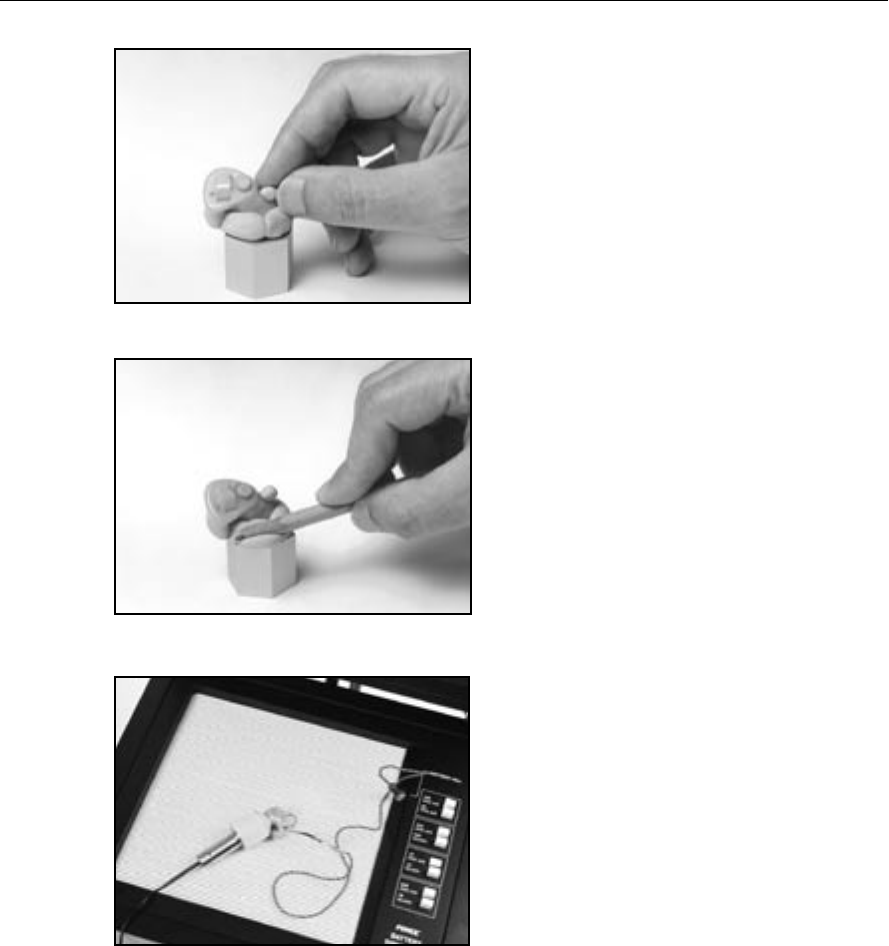
Basic Sound Chamber Tests 61
4. Seal any vent on the aid with a small
kernel of Fun-Tak.
5. Complete the acoustical sealing of
the aid to the coupler by using a pen-
cil or finger. You may want to dou-
ble-check the aid placement through
the open end of the coupler at this
point. Slowly reinsert the coupler
microphone into its access opening.
6. Place the completed assembly at the
reference position in the test cham-
ber. With ITEs, the position of the aid
can affect the frequency response.
As a rule, point the faceplate of the
aid toward the right, with the micro-
phone opening as close as possible
to the reference circle. It is best,
when possible, to angle the faceplate
upward instead of downward (see
the photo at left).
For the sake of repeatability, you may
elect to use a ninety degree angle of
the faceplate to the reference circle,
again with the microphone opening
as close as possible to the reference
circle. If you are using a battery pill,
be sure the metal conductor strip
does not obstruct the sound path.
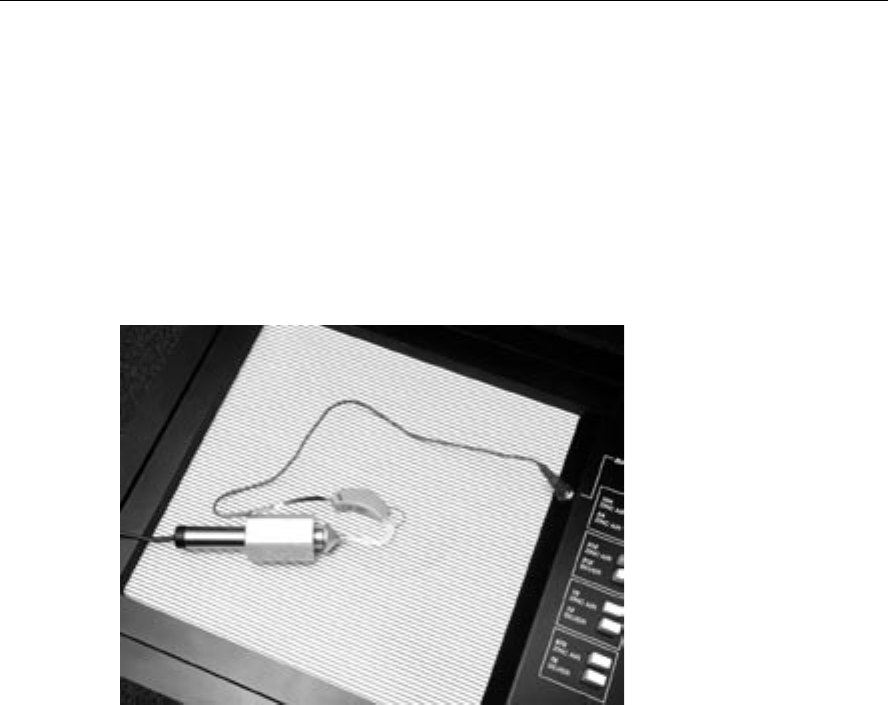
62 FONIX 7000 Hearing Aid Analyzer
3.3.3 Behind-The-Ear (BTE) Aids
1. Insert the coupler microphone into the HA-2 2-cc coupler.
2. Couple the aid to the HA-2 coupler using the ear-level adapter. There should
be 0.4 inches (10 mm) of tubing between the nub of the ear-level adapter
and the nub of the coupler adapter. See Figure 3.3.1-C.
3. Place the microphone of the hearing aid at the reference point in the cham-
ber, as shown in Figure 3.3.3.
4. Close the lid and test as desired.
Figure 3.3.3—Behind-the-Ear Aid with Ear-level Adapter
3.3.4 Open-Ear Hearing Aids
“Open-ear” style hearing aids have boomed in popularity over the past couple
of years. Unfortunately, the ANSI standards have not yet caught up with them.
At the moment, there is no standardized method of performing a coupler mea-
surement on an open-ear style hearing aid. Hearing aid manufacturers have
independently developed different mechanisms for attaching an open-ear hear-
ing aid to an HA-1 or HA-2 coupler. One such device, pictured in Figure 3.3.4A,
is attached to the speaker unit of the open-ear hearing aid and to the tubing of
an HA-2 coupler. Other connecting devices consist of a plate that attaches to an
HA-1 coupler.
To perform a coupler measurement to the ANSI S3.22 standard, we recommend
using Fun-Tak to connect the speaker unit of the open-ear hearing aid to an
HA-1 coupler, as pictured in Figure 3.3.4B. We believe that the HA-1 coupler is
better than the HA-2 coupler for open-ear hearing aids because, unlike the BTE
aids for which the HA-2 was designed, open-ear hearing aids are not attached to
an ear mold.
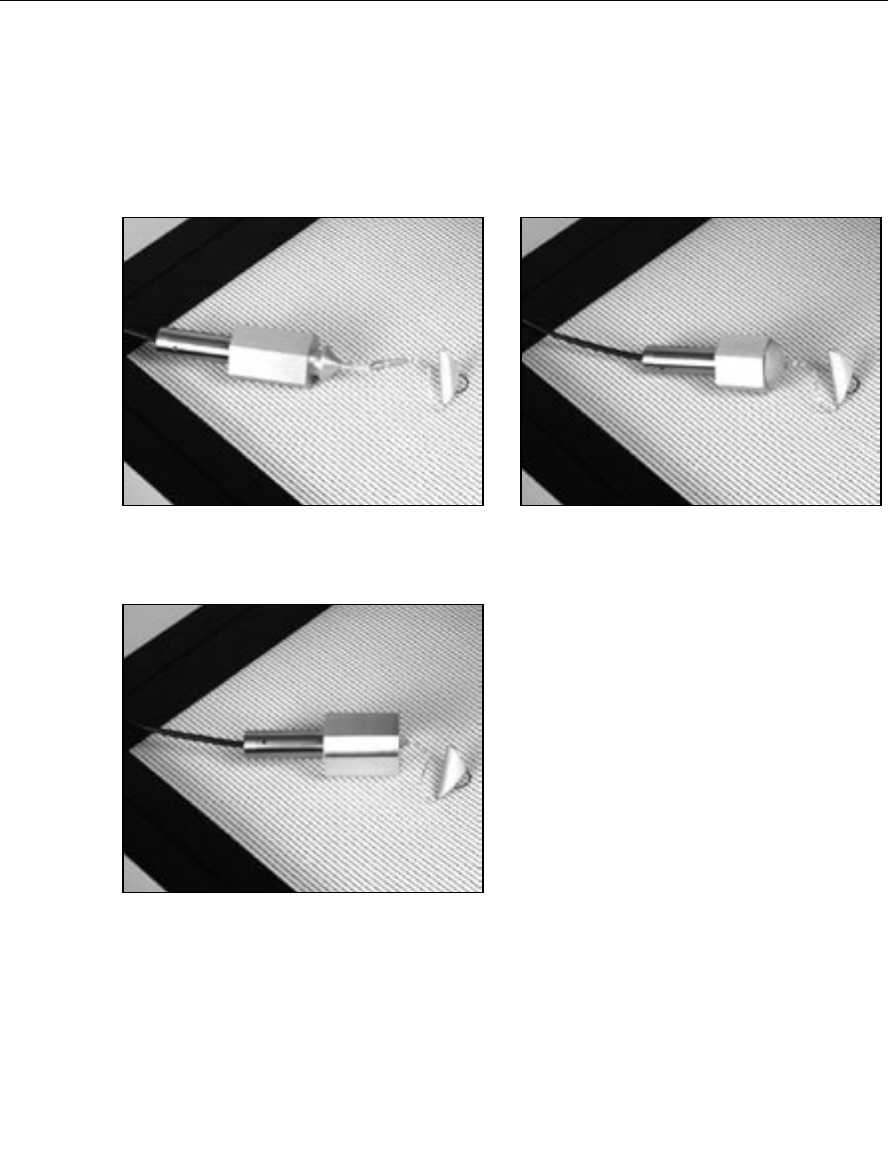
Basic Sound Chamber Tests 63
We have also developed a non-standard coupler for open-ear hearing aids. It has
two design purposes: 1) To make an convenient connection between the hearing
aid and the coupler, and 2) To provide a more real-ear like frequency response
than is possible with an HA-1 or HA-2 coupler. Figure 3.3.4C shows a picture of
the open-ear coupler with an attached hearing aid.
Figure 3.3.4A—HA-2 Coupler Figure 3.3.4B—HA-1 Coupler
Figure 3.3.4C—Open-ear coupler
Figure 3.3.4D contains an example of a comparison of an open-ear hearing aid
tested with an open-ear coupler (Curve 1), an HA-1 coupler attached to the
open-ear hearing aid with Fun-Tak (Curve 2), and an HA-2 coupler with an
open-ear attachment (Curve 3). The dark line (Curve 4) in the graph represents
the KEMAR real-ear gain response of the hearing aid. As illustrated, the open-
ear coupler provides the measurement most like the real-ear response of the
hearing aid.
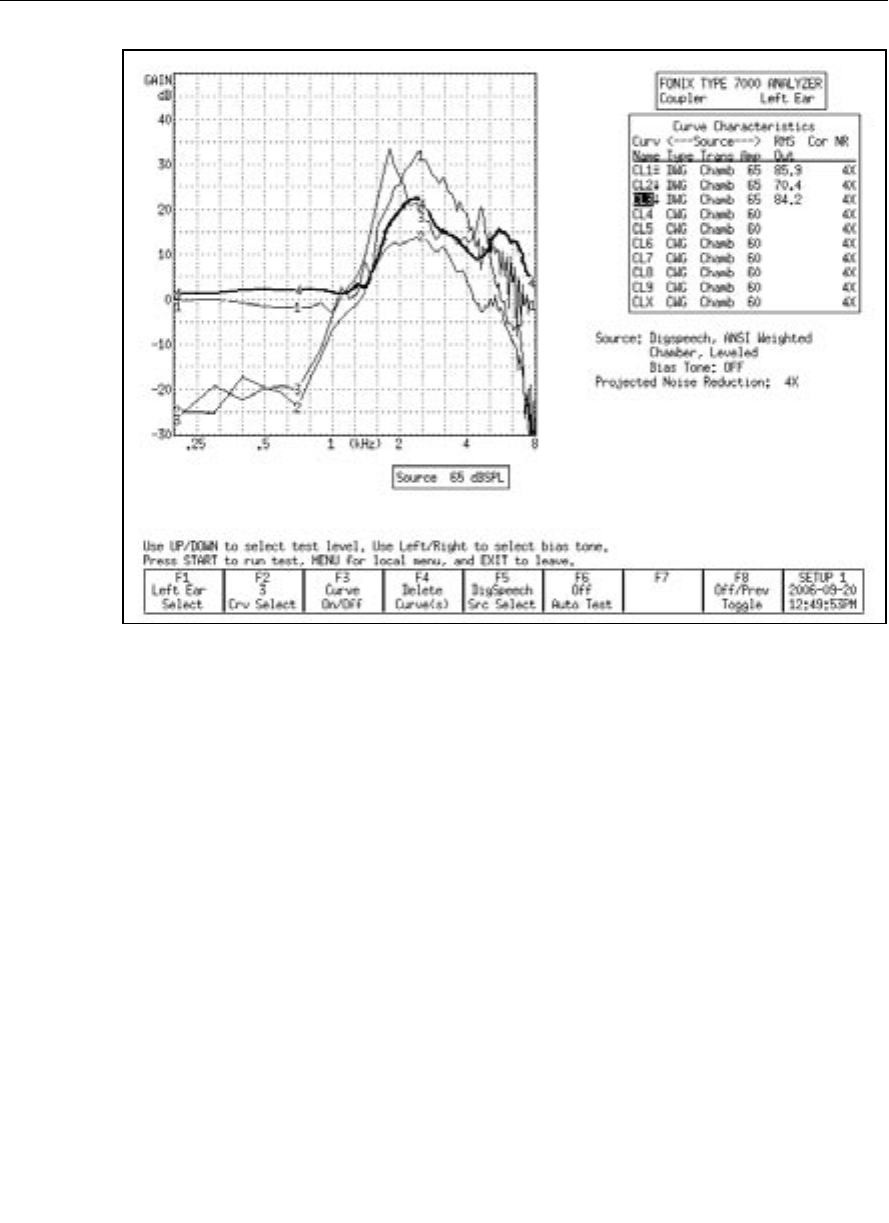
64 FONIX 7000 Hearing Aid Analyzer
Figure 3.3.4D—Comparison of couplers with open-ear hearing aid. Curve 1 was measured
using the Open Ear coupler, Curve 2 with an HA-1 coupler, Curve 3 with an HA-2 coupler, and
Curve 4 is the KEMAR real-ear response.
3.3.5 Body Aids
1. Insert the coupler microphone into the HA-2 coupler. (The most consistent
results for body aids can be obtained by locating the 2-cc coupler outside
the test chamber, preferably on a foam pad to isolate it from vibration.)
2. Snap the earphone (receiver) of the body aid onto the 1/4" recessed-end of
the coupler (Figure 3.3.5A).
3. Place the aid in the test chamber with its microphone opening as close to
the reference point as possible. See Figure 3.3.5B.
4. Turn the gain (volume) control to the desired setting and set the switch for
microphone operation (not telephone coil or “T”).
5. Close the lid and test as desired. (The aid’s cord will not be damaged by
closing and latching the test chamber lid.)
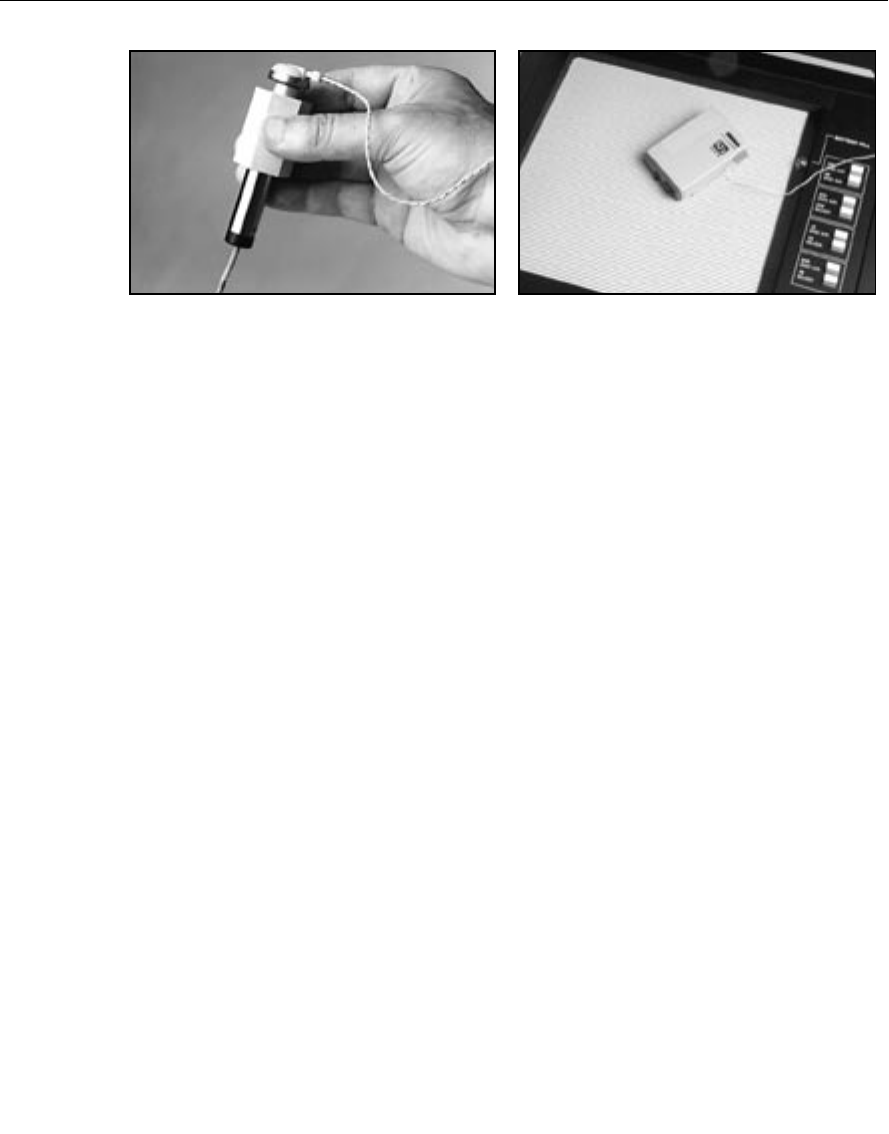
Basic Sound Chamber Tests 65
Figure 3.3.5A—Coupler setup Figure 3.3.5B—Body Aid in test chamber
3.3.6 Eyeglass Aids
1. Follow the manufacturer’s instructions for removing the hearing aid assem-
bly or the temple piece from the eyeglass frame, if possible. Should you be
unable to remove the aid assembly or temple from the frame, it is possible
to place the entire frame in the test chamber for testing. Be sure to fold the
glasses first.
2. Insert the coupler microphone into the HA-2 coupler.
3. Couple the aid to the 2-cc coupler using the BTE aid adapter and the appro-
priate tubing, as shown in Figure 3.3.6.
The length and thickness of the tubing have a significant effect on the fre-
quency response of an aid, especially in the 500 to 1000 Hz region. If an
aid is being compared against the manufacturer’s specifications, the tubing
should be carefully chosen to duplicate that used by the manufacturer to
obtain the original data. For ANSI tests, use 0.6" (15 mm) of #13 thick-
walled tubing (exposed portion).
4. Position the microphone of the aid as close as possible to the reference
point in the test chamber, as shown in Figure 3.3.6.
5. Close the lid, if possible, and then test as desired. If the lid can’t be closed,
measurements can be made with the lid open. But we recommend that you
first re-level the chamber with the lid open, and use the quietest possible
location.
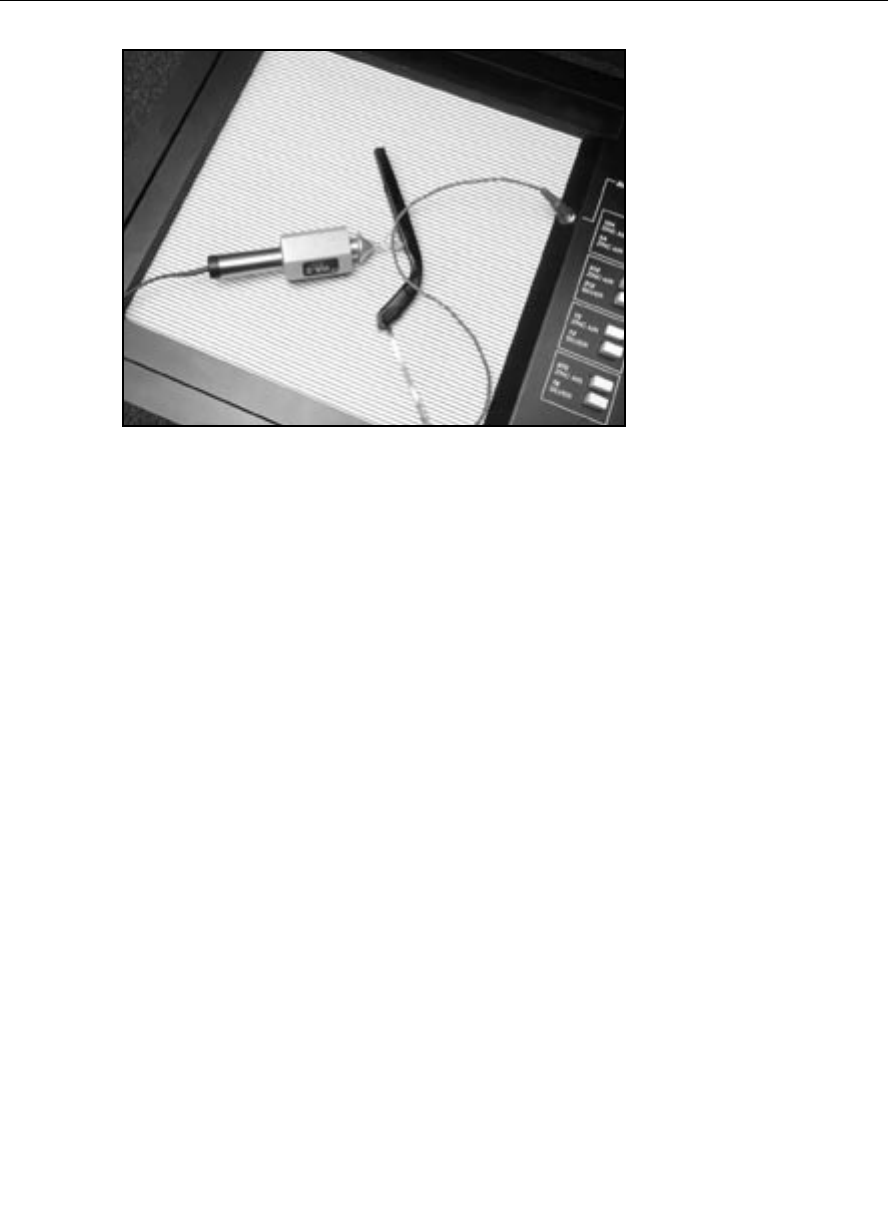
66 FONIX 7000 Hearing Aid Analyzer
Figure 3.3.6—Eyeglass Aid Set-up
3.3.7 Wireless CROS and BICROS Aids
The key to testing these aids is to get the proper amount of separation between
the transmitter and the receiver. This separation may be vertical. The transmit-
ter may be in the chamber while the receiver is on top of it.
If you are using a CRT monitor, it may be necessary to turn it off while testing
these aids, because CRT monitors create magnetic fields which may interfere
with testing. Either turn the monitor back on to view results, or push [PRINT]
to print. LCD monitors should not cause interference.
Wireless CROS
A CROS (Contra-lateral Routing of Signal) aid consists of a transmitter and a
receiver so that sound received on one side of the head can be transmitted to
the other side without a wire connection. You can test these units in the test
chamber of the FONIX 7000 Test System. See Figure 3.3.7.
1. Place the microphone of the transmitter at the reference point in the test
chamber. Turn on the transmitter.
2. Close the lid of the test chamber.
3. Check the specification sheet of the aid under test to determine how far
apart to place the transmitter and the receiver. About 6" (15 cm) is usually
sufficient.
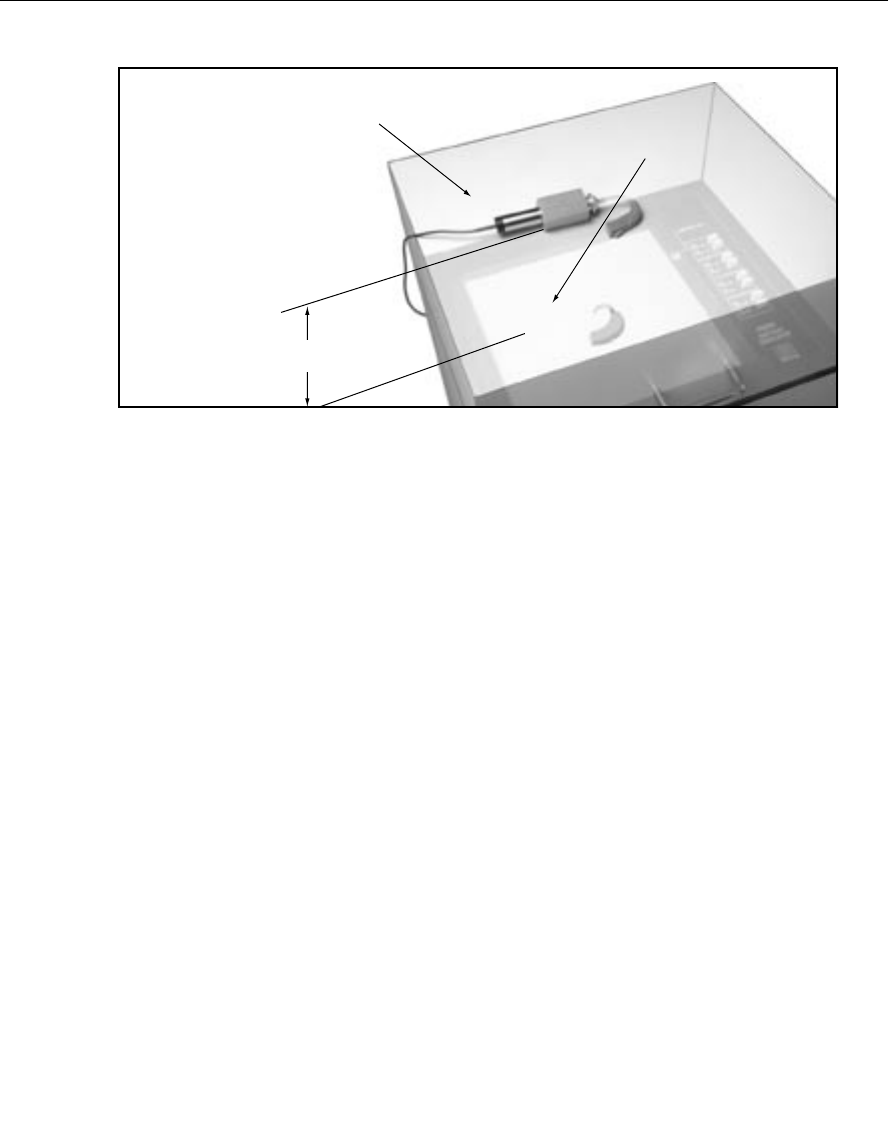
Basic Sound Chamber Tests 67
Figure 3.3.7—Testing Wireless CROS Hearing Aids
4. Place the receiver on top of the lid of the test chamber. The total depth of
the lid of the test chamber is about 5 ½ inches (14 cm). To increase the total
separation, place foam on the top of the test chamber until the total separa-
tion equals that recommended by the aid manufacturer.
5. Attach the coupler to the receiver just as you would for an ordinary BTE or
eyeglass aid.
6. Align the receiver and coupler assembly on the top of the test chamber so
that the receiver is exactly parallel to the transmitter in the test chamber.
7. Test as you would any ordinary hearing aid.
Wireless BICROS
BICROS systems have two microphones: one on the transmitter side and the
other on the receiver side.
1. Test the receiver side as an ordinary hearing aid first.
2. Arrange the transmitter parallel to the receiver, but as far as possible from
it while still in the chamber. You may have to unscrew the ear hooks one-
quarter turn to accomplish this. Fun-Tak may help to keep the units in posi-
tion, but be careful not to obstruct the sound paths to the microphones.
3. Test the hearing aid again. Adding the transmitter should increase the gain
by the amount specified by the manufacturer. It is not possible to get exact
measurements by this measure because at least one of the microphones will
not be at the reference point.
d
Receiver/Coupler Assembly
located parallel to Transmitter,
at specified distance (d )
(see manuf. specs).
Place foam under assembly
if necessary to achieve
specified distance “d.”
Transmitter located
at Reference Point

68 FONIX 7000 Hearing Aid Analyzer
Additional Notes for Testing Wireless Instruments
1. There must not be any metal objects between the transmitter and the receiv-
er sides.
2. The two sides must be directly parallel as illustrated (See Figure 3.3.7).
3. The distance between the two sides should be as specified by the manufac-
turer.
THE GAIN OF THE AID INCREASES AS THE TRANSMITTER AND
RECEIVER MOVE CLOSER TO EACH OTHER. EVENTUALLY, THE
RECEIVER WILL OVERLOAD.
4. No other wireless CROS/BICROS/MultiCROS transmitters are to be turned
on near the test box.
5. Calculators should be kept at least a foot (300 mm) from the test box.
3.3.8 Wire-Type CROS and BICROS aids
CROS
CROS aids are similar to ordinary hearing aids, except that the microphone
and amplifier are separate units connected by a wire. Both units may be placed
inside the test chamber during testing.
1. Place the orifice of the microphone unit at the reference position in the test
chamber.
2. Connect the amplifier unit to the appropriate 2-cc coupler. (See earlier sec-
tions for details.)
3. Place the coupler with the amplifier unit at the left side of the test area.
4. Test as desired.
BICROS
Test wire-type BICROS aids just as you would wireless BICROS aids, except
instead of separating the two units and keeping them parallel, place both units
as close as possible to one another with the microphone openings as close as
possible to the reference circle. (Otherwise, follow the steps given in Section
3.3.7 for BICROS aids.)
3.4 Basic Measurements
In the Coupler screen of the 7000 analyzer, you can perform the following mea-
surements: response curves, single-frequency measurements, three-frequency
averages, harmonic distortion, and intermodulation distortion.

Basic Sound Chamber Tests 69
3.4.1 Signal Types
The following signal types are available:
DIGITAL SPEECH—A randomly interrupted composite signal designed to
mimic speech. This signal is for use with hearing aids with a “noise reduc-
tion” or “speech enhancing” feature that lowers the gain of the aid in the
presence of a continuous signal (such as the regular composite signal).
COMPOSITE—A continuous real-time, speech-weighted signal made up of
79 different frequencies. The composite signal gives you the advantage of
seeing how an aid responds to noise that more closely simulates speech,
and it lets you see immediately how the aid responds to any change in the
amplitude of the signal.
TONE LONG—A detailed frequency response curve that gives you infor-
mation on the amplification of 64 different pure-tone frequencies between
200 and 8000 Hz
TONE NORMAL—A detailed frequency response curve that gives you
information on the amplification of 43 different pure-tone frequencies
between 200 and 8000 Hz.
TONE FAST—A continuous pure-tone sweep that takes measurements at
16 different frequencies between 200 and 8000 Hz.
TONE SHORT—A single pure-tone sweep of 10 different frequencies.
3.4.2 Running a Test Curve
1. Press [MENU] to make any necessary selections. See Section 3.9 for details
on available menu selections.
2. Set up the aid in the sound chamber as described in Section 3.3 and level if
necessary.
3. Select signal type with [F5]. (Press [F5]. Use [∨, ∧] to select the desired sig-
nal type. Press [>] to complete the selection and close the pop-up menu.)
See Section 3.4.1 for details on signal types.
4. Press [START] to initiate the frequency sweep. If you are using the LONG,
NORMAL, or SHORT selections, the test will stop when the sweep is com-
plete. The COMPOSITE, DIG SPEECH, and FAST signals are continuous,
making it necessary to press [STOP] when you want the signal to stop.
5. Use [F2] to select the next curve to be measured.
6. Repeat steps 3-5 to take additional measurements.
Figure 3.4.2 shows a completed normal pure-tone sweep.
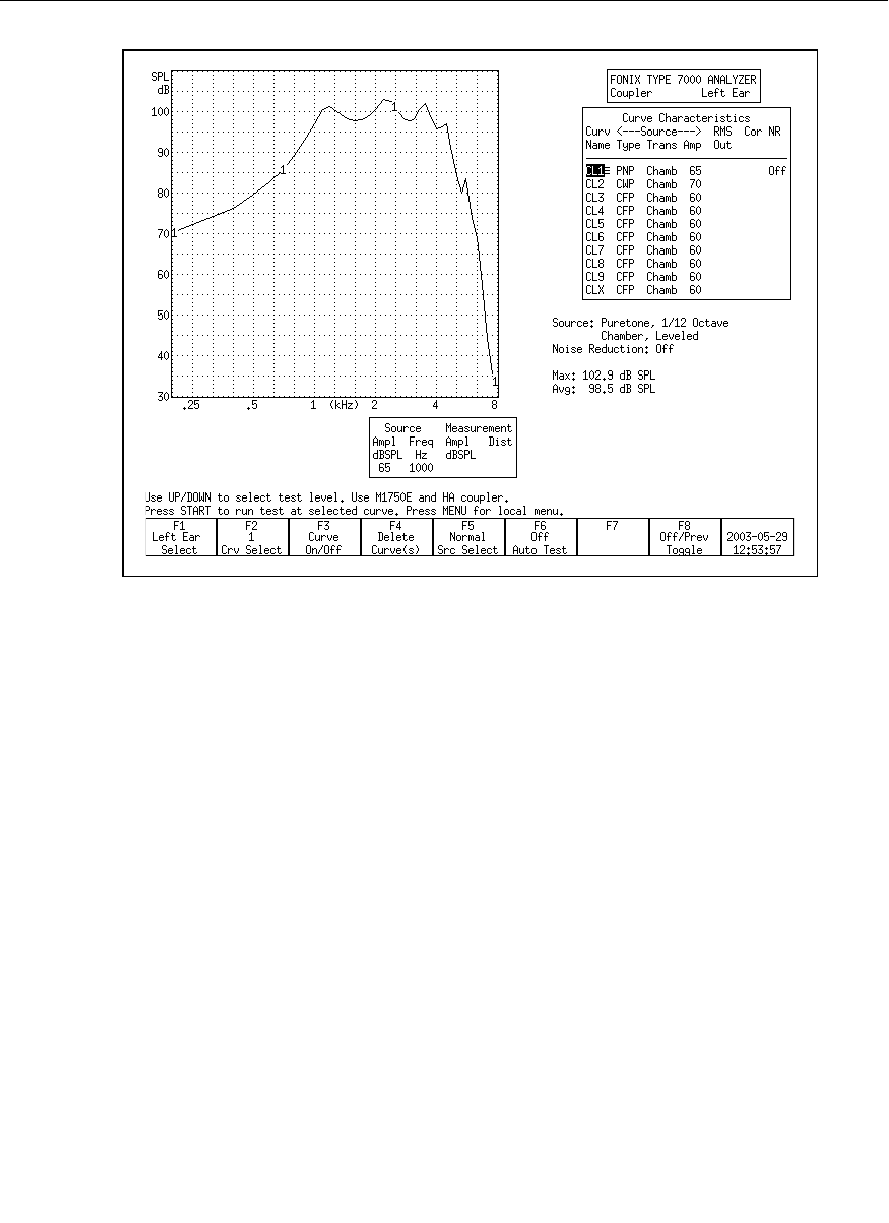
70 FONIX 7000 Hearing Aid Analyzer
Figure 3.4.2—Pure-tone measurement
3.4.3 Example
Following the instructions above, run 4 Gain curves using amplitudes 50, 60,
70, and 80 dB SPL. Use a signal source of COMPOSITE.
This scenario will provide you with a family of curves. Whenever the curves sit
on top of each other, the gain of the aid is the same for the amplitudes of those
curves. This indicates the aid is running linearly. If the curves provide progres-
sively less gain as the input rises, then the aid has some sort of compression
circuit. Figure 3.4.3 shows two examples of this scenario.
Here are the steps:
1. Look at the graph. If it has a display of SPL, press [MENU] and change the
DISPLAY from SPL to GAIN, using the arrow keys. Press [EXIT] to return to
the Coupler screen.
2. Use [F2] to select CRV 1. (Press [F2]. Use [∨, ∧] to select CRV1. Press [>] to
complete the selection and close the pop-up window.)
3. Use [∨, ∧] to select a source level of 50 dB SPL.
4. Use [F5] to select a source type of COMPOSITE.
5. Press [START] to run the first measurement. Press [STOP] when the mea-
surement has stabilized.
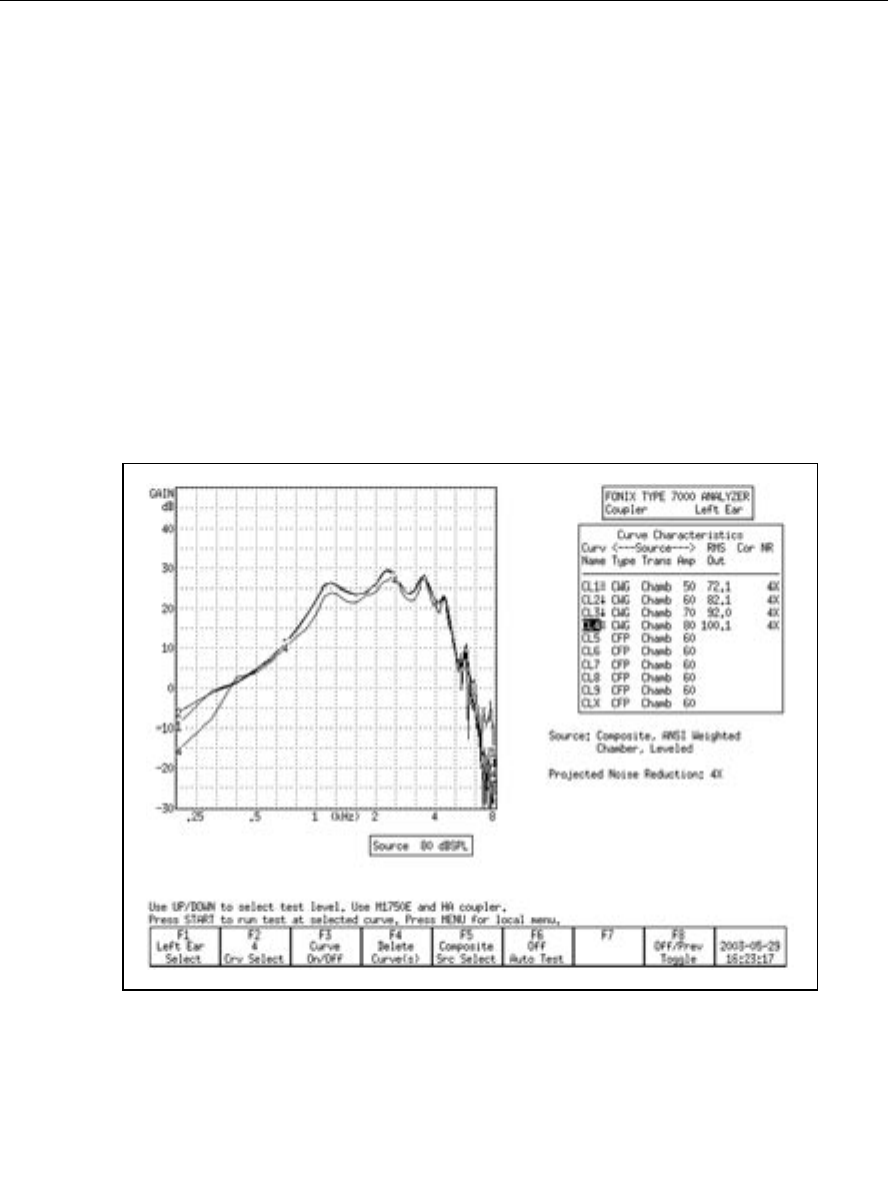
Basic Sound Chamber Tests 71
6. Use [F2] to select CRV 2.
7. Use [∧] to select a source level of 60 dB SPL.
8. Press [START] to run the second measurement. Press [STOP] when the mea-
surement has stabilized.
9. Use [F2] to select CRV 3.
10. Use [∧] to select a source level of 70 dB SPL.
11. Press [START] to run the third measurement. Press [STOP] when the mea-
surement has stabilized.
12. Use [F2] to select CRV 4.
13. Use [∧] to select a source level of 80 dB SPL.
14. Press [START] to run the fourth measurement. Press [STOP] when the mea-
surement has stabilized. You now have a family of curves.
Figure 3.4.3A—Family of curves. Notice how all the curves are on top of each other. This aid
has very little compression between 50 dB and 80 dB SPL.
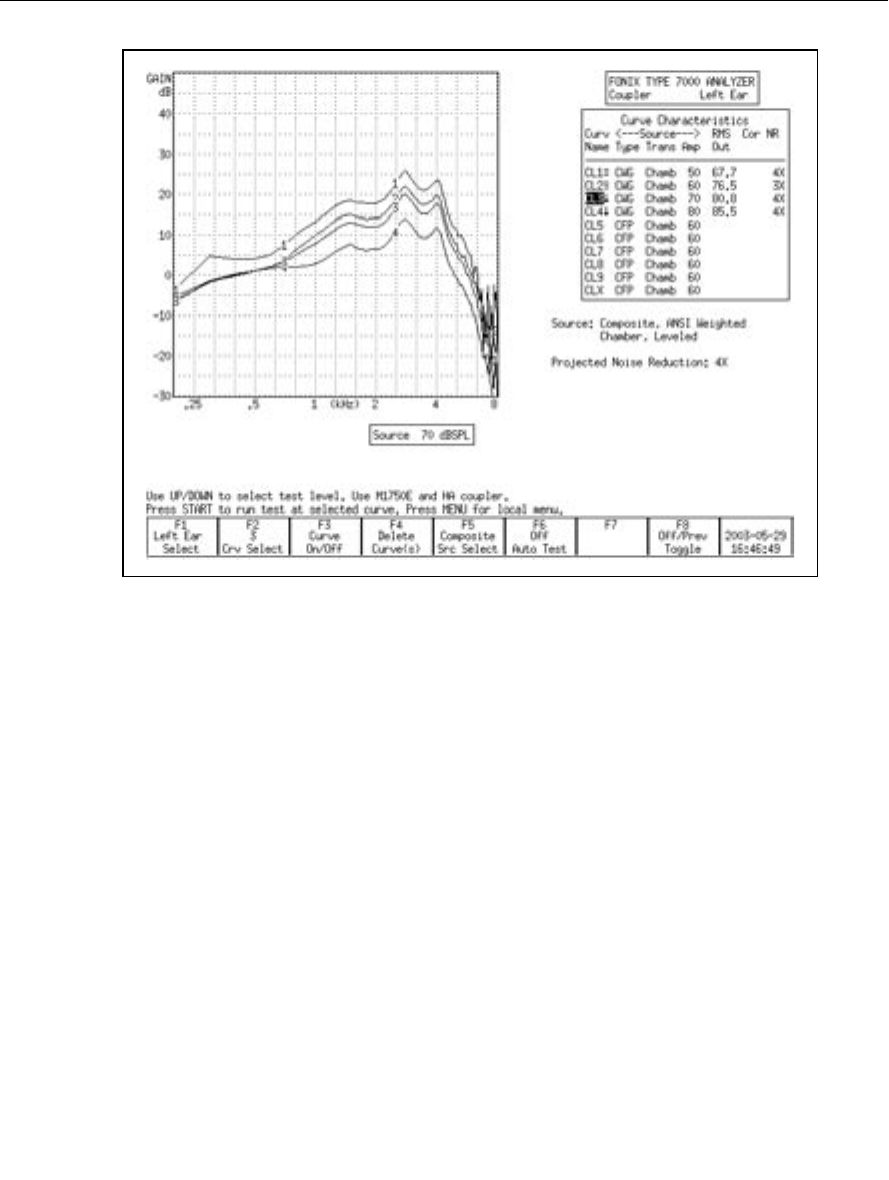
72 FONIX 7000 Hearing Aid Analyzer
Figure 3.4.3B—Family of curves. Notice how the curves show less gain as the amplitude
increases. This aid shows a great deal of compression between 50 dB and 80 dB.
3.4.4 Deleting measurements and settings
Use the [F4] key to permanently delete measurement curves. When you press it,
there are four possible selections:
• Selected Curve: Delete only the selected curve, but keep the curve selec-
tions (usually source type and level).
• Sel Curve & Settings: Delete selected curve and return curve to analyzer
default setting.
• All Curves: Delete all curves, but keep the curve selections.
• All Curves & Settings: Delete all curves and return them all to analyzer
default settings.
To delete a curve:
1. Press [F4].
2. Use [∨, ∧] to make the desired deletion type.
3. Press [>] to perform the deletion and close the pop-up menu.
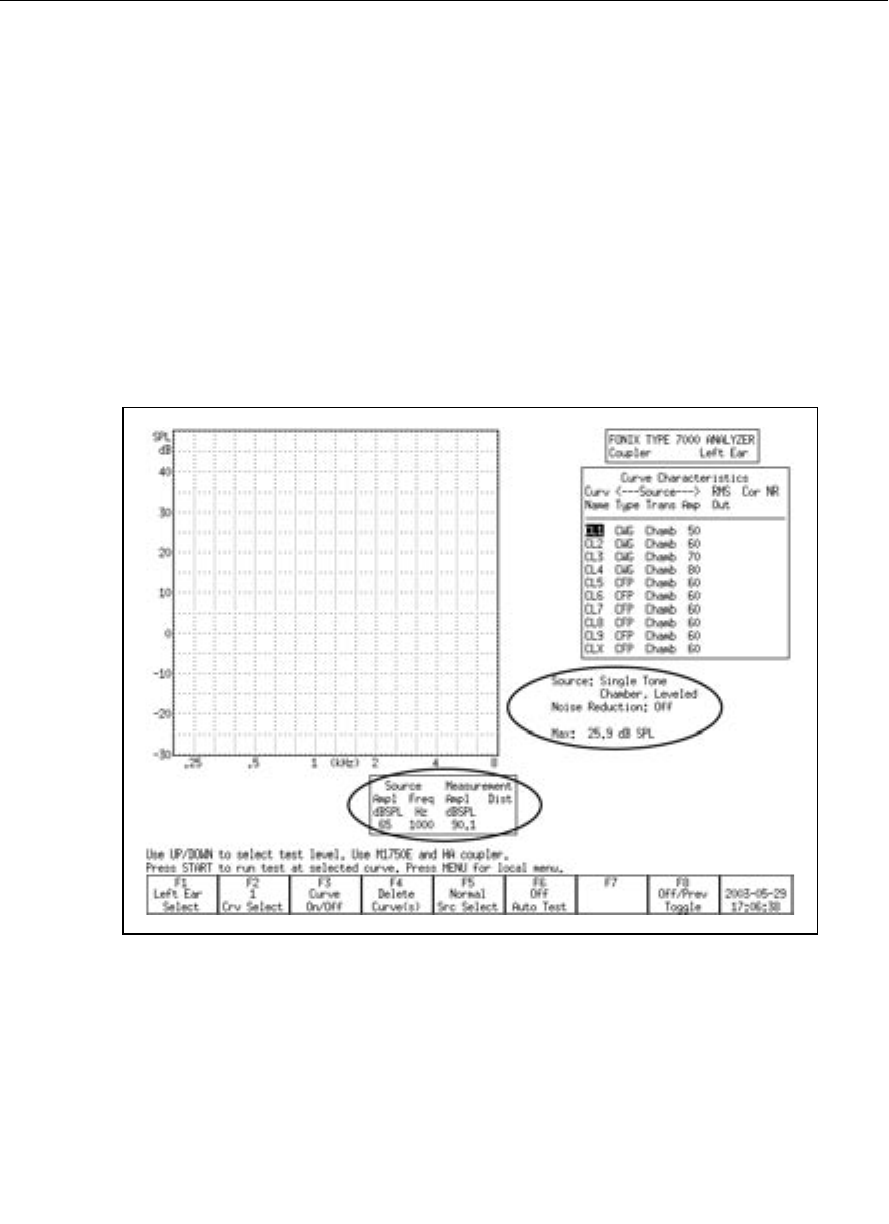
Basic Sound Chamber Tests 73
3.4.5 Running a Single Frequency Measurement
At times, you may want to find out what the frequency response of the hearing
aid is to a single pure-tone signal. See Figure 3.4.5.
1. Press [MENU] from the Coupler screen.
2. Use [∨, ∧] to select Static Tone under Source Settings.
3. Use [<, >] to choose SINGLE.
4. Press [EXIT] to return to the Coupler screen. The single tone will automati-
cally be running.
5. Adjust the frequency using the [<, >] buttons. Adjust the amplitude using
the [∧,∨] buttons.
Figure 3.4.5—Measuring a single frequency
3.4.6 Running a Three-Frequency Average
The ANSI standard includes some three frequency average tests. You can run
a three frequency average test (apart from the test sequence) in the Coupler
screen. See Figure 3.4.6. To do this:
1. Press [MENU] from the Coupler screen.
2. Use [∨, ∧] to select Static Tone under Source Settings.
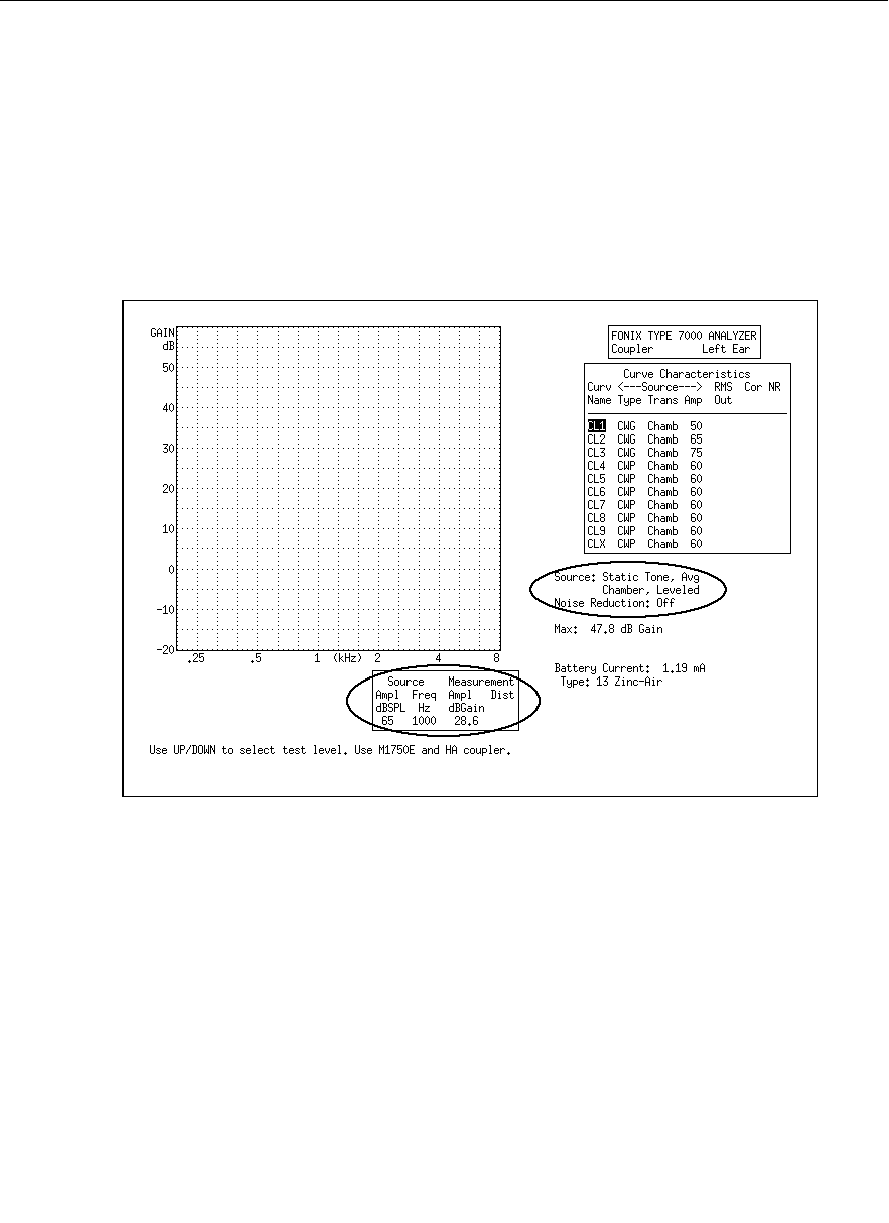
74 FONIX 7000 Hearing Aid Analyzer
3. Use [<, >] to choose AVERAGE.
4. Use [∨, ∧] to select Avg Freqs under Aid Settings.
5. Use [<, >] to choose the highest frequency of the three frequency average.
See Section 2.3.1.1 for a complete list of frequencies.
6. Press [EXIT] to return to the Coupler screen. The three frequency average
will automatically be running.
7. Adjust the amplitude using the [∧,∨] buttons.
Figure 3.4.6—Measuring a three frequency average
3.4.7 Measuring Harmonic Distortion
Harmonic distortion is when the hearing aid returns energy at frequencies not
present in the source signal. The 7000 analyzer allows you test for this phe-
nomenon very easily.
1. Press [MENU] from the Coupler screen.
2. Select Distortion under Measurement Settings using the [∨, ∧] buttons.
3. Select the distortion type desired by using the [<, >] buttons.
The selections are:
2ND: Distortion present at the second harmonics, or twice the presented
frequency.
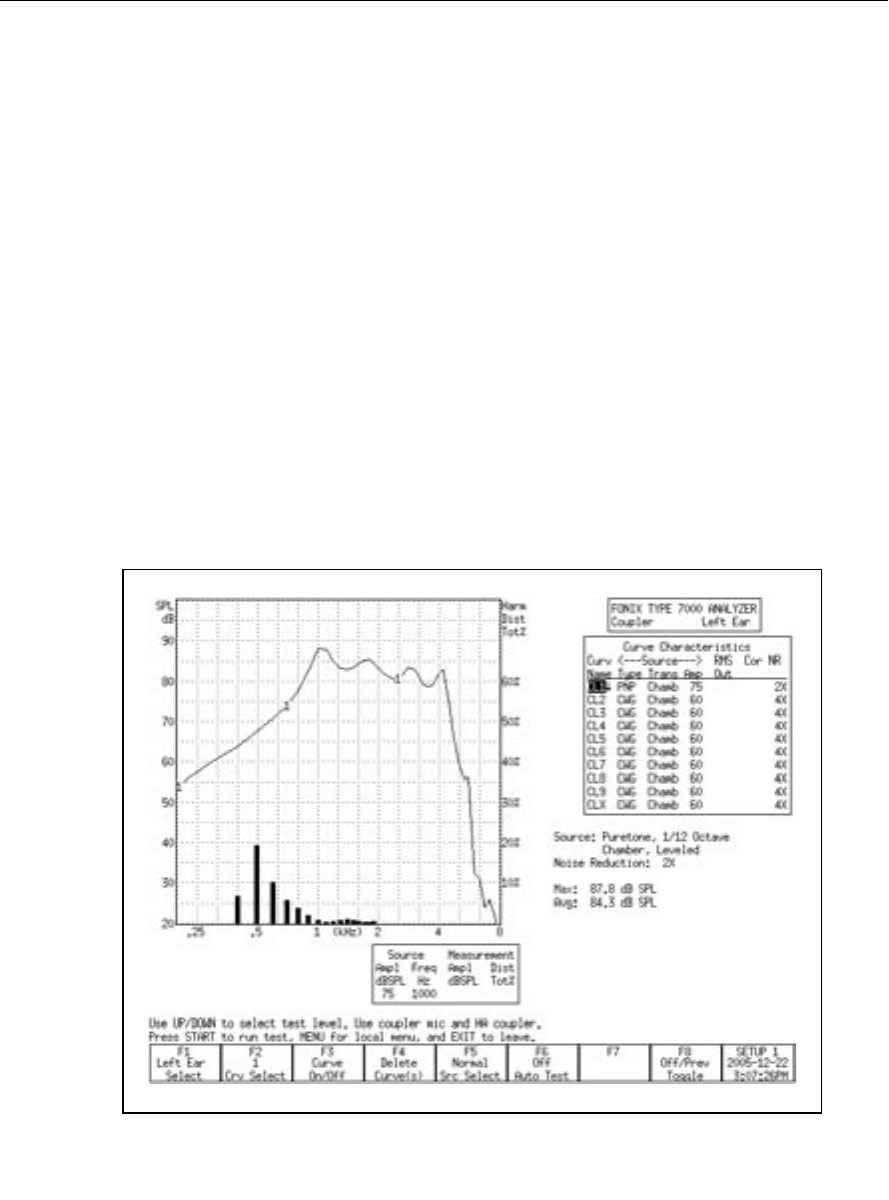
Basic Sound Chamber Tests 75
3RD: Distortion present at the third harmonics, or three times the presented
frequency.
TOTAL: Distortion present at the second and third harmonics.
4. Press [EXIT].
5. Use [F5] to select a signal type of TONE NORMAL. (Press [F5]. Use [∨, ∧]
to select TONE NORMAL. Use [>] to complete the selection and close the
pop-up menu.)
6. Press [START] to run normal frequency sweep.
After running a normal sweep, the harmonic distortion data will appear on the
measurement graph as a series of red bars. The scale for the bars is on the right
side of the graph
In general, you should ignore the harmonic distortion measurement when the
amplitude of the response curve measurement at the second harmonic is more
than 12 dB greater than the amplitude at the first harmonic. This is called the
12 dB rule and is part of the ANSI S3.22 standard.
Figure 3.4.7—Measuring Harmonic Distortion
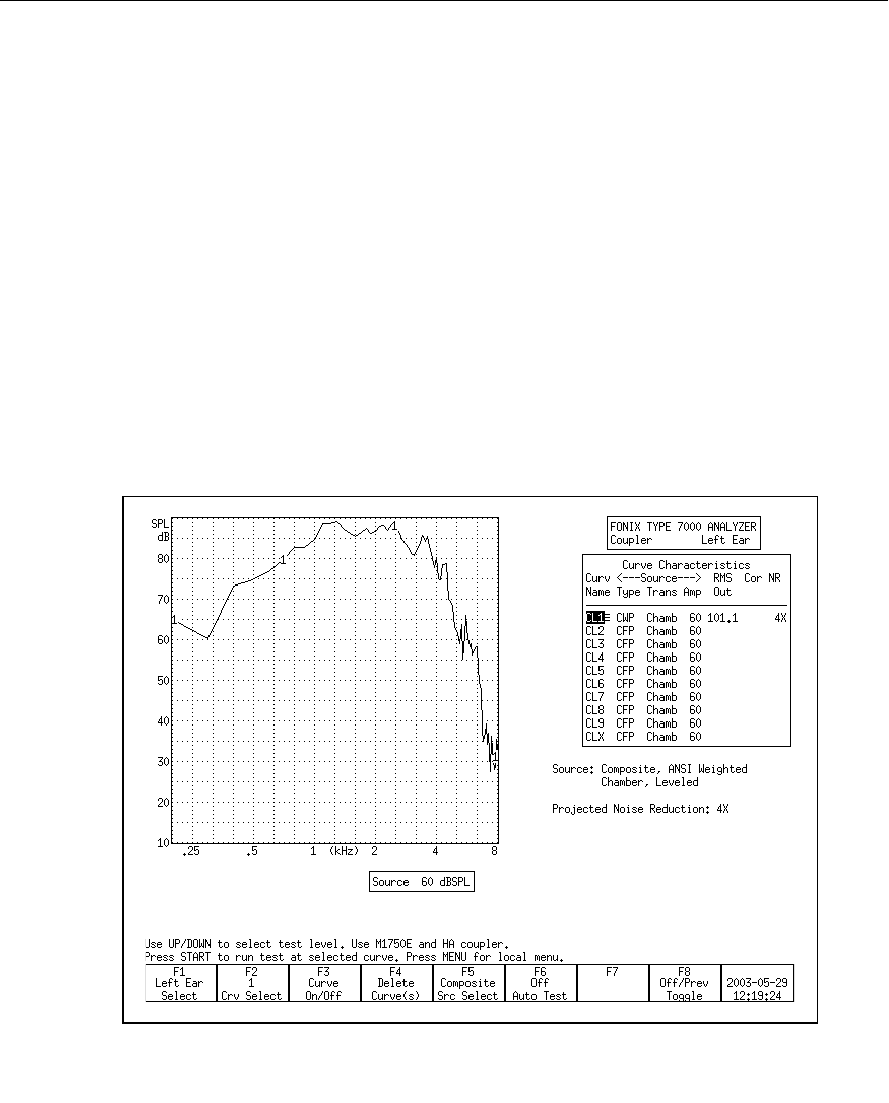
76 FONIX 7000 Hearing Aid Analyzer
3.4.8 Intermodulation Distortion
The composite signal is helpful for identifying intermodulation distortion (IM),
a type of distortion that sometimes occurs in a hearing aid response.
IM distortion occurs when more than one frequency is present in the source
signal and those frequencies combine to create new frequencies not actually
present in the source. IM distortion is disturbing to the client, often more so
than harmonic distortion. When viewing a graph run with the composite signal,
look for points along the graph where the line “breaks up.” Such an appearance
indicates the presence of intermodulation distortion. As IM distortion increases,
the curve becomes more disconnected. See Figure 3.4.8 for an example of IM
distortion.
This type of distortion is only apparent when the composite signal source is
used because pure-tone source types do not contain more than one frequency at
the same time.
Figure 3.4.8—Measuring intermodulation distortion
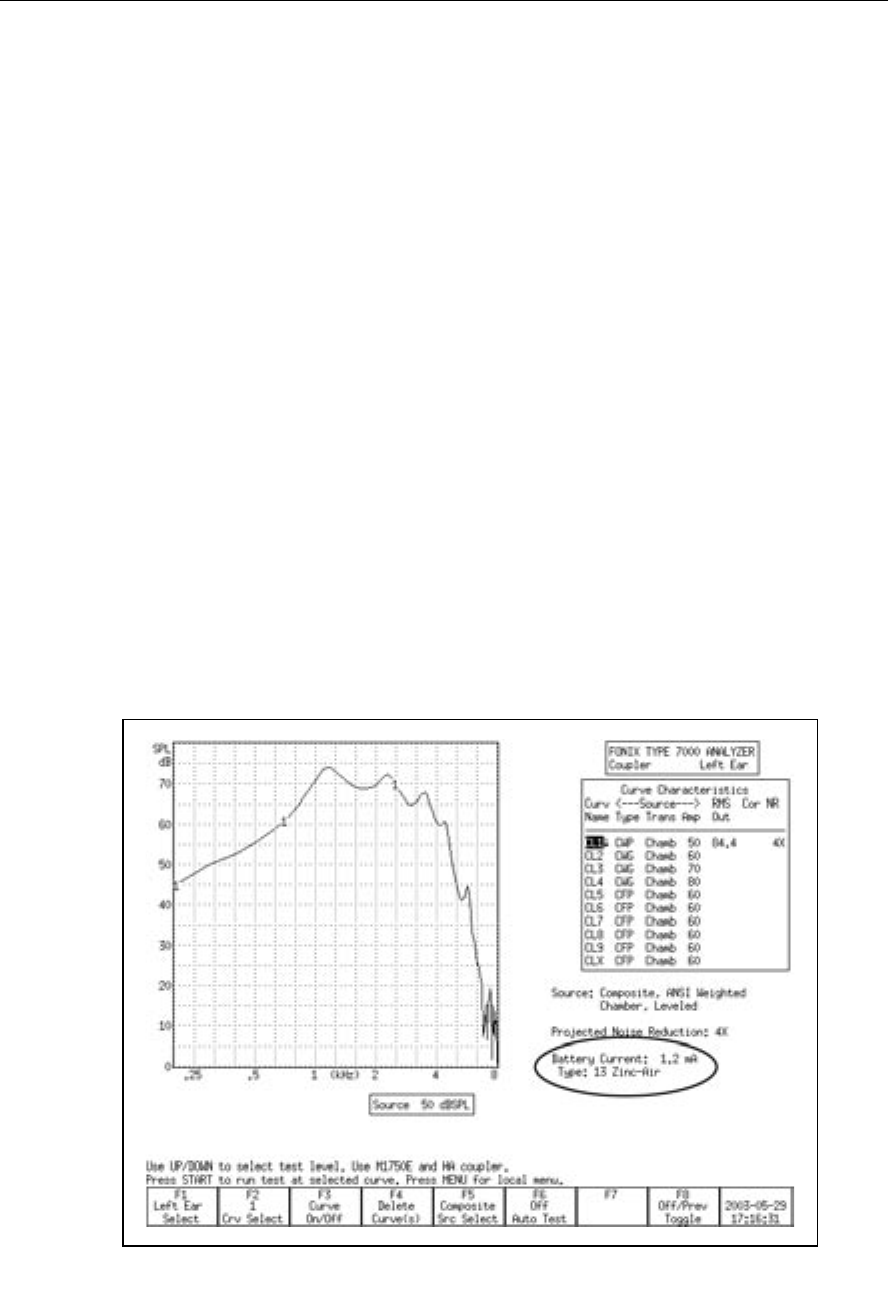
Basic Sound Chamber Tests 77
3.4.9 Battery Current Drain
You can measure the battery current drain in the Coupler screen if you use
battery pills (instead of regular batteries) in the hearing aid while performing
your measurements. To turn on the battery current drain measurement in the
Coupler screen:
1. Set up the hearing aid in the sound chamber for testing. You must use a
FONIX battery pill to test for current drain.
2. Press the appropriate battery button inside the sound chamber.
3. Close the lid of the sound chamber and latch it.
4. Press [MENU] in the Coupler screen.
5. Use [∨, ∧] to select Battery Meas under Misc Settings. (You can use [START]
to skip between groups of selections.)
6. Use [>] to turn ON the Battery Meas.
7. Use [∨] to select Battery Size and use [<, >] to select the hearing aid’s bat-
tery size.
8. Press [EXIT] to return to the Coupler screen. You should now see the bat-
tery current drain measurement below the Curve Characteristics box. See
Figure 3.4.9.
9. Start a frequency response measurement to display the battery current
drain.
Figure 3.4.9—Battery Current Drain

78 FONIX 7000 Hearing Aid Analyzer
3.4.10 Telecoil
Telecoil measurements can be performed in the Coupler screen using any of the
source signals available on the 7000 Hearing Aid Test System. During a telecoil
measurement, a magnetic field is used that is supposed to simulate the field of
a telephone receiver. A telecoil board capable of producing this field is built
into every 7000 sound chamber. When the analyzer has the ANSI option, the
external Telewand can also be used for the measurement.
Analyzer Setup
It is very important to pick a testing location that is free of magnetic disturbanc-
es, especially those caused by fluorescent lights and power lines. To do this:
1. Locate a wide range linear hearing aid with good low frequency response
and a telecoil switch.
2. Set the hearing aid to operate in the telecoil position and turn the gain con-
trol up to its full-on position.
3. Connect the hearing aid to a coupler. Don’t insert the measurement micro-
phone.
4. Walk around your possible testing location and listen for raspy humming
sounds from the hearing aid. This will be the aid responding to magnetic
fields in the room.
5. Pick a location that is as free of such sounds as possible. Rotate the aid in
all directions when looking for a good site.
Testing with the Sound Chamber Telecoil board
Every 7000 sound chamber has a built-in telecoil board that can be used for
telecoil testing.
1. Set up the hearing aid for testing in the usual way by connecting it to the
appropriate coupler and inserting the measurement microphone.
2. Enter the Coupler screen by pressing [F1] in the Opening screen.
3. Press [MENU] in the Coupler screen to open the local menu. Set the
TRANSDUCER to TELECOIL under Source Settings and press [EXIT] to
close the local menu.
4. Use [F5] to set the Source Type to Composite.
5. Press [START] to start a composite measurement.
6. Look at the RMS OUT in the Curve Characteristics box. This shows the cur-
rent output of the hearing aid to the magnetic field input.
7. Position the hearing aid for maximum output. For BTE hearing aids, this
usually occurs when the body of the aid is in a vertical position. If neces-
sary, use Fun Tak to help hold the aid in that position. See Figure 3.4.10A.
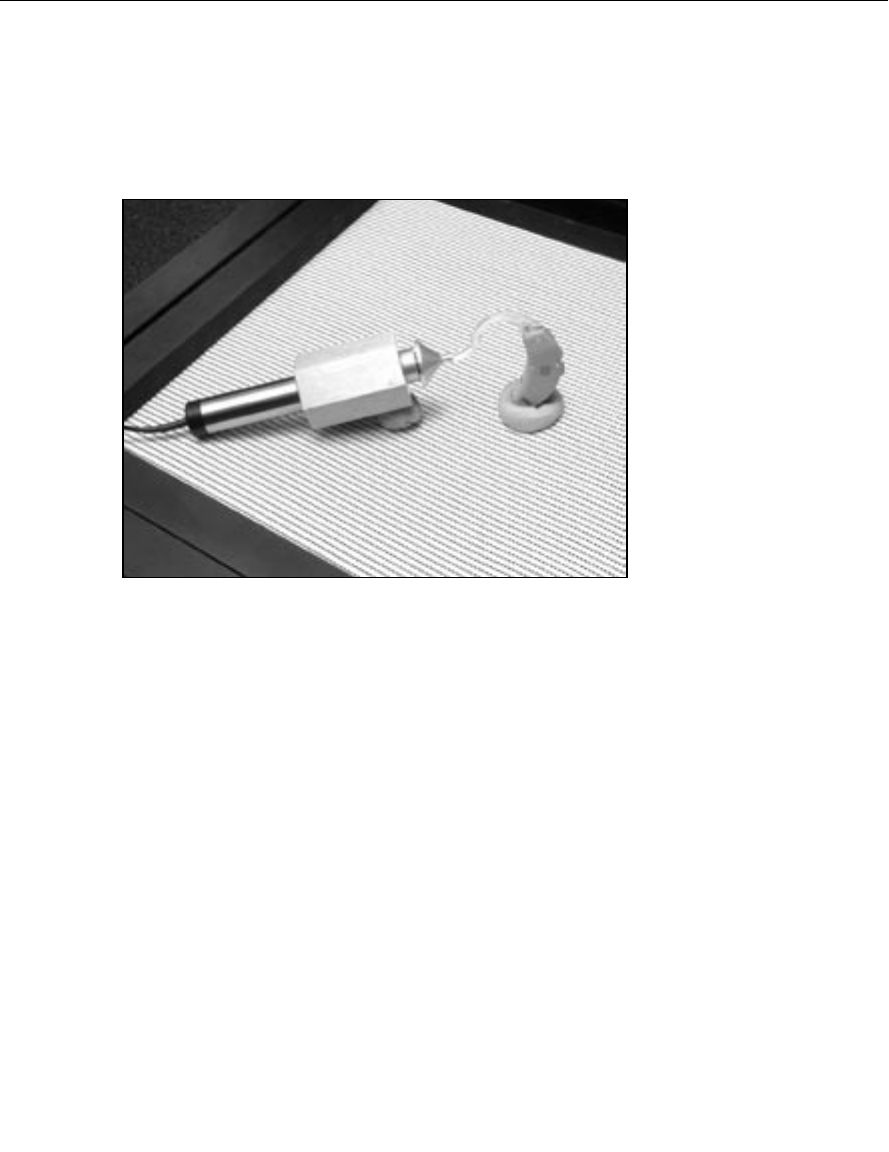
Basic Sound Chamber Tests 79
8. Use [∧, ∨] to change the intensity of the magnetic field. The choices are:
OFF, 1.00, 1.78, 3.16, 5.62, 10.0, 17.8, 31.6, 56.2, and 100 mA/m. 31.6 is the
default source intensity.
9. Press [STOP] to stop the measurement or continue to test, as desired.
Figure 3.4.10A—Testing with the Sound Chamber Telecoil Board
Testing with the Telewand
When the ANSI Option is ordered with the 7000 Hearing Aid Test System, the
Telewand device is also included. Otherwise, you can order it from the factory
as an optional accessory. The Telewand is supposed to provide a more realistic
test of the telecoil features of a hearing aid than the built-in telecoil board in
the sound chamber because it more closely simulates the magnetic field pro-
duced by a telephone receiver.
1. Follow steps 1-5 in the section above.
2. Hold the hearing aid in one hand and the Telewand in the other hand.
Position the Telewand as you would position the receiver of a hearing aid.
That is, hold the Telewand a few millimeters next to the hearing aid, posi-
tioned parallel to the body of a BTE aid or against the faceplate of an ITE
aid.
3. Look at the RMS OUT in the Curve Characteristics box. This shows the cur-
rent output of the hearing aid to the magnetic field input.
4. Position the hearing aid (with the Telewand held against it) for maximum
output. For BTE hearing aids, this usually occurs when the body of the aid
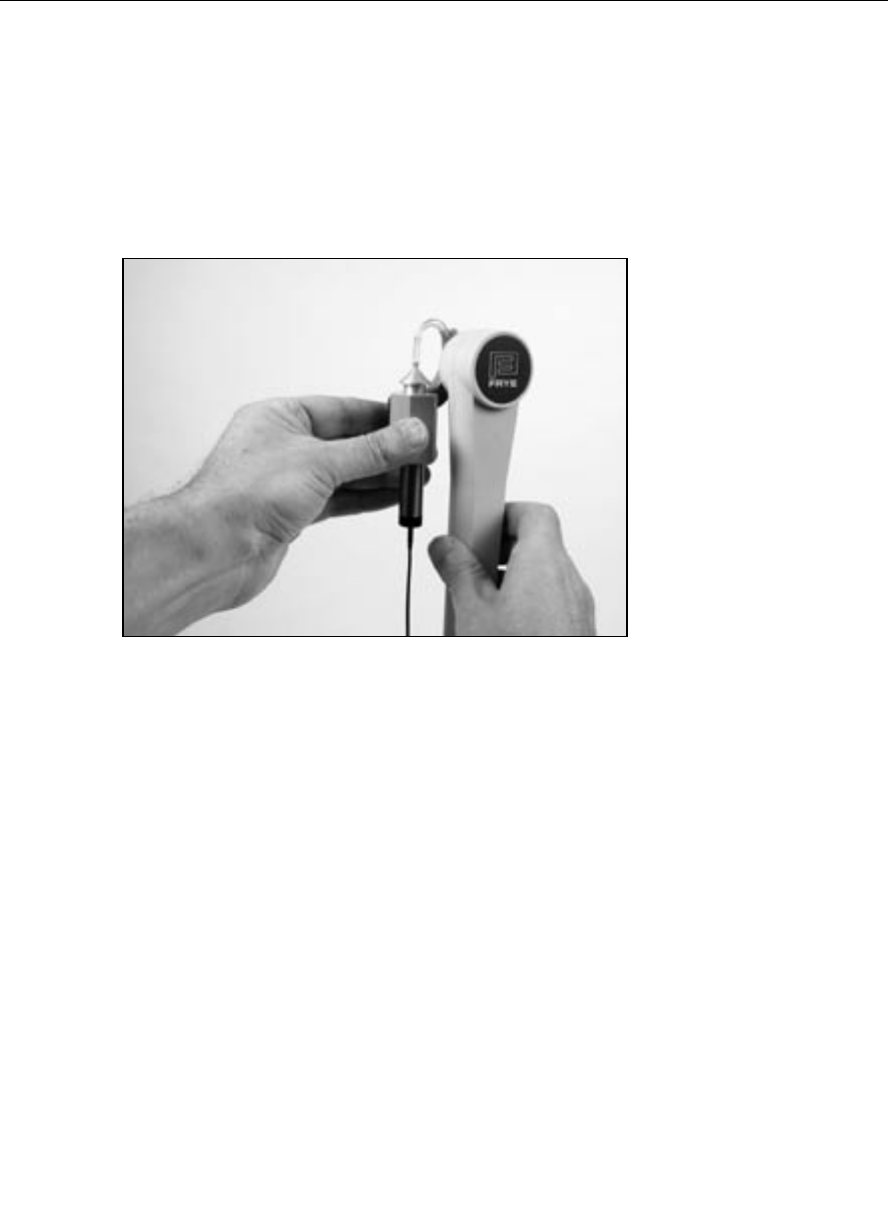
80 FONIX 7000 Hearing Aid Analyzer
is in a vertical position. If necessary, use Fun Tak to help hold the aid in
that position. See Figure 3.4.10B.
5. Use [∧, ∨] to change the intensity of the magnetic field. The choices are:
OFF, 1.00, 1.78, 3.16, 5.62, 10.0, 17.8, 31.6, 56.2, and 100 mA/m. 31.6 is the
default source intensity.
6. Press [STOP] to stop the measurement or continue to test, as desired.
Figure 3.4.10B—Testing with the Telewand
3.4.11 Measuring directionality
Although directional hearing aids can have different types of polar maps and
two or even three microphones, the basic concept is fairly simple: speech sound
from in front of the hearing aid wearer is louder than noise from behind him.
The FONIX 7000 hearing aid test system cannot give you a polar plot of the
directional hearing aid response, but it can provide you with the basic informa-
tion of how much directional benefit the hearing aid wearer is receiving and at
which frequencies.
The directional test takes advantage of the speaker placement in the large sound
chamber and the flat testing surface that makes it easy to position the hearing
aid for testing. There are two measurements: one where the hearing aid is posi-
tioned so that it is facing towards the sound chamber speaker, and one where
the hearing aid is positioned so that it is facing away from the sound chamber
speaker. You should use the same input signal for both measurements. The
source amplitude used for this measurement should be greater than the noise
floor of the testing environment but less than the compression knee point of the
hearing aid, if possible. 50 dB SPL is usually a good choice.
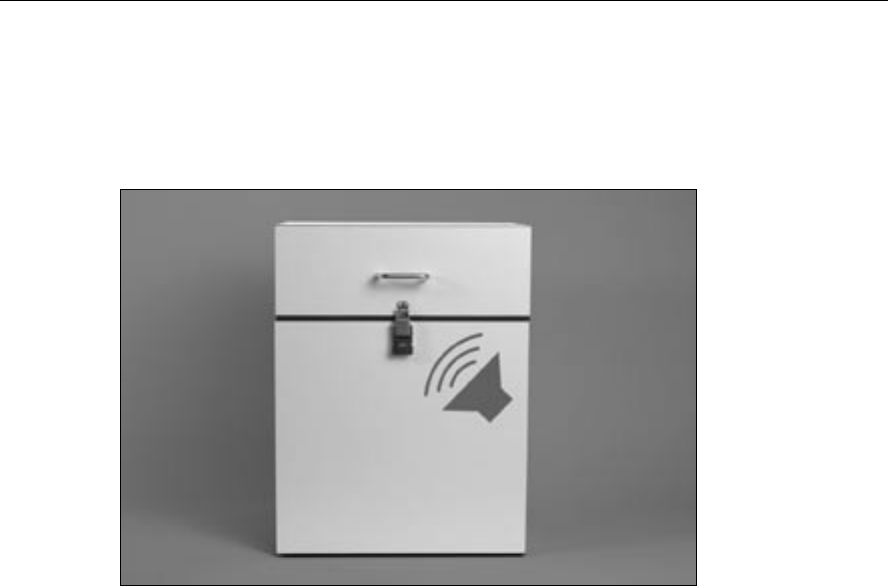
Basic Sound Chamber Tests 81
Speaker Placement
The speaker in the 7000 sound chamber is positioned on the right side of the
chamber at a 45º angle, as illustrated in Figure 3.4.11A. It is important to keep
this in mind when positioning the directional hearing aid for measurements.
Figure 3.4.11A—7000 sound chamber speaker placement
Forward measurement
The first step in doing a directional test is to position the hearing aid in the
sound chamber so that the front of the hearing aid is pointing towards the right
side of the chamber. See Figure 3.4.11B. Close the sound chamber lid and per-
form the following steps:
1. Enter the Coupler Multicurve screen by pressing [F1] from the Opening
screen.
2. Use [F5] to set the source type to Digital Speech.
3. Use [∨, ∧] to set the source amplitude to 50 dB SPL.
4. Press [START]. After the measurement has stabilized, press [STOP]. The
measured curve is the “forward” measurement of the directional test.
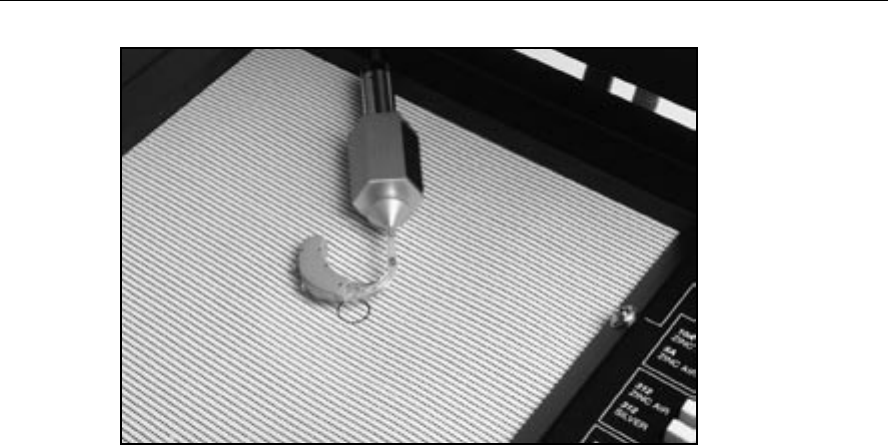
82 FONIX 7000 Hearing Aid Analyzer
Figure 3.4.11B—Forward directional measurement.
Reverse measurement
Next, open the sound chamber and position the hearing aid so that the front
of the hearing aid is pointing towards the left side of the chamber. See Figure
3.4.11C. Different hearing aids have different null points so you will want to
adjust the positioning so that the sound chamber speaker is pointing towards
what should be the null point of the directional aid. Close the sound chamber
lid when finished and perform the following steps:
1. Use [F2] to select the next curve.
2. Use [F5] to set the source type to Digital Speech.
3. Use [∨, ∧] to set the source amplitude to 50 dB SPL.
4. Press [START]. When the measurement has stabilized, press [STOP]. The
measured curve is the “reverse” measurement of the directional test. If the
directional microphones of the hearing aid are working properly, this curve
should have less output or gain than the forward measurement.
The difference in the RMS Out of the two curves will give you the average over-
all advantage provided by the directional microphones. See Figure 3.4.11D. In
this example, the hearing aid has an 8 dB average directional advantage.
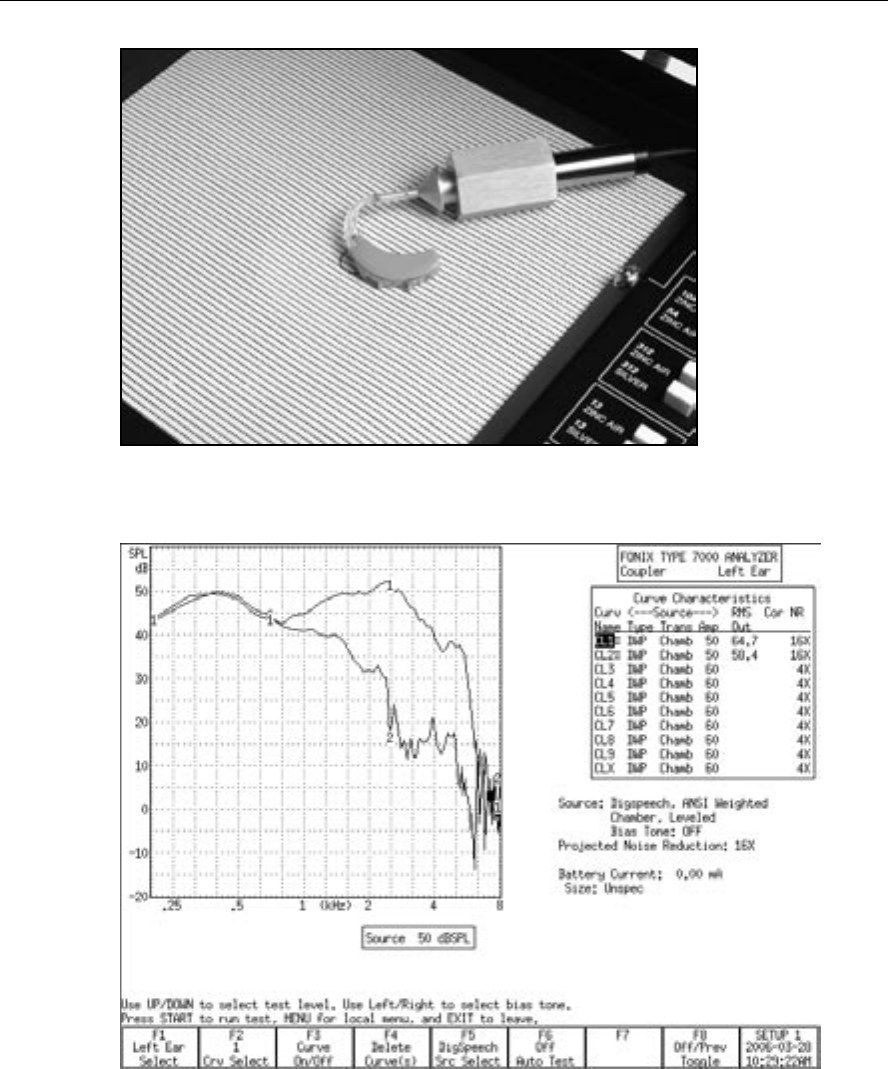
Basic Sound Chamber Tests 83
Figure 3.4.11C—Reverse directional measurement
Figure 3.4.11D—Directional measurement screenshot

84 FONIX 7000 Hearing Aid Analyzer
3.5 Digital hearing aids
All digital aids can be tested, but some of the high-end models require a little
more thought and care; these aids have a “noise suppression” feature (also
known as “speech enhancement”). This noise suppression, not to be confused
with the automatic compression of AGC hearing aids, checks if the sound going
into the hearing aid is a continuous signal that could be regarded as noise. If
the aid decides that the sound is noise, it lowers the gain at the corresponding
frequencies. Conventional testing techniques, such as a pure-tone sweep or the
Composite signal, can cause the high-end digital aid to go into this noise reduc-
tion mode. This means that the gain or output you see on the analyzer’s display
will not necessarily reflect the normal response of the aid in speech.
The Digital Speech signal was developed in order to test noise-reducing digital
hearing aids without fear of them going into noise suppression mode. It does
this by taking the standard Composite signal and interrupting it randomly. The
digital hearing aid responds to this modulated signal as it would respond to nor-
mal speech.
3.5.1 Using Digital Speech
The 7000 analyzer seamlessly incorporates the testing of digital hearing aids
into its normal testing procedures.
To test a digital hearing aid, follow the steps outlined in Section 3.4.2, choos-
ing DIG SPEECH in Step 3. Digital Speech can be used to accurately test any
hearing aid, so if you aren’t sure if the hearing aid is digital, you can always use
Digital Speech and be assured that the frequency response is correct.
3.5.2 Changing the Speech Shape
By default, the Digital Speech (and Composite) signal use the ANSI S3.42
speech weighting. This speech weighting rolls off the high frequencies at a rate
of 6 dB per octave, starting with 3 dB down at 900 Hz. Some clinicians, how-
ever, may prefer to use the ICRA speech weighting.
The ICRA speech weighting was taken from a CD of sounds developed by the
International Collegium of Rehabilitative Audiologists (ICRA) and based on the
long term average speech spectrum. The ICRA rolls off the high frequencies
much more quickly than the ANSI spectrum. To switch to using ICRA:
1. Press [MENU] in the Coupler screen.
2. Use [∨, ∧] to select Composite Filter under Measurement Settings. Use the
[START] key to skip ahead sections, if necessary.
3. Use [<, >] to select ICRA.
4. Press [EXIT] to return to the Coupler screen.
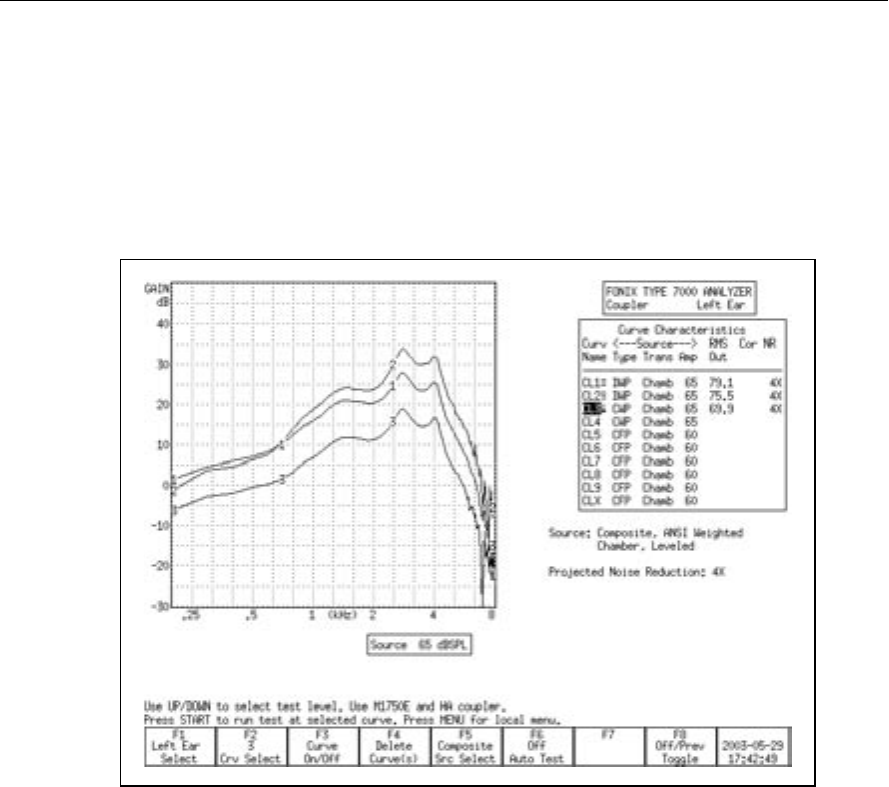
Basic Sound Chamber Tests 85
5. Use [F5] to choose the DIG SPEECH signal source. It will now have the
ICRA speech weighting. See Figure 3.5.2 for a comparison of an aid tested
with the ANSI and ICRA speech weightings.
5. Use [F5] to choose the DIG SPEECH signal source. It will now have the
ICRA speech weighting. See Figure 3.5.2 for a comparison of an aid tested
with the ANSI and ICRA speech weightings.
Figure 3.5.2—Comparison of a digital aid tested with Digital Speech ICRA (CRV1), Digital
Speech ANSI (CRV2), and the Composite signal (CRV3).
3.5.3 Testing with Bias Signals
You can add a pure-tone bias signal to the Digital Speech signal, creating a con-
tinuous signal at the frequency of your choice. This will allow you to see how
the aid reacts to the presence of noise at different frequencies. To add a bias sig-
nal:
1. Select the DIG SPEECH signal with [F5] in the Coupler screen.
2. Press [MENU] to enter the local menu.
3. Use [∨, ∧] to select Bias Tone under Source Settings. Use the [START] key to
skip ahead sections, if necessary.
4. Use [<, >] to select the bias amplitude.
5. Press [EXIT] to return to the Coupler screen.
6. Press [START] to start the frequency response measurement. The Digital
Speech signal will include a bias signal at the amplitude you specified in
Step 4.
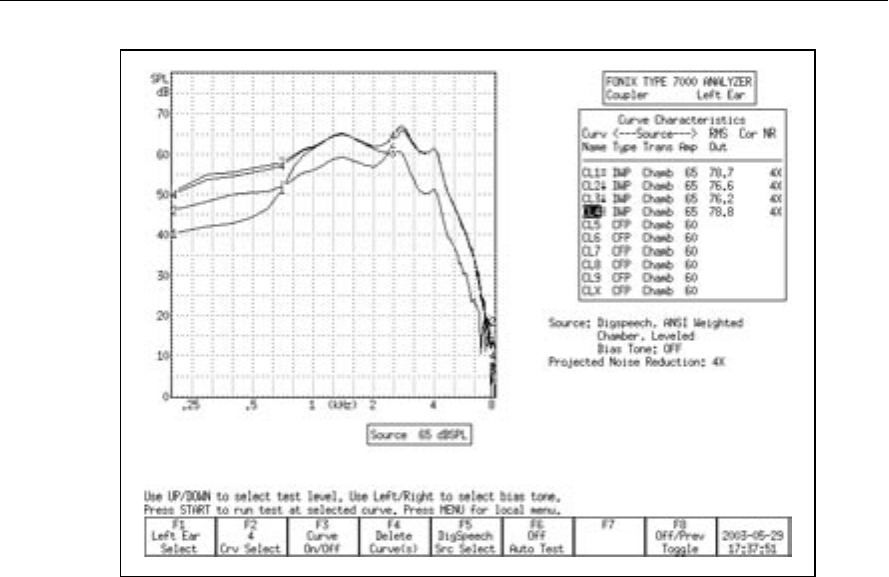
86 FONIX 7000 Hearing Aid Analyzer
Figure 3.5.3—Using the bias signal with Digital Speech. CRV 1-3 have bias signals at 500 Hz,
1000 Hz, and 4000 Hz respectively. CRV 4 was performed with Digital Speech and no bias signal.
7. Use [<, >] to change the frequency of the bias signal. The current selected
frequency will be displayed on the screen below the Curve Characteristics
Box.
8. Press [STOP] when done with the measurement. See Figure 3.5.3 for an
example of using the bias signal at several different frequencies.
3.5.4 Checking Noise Suppression
When testing a digital hearing aid that is supposed to be programmed with a
noise suppression or speech enhancement feature, it is useful to make sure the
feature is working correctly. You can use a combination of Digital Speech and
the Composite signal to test noise suppression.
1. Look at the top left corner of the graph on the Coupler screen. It should
read “dB GAIN.” If it reads “dB SPL,” you will need to change the display to
GAIN. To do this:
a. Press [MENU] from the Coupler screen to open the local menu.
b. Use [∨, ∧] to select Display under Display Settings.
c. Use [<, >] to choose GAIN.
d. Press [EXIT] to return to the Coupler screen.
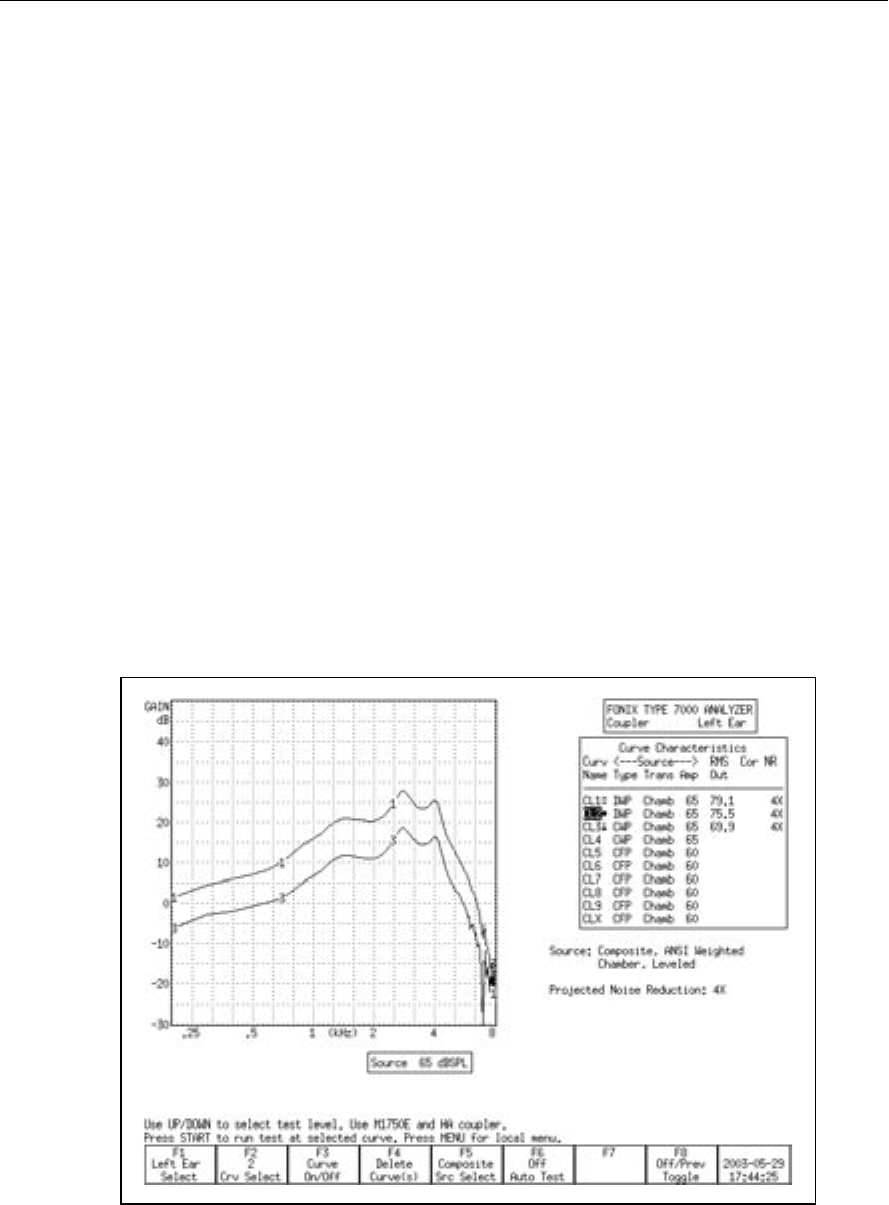
Basic Sound Chamber Tests 87
2. Use [F2] to select CRV 1. (Press [F2]. Use [∨, ∧] to select CRV 1. Use [>] to
complete the selection and close the pop-up menu.)
3. Use [F5] to select DIG SPEECH in the same manner as described above.
4. Use [∨, ∧] to select a normal speech amplitude, such as 65 dB SPL.
5. Make sure the digital noise suppression feature is enabled on the hearing
aid, and set it up for testing in the sound chamber.
6. Press [START] to begin the measurement. When the response curve has sta-
bilized, press [STOP] to stop the measurement.
7. Use [F2] to select CRV 2.
8. Use [F5] to select COMPOSITE.
9. Make sure the signal amplitude is the same as selected in Step 4.
10. Press [START] to begin the measurement. Leave the signal on for at least 15
seconds. This should allow the noise suppression feature time to activate.
When the measurement has stabilized, press [STOP].
11. Compare CRV 1 and CRV 2. If the curves are right on top of each other, the
aid is responding to the Digital Speech signal just as it would respond to the
Composite signal. This could be an indication that the digital suppression
feature is either not enabled or not present on the hearing aid. Figure 3.5.4
gives an example of a hearing aid that is amplifying the Digital Speech sig-
nal and suppressing the Composite signal.
Figure 3.5.4—Digital Noise Suppression test. CRV 1 was measured with Digital Speech. CRV 2
was measured with the Composite signal.

88 FONIX 7000 Hearing Aid Analyzer
3.5.5 Understanding Terminology
With the new testing terminology of hearing aid analyzers combined with the
new technology of hearing aids, it’s easy to get terminology confused. “Noise
Reduction” is a term that Frye Electronics has always used to denote the aver-
aging that the analyzer makes when analyzing data to achieve a smooth curve.
This process is described in Section 2.3.1.2 and Section 2.3.2.1.
Some high-end digital hearings have digital signal processing features that try to
detect noise in the environment and lower the gain at the frequencies in which
it detects the noise. Different manufacturers have different terminology for these
features, but they are most commonly called “Speech Enhancement,” “Noise
Suppression,” or “Noise Reduction.”
Just keep in mind that these are two separate applications of the phrase “Noise
Reduction” that mean two completely different things. When you set the Noise
Reduction on your FONIX 7000 test system, you are setting the amount of aver-
aging the analyzer does. When you set Noise Reduction on your hearing aid,
you are usually setting the amount of noise reduction that the hearing aid does.
3.6 CIC Feature
The CIC Feature is a way of performing a coupler test of a CIC hearing aid that
more accurately reflects the real-ear performance of that aid than a regular 2-cc
coupler measurement. It is not a way to check the manufacturing specifications
of CIC hearing aids because those specifications are based upon 2-cc coupler
measurements.
The CIC Feature consists of a CIC coupler (0.4 cc) and software correction fac-
tors. Both need to be used in order to correctly perform the measurement.
To measure a CIC hearing aid:
1. Attach the CIC coupler to the CIC aid just as you would attach an HA–1
coupler to the aid, and set the hearing aid up for testing as shown in Section
3.3.2.
2. Press [MENU] in the Coupler screen.
3. Highlight Coupler Type under Measurement Settings with [∨, ∧].
4. Select CIC with [<, >].
5. Press [EXIT].
6. Select the desired source type with [F5]. (Press [F5]. Use [∨, ∧] to select the
desired source type. Press [>] to complete the selection and close the pop-
up menu.)
7. Select the desired source amplitude with [∨, ∧].
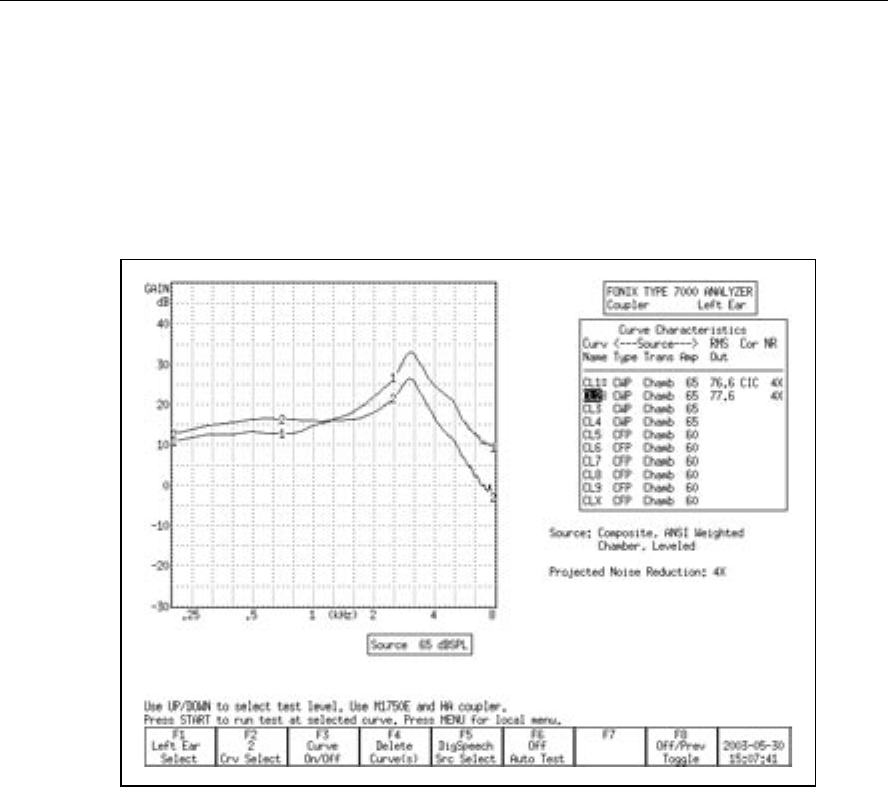
Basic Sound Chamber Tests 89
8. Press [START] to perform the measurement. You should see CIC appear in
the Curve Characteristics box in the “Cor” column of the selected curve. If
you are using the FAST, COMPOSITE, or DIG SPEECH signal, press [STOP]
to end the measurement once it has stabilized.
Figure 3.6 shows the difference between a CIC hearing aid tested with an HA-1
coupler, and the same aid tested with a CIC coupler and correction factors.
Figure 3.6— CURVE 2 uses CIC coupler + correction factors
CURVE 1 uses 2-cc HA-1 coupler
3.7 Occluded Ear Simulator Option
The Occluded Ear Simulator (OES) Option consists of software correction fac-
tors and three special (MZ) couplers. Together, they allow you to simulate
the data you would get with a standard ear simulator (IEC 711 or Zwislocki
coupler), providing the hearing aid or mold being tested is not vented. This
should give you a coupler measurement that more accurately reflects a real-ear
response of an occluded ear than a 2-cc coupler.
Note: The data results from the OES coupler will not be an exact duplicate for
results performed with a Zwislocki coupler.
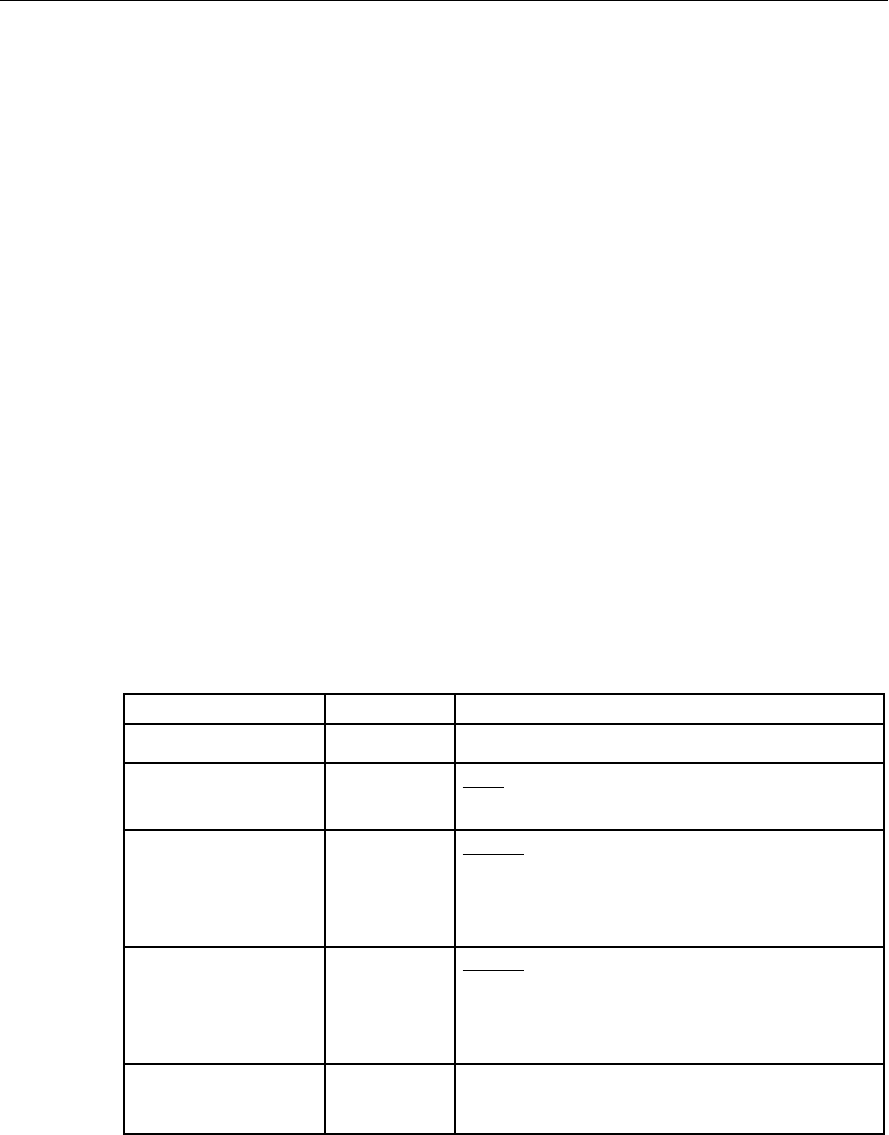
90 FONIX 7000 Hearing Aid Analyzer
To use the OES Option:
1. Attach the MZ coupler to the aid. See Table 3.7 for details on choosing the
correct MZ coupler.
2. Set up the hearing aid for testing as described in Section 3.3.
3. Press [MENU] in the Coupler screen.
4. Highlight Coupler Type under Measurement Settings with [∨, ∧].
5. Select MZ with [<, >].
6. Press [EXIT].
7. Select the desired source type with [F5]. (Press [F5]. Use [∨, ∧] to select the
desired source type. Press [>] to complete the selection and close the pop-
up menu.)
8. Select the desired source amplitude with [∨, ∧].
9. Press [START] to perform the measurement. You should see OES appear in
the Curve Characteristics box in the “Cor” column of the selected curve. If
you are using the FAST, COMPOSITE, or DIG SPEECH signal, press [STOP]
to end the measurement once it has stabilized.
See Figure 3.7 for a comparison of a BTE tested with an MZ coupler as opposed
to a 2-cc coupler.
Table 3.7—Which is the Correct MZ Coupler to use?
TYPE OF AID COUPLER COMMENT
ITE, ITC MZ-1
BTE, or EYEGLASS MZ-1 With custom earmold attached.
(NOTE: Vents must be plugged.)
MZ-2 Without custom earmold attached, when a 3 mm
horn earmold is planned, use with the Ear-Level
Hearing Aid Adaptor that normally snaps onto the
HA-2, 2-cc coupler.
MZ-3 Without custom earmold attached, when a con-
ventional (#13 tubing) earmold is planned, attach a
length of #13 tubing that corresponds to the length
of the sound channel of the wearer’s earmold.
BODY MZ-2 With snap-on receivers, use the MZ-2 without the
Ear-Level Hearing Aid Adapter attached.
Basic Sound Chamber Tests 91
Figure 3.7—Comparison of the responses with the MZ and HA-2 couplers. Curve 2 was
measured with an MZ coupler and OES correction factors. Curve 1 was measured using
a standard 2-cc coupler.
3.8 Automatic Testing—Loading & Saving Groups
You can use the 7000 Test System to program simple automated or semi-auto-
mated test sequences that will help you test hearing aids more efficiently. Each
test sequence can contain up to 10 different response curves with your choice of
source types, source levels, noise reduction, and other adjustments.
In automatic mode, the analyzer will quickly run through all designated tests
without pausing. In semi-automatic mode, the analyzer will automatically
advance to the next curve and stop. This curve will not be measured until you
start the test, but you are saved the step of using F2 to select the next curve
number.
Tests are programmed into the analyzer using the PROGRAM function that is
used to put the analyzer in Program mode. In this mode, you set up the source
type, source level, noise reduction, and any other adjustments you would like to
make for each curve. You can program any of the available 10 curve slots in the
Coupler screen. See Section 3.8.1 for more details.

92 FONIX 7000 Hearing Aid Analyzer
If there is a sequence of tests that you would like to perform frequently, you can
save it into the 7000 Test System’s permanent memory using the SAVE GROUP
function. Three groups of up to 10 curves can be saved into SAVE GROUP 1,
2, and 3, respectively. When you want to load a group that has previously been
saved, you use the LOAD GROUP function. See Section 3.8.2.
3.8.1 Setting up a test sequence
The first step in running your custom automated test sequence is deciding on
the source types and levels of the frequency response curves. When finished,
these selections can be stored into the analyzer’s permanent memory.
1. Use [F4] to delete ALL CURVES & SETTINGS in the Coupler screen. (Press
[F4]. Use [∨, ∧] to select ALL CURVES & SETTINGS. Use [>] to complete the
selection and close the pop-up menu.)
2. Use [F6] to select PROGRAM. This will open a pop-up window with helpful
programming instructions.
3. Use [F1] to select the ear.
4. Use [F2] to select the curve number.
5. Use [F5] to select the desired source type.
6. Use [∨, ∧] to select the desired source level.
7. Press [MENU] and use the arrow keys to select the desired noise reduction,
output transducer, and composite type, if desired. Press [EXIT] to return to
the coupler screen.
8. Save and advance to the next curve. This can be done two ways:
• Press [START] if you want the analyzer to be programmed to automati-
cally advance to the next curve and start measuring it.
• Press [STOP] if you want the analyzer to be programmed to advance to
the next curve, but then pause and wait for user intervention before tak-
ing the next measurement. Use this if you want to make an adjustment
to the aid before taking the next measurement. A horizontal line will be
drawn across the Curve Characteristics box when a pause is inserted in
this fashion.
9. Repeat steps 5-8 to select the desired source type and level for all the curves
that you want to measure in the automated test sequence.
10. Press [STOP] after you have set up the last curve that you want to run in the
test sequence. For instance, if you want to run only 4 curves, press [STOP]
after setting up CRV 4. This will make the analyzer pause after the four mea-
surements – the remaining 6 available curves will not be run.
11. Use [F6] to SAVE GROUP 1, 2, or 3, if desired. This will permanently save
the automated sequence.

Basic Sound Chamber Tests 93
3.8.2 Loading a Saved Test Sequence
It is not necessary to permanently save a custom test sequence, but doing so
allows you to bring it up in the Coupler screen at any time, even if you’ve
turned off and on the analyzer. Follow the directions in Section 3.8.1 to program
and save your custom test sequence. Then, use [F6] to LOAD GROUP 1, 2, or 3.
Choose the group you saved in Step 11 of Section 3.8.1. (Press [F6]. Use [∨, ∧] to
select the correct LOAD GROUP number. Use [>] to complete the selection and
close the pop-up menu.)
The saved test sequence will now be loaded. See Sections 3.8.3 and 3.8.4 for
instructions on running the sequence fully-automatically and semi-automati-
cally. Each user can save and load three custom test sequences. There are three
possible user profiles that can be saved. See Section 2.2.1.
3.8.3 Testing in Fully-Automatic Mode
The fully-automatic mode will automatically run through a programmed test
sequence without the need of user intervention. The analyzer will pause only
when it reaches a programmed pause, which allows the user to make adjust-
ments to the hearing aid before proceeding with the rest of the test sequence.
A programmed pause will be indicated by a horizontal line across the Curve
Characteristics box.
1. Load a test sequence. You can do this by following the directions in Section
3.8.1 to create a new sequence, or by loading a previously saved sequence
by following the directions in Section 3.8.2.
2. Use [F6] to select FULLY AUTOMATIC. (Press [F6]. Use [∨, ∧] to select
FULLY AUTOMATIC. Use [>] to complete the selection and close the pop-
up menu.)
3. Use [F2] to select the curve number to start the sequence.
4. Use [START] to begin the test sequence. The test sequence will continue
until the analyzer reaches a programmed pause.
5. Adjust the hearing aid, if desired, and press [START] to continue the test
sequence if there are more curves to measure after the programmed pause.
Use [F6] to turn the AUTO TEST OFF when you want to return to normal test-
ing mode.
3.8.4 Testing in Semi-Automatic Mode
In semi-automatic mode, once you have finished a measurement by pressing
the [STOP] button or allowing a pure-tone sweep to complete, the analyzer will
automatically advance to the next curve. However, the next measurement will
not be taken until you explicitly press the [START] button.

94 FONIX 7000 Hearing Aid Analyzer
1. If desired, follow the instructions in Section 3.8.2 to load a test sequence.
You can do this by following the directions in Section 3.8.1 to create a new
sequence, or by loading a previously saved sequence by following the direc-
tions in Section 3.8.2.
2. Use [F6] to select SEMI-AUTOMATIC. (Press [F6]. Use [∨, ∧] to select SEMI-
AUTOMATIC. Press [>] to complete the selection and close the pop-up
menu.)
3. Use [START] to start the automated test sequence. If you are using a source
of type COMPOSITE, DIG SPEECH, or FAST, press [STOP] to stop the mea-
surement when it has stabilized. The 7000 analyzer will automatically
advance the curve selection to the next curve.
4. Make any desired adjustments to the hearing aid and repeat Step 3 until you
have measured all your curves.
Use [F6] to turn the AUTO TEST OFF when you want to return to normal test-
ing mode.
3.9 Complete List of Menu Items
The function of all items in the local menu of the Coupler screen are described
in this section. Enter the local menu by pressing [MENU] in the Coupler screen.
Selections are made by using [∨, ∧] to choose an item and [<, >] to change the
setting.
There is a dotted or dashed line in between an item and its selection. If the line
is dotted, the selection will only effect the Coupler screen. If the line is dashed,
the selection is global and will have an effect on other measurement screens.
The local menu is divided into five main categories: Display, Measurement,
Source, Aid, and Misc Settings. To skip ahead to the next category, use the
[START] button.
Display Settings
• Data/Graph: The method of data display. Choose between DATA (numeri-
cal data) and GRAPH.
• Display: Type of display. Choose between SPL (output) and Gain (differ-
ence between input and output).
• Graph Scale: Scaling used when making measurements. NORMAL scales
to the upper-most curve. AUTO scales to the current selected curve.
• Curve Label: Label used for the two available “ears.” Choose between
LEFT/RIGHT, and A/B.

Basic Sound Chamber Tests 95
Measurement Settings
• Coupler Type: The type of coupler being used in making sound chamber
measurements. Selections of CIC and MZ turn on corresponding software
correction factors (see Sections 3.6 and 3.7). A selection of 2CC does not
apply correction factors to the curve but will note a 2-cc coupler was used
in the COR column of the Curve Characteristics Box. The NONE selection
will apply no corrections and leave the COR column blank.
• Distortion: Type of harmonic distortion used in a pure-tone measurement.
Choose between 2nd, 3rd, and TOTAL. See Section 2.3.1.4.
• Noise Red (Tone): Amount of pure-tone noise reduction used. See Section
2.3.1.2.
• Noise Red (Comp): Amount of composite noise reduction used. See
Section 2.3.2.1.
Source Settings
• Output Trans: Transducer used for the measurement. CHAMBER uses the
test box. TELECOIL uses the built-in telecoil or the ANSI 96 telewand.
• Static Tone: Status of individual measurement. Choose SINGLE to emit
a static tone in between composite measurements or pure-tone sweeps.
Choose AVG to emit a three frequency average between other measure-
ments.
• Bias Tone: Amplitude of the bias tone used with Digital Speech. OFF
turns off the bias tone entirely.
• Composite Type: Type of composite signal used. Choose between
STANDARD and CHIRP. See Section 2.3.2.4.
• Composite Filter: Filter used in Composite and Digital Speech measure-
ments. Choose between ANSI, ICRA and FLAT.
Aid Settings
• Aid Type: Type of hearing aid being measured. Choose between
STANDARD (linear), AGC, and ADAPTIVE AGC.
• Avg Freqs: Selection of three frequencies used in a three frequency aver-
age. See Section 2.3.1.1.
• Sweep Start Delay: The amount of time the 7000 test system presents the
first tone in a pure-tone sweep. See Section 2.3.1.3.
• Sweep Meas Delay: The amount of time each subsequent tone is pre-
sented before the measurement is made in a pure-tone sweep. See Section
2.3.1.3.
• Misc Start Delay: The amount of time the 7000 test system presents the
first tone in one of the following measurements: reference test gain mea-
surements (in automated test sequences), averaging, harmonic distortion
measurements, and equivalent input noise measurements. See Section
2.3.1.3.

96 FONIX 7000 Hearing Aid Analyzer
• Misc Meas Delay: The amount of time each subsequent tone is presented
before the measurements is made in one of the measurements listed
above. See Section 2.3.1.3.
Misc Settings
• Battery Meas: Status of the battery current measurement. Choose ON or
OFF.
• Battery Size: Size of battery used with the hearing aid being tested.
• Print Label: Status of the printing label. Choose ON or OFF.
• Printer: Printer used for printouts. Choose INTERNAL or EXTERNAL. See
Section 2.4.

Chapter 4 97
Advanced Coupler Tests
4.1 Enhanced DSP
The Enhanced DSP measurement screen was designed to give you more infor-
mation about digital hearing aids. The new technology in digital hearing aids
has added a great deal of capability such as increased clarity and flexible pro-
gramming. However, the same technology can also have its pitfalls. This test
will tell you the digital processing delay (also known as group delay) and the
signal phase of the hearing aid.
The digital processing delay measurement will help you determine whether or
not a hearing aid is suitable for a monaural fitting. The phase measurement will
help you determine whether custom binaural hearing aids are working properly
together as a team.
4.1.1 Digital Processing Delay
One of the properties of digital technology not normally mentioned in the litera-
ture is that it always takes time to process digital data. Imagine the digital hear-
ing aid as a miniature computer: it takes an analog sound wave, turns it into
digital information, performs some kind of algorithm to amplify the signal, and
turns it back into an analog sound wave for the ear to hear. All of this calculat-
ing takes precious time; it’s never instantaneous. The processing delay for some
hearing aids is so slight that it is imperceptible to the human ear. The process-
ing delay for other aids can extend to several milliseconds.
Why is this a problem? Well, if you fit a client monaurally with an aid with a
significant digital processing delay, that person might experience some confu-
sion because his unaided ear will be hearing sounds slightly faster than his
aided ear. Problems can also be predicted for patients with open canal fittings.
However, if you fit the same patient with an occluded binaural set, then both
ears will be listening with the same delay, and the confusion will be alleviated.
What is a significant delay? At what magnitude does this delay start to affect
speech intelligibility? These are very good questions. Unfortunately, we don’t
have an answer at this time; the field of digital hearing aids is still too young,
and there has not yet been enough research done to establish necessary guide-
lines. A conservative approach would be to avoid monaural and open canal fit-
tings with digital aids that have delays of more than 1 to 2 milliseconds.
For now, this measurement will give you more information about what’s really
going on in that digital hearing aid circuit, and, hopefully, it will help you trou-
bleshoot why some aids work better than other aids with monaural or binaural
fittings.

98 FONIX 7000 Hearing Aid Analyzer
Technical details
The digital processing delay measurement is taken by sending a short impulse
from the sound chamber speaker to the hearing aid. The 7000 Test System
microphone collects information from the hearing aid for 20 milliseconds from
the time the impulse is delivered. This information is a series of numbers of
varying amplitudes.
The 7000 Test System finds the maximum peak amplitude of the resulting
information. Since the impulse response of a hearing aid is not always simple,
the analyzer also checks for any peaks occurring before this maximum peak. If
a smaller peak exists, and it has an amplitude of at least 50% of the maximum
peak, the time of the smaller peak will be considered the processing delay point.
Otherwise, the time of the maximum peak will be considered the processing
delay point. The 7000 Test System delay is subtracted from this delay point in
order to form the actual aid processing delay time. (The 7000 Test System delay
is determined during the sound chamber leveling process.)
The data collected in the digital processing delay measurement is displayed in
graphical format as amplitude vs. time. A dotted vertical line is placed at the
calculated delay point. The numerical value is also displayed. A second dotted
vertical line shows the 7000 system delay for reference.
4.1.2 Signal Phase
The signal phase measurement is a test of the “pushing” and “pulling” of the
amplified sound of the hearing aid. Vibrations in the air create sound—these
vibrations can be thought of as air pushing and pulling against the ear. If sound
goes through a hearing aid, the hearing aid might cause a phase shift, turning a
“push” of the sound wave into a “pull.” This isn’t necessarily a bad thing; there
may be good reasons for a phase shift of the sound wave.
The components of a custom hearing aid are usually wired by hand. The
receiver is typically wired into the amplifier in such a way that it may or may
not cause a phase shift of the signal. If care is not taken, it’s entirely possible to
wire one hearing aid of a custom binaural set one way, and wire the other aid in
the opposite way. This could cause one of the hearing aids to be “pulling” while
the other aid is “pushing,” resulting in strange sound quality for the hearing aid
wearer.
We propose that it could be very important to check the signal phase of the
hearing aids when fitting a client with a binaural set in order to ensure that the
aids are working together as a team.
Technical Details
The signal phase measurement works by generating a 1 kHz cosine wave, turn-
ing it into a test signal, and delivering it to the aid. The cosine wave signal is
offset at the time of generation so that it starts at the baseline (the zero point).
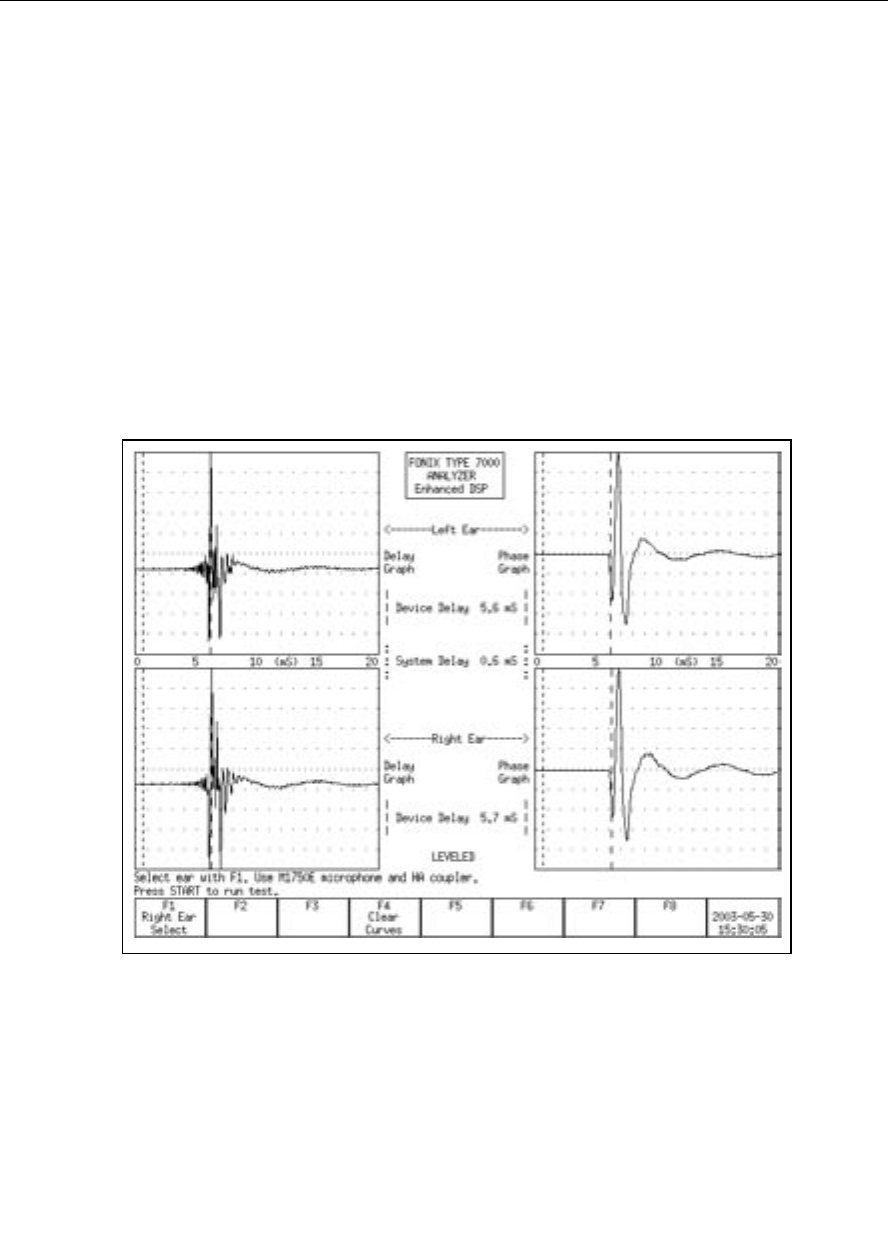
Automated Test Sequences 99
It then continues through a complete cycle and terminates when it reaches the
baseline again. This signal, although consisting of only a single pulse, contains
very few frequencies above 1 kHz and is one millisecond wide at its base.
The data collected from this measurement is displayed in a graphical format 20
milliseconds wide. The system delay and the digital processing delay are noted
for reference on the phase graph in the form of vertical lines.
4.1.3 Procedure
1. Press [F8] in the Opening screen to enter the Enhanced DSP screen.
2. Set up the hearing aid for testing in the sound chamber. See Section 3.3.
Make sure the sound chamber is leveled.
3. Use [F1] to select the desired ear.
Figure 4.1.3—Enhanced DSP measurement results
4. Press [START] to perform the delay and phase tests for that hearing aid. If
the left ear was designated in Step 4, the results will be shown in the upper
two graphs. Otherwise, they will be shown in the lower two graphs.
5. Set up a second hearing aid in the sound chamber, if desired, and use [F1]
to select the other ear. Press [START] to perform the measurements on this
second aid. This will allow you to compare the results of the two hearing
aids. See Figure 4.1.3.

100 FONIX 7000 Hearing Aid Analyzer
When measuring a set of binaural hearing aids, both the phase and the delay
graphs should match fairly closely.
4.2 Battery Current Test
The Battery screen lets you perform extensive tests on the amount of battery
current that the hearing aid uses. These tests were designed to give you a com-
plete picture of the amount of battery current that the hearing aid drains when
exposed to different situations. There are three primary tests:
• Static Test: This test estimates the battery life of the hearing aid by pre-
senting the hearing aid with a single static tone.
• mA/Freq: This test measures battery current drain as a function of fre-
quency. This shows how the battery current varies as you present the
hearing aid with different frequencies.
• mA/Ampl: This test measures battery current drain as a function of
amplitude. This shows how the battery current varies as you present the
hearing aid with different amplitudes.
To run these tests, toggle the test status with [F4], [F5], and [F6], respectively.
Pressing [START] will run the mA/Freq and mA/Ampl tests. The tests will auto-
matically stop when finished. The Static test is always on when its status has
been toggled to On.
In order to perform these measurements, you need to insert a battery pill into
the hearing aid, plug the battery pill into the sound chamber, and push the
applicable button in the chamber.
To enter the Battery screen, from the Opening screen, press [F5]—Other Tests.
Then press [F1]—Battery Test. A short list of the functions of this screen can be
displayed by pressing [HELP].
Note: Many hearing aids do not vary when exposed to signals of varying fre-
quency and amplitude. For those hearing aids, you will see a flat horizontal line
when running both the mA/Freq and mA/Ampl measurements.
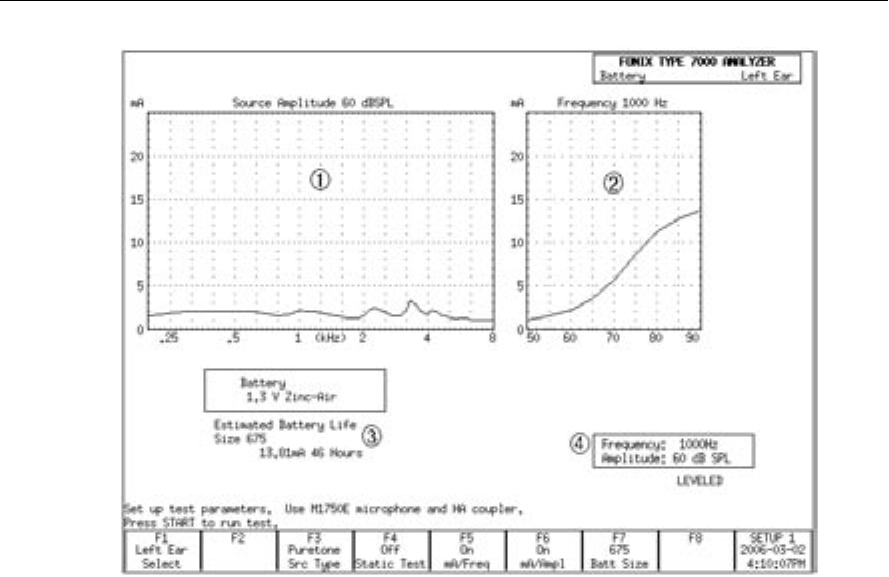
Automated Test Sequences 101
Figure 4.2—Battery Current Test
1. mA/Freq graph
2. mA/Ampl graph
3. Static test (estimated battery life)
4. Selected test settings.
4.2.1 Static Test (Estimated Battery Life)
The Static test estimates the battery life of the hearing aid. To turn on the test:
1. Enter the Battery screen (as described above).
2. Use [F7] to set the battery size: Press [F7]. Use [∨, ∧] to select the battery
size of the hearing aid. Use [>] to complete the selection and close the pop-
up menu.
3. Use [F4] to toggle the Static Tone to On. The estimated battery life should
now be displayed below the ma/Freq graph. See Figure 4.2.
By default, this test uses a pure-tone stimulus of 1000 Hz at 60 dB SPL. The
current source selections are shown in a box below the mA/Ampl graph on the
right side of the screen. You can:
• Change the source Type by using [F3]. Toggle between Puretone and
Composite,
• Change the source Amplitude by using [∨, ∧], and
• Change the source Frequency by using [<, >]. This setting is only avail-
able when the soucre type is set to Puretone with [F3].

102 FONIX 7000 Hearing Aid Analyzer
4.2.2 mA/Freq
The mA/Freq test shows how much battery current the hearing aid drains when
exposed to different frequencies. By default, it runs a 60 dB SPL LONG pure-
tone sweep. The selected amplitude is displayed below the mA/Ampl graph.
This amplitude can be changed by using [∨, ∧].
Press [START] to run the test.
A few technical details about this test:
• The amplitude used for a test currently being displayed on the screen is
shown above the mA/Freq graph.
• The source type selected with [F3] does NOT affect this test; this test
always uses a pure-tone sweep.
• You can view the numerical data results by entering the local menu by
pressing [MENU] and setting DATA/GRAPH to DATA by using the arrow
keys. Close the local menu by using [EXIT] or [MENU] again. Test results
will now be shown in tabular data format.
• You can turn this test off by toggling the test status with [F5]. If the
mA/Freq graph is not displayed, it will not be measured when [Start] is
pressed.
• Use [F1] to switch between left and right ear. Test results for each ear can
be temporarily stored. (All data is lost when the analyzer is turned off or
when the [RESET] button is pressed.)
4.2.3 mA/Ampl
The mA/Ampl test shows how much battery current the hearing aid will drain
when exposed to different input level. A test very similar to the I/O measure-
ment in the ANSI S3.22 test sequence is run. That is, the test begins with a
stimulus being presented at 50 dB SPL. This amplitude increases in 5 dB steps
until the final stimulus at 90 dB SPL is presented. This shows how the battery
current drain varies as the aid is exposed to different amplitudes.
By default, the frequency of the stimulus is 1000 Hz. This can be changed by
using [<, >] buttons. The selected frequency is shown in a box below the mA/
Ampl graph. You can also change the source type from Puretone to Composite
by toggling [F3]. The [<, >] buttons will not be active when Composite is selected.
Press [START] to run the test.
A few technical details about this test:
• The frequency used for a test currently being displayed on the screen is
shown above the mA/Ampl graph.
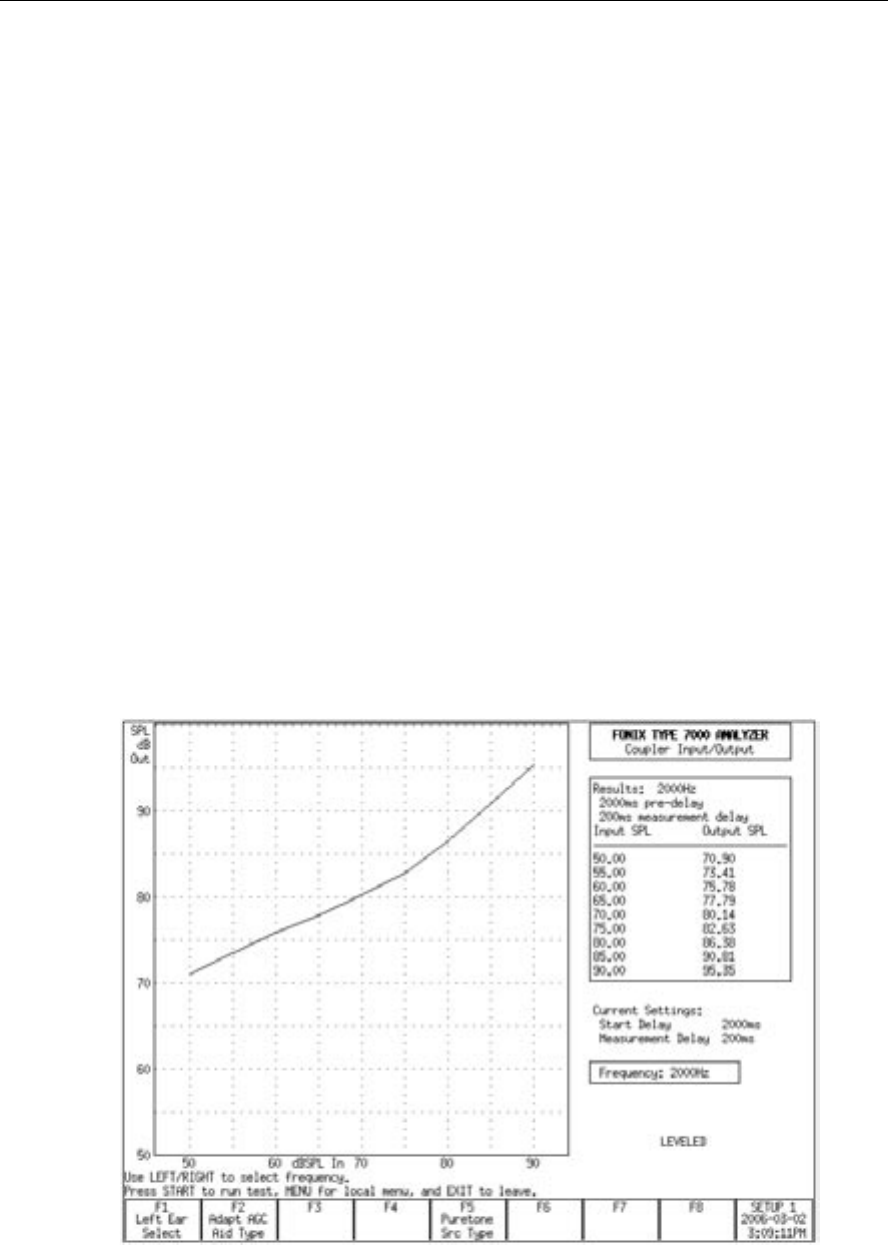
Automated Test Sequences 103
• You can view the numerical data results by entering the local menu by
pressing [MENU] and setting DATA/GRAPH to DATA by using the arrow
keys. Close the local menu by using [EXIT] or [MENU] again. Test results
will now be shown in tabular data format.
• You can turn this test off by toggling the test status with [F6]. If the
mA/Ampl graph is not displayed, it will not be measured when [Start] is
pressed.
• Use [F1] to switch between left and right ear. Test results for each ear can
be temporarily stored. (All data is lost when the analyzer is turned off or
when the [RESET] button is pressed.)
4.3 Coupler I/O
The Coupler I/O Test measures the input/output of the hearing aid from 50 dB
SPL to 90 dB SPL in 5 dB steps. Test results are shown in both graphical format
and numerical format and can be displayed in either Gain or SPL (Output). See
Figure 4.3.
To enter the Coupler I/O screen, press [F5]—Other Tests from the Opening
screen. Then press [F2]—Coupler I/O. Press [START] to run the I/O test.
By default, this test is done with a puretone stimulus at 2000 Hz. The frequency
of this stimulus can be changed by using [<, >]. You can also toggle the source
type between Puretone and Composite by using [F5]. (The frequency selection is
only available when the source type is set to Puretone.)
Figure 4.3—I/O Test

104 FONIX 7000 Hearing Aid Analyzer
A few technical details about this test:
• Choose between showing test results in SPL (Output) and Gain in the
local menu. (Use [MENU] to open the local menu, the arrow keys to
adjust the selections, and [EXIT] or [MENU] again to close the local
menu.)
• [F2] sets the aid type. This changes the length of time each stimulus is
presented before the measurement is taken. Suitable default delay times
are set when the aid type is selected. You can make further adjustments to
the delay settings in the local menu. See Section 2.3.1.3 for details.
• The settings used for the test displayed on the graph are shown above
the data results on the right side of the screen. The settings that will be
used when [START] is pressed are shown below the data under “Current
Settings.”
4.4 Attack & Release
The Attack & Release test demonstrates how the hearing aid reacts to noise at
different intensity levels. The test works by presenting a loud-soft-loud-soft
stimuli sequence to the aid. The first loud-soft tones are done to prepare the
analyzer and the hearing aid for the test. The second loud-soft tones are used
for the actual measurements.
The loud stimulus demonstrates the hearing aid’s attack time. That is, how the
hearing aid reacts to the test stimulus going from a soft level to a loud level. The
last soft stimulus demonstrates the hearing aid’s release time. That is, how the
hearing aid reacts to the test stimulus going from a loud level to a soft level.
To enter the Attack & Release screen, press [F5]—Other Tests from the Opening
screen. Then press [F3]—Attack & Release. Press [START] to run the Attack &
Release test.
Measurement results are displayed in graphical and numeric format. See Figure
4.4. The top graph contains the response of the aid over time to the Attack test.
The bottom graph shows the response of the aid over time to the Release test.
These graphical displays let you see how the device performs over the attack
and release phases. Erratic performance during these critical phases could result
in effects that are audible to a hearing-impaired listener. These effects could be
annoying or even could obscure parts of a conversation. The actual attack and
release times determined by the analyzer are shown in a box to the right of the
graph.
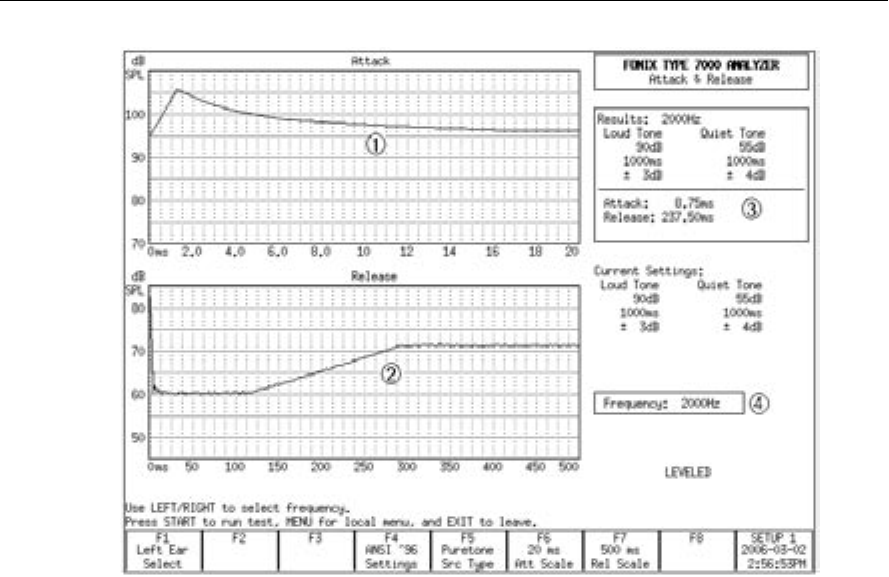
Automated Test Sequences 105
Figure 4.4—Attack & Release Test
1. Attack graph
2. Release graph
3. Measured Attack & Release times and test settings.
4. Currrent Attack & Release settings
By default, the Attack & Release test uses the settings specified by the ANSI 96
test sequence at 2000 Hz. If you want to perform attack and release measure-
ments using a different standard, use the [F4] key. The available test selections
are: IEC Loud, IEC Speech, JIS, IEC, and ANSI 96. (The ANSI 03 test sequence
uses settings identical to ANSI 96.) This changes the test settings to those speci-
fied by the selected standard.
You can further customize the test settings by pressing [MENU] to open the
local menu. Use the arrow keys to make the desired adjustments, and use
[MENU] again or [EXIT] to close the menu. See the Technical Details section
below for more information.
In addition to the settings adjustable in the local menu, you can also change the
frequency and the source type of the test. Use [F5] to toggle between Puretone
and Composite. Use the [<, >] keys to change the selected frequency. (You can
only change the frequency when the Source Type is set to Puretone with [F5].)
Please note that manufacturer specifications normally assume a puretone source
type.

106 FONIX 7000 Hearing Aid Analyzer
For most hearing aids, the most interesting part of the attack and release mea-
surements occurs at the beginning of each test. After the aid reaches its settling
amplitude, the test result just records a rather uninteresting flat line. The user
can zoom in on the beginning of the test by using [F6] and [F7]. These keys re-
scale the test results to show only the selected time interval. The beginning of
the interval is always the beginning of the test. The end of the interval is the
time selected by the user with [F6] and [F7] for the Attack and the Release tests,
respectively. The available time intervals range from 10 ms to 2000 ms. These
settings do NOT change the duration of the test.
Technical Details
• In order to determine the attack and the release times of the hearing aid,
the 7000 analyzer calculates the settling amplitude of each measurement
and uses the tolerance setting to achieve the final test result. The settling
amplitude is calculated by averaging the last 16 measurements of the test.
The attack (or release) time is the first time the aid reaches this ampli-
tude within the set tolerance. The tolerance is one of the settings that is
changeable in the local menu.
• Use [F1] to select ears. The 7000 analyzer can temporarily store one
Attack & Release test per ear. This data is erased by measuring over it,
pressing [RESET], or turning off the analyzer.
• The settings used for a displayed test are shown in a box to the right of
the attack graph. The settings that will be used when [START] is pressed
are shown below this box.

Chapter 5 107
Automated Test Sequences
There are several automated coupler test sequences available for the 7000 hear-
ing aid analyzer. The test sequences present on your analyzer are dependent
upon the features purchased when you ordered your unit. If you would like
access to a test sequence not present on your unit, you can always order an
upgrade. Call the factory or your local distributor for more information.
The following test sequences are available:
• ANSI S3.22-2003 (ANSI 03)
• ANSI S3.22-1996 (ANSI 96)
• ANSI S3.22-1987 (ANSI 87)
• ANSI S3.42-1992 (ANSI 92)
• IEC
• JIS
5.1 ANSI S3.22
The ANSI S3.22 automated test sequences allow you to test hearing aids accord-
ing to the ANSI S3.22 standards. You can use the ANSI tests to control the qual-
ity of the hearing aids that you dispense. Compare the manufacturer’s specifi-
cations with your own ANSI measurements of an aid. If they do not conform
within expected tolerances, you can contact the manufacturer.
There are three different versions of the ANSI S3.22 standard: ANSI 03, ANSI
96, and ANSI 87. This is because the standard periodically gets upgraded by the
ANSI standards committee. After the ANSI S3.22 standard has been updated,
the FDA reviews it and eventually approves it to be used for labeling the specifi-
cations of all hearing aids manufactured in the United States.
The ANSI 96 standard was officially approved by the FDA on March 17, 2000.
This means that any hearing aid designed after this date must be labeled to the
ANSI 96 standard. However, if a manufacturer designed a hearing aid before
this date, they can continue labeling newly manufacturered aids of the same
design to the older ANSI 87 standard.
ANSI 03, which was approved by the FDA in November of 2005, is the newest
version of the ANSI S3.22 standard.

108 FONIX 7000 Hearing Aid Analyzer
Here are the main differences between ANSI 87 and ANSI 96:
• AGC aids are tested at reduced reference test gain in ANSI 96, but tested
at full-on gain in ANSI 87. This will have an effect on nearly all measure-
ment results in the ANSI test sequence.
• The input/output and attack & release measurements are performed at up
to five different frequencies in ANSI 96. ANSI 87 only measures those
functions at 2000 Hz.
• ANSI 96 measures the telecoil function of all aids using a telecoil device
with a stronger magnetic field than the telecoil device used by ANSI 87,
and a whole frequency sweep of measurements is performed in ANSI 96,
instead of only one measurement at a single frequency in ANSI 87.
Here are the main differences between ANSI 96 and ANSI 03:
• In ANSI 03, the frequency response curve is always measured at 60 dB
SPL. In ANSI 96, AGC aids are tested at 50 dB SPL.
• At the beginning of an ANSI 03 test, AGC aids should be set to have mini-
mum compression. Just before the I/O and attack and release measure-
ments, the analyzer will pause to let you turn on the compression con-
trols to maximum.
• The EIN measurement uses a 50 dB SPL input instead of a 60 dB SPL
input. This should give better results of AGC aids with knee points
between 50 and 60 dB SPL.
• In ANSI 96, full-on gain is measured at 50 or 60 dB SPL for linear aids
and 50 dB SPL for AGC aids. In ANSI 03, full-on gain is always measured
at 50 dB SPL.
• The ANSI 96 Simulated Telephone Sensitivity (STS) measurement is
called Relative Simulated Equivalent Telephone Sensitivity (RSETS) in
ANSI 03.
5.1.1 Leveling for ANSI
Before you run an ANSI test, you should make sure the sound chamber is lev-
eled. Even if the screen says that the chamber is leveled, it is a good idea to
periodically re-level it to account for any differences that might have entered
into the testing environment.
The ANSI standard requires that you do a special leveling that accounts for
everything that will be in the chamber during the test. (For most practical office
settings, the leveling procedure explained in Section 3.2 is adequate.
1. Place the dummy microphone (a black cylinder, provided when ANSI
Option is ordered) into the coupler.
2. Attach the hearing aid to the coupler in the way appropriate for the type of
aid under test. See Section 3.3.
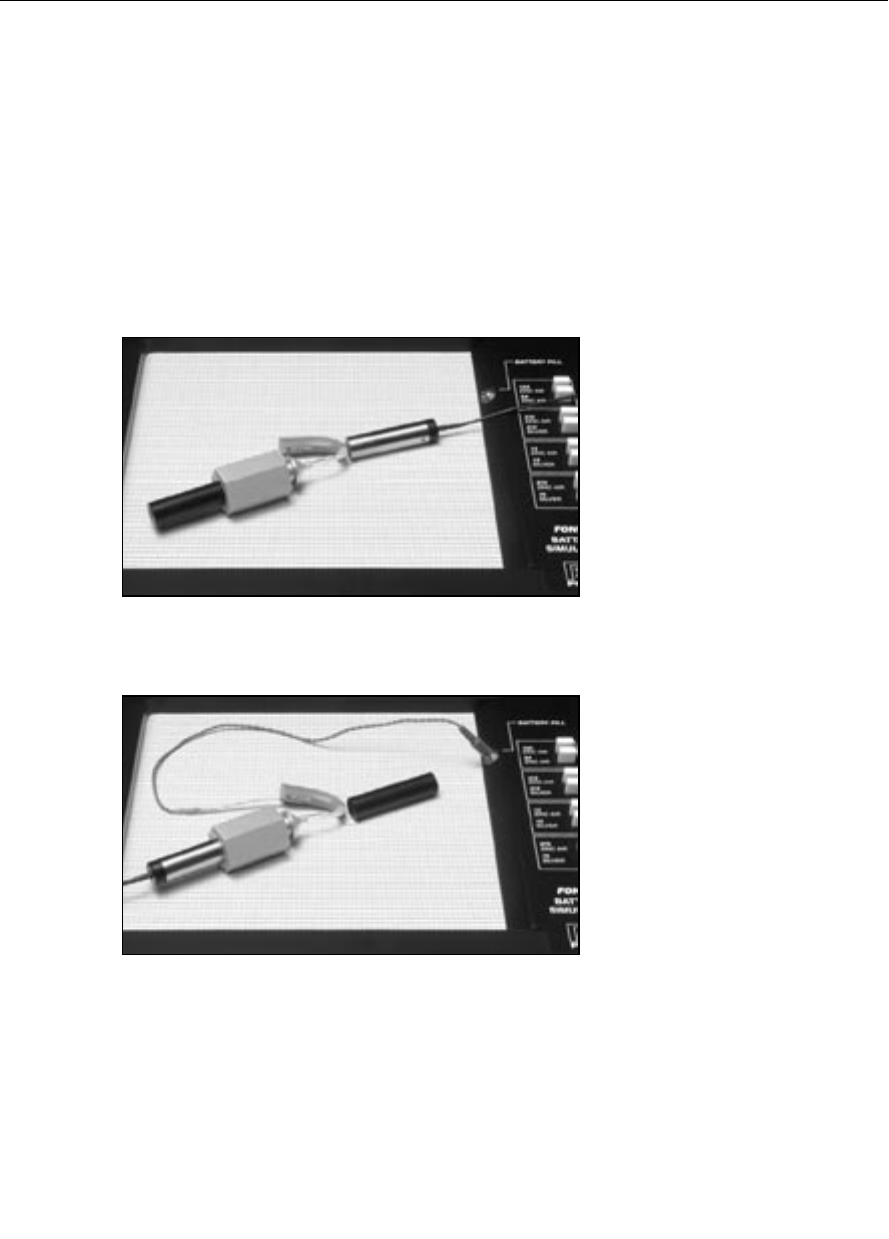
Automated Test Sequences 109
3. Position the hearing aid/coupler assembly in the test chamber with the
microphone of the aid at the reference point of the chamber.
4. Place the test microphone as close as practical to the hearing aid micro-
phone (3-5 mm). See Figure 5.1.1A.
5. Close the lid of the sound chamber.
6. Press the [LEVEL] button. The sound chamber will level.
7. Exchange the position of the dummy microphone and the test microphone
and plug the battery pill into the battery voltage supply. See Figure 5.1.1B.
Figure 5.1.1A—Setup for leveling
Figure 5.1.1B—Setup for aid testing/ equivalent substitution method
5.1.2 Setting up the hearing aid for ANSI
The hearing aid controls must be set to conform with ANSI requirements for
the test results to be valid.
1. Set the controls on the aid (except for the compression controls) to give the
greatest possible output and gain.
2. Set the aid for the widest frequency response range.

110 FONIX 7000 Hearing Aid Analyzer
3. For ANSI 87 and ANSI 96, set AGC aids to achieve the greatest possible
compression or as otherwise specified by the manufacturer. For ANSI 03, set
AGC aids to have the most minimum compression possible or as otherwise
specified by the manufacturer.
4. Put the hearing aid in “test mode,” if applicable. All noise suppression and
feedback cancellation features should be turned off.
5. Set the gain control of the aid to the full-on position.
6. Set the aid up in the sound chamber as described in Section 3.3.
5.1.3 Setting up the analyzer for ANSI
1. Press [F3] in the Opening screen to enter the ANSI S3.22 selection screen
2. Press [F1] to select ANSI 87, [F2] to select ANSI 96, or [F3] to select ANSI
03. The operation of these three tests is very similar.
2. Use [F1] to select LEFT or RIGHT ear.
3. Use [F2] to select the aid type: LINEAR, AGC, or ADAPTIVE AGC. (Press
[F2]. Use [∨, ∧] to choose the selection. Press [>] to complete the selection
and close the pop-up menu.)
4. Use [F3] to select the full-on gain (FOG) amplitude used in the test
sequence. We recommend setting this to AUTO, which will automatically
use the appropriate amplitude. This step does not apply for ANSI 03.
5. Use [F5] to select whether or not to perform a telecoil measurement.
6. Press [MENU] to enter the local menu and make any desired selections. See
Section 5.1.9.
Use [F7] to return all ANSI settings to their power-on default conditions.
Use [F8] to display all selected ANSI settings.
5.1.4 Running an ANSI 96 or an ANSI 03 Test
After leveling the sound chamber as described in Section 5.1.1, setting up the
aid as described in Section 5.1.2, and setting up the analyzer as described in
Section 5.1.3, follow these instructions:
1. Press [START] to begin the test. Usually the 7000 test system will pause
during the measurement process in order to let you adjust the gain of the
hearing aid to the reference test position.
a. Lift the sound chamber lid and adjust the gain control of the aid until the
RTG MEASURED gain matches RTG TARGET.
b. Close the sound chamber lid when finished.
c. Look at the display again. The MEASURED gain should be within 1 dB of
the TARGET gain for ANSI 96, or 1.5 dB for ANSI 03.
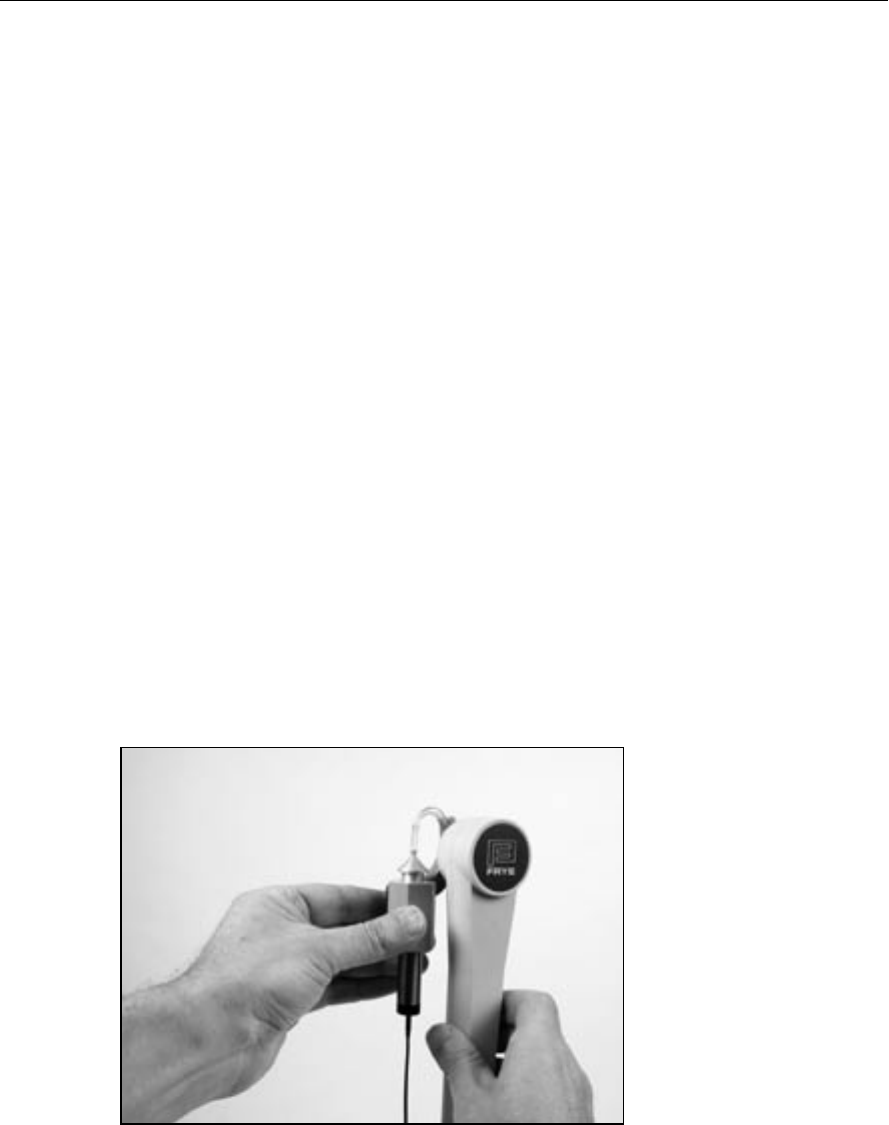
Automated Test Sequences 111
2. Push [START] to continue the test.
3A. If you chose to perform a telecoil measurement, do the following steps when
the analyzer pauses. If you are running an ANSI 03 test of an AGC aid and
are not performing a telecoil measurement, skip to step 3B. Otherwise, just
wait for the test sequence to complete.
a. Open the lid of the sound chamber.
b. Switch the aid to telecoil mode.
c. Plug the telewand into the side of the sound chamber, just above the
cable that connects the sound chamber to the Frye box.
d. Hold the telewand over the aid as if it were the ear piece on a phone.
That is, hold the telewand parallel to the body of a BTE or against the
faceplate of an ITE. It’s also usually best to position the hearing aid verti-
cally to get the best telecoil response. See Figure 5.1.4.
e. Press [START] to measure the telecoil response. The analyzer will pause
after the telecoil measurements are complete.
f. Return the aid to the normal microphone mode, set the AGC controls
to max (ANSI 03 and AGC aids only), reposition the hearing aid in the
sound chamber, close the lid, and press [START] to complete the test
sequence.
3B. If you’re running an ANSI 03 test of an AGC aid without a telecoil measure-
ment, the analyzer will run several measurements and then pause to allow
you to set the AGC controls of your aid to maximum. Do so, close the lid of
the chamber, and press [START] to complete the test sequence.
Figure 5.1.4—Holding telewand parallel to the body of a BTE

112 FONIX 7000 Hearing Aid Analyzer
5.1.5 Running an ANSI 87 Test
After leveling the sound chamber as described in Section 5.1.1, setting up the
aid as described in Section 5.1.2, and setting up the analyzer as described in
Section 5.1.3, follow these instructions:
1. Press [START] from the ANSI 87 screen to start the test.
2. If you have enabled the telecoil test, do the following when the sequence
stops for the telecoil measurement. Otherwise, skip to step 3.
a. Open the lid of the sound chamber.
b. Switch the aid to telecoil mode.
c. While viewing TCOIL 10 mA/m near the upper right corner of the screen,
try many positions for the hearing aid, near the reference point, until you
find the position that gives the highest output with the least variability.
Usually the best position is with the hearing aid held in the vertical posi-
tion.
d. Hold that position and press [START]. This measures the telecoil output.
e. Switch the aid back to normal, microphone mode.
f. Press [START] to resume testing.
3. Depending on the aid type selected and the gain of the hearing aid, the
ANSI sequence may stop for you to adjust the gain control to the reference-
test. If the sequence stops:
a. Open the lid of the sound chamber.
b. While viewing the HF AVG readings in the lower center of the screen,
turn the gain control on the aid down until the MEASURED value match-
es the TARGET value within 1 dB.
c. Close the lid. If the MEASURED number is still correct, press [START] to
complete the test sequence.
5.1.6 Viewing ANSI Results
The test results for ANSI 03, ANSI 96, and ANSI 87 have a similar display. Here
is an explanation of the ANSI 03 results (Figure 5.1.6):
1. OSPL 90 curve: Full-on gain frequency sweep taken at 90 dB SPL.
2. RESP 60 curve: Reference test gain frequency sweep taken at 60 dB SPL.
3. SPLITS curve: Frequency response of the telecoil.
4. Aid type (selected with F2)
5. OSPL 90 MAX: Amplitude and frequency of the maximum output of the aid.
6. OSPL 90 HFA/SPA: Three-frequency response of the OSPL 90 curve.
7. HFA/SPA FOG: Full-on gain three frequency average and the amplitude at
which it was taken.
8. RTG Target: Target reference test gain
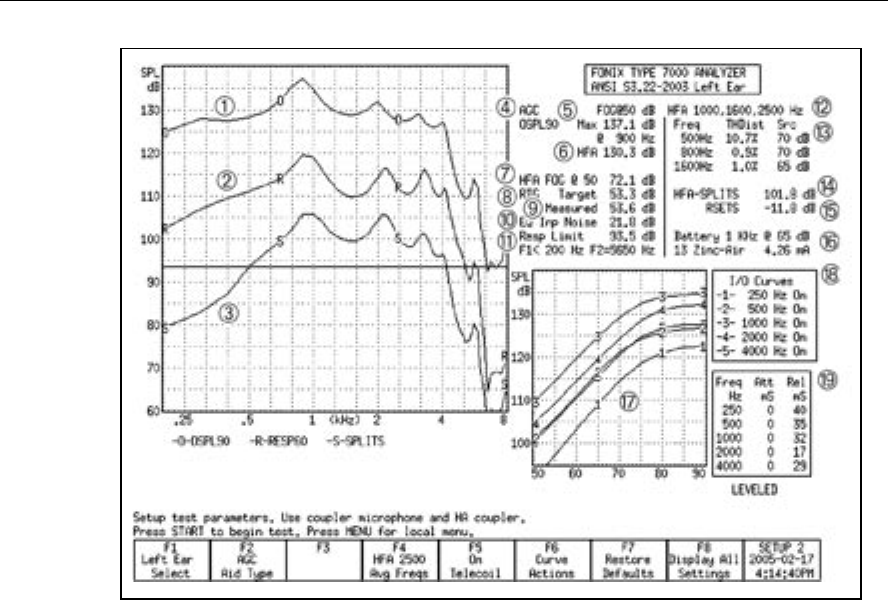
Automated Test Sequences 113
Figure 5.1.6—ANSI 03 test results, Frequency Response Screen
9. RTG Measured: Measured reference test gain
10. EQ Inp Noise: Equivalent input noise measurement
11. Resp Limit: The response limit level is determined by taking the three fre-
quency average of the RESP 50 curve and subtracting 20 dB.
F1 is where the RESP 50 curve crosses the response limit level on the way
up.
F2 is where the RESP 50 curve crosses the response limit level on the way
down.
12. HFA/SPA: Three frequency average chosen in the MENU.
13. TDH: total harmonic distortion measurements and the frequencies and
amplitudes at which they are taken.
14. HFA/SPA-SPLITS: Three-frequency average of the telecoil frequency
response curve.
15. RSETS: The difference between the HFA/SPA of the microphone response
curve and the telecoil response curve.
16. Battery Current measurement
17. I/O curves: the input/output measurements taken of AGC aids. Only selected
frequencies are tested.

114 FONIX 7000 Hearing Aid Analyzer
18. I/O curve selection box: the key to the I/O graph, listing which frequencies
go with which curve.
19. Attack and release measurements, including the frequencies at which they
were measured.
Test Result Differences with ANSI 96 and ANSI 87
• In ANSI 87 and ANSI 96, the response curve (2) is sometimes measured
at 50 dB SPL
• In ANSI 87, I/O (17) is only measured at 2000 Hz
• In ANSI 87, attack and release (19) is only measured at 2000 Hz
• In ANSI 87, AGC aids are measured at full-on gain for the entire test
sequence
• In ANSI 87, the OSPL90 curve is called SSPL90
• In ANSI 96, RSETS (15) is called STS-SPLITS
• In ANSI 87, the telecoil measurement (3, 14, 15) is much different. There
is only one measurement called “TCOIL 10 mA/m”
To delete the displayed results, press [F6] and use [∨, ∧] to select DELETE
ALL CRVS. Press [>] to perform the deletion.
5.1.7 Testing Digital Hearing Aids
The ANSI S3.22 “labeling” standard for hearing aids was not designed with digi-
tal hearing aids in mind. In fact, most of the testing methods employed by ANSI
have been around since the 1970s. However, since ANSI is a standard, in order
to conform to that standard, it must use only the testing techniques outlined in
the standard. For this reason, the 7000 test system has no provisions for incor-
porating composite or digital speech into the ANSI test sequences.
In order to test digital hearing aids with “noise reduction” or “speech enhance-
ment” features to the ANSI standards, put the aid in “test” mode via its pro-
gramming software and do the steps outlined in Section 5.1.4. Contact your
manufacturer to get further suggestions on performing an ANSI 96 specification
test.
In order to get an accurate picture of the aid’s actual performance when it goes
home with your client, put the aid in the mode you will use for that client, and
perform response curve measurements in the coupler and in the real-ear via the
procedures described in Chapter 3 and Chapter 6 using the digital speech (DIG
SPEECH) signal source.
5.1.8 Viewing ANSI measurements in the Coupler screen
It’s possible to copy ANSI response curves to the Coupler screen where they can
be compared to other response curves. To do this:

Automated Test Sequences 115
1. Run the ANSI test sequence.
2. Press [F6].
3. Use [∨] to select Store Crvs Coup, if necessary.
4. Press [>] to store the curves and close the menu. The following is a list of
where the curves are stored in the Coupler screen. Any previous measure-
ments stored in those curve locations will be overwritten.
• SPLITS – CRV 4
• VA CORFIG – CRV 5
• Response – CRV 6
• OSPL90 – CRV 7
5. Press [EXIT] and [F1] to enter the Coupler screen and view the ANSI
response curves.
5.1.9 Explaining the Menu Settings
The following is an explanation of all the ANSI menu selections:
Measurement Settings
• Noise Red (Tone)— The amount of noise reduction used in the pure-tone
measurements. See Section 2.3.1.2 for details.
• Battery Meas—The status of the battery current measurement. Turns it
ON or OFF. (Battery pill required for this measurement.)
• Battery Size—Size of the battery for the hearing aid being tested.
• 12 dB Dist—The status of the 12 dB harmonic distortion rule. When mea-
suring harmonic distortion, if the amplitude of the response at the sec-
ond harmonic of the frequency being measured is 12 dB greater than the
amplitude of that primary frequency, the harmonic distortion measure-
ment should be ignored at the primary frequency. Turn this rule ON or
OFF.
• Equiv Noise Test—Status of the EIN measurement. Turns it ON or OFF. In
ANSI 87 and ANSI 96, this should probably be turned off for compression
aids with a knee point below 60 dB SPL.
• Option—Option used with the test sequence. This can be CIC, which
adds CIC correction factors, (make sure to use the CIC coupler with
this option), or VA-CORFIG, which includes software correction factors
designed by the VA to produce a more realistic response curve than the
normal ANSI response curve.
ANSI Settings
• OSPL90 Sweep Start Delay—The delay after the first tone is presented in
the OSPL90 sweep and before the first measurement is taken.

116 FONIX 7000 Hearing Aid Analyzer
• OSPL90 Sweep Meas Delay—The delay between frequencies in the
OSPL90 sweep.
• Res Crv Sweep Start Delay—The delay after the first tone is presented in
the response curve (at 50 or 60 dB SPL) sweep and before the first mea-
surement is taken.
• Res Crv Sweep Meas Delay –The delay between frequencies in the
response curve (at 50 or 60 dB SPL) sweep.
• Misc Start Delay—The delay after the first tone is presented and before
the first measurement is taken in the HFA/SPA, reference test gain, equiv-
alent input noise, and harmonic distortion measurements.
• Misc Meas Delay—The delay between frequencies in the measurements
mentioned above.
Note: ANSI 87 combines the “OSPL90” and “Res Crv” delays into the “Sweep
Start” delay settings.
AGC Settings
The purpose of the following settings is identical for each I/O frequency.
• AGC frequency—Status of the I/O test at the selected frequency. Turn the
test ON or OFF.
• I/O Start—The delay after the first tone is presented in the I/O sweep and
before the first measurement is taken.
• I/O Meas—The delay between frequencies in the I/O sweep.
• Attack Window—The amount of time the analyzer measures the attack
time of the hearing aid. Select a time that is at least twice as long as the
attack time specified by the manufacturer.
• Release Window—The amount of time the analyzer measures the release
time of the hearing aid. Select a time that is at least twice as long as the
release time specified by the manufacturer.
Note: ANSI 87 only measured I/O at 2000 Hz, and the Attack and Release win-
dow settings are not available.
Misc Settings
• Print Label—Status of the printing label. Choose ON or OFF.
• Printer—Printer used for printouts. Choose INTERNAL or EXTERNAL.
See Section 2.4.

Automated Test Sequences 117
5.2 ANSI S3.42-1992 (ANSI 92)
The ANSI Option includes a test sequence based on the ANSI S3.42-1992 stan-
dard. This standard has been developed to test non-linear hearing aids with a
broadband noise signal. The need for this standard stems from the importance
of evaluating the performance of these circuits in a more real-world environ-
ment. ANSI 92 gives you: noise saturation sound pressure level, noise gain, a
family of frequency responses, and a noise input/output curve.
5.2.1 Understanding ANSI 92
The original signal used in the 7000 test system is that of a speech weighted set
of pure tones starting at 200 Hz and ending at 8000 Hz, with a gradual high fre-
quency roll off of 6 dB per octave. The knee point of the roll off is placed at 900
Hz. The spectrum was developed from data supplied by the National Bureau of
Standards, and is the signal used for the testing of hearing aids submitted for
use in the Veterans Administration hearing aid program.
In 1992, the ANSI standards committee for hearing aid test standards published
S3.42-1992. This standard describes a noise signal that is very similar to the
one we use in the 7000 test system. There are some differences, mostly in the
low frequencies and in the way that the signal spectral shape is specified. The
committee wanted a system that could be built easily by anyone, and assumed
that a manufacturer who would develop equipment to make tests for this stan-
dard would use a white noise signal to produce the roll off above the 900 Hz
knee point.
In order to produce a signal that met with the provisions of the S3.42 standard,
Frye Electronics decided to slightly modify the Composite signal for use in this
ANSI 1992 test sequence. This modified signal is not used in the normal com-
posite operation of the 7000 test system.
Only the most critical operator will see any significant difference in the hearing
aid performance between the two signals. The ANSI S3.42 signal may result in
an increase in noise gain by about 1 dB.
5.2.2 Running ANSI 92.
1. Level the sound chamber, and set up the hearing aid to full on gain as spec-
ified in Section 5.1.1 and 5.1.2.
2. Press [F4] in the Opening screen to enter the ANSI 92 screen.
3. Use [F1] to select the desired ear.
4. Use [F2] to select the settle time used for the test.
5. Use [F3] to set the noise reduction used for the test. See Section 2.3.2.1 for
more information on composite noise reduction.
6. Press [START] to begin the test sequence.

118 FONIX 7000 Hearing Aid Analyzer
For some aids, the analyzer will pause the test and tell you to turn the aid down
to reference test gain. Adjust the volume of the aid until it comes within 1 dB
of the target gain. Take care not to move the aid from its position. If you must
move it in order to adjust the gain control, replace as close as possible to its
original position. Push [START] to complete the test.
To delete the displayed results, press [F4] and use [∨, ∧] to select DELETE ALL
CRVS. Press [>] to perform the deletion.
5.2.3 Viewing ANSI 92 Results
1. Family of composite gain curves made at 50, 60, 70, 80 and 90 dB SPL,
2. NSPL90—Maximum RMS output sound pressure level (SPL) produced with
a 90dB RMS speech-weighted noise input SPL signal.
3. Full-On Noise Gain—Maximum RMS gain with a 60dB SPL noise input sig-
nal. (Note: This test may not elicit a true reading of maximum gain for hear-
ing aids with an onset of non-linear operation below 60dB.)
4. Target Reference Gain—This information is only displayed when the actual
gain is greater than the calculated desired setting of gain. This target is used
to adjust the hearing aid’s actual gain to a level of ±1 dB of the target. The
figure is calculated by adding the 60dB SPL input + 17dB and subtracting it
from the NSPL90 RMS output. (NSPL90 D-77 = desired setting of gain)
5. Actual Reference Gain—The measured amount of gain when the hearing aid
is set to the reference test position.
6. Noise I/O Curve –This demonstrates the compression or limiting of the non-
linear circuit.
For a more detailed explanation of these terms, consult the ANSI S3.42-1992
standard.
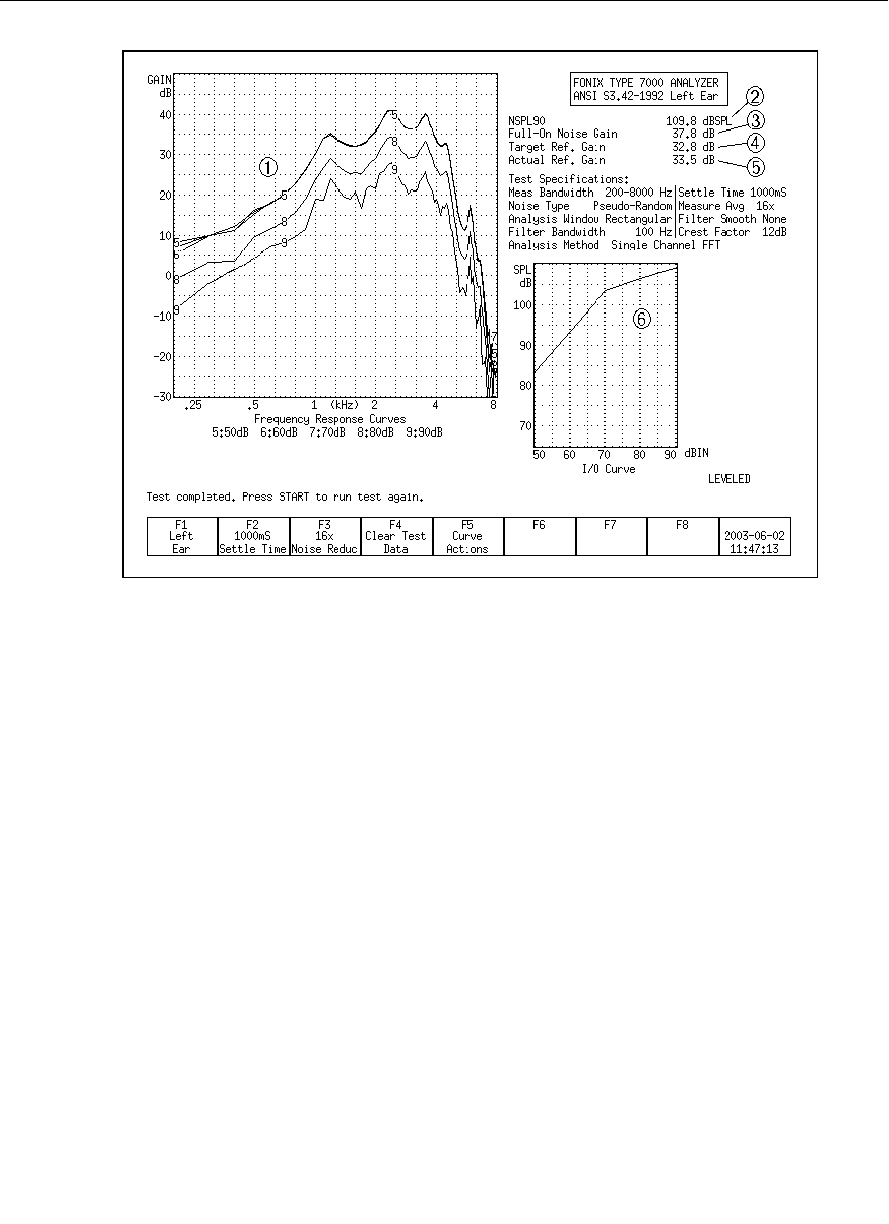
Automated Test Sequences 119
Figure 5.2.3—ANSI 92 test results
5.2.4 Viewing ANSI measurements in the Coupler screen
It’s possible to copy ANSI response curves to the Coupler screen where they
can be compared to other response curves. To do this:
1. Run the ANSI 92 test sequence.
2. Press [F6].
3. Use [∨] to select Store Crvs Coup, if necessary.
4. Press [>] to store the curves and close the menu. The following is a list of
where the curves are stored in the Coupler screen. Any previous measure-
ments stored in those curve locations will be overwritten.
• 50 dB SPL—CRV3
• 60 dB SPL—CRV4
• 70 dB SPL—CRV5
• 80 dB SPL—CRV6
• 90 dB SPL—CRV7
5. Press [EXIT] and [F1] to enter the Coupler screen and view the ANSI
response curves.

120 FONIX 7000 Hearing Aid Analyzer
5.2.5 Explaining the Menu Settings
There are only a couple of menu settings in the local menu of the ANSI 92
screen.
Misc. Settings
• Print Label—Status of the printing label. Choose ON or OFF.
• Printer—Printer used for printouts. Choose INTERNAL or EXTERNAL.
See Section 2.4.
5.3 IEC
The International Electro-technical Commission (IEC) standard in the interna-
tional community is analogous to the ANSI standard in the United States. Press
[F6] from the Opening Screen to enter the IEC Screen.
The IEC 118-7 standard was amended in 1994, and in July of 1995, the IEC
Option was changed to conform to that amendment. The IEC standard is the
equivalent of the Chinese National Standard.
Technical note:
Most of the IEC measurements are made with the aid set to reference test gain.
You can either set the aid to the reference test gain calculated by the 7000 ana-
lyzer, or you can set it to the reference test gain specified by the manufacturer
in IEC 118-7.
We calculate the reference test gain by the following method:
The reference frequency is measured at 90 dB SPL (value A) and 60 dB SPL
(value B).
• If B > A—68, the calculated reference test gain is A—75
• Otherwise, the calculated reference test gain is B—7.
5.3.1 Setting up for IEC
1. Set the controls on the aid to give the maximum output and gain. For AGC
aids, this is usually accomplished by setting for the minimum compression.
2. Set the aid for the widest frequency response range.
3. Insert the appropriate battery simulator pill, but do not yet plug it into the
battery voltage supply.
4. Attach the aid to the appropriate coupler. See Section 5.2 for details. When
testing a BTE aid, use the BTE adapter and a 0.6” (15 mm) length of #13
thick walled tubing. The combined length of the BTE adapter and the tub-
ing is the right length to meet the specification (once you have inserted the
ear hook into the tubing).
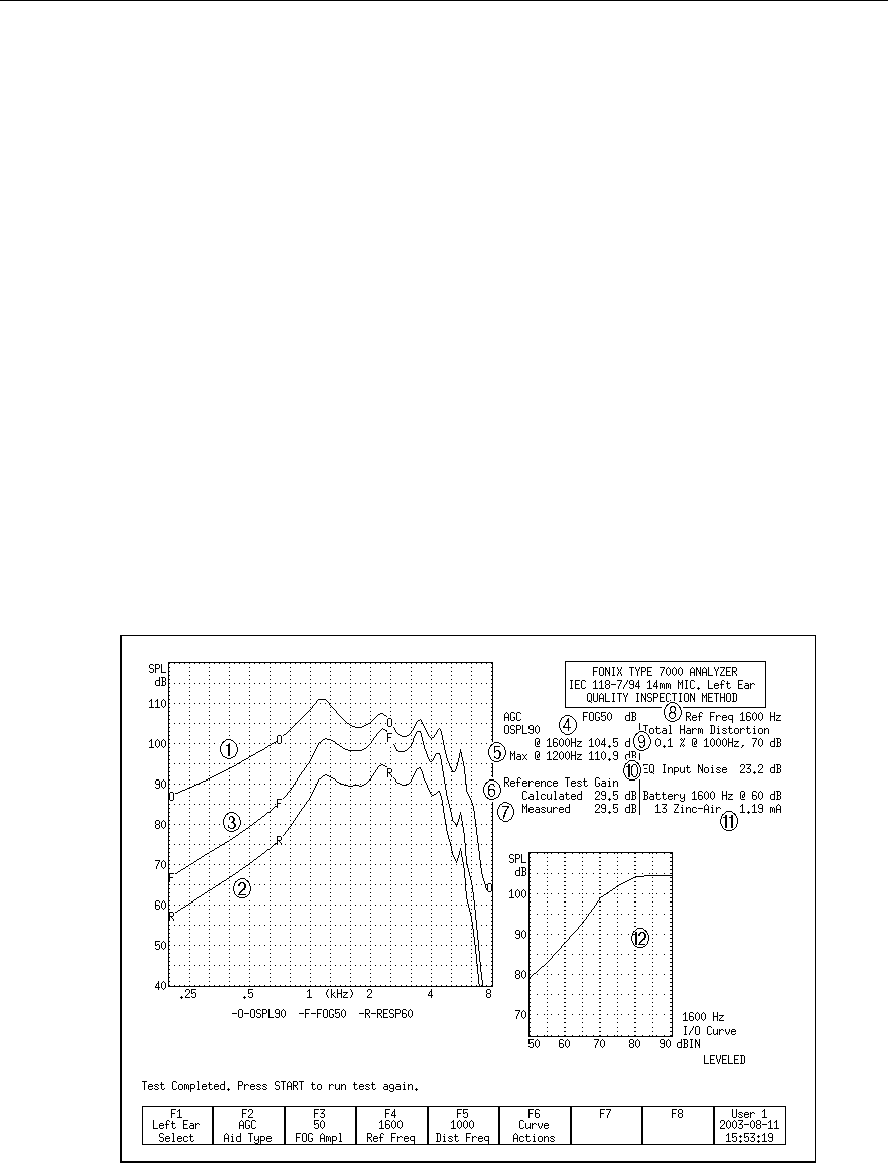
Automated Test Sequences 121
5. Level the sound chamber, if necessary (see Section 5.1.1).
6. Plug the battery simulator into the jack near the battery voltage supply.
5.3.2 Running IEC
1. Press [START] from the IEC screen. The instrument will run a measurement
and then pause.
2. Turn the gain of the aid down to the reference test position. Match the target
value within 1 dB.
3. Press [START] to complete the test sequence.
4. Press [PRINT] to print test results.
5.3.3 Viewing IEC Results
1. OSPL 90 response curve
2. RESP curve measured at reference test gain at 50 or 60 dB SPL
3. Full-on gain curve
4. Output of 90 dB at reference test frequency
5. Maximum output and its frequency
6. Reference test gain calculated (target)
Figure 5.3.3—IEC test results

122 FONIX 7000 Hearing Aid Analyzer
7. Reference test gain measured (actual)
8. Reference frequency
9. Total harmonic distortion
10. Equivalent input noise measurement
11. Battery current drain
12. I/O curve measured at the reference frequency
5.3.4 Viewing IEC measurements in the Coupler screen
It’s possible to copy IEC response curves to the Coupler screen where they can
be compared to other response curves. To do this:
1. Run the IEC test sequence.
2. Press [F6].
3. Use [∧] to select Store Crvs Coup, if necessary.
4. Press [>] to store the curves and close the menu. The following is a list of
where the curves are stored in the Coupler screen. Any previous measure-
ments stored in those curve locations will be overwritten.
• Full-on Gain—CRV 5
• Response—CRV 6
• OSPL90—CRV 7
5. Press [EXIT] and [F1] to enter the Coupler screen and view the IEC response
curves.
5.3.5 Understanding the Menu Settings
The following menu settings are available in the local menu of the IEC screen.
Measurement Settings
• Noise Red (Tone)—The amount of noise reduction used in the IEC mea-
surements. See Section 2.3.1.2 for more details.
• Battery Meas.—The status of the battery current measurement. Turns it
ON or OFF. (Battery pill required for this measurement.)
• Battery Size—The size of the battery of the hearing aid being tested.
IEC Settings
• Equiv Noise Test—Status of the EIN measurement. Turns it ON or OFF.
Aid Settings
• Sweep Start Delay—The delay after the first tone is presented in a pure-
tone frequency sweep and before the first measurement is taken.
• Sweep Meas. Delay—The delay between frequencies in a pure-tone fre-
quency sweep.

Automated Test Sequences 123
• Misc. Start Delay—The delay after the first tone is presented and before
the first measurement is taken in the HFA/SPA, reference test gain, equiv-
alent input noise, and harmonic distortion measurements.
• Misc. Meas. Delay—The delay between frequencies in the measurements
mentioned above.
• I/O Start Delay—The delay after the first tone is presented in the I/O
sweep and before the first measurement is taken.
• I/O Meas. Delay—The delay between frequencies in the I/O sweep.
Misc. Settings
• Print Label—Status of the printing label. Choose ON or OFF.
• Printer—Printer used for printouts. Choose INTERNAL or EXTERNAL.
See Section 2.4.
5.4 JIS
The JIS 2000 automated test sequence allows you to testing hearing aids accord-
ing to the Japanese Instrument Standard. Press [F7] from the Opening screen to
enter the JIS test screen.
5.4.1 Running JIS
Follow these instructions to run a JIS automated test sequence.
1. Press [F7] from the Opening screen to enter the JIS test screen.
2. Use [F1] to select the ear.
3. Use [F2] to select the aid type: Press [F2], use [∨, ∧] to make your selection,
and [>] to complete the selection and close the pop-up menu.
4. Use [F3] to select the amplitude of the full-on gain measurement.
5. Use [F4] to select the test frequency that you want to use.
6. Use [F5] to select the type of coupler you are using for the test. The 2-cc
selection is used for the HA-1 and HA-2 coupler. The MZ selection is used
for the MZ couplers.
7. Press [MENU] and use the arrow keys to make any desired changes to the
menu items. See Section 5.4.4 for more details. Press [EXIT] to close the
local menu.
8. Press [START] to start the test sequence. The instrument will run a measure-
ment and then pause.
9. Turn the gain of the aid down to the reference test position. Match the target
value within 1 dB.
10. Press [START] to complete the test sequence.
11. Press [PRINT] to print test results.
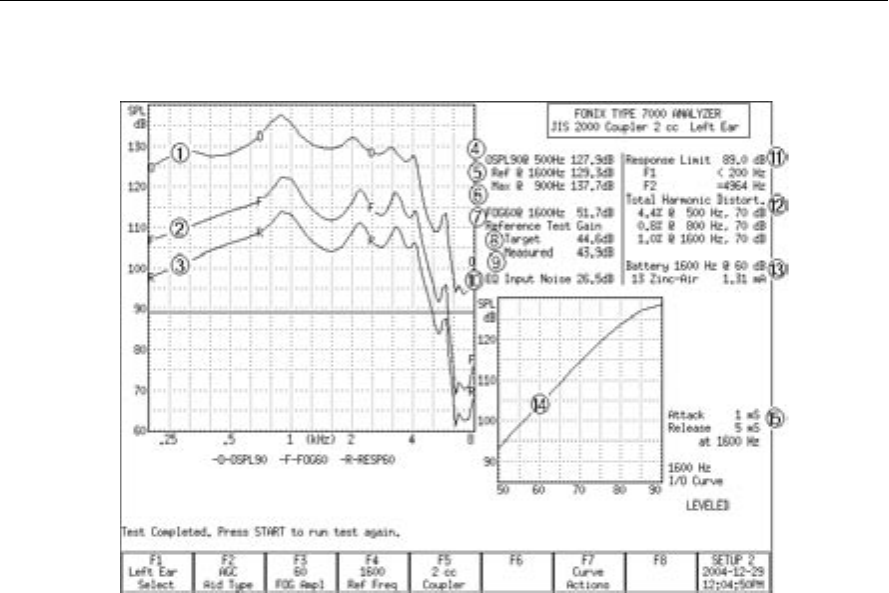
124 FONIX 7000 Hearing Aid Analyzer
5.4.2 Viewing JIS Results
Figure 5.4.2
See Figure 5.4.2 for the following explanation of test results.
1. OSPL90 response curve
2. Full-on gain response curve measured at 50 or 60 dB SPL
3. Response curve measured at reference test gain at 60 dB SPL
4. Output with a 90 dB input at 500 Hz
5. Output with a 90 dB input at the reference frequency
6. Maximum output and the frequency at which it was measured
7. Gain of the FOG curve at the reference frequency
8. Reference test gain calculated (target)
9. Reference test gain measured (actual)
10. Equivalent input noise
11. Response limit and the two frequencies (F1 and F2) at which the response
curve crosses its horizontal line.
12. Total harmonic distortion at 500, 800, and 1600 Hz
13. Battery current drain with 60 dB input at the reference frequency
14. I/O curve measured at the reference frequency.
15. Attack & release measurements at the reference frequency

Automated Test Sequences 125
5.4.3 Viewing JIS measurements in the Coupler screen
It is possible to copy JIS response curves to the Coupler screen where they can
be compared to other response curves. To do this:
1. Run the JIS test sequence.
2. Press [F7].
3. Use [∧] to select Store Crvs Coup, if necessary.
4. Use [>] to “store” the curves (that is, copy them to the Coupler screen) and
close the pop-up menu. The following is a list of where the curves are cop-
ied in the Coupler screen. Any previous measurements stored in those curve
locations will be overwritten.
• Full-on Gain—CRV 5
• Response—CRV 6
• OSPL90—CRV 6
5. Press [EXIT] and [F1] to enter the Coupler screen and view the JIS response
curves.
5.4.4 Understanding the menu settings
The following menu settings are available in the local menu of the JIS screen.
Measurement Settings
• Noise Red (Tone)—The amount of noise reduction used in the JIS mea-
surements. See Section 2.3.1.2 for more details.
• Battery Meas.—The status of the battery current measurement. Turns it
ON or OFF. (Battery pill required for this measurement.)
• Battery Size—The size of the battery of the hearing aid being tested.
Aid Settings
• Sweep Start Delay—The delay after the first tone is presented in a pure-
tone frequency sweep and before the first measurement is taken.
• Sweep Meas. Delay—The delay between frequencies in a pure-tone fre-
quency sweep.
• Misc. Start Delay—The delay after the first tone is presented and before
the first measurement is taken in the HFA/SPA, reference test gain, equiv-
alent input noise, and harmonic distortion measurements.
• Misc. Meas. Delay—The delay between frequencies in the measurements
mentioned above.
• I/O Start Delay—The delay after the first tone is presented in the I/O
sweep and before the first measurement is taken.
• I/O Meas. Delay—The delay between frequencies in the I/O sweep.

126 FONIX 7000 Hearing Aid Analyzer
JIS Settings
• Equiv Noise Test—Status of the EIN measurement. Turns it ON or OFF.
Misc. Settings
• Print Label—Status of the printing label. Choose ON or OFF.
• Printer—Printer used for printouts. Choose INTERNAL or EXTERNAL.
See Section 2.4.
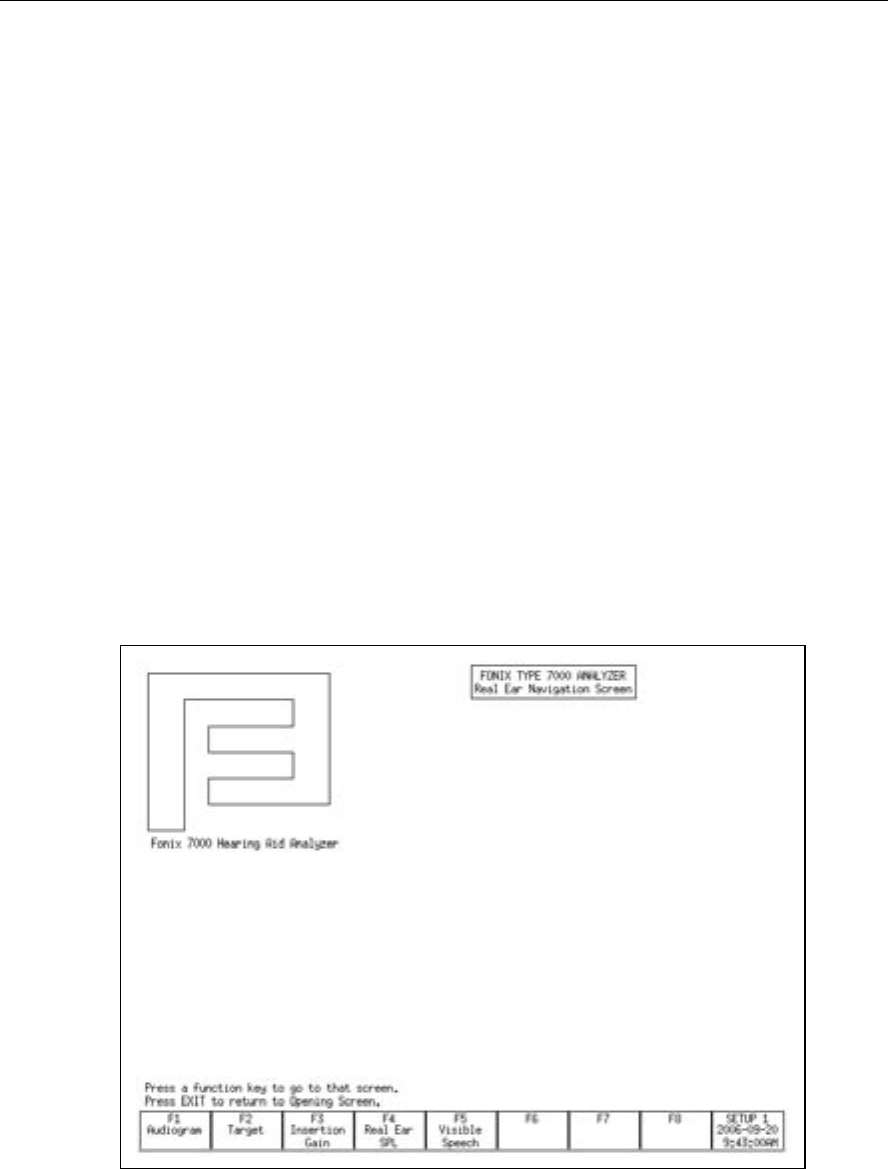
Chapter 6 127
Real-Ear Measurements
6.1 Introduction
The Real-Ear Option gives you the capability to make probe microphone mea-
surements inside your client’s ear. You can:
• Input audiograms
• Create targets
• Perform insertion gain measurements
• Perform SPL measurements
• Perform Visible Speech measurements
• Perform RECD measurements
6.1.1 Understanding the Real-Ear Screens
There are several different screens associated with real-ear measurements. You
access each of these screens from the Real-Ear Navigation screen shown in
Figure 6.1.1.
Figure 6.1.1—Real-Ear Navigation Screen

128 FONIX 7000 Hearing Aid Analyzer
These screens are:
• Audiogram Entry screen [F1]
• Target screen [F2]
• Insertion Gain screen [F3]
• SPL screen [F4]
• Visible Speech [F5]
6.1.2 Navigating through the Real-Ear Screens
The Real-Ear Navigation screen is the key to moving through the different real-
ear screens.
• To enter the Real-Ear Navigation screen from the Opening screen, press
[F2].
• To enter any of the real-ear screens, press the appropriate function key
button from the Real-Ear Navigation screen. You can use the function but-
tons found on the front panel of the 7000 test system or on the remote
module.
• To exit from any of the real-ear measurement screens, press the [EXIT]
button on either the front panel of the 7000 analyzer or the remote mod-
ule. This will return you to the Real-Ear Navigation screen.
6.2 Real-Ear Setup
This section describes how to set up your client and your analyzer for real-ear
measurements. It is important to follow these instructions carefully since your
setup will have a direct impact on the accuracy of your measurements.
6.2.1 Placing the Sound Field Speaker
For the most accurate, repeatable measurements, we recommend a sound field
speaker placement of approximately 12 inches from the client’s head and point-
ing towards the ear to be tested. The speaker should be at an azimuth angle of
45 degrees (halfway between the client’s nose and ear). The height of the loud-
speaker should be level with, or a little above the ear. See Figure 6.2.1.
NOTE: It is especially important for accuracy that the speaker is within 12" if
you are using a 90-dB signal.
Real-Ear Measurements 129
12"
Speaker
(45 degrees)
Reference Mic
Probe Mic
12"
Reference Mic
Probe Mic
Top View Front View
Speaker
(45 degrees)
Figure 6.2.1—Sound field speaker setup
6.2.2 Placing the earhook and reference microphone
1. Place the wedge-style earhook on the client’s ear.
2. Attach the reference microphone, facing forward, on the wedge of the
earhook, directly above the ear to be tested. The reference microphone
should be as close to the head as possible. See Figure 6.2.2.
3. Adjust the round Velcro pad on the wedge style earhook by turning it, so
that the inside pad fits firmly against the client’s neck.
Figure 6.2.2—Placing the reference and probe microphones
130 FONIX 7000 Hearing Aid Analyzer
6.2.3 Inserting the probe tube
There are several different methods used for properly inserting the probe tube.
Here are two easy methods.
Method 1
1. Place an unattached probe tube on a flat surface along with the client’s
earmold or shell.
2. Place or hold the ear mold next to the probe tube, so that the tube rests
along the bottom of the canal part of the earmold, with the tube extending
at least 5 mm past the canal opening. If there is a large vent, you can slide
the tube down the vent until it protrudes at least 5 mm past the canal open-
ing.
3. Mark the probe tube where it meets the outside surface of the earmold with
a marking pen. See Figure 6.2.3A.
4. Attach the probe tube to the body of the probe microphone.
5. Attach the probe microphone to the round Velcro pad on the earhook.
6. Insert the probe tube (without the earmold or aid) into the client’s ear so
that the mark is at the location where the bottom of the outer surface of the
earmold will be, once the earmold is in place.
Figure 6.2.3A—Marking the probe tube
Method 2
This method uses the Composite signal and the fact that there is a dip in gain
inside the ear caused by a standing wave created by the 6 kHz frequency
reflecting off the eardrum.
1. Press [F2] to enter the Real-Ear Navigation screen from the Opening screen.
2. Press [F3] to enter the Insertion Gain screen.

Real-Ear Measurements 131
WARNING
Choose OUTPUT LIMITING carefully (see procedure below).
You don’t want to damage your clients’ hearing or to cause
them discomfort during testing. To ensure safety and comfort,
the 7000 Test System reacts automatically when the OUTPUT
LIMITING level is exceeded at the Probe Microphone. When
the level measured at the Probe Microphone exceeds the pre-
set limit, the words “OUTPUT OVER LIMIT” appear on the
screen, and the signal source is automatically turned off and
the measurement stopped.
The default setting for OUTPUT LIMITING is 120 dB SPL.
You can set the OUTPUT LIMITING to any level between 90
and 140 dB SPL in 5-dB increments (see procedure below). In
special cases, when you select 130 or 140 dB SPL, be aware
that extra care is necessary with any output that may exceed
132 dB SPL.
Keep in mind that the sound pressure level at the eardrum
can be higher than that measured at the mid-ear canal
position, especially at high frequencies. For this reason,
EXTREME CAUTION is advised when performing real-ear
SSPL measurements.
When using pure tones, set Noise Red (Tone) to OFF in the
local menu of the real-ear measurement screen to increase
the test speed. The pure-tone SHORT signal is recommended
when testing output levels at 90 dB SPL.
1. Push [MENU] from the real-ear measurement screen to
enter the local menu.
2. Use [∨, ∧] to select OUTPUT LIMIT under Measurements.
3. Use [<, >] to choose the desired limit.
4. Return to the measurement screen by pressing [EXIT].

132 FONIX 7000 Hearing Aid Analyzer
SANITATION NOTICE
DO NOT REUSE PROBE TUBES.
Use a new probe tube for each ear to prevent the possible
spread of infection. Sterilization of probe tubes is not pos-
sible, and germicidal solutions can leave a residue inside the
tubing which can result in errors. Do not cut off any portion
of the tube.
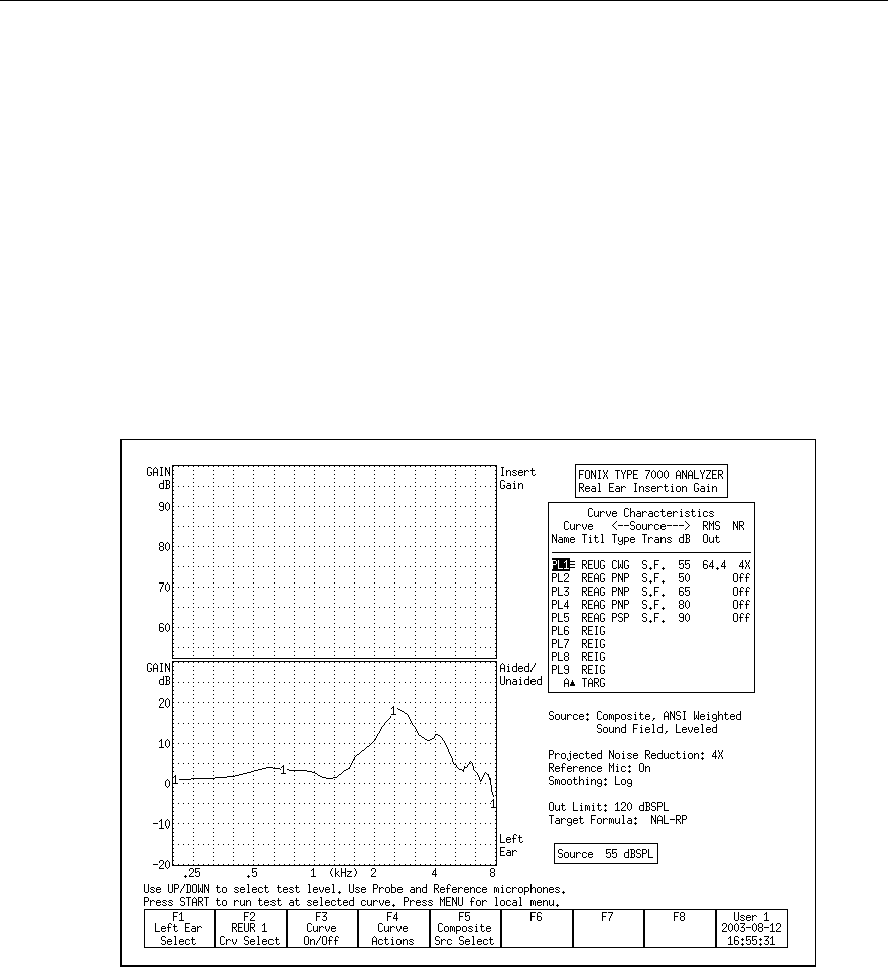
Real-Ear Measurements 133
3. Press [F5] to select the Composite signal as the source type.
4. Press [START] to start a measurement.
5. Insert the probe tube carefully, looking at the composite measurement. At
some point, there will be a large dip below the 0 dB level at 6 kHz caused
by the standing wave inside the ear. Keep inserting the probe tube until that
dip goes away and the unaided response is above 0 dB gain between 6 kHz
and 8 kHz. See Figure 6.2.3B.
6. Press [EXIT] to return to the Real-Ear Navigation screen.
Hints: To help keep the probe tube in place, position the tube so that it runs
through the tragal notch, resting against the lower edge of the tragus. If neces-
sary, reposition the body of the probe microphone lower on the Velcro button of
the ear hanger. If desired, use surgical tape to hold the tube in position.
Figure 6.2.3B—Unaided response with correct insertion of the probe tube
6.2.4 Leveling the Sound Field Speaker
The first step in making real-ear measurements is to level the sound field speak-
er. The sound field includes the room and everything in it: the operator, the cli-
ent, and any ambient noise that may penetrate the room. Leveling is important
so that the input to the hearing aid is properly controlled across the frequency
spectrum. See Figure 6.2.4. You must re-level the sound field for every client
and every ear.
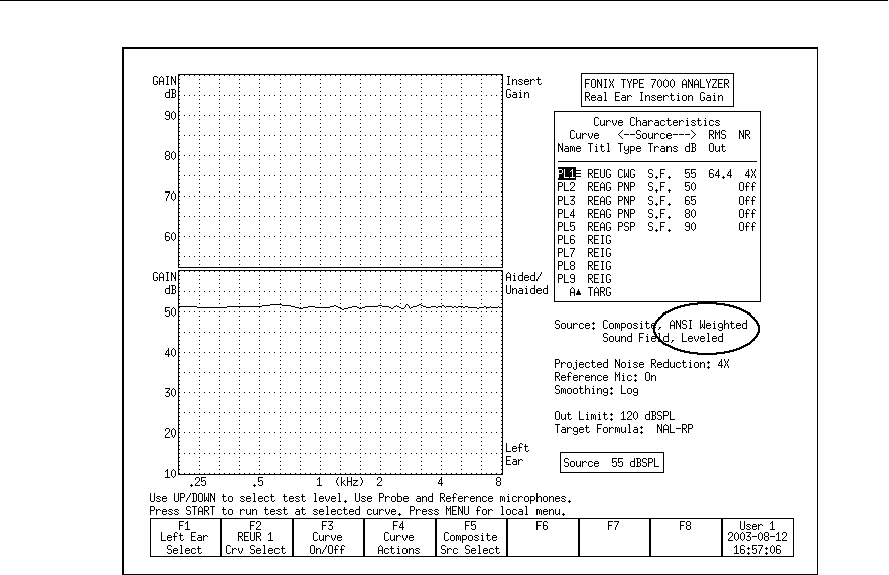
134 FONIX 7000 Hearing Aid Analyzer
Figure 6.2.4—Leveling the sound field speaker
1. Follow the instructions found in Sections 6.2.1 and 6.2.2 to position the
client, sound field speaker, and microphones for testing. Only the larger
reference microphone is used for leveling. However, to speed things up and
ensure the client is in the same position for leveling as he is for measuring,
it is recommended that you insert the probe microphone tube in the client’s
ear (described in Section 6.2.3) before the leveling process.
2. Press [F2] from the Opening screen to enter the Real-Ear Navigation screen.
3. Press [F3] or [F4] from the Real-Ear Navigation screen to enter either the
Insertion Gain screen, or the SPL screen, respectively.
4. Press [LEVEL].
5. The instrument will attempt to level the sound field speaker. There are three
leveling statuses:
a. LEVELED—This indicates the leveling process was correct within 1 dB.
b. LEVEL-FAILED—This indicates that the leveling process is incorrect by at
least 6 dB.
c. SEMI-LEVELED—This indicates that the leveling process was correct
between 1 dB and 2 dB.
d. WEAK-LEVELED—This indicates that the leveling process was correct
between 1 dB and 2 dB, but that the maximum output that the speaker
can produce is less than 80 dB SPL. To produce a louder signal, move the
speaker closer to the patient and re-level.
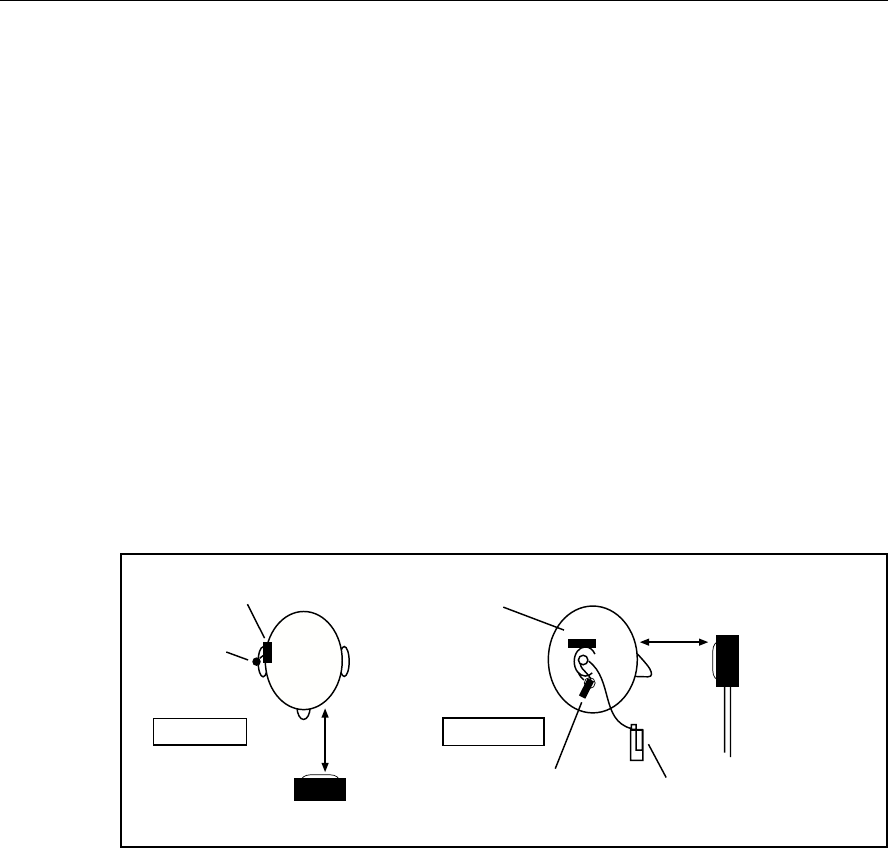
Real-Ear Measurements 135
If the instrument didn’t successfully level, there are several things you can try.
• Check the position of the sound field speaker. It should be 12 to 15 inches
from the client’s head.
• Make sure the microphones are securely plugged into the remote module.
• Make sure the front of the reference microphone is as close to the client’s
head as possible.
• Check the calibration of the loudspeaker and microphones. See Appendix
B.
• Check the noise level in the room. It may be necessary to change or cor-
rect the sound field environment.
See Section 2.8 for details on the leveling status and troubleshooting the level-
ing process.
6.2.5 Setting up Body Aids
The setup below is recommended for Body aids.
REFERENCE MIC
PROBE MIC
TOP VIEW 12"
SPEAKER
REFERENCE MIC
SIDE VIEW
PROBE MIC
(ON EARHOOK) BODY AID
(FACING FORWARD)
SPEAKER
(HEAD HIGH)
12"
Figure 6.2.5—Setting up a body aid for real-ear testing
6.3 Real-Ear Targets
This section describes how to enter a real-ear audiogram, enter or measure a
real-ear to coupler difference (RECD), and create or modify a real-ear target.
6.3.1 Entering an Audiogram
1. Enter the Real-Ear Navigation screen by pressing [F2] from the Opening
screen or [EXIT] from any real-ear screen.
2. Press [F1] to enter the Audiogram Entry screen. See Figure 6.3.1.
3. Press [F1] to select the desired ear.
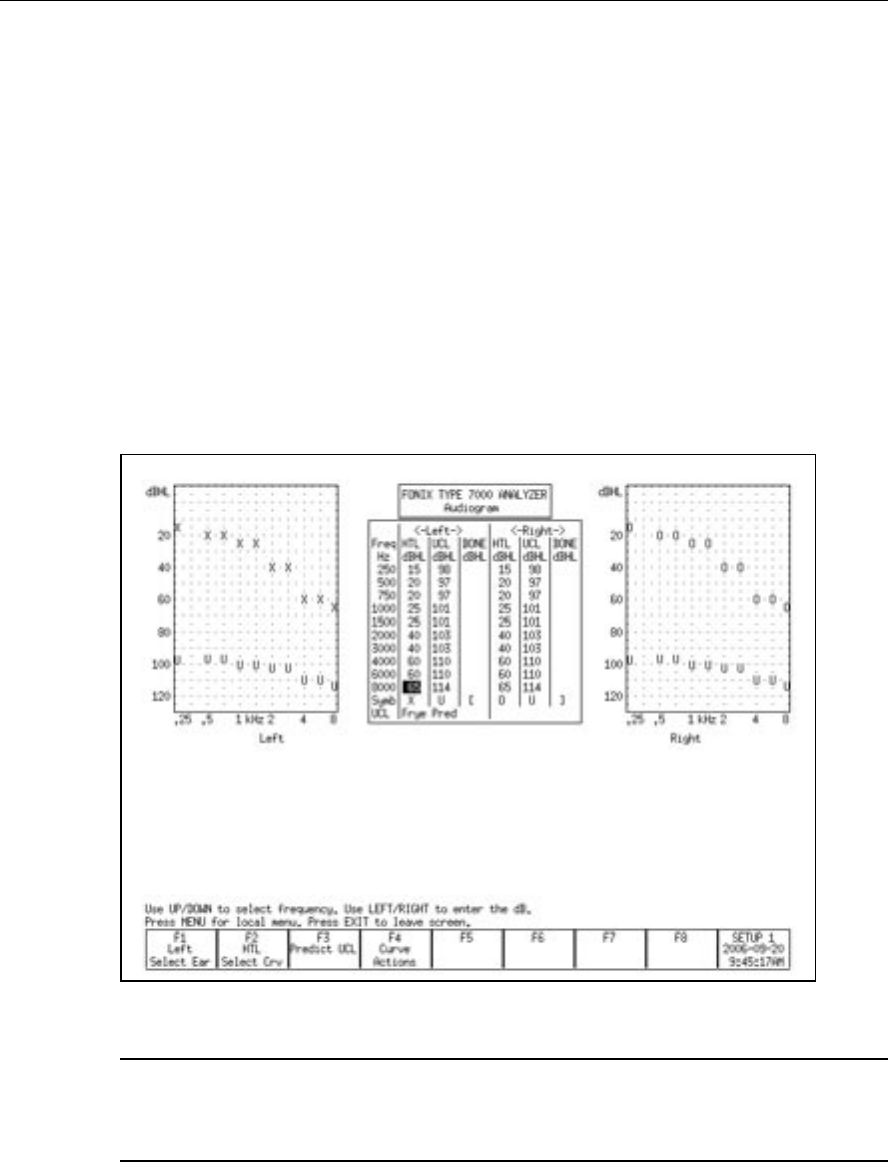
136 FONIX 7000 Hearing Aid Analyzer
4. Make sure HTL is selected above F2. You should see a cursor in the HTL
column for the selected ear in the middle of the display. If the cursor is in a
different column, press [F2] to select HTL.
5. Use the arrow keys to input the client’s HTL (hearing threshold level) val-
ues. Use [<, >] to input the amplitude. Use [∨, ∧] to select the frequency.
6. Use [F5] to select the client’s age. (Press [F5]. Use [∨, ∧] to make the selec-
tion. Press [>] to complete the selection and close the pop-up window.)
7. Press [F2] to select UCL if you would like to input your client’s measured
uncomfortable levels. Press [F3] if you would like to predict the UCL values.
(Pascoe [1988] is used for calculating UCL values.)
8. Press [F4] and select COPY EAR with [∨, ∧] if you would like to copy the
data from the selected ear into the other ear. Press [>] to make the selection.
This is useful if your client has a similar loss in both ears.
Figure 6.3.1—Audiogram Entry screen
To specify the transducer used to take the audiometric measurements,
press [MENU] and use the arrow keys to specify the Aud. Transducer under
Targets.

Real-Ear Measurements 137
6.3.2 Deleting Audiometric Information
If you make a mistake, it’s often useful to be able to delete all or part of the
inputted audiometric data. To do this:
1. Press [F4] and use [∨, ∧] to select the data you would like to delete. You can
delete the client’s HTL, UCL, Bone, and RECD. Selecting “This Ear” will
delete all data in the selected ear. Selecting “New Client” will delete all data
in both ears.
2. Press [>] to perform the action.
6.3.3 Creating a Target
Once you input an audiogram (Section 6.3.1), a target will automatically be cre-
ated when you enter a real-ear measurement screen.
To change a fitting rule:
1. Press [MENU] from the real-ear measurement screen or the Audiogram Entry
screen.
2. Select Fitting Rule under Targets with [∨, ∧].
3. Use [<, >] to select the desired fitting rule.
4. Use [∨, ∧] to select Client Age, and use [<, >] to input the desired selection.
5. If you have selected NAL-NL1, the following menu settings are also avail-
able:
• Compression: The compression kneepoint of the hearing aid. If the hear-
ing aid has multiple compression kneepoints, use the first one.
• No. of Channels: The number of channels of the hearing aid.
• Aid Limit: Type of output limited employed by the aid. Choose from
Multichannel or Wideband.
• Fit Type: Type of hearing aid fitting used by the patient. Choose Unilateral
or Bilateral.
• Sound Field: Position of the sound field speaker during real-ear measure-
ments. If the patient’s threshold values were measured with a sound field
speaker, the same angle used for the audiometric measurements should be
used for the real-ear measurements.
• Ref. Position: Type of leveling used for the real-ear measurement. Head
surface includes the patient inside the sound field (recommended for best
accuracy). Undisturbed Field indicates leveling was done by holding the
reference microphone in front of the sound field speaker.
6. Press [EXIT] to close the menu. If you are in a real-ear measurement
screen, you should see the new selected fitting rule noted under the Curve
Characteristics box.

138 FONIX 7000 Hearing Aid Analyzer
6.3.4 Entering Bone Data
The NAL-NL1 target uses bone data in its calculations. If the patient’s bone
thresholds are not entered, it will assume average values. No other fitting rules
use the bone data. To enter this data:
1. Press [MENU] in the Audiogram Entry screen to open the local menu.
2. Set the FITTING RULE to NAL-NL1 using the arrow keys.
3. Press [EXIT] to exit the local menu.
4. Press [F2] repeatedly until BONE is selected.
5. Use the arrow keys to enter the bone values into the appropriate column of
data.
6.3.5 Performing an RECD measurement
The real-ear to coupler difference (RECD) is the acoustical difference between a
2-cc coupler and the real-ear occluded response of an individual. It involves a
coupler measurement and a real-ear measurement. Both measurements are usu-
ally performed with an insert earphone as the transducer.
It’s also possible to use a linear hearing aid, instead of an insert earphone, to
perform the RECD test. In this case, you would use the same hearing aid, set
with identical volume control and/or other settings, for both the coupler and
real-ear portions of the test. The DSL Method does NOT recommend using a
hearing aid as the RECD transducer.
Coupler Measurement
The coupler part of the RECD is performed when you “calibrate” the insert
earphone used in the measurement. When this calibration is performed, the
coupler measurement is stored into permanent memory. This saves a lot of time
because, after the coupler measurement is made once, you will only have to per-
form the real-ear part of the RECD for each patient. If you change the transducer
or calibrate your microphones, make sure to perform the coupler measurement
again.
The following instructions assume you are using an ER3 insert earphone for
performing the RECD measurement. The 7000 Test System will eventually sup-
port an RECD method using a linear hearing aid, but that feature is not yet
implemented.
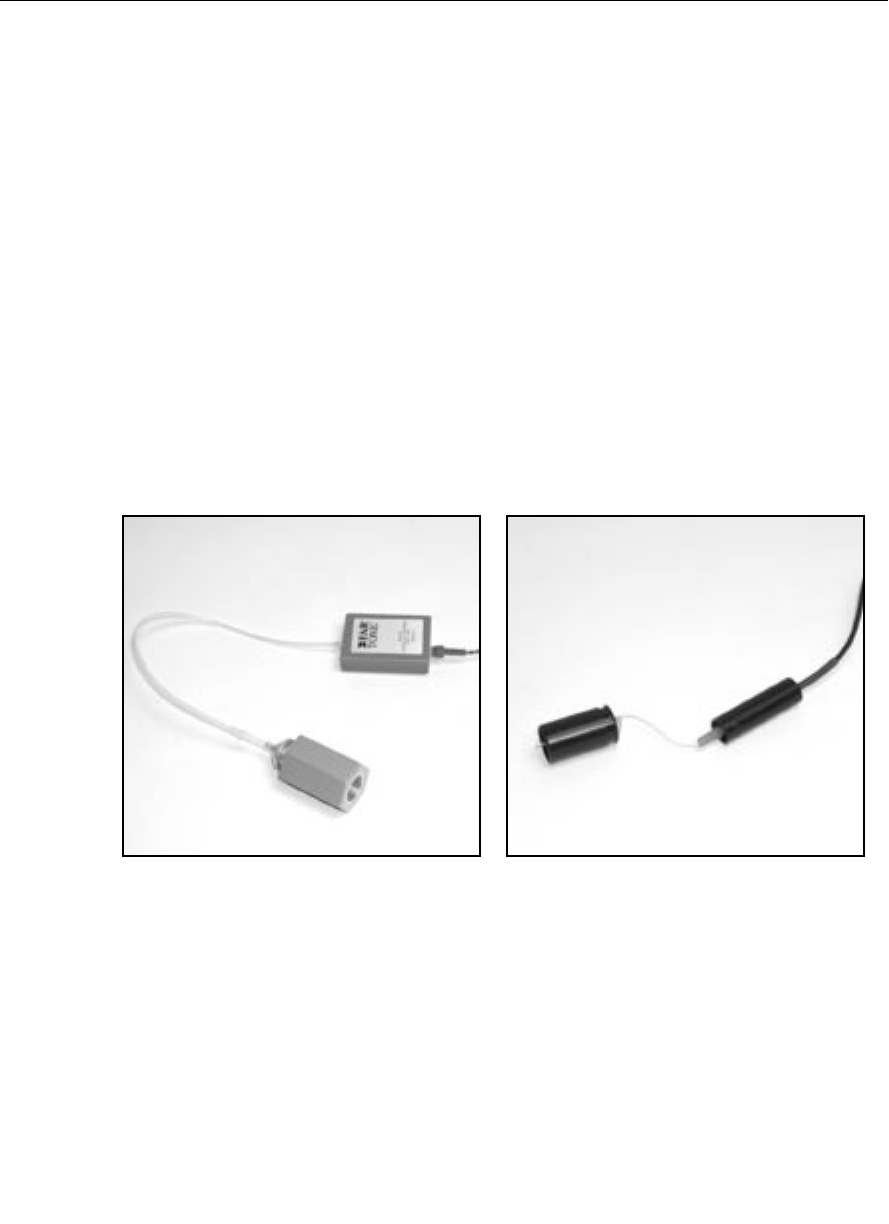
Real-Ear Measurements 139
To perform the coupler measurement:
1. Insert the 50 ohm insert earphone into the jack on the back of the 7000 test
system labeled “EARPHONE.”
2. Plug the other end of the insert earphone into the tubing of the ear level
adapter attached to an HA-2 coupler. See Figure 6.3.5A.
3. Insert a probe tube through the black probe microphone adapter as shown
in Figure 6.3.5B. Attach a dab of Fun-tak to the adapter to keep the probe
tube from slipping.
4. Attach the probe tube to the probe microphone.
5. Insert the adapter into the HA-2 coupler.
6. Press [MENU] from the Opening screen to open the Setup menu.
7. Press [F4] to perform the coupler measurement. This also saves the coupler
measurement in permanent memory.
8. Press [EXIT] to return to the Opening screen.
Figure 6.3.5A Figure 6.3.5B
Insert earphone attached to coupler Probe tube in probe mic adapter
To perform the real-ear measurement:
1. Insert the 50 ohm insert earphone into the jack on the back of the 7000 test
system labeled “EARPHONE.”
2. Insert the probe microphone into the client’s ear, as described in Section
6.2.3. See Figure 6.3.5C.
3. Insert the foam eartip connected to the insert earphone into the client’s
ear, or attach the earphone directly to the client’s earmold, and insert the
earmold into the client’s ear. See Figure 6.3.5D.
4. Press [F2] from the Opening screen to enter the Real-Ear Navigation screen.
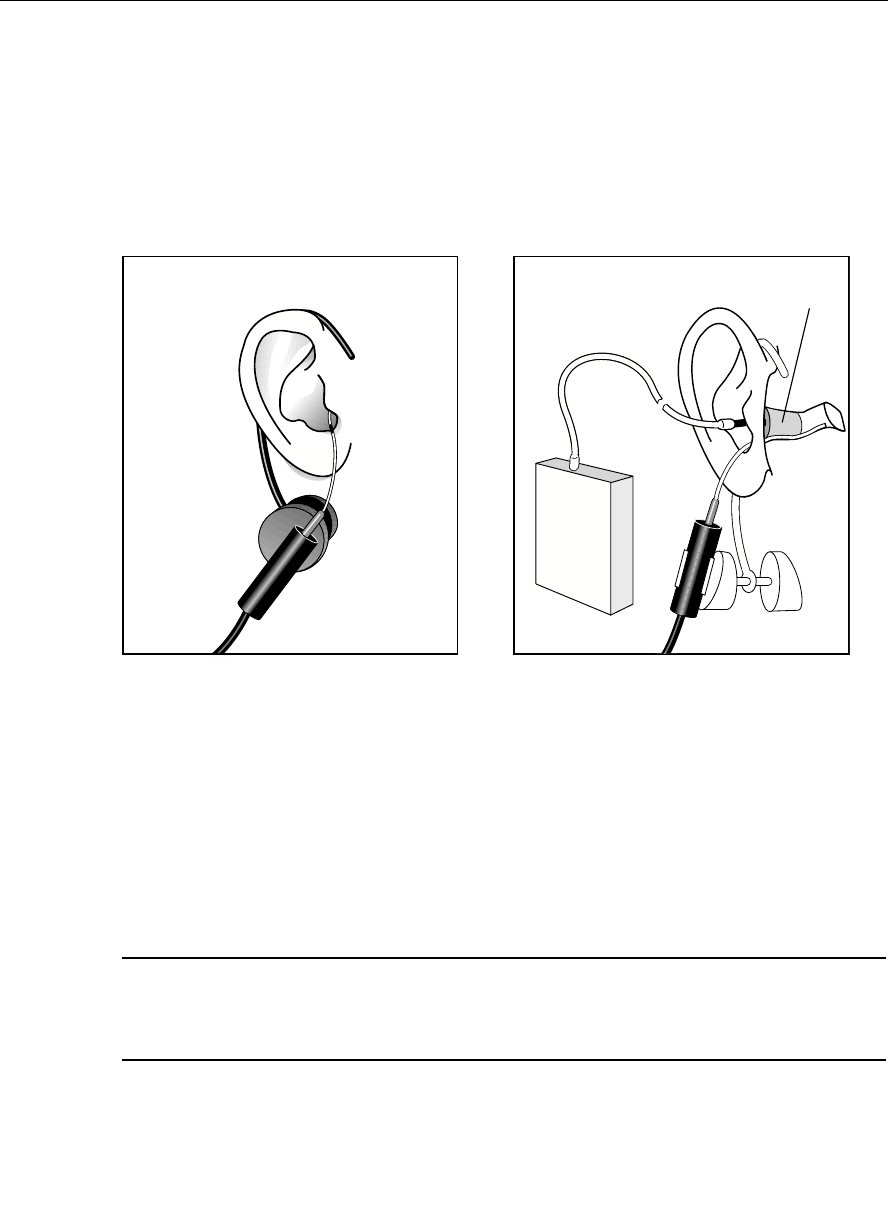
140 FONIX 7000 Hearing Aid Analyzer
5. Press [F1] from the Real-Ear Navigation screen to enter the Audiogram Entry
screen.
6. Press [MENU] from the Audiogram Entry screen to enter the local menu.
7. Use [∨, ∧] to select RECD Mode under Misc, and use [<, >] to choose
Custom Measured.
8. Use [∨, ∧] to select RECD Transducer and use [<, >] to choose ER3.
Probe mic
Probe mic
ER3
INSERT
EARPHONE
Foam plug or
custom earmold
Figure 6.3.5C—Insert probe microphone Figure 6.3.5D—Insert foam eartip connected
to insert microphone.
9. Press [EXIT] to close the menu.
10. Use [F2] in the Audiogram Entry screen to select RECD. You may have to
push the button several times.
11. Press [START] to take the measurement. The results will appear in both
graphical and numeric format. See Figure 6.3.5.E
If you have previously taken an RECD measurement, you can input it (with-
out measuring it) by selecting RECD with [F2] and using the arrow keys as
you would to input HTL values.
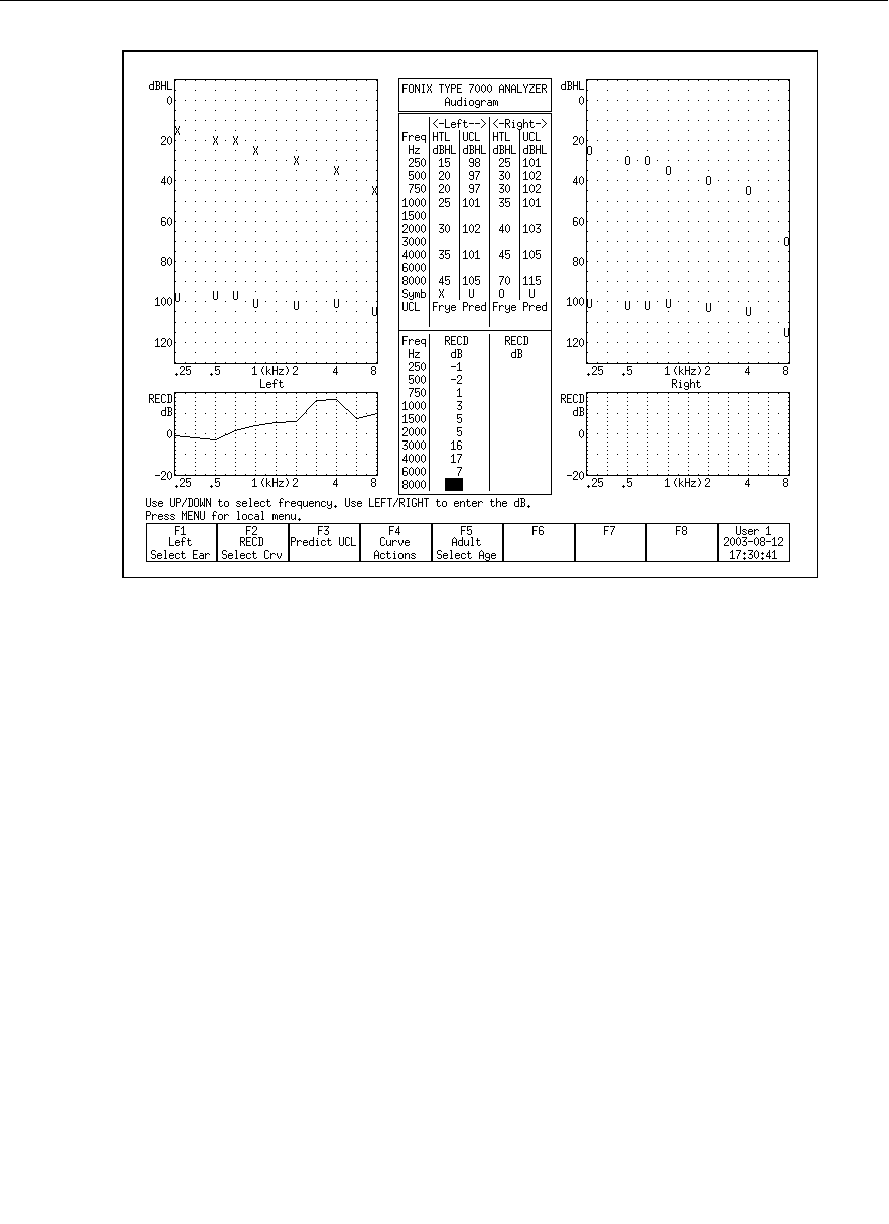
Real-Ear Measurements 141
Figure 6.3.5E—Taking an RECD Measurement
6.3.6 Modifying a Target
Once you input an audiogram in the Audiogram Entry screen, a target will auto-
matically appear on the real-ear measurement screens. You can use the Real-Ear
Target screen to modify a target or to input your own target in dB insertion gain
or dB SPL, edit your client’s HTL and UCL values in dB SPL, and input a cus-
tom real-ear to dial difference (REDD).
1. Enter the Real-Ear Navigation screen by pressing [F2] from the Opening
screen or [EXIT] from a real-ear screen (such as the Audiogram Entry
screen).
2. Press [F2] to enter the Real-Ear Target screen. See Figure 6.3.6. If you have
input an audiogram as described in Section 6.3.1, you should see targets in
both the SPL and gain graphs.
3. Select the desired ear with [F1].
4. Use [F3] to select the desired fitting rule.
5. Use [F2] to select the data you want to edit. The choices are:
• HTL (re): The client’s audiogram in dB SPL
• TARG SPL: The mid-level target in dB SPL
• UCL (re): The client’s uncomfortable levels in dB SPL
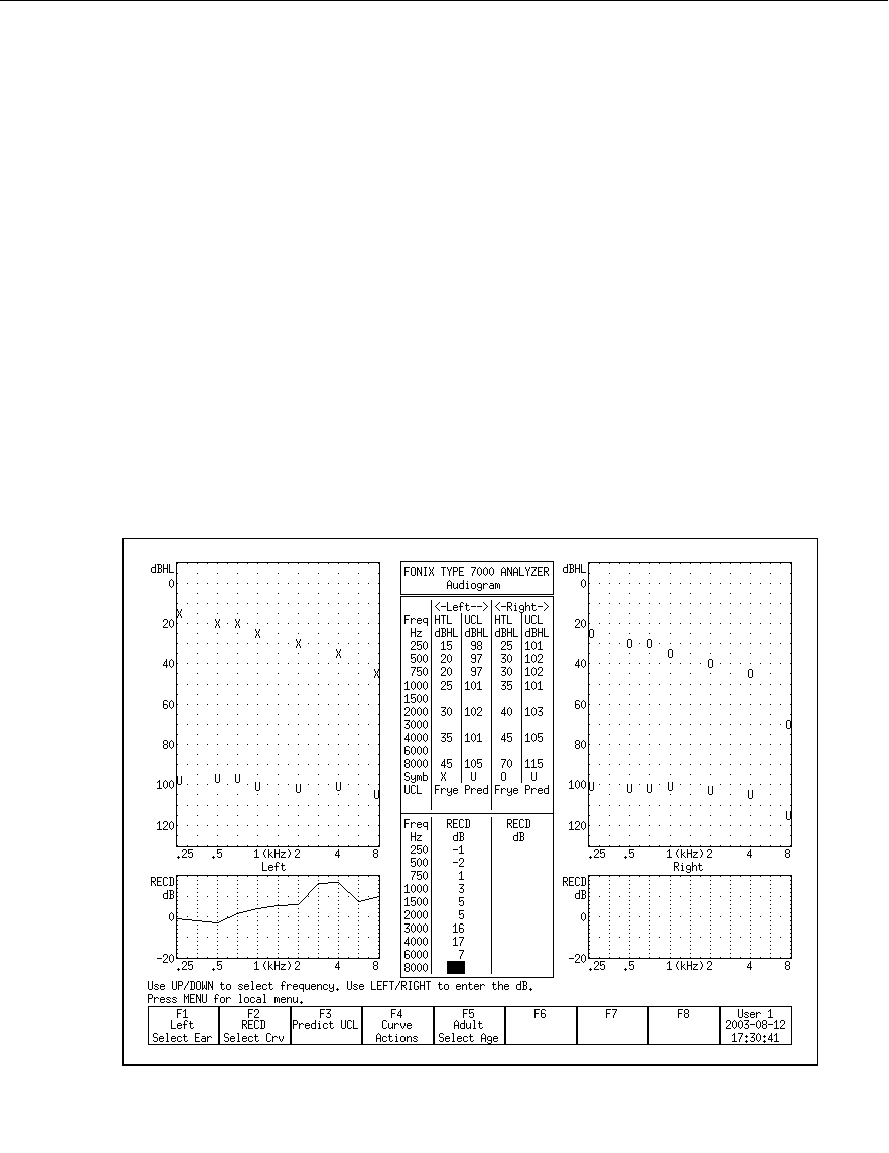
142 FONIX 7000 Hearing Aid Analyzer
• REDD: The real-ear to dial difference (only selectable when REDD is set
to CUSTOM)
• TARG IG: The mid-level target in dB insertion gain
6. Use [F5] to select the signal source if you are modifying the SPL target:
• Select the Source Type. Choose between Tone and Composite. Press
[START] to make your selection without closing the pop-up window.
• Select the Source Level. Choose between 40 through 90 dB SPL. Press [>]
to make your selection and close the pop-up window.
7. Use the arrow keys to make your modifications to the target. The [∨, ∧] keys
select the desired frequency, and the [<, >] keys modify the amplitude 1 dB
at a time.
Note: When you edit the Target IG, the Target SPL will also be updated.
However, when you edit the Target SPL directly, it will not have an effect on the
Target IG.
Figure 6.3.6—The Real-Ear Target screen

Real-Ear Measurements 143
6.3.7 Entering an REDD transform
The REDD transform affects how dB HL values are converted to dB SPL.
To enter a measured REDD value:
1. Enter the Real-Ear Navigation screen by pressing [F2] from the Opening
screen or [EXIT] from a real-ear screen (such as the Audiogram Entry
screen).
2. Press [F2] to enter the Real-Ear Target screen.
3. Press [MENU] in the Real-Ear Target screen.
4. Select REDD using [∨, ∧].
5. Choose CUSTOM using [<, >].
6. Press [EXIT] to return to the Real-Ear Target screen.
7. Use [F1] to select the desired ear.
8. Use [F2] to select REDD. You may have to press [F2] repeatedly. The REDD
column for the selected ear will now be highlighted.
9. Use the arrow keys to input the REDD transform. The [∨, ∧] keys select the
frequency. The [<, >] keys select the amplitude.
6.4 Real-Ear Measurements
The 7000 Hearing Aid Test System has three real-ear measurement test screens:
Insertion Gain, Real-ear SPL, and Visible Speech. The Insertion Gain and Real-
ear SPL screens are explained in this section. See Section 6.7 for operation of
the Visible Speech screen.
6.4.1 Measuring in the Insertion Gain screen
Insertion Gain is the most conventional method used for performing real-ear
measurements. In the typical insertion gain procedure:
1. The probe tube is inserted into the ear canal. (Section 6.2.3)
2. The sound field speaker is leveled. (Section 6.2.4)
3. The unaided response is measured. (Section 6.4.3)
4. The hearing aid is carefully inserted into the ear.
5. The aided response is measured. (Section 6.4.4)
6. The insertion gain response is compared to the prescribed insertion gain tar-
get and any necessary adjustments are made to the hearing aid in order for
the response to better match the target
The Insertion Gain screen itself consists of two graphs. (See Figure 6.4.1.) The
bottom graph displays an unaided response and up to four aided responses in
dB Gain or dB SPL. The top graph displays a prescribed insertion gain target
and up to four insertion gain curves. Insertion gain is the difference between the
patient’s aided and the unaided responses.
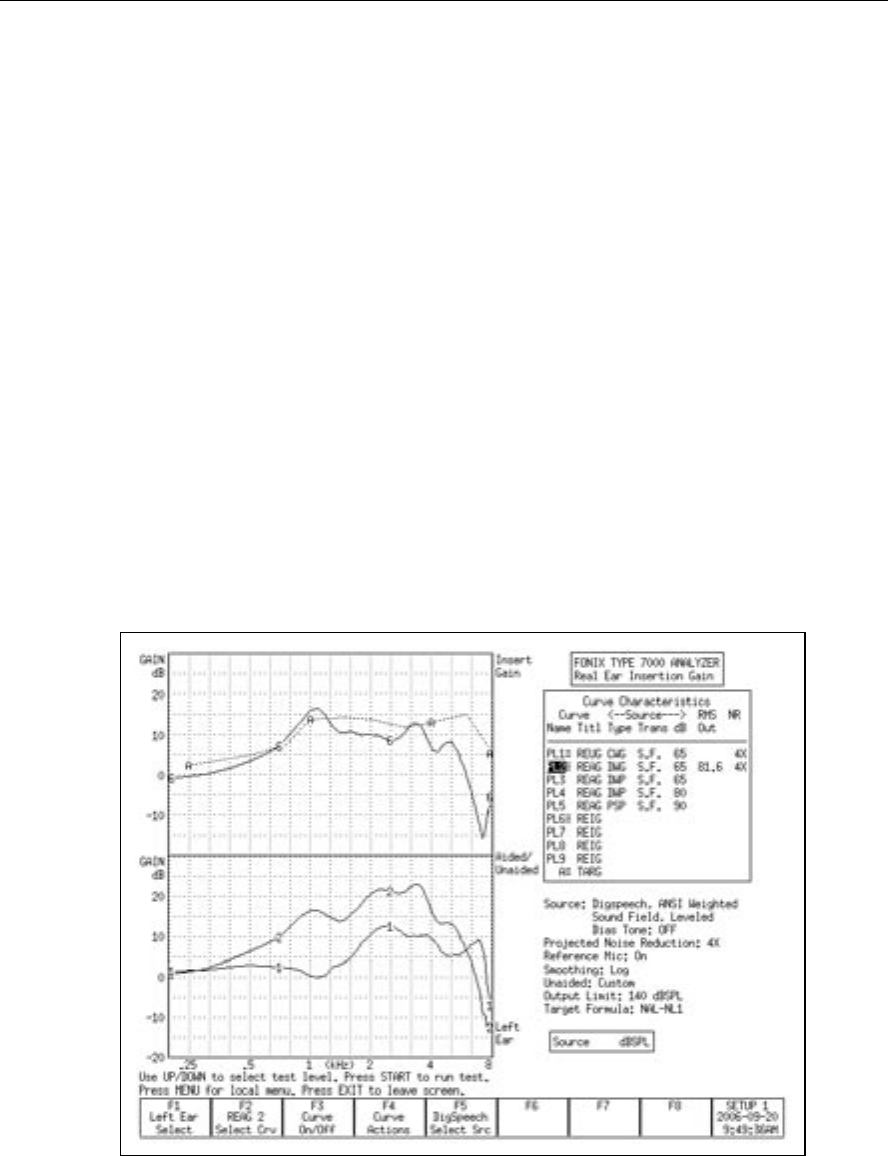
144 FONIX 7000 Hearing Aid Analyzer
In other words, the bottom graph of the insertion gain screen shows the differ-
ence between the sound field measured by the reference microphone outside of
the ear and the probe microphone in the ear canal. (When the reference micro-
phone is disabled, the estimated sound field is subtracted.) The top graph shows
the insertion gain, which are the values obtained when the unaided response is
subtracted from the aided response.
Target Curve A, displayed in the top graph in the Real-ear Insertion Gain screen,
is automatically adjusted to the source type and amplitude of the current select-
ed curve when REAG 2-5 are selected. When REUG 1 is selected, Target Curve
A uses the source settings of REAG 3. (This only applies when the NAL-NL1 fit-
ting rule is selected. All other fitting rules on the 7000 are linear, which means
the target does not change with respect to the source type and amplitude of the
signal.)
Most of the operations of the Insertion Gain screen are identical to the opera-
tions of the Real-ear SPL screen. Therefore, most of the instructions found in
this section apply to measurements performed in both screens. Any differences
between operations in the two screens are noted.
To enter the Insertion Gain screen, press [F2] from the Opening screen to enter
the Real-ear Navigation screen. Then press [F3].
Figure 6.4.1—Real-ear Insertion Gain screen. Curve 1 is an REUG (unaided) measurement.
Curve 2 is an REAG (aided) measurement. Curve 6 is the REIG (insertion gain) curve. Curve A
is the real-ear prescription target.

Real-Ear Measurements 145
6.4.2 Measuring in the Real-ear SPL screen
In the past ten years, the SPL method of performing real-ear measurement has
increased in popularity. In the SPL method, the patient’s hearing threshold lev-
els (HTLs), uncomfortable levels (UCLs), real-ear target, and real-ear measure-
ments are displayed together on one graph in terms of dB SPL. This allows for a
direct comparison of audiometric measurements and real-ear measurements.
The goal in the SPL method is to ensure the response of the hearing aid to soft
signals (50 dB SPL) reach above the patient’s HTLs, the response to average
signals (65-80 dB SPL) meet the target, and the response to loud signals (90 dB
SPL) are below the UCLs.
In the Real-ear SPL screen (Figure 6.4.2), the patient’s HTLs and UCLs are dis-
played on one large graph together with up to three real-ear targets and five real-
ear measurements. The three targets (L, M, and H) are matched to the source
type and amplitude of REAR 2, REAR 3, and REAR 4, respectively. That is,
Target Curve L is appropriate for the settings used in REAR 2, M is appropriate
for REAR 3, and H is appropriate for REAR 4. When changing the source type or
amplitude of any of these three measurement curves, the target will automati-
cally adjust. These curves are color coded to make it easier to match the mea-
surement curve to the appropriate target. Target L and REAR 2 are blue, Target
M and REAR 3 are green, and Target H and REAR 4 are red.
The long term average speech spectrum (LTASS) is also displayed as three
dotted “l”, “m”, and “h” curves. The LTASS is the average real-ear unaided
response. The “m” curve is the real-ear unaided response at 70 dB SPL. The “h”
curve is 12 dB above this curve, and the “l” curve is 18 dB below it. The three
curves of the LTASS are used as a comparison tool to the aided measurement
curves to demonstrate the amplication advantage provided by the hearing aid.
During a typical real-ear measurement using the SPL method:
1. The probe tube AND hearing aid are inserted into the ear canal. (Section
6.2.3)
2. The sound field speaker is leveled. (Section 6.2.4)
3. The hearing aid is carefully inserted into the ear.
4. The aided response is measured (Section 6.4.4) with an input signal of 50
dB SPL and compared to the patient’s HTLs.
5. The aided response is measured with an input signal of 65 dB SPL and com-
pared to the real-ear target.
6. The aided response is measured with an input signal of 90 dB SPL and com-
pared to the patient’s UCLs
Most of the operations of the Real-ear SPL screen are identical to the opera-
tions of the Insertion Gain screen. Therefore, most of the instructions found in
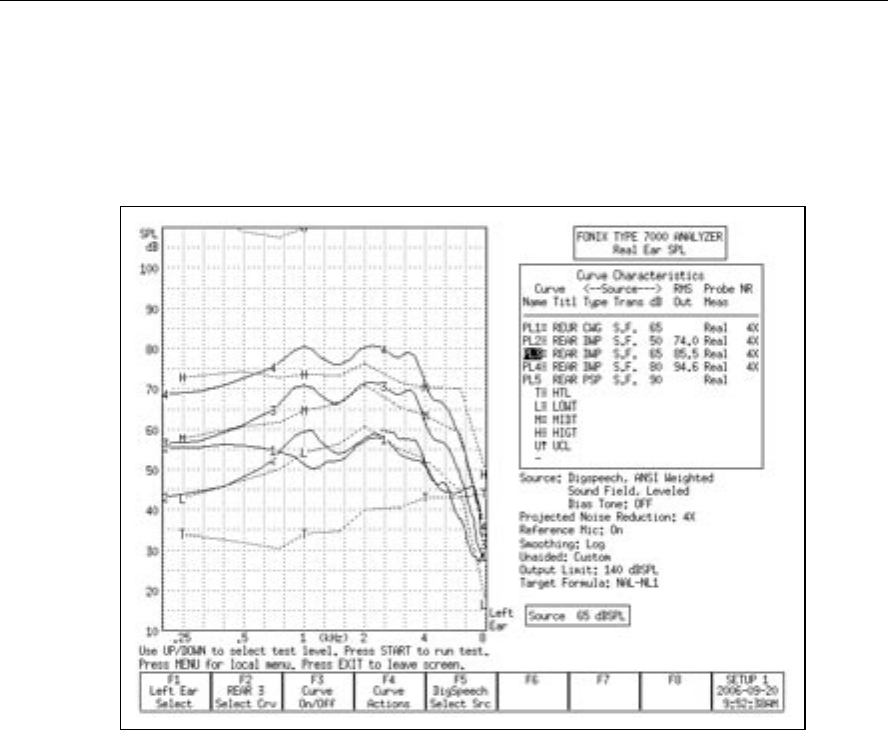
146 FONIX 7000 Hearing Aid Analyzer
this section apply to measurements performed in both screens. Any differences
between operations in the two screens are noted.
To enter the Real-ear SPL screen, press [F2] from the Opening screen to enter
the Real-ear Navigation screen. Then press [F4].
Figure 6.4.2—Rear-ear SPL screen. The T curve represnts the patient’s thresholds, the L, M, and
H curves represent the NAL-NL1 targets. Curve 1 shows the unaided response. Curves 2, 3, and
4 show the aided response at 50, 65, and 80 dB SPL. The patient’s UCLs are just off the top of
the graph.
6.4.3 Measuring the Unaided Response (REUG/REUR)
The REUG/REUR is a measurement of the unaided response of the patient’s ear
canal. It can be measured in either the Real-ear Insertion Gain screen or the
Real-ear SPL screen, and any measurement performed in one of these screens
will be automatically displayed in the other screen.
To measure the unaided response:
1. Position the patient in front of the sound field speaker and place the earhook
and reference microphone on the ear. See Sections 6.2.1 and 6.2.2..
2. Insert the probe tube into the patient’s ear canal. See Section 6.2.3.
3. Input the patient’s audiogram to generate a target, if desired. See Section
6.3.
4. Press [EXIT] in the Audiogram Entry screen to return to the Real-ear
Navigation screen.

Real-Ear Measurements 147
5. Enter the Insertion Gain or Real-ear SPL screen by using [F3] or [F4] in the
Real-ear Navigation screen, respectively.
6. Level the sound field speaker. See Section 6.2.4.
7. Select the desired ear with [F1].
8. Look at the [F2] setting to see which curve is selected. If necessary, use [F2]
to select REUR 1. (Press [F2]. Use [∨, ∧] to select REUR 1. Press [>] to com-
plete the selection and close the pop-up menu.)
9. Use [F5] to select Composite.
10. Use [∨, ∧] to select the desired amplitude for the measurement. We recom-
mend 65 dB SPL.
11. Press [START] to start the measurement.
12 Press [STOP] when the unaided response has stabilized. Curve 1 in the bot-
tom graph of Figure 6.4.1 shows an example of the unaided response using
the Gain display in the Insertion Gain screen.
To choose between Gain and SPL (Output):
In the Real-ear Insertion Gain screen, the bottom graph contains the unaided
and aided measurement curves as a function of gain (REUG/REAG) or of output-
SPL (REUR/REAR). The “SPL” display includes includes the input signal in the
measurement. The “gain” display subtracts the input signal in the measurement.
1. Enter the Real-ear Insertion Gain screen.
2. Press [MENU] to open the local menu.
3. Select Display using the up-down arrow keys.
4. Use the right arrow key to choose between Gain and SPL.
5. Press [EXIT] to return to the Real-ear Insertion Gain screen. The bottom
graph should now match your selection.
The Real-ear SPL screen cannot display measurements in Gain. All measure-
ments are displayed in SPL (output). Therefore, the Display selection in the
local menu is disabled.
To use an average unaided response:
It is also possible to display an average unaided response on the measurement
screen instead of a measured response. This allows the clinician to skip the
unaided response measurement. When the unaided response is set to aver-
age, the REAR 2 curve is automatically selected at the first measurement curve
instead of the REUR 1 curve.
To use an average unaided curve, press [MENU] in the Insertion Gain or Real-
ear SPL screen. Use the arrow keys to set Unaided to Avg. Press [EXIT] to close

148 FONIX 7000 Hearing Aid Analyzer
the local menu. The average unaided response will now be displayed on the
measurement graph.
To auto-adjust the unaided response:
When using the SPL display in the Insertion Gain screen, or when measuring
in the Real-ear SPL screen (in other words, when the unaided response is dis-
played in terms of SPL and not gain), the unaided response includes the input
signal used in the measurement.
In order to directly compare the unaided response to the aided response in an
SPL graph, it is important that the speech weighting and input level of the input
signal are the same for both the unaided and the aided response. For example,
if the unaided response is measured at 65 dB SPL, it is difficult to directly com-
pare it to the measured aided response at 80 dB SPL when viewing the data in
an SPL graph. However, a direct comparison of the unaided and aided response
can be desirable in ensuring the hearing aid amplifies above the unaided
response. Therefore, the 7000 Hearing Aid Test System has an “REUR Auto
Adjust” feature.
When the REUR Auto Adjust is enabled, the unaided response is automatically
adjusted according to the speech weighting and input level of the selected aided
measurement. This allows the clinician to measure the unaided response at one
level and directly compare it to aided measurement curves measured at another
level.
To enable the REUR Auto Adjust, press [MENU] in the Real-ear Insertion Gain
or Real-ear SPL screen to open the local menu. Use the arrow keys to select
REUR Auto Adjust under Measurements and change its setting to On.
The REUR Auto Adjust is automatically enabled when Unaided is set to Average
in the local menu.
6.4.4 Measuring the Aided Response (REAG/REAR)
Up to four different aided curves can be measured and displayed together in the
Real-ear Insertion Gain and Real-ear SPL screens. Any measurement made in
one of these screens will automatically be displayed in the other screen.
To measure the aided response:
1. Follow the instructions found in Section 6.4.3 to measure the unaided
response, if desired. Even if you don’t want to measure the unaided
response, follow the instructions in Steps 1-7 in Section 6.4.3 to enter an
audiogram, enter the measurement screen, insert the probe tube, and level
the sound field speaker.
2. Insert the hearing aid into the ear, being careful not to move the probe tube.
3. Select the signal source with the [F5] button. Digital Speech is a good source
type to use when measuring most hearing aids. (Press [F5] to open the

Real-Ear Measurements 149
pop-up selection menu. Use the up-down arrow keys to make the desired
selection. Press the right arrow key to complete the selection and close the
menu.)
4. Use [F2] to select REAG 2. By default, this curve is set to 50 dB SPL (i.e.,
soft speech). To perform a medium speech curve measurement, use the up
arrow key to increase the source level to 65 dB SPL.
5. Press [START] to take the measurement. When the frequency response has
stabilized, press [STOP] to stop the measurement.
Measuring in the Real-ear Insertion Gain screen:
For a description of the Real-ear Insertion Gain screen, see Section 6.4.1. In
Figure 6.4.1, Curve 2 in the bottom graph shows the aided response, Curve 6 in
the top graph shows the real-ear insertion gain (REIG), and Curve A shows the
REIG prescription target.
When fitting to the prescription target, the Curve 6 should be within 5 dB of
Curve A. Make any necessary adjustments to the hearing aid fitting, and repeat
Step 5 above to make another measurement.
If desired, use [F2] to select REAG 3-5. It is recommended to perform real-ear
measurements as 50, 65, 80, and 90 dB SPL. For this reason, the default source
levels of REAG 2-5 are set accordingly. Use the up-down arrow keys to change
the selected source amplitude at any time. Target Curve A is always adjusted to
the source type and amplitude of the current selected aided curve.
Measuring in the Real-ear SPL screen:
For a description of the Real-ear SPL screen, see Section 6.4.2. In Figure 6.4.2,
Curve 2 is displayed as a solid (blue) curve on the SPL graph. When the NAL-
NL1 target is selected, a (blue) dotted Curve L is the prescription target for the
source type and amplitude used for Curve 2. To match the frequency response
to target, match Curve 2 to Curve L.
When using the NAL-NL1 fitting rule, Target Curve L should be used for REAR
2, Target Curve M should be used for REAR 3, and Target Curve H should be
used for REAR 4. REAR 5 can be compared to the displayed “U”s, representing
the patient’s uncomfortable levels to make sure that the response at 90 dB SPL
does not exceed them.
When using a target other than NAL-NL1, only the M target will be displayed in
the Real-ear SPL screen, which uses the source settings of REAR 3. Therefore,
to match the frequency response to a non-NAL-NL1 target, use [F2] to select
REAR 3, and perform the measurement. REAR 3 can be compared to the M tar-
get.
Make any necessary adjustments to the hearing aid fitting, and use the [START]
and [STOP] keys to make another measurement. If desired, use [F2] to select

150 FONIX 7000 Hearing Aid Analyzer
another measurement curve. It is recommended to perform real-ear measure-
ments as 50, 65, 80, and 90 dB SPL. For this reason, the default source levels of
REAG 2-5 are set accordingly. Use the up-down arrow keys to change the select-
ed source amplitude at any time.
6.4.5 Working with prescription targets
The 7000 Hearing Aid Test System has the following fitting rules available:
NAL-NL1, NAL-RP, 1/3 Gain, 1/2 Gain, 2/3 Gain, Berger, and POGO. The NAL-
NL1 fitting rule is non-linear and changes depending upon the amplitude of the
input signal. The other fitting rules are linear and provide the same amount of
gain regardless of the input level.
To display a target, the clinican must enter the patient’s audiogram in the
Audiogram Entry screen. See Section 6.3.1. Values must be entered at 500, 1000,
2000, and 4000 Hz or the target will not be displayed.
The NAL-NL1 target has a number of settings associated with it that will change
the prescription. Press [MENU] in the Audiogram Entry screen, Insertion Gain,
or Real-ear SPL screen to change the current settings. Press [EXIT] to close the
local menu when the changes are complete.
In the Insertion Gain screen, one insertion gain target is displayed in the top
graph. If the NAL-NL1 fitting rule is selected, this target adjusts according to the
input level setting of the current selected curve. That is, if the amplitude of the
source is set to 50 dB SPL, the displayed target is for a 50 dB SPL input level.
If the clinician changes the input level to 80 dB SPL, the target will decease,
showing the prescription for that input level. When the unaided (REUG 1) is
selected, the target curve uses the source settings for REAR 3.
In the Real-ear SPL screen, up to three SPL targets are displayed on the screen.
When NAL-NL1 is the selected fitting rule, all three targets are automatically
displayed. They are labeled L, M, and H. The L target is tied to the input level
and speech weighting selected for REAR 2. The M target is tied to the input
level and speech weighting selected for REAR 3. The H target is tied to the input
level and speech weighting selected for REAR 4. That is, if the clinican changes
the input level or speech weighting of REAR 2, 3, or 4, the corresponding SPL
target will also adjust.
If a fitting rule other than NAL-NL1 is selected, only the M target is displayed,
which is tied to REAR 3. If desired, the clinican can turn on the display of the
other two targets using [F3], but these targets will be linearly related to each
other. That is, unlike with the NAL-NL1 non-linear target, the shape of the lin-
ear target will not change as the input level of the input signal changes.

Real-Ear Measurements 151
6.4.6 Using Semi-Auto and Fully-Auto Mode
The Real-ear Insertion Gain and Real-ear SPL screens have basic implementa-
tions of Semi-Automatic and Fully-Automatic test modes. In Semi-Automatic
mode, the analyzer automatically advances to the next measurement curve
when the measurement is stopped. That is, if the user selects REUR 1 and takes
a measurement, the analyzer will automatically advanced the curve selection to
REAR 2. This eliminates the need for the clinician to press [F2] and manually
advance to the next curve. Semi-automatic mode is available in both the Real-
ear Insertion Gain and Real-ear SPL screens.
To activate semi-automatic mode:
1. Enter the Real-ear Insertion Gain or Real-ear SPL screen.
2. Press [MENU] to open the local menu.
3. Select Auto Test under Measurements [∨, ∧]. Pressing [START] will jump to
the beginning of the next section in the local menu.
4. Choose Semi-Auto using [<, >].
5. Press [EXIT] to return to the real-ear measurement screen. The analyzer will
now be in Semi-Automatic mode.
Fully automatic mode automatically measures REAR 2, REAR 3, REAR 4, and
REAR 5 in quick succession. When REUR 1 is selected, after pressing [START]
to perform the unaided measurement, the user must still press [STOP] to stop
the test. This will automatically advance the curve selection to REAR 2, but no
measurement will be taken until the [START] button is pressed again.
Fully-automatic mode is only available in the Real-ear SPL screen. It does not
work in the Real-ear Insertion Gain screen.
To activate fully-automatic mode:
1. Enter the Real-ear SPL screen.
2. Press [MENU] to open the local menu.
3. Select Auto Test under Measurements [∨, ∧]. Pressing [START] will jump to
the beginning of the next section in the local menu.
4. Choose Fully-Auto using [<, >].
5. Press [EXIT] to return to the Real-ear SPL screen. The analyzer will now be
in Fully-Automatic mode.
6.4.7 Testing with a single tone or three frequency average
It is sometimes useful to be able to look at a hearing aid’s response to a single
frequency or to a repeating three-frequency sequence. To measure with one of
these selections:

152 FONIX 7000 Hearing Aid Analyzer
1. Enter the Real-ear Insertion Gain or Real-ear SPL screen.
2. Press [MENU] to enter the local menu.
3. Select Static Tone under Source using [∨, ∧]. Pressing [START] will jump
ahead to the beginning of the next section in the local menu.
4. Choose Single or Avg using [<, >]. If choosing Avg for a three-frequency
average, use the Avg Freqs setting to select the highest frequency of the three
frequency average. See Section 2.3.1.1 for more details on the available fre-
quencies.
5. Press [EXIT] to return to the measurement screen.
6. Press [START] to start the test. If performing a SINGLE test, use [<, >] to
adjust the frequency of the tone.
7. Use [∨, ∧] to adjust the amplitude of the test signal.
8. Press [STOP] when the measurement is complete.
6.4.8 Using the reference microphone
When determining the gain of a hearing aid, the analyzer normally subtracts the
response measured by the probe tube from the sound field measured by the ref-
erence microphone positioned outside the ear. This occurs when the reference
microphone is ON. If you are in a particularly noisy environment or if you are
testing an open fit hearing aid, the reference microphone measurement could
introduce unwanted artifacts into your testing.
When the reference microphone is disabled, the analyzer uses the information
determined during the leveling process to determine the signal outside the ear
during the measurement. It is very important that the patient remain still after
leveling and that the sound field is undisturbed, particularly if the reference
microphone has been disabled.
To enable/disable the reference microphone:
1. Enter the Real-ear Insertion Gain or Real-ear SPL screen.
2. Press [MENU] to enter the local menu.
3. Select Reference Mic using [∨, ∧] under Measurements.
4. Use [<, >] to choose ON or OFF.
5. Press [EXIT] to return to the measurement screen.
6.4.9 Viewing numerical curve data
The frequency response curves measured by the 7000 test system can be viewed
in either the standard graphical format or in data format, allowing the clinician
to take a look at the actual numerical values of the measurements.
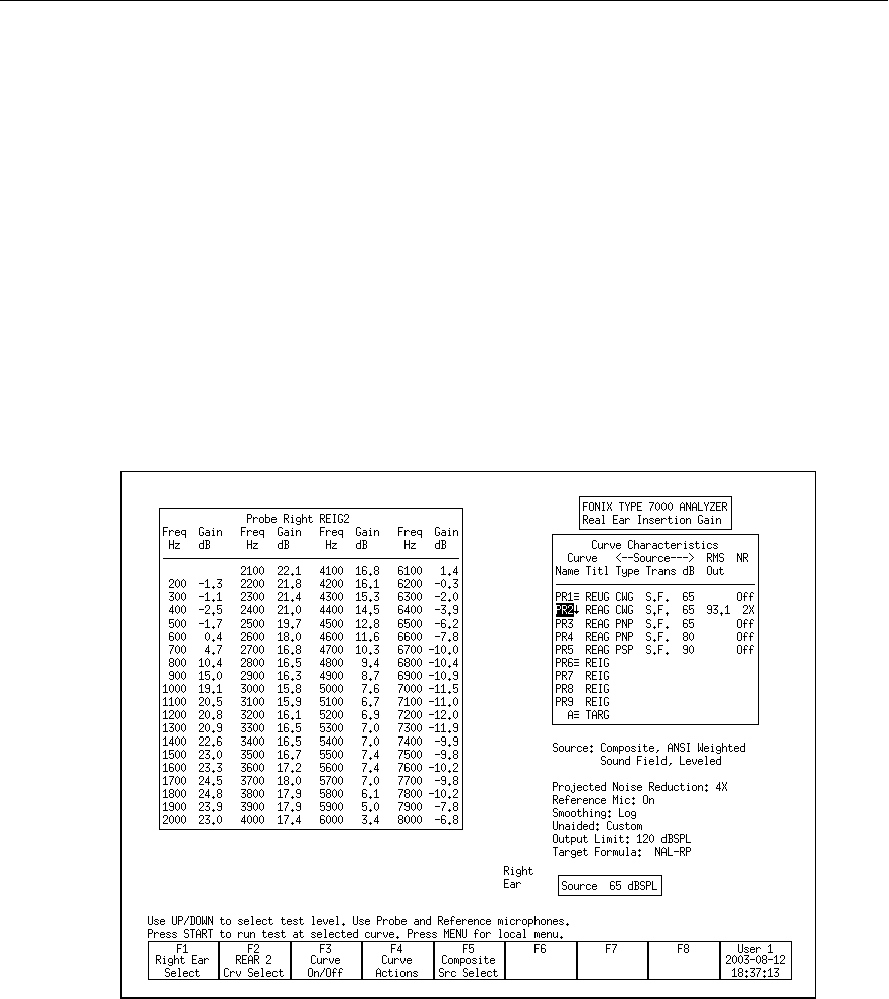
Real-Ear Measurements 153
To view curve data in the Real-ear Insertion Gain screen:
1. Enter the Real-ear Insertion Gain:
2. Press [MENU] to enter the local menu.
3. Select Data/Graph under Display using [∨, ∧].
4. Use [<, >] to choose:
• AIDED DATA: To view selected aided curve.
• IG DATA: To view selected insertion gain curve.
• GRAPH: To view in standard graphical (non-numeric) format.
5. Press [EXIT] to return to the Insertion Gain screen. Instead of the measure-
ment graphs, you will now see tables of numerical data. See Figure 6.4.9.
6. Use [F2] to select the curve you want to view. Depending upon your selec-
tion in Step 3, you will either see the insertion gain or the aided gain
results.
Figure 6.4.9—Insertion Gain data format display
To view curve data in the Real-ear SPL screen:
1. Enter the Real-ear SPL screen:
2. Press [MENU] to enter the local menu.
3. Select Data/Graph under Display using [∨, ∧].

154 FONIX 7000 Hearing Aid Analyzer
4. Use [<, >] to select DATA.
5. Press [EXIT] to return to the Real-ear SPL screen. The numerical data dis-
play will be shown.
6. Use [F2] to select the curve data you want to display.
6.4.10 Deleting and un-displaying measurements
It is often convenient to temporarily clear one or more of the measurement
curves without deleting them.
To turn off/on the display of a curve without deleting it:
1. Press [F3] to open the pop-up menu with the curve selections.
2. Use [∨, ∧] to select the curve you want to turn off or on.
3. Use [>] to toggle the display of the selected curve and close the menu.
Alternately, press [START] to toggle the display but leave the pop-up menu
open. This will allow you to quickly make another display change without
closing the menu. Press [F3] to close the menu.
Note: The status of each curve is displayed in the Curve ON/OFF menu. ON
means the curve is measured and displayed. OFF means the curve is measured
and not displayed. NO means the curve has not been measured.
To permanently delete a curve:
1. Press [F2] to select the curve you want to delete.
2. Use [F4] to delete the selected curve. The following selections are available:
• DELETE SELECTED CURVE: Deletes the curve but retains the curve set-
tings such as the source type and source level.
• DELETE SELECTED CURVE AND SETTINGS: Deletes the curve and
return the source type and level to their default settings.
• DELETE ALL CURVES: Deletes all curves but retains the curve settings.
• DELETE ALL CURVES AND SETTINGS: Deletes all curves and returns
curve settings to their default selections.
6.4.11 Using Smoothing in measurement curves
Smoothing averages together points in a response measurement in order to
achieve a smoother response curve. This is useful for reducing artifacts that
might be introduced in a noisy testing environment, but it can also decrease
the accuracy of the curve. See Figure 6.4.11 for a comparison of a measurement
curve with and without smoothing.
In composite log smoothing:
• From 200 Hz–2000 Hz, measured data points from three consecutive fre-
quencies 100 Hz apart are averaged to get the curve point at the center
frequency.
• From 2000 Hz–3000 Hz, measured data points from five consecutive fre-
quencies 100 Hz apart are averaged to get the curve point at the center
frequency.
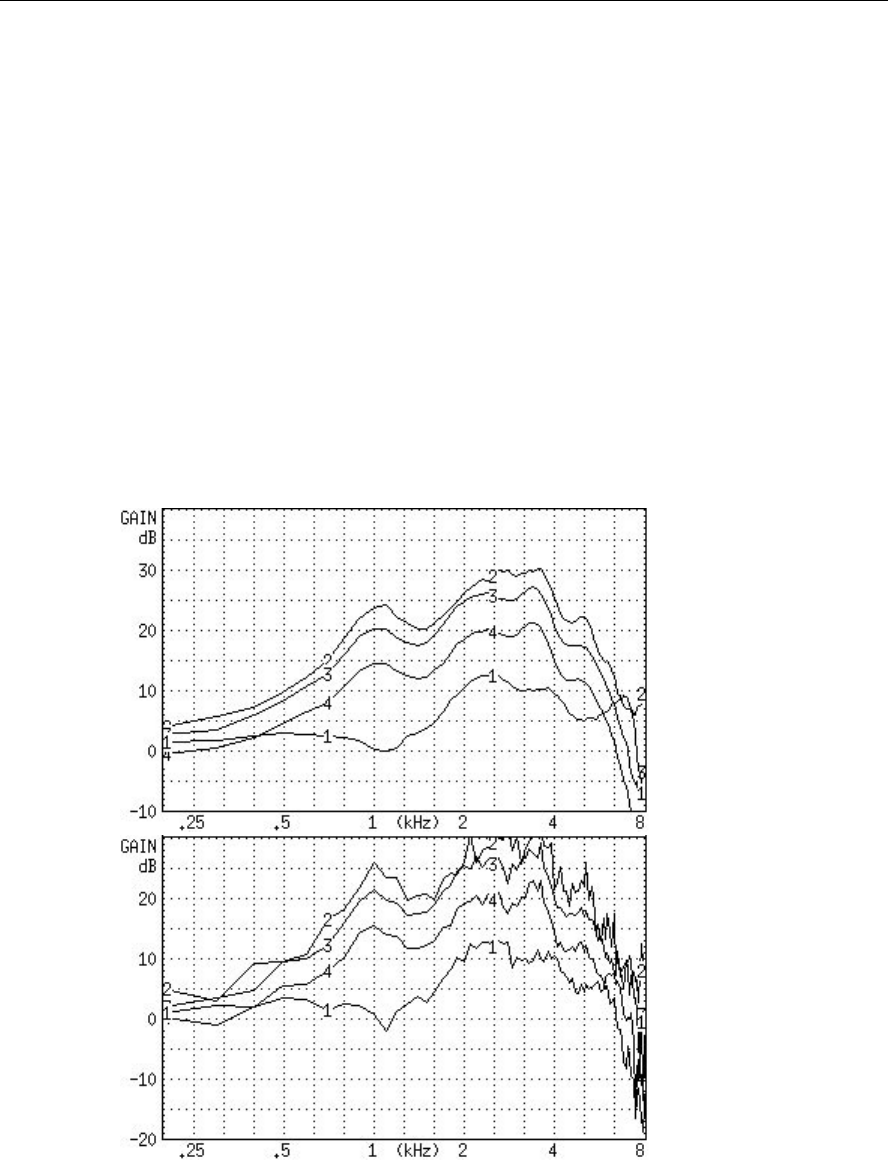
Real-Ear Measurements 155
• From 3000 Hz–8000 Hz, measured data points from seven consecutive
frequencies 100 Hz apart are averaged to get the curve point at the center
frequency.
In normal pure-tone log smoothing:
• Each center frequency is smoothed by averaging it together with the out-
puts from the next upper and lower 12th octave frequency.
To turn on/off log smoothing:
1. Enter the measurement screen.
1. Press [MENU] to enter the local menu.
2. Use [∨, ∧] to select Smoothing under Display.
3. Use [<, >] to choose LOG or OFF.
4. Press [EXIT] to return to the measurement screen. All measurements will
have the chosen smoothing status.
Figure 6.4.11—A comparison of a smoothed (top) and unsmoothed (bottom) curve.

156 FONIX 7000 Hearing Aid Analyzer
6.4.12 Using Output Limiting
When performing real-ear measurements, it is very important not to expose
your client to noises that could conceivably further damage his hearing. For
this reason, the 7000 test system has built-in output limiting. When the probe
microphone reads a value above the output limit at any frequency, the test will
automatically stop.
The default setting for the output limit is 120 dB SPL. In the real-ear measure-
ment menu, you can change this limit to any value between 90 dB SPL to 140
dB SPL in 5 dB steps.
Be aware that extra care is necessary with any output that may exceed 132 dB
SPL. Also, keep in mind that the sound pressure level at the eardrum can be
higher than that measured at the mid-ear canal position, especially at high fre-
quencies. For this reason, extreme caution is advised when performing real-ear
measurements with a source level of 90 dB SPL.
To change the output limit:
1. Press [MENU] to enter the real-ear measurement menu.
2. Press [∨, ∧] to select Output Limit under Measurements.
3. Use [<, >] to choose the desired limit.
4. Press [EXIT] to return to the real-ear measurement screen.
6.4.13 Measuring the occlusion effect
You can use the Insertion Gain screen in order to measure the “occlusion effect”
of a hearing aid. By analyzing the spectrum of your client’s own voice, you can
judge whether the occlusion effect will make the hearing aid uncomfortable,
and you can measure an improvement (lessening) of the occlusion effect after
adjusting the vent opening.
To measure the occlusion effect:
1. Enter the Real-Ear Navigation screen by pressing [F2] from the Opening
screen.
2. Follow the instructions in Section 6.2.3 to insert the probe tube into the cli-
ent’s ear. You do not have to level the sound field speaker for this measure-
ment.
3. Insert the hearing aid in the client’s ear, being careful not the move the
probe tube. The hearing aid can be turned on or off.
4. Enter the Insertion Gain screen by pressing [F3] from the Real-Ear
Navigation screen.
5. Use [F2] to select the REUR 1 curve. (Press [F2]. Use [∨, ∧] to select REUR 1.
Press [>] to complete the selection and close the pop-up menu.)
6. Use [F5] to select a source type of COMPOSITE.

Real-Ear Measurements 157
7. Press [∨] repeatedly until the chosen source is OFF.
8. Press [START] to start the measurement.
9. Instruct your client to sustain the vowel sound “eee.”
10. Press [STOP] while the “eee” is still sounding, and the curve has stabilized.
The client can now stop vocalizing.
11. Look at the amplification in the low frequencies. If it seems high, you may
consider adjusting the vent to a more open condition, to prevent occlusion-
effect discomfort.
12. Press [F2] to select the REAR 2 curve. Make sure that COMPOSITE is the
selected source type, and that the source is turned OFF. Use [F5] and [∨] to
make these selections, if necessary.
13. Press [START] to start a second measurement
14. Ask the client to sustain an “eee” sound again. Press [STOP] during the
vocalization when the measurement has stabilized. (You can then tell your
client to stop.)
15. Examine the REAR 2 curve in the lower graph and the corresponding REIR
curve in the upper graph. REAR 2 is a measurement of the occlusion effect
with the adjusted vents. The REIR curve in the upper graph is a measure-
ment of the difference between the two vent configurations.
6.5 Digital Hearing Aids
All digital aids can be tested, but some of the high-end models require a little
more thought and care; these aids have a “noise suppression” feature (also
known as “speech enhancement”). This noise suppression, not to be confused
with the automatic compression of AGC hearing aids, checks if the sound going
into the hearing aid is a continuous signal that could be regarded as noise. If
the aid decides that the sound is noise, it lowers the gain at the corresponding
frequencies. Conventional testing techniques, such as a pure-tone sweep or the
Composite signal, can cause the high-end digital aid to go into this noise reduc-
tion mode. This means that the gain or output you see on the analyzer’s display
will not necessarily reflect the normal response of the aid in speech.
6.5.1 Using Digital Speech
The Digital Speech signal was developed in order to test noise-reducing digital
hearing aids without fear of them going into noise suppression mode. It does
this by taking the standard Composite signal and interrupting it randomly. The
digital hearing aid responds to this modulated signal as it would response to
normal speech.
The advantage of Digital Speech is that the 7000 analyzer treats it just as anoth-
er signal source. You don’t have to test the digital hearing aid any differently
than you would test a normal analog hearing aid. Just choose Digital Speech
as your testing signal using the [F5] function key in one of the real-ear testing
screens.
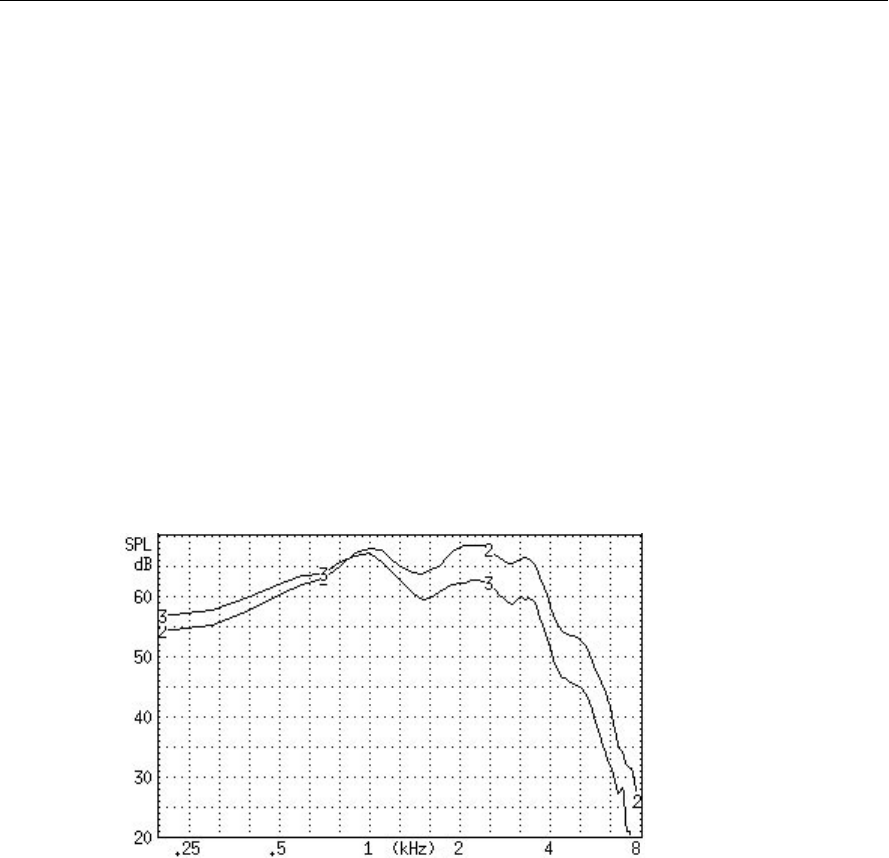
158 FONIX 7000 Hearing Aid Analyzer
6.5.2 Choosing a speech weighting
By default, the Digital Speech (and Composite) signal uses the ANSI S3.42
speech weighting. Some clinicians, however, prefer to test using the ICRA
speech weighting, which was used in the development of some digital hearing
aids. The ICRA weighting available on the 7000 analyzer is based on the ICRA
CD track #1, “unmodulated moderate male weighted artificial speech,” devel-
oped by the International Collegium of Rehabilitative Audiologists (ICRA). See
Figure 6.5.2 for a comparison of an aid being tested with the ANSI and the ICRA
speech weightings.
To change the speech weighting:
1. Press [MENU] from a real-ear measurement screen.
2. Use [∨, ∧] to select Composite Filter under Source.
3. Use [<, >] to choose ANSI or ICRA.
4. Press [EXIT] to return to the real-ear measurement screen. Any Digital
Speech or Composite signal will use the new selected speech weighting.
Figure 6.5.2—A comparison of an aid being tested with Digital Speech using the ICRA (CRV 3)
and the ANSI S3.42 (CRV 2) speech weightings
6.5.3 Testing the digital filters
It is possible to add a bias tone to the Digital Speech signal in order to see how
the aid responds in the presence of noise at different frequencies. This is useful
for checking the filters of the hearing aid and determining how one channel of
the hearing aid reacts to noise in a different channel of the aid.
To introduce a bias signal in a measurement screen:
1. Enter the Real-ear Insertion Gain or Real-ear SPL screen, set up the patient
for real-ear measurements, and level the sound field speaker.
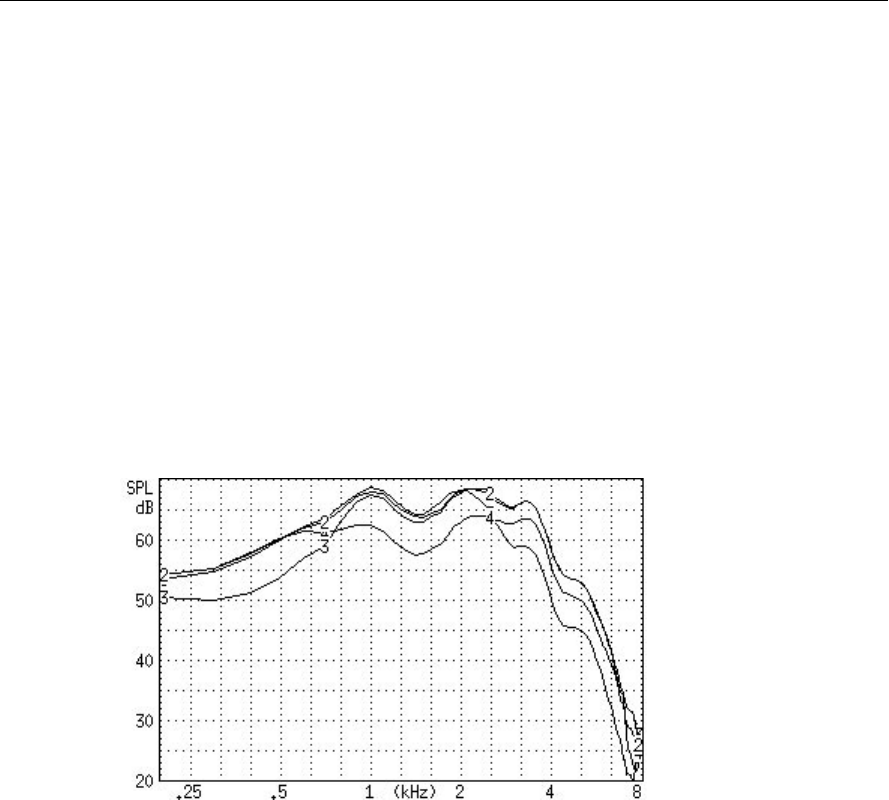
Real-Ear Measurements 159
2. Select the Digital Speech signal source with [F5].
3. Press [MENU] to enter the local menu.
4. Select Bias Tone under Source using [∨, ∧].
5. Use [<, >] to select the level of the bias signal. Choose from 40-90 dB SPL
in 5 dB steps.
6. Press [EXIT] to return to the measurement screen. The Digital Speech signal
will now include the pure-tone bias signal.
7. Press [START] to start the measurement.
8. Use [<, >] to change the frequency of the bias signal. Notice how the aid
reacts when the bias frequency is changed. Some hearing aids don’t react at
all to the bias while other aids react dramatically. See Figure 6.5.3.
9. Press [STOP] when done with testing. Go back into the menu to turn the
bias signal OFF again.
Figure 6.5.3—Using the bias signal in real-ear measurements. CRV 2–5 were measured using
bias signal frequencies of no bias, 500 Hz, 2000 Hz, and 4000 Hz respectively
6.5.4 Testing digital noise suppression
The comparison of the frequency response using the Composite signal and the
Digital Speech signal can be used to see how much the aid lowers its gain when
subjected to a noisy signal. This is a test of the noise suppression technology on
the hearing aid.
1. Enter the Real-ear Insertion Gain or Real-ear SPL screen, set up the patient
for real-ear measurements, and level the sound field speaker.
2. Use [F2] to select REAR 2. (Press [F2]. Use [∨, ∧] to select REAR 2. Press [>]
to complete the selection and close the menu.)
3. Use [F5] to select Digital Speech.
4. Use [∨, ∧] to set the source amplitude to 65 dB SPL.
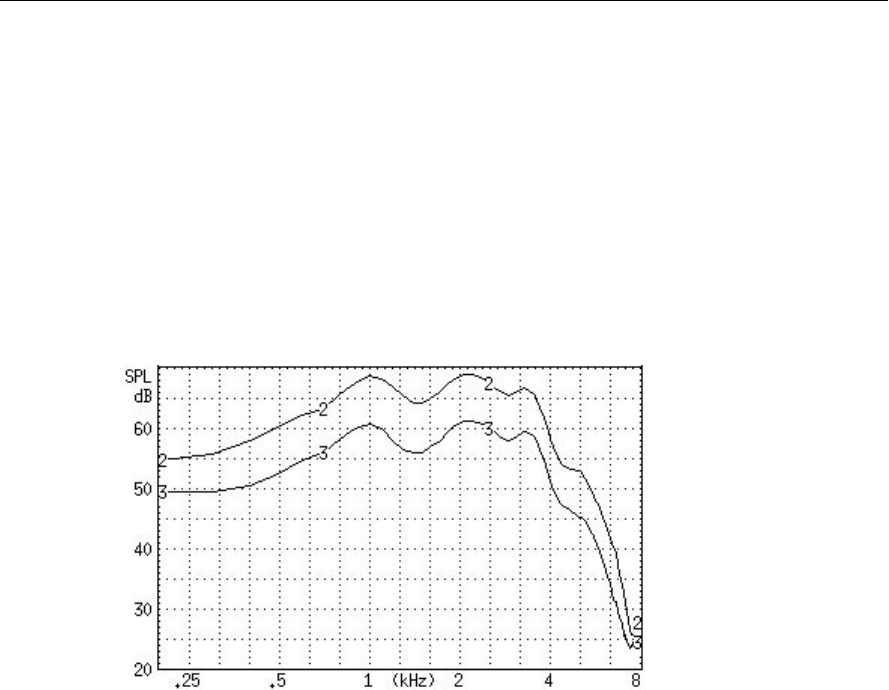
160 FONIX 7000 Hearing Aid Analyzer
5. Press [START] to measure the frequency response of the hearing aid. Press
[STOP] when the measurement has stabilized.
6. Use [F2] to select the REAR 3.
7. Use [F5] to select Composite.
8. Use [∨, ∧] to set the source amplitude to 65 dB SPL.
9. Press [START] to start the measurement. After the measurement has sta-
bilized, press [STOP] to stop the measurement. Figure 6.5.4 illustrates an
example of a digital hearing aid with noise suppresion. Curve 2 shows the
response of the aid to the Digital Speech curve, and Curve 3 shows the
response of the aid to the Composite signal. .
Figure 6.5.4—Testing noise suppression of a digital hearing aid. REAR 2 was tested using
Digital Speech. REAR 3 was tested using the Composite Signal.
6.6 Directional Hearing Aids
The directional advantage provided by a hearing aid can be easily measured
with real-ear measurements. This section describes a method of measuring
directionality using the Real-ear Insertion Gain screen.
6.6.1 Using the insertion gain technique
The Real-ear Insertion Gain screen is ideal for performing real-ear measure-
ments of hearing aid directionality.
To test directionality:
1. Set up the patient for real-ear measurements by inserting the probe micro-
phone and hearing aid.
2. Place the sound field speaker behind the patient at 180° or 135° azimuth.
Point the reference microphone of the probe microphone set towards the
sound field speaker.
3. Enter the Real-ear Insertion Gain screen.
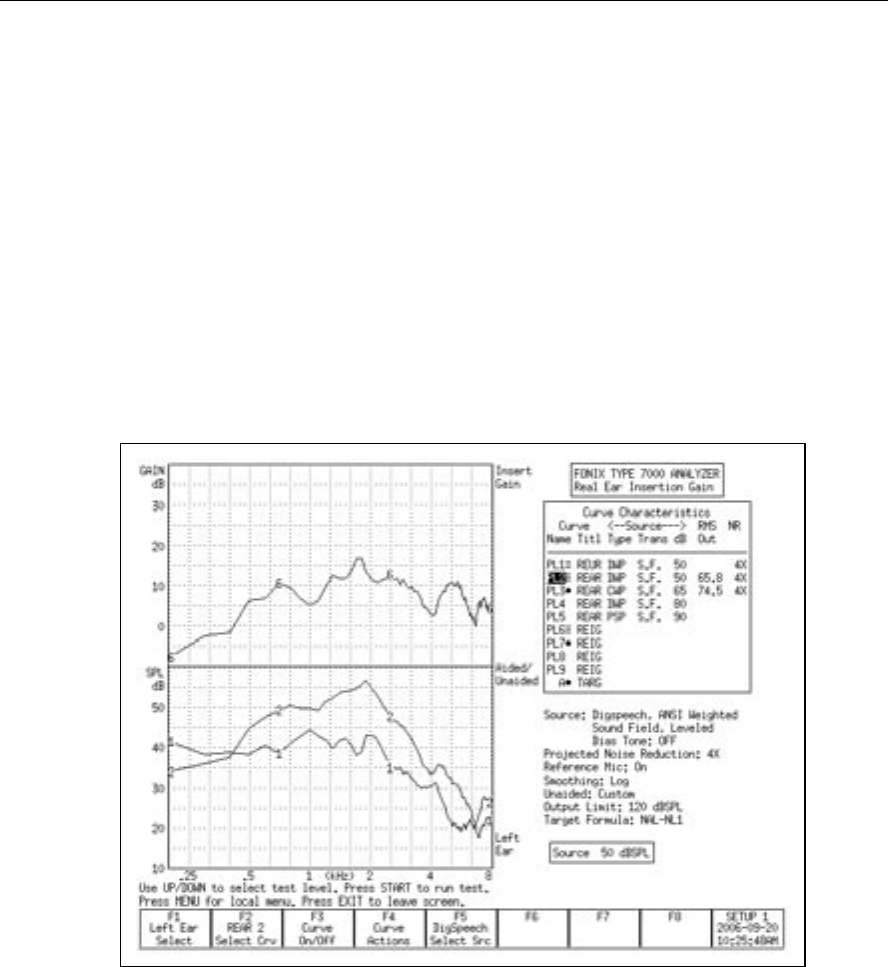
Real-Ear Measurements 161
4. Press [LEVEL] to level the sound field speaker.
5. Use [F2] to select REUG 1. (Press [F2] to open the pop-up selection menu.
Use [∨, ∧] to select REUG 1. Press [>] to complete the selection and close
the menu.)
6. Use [F5] to set the source type to DIG SPEECH.
7. Use [∨, ∧] to set the source amplitude to 50 dB SPL.
8. Press [START] to start the frequency response measurement. When the mea-
surement has stabilized, press [STOP]. This is the “reverse” measurement
curve.
9 Use [F2] to select REAG 2.
10. Use [F5] to set the source type to DIG SPEECH.
11. Use [∨, ∧] to set the source amplitude to 50 dB SPL.
Figure 6.6.1—Testing directionality. REUR 1 was tested with the source at 135° azimuth. REAR
2 was tested with the source at 45° azimuth. Curve 6 illustrates the directional advantage of the
hearing aid.
12. Reposition the patient so that the sound field speaker is placed at 0° or 45°
azimuth. The reference microphone should be repositioned so that it is fac-
ing towards the sound field speaker.
13 Press [LEVEL] to re-level the sound field speaker. This will temporarily clear
(but not erase) the reverse measurement.

162 FONIX 7000 Hearing Aid Analyzer
14. Press [START] to start the frequency response measurement. (The “reverse”
measurement will reappear when the measurement starts.) When the “for-
ward” measurement has stabilized, press [STOP].
15. Look at the difference between the “forward” (REAG 2) and the “reverse”
(REUG 1) frequency responses (Figure 6.6.1). The “forward” frequency
response should show more amplification than the reverse frequency
response. Take note of the differences in the RMS OUT of the two curves.
This will tell you the average amount of amplification advantage that the
directional microphones provide.
6.6.2 Determining the “null”
When performing a directional test, the position of the sound field speaker can
be used to determine the “null” of the directional microphones. The “null” is
the azimuth at which the directional hearing aid provides the least amount of
amplification.
To determine the null, follow Steps 1-8 in Section 6.6.1 to measure the reverse
curve. While performing this measurement, move the sound field speaker
around the patient (this is easier using a speaker on a swing arm than a floor
stand). Try to keep the speaker equal distance from the patient while moving the
speaker in a semi-circle behind him.
Look at the frequency response as the speaker is moved. If the aid is direc-
tional, its frequency response will decrease as the speaker is moved from the
front of the patient to the back of the patient. The angle at which the frequency
response is at its lowest is the “null” of the directional hearing aid.
6.7 Open Ear Hearing Aids
Open ear hearing aids require additional consideration during real-ear measure-
ments because of the special technology used by these aids to eliminate feed-
back. This feedback suppression technology can interfere with the sound field
measured by the reference microphone outside the ear. Therefore, in order to
get an accurate real-ear measurement of an open-ear hearing aid, the reference
microphone of the 7000 Hearing Aid Test System should be disabled.
To set up the analyzer for open fit real-ear testing:
1. Enter the Real-ear Insertion Gain or Real-ear SPL screen.
2. Press [MENU] to open the local menu.
3. Select Reference Mic under Measurements with [∨, ∧].
4. Choose Off with [>].
5. Press [EXIT] to close the local menu.
6. Level the sound field speaker as usual (even though the reference micro-
phone is disabled for measurements, it will still be used for leveling).

Real-Ear Measurements 163
7. Test as usual. With the reference microphone disabled, it is even more criti-
cal than usual that the patient not move after leveling and that the sound
field be undisturbed during testing.
6.8 Visible Speech
The Visible Speech screen, shown in Figure 6.8, is a special screen used for per-
forming real-ear measurements with live speech or other external source types.
The following features are displayed upon the Visible Speech screen before the
test has started.
Visible Speech was designed to demonstrate the real-time response of the hear-
ing aid to the speech signal, the average response of the aid over the time of
the test, and the minimum and maximum amplitudes of each frequency. These
measurements can be compared to the patient’s thresholds, uncomfortable lev-
els, real-ear target(s), and the long term average speech spectrum.
When first entering the Visible Speech screen (Figure 6.8), it has the following
characteristics:
1. Shaded areas below and above the patient’s patient’s threshold and uncom-
fortable values, respectively. The non-shaded area in the center of the graph
represents that patient’s dynamic range of hearing.
2. L, M. H dotted lines indicating the real-ear prescriptive targets at 50, 65, and
80 dB SPL. When NAL-NL1 is not the selected fitting rule, only the M target
(65 dB SPL) will be displayed.
3. l, m, h dotted lines indicating the unamplified the region of average
unamplified speech. These lines are called collectively the LTASS (long term
average speech spectrum). They can be used as a comparison against the
amplified speech response.
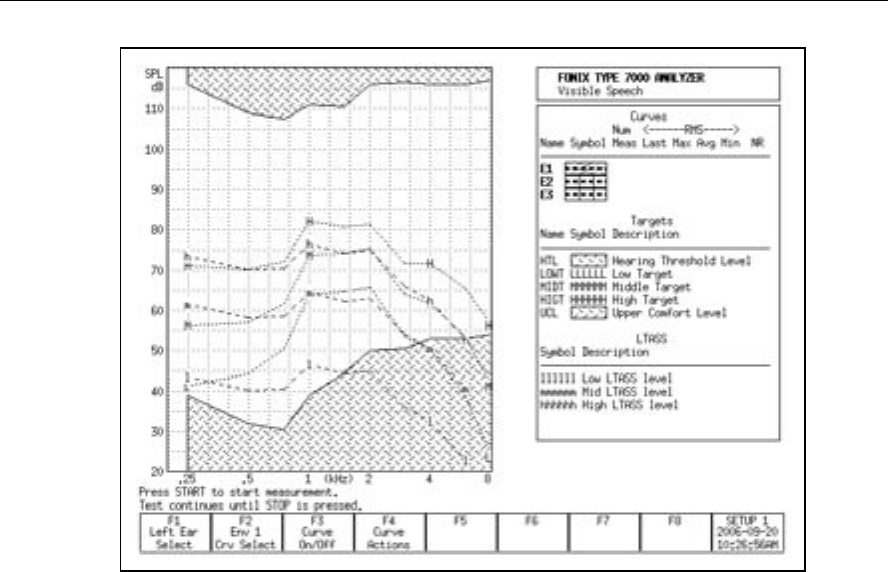
164 FONIX 7000 Hearing Aid Analyzer
Figure 6.8—Visible Speech screen before a measurement is taken. The shaded regions are
below and above the patient’s thresholds and uncomfortable levels. The L, M, and H lines rep-
present the real-ear targets at 50, 65, and 80 dB SPL. The l, m, and h lines represent the region
of unamplified speech.
6.8.1 Performing Visible Speech measurement
1. Enter the patient’s audiogram into the analyzer, as described in Section
6.3.1.
2. Press [EXIT] from the Audiogram Entry screen to return to the Real-ear
Navigation screen.
3. Press [F5] to enter the Visible Speech screen.
4. Insert the probe microphone into the patient’s ear as described in Section
6.2.3. The reference microphone is not used in this measurement. It can be
placed on the earhook as normal, or left hanging behind the patient’s back
5. Insert the hearing aid into the ear, being careful not to move the probe tube.
6. Situate the patient in front of the person who will be providing the live
speech stimulus, or the loudspeaker providing the external signal.
7. Have the person start talking, or start the external signal. It is useful to
have a handheld sound level to monitor the input level of the signal at the
patient’s ear.
8. Press [START] on the 7000 analyzer. This will start the Visible Speech mea-
surement.

Real-Ear Measurements 165
6.8.2 Viewing the Real-time Visible Speech Display
During the Visible Speech test, the analyzer displays four changing measure-
ment curves:
• Real-time measurement curve showing the immediate response of the
hearing aid
• Average frequency response of the hearing aid over the time of the test
• Maximum amplitude of the response per frequency
• Minimum amplitude of the response per frequency
These measurements together give the clinician both the real-time response of
the hearing aid and information about its response over the time of the test.
Press [STOP] when the average response curve has stabilized. This may take 30-
60 seconds.
6.8.3 Viewing Completed Test Results
When the Visible Speech measurement is stopped, the following changes occur:
• The region between the minimum and maximum response curves is
lightly shaded. This indicates the entire region of the frequency response
of the hearing aid over the time of the test.
• The region around the average frequency response curve is darkly shad-
ed. This region represents the standard deviation of the average response
curve. That is, the area containing most of the frequency response curves
measured during the test.
• The real-time measurement curve disappears. Since this curve represents
the latest measurement of an ever-changing speech signal, it is not rel-
evant to the overall test results displayed upon test completion.
See Figure 6.8.3 for an example of a completed Visible Speech measurement.
The curves consisting of Envelope 1 are labeled:
• 1U—Represents the maximum response per frequency over the time of
the test.
• 1u—Represents the upper boundry of the standard deviation around the
average frequency response.
• 1M—Represents the average frequency response of the test.
• 1l—Represents the lower boundry of the standard deviation around the
average frequency response.
• 1L—Represents the minimum response per frequency over teh time of the
test.
Other Visible Speech envelope measurements are labeled similarly using the
number of the envelope.
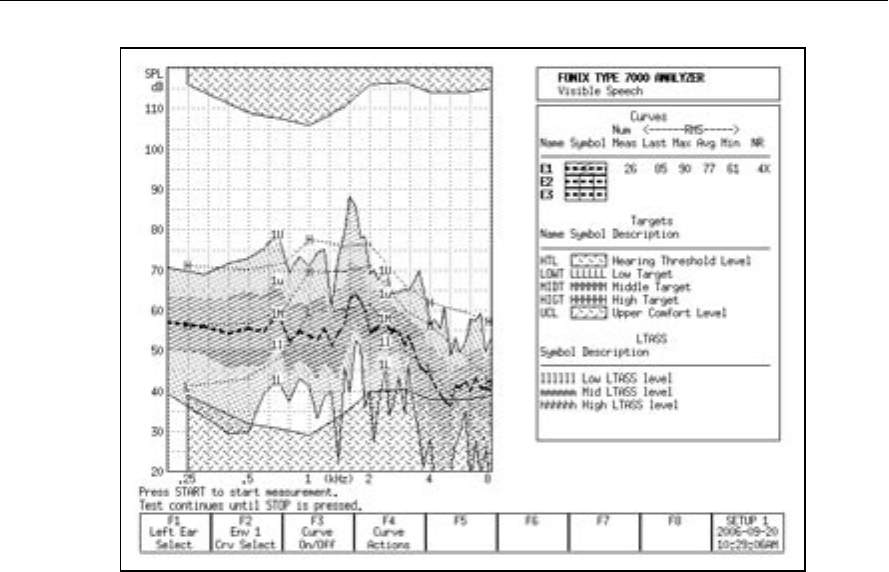
166 FONIX 7000 Hearing Aid Analyzer
Figure 6.8.3—Completed Visible Speech test.
6.8.4 Measuring multiple envelopes
The clinician can measure up to three different Visible Speech envelopes. For
example, it may be beneficial to perform measurements of the different pro-
grams on the hearing aid.
Another example of the usefulness of multiple measurements is when using
the voice of the spouse of the patient. Have the spouse stand a few feet from
the patient when measuring Visible Speech Envelope 1. Then use [F2] to select
Visible Speech Envelope 2. (Press [F2]. Use [∨, ∧] to select the desired envelope.
Press [>] to complete the selection and close the pop-up menu.) Repeat the test
with the spouse standing across the room from the patient. A comparison of the
two envelopes can demonstrate to the patient and the spouse how close they
need to be to each other in order for speech to be easily audible.
When multiple envelopes have been measured, the selected envelope measure-
ments are brighter more visible than measurements of the other envelopes. To
view a different Visible Speech envelope, use [F2] to select it, or use [F3] to tem-
porarily turn off the display of the other envelopes.

Real-Ear Measurements 167
6.9 CROS/BICROS Aids
When performing real-ear measurements on a Body aid, CROS, or Bi-CROS aid,
we suggest the following setups and procedures.
Four Goals:
6.9.1—Measuring the Head Baffle Effect
6.9.2—Measuring the Overcoming of the Head Baffle Effect
6.9.3—Measuring the Overall Insertion Gain
6.9.4—Measuring the Insertion Loss to the “Good” Ear
Each of these measurements uses the insertion gain measurement technique,
taking advantage of the fact that the insertion gain is a difference curve between
two measured curves (usually the unaided and aided response). The techniques
assign the label of “unaided” to one measurement and a label of “aided” to
another measurement.
Take all measurements in the Insertion Gain Screen. For measurements labeled
“Unaided” (even if they aren’t unaided) follow the instructions in Section
6.4.1.2. For measurements labeled “Aided” (even if they aren’t aided) follow the
instructions in Section 6.4.1.3.
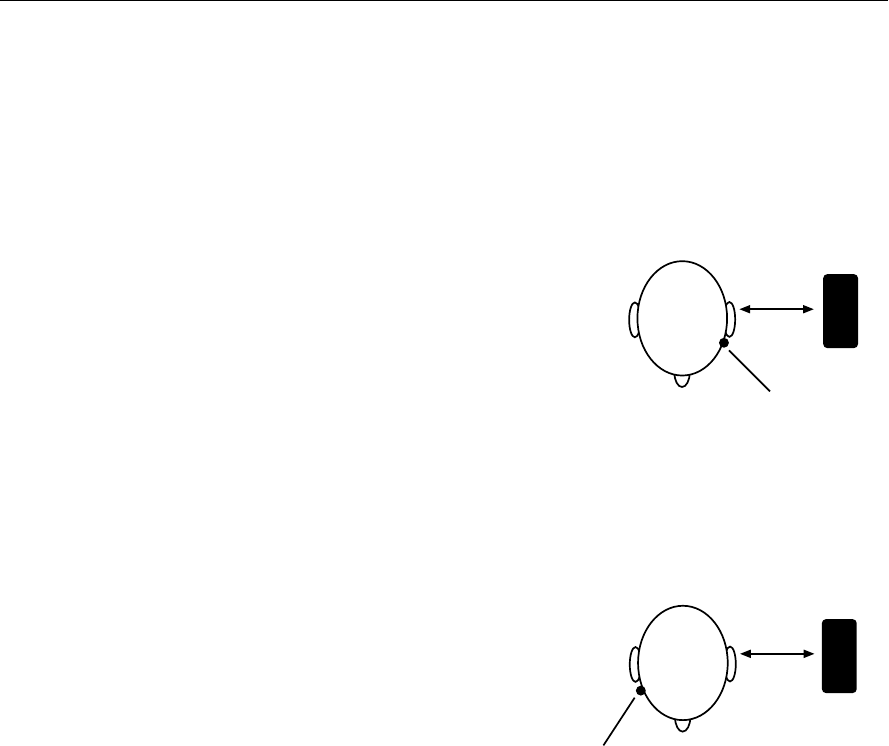
168 FONIX 7000 Hearing Aid Analyzer
6.9.1 Measuring the Head-Baffle Effect
The measurements described in this section are for both CROS and BI-CROS
hearing aids.
Unaided—Real Ear response on “bad ear” side
Set up the 7000 test system as follows.
• System UNLEVELED
• Reference microphone OFF
• Unaided CUSTOM
• Probe microphone over the bad ear, tube
jutting just slightly forward of pinna
• Loudspeaker at 90º, 12 inches from bad
ear
Aided—Real Ear response on “good” ear side
Same setup as above except:
• Probe microphone over the good ear
The difference curve, labeled “Insertion
Gain” on the screen, shows the attenua-
tion of sound arriving at the good ear from
the bad ear side. Since this measurement
excludes the external ear, differences
across individuals should be minimal.
NOTE: Although the above two measure-
ments calls for the 7000 test system to be UNLEVELED with the reference
microphone OFF, the rest of the measurements in this section call for the 7000
test system to be LEVELED with the reference microphone ON.
12"
PROBE MIC
SPEAKER
GOOD
EAR
BAD
EAR
12"
PROBE MIC
SPEAKER
GOOD
EAR
BAD
EAR
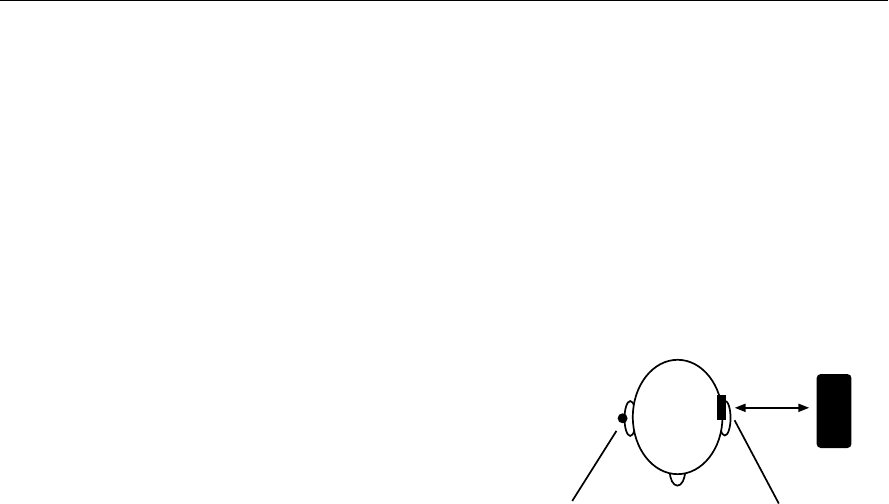
Real-Ear Measurements 169
6.9.2 Measuring the Overcoming of the Head-Baffle Effect
This section describes how to measure how well the hearing aid overcomes the
head-baffle effect. The methods are different for CROS hearing aids than they
are for BICROS hearing aids.
6.9.2.1 CROS
Unaided—Measurement of “good” ear canal (baffled by head)
Set up the 7000 test system as follows.
• Reference microphone ON
• Sound field LEVELED
• Unaided CUSTOM
• Reference microphone over pinna
of bad ear
• Probe microphone inside unoc-
cluded ear canal of good ear
• Loudspeaker at 90º, 12 inches
from bad ear
Aided—Measurement of “good” ear canal (baffle overcome by aid)
Same setup as above, except:
• Aid in place in good ear and set to normal user gain.
The difference curve, labeled “Insertion Gain” on the screen, shows the benefit
the aid gives for sound arriving from the “bad” side.
REFERENCE MIC
PROBE MIC
12"
GOOD
EAR
BAD
EAR
SPEAKER
REFERENCE MIC
PROBE MIC
12"
GOOD
EAR
BAD
EAR
SPEAKER
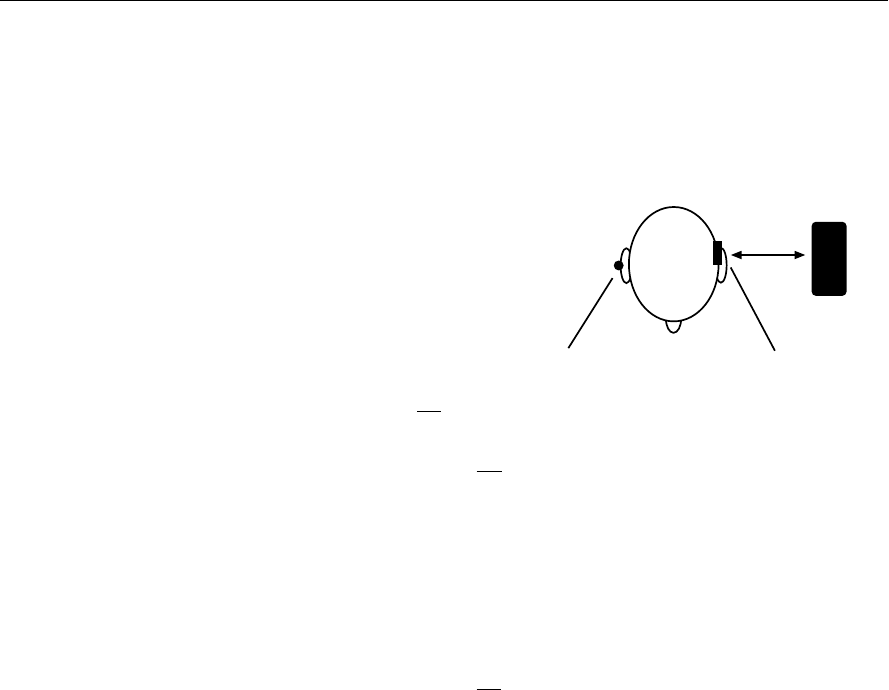
170 FONIX 7000 Hearing Aid Analyzer
6.9.2.2 BI-CROS
Unaided—Measurement of “better” ear canal (baffled by head)
Set up the 7000 test system as follows.
• Reference microphone ON
• Sound field LEVELED
• Unaided set to CUSTOM
• Reference microphone over pinna
of “bad” ear
• Probe microphone inside ear
canal of better ear
• Hearing aid in better ear, on, set
at use gain
• Transmitter on bad side turned off
• Loudspeaker at 90º, 12 inches
from bad ear
Aided—Measurement of “better” ear
canal (baffle overcome by aid)
Same setup as above, except
• Transmitter on bad side turned on
The difference curve, labeled “Insertion Gain” on screen, shows the benefit of
adding the second microphone for sound arriving from the “bad” side.
6.9.3 Measuring Overall Insertion Gain
The methods for measuring the overall insertion gain of CROS and BICROS aids
are described in this section.
Since it has not been shown for CROS and BI-CROS instruments that a 45º
position of the loudspeaker improves the reliability of insertion gain measure-
ments, we recommend a 45º position of the loudspeaker only for monaural
instruments, and a 0º position for CROS and BI-CROS instruments.
REFERENCE MIC
PROBE MIC
12"
BETTER
EAR
BAD
EAR
SPEAKER
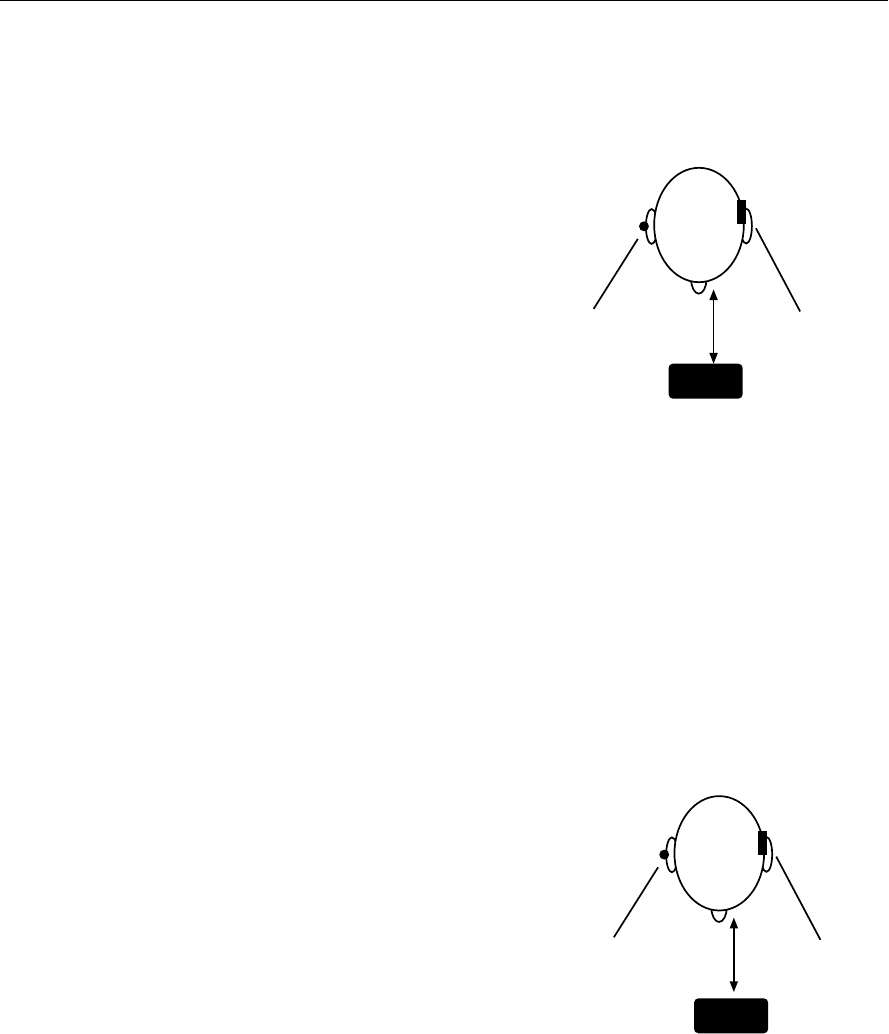
Real-Ear Measurements 171
6.9.3.1 CROS
Unaided—Measurement of “good” ear
Set up the 7000 test system as follows.
• Reference microphone ON
• Sound field LEVELED
• Reference microphone over pinna
of bad ear
• Probe microphone inside unoc-
cluded ear canal of good ear
• Loudspeaker at 0º, 12 inches from
bridge of nose
Aided—Measurement of “good” ear
Same setup as above, except:
• Aid in place in good ear and set to user gain.
The difference curve, labeled “Insertion Gain” on the screen, shows the overall
benefit of inserting the hearing aid.
6.9.3.2 BI-CROS
Unaided—Measurement of “better” ear
Set up the 7000 test system as follows:
• Reference microphone ON
• Sound field LEVELED
• Unaided response CUSTOM
• Reference microphone over pinna of
bad ear
• Probe microphone inside unoccluded
ear canal of better ear
• Loudspeaker at 0º, 12 inches from
bridge of nose
Aided—Measurement of “better” ear
Same setup as above, except—
• Complete aid in place in better ear and set at use gain
• Both transmitters on
The difference curve, labeled “Insertion Gain” on the screen, shows the overall
benefit of inserting the hearing aid.
BETTER
EAR
REFERENCE MIC
PROBE MIC 12"
BAD
EAR
SPEAKER
REFERENCE MIC
PROBE MIC 12"
SPEAKER
GOOD
EAR
BAD
EAR
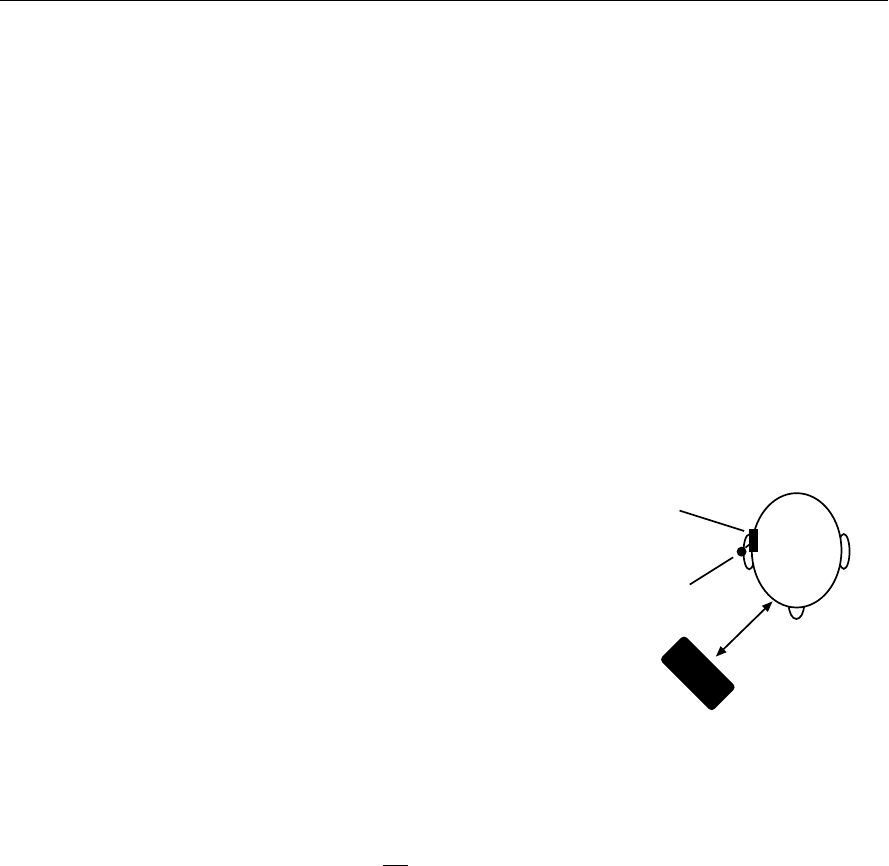
172 FONIX 7000 Hearing Aid Analyzer
6.9.4 Measuring Insertion Loss to the “Good” Ear (CROS)
The method for measuring insertion loss in the patient’s “good” ear is described
in this section. They are the same for CROS and BICROS hearing aids.
When a CROS aid has been prescribed to overcome a severe unilateral high-fre-
quency loss, you may want to ensure that inserting an open ear mold into the
good ear has not significantly attenuated the acoustic transmission to the good
ear.
Since this is a monaural measurement, a 45º position of the loudspeaker is rec-
ommended.
Unaided—Unoccluded Ear canal Response of “good” ear
Set up the 7000 test system as follows.
• Reference microphone ON
• Sound field LEVELED
• Unaided CUSTOM
• Reference microphone over pinna of
good ear
• Probe microphone inside unoccluded
ear canal of good ear
• Loudspeaker at 45º toward good ear, 12
inches from surface of head
Aided—Occluded Response of “good” ear.
Same setup as above except
• Earmold in place in good ear
• Hearing aid is turned off
The difference curve, labeled “Insertion Gain” on screen, shows insertion loss, if
any, caused by inserting the earmold into the good ear.
REFERENCE MIC
PROBE MIC
12"
SPEAKER
GOOD
EAR
BAD
EAR

Appendix A 173
Specifications
ACOUSTIC DRIVE SIGNAL
Frequencies: Composite: 200 to 8000 Hz in 100 Hz intervals
SINE: 200 to 8000 Hz 1/12 oct, nearest 100 Hz intervals
Frequency Accuracy: 1%
Amplitute (RMS 5-dB steps)
Chamber COMPOSITE: 40 to 100 dBSPL; SINE: 40 to 100 dBSPL
Sound Field COMPOSITE: 40 to 90 dBSPL; SINE: 40 to 90 dBSPL
Amplitude Accuracy Within 1 dB from 300 to 5000 Hz, all others within
(All Modes, M1950E only) 3 dB; after leveling
CREST FACTOR
Composite Mode Signal: Less than 12 dB (4 to 1 ratio of peak to RMS value).
TELECOIL DRIVE
1, 1.78, 3.16, 5.62, 10, 17.8, 31.6, 56.2, 100 mA/meter. ANSI S3.22-1996
DIGITAL READOUT OF SOUND PRESSURE LEVEL
Frequency Range: 200 through 8000 Hz.
Amplitude Range: From 0 through 150 dB (–90 through +110 dB gain).
Resolution: 0.1 dB.
Type: True RMS
Accuracy (M1950E)
:
Within 1 dB plus or minus 1 digit from 300 to 5000 Hz; within 2
dB plus or minus 1 digit for all other frequencies.
SPL Equivalent Input Noise:
Less than 50 dB RMS (M1950E)
Noise Reduction: Averages the measured signal in synchronism with the signal
generator by the factor chosen. Factors of 2, 4, 8, and16 available.
Random noise will be reduced by an amount equal to the inverse
of the square root of the factor chosen.
BATTERY CURRENT MEASUREMENT
Range: 0 to 20 mA.
Accuracy: Within ± 5% of reading plus or minus 0.01 mA.
Resolution: 0.01 mA.
Voltages supplied: 1.5 (silver), 1.3 (zinc air). See Appendix B, ANSI S3.22-1996.
Note: The above accuracy applies only if the battery pill is disconnected during the level-
ing operation.

174 FONIX 7000 Hearing Aid Analyzer
SPECTRUM MODE AVERAGING
Spectral : off, 2,4,8 and 16.
HARMONIC DISTORTION ANALYZER
Type: Selectable for 2nd, 3rd, Total (2nd plus 3rd), or none.
Resolution: 0.1 percent.
Reading: Percent (%) with respect to fundamental. Single frequency read-
ings made at 100-Hz intervals from 200 through 2600 Hz. Sweep
readings made at 100 Hz intervals from 400 through 1900 Hz.
ATTACK/RELEASE TIME
Range: 1.25 to 5000 mSec.
Accuracy: ± 10% or 2 mSec + Resolution, whichever is larger.
Resolution: 2000-8000 Hz: 1.25 mSec;
800-1600 Hz: 2.5 mSec;
400, 500 Hz: 5 mSec.
100 to 300 Hz and Composite: 10 mSec.
Available Test Modes: ANSI 96, ANSI 87
Signal Durations: ANSI 87: 2000 mSec
ANSI 96: variable (500 to 5000 mSec)
TEST SEQUENCES
Choose ANSI or IEC as part of standard package. Additional charge for the second test sequence.
ANSI 3.22 (87/92/96)
IEC EN60118-7 1993
FEATURES
Group Delay and Phase Measurement
Battery Current Measurement
Coupler Multi-Curve
RS232 Function
AVAILABLE SIGNALS
Composite, Sine, Digital Speech (ICRA & ANSI)
OPTIONS
Real Ear Measurement (7000 Quik-Probe), 2nd Test Sequence, VA CORFIG, MZ coupler.
PRIMARY POWER
100-240 VAC 50/60 Hz. Power requirement is 50 VA.

Specifications 175
ELECTRONICS MODULE
Color: Blue module case, white front panel and gray bezel
Size: 17.4"W x 6.5"H x 14.6"D (44.2 x 16.5 x 37.1 cm).
Weight: 17 lbs.(7.7 kg).
PRINTER, INTERNAL
Type: High speed line thermal printer
Paper width: 4.41" (112 mm)
Print speed: 80 mm/ s
PRINTER, EXTERNAL (PRINTER NOT PROVIDED)
Port: 25 pin D, female
Type: HP compatible, Epson Stylus series
Language: HPCL3 and ESC-P/2
TEST CHAMBER
Type: FONIX FC 7020
Test Area: 7"x 7.5"x 1.5 deep (17.8 x 19.1 x 3.8cm).
Internal Acoustic SPL at test point will change less than 3 dB above
Reflections: 1 kHz, when lid is raised (w/o feedback compensation).
Ambient Noise Isolation: 45 dB at 1 kHz (allows THD measurement to within 3% at 60 dB
source level and a 60 dB ambient).
Color: Gray with black trim. Black and white test area.
Size: 13.5”W x 18"H x 11.5"D (34.3 x 45.7 x 29.2cm).
Weight: 36 lbs. (16.3 kg).
SHIPPING, INTERNATIONAL
Total Shipping Weight with Quik-Probe Option: 97 lbs. (45 kg)
Total Shipping Weight without Quik-Probe Option: 77 lbs. (35 kg)
STANDARD ACCESSORIES
FONIX M1950E Low Noise 14 mm diameter, pressure type Electret
Microphone: with add-only memory chip. 149 dB maximum SPL.
Microphone Adapter: (044-1006-01) 14mm to 1" (25 mm).
HA-1 Coupler: (044-1003-03) Dimensions per requirements of ANSI S3.7-1995
for testing all-in-the-ear aids and earmolds.
HA-2 Coupler: (044-1001-04) Dimensions per requirements of ANSI S3.7-1995
for testing ear level, eyeglass and body aids.

176 FONIX 7000 Hearing Aid Analyzer
Ear Level Adapter: (044-1007-00) Per requirements of ANSI S3.22-1996 for adapting
ear level aids to the HA-2 coupler.
Sound Chamber Cable: (119-0204-07)
Battery Pills #13: (059-2005-02) #675/76: (059-2004-02)
#312: (059-2006-02) #10A/230: (059-2010-01).
All with 12" cables—24" cables available on request.
Roll of Printer Paper (026-0006-00)
Operator’s Manual: (010-0019-00)
OPTIONAL ACCESSORIES
Video Display Monitor: (058-0077-00) VGA, flat panel, 15", color.
Shipping weight: 21 lbs (10 kg).
6 cc Coupler: (044-1004-03) NBS 9A, for checking audiometer headphones.
Test Chamber Stand: (030-1002-04) Tubular steel stand which brings the testing area
or the test chamber to convenient table height. Blue color.
Quest QC-10 Sound (030-0004-00) For calibration of microphone.
Level Calibrator: amplifier. 1 kHz, 114 dB SPL.
Telewand: (043-1053-00) For checking response of aids in “telephone”
mode. ANSI S3.22-1996.
Telecoil Induction Loop: (120-1002-00) For checking hearing aid response to a magnetic
loop field.
Battery Pills: #AA: (059-1011-00); #41: (059-2009-02); #5: (059-2008-01).
All with 12” cables—24” cables available on request.
Maintenance Manual: (010-0020-00) On request at time of purchase.
SAFETY
Electronics module conforms to IEC 60601-1
GUARANTEE
The FONIX 7000 and its accessories are guaranteed to be free from manufacturing defects
which would prevent the products from meeting these specifications for a period of one
year from date of purchase.
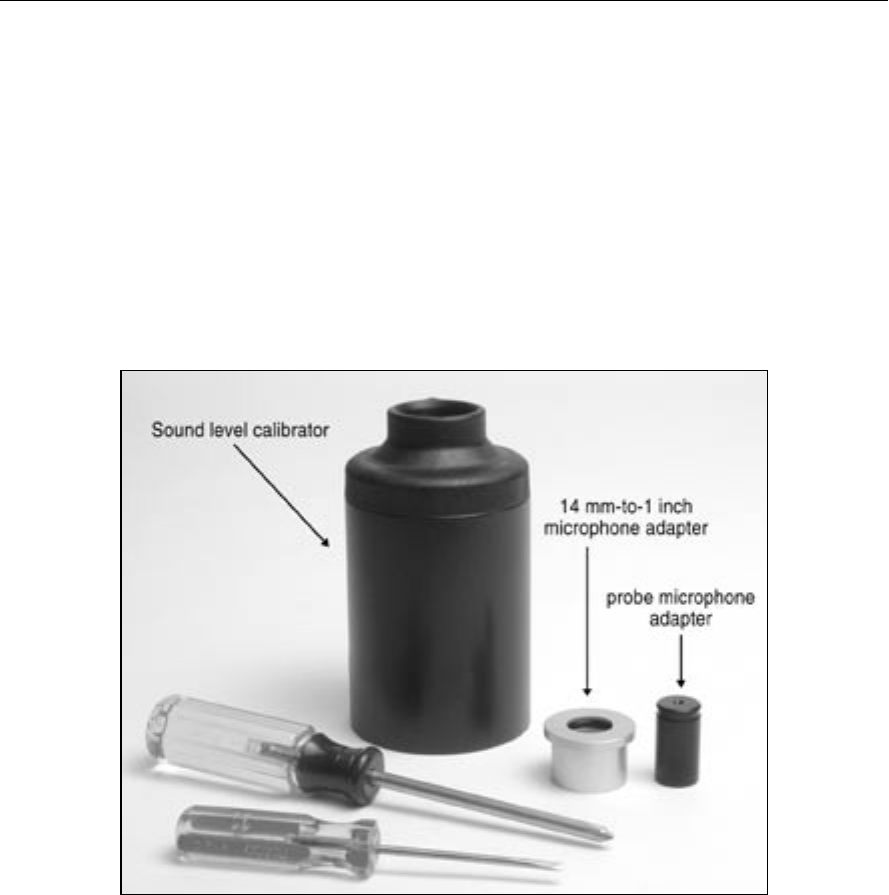
Appendix B 177
Calibration
B.1 Calibrating the microphones
To calibrate the 7000 Test System’s microphones, you will need a sound level
calibrator such as the Quest CA-12, the 14mm-to-1 inch microphone adapter
provided with your 7000 Test System, and a small flathead screwdriver. If you
are calibrating the probe microphone, you will also need the probe microphone
adapter and a Phillips-head screwdriver.
Figure B.1A—Equipment for calibrating the 7000 microphones.
To calibrate the M1950E coupler microphone:
1. Press [MENU] from the Opening screen to open the Setup Menu.
2. Press [F6] to open the Microphone Calibration window.
3. Insert the 14mm-to-1 inch adapter into the sound level calibrator.
4. Insert the M1950E coupler microphone into the adapter.
5. Turn on the sound level calibrator and look at the “Coupler Mic” level in the
Microphone Calibration window. It should match the calibrated tone emit-
ted by the sound field calibrator. This is usually 110 dB SPL or 114 dB SPL.
Check your calibrator for details.
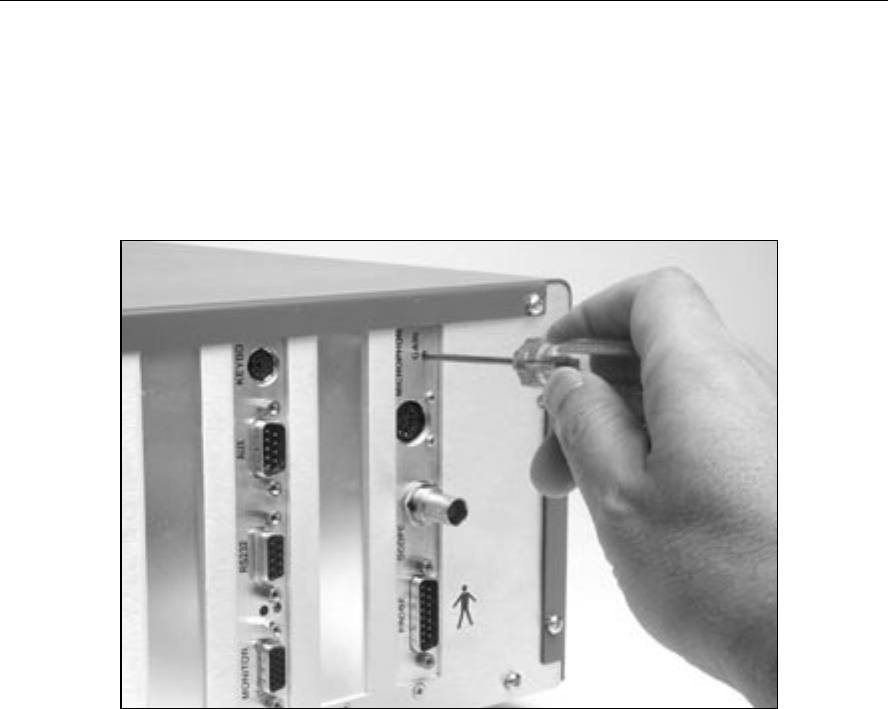
178 FONIX 7000 Hearing Aid Analyzer
6. If necessary, adjust the gain of the 1950E microphone by using the flathead
screwdriver to adjust the “gain” pot on the back of the 7000 Test System
next to the microphone connector. Match the levels as close as possible. If
you are unable to adjust the gain of the microphone to the level emmited by
the calibrator, you probably have a faulty microphone and should contact
your local FONIX distributor or the Frye factory.
Figure B.1B—Adjusting the gain pot with a flat head screwdriver
To calibrate the real-ear probe and reference microphones:
1. Follow steps 1-3 above to set up the 7000 Test System for calibration.
2. Insert the reference microphone into the adapter.
3. Turn on the sound level calibrator and look at the “Ref Mic” level in the
Microphone Calibration window. It should match the calibrated tone emit-
ted by the sound field calibrator. This is usually 110 dB SPL or 114 dB SPL.
Check your calibrator for details.
4. If necessary, adjust the gain of the reference microphone by using the
Phillips-head screwdriver to adjust the “reference” pot on the back of the
remote module of the 7000 Test System. Match the levels as close as possi-
ble. If you are unable to adjust the gain of the microphone to the level emit-
ted by the calibrator, you probably have a faulty microphone and should
contact your local FONIX distributor or the Frye factory.
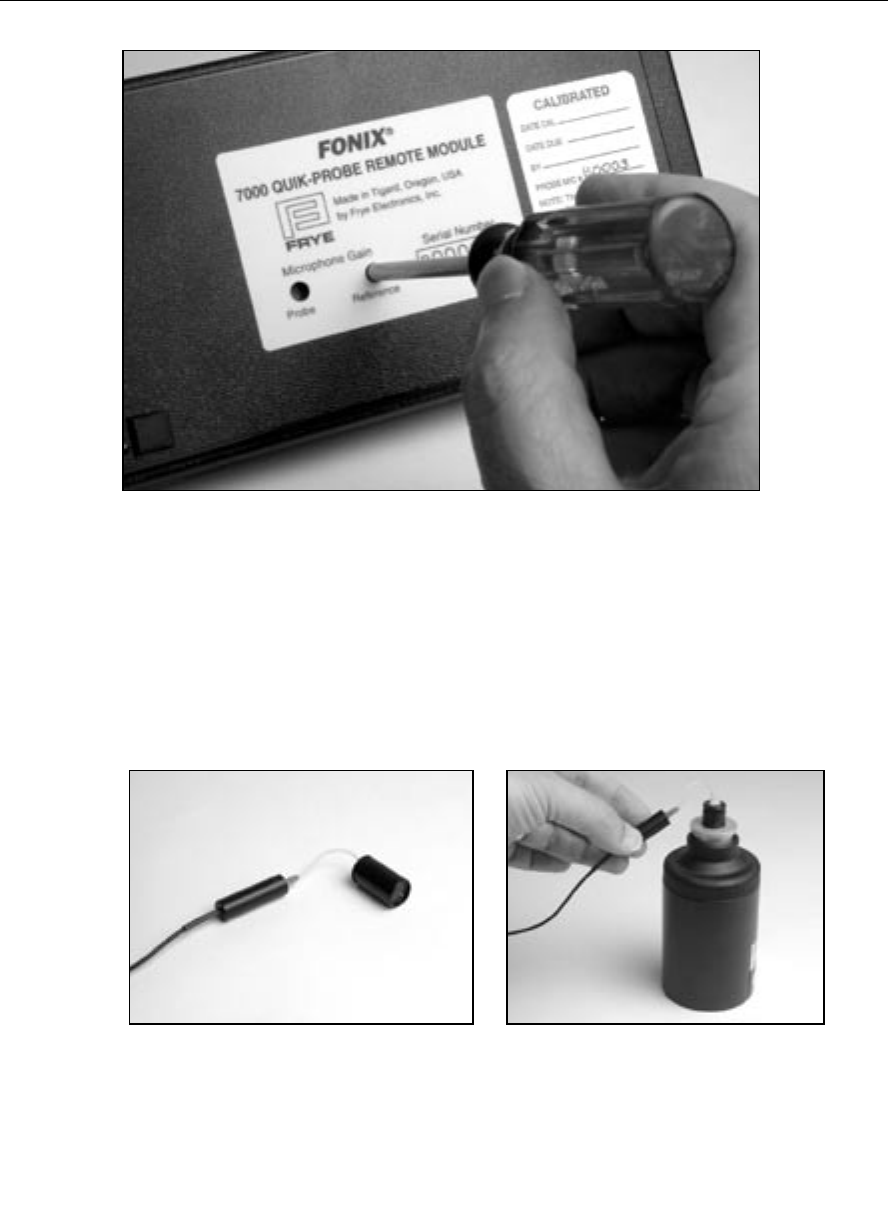
Calibration 179
Figure B.1.C—Adjusting the reference pot with a Phillips-head screwdriver.
5. Remove the reference microphone from the adapter and turn off the calibra-
tor.
6. Attach a new probe tube to the probe microphone.
7. Thread the probe tube through the edged side of the probe microphone
adapter so that the probe tube sticks out a couple of millimeters from the
other end of the adapter. See Figure B.1D.
Figure B.1D—Calibrating the real-ear probe microphone
8. Secure the probe tube in place by putting a dab of Fun-Tak on the edged end
of the adapter.
9. Insert the probe microphone adapter with the attached probe microphone
into the calibrator.

180 FONIX 7000 Hearing Aid Analyzer
10. Turn on the sound level calibrator and look at the “Probe Mic” level in the
Microphone Calibration window. It should match the calibrated tone emit-
ted by the sound field calibrator.
11. If necessary, adjust the gain of the probe microphone by using the Phillips-
head screwdriver to adjust the “probe” pot on the back of the remote mod-
ule of the 7000 Test System. Match the levels as close as possible. If you
are unable to adjust the gain of the microphone to the level emitted by the
calibrator, you probably have a faulty microphone and should contact your
local FONIX distributor or the Frye factory.
12. Press [EXIT] to return to the Opening screen.
B.2 Calibrating the insert earphone for the RECD
The real-ear to coupler difference (RECD) is a measurement that can be per-
formed when you have the Real-Ear Option (Quik Probe). There are two parts
to the RECD: a coupler measurement and a real-ear measurement. The coupler
measurement is considered a calibration procedure and needs to be done only
when the probe and reference microphones are calibrated.
The RECD measurement is usually done with a 50-ohm insert earphone.
Eventually, the 7000 Test System will also support an RECD method performed
with a linear hearing aid, but that has not yet been implemented.
1. Insert the earphone connector into the ¼ inch “Earphone” jack on the back
of the 7000 Test System.
2. Plug the other end of the earphone into the tubing of the ear level adapter
attached to an HA-2 coupler.
3. Attach a new probe tube to the probe microphone.
4. Thread the probe tube through the edged side of the probe microphone
adapter so that the probe tube sticks out a couple of millimeters from the
other end of the adapter. See the setup for calibrating the probe microphone
in the previous section. The probe microphone adapter is used in the same
manner.
5. Secure the probe tube in place by putting a dab of Fun-Tak on the edged end
of the adapter.
6. Insert the adapter into the HA-2 coupler.
7. Press [MENU] from the Opening screen to open the Setup Menu.
8. Press [F4] to perform the measurement. The screen will briefly display that
the measurement is being taken and saved. No further action is necessary.
9. Press [EXIT] to return to the Opening screen.
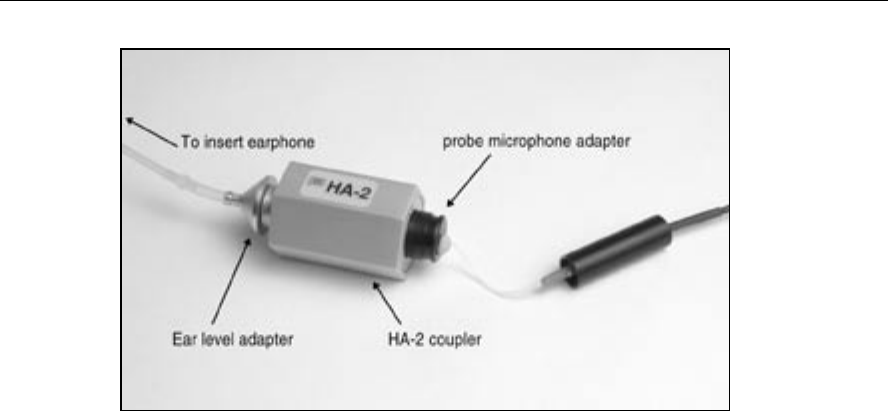
Calibration 181
Figre B.2—Calibrating the insert earphone

182 FONIX 7000 Hearing Aid Analyzer

Appendix C 183
Troubleshooting Guide
These are the most common problems that typically cause instrument failure.
Please check these troubleshooting suggestions and follow the procedures out-
lined in this manual before contacting your local service representative or Frye
Electronics.
General Problems:
No power
a. Check ON switch(s).
b. Make sure the the power cable is plugged into a working wall outlet.
c. Check the fuse in the power entry module.
CRT/VGA/LCD display monitor is not working
a. Check the ON switch.
b. Make sure the power cable is plugged into working wall outlet.
c. Check the monitor brightness and contrast controls.
d. Check the cable between the monitor and instrument.
e. Make sure nothing is resting against the probe keyboard or main panel
and causing a stuck button.
Test Chamber Problems:
Test Chamber Microphone does not Level
a. Check your mic calibration. (See Appendix B)
b. Is the mic properly plugged into the instrument?
c. Are all connections clean and tight?
d. Is the mic head (element) screwed on tightly?
e. Is the mic cable loose, broken, cut, worn or frayed?
f. Make sure everything is out of the test chamber (except the mic) when
trying to level.
g. Open the test chamber and listen for the leveling signal.
h. Check the test chamber cable connections.
i. Is there an unusual amount of background noise in the test area? (air con-
ditioning/heating fans, street noise, people talking, computer fans, etc.)

184 FONIX 7000 Hearing Aid Analyzer
Coupler Problems:
1. HA-2 Coupler (BTE) adapter tubing is missing, loose, or cracked
Replace with #13 thickwall tubing. Length: 0.6" (15mm).
2. Test microphone is difficult to get into coupler or the ear level adapter
does not easily seal to the other end of the coupler
Lubricate the black “O” ring with light petroleum type lubricant.
3. A bump or peak in the low frequency response curve
a. There may be a hearing aid vent leak. Be sure to Fun-Tak the vent.
b. There may be a coupler vent leak.
c. The #13 coupler tubing could be cracked or broken.
Probe Problems:
1. Probe Reference Mic does not Level.
a. Check the reference mic calibration. (See Appendix B)
b. Be sure the reference mic is properly plugged into the instrument.
c. Are all connections clean and tight?
d. Are the mic cables loose, broken, cut, worn or frayed?
e. Is the Leveling signal coming out of the speaker? If not, check cable and
connections.
f. Make sure the distance from the speaker to the ref. mic during leveling is
about 12” (max. 18”).
2. Cleaning probe tubes
DO NOT REUSE probe tubes. There is NO recommended cleaning proce-
dure. Germicidal solutions can leave a residue inside the tubing which can
cause test result errors. DO NOT cut off any portion of the tube.
Printer Problems:
1. Printer does not work
a. Check for a paper jam.
b. Press the FEED Button.
c. Make sure the print head lock-down lever is down.
2. Test results do not print on paper
Make sure you are using thermal paper. To check it, take a hard object, e.g.
a car key, and scratch the surface of the paper on both sides. If a black mark
appears it is thermal paper. If not, it is plain paper and will not work.

Appendix D 185
The FONIX CIC Feature
Background
Zwislocki built an ear simulator coupler years ago to better approximate the real
ear’s impedance variation with frequency. The ear’s volume appears to get larger
at lower frequencies. Mahlon Burkhard at Industrial Research Products agreed
with this approach, especially when they built the KEMAR, and designed an ear
simulator that had impedance changes that matched the Zwislocki figures. This
ear simulator was later standardized by the publication of American National
Standards Association standard, S3.25. Another ear simulator that has similar
characteristics was introduced in Europe a few years later by Bruel and Kjaer,
and is characterized in the standard IEC 711.
Frye Electronics introduced a slightly different approach in the 1980’s when
it came out with the INSITU option (and later, the OES option) for its 5500-Z
hearing aid Analyzer. Realizing that ear simulators which contain frequency
sensitive elements are somewhat fragile and can be damaged as they are
handled in every day use, Frye made a coupler which it labeled the MZ (for
Modified Zwislocki). This coupler had a central volume very similar to the
standardized Zwislocki, but had no frequency sensitive elements. Instead, an
analyzer program was used with the coupler to apply correction factors to the
measured curves from the hearing aid so that the output was very similar to that
which would be obtained if the aid were tested on a standardized ear simulator
as built by Knowles or B&K.
These software corrections work well for most regions in the frequency response
of the aid. In low frequency areas up to about 1500 Hz, if the aid has a response
peak that is influenced by the volume of the cavity, the peak will be slightly
higher in amplitude and slightly higher in frequency than that peak would be if
the aid were measured in a standardized ear simulator. The CIC hearing aid is
not usually affected by this problem.
The Need for a CIC Coupler
The introduction of the CIC hearing aids has made it desirable to be able to
test them with a coupler that more closely approximates the actual volume
and frequency response characteristics of the real ear. The CIC aid fits so close
to the tympanic membrane (TM) of the ear that the volume of the cavity is
reduced greatly and the aid produces a significant amount more gain. Further,
its response can be expected to be substantially influenced by the frequency
dependent impedance variations of the TM.
Frye Electronics felt that the use of a CIC coupler with a proper response cor-
rection would give better data to a hearing professional than the use of the stan-
dard 2 cc coupler or even a Zwislocki ear simulator when attempting to produce

186 FONIX 7000 Hearing Aid Analyzer
a good hearing aid fitting. It also felt that the approach taken in the use of the
MZ coupler has been well accepted by professionals throughout the world and
that the new CIC coupler should use a similar approach, with response correc-
tions modified to take the smaller CIC volume into account.
The Basic Problem
The ear is not a simple structure. It is a biological coupling device that converts
sound energy to nerve impulses. It also has a pinna that helps to direct higher
frequency sounds into the external canal. The part of the structure we are con-
cerned with is the external ear canal or cavity which is terminated by the TM.
The ear canal can be considered to be fairly rigid when it is compared to the
TM. In the lower frequencies below 2000 to 3000 Hz, the frequency related
changes in impedance that we see in an ear can be thought to be mostly caused
by the TM. When we reduce the volume of the cavity between the hearing aid
and the TM by moving the aid closer to it, we should expect to see the TM play
a more important part in determining the response of the aid.
For more shallow standard earmolds, the volume of the central cavity of the ear
reduces the effect of the TM’s frequency impedance changes. This is because
the volume of the cavity is added to the equivalent volume of the TM. If the
cavity volume is large and does not change with frequency, then the large
changes in impedance of the TM are swamped by the large volume of the ear
canal. If, on the other hand, the TM is working into a very small volume, then it
would affect a large change in impedance across the frequency range.
CIC Hearing Aid—Gain and Frequency Response Changes
From the above discussion we see that we can expect that the frequency
response of the CIC hearing aid will be greatly influenced by the frequency
dependent impedance changes of the TM. What is the magnitude of these
changes? A fairly typical ear fitted with a standard hearing aid and earmold
should have characteristics that would normally be predicted by a KEMAR
manikin and standardized ear simulator. When that ear is fitted with a CIC aid,
what is the volume between the hearing aid and the TM? Because of the tilt of
the TM, most professionals probably don’t fit the aid right next to the TM. A
reasonable figure may be 0.25 cubic centimeters. It should be realized that this
number could be higher or lower, depending on circumstances. 0.2 to 0.4 cc
may be a reasonable range.
Now, how much response variation will be introduced because of the small-
er volume of 0.25 cc? This variation is that which is used in the frequency
response correction table used with the CIC coupler. One assumption that we
make in calculations of volumes is that the simulator is small as compared to
the wavelength of sound at the frequency we are examining. In the case of the
standard ear simulator, the length of the cavity begins to affect its response to
sound at frequencies above about 3000 Hz.

The FONIX CIC Feature 187
Knowing the physical volume of the occluded ear canal and its frequency
response variations, it is possible to calculate the equivalent volume of the TM
itself at each frequency and to apply this figure to the response of the 0.25 cc
cavity between the hearing aid and the TM.
When the calculated volume variation of the TM is applied to the smaller vol-
ume of the CIC coupler, the total response variation comes out to be from -8.6
dB at 200 Hz to +5.5 dB at 8000 Hz for a total variation of 14.1dB.
Summary
Using the CIC coupler with its software option gives the dispenser an immediate
idea of how much gain that this new type of hearing instrument is going to give
the hearing impaired individual. It is nice to see that the CIC hearing aid can
really produce significant amounts of gain in spite of its apparently poor perfor-
mance in the 2cc world of the ANSI standard test.
The user must remember that an actual ear may produce differences from the
predicted values.
Acknowledgment
Mead Killion, Mahlon Burkhard and Elmer Carlson are to be thanked for help-
ing assemble the data from which the CIC corrections were derived.
188 FONIX 7000 Hearing Aid Analyzer
CIC CORRECTION FACTORS
dB Hz dB Hz dB Hz dB Hz
-8.7 200 -0.95 2200 3.2 4200 4.54 6200
-8.6 300 -0.5 2300 3.3 4300 4.55 6300
-8.7 400 -0.2 2400 3.5 4400 4.6 6400
-8.75 500 0 2500 3.6 4500 4.65 6500
-9 600 0.3 2600 3.7 4600 4.7 6600
-8.9 700 0.5 2700 3.8 4700 4.75 6700
-8.8 800 0.7 2800 3.85 4800 4.8 6800
-8.2 900 1 2900 3.95 4900 4.85 6900
-6.55 1000 1.2 3000 4 5000 4.9 7000
-6 1100 1.4 3100 4.07 5100 4.95 7100
-5.4 1200 1.65 3200 4.12 5200 5 7200
-4.95 1300 1.9 3300 4.18 5300 5.05 7300
-4.2 1400 2.1 3400 4.2 5400 5.1 7400
-3.6 1500 2.2 3500 4.25 5500 5.15 7500
-3.3 1600 2.4 3600 4.3 5600 5.2 7600
-2.8 1700 2.5 3700 4.35 5700 5.25 7700
-2.3 1800 2.7 3800 4.4 5800 5.3 7800
-2 1900 2.85 3900 4.45 5900 5.4 7900
-1.7 2000 2.91 4000 4.5 6000 5.5 8000
-1.2 2100 3 4100 4.52 6100

Appendix E 189
Fitting Formula Tables
The conversions used by the FONIX 7000 Test System to convert
audiograms to target gain curves are the following:
NAL-RP FITTING FORMULA CALCULATION
The insertion gains at each frequency are calculated according to
the following formulas:
Freq (Hz) Insertion Gain (dB)
250 X + .31 HTL - 17dB + S
500 X + .31 HTL - 8dB + S
750 X + .31 HTL - 3dB + S
1000 X + .31 HTL + 1dB + S
1500 X + .31 HTL + 1dB + S
2000 X + .31 HTL - 1dB + S
3000 X + .31 HTL - 2dB + S
4000 X + .31 HTL - 2dB + S
6000 X + .31 HTL - 2dB + S
8000 X + .31 HTL - 2dB + S
Where you calculate X and S (Slope correction values) as follows:
a. T = (HTL @ 500Hz) + (HTL @ 1000Hz) + (HTL @ 2000Hz)
b. If T is less than or equal to 180dB, then
X = .05 x T
If T is greater than 180dB, then
X = (.05 x 180dB) + (.116 x ( T - 180dB)
c. If the HTL at 2000 Hz is less than 95dB, S = 0
If the HTL at 2000 Hz is greater than or equal to 95dB, then
apply the following slope correction factors at each frequency
based on the 2000Hz measurement:
2000Hz 250 500 750 1000 1500 2k 3k 4k 6k 8k
HTL (dB)
95 4 3 1 0 -1 -2 -2 -2 -2 -2
100 6 4 2 0 -2 -3 -3 -3 -3 -3
105 8 5 2 0 -3 -5 -5 -5 -5 -5
110 11 7 3 0 -3 -6 -6 -6 -6 -6
115 13 8 4 0 -4 -8 -8 -8 -8 -8
120 15 9 4 0 -5 -9 -9 -9 -9 -9

190 FONIX 7000 Hearing Aid Analyzer
POGO
Prescription of Gain/Output (POGO) for Hearing Aids
by: Geary A. McCandless, PhD,
& Poul Erik Lyregaard, MSc
Hearing Instruments vol 34 #1, 1983
Required insertion gain is calculated as follows:
Frequency (Hz) Insertion Gain (dB)
250 1/2 HTL - 10 dB
500 1/2 HTL - 5 dB
* 750 1/2 HTL - 2.5 dB
1000 1/2 HTL
* 1500 1/2 HTL
2000 1/2 HTL
3000 1/2 HTL
4000 1/2 HTL
* 6000 1/2 HTL
* 8000 1/2 HTL
Note: Frequencies preceded by an asterisk (*) are
interpolated because the article does not reference them.
BERGER
A Method of Hearing Aid Prescription
by: Kenneth W. Berger, PhD, Eric N. Hagberg, M.A.,
& Robert L. Rane, PhD
Hearing Instruments July 1978
Required insertion gain is calculated as follows:
Frequency (Hz) Insertion Gain (dB)
* 250 1/2 HTL
500 1/2 HTL
* 750 1/2 HTL
1000 1/1.6 HTL
* 1500 1/1.5 HTL
2000 1/1.5 HTL
3000 1/1.7 HTL
4000 1/2 HTL
* 6000 1/2 HTL
* 8000 1/2 HTL
Note: Frequencies preceded by an asterisk (*) are
interpolated because the article does not reference them.

Fitting Formula Tables 191
1/3, 1/2, 2/3 Gain
The 1/3-2/3 Insertion Gain Hearing Aid Selection Guide
by: Robert Libby
Hearing Instruments vol 37 #3, 1986
Required insertion gain is calculated as follows:
FREQ. INS GAIN INS GAIN INS GAIN
(Hz) (dB) (dB) (dB)
(2/3 rule) (1/3 rule) (1/2 rule)
250 2/3 HTL - 5 dB 1/3 HTL - 5 dB 1/2 HTL -5 dB
500 2/3 HTL - 3 dB 1/3 HTL - 3 dB 1/2 HTL -3 dB
750* 2/3 HTL 1/3 HTL 1/2 HTL
1000 2/3 HTL 1/3 HTL 1/2 HTL
1500* 2/3 HTL 1/3 HTL 1/2 HTL
2000 2/3 HTL 1/3 HTL 1/2 HTL
3000 2/3 HTL 1/3 HTL 1/2 HTL
4000 2/3 HTL 1/3 HTL 1/2 HTL
6000 2/3 HTL - 5 dB 1/3 HTL - 5 dB 1/2 HTL -5 dB
8000* 2/3 HTL - 5 dB 1/3 HTL - 5 dB 1/2 HTL -5 dB
Note: Frequencies marked by an asterisk (*) are
interpolated because the article does not reference them.

192 FONIX 7000 Hearing Aid Analyzer

Appendix F 193
Probe SPL Mode Description
The Target IG is converted to the Target SPL in the following steps:
(Conversion tables appear on the following pages.)
1. Add the source level for Aided curve 2.
2. Interpolate from 10 frequency to 79 frequency curve frame.
3. Add the AVG Unaided ear response REUR in Table 1.
4. If Aided 2 is composite, subtract 10.7 dB from each frequency. If Aided 2 is
Speech Weighted tone, add 2.1 dB to each frequency.
5. If Aided 2 is Speech Weighted, subtract the Speech Weighting in Table 2.
The complete formula is then:
Target SPL = Target IG + CRV2 source + AVG REUR
(If Aided2 is composite) - 10.7 dB - Speech Weighting.
(If Aided2 is speech tone) - Speech Weighting.
• To convert the HTL and UCL from HL to SPL:
Add the corrections in Table 3.
• To predict UCL’s (HL) given the HTL (HL):
Use Table 4 to convert from HTL to UCL.

194 FONIX 7000 Hearing Aid Analyzer
TABLE 1
Average Real-Ear Unaided Response (REUR)
FREQ GAIN FREQ GAIN FREQ GAIN FREQ GAIN
(Hz) dB (Hz) dB (Hz) dB (Hz) dB
2100 13.9 4100 12.7 6100 7.7
200 1.6 2200 14.7 4200 12.4 6200 7.5
300 2.1 2300 15.1 4300 12.2 6300 7.3
400 2.7 2400 15.0 4400 12.0 6400 7.2
500 2.9 2500 15.1 4500 11.9 6500 7.1
600 2.9 2600 15.0 4600 11.7 6600 6.9
700 3.1 2700 14.6 4700 11.6 6700 6.8
800 3.3 2800 14.1 4800 11.2 6800 6.6
900 3.6 2900 13.6 4900 10.7 6900 6.5
1000 3.4 3000 13.7 5000 10.3 7000 6.4
1100 3.1 3100 13.8 5100 9.9 7100 6.2
1200 3.6 3200 14.1 5200 9.5 7200 6.1
1300 4.2 3300 14.5 5300 9.2 7300 6.0
1400 4.4 3400 14.8 5400 8.9 7400 5.7
1500 5.6 3500 14.9 5500 8.7 7500 5.4
1600 7.0 3600 14.7 5600 8.5 7600 5.1
1700 8.1 3700 14.3 5700 8.3 7700 4.8
1800 9.3 3800 13.9 5800 8.2 7800 4.6
1900 10.9 3900 13.5 5900 8.0 7900 4.4
2000 12.6 4000 13.1 6000 7.8 8000 4.2
TABLE 2
Speech Weighting
FREQ FREQ FREQ FREQ
(Hz) dB (Hz) dB (Hz) dB (Hz) dB
2100 8.1 4100 13.4 6100 16.7
200 0.2 2200 8.4 4200 13.6 6200 16.9
300 0.5 2300 8.8 4300 13.8 6300 17.0
400 0.8 2400 9.1 4400 14.0 6400 17.1
500 1.2 2500 9.4 4500 14.1 6500 17.3
600 1.6 2600 9.7 4600 14.3 6600 17.4
700 2.1 2700 10.0 4700 14.5 6700 17.5
800 2.5 2800 10.3 4800 14.7 6800 17.6
900 3.0 2900 10.6 4900 14.9 6900 17.8
1000 3.5 3000 10.8 5000 15.0 7000 17.9
1100 4.0 3100 11.1 5100 15.2 7100 18.0
1200 4.4 3200 11.3 5200 15.4 7200 18.1
1300 4.9 3300 11.6 5300 15.5 7300 18.2
1400 5.3 3400 11.8 5400 15.7 7400 18.4
1500 5.8 3500 12.1 5500 15.8 7500 18.5
1600 6.2 3600 12.3 5600 16.0 7600 18.6
1700 6.6 3700 12.5 5700 16.1 7700 18.7
1800 7.0 3800 12.7 5800 16.3 7800 18.8
1900 7.4 3900 13.0 5900 16.4 7900 18.9
2000 7.7 4000 13.2 6000 16.6 8000 19.0

Probe SPL Mode Description 195
TABLE 3
HL to real-ear SPL (or SPL to HL) conversion
table from ANSI S3.6-1989 Table G.1
FREQ (Hz) dB
250 19.0
500 12.0
750 10.5
1000 9.0
1500 9.5
2000 15.0
3000 15.5
4000 13.0
6000 13.0
8000 14.0
TABLE 4
HTL(HL) to UCL(HL)
prediction table from Pascoe(1988) Table 4
HTL UCL HTL UCL
dBHL HL dBHL HL
0 97 65 114
5 99 70 115
10 99 75 117
15 98 80 120
20 97 85 120
25 101 90 124
30 102 95 130
35 101 100 127
40 103 105 133
45 105 110 134
50 107 115 137
55 108 120 140
60 110

196 FONIX 7000 Hearing Aid Analyzer

Appendix G 197
Glossary of Terms
AGC Automatic Gain Control (or Automatic Volume Control). A feature on
a hearing aid that automatically adjusts the gain, depending either on
the input level (AGC-I) or the output level (AGC-O). Also known as
“Compression.”
AIDED The response of a hearing aid in place on the ear. (Also called “In-situ
RESPONSE Response.”) Subtract the “Unaided Response” from the “Aided
Response” to get the Insertion Gain Response. When the Aided
Response is measured in a real ear (as opposed to a manikin), it is
called the “Real Ear Aided Response” (or “REAR”).
AMBIENT The environmental sounds in a testing area.
NOISE
ANECHOIC A room with little sound reverberation; a room constructed to be
CHAMBER acoustically absorptive.
AMPLITUDE A measure of the magnitude of a signal.
ANSI American National Standards Institute. A national organization that
determines standards for testing equipment. A section number and date
(year) following the initials “ANSI,” designate the standard referred to.
ARTIFACT A false reading.
ASP Automatic Signal Processing. A feature on a hearing aid intended
to overcome the effects of background noise, making it easier to
understand speech when noise is present. The term ASP is not
standardized, and may refer to various forms of signal processing.
Usually, however, ASP refers to a reduction in low-frequency gain in
the presence of ongoing background noise.
AVG Short for Averaging. An option on the 7000 Test System that uses three
pure tones and averages them for the screen display.
BATTERY A battery simulator that conforms to the size and shape of a battery
SUBSTITUTION used in a hearing aid. It connects to the Battery Voltage Supply,
PILL providing the proper voltage to the hearing aid.
BERGER A prescription formula developed by Kenneth W. Berger).
BIAS FREQUENCY The background frequency, acting as noise, when using the Digital-
Speech-in-Noise test.
BIAS AMPL The amplitude of the background frequency used in the Digital-
Speech–in-Noise test.

198 FONIX 7000 Hearing Aid Analyzer
BICROS A CROS aid that has two microphones, one at each ear, sending both
signals to one ear.
BLOOMING A characteristic of pure tone testing at high levels, that typically shows
EFFECT low frequencies being amplified more than they are under normal use
conditions.
CALIBRATOR A sound generator that produces a tone at a precisely controlled
frequency and amplitude.
CHAP Computer Hearing Aid Program. A program designed to interface with
Fonix instruments in order to make the storage of information in computer files quick
and easy. The current version is known as WinCHAP.
CIC COUPLER Completely-in-the-Canal Coupler. A coupler designed to better handle
the unique acoustic qualities of completely-in-the-canal aids. Included
with the CIC Coupler is internal software which provides corrections to
increase the accuracy of CIC measurements even further.
CONCHA The major part of the acoustic effect of the pinna, contributing
RESONANCE significant energy to the External Ear Effect in the region of 5000 Hz.
COIL Abbreviation for telephone pickup coil.
COMPOSITE The FONIX test signal consisting of 79 pure tones presented
simultaneously.
CONVERSION A hearing aid prescription formula, used to convert an audiogram to a
FORMULA target curve. Common formulas are the NAL, Berger, POGO, and the
1/2, 1/3, or 2/3 Gain rules.
CORFIG Coupler Response for Flat Insertion Gain (or “correction figure”). This is
the transformation that, when added to a target insertion-gain response,
will give the target coupler response. The inverse of “CORFIG” is
“GIFROC.”
COUPLER A device that connects a test microphone to a hearing aid to provide an
accurate testing situation.
CROS Contralateral Routing of Signal. A type of hearing aid that uses a wired
or wireless system to send a signal to the opposite ear.
CRT Cathode Ray Tube. The device in a computer system that projects
information onto a display screen.
CURVE A visual diagram of a measurement using two variables. In testing
hearing aids, one variable may be frequency, shown on the horizontal
axis of the curve, and the other variable amplitude, shown on the
vertical axis of the curve.

Glossary of Terms for the FONIX 7000 199
DATA In FONIX analyzers, the word “data” refers to displaying curve
information as a table of numbers.
DEFAULT A choice automatically made by a computer program.
DIN A European-standard connector with pins surrounded by a round
CONNECTOR metal shell.
DISTORTION Elements of a reproduced sound that deviate from the original.
DSIN Digital speech-in noise. The source signal used for testing digital aids.
The ANSI and ICRA speech weightings are available.
EAR CANAL An acoustic property of the ear canal, often characterized by a peak at or
RESONANCE near 3000 Hz. Along with the acoustic properties of the head, torso,
and pinna, the Ear canal Resonance contributes significantly to the
External Ear Effect.
EIN Equivalent Input Noise. The amplitude of internal noise created by a
hearing aid.
ERROR The latitude of inaccuracy in a testing system. It usually is expressed
in +/- units and/or percent.
EXTERNAL See Unaided Response.
EAR EFFECT
FAST FOURIER A computer “short-cut” of the FOURIER TRANSFORM method for
ANALYSIS determining the frequency content of a signal.
FLAT Same as UNWEIGHTED, referring to a signal that has equal amplitude at
WEIGHTED every frequency.
FOURIER A mathematical procedure that changes “time” information into
TRANSFORM “frequency” information.
FREQUENCY The number of vibrations, or cycles, per second, of a periodic wave.
The unit of measurement is Hertz (Hz).
FREQUENCY A measure of the output or gain of a device across a range of
RESPONSE frequencies of the input signal.
FUNDAMENTAL The lowest frequency in a harmonic complex tone, such as the FONIX
FREQUENCY Composite signal. The fundamental frequency determines the “pitch”
of a tone.
FUN-TAK A brand name for a modeling clay-like substance used to attach and
seal hearing aids to couplers.
GAIN The amplification or increase in sound power in a hearing aid. In
testing, it results from subtracting the level of the input from the level
of the output of the aid.

200 FONIX 7000 Hearing Aid Analyzer
GIFROC The inverse of “CORFIG.” GIFROC is the transformation that, when
added to a coupler response, will give the estimated insertion-gain
response.
GRAPH A grid of lines, with the vertical lines representing one set of
information and the horizontal lines representing another. A “Curve”
superimposed on a graph grid, gives information about test results.
HAIC Hearing Aid Industry Conference.
HARMONICS Integral multiples of a pure tone. The tone itself is the 1st harmonic,
or fundamental frequency; twice the frequency of the tone is the 2nd
harmonic; three times the frequency of the tone is the 3rd harmonic;
etc.
HARMONIC The presence of harmonics in a reproduced signal that are not present in
DISTORTION the original signal.
HFA High frequency average: according ANSI S3.22-1987, the averaged
response at 1000, 1600, and 2500 Hz.
HEAD BAFFLE Refers to the comparative augmentation of high-frequency sound
EFFECT caused by the acoustic diffraction of low-frequency sound by the head
and pinna blending to produce a baffle.
HL Hearing Level. The amount of decibels above audiometric zero at
which a measured ear barely hears a sound.
Hz Hertz. Unit of frequency, referring to cycles per second.
ICRA International Collegium of Rehabilitative Audiology.
IEC International Electrotechnical Commission. An international
organization that sets standards for measurements.
INSERT Earphone whose transducer is joined to the ear by means of a tube
EARPHONE attached to a foam eartip that is placed into the outer ear canal; used in
finding Real Ear to Coupler Difference (RECD) measurements.
INSERTION A measure of the acoustic benefit of a hearing aid, measured in a
GAIN patient’s ear. The insertion gain is the difference, at any particular
RESPONSE frequency, between the Aided Response and the Unaided Response.
When considered across a range of frequencies, the measure is called
the “Insertion-gain Response.” When measured in a real ear (as
opposed to a manikin), the insertion-gain response is called the “Real
Ear Insertion-gain Response” (or “REIR).
IN-SITU Latin for “in position.” In audiometry, it designates measurements
taken with the hearing aid “in place” in the ear.

Glossary of Terms for the FONIX 7000 201
INTER- Distortion generated by the faulty mixture of different input frequencies.
MODULATION This is a primary cause of harshness and lack of intelligibility in a
DISTORTION hearing aid.
INVALID In the Multi-Curve Option, this word appears when there is no curve
stored in a selected memory location.
JIS Japanese Industrial Standard. The organization which sets standards for
measurements in Japan.
KEMAR Knowles Electronics Manikin for Acoustic Research. Model, which
nearly reproduces the acoustic qualities of an average adult head and
torso, that is utilized in the assessment of hearing aid performance.
LED Light Emitting Diode. A small pilot light on an instrument panel.
LEVELING An automatic calibration procedure, establishing a “zero line” for
measurements, taking into account all the acoustic properties of the test
chamber or the testing room.
MENU A list of choices offered by a computer.
MULTI-CROS A hearing aid system that has a switch to select either a CROS, a BI-
CROS, or a Monaural arrangement.
MZ COUPLERS Modified Zwislocki Couplers. Three couplers based on the Zwislocki
design, but sturdier; provided with the OES option.
NAL National Acoustic Laboratories of Australia.
NBS National Bureau of Standards (U.S.), now known as National Institute
of Standards and Technology.
NOISE The 7000’s method of producing a more stable reading by averaging
REDUCTION many samples.
OCCLUDED A frequency response measured inside the ear canal with the hearing aid
RESPONSE earpiece in place, but with the hearing aid turned off. This is a
measure of how much unamplified sound leaks into the ear through the
earpiece (such as with an open fitting). When measured in a real ear (as
opposed to a manikin), it is called the “Real Ear Occluded Response”
(or “REOR”).
OCCLUSION Low-frequency intensification in the loudness level of bone-conducted
EFFECT signals resulting from the blocking of the ear canal.
OES Occluded Ear Simulator. An option on the 7000, using three special
couplers, that provides the same data obtained with a standard ear
simulator.
POGO Prescription Of Gain and Output. A hearing aid prescription formula.

202 FONIX 7000 Hearing Aid Analyzer
POWER The output of an aid, in dB SPL.
PROBE A miniature microphone with a thin, flexible tube that is inserted into
MICROPHONE an ear canal to measure sound.
PT BURST A burst of ten pure tones corresponding to standard audometric
frequencies. The entire signal lasts for less than two seconds.
PURE TONE A testing tone consisting of only one frequency.
REAL EAR A special test procedure using a probe microphone and a special
MEASURE- instrument capable of measuring sound levels inside an ear canal.
MENT
REAL-TIME The ability to view instantly the results of hearing aid tests.
TESTING
RECD Real Ear to Coupler Difference. Measurement of the difference in
decibels between the output of a hearing aid found with a probe
microphone in the ear canal and the output of the aid found in a 2-cc
coupler.
REFERENCE With the QUIK-PROBE Option, the microphone, placed above the ear,
MICROPHONE which provides a reference measurement that is compared to that of the
probe microphone placed in the ear canal.
REFERENCE The location in a test chamber where the microphone of a hearing aid
POINT must be placed for accurate testing. In the 7000, it is the small circle in
the center of the test chamber.
REAR Real Ear Aided Response. See “Aided Response.”
REDD Real-Ear to Dial Difference. This is the difference of the output of an
audiometer, in dB HL, and the measured dB SPL value measured with a
probe microphone in the ear.
REIR Real Ear Insertion-gain Response. See “Insertion Gain.”
RESONANCE The tendency of an acoustic system to reinforce sounds of a certain
frequency, the frequency determined by the shapes and sizes of the
components of the system.
REOR Real Ear Occluded Response. See “Occluded Response.”
RESPONSE LIMIT The high and low points of the frequency range found in the ANSI test
sequence conditions.
RESR Real Ear Saturation Response. A special case of the REAR for which the
hearing aid is operated at its saturation level. This is akin to the coupler
measurement known as the “SSPL-90.”
REUR Real Ear Unaided Response. See “Unaided Response.”

Glossary of Terms for the FONIX 7000 203
RMS Root Mean Square. An overall measurement of the signal going in or
coming out of a hearing aid. When measuring with Pure tones, the
RMS level at each individual frequency will be the same as the level
shown at each frequency on a response curve. When measuring with
a Composite Tone, the (overall) RMS level will be several dB higher
than the level at each frequency on a response curve, since all the
frequencies are presented at once.
SATURATION The condition where any further increase in input level will yield no
further increase in output level.
SINE TONE A testing tone consisting of only one frequency. Same as Pure tone.
SMOOTHING A “rounding-off” of a curve, removing minor peaks and valleys, to
create a more readable curve, using a method that is equivalent to
warbling the input signal.
SOFTWARE The programming part of a computer system.
SPA Special purpose average: according to ANSI S3.22, the averaged
response at specially designated frequencies.
SPL Sound Pressure Level. Expressed in decibels (dB), a logarithmic
measure of the energy (amplitude) of a particular sound as compared to
the energy of a specified reference sound.
SSPL (OSPL) Saturation Sound Pressure Level. The greatest SPL that a given
amplifier can produce.
SSPL-90 Saturated Sound Pressure Level for an input of 90 dB SPL.
(OSPL-90)
SWEEP A sequence of pure tone frequencies, which generates a frequency
response curve.
TARGET A curve, based on an audiogram and a prescription strategy, presenting
the theoretically optimum response that a hearing aid should have for a
particular hearing loss.
TELECOIL Same as COIL. In the 7000, it is an accessory that generates a magnetic
field for testing the telephone pickup of a hearing aid. The telecoil is a
standard feature with the 7020 sound chamber.
UNAIDED A frequency response measured inside the ear canal without a hearing
RESPONSE aid in place. Also known as “External Ear Effect,” the Unaided
Response consists of the combined acoustic affects of the head, torso,
pinna, and ear canal. When measured in a real ear (as opposed to a
manikin), it is called the “Real Ear Unaided Response” (or “REUR”).
UNWEIGHTED A measurement of the amplification (gain) of an aid using an input
GAIN signal (source) that has equal power across all test frequencies.

204 FONIX 7000 Hearing Aid Analyzer
WARBLE TONE A pure tone with slight, but rapid, frequency variations.
WEIGHTED A measure of the amplification (gain) of an aid, using an input signal
GAIN (source) that has a spectral shape similar to that of the long term
average of speech.
WEIGHTED The measurement of amplitude, in SPL, of the output of an aid, using
POWER an input signal (source) that has a spectral shape similar to that of the
long term average of speech.
WHITE NOISE A signal composed of all frequencies, which vary randomly in phase,
each frequency having equal long-term energy levels.
WINCHAP Windows® Computer Hearing Aid Program used for storing hearing aid
tests and client information on a personal computer.

205
Index
A
Adaptive AGC 36
AGC frequency 116
AIDED DATA 153
Aided response 148
Aid type 95
ANSI 84, 158
ANSI 03 107, 108, 110
ANSI 92 117
ANSI Option 3
Arrow keys 12, 28
Attack & Release test 104
Attack Window 116
Audiogram 135
Automatic 151
Automatic testing 91
Average 73
Average unaided response 147
Avg Freqs 95
Azimuth 128
B
Battery 100
Battery current drain 77
Battery Meas 96, 115, 122, 125
Battery Size 96, 115, 122, 125
Battery substitution pills 5, 9
Bias signals 85
Bias tone 95, 159
BICROS 66
wireless 67
wiretype 68
Body Aids 64, 135
BTE 62
Button operation 23
C
Calibration 177
Calibrator 9
Chirp 40
CIC 88, 115
CIC coupler 8, 9
Cleaning 19
Composite 37, 69, 84
amplitude 41
chirp 40
display 56
shape 84
standard 40
type 40
Composite Filter 84, 95
Composite Type 95
Computer connection 52
Connections 17
COPY EAR 136
Couplers 59
6-cc 8
CIC 8, 185
ear level adapter 4
HA-1 4
HA-2 59
MZ 8, 9 0
open ear 9, 63
Coupler I/O 103
Coupler screen 55
local menu 94
Coupler type 95
Crest factor 40
CROS
wireless 66
wiretype 68
CROS/BICROS 167
Curve characteristics box 49
Curve label 94
D
Data 51, 152
Data/Graph 94, 153
Date 29
Default settings 29
Delay times 35
Delete 72, 154
Digital filters 158
Digital hearing aids 114, 157
coupler 84
Digital Processing Delay 97
Digital Speech 37, 69, 84, 85, 157
Display 94, 154
DSL earphone package 11
DSP
enhanced 97
Dummy Microphone 5, 108
FONIX 7000 Hearing Aid Analyzer

206 FONIX 7000 Hearing Aid Analyzer
E
Ear-level adapter 4, 59
Ear hook 7, 129
Enhanced DSP 97
Equiv Noise Test 115, 122, 126
EXIT 12, 28
Eyeglass 65
F
Factory 22
FAST 33, 69
FEED 12, 28
Fitting formula tables 189
Fitting rules 150
FM kit 10
Frequency 151
Frequency sweep 69
Front panel layout 11
Fully-automatic 151
Fully-automatic mode 93
Function keys 11, 23
G
Gain 147
Glossary 197
GRAPH 153
Graph scale 94
Group delay 97
H
HA-1 4, 59
HA-2 4, 59
Harmonic distortion 36, 74
Head-baffle effect 168
Headband 8
Hearing aid
setup 58
HELP 12
History 1
HTL 136, 141
I
I/O Meas 116
I/O Meas. Delay 123, 125
I/O Start 116
I/O Start Delay 123, 125
I/O Test 103
ICRA 84, 158
IEC 120
IEC 60601 14
IEC Option 3
IG DATA 153
Infant earhook 8
Insertion gain 143, 149, 150, 160
Intermodulation distortion 38, 76
ITE 60
J
JIS 123–125
L
Label 43
LEDs 12
LEVEL 12, 28
Leveling 57, 108
removing 58
saving 58
sound field 133
sound field speaker 133
Local menu
coupler screen 94
Location of 7000 17
Loudspeaker Floor Stand 6
LTASS 145
M
M1750E microphone 20
mA/Ampl 102
mA/Freq 100, 102
Maintenance 19
MENU 12
Menu
local 27
pop-up 24, 26
setup 28
Microphone Adapter 5
Misc. Meas. Delay 96, 116, 123, 125
Misc. Start Delay 95, 116, 123, 125
Monitor headset 7
MZ couplers 8, 89
N
NAL-NL1 149
Navigation 24, 25, 128

Index 207
Noise reduction 35, 38, 88
Noise Red (Comp) 95
Noise Red (Tone) 95, 115, 122, 125
Noise suppression 84, 86, 88, 159
NORMAL 33, 69
O
Occluded ear simulator 89
Occlusion effect 156
OES 89
OES Option 3
Open ear 62, 162
Option 115
OSPL90 115
Output 147
Output limit 156
Output limiting 156
Output Trans 95
P
Phase 98
Powering 19
Prescription targets 150
PRINT 12, 28
Printer 96, 116, 120, 123, 126
choice 42
error messages 44
external 48
internal 44
label 43
loading 45
Printing 42
Print Label 96, 116, 120, 123, 126
Probe tube 7, 130
Program mode 91
Pure-tone
delay 35
display 55
FAST 69
fast 33
noise reduction 35
NORMAL 69
normal 33
settings 34
SHORT 69
short 33
Pure-tone signals 33
R
REAG 144, 148. See REAR
Real-Ear Navigation screen 127
Real-Ear Option 2, 127
Real-ear SPL 145, 149, 150
Real-ear targets 145
REAR 145, 147, 148
Rear panel layout 13
RECD 138, 180
REDD 142, 143
Reference mic 162
Reference microphone 129, 152
REIG 149
Release Window 116
Remote module 6, 52
RESET 12, 28
Res Crv Sweep Meas Delay 116
Res Crv Sweep Start Delay 116
REUG 144, 146
REUR 146, 147, 148
REUR Auto Adjust 148
RS232 30, 52
S
Safety 14
Semi-automatic 151
Semi-automatic mode 93
Serial number 20
Setup 16
body 64
BTE 62
eyeglass 65
ITE 60
real-ear 128
wireless CROS, BICROS 66
wiretype CROS, BICROS 68
Setup menu 28
Shape 84
SHORT 33, 69
Signal types 69
Single frequency 73, 151
Single tone. See tone
Smoothing 154
Software version 20
Sound chamber stand 10
Sound field speaker 6, 128
Sound level calibrator 9
Source types 33

208 FONIX 7000 Hearing Aid Analyzer
Specifications 173
Speech mapping. See live speech mapping
Speech weighting 158
SPL 145, 147, 149, 150, 193
START 12, 28
Static test 101
Static Tone 95
STOP 12, 28
Sweep Meas. Delay 95, 122, 125
Sweep Start Delay 95, 122, 125
Swing arm 6
T
Target 135, 137, 149, 150
modifying 141
SPL 141
Targets 145
Telecoil 78, 111, 112
Telewand 79, 111
Test Chamber Cable 5
Three-frequency average 73, 151
Three-frequency sequence 151
Time 29
Toggle 24
Tone 151
Tone filter 32, 36
Transducer 136
Troubleshooting 183
general 183
12 dB Dist 115
U
UCL 136, 141
Unaided response 146
User mode 30
V
VA-CORFIG 3, 115
Visible Speech 163
W
Warranty 22
