Fujitsu NETSMART 2000 Netsmart2000
User Manual: Fujitsu NETSMART 2000 FNC Resources — Data Sheets - Fujitsu United States
Open the PDF directly: View PDF ![]() .
.
Page Count: 11
1
NETSMART® 2000
Design and Planning Tool
shaping tomorrow with you
The NETSMART® 2000 Design and Planning Tool
saves time and money in planning, deploying,
and operating DWDM networks, by improving
business processes and automating labor-
intensive tasks.
2
The NETSMART® 2000 Design and Planning Tool saves money by improving design,
planning, review, and inventory management processes for Fujitsu DWDM networks.
By automating labor-intensive procedures, the NETSMART 2000 tool also drastically
reduces the number of person-hours needed to complete essential tasks. Overall, the
NETSMART 2000 system puts control in your hands and greatly reduces the cost of
planning, deploying and operating a DWDM network.
Plan and Design for Efcient Service Rollout
The NETSMART 2000 system’s superior planning and design features ultimately lead
to rapid, cost-effective service rollout. The system collects and compiles key data that
makes it simpler for you to review and plan your network. Designs created using the
NETSMART 2000 system facilitate economical equipment selection, demand
aggregation, and wavelength allocation.
This easy-to-use tool enables operations, business planning, engineering, strategic
planning, and installation personnel to cost-effectively create, operate, and grow a
DWDM network consisting of the FLASHWAVE® 7500 Multifunction ROADM/DWDM
Platform or FLASHWAVE 9500 Packet Optical Networking Platform.
Key Features of NETSMART 2000
• Audit Management* for faster, lower-cost equipment reconciliation
• Reachability Matrix* for easy identication of the best wavelength pathways
• Custom Prole* for increased accuracy of eld deployments
• Models and PIDs* for exporting rack, shelf, and card data into customer-specic
format
• TRIB site-additional shelves for the FLASHWAVE 7500 and 9500 platforms,
enabling assignment for larger sites
• Customer-specic support kits provide customized Bills of Material (BoMs) to suit
customer needs
• Site location by vertical and horizontal coordinates for increased design exibility
and accuracy
• Single Network Design Method for reducing time and effort when creating a
phased design
• Customized Excel and print options speed up importing and printing of network
information
• Large network support for networks of more than 1,000 NEs
• FLASHWAVE 9500 integration with FLASHWAVE 7500 network topology
* This feature is optional and must be purchased separately
NETSMART 2000
Design and Planning Tool
Save Time—Cut Costs
• Browneld
• Demand Cloning
• Failed Subnetworks
• Network Reachability
• Unit Classication
• Wavelength Re-coloring
• Least-Cost Design
• Price List
• Site and Network BOM
• Price List
• Rack and Shelf Drawing
• Cable Connection List
• Audit Management
• Browneld
• Reports
• Site and Network BOM
• Channel Plan
Collect
Network
Data
Draft
Network
Design
Up to
50%
Up to
70%
Up to
85%
Up to
90%
Up to
50%
Up to
70%
Review
Budgetary
Design
Conrm
Fiber
Characteristics
Turn Up
and
Troubleshoot
Engineer
Network
Network
Validation
Network Design Task
NETSMART 2000 Feature
Potential Savings
over Manual Methods
Purchase
Equipment
Install
Equipment
3
How NETSMART 2000 Controls CAPEX and OPEX
• Reduces manual labor by automating tasks
• Reduces the risk associated with designing a network
• Decreases overall deployment costs
• Reduces the time taken to install equipment
• Increases design accuracy
• Optimizes network performance
Optimize Network Optical Performance and Trafc Demand
The NETSMART 2000 Design and Planning Tool congures the
FLASHWAVE 7500 or the FLASHWAVE 9500 platform into a wide variety
of topologies. Network designs are quickly and accurately optimized
based upon optical performance parameters and trafc demand for
initial deployment and future expansion. At the same time, the
application supports ne tuning of network capacity for the best
possible performance and revenue-generating services, while
achieving the lowest-cost design.
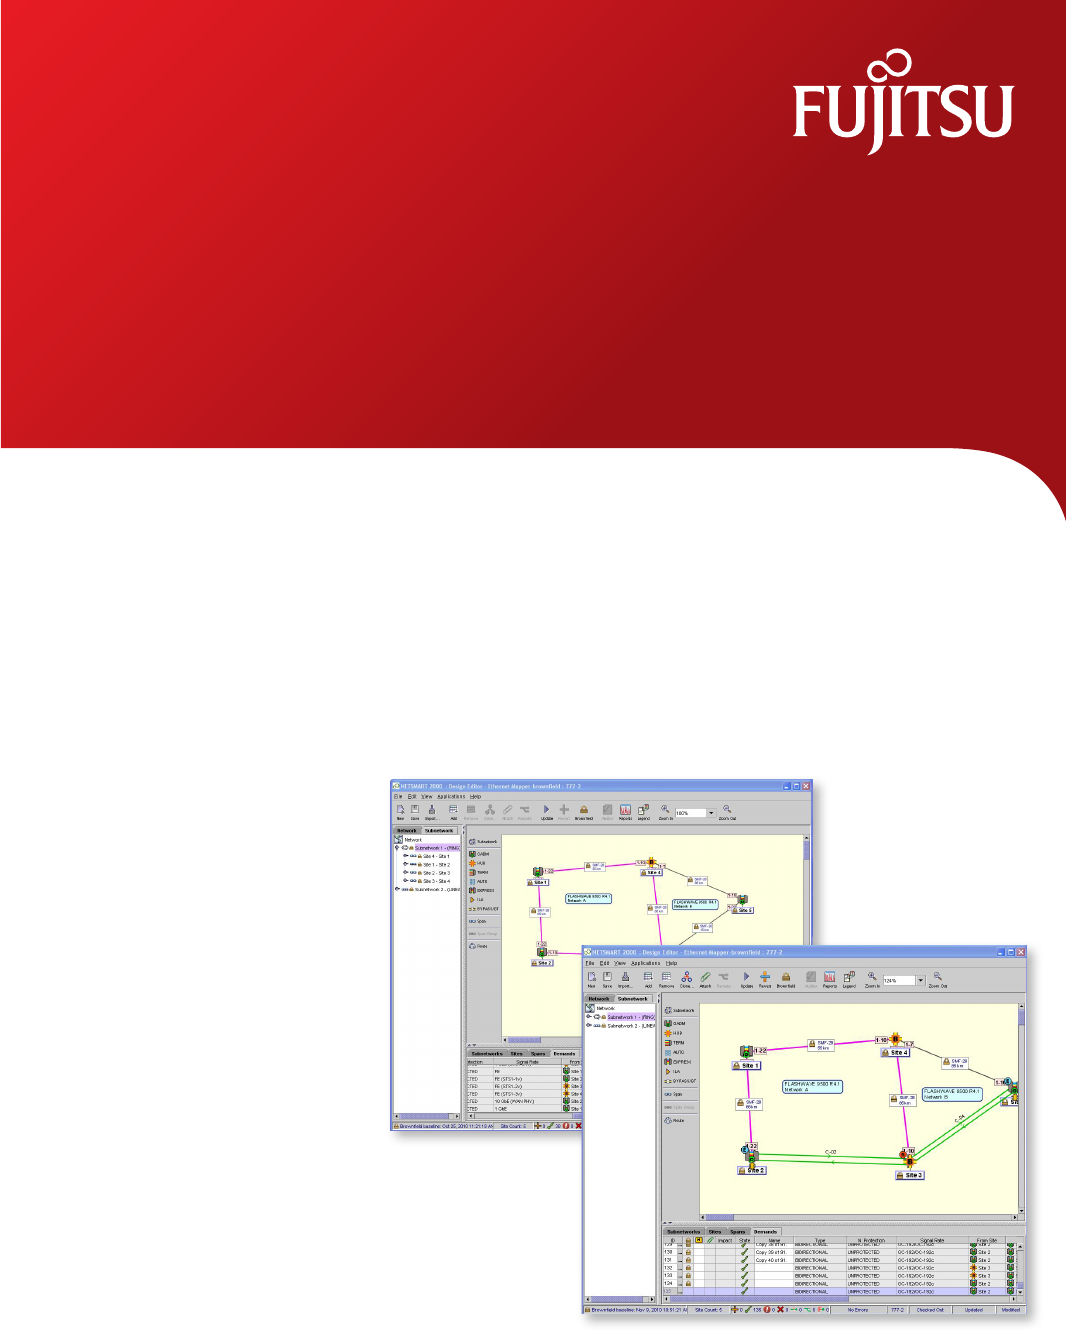
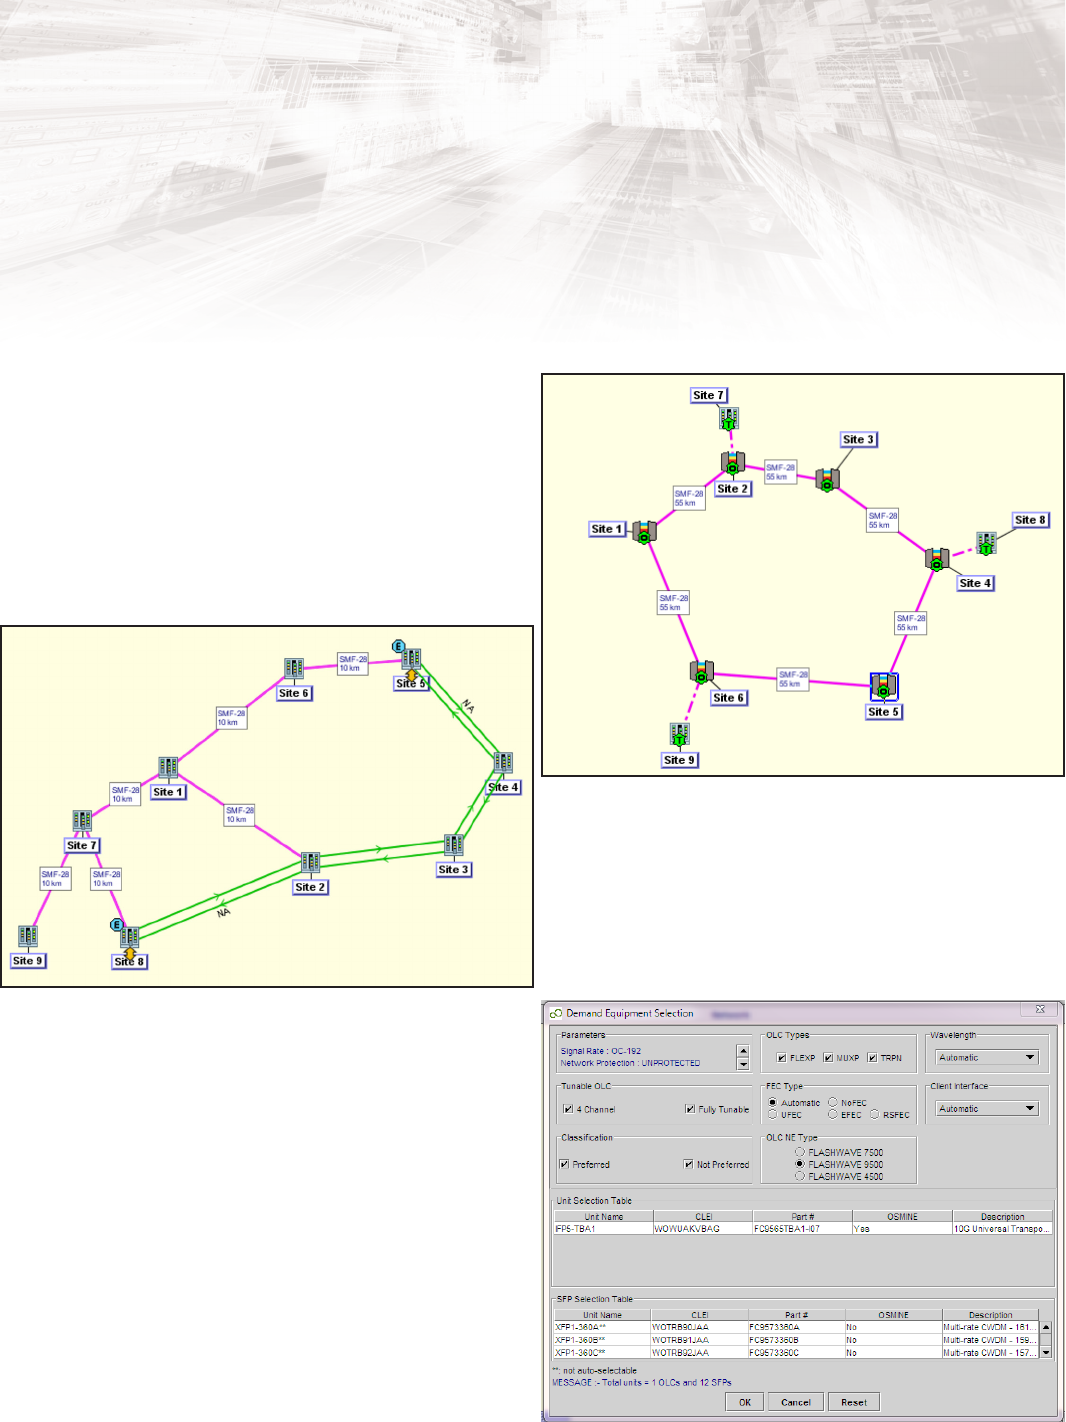
Easy-to-Use GUI Features
The NETSMART 2000 system provides a comprehensive design and
planning tool that boosts productivity and accuracy with purpose-built
features:
• Graphical view of Network Elements (NEs), spans, and site data
• Flexible auto-complete data entry options
• Design le management offers shared network designs, user roles
and user logging
• Revision history and version control
• Audit feature compares as-designed with as-deployed networks for
future planning
• Wide range of topology designs and site types supported:
• Linear
• Point-to-point
• Ring
• Error checking and validation of data entries
• Comprehensive nal design output
• Reports contain all the information needed for network build-out
NETSMART 2000
Design and Planning Tool
Achieve the Least-Cost Solution
Intuitive design and planning features
4
NETSMART 2000
Design and Planning Tool
Increase Design Flexibility, Efficiency and Accuracy
Browneld Designs
Browneld support in the NETSMART 2000 system
increases the usability and convenience of working
with browneld design features:
• Revert a demand to greeneld
• Delete a subset of staged/grouped demands
• Change a bypass site to ILA or ROADM
• Insert a greeneld site into a browneld design
Customer-Specic Support Kits
Customer-specic support kits increase the efciency and accuracy of BoM
updates:
• Modify both site-level and complete BoMs via a modied text le
• Hide parts in a bill of material and remove unnecessary parts such as racks,
ller panels, and covers
• Replace parts in a BoM or swap a part for a similar part
• Organize parts into custom kits, and group parts under a preferred part number.
• Parts can be replacement parts or preferred cables, or line cards with
preferred optics
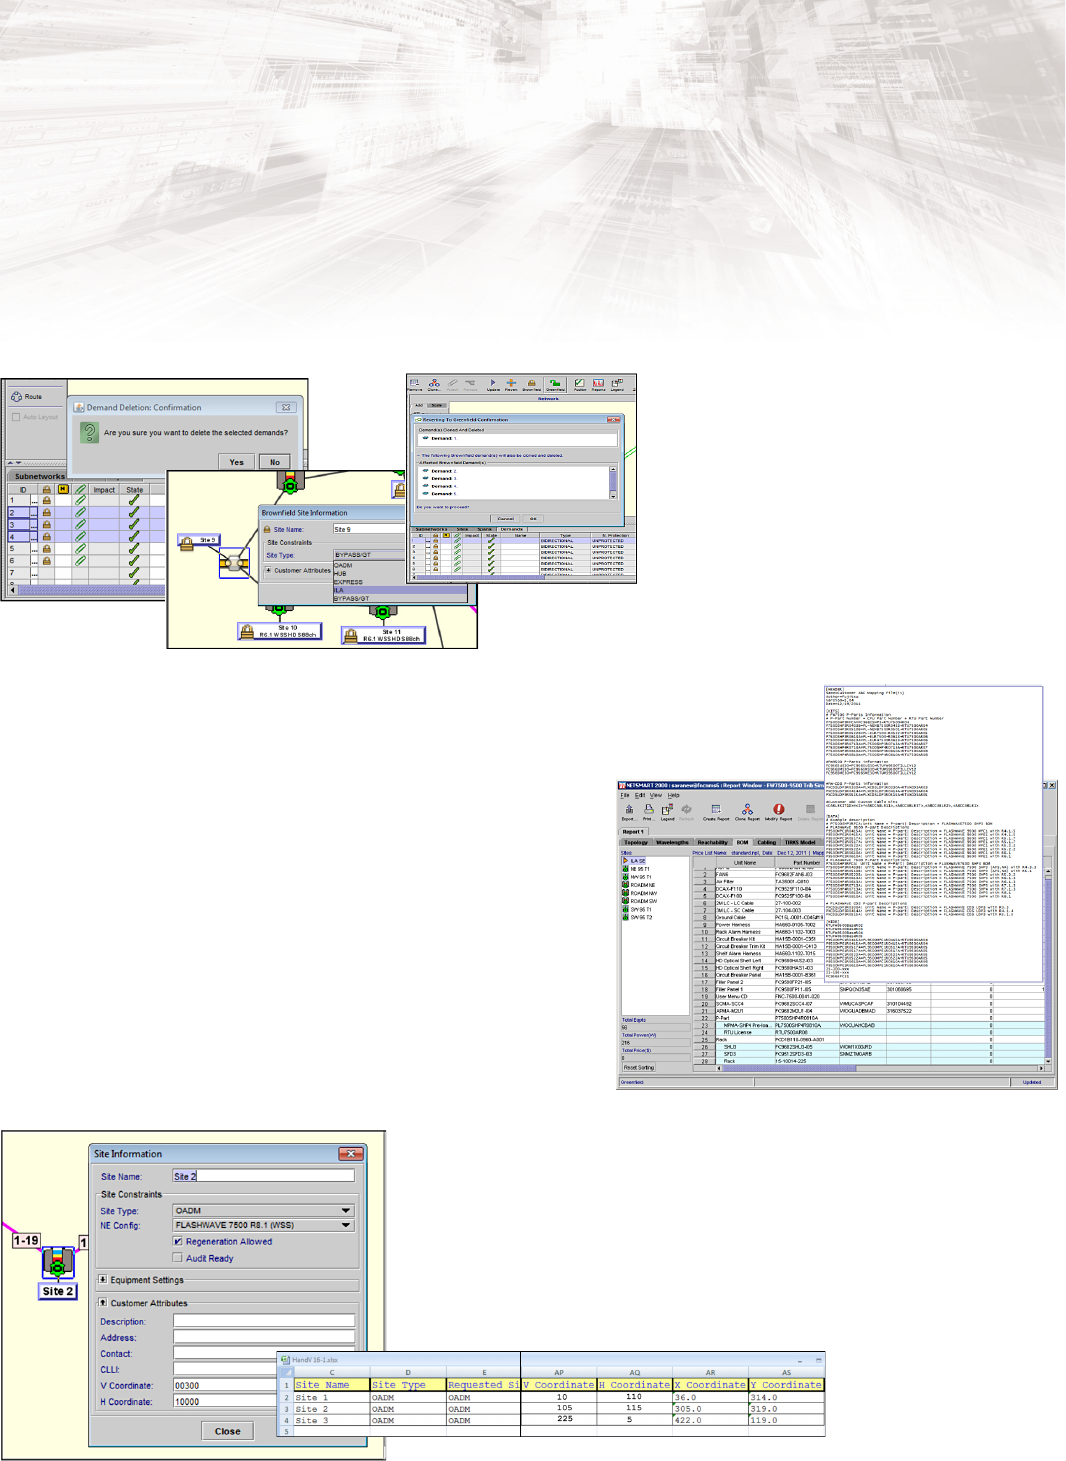
Site Location by Vertical and Horizontal Coordinates
The ability to view site location by vertical and horizontal coordinates offers
increased design exibility and accuracy by maintaining topologies for imported
designs as well as previously supported exported designs. This feature also
enables you to import designs from Excel and maintain site locations in the
topology view.
5
NETSMART 2000
Design and Planning Tool
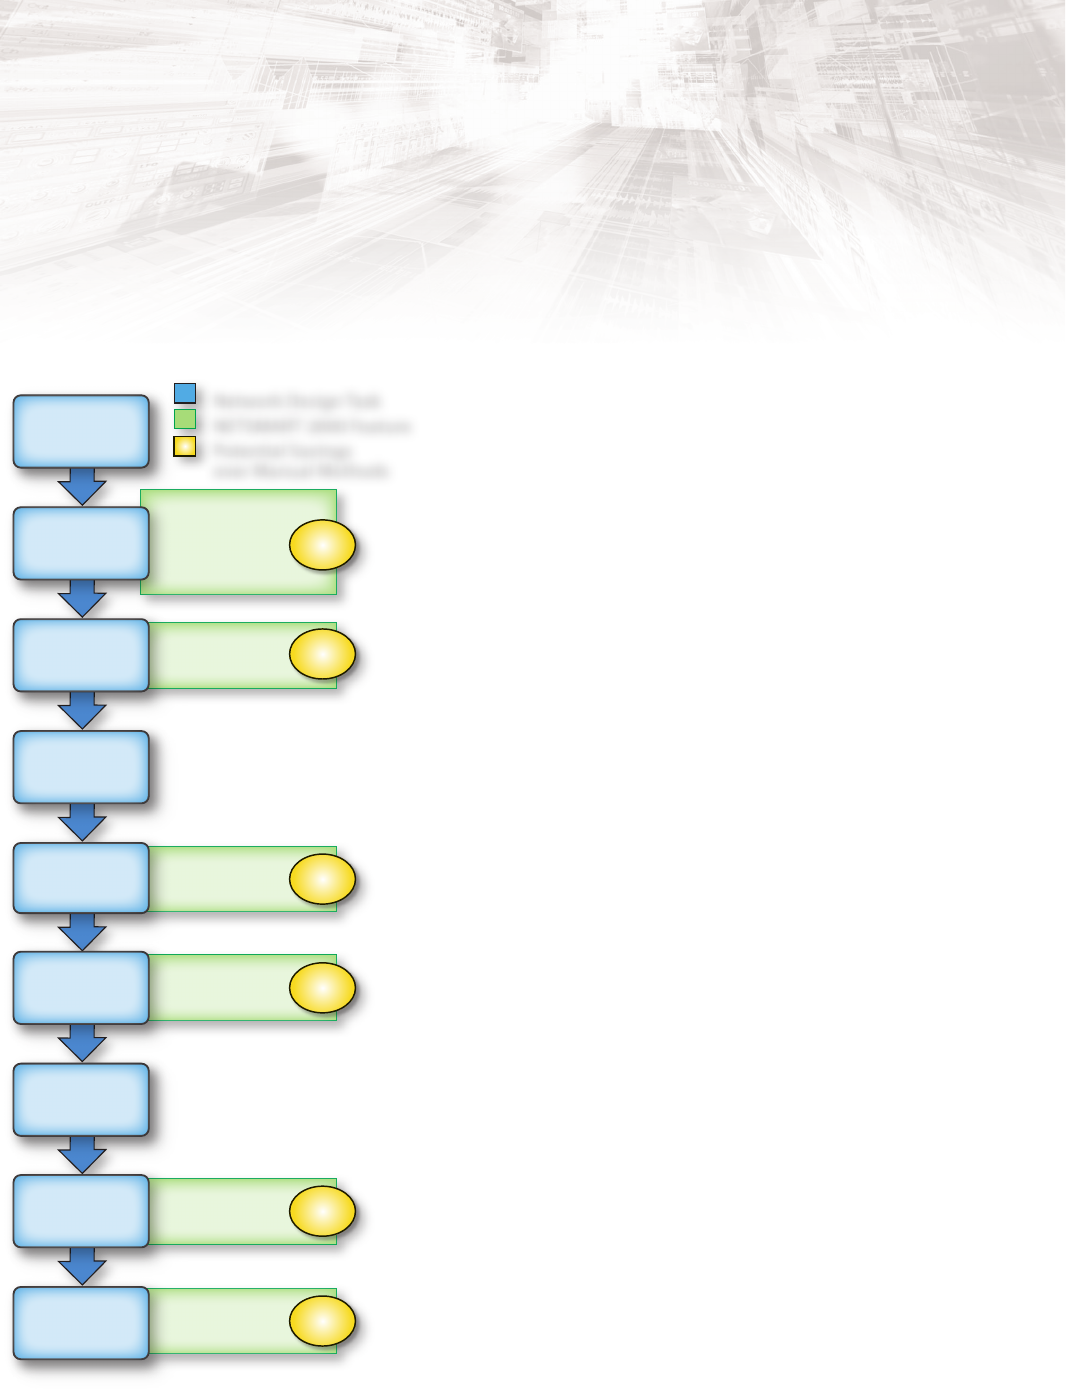
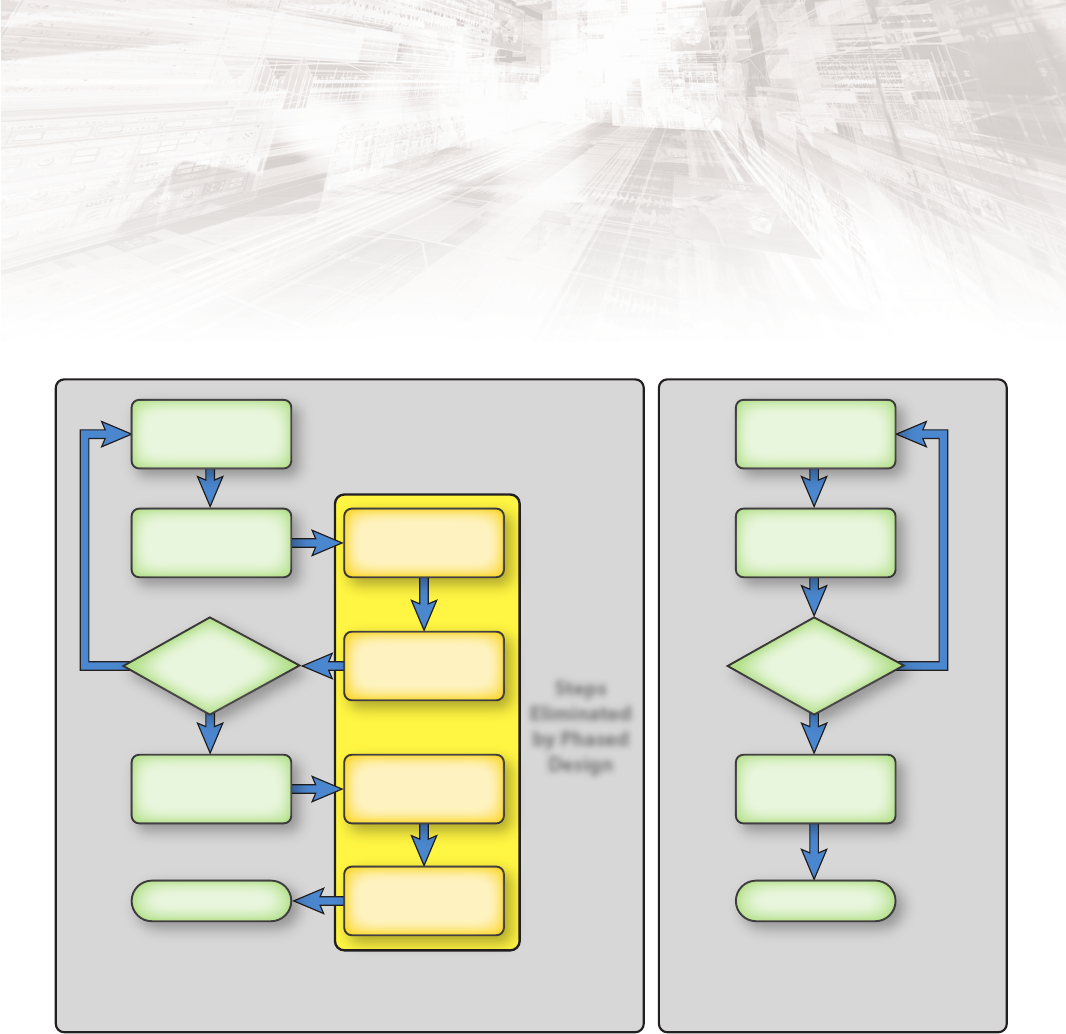
Phased Design
The single network design method provides efcient, reliable, and accurate designs, BOMs, and reports for tracking equipment changes and
network reachability associated with phased designs. This approach eliminates redundant manual steps when designing a network and
incorporating changes over time.
Single network design is possible with the phased design feature. The phased design feature tracks network design revisions, additions or
deletions per phase. Each phase is represented by name and date. Summaries are tracked automatically, ensuring efcient, reliable, and
accurate network designs. The information associated with a phase is incorporated into generated reports and detailed in exported reports
including bill of material, sites, spans and subnetworks.
Eliminate Manual Design Steps
Create Design
(treat as base)
Create Design
Topology
Mark as
Browneld
Save and
Create New Design
Export
Report
Remove BOM
to Match Phase
Create Design
(base is automatic)
Create Design
Topology
Multiple Network Design Method
(Prior to Phased Design)
Single Network Design Method
(with Phased Design)
Steps
Eliminated
by Phased
Design
Generate
Phased Report
Generate
Phased Report
More
Phases or
Edits?
More
Phases or
Edits?
Yes Yes
No No
ReviewReview
6
NETSMART 2000
Design and Planning Tool
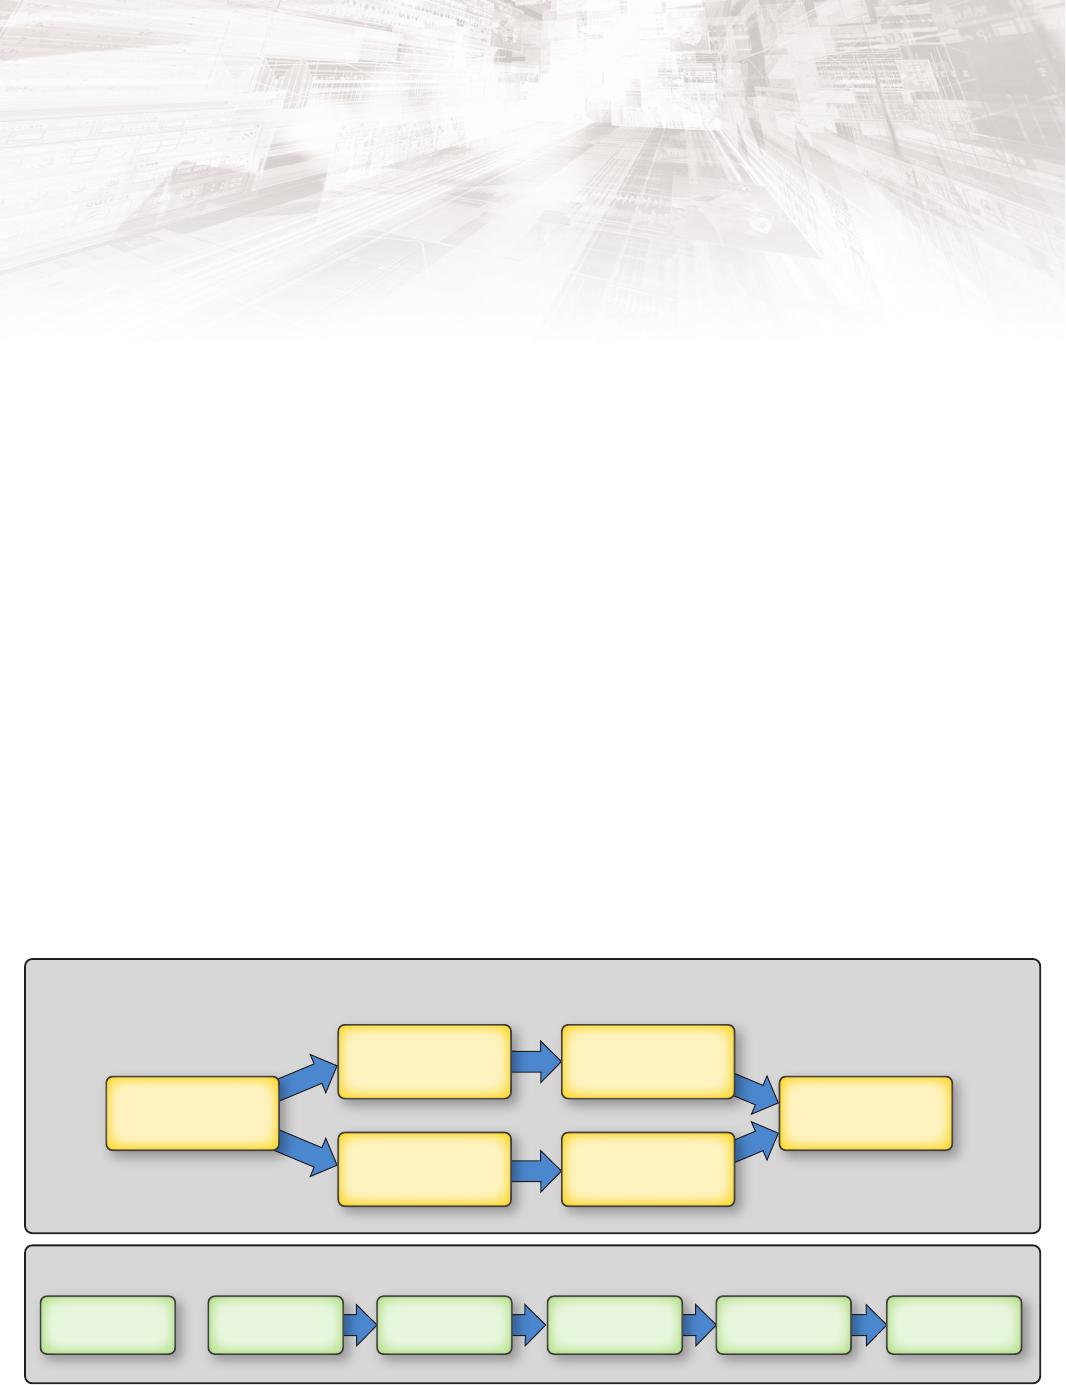
Audit Management for Fast, Accurate Design Verication
In comparison to manual methods, the NETSMART 2000 Audit
Management feature* cuts network auditing time by 50%. The audit
management feature provides an actual equipment review against the
planned network design, centralizes the data storage, and speeds up
the process of verifying equipment selection and network placement.
Used in conjunction with the NETSMART 1500 Management System,
operations and planning personnel can review the state of the
network remotely. The audit management feature accurately compares
inventory with proposed network equipment changes and enables
discrepancies to be identied without the need for site visits. The audit
management tool also increases equipment lifespan by conrming
that deployed and planned ber characteristics are within a
comparable range of designated values.
Key Audit Management Capabilities
For a site or subnetwork, an audit is conducted by importing data
generated from a NETSMART 1500 report and correlating site names to
the TIDs in the inventory report, either manually or using a global
mapping le. Once the sites are mapped, an audit of the network is
executed by selecting the Audit icon from the toolbar. A report is
generated detailing discrepancies for the following items:
• Site • Line card
• Shelf • SFPs
• Amplier • Fiber connection
• Common • Fiber characteristics
• DCM
The audit management feature provides objective validation of
network deployment. With other vendors’ auditing systems or services,
subjective reports are gathered manually, a time-consuming and error-
prone process. The NETSMART 2000 Design and Planning Tool offers
an economical, accurate, time-sensitive method.
The automatic polling interface for the audit management feature
uses federation creation provided to aid in communication to the
NETSMART 1500 server. There is an online mode for automated edits
and an ofine mode for setup and manual edits. The interface reduces
setup time to execute an audit by automatically scheduling audits,
eliminating manual intervention.
* The Audit Management feature is optional and must be purchased
separately from the latest NETSMART 2000 software release. It is only
available on a server-based deployment of the NETSMART 2000 system.
Cut Network Auditing Time
Audit management cuts network auditing time
20 minutes 1 day
5 minutes
5 minutes 5 minutes 5 minutes2 minutes 3 minutes
5 minutes
Number of days depends
on network size
Audit
Network
Generate and Import
NETSMART 1500
Inventory Report
Select Network
or Site(s) to
be Audited
Map to
NETSMART 2000
Design
Conduct
Audit
Review
Discrepancies
Compare NETSMART 1500
Extracted Data to
NETSMART 2000
Exported Reports
Audit
Network
PM Report
Generated by
Operations
Other Solutions
Fujitsu Solution
Site Details Must Be
Extracted and Submitted
to a Useful Format
Generate NETSMART 2000
Site Reports: Rack and Stack,
BOM, and Cabling Reports
Export NETSMART 2000
Site Reports: Rack and Stack,
BOM, and Cabling Reports
7
NETSMART 2000
Design and Planning Tool
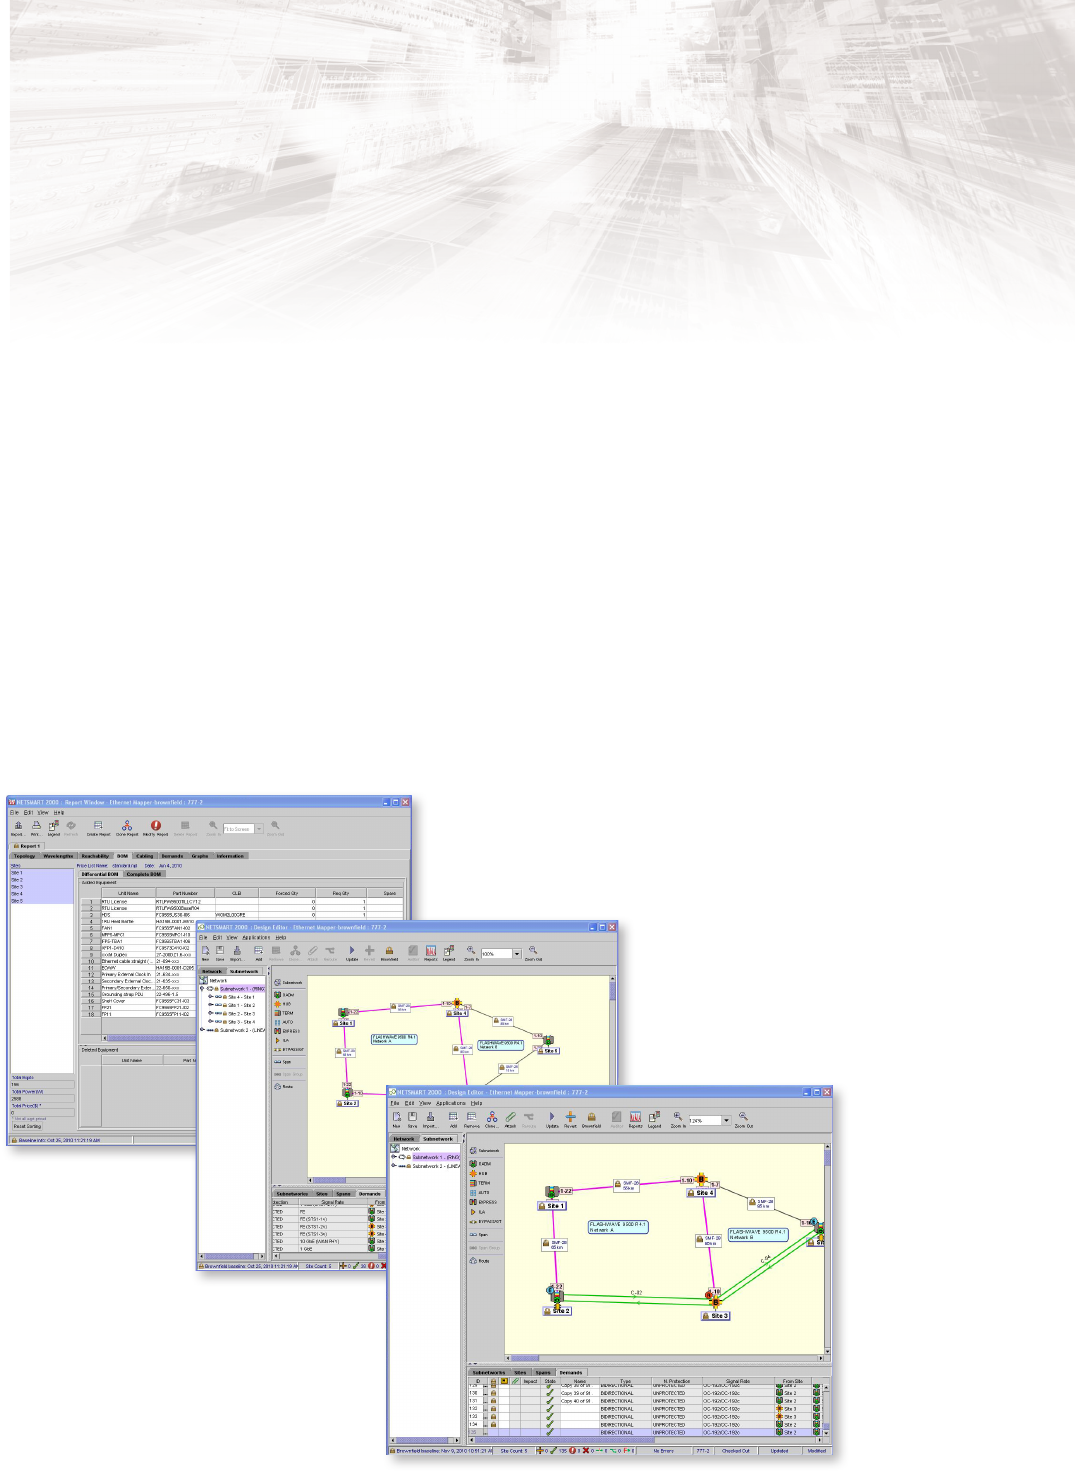
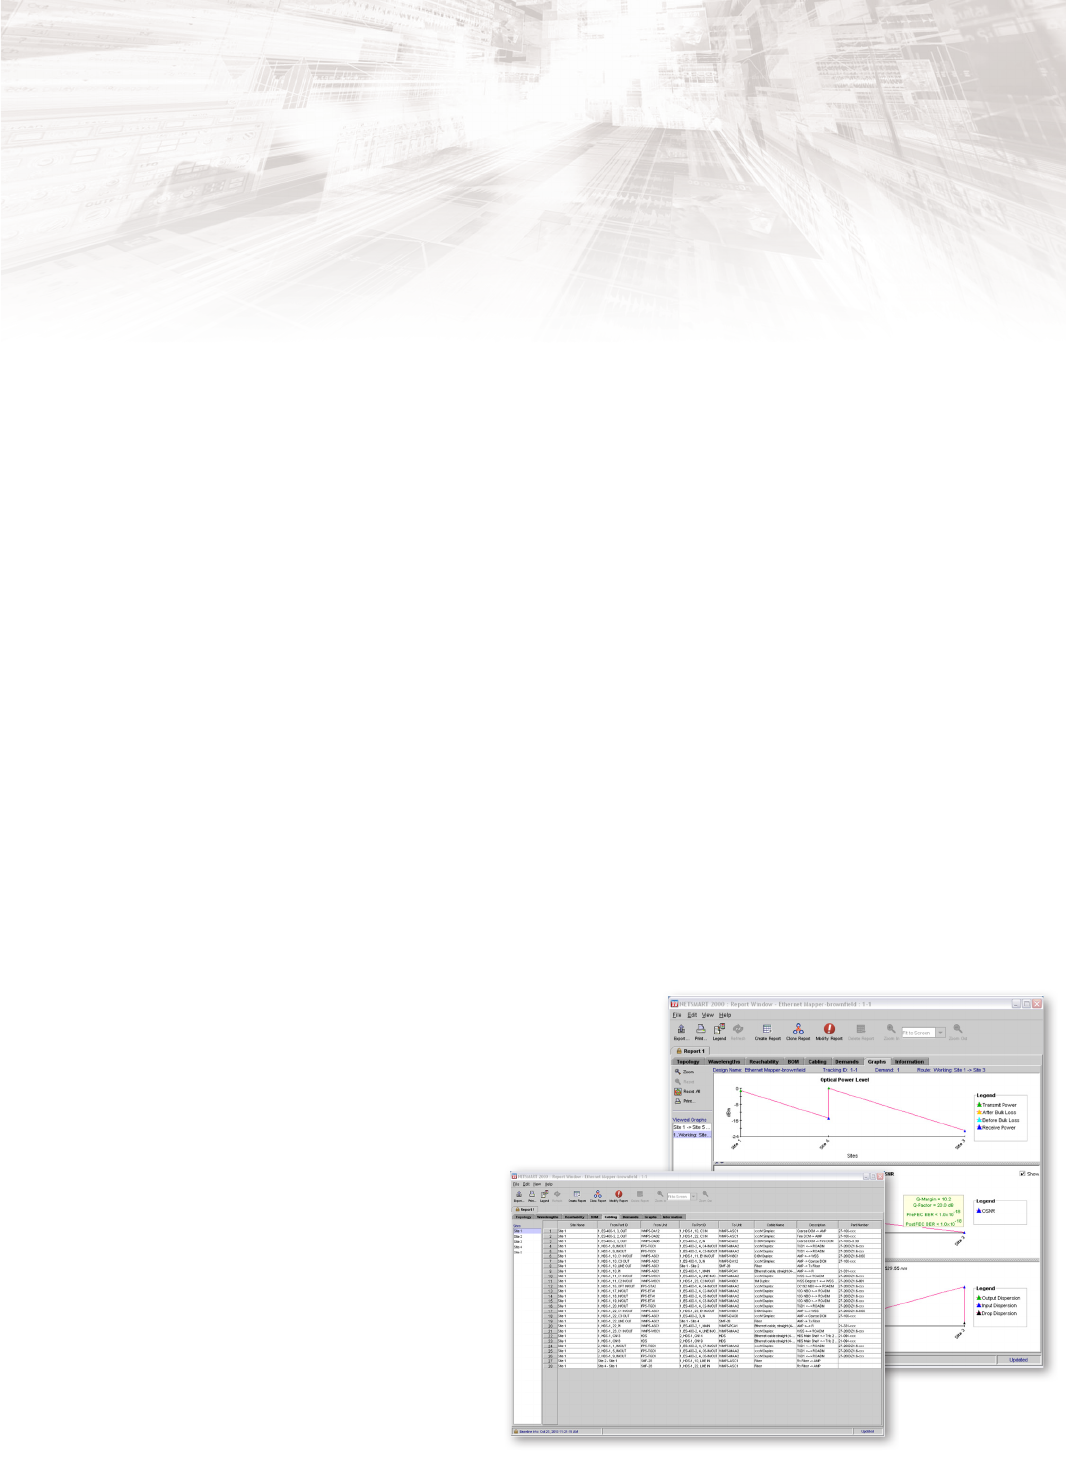
Efcient Reporting and On-Demand Rack Face Drawings
The NETSMART 2000 system provides the most comprehensive
reporting available on the market for a service provider-controlled
network design tool. These reports allow personnel to quickly evaluate
network designs:
• Performance and cabling reports deliver accurate information for
quick troubleshooting of network errors with optical performance
characteristics.
• Rack face drawings reduce the time needed to engineer and install a
site, and consequently speed up time to market for new service
offerings.
These printable reports and drawings are generated in just a few
seconds, with critical network information presented in an easy-to-
review graphical format. The NETSMART 2000 system replaces
numerous tedious, time-consuming tasks with a single reporting
menu.
Installation, Troubleshooting and Turn-Up in Less Time
NETSMART 2000 reports are particularly useful for operations and
planning personnel who need to improve troubleshooting accuracy by
improving access to information about the network. The NETSMART
2000 performance reporting features are also particularly useful for
installers and turn-up technicians when activating a site.
Manually creating a rack face drawing is very labor-intensive process
and requires in-depth knowledge of equipment. The drawing may
need to be separately acquired from a specic department or group.
With NETSMART 2000, users can create customizable rack
conguration designs which match their network standards,
signicantly decreasing the time required to congure the expansion
racks. Users can also align OADM equipment and bers with deployed
networks to document “as built” states. NETSMART 2000 reporting
features also speed up the process of creating demand reports
detailing equipment for sites and demands. This includes
information about slot placement, and characteristics such as
protection schemes, latency values, demand endpoints and
intermediate sites. Optical performance reports provide accurate
information about metrics such as Optical Signal-to-Noise Ratio
(OSNR) and power levels. This speeds up testing and
troubleshooting times. Cabling reports list each individual cable
together with information about the end units and port
connections.
NETSMART 2000 Performance Reports
• Cabling – Reduces the time needed to produce an installation
plan by providing complete information about network needs
• Channel plan – A graphical representation of the channels in use on
each segment of a subnetwork
• Demands – Comprehensive information including add/drop
endpoints, signal rate, protection for client and network, equipment
selection and wavelength, attached sub-rates for staged demands,
equipment shelf and slot location, and working path latency
• Network reachability – A graphical representation of viable paths
from node to node in a subnetwork, with details about supported
line rates and failed lightpaths
• Optical graphs – Graphical representations of power levels for a
subnetwork, showing both transmit and receive power (dBm) for
each site of a subnetwork, in addition to optical power levels (dBm),
OSNR level (dB), and chromatic dispersion (ps/nm)
• Rack and shelf illustrations – Graphical shelf illustrations showing
unit placement
• Models and PIDs – Enables site-level BOMs to be formatted to
match specied models and exported to Excel. The report details
equipment for a site at the rack, shelf, and card level. This report
requires the purchase of the Models and PIDs optional feature.
Detailed performance reports
Speed Up Equipment Installation
8
NETSMART 2000
Design and Planning Tool
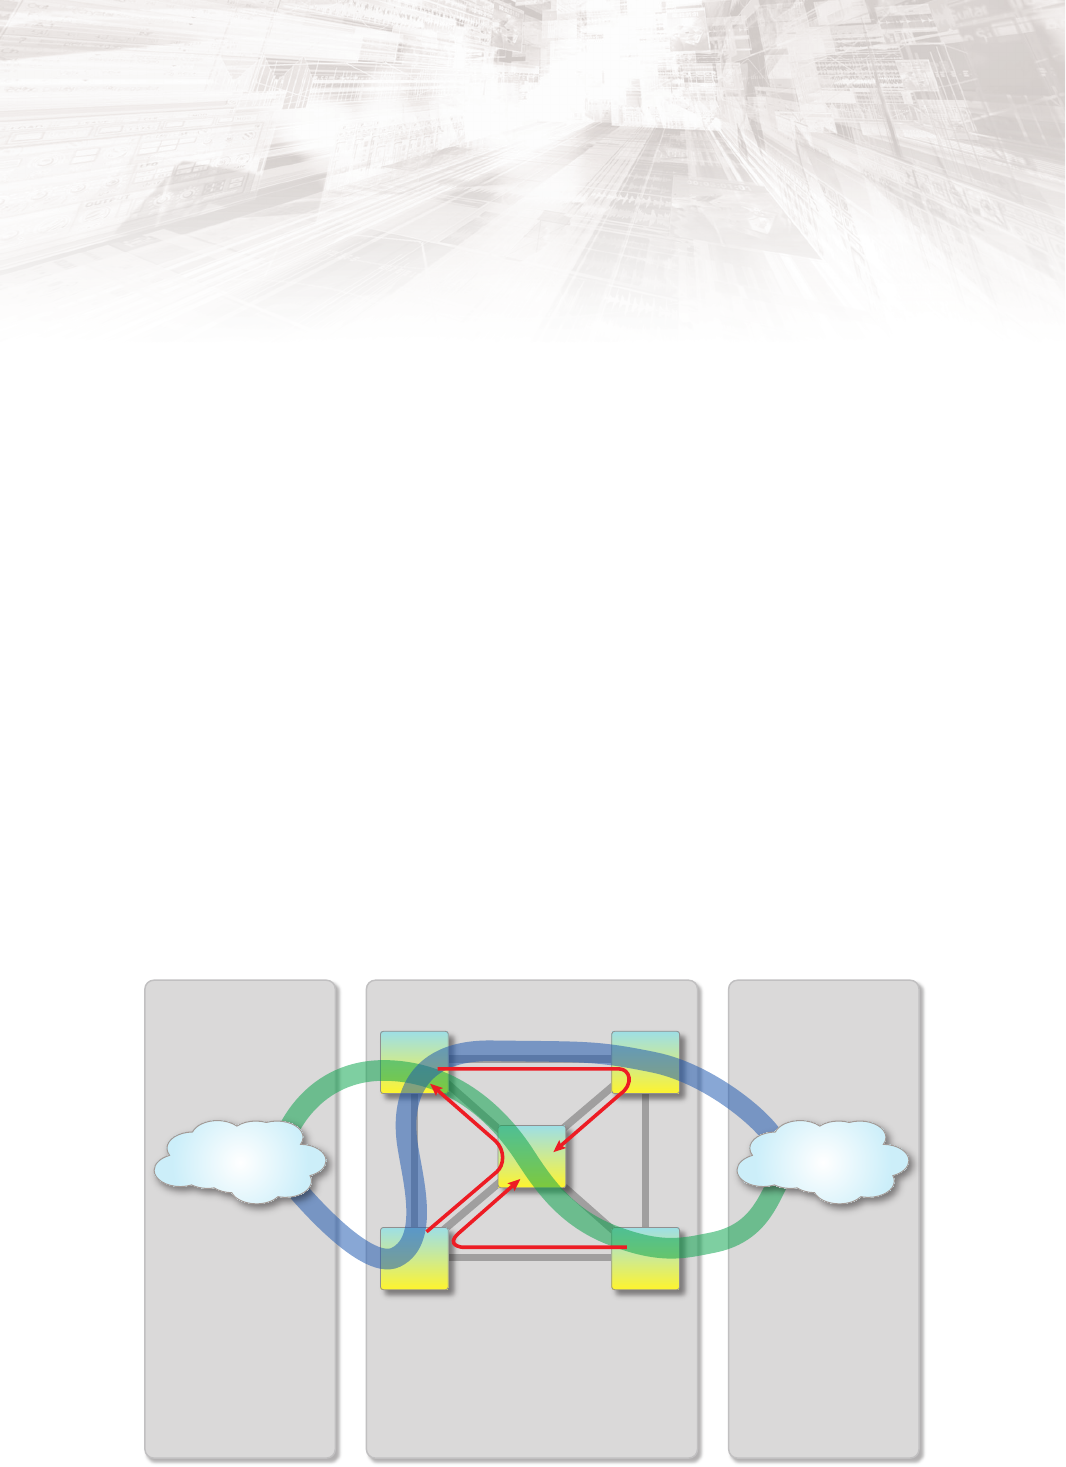
Network Reachability Reporting Determines
Optimal Network Pathways
Network reachability and Network Reachability Matrix* reduce the cost
of network deployment by identifying and selecting the lowest cost
paths for 10, 40 and 100 Gbps wavelengths at designated FEC rates.
The feature enables service providers to evaluate optimized routes in
ring, linear, and mesh networks. Reachability matrix reviews the
viability of every possible route and documents the viable paths.
Reachability provides data that can be displayed on demand for any
selected path, segment or subnetwork, and reachability matrix is able
to review the entire network.
Unique Demand-Planning Capabilities
Network reachability has high value for managing large networks in
determining the most effective route for a particular demand.
Reachability matrix is the only demand planning feature on the
market that automates the process of reviewing network trafc from
subnetwork to subnetwork. Without the NETSMART 2000 system, this
critical demand planning process is manual, extremely time-
consuming, and carries a high error margin. In comparison, network
reachability decreases the effort required to review trafc for demand
planning activities by up to 50%.
Least-Cost Design and Price-List Management Features
The least-cost design and price-list management features decrease the
total cost of ownership of a new network design and increase the
accuracy and cost-effectiveness of the budgeting process by:
• Simplifying the network design selection process by verifying that
the desired network design represents the lowest possible total cost
of ownership
• Increasing the accuracy of budgetary processes with the ability to
remove obsolete price lists
The network reachability scheduler feature increases scheduling
exibility. Reporting activities can be scheduled at any time during the
day, even after normal business hours or holidays.
* The Network Reachability Matrix feature, which provides data for all
subnetworks and paths, is an optional feature and must be purchased
separately from the latest NETSMART 2000 software release. It is only
available on a server-based deployment of the NETSMART 2000 system.
Standard network reachability reporting only applies to a selected path or
subnetwork.
Decrease Total Ownership Costs
Subnetwork 2
Subnetwork 1
Subnetwork 3
Subnetwork 4
Other Vendors’
Equipment
Vendor Solution
Other Vendors’ design tools
may or may not have reachability
features. If not, routes must be
assembled and reviewed
manually.
Vendor Solution
Other vendors’ design tools
may or may not have reachability
features. If not, routes must be
assembled and reviewed
manually.
Reachability report is a basic feature that evaluates
line-rate reachability for all FEC rates on a
per-subnetwork or per-path basis (red paths).
Reachability matrix is a licensed feature that
automatically reviews every possible path through
the Fujitsu network. Viable paths are documented
in a data le for import to a custom program, where
circuits are reviewed for adjoining networks.
Fujitsu Network
Other Vendors’
Equipment
Network Reachability report and Network Reachability Matrix reduce deployment costs

9
NETSMART 2000
Design and Planning Tool
Custom Prole Improves Organization and Recordkeeping
The Custom Prole feature* allows service providers to organize and
constrain possible line card and interface module selections for use in
network designs. Custom proles can save service providers thousands
of dollars each year by reducing the variety of hardware needed for the
network and consequently streamlining the range of needed spare
parts. The feature reduces the variety of card types and reduces
manpower needed to properly manage inventory. Line cards are
selectable using parameters such as OSMINE compliance, card type,
pricing and SFP types. Custom prole also allows users to designate
card placement in a shelf. Designers can align card deployment with
company standards. The feature also aids in realigning network
designs with deployed networks, resulting in an increase in the
accuracy of equipment management.
In addition to line card ltering and line card placement, it is possible
to adjust cable length in the BoM generated in the NETSMART 2000
reports. The result is accurate cable selection for a site by providing
parts that align with established customer standards.
Core card override, a custom prole v5 enhancement, enhances user
conguration usability and increases accuracy of eld deployments.
This function allows user to align eld deployment with planned
designed (even after the fact). Core cards include lambda access
modules, switch fabrics, PE mappers, dispersion compensation
modules, sync cards, and single channel ampliers
* TheCustom Prole feature is optional and must be purchased separately from
the latest NETSMART 2000 software release. It is only available on a
server-based deployment of the NETSMART 2000 system.
Wavelength Recoloring Speeds Up Demand Routing
The process of identifying new wavelength paths has historically been
performed manually by network engineers. This is particularly
labor-intensive when routing wavelengths through several
subnetworks, increasing the likelihood of error. The menu-driven
wavelength recoloring feature automatically reviews wavelength
paths, saving time and increasing the accuracy with which subnetwork
capacity can be reviewed. The feature eliminates the need to manually
track available wavelengths from subnetwork to subnetwork when
evaluating network capacity and adding demands.
Browneld Support Reduces Error Potential
Browneld support improves accuracy and reduces the potential for
error when designing new subnetwork deployments or adding
demands to an existing deployment. The browneld feature assists in
the process of preplanning and predesigning networks prior to
deployment. A revision of the network design can be locked down,
limiting impact to existing trafc. Browneld support ensures that
networks are deployed to the intended design and conguration.
The feature also:
• Prevents equipment re-selection in revised designs by locking unit
selections and placement of the original network design
• Minimizes impact to the original design for the life of the network
through extensive review of incremental changes
• Provides clear and detailed information about the equipment
needed to support new demands and subnetworks
• Provides exibility by allowing sites, spans, and subnetworks to
revert to greeneld state for either site upgrades, site additions, or
ber modication
• Provides exibility by permitting wavelength number change for
browneld demands
• Aligns degree to ber and amplier feature to synchronize network
design with deployed equipment
• Increases design convenience and usability by the ability to revert a
demand to greeneld and change a bypass site to an ILA or ROADM
site
Browneld support enables new subnetworks and demands to be
tracked in an incremental BoM. The incremental BoM tracks additions
and deletions that result from revised design. Browneld support also
enables phased design approaches. Overall, browneld support
reduces the risk and manual labor associated with new network
implementations and changes.
Deploy Networks in Alignment with Design
10
NETSMART 2000
Design and Planning Tool
FLASHWAVE 7500 Extension Shelf Support
NETSMART 2000 supports the FLASHWAVE 7500 Extension Shelf for
standalone non-ROADM service applications. The software supports
topologies created solely with 7500 Extension shelves for transport of
services from remote locations to the core, or to other remote
locations. The feature delivers high-capacity services to the customer
premises where OADM infrastructure is not needed. The software
reduces operational expenses by consolidating the complete DWDM
infrastructure, from the customer to the network core, onto a unied
platform. SAS topologies are limited to the 23” shelf over SMF ber.
Platform Integration of FLASHWAVE 9500 and
FLASHWAVE 7500 Systems
The NETSMART 2000 system now includes support for FLASHWAVE
9500 optical line cards with FLASHWAVE 7500-designed networks.
This capability facilitates easier transition to the FLASHWAVE 9500
platform, while maintaining deployed FLASHWAVE 7500 systems. The
feature is available when a demand is created. It is possible to choose
FLASHWAVE 9500 optical line cards in the Equipment Selection menu
when creating new demands. FLASHWAVE 9500 optical line cards are
reected in the BoM.
FLASHWAVE 7500 and FLASHWAVE 9500 Platform Support
Remote SAS topology
FLASHWAVE 9500 trib site for integration to
FLASHWAVE 7500 network
FLASHWAVE 9500 platform integration

11
NETSMART 2000
Design and Planning Tool
10.0/R6.1/08.13
Microsoft Windows standalone • Pentium Processor 2 GHz or greater
• 40 GB free disk space
• 16-bit sound card
• 256 MB video RAM
• Monitor with 1024 x 768 resolution
• 10/100 Ethernet card
• Microsoft Windows 7 (32- or 64-bit)
• DVD-ROM drive
Microsoft Windows client • Intel Pentium IV 2.0 GHz or faster processor
• RAM requirements:
• Windows 7: 3 GB RAM
• 40 GB free disk space
• 256 MB video RAM
• DVD-ROM drive
• Monitor with 1024 x 768 resolution
• 10/100 Ethernet card
• Microsoft Windows 7
Linux OS server • IBM X3550 M3 server
• Six-core X3 GHz CPU
• 32 GB RAM
• DVD-ROM drive
• 292 GB total storage
• (2) 100Base-T ports
• Red Hat Enterprise Linux release 6.1 or 6.3
Virtual Server Environment • KVM Linux VSE software
• VMWare™-certied software
Summary of Supported Systems and Requirements
Fujitsu Network Communications Inc.
2801 Telecom Parkway, Richardson, TX 75082
Tel: 888.362.7763
us.fujitsu.com/telecom
© Copyright 2013 Fujitsu Network Communications, Inc. FLASHWAVE
®
and NETSMART
®
are trademarks of Fujitsu Network Communications Inc. (USA).
FUJITSU (and design)
®
and “shaping tomorrow with you” are trademarks of Fujitsu Limited in the United States and other countries. All Rights Reserved.
All other trademarks are the property of their respective owners. Conguration requirements for certain uses are described in the product documentation.
Features and specications subject to change without notice.
