GE Medical Systems Information Technologies 2014748-002 Medical Telemetry Transmitter User Manual
GE Medical Systems Information Technologies Inc. Medical Telemetry Transmitter
Contents
Manual Draft1 Part 7

7-2 ApexPro™ 2001989-301A- draft 1
Viewing real-time patient data
Real-time patient views
You can view real-time data for patients located in your care unit, and when
networked with other CIC Pro centers, you may also view real-time data for patients
located outside of your care unit.
The CIC Pro center allows you to view real-time patient data from two different
patient viewers. Each viewer provides a different level of data granularity:
Multi-patient viewer
Single patient viewer
CAUTION
TREATMENT — Do not treat a patient based solely on the alarm
messages and/or numerics presented via the connectivity device to
the monitor. You must verify the accuracy of the alarm message and/
or numerics at the peripheral device itself before initiating treatment.
Treatment should be based on the information presented at the
peripheral device.
Data synchronization
Information displayed on the ECG tab sheet is synchronized with the source
(transmitter) every two seconds. If differences are detected, the display is refreshed
with new patient data.
Multi-patient viewer
The multi-patient viewer displays a snapshot of real-time parameter data for a
maximum of 16 patients. You can do the following real-time tasks from the multi-
patient viewer:
View abbreviated real-time patient data.
View a snapshot of real-time Graphic Trends data for a maximum of two
different parameters. See Configuring the real-time trend window on page 7-6.
Print parameter limits or waveform data for all patients in the care unit. See
Printing parameter limits or waveforms for all in-unit patient beds on page 7-9.
View a single patient’s detailed real-time parameter data. See Single patient
viewer on page 7-3.
View a single patient experiencing an alarm condition. See Viewing in-unit
patients experiencing an alarm condition on page 7-5.
Admit or discharge a patient. See Chapter 6.
View beds outside your care unit. See Out-of-unit patient beds on page 7-6.
Silence all alarms. See Silencing alarms on page 5-7.
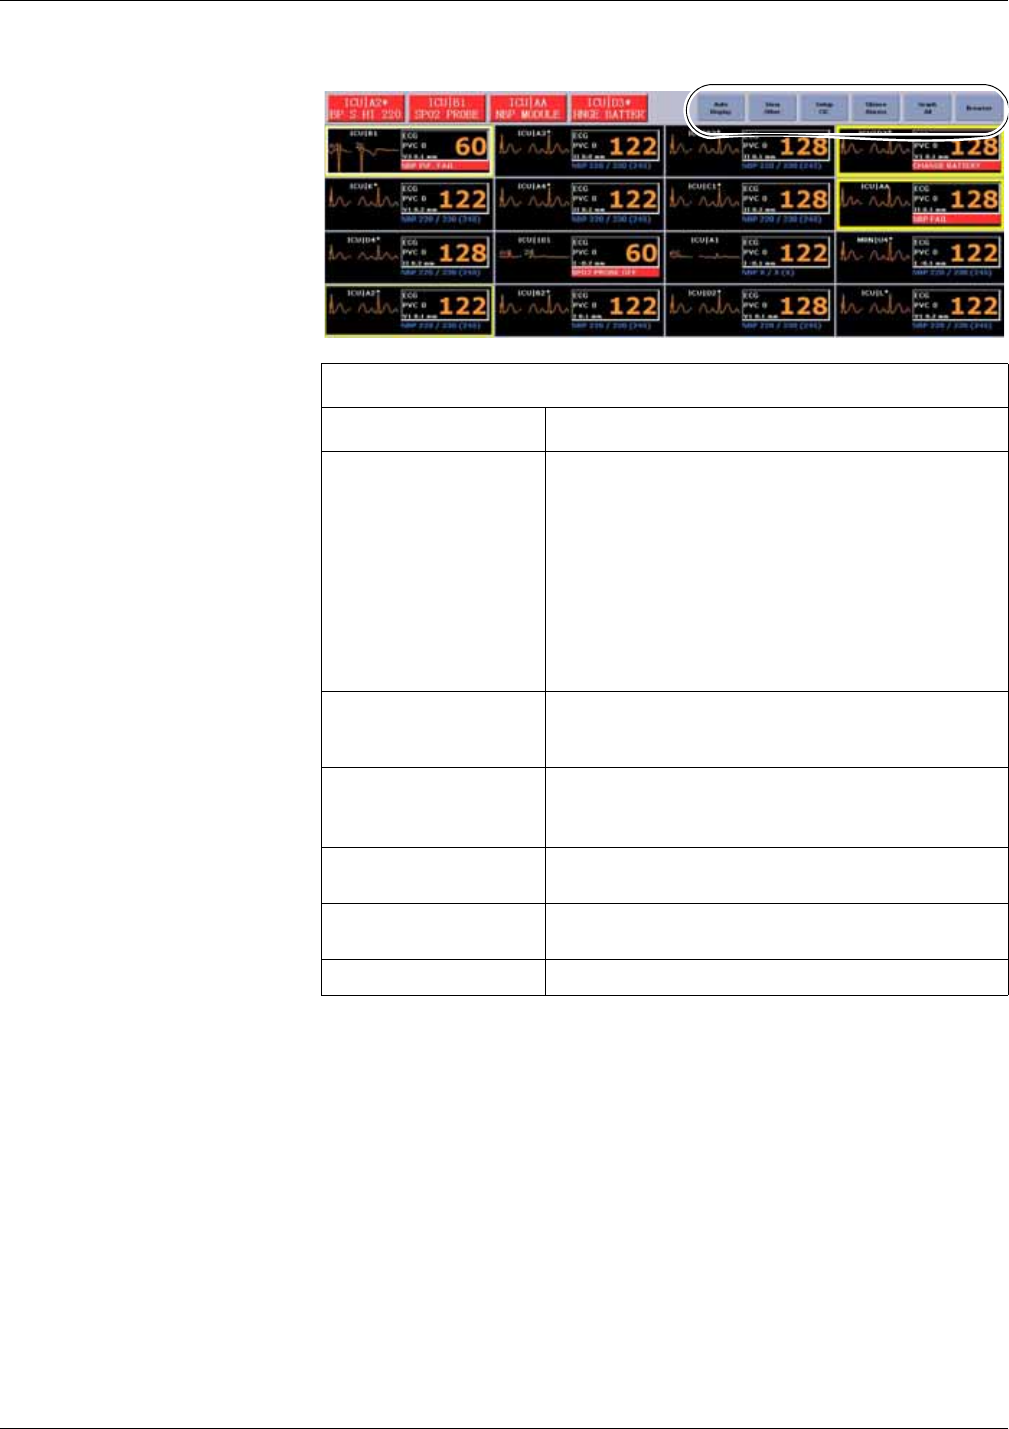
The multi-patient viewer displays menu bar options similar to the following:
Draft
Viewing real-time patient data
2001989-301A- draft 1 ApexPro™ 7-3
059A
Single patient viewer
The single patient viewer displays detailed real-time parameter data for a selected
patient. You can complete the following tasks from the single patient viewer:
View detailed real-time parameter data.
View, change, or print Alarm Control or parameter control settings for any in-
unit patient. These changes are also adopted by the monitor. See Adjusting alarm
control settings on page 5-8. See Adjusting parameter control settings on page 7-
11.
View Alarm Control or parameter control settings for out-of-unit patient beds on
the Unity Network. See Adjusting alarm control settings on page 5-8. See
Adjusting parameter control settings on page 7-11.
Multi-patient viewer menu bar options
Option Function
Auto Display When enabled, the Auto Display button is selectable from the
menu bar.
Clicking the Auto Display button while viewing the multi-
patient viewer automatically completes the following tasks:
Removes any un-locked, unoccupied beds.
Adds at least one empty patient window with an Admit
button.
Resizes the remaining patient windows to maximize the
amount of displayed patient data.
View Other View any patient bed on the Unity Network that is inside or
outside of the care unit, floor, or hospital. See In-unit patient
beds on page 7-5. See Out-of-unit patient beds on page 7-6.
CIC Setup View the CIC Pro center default settings. You can customize
some of the user-level defaults. See Customizing the system
on page 4-4.
Silence Alarms Silence audible alarm tones for one minute. See Silencing
alarms on page 5-7.
Graph All Print the parameter limits or the waveform data for all patients
in the care unit.
Browser Access stored patient data from the web access server.
Draft
7-4 ApexPro™ 2001989-301A- draft 1
Viewing real-time patient data
NOTE
You cannot change the Alarm Control or parameter control settings of an
out-of-unit patient.
Adjust the real-time trend window for any in-unit patient. See Configuring the
real-time trend window on page 7-6.
Print real-time parameter data and waveforms for any in-unit patient. See
Printing real-time data on page 7-8.
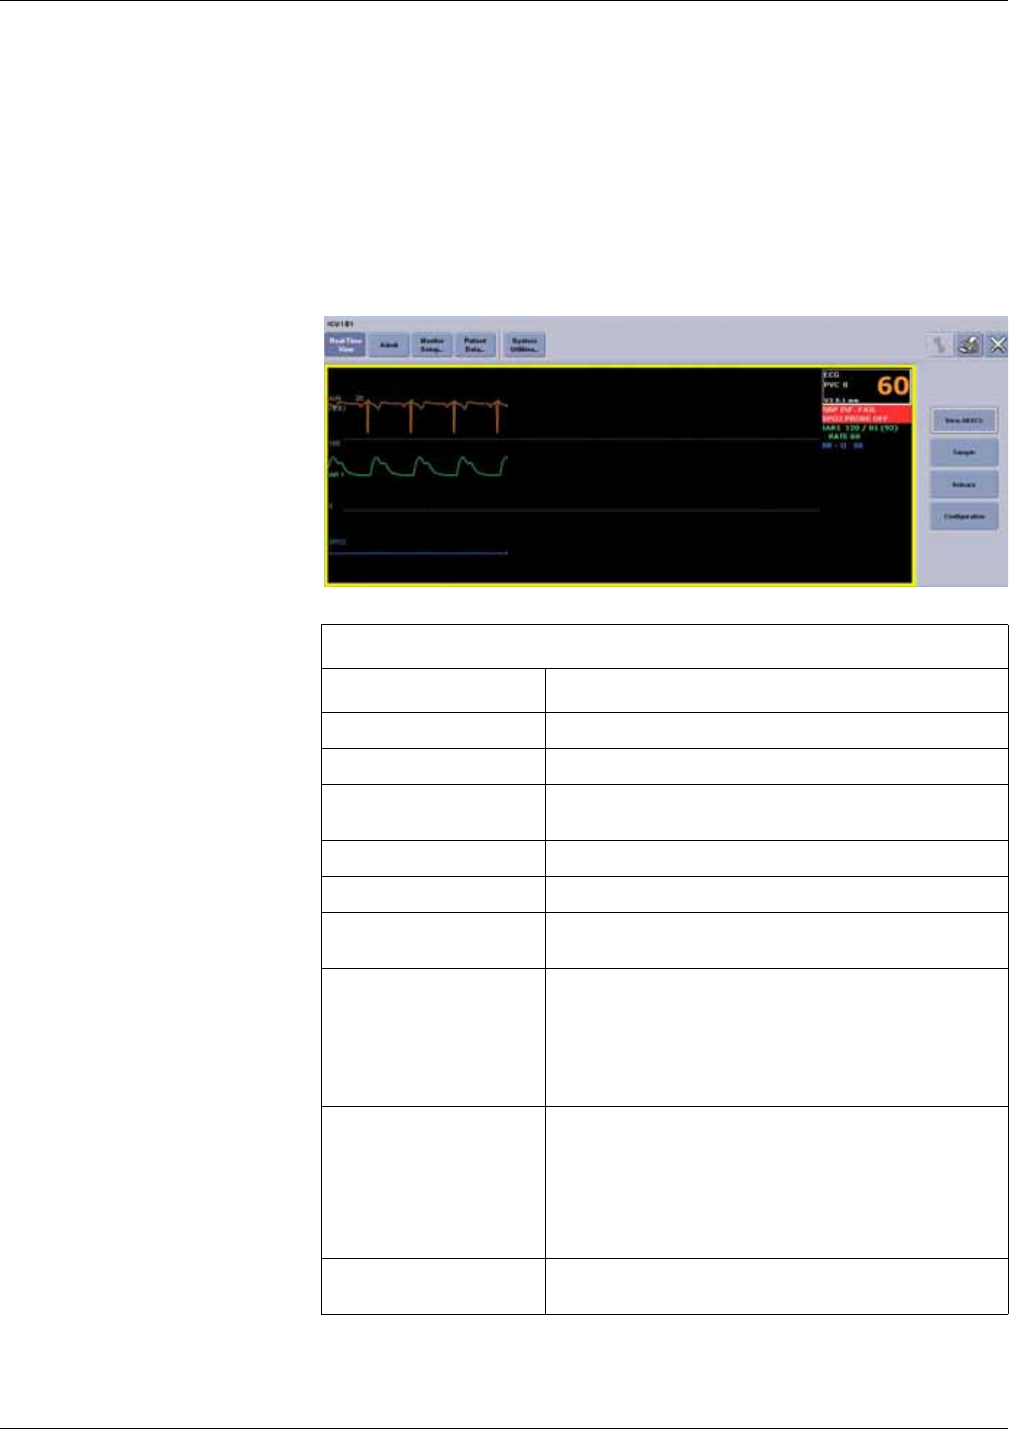
The single patient viewer displays menu bar options similar to the following:
060A
Single patient viewer menu bar options
Option Function
Real-Time View Return to the real-time display of patient data.
Admit Display the Admit window.
Monitor Setup... Temporarily adjust a patient’s parameter, alarm, or print
control settings.
Patient Data... Display stored patient data. See Chapter 8.
System Utilities... Access web access server data.
View all ECG Display waveforms for ECG leads I, II, III, V, aVR, aVL, and
aVF.
Sample Record and store a 10-second sample of a patient’s real-time
ECG data. Data samples are stored in Events directory.
Monitor: Parameter numeric data and up to three
waveforms.
Telemetry: ECG waveforms only.
Relearn Relearn the selected patient’s ECG rhythm after changes
occur to heart rate or rhythm. The CIC Pro center uses 14
current complexes to relearn the patient’s ECG pattern.
The heart rate value appears briefly as Xs during the relearn
process and returns to numerics when the relearn process is
complete.
Configuration Configure the selected patient’s real-time trend window. See
Configuring the real-time trend window on page 7-6.
Draft
Viewing real-time patient data
2001989-301A- draft 1 ApexPro™ 7-5
In-unit patient beds
You can view any in-unit patient bed that is on the Unity Network.
Viewing in-unit patients experiencing an alarm condition
When an in-unit patient experiences an alarm condition, you can quickly display this
patient’s data by displaying the single patient viewer.
You can use one of the following methods to display the single patient viewer of an
alarming patient bed:
Click in the patient window.
Click the alarm button.
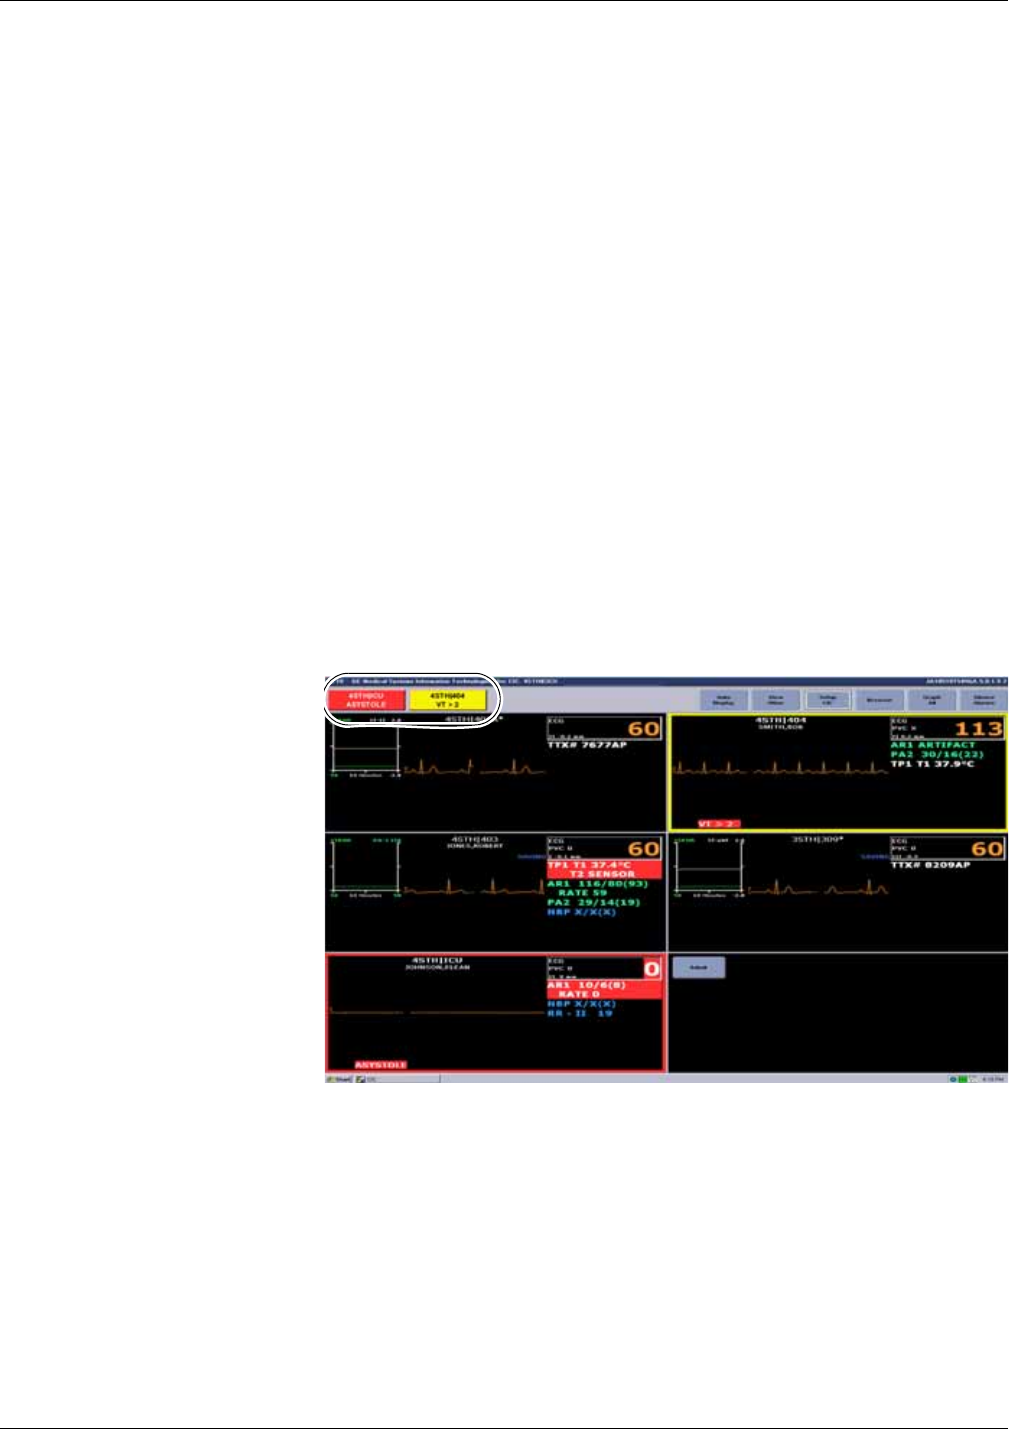
The CIC Pro center can display an alarm button for a maximum of four patients. This
row of alarm buttons display across the top of the multi-patient viewer and show the
unit name, bed number, and the cause of the alarm.
The color of the alarm button indicates the severity of the patient alarm condition.
Red indicates a Crisis alarm condition, yellow indicates a Warning alarm condition,
and white indicates an Advisory alarm condition.
Another name for this row of alarm buttons is the Alarm Display Unit (ADU) line.
058A
Alarm buttons, also known as Alarm Display Unit (ADU) line
Viewing patient beds from another in-unit CIC Pro center
When you have more than one CIC Pro center in your care unit, you can view
(monitor) a patient bed from another in-unit CIC Pro center.
Complete the following procedure to view (monitor) in-unit patient beds from another
in-unit CIC Pro center:
Draft

7-6 ApexPro™ 2001989-301A- draft 1
Viewing real-time patient data
1. Go to the CIC Pro center in your care unit that has room to view additional
admitted patient beds.
2. From the multi-patient viewer, right click in an empty patient window displaying
an Admit button. The right click menu displays.
3. From the right click menu, choose Select Care Unit then Bed Number. A list of
networked care units displays.
4. From the list, choose the care unit and bed name you want to view. The patient
bed is displayed in the multi-patient viewer.
Out-of-unit patient beds
You can view out-of unit patient beds that are not displayed at your CIC Pro center.
The bed you wish to view must be on the Unity Network.
NOTE
You cannot change the Alarm Control or parameter control settings of an out-of-
unit patient.
Viewing an out-of-unit patient bed
Complete the following procedure to view networked out-of-unit patient beds:
1. From the multi-patient viewer, click View Other. A list of networked care units,
floors, or hospitals displays.
2. Click the + sign next to the desired unit, floor, or hospital to display the list of
viewable beds.
3. Select the bed you want to view and click OK. The single patient viewer displays
for this patient. The patient bed is displayed in the multi-patient viewer and the
single patient viewer also displays for this patient.
4. To close the single patient viewer, click the (close button) on the top right
side of the window.
Removing viewed out-of-unit patient beds
Complete the following steps to remove out-of-unit patient beds you are viewing
from the multi-patient viewer:
1. From the multi-patient viewer, right click on the patient bed you want to remove.
2. From the right click menu, choose Select Care Unit then Bed Number > None.
Configuring the real-time trend window
You can configure the display of a real-time trend window in the multi-patient viewer.
The real-time trend window displays the recent patient trends for a maximum of two
parameters.
Draft
Viewing real-time patient data
2001989-301A- draft 1 ApexPro™ 7-7
Complete the following procedure to configure a patient’s real-time trend window:
1. Choose one of the following methods to access the Real-time Trend Graph
configuration window from the multi-patient viewer:
Right-click on the patient you want to configure and select Configuration.
The Real-time Trend Graph window displays.
Click on the patient you want to configure. The single patient viewer
displays. From the single patient viewer, click Real-time View to display the
real-time window.
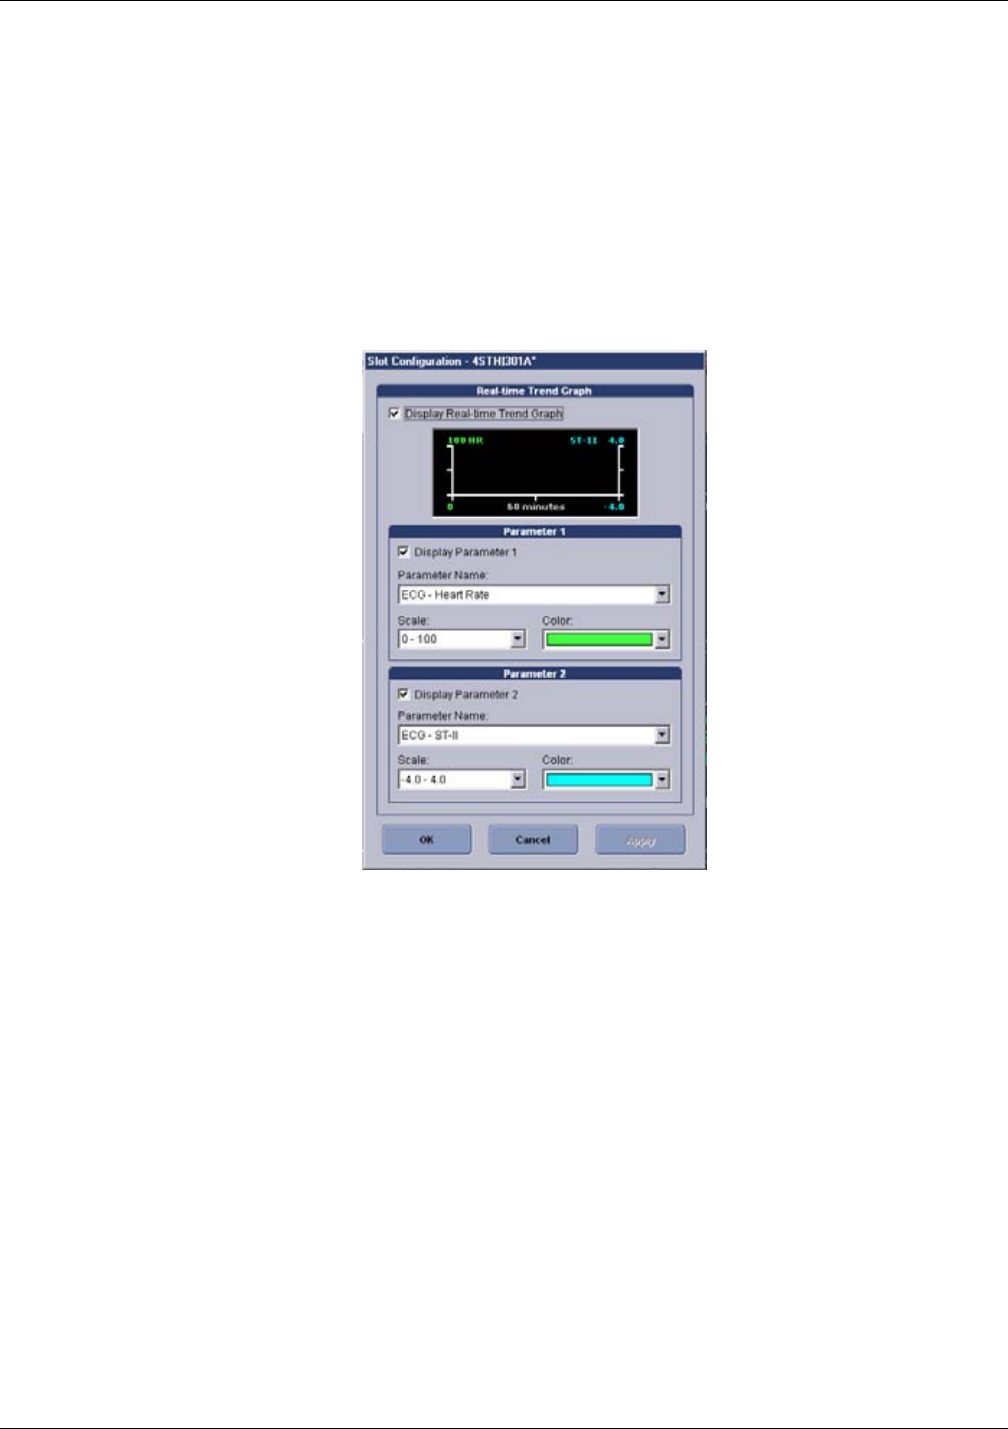
2. Click Configuration to display the Real-time Trend Graph window.
062A
3. Change any of the undimmed setting options.
Draft

7-8 ApexPro™ 2001989-301A- draft 1
Viewing real-time patient data
4. After making your selections, complete one of the following tasks:
Click OK to apply your changes and close the window.
Click Cancel to cancel your changes and close the window.
Click Apply to apply your changes without closing the window.
See Viewing stored patient data on page 8-1.
Printing real-time data
While viewing the in-unit real-time patient data from the multi-patient viewer, you
can manually print a continuous ECG strip for a single patient bed or print the
parameter limits and waveforms for all displayed patient beds.
Printing a continuous ECG strip
From the multi-patient viewer, you can click in the ECG parameter window of any
displayed in-unit patient bed to print a continuous ECG strip. A print icon appears as
you position the cursor over the ECG parameter window.
Real-time Trend Graph control settings
Option Function
Display Real-time Trend
Graph
Display a real-time trend window with a maximum of two
real-time parameter trends.
To display the Real-time Trend Graph, click in the
empty check box to fill the box with a check mark.
Display Parameter 1 Display the first real-time parameter trend.
To display one real-time parameter trend, click in the
empty check box to fill the box with a check mark. Then,
click the down arrow to set the display properties:
Parameter Name: Set the displayed parameter.
Scale: Set the size of the displayed waveform
trend.
Color: Set the color of the displayed parameter text
and waveform trend.
Display Parameter 2 Display the second real-time parameter trend.
To display a second real-time parameter trend, click in
the empty check box to fill the box with a check mark.
Then, click the down arrow to set the display properties:
Parameter Name: Set the displayed parameter.
Scale: Set the size of the displayed waveform
trend.
Color: Set the color of the displayed parameter text
and waveform trend.
Draft

Viewing real-time patient data
2001989-301A- draft 1 ApexPro™ 7-9
NOTE
When using a digital writer, click in the ECG parameter window of any displayed
in-unit patient bed.
Then, press the (Graph Stop) button on the front of the digital writer to
stop printing a continuous ECG strip.
NOTE
The printing formats are controlled by the data source device (monitor or
telemetry system). This includes printed waveforms, speed, and graph location.
See the operating instructions for the devices you are using.
Printing parameter limits or waveforms for all in-unit patient beds
You can print the parameter waveform data for all in-unit patients displayed at a CIC
Pro center by using the Graph All function. In addition, you can also print the
parameter limits for telemetry beds.
Selecting the Graph All function results in printing a 10-second graph for each
admitted telemetry bed and a 20-second graph for hard-wired beds. The graph speed
of a telemetry graph is 25 millimeters per second and the graph speed of a hard-wired
graph is determined by the monitor.
NOTE
Close any open single patient viewer windows before selecting the Graph All
function. Otherwise, only the single patient viewer data prints.
The following conditions apply when using the Graph All function:
When you press the (Graph Stop) button on the local digital writer, the
current patient’s graph stops and the writer begins to print a 10-second graph for
the next patient.
When a patient’s data is currently graphing or is being saved to graph when a
Graph All function request is started, this patient’s data is not included in the
Graph All Patients graph. This patient’s data graphs independently of the Graph
All Patients graph.
When you click in the ECG parameter window of a patient whose data is saving,
this cancels the Graph All Patients request for that patient.
When an arrhythmia alarm sounds for a patient while a Graph All Patients
request is running, the alarm data replaces the data that was saved for the Graph
All Patients request.
When a telemetry patient initiates a graph from a transmitter while a Graph All
Patients request is running, the Graph All Patients graph for that patient is
replaced by a transmitter graph.
Complete the following procedures to print parameter limits or waveforms for all
patient beds displayed in the multi-patient viewer:
Printing limits
NOTE
The Limits option only prints parameter limits for telemetry beds.
Draft

7-10 ApexPro™ 2001989-301A- draft 1
Viewing real-time patient data
Complete the following procedure to print telemetry bed parameter limits:
1. From the multi-patient viewer, click Graph All. The Graph All Patients window
displays.
2. From the Graph All Patients window, click Limits.
3. Click OK to begin printing.
Printing waveforms
Complete the following procedure to print parameter waveforms for all displayed
patient beds:
1. From the multi-patient viewer, click Graph All. The Graph All Patients window
displays.
2. From the Graph All Patients window, click Waveforms.
3. Click OK to begin printing.
Stopping a print job
You must stop a print job from the same CIC Pro center you used to send the print job
to the printer.
Stop printing to a laser printer
Complete the following procedure to stop printing all print jobs sent to the laser
printer:
1. From the multi-patient viewer, click CIC Setup > CIC Defaults. The CIC
Defaults window displays.
2. Under Printer/Writer, click Cancel Print Jobs for the printer you want to stop
printing to.
3. After making your selection, complete one of the following tasks from the CIC
Defaults window:
Click OK to apply your changes and close the CIC Defaults window.
Click Cancel to cancel your changes and close the CIC Defaults window.
Click Apply to apply your changes without closing the CIC Defaults
window.
Stop printing to a local digital writer
Complete the following procedure to stop printing all print jobs sent to a local digital
writer:
1. Locate the digital writer.
2. Press the (Graph Stop) button located on the front of the digital writer to
stop the print job.
Draft

Viewing real-time patient data
2001989-301A- draft 1 ApexPro™ 7-11
Monitored parameters
The CIC Pro center can display data for many monitoring parameters.
NOTE
For a complete list of supported parameters, refer to the CIC Pro Clinical
Information Center Operator’s Manual.
Adjusting parameter control settings
The following guidelines apply to adjusting parameter control settings at the CIC Pro
center:
You may view and adjust parameter settings for any in-unit patient. Any changes
are temporary and return to the default settings when a patient is discharged.
These changes are also adopted by the monitor.
You may not be able to adjust some of the control settings for non-GE acquisition
devices that are interfaced via the Unity Network Interface Device.
You may view parameter settings for any out-of-unit patient. However, you
cannot adjust these settings.
To permanently change the parameter default settings, see the CIC Pro Clinical
Information Center Bedrock Hardware Platform Service Manual.
This section briefly covers adjusting control settings for the following parameters:
ECG
SpO2
Non-invasive pressures
Invasive pressures
ECG
ECG control settings
Complete the following procedure to adjust the control settings.
1. From the multi-patient viewer, click on the patient you want to view. The single
patient viewer displays.
2. From the single patient viewer, click Monitor Setup.
3. Click ECG to display the control window.
4. Change any of the undimmed setting options. When an option appears dimmed,
you cannot change it unless you enter the service-level password.
Draft
7-12 ApexPro™ 2001989-301A- draft 1
Viewing real-time patient data
063A
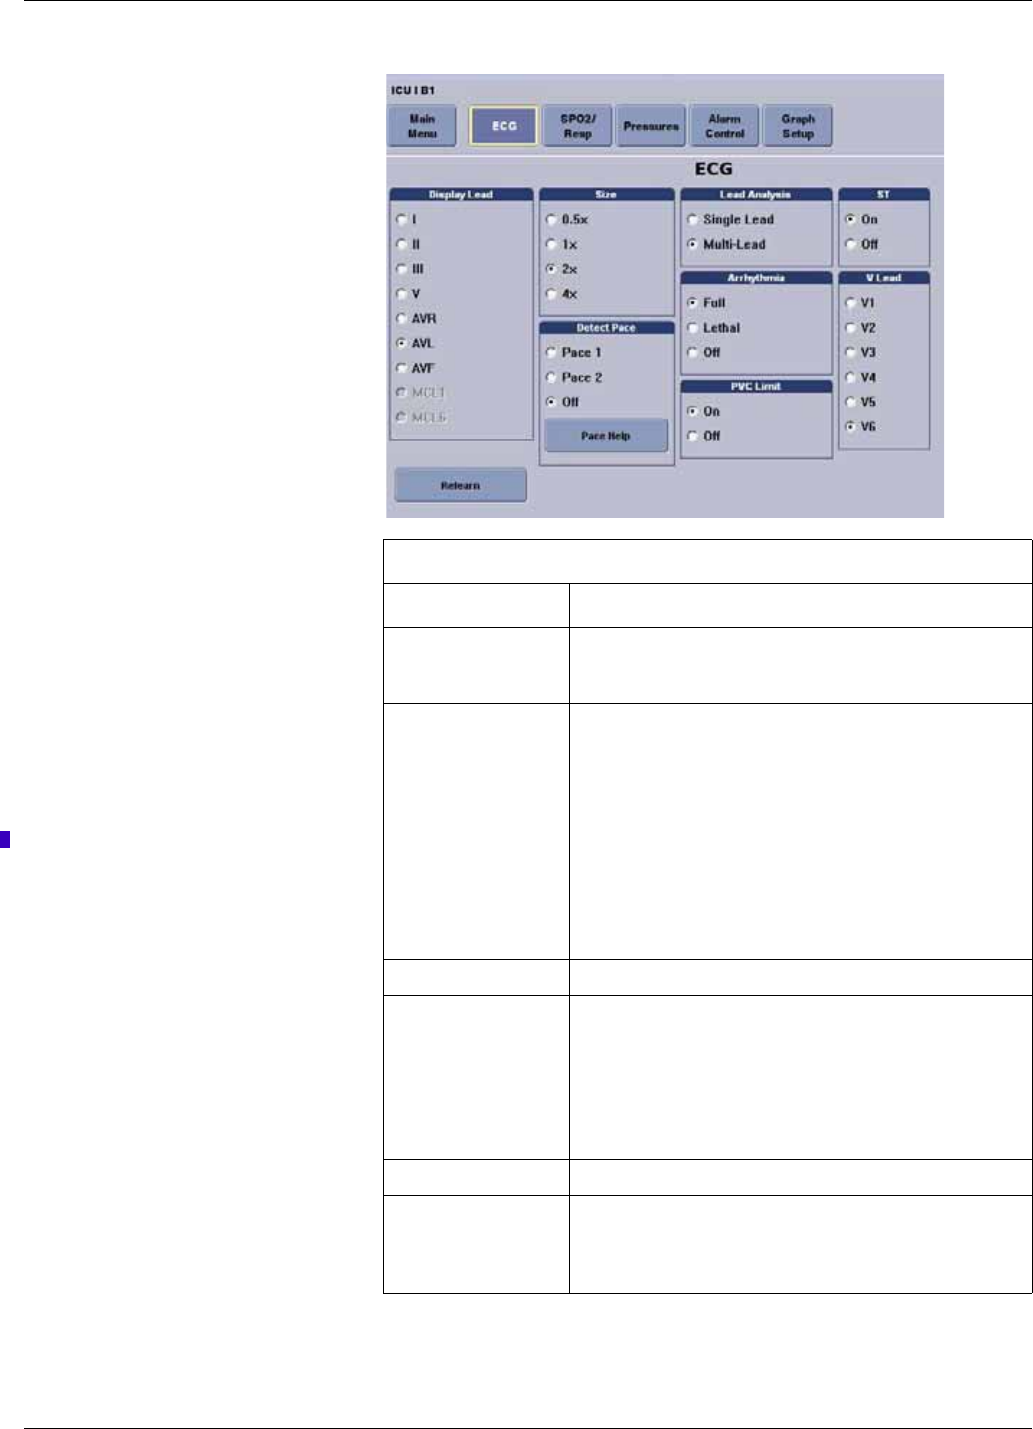
ECG control settings
Option Function
Display Lead Set the top or first lead displayed on the monitor and on the
CIC Pro center. This is the lead data that prints during an
alarm or manual graph.
Relearn button Relearn the selected patient’s ECG rhythm after changes
occur to heart rate or rhythm. The CIC Pro center uses 14
current complexes to relearn the patient’s ECG pattern.
Remove the V Fail message or activate the second V-lead
when changing between a 5-and 6-leadwire set on the
transmitter.
NOTE
The heart rate value appears briefly as Xs during the
relearn process and returns to numerics when the relearn
is complete.
Size Set the waveform size. 1X is standard.
Detect Pace Set the pacemaker detection mode:
Pace 1: Alternate pacemaker detection mode when Pace
2 does not adequately detect pacemaker spikes.
Pace 2: Normal pacemaker detection mode.
For more information, refer to Monitoring pacemaker patients
on page 7-13.
Pace Help button View solutions to common pacemaker detection problems.
Lead Analysis Set the leads for ECG and arrhythmia data processing:
Single-Lead: Use the top Display Lead.
Multi-Lead: Use leads I, II, III and V lead.
Draft
Viewing real-time patient data
2001989-301A- draft 1 ApexPro™ 7-13
5. After making your selections, complete one of the following tasks:
Click a different Monitor Setup option to apply your changes without
closing the Monitor Setup window.
Click the (close button) on the top right side of the window to apply
your changes and close the Monitor Setup window.
Monitoring pacemaker patients
Be aware of the following when monitoring a patient with a pacemaker.
WARNING
FALSE CALLS—False low heart rate indicators or false asystole
calls may result with certain pacemakers because of electrical
overshoot.
WARNING
MONITORING PACEMAKER PATIENTS—Monitoring of
pacemaker patients can only occur with the pace program activated.
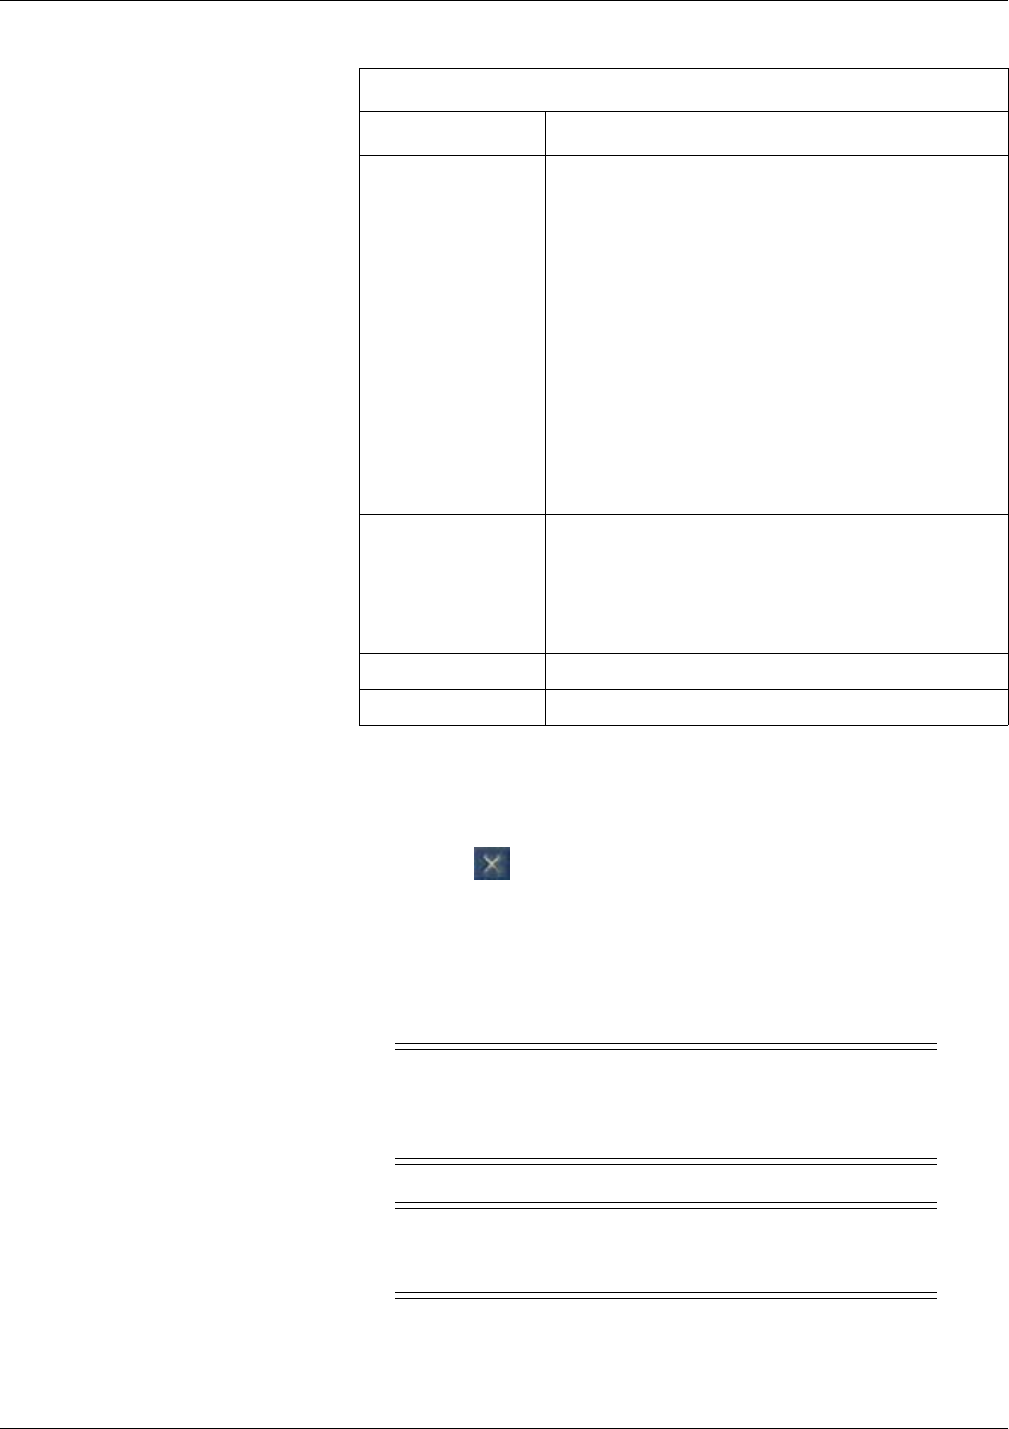
Arrhythmia Set the arrhythmia detection level:
Full: Detect all arrhythmia conditions defined by the
software.
Lethal: Detect lethal arrhythmia conditions.
Off: Turn off arrhythmia detection.
Arrhythmia detection remains off until you choose Full or
Lethal, or the patient is discharged.
NOTE
OFF appears dimmed and is not selectable when
the following option is set: CIC Setup > CIC
Defaults > Allow Alarms OFF on this CIC > No.
The Allow Alarms OFF on this CIC setting is a
service-level default and is protected by the Service
Password.
PVC Limit Turn On to count PVCs per minute. A PVC counter appears in
the ECG parameter window.
NOTE
To display the PVC counter, the Arrhythmia detection
level must be set to Full.
ST Turn On to display, store, and enable ST alarms.
V Lead Label the V Lead position.
ECG control settings
Option Function
Draft

7-14 ApexPro™ 2001989-301A- draft 1
Viewing real-time patient data
WARNING
PACEMAKER SPIKE—An artificial pacemaker spike is displayed
in place of the actual pacemaker spike. All pacemaker spikes appear
uniform. Do not diagnostically interpret pacemaker spike size and
shape.
WARNING
PATIENT HAZARD—A pacemaker pulse can be counted as a QRS
during asystole in either pace mode. Keep pacemaker patients under
close observation.
WARNING
RATE METERS—Keep pacemaker patients under close
observation. Rate meters may continue to count the pacemaker rate
during cardiac arrest and some arrhythmias. Therefore, do not rely
entirely on rate meter alarms.
CAUTION
FDA POSTMARKET SAFETY ALERT—The United States FDA
Center for Devices and Radiological Health issued a safety bulletin
October 14, 1998. This bulletin states “that minute ventilation rate-
adaptive implantable pacemakers can occasionally interact with
certain cardiac monitoring and diagnostic equipment, causing the
pacemakers to pace at their maximum programmed rate.”
The FDA further recommends precautions to take into consideration
for patients with these types of pacemakers. These precautions
include disabling the rate responsive mode and enabling an alternate
pace mode. For more information contact:
Office of Surveillance and Biometrics, CDRH, FDA
1350 Piccard Drive, Mail Stop HFZ-510
Rockville, MD 20850
U.S.A.
NOTE
ECG monitoring with patients on non-invasive transcutaneous pacemakers may
not be possible due to large amounts of energy produced by these devices.
Monitoring ECG with an external device may be needed.
The Detect Pace option enables/disables the pacemaker detection program. It must be
used whenever the monitored patient has a pacemaker.
There are two pacemaker processing modes, Pace 1 and Pace 2. The modes use
different algorithms for pacemaker artifact rejection. The clinician must be the judge
as to which mode is better for each patient. The pacemaker detection program
defaults OFF, so if you have a patient with a pacemaker, you will have to select a
mode. For more information, refer to ECG control settings on page 7-11.
Draft

Viewing real-time patient data
2001989-301A- draft 1 ApexPro™ 7-15
The Pace 1 mode allows successful detection of the largest variety of paced QRS
morphologies. As a direct consequence, this mode does have a higher risk of counting
pacemaker artifact as QRS complexes during ASYSTOLE. For this reason, it is
imperative that the user keep patients with pacemakers under close observation. It is
also recommended that the user set the low heart rate limit on the monitor close to the
minimum pacing rate, and that the BRADY arrhythmia alarm level be elevated to a
Warning or Crisis level.
The Pace 2 mode is much more conservative in recognizing paced QRS
morphologies and is recommended for use whenever possible. It is designed to
minimize the possibility of counting pacemaker artifact as QRS complexes during
ASYSTOLE. If the monitor does not adequately detect paced beats in the Pace 2
mode, then the user may wish to try the Pace 1 mode.
When either pace mode is enabled, the software places an artificial spike on the
waveform whenever the pacemaker triggers. When pacemaker detection is on, it is
indicated by a “P” in the patient’s ECG parameter window.
For successful monitoring of pacemaker patients follow these suggestions:
Use recommended electrode placement.
Brady, Pause, and Low Heart Rate are additional alarms available for use when
monitoring pacemaker patients.
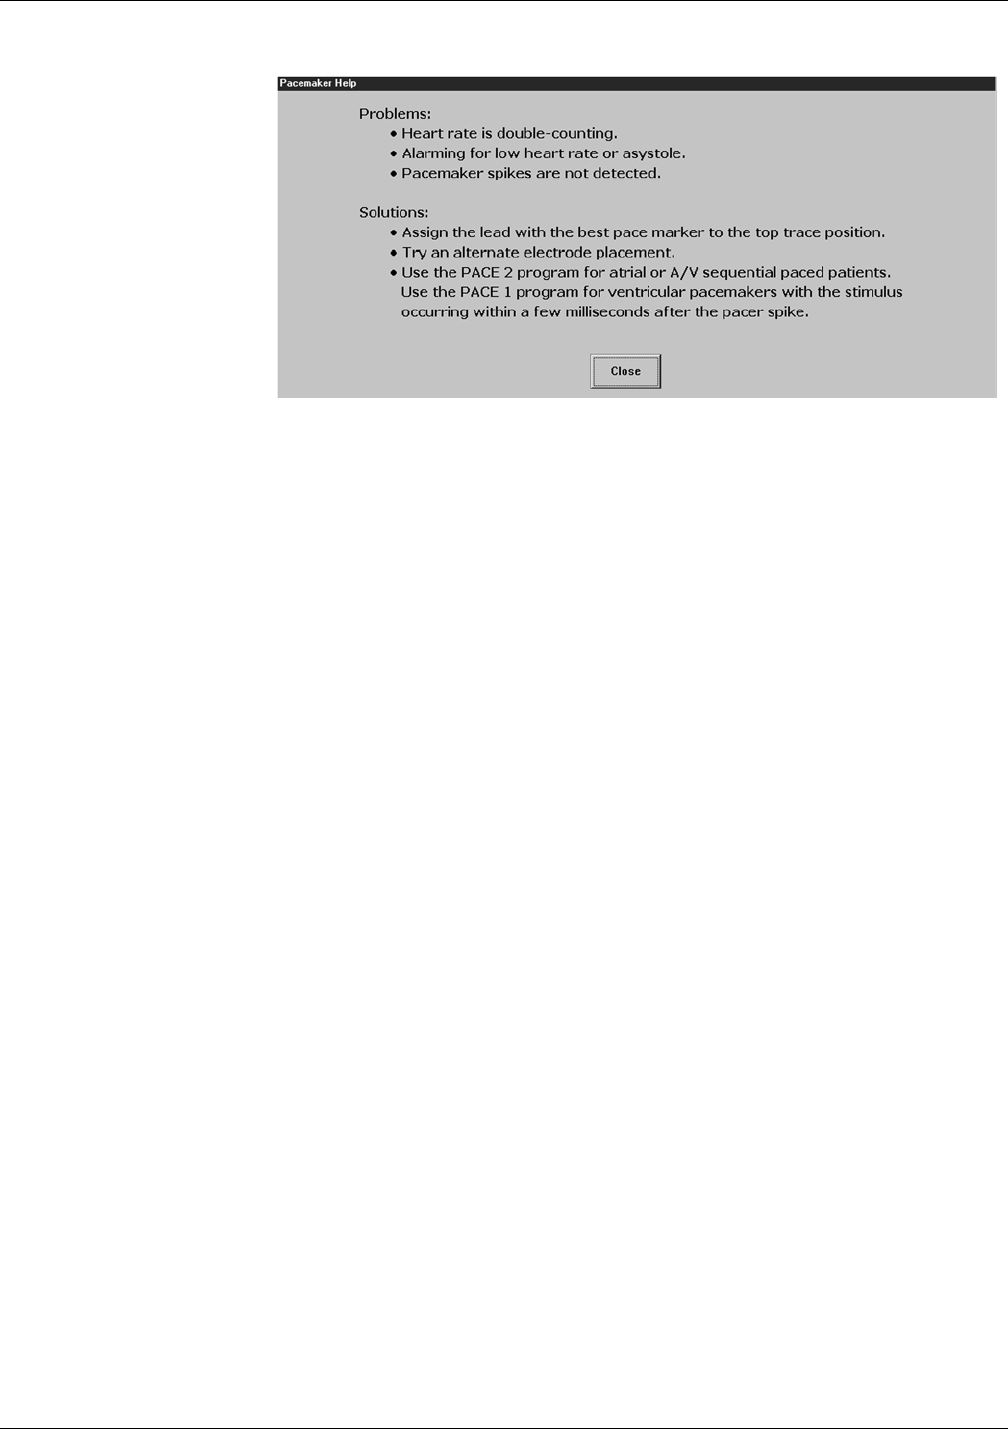
Problems you may experience are:
heart rate double counting;
inaccurate alarms for low heart rate or asystole;
pacemaker spikes not recognized by the software.
Possible solutions to above problems are:
relearn arrhythmia;
try an alternate electrode placement;
try Single-Lead analysis;
try switching to the other pace detection mode.
Multi-vector pace detection
The T14 transmitter uses multi-vector pace detection. Here are some additional
guidelines for successful monitoring pacemaker patients when using the T14
transmitter.
When using the 5- or 6-leadwire set with all the electrodes attached, pace
detection occurs on two ECG leads simultaneously.
The default leads used for detection are II and V. If these leads are not available,
multi-vector pace detection switches to available leads.
Pace detection switches to Single-Lead when using a 3-leadwire set.
For more information, refer to “Pacemaker troubleshooting” on page D-3.
Pace help
Clicking on the Pace Help button opens a window that shows common problems and
solutions in regard to pacemaker detection. This window is shown below.
Draft
7-16 ApexPro™ 2001989-301A- draft 1
Viewing real-time patient data
047A
Lead analysis
The Lead Analysis control signals the transmitter to process the ECG in Single-Lead
or Multi-Lead mode. Use the mouse to click on your selection. Multi-Lead analysis is
the default setting for Adult.
NOTE
ECG is relearned whenever Lead Analysis is changed.
Multi-Lead analysis
Multi-Lead analysis simultaneously examines ECG leads I, II, III, and V (whether
they are displayed or not) to help eliminate false alarms and improve the ability of the
system to:
Detect beats which occur isoelectric to a single chest lead.
Discriminate artifact that appears in one lead compared to the other lead vectors.
Provide a smart-lead fail feature, where the failed lead is identified, and if
available, another lead is provided for display.
Continue arrhythmia processing even after a lead change.
Single-Lead analysis
Single-Lead analysis uses only the lead displayed on the CIC Pro center screen to
process ECG and arrhythmia information. To change the lead used for Single-Lead
analysis, you must change the displayed lead.
Single-Lead ECG may be acquired using a 3-, 5-, or 6-leadwire set. However, only a
Single-Lead ECG is transmitted or processed.
Single-Lead analysis is beneficial when troubleshooting pacemaker detection and/or
arrhythmia detection. Single-Lead analysis must always be used when monitoring
with a 3-leadwire set. Single-Lead analysis can be set up as a unit default. Refer to
Customizing the system on page 4-4 for more information.
Draft

Viewing real-time patient data
2001989-301A- draft 1 ApexPro™ 7-17
Single-Lead ECG telemetry data
NOTE
When acquiring Single-Lead ECG data using a 5- or 6-leadwire set, it is not
necessary to connect the V leads or the right leg lead to the transmitter or to the
patient.
The following constraints apply when using Single-Lead ECG telemetry data.
Arrhythmia
WARNING
INCORRECT ALGORITHMS, ARRHYTHMIA PROCESSING
AND CALCULATIONS BASED ON PATIENT AGE — After
manually updating or automatically retrieving patient demographic
information from a network database, always confirm that the
entered patient’s date of birth matches the patient’s actual date of
birth. Otherwise the appropriate age-related algorithms, arrhythmia
detection, and calculations will not be applied.
Function Single-Lead Constraints
change the displayed
lead
The factory default Display Lead is lead II.
Contact your local service representative to change the
default displayed lead.
Display Lead appears to be selectable at the CIC Pro
center. However, your selection is temporary and will
revert back to the transmitter’s default displayed lead.
NOTE
When the clinical situation dictates monitoring a lead
other than the default lead, you can move the leads
and/or electrodes to view a different lead. Be aware
that the label on the display and on the printout will
show the default lead label.
Lead Analysis Multi-Lead analysis may appear to be selectable at the
CIC Pro center. However, your selection is temporary and
will revert back to the Single-Lead analysis mode.
select a V lead V leads may appear to be selectable at the CIC Pro
center. However, your selection does not change the
transmitter’s default displayed lead.
select displayed leads
from a single viewer
Leads other than the default displayed lead may appear to
be selectable at the CIC Pro center. However, your
selection is temporary and will revert back to the
transmitter’s default displayed lead.
select graph waveforms Leads other than the default displayed lead may appear to
be selectable at the CIC Pro center. However, you must
select the transmitter’s default displayed lead to obtain a
graph of the waveform.
Draft

7-18 ApexPro™ 2001989-301A- draft 1
Viewing real-time patient data
WARNING
SUSPENDED ANALYSIS—Certain conditions suspend arrhythmia
analysis. When suspended, arrhythmia conditions are not detected
and alarms associated with arrhythmias do not occur. The messages
which alert you to the conditions causing suspended arrhythmia
analysis are: ALL ALARMS OFF, ALARM PAUSE, ARR OFF,
ARR SUSPEND, DISCHARGED, LEADS FAIL, and NO
TELEM. Additionally, the alarms off with reason options and
disabling the Alarm Pause Breakthrough feature also suspend
arrhythmia analysis.
WARNING
VENTRICULAR ARRHYTHMIAS—The arrhythmia analysis
program is intended to detect ventricular arrhythmias. It is not
designed to detect atrial or supraventricular arrhythmias, with the
exception of atrial fibrillation. Occasionally it may incorrectly
identify the presence or absence of an arrhythmia. Therefore, a
physician must analyze the arrhythmia information in conjunction
with other clinical findings.
The arrhythmia control signals the CIC Pro center to ignore or accept arrhythmia
calls. To modify arrhythmia settings, use the mouse to click on Full, Lethal, or Off.
NOTE
Full arrhythmia processing is suspended when the level 1 ARTIFACT message is
displayed. Lethal arrhythmia is still active but its accuracy may be hindered by
the artifact.
NOTE
When arrhythmia program is in Full mode, the program counts the number of
PVCs that occur within a minute.
Turning arrhythmia on automatically starts a relearn procedure.
When arrhythmia is turned off, ARR OFF appears in the ECG parameter
window.
No arrhythmia detection with 7015 software level patient monitors
If an ApexPro system patient is admitted to a patient monitor at the 7015 software
level (ECG source is telemetry, not the monitor), the following scenario may occur
when monitoring in Combo or Rover Combo monitoring modes:
Since the 7015 software level does not support arrhythmia processing,
arrhythmia detection for the telemetry patient is reduced from full arrhythmia
detection to no arrhythmia detection (arrhythmia OFF). This occurs because the
software is designed to take on the attributes of the bedside monitor when in
Combo or Rover Combo monitoring modes.
Draft

Viewing real-time patient data
2001989-301A- draft 1 ApexPro™ 7-19
CAUTION
Under these conditions, arrhythmia detection is OFF. There is NO
INDICATION of this at the bedside monitor, central station or CIC
Pro center.
If the patient is later discharged from the monitor, and monitoring continues from
telemetry, the message ARR OFF will then appear at the central station or CIC
Pro center. Arrhythmia monitoring remains OFF.
NOTE
Solar 7000 monitors, Solar 8000 monitors, Dash monitors, and Eagle
monitors may include the 7015 software level.
Full arrhythmia conditions
The following is an alphabetical list of the Arrhythmia messages that are displayed
when full arrhythmia is selected and the condition occurs. Definitions of each
condition are included. The CIC Pro center’s response to each condition is determined
by the alarm level to which the arrhythmia has been assigned.
ACC VENT Adult—Accelerated ventricular occurs when six or more ventricular
beats are detected with an average heart rate for the ventricular beat
between 50 and 100 beats per minute.
0-2 years—Occurs when six or more ventricular beats are detected
with an average heart rate for the ventricular beat between 60 and 160
beats per minute.
3-10 years—Occurs when six or more ventricular beats are detected
with an average heart rate for the ventricular beat between 60 and 140
beats per minute.
11-13 years—Occurs when six or more ventricular beats are detected
with an average heart rate for the ventricular beat between 60 and 130
beats per minute.
Atrial FIB Atrial fibrillation identification occurs when random. chaotic, low-amplitude
deflections of the supraventricular component of the ECG waveform. This
results in irregular timing of QRS complexes and the absence of uniform P
waves proceeding the QRS complex.
NOTE
AFIB alarms can take up to 90 seconds to display while the algorithm
verifies the event.
ASYSTOLE Ventricular asystole occurs whenever the displayed heart rate drops to zero.
BIGEMINY Occurs when three or more bigeminal cycles (a ventricular beat followed by
a non-ventricular beat) are detected.
BRADY Bradycardia is the average of the most recent eight R-to-R intervals at a
heart rate less than the set LOW heart rate limit.
NOTE
The Brady limit matches the low heart rate limit. If the low heart rate
limit is changed, the Brady limit changes.
COUPLET Occurs when two ventricular beats are detected and have non-ventricular
beats before and after the couplet. The coupling interval must be less than
600 milliseconds.
Draft

7-20 ApexPro™ 2001989-301A- draft 1
Viewing real-time patient data
IRREGULAR Occurs when six consecutive normal R-to-R intervals vary by 100
milliseconds or more.
PAUSE Occurs when a 3-second interval without a QRS complex is detected.
NOTE
Some bedside monitors allow the Pause time interval to be adjusted.
For more information, refer to the appropriate bedside monitor’s
operator’s manual.
PVC Isolated premature ventricular complexes occur when a premature
ventricular beat is detected and has non-ventricular beats before and after.
PVC limit When on, the PVC Limit control displays a PVC counter in the ECG
parameter window. When off, the PVC counter is not displayed. Use the
mouse to turn the PVC Limit control On or Off. The PVC limits are preset in
Alarm Control defaults.
R ON T Occurs when a ventricular complex is detected within the repolarization
period of a non-ventricular beat.
TACHY Tachycardia is four R-to-R intervals at a heart rate greater than the set HIGH
heart rate limit.
NOTE
The Tachy limit matches the high heart rate limit. If the high heart rate
limit is changed, the Tachy limit changes.
TRIGEMINY Occurs when three or more trigeminal cycles (a ventricular beat followed by
two non-ventricular beats) are detected.
V BRADY Adult—Ventricular bradycardia occurs when a run of three or more
ventricular beats is detected with an average heart rate that is less than or
equal to 50 beats per minute.
0-2, 3-10, and 11-13 years—Occurs when a run of three or more ventricular
beats is detected with an average heart rate that is less than or equal to 60
beats per minute.
VFIB/ VTAC Ventricular fibrillation occurs when the ECG waveform indicates a chaotic
ventricular rhythm.
WARNING
VFIB/VTAC should not be considered a substitute for the V TACH
arrhythmia call. Efforts to lower the V TACH alarm level can result in missed
ventricular tachycardia alarms.
Draft

Viewing real-time patient data
2001989-301A- draft 1 ApexPro™ 7-21
Lethal arrhythmia conditions
When Lethal arrhythmia is selected, the following conditions (as defined for Full
arrhythmia) are detected:
ASYSTOLE
VFIB/VTAC
V TACH (defaults to the Crisis level, but can be moved to a different level)
BRADY (if the Patient Age range selected is 0-2 years or 3-10 years)
AFIB identification
NOTE
AFIB trending is only available when the bedside monitor supports this feature.
If your bedside monitor does not support AFIB trending, this feature is not
available. Contact your sales/service representative for more information.
Atrial fibrillation (AFIB) is characterized by random, chaotic, low-amplitude
deflections of the supraventricular component of the ECG waveform, resulting in
irregular timing of QRS complexes and an absence of uniform P waves preceding the
QRS complex.
V TACH Adult—Ventricular tachycardia occurs when a run of six or more
ventricular beats is detected with an average heart rate greater than or
equal to 100 beats per minute.
0-2 years—Occurs when a run of six or more ventricular beats is
detected with an average heart rate greater than or equal to 160 beats
per minute.
3-10 years—Occurs when a run of six or more ventricular beats is
detected with an average heart rate greater than or equal to 140 beats
per minute.
11-13 years—Occurs when a run of six or more ventricular beats is
detected with an average heart rate greater than or equal to 130 beats
per minute.
VT > 2 Adult—Ventricular tachycardia >2 occurs when a run of ventricular
beats is detected with a duration of less than six beats but longer than
two beats and with an average heart rate that is greater than or equal
to 100 beats per minute.
0-2 years—Occurs when a run of ventricular beats is detected with a
duration of less than six beats but longer than two beats and with an
average heart rate that is greater than or equal to 160 beats per
minute.
3-10 years—Occurs when a run of ventricular beats is detected with a
duration of less than six beats but longer than two beats and with an
average heart rate that is greater than or equal to 140 beats per
minute.
11-13 years—Occurs when a run of ventricular beats is detected with
a duration of less than six beats but longer than two beats and with an
average heart rate that is greater than or equal to 130 beats per
minute.
Draft

7-22 ApexPro™ 2001989-301A- draft 1
Viewing real-time patient data
The AFIB algorithm feature identifies atrial fibrillation arrhythmias for the
transmitter. When an AFIB event is detected, the ATRIAL FIB alarm text replaces
the IRREGULAR arrhythmia alarm text.
AFIB event patient data is stored for review in the Graphic Trends and Vital Signs
tab sheets.
Alarms
A patient status alarm is triggered when an AFIB arrhythmia is detected. The message
ATRIAL FIB is displayed in the message area of the display.
NOTE
There is approximately a 90 second delay while the AFIB algorithm verifies the
AFIB arrhythmia condition.
The AFIB alarm defaults to a Message alarm level but can be changed under
Arrhythmia Alarm Level, in the Telemetry Alarm Control Defaults tab sheet on the
CIC Pro center. How the monitor responds to each condition is determined by the
alarm level to which the AFIB arrhythmia detection has been assigned. When set for
Advisory or greater, AFIB alarms will be recorded and displayed in the alarm area on
the CIC Pro center.
NOTE
AFIB alarms can only be adjusted at the CIC Pro center. If AFIB is not available/
enabled at a bedside monitor in Combo mode, you will not be able to
immediately adjust the alarm. You must discharge the patient from the bedside
monitor, adjust the alarm setting at the CIC Pro center and then admit the patient
at the bedside monitor.
ST analysis
The patient’s most dominant, normal beat is used for ST measurement. This beat is
identified by the arrhythmia analysis program. Turn ST ON to display the numerics
calculated for ST at the CIC Pro center.
GE identifies the ST segment of the QRS complex as beginning at the J point and
ending 60 milliseconds following the J point in Adult mode. The ST measurement
factory defaults are:
Adult— J+ 60ms
0–2 years— J+ 30ms
3–10 years— J+ 40ms
11–13 years— J+ 50ms
The ST numeric displayed (millimeters) indicates either a positive or negative
elevation in relation to the isoelectric reference point (which is also determined by the
arrhythmia program and the patient’s age).
When ST is on, numerics are displayed under each ECG lead label on the screen. (A
negative deflection is preceded by a minus sign.) These numerics are updated about
every 15 seconds.
Draft

Viewing real-time patient data
2001989-301A- draft 1 ApexPro™ 7-23
The ST value shown in the ECG parameter window is the lead with the greatest ST
deviation. This may or may not be the lead that is in alarm, since a lead with a lesser
deviation from the isoelectric line may have changed more than the lead with the
greatest deviation.
NOTE
ST numerics are always calculated with reference to 1X size. Displaying the
ECG waveform at a different size does not affect the ST values.
NOTE
When a new dominant beat is detected or a relearn occurs, the arrhythmia
program calculates ST based on the new beat. This could affect the ST values
displayed. This may not necessarily represent a change in the patient’s condition.
The clinician needs to assess the patient any time there is an ST change.
NOTE
Adjustable ST alarms are only available when using a CIC Pro center running
software version 5 or later. If your CIC Pro center is running an earlier version of
software, this feature is not available. Contact your sales/service representative
for more information.
ST deviation alarm
When any individual ST value is beyond the limit, an ST deviation alarm occurs. It is
considered a parameter alarm, and the default alarm level is Warning. This can be
modified in the parameter alarm level setup.
When the ST program is turned on, or a relearn is done with ST on, the ST
deviation values are set for all leads of ST.
The current ST value is determined in all eight leads.
The ST value in the ECG parameter window turns red to indicate an alarm.
ST limits can also be adjusted individually in the patient’s Alarm Control tab.
NOTE
ST limits can also be adjusted at the CIC Pro center from Monitor Setup > ECG.
Adjusting ST limits
ST alarm limits and levels for telemetry patients are typically controlled by the
default ST alarm levels from the CIC Pro center. Some bedside monitors allow users
to adjust ST alarm limits and levels at the bedside when the patient is admitted in
combination monitoring mode. For more information on adjusting ST limits, refer to
the bedside monitor operator’s manual.
Draft
7-24 ApexPro™ 2001989-301A- draft 1
Viewing real-time patient data
SpO2
Introduction
NOTE
SpO2 and SPO2 are used interchangeably throughout this manual to refer to
pulse oximetry.
The transmitter supports the Apex oximeter and the Xpod oximeter. Unless specified,
oximeter refers to both units.
The Xpod oximeter connects to the transmitter and provides the following oximetry
vital signs for display at the CIC Pro center:
arterial oxygen saturation (SpO2)
peripheral pulse rate (PPR)
perfusion quality indicator
The Apex oximeter functions as a stand-alone device, and displays digital values for
SpO2 and pulse rate. When the Apex oximeter is connected to the transmitter, digital
values for SpO2 and pulse rate are also displayed at the CIC Pro center.
NOTE
When monitoring SpO2 using an transmitter, an SpO2 waveform is neither
generated nor displayed on the Apex oximeter or CIC Pro center. Additionally,
no alarm histories are generated or stored.
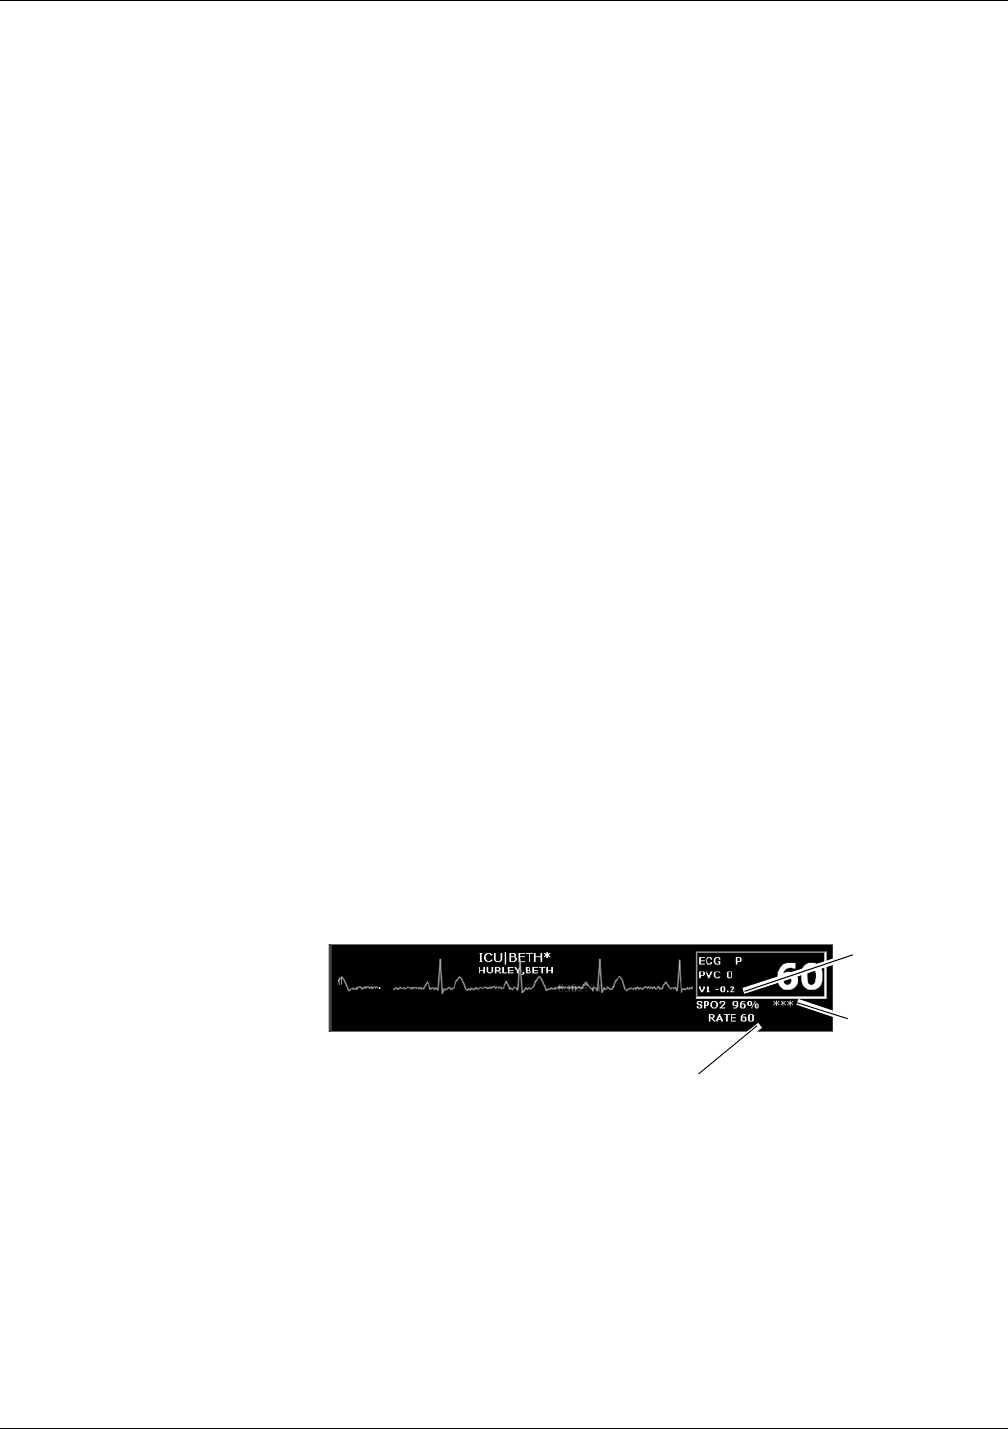
SpO2 in the multi-patient viewer
In the multi-patient viewer, the bed window for a telemetry patient being monitored
for SpO2 displays the current SpO2 value; one, two, or three asterisks indicating
signal strength; and, if turned on, the derived pulse rate for the patient. Below is an
example of a telemetry patient’s bed window in the multi-patient viewer.
346B
SpO2 control settings
Complete the following procedure to adjust the control settings.
1. From the multi-patient viewer, click on the patient you want to view. The single
patient viewer displays.
2. From the single patient viewer, click Monitor Setup.
Signal Strength
Indicator
SpO2 Value
Pulse Rate Value
Draft
Viewing real-time patient data
2001989-301A- draft 1 ApexPro™ 7-25
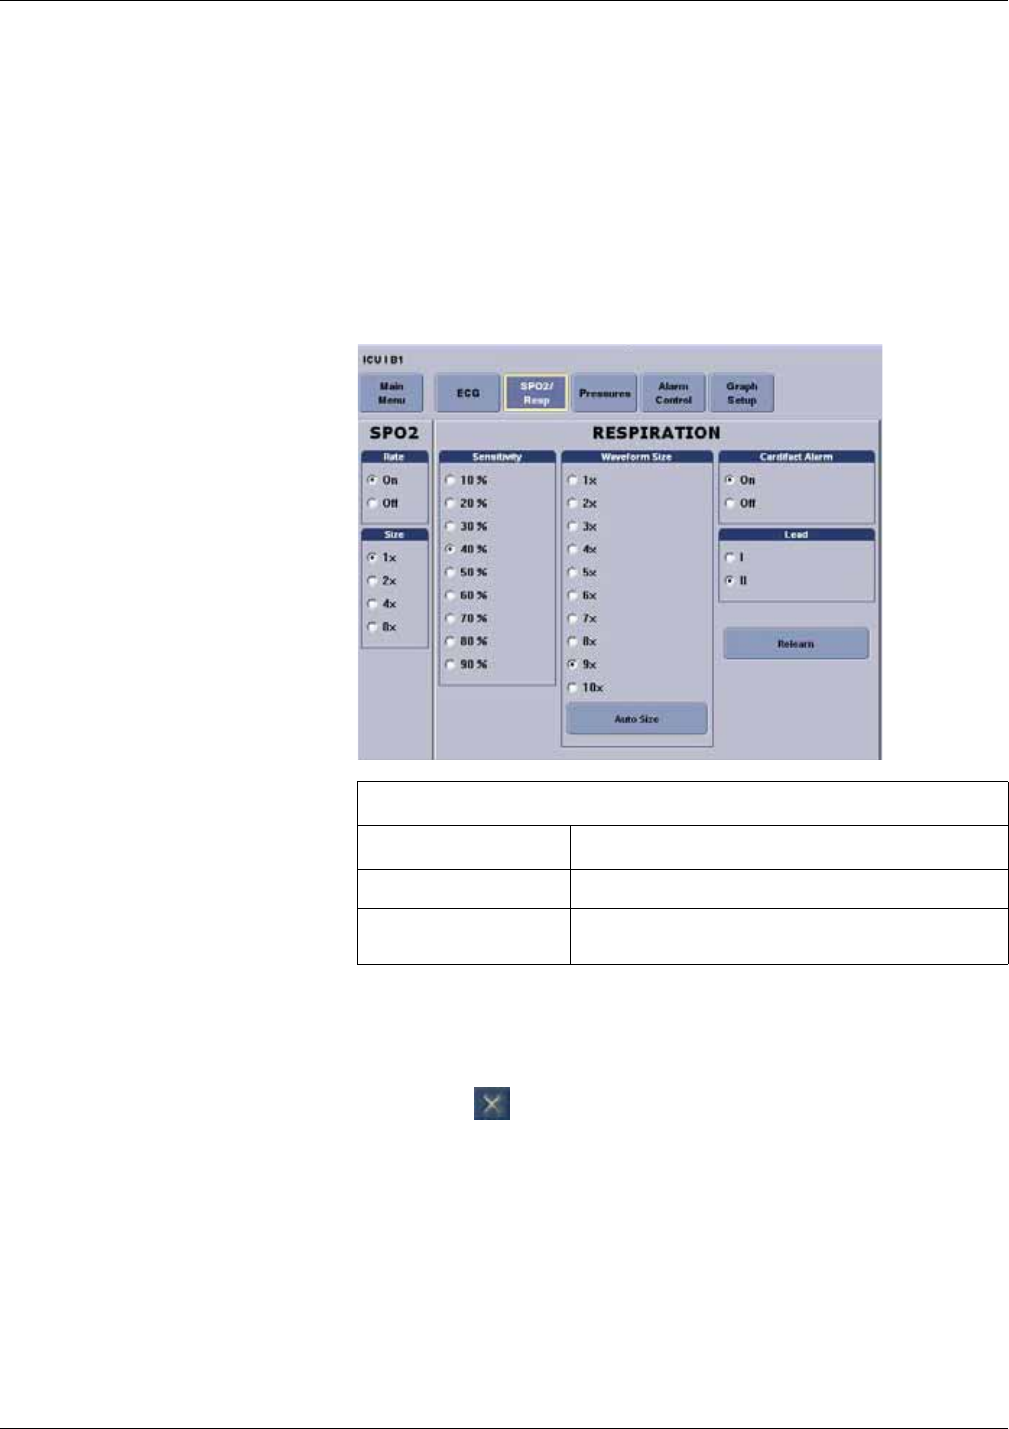
3. Click SPO2/Resp to display the control window.
NOTE
The SpO2 tab is labeled SpO2/Respiration because respiration monitoring
settings are available on this tab sheet for bedside monitored patients only.
Respiration monitoring is not an option for telemetry patients. Therefore
only SpO2 information appears on this tab sheet when monitoring a
telemetry patient.
4. Change any of the undimmed setting options.
064A
5. After making your selections, complete one of the following tasks:
Click a different Monitor Setup option to apply your changes without
closing the Monitor Setup window.
Click the (close button) on the top right side of the window to apply
your changes and close the Monitor Setup window.
SpO2 probe safety
Be sure to read all literature accompanying probes for specific safety information. Be
aware of the following safety precautions when using SpO2 probes.
SpO2 control settings
Option Function
Rate Turn On to display the SpO2 heart rate.
Size Set the waveform size. No waveform is displayed for
telemetry patients. This option will appear dimmed.
Draft

7-26 ApexPro™ 2001989-301A- draft 1
Viewing real-time patient data
WARNING
DATA VALIDITY—Do not expose probe detector to strong ambient
light while monitoring a patient. A poor signal may result.
Do not allow tape to block the probe light detector.
WARNING
PATIENT SAFETY—Prolonged monitoring may require changing
the probe site periodically. Move the probe if there is any sign of
skin irritation or impaired circulation. Change the probe site AT
LEAST every four hours to prevent ischemic skin necrosis. If
required, reduce the application periods to HALF the times
recommended above.
If a probe is damaged in any way, discontinue use immediately.
CAUTION
Use only Nonin SpO2 probes with the Apex oximeter and Xpod
oximeter. The reliability of SpO2 data obtained with any other probe
has not been verified.
Infants and pulse oximetry
WARNING
The display of inaccurate pulse oximetry (SpO2) values has been
linked to the presence of poor signal strength or artifact due to
patient motion during signal analysis. This condition is most likely
to be encountered when the equipment is used on infants. These
same conditions in adults do not impact the SpO2 values to the same
extent.
When using pulse oximetry on infants, always observe the following
precautions.
Precautions
We recommend the application of the following criteria when using the pulse
oximetry function on infants:
1. The peripheral pulse rate (PPR) as determined by the SpO2 function must be
within 10% of the heart rate, and
2. the SpO2 signal strength indicator must have 2 or 3 asterisks displayed, and
3. stable SpO2 values are displayed for six seconds.
Draft

Viewing real-time patient data
2001989-301A- draft 1 ApexPro™ 7-27
Procedures or devices previously applied in your facility for SpO2 monitoring should
be used in the event that the SpO2 value from the equipment cannot be validated by
the above criteria.
CAUTION
Do not use the Apex oximeter on neonatal patients. It is not designed
for use on neonates.
Signal and data validity
It is extremely important to determine that the probe is attached to the patient
correctly and the data is verifiable. To make this determination, the signal strength
indicators on the Apex oximeter and the CIC Pro center are of assistance.
Signal strength indicator
A signal strength (perfusion) indicator is displayed on the Apex oximeter display and
at the CIC Pro center in the appropriate patient window.
On the Apex oximeter, this indicator is a perfusion LED that blinks with each SpO2
pulse detected. The LED blinks green for each acceptable strength pulse. It blinks
yellow for SpO2 signals of marginal quality, and blinks red when the SpO2 signal is
too weak or the quality is very poor. When the perfusion LED blinks red, the numeric
data displayed on the Apex oximeter will be replaced by dashes within 10 seconds.
At the CIC Pro center, the signal strength indicator consists of 0, 1, 2, or 3 (strongest)
asterisks, depending on the strength of the signal.
Proper environmental conditions and probe attachment help ensure a strong signal.
WARNING
In the monitoring of patients the coincidence of adverse conditions
may lead to a disturbed signal going unnoticed. In this situation
artifacts are capable of simulating a plausible parameter reading, so
that the monitor fails to sound an alarm. In order to ensure reliable
patient monitoring, the proper application of the probe and the signal
quality must be checked at regular intervals.
Error messages
If the probe is not correctly attached to the patient and data is not verifiable, one of the
following error messages may appear in the patient’s bed window at the CIC Pro
center:
SPO2 PROBE OFF
SPO2 PROBE
If either of the above messages appears, check the position of the probe or replace the
probe. If the problem persists, call GE Service or contact your sales/service
representative.
Draft
7-28 ApexPro™ 2001989-301A- draft 1
Viewing real-time patient data
Pressures
The Pressures tab sheet allows you to view and modify settings specific to the viewed
telemetry patient’s NBP display. Settings may be viewed for any patient. However,
you can only modify settings for patients who are admitted to a bed in your unit.
NOTE
The NBP tab is labeled Pressures because other invasive pressures settings are
available on this tab sheet for bedside monitored patients only.
Invasive pressure monitoring is not an option for telemetry patients. Therefore,
only NBP information appears on this tab sheet when monitoring a telemetry
patient.
Non-invasive blood pressure control settings
Complete the following procedure to adjust the control settings.
1. From the multi-patient viewer, click on the patient you want to view. The single
patient viewer displays.
2. From the single patient viewer, click Monitor Setup.
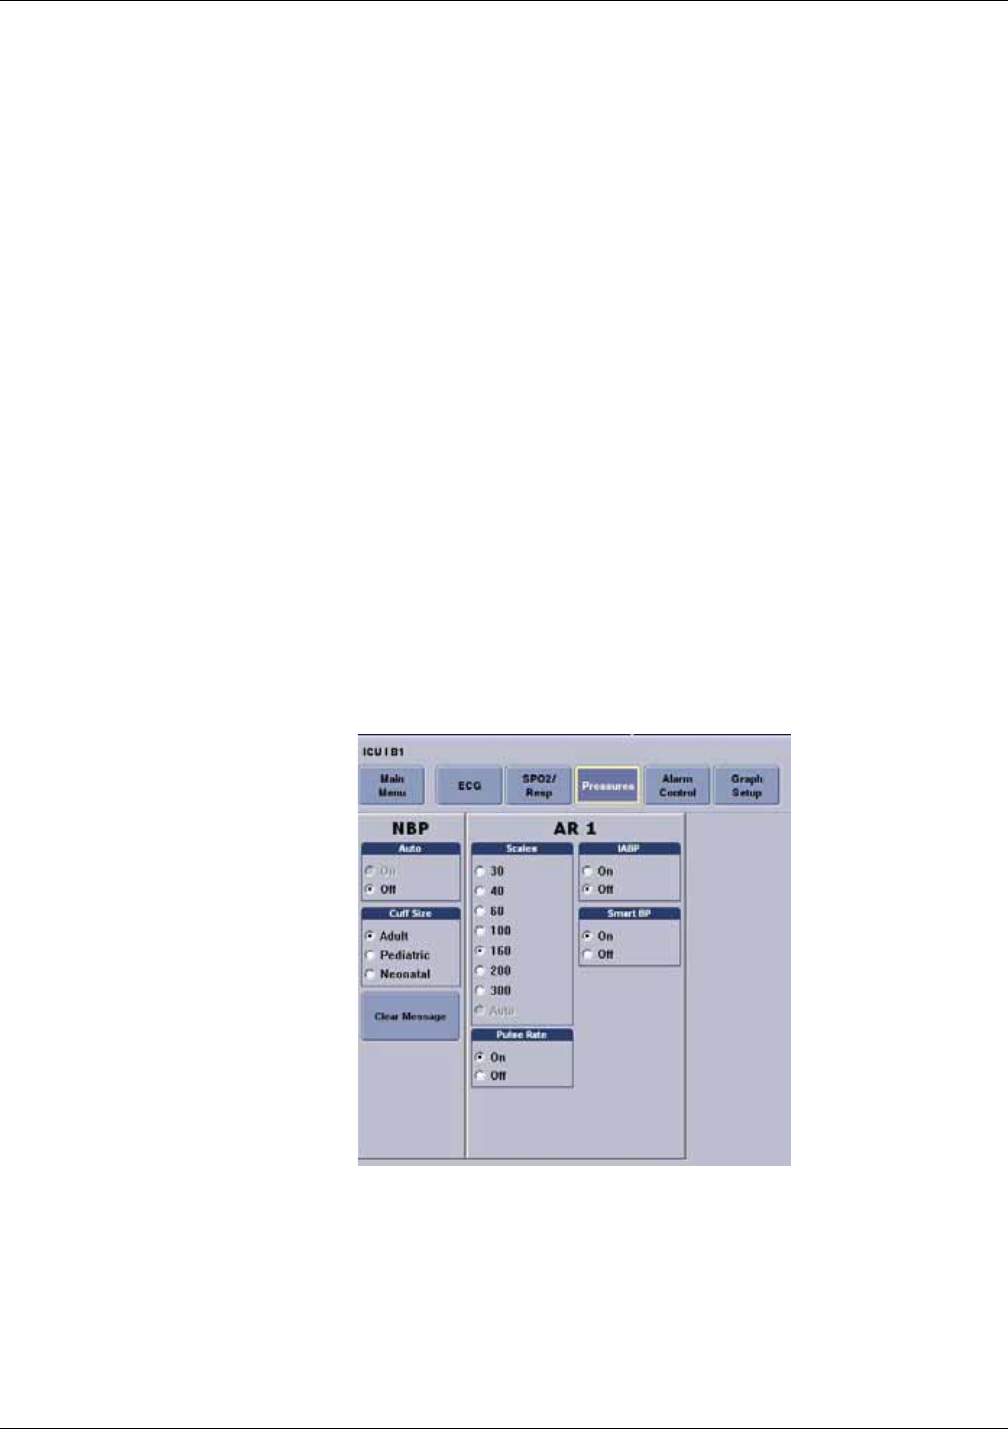
3. Click Pressures to display the control window.
4. Change any of the undimmed setting options.
065A
Draft
Viewing real-time patient data
2001989-301A- draft 1 ApexPro™ 7-29
5. After making your selections, complete one of the following tasks:
Click a different Monitor Setup option to apply your changes without
closing the Monitor Setup window.
Click the (close button) on the top right side of the window to apply
your changes and close the Monitor Setup window.
NBP monitoring with telemetry
NBP monitoring via telemetry is done with an Accutracker DX or Dinamap Pro blood
pressure monitor connected to the transmitter. The blood pressure cuff is connected to
the blood pressure monitor, which measures and displays systolic and diastolic blood
pressures using the auscultatory method. When the blood pressure monitor is
connected to an transmitter, digital values are also displayed at the CIC Pro center.
WARNING
The following conditions may affect the accuracy of noninvasive
blood pressure readings: seizures, tremors, extreme hypotension or
hypertension, arrhythmias, or extremely high or low heart rate.
Patient preparation
Blood pressure cuff selection and application are important. Inappropriate selection or
improper application of the cuff will result in erroneous measurements.
Most people use their non-dominant arm for acquiring ambulatory noninvasive blood
pressure readings.
Follow these steps to prepare the patient for NBP monitoring:
Non-invasive blood pressure control settings
Option Function
Auto Turn Off automatic NBP measurements.
When turned On at the monitor, NBP measurements are
acquired automatically at regular intervals.
NOTE
This option does not apply to telemetry beds and
cannot be turned on from the CIC Pro center.
Cuff Size Set the inflation pressure used during the first NBP
measurement and for calculating the NBP pressure:
NOTE
For more information, refer to the appropriate
bedside monitor’s operator’s manual.
Clear Message button Clear the display of inflation messages and current NBP
readings.
Draft
7-30 ApexPro™ 2001989-301A- draft 1
Viewing real-time patient data
1. Place the K-sound microphone in the microphone pad (or blood pressure cuff).
For more information on microphone placement, refer to Microphone placement
on page 7-30.
2. Locate the patient’s brachial artery on the inside of the arm, just above the elbow.
Mark the location with a pen for easy microphone placement.
3. Remove the backing from the microphone pad and adhere it in the location
marked on the patient’s arm. Do not bend or squeeze the microphone. Route the
microphone cable up, toward the patient’s shoulder.
4. Wrap the blood pressure cuff around the arm. Be sure that the artery marker is
aligned over the brachial artery.
5. Drape the cuff hose over the patient’s shoulder and attach an adhesive cuff
anchor to the snap on the cuff hose. Do not adhere the cuff anchor to the patient
at this time.
6. Place the blood pressure monitor in its pouch and attach it to the patient using the
belt or shoulder strap provided.
7. Adhere the cuff anchor to the patient’s upper arm by removing the adhesive
backing and pressing firmly.
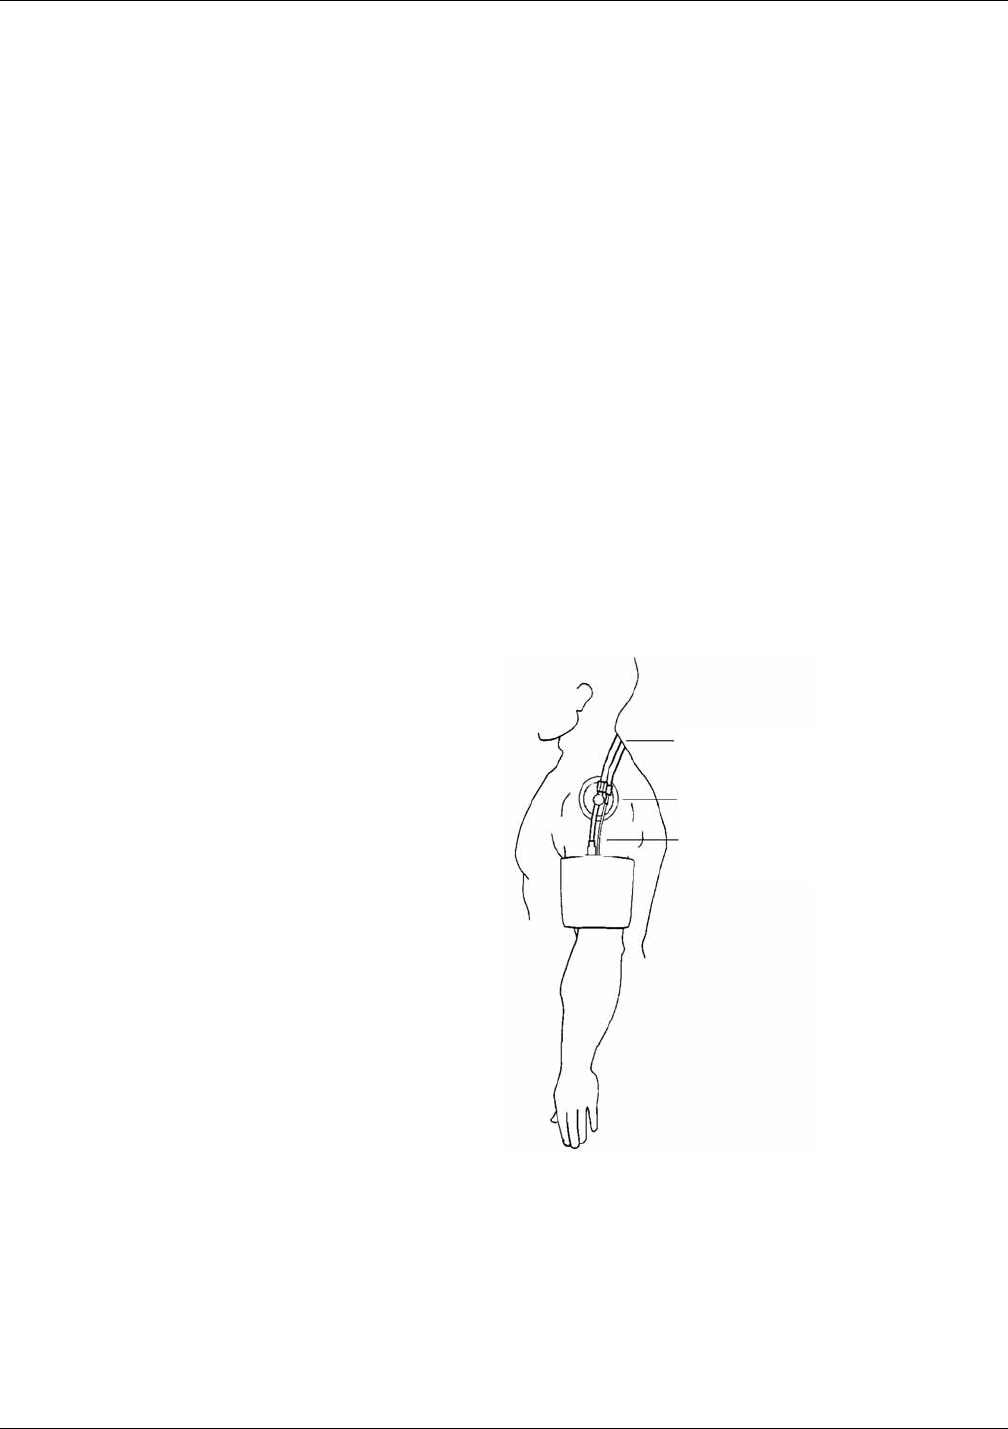
When attached, the blood pressure cuff and hoses should be positioned like those in
the following illustration.
408A
Microphone placement
A microphone is used to hear the Korotkoff sounds (K-sounds) that the blood
pressure monitor uses to determine the systolic and diastolic pressure readings. The
microphone can be placed in a microphone pad and adhered to the patient’s arm under
Hoses Routed Over
Shoulder
Cuff Anchor Clip
Cuff/Microphone
Connections
Draft

Viewing real-time patient data
2001989-301A- draft 1 ApexPro™ 7-31
the blood pressure cuff, or alternatively, it can be placed directly into the microphone
pocket inside the blood pressure cuff.
Placement in the microphone pad
Using a microphone pad is recommended. Place the microphone in the pad as
illustrated below. Do not bend or squeeze the microphone when placing it in the pad,
or when adhering the pad to the patient’s arm.
410A
Placement in the blood pressure cuff
As already stated, using the microphone pad is recommended, especially in the case
of ambulatory patients or patients with weak K-sounds. However, as an alternative,
the microphone can also be placed directly in the blood pressure cuff. Follow the
directions below.
NOTE
Blood pressure readings taken with the microphone in the blood pressure cuff
may not be as accurate as readings obtained when using the microphone pad.
1. Remove the bladder from the cuff.
2. Turn the cuff bladder pouch inside out to expose the microphone pocket.
3. Open the Velcro pocket flap and gently insert the microphone into the pocket.
4. When the microphone is completely inserted, close the Velcro flap over the
microphone cable and turn the cuff right side out.
5. Replace the bladder and exit the bladder hose and microphone cable out of the
same exit site, either right arm or left arm, as marked on the cuff.
Microphone Cable
K-sound Microphone
Microphone Pad
Draft

7-32 ApexPro™ 2001989-301A- draft 1
Viewing real-time patient data
Safety considerations
WARNING
The Accutracker DX blood pressure monitor is designed for use
with adult patients only. Do not use on neonates or on patients
known to be susceptible to bruising.
Do not attach the blood pressure cuff to a limb being used for IV
infusions as the cuff inflation can block the infusion, causing harm
to the patient.
CAUTION
The blood pressure monitor’s safety and effectiveness in neonates
has not been established.
Blood pressure measurements may be affected by the patient’s
position, physical condition, and other factors.
Do not use the blood pressure monitor if it has failed its diagnostic
self test or if it displays a pressure greater than zero with no cuff
attached. The values displayed by such a unit may be inaccurate.
If you must ship the Accutracker DX blood pressure monitor for
service or other reasons, place it in a sealable plastic bag, seal it
tightly, then package it in a cardboard box. Label the shipping
container –20 to +50° C and ship appropriately. Failure to follow
these instructions can result in device failure due to improper
shipping/storage conditions.
Setting the measurement interval
When the blood pressure monitor is turned on, it performs a battery voltage check,
then the display shows the following:
INT= 5 (***)
INCR DECR START?
NOTE
The number 5 above represents any measurement interval, including MAN
(manual). When the blood pressure monitor is turned on, the number displayed is
the last measurement interval set as the default.
Use the YES + button or the NO – button on the blood pressure monitor to increase or
decrease the interval (INT) at which the blood pressure readings are taken.
The available measurement intervals are: MAN (manual), or 5, 6, 7, 8, 9, 10, 15, 20,
25, 30, 35, 40, 45, 50, 55, 60, 90, 120, or 240 minute intervals.
Draft

Viewing real-time patient data
2001989-301A- draft 1 ApexPro™ 7-33
When the desired measurement interval is reached, press the START/STOP button.
The blood pressure monitor immediately begins a measurement cycle. It will attempt
one retry if the first measurement cycle fails.
Measurements are taken at the selected interval. A measurement may be initiated in
between intervals by pressing the START/STOP button. This wakes up the blood
pressure monitor from sleep mode, and offers the option to change the measurement
interval as described above, as well as the option to view the time left until the next
measurement. A manual measurement is initiated by pressing the START/STOP
button a second time. The next measurement will then be taken at the scheduled
interval (X number of minutes) after the manual measurement is complete.
The patient’s blood pressure is displayed for one minute on the blood pressure
monitor and for two hours on the CIC Pro center. The blood pressure reading is
updated each time a measurement is successfully completed.
Measurements are taken at the selected interval until the blood pressure monitor is
turned off, or until the monitor determines that the batteries are too weak for
additional measurements.
A measurement may be stopped by pressing the START/STOP button while the
measurement is in progress.
Setting test parameters
The maximum and minimum inflation pressures, dynamic or fixed inflate, and deflate
rate can be adjusted. Follow these steps:
1. Turn the blood pressure monitor on while holding down the NO – button. The
display shows:
CHANGE TEST
PARAMETERS?
2. Press the YES + button to change the parameters.
3. The MAXIMUM PRESSURE can be set to: 250, 240, 230, 220, 210, 200, 190,
180, 170, 160, 150, 140, 130, 120, 110, or 100 mmHg using the YES + and NO –
buttons. A setting of 200 to 250 mmHg is recommended for the maximum cuff
inflation pressure.
4. When the maximum pressure has been set, press the NEXT button to set the
MINIMUM PRESSURE. It can be set to: 100, 90, 80, 70, 60, 50, 40, 30, 20, or
10 mmHg using the YES + and NO – buttons. A setting of 40 mmHg is
recommended for the minimum cuff deflate pressure.
5. When the minimum pressure has been set, press the NEXT button to select
DYNAMIC INFLATE or FIXED INFLATE. Press the YES + button to turn
dynamic inflate on, or press the NO – button for fixed inflate.
When dynamic inflate is turned on, the blood pressure cuff inflation pressure
automatically ranges 30 mmHg above the most recent systolic reading.
Fixed inflate always inflates the blood pressure cuff to the set maximum inflation
pressure.
Draft

7-34 ApexPro™ 2001989-301A- draft 1
Viewing real-time patient data
Dynamic inflate is recommended for most patients. However, if a patient’s
systolic pressure readings vary by 25 mmHg or more, fixed inflate may be more
comfortable for the patient. In all likelihood, dynamic inflate would not inflate
the cuff high enough for such a patient, prompting the blood pressure monitor to
retry, and causing the patient to endure two inflations for each reading. A fixed
inflation to the set maximum pressure eliminates the double inflation and
increases the patient’s comfort. Reducing the maximum cuff inflation pressure
setting for a patient being monitored with fixed inflate will also increase the
patient’s comfort.
6. After selecting dynamic or fixed inflate, the DEFLATE RATE can be set. It can
be set to: 6, 5, 4, 3, or 2 mmHg, using the YES + and NO – buttons. A deflate
rate of 3 mmHg per second is recommended.
NOTE
A patient with a slow heart rate requires a slower deflation rate than a patient
with a faster heart rate. If the cuff deflates too quickly, it may not be possible
to determine a blood pressure. If the cuff deflates too slowly, it may be
uncomfortable for the patient. The recommended deflate rate of 3 mmHg per
second meets most patients’ requirements, but it can be adjusted when
needed.
7. Press the NEXT button to return to the CHANGE TEST PARAMETERS?
prompt, then press the NO – button to return to:
INT= 5 (***)
INCR DECR START?
Setting limits
It is possible to set the maximum and minimum values, as well as the change (delta)
limit, at which the blood pressure monitor will reject a systolic, diastolic, or pulse
pressure reading and attempt a new measurement. Contact technical support for more
information about setting these limits.
Software and hardware versions
To verify what software and hardware versions your blood pressure monitor has, turn
on the blood pressure monitor while holding down the LAST button. A display
similar to the following appears:
Vsn: XX/ZZ
K3: 0 PR: 0
Your hardware version appears in place of the XX in the above example; your
software version appears in place of the ZZ in the above example.
NOTE
Although it is not shown on the blood pressure monitor display, both the software
and hardware version have a period in them. For example, if the hardware
version reads 11 on the display, this actually indicates that it is hardware version
1.1.
Draft

2001989-301A- draft 1 ApexPro™ 8-1
8
Viewing stored patient
data
Draft

8-2 ApexPro™ 2001989-301A- draft 1
Viewing stored patient data
Stored data
The CIC Pro center can retrieve in-unit parameter data from patient monitors
connected to the Unity Network and retrieve parameter data from secondary devices
connected through a Unity Network Interface. Stored events, parameter numeric data,
graphic trends, and full disclosure patient data is identified by the date and time the
data was collected. As a result, stored data is linked to a specific time focus.
You can review or print stored patient data from the following data review tools:
Events directory
Event Strip
FD Strip (full disclosure) (purchased option)
FD Page (full disclosure) (purchased option)
Graphic Trends
Vital Signs (parameter numeric data)
Calipers
NOTE
When using a second display, the second display will always open the most
recently used data review tool.
NOTE
Solar 9500 information monitor parameters not supported by the CIC Pro center
will not be available for viewing or printing at the CIC Pro center. However, this
data will be available locally at the Solar 9500 monitor.
Time focus data
When parameter data is collected and stored, the stored patient data is linked to a
specific time focus. When viewing an area of interest for one type of patient data (e.g.
Vital Signs), you can view another type of patient data (e.g. Graphic Trends) that was
collected and stored at that same time focus.
As a result, when viewing a patient’s parameter numeric data (vital signs) that was
collected and stored at 7:28 pm on January 10, you can select Graphic Trends to view
the graphic trend data that was also collected and stored at 7:28 pm on January 10.
NOTE
When reviewing stored ECG data samples or strips, the degree of linking
between time focus and the data is determined by your Full Disclosure license.
You can only view full disclosure data that was stored within the time span
identified by your Full Disclosure license. If you attempt to view data that
exceeds your Full Disclosure license, the CIC Pro center displays the following
message: No data is available for requested time.
NOTE
When using a second display, you can display data from two different data
review tools using the same time focus in the top and bottom halves of the
display screen.
Draft
Viewing stored patient data
2001989-301A- draft 1 ApexPro™ 8-3
Events directory
From the Events directory, you can view information about any Crisis, Warning, or
Advisory level arrhythmia or ST event that is stored at a bedside monitor. You can
also view any ECG data sample that is also stored at a bedside monitor from the
Events directory.
Up to 131 alarm events are stored for each admitted patient, with the following
maximum number of event types:
100 arrhythmia alarm events
20 ST limit alarm events
10 samples
1 ST reference
NOTE
The Events directory can be displayed along with the other data review tools. If it
is not displayed, you can display the directory by clicking Events.
NOTE
To review stored non-ECG parameter data, use the FD Strip and FD Page data
review tools.
Viewing the Events directory
Complete the following procedure to view the Events directory:
1. From the multi-patient viewer, click on the patient you want to view. The single
patient viewer displays.
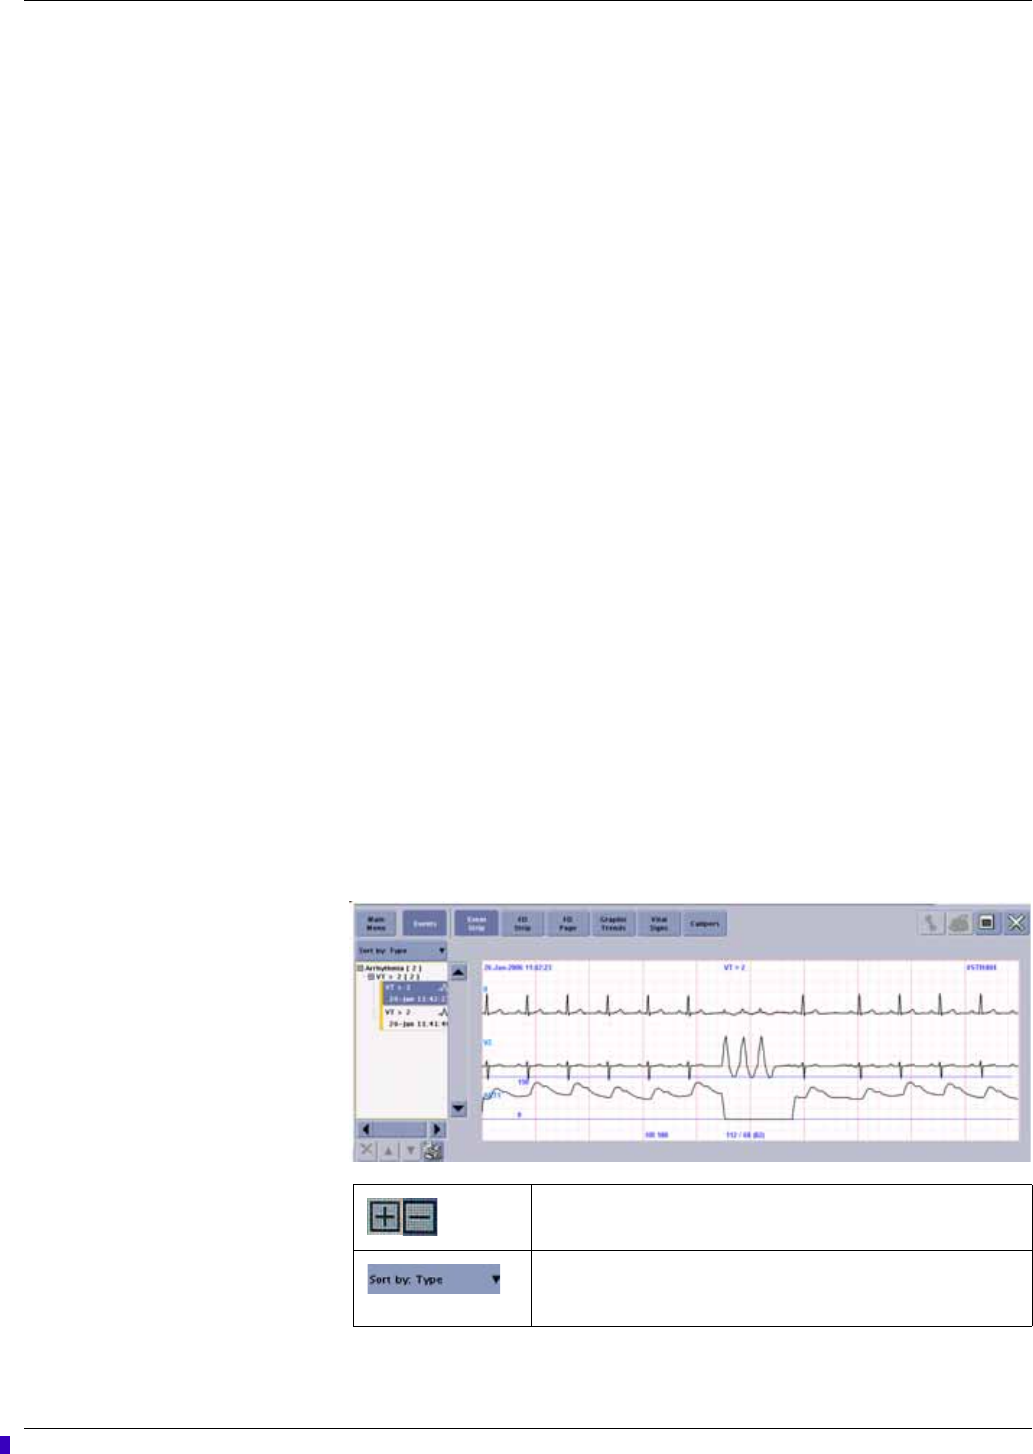
2. From the single patient viewer, click Patient Data... > Events. The Events
directory window displays.
066A
Event list. When the list is sorted by type, click the plus sign to
expand the list or the minus sign to collapse the list.
Sort tool. Click the down arrow to sort stored events and data
samples by the date and time the event occurred or by the type of
event (e.g. arrhythmias).
Draft
8-4 ApexPro™ 2001989-301A- draft 1
Viewing stored patient data
Printing the Events directory
Complete the following procedure to print a list of events and data samples stored in
the Events directory:
1. From the single patient viewer, click Patient Data... > Events. The Events
directory displays.
2. Sort the data by event time or by event type.
3. Click (print directory button) located under the Events directory to print the
displayed list of events.
Counting how many events occurred
Complete the following procedure to identify how many events occurred in each
event category (e.g. V TACH or VFIB/VTAC):
1. From the single patient viewer, click Patient Data... > Events. The Events
directory displays.
2. When the Events list is not sorted by type, click the down arrow next to Sort by:
Time and choose Sort by: Type from the displayed list. The list sorts itself by
event category.
3. Use the scroll bar to move up or down through the list. The quantity of each event
category is listed in square brackets next to the event name (e.g. V TACH [2]).
Identifying the most recent occurring event
Complete the following procedure to identify the most recent occurring event:
1. From the single patient viewer, click Patient Data... > Events. The Events
directory window displays.
2. When the Events list is not sorted by date and time, click the down arrow next to
Sort by: Type and choose Sort by: Time from the displayed list. The list sorts
itself by event time.
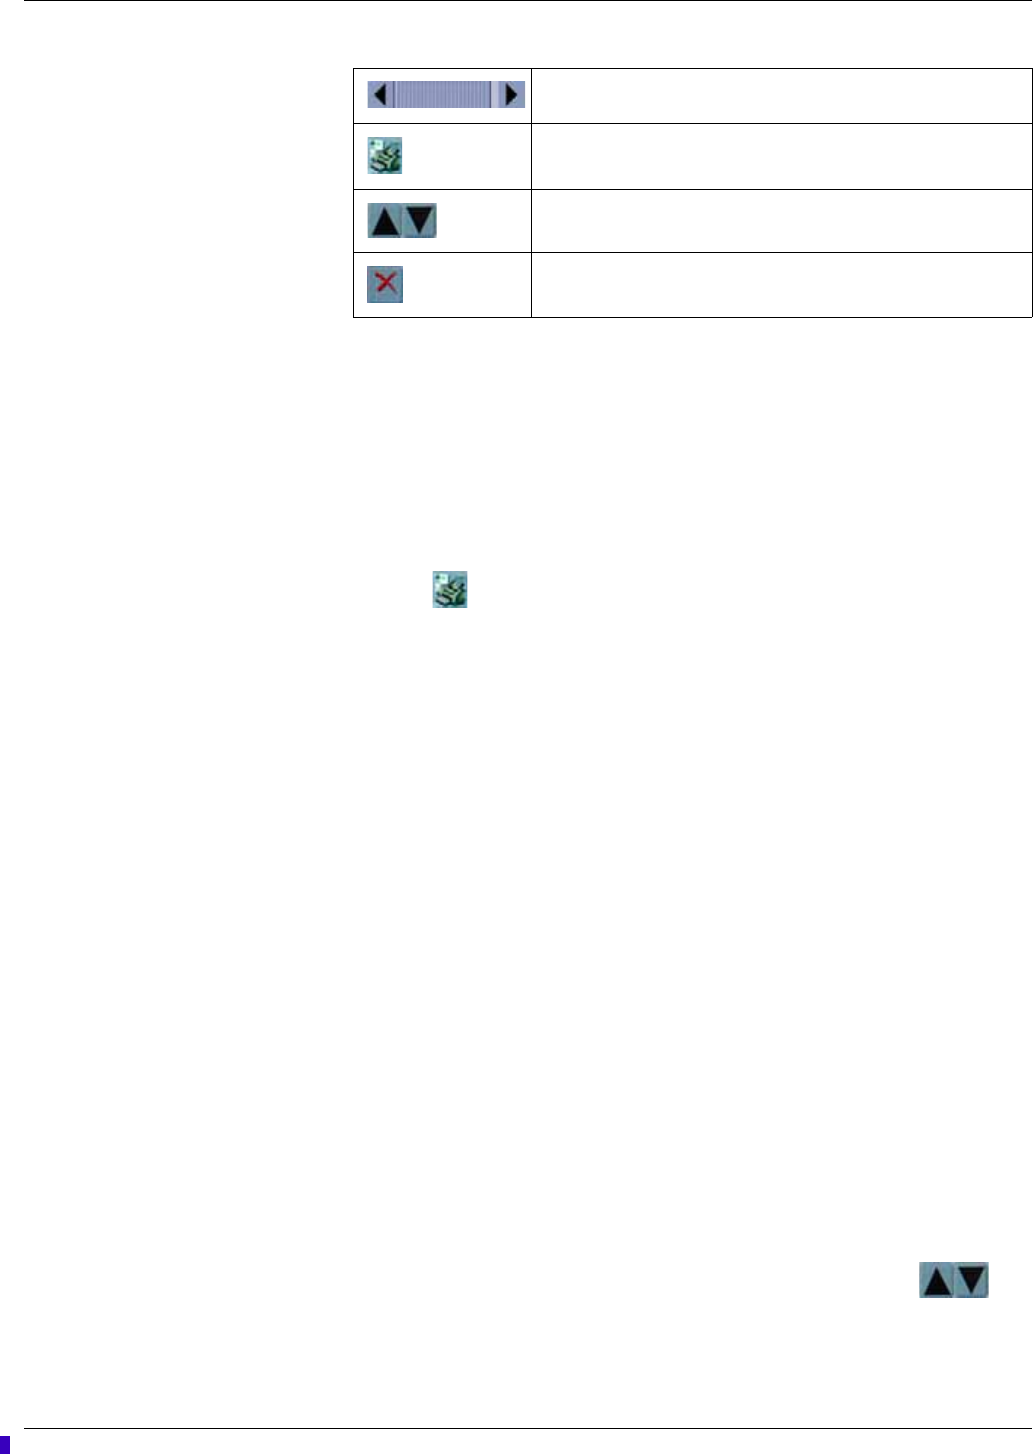
3. To move up or down through the list of events one at a time, click
arrows located under the Events directory.
Scroll bar. Move up or down through the directory.
Print directory button. Print the list of events displayed in the Events
directory.
Up and down buttons. Move up or down through the directory one
event at a time.
Delete event button. Delete the selected event or data sample from
the Events directory.
Draft
Viewing stored patient data
2001989-301A- draft 1 ApexPro™ 8-5
4. Use the scroll bar to move up or down through the list of events and data
samples.
Deleting a stored event or data sample
NOTE
Deleting an event or data sample from the CIC Pro center Events directory
also deletes the corresponding data from the monitor or telemetry system.
When the Patient Data Server (PDS) is active, the delete events button is
dimmed and you cannot delete any events or data samples from the Events
directory.
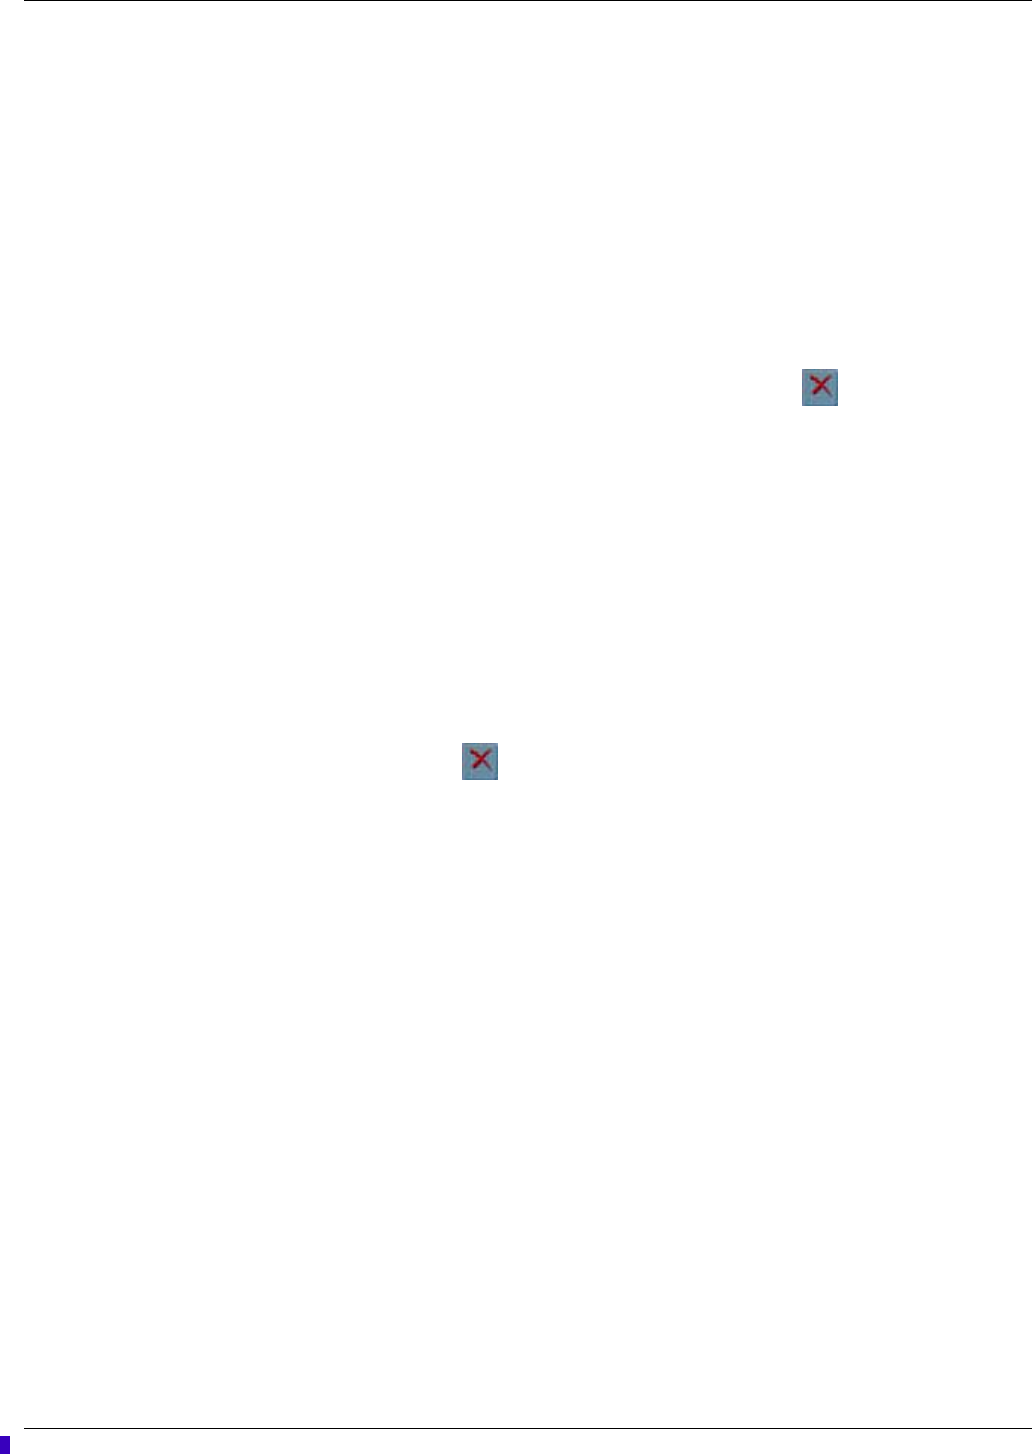
To delete a stored event or data sample, use the (delete event button)
with the red X.
Complete the following procedure to delete an event or data sample stored in the
Events directory:
1. From the single patient viewer, click Patient Data... > Events. The Events
directory displays.
2. Sort the data by event time or by event type.
3. Use the scroll bar to move up or down through the list of events and data
samples.
4. Click the single event or data sample you want to delete, or hold down CNTRL
and continue to click the left mouse button to select multiple events or data
samples.
5. Click the (delete event button). This button is located under the Events
directory and has a red-colored X on it. A window displays a message similar to
the following, Are you sure you want to delete this event?
6. Verify you selected the correct event or data sample for deletion:
Click OK to delete this event or data sample.
Click Cancel if you do not want to delete this event or data sample.
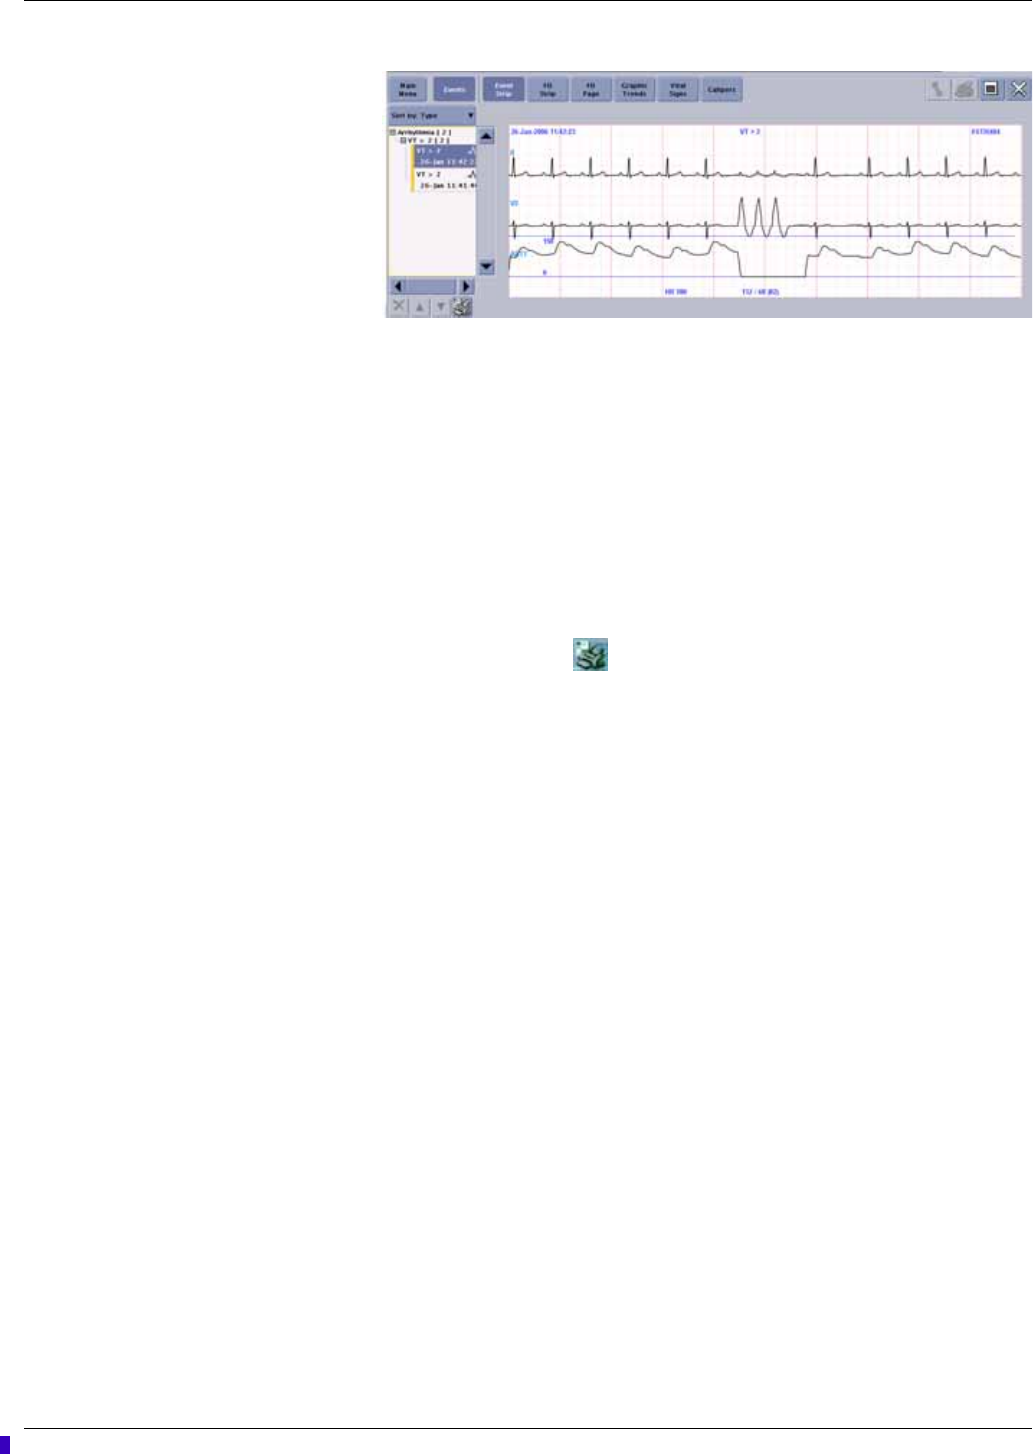
Viewing or printing an Event strip
You can view or print a maximum of a 10-second strip for any arrhythmia event or
ECG data sample stored in the Events directory. You can also view or print the current
and reference ST complexes for all available ECG leads.
The following is an example of an Event Strip.
Draft
8-6 ApexPro™ 2001989-301A- draft 1
Viewing stored patient data
066A
Complete the following procedure to view or print an event strip or data sample
stored in the Events directory:
1. From the single patient viewer, click Patient Data... > Events. The Events
directory displays.
2. Sort the data by event time or by event type.
3. Use the scroll bar to move up or down through the list of events and data
samples.
4. Click on a single event or data sample you want to view or print.
5. From the patient data menu, click Event Strip. The selected event strip displays.
6. To print this strip, click (print button) located in the upper right corner of the
single patient viewer.
Full disclosure data
NOTE
This section provides a brief overview of the Full Disclosure function. For more
information, refer to the CIC Pro Clinical Information Center Operator’s Manual.
An admitted patient’s parameter waveforms and numeric data is continually collected
for a maximum of 72 hours (license dependent). After the maximum hours of data
collection have elapsed, the oldest data is deleted to accommodate newer data.
NOTE
The amount of full disclosure data collected for a patient is determined by the
type of licenses installed on the CIC Pro center. One hour of full disclosure data
collection and storage is standard without additional licensing.
You can view full disclosure data using the following data review tools:
Full disclosure strip: Automatically scan forwards and backwards through full
disclosure data for specific areas of interest.
Full disclosure page: View full disclosure waveform data in a full page format
and view specific areas of interest.
Draft
Viewing stored patient data
2001989-301A- draft 1 ApexPro™ 8-7
Full disclosure strip
A full disclosure strip displays a maximum of 10-seconds of available full disclosure
parameter waveforms and numeric data. You can choose to view the waveforms and
numeric data for all monitored parameters or all of the ECG waveforms and numeric
data.
You can automatically scroll backward or forward through the displayed data, view,
and print a selected full disclosure strip.
For more information, refer to the CIC Pro Clinical Information Center Operator’s
Manual.
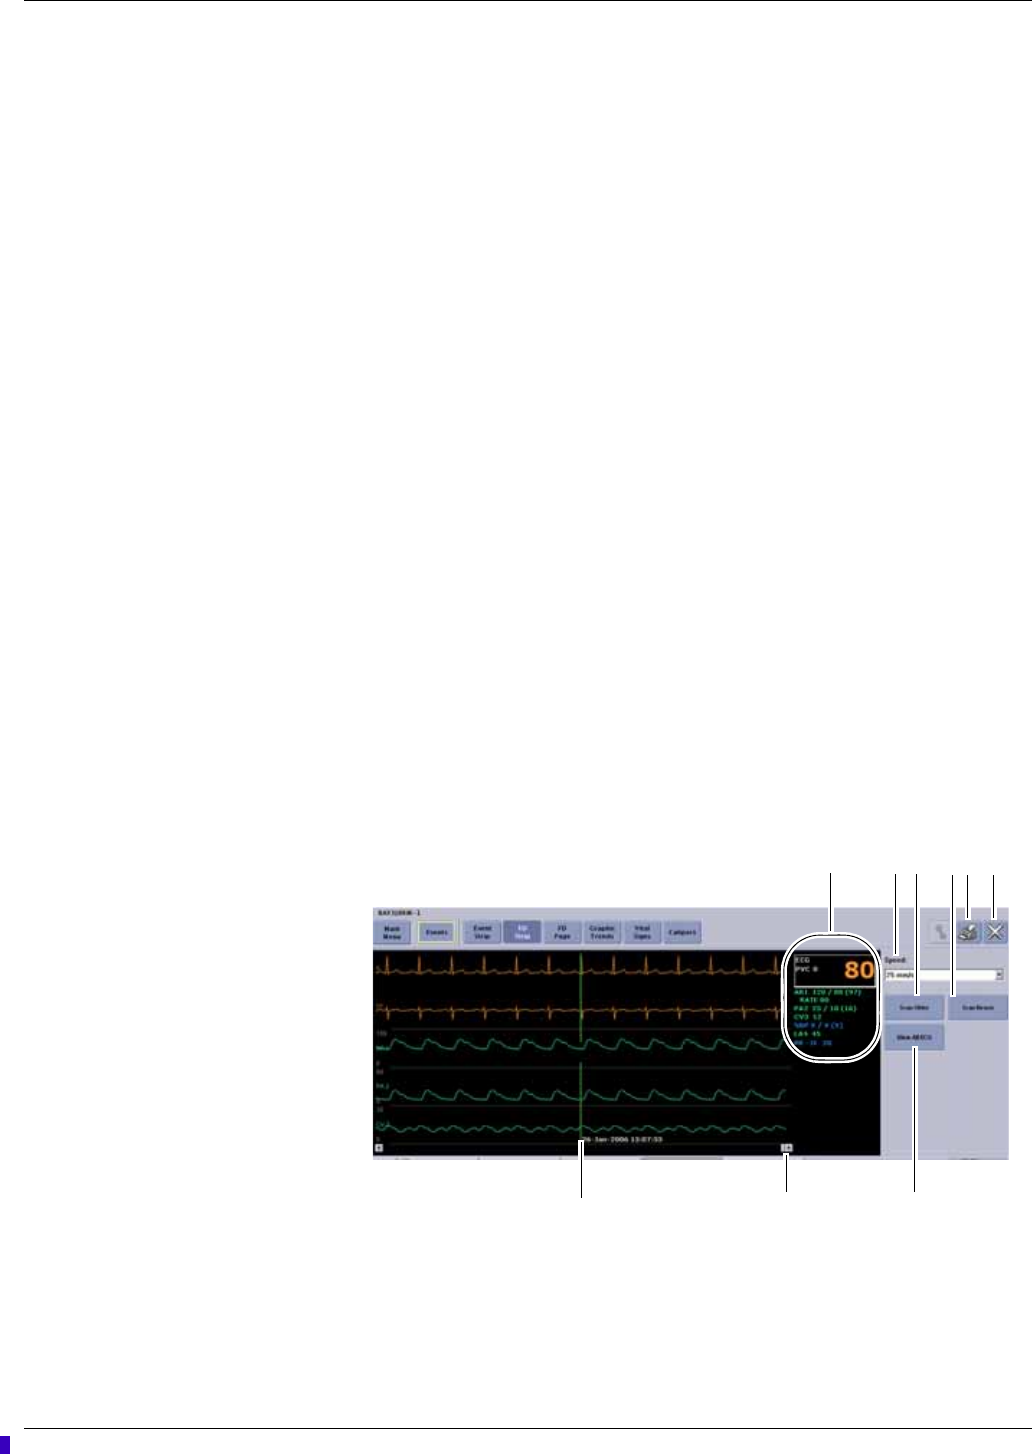
Viewing or printing a full disclosure strip
NOTE
Requires a laser printer to print.
NOTE
When viewing the full disclosure strip, the arrhythmia label text follows the
waveform event and is displayed to the left of the cursor.
Complete the following procedures to view or print a full disclosure strip:
Display the full disclosure strip window
1. From the multi-patient viewer, click on the patient you want to view. The single
patient viewer displays.
2. From the single patient viewer, click Patient Data... > FD Strip. The full
disclosure strip window displays.
067A
8
1
9
5 6
234
7
Draft

8-8 ApexPro™ 2001989-301A- draft 1
Viewing stored patient data
Print a full disclosure strip
Once you have placed the cursor on an area of interest, you can print a strip of this full
disclosure data. The printed strip displays the parameter waveform and numeric data
for the selected time focus.
The duration of the printed FD Strip is determined by the in the Strip > Duration
setting in the Full Disclosure Defaults window.
FD Strip window
Item Description
1 Parameter numeric data corresponding with the cursor’s time focus.
2Speed. Adjust the sweep speed of the scanned waveforms.
For example, when you choose 25 mm/s, the displayed data scrolls in 8-
second increments.
3Scan Older. Scan through the older full disclosure data. When the end of the
data has been reached, the scan automatically stops.
During the scanning process, this button function changes to Stop. Click
Stop to stop the scan at any time.
4Scan Newer. Scan through the newer full disclosure data. When the end of
the data has been reached, the scan automatically stops.
During the scanning process, this button function changes to Stop. Click
Stop to stop the scan at any time.
5 Print button. Print the full disclosure waveform and parameter numeric data
displayed in the FD Strip window.
The print duration of the FD Strip is determined by the in the Strip >
Duration setting in the Full Disclosure Defaults window.
6 Close button. Close the FD Strip window.
7View All ECG. Display all of the available ECG leads and parameter numeric
data. Once selected, this button function and label changes to Monitor.
Monitor. Display all of the parameter waveforms and numeric data displayed
at the monitor when the CIC Pro center collected the full disclosure data.
Once selected, this button function and label changes to View All ECG.
8 Scroll bar. Move backward or forward in time.
NOTE
The scroll bar and the scroll bar arrows move the displayed data at
different rates of speed:
Clicking inside the scroll bar moves the displayed data in time
increments defined by the Speed setting.
Clicking the scroll bar arrows moves the displayed data in one-
second increments.
9 Cursor. Identify the date and time of the parameter waveform and parameter
numerics data you are currently viewing.
You can move the cursor by using the scroll bar or by clicking on the
waveform to move the cursor to that position.
Draft

Viewing stored patient data
2001989-301A- draft 1 ApexPro™ 8-9
Complete the following procedure to print a full disclosure strip:
1. Position the cursor on the waveform area of interest.
2. Click (print button) located in the top right corner of the FD Strip window.
The full disclosure strip prints.
Full disclosure page
The full disclosure page allows you to view and examine the full range of stored
waveforms, zoom in on areas of interest, and print a customized full disclosure report.
Viewing or printing a full disclosure page
NOTE
Can print to a laser printer or DDW.
Complete the following procedures to view the stored full disclosure waveforms:
Display the FD Page window
1. From the multi-patient viewer, click on the patient you want to view. The single
patient viewer displays.
2. From the single patient viewer, click Patient Data... > FD Page. The full
disclosure page displays.
NOTE
When you select a specific time focus or an alarm event from the Events,
Event Strip, Graphic Trends, or Vital Signs data review tools, the FD Page
automatically displays the available full disclosure data for that time focus or
event. Otherwise, the most current full disclosure data displays.
NOTE
When an event or ECG data sample occurs outside of the time limit of your
full disclosure license, a message similar to the following displays: No
patient data is available for the selected time.
Draft
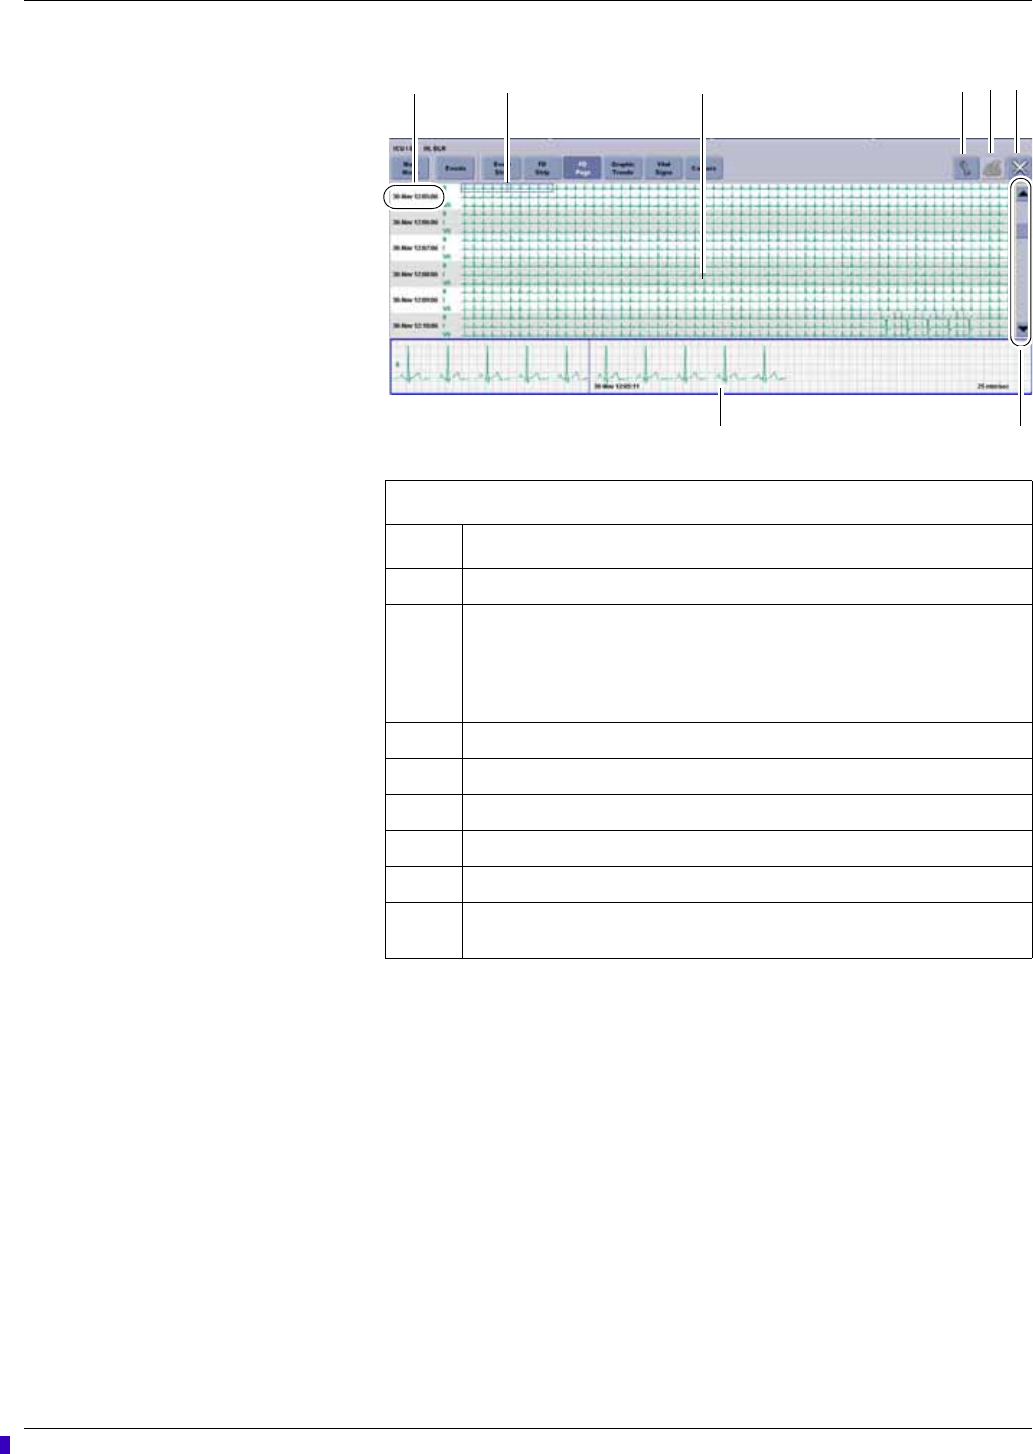
8-10 ApexPro™ 2001989-301A- draft 1
Viewing stored patient data
068A
Graphic trends data
The CIC Pro center can retrieve parameter numeric data from patient monitors
connected to the Unity Network and retrieve parameter numeric data from secondary
devices connected through a Unity Network Interface. The CIC Pro center can
display this collected data in a graphical format, over a specified period of time.
Depending how your CIC Pro center is configured, you can view a maximum of six
graphic trends in half-screen mode and a maximum of 12 graphic trends in the full-
screen mode. You can view graphic trends in varying time scales and print them at a
laser printer or a digital writer.
A patient’s parameter numeric data is continually collected for a maximum of 24
hours. After the maximum hours of data collection have elapsed, the oldest data is
deleted to accommodate the newer data.
FD Page window
Item Description
1 Time and date stamp for this row of waveform data.
2 Zoom box.
Click inside the small blue-colored zoom box to display an enlarged view
of the selected waveform area.
Click on another area of interest to re-position the zoom box.
3 Waveform data.
4 Tools icon. Customize the on-screen display of full disclosure data.
5 Print icon. Customize and print a full disclosure report.
6 Close icon. Close the FD Page window.
7 Scroll bar. Display older or newer data.
8Zoom Window. View the enlarged waveform selected in the small blue-
colored zoom box.
123 4
5 6
78
Draft

Viewing stored patient data
2001989-301A- draft 1 ApexPro™ 8-11
The CIC Pro center retrieves non-episodic parameter data at one-minute resolution
from the patient monitor and displays it at one-minute resolution. Episodic parameter
events (e.g. NBP) are retrieved every time episodic events are recorded. If more than
one episodic event occurs during the same minute, the more recent episodic event
overwrites the older episodic event.
The CIC Pro center also retrieves AFIB trend data from telemetry patients. AFIB
event patient data is stored for review in the Graphic Trends and Vital Signs tab
sheets.
Viewing graphic trends
NOTE
From the multi-patient viewer, you can click in the real-time trend window to
automatically display the current Graphic Trends window for this patient.
NOTE
When two trends are displayed across from each other in the Graphic Trends
window and both trends have the same data values, those graphic trend
waveform areas will overlap each other. The overlapping waveform colors will
not blend together. This is a normal behavior. As the trend values change, the
waveform shape will also change, allowing its individual waveform color to
become visible.
NOTE
If you position the time cursor inside a visible gap of trended data, parameter
numerics are displayed. Depending upon the position of the time cursor within
the gap, the displayed parameter numerics are either the last known parameter
values before the gap or the first known parameter values after the gap.
NOTE
When viewing episodic telemetry data, any data reading collected after the
minute mark will display in the next trended minute.
Complete the following procedures to view the graphic trends of parameter numeric
data:
Display the graphic trends window
1. From the multi-patient viewer, click on the patient you want to view. The single
patient viewer displays.
2. From the single patient viewer, click Patient Data... > Graphic Trends. The
Graphic Trends window displays the current parameter trends.
Draft
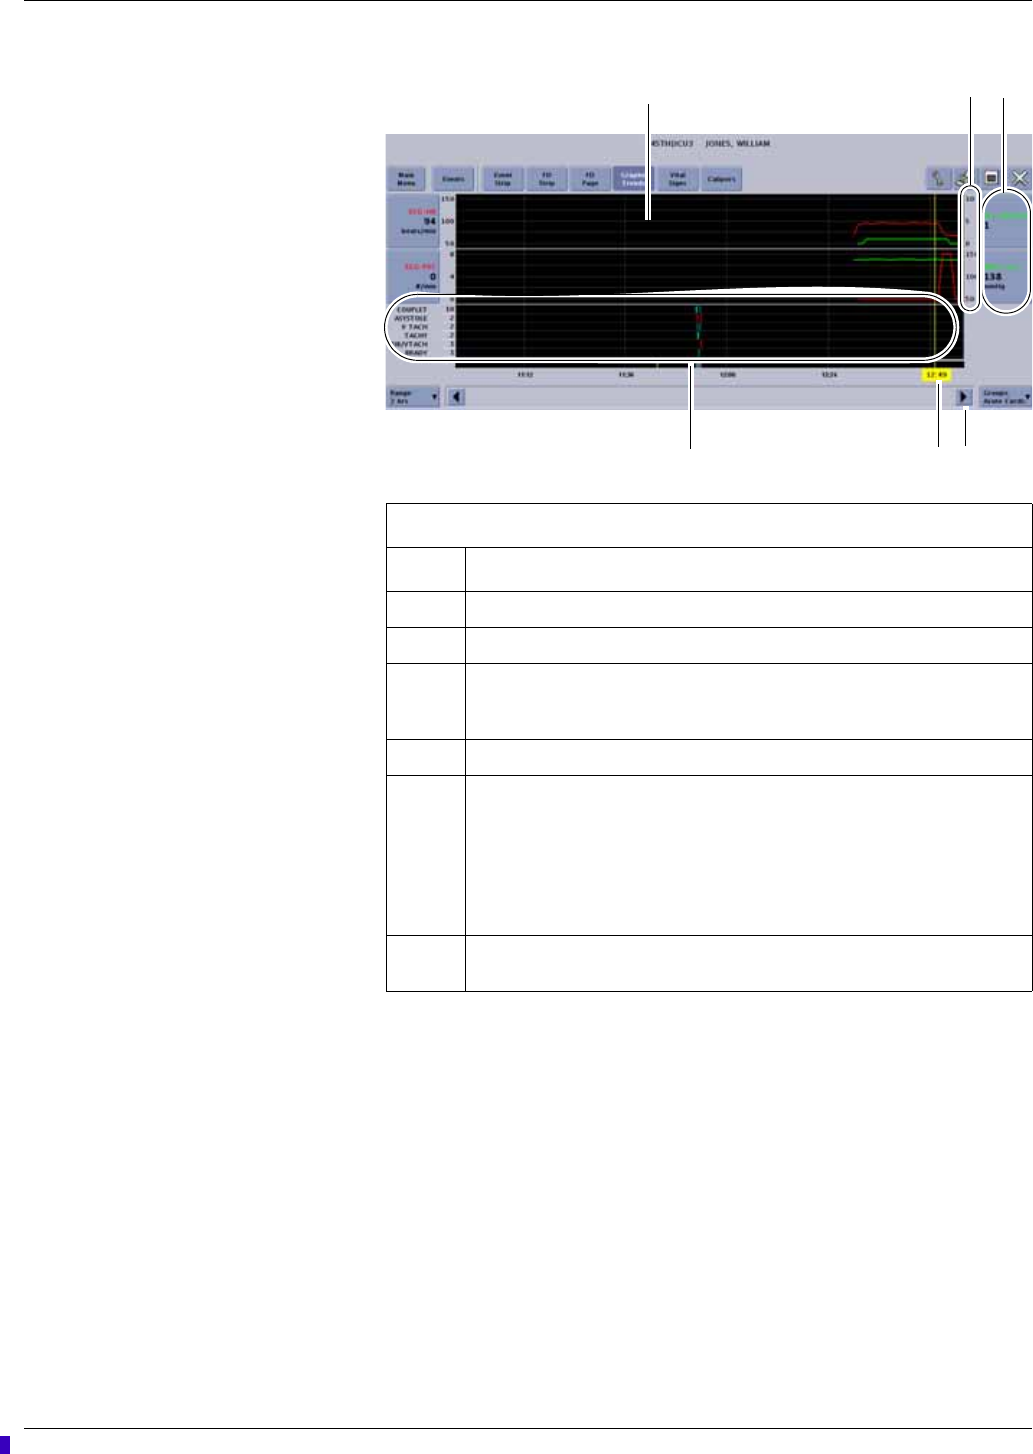
8-12 ApexPro™ 2001989-301A- draft 1
Viewing stored patient data
073A
Choose the trend group you want to display
Complete the following procedure to display trends from a preset group of
parameters:
1. From the Graphic Trends window, click Groups. A list of trend groups displays.
2. Choose the trend group you want to display.
Adjust the displayed time period
NOTE
The Graphic Trends window displays the current trends.
Graphic Trends window
Item Description
1Graphic Trends window.
2 Graphic trend scales.
3 Graphic trend buttons. Identify the trended data and the associated
parameter numeric values. Click on a graphic trend button to change the
scale of this graphic trend.
4 Scroll bar. Move backward or forward in time.
5 Time focus cursor (yellow line) and time focus label (yellow label). Landmark
the date, time, and parameter numeric data corresponding to the cursor
placement.
NOTE
The date only appears in the time cursor label when the viewed data is
not from the current day.
6 Event summary. Display a brief overview of the type and number of events
that occurred during a specific time focus.
123
64
5
Draft

Viewing stored patient data
2001989-301A- draft 1 ApexPro™ 8-13
Complete the following steps from the Graphic Trends window to adjust the start and
stop time of the displayed graphic trends:
1. To make minor time adjustments, use the scroll bar to move backward and
forward in time.
2. To display a specific time range (e.g. 30 Minutes), complete the following steps:
a. Click Range to display a list of time ranges.
b. Choose the time range for the displayed trended data. You can choose from
15, 30 minutes or 1, 2, 4, 8, 12, 24 hours.
Adjust the trend scale size
Complete the following steps to adjust the scale size of a parameter trend:
1. From the Graphic Trends window, click on the parameter trend you want to
adjust. A window displays the parameters scales available for the selected
parameter trend.
2. Choose the desired scale. The window closes and the scale setting is
automatically applied.
3. Repeat step 1 and step 2 for each parameter trend scale you want to adjust.
Printing graphic trends data
When printing graphic trends data, the following factors apply:
Graphs print in the same scale as displayed on screen.
A maximum of four graphs can be printed on each page.
The event trend prints on its own page and includes all the event calls that
occurred during the report period.
Trend values that exceed the displayed trend scale print as a red-colored dashed
line.
For monitor patients, graphic trend printouts that are initiated from a CIC Pro
center print only to a laser printer. If the graphic trend printout is initiated from a
patient’s bedside, it can print to a digital writer or to a laser printer (depending on
how the print functions are configured on the monitor).
For telemetry patients, graphic trend printouts can print to a laser printer or to a
digital writer.
NOTE
When printing graphic trends data from telemetry patients to a digital writer,
the time duration of the printed output is as follows:
Digital writer output for stored telemetry graphic trends data
Displayed data Printed output
15, 30, 60 minutes 90 minutes
2 hours 3 hours
4 hours 6 hours
Draft

8-14 ApexPro™ 2001989-301A- draft 1
Viewing stored patient data
To print the displayed graphic trends data, click (print button) located in the top
right corner of the Graphic Trends window.
Vital signs data
The CIC Pro center can continuously retrieve parameter numeric data (vital signs)
from in-unit or out-of-unit patient monitors connected to the Unity Network and
retrieve parameter numeric data from secondary devices connected through a Unity
Network Interface.
You can view trended parameter numeric data for varying time intervals. When the
CIC Pro center is connected to a laser printer, you can also print the trended parameter
numeric data. Telemetry beds can print to a writer if a laser printer is not connected to
the CIC Pro center.
For non-episodic parameters (e.g., HR), a median value is determined and stored for
display at one-minute resolution. Episodic parameters (e.g., NBP) are stored every
time one occurs. If more than one episodic event occurs during the same minute, the
more recent event overwrites the earlier one.
NOTE
When the first parameter on the list is an episodic parameter (e.g. NBP), all other
parameters on the list only display data at the episodic measurement points. For
example, when NBP is the first parameter on the list, and NBP measurements
were taken at 10:10, 10:15, and 10:20, then data for all other parameters on the
list is only available for the same times.
NOTE
Episodic data is displayed at the closest time interval for the selected time. If the
time for the measurement occurred before or after the displayed time, an ellipses
symbol (...) is appended after the episodic value.
The CIC Pro center also retrieves AFIB trend data from telemetry patients. AFIB
event patient data is stored for review in the Graphic Trends and Vital Signs tab
sheets.
Viewing vital signs data
Complete the following procedure to view periodic and episodic trend data in a
tabular format:
1. From the multi-patient viewer, click on the patient you want to view. The single
patient viewer displays.
8 hours 12 hours
24 hours 24 hours
Digital writer output for stored telemetry graphic trends data
Displayed data Printed output
Draft
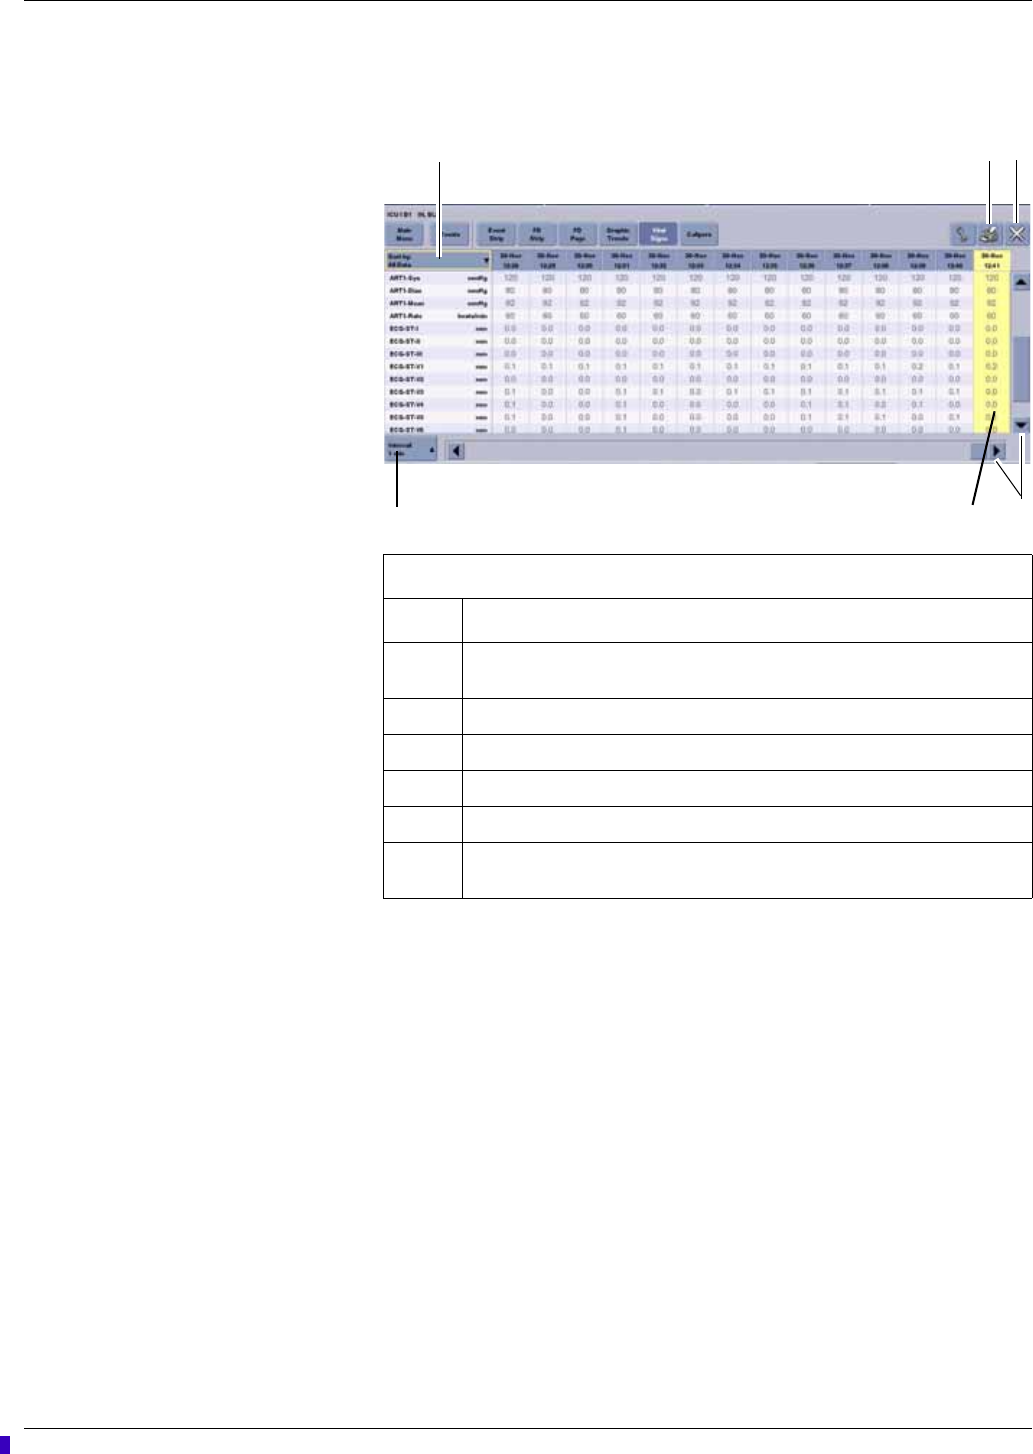
Viewing stored patient data
2001989-301A- draft 1 ApexPro™ 8-15
2. From the single patient viewer, click Patient Data... > Vital Signs. The Vital
Signs window displays.
074A
3. Click the down arrow next to the Vital Signs sort tool and choose the data group
you want to display. The data sorts itself by your chosen category.
NOTE
When reviewing data in the Vital Signs window, be aware that if you
changed to monitoring a different V lead, both the current and previous V
lead data is trended and both V lead labels will appear in the Vital Signs
window. In addition, the V lead numeric data appears at the time the V lead
data was collected.
4. Click the Interval button to choose the time interval of the displayed data. You
can choose from 1, 5, 15, 30, or 60 minutes.
5. Use the up and down or left and right scroll bars to move through the displayed
data.
Vital Signs window
Item Description
1Vital Signs sort tool. Click the down arrow to choose the data group you want
to display.
2 Print button. Print the list of events displayed in the Events directory.
3 Close button. Close this window.
4 Scroll bars. Move up and down or left and right through the displayed data.
5 Focus indicator. Highlights one event for easier viewing.
6 Interval button. Click the down arrow to choose the time interval of the
displayed data.
1 2 3
4
5
6
Draft

8-16 ApexPro™ 2001989-301A- draft 1
Viewing stored patient data
Printing vital signs data
NOTE
Up to five events of the Vital Signs data for telemetry patients can be printed to a
digital writer.
Complete the following procedure to print periodic and episodic trend data in a
tabular format to a laser printer:
1. From the single patient viewer, click Patient Data... > Vital Signs. The Vital
Signs window displays.
2. Click the down arrow next to the Vital Signs sort tool and choose the data group
you want to display. The data sorts itself by your chosen category.
3. Click the Interval button to choose the time interval of the displayed data.
4. Click (print button) located in the top right corner of the Vital Signs
window.
Measuring ECG waveform intervals and amplitude
NOTE
This section provides a brief overview of the calipers function. For more
information, refer to the CIC Pro Clinical Information Center Operator’s Manual.
When full disclosure data is collected and stored at the CIC Pro center, you can use
the Calipers measurement tool to measure the PR, QRS, QT, and R-R waveform
intervals and the ST waveform amplitude.
Viewing or printing a waveform from the Calipers window
Complete the following procedure to print or view a waveform from the Calipers
window:
1. From the multi-patient viewer, click on the patient you want to view. The single
patient viewer displays.
2. From the single patient viewer, click Patient Data... Then, choose the data
review tool you want to use to locate a waveform segment or waveform strip you
want to measure.
NOTE
When an event or ECG data sample occurs outside of the time limit of your
full disclosure license, the data will not be available to view from the
Calipers measurement tool.
3. Click Calipers to display the Calipers window. Ten seconds of waveform data
displays.
Draft
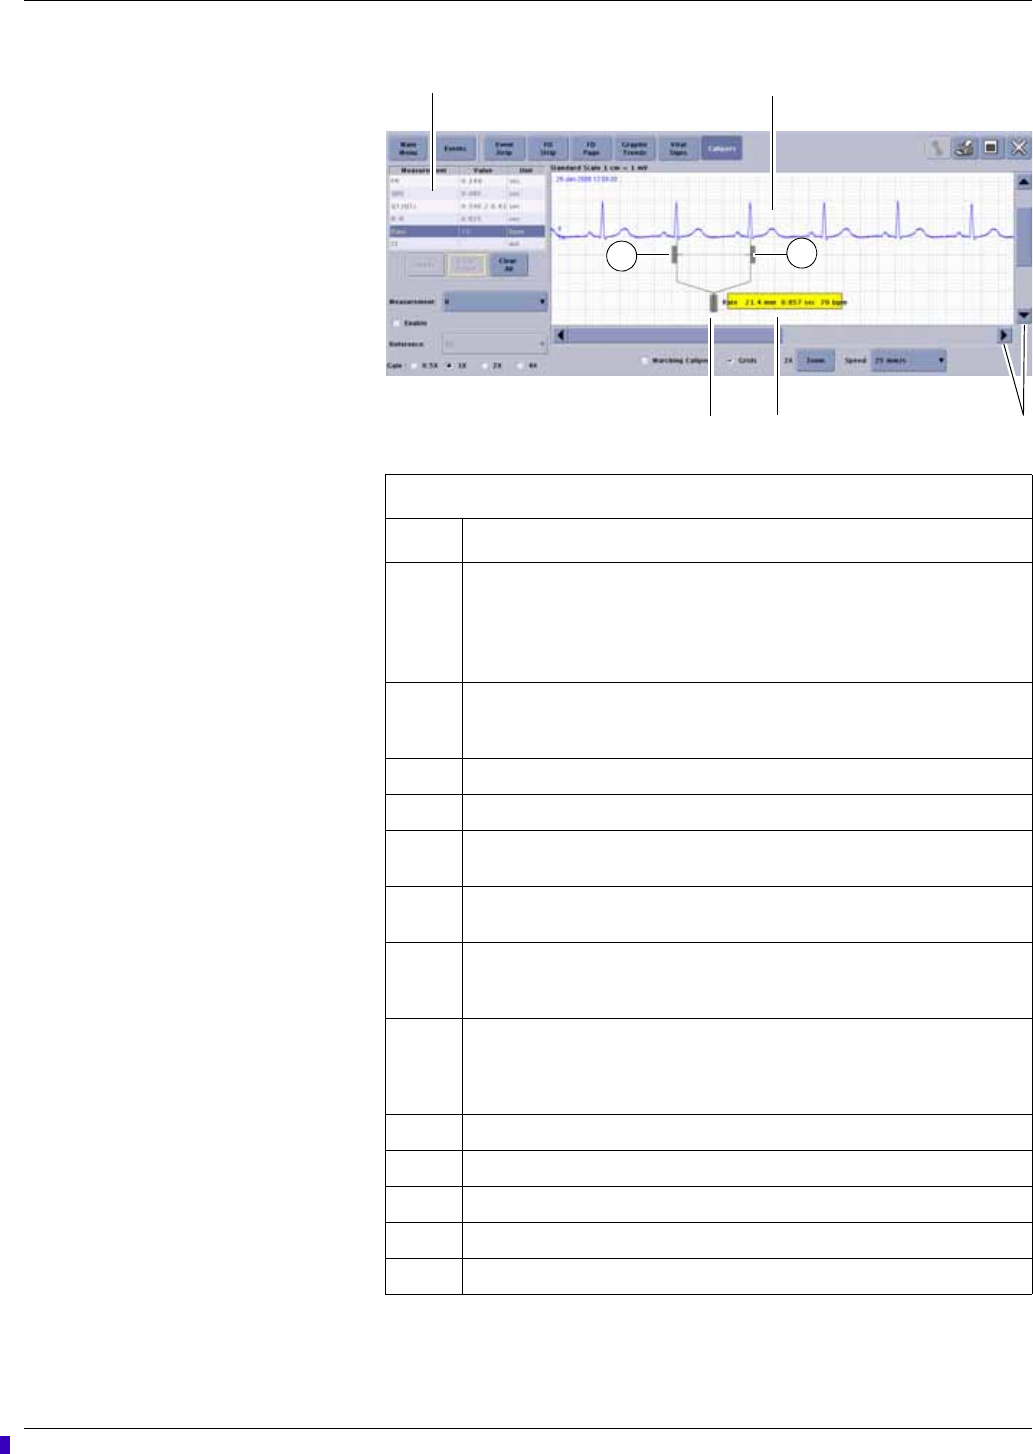
Viewing stored patient data
2001989-301A- draft 1 ApexPro™ 8-17
079A
Calipers window
Item Description
1 Measurement table. Enter or clear the waveform measurement values for the
PR, QRS, QT, R-R, and ST intervals or amplitudes.
NOTE
The QTc value is a calculated value.
2 Measurement window. View, measure time intervals and amplitude for
displayed waveforms, and compare the interval of multiple waveform
complexes.
3 Scroll bars. Move up and down or left and right through the displayed data.
4 Calculated measurement label. Click and drag to reposition.
5 Calipers central handle. Click and drag this handle to position the caliper on a
desired waveform complex.
6 Caliper arm handles. Click and drag these handles to resize or reposition the
caliper arms over the waveform.
Measurement: Choose one of the following leads to measure: I, II, III, V,
AVR, AVL, and AVF. For telemetry only, a second V lead would be available
for display.
Reference: Fill the Enable box with a check mark and choose one of the
following reference leads for display: I, II, III, V, AVR, AVL, and AVF. For
telemetry only, a second V lead would be available for display. Measurements
taken on a reference lead are not recorded in the measurement table.
Gain: Adjust the gain of the displayed waveform.
Marching Calipers: Compare the rate of multiple waveforms.
Grids: Apply a background grid.
Zoom: Zoom in for a closer look at the waveform.
Speed: Change the sweep speed of the displayed waveform.
1
4
2
3
6
6
5
Draft
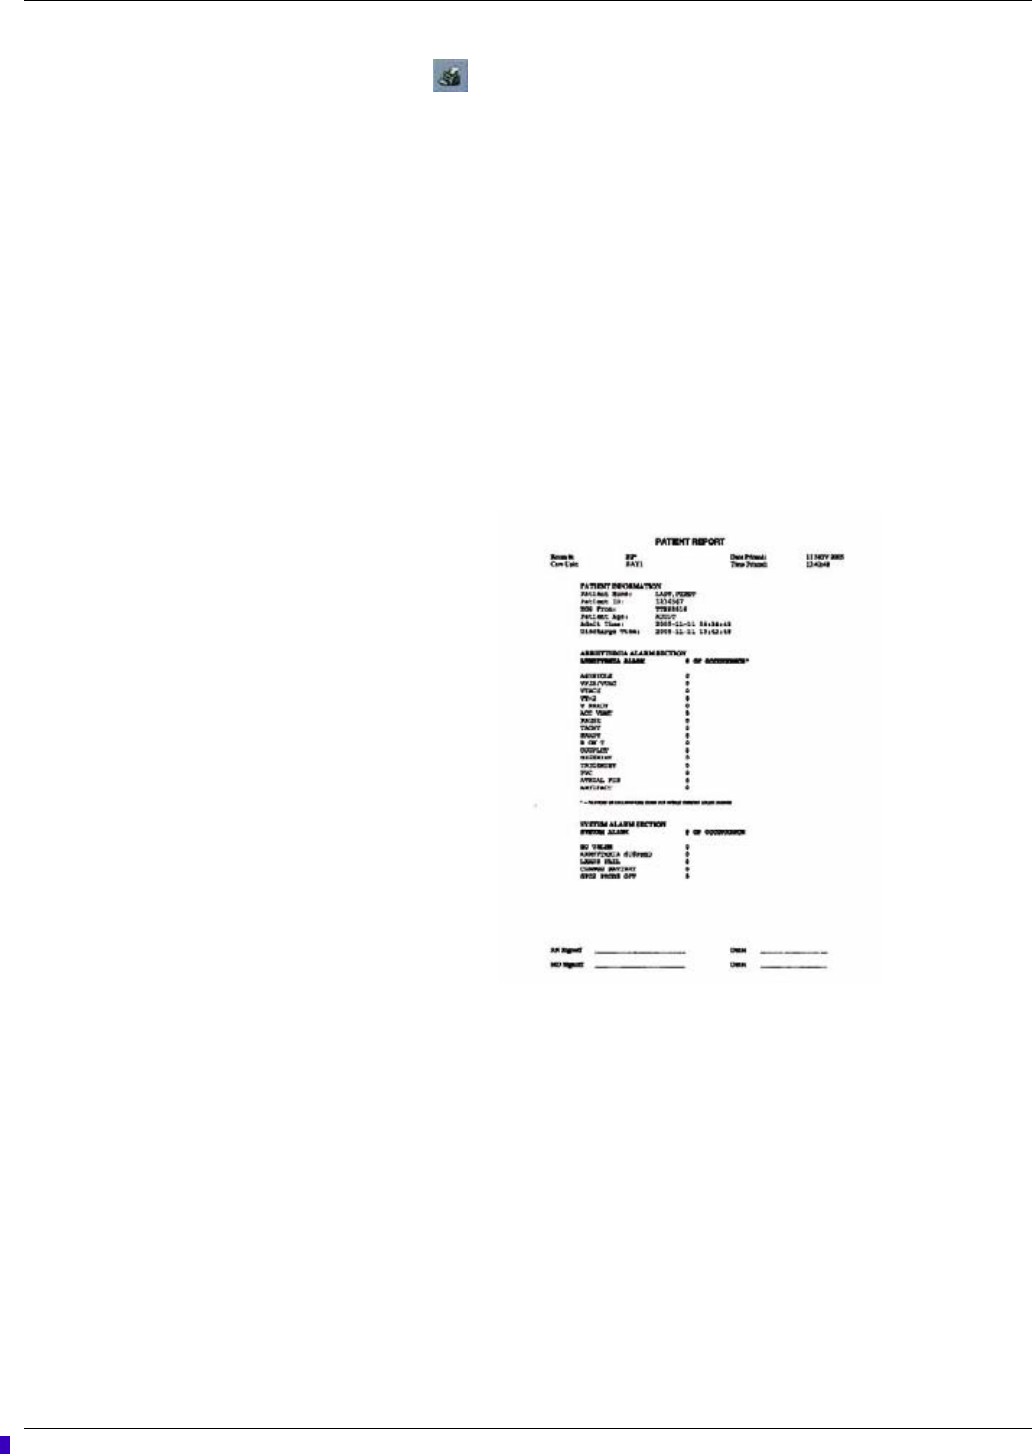
8-18 ApexPro™ 2001989-301A- draft 1
Viewing stored patient data
4. Click (print button) located in the top right corner of the Calipers window.
All measurements are lost when the window is closed.
Reports
The following reports are available for telemetry patients if a laser printer is
configured for the CIC Pro center. These reports are enabled and configured through
Webmin. Refer to the CIC Pro Clinical Information Center Bedrock Hardware
Platform Service Manual for more information.
Patient discharge summary report
The Patient Discharge Summary report automatically prints to a configured laser
printer for the CIC Pro center when a telemetry patient is discharged. The report
provides general patient, system status alarm and patient status alarm information.
Transmitter battery status report
The Transmitter Battery Status report prints to a configured laser printer for the CIC
Pro center on a user demand basis. The report lists all transmitters with admitted
telemetry patients, the associated unit and bed name and transmitter’s current battery
level.
Draft

2001989-301A- draft 1 ApexPro™ 9-1
9
Printing
Draft
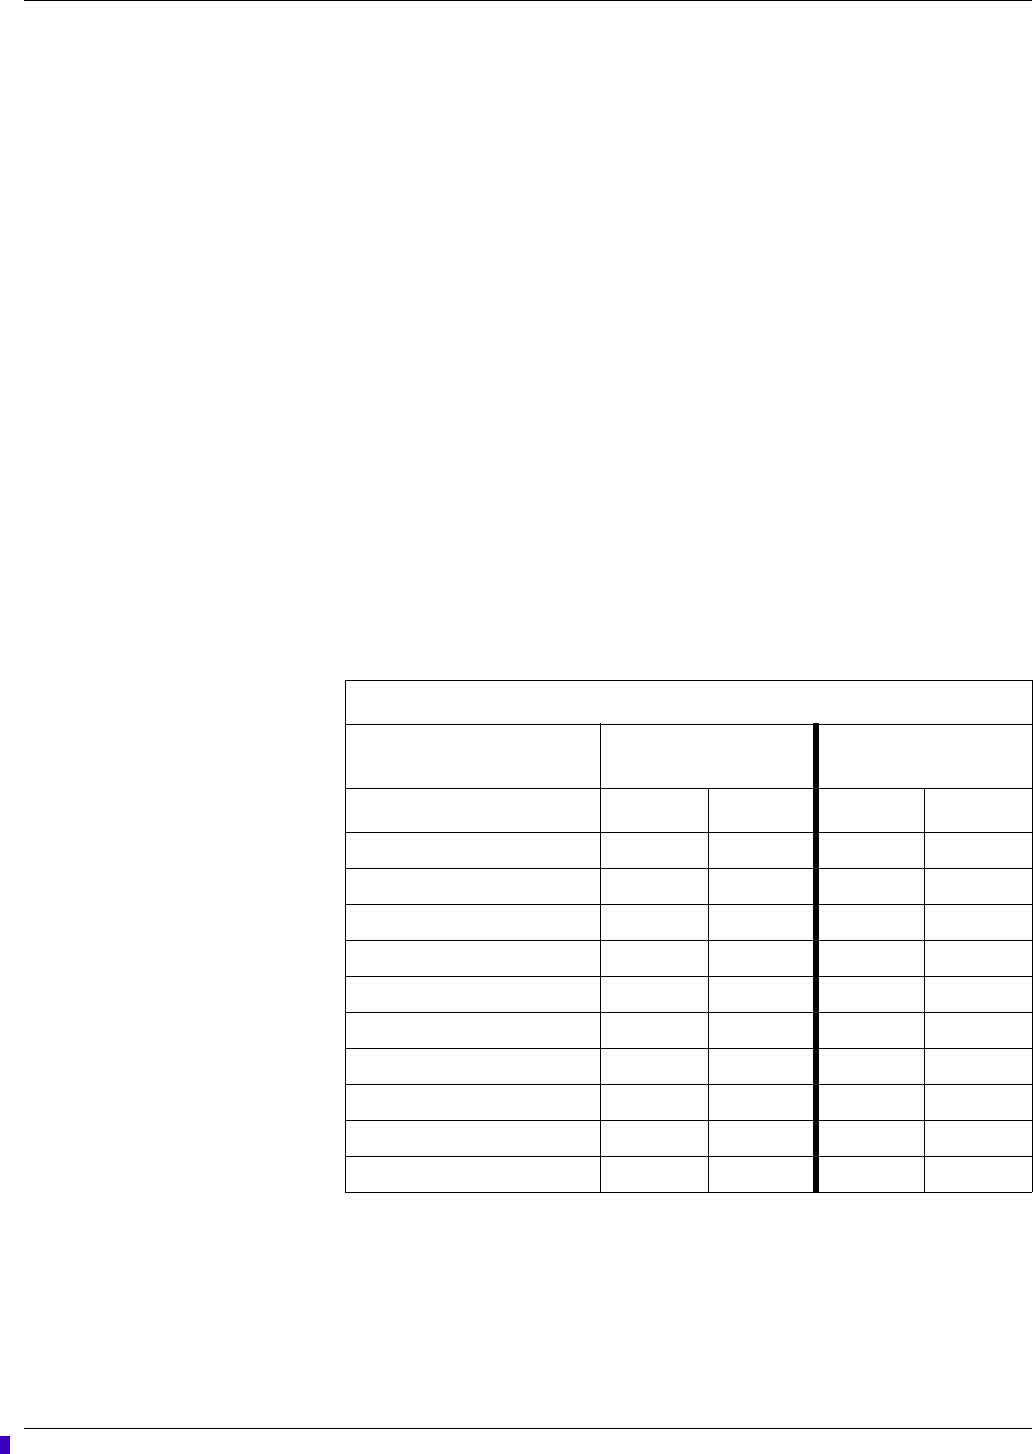
9-2 ApexPro™ 2001989-301A- draft 1
Printing
Print devices
You can print real-time and stored parameter data to the following Unity Network
print devices:
PRN 50-M digital writer
Laser printer
Print output
You can print displayed real-time or stored parameter data from a CIC Pro center or
from other GE patient monitors that are connected to the Unity Network.
The type of parameter data available to print depends on the source of the patient data
(e.g., hardwired bed, Combo bed, or telemetry bed) and from where you choose to
initiate the printing of this information (e.g., CIC Pro center or patient monitor).
Telemetry bed parameter data
The following table identifies the telemetry bed parameter data available to print from
a CIC Pro center or GE patient monitor.
Graph location
Where your data prints out (graph location) is first determined by the default Graph
Setup control settings and second, by other operating conditions.
Telemetry bed parameter data
Data printed from a CIC
Pro center Data printed from a
monitor
Parameter data Writer Printer Writer Printer
Vital Signs Yes Yes Yes Yes
Graphic Trends Yes Yes Yes Yes
Alarm history Yes Yes Yes Yes
Events directory Yes Yes Yes Yes
Alarm control Yes Yes Yes Yes
View patient Yes Yes Yes Yes
Alarm graph Yes Yes Yes Yes
Full disclosure strip -- Yes -- --
Full disclosure report -- Yes -- --
Calipers -- Yes -- --
Draft

Printing
2001989-301A- draft 1 ApexPro™ 9-3
Use the following guidelines to identify the operating conditions that determine
where your data prints out (graph location):
Manual graphs and print windows: These print at the CIC Pro center where the
graph was requested, provided that CIC Pro center has the same type of writer or
printer as the graph location set for the patient for that type of graph. If the CIC
Pro center where the graph was requested does not have the same type of writer
or printer, the graph prints to the patient’s specified graph location.
When the CIC Pro center is not connected to a printer: When viewing a patient
on a CIC Pro center that is not connected to a printer, the graph settings default to
the graph location configured in the Graph Setup defaults.
Patient moved to a different bed: When you move a patient bed, the patient’s
graph settings are retained as set on the CIC Pro center where the patient was first
admitted.
Duplicated telemetry patient: When a telemetry patient is duplicated on another
CIC Pro center, alarm graphs continue to print at the CIC Pro center where the
patient was first admitted.
No graph location for a telemetry patient: When no graph location is defined for
a telemetry patient at the time of admission, the message Saving displays. Graphs
are not sent to printers outside the unit.
Printing real-time data
In addition to patient alarm graphs printing automatically, you can print a continuous
strip for a single patient, or print parameter waveforms or parameter limits for all
patients displayed in the multi-patient viewer.
To print real-time data, see the following sections of this manual:
Printing a continuous ECG strip on page 7-8.
Initiating a graph all patients request on page 9-5.
Printing stored patient data
You can print patient data that has been collected and stored at this CIC Pro center.
To print stored patient data, see the following sections of this manual:
Printing the Events directory on page 8-4.
Viewing or printing an Event strip on page 8-5.
Viewing or printing a full disclosure strip on page 8-7.
Printing graphic trends data on page 8-13.
Printing vital signs data on page 8-16.
Initiating a manual graph
If you click on a patient’s ECG parameter window, a continuous graph is initiated for
the patient. Clicking on the ECG parameter window again will stop the graph.
Draft

9-4 ApexPro™ 2001989-301A- draft 1
Printing
The PRN 50 digital writer and the Direct Digital Writers (DDW) print patient data
(generally referred to as a graph or graph strip). Data can also be printed on a laser
printer.
The waveforms graphed and graph speed are controlled in the individual patient’s
Graph Setup tab sheet. Unit defaults for telemetry patients can be set in the CIC
Defaults tab sheet and the Telemetry Unit Defaults tab sheet. Refer to Telemetry unit
defaults on page 4-7 for more information on setting Telemetry Unit Defaults.
Transmitter initiated graphs (manual graphs)
When the Graph button on the transmitter is pressed, a 20-second graph strip is
printed at a speed of 25 millimeters per second and the event is stored in alarm
history.
When an IMPACT.wf paging system (version II or later) is also available in the same
care unit, pressing the Graph button enables the View on Demand feature (also called
the Apex Graph Button Push feature). The IMPACT.wf server generates a manually
initiated sample page or snapshot of the patient’s ECG waveform and any other
enabled/monitored non-arrhythmia parameters.
When you press the Graph button on the transmitter, it generates both an IMPACT.wf
update page as well as a standard ECG waveform graph at the CIC Pro center. The
IMPACT.wf page is labeled Sample when this data is displayed on the IMPACT.wf
receiver and stored in history. Additionally, all pagers assigned to the patient receive a
page.
Automatic alarm graphs
A graph prints automatically when a patient experiences a Crisis or Warning alarm
condition. Arrhythmia alarm graphs run until the end of the alarm event unless
manually stopped by the user. The printer prints up to 10 seconds of data that
occurred immediately before the event, and prints for the duration of the event. The
printer stops printing when the patient returns to a normal rhythm.
If a printer is not available at the time of the alarm event, a 20-second graph is saved.
This saved graph will print when a printer becomes available.
Graph messages
One of the following messages is displayed on the CIC Pro center screen during
graphing:
GRAPH ALARM—An alarm graph was initiated and is running.
GRAPH MANUAL—A manual graph was requested and is running.
GRAPH TTX—The Graph button on the transmitter was pressed and a 20-second
graph strip is running.
PRINTING—A non-real time graph is currently being printed.
SAVING—An alarm or a manual graph has been requested but the writer is in use;
the writer door is open; or the writer is out of paper. The graph is being saved until the
Draft

Printing
2001989-301A- draft 1 ApexPro™ 9-5
writer is available. The most recent 20-second alarm or manual graph will be saved in
alarm history. Additional data maybe available with Full Disclosure.
Graph all patients
Clicking on the Print button at the bottom of the CIC Pro center display sends a
Graph All Patients request to all beds displayed on the CIC Pro center, initiating a 10-
second graph for all telemetry and Combo patients and a 20-second graph for all
bedside patients. When this option is selected for telemetry patients, graph requests
always print at a speed of 25 millimeters per second.
NOTE
This Graph All Patients function is only available when the single patient viewer
is closed. If a single patient viewer is open, selecting Print from the main menu
initiates a printout of whichever tab sheet is in front.
The print process stops automatically. If the Graph Stop control key is pressed on the
external DDW, the current patient’s graph stops and the writer begins to print a graph
for the next patient.
If a patient’s data is currently printing or is being saved to print when a Graph All
Patients request is initiated, this patient’s data will not be included in the Graph All
Patients graph. This patient’s data will print independently of the Graph All Patients
graph.
Clicking on the ECG parameter window for a patient whose data is saving will cancel
the Graph All Patients request for that patient.
If, while a Graph All Patients request is in progress, an arrhythmia alarm occurs for a
patient, the alarm data will replace the data that was saved for the Graph All Patients
request. The alarm data will then appear on the graph printout.
If, while a Graph All Patients request is running, a telemetry patient initiates a graph
from his or her transmitter, the saved data for the Graph All Patients graph will be
replaced by data from the patient’s transmitter. The data from the transmitter will then
appear on the graph printout.
Initiating a graph all patients request
To initiate a Graph All Patients request, follow these steps.
1. Click on the Print button at the bottom of the CIC Pro center display. The Graph
All Patients window opens.
2. Click on Limits or Waveforms.
Selecting Limits graphs all patient limits.
Selecting Waveforms graphs all patient waveforms.
3. Click on the OK button to complete the Graph All Patients request.
Draft

9-6 ApexPro™ 2001989-301A- draft 1
Printing
Stopping a print job
You must stop a print job from the same CIC Pro center you used to send the print job
to the printer.
Stop printing to a laser printer
Complete the following procedure to stop printing all print jobs sent to the laser
printer:
1. From the multi-patient viewer, click CIC Setup > CIC Defaults. The CIC
Defaults window displays.
2. Under Printer/Writer, click Cancel Print Jobs for the printer you want to stop
printing to.
3. After making your selection, complete one of the following tasks from the CIC
Defaults window:
Click OK to apply your changes and close the CIC Defaults window.
Click Cancel to cancel your changes and close the CIC Defaults window.
Click Apply to apply your changes without closing the CIC Defaults
window.
Stop printing to a local digital writer
Complete the following procedure to stop printing all print jobs sent to a local digital
writer:
1. Locate the digital writer.
2. Press the (Graph Stop) button located on the front of the digital writer to
stop the print job.
Adjusting print control settings
To temporarily adjust the graph location and settings for a specific patient, complete
the following procedure:
NOTE
All changes are temporary and return to the default settings when the patient is
discharged. To permanently change these settings, see the CIC Pro Clinical
Information Center Bedrock Hardware Platform Service Manual.
1. From the multi-patient viewer, click on the patient you want to view. The single
patient viewer displays.
2. From the single patient viewer, click Monitor Setup > Graph Setup to display
the Graph Setup window.
Draft
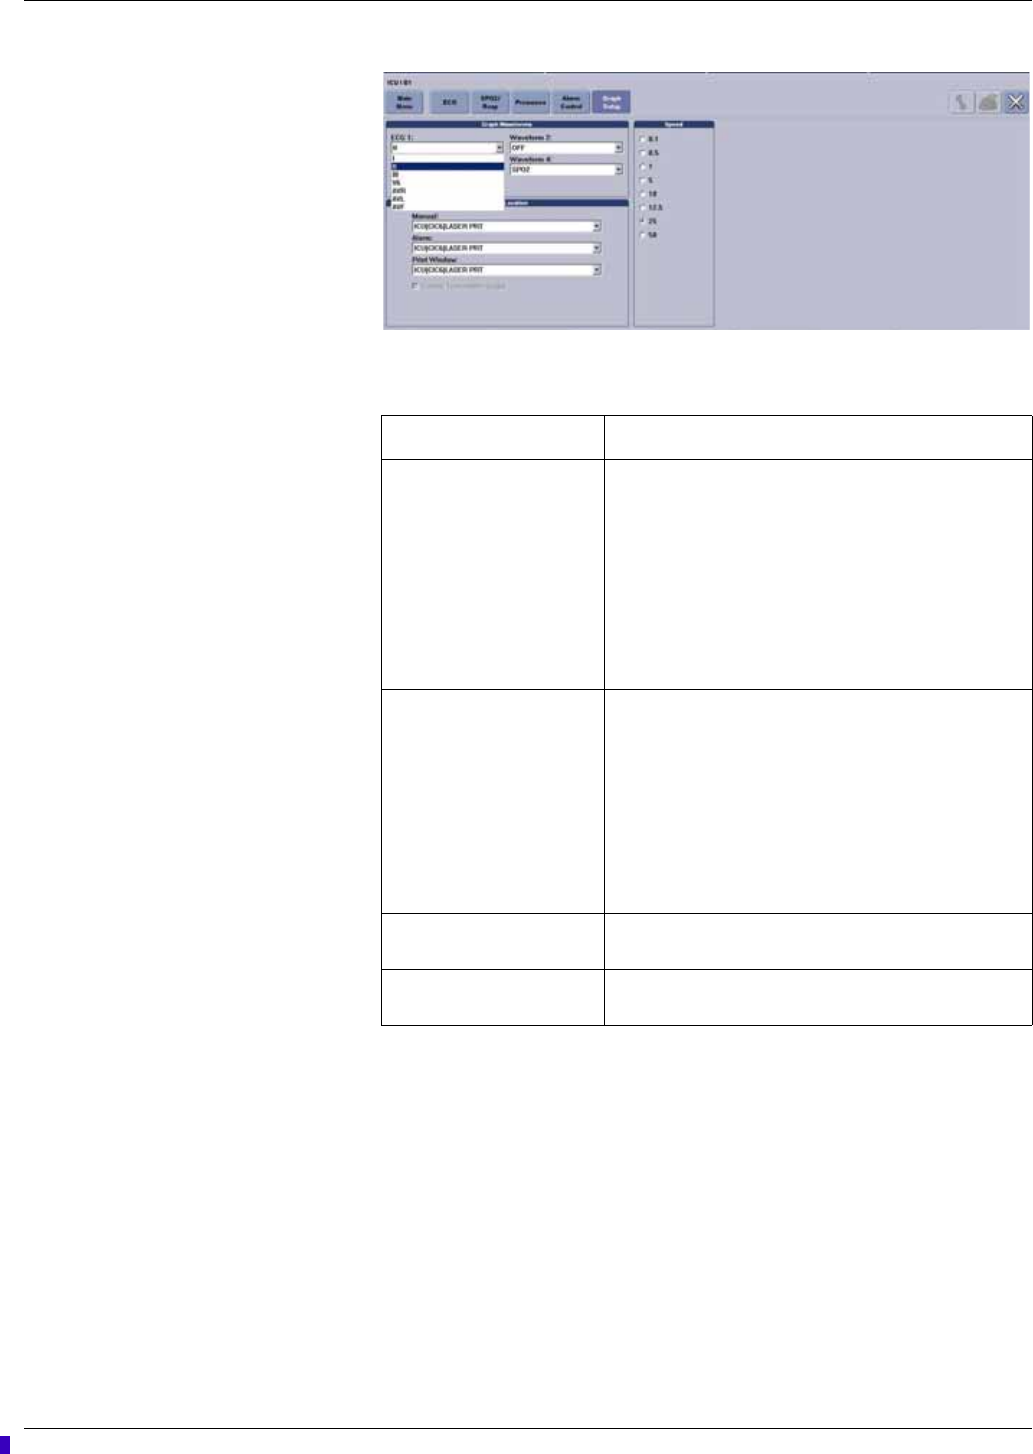
Printing
2001989-301A- draft 1 ApexPro™ 9-7
081A
3. Change any of the undimmed setting options. When an option appears dimmed,
you cannot change it unless you enter the service-level password.
Enable transmitter graph
The Enable Transmitter Graph option allows you to turn off/on the Transmitter
Graph function for telemetry patients. When this option is enabled at the CIC Pro
center, you can initiate a graph by pressing the graph button on the transmitter. When
this option is disabled at the CIC Pro center, no graph can be initiated from the
transmitter. To enable or disable this option, follow this procedure:
1. To enable the Transmitter Graph option, point and click with the mouse to place
a check mark in the Enable Transmitter Graph check box.
Option Function
Graph Waveforms Set the print order of the ECG waveforms:
ECG 1: Set the lead and its associated waveform to
print first.
Waveform 2: Set the ECG lead or parameter and its
associated waveform to print second.
Waveform 3: Set the ECG lead or parameter and its
associated waveform to print third.
Waveform 4: Set the ECG lead or parameter and its
associated waveform to print fourth.
Graph Location Choose from available printers to set the graph location
of the manual, alarm, and print window graphs:
Manual: Any real-time patient data you initiate the
printing of.
Alarm: An alarm graph that is triggered by a patient
Crisis or Warning alarm condition.
Print Window: Any stored patient data you initiate
the printing of. This graph location also prints the
Graph All > Limits data.
Enable Transmitter Graph Turn on or turn off the ability to initiate graph printing from
a transmitter.
Speed Set the print speed. The slower the speed, the more
condensed the data. 25 mm/second is standard.
Draft
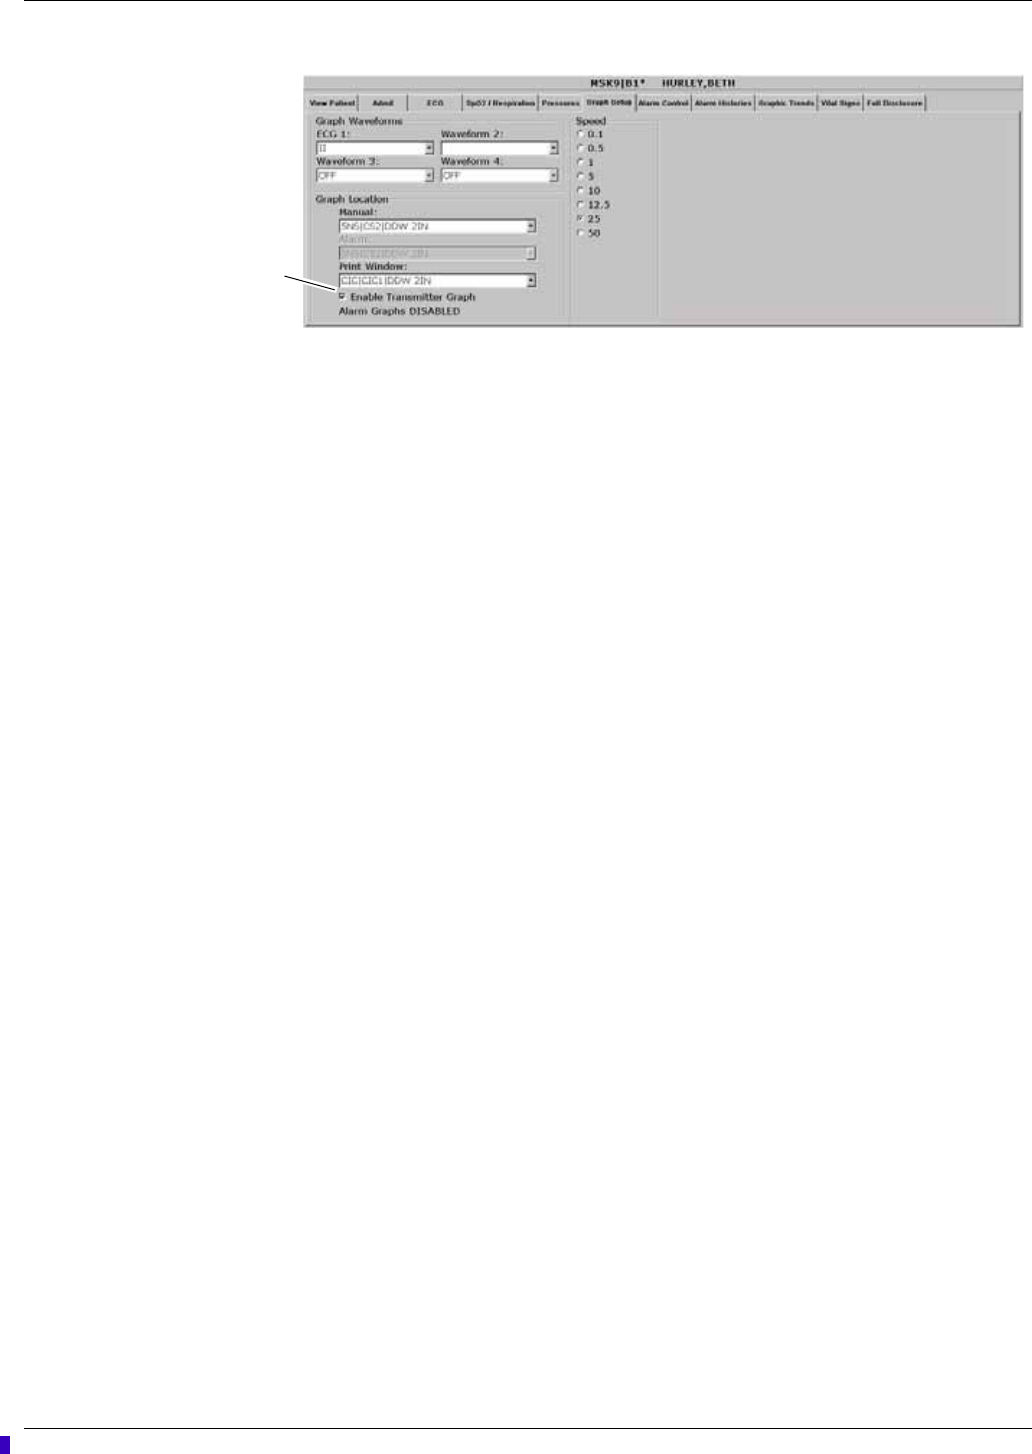
9-8 ApexPro™ 2001989-301A- draft 1
Printing
357C
2. To disable the Transmitter Graph option, point and click with the mouse to
remove the check mark in the Enable Transmitter Graph check box.
Alarm graphs enabled/disabled
This message line indicates whether the graph on alarm feature is on (Alarm Graph
ENABLED) or off (Alarm Graph DISABLED). This feature cannot be set on an
individual patient basis. Use the Alarm Graph option in the Telemetry Unit Defaults
tab sheet to set it for all patients admitted to the CIC Pro center.
Graph paper out indicator
When there is no graph paper in the writer (or the door is open), the message Graph
Paper Out/Door Open is displayed at the top of the screen.
When printing to a laser printer, a similar status message is displayed if the printer is
unable to print.
NOTE
Because the CIC Pro center can communicate with many laser printers, specific
status messages are not documented in this manual.
Enable
Transmitter
Graph Check Box
Draft

2001989-301A- draft 1 ApexPro™ A-1
A
Abbreviations and
symbols
Draft

A-2 ApexPro™ 2001989-301A- draft 1
Abbreviations and symbols
Abbreviations
Abbreviations and symbols that you may encounter while reading this manual are
listed below with their meanings.
12SL 12-lead ECG analysis
A
AC alternating current
Acc accelerated
ACI acceleration index
AD adult
ADU alarm display unit
AFIB atrial fibrillation
ALRM alarm
AMI acute myocardial infarctions
ANT anterior
Arr, Arrhy arrhythmia
ART arterial
Auto automatic
Aux auxiliary
A-V arterial venous
AVG average
AVOA automatic view on alarm
B
BIS bispectral index
BP blood pressure
Brady bradycardia
BT blood temperature
C
Ccelsius
Cal calibrate
Calc, calcs calculation(s)
cc cubic centimeter
CC computation constant
CCO continuous cardiac output
CD compact disc
Draft

Abbreviations and symbols
2001989-301A- draft 1 ApexPro™ A-3
CI cardiac index
CIC CIC Pro Clinical Information Center
cm centimeter
CO cardiac output
CO carbon monoxide
CO2carbon dioxide
comm communication
CP cardiopulmonary
CPP cerebral perfusion pressure
CRG cardiorespirogram
CSA Canadian Standards Association
CVP central venous pressure
D
D diastolic
DES desflurane
DIDCA direct interface device connection adapter
DSC digital signal converter
E
Eexpired
e.g. for example
ECG electrocardiograph
eDO2I estimated delivered oxygen index
EEG electroencephalograph
EMC electromagnetic compatibility
EMI electromagnetic interference
ENF enflurane
ESU electrosurgical cautery unit
et al and others
ET CO2end-tidal carbon dioxide
etc. etcetera
ETO ethylene oxide
EXP expired
F
F Fahrenheit
FEM femoral
Draft

A-4 ApexPro™ 2001989-301A- draft 1
Abbreviations and symbols
G
ggram
gHz gigahertz
gtt drops
H
HAL halothane
Hb hemoglobin
HR heart rate
Hz hertz
I
I inspired
IABP intra-aortic balloon pump
ICG impedance cardiography
ICP intracranial pressure
ICU intensive care unit
ID identification
in inches
INDV individual
INF infusion, inferior
Inject injectate
INSP inspired
INT interior
ISO isoflurane
IT injectate temperature
IV intravenous
J
J ST measurement point
K
kg kilogram
L
L, LD lead
Lleft
lliter
LA left arm
LA left arterial
LAN local area network
Draft

Abbreviations and symbols
2001989-301A- draft 1 ApexPro™ A-5
LAT lateral
lbs pounds
LCWI left cardiac work index
LED light emitting diode
LIS lab information system
LL left leg
LVET left ventricular ejection time
LVSWI left ventricular stroke work index
M
M mean
MAC minimum alveolar concentration
MAP mean arterial pressure
Min minimum
mm millimeters
mmHg millimeters of mercury
MPSO multiple portable socket outlet
MRI magnetic resonance image
ms milliseconds
mV millivolt
N
N/A not applicable
N2O nitrous oxide
NBP, NIBP non-invasive blood pressure
Neo neonatal
O
O2oxygen
O2CI oxygen consumption index
OR operating room
P
Ppace
PA pulmonary artery
PAD pulmonary artery diastolic
Par parameter
PAW pulmonary artery wedge
PC personal computer
Draft

A-6 ApexPro™ 2001989-301A- draft 1
Abbreviations and symbols
pCO2, pO2partial pressure of arterial carbon dioxide
PED pediatric
PEP pre-ejection period
PVC premature ventricular resistance
Q
QRS interval of ventricular depolarization
Qty quantity
R
R right
Rrate
R&TTE Radio and Telecommunication Terminal Equipment
RA right arm
RA right artial
REF reference
Reprep re-prepare
RES resistance
Resp respiration
RF radio-frequency
RHY rhythm
RL right leg
RR respiration rate
S
Ssystolic
sec second
SEV sevoflurane
SIM simulator
Sol solution
SP special
SpO2arterial oxygen saturation (pulse oximetry)
SQI signal quality index
ST interval of ventricular repolarization
Stat right away
STR systolic time radio
SV stroke volume
SvO2 mixed venous oxygen saturation
Draft

Abbreviations and symbols
2001989-301A- draft 1 ApexPro™ A-7
Symbols
SVR systemic vascular resistance
SVRI systemic vascular resistance index
Sync synchronized
T
T1, T2 temperature sites
Tachy tachycardia
TC transcutaneous
Tech technical
Temp, TMP, TP temperature
TFC thoracic fluid content
TIR technical information report
U
UAC umbilical artery catheter
UO urometer
UVC umbilical venous catheter
V
Vvolt
V version
V ventrical lead
Vent ventilator
VFib ventricular fibrillation
VI velocity index
VOA view on alarm
Vol volume
VTach ventricular tachycardia
W
WF, WFS waveform(s)
X
X multiplier (2X)
X invalid data
& and
° degree(s)
Draft

A-8 ApexPro™ 2001989-301A- draft 1
Abbreviations and symbols
> greater than
< less than
- minus
# number
% percent
± plus or minus
" inches
µmicro
Draft

2001989-301A- draft 1 ApexPro™ B-1
B
Customized defaults
worksheet
Draft
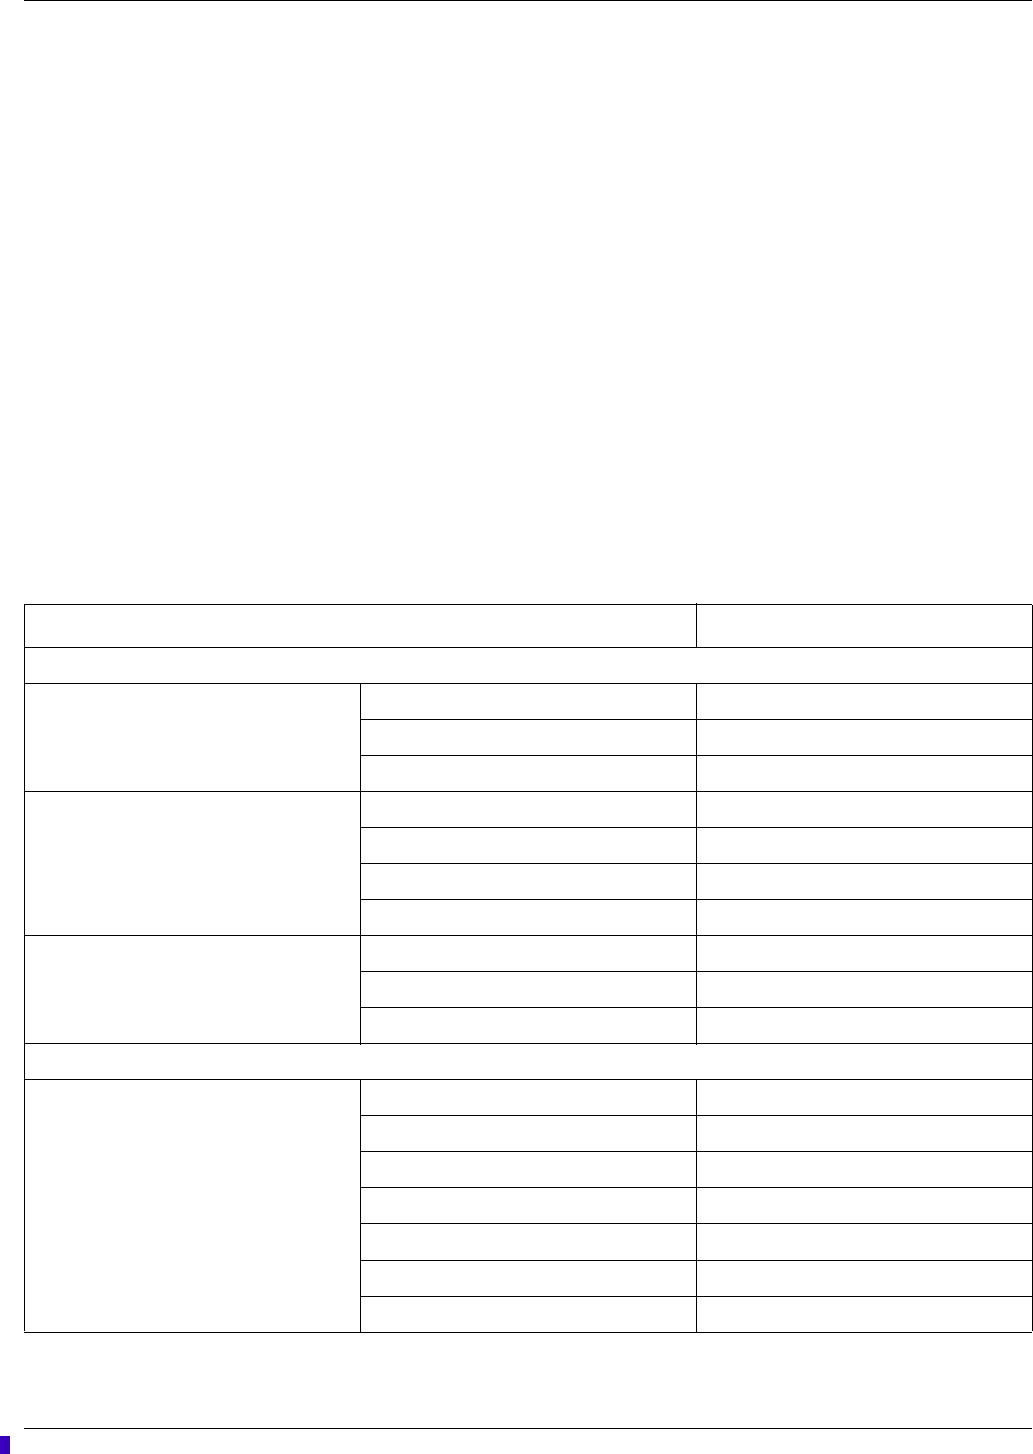
B-2 ApexPro™ 2001989-301A- draft 1
Customized defaults worksheet
NOTE
Before filling out this worksheet, you should make additional copies for future
use.
Use this worksheet to record customized settings for the following defaults:
Alarms Off selection on page B-2.
Telemetry Unit Defaults on page B-2.
Telemetry parameter limits and alarm levels on page B-3.
Alarms Off selection
This telemetry setting is located in CIC Setup > CIC Defaults.
Telemetry Unit Defaults
Allow Alarms Off On this CIC? (Circle one) Yes No
Telemetry unit default Default setting
Graph Setup
Default Locations for this CIC Manual
Alarm
Print Window
Waveforms ECG 1 II
Waveform 2 V
Waveform 3 Off
Waveform 4 Off
Transmitter Graph On
Alarm Graph Always On
Event Marker Graph On
ECG
Display Lead II
Arrhythmia Full
Lead Analysis Multi-Lead
ST Analysis On
Va Lead V1
Vb Lead V2
Detect Pace Off
Draft
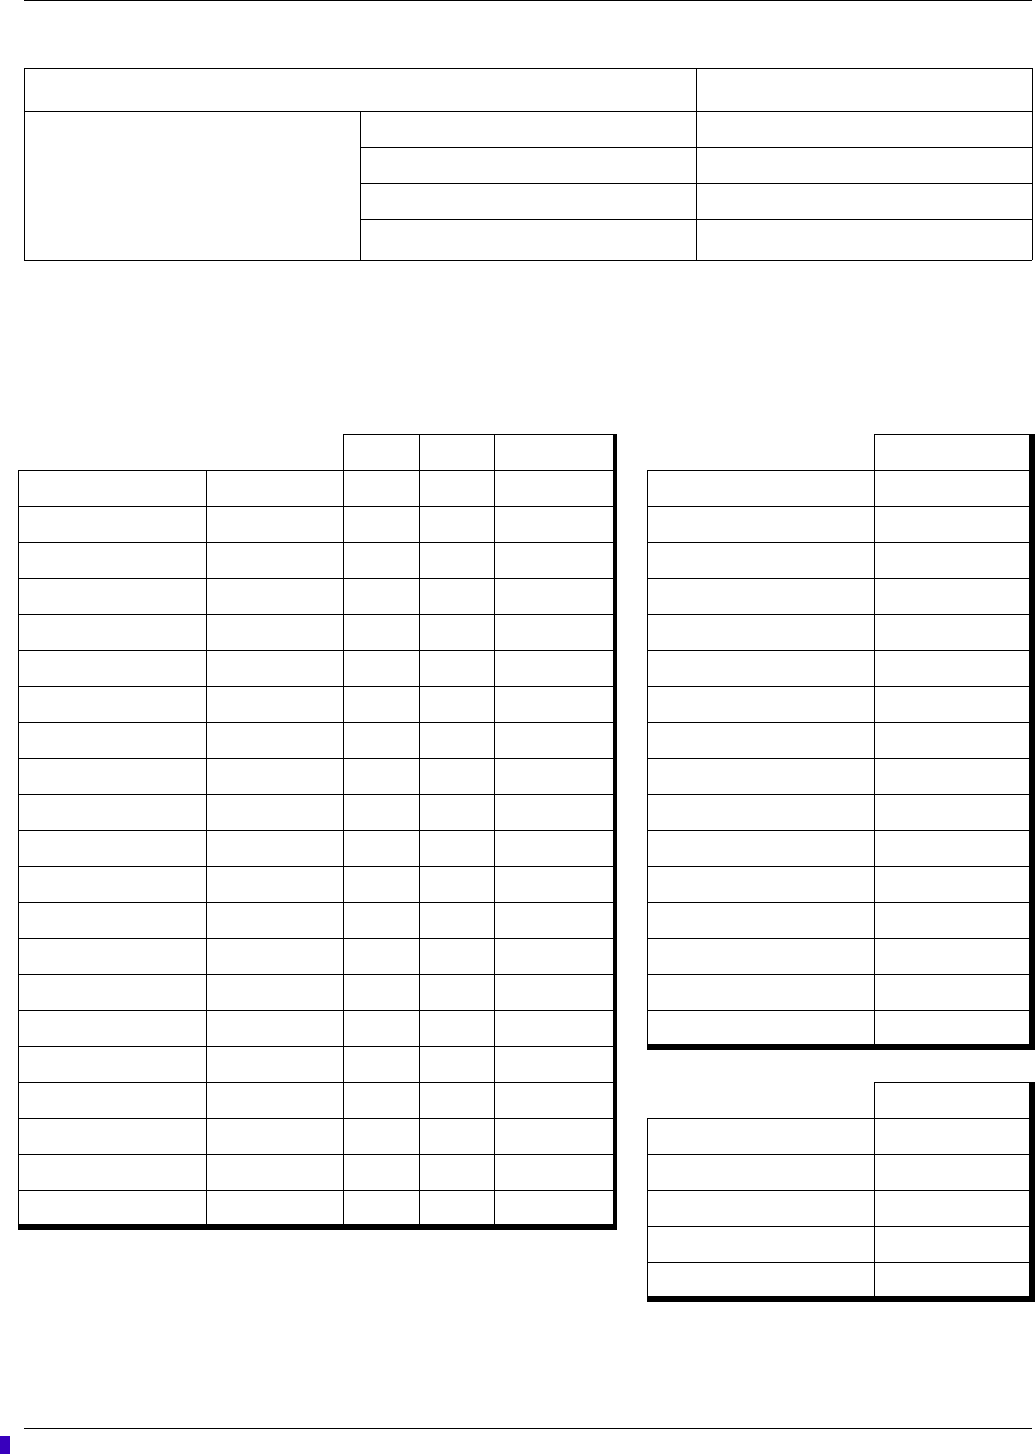
Customized defaults worksheet
2001989-301A- draft 1 ApexPro™ B-3
Telemetry parameter limits and alarm levels
Patient Age Adult
Transmitter Pause Enabled
Alarm Pause Breakthrough Always On
Event Marker1On
1
The
Event Marker Graph
and
Event Marker
features are not applicable to all transmitters.
Telemetry unit default Default setting
Parameter Limits and Alarm Levels Low High Level Arrhythmia Alarm Levels Levels
HR bpm 50 150 Warning Asystole Crisis
ST-I mm -2.0 2.0 Warning VFIB/VTAC Crisis
ST-II mm -2.0 2.0 Warning V Tach Crisis
ST-III mm -2.0 2.0 Warning VT > 2 Crisis
ST-V mm -2.0 2.0 Warning V Brady Crisis
ST-V2 mm -2.0 2.0 Warning Acc Vent Advisory
ST-V3 mm -2.0 2.0 Warning Pause Advisory
ST-V4 mm -2.0 2.0 Warning Tachy Advisory
ST-V5 mm -2.0 2.0 Warning Brady Advisory
ST-V6 mm -2.0 2.0 Warning R on T Message
ST-AVR mm -2.0 2.0 Warning Couplet Message
ST-AVL mm -2.0 2.0 Warning Bigeminy Message
ST-AVF mm -2.0 2.0 Warning Trigeminy Message
NBP-S mmHg 80 200 Warning PVC Message
NBP-D mmHg 20 120 Warning Irregular Message
NBP-M mmHg 40 140 Warning Atrial Fib Message
SPO2 % 90 105 Warning
SPO2-R bpm 50 150 Warning System Alarm Levels Levels
RR breaths/min 5 30 Warning CHANGE BATTERY System Warning
RR-APNEA seconds 30 Warning OFF NETWORK System Warning
PVC #/min 6 Advisory ARR SUSPEND System Warning
LEADS FAIL System Warning
PROBE OFF System Warning
Draft

B-4 ApexPro™ 2001989-301A- draft 1
Customized defaults worksheet
Draft

2001989-301A- draft 1 ApexPro™ C-1
C
Maintenance
Draft

C-2 ApexPro™ 2001989-301A- draft 1
Maintenance
Biocompatibility
When used as intended, the parts of the product described in this operator manual,
including accessories that come in contact with the patient during the intended use,
fulfill the biocompatibility requirements of the applicable standards. For more
information, contact your local sales/service representative.
Supplies
To ensure patient safety, use only supplies manufactured or recommended by GE. For
more information, contact your local sales/service representative.
Inspection
An effective maintenance schedule should be established for your monitoring
equipment and reusable supplies. This should include inspection as well as general
cleaning on a regular basis. The maintenance schedule must comply with the policies
of your institution’s infection control unit and/or biomedical department.
CAUTION
Failure on the part of the responsible hospital or institution
employing the use of this monitoring equipment to implement a
satisfactory maintenance schedule may cause undue equipment
failure and possible health hazards.
Check with your biomedical department to be sure preventive maintenance and
calibration is complete. Qualified service personnel should repair or replace damaged
equipment or reusable supplies. Refer to the appropriate service manuals for detailed
maintenance and repair information.
Use the following guidelines when inspecting the equipment:
Inspect the equipment for obvious physical damage.
Inspect all cords for fraying or other damage.
Inspect all plugs and connectors for corrosion, contaminants, bent prongs or pins.
Inspect all cable insulation for cracks, tears, or other damage.
In the U.S., GE Service is available 24-hours a day by calling 800-558-7044. Outside
the U.S., please contact your local sales/service representative.
NOTE
Refer to the appropriate service manuals for more comprehensive checkout
procedures.
Draft

Maintenance
2001989-301A- draft 1 ApexPro™ C-3
Disposal
WARNING
PACKAGING DISPOSAL—Dispose of all packaging material,
observing all applicable waste control regulations and keeping out of
children’s reach.
WARNING
DISPOSAL—At the end of its service life, the products described in
this manual, as well as its accessories, must be disposed of in
compliance with guidelines regulating the disposal of each product.
If you have any questions concerning disposal of a product, please
contact GE or its representatives.
Cleaning
All equipment should be cleaned on a regular basis. Comply with the policies of your
institution’s infection control unit and/or biomed department. The decision to
disinfect or sterilize must be made per your institution’s requirements with an
awareness of the effect on the integrity of the transmitter and leadwire.
WARNING
Disconnect AC-powered equipment from the power line before
cleaning or disinfecting its surface. Turn off the power to battery-
powered equipment before cleaning or disinfecting its surface.
WARNING
CONTAMINATED LEADWIRES— Contaminated leadwires may
cause infection. Always follow the skin preparation guidelines and
leadwire cleaning instructions provided in this manual.
WARNING
IMPROPER TRANSMITTER/LEADWIRE APPLICATION —
Applying a transmitter and/or leadwire that is not thoroughly dry to
a patient can result in an electrically conductive path being
established and a Leads Fail alarm not being provided if leadwires
come off the patient.
CAUTION
Never immerse devices, cables, or leadwires in any liquid.
Draft

C-4 ApexPro™ 2001989-301A- draft 1
Maintenance
CAUTION
Do not pour or spray any liquid directly on cables or leadwires or
permit fluid to seep into connections or openings.
CAUTION
Never use conductive solutions, solutions that contain chlorides,
wax, or wax compounds to clean devices, cables or leadwires.
CAUTION
Never use solutions or products that contain the following:
Any type of Ammonium Chloride such as, but not limited to:
Dimethyl Benzyl Ammonium Chloride
Quaternary Ammonium Chloride solutions
Abrasive cleaners or solvents of any kind
Acetone
Ketone
Betadine
Alcohol-based cleaning agents
Sodium salts
CAUTION
Never autoclave or steam clean devices, cables or leadwires.
CAUTION
Do not attach the device to a patient until it is thoroughly dry.
Results of improper cleaning
Appearance of waveforms when the device is not connected to a patient, causing
false alarms instead of a Leads Fail alarm and may not provide a visual and/or
audible Leads Fail alarm.
Brittle and breaking device case.
Overall system performance degradation.
Melting, dulling, or distorting the case.
Total handheld medical device failure requiring replacement.
Unit malfunction.
Void warranty.
Draft

Maintenance
2001989-301A- draft 1 ApexPro™ C-5
Cleaning products to avoid
Cleaning products known to cause the types of problems listed above include, but are
not limited to:
Sani-Cloth Wipes
Ascepti Wipes
HB Quat
Clorox Wipes (they do not contain bleach)
Over-the-counter detergents (e.g. Fantastic, Tilex, etc.)
Products that contain active ingredients and solutions similar to these products should
also be avoided.
Transmitter/device cleaning
These instructions apply to transmitters and any other devices, such as oximeters,
blood pressure monitors, etc.
Cleaning/disinfecting
1. Remove all batteries and leadwires.
2. Close the battery door before cleaning the device.
3. Wipe the exterior of the device with a soft lint-free cloth, using the following
solution as recommended in the APIC Guidelines for Selection and Use of
Disinfectants (1996):
Sodium hypochlorite (5.2% household bleach) minimum 1:500 dilution
(minimum 100 ppm free chlorine) and maximum 1:10 dilution.
Any sodium hypochlorite wipe product that meets the above guidelines of
can be used.
NOTE
Wring excess disinfectant from wipe before using.
NOTE
Any contact of disinfectant solutions with metal parts may cause
corrosion.
4. Allow disinfectant solution to remain on device for a minimum of one minute or
per hospital guidelines.
5. Wipe off cleaning solutions with a clean, moist cloth.
6. Dry thoroughly with a dry lint-free cloth and let air dry for at least 30 minutes.
NOTE
Drying times may vary based on the environmental conditions.
7. Take care not to let fluid pool around connection pins. If this should happen, blot
dry with a soft, lint-free cloth.
Draft

C-6 ApexPro™ 2001989-301A- draft 1
Maintenance
Storage
Always remove batteries when the device is not in use (even for short periods of
time).
Store in a dry well-ventilated area.
Hang the device, use a holder if available.
If leadwires/cables are attached, they should hang straight.
Do not coil leadwires/cables tightly around the device.
ECG cable/leadwire cleaning
Results of improper cleaning
Product discoloration.
Metal part corrosion.
Brittle wires.
Brittle and breaking connectors.
Reduced cables and leadwires life.
Unit malfunction.
Void warranty.
Cleaning/disinfecting
1. Remove cables and leadwires from the handheld device or system before
cleaning.
2. Use care in cleaning leadwires to prevent pulling the long wires from the
connector ends. Metal connections can be pulled away from the connectors.
3. For general cleaning of cables and leadwires, wipe using a lightly moistened
cloth with a mild soap and water solution. Then wipe and air dry.
4. For disinfecting the cables and leadwires, wipe exterior with a soft lint-free cloth,
using the following solution as recommended in the APIC Guidelines for
Selection and Use of Disinfectants (1996):
Sodium hypochlorite (5.2% household bleach) minimum 1:500 dilution
(minimum 100 ppm free chlorine) and maximum 1:10 dilution.
Any sodium hypochlorite wipe product that meets the above guidelines of
can be used.
NOTE
Wring excess disinfectant from wipe before using.
NOTE
Any contact of disinfectant solutions with metal parts may cause
corrosion.
5. Do not immerse either end of a cable or leadwire connector. Immersing or
soaking the connector ends may corrode metal contact ends and affect signal
quality.
Draft

Maintenance
2001989-301A- draft 1 ApexPro™ C-7
6. Wipe off cleaning solutions with a clean, lightly moistened cloth.
7. Dry thoroughly with a dry lint-free cloth and let air dry for at least 30 minutes.
NOTE
Drying times may vary based on the environmental conditions.
8. Take care not to let fluid pool around connection pins. If this should happen, blot
dry with a soft, lint-free cloth.
9. Do not use excessive drying techniques, such as oven, forced heat or sun drying.
Sterilizing
NOTE
EtO sterilization is not recommended, but may be required for cables and
leadwires. Frequent sterilization will reduce the useful life of cables and
leadwires.
Sterilize with ethylene oxide gas (EtO) at a maximum temperature of 50° C (122° F).
After EtO sterilization, follow the recommendations from the sterilizer manufacturer
for required aeration.
Storage
Store in a dry well-ventilated area.
Vertically hang cables and leadwires.
Do not coil leadwires or cables tightly around any medical device.
Draft

C-8 ApexPro™ 2001989-301A- draft 1
Maintenance
Draft

2001989-301A- draft 1 ApexPro™ D-1
D
Troubleshooting
Draft

D-2 ApexPro™ 2001989-301A- draft 1
Troubleshooting
ECG
Arrhythmia troubleshooting
Problem: Inaccurate heart rate and/or false asystole
Solution: Check ECG signal from patient:
1. Check/adjust lead placement.
2. Check/perform skin preparation.
3. Check/replace electrodes.
Check amplitude of ECG waveform:
1. Click on the patient’s ECG tab.
2. Click on all ECG leads in the Display section and check for 0.5 mV amplitude at
normal (1X) size. (At least 0.5 mV amplitude is required for QRS detection.) For
borderline signals, validate on a graph.
3. If amplitudes are low, electrodes may need to be repositioned or replaced.
Relearn arrhythmia:
1. Click on the patient’s ECG tab.
2. Click on the Relearn button.
IF PROBLEM CONTINUES: Change to Single-Lead ECG detection and processing:
1. Click on the patient’s ECG tab.
2. Click on Single-Lead in the Lead Analysis section.
3. Click on the ECG leads in the Display section and change top ECG waveform to
display the lead with the greatest amplitude. (At least 0.5 mV amplitude is
required for QRS detection.)
Problem: False ventricular calls
Solution: Check ECG signal from patient: (V leads may exhibit polarity changes
which may occasionally cause an inaccurate call.)
1. Check/adjust lead placement.
2. Check/perform skin preparation.
3. Check/replace electrodes. (If V lead is a problem, move the V lead to another V
position.)
4. Relearn ECG:
Click on the patient’s ECG tab.
Click on the Relearn button.
IF PROBLEM CONTINUES:
1. Remove the V lead(s).
Draft

Troubleshooting
2001989-301A- draft 1 ApexPro™ D-3
2. Click on the patient’s ECG tab.
3. Click on the Relearn button.
Problem: ARR Suspend
Solution: Check ECG signal from patient.
1. Check/adjust lead placement.
2. Check/perform skin preparation.
3. Check/replace electrodes.
4. Correct artifact source.
Pacemaker troubleshooting
There are two general things that occur when the pace mode is activated for
pacemaker patients:
1. Beats that would otherwise be classified as ventricular are instead classified as V-
paced if a ventricular pacemaker event is detected.
2. Residual pacemaker energy that might otherwise appear in the ECG is removed,
and a white pacemaker enhancement spike is artificially placed in the ECG.
Pace detection is indicated visually in the ECG parameter box. When watching the
ECG waveform, pace detection is indicated by uniform, upright pacemaker
enhancement spikes in the ECG data (both displayed and graphed).
NOTE
To improve pacemaker detection, reposition the electrodes and ensure a good
skin preparation to maximize R-wave detection. Perform a relearn any time lead
positions are changed. For more information, refer to Electrode placement on
page 6-2.
During telemetry monitoring, the pacemaker signal is acquired from lead II or on II
and V simultaneously when using the T14 transmitter. Changing the displayed lead
has no effect on pacemaker detection.
NOTE
With all leads connected, pacemaker signal acquisition occurs on lead II or on II
and V simultaneously when using the T14 transmitter. In a Leads Fail condition,
signal acquisition occurs on any available lead. When a 3-leadwire set is used,
single channel acquisition occurs on the programmed lead.
To improve pacemaker detection, reposition the electrodes and assure a good skin
preparation to maximize R-wave detection. The following is a suggested
configuration:
Draft
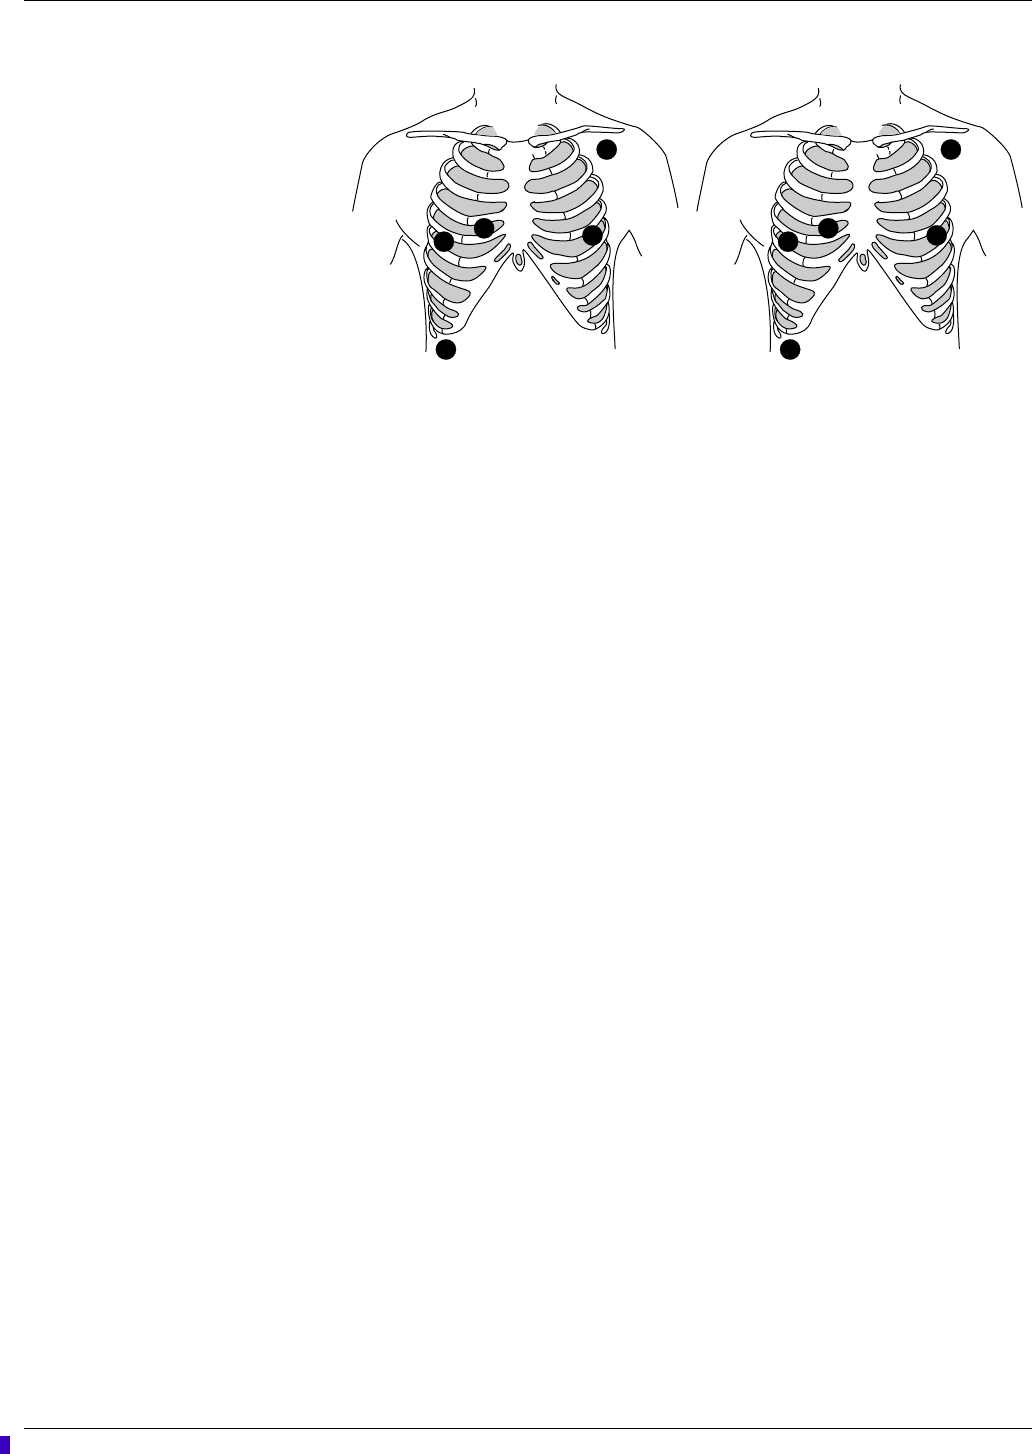
D-4 ApexPro™ 2001989-301A- draft 1
Troubleshooting
369B, 374B
The right arm electrode is moved down to the fifth intercostal space, and the left leg
electrode is moved up to the fifth intercostal space.
NOTE
After all electrodes are in place, ensure that a minimum of 1/2 mV of signal is
present on each lead (I, II, III, V).
Interface connector ports
Pace detection performance is optimized with proper lead application and correct use
of the serial interface connector ports. If you are experiencing degraded pace
detection performance, verify that all leads are properly attached to the patient and
verify that any connected serial device(s) are in the appropriate serial interface
connector ports.
The inside port, labeled 2 on the dust cover, is for use with episodic monitoring
serial devices, such as NBP.
The outside port, labeled 1 on the dust cover, is for use with continuous
monitoring serial devices, such as SpO2.
Problem: Inaccurate pacemaker detection
Solution: Use pacemaker processing:
1. Click on the patient’s ECG tab.
2. In the Detect Pace section, select either Pace 1 or Pace 2.
Solution: Exchange the right and left arm leads and perform a relearn.
Notes
In general, BE AWARE that a pacemaker pulse could be falsely counted as a
QRS during asystole.
Pace 1 mode analyzes the presence of a pacer spike, assesses the waveform for
residual pacemaker energy, and determines the presence of an R wave following
the pacer spike. If an event occurs during the first few milliseconds following the
pacer spike, it will be counted.
RA
LA
V1 LL
RL
L
C1
RF
N
Draft

Troubleshooting
2001989-301A- draft 1 ApexPro™ D-5
Pace 2 mode analyzes waveforms with the added capability of minimizing the
chance of counting severe residual pacemaker energy as QRS complexes. In
relation to the event rejection capability of Pace 2 pace mode, certain
morphologies may not be detected. Arrhythmia calls like asystole or pause may
be made with heart rate identified as less than actual.
Again, pacemaker patients should be kept UNDER CLOSE OBSERVATION. The
appropriate pace mode may be determined at the time the pacemaker patient is
admitted to the monitoring system. The Pace 2 mode is recommended for use
whenever possible.
Check ECG signal from patient:
1. Check/adjust lead placement.
2. Check/perform skin preparation.
3. Check/replace electrodes.
ST troubleshooting
Problem: ST numerics changed to Xs
Solution: An ST value changes to Xs when the patient’s dominant morphology has
not been detected 16 times in the last 30 seconds. The program waits one minute and
then automatically relearns. ST numerics will be displayed after the relearn.
IF PROBLEM CONTINUES:
1. Check for morphology change.
2. Check for noise on ECG.
3. Relearn:
a. Click on the patient’s ECG tab.
b. Click on the Relearn button.
SpO2 messages
Below is a list of system status alarm messages that may be displayed in the patient’s
bed window during monitoring. SpO2 messages appear in abbreviated form in graph
headers. If you are unable to resume SpO2 monitoring, contact your sales/service
representative.
NOTE
The Xpod oximeter can display the same SpO2 system status messages as the
Apex oximeter, except for the CHANGE BATTERY message. The Xpod
oximeter uses the battery power supplied by the transmitter and therefore does
not support this message.
Draft

D-6 ApexPro™ 2001989-301A- draft 1
Troubleshooting
NBP
Troubleshooting
Problem: Erroneous NBP measurement
Solution:
1. Check for proper cuff size:
Too small a cuff can give an erroneously high value.
Too large a cuff can give an erroneously low value.
NOTE
For proper fit of an NBP cuff, the arm should be measured from the top of
the shoulder joint to the elbow. Divide the length by 2 and measure from the
middle of measurement on the arm. Measure the circumference in
centimeters around the arm. Refer to the NBP cuffs for proper fitting size.
2. Check for residual air left in the cuff from a previous measurement. This could
indicate a hardware problem that may require service.
3. Make sure the cuff is not too tight or too loose.
4. Make sure the cuff and the heart are at the same level; otherwise hydrostatic
pressure will offset the NBP value.
5. Watch for pulsus paradoxis.
6. Check for leak in cuff or tubing.
CHANGE BATTERY Message displayed with SPO2 data displayed—The batteries in the Apex oximeter
are low. There is approximately 1 hour of reserve power left in the batteries.
Change the batteries.
Message displayed, no SPO2 data displayed—The batteries in the Apex oximeter
are depleted. Replace the batteries. This is a system Warning alarm. The alarm
will sound, and a red alarm button will appear on the CIC Pro center display. If the
batteries are not replaced within 20 minutes, all SPO2 parameter information will
be removed from the display. If the batteries are replaced within 20 minutes, SpO2
monitoring will resume.
SPO2 PROBE The probe has been disconnected from the oximeter (no data is displayed).
SIGNAL SpO2 data continues to be displayed, but the quality of the signal is questionable.
Check the patient and the probe.
NO DATA The oximeter is still connected, but no valid data is being transmitted to the
receiver. Check that the patient is within antenna range. If the problem persists,
contact GE Service.
SPO2 PROBE OFF The probe is off the patient. Check the probe.
The saturation value is X The oximeter is still connected, but no valid data is being received at the receiver.
The patient may be in an area of poor antenna reception, where some, but not all
data is being transmitted.
This message remains on the CIC Pro center for three minutes. If no data is
detected after three minutes, the message changes to NO DATA.
Draft

Troubleshooting
2001989-301A- draft 1 ApexPro™ D-7
7. Patient may have a weak pulse.
8. Calibration may be necessary.
NBP status messages
NBP status messages appear in abbreviated form in graph headers, when applicable.
A message will clear when the next measurement is initiated, or a message can be
cleared manually with the Clear Message option on the NBP tab sheet.
The following system status alarm messages may be displayed in the patient’s bed
window during monitoring.
Messages
Alarm messages
The following messages appear in the patient’s bed window at the CIC Pro center.
CHANGE BATTERY An NBP measurement was attempted with low batteries. Change the batteries in
the blood pressure monitor and try another measurement.
FAIL A hardware failure has been detected in the blood pressure monitor. In the U.S.,
contact GE Service. Outside the U.S., contact your local sales/service
representative.
LEAK The NBP cuff is loose or there is an air leak in the cuff or tubing. Check that the
cuff is on snugly. Check the connection between the cuff and the tubing. Check
the connection between the tubing and the blood pressure monitor. Try another
measurement. If the problem persists, contact your local sales/service
representative.
LOW INFLATION PRESS This message appears when K-sounds are detected immediately upon inflation.
The inflation pressure is too low for proper NBP measurement. Try another
measurement or adjust dynamic/fixed inflate. If the problem persists, contact your
local sales/service representative.
MOVEMENT This message appears when there is excessive patient arm movement, or if the
patient’s arm was bent during the measurement. Check the patient and try
another measurement.
SENSOR? This message appears when the K-sounds on the measurement were too weak,
or not enough sounds were detected. Reposition the microphone and try another
measurement. This message can also appear if the deflate rate is not properly
adjusted. If the problem persists, contact your local sales/service representative.
WEAK PULSE The patient’s heart rate is erratic. Check that the microphone cable is plugged
firmly into the patient cable, and check that the microphone is positioned correctly
on the patient. Try another measurement. If the problem persists, it could indicate
a defective microphone, microphone cable, or patient cable. Contact your local
sales/service representative.
Draft

D-8 ApexPro™ 2001989-301A- draft 1
Troubleshooting
ALARM PAUSE All alarms for this patient have been turned off for five
minutes. This is initiated from the transmitter by pressing
both the Verify Leads and Graph buttons simultaneously.
Refer to ALL ALARMS OFF.
ALL ALARMS OFF All alarms for this patient have been turned off. No graph
strips run, arrhythmia events are not stored, and no audible
tones sound if an alarm condition should occur.
ARR OFF The arrhythmia program for a selected patient has been
turned off. No arrhythmia messages are displayed,
arrhythmia event s are not stored, no graph strips run, and no
audible tones sound if an arrhythmia alarm condition occurs.
ARTIFACT ARR SUSPEND All artifact begins at level 1. Sustained artifact progresses to
level 2 when noise on ECG lasts for 20 of the last 30
seconds.
Level 1 — Upon immediate detection of artifact, the
message ARTIFACT is displayed. There is no alarm
tone. Only lethal arrhythmia processing is available.
Level 2 — Arrhythmia monitoring is suspended in this
condition. A system warning alarm sounds, no
arrhythmia messages are displayed, no graph strips run
and no arrhythmia events are stored. Heart rate and
PVC values change to X, an additional message, ARR
SUSPEND, is displayed.
LEADS FAIL All leads have failed, right leg lead failed, lead wires
unplugged or reference lead failed. If set to Warning or
Advisory level, a system alarm is heard. This will self-
silence if condition is corrected, or the user can silence for
one minute with the Silence Alarms button at the bottom of
the CIC Pro center display.
Draft

Troubleshooting
2001989-301A- draft 1 ApexPro™ D-9
Graph messages
The following messages appear in the patient’s bed window on the CIC Pro center
display. These relate to running graphs at the printer.
NO TELEM The NO TELEM alarm occurs in two situations:
1. The patient moves out of range.
If the transmitter is out of range for more than 30
seconds, the NO TELEM message displays. Should a
LEADS FAIL condition occur prior to a NO TELEM
condition, the LEADS FAIL condition takes priority. The
LEADS FAIL message is displayed along with the NO
TELEM message.
2. Transmitter batteries are extremely low or dead.
If batteries are extremely low or completely dead, the
NO TELEM message appears, a CHANGE BATTERY
message appears in the patient’s bed window, and the
audible alarm sounds. Activating the ALL ALARMS
OFF feature prevents the audible alarm from sounding.
OFF NETWORK In the Combo mode, telemetry patient data is provided from
the bedside monitor to the CIC Pro center. If the bedside
monitor is removed from the network or becomes otherwise
unavailable, the NO COMM message displays first on the
CIC Pro center and there is a loss of monitoring for about 45
seconds, then waveforms return and the OFF NETWORK
message is displayed below the HR parameter window.
The CIC Pro center will then display patient data directly from
the telemetry bed along with this message in that CIC Pro
center bed window. Should the bedside monitor reappear on
the network, the Combo monitoring application will
automatically resume and the alarm will be cleared.
This alarm is also generated if the receiver system is
removed from the network or becomes otherwise
unavailable. The bedside monitor does not sound alarms, but
the alarms must be turned back on at the bedside monitor if
they were previously paused or off.
GRAPH ALARM An alarm graph was initiated and is running.
GRAPH MANUAL A manual graph was requested and is running.
GRAPH TTX The Graph button on the transmitter was pressed and a
20-second graph strip is running.
PRINTING A non-real time graph is currently being printed.
SAVING An alarm or a manual graph has been requested but the
writer is in use, the writer door is open, the print location is
not correct, or the writer is out of paper. The request is
saved and will run as soon as the writer is available.
Draft

D-10 ApexPro™ 2001989-301A- draft 1
Troubleshooting
Transmitter-related messages
The following messages appear in the patient’s bed window on the CIC Pro center
display.
System status messages
System status alarms (generated by mechanical conditions) are displayed in the lower
left corner of the CIC Pro center screen. Each message is preceded by the receiver
system’s name, if it has been entered, or a name created by using the last six numbers
of the receiver system Ethernet address.
Patient status messages
Patient status messages are also displayed in the lower left corner of the CIC Pro
center screen. They are not, however, preceded by the receiver system name or
Ethernet address.
CHANGE BATTERY This message flashes when the batteries are low. There is
approximately 1 hour of use left after this message
appears. If the batteries are extremely low or completely
dead, a NO TELEM message flashes, and an audible
alarm sounds.
LEADS FAIL All leads have failed, right leg lead failed, right arm lead
failed, leadwires unplugged or reference lead failed. If set
to System Warning or System Advisory level, a system
alarm occurs. This will self-silence if condition is
corrected, or user can silence for one minute with Silence
Alarms button at the bottom of the CIC Pro center display.
NOTE
LEADS FAIL will not result in a NO TELEM alarm
message after 30 seconds.
RA (LA, LL, V) FAIL One of these may appear, indicating failure of a lead.
NO TELEM The transmitter was out of range for more than 30
seconds. If this condition persists, contact GE Technical
Support.
If a LEADS FAIL condition occurs prior to a NO TELEM
condition, the LEADS FAIL condition takes priority
TTX number is already in
use This message displays when attempting to admit a
transmitter that is sequentially numbered with another
admitted transmitter. For example, you cannot admit TTX
ID number 54078 and 54079 at the same time. Use
another transmitter with a non-sequential TTX ID number
to admit the patient.
DUPLICATE TOWER NAME A network problem exists. Restart the system. If this
condition persists, contact GE Technical Support.
DUPLICATE NAME A network problem exists. Restart the system. If this
condition persists, contact GE Technical Support.
Draft

Troubleshooting
2001989-301A- draft 1 ApexPro™ D-11
“Unit/Bed” IS
UNMONITORED A telemetry patient is admitted but is not displayed (and
therefore is unmonitored) on any CIC Pro center. If an
alarm occurs on an unmonitored bed, the information will
appear in the alarm text line and an audible tone will
sound. You must view the patient first if you would like to
silence the alarm. To view an unmonitored bed, click on
the View Other button.
“Unit/Bed”: DUPLICATE
NAME There is another device on the network with the same bed
name. The duplicate device must be renamed.
Draft

D-12 ApexPro™ 2001989-301A- draft 1
Troubleshooting
Draft

2001989-301A- draft 1 ApexPro™ E-1
E
Technical
specifications
Draft
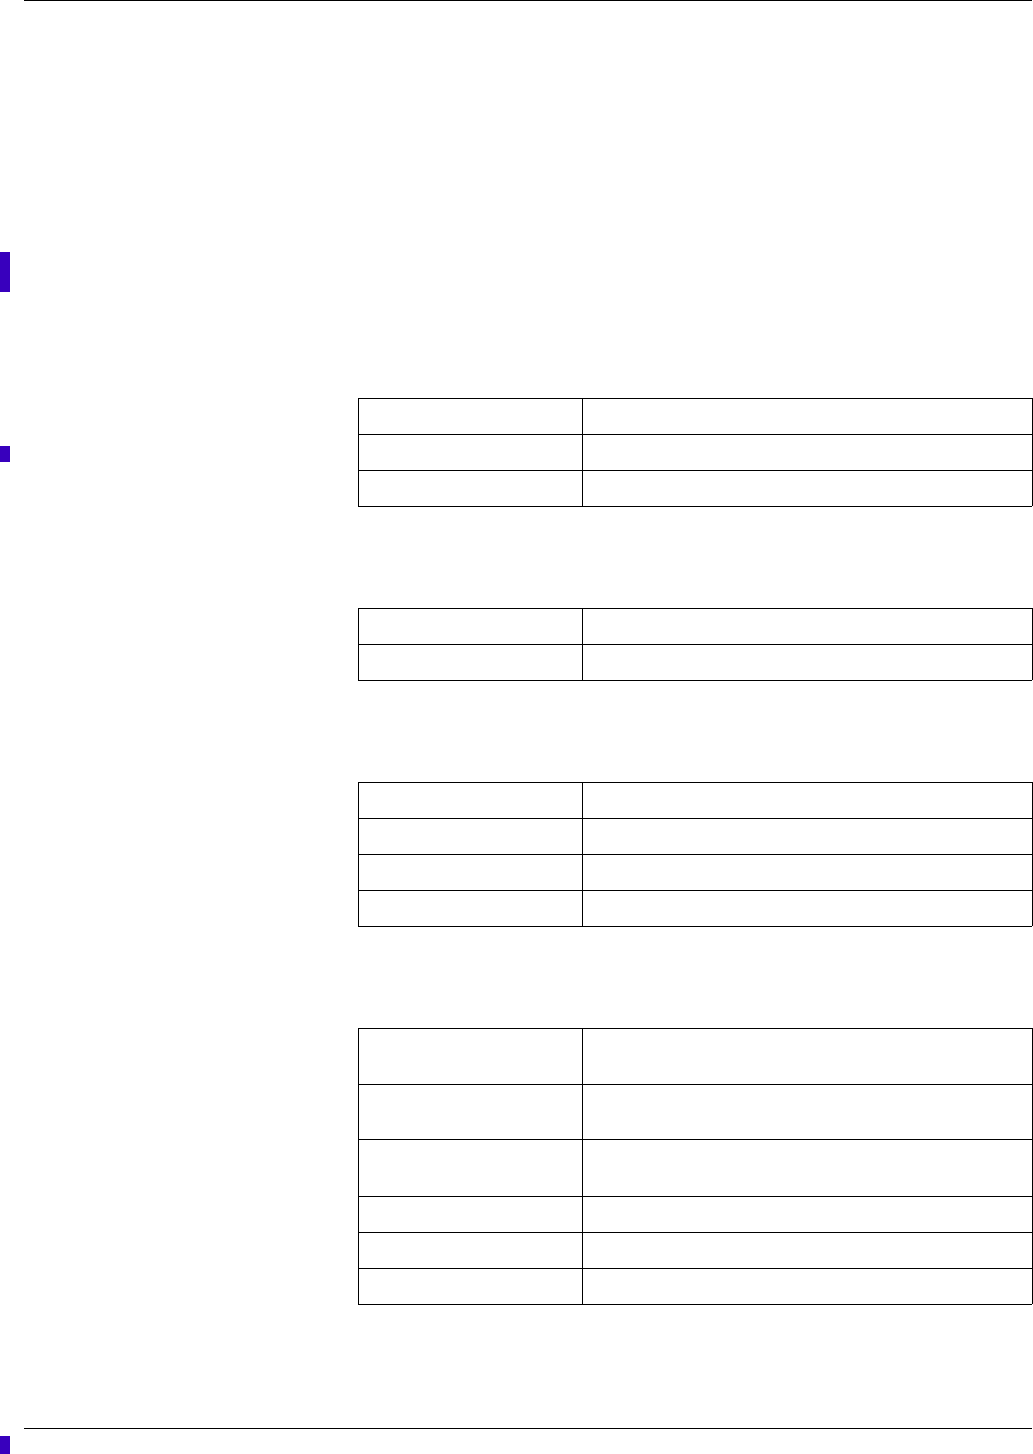
E-2 ApexPro™ 2001989-301A- draft 1
Technical specifications
NOTE
Specifications are provided to help you determine the space, ventilation, air
conditioning and power requirements to ensure proper operation of your system.
Specifications are approximate and may change with the actual unit shipped.
Specifications are subject to change without notice. Contact your sales or service
representative for more information.
T14 transmitters
Power requirements
Alarms and controls
Transmission
ECG
Battery type ANSI/NEDA 15 A, 1.5V AA alkaline (2 required)
Battery life hours
Polarity Electronic reverse polarity protection
Battery integrity Transmitted and indicated via LED
Leads Fail indication Transmitted and indicated via LED
Channel spacing 25 kHz
Frequency stability ± 0.0001% of assigned channel frequency
Bit rate 10 kbps
Antenna Formed by leadwire shield
Multi-channel configuration
(5- or 6- leadwire)
I, II, III, Va, Vb, aVR, aVL, aVF
Leads analyzed
simultaneously
Four (I, II, III, V)
Single-channel (3-leadwire)
configuration
I, II or III, configurable
Heart rate detection 30 to 300 BPM
QRS detection range 0.5 to 5 mV
Frequency response 0.05 to 40 Hz (-3 dB)
Draft
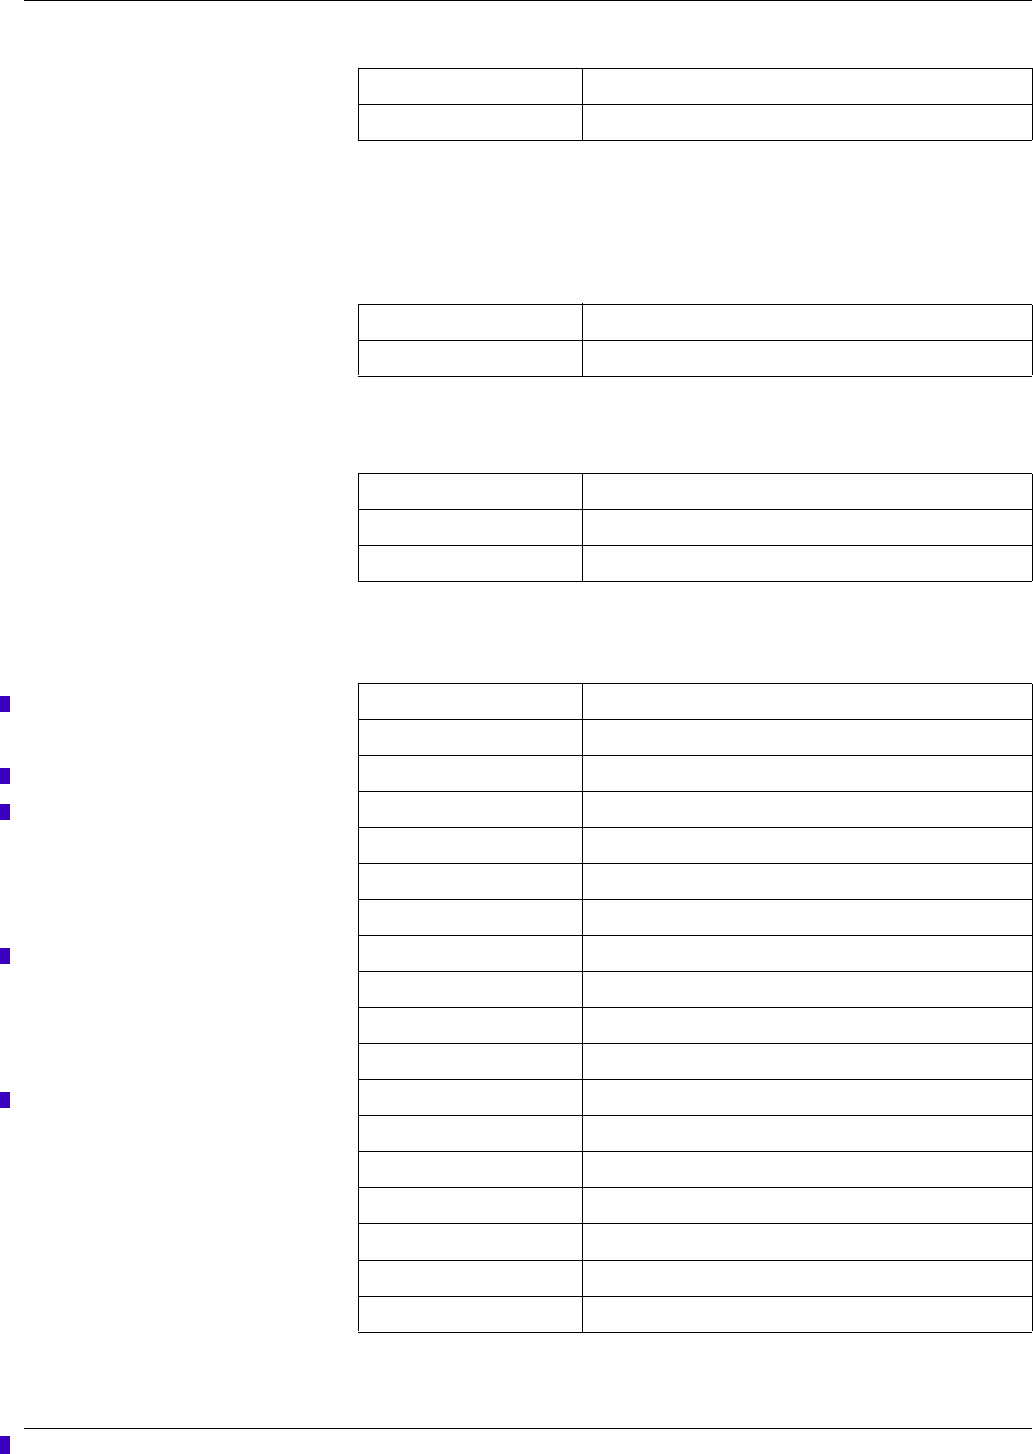
Technical specifications
2001989-301A- draft 1 ApexPro™ E-3
Environmental specifications
Operating conditions
Storage conditions
Device specifications
A/D converter resolution 10 bits, 9.75 µV (RTI)
Sample rate 240 samples/seconds
Temperature 5 to 40° C
Relative humidity 15 to 95% (non-condensing)
Temperature -20 to 70° C
Relative humidity 15 to 95% (non-condensing)
Pressure 700 to 1060 hPa
Water resistance IEC 60529 IPX7 rating (can survive inadvertent submersion)
Input configuration 3, 5 or 6 electrodes
Frequency range
Modulation GFSK
Serial I/O ports 2
Alarm pause Transmitted and indicated via LED
Graph request Transmitted
Event Marker Transmitted
Attendant request Transmitted
Maximum transmitters 239 active within WTMS at a single facility
Dynamic range ± 5 mV (RTI)
Input offset ± 400 mV (RTI)
Input impedance 15 M ohm minimum differential @ 10 Hz
ECG gain selection 5, 10, 20, 40 mm/mV (RTI)
ECG gain accuracy ± 5% @ 15 Hz
Common mode rejection 100 dB minimum @ 60 Hz
Defibrillator protection ± 5000 VDC, 360 joules into 100 ohm
Defibrillator recovery time Transmitter recovers within 2 seconds
Draft
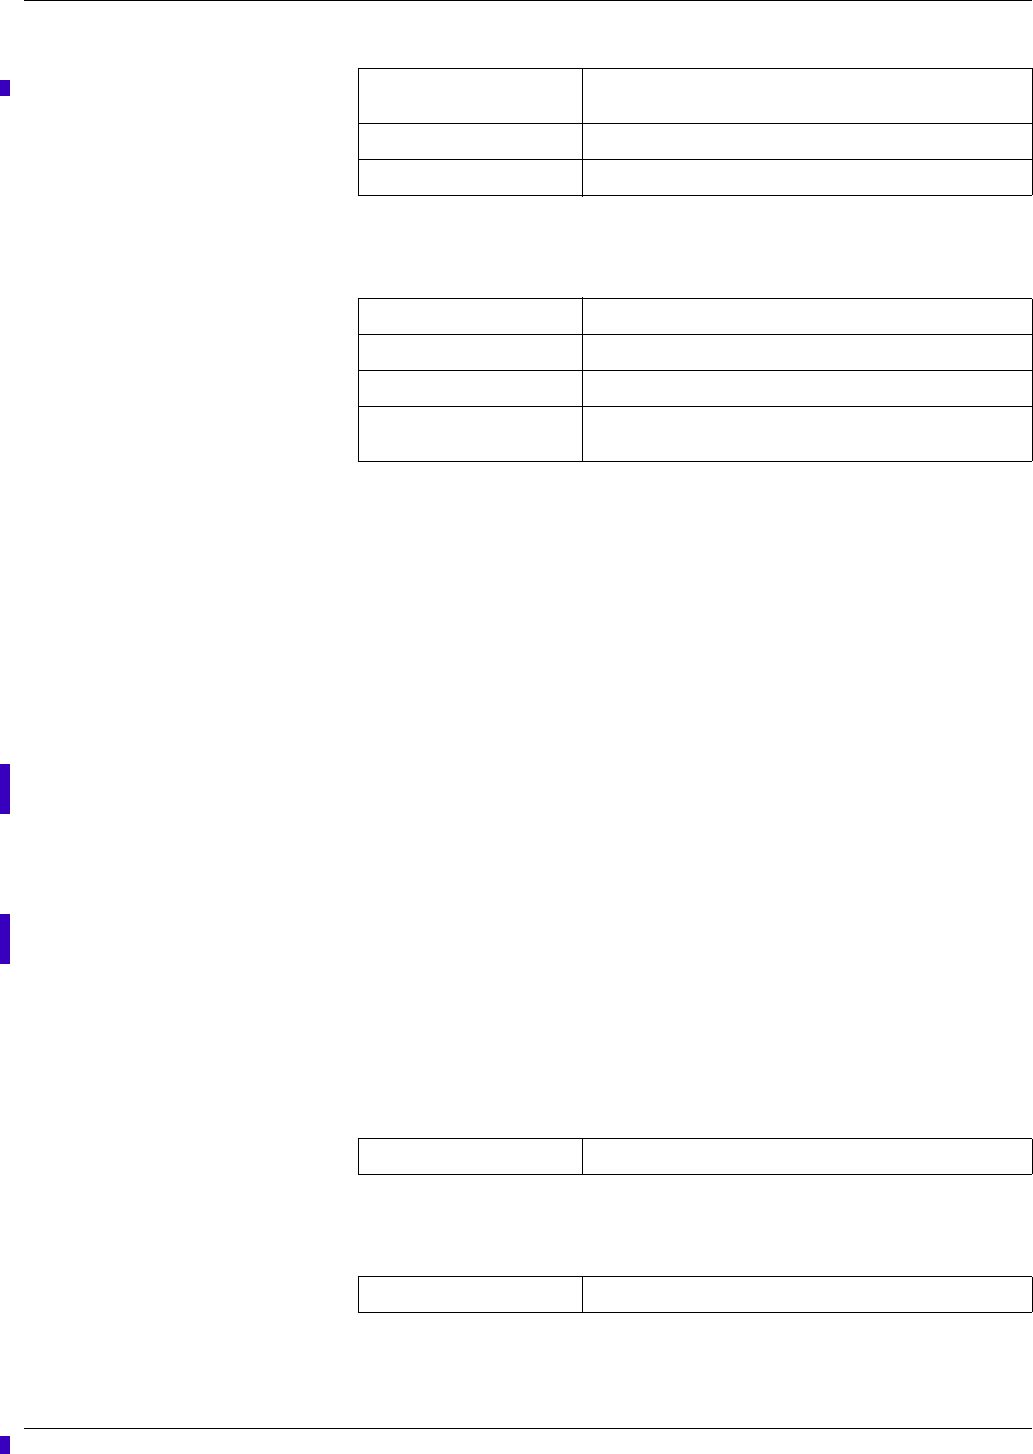
E-4 ApexPro™ 2001989-301A- draft 1
Technical specifications
Physical specifications
FCC compliance information
This device complies with Part 95 of the FCC Rules and RSS-210 of Industry
Canada.
Operation of this equipment requires the prior coordination with a frequency
coordinator designated by the FCC for the Wireless Medical Telemetry Service.
Certifications
UL/IEC/EN 60601-1
IEC/EN 60601-1-1
IEC/EN 60601-1-2
IEC/EN 60601-1-4
IEC/EN 60601-2-27
IEC/EN 60601-2-49
608.025 to 613.975 MHz - FCC Part 95
ApexPro telemetry server
Display specifications
Power specifications
Pacemaker detection ± 2 mV to ± 700 mV (RTI); 100 µsec to 2 msec; either
polarity; on multiple leads
Patient leakage current Meets UL/IEC 60601-1
Serial communications 2 ports at 9600 baud asynchronous
Height 13.7 cm (5.38 in)
Width 7.3 cm (2.875 in)
Depth 2.3 cm (0.91 in)
Weight 141.8 g (0.275 lb) without battery; 170.1 g (0.375 lb) with
battery
Video output 1024 X 768 @ 75 Hz
Power supply 300 watt ATX dual-redundant
Draft
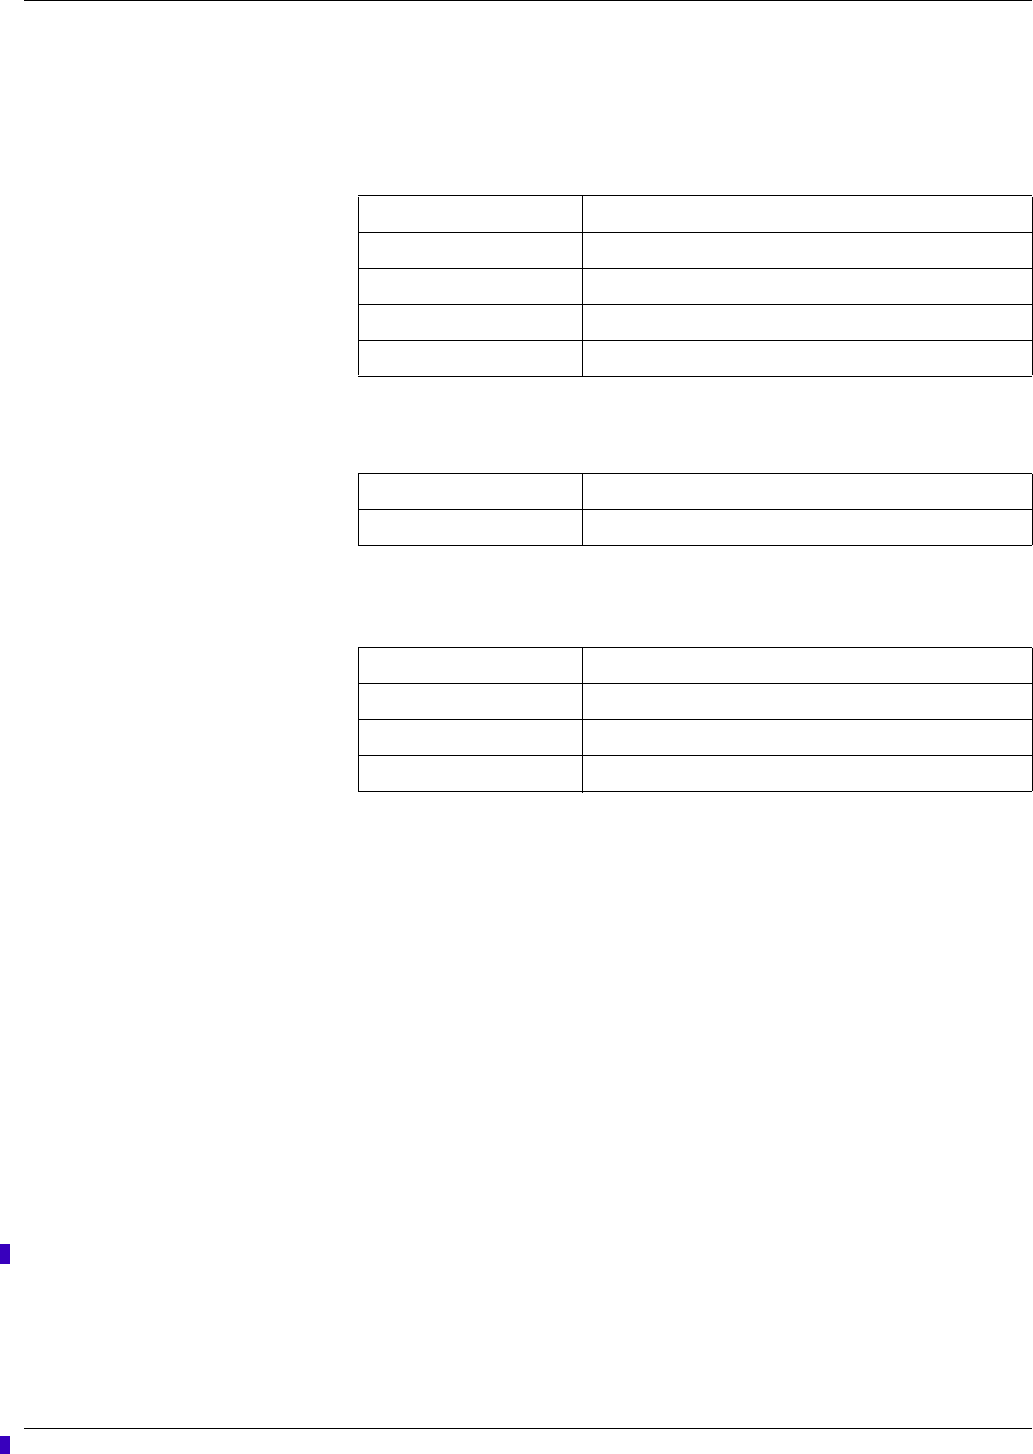
Technical specifications
2001989-301A- draft 1 ApexPro™ E-5
Environmental specifications
Operating conditions
Storage conditions
Physical specifications
FCC compliance information
This device complies with Part 95 of the FCC Rules and RSS-210 of Industry
Canada.
Operation of this equipment requires the prior coordination with a frequency
coordinator designated by the FCC for the Wireless Medical Telemetry Service.
Certifications
IEC/EN/UL 60950-1
CAN/CSA C22.2 No.950
IEC/EN 60601-1-4
EN 55022 (Class A)
EN 55024
EN 61000-3-2
EN 61000-3-3
CE marked to the Medical Device Directive 93/42/EEC
Temperature 10 to 35° C (50 to 95° F)
Relative humidity 15 to 80% (non-condensing)
Vibration 5 to 500 Hz, 0.5 G RMS
Altitude 0 to 3048m (0 to 10000 ft)
Acoustic noise Less than 52 dB sound pressure at 5 to 28° C (41 to 82° F)
Temperature -23 to 49° C (-10 to 120° F)
Relative humidity 10 to 90% (non-condensing)
Height 8.8 cm (3.46”)
Depth 45 cm (17.7”)
Width 48.2 cm (19”)
Weight 15.8 kg (35 lb)
Draft
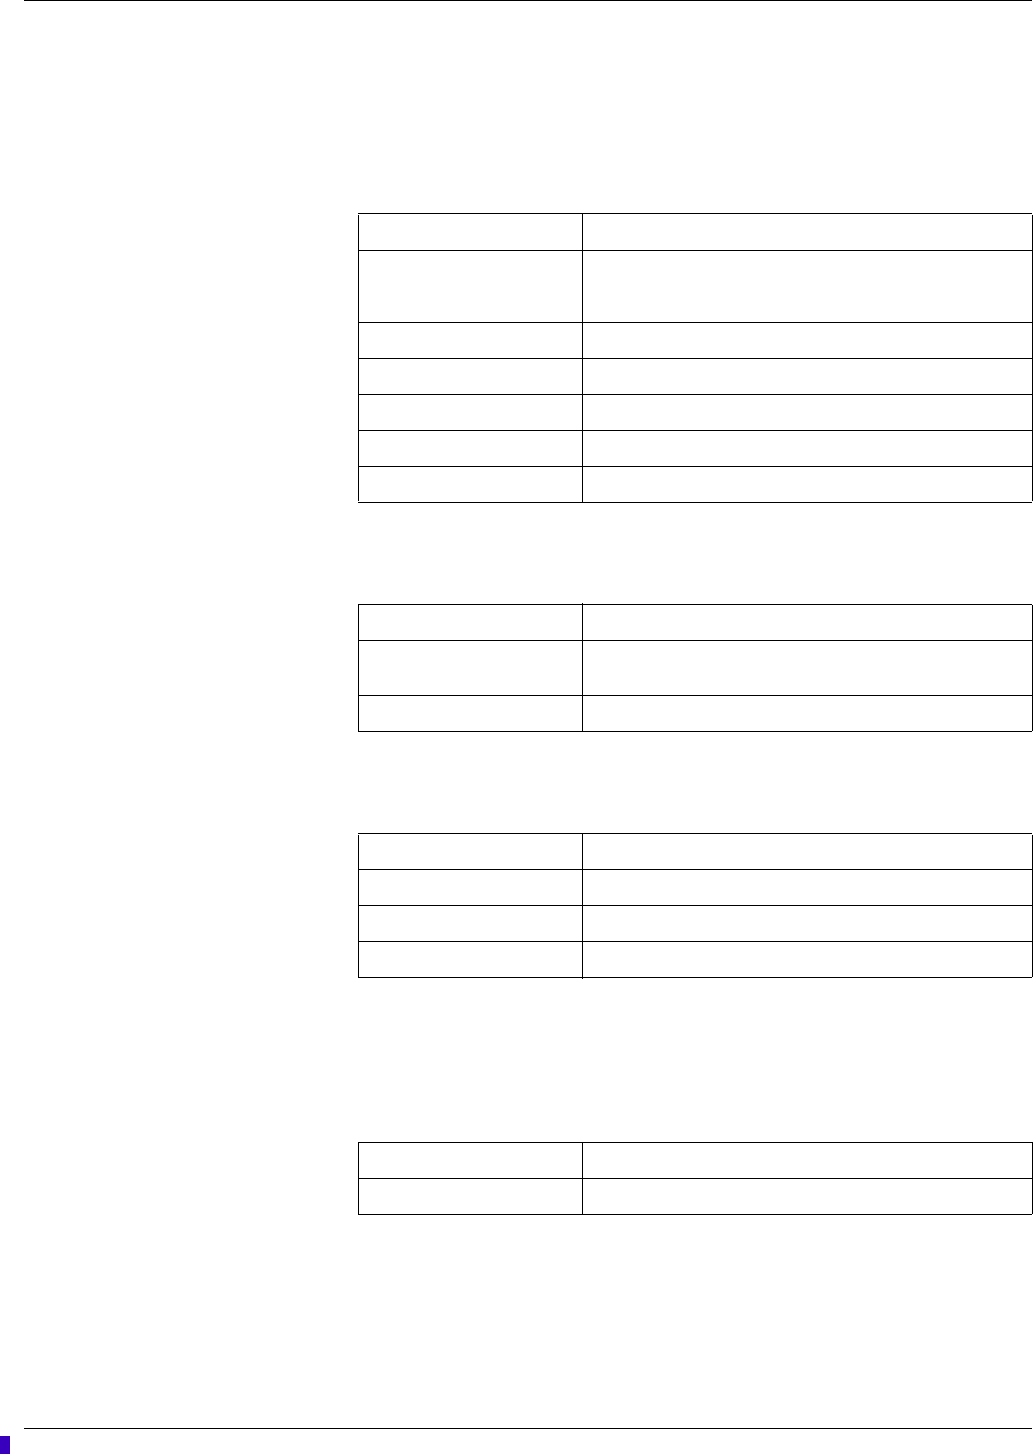
E-6 ApexPro™ 2001989-301A- draft 1
Technical specifications
ApexPro receiver system
Performance specifications
Network requirements
Power requirements
Environmental specifications
Operating conditions
RF module type GFSK and GMSK digitally demodulated
UHF frequency range 560.025 to 613.975 MHz (U.S.)
420 to 460 MHz (International)
Frequency step resolution Synthesized tuning to any transmitter; 25 kHz spacing
Receiver system capacity 1 to 4 quad receiver modules (4 to 16 receivers)
Frequency stability ± 0.0003% (3 PPM) of assigned channel frequency
Bit rate 10 kbps
Sensitivity 8.7 µV (-90 dB) minimum for 1 bit error/million bits received
Physical IEEE 802.3 compatible, physical connector via 10 base T
Serial protocol 19200 baud, 1 stop bit, 8 data bits, no parity, XON/XOFF
flow control
System status indicators 7 bicolor LEDs
Input voltage 100 to 240 VAC
Input frequency 50/60 Hz
Power consumption 25 watts maximum with 4 quad receiver
Cooling Free air convection
Temperature 5 to 40° C
Relative humidity 15 to 90% (non-condensing)
Draft
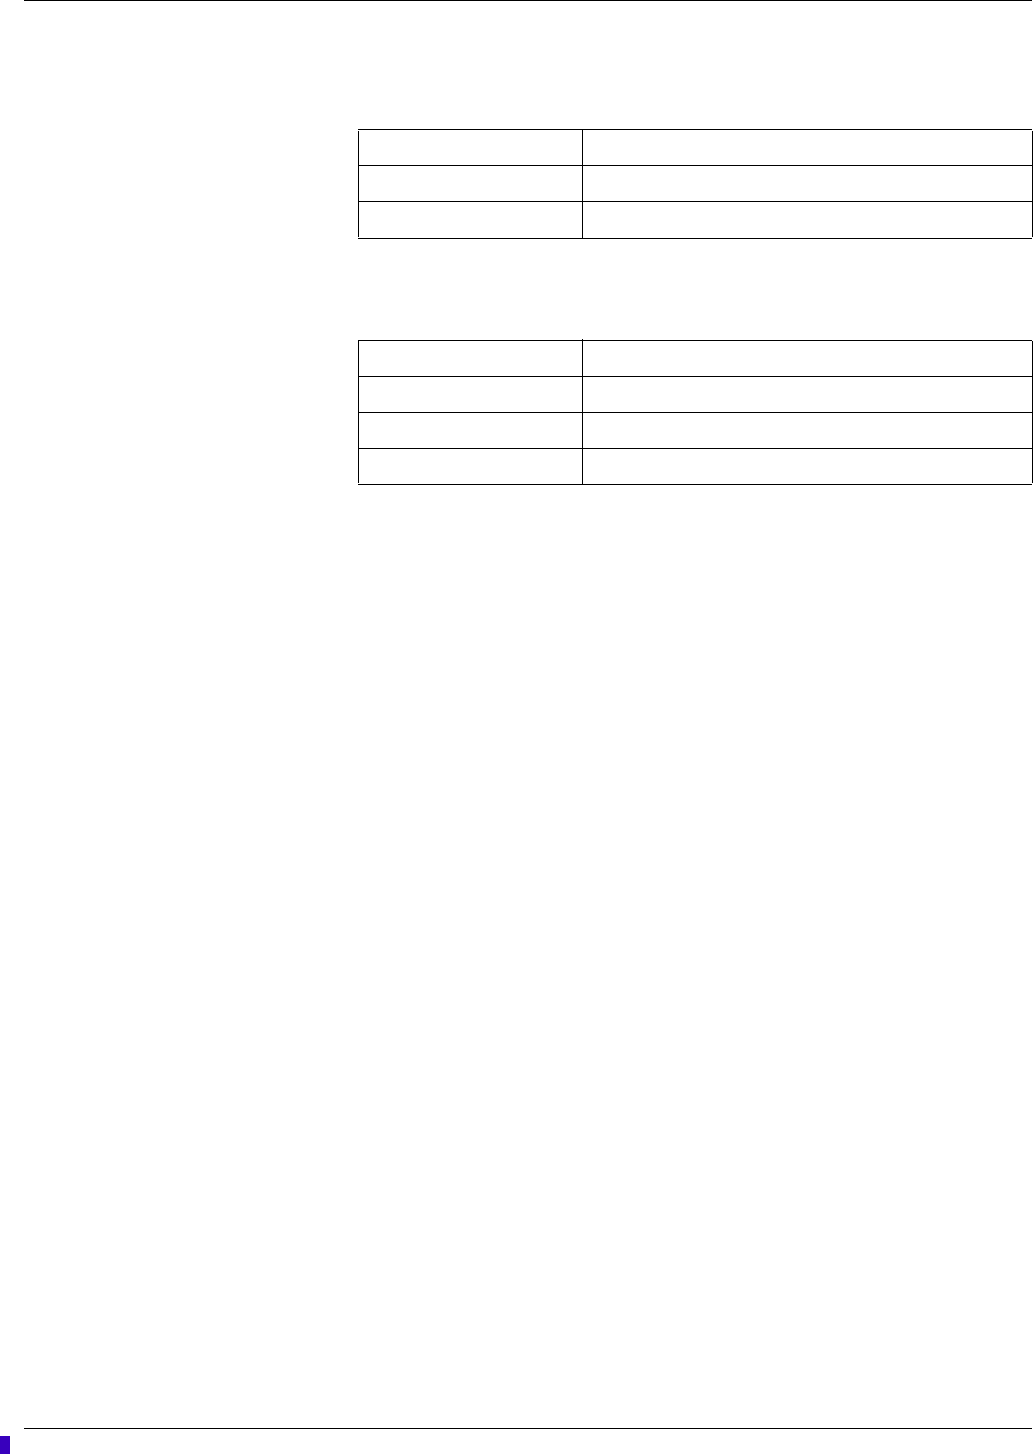
Technical specifications
2001989-301A- draft 1 ApexPro™ E-7
Storage conditions
Physical specifications
FCC compliance information
This device complies with Part 95 of the FCC Rules and RSS-210 of Industry
Canada.
Operation of this equipment requires the prior coordination with a frequency
coordinator designated by the FCC for the Wireless Medical Telemetry Service.
Certifications
UL/IEC/EN 60601-1
CAN/CSA C22.2 No.601.1
IEC/EN 60601-1-2
IEC/EN 60601-1-4
CE marked to the Medical Device Directive 93/42/EEC
Temperature -20 to 50° C
Relative humidity 15 to 90% (non-condensing)
Pressure 700 to 1060 hPa
Height 17.0 cm (6.7 in)
Width 32.5 cm (12.8 in)
Depth 25.0 mm (9.8 in)
Weight 6.4 kg (14 lb)
Draft

E-8 ApexPro™ 2001989-301A- draft 1
Technical specifications
Draft

2001989-301A- draft 1 ApexPro™ 1
Index
A
admit ..................................................................... 6-11
alarm
control settings ................................................. 5-8
levels .............................................................. 5-10
notification ........................................................ 5-2
patient status alarms ........................................ 5-3
pause breakthrough.......................................... 5-6
silence .............................................................. 5-7
system status alarms........................................ 5-4
unit defaults .................................................... 5-12
volume............................................................ 4-18
automatic graphs .................................................... 9-4
B
battery
blood pressure monitor................................... 3-11
transmitters....................................................... 3-3
bed number........................................................... 6-15
blood pressure monitor ......................................... 3-10
C
calipers.................................................................. 8-16
CE marking information ....................................... CE-1
compliance .................................................... CE-1
exceptions ..................................................... CE-1
compliance............................................................ 1-15
FCC ................................................................ 1-16
IEC, UL, EN.................................................... 1-15
Industry Canada ............................................. 1-16
configuration
defaults............................................................. 4-6
service-level ............................................... 4-7
licenses............................................................. 4-5
configure
control settings ............................................... 4-18
control settings...................................................... 4-18
D
defaults ................................................................... 4-6
discharge .............................................................. 6-19
display
primary.............................................................. 4-3
secondary......................................................... 4-3
E
ECG
calipers ........................................................... 8-16
control settings ............................................... 7-11
electrode placement ......................................... 6-3
3-leadwire................................................... 6-4
5-leadwire................................................... 6-4
6-leadwire................................................... 6-3
neonate patients......................................... 6-5
pediatric patients........................................ 6-5
measurements................................................ 8-16
setting source ................................................. 6-21
signal ................................................................ 6-6
skin preparation ................................................ 6-2
troubleshooting
arrhythmia .................................................. D-2
pacemaker ................................................. D-3
ST............................................................... D-5
electrode placement................................................ 6-3
events directory....................................................... 8-2
F
FCC compliance.................................................... 1-16
RF exposure ................................................... 1-16
full disclosure .......................................................... 8-7
G
graph location.......................................................... 9-2
graphic trends ....................................................... 8-11
I
IMPACT.wf paging system...................................... 3-3
L
lead analysis ......................................................... 7-16
multi-lead analysis .......................................... 7-16
single lead analysis ........................................ 7-16
licenses ................................................................... 4-5
M
manual graph .......................................................... 9-3
monitoring mode
combo............................................................. 6-10
rover ............................................................... 6-10
rover combo.................................................... 6-10
standard.......................................................... 6-10
move patient.......................................................... 6-17
multi-patient viewer ................................................. 7-2
N
NBP
control settings ............................................... 7-28
microphone placement ................................... 7-30
patient preparation.......................................... 7-29
troubleshooting ................................................. D-6
P
parameter alarm limits........................................... 5-10
patient demographics............................................ 6-13
primary display........................................................ 4-3
Draft

2 ApexPro™ 2001989-301A- draft 1
printalarm graphs................................................... 5-17
all patients ........................................................ 9-5
automatic graphs.............................................. 9-4
control settings ................................................. 9-6
devices ............................................................. 9-2
graph location................................................... 9-2
manual graph.................................................... 9-3
real-time data.................................................... 9-3
stop................................................................... 9-6
stored data........................................................ 9-3
telemetry data................................................... 9-2
transmitter graph .............................................. 9-7
R
R&TTE ................................................................. CE-1
real-time data .......................................................... 7-2
real-time trend window............................................ 7-6
S
secondary display ................................................... 4-3
single patient viewer................................................ 7-3
SpO2..................................................................... 7-24
control settings ............................................... 7-24
messages ......................................................... D-5
signal .............................................................. 7-27
ST analysis............................................................ 7-22
ST troubleshooting.................................................. D-5
stored data .............................................................. 8-2
T
transmitter graph..................................................... 9-7
transmitters ............................................................. 2-2
battery............................................................... 3-3
buttons/LEDs .................................................... 3-2
electrodes ......................................................... 3-5
leadwires .......................................................... 3-5
V
vital signs .............................................................. 8-14
Draft
Draft

GE Medical Systems
Information Technologies, Inc.
8200 West Tower Avenue
Milwaukee, WI 53223 USA
Tel: + 1 414 355 5000
1 800 558 5120 (US only)
Fax: + 1 414 355 3790
GE Medical Systems
Information Technologies GmbH
Munzinger Straße 3-5
D-79111 Freiburg
Germany
Tel: + 49 761 45 43 - 0
Fax: + 49 761 45 43 - 233
Asia Headquarters
GE Medical Systems
Information Technologies Asia; GE (China) Co., Ltd.
24th Floor, Shanghai MAXDO Center,
8 Xing Yi Road, Hong Qiao Development Zone
Shanghai 200336, P.R. China
Tel: + 86 21 5257 4650
Fax: + 86 21 5208 2008
GE Medical Systems Information Technologies, a General Electric Company, going to market as
GE Healthcare.
www.gehealthcare.com
0459
Draft