HWM Water 068 Water network leak detector User Manual Touch Pro Operating Manual
HWM-Water Ltd Water network leak detector Touch Pro Operating Manual
User manual
0
Touch Pro Operating Manual
Version 1.8
Warning: This manual contains important safety and operating information.
Please read, understand and follow the instructions in the manual.

1
TABLE OF CONTENTS
Important Safety Procedures
Electrical Safety
Battery Installation and Charging
Section 1.0 Introduction
The Correlation Principle
Section 2.0 System Overview
Base Unit
Accelerometer Sensors
Outstations
Headphones
Charging Case
Section 3.0 Optional Equipment
Vehicle Mounted Aerials
Hydrophone Sensors
Section 4.0 Typical Operating Ranges
Section 5.0 User Guide
Switching On the Base Unit
Outstation Deployment
The Main Correlation Screen
Starting a Correlation
Pipe Material Selection
Pipe Diameter Selection
Pipe Length Selection
Multi Section Editor
Filter Optimization
Performing A Survey to check for the presence of a leak
Set Up Options
Power Off Settings
Brightness Settings
Station Selection
Set Clock
Info
Status Display
Advanced Settings
Metric/Imperial Measurement Selection
Time Delay Display Selection
Language Settings

2
Correlation Technique (Time Domain / Frequency Domain)
Correlation Display Mode (Single Histogram/ Multi Filter Display)
Filter Optimization Mode
File
Saving a Correlation Result
Opening a Previously Saved Correlation Result
Adding information about a Correlation Result
Menu
Compute Mode
Snapshot
Sound Speed Calculator
Material Database
Listen
Filters
Frequency Spectrum Graphs (Red, Blue and Coherence)
Changing Filter Settings
Set Low Cut Off
Set High Cut Off
Set Notch Cutout
Clear All
Automatic Settings
Material Defaults
Quick Set Metallic
Quick Set Plastic
Auto Cursor
Zoom
Zoom in/Zoom out
Full Pipe View
Zoom Max
Peak Suppress
Section 6.0 Technical Specification
Appendices
The Basic Principles of Leak Location Using Noise Correlation
Use Of Hydrophones
Routine Care and Maintenance
Troubleshooting Guide
Metric-Imperial Equivalents

3
SAFETY PROCEDURES
I M P O R T A N T
Working with water and other fluids under pressure can be hazardous. Recommended safety
procedures for the working conditions must be followed at all times, and operational procedures
described in this manual should not take precedence over current safe working practice or
company procedure. If in doubt, ask your safety officer.
Use of Touch Pro equipment with the water supply must be subject to the hygiene procedures
applicable to any objects coming into contact with drinking water supplies. Hydrophone sensors
and adapters should be appropriately sterilized prior to use and applicable procedures should be
followed during their installation.
Use of Touch Pro with other liquids or gases should follow national and company safety
procedures for operation in proximity with these substances.
DO NOT use your hands for installing the sensors in valve/hydrant chambers or meter boxes
without checking for foreign objects. Sharp objects such as disused syringes can easily pierce
gloves. If any excavation is required, use suitable tools.
SENSOR MAGNET DESENSITISATION
The Touch Pro Sensors are equipped with Alnico (iron alloy) Magnets. This type of magnet
has been chosen due to its high resistance to impact and magnetic strength. These magnets
are supplied with a “keeper” plate, which should be used when the sensor is not deployed.
The Touch Pro outstations are equipped with a Neodymium Magnet. This feature allows the
outstation to be connected to a ferrous pit lid, and remain stable even under high-wind
conditions. This magnet has been chosen due to its magnetic strength and small size.
If these two dissimilar magnets come into close proximity or contact for a short period of time,
then the sensor magnet will become de-sensitized. This will severely degrade the
performance of the Touch Pro correlator.
ELECTRICAL SAFETY
Water pipes are frequently used as the connection for electrical earth. Danger of electric shock
exists with metal pipes when disconnecting meters, etc. An earthing strap should be fitted
between the two ends of the pipe before disconnection.
4
BATTERY INSTALLATION AND CHARGING
Due to shipping regulations, the Touch Pro Base Unit and Outstations are dispatched with the
battery packs packaged separately. All batteries supplied are rechargeable lithium-ion.
When delivered, the internal batteries required for the Base Unit and Outstations will only
have a nominal charge and should be fully charged before mobile operations are
undertaken.
To charge the batteries they must first be installed in the unit. The units will charge regardless of
on/off status.
When the following procedure is initially carried out, the units will require a full charge before
use.
The procedure to install the battery packs is as follows:
Tools / Consumables Required
Description
No. 1 Posi bit
Torque driver set to 0.8 – 1.0 Nm
Flat head screwdriver
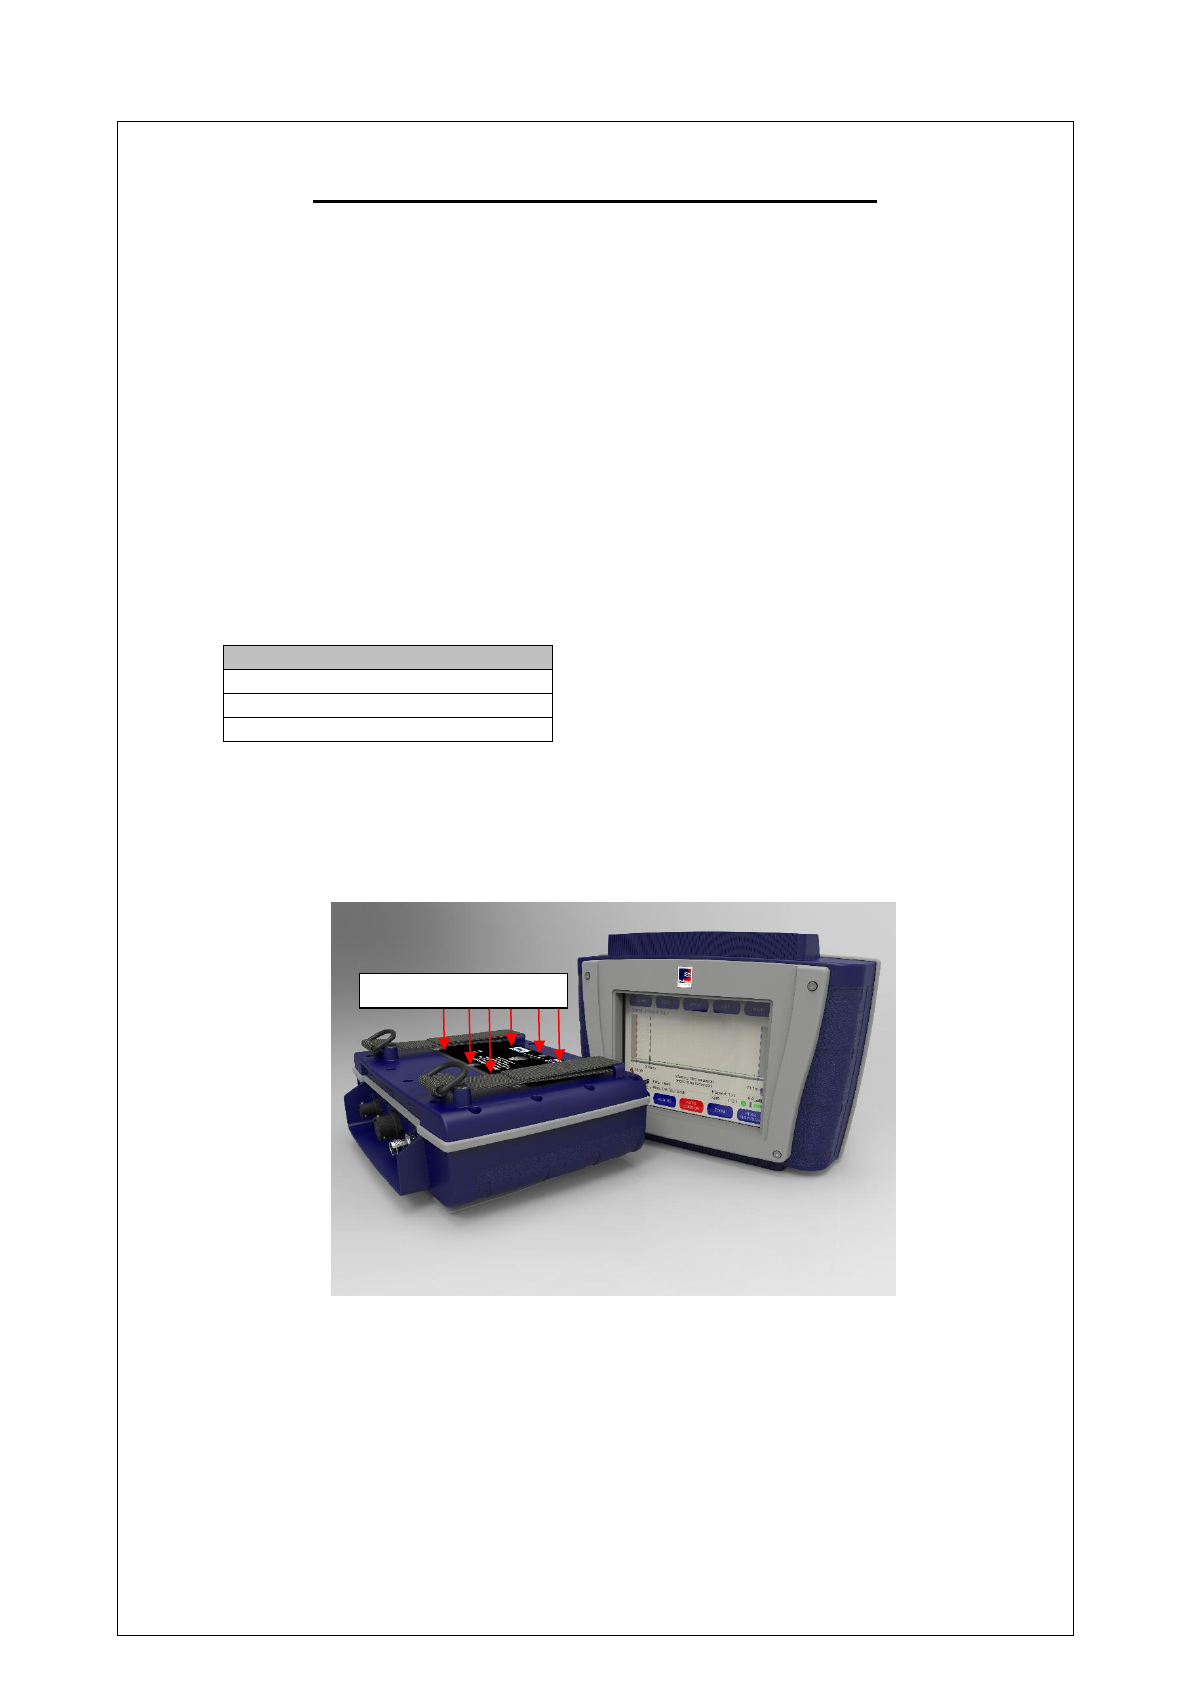
Procedure – Base Unit
1. Loosen / remove the Velcro hand straps from the rear of the unit.
2. Remove 6 off M3 x 10 Posi countersunk screws as indicated in figure 1 using a No. 1
Posi bit.
Figure 1
3. Remove the battery cover.
4. Install and connect battery.
5. Replace the battery cover and secure with 6 off M3x10 Posi countersunk screws
using a No.1 Posi bit and tighten to 0.8 – 1.0 Nm.
6. Replace / tighten the Velcro hand straps.
Remove screws x6 here
5
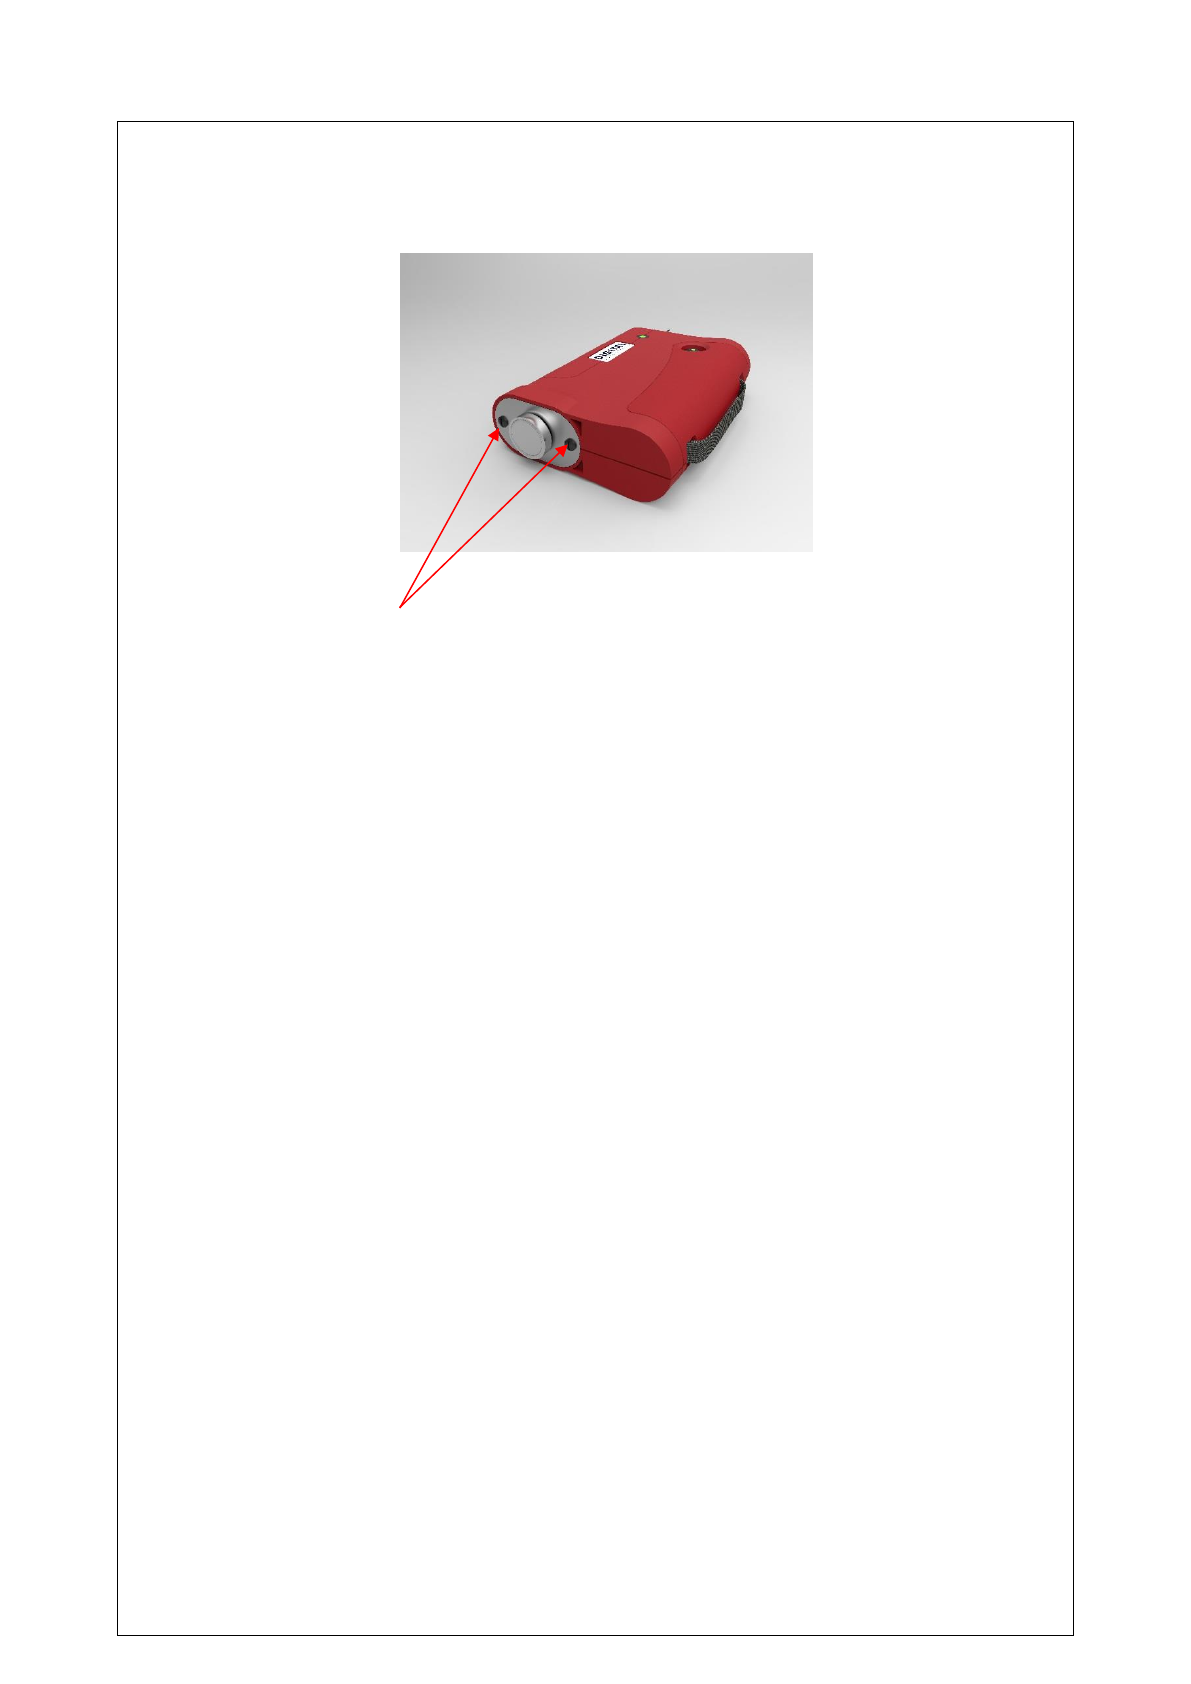
Procedure – Outstation
7. Remove the 2 off ¼ turn fasteners from the base of the unit as indicated in figure 2
using a flat head screwdriver.
Figure 2
8. Remove the battery cover assembly.
9. Install and connect battery.
10. Replace the battery cover assembly.
11. Tighten the 2 off ¼ turn fasteners from the base of the unit using a flat head
screwdriver.
12. Repeat steps 7 – 11 with second outstation.
Do not short-circuit these batteries. Any misuse may result in explosion or fire. They must not
be used in any other application or used with any other equipment. Only batteries/battery-packs
supplied by HWM-Water Ltd must be used. The sealed battery packs contain circuitry to
prevent overcharging and over discharging.
All batteries may be charged simultaneously while the components are stored in the Touch Pro
case. Only batteries with the correct specification and type must be used. These are available
from HWM-Water Ltd should replacements be required.
All batteries are identical and are interchangeable. Charging for all batteries takes up to 6 hours
from flat, although an overnight charge is recommended for maximum performance.
When the batteries are fully discharged, they should be recharged within 24 hours.
Provided the above instructions are followed carefully maximum battery life should be
maintained.
NOTE: If the system is going to be stored for any length of time, to ensure long life of
batteries it is recommended that they are charged to approx. 1/4 of capacity. On a
monthly basis the batteries should be removed from the units during extensive periods of
storage.
Plugging a charger into an outstation that is switched on will automatically switch off
the outstation. This is to prevent the outstation being left on when charging in the
case. To use an outstation while it is charging please depress the on/off button for 2
seconds to switch the outstation back on. An outstation will always charge when a
charger is connected and the battery is not full, regardless of whether the outstation is
on or off.
Please ensure when replacing the battery that no USB is connected to that Outstation.
No damage will be done to the unit but a connected USB when power is applied will

6
cause the outstation to run a bootloader. This is done deliberately so the bootloader
can be run via hardware. SECTION 1.0
INTRODUCTION
The Touch Pro is a high speed leak location system which employs a class-leading sensor, a
large full-colour touch screen, and integrated noise filtering, analysis and management
software to produce accurate survey data using cross correlation techniques.
Leak correlation is used to find the exact location of a leak on a pipe. Highly-sensitive
acoustic sensors are placed at intervals on the pipe, and listen to the sound made by the leak.
The data is transmitted wirelessly to a handheld ‘base unit’, which processes the information
to identify the leak sound, and then applies mathematical algorithms to pinpoint the leak
position.
This latest model retains all the key features of earlier Touch Pro systems and provides many
new benefits which ensure greater operating flexibility and faster operating speed.
The Touch Pro system is fully menu driven and is operated by touch screen, making it much
easier to input data and maximising the visible screen area to display results more clearly
than has ever been possible before.
The Touch features a newly-developed sensor designed to be at least twice as sensitive as
anything else available on the market today. This enables it to perform well even in
traditionally difficult conditions, such as on plastic and large diameter pipes.
It is also the first standalone correlator to feature a high visibility full colour VGA touch screen
to greatly improve data entry and the quality of data presentation. The intuitive user interface
eases and simplifies leak-finding without compromising on functionality or precision, and
enables the unit to be operated with the minimum number of key presses. The large screen,
with anti-glare screen protection, clearly displays correlation results and supportive
information even in bright sunshine, effectively combining outstanding performance with
excellent ease of use.
The system is equipped with an innovative multi-filter correlation option which can
simultaneously perform three correlations at different filter settings. This is particularly useful
when the pipe material is uncertain.
The outstation is compact with high quality long range radio transmission; it also features a
magnet to secure onto metallic street furniture.
The purpose designed robust case not only carries and protects all components but charges
them via mains or vehicle supply. The charge level for all items can be shown at the touch of
a button.
7
THE CORRELATION PRINCIPLE
The prime function of the sophisticated correlator built into Touch Pro is to measure the time
difference between the leak noise signals arriving at each sensor. Touch Pro determines the
leak position by relating this difference in propagation (travel) time to the velocity of sound along
the pipe and to the measured distance between the sensors.
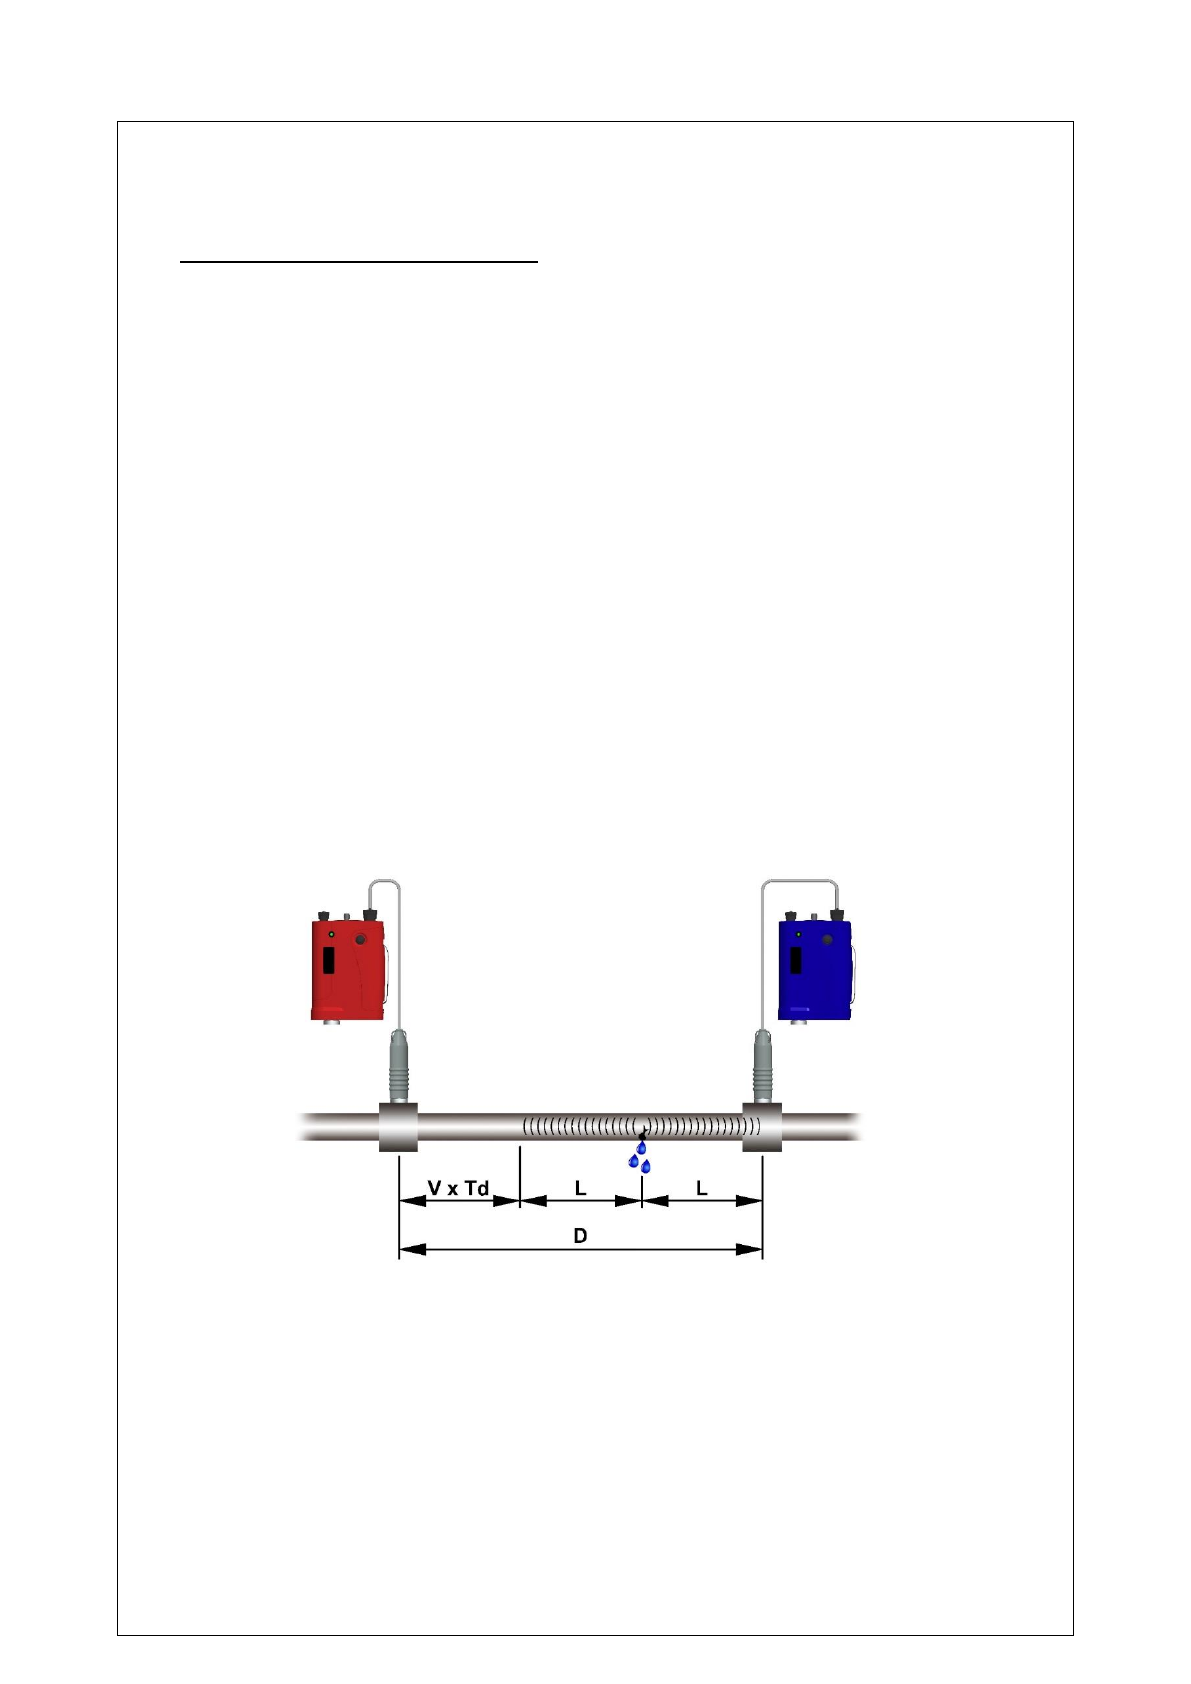
In the "classic" correlation process, two sensors are deployed on pipe fittings
("dry"connection) or connected to hydrants using hydrophones ("wet" connection).
The sensors are positioned either side of the suspected leak position. Noise is created by the
leak as it escapes from the pipe under pressure.
This noise is conducted in both directions away from the leak through the pipe wall (as minute
vibrations) and through the water column (as a pressure wave).
The leak noise travels at a constant velocity (V), which depends on the material and diameter of
the pipe, and arrives first at the sensor nearer the leak.
The arrival time at each sensor is registered. The time difference (Td) between the two arrival
times, combined with knowledge of the sound velocity which is provided by the pipe type and
length, allows the leak position to be calculated by the correlator.
The principle of correlation can be defined by: L = ½ (D-(VxTd)) and is shown graphically below:
Operators who are experienced with earlier Touch Pro systems, and are fully conversant with
leak noise correlation techniques, may wish to refer straight to Section 5.0 which provides
start-up and operating procedures for the Touch Pro.
Other users are recommended to read Appendix One - THE BASIC PRINCIPLES - and then to
read Sections 2.0, 3.0 and 4.0 of this Manual before operating Touch Pro. These sections
provide an overview of the Touch Pro system and detail optional equipment which increases
operating flexibility.
8
SECTION 2.0
SYSTEM OVERVIEW
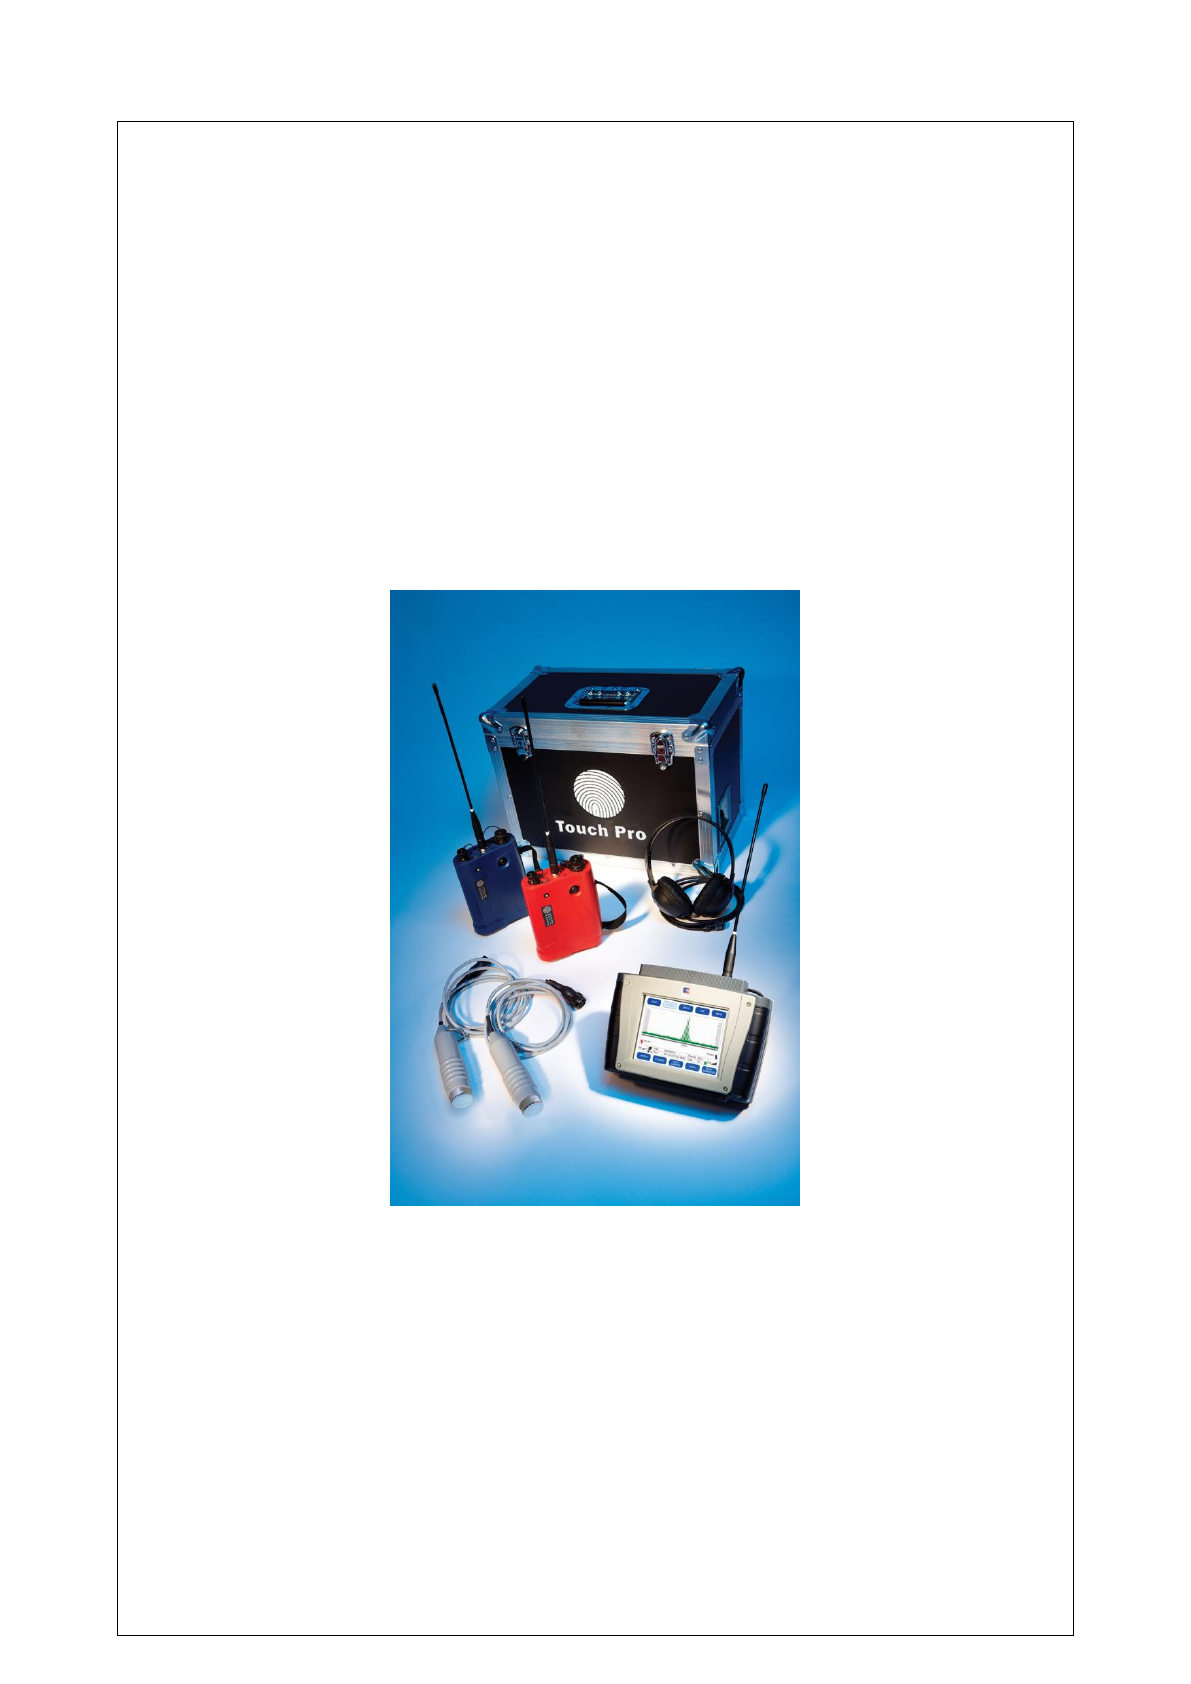
Touch Pro is generally supplied in the following basic kit form which is the minimum system
configuration specified for effective leak location operations:
1. One Touch Pro Base Unit
2. Two Accelerometer Sensors with protective shrouds and leads
3. Two Outstations (Red and Blue)
4. Headphones
5. Carry case that enables in case charging of all components through mains or 12V
vehicle supply, and indicates charge for all components
In addition, the following optional extras are available
1. Vehicle Mounted Aerials
2. Hydrophone Sensors
3. Soft Carry Case
4. 12V Vehicle Supply Cable
5. Mains Charge Cable
9
ACCELEROMETER SENSORS
Accelerometers are suitable for a very wide range of leak detection operations on pipes or
fittings.
The two accelerometer sensors supplied with the Touch Pro system detect the noise signals
travelling along the pipe from the leak point. These signals are then fed into the correlator unit
for measurement and analysis.
An accelerometer is positioned on either end of the pipe work under investigation and
connected either to an outstation or directly to the base unit. The normal operation is to have
two outstations operating remotely and linked via radio to the base unit. The two sensors are
connected to each outstation (red and blue). The radio inside each outstation, which
transmits data to the base unit automatically, switches on when a sensor is connected.
Operators should note that all sensors can be damaged by sudden shock impact and
should be handled with care. Do not drop sensors onto the ground and ensure they do
not bang against the pipeline during fitting or removal. Ensure the connecting sockets
are clean and dry and do not clean the sockets with water based solvents
Arm cable
Protective shroud
Deployment hook
Magnet for attaching to pipe
10
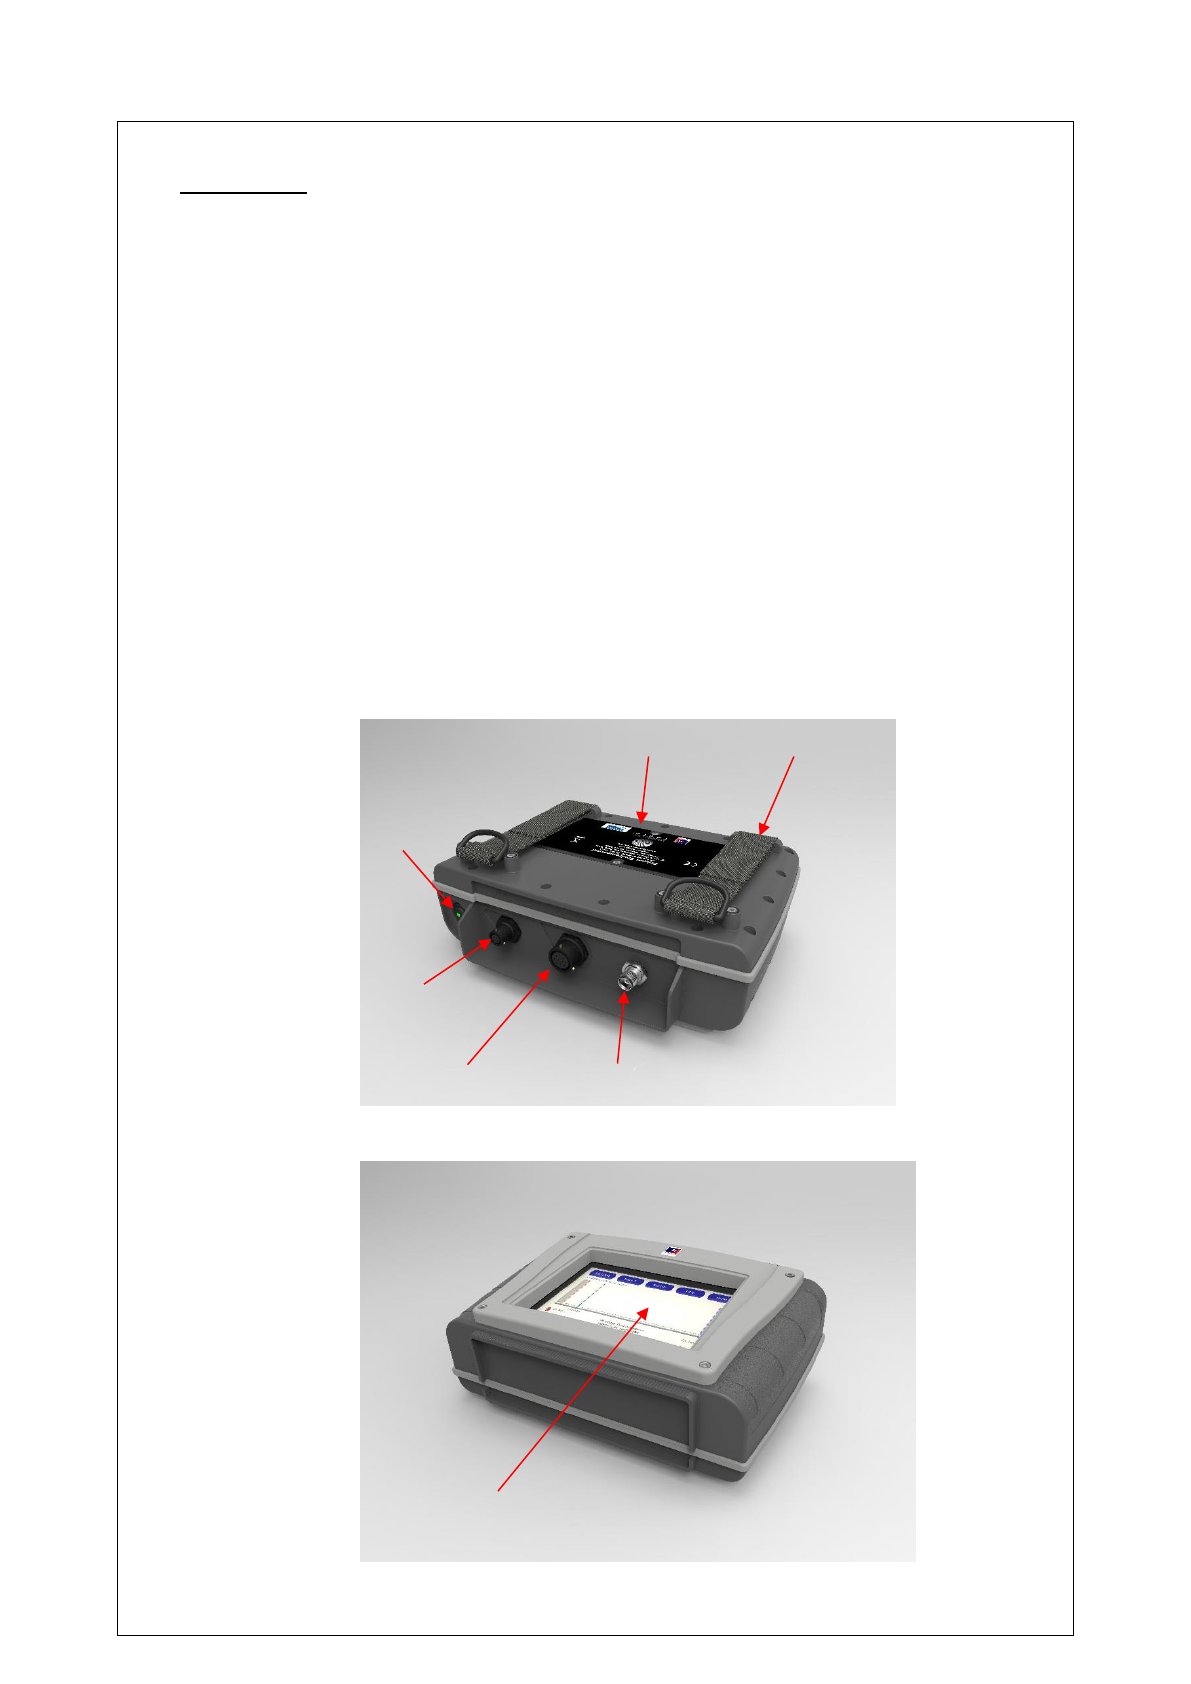
BASE UNIT
Touch Pro is a totally self-contained electronic unit which performs the leak noise correlation
calculations accurately and very quickly. The system features a MS Windows-CE embedded
software driven operating system with a large number of intuitive menus, which guide and
prompt the operator throughout all data input and processing phases.
The system is designed primarily for rapid Leak Position and Velocity Measurement
operations but it also incorporates excellent Listening mode and Surveying mode facilities. A
key feature of Touch Pro is its Windows compatible software and USB to PC software-
enabled printing.
The Touch Pro base unit can be connected to a personal computer via the USB port. Windows
Mobile Device will recognize the unit when it is connected, and will display a folder containing all
data files without the need for any external software. This enables easy navigation of the data
via the PC.
The intuitive menu driven touch screen enables the operator to navigate the set up procedure by
simply tapping the appropriate virtual buttons on the high visibility full colour VGA display screen.
A range of language options are selectable via the menu screen.
Battery compartment
Sensor & USB
connection
Charger &
headphone
connection
Handle strap
Arm cable
Full colour VGA touchscreen
On/Off
switch
11
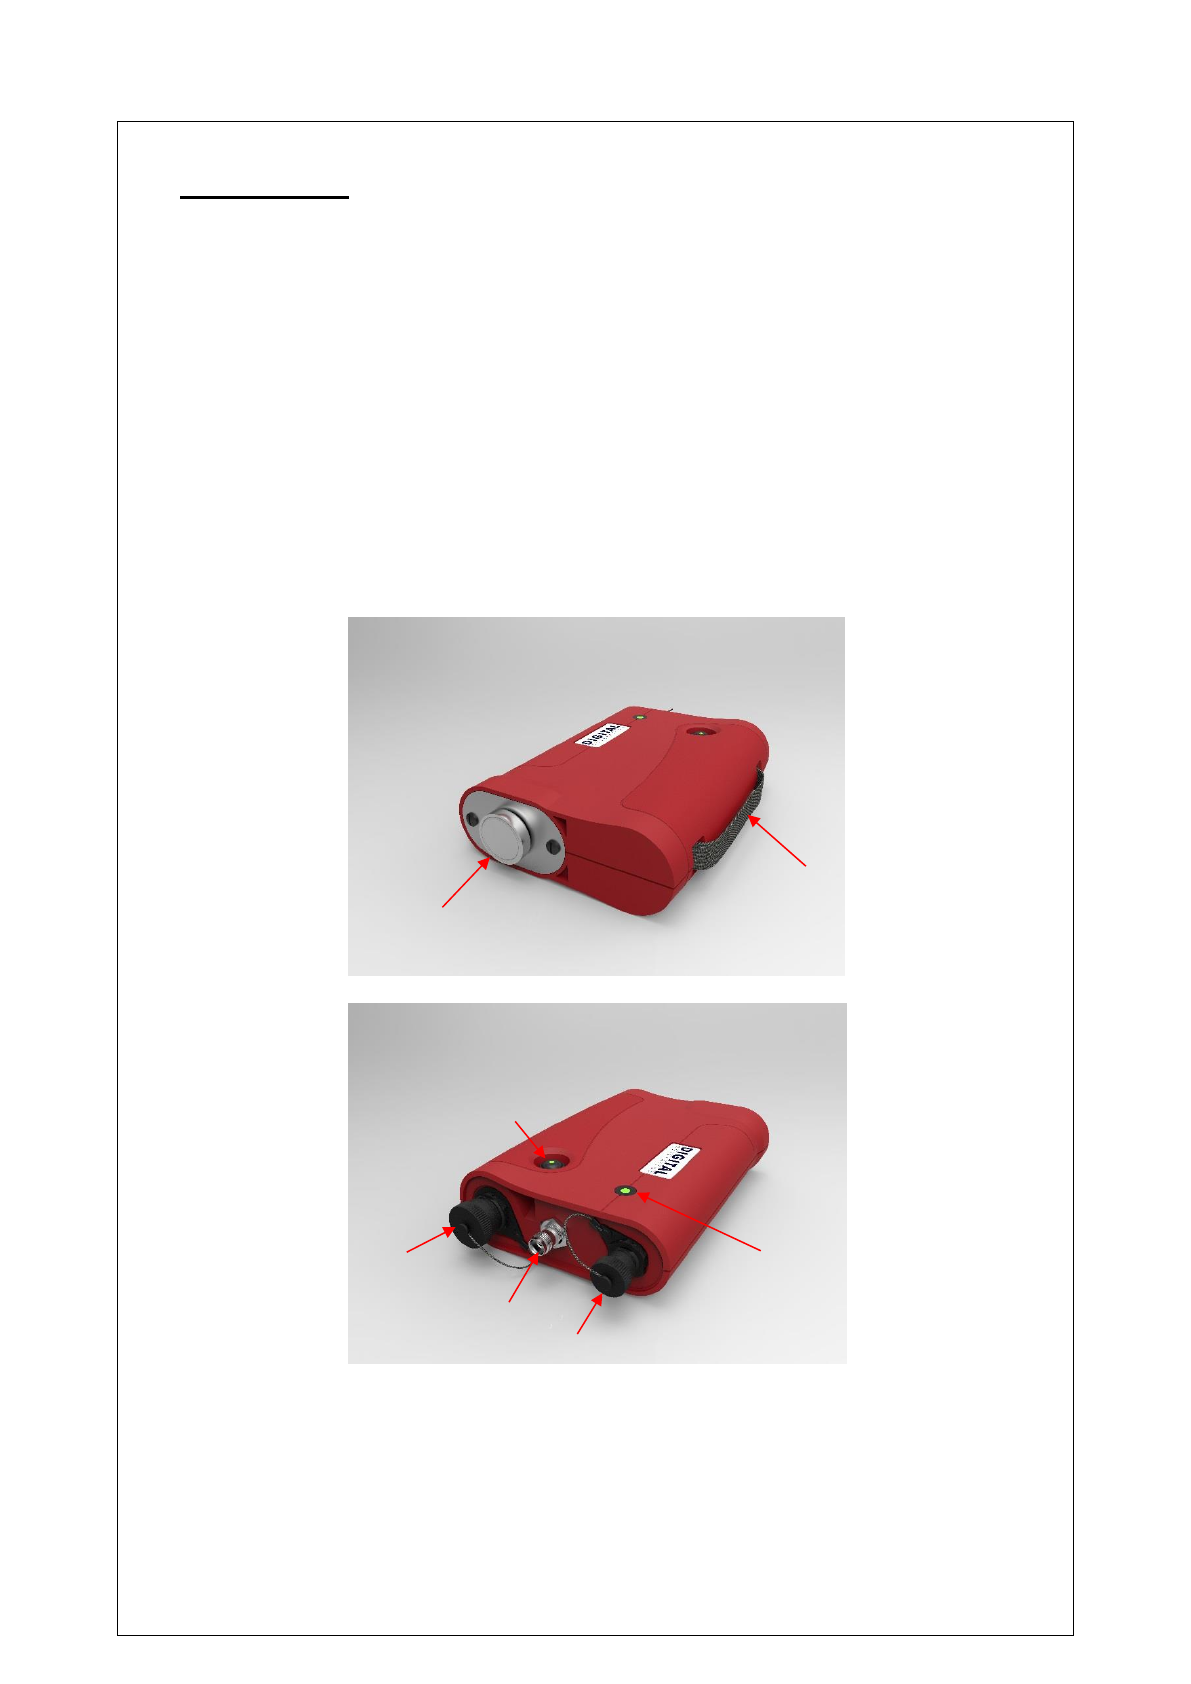
OUTSTATIONS
Touch Pro is supplied with two outstations which are coded 'Red' and 'Blue' for ease of
identification during operations. They are identical in operation (but with different transmission
frequencies - each matched to its appropriate receiver built into the Touch Pro Base Unit).
The basic Touch Pro kit includes a Red outstation which is connected to the remote sensor. The
outstation captures the leak noise from the sensor and transmits the signals at U.H.F. to the
Base Unit. The addition of the optional Blue Channel secondary radio link provides greater
operational flexibility and speeds up many aspects of on-site work. Radio links also increase
operator safety by allowing the sensors to be deployed remotely in busy streets or other work
areas with heavy traffic flows. A base magnet at the bottom of each outstation allows the unit to
be securely held in an upright position on metallic street furniture during use.
The outstations are powered by a lithium-ion battery which is recharged either in the Touch Pro
carry case or with a supplied power lead, or 12V supply cable. With both sensors plugged into
outstations the Touch Pro base unit can be located anywhere within radio signal range or
mounted in a vehicle for fully mobile operations. The sensor connection on the outstation can
either be used with three different sensor types – analogue sensor, accelerometer and
hydrophones.
Battery compartment &
Base magnet
Antenna
connection
LED indicator
Antenna
connection
On / Off
switch
Sensor & USB connection
Charging &
headphone
connection
12
HEADPHONES
The Touch Pro operator monitors the noise from the sensors with stereo headphones which
confirms instantly that the sensor pick up and signal transmission part of the system is
functioning correctly. This important procedure also enables experienced operators to determine
if the leak signals are suitable for effective correlation and to check for the presence of
background interference in the pipework under test.
The studio quality stereo headphones supplied have earpieces labeled 'Right' and 'Left' and
should be worn accordingly for effective operations. Headphones are supplied to enable the
user to listen to the leak noise either from red, blue or both outstations. The Base Unit gives the
operator full control over the source into the headphones.
The headphones can also be plugged directly into each outstation connected to a remote sensor
on the pipe to monitor a monaural signal. This technique aids sensor installation and set up by
allowing the operator to confirm leak noise and interference levels quickly at each sensor position
before completing the correlation.
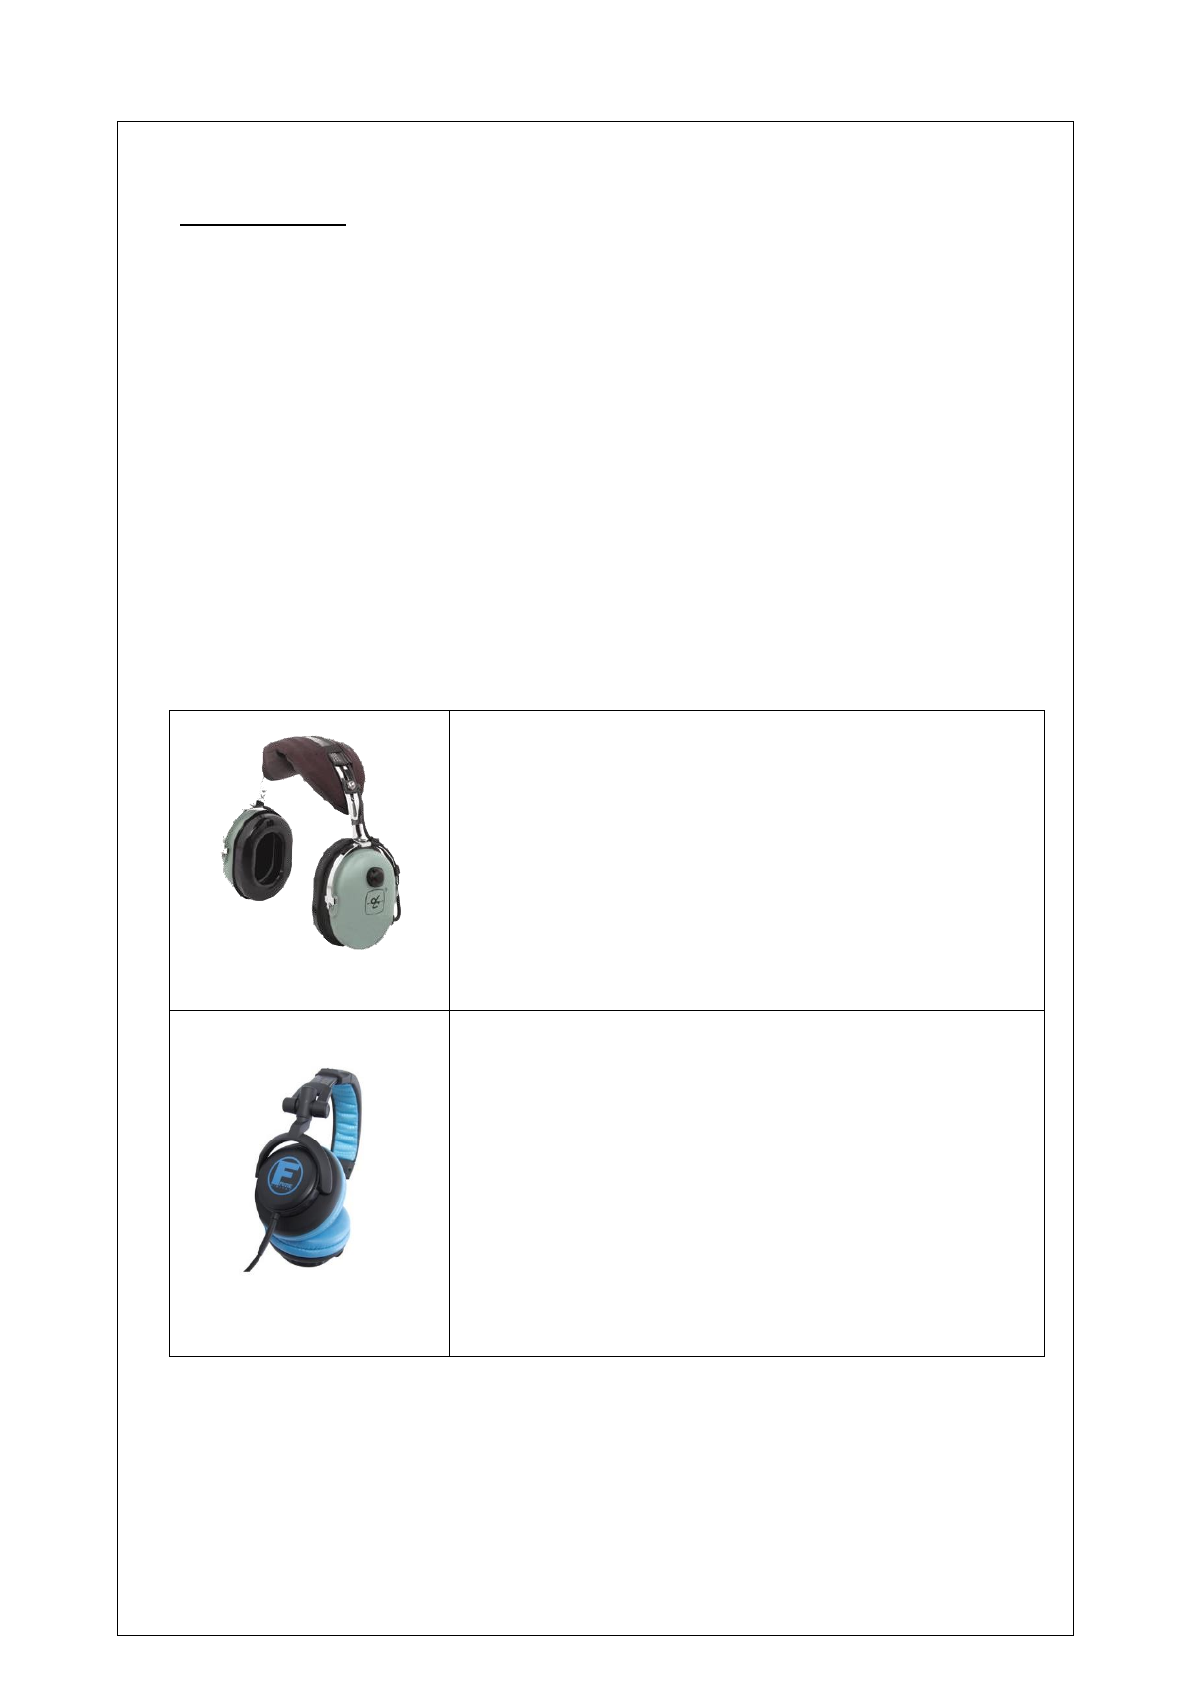
HWM-Water Ltd supplies an optional choice of quality headphones which include the following:
David Clark Model 10S-DC
David Clark Model 10S-DC (Optional)
Stereo Noise Attenuating Headset.
Newest Undercut, Comfort Gel Ear Seals
Double-Foam Headpad
Dual volume controls
Lightweight, 5ft. straight cord
Earphone elements are hi-fidelity, dynamic with a range of 10-
20,000 Hz.
NRR 23dB
Fame Headphones
Fame Headphones (Standard)
Spatial sound image
Outstanding wearing comfort for long listening sessions
Excellent attenuation of ambient noise
Ear cup is rotatable for one-ear listening
Convenient protective pouch included
Extremely rugged
Single-sided coiled cable, detachable
Comfortable headband and ear pads
13
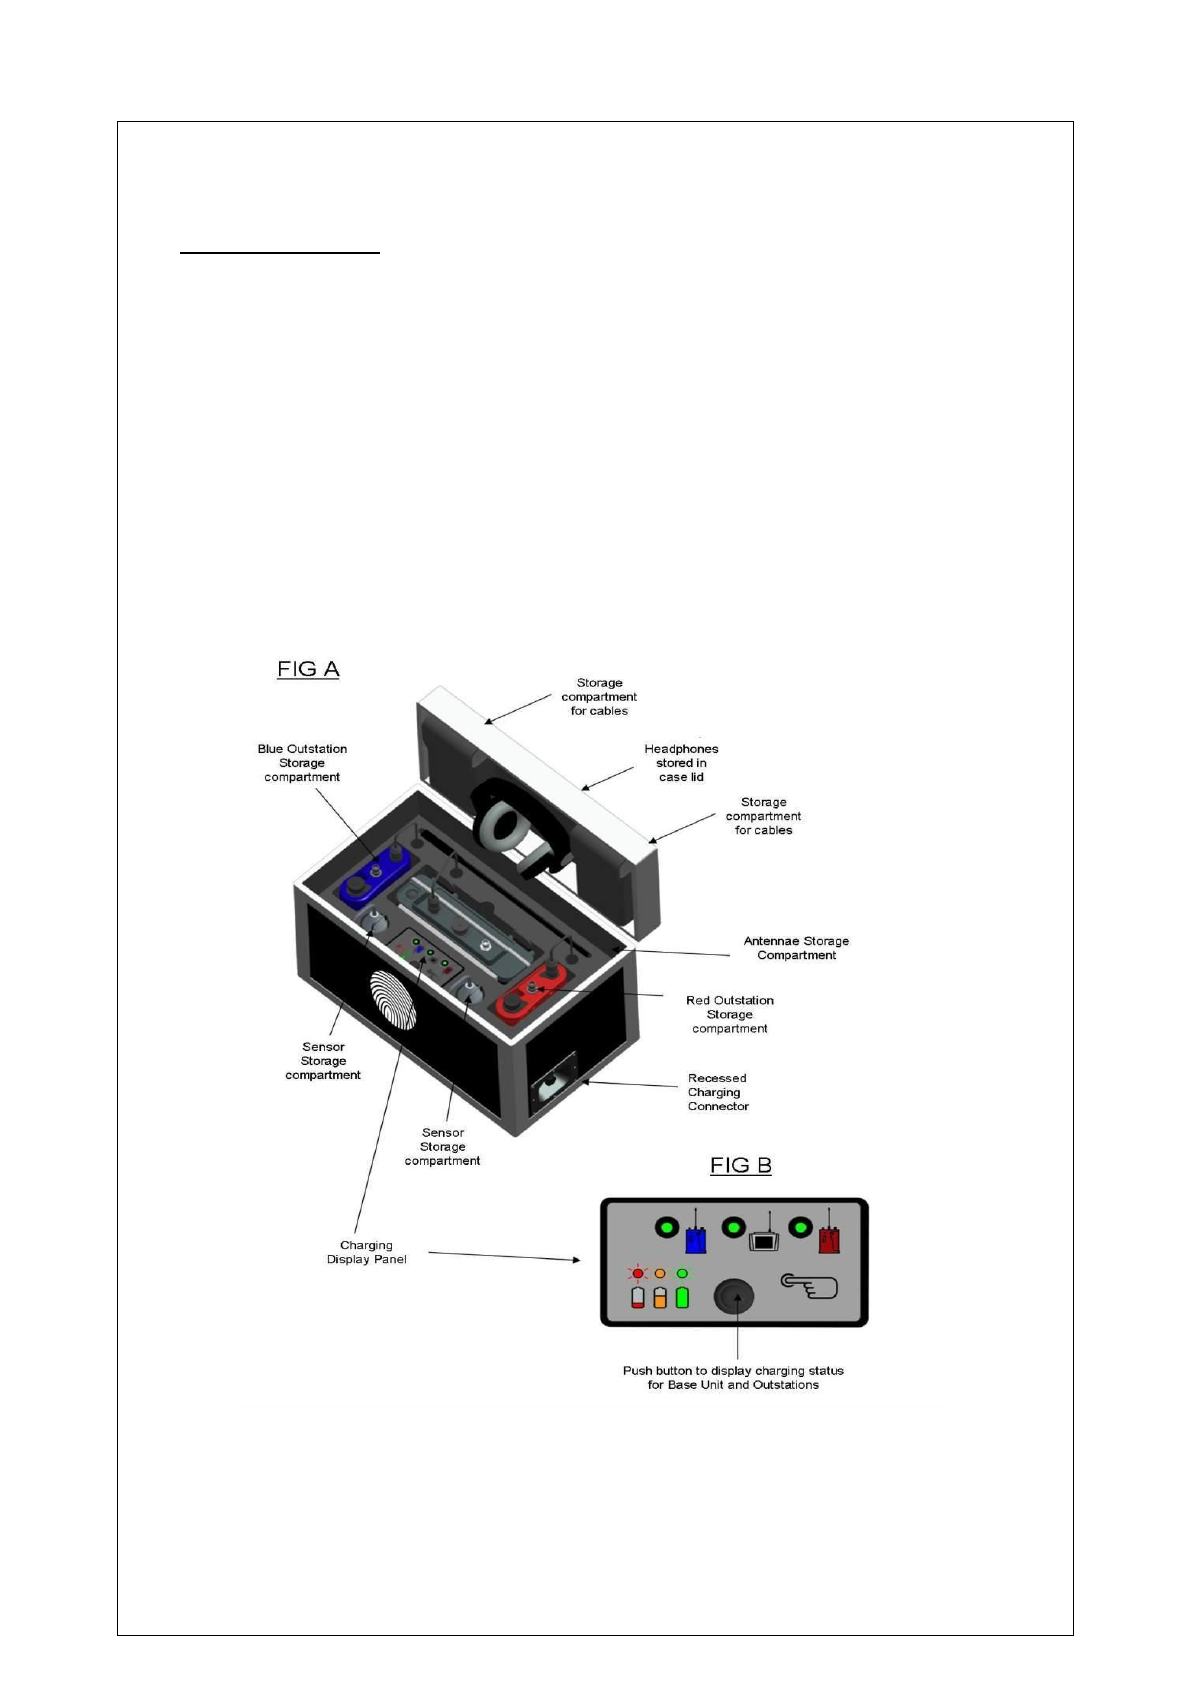
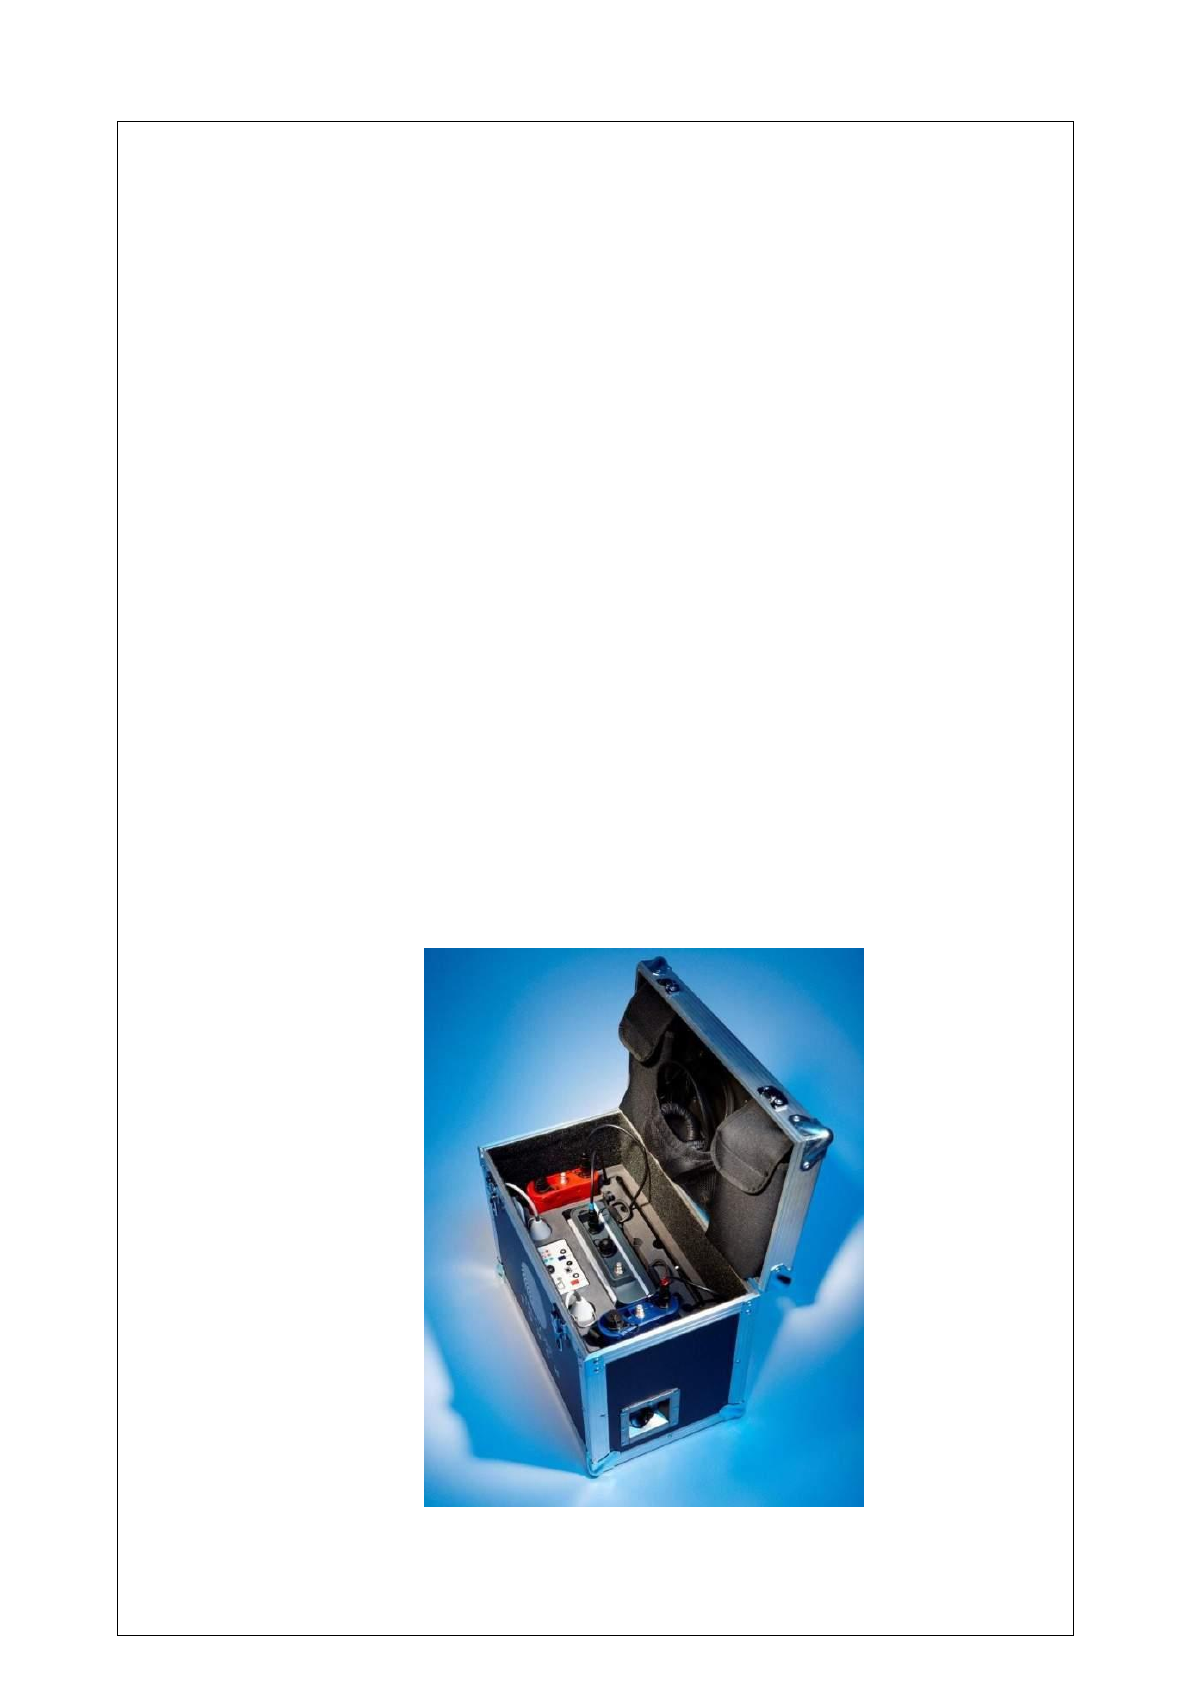
CHARGING CASE
The Touch Pro carry case enables all components to be stored and charged simultaneously (FIG
A).
A single recessed charging connector on the side of the case charges the two outstations and
the base unit when they are in storage. A display panel inside the charging case (FIG B) enables
the operator to view the charging status of each component at the touch of a button without
needing to remove them from the case.
In case charging can take place through mains power or 12V vehicle supply. The internal battery
of the Touch Pro system will run continuously for approximately eight hours without re-charging.
The system draws very little current and can also be operated from a vehicle's 12 volt battery for
long-term site operations. The lithium-ion rechargeable batteries employed are interchangeable
with those of the outstations.
Units can be stowed with sensors still connected for fast deployment
14
The battery display panel inside the case (FIG B) is used to show the battery status of each
connected outstation and base units without having to physically switch on each unit.
An LED displays the battery status of each individual unit connected. To operate, simply push
the button to activate the LEDs.
The LED colour displayed will be green, amber or red to show the battery level for each unit
connected.
The LED will remain lit for 5 seconds after the button is pressed before switching off.
Any LED that does not light when the push button is pressed indicates that individual unit is
not connected or faulty.
When the charging adapter is connected, any unit connected to the case charger will be
charged. Units may be disconnected or re-connected to the case charger whilst charging at
any time. Whilst each unit is charging, an LED on that unit will slowly flash green. When
charging is completed, the LED will stop flashing.
Pushing the button whilst charging to display the battery status will temporarily stop the
charging in order to allow an accurate reading to be taken. When the 5 seconds has expired
the lights on the display panel will switch off and charging will resume automatically.
When the charging adapter is initially connected to the connector on the outside of the case
the LEDs will light to show the battery levels of the connected units. After 5 seconds the
lights will switch off and the charging will begin. This automatic process can be used to check
that the units have been connected to the charger successfully and will charge when power is
applied.
It must be noted because of this initial power on process charging of the units will always start
5 seconds after the charging adapter has been connected.

15
SECTION 3.0
OPTIONAL EQUIPMENT
HWM-Water Ltd can provide the following optional equipment which expands the overall
capability of Touch Pro even further and improves operating flexibility in difficult situations.
VEHICLE MOUNTED AERIALS
An extension aerial is required for effective receiver operation when Touch Pro is mounted in a
vehicle and operating over extended ranges.
The standard Touch Pro receiver aerial is simply unscrewed and the coaxial cable of the
extension aerial is connected instead. The extension aerial has a magnetic base for fixing to the
vehicle's roof. Alternatively mounts for non-ferrous roofs are available.
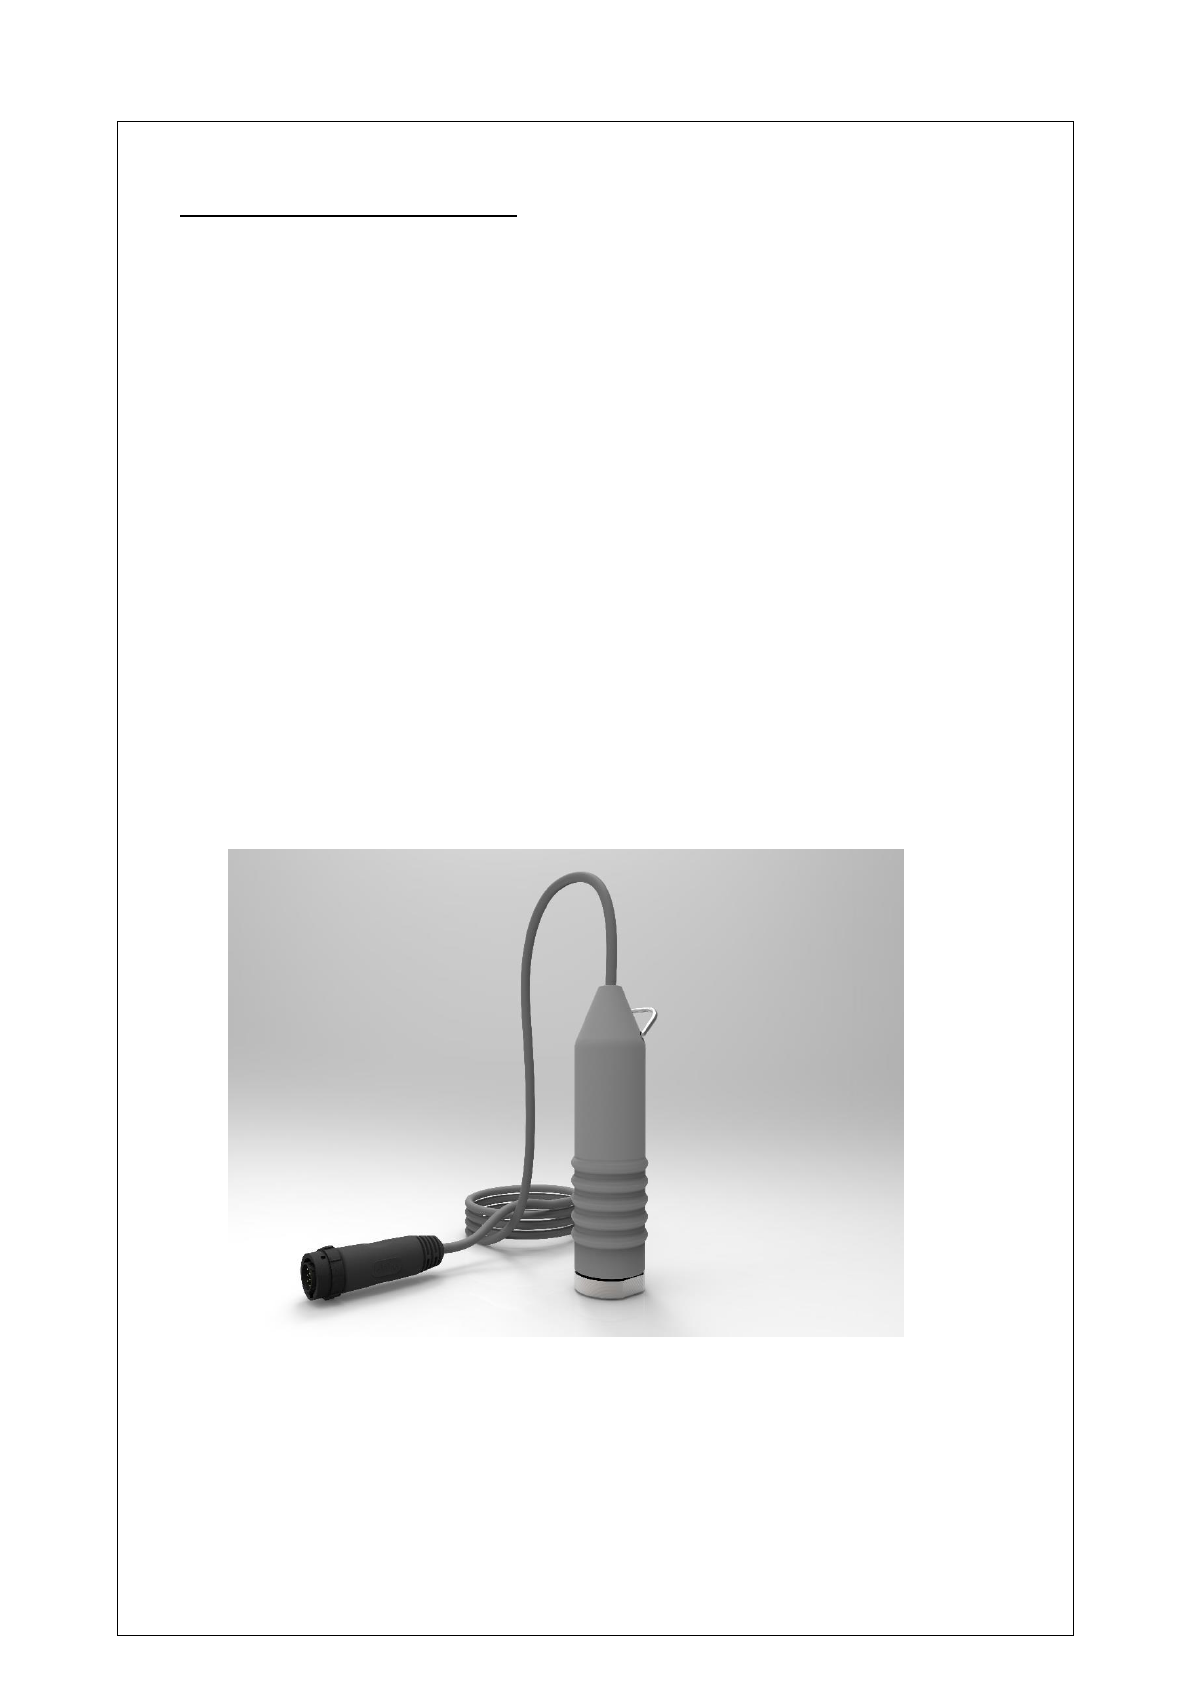
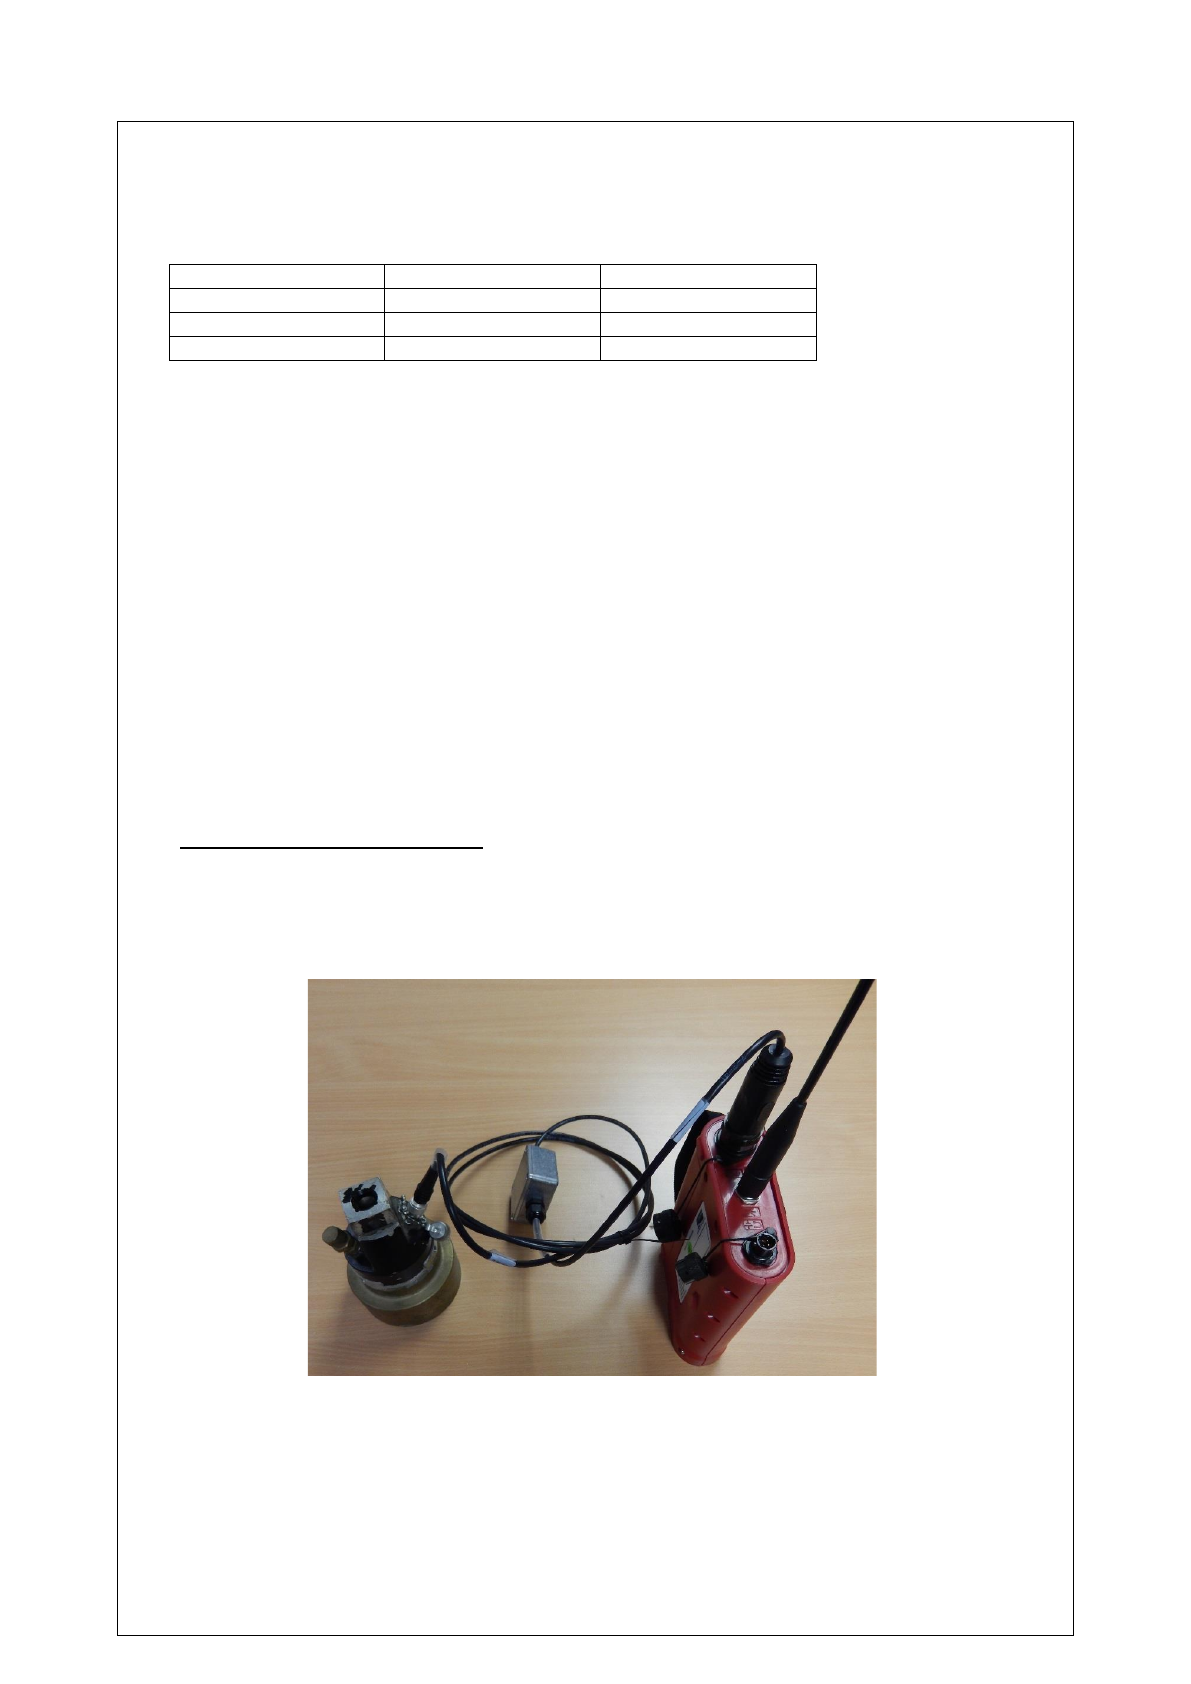
HYDROPHONE SENSOR
Because accelerometers are attached to the external surfaces of pipe systems, weak noise
signals may sometimes be degraded by mechanical filtering or high background interference
effects. In these instances, and if suitable pipe fittings are available, Hydrophone sensors can be
used instead of accelerometers. Hydrophones, which are available as optional equipment, may
provide better leak noise signals in difficult operating conditions.
If two suitable pipe fittings are not available, operators may use one hydrophone and one
accelerometer. It should be noted, however, that this technique is not generally recommended
because the hydrophone sensitivity and working range is restricted by the accelerometer sensor
performance.
Hydrophone sensors are mounted for direct contact with the water at hydrant, air valve or
flowmeter points. A selection of pipe fitting adapters are supplied in the hydrophone kit which is
described in Appendix 2. It is important that the connection instructions given in Appendix 2 are
followed. These should be referred to before using the hydrophones.
Leak noise propagates very efficiently along the water core which gives hydrophones a greater
working range than accelerometers. Hydrophones are also far more sensitive to low pressure
waves (signals) and they are particularly effective in locating leaks in large diameter trunk lines.
Hydrophones generally give good results in all types of plastic pipe systems and the signal
information from hydrophones often increases operator confidence where any soft or
non-metallic pipe materials are encountered.
16
Trunk Mains
Pipe Material
Accelerometers
Hydrophones
Iron, Steel
500 - 800 metres
2000 - 3000 + metres
A/C, Concrete
400 - 600 metres
1000 - 2500 + metres
Plastic
100 - 200 metres
500 - 1500 + metres
Use with Touch & Pro Analogue correlator
To connect hydrophones to a Touch Pro analogue correlator the following part is
required:
HYDMCTAMP = 2m (part number includes all cables)
HYDMCTAMP/5M = 5metres
Note you will require two for each Hydrophone kit (1 for each hydrophone)
HYDMCTAMP
CABLE LENGTH OPTIONS
CABA9295 – This cable has the option to be up to10 meters in length.

17
SECTION 4.0
TYPICAL OPERATING RANGES
Using hydrophones, the operating range between outstations can be very high particularly during
a quiet period of the day. For example, distances over 4km of 4" iron can be achieved from leak
to sensor.
Increasing the operating distance always decreases the chance of correlating
successfully.
Radio power may also be a limiting factor at extreme distances
Actual operating ranges are influenced by a number of variables. The results will vary
dependent, for example on pipe wall thickness, ground conditions, size and shape of the leak,
background noise and other noises in the pipe system. Successful correlation distances in
excess of 2,000 meters have been achieved on 8" PVC pipe using hydrophones.
The following table gives a general indication of maximum working distances. It is stressed that
the actual range achieved may be better or worse than indicated depending on the site
conditions.
General reliable maximum Pipe Materials working distances for pressures above 2 Bar
Urban Network
Pipe Material
Accelerometers
Hydrophones
Iron, Steel, Copper
400 metres
800 - 1200 metres
Lead, A/C, Concrete
300 metres
600 - 800 metres
Plastic
50 - 100 metres
400 - 500 metres
Trunk Mains
Pipe Material
Accelerometers
Hydrophones
Iron, Steel
500 - 800 metres
2000 - 3000 + metres
A/C, Concrete
400 - 600 metres
1000 - 2500 + metres
Plastic
100 - 200 metres
500 - 1500 + metres
SECTION 5.0

18
USER GUIDE
This section covers Touch Pro operating procedures and describes the functions and effects of
the various keys and controls.
Always press the keys on the touch screen with the flat end of a finger, not sharp objects.
The Touch Pro features an intuitive user interface designed to perform accurate correlation with
the minimum number of key presses. In this manual, we will show you some of the key screens
that will be used during a correlation.
SWITCHING ON THE BASE UNIT FOR THE FIRST TIME
Ensure batteries have been charged and correctly installed, see page 15.
The On/Off power switch on the Base Unit is situated at the top (please refer to the diagram on
page 10)
Switch the Base Unit on by pressing the On/Off button for at least 2 seconds, A number of
system tests and calibrations are carried out on power up to ensure the unit is fully functional.
After a few seconds the main Correlation screen will appear on the display.
OUTSTATION DEPLOYMENT
Once the batteries have been installed and charged in the Base Unit and the Outstations,
connect the antennas, sensor cables and sensors to each Outstation.
Switch on each Outstation by pressing the On/Off button for at least 2 seconds.
Set the outstation transmit power to low by pressing the On/Off button a second time for
at least 2 seconds.
Switch off the outstation by pressing the On/Off button a third time for at least 2 seconds.
If operating the Base Unit within 20m of an outstation it is recommended that the Outstation is set
to low transmit power, to ensure that the more distant Outstation is received.
To check that the sensors are working correctly, connect the headphones to the Outstation and
listen while running your finger over the sensor magnet. A clear crisp noise should be heard.
Deploy each sensor on a water pipe fitting either side of the suspected leak position. The sensor
has a strong magnet that will enable it to remain in position on steel/iron fittings.
Always ensure that the contact point is free from dirt so that the magnet makes a good contact.
We recommend the use of a wire brush to clean the pipe/valve/hydrant fitting prior to attaching
the sensor.
If the contact point is not magnetic then the sensor ideally must be placed on top of the fitting
without touching the access hole walls if possible.
Also the sensor must ideally be mounted vertically on top of the tap where possible. Mounting
the sensor horizontally on the side of the tap may affect the sensor sensitivity.
Outstation LED Functions:
The Outstation incorporates a green LED in the On/Off button which indicates the transmit power
level and a tri-colour LED, which displays the battery charge level.

19
On/Off button LED
Green = Transmit power high.
Off= Transmit power low.
Tri-colour LED
Green = Battery OK
Yellow = Mid Level
Red = Low Battery
When the unit is on and functioning normally, the LED flashes briefly once a second. To indicate
the battery status the LED will change from Green to Yellow and Red. The LED will remain green
for most of its battery life and turn yellow when the battery is starting to run down. A Red flashing
LED indicates the battery requires immediate charging.
HWM-Water Ltd recommends that no correlations are attempted when the outstation requires
charging, as this may interfere with the quality of the correlation result.
When the outstation is initially connected to a sensor the LED should flash 10 times quickly.
This will indicate that the sensor has been registered, the radio has been switched on and the
relevant filters have been setup.
When charging voltage is applied to the outstation the status LED will begin flashing green to
indicate charging. If the outstation is switched on then it will automatically switch off when
power is applied. When the battery is fully charged then the LED on the unit will switch off.
If the outstation is charged while the outstation is switched on the LED will flash 10 times faster
than normal. When charging completes the LED will return to its normal flashing rate.
When charging the outstations the Led will flash be green.
The case charger automatically stops the charge temporarily when the button is pressed.
Upgrading Outstation Interface Firmware
Each outstation has bootloader firmware installed. This firmware is used to interface with the
PC software when upgrading the outstation. During normal operation the bootloader is
disabled and will not be seen by the user. The bootloader will run automatically if either a
problem is found with the normal application firmware or when the PC software is used to
upgrade the outstation.
When the bootloader is running pressing the on/off button will result in 10 Red LED flashes
after which the outstation will switch off. If the bootloader is running when the USB is
connected then disconnect the USB and try and switch on the outstation.
If the application firmware is OK then the outstation will switch on and can be used as normal.
If the bootloader continues to run then please reconnect the USB and perform an upgrade.
20
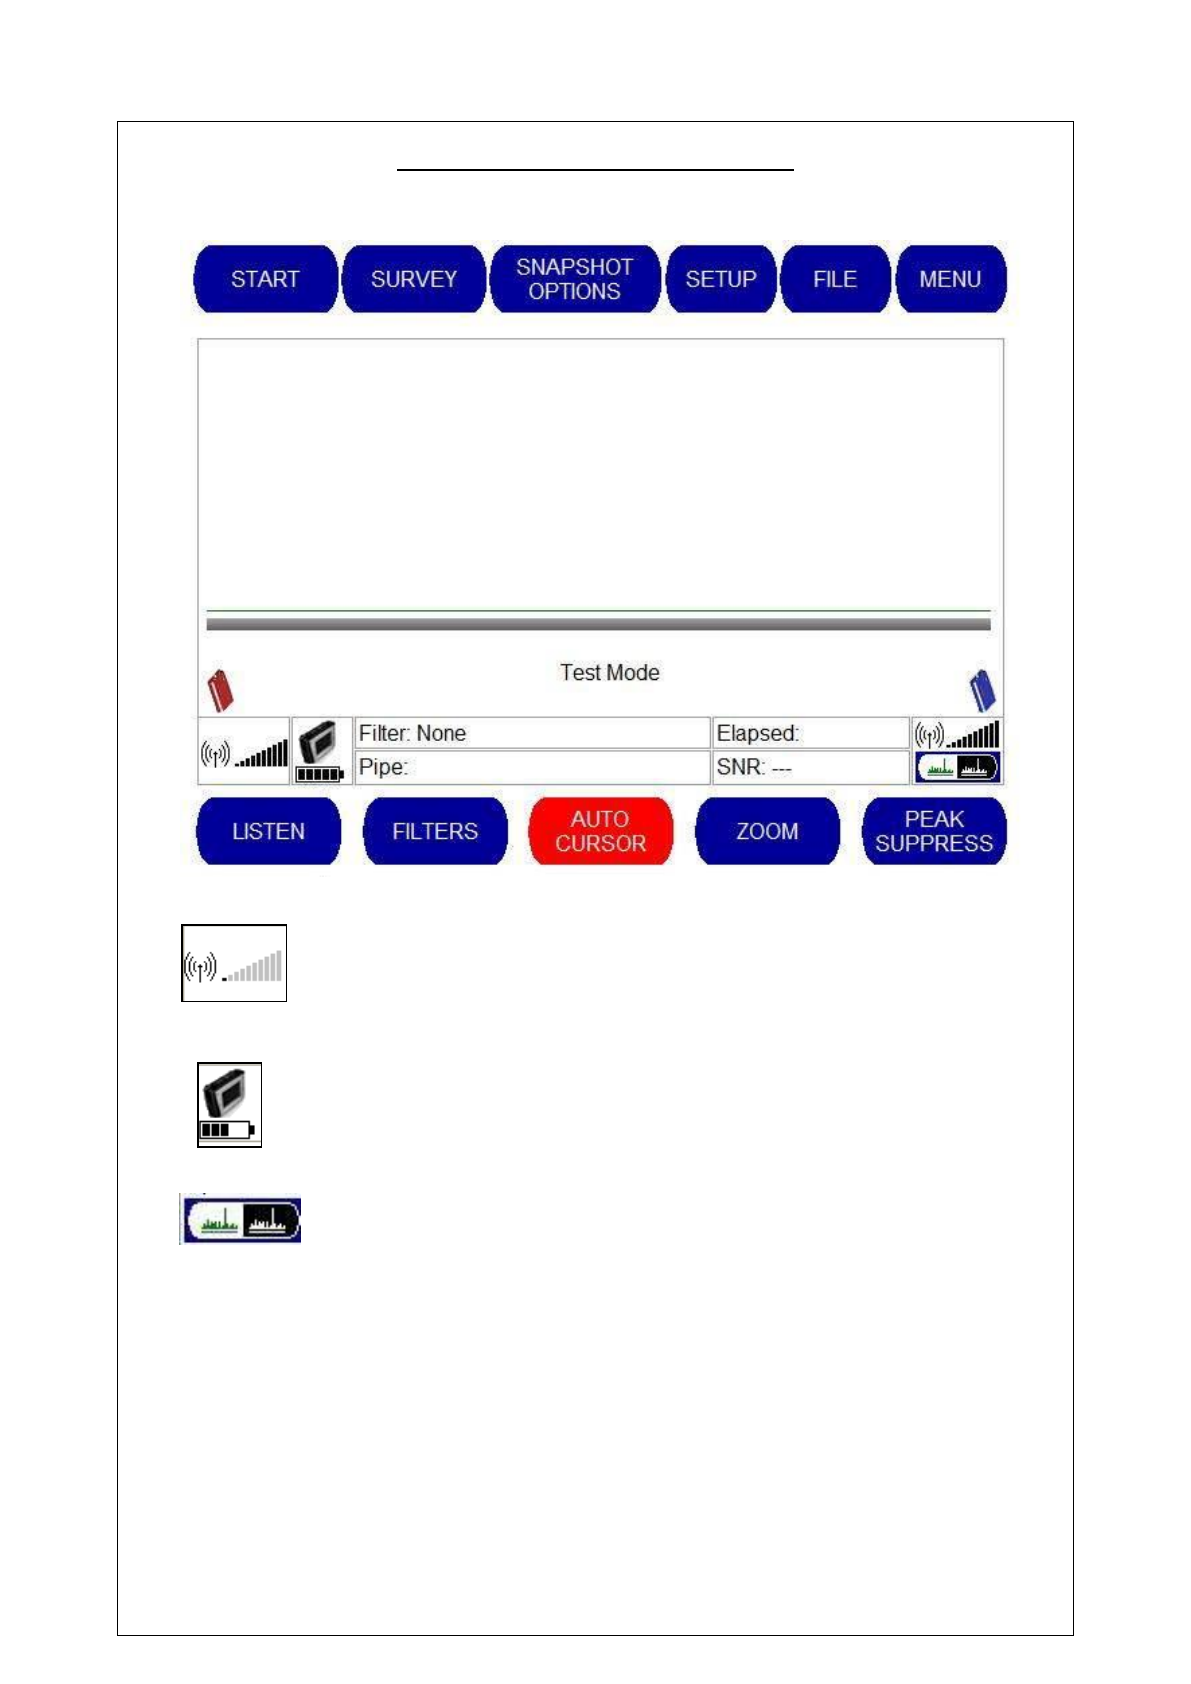
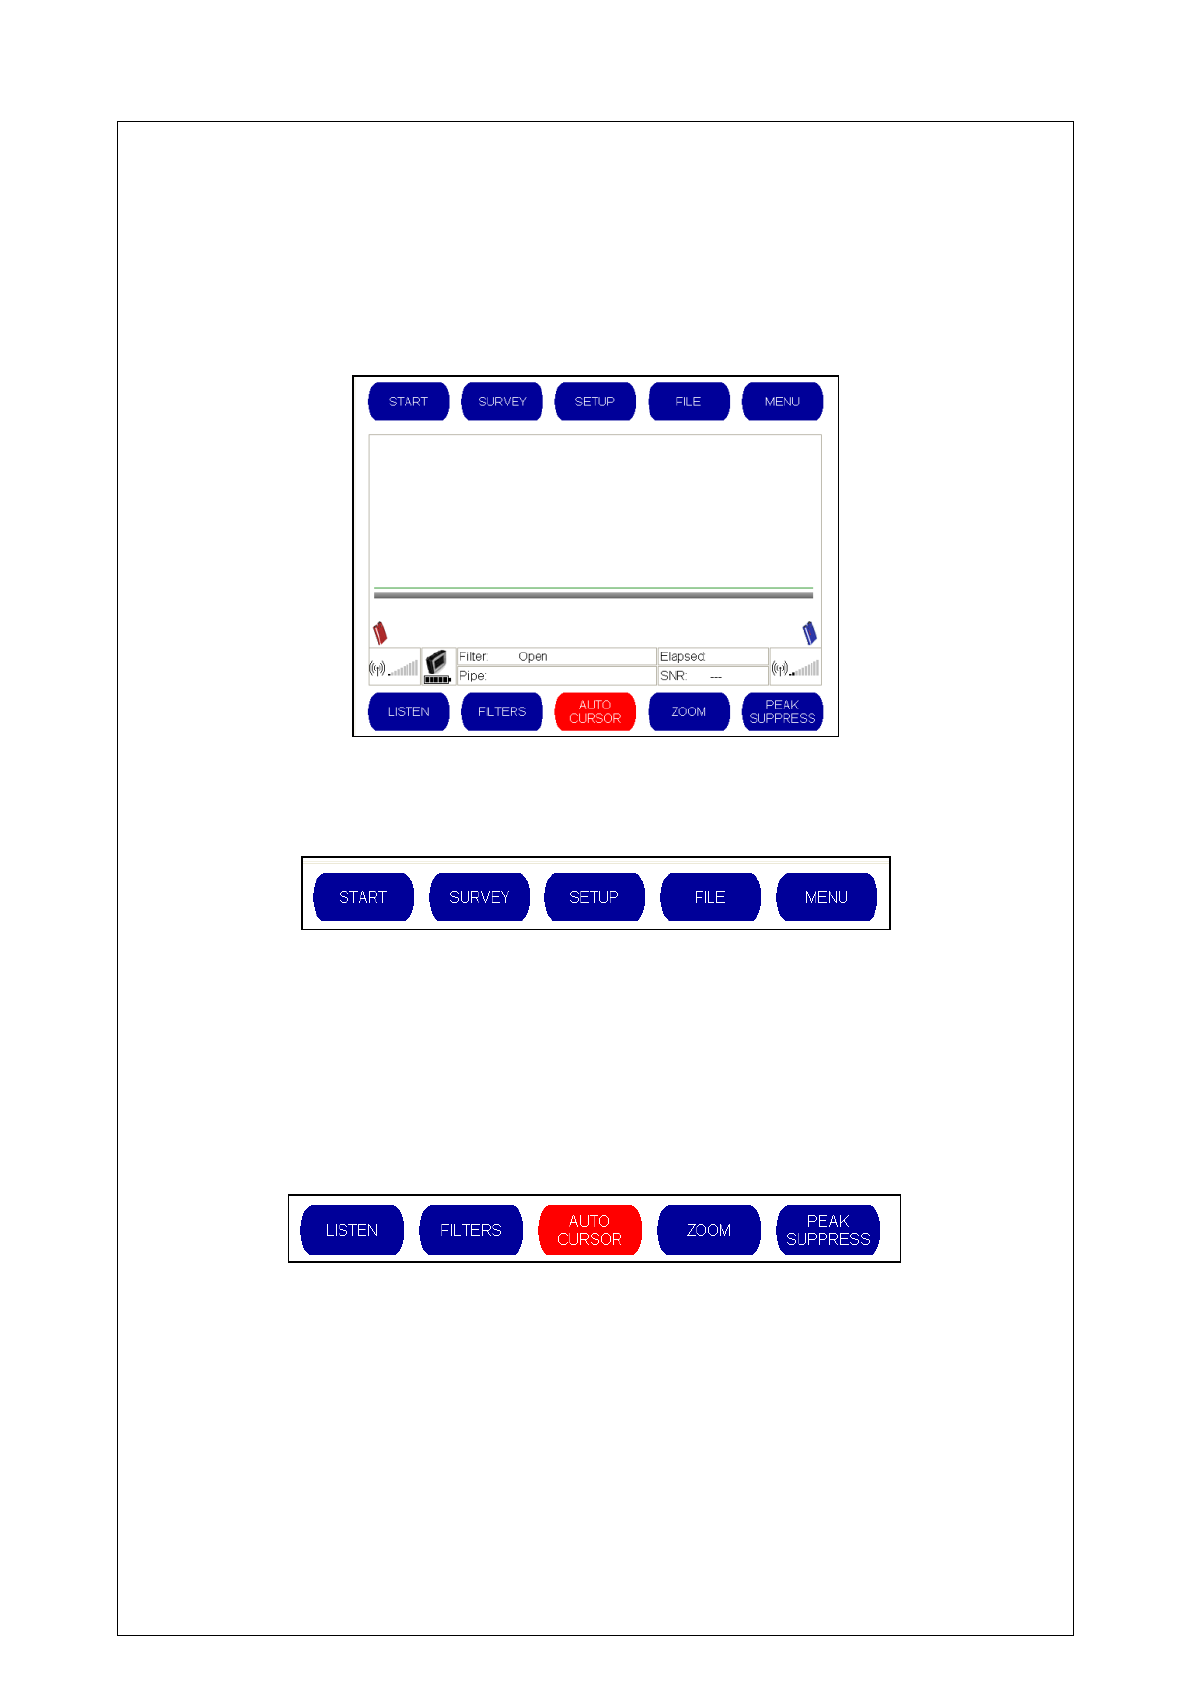
THE MAIN CORRELATION SCREEN
The main correlation screen is the screen you will see when the base unit is powered on.
The signal bars on either side of the display panel show the signal strength of
the two outstations to the base unit. The radio inside each outstation, which
transmits data to the base unit automatically, switches on when a sensor is
connected.
The battery level for the base unit is shown. When the battery level is critically
low this icon will turn red. We advise that no correlations be performed when the
battery life is critical as this can have an adverse result on the correlation result.
The high contrast mode is useful when using Touch Pro in bright sunshine.
Pressing this button will remove most of the color from the screen and create a
monochrome display that is easier to view in direct sunlight. The red and blue
outstations and SNR color signal remain in color when High Contrast mode is
activated. To return the screen to full color, simply press the button again.
Filter: This reading shows the filter settings that have been used to obtain the correlation result.
Pipe: This reading shows the selected pipe material and the total length of pipe that has been
input for this correlation.
Elapsed: This displays the time that the unit has been correlating. The longer the correlation
the more data is used to calculate the precise leak location.
21
SNR: The Signal to Noise Ratio (SNR) displays confidence in the highest peak. By measuring
the ratio between the highest peak and the next highest peak, the unit gives a confidence factor.
A high peak (i.e. an SNR of 20:1) will be a strong clearly defined peak which equates to a good
correlation. A green light will be displayed next to this result to indicate that confidence is high for
this correlation. A less well defined peak (e.g. 8:1) will display an Amber light. If there is no
clearly defined single peak (e.g. 3:1), a red light will show that confidence is low on this result. An
SNR of 99:1 indicates either a problem with the system or a failure to be able to correlate.
The operator will find ten selectable options displayed on the Main Correlation Screen.
The top of the screen has five menu options:
START – This begins the correlation process
SURVEY – This helps the user to identify whether there is a leak on the pipe
SETUP – These enable the operator to change the configuration settings on the unit.
FILE – This allows you to save a correlation result or load a previously saved result
MENU – This gives you access to advanced settings
The bottom of the screen has another five menu options:
LISTEN – Enables the operator to select which sounds are heard through the
headphones
FILTERS – Enables the operator to adjust the filter settings
AUTO CURSOR – When selected, the auto cursor will always display the highest peak
ZOOM – Enables improved resolution of a user specified section of the correlation graph
PEAK SUPPRESS – Allows the operator to remove an unwanted peak from the
correlation result
We will now examine each of these menu options in more detail.
22
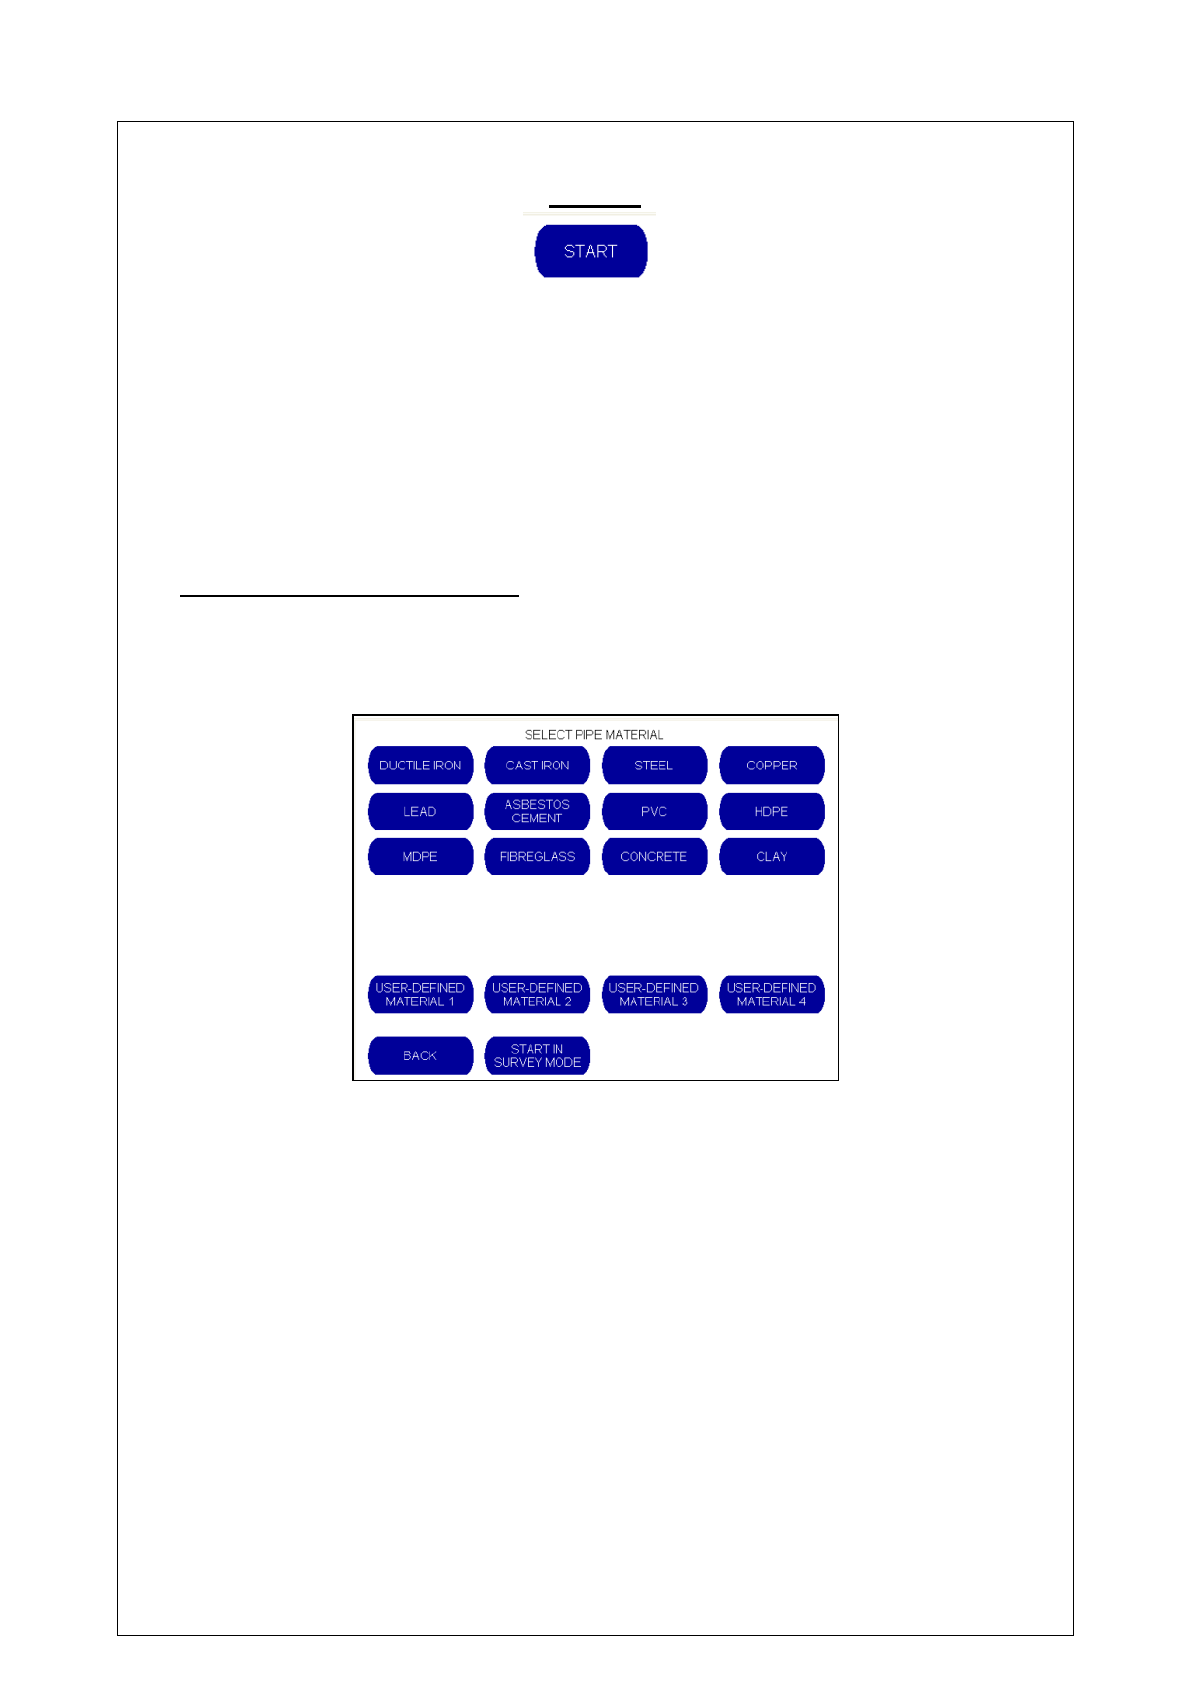
START
Selecting the “START” button from the main correlation screen begins the correlation process.
Before beginning a correlation, ensure that each sensor is positioned at either end of the
pipework under investigation, and has been connected either to an outstation or to the main base
unit. When a sensor is connected to an outstation it automatically transmits its signal. The
operator can check to see whether the signal is being received by examining the signal bars on
either side of the main correlation screen.
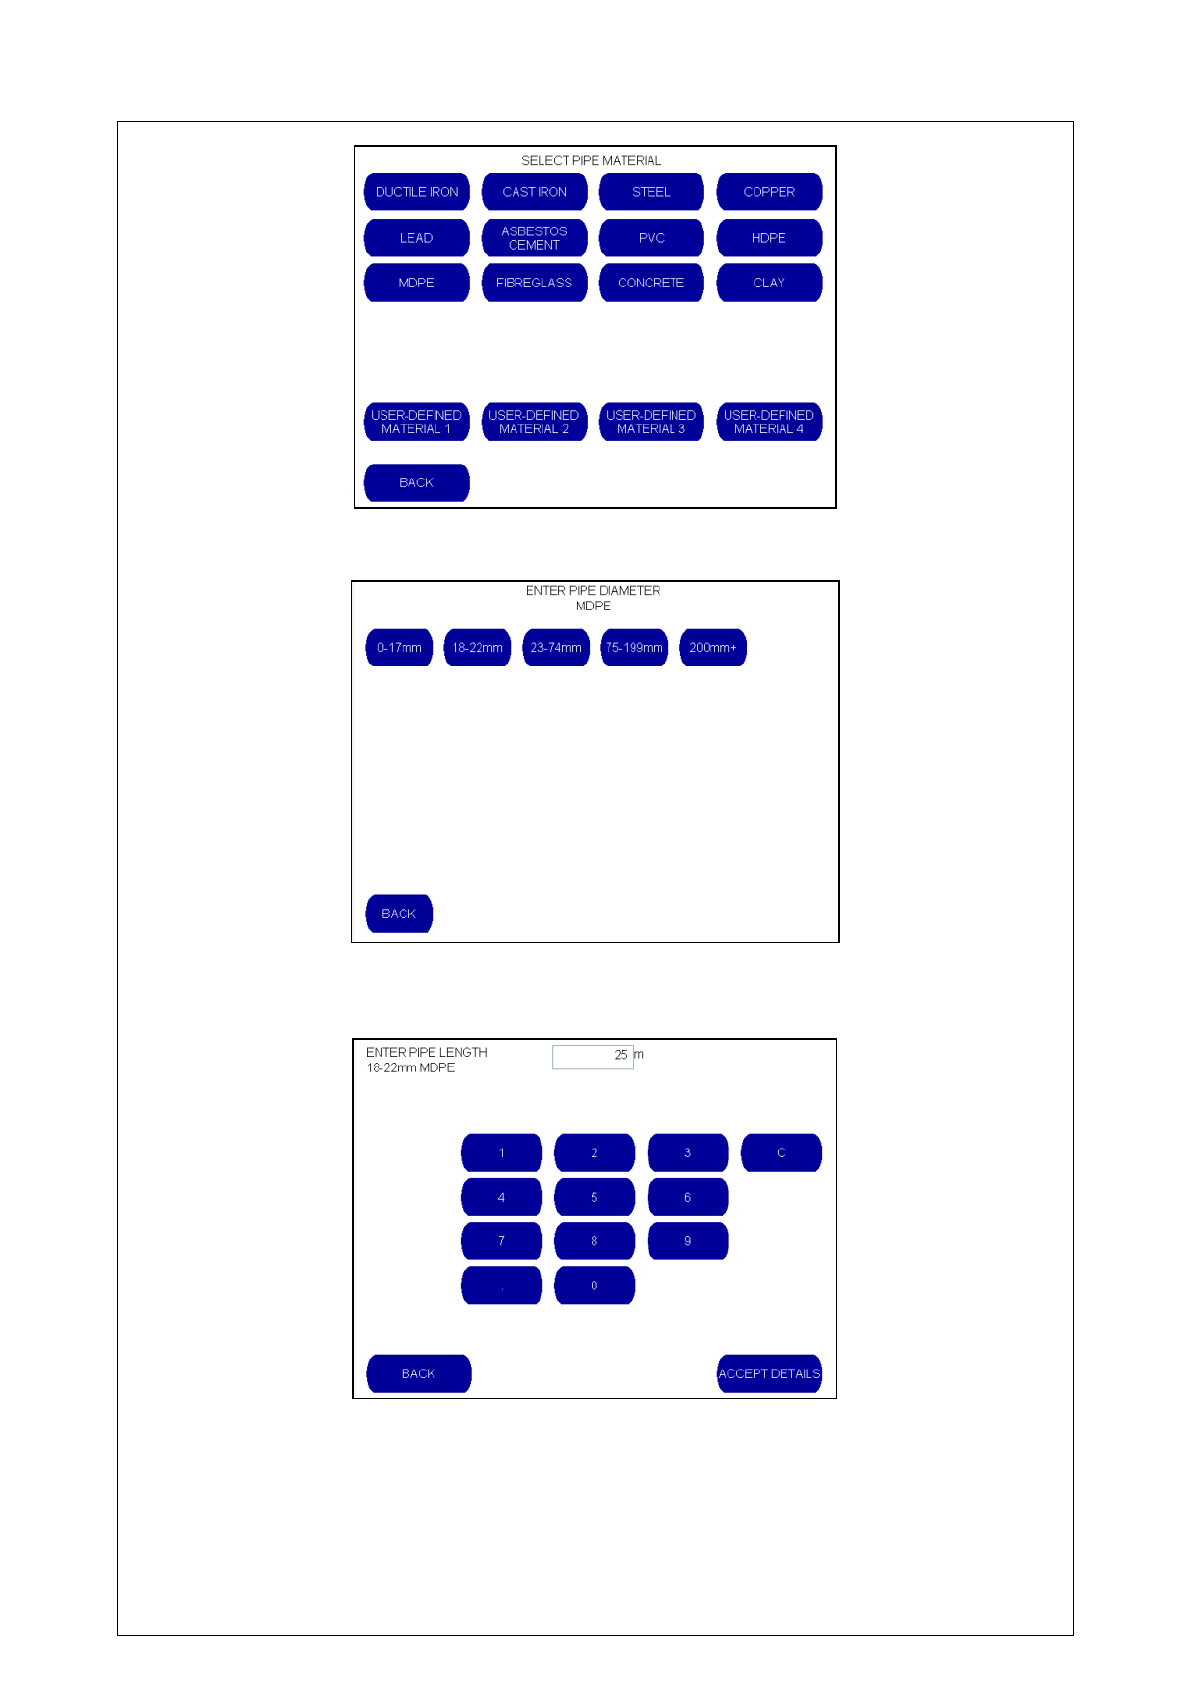
Pipe Material Selection Screen
When the Start button is pressed, the operator will be presented with the following Pipe Material
Screen.
This presents a list of pipe materials that the operator can select, or four user defined materials.
The Touch Pro is preconfigured with the sound velocities and default filter settings for the
following pipe materials.
Ductile Iron
Lead
MDPE
Cast Iron
Asbestos Cement
Fibreglass
Steel
PVC
Concrete
Copper
HDPE
Clay
In addition, the operator can select up to four user defined materials.
After selecting the required pipe material, the operator is automatically taken to the pipe diameter
screen.
23
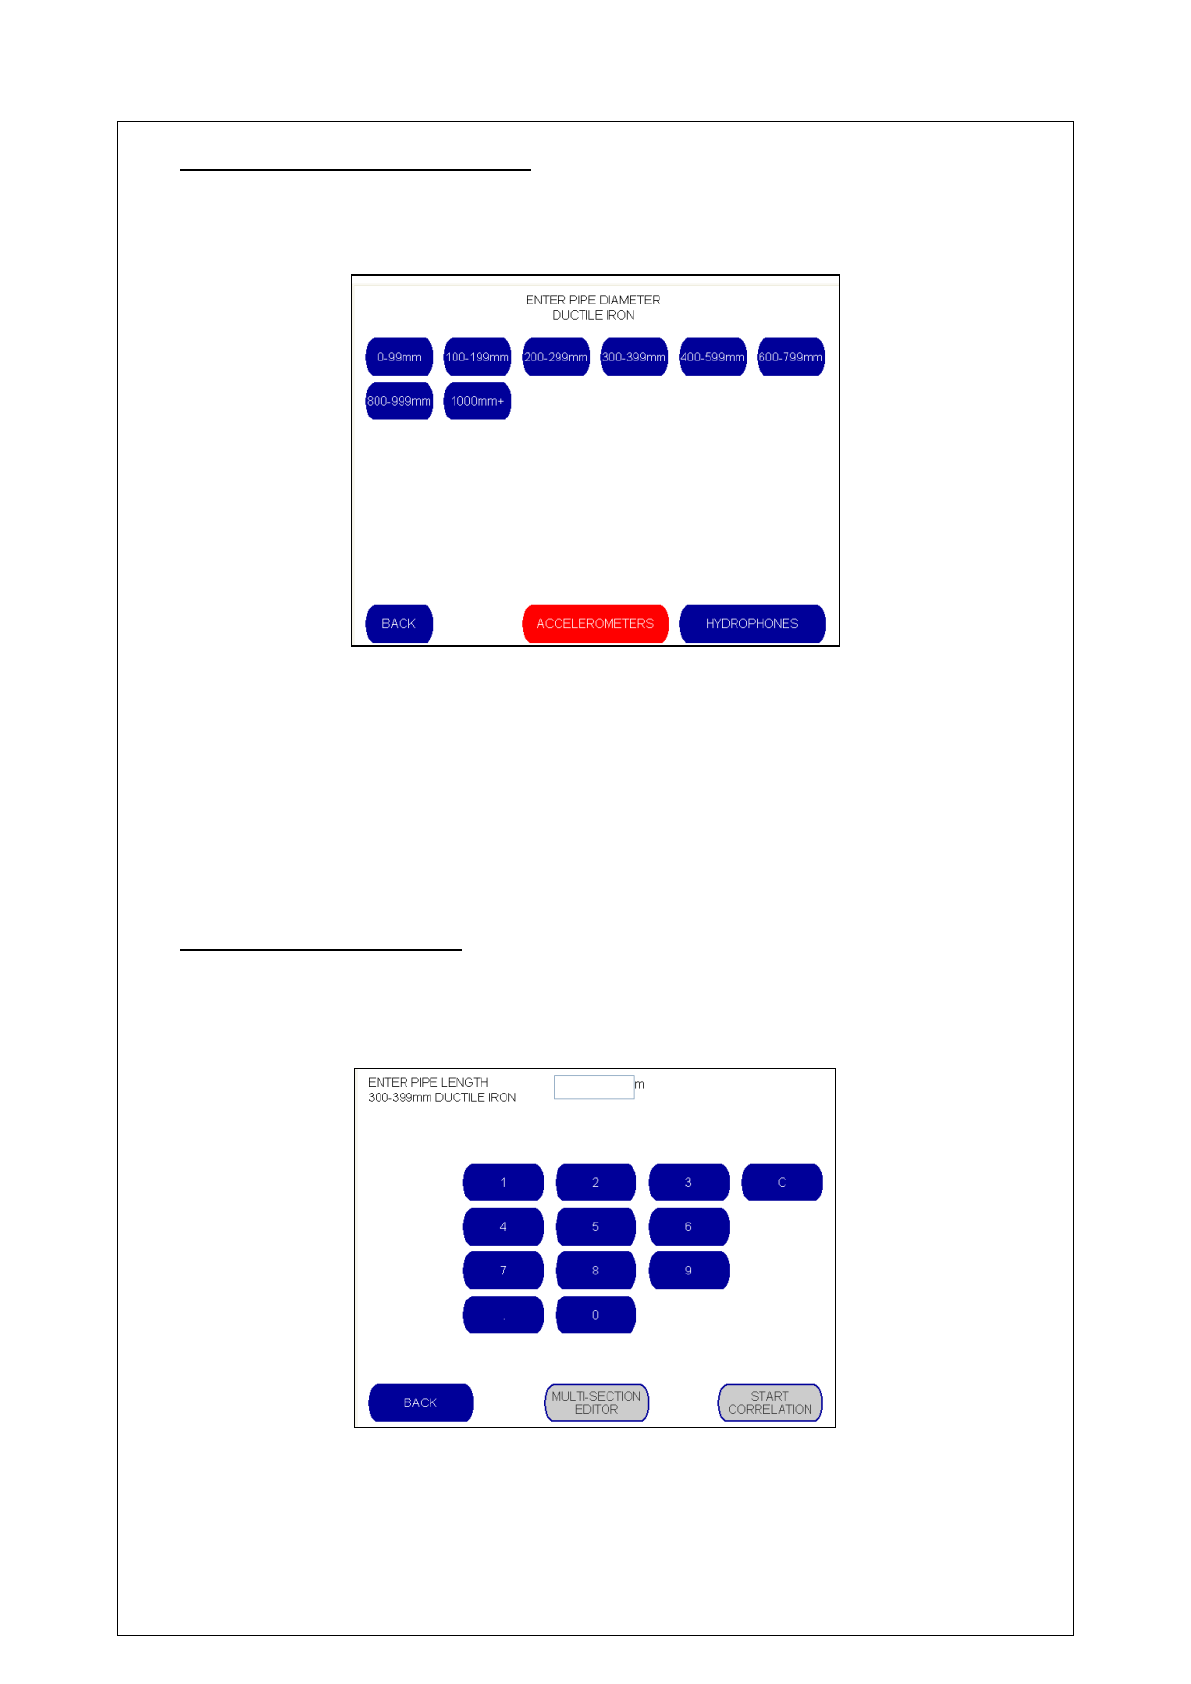
Pipe Diameter Selection Screen
The operator is then asked to input the diameter of the pipe.
A range of pipe diameters is displayed automatically to suit the material selected. When you
select and enter your required pipe diameter the velocity and filter values are set automatically.
If the operator is using Hydrophone Sensors instead of Accelerometers, they can notify the Base
Unit at this point. The sensor type is set to Accelerometers by default. This is indicated by the
fact that the Accelerometer setting is displayed in red. If Hydrophones are selected, the
Hydrophones button turns red, and the Accelerometers button turns blue, to indicate the current
configuration.
The operator is then taken to the Pipe Length Input Screen
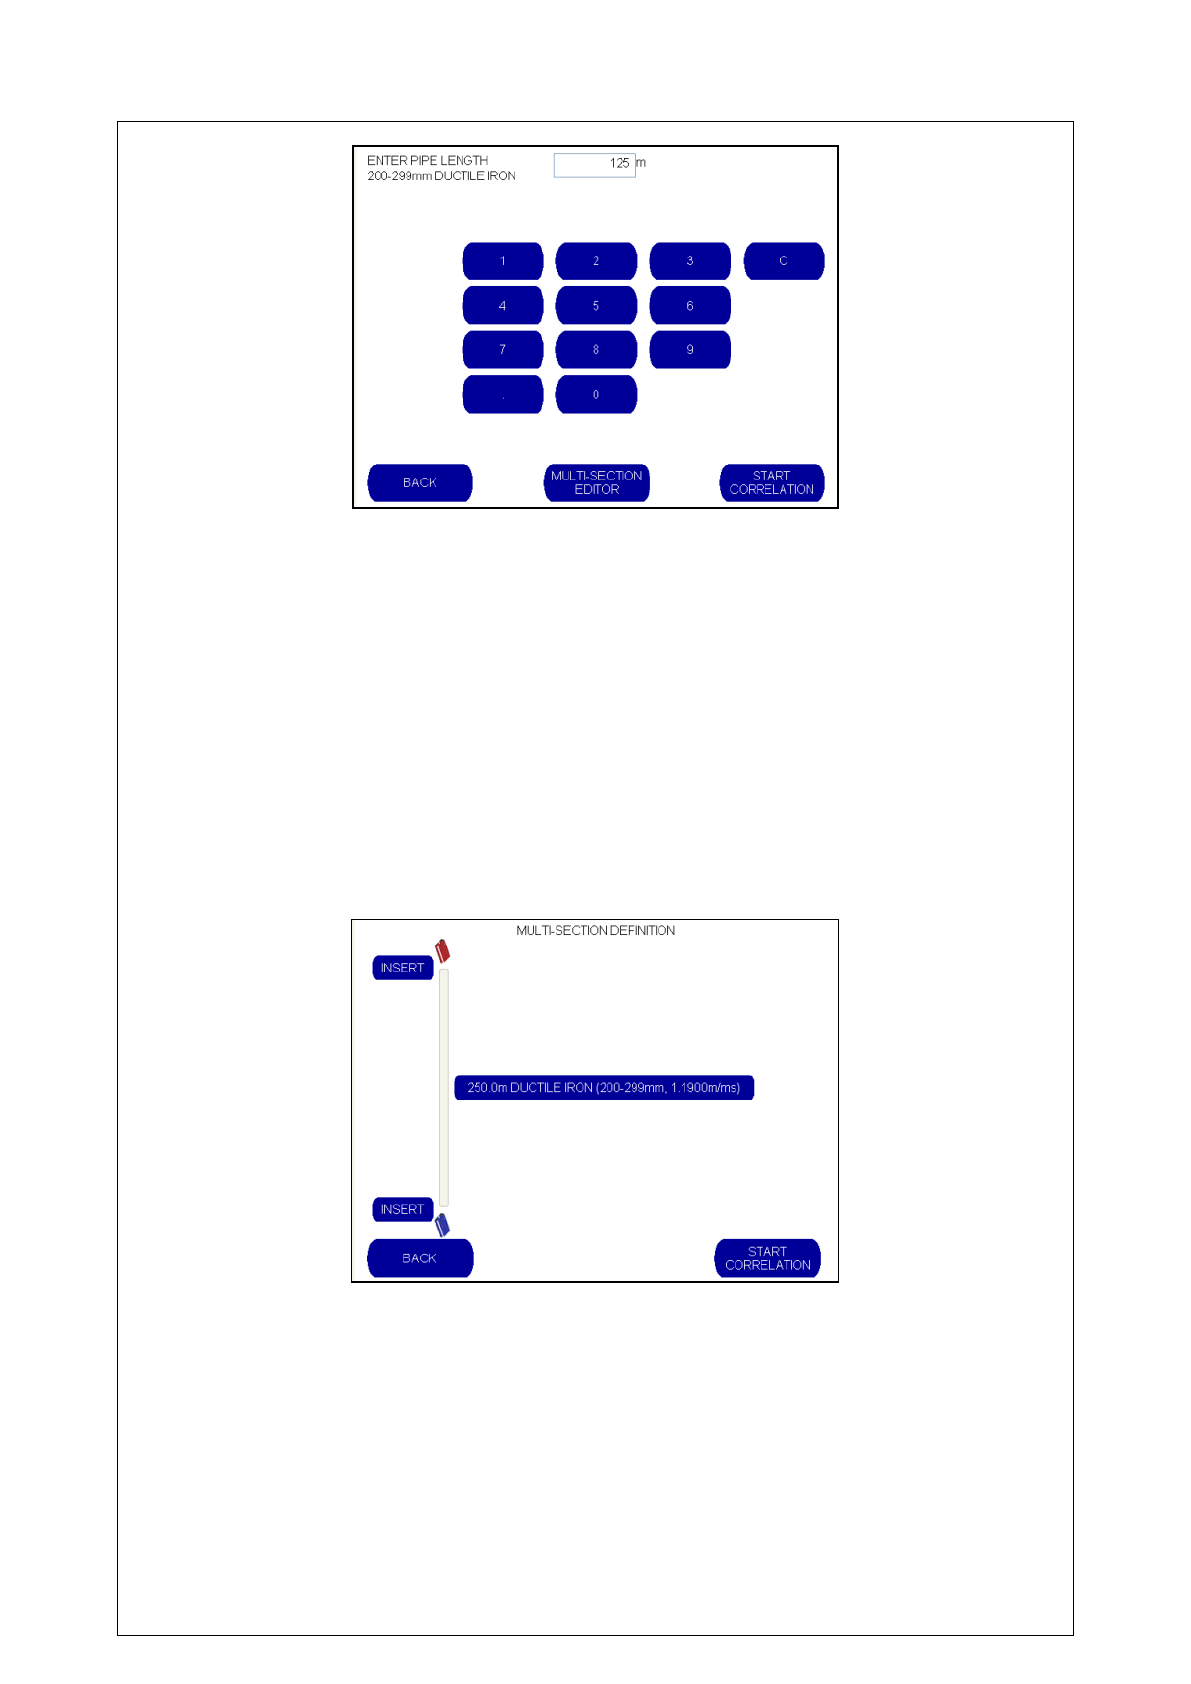
Pipe Length Input Screen
The operator is asked to input the length of the pipe using a virtual numeric key pad as shown
below.
When the pipe length has been input, the buttons “Multi Section Editor” and “Start Correlation”
turn from grey to blue, enabling them to be selected.
24
If the full length of pipe uses the same material, the operator can then select the “START
CORRELATION” button to be returned to the main correlation screen, and the correlation
process begins.
If the pipe has been constructed using different materials, these can be input by selecting the
“MULTI SECTION EDITOR” button.
Multi-Section Editor Screen
When selected, the Multi-Section Definition screen displays the first length of pipe input. In the
example shown below, 250m of Ductile iron pipe has been selected.
The operator can then select where to insert the second section of pipe by using one of the
“INSERT” buttons. In this example, the operator wishes to add a short 25m section of MDPE
pipe, located 250m from the Red Outstation.
To do this, the operator selects the “INSERT” button closest to the Blue Outstation and inputs the
required pipe material.
25
Then, the operator inputs the pipe diameter.
Finally, the operator inputs the pipe length and selects “ACCEPT DETAILS”
The operator is then returned to the Multi-Section Definition screen which now displays the two
different pipe materials and lengths.
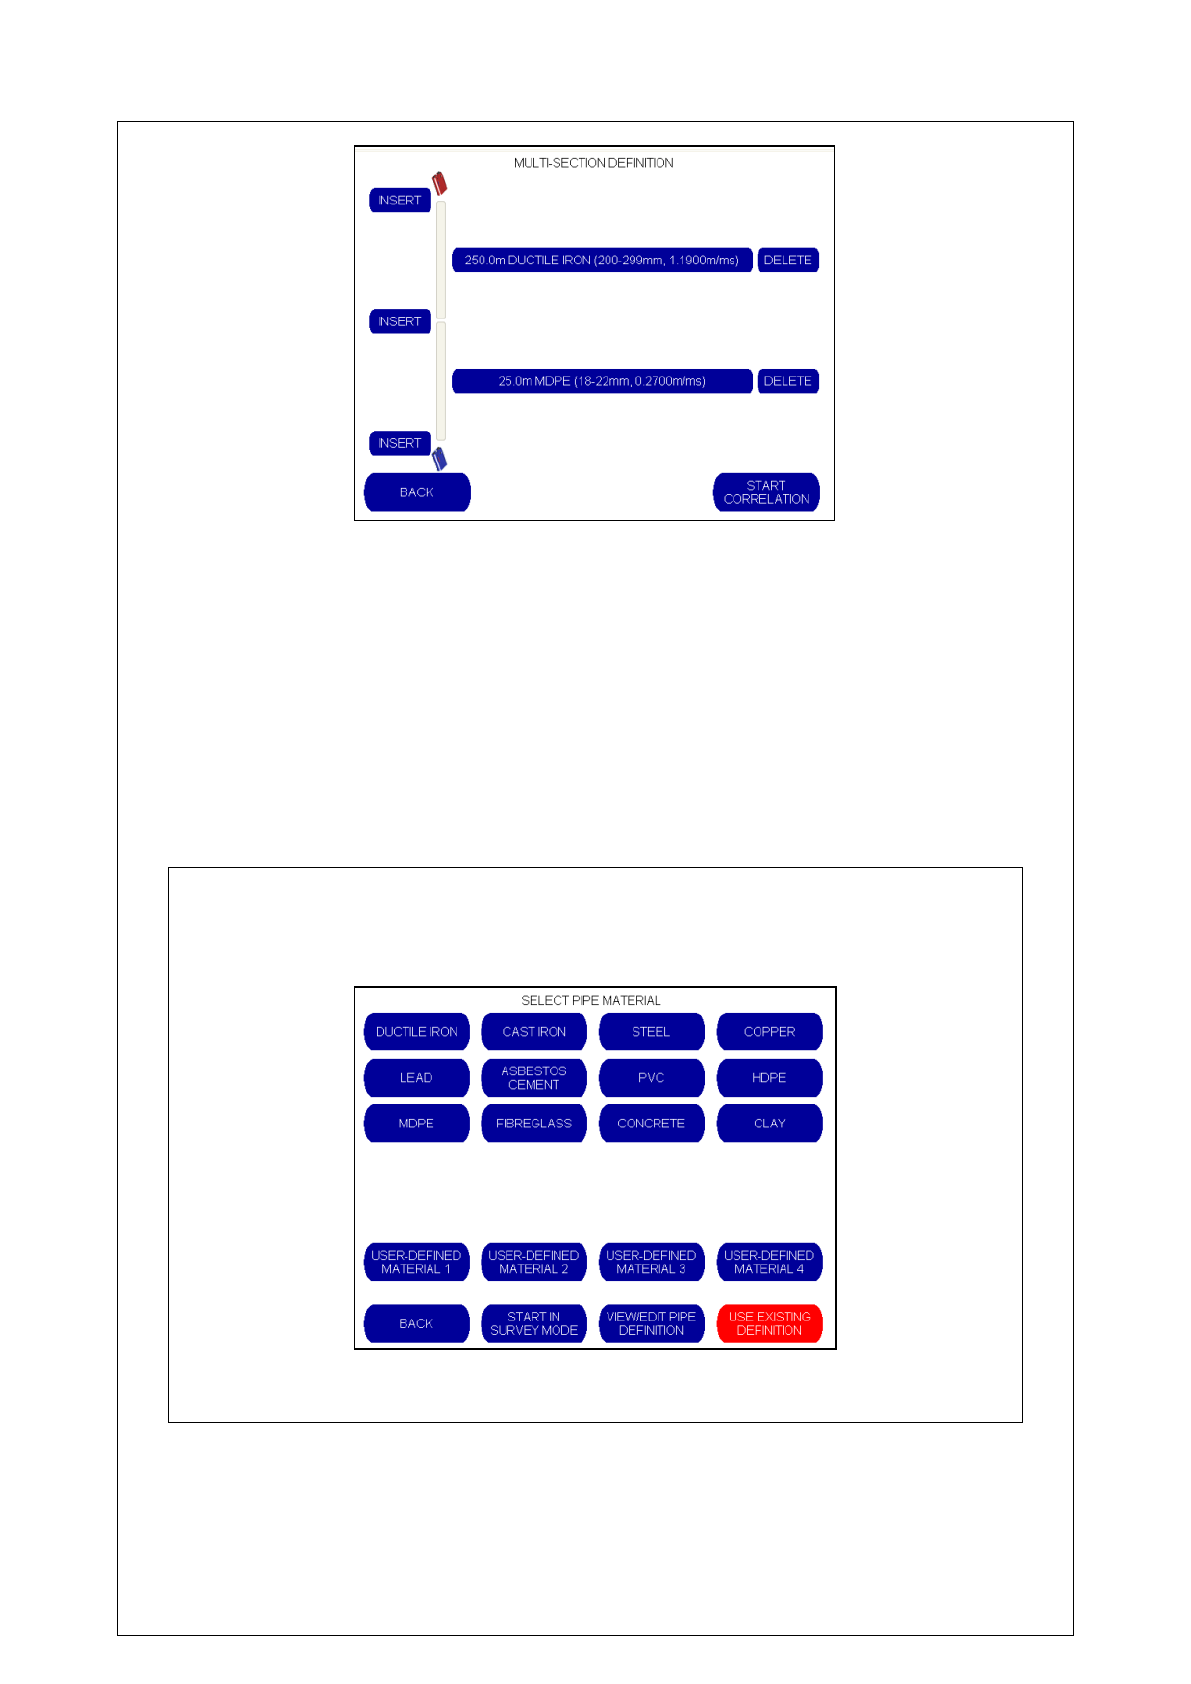
26
If an error has been made a pipe length can be deleted simply by selecting the “DELETE” button
next to the description of the unwanted section.
Alternatively, additional sections of pipe material can be added by selecting the “INSERT” button
until the full length of pipe located between the two outstations has been input.
When the operator is ready to begin the correlation, select the “START CORRELATION” button
to proceed.
HELPFUL NOTE
If, following a correlation, the operator wishes to perform a new correlation, the Pipe Material
screen will give the operator the option of selecting “USE EXISTING DEFINITION” to select the
pipe material used in the previous correlation.
27
Filter Optimization (AFIS)
Touch Pro provides default filter settings for a wide range of different pipe materials and sizes.
However, due to the number of unknown variables that can change the frequency of leak
noise, default filter settings can never be optimised for every leak situation. Experienced
users can manually change the filter settings to find the leak, but this is often a time
consuming process involving multiple correlations. Even then it can be “hit or miss” to
successfully locate the leak.
To assist the operator, Touch Pro incorporates a unique Automated Filtering Intelligence
System (AFIS) which effectively builds an ‘expert user’ into the unit. AFIS works by
automatically applying multiple filter settings to determine the best possible correlation result
during the correlation.
Touch Pro runs 55 different filter combinations on the correlation data, checking the quality of
the result and optimising the filter settings as required, until the clearest and most accurate
result can be presented.
AFIS Filter Optimisation is set to run automatically during a correlation whenever the default
filter setting is not effective in producing an accurate correlation. The operator can choose to
disable this feature, or set it as a manual function that is activated only when specifically
requested by the operator.
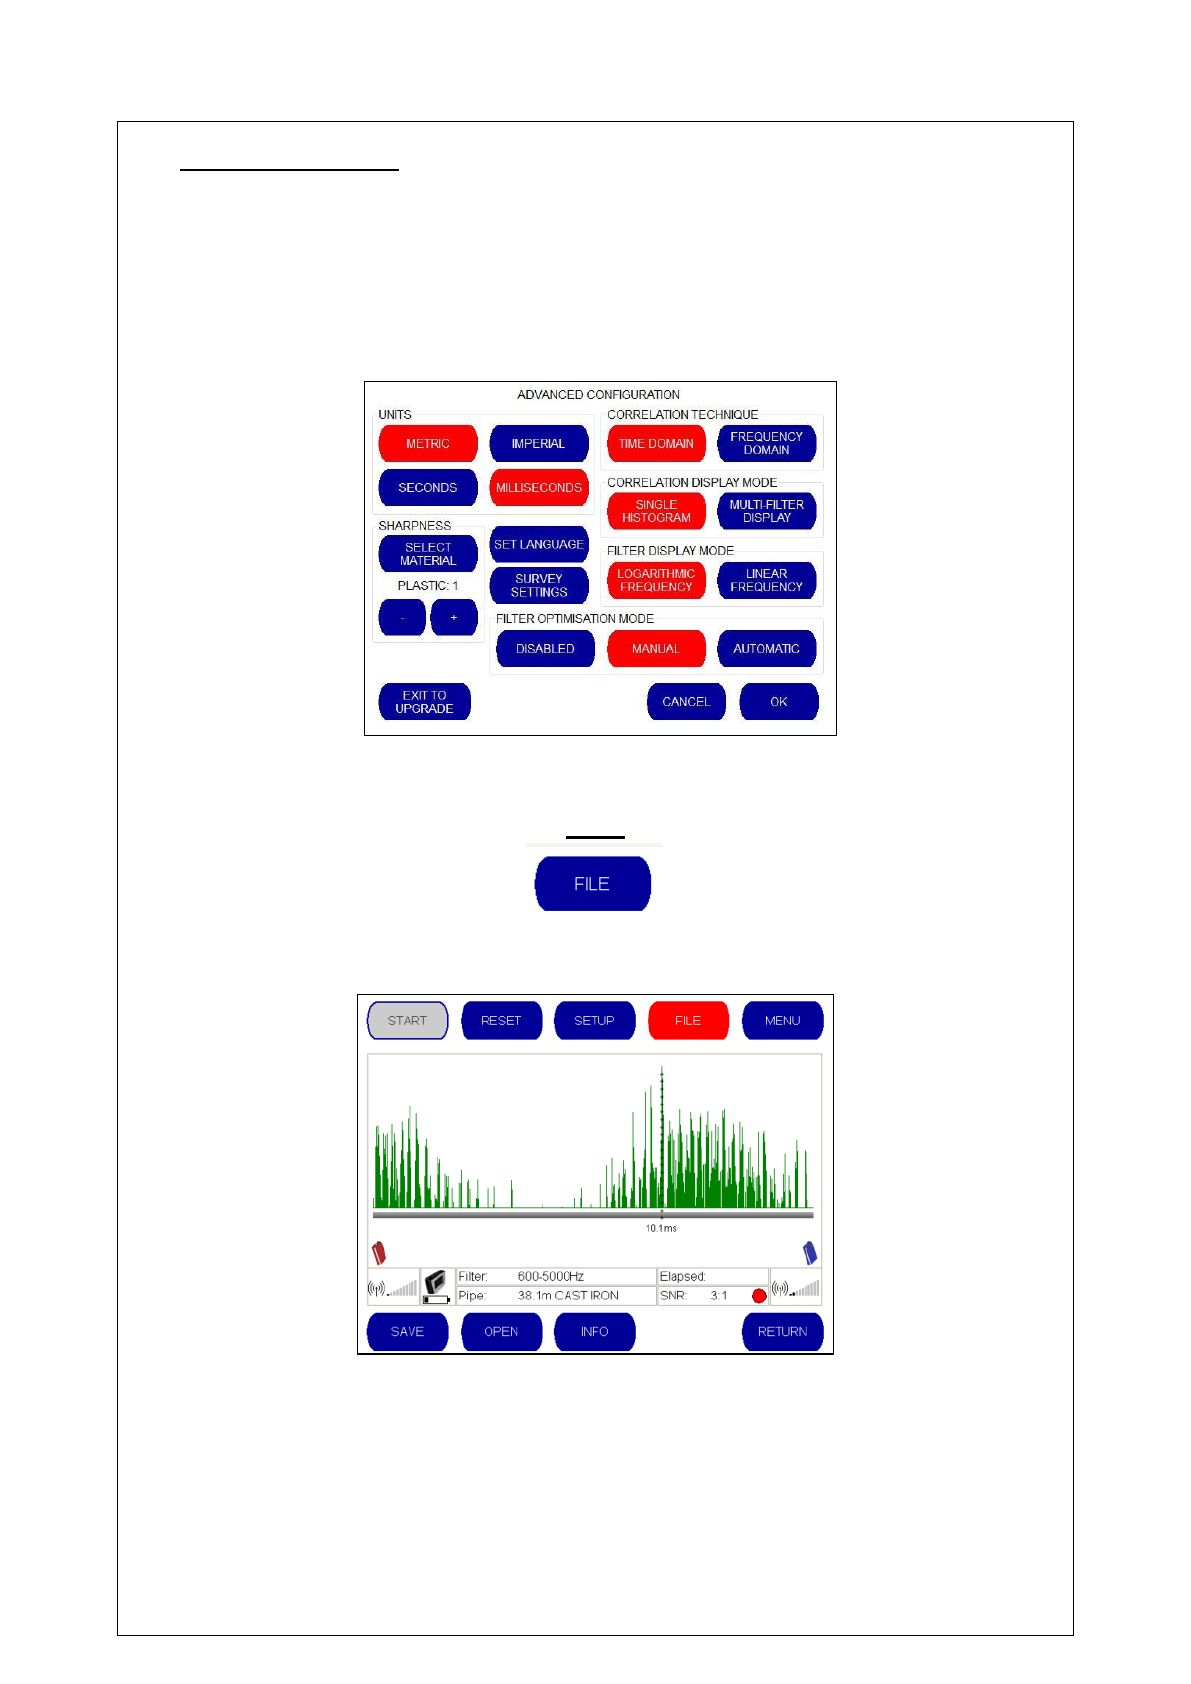
These options can be accessed from the Advanced Configuration screen (see below) which
can be located from the Set Up menu
28
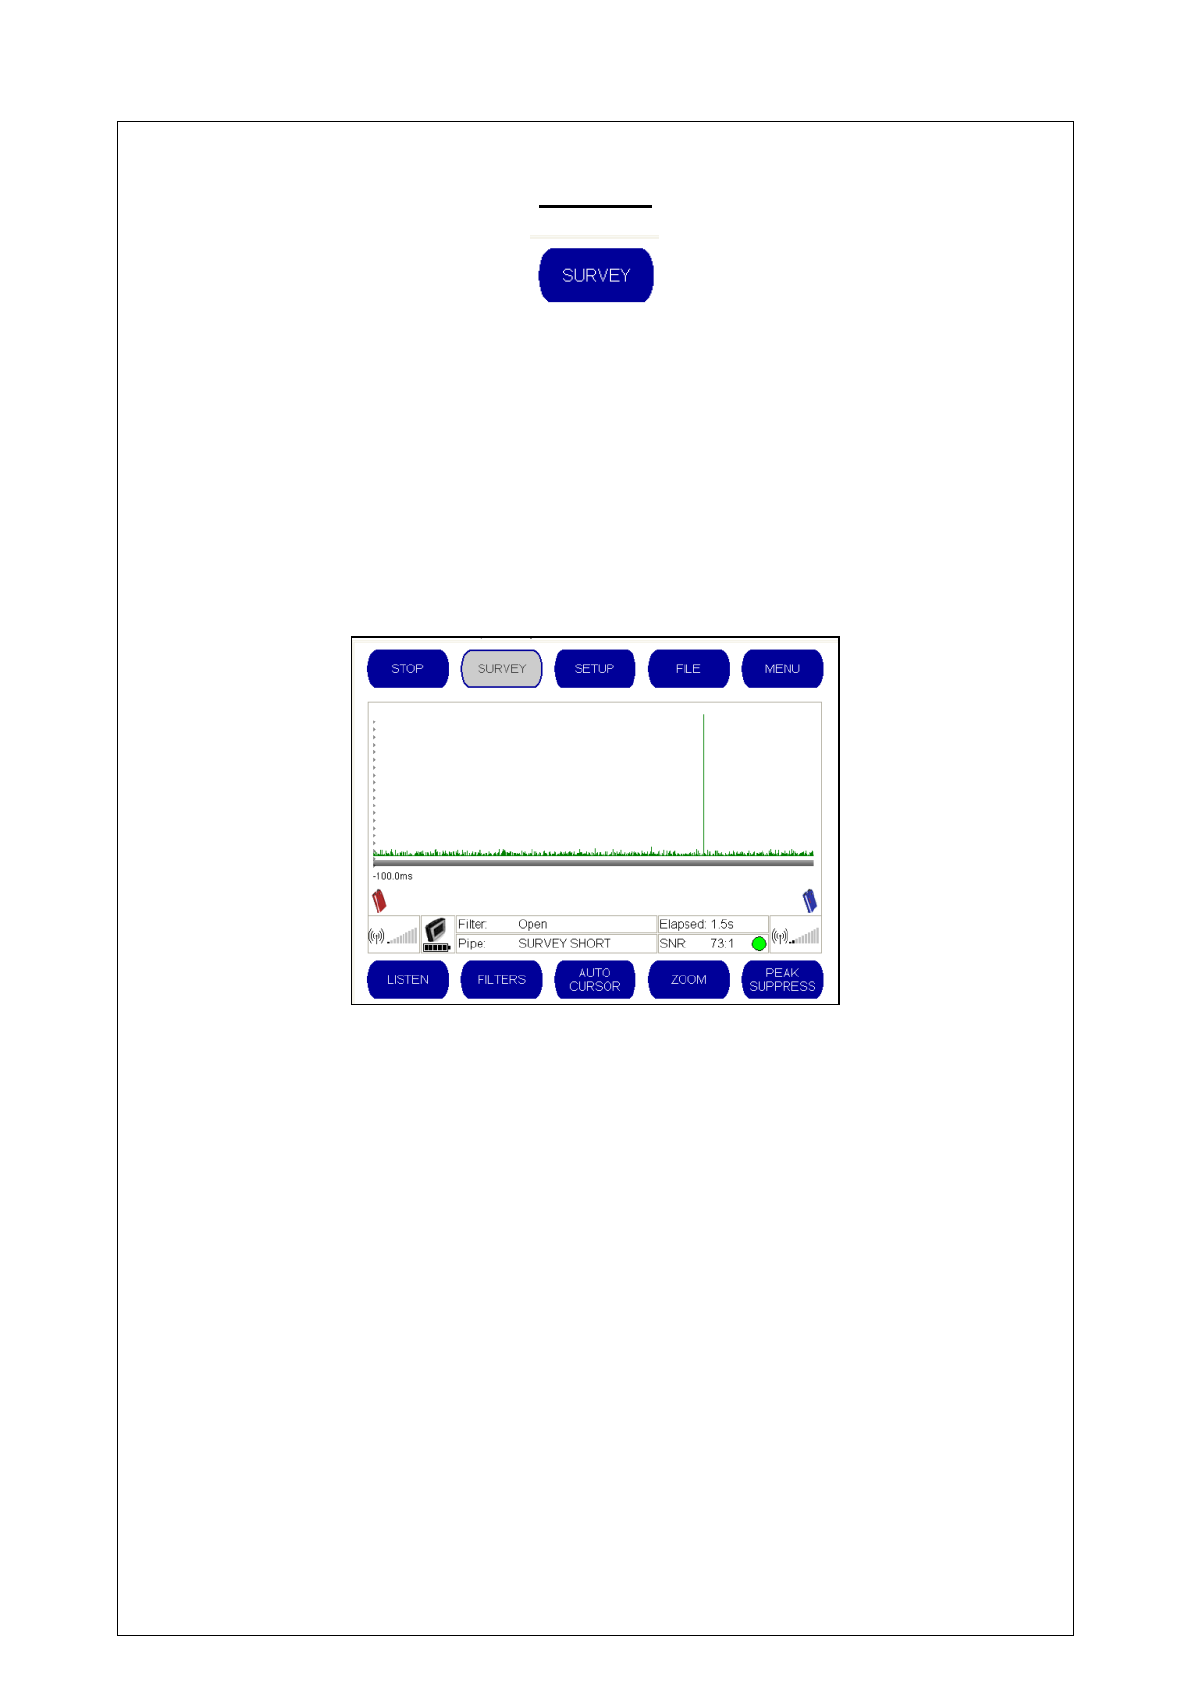
SURVEY
Survey Mode provides a correlation display that enables you to check large distances rapidly for
the presence of leaks. The survey mode helps the user to identify whether there is a leak on the
pipe. No pipe material settings are required as all of the filters are set to open.
Filters can be manually set if required. For more information, please refer to the “Filters” section
of the manual.
Upon pressing the button, a graph appears. If a peak is shown on the graph this is an indication
that a leak exists between the two points.
Accelerometers are the most practical signal sensors for quick operation and the distance
between sensors should be kept reasonably short; generally up to 400 metres for metal pipes
and 50-60 meters for plastic is a good maximum for accelerometers in this mode of operation.
To begin Survey mode, attach the sensors to the pipe fittings and select the “SURVEY” button.
It should be noted that no leak position calculations are performed in this mode although the
Sound to Noise ratio (SNR) is displayed to indicate the unit’s confidence in a leak having been
identified.
29
SET UP
The Setup screen shows the main configuration settings. From here, you will be able to change
the power off settings, outstation settings and clock settings. You will also be able to check the
status of your outstations to ensure that they are transmitting to the base unit correctly.
In addition, advanced settings are available which allow you to change measurement settings,
time display settings and language options. You also have the opportunity to change the
graphical display when a correlation is performed from a single graph to three graphs each
displaying different filter settings.
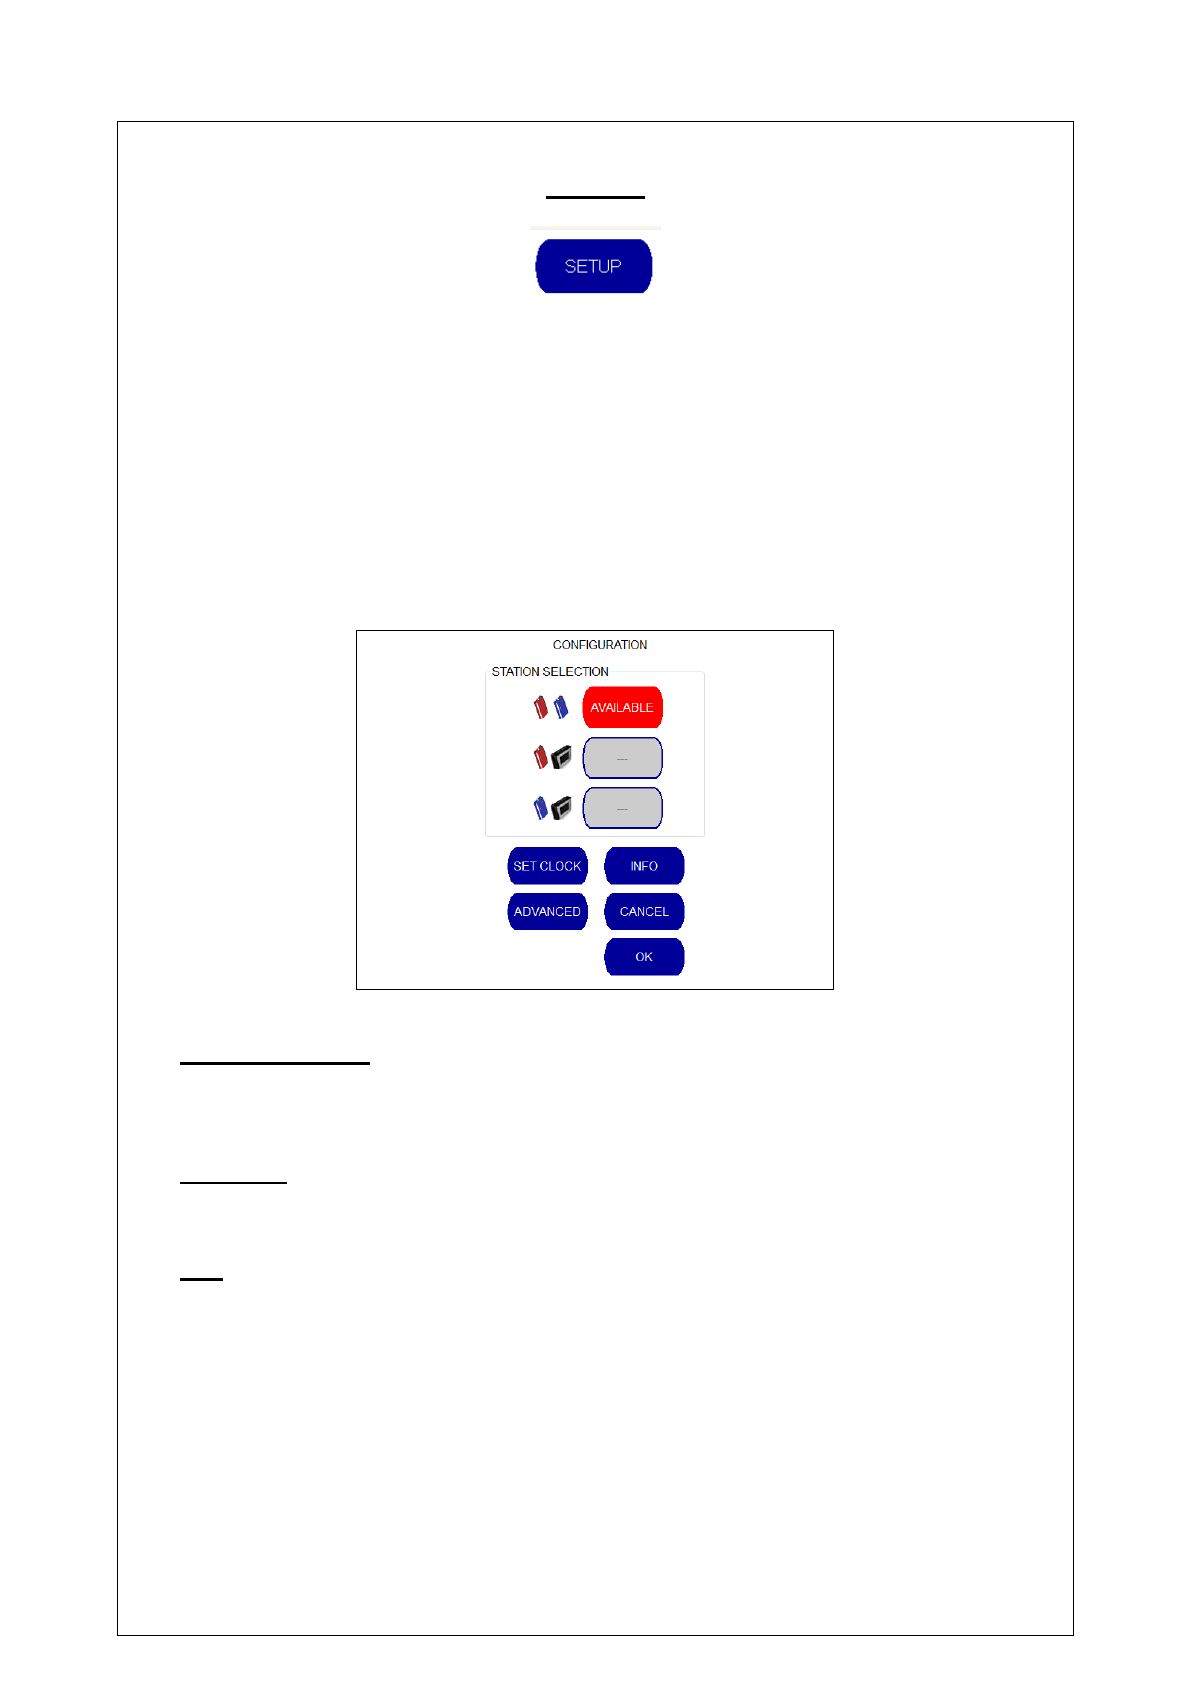
Upon selecting the “SETUP” button, the following Configuration screen is displayed.
Station Selection
This enables you to specify which two units you are correlating between (either red and blue, red
and base station or blue and base station).
Set Clock
This button sets the internal clock.
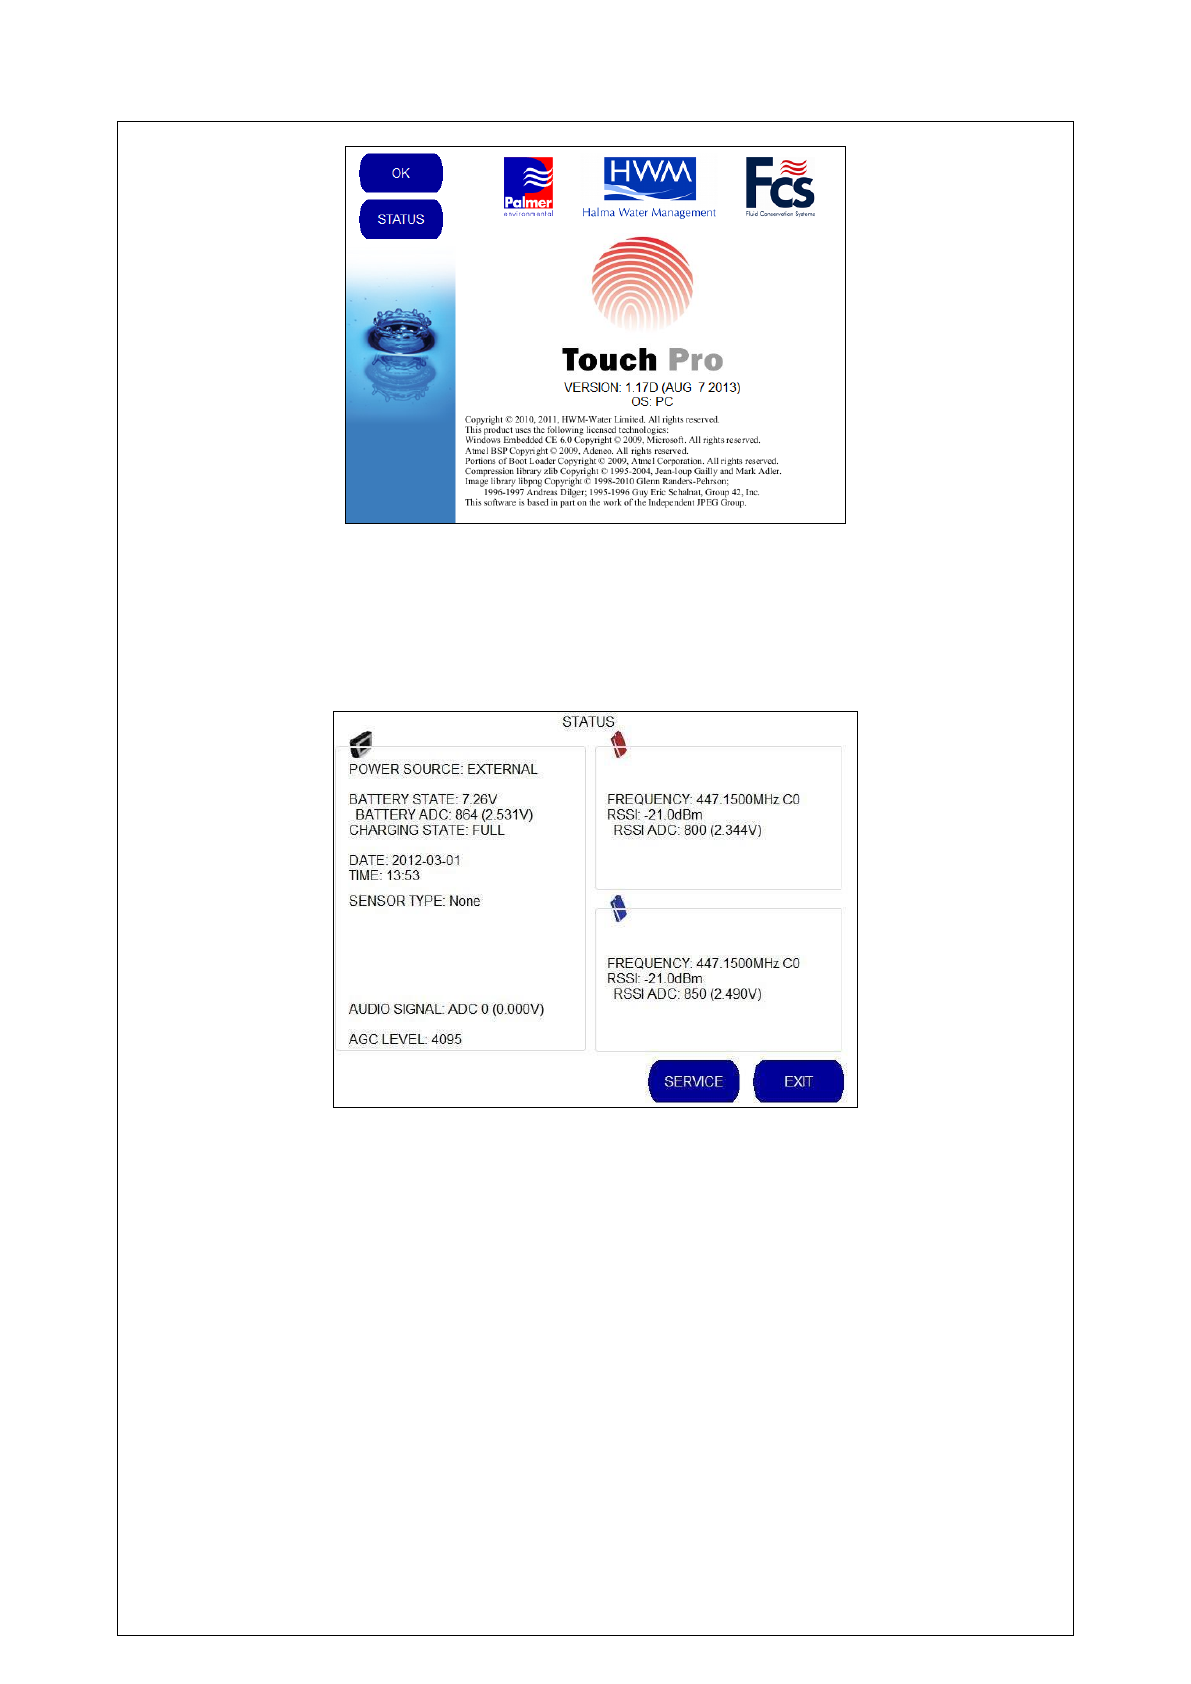
Info
The Info button displays product information about the Touch Pro
30
The status button displays information about the base unit and outstations including battery and
charging status of the base unit, and the frequency received from the two outstations.
`
This is a useful diagnostic tool to check that the signal is being received from the outstations.
Pressing the “EXIT” button will return you to the Setup screen.
Please note that the “SERVICE” button is for use only by HWM-Water Ltd engineering
personnel.
31
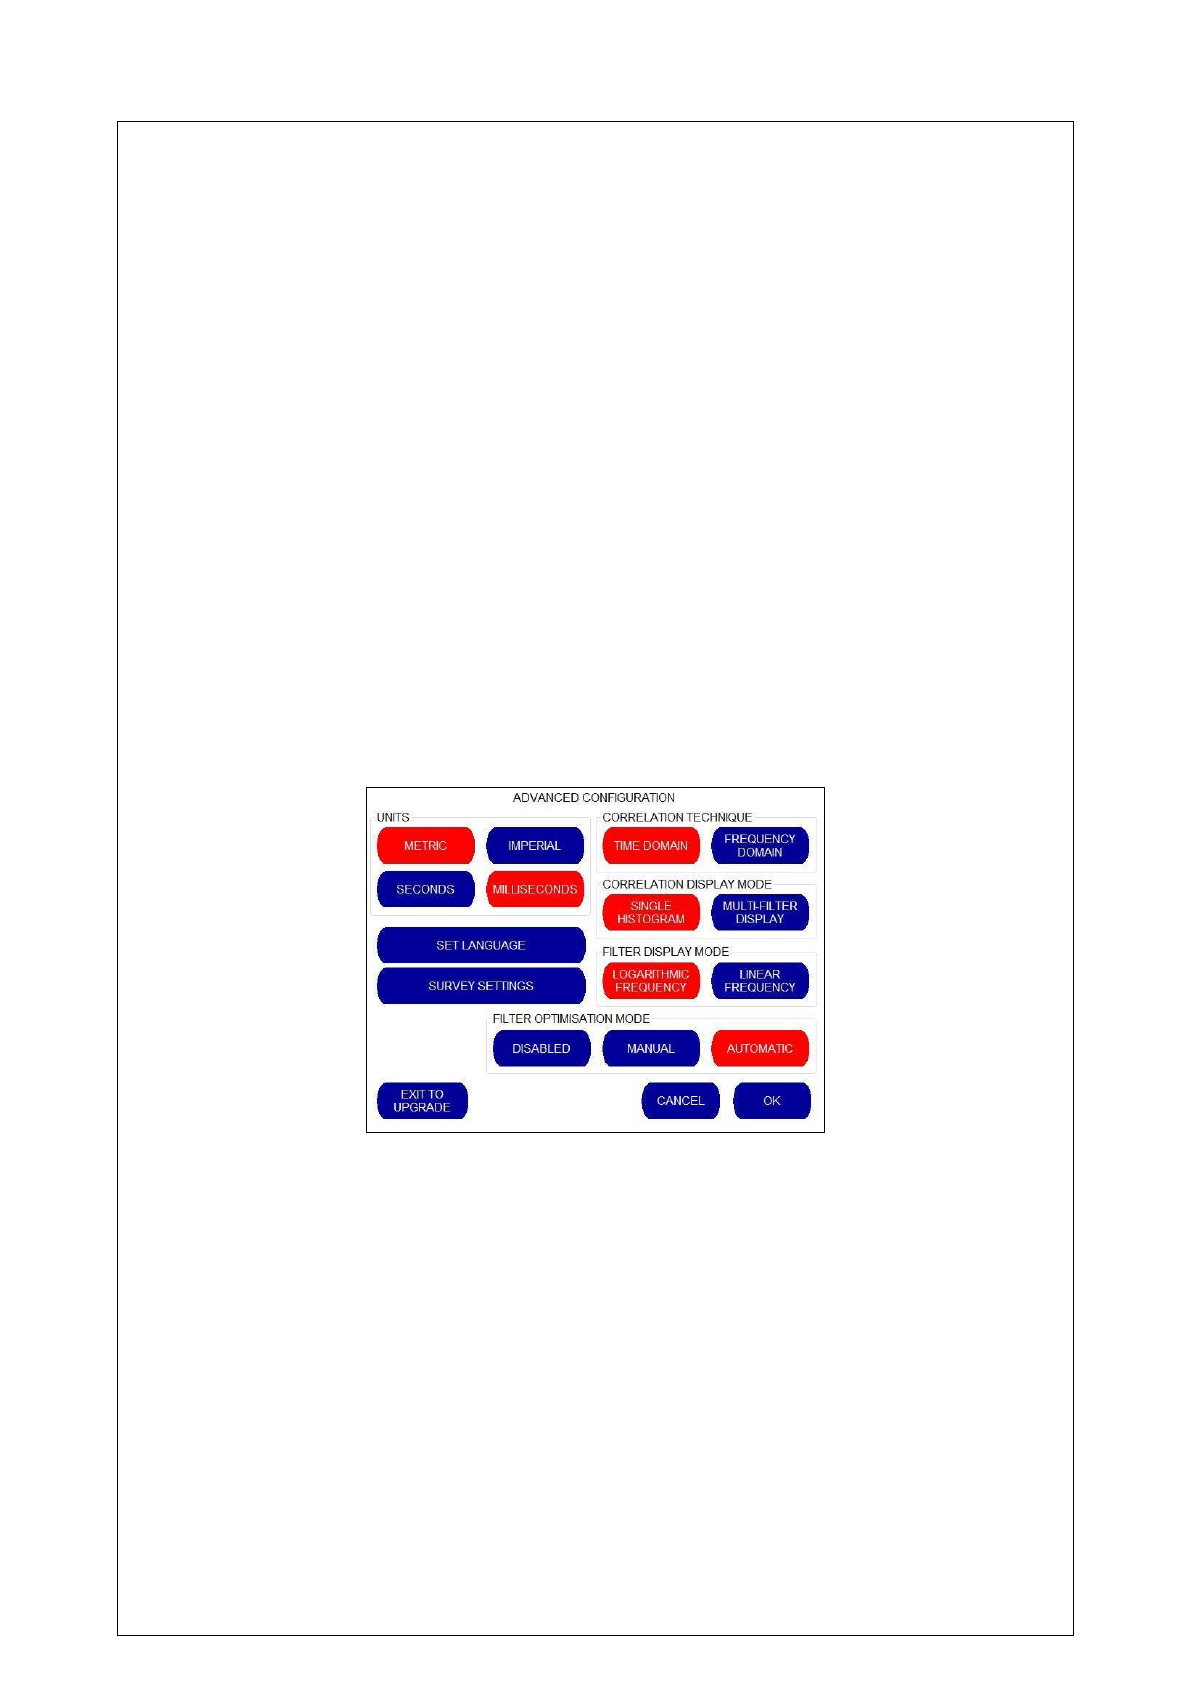
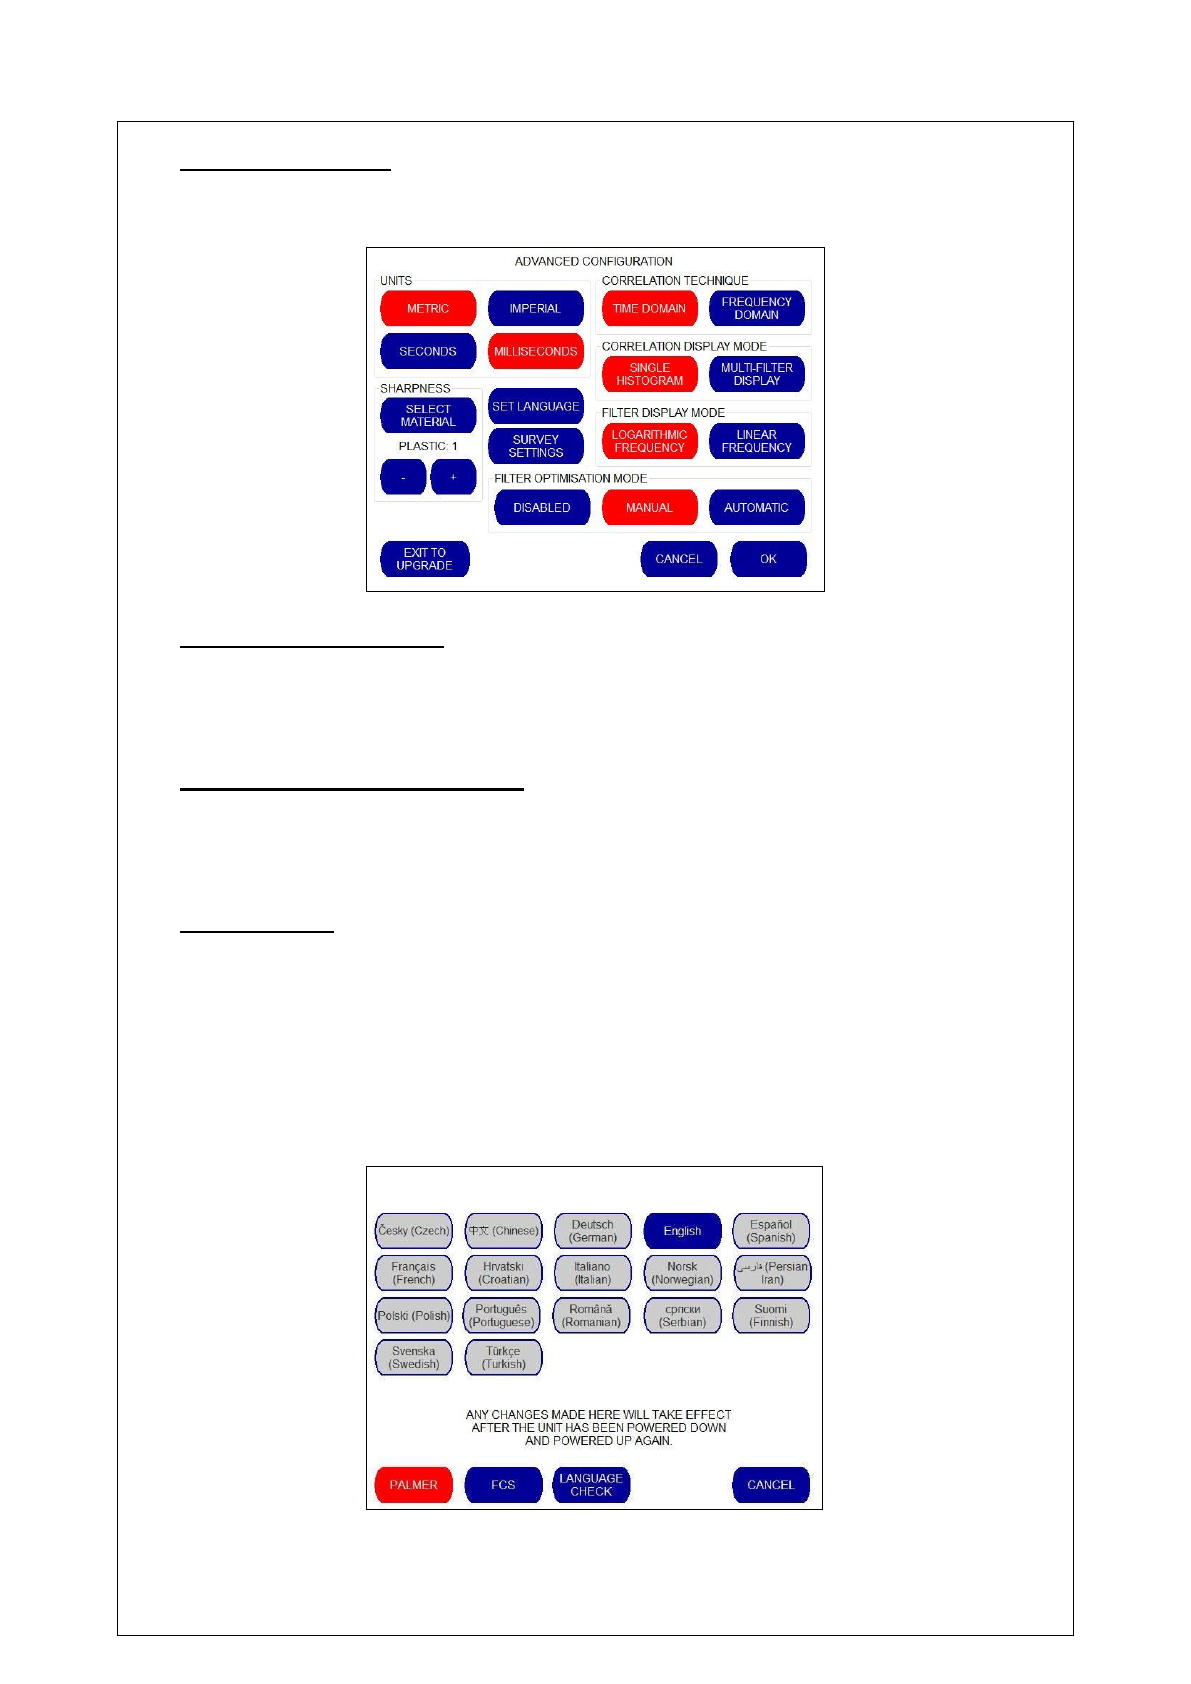
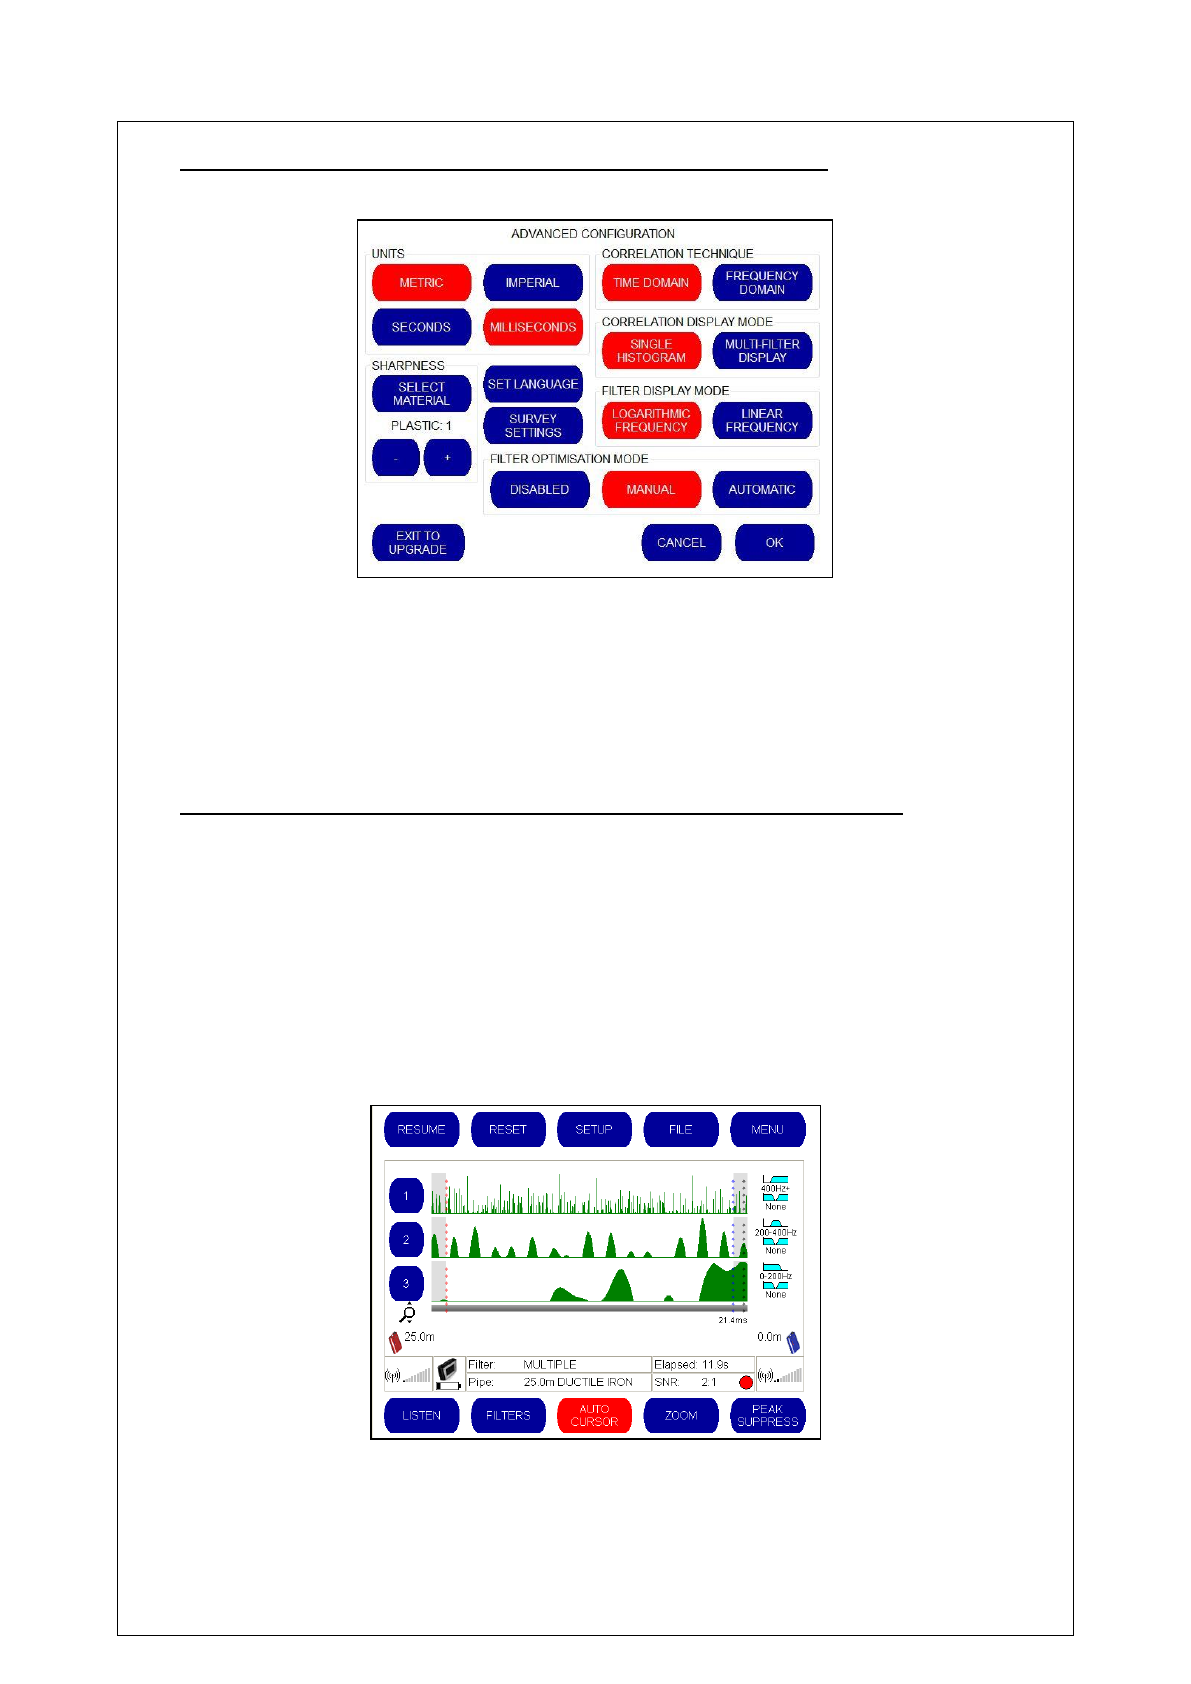
Advanced Settings
Selecting the “ADVANCED” button from the Configuration screen takes you to the Advanced
Configuration screen
Metric/Imperial Settings
The Advanced Configuration screen shown above enables the operator to toggle between metric
or imperial measurements. The operator simply presses the button to select the measurement
unit required. The unit of measurement displayed in red is the selected option.
Seconds/Milliseconds Settings
The Advanced Configuration screen shown above enables the operator to toggle between
displaying the time delay in seconds or milliseconds. The unit of measurement displayed in red
is the selected option.
Set Language
When the “SET LANGUAGE” button is selected from the Advanced Configuration screen shown
above the operator is presented with a list of the language options currently available for the
Touch Pro.
As of February 2012, language options include Czech, Chinese, Danish, German, Spanish,
French, Croatian, Italian, Lithuanian, Norwegian, Persian Iran, Polish, Portuguese, Romanian,
Russian, Serbian, Finnish, Swedish and Turkish.
To select a language, simply press the required button.
32
Survey Settings
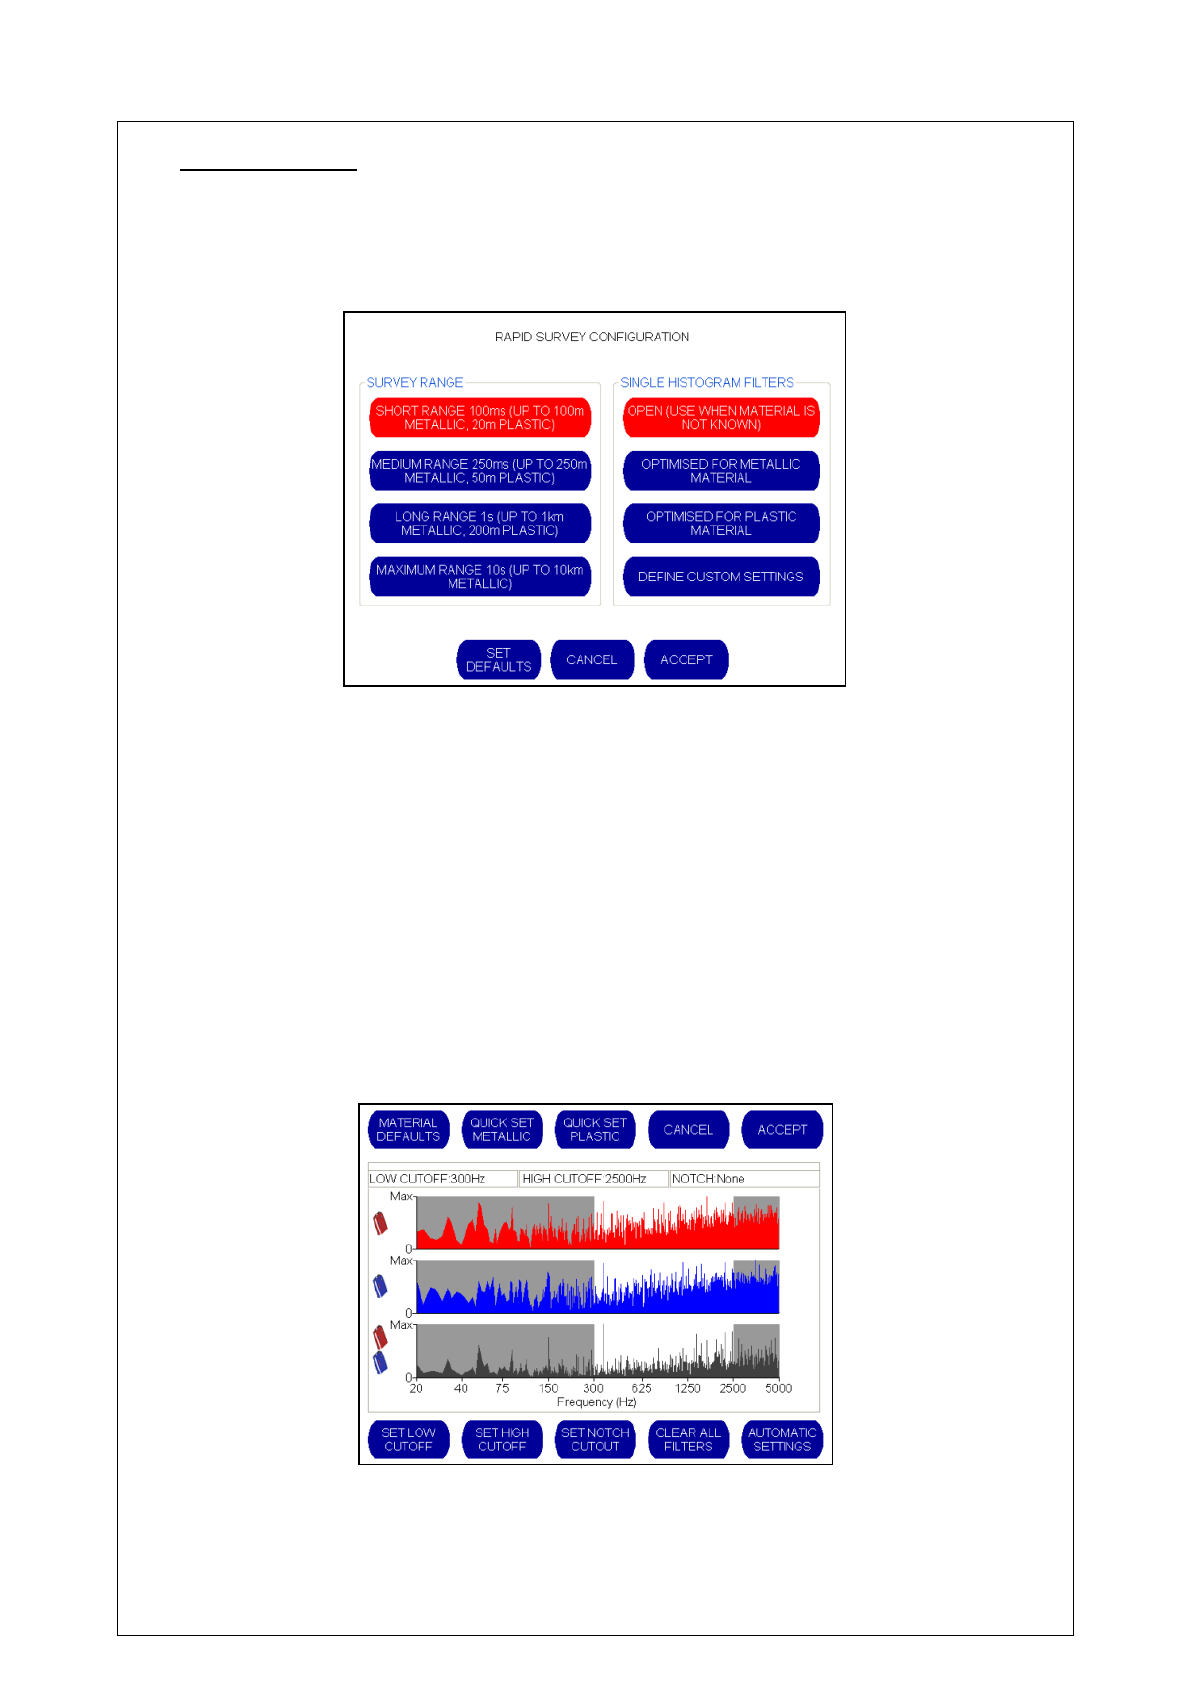
When the operator selects “SURVEY SETTINGS” from the Advanced Configuration menu, the
following “Rapid Survey Configuration” screen is displayed.
The Rapid Survey Configuration screen enables the operator to change the default settings on
the survey tool. Short, Medium, Long and Maximum range settings can be selected, and filters
can be optimised for metallic, plastic or unknown pipe materials.
When the rapid survey configuration settings have been selected, the operator has the option to
return to the pre set defaults by selecting the “SET DEFAULTS” button. Alternatively, the
operator can exit without saving the new settings by selecting the “CANCEL” button, or save
these new settings by selecting the “ACCEPT” button.
The operator will then be returned to the Advanced Configuration screen.
NOTE: Selecting the “DEFINE CUSTOM SETTINGS” button on the above screen will
automatically take the operator to the Filter Settings screen shown below. For more information
on this screen, please refer to the Filters section in this manual.
33
Correlation Technique (Time Domain / Frequency Domain)
The Advanced Configuration screen shown above enables the operator to toggle between “TIME
DOMAIN” and “FREQUENCY DOMAIN”. These refer to different mathematical processes used
to calculate the correlation result. HWM-Water Ltd recommends that the pre-set time domain
correlation technique be used. However, it should be noted that Frequency Domain may speed
up correlations in long pipe situations.
The correlation technique displayed in red is the selected option.
Correlation Display Mode (Single Histogram / Multi Filter Display)
The Advanced Configuration screen shown above enables the operator to change the graphical
display when a correlation is displayed. The correlation technique displayed in red is the
selected option.
The normal default setting is to display a single histogram graph during the correlation. This can
be toggled to the Multi Filter display if required. When this option is selected, the screen will
display three correlation graphs with different filter settings simultaneously, thereby enabling the
operator to select the best correlation result.
When Multi-Filter display is activated, the main Correlation screen changes to display three
graphs as follows:
This setup allows the operator to perform three different correlations simultaneously at the leak
site.
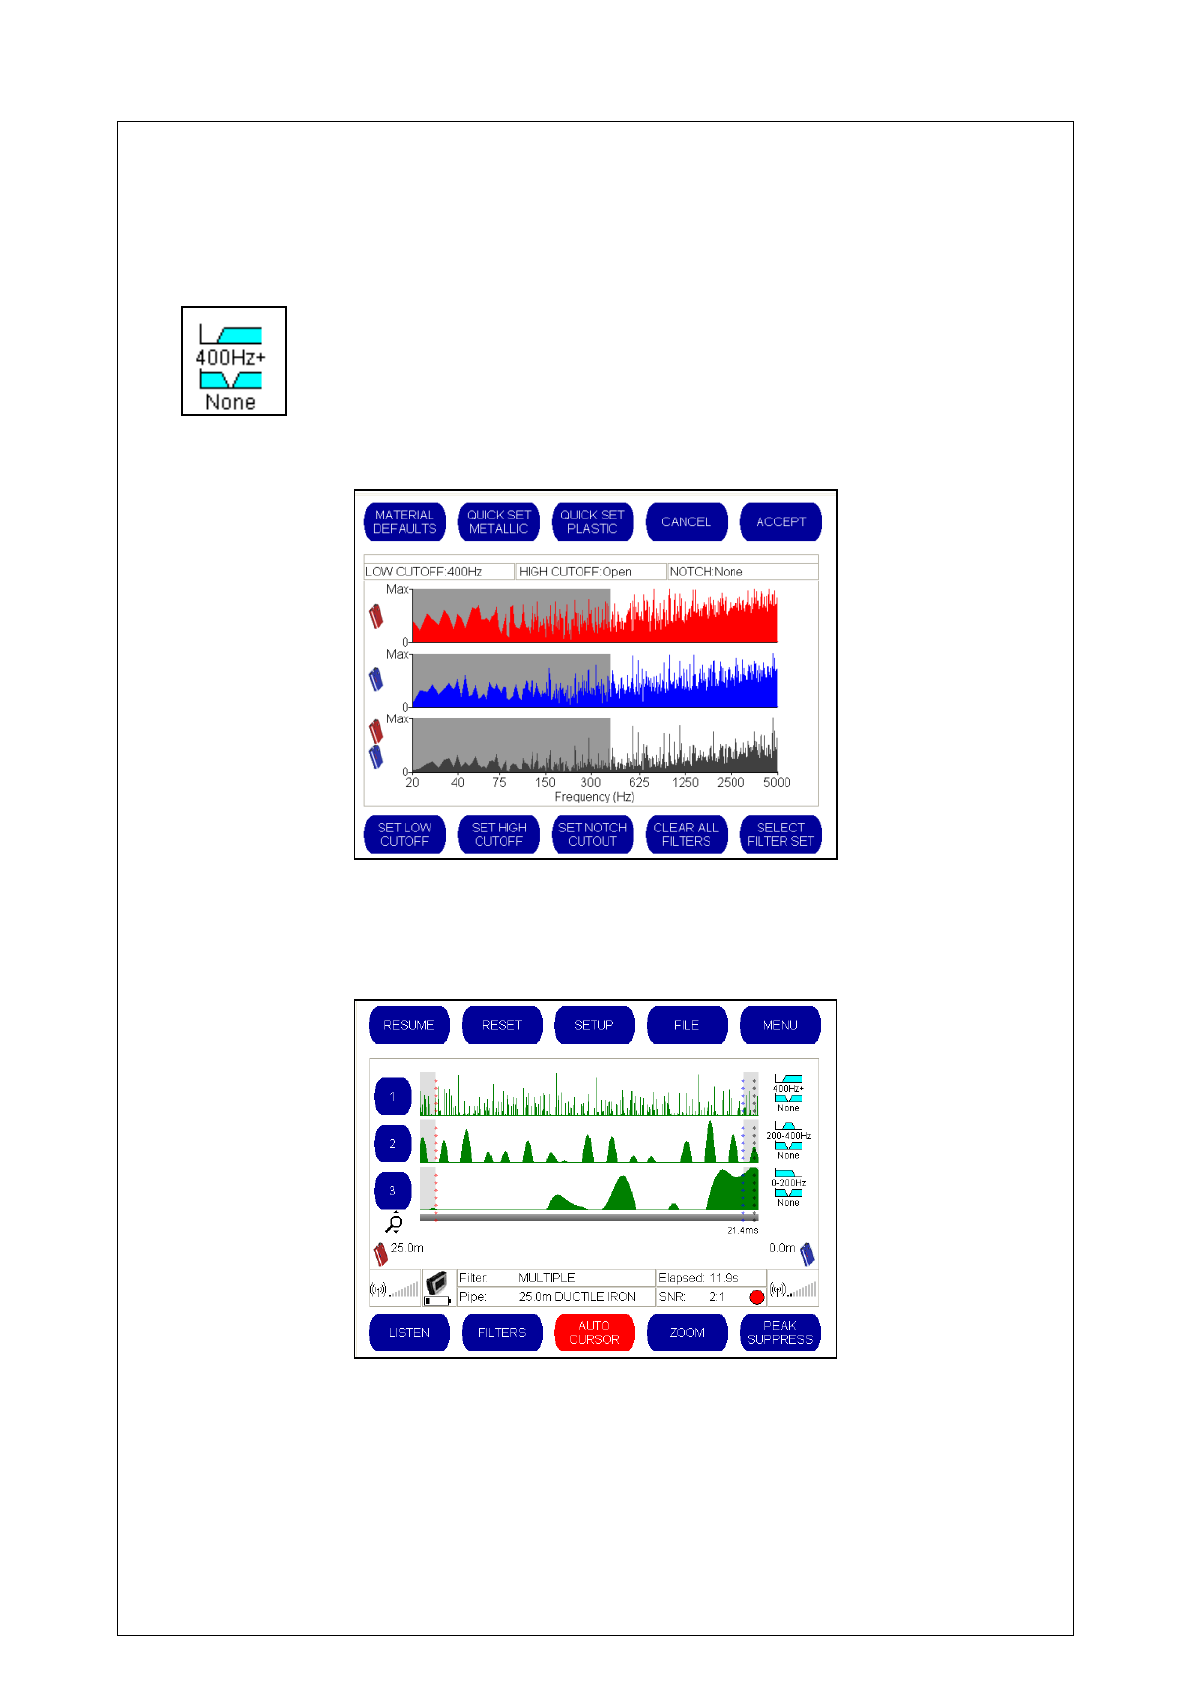
34
Each correlation can have three separate filter configurations, allowing the operator to choose
which filter settings work best. This is particularly useful when pipe material is uncertain or when
performing a survey to identify whether a leak is present on the pipe.
On the right hand side of the screen the filter settings for each of the three graphs is displayed.
This can be changed by simply pressing one of the pale blue filter settings as shown below:
Selecting a filter setting will take the operator to the filter setup screen as shown below.
The filter settings can now be changed. For more information about changing Filter Settings,
please refer to the “Filters” section of this manual. When filter settings have been changed,
select “Accept” to return to the main correlation screen and repeat the process for the other filter
settings if required.
For convenience, each correlation graph is numbered 1, 2 and 3. Pressing one of these
numbers will expand that particular graph to give a larger display. For example, if the middle
graph were required, pressing the blue button labeled “2” shown to the left of the graph will
change the display as follows:
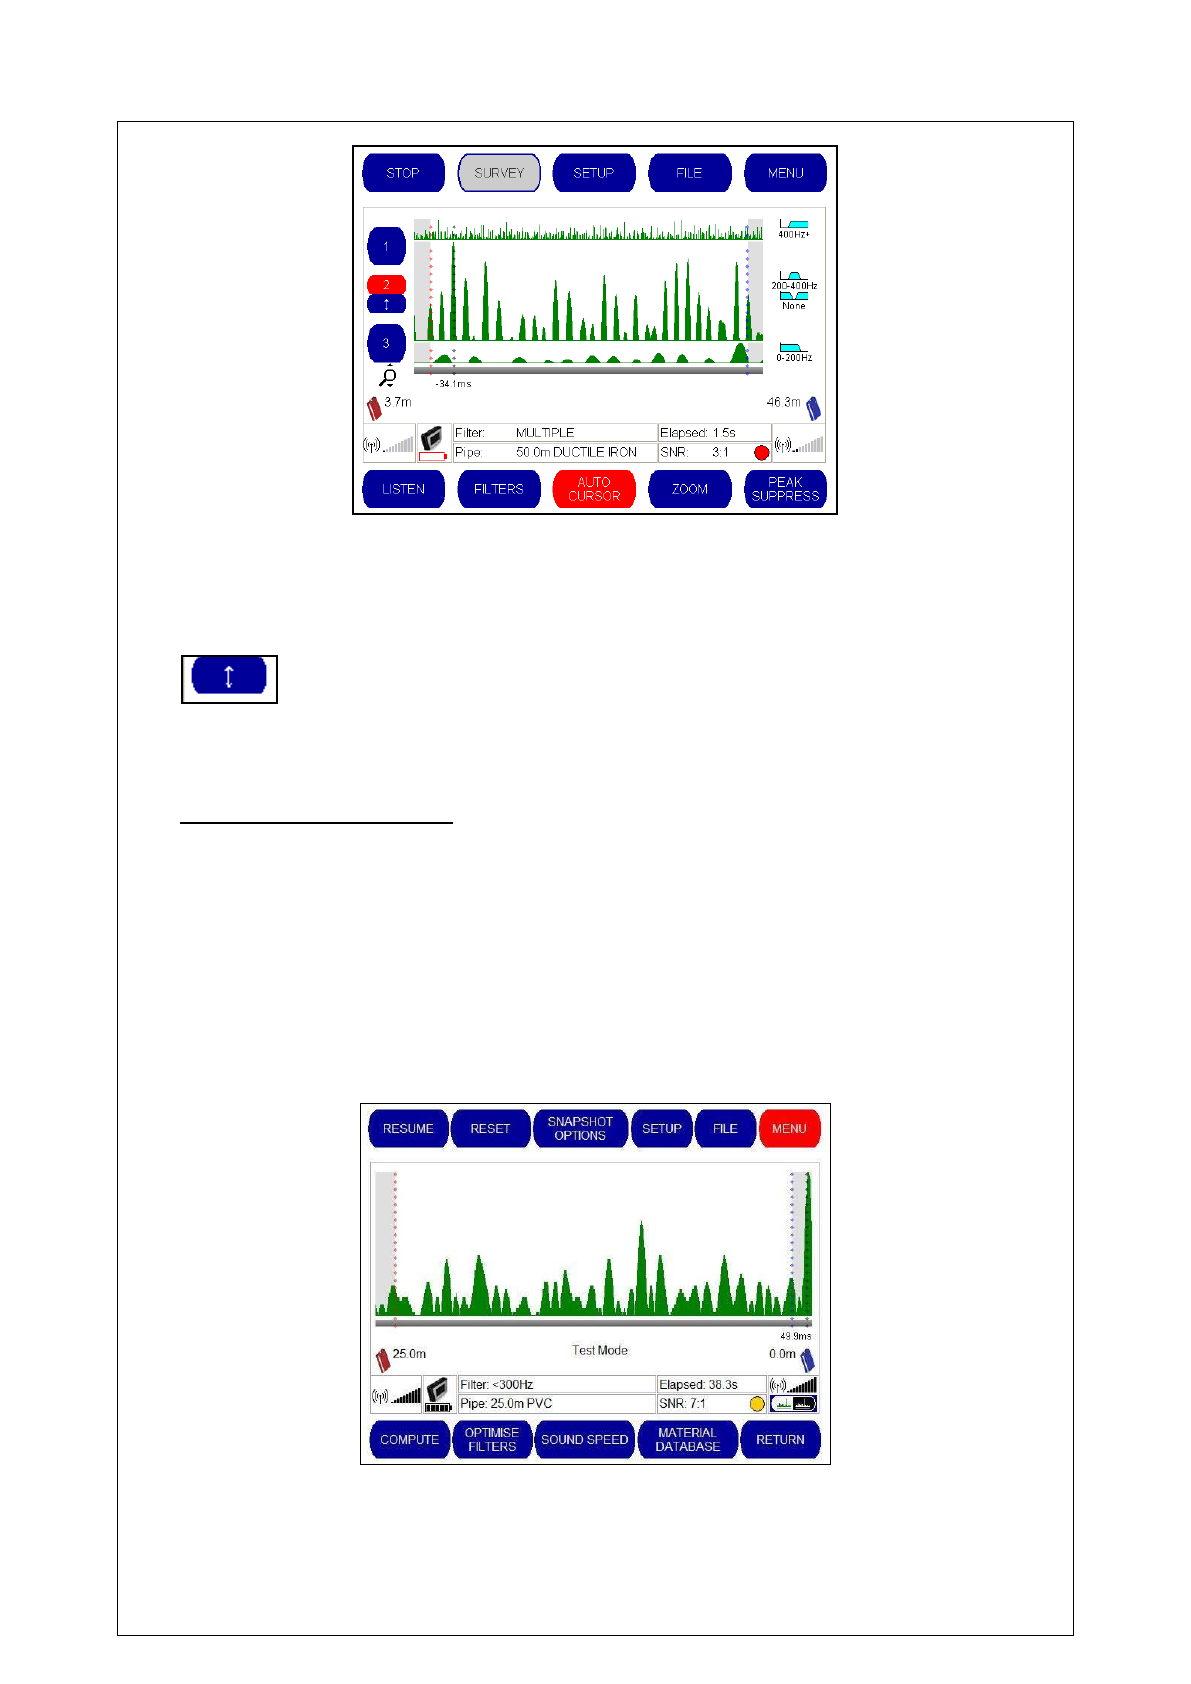
35
Selecting a specific graph maximizes the view of this graph and minimizes the other graphs
shown on the screen. Pressing the number 2 again (now shown in red) will return the operator to
the previous screen where all three graphs were displayed in equal sizes. Alternatively, if the
operator wishes to select the filter settings used to generate Graph Number 2, the small blue
arrow button underneath the number can be selected:
This will apply these filter settings and return the operator to a single histogram view showing the
correlation produced with these filter settings.
Filter Optimization Mode
Touch Pro incorporates a unique Automated Filtering Intelligence System (AFIS) which works
by automatically applying 55 different filter combinations on the correlation data until the
clearest and most accurate result can be presented. Filter Optimisation has been proven to
improve correlation results, and it is set by default to run automatically whenever the default
filter setting is not effective in producing an accurate correlation.
The operator can choose to disable this feature, or set it as a manual function that is activated
only when specifically requested. If the manual option is selected, the operator can activate
Filter Optimisation during a correlation by selecting the “MENU” button and choosing
“Optimise Filters” from the menu that appears at the bottom of the screen, as shown below.
36
Sharpness Settings
Touch Pro incorporates a sharpening function to help pinpoint leaks where the correlation
data has broad rounded peaks, as commonly happens with plastic materials. There are two
sharpness values, one used for plastic pipes and one for all other materials. A value of 0
represents no sharpening and values of 1-15 represent increasing degrees of sharpness.
Plastic pipes normally require a higher value. The default values are 2 for plastic and 0 for
other materials. As shown below, use the SELECT MATERIAL button to determine which
value to change, and use the + and – buttons to adjust the value.
.
FILE
When this option is selected from the main Correlation screen, the buttons on the bottom line
change.
SAVE Saves the current graph and allows you to name it
OPEN Loads a saved graph into the correlation screen if available
INFO Allows the operator to input information about the correlation for future
reference – 5 lines of text are available.
RETURN Returns the operator to the main correlation screen
37
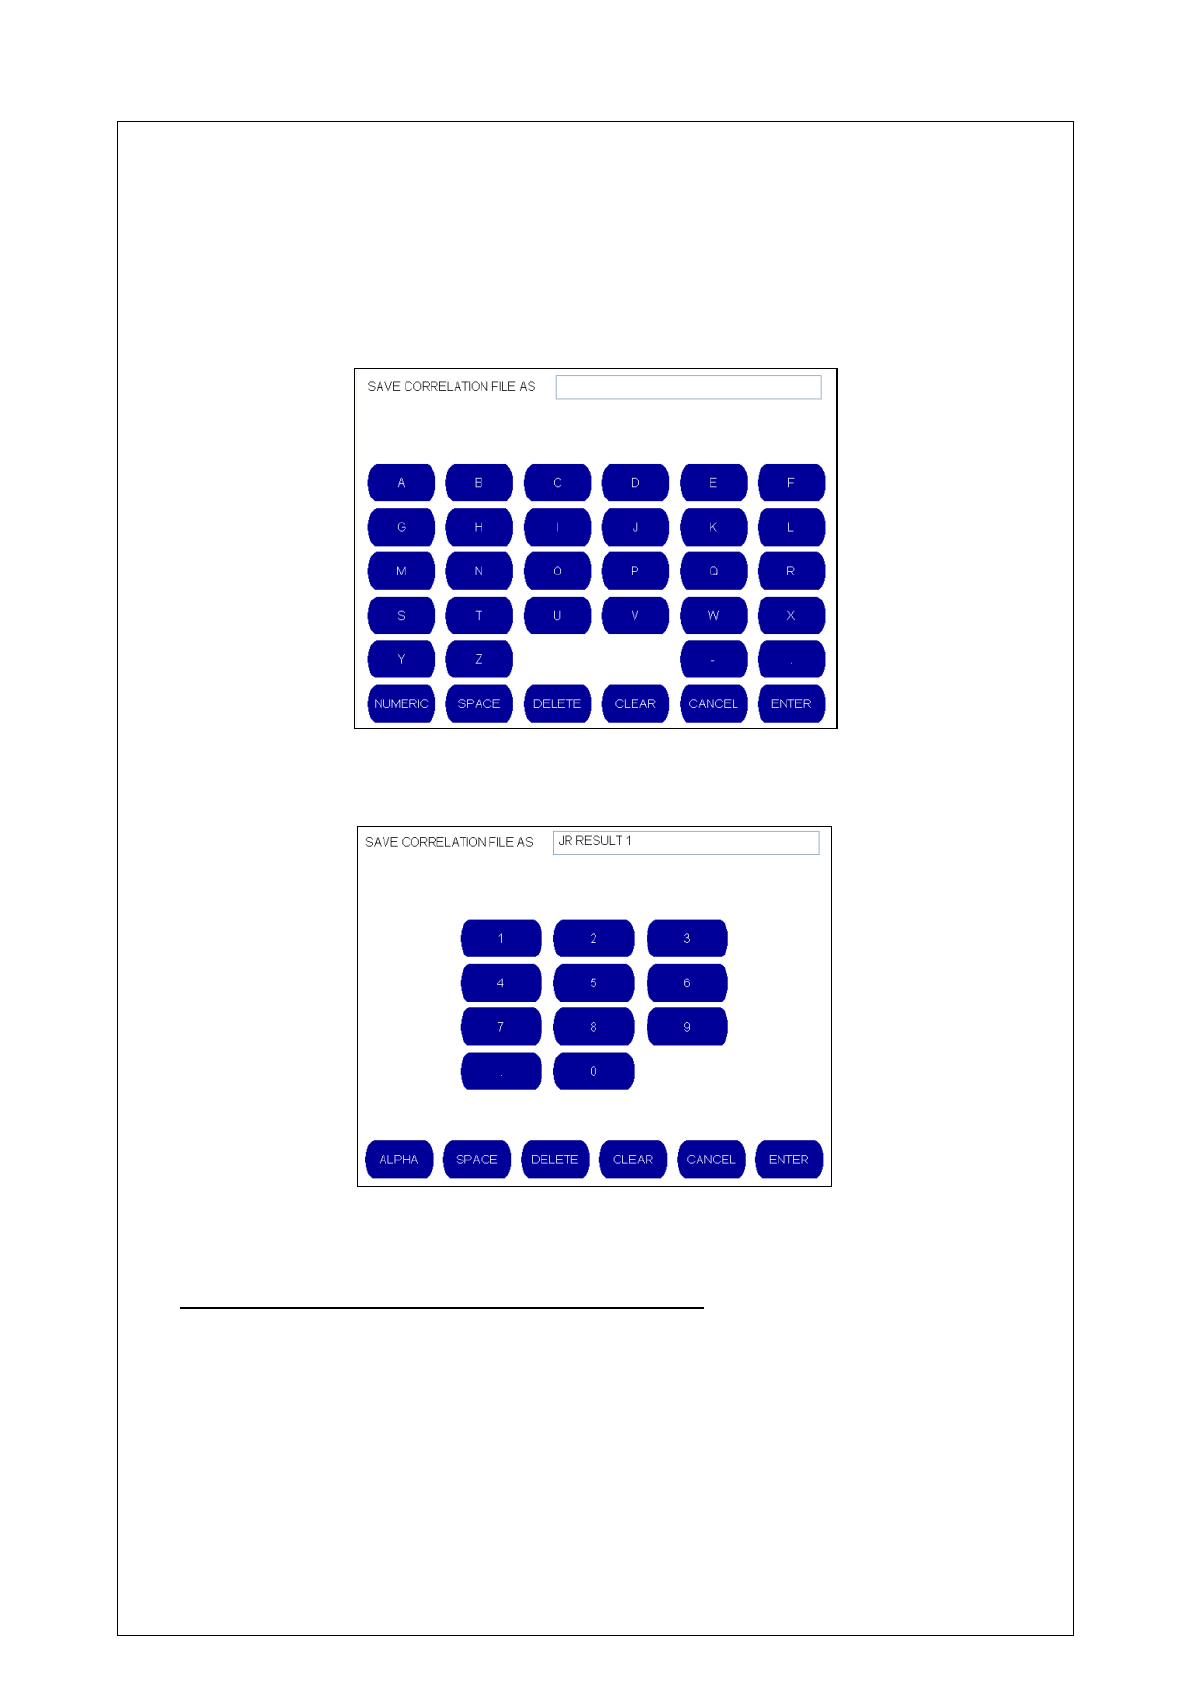
Saving a Correlation Result
Select the “FILE” button from the Main Correlation Screen, and press the “SAVE” button that
appears at the bottom left of the screen.
When the Save button is selected, the operator is presented with the virtual keyboard and invited
to input a name for the correlation file. This file name can be a combination of numbers and
letters.
The operator can toggle between numbers and letters by selecting the “ALPHA” or “NUMERIC”
buttons that appear at the bottom left of the screen.
When the file name has been input, press Enter to return to the File Screen.
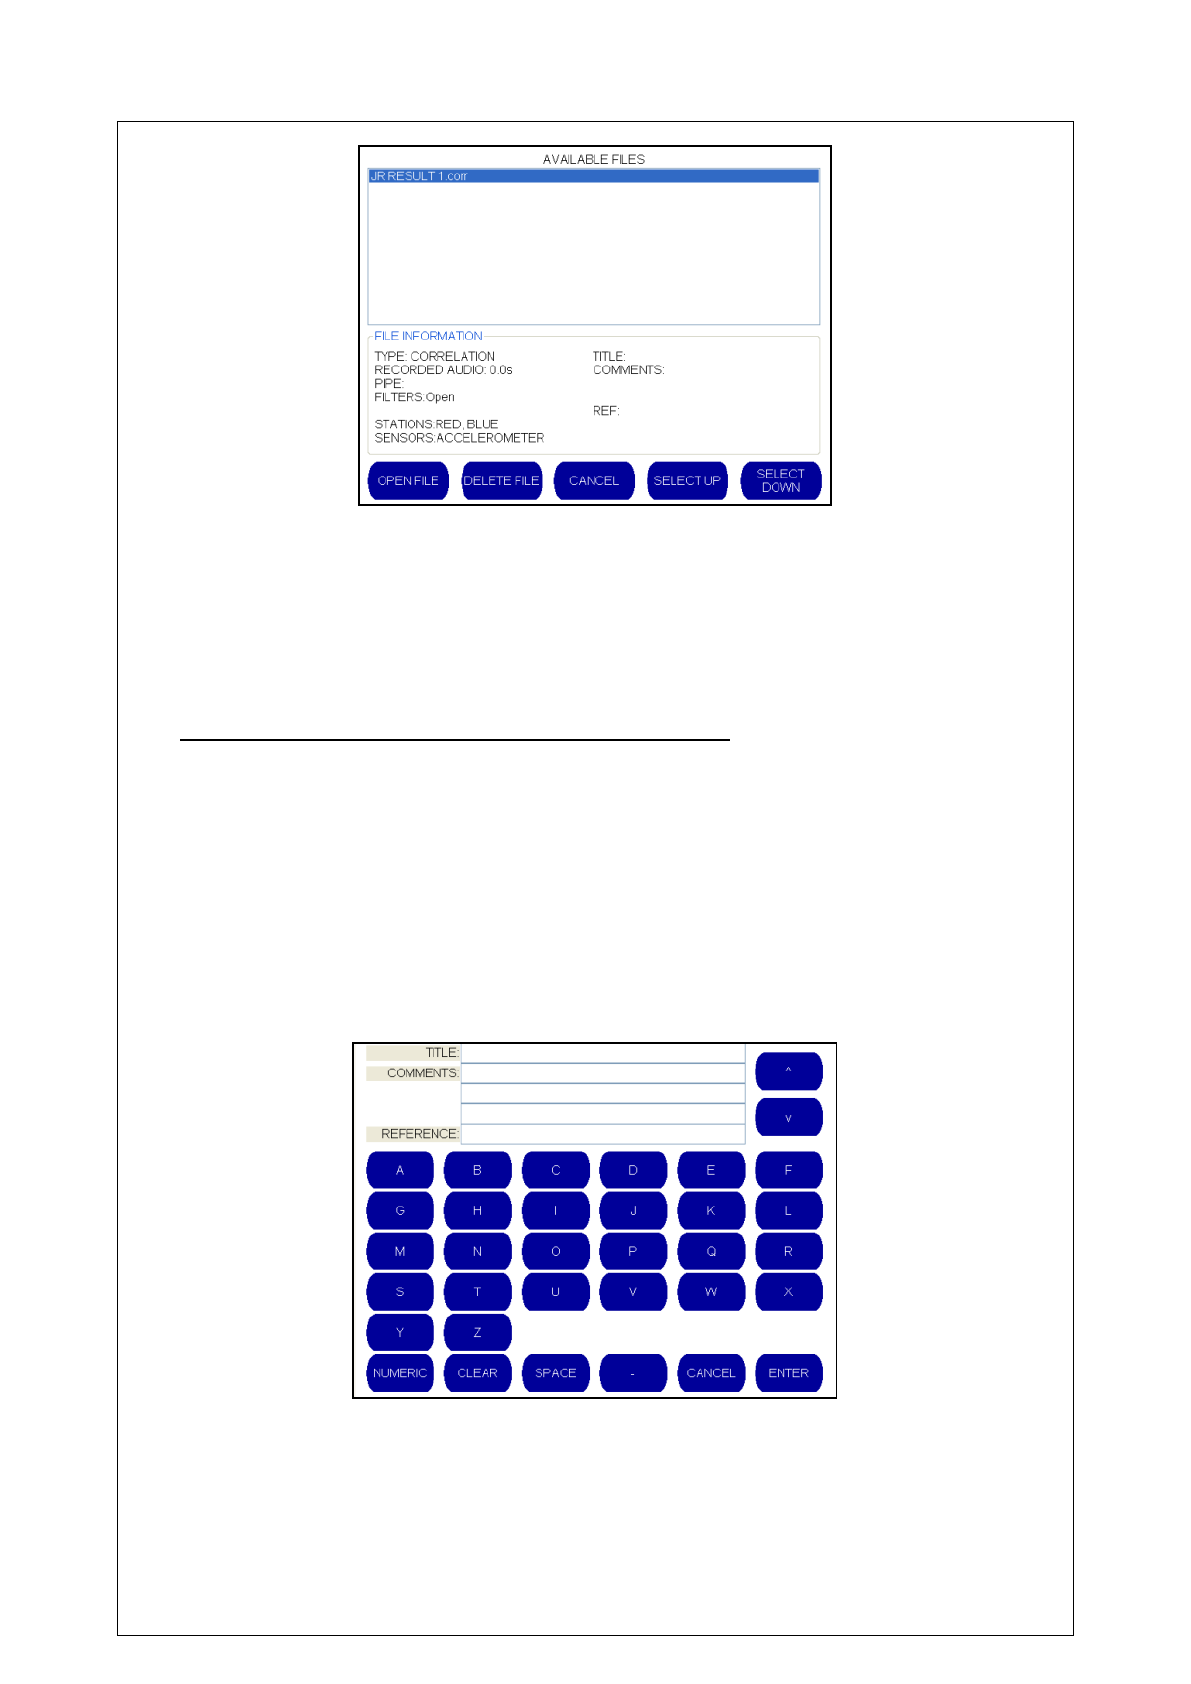
Opening a Previously Saved Correlation Result
Select the “FILE” button from the Main Correlation Screen, and press the “OPEN” button that
appears at the bottom of the screen.
The unit will now display a list of saved correlation results.
The operator can now select a file to open by using the “SELECT UP” and “SELECT DOWN”
buttons.
38
When the file has been selected, press the “OPEN FILE” button to view this correlation result.
Alternatively, the operator can choose to delete this correlation result from the system by
pressing the “DELETE FILE” button or cancel the operation by selecting “CANCEL” to return to
the File Menu.
Recording Information about a Correlation Result
Select the “FILE” button from the Main Correlation Screen, and select the “INFO” button at the
bottom of the screen.
The operator will now be presented with a virtual keyboard that allows information relating to the
correlation to be input and saved with the correlation result. This useful tool can be used to
record the location of the correlation, environmental factors, access information, operator details
etc.
The operator can toggle between numbers and letters by selecting the “NUMERIC” or “ALPHA”
buttons that appear at the bottom left of the screen.
When the information has been written, select the “ENTER” button at the bottom right of the
screen to return to the Correlation graph.
39
Then, select the “SAVE” button to save the correlation result, and the information you have just
written will be saved with that correlation result.
How many correlations can be stored in the memory?
The Base Unit is supplied with approximately 200Mb of free space which can be used to store
correlation results. A correlation that uses one minute of data will create 2.4Mb of audio data,
enabling about 80 of these correlations to be stored in the base unit at any one time. Saving a
result stores a maximum of 1 minute of audio samples.
However, most correlations will require substantially less data; thereby enabling a much larger number of correlations
to be stored in between downloads to the PC.
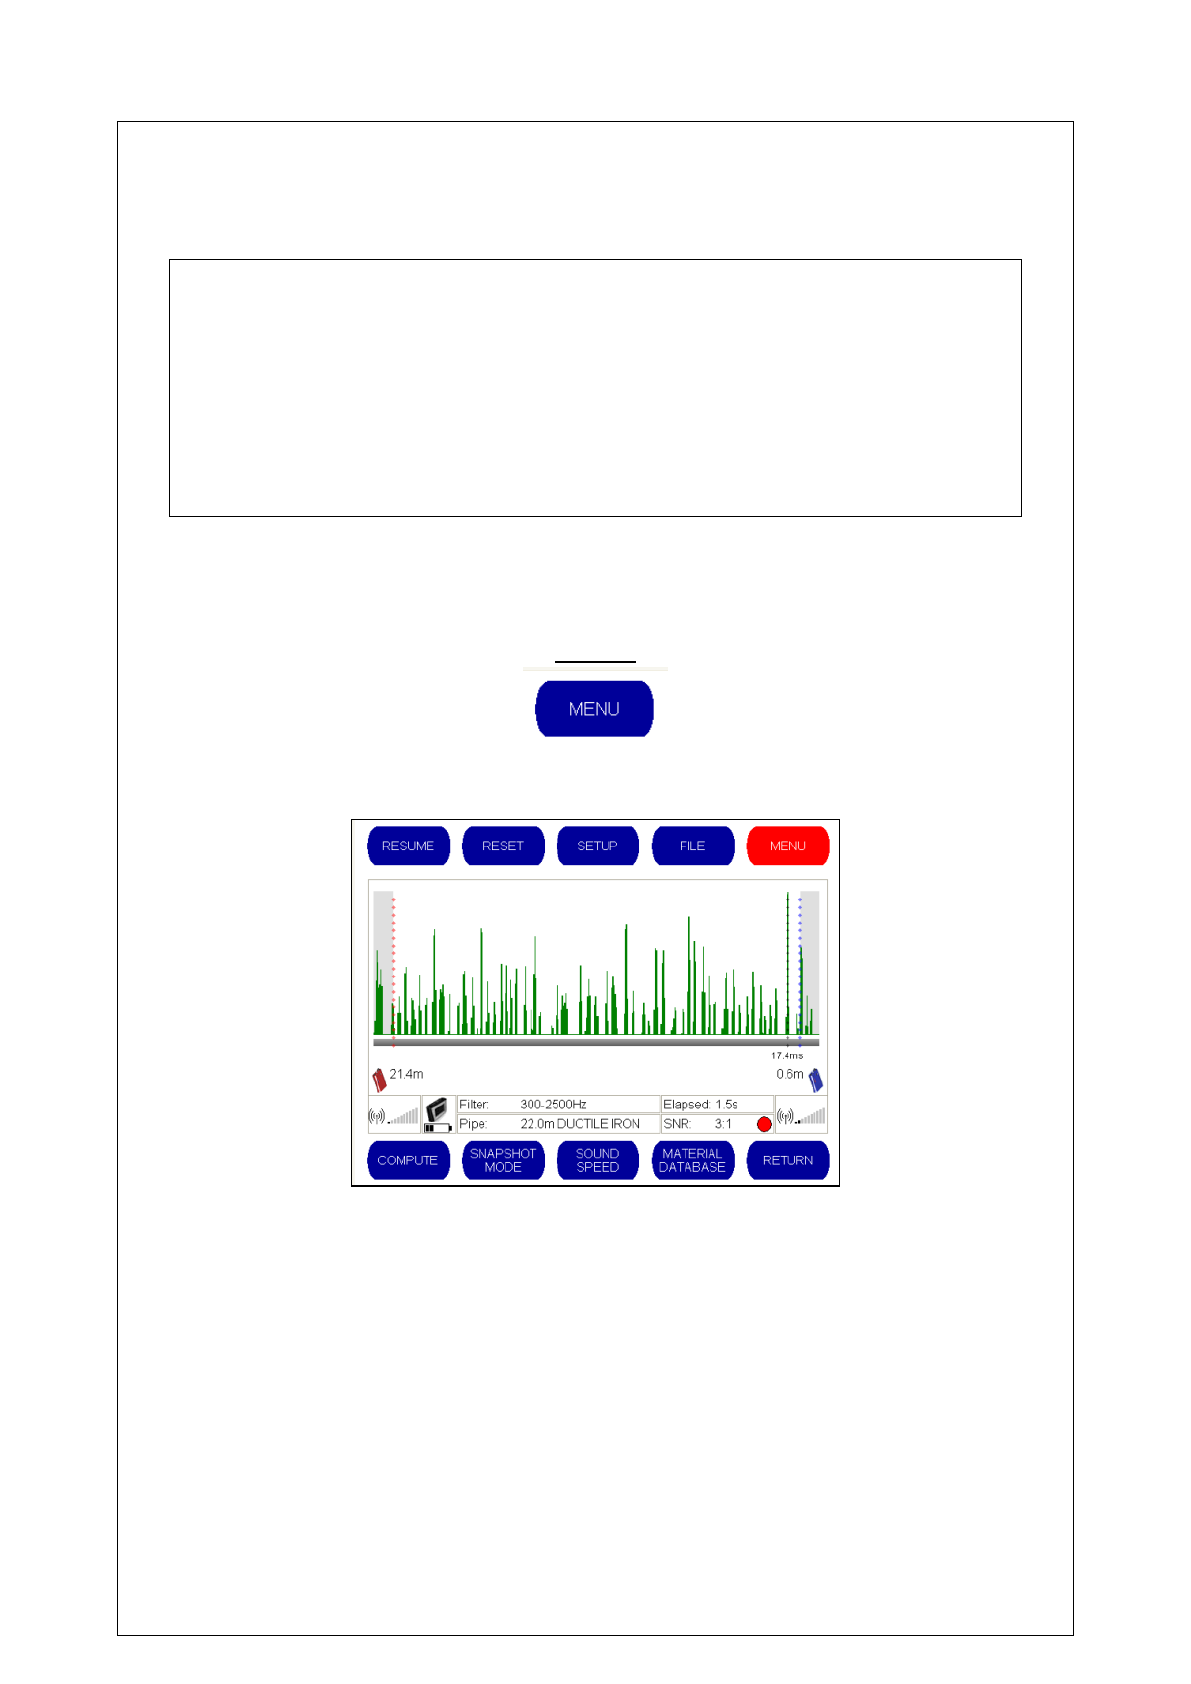
MENU
When the “MENU” button is selected from the Main Correlation screen, the buttons at the bottom
of the screen change.
“COMPUTE” Advanced leak pinpointing using multiple correlations conducted on the
same pipe
“SNAPSHOT” Takes a still image of the correlation graph for on screen comparison
“SOUND SPEED” Calculator to work out time delay and velocity when leak position is
already known
“MATERIAL DATABASE” Enables pipe material settings stored in the base unit to be
changed.
“RETURN” Takes the operator back to the main correlation screen menu options
40
Compute Mode
It should be noted that the leak position measurements described so far are based on the
estimated velocity of sound within the pipe. Greater confidence in the result is achieved if two or
more correlation runs are conducted for the same leak.
Compute mode provides an additional way of pinpointing leak positions by using a set of
correlation results, rather than an individual correlation result. This also provides a useful way of
measuring an accurate velocity.
Where the same pipe material and diameter are used within the network, the time delay/distance
relationship of the correlation is theoretically linear. As the distance between a sensor and the
leak noise increases, the time taken for the sound to reach the sensor increases proportionally
with the distance. For example, if you move the sensor twice as far away, the sound will take
twice as long to reach it. It is this linear relationship that makes it possible to determine the
sound speed and therefore the leak point automatically when using a set of correlation results.
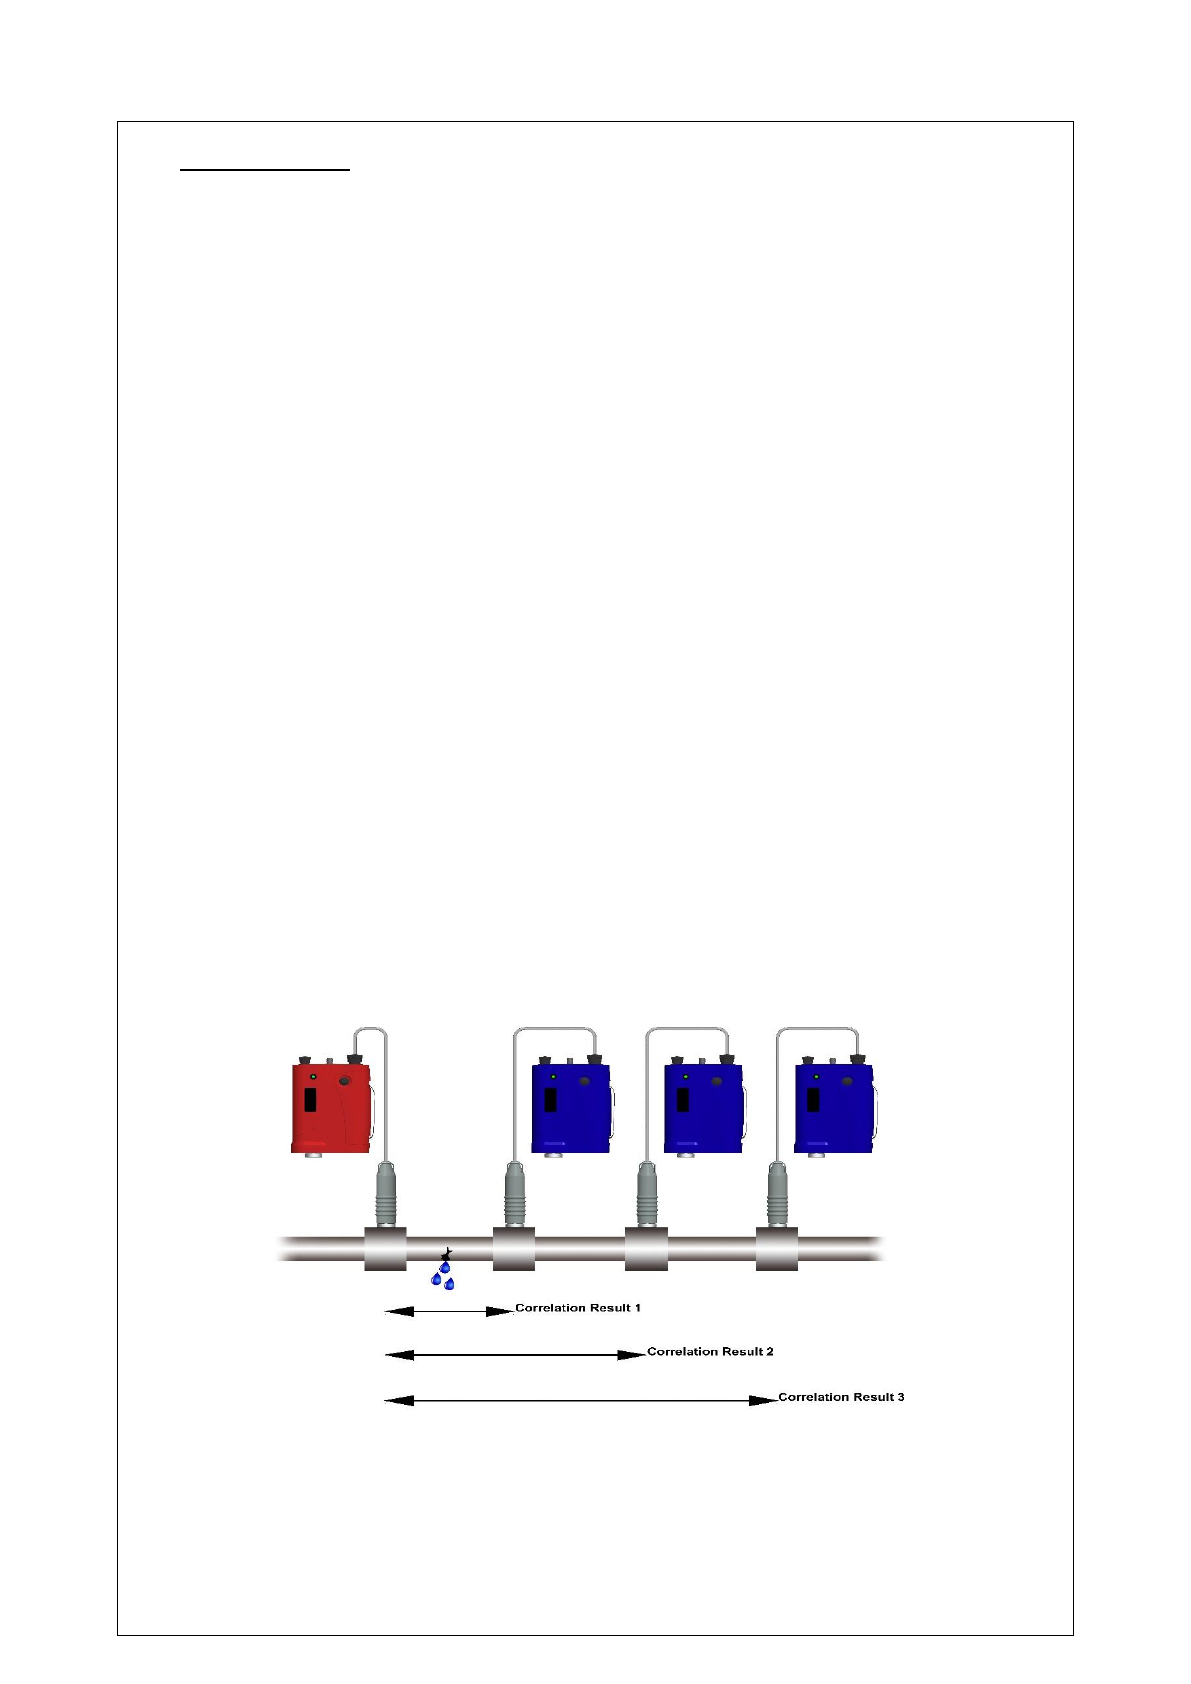
In Compute mode the base unit will give you the leak position from the static sensor based on
multiple correlations taken when moving the other sensor to different access points away from
the leak.
During the extra correlation 'runs' carried out as part of a compute exercise, one sensor remains
static on a selected pipe fitting and the other sensor is moved from fitting-to-fitting for each
compute run.
Compute mode enables the operator to utilize any previously stored leak position files to compile
a computed result. Simply enter in the relevant files to produce the computed calculation and
graphical plot.
Before the Compute feature can be used, correlations must have been saved on the control unit.
For an accurate result it is recommended to save three or more correlations. Care must be taken
to ensure that all files used are taken from the same leak site and that one sensor remained on
the same fitting for all selected runs.
Note: One of the sensors must remain static during each of the correlations used. It
does not matter which sensor remains static.
The compute function calculates the sum velocity based on the correlation graphs previously
entered, thereby giving you a more accurate overall correlation result. A graph is displayed
showing all correlation results pinpointed, and an average line is drawn through each correlation
to pinpoint the leak position.
41
To use compute mode, follow the normal procedure for a standard leak correlation.
a) Select Pipe Material
b) Select Diameter
c) Enter the Pipe length (i.e. the distance between sensors).
d) Correlate and obtain definite peak. Adjust filter settings as required to obtain a
good correlation peak.
e) Select the “FILE” menu and save the correlation result.
Then, move one outstation and repeat the correlation procedure, inputting the new pipe length
and saving the new correlation result.
HWM-Water Ltd recommends at least three separate correlations be conducted in this manner.
The more times this correlation process is repeated, the more data is available to improve the
overall accuracy of the combined correlation graph.
The operator is now ready to commence the compute operation.
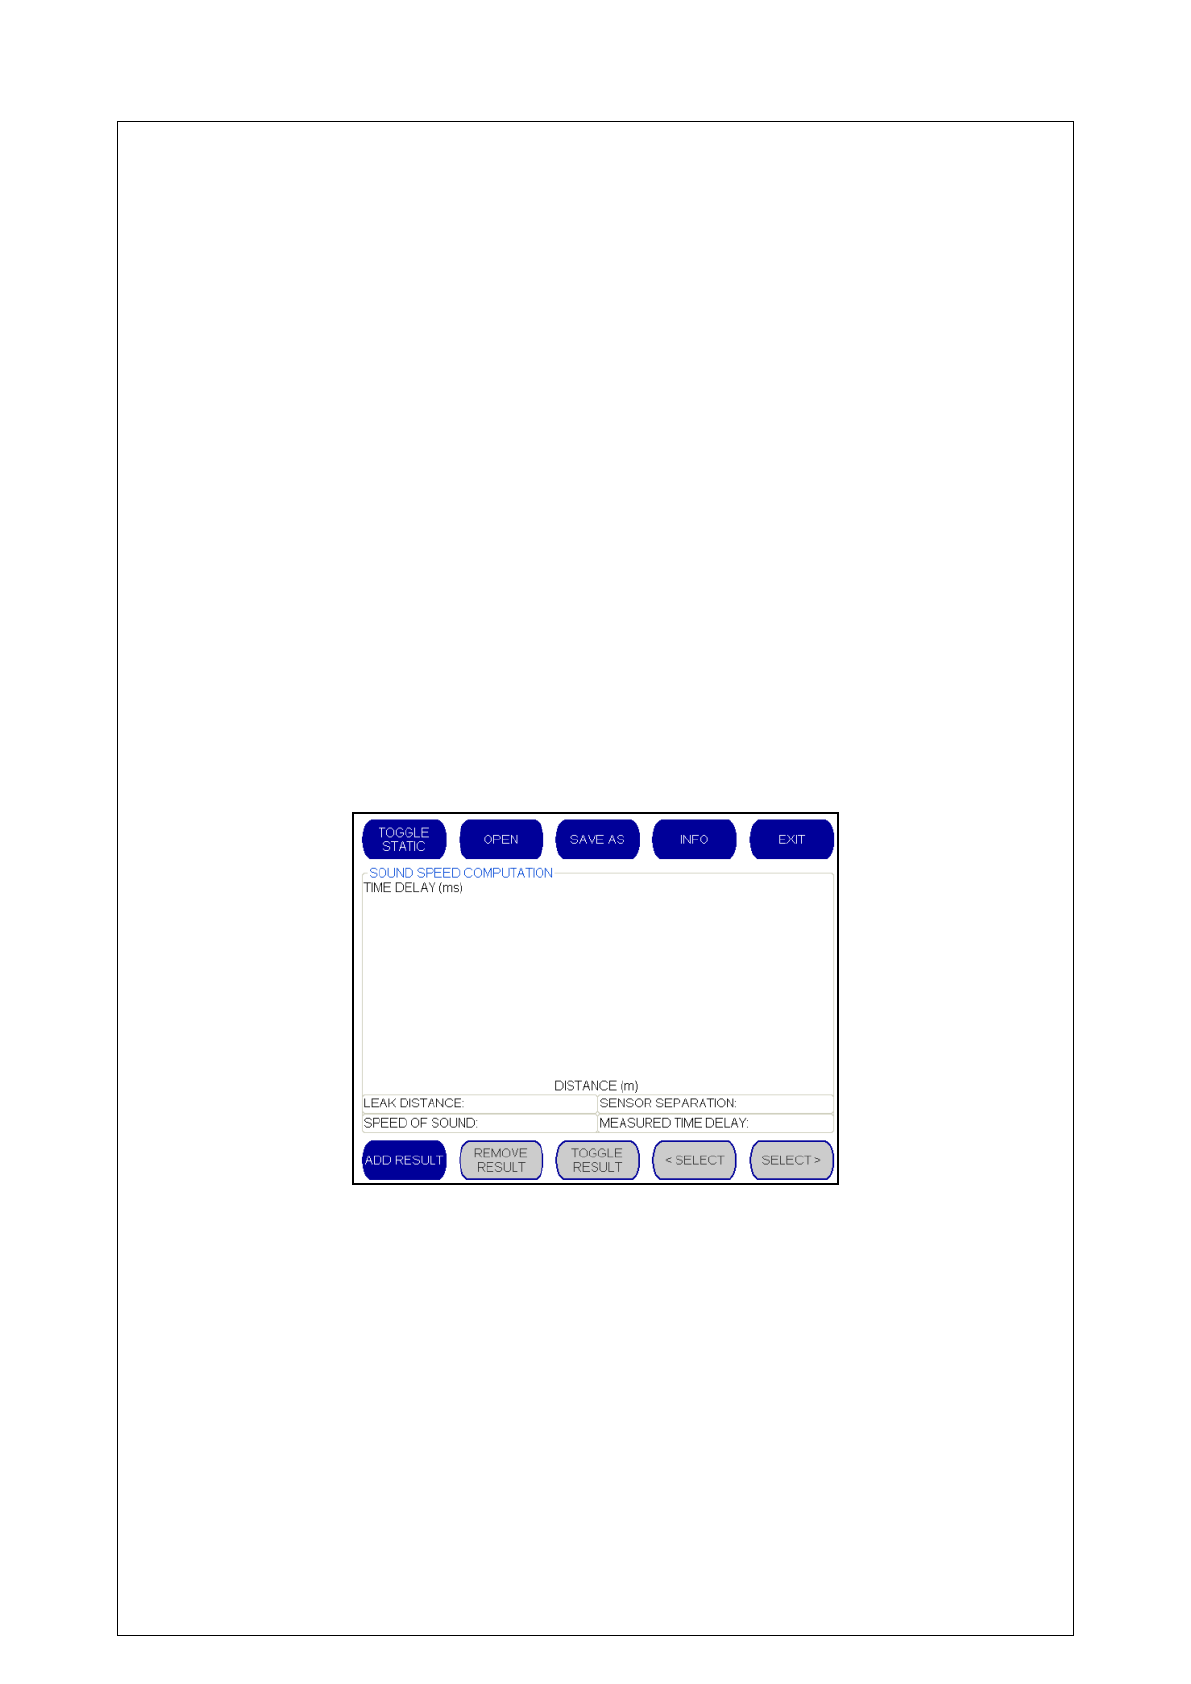
When “COMPUTE” is selected from the Menu, the following Sound Speed Computation screen
will be displayed:
“TOGGLE STATIC” - Enables the operator the change the static outstation
“OPEN” - Enables the operator to open a saved graph from a previous Compute.
“SAVE AS” - Enables the operator to save the current Compute graph.
“INFO” - Enables the operator to write notes to accompany the Compute graph (e.g.
where it was conducted, ambient conditions, who conducted the correlations etc)
“EXIT” - Returns the operator to the main menu
42
“ADD RESULT” - Allows previous saved correlations to be added to the Compute
screen
“REMOVE RESULT” - Allows the operator to remove a correlation from the graph.
“TOGGLE RESULT” – Enables the operator to toggle the influence of a selected
correlation result from the Compute graph.
“<SELECT” / “SELECT>” – Allows a correlation result to be highlighted so that it can
be removed or toggled on/off during a computation.
Adding Previously Saved Correlations to the Computation
To generate a new Compute result, the operator must first add the saved correlations conducted
on the length of pipe with the stationary outstation.
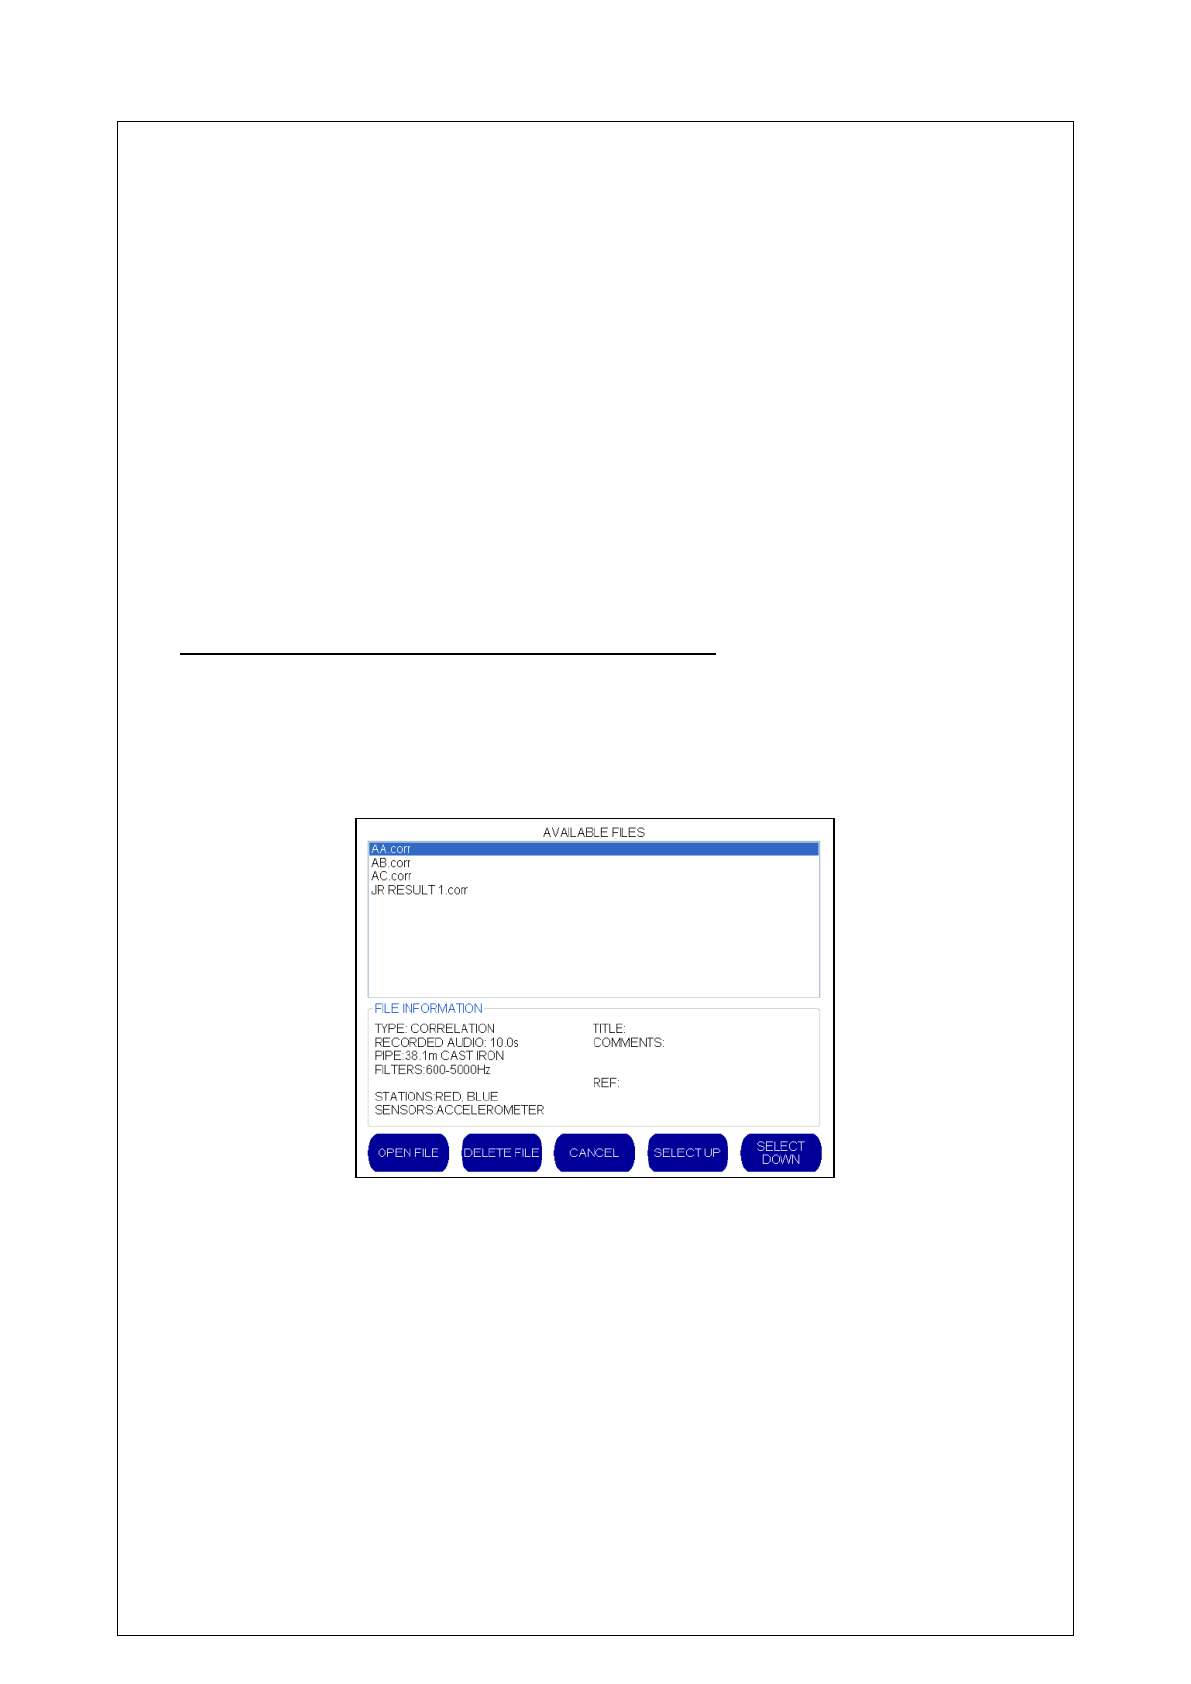
Select “ADD RESULT” to select one of the saved correlations.
Use the “SELECT UP” and “SELECT DOWN” buttons to select the correlation result and then
select “OPEN FILE” to load this correlation result into the Compute graph. The selected
correlation result will now appear as a cross hair on the Compute screen, as shown in the
example below.
43
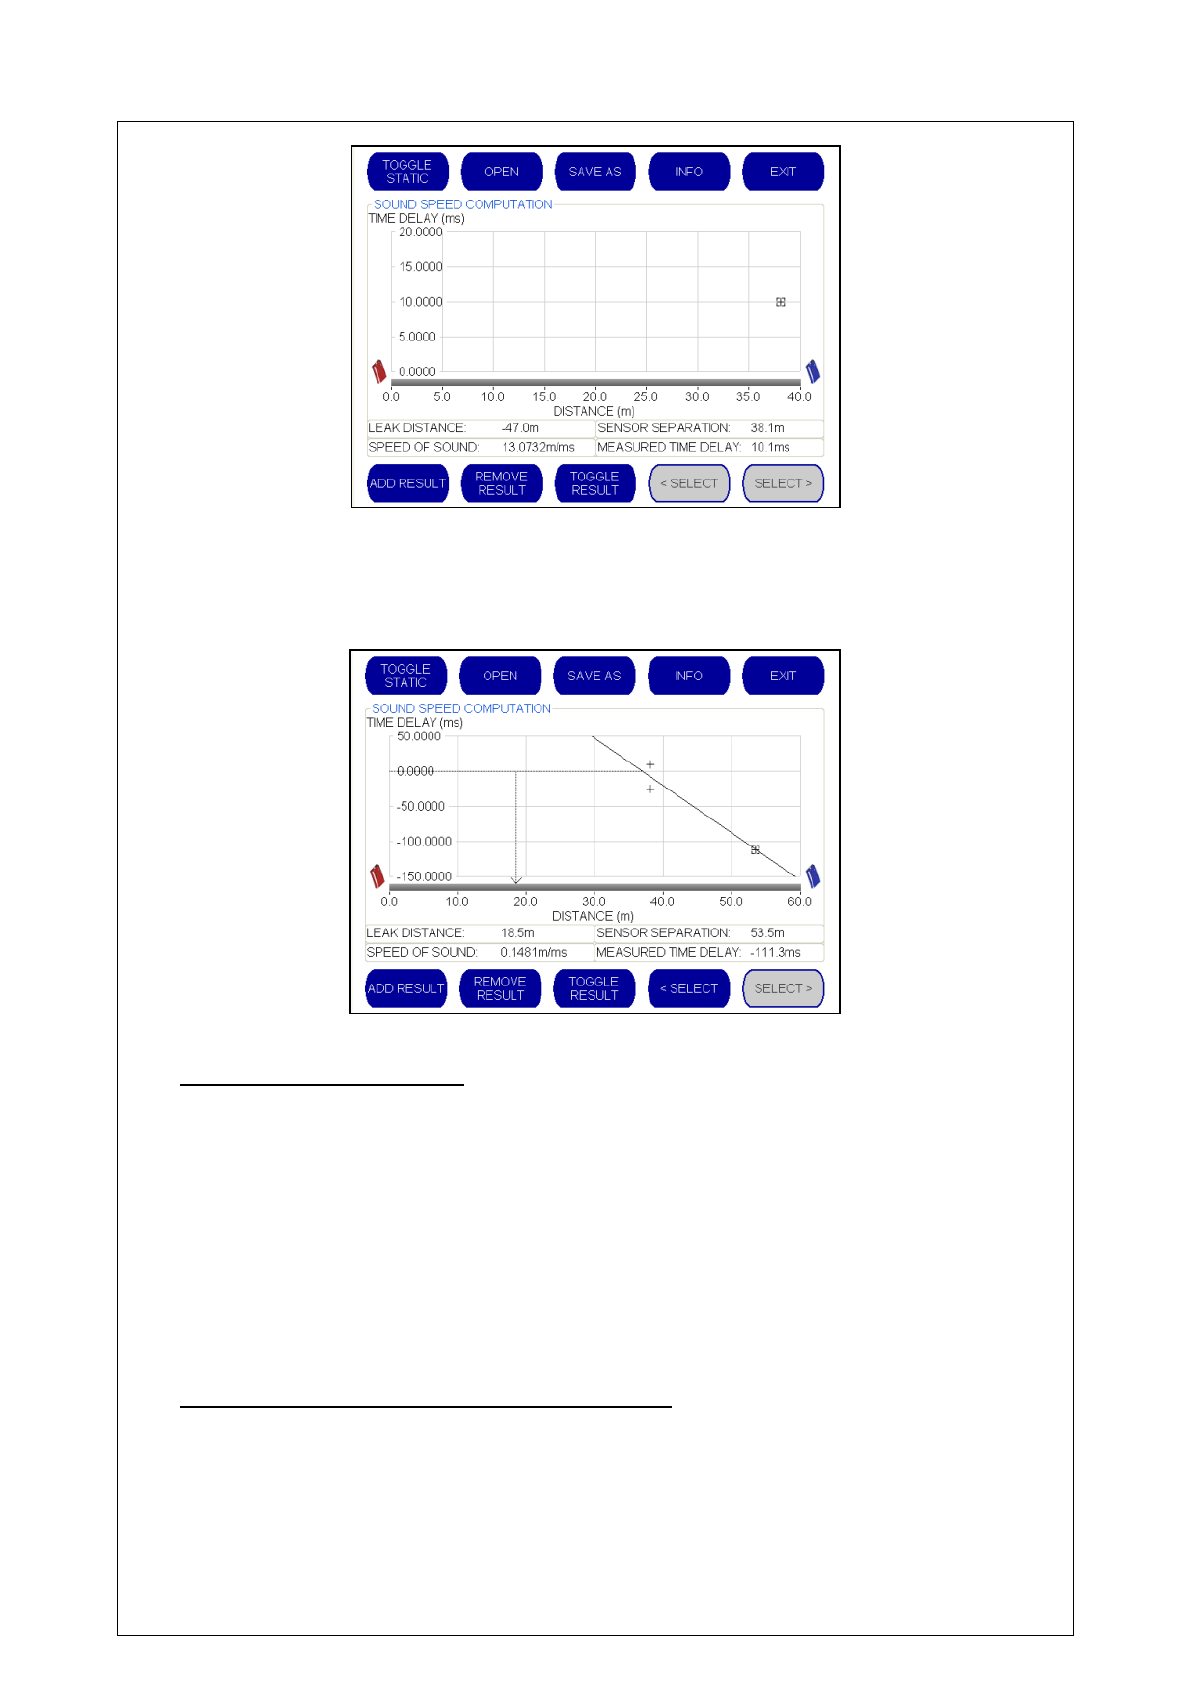
Repeat this procedure to add all of the correlation results conducted on the pipe to the compute
screen. In the example below, three correlation results have been plotted onto the Compute
graph
Changing the Static Outstation
In order to perform a successful computation the base unit needs to know which outstation
remained static during the correlations.
The base station by default assumes that the red outstation has remained static during the
different correlations. If this is not correct, the blue outstation can be selected as the stationary
outstation simply by pressing the “TOGGLE STATIC” button – this toggles the static outstation
used during the different correlations.
The static correlator is always displayed on the left hand side of the graph.
Removing a Correlation Result from the Computation
To move between the different correlation results displayed on the Compute graph, use the
“<SELECT” and “SELECT>” buttons located on the bottom right of the screen.
44
Any Correlation results which are considered by the operator to be significantly 'off-the-line' and
therefore skewing the leak position can be excluded from the computed results.
Using the “<SELECT” and “SELECT>” buttons, move the cursor over the erroneous correlation
result. Then, press the “TOGGLE RESULT” button to exclude this specific result from the
computed results. The correlation result remains on the screen but does not influence the
plotting of the compute position until the “TOGGLE RESULT” button is pressed again.
Alternatively, a correlation result can be removed from the Compute graph completely by moving
the cursor over the result and selecting the “REMOVE RESULT” button.
The greater the number of runs used, the more easily an erroneous result can be spotted.
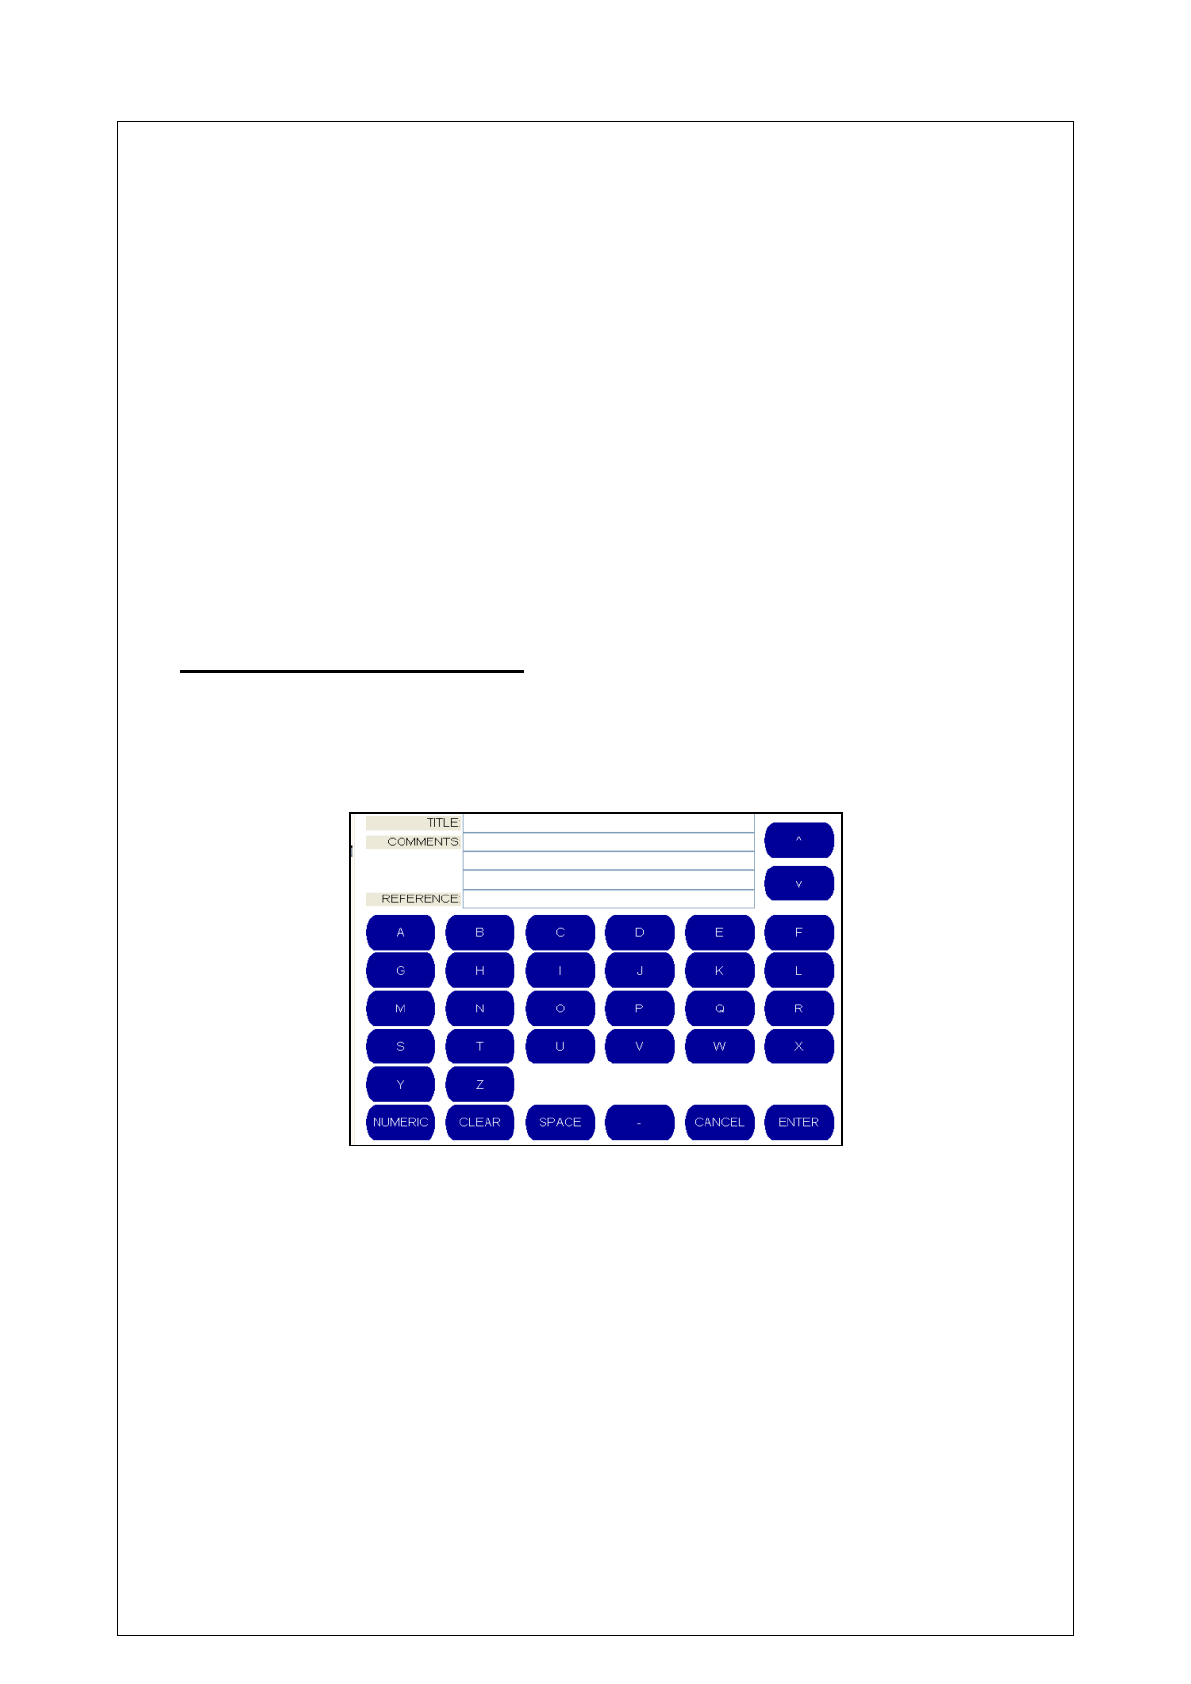
Adding Information to a Computation
The operator can add information about the computation by selecting the “INFO” button from the
Sound Speed Computation screen. A virtual keyboard is then displayed with which the operator
can input a title, comments and reference.
To input numbers, select the “NUMERIC” button in the bottom left hand corner
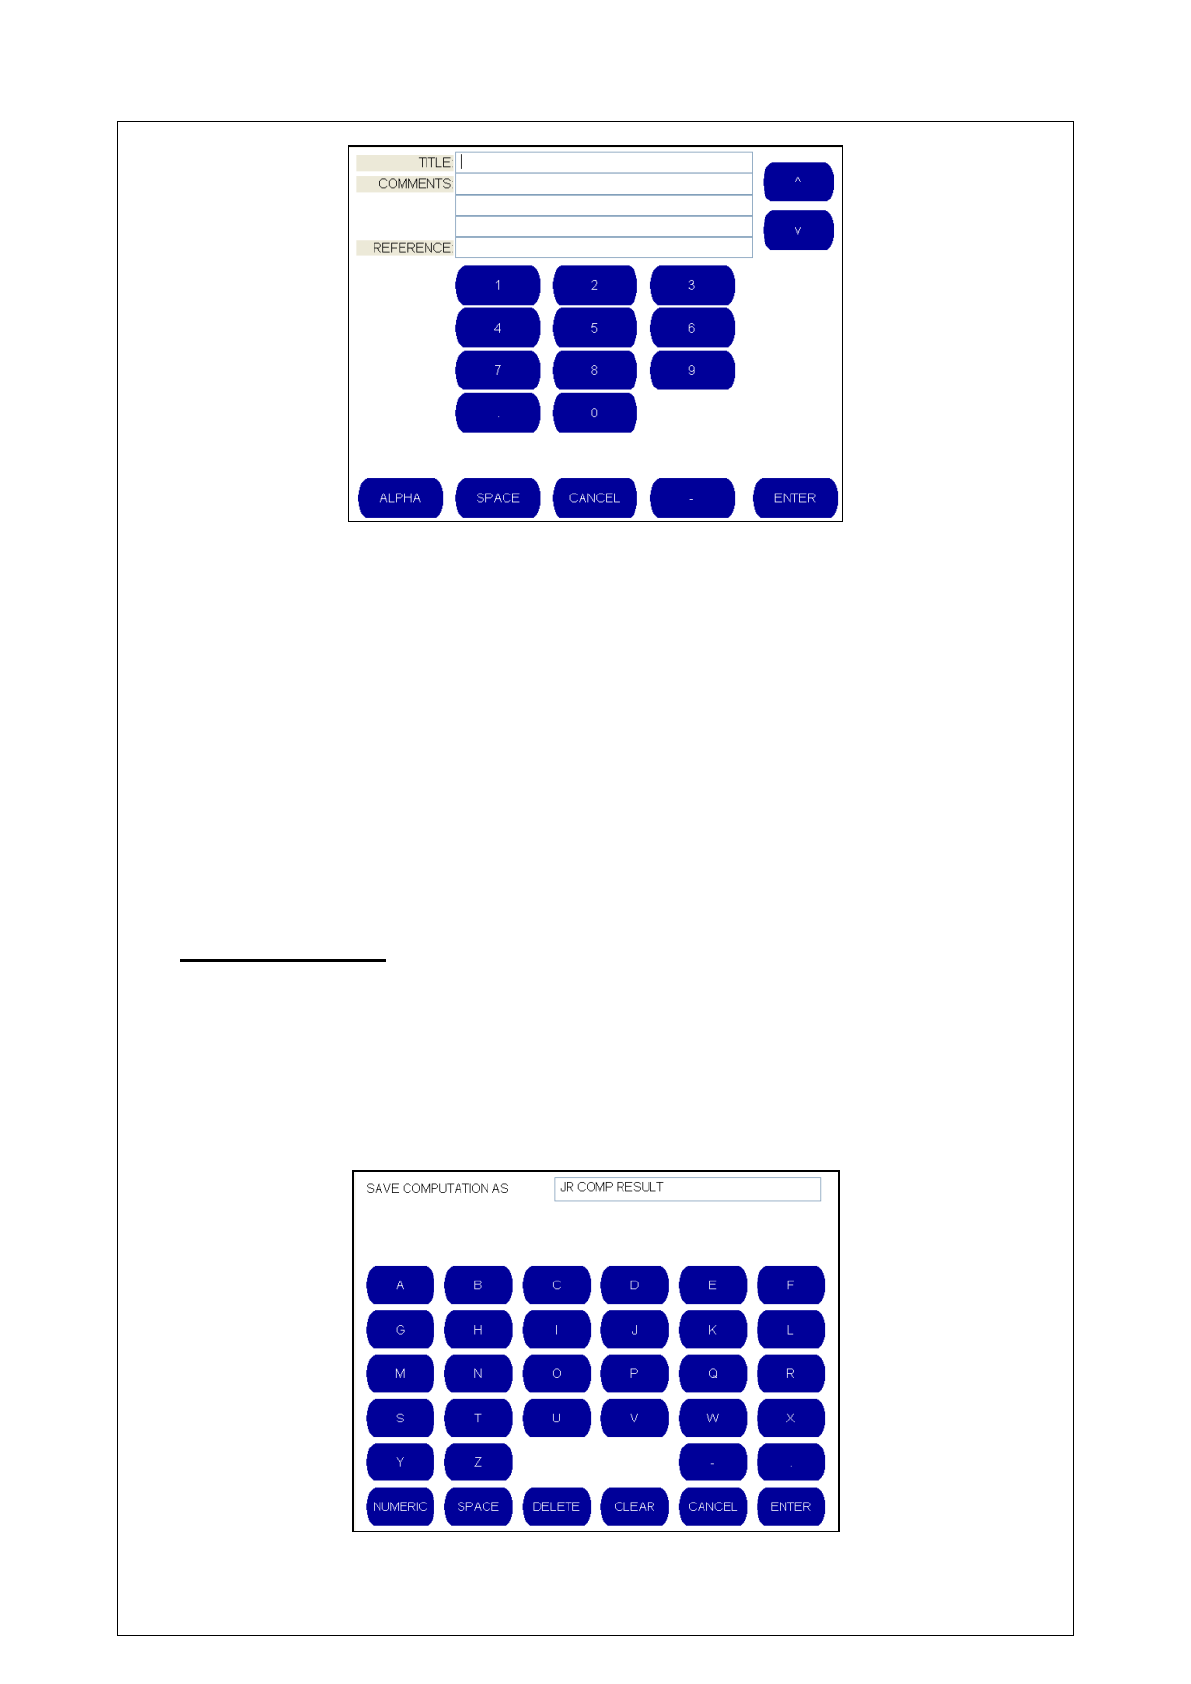
45
To switch back to inputting letters, select the “ALPHA” button now displayed in the bottom left
hand corner.
When the details have been input, select “ENTER” to return to the Sound Speed Computation
screen.
Saving a Computation
Before saving a computation, please ensure that you have added any additional information if
required by following the above procedure.
To save a computation, select “SAVE AS” from the Sound Speed Computation screen. A virtual
keyboard is then displayed with which the operator can input the name of the computation.
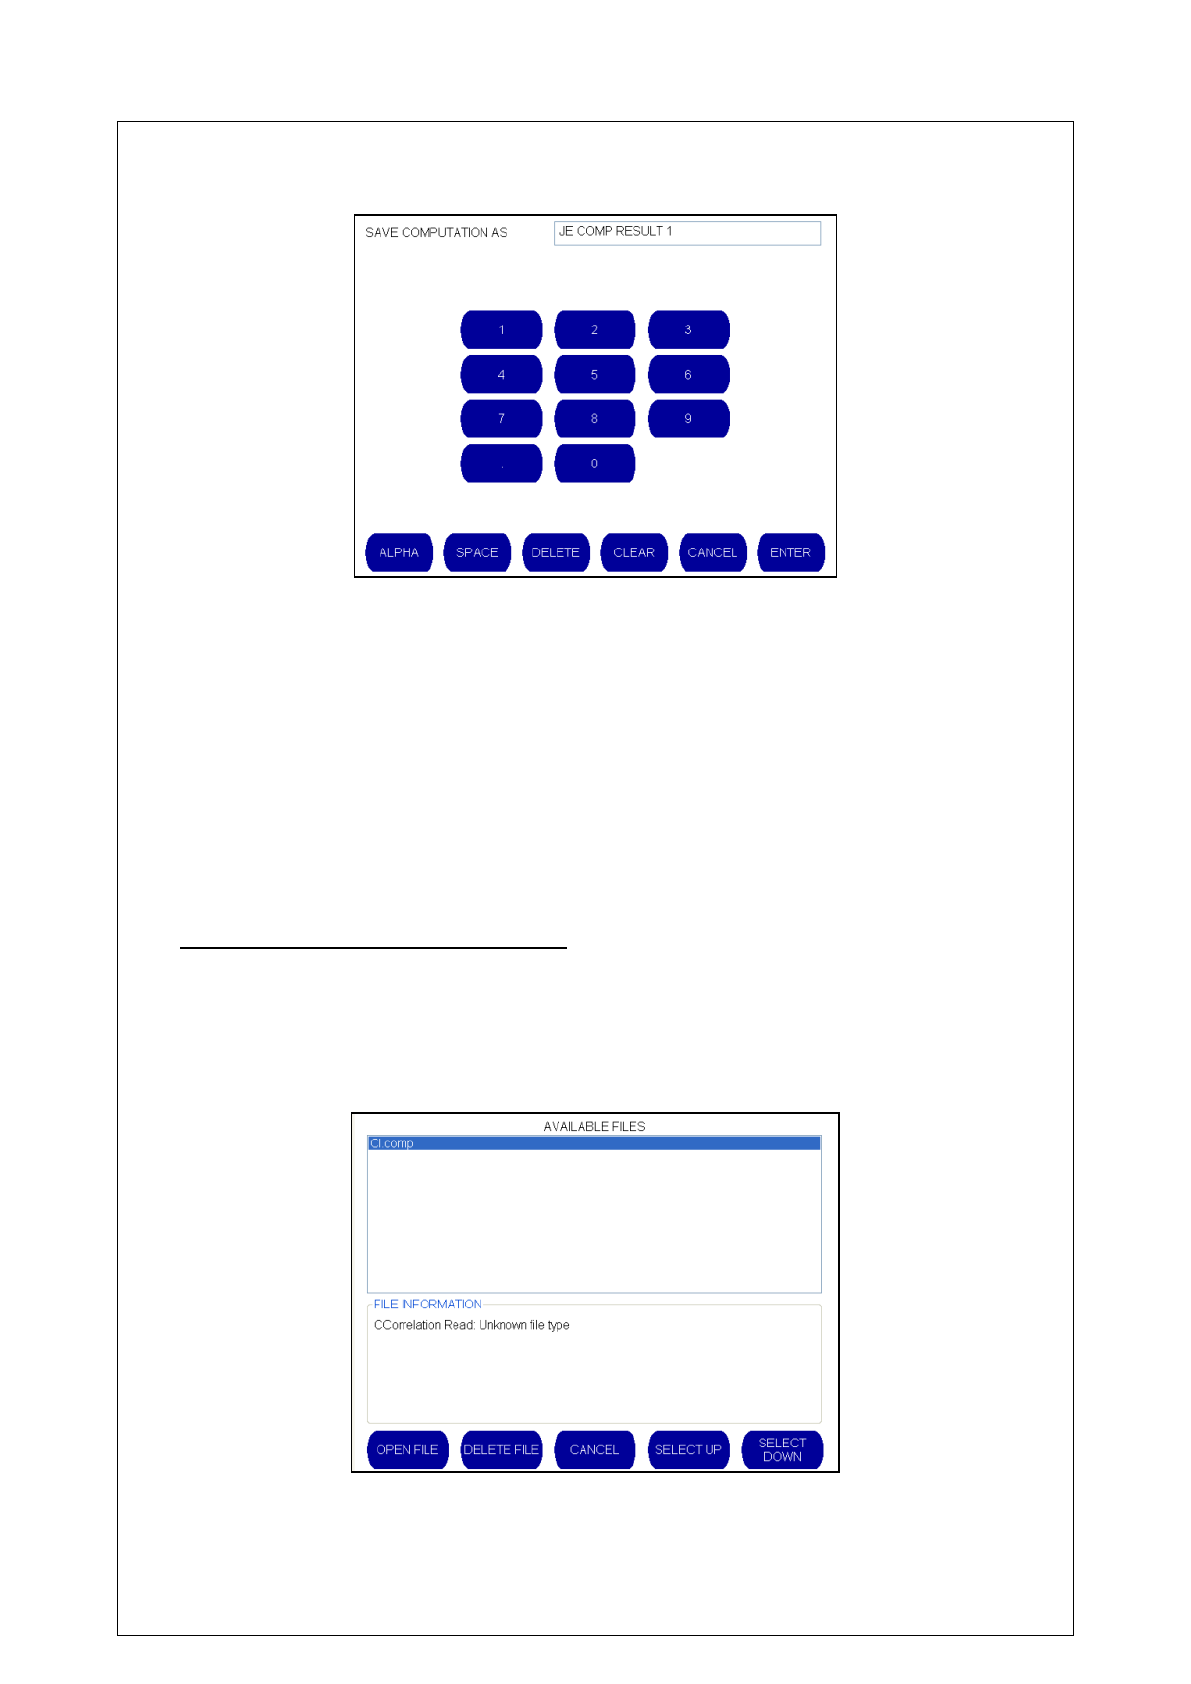
46
To input numbers, select the “NUMERIC” button in the bottom left hand corner.
To switch back to inputting letters, select the “ALPHA” button now displayed in the bottom left
hand corner.
When inputting the name, use the “CLEAR” and “DELETE” buttons to remove characters already
input.
The “DELETE” button removes the right most character only
The “CLEAR” button removes the whole line of text
Press the “CANCEL” button to return to the Sound Speed Computation screen without saving the
file.
Press the “ENTER” button to save the computation
Opening a Previously Saved Computation
From the Sound Speed Computation screen, select “OPEN”.
The operator will then be presented with a list of previously saved computations which can be
selected using the “SELECT UP” and “SELECT DOWN” buttons.
47
When the correct file is highlighted, the computation can be deleted by selecting “DELETE FILE”
or opened by selecting “OPEN FILE”.
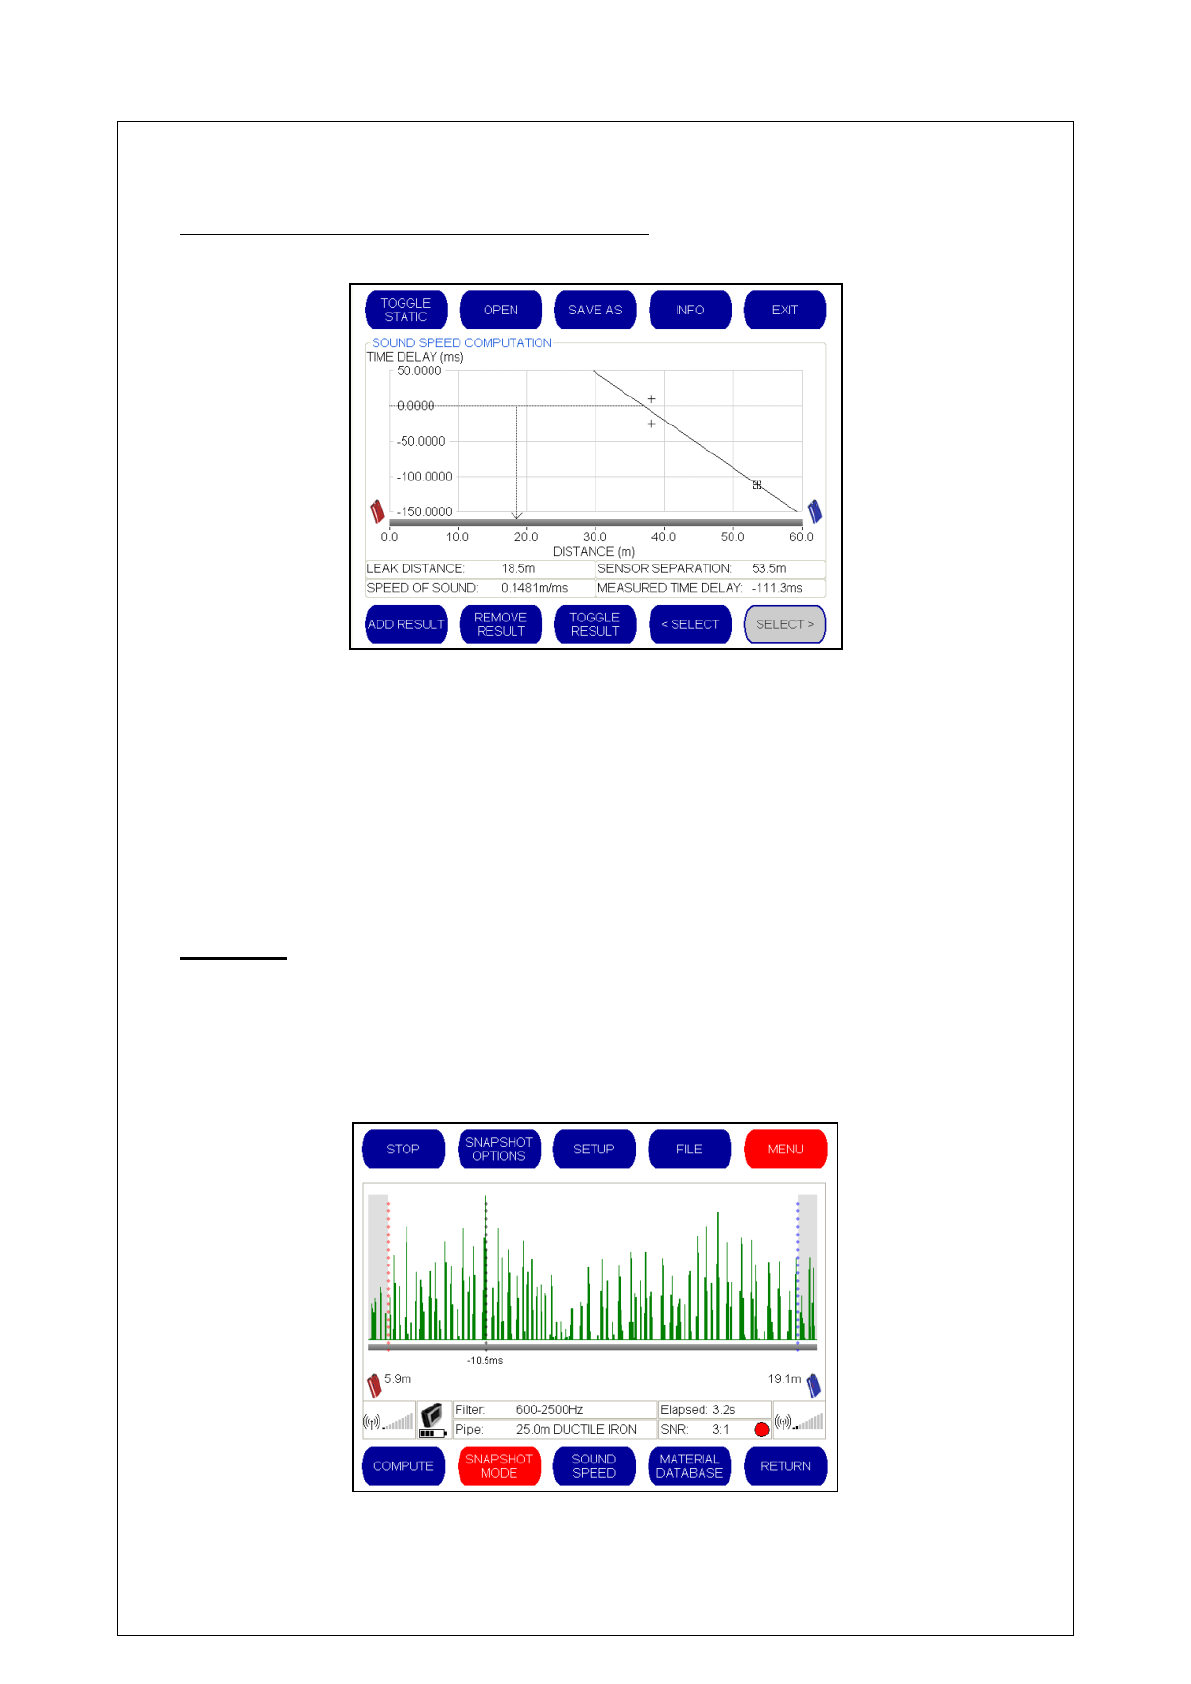
Understanding the Data Produced from a Computation
LEAK DISTANCE – This displays the result of the Compute graph, giving the distance
between the identified leak position and the stationary outstation.
SPEED OF SOUND – This displays the speed of the sound traveling through the pipe
that has been calculated by the Compute graph.
SENSOR SEPARATION – This displays the distance between the non static sensor and
the static sensor for each correlation.
MEASURED TIME DELAY – This is the time delay for all of the combined correlations.
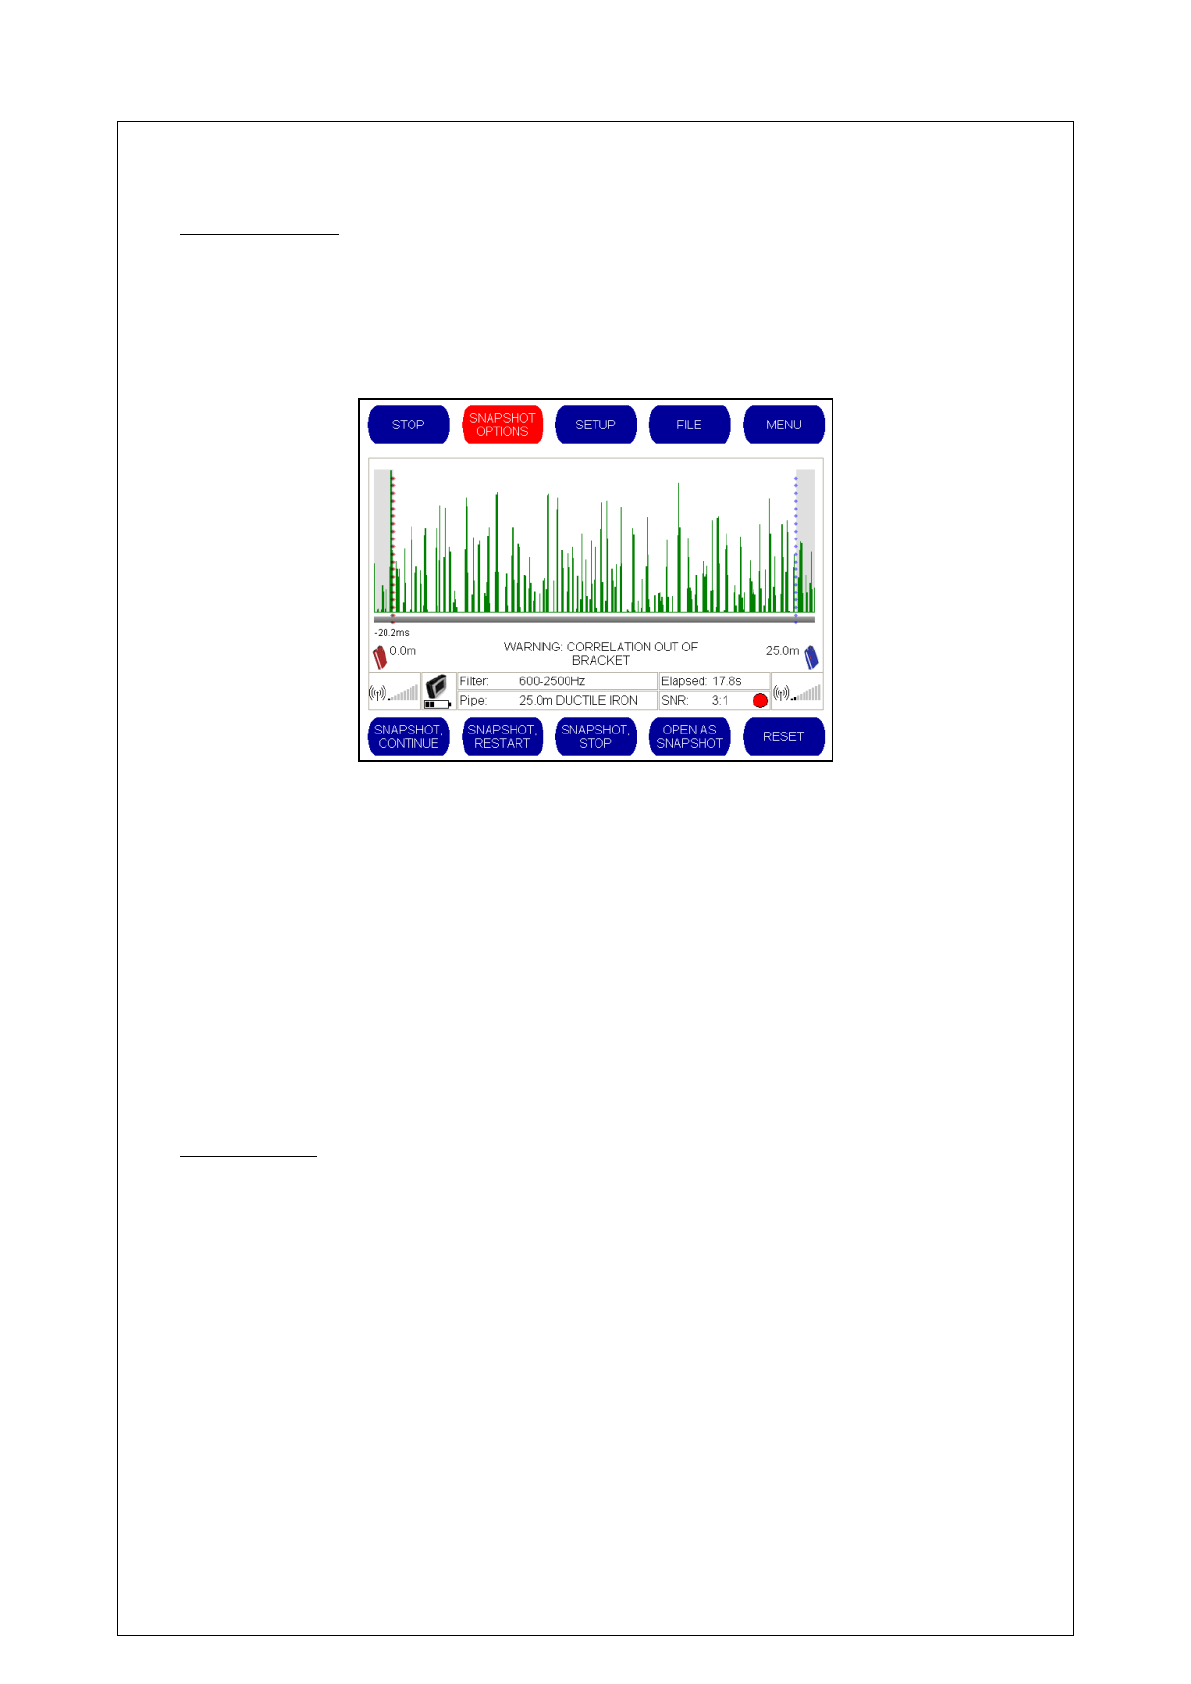
Snapshot
The Snapshot feature enables the operator to record a still image of the correlation graph at any
time during a real-time correlation. This is useful for highlighting temporary noises such as a
flushing toilet or sudden traffic noise that might interfere with the correlation result.
48
When a correlation is in process, select the “MENU” button and then select the “SNAPSHOT”
button that appears at the bottom of the screen to activate this feature.
Snapshot Options
When the Snapshot button is pressed during a correlation, the “SURVEY” button that appears
on the main correlation screen is replaced with a button labeled “SNAPSHOT OPTIONS”.
When “SNAPSHOT OPTIONS” is selected, the buttons at the bottom of the screen change as
follows:
“SNAPSHOT CONTINUE” – This makes a copy of the current result which will be
displayed above the active correlation, and allow the current correlation to continue.
“SNAPSHOT RESTART” – This makes a copy of the current result in the same way,
and starts a new correlation.
“SNAPSHOT STOP” - This makes a copy of the current result and stops the
correlation.
“OPEN AS SNAPSHOT” - This opens an existing correlation as a snapshot.
“RESET” - This clears the current correlation.
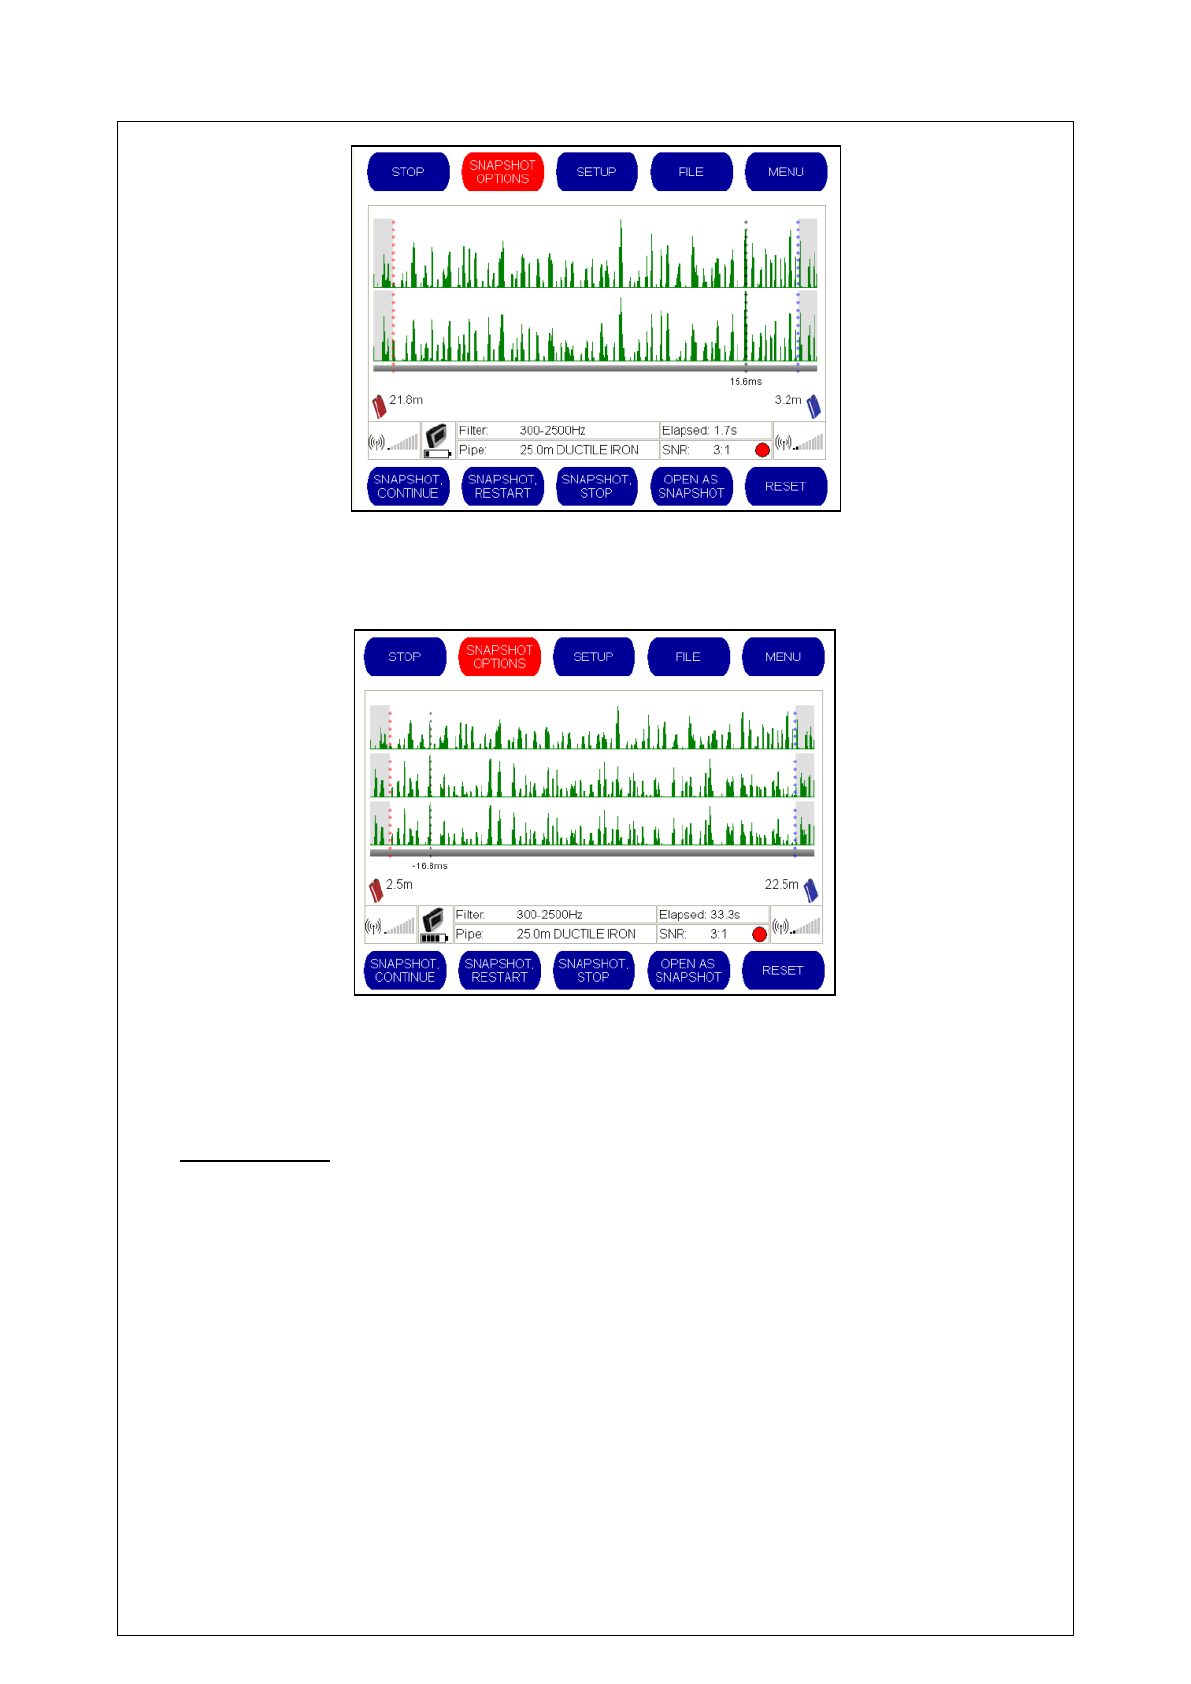
Using Snapshot
The Snapshot feature effectively enables the operator to compare noise levels at different points
during the correlation process. When the “”SNAPSHOT CONTINUE” or “”SNAPSHOT
RESTART” buttons are selected, the static snapshot image appears at the top of the screen,
while the real time correlation continues to run underneath.
49
It is possible to take up to five separate Snapshot images during a correlation. The graph size
reduces each time to accommodate the new image (as shown below)
WARNING: Activating the Snapshot button replaces the “RESET” button on the main
correlation screen with the “SNAPSHOT OPTIONS” button. To reset the correlator in
order to perform a new correlation, the Snapshot feature will have to be deactivated from
the Menu screen.
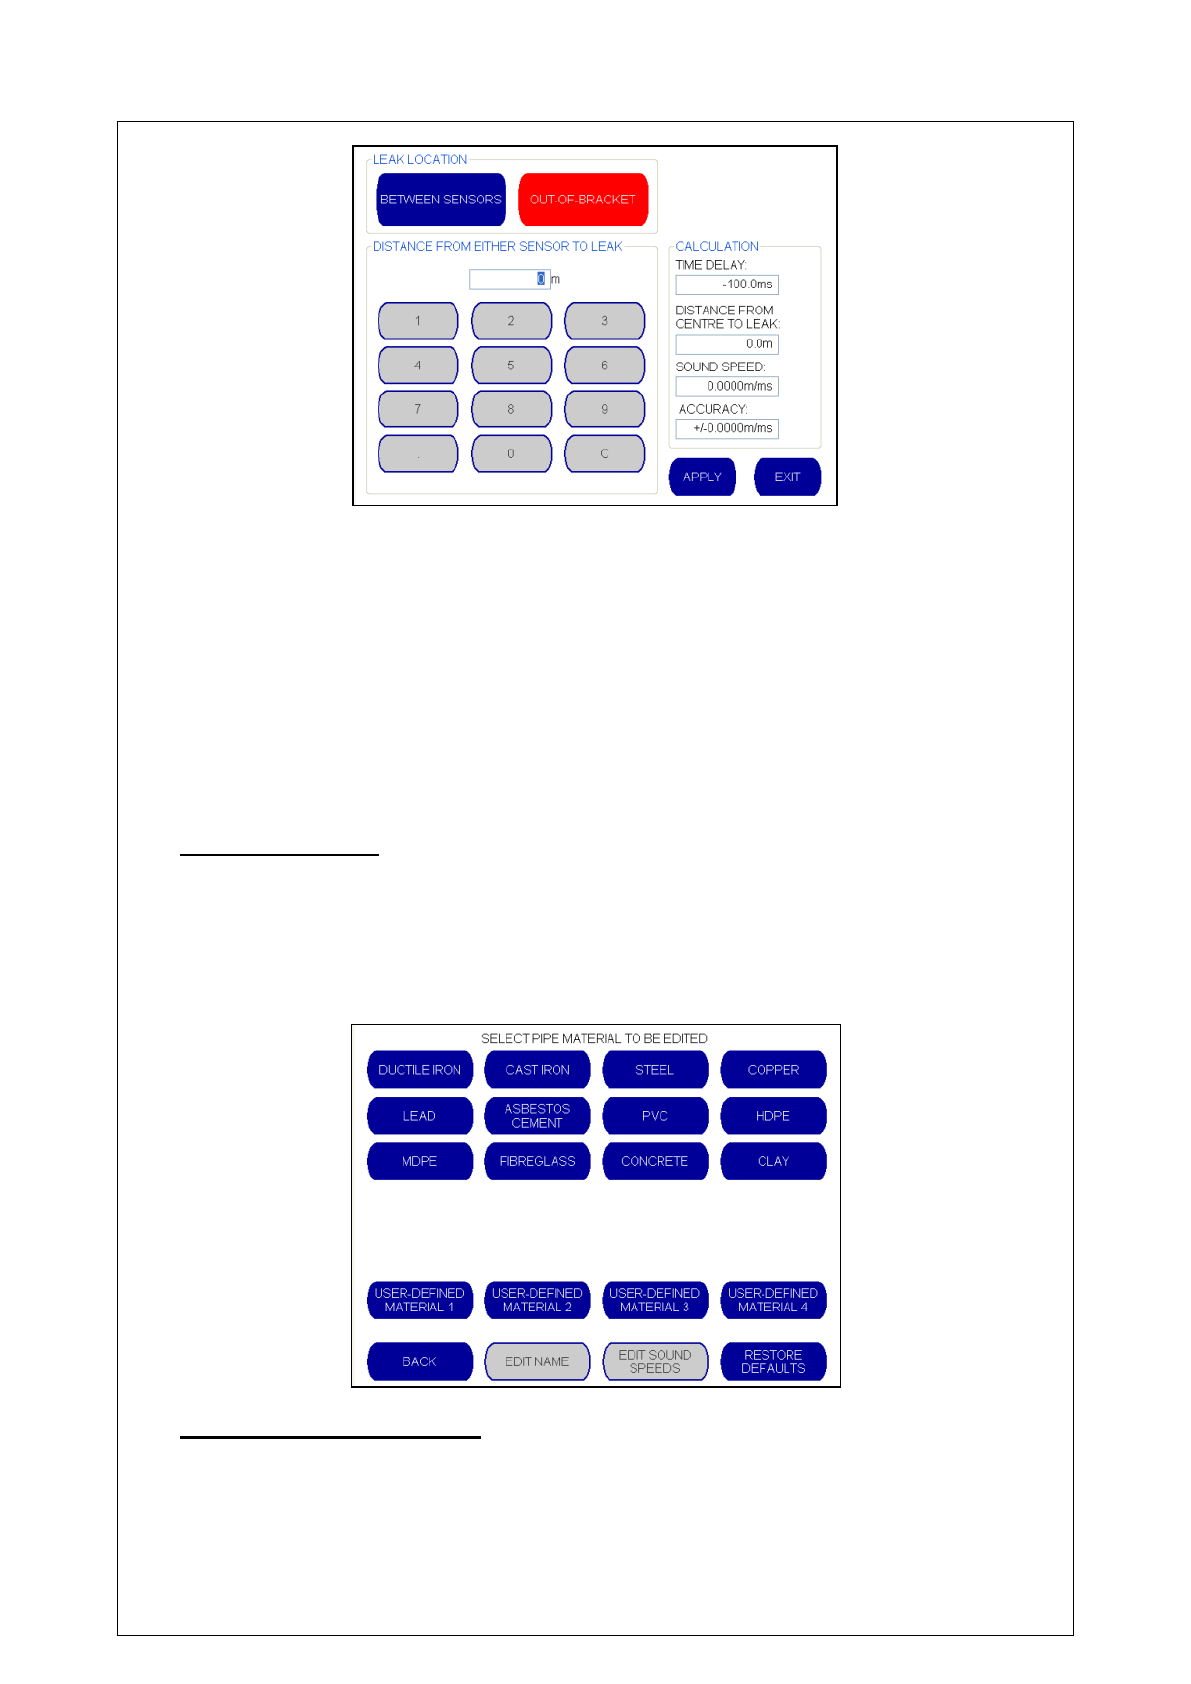
Sound Speed
This is basically a calculator to work out the time delay and velocity when a leak position is
already known. This is useful when the pipe material or sound velocity is uncertain.
50
If the Main Correlation Screen displays an “Out of Bracket” warning, indicating that a possible
leak has been identified outside the area between the two outstations, the Sound Speed screen
shown above will display the velocity reading from this out of bracket correlation.
This velocity reading will be useful in the next correlation, when the outstation has been moved
so that the suspected leak position falls between the two outstations. This will bring the leak
within the bracket to get a correlation result. The operator can choose whether to use the
velocity calculation from the Out of Bracket attempted correlation to generate a user defined
material or to continue using the default material velocities.
Material Database
The Material Database screen enables the operator to edit the name and sound speeds of pre-
programmed pipe materials stored in the Base Unit.
Every pipe material type and pipe diameter is pre-programmed with tables logging the speed of
sound traveling through it. This data enables the correlator to pinpoint the distance from the
sensor to the leak when the correct pipe material and diameter is identified.
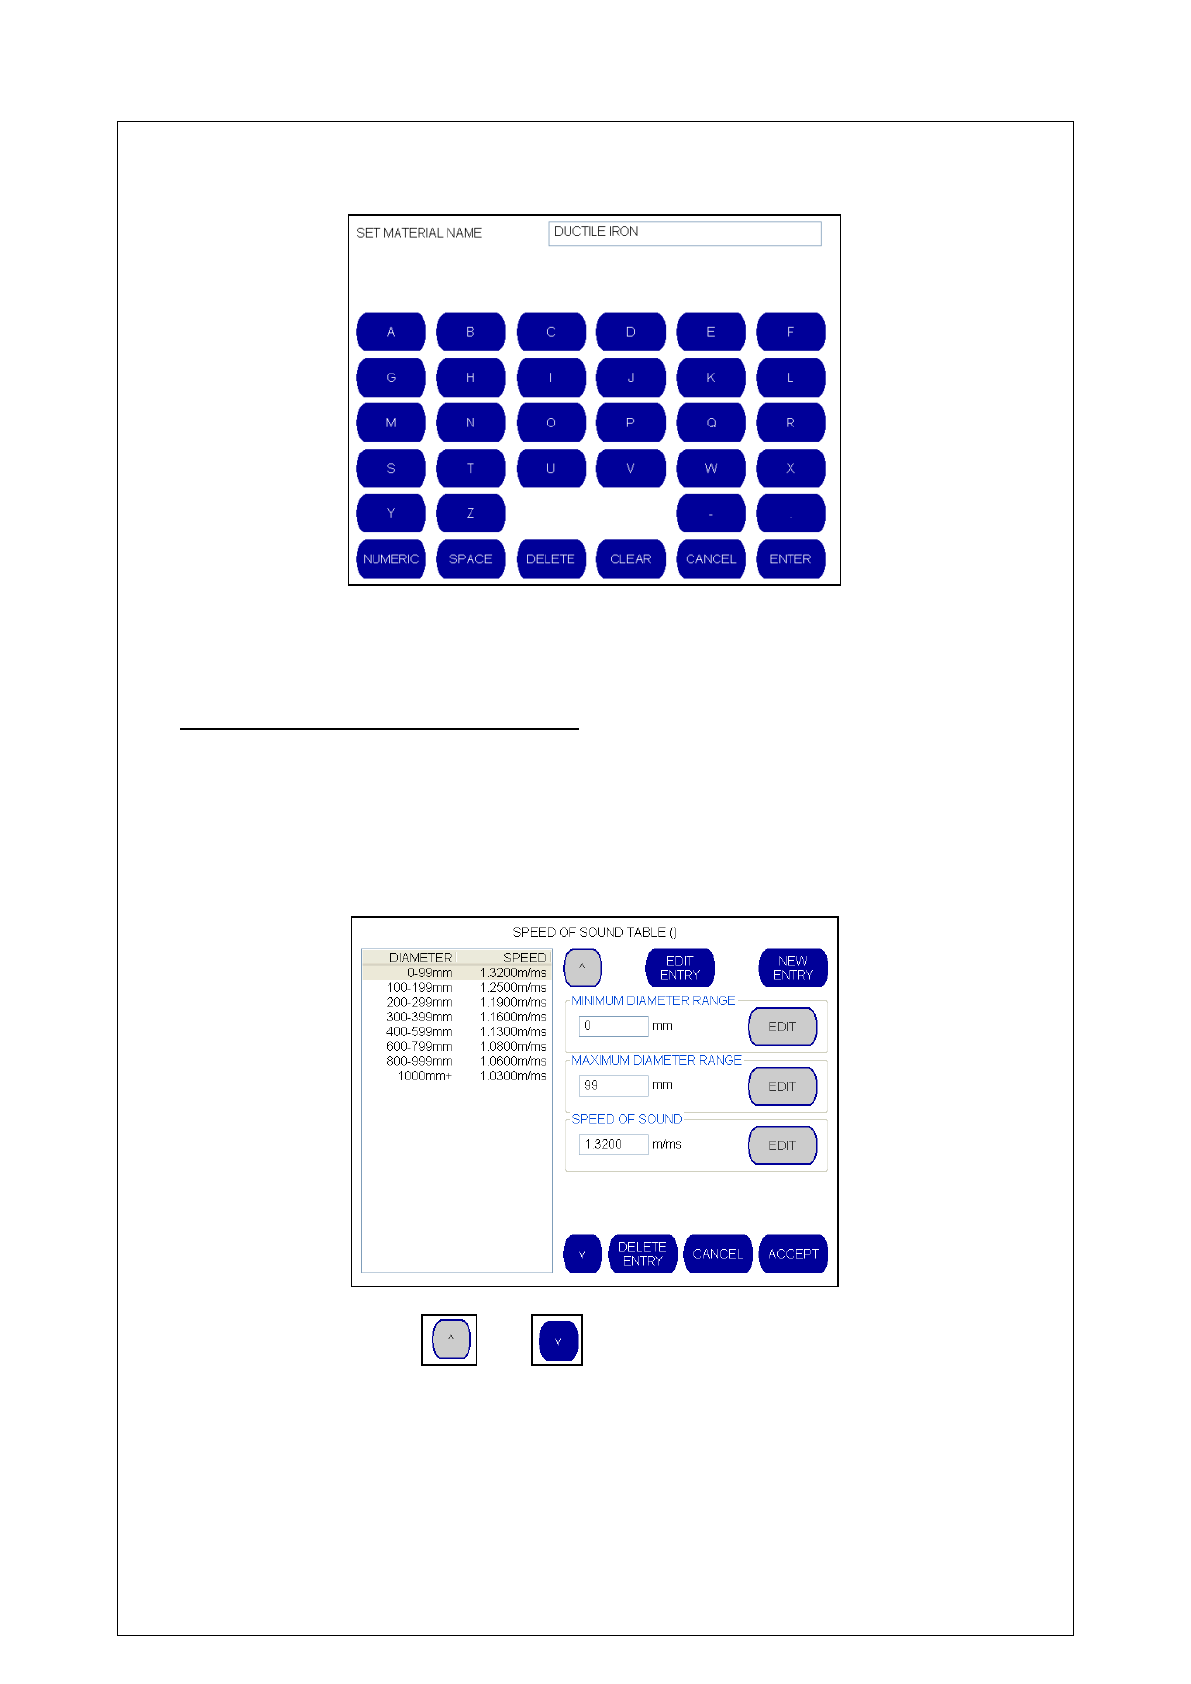
To Edit Pipe Material Name
Select the pipe material to be edited and select “EDIT NAME”.
51
Use the virtual keyboard (shown below) to input the new name. If numbers are selected, the
“NUMERIC” button can be change the key board to a numeric display.
When the name has been changed, select “ENTER” to return to the Materials Database, where
the new name will be displayed.
To Edit Pipe Material Sound Speeds
Select the pipe material to be edited and select “EDIT SOUND SPEEDS”
The speed of sound table for that pipe material is displayed.
For example, if “DUCTILE IRON” is selected, followed by “EDIT SOUND SPEEDS” the following
screen is displayed.
The operator can use the and buttons to scroll up and down the sound table
displayed on the left hand side of the screen. This will automatically populate the fields, enabling
the operator to edit only the field(s) that require changing.
To create a new entry, the operator selects the “NEW ENTRY” button at the top of the screen
which activates the edit options as shown below.
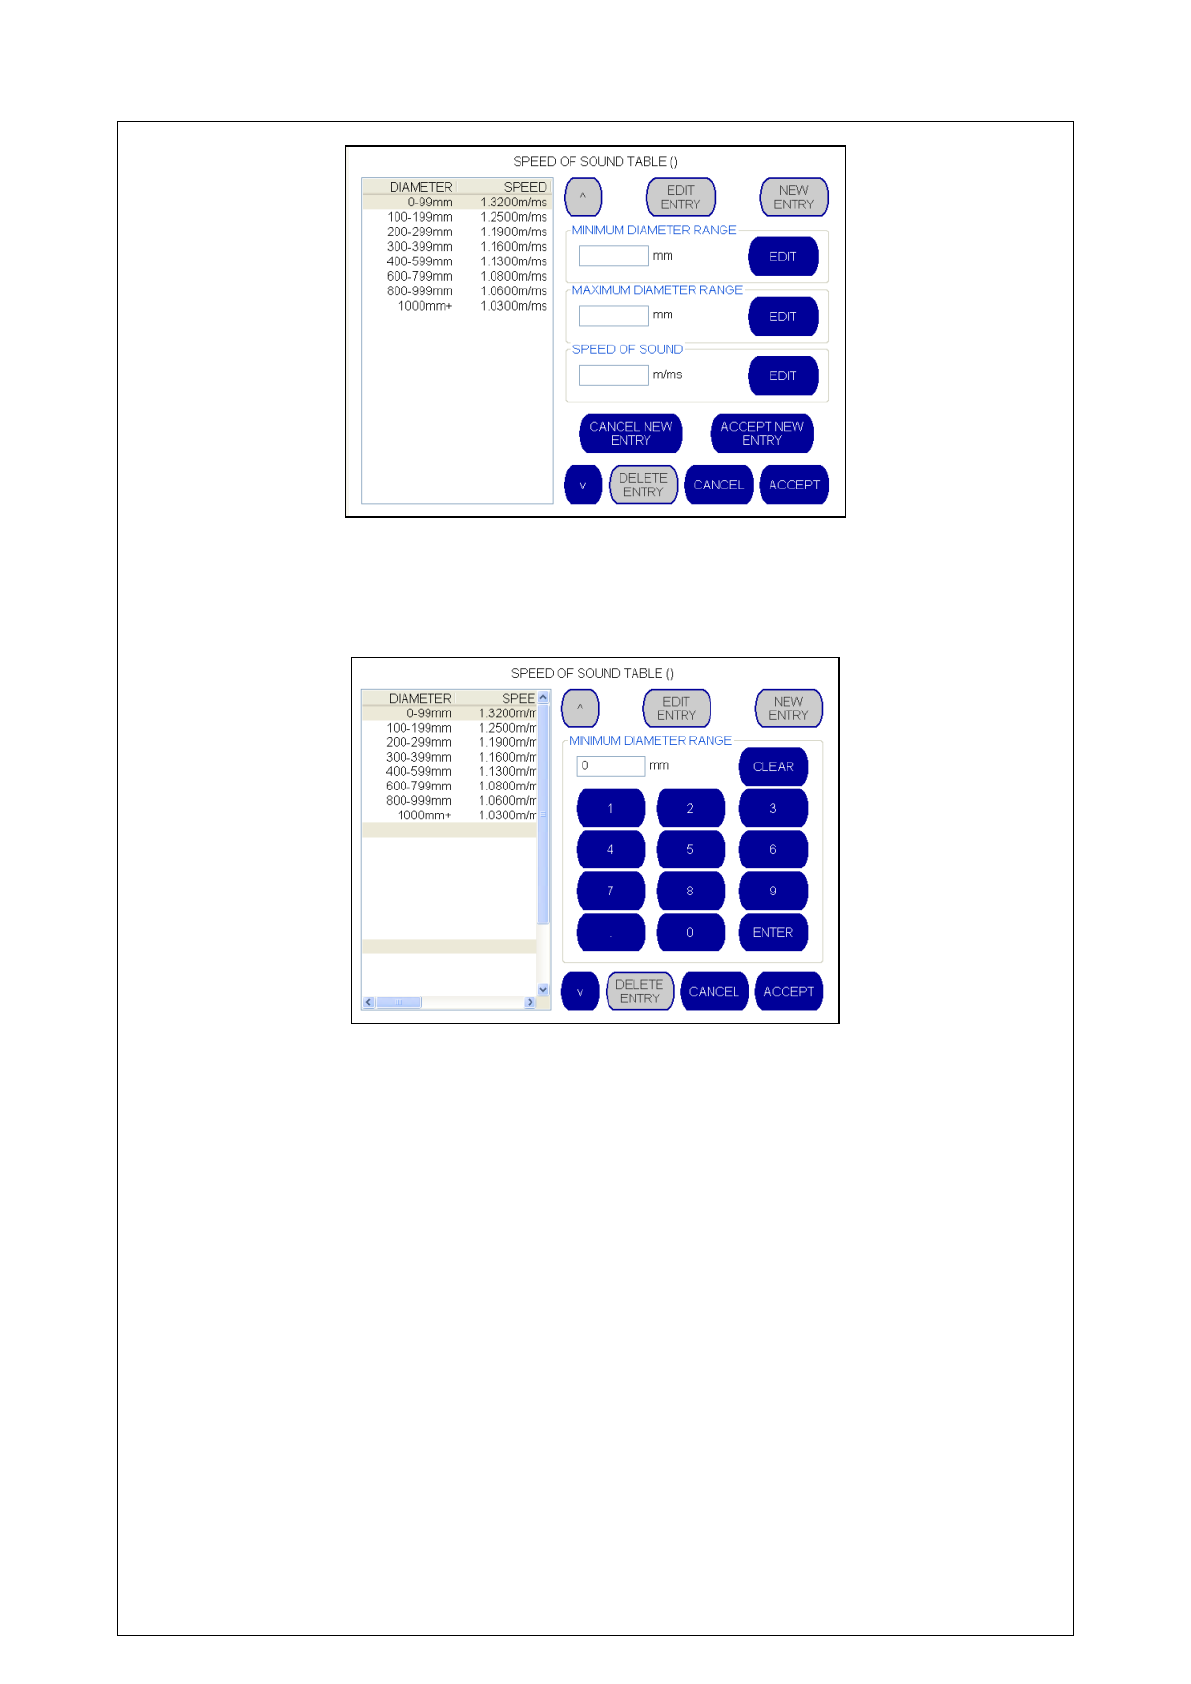
52
The operator can populate the Minimum Diameter Range, Maximum Diameter Range and Speed of Sound by
selecting the “EDIT” button located next to the field that they wish to populate. This brings up a numeric keypad to
enable the operator to input the required information.
After inputting the value, the operator can select “ENTER” or “CLEAR” to return to the previous
screen.
When the new Minimum Diameter Range, Maximum Diameter Range and Speed of Sound
values have been input in this way, the operator can choose to accept or cancel this new entry
by selecting either the “ACCEPT NEW ENTRY” or “CANCEL NEW ENTRY” button. If they
choose to accept the new entry, it will appear in the sound table on the left hand side of the page
with the other sound tables.
To edit and existing entry, the operator selects the “EDIT ENTRY” button at the top of the screen
which activates the edit options. The process for inputting data values is identical to that
described above.
When the new or edited entry has been successfully input, the operator has the opportunity to
save these new settings and return to the main correlation screen by selecting “ACCEPT”, return
to the main correlation screen without saving by selecting “CANCEL” or delete an entry by
selecting “DELETE ENTRY”.
53
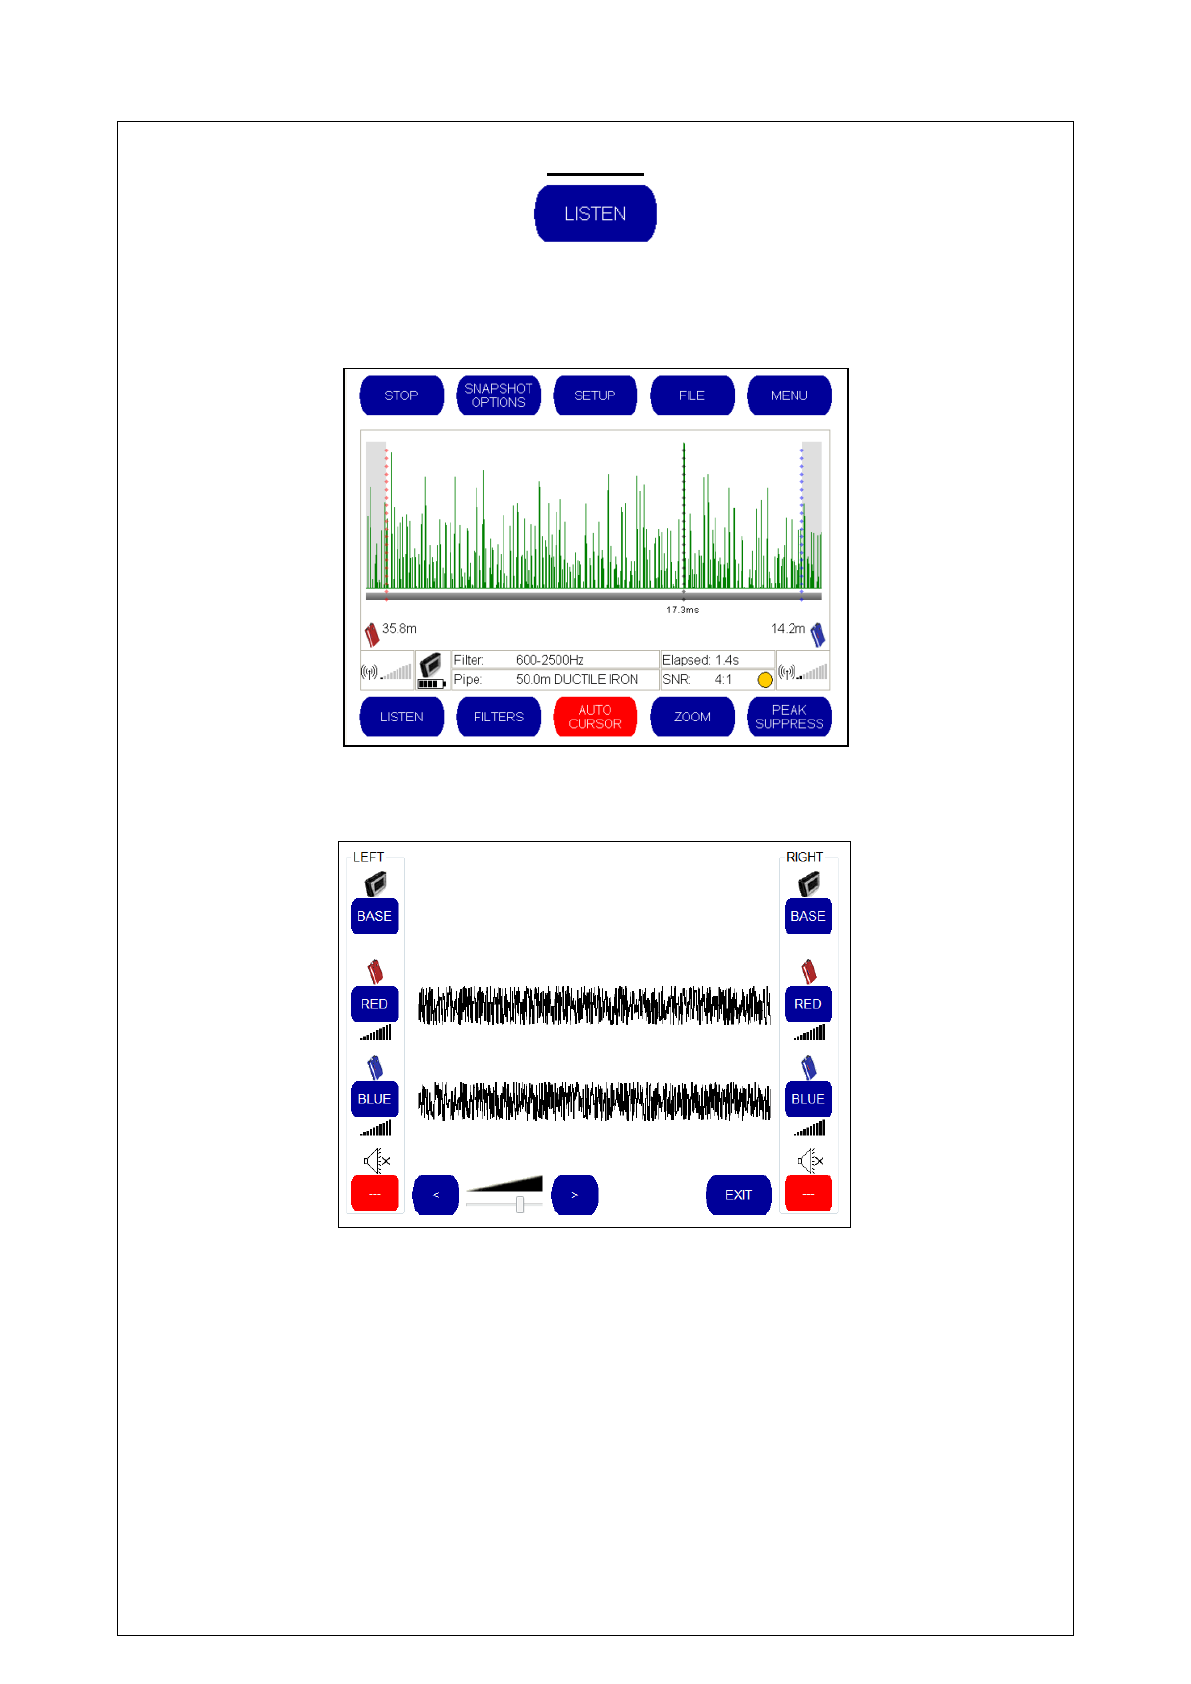
LISTEN
The “LISTEN” button allows the operator to listen to the noise received by the Base Unit through
the headphones. This is a useful feature for confirming that noise is being successfully
transmitted and received.
After pressing the “LISTEN” button from the bottom left hand corner of the main correlation
screen, the following screen is displayed.
The screen is split into three panels:
If a sensor has been connected directly to the Base Unit, the noise produced from that
sensor is displayed graphically in the top panel.
If a sensor has been connected to the Red Outstation, the noise produced from that
sensor is displayed graphically in the middle panel.
If a sensor has been connected to the Blue Outstation, the noise produced from that
sensor is displayed graphically in the bottom panel.
In the above example, the operator can clearly see that noise is being received from both the red
and blue outstations. This is displayed as a black band of noise when a correlation has been
performed
54
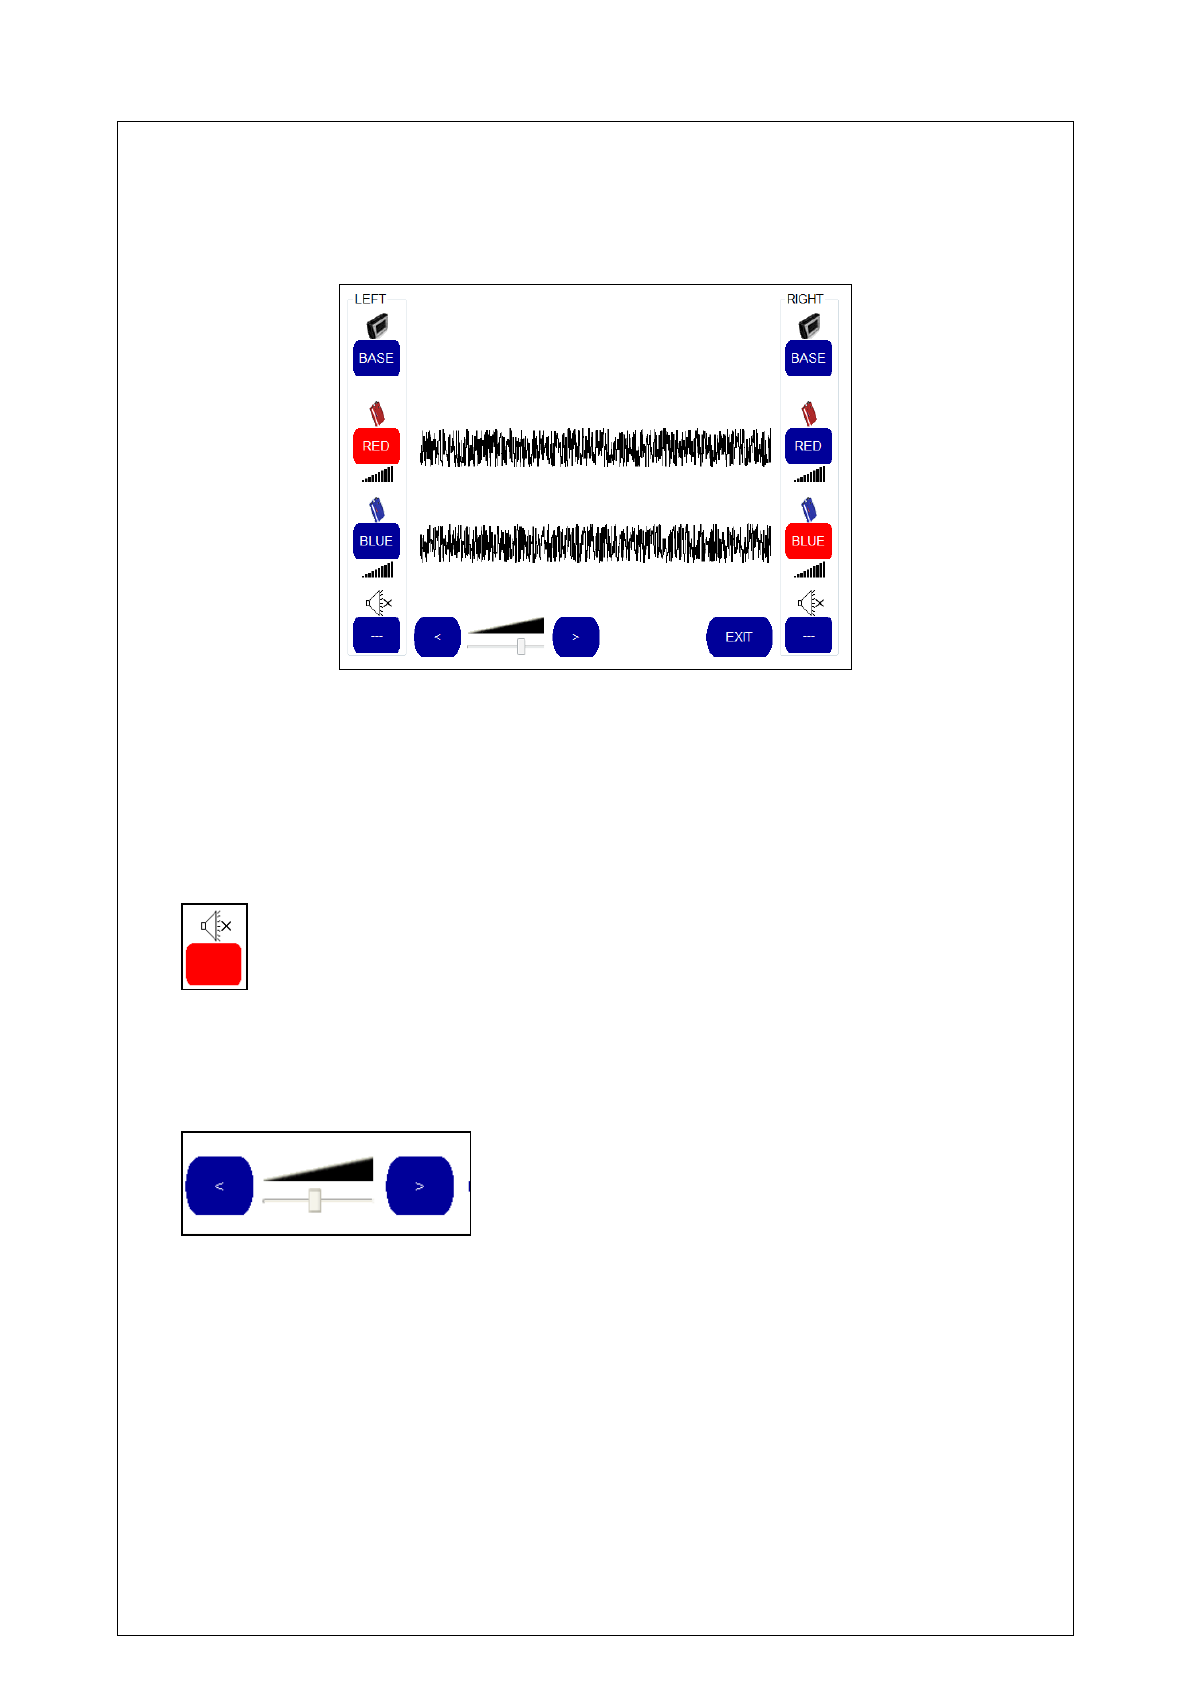
The operator can now use the buttons on the screen to select the noise that is heard through the
left and right speaker on the headphones. For example, if the operator wished to listen to the
sound from the red outstation through his left ear and the sound from the blue outstation through
his right ear, he would select the following configuration:
The button turns red when selected to show the operator what is being heard through each
speaker.
If the operator wished to hear only the noise transmitted from the blue outstation, he could select
the blue outstation for both the left and the right speakers. Alternatively, the operator could
choose to listen to the sound through one speaker only, and mute the other speaker by selecting
the “Audio Off” icon for that particular speaker, as shown below.
When pressed, the button turns red to show the operator that the “Audio Off” option has been
selected for this specific ear.
Audio volume into the headphones can be controlled using the “<” and “>” buttons shown below.
The “EXIT” button returns the operator to the main correlation screen.
55
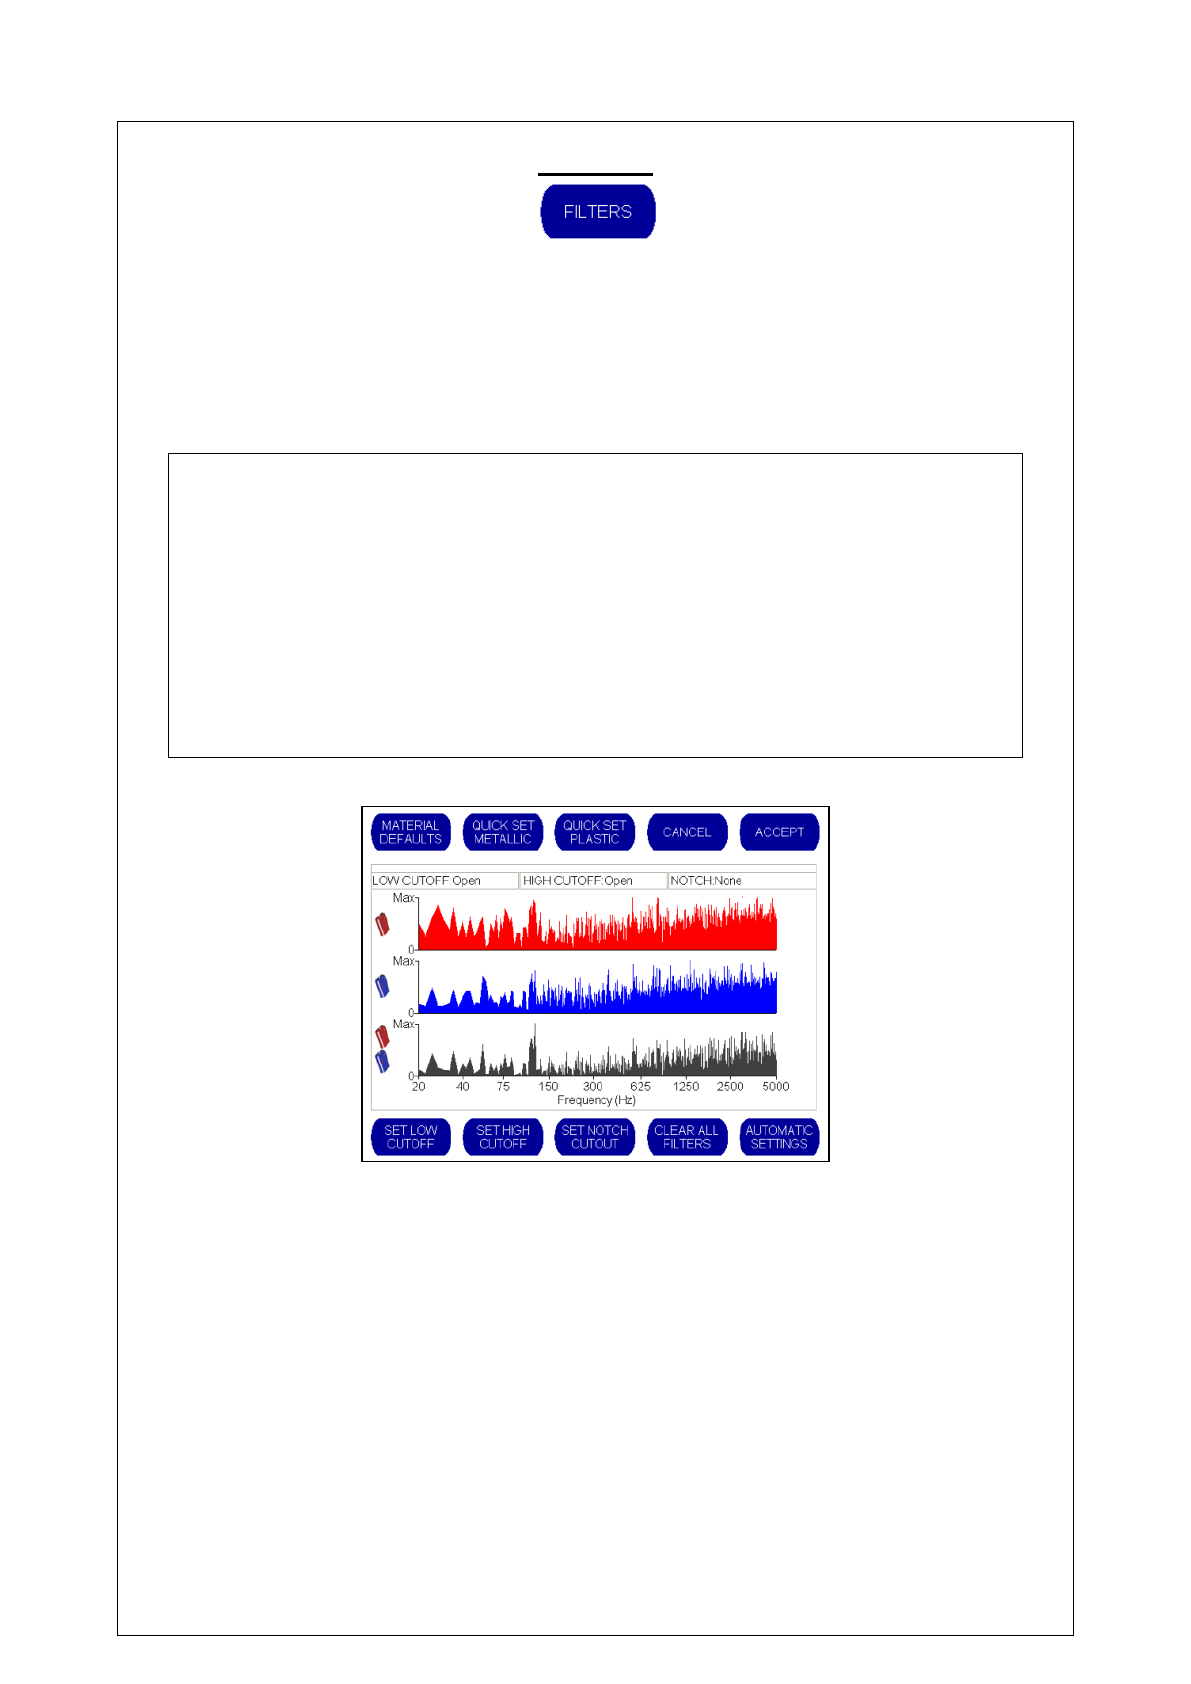
FILTERS
The comprehensive audio filters in Touch Pro cover the frequency range up to 5000 Hz and are
designed to eliminate background noise and to enhance the leak noise signals. Hz is the
international abbreviation for Hertz which stands for cycles per second. Adjustment may be
made to maximise the similarity between the two sound channels, to compensate for the
modification of the leak noise by the pipe material. The filter settings below 20Hz are lower than
human hearing can notice, although Touch Pro can analyze and correlate at these subsonic
frequencies.
HELPFUL NOTE
Touch Pro uses a unique Automated Filtering Intelligence System (AFIS) which automatically
runs up to 55 different filter combinations on the correlation, checking the quality of the result and
optimizing the filters until the best result is obtained. AFIS works with both live and pre-recorded
data, and is designed to make manual filter setting a thing of the past by effectively building an
“expert user” into the unit.
AFIS Filter Optimization is set by default to be “always on” enabling it to work whenever a
correlation fails to produce an accurate result. The feature can be switched off or set to manual
mode on the Advanced Settings menu screen.
We recommend that the Filter Optimization mode is used to automatically optimize filter
settings during the correlation before deciding whether any manual filter adjustments are
required.
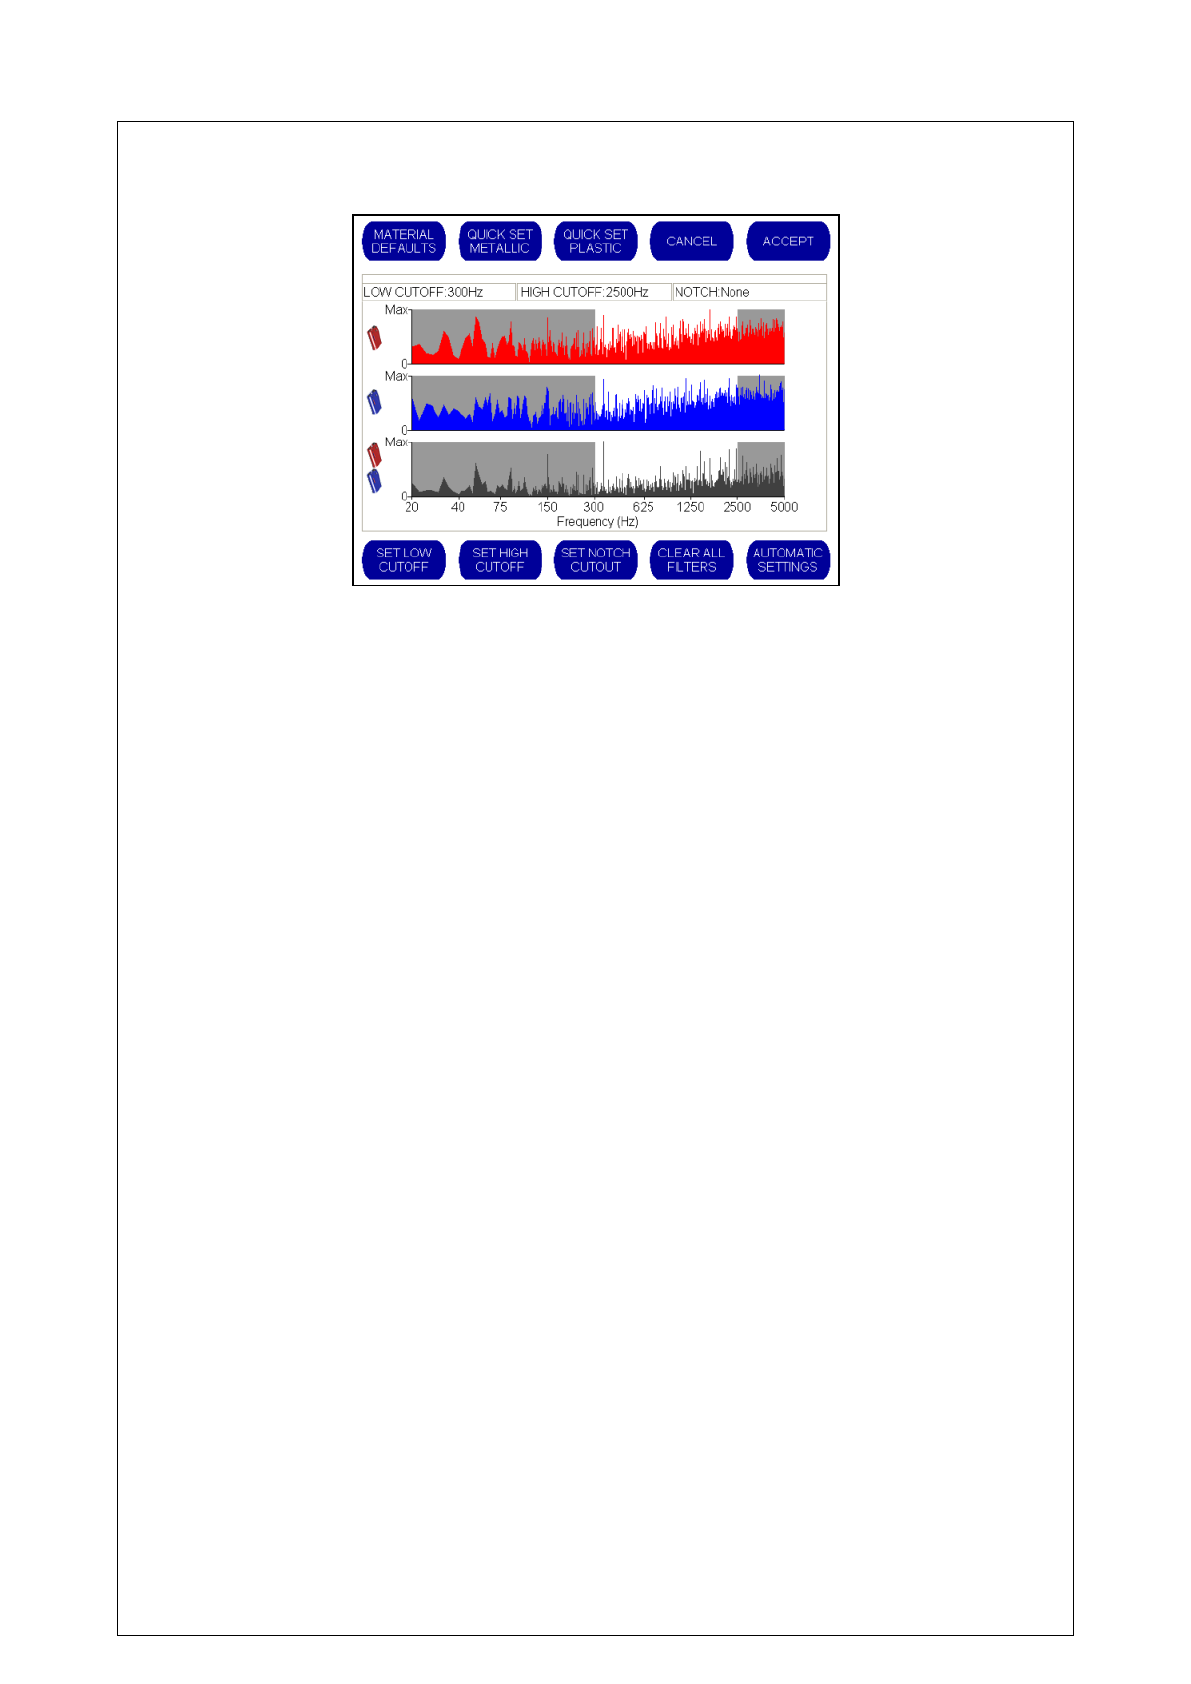
When the Filters button is pressed, the following screen is displayed
This screen shows the frequency spectrum of the noise being received. The range is 0-5 kHz.
Three graphs are displayed:
The top graph shows the noise being received from the red outstation. Noise data is
displayed in red.
The middle graph shows noise being received from the blue outstation. Data is
displayed in blue.
The bottom graph shows the noise being received from a combination of the red and
blue outstations. This is known as the Coherence Graph. Noise data is displayed in
black.
In the example shown above, no filters have been selected because the whole spectrum of noise
is displayed against a white background. When filters are applied, the frequencies being filtered
out are displayed against a grey background.
56
This makes it easy for the operator to see which filters have been applied, as shown in the
example below:
Only noise displayed against a white background is used to perform the correlation.
Using the touch screen, the filter bands can be moved simply by dragging a finger to the left or
right of the graph to widen or narrow the white non filtered area.
Alternatively, the operator can change the filter bands in a variety of ways:
Press the “SET LOW CUT OFF” button and then touch the screen at the point on the
graph that the cut off is to be applied up to. The area immediately to the left of this point
will be filtered out, and displayed graphically on a grey background.
Press the “SET HIGH CUT OFF” button and then touch the screen at the point on the
graph that the cut out is to be applied up to. The area immediately to the right of this
point will be filtered out, and displayed graphically on a grey background.
Press the “SET NOTCH CUTOUT” button and then touch the screen on either side of
noise spectrum that is to remain unfiltered. The rest of the noise spectrum will then be
filtered out, and displayed graphically on a grey background. The area of the noise
spectrum in between the two selected points will be unfiltered, and displayed graphically
on a white background.
The “CLEAR ALL FILTERS” button removes all of the grey filtered areas.
The “AUTOMATIC SETTINGS” button looks at the black coherence graph and sets the
filters so that it only allows the area that contains the most noise through. This allows
the specific noise to be correlated and removes additional background noise.
The “MATERIAL DEFAULTS” button configures the filters to the settings specified by the
selected pipe material.
The “QUICK SET METALLIC” button is recommended if the specific metal of the pipe
material is uncertain. This automatically cuts out the lower frequencies and uses only
the higher frequencies (i.e. above 300Hz) to identify the leak noise.
The “QUICK SET PLASTIC” button is recommended for non metallic pipes if the specific
pipe material is uncertain. This automatically cuts out the higher frequencies and uses
only the lower frequencies (i.e. up to 200Hz) to identify the leak noise.
The “CANCEL” button cancels the settings and returns you to the main correlation
screen.
The “ACCEPT” button saves the settings and returns you to the main correlation screen.
When the new filter settings are accepted the correlation will restart using the new
filter settings.
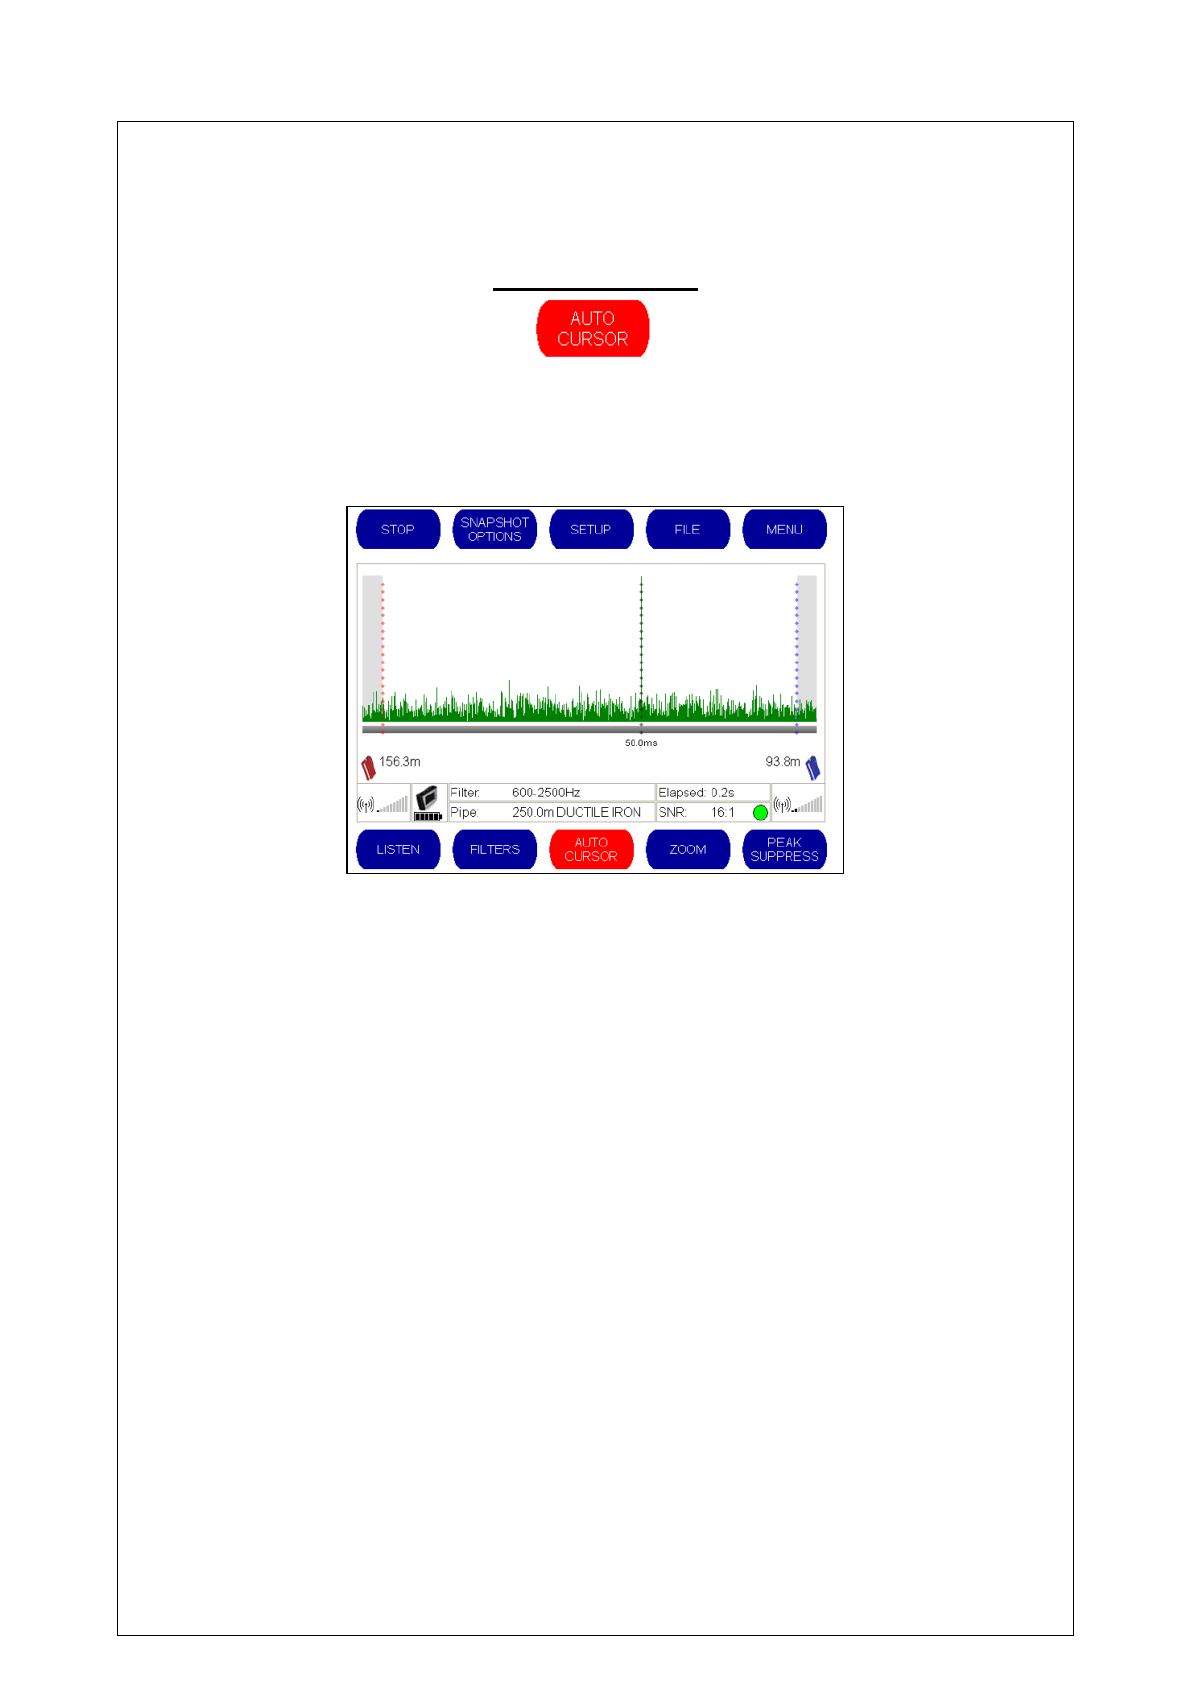
57
Please note that when a new correlation is performed, the filter settings will revert back
to the standard settings for the material, diameter and pipe length.
AUTO CURSOR
The Auto Cursor is on by default, but can be turned off at any time simply by pressing the button.
When the Auto Cursor is on the button will be red. When it is off, the button will be blue.
When switched on, the auto cursor will always display the highest peak, allowing the operator to
pinpoint exactly where the highest peak is. The distance between the highest peak and the
outstations will be displayed.
In the above example, the Auto Cursor is automatically positioned over the highest peak. The
distance from the highest peak to the red outstation is displayed (156.3m), and the distance from
the highest peak to the blue outstation is also displayed (93.8m). The Signal to Noise Ratio
(SNR) is 16:1 and displaying a green light, indicating that that confidence is high for this
particular correlation.
Should the operator wish to move the cursor to another point on the graph, this can be achieved
simply by touching the screen at the required point. The Auto Cursor is immediately switched off
and the screen displays the distance from the outstations to the selected position.
To move the cursor back to the highest peak, press the Auto Cursor button again.
Please note that the position of the cursor may take several seconds to steady during a
correlation depending on how well defined the correlation peak is.
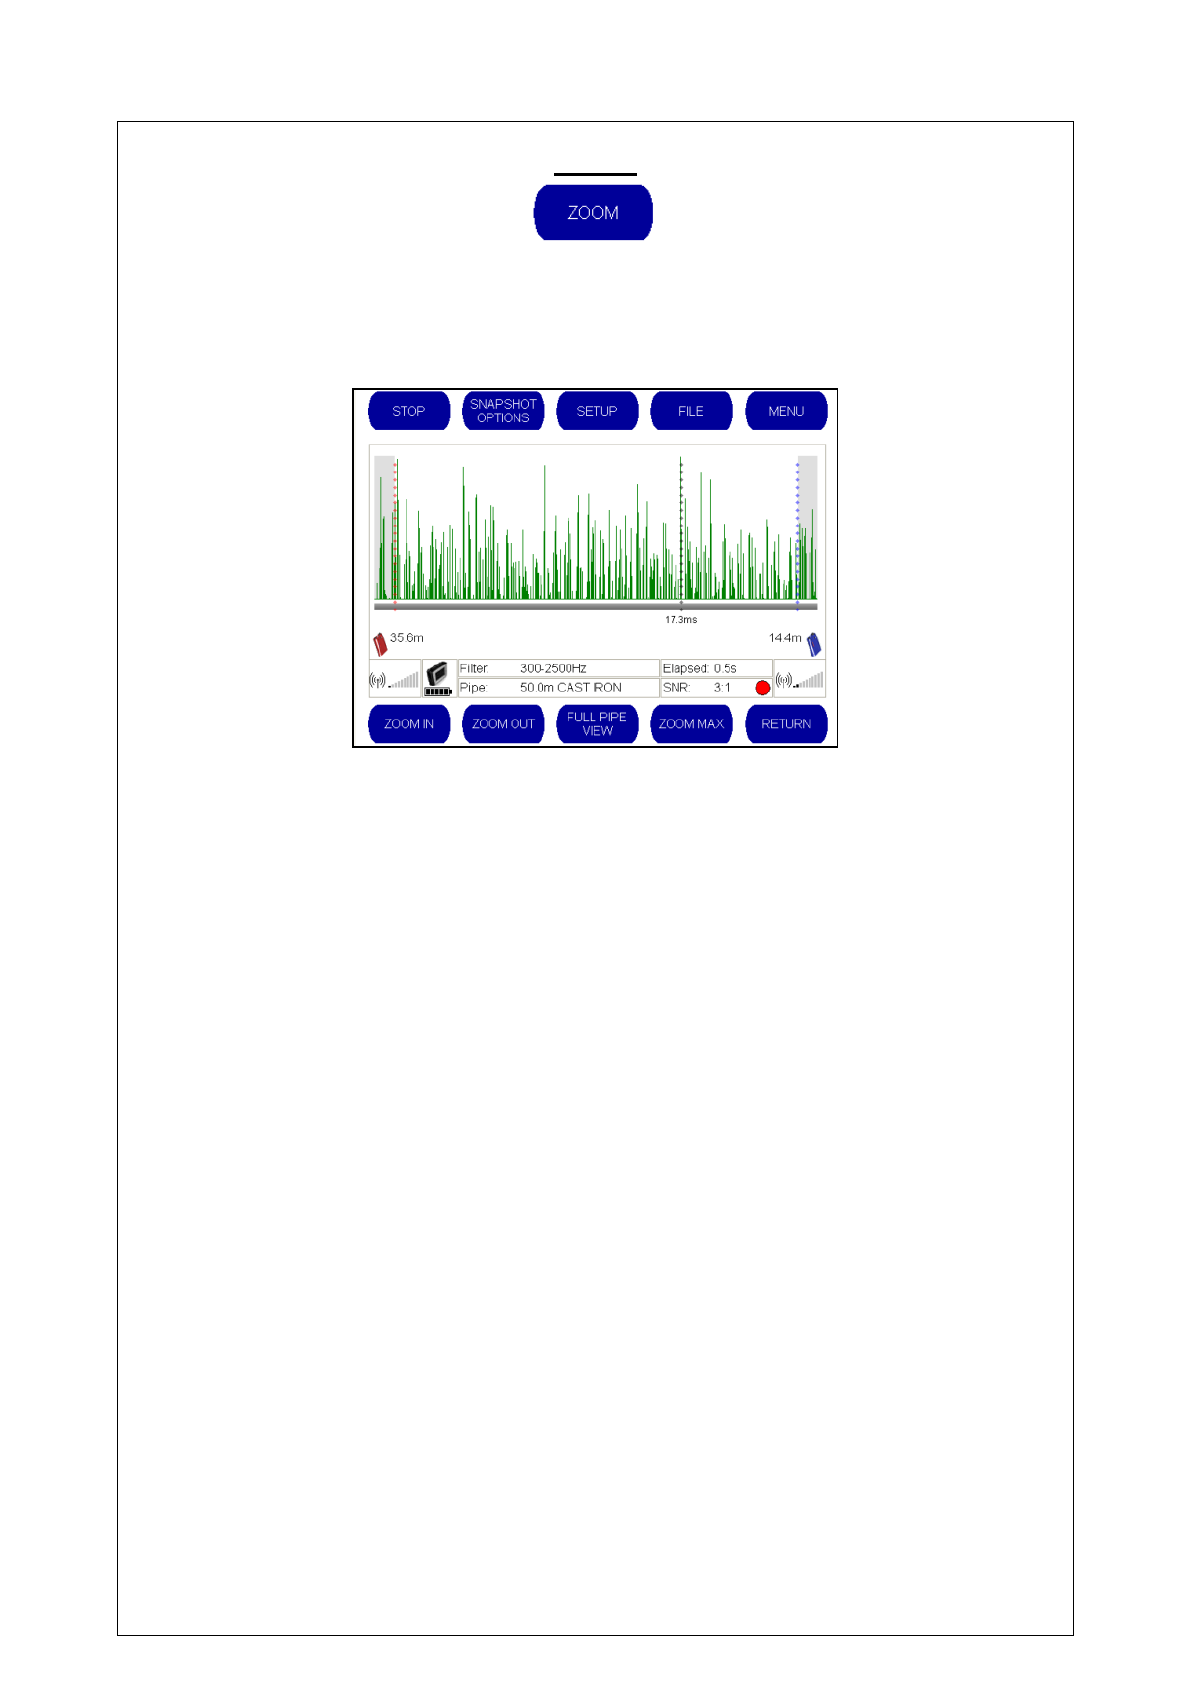
58
ZOOM
To improve the resolution you can zoom in to a particular section of the correlation peaks. Using
the zoom function changes the scale and gives improved leak position resolution which is
particularly useful when the sensors are far apart.
When the Zoom button is pressed the buttons on the bottom of the screen change as shown
below:
“ZOOM IN” / “ZOOM OUT” – Magnifies up to two levels
“FULL PIPE VIEW” – Automatically displays the full correlation graph
“ZOOM MAX” – Automatically zooms to the maximum level
“RETURN” – Returns you to the main correlation menu.
The zoom function centres on the cursor position. The cursor position can be changed prior to
activating the zoom function simply by tapping the area of the graph that you wish to magnify.
Alternatively, selecting the “AUTO CURSOR” button on the Main Correlation screen prior to
selecting the zoom option will automatically locate the cursor over the highest peak.
When the “ZOOM IN” button is selected for the first time, the area around the cursor position is
magnified. When the Zoom In button is pressed again, the area is magnified again.
To return to the original view, the operator can press the “ZOOM OUT” button until the full graph
is displayed, or can select the “FULL PIPE VIEW” button to return immediately to the full
correlation graph.
Alternatively, if the operator wishes to zoom in immediately to the maximum setting, the “ZOOM
MAX” button can be selected.
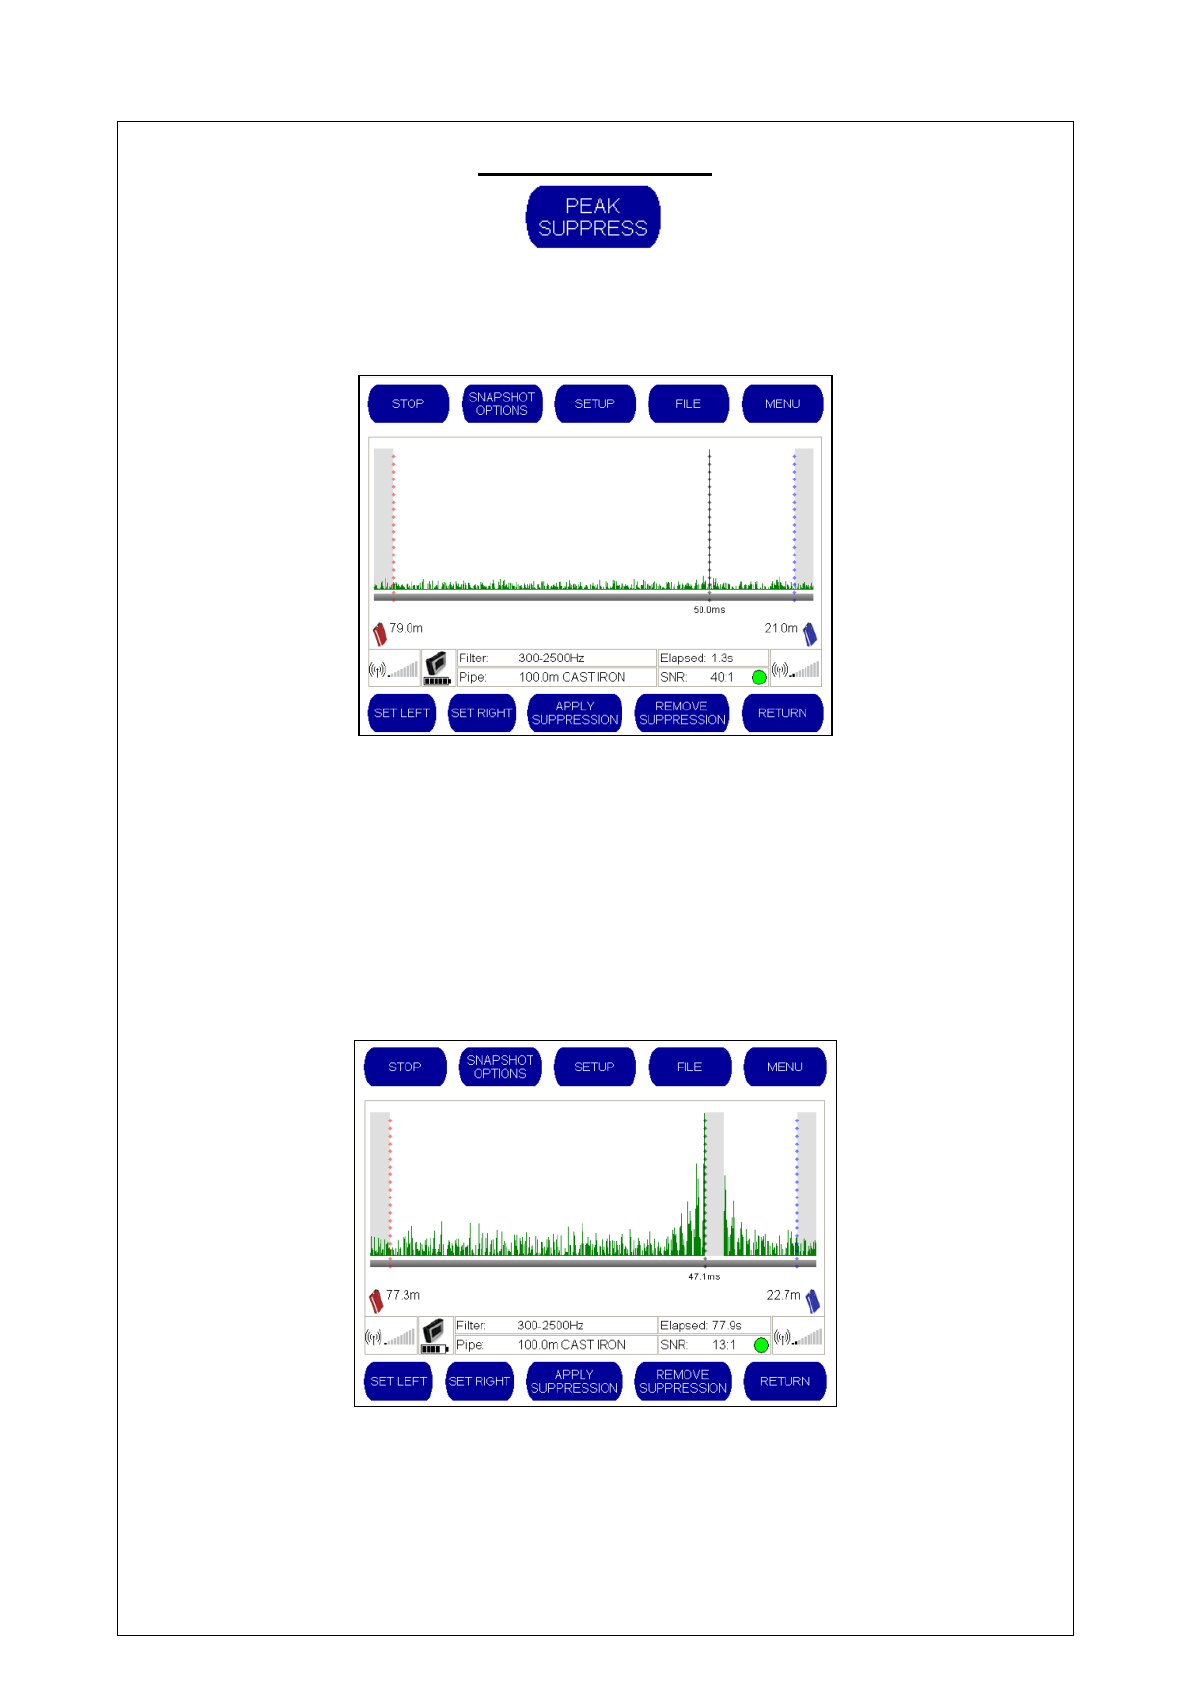
59
PEAK SUPPRESS
Peak suppression allows the operator to remove an unwanted peak from the correlation result.
This is useful when the source of that peak has been identified as a non-leak. By suppressing
this, the unit will correlate ignoring the sound levels being produced at this location on the pipe.
When the “PEAK SUPPRESS” button is selected from the main correlation screen, the following
buttons appear at the bottom of the screen.
There are two ways to suppress an area of the graph. The simplest approach is for the operator
to drag the area to be suppressed with a finger on the touch screen. The dragged area will then
turn grey indicating that this area will be removed from the correlation.
The second method to use the “SET LEFT” and “SET RIGHT” buttons to mark the area to be
suppressed. To do this, select the “SET LEFT” button and then touch the screen to mark the
point to the left of the peak to be suppressed. Then, select the “SET RIGHT” button and then
touch the screen to mark the point to the right of the peak to be suppressed. The background
area in between the two settings will then turn grey to indicate that this selected area will be
removed from the correlation.
In the example below, the grey area shows the suppressed peak.
To view the correlation graph without the suppression, select the “REMOVE SUPPRESSION”
button. To view the correlation with the suppression, select the “APPLY SUPPRESSION” button
to restore the previous suppression settings. SECTION 6.0

60
TECHNICAL SPECIFICATION
BASE UNIT
Filter selection
Manual, FFT, Coherence and Tri Filter Correlation.
Pipe-data related default settings.
AFIS Filter Optimisation mode running 55 different filter combinations.
Resolution
± 0.1m
Display
High Visibility Full Color VGA.
High Contrast mode for viewing in bright sunlight.
Antennae
External antenna. Magmount available as an option.
Battery type
Rechargeable Lithium-ion batteries. Field replaceable
Battery life
Up to 12 hours (Rechargeable) in Case
Type of keypad
Touch Screen interface
Key functions
Automated Filter Optimization (AFIS)
Combined correlation/survey mode
Listen (acoustic survey)
Frequency analysis
Peak suppression
User definable pipe types & velocities
Intuitive user interface
In case charging
Language
Selectable via menu. Multiple language options available.
Operating software
MS Windows-CE embedded.
Printer output
USB to PC software-enabled printing
PC download
Via PC software, Windows-compatible software
Dimensions
Height to Top: 90mm Width: 250mm. Depth: 180mm
Weight
1.9kg
Operating temp
-15°C to +50°C
Environmental
IP65
Enclosure
High Impact PC/ABS plastic
Connectors
Military specification Amphenol-Type
61
OUTSTATION
Optional 1 or 2 Radio Outstation Systems
Radio Frequency
Local regulations apply
Connections
Headphones, External antenna, Charging
Battery type
Rechargeable Lithium-ion batteries. Field replaceable
Battery life
Up to 8 hours (Rechargeable)
Antenna
External antenna
Dimensions
L 200mm W 135mm D 50mm
Weight
0.87kg
Environment
IP65
Housing
High-impact PC/ABS plastic
Connectors
Military specification Amphenol
SENSOR
Frequency Response
d.c.- 5000Hz, High V/g
Environment
IP68, rubber shroud for shock protection
Connection
Optional 2m/3m/5m cables with strain relief. Military spec connector
Hydrophones
Available as option
CASE
Optional
Charging
In case charging through mains or 12V vehicle supply.
Case indicates charge for all components

62
APPENDICES
Appendix 1 - The Basic Principles of Leak Location Using Noise Correlation
Appendix 2 - Use Of Hydrophones
Appendix 3 - Routine Care and Maintenance
Appendix 4 – Troubleshooting Guide
Appendix 5 - Metric-Imperial Equivalents
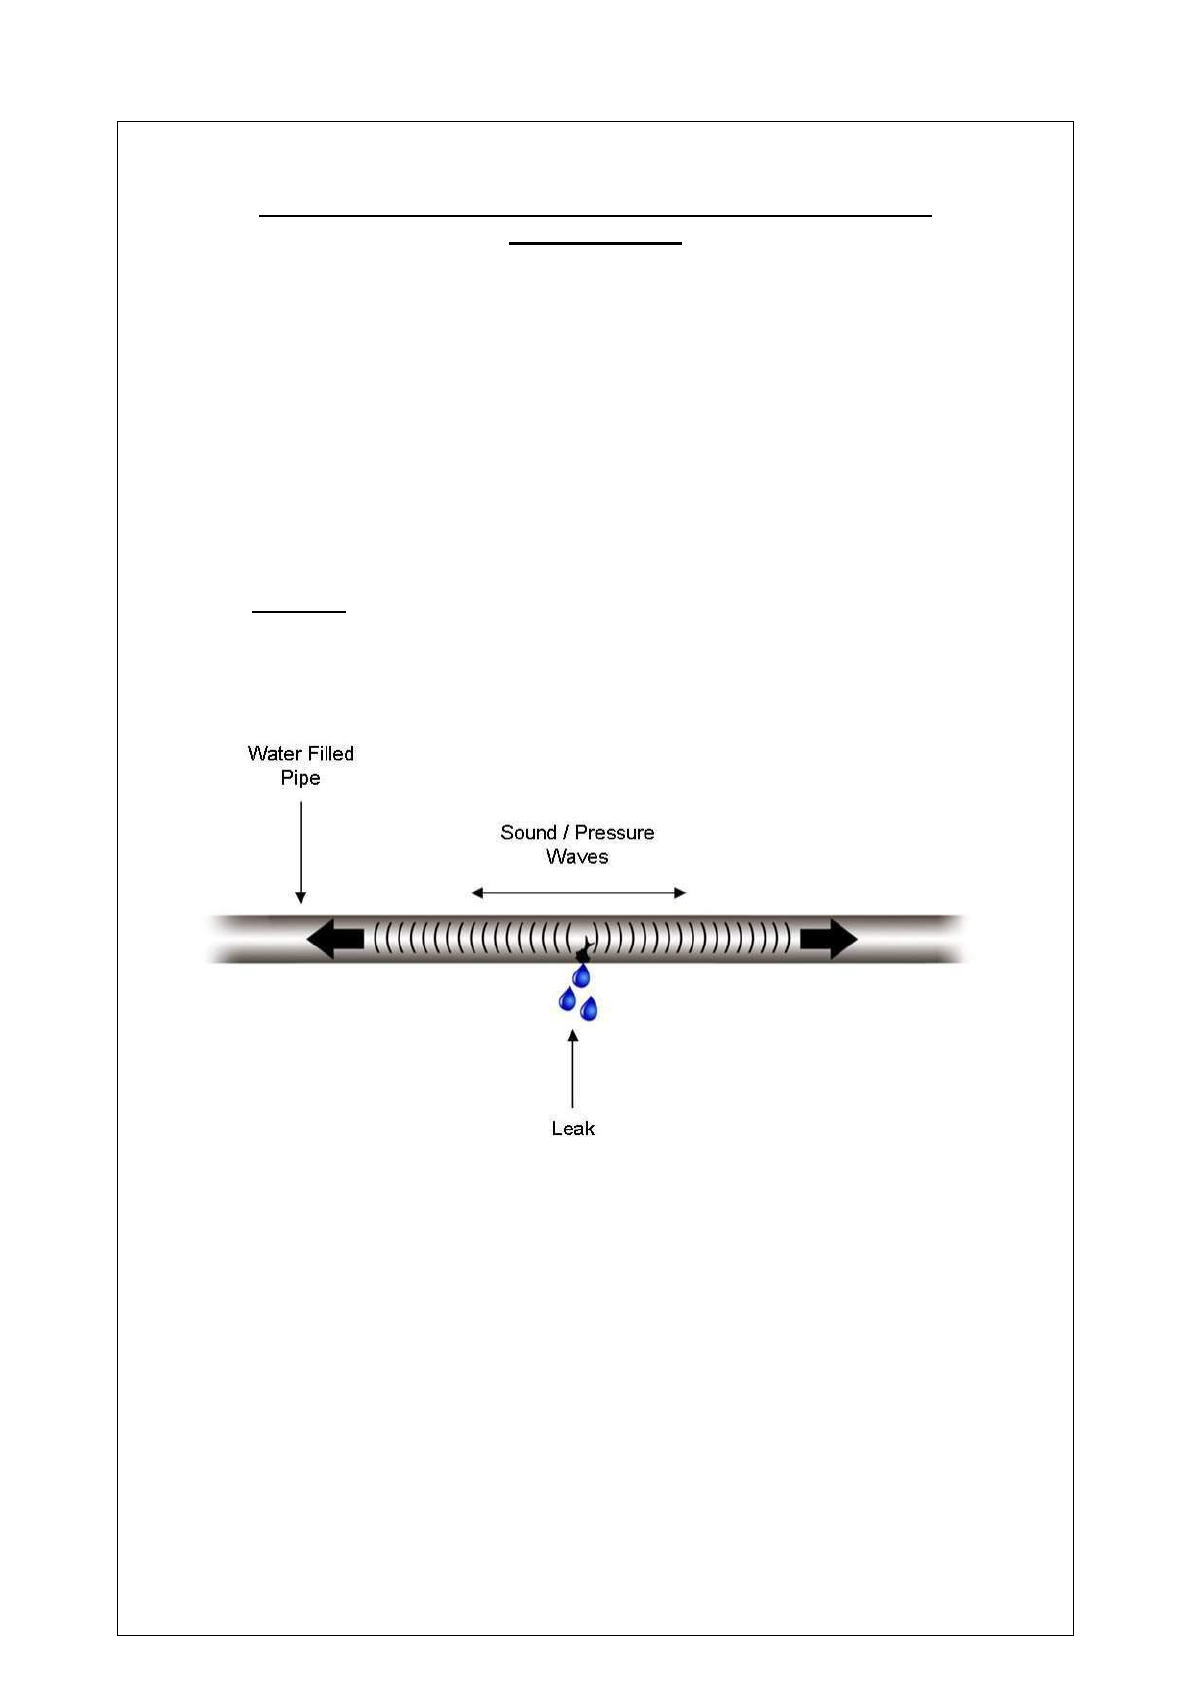
63
APPENDIX 1.0
THE BASIC PRINCIPLES OF LEAK LOCATION USING NOISE
CORRELATION
This Appendix section of the Touch Pro Operating Manual provides an overview of the basic
theory and principles of leak location using noise correlation techniques.
LEAK NOISE
When a liquid under pressure escapes from a pipeline it creates a sound pressure wave (leak
noise) which travels along the pipe from the exit point. The velocity at which the sound travels
within the pipe depends mainly on the pipe diameter and material.
Diagram 1
The Touch Pro system detects these leak noise sound signals with two sensors which are
attached to the pipe on either side of the leak point. The sensors can be attached to pipe valves,
hydrants or stop taps etc.
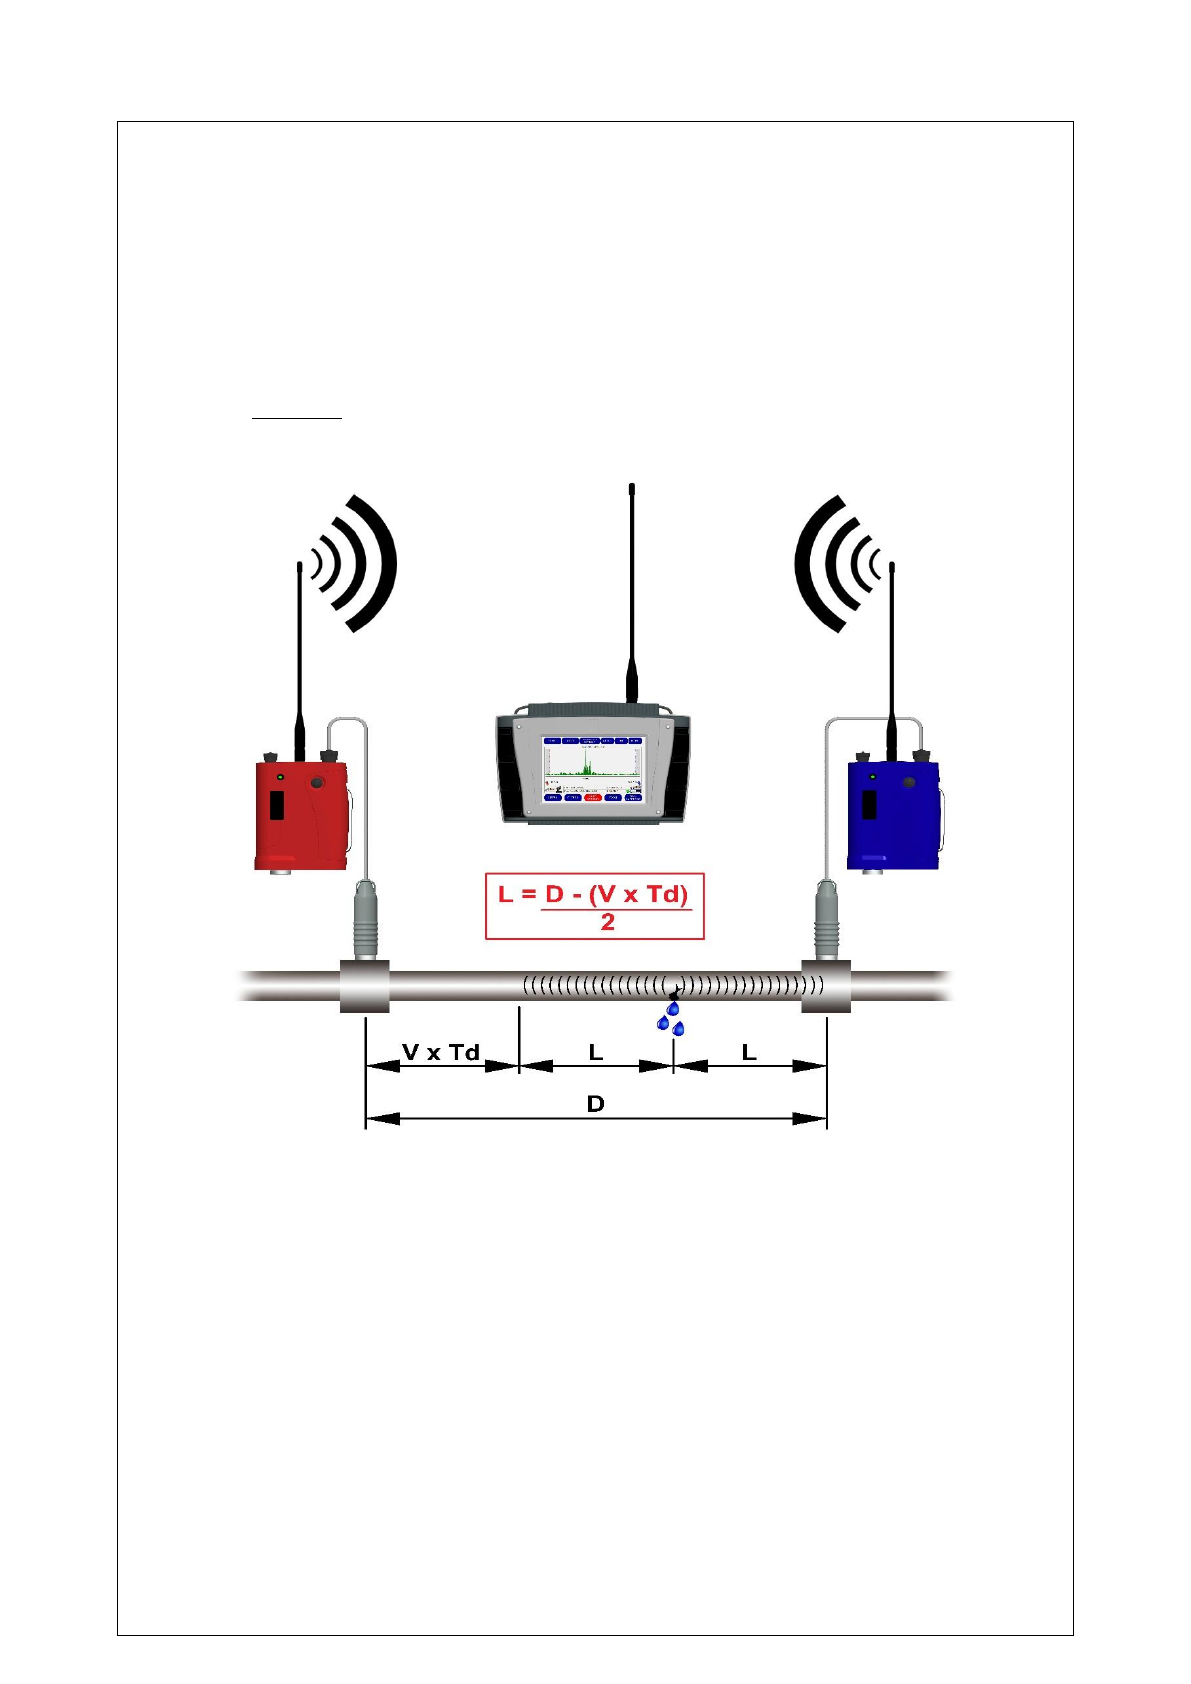
64
TIME DIFFERENCE
Diagram 2 shows the Red and Blue colour-coded sensors which are attached to the pipe on
either side of the leak. The sensors detect the sound wave signals and transmit this information
to Touch Pro Base Unit by radio or by cable links.
In our illustration the leak is situated at L distance from the Blue sensor. Touch Pro determines L
by measuring the time for the sound wave to reach each sensor.
Diagram 2
If the leak was exactly between the two sensors the sound pressure wave would reach each
sensor at precisely the same time. In this theoretical situation we should say there was zero
time- difference between the two signals.
Diagram 2 shows the leak closer to the Blue sensor so the sound wave reaches this sensor first
and Touch Pro measures the exact travel-time. At that precise moment, of course, the sound
wave has also traveled L distance towards the Red sensor.
Touch Pro now determines the time for the sound wave to travel the extra distance N to reach
the Red sensor. This extra travel time creates a time-difference between the signals arriving at
the Red and Blue sensors. The time-difference is referred to as Td.

65
VELOCITY-TIME-DISTANCE
As the velocity of sound V for various liquids and pipe systems is known we can now determine
distance by applying the formula: Distance = Velocity x Time (D = V x T). As we are interested
in the time-difference between sensor signals our formula becomes
D = V x Td.
Distance N is determined simply from N = V x Td. The total distance between the Red and Blue
sensors is given by:
D = 2L + (V x Td)
As we wish to find L, which is the distance between the Blue sensor and the leak point, we
rearrange the equation to:
D - (V x Td)
L =
2
So we can measure the distance between the sensors D and estimate the velocity V from our
knowledge of the pipe size and material. We then measure the time-difference Td between the
sound waves reaching each sensor and apply all these data to calculate L which gives us the
actual leak location.
In practice, Touch Pro performs all of the time measurements and calculations for you.
In diagram 2 the leak point was shown nearer to the Blue sensor. In fact, it doesn't actually
matter if the leak point is nearer the Red sensor as Touch Pro automatically deals with either
situation.
SENSOR BRACKETS
In order to locate leaks precisely the two sensors must 'bracket' the leak point. This means that
the leak should be between the Red and Blue sensors.
If the sensors are incorrectly positioned Touch Pro will detect the 'non-bracket' condition and
warn you by displaying a message on the screen. Touch Pro will also indicate which sensor is
nearest to the leak so you know which one to move.
If the leak is shown fairly near to one sensor it is good operating practice to treat this as a
non-bracket condition. In these instances you should move the near sensor away from the
indicated leak position and re-correlate.
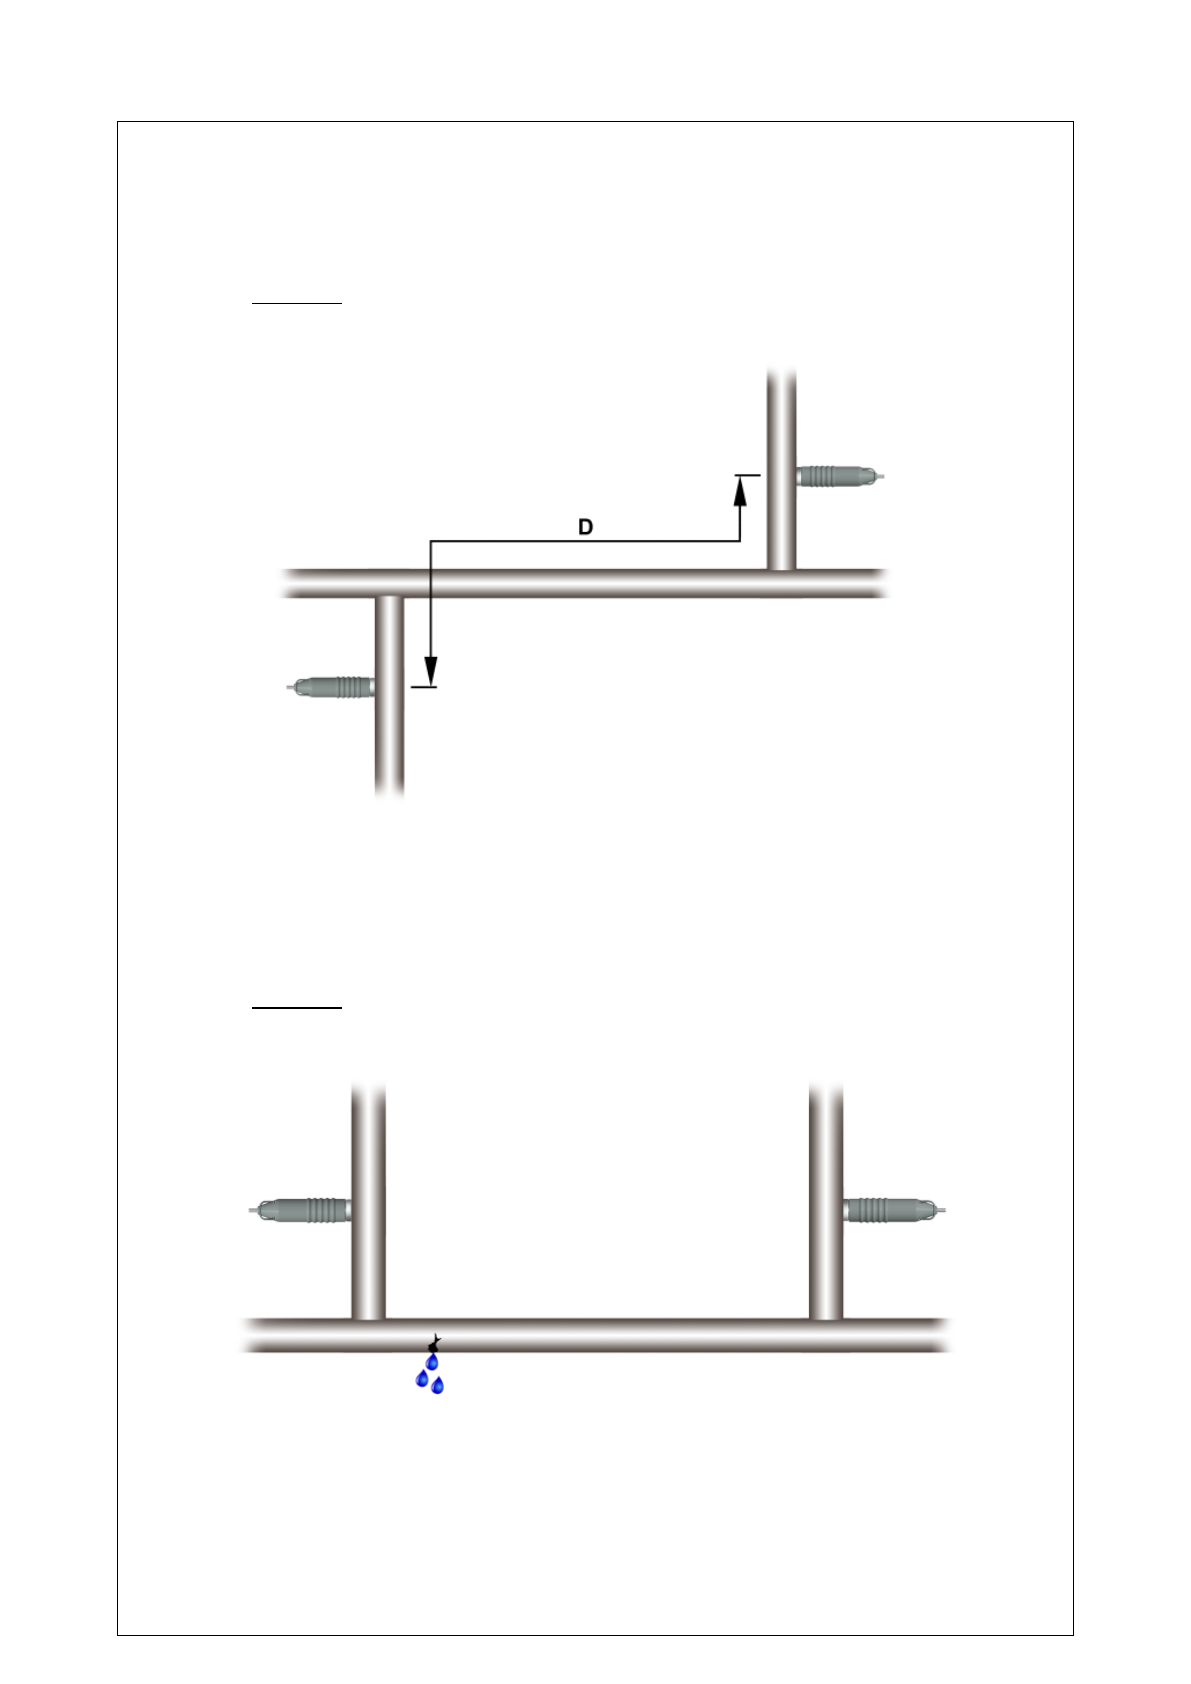
66
‘T’ CONNECTIONS
The distance D which you have to key-in to Touch Pro refers to the total length of pipe between
the sensors. If the sensors are attached to T connections then the length of the T network must
be included in D.
Diagram 3
Sensors Connected to Fittings on T Connections
Care is required when interpreting the results from T connection surveys. The following
illustrations demonstrate predicted results for various pipe-work layouts and shows
recommended actions.
Diagram 4
The Leak will be indicated correctly.
Sensor
Sensor
Sensor
Sensor
Leak
67
Diagram 5
The Leak will be indicated at the left T connection 'O'.
Action: Move the left hand sensor further to the left and try again.
Diagram 6
The leak will be indicated at the right hand T connection 'O'.
Action: Move the right hand sensor further to the right and try again.
Sensor
Sensor
Sensor
Leak
Sensor
68
Diagram 7
Leak indicated correctly
Diagram 8
Leak indicated at T connection.
Action: Move either sensor to a fitting down the T connection (P) and try again.
Sensor
Sensor
Leak
Sensor
Sensor
Leak
69
Diagram 9
The speed or velocity at which leak noise travels is greatly dependent on pipe material.
Different pipe materials give different velocities.
To locate a leak in a pipe run made up of mixed materials, the velocities applicable to each
material must be used. This is not the same as using an average velocity.
Using an average velocity a leak was indicated at 65.9 metres from the red (R) sensor.
In fact, Touch Pro in Mixed Pipe Material Mode under identical conditions calculated the true leak
position at 88.9 metres from the red (R) sensor.
COMPUTE MODE THEORY
Compute Mode is a special Touch Pro operating feature which can improve the overall accuracy
of correlation surveys.
In Compute Mode the data from two or more correlation runs are combined to produce a result
which is totally independent on the velocity of sound V. The effect of any error in the
measurement of the distance D between sensors is also significantly reduced. In practice at least
three results are needed.
Touch Pro takes the basic equation D = 2L + (V x Td) and solves the equation for two or more
values of D and Td.
The additional values for D and Td are obtained by keeping (in this example) the Red sensor on
one fitting while the Blue sensor is moved from fitting to fitting (B1, B2, B3). In practice either
sensor can be selected to remain fixed as the reference sensor. The sensors must bracket the
leak for the Compute Mode runs to be valid. The new values of D and Td generate a very
accurate figure for V which is then used to calculate the leak position from the fixed sensor.
70
Diagram 10
Distance from the Red
Indicated leak position R - B1 : 52.8M)
R - B2 : 48.4M) Average position 47.8M
R - B3 : 42.4M) Computed position 49.0M
Particular care should be taken when using Compute Mode with T connection pipe-work. If a
leak is indicated near to a T connection it is quite possible that the leak is actually down the T as
shown below.
Diagram 11
If this situation occurs the Red sensor should be moved to a fitting down the T connection (P)
and a complete re-run in Compute Mode should be carried out.
Leak

71
APPENDIX 2.0
THE USE OF HYDROPHONES
IMPORTANT SAFETY PROCEDURES
Working with water and other fluids under pressure can be hazardous. Recommended safety
procedures for the working conditions must be followed at all times, and operational procedures
described in this manual should not take precedence over current safe working practices or
company procedure. If in doubt, ask your safety officer.
Use of Touch Pro equipment with the water supply must be subject to the hygiene procedures
applicable to any objects coming into contact with drinking water supplies. Hydrophone sensors
and adapters should be appropriately sterilised prior to use and applicable procedures should be
followed during their installation. Use of Touch Pro with other liquids or gases should follow
national and company safety procedures for operation in proximity with these substances.
DO NOT use your hands for installing the sensors in valve/hydrant chambers or meter
boxes without checking for foreign objects. Sharp objects such as disused syringes can
easily pierce gloves. If any excavation is required, use suitable tools.
The Touch Pro hydrophone kit comprises.
1) 2 x Hydrophones
2) 2 x Hydrophone adapters
3) 1 x tommy bar
4) 2 x 1 1/2 inch BSP nipple
5) 2 x 1 1/2 inch to 1/2 inch reducer (fitted with 'O' ring seal)
6) 2 x 1/2 inch BSP nipple
7) 1 x tube silicone grease
8) 1 x reels PTFE tape
9) 1 x carry case
10) 2 x HYDMCTAMP – Hydrophone amplifiers and connection cables
The hydrophones can be connected to fire hydrants using standard London thread adapters.
Alternatively, by use of the other adapters provided they can be connected to air valves or
flowmeter fittings. Fitting instructions for the hydrophones and adapters are as follows.
The basic UK hydrophone kit is supplied with a range of adapters to suit a variety of fittings. The
London round thread adapter (or the meter box adapter - if supplied) is fitted with a sealing
washer.
DO NOT seal the threads between the Hydrophone sensor and the London round thread
(or meter box) adapter with PTFE tape or any other sealing material, as this could
irreversibly lock the threads together.

72
Connection to Hydrant
1) Remove hydrant cap and gently open hydrant valve to flush out dirt. Close hydrant
valve. Inspect the hydrant thread for dirt or debris.
2) To use the LONDON ROUND THREAD adapter with the hydrophone sensor, first lightly
coat the internal rubber seal fitted to the lightly round thread adapter with silicone
grease. Remove the plastic thread protectors. Do not use any sealing material between
the adapter and the hydrophone sensor screw threads, but apply a regular, light coat of
silicone grease to lubricate them.
Fit the London round thread adapter to the hydrophone sensor taking care not to
damage or cross the threads. Tighten the adapter until the castellation’s fitted to the top
of the adapter are secured by the quick release mechanism fitted to the hydrophone
sensor. The hydrophone may then be fitted to the hydrant and tightened by using a
valve key or tommy bar.
3) Connect hydrophone lead after unscrewing waterproof cap.
4) Open hydrant valve fully to allow water into hydrophone. Remove trapped air via the
bleed valve. Close bleed valve. A fully open hydrant valve will allow the best
transmission of sound to the hydrophone.
5) Ensure hydrophone does not leak from the main thread, tighten as necessary. Ensure
that hydrant valve gland is not leaking. If the hydrant frost plug is 'blown' this must be
re-inserted to prevent another source of leak noise.
6) Connect lead to input on transmitter.
7) After use ensure the cap is replaced onto the electrical connector, and the plastic thread
protector replaced on the hydrophone sensor.
Connection to Air Valves and Flowmeter Fittings
1) Connect nipple and/or reducer to the hydrophone sensor as required. Use PTFE tape
on all threads (except the London round thread (or meter box adapter) to hydrophone
sensor thread).
2) Screw assembly onto pipe fitting. Open valve and bleed. Check for leaks and tighten as
necessary. As in 4 above, a fully open valve will allow best transmission of sound to the
hydrophone.
Note: Should the hydrant location be flooded the hydrophone, lead should be connected to the
hydrophone before it is submerged. The hydrophone sensor connector is only waterproof when
connected.

73
APPENDIX 3.0
ROUTINE CARE AND MAINTENANCE
The following care and maintenance procedures are designed to keep your Touch Pro system in
good general working order. If any part of your Touch Pro system does not work correctly please
contact the Service Team at HWM-Water Ltd or your local Touch Pro Distributor.
Do not open up any part of the Touch Pro system as this invalidates any repair warranty in force
for your particular operating area. Please be extra careful with items of the system which are
connected to mains electricity supplies as the high voltage currents involved can be lethal.
If Touch Pro equipment which is connected to the mains electricity supplies fails to operate get a
qualified electrician to check the power circuits and the cables to the equipment.
ACCELEROMETERS
The accelerometers supplied with Touch Pro are sensitive to sudden shock or impact and
these sensors should be handled with care at all times. Ensure the connecting sockets are
clean and dry and do not clean the sockets with water based solvents.
Check the accelerometers daily before conducting any field operations. Connect one of the
accelerometers to an outstation and monitor the signals on the headphones as you gently stroke
the base of the sensor with your fingers.
Then plug in the other accelerometer and repeat the test. If there is a large difference in the
signal levels from the accelerometers please contact the Service Team at HWM-Water Ltd or
your local Touch Pro Distributor.
To preserve the strength of the magnets they should always be stored with their 'keeper' plates
fitted. The magnets on the accelerometers may effect or even damage magnetically sensitive
equipment if placed too near.
The system can be further checked by placing both sensors together on a desk (or fitting) and
correlating whilst "scratching" the surface of the desk or fitting. A rapid centre correlation should
be produced.
When a sensor is connected to an outstation, the LED on the outstation will flash quickly ten
times to show that it is transmitting the signal
HYDROPHONES
Before use check that the rubber sealing washer is undamaged and lubricate the washer with
silicone grease provided to ensure you obtain a good watertight seal.
Check the washer regularly during use and apply a little silicone grease at frequent intervals
during the daily operations. This simple maintenance will ensure good watertight seals and will
reduce wear on the seals themselves.
Always chlorinate the hydrophones before contact with the drinking water supply.
BATTERIES
The lithium-ion batteries fitted to the Touch Pro and transmitters are interchangeable between
units. Recharge only with the supplied Touch Pro charger.

74
CAUTION
IMPORTANT SAFETY CONSIDERATIONS:
1) Do not incinerate.
2) Do not directly connect the positive and negative terminals.
3) Do not use other than the specified battery charger.
TO PREVENT DETERIORATION OR DAMAGE TO THE BATTERY:
1) Do not drop or subject to strong physical shock.
2) Batteries should only be charged using a Touch Pro charger supplied by HWM
3) Do not use below 0C (32F) or above +55C (131F). There is no built in safety device to
stop any operations outside these temperatures. However, the battery does have
internal circuitry to protect just the battery from damage
TO ENSURE LONG BATTERY LIFE:
1) Do not discharge completely.
2) Recharge battery immediately after use.
3) Do not invert the battery during recharging.
It should be noted that regular overcharging will reduce the battery life.
The batteries may not be charged below 0C and there is a safety cut out to stop this from
happening.
CLEANING
Touch Pro and its accessories must not be cleaned with any solvent or abrasive type cleaners as
these may damage the equipment. For safety, ensure that all items are disconnected from
the mains electricity supplies before you start cleaning.
Touch Pro equipment should be cleaned with a soft cloth which has been lightly moistened with
water and a mild household detergent. Use only light hand pressure when cleaning all items and
be particularly careful when cleaning the Touch Pro display screen to avoid scratching the
surface.
All electrical connectors should be cleaned with a 'no deposit' type electrical cleaner.
ENVIRONMENT
Touch Pro outstations and accelerometers are waterproof but care should be taken to keep
water off them where possible. Always dry the equipment carefully before storing it away.
The Touch Pro outstation operates effectively between 0 and 55 Celsius. At temperatures
below 0 and above 55 Celsius performance may become erratic and extreme temperatures
will eventually damage the system.
Do not leave Touch Pro behind glass in direct sunlight as temperatures above 55 Celsius may
be exceeded even in the U.K.
In very hot climates the battery charge capacity may be reduced and you will have to re-charge
the units more frequently

75
APPENDIX 4.0
TROUBLESHOOTING GUIDE
Problem - There is no RF Signal being received from the Outstations
Recommended Actions
Check that the outstations are switched on.
Check that the antenna is connected and RF connector is clean.
Check that the outstation is registering the connected sensor (LED Flashes)
Check the outstation and Base Unit battery levels.
On the Base Unit check that you have the correct stations selected
(e.g. correlate between RED–BLUE not RED-BASE)
On the Base Unit check in the display screen that the outstation frequency is correct and
that the RSSI should approximately -80dBm or less and battery is at a minimum 7.2V
If standing close to one of the outstations and receiving no RF signal from the other
check that the nearest outstation is set to low transmit power.
Problem - The RF Signal is being received but it is very weak
Recommended Actions
Check the battery levels on all units
Check that the antennas are not damaged (to check the outstation antennas can be
swapped to see if problem follows)
There may be interference from another RF system operating in that area on the same
frequency
Check that the outstations are at least 2M away from the Base Unit
To improve signal strength, try using a magmount antenna on base unit
Problem – Audio being received but the correlation peak is poor
Recommended Actions
Check for leak noise signal at both outstations through headphones to ensure leak noise
can be heard as clearly as possible
Check that both sensors are working correctly (sensor test mentioned above)
Check that both Outstation signals are being received over the RF clearly at the Base
Unit through headphones
Adjust the filters on the Base Unit to take out any unwanted ambient noise
Try correlating at a different time of day/night in case there are pumps or other external
noise sources interfering with the correlation result.
Check sensor cables and connectors for damage
To improve leak noise signal at outstation
Ensure that the accelerometer mounting point is on the pipe where the suspected leak is
located. Confirm this with a map of the network.
Check that sensor contact on the pipe is clean from debris
Try different contact points on the fitting if possible to get the best leak noise (metal
surfaces are preferred). Always check leak noise at the Outstation with headphones first
Ensure that the accelerometer is mounted vertically where possible
If there is ambient noise try correlating using hydrophones
Note: Don’t stand too close to sensor when listening through headphones to avoid audio
feedback

76
Problem – The Main Correlation Screen displays the warning message “Correlation out of bracket”
Recommended Actions
This message means that a possible leak has been found but is outside the area in-between
the outstations. The Touch Pro will not give a position on an out of bracket leak so the
outstations will need to be re-positioned so that the suspected leak is in between the
outstations. However out of bracket leaks can be used to get the pipe speed of sound velocity
reading.
Problem – The Main Correlation Screen displays the warning message “Centre correlation”.
Recommended Actions
This message means that a correlation peak has occurred exactly at the midpoint between the
two sensors. This may not be a leak at all. A non-leak noise heard on the pipe could also
produce this effect. Therefore, caution is advised. Move one outstation to the next convenient
point to ensure the leak position is well away from the center point, and perform the correlation
again to ensure that the result is genuine.
If one or both outstations are closer than 20m to the base station, ensure those that are close to
the base station are operating in low power mode.
Problem – The Main Correlation Screen shows good peak but no leak can be heard at that
location
Recommended Actions
Check the audio signals at the Base Unit through headphones to ensure that the leak
noise can be heard as clearly as possible
Check that the pipe length entered is as accurate as possible and that the pipe
material is correct. Confirm this with a network map if necessary.
Check on the Filters screen that noise levels are included in the filter pass band (the
white area)
Perform a velocity check on the pipe. This can be done in 3 ways
- Use an Out of Bracket leak and retrieve the velocity from sound speed
screen
- Open a tap and use the velocity check facility on the Touch Pro. Perform the
correlation using this velocity reading
- Use Compute mode on the Touch Pro to give both velocity reading and a
leak position based on more than one correlation.
Use the Peak Suppression facility to eliminate any unwanted peak. The graph will
rescale at the next highest peak.
Check that the batteries on all units are not low.
Check that the sensors are not damaged.
Check that there is no RF interference
Note: It is recommended that all leak positions from the correlation results be confirmed with
a listening device such as Ground Microphone.
Problem – Windows ActiveSync or Windows Mobile Device Center will not connect to the
Base Unit
Recommended Actions
Try using a different USB port in the PC.
Check any virus scans are not preventing the connection.
Check the active sync is configured to start when a connection is detected.
Check the USB cable for damage.

77
Problem - Cannot connect to the outstation using the USB port
Recommended Actions
Check that the Outstation is turned on. After a successful upgrade the outstation will
always automatically switch off
Check the LED when ON/OFF button is pressed. The LED should continually flash
once a second when valid application firmware is running
Problem – The units will not charge
Recommended Actions
The lithium-ion batteries may not be charged at temperatures below 0C and there is
a safety cut out to stop this from happening.
Try swapping the batteries from the other units to identify whether the battery is
defective.
Check that power is being applied to the units by plugging in the charger and
checking that the light on the charging adapter is lit.
If the charging adapter is not lit, check that the fuse in the plug is working correctly.
When power is applied to the case charger, the LED should initially light up to give
the current battery level of any connected units. After 5 seconds the LEDs will go out
and the charging will begin. If a unit is connected and the LED doesn’t light this
means that either the battery is defective or the connection is faulty for that unit
Check the Amphenol connectors and cables for damage
Note that whilst a unit is charging, a green LED will flash slowly on the unit. When
charging is completed, the LED will be extinguished.
Problem - When trying to switch on the outstation the LED flashes 10 times quickly and then
switches off. The outstation will not operate at all
The outstation bootloader is running. If the USB lead is connected then please
disconnect the USB lead and switch on the outstation.
If the 10 lead flashes still show when the ON/OFF button is pressed then please
reconnect the USB and perform and upgrade using the Touch Pro PC software
provided.
Problem - All units connected in case for charging but 1 or more LEDs do not light when pushing
the button
Check that the unit indicated by the unlit LED has been connected to the case correctly.
Ensure that the unit will switch on or if the battery is too low, ensure that the battery is
connected inside the unit correctly.
The battery level may be too low to register on the display panel of the charging case.
Charge the unit for approximately 30 minutes and then check again
Check to see whether a defective battery is causing the problem by swapping batteries
with another unit to see if the corresponding LED will light
Check to see whether the case charger circuit and connection is defective by attaching
the unit to another connector and to see whether the corresponding LED will light when
the button is pressed
WARNING:
There are no user serviceable parts inside Touch Pro and no attempt should be made to
open the case as the internal circuits may be damaged by static discharge.
78
APPENDIX 5.0
TABLE OF EQUIVALENTS
PRESSURE
1 bar = 100000 Newtons/square meter (N/m²) = 100000 Pascal (Pa) = 10.197mH20 =
401.46inH20
1 atm = 14.696 psi = 406.72inH20 = 101325 Pa = 10.332 mH20
LENGTH
1 yard = 3 feet (ft) = 36 inches (in) = 0.9144 meter (m)
1 meter (m) = 1000 millimeters (mm) = 1.09361 yd = 3.28084 ft = 39.3701 in
1 mile = 1760 yards = 1.609344 km
1 kilometer (km) = 1000 meter = 0.621371 mile
1 inch = 25.4 mm
VOLUME
1 cubic meter = 1000 liters = 219.969 imp. gallons = 264.172 US gallons
1 cubic meter = 1.30795 cubic yards = 35.3147 cubic feet
1 imp. gallon = 8 pints = 4.54609 liters
PIPE DIAMETERS
The approximate equivalent metric and imperial sizes are listed.
True sizes of pipes vary between manufacturers.
Imperial
(inches)
Metric
(mm)
1/2
12
3/4
20
1
25
1 1/2
40
2
50
3
75
4
100
6
150
8
200
9
225
Imperial
(inches)
Metric
(mm)
10
250
12
300
14
350
16
400
18
450
24
600
30
750
36
900
48
1200
72
1800
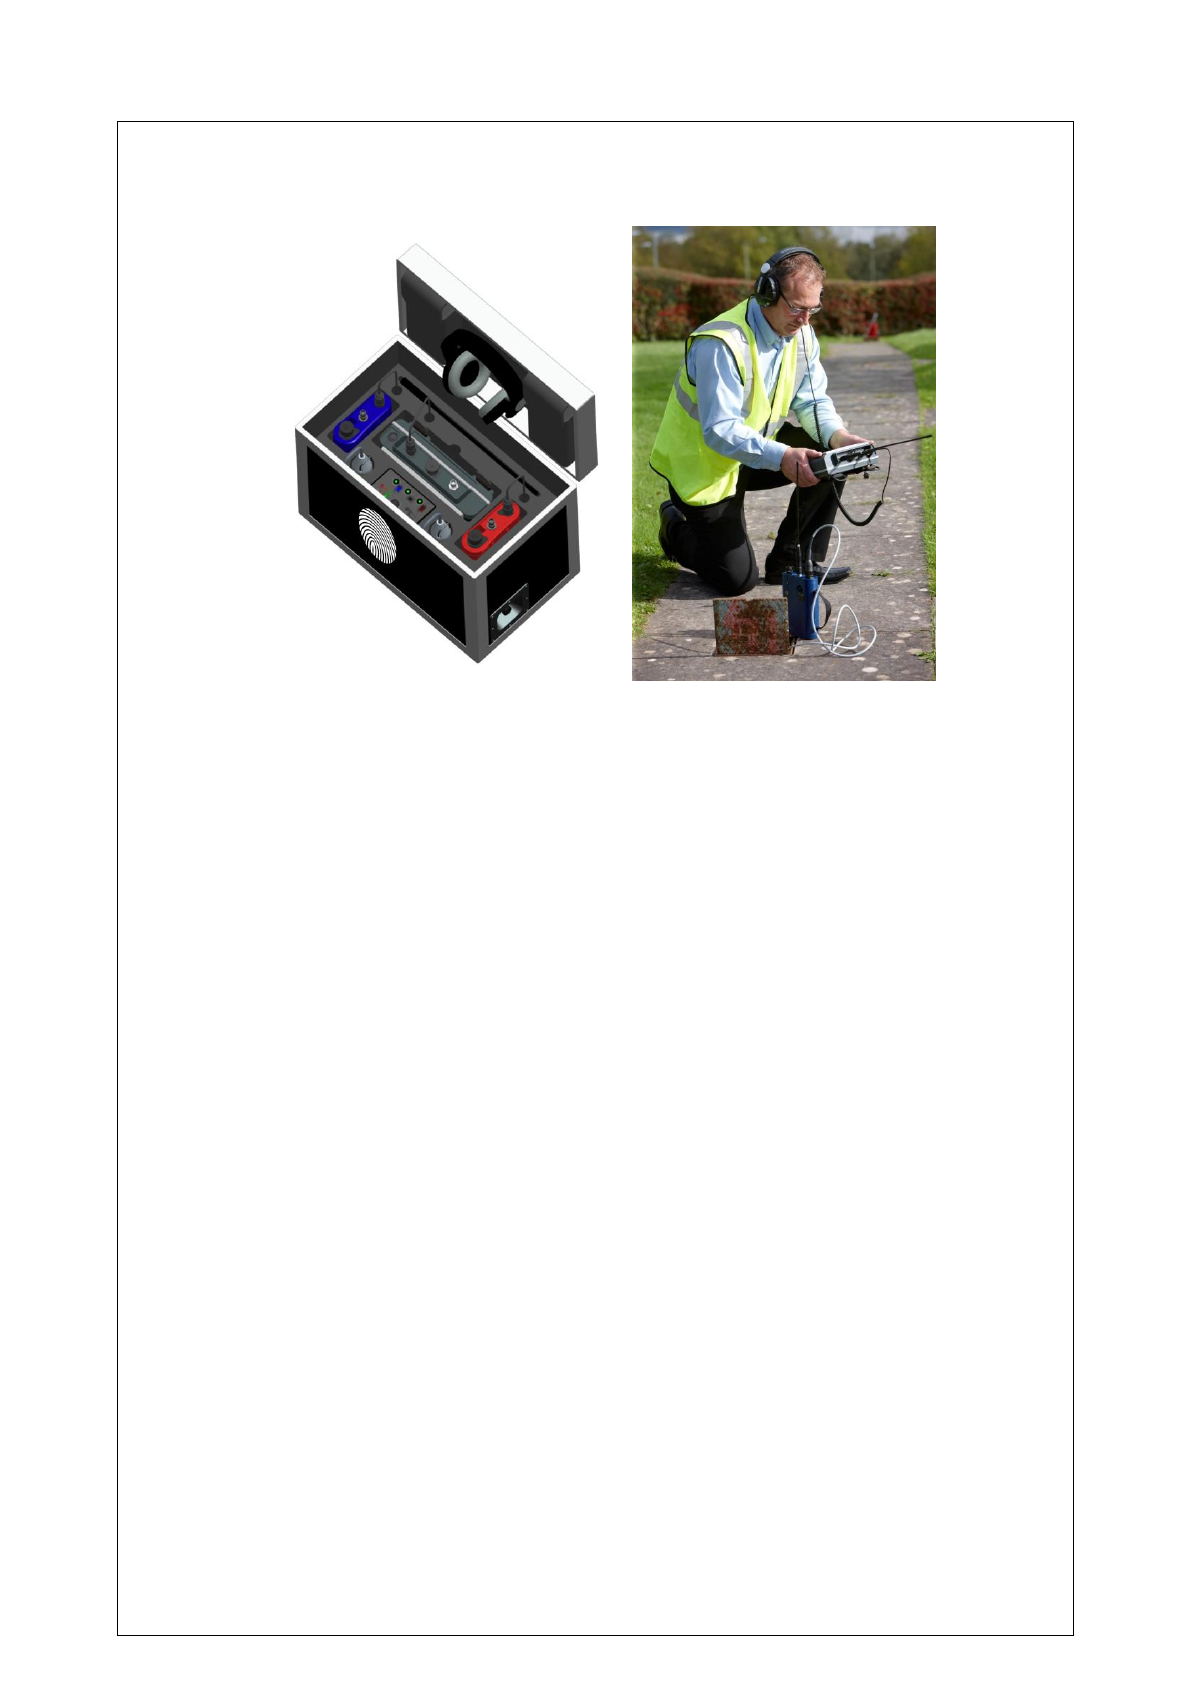
79
The Outstation USB driver although developed and tested by HWM-Water is based on code examples generated by
Atmel Corporation. To satisfy Atmel copyright licensing requirements, HWM-Water must display the following Atmel
disclaimer:-
Copyright (c) 2007, Atmel Corporation All rights reserved.
Redistribution and use in source and binary forms, with or without modification, are permitted provided that the
following conditions are met:
1. Redistributions of source code must retain the above copyright notice, this list of conditions and the following
disclaimer.
2. Redistributions in binary form must reproduce the above copyright notice, this list of conditions and the following
disclaimer in the documentation and/or other materials provided with the distribution.
3. The name of ATMEL may not be used to endorse or promote products derived from this software without specific
prior written permission.
THIS SOFTWARE IS PROVIDED BY ATMEL ``AS IS'' AND ANY EXPRESS OR IMPLIED WARRANTIES,
INCLUDING, BUT NOT LIMITED TO, THE IMPLIED WARRANTIES OF MERCHANTABILITY AND FITNESS FOR A
PARTICULAR PURPOSE ARE EXPRESSLY AND SPECIFICALLY DISCLAIMED. IN NO EVENT SHALL ATMEL
BE LIABLE FOR ANY DIRECT, INDIRECT, INCIDENTAL, SPECIAL, EXEMPLARY, OR CONSEQUENTIAL
DAMAGES (INCLUDING, BUT NOT LIMITED TO, PROCUREMENT OF SUBSTITUTE GOODS OR ; SERVICES
LOSS OF USE, DATA, OR PROFITS; OR BUSINESS INTERRUPTION) HOWEVER CAUSED AND ON ANY
THEORY OF LIABILITY, WHETHER IN CONTRACT, STRICT LIABILITY, OR TORT (INCLUDING NEGLIGENCE
OR OTHERWISE) ARISING IN ANY WAY USE OF OUT OF THE THIS SOFTWARE, EVEN IF ADVISED OF THE
POSSIBILITY OF SUCH DAMAGE.

80
SIMPLIFIED DECLARATION OF CONFORMITY
This simplified EU declaration of conformity referred to in article 10(9) shall be provided as
follows:
Hereby, HWM Ltd declares that the radio equipment type transceiver is in compliance with
Directive 2014/53/EU.
The full text of the EU declaration of conformity is available at www.hwmglobal.com
WARNINGS:
FCC warning statement:
This device complies with Part 15 of the FCC Rules. Operation is subject to the following two
conditions:
(1) This device may not cause harmful interference, and
(2) This device must accept any interference received, including interference that may cause
undesired operation.
This equipment complies with FCC radiation exposure limits set forth for an uncontrolled
environment. End users must follow the specific operating instructions for satisfying RF exposure
compliance. This transmitter must not be co-located or operating in conjunction with any other
antenna or transmitter. Changes or modifications not expressly approved by the party responsible for
compliance could void the user's authority to operate the equipment
Under Industry Canada regulations, this radio transmitter may only operate using an antenna of a
type and maximum (or lesser) gain approved for the transmitter by Industry Canada. To reduce
potential radio interference to other users, the antenna type and its gain should be so chosen that the
equivalent isotropically radiated power (e.i.r.p.) is not more than that necessary for successful
communication. This device complies with Industry Canada licence-exempt RSS standard(s).
Operation is subject to the following two conditions: (1) this device may not cause interference, and
(2) this device must accept any interference, including interference that may cause undesired
operation of the device.
Conformément à la réglementation d'Industrie Canada, le présent émetteur radio peut fonctionner
avec une antenne d'un type et d'un gain maximal (ou inférieur) approuvé pour l'émetteur par
Industrie Canada.
Dans le but de réduire les risques de brouillage radioélectrique à l'intention des autres utilisateurs, il
faut choisir le type d'antenne et son gain de sorte que la puissance isotrope rayonnée équivalente
(p.i.r.e.) ne dépasse pas l'intensité nécessaire à l'établissement d'une communication satisfaisante.
Le présent appareil est conforme aux CNR d'Industrie Canada applicables aux appareils radio exempts
de licence. L'exploitation est autorisée aux deux conditions suivantes : (1) l'appareil ne doit pas
produire de brouillage, et (2) l'utilisateur de l'appareil doit accepter tout brouillage radioélectrique
subi, même si le brouillage est susceptible d'en compromettre le fonctionnement.
HWM-Water Ltd
Ty Coch House
Llantarnam Park Way
Cwmbran
NP44 3AW
United Kingdom
+44 (0)1633 489479
www.hwmglobal.com
MAN-068-0001-K (Touch Pro User Manual)
©HWM-Water Limited. This document is the property of HWM-Water Ltd. and must not be copied or disclosed to a third party without
the permission of the company. Copyright reserved.