Humatics 200SGT-0702 UWB Signal Generator / Transmitter User Manual Q KEVENT 1 FCCCER 1 Front Matt
TDC Acquisition Holdings Inc. UWB Signal Generator / Transmitter Q KEVENT 1 FCCCER 1 Front Matt
UserManual.wiki
>
Humatics
>
200SGT 0702 User Manual
TAG Manual
Navigation menu
Upload a User Manual
Namespaces
Wiki Guide
HTML
PDF
Info
Views
User Manual
Discussion / Help
Navigation


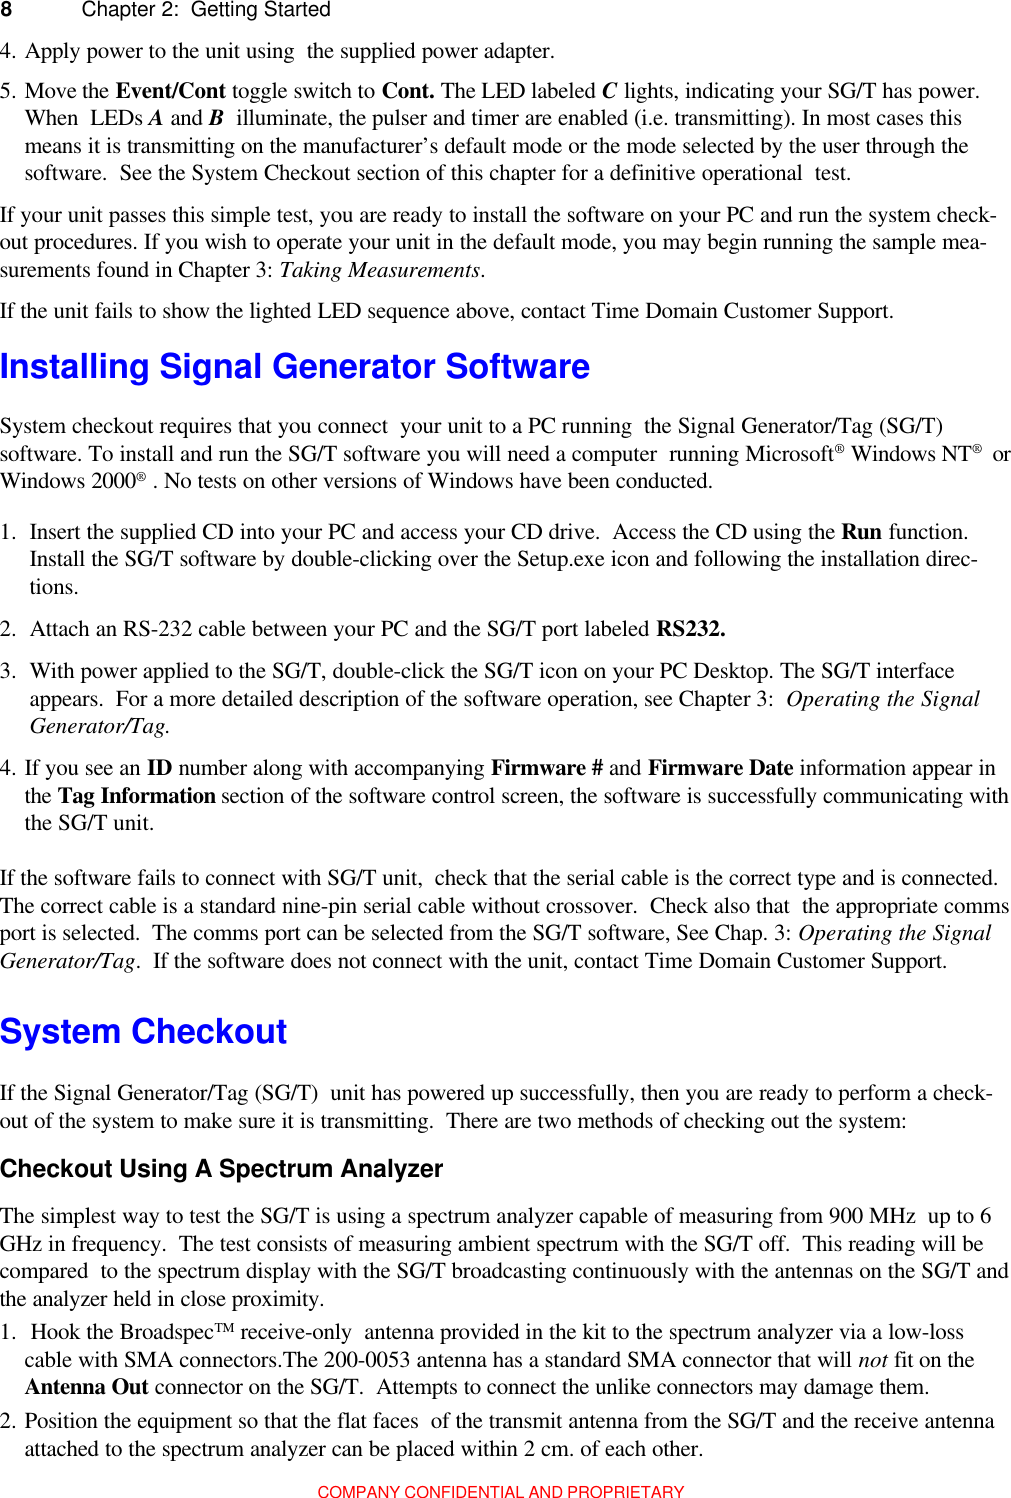
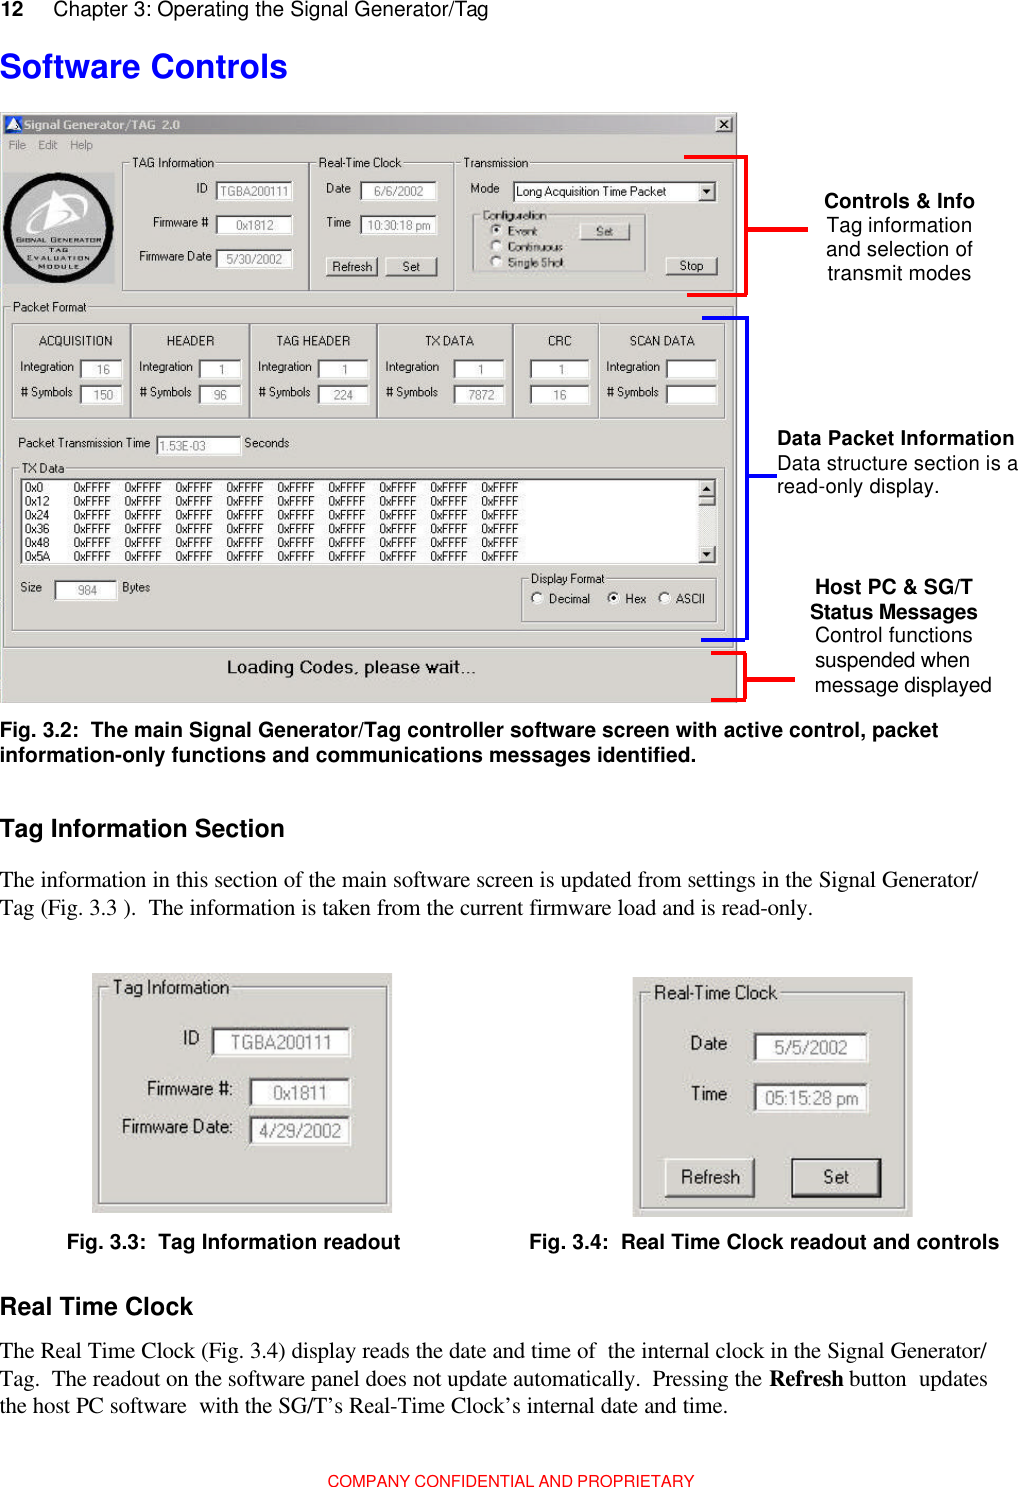
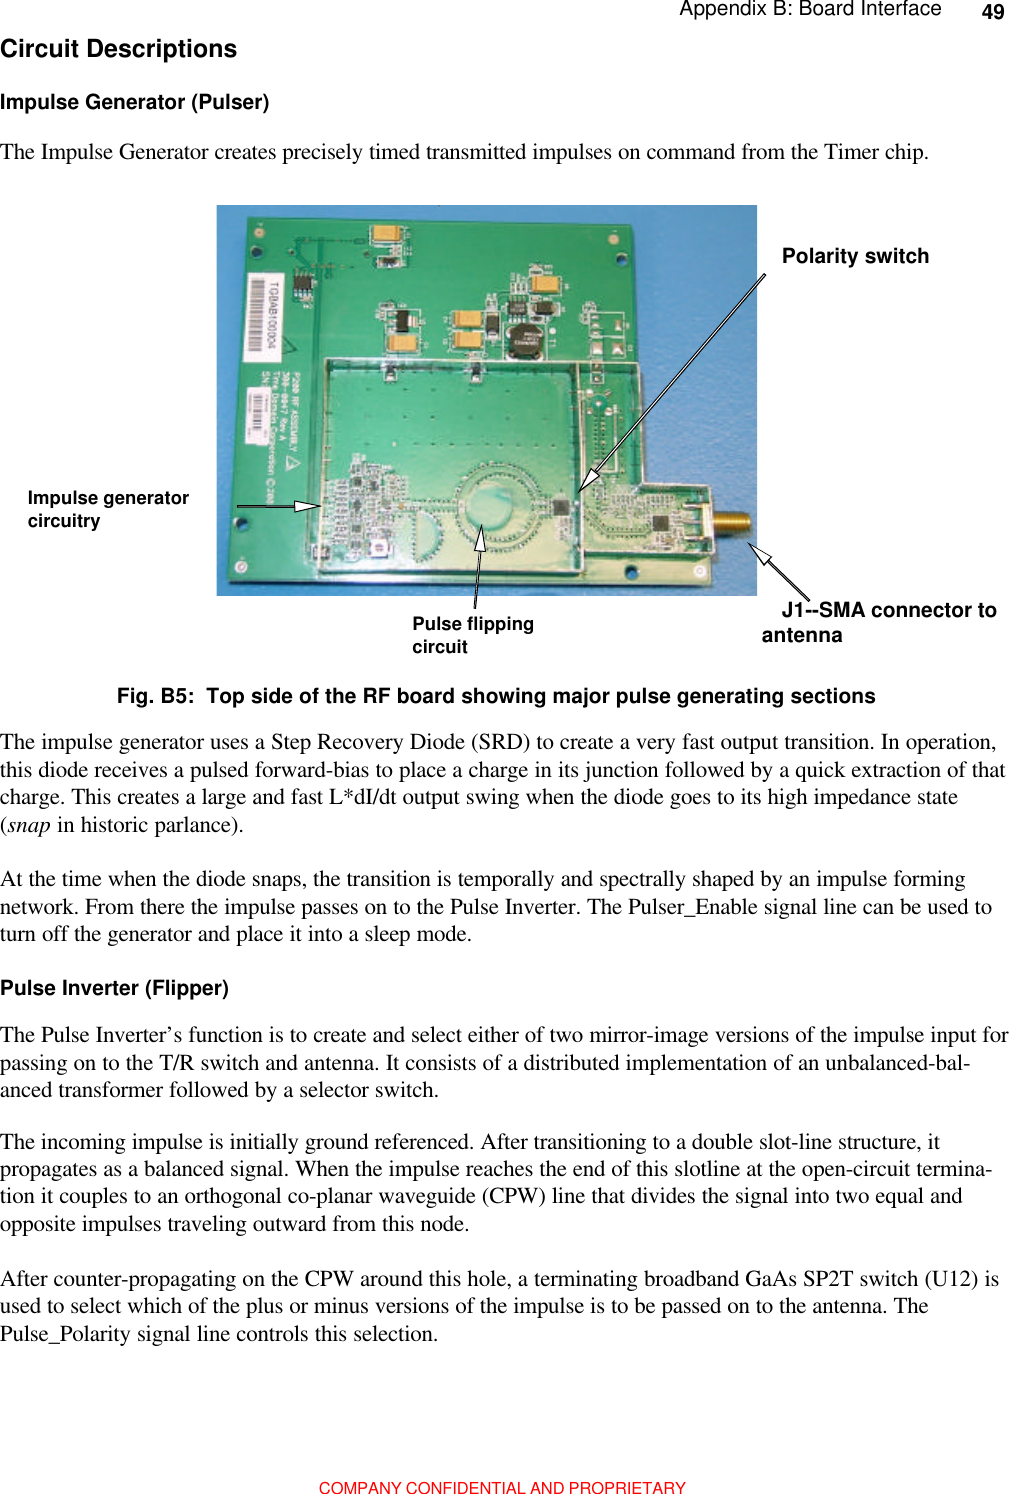
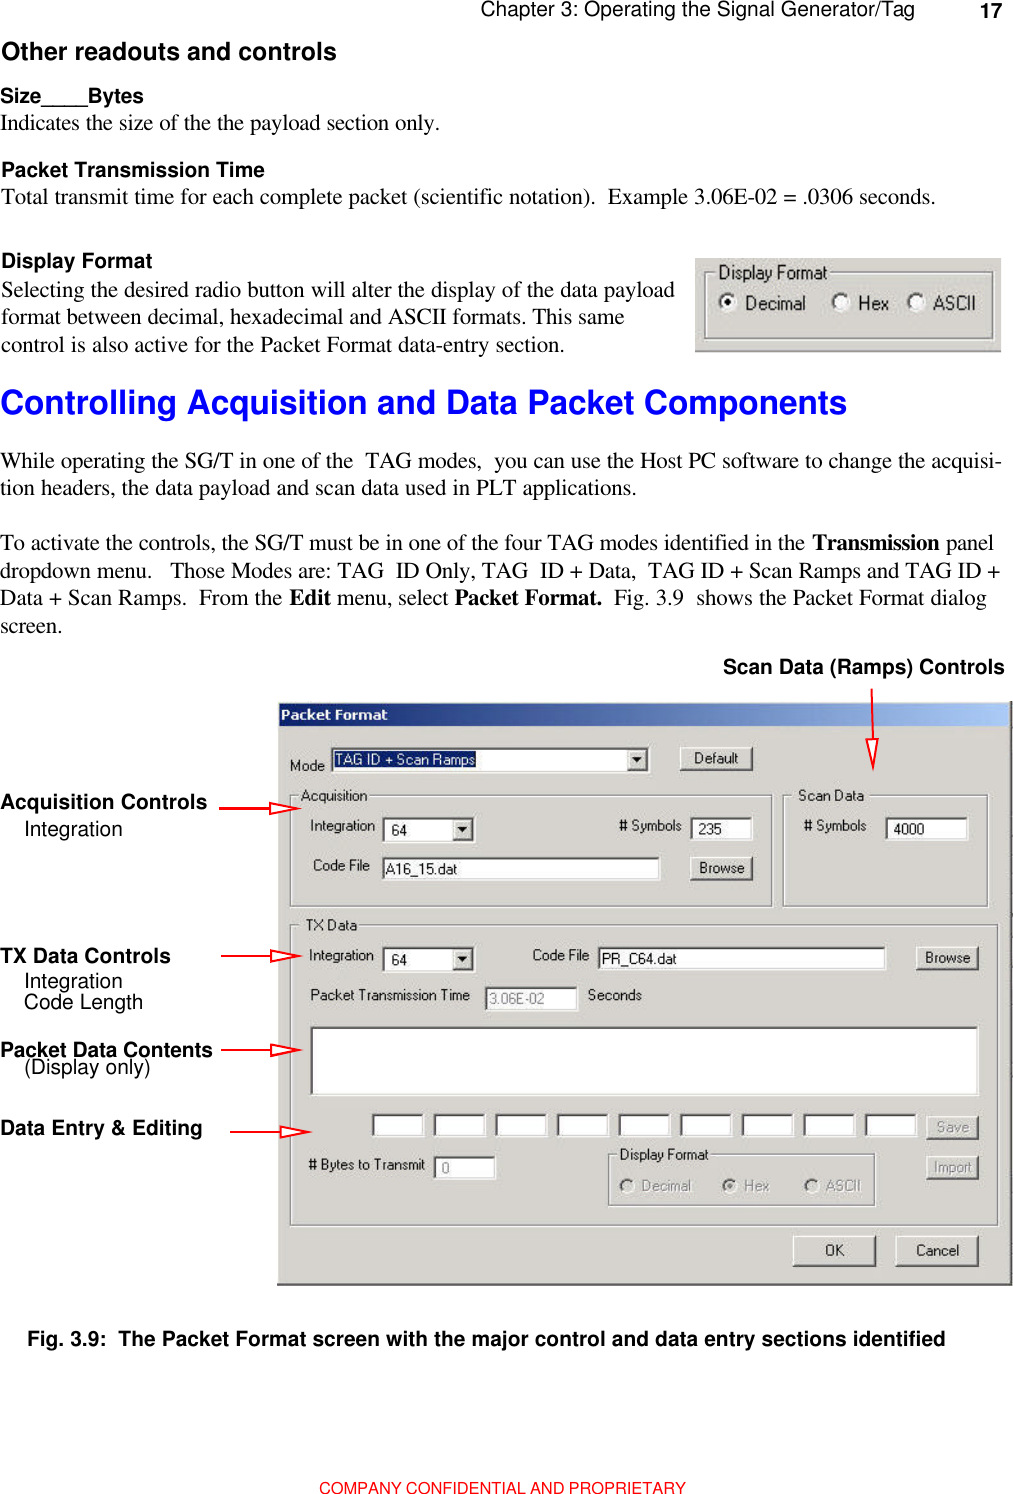
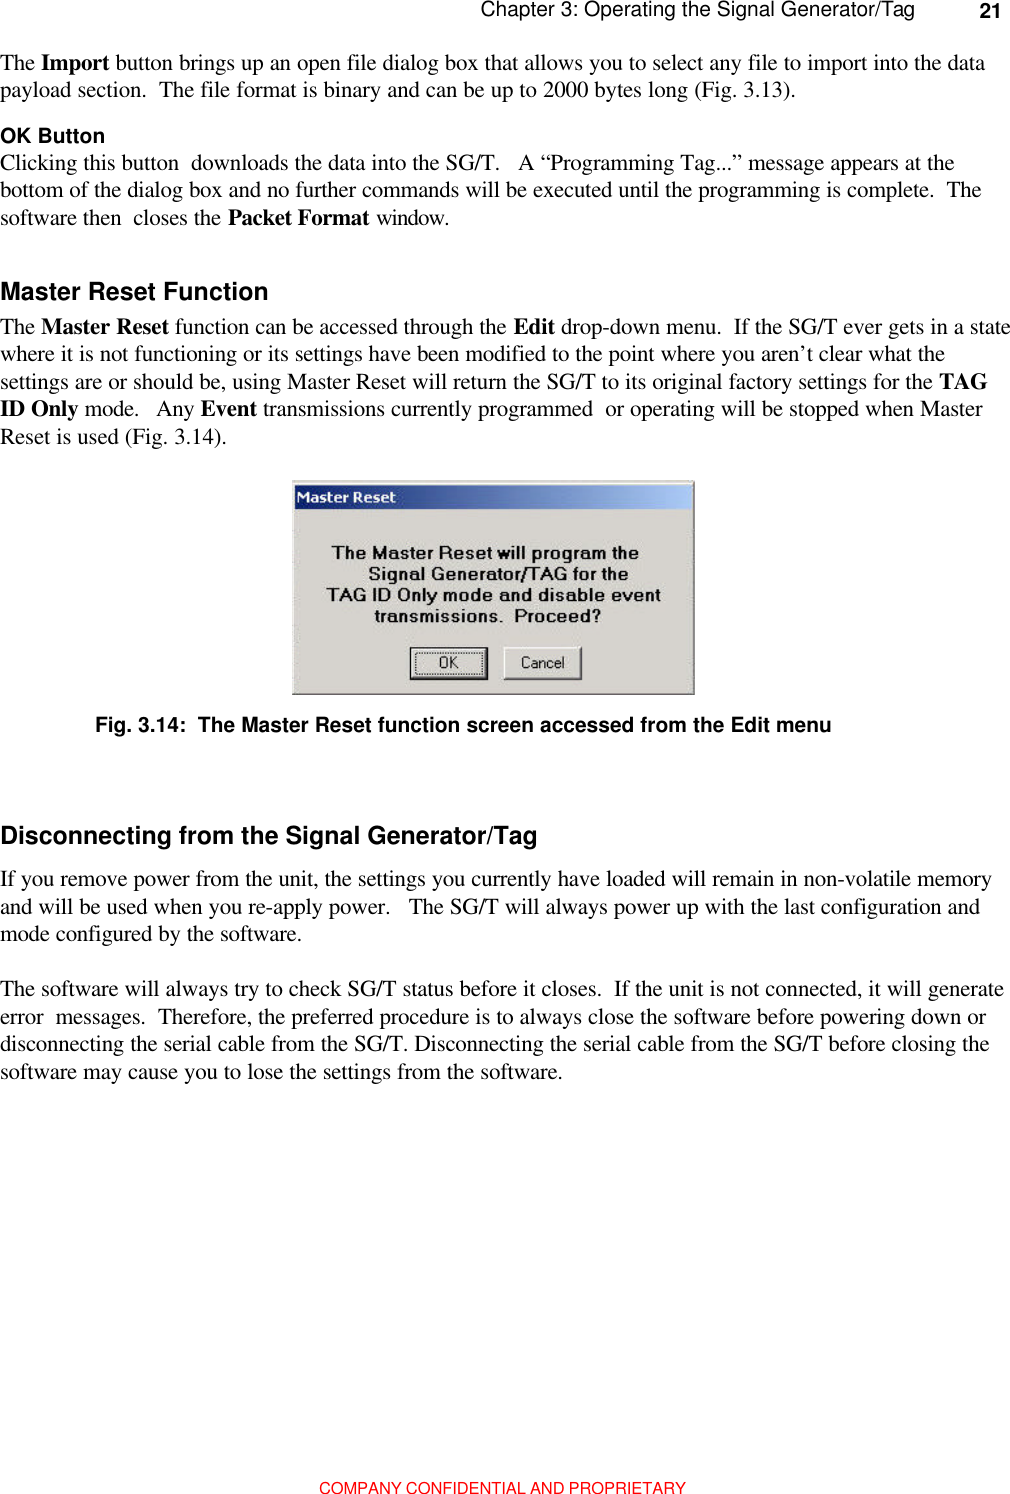
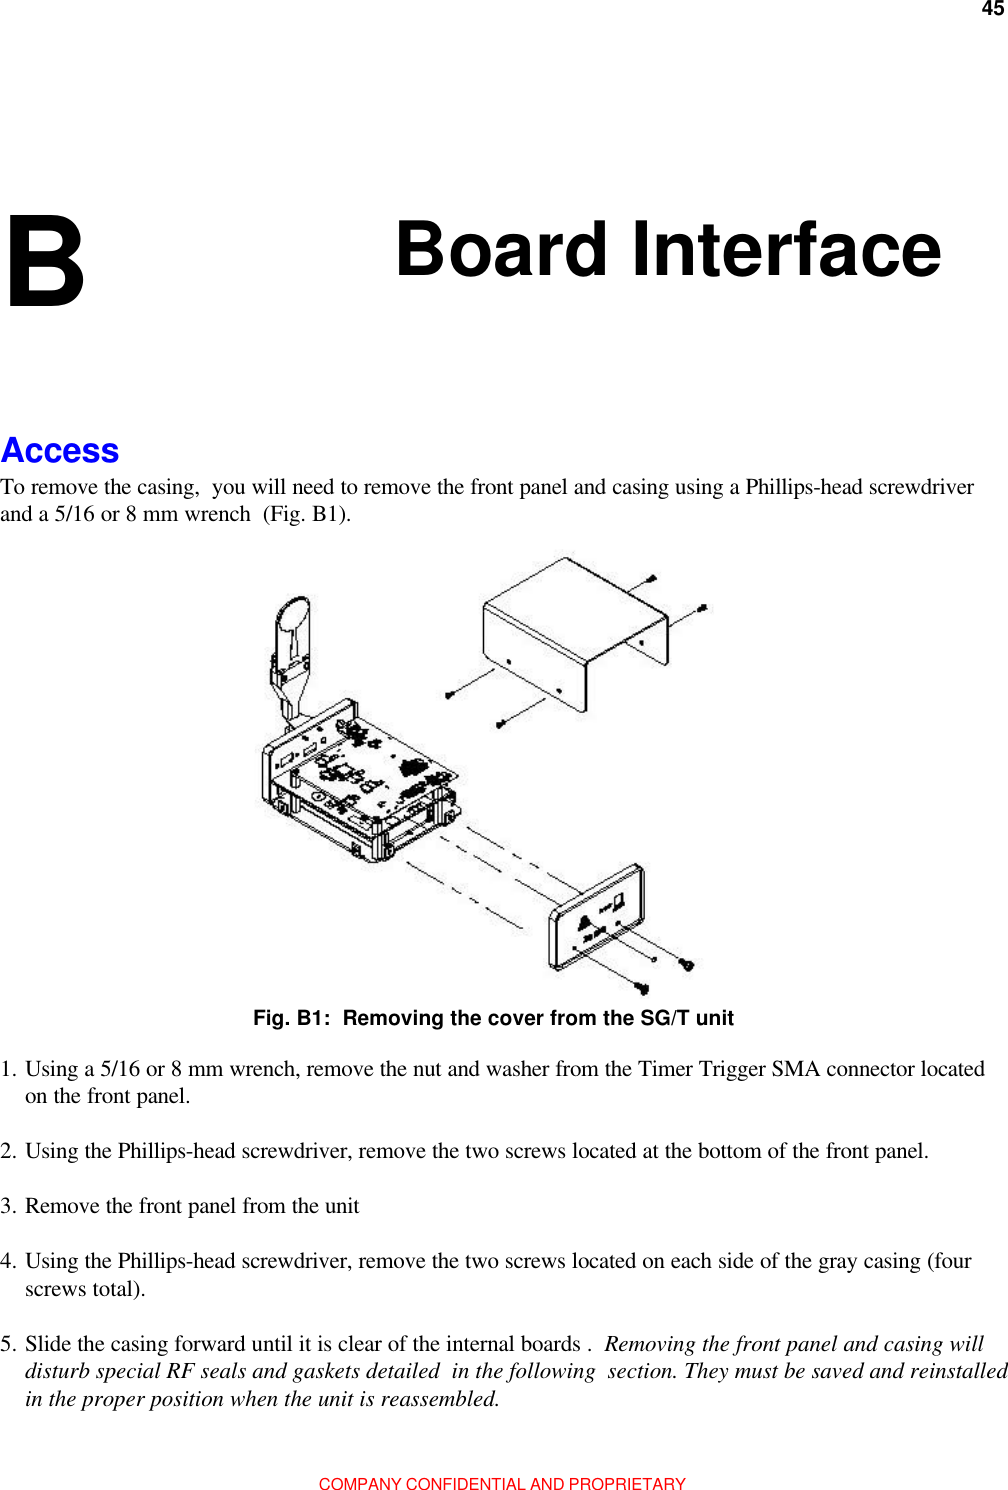
![15Chapter 3: Operating the Signal Generator/TagCOMPANY CONFIDENTIAL AND PROPRIETARYNote that these TAG modes are active to allow studies of the spectral characteristics of transmissions. Vari-ables that can affect the spectral characteristics of the various Modes:• Acquisition pseudorandom coding [user selectable, not user programmable].• Data payload pseudorandom coding [user selectable, not user programmable].• Number of integrations for acquisition• Number of integrations for data payload, TAG Header, CRC and Scan Data• Size of the data payload• Number of Scan Data symbols• Transmission period [ Continuous, Event (periodic) Single Shot ]•Single Shot: The SG/T will send a single packet of whatever mode type is selected when the Start button isclicked. It will then cease until activated again. Although the Single Shot can be initiated by clicking on thebutton on the software screen or by pushing the button on the rear panel of the SG/T unit, the Single Shotconfiguration works only when the SG/T is connected to the host PC signal generator software and theSingle Shot Configuration is selected. Configuring the Packet Repetition CycleThe SG/T can be programmed to transmit each of the transmission modes in the Transmission section Modesdrop down menu. (These will be detailed in the next secion.) The options for transmission periodicity areselected by radio buttons in the Configuration section as shown in Fig. 3.6. The choices are:•Continuous: Once activated by the Start button the device will repeat the selected packet until the Stopbutton is clicked, or until another configuration is selected on the software Transmission panel.•Event: Selecting the Event radio button and then clicking on the Set button activates the screen fordefining the transmission period. The minimum period is 1 second. The maximum period is 255 minutes (4hrs. 15 min.).To configure the repetition cycle of the signal, simply select the Event radio button, then click on the Setbutton. The Event Period dialog screen pops up. (Fig. 3.7) After selecting the Transmit Interval radiobutton, a period increment of either seconds or minutes can be selected from the drop-down menu. .The size ofthe interval is typed into the first transmit interval field. The period defined can be up to 255 integers long.Those integers can represent seconds or minutes.Fig. 3.7: Setting the periodic transmission cycle on the Transmission Period screenSelecting the Disable radio button disables any value selected as the periodic transmission cycle. Clicking onNext Tx button displays the time until the next timed event.Once the transmission period values are selected, click on the Apply button. This returns you to the mainscreen. The Start/Stop button in the Transmission section of the main screen turns the periodic event on andoff.](https://usermanual.wiki/Humatics/200SGT-0702/User-Guide-259558-Page-15.png)
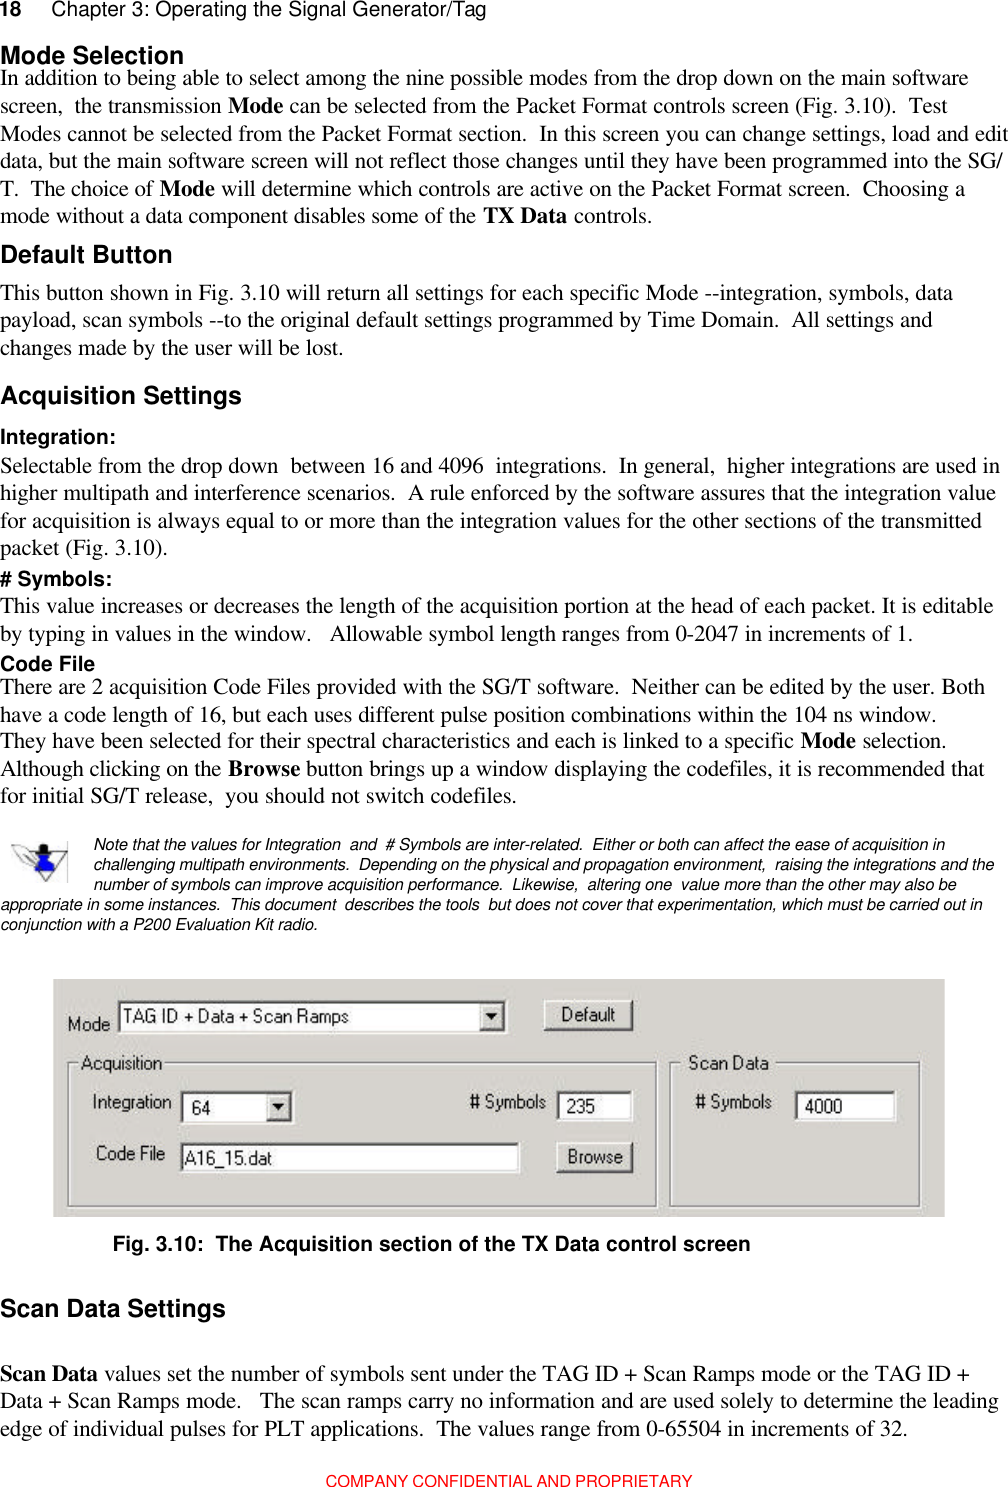

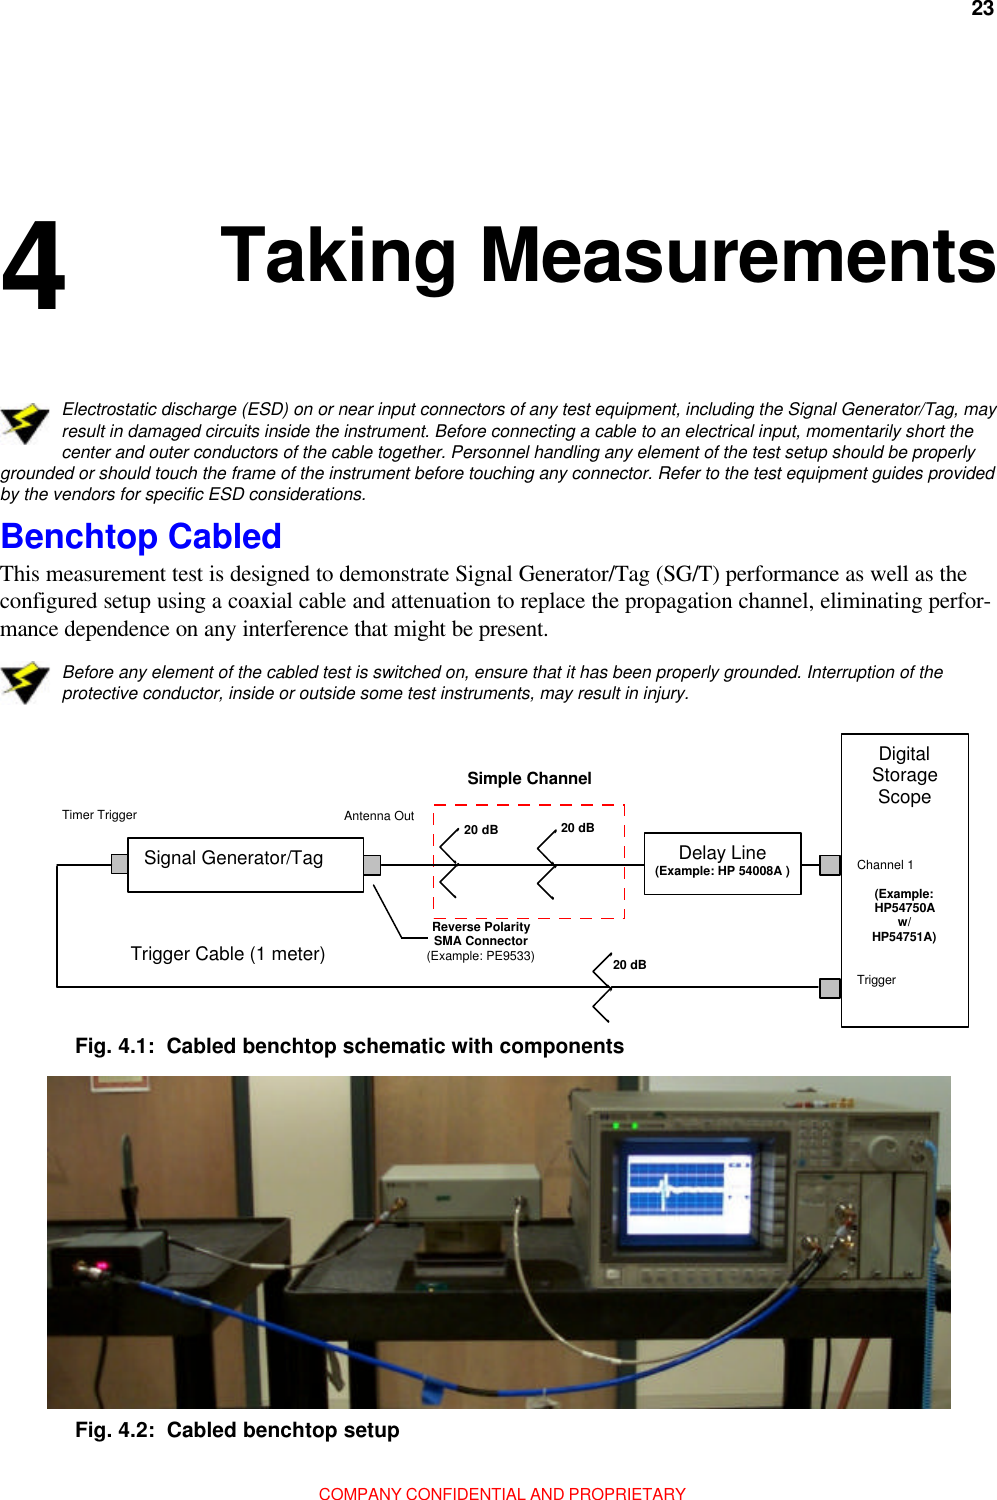
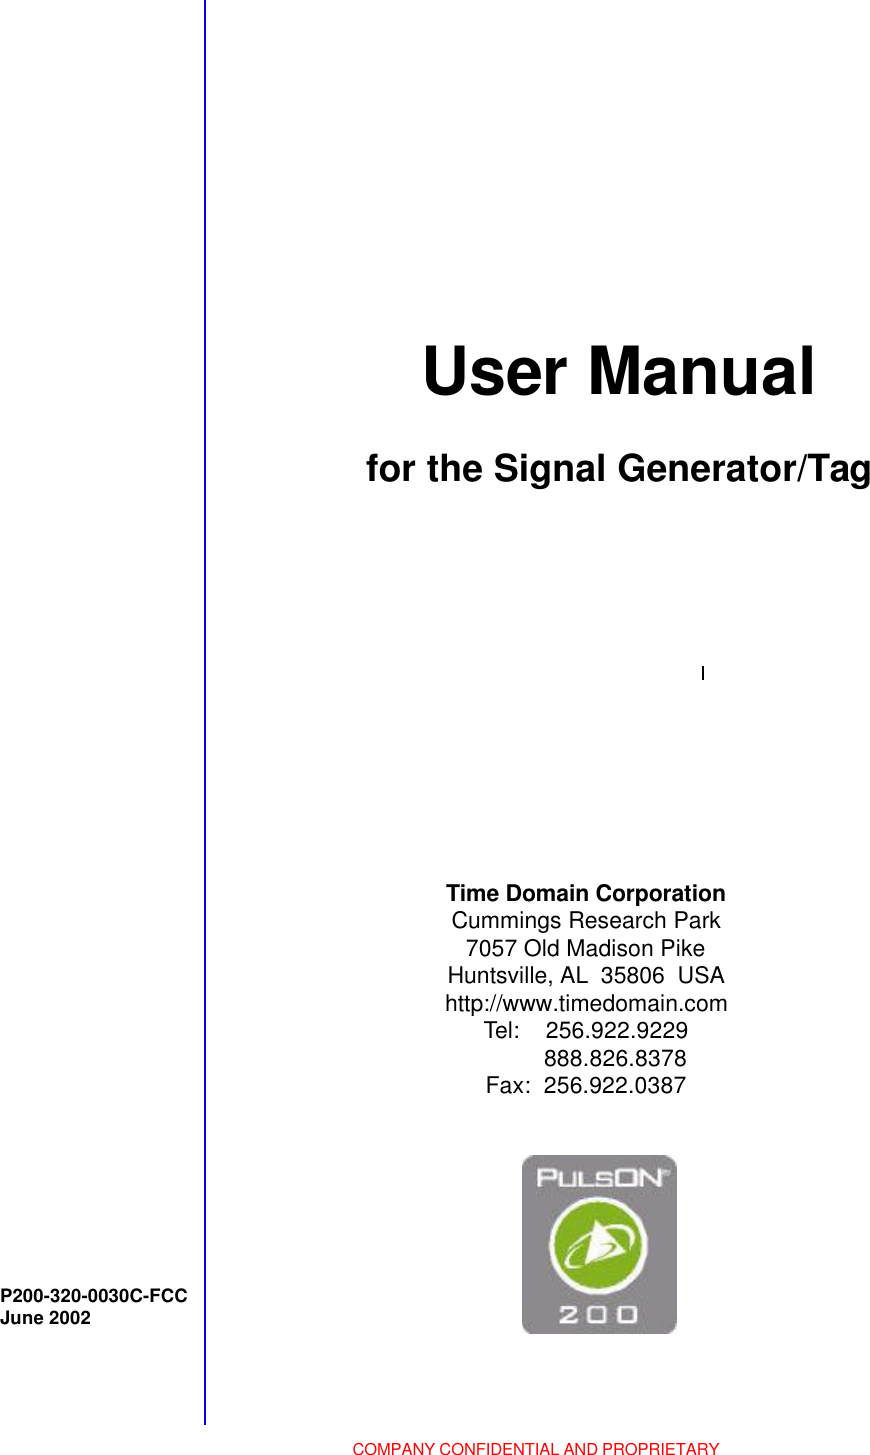
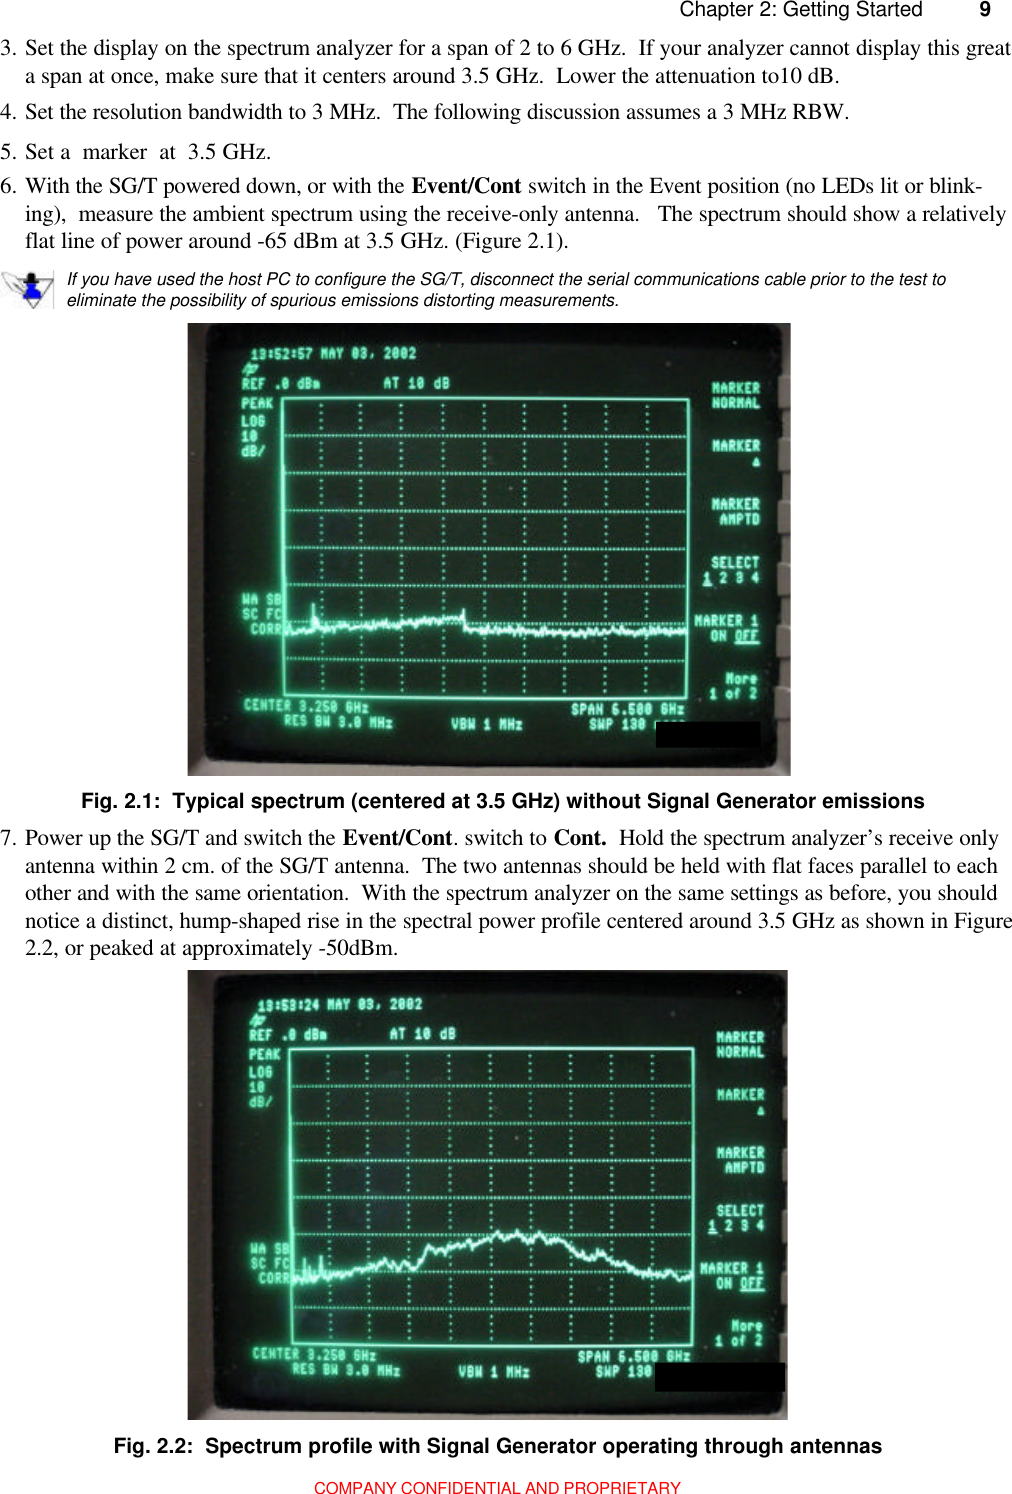
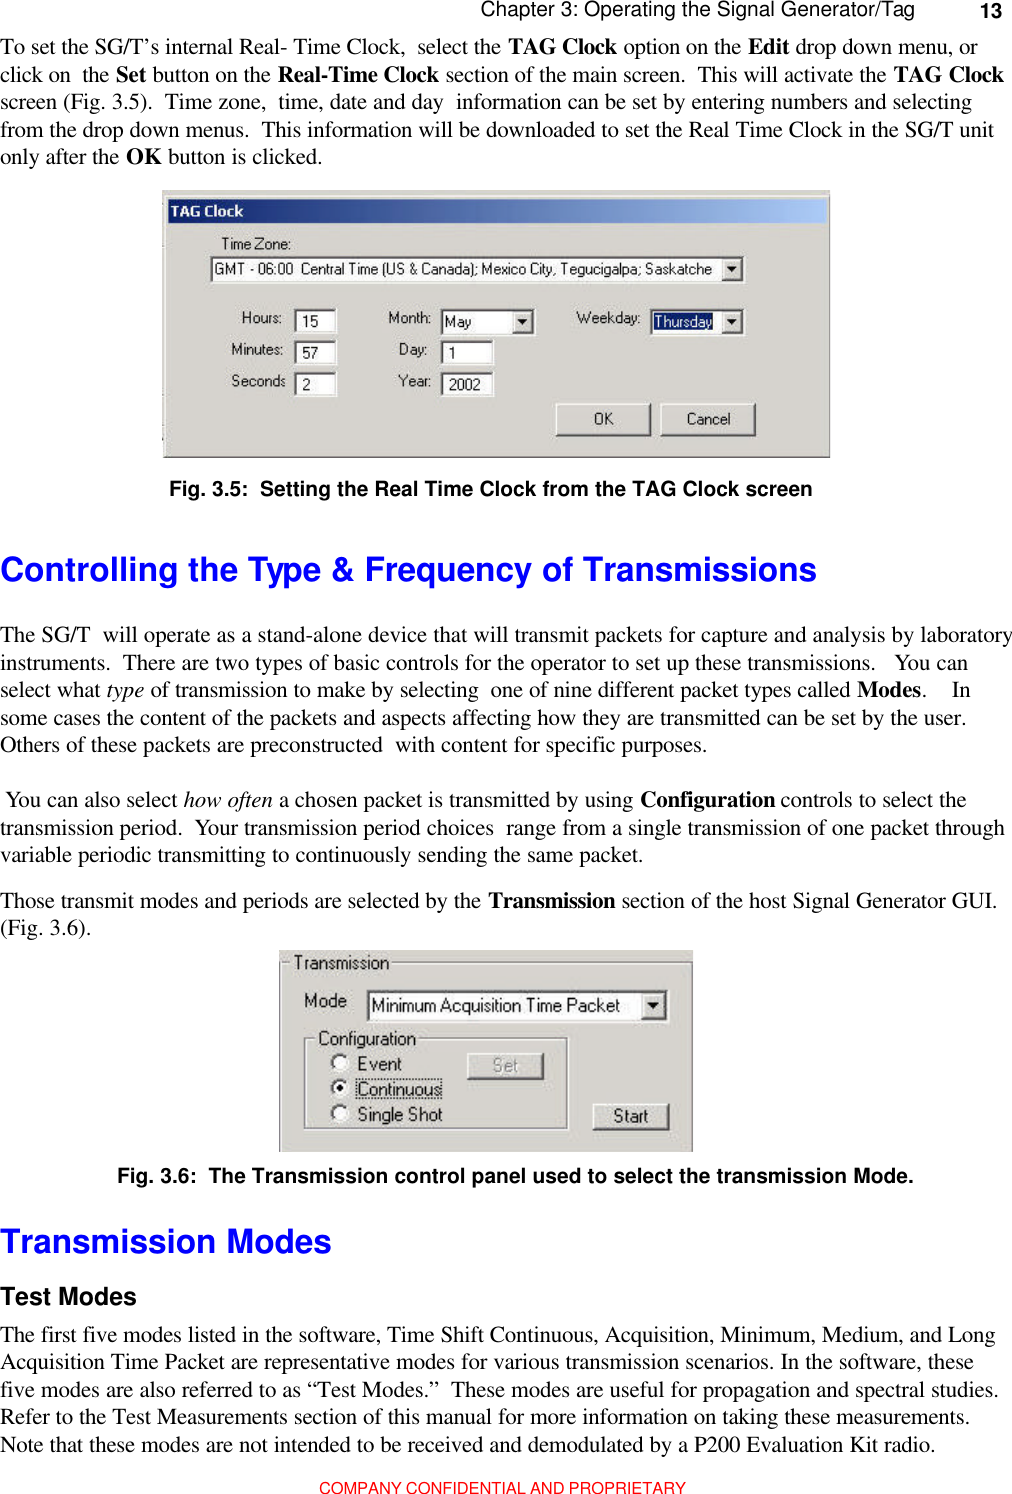
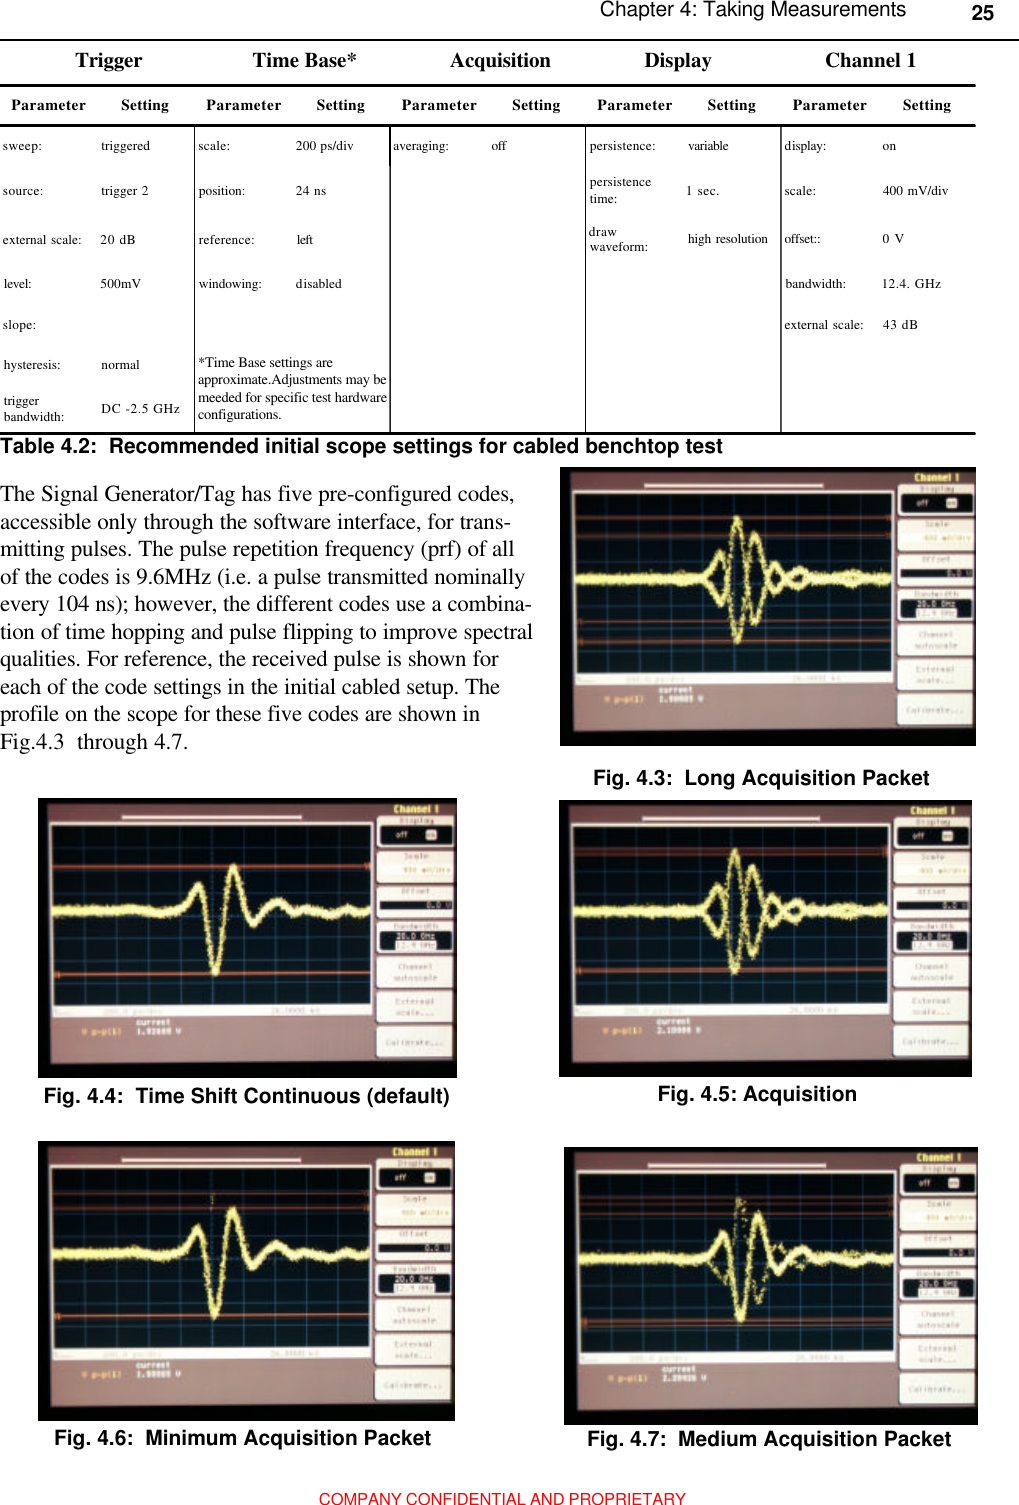
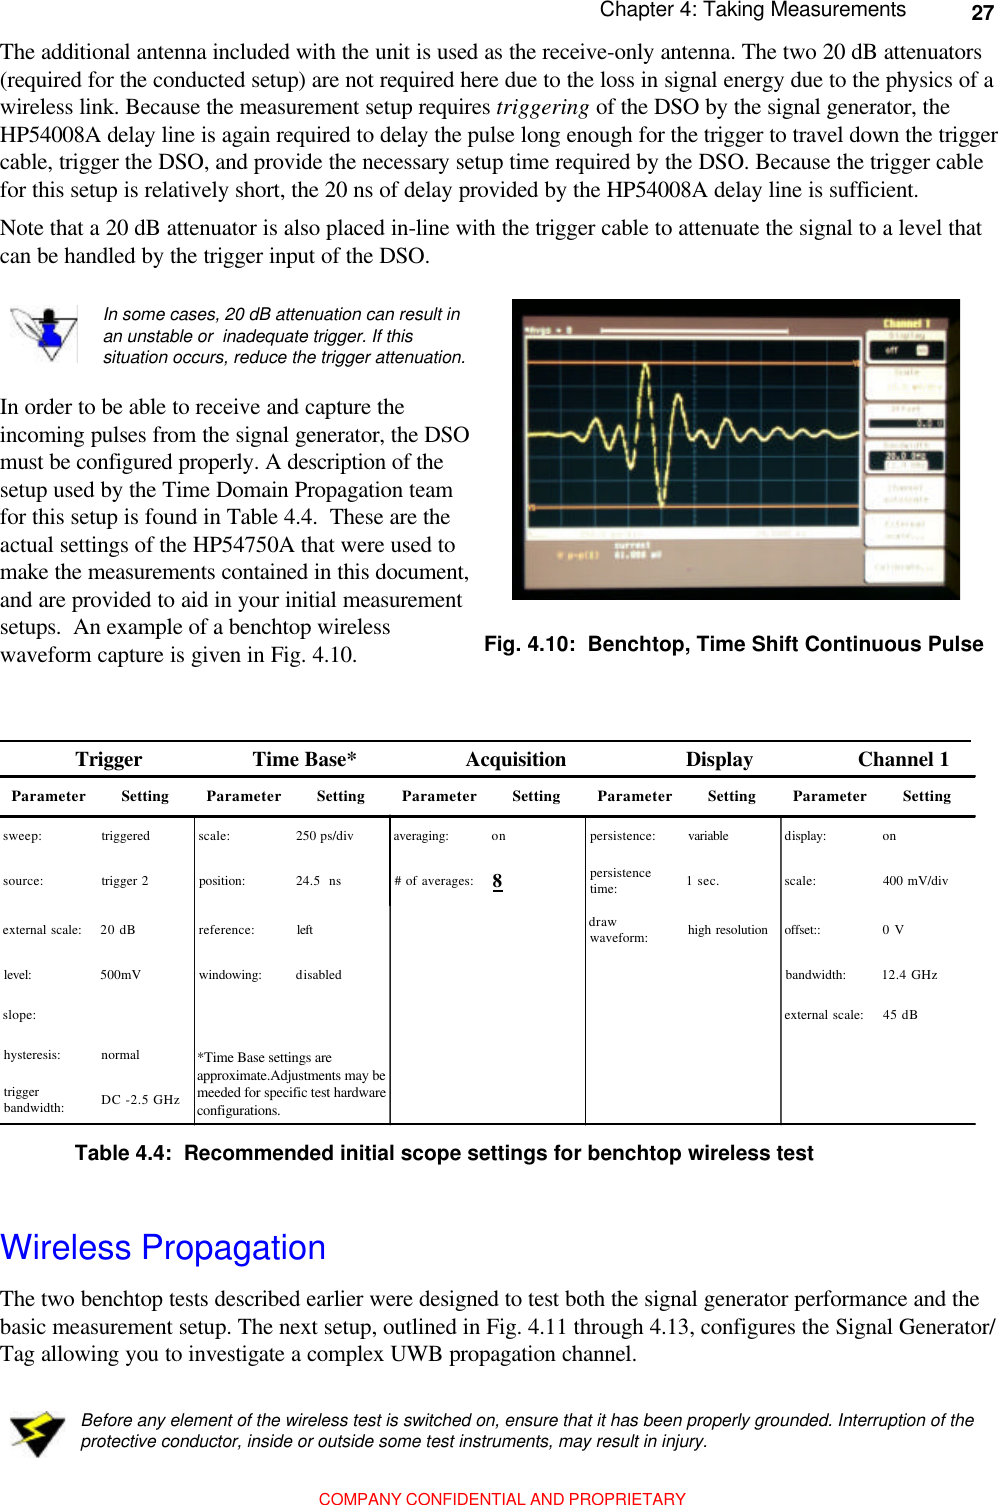
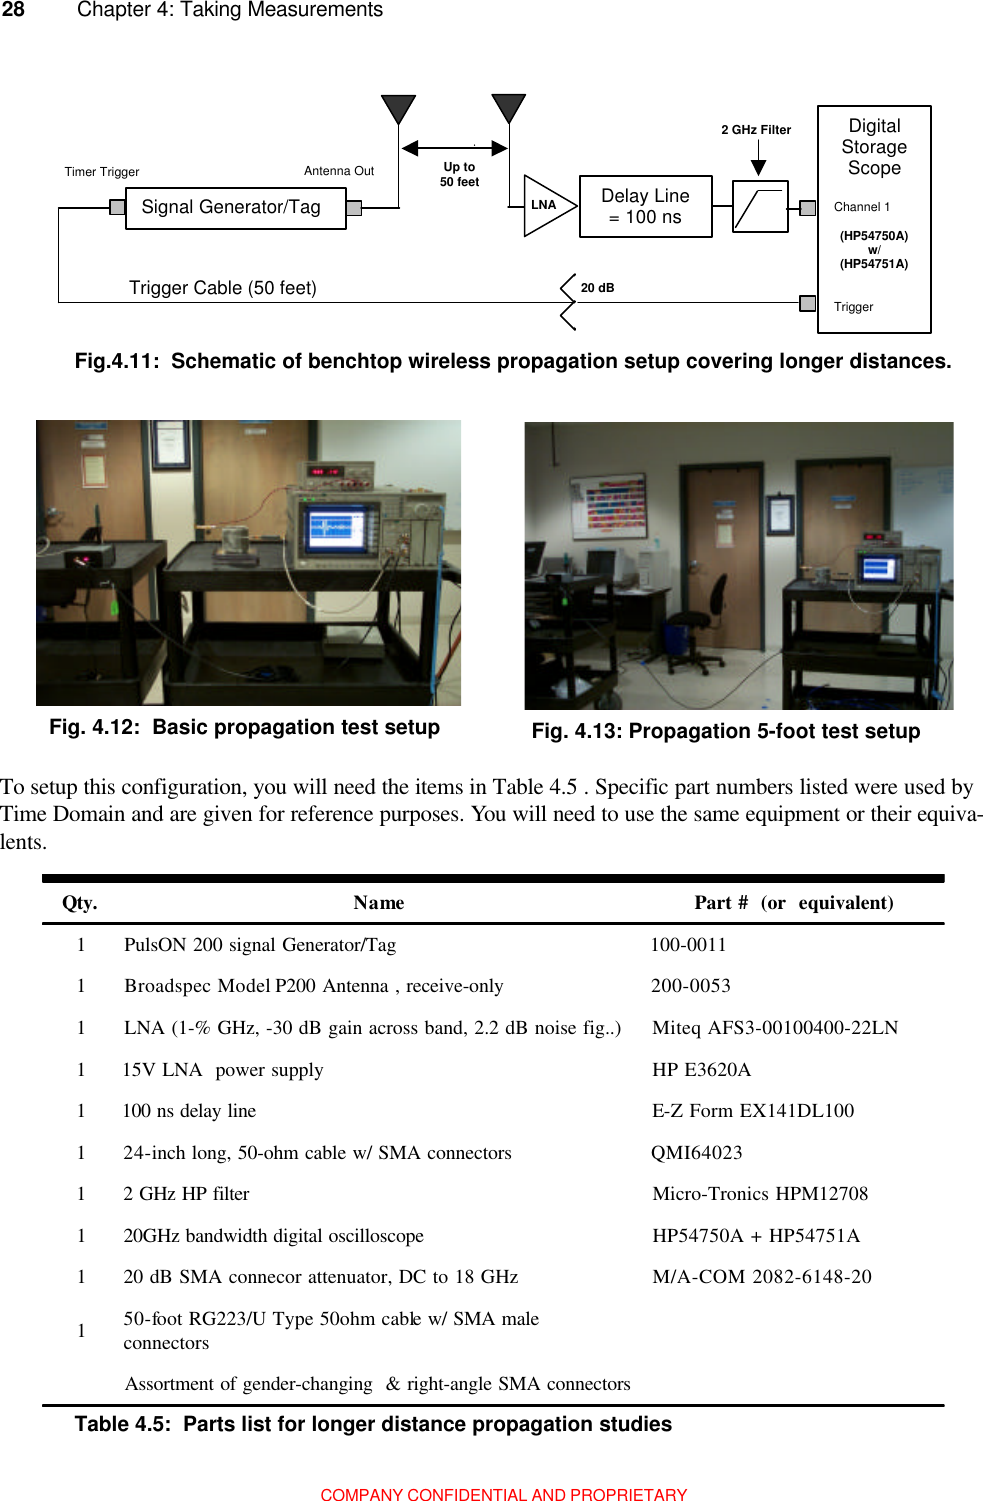
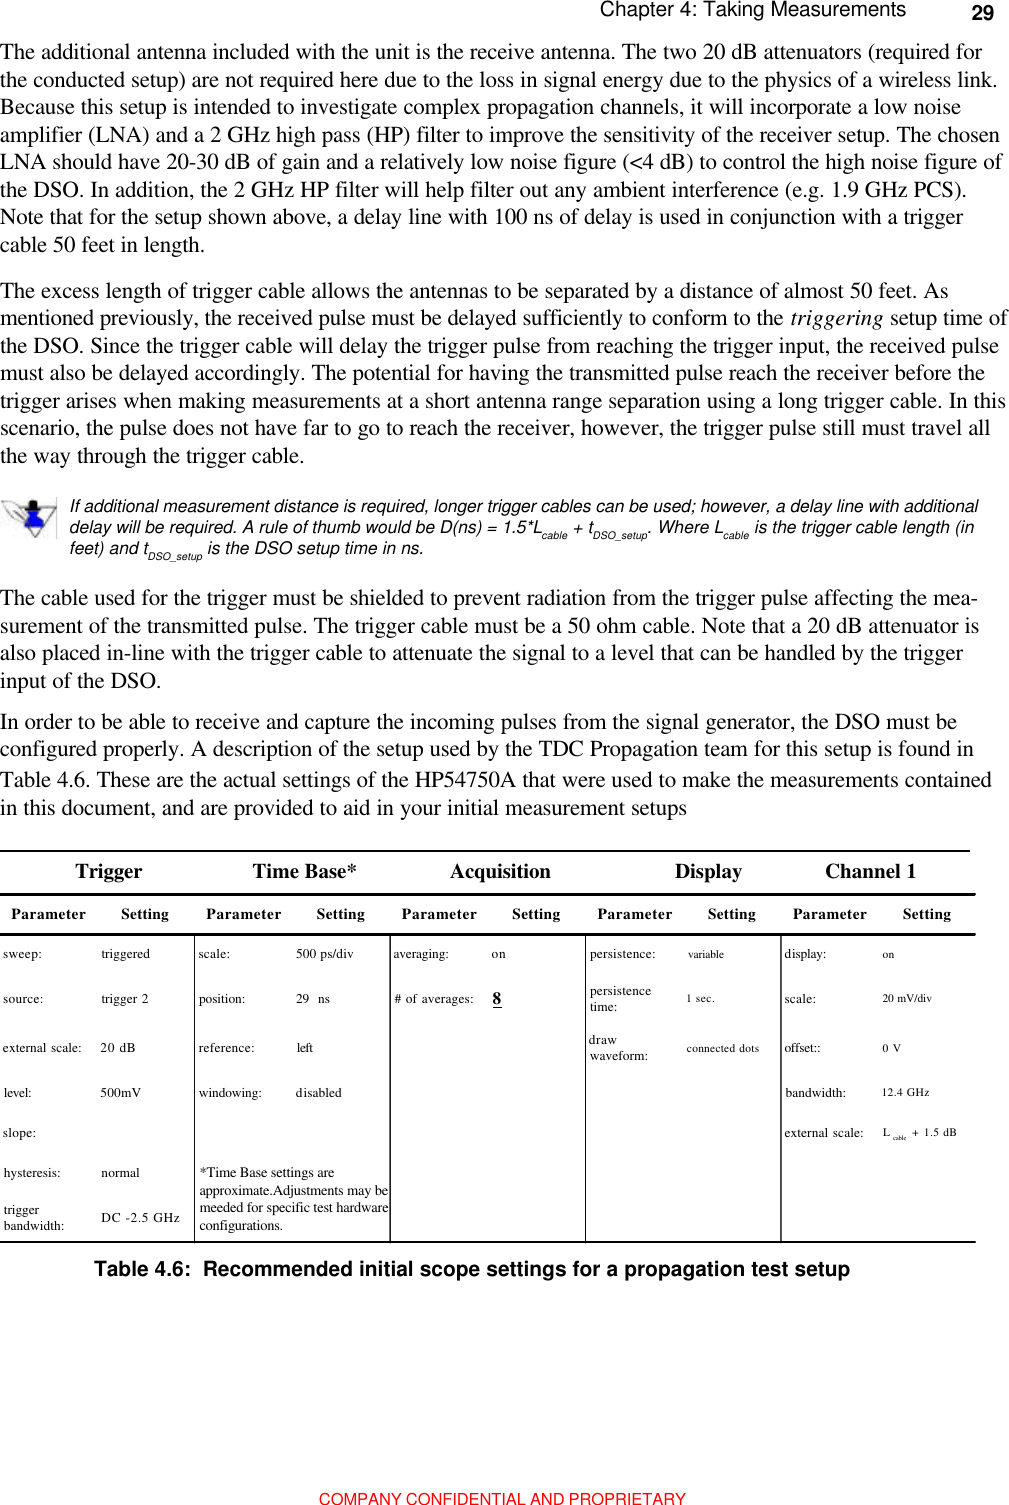
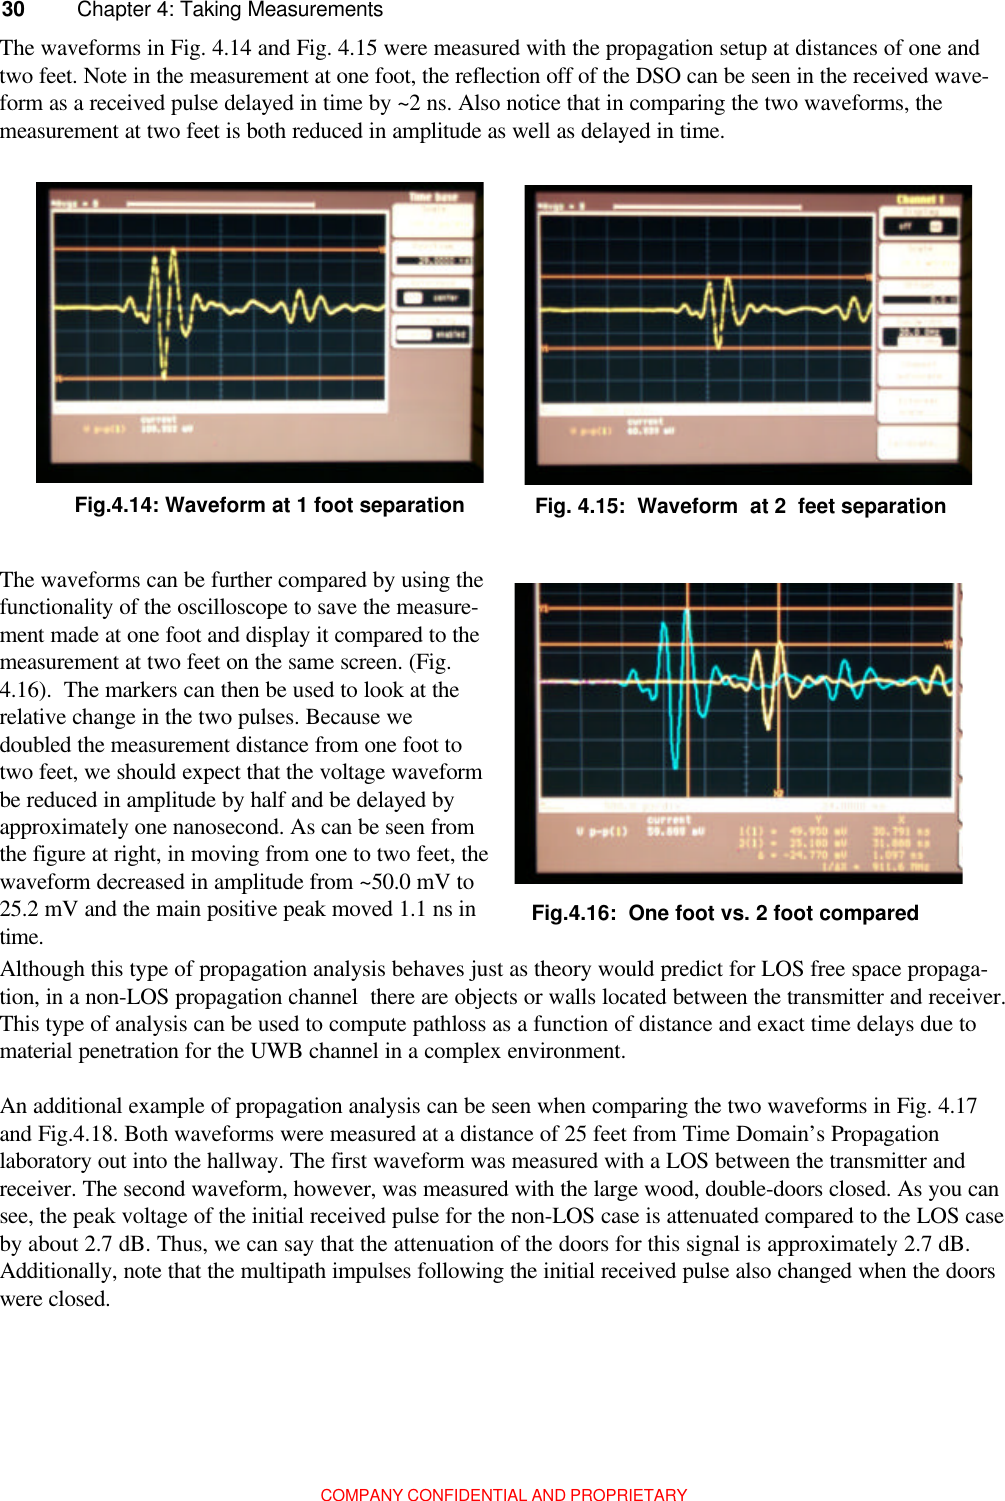
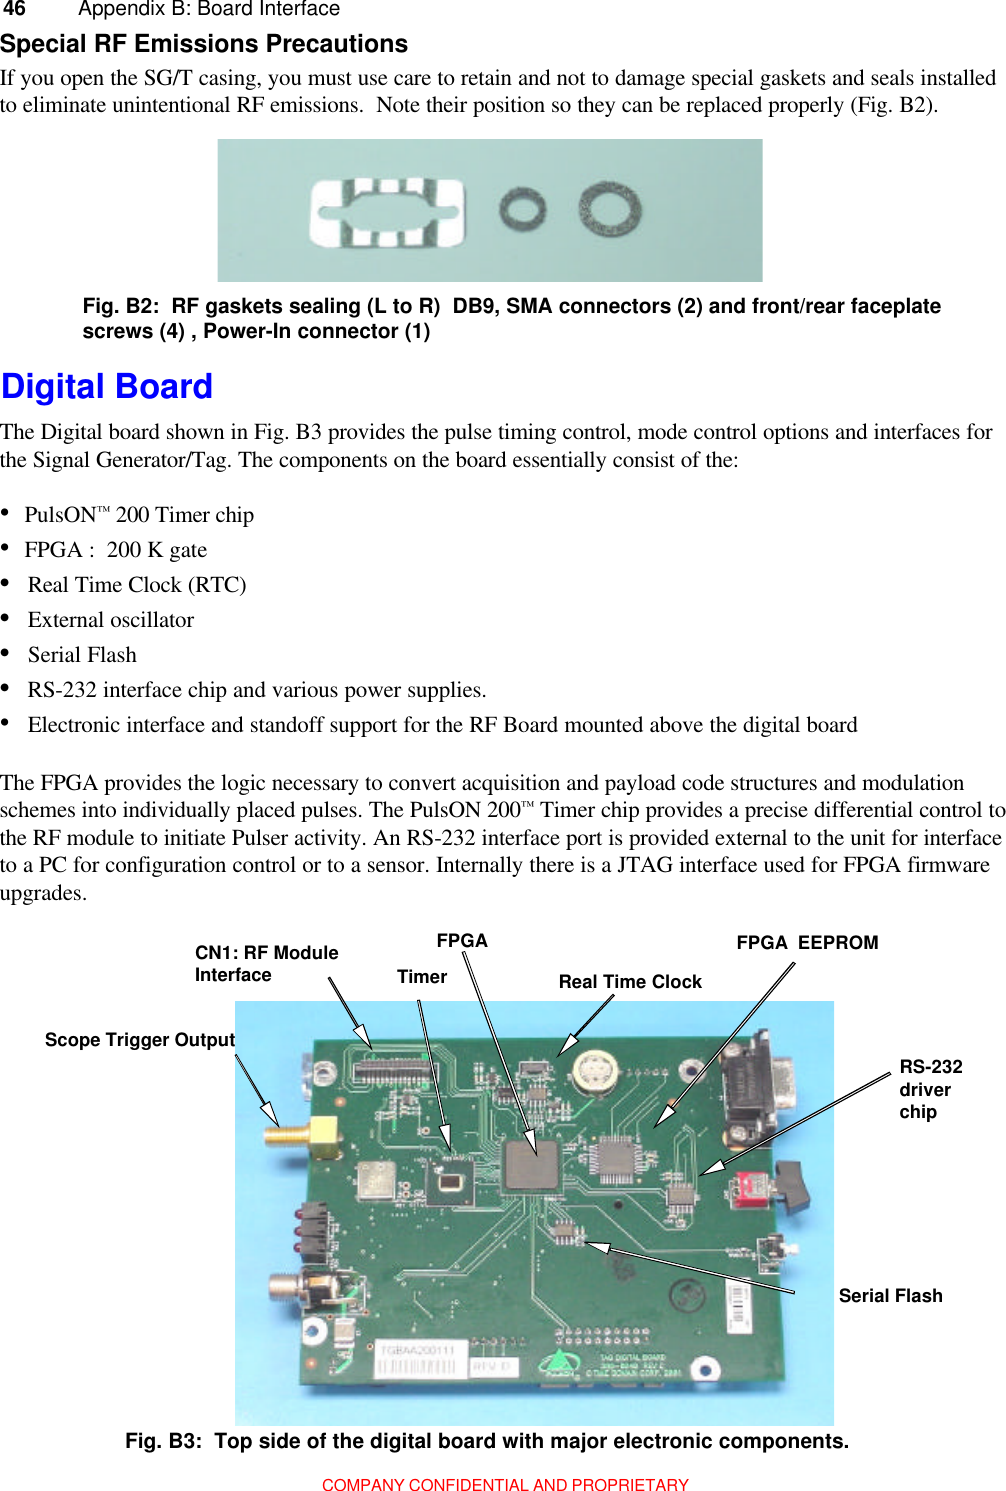
![COMPANY CONFIDENTIAL AND PROPRIETARY24 Chapter 4: Taking MeasurementsAntennas are not used for this setup. Because the PulsON 200™ transmit antenna has a non-standard connector,the PE9533 SMA connector is needed to adapt the RF output of the Signal Generator/Tag so that it can beconnected to a standard SMA cable. The two 20 dB attenuators are required to attenuate the signal to a levelthat can be handled by the channel input of the digital sampling scope (DSO). Because the measurement setuprequires triggering of the DSO by the signal generator, the HP54008A delay line is required to delay the pulselong enough for the trigger to travel down the trigger cable, trigger the DSO, and provide the necessary setuptime required by the DSO. A schematic and photo of this setup are shown in Fig. 4.1 and Fig. 4.2.The setup time required by the DSO is the time needed between the time it receives the trigger to the time it is ready toreceive a waveform. For the HP54750A, the setup time is 22 ns If your DSO has a delay feature built into the device, thedelay line component can be eliminated from setup.In some cases, 20 dB attenuation can result in an unstable or inadequate trigger. If this situation occurs, reduce the triggerattenuation.In order to be able to receive and capture the incoming pulses from the signal generator, the DSO must beconfigured properly. A description of the setup used by Time Domain’s Propagation team is found in Table 4.2These are the actual settings of the HP54750A that were used to make the measurements contained in thisdocument, and are provided to aid in your initial measurement setups.Because the trigger cable for this setup is relatively short, the 20 ns of delay provided by the HP54008A delayline is sufficient. As we will see with later setups, if a longer trigger cable is used, a longer delay in the signalpath must also be used. Note that a 20 dB attenuator is also placed in-line with the trigger cable to attenuate thesignal to a level that can be handled by the trigger input of the DSO.Table 4.1: Required parts for cabled test setupQty. Name Part #1PulsON 200 signal Generator/Tag 100-00111Reverse polarity SMA male-female connector Pasternak Enterprises PE9533112-inch long, 50-ohm cable w/SMA connectors Tensolite-QMI 1-3636-301-.3212124-inch long, 50-ohm cable w/SMA connectors Tensolite-QMI 1-3636-510-3224320 dB SMA connector attenuator, DC to 18 GHz M/A-COM 2082-6148-20120ns delay line HP54008A120 GHz bandwidth digitizing oscilloscope + 20 GHz plug-in HP54750A + HP54751A11-meter long, 50-ohm cable w/ SMA connectors QMI64039Assortment of gender-changing & right angle SMA connectorsRecommended Test Instruments and EquivalentsTo conduct this test and all the tests in this chapter, you will need the items in Tables 4.1, 4.3 and 4.5. TimeDomain conducted its tests with the equipment listed in the tables, but equivalents are acceptable. The mainrequirements for digital sampling oscilloscopes [DSOs] is that they have a 20 GHz bandwidth and be able totrack a vertical rise time of 30 picoseconds. Two alternatives that meet the specification are:• Agilent 86100B DSO with an 834484A 2-channel 50 GHz module.• TektronixTDS 8000 or CSA 8000 DSO with 80E03 20 GHz module.These citations are for reference only. Time Domain has not used this equipment to verify its suitability. Notealso that connector compatibility must be verified with the equipment vendor.](https://usermanual.wiki/Humatics/200SGT-0702/User-Guide-259558-Page-24.png)

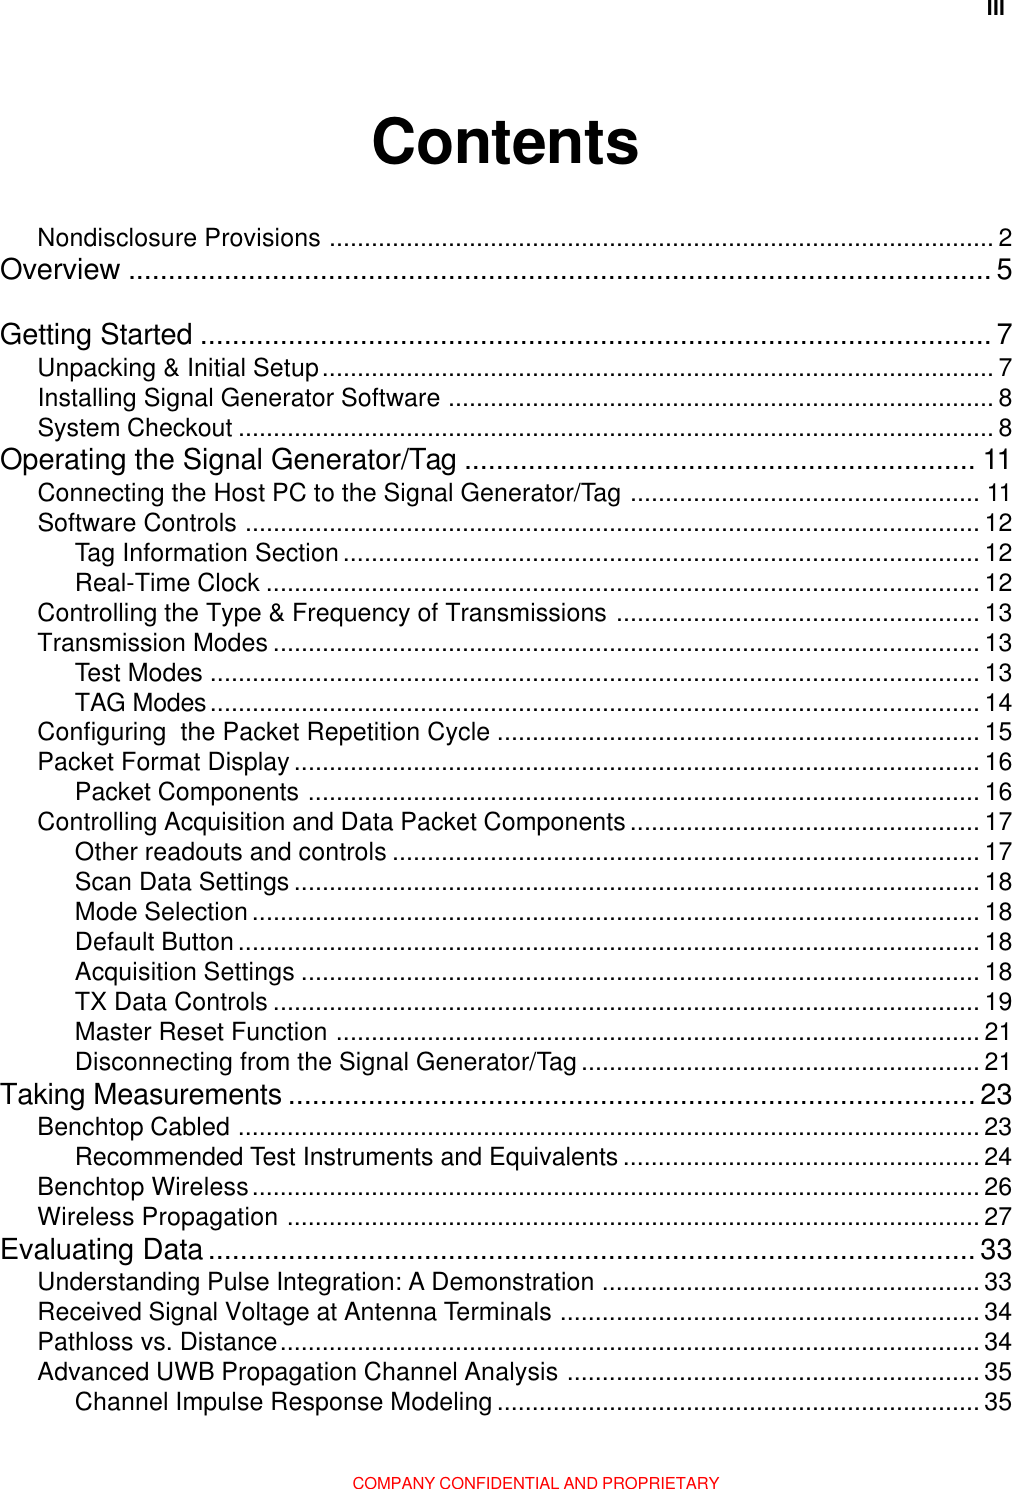
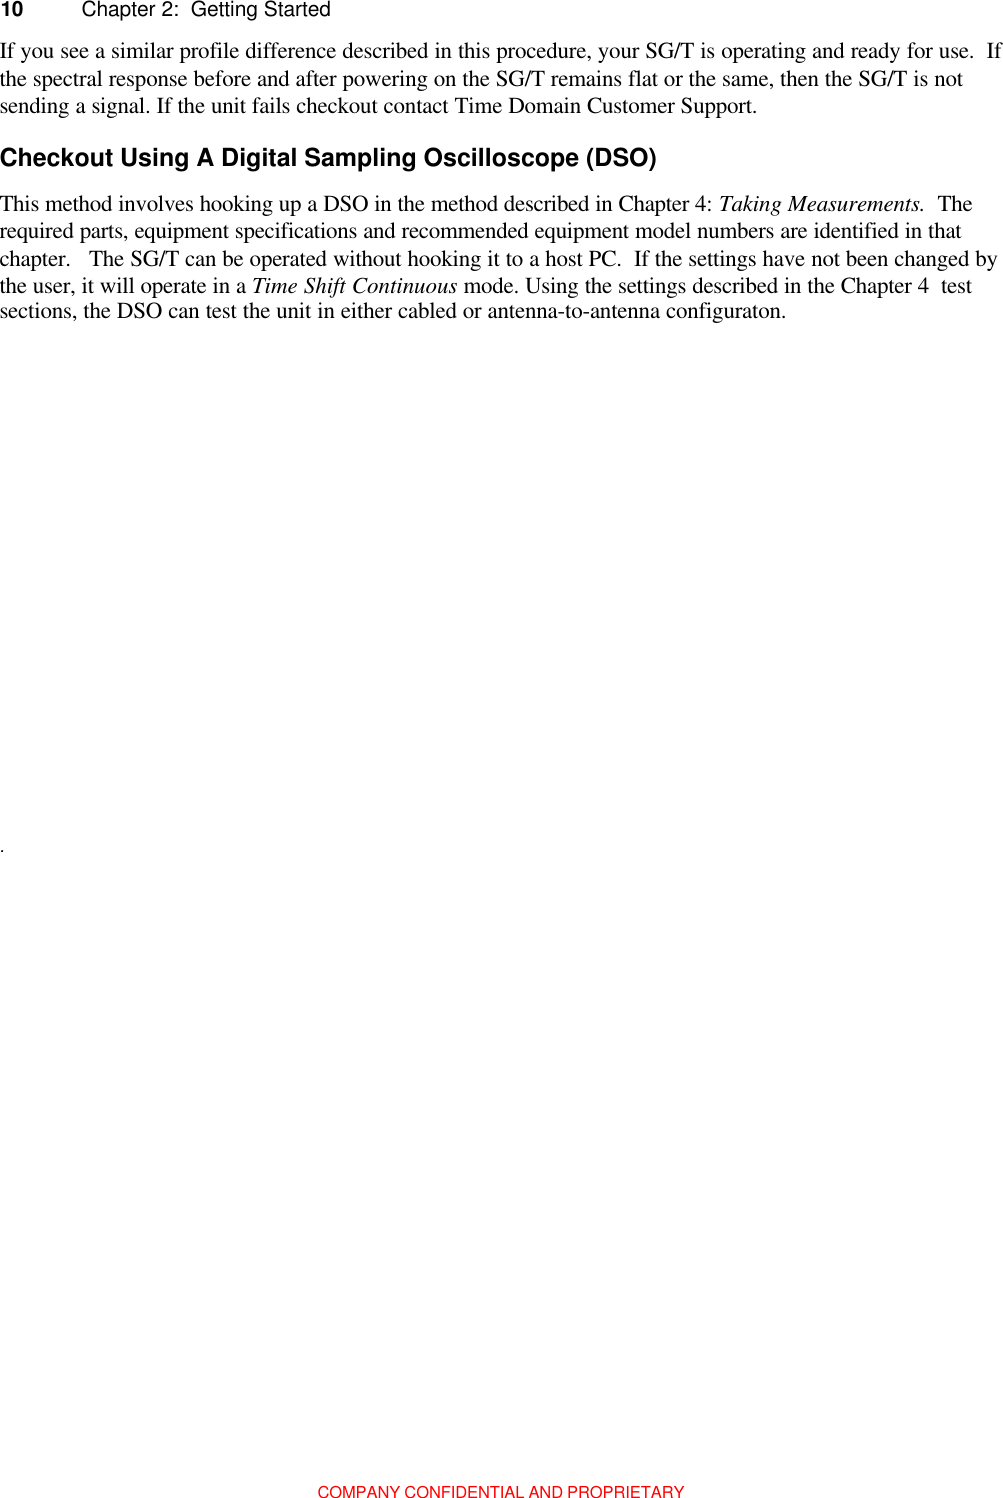
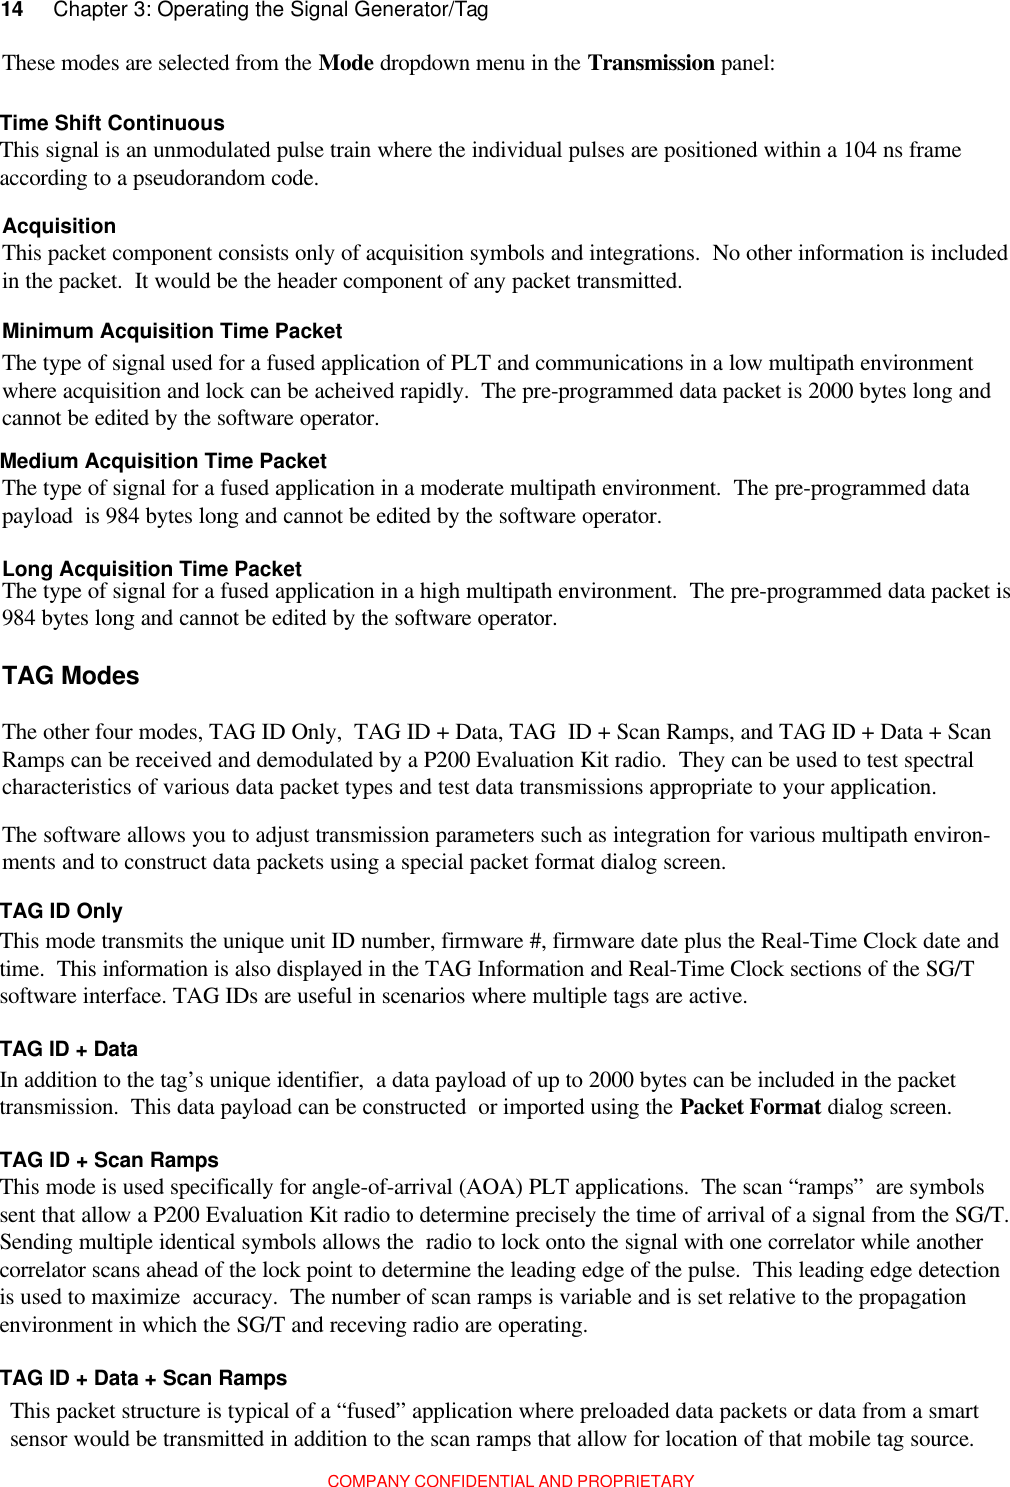
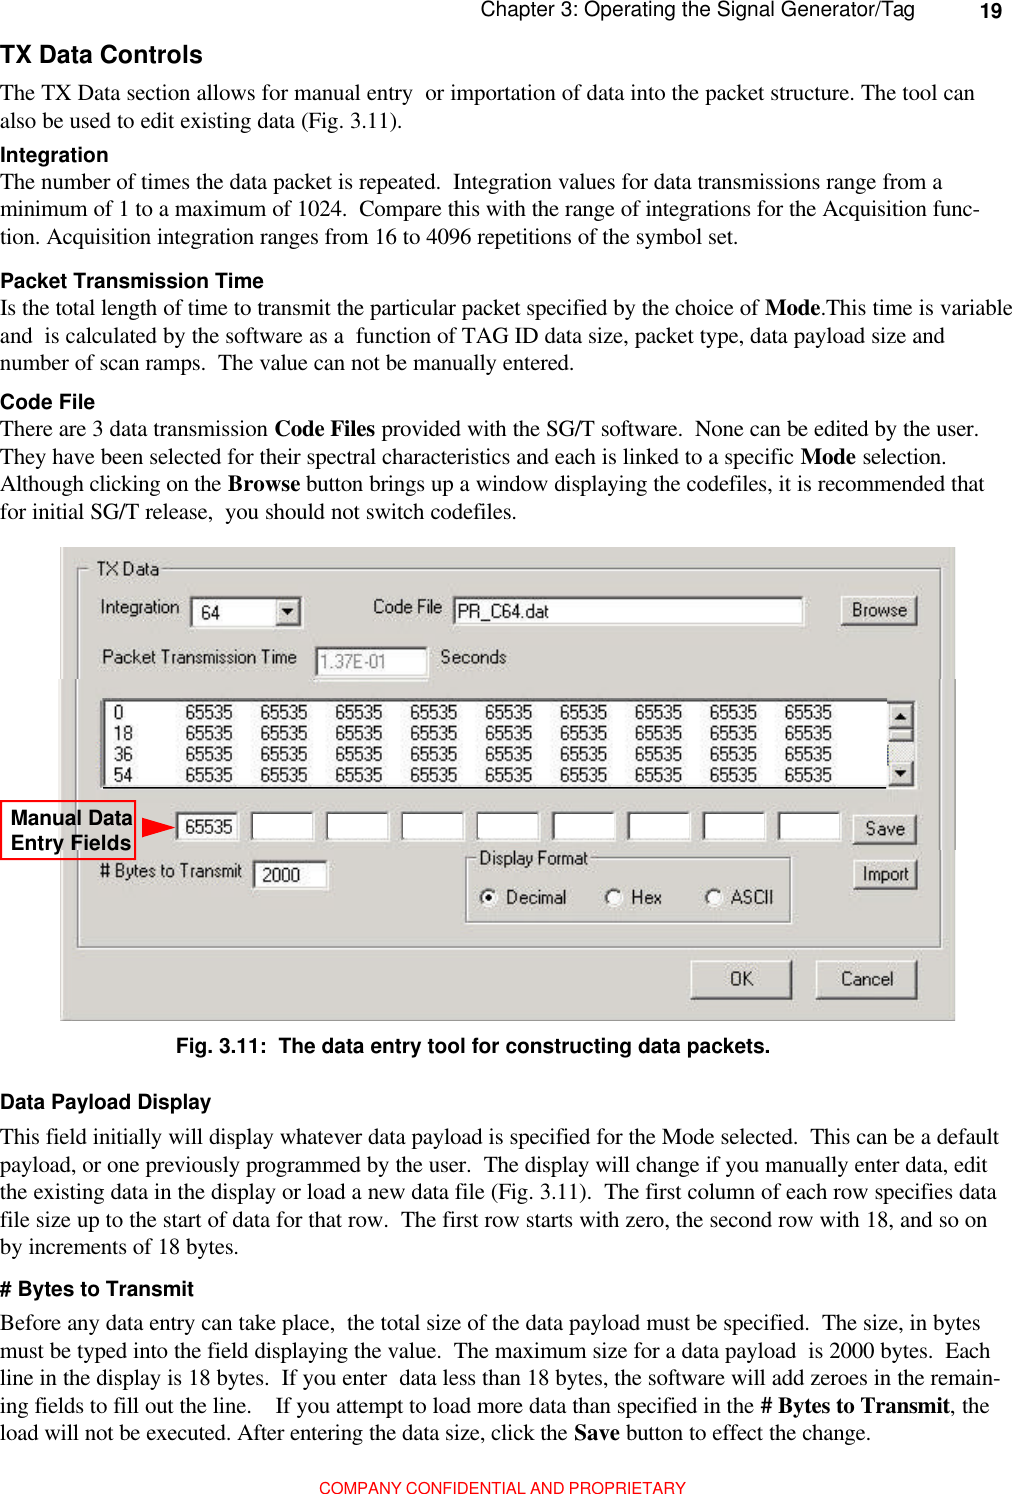
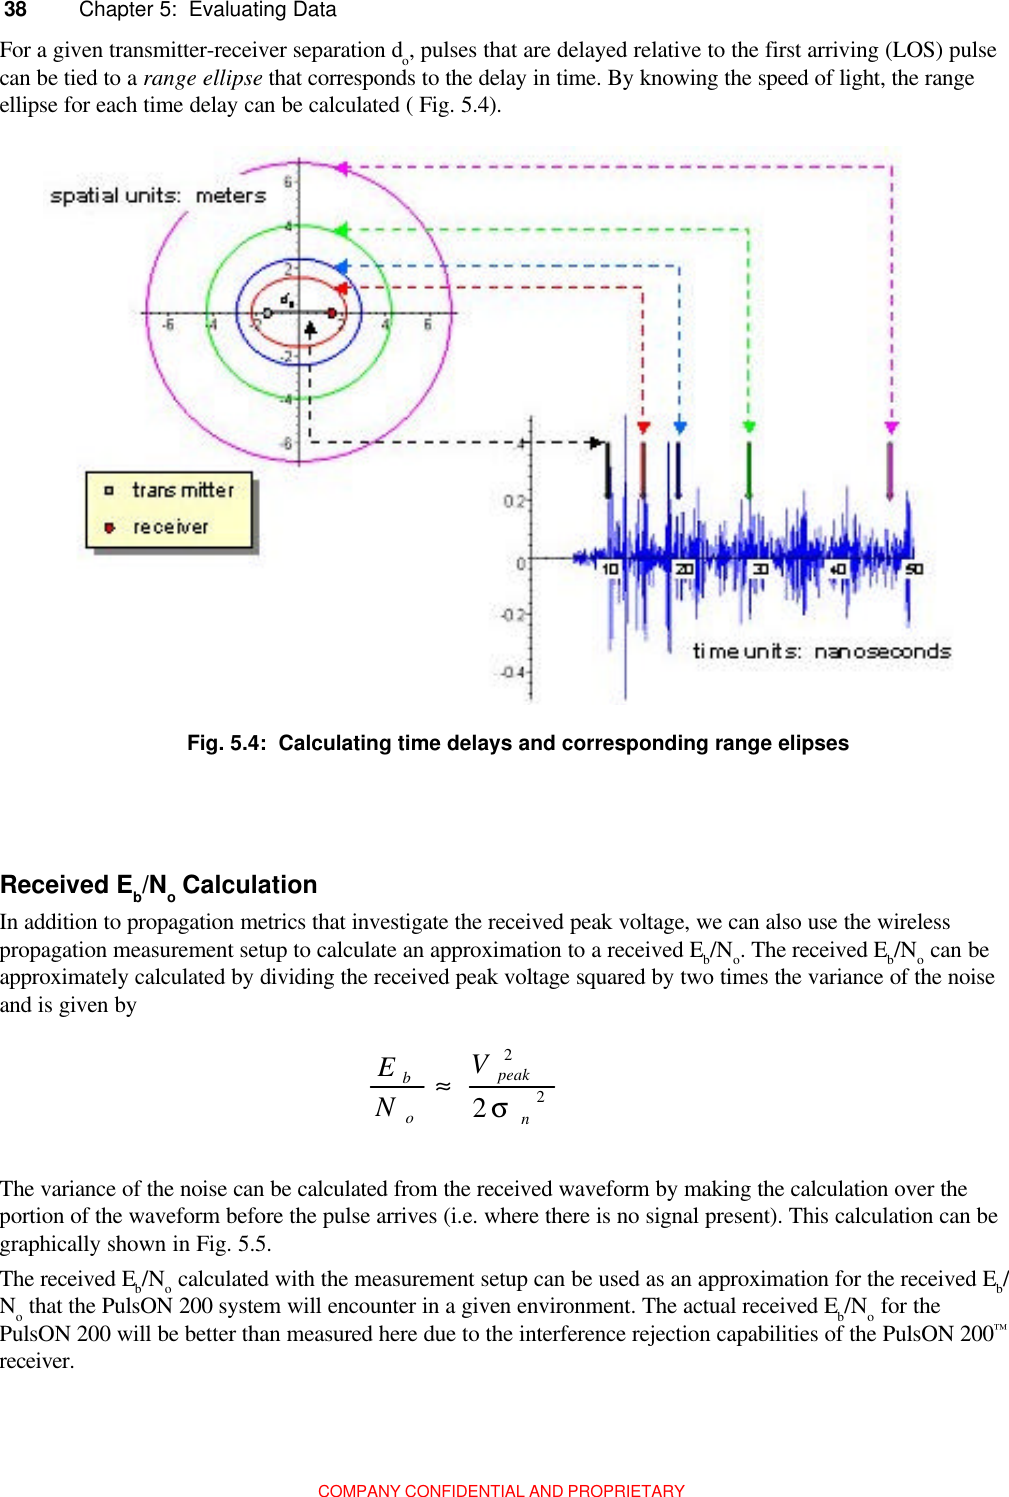
![36 Chapter 5: Evaluating DataCOMPANY CONFIDENTIAL AND PROPRIETARYDelay Spread CalculationSince the CIR resulting from this technique has had the effects of the measurement system removed, analysis ofthe CIR can be applied to any generic UWB system. The time dispersive nature of a CIR is used as a metric tocompare the CIR of different measured channels. The mean excess delay spread, rms delay spread, and excessdelay spread are statistical multipath channel parameters that can be determined from a power delay profile,where the power delay profile (PDP) is defined as P(t)=|hchannel(t)|2 [2]. The mean excess delay spread and rmsdelay spread most commonly quantify the time dispersive properties of multipath channels. The mean excessdelay spread is the first element of the PDP and is given byThe rms delay spread is the square root of the second central element of the PDP and is given bywhereBoth the mean excess delay and rms delay are measured from the first detectable signal peak in the CIR. Thesecalculations are not affected by the absolute power in P(t) but only the relative amplitudes of the multipathcomponents. The rms delay spread is a good measure of the multipath channel as it gives an indication of thepotential for intersymbol interference and has been shown to be correlated to indoor wireless system perfor-mance [1]. ()( )∑∑=kkkkktPttPτ( )22ττστ−= ()( )∑∑=kkkkktPttP22τThe excess delay spread of the PDP is defined as the maximum delay relative to the first arriving peak at whicha multipath component is within a set power threshold of the strongest arriving multipath peak. According tothe equations above, each sample point with non-zero power is included in the rms delay spread calculation andrepresents a received signal component. This artificially extends the delay spread and causes errors in thecalculated channel parameters [3].To eliminate noise contributions from affecting these calculated spreads, a threshold is incorporated in thecomputation of the mean and rms delay spreads. Implementing this method, only the points of peak powerabove the threshold level are included in the computations. The statistical metrics defined can be graphicallyshown for an example CIR taken at a 30 feet LOS distance down a hallway (Fig. 5.2).Fig. 5.2: Calculation of mean, excess and rms delay spreads](https://usermanual.wiki/Humatics/200SGT-0702/User-Guide-259558-Page-36.png)
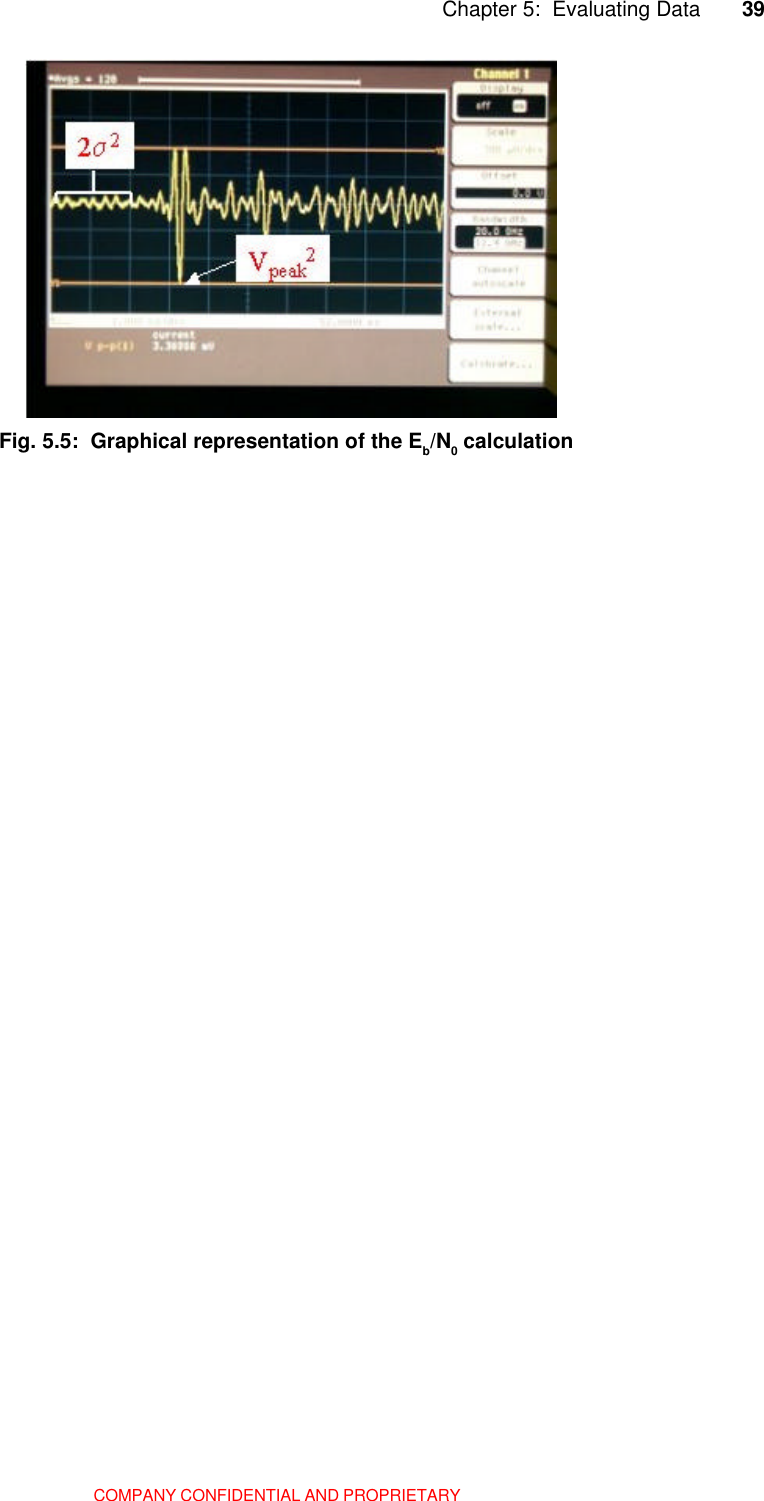
![37 Chapter 5: Evaluating DataCOMPANY CONFIDENTIAL AND PROPRIETARY[1] H. Hashemi. “The Indoor Radio Propagation Channel,” Proceedings of the IEEE, Vol. 18, pp.943-968, July1993.[2] T.S. Rappaport. Wireless Communications: Principles and Practices. Prentice Hall, 1996.[3] W.G. Newhall. Wideband Propagation Measurement Results, Simulation Models, and Process Techniquesfor a Sliding Correlator Measurement System. Master’s Thesis, Virginia Polytechnic Institute and University,1997.In addition to the calculations presented above to quantitatively evaluate the propagation channel, we can alsoqualitatively investigate a received waveform by correlating the received multipath pulses in the waveform toactual propagation paths in the physical environment. For example, if the transmitter and receiver are set up at10 feet separation in close proximity to a wall, then the waveform at the receiver will be comprised of 2 distinctpulses that are separated in time based on the difference in path lengths that each pulse took in traveling fromthe transmitter to the receiver. ( Fig. 5.3)This phenomenon can be seen in the received waveform for the measurement taken at 1 foot for the wirelesspropagation setup. Note that the received waveform consists of the LOS pulse as well as an additional pulsethat is attenuated and delayed in time. The delayed, attenuated pulse has traveled from the transmitter, beenreflected off of the DSO, and then received at the antenna. Because the path length for this pulse is longer thanthat of the LOS pulse, it is delayed in time.In Fig. 5.2, the starred peaks represent the points that are used to calculate the mean excess and rms delayspreads. Note that while several of the peaks actually span more than 2 ns (and therefore contain more than onesample point), each peak is weighted only by the single point of highest power. By doing so, each peak in thecalculations is weighted equally. From the figure, it is seen that the calculation of the PDP statistics are ex-tremely dependent on the chosen threshold as it determines the points from h(t) that are included in the calcula-tionsPropagation Channel Ray TracingFig. 5.3: Example of received waveform differences from multipathThe term “ray tracing” is commonly used for this type of analysis that investigates the multiple paths (i.e.multipath) by which a signal takes to arrive at a receiver. Because the PulsON 200® UWB system has ex-tremely fine time resolution, ray tracing analysis can be used to correlate time-delayed pulses in the receivedwaveform directly to spatial placement of physical objects in a given environment.](https://usermanual.wiki/Humatics/200SGT-0702/User-Guide-259558-Page-37.png)


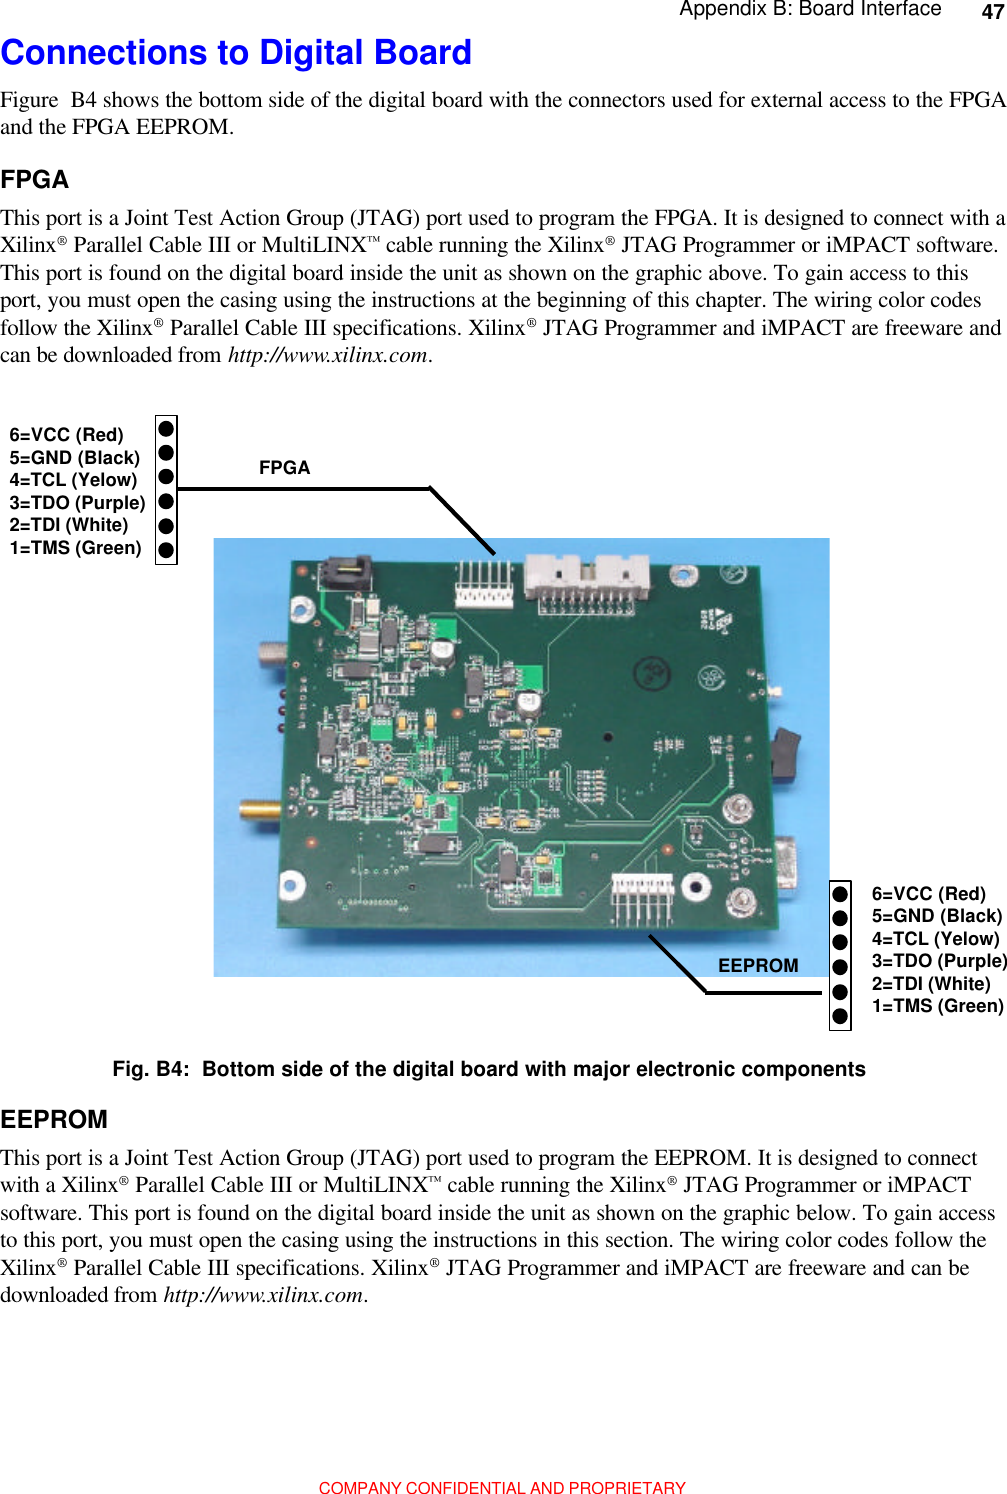
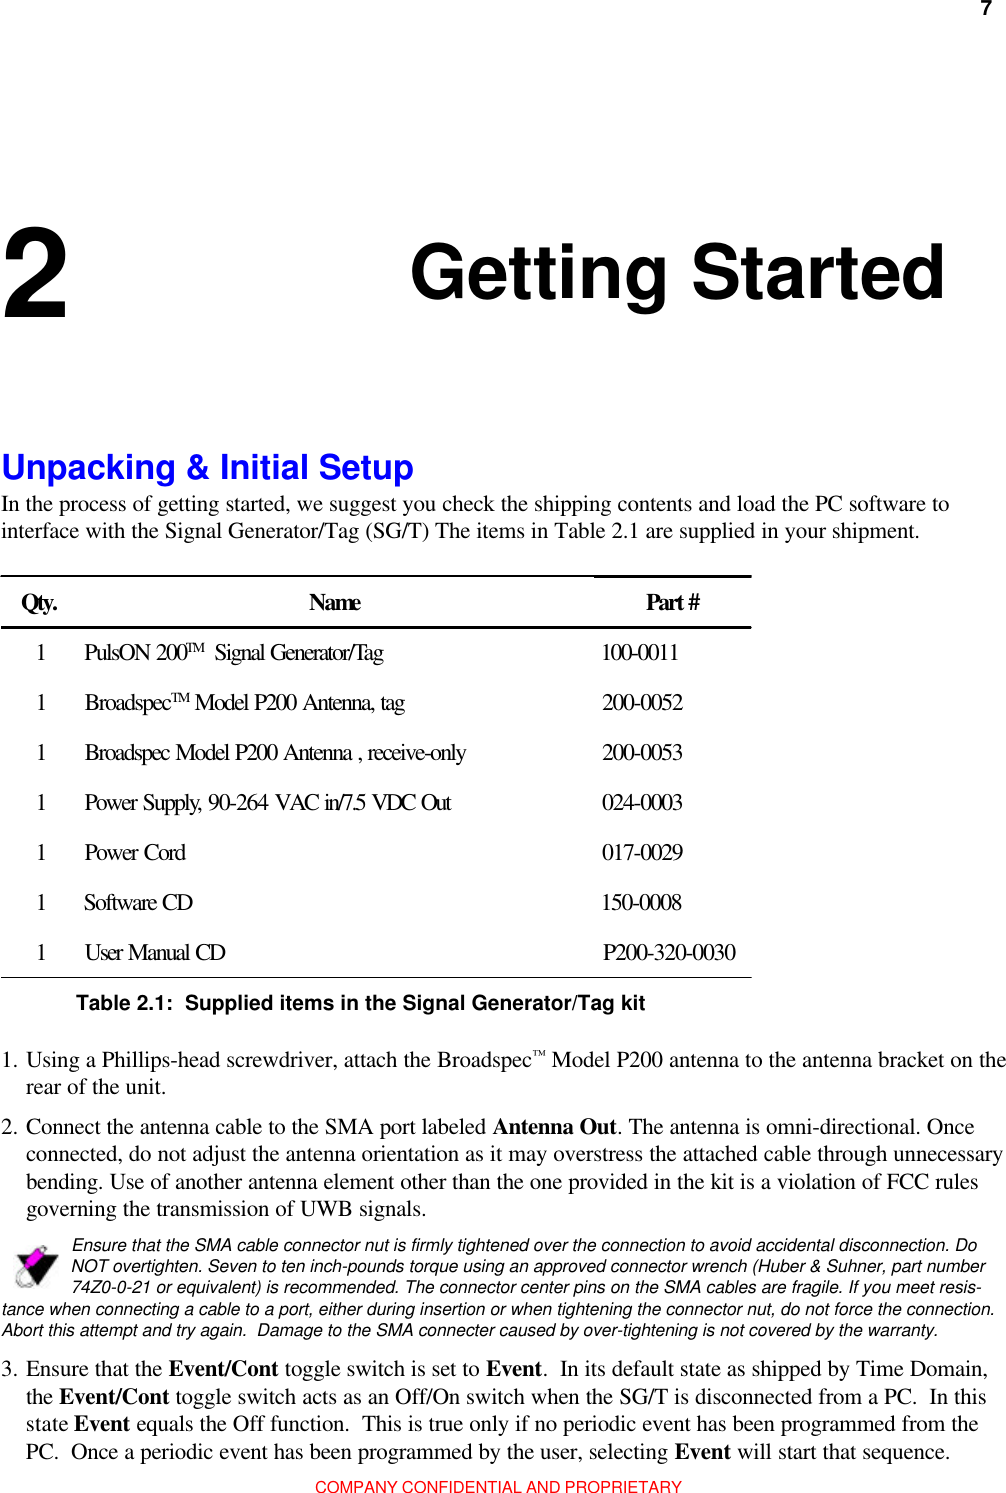
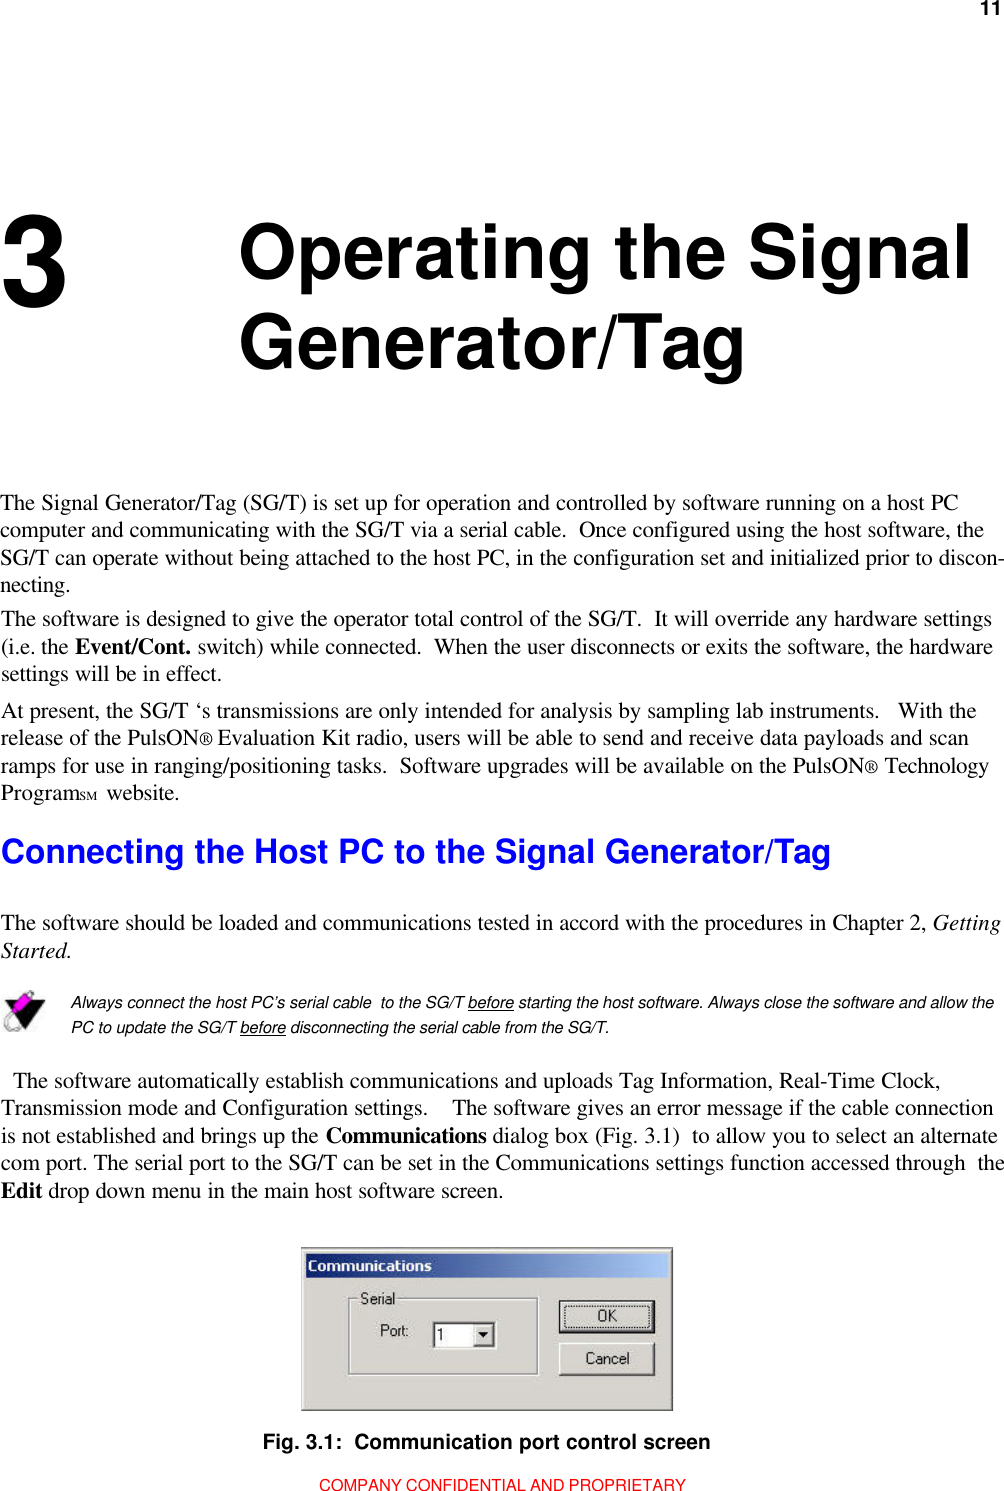
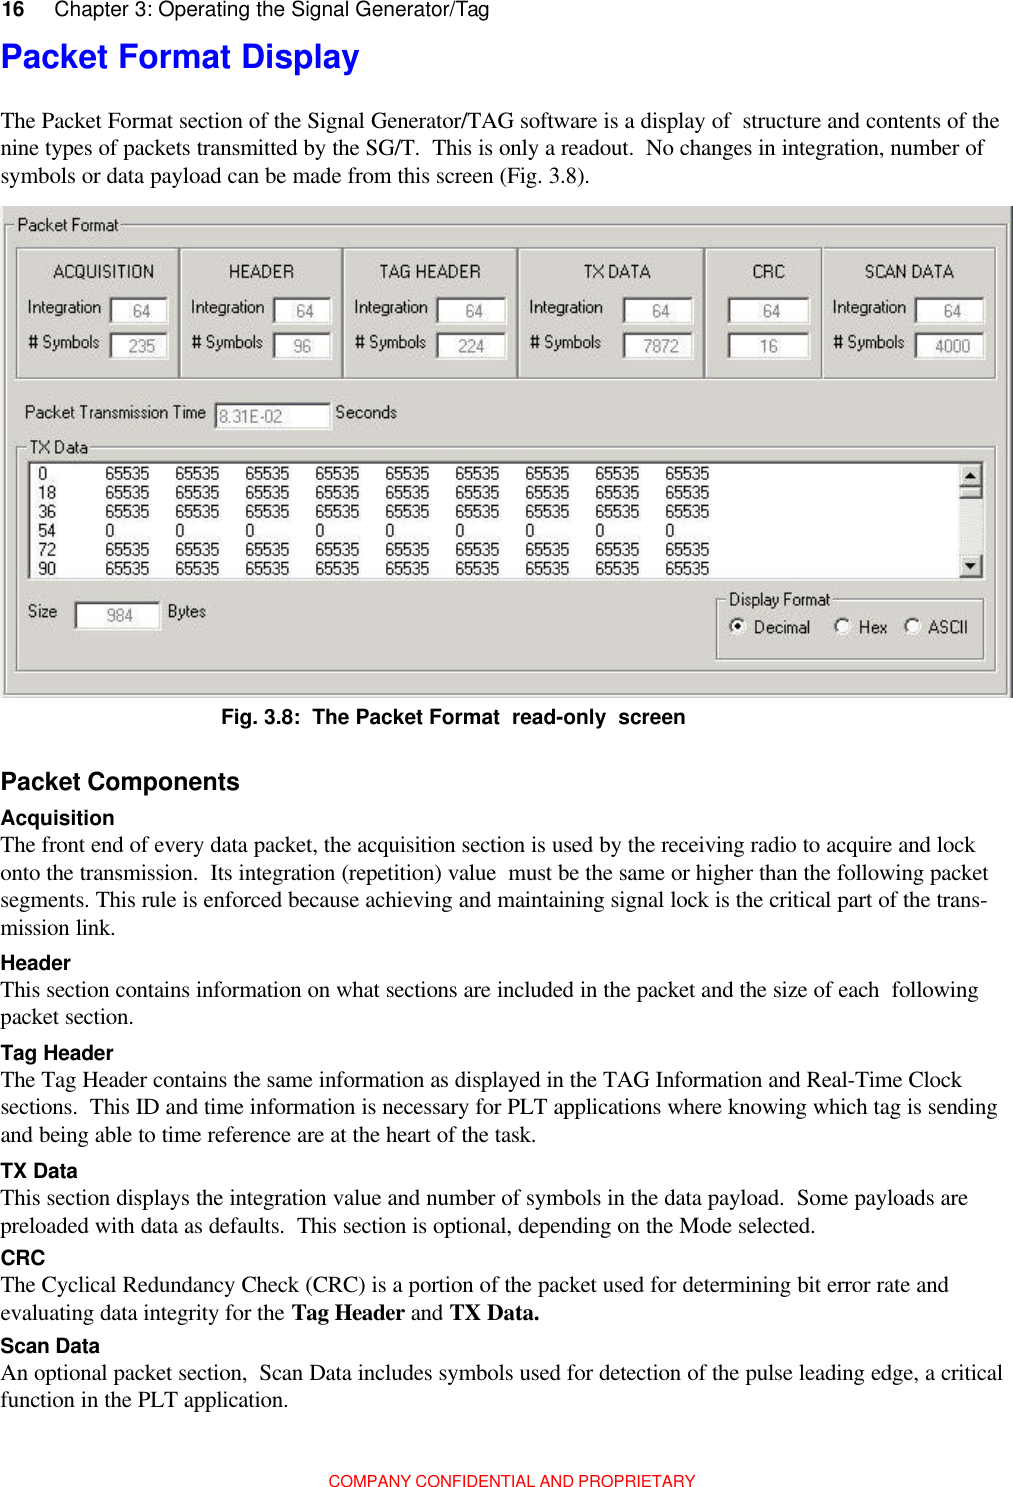
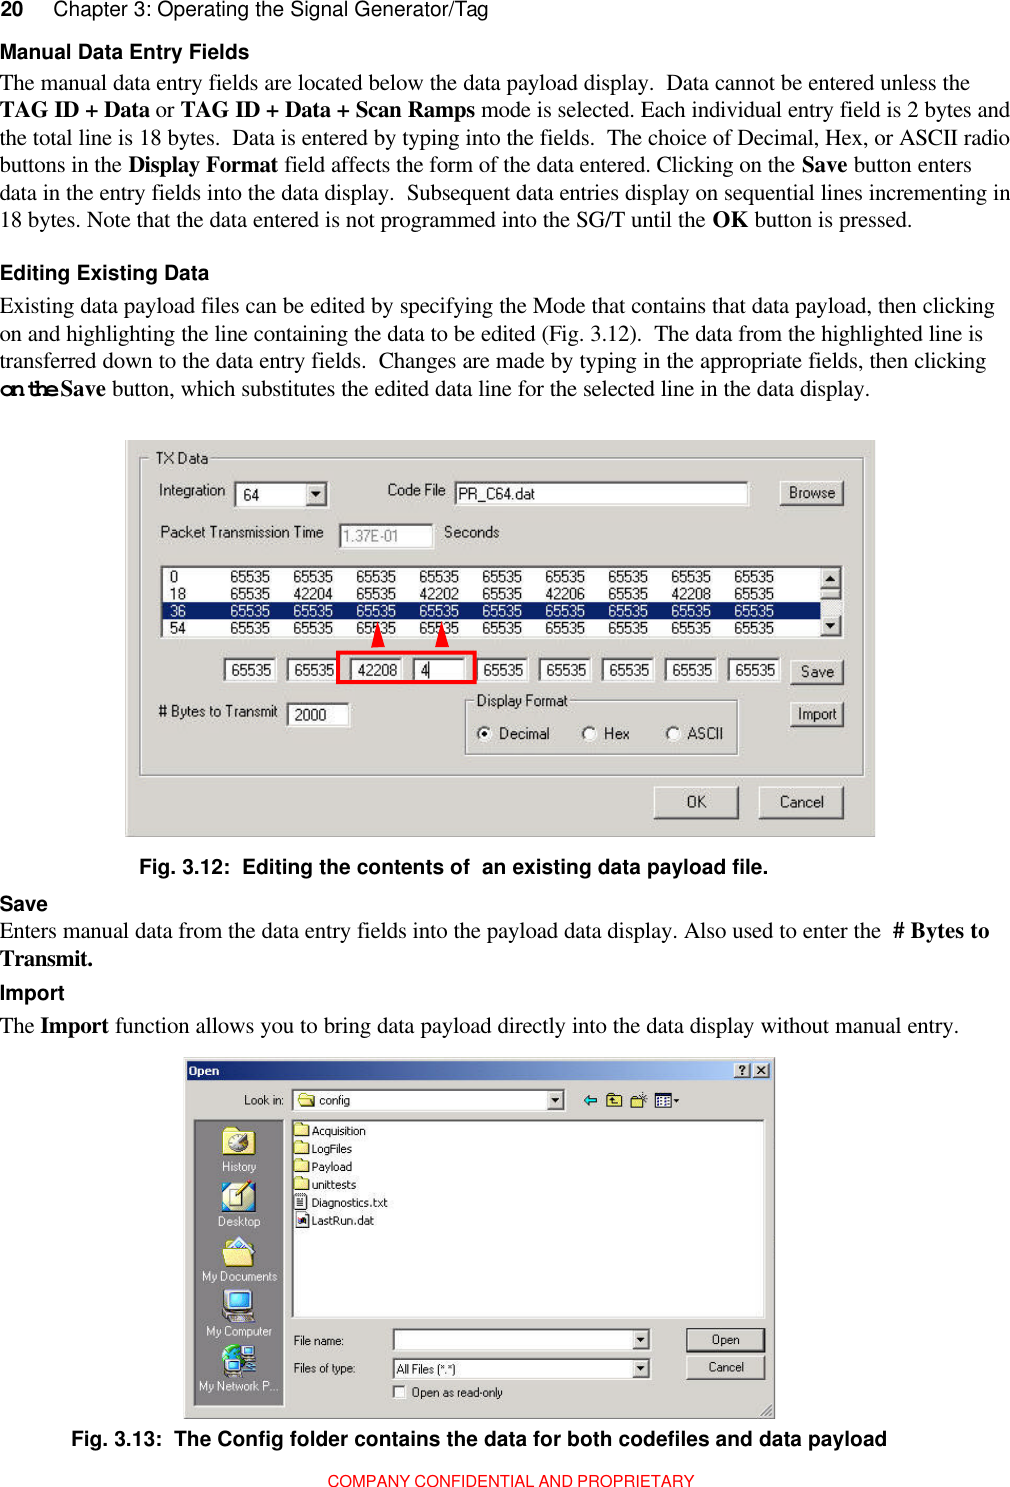
![48 Appendix B: Board InterfaceCOMPANY CONFIDENTIAL AND PROPRIETARYSignal Name Connector Pin DescriptionAntenna J1 50-ohm coaxial SMA - Antenna I/OV_Supply CN1 -1,2,3,4 Supply voltage to RF Board, +7 VDC nom.Ground CN1 - 5,6,7,8,9,10 Reference for Vsupply, return path for Vsupply current12, 13, 14, 16, 17,18, 21, 22, 23, 24Serial _Clk+ 3.3.VCN1 - 25CN1 - 26Pins 25-30 are dedicated to an EEPROM to carry identification andcalibration data. The chip is intended to exist in electrical isolation from otherRF circuitry, hence the dedicated +3.3Vcc and Ground returns.Serial _ DI CN1 - 27PROM_GND CN1 - 28Serial_DO CN1 - 29RF_PROM_CS CN1 - 30Pulse _Trigger_+Pulse_Trigger_-CN1 - 19CN1 _ 20Timer chip +3.3V referenced 900 mVpp differential lines with 150-ohm OddMode Impedance. Plus exceeding Minus will fire Impulse Generator in~5ns.Pulse_Polarity CN1 - 15 3.3V CMOS logic from Timer chip which determines + or - version ofoutput impulse.Pulser_Enable CN1 - 11 A positive 3.3V CMOS logic state will power enable the Impulse Generatorcircuit.TR_ RX_Select CN1 - 7 A positive 3.3V CMOS logic state will connect the ANTENNA to theImpulse Generator.The RF module has two broadband coaxial interfaces and a 30-pin Samtec connector. The coaxial connectionJ1 to the exterior antenna is an end-launch reverse-polarity bulkhead SMA [Johnson Components 142-4701-801]. The RF module receives its power supply and signaling through CN1, a 30-pin male Samtec connector[TFM-115-32-S-D-A] having a 0.050 inch pitch on a 2x15 grid (Table B1).For reliable operation, it is necessary that the antenna cable SMA connectors be properly torqued to between 7and 10 inch-ounces at the RF module input and that the RF module be fully seated onto the 30-pin connectorand the MMBX connector piro to securing the RF module to the digital board.Interface DefinitionsTable B1: RF Board interface connectors with pin-outs for CN1 interface with the digital boardRF BoardThe RF board is similar, except for the Bill of Materials, to the RF board on the PulsON 200™ Evaluation Kit. The followingdescription was extracted from the PulsON 200™ Evaluation Kit Hardware Manual and refers to the RF module in the Evaluation Kit.The RF board creates UWB transmit pulses centered on 3.7 GHz (Rev.B, Rev. C) and passes them to anexterior antenna. It sits on top of the digital board and connects to the digital board via the RF module interfaceconnector.](https://usermanual.wiki/Humatics/200SGT-0702/User-Guide-259558-Page-48.png)