IceRobotics ICEQUBE MOTION SENSOR User Manual CowAlert User Guide FCCx
IceRobotics Limited MOTION SENSOR CowAlert User Guide FCCx
Contents
- 1. USER MAUAL 1
- 2. USER MANUAL 2
USER MAUAL 1
© IceRobotics Ltd 2012 Page 1 V0.15 EN(UK)Nov 2012
User Guide
V.14 – Oct 2012 English (UK)
Information and Support Enquiries:
Email: support@cowalert.com
Tel: +44 131 541 2010

© IceRobotics Ltd 2012 Page 2 V0.15 EN(UK)Nov 2012
Contents
1
Introduction ....................................................................................................................................4
1.1
The origins of the IceQube and the CowAlert System............................................................4
1.2
Minimum System Requirements to view CowAlert................................................................5
2
Getting connected to CowAlert ......................................................................................................6
3
CowAlert Home Page ......................................................................................................................8
3.1
Navigation Bar Details (User profile and language selection) ................................................8
3.2
Navigation Bar Details.............................................................................................................9
3.3
Search for Cow or IceQube Numbers ...................................................................................10
4
Behaviour Graphs & Summary Information .................................................................................11
4.1
Behaviour graph: Hours view................................................................................................11
4.2
Behaviour Graph: Multi-day view.........................................................................................12
4.3
Behaviour Tables...................................................................................................................13
4.4
IceScore Mobility ..................................................................................................................14
4.5
Interpreting the graphs.........................................................................................................15
5
Heat Alerts ....................................................................................................................................16
5.1
Viewing recent heat alerts and their associated behaviour graphs .....................................16
5.2
Viewing all Heat alerts ..........................................................................................................17
5.3
Receiving Heat Alerts by email .............................................................................................17
6
Lying Behaviour.............................................................................................................................18
6.1
Lying behaviour for the individual cow.................................................................................18
6.2
Lying behaviour for the group or herd..................................................................................20
6.3
Lying behaviour graphs for an individual cow ......................................................................21
7
Managing Cows and IceQubes......................................................................................................22
7.1
Getting started – creating the initial association between Cows and IceQubes..................22
7.2
Generating a list of Cow numbers ........................................................................................22
7.3
Generating a list of IceQubes................................................................................................24
7.4
Attaching an IceQube to a Cow within CowAlert .................................................................25
7.5
Adding new cows to CowAlert..............................................................................................26
7.6
Detaching an IceQube from a cow number..........................................................................27
7.7
Deleting a Cow and its record from CowAlert ......................................................................28
8
Reports..........................................................................................................................................28
8.1
Lying Time .............................................................................................................................28
8.2
IceScore Mobility ..................................................................................................................30
© IceRobotics Ltd 2012 Page 3 V0.15 EN(UK)Nov 2012
8.3
IceScore Mobility Historic Performance ...............................................................................31
8.4
IceQube Population ..............................................................................................................31
9
Site Information ............................................................................................................................32
9.1
User Settings ............................................................................................................................32
10
Help and Support .....................................................................................................................33
11
Feedback..................................................................................................................................33
12
Attaching an IceQube to a cow’s leg........................................................................................34
13
Removing an IceQube from a cow’s leg...................................................................................35

© IceRobotics Ltd 2012 Page 4 V0.15 EN(UK)Nov 2012
1 Introduction
1.1 The origins of the IceQube and the CowAlert System
IceRobotics has been supplying animal science institutions worldwide with specialist behaviour
monitoring solutions since 2005. Its IceTag and IceQube sensors are used by leading livestock
researchers in over 20 countries to enable research into health, welfare and behaviour, principally in
dairy cattle. Research based on these sensors appears in highly regarded journals such as the Journal
of Dairy Science and the Journal of Applied Animal Behaviour Science. Recent published papers have
covered diverse themes including oestrus expression, lameness patterns, different bedding types,
hoof trimming methods and feed intake.
The IceQube was developed in 2008 from the proven IceTag platform to provide a sensor that is
suitable both for large-scale research and commercial farm applications. It was launched in 2010
after extensive field-trialling across many herds and sites. The IceTag and IceQube are designed to
be fully compatible with each other to ensure that ongoing research insights can be extended into
practical applications in commercial farming.
Both sensors use a 3-axis accelerometer, capturing precise data on the cow’s movements several
times per second, providing highly detailed activity and behaviour information. The CowAlert system
was developed to provide advanced management and analysis capability for the data generated by
the IceQube.
The system’s internet connectivity allows large amounts of data to be securely stored and
extensively analysed. Users can keep information over several generations of animals if they wish
and complex mathematical analysis and calculations can be performed which would not be possible
on older-generation stand-alone systems. Information from different sites can be compared or
combined and users can access the system from any location with an internet connection.
Information can therefore be shared remotely with third parties such as vets or feed advisors if
desired.
The IceQube’s excellent heat detection performance has been verified through a series of scientific
trials involving progesterone testing. With the IceTag established as the market leading choice of
dairy animal scientists, the award winning IceQube and CowAlert system is now being selected by
the most progressive dairy farmers.
CowAlert and IceQube are Registered Trade Marks of IceR
obotics Ltd

© IceRobotics Ltd 2012 Page 5 V0.15 EN(UK)Nov 2012
1.2 Minimum System Requirements to view CowAlert
Using your unique User ID and password you can access CowAlert from anywhere there is a reliable
internet connection and a modern web browser, whether that is the farm office or from the other
side of the world. There is no software to be installed and all updates are automated so the most
recent version will always be available. Accessing CowAlert through an internet broadband
connection is preferred as this provides good speed and reliability.
CowAlert can therefore be viewed on any internet-enabled device such as a PC, Mac, laptop or
tablet PC. It is suggested that equipment with a reasonable sized screen is used to ensure full benefit
from the advanced graphing capability.
Recommended web browsers include:
• Firefox version 4
• Google Chrome (this updates itself so the latest version should always be installed)
• Internet Explorer 8
• Safari for mobile devices
© IceRobotics Ltd 2012 Page 6 V0.15 EN(UK)Nov 2012
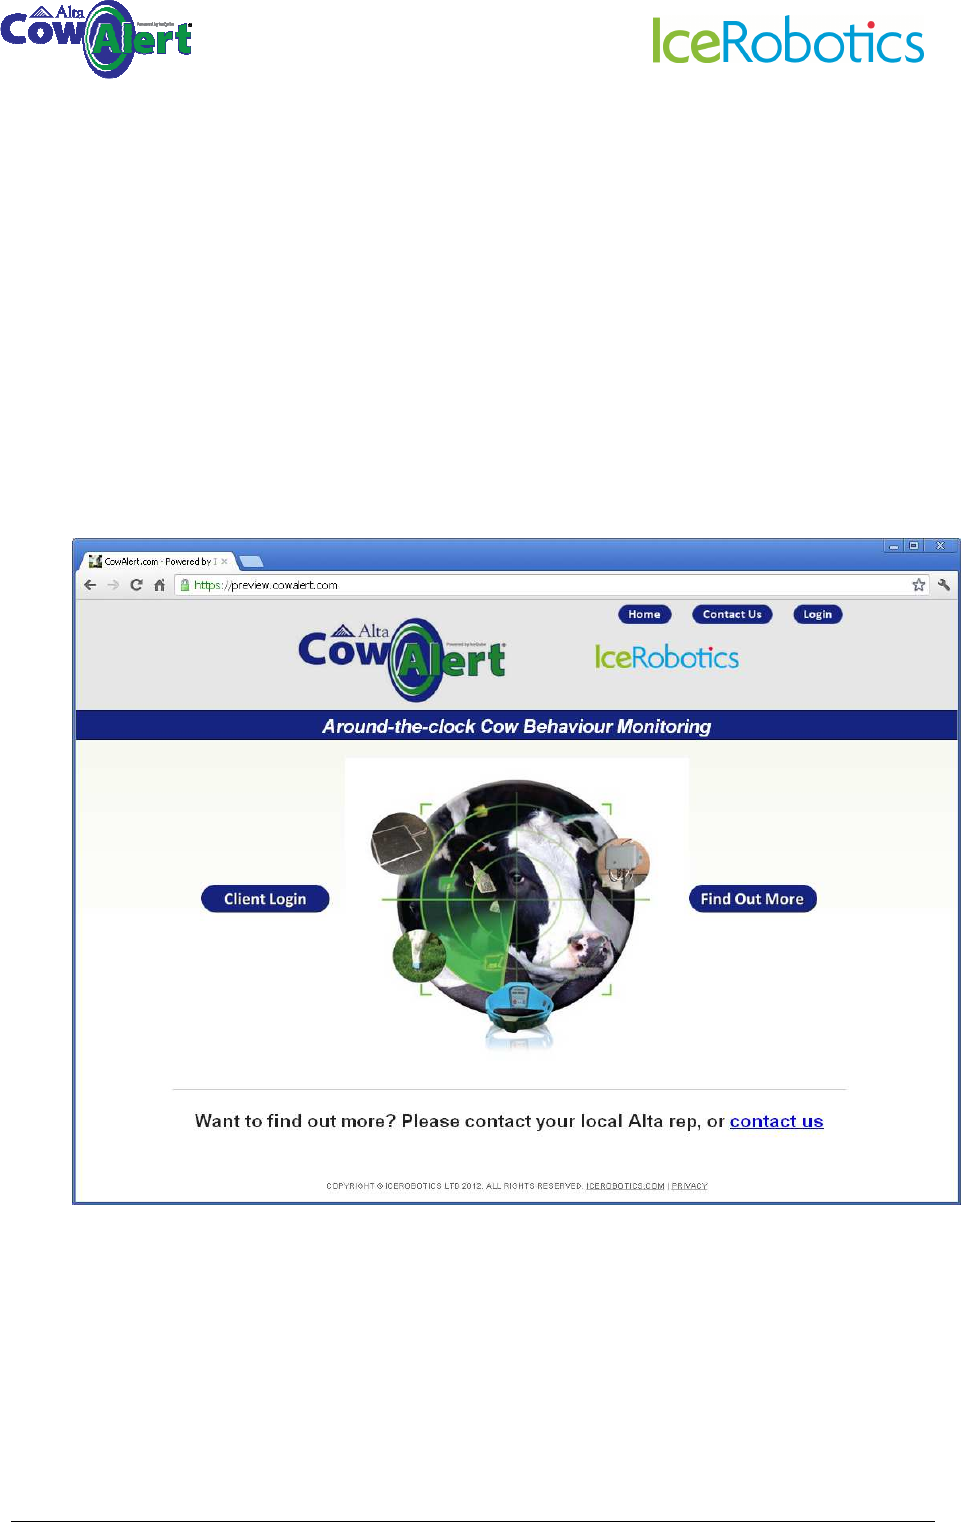
2 Getting connected to CowAlert
1. You should have a modern internet browser (such as Google Chrome, Firefox 4, Internet
Explorer 8 or Safari) installed on your PC or equivalent.
2. Ensure that you are connected to the internet
3. Open your internet browser
4. In the address bar, type this address and then press enter
www.cowalert.com
5. You should now see this login screen:
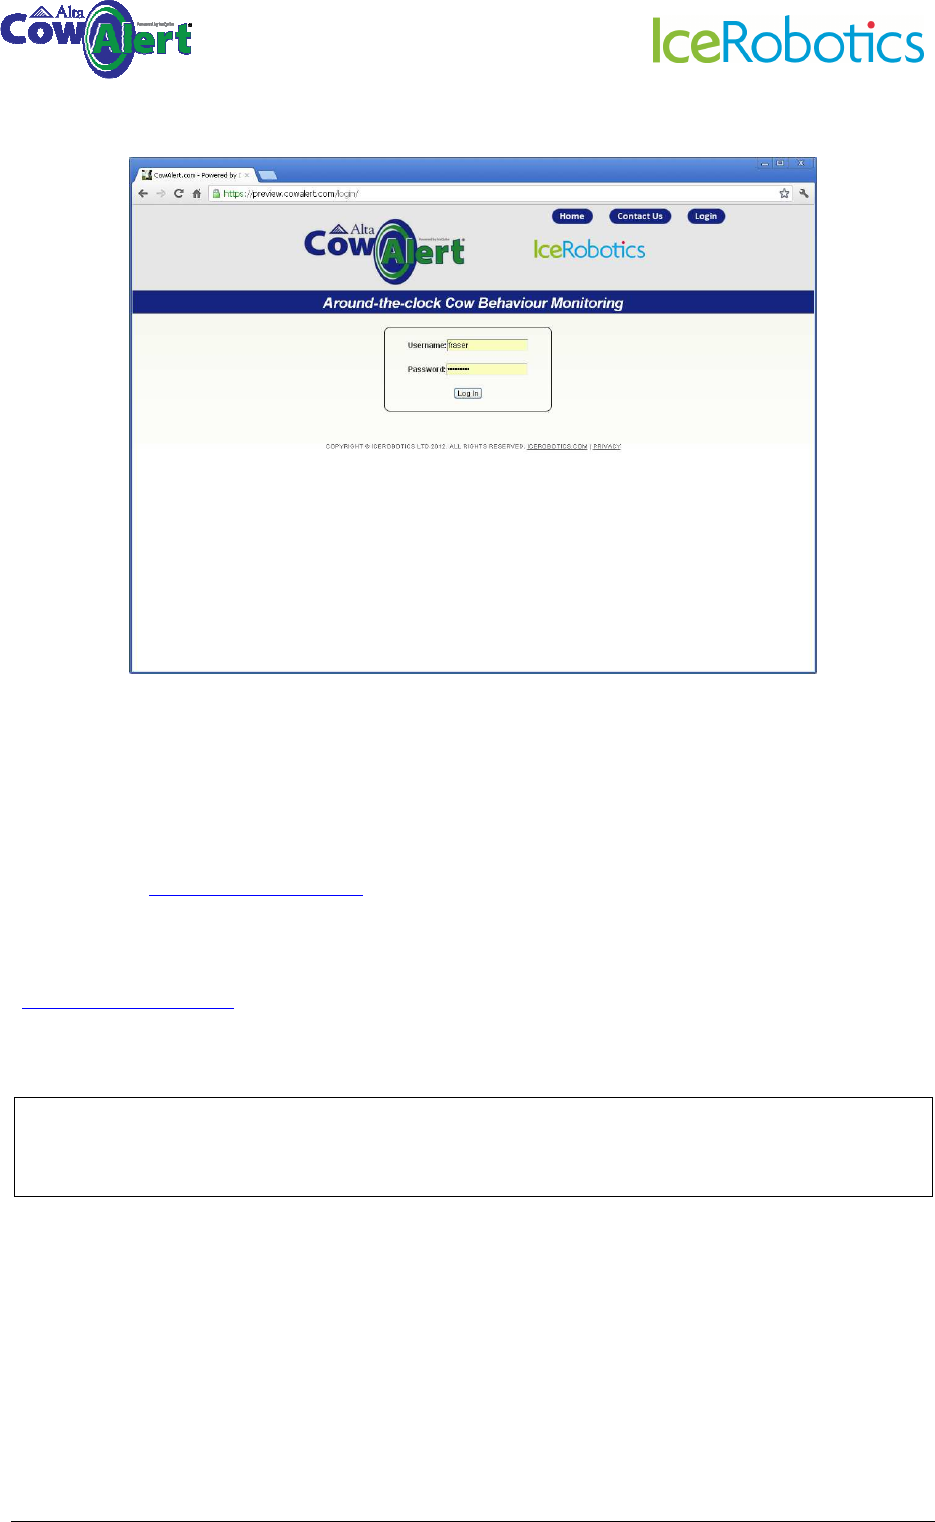
© IceRobotics Ltd 2012 Page 7 V0.15 EN(UK)Nov 2012
6. Click on Client login which will take you to the login page.
7. Enter your username and password and press Enter – this will take you to the Home Page of
the CowAlert system for your farm.
Your username and password are unique to you. Please do not share these details with others as
they will then be able to make changes that may affect your data and therefore the effective
functioning of the system. If however, you would like to authorise someone else to have access,
please email support@cowalert.com and a separate username and password can be issued for
each additional user.
If you forget your password or believe that it is no longer secure, please email
support@cowalert.com and a replacement will be issued.
TIP: Bookmark your CowAlert page, or set it up as your Home Page on your browser, so you can
access it quickly in the future
© IceRobotics Ltd 2012 Page 8 V0.15 EN(UK)Nov 2012
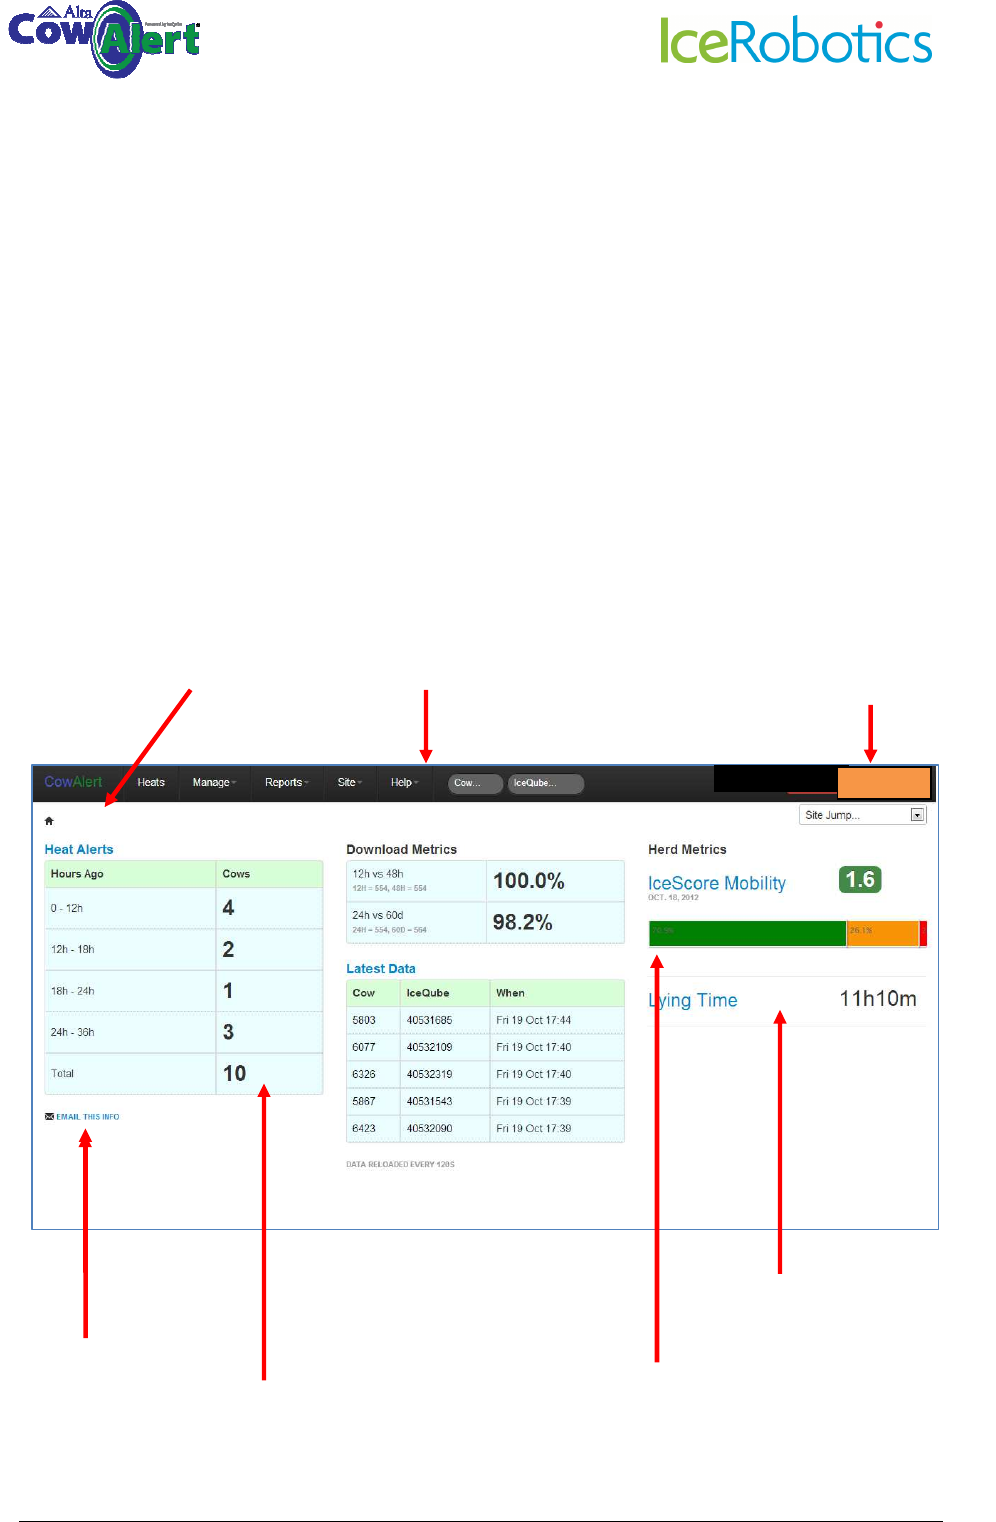
3 CowAlert Home Page
The Home Page allows you to access the different functions of the system – it is like a Table of
Contents to direct you to where you want to go in the system.
The functions are:
• Animal activity graphs
• Heat alerts
• Health alerts if you have subscribed to receive them
• Average herd lying times
• IceQube management functions
The illustration below provides an overview of the CowAlert front page.
3.1 Navigation Bar Details (User profile and language selection)
Navigation bar allows you to
access different features of
CowAlert
The number of cows
in
heat. Click on any
number takes you
directly to the detail
for that cow
(see section 4)
Average lying time of
the herd over 24 hours
The middle section shows
the download performance
and the latest downloads
and times.
Click on your farm name on any
page to come back to this front
page. It acts as a “Home” button.
Click here to logout from
the system and select your
language preference.
Users can logout from any
page.
Click this link to email
the heats summary to
someone. A pop up
window will appear
and you enter the
email address
IceScore Mobility. Average Mobility Score of the Herd,
plus indicator of the number of animals flagged as
green, amber and red. Poor mobility scores may
indicate lameness or another health problem.
measure of
a.user
The Dairy Farm
© IceRobotics Ltd 2012 Page 9 V0.15 EN(UK)Nov 2012
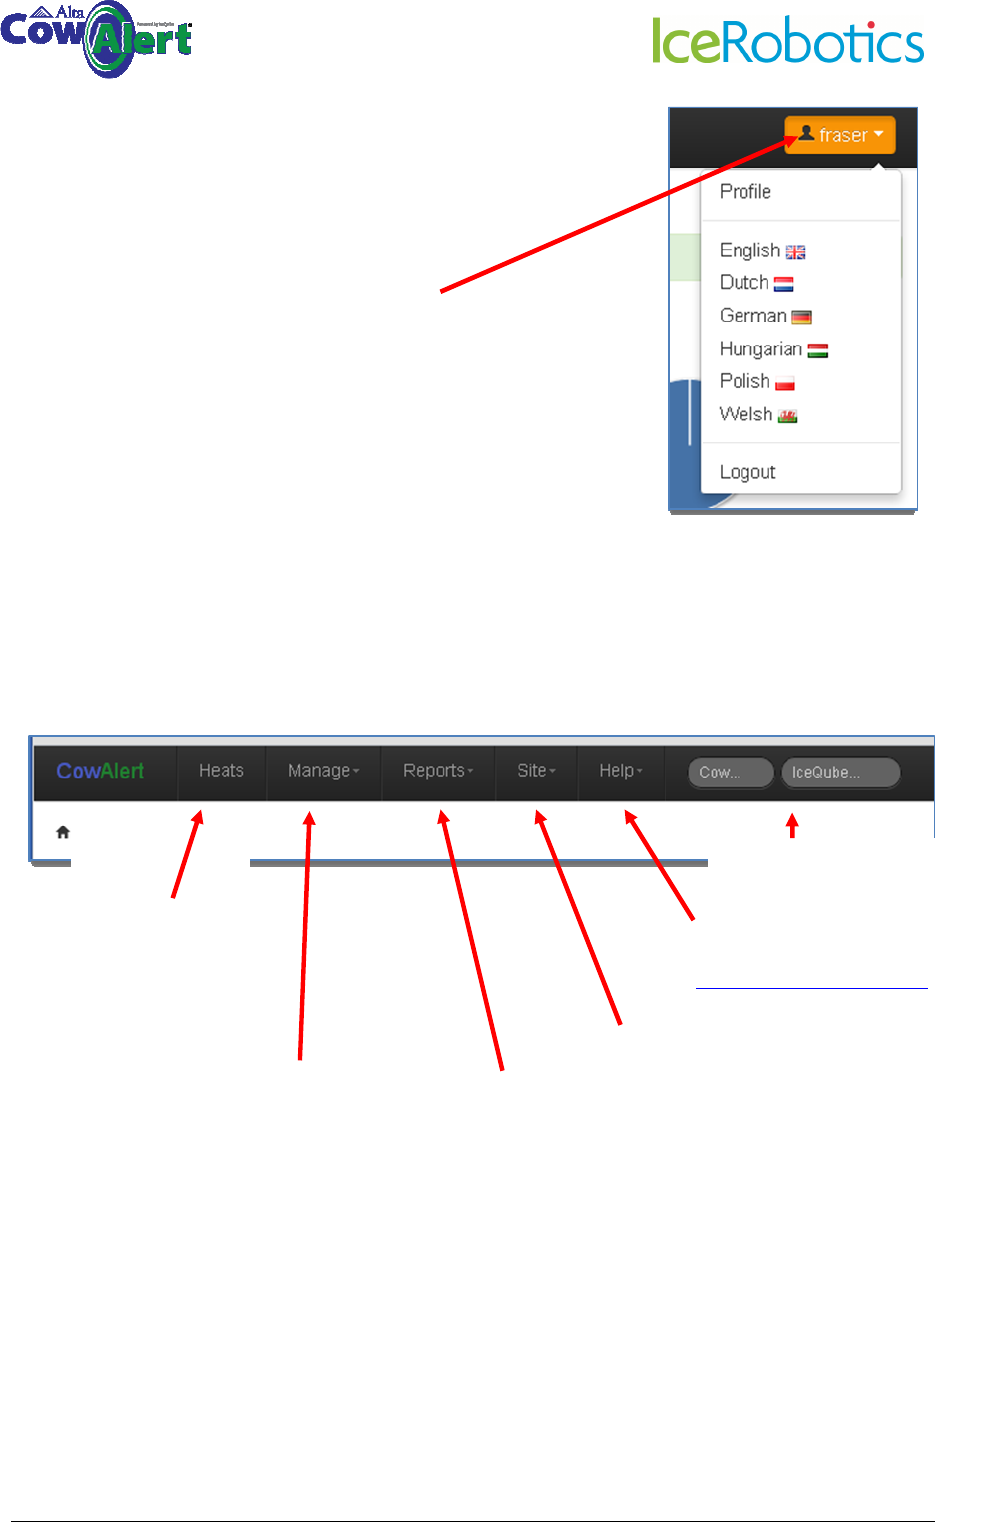
3.2 Navigation Bar Details
Separate sections will be covered in more detail below.
Click on orange button to open
up user profile options such as
language selection and to logout.
Other languages will be added as
they become available.
Heats: Accesses list of
heats
–
see section
5
Manage: Associating
cows with IceQubes,
removing attachments,
adding cows – see
section7
Help: Send an email to
support@icerobotics.com –
see section 13
Cow / IceQube: Search
directly by Cow or IceQube
number
Reports: Accesses lying time,
IceScore and IceQube reports
- see section 8
The Dairy Farm
Site: Accesses information
and settings – see section 9
© IceRobotics Ltd 2012 Page 10 V0.15 EN(UK)Nov 2012
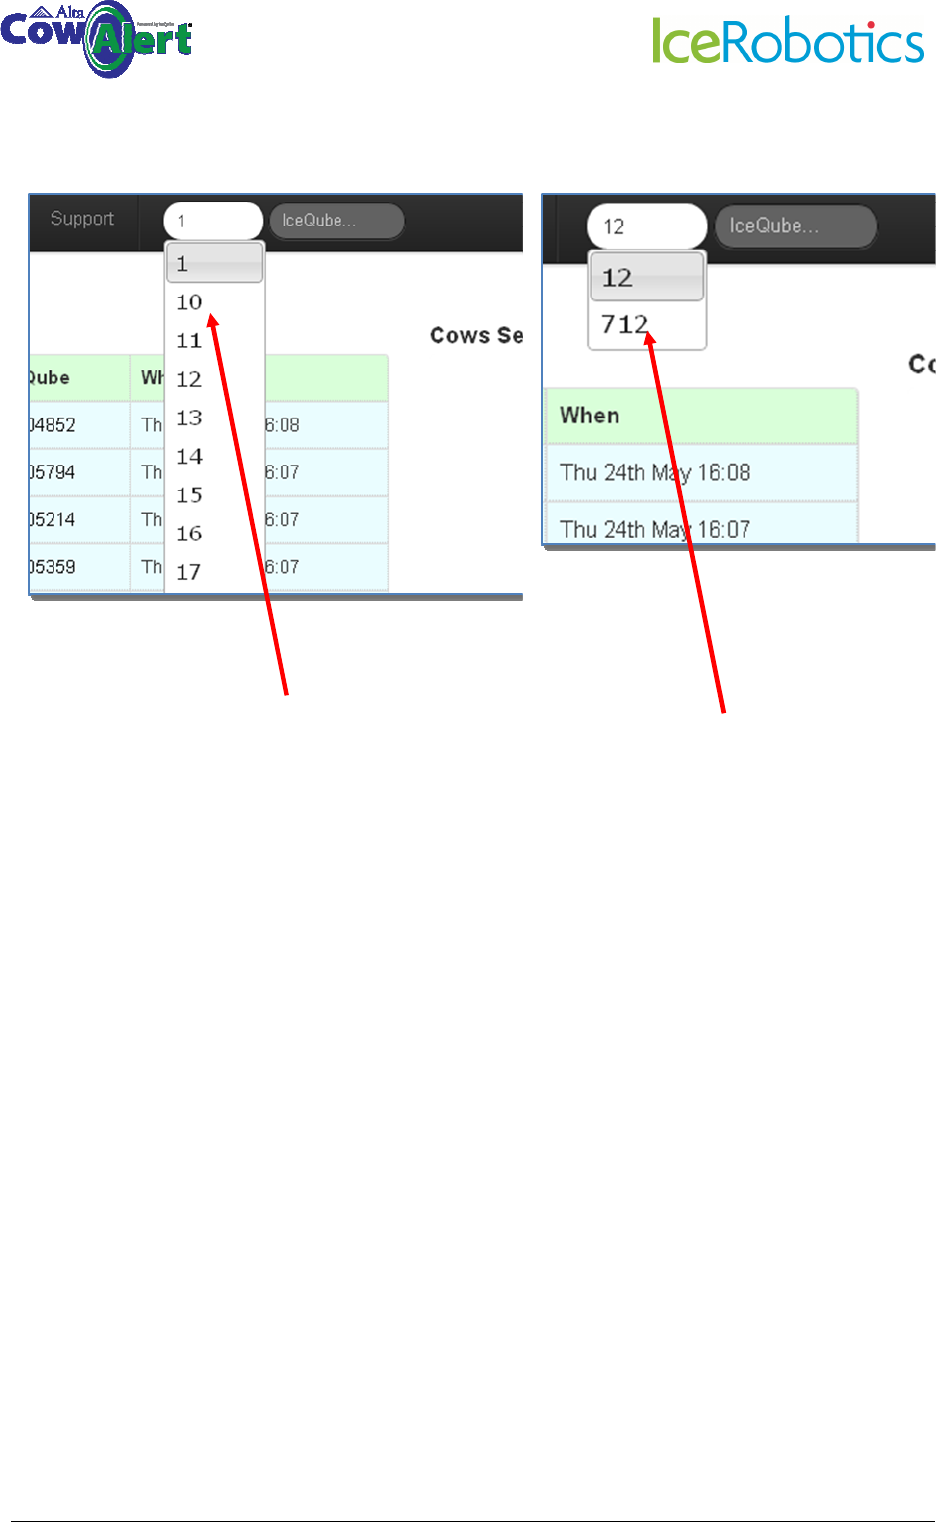
3.3 Search for Cow or IceQube Numbers
Use the same process to search for an IceQube number, using the IceQube field.
Search by Cow: Entering a
number 1 shows all cows that
have the number 1 in cow
number
Adding a second digit, in this
case a 2, searches for the
number 12 and displays all cow
numbers with this number pair.
Select the cow you wish to view
and left mouse click to select,
or enter a cow number and
<enter>
© IceRobotics Ltd 2012 Page 11 V0.15 EN(UK)Nov 2012
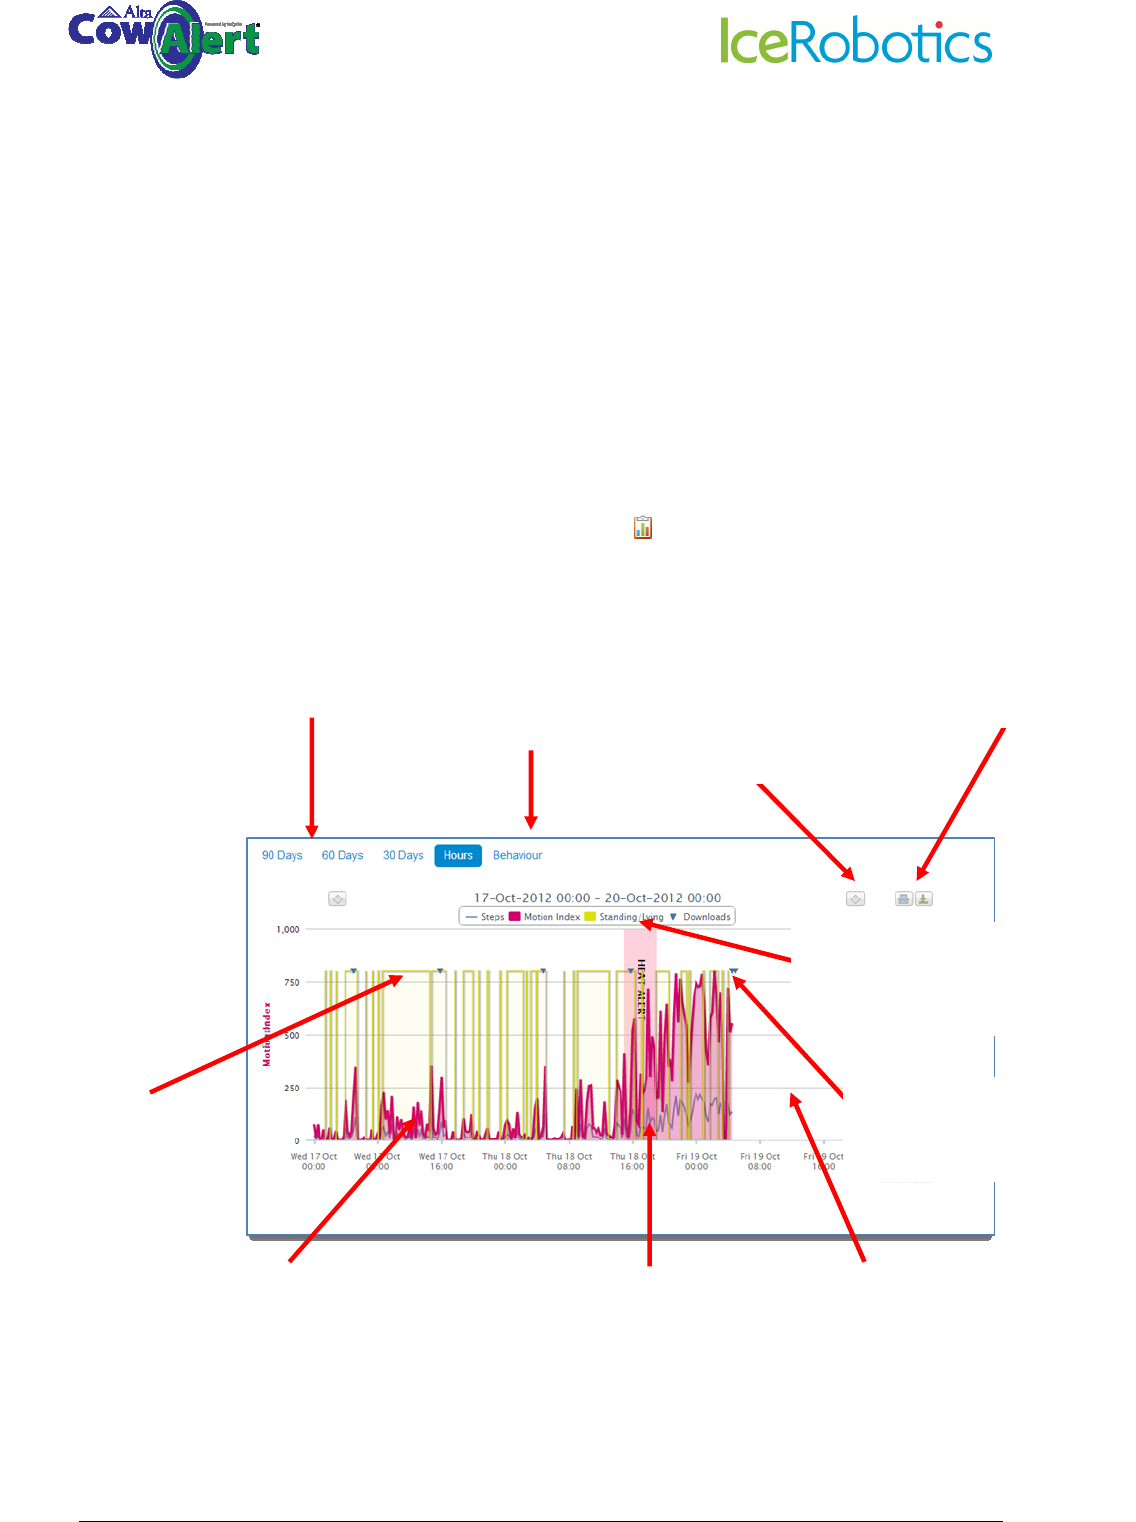
4 Behaviour Graphs & Summary Information
The behaviour graph page is divided into a graph and several tables.
4.1 Behaviour graph: Hours view
The Hours activity graph provides more detailed information on the animal’s behaviour. This view is
particularly useful when looking at heat events or suspected health anomalies.
The Hours graph can be accessed either from:
• Selecting a heat event and clicking on the chart icon (see section 5)
• Selecting the Hours tab on the main cow activity screen
Behaviour
shows detailed
behaviour information for the
cow. See more in section 8.1
Select the time period (15 hours to
90 days) to view the data for that
period
Scroll back/forward in
time
Options to print and
export the graph
Standing/lying time
is denoted by the
yellow line. Here the
cow is standing.
The pink line shows the
MotionIndex. This is a measure
of how active the animal is.
Note the raised activity level
during oestrus.
The blue line shows the Step
Count. Note that the
MotionIndex is a more accurate
measure of activity.
Clicking on any of these
headings hides/shows them on
the graph
The blue triangle shows when
the IceQube downloaded.
The Hours view is fixed width.
Data will progressively fill the
window.
© IceRobotics Ltd 2012 Page 12 V0.15 EN(UK)Nov 2012
4.2 Behaviour Graph: Multi-day view
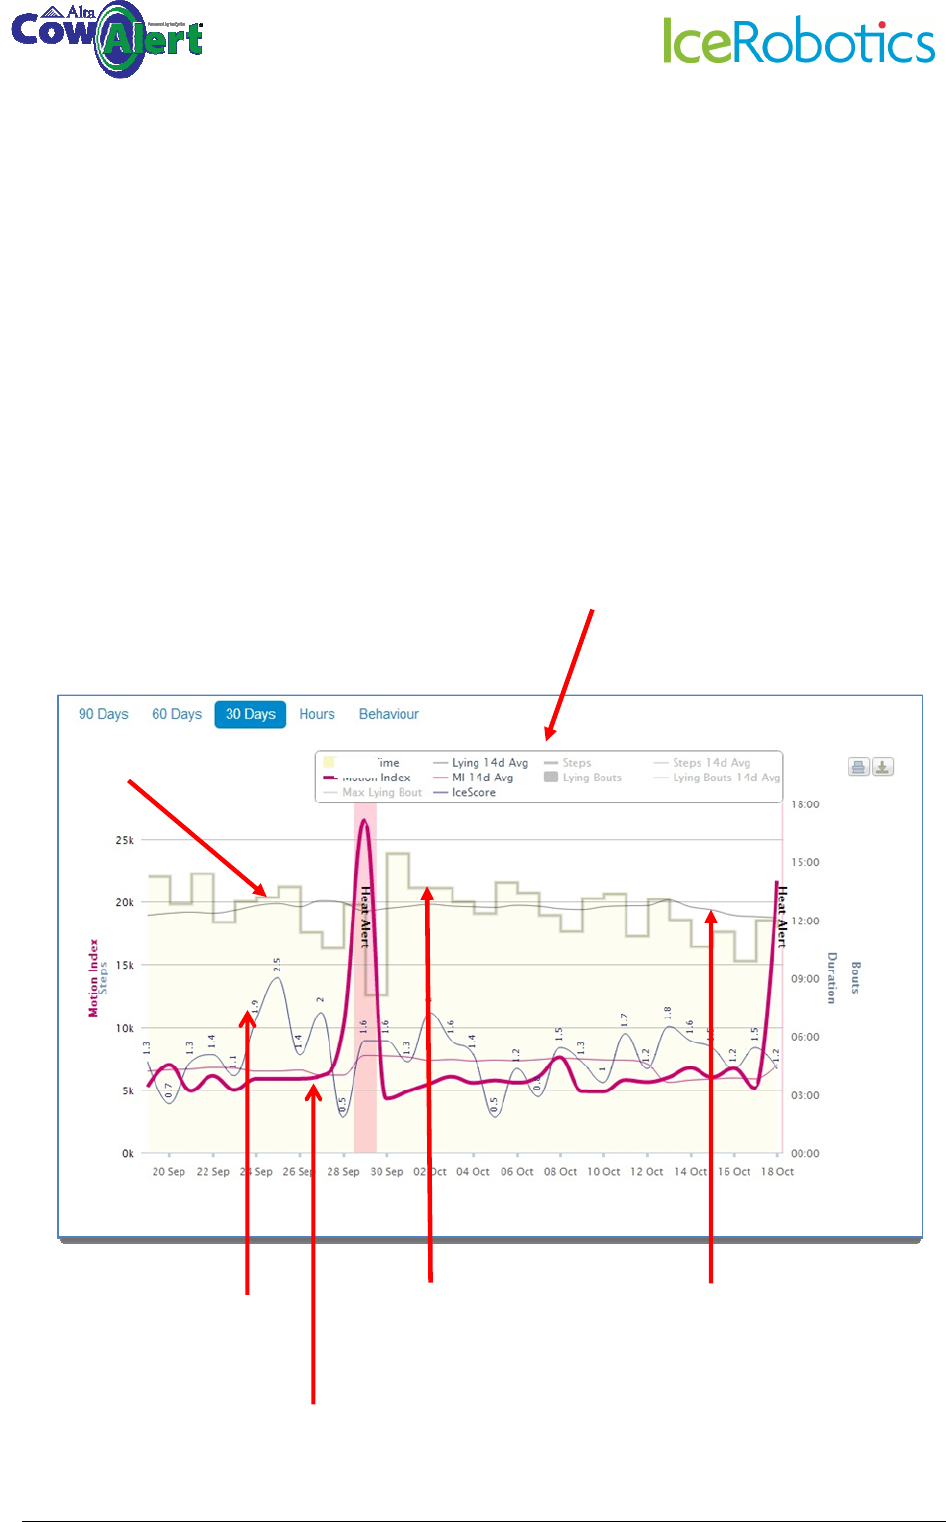
An example of a 30 day activity graph is shown below. The activity graphs include the following
information:
• MotionIndex – how active the animal has been (thick pink line)
• MotionIndex 7 day average (thin pink line)
• Lying/standing (thick grey line)
• Lying time 7 day average (thin grey line)
• Steps (thick blue line)
• Steps 7 day average (thin blue line)
• IceScore
Click on any of these headings to show or hide
that feature on the graph
Lying time (highe
r
values indicate
that the cow is
lying for longer)
MotionIndex
IceScore: Numbers above 2
denote a potential health
problem
Lying time
average. Note
that this is very
consistent for this
cow.
© IceRobotics Ltd 2012 Page 13 V0.15 EN(UK)Nov 2012
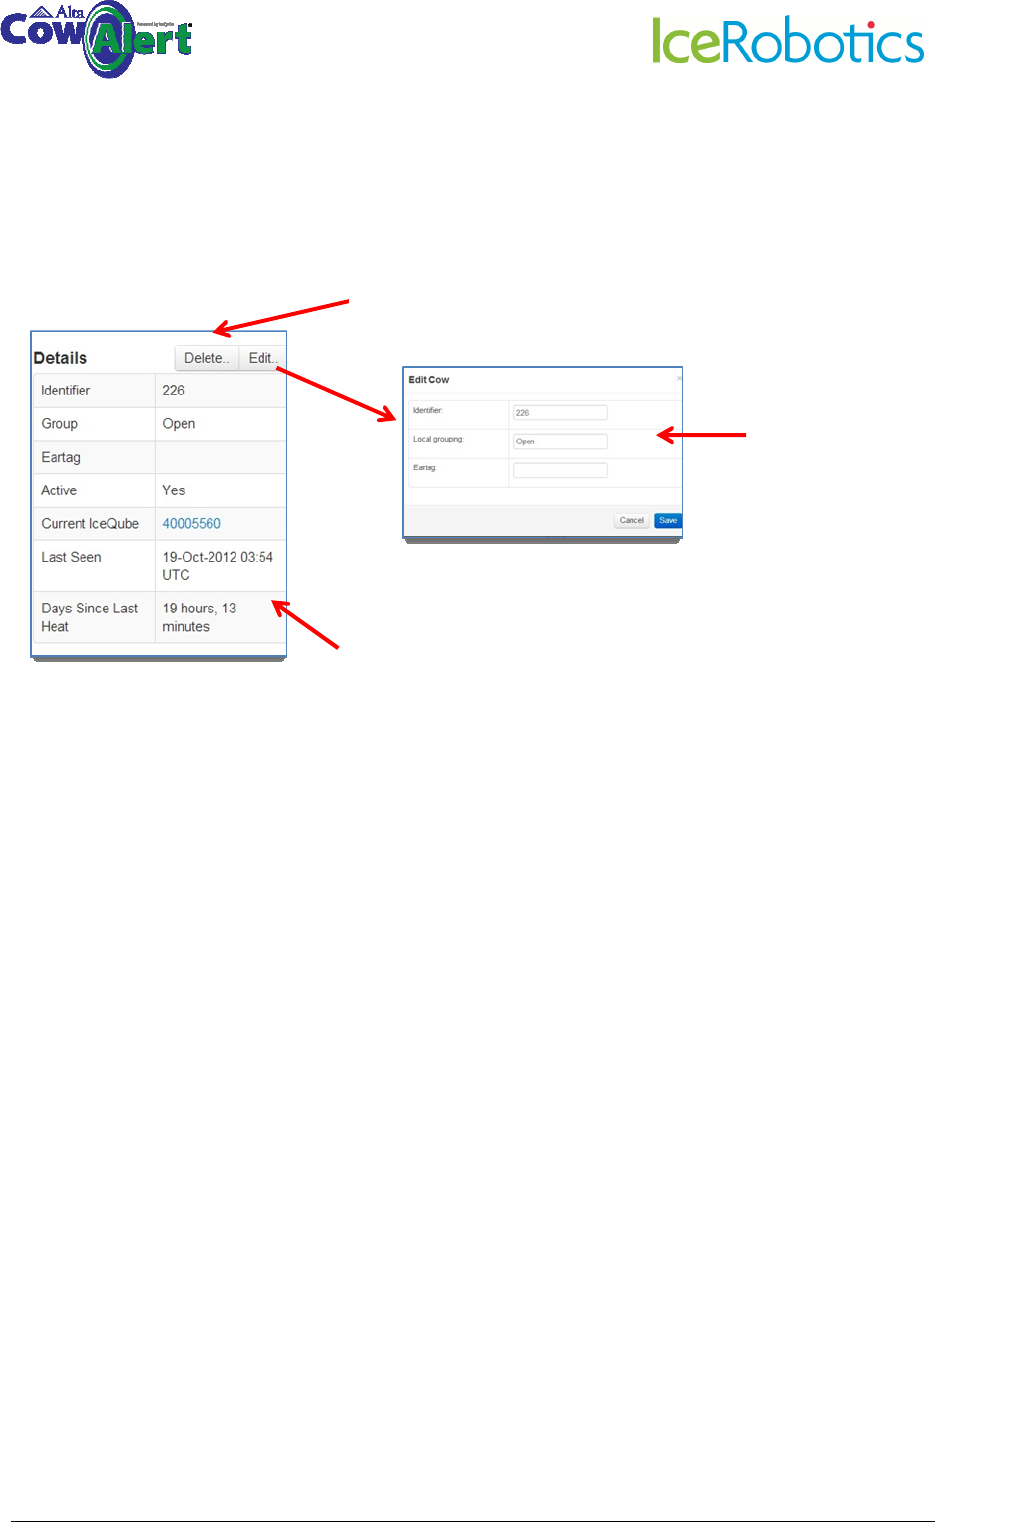
4.3 Behaviour Tables
Several tables are shown on the screen along with the behaviour graph.
The Events Table provides a list of the dates of previous Heats.
The IceQube Attachments table provides details on when IceQubes were attached and removed
from the cow, and the associated IceQube numbers.
The Summary Information Table provides summary information for the current day, the average of
the last 7 days and the average of the last 14 days
Summary information on the cow, including optional Group
allocation and Eartag number. The table shows the number
of the IceQube that is currently attached, when the
IceQube last downloaded, and when the last heat event
occurred.
Delete a cow by clicking here . Note that this will remove the
animal from the cow list along with all its data. The data can not
be recovered, so this function should be used with caution.
Click on
Edit
to edit the
Cow Number, Group or
Eartag fields. Use Cancel
to exit without saving.
© IceRobotics Ltd 2012 Page 14 V0.15 EN(UK)Nov 2012
4.4 IceScore Mobility
IceScore is an optional paid-for subscription service subject to a free trial period during its validation
phase. It provides an alert for animals that exhibit a change in mobility that is likely to be related to
some sort of health issue such as lameness or mastitis.
The example below shows an IceScore trace for a cow that was confirmed to have gone lame.
See also section 8.2 for further information on IceScore Mobility.
Dairyman reported
problem here, 2 or 3
days into the problem
IceScore identified a mobility issue
© IceRobotics Ltd 2012 Page 15 V0.15 EN(UK)Nov 2012
4.5 Interpreting the graphs
To assist in identifying unusual behaviour patterns it is useful to know the expected range of
“normal” behaviours.
Whilst this can vary between farms, the table below shows the typical ranges for Motion Index,
Step Count and Lying Time.
Behaviour Measure Indoor Grazing
Motion Index 5000-10000 10000+ (can be as high as
30000, 40000 depending on
how far cows have to walk to
pasture)
Step Count 1000-3000 (generally around
1/4 of the Motion Index)
3000-10000
Lying time 8-16 hours. Note that scientific
experts recommend that dairy
cows should lie for 12 hours per
day
1
Low herd or individual lying
times could be an indicator of
several factors including illness
or cow comfort issues.
8-16 hours (often higher
outdoors than indoors)
1
Jensen, M.B., L.J. Pedersen, and L. Munksgaard. 2005. The effect of reward duration on demand functions
for rest in dairy heifers and lying requirements as measured by demand functions. Appl. Anim. Behav. Sci.
90:207-217
© IceRobotics Ltd 2012 Page 16 V0.15 EN(UK)Nov 2012
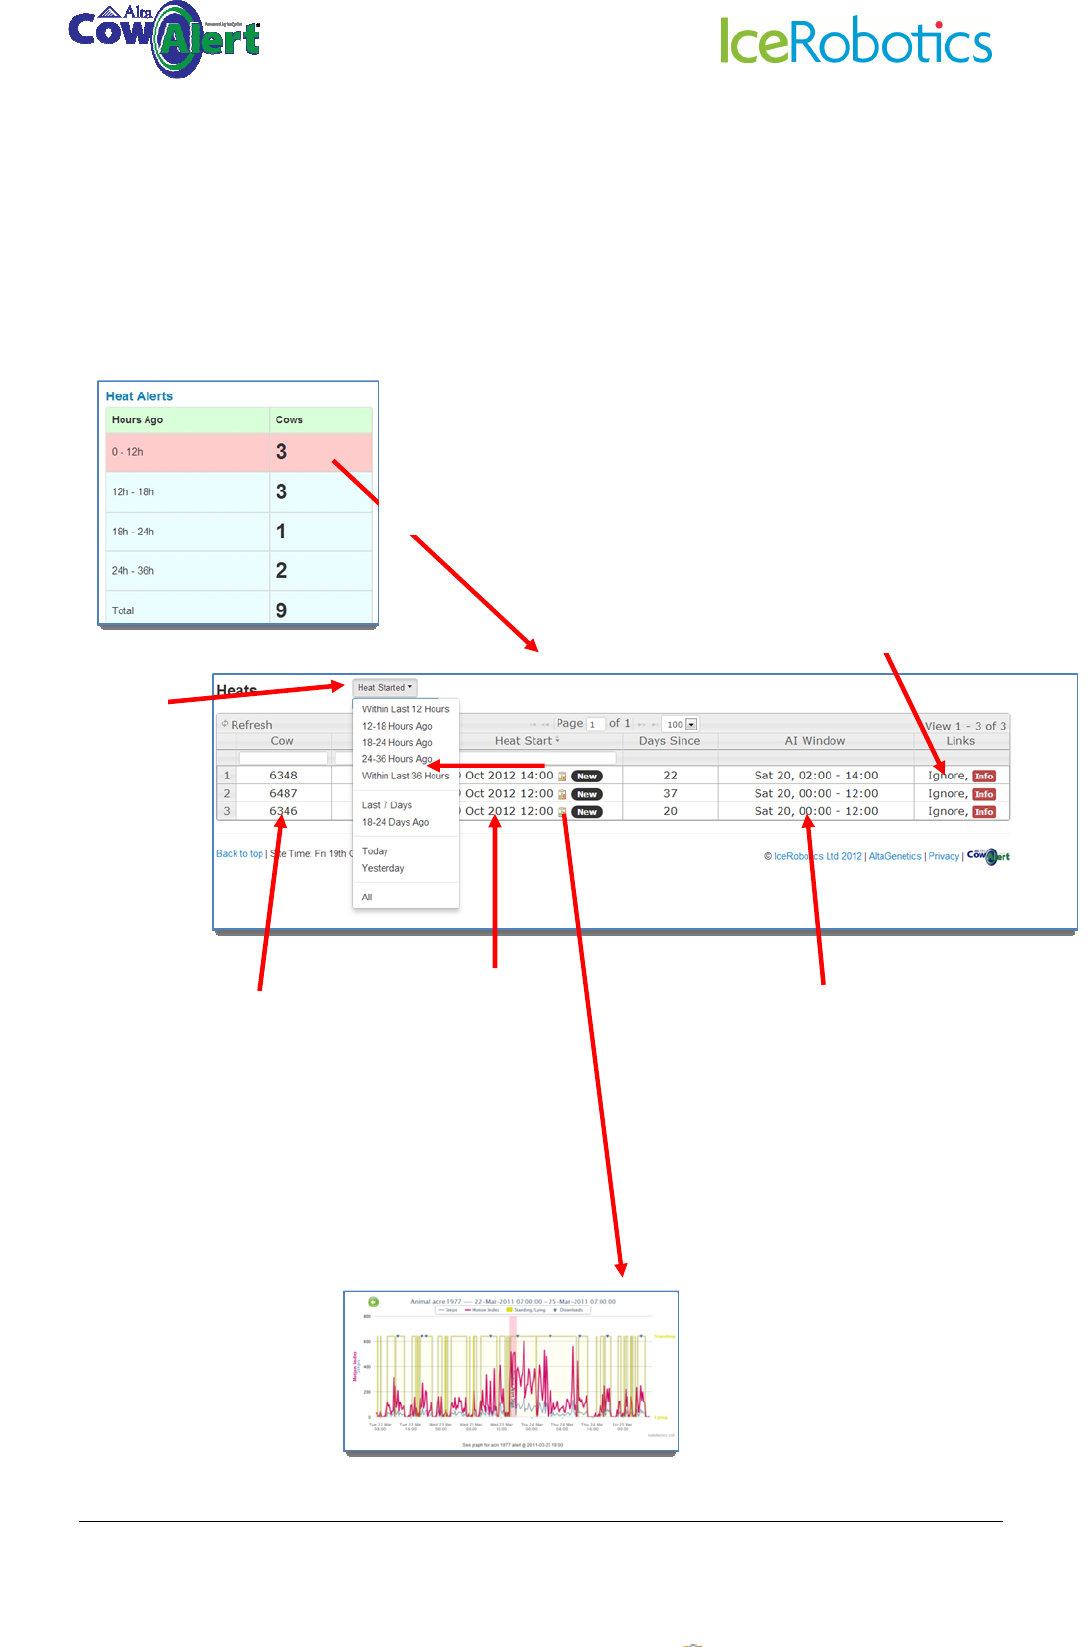
5 Heat Alerts
5.1 Viewing recent heat alerts and their associated behaviour graphs
Heat alerts are shown in the left-hand table on the farm homepage.
Clicking the chart icon opens
the Hours behaviour graph so
the user can view the activity
around the Heat
This column gives the
time the heat started.
The search box below
it also allows further
refinement. Click
column header to
order by date /time
This is the
recommended AI
window and is set by
the farm by selecting
Site from the main
menu bar, and then
Settings (see section
9.1)
Click the cow
number to show
activity graphs
for this animal
Click on any row to open the
details of the highlighted alerts
Click to open
drop-down
menu to select
different
search criteria
Use the Ignore button to cancel
the Heat alert (eg if caused by a
known event). Use the Info
button to view further details
and to reinstate an alert (eg if
Ignored by accident)
© IceRobotics Ltd 2012 Page 17 V0.15 EN(UK)Nov 2012
5.2 Viewing all Heat alerts
A list of all cows and Heat alerts can be accessed by selecting Heats from the top menu bar.
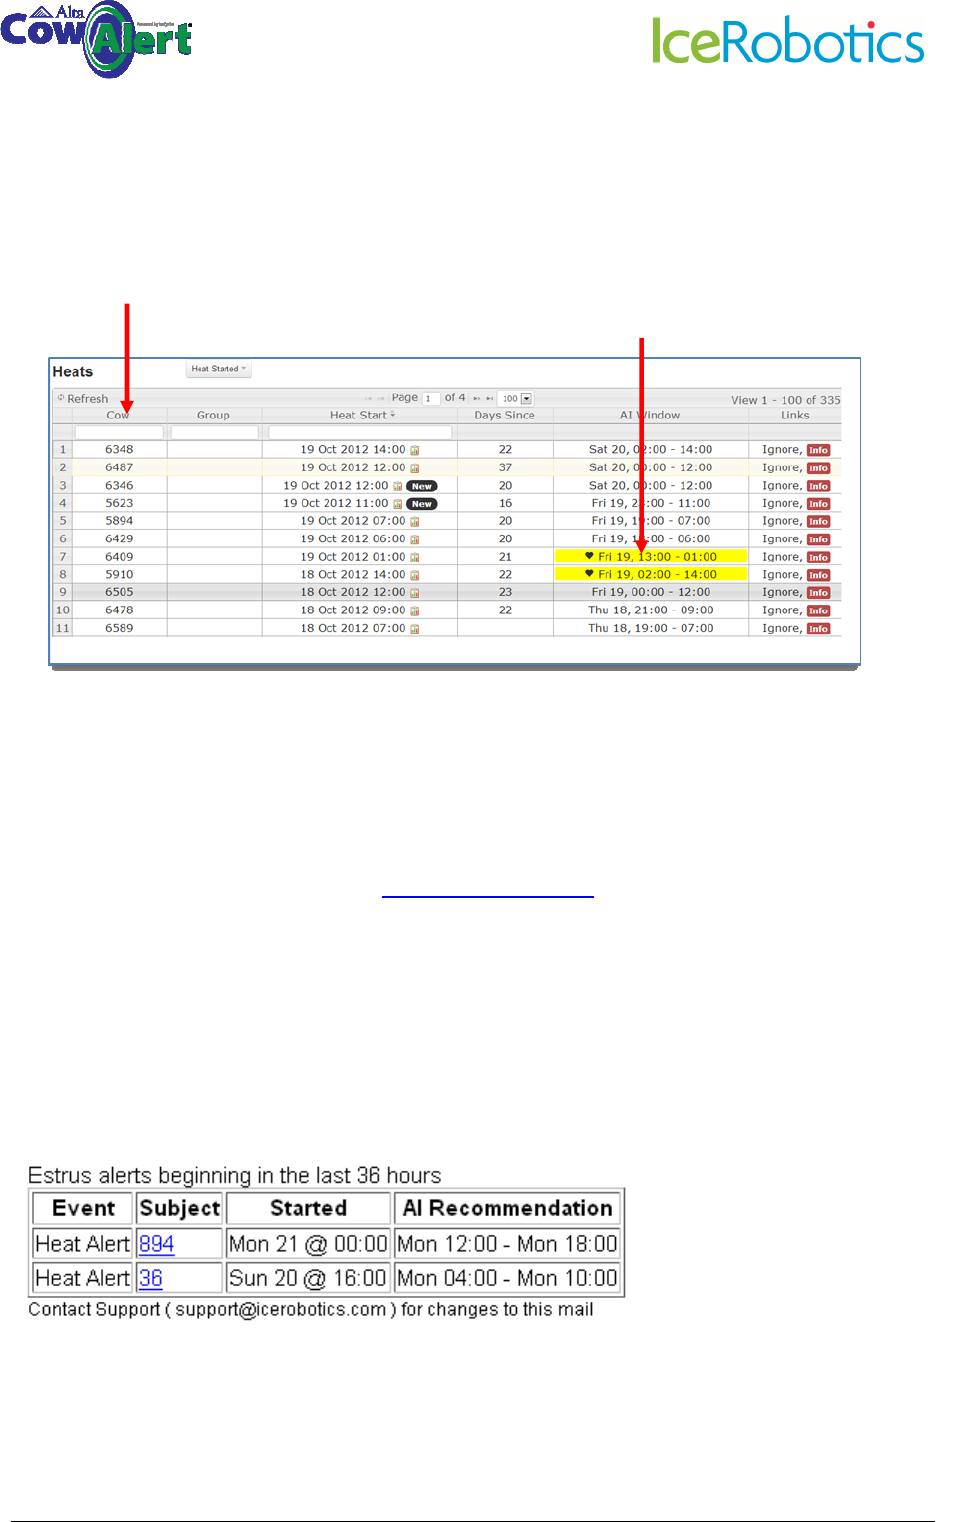
5.3 Receiving Heat Alerts by email
In addition to viewing heat alerts at any time via CowAlert, automated email messages can be sent
to specific email addresses.
To set up automated email alerts, email support@cowalert.com with the following information:
• Farm name
• Name and email address of the person/people to receive email alerts
• When the email alert should be received, eg once a day, sent at 3pm, or twice a day, sent at
6am and 6pm.
The email that is sent will include heat alerts generated within the last 72 hours and will look like the
example below. Note that clicking on the cow number will show the relevant activity graph.
The table can be sorted Cow or Heat Start by
clicking on the appropriate column heading
Note that the cows within a current AI time
window are highlighted in yellow. See section
9.1 on how to set the AI window.
© IceRobotics Ltd 2012 Page 18 V0.15 EN(UK)Nov 2012
6 Lying Behaviour
6.1 Lying behaviour for the individual cow
For the individual cow, CowAlert provides:
• Cow-level: Graphical overview of lying time and average lying time (Activity graphs)
• Cow-level: Total Lying time per day, and as a 7 and 14 day average (table located below
activity graph for the specific cow) and as a graphical view (Behaviour view option on
Activity graph)
• Cow-level: Number of lying bouts each day. A lying bout is when a cow changes from
standing to lying to standing. (table located below activity graph for the specific cow)
• Herd-level: average number of hours the herd is lying.
• Typically she will have a very similar number of bouts each day and any change to that may
indicate a potential problem.
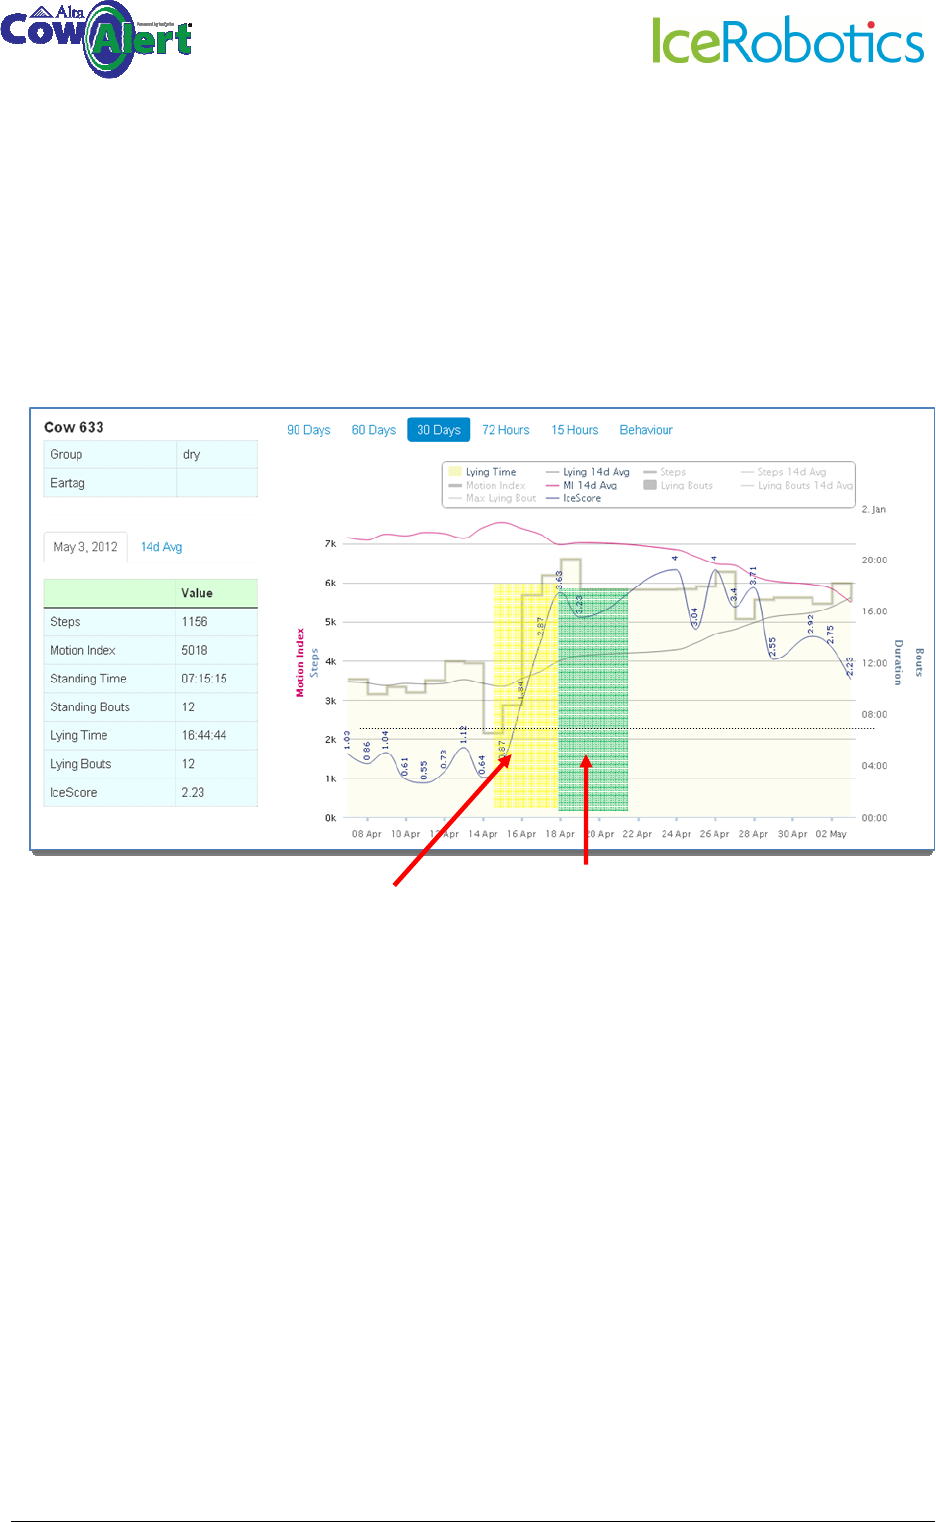
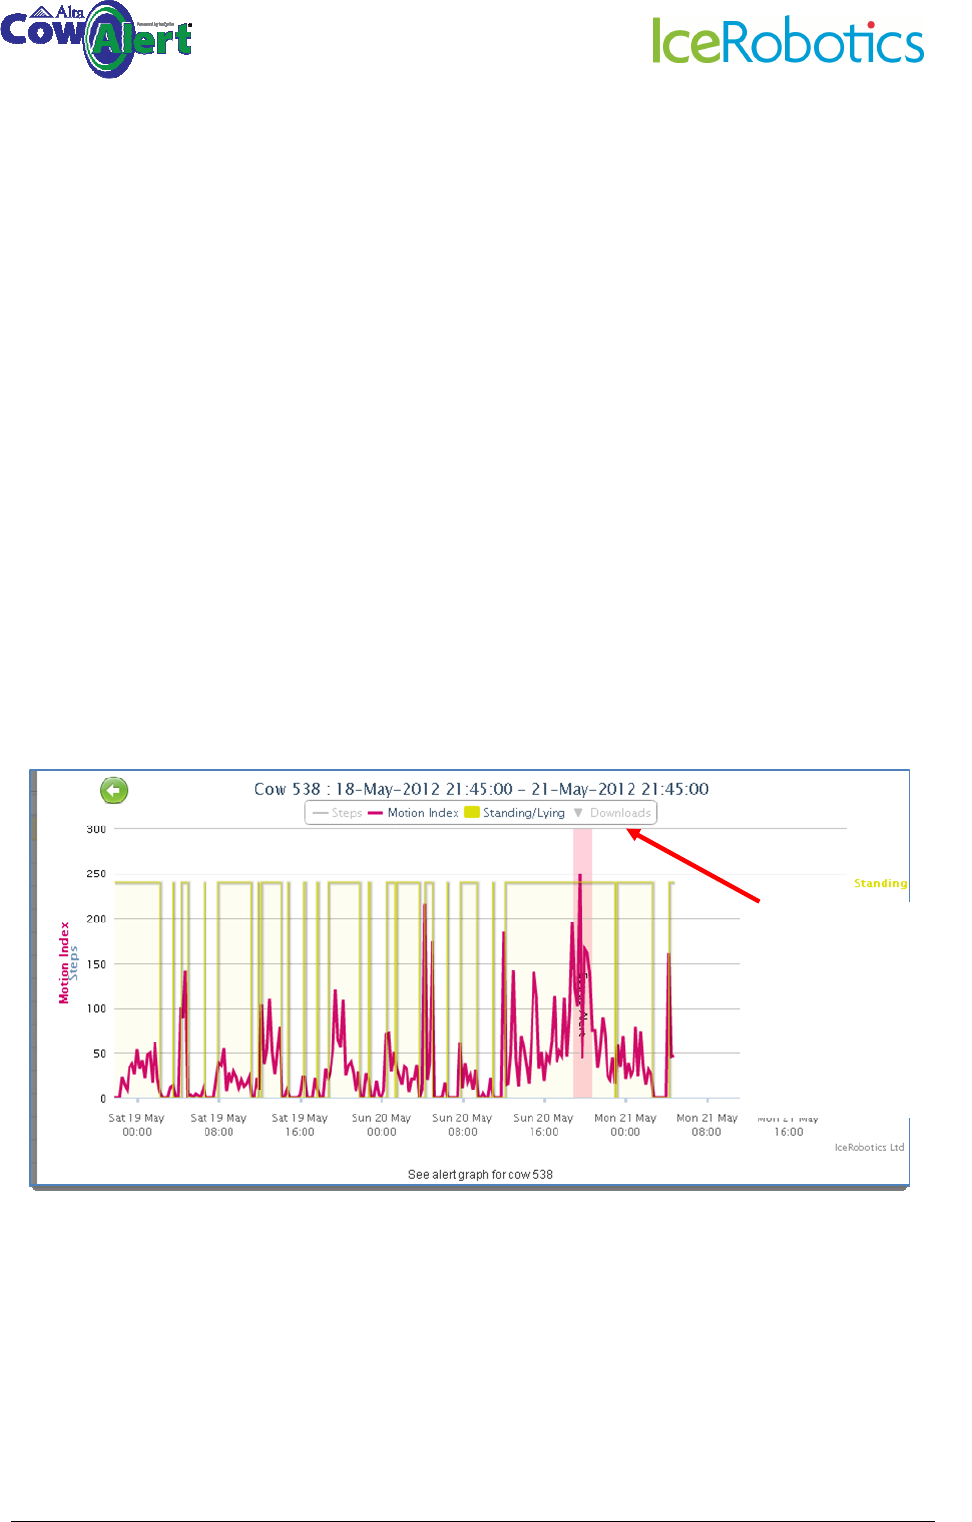
Below is an example of an Hours graph, showing only the MotionIndex and the lying/standing
patterns. Note the increased activity and increased standing time associated with the Heat event.
The steps and downloads are hidden by deselecting them in the key.
Hours graph with
Steps and Downloads
hidden from view by
clicking on those
headings
© IceRobotics Ltd 2012 Page 19 V0.15 EN(UK)Nov 2012
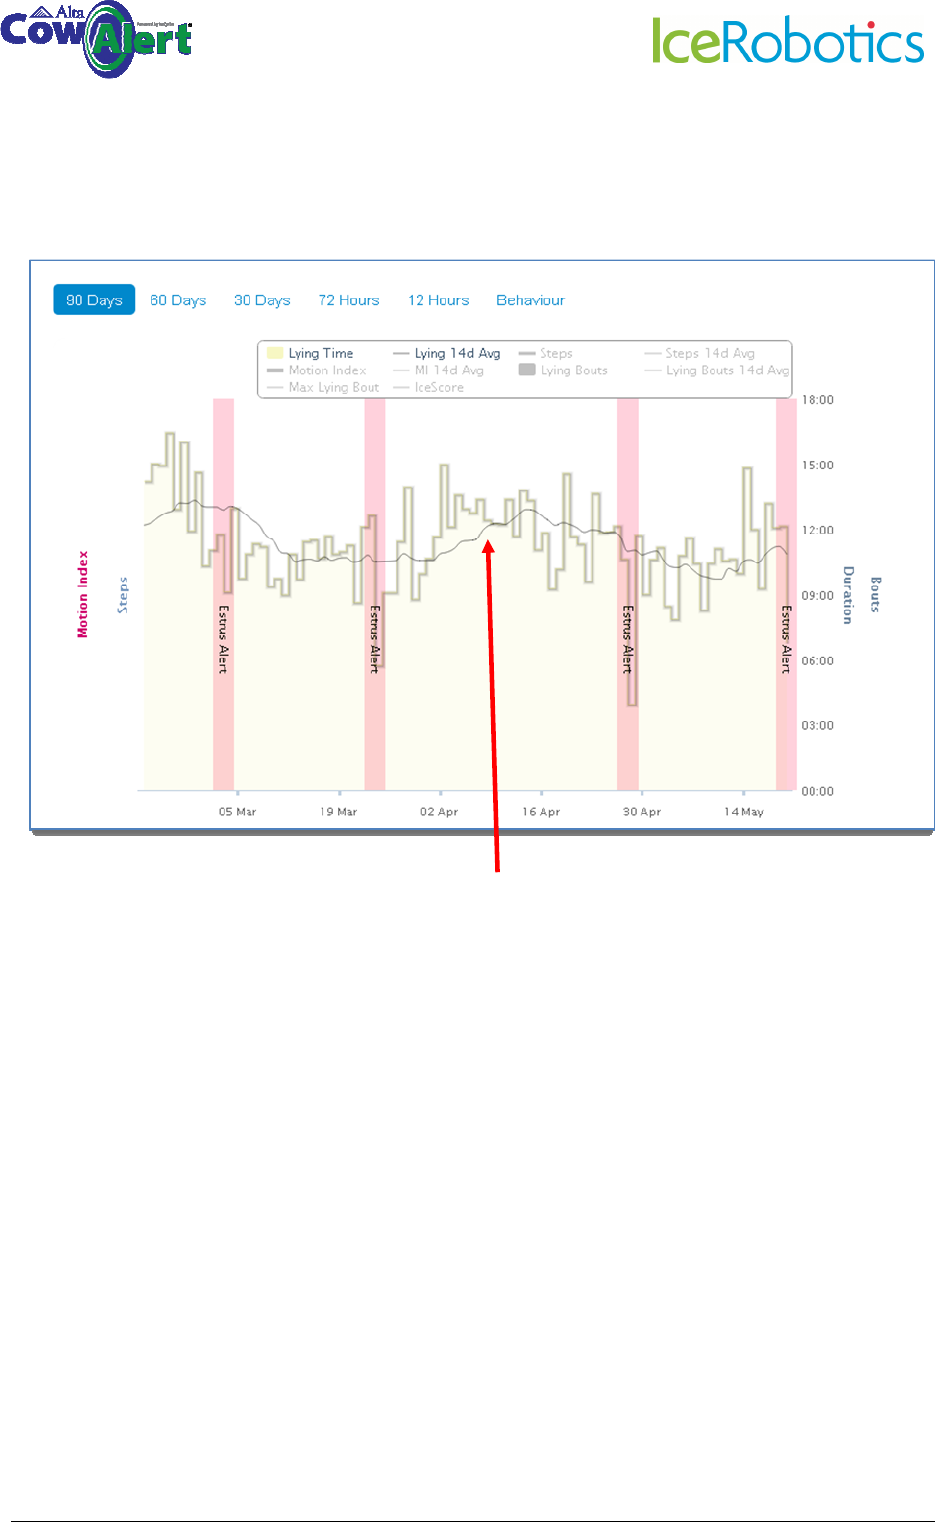
Below is an example of a 90 day graph showing only the lying time plus 7 day average lying time.
Hiding the Steps and MotionIndex from
view clearly shows the lying pattern and
lying time trend of this animal.