JBL Graphing Calculator Application For TI 84 Plus CE View: 84Plus App Guide UK
User Manual: JBL View: TI-84 Plus CE Guidebooks
Open the PDF directly: View PDF ![]() .
.
Page Count: 65
- Important Information
- Using Cabri™ Jr. Geometry App
- Using CellSheet™ App
- Using Conic Graphing App
- Using Vernier EasyData™ CE App
- Using Inequality Graphing App
- Using Periodic Table App
- Using Polynomial Root Finder & Simultaneous Equation Solver App
- Using Probability Simulation App
- Using Science Tools App
- Using Transformation Graphing App
- General Information


Important Information
Texas Instruments makes no warranty, either expressed or implied, including but not
limited to any implied warranties of merchantability and fitness for a particular
purpose, regarding any programs or book materials and makes such materials
available solely on an “as-is” basis.
In no event shall Texas Instruments be liable to anyone for special, collateral,
incidental, or consequential damages in connection with or arising out of the purchase
or use of these materials, and the sole and exclusive liability of Texas Instruments,
regardless of the form of action, shall not exceed the purchase price of this product.
Moreover, Texas Instruments shall not be liable for any claim of any kind whatsoever
against the use of these materials by any other party.
This graphing product application (APP) is licensed. See the terms of the license
agreement.
Learn More
For more information, view the expanded Apps Guidebook at
education.ti.com/go/download.
Choose Applications as your technology, and then select:
Guidebook for TI-83 Plus/TI-84 Plus.
Note: The expanded guidebooks contain comprehensive information, but some content
may refer to older versions of the App.
The TI-83 Plus/TI-84 Plus App guidebooks contain:
• Getting started activities
• Comprehensive feature information
• Step-by-step functional details
Note: Some functionality may differ on the CE graphing calculators.
© 2017 Texas Instruments Incorporated
ii

Contents
Important Information ii
Learn More ii
Using Cabri™ Jr. Geometry App 1
Example Activity – Draw and Measure a Triangle 1
Menus and Functions 3
Error Messages 6
Using CellSheet™ App 7
Example Activity – Simple Compound Interest 7
Menus and Functions 11
Error Messages 14
Using Conic Graphing App 16
Example Activity – Conic Graphing 16
Conic Graphing App - Basics 16
Circle in (X,Y) Form 17
Circle in Polar Form 17
Parabola in Polar Form 18
Menus and Functions 19
Error Messages 22
All Equations 22
Circles 23
Ellipses 23
Hyperbolas 24
Parabolas 24
Using Vernier EasyData™ CE App 25
Example Activity - Vernier EasyData™ 25
Menus and Functions 25
Error Messages 27
Using Inequality Graphing App 29
Example Activity – Inequality Graphing 29
Menus and Functions 31
Error Messages 32
Using Periodic Table App 33
Example Activity – Periodic Table 33
Menus and Functions 34
iii

iv
Using Polynomial Root Finder & Simultaneous Equation Solver App 37
Example Activity – Polynomial Root Finder 38
Example Activity – Simultaneous Equation Solver 40
Menus and Functions 42
Using Probability Simulation App 45
Example Activity – Toss Coins Simulation 45
Menus and Functions 47
Error Messages 51
Using Science Tools App 52
Example Activity – Science Tool 52
Exploring the Significant Figures Calculator 52
Exploring the Vector Calculator 53
Exploring the Vector Calculator 53
Menus and Functions 54
Error Messages 55
Using Transformation Graphing App 57
Example Activity 57
Explore the Function Y=AX2+BX+C 57
Menus and Functions 59
Transformation Graphing Rules 60
General Information 61
Texas Instruments Support and Service 61
General Information: North and South America 61
For Technical Support 61
For Product (Hardware) Service 61
For All Other Countries: 61
Service and Warranty Information 61
Using Cabri™ Jr. Geometry App
Use the Cabri™ Jr. App to construct, analyse and transform mathematical models and
geometric diagrams on your TI graphing calculator. You can:
• Perform analytic, transformational and Euclidean geometric functions
• Build geometric constructions interactively with points, a set of points for locus,
lines, polygons, circles and other basic geometric objects
• Alter geometric objects on the fly to see patterns, make conjectures and draw
conclusions
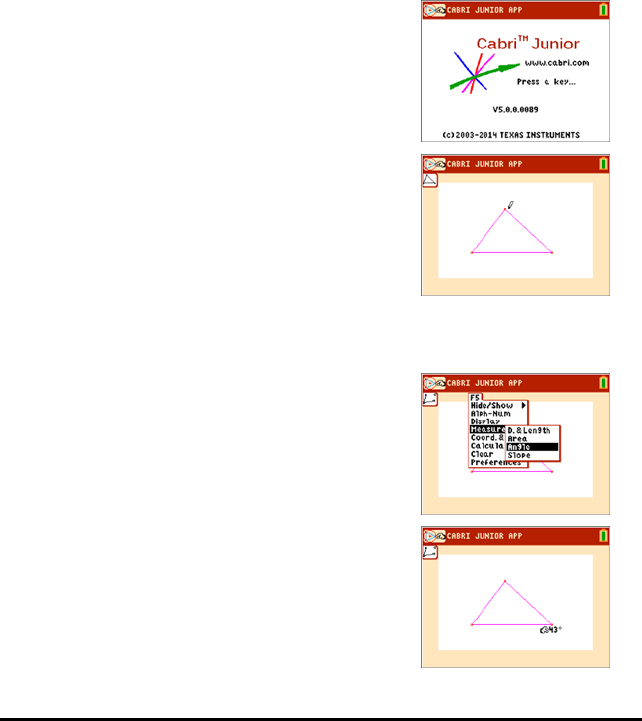
Example Activity – Draw and Measure a Triangle
Use this activity to learn the basics the Cabri™ Jr. App.
1. Press the Œkey and select Cabri™ Jr.
2. Press any key.
3. Create a triangle.
a) Press pto open the F2 menu.
b) Select Triangle.
c) Move the pencil using the|~}†keys to a
location for the first vertex. Press Í.
d) Move the pencil using the |~}†keys to a
location for the 2nd vertex. Press Í.
e) Move to a 3rd vertex. Press Í.
4. Press sto open the F5 menu.
5. Highlight Measure, press the right cursor and select
Angle.
6. Measure one of the interior angles of the triangle.
a) Move the pencil to one of the vertex points.
Press Í.
b) Move the pencil to the vertex of the angle being
measured. The vertex point will blink. Press
Í.
Using Cabri™ Jr. Geometry App 1
2 Using Cabri™ Jr. Geometry App
c) Move the pencil to the third vertex. Press Í.
Note: The App will calculate and display the angle
measurement near the angle being measured. To
drag the numerical measurement to a desired
location, use any of the |~}†keys. Press
Íwhen the angle measurement arrives at the
desired location.
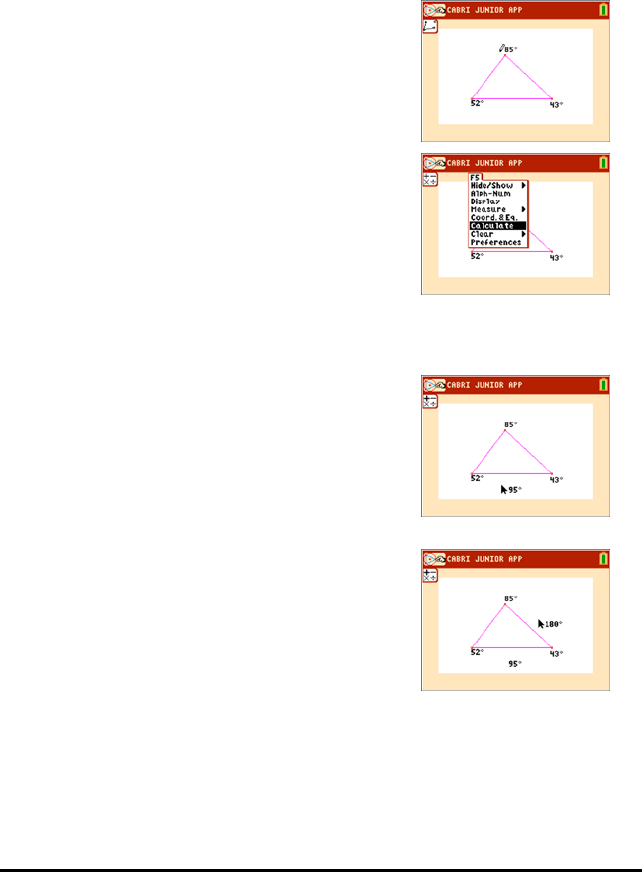
7. Repeat step 6 to find the angle measurements of the
other two interior angles of the triangle.
8. Calculate the sum of the three interior angles.
a) Press sto open the F5 window.
b) Select Calculate.
c) Move the arrow to one of the numerical angle
measurements. The number will begin blinking
when the angle is selected. Press Í.
d) Press Ãkey from the keypad.
e) Move the arrow to another angle measurement
until it starts blinking. Press Í.
f) The sum of the two angles selected will be
output and you can drag them by using the | ~
}†keys. Move the new calculation to a
desired location and press Í.
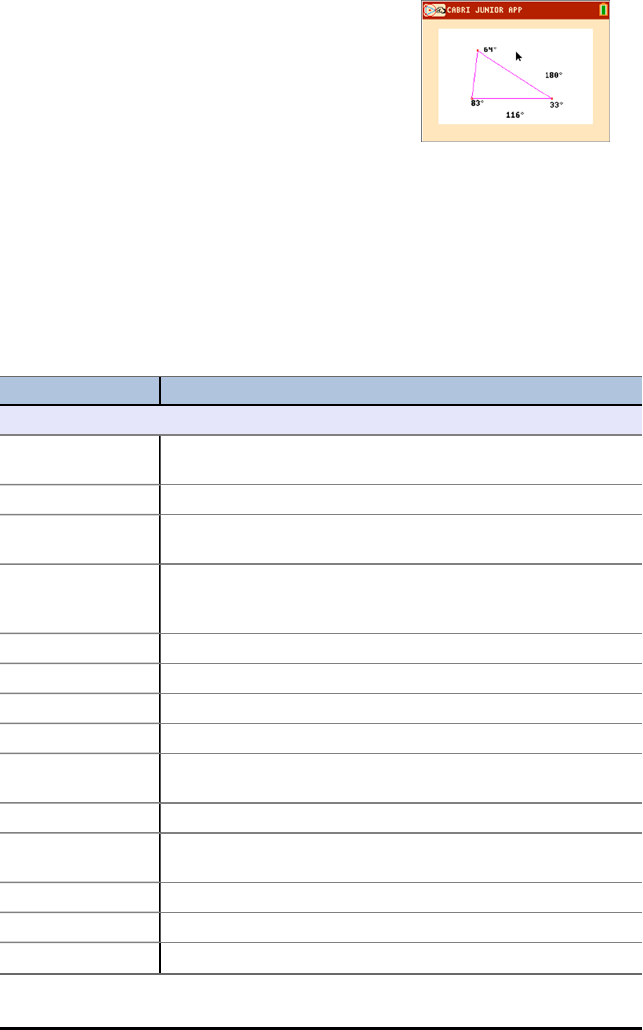
g) Point to the new calculation until it starts
blinking (sum of the 2 angles) and press Íto
select it.
h) Press the Ãkey.
i) Move the arrow to the measurement for the
unselected 3rd angle. Press Í.
j) The calculation output will represent the sum of
all three interior angles. Move the new
calculation to a desired location and press Í.
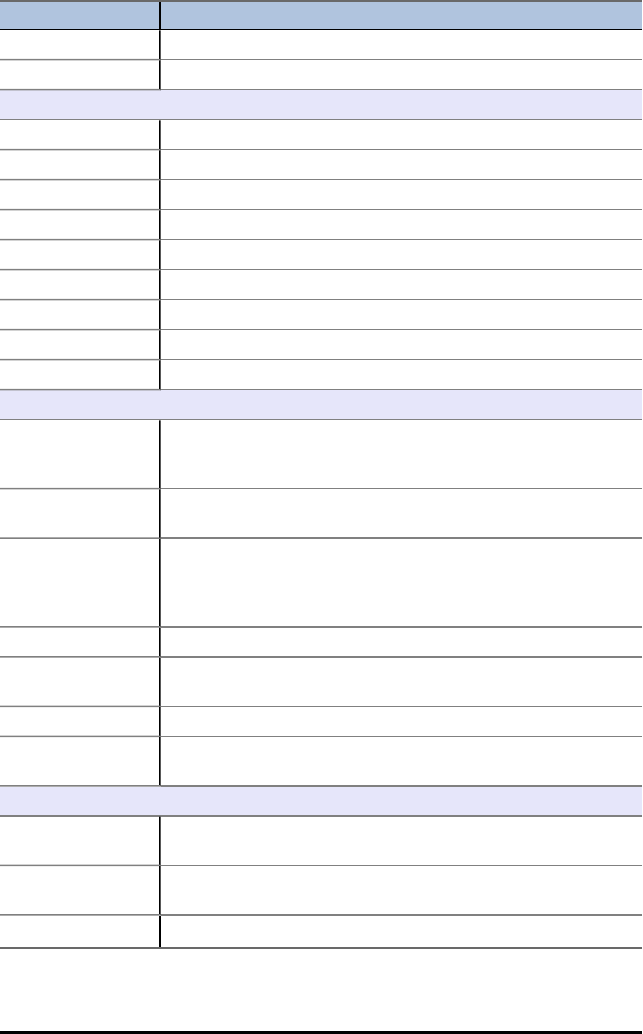
9. Press ‘to stop the measurement tool and move
the arrow to one of the three triangle vertices. The
arrow will become “hollow” to indicate that the
vertex being selected.
10. Press the ƒkey once and use any of the |~}
†keys to drag the vertex to a different location.
Note:When the arrow is near a geometric object,
press ƒto turn the arrow into a hand icon so that
you can drag the object.
Notice that the angle measurements change
accordingly as the triangle changes shape, but their
sum is always the same.
Menus and Functions
The menus are labelled F1-F5 and correspond to the graphing keys directly below the
screen. You can press the graphing keys (o,p,q,r,s) for the
corresponding function keys or you can press ƒplus one of the function keys
(^-b) to open the menu.
Tip: When the arrow is near a geometric object, press ƒto turn the arrow into a
hand icon so that you can drag the object.
Menus Functions
F1 – File Menu
Animate Set a point or points in motion along an object, as well as all
objects logically depending on it.
Undo
Undo Undo the last action. This functionality is available as long as the
current figure does not contain more than 128 objects.
Explore Explore a figure by replaying (forward or backward) each step in
drawing the figure. You can also use this feature to undo
multiple steps that you took to draw a figure.
Help
About App version number information.
F1: File Built-in help for using the F1 menu.
F2: Creation Built-in help for using the F2 menu.
F3:
Construction
Built-in help for using the F3 menu.
F4: Transform. Built-in help for using the F4 menu.
F5:
Appearance
Built-in help for using the F5 menu.
New Create a new file.
Open… Open a file.
Save Save a file.
Using Cabri™ Jr. Geometry App 3
4 Using Cabri™ Jr. Geometry App
Menus Functions
Save as… Save a file with a new name.
Quit Quit the application.
F2 – Creation Menu
Point
Point Draw a point at any location.
Point on Draw a point on an object.
Intersection Draw an intersection point.
Line Draw a line from new locations or existing points.
Segment Draw a segment from new locations or existing points.
Circle Draw a circle from new locations or existing points.
Triangle Draw a triangle from new locations or existing points.
Quad. Draw a quadrilateral from new locations or existing points.
F3 – Construction Menu
Perp. Draw a perpendicular line 1) with respect to another object or
2) draw the line through a given point with respect to another
object.
Parallel Draw a parallel line 1) with respect to another object or 2) draw
the line through a given point with respect to another object.
Perp. Bis. Draw the perpendicular bisector of a line segment that you
select or draw a line that is the perpendicular bisector between
two points, when the line segment between the two points has
not been drawn.
Angle Bis. Select three points of a triangle to draw an angle bisector.
Midpoint Draw the midpoint of two points or the midpoint of a line
segment.
Compass Draw a circle using the compass tool.
Locus Build the locus of an object that depends on a point located on a
segment, line or circle.
F4 – Transformations Menu
Symmetry Select the centre point of symmetry and then select the object.
The new object is drawn.
Reflection Select the line or segment about which the object will be
reflected. Select the object to reflect. The object is reflected.
Translation Select either a line segment or two points and then select the
Menus Functions
object. A new translated object is created.
Rotation Select the point around which an object will be rotated and
then select the object to rotate. Select the three points that
determine the angle of rotation. A new rotated object is
created.
Dilation Select the object, select the point and then select the dilation
factor. A new dilated object is created.
F5 – Appearance Menu
Hide/Show
Object Hide or show an object.
Axes Hide or show the axes.
Alph-Num Label points, enter comments and enter numerical values.
Display Control the display of objects by toggling between solid and
dotted outlines. Toggle the equation of a circle between the
two forms.
Measure
D. & Length Find the distance between two points; length of a line segment;
perimeter of a triangle or quadrilateral; or the circumference of
a circle.
Area Compute the area of a triangle, quadrilateral or circle.
Angle Measure angles (in degrees) determined by three points, the
second of which is the vertex of the angle. The angle measured
is the interior angle.
Slope Find the slope of a line segment or line. If the slope is too large
to be displayed numerically, ### is displayed instead.
Coord.&Eq. Display coordinates of points and equations of lines and circles,
in the underlying system of axes.
Calculate Perform calculations using values that are displayed on the
drawing screen. You can add, subtract, multiply and divide
numbers, as well as take the square root of a number.
Clear
Object Clear an object.
All Clear the entire screen.
Preferences Set colour for point, line, segment, circle, triangle, quadrilateral,
axes and locus.
Using Cabri™ Jr. Geometry App 5

6 Using Cabri™ Jr. Geometry App
Error Messages
Error Message Description
Not Enough
Memory! Add. RAM
needed.
Cabri™ Jr. needs at least 4802 free bytes to run (roughly 5k). The
dialogue box indicates how much more free memory you need to
be able to run Cabri™ Jr. It is possible to make more RAM or Flash
memory available to Cabri™ Jr., by removing files stored in RAM or
in Flash. Refer to the calculator manual for more information.
Continue without
Undos?
When more than 128 objects have been drawn, Undo must be
disabled to continue. After this error message is displayed, a
dialogue box asks if you want to continue. If you continue, Undo is
disabled
Undo will be automatically re-enabled if the number of objects
becomes lower than 128.
Max. object#
reached.
Cabri™ Jr. figures can have a maximum of 256 objects.
Not Enough
Memory! to save
file.
When this message displays, the current figure is not lost. You can
save the figure by:
• Quitting Cabri™ Jr. and deleting some files to create additional
free RAM (5K should be enough). You must not delete the
AppVar CurrCaJ2; it contains the current figure.
• Saving CurrCaJ2 on your computer or another unit and making
use of it later when you have enough available RAM on your
device.
No figure to open! You have selected Open from the F1 menu, but there are no
saved figures on your calculator to open.
Name already exists!
Continue anyway?
You have entered a file name for your figure that already exists.
Select OK to overwrite the existing file or select No to return to
the Save dialogue box so that you can enter a different file name.
CURRCAJU is
reserved
You cannot use or CURRCAJU or CURRCAJ2 as a file name. They are
reserved AppVar names.
Figure abc not re-
archived!
This happens, under tight Flash RAM conditions, when you have
worked with an archived figure and made it significantly larger. In
this case, you may not have enough memory to save the figure in
Flash RAM, so the App saves it as a regular AppVar in RAM.
Batteries too low to
access archived files!
The batteries in your calculator are low, so the App cannot save
the file into Flash RAM . You can save the file without archiving it,
then change the batteries and archive the file later.
Using CellSheet™ App
The CellSheet™ application combines spreadsheet functionality with the power of a
graphing calculator. Using the CellSheet™ application, you can:
• Create spreadsheets using
- Integers
- Real numbers
- Formulas
- Variables
- Text and numeric strings
- Functions
• Create cell formulas
• Use built-in functions
• Create spreadsheets containing 999 rows and 26 columns
• Enter data that is limited only by the available memory (RAM)
Example Activity – Simple Compound Interest
Use this activity to learn the basics of the App.
1. Press Œ.
2. Choose CelSheet from the APPLICATIONS menu.
The splash screen will appear.
3. Press any key other than y 5 to dismiss the
splash screen.
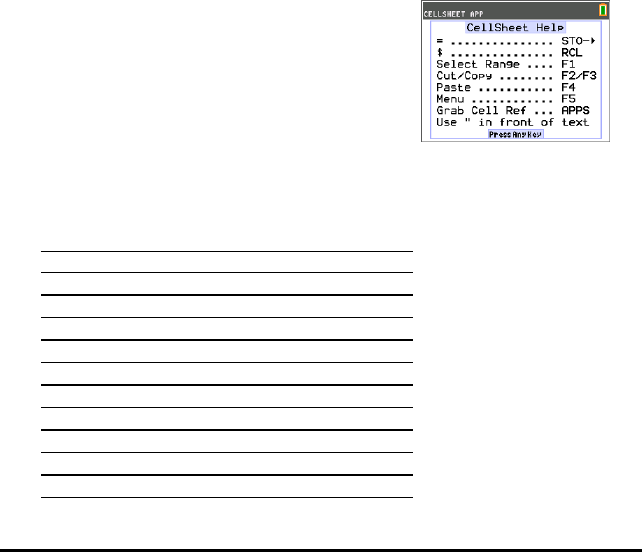
The Help screen will appear.
The function keys enable spreadsheet functionality
(Select Range,Cut,Copy,Paste, and Menu).
The ¿and Kkeys are overwritten to provide
quick access to common spreadsheet characters (=
to start formula, $to add absolute reference).
CellSheet Help
ACTION PRESS THIS KEY
=¿
$ RCL y K
Select Range ^
Cut _
Copy `
Paste a
Menu b
Grab Cell Œ
Press Any Key
Using CellSheet™ App 7
8 Using CellSheet™ App
1. Press any key for the spreadsheet to appear.
The edit line with the cell reference appears on the
left side.
The Menu soft key appears above [F5], as listed on
the CellSheet Help screen.
Note:
• Press the arrows to show that the cursor moves
from cell to cell. The cell reference at the left side
of the edit line changes as the cursor moves
around.
• Use ƒwith the arrow keys to move up/down/
left/right one screen at a time.
• Use the arrow keys to move into a row/column
heading to select the entire row/ column or into
the very top-left corner to show the file name on
the edit line.
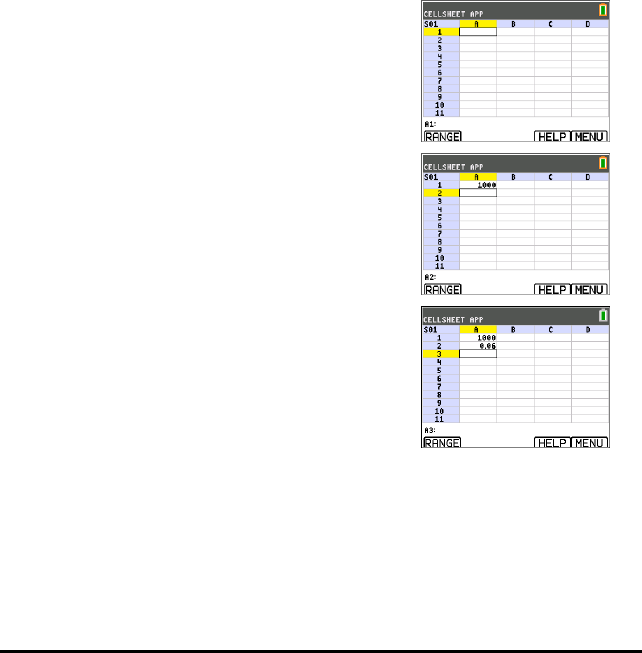
2. Scroll to cell A1. Press Í.
The cursor is active on the edit line, and the Menu
soft key disappears so you can use the entire edit
line.
3. Type in a principal amount, for example: 1000.
4. Press Í.
5. The cursor has moved down to cell A2. Now type in
an annual interest rate, for example: 0.06. Press
Í.
6. To create a column for time:
a) Scroll to cell B1 and type “YEAR (using the ƒ
key, or Alpha Lock y 7, as needed).
Note: You must add a quotation mark (") before
the word YEAR. The quotation mark tells
CellSheet to treat this as text rather than as a
variable.
b) Press Í.
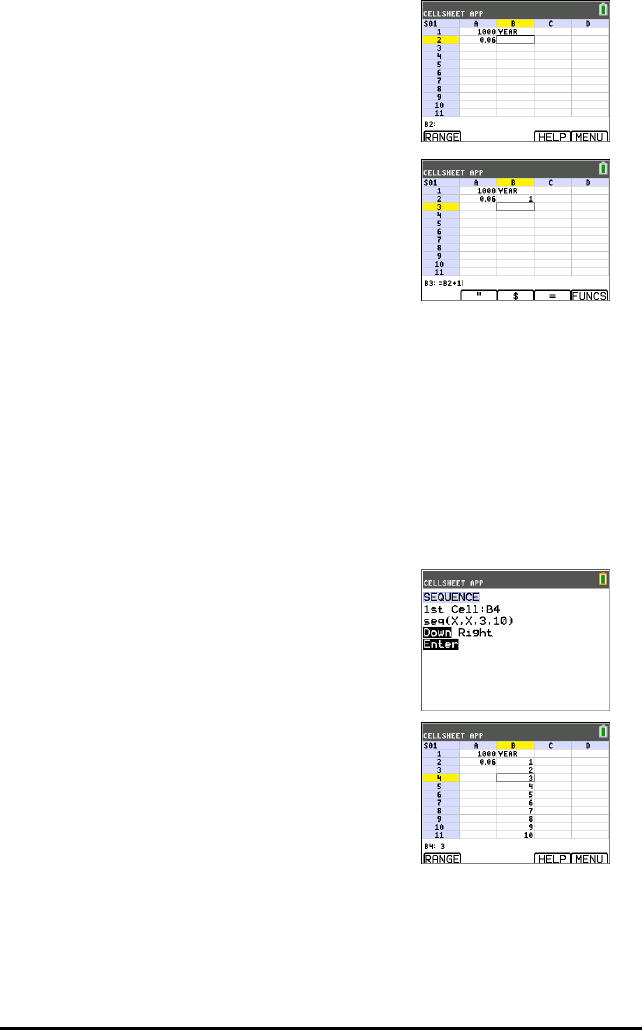
7. To designate time periods using a formula:
a) In cell B2, press Àto designate year 1.
b) Press Íto move to cell B3.
c) Press Íto move the cursor to the edit line.
d) Type the first formula =B2+1. (See shortcut keys
on screen for = sign a.)
e) Press Í.
The cell should return the value 2 for year 2.
f) Press the up arrow to see that the formula is still
on the edit line for that cell.
Note: You can copy the formula down the
column. See CellSheet Help for copy `select
range ^, and paste ashortcut keys.
8. Create a sequence using the Sequence option from
the Options menu:
a) Press †to move to B4.
b) Press bto open the MENU.
c) Choose 3:Options..., then 3:Sequence....
The input screen will appear.
d) Fill in the fields as indicated in the screen.
e) Scroll to the Enter area.
f) Press Í.
A sequence from 3 to 10 fills in from cell B4
down.
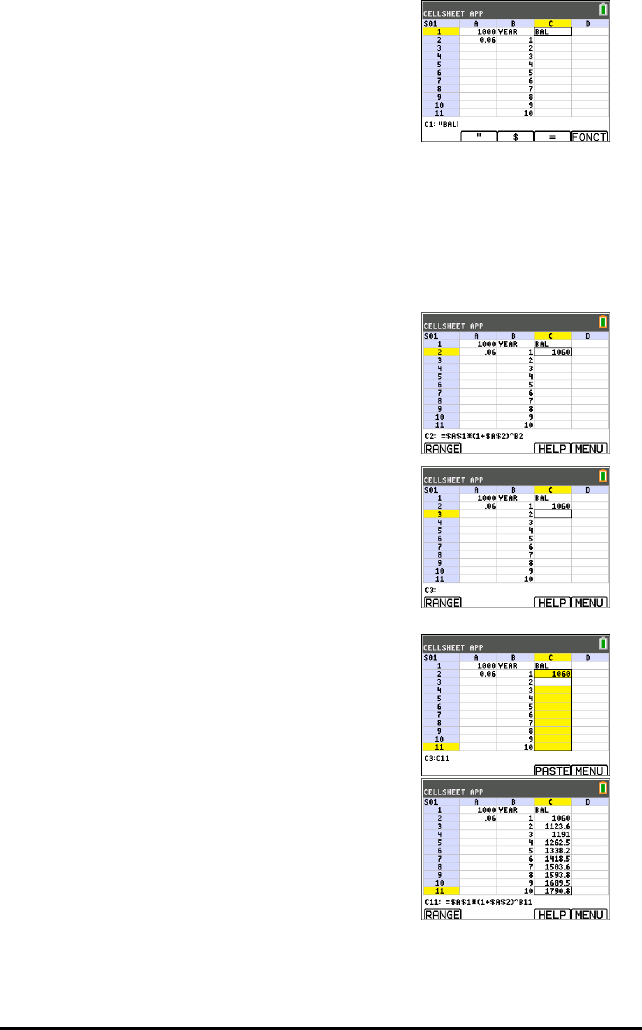
9. Create a column for the balance.
a) Press the }and ~keys to scroll to cell C1 and
type “BAL (using the ƒkey, or Alpha Lock
y 7, as needed).
b) Press Í.
Using CellSheet™ App 9
10 Using CellSheet™ App
10. For the balance at the end of year 1:
a) In cell C2, press Íto move the cursor to the
edit line.
b) Enter the formula =$A$1*(1+$A$2)^B2.
Note: You must use the $ signs, because in order
to copy the formula down the column, you need
to create an absolute reference to cells A1 and
A2 to make sure that the original principal and
interest rate are the same in every copied
formula. (See shortcut keys on screen for = sign
aand $ `when editing a cell.)
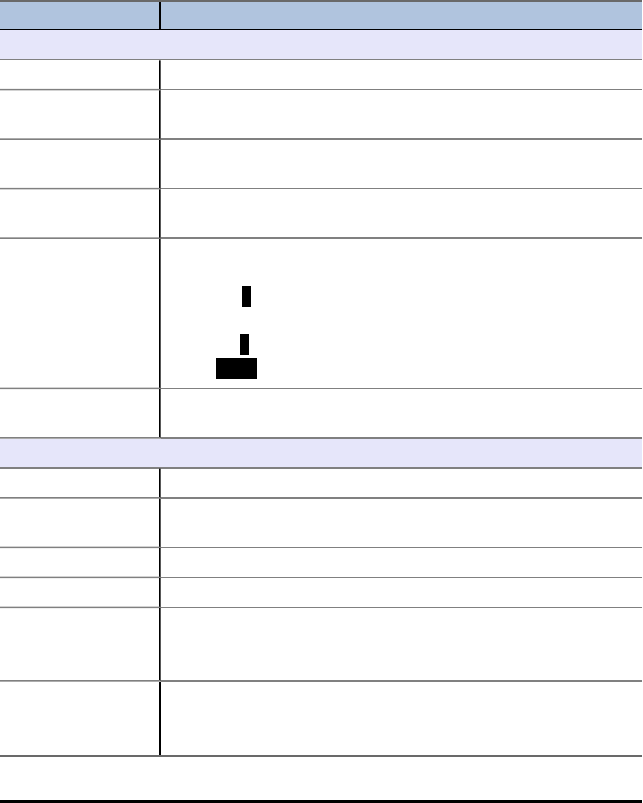
c) Press Í.
To watch the balance grow over time, copy cell C2 and
paste it to the range C3:C11 as follows:
11. To copy cell C2:
a) With cursor in cell C2, press RANGE ^.
b) Press COPY `.
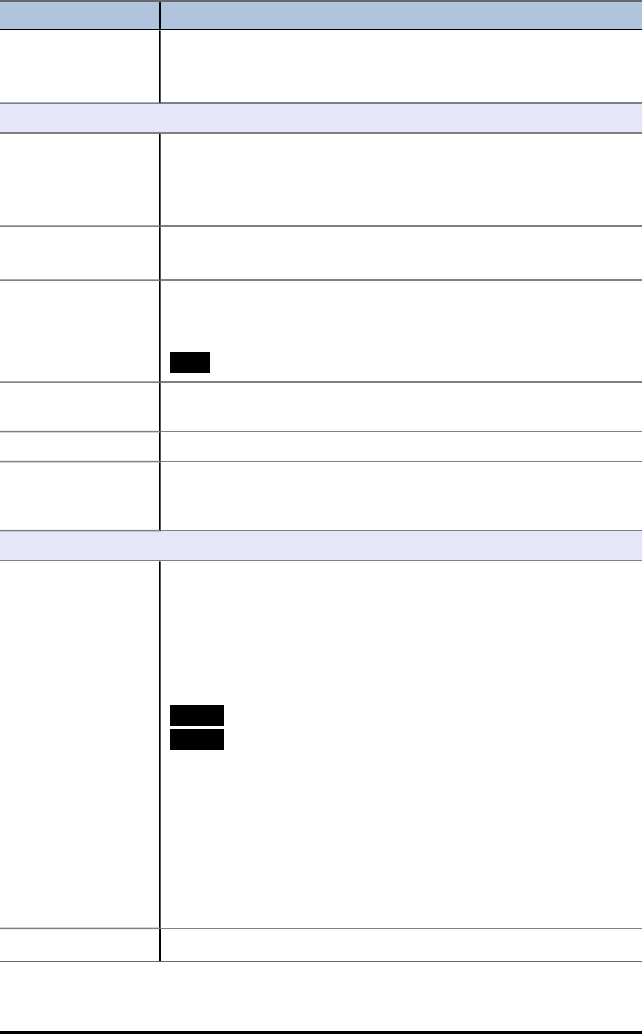
12. To select the range:
a) Press the †key to scroll to cell C3.
b) Press RANGE ^to choose a range to copy to
(not shown).
c) Press the †key to select the cells in the range
from C3:C11.
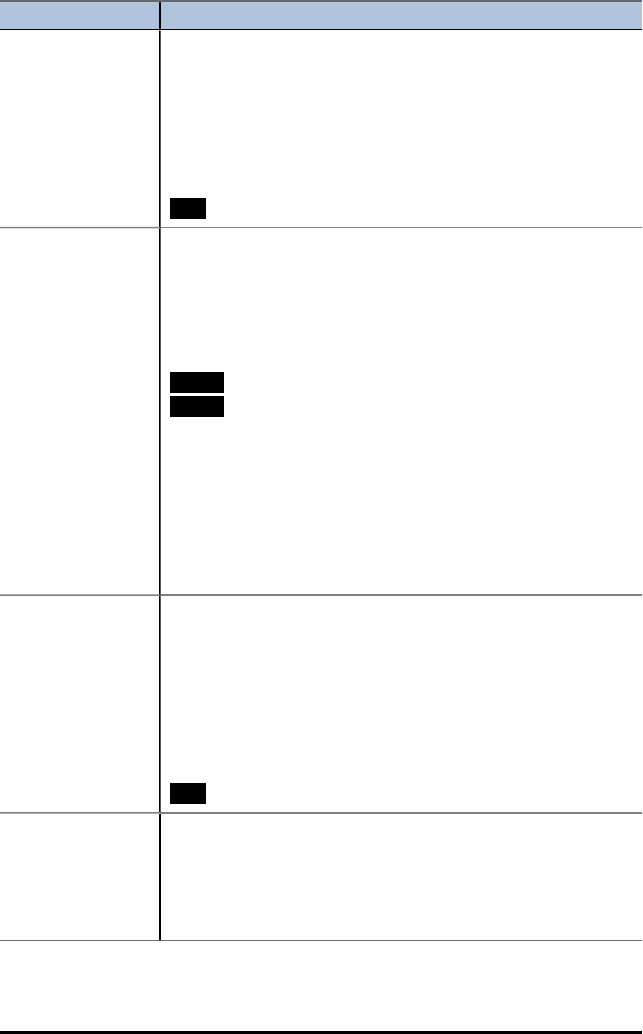
d) Press PASTE ato paste to this range.
13. After watching the balance grow, experiment by
changing the interest rate in cell A2. Simply scroll to
cell A2, change the number, and watch all of the
balance values update. You can also experiment by
changing the principal.
Menus and Functions
• To display the CELLSHEET MENU, select Menu (press b).
• To display a help screen for common tasks, select Help from the CELLSHEET MENU.
• To exit the application, select Quit CellSheet from the CELLSHEET MENU.
• Press ‘or y 5 to:
- Return to the main menu from a submenu.
- Return to the spreadsheet from the main menu.
Menus Functions
File Menu
1: Open... Opens an existing spreadsheet file.
2: Save As... Saves the current spreadsheet with the same name or with a
different name.
3: New... Creates a new spreadsheet and allows you to use a new or
existing name.
4: Delete... Deletes a spreadsheet. You cannot delete the currently open
spreadsheet.
5: Format... Sets up formatting options.
(Default values are highlighted.)
AutoCalc: YN
Cursor Mvmt: † ~
Init Help: YN
Show: FMLA VALUE
6: Recalc Recalculates the spreadsheet (only needed when the
autocalculation feature in the FORMAT menu is turned off).
Edit Menu
1: Go To Cell... Moves the cursor to a specific cell.
2: Undelete Cell Retrieves the contents of the cell that you just deleted or
cleared.
3: Clear Sheet... Deletes all data from the current spreadsheet.
4: Select Range... Selects a range of cells.
5: Cut Cuts the contents and formulas from the currently selected cell,
or range of cells, and places them on the clipboard.
Shortcut key: _
6: Copy Copies the contents and formulas from the currently selected
cell, or range of cells, and places them on the clipboard.
Shortcut key: `
Using CellSheet™ App 11
12 Using CellSheet™ App
Menus Functions
7: Paste Pastes the contents and formulas that were just cut or copied to
the clipboard into the current cell.
Shortcut key: a
Options Menu
1: Statistics... Calculates linear regression for the currently selected cell range.
1: 1-variable statistics
2: 2-variable statistics
3: Linear Regression - LinReg(ax+b)
2: Fill Range... Fills a range of cells with a formula, number, or text.
3: Sequence... Fills a range of cells with a sequence of numbers.
1st Cell:
seq(
DownRight
4: Import/Export ... Imports and exports calculator files such as lists, matrices, or
variables.
5: Sort... Sorts a range of cells in ascending or descending order.
6: Col Decimal... Sets the decimal mode display for a column. The calculator
decimal mode display (accessed by pressing z) does not
affect the CellSheet™ application.
Charts Menu
1: Scatter... Displays a scatter chart for a range of cells.
XRange:
YRange 1:
YRange 2:
YRange 3:
Title:
AxesOn AxesOff
DrawFit Draw
Notes:
• You can set the color of the graph using the color spinner in
the left column. After you enter a range, move the cursor to
the color spinner and press Í. Next, use |~to select
a new color. Press †to set the new color.
• DrawFit Autoscales the graph of the chart. Draw uses the
chart window settings in the CellSheet Chart menu (not the
Operating System Window settings) to graph the chart.
2: Scatter Window Displays the parameters for the viewing window for the scatter
Menus Functions
chart so that you can change the values.
Xmin=
Xmax=
Xscl=
Ymin=
Ymax=
Yscl=
Draw Save
3: Line... Displays a line chart for a range of cells.
XRange:
YRange 1:
YRange 2 :
YRange 3:
Title:
AxesOn AxesOff
DrawFit Draw
Notes:
• You can set the color of the graph using the color spinner in
the left column. After you enter a range, move the cursor to
the color spinner and press Í. Next, use | ~to select a
new color. Press †to set the new color.
• DrawFit Autoscales the graph of the chart. Draw uses the
chart window settings in the CellSheet Chart menu (not the
Operating System Window settings) to graph the chart.
4: Line Window... Displays the parameters for the viewing window for the line
chart so that you can change the values.
Xmin=
Xmax=
Xscl=
Ymin=
Ymax=
Yscl=
Draw Save
5: Bar... Displays a bar chart for a range of cells.
Categories:
Series1:
Ser1Name:
Series2:
Using CellSheet™ App 13
14 Using CellSheet™ App
Menus Functions
Ser2Name:
Series3:
Ser3Name:
Title:
Vertical Horiz
DrawFit Draw
Notes:
• You can set the color of the graph using the color spinner in
the left column. After you enter a range, move the cursor to
the color spinner and press Í. Next, use | ~to select a
new color. Press †to set the new color.
• Vertical Horiz display the bars in specified directions.
• DrawFit Autoscales the graph of the chart. Draw uses the
chart window settings in the CellSheet Chart menu (not the
Operating System Window settings) to graph the chart.
6: Bar Window Displays the parameters for the viewing window for the bar chart
so that you can change the values.
Barmin=
Barmax=
Draw Save
7: Pie... Displays a pie chart for a range of cells.
Categoreis:
Series:
Number Percent
Title:
Draw:
Error Messages
Error Message Description
INVALID CELL,
INVALID RANGE.
This occurs when you type in an invalid cell or a range such as A0,
BZ12, or A1:A1000. Valid cells are A1 to Z999.
CIRCLE REF This occurs when the logic of cell formulas results in a loop, for
example when A1 is set to =A1.
CANNOT SORT The CellSheet™ application does not sort ranges that contain
formulas.
INVALID NAME The name that you entered is too long, or contains characters that
are invalid.
INVALID LIST,
INVALID MATRIX,
INVALID VAR
The list name, matrix name, or variable name does not exist.

Error Message Description
SYNTAX This occurs when you enter an invalid cell reference (e.g., A0), or
if you delete a cell that is referred to by another cell.
Using CellSheet™ App 15
16 Using Conic Graphing App
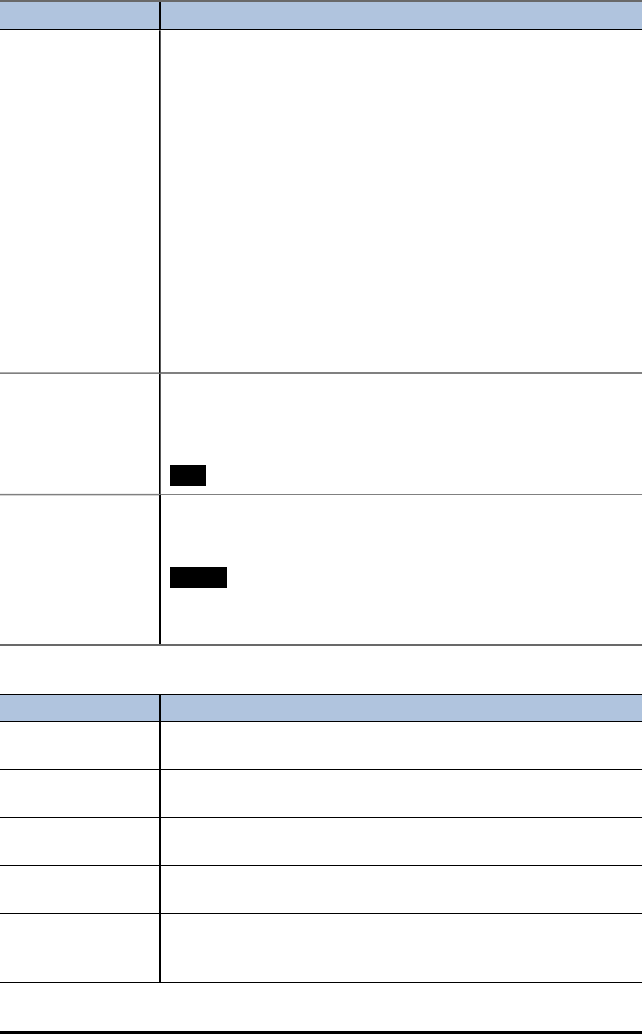
Using Conic Graphing App
This App presents equations in function, parametric or polar form and provides a
simple way to graph the four conic shapes:
Ellipse Circle Parabola Hyperbola
Enter the required parameters to graph, trace or solve for the conic's characteristic.
Example Activity – Conic Graphing
Tip: Options display at the bottom of the screen to help
you navigate and perform specific tasks.
To select one of these options, press the graphing key
directly below it.
For example, to select [ESC], press o.
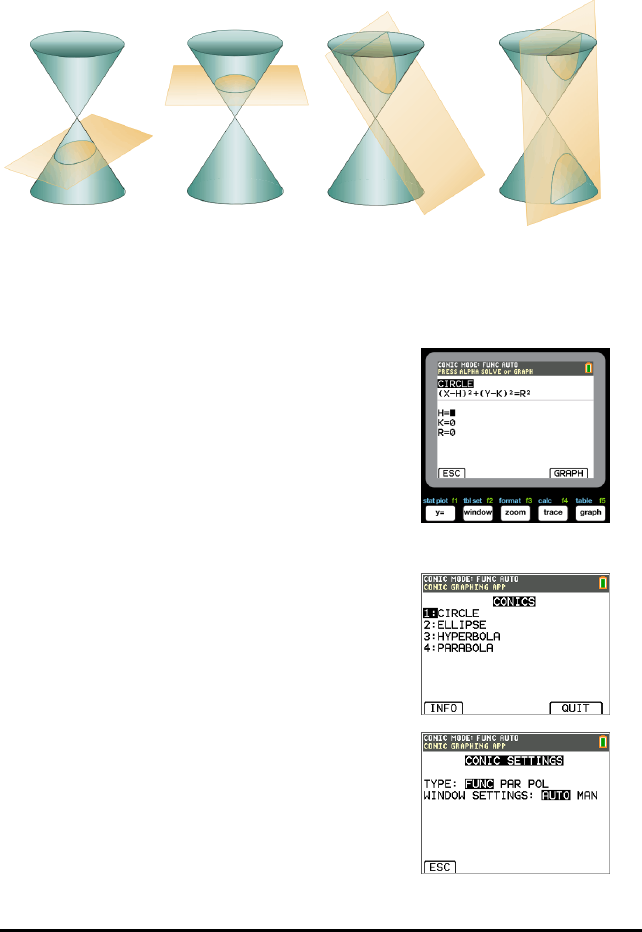
Conic Graphing App - Basics
1. Select the App by pressing the Œkey and
selecting Conics.
2. Press any key to clear the splash screen.
3. Press zand ensure the window setting is AUTO.
4. Press [ESC] to return to the main menu.
5. Press Íor Àto select circle.
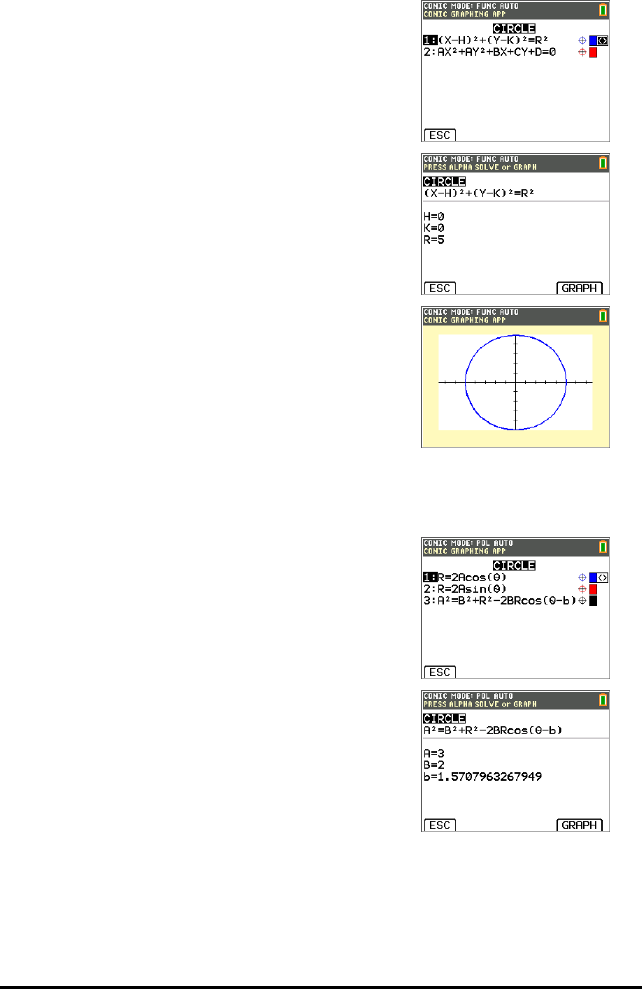
Circle in (X,Y) Form
Here are the two equations for a circle in the X,Y form.
1. Select Equation 1 by pressing À.
Note: You may change the colour of the circle by
pressing the | ~keys.
2. Enter H=0, K=0 and R=5.
3. Press [GRAPH].
The circle is displayed.
4. Press the ‘key to go back to the CIRCLE
parameter entry screen.
5. Press rto show the points along the curve.
Note: Use the |~keys to move along the curve.
Circle in Polar Form
1. Continuing from the previous example, press z
to return to the CONICS SETTINGS menu (not shown).
2. Use the ~key to change the CONIC SETTINGS TYPE
to POL.
3. Press [ESC] to display the equation screen.
4. Select equation 3.
5. Enter A=3, B=2 and b = π/2.
Notes:
•π/2 is evaluated to 1.5707963267949.
• B and b are the polar form of the offsets.
• Fractions and MathPrint™ templates are not
supported in the Conic Graphing App.
Using Conic Graphing App 17
18 Using Conic Graphing App
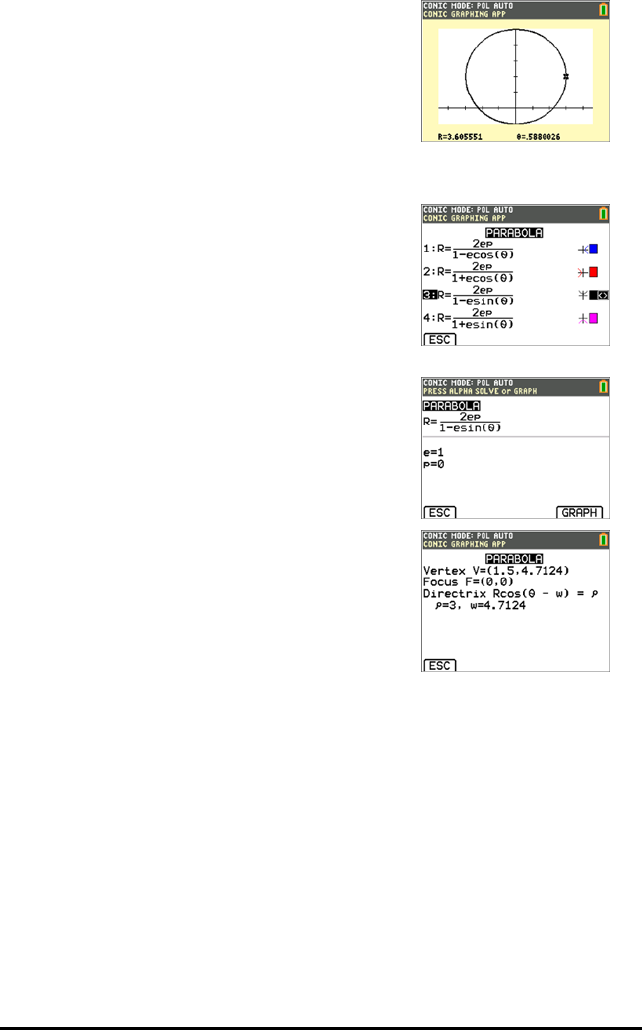
6. Press s.
7. Press rto show the points along the curve and
note the different coordinate system used.
Note: Use the |~keys to move along the curve.
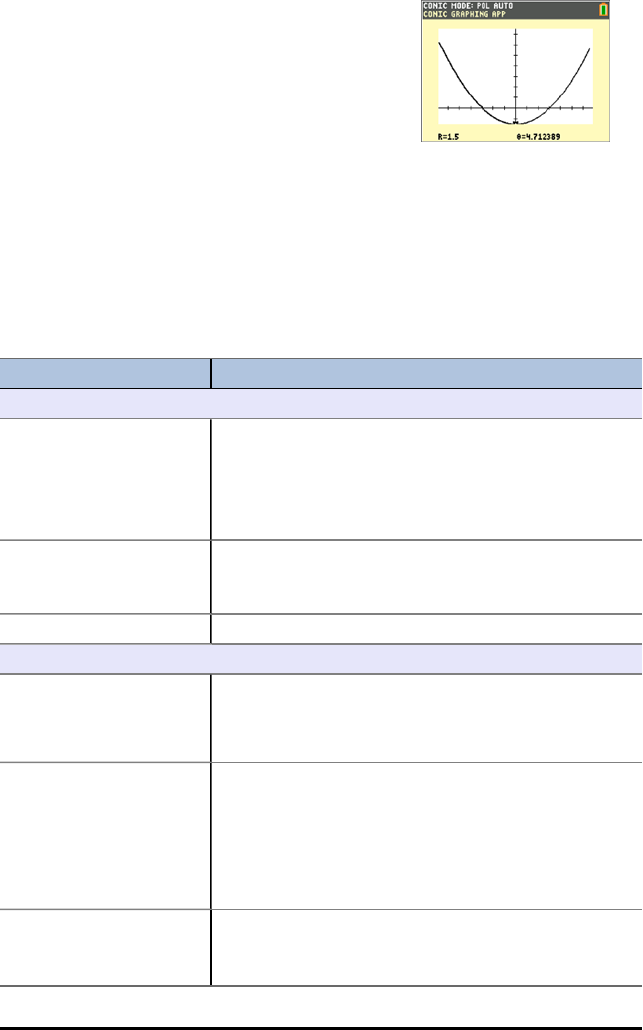
Parabola in Polar Form
1. From the circle, press [ESC] until you return to the
main menu.
Note: [ESC] does not appear on the graph screen but
pressing obehaves as [ESC].
2. Press ¶on the main CONIC screen for parabola
options. The equations for parabolas in polar form are
listed.
3. Select equation 3.
4. Enter the eccentricity, e, of the parabola to 1.
5. Change the p value to be 1.5.
6. Press the ƒ \ key. The context help line of
the status bar displays PRESS ALPHA SOLVE OR
GRAPH.
Note: Here, the solutions to parabola specific terms
are shown in polar form.
The solutions are computed in radian mode since the
calculator setting is in radian mode.
7. To recalculate in degree mode:
a) Quit the App. To quit the App, press y 5.
b) Press z.
c) Use the †key until RADIANis blinking.
d) Use the ~key to change the mode setting to
DEGREE.
e) Press Í.
8. Re-enter the App.
9. Repeat steps 2 and 3 above.
10. Press ƒ \ to show the difference.
11. Press the rkey and use the |~keys to move
along the curve.
Menus and Functions
• To quit the application select [QUIT] from the CONICS main menu. From any
CONICS screen, press y 5 several times to quit the App and return to the
home screen.
• Values you input in Conic Graphing are saved in an application variable (AppVar)
when you exit the application. The next time you run the application, the last
values you entered will display.
Menus/Menu Items Description
Conic Settings (Press z)
Type Select the calculator mode.
FUNC: Function plots functions where Y is a function of X.
PAR: Parametric plots relations where X and Y are
functions of T.
POL: Polar plots functions where R is a function of
Window Settings Select AUTO so that the windows change automatically.
Select MAN so that you can manually change window
settings.
Esc Return to the previous screen.
Main Menu
Circle A circle is the set of points in a plane whose distance
from a given fixed point in the plane is constant. The
fixed point is the centre of the circle; the constant
distance is the radius.
Ellipse An ellipse is the set of points whose distances from two
fixed points in the plane have a constant sum. The two
fixed points are the foci of the ellipse. The line through
the foci of an ellipse is the ellipse's focal axis. The point
on the axis halfway between the foci is the centre. The
points where the focal axis and ellipse intersect are the
ellipse's vertices.
Hyperbola A hyperbola is the set of points in a plane whose
distances from two fixed points in the plane have a
constant difference. The two fixed points are the foci of
Using Conic Graphing App 19
20 Using Conic Graphing App
Menus/Menu Items Description
the hyperbola. The line through the foci of the hyperbola
is the focal axis. The point on the axis halfway between
the foci is the hyperbola's centre. The points where the
focal axis and hyperbola cross are the vertices.
Parabola A set that consists of all the points in a plane equidistant
from a given fixed point and a given fixed line in the
plane is a parabola. The fixed point is the focus of the
parabola. The fixed line is the directrix. The point where
the focal axis intersects the parabola is the vertex.
Info Display the information screen, which contains the
application version number.
Quit Select QUIT to exit Conic Graphing.
Esc Select ESC to go back one screen.
Circle Menu
(X-H)2+ (Y-K)2= R2In FUNC mode, select this equation and input H, K and R.
AX2+ AY2+ BX + CY+ D =
0
In FUNC mode, select this equation and input A, B, C and
D.
X=Rcos(T)+H
Y=Rsin(T)+K
In PAR mode, select this parametric equation and input
H, K and R.
1:R+2Acos(0) In POL mode, select this polar equation and input A.
2:R=2Asin(0) In POL mode, select this polar equation and input A.
3:A2=B2+R2-2BRcos(0-b) Select this polar equation and input A, B and b.
[GRAPH] Select to graph the equation.
ƒ \ Display the centre and radius.
rTrace the circle.
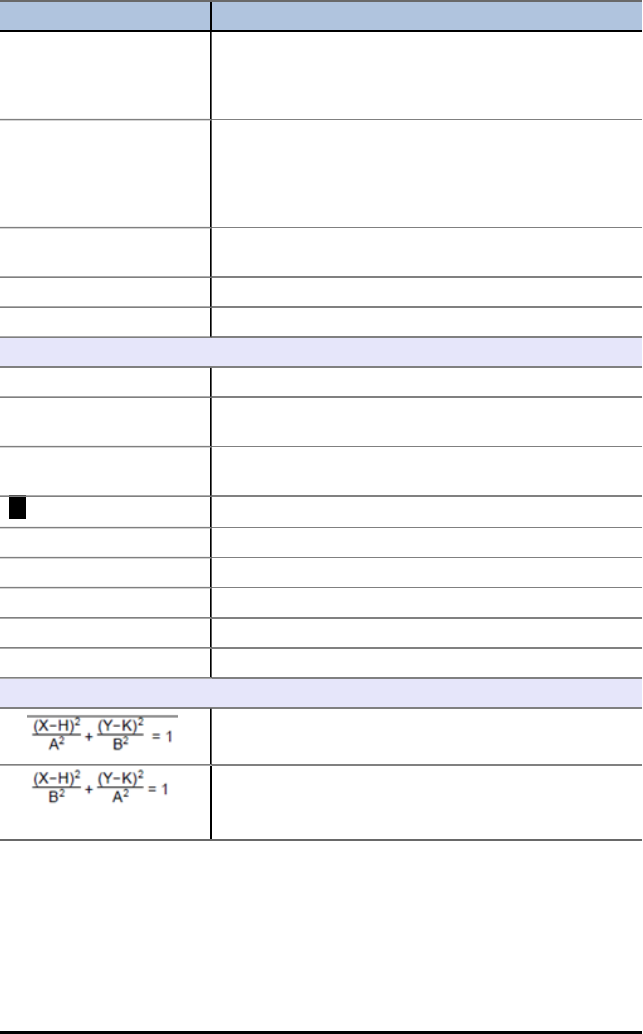
Ellipse Menu
1:
In FUNC mode, select this equation and input A, B, H and
K.
2:
In FUNC mode, select this equation and input A, B, H and
K.
Menus/Menu Items Description
In PAR mode, select this parametric equation and input
A, B, H and K.
In PAR mode, select this parametric equation and input
A, B, H and K.
In POL mode, select this polar equation and input e and
p.
In POL mode, select this polar equation and input e and
p.
In POL mode, select this polar equation and input e and
p.
In POL mode, select this polar equation and input e and
p.
[GRAPH] Select to graph the equation.
ƒ \ Display the centre and foci.
r ¤ Trace the orbit.
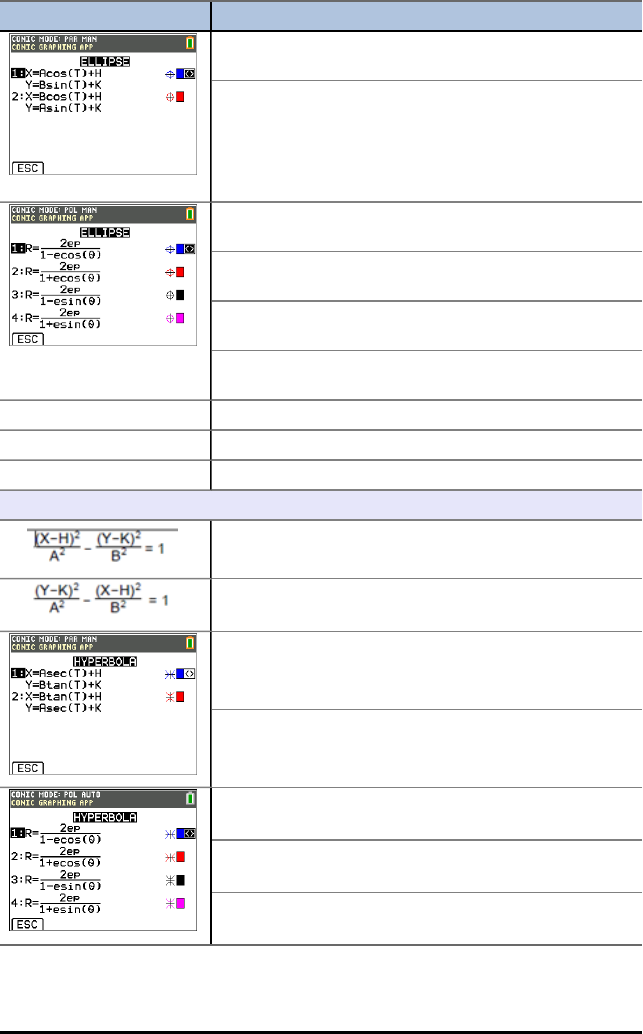
Hyperbola Menu
1:
In FUNC mode, select this function equation and input A,
B, H and K.
2:
In FUNC mode, select this function equation and input A,
B, H and K.
In PAR mode, select this parametric equation and input
A, B, H and K.
In PAR mode, select this parametric equation and input
A, B, H and K.
In POL mode, select this polar equation and input e and
p.
In POL mode, select this polar equation and input e and
p.
In POL mode, select this polar equation and input e and
p.
Using Conic Graphing App 21
22 Using Conic Graphing App
Menus/Menu Items Description
In POL mode, select this polar equation and input e and
p.
[GRAPH] Select to graph the equation.
ƒ \ Display the centre, vertices, foci and slope of the
asymptotes.
r ¤ Trace the hyperbola.
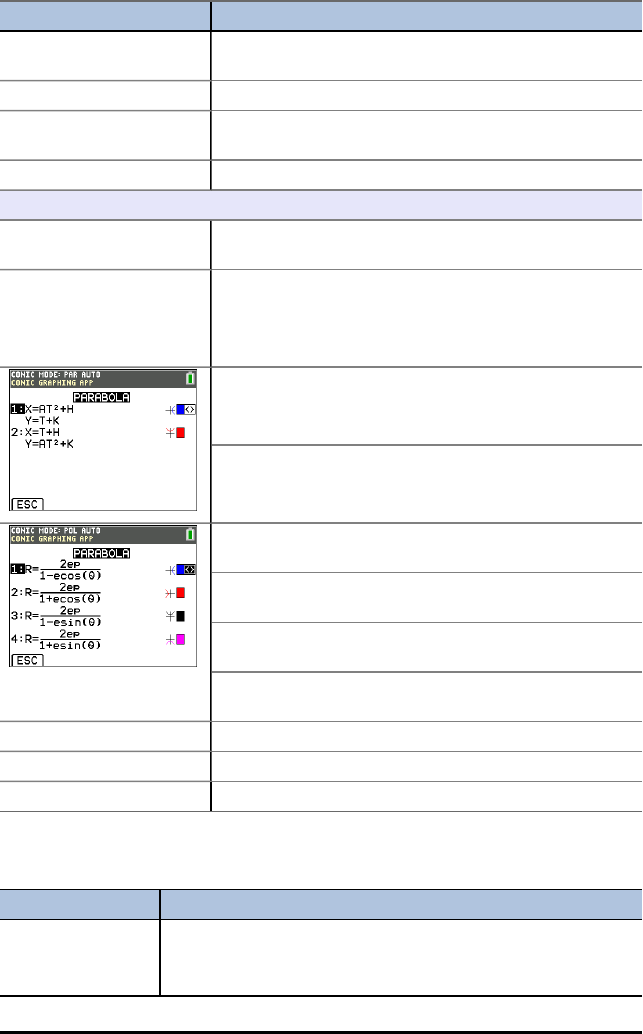
Parabola Menu
1: (Y-K)2= 4P(X-H) In FUNC mode, select this function equation and input A,
B, H and K.
2: (X-H)2= 4P(Y-K) In FUNC mode, select this function equation and input A,
B, H and K.
In PAR mode, select this parametric equation and input
A, H and K.
In PAR mode, select this parametric equation and input
A, H and K.
In POL mode, select this polar equation and input e and
p.
In POL mode, select this polar equation and input e and
p.
In POL mode, select this polar equation and input e and
p.
In POL mode, select this polar equation and input e and
p.
[GRAPH] Select to graph the equation.
ƒ \ Display the vertex, focus and directrix.
r ¤ Trace the trajectory.
Error Messages
All Equations
Error Message Description
The curve does not
display correctly or a
partial curve
The parameters you entered may be outside of the acceptable
range for the calculator.
If you changed the CONIC SETTINGS window settings mode to
Error Message Description
displays. MAN, press qand select Zoom Conic to redefine the window
settings.
Window range error
or zoom error.
Change the window parameters (Xmin,Xmax,Ymin,Ymax) so that
the window is larger or smaller, depending on the graph.
Invalid input Change the input to a valid value.
Requested zoom has
invalid results.
Change the window parameters (Xmin,Xmax,Ymin,Ymax) or
Xfact and Yfact zoom factors. You must exit Conic Graphing to
change the Xfact and Yfact zoom factors.
Invalid AppVar
CONICSD. Please
remove.
The application variable (AppVar) named CONICSD has been
corrupted or another application variable uses the same name.
Delete the AppVar or use TI Connect™ CE Software to remove it
and save it on your computer.
Error saving Conics
settings.
The AppVar CONICSD cannot be modified.
Delete the AppVar or use TI Connect™ CE Software to remove it
and save it on your computer.
Circles
Error Message Description
Allowed parameter
values: R ≥ 0.
Change the parameter so that R ≥ 0.
Allowed parameter
values: A ≥ 0.
Change the parameter so that A ≥ 0.
Values out of range
for computation.
Recheck window
settings.
Change the parameter so that b < 1E12 (occurs only in polar mode
in equation 3).
Parameters create a
non-real answer.
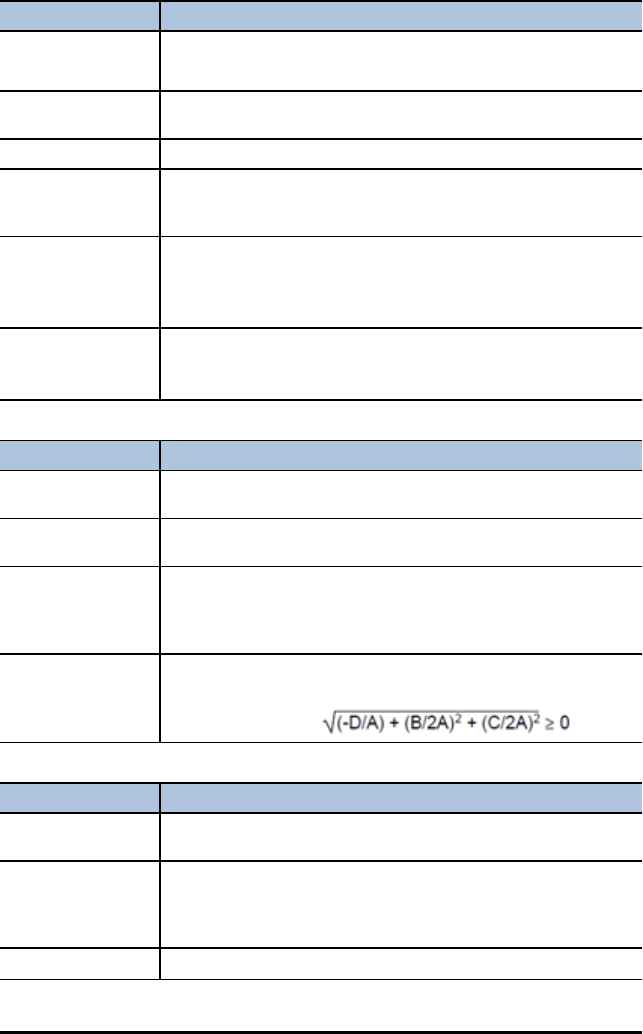
Change the parameters so that for the equation
AX2+AY2+BX+CY+D=0, the
following is satisfied:
Ellipses
Error Message Description
Allowed parameter
values: 0 < A < B.
Change the parameter so that A > B and B > 0.
Values out of range
for computation.
Recheck window
settings.
Change the parameter so that 0 < A < 1E50.
Allowed parameter Change the parameter so that e > 0 and e < 1.
Using Conic Graphing App 23
24 Using Conic Graphing App
Error Message Description
values: 0 < e < 1.
Allowed parameter
values: p ≠ 0.
Change the parameter so that p < 0 or p > 0.
Hyperbolas
Error Message Description
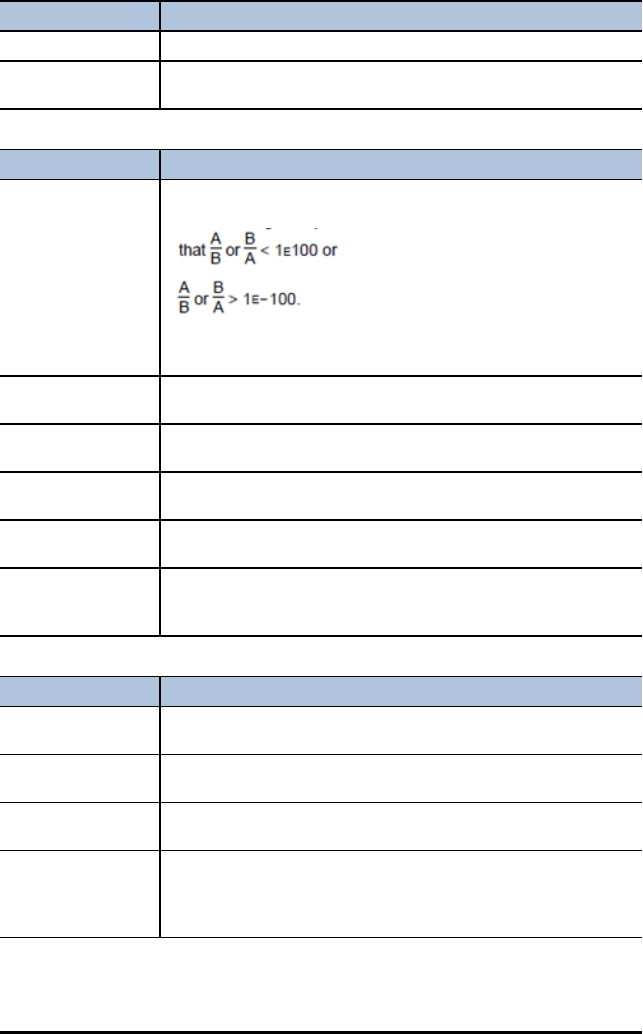
Values out of range
for computation.
Recheck window
settings.
If the calculator is in FUNC or PAR mode, change the parameters
so that
If the calculator is in POL mode, change the e or p parameter so
that e2or ep < 1E100.
Allowed parameter
values: A > 0.
Change the parameter so that A > 0.
Allowed parameter
values: B > 0.
Change the parameter so that B > 0.
Allowed parameter
values: e > 1.
Change the parameter so that e > 1.
Allowed parameter
values: p ≠ 0.
Change the parameter so that p < 0 or p > 0.
Window range error
or zoom error.
Change the window characteristics or change P so that the values
involved in the calculation do not exceed the calculator’s
limitations.
Parabolas
Error Message Description
Allowed parameter
values: A ≠ 0.
Change the parameter so that A < 0 or A > 0.
Allowed parameter
values: p ≠ 0.
Change the parameter so that p < 0 or p > 0.
Window range error
or zoom error.
Change the window parameters (Xmin,Xmax,Ymin,Ymax) and/or
the p value.
Values out of range
for computation.
Recheck window
settings.
Change the window parameters (Xmin,Xmax,Ymin,Ymax) and/or
the p value.
Using Vernier EasyData™ CE App
The EasyData™ CE App from Vernier Software & Technology enables single-sensor data
collection. The App auto-launches data collection when you connect supported Vernier
sensors to the mini-USB port on the graphing calculator. Built-in analysis and
experiments for supported Vernier sensors are available. Vernier EasyData™ supports
data collection with the CBR 2™ Motion Detector, the Vernier EasyTemp™ sensor, and
other Vernier sensors that use the Vernier EasyLink™ adapter.
For more information on compatible Vernier sensors, visit the Vernier sensor wizard.
Example Activity - Vernier EasyData™
Use this activity to learn the basics of the App.
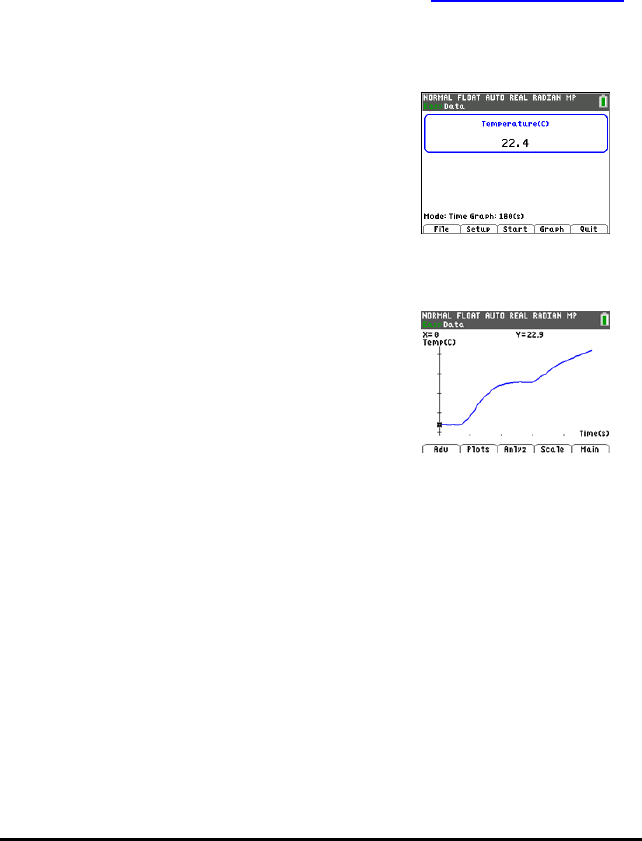
1. Connect the Vernier EasyTemp™ sensor to the
calculator. After a few seconds, the Vernier
EasyData™ main screen displays. This main screen
shows the current Vernier EasyData™ mode and the
current sensor reading in a meter format.
2. Select Start to start collecting data and then wait five
seconds.
3. Hold the tip of the Vernier EasyTemp™ sensor for
about 30 seconds. The graph shows the temperature
as it changes.
4. Select Stop to stop collecting data. Vernier
EasyData™ displays a scaled graph of the sampled
temperatures.
5. Press ~repeatedly to scroll the cursor to the right
and note the temperature at each data point.
6. When you finish exploring the graph, select Main to
return to the Vernier EasyData™ main screen.
Tip: On the graph screen, select [Anlyz] (q) to see all
the features to analyse the data.
Tip: On the main screen with the sensor reading in meter
format, press [Setup] (p) to choose activities
designed for the connected sensor.
7. Select Quit. A message indicates that Vernier
EasyData™ has stored the collected data in calculator
lists.
Menus and Functions
To quit the App, press [Quit] (s).
Using Vernier EasyData™ CE App 25
26 Using Vernier EasyData™ CE App
Menus Functions
Main Menu
File Save the data from an experiment or select New and Vernier
EasyData™ App restarts in the default data-collection mode and
the default settings are restored.
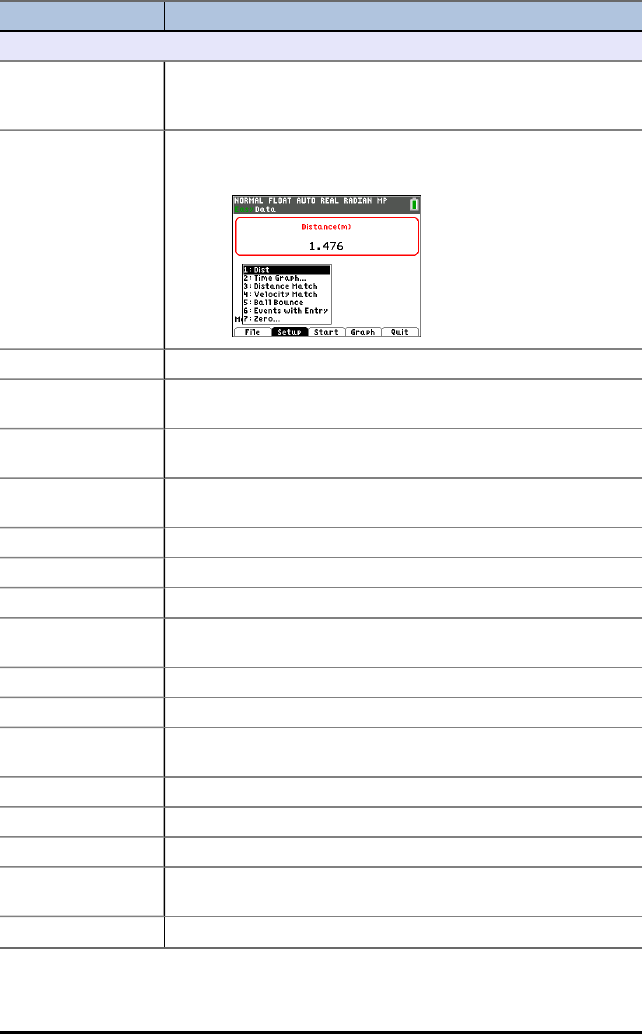
Setup Set up the experiment.
The menu will differ depending on the sensor. For example, for
connected CBR 2™ motion detector, the setup menu displays as
follows:
Time Graph Open the Time Graph Settings wizard.
Sample
Interval
Set the interval in seconds. Select Next to go to the next
setting.
Number of
Samples
Set the total number of samples to collect.
Experiment
Length
Set the length of the experiment in seconds.
Edit Edit the time graph settings.
Cancl Cancel your changes and return to the previous settings.
OK Return to the main menu.
Events with Entry Capture samples manually for a set of events that you define.
Each sampled value becomes a y-value; you enter the x-value.
Keep Capture the current sampled (y) value.
Enter value Assign an x-value to define the data point. Then select OK.
Stop Select Stop to end the experiment. The data points are
displayed as a graph (a calculator scatter plot).
Main Return to the main menu.
Zero Use the current data reading as a zero reference.
Start Start collecting data.
Stop Stop collecting data. A scaled graph of the collected data
appears.
Main Return to the main menu.
Menus Functions
Graph Graph the resulting equation.
Adv Select independent and dependent lists to plot various views of
the data.
Plots Plot options such as distance vs. time, velocity vs. time and
acceleration vs. time (dependent on sensor connected).
Anlyz Computes statistics on data collected and finds a variety of
regression fit to data (dependent on sensor connected).
Scale Options to auto-fit or manually edit the graph scaling.
Quit Quit the application. The collected data has been transferred to
the calculator’s lists.
Error Messages
Error Message Description
No Interface
Connection
• Firmly connect cables.
• Check the power.
• Choose Scan to retry.
• Choose None to continue without the interface.
• Choose Quit to exit the App.
The calculator could not recognise a valid connection to the data
collection device. Make sure a sensor is connected. Check all
physical connections, power supply and device batteries. Restore
the default settings:
On the Vernier EasyData™ App main screen, select File and then
select New.
No Data • A graph cannot be drawn because the data lists are empty.
A graph plot was requested without collecting any data. You can
display a graph only after you have run an experiment to store
data in the calculator memory.
Communications
Error
• Firmly connect cables.
• Check the power.
• Choose Field to search for interface and sensors.
• Choose Quit to exit the App.
Check all physical connections, power supply and device batteries.
Memory Error
There is insufficient
RAM to run the
Vernier EasyData™
App.
You need to delete items from the calculator memory.
Battery Level Recharge calculator battery in the calculator or replace batteries
Using Vernier EasyData™ CE App 27

28 Using Vernier EasyData™ CE App
Error Message Description
Calculator: Bad,
please replace
Data Collection
Device: Good
Battery Level
Calculator: Good
Data Collection
Device: Bad, please
replace.
in the data collection device.
Using Inequality Graphing App
The Inequality Graphing App adds enhanced features for graphing equations and
inequalities, and displays the relationships between them. Using the Inequality
Graphing application, you can:
• Enter inequalities using relation symbols
• Graph inequalities and shade the union and intersection regions
• Enter inequalities (vertical lines only) in an X=editor
• Trace points of interest (such as intersections) between relations
• Store (x,y) coordinate pairs to lists for viewing and optimizing functions for linear
programming
Example Activity – Inequality Graphing
Use this activity to learn the basics of the App.
1. To begin:
a) Press Œ.
b) Choose Inequalz.
c) Press any key to dismiss the splash screen.
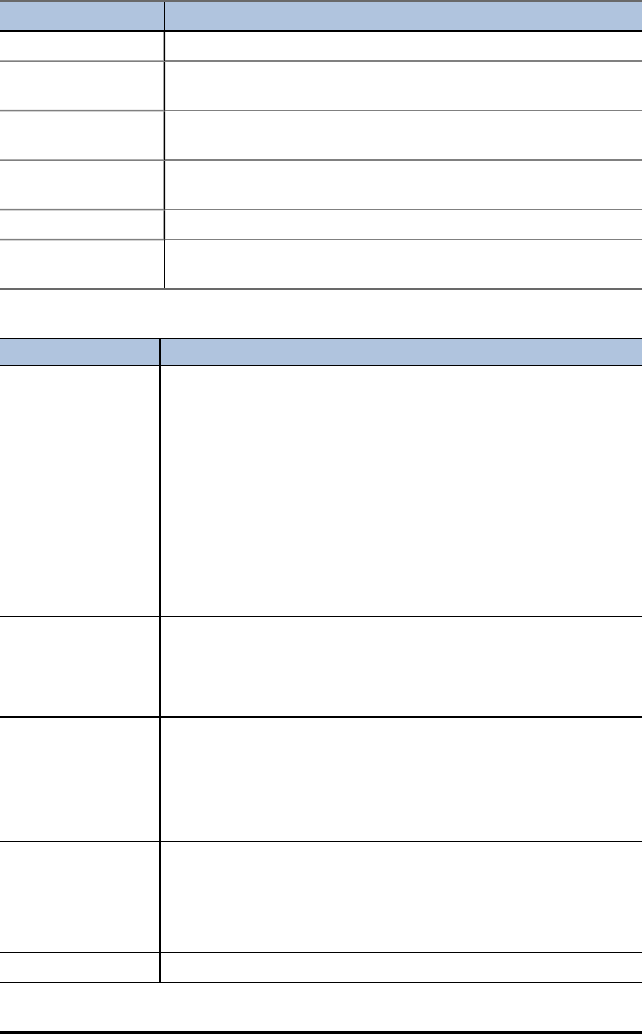
The cursor will blink over the = sign in the
enhanced inequality Y=editor.
Note: The context help line of the status bar gives
help such as :
SELECT RELATION: | Í. (See screen.)
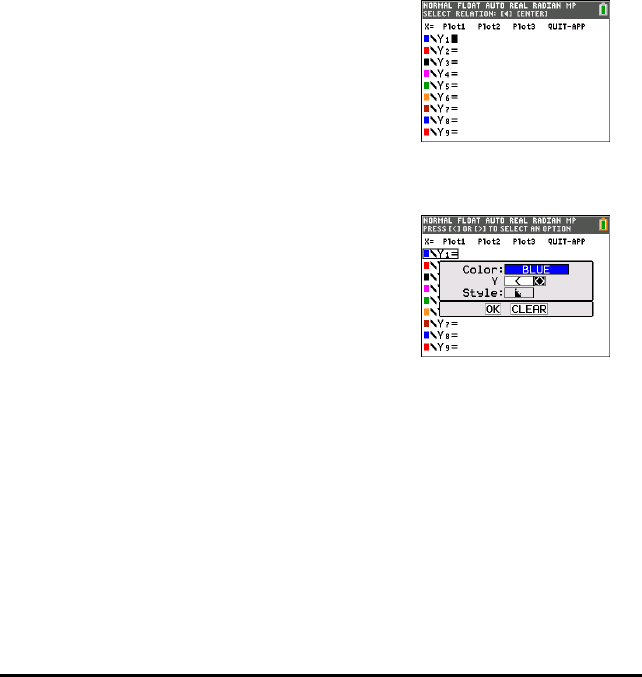
2. Press | Í to open the graph style dialog to
select the relation.
3. Press †to move the cursor to Y.
4. Press |or ~to change selections to "less than."
5. Press †to highlight OK.
6. Press Í.
Note: The TI-84 Plus CE version of Inequality
Graphing uses the same graph style setting dialog box
as the operating system. The context help line of the
status bar indicates PRESS [<] OR [>] TO SELECT AN
OPTION.
The TI-84 Plus C version relation selection uses
shortcuts F1-F5 to change the relation type.
Using Inequality Graphing App 29
30 Using Inequality Graphing App
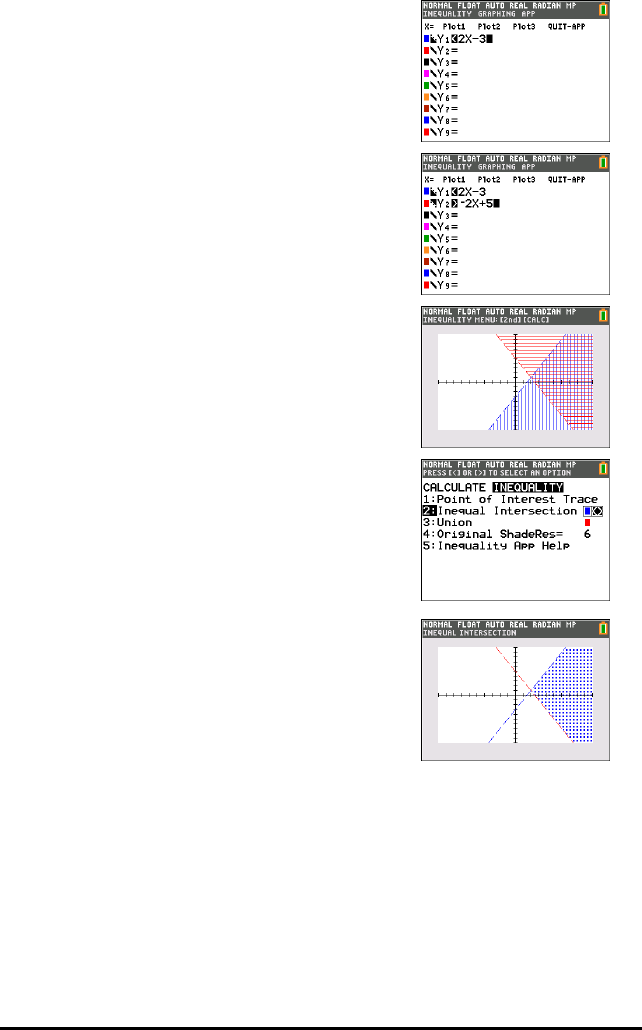
7. Press ~to move the cursor and enter
Y1<2x-3.
8. Repeat the steps above to change the relation of Y2
to "greater than" and enter
Y2> -2X+5.
9. Press sto view the shaded inequalities.
Note: The context help line of the status bar displays
INEQUALITY MENU: y /. This menu contains
the tools for an inequality intersection and other
features. The TI-84 Plus C version displays these tools
as shortcut [F1]-[F5] on the graph screen.
10. To find the intersection of the two inequalities:
a) Press y /.
b) Press ~to select the INEQUALITY menu.
c) Select 2:Inequal Intersection.
Notes:
• You can change the color of the intersection by
pressing [<] or [>] when the color spinner on the right
of the screen is blinking.
• Use the features on the INEQUALITY menu to find
Point of Interest Trace, which gives the intersection
point(s) of the boundaries of the regions shaded.
• Use the Union feature on the INEQUALITY menu to
display the union of the regions. Use Original Shade
to display the original shading of the regions.
Note: The Inequality menu features are accessed with
shortcut keys [F1]-[F5] on the graph screen in the TI-84
Plus C version.
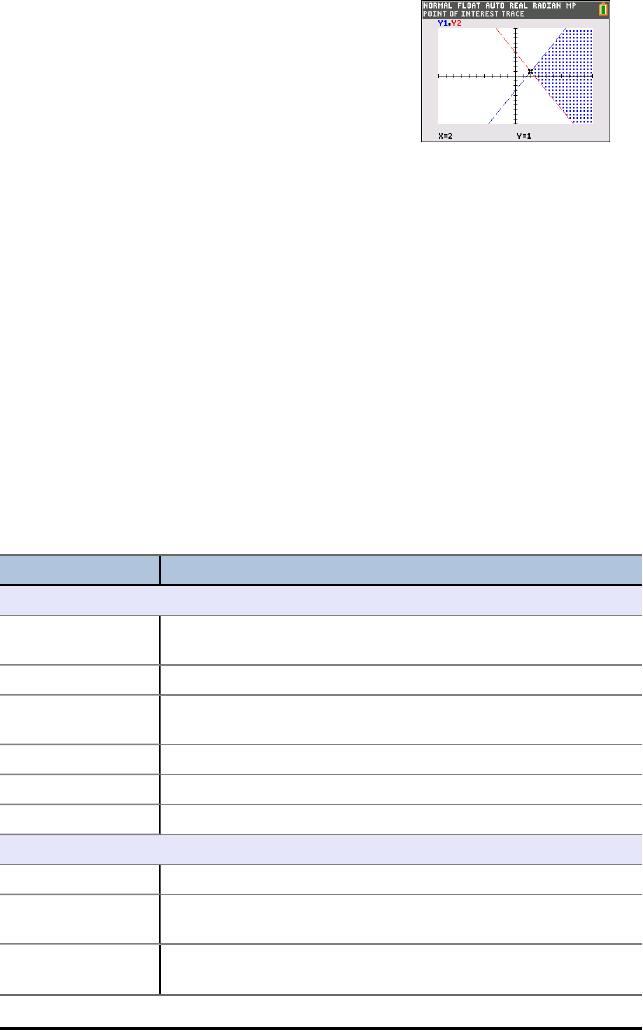
11. To examine the intersection of the boundaries of the
two regions:
a) Press y /.
b) Press ~to select the INEQUALITY menu.
c) Select 1: Point of Interest Trace.
Notes:
• Since both Y1and Y2are strict inequalities, the
notation used in the expression area is Y1, Y2, which
is called a point of interest. If point of interest is an
intersection of a boundary included in the region,
the notation will display the intersection symbol.
• If more than one point of interest is in the graph
area, use the arrow keys to trace point to point. Not
all points of interest may be located if boundaries are
non-linear.
Menus and Functions
• To quit the App, select the QUIT-APP option at the upper-right of the Y=screen.
Select 2:Quit Inequal at the prompt.
• Inequality Graphing App and Transformation Graphing App cannot run at the same
time since they enhance the Function Mode of the oeditor. If the Apps are in
conflict, follow the prompts to quit the conflicting App, which will allow the other
App to run as an enhanced oeditor.
Menus Functions
Graph/Plot Setup Keys
Y= Displays the Y= Editor, where you can enter one or more
inequalities to graph and change the graph color and line style.
X= Graph a vertical inequality.
Window Set the viewing window to produce the best display of your
graph.
Zoom Quickly adjust the window to a pre-defined setting.
Trace Move the cursor along the graphed function using |and ~.
Graph Display the graph you have defined..
Inequality Menu
INEQUALITY
1: Point of Interest
Trace
Trace points of interest (such as intersections) b.etween
relations.
2: Inequal
Intersection
Display the intersection of the inequalities and select the color
of the shading.
Using Inequality Graphing App 31
32 Using Inequality Graphing App
Menus Functions
3: Union Display the combined area of the inequalities and select the
color of the shading.
4: Original
ShadeRes=
Return to the original inequality graph.
5: Inequality App
Help
Help for Inequality Graphing.
Quit Menu
1: Continue
Running
Continue using the Inequality Graphing app.
2: Quit Quit the App.
3: About Display the opening screen with version number information.
Error Messages
Error Message Description
ERR: MEMORY 600
Bytes Free RAM
Needed
1: Quit Inequal
The calculator does not have enough free RAM to create the
INEQVAR AppVar. Delete some items to free at least 600 bytes of
RAM.
Conflicting APPS
1: Quit Inequal
2: Quit Apps listed
below
One or more applications that are currently running use the same
resources as the Inequality Graphing application. To run the
Inequality Graphing application, you must quit the conflicting
application(s).
ERR: INEQVAR
1:Overwrite
2:Quit Inequal
An AppVar named INEQVAR already exists, but it is not related to
this application. Select one of the following options: 1. Overwrite
to overwrite the current AppVars. 2. Quit Inequal to quit the
application. Inequality Graphing will not run without the correct
version of INEQVAR. You must either rename the existing AppVar
or let Inequality Graphing overwrite it.
ERR: Data Type
1: Quit
2: Goto
An X-variable (in the X=editor) evaluates to a number that is not
real. Select one of the following options:
1. Quit to restore the previous value for that X-variable.
2. Goto to change the X-variable so that it evaluates to a real
number.
ERR: Divide by 0
1:Quit
2:Goto
You have entered an expression on the Y=Editor or X=Editor that
is divided by zero. Select one of the following options:
1. Quit to restore the previous value for that X-variable.
2. Goto to change the expression so that it evaluates to a real
number.
Using Periodic Table App
This App provides a graphical representation of the elements of the Periodic Table.
Note: This guide uses the CRC Handbook of Chemistry and Physics, 94th Edition.
This application allows you to:
• Observe and explore the Periodic Table of the Elements
• Find property data and useful information about the known elements
• Sort the elements by atomic number, alphabetically by name, or alphabetically by
symbol
• Identify groups of elements by region (noble gasses, halogens, etc.) and block (p-,
d-, s- and f-)
• Export property data to lists for further analysis
• Graph the major properties (atomic radii, electronegativities, etc.) against atomic
number to illustrate the periodic nature of the elements
Example Activity – Periodic Table
Use this activity to learn the basics of the App.
Tip: Options display at the bottom of the screen to help
you navigate and perform specific tasks.
To select one of these options, press the graphing key
directly below it.
For example, to select [TBL], press r.
1. To begin:
a) Press Œ.
b) Choose Periodic using the }†keys.
c) Press any key to dismiss the splash screen.
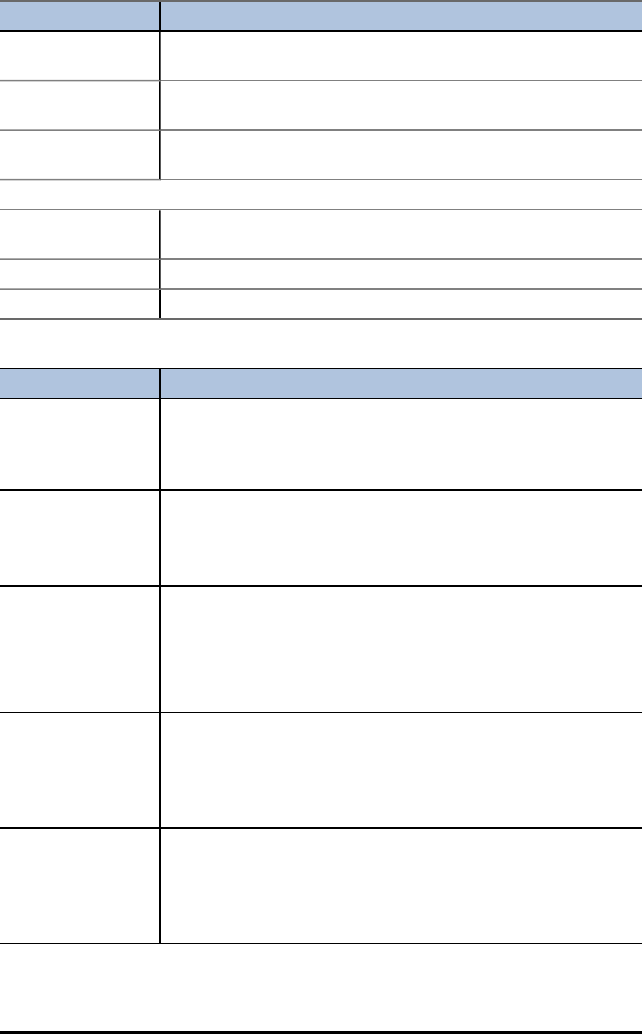
2. To find a specified element:
a) Use |~}†to find the element.
b) Press Í.
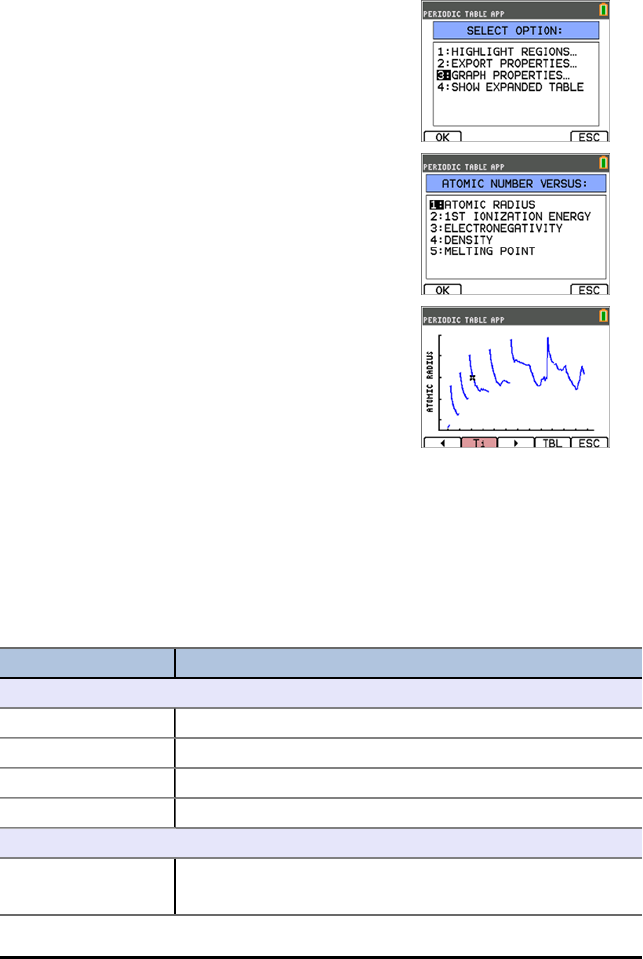
c) Use the }†keys to examine and explore 15
properties of the specified element.
Using Periodic Table App 33
34 Using Periodic Table App
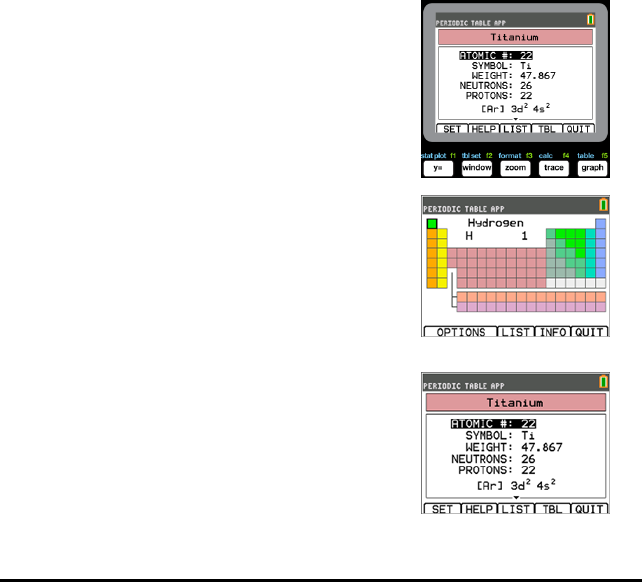
3. Press [TBL] (r) to return to the main Periodic
Table screen.
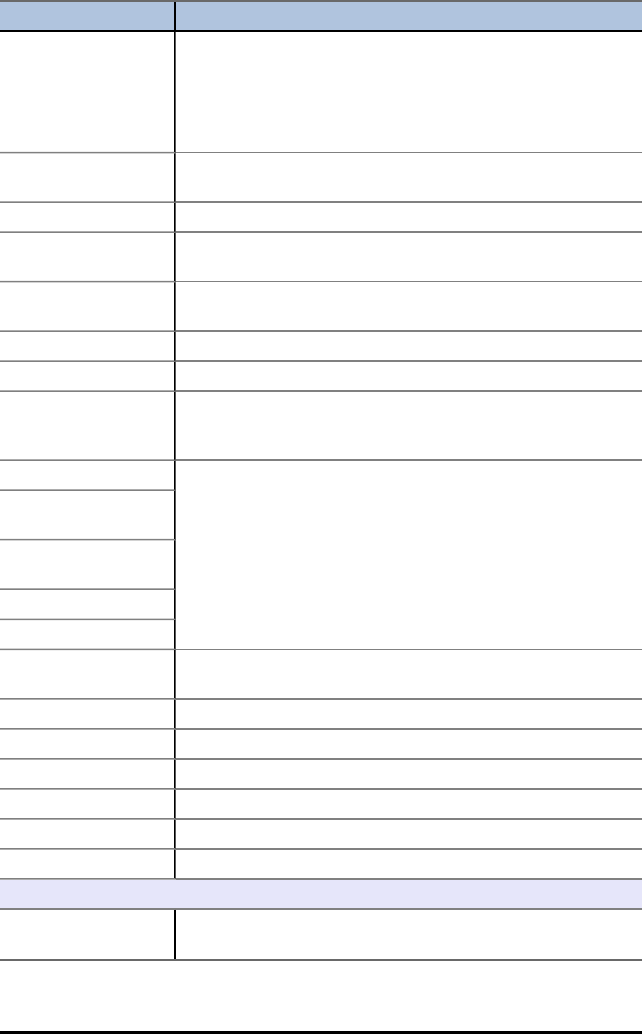
4. Press [OPTIONS] (p).
5. Choose GRAPH PROPERTIES.
6. Choose ATOMIC RADIUS.
7. Use |~to explore how atomic radius relates to
each element (notice that the element symbol
changes in one of the “soft keys”). This graph is
patterned to show distinct regions; in this case, it
shows the elements that occupy the lower points of
each region.
8. Press [TBL] (r) to return to the Periodic Table
main screen.
9. Press [QUIT] (s) to quit the app.
Menus and Functions
• The app will continue running until it is turned off. Press Œand then select
Periodic. Select 2: Quit Periodic.
Menus Functions
Periodic Table
Options Select the options menu.
List Display the list of elements.
Info Display the opening screen with the version number.
Quit Exits the Periodic Table application.
Option Menu
1: Highlight
Regions...
Select one region to highlight on the Periodic Table.
The regions are: ALL, ALKALI METALS, ALKALINE METALS,
Menus Functions
TRANSITION
ELEMENTS, INNER-TRANSITION, HALOGENS, NOBLE GASES,
METALLOIDS, NON-METALS, ACTINIDE SERIES, LANTHANIDE
SERIES,
and METALS
2: Export
Properties...
Creates two lists, each with 118 items. ÙNUM, contains the
atomic numbers for every element.
1:Atomic Radius Select to create the second list ÙRAD..
2: 1st Ionization
Energy
Select to create the second list ÙION.
3:
Electronegativity
Select to create the second list ÙENEG.
4: Density Select to create the second list ÙDEN
5: Melting Point Select to create the second list ÙMP.
3: Graph Properties... Select the property values included in a Y list. The calculator
graphs the Y-list versus the constant X list labeled ATOMIC
NUMBER.
1:Atomic Radius Highlight one of the options as the Y-list and select OK to
display the graph. Select |or ~to trace the graph.
2: 1st Ionization
Energy
3:
Electronegativity
4: Density
5: Melting Point
4: Show Expanded
Table
SHighlights the s-block of elements
DHighlights the d-block of elements ¤
PHighlights the p-block of elements ¤
FHighlights the f-block of elements ¤
OK Select the block.
ESC Returns to the Periodic Table.
Element Detail Screen
Set While highlighting any numerical value on this menu, select
SET to send the value to your calculator’s home screen.
Using Periodic Table App 35

36 Using Periodic Table App
Menus Functions
Help Displays units of measurement and definitions.
List Displays a LIST of the Periodic Table elements.
Tbl Returns to the Periodic Table.
Quit Exits the Periodic Table application.
List Menu
Reset Reset list to sort by the default setting: atomic number.
Sort Sort the list by atomic number, name, or symbol.
Tbl Returns to the Periodic Table.
Quit Exits the Periodic Table application.

Using Polynomial Root Finder & Simultaneous Equation
Solver App
The Polynomial Root Finder & Simultaneous Equation Solver application:
•Calculates the roots (zeros) of polynomials of degree 1 through 10, with a
convenient, easy to use interface.
You can enter the coefficients to a polynomial to solve, store solutions into lists,
load lists into the App as coefficients, and store the polynomial to a Y-Var to graph
after quitting the App.
•Finds solutions to systems of linear equations.
You can enter a system of equations to solve, load matrices containing the
coefficients of a linear system, and identify whether a given system has a unique
solution, an infinite number of solutions, or no solution.
Using Polynomial Root Finder & Simultaneous Equation Solver App 37
38 Using Polynomial Root Finder & Simultaneous Equation Solver App
Example Activity – Polynomial Root Finder
Use this activity to learn the basics of the App.
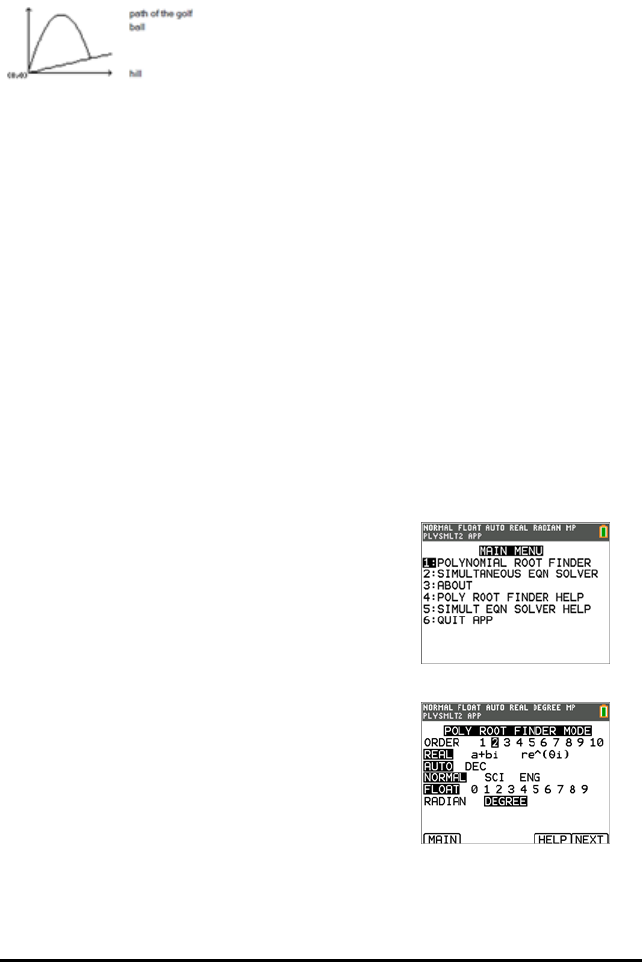
A golfer hits a golf ball from a tee at the bottom of a hill.
You can describe the hill by y(x) =0.8x.
The ball follows the path y(x) = -x2+ 12x.
If the golfer is standing at the tee (0, 0) and hits the ball, where does the ball hit the
ground on the hill?
First, equate the two equations:
x2+ 12x = 0.8x
-x2+ 11.2x = 0
The roots of the resulting polynomial will give the intersection points of the ball path
and the hill.
1. Press Œto display a list of applications on your
calculator.
2. Select PlySmlt2.
The ABOUT screen displays.
3. Press any key to continue.
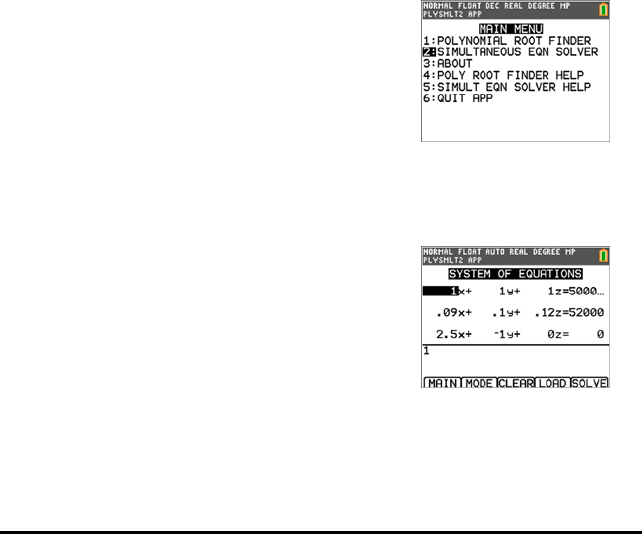
The MAIN MENU displays.
4. Select POLYNOMIAL ROOT FINDER.
5. Select the degree of the polynomial as ORDER 2.
6. Press NEXT(s). Enter the coefficients of -
x2+11.2x=0.

Note: You can also change the operation in the
polynomial as needed.
7. Select SOLVE (s) to calculate and display the
roots. Two answers are displayed in fraction form as
shown. Press [Fe3 4D] (s) to toggle to the decimal
results:
x1 = 0 and x2 = 56/5
Note: If you exit the application, graph the two
functions and find their intersection (press y
/and then select Intersect), you can see that the
ball starts at (0, 0) and hits the hill at (11.2, 8.96).
Using Polynomial Root Finder & Simultaneous Equation Solver App 39
40 Using Polynomial Root Finder & Simultaneous Equation Solver App
Example Activity – Simultaneous Equation Solver
Use this activity to learn the basics of the App.
A small corporation borrowed £500,000 to expand its product line. Some of the money
was borrowed at 9% interest, some at 10% and some at 12%. How much was
borrowed at each rate if the annual interest was £52,000 and the amount borrowed at
10% was 2.5 times the amount borrowed at 9%?
Let x = amount of money borrowed at 9%
y = amount of money borrowed at 10%
z = amount of money borrowed at 12%
1. Write an equation for each of the statements:
x + y + z = 500,000
0.09x + 0.1y + 0.12z = 52,000
2.5x – y = 0
2. Press Œto display a list of applications on your
calculator.
3. Select PlySmlt2. The information screen displays.
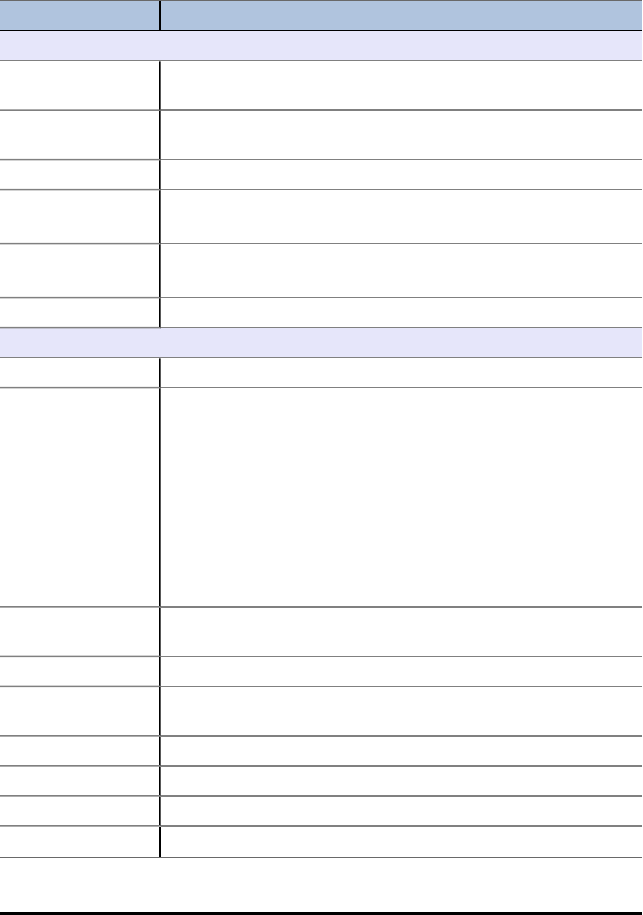
4. Press any key to continue. The MAIN MENU displays.
5. Select Simultaneous Eqn Solver.
6. Select 3 equations and 3 unknowns on the
Simultaneous Equation Solver Mode screen. Press
NEXT to continue.
7. Enter the coefficients for the variables and the
constants in the equation. Press Íafter each
entry to move the cursor to the next position.

8. Select SOLVE ( s) to solve the system of
equations. You see that the corporation borrowed
£100,000 at 9%, £250,000 at 10% and £150,000 at
12%.
Using Polynomial Root Finder & Simultaneous Equation Solver App 41
42 Using Polynomial Root Finder & Simultaneous Equation Solver App
Menus and Functions
• To display the MAIN MENU, select Menu (s).
• To exit the application, select Quit App from the MAIN MENU.
Menus Functions
Main Menu
1: Polynomial Root
Finder
Open the Polynomial Root Finder app.
2: Simultaneous
Eqn Solver
Open the Simultaneous Equation Solver app.
3: About Display the home screen with the version number.
4: Poly Root Finder
Help
Help file for Polynomial Root Finder.
Press y 5 to return to the Main Menu.
5: Simult Eqn
Solver Help
Help file for Simultaneous Equation Solver.
Press y 5 to return to the Main Menu.
6: Quit App Closes the app and returns to the calculator home screen.
Polynomial Root Finder Modes
Order Set from 1 to 10.
Real / a+bi / re^θi Real mode does not display complex results. If you select this
mode setting and the answer is complex, the result displays as
NONREAL.
a+bi (rectangular complex) mode displays complex numbers in
the form
a+bi. You may need to press ~to display all of the complex
number.
re^θi (polar complex) mode displays complex numbers in the
form of re^θi. You may need to press ~to display all of the
complex number.
Auto / Dec AUTO displays answers in a similar format as the input. DEC
displays answers as integers or decimal numbers.
Normal / Sci / Eng Set the notation mode to Normal, Scientific or Engineering.
Float Floating decimal mode displays up to 10 digits, plus the sign and
decimal.
Radian / Degree Interpret angle values and display answers in radians or degrees.
Main Display the main menu.
Help Display the help screen.
Next Go to the next screen – Polynomial coefficient entry.
Menus Functions
Main MAIN displays the main menu.
Mode Return to the mode screen.
Clear Clear all of the coefficient values that you have entered.
Load Enter a list name that contains the coefficient values you want
to use. You must set up the list in the list editor before you can
use the list in the Polynomial Root Finder application. You
cannot access the list editor while the application is running.
Solve
Main MAIN displays the main menu.
Mode Return to the mode screen.
Coeff Change the coefficient.
Store Store the coefficients to a list, store polynomial to Y= or store
roots to a list.
Convert values from fraction to decimal.
Simultaneous Eqn Solver
Equations Set the number of equations.
Unknowns Set the number of unknowns.
Auto / Dec AUTO displays answers in a similar format as the input. DEC
displays answers as integers or decimal numbers.
Normal / Sci / Eng Set the notation mode to Normal, Scientific or Engineering.
Float Floating decimal mode displays up to 10 digits, plus the sign and
decimal.
Radian / Degree Interpret angle values and display answers in radians or degrees.
Main Display the main menu.
Help Display the help screen.
Next Go to the next screen – System of Equations.
Main MAIN displays the main menu
Mode Return to the mode screen.
Clear Clear all of the matrix values that you have entered.
Load Enter a matrix name that contains the matrix values you want to
use. You must set up the matrix in the matrix editor before you
can use the matrix in the app. You cannot access the matrix
editor while the application is running.
Using Polynomial Root Finder & Simultaneous Equation Solver App 43
44 Using Polynomial Root Finder & Simultaneous Equation Solver App
Menus Functions
Solve Solve the system of equations. The entire solution may not fit on
one screen. If an arrow displays on the left side of the screen,
press †and }as necessary to view the entire solution. Each
line of the matrix may not fit on the screen. Press ~to scroll to
the right to view the part of the line that is off the screen.
Main MAIN displays the main menu.
Mode Return to the mode screen.
Sysm Display the system of equations screen so you can view or
change the values.
Store Store the system matrix or the solution matrix.
rref Display the reduced row-echelon form of a matrix that has either
no solution or infinite solutions.
Main Display the main menu.
Back Return to the solution set.
Sysm Display the matrix entry screen so that you can view or change
the values.
Store rref Store the reduced row echelon form of a matrix to a matrix
variable that you select.
Using Probability Simulation App
Explore probability theory with animation that simulates the following:
• Toss coin
• Roll dice
• Pick marbles
• Spin spinner
• Draw cards
• Generate random numbers
Options include:
• Display of Data:
- Bar Graph
- Table of trials data
• Settings
- Customize simulation
- Number of trials
- Weighting
You can save simulation data to lists for further exploration.
Example Activity – Toss Coins Simulation
Tip: Options display at the bottom of the screen to help
you navigate and perform specific tasks.
To select one of these options, press the graphing key
directly below it.
For example, to select [TBL], press s.
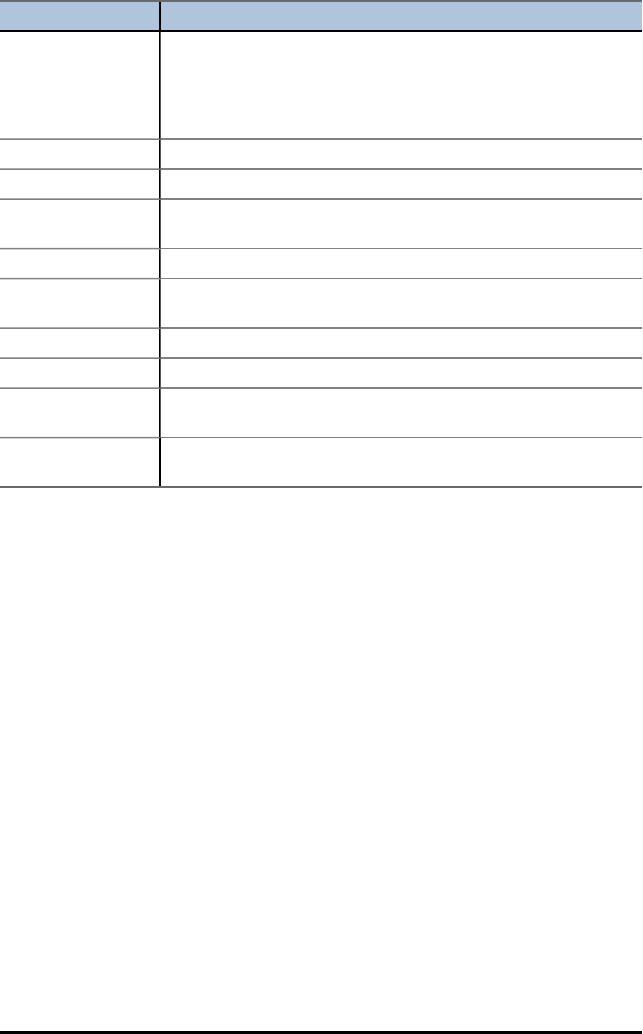
1. Press Œ.
2. Choose Prob Sim.
3. Choose 1: Toss Coins.
Using Probability Simulation App 45
46 Using Probability Simulation App
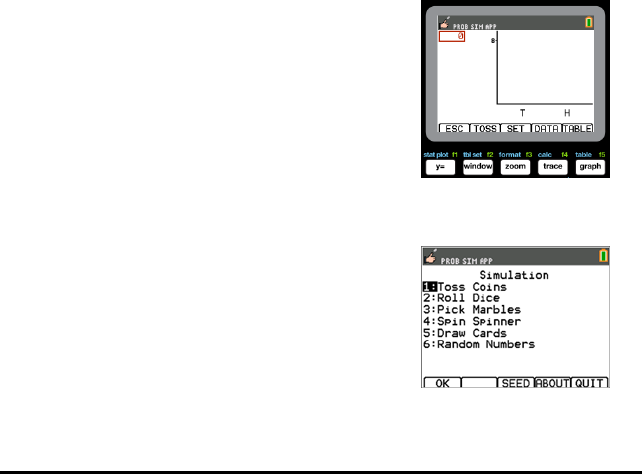
4. Use the following key presses for this App:
•ESC to move to previous screen
•TOSS to toss one coin and access more tosses
•SET to get to the Settings screen (see below)
•DATA to store the collected data to a list
•TABL to show a table of the trials
•GRPH to show a graph of the trials
Note: You can toggle between the table and the
graph.
5. Change these settings depending on what values are
needed for the simulation. Press ADV from the
Settings screen to change the weight of the coins.
6. Currently, the coins are equally weighted. Press OK
when the settings and the weight for the simulation
are appropriate. Next, press TOSS .
7. One coin will toss. Now, press +1,+10, or +50
depending on the data you wish to collect. The
Frequency Graph updates with each coin toss. Press
<ESC> when finished tossing the coins for this
simulation.
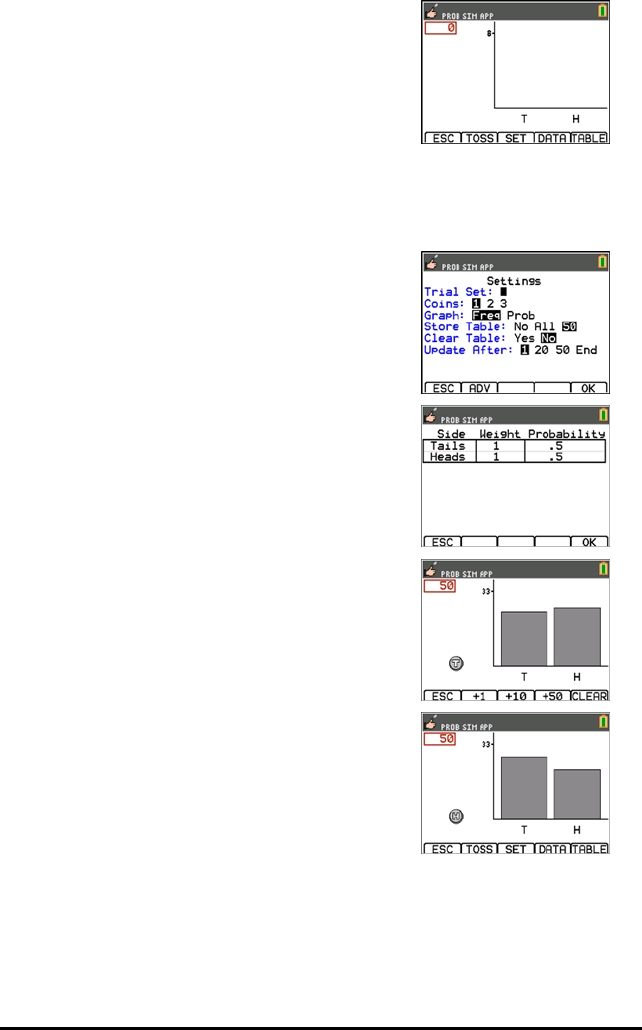
8. Next, press ESC and examine the table (TABL) or use
DATA to store the data into lists.
9. Press TABL to see the value for each toss and the
cumulative number of heads for the number of trials.
10. Press DATA to store the data in lists, which can be
accessed later in the List Editor. The values of 0 for
Tails and 1 for Heads are stored in list LC1.
11. Next, quit the App by pressing OK, <ESC, YES, QUIT,
YES. Make sure to save the data in lists (as shown
above) so the simulation remains in memory when
you turn the graphing calculator off.
Menus and Functions
Each simulation has features appropriate for the type of simulation. The table below is
a quick guide to see the features and options in each simulation.
• The main menu will appear when you open the App.
• Press ESC (press o) and YES (press o) to return to the main menu from a
simulation.
• To exit the application, select QUIT (press s) from the main menu.
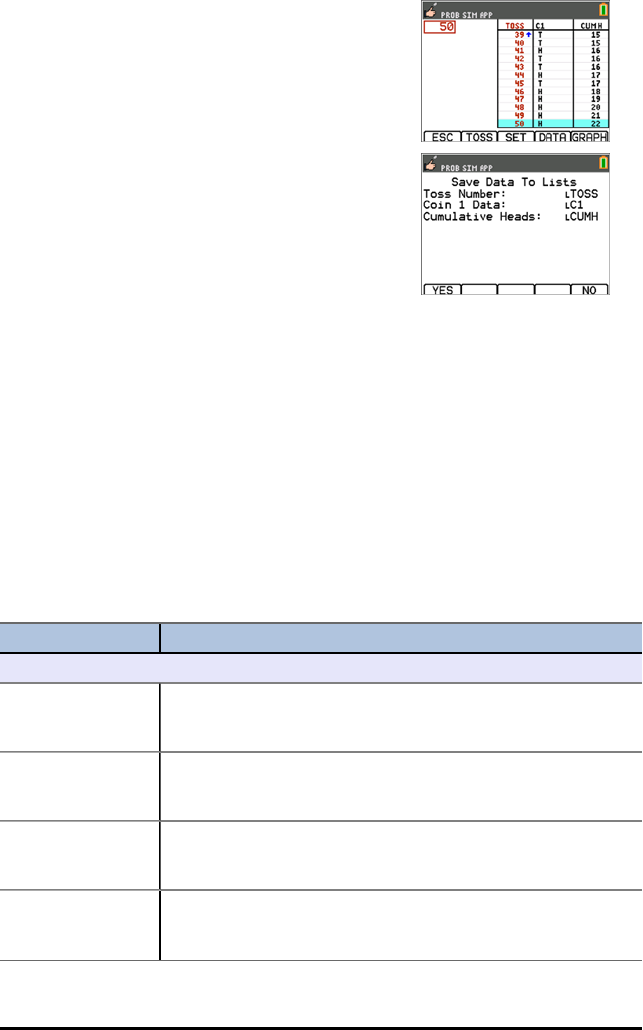
Menus Functions
Main Menu
Toss Coins Creates a simulation of a two-sided coin toss, and you have the
option to weight the sides of the coin. You can flip up to 3 coins
at once, and the number of heads is tallied.
Roll Dice Creates a simulation of rolling up to three dice. The type of dice
includes 6, 8, 10, 12, and 20 sides. The sum of the faces is
tallied.
Pick Marbles Creates a simulation of picking up to 5 different marbles from a
bag. The simulation can run with or without replacement. The
number of each type of marble in each pick is tallied.
Spin Spinners Creates a simulation of one spinner with between 2 and 8
sections. Each section can be weighted. The spinner results are
tallied.
Using Probability Simulation App 47
48 Using Probability Simulation App
Menus Functions
Draw Cards Creates a simulation of drawing one card at a time from a 52- or
32-card deck. For each pick, the number and suit are tallied. The
draw of a card from the deck can be set with or without
replacement from each draw. You can only use one deck at a
time.
Random Numbers Generates (draws) a set of up to 6 random numbers. The number
range can be set from 0 to 99. Repetition or no repetition of
numbers from the range can be set as an option. Each draw of
the random set is tallied on the screen.
OK Open the selected simulation.
SEED Set the random seed value.
ABOUT App version number information.
QUIT Exit the application.
Toss Coins
ESC Return to the previous screen
TOSS Toss one coin and access more tosses.
SET (Settings) Change the settings for the simulation.
Trial Set Tosses coin(s) as per trial settings and allows shortcut option to
toss +1, +10, or +50 more tosses to add on to the simulation.
Enter trial value from 1 to 999 tosses.
Coins Set the number of coins tossed per trial to 1, 2, or 3.
Graph Set graph display to frequency or simulated probability. Use right
and left arrows on the bar graph view to display these values.
StoTbl (Store
Table)
Set to No, All, or 50 to control the trials displayed in the table
view.
ClearTbl (Clear
Table)
Set to Yes if you want to clear the data of an existing simulation.
Updates
(Update After)
Number of trials before the graph and data are updated.
DATA Save the collected data to a list.
TABLE Show a table of the trials.
GRAPH Show a graph of the trials.
Roll Dice
ESC Return to the previous screen
ROLL Rolls a die or dice as per trial settings and allows shortcut option

Menus Functions
to toss +1, +10, or +50 more rolls to add on to the simulation.
SET (Settings) Change the settings for the simulation.
Trial Set Enter trial value from 1 to 999.
Dice Set the number of die or dice tossed per trial to 1, 2, or 3.
Sides Set number of sides to 6, 8, 10, 12, or 20.
Graph Set graph display to frequency or simulated probability. Use right
and left arrows on the bar graph view to display these values.
StoTbl (Store
Table)
Set to No, All, or 50 to control the trials displayed in the table
view.
ClearTbl (Clear
Table)
Set to Yes if you want to clear the data of an existing simulation.
Updates
(Update After)
Number of trials before the graph and data are updated.
DATA Save the collected data to a list.
TABLE Show a table of the trials.
GRAPH Show a graph of the trials.
Pick Marbles
ESC Return to the previous screen
PICK Pick number of marbles as per trial settings.
SET (Settings) Change the settings for the simulation.
Trial Set Enter trial value from 1 to 999.
Types Set the number of different types of marbles in the simulation to
1, 2, or 3.
Graph Set graph display to frequency or simulated probability. Use right
and left arrows on the bar graph view to display these values.
StoTbl (Store
Table)
Set to No, All, or 50 to control the trials displayed in the table
view.
ClearTbl (Clear
Table)
Set to Yes if you want to clear the data of an existing simulation.
Replace Yes: Replaces the marble after it is drawn. No: The marble is
removed when it is drawn.
Updates
(Update After)
Number of trials before the graph and data are updated.
DATA Save the collected data to a calculator list.
Using Probability Simulation App 49
50 Using Probability Simulation App
Menus Functions
TABLE Show a table of the trials.
GRAPH Show a graph of the trials.
Spin Spinner
ESC Return to the previous screen.
SPIN Spins the spinner as per trial settings and allows shortcut option
to toss +1, + 10, or +50 more spins to add on to the simulation.
SET (Settings) Change the settings for the simulation.
Trial Set Enter trial value from 1 to 999.
Sections Set the number of sections of the spinner from 2 to 8 sections.
Graph Set graph display to frequency or simulated probability. Use right
and left arrows on the bar graph view to display these values.
StoTbl (Store
Table)
Set to No, All, or 50 to control the trials displayed in the table
view.
ClearTbl (Clear
Table)
Set to Yes if you want to clear the data.
Updates
(Update After)
Number of trials before the graph and data are updated.
DATA Save the collected data to a list.
TABLE Show a table of the trials.
GRAPH Show a graph of the trials.
Draw Cards
ESC Return to the previous screen
DRAW Draw one card.
SET (Settings) Change the settings for the simulation.
Decks Set to 1, 2, or 3 decks.
Replace Yes: Replaces the card after it is drawn.
No: The card is removed when it is drawn.
Deck Size Set the card deck size to 52 or 32 cards.
DATA Save the collected data to a list.
CLEAR Clear all trials from memory.
Random Number Sets
ESC Return to the previous screen.
Menus Functions
Draw Roll one dice.
SET (Settings) Change the settings for the simulation.
Numbers Set between 1 and 6 random numbers per draw.
Range Enter the range of numbers from 0 to 99.
Repete Yes: Reuse numbers after they have been chosen.
No: each trial will be unique.
DATA Save the collected data to a list.
CLEAR Clear all trials from memory.
Advanced Options Menu
ADV (Advanced) Set weight or probabilities for Toss Coin, Roll Dice, or Spin
Spinner outcomes. Set the amount of each different marble in
the simulation for Pick Marbles.
Error Messages
Error Message Description
There is no data to
export.
Memory Error
No simulations were stored.
There is not enough
memory to export
data.
Maximum Trials
Reached
Leave the App and delete memory to create room to store your
simulations.
Not enough memory
to store more
individual trials.
Leave the App and delete memory to create room to store your
simulations.
Using Probability Simulation App 51
52 Using Science Tools App
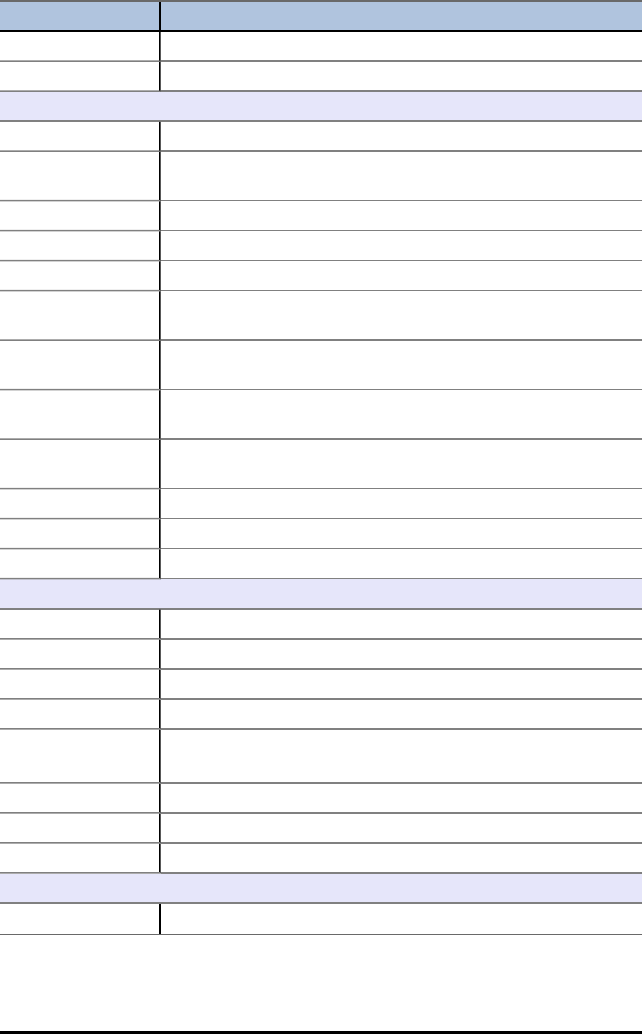
Using Science Tools App
Science Tools App allows you to perform unit conversions on your calculator. App
elements include:
• Significant Figures Calculator
• Constants and Conversions
• Data and Graph Wizard
• Vector Calculator
Example Activity – Science Tool
Tip: Options display at the bottom of the screen to help
you navigate and perform specific tasks.
To select one of these options, press the graphing key
directly below it.
For example, to select [X,Y], press o.
Exploring the Significant Figures Calculator
1. To begin:
a) Press Œ.
b) Use the |~}†keys to highlight and choose
SciTools.
c) Press Í.
d) Press any key to enter the Science Tools App.
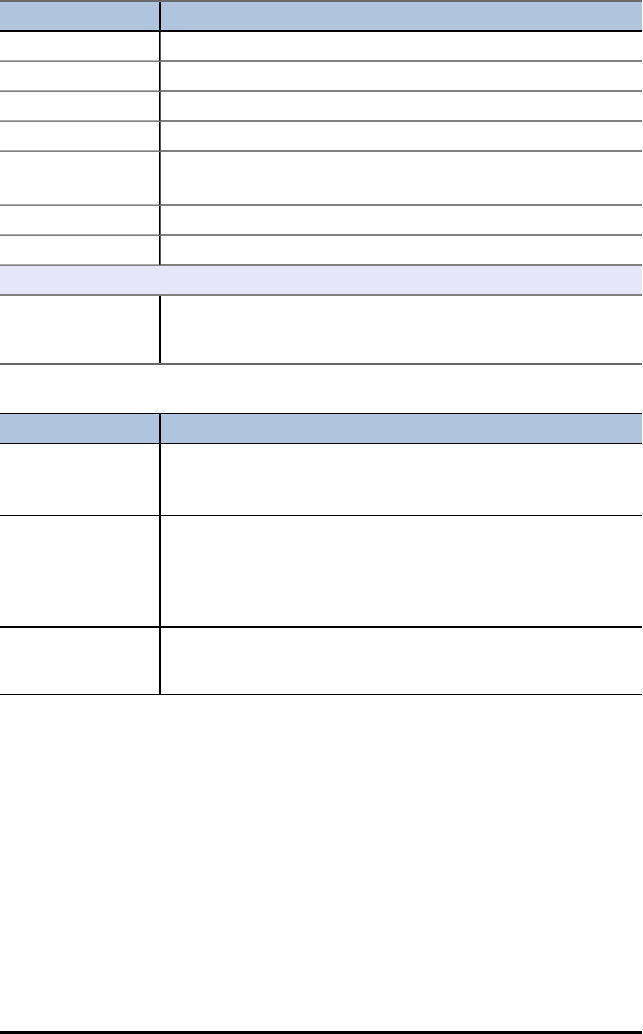
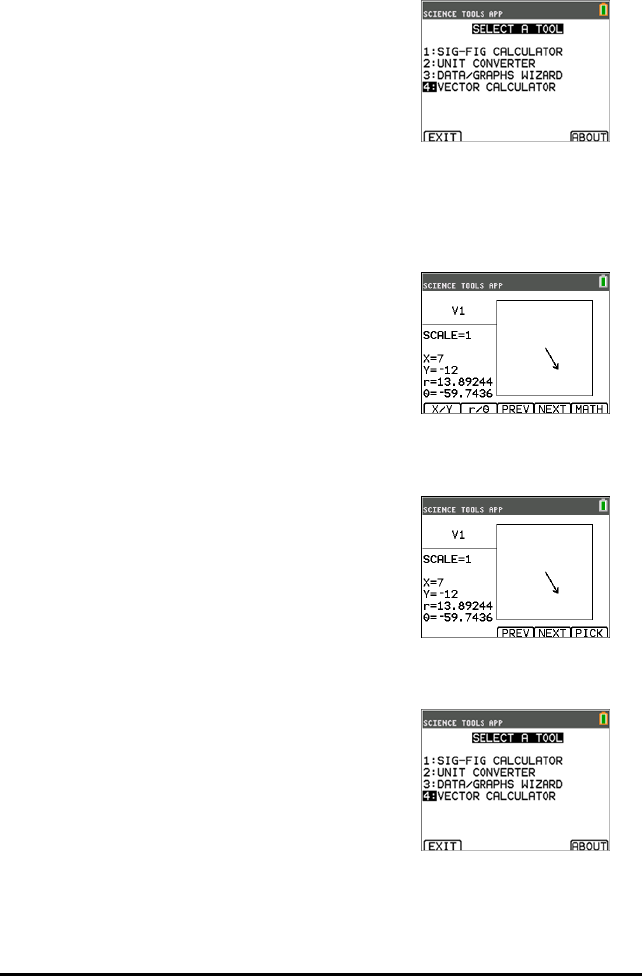
2. Choose 1:SIG-FIG CALCULATOR.
3. Key in 2.03 + 4.256 and press Í.
Notice how the environment takes into account the
number of significant digits when performing
computations.
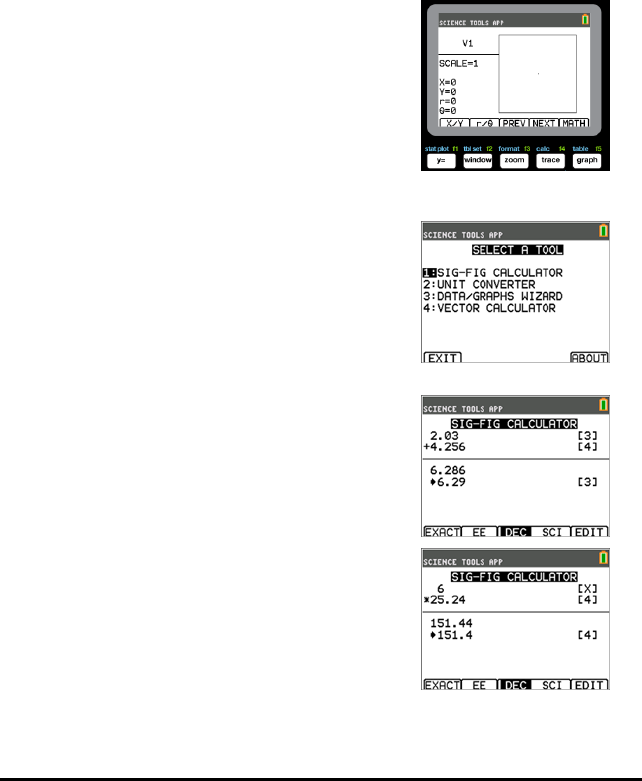
4. Press Íto clear the screen.
5. Key in 6.0 and press [EXACT] (o).
Note: This marks 6.0 as an exact value and will not
affect the number of significant figures in the final
result.
6. Press ¯and input 25.24.
7. Press Í.
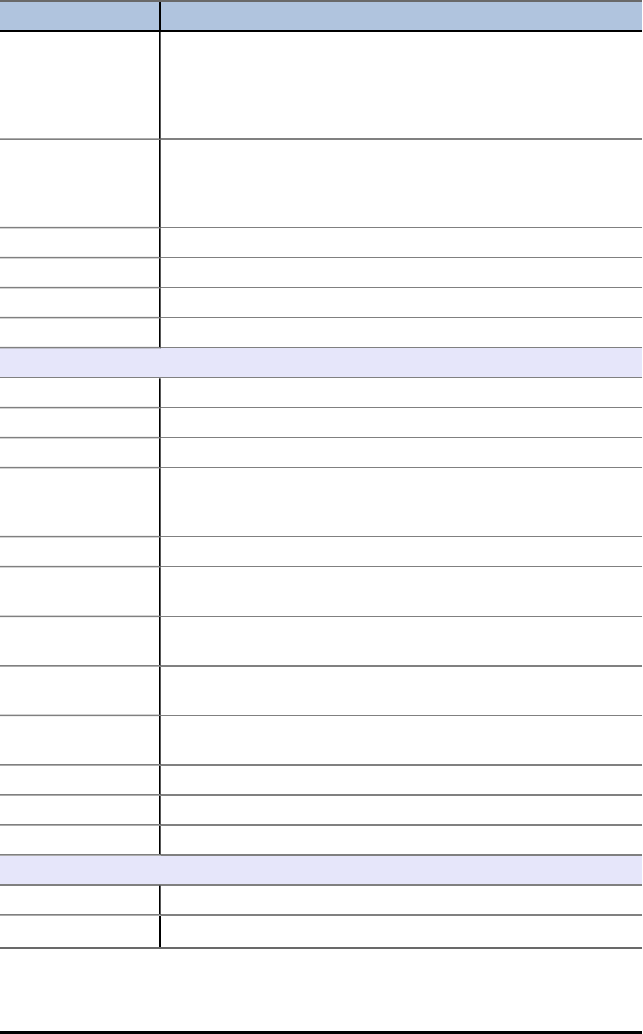
Exploring the Vector Calculator
1. To begin:
a) Press Œ.
b) Use the |~}†keys to highlight and choose
SciTools.
c) Press Í.
d) Press any key to enter the Science Tools App.
2. Choose 4:Vector CALCULATOR.
To draw a vector graphically:
a) Press [X/Y] (o) to input a vector’s coordinates.
b) Key in 7for the X-value.
c) Key in -12 for the Y-value.
d) Press s.
Note: The App computes "r" and “θ” values .
3. Press [MATH] (s).
4. Choose V1 (the first vector) by pressing the [PICK]
(s) button.
5. Choose [+] (o) and then press [NEXT] (r)to find
the second vector. Once found, press [PICK]. Notice
how the resultant vector is computed and drawn.
Exploring the Vector Calculator
1. Continuing from the previous example, press y
5to return to the SELECT A TOOL screen.
2. Choose 4:VECTOR CALCULATOR.
3. Draw 2 Vectors:
a) Press [X/Y] to input V1 coordinates.
b) Enter 7for the X-value and press Í.
Using Science Tools App 53
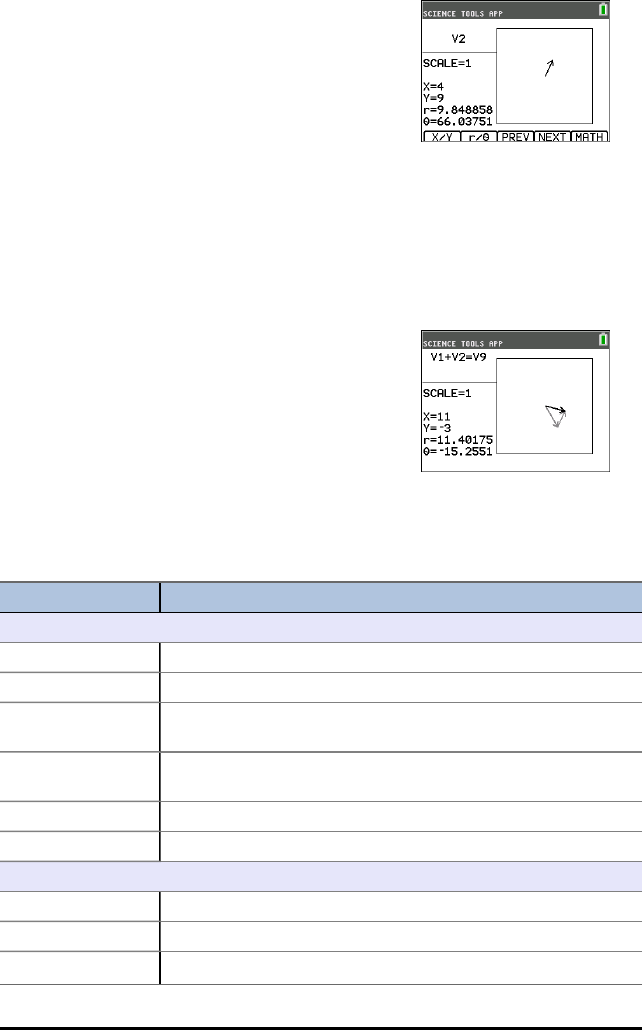
54 Using Science Tools App
c) Enter -12 for the Y-value and press Í.
d) Press [VIEW].
Note: The App computes "r" and “θ” values .
e) Press [NEXT] to enter V2 coordinates.
f) Press [X/Y].
g) Enter 4for the X-value and press Í.
h) Enter 9for the Y-value and press Í.
4. Vector Calculations:
a) Press [MATH].
Note: This is the [MATH] shortcut key at the
bottom of the screen and not the »key on
the graphing calculator. In this case, press the
skey to get [MATH].
b) Choose V1 (the first vector) by selecting [PICK].
c) Choose [+] and then press [NEXT] to find the
second vector.
d) Once found, press [PICK].
Notice how the resultant vector is computed and
drawn.
Menus and Functions
• Use y 5 to return to the Main Menu from the science tools.
Menus Functions
Main Menu
1: Sig-Fig Calculator Display the significant digits and figures calculator tool.
2: Unit Converter Display the unit converter tool.
3: Data/Graphs
Wizard
Display the data/graphs wizard.
4: Vector
Calculator
Display the vector calculator.
Exit Exit the application.
About App version number information.
Sig-Fig Calculator Menu
Exact Set a value as “exact” so that it will not be subject to rounding.
EE Enter a value in scientific notation.
Dec / Sci Specify whether results are displayed in decimal notation (DEC)
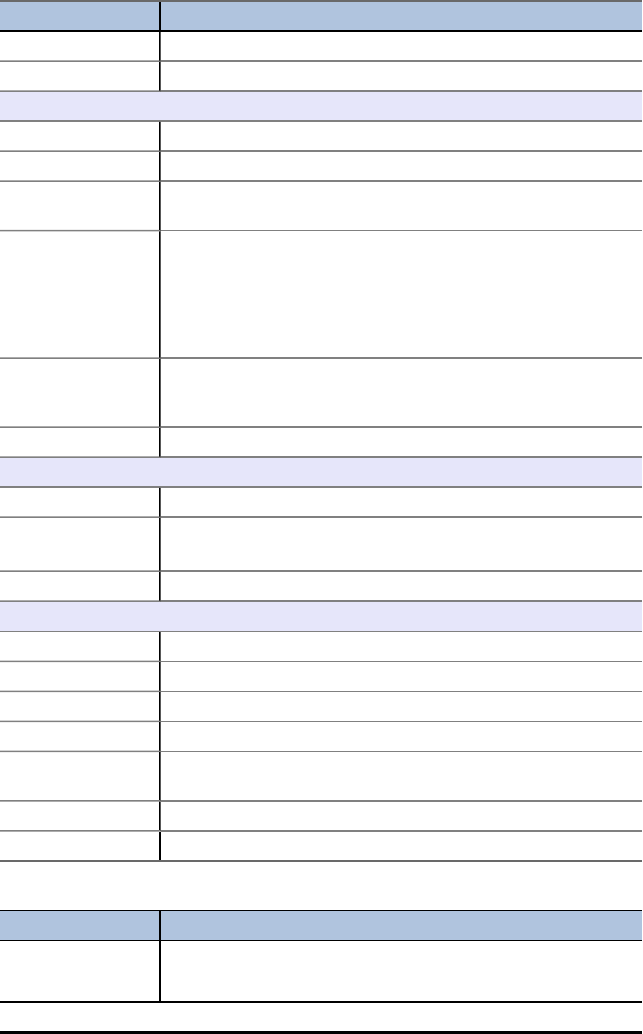
Menus Functions
or scientific notation (SCI).
Edit Edit the previous calculation.
Unit Converter Menu
Constant Displays the CONSTANTS menu.
Convert Returns to the UNIT CONVERTER menu.
Expt Pastes (exports) the constant to the home screen. You must exit
the application to view the home screen.
Edit Copies the constant to a conversion screen. If the constant
corresponds to a conversion category, the category is
automatically selected. If it does not correspond to a conversion
category, the UNIT CONVERTER menu is displayed. After you
select a conversion category, the constant is pasted into the
conversion screen.
Copy Display the UNIT CONVERTER menu. After you select another
conversion category, the converted value is pasted into the
conversions screens.
Edit Allows you to edit the converted value.
Data/Graphs Wizard Menu
Data Enter or edit data in lists
Plot
)
Plot data.
Stat Analyse data.
Vector Calculator Menu
X/Y Enter x and y coordinates for the head of the vector.
r/θ Enter r and θ coordinates for the head of the vector.
Prev Display the previous screen.
Next Display the next vector screen.
Math Display the vector maths operators at the bottom of the screen
(+, -, •, x) .
View Display all of the values for the vector (x, y, r and θ) .
Pick Select the current vector for a vector maths operation.
Error Messages
Error Message Description
Arithmetic Error This is a general error caused by a limitation error (such as an
overflow error when a result is ≥ 1E100) or a mathematical error
Using Science Tools App 55

56 Using Science Tools App
Error Message Description
(such as divide-by-zero).
Err: Memory This error occurs when the graphing calculator does not have
enough free RAM to perform the operation. Also, if the unit has
less than XXXX bytes, the application will not start.
Fit Error This error occurs when a regression fit cannot be performed on a
scatterplot or xyline plot, because the data in the lists is not
compatible with that type of regression. The error also occurs if
you press Éto break (stop) a regression fit calculation in
progress.
Input Error This error occurs when an invalid entry is entered into an editor
field. For example, an error occurs if you enter 1..2 instead of 1.2.
Stat Error This error occurs if you select STAT to perform a one-variable
statistical calculation on a list containing data that is incompatible
with one-variable analysis.

Using Transformation Graphing App
Transformation Graphing App enhances the ofunction mode and lets you observe the
effects of changing coefficient values without leaving the graph screen. The
transformation feature is only available in function mode (z).
Transformation Graphing allows you to manipulate up to four coefficients on the
graph: A, B, C and D. All other coefficients act like constants, using the value in
memory. You step through the transformation of a function or animate the
transformation using play styles, play/pause, play and fast play. You can enter
functions directly or use the colour/line style spinner dialogue to paste functions such
as:
AX + B
AX2+ B
A(X-B)2+ C
A(X-B)(X-C)
AX2+ BX + C
A(X-B)3+ C
AX3+ BX2+ CX + D
A abs(B(X-C)) + D
A sin(B(X-C)) + D
A cos(B(X-C)) + D
A tan(B(X-C)) + D
Example Activity
Explore the Function Y=AX2+BX+C
Use this activity to learn the basics the Transformation Graphing App.
Note: Reset the calculator defaults (y L 7:Reset...,2:Defaults...,2:Reset) before
this performing this activity.
1. Press Œ.
2. Choose Transfrm.
3. Read the message on the splash screen.
4. Press any key to dismiss the splash screen.
5. In Func mode, press oto display the Y= editor.
6. Press ‘to clear Y1.
7. To quickly paste the function Y1=AX2+BX+C, press |
| Í to launch the line style spinner.
8. Press ††and then ~to the desired function.
9. Select OK and press Í.
Note: The colour/line style spinner dialogue also
lets you select the animation of the transform
Using Transformation Graphing App 57

58 Using Transformation Graphing App
graph. Play-Pause 3will allow you to control the
animation of the graph using the arrow keys on the
graph screen.
Tip: If you enter a function using the keypad, only A-D are allowed in transform equations
Y1 and/or Y2. Those letters can be found using the ƒkey. For example, to enter the
coefficient A, press ƒ[A] (above the »key).
10. Press q6 to select 6:ZStandard. The graph screen
displays automatically. The selected Y= function and
the current values of the coefficients A, B and, C
display on the screen. The values of A, B and C may
be different on your calculator.
11. Press ~to increment the value of Aby the Step
value (1) from 1to 2. The graph is redrawn
automatically, showing the effect of increasing the
coefficient of Xby step size 1 as set in the SETTINGS
([SETUP]) menu.
If the coefficient Ais not selected, press †until
the = sign for A is highlighted.
12. Press †to highlight the = sign for B. Press ~several
times (pausing briefly each time as the graph is
redrawn) to observe the effect of increasing the value
of B.
Tip: Press [SETUP] (b) on the graph screen to display the
SETTINGS menu.
Select TrailOn to leave a dotted graph each time you
change or animate a coefficient. Default is TrailOff.
TrailOff and TrailOn are also available in y..
The play 1and play fast 2settings allow you to create
animated slide show of the graph transforming by one
selected parameter. The parameter values for A-D can be
entered in SETTINGS as long as they are used in Y1
and/or Y2.
The Step value determines the increment of the
parameter value. The Max value is the upper bound of
the parameter expected in the animation.
Example: Y1=AX
In SETTINGS, let A=1, Step = 2 and Max = 10. Five
screens will be created to animate the graph for A = 1, 3,
5, 7, 9. Note 9 < 10 = Max.
There can be up to 13 screens created for the animation.
A memory error will be given if the Step and Max
request more than 13 screens for the animation. To
continue, press pand press }to SETTINGS. Modify
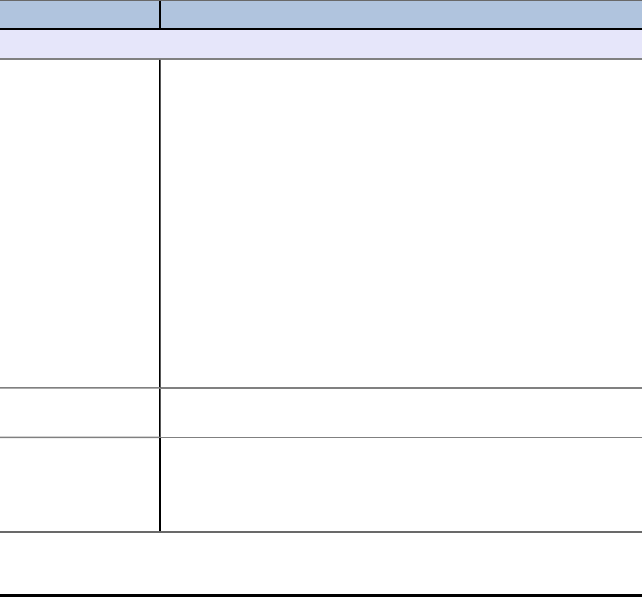
the Step or Max value to remain within the 13 screen
limit.
Note: Enter a quadratic function in vertex form to graph in Y3. Try to match Y1 to the
graph of Y3!
Menus and Functions
• To quit the App, select the QUIT-APP option at the upper-right of the Y=screen.
Select 2:Quit Transfrm at the prompt.
• Inequality Graphing App and Transformation Graphing App cannot run at the same
time since they enhance the Function Mode of the oeditor. If the Apps are in
conflict, follow the prompts to quit the conflicting App, which will allow the other
App to run as an enhanced oeditor.
• The Transformation Graphing App is best used for animation graphing
investigations. The window variable Xres is set to 3 when the app launches. This
plots every third graphing pixel and provides the best experience when using
animations for Y1 and/or Y2. While Xres can be set to 1 in p, your general
graphing experience without animations will be optimal in the standard graphing
mode where Xres defaults to 1.
Menus Description
Graph/Plot Setup Keys
oDisplays the oEditor, where you can:
• enter one or more functions
• animate functions in Y1 and/or Y2
• graph functions using Y3-Y0
• graph up to three plots
• change the graph colour
• change the transformation play type
• select a function format to paste for Y1 and/or Y2
• change the colour and line style of Y3-Y0
Press |until the cursor is over the style column at the left of
the Yn function. Press Í. Navigate to the options using †.
Press |or ~on a spinner menu to make a selection. Select OK
or CLEAR to accept or dismiss the changes.
Play-Pause
(3)
Controls which coefficient is changed and when the graph is
plotted.
Play
(1)
Stores a series of changes as pictures to display in a slide show
format. The pictures play in a continuous loop until you stop
them. Use Íand then Éto stop animations.
*See Note following the table.
Using Transformation Graphing App 59
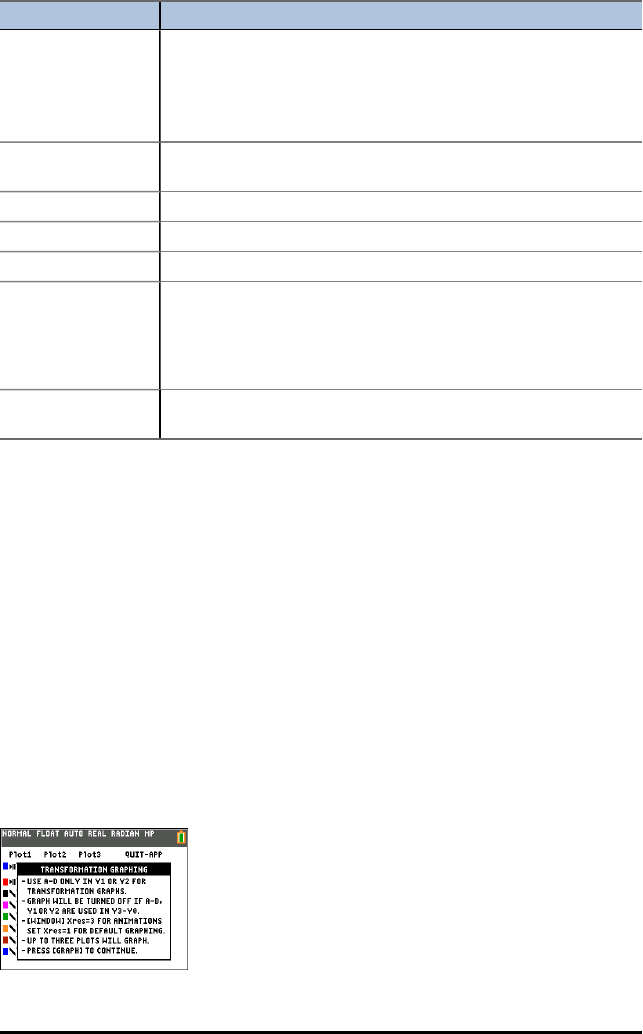
60 Using Transformation Graphing App
Menus Description
Play Fast
(2)
Stores a series of changes as pictures to display in a slide show
format. The pictures play in a continuous loop until you stop
them. It displays the pictures at a more rapid rate than Play. Use
Íand then Éto stop animations.
*See Note following the table.
pSet the viewing window to produce the best display of your
graph.
qQuickly adjust the window to a pre-defined setting.
rMove the cursor along the graphed function using |and ~.
sDisplay the graph you have defined.
[SETUP] On the graph screen, pressing [SETUP] (s) will display the
SETTINGS menu where you can select animation play types,
TrailOff/TrailOn setting and set the values of the parameters A,
B, C or D (if entered in Y1 and/or Y2). Press son the
SETTINGS screen to display the graph.
TrailOff
TrailOn
In y ., TrailOn leaves a dotted graph style of each graph
as the coefficient is changed or animated. Default is TrailOff.
*Note: A memory error occurs if there are more than 13 screens to create for the
animation. Press pand }to SETTINGS. Change the parameter start value, the
step and/or the Max so the sequence of screens requested remains at most 13.
Transformation Graphing Rules
The following rules are applied when using the Transformation Graphing App:
• Allows Y1 and/or Y2 to transform using parameters A, B, C or D in the functions.
Graphing using Y3-Y0 is allowed, however, A-D, Y1 and Y2 are not allowed in Y3-
Y0.
•psetting Xres=3 is set for animations. Set Xres=1 in [window] for default
graphing if needed when only graphing in Y3-Y0.
• Up to three stat plots can be graphed.
• Recommend using QUIT-APP in [Y=] when not transforming graphs.
If any of these rules are broken, the following message will appear and the offending
Y-Vars are disabled and the remaining graphs will appear.

General Information
Texas Instruments Support and Service
General Information: North and South America
Home Page: education.ti.com
KnowledgeBase and e-mail inquiries: education.ti.com/support
Phone: (800) TI-CARES / (800) 842-2737
For North and South America and U.S.
Territories
International contact information: education.ti.com/support/worldwide
For Technical Support
Knowledge Base and support by e-mail: education.ti.com/support or
ti-cares@ti.com
Phone (not toll-free): (972) 917-8324
For Product (Hardware) Service
Customers in the U.S., Canada, Mexico, and U.S. territories: Always contact Texas
Instruments Customer Support before returning a product for service.
For All Other Countries:
For general information
For more information about TI products and services, contact TI by e-mail or visit the
TI Internet address.
E-mail inquiries: ti-cares@ti.com
Home Page: education.ti.com
Service and Warranty Information
For information about the length and terms of the warranty or about product service,
refer to the warranty statement enclosed with this product or contact your local Texas
Instruments retailer/distributor.
General Information 61
