JBL Topics In Algebra I Guidebook For TI 83 Plus / 84 (English) Alg1 Book
User Manual: JBL Topics in Algebra I guidebook for TI-83 Plus / TI-84 Plus (English) Topics in Algebra Guidebook for TI-83 Plus / TI-84 Plus
Open the PDF directly: View PDF ![]() .
.
Page Count: 200 [warning: Documents this large are best viewed by clicking the View PDF Link!]
- Topics in Algebra 1, Front Cover
- Topics in Algebra 1, Title Page
- Chapter 1: Number Sense
- Chapter 2: Linear Equations
- Chapter 3: Linear Functions
- Chapter 4: Linear Inequalities: 1-Variable
- Chapter 5: Linear Systems
- TIps
- 1: Resetting Your Calculator
- 2: Adjusting Your Calculator Settings
- 3: Graphing a Function in the Standard Window
- 4: Creating a Table
- 5: Adjusting the Viewing Window
- 6: Using Lists
- 7: Creating a Statistical Plot
- 8: Finding the Best Line of Fit for a Set of Data
- 9: Sending and Receiving Data between Calculators
- 10: Managing Your Calculator’s Memory
- General Information
- End User License Agreement


Topics in Algebra 1
Software Application
for the
TI-83 Plus and the TI-73
Student and Teacher
Classroom Materials
Chapters 1 – 5
ti
Important notice regarding book materials
Texas Instruments makes no warranty, either expressed or implied, including
but not limited to any implied warranties of merchantability and fitness for a
particular purpose, regarding any programs or book materials and makes such
materials available solely on an “as-is” basis. In no event shall Texas
Instruments be liable to anyone for special, collateral, incidental, or
consequential damages in connection with or arising out of the purchase or
use of these materials, and the sole and exclusive liability of Texas
Instruments, regardless of the form of action, shall not exceed the purchase
price of this book. Moreover, Texas Instruments shall not be liable for any
claim of any kind whatsoever against the use of these materials by any other
party.
Permission is hereby granted to teachers to reprint or photocopy in
classroom, workshop, or seminar quantities the pages or sheets in this work
that carry a Texas Instruments copyright notice. These pages are designed to
be reproduced by teachers for use in their classes, workshops, or seminars,
provided each copy made shows the copyright notice. Such copies may not be
sold, and further distribution is expressly prohibited. Except as authorized
above, prior written permission must be obtained from Texas Instruments
Incorporated to reproduce or transmit this work or portions thereof in any
other form or by any other electronic or mechanical means, including any
information storage or retrieval system, unless expressly permitted by federal
copyright law. Send inquiries to this address:
Texas Instruments Incorporated
7800 Banner Drive, M/S 3918
Dallas, TX 75251
Attention: Manager, Business Services
Copyright © 2001, 2002 Texas Instruments Incorporated. Except for the
specific rights granted herein, all rights are reserved.
Printed in the United States of America.
³ TIp and ³ Try-It! are trademarks of Texas Instruments Incorporated.
Table of Contents
Introduction to Topics in Algebra 1
Note to Teachers i
Organization of Topics in Algebra 1 ii
Classroom Materials iii
NCTM Principles and Standards for School Mathematics iv
Acknowledgements iv
Installing This Application v
Deleting an Application v
Navigating Topics in Algebra 1 vi
Chapter 1: Number Sense
Section 1: Integers
Student Worksheet 1-1
Teacher Notes 1-6
Section 2: Rational Numbers
Student Worksheet 1-11
Teacher Notes 1-18
Section 3: Real Numbers
Student Worksheet 1-23
Teacher Notes 1-30
Chapter 2: Linear Equations
Section 1: Using Graphs & Tables
Student Worksheet 2-1
Teacher Notes 2-6
Section 2: Using Algebra
Student Worksheet 2-10
Teacher Notes 2-16
Chapter 3: Linear Functions
Section 1: Slope with Grid
Student Worksheet 3-1
Teacher Notes 3-6
Section 2: Slope Using Coordinates
Student Worksheet 3-10
Teacher Notes 3-14
Section 3: Slope Rate of Change
Student Worksheet 3-18
Teacher Notes 3-24
Section 4: Slope-Intercept Form
Student Worksheet 3-28
Teacher Notes 3-33
Chapter 4: Linear Inequalities: 1-Variable
Section 1: Using Graphs & Tables
Student Worksheet 4-1
Teacher Notes 4-6
Section 2: Using Algebra
Student Worksheet 4-11
Teacher Notes 4-17
Chapter 5: Linear Systems
Section 1: Using Graphs & Tables
Student Worksheet 5-1
Teacher Notes 5-8
Section 2: Using Algebra
Student Worksheet 5-15
Teacher Notes 5-28
³ TIpsé
³ TIpé 1: Resetting Your Calculator 1-1
³TIpé2: Adjusting Your Calculator Settings 2-1
³TIpé 3: Graphing a Function in the Standard Window 3-1
³TIpé 4: Creating a Table 4-1
³TIpé 5: Adjusting the Viewing Window 5-1
³TIpé 6: Using Lists 6-1
³TIpé 7: Creating a Statistical Plot 7-1
³TIpé 8: Finding the Best Line of Fit for a Set of Data 8-1
³TIpé 9: Sending and Receiving Data between Calculators 9-1
³TIpé 10: Managing Your Calculator’s Memory 10-1

Topics in Algebra 1 © 2001 Texas Instruments Introduction i
Introduction to Topics in Algebra 1
Note to Teachers
Welcome to the Topics in Algebra 1 software application for the TI-83 Plus and TI-73 graphing
calculators. The application and Classroom Materials were designed to help students review and
reinforce selected concepts taught at the Algebra 1 level. Topics in Algebra 1 is easy to use, even
for inexperienced calculator users, and it encourages students to explore concepts on their own.
Navigating Topics in Algebra 1 (pages vi–ix) explains how to move around the application. You
may wish to copy these pages for your students.
We hope Topics in Algebra 1 proves useful to you and your students. All of your comments and
suggestions are appreciated. You can contact TI:
• Phone 1-800-TI-CARES (1-800-842-2737)
• E-mail ti-cares@ti.com
• TI website education.ti.com

Topics in Algebra 1 © 2001 Texas Instruments Introduction ii
Organization of Topics in Algebra 1
Topics in Algebra 1 is organized in textbook fashion with chapters and sections arranged in
table-of-contents form.
Chapters Sections
1: Number Sense 1: Integers
2: Rational Numbers
3: Real Numbers
2: Linear Equations 1: Using Graphs & Tables
2: Using Algebra
3: Linear Functions 1: Slope with Grid
2: Slope Using Coordinates
3: Slope Rate of Change
4: Slope-Intercept Form
4: Linear Inequalities: 1-Variable 1: Using Graphs & Tables
2: Using Algebra
Note: Chapters can be installed and deleted individually. This provides flexibility, allowing calculators to have only the applications
students currently need.
Each section in the application contains three subsections.
• The
Overview presents definitions and concepts for teachers to use in class discussions and
for students to use for study and review. They contain animation and real-world examples.
• The
Observations show concepts or examples, followed by Write An Observation screens.
Students are asked to write in the space provided on the Student Worksheet their
observations about the content presented. Screens entitled Did you know display additional
information and facts about the current concept.
• The
Activities include interactive activities that reinforce the concepts covered in the section.
Many of the activities are in the form of games. Students can practice calculating equations
with integers, rational numbers, and real numbers, or they can find the equation of a line. The
application checks answers, gives a score, and provides students with the correct answer if
they are unable to answer a question correctly. In the Linear Functions chapter, students can
play a game called Screen Cross where they link to each other’s calculators and race to see
who finishes first.

Topics in Algebra 1 © 2001 Texas Instruments Introduction iii
Classroom Materials
The Topics in Algebra 1 Classroom Materials include Student Worksheets, Teacher Notes (with
answers), and ³ TIpsé.
• Student Worksheets provide explanations and instructions to students about using the
application to review the concepts in the section. Each worksheet is divided into four parts—
Overview, Observations, Activities (which correspond to the subsections of the application),
and ³ Try-It!é on Your TI-83 Plus or TI-73.
³ Try-It!é activities let students investigate specific features on the calculator related to the
section concepts. This includes step-by-step instructions with the exact keys to press to
complete each step and corresponding screen pictures. The screens shown in the ³ Try-It!
activities are for the TI-83 Plus. Usually, the TI-73 display varies only slightly, and the
students should have no problems following the instructions. However, in the cases where
the two calculators vary, the ³ Try-It! activities contain two separate exercises, one for each
of the two calculators. Therefore, you only need to copy the section appropriate for the
calculator that you use in your classroom.
• Teacher Notes give a brief explanation of the concepts covered in the section, some of the
common student errors that might be encountered, and answers to the questions on the
Student Worksheets. There are Teacher Notes for each Student Worksheet.
• ³ TIpsé provide keystroke examples for some of the more common tasks that you and your
students need for Algebra 1 and beyond. The ³ TIps are intended to help students learn how
to use the features of the calculator. The ³ TIps topics are:
³ TIp 1: Resetting Your Calculator
³ TIp 2: Adjusting Your Calculator Settings
³ TIp 3: Graphing a Function in the Standard Window
³ TIp 4: Creating a Table
³ TIp 5: Adjusting the Viewing Window
³ TIp 6: Using Lists
³ TIp 7: Creating a Statistical Plot
³ TIp 8: Finding the Best Line of Fit for a Set of Data
³ TIp 9: Sending and Receiving Data between Calculators
³ TIp 10: Managing Your Calculator’s Memory
When students need to learn how to use the feature being covered, you can distribute the
³ TIps to them to make sure they are prepared for the lesson.

Topics in Algebra 1 © 2001 Texas Instruments Introduction iv
NCTM Principles and Standards for School Mathematics
The Topics in Algebra 1 application and the Classroom Materials were written with the
guidelines of the NCTM Principles and Standards for School Mathematics in mind. Attention
was paid to the expectations laid out for the Algebra Content Standard for the Algebra 1 level
that crosses the 6–8 and 9–12 grade bands.
Some examples include:
NCTM Standards and Expectations On the Application
To understand patterns, relations, and
functions.
Students see how battery voltage values in a
series can be represented by a linear function.
To model and solve contextualized problems
using various representations, such as graphs,
tables, and equations.
Students experience how to work with tables of
values, graphs, and linear equations to see the
multiple approaches to problem solving.
To analyze the nature of changes in quantities
in linear relationships.
Students determine the constant rate of change of
a diving submarine along each segment of its dive.
In addition, scored, interactive activities at the end of each section help reinforce the concepts
reviewed in the Overview and Observations subsections.
You can find the complete expectations for the Algebra Content Standard and for the various
grade bands set out by the NCTM at:
http://standards.nctm.org/document/appendix/alg.htm
You can view the NCTM Principles and Standards for School Mathematics online at:
http://standards.nctm.org/
Acknowledgements
Texas Instruments would like to thank these individuals for their support, ideas, and suggestions.
Sharon Cichocki Hamburg High School Hamburg, NY
Michael Corrigan Assumption Catholic School Jacksonville, FL
Cathy Jahr Westview High School Martin, TN
John LaMaster Indiana University-Purdue University Fort Wayne Fort Wayne, IN
Brenda Levert Academy for Academics and Arts Huntsville, AL
Nicol Reiner Roosevelt High School Sioux Falls, SD
Melissa Rowe South Grand Prairie High School Grand Prairie, TX
Bill Stiggers Cleveland Public Schools Cleveland, OH
Bob Tower Roosevelt High School Sioux Falls, SD

Topics in Algebra 1 © 2001 Texas Instruments Introduction v
Installing This Application
Students may install all four chapters as a unit (ALG1PRT1) or one or more of the chapters
individually (ALG1CH1, ALG1CH2, ALG1CH3, ALG1CH4). This provides flexibility, allowing
calculators to have only the applications students currently need. When two or more chapters are
installed separately, they each must be accessed directly from the Πmenu.
Installing this application requires TI-GRAPH LINKé software and link cable. A link cable can be
purchased from the online store:
http://epsstore.ti.com
If an Archive Full error message appears while installing Algebra 1 or one of the chapters, the
calculator does not have sufficient memory for the application. Applications and/or archived
variables must be deleted to make room (see below).
Deleting an Application
Deleting an application completely removes the application from the calculator. The space then
becomes available for a different application. The deleted application may be reloaded at a later
date. Before deleting an application from the calculator, it can be backed up to a PC using the
Link > Receive Flash Application menu in TI-GRAPH LINK. You can reload it to the calculator
later using the Link > Send Flash Software menu in TI-GRAPH LINK.
To delete an application or archived variable:
1. Press y L to display the MEMORY menu.
2. Select 2:Mem Mgmt/Del (4:Delete… on the TI-73).
3. Select A:Apps... or B:AppVars... (8:Apps... or 9:AppVars... on the TI-73).
4. Press † until the 4 indicator is next to the item you wish to delete.
5. Press { (Í on the TI-73).
6. Select 2:Yes when asked Are You Sure?
7. Press y 5 to return to the Home screen.
Topics in Algebra 1 © 2001 Texas Instruments Introduction vi
Navigating Topics in Algebra 1
Starting the Application
1. Press
9 to display the APPLICATIONS menu.
2. Press
# until ALG1PRT1 (or a chapter such as ALG1CH1) is highlighted, and then press b to
select it. The application title page is displayed.
3. Press any key to start the application.
A Table of Contents page is displayed. It is the Table of Contents from which you last exited
Algebra 1. You may select one of the items on the menu or press áUPâ as often as necessary to go
to the Table of Contents screen that you need.
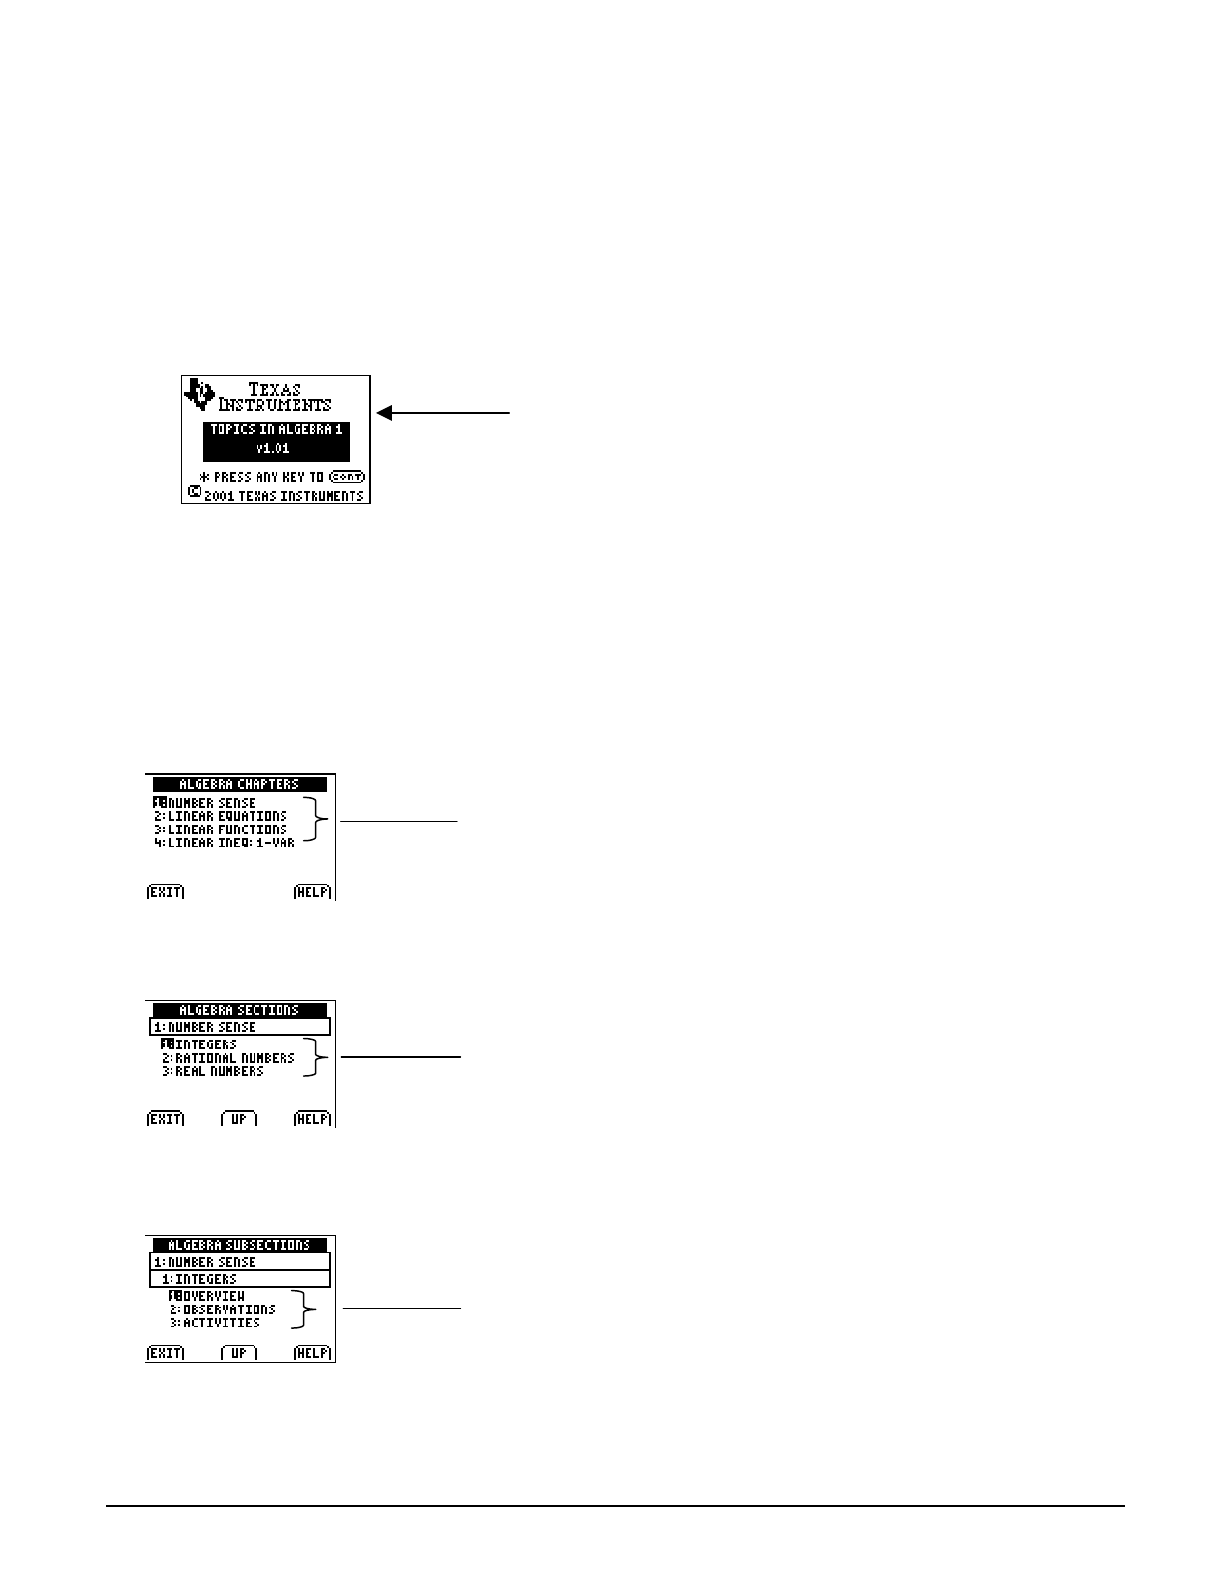
Table of Contents Screens
There are three types of Table of Contents screens—chapters, sections, and subsections.
When you select a chapter, the Algebra Sections screen is displayed. The number of sections
listed varies according to chapter.
When you select a section, the Algebra Subsections screen is displayed. The items listed are always
the same—Overview, Observations, and Activities.
Note: When you exit and re-enter Topics in Algebra 1, you return to the Table of Contents screen from which you exited.
Topics in Algebra 1 title page
A
lgebra Chapters
A
lgebra Sections
A
lgebra Subsections
Note: If you have installed the
chapters individually, only the current
chapter is shown on this screen.
Press Í to select the chapter.
Topics in Algebra 1 © 2001 Texas Instruments Introduction vii
Navigating Topics in Algebra 1 (continued)
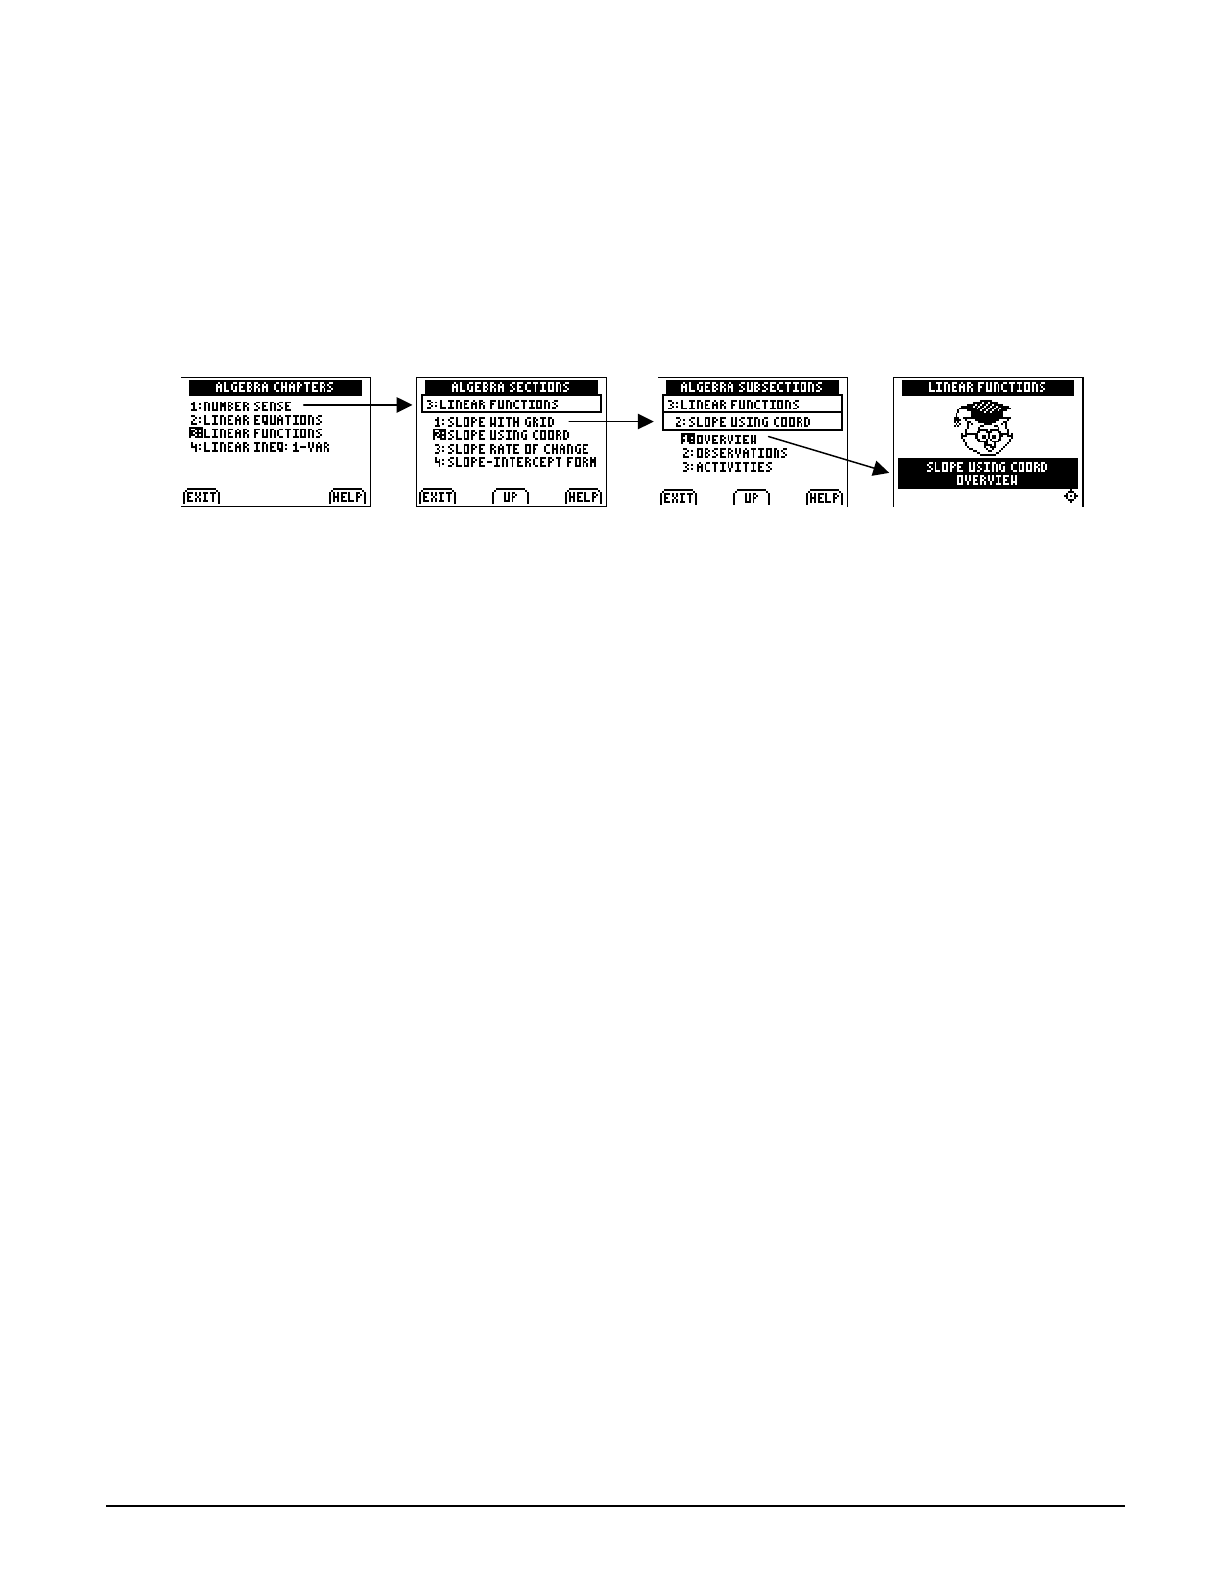
Selecting the Chapter, Section, and Subsection You Want
To select from a Table of Contents screen, press # if necessary to highlight the name of the
chapter, section, or subsection, and then press b.
When the Overview, Observations, or Activities opening screen appears, press ~ to begin.
Returning to the Table of Contents
From most Overview, Observations, or Activities screens, you can press - l as many times
as necessary to return to the Table of Contents. You may then select one of the items on the
menu or press áUPâ to go to higher levels of the Table of Contents.
Note: If you see áCONTâ on the current screen, you must first press any key to continue.
Leaving the Application
To leave the application, press - l as many times as needed to return to a Table of
Contents screen, and then press áEXITâ. When you re-enter the application, you return to this
Table of Contents screen.
Topics in Algebra 1 © 2001 Texas Instruments Introduction viii
Navigating Topics in Algebra 1 (continued)
Navigation Star
The navigation star is located on the bottom right of most Overview and Observations screens.
When the right and left arrows of the navigation star are flashing, press | and ~ on the
calculator to page back and forward between screens. When the up and down arrows are
flashing, } and † are used to navigate vertical menus (see below).
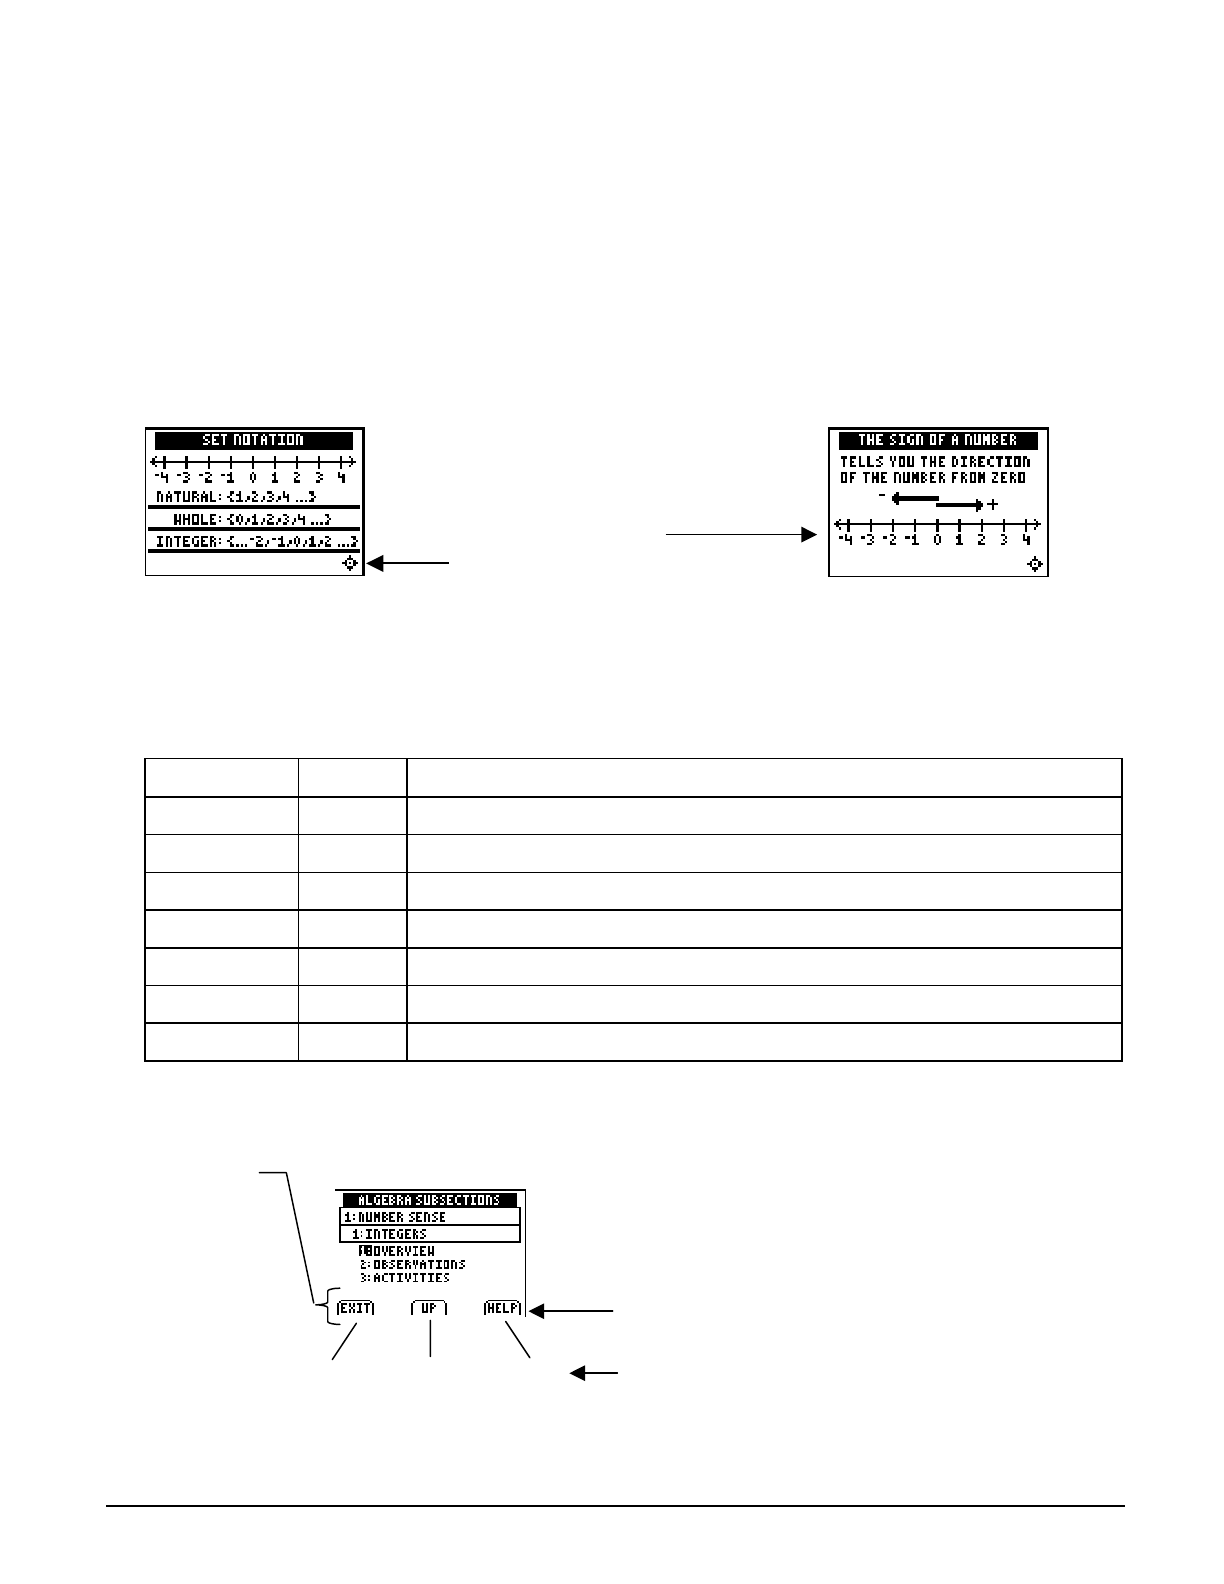
Horizontal Menus
A horizontal menu may be displayed at the bottom of the screen. The menu items help you move
between screens in the application. The menu items change from one screen to another. The
following are the most frequently displayed menu items.
Menu Item Press To Do This
áEXITâ o Exit the application.
áUPâ q Move up a level in the menu structure.
áHELPâ s Display the
HELP MENU.
áMAINâ o Return to the previous screen from the HELP MENU.
áBACKâ p Return to the HELP MENU from a HELP explanation screen.
áMENUâ o Return to the previous menu screen.
áQUITâ o Quit an activity.
To select a menu item, press the calculator key that corresponds to the menu item on the screen.
& ' ( ) *
* In these materials, the items
in the horizontal menus are
shown in angle brackets; for
example áEXITâ, áUPâ, and
áHELPâ.
The menu items change
from one screen to another.
On some screens, different
menu items are mapped to
the calculator keys.
These menu items
map to
these calculator keys. *
Horizontal
menu
Navigation star
Press ~ to display the
next screen.
Topics in Algebra 1 © 2001 Texas Instruments Introduction ix
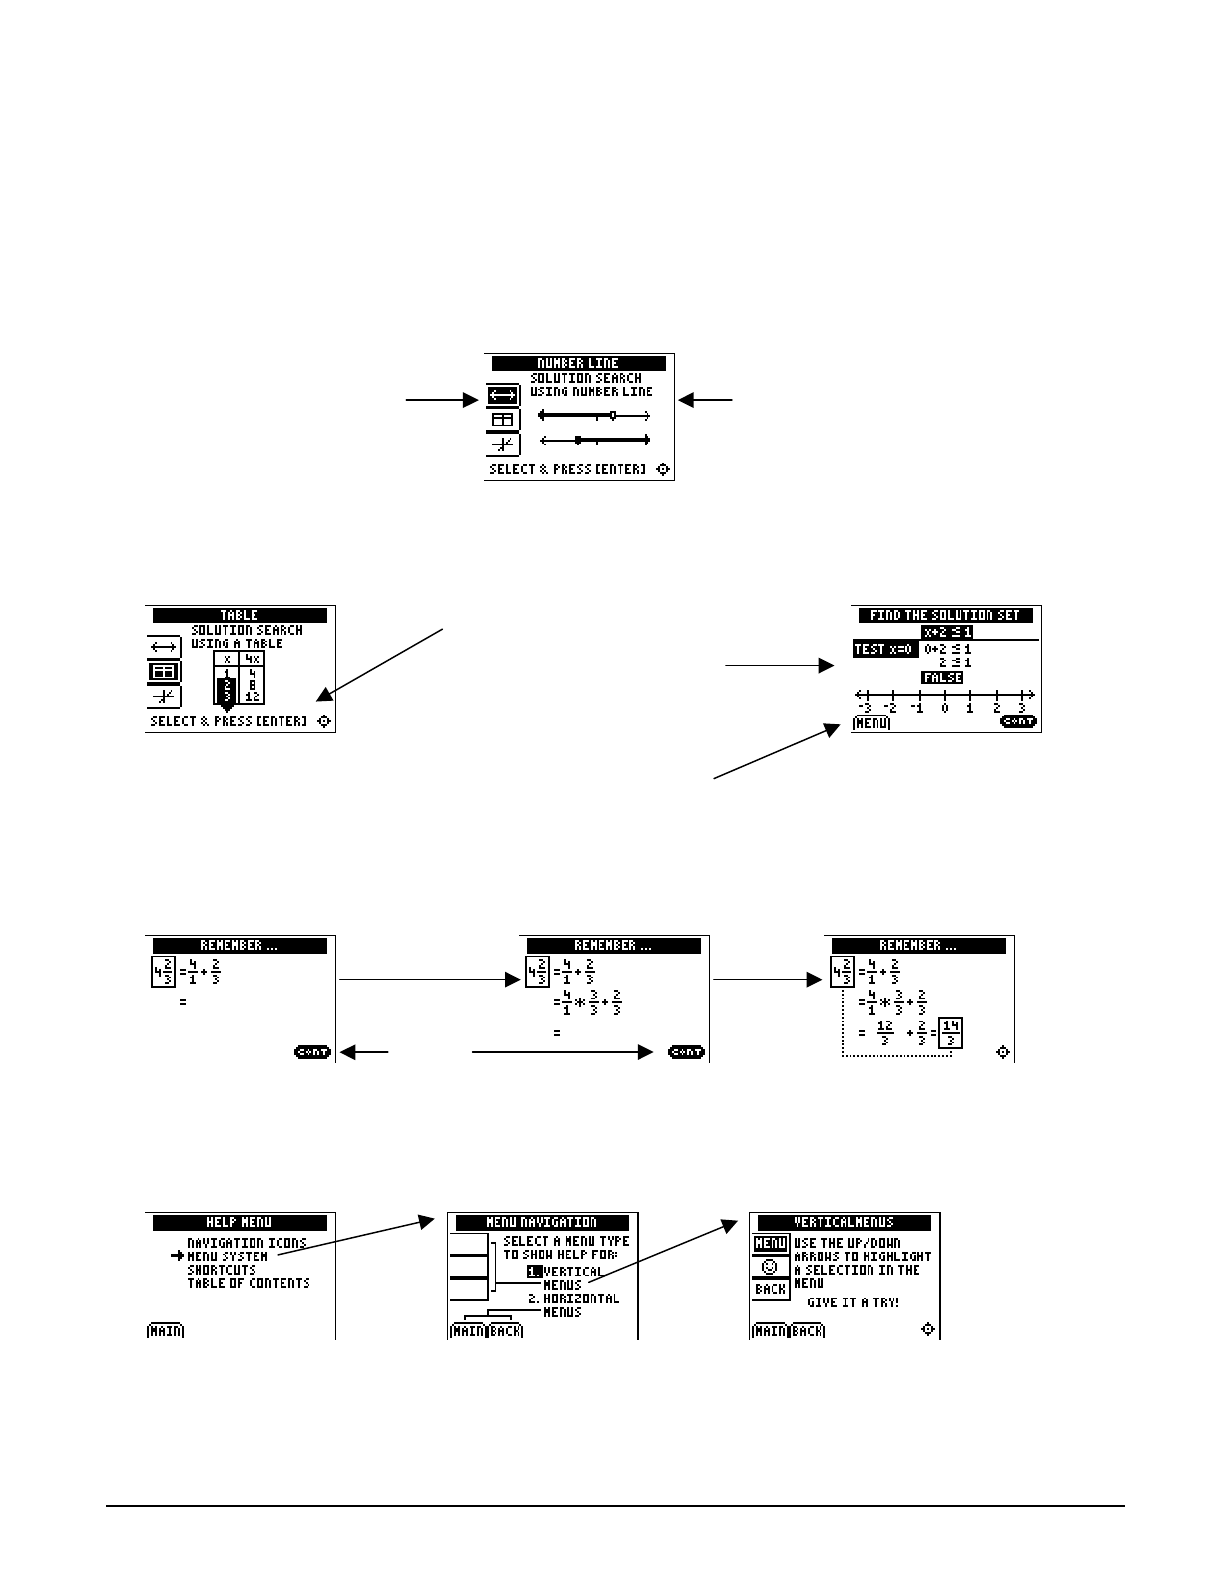
Navigating Topics in Algebra 1 (continued)
Vertical Menus
When the up and down arrows of the navigation star are flashing, press † and } on the
calculator to highlight an item in a vertical menu.
Some vertical menus only provide information. Other vertical menus are used for navigation. If
Select or Select & Press [Enter] is displayed, you can press Í to select an item or to see more
information.
áCONTâ
When you see áCONTâ (continue), you can press any key to go to the next screen.
HELP
From a Table of Contents screen, press áHELPâ to view information about features of the
application. To select an item, press # to highlight it, and then press Í.
Continue
V
ertical menu
First item is highlighted.
A
s you press † and } to move
through the menu, additional
information is displayed to the
right of the menu.
Press Í to select the
second item on the vertical
menu and display the first
in a sequence of screens
for this selection.
Press áMENUâ (&) to
return to the menu screen.
Chapter 1: Number Sense Name
Section 1: Integers Date
Topics in Algebra 1 © 2001 Texas Instruments Student Worksheet 1-1
Number Sense: Integers Student Worksheet
Overview
The Overview introduces the topics covered in Observations and Activities. Scroll through the
Overview using " (! to review, if necessary). Read each screen carefully. Look for new terms,
definitions, and concepts.
Observations
The Observations illustrate number sense concepts relating to the set of integers. Scroll through
the Observations using " (! to review, if necessary). Read each screen carefully. When you
come to a Write an Observation screen, stop and write the answers to the questions on your
worksheet.
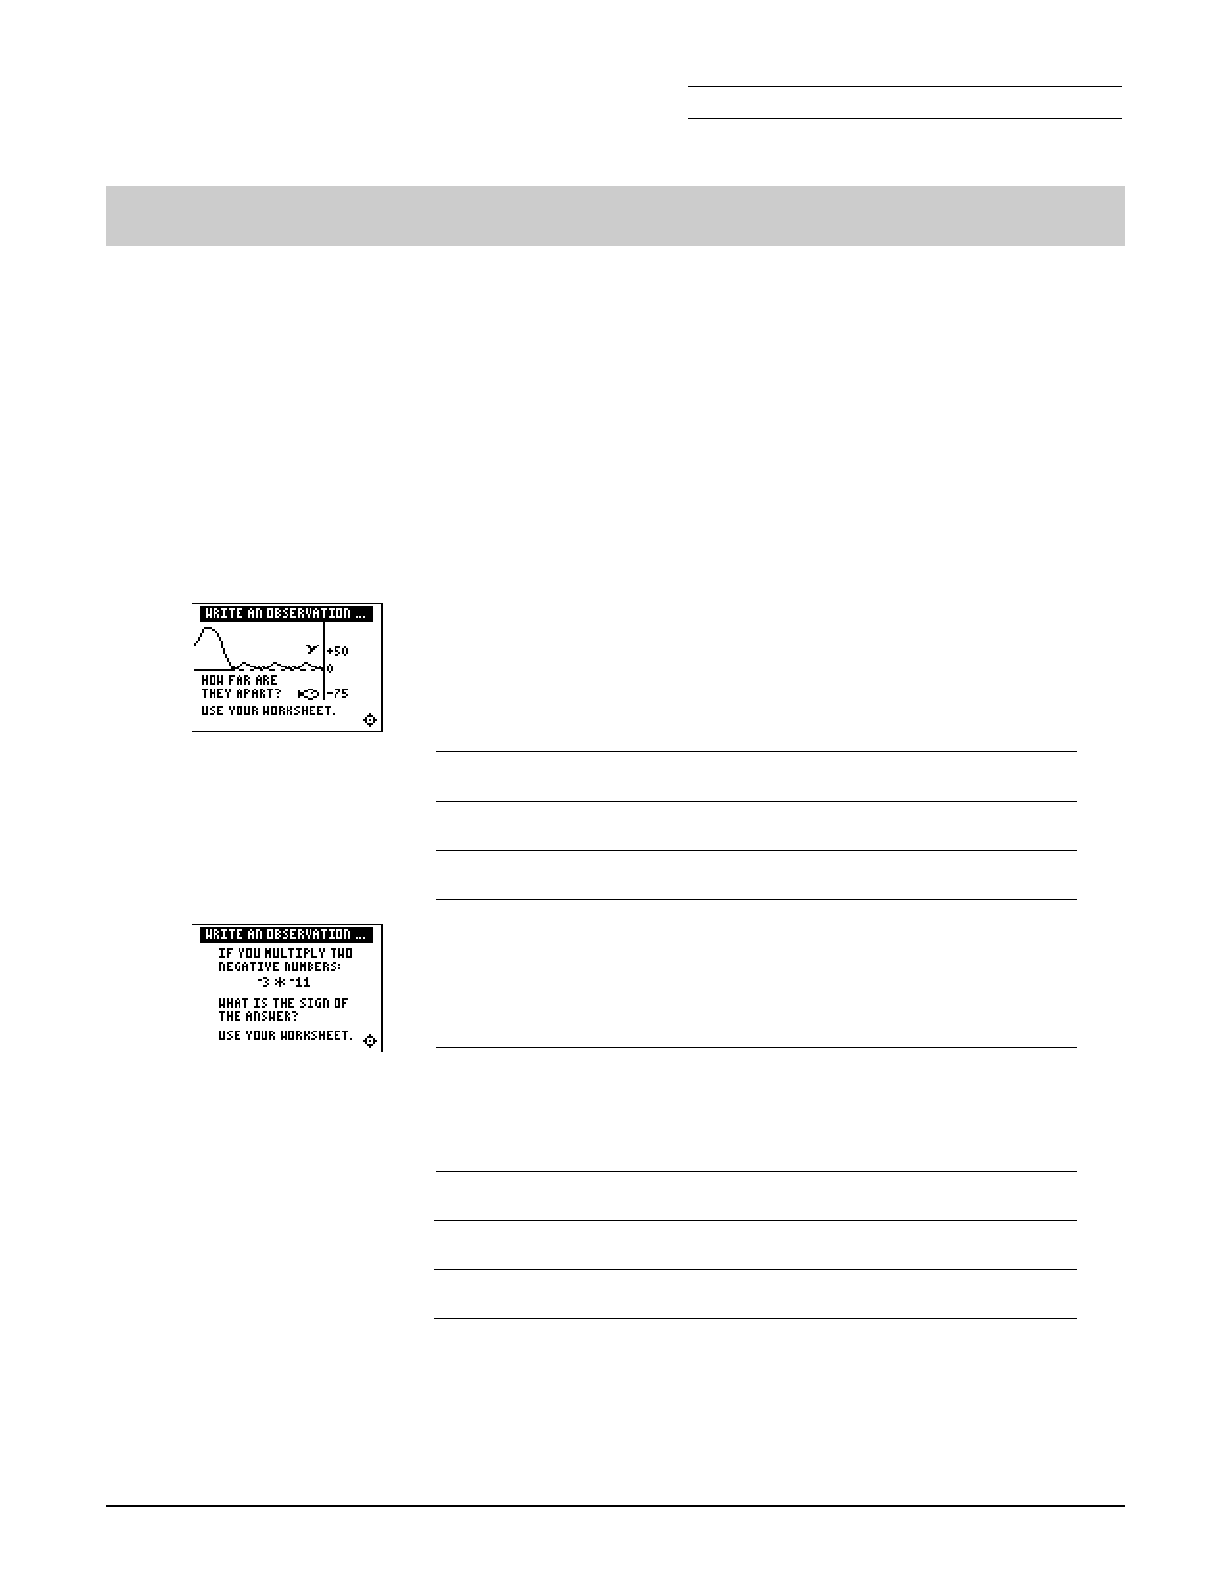
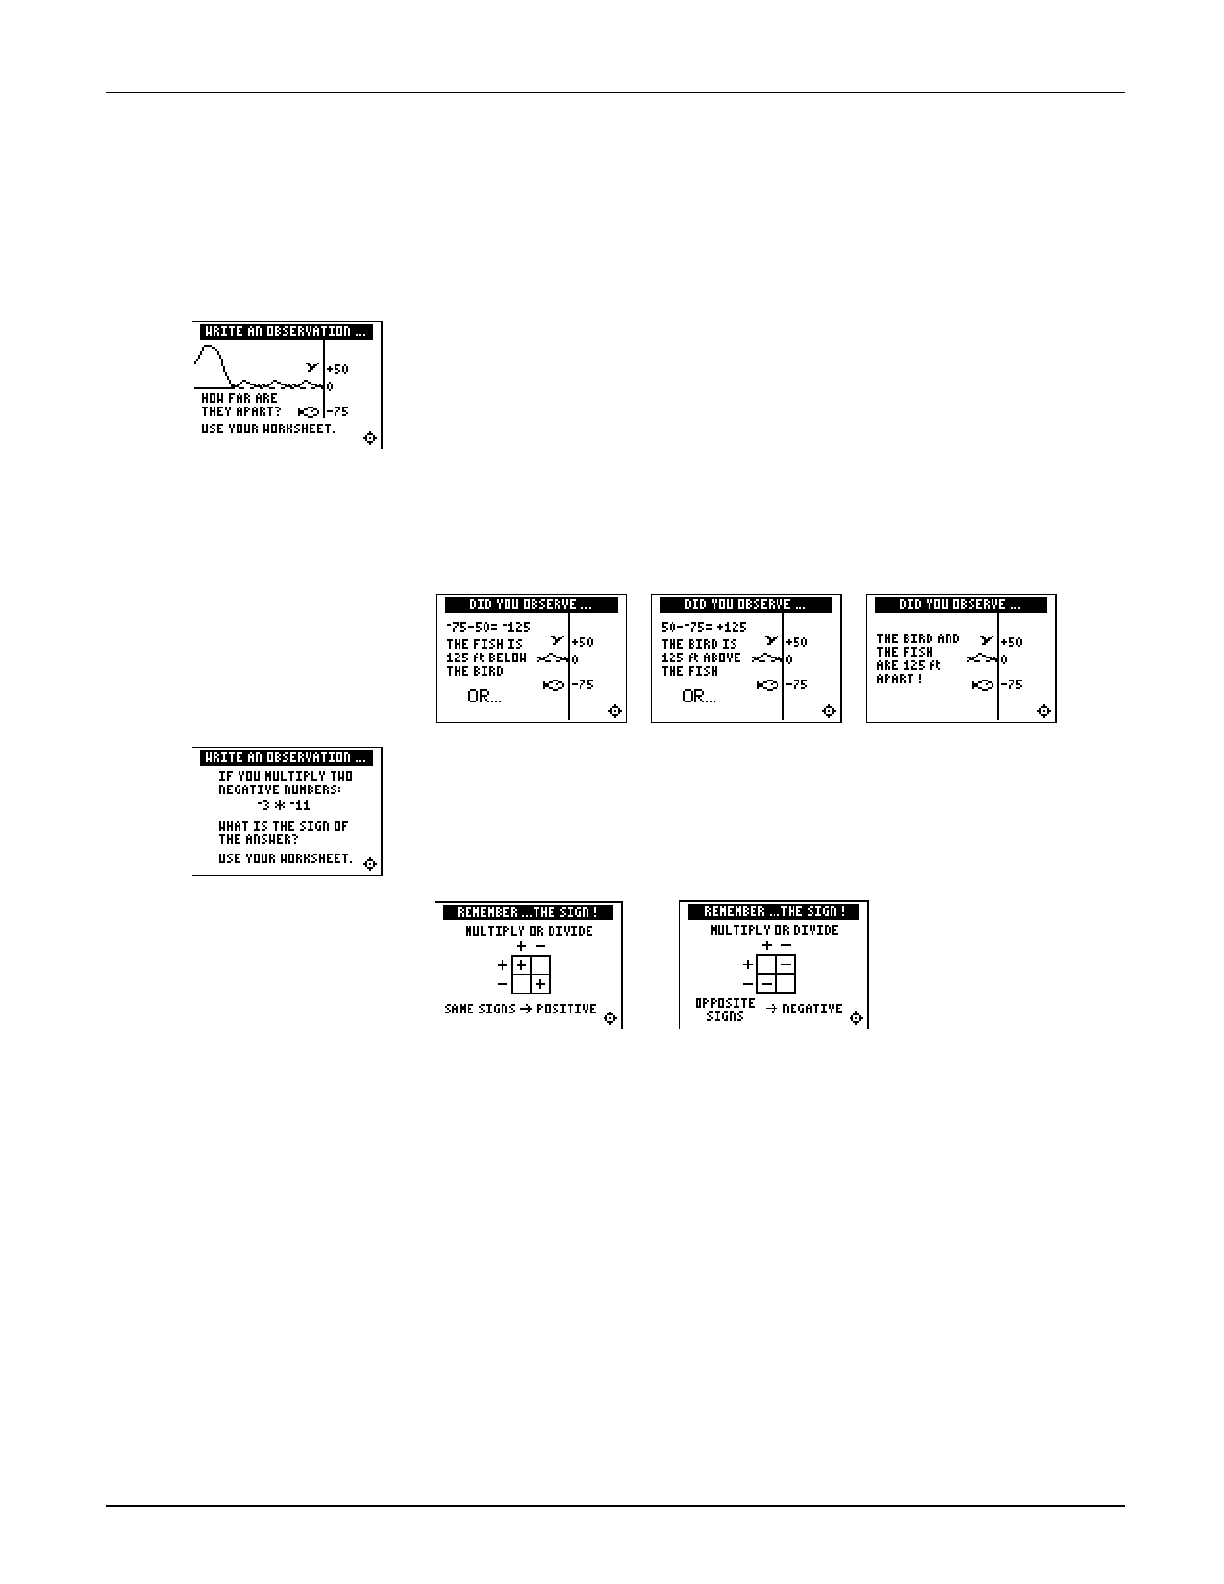
Observation 1
How far apart are the bird and the fish? Should your answer be
positive or negative? Write an explanation for your answers here.
Observation 2
What is the sign of the answer to the problem L3 Q L11?
In your own words, state the rules for multiplying and dividing
signed numbers (shown in the grids on the next screens).
Chapter 1: Number Sense Name
Section 1: Integers Date
Topics in Algebra 1 © 2001 Texas Instruments Student Worksheet 1-2
Activities
The Activities help you practice integer concepts. You can select from two different activities—
What Is My Sign? and Integer Smash. Follow these steps to play the activity and complete your
worksheet.
1. Make sure you are in the Activities for this section.
2. Highlight an activity using $ or #, and press b.
Scoring: Every correct
response earns 2 points.
The game automatically
ends if you have
answered incorrectly four
times (shown in the top
right corner), or you press
áQUITâ to stop.
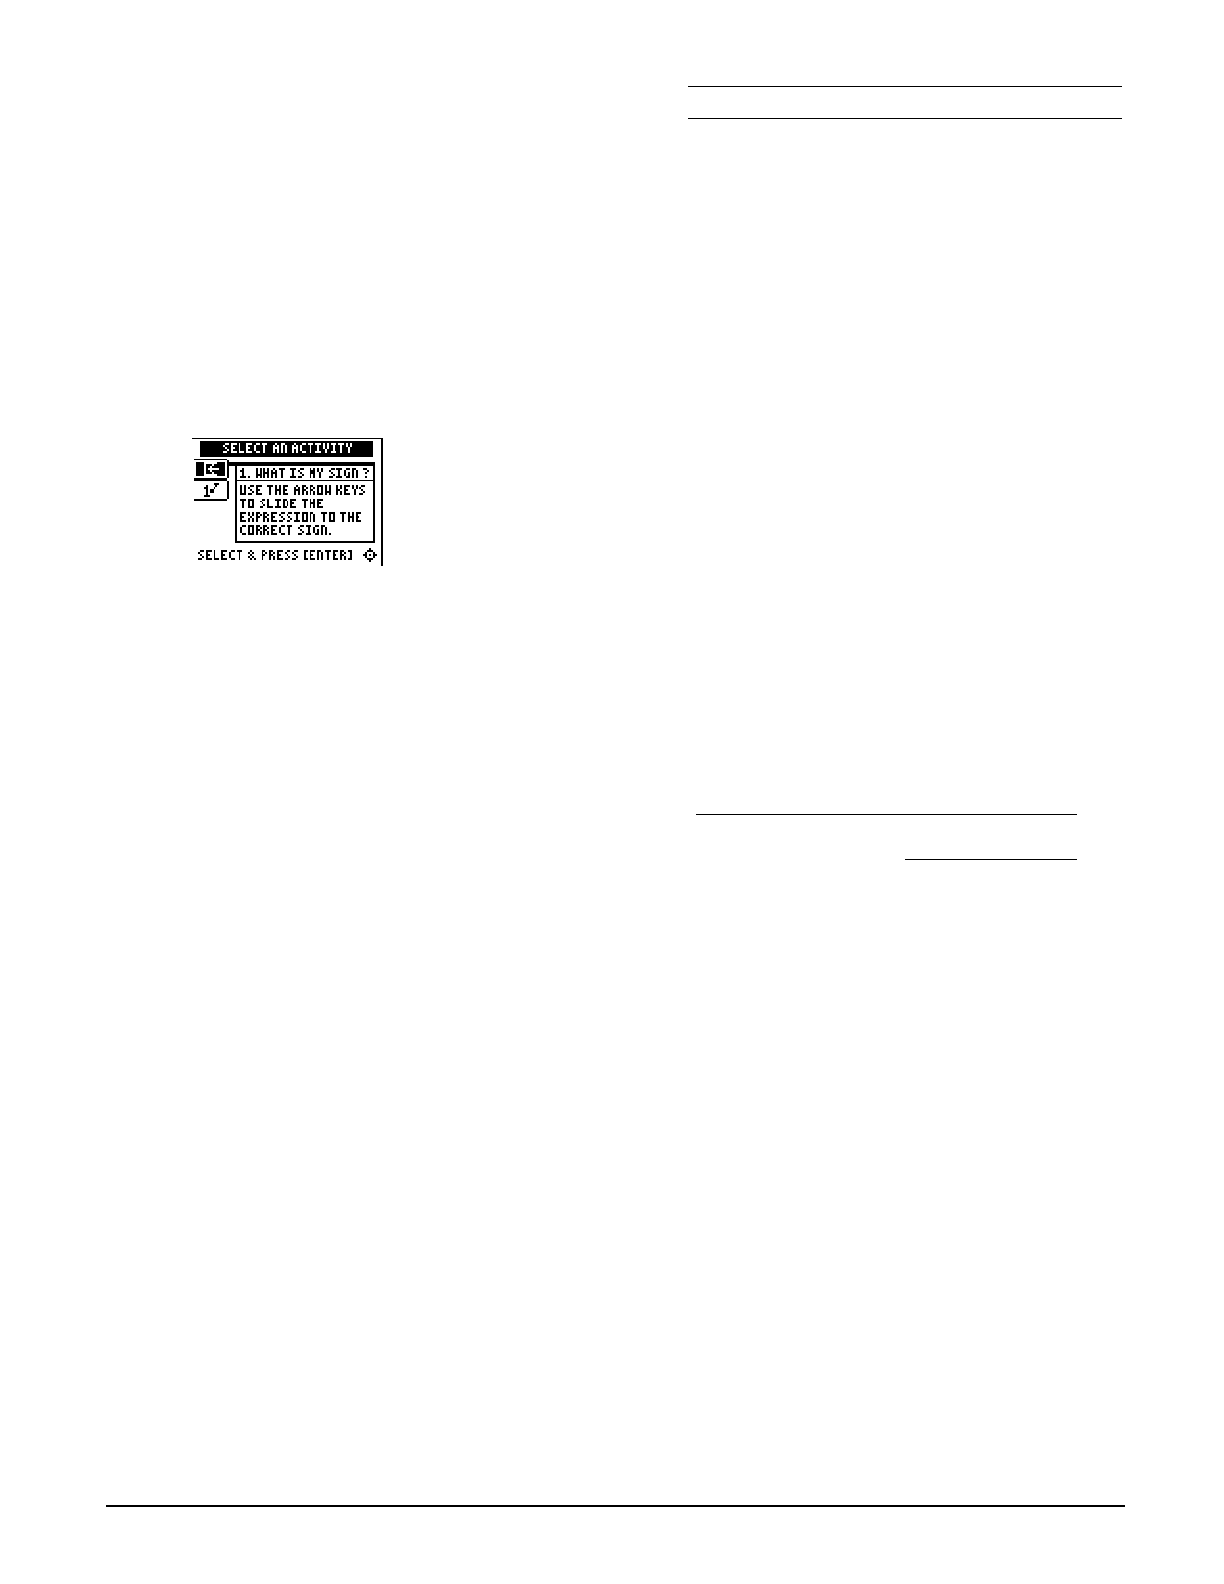
What Is My Sign?
1. In your head, quickly solve the sliding expression to
determine if the result is positive, negative, or zero.
2. As soon as you know the sign of the result, press # and $ to
move the expression into the proper category on the left
(+, 0, or M). Once the expression is in the correct row, you can
press ! to slide it quickly to the left. If the answer is
incorrect, the correct answer is displayed; press any key to
resume play.
3. Follow your teacher’s instructions for how long to play the
activity.
4. What was your score?
5. How many incorrect answers did you have?
(Shown in top right corner of the screen.)

Chapter 1: Number Sense Name
Section 1: Integers Date
Topics in Algebra 1 © 2001 Texas Instruments Student Worksheet 1-3
Activities (continued)
Scoring: You get two
attempts to solve each
problem. You earn 2
points for a correct
answer on the first try, 1
point for a correct answer
on the second try.
You can earn up to 10
points.
Integer Smash
1. Highlight a level (bronze = least difficult; gold = most
difficult), and press b to select it.
2. For bronze or silver levels only, press á+â, áNâ, á¦â, or á÷â to
select the operation you want to practice.
3. Enter the missing number (press Ì for negative numbers)
and press b. If the answer is incorrect on the second
attempt, the correct answer is displayed; press any key to
resume play. As you play the activity, write each number
sentence and solution. Show your work here.
4. What level and operation (bronze and silver only) did you
play?
5. What was your score?
Chapter 1: Number Sense Name
Section 1: Integers Date
Topics in Algebra 1 © 2001 Texas Instruments Student Worksheet 1-4
³ Try-It!é on Your TI.83 Plus or TI.73
Learn to use the subtraction key (¹), the negation key (Ì), and the absolute value function
(abs().
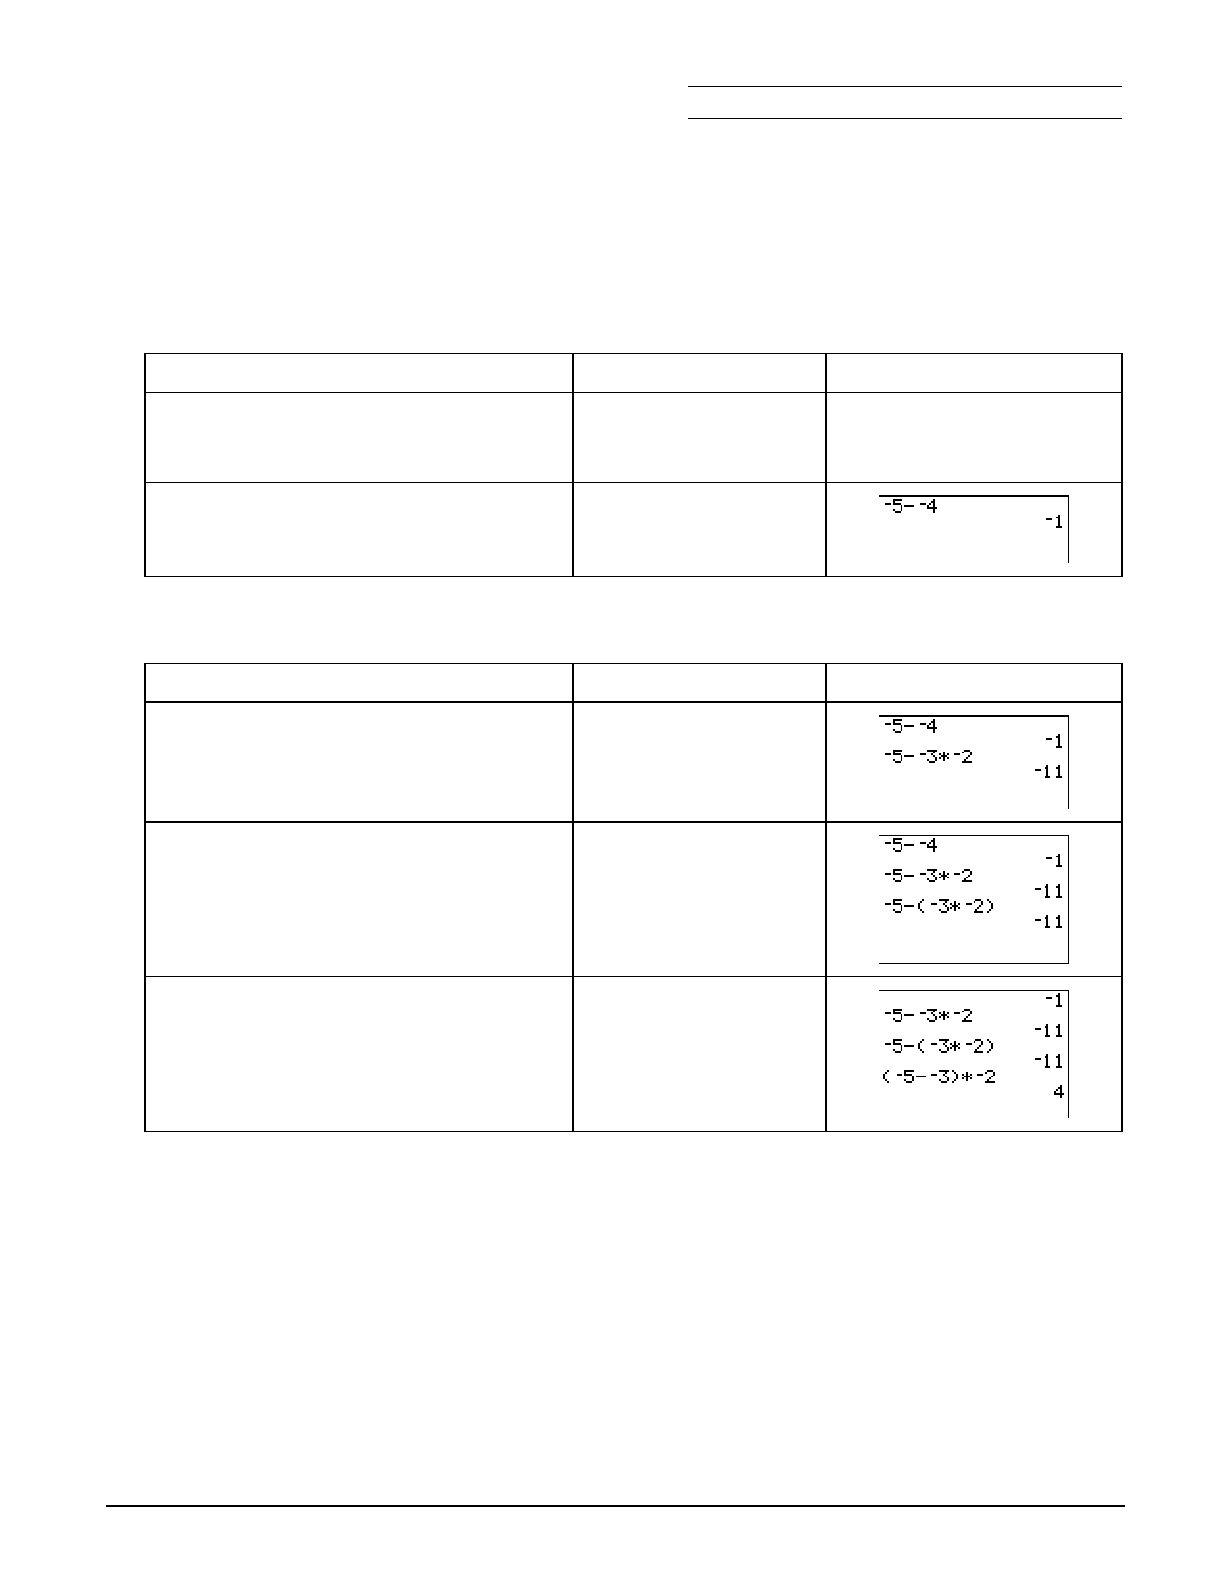
Use the negation and the subtraction keys to calculate M5 N M4.
To Do This Press Display (TI.83 Plus shown)
1. Exit the Topics in Algebra 1
application and clear the Home
screen.
y l
áEXITâ :
2. Calculate
M5 N M4.
Note: The negation key (Ì) and the subtraction key
(¹) are different.
Ì 5 ¹ Ì 4
Í
Enter M5 N M3 Q M2, first without using parentheses and then using parentheses.
To Do This Press Display (TI.83 Plus shown)
1. Calculate
M5 N M3 Q M2.
Note: On the TI-73, notice the difference between
the x variable key (I) and the multiplication
key (M).
Ì 5 ¹ Ì 3 M Ì2
Í
2. Calculate
M5 N (M3 Q M2).
Ì 5 ¹
D Ì 3 M Ì 2 E
Í
3. Calculate (M5 N M3) Q M2.
D Ì 5 ¹ Ì 3 E
M Ì 2
Í
The calculator uses the Order of Operations rules, which say that multiplication and division are
performed from left to right, and then addition and subtraction are performed from left to right.
Notice that multiplication was calculated before subtraction in the expression M5 N M3 Q M2. Notice
that the expression M5 N (M3 Q M2) has the same answer.
The calculator performs operations inside the parentheses before operations outside the
parentheses. Notice that the expression (M5 N M3) Q M2 has a different answer than the expressions
M5 N M3 Q M2 and M5 N (M3 Q M2).
Chapter 1: Number Sense Name
Section 1: Integers Date
Topics in Algebra 1 © 2001 Texas Instruments Student Worksheet 1-5
³ Try-It!é on Your TI.83 Plus or TI.73 (continued)
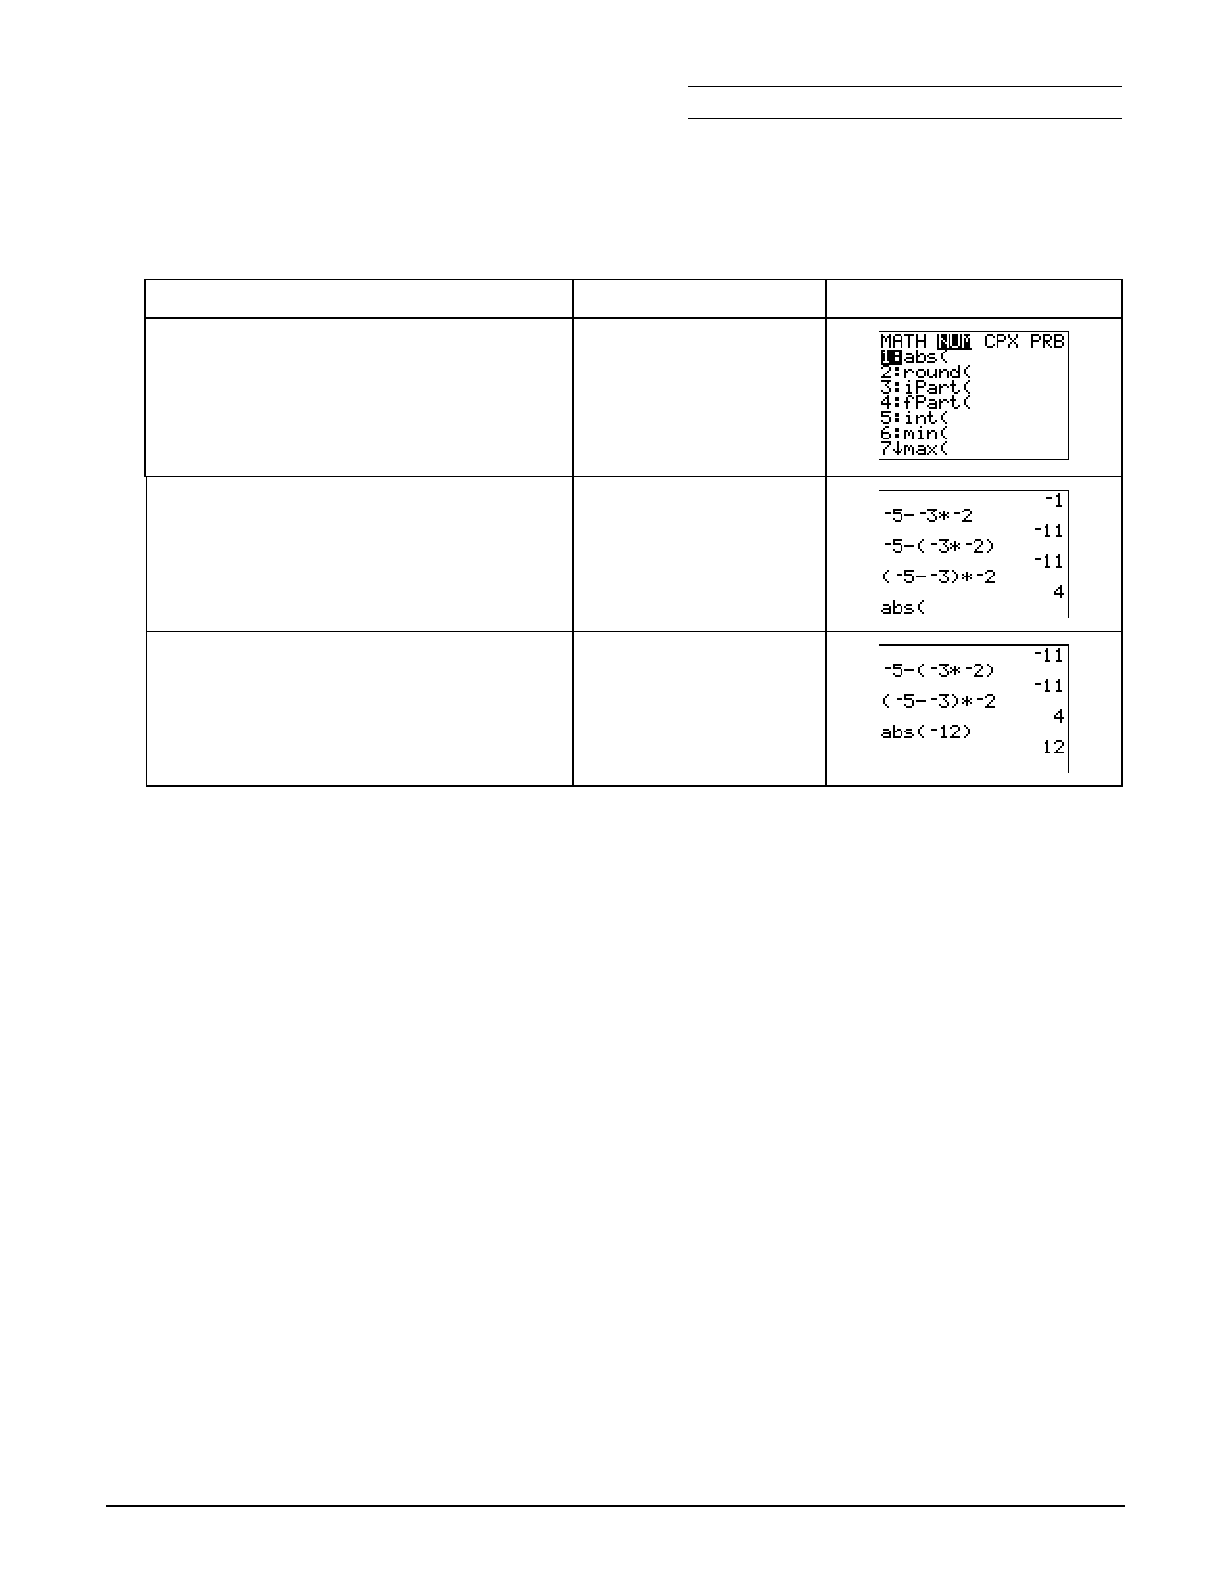
Use the absolute value (abs() function on the calculator to find the absolute value of M12.
To Do This Press Display (TI.83 Plus shown)
1. Find the absolute value of M12, which
is written as |M12 |.
Note: The 1 NUM menu varies slightly from the
TI-73 to the TI-83 Plus.
1 "
2. Select the absolute value (abs()
function. It is copied to the Home
screen.
1:abs(
3. Calculate the result. a 12 E
Í
Additional problems—Calculate the following problems by hand, then check your answers
using the calculator. Remember to use the Order of Operations rules.
1. M4 + M12 Q M10 = 2. 4
Q M8 − M10 Q 2 =
3. M30 ÷ M5 − 6 = 4. | M12 +M28 | =
5. | M4 Q M8 N M10 Q 2 | = 6. M| M3 N 14 N M10 | =

Chapter 1: Number Sense Section 1: Integers
Topics in Algebra 1 © 2001 Texas Instruments Teacher Notes 1-6
Number Sense: Integers Teacher Notes
Objectives
• To illustrate the set of integers in a Venn diagram.
• To give an overview of the following definitions: the sign of a number, numbers of opposite
sign, and absolute value.
• To give illustrations of the sets of positive and negative integers, and zero.
• To review ordering and the additive inverse property.
• To show examples of addition, subtraction, multiplication, and division of integers.
Math Highlights
This section begins with a Venn diagram and follows with an illustration of the use of integers on
the Fahrenheit and Celsius scales. The temperature equivalencies shown are integer values.
Students are reminded that the absolute value operation is defined as the distance of the number
from zero. Examples of addition, subtraction, multiplication, and division operations are given. A
number line model is used for addition and subtraction. Subtraction uses the add-the-opposite
rule.
Common Student Errors
Students may have trouble identifying rules, such as the add-the-opposite rule for subtraction.
Note: The number line model for addition and subtraction is shown on the calculator when the Topics in Algebra 1 application is
installed.
Following are some activities to help students construct the rules for multiplication and division.
These activities are not part of the Topics in Algebra 1 application.
Pattern Development for Multiplication and Division
Investigation 1: What is the product of a positive and negative
number?
Begin by writing the product of two positive numbers, for example,
3 Q 3 = 9. Keep decreasing the second term by 1 to create the sequence
of multiplication values shown to the right. Notice the values on the
right side of the number sentences decrease by 3.
Observation: The product of a positive and negative number is
negative.
3
Q 3 = 9
3
Q 2 = 6
3
Q 1 = 3
3
Q 0 = 0
3
Q M1 = M3
3
Q M2 = M6
3
Q M3 = M9
. . .

Chapter 1: Number Sense Section 1: Integers
Topics in Algebra 1 © 2001 Texas Instruments Teacher Notes 1-7
Common Student Errors (continued)
Pattern Development for Multiplication and Division (continued)
Investigation 2: What is the product of two negative numbers?
Start with the last number sentence from Investigation 1 (3 × M3 = M9).
Keep decreasing the first term by 1 to create the sequence of
multiplication values shown to the right. Notice that the values on the
right side of the number sentences increase by 3.
Observation: The product of two negative numbers is positive.
3
× M3 = M9
2
× M3 = M6
1
× M3 = M3
0
× M3 = 0
M1 × M3 = 3
M2 × M3 = 6
M3 × M3 = 9
…
Investigation 3: What are the division rules for multiplying signed
numbers?
Observation: Division rules are developed using multiplication as the
inverse operation. The rules are similar.
M6 ÷ 3 = M2 since
3
× M2 = M6
M6 ÷ M2 = 3 since
M2 × 3 = M6
Student Worksheet Notes with Answers
Overview
Tell students:
1. How to find the Overview, if necessary.
2. How to navigate the application, if necessary.
3. To scroll through the Overview on the calculator. Point out new terms, definitions, and
concepts, and tell students to look for them as they go through the Overview.
Chapter 1: Number Sense Section 1: Integers
Topics in Algebra 1 © 2001 Texas Instruments Teacher Notes 1-8
Observations
The Observations help students understand operations with signed integers. If necessary, tell
students how to find the Observations.
Observation 1
How far apart are the bird and the fish? Should the answer be
positive or negative? Students write an explanation of their
answers.
The bird and the fish are +125 ft. apart. The distance is
positive. (Students will see the answers on the next three
screens. Signed numbers give a perspective as shown on the
screens.) Explanations will vary.
Students see the answers
on the following three
screens.
Observation 2
What is the sign of the answer to the problem M3 Q M11?
The answer is positive.
M
3
Q
M
11 = 33.
Students see grids
explaining the rules.
What are the rules for multiplying and dividing signed numbers?
The product of a positive and negative number is negative.
The product of two numbers with the same sign is positive.
Rules for division are similar to the rules for multiplication.

Chapter 1: Number Sense Section 1: Integers
Topics in Algebra 1 © 2001 Texas Instruments Teacher Notes 1-9
Activities
Scoring: Students earn 2
points for each correct
response.
Unless you specify point
or time limits for this
activity, students can play
the activity until they have
answered incorrectly four
times or they press
áQUITâ to stop. There is
no time limit.
What Is My Sign?
Tell students to:
1. Quickly solve the expression in their heads before it slides all
the way to the left.
2. Move the expression into the correct category (+, 0, or M) using
$ and #. Once the expression is in the correct row, they can
press ! to slide it quickly to the left. If the answer is incorrect,
the correct answer is displayed; press any key to resume play.
3. Follow your instructions. For example, students can play:
• Until they have answered incorrectly four times (no time
limit).
• Until a certain amount of time has expired (highest score
with the fewest misses wins).
• Until a certain score has been reached (first student to
reach the score with the fewest misses wins).
• Repeatedly over a period of time (days, weeks, etc.) for
tracking improvement of high scores.
4. Record their score.
5. Record how many incorrect answers they had.
(Shown in top right corner of the screen.)
Scoring: Students get
two attempts to solve
each problem. They earn
2 points for a correct
answer on the first try, 1
point for a correct answer
on the second try.
Students can earn up to
10 points.
Tip: You may want to
remind students playing
at the gold level about the
Order of Operations rules.
Integer Smash
Tell students to:
1. Highlight a level (bronze = least difficult; gold = most difficult),
and press b to select it.
2. Bronze or silver levels only: Press á+â, áNâ, á¦â, or á÷â to select
the operation that they want to practice.
3. Enter the missing number (press Ì for negative numbers) and
press b. As they play the activity, write each number
sentence and solution, showing all of their work on the
worksheet.
4. Record the level and operation (bronze and silver only) they
played.
5. Record their score.

Chapter 1: Number Sense Section 1: Integers
Topics in Algebra 1 © 2001 Texas Instruments Teacher Notes 1-10
³ Try-It!é on Your TI.83 Plus or TI.73
These keystroke exercises let students practice using the basic operation keys (\, T, M, F), the
negation key (a), the parentheses keys (D E), and the absolute value function (1 NUM
1:abs( ).
Tell students to follow the steps exactly on the calculators. Example screens are displayed on
the worksheets for students to compare with the calculator screens.
Additional problems—These problems give students additional practice using the subtraction
key (T), the negation key (a), and the absolute value function (1 NUM 1:abs( ). Remind
them to follow the Order of Operations rules.
Tell students to do the following calculations by hand, and then check the answers using the
calculator.
1.
M4 + M12 Q M10 = 116 2. 4 Q M8 − M10 Q 2 = M12
3.
M30 ÷ M5 − 6 = 0 4. | M12 +M28 | = 40
5. | M4 Q M8 N M10 Q 2 | = 52 6. M| M3 N 14 N M10 | = M7
Chapter 1: Number Sense Name
Section 2: Rational Numbers Date
Topics in Algebra 1 © 2001 Texas Instruments Student Worksheet 1-11
Number Sense: Rational Numbers Student Worksheet
Overview
The Overview introduces the topics covered in Observations and Activities. Scroll through the
Overview using " (! to review, if necessary). Read each screen carefully. Look for new terms,
definitions, and concepts.
Observations
The Observations illustrate number sense concepts relating to rational numbers. Scroll through
the Observations using " (! to review, if necessary). Read each screen carefully. When you
come to a Write an Observation screen, stop and write the answers to the questions on your
worksheet.
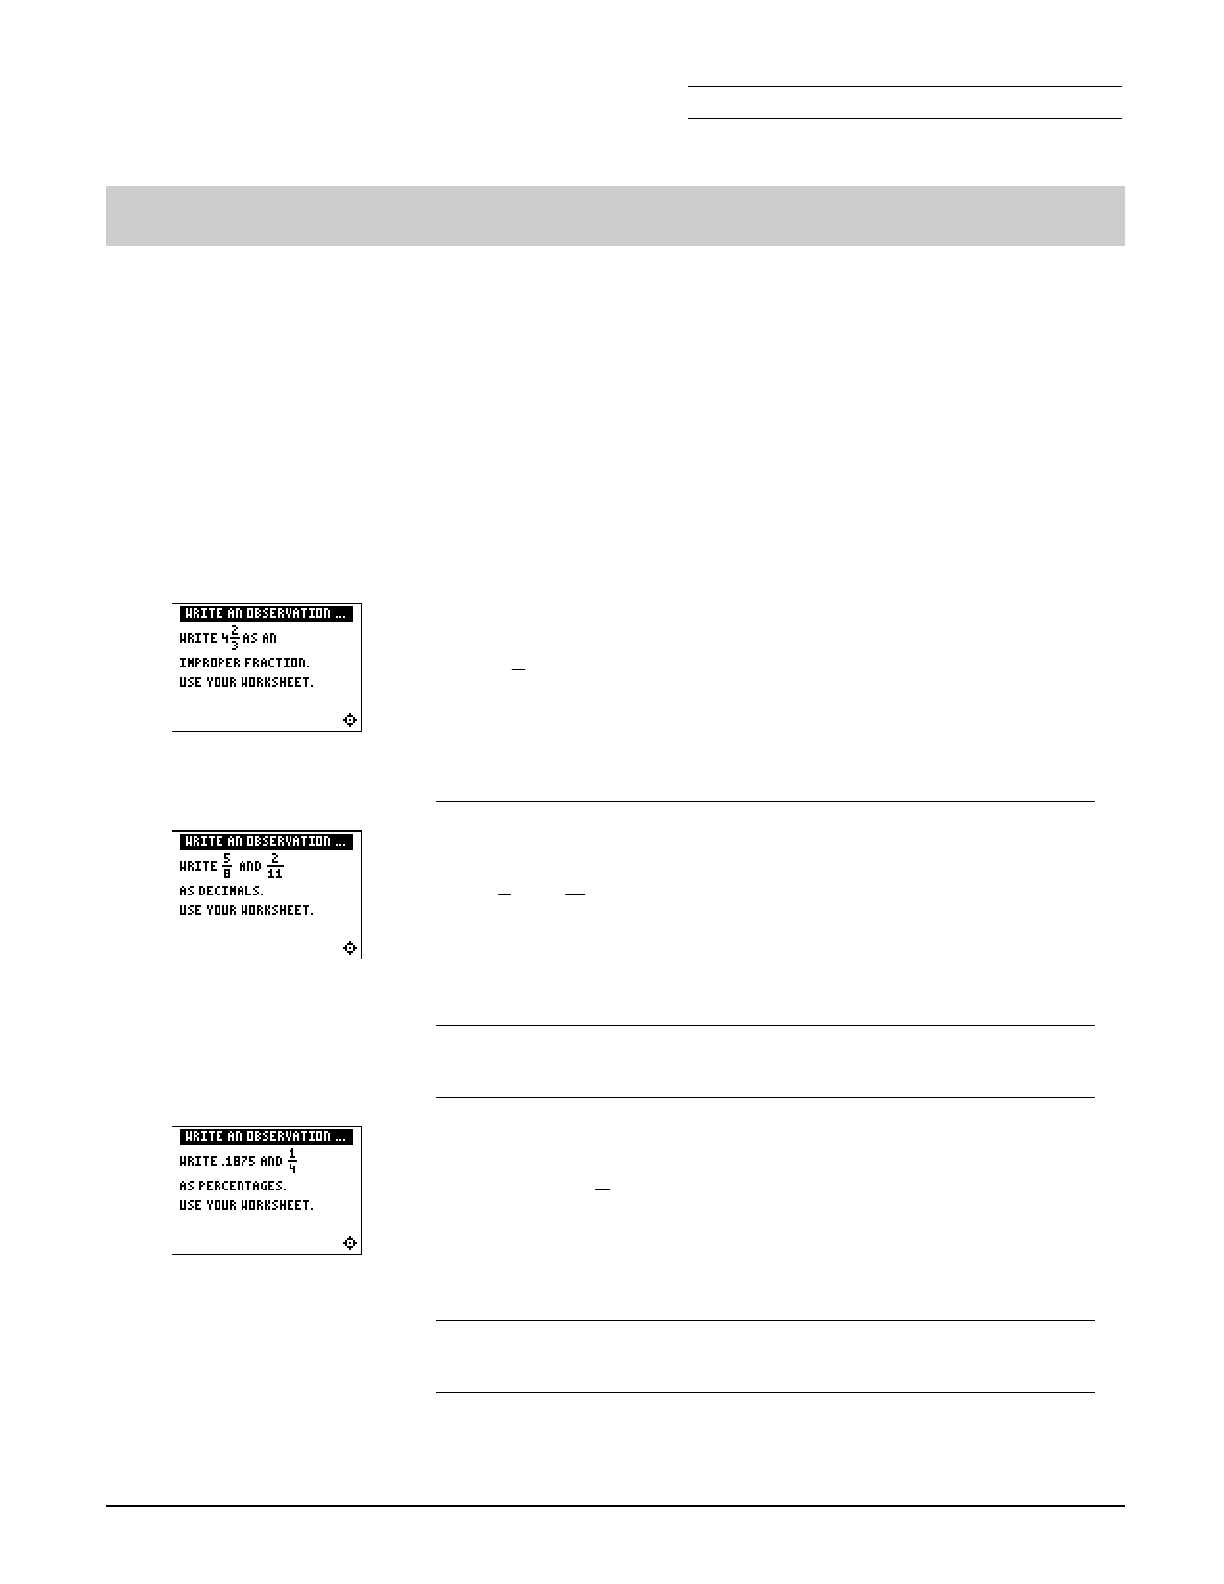
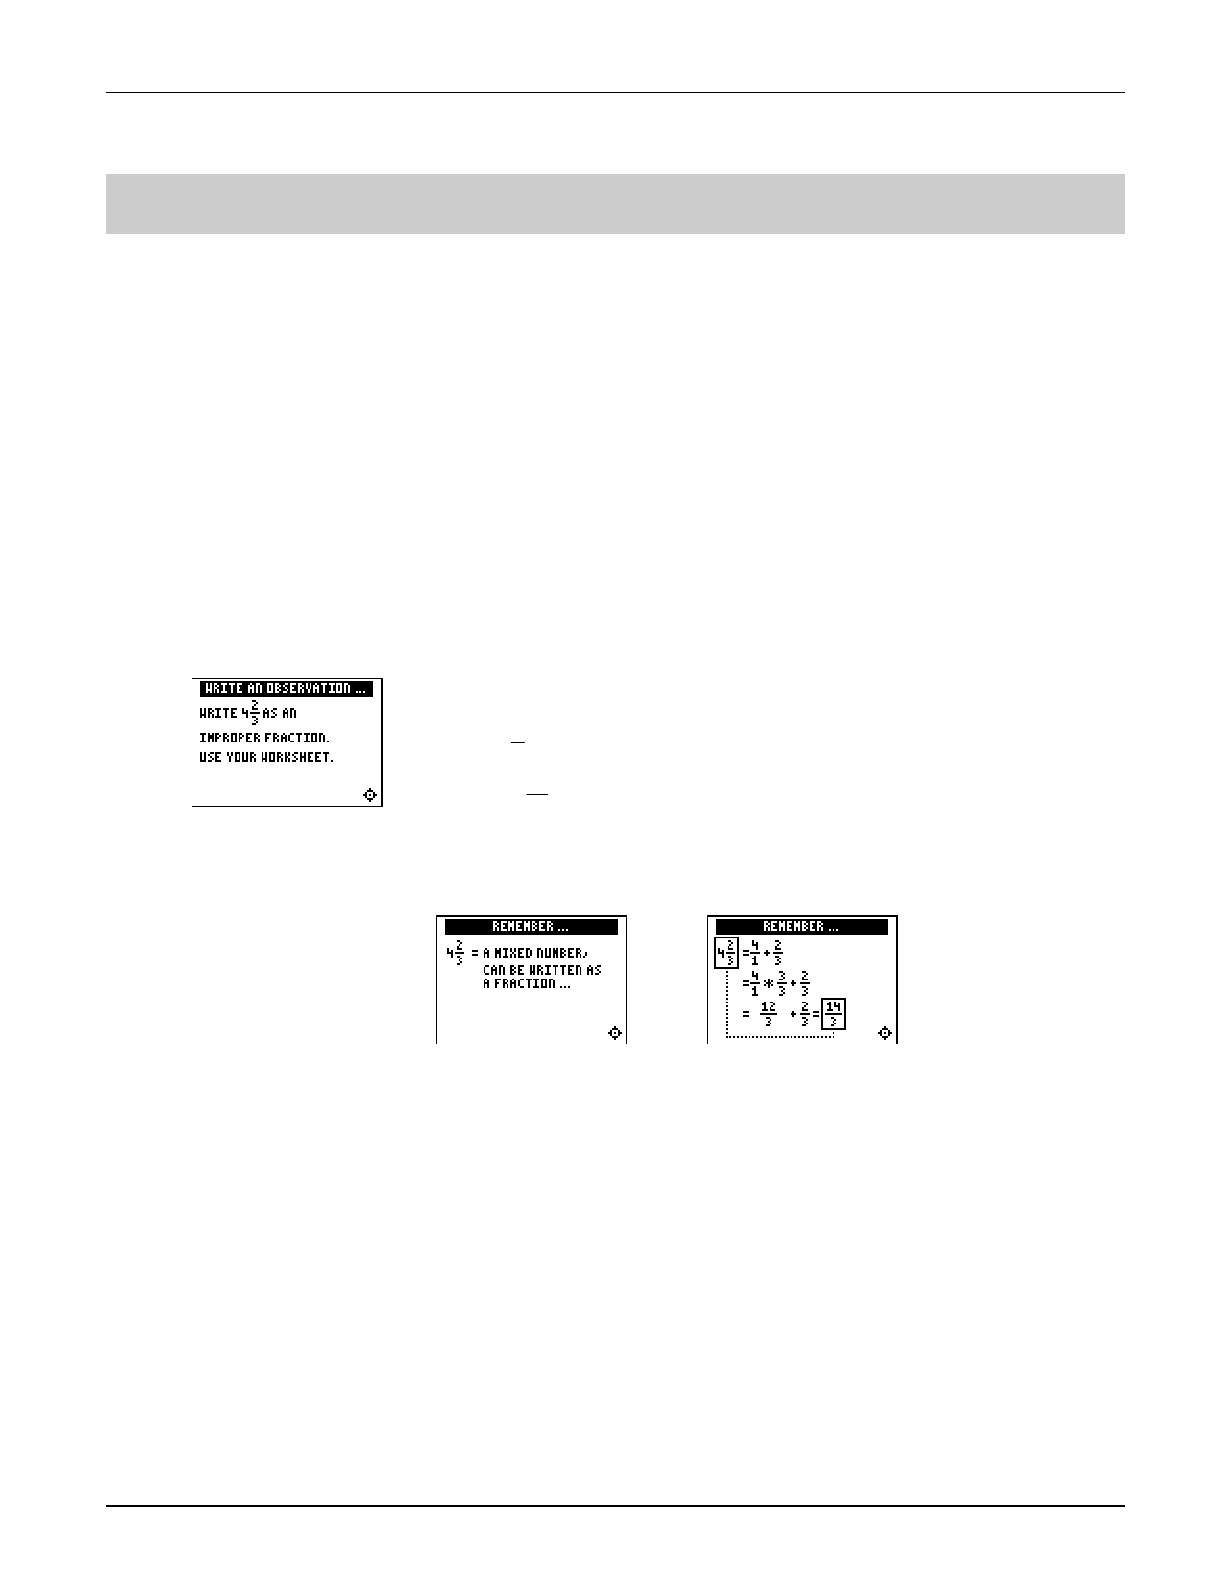
Observation 1
Write 3
2
4 as an improper fraction.
Write your answer here. Show all of your work.
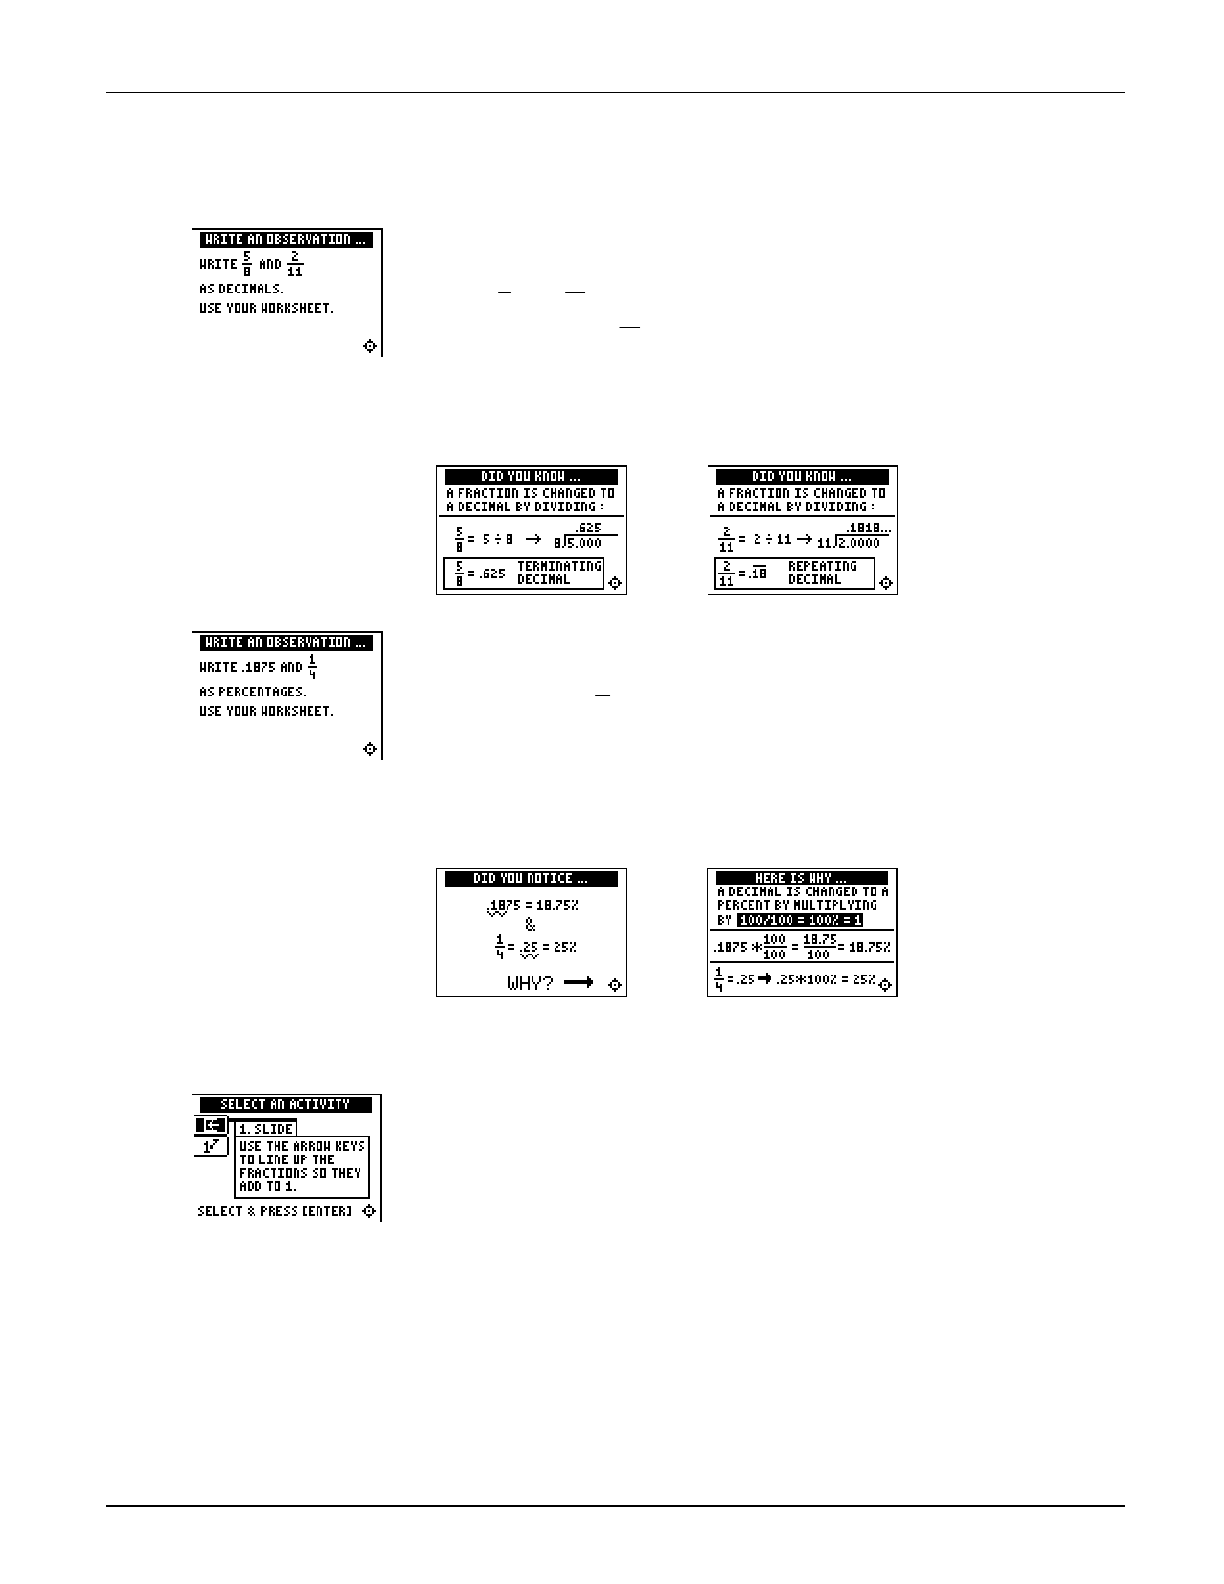
Observation 2
Write 8
5 and 11
2 as decimals.
Write your answer here. Show all of your work.
Observation 3
Write .1875 and 4
1 as percentages.
Write your answer here. Show all of your work.
Chapter 1: Number Sense Name
Section 2: Rational Numbers Date
Topics in Algebra 1 © 2001 Texas Instruments Student Worksheet 1-12
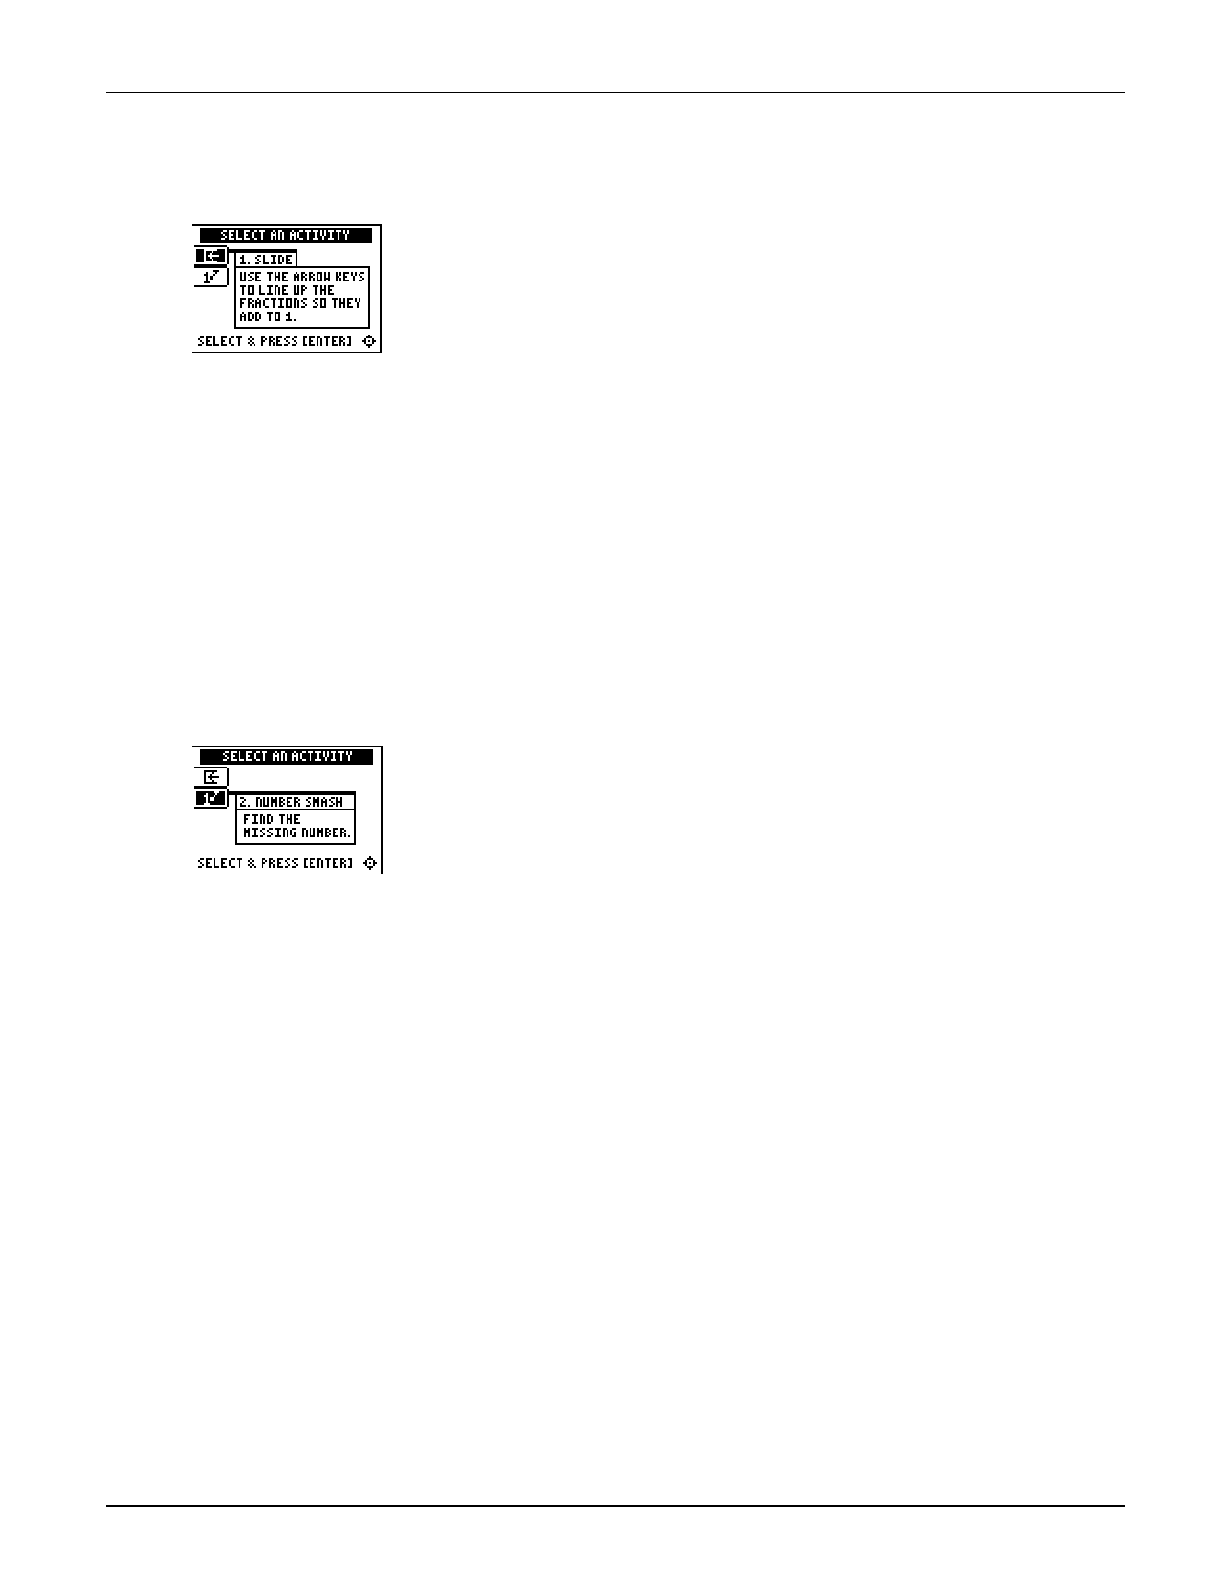
Activities
The Activities help you practice rational number concepts. You can select from two activities—
Slide and Number Smash. Follow these steps to play the activity and complete your worksheet.
1. Make sure you are in the Activities for this section.
2. Highlight an activity using $ or #, and then press b.
Scoring: When a row or
column adds up to 1, it
disappears, and you
score 2 points.
The game automatically
ends if the screen is full
or if you press áQUITâ to
stop.
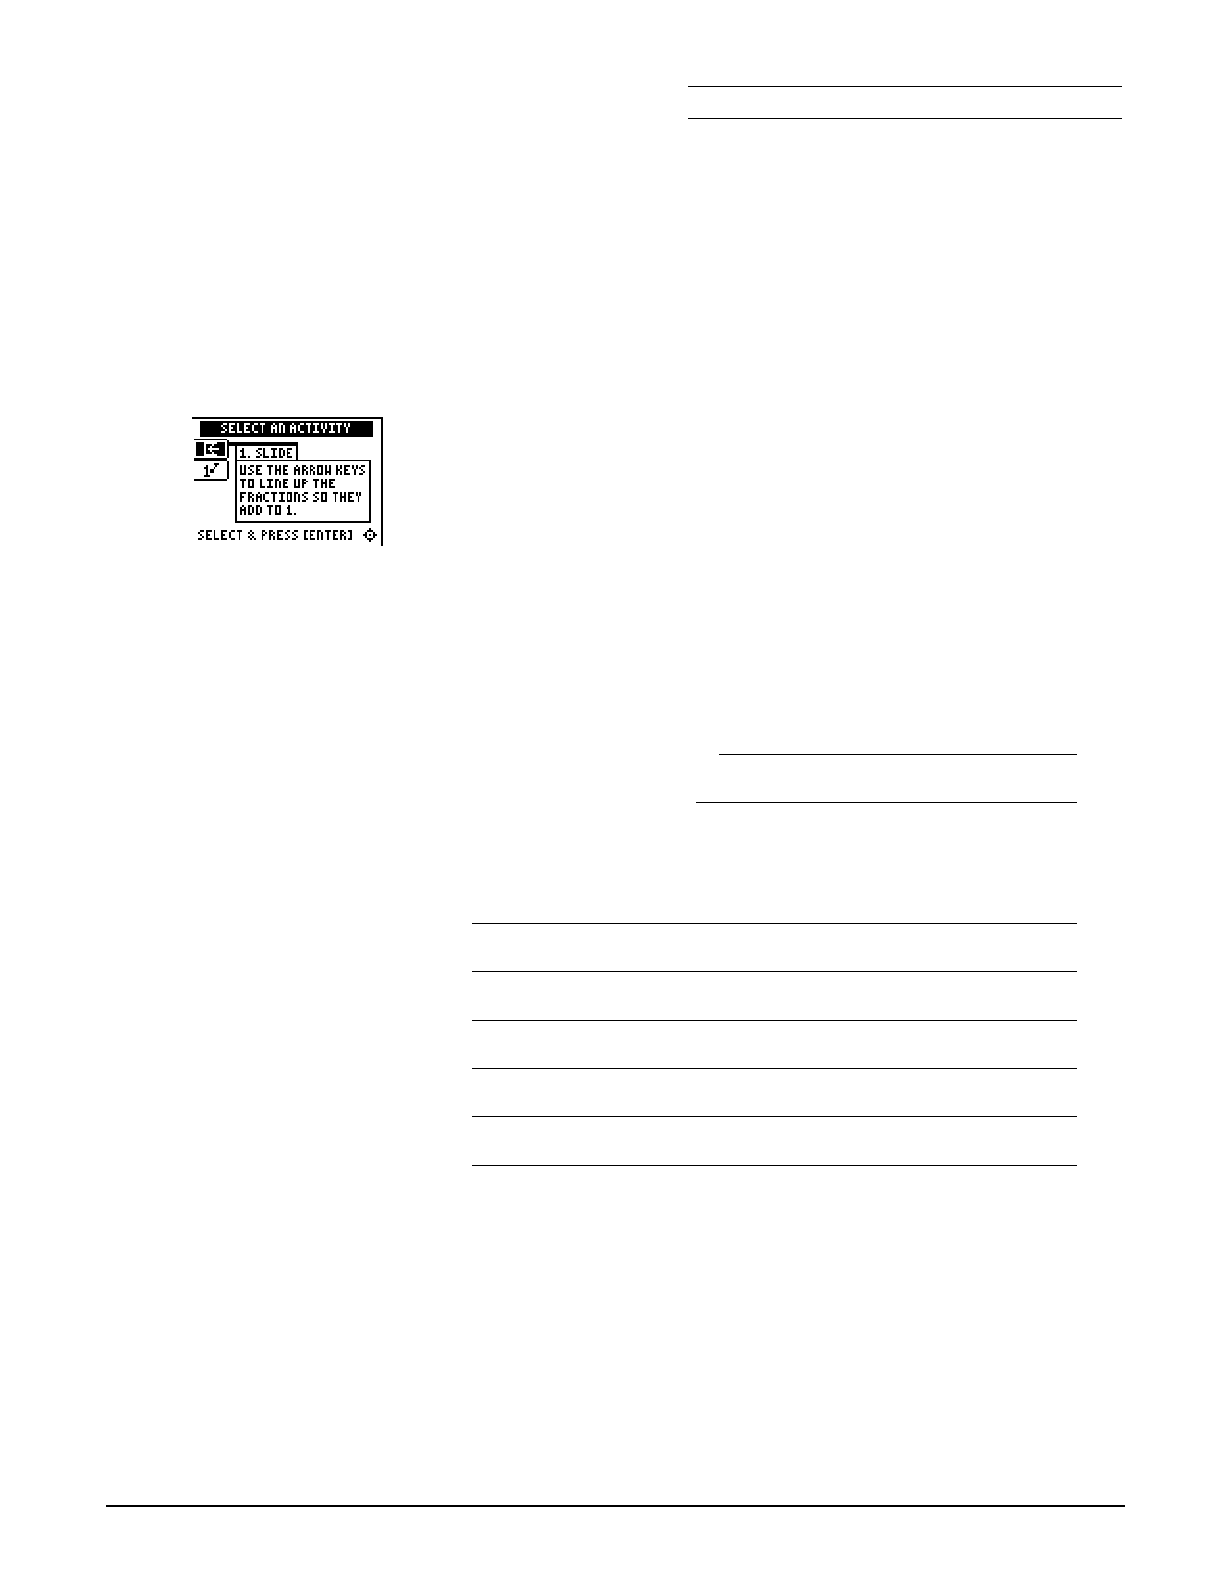
Slide
1. Highlight a level (bronze = least difficult; gold = most
difficult), and press b to select it.
2. Line up the fractions so they add to 1 (horizontally or
vertically). As a fraction slides across the screen, press # and
$ to move it up or down. Once a fraction is in the correct
row, you can press ! to slide it quickly to the left.
3. Follow your teacher’s instructions for how long to play the
activity.
4. What level did you play?
5. What was your score?
6. Write a paragraph describing the Slide activity. What was your
strategy for playing the game?

Chapter 1: Number Sense Name
Section 2: Rational Numbers Date
Topics in Algebra 1 © 2001 Texas Instruments Student Worksheet 1-13
Activities (continued)
Scoring: You get two
attempts to solve each
problem. You earn 2
points for a correct
answer on the first try, 1
point for a correct answer
on the second try.
You can earn up to 10
points.
Tip: To change an
answer before you press
b, press : and
re-enter the answer.
Tip: Press án/dâ to move
between the numerator
and denominator.
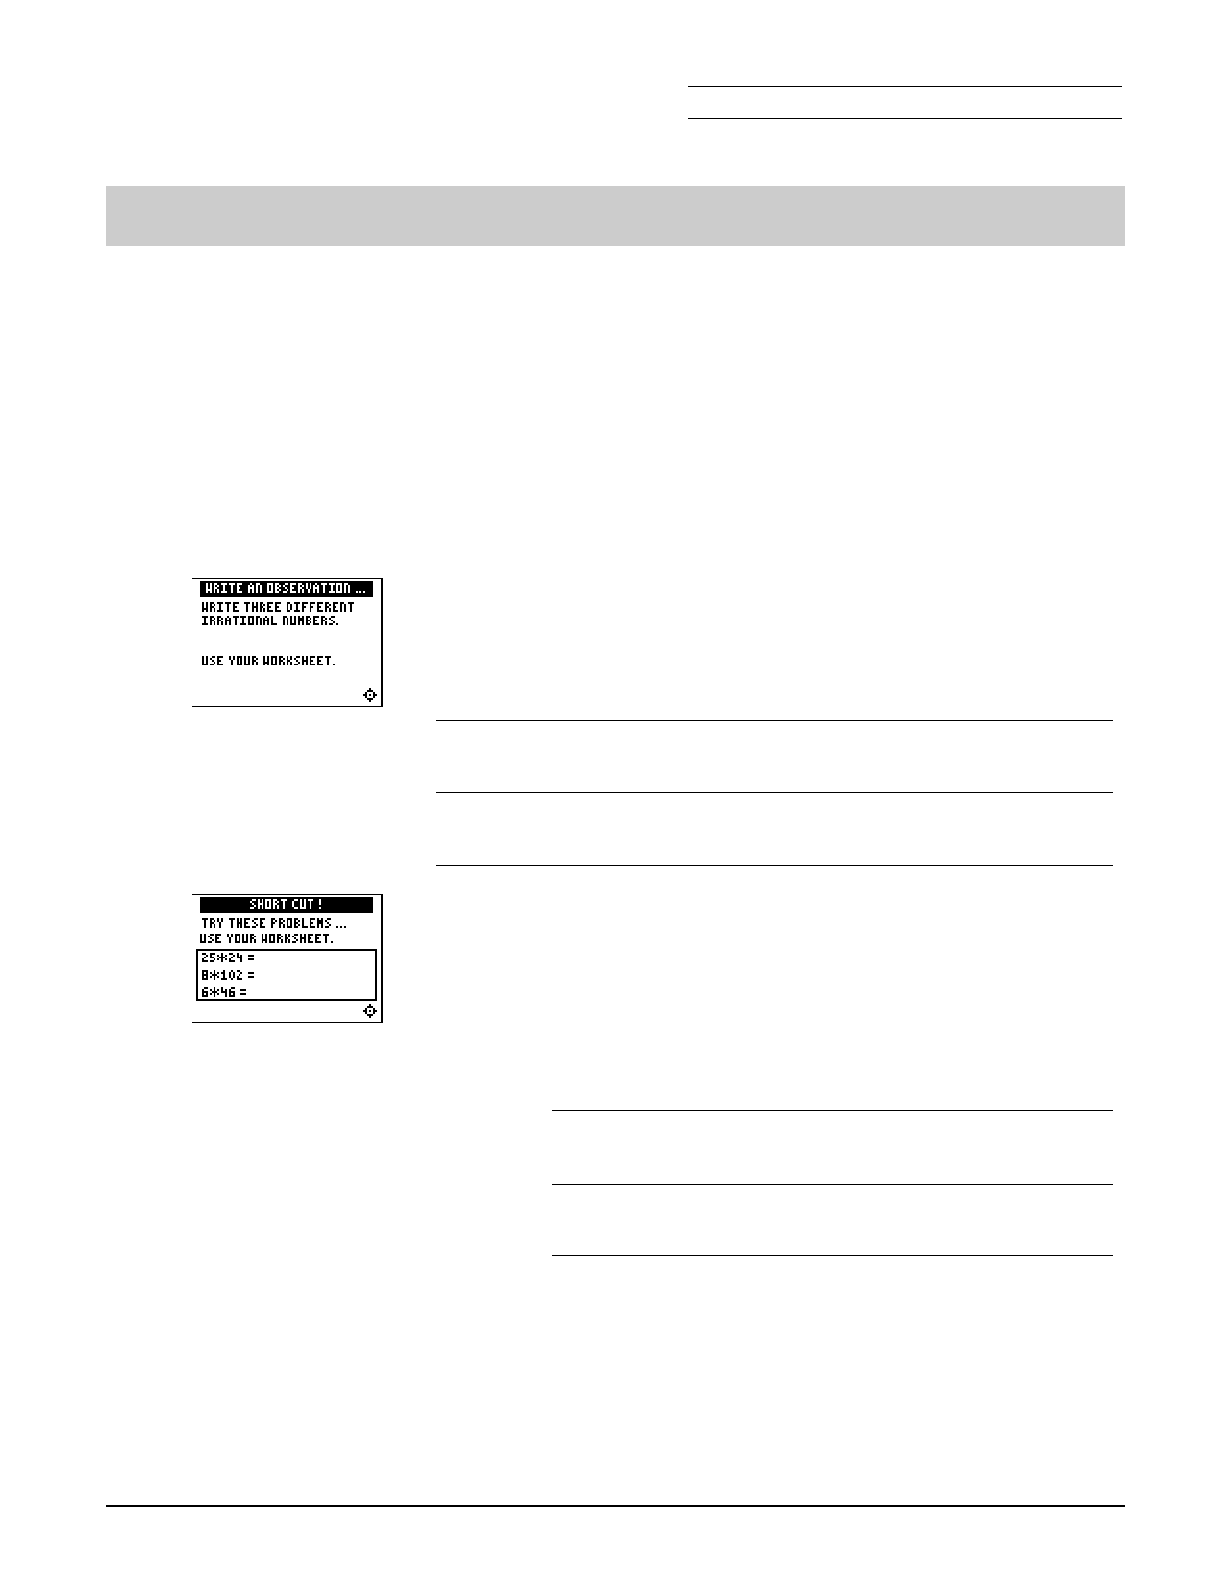
Number Smash
1. Highlight a level (bronze = least difficult; gold = most
difficult), and press b to select it.
2. Press
á+â, áNâ, á¦â, or á÷â to select the operation you want to
practice.
3. Enter the missing number (press Ì for negative numbers),
and press b. As you play the activity, write each number
sentence and solution. Show your work below.
• To enter a mixed number, enter the whole number and
press áUNITâ. Then enter the fraction.
• To enter a fraction, press án/dâ and enter the numerator.
Press án/dâ again and enter the denominator.
If the answer is incorrect, the correct answer is displayed;
press any key to resume play.
4. What level and operation did you play?
5. What was your score?
Chapter 1: Number Sense Name
Section 2: Rational Numbers Date
Topics in Algebra 1 © 2001 Texas Instruments Student Worksheet 1-14
³ Try-It!é on Your TI.83 Plus
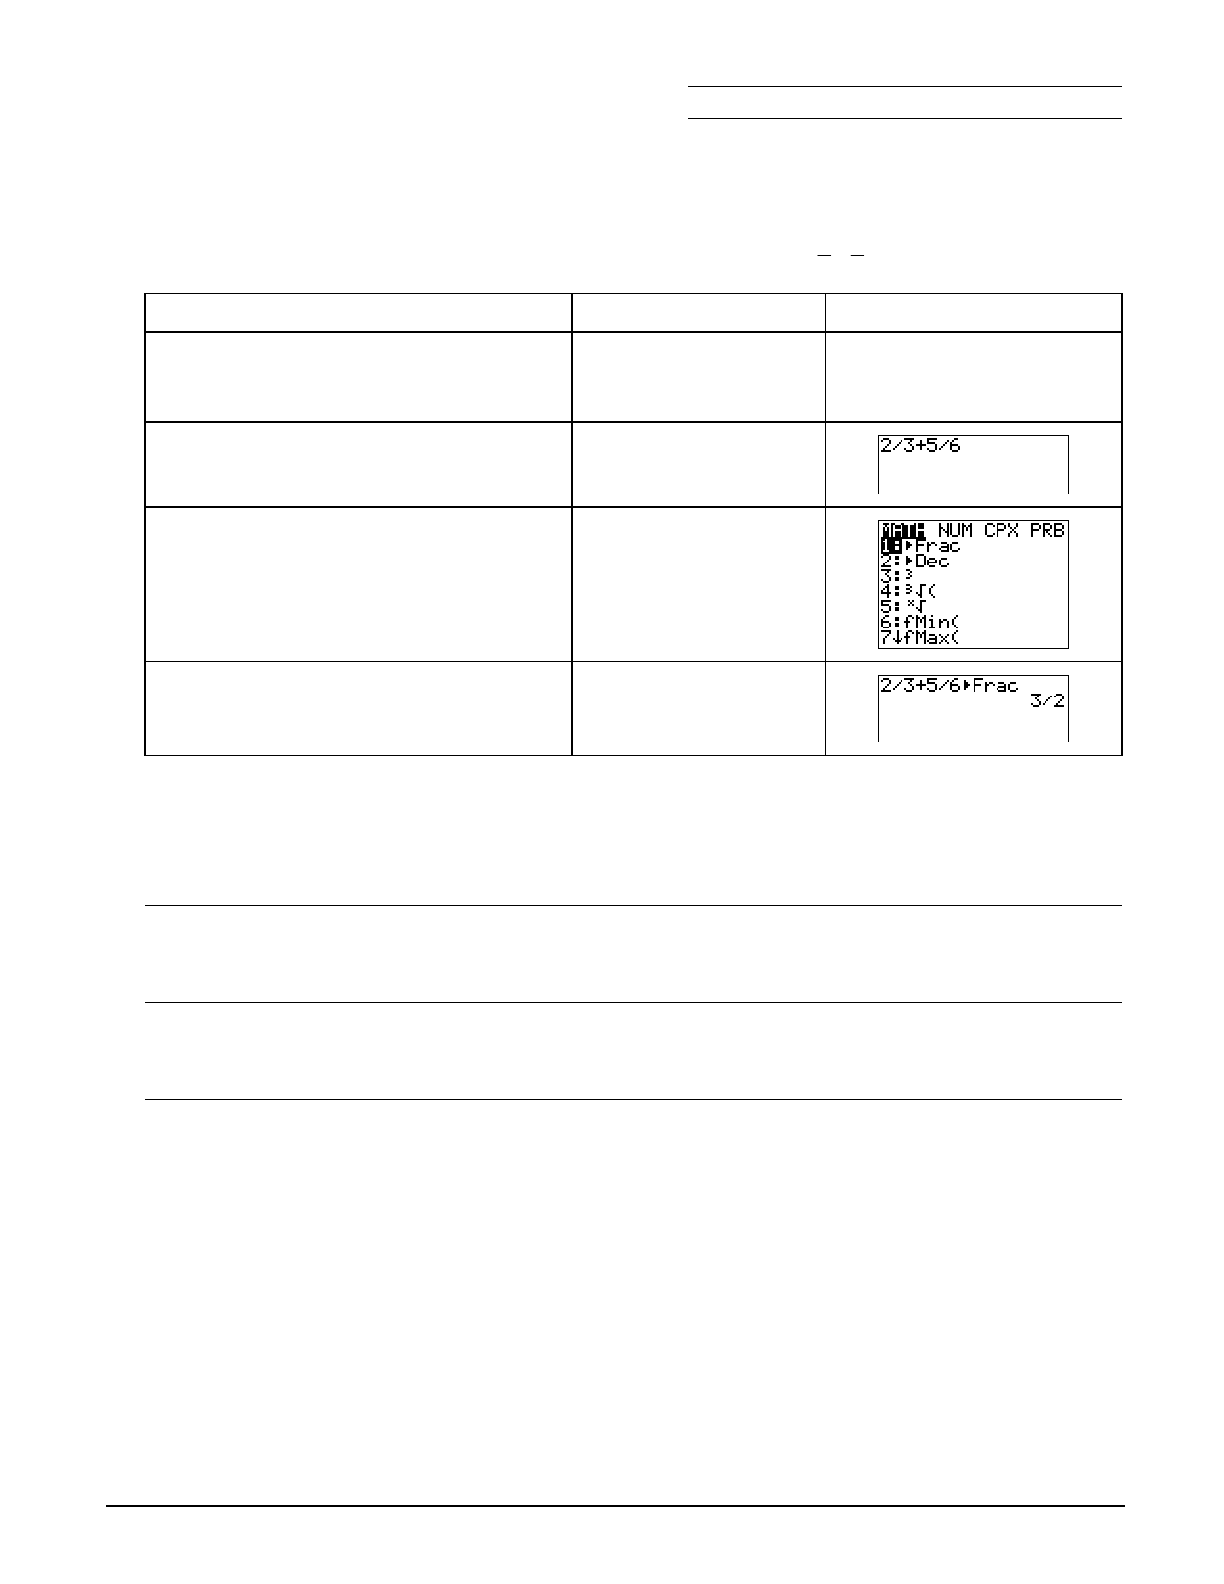
Investigate how the calculator computes addition expressions. Solve 6
5
3
2+.
To Do This Press Display (TI.83 Plus shown)
1. Exit the Topics in Algebra 1
application and clear the Home
screen.
y l
áEXITâ :
2. Enter the expression on the Home
screen. 2 ¥ 3 Ã 5 ¥ 6
3. To specify that you would like the
result to be shown in fraction form,
select 4Frac. It is copied to the Home
screen.
1:4Frac
4. Evaluate the answer. Í
Notice that the answer is in simplified form. The calculator follows the Order of Operations
rules. Division is performed before addition. Solve this problem by hand. Show all of your work.
Chapter 1: Number Sense Name
Section 2: Rational Numbers Date
Topics in Algebra 1 © 2001 Texas Instruments Student Worksheet 1-15
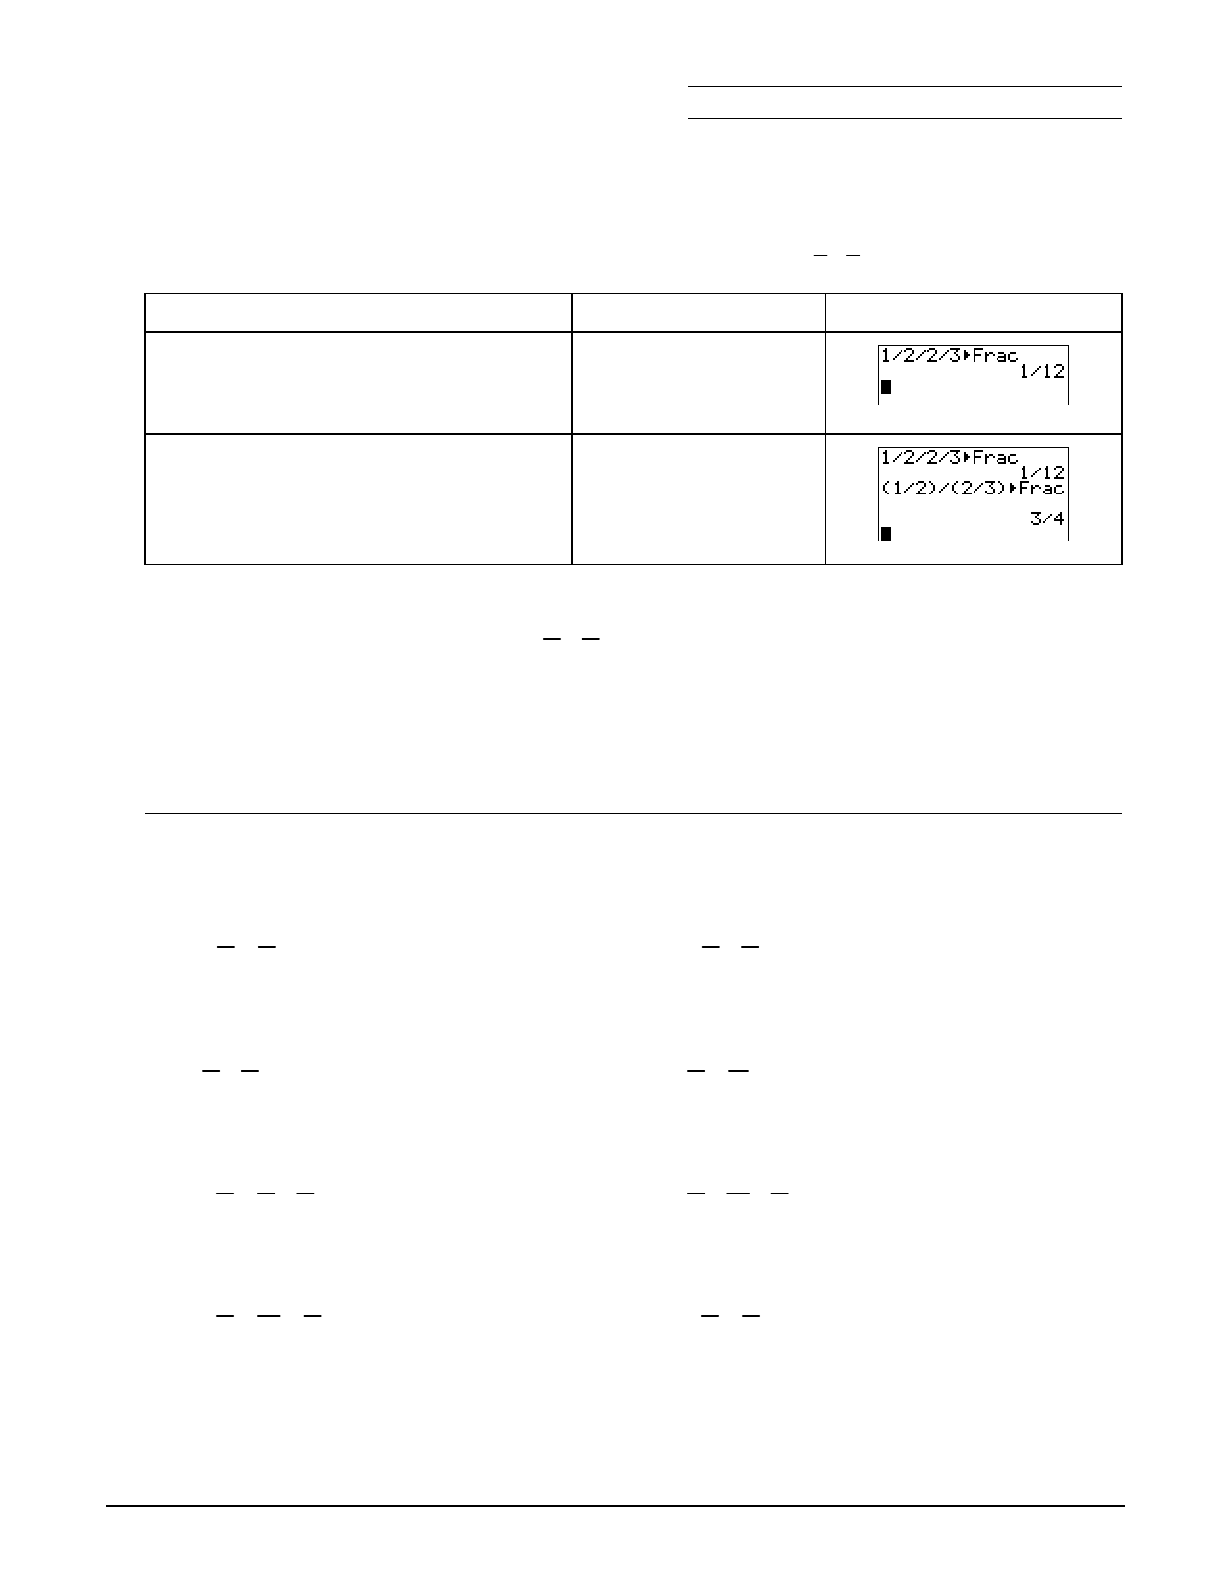
³ Try-It!é on Your TI.83 Plus (continued)
Investigate how the calculator computes division expressions. Solve 3
2
2
1÷.
To Do This Press Display (TI.83 Plus shown)
1. Solve without parentheses and
specify that you want the result in
fraction form.
1 ¥ 2 ¥ 2 ¥ 3
1:4Frac
Í
2. Solve using parentheses and specify
that you want the result in fraction
form.
£ 1 ¥ 2 ¤ ¥
£ 2 ¥ 3 ¤
1:4Frac
Í
The calculator gives two different answers, depending on how you entered the expression.
Which one is the answer for the problem 1
2 P 2
3 ?
Solve this problem by hand. Show all of your work here. Explain which answer from the
calculator is the desired answer and why.
Additional problems—Calculate the following problems by hand. Simplify your answers. Then
check your answers using the calculator. Remember to use the Order of Operation rules.
1. M 1
3 + 1
4 = 2. M 2
3 Q 5
6 =
3. 3
5 P 5
6 = 4. 1
2 N
M2
5 =
5. M 2
5 + 1
4 Q 2
3 = 6. 1
8 Q 3
16 P 1
2 =
7. M 1
6 N 1
12 + 3
4 = 8. M 1
2 N 3
4 P (M3) =
Chapter 1: Number Sense Name
Section 2: Rational Numbers Date
Topics in Algebra 1 © 2001 Texas Instruments Student Worksheet 1-16
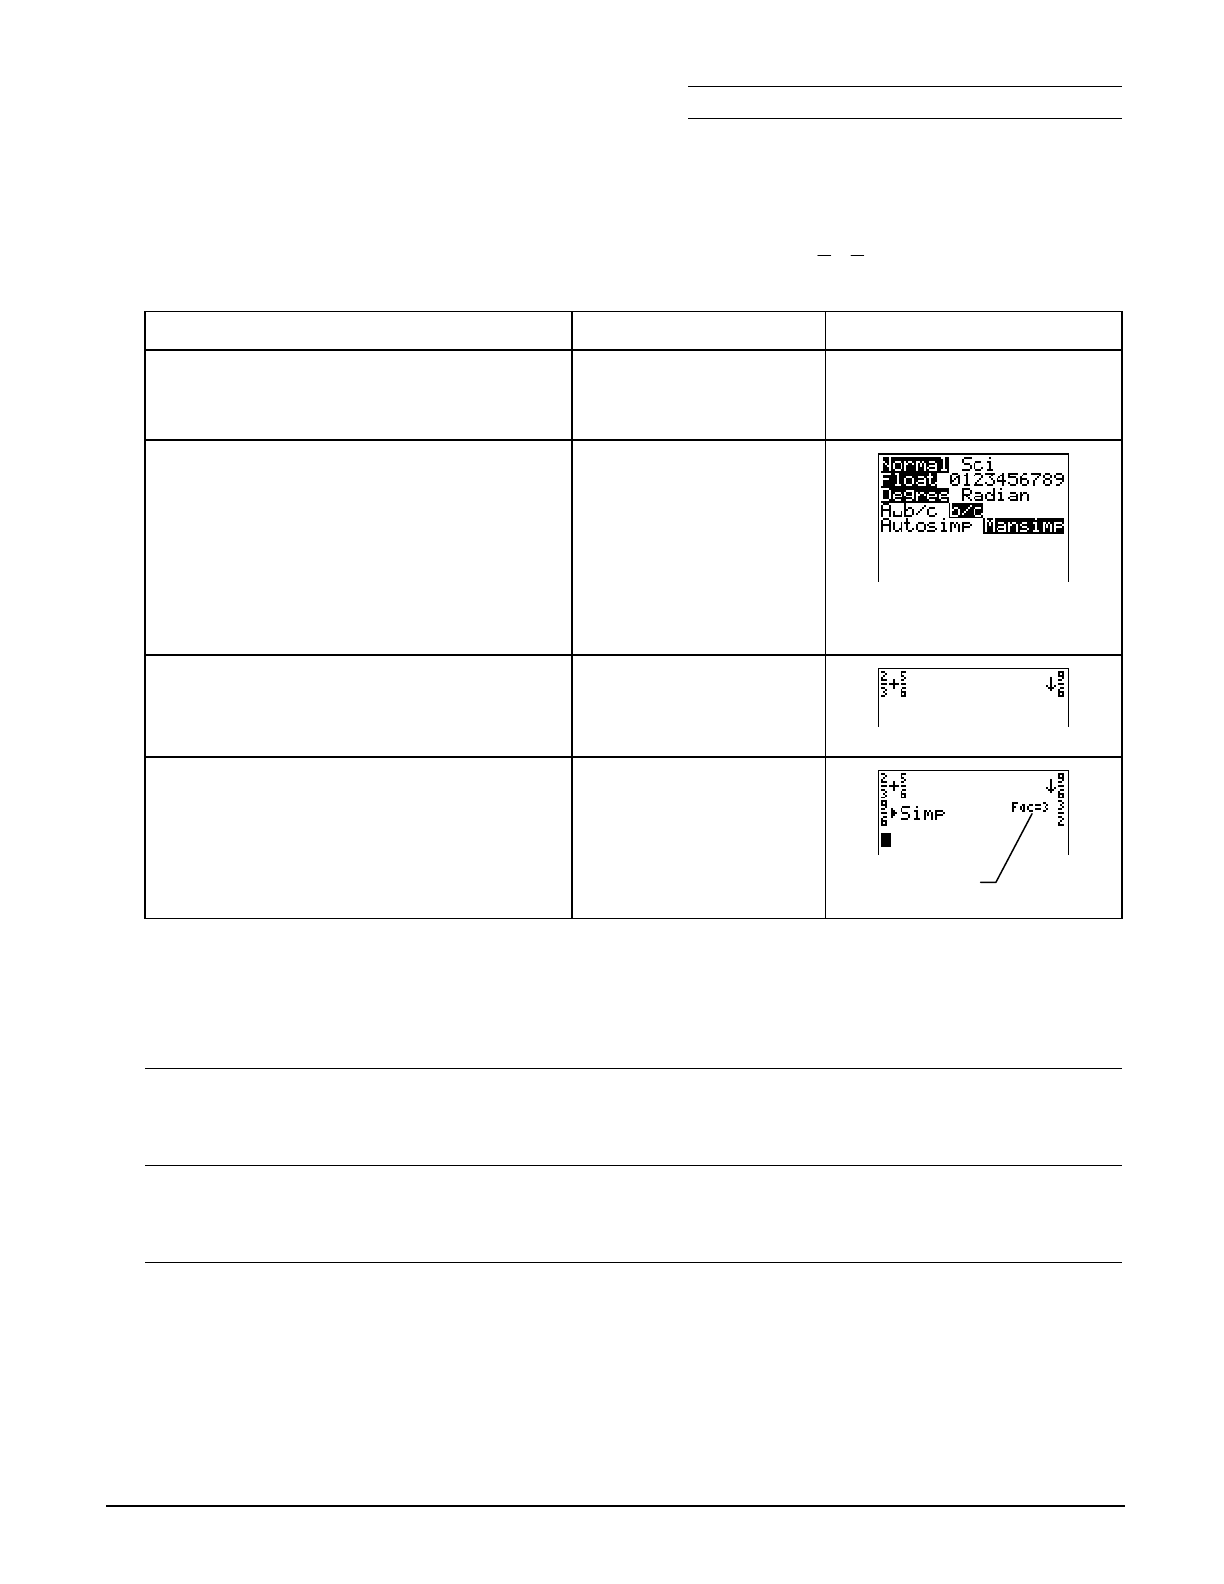
³ Try-It!é on Your TI.73
Investigate how the calculator computes addition expressions. Solve 6
5
3
2+.
To Do This Press Display (TI.73 shown)
1. Exit the Topics in Algebra 1
application and clear the Home
screen.
y l
áEXITâ :
2. Select the
b/c and Mansimp mode
settings.
Note: See ³ TIpé 2:
Adjusting Your Calculator
Settings
for more information.
.
# # # " to highlight
b/c
b
# " to highlight
Mansimp
b
3. Calculate the result. - l
2 = 3 " \
5 = 6 b
4. Simplify the fraction. B b
Notice that the answer is in simplified form. The calculator follows the Order of Operations
rules. Division is performed before addition. Solve this problem by hand. Show all of your work.
Simplified by a
factor of 3.
Chapter 1: Number Sense Name
Section 2: Rational Numbers Date
Topics in Algebra 1 © 2001 Texas Instruments Student Worksheet 1-17
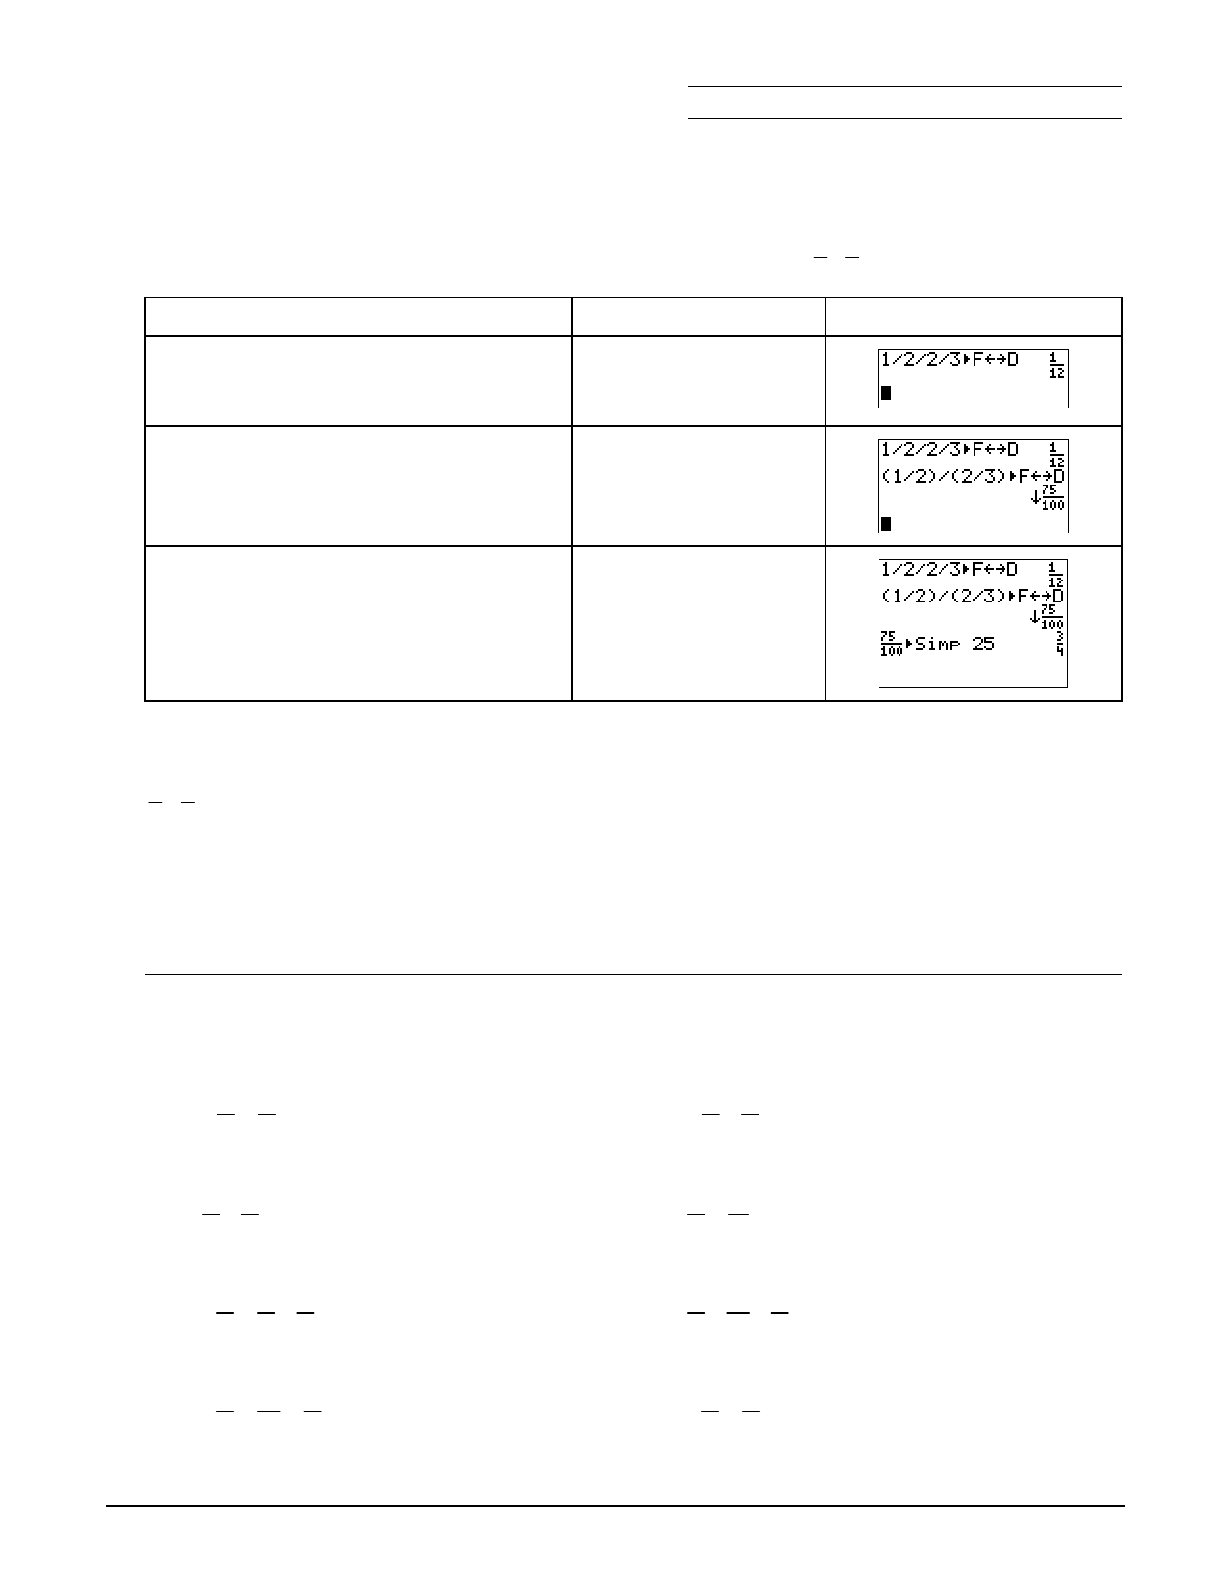
³ Try-It!é on Your TI.73 (continued)
Investigate how the calculator computes division expressions. Solve 3
2
2
1÷.
To Do This Press Display (TI.73 shown)
1. Solve without parentheses and
specify that you want the result in
fraction form.
1 F 2 ¥ 2 F 3
> Í
2. Solve using parentheses and specify
that you want the result in fraction
form.
£ 1 F 2 ¤ ¥
£ 2 F 3 ¤
> Í
3. Simplify the result by a factor of 25. B 25
The calculator gives two different answers, depending on how you entered the expression.
Which one is the answer for the problem:
3
2
2
1÷
Solve this problem by hand. Show all of your work here. Explain which answer from the
calculator is the desired answer and why.
Additional problems—Calculate the following problems by hand. Simplify your answers. Then
check your answers using the calculator. Remember to use the Order of Operation rules.
1. M 1
3 + 1
4 = 2. M 2
3 Q 5
6 =
3. 3
5 P 5
6 = 4. 1
2 N
M2
5 =
5. M 2
5 + 1
4 Q 2
3 = 6. 1
8 Q 3
16 P 1
2 =
7. M 1
6 N 1
12 + 3
4 = 8. M 1
2 N 3
4 P (M3) =

Chapter 1: Number Sense Section 2: Rational Numbers
Topics in Algebra 1 © 2001 Texas Instruments Teacher Notes 1-18
Number Sense: Rational Numbers Teacher Notes
Objectives
• To review the definition of rational numbers as ratios and as terminating and repeating
decimals.
• To review ordering and the reciprocal property of rational numbers.
• To review operations with rational numbers.
Math Highlights
Students review rational numbers. This includes rational numbers as ratios, terminating
decimals, repeating decimals, and integers, as well as operations with fractions. In the
Observations, students are reminded of the connection between fractions, decimals, and
percents.
Common Student Errors
• Students might confuse the algorithms for addition, subtraction, multiplication, and division
of fractions.
• Students may have trouble identifying whether a fraction is positive or negative. For
example:
M1
M3 = 1
3 or
1
M3 = M1
3 = M 1
3
• Students may have problems because they use short cuts to change the decimal
representation of a number to a percent representation. Using short cuts does not provide an
understanding of why the representations are equal. Students should understand that the
quantity stays the same. Using the multiplicative identity, 1=100/100, is the key to the change
in the representation. For example, students change .1875 to a percent. A shift of the decimal
point gives the correct answer, but without any connection to the math they know. However,
multiplying by 1 in the form 100/100 gives the same result and makes the connection to the
math as well.
.1875
Q 100
100 = 18.75
100 = 18.75%
Chapter 1: Number Sense Section 2: Rational Numbers
Topics in Algebra 1 © 2001 Texas Instruments Teacher Notes 1-19
Student Worksheet Notes with Answers
Overview
Tell students:
1. How to find the Overview, or tell them to review the instructions on the worksheet.
2. How to navigate the application, if they are not yet familiar with the application.
3. To scroll through the Overview on the calculator. Point out new terms, definitions, and
concepts, and tell students to look for them as they go through the Overview.
Observations
The Observations help students understand number sense concepts relating to rational numbers.
If necessary, tell students how to find the Observations.
Observation 1
Write 3
2
4 as an improper fraction.
Answer: 3
14
Remind students to write the answer on the worksheet and to
show all of their work.
Students see the answer
on the next two screens.
Tell students to check the
answers on the
worksheet.
Chapter 1: Number Sense Section 2: Rational Numbers
Topics in Algebra 1 © 2001 Texas Instruments Teacher Notes 1-20
Observations (continued)
Observation 2
Write 8
5 and 11
2 as decimals.
Answer: .625 and 18..
Remind students to write the answers on the worksheet and to
show all of their work.
Students see the answers
on the next two screens.
Tell students to check the
answers on the
worksheet.
Observation 3
Write .1875 and 4
1 as percentages.
Answer: 18.75% and 25%.
Remind students to write the answers on the worksheet and to
show all of their work.
Students see the answers
on the next two screens.
Tell students to check the
answers on the
worksheet.
Activities
Scoring: When a row or
column adds up to 1, it
disappears, and the player
scores 2 points.
The game automatically
ends if the screen is full,
or you press áQUITâ to
stop.
Slide
Tell students to:
1. Highlight a level (bronze = least difficult; gold = most
difficult), and press b to select it.
2. Line up the fractions so they add to 1 (horizontally or
vertically). As a fraction slides across the screen, press # and
$ to move it up or down. Once a fraction is in the correct
row, they can press ! to slide it quickly to the left.
Chapter 1: Number Sense Section 2: Rational Numbers
Topics in Algebra 1 © 2001 Texas Instruments Teacher Notes 1-21
Activities (continued)
Scoring: When a row or
column adds up to 1, it
disappears, and the player
scores 2 points.
The game automatically
ends if the screen is full,
or you press áQUITâ to
stop.
Slide (continued)
3. Follow your instructions. For example, students can play:
• Until the screen fills up (no time limit).
• Until a certain amount of time has expired (highest score
wins).
• Until a certain score has been reached (first student to
reach the score wins).
• Repeatedly over a period of time (days, weeks, etc.) for
tracking improvement of high scores.
4. Record the level they played.
5. Record their scores.
6. Write on the worksheet a paragraph in which they describe
the Slide activity and the strategy for playing.
Scoring: Students get
two attempts to solve
each problem. They earn
2 points for a correct
answer on the first try, 1
point for a correct answer
on the second try.
They can earn up to 10
points.
Tips: Tell students that
they can:
• Change the answer
before they press
b by pressing
: and re-entering
the answer.
• Press
án/dâ to move
between the numerator
and denominator.
Note: Unsimplified
fractions are counted as
correct.
Number Smash
Tell students to:
1. Highlight a level (bronze = least difficult; gold = most
difficult), and press b to select it.
2. Press
á+â, áNâ, á¦â, or á÷â to select the operation that they want
to practice.
3. Enter the missing number (press Ì for negative numbers),
and press b. As they play the activity, they should write
each number sentence and its solution on the worksheet,
showing all their work. If the missing number is a mixed
number or fraction, tell them:
• To enter a mixed number, enter the whole number, press
áUNITâ, and then enter the fraction.
• To enter a fraction, press án/dâ and enter the numerator.
Press án/dâ again and enter the denominator.
If the answer is incorrect, the correct answer is displayed;
press any key to resume play.
4. Record the level and operation they played.
5. Record their scores.

Chapter 1: Number Sense Section 2: Rational Numbers
Topics in Algebra 1 © 2001 Texas Instruments Teacher Notes 1-22
³ Try-It!é on Your TI.83 Plus or TI.73
Review the Order of Operations rules with students, if necessary. Explain to them that the
calculator uses the Order of Operations rules to simplify expressions. Discuss with them how
parentheses are used.
Note: The ³ Try-It! activities are repeated for each of the two calculators—the TI-83 Plus and then the TI-73. The problems are the
same, but they vary due to the differences in the two calculators. The Additional problems, which are identical, can be performed on
either calculator. They are repeated for your convenience when you copy the activities.
Tell students to do the two calculator ³ Try-It! investigations.
• Investigate how the calculator computes addition expressions. Solve 6
5
3
2+.
• Investigate how the calculator computes division expressions. Solve 3
2
2
1÷.
Ask students to explain the difference in the two results in second investigation.
Although each of the two results is correct based on how the problem was entered, to make sure
that the division is performed correctly, the problem must be entered as (1 à 2) à (2 à 3). The
answer is 3/4, not 1/12. The calculator uses the Order of Operations rules. Operations inside
parentheses are performed before operations outside parentheses.
On the TI-73, students must simplify the fraction 75/100 to get 3/4. They may either specify the
factor to use, as shown, or let the calculator simplify the fraction, one factor at a time by
repeatedly pressing B.
Additional problems—Make sure that students understand and use the Order of Operation
rules so they can determine when to use parentheses.
1. M 1
3 + 1
4 = M 1
12 2. M 2
3 Q 5
6 = M 5
9
3. 3
5 P 5
6 = 18
25 4. 1
2 N
M2
5 = 9
10
5. M 2
5 + 1
4 Q 2
3 = M 7
30 6. 1
8 Q 3
16 P 1
2 = 3
64
7. M 1
6 N 1
12 + 3
4 = 1
2 8. M 1
2 N 3
4 P (M3) = M 1
4
Chapter 1: Number Sense Name
Section 3: Real Numbers Date
Topics in Algebra 1 © 2001 Texas Instruments Student Worksheet 1-23
Number Sense: Real Numbers Student Worksheet
Overview
The Overview introduces the topics covered in Observations and Activities. Scroll through the
Overview using " (! to review, if necessary). Read each screen carefully. Look for new terms,
definitions, and concepts.
Observations
The Observations illustrate number sense concepts relating to real numbers. Scroll through the
Observations using " (! to review, if necessary). Read each screen carefully. When you come
to a Write an Observation screen, stop and write the answers to the questions on your worksheet.
Observation 1
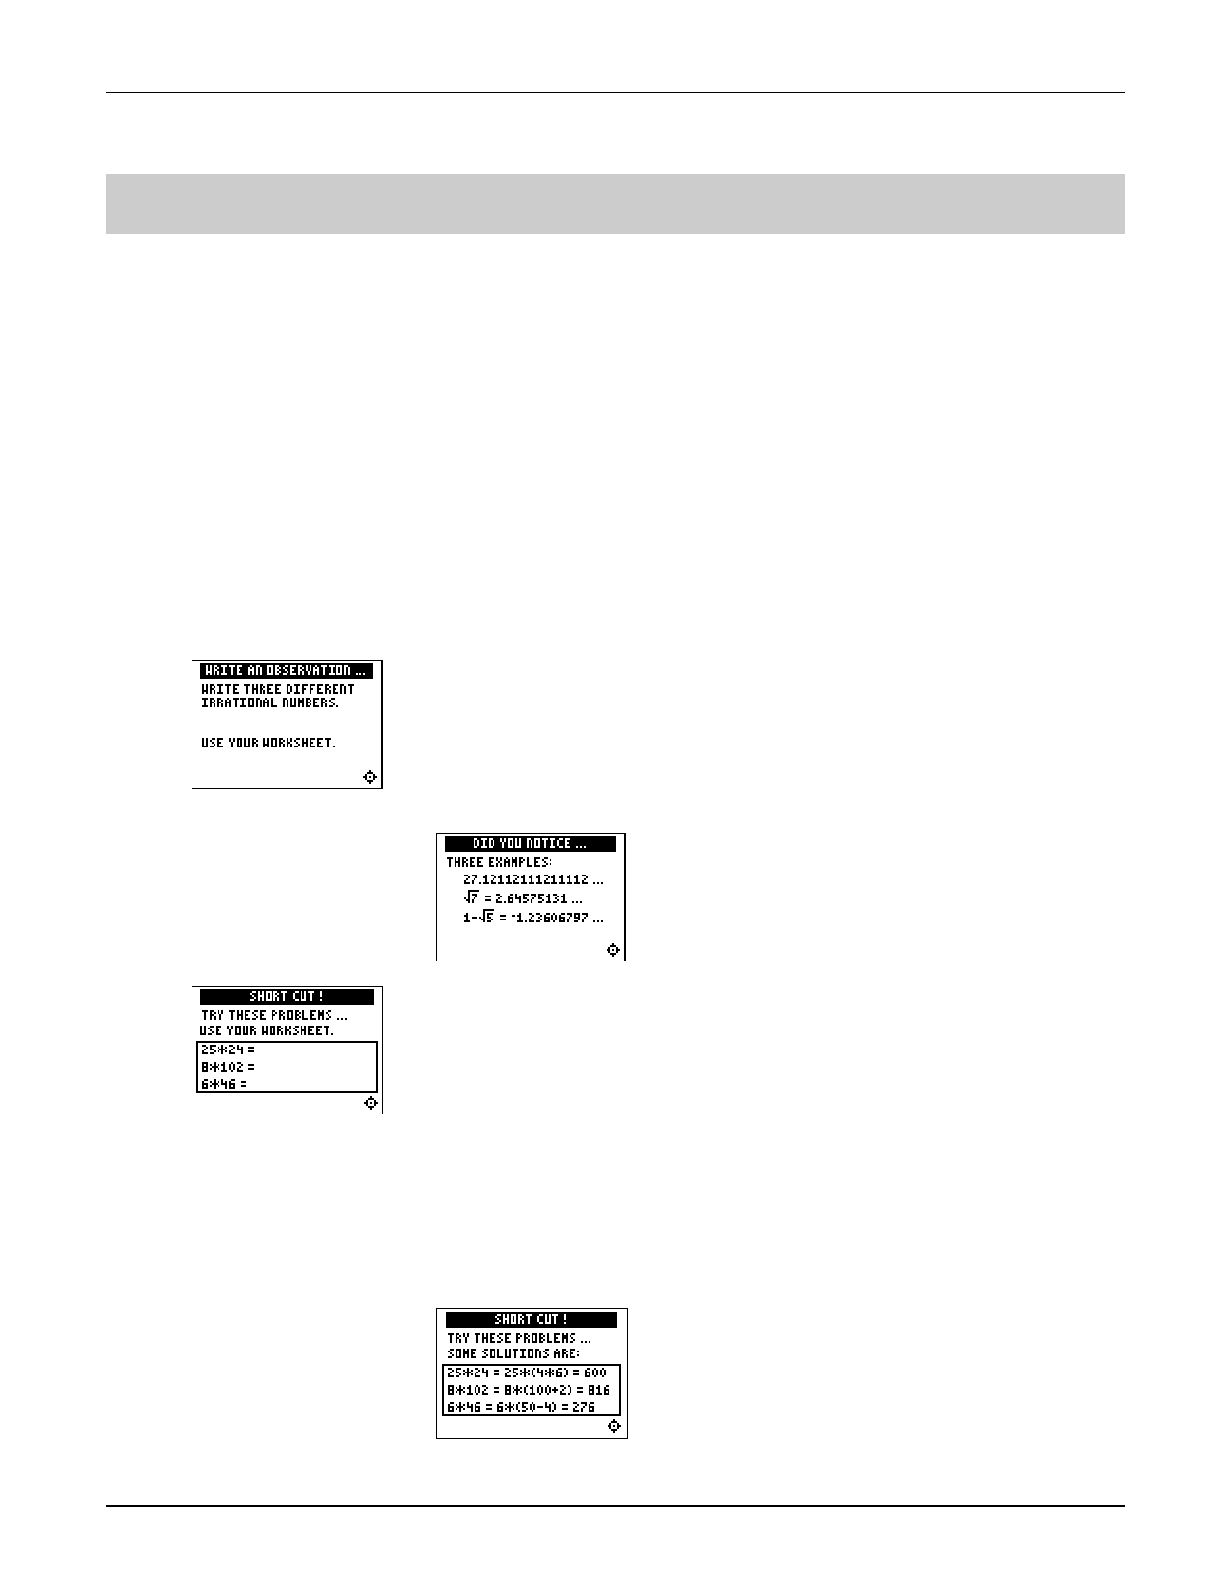
Write three different irrational numbers. Show your work.
Observation 2
Try these problems . . .
Use the real number properties to solve the following problems
quickly. Show your work.
25 Q 24 =
8 Q 102 =
6 Q 46 =
Chapter 1: Number Sense Name
Section 3: Real Numbers Date
Topics in Algebra 1 © 2001 Texas Instruments Student Worksheet 1-24
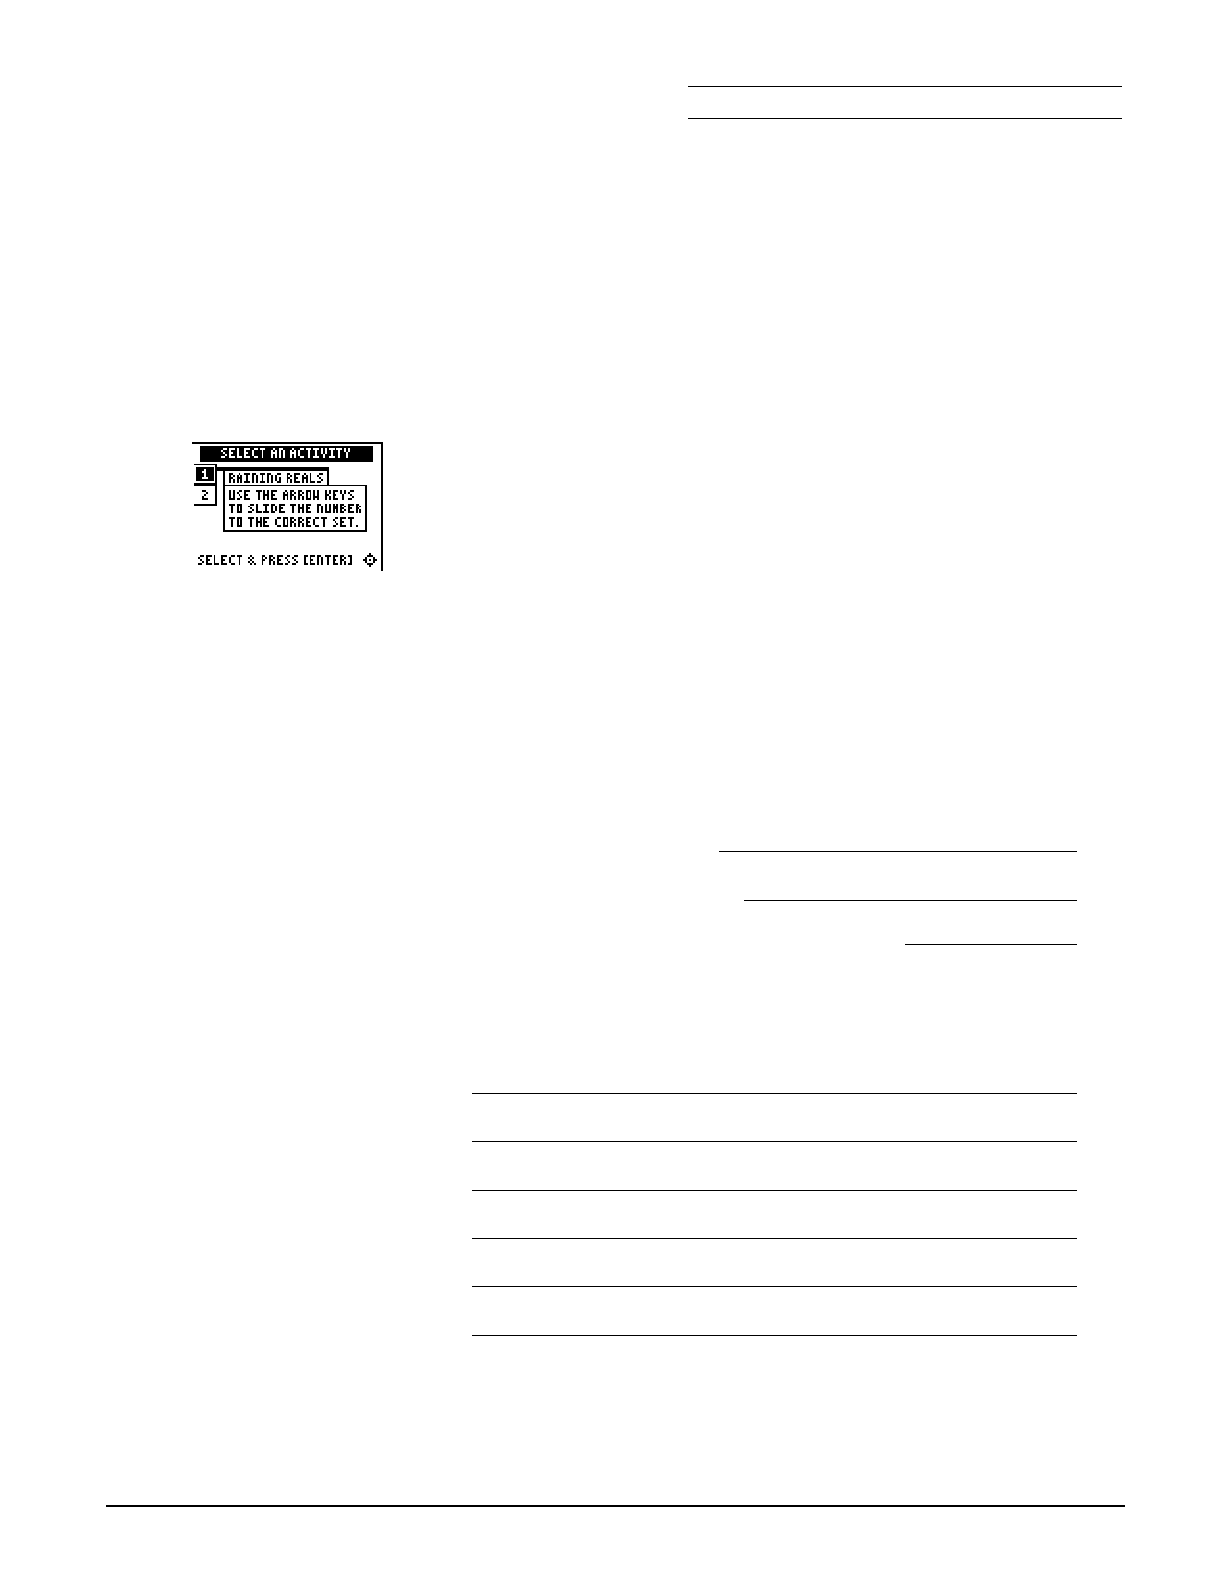
Activities
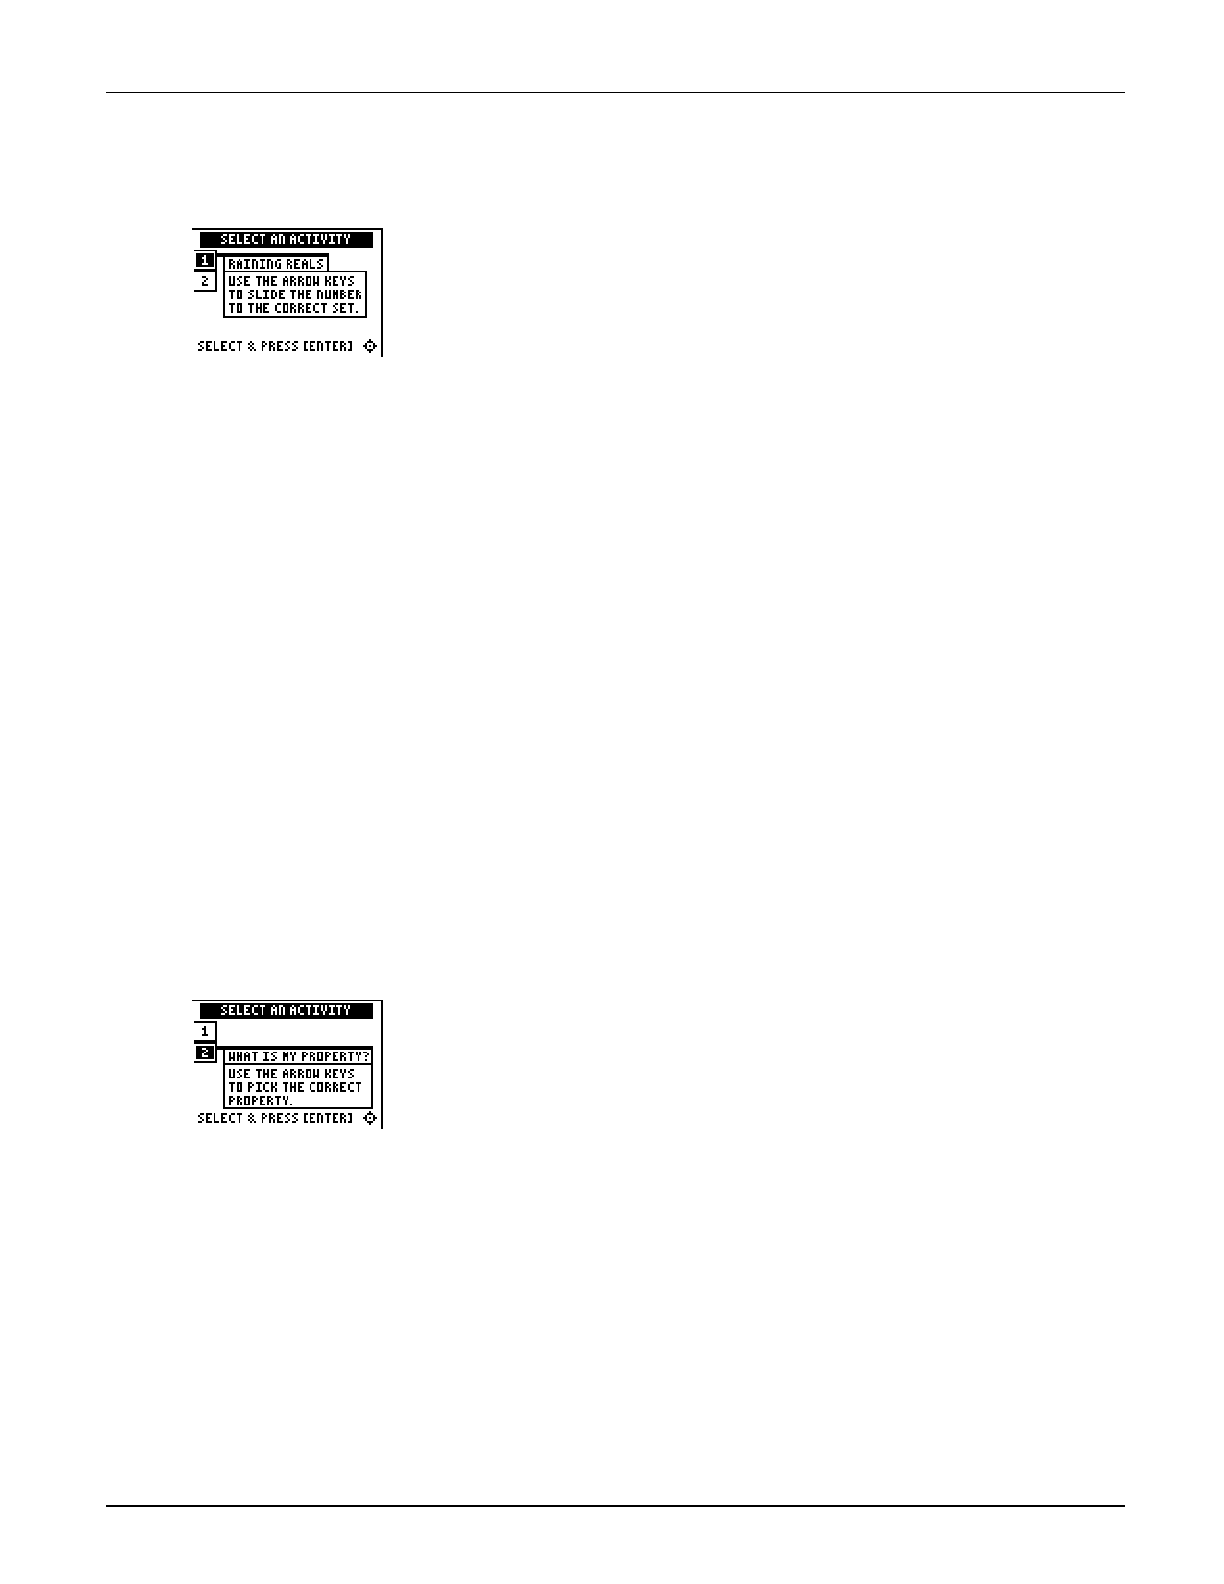
The Activities help you practice real number concepts. You can select from two activities—
Raining Reals and What Is My Property? Follow these steps to play the activity and complete
your worksheet.
1. Make sure you are in the Activities for this section.
2. Highlight an activity using $ or #, and press b.
Scoring: Every correct
placement earns 2 points.
The game automatically
ends if you have
answered incorrectly four
times (shown in the top
right corner), or you press
áQUITâ to stop.
Raining Reals
1. Highlight a level (silver = less difficult; gold = more difficult),
and press b to select it.
2. As the numbers fall on your screen, quickly determine if the
“raining” number is rational or irrational.
3. Press
! to move the number into the RATIONAL set, or press
" to move the number into the IRRATIONAL set. If the
answer is incorrect, the correct answer is displayed; press any
key to resume play.
4. Follow your teacher’s instructions for how long to play the
activity.
5. What level did you play?
6. What was your final score?
7. How many incorrect answers did you have?
(Shown in top right corner of the screen.)
8. Write a paragraph describing the activity. Describe your
strategy for playing.

Chapter 1: Number Sense Name
Section 3: Real Numbers Date
Topics in Algebra 1 © 2001 Texas Instruments Student Worksheet 1-25
Activities (continued)
Scoring: You get two
attempts to solve each
problem. You earn 2
points for a correct
answer on the first try, 1
point for a correct answer
on the second try.
You can earn up to 16
points.
What Is My Property?
1. Look at the equation and decide which single property, out of
these six, it represents.
• Commutative +
• Commutative …
• Associative +
• Associative …
• Distributive … Over +
• Distributive … Over N
2. Scroll through the property choices with # and/or $. To
select a property, press b. If the answer is incorrect, the
correct answer is displayed; press any key to resume play. As
you play the activity, record each equation and its property.
3. What was your score?
Chapter 1: Number Sense Name
Section 3: Real Numbers Date
Topics in Algebra 1 © 2001 Texas Instruments Student Worksheet 1-26
³ Try-It!é on Your TI.83 Plus or TI.73
Investigate how the calculator deals with irrational numbers.
In the Overview, you used the Pythagorean theorem to find the length of À 2 . Draw a right
triangle so that the hypotenuse has length À 2 . Pythagoras (569–475 B.C.), a great Greek
mathematician, discovered irrational numbers (numbers that are not rational and therefore are
not ratios). There is a proof that, for example, À 2 cannot be written as a fraction.
Hint: Draw each leg with length 1 inch. The hypotenuse is Á12+12 = À1+1 = À 2
Remember that À 2 Q À 2 = 2. Picture this by envisioning a square whose sides measure À 2 units.
You created this length in your picture above.
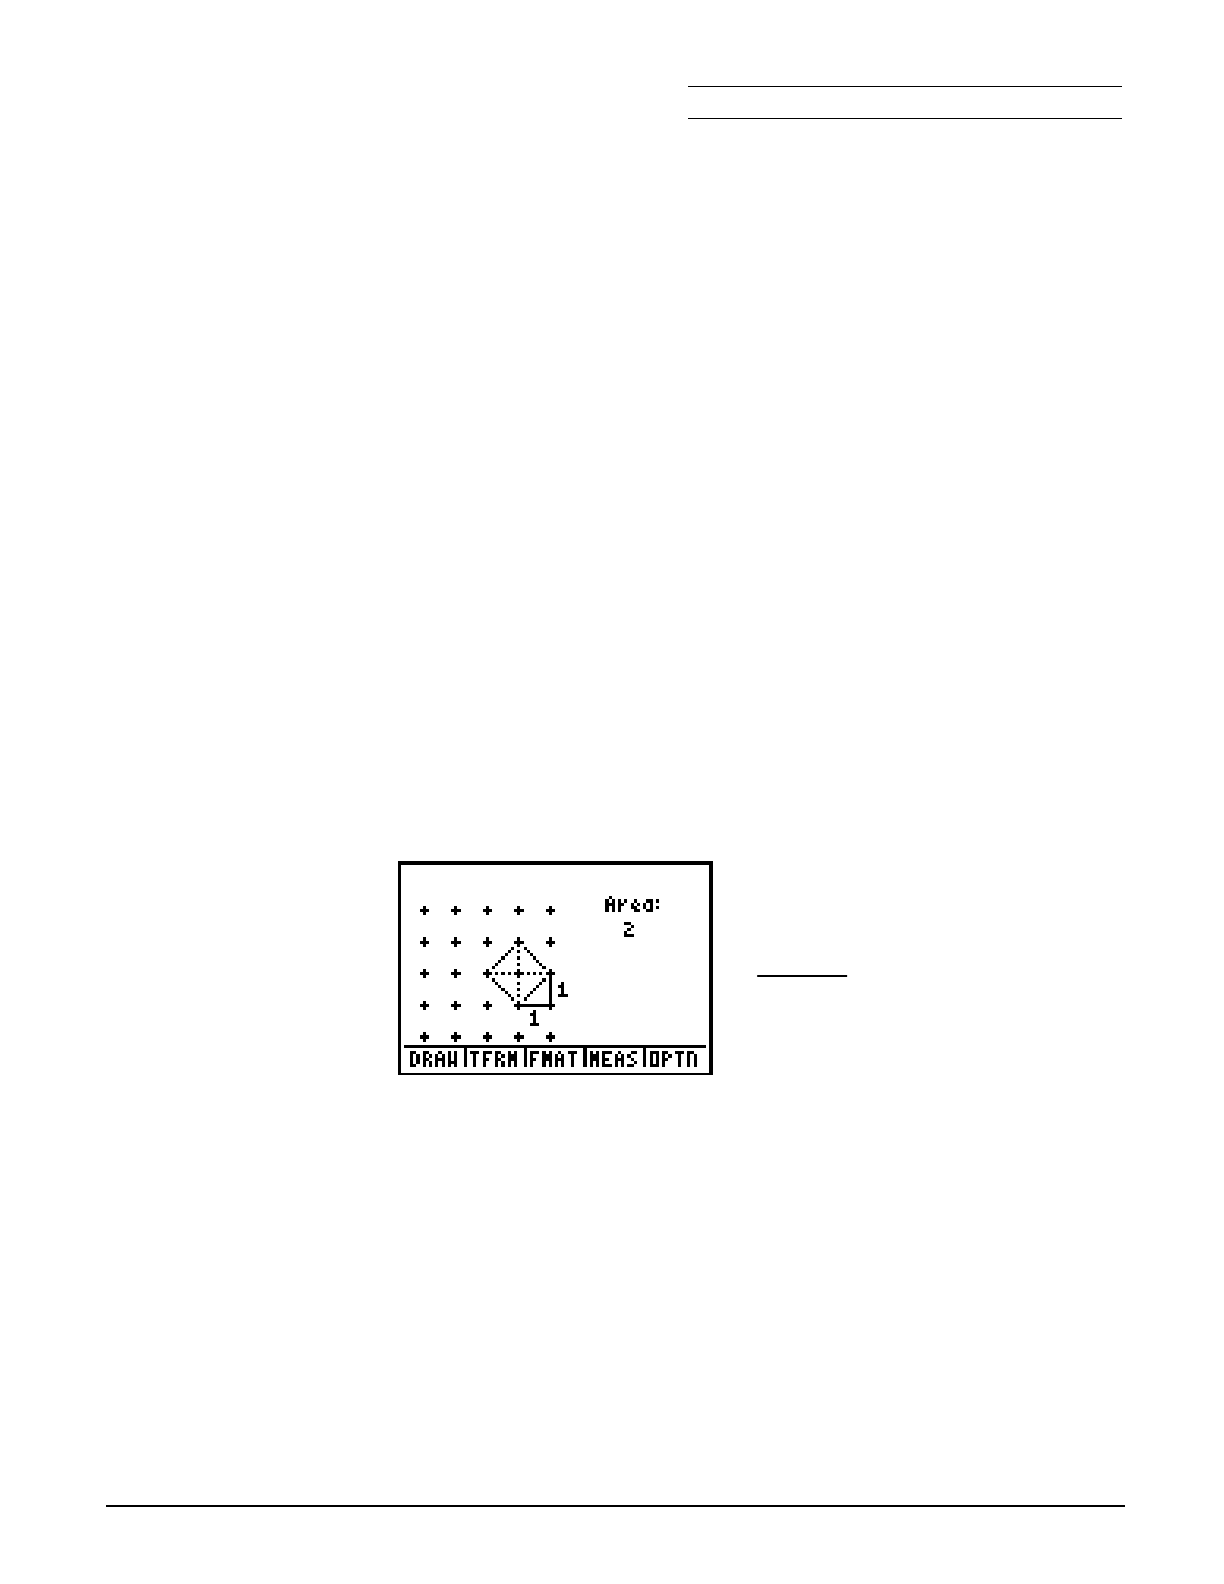
Look at the square whose side has a length of À 2 on the Geoboard screen below. Can you see
that the area is À 2 Q À 2 = 2 square units? Count it up! Shade in the area on the screen shown.
From the TI-73 Geoboard
application
Chapter 1: Number Sense Name
Section 3: Real Numbers Date
Topics in Algebra 1 © 2001 Texas Instruments Student Worksheet 1-27
³ Try-It!é on Your TI.83 Plus or TI.73 (continued)
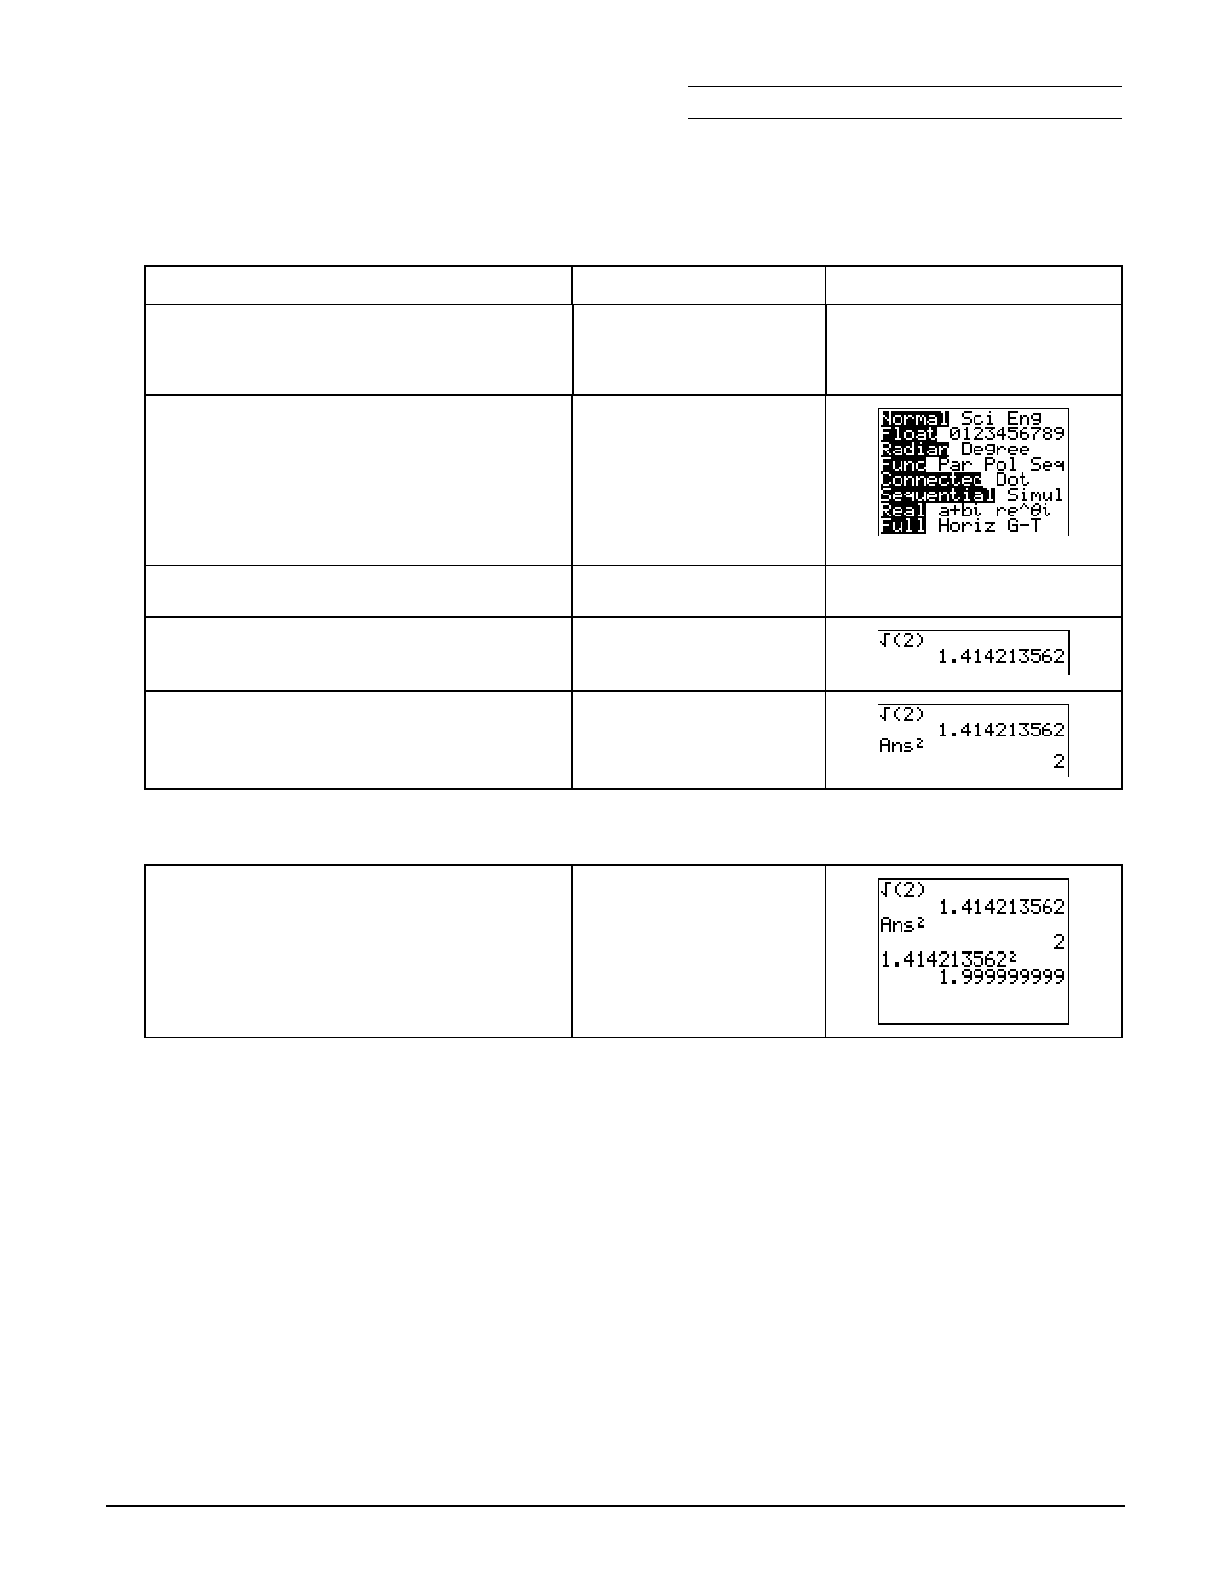
Find the calculator decimal approximation for À 2 .
To Do This Press Display (TI.83 Plus shown)
1. Exit the Topics in Algebra 1
application and clear the Home
screen.
y l
áEXITâ :
2. Select the
Float setting from the mode
screen.
Notes: See ³ TIpé 2:
Adjusting Your Calculator
Settings
for details.
The TI-83 Plus mode screen varies slightly from the
TI-73.
.
# until Float is
highlighted
b
3. Return to the Home screen. - l
4. Calculate the decimal approximation
for À 2.
- z 2 E
b
5. Square your result.
Note: Ans = previous answer. The calculator
remembers that you entered ‡(2).
6
b
Is À 2 equal to the decimal 1.414213562? It looks like the calculator says this is true. Calculate
1.4142135622 to see.
6. Calculate the square of 1.414213562. 1 ` 4142135626
b
The answer shows 1.999999999, but you know you should get the answer 2.
Be careful! When you use your calculator, you have to know your math. The calculator can do
amazing math, but it only shows you an approximation for many answers. You have to
understand the problem before you use the calculator. It is up to you to determine if calculator
answers are reasonable and how you will use them.

Chapter 1: Number Sense Name
Section 3: Real Numbers Date
Topics in Algebra 1 © 2001 Texas Instruments Student Worksheet 1-28
³ Try-It!é on Your TI.83 Plus or TI-73 (continued)
Word Problem: Missy’s Garden
Missy wants to build a small fence around a garden in her backyard. The
garden is in the shape of a right triangle. One leg is 2 meters and the
other leg is 1 meter. The store sells fencing in tenths of a meter.
1. What is the exact perimeter of Missy’s garden? Show all your work.
Math Hint: Use the Pythagorean theorem to find the length of the third side of the garden, and then find the perimeter of the
garden. (See the Real Numbers Overview on the calculator.)
2. What length of fencing should Missy buy if the store only sells the fencing in tenths of a meter?
Use the calculator. Show all your work.
Calculator Hint: After you calculate the approximate answer on your calculator, try setting . so that Float=1.
See ³ TIpé 2:
Adjusting Your Calculator Settings
for details. This will give you one decimal place or tenths. Observe how the
calculator displays the results!
2 m
1 m

Chapter 1: Number Sense Name
Section 3: Real Numbers Date
Topics in Algebra 1 © 2001 Texas Instruments Student Worksheet 1-29
³ Try-It!é on Your TI.83 Plus or TI-73 (continued)
Word Problem: Jose and Maria’s Backyard Pool
Jose and Maria have a circular pool in their backyard. Their parents
would like to make a cover for the pool. They bought a square piece of
material whose sides are the same length as the diameter of the pool.
The diameter of the pool is 3.5 meters.
1. How much material will they have left over? Find the exact and approximate answers. Use the
calculator. Show all your work. (See Hints below.)
2. Exact answer:
3. Approximate answer (to 3 decimal places):
Calculator Hints:
• Use
Float = 3 on your calculator to display 3 decimal places.
• Press
- „ to find the calculator's approximation for p.
Math Hints:
• Area of a square: A = s2, where s is the length of the sides of the square.
• Area of a circle: A = p r2, where r is the radius of the circle (diameter = 2r).
3.5 meters

Chapter 1: Number Sense Section 3: Real Numbers
Topics In Algebra 1 © 2001 Texas Instruments Teacher Notes 1-30
Number Sense: Real Numbers Teacher Notes
Objectives
• To illustrate the real number system in a Venn diagram.
• To identify real numbers as rational numbers ∪ irrational numbers.
• To review writing rational numbers as terminating or repeating decimals.
• To review writing irrational numbers as nonterminating, nonrepeating decimals.
• To show physical representations of the irrational numbers, À 2 and p, and to review the
Pythagorean theorem and the formula for finding the circumference of a circle.
• To state the real number system properties—commutative, associative, and distributive—as
well as the identity and inverse properties.
Math Highlights
This section starts with the building of the Venn diagram of the real number system. Definitions of
rational and irrational numbers are given. Two examples of irrational numbers, À 2 and p, are
developed. À 2 is shown as the length of the hypotenuse of a right triangle with legs of 1 unit. p is
shown as the circumference divided by the diameter for any circle. The statements of the properties
of the real numbers follow.
Common Student Errors
• Many students may not have developed a solid understanding of number sets. Remind them
that using rational and irrational numbers, they can name every location on a number line.
Later in their studies of mathematics, this will be referred to as the Completeness Property of
Real Numbers, which was an important discovery in mathematics. Later, they will also
extend the real numbers to the complex numbers, a + bÀ M1 = a + bi, which are numbers used,
for example, in the study of the relationship between electricity and magnetism.
• Students probably have used 22/7 or 3.14 as an approximation of p. They may think that these
values are exactly p, but they are not equal to p. This provides an opportunity to talk about
approximations to several decimal places in real problems. The worksheet problems give
students an opportunity to find exact and approximate answers. There are wonderful web
sites that show p to millions of places. Mathematicians are still searching for more place
values. This study of p requires the use of computers to assist the search.
• Some students may not be aware that the ratio of the circumference of a circle C divided by
the diameter d is p. C/d= p. This may be confusing because they have been told that p is
irrational and is not a ratio. Yet p came from a ratio of circumference to diameter. It turns
out that either C or d is also irrational. The mathematics to prove this is not given at this
level; therefore, students have to accept this without much explanation. This is a deep
discussion that will not be of interest to some students, but other students may find it
fascinating.
Chapter 1: Number Sense Section 3: Real Numbers
Topics In Algebra 1 © 2001 Texas Instruments Teacher Notes 1-31
Student Worksheet Notes with Answers
Overview
Tell students:
1. How to find the Overview, or tell them to review the instructions on the worksheet.
2. How to navigate the application, if they are not yet familiar with the application.
3. To scroll through the Overview on the calculator. Point out new terms, definitions, and
concepts, and tell students to look for them as they go through the Overview.
Observations
The Observations help students understand number sense concepts relating to real numbers. Tell
students how to find the Observations.
Observation 1
Write three different irrational numbers. Students show their
work.
Answers will vary.
Students see this screen
with three possible
answers.
Observation 2
Try these problems . . .
Students use the real number properties to solve the problems,
showing their work.
Students should show
that they know how to use
the properties of the real
number computations as
shortcuts without the
calculator.
• associative … property:
25 … 24 = 25 … (4 … 6) = (25 … 4) … 6 = 100 … 6 = 600
• distributive … over + property:
8 … 102 = 8 … (100 +2) = (8 … 100) + (8 … 2) = 800 +16 = 816
• distributive … over N property:
6 … 46 = 6 … (50 N 4) = (6 … 50) N (6 … 4) = 300 N 24 = 276
Students see the answers
on the next screen.
Chapter 1: Number Sense Section 3: Real Numbers
Topics In Algebra 1 © 2001 Texas Instruments Teacher Notes 1-32
Activities
Scoring: Every correct
placement earns 2 points.
When students give an
incorrect answer, the
correct answer displays.
The game automatically
ends when they have
answered incorrectly four
times (shown in the top
right corner), or they
press áQUITâ to stop.
Raining Reals
Tell students to:
1. Highlight a level (silver = less difficult; gold = more difficult),
and press b to select it.
2. Determine if the “raining” number is rational or irrational.
3. Press
! to move the number into the RATIONAL set, or press
" to move the number into the IRRATIONAL set. If the
answer is incorrect, the correct answer is displayed; press any
key to resume play.
4. Follow your instructions. For example, students can play:
• until they have answered incorrectly four times (no time limit)
• until a certain amount of time has expired (high score wins)
• until a certain score has been reached (first student to
reach the score with the fewest misses wins)
• over a period of time (days, weeks, etc.) for tracking
improvement of high scores
5. Record the level they played.
6. Record their final scores.
7. Record how many incorrect answers they had.
(Shown in top right corner of the screen.)
8. Write their strategy for playing the game.
Scoring: Students get
two attempts to answer.
They earn 2 points for a
correct answer, 1 point for
a correct answer on the
second try.
They can earn up to 16
points.
What Is My Property?
Tell students to:
1. Look at the equation and decide which one property, out of
these six, it represents:
• Commutative +
• Commutative
…
• Associative +
• Associative
…
• Distributive
… Over +
• Distributive
… Over N
2. Scroll through the choices with # and/or $ and press b
to select the correct property. If the answer is incorrect, the
correct answer is displayed; press any key to resume play. As
they play the activity, record each equation and its property.
3. Record their scores.

Chapter 1: Number Sense Section 3: Real Numbers
Topics In Algebra 1 © 2001 Texas Instruments Teacher Notes 1-33
³ Try-It!é on Your TI.73 or TI.83 Plus
Tell students to:
• Use the Pythagorean theorem to draw a triangle whose two legs = 1 unit and whose
hypotenuse = À 2 units.
• Shade in the area on the Geoboard screen on the worksheets.
• Go through the keystroke example to:
- Find the calculator decimal approximation for À 2 .
- Understand how the calculator approximates numbers.
- Understand that they must be conscientious about the mathematics involved.
Word Problem: Missy’s Garden
Remind students to:
• Use the Pythagorean theorem to find the third side of the garden and then the perimeter.
• Set the decimal mode notation (.) to Float and then to 1 (answer rounded to tenths), so
they can see how the calculator displays answers.
1. Exact perimeter: 1 + 2 + À 5 meters
2. Length of fencing rounded to tenths: 5.2 meters
Note: The number rounds down. This is mathematically correct, but impractical in the real world, where Missy would need to purchase 5.3
meters in order to fence the garden. You may want to discuss meaningful interpretation of word problems with the students.
Word Problem: Jose and Maria’s Backyard Pool
If necessary, review the formulas for area of a square and area of a circle. They are shown on the
worksheet.
Covering material left over:
1. Exact: Area of square—area of circle = (3.5)2 N p(3.5/2)2= 12.25 N 3.0625 p square meters
2. Approximate:
2.629 square meters (3 decimal places; use Float=3)

Chapter 2: Linear Equations Name
Section 1: Using Graphs & Tables Date
Topics in Algebra 1 © 2001 Texas Instruments Student Worksheet 2-1
Linear Equations: Using Graphs & Tables Student Worksheet
Overview
The Overview introduces the topics covered in Observations and Activities. Scroll through the
Overview using " (! to review, if necessary). Read each screen carefully. Look for new terms,
definitions, and concepts.
Observations
The Observations illustrate linear equation concepts relating to graphs and tables. Scroll through
the Observations using " (! to review, if necessary). Read each screen carefully. When you
come to a Write an Observation screen, stop and write the answers to the questions on your
worksheet.
Observation 1
Using a table, find the solution of MxN6 = M3.5.
First, find the solution by hand, making a table with at least five x
and y values. You can start with any x value you want. Show your
work.
x y
Next, graph your solution on a number line. Be sure to label all points
on the number line.
←→
Chapter 2: Linear Equations Name
Section 1: Using Graphs & Tables Date
Topics in Algebra 1 © 2001 Texas Instruments Student Worksheet 2-2
Activities
The Activities help you practice graphs and tables. You can select from two activities—Beam
Dale Up or Worksheet Activity. Follow these steps to play the activity and complete your
worksheet.
1. Make sure you are in the Activities for this section.
2. Highlight an activity using $ or #, and press b.
Scoring: You get two
attempts to solve each
problem. You earn 2
points for a correct
answer on the first try, 1
point for a correct answer
on the second try.
You can earn up to 10
points.
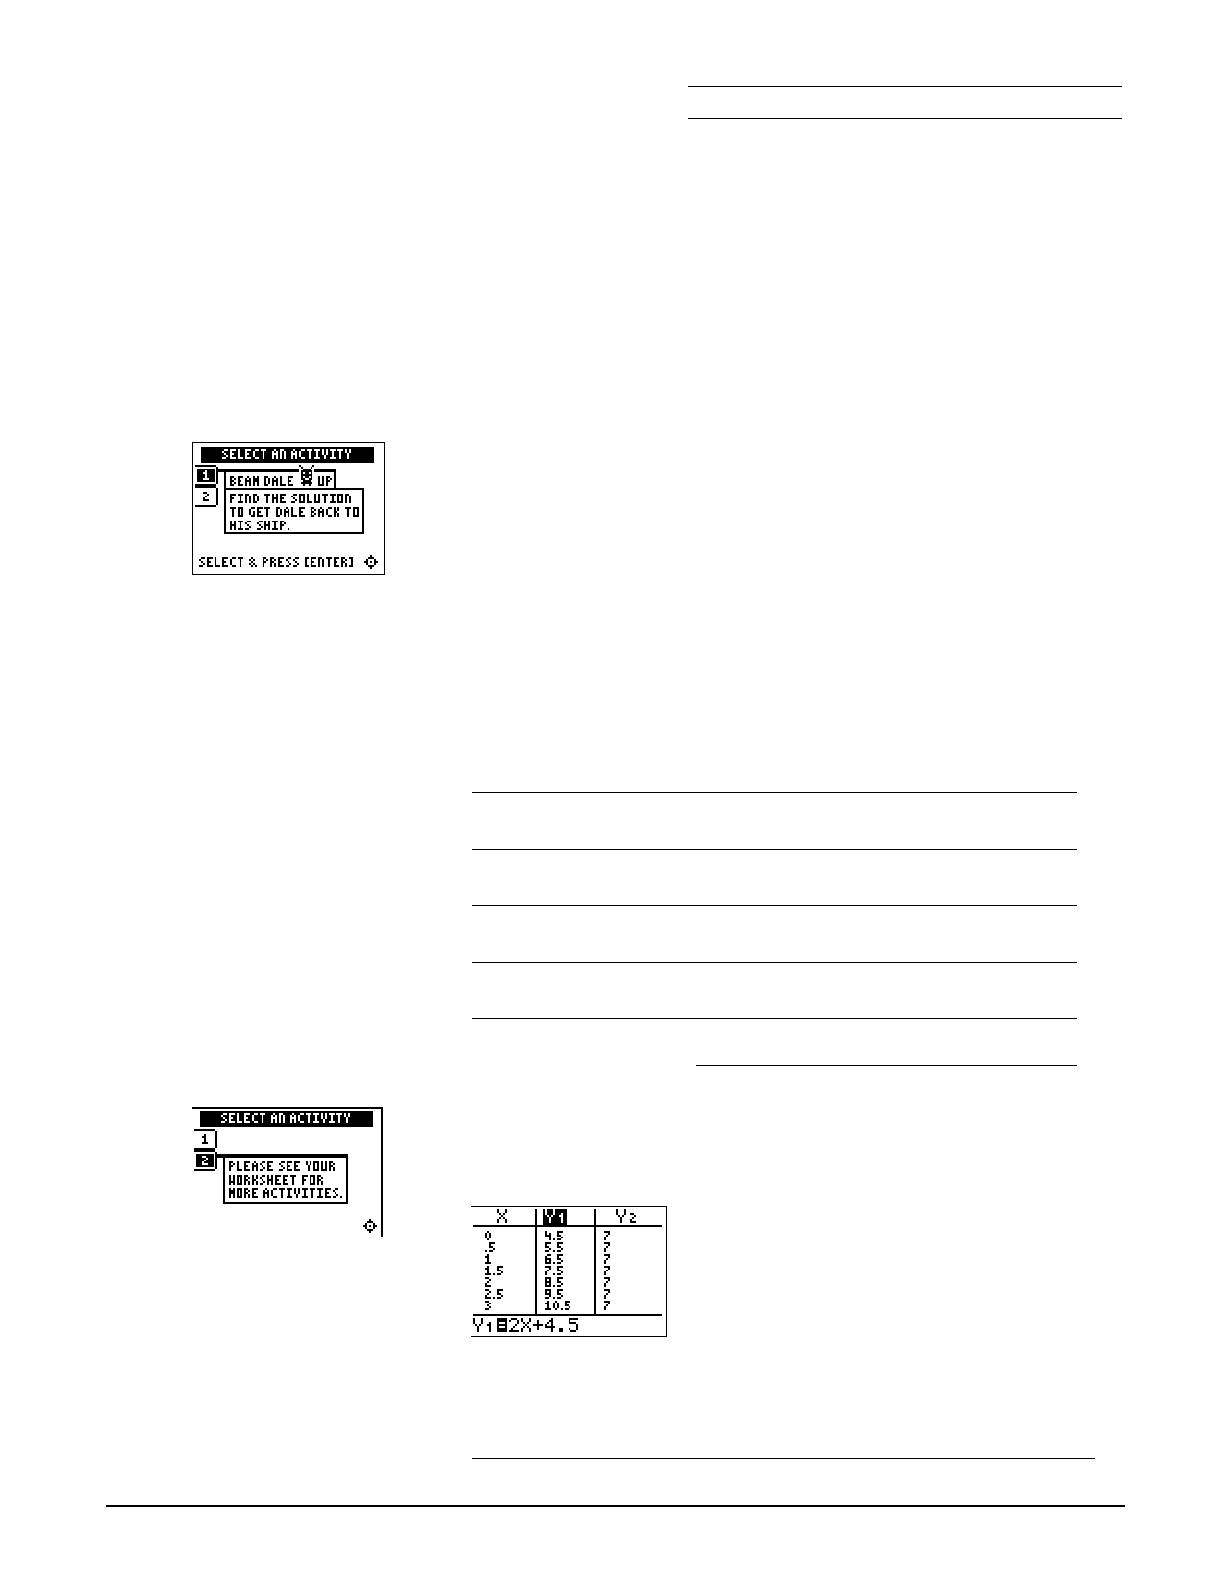
Beam Dale Up
1. Look at the problem on the space ship and determine how to
solve the equation for x from the four choices given. The
values are ordered as they are on a number line.
2. Press
! and " to move Dale the Martian over the correct x
value, and then press b. If the x value you pick is correct,
Dale is beamed up to his ship! If the answer is incorrect on
the second attempt, the correct answer is displayed; press any
key to resume play. As you play the activity, solve each
equation in the space below. Show all steps and work.
3. What was your score?
Note: Press | or ~ to
leave this screen.
Worksheet Activity
1. Look at the table of values of equations Y1=2X+4.5 and Y2=7.
2. When is
2X+4.5=7 (or, when is Y1=Y2)? Look at the table
carefully. The solution is between which two X values?
Chapter 2: Linear Equations Name
Section 1: Using Graphs & Tables Date
Topics in Algebra 1 © 2001 Texas Instruments Student Worksheet 2-3
³ Try-It!é on Your TI.83 Plus or TI.73
Use the table feature on your calculator to search for the solution (when Y1=Y2).
To Do This Press Display (TI.83 Plus shown)
1. Exit the Topics in Algebra 1
application and clear the Home
screen.
y l
áEXITâ :
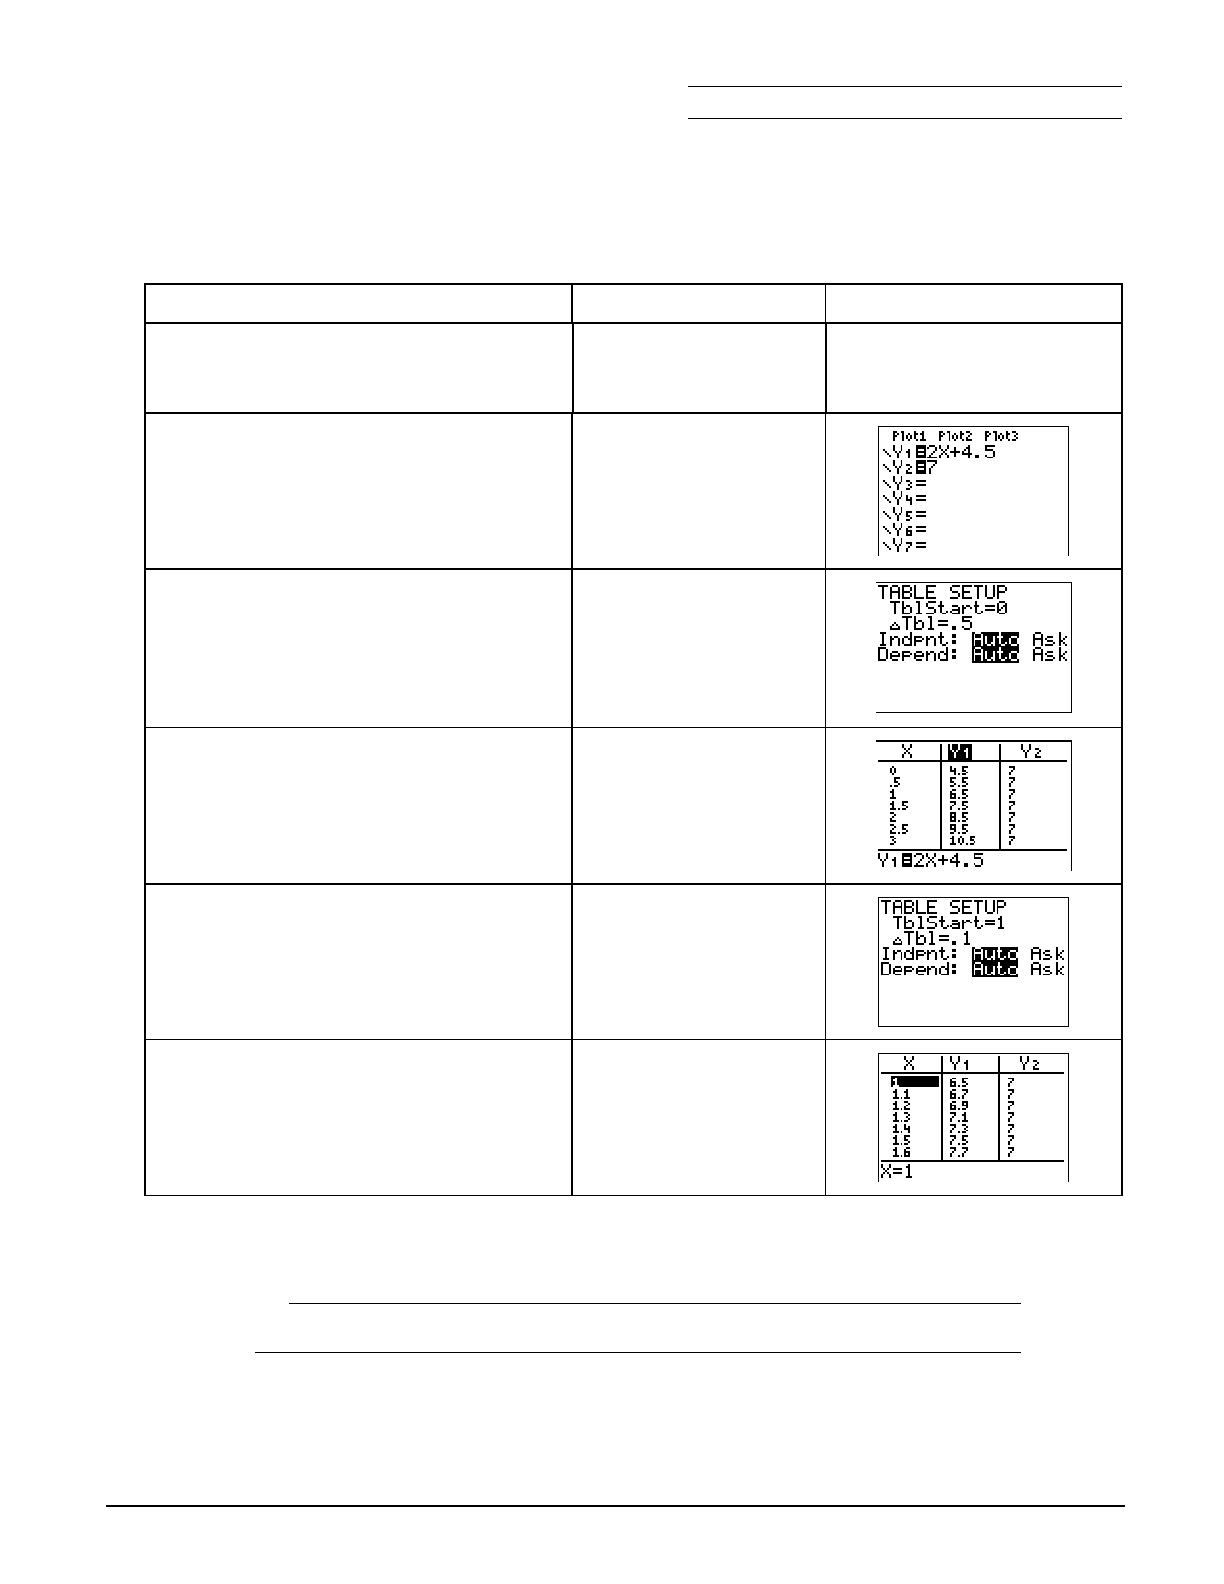
2. First, enter
2X+4.5 as Y1 and 7 as Y2 in
the Y= editor.
Note: See ³ TIpé 3:
Graphing a Function in the
Standard Window
for more information.
Note: On the TI-73, use I rather than „.
& ‘
2 „ \ 4 ` 5
# ‘
7
3. Change the table settings to those
used in the Worksheet Activity.
y f
0
# .5
# Í
# Í
4. Display the table. y 0
5. Change the table settings to focus on
the range you found in the Worksheet
Activity. Begin the table at the lower
value and make the increments
smaller.
y f
1
# .1
6. Display the table with the new
settings.
y 0
7. The table still does not display the exact solution. What table settings would you choose in
order to display the exact solution?
TblStart=
@Tbl=
8. What is the solution (when is Y1=Y2)? _________________________________________
9. How do you know this is the solution? ________________________________________
Chapter 2: Linear Equations Name
Section 1: Using Graphs & Tables Date
Topics in Algebra 1 © 2001 Texas Instruments Student Worksheet 2-4
³ Try-It!é on Your TI.83 Plus or TI.73 (continued)
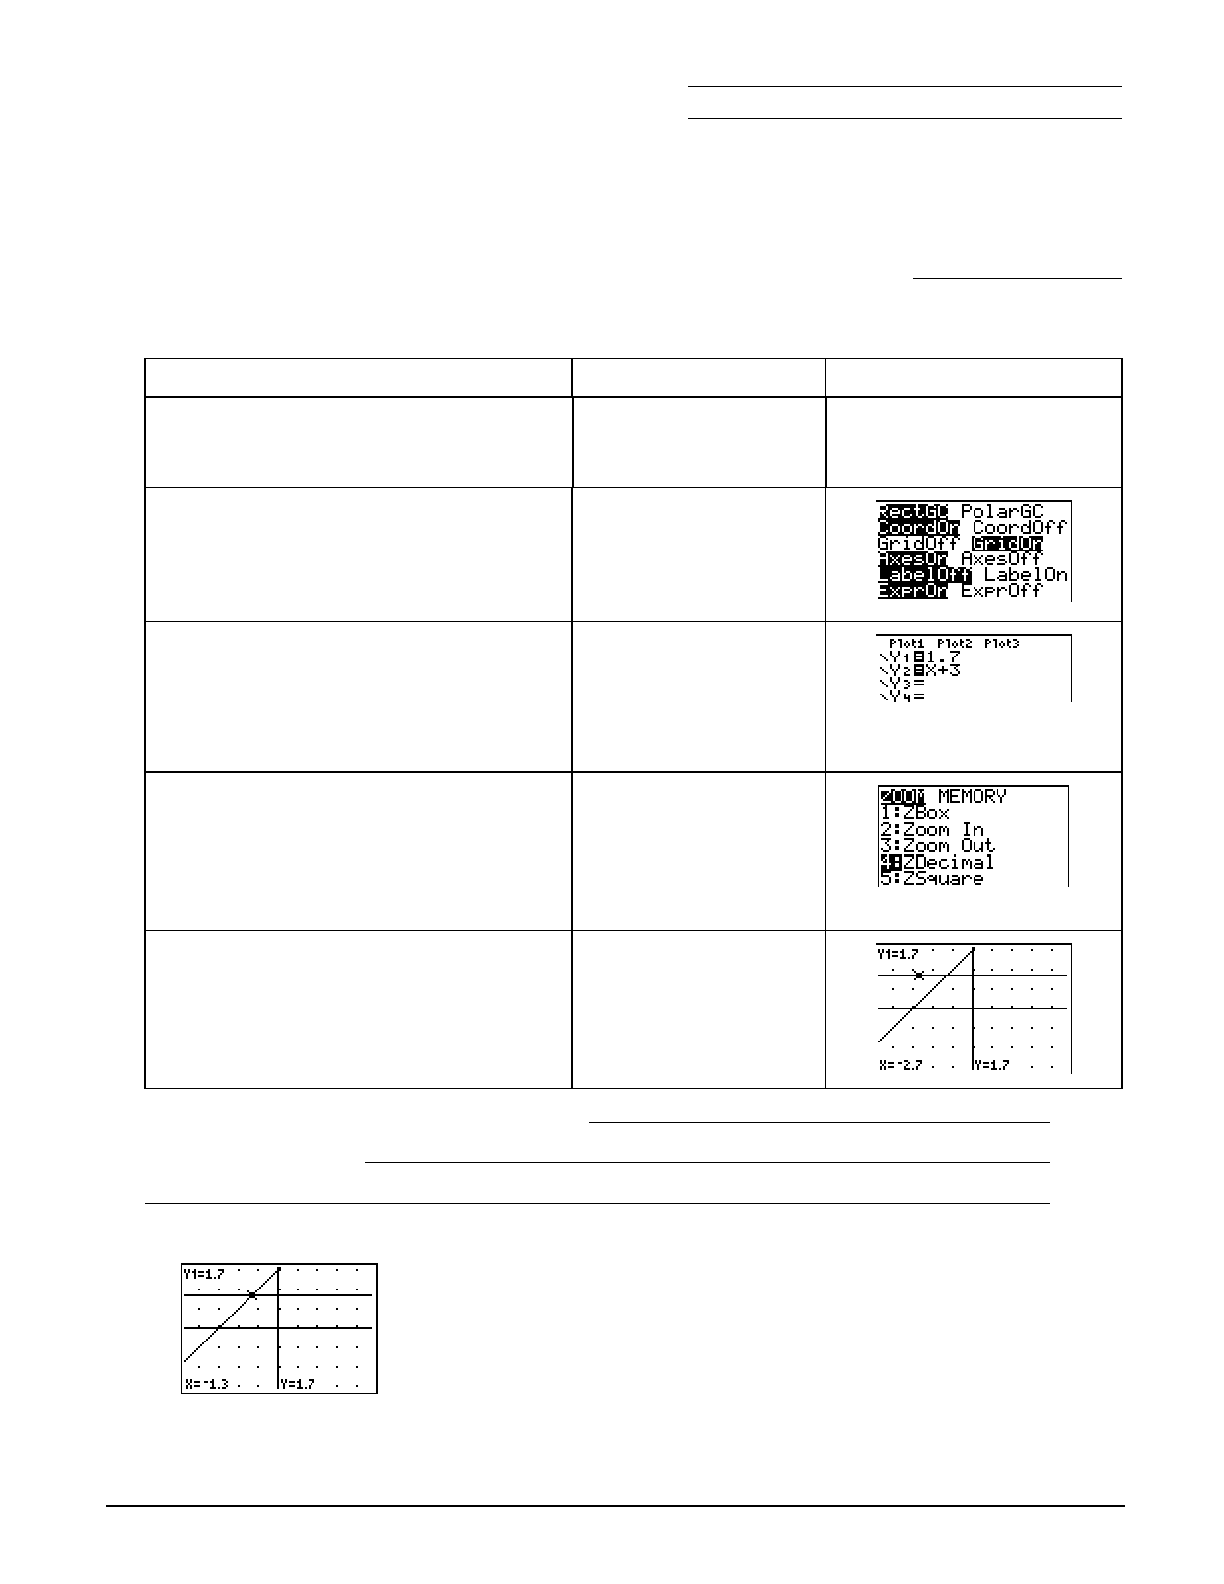
Solution Search Using X-Y Graphs: Find the solution for the equation X+3=1.7. First, use your
number sense to estimate the solution for X+3=1.7. Record your estimate here.
Use the table feature on your calculator to search for the solution (when Y1=Y2).
To Do This Press Display (TI.83 Plus shown)
1. Exit the Topics in Algebra 1
application and clear the Home
screen.
y l
áEXITâ :
2. Set the window format as shown.
Note: See ³ TIpé 2:
Adjusting Your Calculator
Settings
for more information. Screens are shown
for the TI-83 Plus. There are slight differences on
the TI-73.
y g
3. Enter both sides of the equation into
the Y= editor as shown.
Note: See ³ TIpé 3:
Graphing a Function in the
Standard Window
for more information.
Note: On the TI-73, use I rather than „.
& ‘
1 ` 7
# ‘
„ Ã 3
4. Select
ZDecimal to set the viewing
window and automatically graph the
functions.
TI-83 Plus:
( 4:ZDecimal
TI-73:
( 8:ZDecimal
5. Trace
Y1=1.7.
6. Trace
Y2=X+3.
Note: The function displays in the upper left corner
of the screen; the X and Y values are displayed on
the bottom of the screen.
r
| or ~ to trace a
function
} and † to move
between functions
7. Find where X+3=1.7. What is the solution?
8. How do you know?
9. Did you notice that the value of X+3 is 1.7 when X=M1.3?

Chapter 2: Linear Equations Name
Section 1: Using Graphs & Tables Date
Topics in Algebra 1 © 2001 Texas Instruments Student Worksheet 2-5
³ Try-It!é on Your TI.83 Plus or TI.73 (continued)
Solution Search: Write the solution and explain how you found the solution using graphs and
tables for each of the problems below.
For each problem:
• Before you start, estimate the solution so you have an idea of where the solution is located.
• Search for the solution of the equation on the calculator using graphs and table.
Note: See ³ TIpé 4:
Creating a Table
for additional help with the calculator.
• Remember to change your viewing window or your table setting to do your search.
Note: See ³ TIpé 5
: Adjusting the Viewing Window
for additional help with the calculator.
• Explain how you found the solution.
Calculator Fact: The calculator only uses the variables X and Y for graphs and tables. If an equation uses letters other than X, you will
have to enter the letter for the unknown variable as X in the calculator in order to make the graphs and tables for your solution search.
1. p + 3 = 1
2. 3x
− 2 = 1.6
3. 1
2 x + 5
8 = 7
8
4. 4 + 0.5C = 7
Calculator Hint: Use ZStandard to change the graph window so that: M10X10 and M10Y10.

Chapter 2: Linear Equations Section 1: Using Graphs & Tables
Topics in Algebra 1 © 2001 Texas Instruments Teacher Notes 2-6
Linear Equations: Using Graphs & Tables Teacher Notes
Objectives
• To illustrate how to locate the real number solution of a linear equation using tables.
• To illustrate how to locate the real number solution of a linear equation using a graphical
method on a Cartesian (x-y) graph.
Math Highlights
In the table of values method, students see a table of values for the left and right side of the
equation. They see that the x value, which makes the two sides of the equation equal, is the
solution. They also see that they may need to refine the table of values to search for the solution.
In the x-y graphical method, students graph both sides of the equation and find the intersection
of the lines. If students have not graphed lines, they can first make a table of values and then plot
the points to graph the lines. The x coordinate of the intersection of the lines is the solution.
Common Student Errors
• Using graphs and tables can mislead a student to think that they can always find the exact
solution using these methods. Although they often will find exact solutions using these
methods, using algebra will give exact answers for these equations. Have students try to
search for the solution to x + À 2 = À 7 . The exact answer is x = À 7 N À 2 = 1.2315377 . . .
• At times, introducing the algebraic solution of equations gives students just the mechanics of
doing a problem. Algebraic methods alone usually do not invite the student to reason out the
solution using number sense. The graphs and tables method gives students the opportunity to
see the values of each side of the equation so they can see when the right side and left side of
the equation are equal.
Visual learners benefit by seeing the numbers and graphs first, and then by using these as the
tool to find the solution.
• Some students are able to see the solution to an equation using their number sense and may
have difficulty taking the time to show their work. This may also be an issue in
Chapter 2: Linear Equations, Section 2: Using Algebra. Encourage the use of written
mathematics and drawing graphs and tables as a communication tool. Have students look in
newspapers for graphs and tables of information to show real examples for the need for this
communication skill.
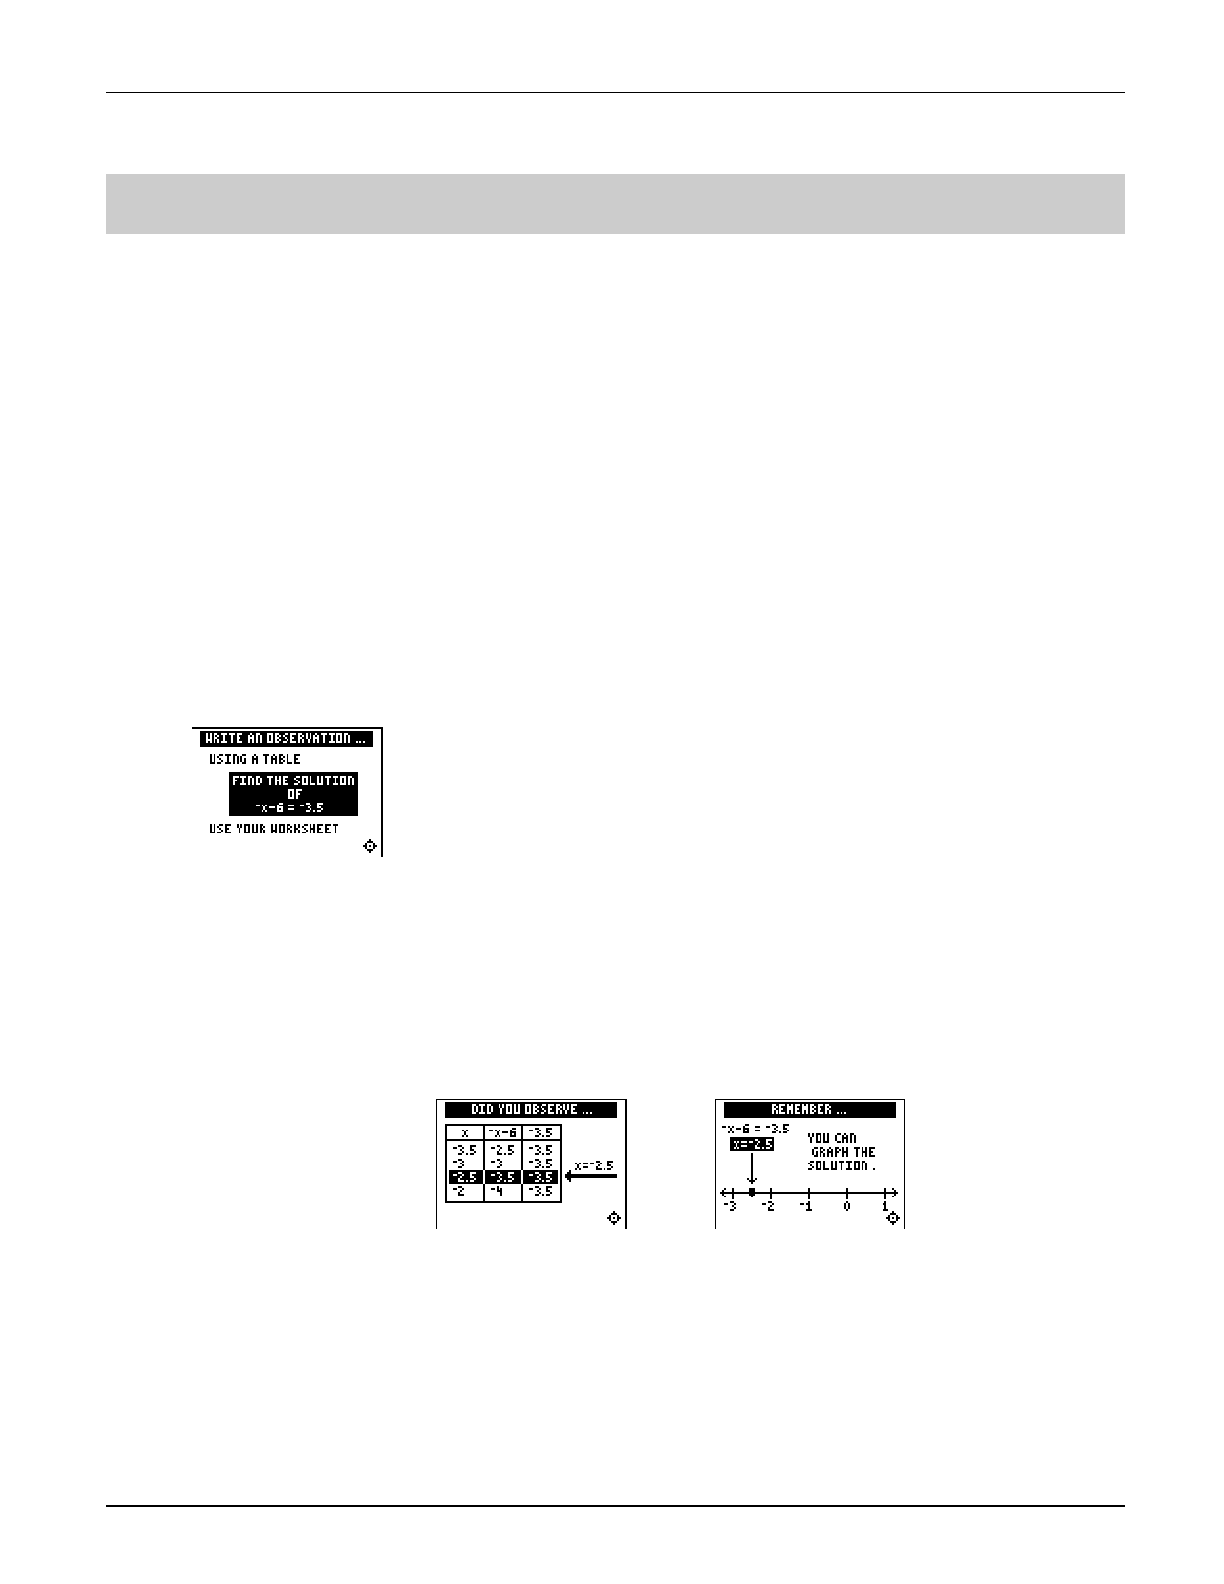
Chapter 2: Linear Equations Section 1: Using Graphs & Tables
Topics in Algebra 1 © 2001 Texas Instruments Teacher Notes 2-7
Student Worksheet Notes with Answers
Overview
Tell students:
1. How to find the Overview or tell them to review the instructions on the worksheet.
2. How to navigate the application, if they are not yet familiar with the application.
3. To scroll through the Overview on the calculator. Point out new terms, definitions, and
concepts, and tell students to look for them as they go through the Overview.
Observations
The Observations help students understand linear equation concepts relating to graphs and
tables.
If necessary, tell students how to find the Observations section for this section.
Observation 1
Using a table, find the solution of MxN6 = M3.5.
First, find the solution by hand, making a table with at least five x and
y values. The students can start with any x value they want. Students
show their work.
Next, they graph the solution on a number line. Remind them to label
all points on the number line.
Students make a table by hand on the worksheet to search for the
solution of
M
x
N
6 =
M
3.5. Then they transfer these x and y values to
a number line. Look for correct labeling.
Students see the table
and graph screens as
they finish viewing the
observation.
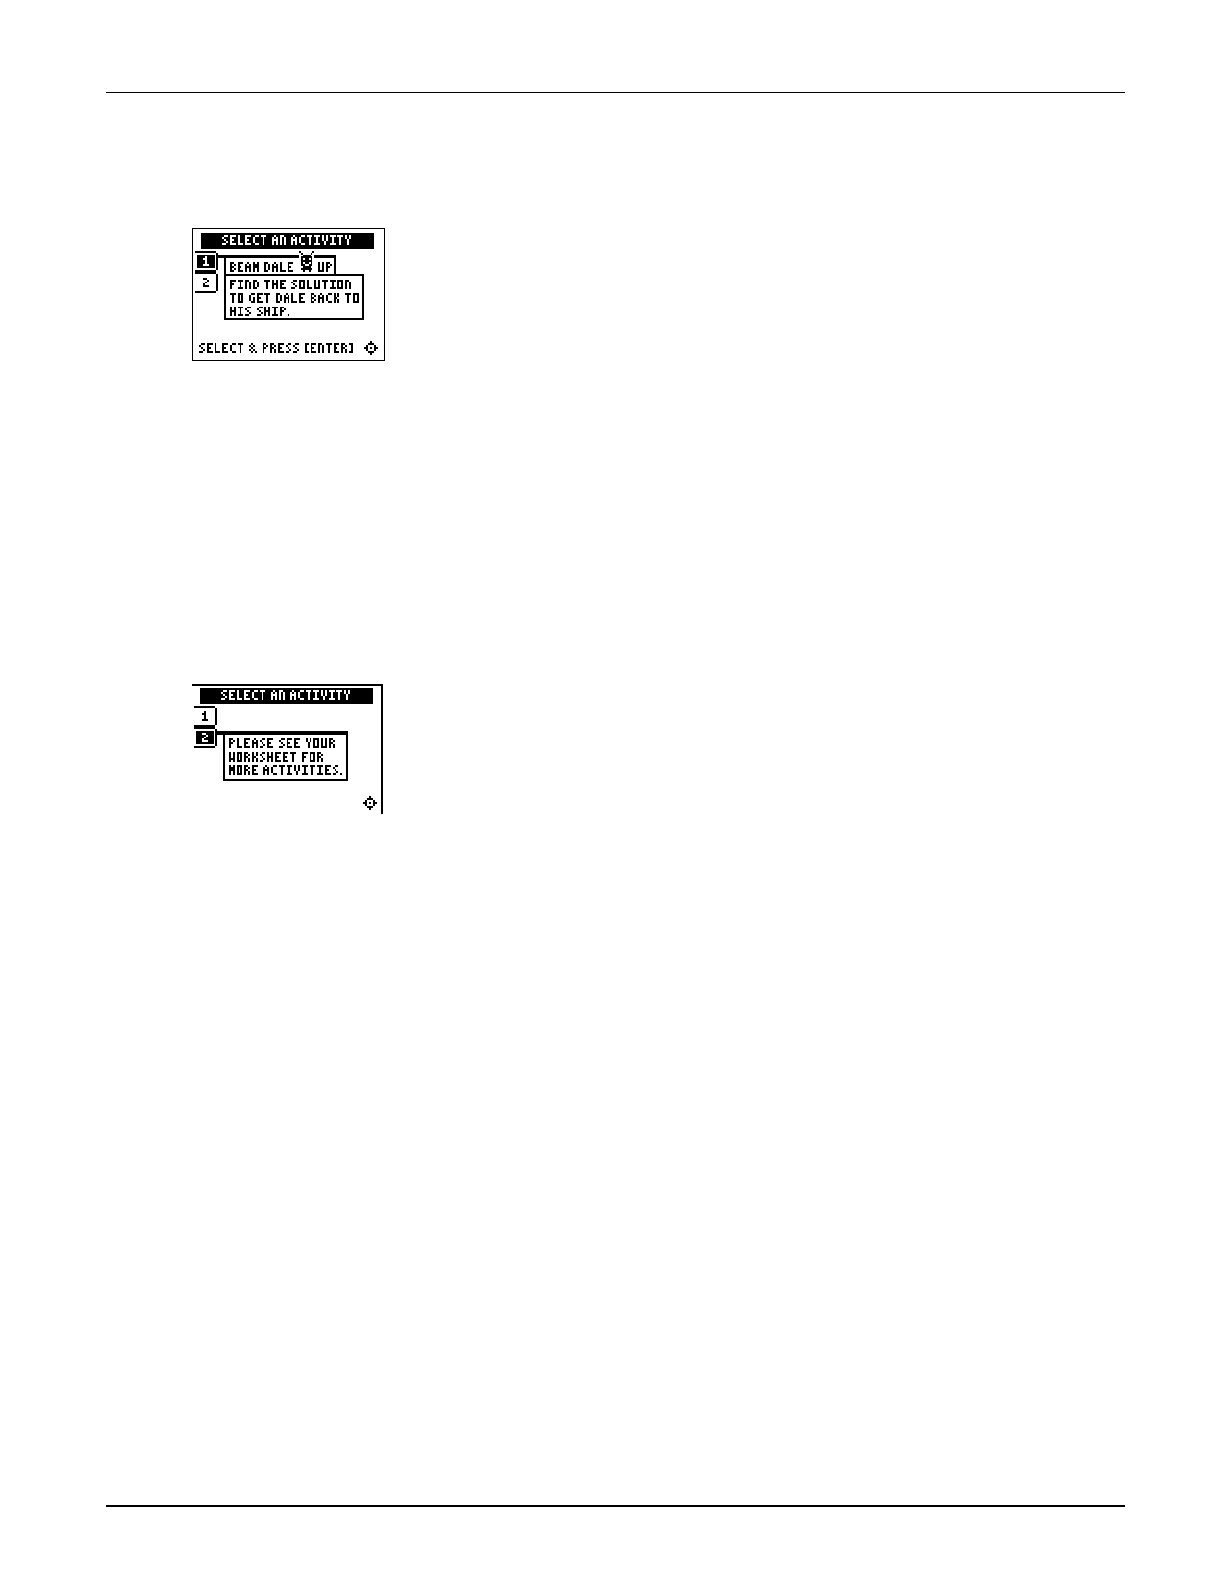
Chapter 2: Linear Equations Section 1: Using Graphs & Tables
Topics in Algebra 1 © 2001 Texas Instruments Teacher Notes 2-8
Activities
Scoring: Students get
two attempts to solve
each problem. They earn
2 points for a correct
answer on the first try, 1
point for a correct answer
on the second try.
Students can earn up to
10 points.
Beam Dale Up
Tell students to:
1. Look at the problem on the space ship and determine how to
solve the equation for x from the four choices given. The
values are ordered as they are on a number line.
2. Press
! and " to move Dale the Martian over the correct x
value, and then press b. If the x value they pick is
correct, Dale is beamed up to his ship! As they play the
activity, students record the solution to each equation,
showing all steps and work. If the answer is incorrect on the
second attempt, the correct answer is displayed; press any
key to resume play.
3. Record their scores.
Note: Press | or ~ to
leave this screen.
Worksheet Activity
Tell students to:
1. Look at the table of values of the expressions, Y1=2X+4.5 and
Y2=7.
2. Answer the questions: When is 2X+4.5=7 (or, when is Y1=Y2)?
The solution is between which two X values?
The solution for 2X+4.5=7
is found between 1 and 1.5.
Students will continue to search for the solution in the ³ Try-It!
section.
Chapter 2: Linear Equations Section 1: Using Graphs & Tables
Topics in Algebra 1 © 2001 Texas Instruments Teacher Notes 2-9
³ Try-It!é on Your TI.83 Plus or TI.73
Tell students to:
• Follow the steps exactly on the calculator, using the table feature to find the solution.
Example screen pictures are displayed on the worksheet for students to compare with the
calculator screen. This keystroke exercise lets students define Y1=2X+4.5 and Y2=7.
• Determine what the table settings should be for an exact solution and record them on their
worksheet.
Answer: ∆Tbl=0.25
and TblStart=1.
• Find the solution and record it. Answer
:
Y1=Y2 when X=1.25.
Solution Search Using X-Y Graphs: Find the solution for the equation X+3=1.7.
Tell students to:
• Estimate the solution and record it on their worksheets.
• Follow the steps exactly on the calculator. Example screen pictures are displayed on the
worksheet for students to compare with the calculator screen. This keystroke exercise lets
students find the solution where X+3=1.7.
• Record the solution and explain their answers on the worksheet after step 6.
Answers will vary. Student estimates using number sense should be close to the answer
M1.3. They see that the two lines intersect at x=M1.3.
Note: See the
TI-83 Plus Guidebook
, for information on the TI-83 Plus automatic feature “Intersection,” which is not covered in this
section. This feature is not on the TI-73.
Solution Search: Students write the solution and explain how they found the solution using
graphs and tables for each of the problems below.
Tell students to:
• Review how to use the graphing features of the calculator to search for a solution.
• Find the intersection of the lines by tracing the graph. Remind students that the viewing
window must be set appropriately to find the intersection, and finding the exact solution is
not guaranteed; they must combine the two methods to find the solutions.
• Use number sense to complete the search.
1. p + 3 = 1 when p = M2 2. 3x
− 2 = 1.6 when x = 1.2
3. 1
2 x + 5
8 = 7
8 when x = 1
2 4. 4 + 0.5C = 7 when C = 6
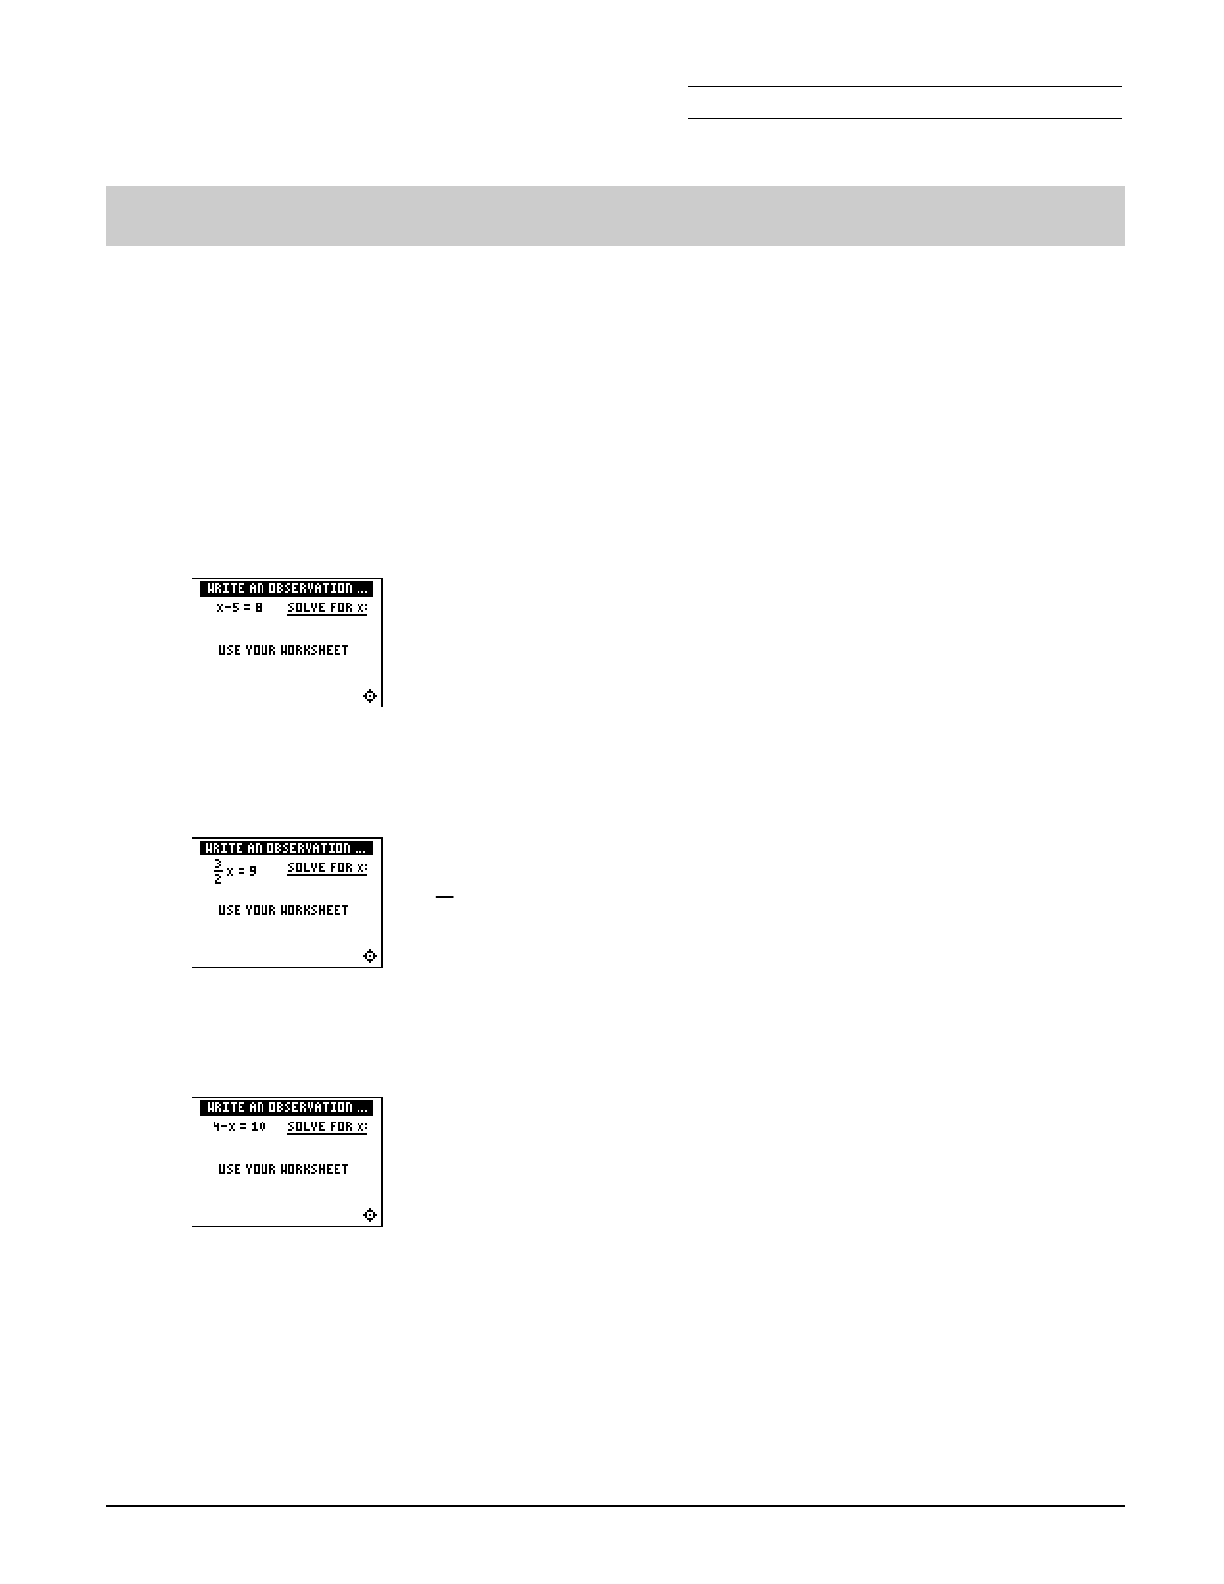
Chapter 2: Linear Equations Name
Section 2: Using Algebra Date
Topics in Algebra 1 © 2001 Texas Instruments Student Worksheet 2-10
Linear Equations: Using Algebra Student Worksheet
Overview
The Overview introduces the topics covered in Observations and Activities. Scroll through the
Overview using " (! to review, if necessary). Read each screen carefully. Look for new terms,
definitions, and concepts.
Observations
The Observations illustrate linear equation concepts relating to algebra. Scroll through the
Observations using " (! to review, if necessary). Read each screen carefully. When you come
to a Write an Observation screen, stop and write the answers to the questions on your worksheet.
Observation 1
xN5 = 8 Solve for x. Show all of your work below.
Observation 2
3
2 x = 9 Solve for x. Show all of your work below.
Observation 3
4Nx = 10 Solve for x. Show all of your work below.
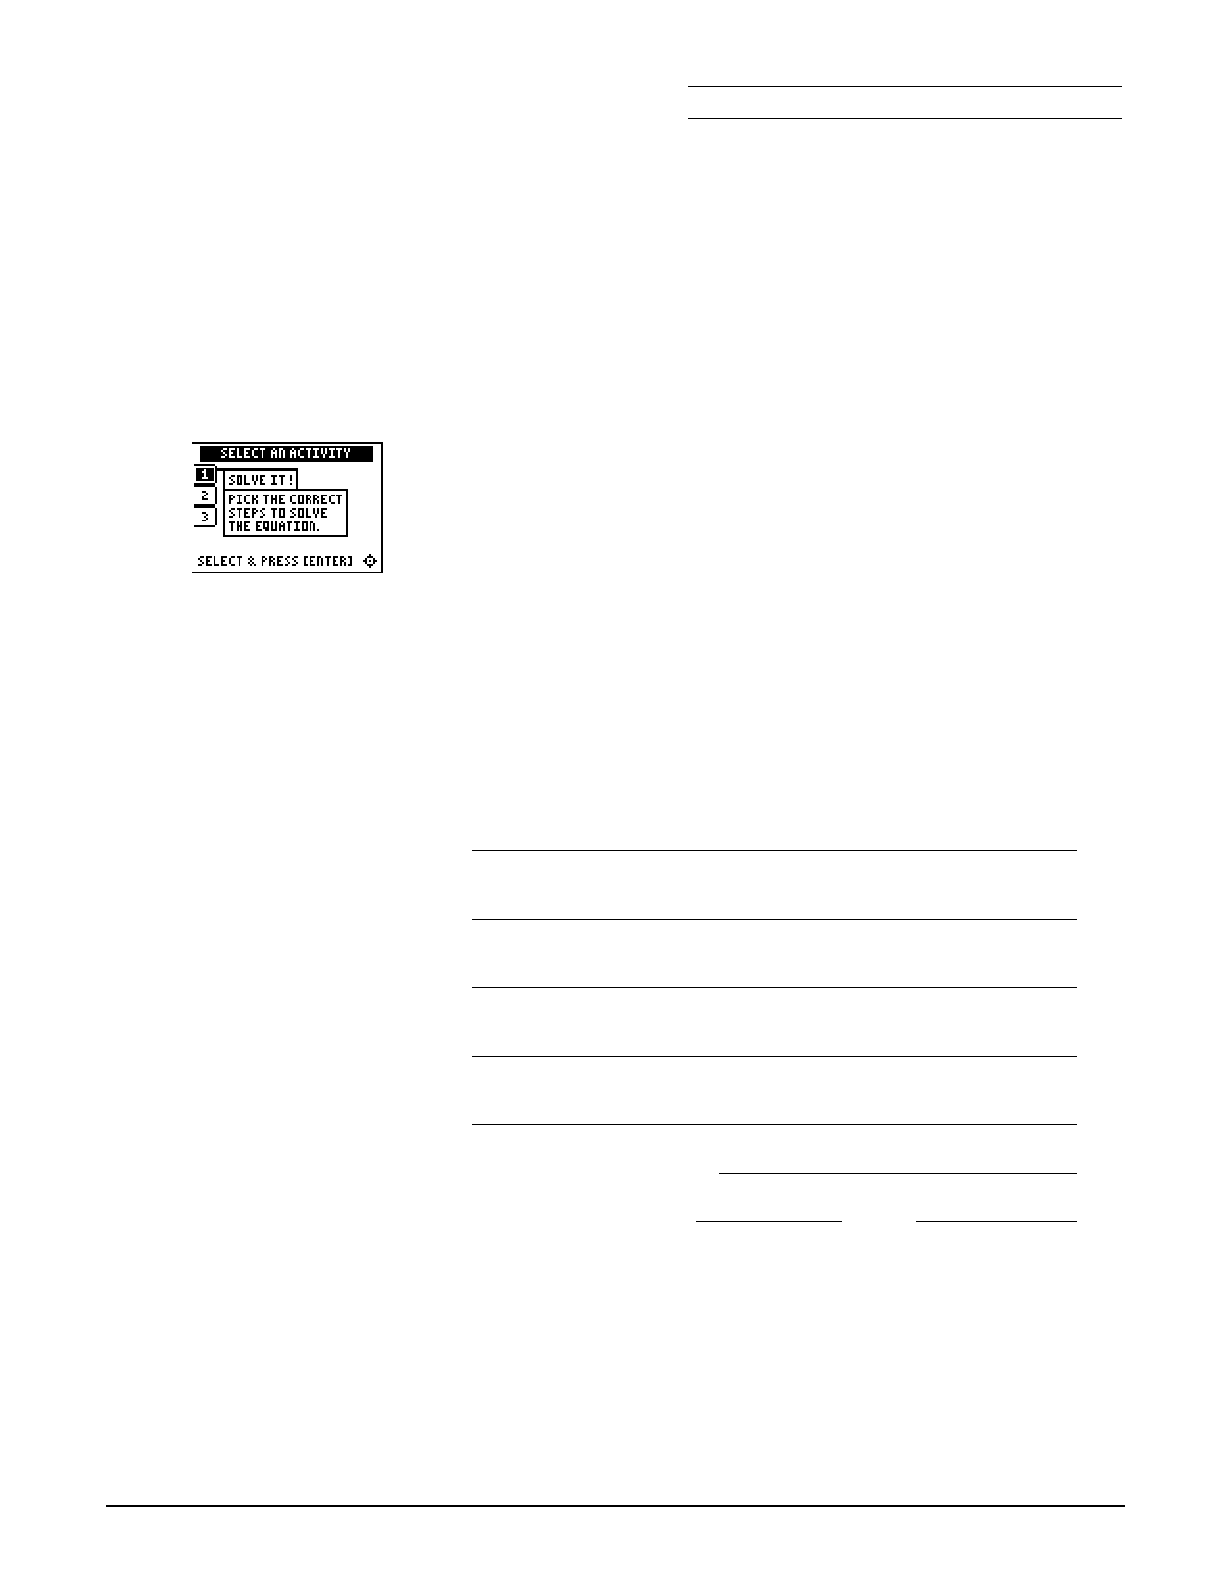
Chapter 2: Linear Equations Name
Section 2: Using Algebra Date
Topics in Algebra 1 © 2001 Texas Instruments Student Worksheet 2-11
Activities
The Activities help you practice algebraic concepts. You can select from three activities—
Solve It!, Beam Dale Up, and Free Fall. Follow these steps to play an activity and complete your
worksheet.
1. Make sure you are in the Activities for this section.
2. Highlight an activity using $ or #, and press b.
Scoring: You get two
attempts to pick the
correct step or steps. You
get 2 points for a correct
choice on the first try, and
1 point for a correct
choice on the second try.
You get an additional 2
points for the correct
solution.
The total number of points
available varies.
Solve It!
1. Highlight a level (silver = less difficult; gold = more difficult),
and press b to select it.
2. Look at the algebraic expression at the top of the screen and
decide what step to take to solve the equation for x.
3. Press
# or $ to cycle through steps to choose from, and then
press b to select the correct step (some problems require
two steps). If your second choice is incorrect, the correct step
is displayed; press any key to continue play. As you play the
activity, write the equations, the steps required to solve them,
and the solutions to the equations.
4. What level did you play?
5. What was your score? out of

Chapter 2: Linear Equations Name
Section 2: Using Algebra Date
Topics in Algebra 1 © 2001 Texas Instruments Student Worksheet 2-12
Activities (continued)
Scoring: You get two
attempts to solve each
problem. You earn 2
points for a correct
answer on the first try, 1
point for a correct answer
on the second try.
You can earn up to 10
points.
Beam Dale Up
1. Highlight a level (silver = less difficult; gold = more difficult),
and press b to select it.
2. Look at the problem on the space ship and determine how to
solve the equation for x from the four choices given.
3. Press
! and " to move Dale the Martian over the correct x
value, and then press b. If the x value you pick is correct,
Dale is beamed up to his ship! If the answer is incorrect on
the second attempt, the correct answer is displayed; press any
key to resume play. As you play the activity, solve each
equation in the space below. Show all steps and work.
4. What level did you play?
5. What was your score?

Chapter 2: Linear Equations Name
Section 2: Using Algebra Date
Topics in Algebra 1 © 2001 Texas Instruments Student Worksheet 2-13
Activities (continued)
Scoring: Points are
based on how quickly you
solve each equation.
The game automatically
ends if four missed
equations stack up, or
you press áQUITâ to stop.
Free Fall
1. Highlight a level (silver = less difficult; gold = more difficult),
and press b to select it.
2. When you are ready to start, press any key.
3. Watch the equation as it falls, and quickly solve for x. Enter
the solution (press Ì for negative numbers), and press b
before the equation hits bottom. If you give an incorrect
answer, the correct answer is displayed; press any key to
resume play. The incorrect equation stacks up at the bottom
of the screen, giving you less time to solve the next equation.
4. Follow your teacher’s instructions for how long to play the
activity.
5. What level did you play?
6. What was your score?
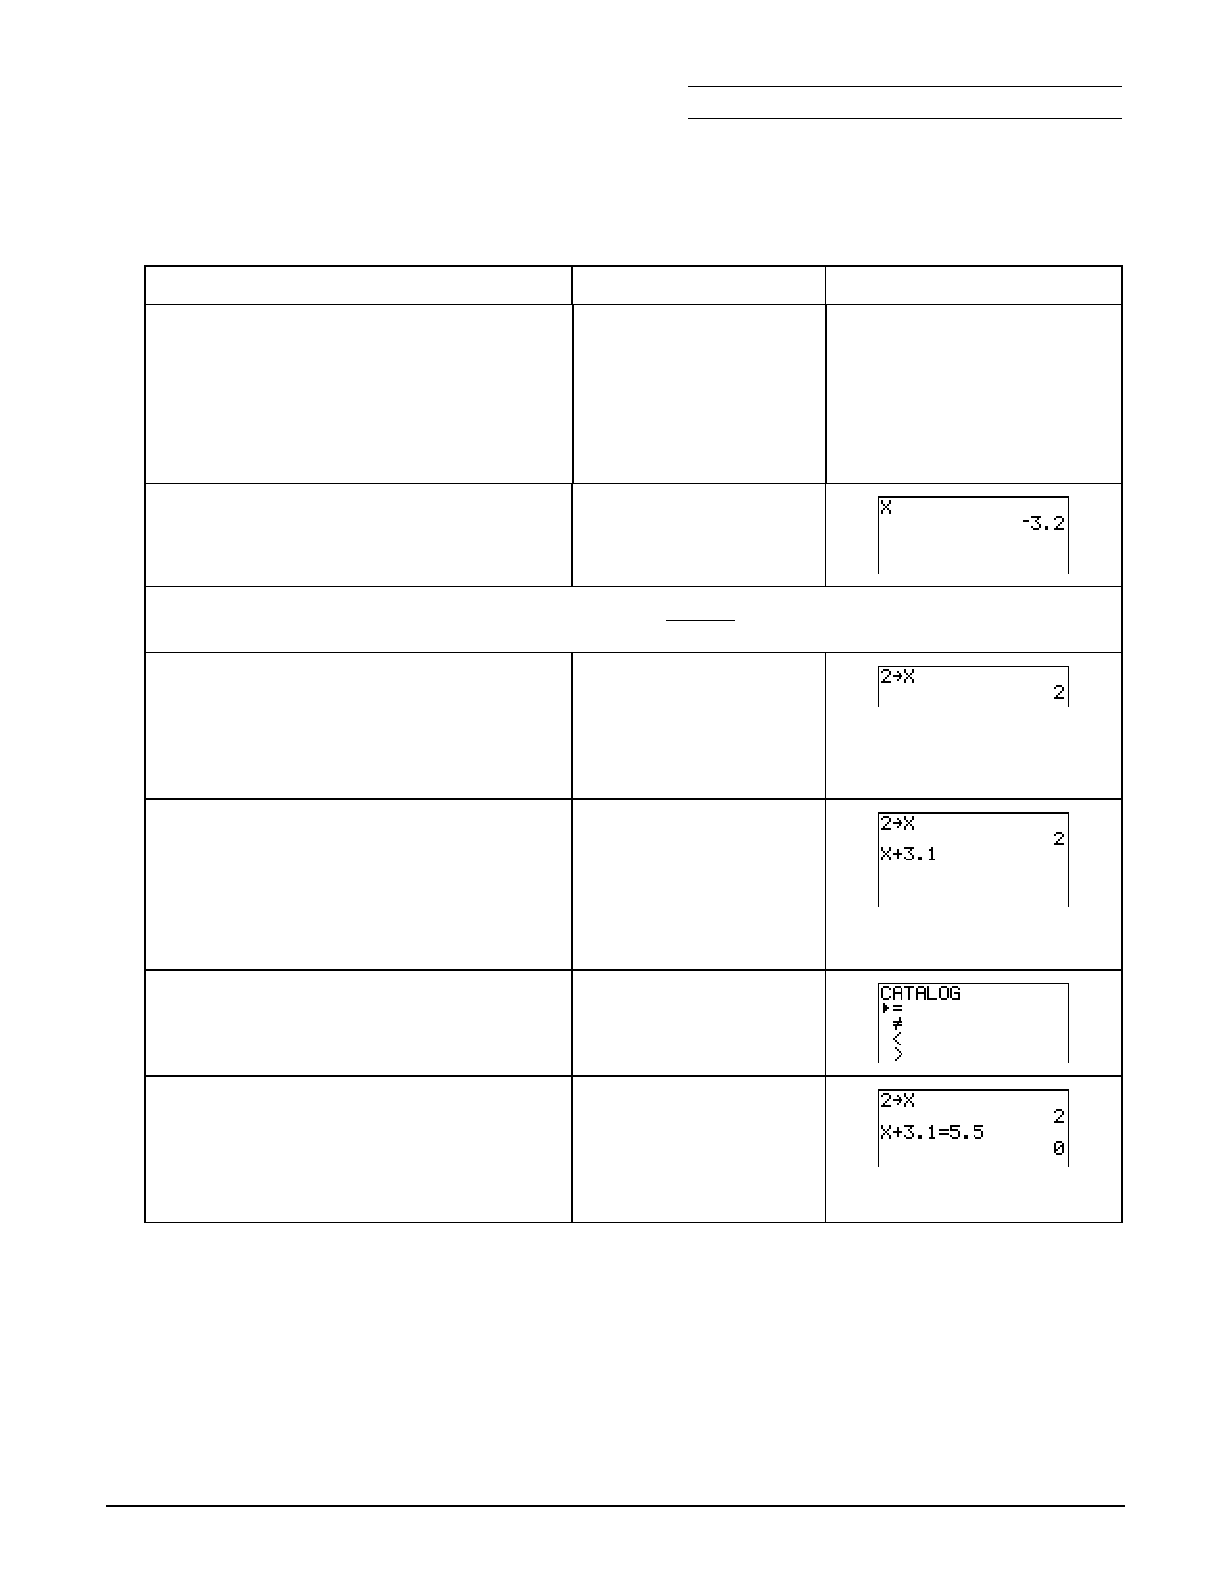
Chapter 2: Linear Equations Name
Section 2: Using Algebra Date
Topics in Algebra 1 © 2001 Texas Instruments Student Worksheet 2-14
³ Try-It!é on Your TI.83 Plus or TI-73
Can your calculator check your work? Is X=2 the solution to the equation X+3.1=5.5?
To Do This Press Display (TI.83 Plus shown)
1. Exit the Topics in Algebra 1
application and clear the Home
screen.
From the Home screen, the calculator
can tell you if a sentence is TRUE or
FALSE (1=TRUE and 0=FALSE).
y l
áEXITâ :
2. First, check for the value currently
stored in X.
Note: On the TI-73, use I rather than „.
„
Í
3. What is the value of X stored in your calculator?
Check around the class. Most likely, there are many different values stored to X.
4. Next, find out: Is X+3.1=5.5 true or
false when X=2? When you tell the
calculator that X=2, this is called
storing a value in X.
Note: On the TI-73, use I rather than „.
2 X „
Í
5. Enter the expression
X+3.1=5.5.
This
takes three steps.
a. Enter the first part of the
expression: X+3.1.
Note: On the TI-73, use I rather than „.
„ \ 3 ` 1
b. Enter the equal sign (=) for
the test.
- | $ until =
is highlighted
Í
c. Now, complete the sentence
and see the result. Since the
result is 0 (1=TRUE and
0=FALSE), the sentence
X+3.1=5.5 is false when X=2.
5 ` 5
Í
6. Test another point. Try X=3. Is the sentence true or false? What value do you think makes the
sentence true?
Hint: You do not have to type in the expressions again.
• On the TI-73, press $ to highlight previous entries, and press b to paste an entry on the current line. You can edit
the line and use it again.
• On the TI-83 Plus: y [ displays previous entries. When you get to the one you want, you can edit the line and
use it again.

Chapter 2: Linear Equations Name
Section 2: Using Algebra Date
Topics in Algebra 1 © 2001 Texas Instruments Student Worksheet 2-15
³ Try-It!é on Your TI.83 Plus or TI-73 (continued)
Additional Problems—Solve the following equations by hand. Show all of your work. Then test
your solution using the calculator as shown in the ³ Try-It! example on the previous page.
1. x
− (M4) = 12
2. 3
4W N 1
4 = M 5
8
3. 5.25 + P = M3.5
Hint: To find = and other relations:
• TI-83 Plus: Press y :, and then select the relation you want.
• TI-73: Press - t to enter the text editor, select the relation you want, press b, select Done, and press b.

Chapter 2: Linear Equations Section 2: Using Algebra
Topics in Algebra 1 © 2001 Texas Instruments Teacher Notes 2-16
Linear Equations: Using Algebra Teacher Notes
Objectives
• To review one-step and two-step linear equations.
• To review the idea of isolating the variable, balancing equations and checking solutions.
• To review the properties of equality.
Math Highlights
This section opens with an explanation of the idea of balancing equations using a pan balance.
The properties of equality are displayed. Then, examples of solving linear equations of the forms
x + a = b, ax = b, and ax + b = c are shown. These examples start with word problems and are
then modeled with linear equations, solved, and the solution is checked.
Common Student Errors
• Students may have a hard time deciding which steps to follow to solve an equation. In
particular, if they are given an equation in the form x + a = b, they may choose the wrong step
to take if the equation is given as a + x = b. Students might make sign errors as they add or
subtract from both sides of the equation.
• Students should connect the idea of a zero model from working with integers; for example,
they should connect 7 + M7 = 0 with the concept of an additive inverse. They use the additive
inverse to create the zero model. The term zero model is not discussed.
• Students should notice that they are using the multiplicative inverse to isolate the variable
when they multiply or divide both sides of equations.
• Although this section deals with the mechanical way of finding the solution set, students
should be reminded that they should check to see if the solution is reasonable. They need to
keep using number sense.
• Many students are able to see the answer using number sense without the written work.
Learning how to write mathematics correctly is part of the communication skill and needs to
be encouraged. This can cause frustration for students who find the problems easy to solve
“in their heads.”
Student Worksheet Notes with Answers
Overview
Tell students:
1. How to find the Overview, or tell them to review the instructions on the worksheet.
2. How to navigate the application, if they are not yet familiar with the application.
3. To scroll through the Overview on the calculator. Point out new terms, definitions, and
concepts, and tell students to look for them as they go through the Overview.
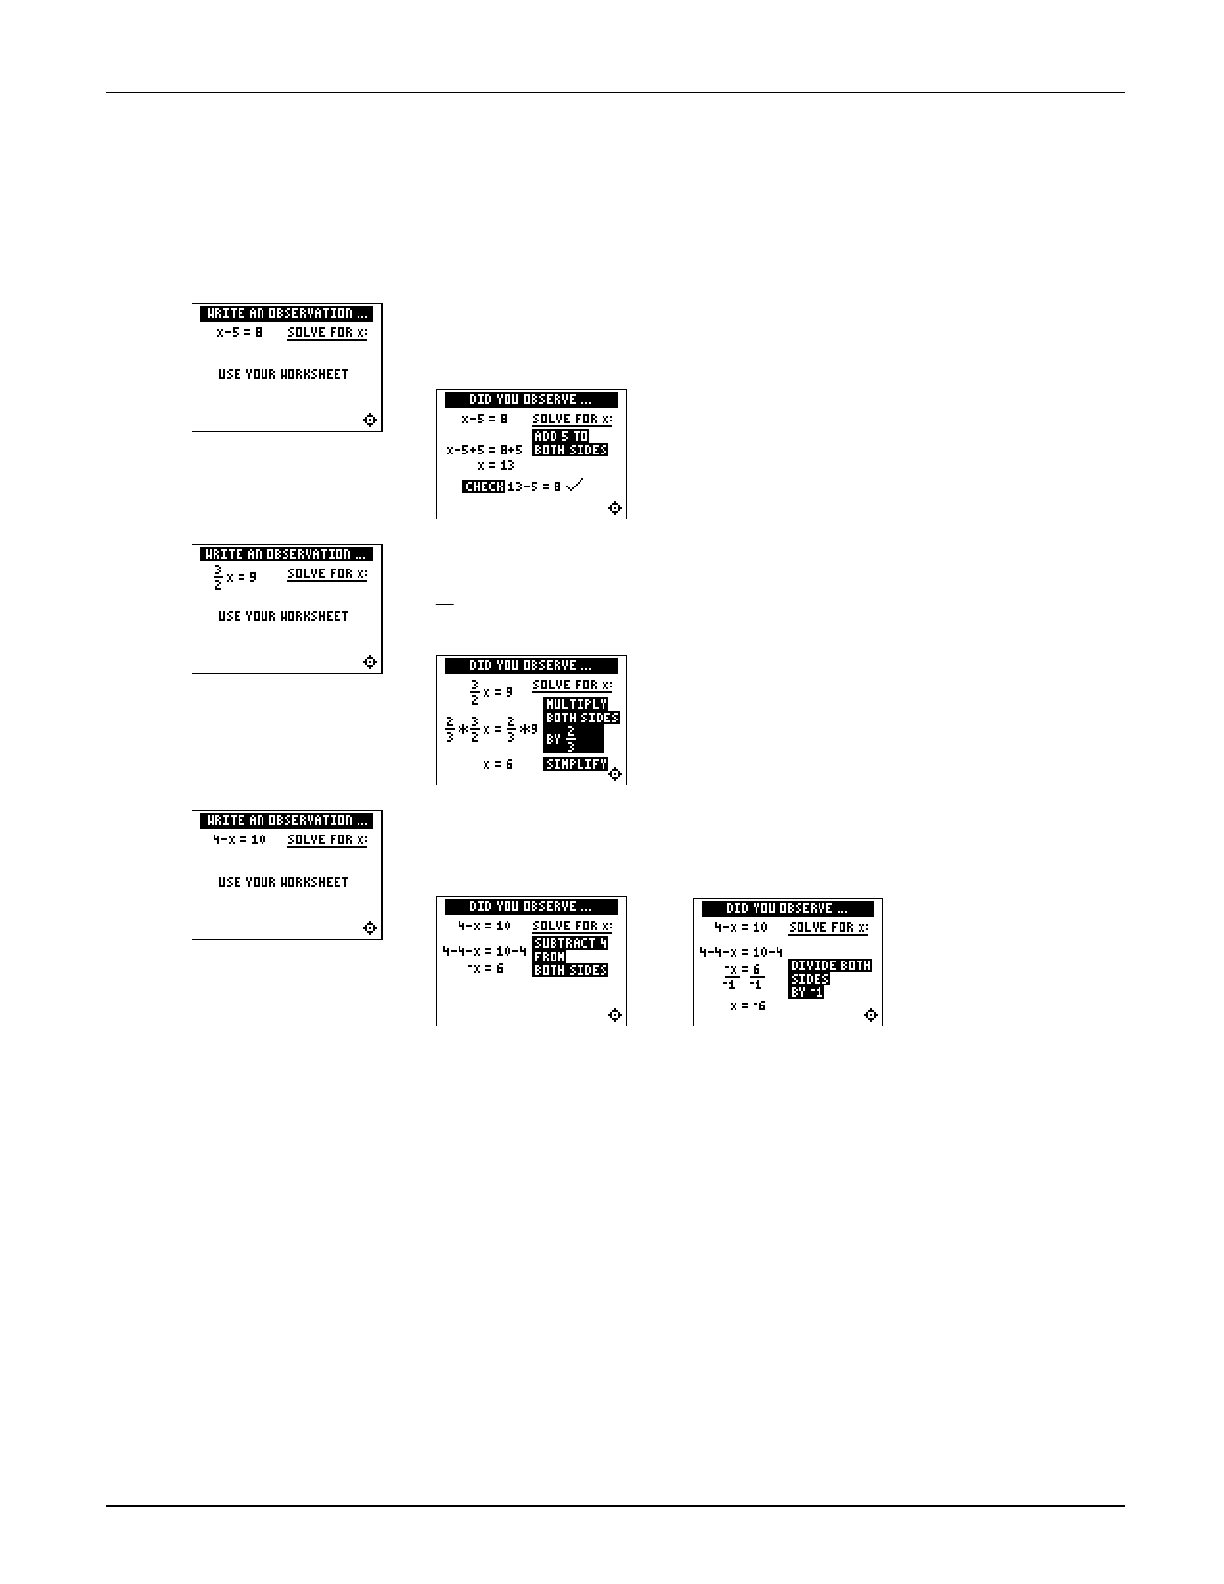
Chapter 2: Linear Equations Section 2: Using Algebra
Topics in Algebra 1 © 2001 Texas Instruments Teacher Notes 2-17
Observations
The Observations help students understand algebraic concepts relating to linear equations. If
necessary, tell students how to find the Observations.
Students solve for x. The
answer is displayed on
this screen.
Observation 1
x−5 = 8 Solve for x. Students show all their work.
Students solve for x. The
answer is displayed on
this screen.
Observation 2
3
2 x = 9 Solve for x. Students show all their work.
Students solve for x. The
answer is displayed on
these screens.
Observation 3
4−x = 10 Solve for x. Students show all their work.
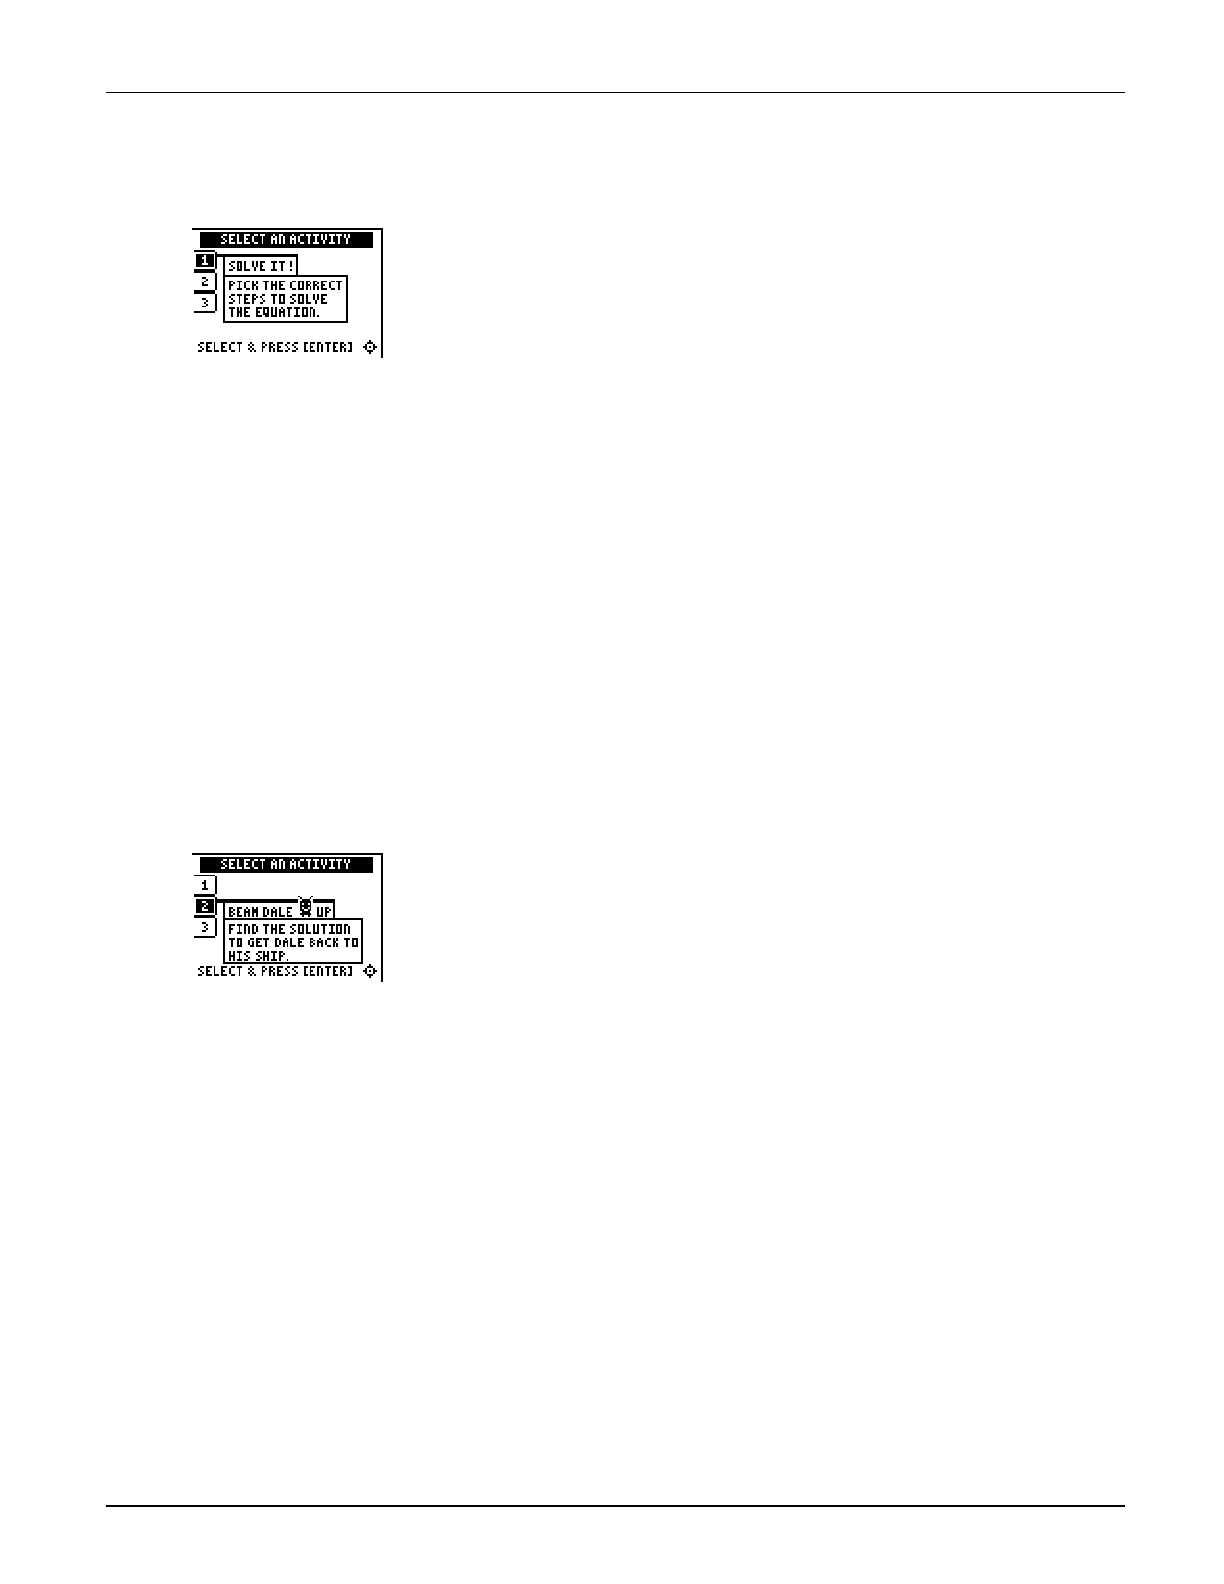
Chapter 2: Linear Equations Section 2: Using Algebra
Topics in Algebra 1 © 2001 Texas Instruments Teacher Notes 2-18
Activities
Scoring: Students get
two attempts to pick the
correct step or steps.
They get 2 points for a
correct choice on the first
try, and 1 point for a
correct choice on the
second try. They get an
additional 2 points for the
correct solution.
The total number of points
available varies.
Solve It!
Tell students to:
1. Highlight a level (silver = less difficult; gold = more difficult),
and press b to select it.
2. Look at the algebraic expression at the top of the screen and
decide what must be done to solve the equation for x.
Students must select from the choices offered; this activity
presents only one sequence of steps (to first isolate x and then
change the coefficient of x to 1), although other sequences
may be correct.
3. Press
# or $ to cycle through steps to choose from, and then
press b to select the correct step (some problems require
two steps). If the second choice is incorrect, the correct step
is displayed. They must press a key to continue play. As they
play the activity, students should write the equations, the
steps required to solve them, and the solutions.
4. Record the level they played.
5. Record their scores.
Scoring: Students get
two attempts to solve
each problem. They earn
2 points for a correct
answer on the first try, 1
point for a correct answer
on the second try.
Students can earn up to
10 points.
Beam Dale Up
Tell students to:
1. Highlight a level (silver = less difficult; gold = more difficult),
and press b to select it.
2. Look at the problem on the space ship and determine how to
solve the equation for x from the four choices given.
3. Press
! and " to move Dale the Martian over the correct x
value, and then press b. If the x value they pick is
correct, Dale is beamed up to his ship! As they play the
activity, students record the solution to each equation,
showing all steps and work. If the answer is incorrect on the
second attempt, the correct answer is displayed; press any
key to resume play.
4. Record the level they played.
5. Record their scores.

Chapter 2: Linear Equations Section 2: Using Algebra
Topics in Algebra 1 © 2001 Texas Instruments Teacher Notes 2-19
Activities (continued)
Scoring: Points are
based on how quickly
students solve each
equation.
Unless you specify point
or time limits for this
activity, students can play
the activity when four
missed equations stack
up, or they press áQUITâ
to stop. There is no time
limit.
Free Fall
Tell students to:
1. Highlight a level (silver = less difficult; gold = more difficult),
and press b to select it.
2. When they are ready to start, press any key.
3. Watch the equation as it falls, and quickly solve for x. Enter
the solution (press Ì for negative numbers), and press b
before the equation hits bottom. If students give an incorrect
answer, the correct answer is displayed; press any key to
resume play. The incorrect equation stacks up at the bottom
of the screen, giving them less time to solve the next equation.
4. Follow your instructions. For example, students can play:
• Until they have answered incorrectly four times (no time
limit).
• Until a certain amount of time has expired (highest score
with the fewest misses wins).
• Until a certain score has been reached (first student to
reach the score with the fewest misses wins).
• Repeatedly over a period of time (days, weeks, etc.) for
tracking improvement of high scores.
5. Record the level they played.
6. Record their scores.
³ Try-It!é on Your TI.83 Plus or TI.73
Tell students to:
• Solve the following equations by hand and show all of their work.
• Test their solutions using the calculator as shown in the ³ Try-It! example on the previous
page.
1. x
N (M4) = 12 when x = 8
2. 3
4W N 1
4 = M 5
8 when W = M 1
2
3. 5.25 + P = M3.5 when P = M8.75

Chapter 3: Linear Functions Name
Section 1: Slope with Grid Date
Topics in Algebra 1 © 2001 Texas Instruments Student Worksheet 3-1
Linear Functions: Slope with Grid Student Worksheet
Overview
The Overview introduces the topics covered in Observations and Activities. Scroll through the
Overview using " (! to review, if necessary). Read each screen carefully. Look for new terms,
definitions, and concepts.
Observations
The Observations illustrate the slope of a straight line. Scroll through the Observations using "
(! to review, if necessary). Read each screen carefully. When you come to a Write an
Observation screen, stop and write the answers to the questions on your worksheet.
Observation 1
What do you notice about the slope of straight lines? Write your
thoughts.
Activities
The Activities help you practice determining the slope of a line using a grid. You can select from
two activities—Screen Cross or Linked Calculators Screen Cross. Follow these steps to play the
activity and complete your worksheet.
1. Make sure you are in the Activities for this section.
2. Highlight an activity using $ or #, and press b.
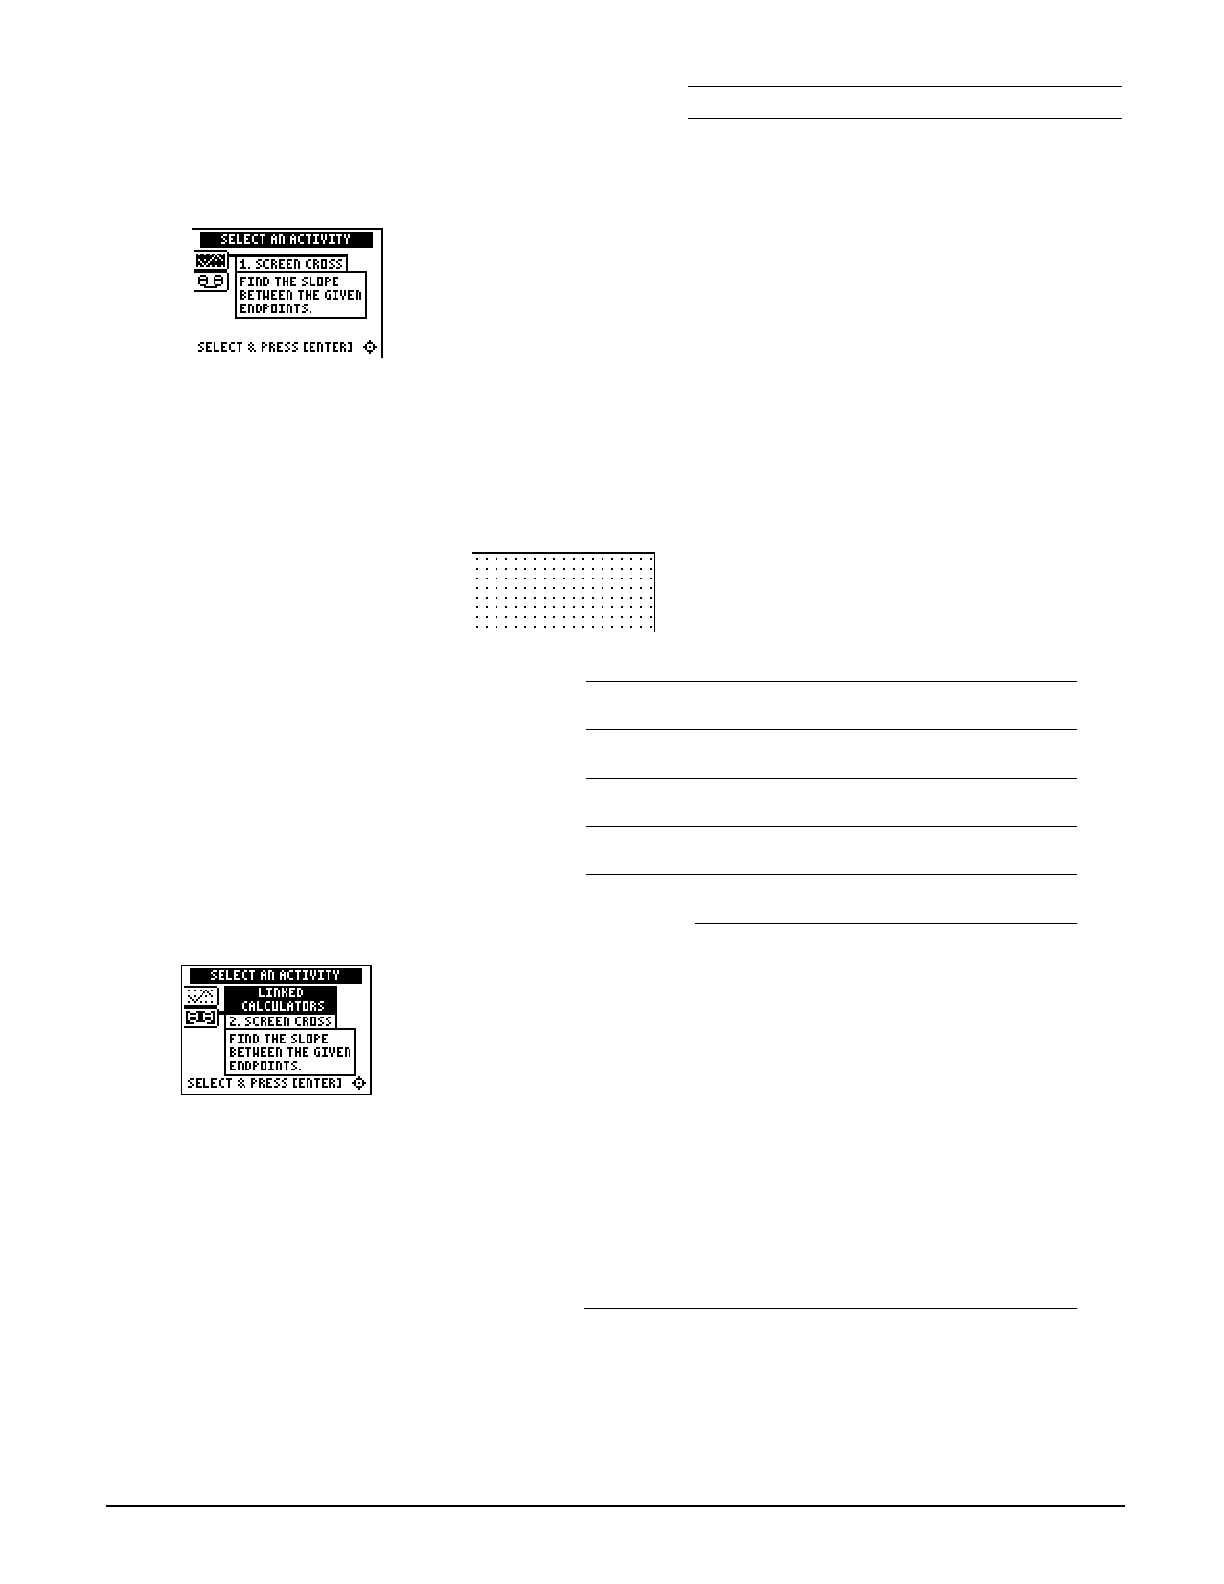
Chapter 3: Linear Functions Name
Section 1: Slope with Grid Date
Topics in Algebra 1 © 2001 Texas Instruments Student Worksheet 3-2
Activities (continued)
Scoring: You get two
attempts to solve each
problem. You earn 2
points for a correct
answer on the first try, 1
point for a correct answer
on the second try.
You can earn up to 10
points.
Screen Cross
1. Read the directions on the screen, and then press any key to
continue.
Note: Repeat steps 2 and 3 for line segments 2 through 5.
2. Calculate the slope between the two points. Record your
work below.
3. Press
$ or # to view the choices for the slope (UNDEF =
undefined slope). When you think the correct slope is
displayed, press b.
segment 1:
segment 2:
segment 3:
segment 4:
segment 5:
4. What was your score?
Scoring: There are no
points awarded in the
linked version. You must
answer correctly before
the next line segment is
shown.
The player who reaches
the right side of the grid
first wins.
Linked Calculators Screen Cross
Play Screen Cross against another student. Race another student
across the screen by calculating the slopes more quickly than
your opponent.
1. Connect two similar calculators using a unit-to-unit cable.
2. Use the grid to help determine the slope of the line segment as
quickly as possible.
3. Select the slope as you did in Screen Cross.
4. Who won?
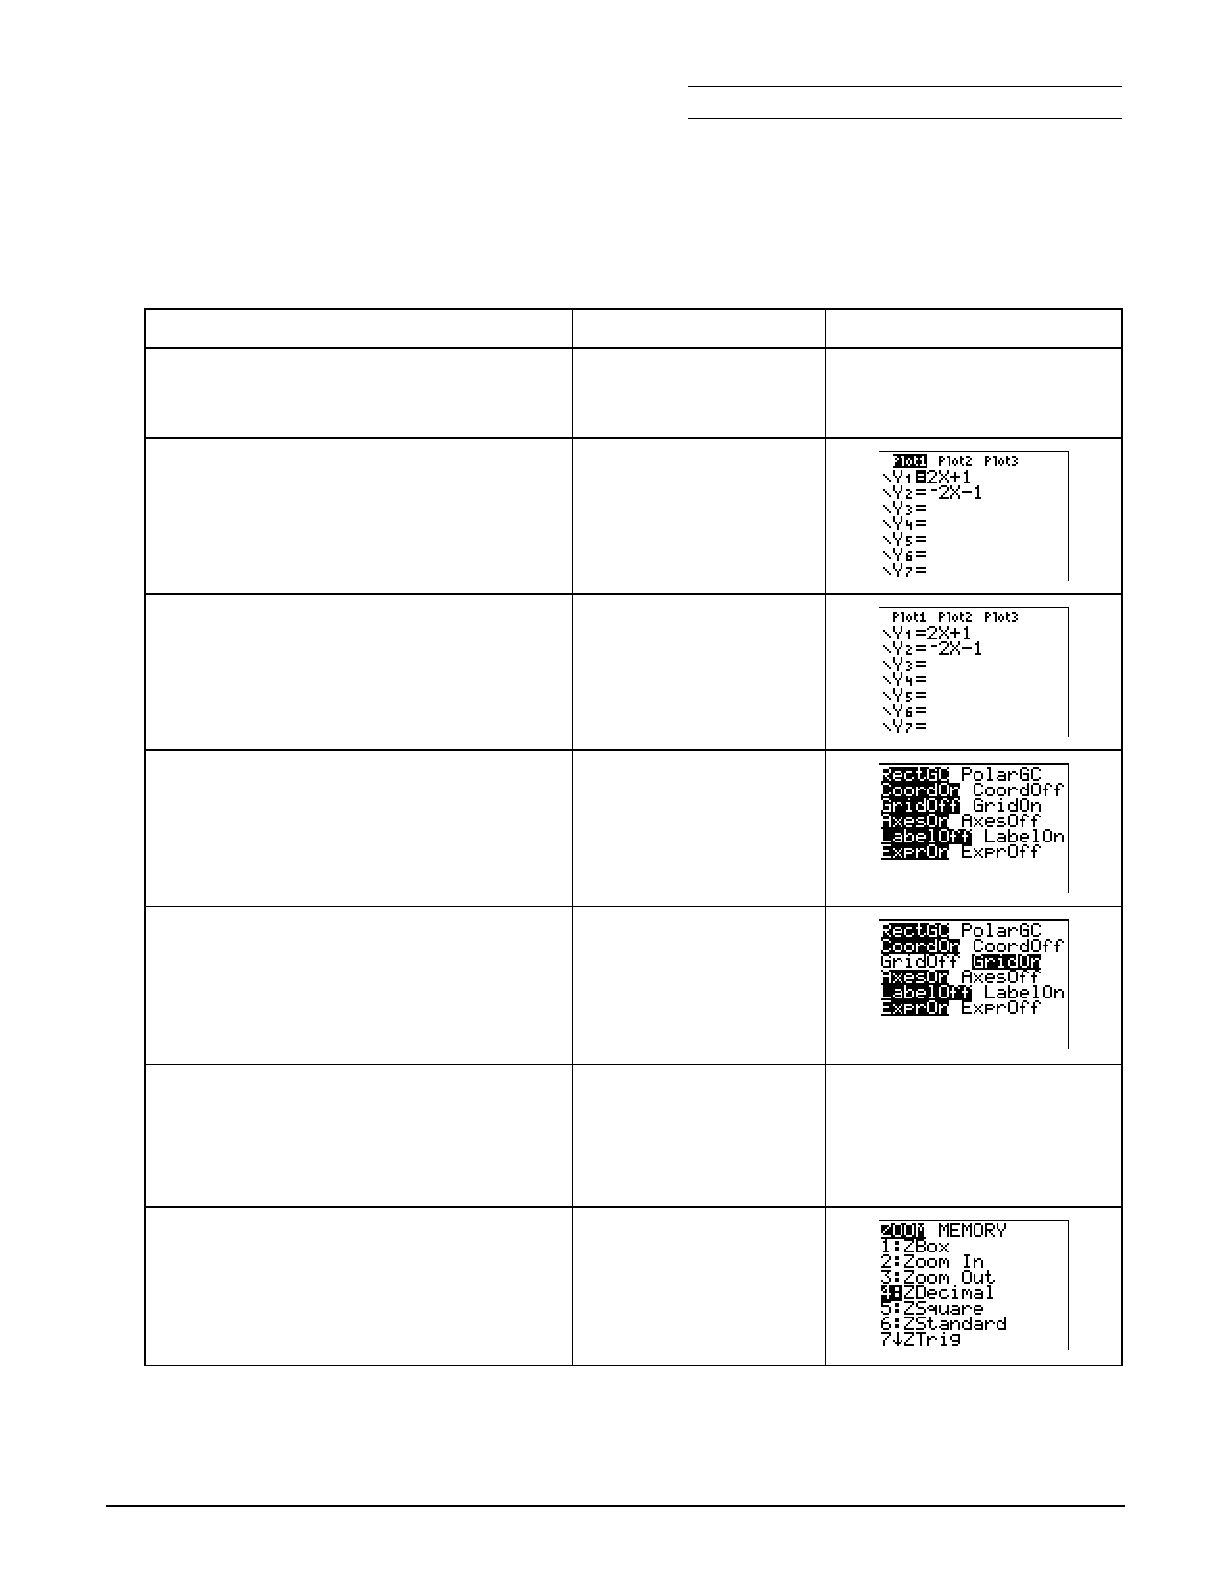
Chapter 3: Linear Functions Name
Section 1: Slope with Grid Date
Topics in Algebra 1 © 2001 Texas Instruments Student Worksheet 3-3
³ Try-It!é on Your TI.83 Plus or TI.73
Draw a line segment with endpoints at (M2,2) and (3,M2). Use the Line( command, which draws
line segments on the graph screen.
To Do This Press Display (TI.83 Plus shown)
1. Exit the Topics in Algebra 1
application and clear the Home
screen.
y l
áEXITâ :
2. Check to see if any functions or
statistical plots are turned on.
o
3. Turn off statistical plots or functions,
if necessary.
Note: See ³ TIpé 8:
Creating a Statistical Plot
for
more information.
!, ", #, or $
b to deselect
4. Display the window format screen. - g
5. Select
GridOn. TI-83 Plus:
# # " b
TI-73:
# " b
6. Display the
ZOOM menu. These
settings set the viewing window
automatically.
Note: For more information, see ³ TIp 5:
Adjusting
the Viewing Window
.
(
7. Select
ZDecimal.
Note: This also displays the graph screen
automatically.
TI-83 Plus:
4:ZDecimal
TI-73:
8:ZDecimal
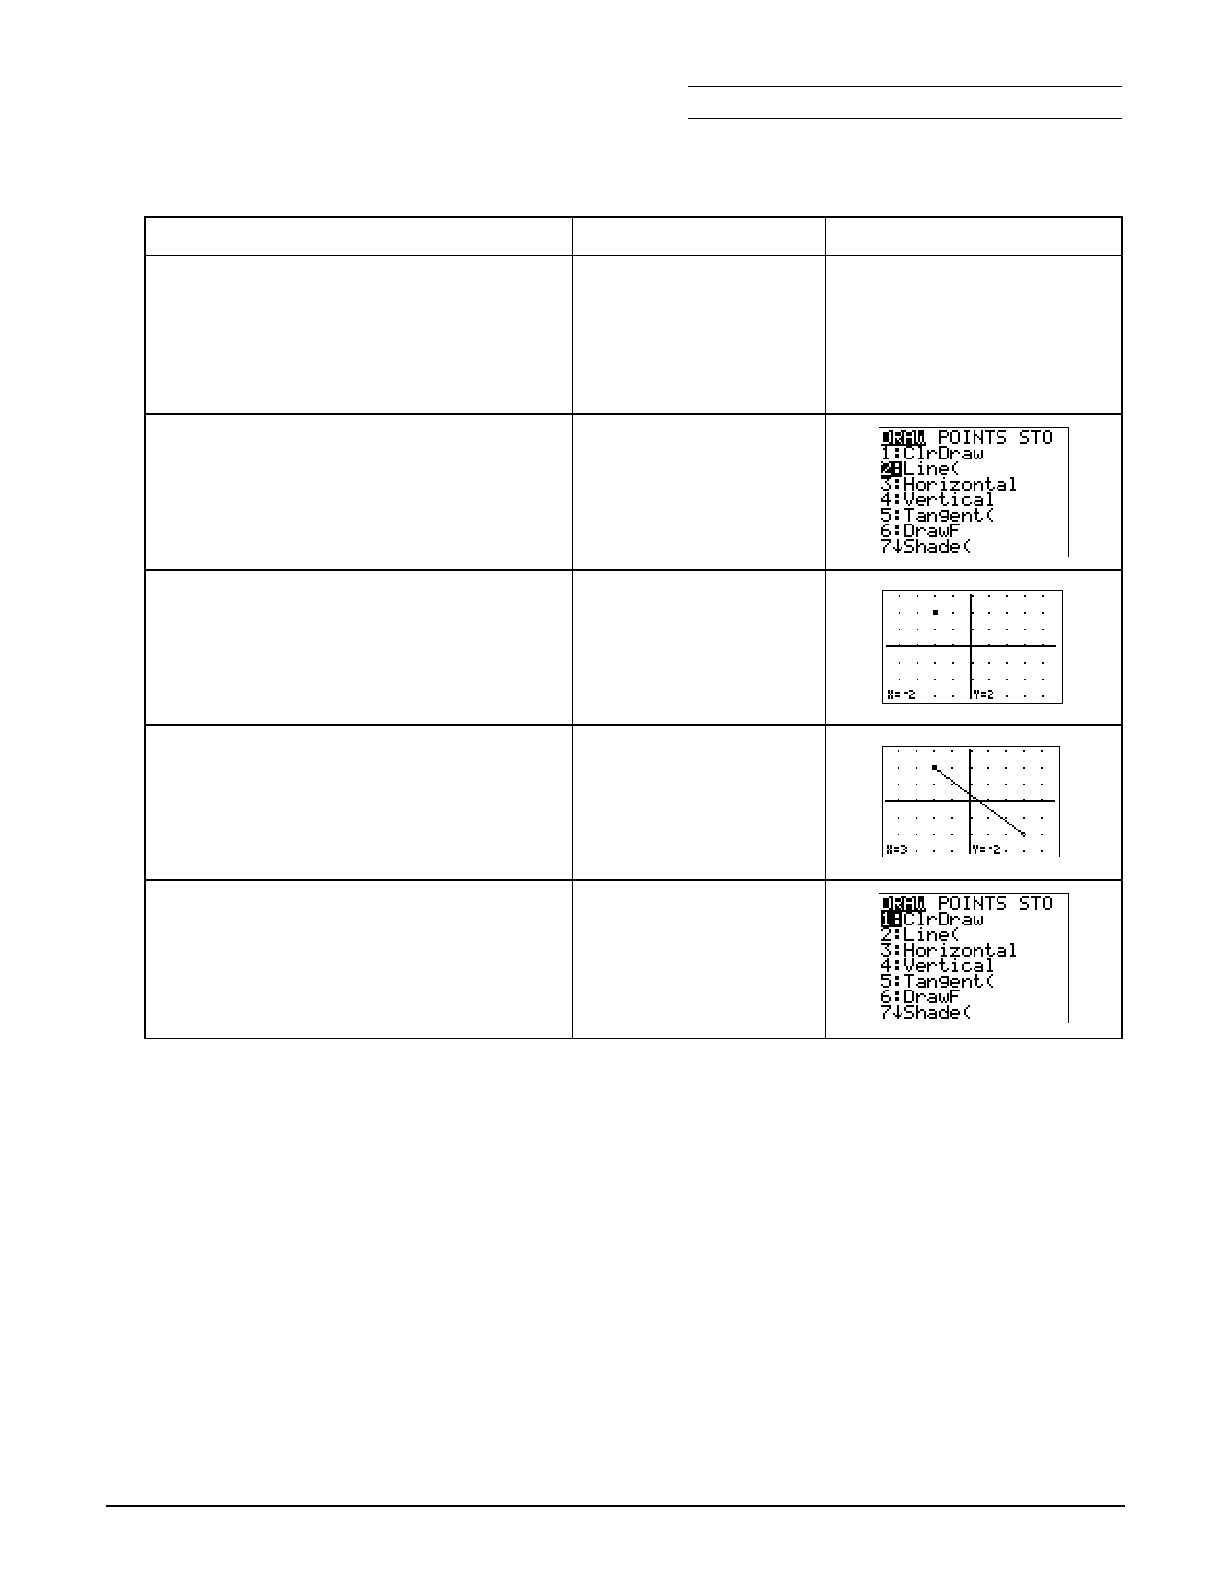
Chapter 3: Linear Functions Name
Section 1: Slope with Grid Date
Topics in Algebra 1 © 2001 Texas Instruments Student Worksheet 3-4
³ Try-It!é on Your TI.83 Plus or TI.73 (continued)
To Do This Press Display (TI.83 Plus shown)
8. Select the
DRAW menu. TI-83 Plus:
- <
TI-73:
2
9. Select the
Line( command, which
draws line segments on the graph
screen.
2:Line(
10. Move the cursor to (M2,2).
11. Set the endpoint (M2,2).
!, ", #, or $
b
12. Move the cursor to (3,M2).
13. Set the other endpoint (3,M2). The line
segment is drawn.
!, ", #, or $
b
14. Clear your drawing with ClrDraw, if
desired.
TI-83 Plus:
- 2 1:ClrDraw
TI-73:
2 1:ClrDraw
Chapter 3: Linear Functions Name
Section 1: Slope with Grid Date
Topics in Algebra 1 © 2001 Texas Instruments Student Worksheet 3-5
³ Try-It!é on Your TI.83 Plus or TI.73 (continued)
Draw the Slopes!
1. On your calculator use Line to draw segments that have the following slopes (m), and then
copy the graph onto the screens below.
a. m = 1/2
b. m = 2/4
c. m = 3/2
d. m = M2/3
2. Compare your graphs with others in your class. Do you all get the same graph? If not, why?
____________________________________________________________________________________
____________________________________________________________________________________
____________________________________________________________________________________
3. Compare the four segments drawn. Record your observations.
____________________________________________________________________________________
____________________________________________________________________________________
____________________________________________________________________________________
____________________________________________________________________________________
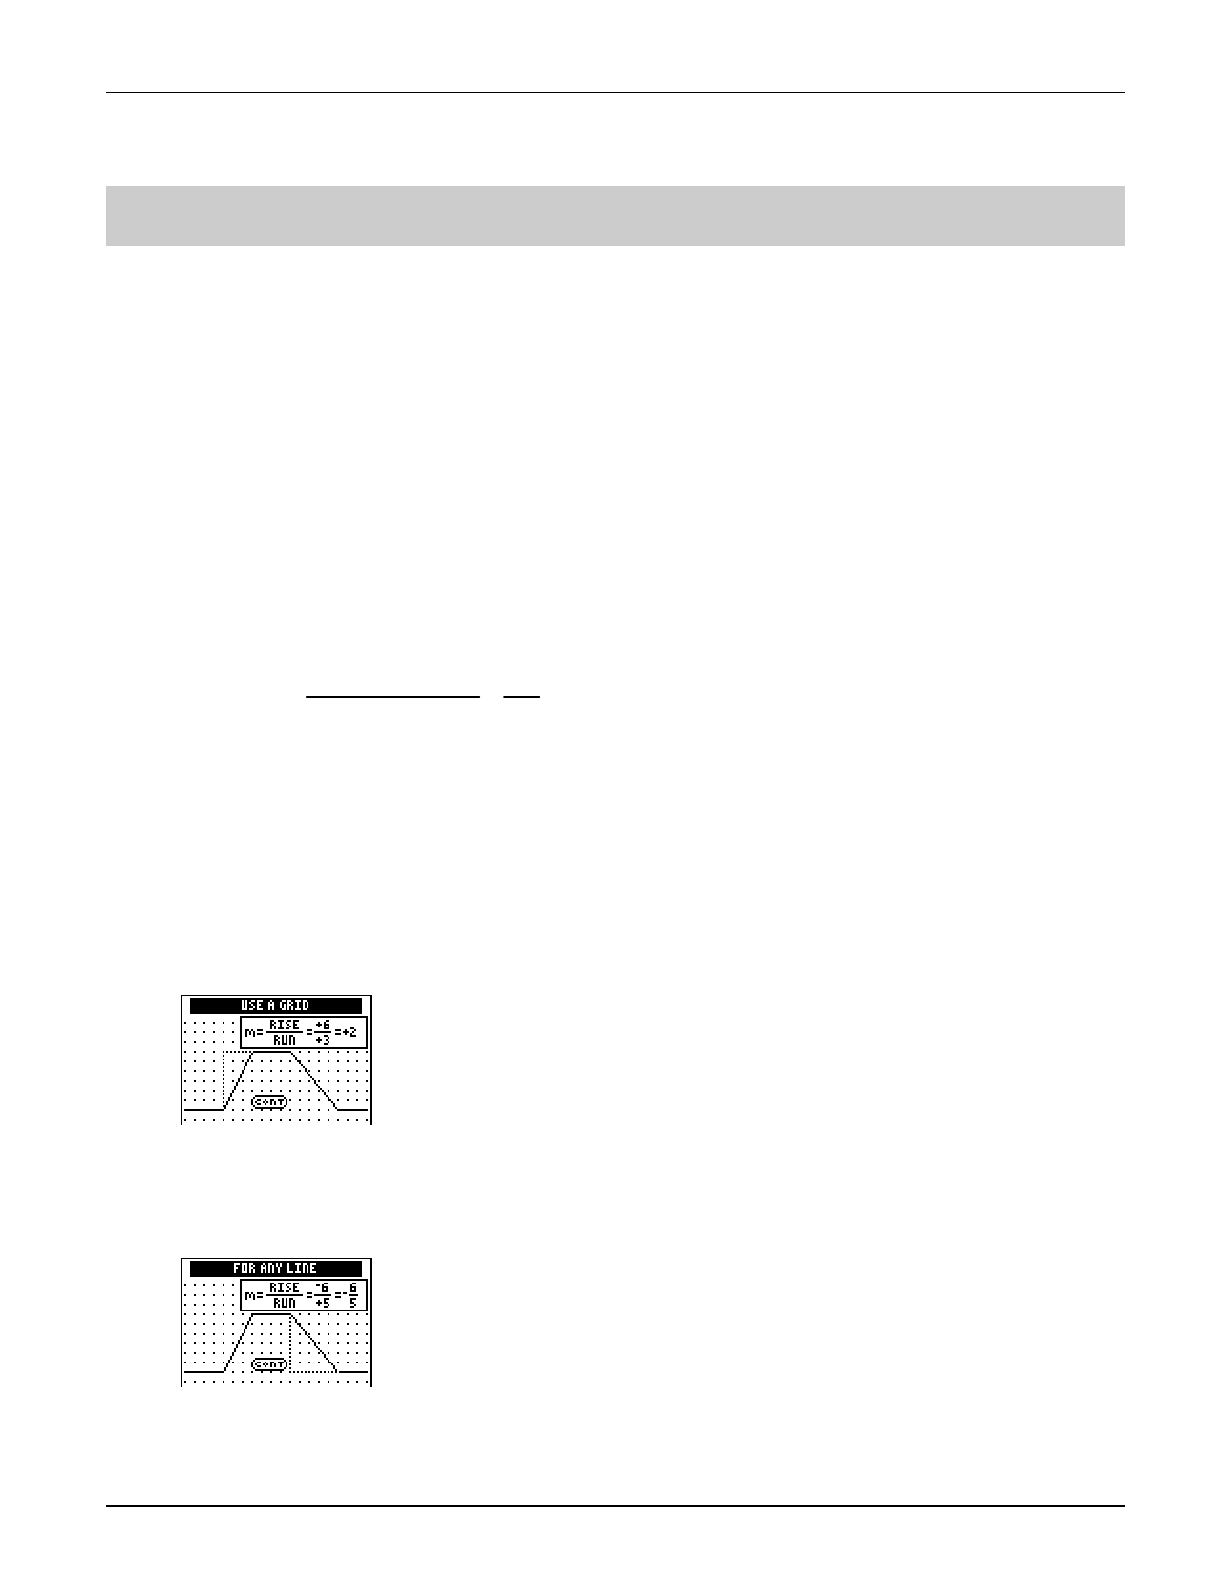
Chapter 3: Linear Functions Section 1: Slope with Grid
Topics in Algebra 1 © 2001 Texas Instruments Teacher Notes 3-6
Linear Functions: Slope with Grid Teacher Notes
Objectives
• To impose a grid on a line to quantify the steepness of a line.
• To introduce slope as the ratio of the vertical change divided by the horizontal change.
• To illustrate the slope characteristics of lines as positive, zero, negative, or undefined (no
slope).
• To associate the terms with the appropriate graph of a line: increasing, horizontal,
decreasing, or vertical.
• To observe that the slope of a straight line is a constant.
Math Highlights
This section defines slope as the steepness of a line. It begins with a bike riding along a
piecewise linear path. Students see the definition of slope as a ratio:
Slope =
m= vertical change
horizontal change = rise
run
A grid is imposed on the bike path to help illustrate how students can quantify the slope of each
line segment. Next, lines with positive, zero, negative, and no slope are illustrated.
Common Student Errors
• Students may have difficulties counting the spaces between grid points; therefore, they may
count the grid points instead of the spaces. For example, students who count grid points may
think that the slope shown on the screen below is 7à4 instead of 6à3. Using a Geoboard or
grid paper, redraw the line segment to help these students count the distance between the
grid points rather than the points themselves.
• In the screen below, the rise/run of the fourth segment is calculated as M6à5. For some
students, associating “down 6 units, or M6” with the word rise can be confusing. The use of
the terms vertical change or horizontal change helps students understand that change could
be up or down, right or left.
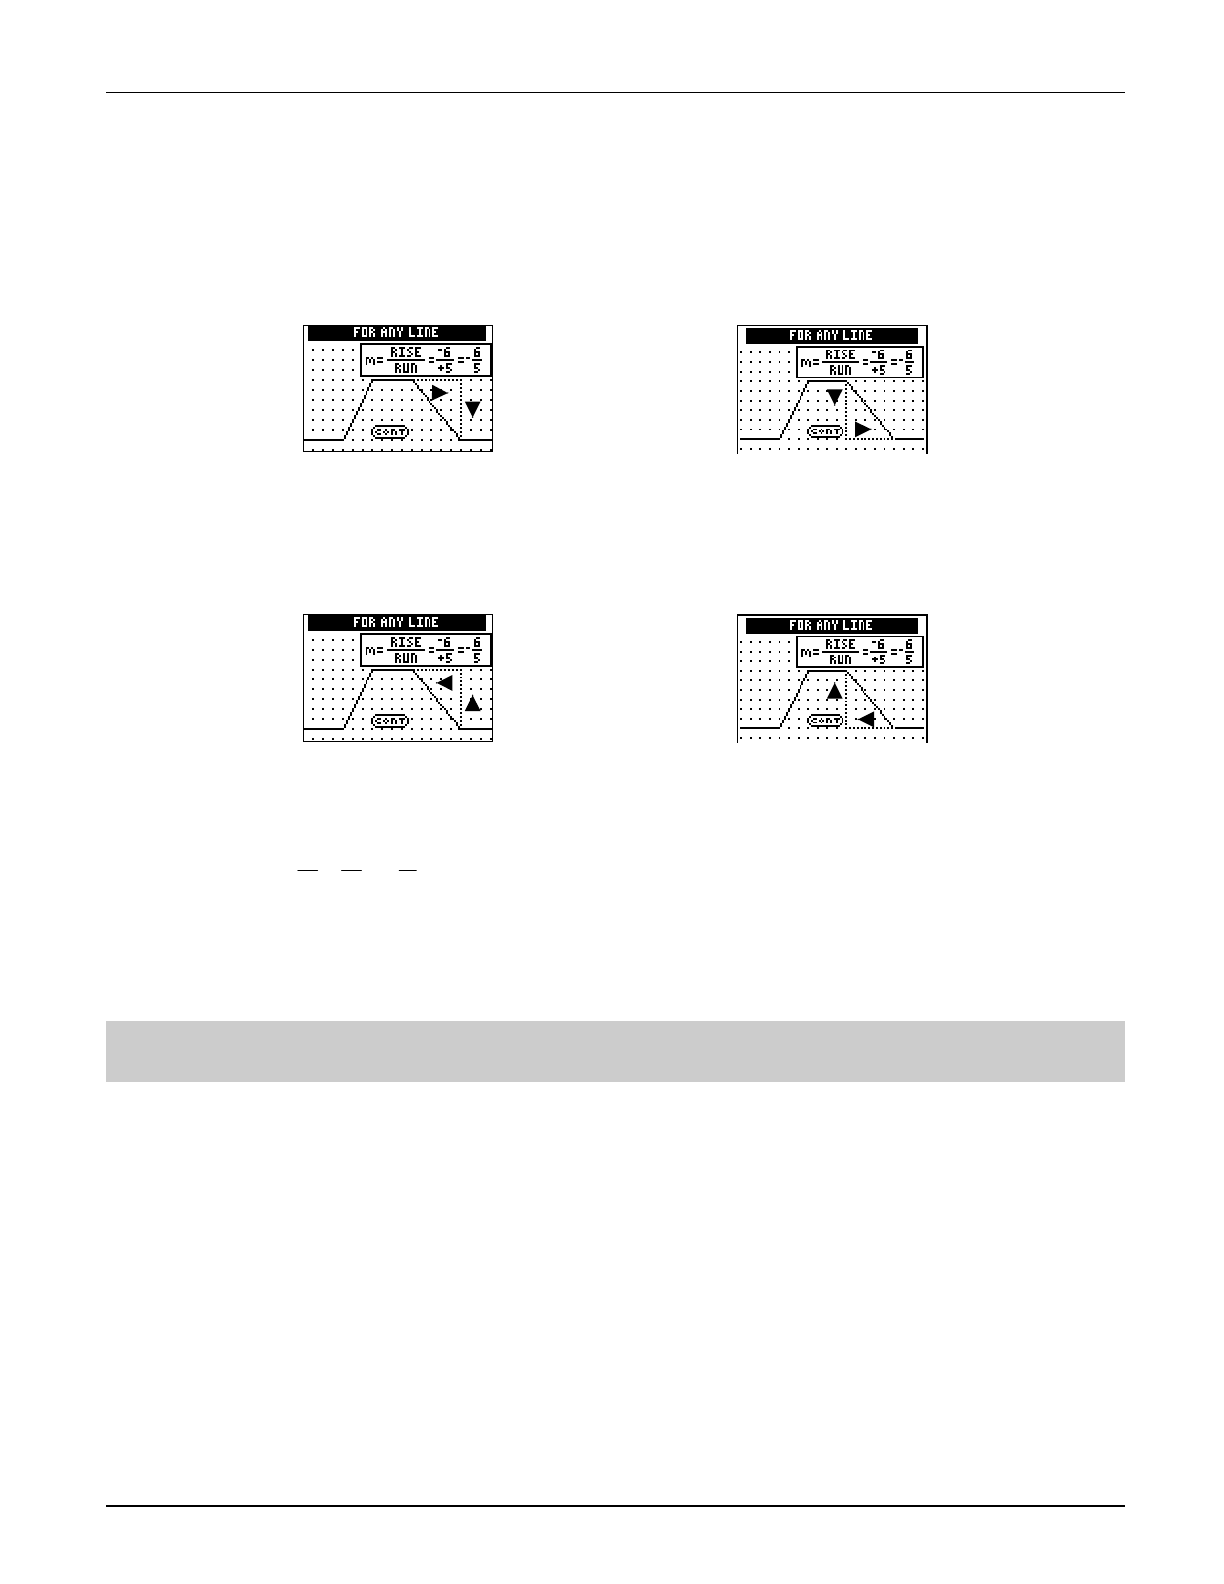
Chapter 3: Linear Functions Section 1: Slope with Grid
Topics in Algebra 1 © 2001 Texas Instruments Teacher Notes 3-7
Common Student Errors (continued)
• Students can calculate the slope for the fourth segment in four ways.
With the animation to show direction, students usually will begin counting with the upper
left-hand point on the segment.
5 spaces to the right (+5) and
6 spaces down (M6)
to get M6à5
6 spaces down (M6) and
5 spaces to the right (+5)
to get M6à5
Without the animation to show direction, students may be as likely to begin counting from
the lower right-hand point on the segment.
6 spaces up (+6) and
5 points to the left (M5)
to get 6àM5
5 points to the left (M5) and
6 spaces up (+6)
to get 6àM5
Slope =
m= 6
M5 = M6
5 = M 6
5
All four ways of counting are correct, resulting in the same slope. The Observations reinforce
this, stating, “The slope between any two points on a line is always the same ratio.”
Student Worksheet Notes with Answers
Overview
Tell students:
1. How to find the Overview, or tell them to review the instructions on the worksheet.
2. How to navigate the application, if they are not yet familiar with the application.
3. To scroll through the Overview on the calculator. Point out the new terms, definitions, and
concepts, and tell students to look for them as they go through the Overview.
or
or
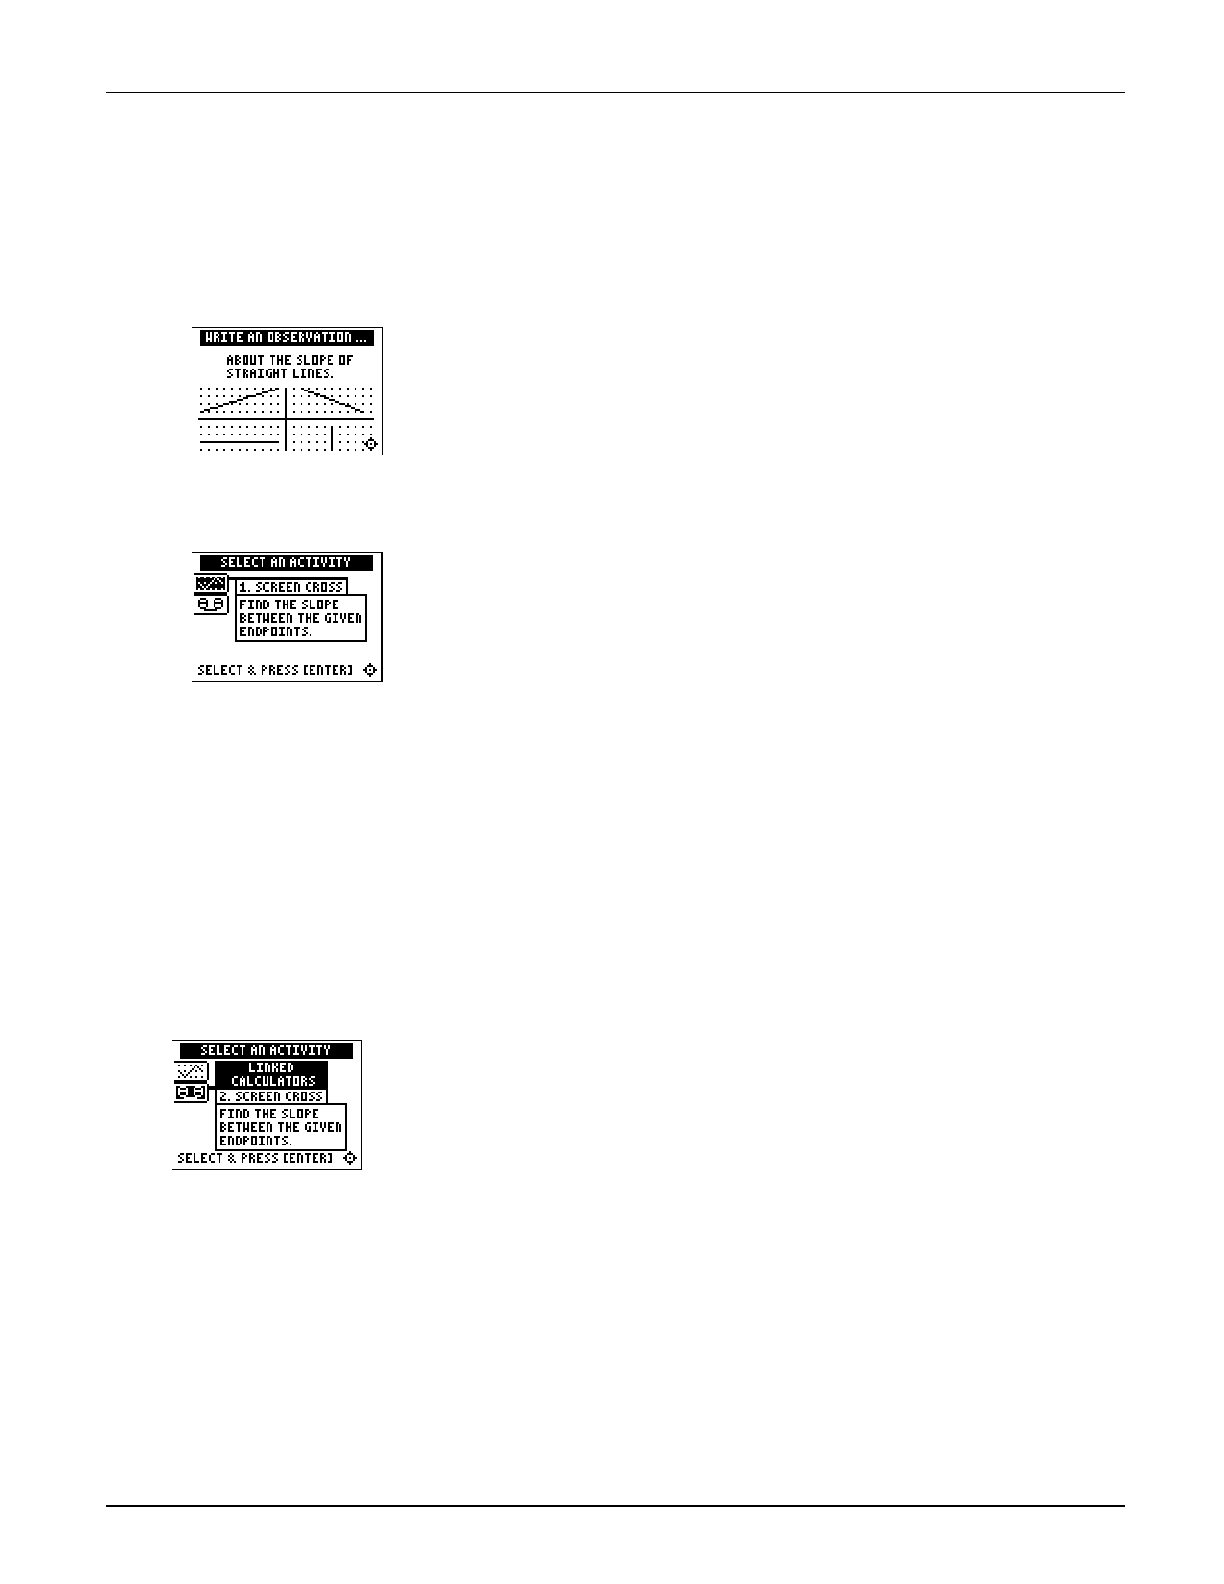
Chapter 3: Linear Functions Section 1: Slope with Grid
Topics in Algebra 1 © 2001 Texas Instruments Teacher Notes 3-8
Observations
The Observations help students understand the slope of a straight line.
If necessary, tell students how to find the Observations for this section.
Observation 1
Students write what they observe about the slope of straight lines.
Answers may vary. Students observe that a line has constant slope.
Activities
Scoring: Students get
two attempts to solve
each problem. They earn
2 points for a correct
answer on the first try, 1
point for a correct answer
on the second try.
Students can earn up to
10 points.
Screen Cross
Tell students to:
1. Read the directions on the screen, and then press any key to
continue.
Note: Repeat steps 2 and 3 for line segments 2 through 5.
2. Calculate the slope between the two endpoints. Record their
work.
3. Press
$ or # to view the choices for the slope (UNDEF =
undefined slope). When they think the correct slope is
displayed, press b.
4. Record the endpoints and slopes for each segment and their
final score. The segments are different on each calculator and
each time the game is played.
Scoring: There are no
points awarded in the
linked version. Students
must answer correctly
before the next line
segment is shown.
The player who reaches
the right side of the grid
first wins.
Linked Calculators Screen Cross
Tell students to:
1. Connect two similar calculators using a unit-to-unit cable.
2. Use the grid to help determine as quickly as possible the slope
of the line segment.
3. Select the slope as they did in Screen Cross.
4. Record which player won.
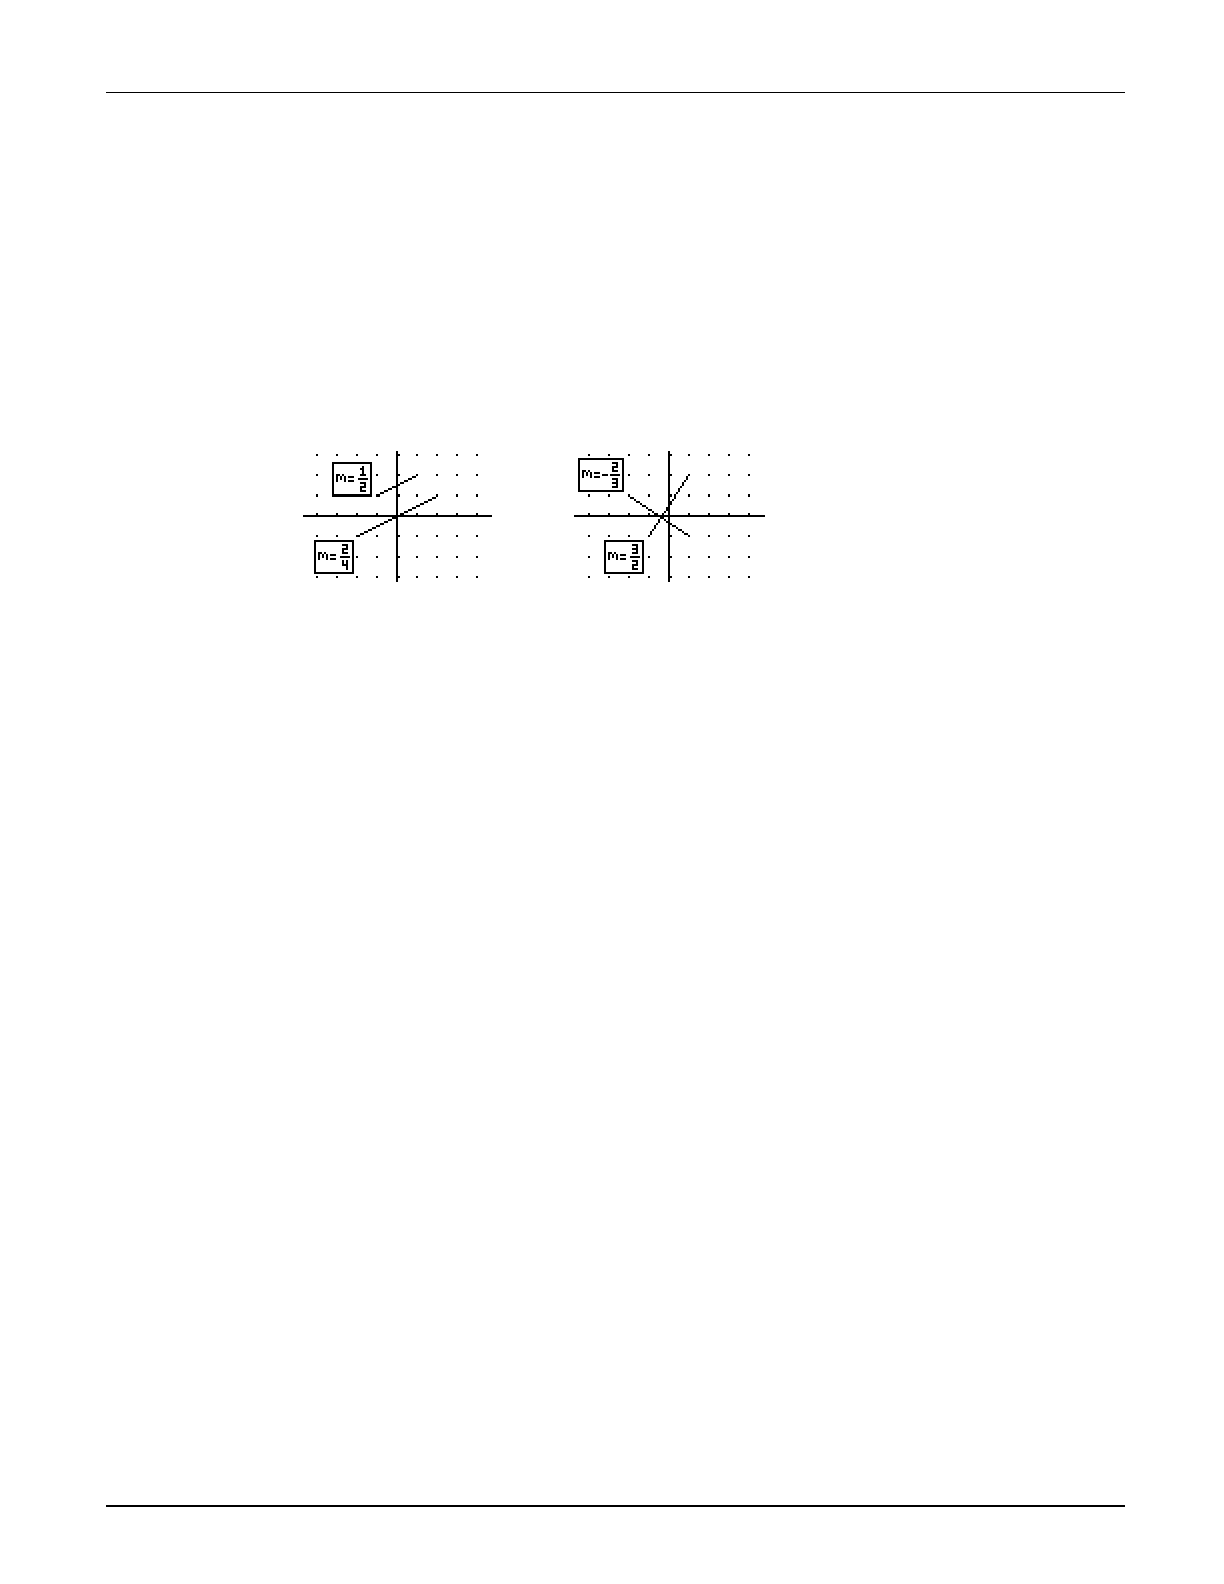
Chapter 3: Linear Functions Section 1: Slope with Grid
Topics in Algebra 1 © 2001 Texas Instruments Teacher Notes 3-9
³ Try-It!é on Your TI.83 Plus or TI.73
Students follow the example, which covers drawing a line on the graph screen from specified
endpoints using the Draw menu.
Draw the Slopes!
1. These are sample answers only. Segment location varies depending on the starting point
used.
a. and b. c. and d.
2. Students should notice that their segments are not necessarily the same as others depending
on the starting point used. Later, they will see that the slope and a point determine a line.
3. Students should notice that 1/2 and 2/4 have the same steepness. These segments are parallel
(or on the same line). They should also observe that segments with slopes, M2/3 and 3/2, are
perpendicular line segments. See graphs above.
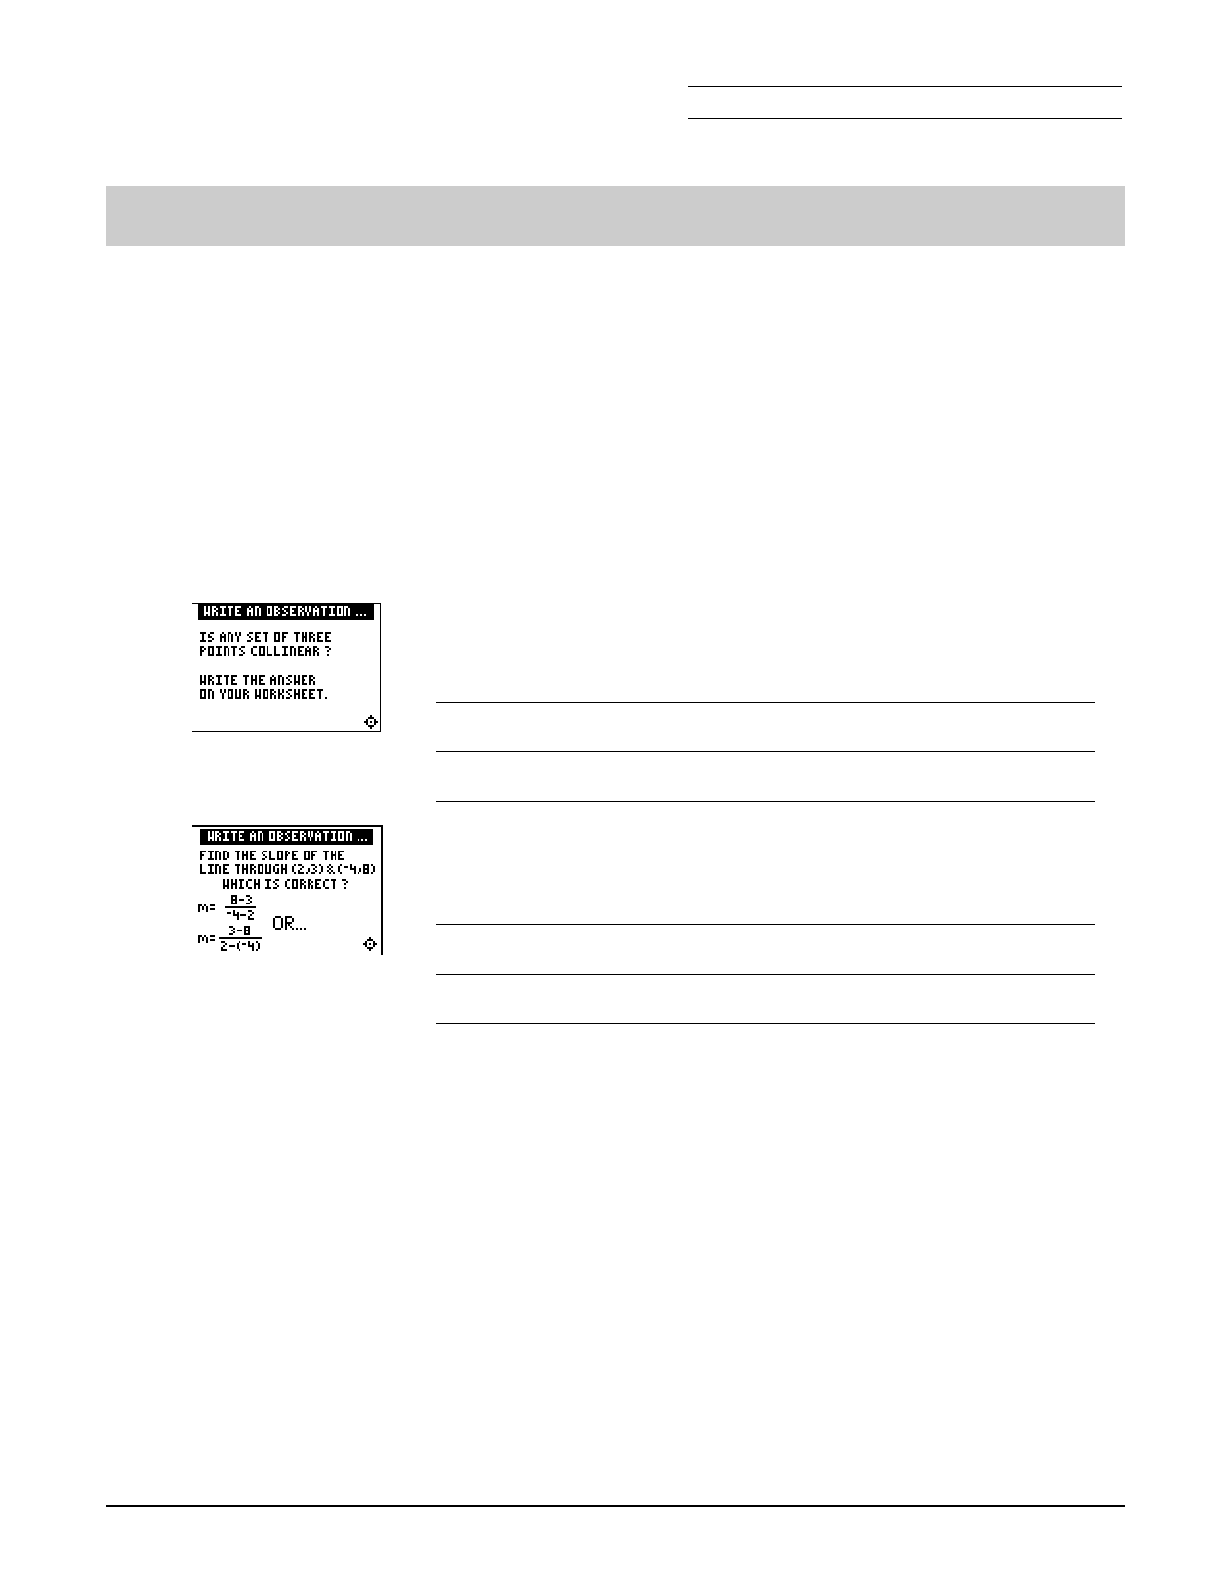
Chapter 3: Linear Functions Name
Section 2: Slope Using Coordinates Date
Topics in Algebra 1 © 2001 Texas Instruments Student Worksheet 3-10
Linear Functions: Slope Using Coordinates Student Worksheet
Overview
The Overview introduces the topics covered in Observations and Activities. Scroll through the
Overview using " (! to review, if necessary). Read each screen carefully. Look for new terms,
definitions, and concepts.
Observations
The Observations illustrate mathematical concepts relating to finding the slope using graph
coordinates. Scroll through the Observations using " (! to review, if necessary). Read each
screen carefully. When you come to a Write an Observation screen, stop and write the answers to
the questions on your worksheet.
Is every set of three coordinate points collinear? Write your
thoughts below.
Which is the correct way to calculate the given slope? Write your
thoughts below.
Activities
The Activities section helps you practice finding a slope using graph coordinates. You can select
from two activities—Screen Cross or Linked Calculators Screen Cross. Follow these steps to
play the activity and complete your worksheet.
1. Make sure you are in the Activities for this section.
2. Highlight an activity using $ or #, and press b.
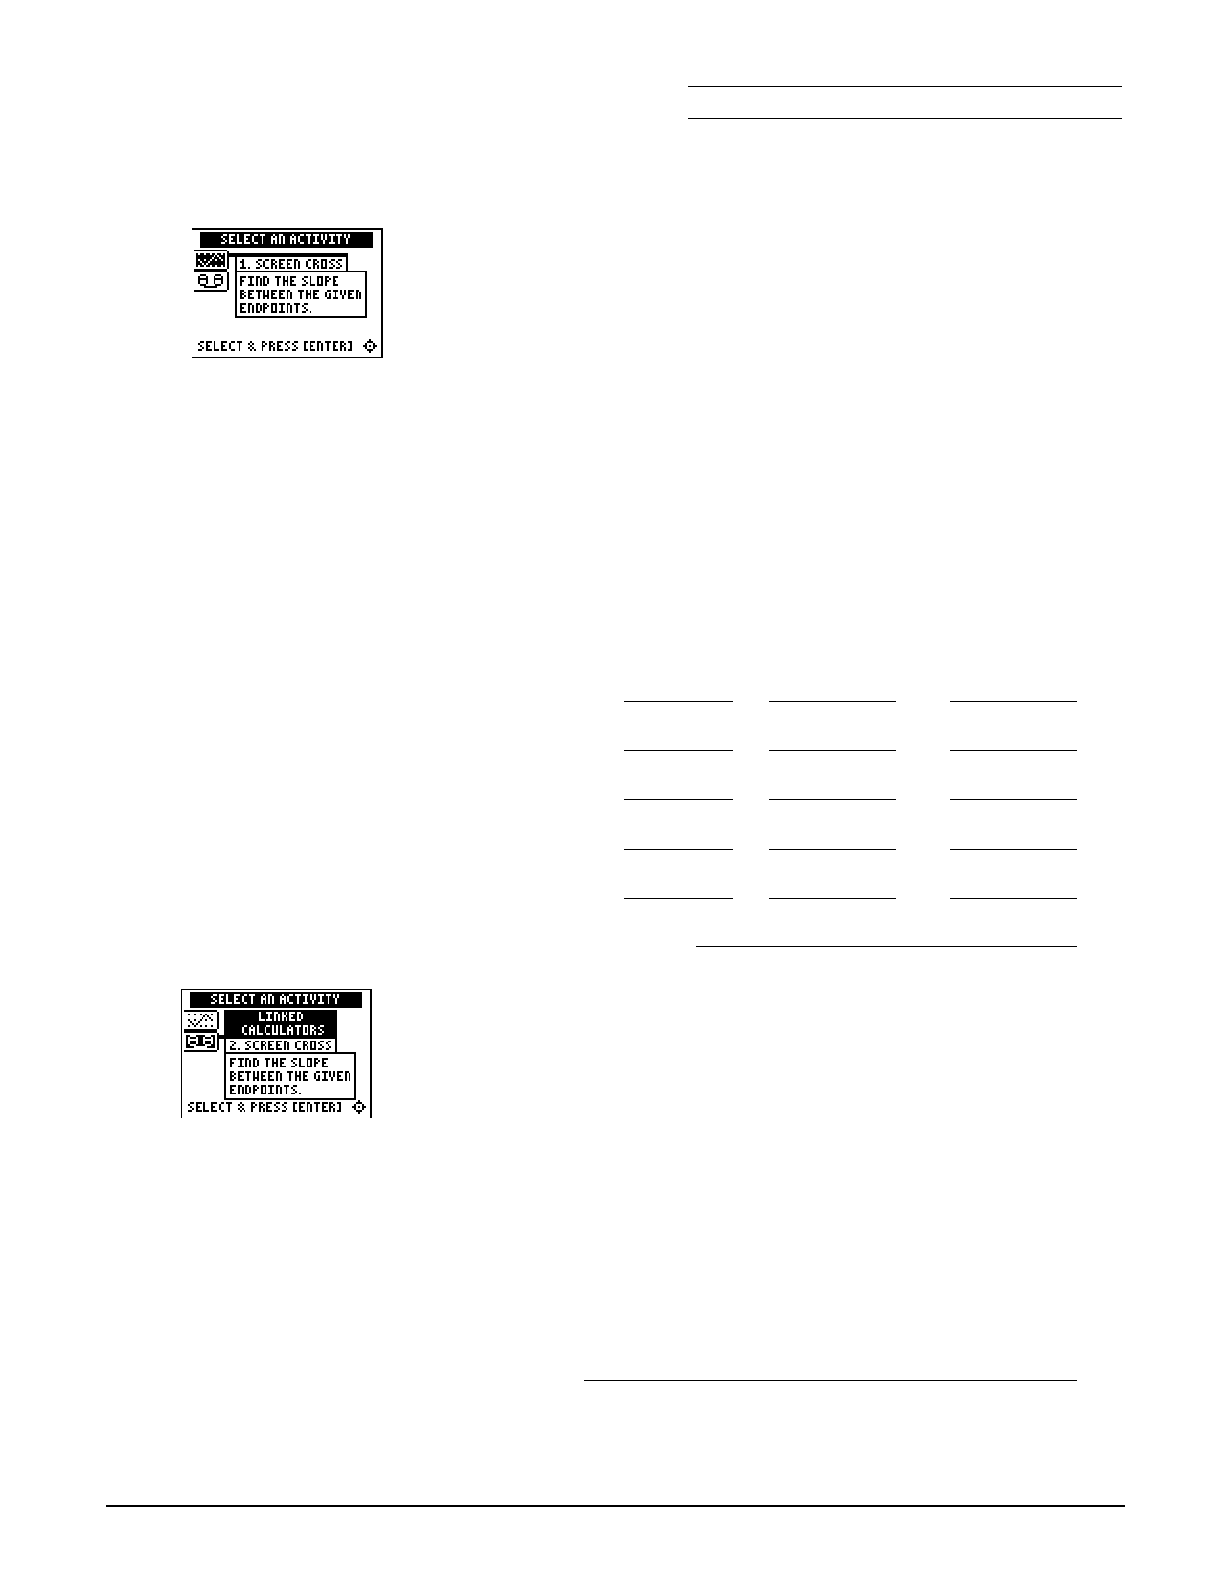
Chapter 3: Linear Functions Name
Section 2: Slope Using Coordinates Date
Topics in Algebra 1 © 2001 Texas Instruments Student Worksheet 3-11
Activities (continued)
Scoring: You get two
attempts to solve each
problem. You earn 2
points for a correct
answer on the first try, 1
point for a correct answer
on the second try.
You can earn up to 10
points.
Screen Cross
This activity is similar to the Screen Cross in the Slope with Grid
section. There is no grid displayed, but the endpoints are given.
1. Read the directions on the screen, and then press any key to
continue.
Note: Repeat steps 2 and 3 for line segments 2 through 5.
2. Calculate the slope between the two points. Record your
work below.
3. Press
$ or # to view the choices for the slope (UNDEF =
undefined slope). When you think the correct slope is
displayed, press b.
point 1 (x1,y1) point 2 (x2,y2) slope
segment #1
segment #2
segment #3
segment #4
segment #5
4. What was your score?
Scoring: There are no
points awarded in the
linked version. You must
answer correctly before
the next line segment is
shown.
The player who reaches
the right side of the grid
first wins.
Linked Calculators Screen Cross
Play Screen Cross against another student. Race another student
across the screen by calculating the slopes more quickly than
your opponent.
1. Connect two similar calculators using a unit-to-unit cable.
2. Use the grid to help determine as quickly as possible the slope
of the line segment.
3. Select the slope as you did in Screen Cross.
4. The player who reaches the right side of the grid first wins.
5. Who won?
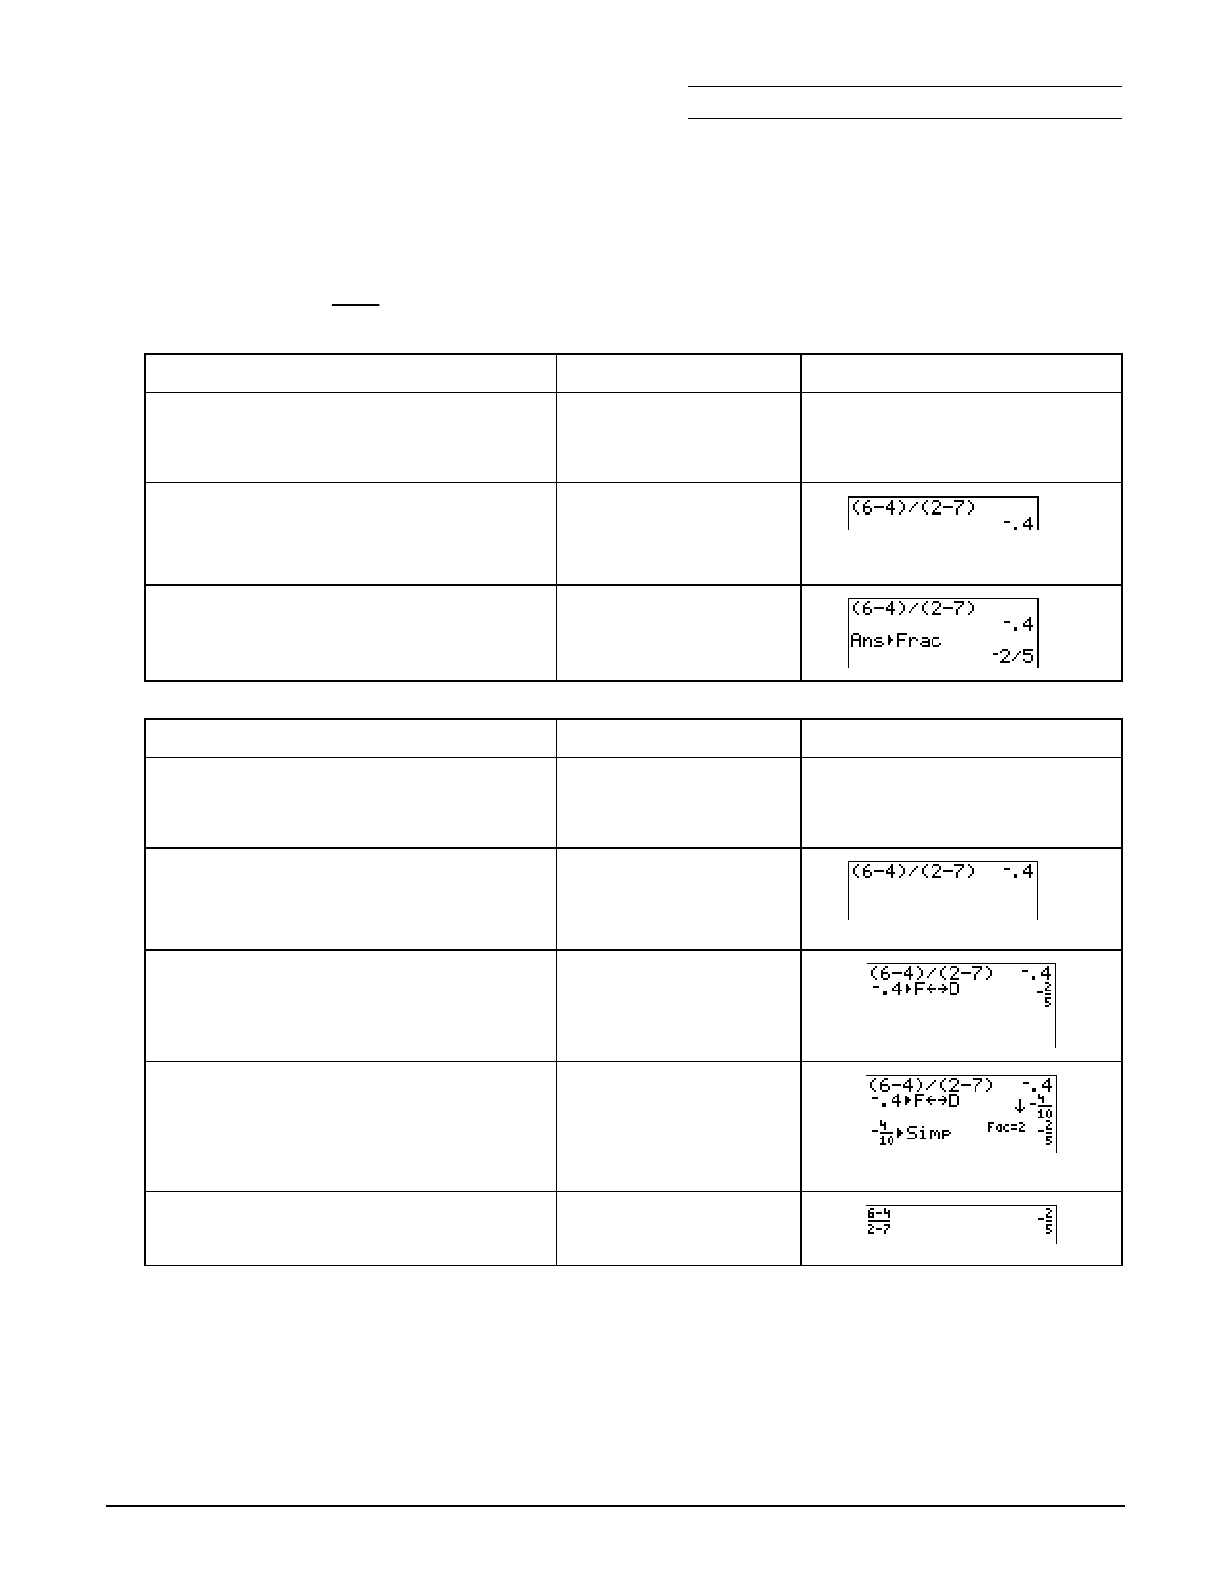
Chapter 3: Linear Functions Name
Section 2: Slope Using Coordinates Date
Topics in Algebra 1 © 2001 Texas Instruments Student Worksheet 3-12
³ Try-It!é on Your TI.83 Plus or TI-73
Use the calculator to find the slope of a line through the points (2,6) and (7,4).
The slope is: m = 6 N 4
2 N 7
To Do This on the TI.83 Plus Press Display (TI.83 Plus shown)
1. Exit the Topics in Algebra 1
application and clear the Home
screen.
y l
áEXITâ :
2. Calculate the slope. £ 6 ¹ 4 ¤ ¥
£ 2 ¹ 7 ¤
b
3. Change the fraction to a decimal.
Use the 4Frac function on the
MATH menu.
1:4Frac
b
To Do This on the TI.73 Press Display
(TI.73 shown)
1. Exit the Topics in Algebra 1
application and clear the Home
screen.
y l
áEXITâ :
2. Calculate the slope. £ 6 ¹ 4 ¤ ¥
£ 2 ¹ 7 ¤
b
3. Change the decimal to a fraction. > b
4. Simplify the fraction.
Note: The mode setting ManSimp must be
selected first. For more information, see ³ TIp 2:
Adjusting Your Calculator Settings
.
. # # # #
" to ManSimp
b
B b
5. Use
= to enter the problem. = 6 T 4
= 2 T 7 b

Chapter 3: Linear Functions Name
Section 2: Slope Using Coordinates Date
Topics in Algebra 1 © 2001 Texas Instruments Student Worksheet 3-13
³ Try-It!é on Your TI.83 Plus or TI-73 (continued)
Additional Problems
1. Calculate the same problem, m = 6 N 4
2 N 7 , on the calculator from the Home screen, using the
following keystrokes:
6 T 4 F 2 T 7 b
Did you get the same answer? If not, why not? Which answer is correct?
2. Find the slope of the line containing the given points using the calculator. Who can do these
problems faster, the calculator or you? You can also pair with another student and challenge
each other to see who is faster at the calculations. Write your calculations and answers.
a. (3,M4) and (M2,8)
b. (M12,17) and (5,M6)
c. (36,6) and (M25,6)
d. (1.36,2.54) and (1.36,5.72)

Chapter 3: Linear Functions Section 2: Slope Using Coordinates
Topics in Algebra 1 © 2001 Texas Instruments Teacher Notes 3-14
Linear Functions: Slope Using Coordinates Teacher Notes
Objectives
• To introduce slope as a ratio as the change in y to the change in x.
• To find the slope of a line using the slope formula.
• To illustrate the characteristics of lines with positive, zero, negative, or undefined slope.
• To associate
increasing,
horizontal,
decreasing, or vertical with the appropriate slope.
Math Highlights
This section again highlights a review of slope as the steepness of a line. The section opens with
a bike riding along a piecewise linear path. Students see the definition of slope as a ratio.
Slope =
m = rise
run = change in y
change in x = y2 N y1
x2 N x1
Several examples of the calculations are shown. Next, the characteristics of lines with positive,
zero, negative and undefined slopes are summarized.
Common Student Errors
• Many students are concerned that they have to know which point is (x1, y1) and which point
is (x2,y2). Show that both calculations give the same answer. In the second example below,
some students are confused when they see division with two negative numbers results in a
positive slope. Discuss this. For the line containing the points (0,0) and (10,2), the slope is
calculated by:
2 N 0
10 N 0 = 1
5 or 0 N 2
0 N 10 = M1
M5 = 1
5
• Watch for an incorrect substitution where students switch the order in the numerator or
denominator. For the example above,
Incorrect:
0
N 2
10 N 0 or 2
N 0
0 N 10
• This is a good opportunity to open a discussion on different representations of the same
number. Students might write a calculator answer without thinking about whether or not the
representation is the best for the problem. Ask when it is most useful to have the slope
represented in decimal form versus in fraction form.
• Remind students that they need to use the Order of Operations rules.
• In the
³ Try-It!é section, the correct calculation is (6 − 4) ÷ (2 − 7), not 6 − 4 ÷ 2 − 7 (where
division would be performed before subtraction).
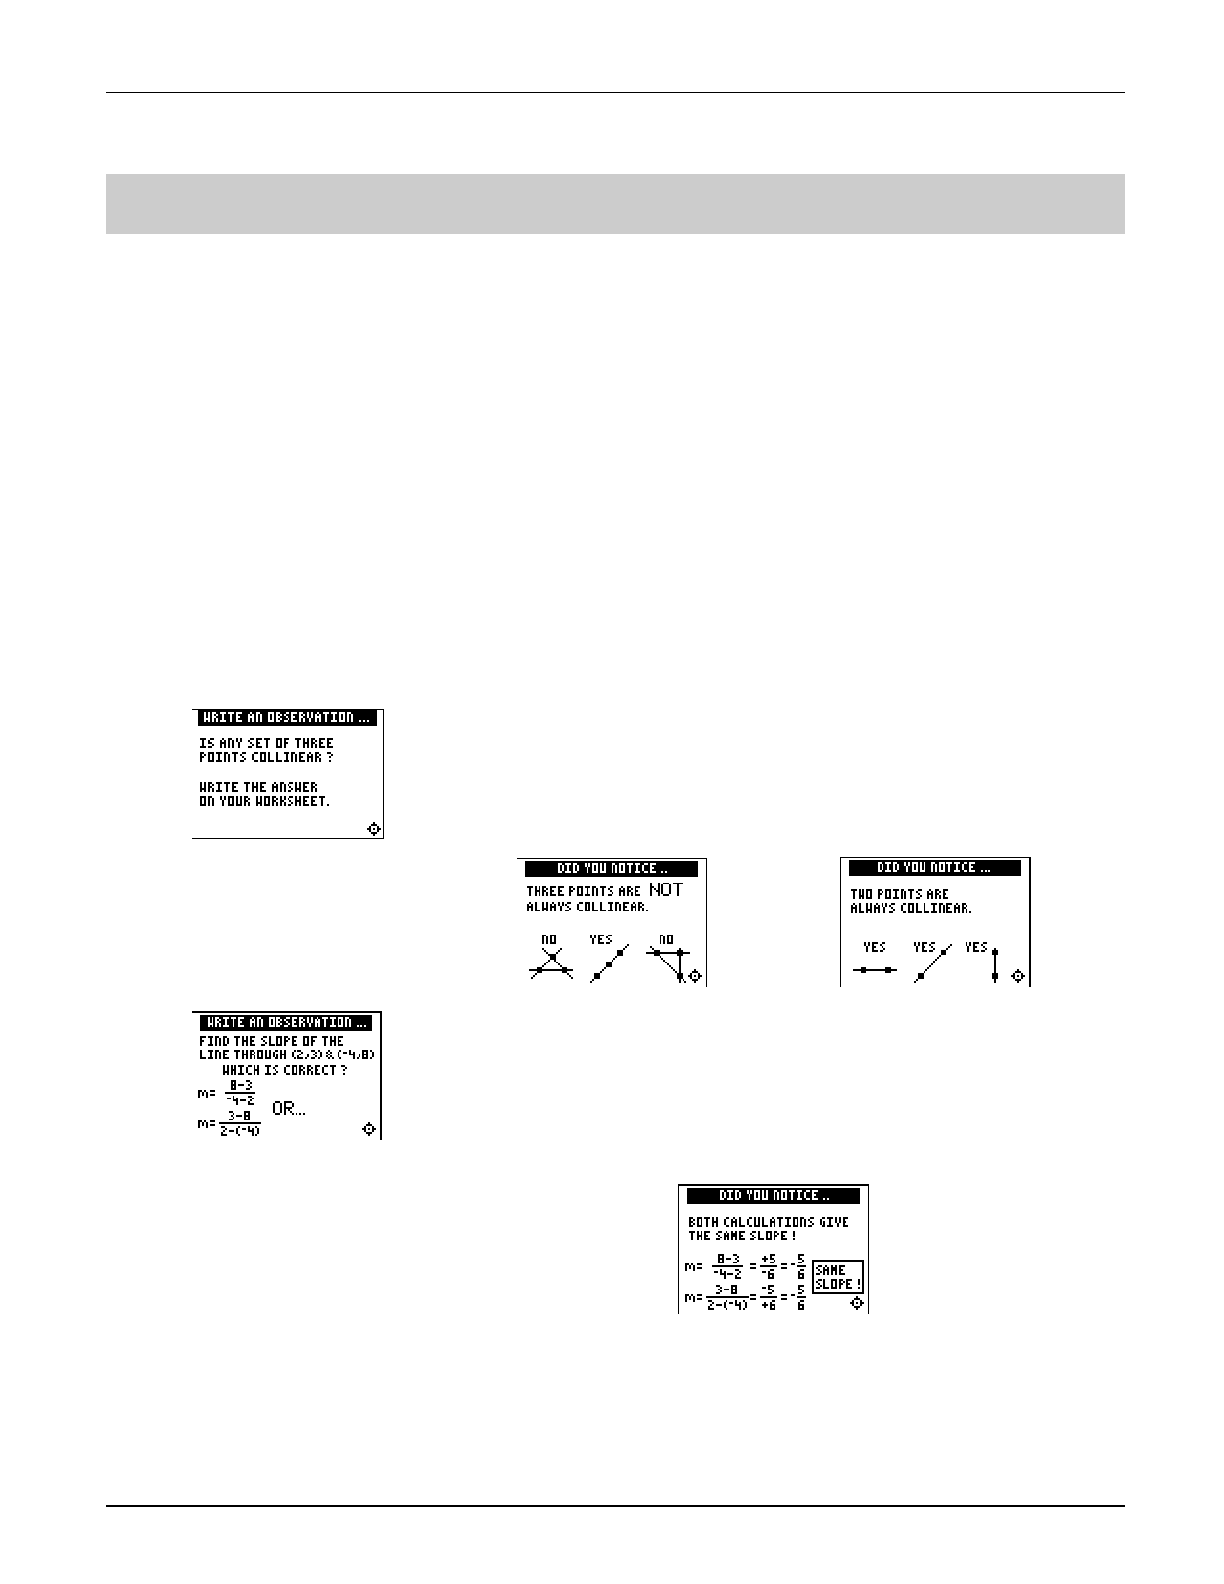
Chapter 3: Linear Functions Section 2: Slope Using Coordinates
Topics in Algebra 1 © 2001 Texas Instruments Teacher Notes 3-15
Student Worksheet Notes with Answers
Overview
Tell students:
1. How to find the Overview, or tell them to review the instructions on the worksheet.
2. How to navigate the application, if they are not yet familiar with the application.
3. To scroll through the Overview on the calculator. Point out new terms, definitions, and
concepts, and tell students to look for them as they go through the Overview.
Observations
The Observations help students understand mathematical concepts relating to finding the slope
using graph coordinates.
If necessary, tell students how to find the Observations for this section.
Observation 1
Is any set of three points collinear?
Three points may be collinear, but are not necessarily collinear.
Observation 2
Find the slope of the line through (2,3) and (L4,8).
Students can pick either point as (x1,y1) and (x2,y2) to compute the
slope using the formula.
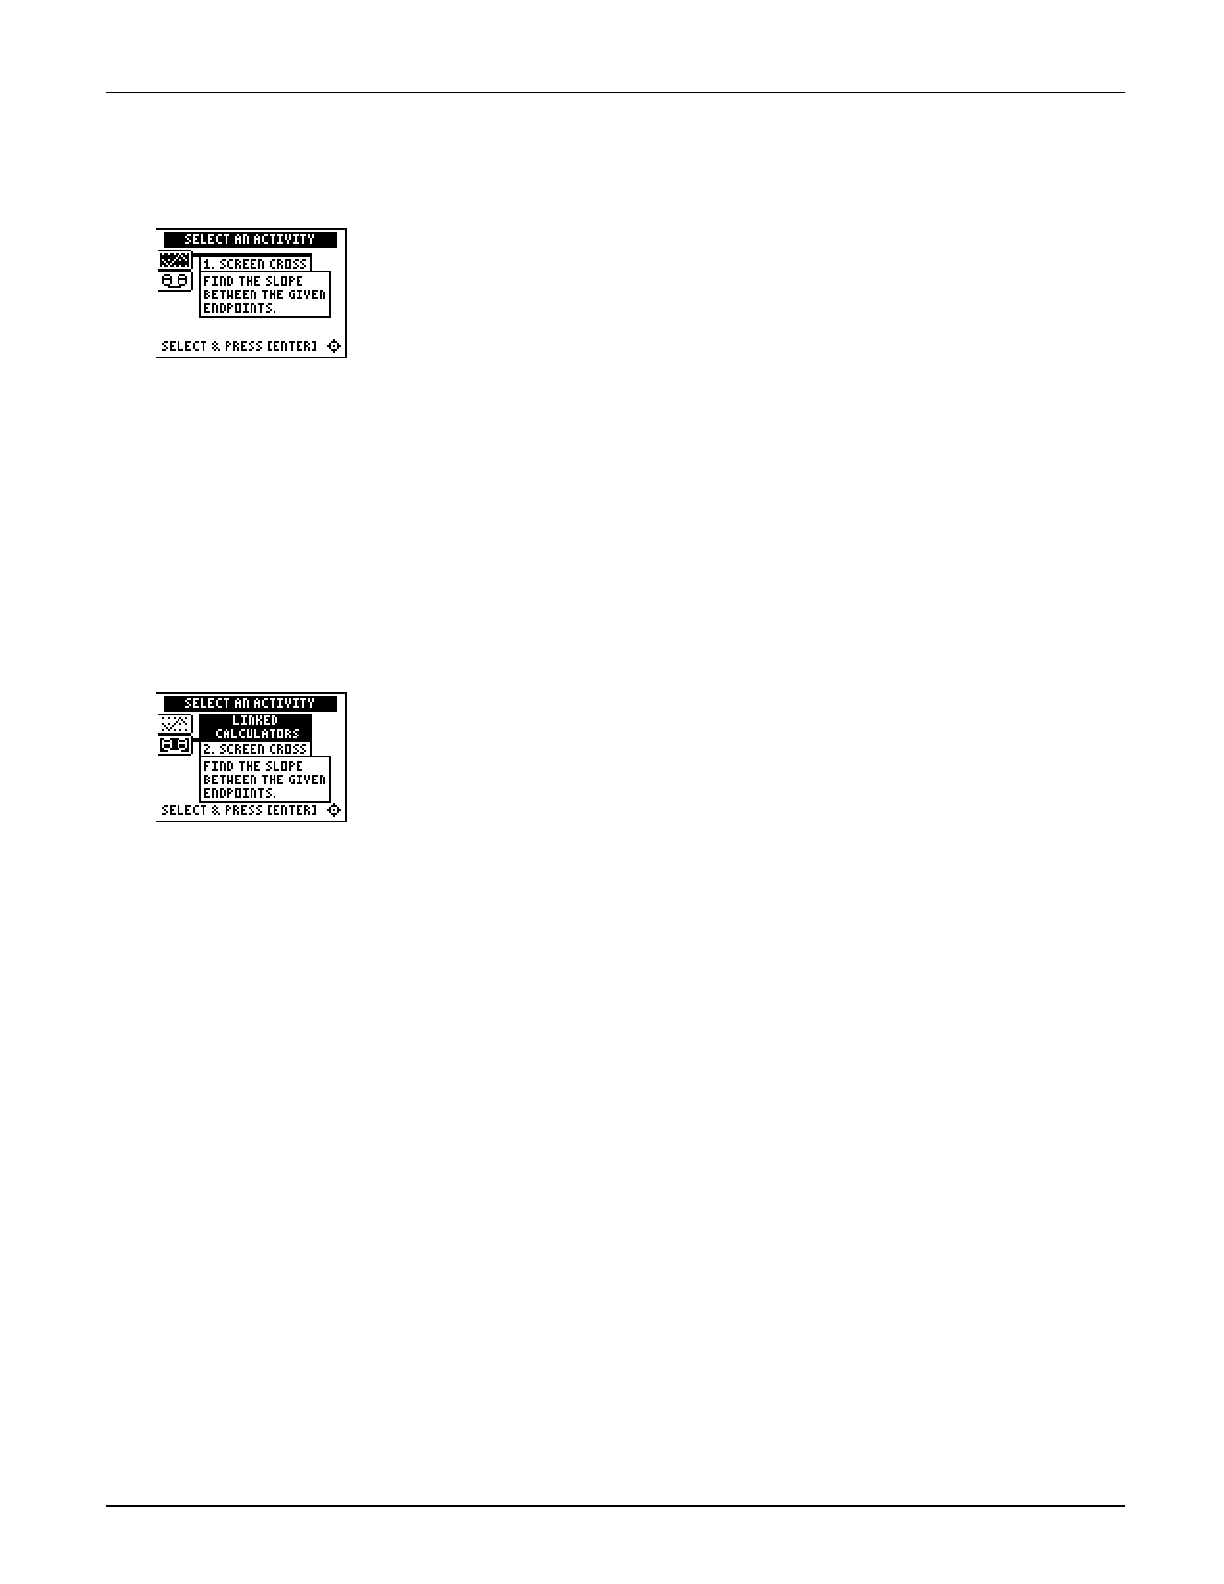
Chapter 3: Linear Functions Section 2: Slope Using Coordinates
Topics in Algebra 1 © 2001 Texas Instruments Teacher Notes 3-16
Activities
Scoring: Students get two
attempts to solve each
problem. They earn 2 points
for a correct answer on the
first try, 1 point for a correct
answer on the second try.
Students can earn up to 10
points.
Screen Cross
Tell students to:
1. Read the directions on the screen, and then press any key to
continue.
Note: Repeat steps 2 and 3 for line segments 2 through 5.
2. Calculate the slope between the two points. Record their work.
3. Press
$ or # to view the choices for the slope (UNDEF =
undefined slope). When they think the correct slope is
displayed, press b. Record the endpoints and slopes for
each segment. The segments are different on each calculator
and each time the game is played.
4. Record their final score.
Scoring: There are no
points awarded in the linked
version. Students must
answer correctly before the
next line segment is shown.
The player who reaches the
right side of the screen first
wins.
Linked Calculators Screen Cross
Tell students to:
1. Connect two similar calculators using a unit-to-unit cable.
2. Try to determine as quickly as possible the slope of the line
segment.
3. Select the slope as they did in Screen Cross.
4. The player who reaches the right side of the screen first wins.

Chapter 3: Linear Functions Section 2: Slope Using Coordinates
Topics in Algebra 1 © 2001 Texas Instruments Teacher Notes 3-17
³ Try-It!é on Your TI.83 Plus or TI.73
Students investigate how to input the calculation for slope on the Home screen. See the Student
Worksheet for instructions.
Warn students about the correct use of parentheses. They need to be reminded of the Order of
Operations rules. Notice that the TI-73 has stacked fraction capabilities; therefore, the
calculation is performed correctly without parentheses.
Additional Problems
1. Students input
6−4à2−7 in the calculator. The calculator computes 6 − (4 ÷ 2) − 7 = M3 since
division is performed before subtraction according to the Order of Operation rules. This is
not the correct answer. Students need to be aware that parentheses, such as (6 − 4) ÷ (2 − 7),
override the Order of Operation rules.
2. Students practice calculating the slope using the calculator, but remind students that they
can compute these answers faster than the calculator can! Pair students and challenge them
to try to beat the calculator.
a. (3,M4) and (M2,8) slope = M 12
5
b. (M12,17) and (5,M6) slope = M 23
17
c. (36,6) and (M25,6) slope = 0
d. (1.36,2.54) and (1.36,5.72) slope = undefined

Chapter 3: Linear Functions Name
Section 3: Slope as Rate of Change Date
Topics in Algebra 1 © 2001 Texas Instruments Student Worksheet 3-18
Linear Functions: Slope as Rate of Change Student Worksheet
Overview
The Overview introduces the topics covered in Observations and Activities. Scroll through the
Overview using " (! to review, if necessary). Read each screen carefully. Look for new terms,
definitions, and concepts.
Observations
The Observations illustrate mathematical concepts relating to finding the slope using graph
coordinates. Scroll through the Observations using " (! to review, if necessary). Read each
screen carefully. When you come to a Write an Observation screen, stop and write the answers to
the questions on your worksheet.
What kinds of graphs have a nonconstant rate of change?
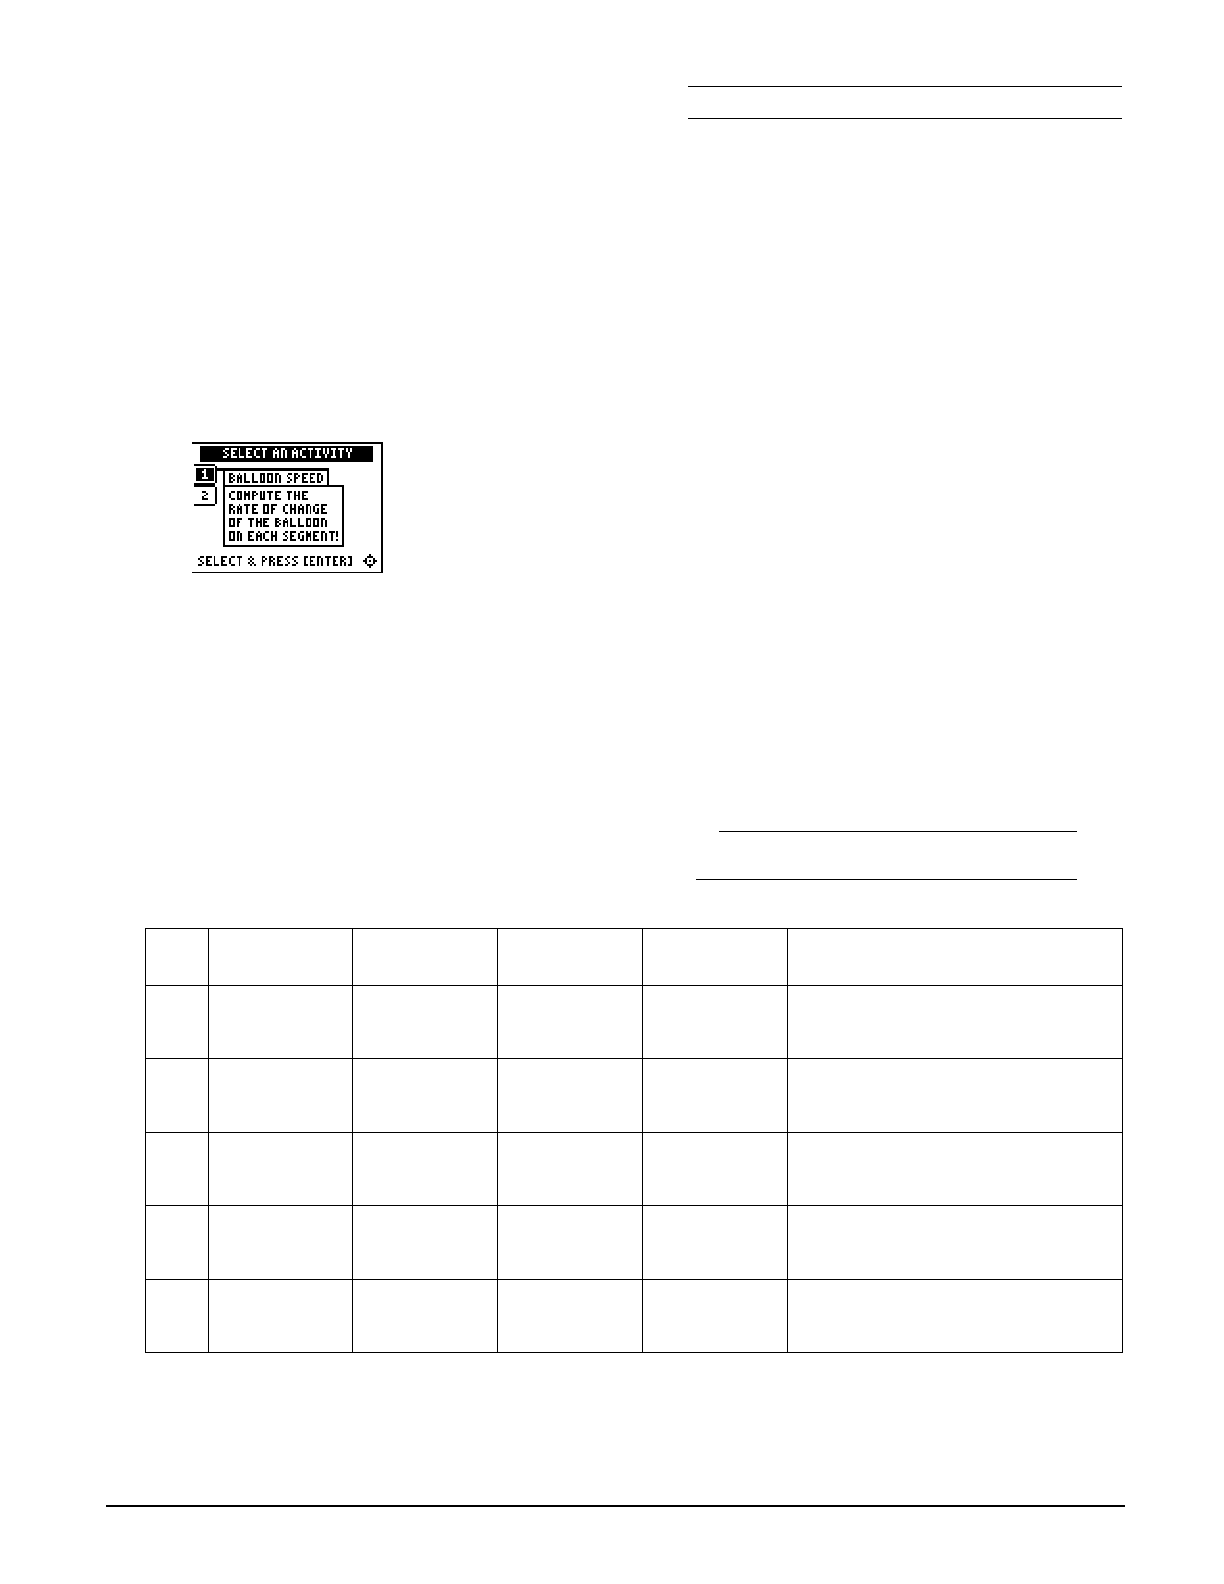
Chapter 3: Linear Functions Name
Section 3: Slope as Rate of Change Date
Topics in Algebra 1 © 2001 Texas Instruments Student Worksheet 3-19
Activities
The Activities section helps you practice finding a slope as rate of change. You can select from
two activities—Balloon Speed or Dive. Follow these steps to play the activity and complete your
worksheet.
1. Make sure you are in the Activities for this section.
2. Highlight an activity using $ or #, and press b.
Scoring: You get two
attempts to solve each
problem. You earn 2
points for a correct
answer on the first try, 1
point for a correct answer
on the second try.
You can earn up to 10
points.
Balloon Speed
1. Highlight a level (bronze = least difficult; gold = most
difficult), and press b to select it.
2. Select whether you want to play during Nighttime or Daytime.
3. Take a trip in the balloon. Record the times and positions in
the table.
4. Calculate the rate of change (the slope) of each trip, showing
all work, including the correct units. Enter the rate and press
Í. If the answer is incorrect, the correct answer is
displayed; press any key to resume play.
5. What level did you play?
6. What was your score?
Trip Start
Time Start
Position Stop
Time Stop
Position Speed
(include units)
1
2
3
4
5
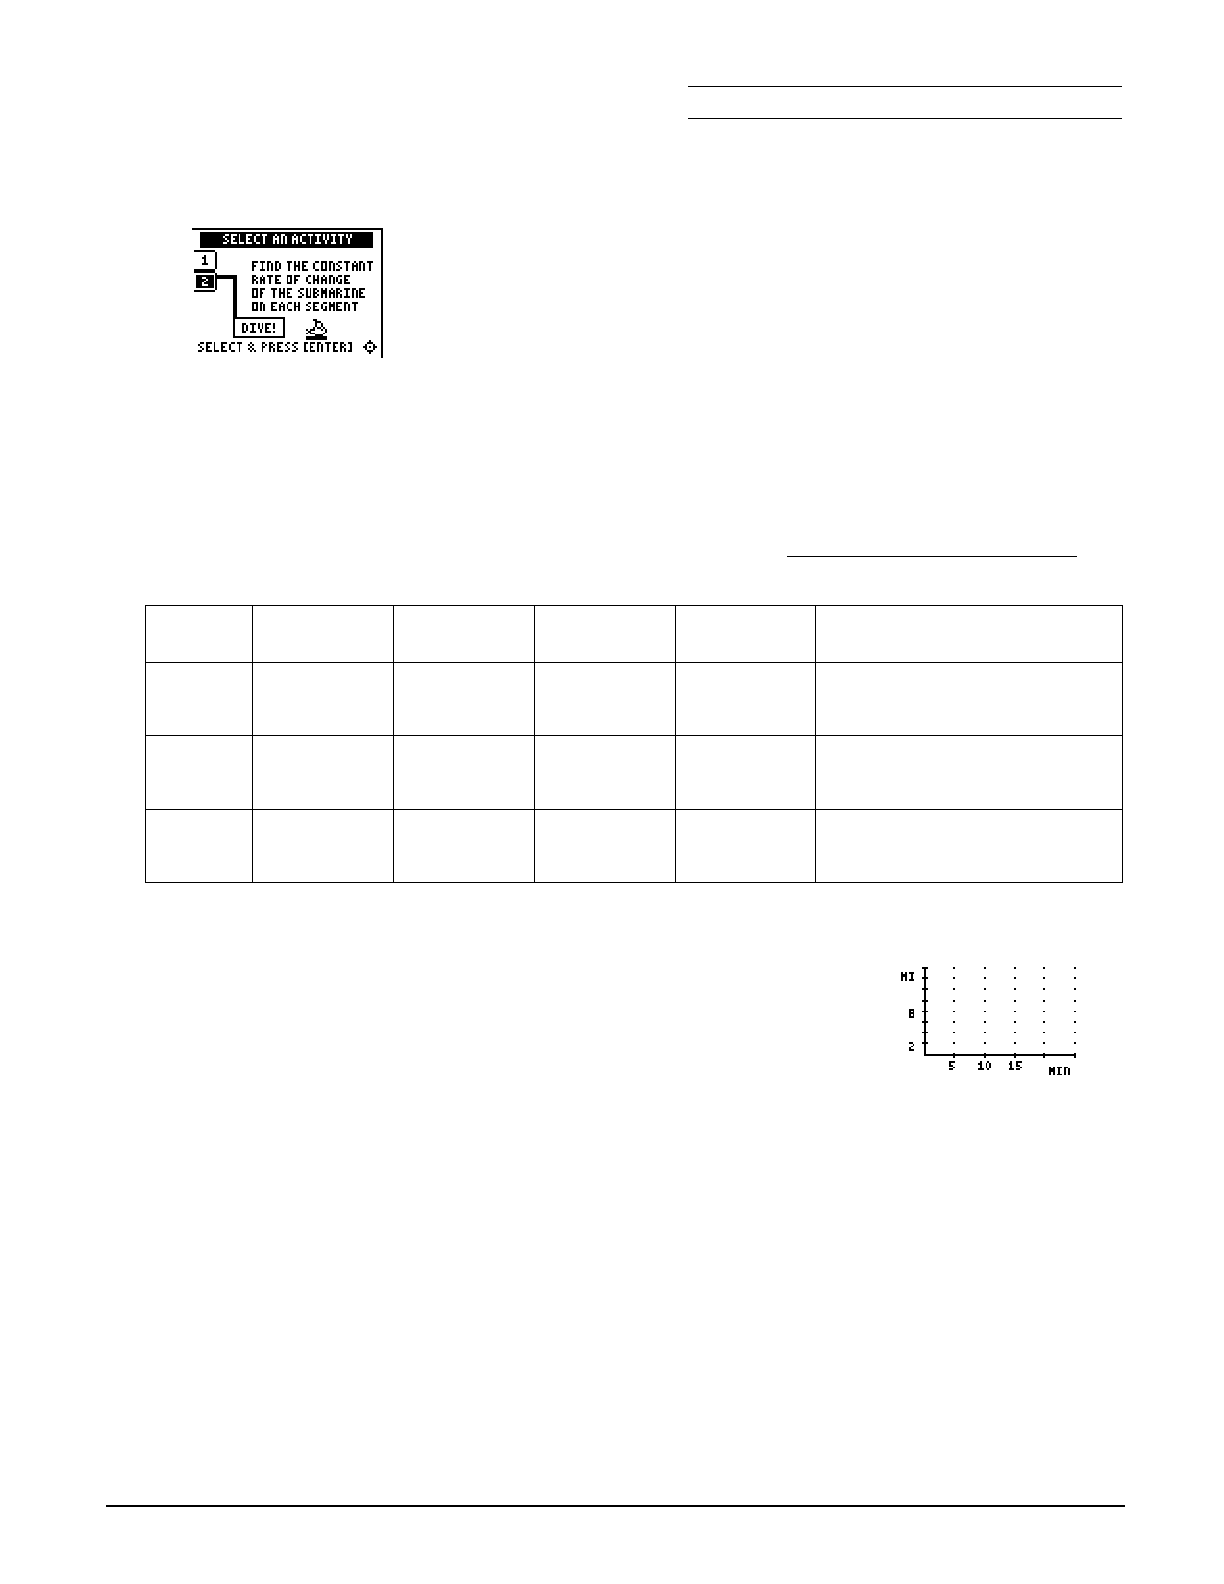
Chapter 3: Linear Functions Name
Section 3: Slope as Rate of Change Date
Topics in Algebra 1 © 2001 Texas Instruments Student Worksheet 3-20
Activities (continued)
Scoring: You get one
attempt to select the
correct row. If you select
an incorrect row, the
correct row is identified.
Dive
1. Take a dive in the submarine. Record the times and positions
in the table below.
2. Calculate the rate of change (slope) of each segment in the
table below. Show all your work. Include the correct units.
3. After the third segment, the next screen displays three rows
of three rates. Use your rate answers from the table to
determine the correct row. To select a row, press # or $ to
move the submarine cursor, and then press b.
4. Did you select the correct row?
Segment Start Time Start
Position
Stop Time Stop
Position Speed
(include units)
1
2
3
Car Trip Word Problem
A car takes a 20-minute trip. The car starts at home, (0,0). It travels
6 miles in 10 minutes. The car stops in traffic for 5 minutes. The
driver forgot something at home so the car returns in 5 minutes.
Draw a straight-line graph of the trip. Write the rate of change for
each leg of the trip on the graph to the right.
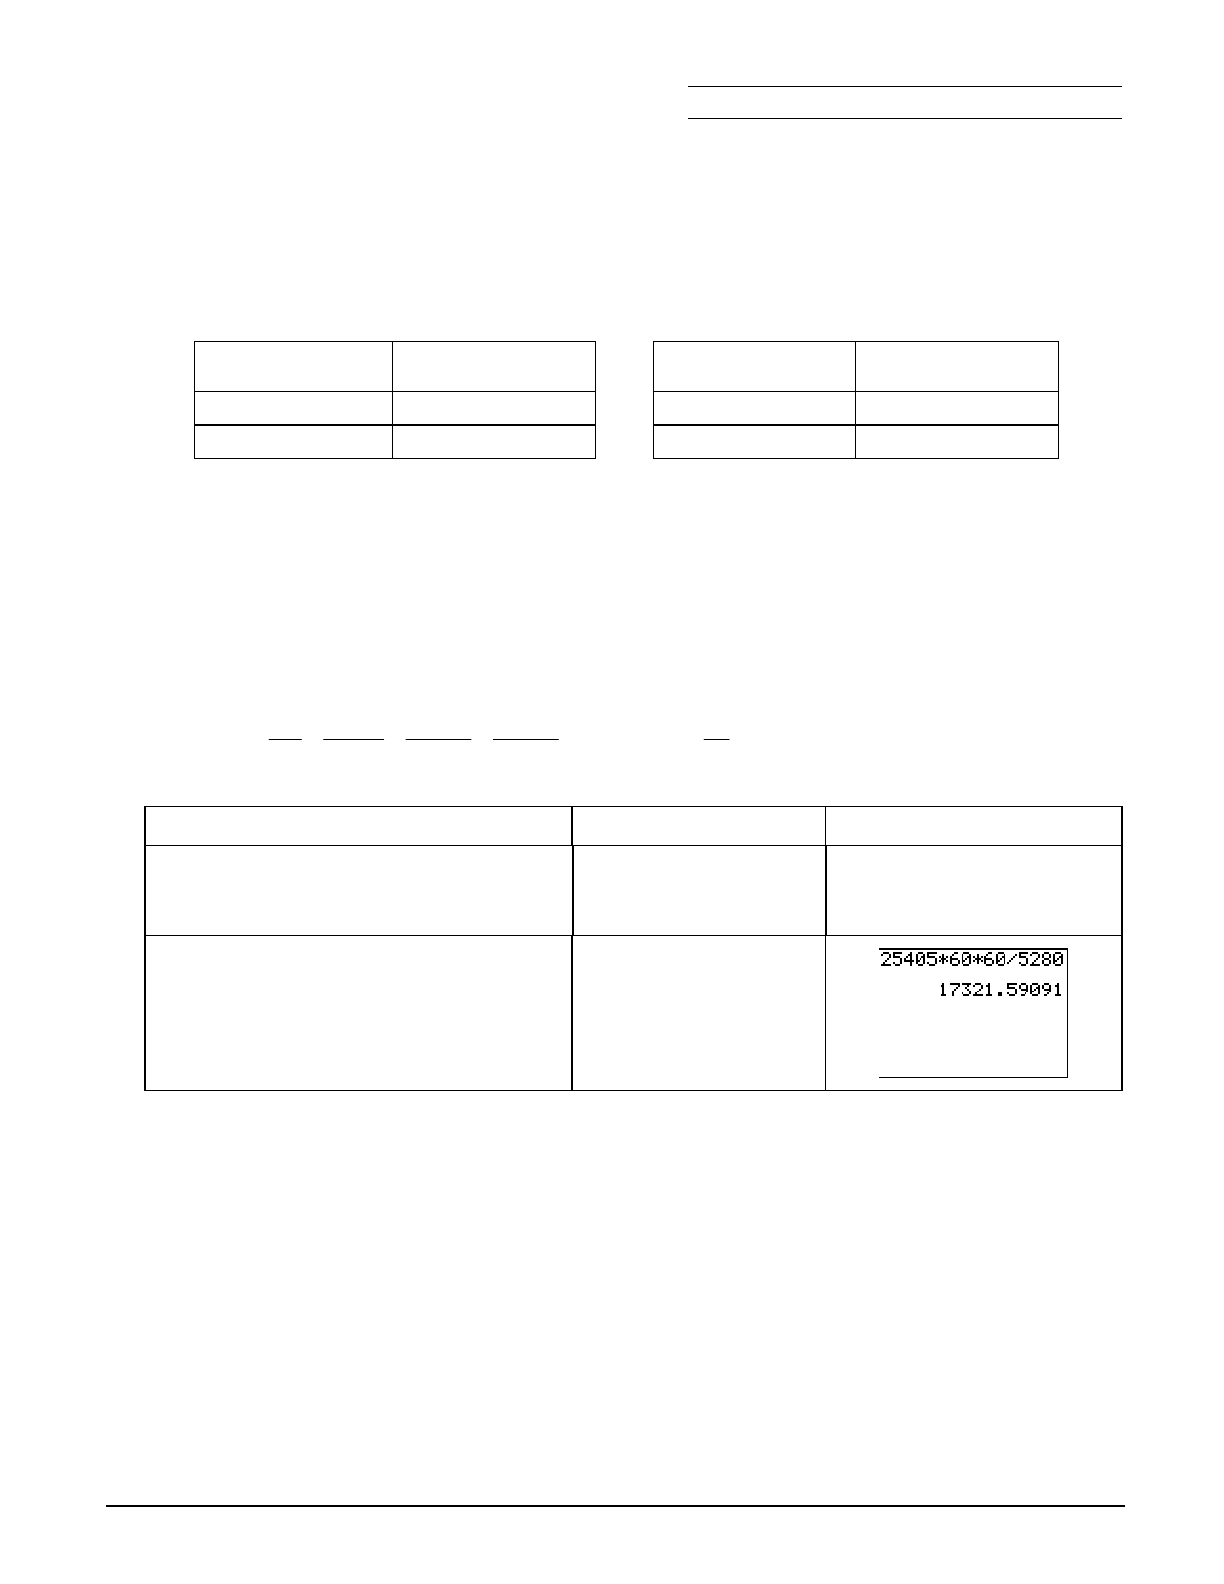
Chapter 3: Linear Functions Name
Section 3: Slope as Rate of Change Date
Topics in Algebra 1 © 2001 Texas Instruments Student Worksheet 3-21
³ Try-It!é on Your TI.83 Plus
See the section on Slope Using Coordinates to find out how to use your calculator to find the
slope of a line containing two given points. Review the keystrokes. Use these keystrokes to
compute the rate of change for each pair of data points given. Include the correct units with your
answer.
1. x (seconds) y (feet) 2. x (hour) y (phone calls)
10 6.72 2 18
20 8.05 4 25
Rate of Change _______________________ Rate of Change _____________________
3. A space shuttle has an average velocity of 25,405 ft/sec. The velocity of a car on a highway
can be 60 mi/hr. To find out how many times faster the space shuttle travels compared to the
car, you must convert the speed of the space shuttle to miles per hour. First, look at the
conversion by hand, and then do it on the calculator. When set to Float, the calculator shows
the answer to five decimal places.
25,405
ft
sec Q 60 sec
1 min Q 60 min
1 hr Q 1 mi
5280 ft = 17321.59091 mi
hr
To Do This Press Display (TI.83 Plus shown)
1. If necessary, exit the Topics in
Algebra 1 application and clear the
Home screen.
y l
áEXITâ :
2. Calculate 25,405 Q 60 Q 60 à 5,280. 25405¯60¯60¥
5280Í
3. How many times faster does the space shuttle travel compared to the car? ____________
Additional Problems
Try these by hand, and show your work below. Then check the answers on your calculator.
5280 feet = 1 mile 1000 meters = 1 kilometer
60 seconds = 1 minute 60 minutes = 1 hour
1. 55 miles/hour
" feet/second
2. 35 meters/second
" kilometers/hour
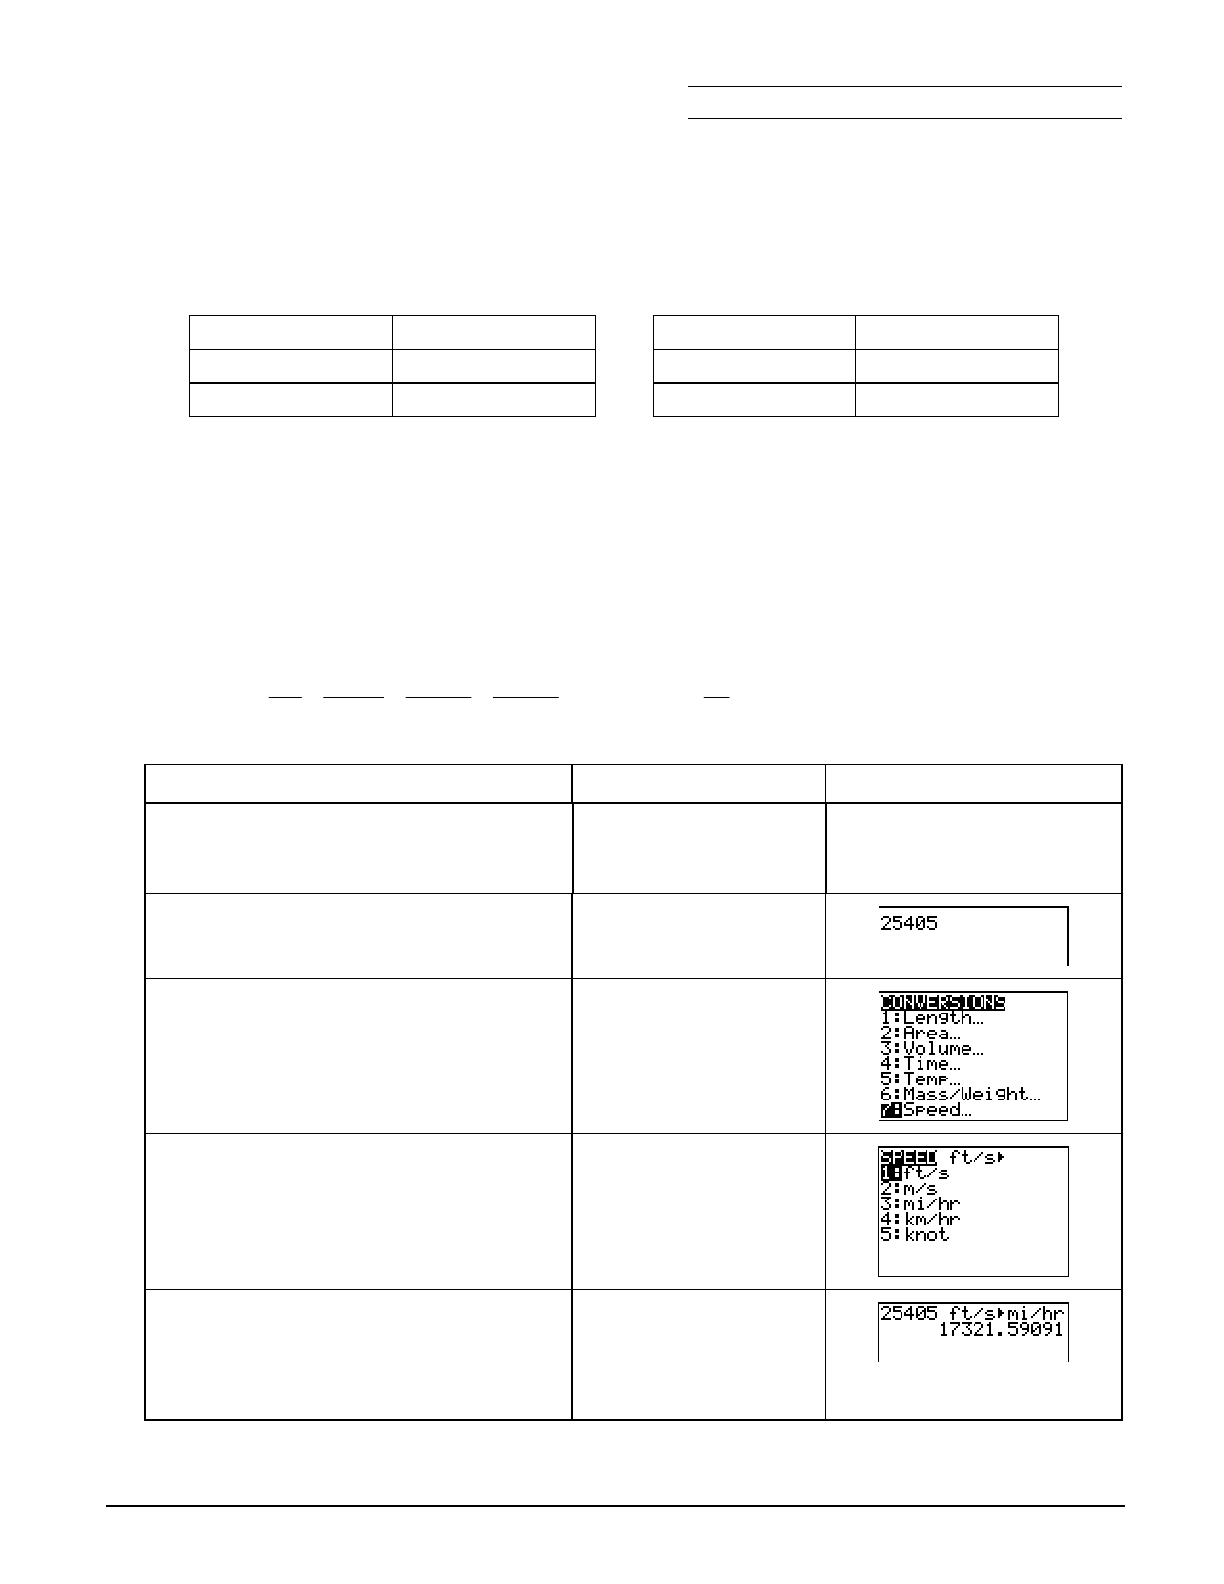
Chapter 3: Linear Functions Name
Section 3: Slope as Rate of Change Date
Topics in Algebra 1 © 2001 Texas Instruments Student Worksheet 3-22
³ Try-It!é on Your TI.73
See the section on Slope Using Coordinates to find out how to use your calculator to find the slope
of a line containing two given points. Review the keystrokes. Use these keystrokes to compute the
rate of change for each pair of data points given. Include the correct units with your answer.
1. x (seconds) y (feet) 2. x (hour) y (phone calls)
10 6.72 2 18
20 8.05 4 25
Rate of Change _______________________ Rate of Change _____________________
3. A space shuttle has an average velocity of 25,405 ft/sec. The velocity of a car on a highway
can be 60 mi/hr. To find out how many times faster the space shuttle travels compared to the
car, you must convert the speed of the space shuttle to miles per hour. First, look at the
conversion by hand, and then do it on the calculator. When set to Float, the calculator shows
the answer to five decimal places.
25,405
ft
sec Q 60 sec
1 min Q 60 min
1 hr Q 1 mi
5280 ft = 17321.59091 mi
hr
To Do This Press Display (TI.73 shown)
1. Exit the Topics in Algebra 1
application and clear the Home
screen.
y l
áEXITâ :
2. Enter the velocity, 25,405 on the
Home Screen. 25405
3. Open the
CONVERSIONS menu, and
select the category, Speed.
- ‚
7:Speed
4. Select the units you are converting
from, ft/sec. 1:ft/sec
5. Select the units you are converting to,
mi/hr.
25,405 ft/s rounded to tenths is
17321.6 mi/hr.
3:mi/hr
b
6. How many times faster does the space shuttle travel compared to the car?_______________

Chapter 3: Linear Functions Name
Section 3: Slope as Rate of Change Date
Topics in Algebra 1 © 2001 Texas Instruments Student Worksheet 3-23
³ Try-It!é on Your TI.73 (continued)
Additional Problems
Try these by hand, and show your work below. Then check the answers on your calculator.
5280 feet = 1 mile 1000 meters = 1 kilometer
60 seconds = 1 minute 60 minutes = 1 hour
1. 55 miles/hour
" feet/second
2. 35 meters/second
" kilometers/hour

Chapter 3: Linear Functions Section 3: Slope as Rate of Change
Topics in Algebra 1 © 2001 Texas Instruments Teacher Notes 3-24
Linear Functions: Slope as Rate of Change Teacher Notes
Objectives
• To associate the slope of a straight line with a constant rate of change.
• To calculate the rate of change from data points on a line, using the correct units.
• To read from a linear graph: the rate of change, the scale of the axes, and the correct units.
Math Highlights
This section highlights the use of the slope formula to find the rate of change from graphs and
data. Students may need to review the slope formula; see previous sections on the calculator.
rate of change = m= y2 N y1
x2 N x1 units
Emphasize the use of appropriate units. For example, in the Fill the Pool example in the
Overview, the students see a pool filling at a constant rate of change. Two data points from the
growth graph or table shown are (4,2) and (6,3). To find the slope, students should calculate:
rate of change = m = 3 N 2
6 N 4 ft
hr = 1
2 ft
hr = .5 ft
hr
Mention to students that if the graph of a real problem were nonlinear, the calculation of the rate of
change using two data points gives the average rate of change over the interval chosen.
Common Student Errors
• Neglecting to write the appropriate units.
• Misunderstanding how to use the position with respect to a starting place rather than
distance. In the slope formula, y2−y1 gives the signed distance traveled.
• Specifying which point is (x1,y1) and which point is (x2,y2). Show students that both
calculations give the same answer. Some students are confused when they see a division by
two negative numbers that results in a positive growth. Discuss this with the students. Watch
for an incorrect substitution where students switch the order in the numerator or
denominator. For example, if the data points (0,0) and (10,2) give the growth of a plant in cm
per day, the rate of change is calculated:
Correct: 2
N 0
10 N 0 cm
day = 1
5 cm
day or 0 N 2
0 N 10 cm
day = M1
M5 cm
day
Incorrect:
0
N 2
10 N 0 cm
day
• Students need to be exposed to other variables besides x and y. For example, it is useful to
use t for time and d for distance.
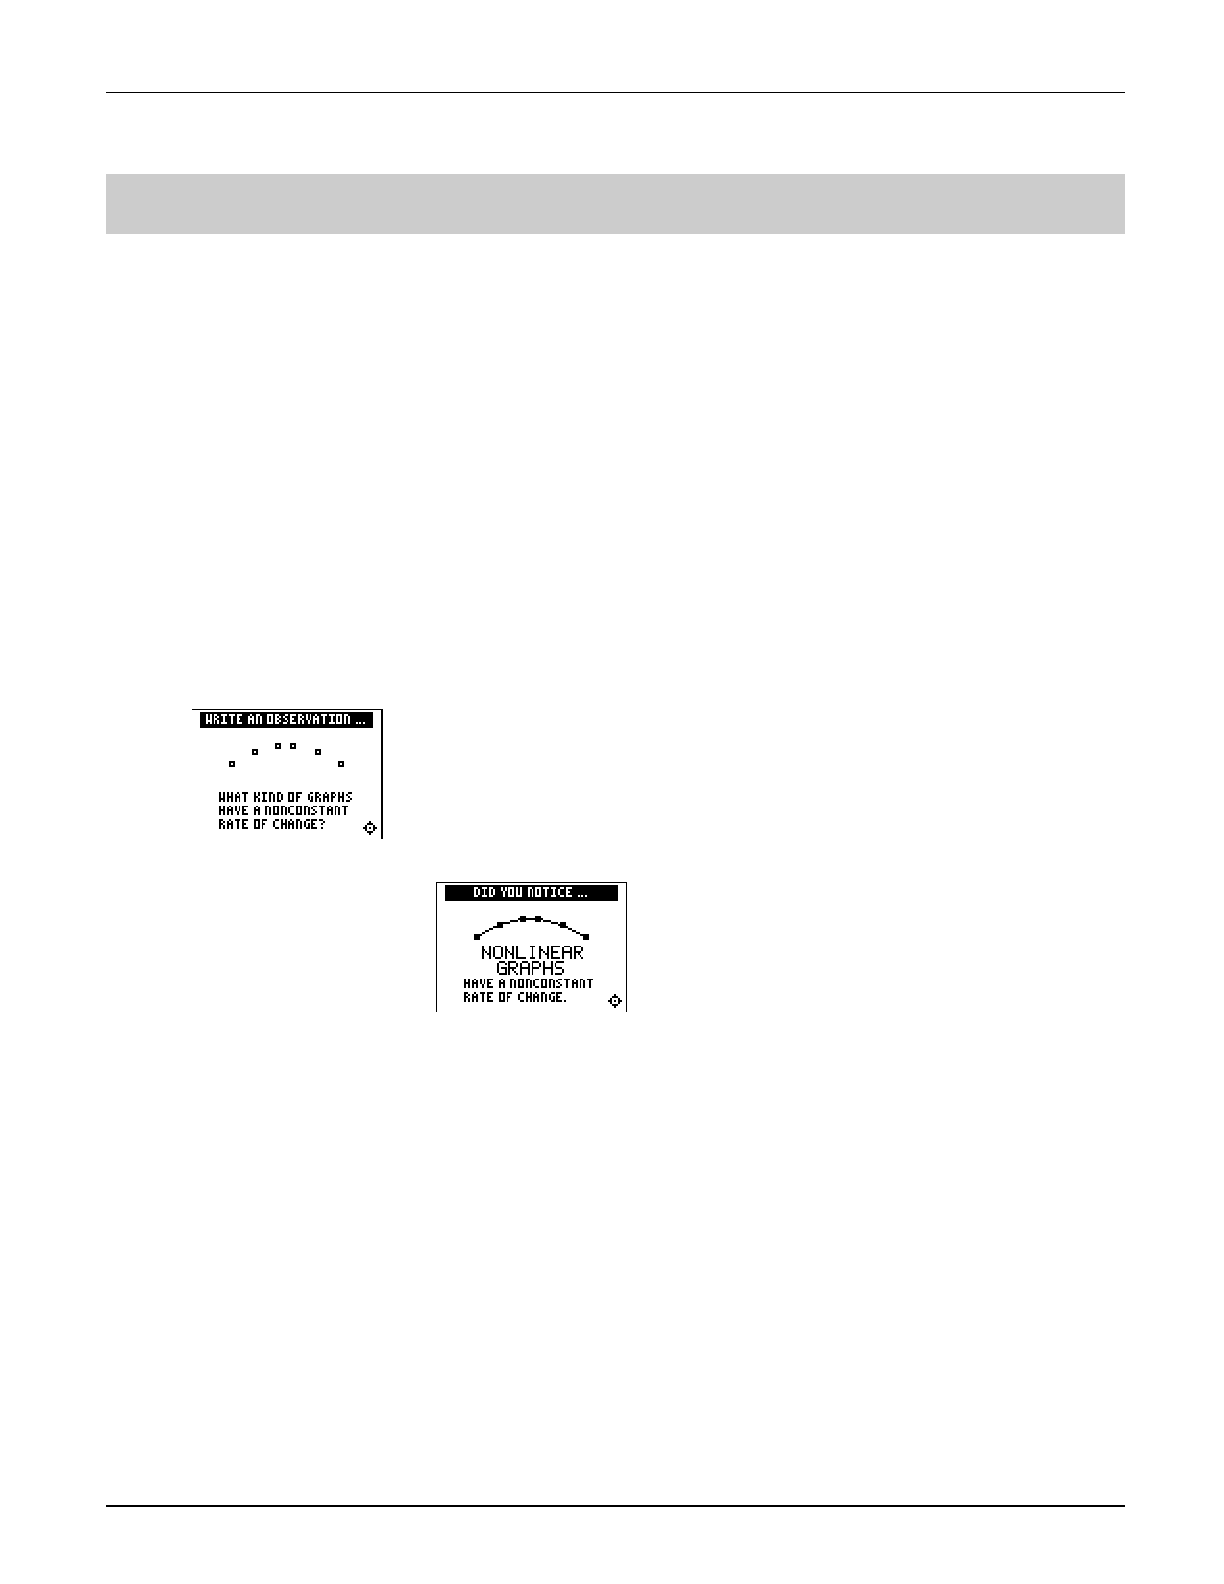
Chapter 3: Linear Functions Section 3: Slope as Rate of Change
Topics in Algebra 1 © 2001 Texas Instruments Teacher Notes 3-25
Student Worksheet Notes with Answers
Overview
Tell students:
1. How to find the Overview or tell them to review the instructions on the worksheet.
2. How to navigate the application, if they are not yet familiar with the application.
3. To scroll through the Overview on the calculator. Point out new terms, definitions, and
concepts, and tell students to look for them as they go through the Overview.
Observations
The Observations help students understand mathematical concepts relating to finding the slope
using graph coordinates.
If necessary, tell students how to find the Observations for this section.
Observation 1
What kinds of graphs have a nonconstant rate of change?
Students write their answer on their worksheet.
Nonlinear graphs have a nonconstant rate of change.
Students see the answer
on the screen at the right.
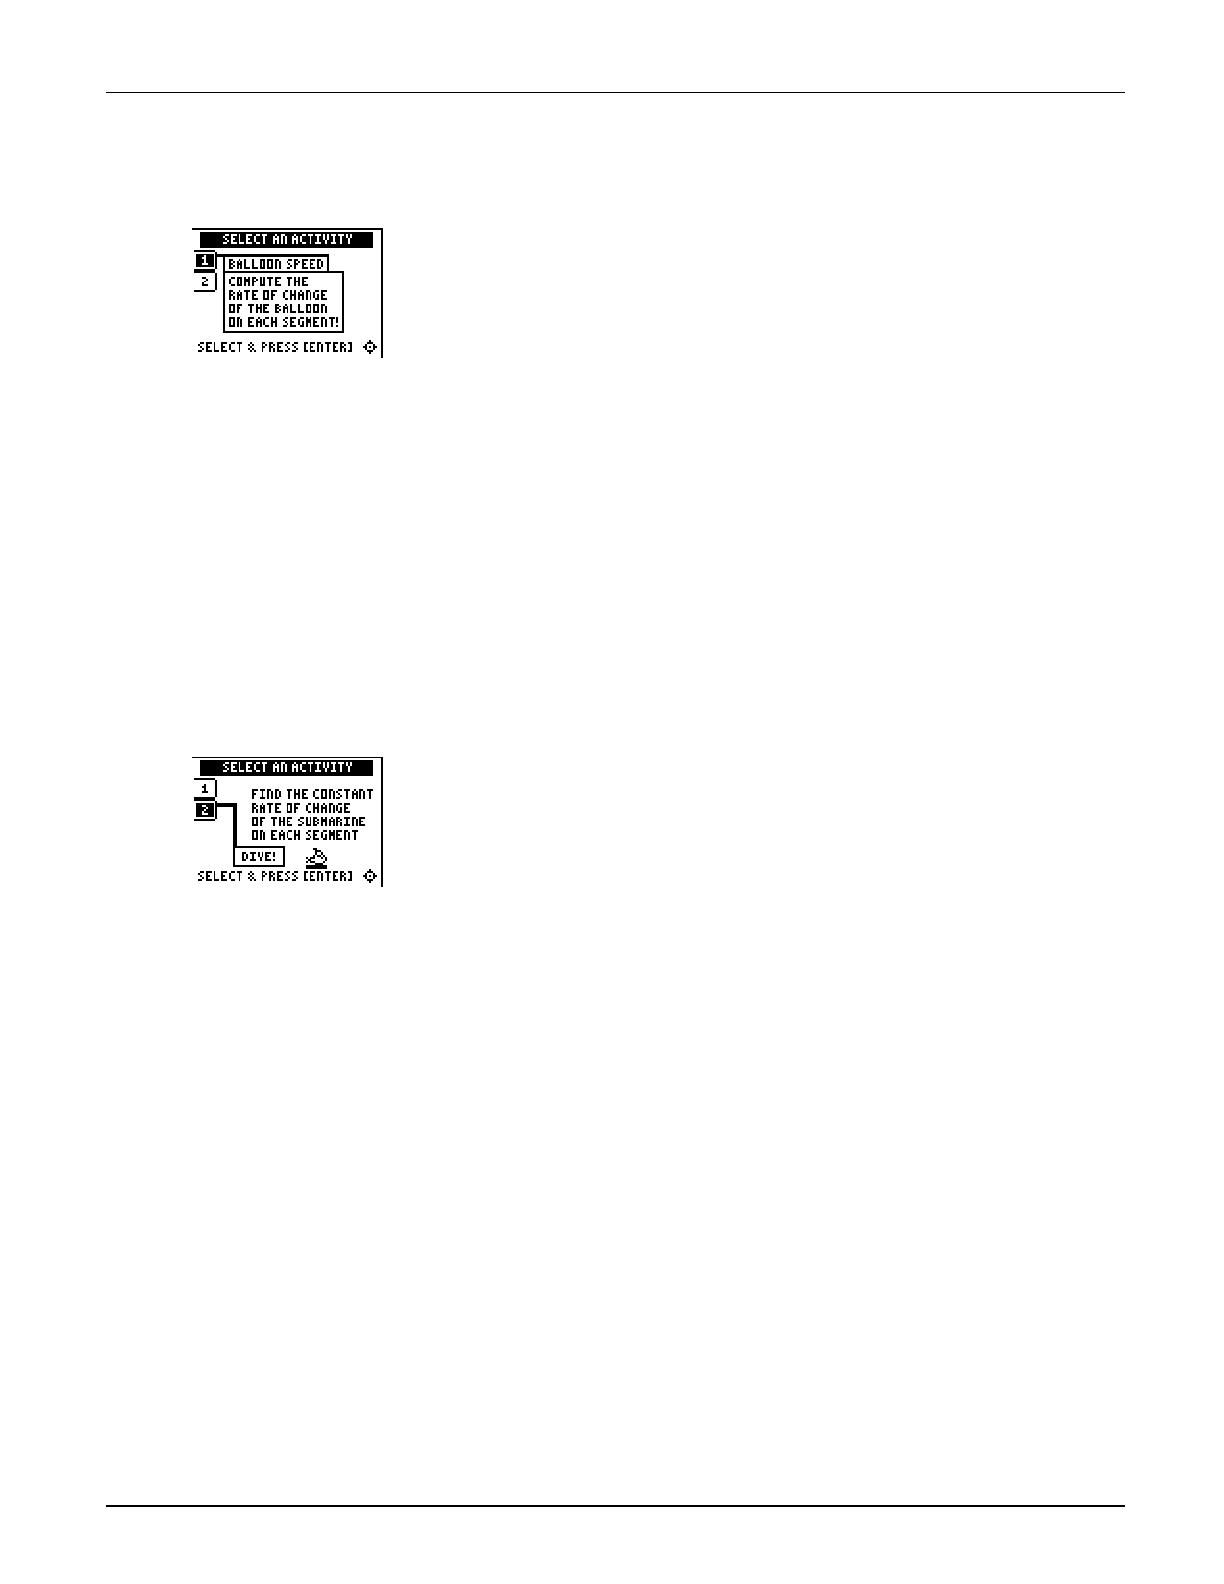
Chapter 3: Linear Functions Section 3: Slope as Rate of Change
Topics in Algebra 1 © 2001 Texas Instruments Teacher Notes 3-26
Activities
Scoring: Students get
two attempts to solve
each problem. They earn
2 points for a correct
answer on the first try, 1
point for a correct answer
on the second try.
Students can earn up to
10 points.
Balloon Speed
Tell students to:
1. Highlight a level (bronze = least difficult; gold = most
difficult), and press b to select it.
2. Select whether they want to play during Nighttime or Daytime.
3. Take a trip in the balloon. Record the times and positions in
the table.
4. Calculate the rate of change (the slope) of each trip, showing
all work, including the correct units. Enter the rate and press
Í. If the answer is incorrect, the correct answer is
displayed; press any key to resume play.
5. Record the level they played.
6. Record their score.
Scoring: You get one
attempt to select the
correct row. If you select
an incorrect row, the
correct row is identified.
Dive
Tell students to:
1. Take a dive in the submarine. Record the times and positions
in the table below.
2. Calculate the rate of change (slope) of each segment in the
table on the worksheet, showing all their work, including the
correct units.
3. After the third segment, the next screen displays three rows
of three rates. Students use their rate answers from the table
to determine the correct row. To select a row, press # or $
to move the submarine cursor, and then press b.
4. Record whether they selected the correct row.
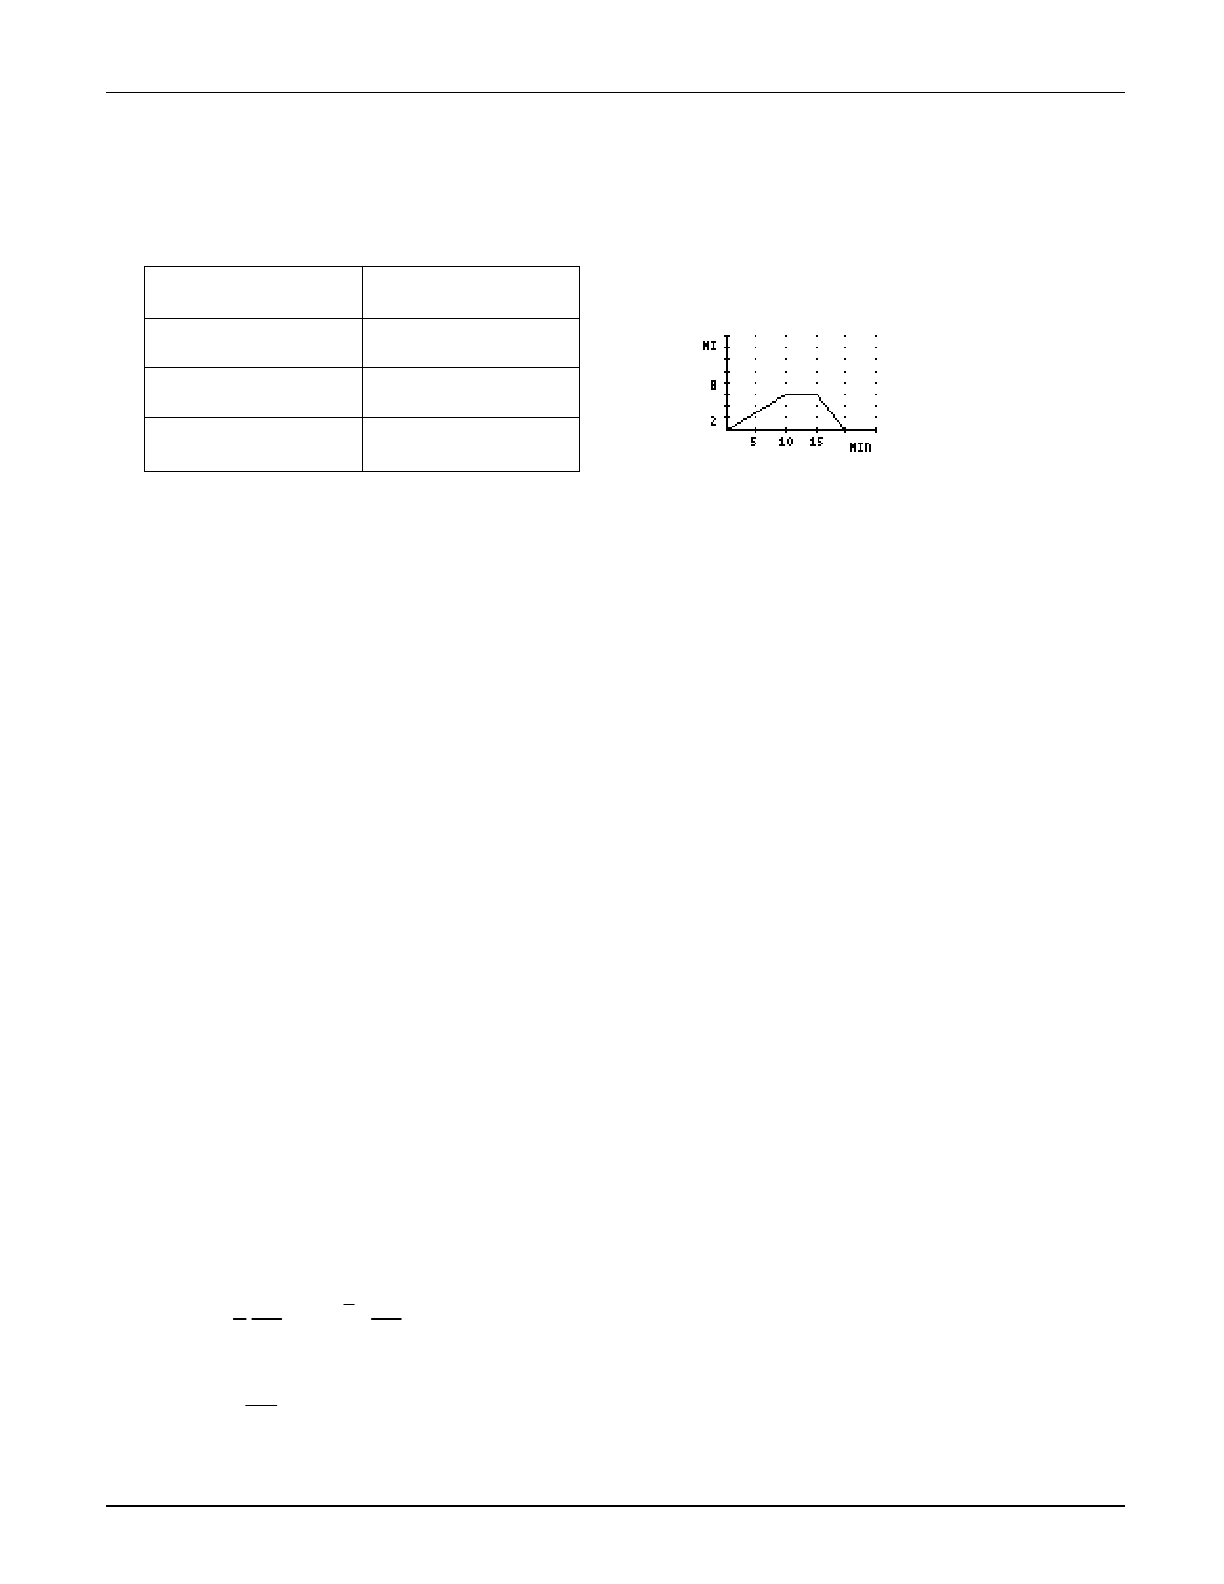
Chapter 3: Linear Functions Section 3: Slope as Rate of Change
Topics in Algebra 1 © 2001 Texas Instruments Teacher Notes 3-27
Activities (continued)
Car Trip Word Problem
Distance Rate
(0,0) to (10,6) .6 mi/min
(10,6) to (15,6) 0 mi/min
(15,6) to (20,0) M1.2 mi/min
Notice that the rate is positive going away from home. The rate is negative on the return part of
the trip indicating the direction of going back home.
³ Try-It!é on Your TI.83 Plus or TI.73
Note: There is a ³ Try-It for the TI-83 Plus and one for the TI-73; they are on separate pages.
Students review using the calculator to compute the slope of a line containing two points. They
also see how to use the calculator to do conversions. The TI-73 has conversion functionality
whereas users of the TI-83 Plus have to know how to set up the conversion. See the Student
Worksheet for instructions.
1. 0.133 ft per sec
2. 3.5 phone calls per hour
Have students discuss the meaning of the rates and their choice of representation. For example,
is 3.5 phone calls per hour the most meaningful way of communicating the rate of change or is 7
phone calls every two hours a better way of describing the rate? Have students justify their
reasoning.
3. (TI-83 Plus) or 6. (TI-73)
The space shuttle travels 288.7 times faster than a car (17321.59091 m
à
hr P 60 mi
à
hr).
Calculator Problems
Tell students to follow the steps exactly on the calculators. Example screens are displayed on
the worksheets for students to compare with the calculator screens.
Additional Problems
Students work problems by hand and check on calculator.
1. 80 2
3 ft
sec = 6.80 ft
sec
2. 126 km
hr
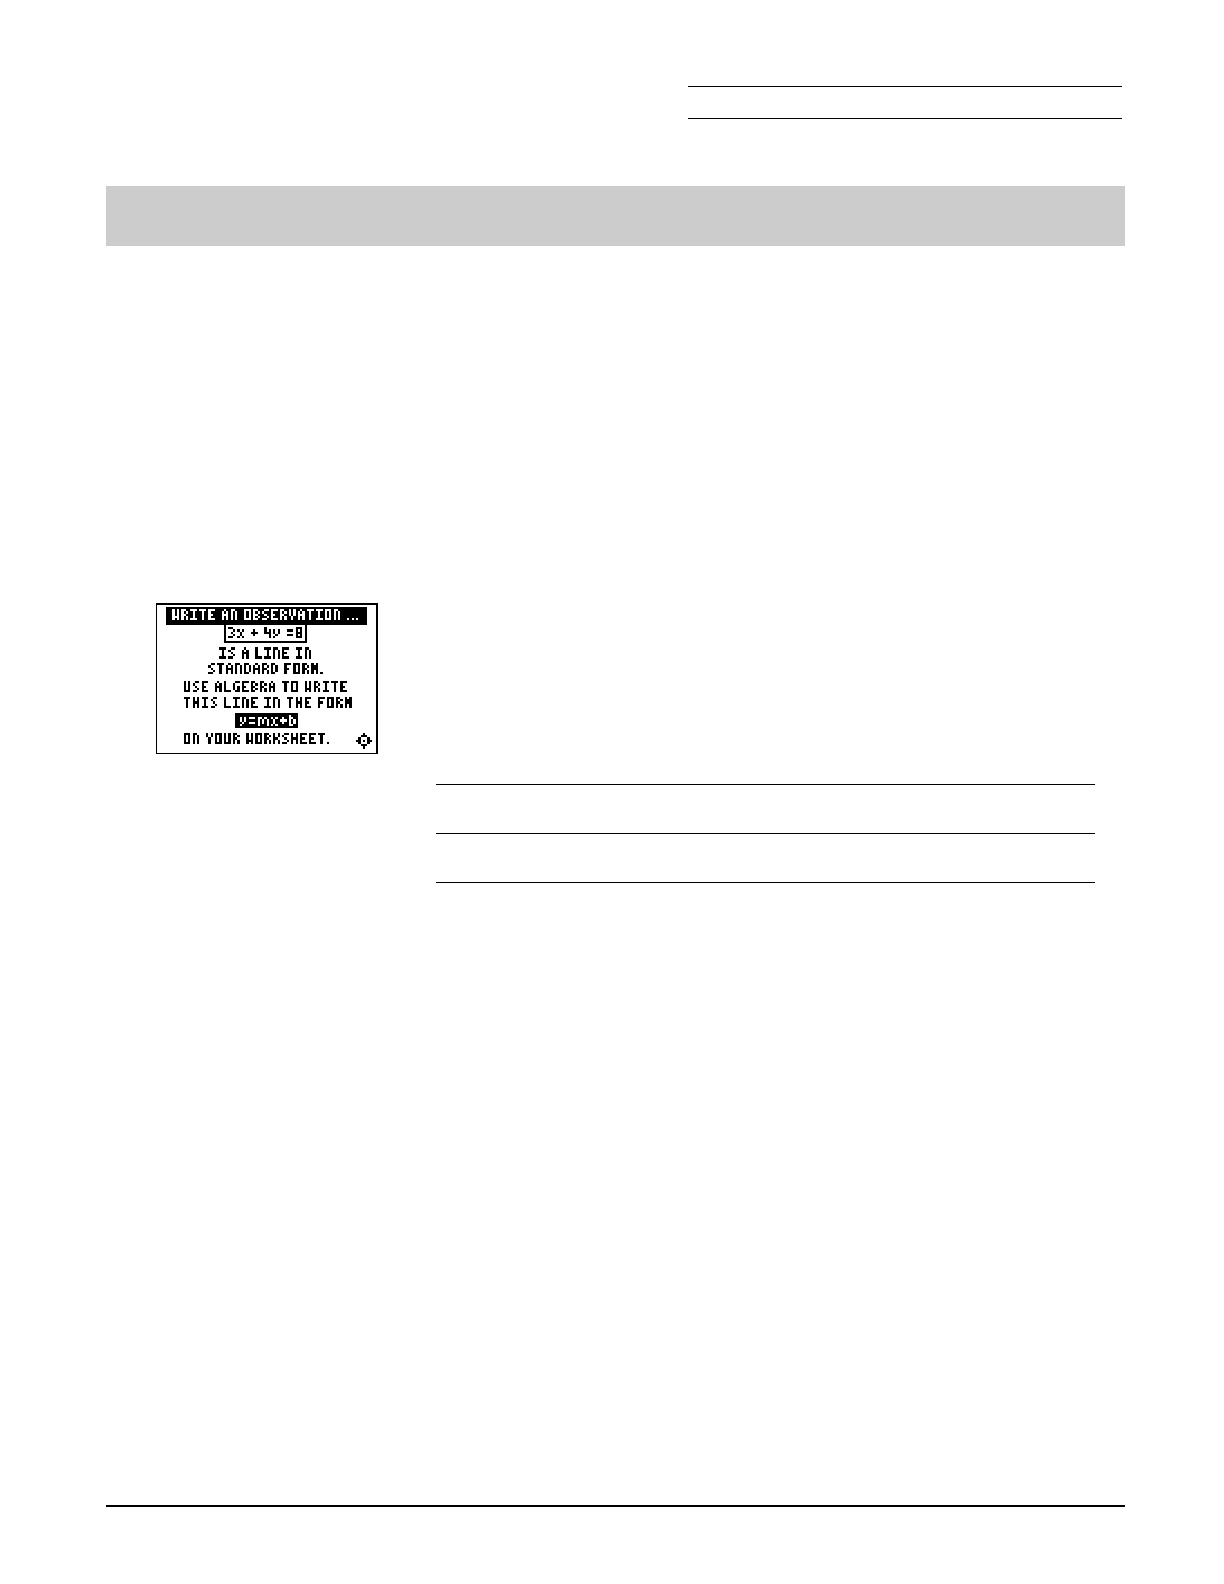
Chapter 3: Linear Functions Name
Section 4: Slope-Intercept Form Date
Topics in Algebra 1 © 2001 Texas Instruments Student Worksheet 3-28
Linear Functions: Slope-Intercept Form Student Worksheet
Overview
The Overview introduces the topics covered in Observations and Activities. Scroll through the
Overview using " (! to review, if necessary). Read each screen carefully. Look for new terms,
definitions, and concepts.
Observations
The Observations illustrate mathematical concepts relating to writing slope in slope-intercept
form. Scroll through the Observations using " (! to review, if necessary). Read each screen
carefully. When you come to a Write an Observation screen, stop and write the answers to the
questions on your worksheet.
Observation
Use your algebraic knowledge to change 3x + 4y = 8 to the form
y = mx + b. Show your work.
Remember: 3x + 4y = 8 is Standard Form.
Activities
The Activities section helps you practice using the slope-intercept form of lines. You can select
from two activities—Match It! or Line Soccer. Follow these steps to play the activity and
complete your worksheet.
1. Make sure you are in the Activities for this section.
2. Highlight an activity using $ or #, and press b.

Chapter 3: Linear Functions Name
Section 4: Slope-Intercept Form Date
Topics in Algebra 1 © 2001 Texas Instruments Student Worksheet 3-29
Activities (continued)
Scoring: You get two
attempts to answer the
problem. You earn 2
points for a correct
answer, 1 point for a
correct answer on the
second try.
You can earn up to 12
points.
Match It!
1. Select the correct answer to the question. Questions include:
• Selecting the graph that correctly illustrates an equation.
• Selecting the equation that correctly describes a graph.
• Selecting the equation that goes with the table.
2. What was your score?
Scoring: You get two
attempts to answer the
problem. You earn 2
points for a correct
answer on the first try, 1
point for a correct answer
on the second try.
You score a goal when
you answer a question
correctly against Alex, the
goalkeeper. You also get
to keep any points you
earned while passing the
ball.
Line Soccer
1. Pass the ball by answering a question correctly. Possible
slope-intercept questions include:
• Selecting the (x,y) coordinate that solves an equation.
• Using an (x,y) coordinate and b to solve for m in an
equation.
• Using an (x,y) coordinate and m to solve for b.
• Using two (x,y) coordinates to calculate m and b.
2. To enter your answer:
• As a negative number, press Ì.
• As a mixed number, enter the whole number and press
áUNITâ, and then enter the fraction.
• As a fraction, press án/dâ and enter the numerator. Press
án/dâ again and enter the denominator.
3. Show your work for each problem:
4. What was your score?
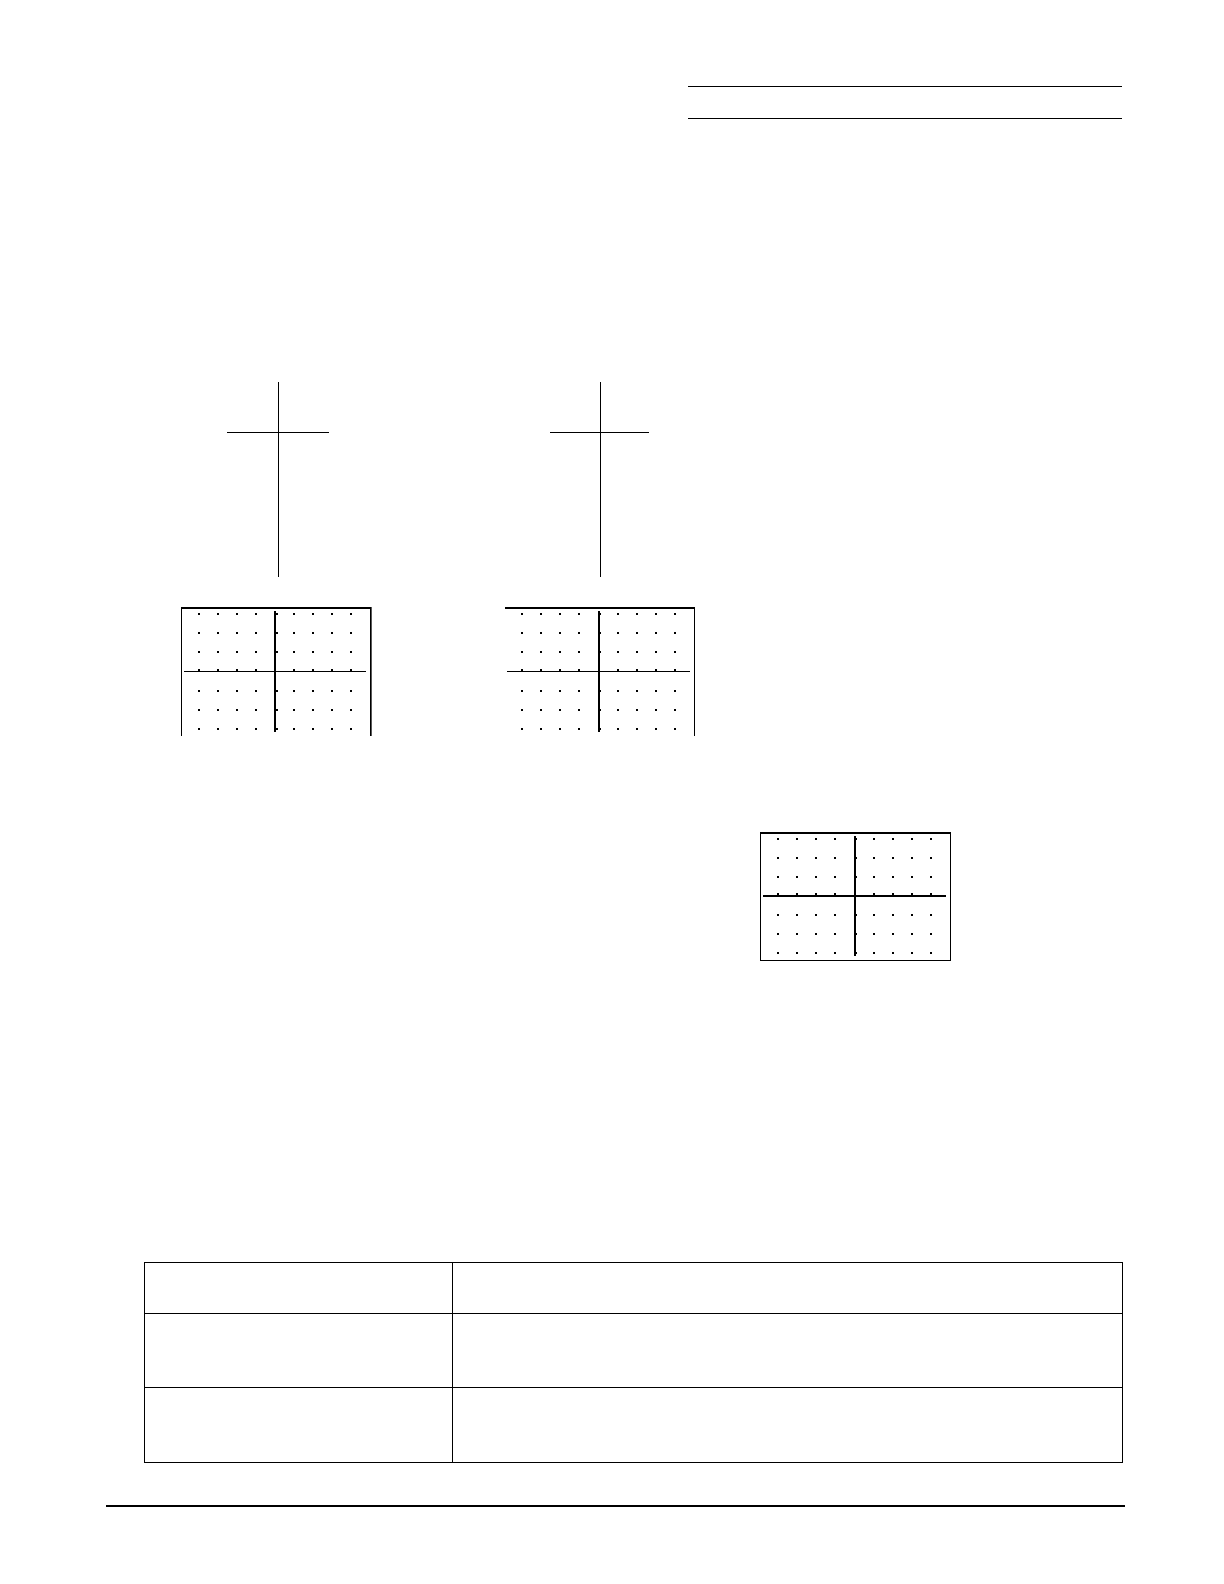
Chapter 3: Linear Functions Name
Section 4: Slope-Intercept Form Date
Topics in Algebra 1 © 2001 Texas Instruments Student Worksheet 3-30
Activities (continued)
Additional Problems
1. Make a table and draw the graph for the following linear functions.
a. Y =
MX + 2 b. Y = 2X N 1
X Y X Y
2. Think of the graph below as a map. You start to walk from the point (M1,1). You can walk only
along a path that is the line with the slope: m = M2
a. Label two points, A and B, that you can walk to
on the graph if the slope of your path =M2. Each
tick mark is 1 unit.
b. Find the equation of the line that describes your
walking path. Show your work below.
c. Record the coordinate points of A and B below.
Use the equation of your path to check to see if
your points A and B are on really on your line!
Show your work below.
Point Check It
A=
B=
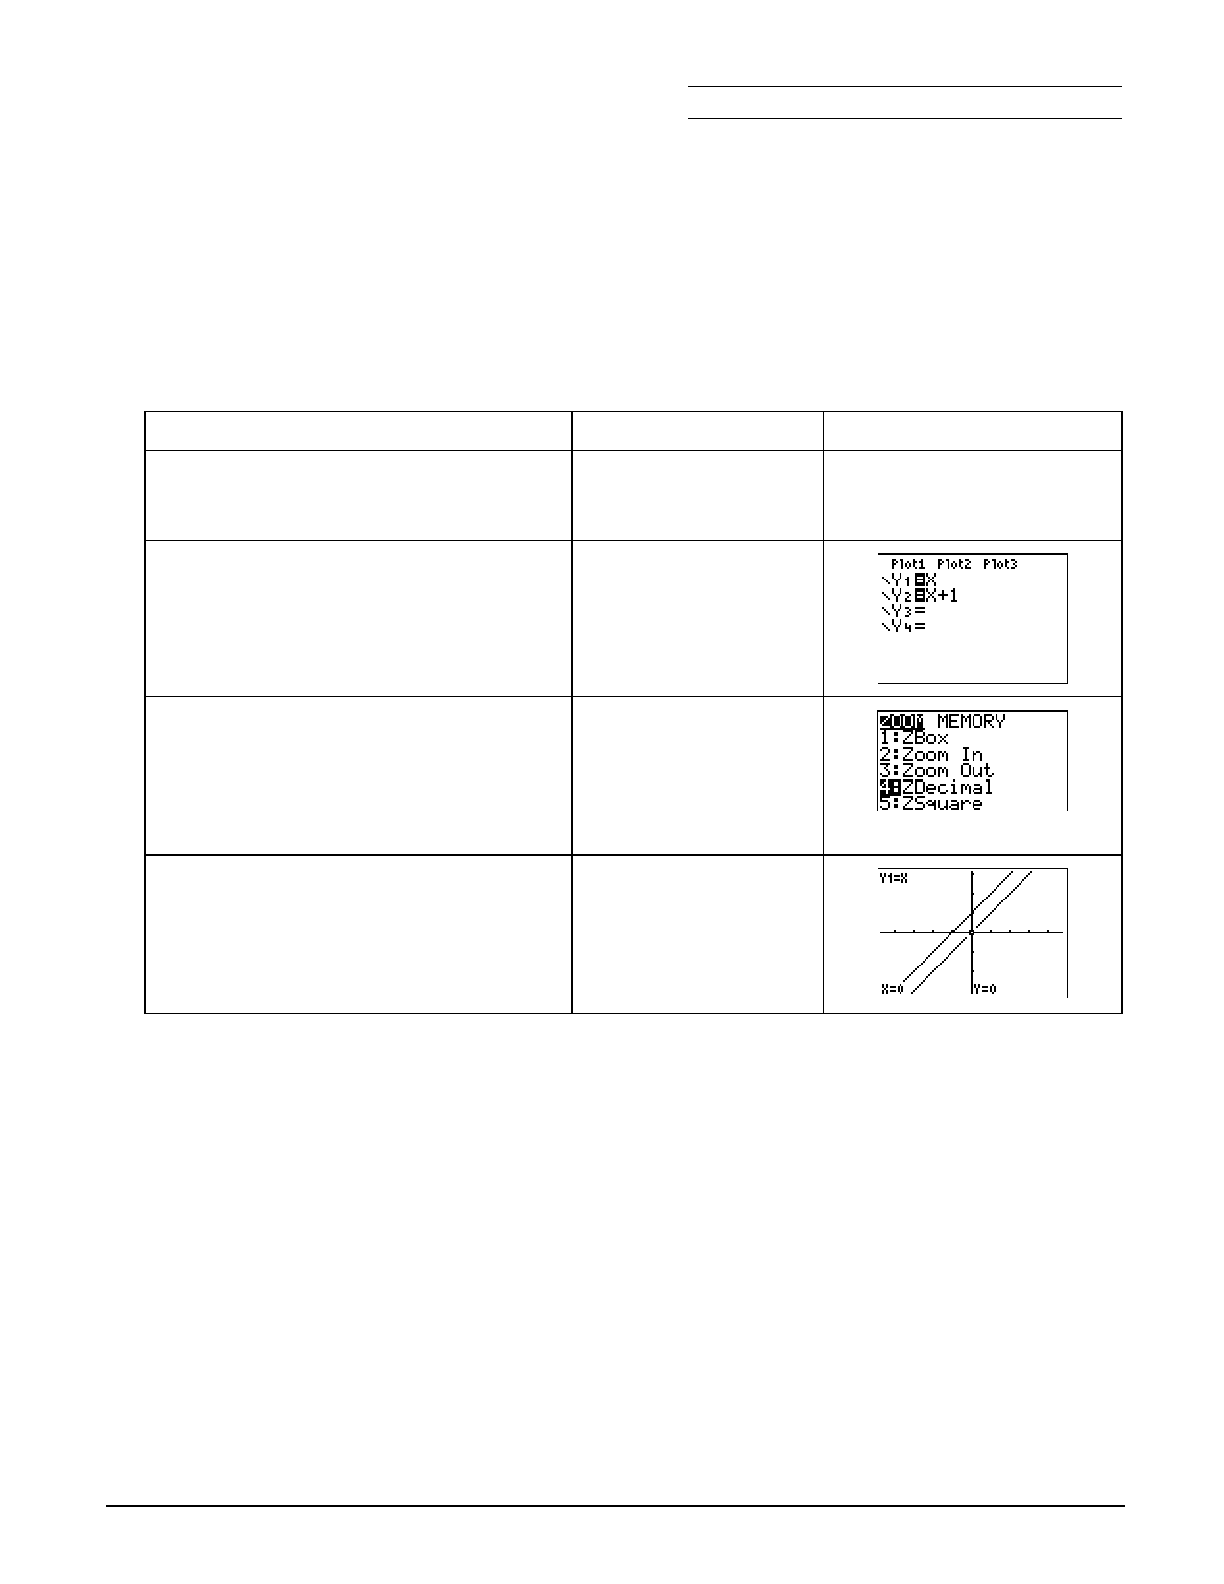
Chapter 3: Linear Functions Name
Section 4: Slope-Intercept Form Date
Topics in Algebra 1 © 2001 Texas Instruments Student Worksheet 3-31
³ Try-It!é on Your TI.83 Plus or TI.73
Parent and Family of Functions
Compare graphs of Y1=X and Y2=X+1. If you know the graph of Y1=X, can you draw the graph of
any line in slope-intercept form? Investigate using your calculator!
Note: See ³ TIpé 3:
Graphing a Function
and ³ TIpé 5
:
Adjusting the Viewing Window
for instructions if you need help. Set up your
calculator so that GridOn on the window format (y .) screen and ZDecimal on the zoom menu (q) are selected.
To Do This Press Display (TI.83 Plus shown)
1. Exit the Topics in Algebra 1
application and clear the Home
screen.
y l
áEXITâ :
2. Define
Y1=X and Y2=X+1.
Note: On the TI-73, use I rather than „.
o :
„
# :
„ \ 1
3. Set the viewing window. TI-83 Plus:
( 4:ZDecimal
TI-73:
( 8:ZDecimal
4. Trace both
Y1 and Y2. r
| or ~ to trace a
function
} and † to move
between functions
5. Write a description of what you see. How does the graph of Y=X compare to the graph of
Y=X+1?
________________________________________________________________________________
________________________________________________________________________________
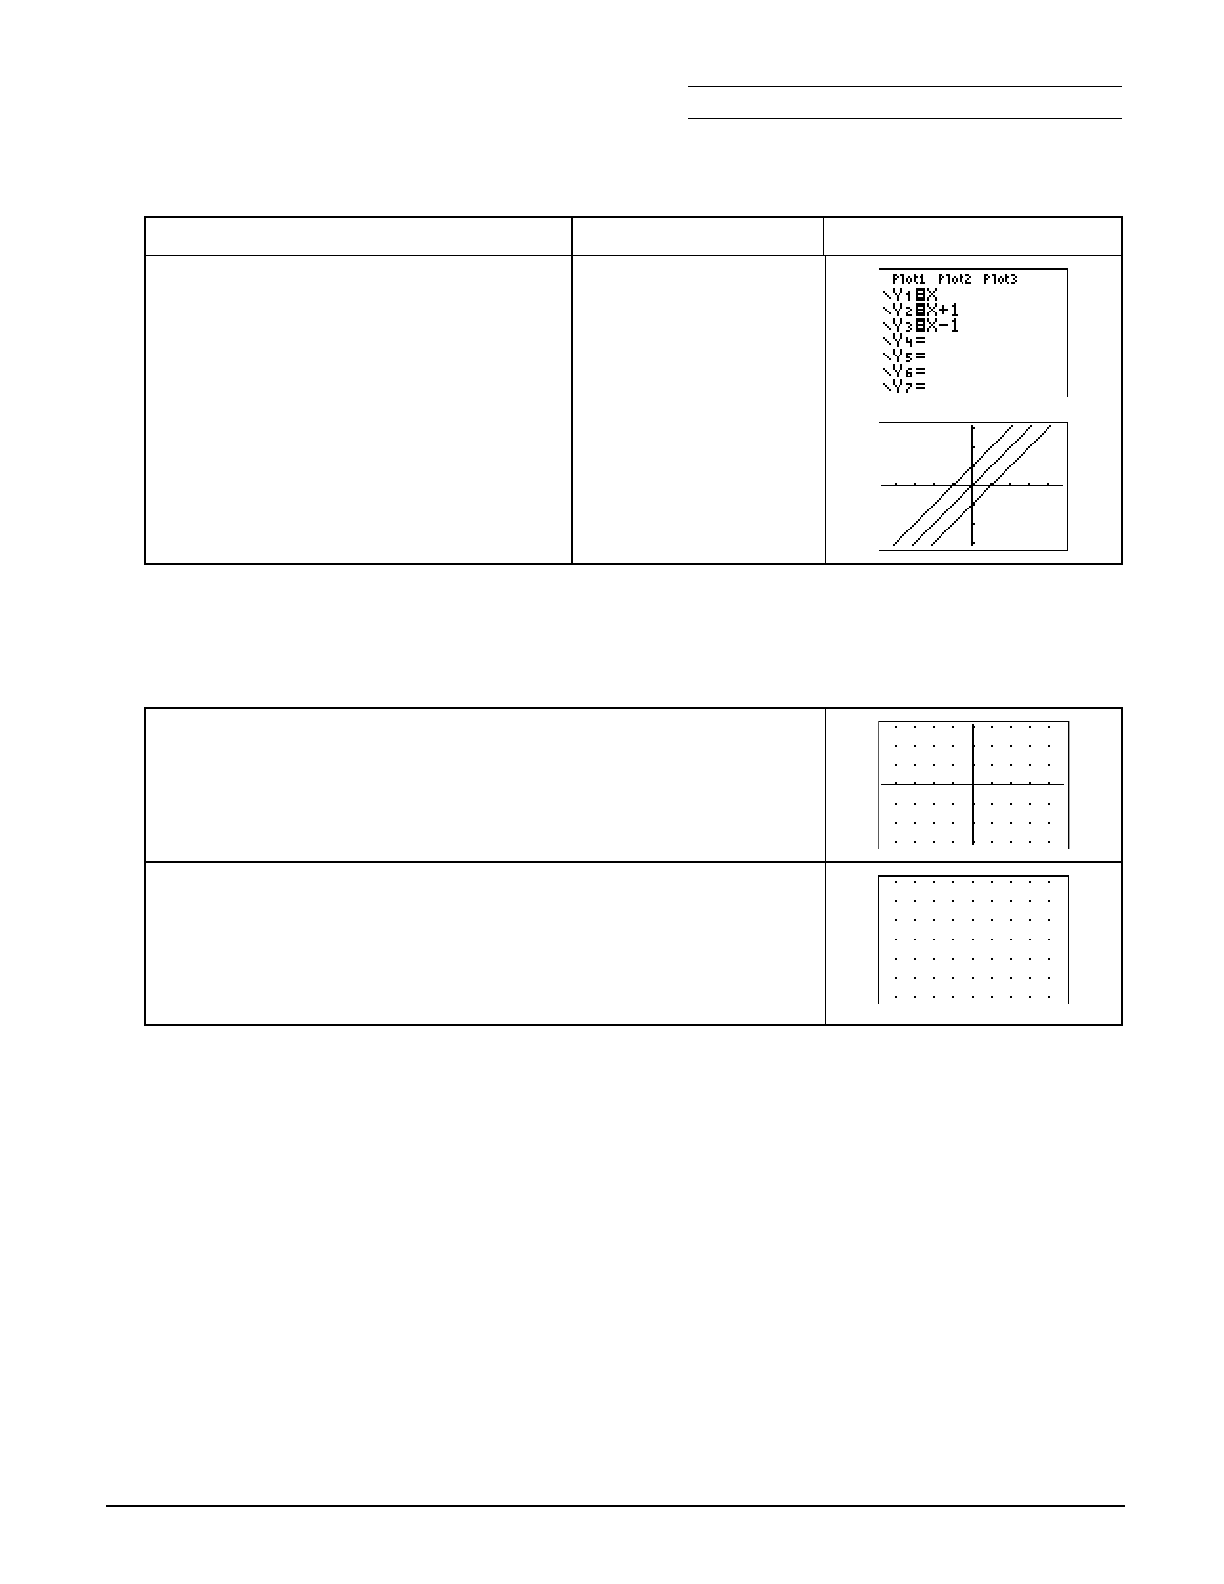
Chapter 3: Linear Functions Name
Section 4: Slope-Intercept Form Date
Topics in Algebra 1 © 2001 Texas Instruments Student Worksheet 3-32
³ Try-It!é on Your TI.83 Plus or TI.73 (continued)
To Do This Press Display (TI.83 Plus shown)
6. Enter and trace Y3=XN1.
Note: On the TI-73, use I rather than „.
&
# # :
„ T 1
r
| or ~ to trace a
function
} and † to move
between functions
7. Write a description of what you see. How does the graph of Y=X compare to the graph of
Y=XN1?
________________________________________________________________________________
8. Where will the line, Y=X+2 be located? Draw in your prediction
and then use the calculator to check your work. Was your graph
correct? If not, why not?
9. Now predict and draw the following lines on the graph to your
right. Draw your own axes. Do not use the calculator.
Y=X+3
Y=XN3
Y=X+8
Y=XN8
10. Check your work! Graph each line on the calculator. Could you see all of the lines? Record
your observations.
Note: On the TI-73, you need to clear a line in the Y= editor to make room for your new lines.
________________________________________________________________________________
11. You cannot see Y=X+8 or Y=X.8 on your graphing calculator. Why do you think that the line is
not showing? Change your WINDOW (') settings so that you are able to see these lines.
Record the changes you made.
________________________________________________________________________________
12. Compare the lines: Y=X, Y=2X, and Y=3X. What do you notice? Try other lines in the form
Y = AX. Next, try to graph Y=2X+3 without the calculator. Explain your strategy.
________________________________________________________________________________

Chapter 3: Linear Functions Section 4: Slope-Intercept Form
Topics in Algebra 1 © 2001 Texas Instruments Teacher Notes 3-33
Linear Functions: Slope-Intercept Form Teacher Notes
Objectives
• To review the form of the equation y = mx + b, where m is slope and b is the y-intercept.
• To view graphing lines and developing equations from data.
• To view tables of values and graphing lines from an equation of the form y = mx + b.
• To emphasize three ways of looking at lines, tables, graphs and equations.
• To develop the equation of a line from information given, such as slope and y-intercept, point
and slope, and two points.
• To review the slope of parallel and perpendicular lines.
Math Highlights
This section highlights a review of the slope-intercept form of a line, y = mx + b. Students will
review graphing a line using one point and the slope of the line. They will also see the equation of
a line developed inductively from data by simulating the amount of volts produced by lining up
batteries in series. Students will also review how to find a table and graph a line using the
equation y = mx + b.
A review of calculations follow, which show the step-by-step procedures needed to find the
equation of a line given, the slope and y-intercept, the slope and a point on the line, and finally
two points.
Common Student Errors
• When students perform the calculations to find the equation of a line given the slope and
y-intercept, the slope and a point on the line, or two points, they often have problems
following the steps. For example, given two points, the student needs to perform three steps.
First, the student needs to calculate the slope of the line. Students may forget the formula for
slope, and then be careless about substituting the correct values in the formula. Also, they
may make errors in sign. In the second step, they need to find b using the calculated slope
and one of the points. Students need to understand that they could pick either point for this
calculation. If the slope is incorrect from the first step, the error cascades into the rest of the
solution. In the third step, they need to place all of the information into the final answer as
y = mx + b.
• Students become comfortable using the variables x and y. They should be exposed to the use
of other letters for the independent and dependent variables. Students should be able to
recognize, for example, D = 2T + 4 as a linear relationship with independent variable T,
dependent variable D, a slope of 2 and the D-intercept as 4. They need to learn that they will
need to change the variables so the function reads y = 2x + 4 in order to graph it on the
calculator.
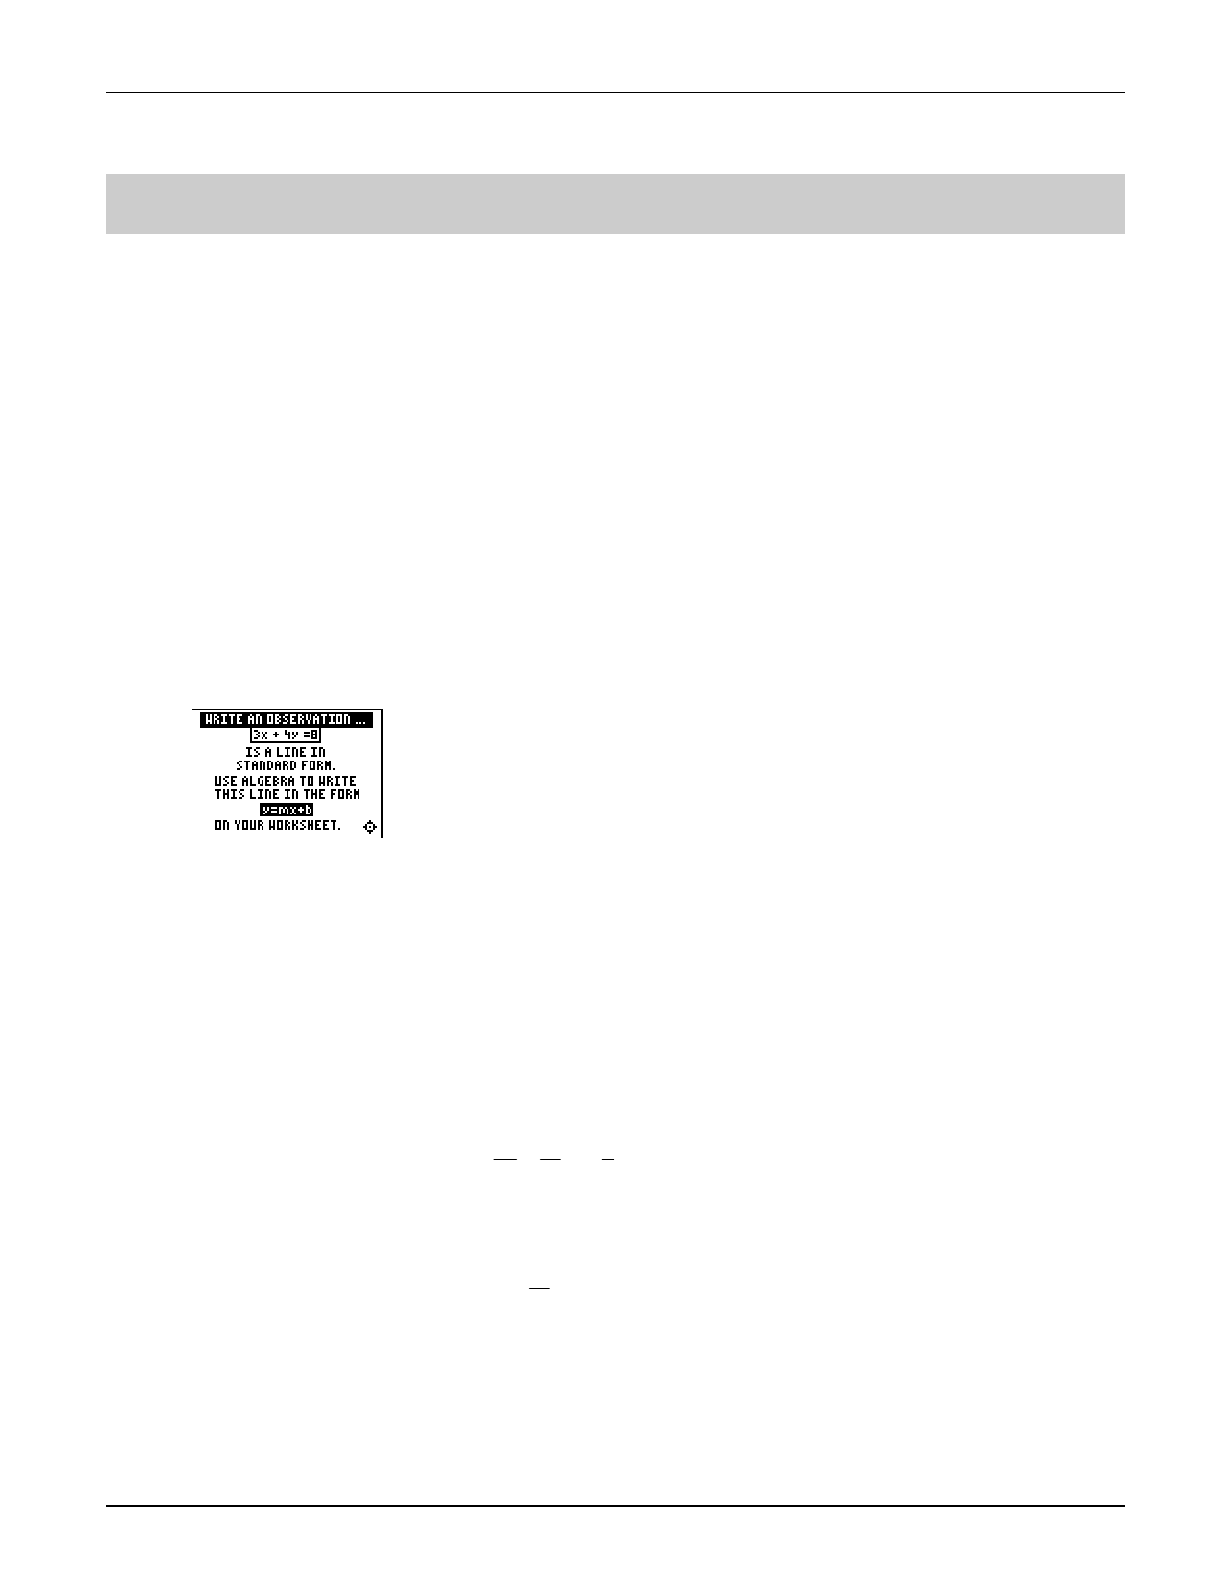
Chapter 3: Linear Functions Section 4: Slope-Intercept Form
Topics in Algebra 1 © 2001 Texas Instruments Teacher Notes 3-34
Student Worksheet Notes with Answers
Overview
Tell students:
1. How to find the Overview, or tell them to review the instructions on the worksheet.
2. How to navigate the application, if they are not yet familiar with the application.
3. To scroll through the Overview on the calculator. Point out new terms, definitions, and
concepts, and tell students to look for them as they go through the Overview.
Observations
The Observations help students understand using algebra to change a linear equation in standard
form to slope-intercept form.
If necessary, tell students how to find the Observations for this section.
Observation
Students use algebra to write 3x+4y=8 in y=mx+b form.
Answers may vary, especially the step order. One possible
answer:
Step 1: Subtract 3x from both sides of the equation.
3x - 3x + 4y = 8 - 3x
Step 2: Simplify the equation.
4y =
M3x + 8
Step 3: Divide both sides of the equation by 4.
4y
4 = M3
4 x + 8
4
Step 4: Simplify to get the answer.
y =
M3
4 x + 2
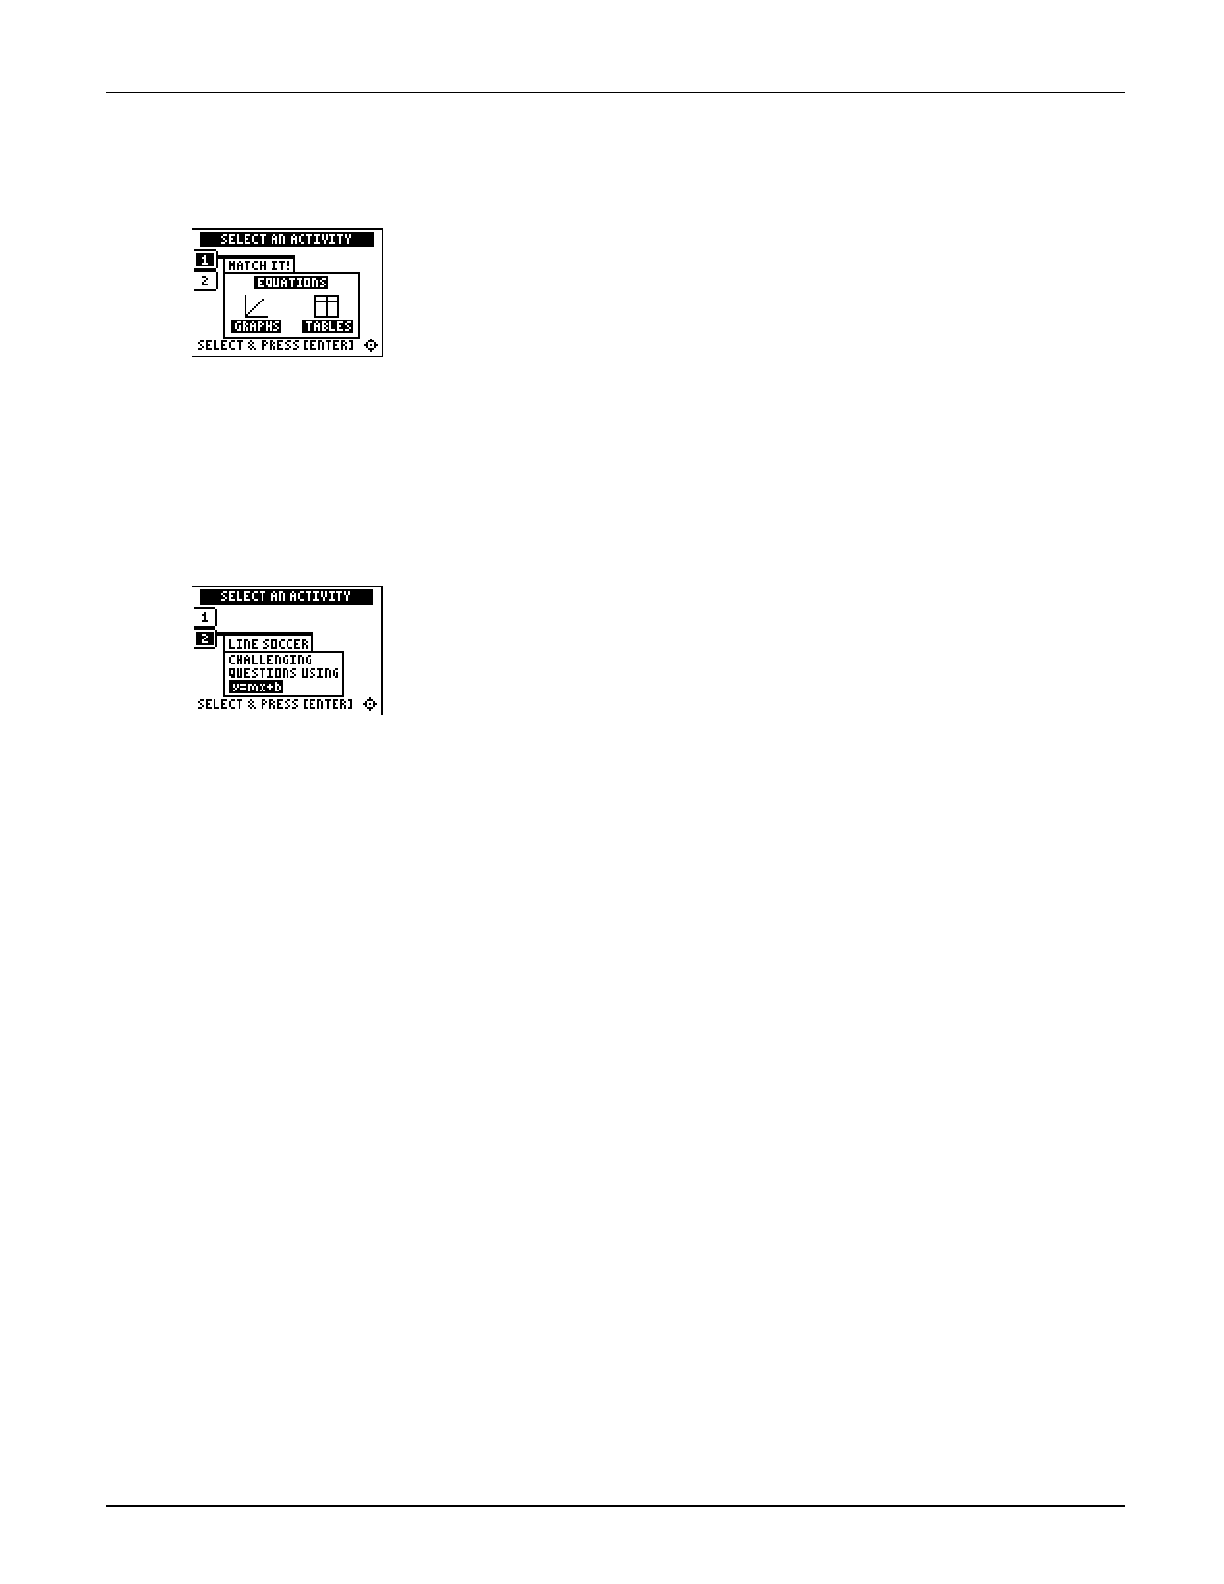
Chapter 3: Linear Functions Section 4: Slope-Intercept Form
Topics in Algebra 1 © 2001 Texas Instruments Teacher Notes 3-35
Activities
Scoring: Students get
two attempts to answer
the problem. They earn 2
points for a correct
answer, 1 point for a
correct answer on the
second try.
Students can earn up to
12 points.
Match It!
Tell students to:
1. Select the correct answer to the question. Questions include:
• Selecting the graph that correctly illustrates an equation.
• Selecting the equation that correctly describes a graph.
• Selecting the equation that goes with the table.
2. Record their scores.
Scoring: Students get
two attempts to answer
the problem. They earn 2
points for a correct
answer, 1 point for a
correct answer on the
second try.
Students score a goal
when they answer a
question correctly against
Alex, the goalkeeper.
They also get to keep any
points they earned while
passing the ball.
Note: Unsimplified
fractions are counted as
correct.
Line Soccer
Tell students to:
1. Pass the ball by answering a question correctly. Possible
slope-intercept questions include:
• Selecting the (x,y) coordinate that solves an equation.
• Using an (x,y) coordinate and b to solve for m in an
equation.
• Using an (x,y) coordinate and m to solve for b.
• Using two (x,y) coordinates to calculate m and b.
2. Enter their answers in the following ways, as necessary:
• as a negative number, press Ì.
• as a mixed number, enter the whole number and press
áUNITâ, and then enter the fraction.
• as a fraction, press án/dâ and enter the numerator. Press
án/dâ again and enter the denominator.
3. Show their work for each problem.
4. Record their scores.

Chapter 3: Linear Functions Section 4: Slope-Intercept Form
Topics in Algebra 1 © 2001 Texas Instruments Teacher Notes 3-36
Activities (continued)
Additional Problems
1. Students make a table and draw the graph for Y=MX+2 and Y=2XN1.
Answers may vary. Make sure that students correctly label the axes and all points from the
corresponding table.
2. Students label two points, A and B, where the line segment between the two has a slope that
is M2.
a. Possible points students can walk to on the screen shown are (M2,3), (0,M1), and (1,M3).
b. Students should use m=M2 and the point; for example, (M1,1) to find the y-intercept, b.
The answer is y=M2xN1.
c. Students should substitute their point in the line to see if the equation is satisfied.
³ Try-It!é on Your TI.83 Plus or TI.73
Students need to know the features of the calculator covered in ³ TIpé 3: Graphing a Function
and ³ TIpé 5: Adjusting the Viewing Window. They work through an investigation of parent
and family of functions of Y=X. See Student Worksheet for details.
Tell students to follow the steps exactly on the calculators. Example screens are displayed on
the worksheets for students to compare with the calculator screens.
This keystroke exercise lets students discover the connection between the parent and family of
functions so they can quickly graph functions of the form y=mx+b.
5. Possible answers for comparing the graph of Y=X to Y=X+1: parallel, equivalent slope, offset
by 1, Y=X crosses the origin (0,0), etc.
7. Possible answers for comparing the graph of Y=X to Y=XN1: same as above.
8. Students should draw the function on the worksheet first before graphing it on the
calculator. Y=X+2 intersects the X-axis at (
M
2,0) and the Y-axis at (0,2).
10. Students should draw the function on the worksheet first before graphing it on the
calculator. If they graph it without changing the window values, the screen looks like this:
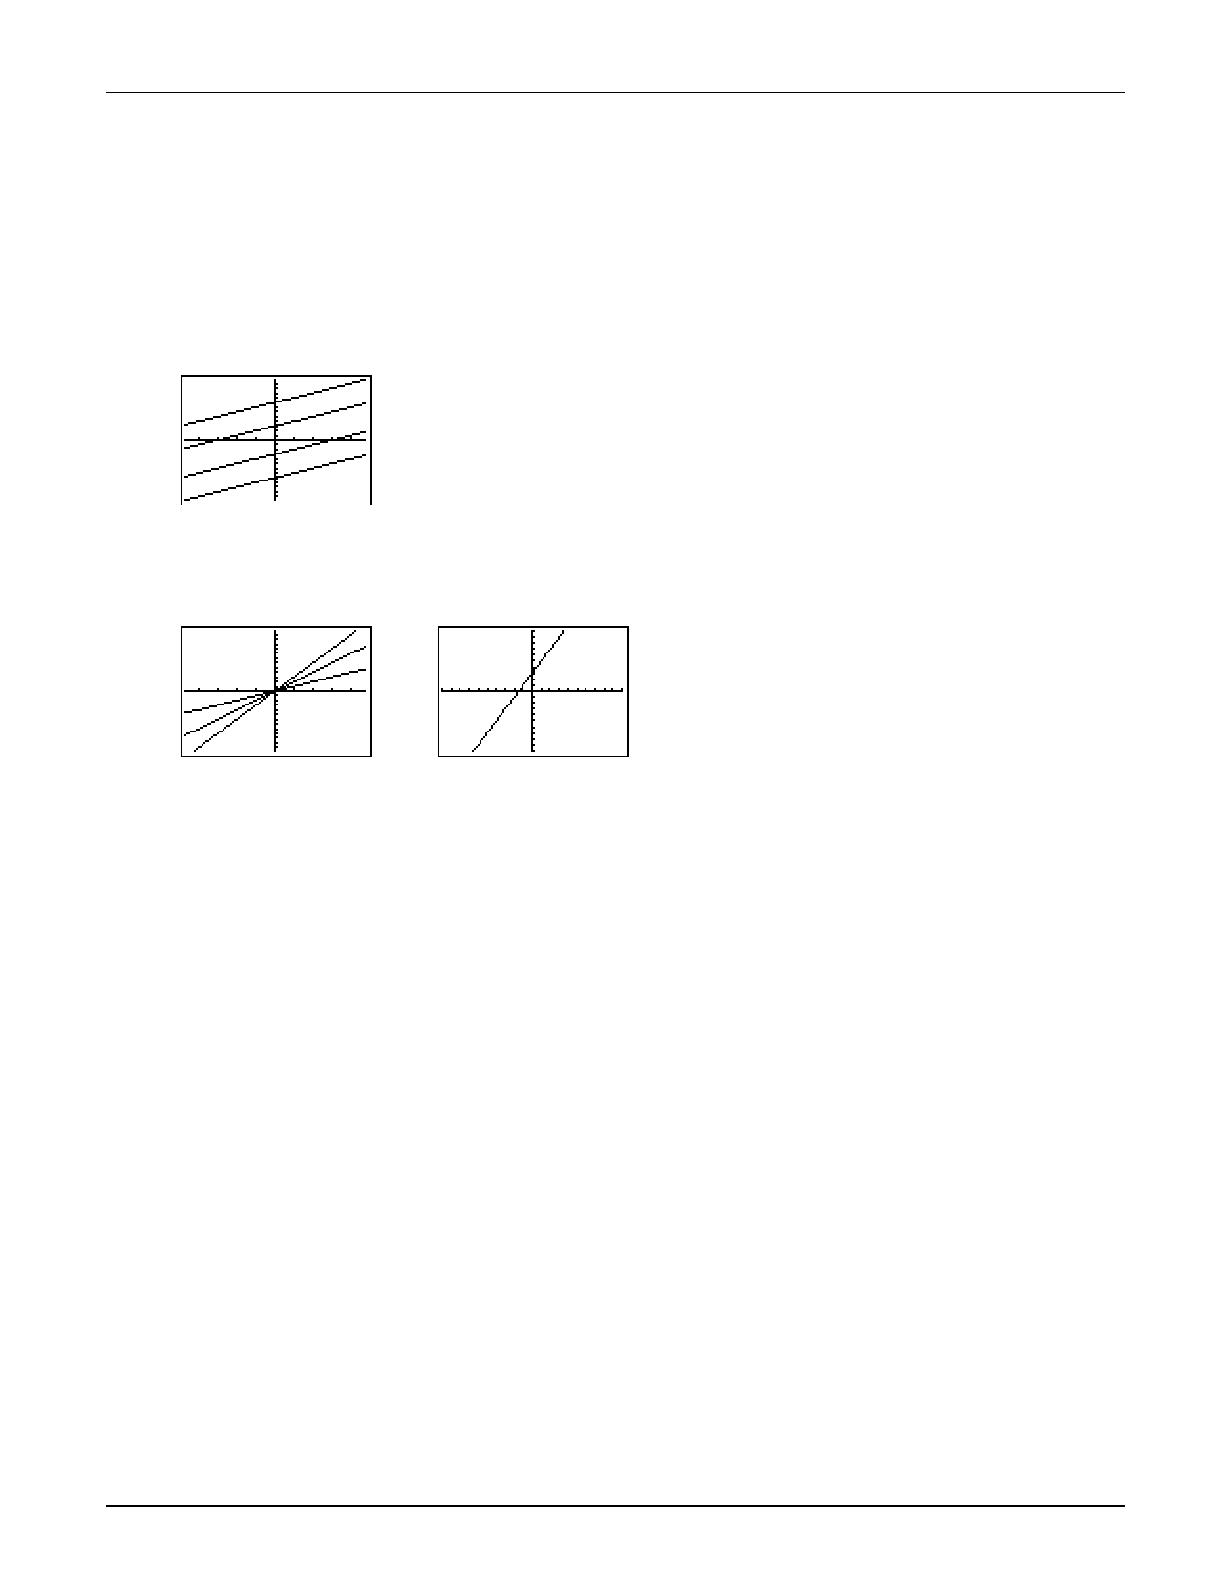
Chapter 3: Linear Functions Section 4: Slope-Intercept Form
Topics in Algebra 1 © 2001 Texas Instruments Teacher Notes 3-37
³ Try-It!é on Your TI.83 Plus or TI.73 (continued)
Parent and Family of Functions
11. Students cannot see all functions when they don’t change their window values, which are:
Xmin=M4.7, Xmax=4.7, Xmin=M3.1, Xmax=3.1. To fit all functions on the screen, Xmin>8 and
Xmax>8. Functions in order from top to bottom: Y=X+8, Y=X+3, Y=XN3, Y=XN8.
12. In order from top to bottom: Y=3X, Y=2X, Y=X (ZFit window values). Graph of Y=2X+3
(ZStandard window values). To graph the function Y=2X+3, students should think that the
graph is parallel to Y=2X, and then shift Y=2X up 3 units on the Y-axis.

Chapter 4: Linear Inequalities Name
Section 1: Using Graphs & Tables Date
Topics in Algebra 1 © 2001 Texas Instruments Student Worksheet 4-1
Linear Inequalities: Using Graphs & Tables Student Worksheet
Overview
The Overview introduces the topics covered in Observations and Activities. Scroll through the
Overview using " (! to review, if necessary). Read each screen carefully. Look for new terms,
definitions, and concepts.
Observations
The Observations illustrate mathematical concepts relating to inequalities. Scroll through the
Observations using " (! to review, if necessary). Read each screen carefully. When you come
to a Write an Observation screen, stop and write the answers to the questions on your worksheet.
Observation 1
If x is a real number, draw the number line graph of each
inequality. Remember to use open and closed notation and to
label each number line correctly.
1. x < 3
←→
2. x
≤ 3
←→
3. x > 6
←→
4. x ≥ 6
←→
Draw the number line graphs for these inequalities (which are not
in the Topics in Algebra 1 application).
5. x > M 1
2
←→
6. x 1.25
←→

Chapter 4: Linear Inequalities Name
Section 1: Using Graphs & Tables Date
Topics in Algebra 1 © 2001 Texas Instruments Student Worksheet 4-2
Activities
The Activities help you practice using graphs and tables to solve inequalities. You can select from
three different activities—Build the Solution Set!, Worksheet Activity 1, and Worksheet Activity 2.
Follow these steps to play the activity and complete your worksheet.
1. Make sure you are in the Activities for this section.
2. Highlight an activity using $ or #, and press b.
Scoring: There are five
problems in each set. You
get two attempts to solve
for x for each problem.
You get 2 points for a
correct choice on the first
try, and 1 point for a
correct choice on the
second try.
You can earn up to 10
points.
Build the Solution Set!
1. Use
! or " to move the cursor along the number line. Press
b to select the first point to test. The point is displayed
along with the result of the test.
2. Choose another point to test. After the point and result of the
test for the second point are displayed, four possible solutions
for x are displayed.
3. Press
! or " to highlight the correct solution, and then press
b to select it. If you choose an incorrect solution on the
first try, you get another try. If you choose an incorrect
solution on the second try, the correct answer is displayed;
press any key to go to the next problem. As you play the
activity, write the inequalities and their solutions.
4. What was your score?
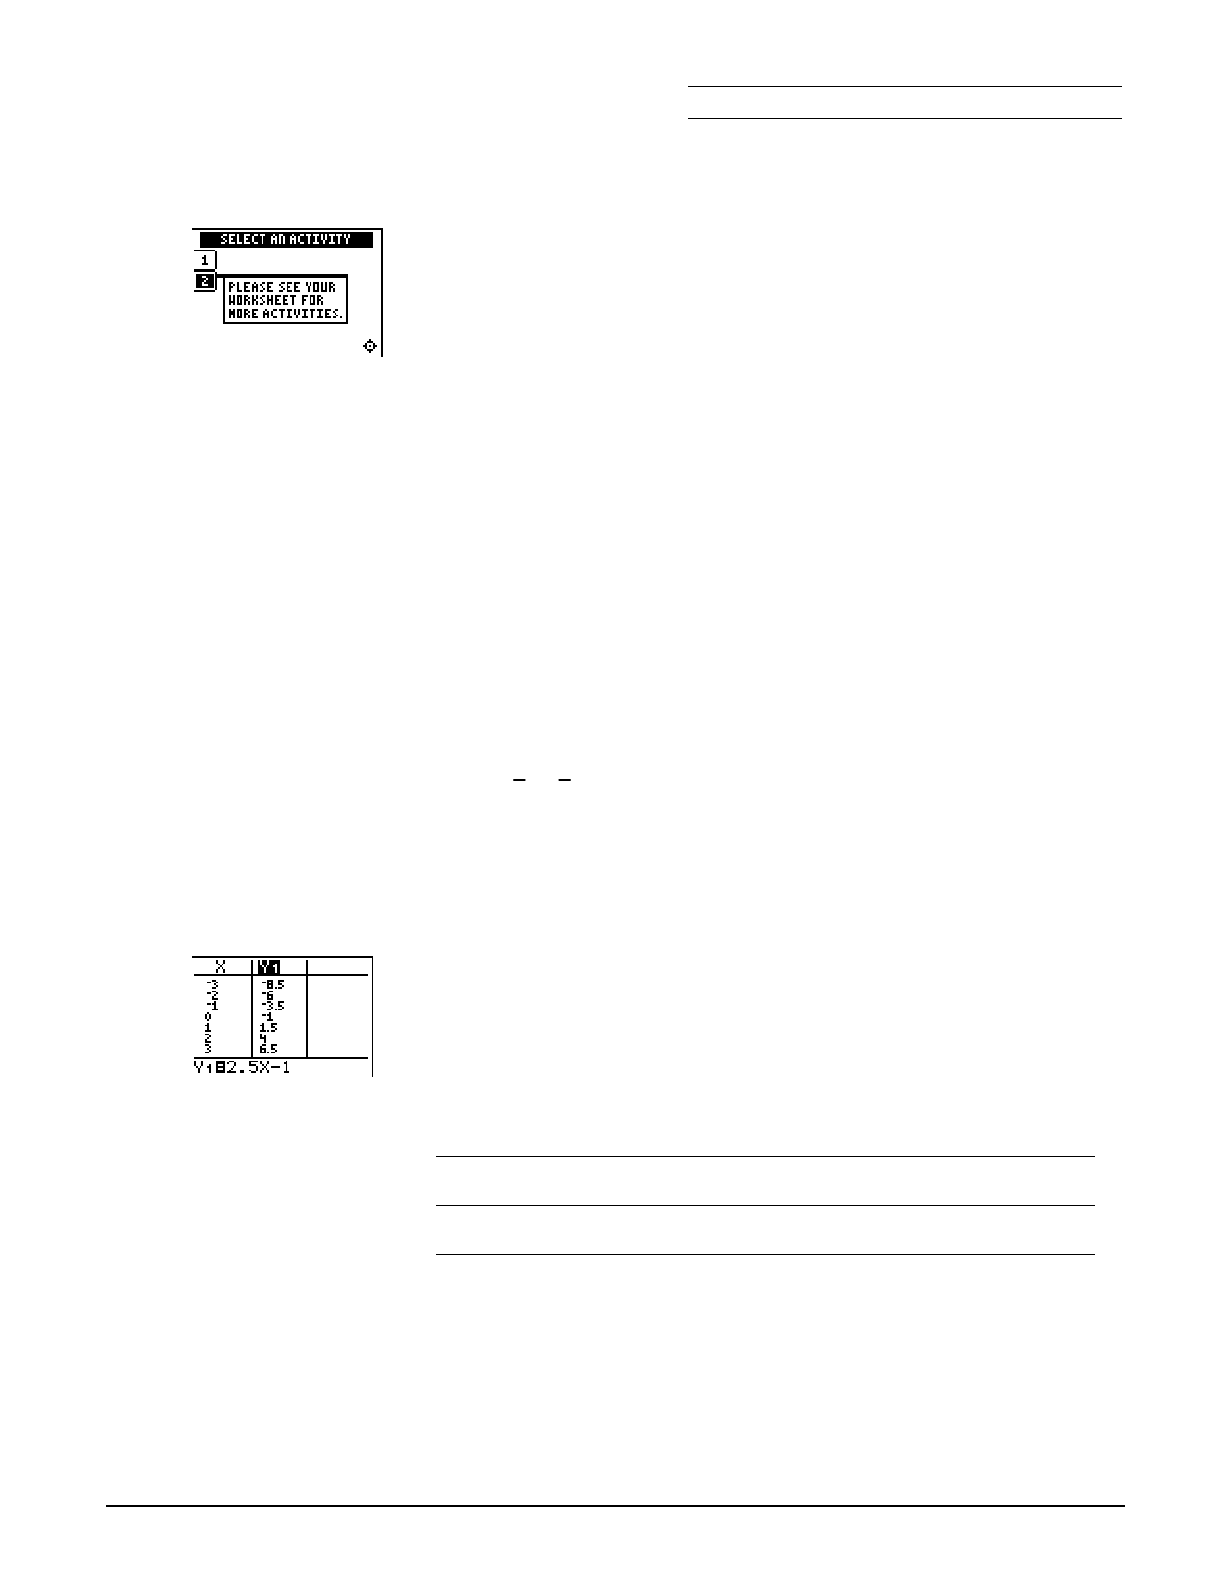
Chapter 4: Linear Inequalities Name
Section 1: Using Graphs & Tables Date
Topics in Algebra 1 © 2001 Texas Instruments Student Worksheet 4-3
Activities (continued)
Note: Press | or ~ to
leave this screen.
Worksheet Activity 1
Use the number lines below to estimate the solution set of the
following inequalities. Use number sense to place a scale on each
number line so that you are able to show the solution set. Check
several points as shown in the previous activity. Show all of your
work.
1. x + 2.5 < 7
←→
2. x
N 3.6 M2
←→
3. x +
3
4 > 41
8
←→
Worksheet Activity 2
Use the table of the expression 2.5X−1 at the left to find out when
2.5X−1<3. First estimate the answer, and then use number sense
to determine the exact answer. Write your strategy for the
solution, and draw the solution set on a number line.
2.5X−1<3
←→
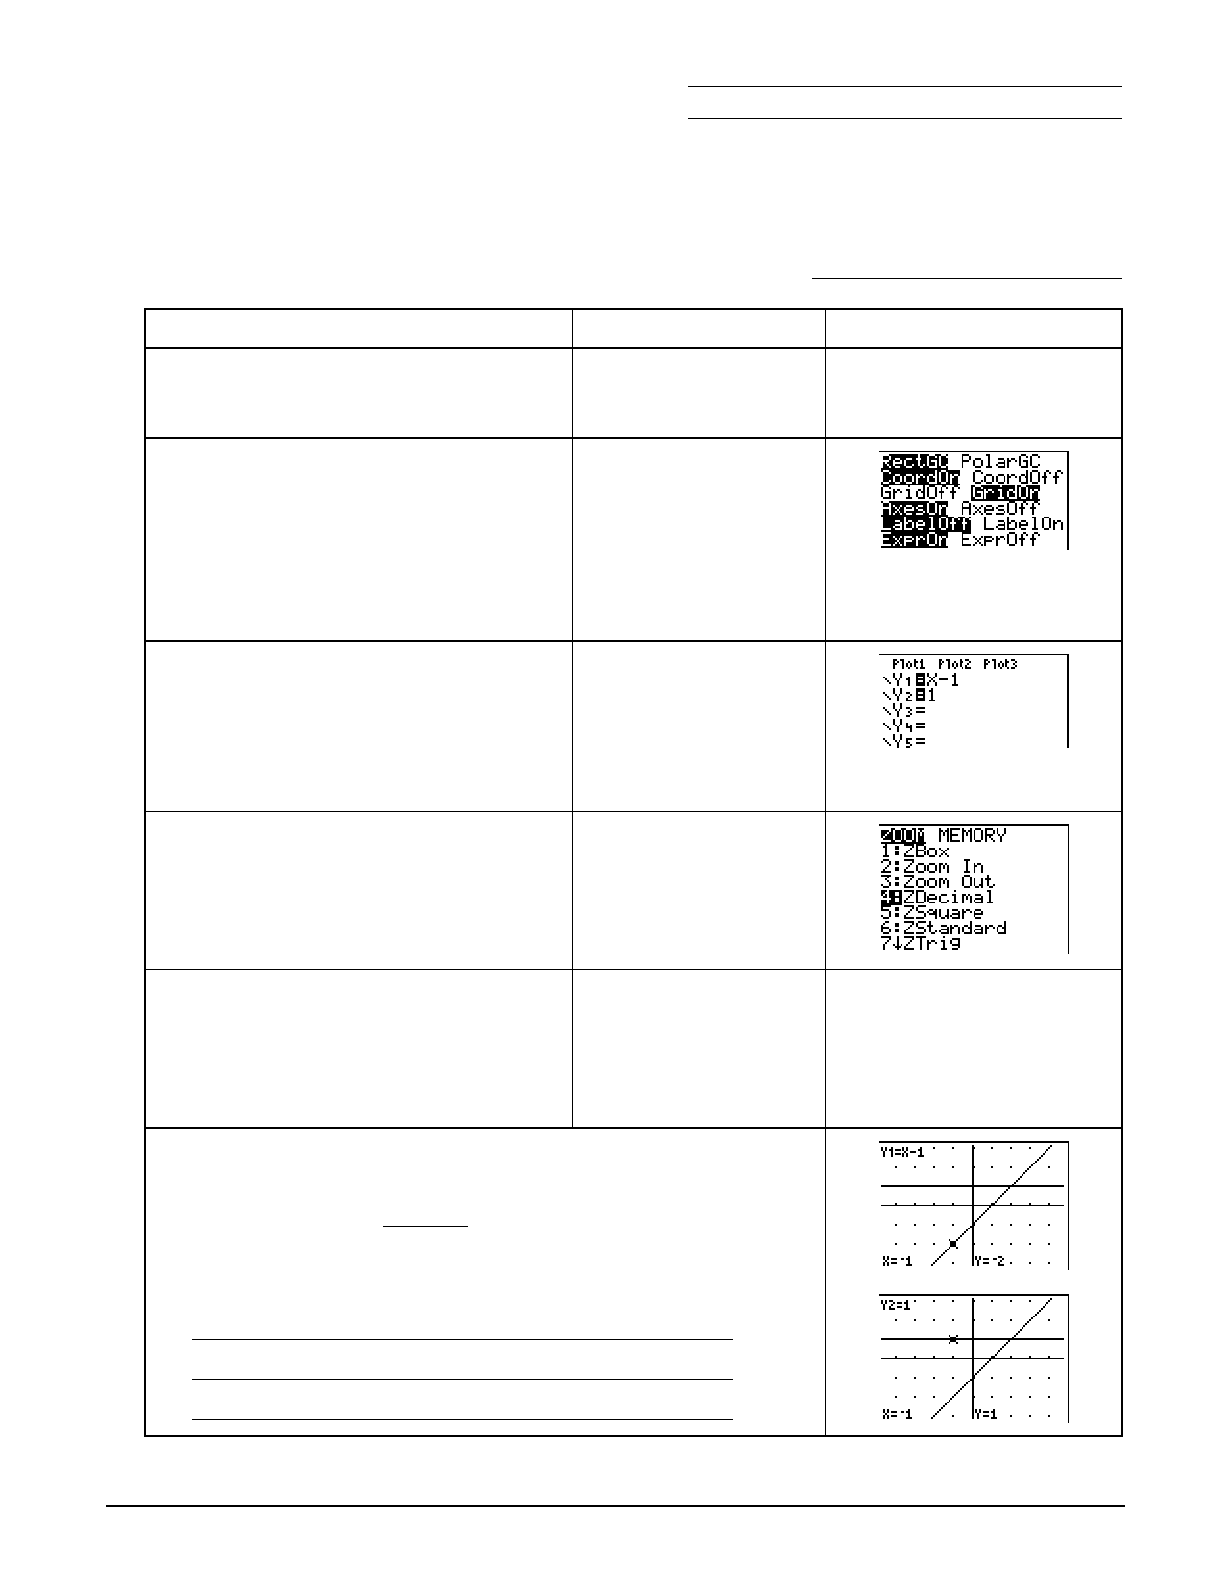
Chapter 4: Linear Inequalities Name
Section 1: Using Graphs & Tables Date
Topics in Algebra 1 © 2001 Texas Instruments Student Worksheet 4-4
³ Try-It!é on Your TI.83 Plus or TI.73
Solution search using X-Y graphs: Find the solution set for the inequality X−1<1. Before you start,
estimate the solution using number sense. Write your estimate here.
To Do This Press Display (TI.83 Plus shown)
1. Exit the Topics in Algebra 1
application and clear the Home
screen.
y l
áEXITâ :
2. Set your window format as shown.
Note: See ³ TIpé 5:
Adjusting the Viewing Window
for more information.
TI-83:
- g
# # " b
TI-73:
- g
# " b
3. Enter both sides of the inequality into
the Y= editor as shown.
Note: On the TI-73, use I rather than „.
Note: You may need to deselect the other Y=
functions. See ³ TIpé 3:
Graphing a Function in the
Standard Window
.
& :
„ T 1
# :
1
4. Select
ZDecimal
to set the viewing
window and graph the functions.
TI-83:
( 4:ZDecimal
TI-73:
( 8:ZDecimal
5. Trace the functions.
Note: The function displays in the upper left corner
of the screen; the X and Y values are displayed on
the bottom of the screen.
r
| or ~ to trace a
function
} and † to move
between functions
6. Compare
Y1 and Y2 for the same X values. For example, notice
that when X = M1, Y1= M2 and Y2=1 as shown on the screens.
Where is X −1 < 1?
Hint: Trace Y1 to find out when Y1< Y2.
7. Why?

Chapter 4: Linear Inequalities Name
Section 1: Using Graphs & Tables Date
Topics in Algebra 1 © 2001 Texas Instruments Student Worksheet 4-5
³ Try-It!é on Your TI.83 Plus or TI.73 (continued)
Additional Problems
Solution Search: On the following problems, first estimate the solution using number sense. Then
search for the solution set for each inequality using graphs as shown in the previous example.
Finally, draw your graphs from your calculator and show your work.
Don’t forget to set an appropriate viewing window in order to see your graphs.
Note: See ³ TIpé 5:
Adjusting the Viewing Window
for more information.
1. 2X+3 7
2. X+4 > M3
3. 0.5XN1 < 2
4. XN2 ‚ M3

Chapter 4: Linear Inequalities Section 1: Using Graphs & Tables
Topics in Algebra 1 © 2001 Texas Instruments Teacher Notes 4-6
Linear Inequalities: Using Graphs & Tables Teacher Notes
Objectives
• To illustrate how to estimate the solution set, in the real numbers, of a linear inequality using
graphical methods on a number line and on a Cartesian (x-y) graph.
• To illustrate how to estimate the solution set, in the real numbers, of a linear inequality using
tables.
Math Highlights
In the number line method, students use a guess-and-test approach to search for the solution on
a number line. A point is chosen to test, the substitution is shown and students see whether the
statement is true or false. A point is plotted for a true statement. Students see an estimate of the
solution set built on the number line.
In the table of values method, students see a table of values for each side of the inequality. They see
where the inequality is satisfied, and then they see how to refine the estimate of the solution set.
In the x-y graphical method, students plot both sides of the inequality and use the graph to determine
the solution set for the inequality by testing points. In the 2-D graph, students are able to see which
graph is higher or lower than the other graph. This helps them estimate the solution set.
Note: The inequalities of the form ax + b < c (for <, ≤, >, ≥) with a < 0 are not discussed in this
section.
Common Student Errors
• Using graphs and tables can mislead students. They may think that they can always find the
exact solution using graphs and table. Although they will often find exact solutions using
these methods, using algebra will always give exact solutions for inequalities. For the
calculator example, x + 2 1, only integer values are tested. If the example had been
x + 2 < 1, the students would need to test points closer and closer to x = M1 to see that the
solution set contains values strictly less than M1. The endpoint (M1) is not included in the
solution. Encourage students to pick many points. Remind them that they would have to test
all points with these methods to get the exact solution, in the real numbers and that is
physically impossible to test all points!
• At times, introducing the algebraic solution of inequalities gives students just the mechanics
of doing a problem. Algebraic methods alone usually do not invite students to reason out the
solution using number sense. The graphs and tables method gives students the opportunity to
see the values of each side of the inequality as a graph or table so they can compare the size
of the numbers, thus helping them create the solution set.
• Visual learners can benefit by seeing the graphs and numbers and using them as the tool to
find the solution set.
• Some students may still have difficulty remembering the meaning of the symbols, <, ≤, >, and
≥.
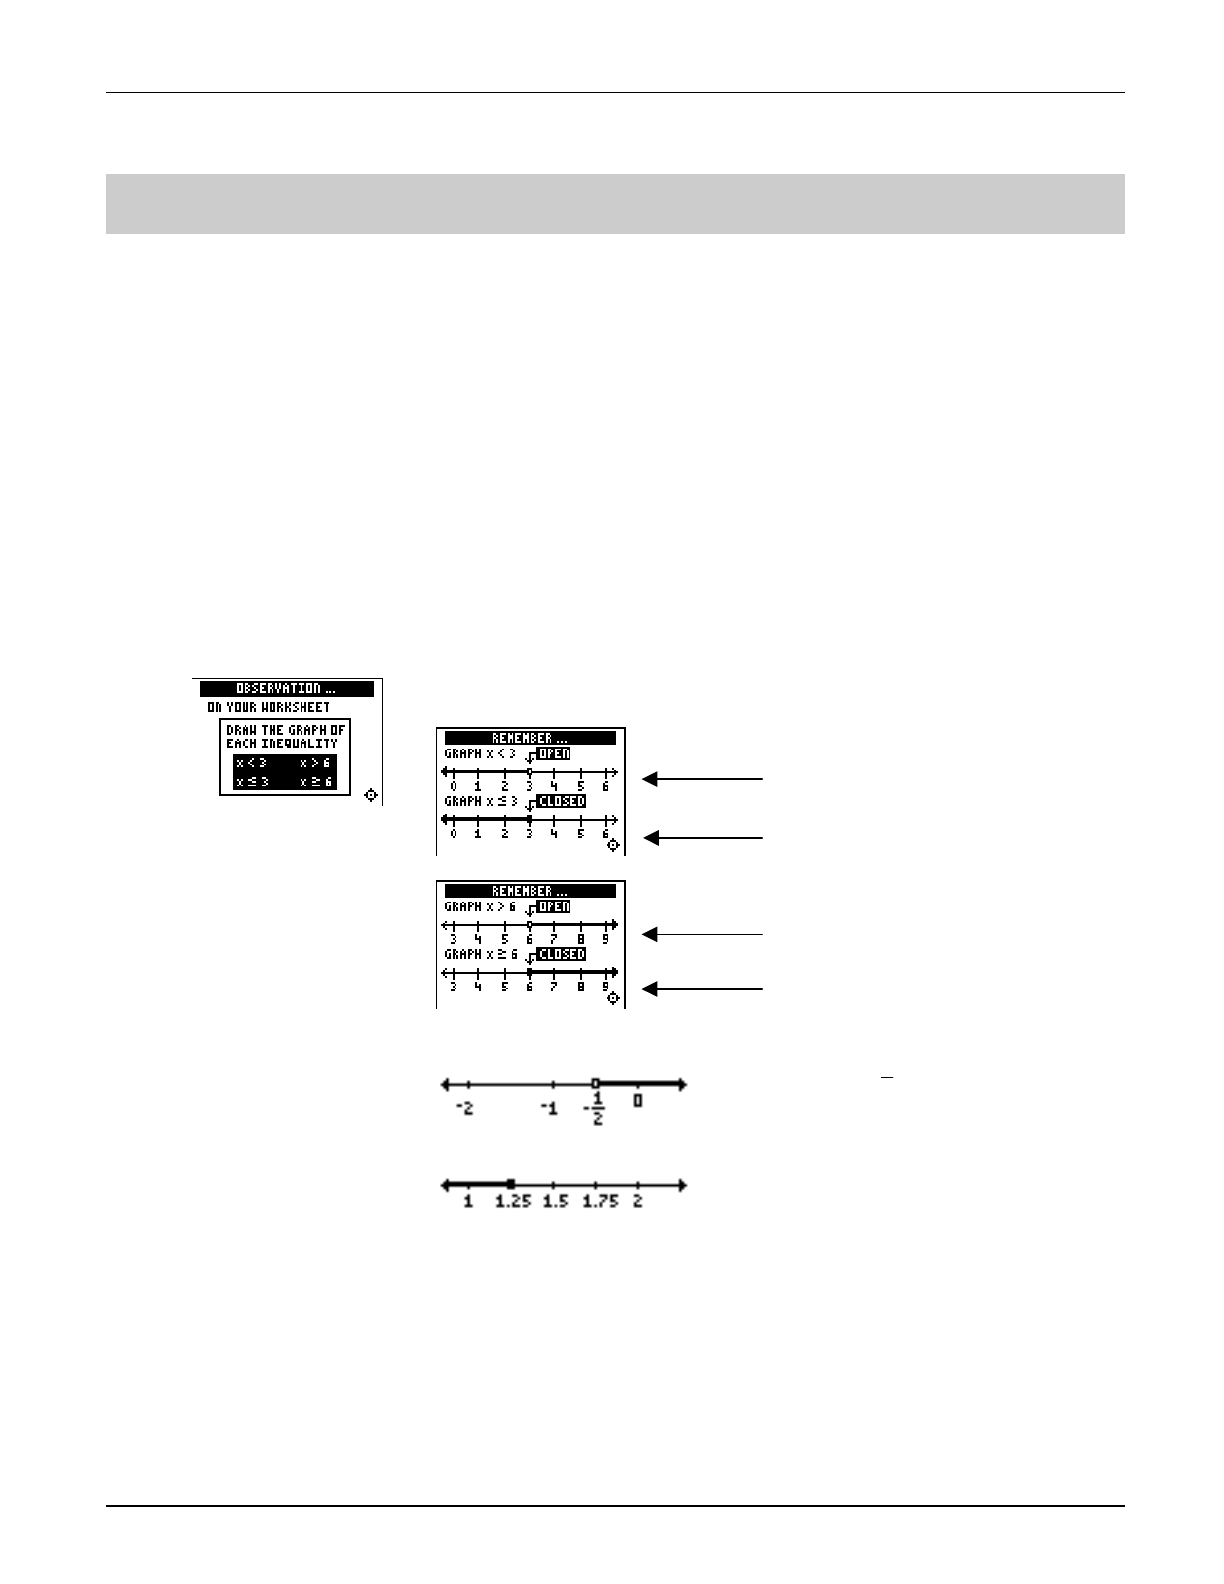
Chapter 4: Linear Inequalities Section 1: Using Graphs & Tables
Topics in Algebra 1 © 2001 Texas Instruments Teacher Notes 4-7
Student Worksheet Notes with Answers
Overview
Tell students:
1. How to find the Overview, or tell them to review the instructions on the worksheet.
2. How to navigate the application, if they are not yet familiar with the application.
3. To scroll through the Overview on the calculator. Point out new terms, definitions, and
concepts, and tell students to look for them as they go through the Overview.
Observations
The Observations help students understand concepts about linear inequalities relating to graphs
and tables. If necessary, tell students how to find the Observations.
Observation 1
1. x < 3
2. x
3
3. x > 6
4. x ≥ 6
5. x > M 1
2
(Not in the Topics in Algebra 1
application.)
6. x 1.25
(Not in the Topics in Algebra 1
application.)
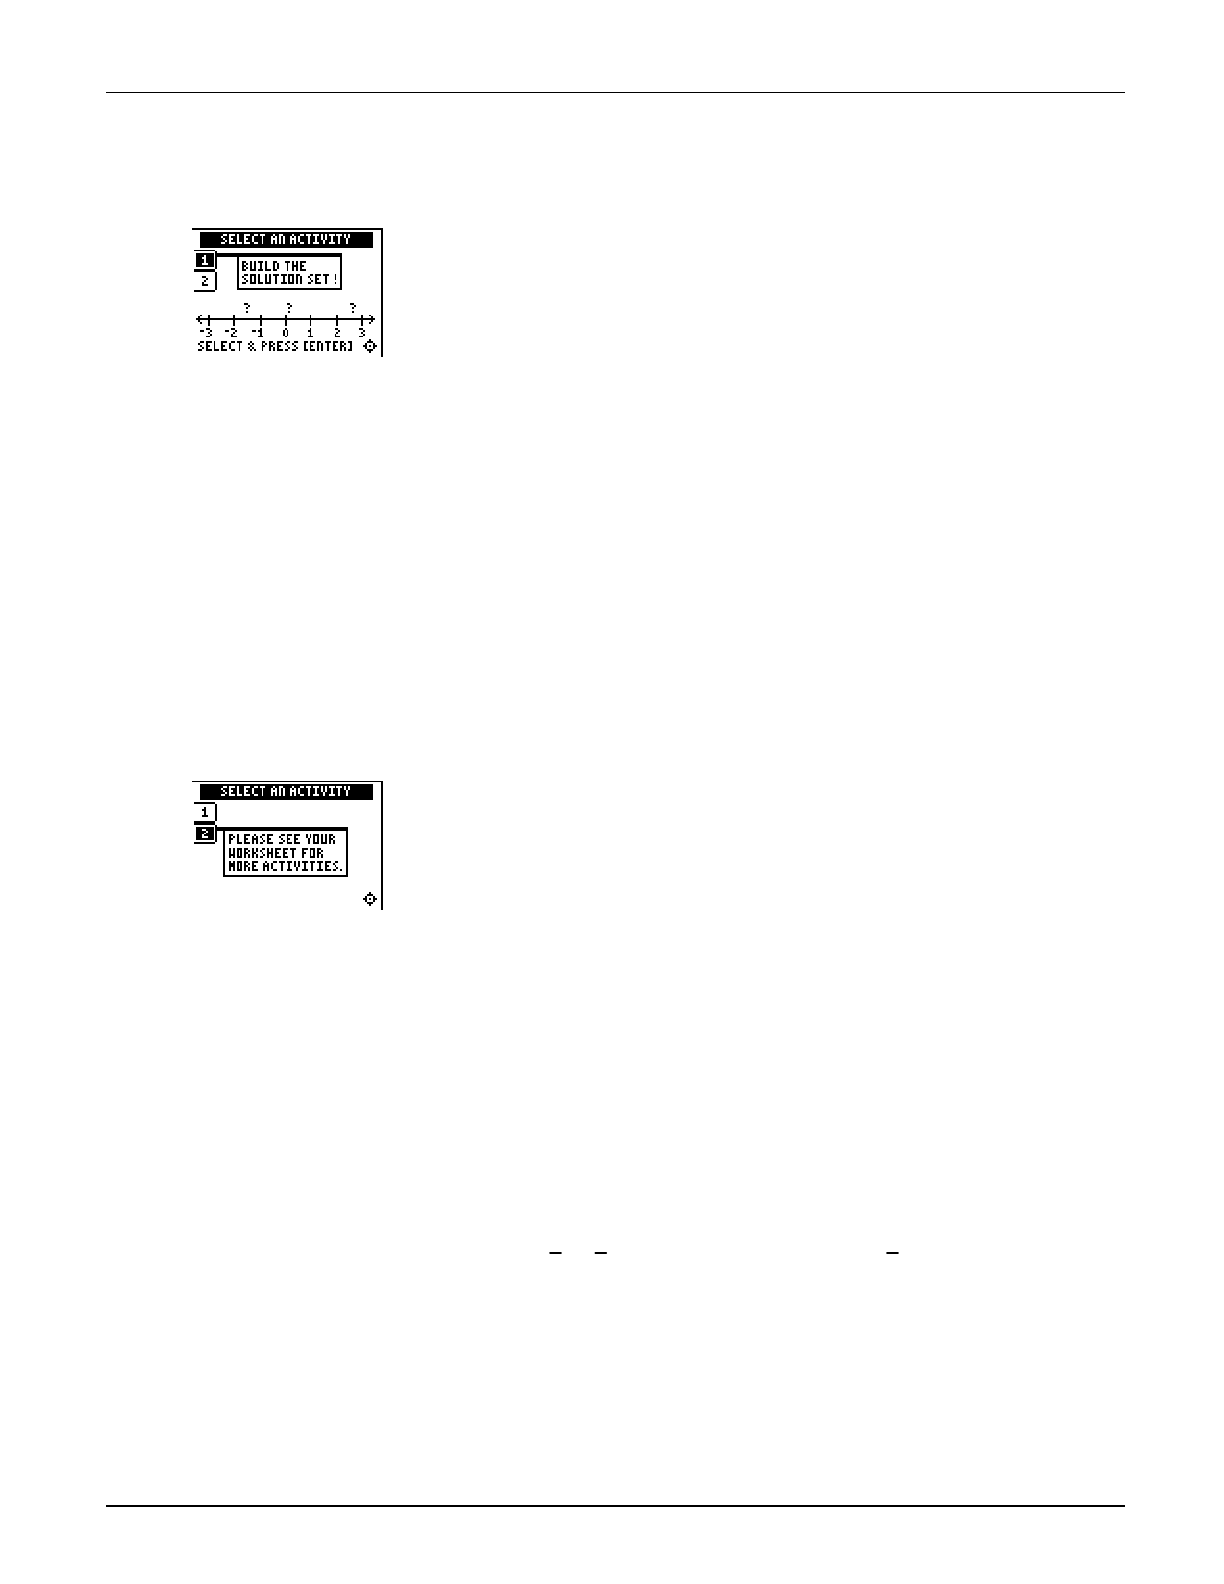
Chapter 4: Linear Inequalities Section 1: Using Graphs & Tables
Topics in Algebra 1 © 2001 Texas Instruments Teacher Notes 4-8
Activities
Scoring: There are five
problems in each set.
Students get two attempts
to solve for x for each
problem. You get 2 points
for a correct choice on the
first try, and 1 point for a
correct choice on the
second try.
Students can earn up to
10 points.
Build the Solution Set!
Tell students to:
1. Use
! or " to move the cursor along the number line. Press
b to select the first point to test. The point is displayed
along with the result of the test.
2. Choose another point to test. After the point and result of the
test for the second point are displayed, four possible solutions
for x are displayed.
3. Press
! or " to highlight the correct solution, and then press
b to select it. If students choose an incorrect solution on
the first try, they get another try. If they choose an incorrect
solution on the second try, the correct answer is displayed.
Students can press any key to go to the next problem. As they
play the activity, they should write the inequalities and their
solutions.
4. Record their scores.
Note: Students can press
| or ~ to leave this
screen.
Worksheet Activity 1
Tell students to:
1. Use number sense to estimate the solution set for the
following three inequalities on the number lines provided.
2. Place the appropriate scale on each number line so that they
are able to show the solution set appropriately.
3. Check several points as shown in the activity above.
4. Show all of their work.
1. x + 2.5 < 7 when x < 4.5
2. x N 3.6 M2 when x 1.6
3. x + 3
4 > 41
8 when x > 33
8
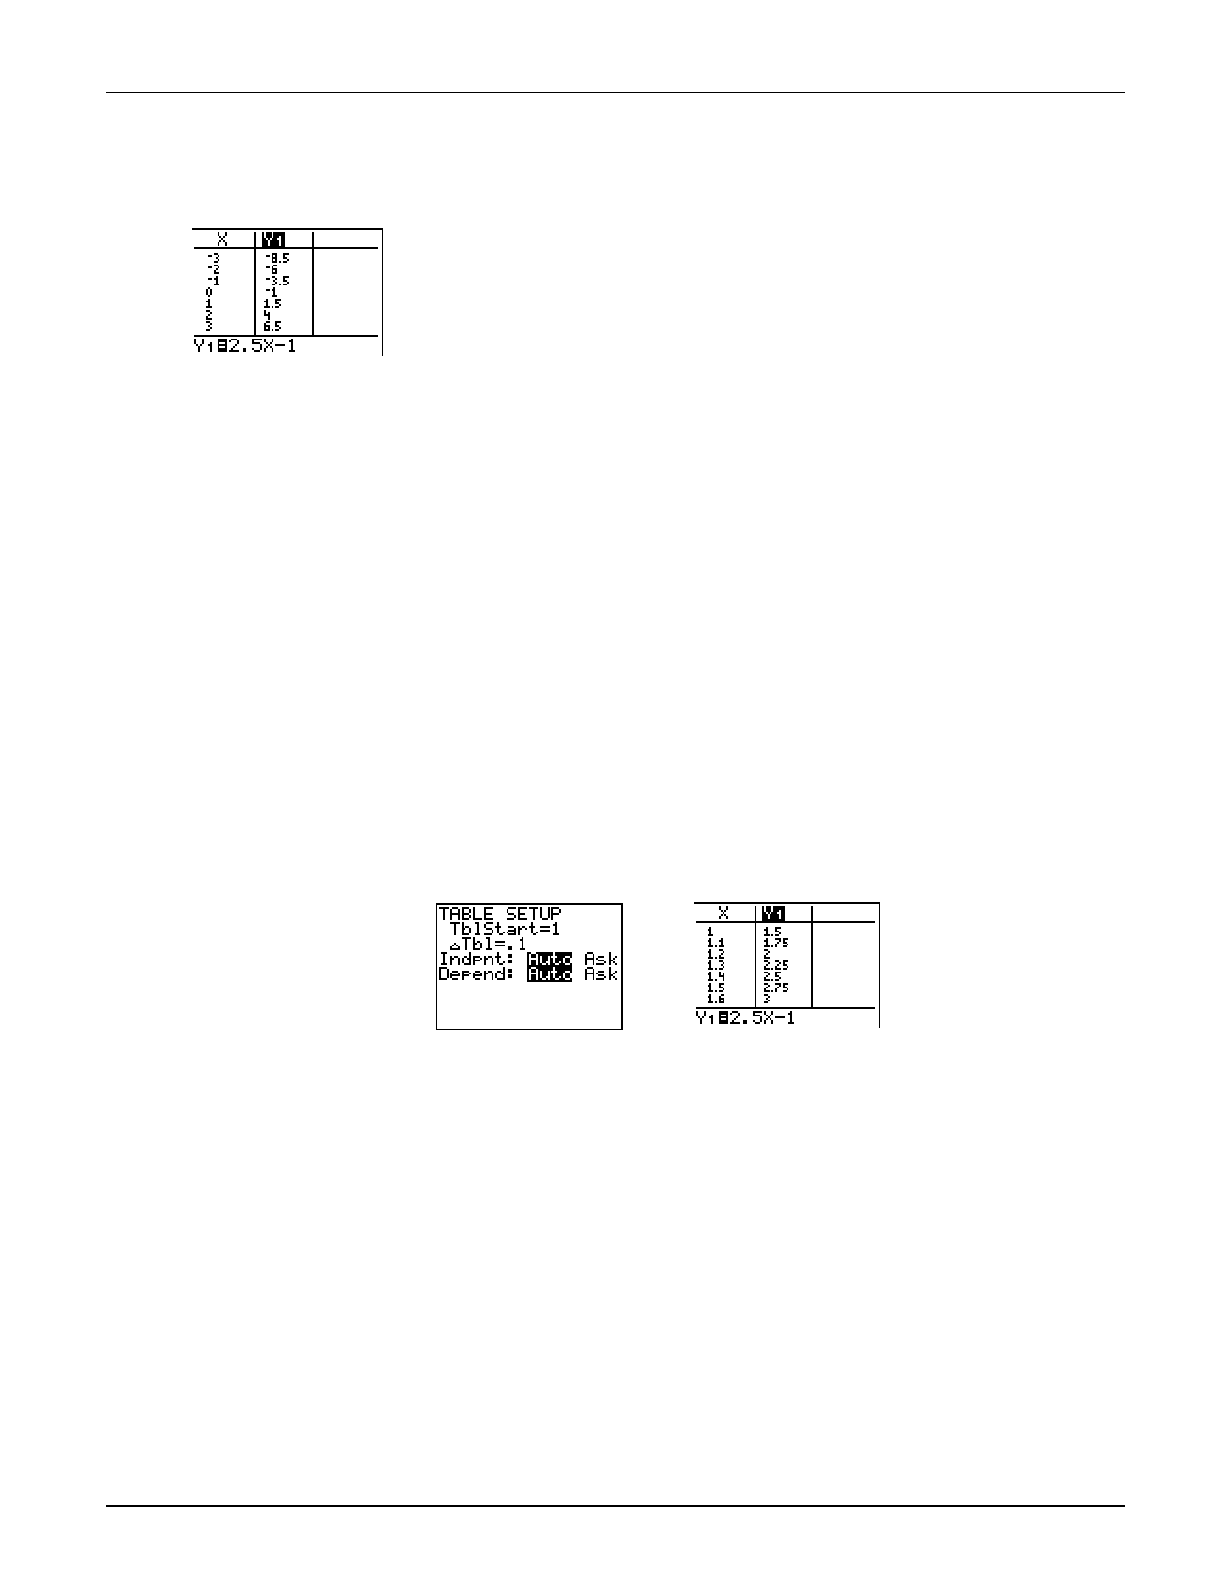
Chapter 4: Linear Inequalities Section 1: Using Graphs & Tables
Topics in Algebra 1 © 2001 Texas Instruments Teacher Notes 4-9
Activities (continued)
Worksheet Activity 2
Tell students to:
Use the table of the expression 2.5X−1 shown on their worksheets
(shown at left) to find out when 2.5X−1<3 by first estimating the
answer, and then using number sense to determine the exact
answer. Remind them to write their strategy for the solution and
to draw the solution set on a number line.
From the table, students should see that they need to test more
values between X=1 and X=2 to find where 2.5XN1<3.
If you wish the students to continue the activity on their
calculators, tell them to enter the function in the Y= editor. Then
on the TABLE SETUP
screen (- f), they can refine their
search as shown in the screens below.
The students see that 2.5XN1 is equal to 3
at X=1.6, but they need
to figure out when 2.5XN1< 3. Students can go to the TABLE
SETUP screen and change the settings to TblStart=1 and ∆Tbl=.1,
and then investigate further. This problem should be discussed
to show that the search should still continue because the
endpoint of 1.6 is not in the solution set. The answer is X<1.6.
To investigate further, refine the table values by changing
TblStart=1.5, and ∆Tbl=.01
.
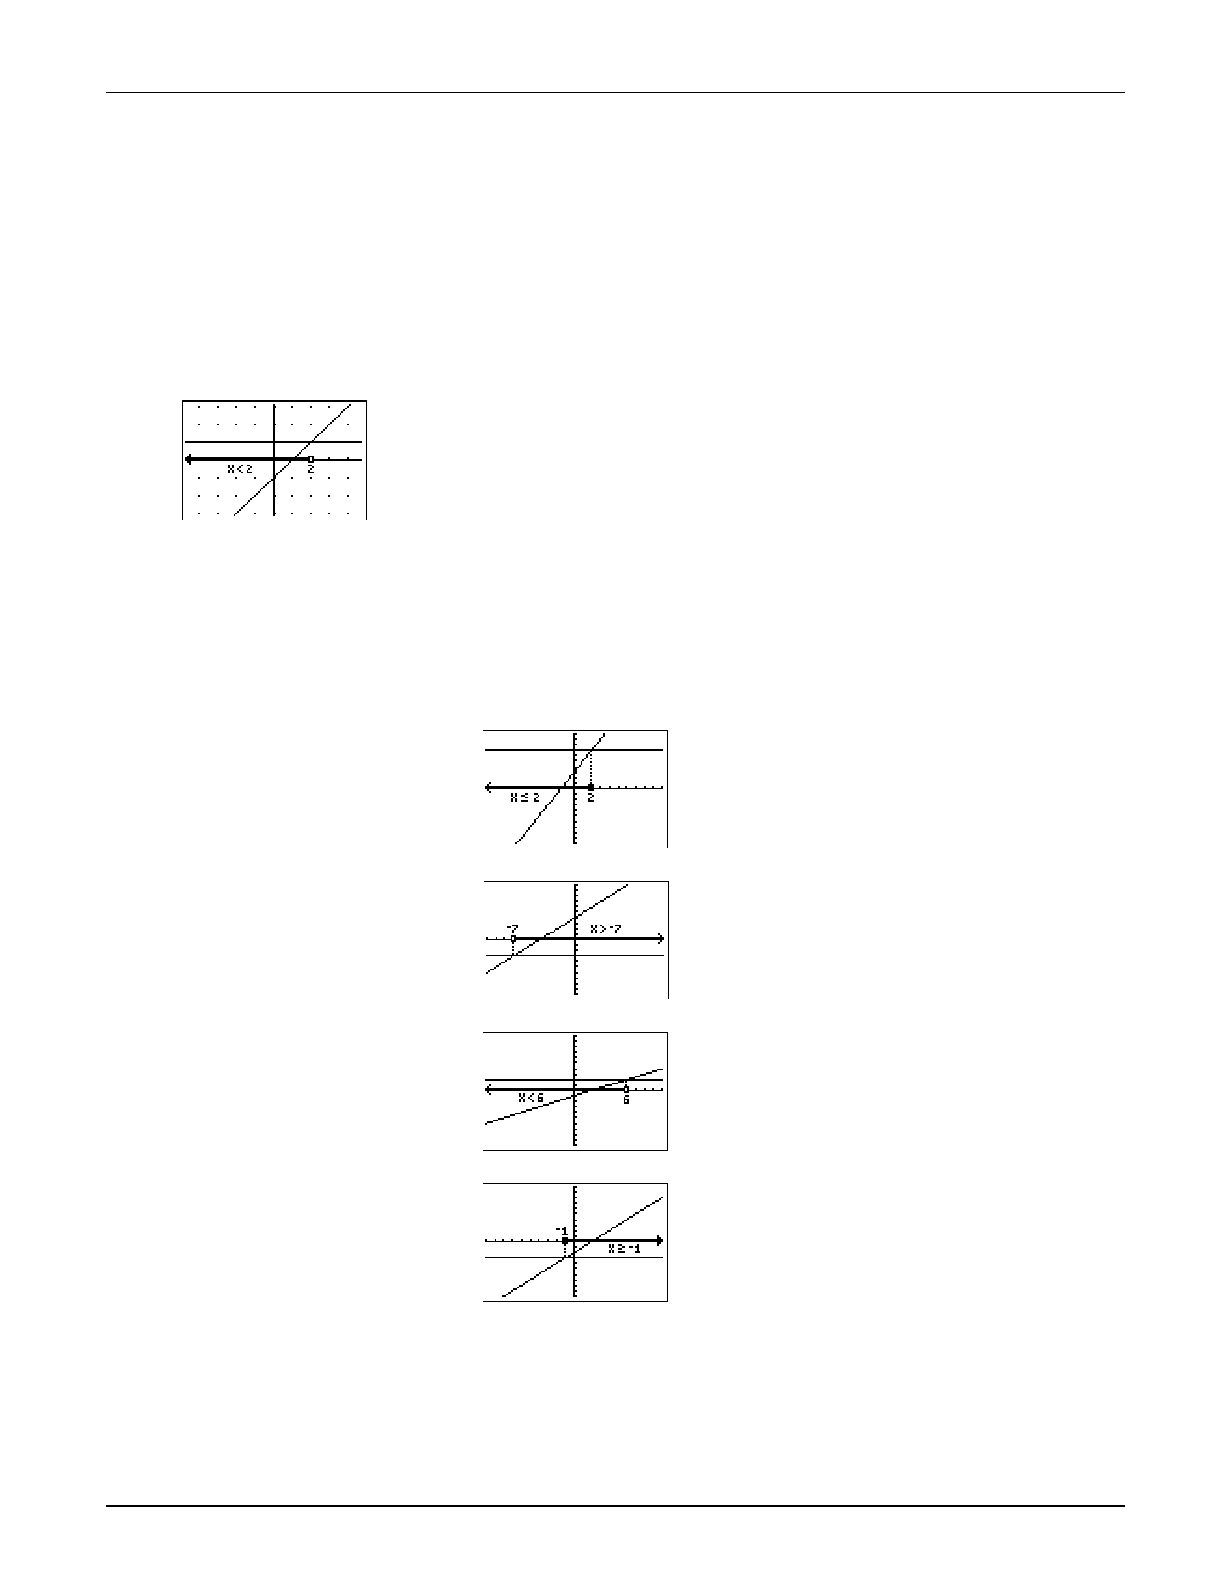
Chapter 4: Linear Inequalities Section 1: Using Graphs & Tables
Topics in Algebra 1 © 2001 Texas Instruments Teacher Notes 4-10
³ Try-It!é on Your TI.83 Plus or TI.73
Solution Search Using X-Y Graphs: Tell students to first estimate the solution for the inequality
X−1<1 using number sense and then find the solution set using a calculator.
6. X−1 < 1 when X< 2.
7. Answers may vary. Students can trace the graph to see the result.
Additional Problems
Students investigate inequalities using X-Y graphs to compare numbers in order to create the
solution set. See the student worksheet for calculator details. Students must set appropriate
graphing windows in order to see the graphs. Graphing windows shown use ( ZStandard
,
which sets X and Y values so that M10 ≤ value ≤ 10.
1. 2X+3 7
2. X+4 > M3
3. 0.5XN1 < 2
4. XN2 ‚ M3
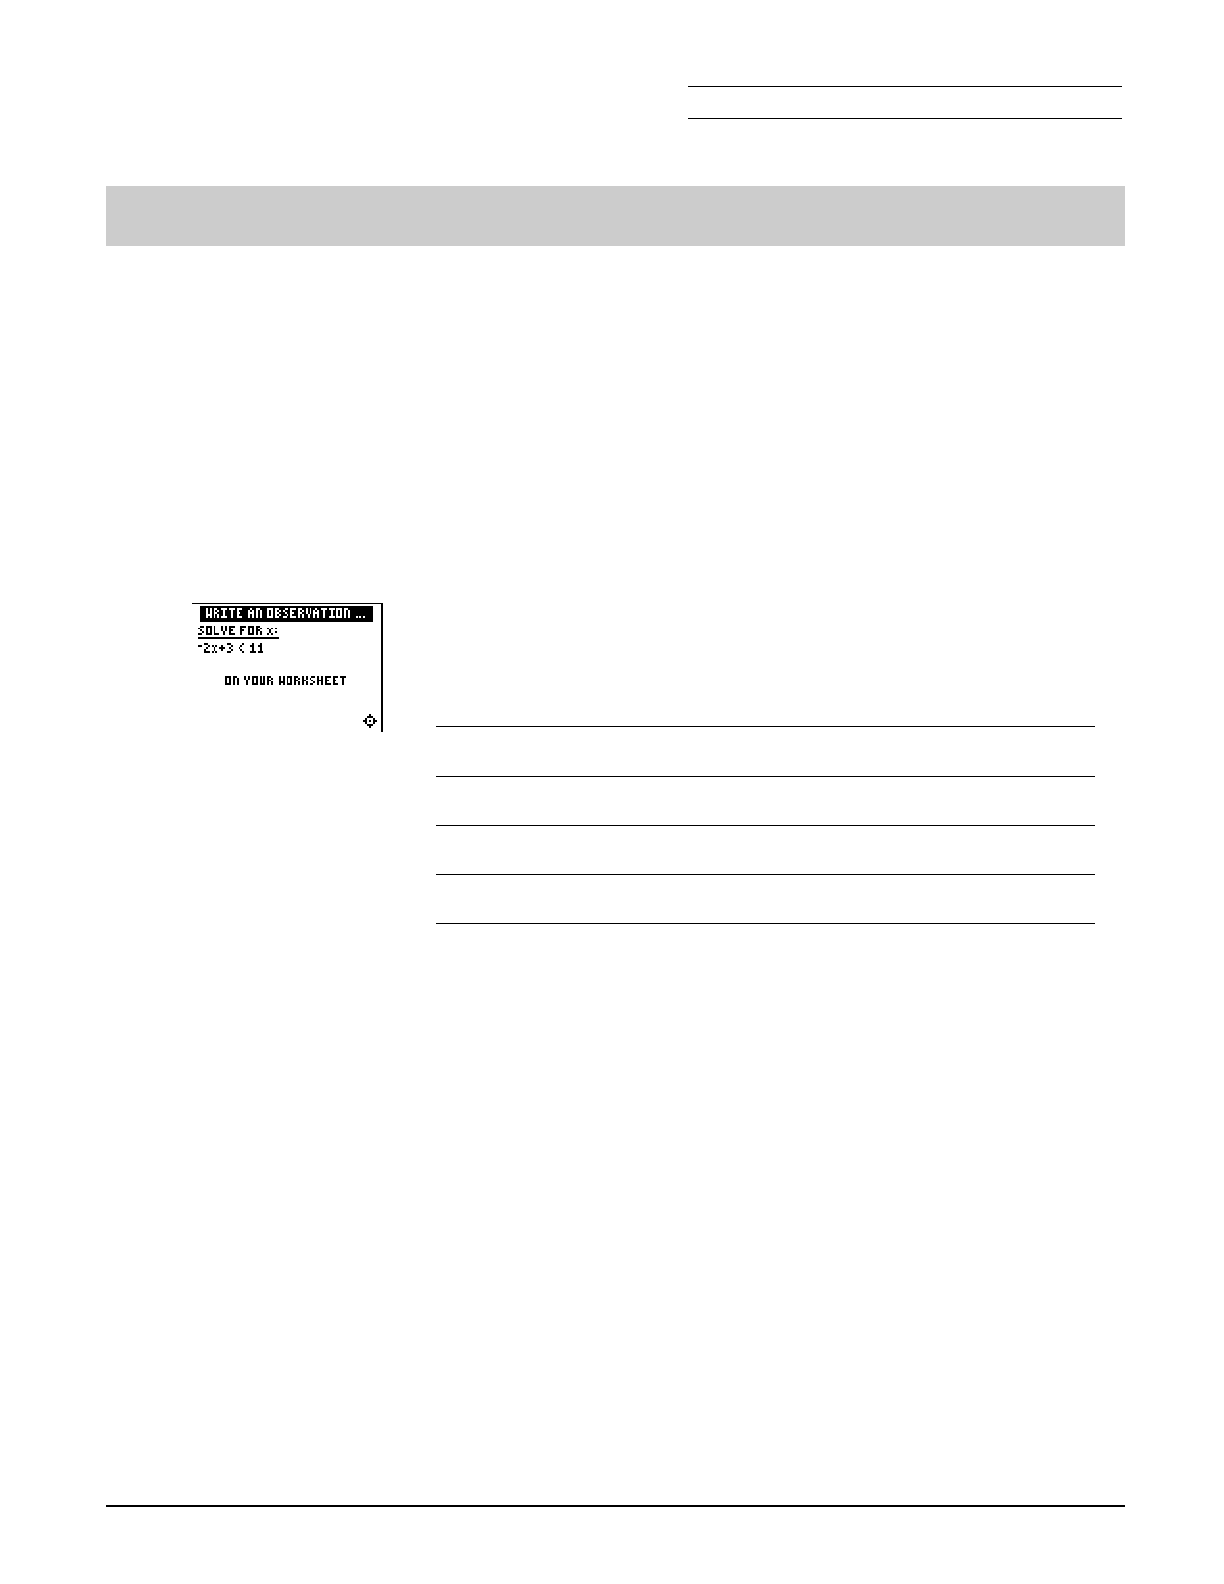
Chapter 4: Linear Inequalities Name
Section 2: Using Algebra Date
Topics in Algebra 1 © 2001 Texas Instruments Student Worksheet 4-11
Linear Inequalities: Using Algebra Student Worksheet
Overview
The Overview introduces the topics covered in Observations and Activities. Scroll through the
Overview using " (! to review, if necessary). Read each screen carefully. Look for new terms,
definitions, and concepts.
Observations
The Observations illustrate mathematical concepts relating to using algebra in linear inequalities.
Scroll through the Observations using " (! to review, if necessary). Read each screen carefully.
When you come to a Write an Observation screen, stop and write the answers to the questions on
your worksheet.
Observation
Solve the inequality. Show your work.
Draw the solution set on the number line.
←→

Chapter 4: Linear Inequalities Name
Section 2: Using Algebra Date
Topics in Algebra 1 © 2001 Texas Instruments Student Worksheet 4-12
Activities
The Activities help you practice using algebra to solve inequalities. You can select from two
different activities—Solve It! and Free Fall. Follow these steps to play the activity and complete
your worksheet.
1. Make sure you are in the Activities for this section.
2. Highlight an activity using $ or #, and press b.
Scoring: You get two
attempts to pick the step.
You earn 2 points for a
correct answer on the first
try, 1 point for a correct
answer on the second try.
You get an additional 2
points for the correct
solution.
The total number of points
available varies.
Solve It!
1. Highlight a level (silver = less difficult; gold = more difficult),
and press b to select it.
2. Look at the algebraic expression at the top of the screen and
decide what must be done to solve the inequality for x.
3. Press
# or $ to cycle through steps to choose from, and then
press b to select the correct step (some problems require
two steps). If your second choice is incorrect, the correct step
is displayed; press any key to continue play. If the activity
prompts you to select the correct result, highlight it with " or
!, and then press b to select it. As you play the activity,
write each inequality. What was your strategy for finding the
solution?
4. What level did you play?
5. What was your score?

Chapter 4: Linear Inequalities Name
Section 2: Using Algebra Date
Topics in Algebra 1 © 2001 Texas Instruments Student Worksheet 4-13
Activities (continued)
Scoring: Points are
based on how quickly you
solve each equation.
Unless you specify point
or time limits for this
activity, students can play
the activity when four
missed equations stack
up, the game is over.or
they press áQUITâ to stop.
There is no time limit.
Free Fall
1. Highlight a level (silver = less difficult; gold = more difficult),
and press b to select it.
2. When you are ready to start, press any key.
3. Watch the equation as it falls, and quickly solve for x. Enter
the solution (press Ì for negative numbers), and press b
before the equation hits bottom. If you give an incorrect
answer, the correct answer is displayed; press any key to
resume play. The incorrect equation stacks up at the bottom
of the screen, giving you less time to solve the next equation.
4. Follow your teacher’s instructions for how long to play the
activity.
5. What level did you play?
6. What was your score?
Additional Problems
Solve the following inequalities. Show your work.
1. 6.4x > 16 2. 1
2 x N 2 M2
3. 2x
N 2.1 < M3.5
4. A cell phone company charges a flat fee of $15 per month to use the phone. They also charge
25 cents for each phone call you make no matter how long you are on the phone. Your budget
allows you to spend at most $30 per month for the phone. How many phone calls will you be
able to make each month? (Tax is included in the prices.) Show your work. Write a short
paragraph explaining why would you choose this company or why not.
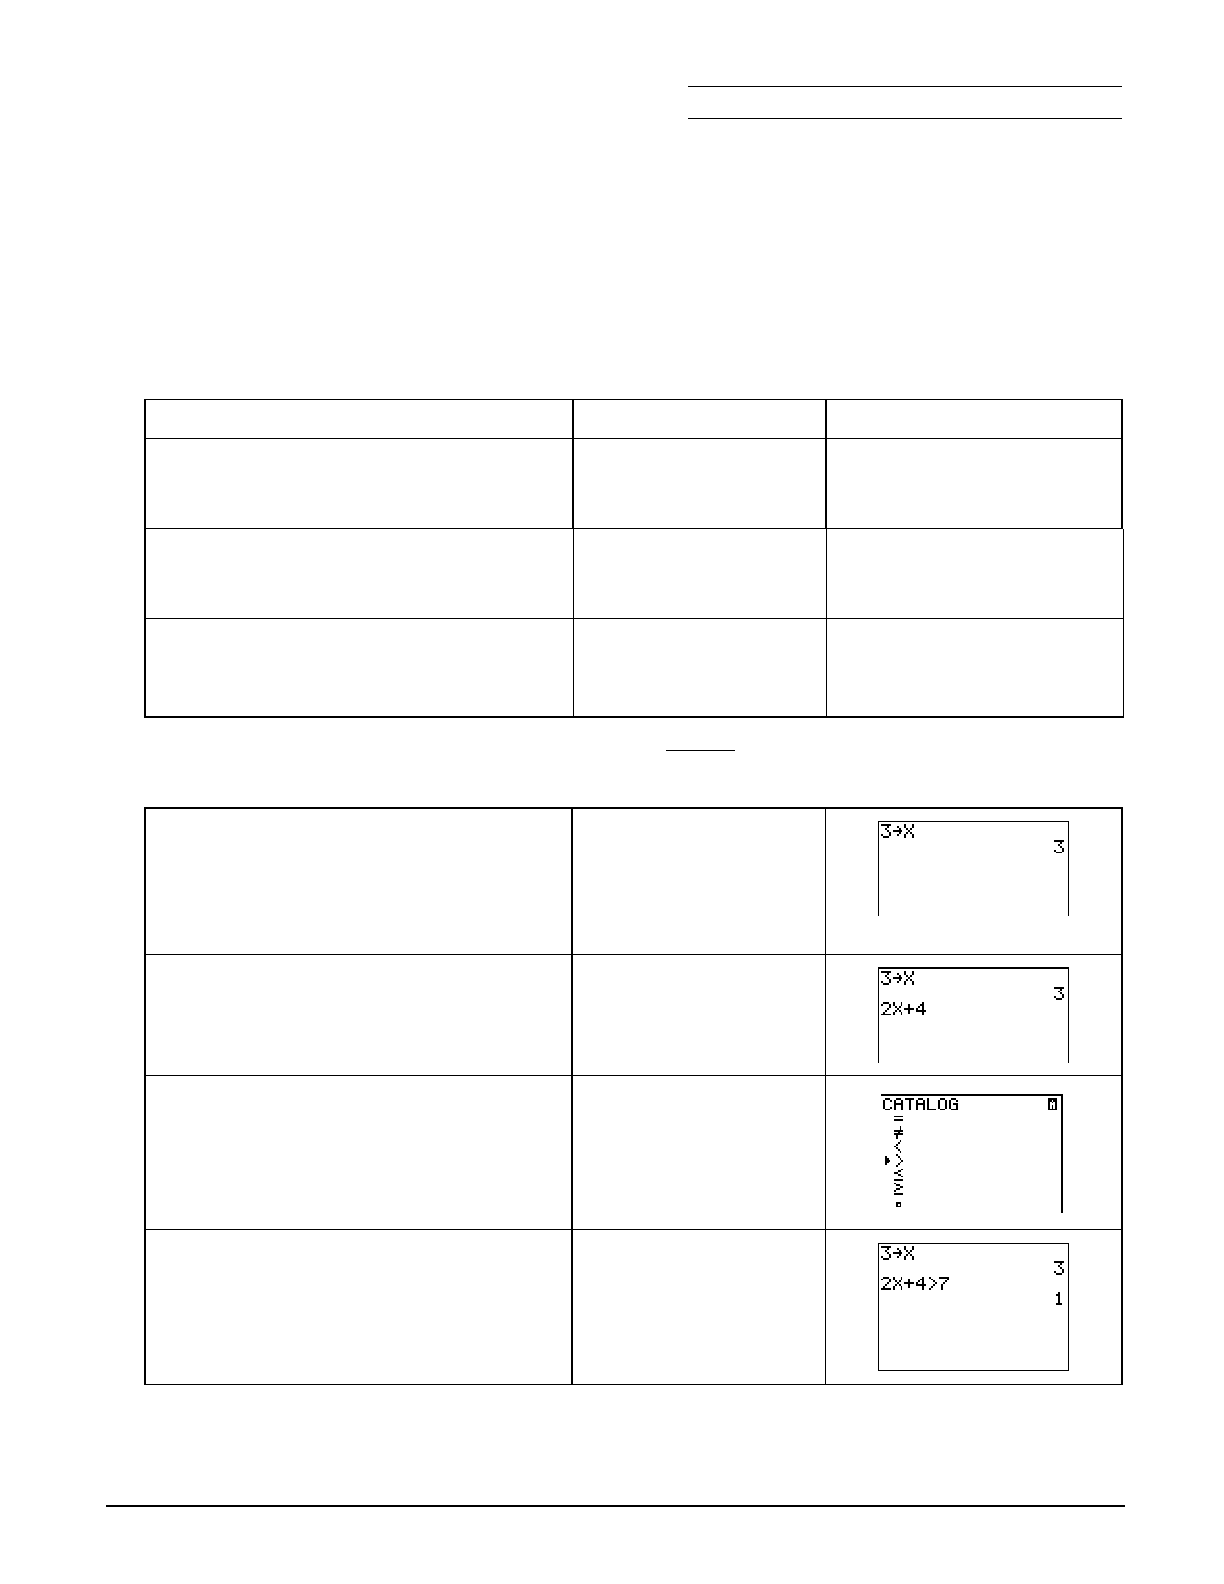
Chapter 4: Linear Inequalities Name
Section 2: Using Algebra Date
Topics in Algebra 1 © 2001 Texas Instruments Student Worksheet 4-14
³ Try-It!é on Your TI.83 Plus or TI.73
Testing points and graphing solution sets: If X=3, is 2X+4>7 true or false? Try it by hand first.
Show your work below.
To Do This Press Display (TI.83 Plus shown)
1. Exit the Topics in Algebra 1
application and clear the Home
screen.
y l
áEXITâ :
2. From the Home screen, the calculator
can tell you if a sentence is TRUE or
FALSE (1=TRUE and 0=FALSE).
3. First, check what value is currently
stored in X.
Note: On the TI-73, use I rather than „.
„
Í
4. What is the value of X stored in your calculator?
Check around the class. Most likely, there are many different values of X.
5. First, if you want to find out if
2X+4 > 7 is true or false when X=3,
you must tell the calculator that X=3,
which is called storing a value in X.
Note: On the TI-73, use I rather than „.
:
3 X „
Í
6. Next, input the number sentence
2X+4>7. This takes two steps.
Note: On the TI-73, use I rather than „.
2 „ \ 4
7. You can find the > (greater than) sign
in the catalog (- |).
Shortcuts: On the TI-83 Plus, press y : 3.
On the TI-73, press - t # # # " " b
to select > and # b to select Done.
- |
$ until the cursor is
next to >
Í
8. Now, complete the sentence and see
the result!
Remember,
1=TRUE and 0=FALSE. If
you substitute X=3, you get 10>7
which is TRUE.
7
Í
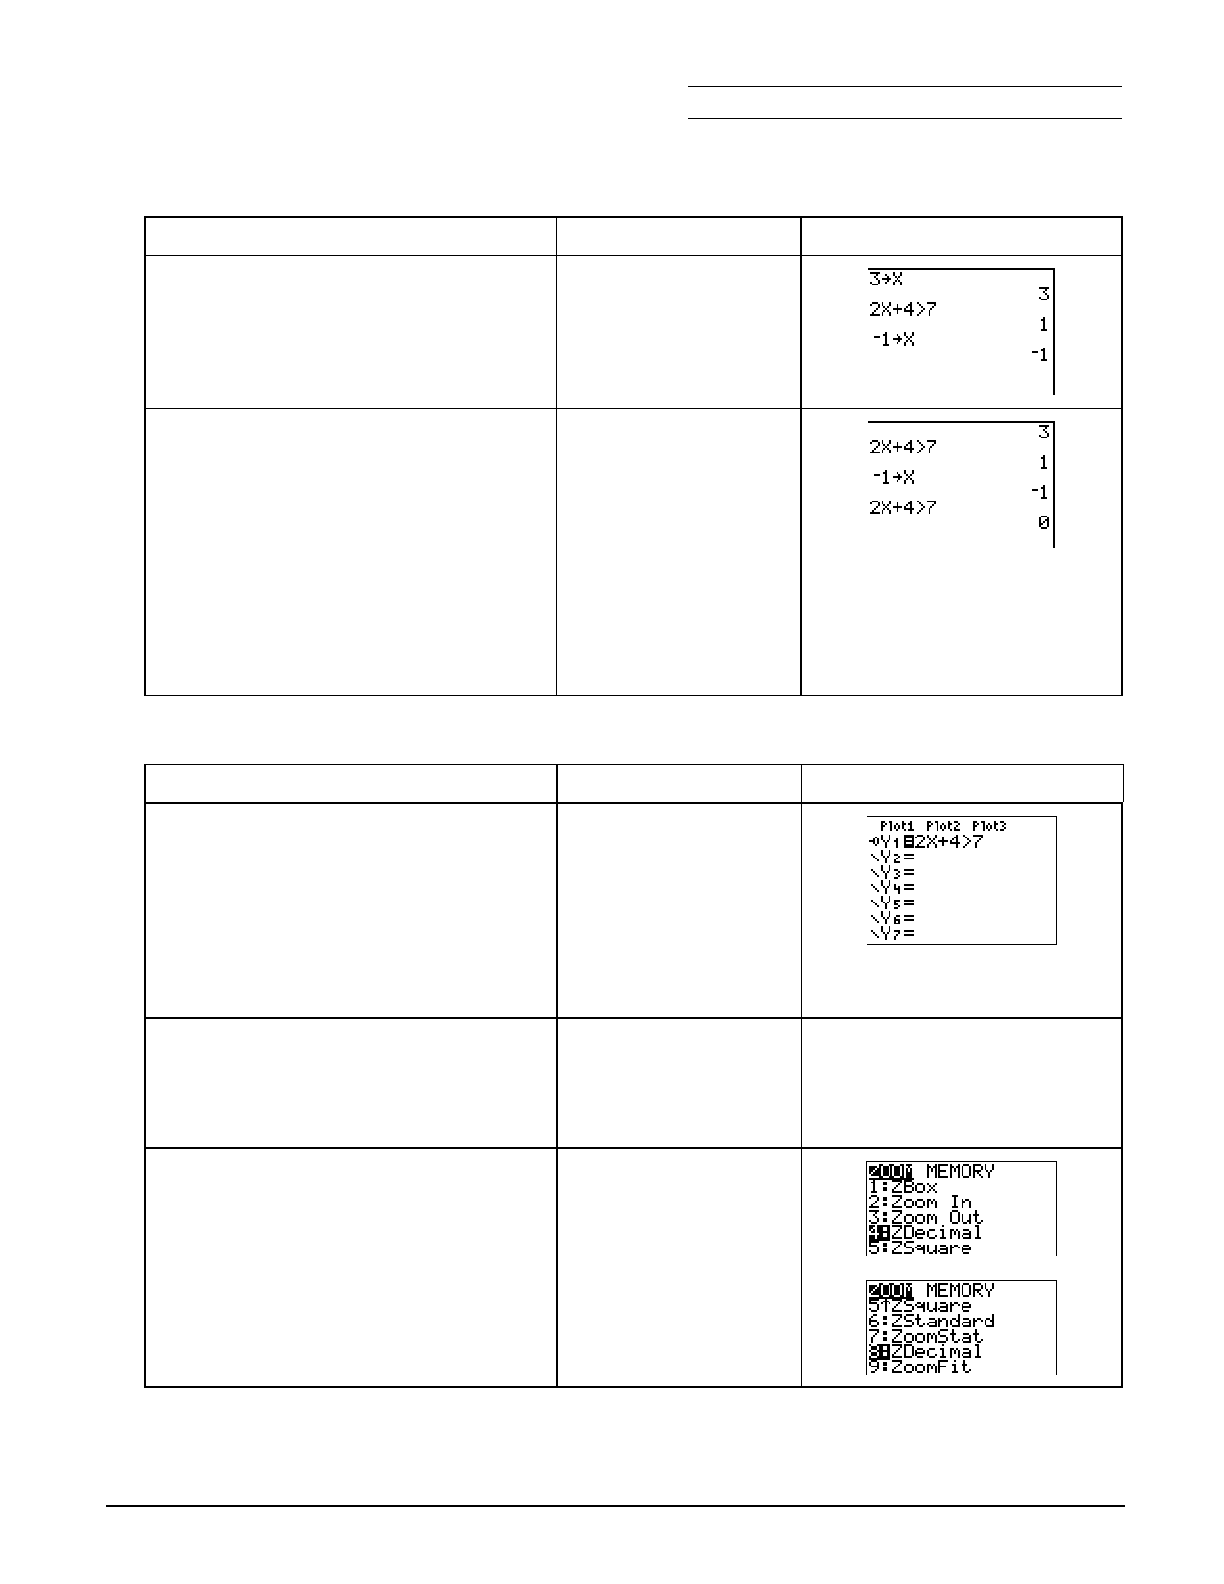
Chapter 4: Linear Inequalities Name
Section 2: Using Algebra Date
Topics in Algebra 1 © 2001 Texas Instruments Student Worksheet 4-15
³ Try-It!é on Your TI.83 Plus or TI.73 (continued)
To Do This Press Display (TI.83 Plus shown)
9. Test another point! (Try M1.)
Note: On the TI-73, use I rather than „.
a 1 X „
Í
10. You do not have to type in the
number sentence 2X+4>7 again.
Note: You also can edit an expression after it is
pasted to the line.
Since
1=TRUE and 0=FALSE,
2X+4>7 is FALSE when X=M1.
TI-83 Plus:
y [
y [
Í
TI-73:
$ $ $ $ to highlight
expression
Í to copy
Í
Graph the inequality 2X + 4 > 7.
To Do This Press Display (TI.83 Plus shown)
1. Graph this solution set.
Note: On the TI-73, use I rather than „.
& :
2 „ \ 4
- |
$ until the cursor is
next to >
Í
7
2. Set the graph style to the animate
graph style, which lets you see the
graph as it is being plotted, even
when it is on the axis at Y=0.
! until the cursor is in
the left column
Í until the ë style
is indicated
3. Set the viewing window and graph
the inequality by selecting ZDecimal. TI-83 Plus:
( 4:ZDecimal
TI-73:
( 8:ZDecimal
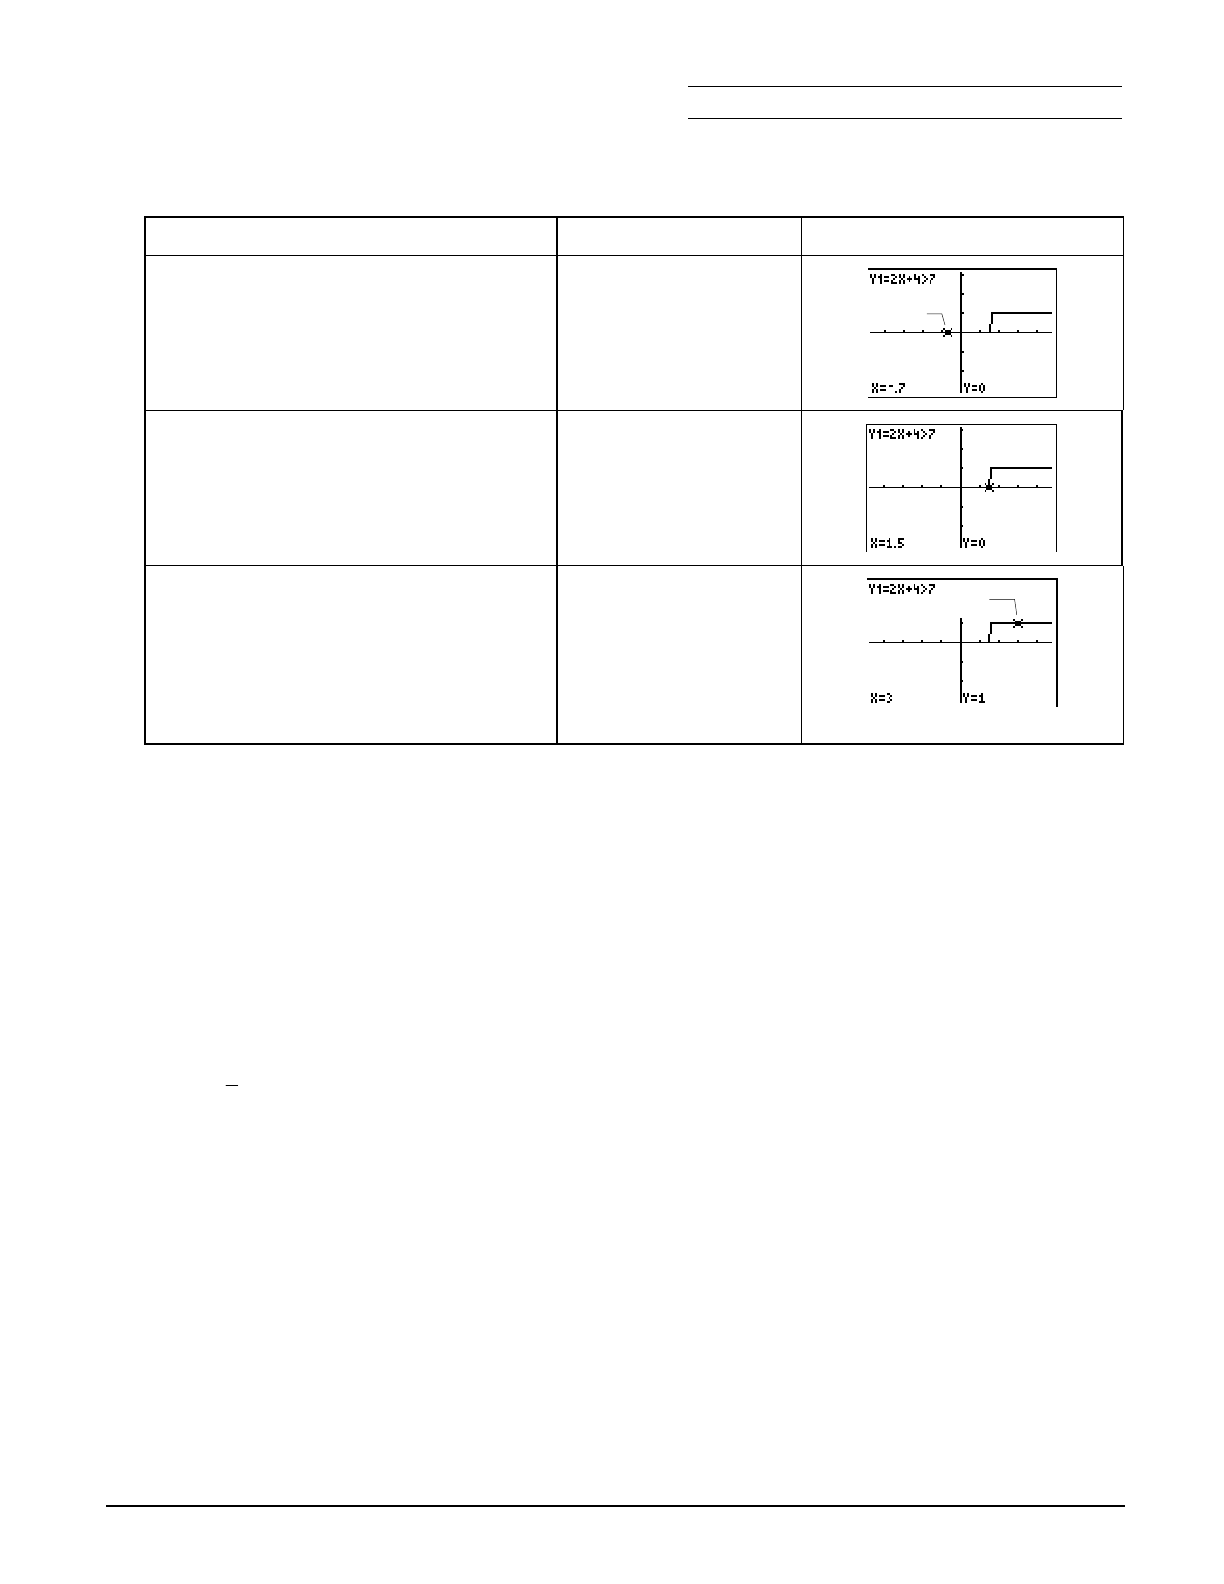
Chapter 4: Linear Inequalities Name
Section 2: Using Algebra Date
Topics in Algebra 1 © 2001 Texas Instruments Student Worksheet 4-16
³ Try-It!é on Your TI.83 Plus or TI.73 (continued)
To Do This Press Display (TI.83 Plus shown)
4. Trace the function. Notice that
where the graph is FALSE, Y1=0;
where the graph is TRUE, Y1=1.
)
| or ~ to trace the
function
5. Notice that
Y1=0 (FALSE) up
through X=1.5 (when X1.5).
! or " to trace the
function
6. Keep tracing and you see that the
graph jumps to Y1=1 (TRUE) when
X>1.5.
Find the exact set using algebra.
Solve 2X+4>7. Does your answer
agree with this graph?
! or " to trace the
function
Additional Problems
Above, you solved the following inequalities using algebra. Now, graph the solution set of these
inequalities using your calculator. Compare the graph to your calculated answers above.
1. 6.4X>16
2. 1
2XN2M2
3. 2XN2.1<M3.5
True
False

Chapter 4: Linear Inequalities Section 2: Using Algebra
Topics in Algebra 1 © 2001 Texas Instruments Teacher Notes 4-17
Linear Inequalities: Using Algebra Teacher Notes
Objectives
• To review one-step and two-step linear inequalities.
• To review the Properties of Inequalities.
Math Highlights
This section opens with examples of solving linear inequalities of the forms, x + a < b, ax < b,
and ax + b < c for any relation <, ≤, >, and ≥. Word problems about an amusement park are
included for students to solve. The students also see the need to interpret the answers obtained
using the appropriate number set. For example, they find that they have to knock down at least
9 3/8 bottles to earn enough points for the best prize. They see that they need to interpret this
answer as at least 10 bottles in order to win the prize.
The inequality properties of addition, subtraction, multiplication and division are given. When
multiplying or dividing by a negative number, students are reminded about the reversal of the
inequality sign. They also are reminded of how to translate phrases such as “at least” and “at
most” to the appropriate relation in the Observations subsection.
Common Student Errors
• Students may have a hard time deciding which steps to follow to solve the inequality. They
should connect this work back to the methods of solving linear equations. Students might
make sign errors as they add or subtract from both sides of the inequality or reverse the
inequality when multiplying or dividing by a negative number.
• Students may have difficulty making the connection that C > 0 means C is positive and C < 0
means C is negative.
• Although this section deals with the mechanical way of finding the solution set, students
should be reminded that they should check to see if the solution set is reasonable. They need
to keep using number sense.
• Many students are able to find the answer using number sense without the written work.
Learning how to write mathematics correctly is part of the communication skill and needs to
be encouraged. This can cause frustration for students who find the problems easy to solve
“in their heads.”
• Some students have difficulty remembering the meaning of the symbols, <, ≤, >, and ≥. They
also have trouble translating the phrases such as “at least” and “at most.”
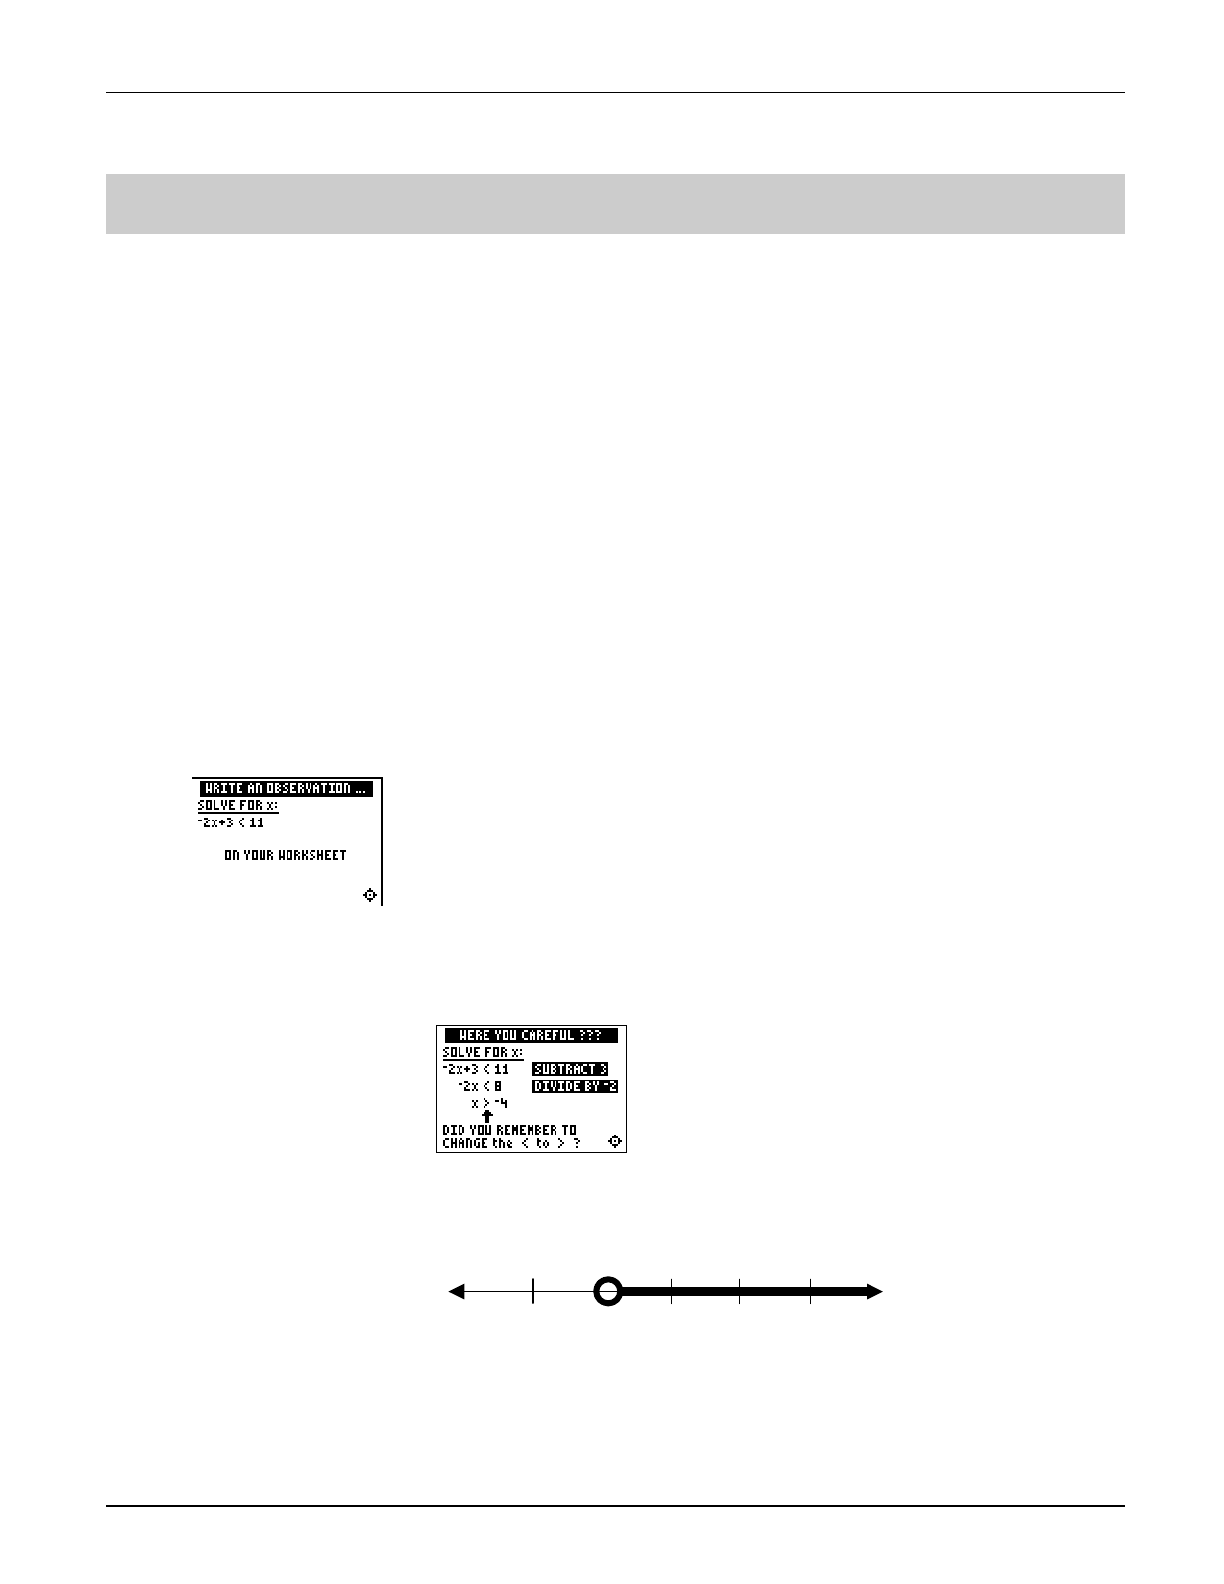
Chapter 4: Linear Inequalities Section 2: Using Algebra
Topics in Algebra 1 © 2001 Texas Instruments Teacher Notes 4-18
Student Worksheet Notes with Answers
Overview
Tell students:
1. How to find the Overview, or tell them to review the instructions on the worksheet.
2. How to navigate the application, if they are not yet familiar with the application.
3. To scroll through the Overview on the calculator. Point out new terms, definitions, and
concepts, and tell students to look for them as they go through the Overview.
Observations
The Observations give students an opportunity to practice finding the solution set to given
inequalities. They are reminded about reversing the inequality sign when multiplying or dividing
an inequality by a negative number. They also see a reminder of how to translate a phrase such
as more than to the symbol >.
If necessary, tell students how to find the Observations for this section.
Observation 1
Solve for x:
M2x+3 <11
x>
M
4.
Students will see the answers on the next screen. Students’ work
may vary with the step order shown on the screen.
Students label the result on a number line. A possible number
line looks like this:
M6 M4 M2 0 2
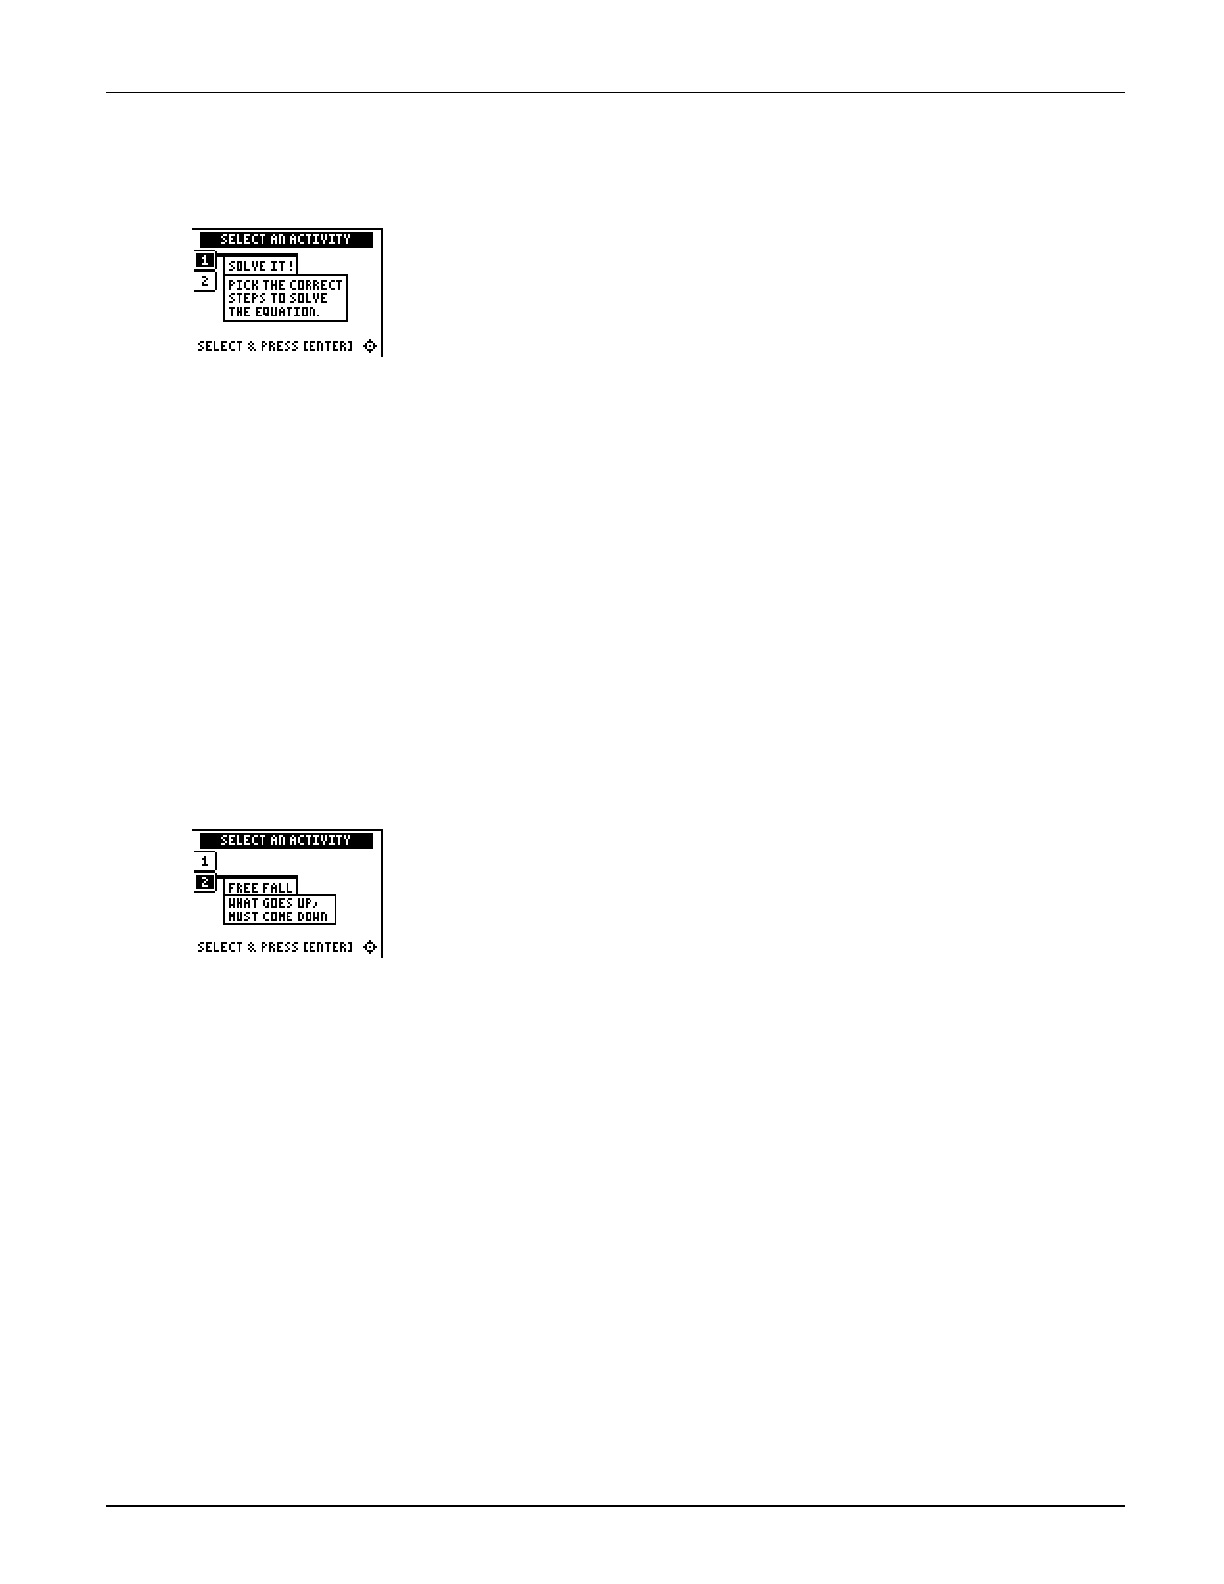
Chapter 4: Linear Inequalities Section 2: Using Algebra
Topics in Algebra 1 © 2001 Texas Instruments Teacher Notes 4-19
Activities
Scoring: Students get
two attempts to solve
each problem. They earn
2 points for a correct
answer on the first try, 1
point for a correct answer
on the second try. They
get an additional 2 points
for the correct solution.
The total number of points
available varies.
Solve It!
Tell students to:
1. Highlight a level (silver = less difficult; gold = more difficult),
and press b to select it.
2. Look at the algebraic expression at the top of the screen and
decide what must be done to solve the inequality for x.
Students must select from the choices offered; this activity
presents only one sequence of steps (to first isolate x and then
change the coefficient of x to 1), although other sequences may
be correct.
3. Press
# or $ to cycle through steps to choose from, and then
press b to select the correct step (some problems require
two steps). If their second choice is incorrect, the correct step
is displayed; press any key to continue play. If the activity
prompts them to select the correct result, highlight it with "
or !, and then press b to select it. As they play the
activity, write each inequality and their strategy for finding the
solution.
4. Record the level they played.
5. Record their scores.
Scoring: Points are
based on how quickly
students solve each
equation. If they give an
incorrect answer, the
equation stacks up at the
bottom of the screen,
giving them less time to
solve the next equation.
Unless you specify point
or time limits for this
activity, students can play
the activity when four
missed equations stack
up, the game is over.or
they press áQUITâ to stop.
There is no time limit.
Free Fall
Tell students to:
1. Highlight a level (silver = less difficult; gold = more difficult),
and press b to select it.
2. When they are ready to start, press any key.
3. Watch the equation as it falls, and quickly solve for x. Enter the
solution (press Ì for negative numbers), and press b
before the equation hits bottom. If they give an incorrect
answer, the correct answer is displayed; press any key to
resume play.
4. Follow your instructions. For example, students can play:
• Until they have answered incorrectly four times (no time
limit).
• Until a certain amount of time has expired (highest score
with the fewest misses wins).
• Until a certain score has been reached (first student to
reach the score with the fewest misses wins).
• Repeatedly over a period of time (days, weeks, etc.) for
tracking improvement of high scores.
5. Record the level they played.
6. Record their scores.

Chapter 4: Linear Inequalities Section 2: Using Algebra
Topics in Algebra 1 © 2001 Texas Instruments Teacher Notes 4-20
Activities (continued)
Additional Problems
1. 6.4x > 16 when x>2.5
2. 1
2 x N 2 M2 when x 0
3. 2x
N 2.1 < M3.5 when x < M0.7
4. Let C = the number of phone calls per month. Therefore, 15 + 0.25C ≤ 30. The solution is
C ≤ 60. Students could discuss that this is about 2 calls per day. They should write whether or
not this phone plan would be adequate for them.
³ Try-It!é on Your TI.83 Plus or TI.73
This keystroke exercise lets students learn about the logic functionality built in the calculator.
They see how to store a variable, test an inequality and finally graph a TRUE(1)/FALSE(0) graph.
By graphing the solution set using the calculator’s logic, they can verify their algebraic work on
the inequalities.
Students first solve the problem by hand. They should show all their work.
If X=3, is 2X+4>7 true or false?
Answer: 2(3) + 4 >7
6 + 4 >7
10>7
Therefore, the statement is true.
Tell students to follow the steps exactly on the calculators. Example screens are displayed on
the worksheets for students to compare with the calculator screens.
Additional Problems
Tell students to do the following calculation by hand, and then check the answers using the
calculator. They should show all their work.
The graphs are shown below using ZDecimal (() window values. Students should discuss
how they determine the endpoint of the solution set. Remind them that using algebra gives the
exact answer. The graph helps them see where the solution is approximately located.
1. 2. 3.
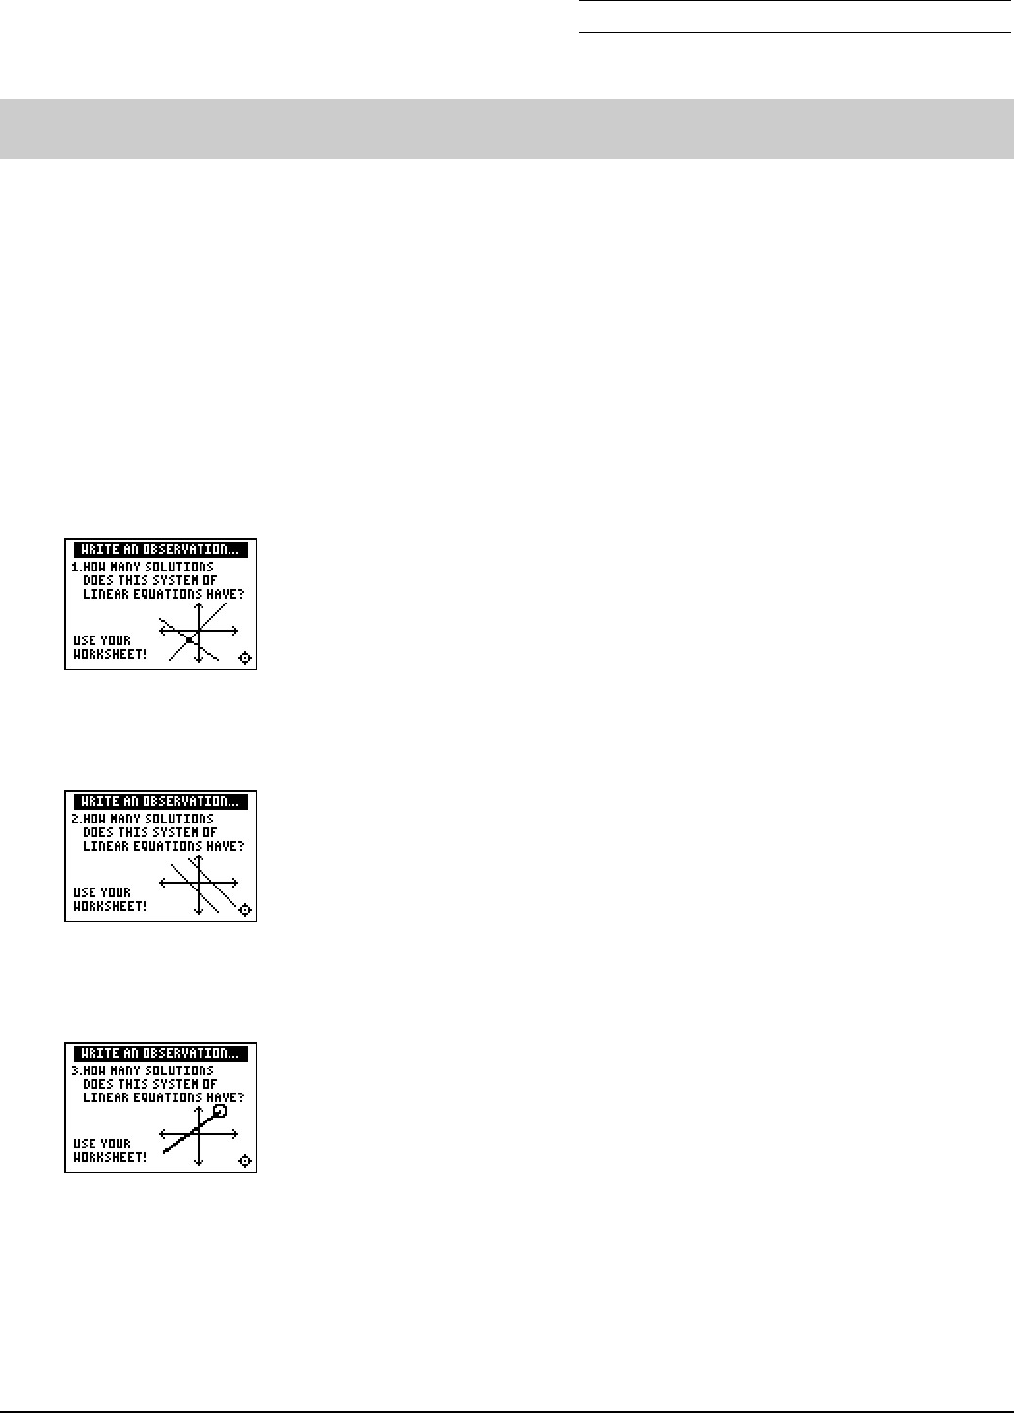
Chapter 5: Linear Systems Name
Section 1: Using Graphs & Tables Date
Topics in Algebra 1 © 2001, 2002 Texas Instruments Student Worksheet 5-1
Linear Systems: Using Graphs & Tables Student Worksheet
Overview
The Overview introduces topics covered in Observations and Activities.Scroll through the
Overview using ~(|to review, if necessary). Read each screen carefully. Look for new terms,
definitions, and concepts.
Observations
The Observations illustrate that two lines in a plane intersect, are parallel or are the same line.
By graphing the lines of a system of two linear equations with two variables, you can determine
the possible number of solutions. Scroll through the Observations using ~(|to review, if
necessary). Read each screen carefully. When you come to a Write an Observation screen, stop
and write the answer to the question on your worksheet.
Observation 1
How many solutions does this system of linear equations have?
Observation 2
How many solutions does this system of linear equations have?
Observation 3
How many solutions does this system of linear equations have?
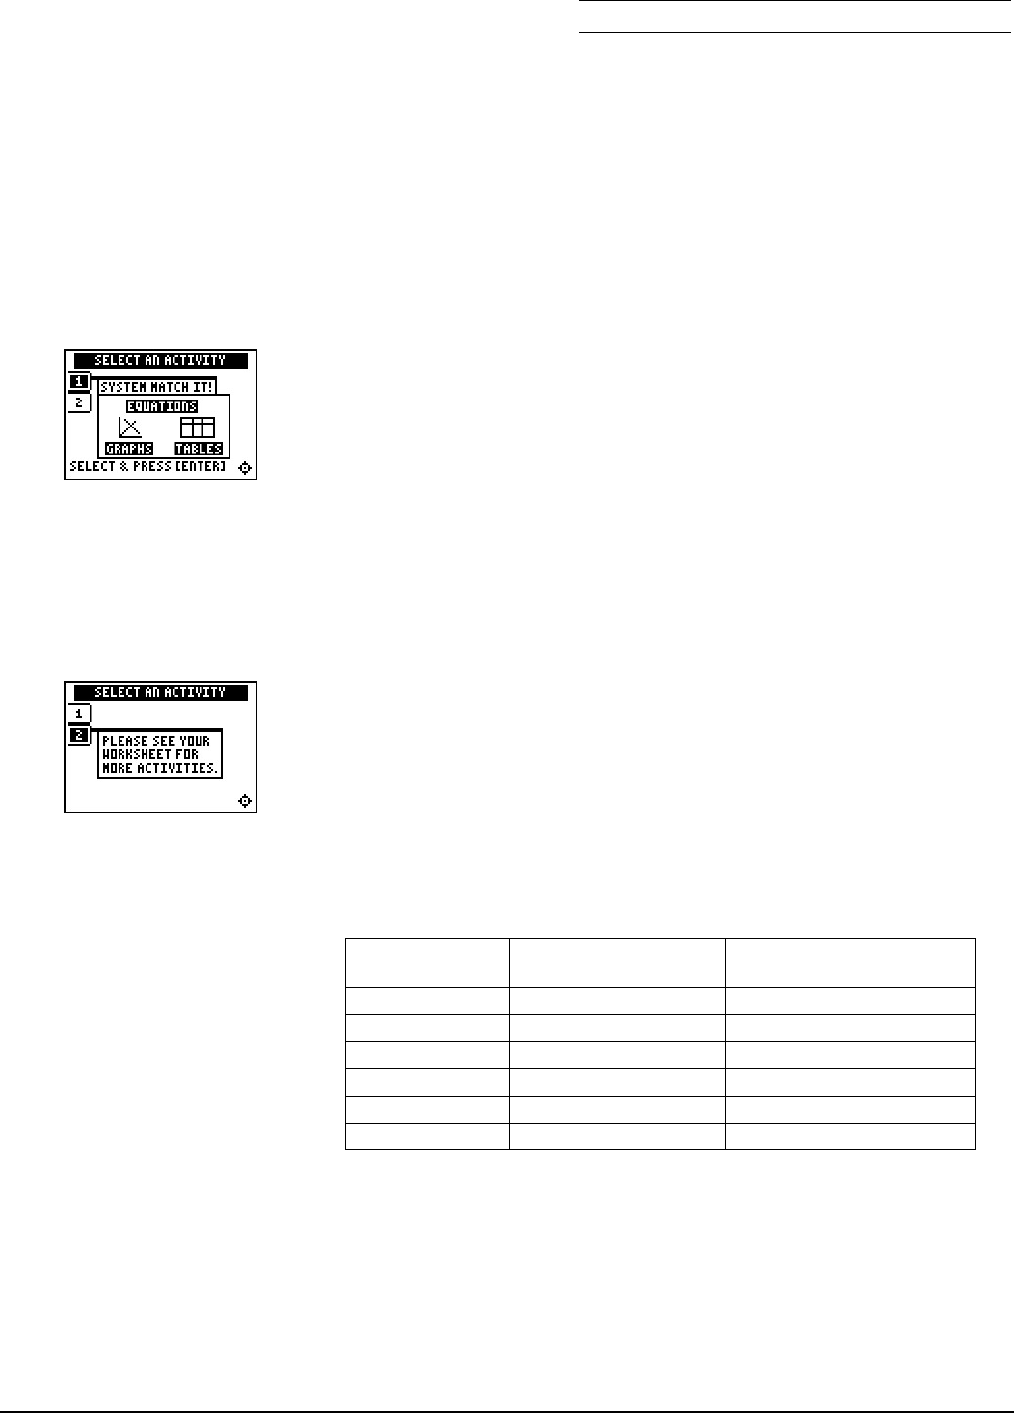
Chapter 5: Linear Systems Name
Section 1: Using Graphs & Tables Date
Topics in Algebra 1 © 2001, 2002 Texas Instruments Student Worksheet 5-2
Activities
The Activities help you practice using graphs and tables. You can select from two different
activities—System Match It! and a worksheet activity. Follow these steps to play the activities
and complete your worksheet.
1. Make sure you are in the Activities for this section.
2. Highlight an activity using $or #,and press b.
Scoring:You get one
attempt to answer the
problem. You earn 2 points
for a correct answer. You can
earn up to 12 points.
Tip: Be careful! The graphs
may appear close together.
System Match It!
1. Select the correct answer to the question. Questions include:
•Selecting the graph that correctly illustrates the system.
•Selecting the system that correctly describes a graph.
•Selecting the correct solution of a system given a table.
2. What was your score?
Notes: See ³TIp™ 4:
Creating a Table to help you
with tables.
See also ³Try-It!™ in
Chapter 2 Sections 1 and 2
for working with tables and
linear equations.
Worksheet Activity
Solve a system using tables.
a. Blue Lake is Pat’s favorite place to swim during the summer.
There is an entry fee of $12.00 per car per day. Pat notices a sign
as they approach the entrance. His family could join the Blue
Lake Club for the summer! It costs $48.00 to join and then the
entry fee becomes $6.00 per car per day. Fill in the table to help
you develop the equations.
Days at the
Lake Cost Without
Membership Cost With
Membership
1$12(1) = $12 $48 + $6(1) = $54
2$12(2) = $24 $48 + $6(2) = $60
3
4
… … …
D
b. Let C = the entry cost to the lake. Let D = the number of days
Pat’s family goes to the lake during one summer. Write the system
of two equations that describe the cost of the entry fee without
membership and with membership. Use the table above (in part
a) to help you write the equations.
Cost Without Membership: _______________________________
Cost With Membership: ________________________________

Chapter 5: Linear Systems Name
Section 1: Using Graphs & Tables Date
Topics in Algebra 1 © 2001, 2002 Texas Instruments Student Worksheet 5-3
Activities (continued)
c. Check that the equations are written in slope-intercept form,
y = mx + b. This prepares you to enter the system into your
calculator. You will also have to change the variable. Notice that
the cost, C, is the dependent variable (Y) and the number of days,
D, is the independent variable (X). Write the equations so you can
enter them in your calculator.
Y1= _________________
Y2= _________________
d. Use a table to find the cost of the entry to the lake with and
without membership. When is the entry cost without membership
equal to the entry cost with membership?
e. If Pat’s family goes to the lake 6 times this summer, should they
join the Blue Lake Club to save money? Why?
f. If Pat’s family goes to the lake 10 times this summer, should they
join the Blue Lake Club to save money? Why?
Challenge: Learn how to take a picture of a screen on your
calculator using TI Connect™ software or TI-GRAPH LINK™
software and cable. You can paste a screen into a word processor
and then print it out to hand in for your homework! Go to
http://education.ti.com and search for TI Connect or
TI-GRAPH LINK.
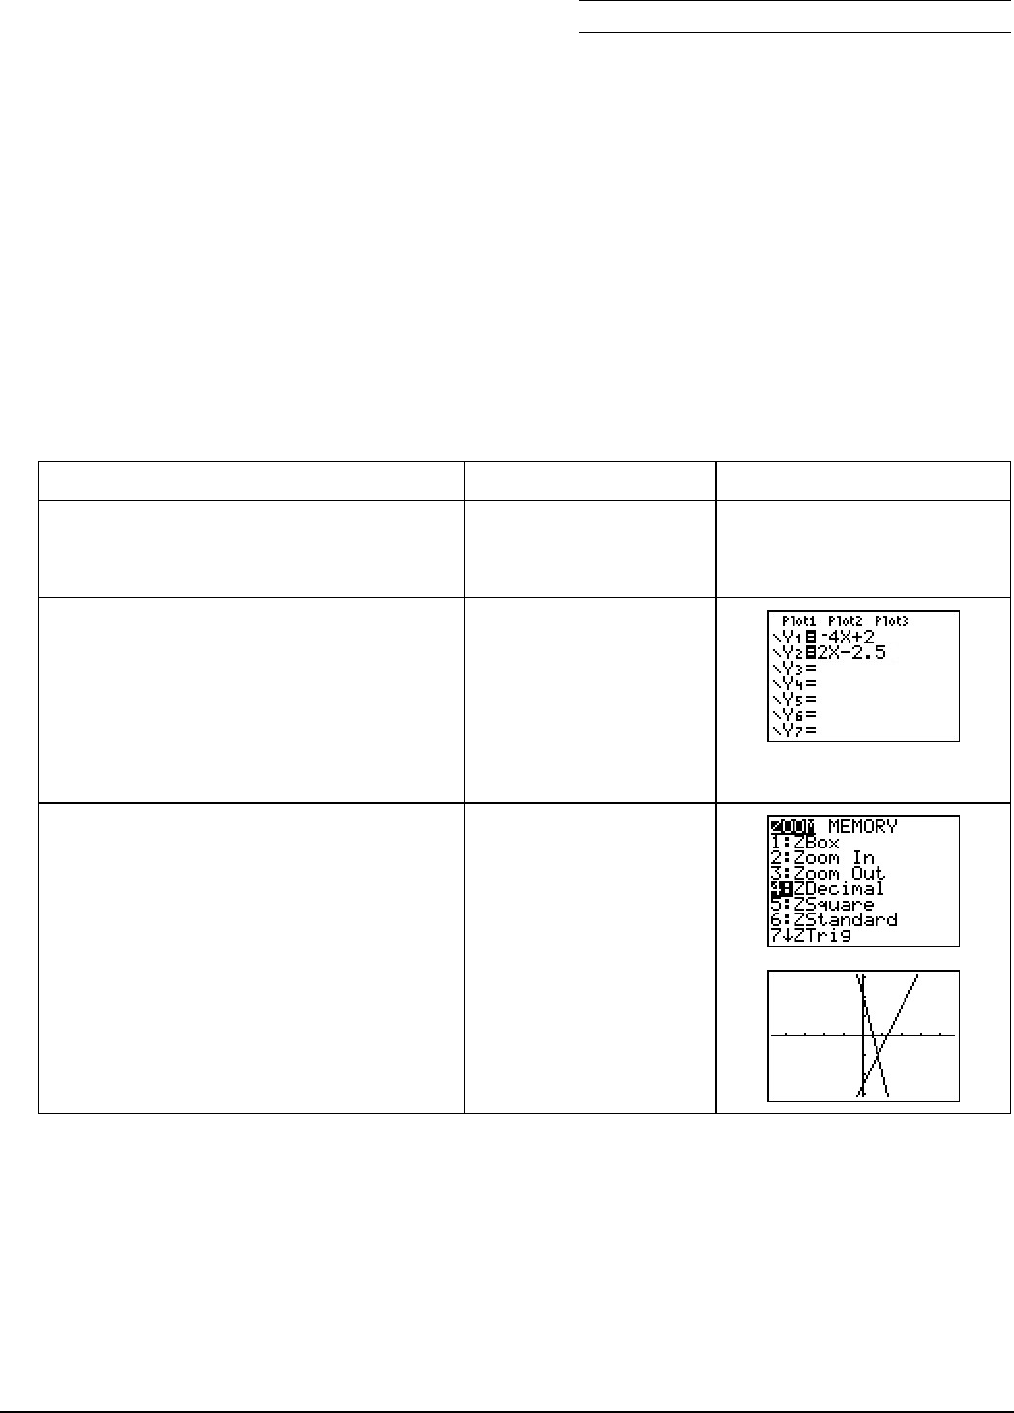
Chapter 5: Linear Systems Name
Section 1: Using Graphs & Tables Date
Topics in Algebra 1 © 2001, 2002 Texas Instruments Student Worksheet 5-4
³Try-It!éon Your TI-83 Plus or TI-73
You will:
•Graph two lines of a system of equations.
•Use rto locate the intersection of the lines.
•Use y 0 and y - to locate the exact solution of the system of equations.
Find the solution of the system: Y1 = L4X + 2
Y2 = 2X N2.5
Notice that these equations are already in the form of y = mx + b. They are in the form to enter
into your calculator.
To Do This Press Display (TI.83 Plus shown)
1. Exit the Topics in Algebra 1
application and clear the Home
screen.
y 5
áEXITâ‘
2. First, enter L4X + 2 as Y1 and
2X N2.5 as Y2 in the Y= editor.
Note: See ³TIp3: Graphing a Function in
the Standard Window for more information.
Note: On the TI-73, use Irather than
„.
o ‘
Ì4„ Ã 2
† ‘
2„ ¹ 2Ë5
3. Select the Zoom Decimal viewing
window. The graph displays.
Remember: You have to adjust the viewing
window depending on the system of
equations. You can see the intersection of
the lines in the ZDecimal window for this
example.
TI-83 Plus:
q4:ZDecimal
TI-73:
q8:ZDecimal
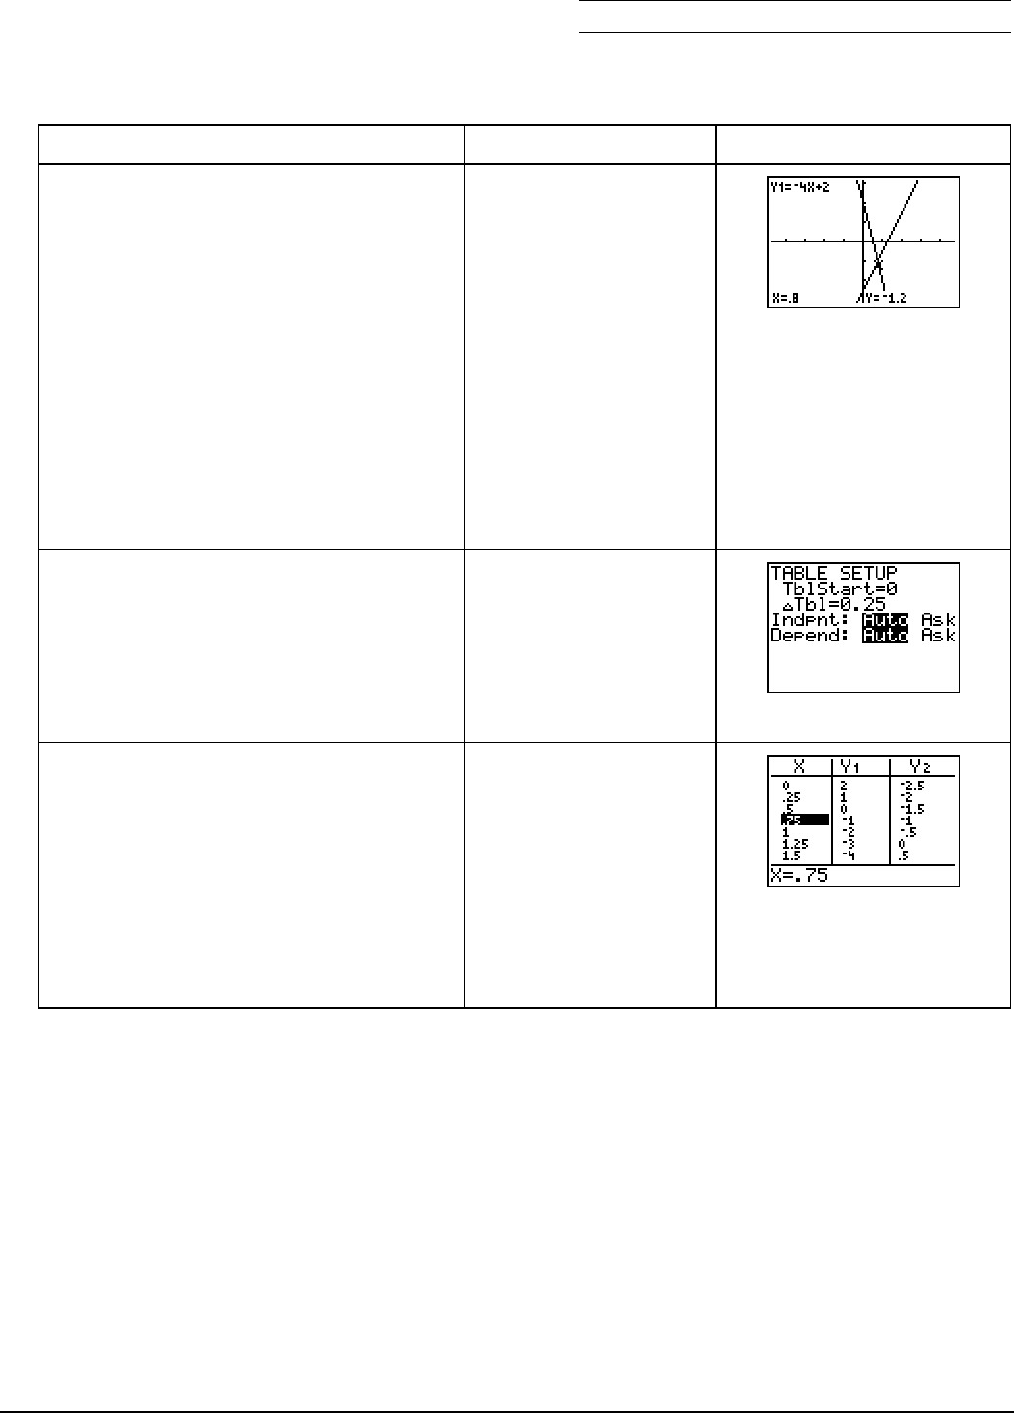
Chapter 5: Linear Systems Name
Section 1: Using Graphs & Tables Date
Topics in Algebra 1 © 2001, 2002 Texas Instruments Student Worksheet 5-5
³Try-It!éon Your TI-83 Plus or TI-73 (continued)
To Do This Press Display (TI.83 Plus shown)
4. Trace close to the intersection of
the graphs to find a value close to
the solution.
Since Zoom Decimal traces by
tenths, you can get close to the
answer but this is not the exact
answer. Notice that the point
(0.8, L1.2) on the screen is on Y1.
Is this point on Y2? Check it out!
For this particular calculator
setup, you don’t get the exact
answer. Read on to see how to
refine the answer.
r
},†,~,or |
5. Use the table setup to refine the
solution.
Set up your table to show values
close to X = 0.8. As shown here,
you can use a starting value of 0
with increments of 0.25.
y -
‘0†0.25 ‘
6. Search through the table to see
that the lines intersect at (0.75, L1).
Notice that both Y1 and Y2 are L1
when X = 0.75. Verify by hand that
the solution is (X, Y) = (0.75, L1).
You also know that there is only
one solution because the lines
intersect at one point, so your
search is complete.
y 0
Note: Learn more about the calculator features intersect and Solver in the ³Try-It!™ section in
Chapter 5: Linear Systems, Section 2: Using Algebra.

Chapter 5: Linear Systems Name
Section 1: Using Graphs & Tables Date
Topics in Algebra 1 © 2001, 2002 Texas Instruments Student Worksheet 5-6
Solution Search
Write the solution and explain how you found the solution using graphs and a table for each of
the problems below. Do the following for each problem.
•Rewrite the system in slope-intercept form, y = mx + b, if necessary.
•Use the slope-intercept form of the equations to draw a rough sketch of the lines. You can
verify your graph on your calculator. Estimate the solution so that you have an idea of how
many solutions there are and where the solution is located.
•Search for the solution of the equation on the calculator using graphs and a table.
•See ³TIp4: Creating a Table and ³TIp 5: Adjusting the Viewing Window for additional
help with the calculator.
•Remember to change your viewing window ( p)or your table setting ( y - )
to do your search.
•Explain how you found the solution.
•Write out how you checked the solution.
Remember: The TI-73 and the TI-83 Plus only use the variables X and Y for graphs and tables. If an equation uses letters other than X and
Y, you have to change the variables in the problem to X and Y on the TI-73 and the TI-83 Plus. Use parentheses, if needed, when entering
the equations in the Y= editor.
1. y = 2x + 4
3x + y = L11
2. Lx + 3y = 4
1
3x + y = 10
3

Chapter 5: Linear Systems Name
Section 1: Using Graphs & Tables Date
Topics in Algebra 1 © 2001, 2002 Texas Instruments Student Worksheet 5-7
Solution Search (continued)
3. 2w + t = 35
L2
5w + 1
5t = 19
4. 4x + 7y = 8
4x + 7y = 14
5. x N9y = 7
2x N18y = 14

Chapter 5: Linear Systems Section 1: Using Graphs & Tables
Topics in Algebra 1 © 2001, 2002 Texas Instruments Teacher Notes 5-8
Linear Systems: Using Graphs & Tables Teacher Notes
Objectives
•To illustrate how to locate the real number solution of a system of linear equations (two
equations and two variables) using tables.
•To illustrate how to locate the real number solution of a system of linear equations (two
equations and two variables) using graphs.
•To graphically illustrate the types of solutions expected for a system of linear equations.
Math Highlights
Students work with a system of linear equations that has two equations in two variables. They
begin the Overview by setting up an analysis of two different cell phone plans. The two plans
can be modeled by linear equations. They investigate when the two plans cost the same amount
of money.
In the table of values example, students see a table of values for each equation. To create the
table, the equations are in the form y = mx + b. They see that the x value that gives the same y
value for both equations is the solution. They also see that they may need to refine the table of
values to search for the solution.
In the x-y graphical example, students graph both equations and locate the intersection of the
lines. The (x,y) coordinate of the intersection of the lines is the solution. Since the graphs of the
linear equations in the system can intersect, be parallel, or be the same line, students also see
that they may find a unique solution, no solution, or an infinite number of solutions to the
system.
In Observations, students associate the graphs of the lines of a system with the number of
solutions of the system. This is covered again at a higher level in Section 2: Using Algebra.
Common Student Errors
•Students have to rewrite the system in slope-intercept form in order to enter the equations
into the calculator. Many students tend to make sign errors and division errors when they
rewrite equations. For example, given 2T + 3S = 57 students would first have to rewrite the
equation as S = (L2/3)T + (57/3), assuming S is the dependent variable. Then, the students
have to rewrite this equation as Y1 = (L2/3)X + (57/3). A common division error is to write
the equation as Y1 = (L2/3)X + 57, which is incorrect.
•Students forget to enter fractions into the Y= editor using parentheses. Remind students
about the order of operation. If they enter M2/3X, the calculator interprets this as L2÷(3 QX)
following the order of operation rules. The correct entry is (M2/3) QX.
Note: TI-73 users can use = to enter the fractions. However, you should still remind them
how to use parentheses and about the order of operation rules.
•When solving by graphing using the graphing calculator, some students trace along one
function to what appears to be the intersection point without verifying that that point is also
on the other line.

Chapter 5: Linear Systems Section 1: Using Graphs & Tables
Topics in Algebra 1 © 2001, 2002 Texas Instruments Teacher Notes 5-9
Common Student Errors (continued)
•After students have practiced using graphs and tables to solve a system of equations, they
may think that they can always find the exact solution for a system using these methods.
Although they can often find exact solutions using these methods, using algebra always
gives exact answers for these equations. To help them understand this idea, have students
try to search for the solution to the system y = 2x + 3 and y = 2x + 4. Using a table, they
could search forever since these lines are parallel. Using a graph, they might think that the
lines are parallel, but they are only looking at a few viewing windows. Ask them how they
can know if there is a window where the lines intersect. Open a discussion with your class
to see if they think they can verify that this system has no solution using tables or graphs.
•Algebraic methods alone usually do not invite the student to reason out the solution using
their knowledge of number sense and geometry. Many students learn the mechanics of
solving a problem without understanding the problem or the solution. The graphs and tables
method gives students the opportunity to see the values and graphs of the equations so they
can see when two equations have the same value.
Ask students to look at the equations y = 2x +3 and y = 2x + 4 again, and use their number
sense. Ask them if 2x + 3 could ever be the same value as 2x + 4 for a given x? Encourage
students to first look at the equations to see if their knowledge of geometry or their number
sense can tell them something about the system before they start their method of solution.
•Some visual learners benefit by seeing the numbers and graphs first, and then by using these
as the tool to find the solution. However, many students can see the solution to some
systems using their number sense. These students may have difficulty taking the time to
show and write about their work. This may also be an issue in Chapter 5: Linear Systems,
Section 2: Using Algebra. Encourage student to use written mathematics as well as drawing
graphs and tables as a communication tool. Have students look in newspapers and on the
web for graphs and tables of information to show real examples for the need for this
communication skill.
Require students to write out complete solutions to problems, including the mathematics
and the interpretation of what the numbers mean in the problem. For example, the cell
phone problem in the Overview subsection requires not only the numeric answer but also an
explanation about what the numbers mean with respect to the cell phone users.

Chapter 5: Linear Systems Section 1: Using Graphs & Tables
Topics in Algebra 1 © 2001, 2002 Texas Instruments Teacher Notes 5-10
Student Worksheet Notes with Answers
Overview
Tell students:
1. How to find the Overview, if necessary.
2. How to navigate the application, if necessary.
3. To scroll through the Overview on the calculator. Point out new terms, definitions, and
concepts, and tell students to look for them as they go through the Overview.
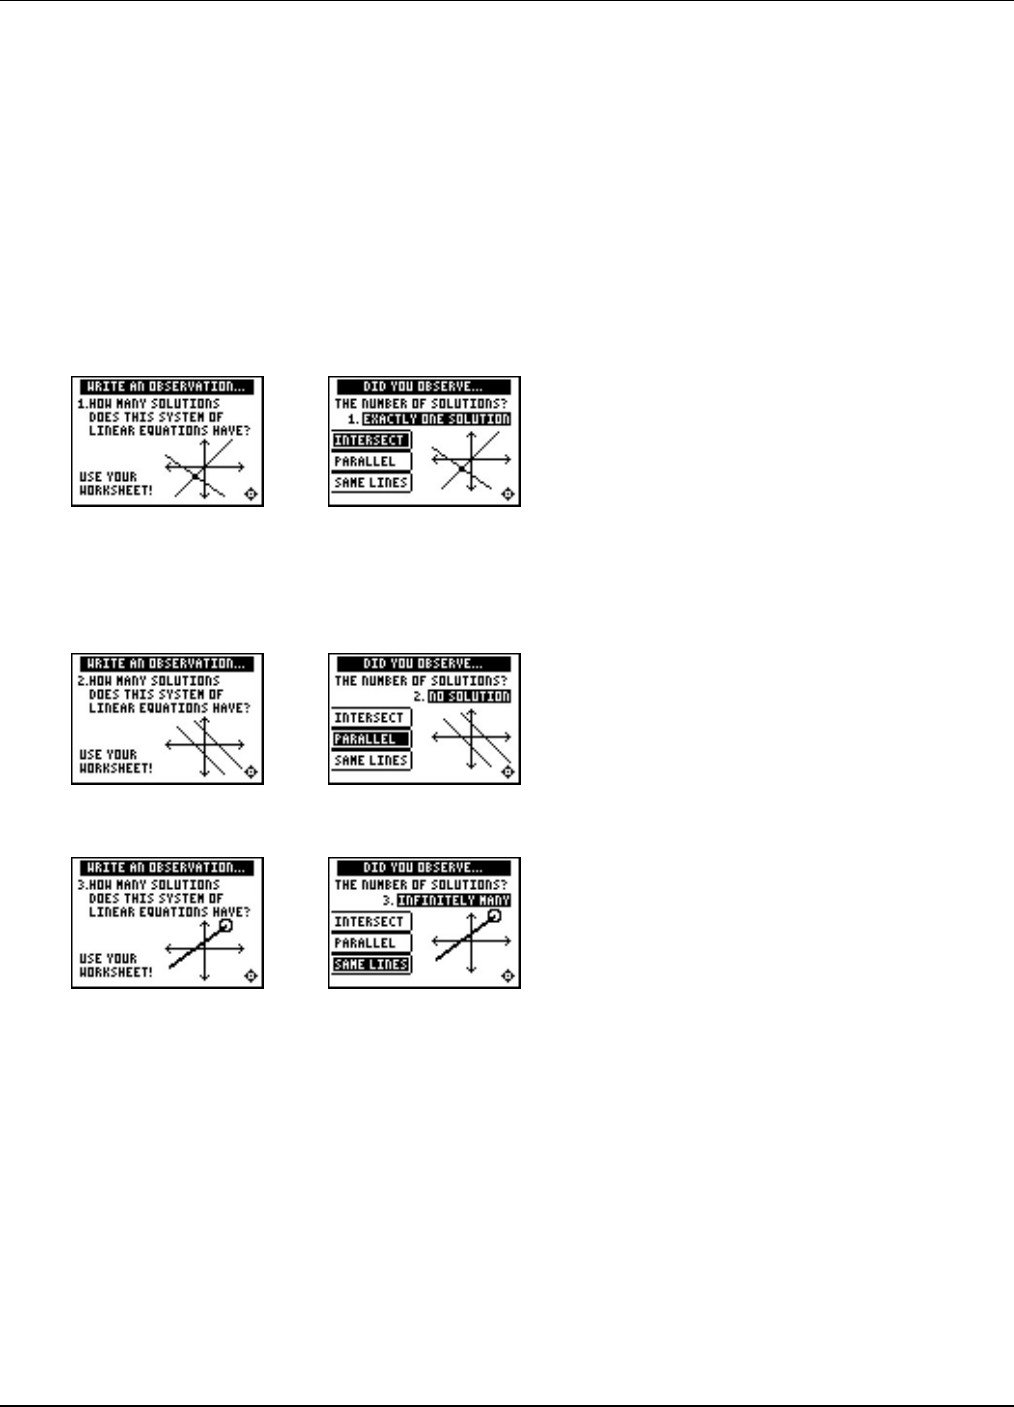
Chapter 5: Linear Systems Section 1: Using Graphs & Tables
Topics in Algebra 1 © 2001, 2002 Texas Instruments Teacher Notes 5-11
Observations
The Observations help students start to uncover the types of solutions that arise in systems of
linear equations. If necessary, tell students how to find the Observations section.
Students are asked to observe the number of solutions from the given graph. They should
question whether they are seeing enough of the graph to make a conjecture about the number of
solutions.
Students see the answer
after the third observation
question.
Observation 1
Observation 2
Observation 3
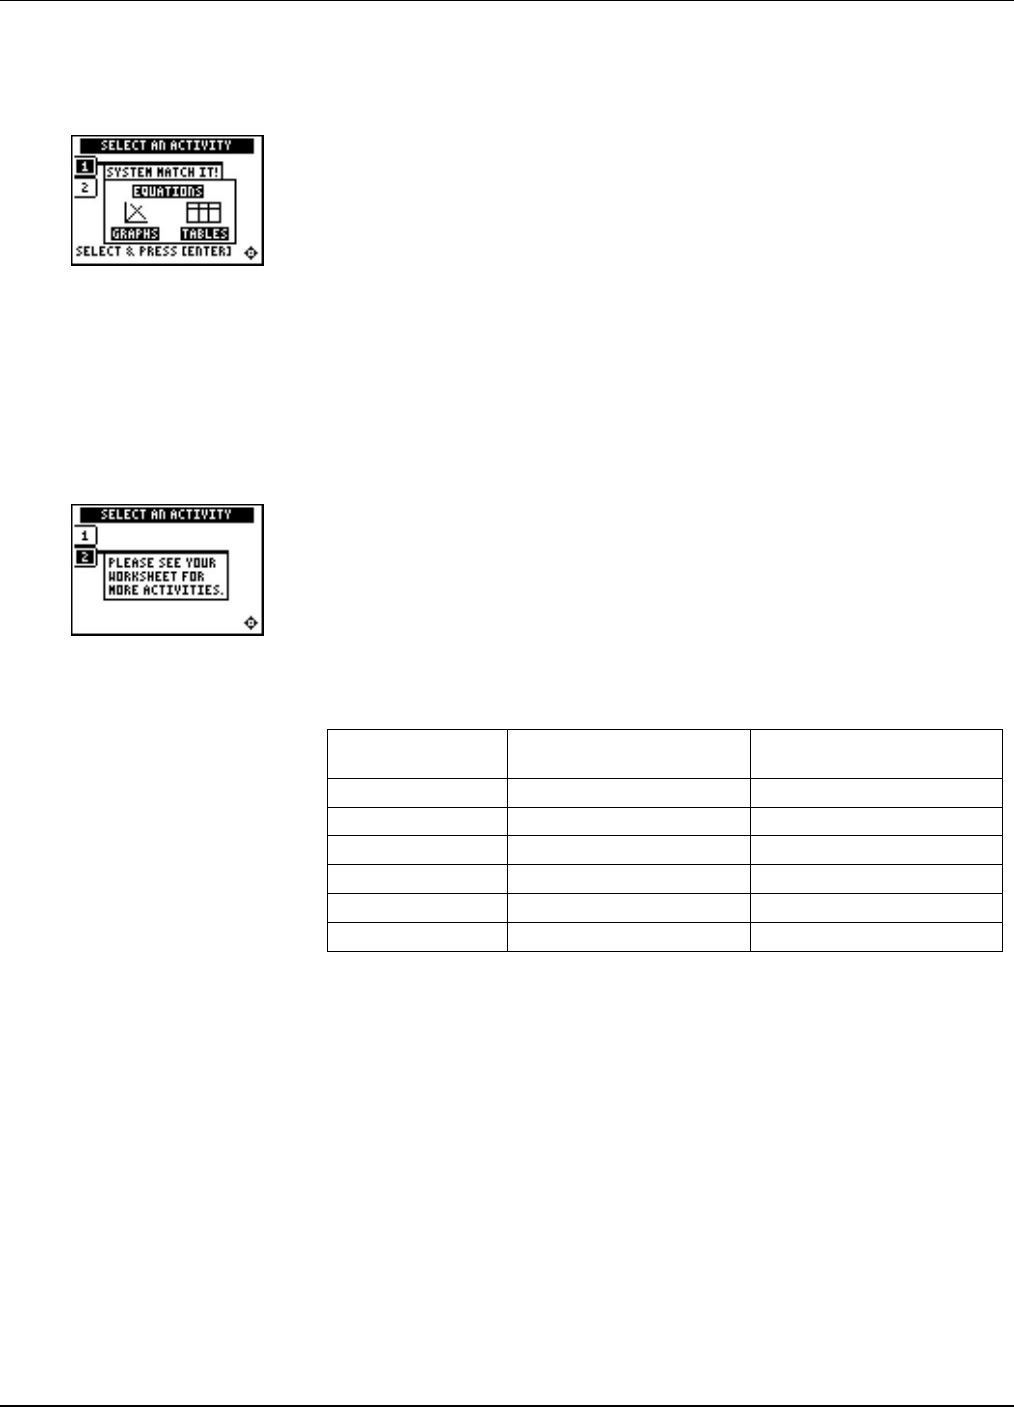
Chapter 5: Linear Systems Section 1: Using Graphs & Tables
Topics in Algebra 1 © 2001, 2002 Texas Instruments Teacher Notes 5-12
Activities
Scoring: You get two
attempts to answer the
problem. You earn 2 points
for a correct answer on the
first try, 1 point for a correct
answer on the second try.
You can earn up to 12 points.
System Match It!
Tell students to:
1. Select the correct answer to the question. Questions include:
•Selecting the graph that correctly illustrates the system.
•Selecting the system that correctly describes a graph.
•Selecting the correct solution of a system given a table.
2. Record their scores.
Remind students that the graphs might appear very close together
on the screen. They need to use their knowledge about both the
functions and the graph to determine the correct answer.
Notes: See ³TIps™ 4:
Creating a Table to help you
with tables.
See ³Try-It!™ in Chapter 2
Sections 1 and 2 for working
with tables and linear
equations.
Worksheet Activity
Students investigate the entry fee to Blue Lake. They compare the
entry fees with and without a membership fee.
a. Students should gather information from the problem to write
a system of equations for the investigation. Filling in the table
with all of the calculations written out helps students develop
the equations inductively.
Days at the
Lake Cost Without
Membership Cost With Membership
1 $12(1) = $12 $48 + $6(1) = $54
2 $12(2) = $24 $48 + $6(2) = $60
3 $12(3) = $36 $48 + $6(3) = $66
4 $12(4) = $48 $48 + $6(2) = $72
… … …
D 12D 48 + 6D
b. Variables are suggested. Review the concept of independent
and dependent variables with the students.
Let C = the entry cost to the lake.
Let D = the number of days Pat’s family goes to the lake
during one summer.
C = 12D
C = 6D + 48 (Students could also enter 48 + 6D.)
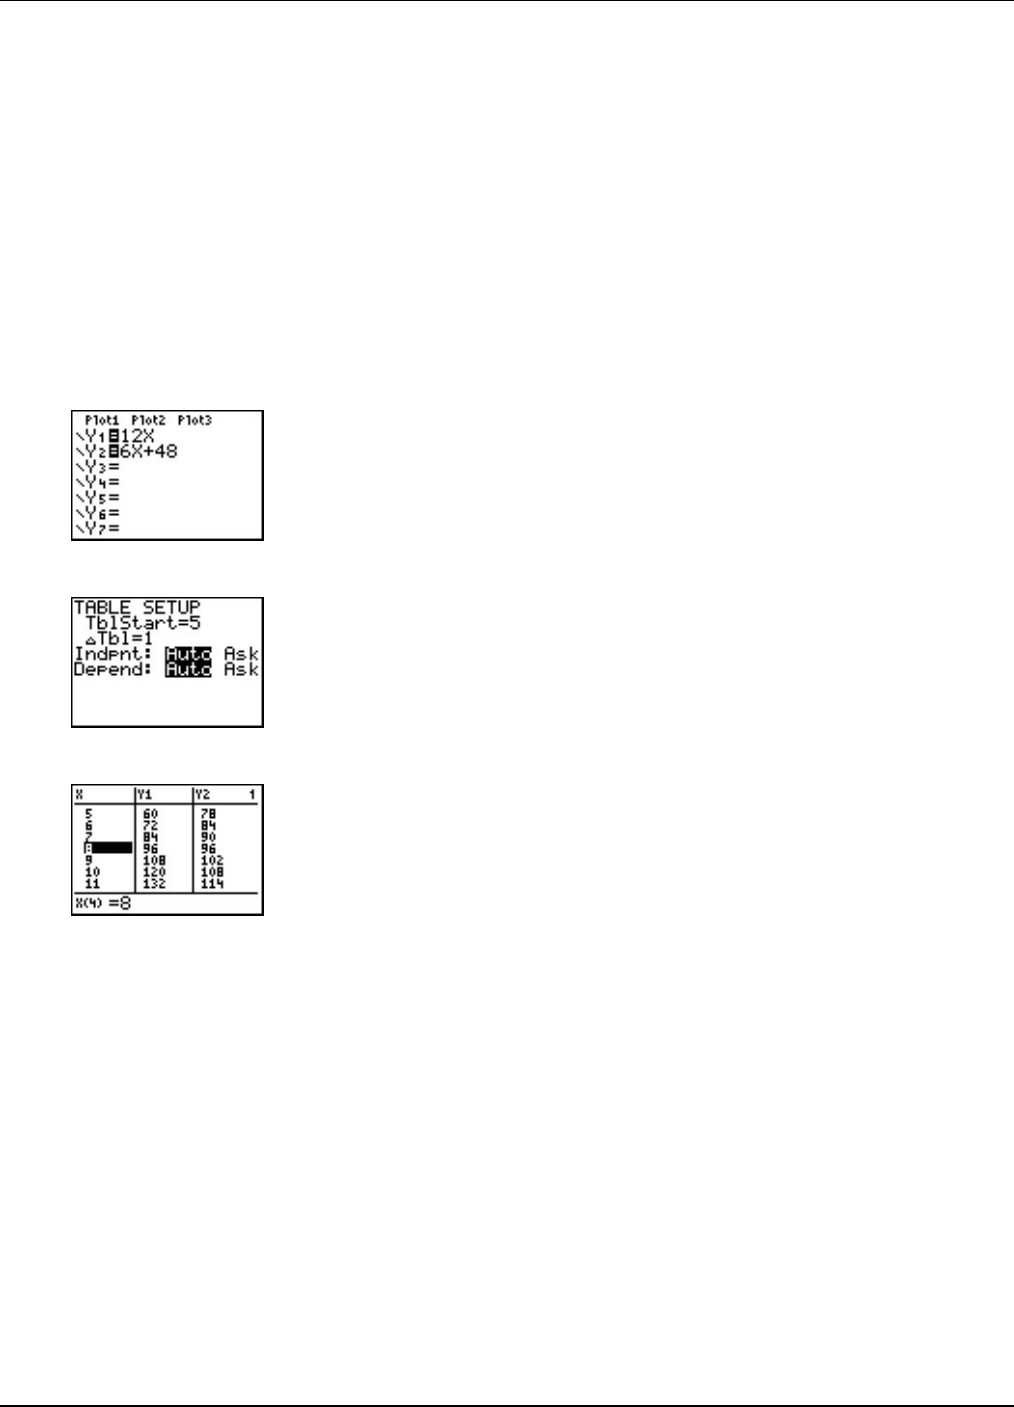
Chapter 5: Linear Systems Section 1: Using Graphs & Tables
Topics in Algebra 1 © 2001, 2002 Texas Instruments Teacher Notes 5-13
Activities (continued)
Enter equations in Y= editor.
Set up the table.
Search for where the
equations are equal.
c. Rewrite the problem in terms of Y1, Y2 and X to prepare to
enter the system into the Y= editor.
Y1 = 12X —or— Y1 = 6X + 48
Y2 = 6X + 48 Y2 = 12X
The independent variable (days at the lake) and the dependent
variable (entry cost) are stated in the problem. Remind
students that the calculator treats X as the independent
variable and Y as the dependent variable.
d. Students need to enter the equations in the Y= editor and
should set up the table. Discuss that the domain of the system
should be whole numbers starting at 0 since x counts the
number of trips to the lake. Notice at x = 8, Y1 = Y2 which is
the breakeven point. If Pat’s family goes to the lake up to and
including 8 times, they might not choose to join the Blue Lake
club.
e. If Pat’s family goes to the lake only 6 times during the summer,
they will spend more money if they join the club for $48.
f. If Pat’s family goes to the lake 10 times during the summer,
they will save money if they join the club. They will save
$120 N$108 = $16. Discuss the savings if the family goes to the
lake more than 10 times. Pose questions such as, when will
they save $50?
Have students find other situations that set fees in this manner.
One source is the national and state park services web pages.

Chapter 5: Linear Systems Section 1: Using Graphs & Tables
Topics in Algebra 1 © 2001, 2002 Texas Instruments Teacher Notes 5-14
³ Try-It!é on Your TI-83 Plus or TI-73
Students search for the solution of a system of two linear equations in two variables using
graphing and tracing, and a table. The problem has been chosen so that students do not trace to
the exact solution and need to use the table to search. They could also choose to change the
window so that they could trace to the exact solution. This is not an efficient choice, but could
be pursued, and the investigation would be enriching.
The students will:
•Graph two lines of a system of equations.
•Use r to locate the intersection of the lines.
•Use y - and y 0 to locate the exact solution of the system of equations.
Note: Students will learn more about the calculator features intersect (TI-83 Plus) and Solver (TI-83 Plus and TI-73) in the ³ Try-It! section
in Chapter 5: Linear Systems, Section 2: Using Algebra.
Tell students to follow the steps exactly on the calculators. Example screens are displayed on
the worksheets for students to compare with the calculator screens.
Solution Search
Tell students to:
•Rewrite the system in slope-intercept form, y = mx + b, if necessary.
•Use the slope-intercept form of the equations to draw a rough sketch of the lines. Verify the
graphs on the calculator. Estimate the solution so they have an idea of how many solutions
there are and where the solution is located.
•Search for the solution of the equation on the calculator using graphs and a table.
Notes: Since the calculator only uses the variables X and Y for graphs, tables and some other features, students must decide which
variable in the problem should be X and which one should be Y when the problem uses other variables. Discuss independent and
dependent variables, emphasizing that the calculator is set up to treat X as the independent variable and Y as the dependent variable.
Remind students to use parentheses correctly when they enter equations into the Y= editor. For example, (1/3)X is not the same as
1/3X which is 1/(3X) when the order of operation rules are applied by the calculator. However, when TI-73 users enter 1/3 using the =
key, their entry is calculated correctly.
Remind students to change the viewing window ( p ) or table setting ( y - ) to do the search. ³ TIp 4: Creating a Table
and ³ TIp 5: Adjusting the Viewing Window provide additional help with the calculator.
•Explain how they found the solution.
•Write out the check of their solution.
Answers:
1. (x, y) = (M3, M2)
2. (x, y) = (3, 7/3)
3. (w, t) = (M15, 65) Students are not given which variable is dependent and which is
independent. They may very well write the solution as (t, w) = (65, M15).
4. Lines are parallel, which implies that there are no solutions.
5. Lines are the same, which implies that there are an infinite number of solutions.
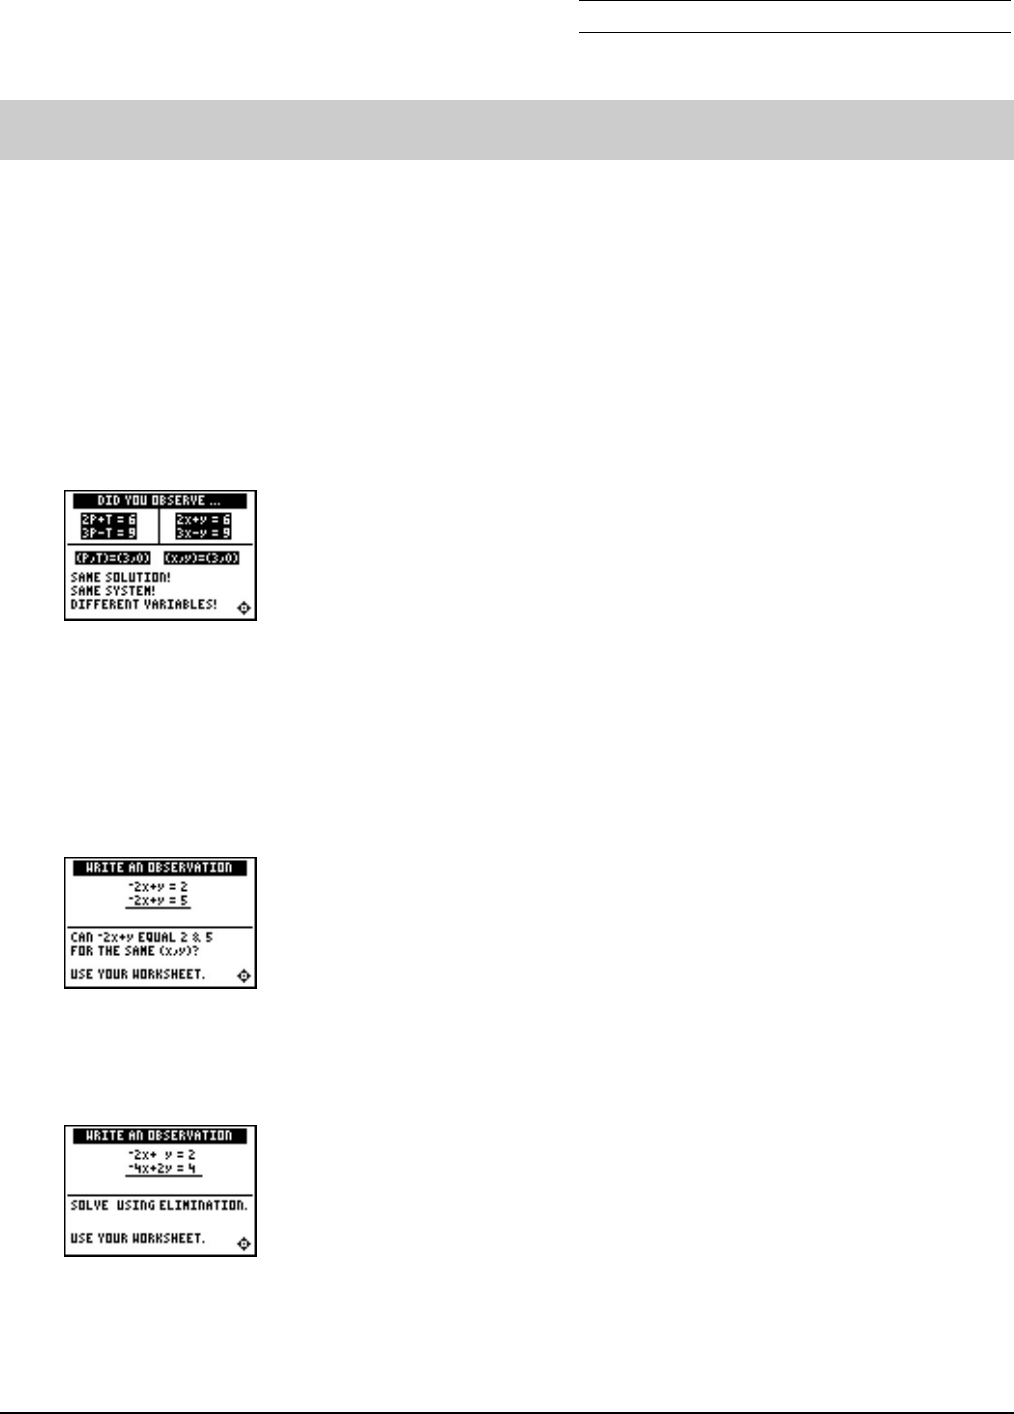
Chapter 5: Linear Systems Name
Section 2: Using Algebra Date
Topics in Algebra 1 © 2001, 2002 Texas Instruments Student Worksheet 5-15
Linear Systems: Using Algebra Student Worksheet
Overview
The Overview introduces the topics covered in Observations and Activities. Scroll through the
Overview using ~ ( | to review, if necessary). Read each screen carefully. Look for new terms,
definitions, and concepts.
Observations
Scroll through the Observations using ~ ( | to review, if necessary). Read each screen
carefully. When you come to a Write an Observation screen, stop and write the answers to the
questions on your worksheet.
Observation 1
Find the solution of each system shown on the screen. Use either the
substitution or elimination method.
Observation 2
For the system of equations shown on the screen, can the expression
L2x + y equal 2 and 5 for the same (x, y)?
Observation 3
Solve the given system using the elimination method.
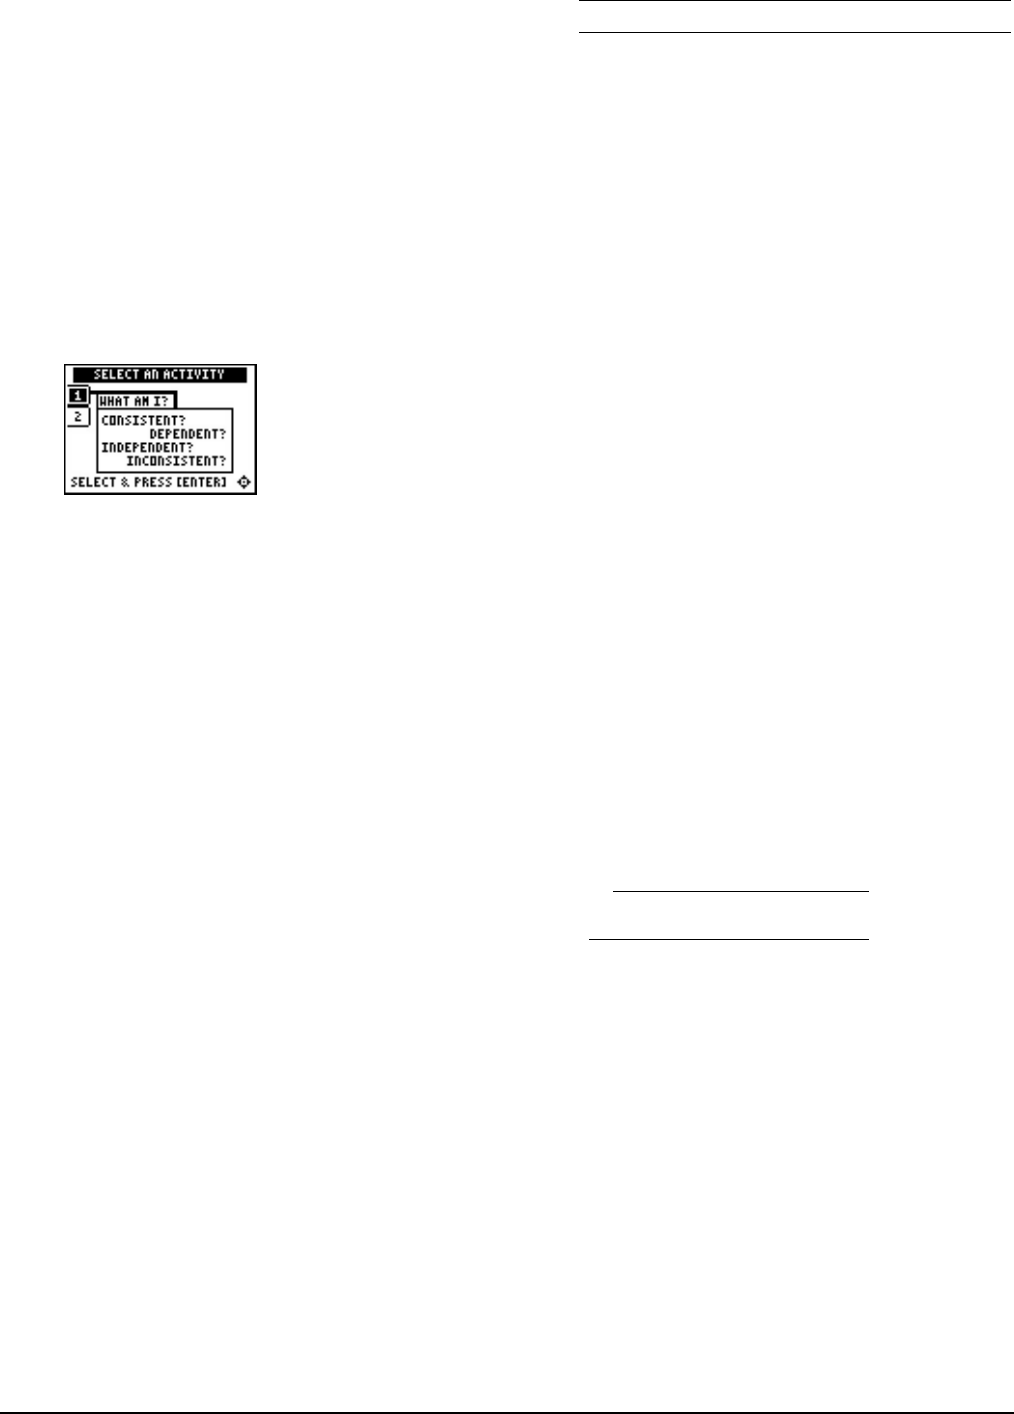
Chapter 5: Linear Systems Name
Section 2: Using Algebra Date
Topics in Algebra 1 © 2001, 2002 Texas Instruments Student Worksheet 5-16
Activities
The Activities help you practice using algebra to solve linear systems. You can select from two
different activities—What Am I? and Balloon Ride. Follow these steps to play the activities and
complete your worksheet.
1. Make sure you are in the Activities for this section.
2. Highlight an activity using } or † and press Í.
Scoring: You get one
attempt to pick the correct
classification of the system.
You get 2 points for a correct
choice and 1 point for a
correct choice if you press
áHINTâ to see the graph.
Four systems are given for a
maximum score of 8 points.
What Am I?
1. Highlight a level (silver = less difficult; gold = more difficult),
and press Í to select it.
2. Look at the system of equations and decide if the system is
consistent & independent, consistent & dependent, or
inconsistent.
Press áHINTâ if you need to see the graph. You only get 1 point
for the problem if you press áHINTâ.
Press } or † to cycle through the choices and then press
Í to select the correct answer. The correct answer and
graph are displayed if the incorrect answer is chosen. You
must press a key to continue play.
3. In the space below, write out the algebraic steps (using
elimination or substitution) for each problem or explain why
you knew the correct answer.
4. What level did you play?
5. What was your score?
Problem 1: Problem 2:
Problem 3: Problem 4:

Chapter 5: Linear Systems Name
Section 2: Using Algebra Date
Topics in Algebra 1 © 2001, 2002 Texas Instruments Student Worksheet 5-17
Activities (continued)
Scoring: You get two
attempts to pick or input the
correct solution to the system
of equations. You get 2 points
for a correct choice or input
on the first try, and 1 point for
a correct choice or input on
the second try.
There are 4 problems for a
maximum score of 8 points.
Balloon Ride
1. Highlight a level (silver = less difficult; gold = more difficult),
and press Í to select it.
2. Look at the system of equations and solve using the algebraic
methods of substitution or elimination.
Silver level: Press } or † to cycle through the solutions to
choose from, and then press Í to select the solution. You
must press a key to continue play.
Gold level: Use } or † to select an answer or to get to the
input box. Select or input your answer and press Í.
(Press Ì to enter negative numbers.) You must press a key to
continue play.
3. As you play, write out the algebraic steps (using elimination
or substitution) for each problem or explain why you knew
the correct answer in the space below.
4. What level did you play?
5. What was your score?
Problem 1: Problem 2:
Problem 3: Problem 4:

Chapter 5: Linear Systems Name
Section 2: Using Algebra Date
Topics in Algebra 1 © 2001, 2002 Texas Instruments Student Worksheet 5-18
Extra Practice: Using Substitution or Elimination
1. Cathy found a part-time job for the summer. Each week, when she works up to 10 hours,
she earns a regular hourly wage. If she works more than 10 hours each week, she earns
more money per hour for the overtime hours. She worked 14.5 hours during the first week.
Her paycheck, before taxes and deductions, was $93.75. The second week, she worked 12
hours and her paycheck, before taxes and deductions, was $75.00. Cathy’s boss had told her
what her hourly and overtime rates were, but Cathy was so excited to get the job that she
couldn’t remember what she was told.
•Write a system of equations for Cathy’s hourly and overtime pay rates. Clearly define the
variables and their meanings.
•Solve the system of equations using substitution. Show your work and explain the steps
you used to solve the system of equations. Show the check of your solution.
•Write a sentence explaining Cathy’s pay rate. ___________________________________
__________________________________________________________________________
__________________________________________________________________________
__________________________________________________________________________

Chapter 5: Linear Systems Name
Section 2: Using Algebra Date
Topics in Algebra 1 © 2001, 2002 Texas Instruments Student Worksheet 5-19
2. Cathy decides to spend some of her earnings from her new job, so she and her friend
Brenda go to the mall. Their favorite store has blouses and jeans on sale. A variety of
blouses is on one rack and are all the same price. A variety of jeans is on another rack and
are all the same price. The price tags are not on the clothes but Cathy and Brenda know that
the store’s prices are usually within their budgets.
Cathy picks out 3 blouses and 2 pairs of jeans from the sale racks. At the checkout, she sees
that her total bill is $57.00. Brenda picks out 4 blouses and 3 pairs of jeans from the sale
racks. Her total bill is $81.00. They are shopping in the state of Delaware where there is no
sales tax.
To find the cost of one blouse or one pair of jeans, Cathy and Brenda could just look at the
sales receipt. Instead, they try to figure out the prices themselves.
•Write the system of equations that Cathy and Brenda need to solve. Clearly define the
variables and their meaning.
•Solve the system of equations using elimination. Show your work and explain the steps
you used to solve the system of equations. Show the check of your solution.
Hint: You can multiply both equations by a factor to avoid working with fractions!
•Write a sentence explaining the price Cathy and Brenda paid for each top and each pair
of jeans.
Remember: You always have a choice of picking the method that you think will be easiest to perform when solving systems
of equations. In the problems above, you are asked to use a specific method.
__________________________________________________________________________
__________________________________________________________________________
__________________________________________________________________________
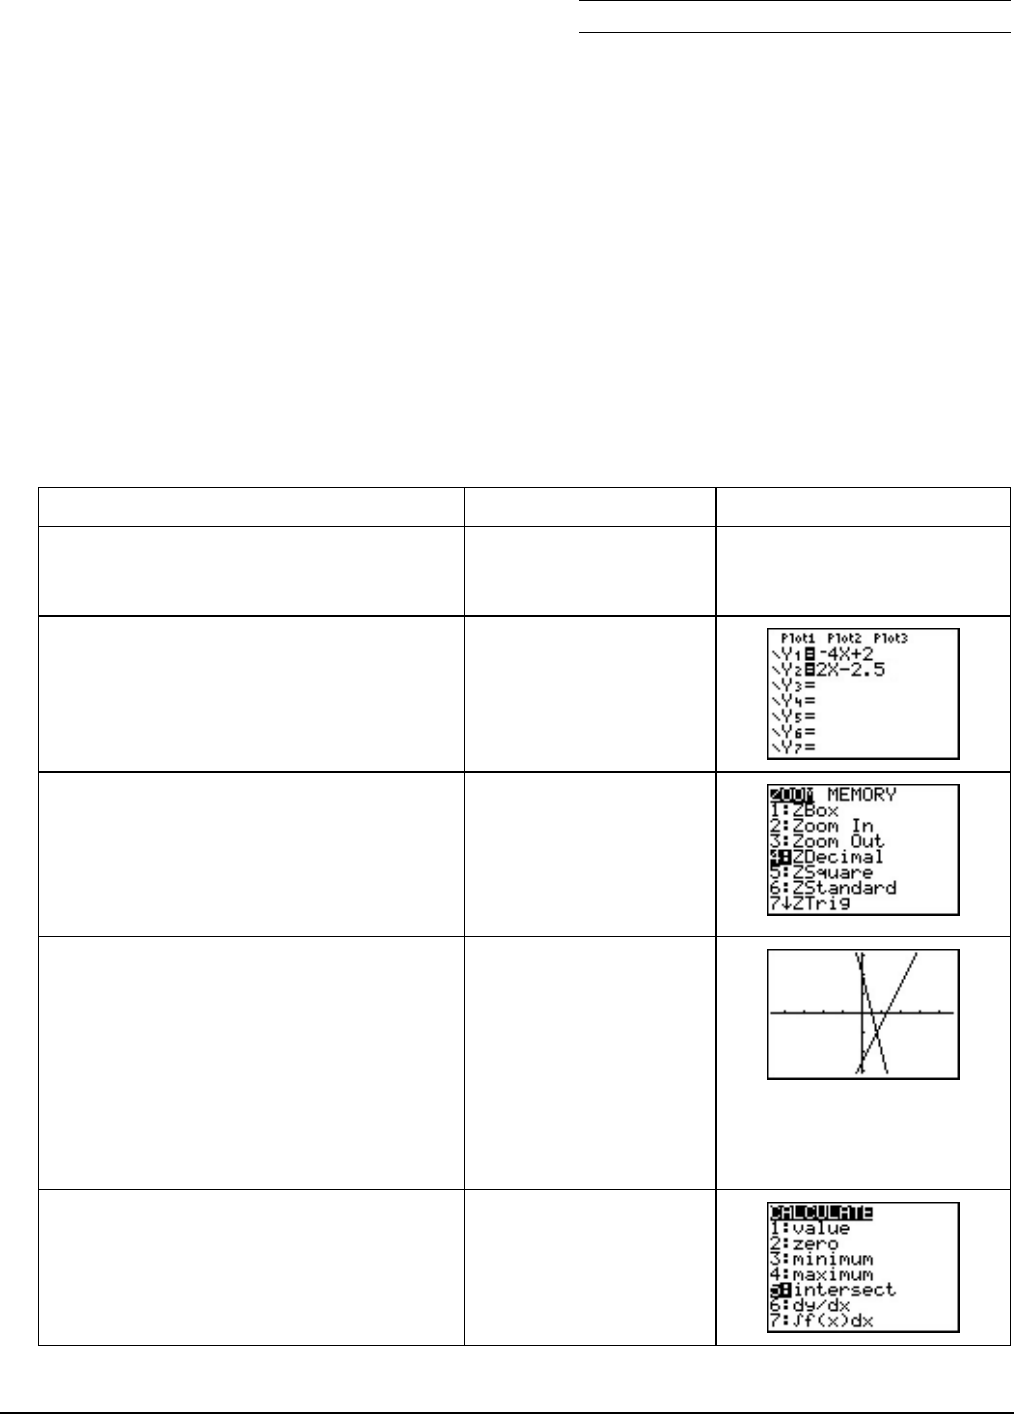
Chapter 5: Linear Systems Name
Section 2: Using Algebra Date
Topics in Algebra 1 © 2001, 2002 Texas Instruments Student Worksheet 5-20
³ Try-It!é on Your TI.83 Plus
You will:
•Graph two lines of a system of equations.
•Use ) to locate the intersection of the lines.
•Use the intersect feature to find the solution to a system of equations.
•Check the solution on the home screen using ¿.
Find the solution of the system: Y1 = L4X + 2
Y2 = 2X N2.5
Notice that these equations are already in the form of y = mx + b. They are in the form to enter
into your calculator.
To Do This Press Display
1. Exit the Topics in Algebra 1
application and clear the Home
screen.
yl
áEXITâ:
2. First, enter M4X + 2 as Y1 and
2X N2.5 as Y2 in the Y= editor.
Note: See TIp 3: Graphing a Function in the
Standard Window for more information.
o ‘
Ì4„ Ã 2
† ‘
2„ ¹ 2Ë5
3. Select the Zoom Decimal viewing
window.
Remember: You have to adjust the viewing window
depending on the system of equations. You can see
the intersection of the lines in the ZDecimal window
for this example.
q4:ZDecimal
4. The graph displays. Since this system
has one solution, you can find the
numerical solution using the intersect
feature.
Important Reminder: Be sure to use your
knowledge about the equations of lines to determine
if the lines are parallel or the same line. When you
use the intersect feature, an error displays if the lines
are parallel. If the lines are the same line, the
calculator shows ONLY one answer.
5. Use the CALCULATE menu item
called intersect to find the calculated
numeric solution.
y / 5:intersect
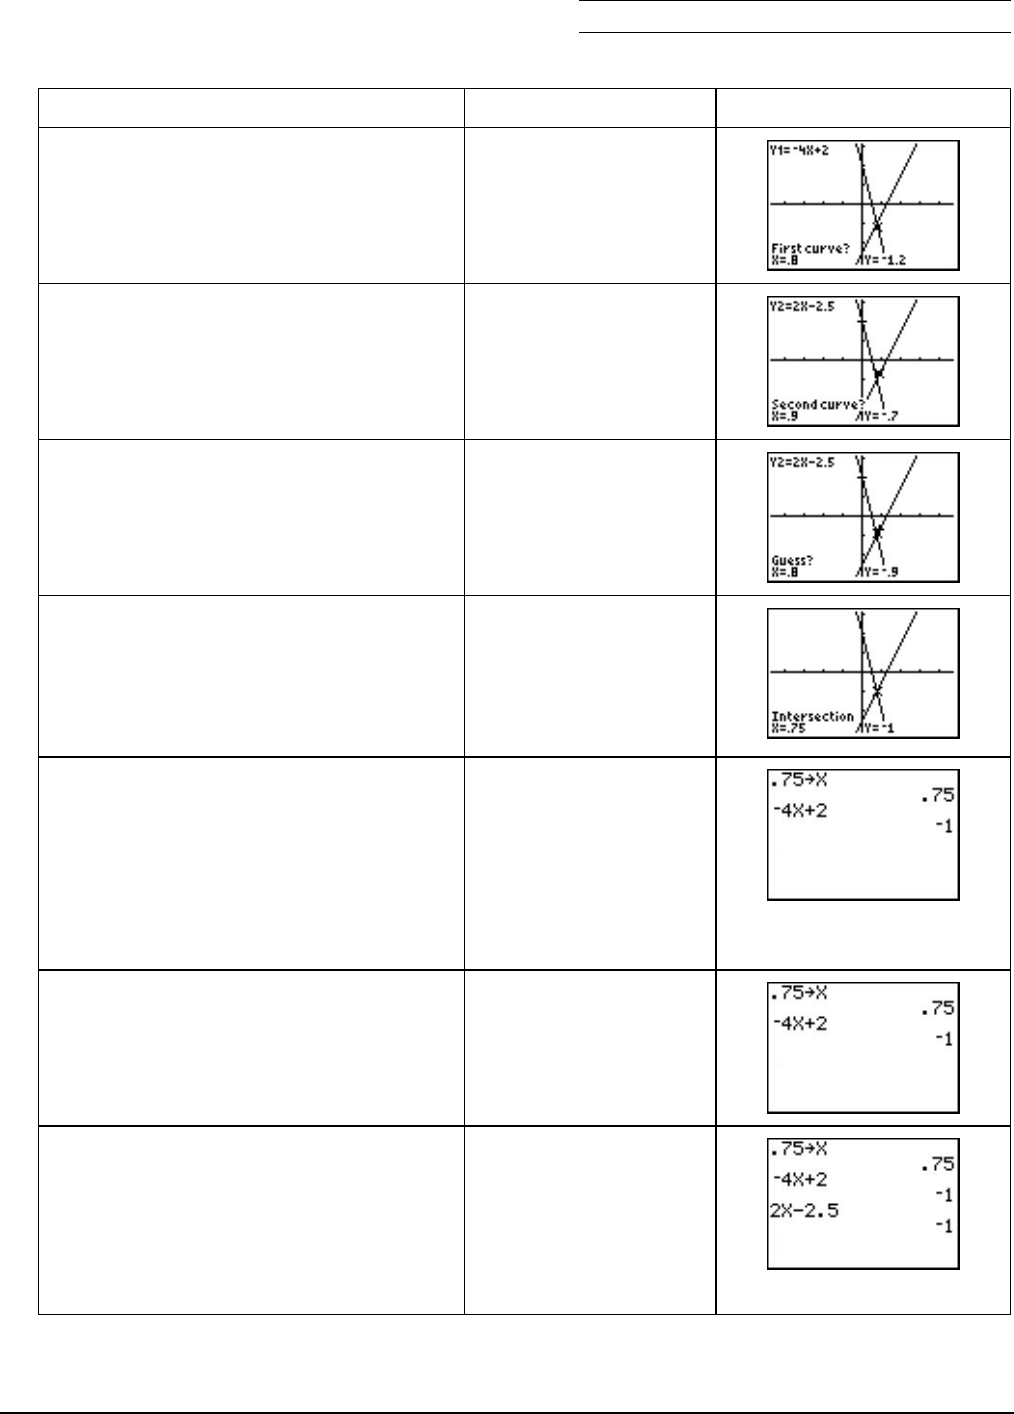
Chapter 5: Linear Systems Name
Section 2: Using Algebra Date
Topics in Algebra 1 © 2001, 2002 Texas Instruments Student Worksheet 5-21
To Do This Press Display
6. You have to select a First Curve in
order for the calculator to calculate
the numerical solution. Notice the
cursor is on the line Y1 = L4X + 2.
Í
7. You have to select a Second Curve in
order for the calculator to calculate
the solution. Notice the cursor is on
the line Y2 = 2X N2.5.
Í
8. The calculator now needs a close
guess at the solution. Move the
cursor closer to the intersection.
~ or |
9. The calculator uses a program to
calculate the numerical solution. The
numerical solution given is at
(0.75, L1). Check to see if this
solution is the exact solution or an
approximate value.
b
10. Check the solution on the home
screen. The value 0.75 is stored in the
X variable in the calculator. X is fixed
at 0.75 after you follow these steps.
Important Reminder: The calculator always has a
value stored in each variable. You must store the
value you want in order to understand how the
calculator interprets a variable expression.
-5 ‘
Ë75
¿ „ Í
11. Enter L4X + 2 to find the Y1 value at
X = 0.75. Notice that the output is L1.
Ì4„ Ã 2Í
12. Enter 2X N2.5 to find the Y2 value at
X = 0.75. Notice that the output is L1
and Y1 = Y2 at X = 0.75.
The solution is (0.75, L1). Press
* to see if this agrees with
the graph of the lines!
2„ ¹ 2Ë5
Í

Chapter 5: Linear Systems Name
Section 2: Using Algebra Date
Topics in Algebra 1 © 2001, 2002 Texas Instruments Student Worksheet 5-22
Extra Practice: Using Your Calculator to Find Solutions
1. Use your calculator to find the solution to each system of equations. Write the solution and a
description of how you used your calculator to find and verify the solution.
Remember: You need to rewrite the equations in the form y = mx + b to work with your calculator.
Note: If the calculator gives the value .6666666667 or X=.66666666666666 in Solver the exact answer is most likely X = 2
3.
Explain how you found the exact answer if the calculator only gave an approximate answer. Verify your answer!
a. y = L1.2x + 3.725
3x N y = 8.875
b. 3x + y = 6
1
2x N1
3y = L1
2. Solve each of the systems you found in Extra Practice: Using Substitution or Elimination,
using your calculator. Write an explanation of how you used your calculator.
a. Cathy’s pay rate
b. Cathy and Brenda’s shopping trip

Chapter 5: Linear Systems Name
Section 2: Using Algebra Date
Topics in Algebra 1 © 2001, 2002 Texas Instruments Student Worksheet 5-23
Challenge
Investigate using the Solver feature on the TI-83 Plus to find the solution! Find this feature in
0:Solver. It is best to use this feature if the system has only one solution.
Hint: Press and select 0:Solver.You have to enter the equation in the Solver as 0 = L4X + 2 N(2XN2.5) to solve for the X value. You
have to input a guess for the X solution. bound = {M1å
ååå99, 1å
ååå99} represents the real number line for the calculator. You can make the set
smaller to find solutions in a particular interval. Then, use ƒ \ to find the calculator’s numerical solution. See the TI-83 Plus
guidebook for more details about the Solver feature.
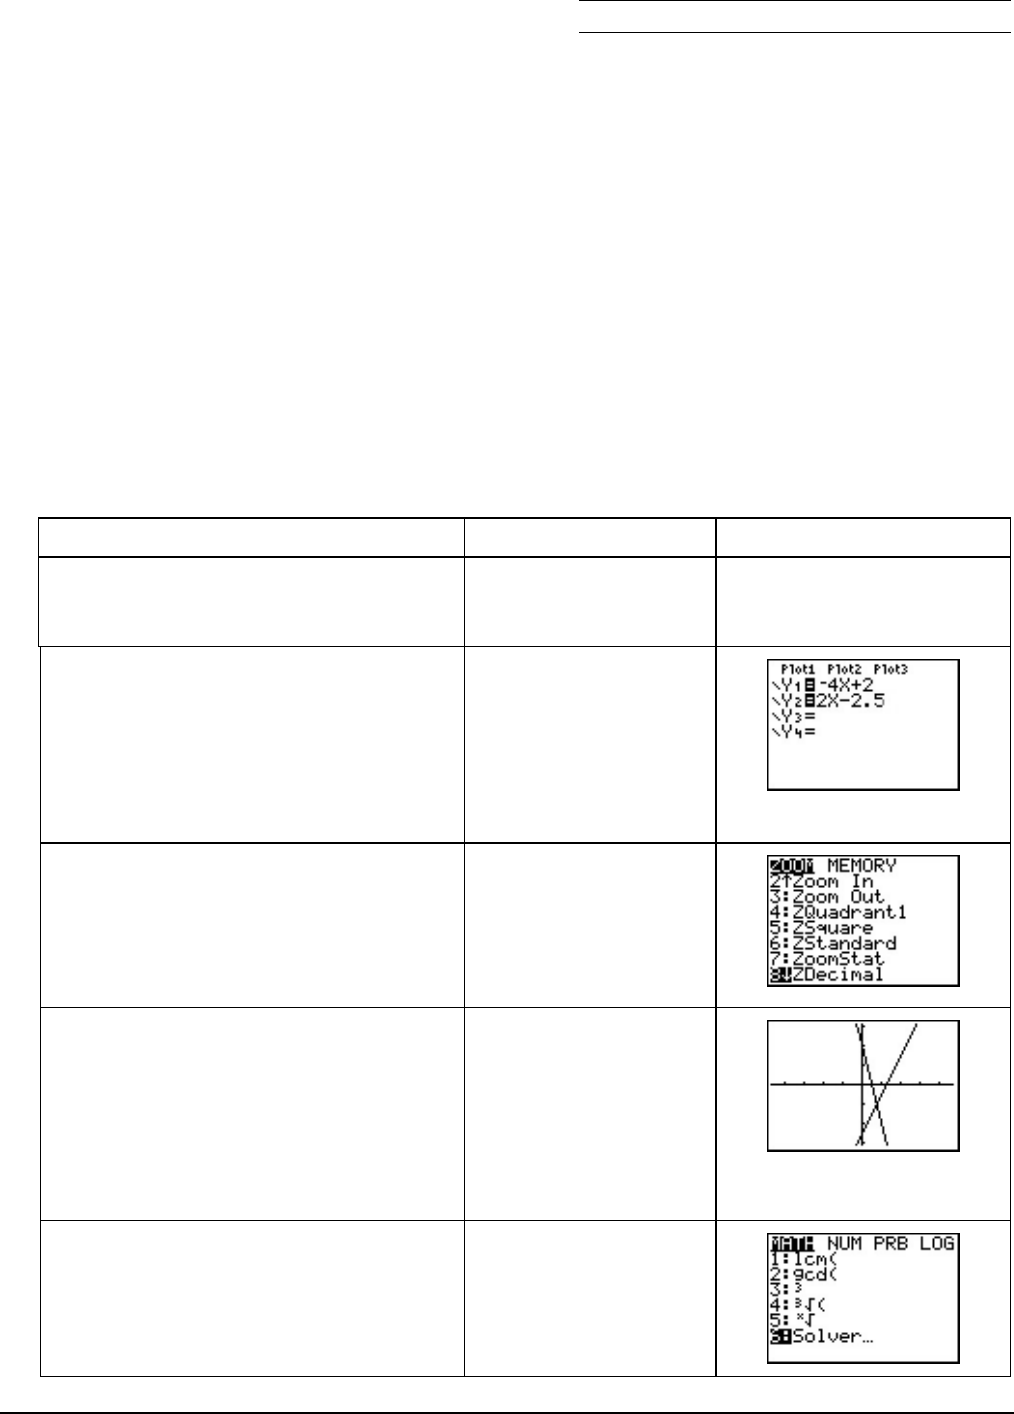
Chapter 5: Linear Systems Name
Section 2: Using Algebra Date
Topics in Algebra 1 © 2001, 2002 Texas Instruments Student Worksheet 5-24
³ Try-It!é on Your TI.73
You will:
•Graph two lines of a system of equations.
•If the lines intersect, use the 1 feature Solver to find the X value of the solution to the
system.
•Find the Y value by using X on the home screen.
Find the solution of the system: Y1 = L4X + 2
Y2 = 2X N 2.5
Notice that these equations are already in the form of y = mx + b. They are in the form to enter
into your calculator.
To Do This Press Display
1. Exit the Topics in Algebra 1
application and clear the Home
screen.
- l
áEXITâ:
2. It is good practice to look at the
graph of the system before you use
the Solver feature. Enter L4X + 2 as
Y1 and 2X N2.5 as Y2 in the
Y= editor.
Note: See TIp 3: Graphing a Function in the
Standard Window for more information.
& :
a4I \ 2
#‘
2I T 2`5
3. Select the Zoom Decimal viewing
window.
Remember: You will have to adjust the viewing
window depending on the system of equations. You
can see the intersection of the lines in the ZDecimal
window for this example.
(8:ZDecimal
4. The graph displays. Since this system
has one solution, find the numerical
solution next using the Solver
feature on the TI-73.
Important Reminder: Before you use the intersect
feature, use your knowledge about the equations of
lines to determine if the lines are parallel or the same
line.
5. Use the 1menu item called
Solver to find the calculated
numerical solution.
16:Solver
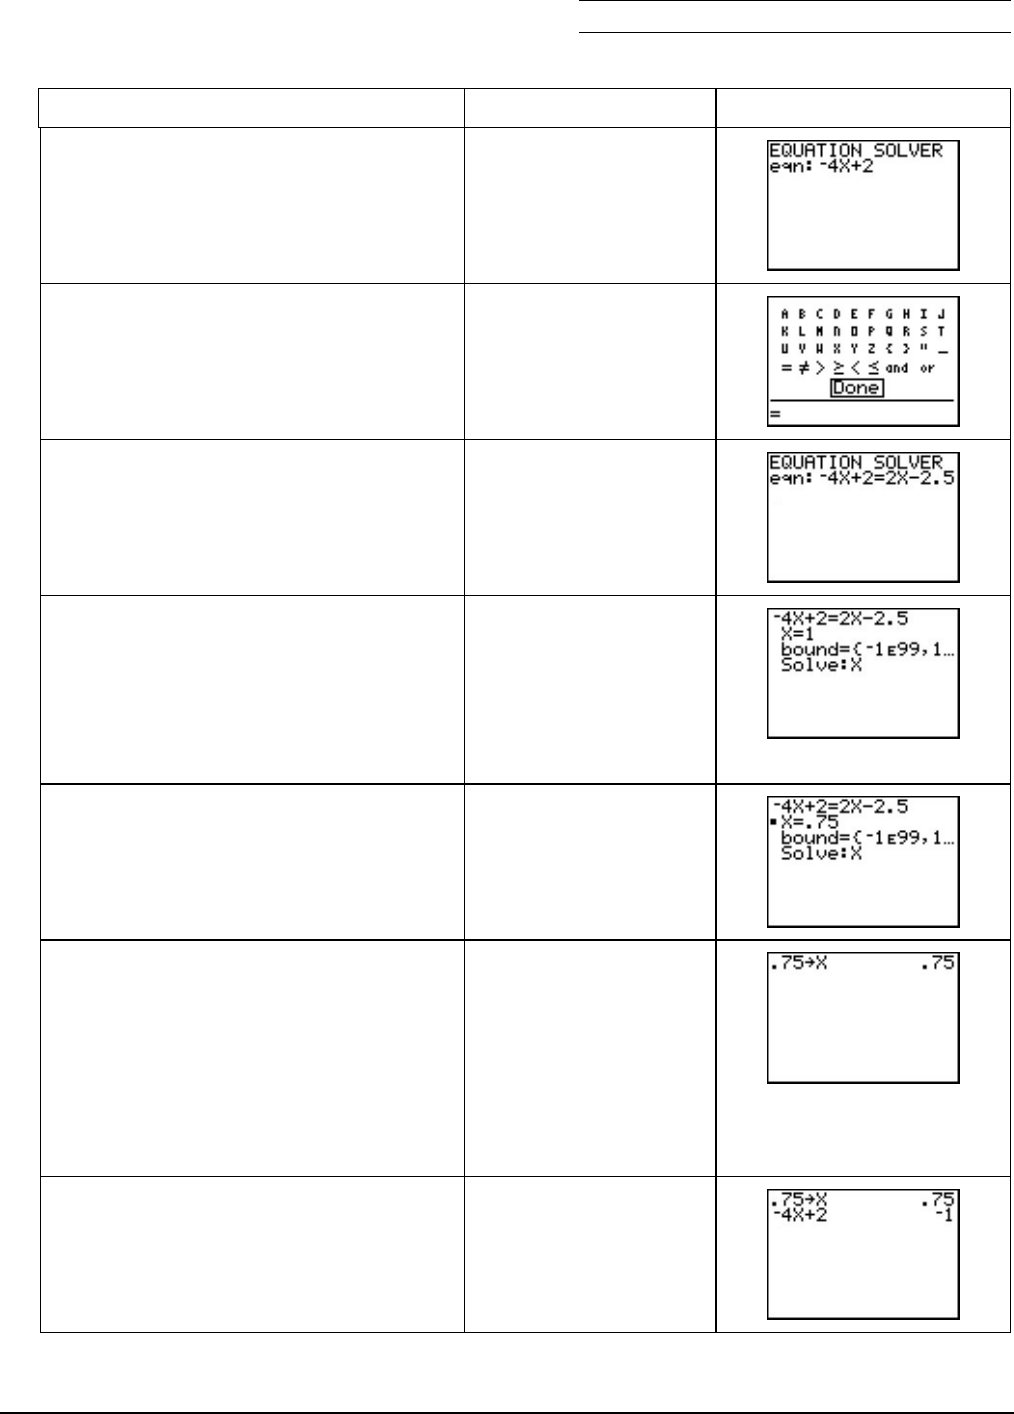
Chapter 5: Linear Systems Name
Section 2: Using Algebra Date
Topics in Algebra 1 © 2001, 2002 Texas Instruments Student Worksheet 5-25
To Do This Press Display
6. To find the solution, you want to find
when the two equations are equal.
Find Y1 = Y2. You need to enter
L4X + 2 = 2x N2.5 on the eqn: line.
a4I\2
7. Find the equal sign (=) in - t.- t
###b
#
8. Finish entering the equation. b2 IT2 `5
9. Enter a guess of X=1 as the solution.
The calculator needs a starting value
for its computation.
Hint: bound = {L1å99, 1å99} represents the real
number line for the calculator. You can make the set
smaller to find solutions in a particular interval. See
the TI-73 guidebook for more details.
b : 1
10. Highlight X on the Solve:X line and
the solution is given as $X=.75.
Notice that $ appears after the
calculator has computed the
numerical solution.
##b
11. Find the Y1 and Y2 values on the
home screen using X. The value
0.75 will be stored in the X variable
in the calculator. X is fixed at 0.75
once you follow these steps.
Important Reminder: The calculator always has
some value stored in each variable. You must store
the value you want in order to understand how the
calculator interprets a variable expression.
- l :
`75
X I b
12. Enter L4X + 2 to find the Y1 value.
Notice that the output is L1.
a4I \ 2b

Chapter 5: Linear Systems Name
Section 2: Using Algebra Date
Topics in Algebra 1 © 2001, 2002 Texas Instruments Student Worksheet 5-26
To Do This Press Display
13. Enter 2X N2.5 to find the Y2 value.
Notice that the output is L1 and
Y1 = Y2 at X = 0.75.
The solution is (0.75, L1). Press
* to see if this agrees with the
graph of the lines!
2I T 2`5b
Extra Practice: Using Your Calculator to Find Solutions
1. Use your calculator to find the solution to each system of equations. Write the solution and a
description of how you used your calculator to find and verify the solution.
Remember: You need to rewrite the equations in the form y = mx + b to work with your
calculator.
Note: If the calculator gives the value .6666666667 or X=.66666666666666 in Solver, the exact answer is most likely X = 2
3.
Explain how you found the exact answer if the calculator only gave an approximate answer. Verify your answer!
a. y = L1.2x + 3.725
3x N y = 8.875
b. 3x + y = 6
1
2x N1
3y = L1

Chapter 5: Linear Systems Name
Section 2: Using Algebra Date
Topics in Algebra 1 © 2001, 2002 Texas Instruments Student Worksheet 5-27
2. Solve each of the systems you found in Extra Practice: Using Substitution or Elimination
using your calculator. Write an explanation of how you used your calculator.
a. Cathy’s pay rate
b. Cathy and Brenda’s shopping trip

Chapter 5: Linear Systems Section 2: Using Algebra
Topics in Algebra 1 © 2001, 2002 Texas Instruments Teacher Notes 5-28
Linear Systems: Using Algebra Teacher Notes
Objectives
•To review the substitution method of solving a system of two linear equations in two
variables.
•To review the elimination method of solving a system of two linear equations in two
variables.
•To review the definitions of consistent (independent and dependent) and inconsistent
systems.
•To associate the number of solutions of a system with the classification of consistent
(independent and dependent) and inconsistent systems.
Math Highlights
In this section, students work with a linear system of equations with two equations and two
variables and review the methods of substitution and elimination.
In the Overview, students associate the graphs of the lines of a system with the number of
solutions of the system and the classification of the system as consistent and inconsistent
(dependent and independent) systems. This was also covered at a lower level in
Section 1: Using Graphs & Tables.
In the substitution example, caramel corn is sold as a class fundraiser, and the students need to
know how many bags of caramel corn they need to sell to make a profit. A system of linear
equations is written to model the costs of producing the caramel corn and the revenue earned
from selling bags of caramel corn. Solving the system of equations gives the number of bags of
caramel corn the students need to sell to make a profit. The term profit is used and should be
discussed in the class. The terms breakeven and loss are not covered, but students would benefit
from a complete classroom discussion of the problem, not just the profit point.
In the elimination example, Jon and Mia earn money by recycling cans and glass. The recycling
center gives each of them one payment for both the cans and the glass. Jon and Mia want to
know how much money they earned for each pound of cans and each pound of glass. A system
of linear equations is written to model the amount of money that Jon and Mia earned for
recycling. Solving the system of equations gives the prices per pound that they were paid for
cans and glass. Students can eliminate either variable in the example.
The variables used in these problems are x and y; however, you should encourage students to
use variables that make sense in the problem.
The Try-It! examples for the TI-83 Plus and the TI-73 are slightly different. They are printed
on separate pages so that you can make copies of only the pages you need. Students can use
either calculator to complete the problems in the Student Worksheet.

Chapter 5: Linear Systems Section 2: Using Algebra
Topics in Algebra 1 © 2001, 2002 Texas Instruments Teacher Notes 5-29
Common Student Errors
•When they use the substitution method, students may make sign and division errors when
they solve for one of the variables. They may also need to be reminded to use parentheses
when needed. Students might incorrectly distribute expressions.
•When solving by substitution, students might solve one equation for y (or x) and substitute
back into the same equation getting a result of 0 = 0, when they should have substituted
back into the other equation.
•When they use the elimination method, students may miss multiplying every term in an
equation by the appropriate constant.
•As they continue using the elimination method, many students subtract incorrectly. They
usually subtract the first term correctly, but often forget to subtract the other terms.
Encourage students to choose the multiplier so that they add the equations for the
elimination rather than subtract them.
•When an algebraic solution results in a statement that is always true, such as 2 = 2 in a
dependent system (coincident lines), or a statement that is never true, such as 2 = 4 in an
inconsistent system (parallel lines), students may be unsure how to state the solution.
•Students often skip checking their solution. In addition to checking their solution by
substituting it back into the original equations, they should also make sure that the solution
is reasonable. For example, in the Student Worksheet problem where Cathy and Brenda are
shopping for tops and jeans, the variable must be positive.
•Students should practice rewriting the system after each step to keep track of their
manipulations.
Encourage students to create good math habits by doing the following.
•Pick the method—graphs, tables, substitution, or elimination—which is best for the system.
First, look at the physical problem, if appropriate, or use geometry and number sense to
analyze the system.
•Remember that for real problems (word problems), some solutions may need to be omitted.
For example, if you need to find the quantity of an item, the solution must be positive.
•Notice when a system obviously has no solution because the lines have the same slope
(i.e., parallel lines), and when a system has an infinite number of solutions because the lines
are the same line.
•Rewrite the system after each step to keep track of the manipulations.
Note: Students who can think through the steps in their mind tend to be impatient with recording each step. However, forming this habit
now will help them in the future, especially when they learn how to solve systems using matrices.
•Write out the mathematics you use to solve the system. Also, write phrases or sentences that
explain your steps. Draw graphs and tables to use as aids.
•Interpret what the solution means in real problems. For example, the recycling problem in
the Overview subsection requires not only the numeric answer but also an explanation about
what the numbers mean with respect to the price per pound.
Tip: Have students look in newspapers and on the web for graphs and tables of information to show real examples of the importance of
both computations and explaining what the computations mean.
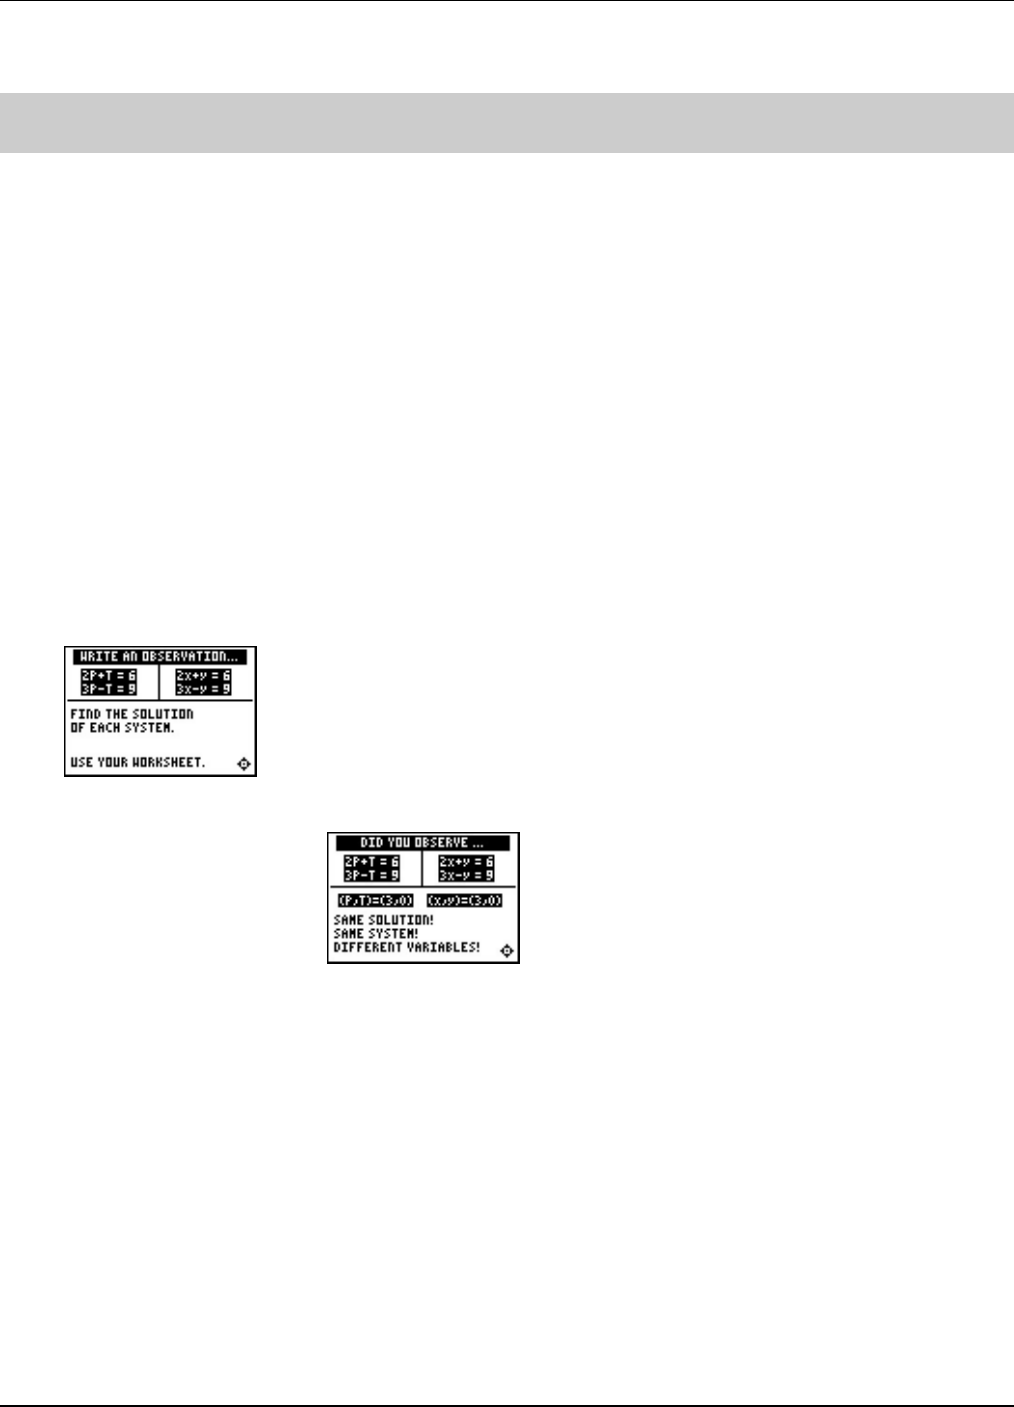
Chapter 5: Linear Systems Section 2: Using Algebra
Topics in Algebra 1 © 2001, 2002 Texas Instruments Teacher Notes 5-30
Student Worksheet Notes with Answers
Overview
Tell students:
1. How to find the Overview, if necessary.
2. How to navigate the application, if necessary.
3. To scroll through the Overview on the calculator. Point out new terms, definitions,
and concepts, and tell students to look for them as they go through the Overview.
Observations
The Observations help students review substitution and elimination methods. If necessary, tell
students how to find the Observations.
Observation 1
Students are asked to solve both systems using either the
substitution method or the elimination method. The systems are
identical except for the choice of variables. Students should become
comfortable with a change in variables and should recognize that
they do not have to do this calculation twice.
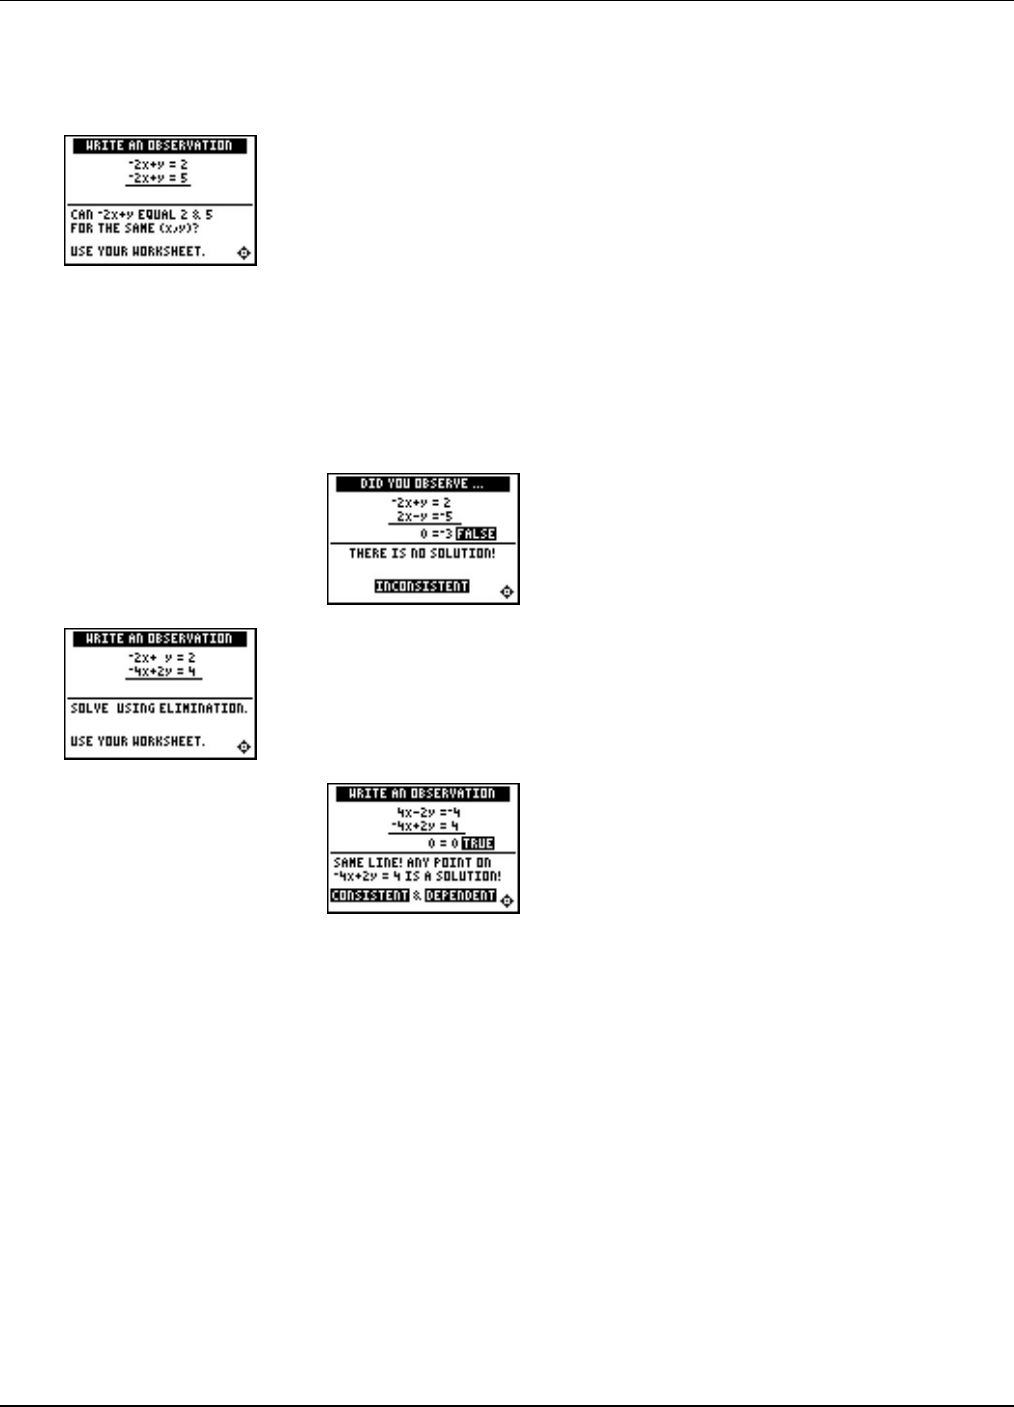
Chapter 5: Linear Systems Section 2: Using Algebra
Topics in Algebra 1 © 2001, 2002 Texas Instruments Teacher Notes 5-31
Observations (continued)
Observation 2
Students are asked if the same left-hand sides of the equations can
equal different right-hand sides. They should be able to reason this
out using their number sense. They can then verify their answer
using algebra. They will see the verification using the elimination
method on the following screens in the application.
The second equation is multiplied by L1 and then the equations are
added. Multiplying by L1 was chosen to avoid sign errors.
Some students will want to immediately subtract the two equations.
This is also correct, but they need to be very careful to subtract each
term!
Observation 3
Students see the elimination steps on the following screens in the
application. The result screen is given below.

Chapter 5: Linear Systems Section 2: Using Algebra
Topics in Algebra 1 © 2001, 2002 Texas Instruments Teacher Notes 5-32
Activities
Scoring: Students get one
attempt to pick the correct
classification of the system.
They earn 2 points for each
correct choice, and 1 point
for a correct choice if they
press áHINTâ to see the
graph.
Four systems are given for a
maximum score of 8 points.
What Am I?
Tell students to:
1. Highlight a level (silver = less difficult; form y = mx + b; gold =
more difficult; mixed slope-intercept and standard forms), and
press Í to select it.
2. Look at the system of equations and decide if the system is
consistent & independent, consistent & dependent, or
inconsistent.
3. Write out the algebraic steps to make this determination, except
possibly at the silver level. Students could use their knowledge
of the graph of y = mx + b in order to answer some problems.
4. Press áHINTâif they want to see a graph of the system. They will
only get 1 point for the problem if they use the áHINTâ.
5. Press } or † to cycle through the choices and then press Í
to select the correct answer. The correct answer and graph will
show if the incorrect answer is chosen. They must press a key to
continue play. As they play the activity, students should write an
algebraic solution to the system on their worksheet.
6. Record the level they played.
7. Record their scores.

Chapter 5: Linear Systems Section 2: Using Algebra
Topics in Algebra 1 © 2001, 2002 Texas Instruments Teacher Notes 5-33
Activities (continued)
Scoring: Students get two
attempts to pick or input the
correct solution to the system
of equations. They earn 2
points for a correct choice or
input on the first try, and 1
point for a correct choice or
input on the second try.
There are 4 problems for a
maximum score of 8 points.
Balloon Ride
Tell students to:
1. Read the introduction screen and then highlight a level (silver =
less difficult; gold = more difficult), and press Í to select it.
Students answer multiple-choice problems in the silver level and
they input their solution in the gold level.
Silver Level: Press } or † to cycle through the solutions to
choose from, and then press Í to select the solution.
Students must press a key to continue play.
Gold Level: Use } or † to select an answer or to get to the
input box. Select or input your answer and press Í. (Press
¹ to enter negative numbers.) Students must press a key to
continue play.
3. As they play the activity, students should write their work using
either elimination or substitution.
4. Record the level they played.
5. Record their scores.
Extra Practice: Using Substitution or Elimination
1. Cathy’s pay rate can be determined by the following.
Let S = hourly pay rate
Let T = overtime pay rate
Week 1: 10S + 4.5T = 93.75
Week 2: 10S + 2T = 75 10S = 75N2T
To use substitution, the student could solve the Week 2 equation for 10S, 10S = 75N2T. Then,
the Week 1 equation becomes the following.
(75 N2T) + 4.5T = 93.75 2.5T = 18.75 T = 7.5
Once T is known, substitute T into either equation and solve for S.
10S + 4.5(7.5) = 93.75 10S = 60 S = 6
Interpret the answer:
S = $6.00 per hour
T = $7.50 per hour
Cathy earns $6.00 per hour for the first 10 hours and $7.50 per hour for any overtime.

Chapter 5: Linear Systems Section 2: Using Algebra
Topics in Algebra 1 © 2001, 2002 Texas Instruments Teacher Notes 5-34
2. Brenda and Cathy can figure out the cost of each top and pair of jeans purchased by the
following.
Let T = price of one top
Let J = price of one pair of jeans
Cathy: 3T + 2J = 57
Brenda: 4T + 3J = 81
To use elimination, multiply Cathy’s equation by 4 and Brenda’s equation by M3.
Cathy: 12T + 8J = 228
Brenda: -12T N9J = M243
Add the two equations to get:
LJ = L15 J = 15
Substitute this value for J into either equation to find T.
3T + 2(15) = 57 3T = 27 T = 9
Interpret the answer:
T = $9.00 per top
J = $15.00 per pair of jeans
Cathy and Brenda paid $9.00 for each top and $15.00 for each pair of jeans.
³ Try-It!é on Your TI.83 Plus and TI.73
Note: The Try-It! exercises cover different functionality available to solve a system of equations. The TI-83 Plus exercise uses the
intersect feature that the TI-73 does not have. The TI-73 exercise uses the Solver to solve an independent system. The TI-83 Plus also has
a Solver feature. Using the Solver feature on the TI-83 Plus is given as a challenge investigation for the students. (Hints are given below.)
The linear system to be solved is the same for both calculators. The problem set, Using Your Calculator to Find Solutions, given after the
Try-It!, is identical and is repeated after each Try-It! for your copying convenience.
On the TI-83 Plus, students will:
•Graph two lines of a system of equations.
•Use r to locate the intersection of the lines.
•Use the y / intersect feature to find the solution to a system of equations.
Check the solution on the home screen using ¿.
On the TI-73, students will:
•Graph two lines of a system of equations.
•If the lines intersect, use the 1Solver feature to find the X value of the solution to the
system.
•Find the Y value by using the X on the home screen.

Chapter 5: Linear Systems Section 2: Using Algebra
Topics in Algebra 1 © 2001, 2002 Texas Instruments Teacher Notes 5-35
Reminders for the Try-It!™ Exercises
TI-83 Plus and TI-73:
•Only the variables X and Y are used for graphs and tables. If an equation uses letters other
than X and Y, you have to change the variables in the problem to X and Y in order to use
some features on the calculators.
•Some value is always stored in each variable. You must store the value you want in order to
understand how the calculator interprets a variable expression. The calculator does not
perform symbolic manipulations.
•The intersect feature on the TI-83 Plus and the Solver feature on both the TI-83 Plus and the
TI-73 are best used to find the solution to a system with one solution. Students should use
their knowledge about the equations of lines to determine if lines are parallel or the same
line before working the problem.
•In the Solver, bound = {M1å
ååå99, 1å
ååå99} represents the real number line for the calculator. You
can make the set smaller to find solutions in a particular interval. See the TI-83 Plus or TI-73
guidebook for more details.
TI-83 Plus:
•When the intersect feature is used, an error is displayed if the lines are parallel. If the lines
are the same line, the calculator will show only one answer.
•In the challenge problem, students are asked to investigate using the Solver feature on the
TI-83 Plus to find the solution. Find this feature in 0:Solver. See the TI-83 Plus
guidebook for details about the Solver feature. You have to enter the equation in the Solver
as 0 = L4x + 2 N(2x N2.5). You have to input a guess for the X solution. Then, use ƒ
\ to find the calculator’s numerical solution.
Extra Practice: Using Your Calculator to Find Solutions
Note: These problems are identical for both the TI-83 Plus and the TI-73.
1a. (3, 0.125)
1b. (2/3, 4)
2a. Answers will vary. Students use their choice of calculator feature to solve for Cathy’s pay
rate.
2b. Answers will vary. Students use their choice of calculator feature to solve for Cathy and
Brenda’s shopping trip.
³ TIp 1: Resetting Your Calculator
Topics in Algebra 1 © 2001 Texas Instruments ³ TIp 1-1
³ TIpé 1: Resetting Your Calculator
You can easily reset all default, or factory, settings on your calculator from the MEMORY menu.
Resetting the default settings ensures that all calculators show exactly the same results in the
same form.
Resetting defaults does not erase any lists, programs, or variables stored in memory.
Note: You should reset your calculator’s default settings to ensure that the results you see on your calculator will match the results in all
example screens in the ³ TIps.
Resetting your calculator to the defaults For more information
Resets all mode and window format defaults. ³ TIp 2: Adjusting Your Calculator Settings
Turns off function plots. ³ TIp 3: Graphing a Function in the Standard Window
Resets window values to ZStandard. ³ TIp 5: Adjusting the Viewing Window
Turns off statistical plots. ³ TIp 7: Creating a Statistical Plot
Calculator Keys Used in This ³ TIpé
y L 7:Reset 2:Defaults 2:Reset
³ TIpé Highlights
Your calculator contains many settings that control the interpretation of results and graphs. For
example, you can control how the calculator:
• Displays mathematical results (for example, with floating or fixed decimal notation).
• Interprets and displays graphs and statistical plots (for example, scale of the X-axis and
Y-axis).
Note: Types of settings vary between the TI-83 Plus and the TI-73. For more information, see the calculator guidebook.
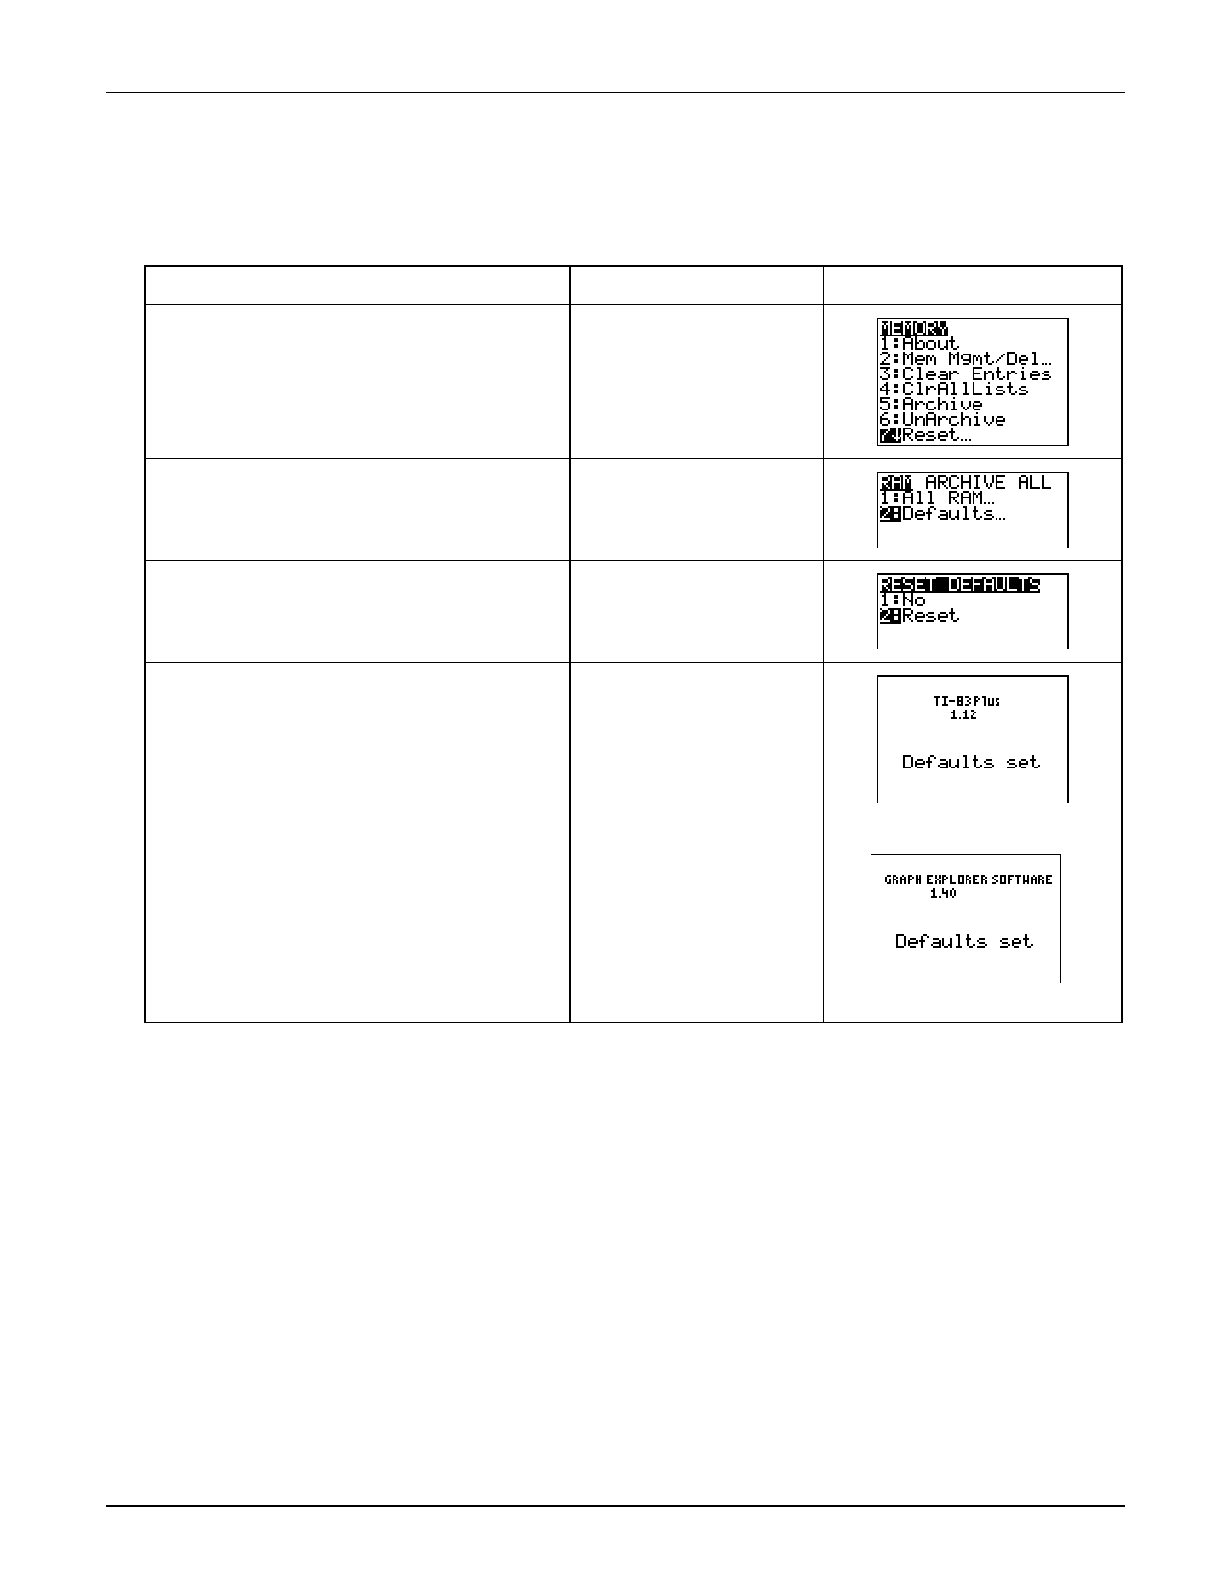
³ TIp 1: Resetting Your Calculator
Topics in Algebra 1 © 2001 Texas Instruments ³ TIp 1-2
³ Try-It!é on Your TI.83 Plus or TI.73
Reset the calculator defaults.
To Do This Press Display (TI.83 Plus shown)
1. Display the
MEMORY menu and
select Reset.
- Ÿ
7:Reset
2. Select
Defaults. 2:Defaults
3. Select
Reset to reset the calculator. 2:Reset
4. Clear the screen and return to the
Home screen. :
TI-83 Plus
TI-73
You are now ready to work through the ³ TIps. Remember, resetting the calculator ensures that
you get the same results shown in all ³ TIps examples.
After you become familiar with your calculator, it will not be necessary to reset it every time
because you will know how you have changed the settings, and you will understand the results
the calculator displays in light of those changes.
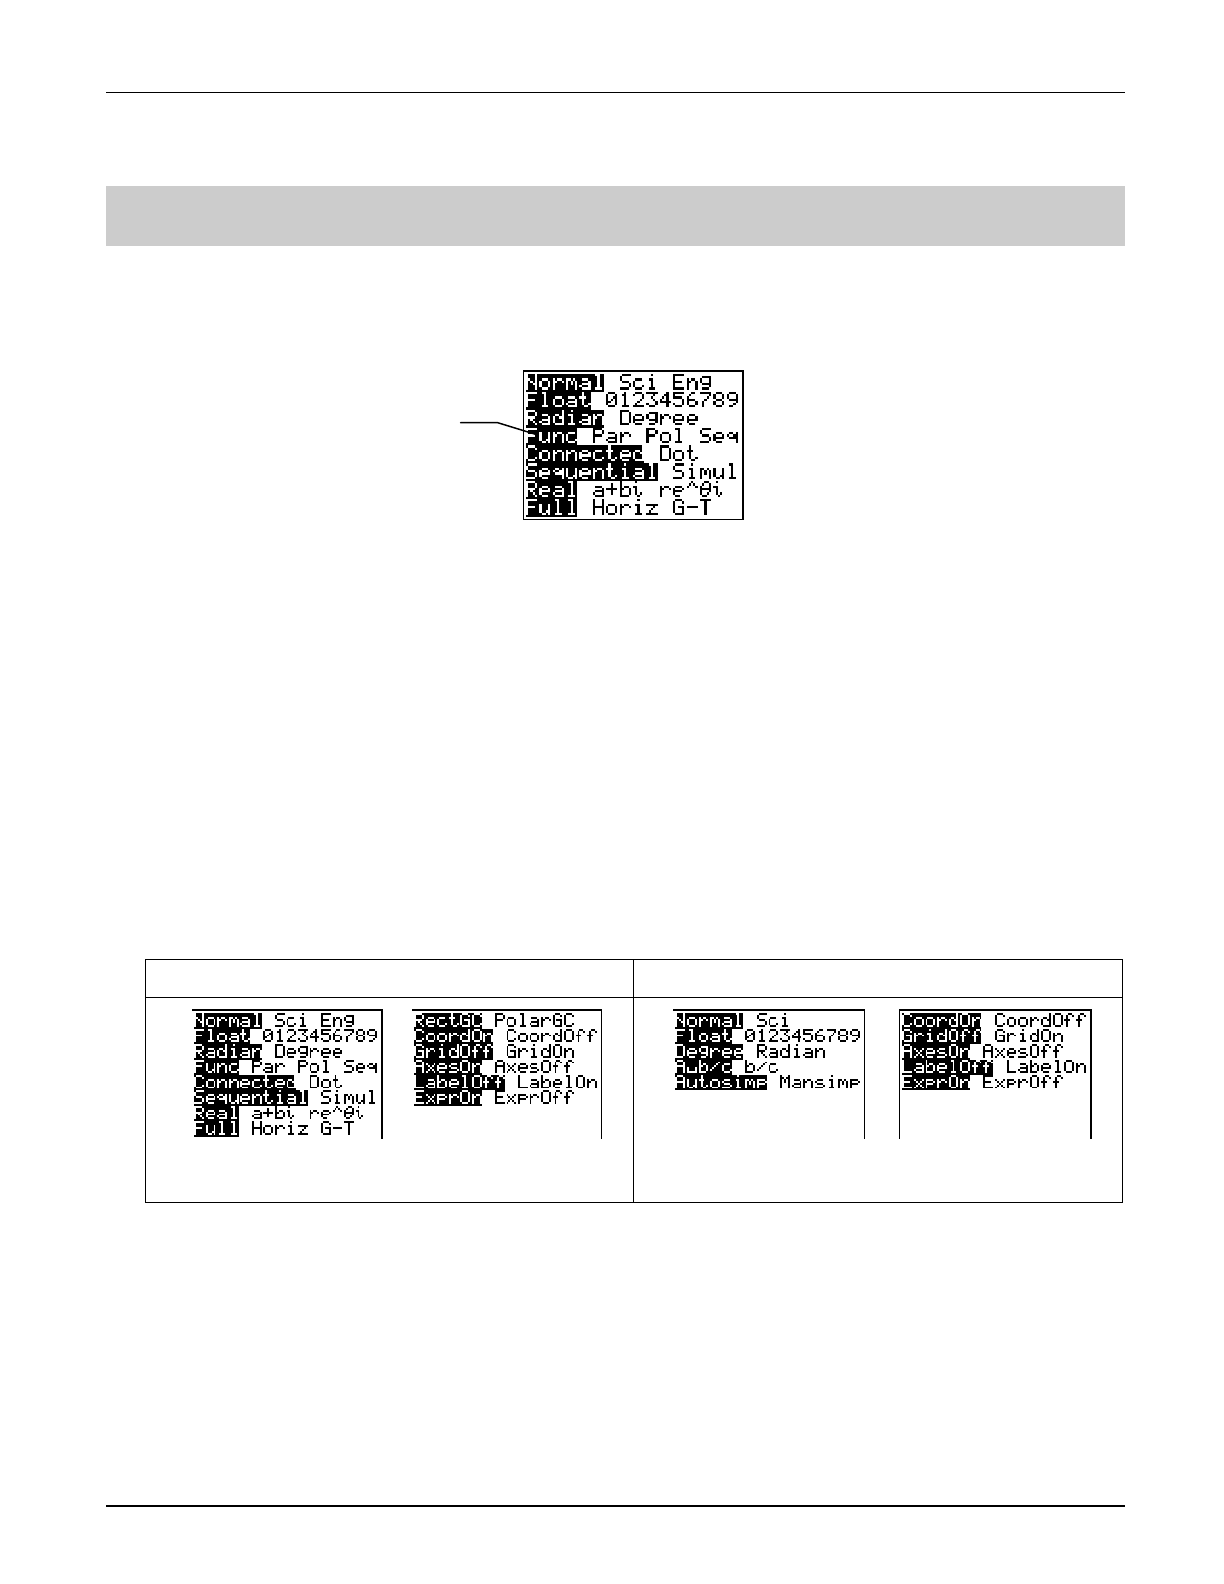
³ TIp 2: Adjusting Your Calculator Settings
Topics in Algebra 1 © 2001 Texas Instruments ³ TIp 2-1
³ TIpé 2: Adjusting Your Calculator Settings
You can control how the calculator displays results and graphs by changing settings. For
example, the mode settings screen is displayed below (varies slightly for the TI-73). The
highlighted settings are the ones that are selected.
Calculator Keys Used in This ³ TIpé
• .
• y .
³ TIpé Highlights
This ³ TIp shows how to change settings on two frequently-used screens—the mode screen and
the window format screen. For more information about settings, see the calculator guidebook.
• Mode (.) settings determine how the calculator interprets and/or displays numbers and
results.
• Window format (y .) settings determine how the calculator interprets and/or
displays graphs.
Note: The TI-83 Plus and the TI-73 mode and window format screens are slightly different.
TI-83 Plus TI-73
In the ³ Try-It! example, you will select new calculator settings following these main steps.
1. Display the setting screen.
2. Press
#, $, !, or ", as necessary, to highlight the setting you want to select.
3. Press
b to select it.
Note: The examples in the next section assume that the calculator has been reset to the default settings as described in
³ TIp 1:
Resetting Your Calculator.
A
ll highlighted
settings are selected.
Mode screen Window Format Screen Window Format Screen
Mode screen
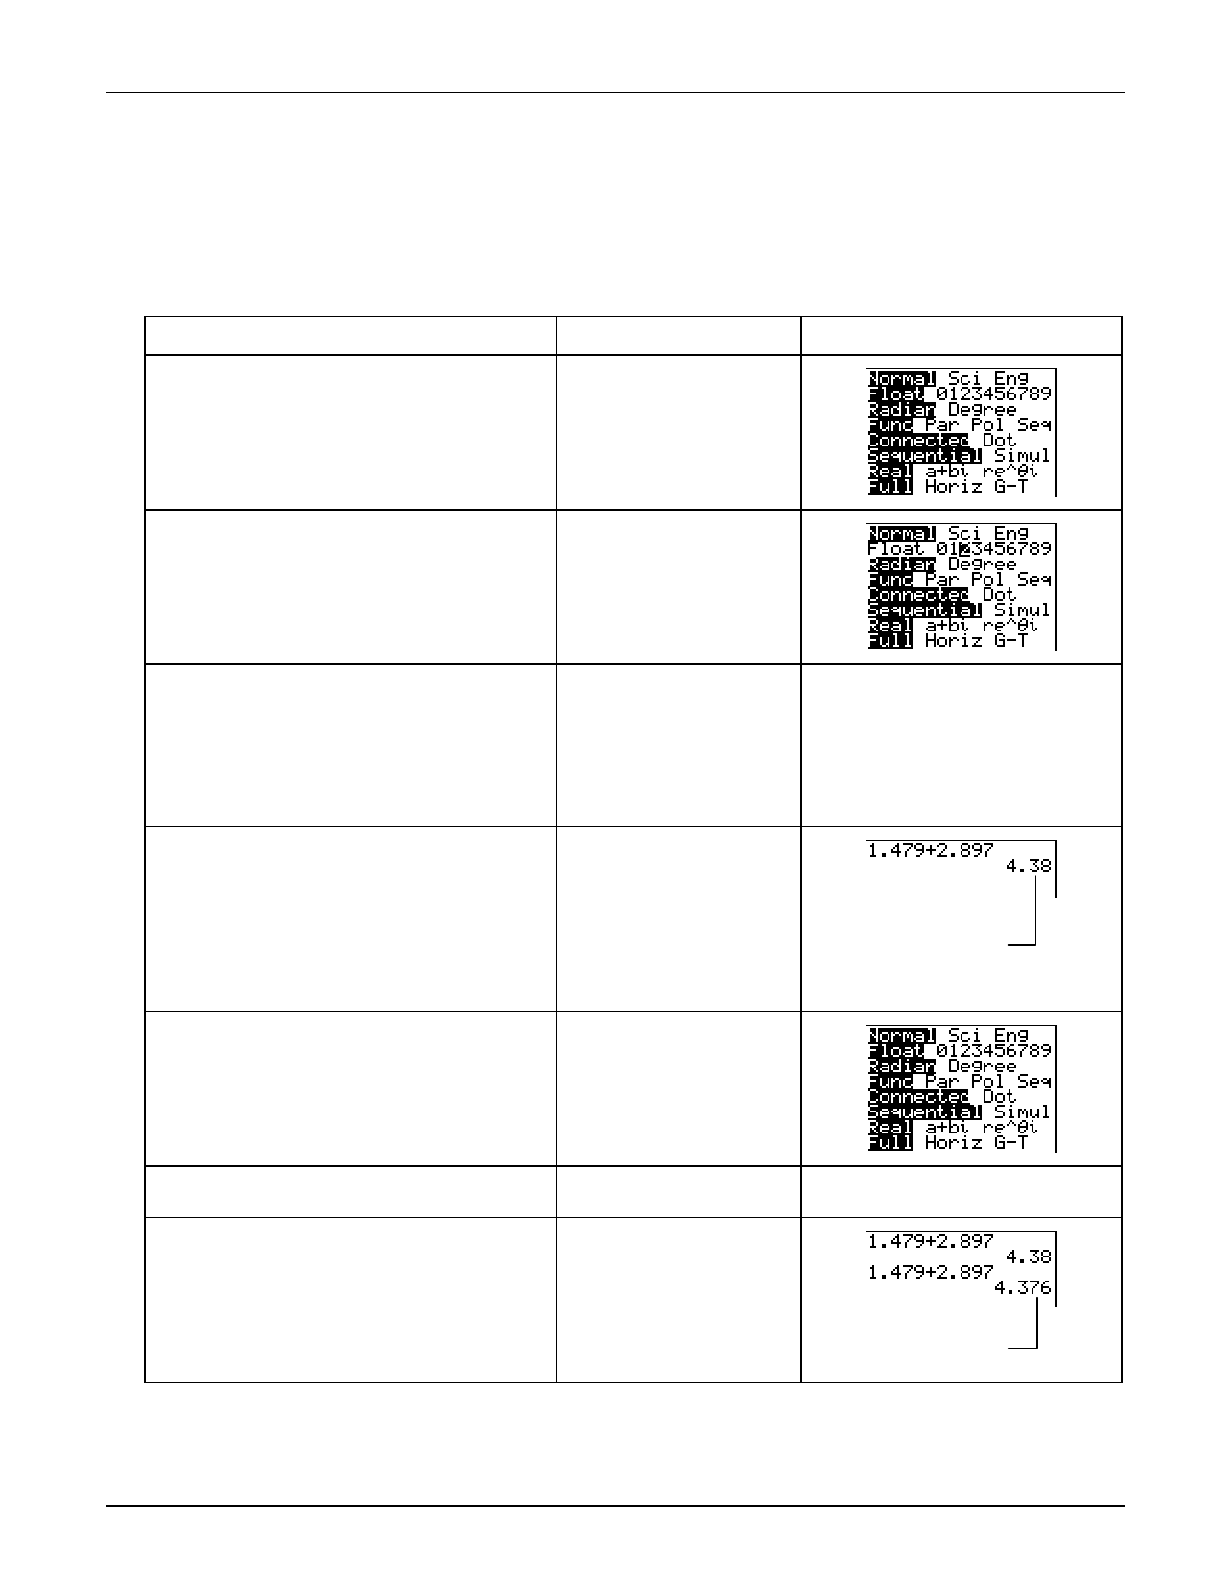
³ TIp 2: Adjusting Your Calculator Settings
Topics in Algebra 1 © 2001 Texas Instruments ³ TIp 2-2
³ Try-It!é on Your TI.83 Plus or TI.73
Change a Mode Setting
Change the mode setting so that results display to 2 decimal places.
To Do This Press Display (TI.83 Plus shown)
1. Display the mode settings screen.
Note: The TI-73 mode screen varies slightly from
the TI-83 Plus.
.
2. Change the decimal notation setting
from Float to 2.
# until Float is
highlighted
" until 2 is
highlighted
b to select
3. Press
- l to return to the
Home screen, and clear the current
line, if needed.
Tip: Pressing - l always takes you back to
the Home screen, except in the Topics in
Algebra 1 application.
- l
:
4. Calculate 1.479 + 2.897. 1 ` 4 7 9 \
2 ` 8 9 7
b
5. Change the decimal notation setting
back to Float.
Note: Float displays a number up to 10 digits.
.
# until Float is
highlighted
b to select
6. Return to the Home screen. - l
7. Calculate 1.479 + 2.897 again.
Tip: On the TI-73, you can press $ $ to
highlight a previous entry on the Home screen,
and then press b to paste it to the current
line.
- £ to display
the previous entry
b
The calculator
rounds the result to
2 decimal places.
The calculator
displays up to 10
digits.
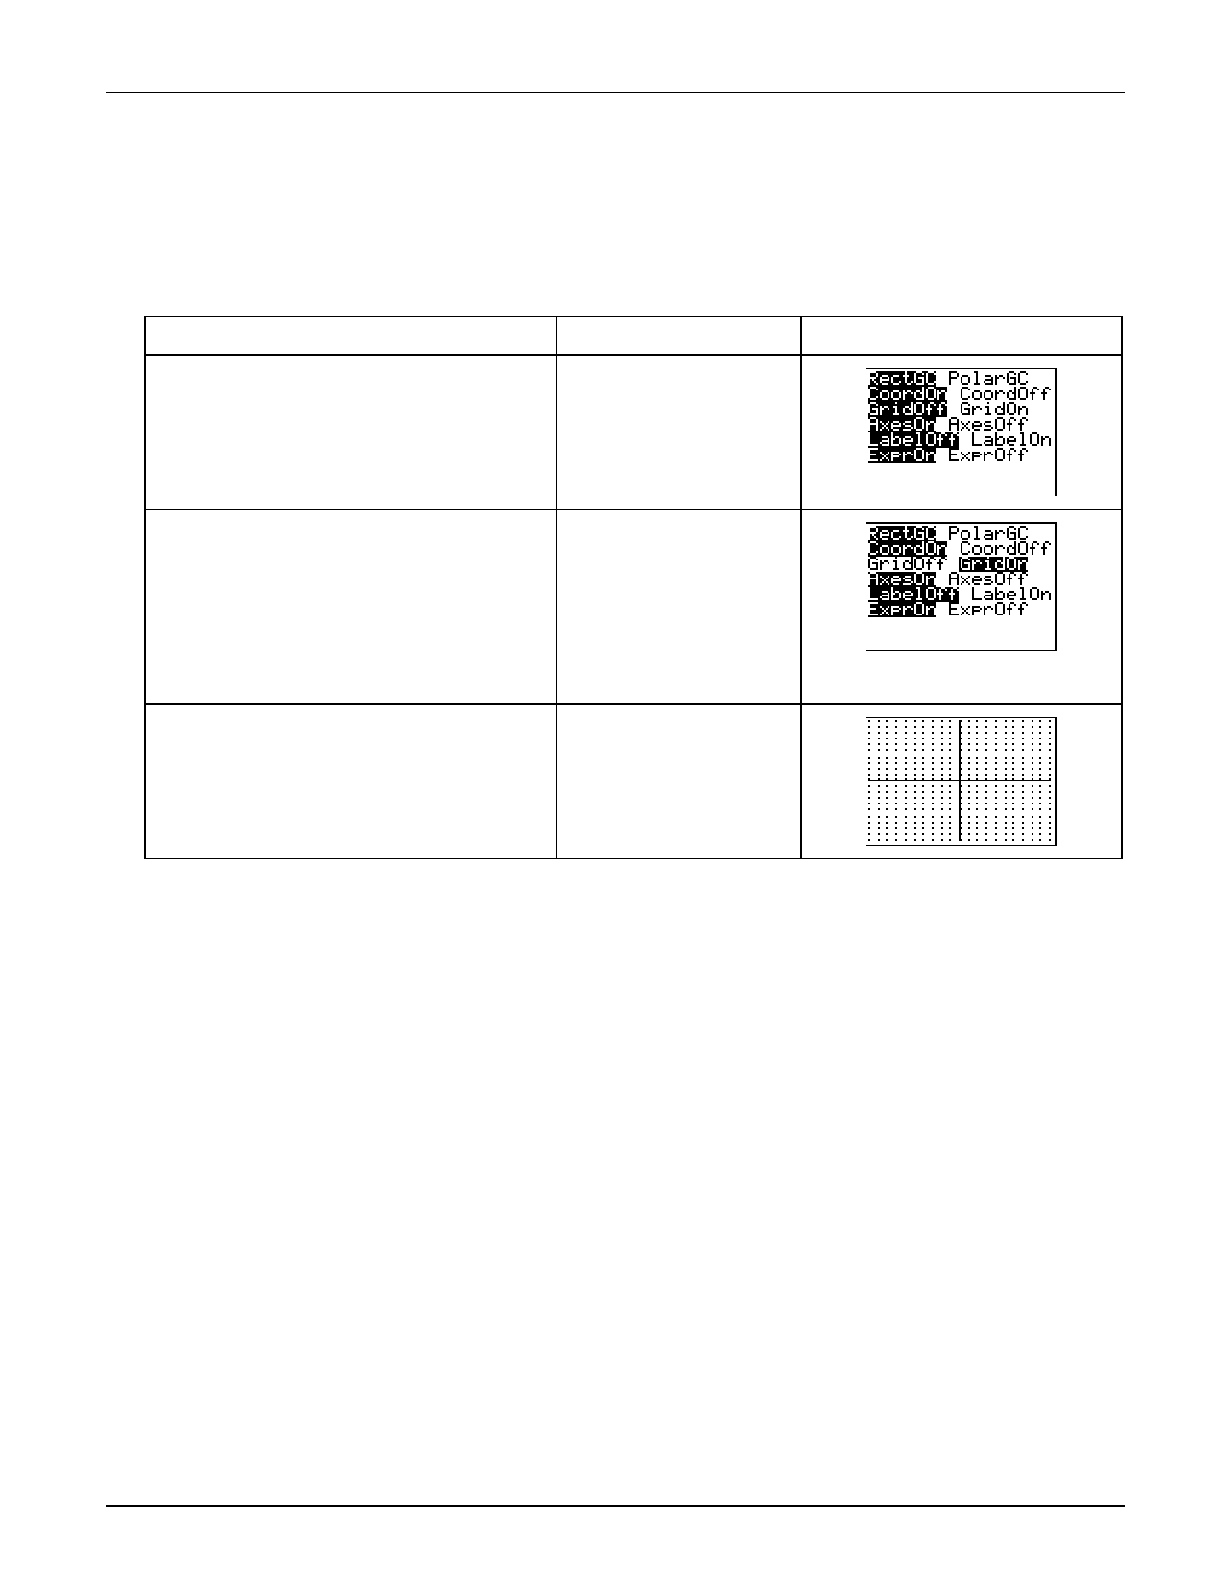
³ TIp 2: Adjusting Your Calculator Settings
Topics in Algebra 1 © 2001 Texas Instruments ³ TIp 2-3
³ Try-It!é on Your TI.83 Plus or TI.73 (continued)
Change a Window Format Setting
To display a grid on the graph screen, select GridOn from the window format screen.
To Do This Press Display (TI.83 Plus shown)
1. Display the window format screen.
Note: The TI-73 mode screen varies slightly from
the TI-83 Plus.
- g
2. Change the grid setting from GridOff
to GridOn.
# until GridOff is
highlighted
" until GridOn is
highlighted
b to select
3. Show the graph screen. Notice both
the grid and axes are on.
*
On Your Own
³ Change your mode setting (.) to scientific notation (Sci). Do some calculations on the
Home screen. Try 25¦63. Notice how the calculator displays scientific notation. Is this the
way you write scientific notation? Explain how this setting affects your results.
³ Turn the grid off on the graph screen. Check this by pressing *.
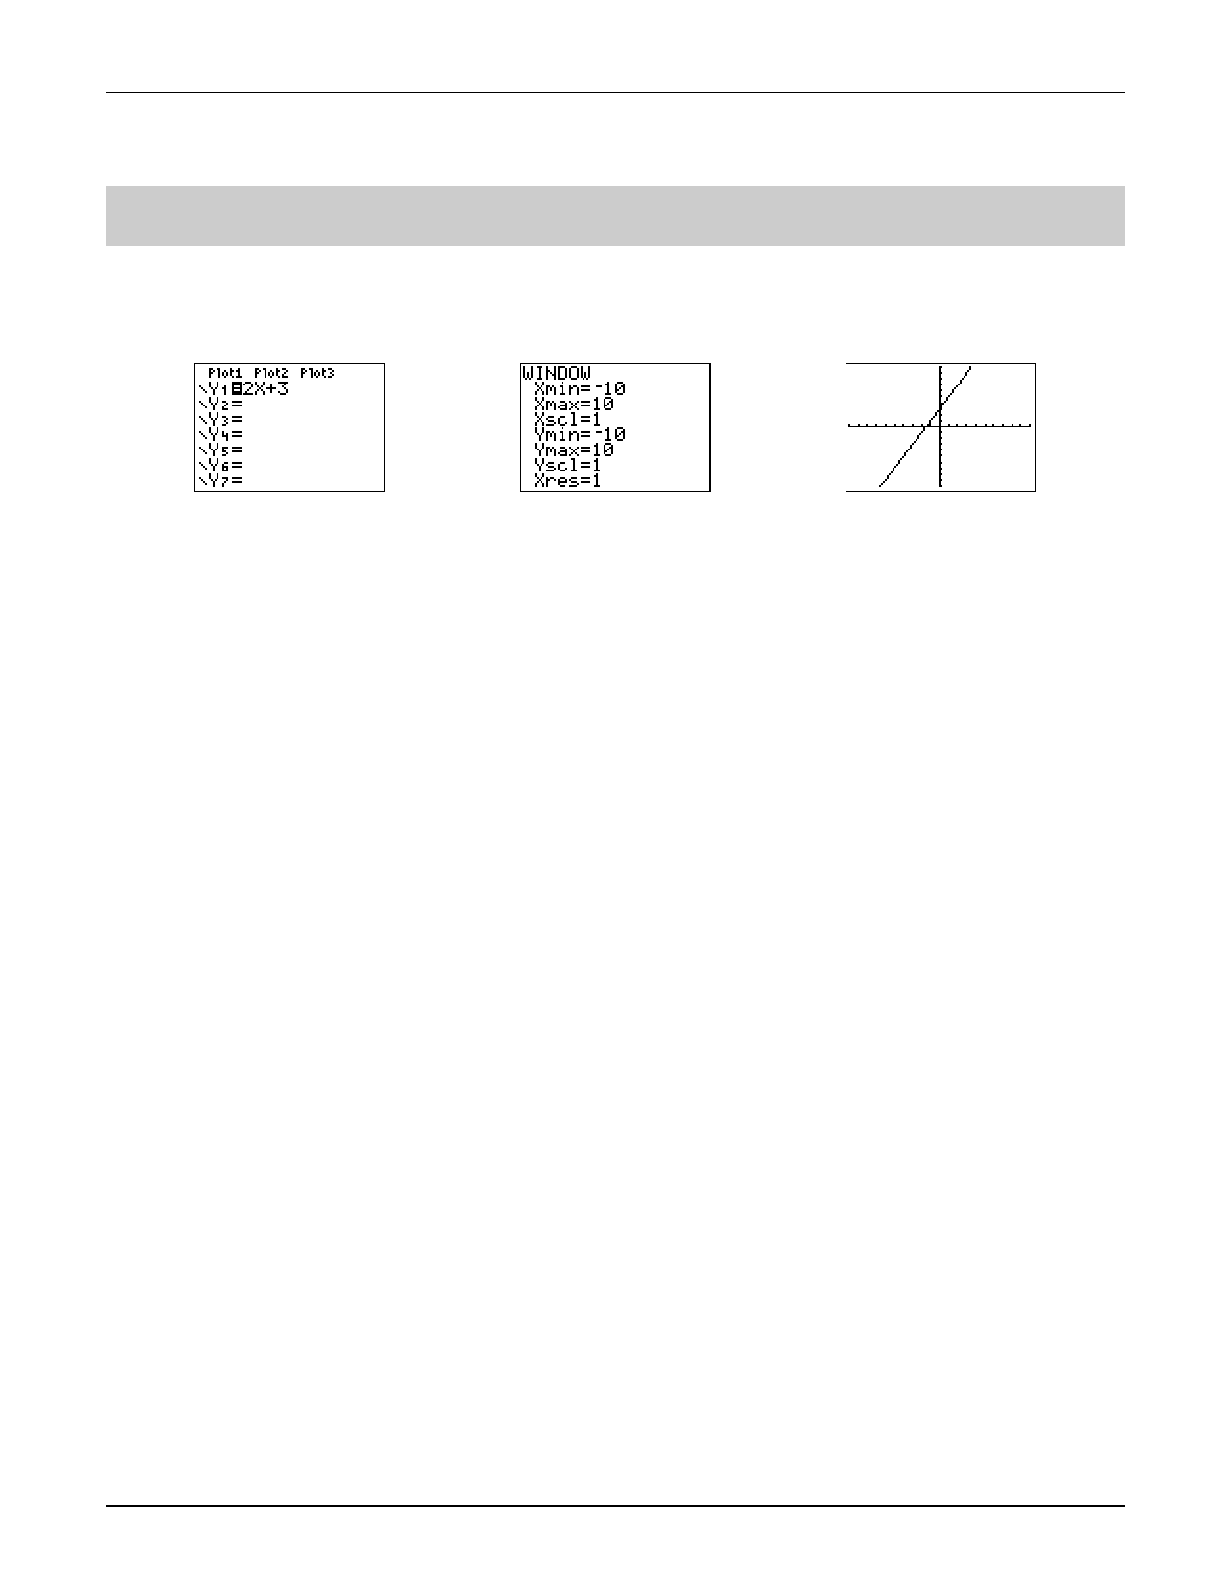
³ TIp 3: Graphing a Function in the Standard Window
Topics in Algebra 1 © 2001 Texas Instruments ³ TIp 3-1
³ TIpé 3: Graphing a Function in the Standard Window
You can graph a function on the graph screen. First, enter the function in the Y= editor, and then
you can graph the function in the standard graphing window. Screens on the TI-73 may vary.
Calculator Keys Used in This ³ TIpé
• &
• *
• )
³ TIpé Highlights
In the ³ Try-It! example, you will graph a function following these main steps.
1. Enter the function in the Y= editor (&).
2. Graph the function on the graph screen (*).
Note: If you reset your calculator defaults (³ TIp 1:
Resetting Your Calculator
), the graphing window sets up the following
boundaries for the X and Y values: L10 { X { 10 and L10 { Y { 10.
3. Press
). Then press " or ! to move the cursor from one plotted point to another.
Tracing the graph displays the (X,Y) values at the bottom of the screen.
For some functions, the graphing window has to be adjusted so that you can see your graph. This
³ TIp uses the standard window settings (L10 { X { 10 and L10 { Y { 10). The function selected
for the example on the next page displays the graph in this window. For more information on
adjusting window settings on the WINDOW menu, see ³ TIp 5: Adjusting the Viewing Window.
Note: The examples in the next section assume that the calculator has been reset to the default settings as described in
³ TIp 1:
Resetting Your Calculator.
Y1=2x+3 in the Y= editor Standard Graphing Window Graph of Y1=2x+3
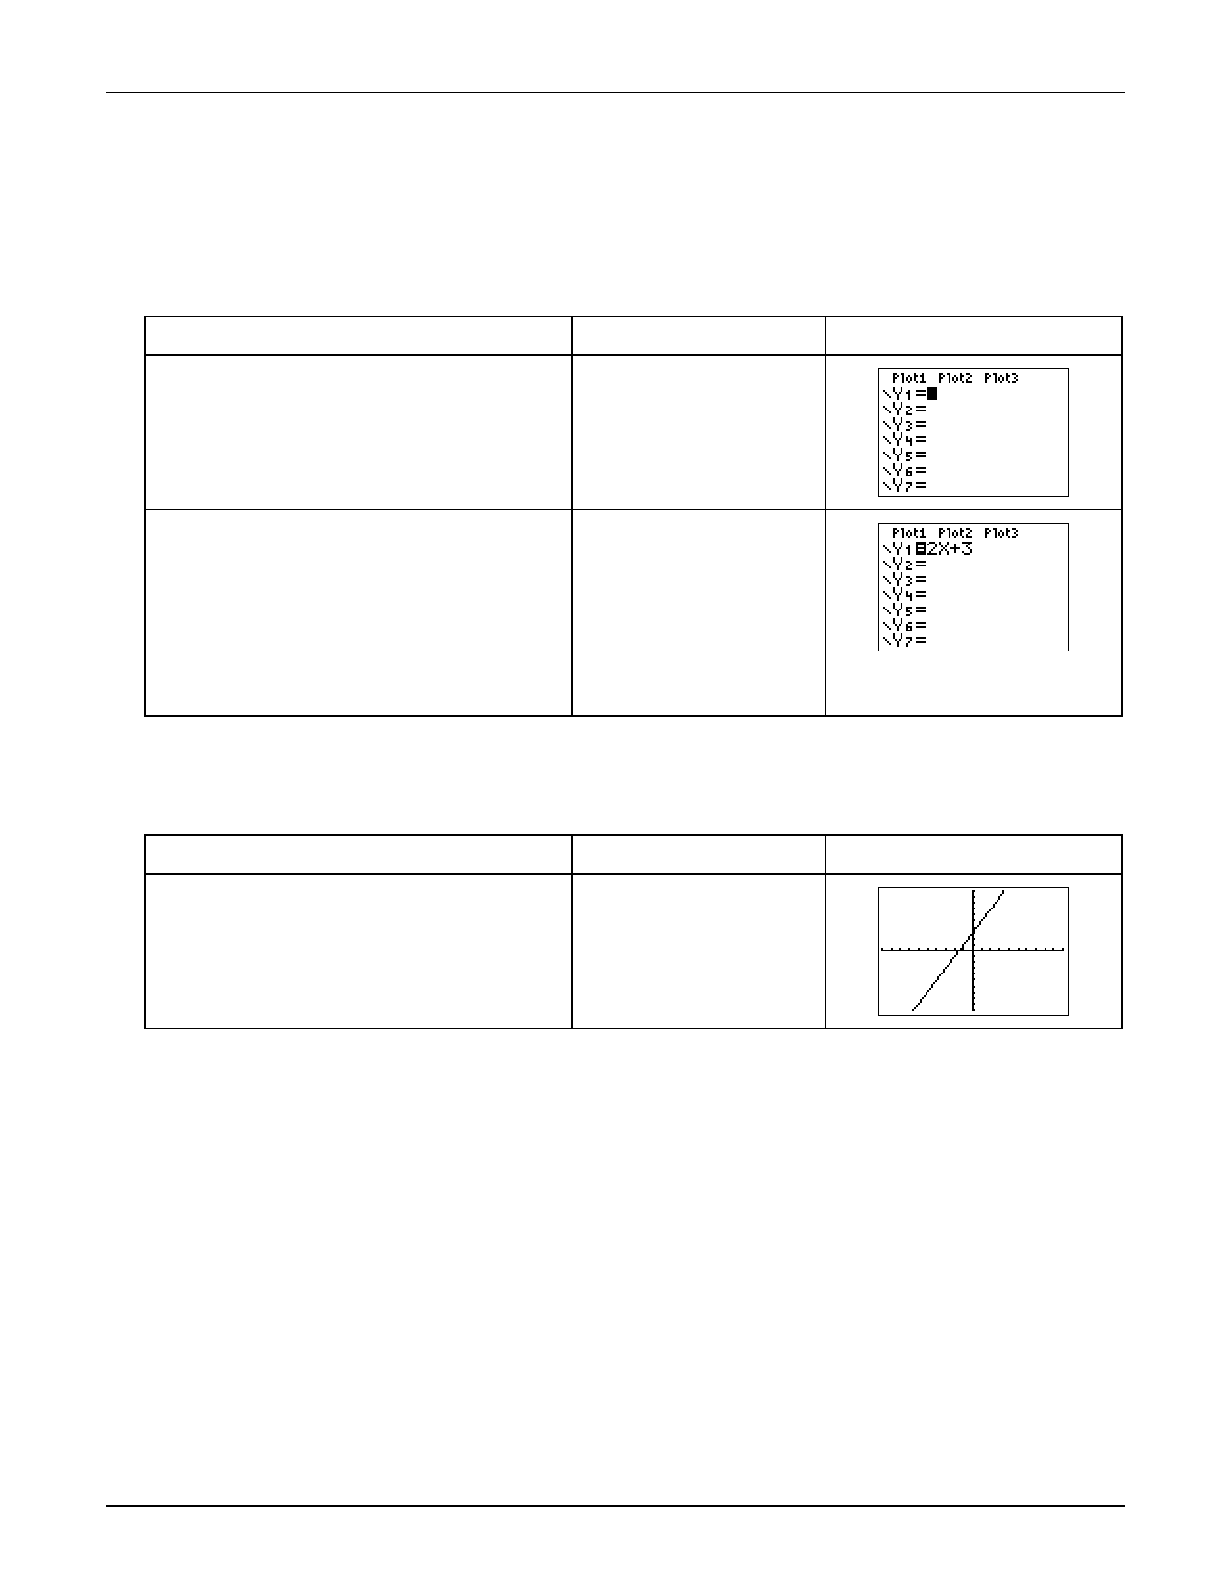
³ TIp 3: Graphing a Function in the Standard Window
Topics in Algebra 1 © 2001 Texas Instruments ³ TIp 3-2
³ Try-It!é on Your TI.83 Plus or TI.73
Enter the Function
Enter y = 2x + 3 as Y1=2X+3 in the Y= editor.
To Do This Press Display (TI-83 Plus shown)
1. Enter the Y= editor.
Note: The TI-73 Y= editor varies slightly from the
TI-83 Plus. The TI-73 lets you enter up to 4
functions.
&
2. Clear
Y1 and enter the function, 2X+3.
Note: On the TI-73, use I rather than „.
Note: The equal sign next to the function is
highlighted. This means that the function is selected
or turned on and will be graphed. If other functions
are selected, press # and ! as necessary to
position the cursor over the = sign and press enter
to turn off the function.
:
2 „ \ 3
Display the Graph
Display the graph of Y1=2X+3 on the graph screen.
To Do This Press Display (TI-83 Plus shown)
1. Display the graph. *
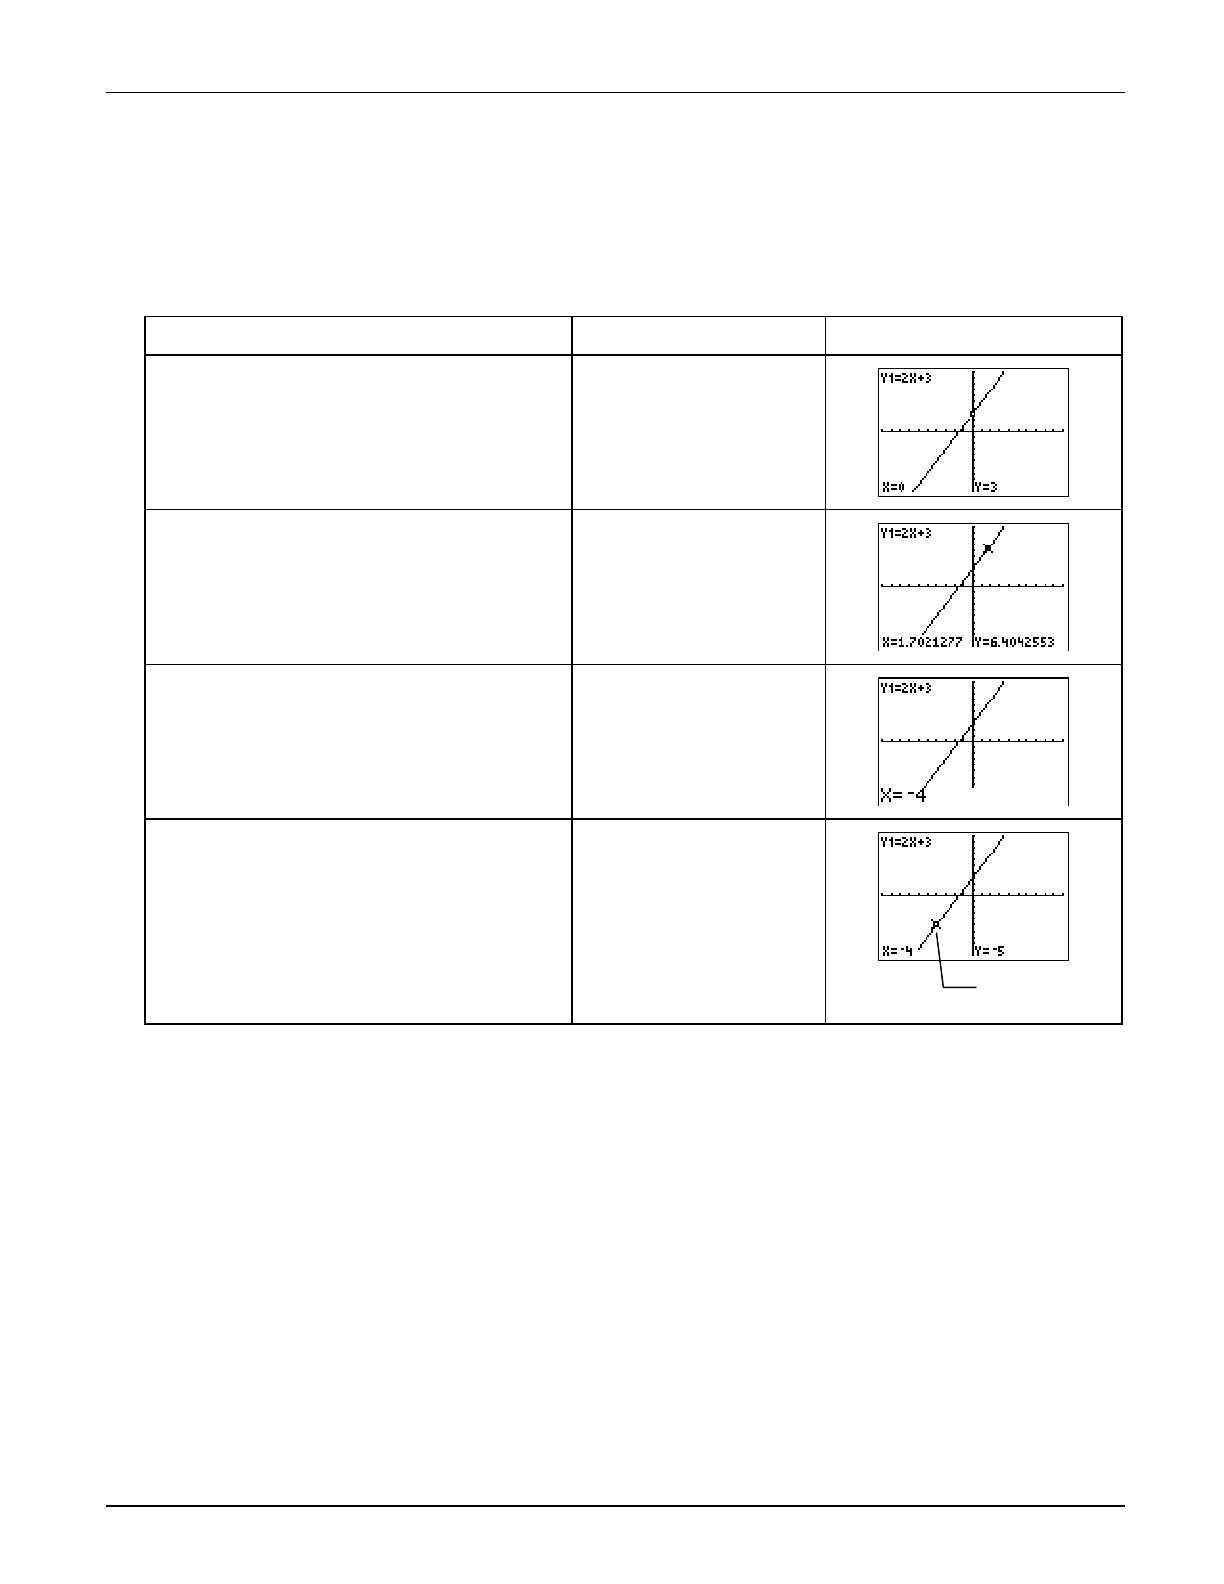
³ TIp 3: Graphing a Function in the Standard Window
Topics in Algebra 1 © 2001 Texas Instruments ³ TIp 3-3
³ Try-It!é on Your TI.83 Plus or TI.73 (continued)
Trace the Graph
Trace the (X,Y) values for Y1=2X+3 on the graph screen.
To Do This Press Display (TI-83 Plus shown)
1. Enter trace mode. )
2. Trace the (X,Y) values along the
graph.
X and Y values display at the bottom
of the screen.
" and !
3. Quickly find
Y when X=M4. a 4
4. Notice that when X=M4 then Y=M5. b
On Your Own
³ Display a grid on the graph screen by selecting GridOn in the window format screen
(- g).
³ Define Y2= MX+6.
³ Graph
Y1=2X+3 and Y2= MX+6 at the same time and compare. Now trace along each function
to find the point of intersection. Record the point of intersection.
Hint: Use # and $ to move between functions.
³ Graph
Y2 only.
Hint: You must deselect Y1 so that the calculator does not graph it. To deselect Y1, highlight its equal sign (=) in the Y= editor with
the cursor, and then press b. Notice the equal sign is no longer highlighted.
Cursor moves
to (L4, L5).
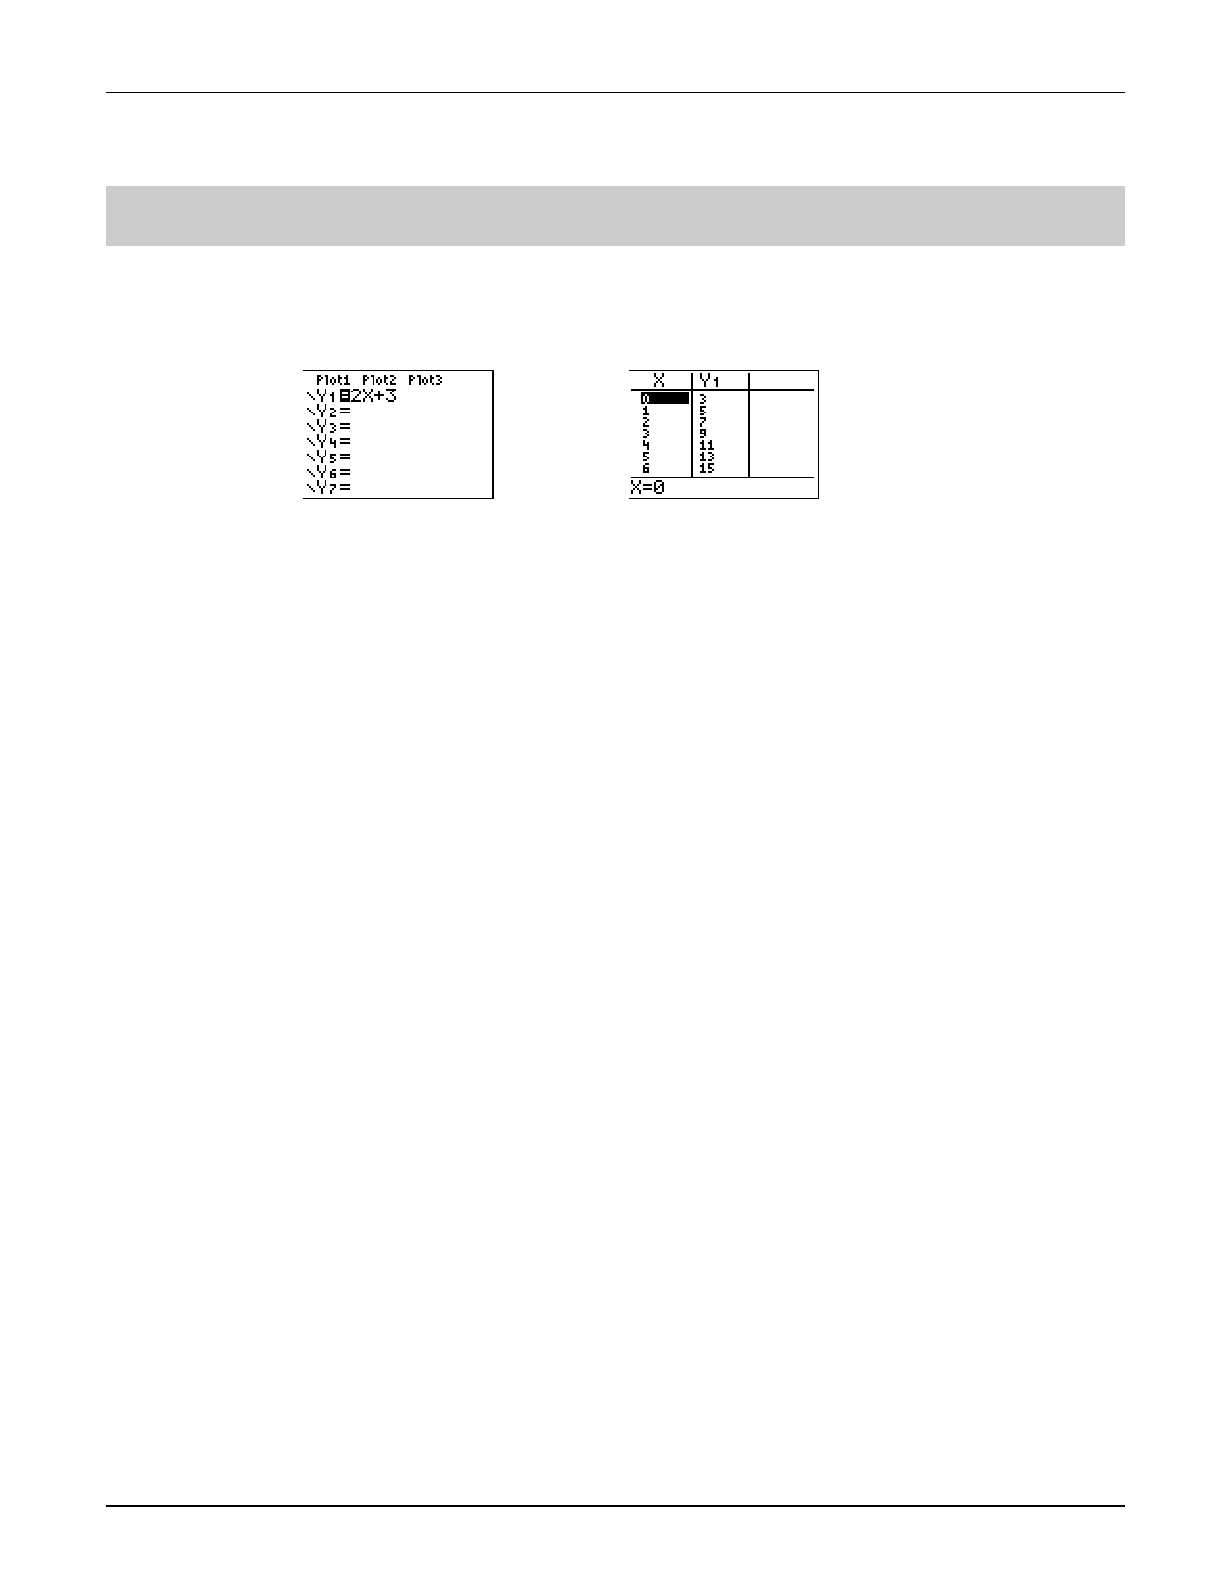
³ TIp 4: Creating a Table
Topics in Algebra 1 © 2001 Texas Instruments ³ TIp 4-1
³ TIpé 4: Creating a Table
You can automatically create a table of values (X,Y) based on functions in the Y= editor. For
example, if Y=2X+3 is defined in the Y= editor, a corresponding table of (X,Y) values could look
like this:
Calculator Keys Used in This ³ TIpé
• - i
• - f
³ TIpé Highlights
In the ³ Try-It! example, you will display the table values (X,Y) for a function defined in the
Y= editor following these main steps.
1. Define a function (Y1=2X+3) in the Y= editor (&).
2. Set up your table in the TABLE SETUP screen (y -).
3. Display the table (- i).
The following settings in the table setup (y -) screen determine how the table is
displayed.
• TblStart
— First X value.
• @Tbl — Amount by which X values increase and decrease (for example, if @Tbl=5, then X
values increase or decrease by 5).
• Auto or Ask — Allows you to choose whether or not to display automatically the
independent (X) or dependent (Y) variable values.
For more information about table settings, see the calculator guidebook.
Note: The examples in the next section assume that the calculator has been reset to the default settings as described in
³ TIp 1:
Resetting Your Calculator.
Y1=2x+3 in the Y= editor Table for Y1=2x+3
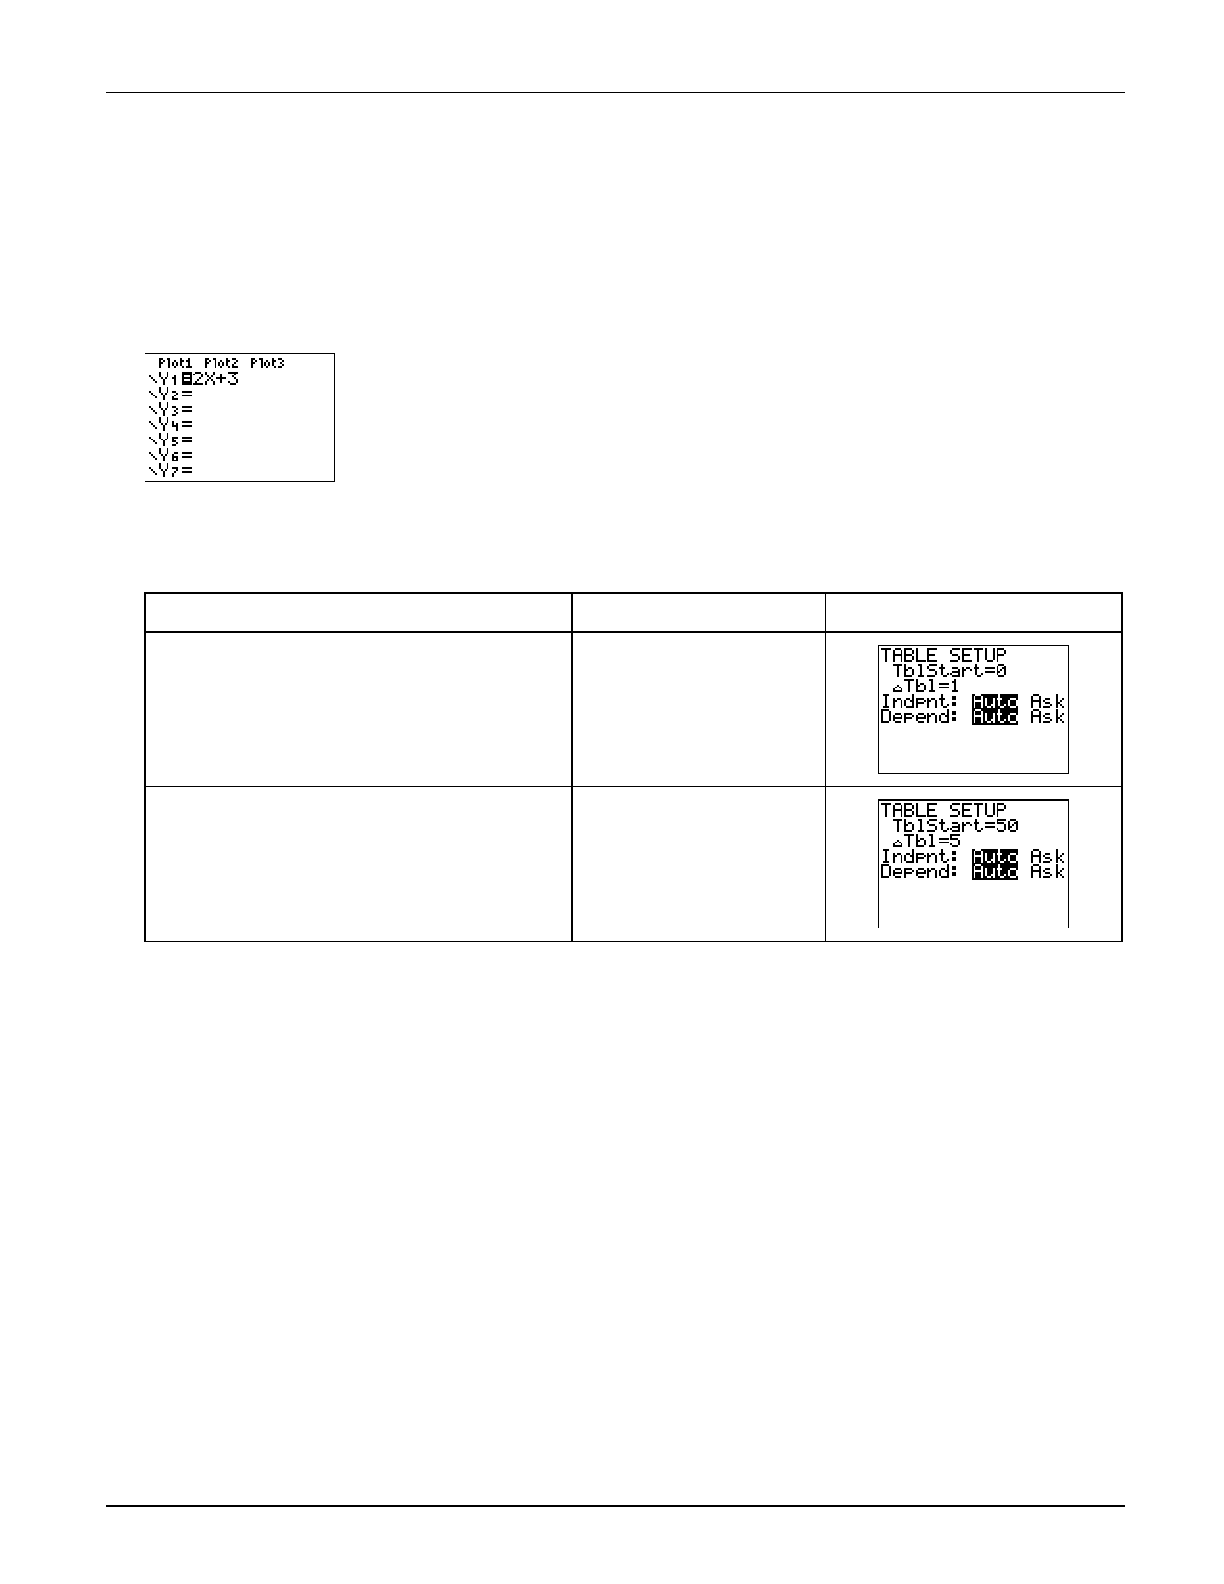
³ TIp 4: Creating a Table
Topics in Algebra 1 © 2001 Texas Instruments ³ TIp 4-2
³ Try-It!é on Your TI.83 Plus or TI.73
Enter the Function
Enter Y1=2X+3 in the Y= editor (&). See ³ TIp 3: Graphing a Function in the Standard
Window for step-by-step instructions for defining functions. Your Y= editor should look like this.
Change the Table Settings
Define the following settings for your table: TblStart=50 and @Tbl=5.
To Do This Press Display (TI-83 Plus shown)
1. Display the table setup screen. y -
2. Change the following settings:
TblStart=50, @Tbl=5.
Note: Indpnt:Auto and Depend:Auto are the
defaults.
: 50
#
: 5
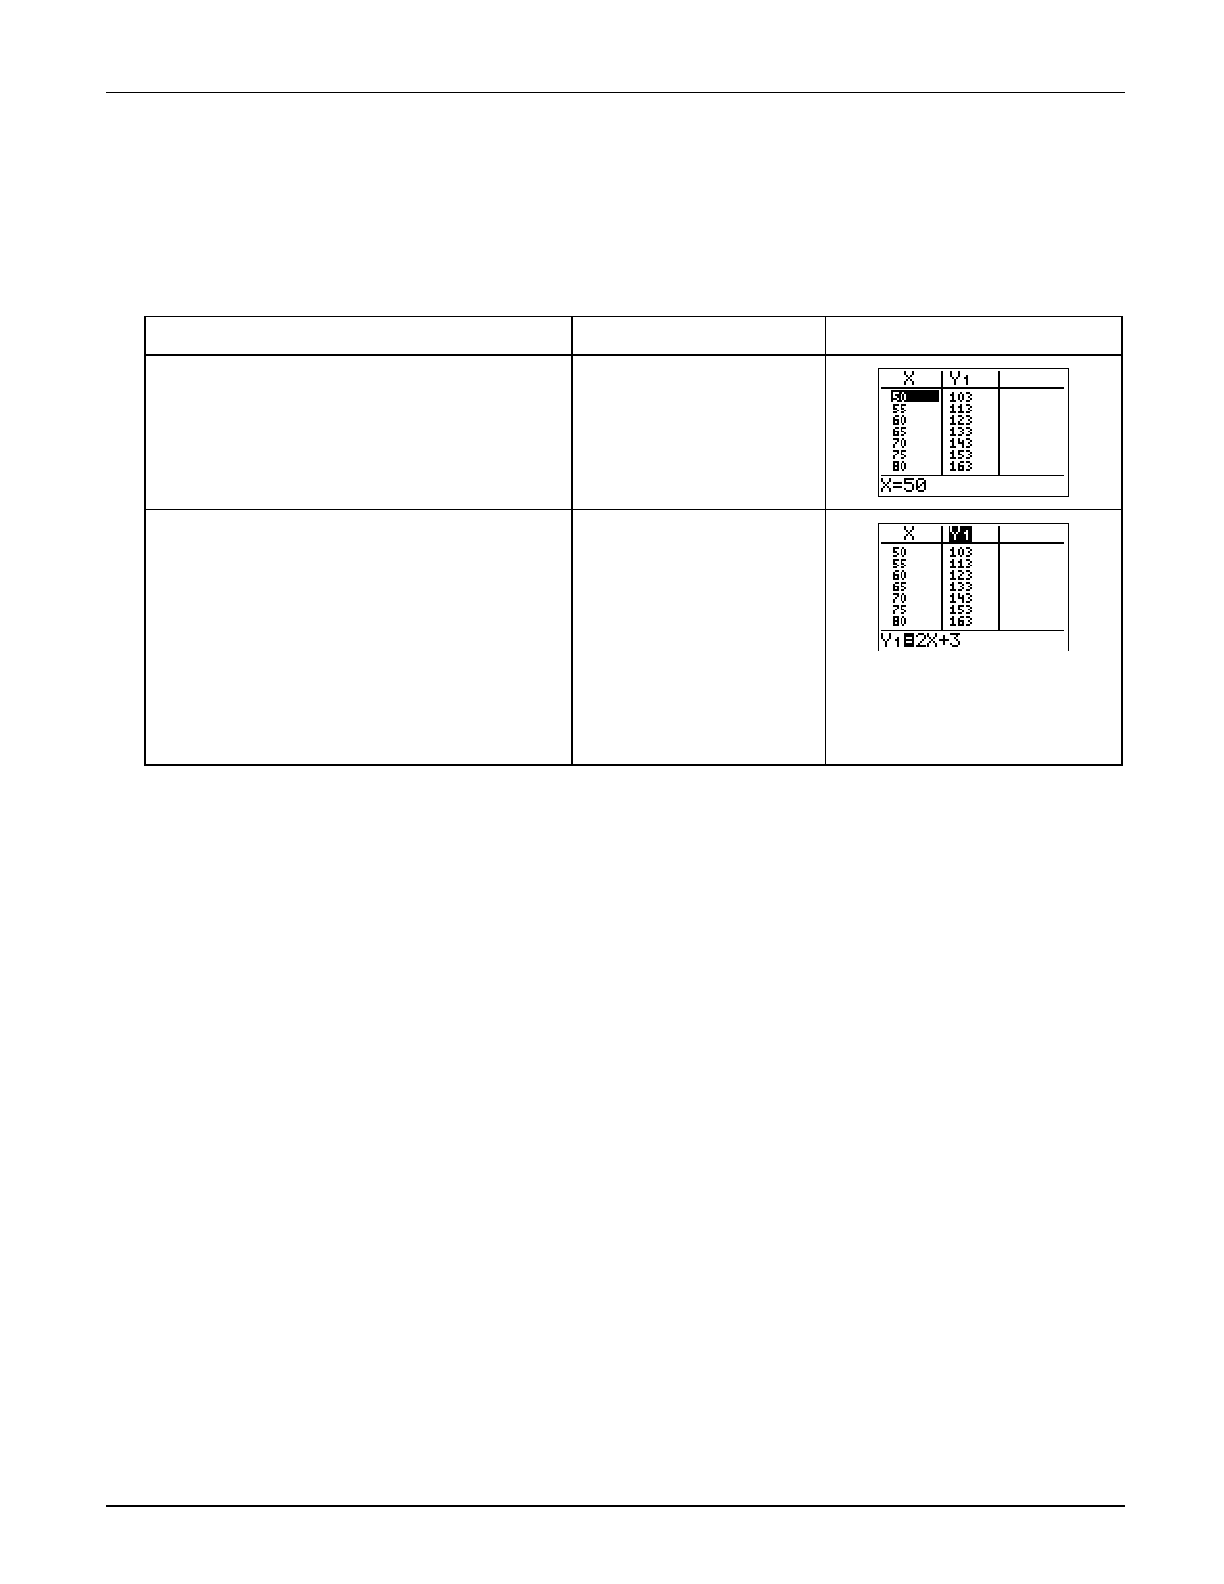
³ TIp 4: Creating a Table
Topics in Algebra 1 © 2001 Texas Instruments ³ TIp 4-3
³ Try-It!é on Your TI.83 Plus or TI.73 (continued)
Display the Table
Display the table for Y1=2X+3 on the graph screen.
To Do This Press Display (TI-83 Plus shown)
1. Display the table. - i
2. Scroll through the table values with
the arrow keys.
Note: Notice that when you press $ and move to
the top of the Y1 column, the cursor moves to Y1
instead of displaying Y-values that are off the
screen. The function is displayed on the edit line
and can be changed.
!, ", #, or $
as necessary
On Your Own
³ Try to display more (X,Y) values. Set @Tbl=1 (pronounced “delta table”) and display the table
again. Then set @Tbl=.1 and display the table. Notice how the table values differ.
³ Enter Y2=MX+6 in the Y= editor. Display the table of values for both Y1 and Y2. Is Y1 ever equal
to Y2?
Hint: Set TblStart=0 and @Tbl =1 and search through the table.
³ Change the mode (.) setting from Normal to Sci. Display the table. Notice how this
affects the table values.
³ Go to the table setup screen and figure out what the Depend: Ask setting does.
Hint: To reveal an invisible Y value in the table, place the cursor on that space and press b.
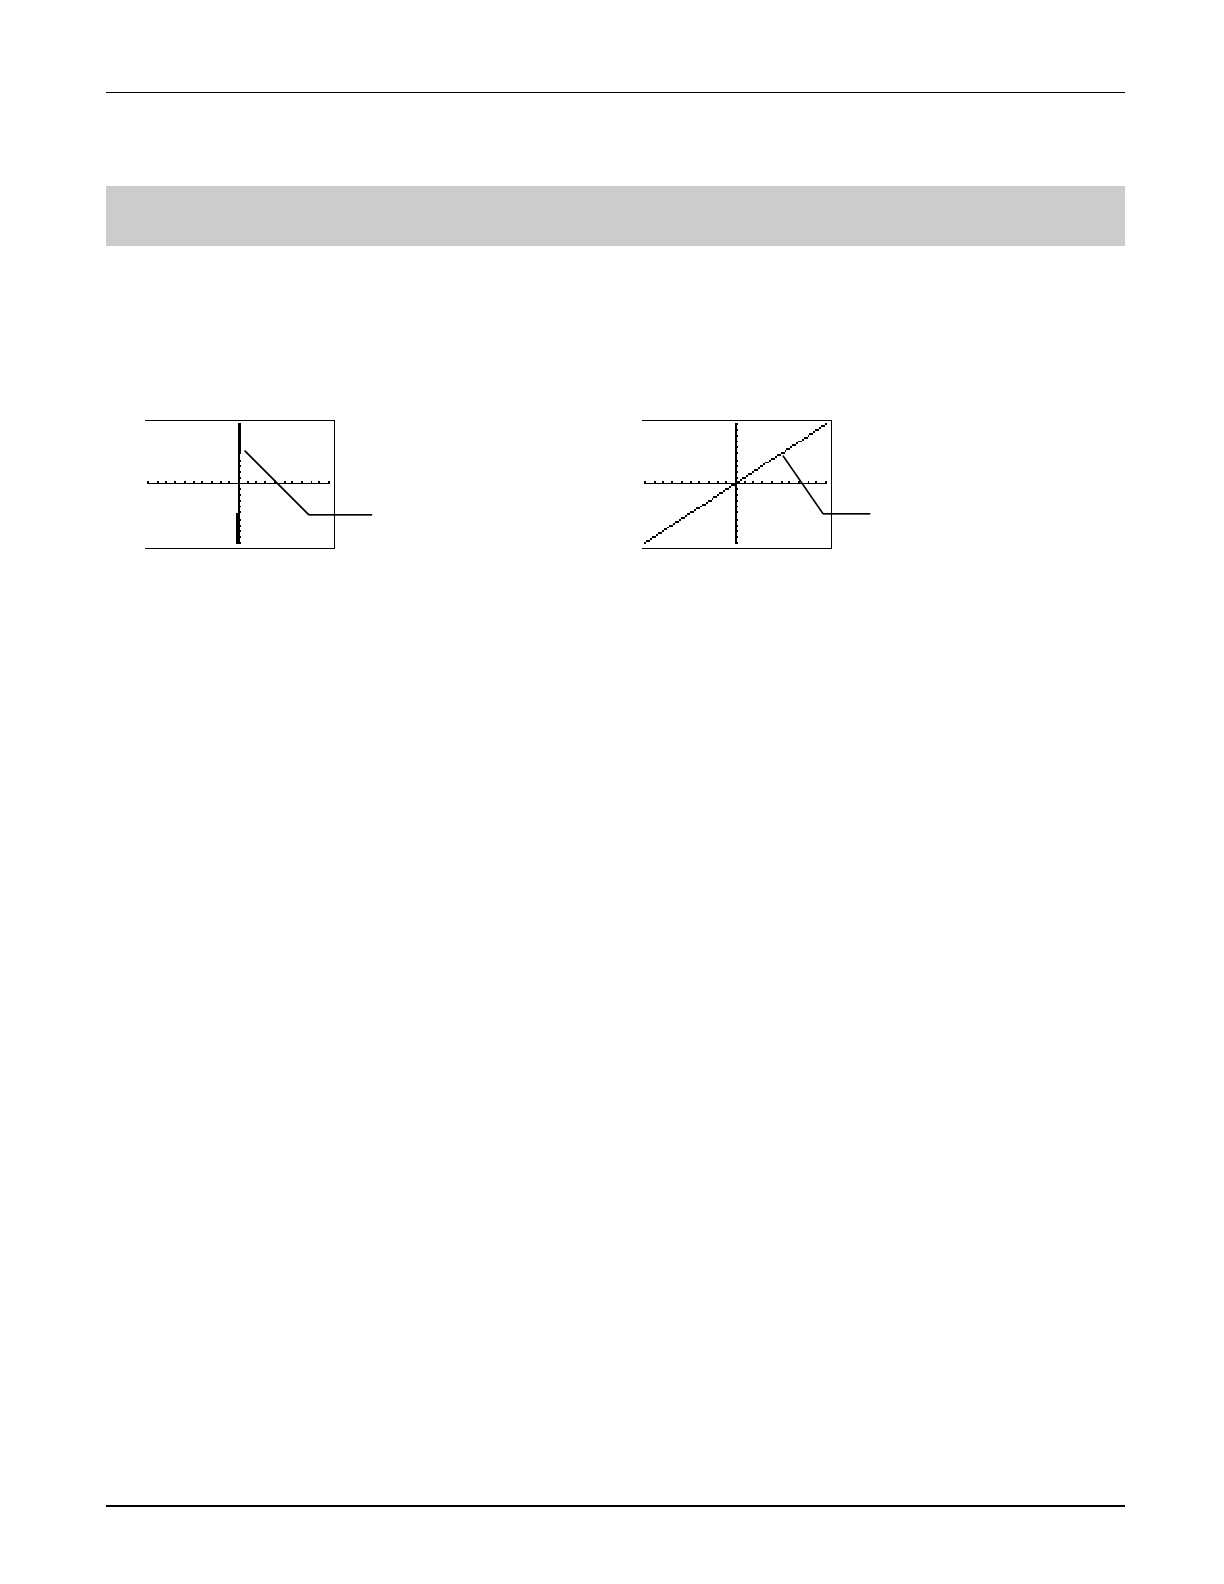
³ TIp 5: Adjusting the Viewing Window
Topics in Algebra 1 © 2001 Texas Instruments ³ TIp 5-1
³ TIpé 5: Adjusting the Viewing Window
You can adjust the viewing window for a specific graph. For example, with the ZStandard
viewing window default values of L10 { X { 10 and L10 { Y { 10, the graph of Y1=50X appears as
shown in the screen below on the left. Y increases so rapidly in relation to X that this line is not
easily seen in this window. You can adjust the window (') values by scaling the
X axis and Y axis to see the graph in a better perspective.
Calculator Keys Used in This ³ TIpé
• '
• (
³ TIpé Highlights
Window values put specific boundaries on the graph screen. ZOOM (q) functions
automatically adjust window values for you; however, you can manually set window values using
the window (p) menu. You can set minimum and maximum X and Y values (Xmin, Xmax,
Ymin, and Ymax), and you can set the scale (distance between tick marks) of the X axis and Y
axis (Xscl and Yscl).
In the ³ Try-It! example, you will adjust the viewing window values in two ways.
• Automatically adjust them by selecting a zoom function from the ZOOM (() menu.
• Manually adjust them using the window (') menu.
In the example that follows, you see how to change window (p) values to see a different
perspective of the graph of Y1=50X.
Note: The examples in the next section assume that the calculator has been reset to the default settings as described in
³ TIp 1:
Resetting Your Calculator
.
Y1=50X viewed
with the default
window values.
Y1=50X viewed with
adjusted window
v
alues.
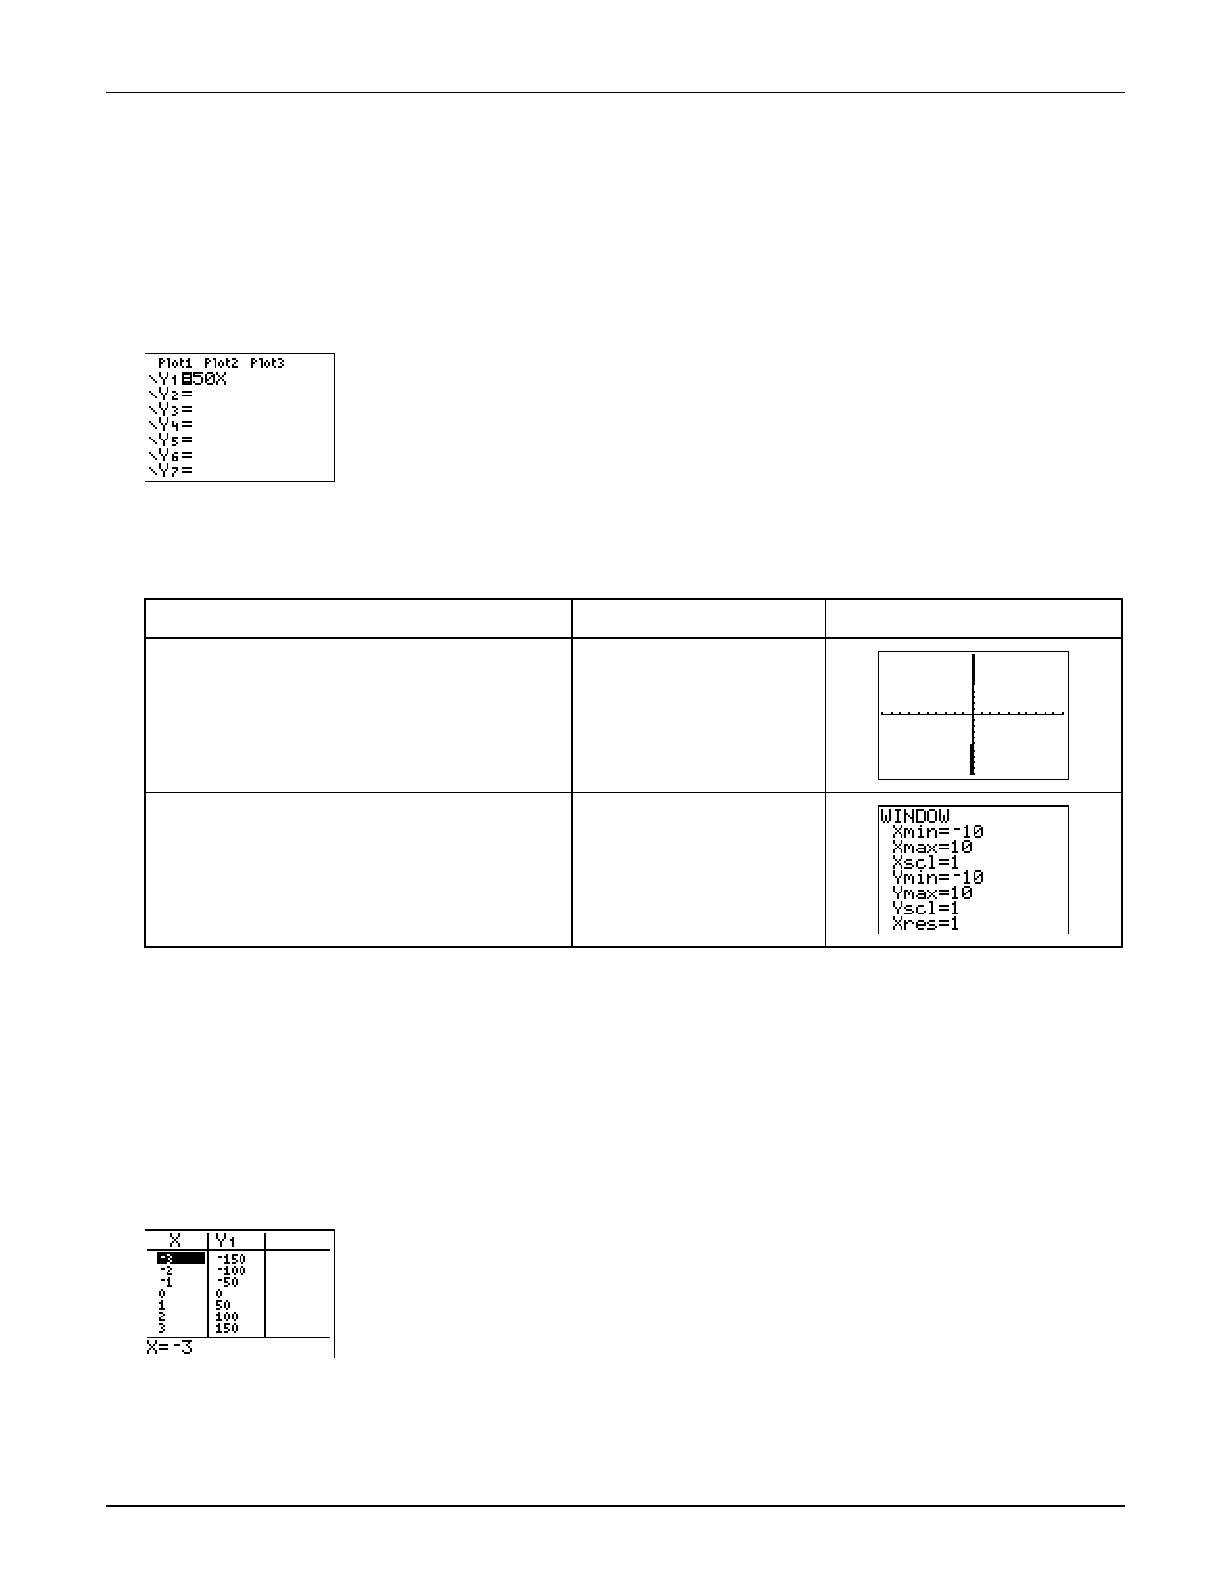
³ TIp 5: Adjusting the Viewing Window
Topics in Algebra 1 © 2001 Texas Instruments ³ TIp 5-2
³ Try-It!é on Your TI.83 Plus or TI.73
Enter the Function
Enter Y1=50X in the Y= editor (&). See ³ TIp 3: Graphing a Function in the Standard Window
for step-by-step instructions for defining functions. Your Y= editor should look like this.
Display the Function on the Graph Screen
Note: The window values shown here are the default window values, also equivalent to ZStandard (() (L10 { X { 10; L10 { Y { 10).
To Do This Press Display (TI-83 Plus shown)
1. Graph
Y1. s
2. Display the window settings menu.
Note: This window shows (X,Y) values so that
L10 { X { 10 and L10 { Y { 10. This is equivalent to
the default ZStandard setting.
'
Define a Different Viewing Window for Your Graph
View the table of (X,Y) values created by Y1=50X to help you redefine window values. Start the
table at L3 and increment the values by 1. See ³ TIp 4: Creating a Table for step-by-step
instructions for creating a table.
Tip: You can choose any X values for the table. For this exercise, you view a table of values when L3 X 3. When you set the table to
start at L3 with increments of 1, you can see the relationship between X and Y near the origin of the graph.
Your table should look like this:
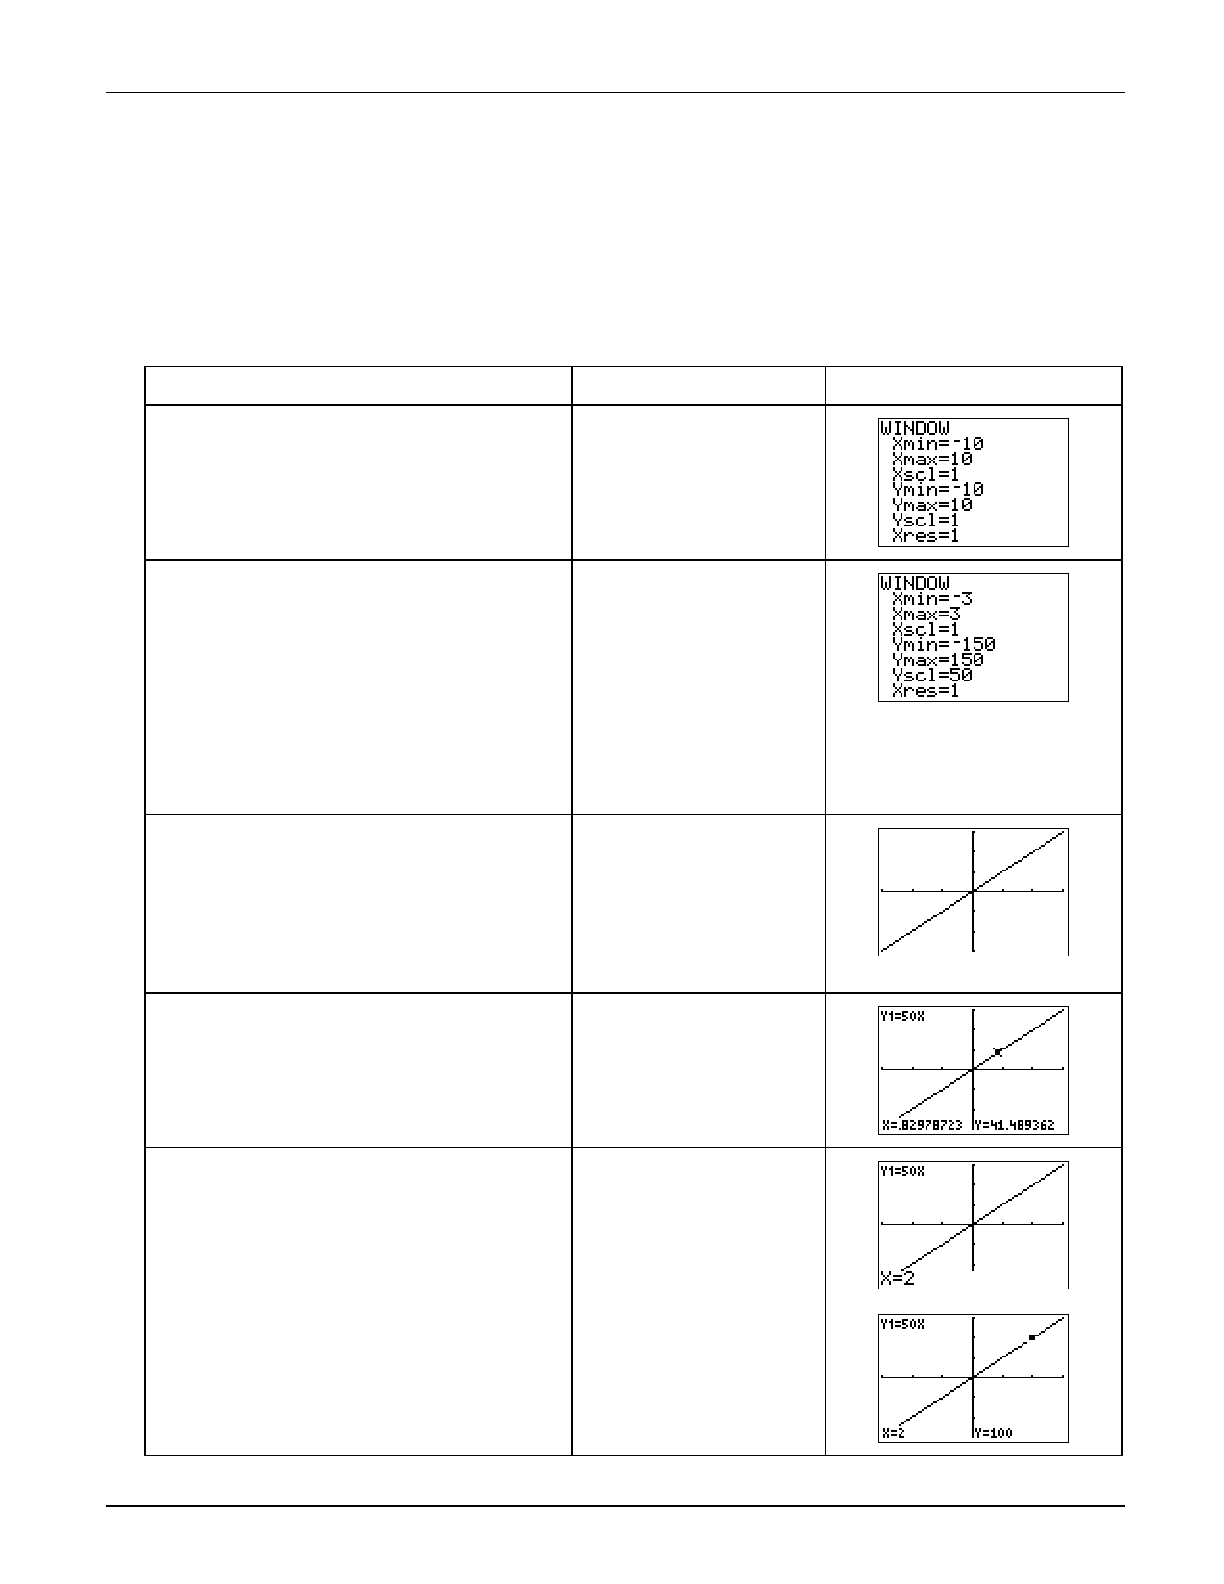
³ TIp 5: Adjusting the Viewing Window
Topics in Algebra 1 © 2001 Texas Instruments ³ TIp 5-3
³ Try-It!é on Your TI.83 Plus or TI.73 (continued)
Define a Different Viewing Window for Your Graph (continued)
Notice in the table that when L3 X 3, the Y values range from L150 Y 150. Since Y increases
by 50 each time X increases by 1, you can set the Yscl to 50 and leave Xscl set at 1. Now, create a
window to see the graph for this domain and range by changing the window values.
To Do This Press Display (TI-83 Plus shown)
1. Display the window settings screen.
Note: Window settings screen is slightly different on
the TI.73.
p
2. Define the values so that Xmin = M3,
Xmax = 3, Xscl = 1,Ymin = M150,
Ymax = 150, and Yscl = 50.
Note: This changes the settings so that:
L3 { X { 3 and L150 { Y { 150. Since Xscl=1 and
Yscl=50, there is one unit between each tick mark
on the X axis and 50 units between each tick mark
on the Y axis.
TI-73: @X scales automatically, based on Xmin and
Xmax. See the calculator guidebook for details.
a 3 # (to Xmax)
3 # (to Ymin)
a 150
# (to Ymax)
150 # (to Yscl)
50
3. Graph
Y1=50X in this different
window.
Note: Remember that each tick mark on the X axis
represents 1 unit, while each one on the Y axis
represents 50. It’s always important to know the
scale of your graphs so that you understand the
graph you are viewing.
*
4. Trace the graph.
Note: Each tick mark on the X axis is 1 and on the
Y axis is 50.
)
! or " as necessary
5. Display the
Y value when X=2.
Tip: You can go directly to any coordinate pair on
the graph by entering the value you want.
2
b
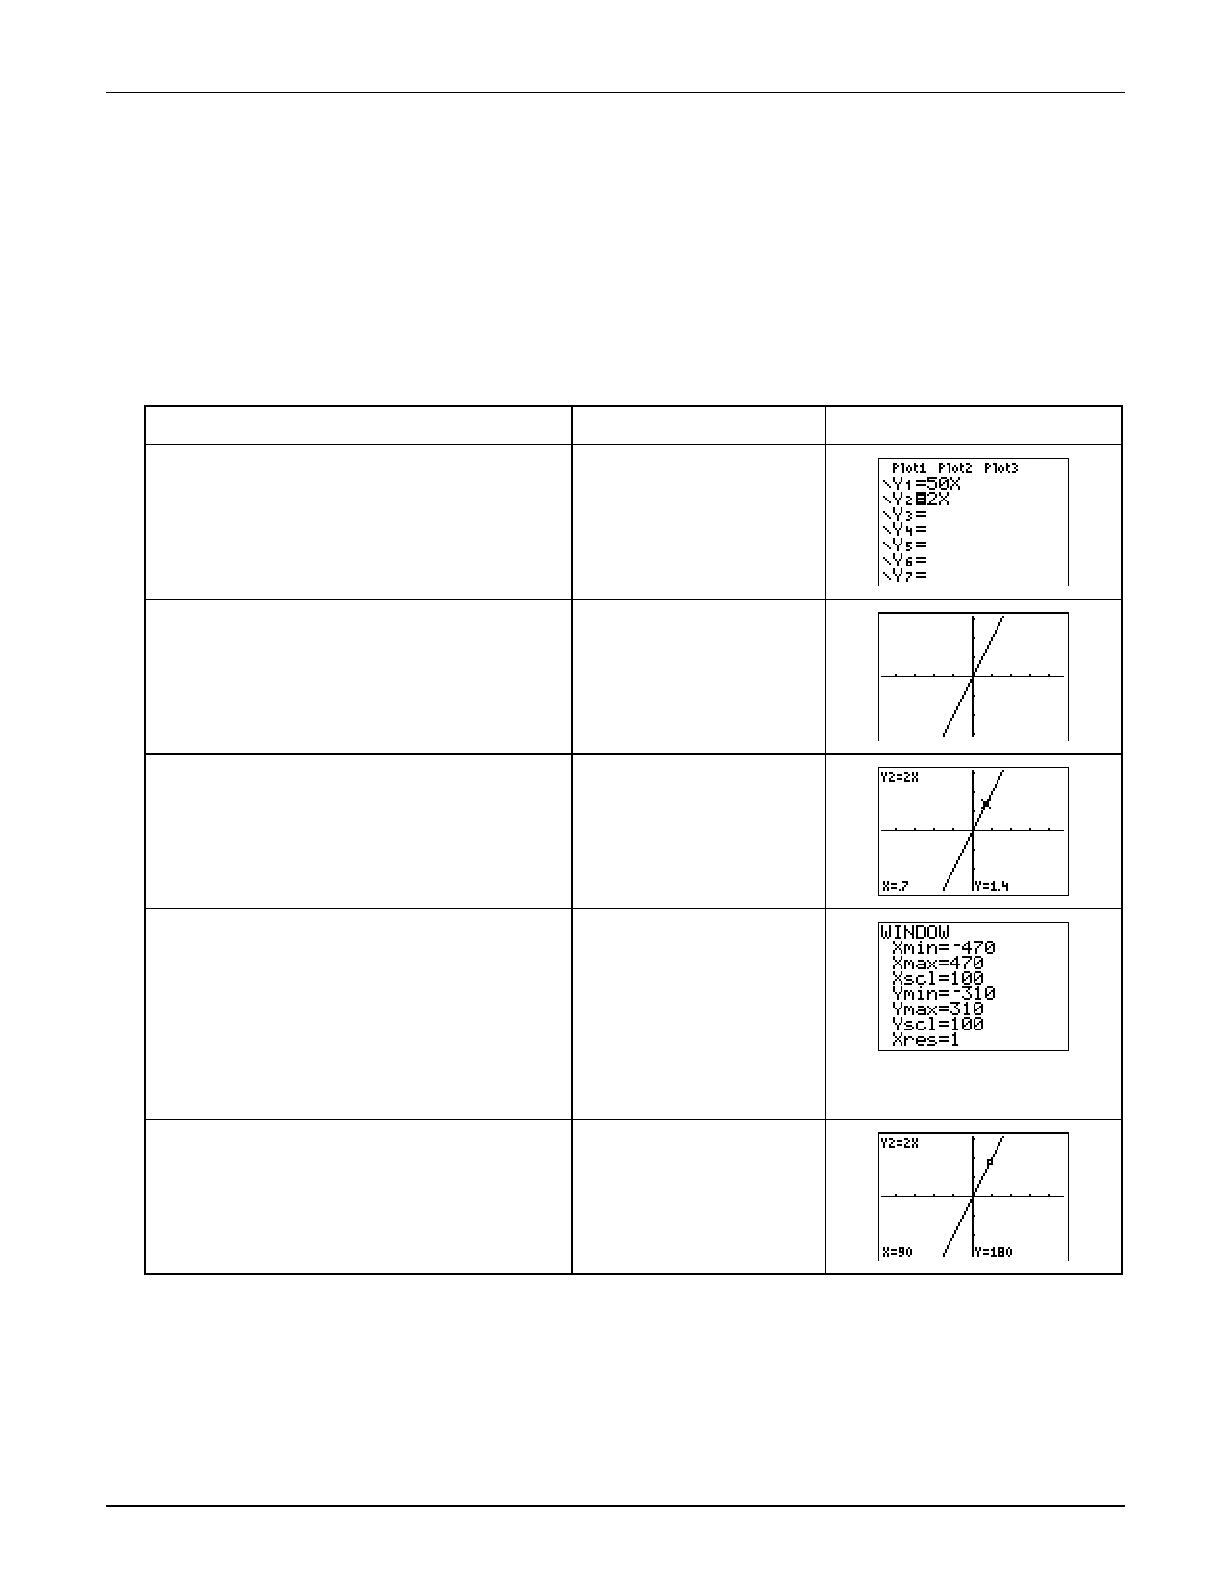
³ TIp 5: Adjusting the Viewing Window
Topics in Algebra 1 © 2001 Texas Instruments ³ TIp 5-4
³ Try-It!é on Your TI.83 Plus or TI.73 (continued)
Using ZDecimal—the Friendly Window
• Display and trace the graph Y2=2x, using ZDecimal window values. ZDecimal lets you trace
the X values by tenths (.1, .2, .3, …).
• Multiply
Xmin,
Xmax, Xscl, Ymin, Ymax, and Yscl by 100 in the window menu, and trace the
function. This lets you trace the X values by tens.
To Do This Press Display (TI-83 Plus shown)
1. Turn off the graph and table of
Y1=50X and enter Y2=2x in the
Y= editor.
Note: On the TI-73, use I rather than „.
&
! Í
# " ‘
2 „
2. Graph
Y2=2x using ZDecimal window
values.
(
# until ZDecimal is
highlighted
Í
3. Trace the graph.
Note: Notice that the window is set up so that the X
values are tracing by tenths.
)
! or " as necessary
4. Multiply
Xmin, Xmax, Xscl, Ymin,
Ymax, and Yscl by 100.
Tip: Press - " to move the cursor to the end of
a window setting line.
Note: TI-83 Plus: See the calculator guidebook for
details about Xres. It is not discussed in this ³ TIp.
TI-73: See the calculator guidebook for details
about @X. It is not discussed in this ³ TIp.
p
Repeat for each value:
- "
M 100
Í
5. Trace the graph.
Note: Notice that the window is set up so that the X
values are tracing by tens.
)
! or " as necessary
On Your Own
³ Graph Y1=.1X. How can you set an appropriate viewing window for this graph?
Hint: Make a table of values for Y1=.1X and use the table information to change the window values. Try finding the best values to choose
when L5X5. If X=5, Y=.1(5)=.5. Therefore, the Y values need to be very small. Try changing Ymin, Ymax, and Yscl.
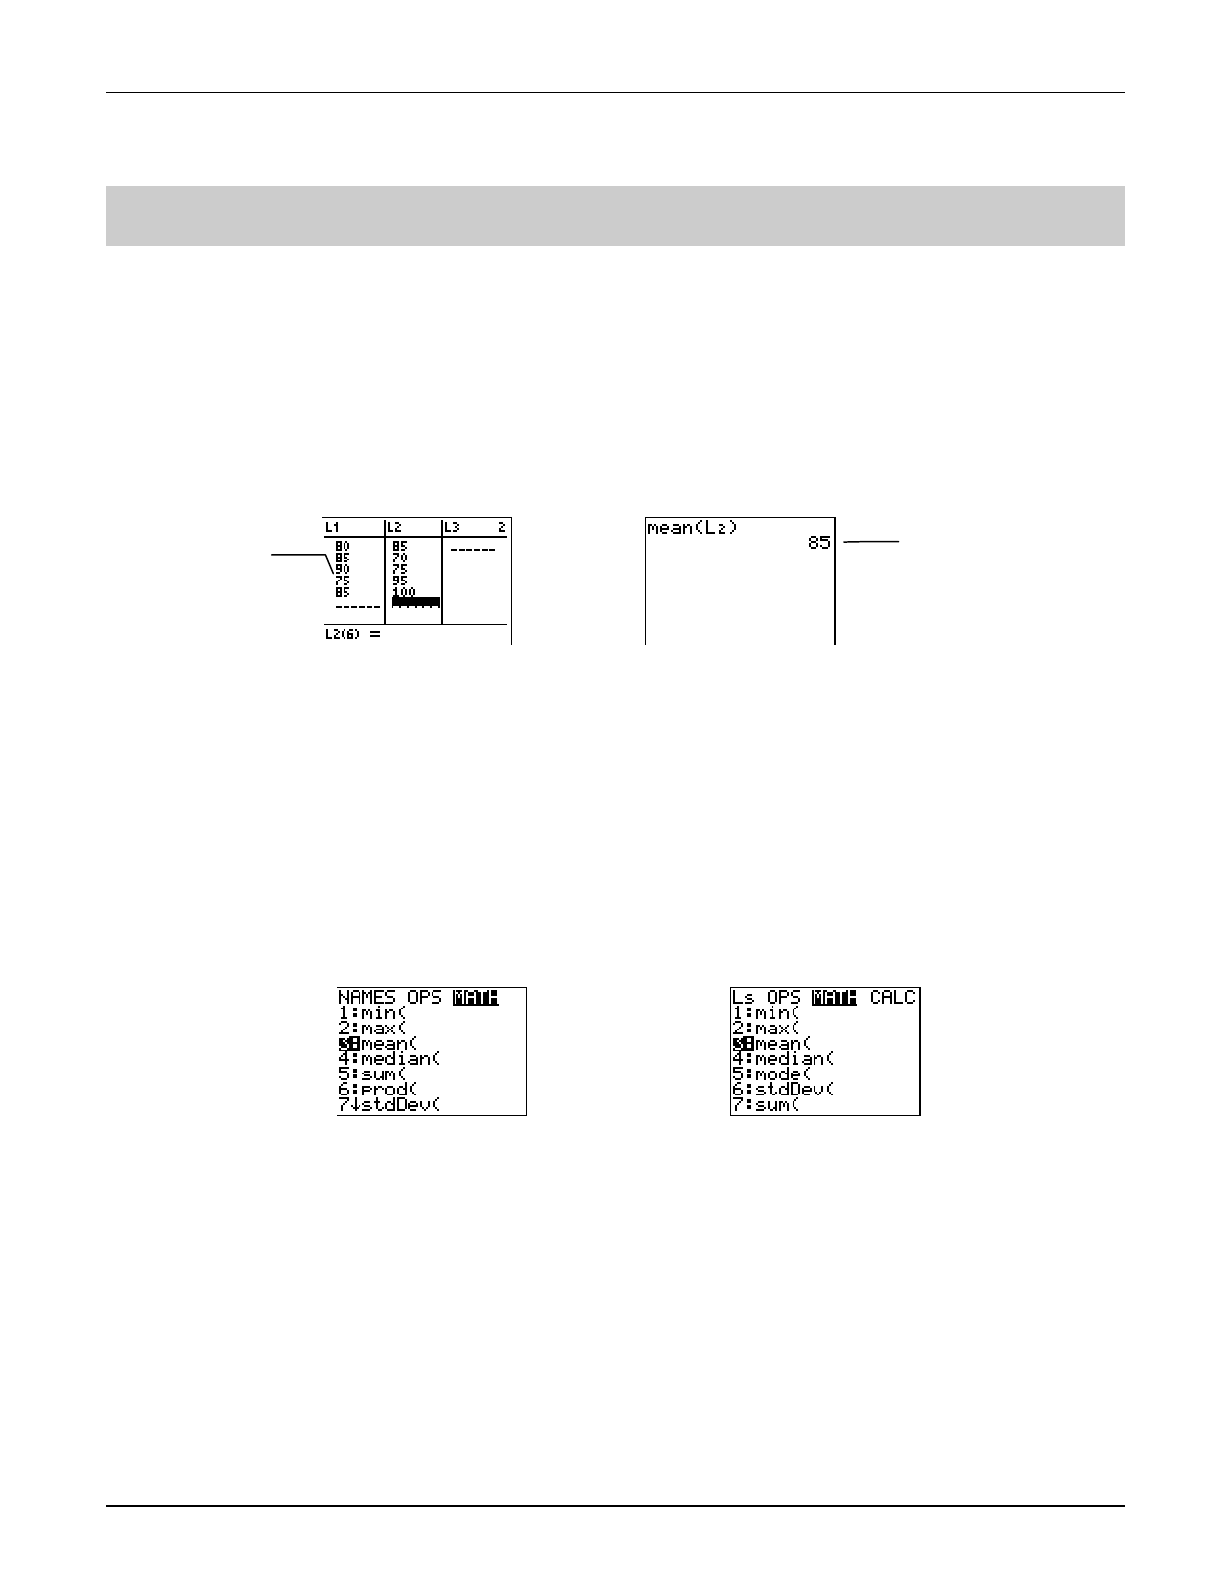
³ TIp 6: Using Lists
Topics in Algebra 1 © 2001 Texas Instruments ³ TIp 6-1
³ TIpé 6: Using Lists
You can enter lists of different kinds of data into the list editor. For example, let’s look at two
students’ test scores.
• Jamal’s test scores are 80, 85, 90, 75, and 85.
• Jian’s test scores are 85, 70, 75, 95, and 100.
You can create two separate lists in the list editor containing these scores. Then, on the Home
screen, you can find the sum of the elements of both lists, and then divide by the number of
elements (5) to calculate each student’s test average or mean.
Calculator Keys Used in This ³ TIpé
• - | (to access the ClearAllLists and SetUpEditor commands)
• TI-83 Plus: y 9, …
• TI-73: 3, - v
³ TIpé Highlights
Both the TI-83 Plus and the TI-73 have two menus—OPS and MATH—that contain various list
commands that help you find mean, median, and much more. For more information on all menu
items, see the calculator guidebook.
TI-83 Plus:
y 9 " "
TI-73:
- v " "
In the ³ Try-It! example, you will use the ClearAllLists and SetUpEditor commands, which are
located in the CATALOG (- |) on both the TI-83 Plus and the TI-73. These commands
clear and set up the list editor as described below.
• ClearAllLists erases all elements of all existing lists on your calculator. The list names are still
in memory, but the lists are empty. You cannot get the list elements back.
• SetUpEditor removes all list names from the list editor except the default list names, L1
through L6. It also creates one blank list after L6.
Note: The examples in the next section assume that the calculator has been reset to the default settings as described in
³ TIp 1:
Resetting Your Calculator
.
L1 lists Jamal’s
scores.
You can find the
mean or median on
the Home screen.
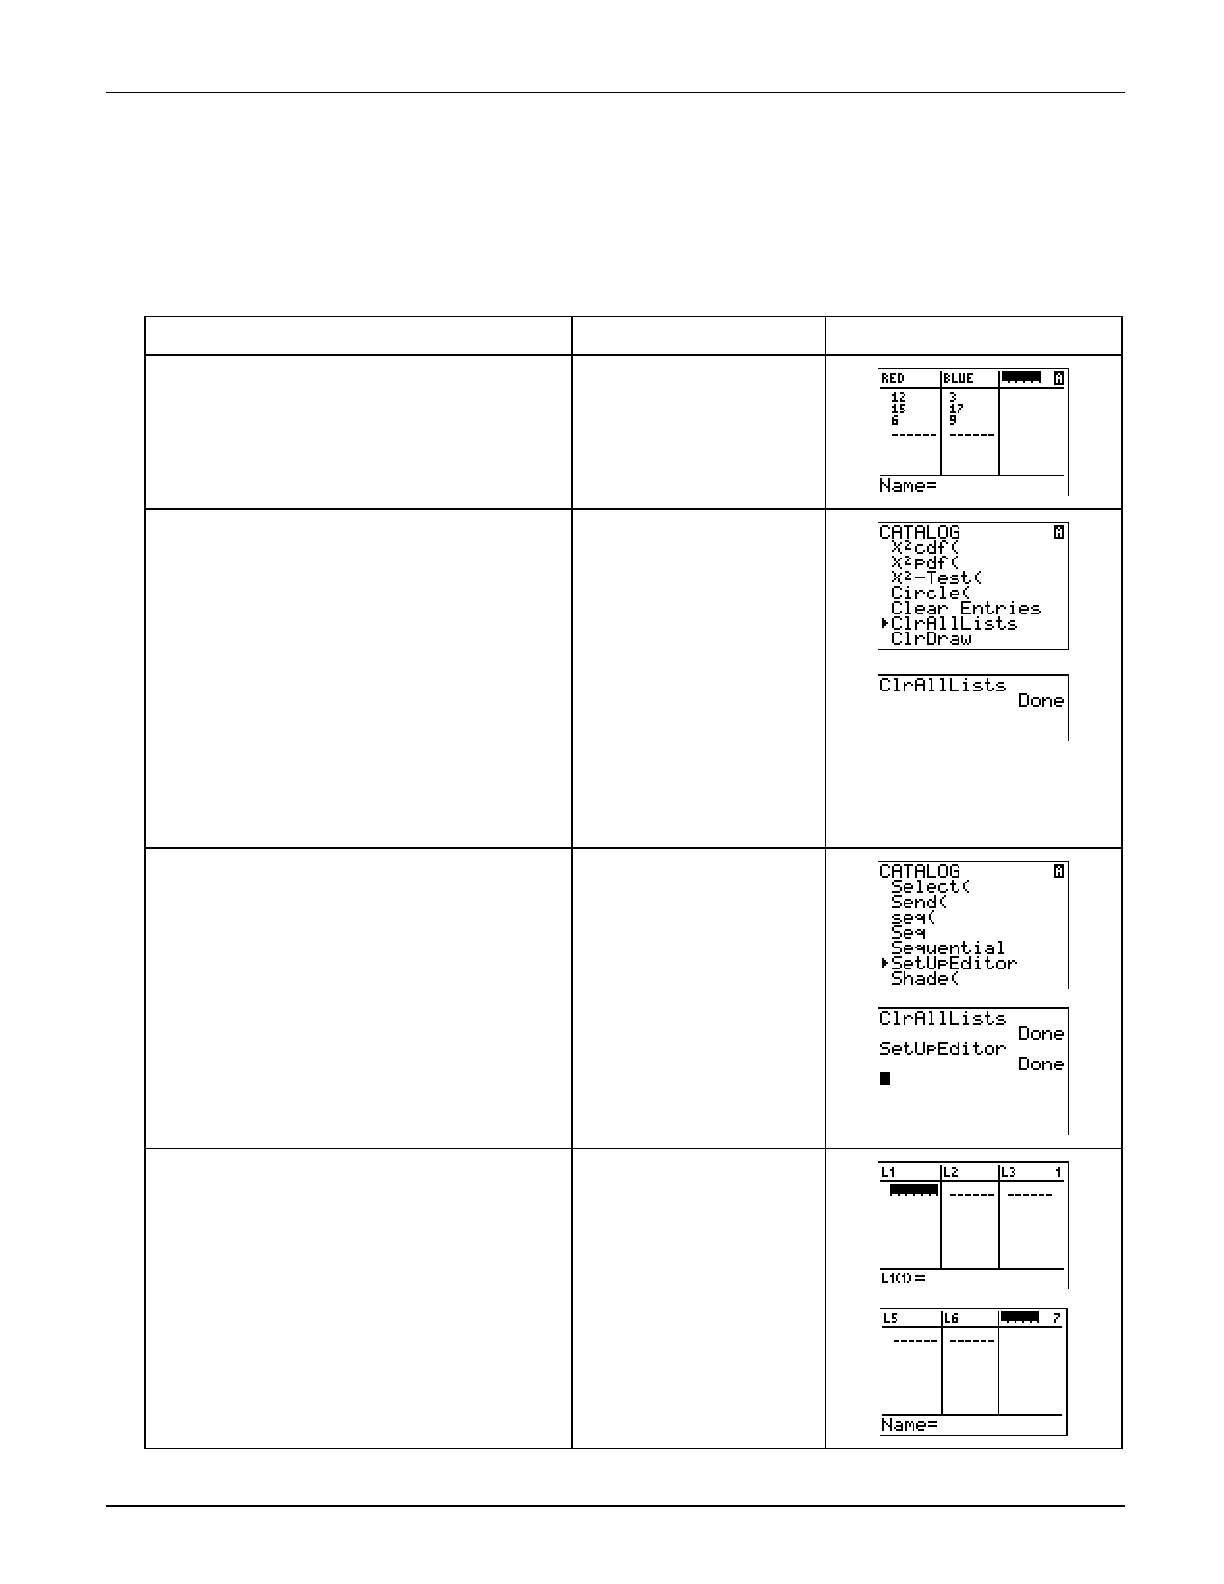
³ TIp 6: Using Lists
Topics in Algebra 1 © 2001 Texas Instruments ³ TIp 6-2
³ Try-It!é on Your TI.83 Plus or TI.73
Set Up the List Editor
Use the commands ClearAllLists and SetUpEditor to reset the list editor.
To Do This Press Display (TI-83 Plus shown)
1. Display the list editor.
Note: Your list editor may vary. The following
commands will clear and set up lists L1 through L6
in your list editor.
TI-83 Plus:
… 1:Edit
TI-73:
3
2. Return to the Home screen and clear
it. Then clear all lists in the list editor
by selecting ClearAllLists.
Note: This command clears all elements from the
lists. The list names are still in memory, but the lists
are empty.
Hint: In the CATALOG, you can go to the first item
starting with a particular letter:
TI-83 Plus: Press C (). Notice that you are
already in ALPHA mode since the Ø displays in the
upper right corner.
TI-73: Press - t, highlight C, and then press
b.
- l :
- |
# until ClrAllLIsts is
selected
b
b
3. Setup the list editor with SetUpEditor.
Hint: You also can select SetUpEditor on the
TI-83 Plus by pressing … 5.
- |
# until you highlight
SetUpEditor
b
b
4. Display the list editor.
Note: Lists L1 through L6 appear and are clear, and
there is a blank list following L6.
TI-83 Plus:
… 1:Edit
TI-73:
3
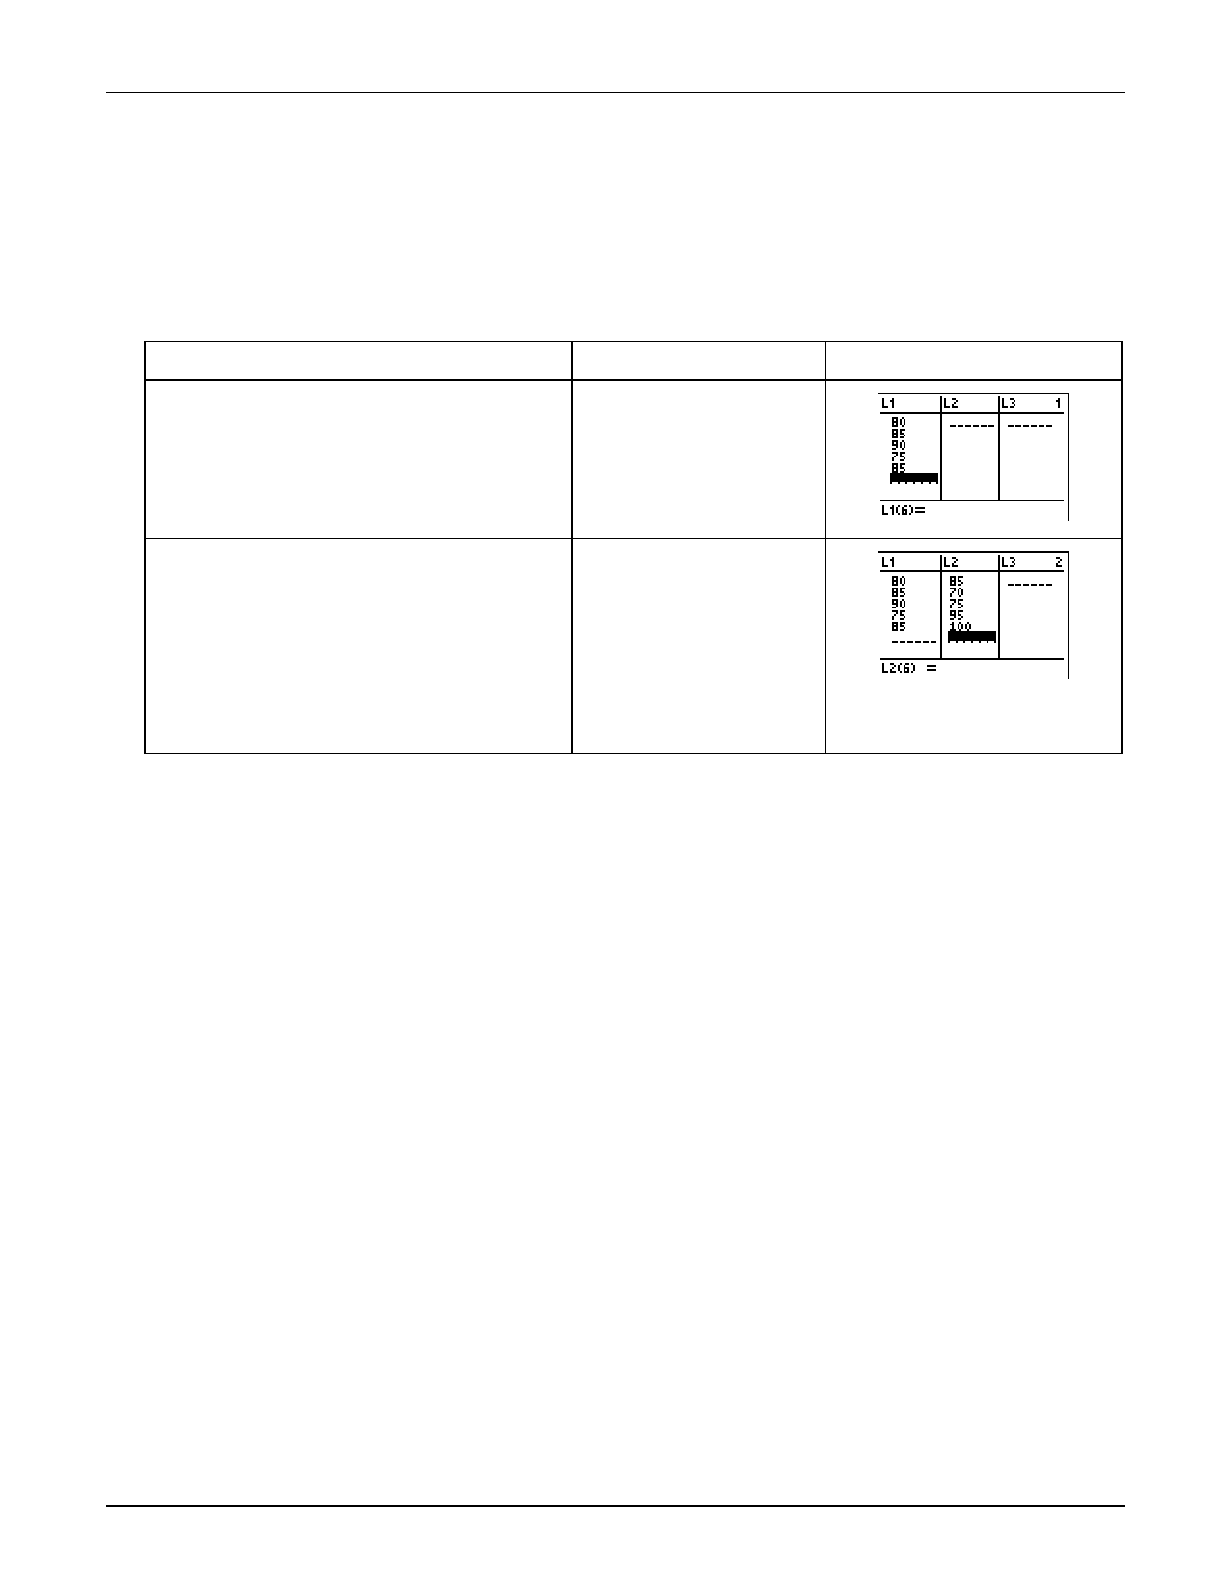
³ TIp 6: Using Lists
Topics in Algebra 1 © 2001 Texas Instruments ³ TIp 6-3
³ Try-It!é on Your TI.83 Plus or TI.73 (continued)
Enter the Lists
In the list editor, enter Jamal’s scores as L1={80,85,90,75,85} and Jian’s scores as
L2={85,70,75,95,100}.
To Do This Press Display (TI-83 Plus shown)
1. Enter data into L1. 80 #
85 #
90 #
75 #
85 #
2. Enter data into
L2. " (to place the cursor
under L2)
85 #
70 #
75 #
95 #
100 #
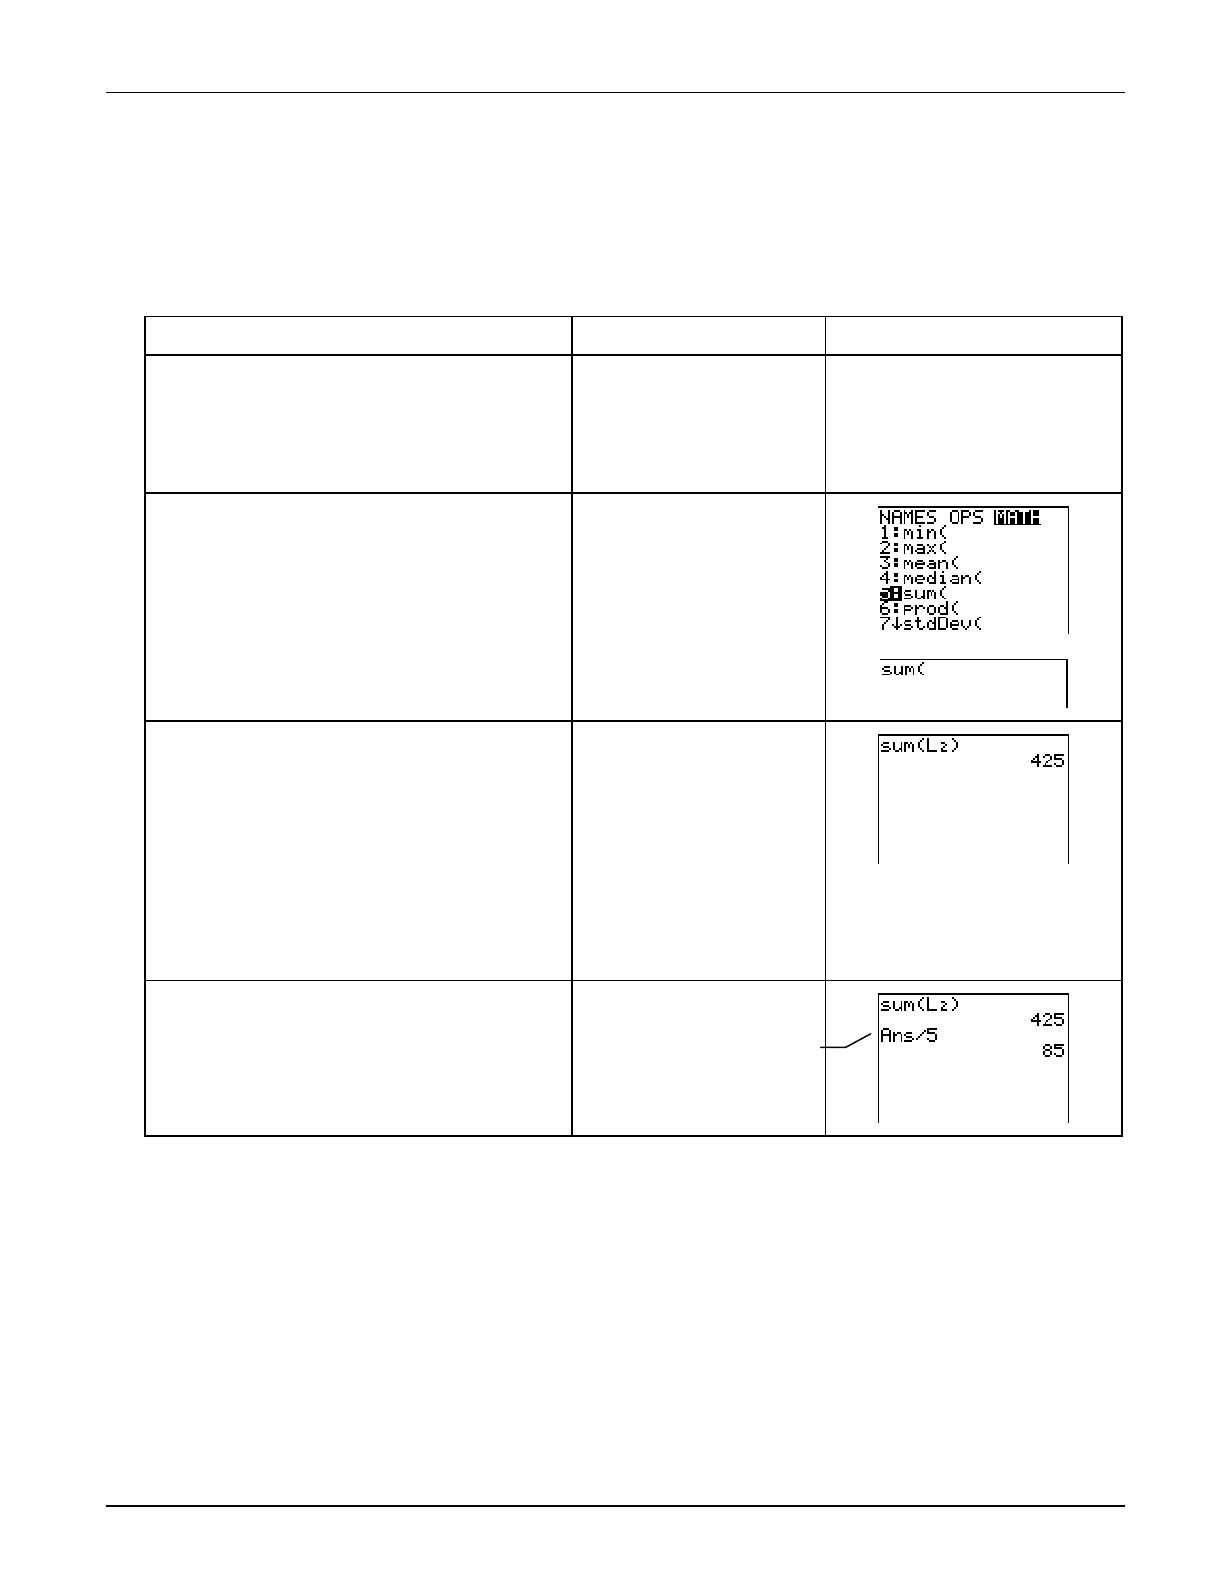
³ TIp 6: Using Lists
Topics in Algebra 1 © 2001 Texas Instruments ³ TIp 6-4
³ Try-It!é on Your TI.83 Plus or TI.73 (continued)
Display the Sum and Average of All Elements in a List
On the Home screen, find the sum of Jian’s test scores (L2).
To Do This Press Display (TI-83 Plus shown)
1. Return to the Home screen and clear
the current line, if needed.
Tip: Once you exit the application, you can press
y 5 to return to the Home screen from any
menu or command.
y 5 :
2. Select
sum( from the MATH menu. TI-83 Plus:
y 9 " "
5:sum(
TI-73:
- v " "
7:sum(
3. Select the list (L2) you want, and
display the sum.
TI-83 Plus:
y 9
2:L2 E
b
TI-73:
- v
2:L2 E
b
4. Divide
L2 by 5 (the number of test
scores) to find the average (or mean)
of the list of the scores.
Note: Ans is the previous
answer
, 425.
F 5
b
Ans = 425
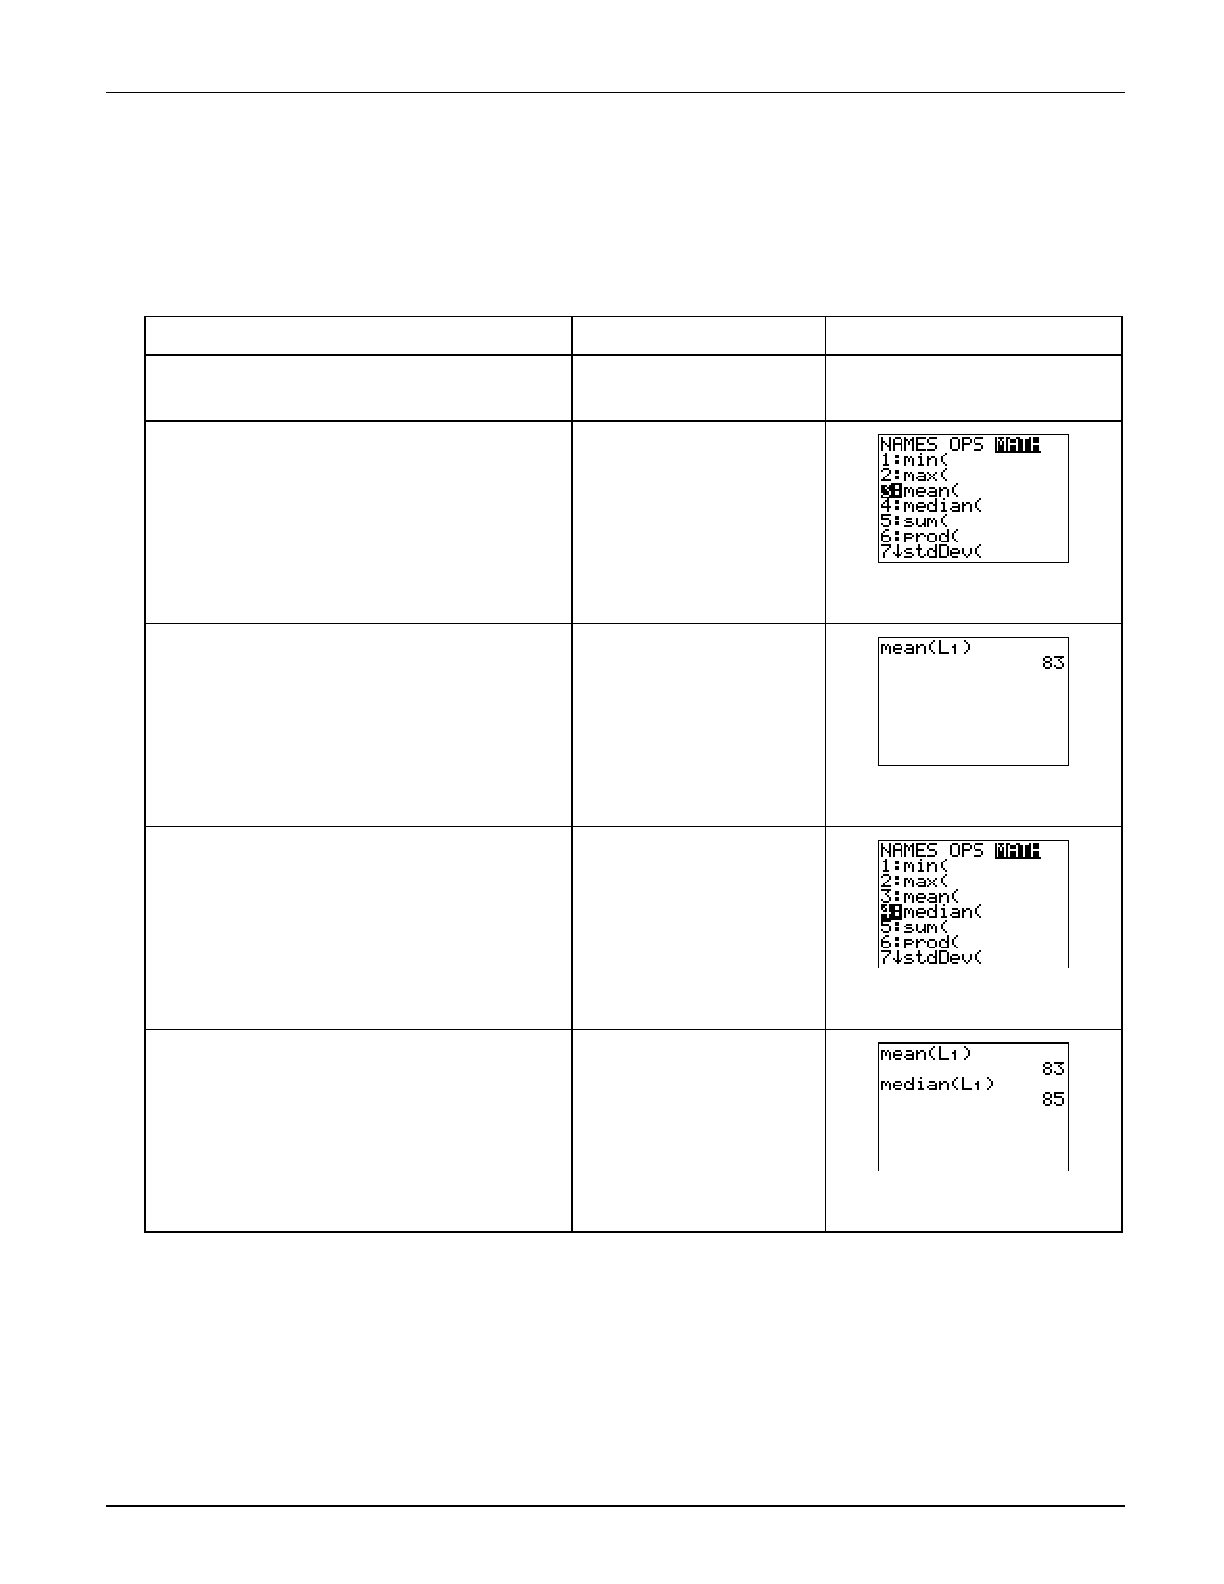
³ TIp 6: Using Lists
Topics in Algebra 1 © 2001 Texas Instruments ³ TIp 6-5
³ Try-It!é on Your TI.83 Plus or TI.73 (continued)
Find the Mean and Median of a Set of Data
On the Home screen, find the mean and median of Jamal’s test scores (L1).
To Do This Press Display (TI-83 Plus shown)
1. Return to the Home screen and clear
the current line, if needed.
y 5 ‘
2. Select
mean(
from the MATH menu. TI-83 Plus:
y 9 " "
3:mean(
TI-73:
- v " "
3:mean(
3. Select the list (L1) that you want, and
then calculate the mean.
TI-83 Plus:
y 9 1:L1 E
b
TI-73:
- v 1:L1 E
b
4. Select
median( from the MATH menu. TI-83 Plus:
y 9 " "
4:median(
TI-73:
- v " "
4:median(
5. Select the list (L1) that you want, and
then display the median.
TI-83 Plus:
y 9 1:L1 E
b
TI-73:
- v 1:L1 E
b

³ TIp 6: Using Lists
Topics in Algebra 1 © 2001 Texas Instruments ³ TIp 6-6
³ Try-It!é on Your TI.83 Plus or TI.73 (continued)
On Your Own
³ Calculate the 1-variable statistics analysis for L1 using the 1-Var Stats command on the Home
screen. Use the arrow keys (# and $) to view all of the information about L1.
Select the 1-Var Stats command from this menu:
• TI-83 Plus: … CALC menu
• TI-73: - v CALC menu
Hint: Select the 1-Var Stats command first, and then select L1. For more information about 1-Var Stats, see the calculator
guidebook.
³ If you are already familiar with statistical plots, find the quartile statistics in the list of data
that was generated above, and draw a box plot of the data. For help, see ³ TIp 7: Creating a
Statistical Plot.
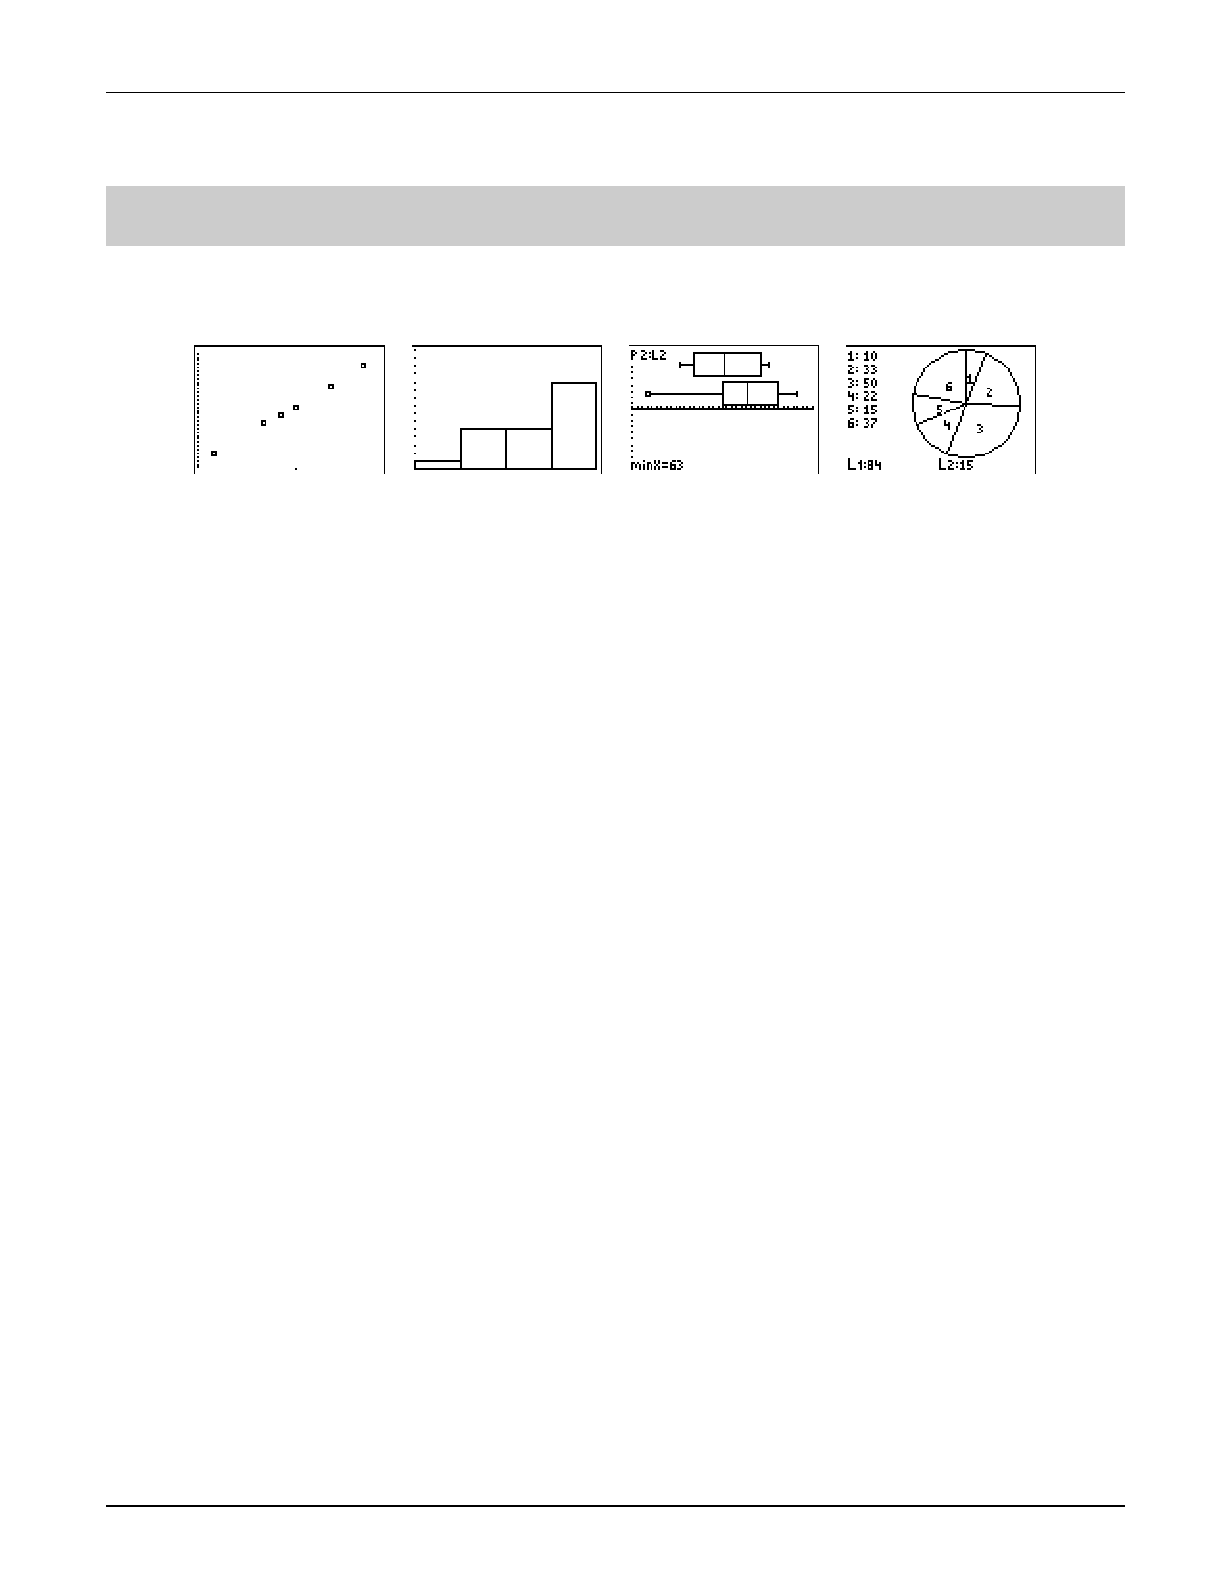
³ TIp 7: Creating a Statistical Plot
Topics in Algebra 1 © 2001 Texas Instruments ³ TIp 7-1
³ TIpé 7: Creating a Statistical Plot
Statistical plots are graphs of data values that have been stored in lists. You can create several
types of statistical plots, such as scatter plots, histograms, box plots, and pie charts (TI-73 only).
Calculator Keys Used in This ³ TIpé
• TI-73: - e
• TI-83 Plus: - ,
• ( ZoomStat
³ TIpé Highlights
In the ³ Try-It! example, you will graph a statistical plot following these main steps.
1. Enter all necessary lists in the list editor.
2. Define your statistical plot in the stat plot editor.
3. Display the statistical plot by pressing ( (ZoomStat).
Pressing ) allows you to move the cursor from one plotted point to another using " and !.
It also displays the values (X,Y) at the bottom of the screen. For more information about
statistical plot options, see the calculator guidebook.
Note: The examples in the next section assume that the calculator has been reset to the default settings as described in
³ TIp 1:
Resetting Your Calculator.
Scatter Plot Pie Chart (TI.73 only) Box Plot Histogram
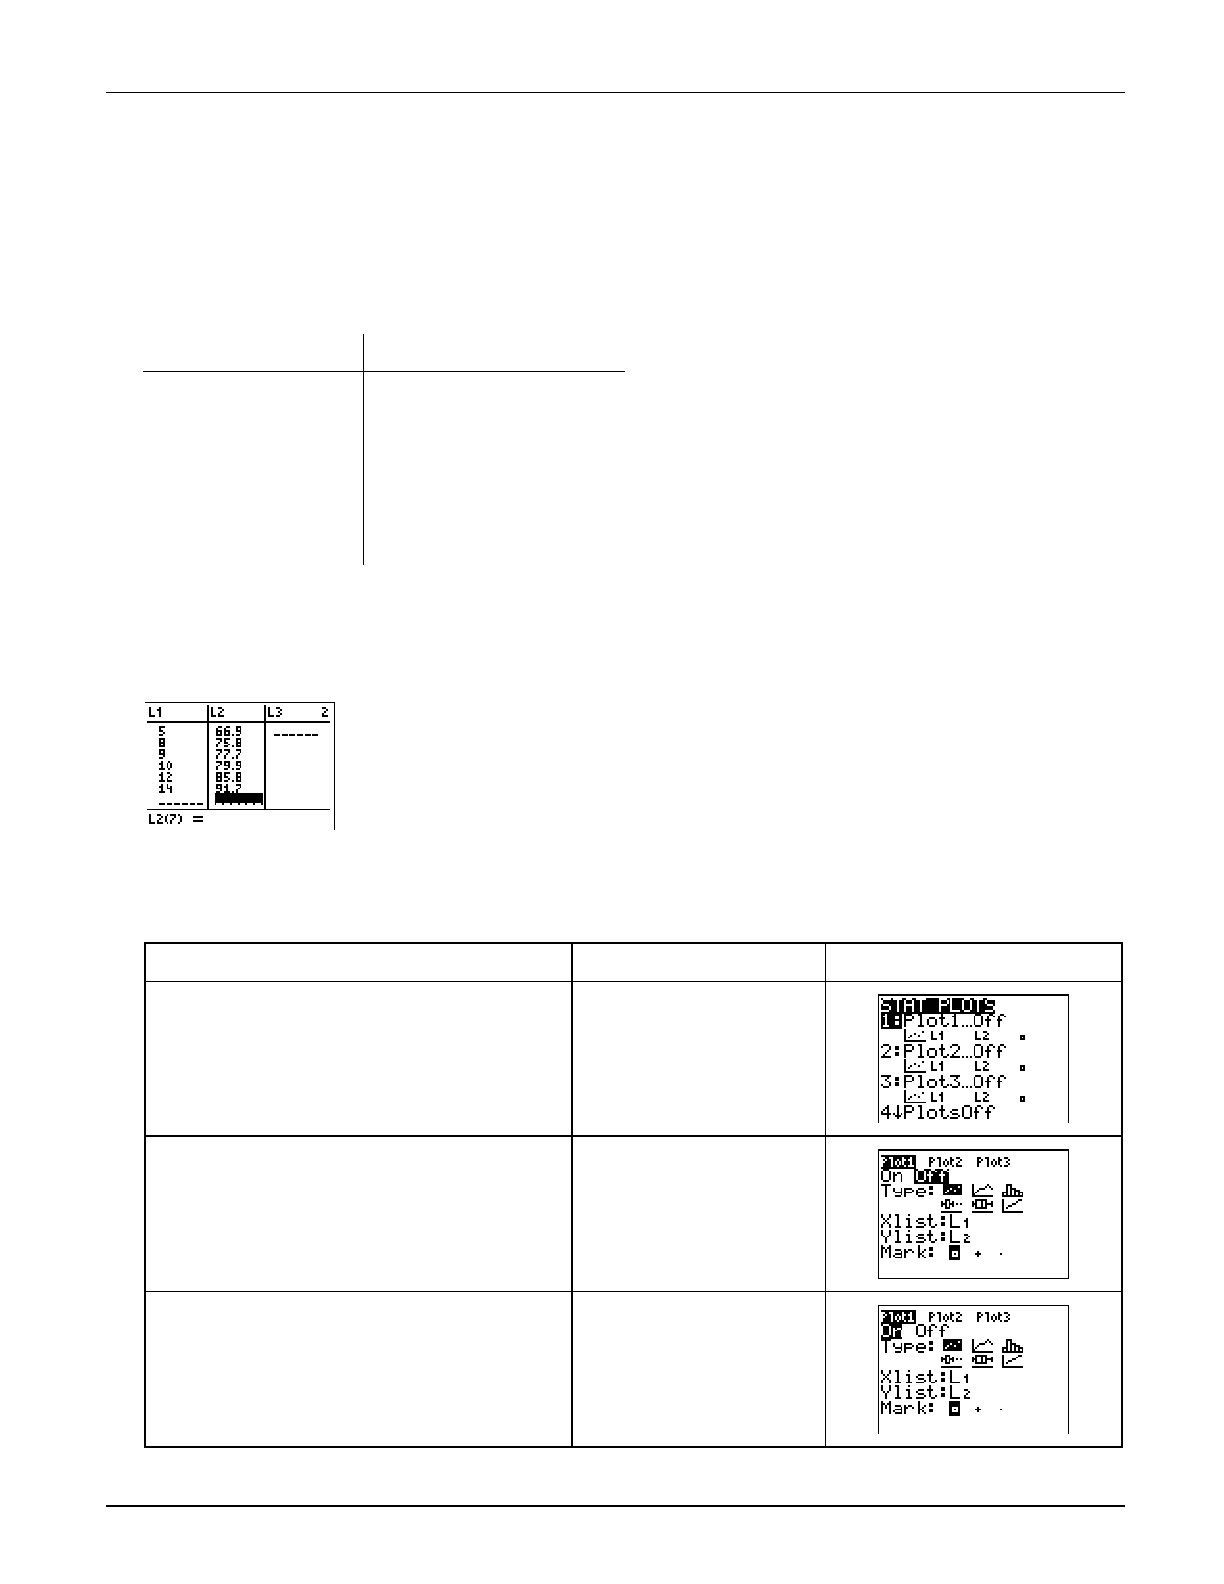
³ TIp 7: Creating a Statistical Plot
Topics in Algebra 1 © 2001 Texas Instruments ³ TIp 7-2
³ Try-It!é on Your TI.83 Plus or TI.73
You have collected the measurements (in inches) of how far a boy from age 5 to age 14 could
throw a ball above his head. The following data was recorded. Create a scatter plot (Ô) based
on these lists, where L1 = Age in years and L2 = Distance in inches.
Age in years (L1) Distance in inches (L2)
5 66.9
8 75.8
9 77.7
10 79.9
12 85.8
14 91.7
Enter the Lists in the List Editor
See ³ TIp 6: Using Lists for step-by-step instructions for entering lists of data (remember to use
ClearAllLists and SetUpEditor). Your list editor should look like this:
Define the Statistical Plot
Define Plot1 as a scatter (Ô) plot where Xlist=L1 and Ylist=L2.
To Do This Press Display (TI-83 Plus shown)
1. Display the
STAT PLOTS screen. TI-83 Plus:
y ,
TI-73:
- e
2. Display the Plot1 settings screen. 1:Plot1
3. Select
On to turn on Plot1.
Note: Scatter (Ô), is already selected because
you reset the calculator for this ³ TIp. Xlist and
Ylist do not have to be changed because, by
default, they already match our selected lists.
b

³ TIp 7: Creating a Statistical Plot
Topics in Algebra 1 © 2001 Texas Instruments ³ TIp 7-3
³ Try-It!é on Your TI.83 Plus or TI.73 (continued)
Display the Statistical Plot on the Graph Screen
Display the statistical plot on the graph screen using the ZoomStat command and trace it.
To Do This Press Display (TI-83 Plus shown)
1. Select
ZoomStat
from the ZOOM
menu.
TI-83 Plus:
(
9:ZoomStat
TI-73:
(
7:ZoomStat
2. Trace along the statistical plot.
Note: P1:L1,L2 in the upper left corner shows that
the lists L1 and L2 contain the data for the graph.
The data points are displayed at the bottom of the
screen.
)
" or ! as necessary
L1 and L2 contain the
data for this graph.
(X,Y) coordinates of
the data point at the
cursor location.

³ TIp 7: Creating a Statistical Plot
Topics in Algebra 1 © 2001 Texas Instruments ³ TIp 7-4
³ Try-It!é on Your TI.83 Plus or TI.73 (continued)
On Your Own
1. Enter the following math test scores in L1 and L2.
Scores (L1) Frequency (L2)
99 4
96 4
92 3
88 2
84 3
78 2
74 2
70 1
66 1
64 1
2. Set up the histogram (Ò) where Xlist=L1 and Freq=L2 in the STAT PLOTS menu.
3. Graph the histogram using ZoomStat, and then trace ()) the histogram. Letter grades
correspond to these test scores: A = 100–90; B = 89–80; C = 79–70; D = 69–60; F = 59–0. Did
the graph display the way you expected? Why is it necessary to change the window values
manually?
4. Change the window values manually to group the data in intervals of 10. Remember that you
want the data grouped in intervals of 10 so you can see how many test scores fall into the
grade categories given above. You can tell the calculator to do this by setting Xscl=10 on the
graphing window ('). Xmin should be a little less than the lowest score and Xmax
should be a little higher than the highest score to display a nice graph. Try setting the window
as Xmin=50, Xmax=100, Ymin= M4, Ymax=15, and Yscl=10.
5. Graph and trace the histogram again to see why these settings show the grades grouped by
scores that match the letter grades A, B, C, D, and F.
Hint: Remember that if you have functions defined and turned on in the Y= editor, the calculator graphs these at the same time as the stat
plot. To turn off a function, highlight the = sign next to it, and then press b.
Or you can select FnOff. To do this:
• On the TI-83 Plus: Press ~ 4:On/Off 2:FnOff
• On the TI-73: Press
- } 2:Y-Vars 6: FnOff
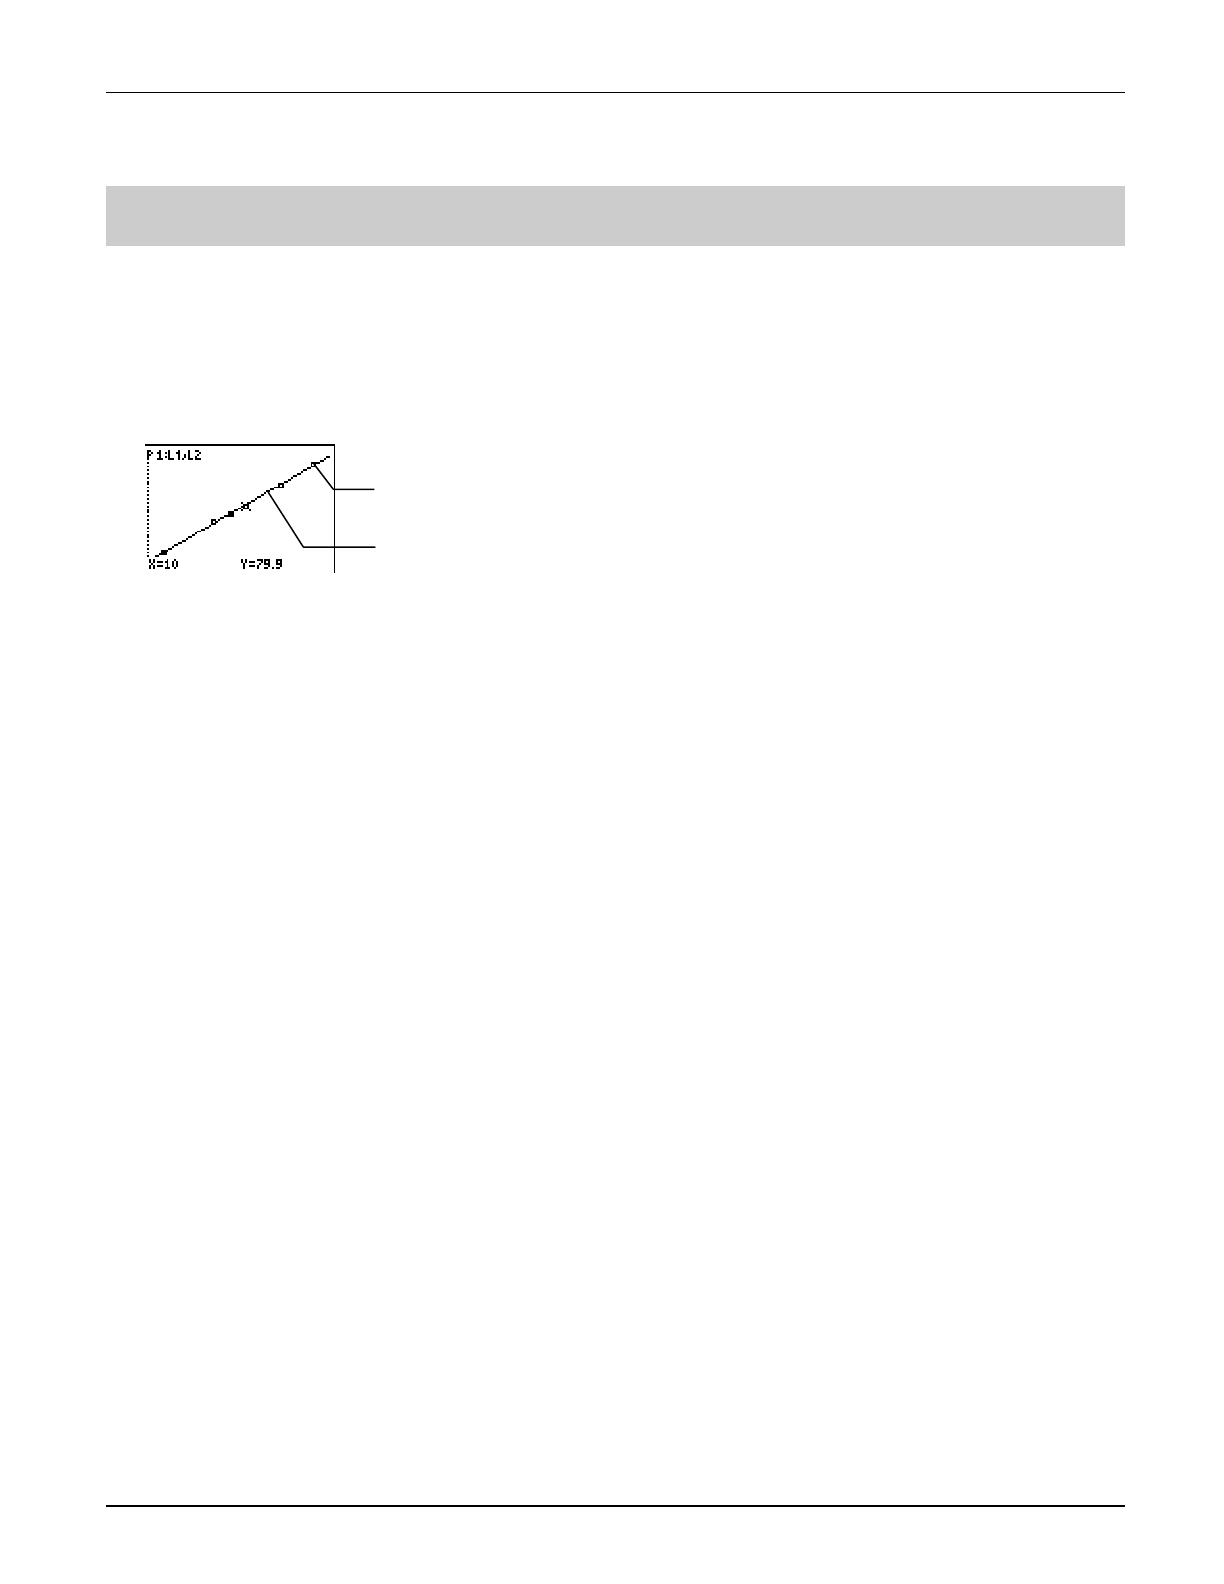
TIp 8: Finding the Best Line of Fit for a Set of Data
Topics in Algebra 1 © 2001 Texas Instruments ³ TIp 8-1
³ TIpé 8: Finding the Best Line of Fit for a Set of Data
Both the TI-83 Plus and the TI-73 have regression commands that automatically find the closest
equation to your statistical plot data. The LinReg(ax+b) command finds the closest linear
equation y=ax+b and displays the values for a (slope) and b (y-intercept) on the Home screen.
You can save this equation in the Y= editor so that you can graph the regression equation and the
statistical plot data at the same time, and then compare the two.
Calculator Keys Used in This ³ TIpé
• TI-83 Plus: … ~ (CALC menu) LinReg(ax+b)
• TI-73: - v ! (CALC menu) LinReg(ax+b)
³ TIpé Highlights
This ³ TIp shows you how to use LinReg(ax+b) on the Home screen to find the linear regression
of two list names, XList (L1) and YList (L2). You will use the same list values that you used to
define the statistical plot.
Note: For more information about statistical plots, see ³ TIp 7:
Creating a Statistical Plot
.
In the ³ Try-It! example, you will find a linear regression following these main steps.
1. Select
LinReg(ax+b)
from the … CALC menu.
2. Enter the two list names that define the statistical plot.
3. Save the equation in the Y= editor.
4. Graph the statistical plot and the linear regression.
Note: The examples in the next section assume that the calculator has been reset to the default settings as described in
³ TIp 1:
Resetting Your Calculator.
Statistical plot data points
Linear Regression line based
on statistical plot data
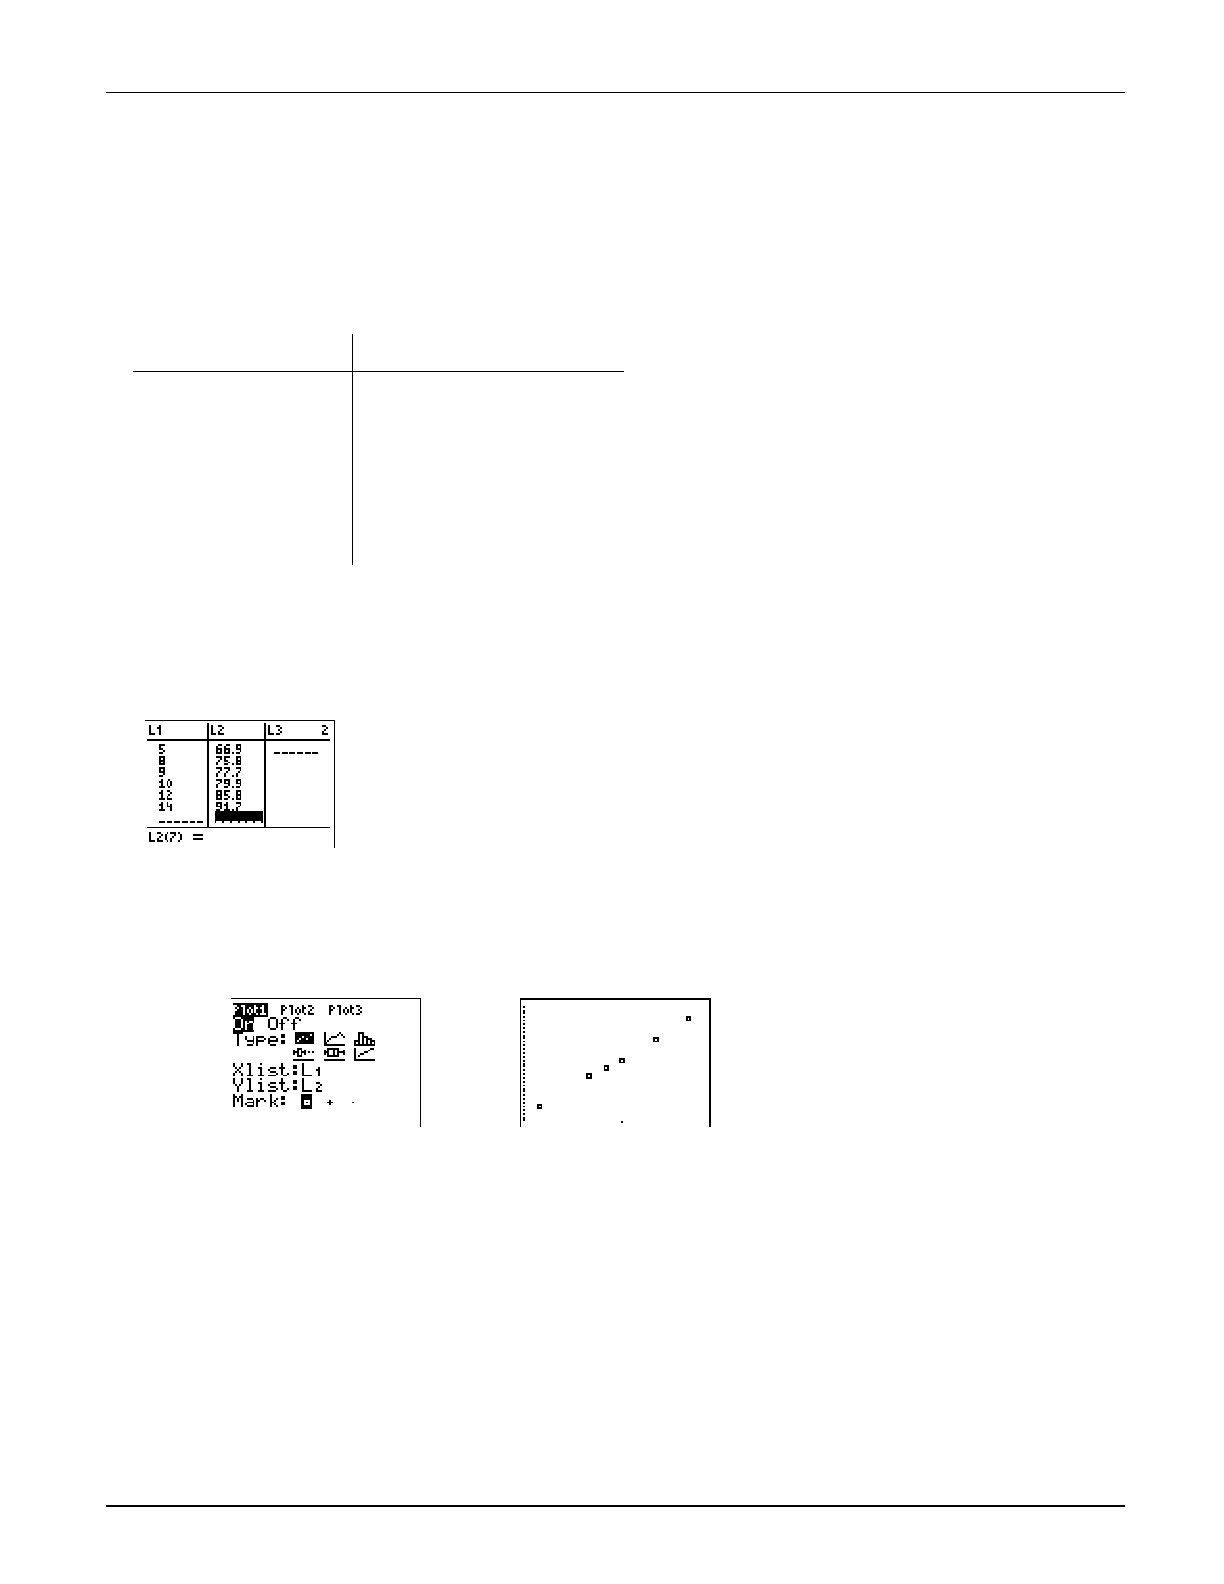
TIp 8: Finding the Best Line of Fit for a Set of Data
Topics in Algebra 1 © 2001 Texas Instruments ³ TIp 8-2
³ Try-It!é on Your TI.83 Plus or TI.73
You have collected the measurements (in inches) of how far a boy could throw a ball above his
head from age 5 to age 14. The following data was recorded. Create a scatter (Ô) plot based on
these lists, where Xlist=L1 and YList= L2.
Age in years (L1) Distance in inches (L2)
5 66.9
8 75.8
9 77.7
10 79.9
12 85.8
14 91.7
Enter the Lists for the Statistical Plot
See ³ TIp 6: Using Lists for step-by-step instructions for entering lists of data. Your list editor
should look like this:
Create a Scatter Statistical Plot for L1 and L2
See ³ TIp 7: Creating a Statistical Plot for step-by-step instructions for creating a scatter
statistical plot. Your statistical plot editor and scatter plot (using ZoomStat) should look like this:
Note: The stat plot editor in the TI-73 looks slightly different.
Stat Plot Editor Graph of Plot
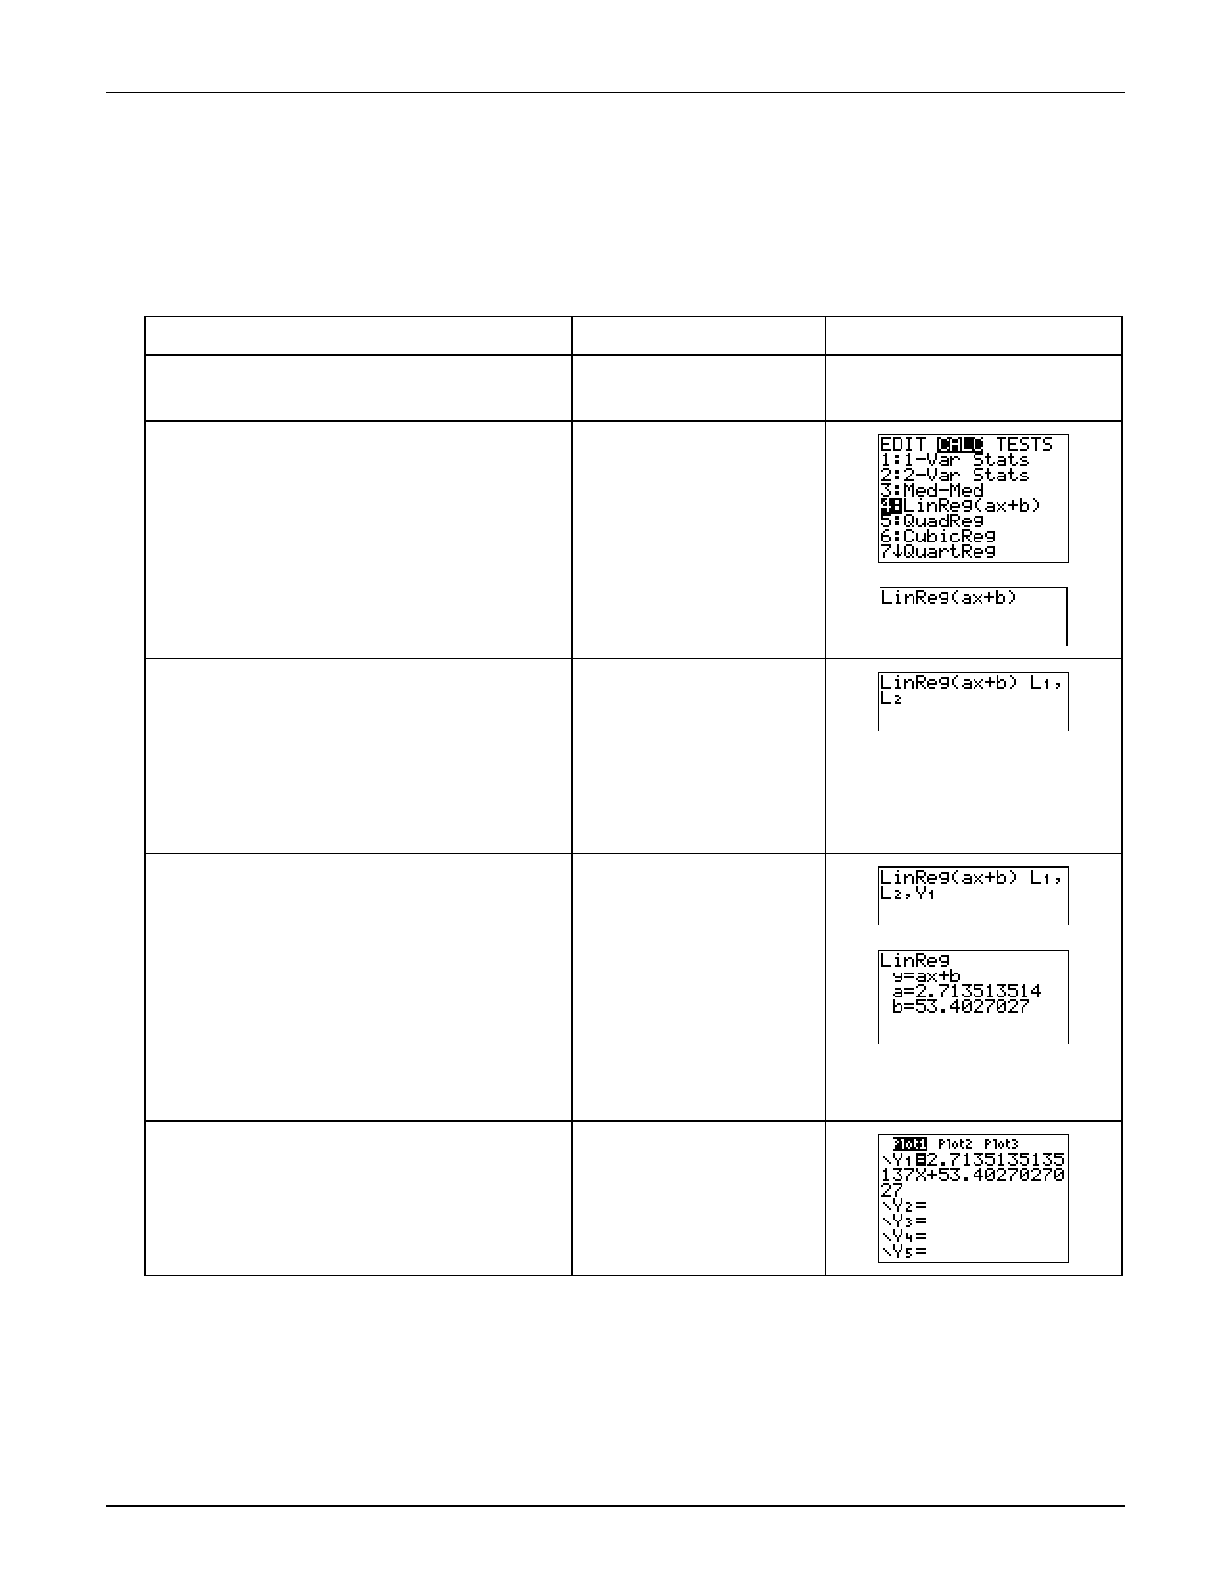
TIp 8: Finding the Best Line of Fit for a Set of Data
Topics in Algebra 1 © 2001 Texas Instruments ³ TIp 8-3
³ Try-It!é on Your TI.83 Plus or TI.73 (continued)
Find the Linear Regression for the Scatter Plot
Find the regression (the line which best fits the data) for L1 and L2 using LinReg(ax+b).
To Do This Press Display (TI-83 Plus shown)
1. Return to the Home screen, and clear
it.
- l :
2. Select
LinReg(ax+b) from the STAT
CALC menu.
TI-83 Plus:
… "
4:LinReg(ax+b)
TI-73:
- v !
5:LinReg(ax+b)
3. Select the lists L1 and L2. TI-83 Plus:
y 9 1:L1 ¡
y 9 2:L2 ¡
TI-73:
- v 1:L1 ¡
- v 2:L2 ¡
4. Display
Y-VARS menu. Then select
the Y variable (Y1) from the
FUNCTION menu.
5. Calculate the regression equation.
TI-83 Plus:
~
1:Function
1:Y1
b
TI-73:
- } 2:Y-Vars
1:Y1
b
6. Display the Y= editor.
Note: Both Y1 and Plot1 are highlighted. This
means that both graph and the plot are turned on.
&
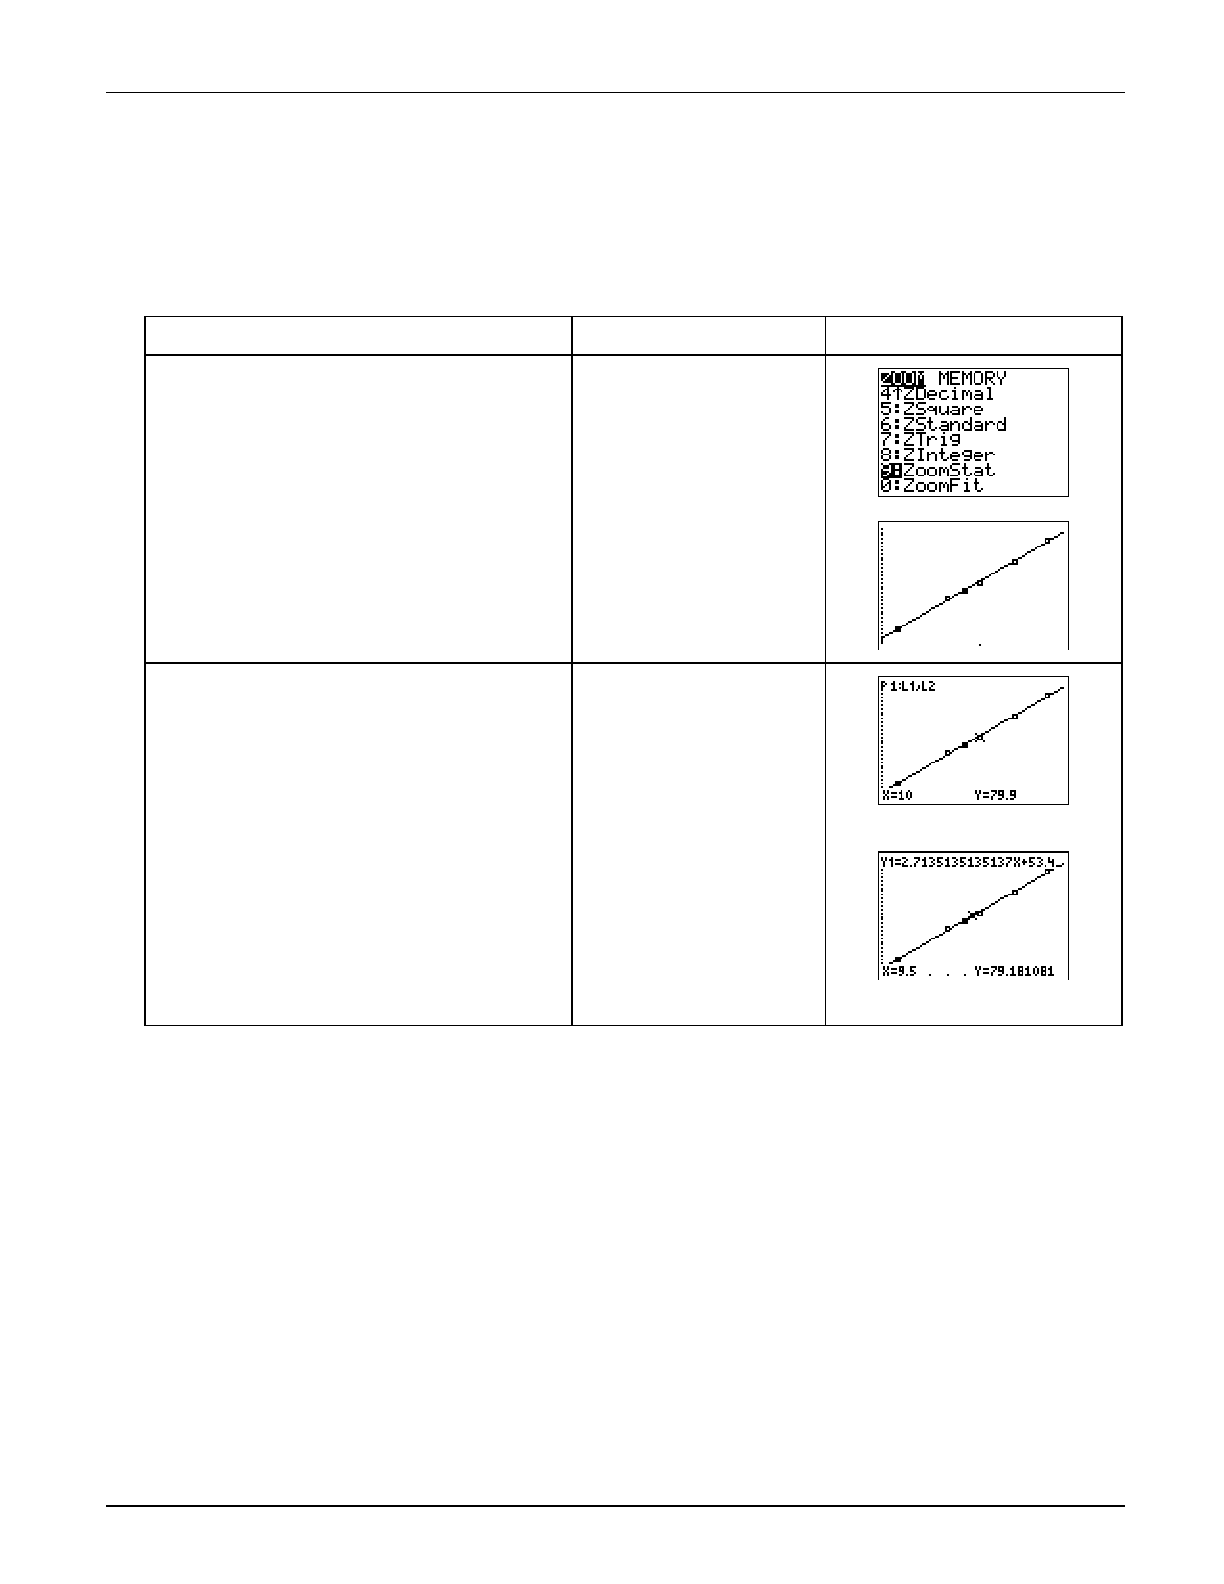
TIp 8: Finding the Best Line of Fit for a Set of Data
Topics in Algebra 1 © 2001 Texas Instruments ³ TIp 8-4
³ Try-It!é on Your TI.83 Plus or TI.73 (continued)
Graph the Statistical Plot and the Linear Regression
Graph and trace the statistical plot and linear regression at the same time and compare them.
To Do This Press Display (TI-83 Plus shown)
1. Select the ZoomStat function to
display the statistical plot and the
regression on the graph screen at the
same time.
TI-83 Plus:
q
9:ZoomStat
TI-73:
q
7:ZoomStat
2. Trace the function or the statistical
plot.
Notes: The function or plot being traced is
displayed in the upper left corner of the screen. The
X and Y coordinates display at the bottom of the
screen.
r
| or ~ to trace a
function
} and † to move
between functions
Tracing along the stat plot
Tracing along the line
On Your Own
³ Use the function to predict approximately how far you think the boy can throw the ball
above his head at 18 years old. Do you think the line will give a good idea of how high this
person will be able to throw the ball when he is 35? Explain your thoughts.
Hint: Use the table to determine the value of Y1 when X=18.

³ TIp 9: Sending and Receiving Data between Calculators
Topics in Algebra 1 © 2001 Texas Instruments ³ TIp 9-1
³ TIpé 9: Sending and Receiving Data between Calculators
You can send and receive data between calculators using the SEND and RECEIVE menus.
To connect two calculators using the unit-to-unit cable, which comes packaged with your
calculator, use the I/O (input/output) port located at the center of the bottom edge of the
calculator.
• Insert either end of the unit-to-unit cable into the I/O calculator port.
• Insert the other end of the cable into the I/O port of the other calculator.
Tip: The cable must be
firmly
inserted into the I/O port. If you receive a “link error,” make sure the cable is completely inserted.
Sending unit Receiving unit
I/O ports for cable
Calculator Keys Used in This ³ TIpé
• TI-83 Plus: y 8
• TI-73: 9 1:Link
³ TIpé Highlights
You can send or receive many types of data such as lists, programs, pictures, and applications
that can be shared.
To communicate between two calculators, you must set up one calculator to send the data and
the other calculator to receive the data.
Note: You can only link two TI-73 calculators or two TI-83 Plus calculators. You cannot link a TI-73 and a TI-83 Plus.
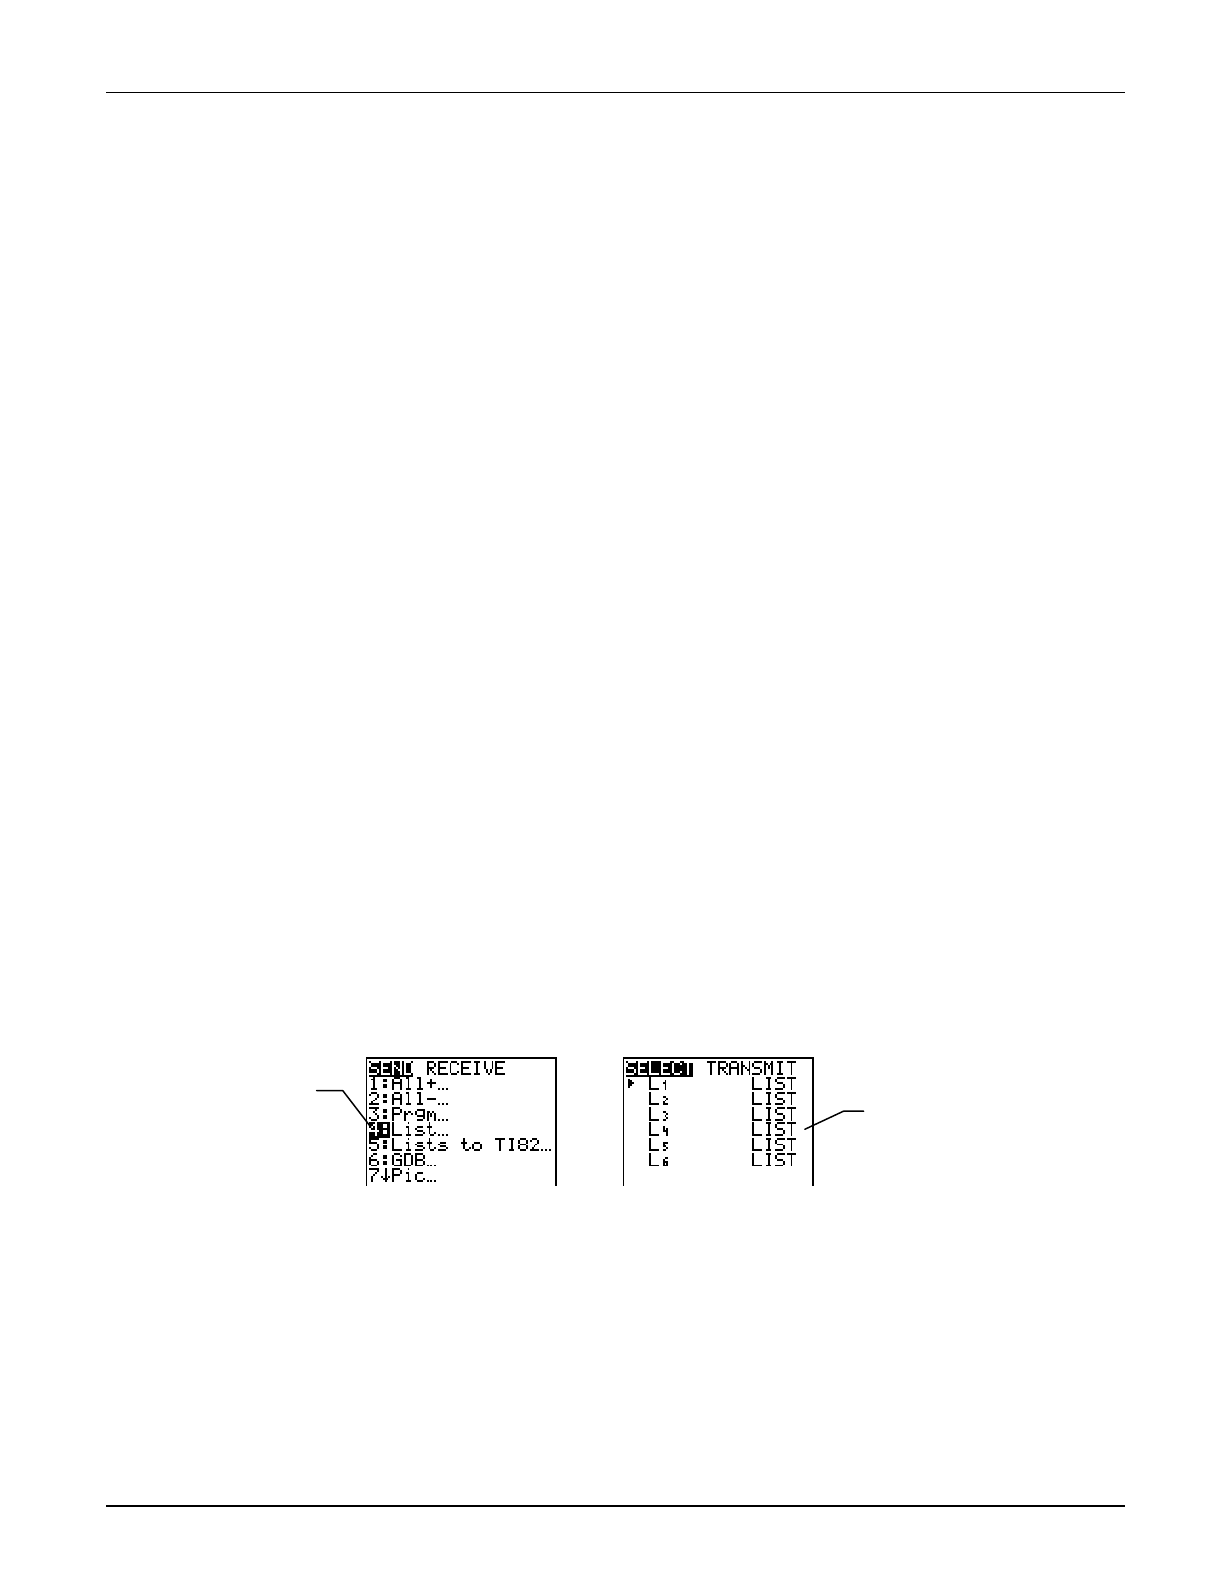
³ TIp 9: Sending and Receiving Data between Calculators
Topics in Algebra 1 © 2001 Texas Instruments ³ TIp 9-2
³ TIp Highlights (continued)
In the ³ Try-It! example, you will link two calculators and send lists of data from one calculator
to the other following these main steps.
Receiving Data
After you link the calculators using the unit-to-unit cable, set up one calculator to receive data by
following these steps:
1. Display the link menu.
• TI-83 Plus: y 8
• TI-73: 9 1:Link
2. Press
" to display the RECEIVE menu.
3. Select
1:Receive. The message Waiting… and the busy indicator are displayed. The calculator
is ready to receive transmitted items.
Sending Data
After you link the calculators using the unit-to-unit cable and have one calculator waiting to
receive data, set up the other calculator to send data by following these steps:
1. Display the link menu.
• TI-83 Plus: y 8
• TI-73: 9 1:Link
2. Select the type of data (for example, lists) that you want to send. The corresponding SELECT
screen is displayed. Each SELECT screen is displayed initially with no items selected.
Note: The All+ menu item selects all items on your calculator that can be transmitted. The All- menu item deselects all items that
you have selected to transmit.
3. Press
$ and # to move the selection cursor (4) to an item you want to select or deselect.
4. Press
b to select or deselect an item. Selected names are marked with a box (0). You can
select more than one if you want.
Select the
type of data.
A
ll lists on the
calculator are
displayed.
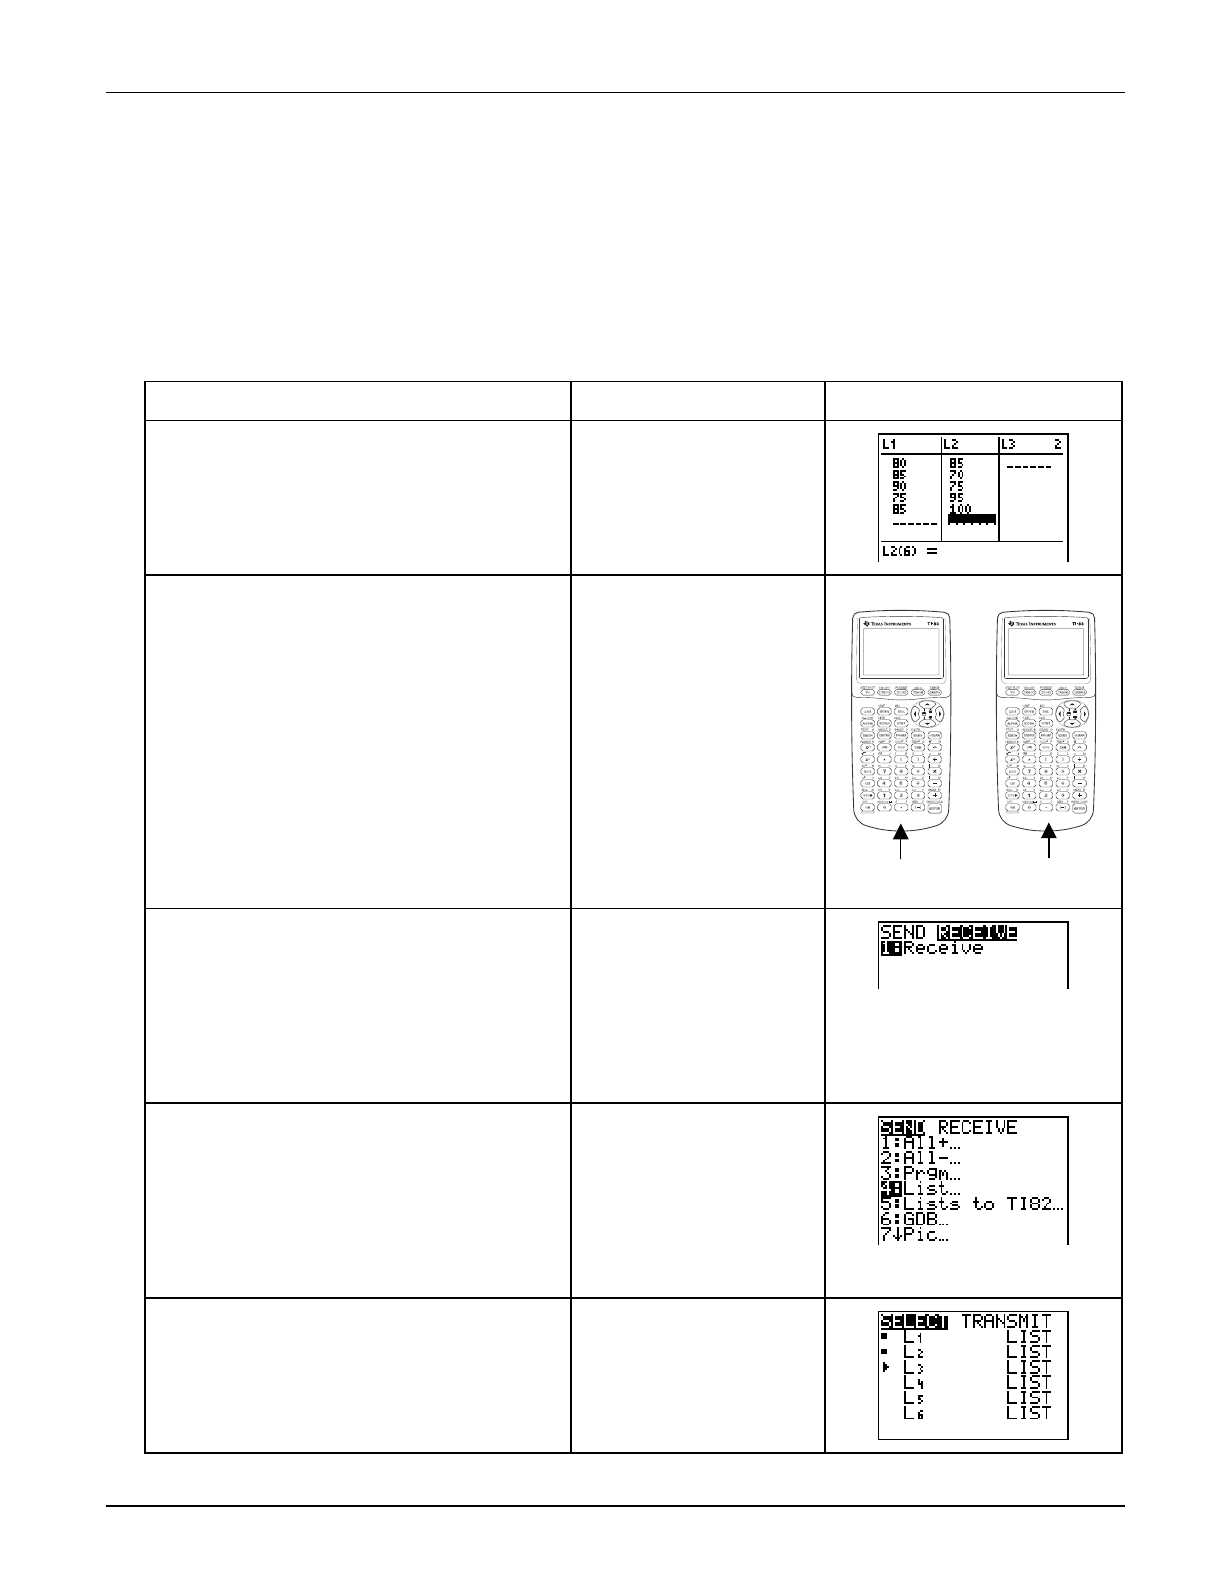
³ TIp 9: Sending and Receiving Data between Calculators
Topics in Algebra 1 © 2001 Texas Instruments ³ TIp 9-3
³ Try-It!é on Your TI.83 Plus or TI.73
Transfer L1 and L2 from one calculator to another one. Use L1 and L2 as defined in
³ TIp 6: Using Lists.
• L1={80,85,90,75,85}
• L2={85,70,75,95,100}
To Do This Press Display (TI-83 Plus shown)
1. On the sending calculator, enter the
lists above in the list editor.
TI-83 Plus:
… 1:Edit
TI-73:
3
2. Link the two calculators using the
unit-to-unit cable. Sending unit Receiving unit
Connect the calculators with
the cable using the I/O ports.
3. On the receiving calculator, select
Receive.
Confirm that
Waiting… is displayed
on the screen. Your calculator is now
ready to receive the lists.
TI-83 Plus:
y 8
" 1:Receive
TI-73:
9 1:Link
" 1:Receive
4. On the sending calculator, display the
SEND menu, and then select List.
TI-83 Plus:
y 8
4: List
TI-73:
9 1:Link
4: List
5. Select
L1 and L2.
Note: The selected lists are marked with a box (0).
b
# b
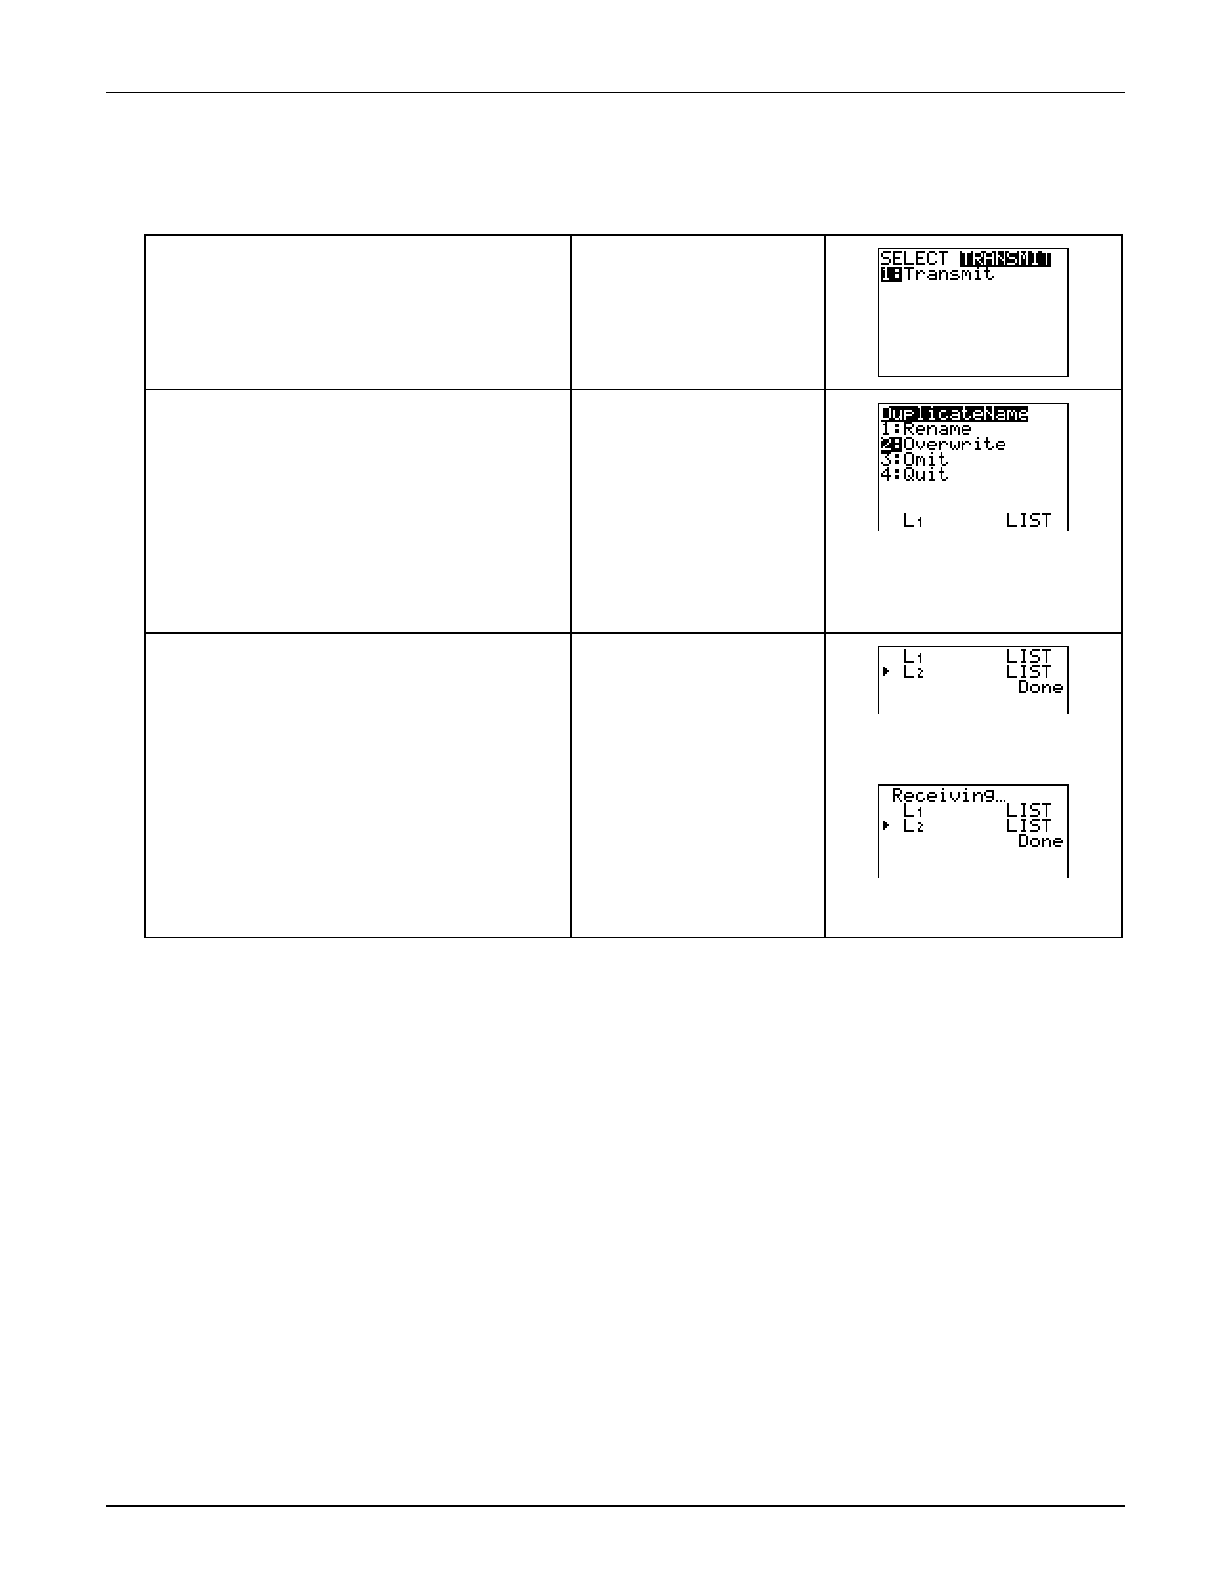
³ TIp 9: Sending and Receiving Data between Calculators
Topics in Algebra 1 © 2001 Texas Instruments ³ TIp 9-4
³ Try-It!é on Your TI.83 Plus or TI.73 (continued)
6. Send the lists to the receiving
calculator using the TRANSMIT menu.
"
1:Transmit
7. If the lists have been previously
defined, the receiving calculator asks
you if you want to:
1: Rename
2: Overwrite
3: Omit
4: Quit
Select Overwrite for each list.
2:Overwrite
The name and type of each data
item are displayed line by line on
the sending unit as the item is
transmitted, and then on the
receiving unit as each item is
accepted.
After both lists are transmitted,
the message, Done, is displayed
on both calculators.
Sending calculator
Receiving calculator
On Your Own
³ Enter a function in the Y= editor and send it to another calculator.
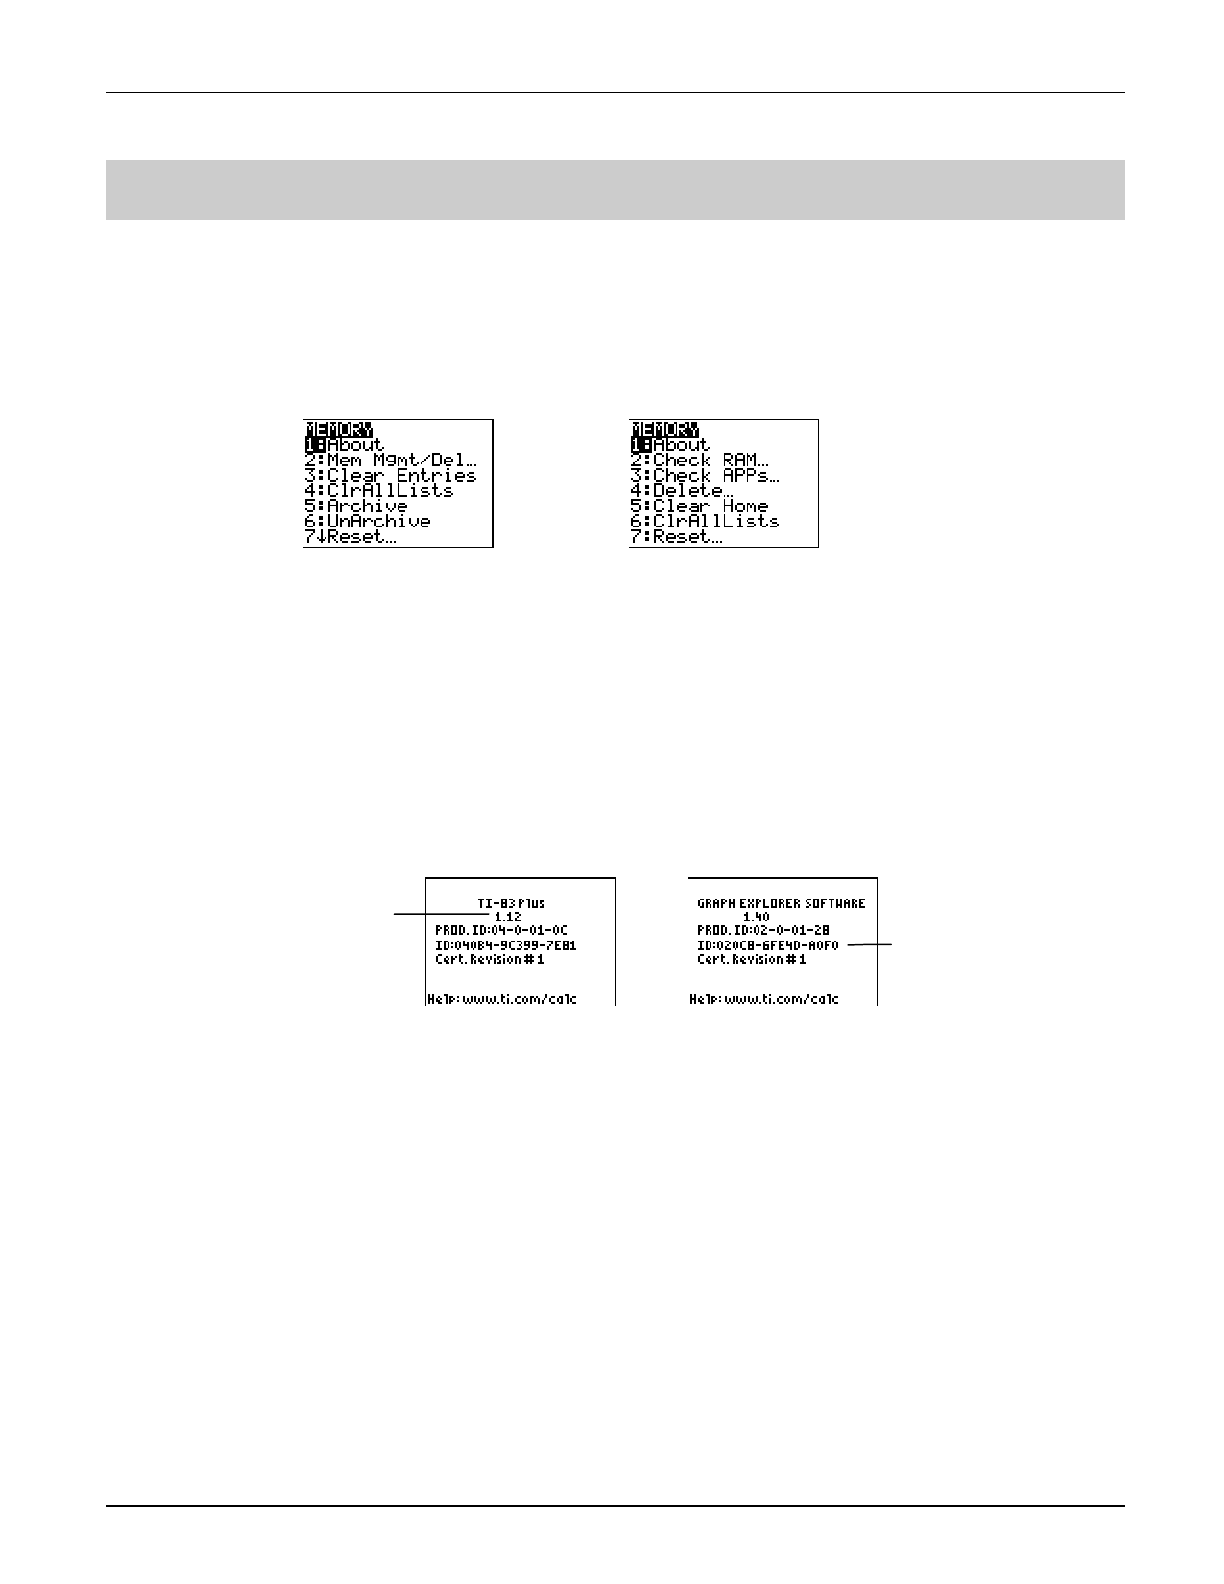
³ TIp 10: Managing Your Calculator’s Memory
Topics in Algebra 1 © 2001 Texas Instruments ³ TIp 10-1
³ TIpé 10: Managing Your Calculator’s Memory
You can check available memory, manage memory, and get information about your calculator by
selecting items from the - Ÿ MEMORY menu. For example, you can find your calculator ID
number, which is necessary for registering and installing some applications. A delete menu item
lets you delete any type of data (variables, lists, programs, applications, etc.) so that you can set
up your calculator with the information you need for your current classes. You can change the
data for future classes.
Calculator Keys Used in This ³ TIpé
y L
³ TIpé Highlights
The About screen displays:
• Your calculator operating system version number
• Your calculator ID number, which is used to register and install or reinstall an application
As new operating system versions become available, you can download them from the Texas
Instruments website. To obtain some applications from Texas Instruments, you must provide
your calculator ID number, which is unique to your calculator.
The Mem Mgmt/Del menu item lets you delete variables, lists, programs, applications, etc., so that
you can set up your calculator with the information you need for your current classes.
The Reset menu item lets you reset your calculator default settings. Resetting all RAM on your
calculator:
• Restores memory to the factory settings.
• Deletes all programs.
Note: Resetting RAM does NOT erase applications.
To find out more about resetting defaults, see ³ TIp 1: Resetting Your Calculator.
The operating system
version number The calculator ID number
TI-83 Plus TI-73
TI-83 Plus TI-73
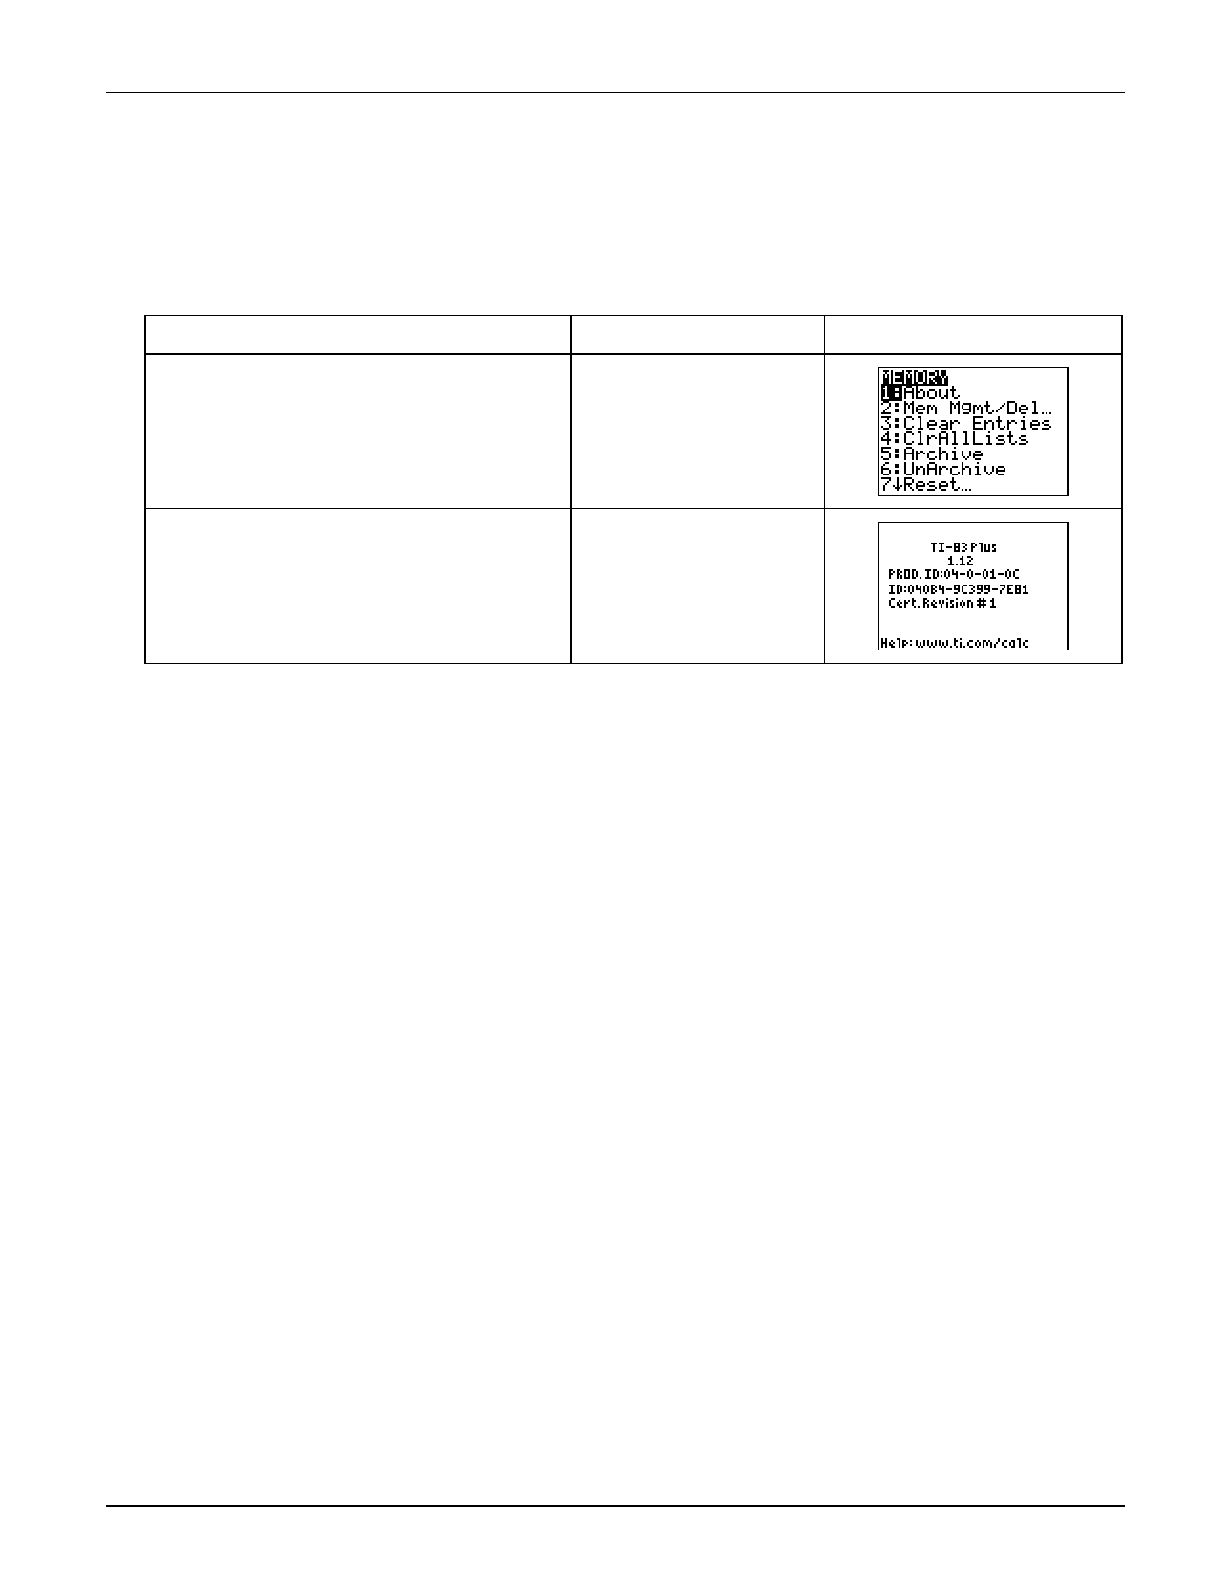
³ TIp 10: Managing Your Calculator’s Memory
Topics in Algebra 1 © 2001 Texas Instruments ³ TIp 10-2
³ Try-It!é on Your TI.83 Plus or TI.73
Displaying the About Screen
Display your calculator’s About screen and find the operating system version number and the ID
number.
To Do This Press Display (TI-83 Plus shown)
1. Select
About from the MEMORY
menu.
- Ÿ
1:About
2. Notice the operating system version
number under the name of the
calculator (1.12) and the ID number
composed of 14 numbers and letters.
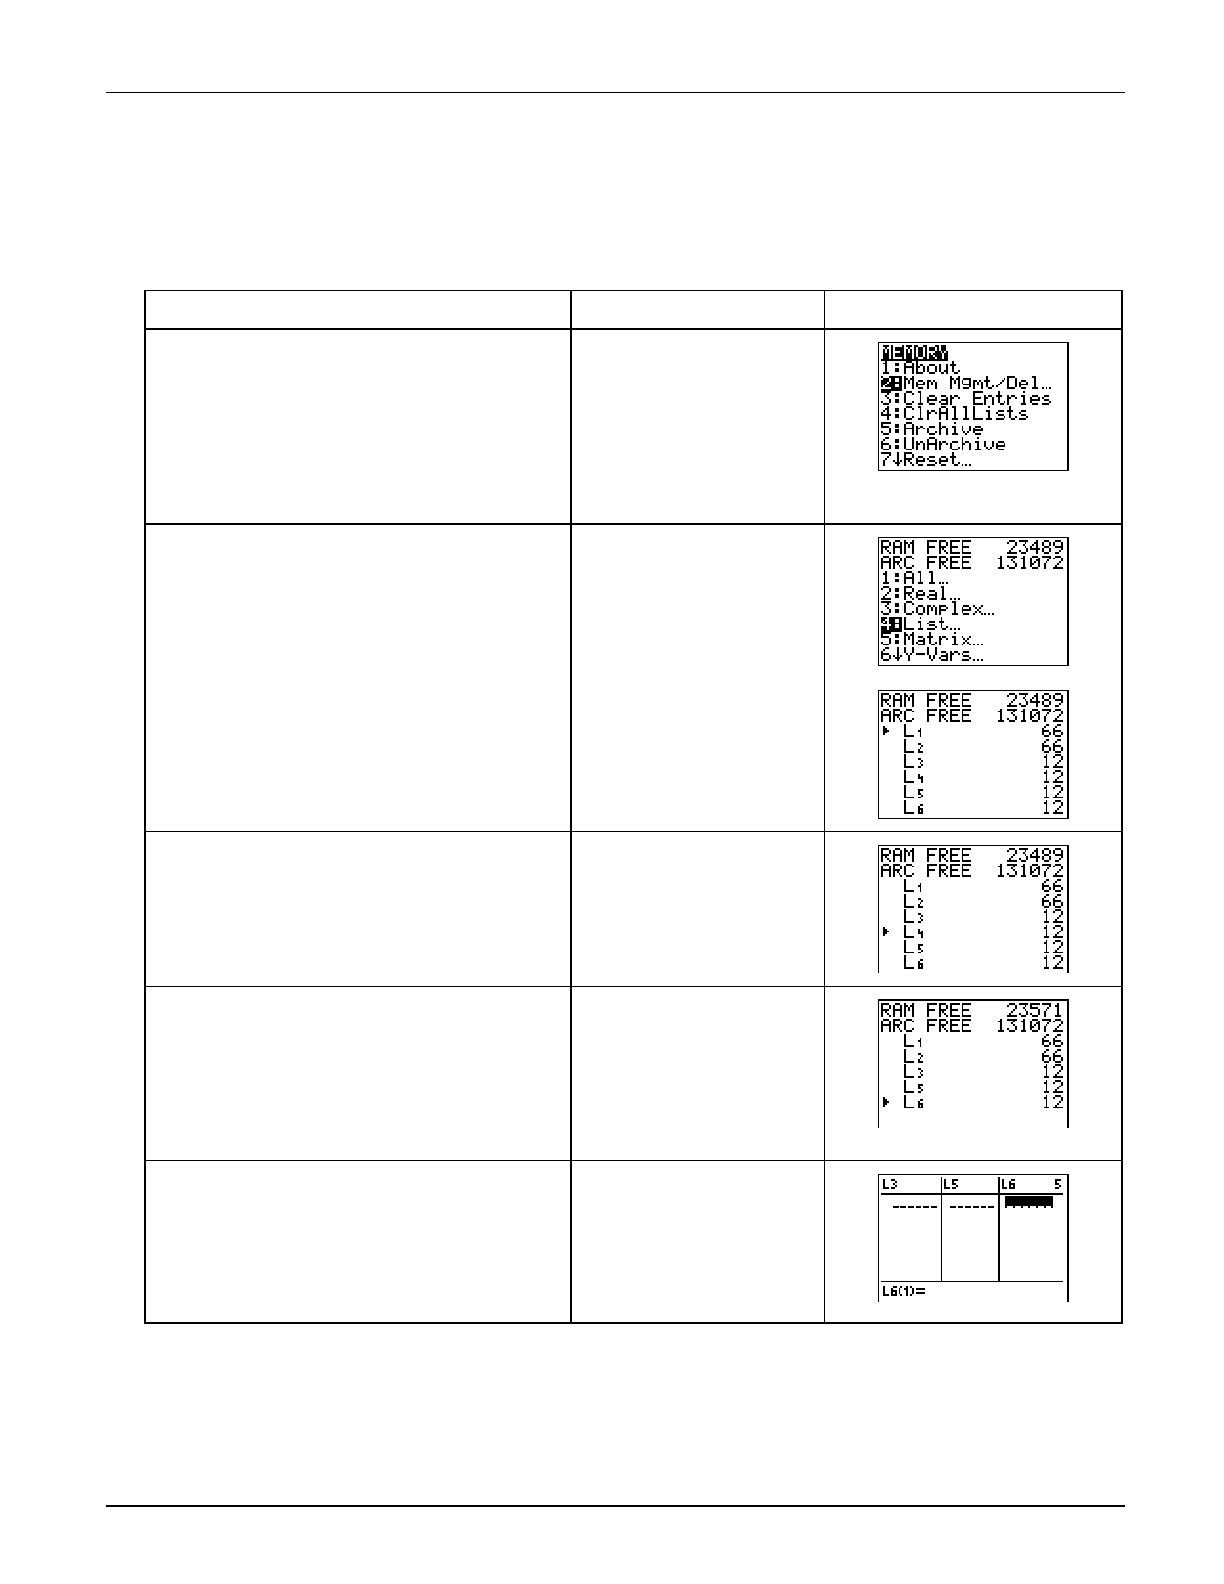
³ TIp 10: Managing Your Calculator’s Memory
Topics in Algebra 1 © 2001 Texas Instruments ³ TIp 10-3
³ Try-It!é on Your TI.83 Plus or TI.73 (continued)
Deleting Items
Delete L4 from your calculator’s memory.
To Do This Press Display (TI-83 Plus shown)
1. Display the
MEMORY menu and select
Mem Mgmt/Del.
Note: The TI-73 screen looks somewhat different.
TI-83 Plus:
- Ÿ
2:Mem Mgmt/Del
TI-73:
- Ÿ
4:Delete
2. Select the category, List.
All existing lists on your calculator
display on this screen and the number
of bytes of RAM that they use (L1=66
bytes, etc.).
TI-83 Plus:
4:List
TI-73:
3:List
3. Move the cursor so that it points to
L4.
# to L4
4. Delete
L4.
Note: Notice that no confirmation message
displayed when you deleted this item. Confirmation
messages only display when you delete an item
from Flash ROM (an application) or when you
delete an archived item. If an item has an asterisk
(…) next to it, it is archived (TI-83 Plus only).
TI-83 Plus:
/
TI-73:
b
5. L4 no longer displays in the list editor.
Use the arrow key (") to scroll
through the lists.
Tip: See ³ TIp 6:
Using Lists
for information on
how to use the SetUpEditor to put L4 back into the
list editor.
TI-83 Plus:
… 1:Edit "
TI-73:
3 "
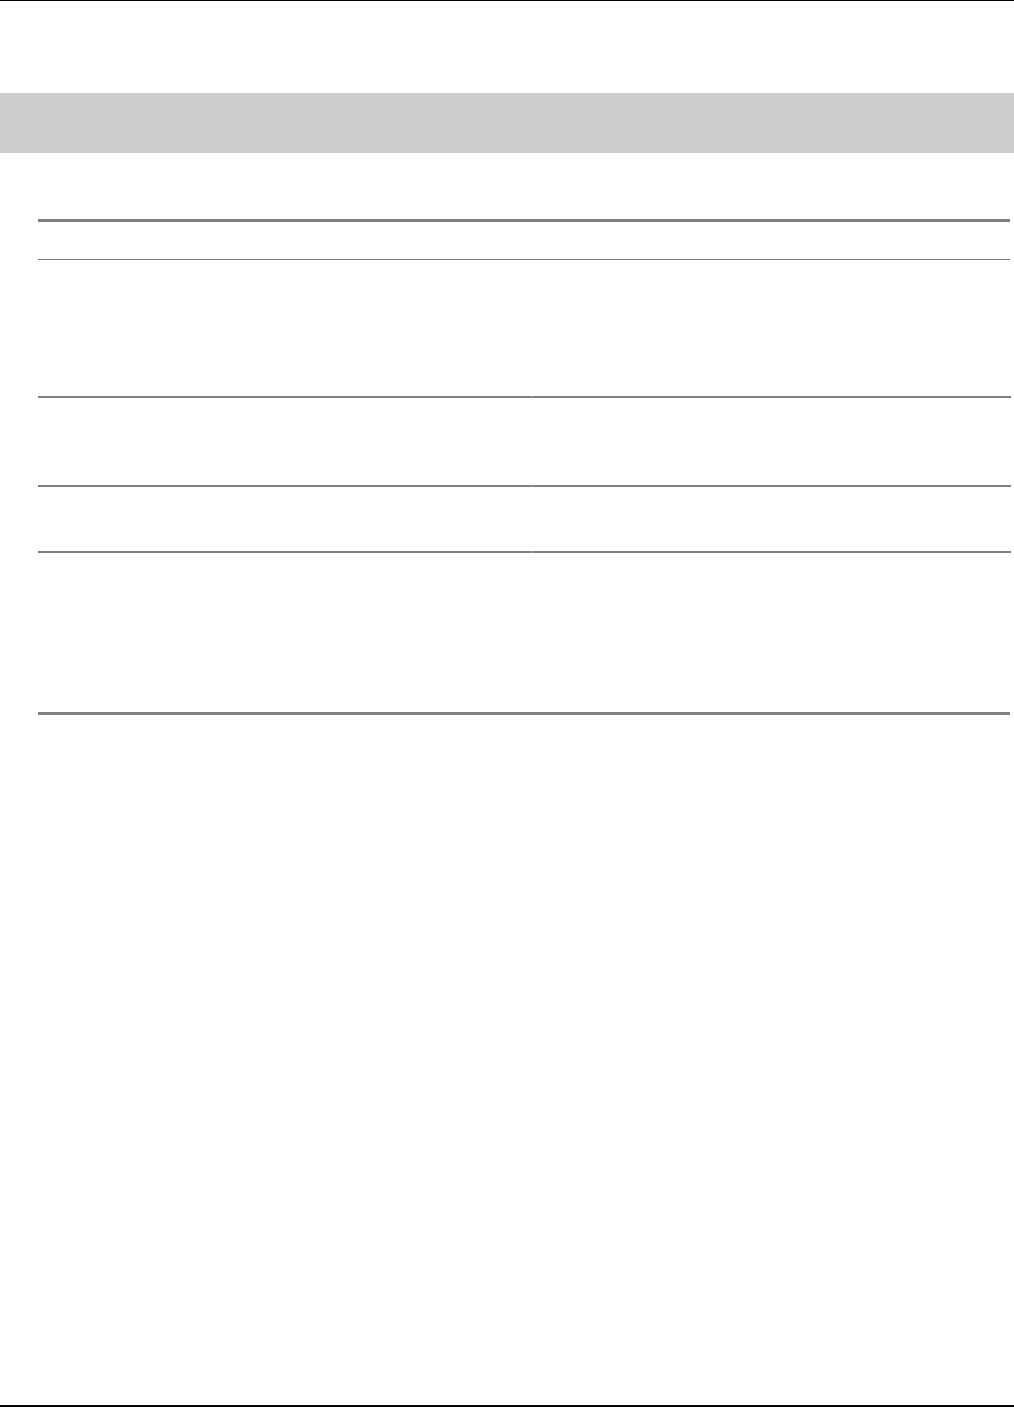
General Information Hardware and Software Requirements
Topics in Algebra 1 © 2002 Texas Instruments 1-1
Hardware and Software Requirements
Hardware and software Notes
TI-73 with version 1.60 or higher of the Graph
Explorer software
—or—
TI-83 Plus or TI-83 Plus Silver Edition with version
1.14 or higher of the operating system software
You can download a free copy of the latest Graph
Explorer or operating system software from
education.ti.com/softwareupdates. Follow the link
to Operating Systems.
Computer with Microsoft ® Windows® 95/98/2000,
Windows NT®, or Apple® Mac® OS 7.1 or higher
installed
TI-GRAPH LINK™ computer-to-device cable If you do not have this cable, call your distributor,
or order the cable from TI’s online store.
TI-GRAPH LINK software that is compatible with the
TI-73 or the TI-83 Plus
—or—
TI™ Connect software, which works with all
supported models of Flash-based TI graphing
devices.
You can download free copies of TI-GRAPH LINK
and TI Connect software from
education.ti.com/softwareupdates. Follow the link
to Connectivity Software.

General Information Deleting an Application
Topics in Algebra 1 © 2002 Texas Instruments 1-2
Deleting an Application
TI-73
1. Press y L to display the MEMORY menu.
2. Select Delete.
3. Select Apps.
4. Move the cursor to the application name.
5. Press Í. A confirmation message is displayed.
6. Select Yes to delete the application.
TI-83 Plus
1. Press y L to display the MEMORY menu.
2. Select Mem Mgmt/Del.
3. Select Apps.
4. Move the cursor to the application name.
5. Press {. A confirmation message is displayed.
6. Select Yes to delete the application.

General Information Installation Error Messages
Topics in Algebra 1 © 2002 Texas Instruments 1-3
Installation Error Messages
Low Battery
Do not attempt to download a Flash application if the low-battery message appears on the home
screen. Low battery indication is shown on the initial screen. If you receive this error during an
installation, change the batteries before trying again.
Invalid Signature or Certificate
Either this device does not have a certificate to run the application, or electrical interference
caused a link to fail. Try to install the application again.
Error in Xmit
This problem is usually associated with the unit-to-unit cable and its connection between the
devices. Make sure the cable is firmly inserted in the link port of each device.
Communication Error
This error indicates that the TI Connect™ software (“Unable to communicate with device”) or
TI-GRAPH LINK™ software (“Link Transmission Error”) is unable to communicate with the
device. The problem is usually associated with the TI-GRAPH LINK cable and its connection to
the device or to the computer.
•Make sure the cable is firmly inserted in the device link port and the computer.
•Verify that the correct cable type is selected in the software link settings.
•Verify that the correct communications port (Com Port) is selected in the software link
settings. (This does not apply if you use the USB port and TI Connect software.)
Archive Full
This error occurs when the TI-83 Plus does not have sufficient memory for the application. In
order to make room for another application, you must delete an application or archived
variables from the TI-83 Plus. Before you delete an application from the TI-83 Plus, you can save
it on your computer using TI Connect or TI-GRAPH LINK™ software for the TI-83 Plus. You can
reload it to the TI-83 Plus later using TI Connect or TI-GRAPH LINK software.
Memory Error
This error occurs when the TI-73 does not have sufficient memory for the application. In order
to make room for another application, you must delete an application from the TI-73. Before
you delete an application from the TI-73, you can save it on your computer using TI Connect
software or TI-GRAPH LINK software for the TI-73. You can reload it to the TI-73 later using
TI Connect or TI-GRAPH LINK software.
Other Errors
See Appendix B in the TI-73 guidebook or pages B-6 through B-10 in the TI-83 Plus guidebook
for information about the specific error.

General Information Checking Version Numbers and Free Space
Topics in Algebra 1 © 2002 Texas Instruments 1-4
Checking Version Numbers and Free Space
Verify Operating System Version and ID Number
The Topics in Algebra 1 application is compatible with TI-73 Graph Explorer software version
1.60 and higher or the TI-83 Plus operating system 1.14 and higher.
To verify your operating system version number:
1. From the home screen, press y L.
2. Select ABOUT.
The operating system version number is displayed below the product name and has the format
x.yy. The ID number appears on the line below the product number.
Verify Flash Application Version
The version number appears on the information screen below the application name. To display
the information screen, do one of the following:
•Press Œ, and then select MathHand.
—or—
•Select INFO from the application’s SELECT AN OPERATION menu.
Check Amount of Flash Application Free Space
TI-73
1. From the home screen, press y L.
2. Select Check Apps.
The Math by Hand application requires one free space to load the application.
For more information about memory and memory management, refer to the TI-73 guidebook.
TI-83 Plus
1. From the home screen, press y L.
2. Select Mem Mgmt/Del.
The Math by Hand application requires at least 16,384 bytes of ARC FREE (Flash), or one space,
to load the application.
For more information about memory and memory management, refer to the TI-83 Plus
guidebook.

General Information Support and Service Information
Topics in Algebra 1 © 2002 Texas Instruments 1-5
Texas Instruments (TI) Support and Service Information
For General Information
E-mail: ti-cares@ti.com
Phone: 1.800.TI.CARES (1.800.842.2737)
For US, Canada, Mexico, Puerto Rico, and Virgin Islands only
Home page: http://education.ti.com/
For Technical Questions
Phone: 1.972.917.8324
For Product (Hardware) Service
Customers in the US, Canada, Mexico, Puerto Rico, and Virgin Islands: Always contact
TI Customer Support before returning a product for service.
All other customers: Refer to the leaflet enclosed with your product (hardware) or contact
your local TI retailer/distributor.
04/13/00 [Item #]
I:\Legal Information\Support&Serv, Warranty, & Licenses\Licenses\Calcapps\Standard\Sold_doc\sold-cal-app-eng.doc
End-User License Agreement
Calculator Applications
IMPORTANT - Read this agreement (“Agreement”) carefully before installing the software program(s) and/or calculator application(s). The
software program(s) and/or calculator program(s) and any related documentation (collectively referred to as the Program) are licensed, not
sold, by Texas Instruments Incorporated (TI) and/or any applicable licensors (collectively referred to as Licensor). By installing or otherwise
using the Program, you agree to be bound by the terms of this license. If the Program was delivered to you on diskette(s) or CD and you do
not agree with the terms of this license, return this package with all its contents to the place of purchase for a full refund of any license fee
paid. If the Program was delivered to you over the Internet and you do not agree with the terms of this license, do not install or use the
Program and contact TI for instructions on obtaining a refund of any license fee paid.
Specific details of the license granted depend upon the license fee you paid and are set forth below. For purposes of this Agreement, a site (“Site”)
consists of one entire physical campus of an educational institution accredited by an association recognized by the U.S. Department of Education or the
State Board of Education, or by their equivalents in other countries. All additional terms of the Agreement apply regardless of the license granted.
SINGLE USER LICENSE
If you paid a license fee for a Single User License, Licensor grants to you a personal, non-exclusive, non-transferable license to install and use the
Program on a single computer and calculator. You may make one copy of the Program for backup and archival purposes. You agree to reproduce all
copyright and proprietary notices shown in the Program and on the media. Unless otherwise expressly stated in the documentation, you may not
duplicate such documentation.
EDUCATIONAL MULTIPLE USER LICENSE
If you paid a license fee for an Educational Multiple User License, Licensor grants you a non-exclusive, non-transferable license to install and use the
Program on the number of computers and calculators specified for the license fee you paid. You may make one copy of the Program for backup and
archival purposes. You agree to reproduce all copyright and proprietary notices shown in the Program and on the media. Except as expressly stated
herein or in the documentation, you may not duplicate such documentation. In cases where TI supplies the related documentation electronically, you
may print the same number of copies of the documentation as the number of computers/calculators specified for the license fee you paid. All the
computers and calculators on which the Program is used must be located at a single Site. Each member of the institution faculty may also use a copy of
the Program on an additional computer/calculator for the sole purpose of preparing course materials.
EDUCATIONAL SITE LICENSE
If you paid a license fee for an Educational Site License, Licensor grants you a non-exclusive, non-transferable license to install and use the Program on
all institution, teacher, or student owned, leased or rented computers and calculators located or used at the Site for which the Program is licensed.
Teachers and students have the additional right to use the Program while away from the Site. You may make one copy of the Program for backup and
archival purposes. You agree to reproduce all copyright and proprietary notices shown in the Program and on the media. Except as expressly stated
herein or in the documentation, you may not duplicate such documentation. In cases where TI supplies the related documentation electronically, you
may print one copy of such documentation for each computer or calculator on which the Program is installed. Each member of the institution faculty
may also use a copy of the Program on an additional computer/calculator for the sole purpose of preparing course materials. Students must be
instructed to remove the Program from student-owned computers and calculators upon the end of their enrollment in the institution.
Additional Terms:
WARRANTY DISCLAIMER AND DAMAGES EXCLUSIONS AND LIMITATIONS
Licensor does not warrant that the Program will be free from errors or will meet your specific requirements. Any statements made concerning the utility
of the Program are not to be construed as express or implied warranties.
LICENSOR MAKES NO CONDITIONS OR WARRANTIES, EITHER EXPRESS OR IMPLIED, INCLUDING BUT NOT LIMITED TO ANY IMPLIED
CONDITIONS OR WARRANTIES OF MERCHANTABILITY, FITNESS FOR A PARTICULAR PURPOSE, OR NON-INFRINGEMENT REGARDING
THE PROGRAM AND MAKES THE PROGRAM AVAILABLE ON AN "AS IS" BASIS.
Although no warranty is given for the Program, the media, if the Program was delivered to you on diskette(s) or CD, will be replaced if found to be
defective during the first ninety (90) days of use, when the package is returned postage prepaid to TI. THIS PARAGRAPH EXPRESSES LICENSOR'S
MAXIMUM LIABILITY AND YOUR SOLE AND EXCLUSIVE REMEDY FOR DEFECTIVE MEDIA.
LICENSOR SHALL NOT BE RESPONSIBLE FOR ANY DAMAGES CAUSED BY THE USE OF THE PROGRAM, OR SUFFERED OR INCURRED
BY YOU OR ANY OTHER PARTY INCLUDING BUT NOT LIMITED TO SPECIAL, INDIRECT, INCIDENTAL OR CONSEQUENTIAL DAMAGES,
EVEN IF LICENSOR HAS BEEN ADVISED OF THE POSSIBILITY OF SUCH DAMAGES. IN JURISDICTIONS WHICH ALLOW TEXAS
INSTRUMENTS TO LIMIT ITS LIABILITY, TI’S LIABILITY IS LIMITED TO THE APPLICABLE LICENSE FEE PAID BY YOU.
Because some states or jurisdictions do not allow the exclusion or limitation of incidental or consequential damages or limitation on how long an implied
warranty lasts, the above limitations or exclusions may not apply to you.
GENERAL
This Agreement will immediately terminate if you fail to comply with its terms. Upon termination of this Agreement, you agree to return or destroy the
original package and all whole or partial copies of the Program in your possession and so certify in writing to TI.
The export and re-export of United States original software and documentation is subject to the Export Administration Act of 1969 as amended.
Compliance with such regulations is your responsibility. You agree that you do not intend to nor will you, directly or indirectly, export, re-export or
transmit the Program or technical data to any country to which such export, re-export or transmission is restricted by any applicable United States
regulation or statute, without the proper written consent or license, if required of the Bureau of Export Administration of the United States Department of
Commerce, or such other governmental entity as may have jurisdiction over such export, re-export or transmission.
If the Program is provided to the U.S. Government pursuant to a solicitation issued on or after December 1, 1995, the Program is provided with the
commercial license rights and restrictions described elsewhere herein. If the Program is provided to the U.S. Government pursuant to a solicitation
issued prior to December 1, 1995, the Program is provided with "Restricted Rights" as provided for in FAR, 48 CFR 52.227-14 (JUNE 1987) or DFAR,
48 CFR 252.227-7013 (OCT 1988), as applicable.
Manufacturer is Texas Instruments Incorporated, 7800 Banner Drive, M/S 3962, Dallas, Texas 75251.
