JBL GetStart Getting Started With TI Inter Active! Version 1.1 (English) Getstart1 1
User Manual: JBL Getting Started with TI InterActive! version 1.1 (English) Getting Started with TI InterActive!™
Open the PDF directly: View PDF ![]() .
.
Page Count: 63
- Getting Started
- Important
- Table of Contents
- Introduction
- Installing TI InterActive!
- Exercise 1: Performing Calculations in a Document
- Exercise 2: Storing Values as Variables
- Storing a value in a variable
- Checking a variable’s value
- Using a variable in a calculation
- Updating a variable
- Types of variables
- Entering multiple statements in a Math Box
- Effects of repositioning or deleting math objects
- Resetting all variables by inserting a math section break
- Rules for naming variables
- Reusing the last answer
- Reusing the last entry
- Exercise 3: Creating a Function-Graphing Assignment
- Exercise 4: Creating a Report
- Exercise 5: Analyzing Data from a Web Site
- Exercise 6: Reviewing Miscellaneous Functions
- Essential Skills for Using TI InterActive!
- Where Do I Go from Here?
- Texas Instruments (TI) Support and Service Information
- Texas Instruments (TI) End-User License Agreement
- Index

TII_GettingStarted.doc Getting Started with TI InterActive! Karen Davis Revised: 8/22/03 12:20 PM Printed: 8/25/03 8:04 AM Page 1 of 64
Getting Started
with
TI InterActive!é
Microsoft, Windows, Windows NT, Abode, Acrobat, and Reader are trademarks of their
respective owners.
TI InterActive! contains Formula One from Visual Components. Copyright 1994-1997. All
rights reserved.
Exercise 5 data provided by Michael J. Shepston & Associates, www.scottsdalelaw.com
Copyright © 2000, 2001, 2003 Texas Instruments Incorporated.

TII_GettingStarted.doc Getting Started with TI InterActive! Karen Davis Revised: 8/22/03 12:20 PM Printed: 8/25/03 8:04 AM Page 2 of 64
Texas Instruments makes no warranty, either express or implied,
including but not limited to any implied warranties of
merchantability and fitness for a particular purpose, regarding
any programs or book materials and makes such materials
available solely on an “as-is” basis.
In no event shall Texas Instruments be liable to anyone for
special, collateral, incidental, or consequential damages in
connection with or arising out of the purchase or use of these
materials, and the sole and exclusive liability of Texas
Instruments, regardless of the form of action, shall not exceed
the purchase price of this product. Moreover, Texas Instruments
shall not be liable for any claim of any kind whatsoever against
the use of these materials by any other party.
Important

Getting Started with TI InterActive! 3
TII_GettingStarted.doc Getting Started with TI InterActive! Karen Davis Revised: 8/22/03 12:20 PM Printed: 8/25/03 8:04 AM Page 3 of 64
Introduction........................................................................................... 4
Installing TI InterActive!...................................................................... 5
Exercise 1: Performing Calculations in a Document.....................10
Exercise 2: Storing Values as Variables........................................... 18
Exercise 3: Creating a Function-Graphing Assignment ................ 27
Exercise 4: Creating a Report ...........................................................33
Exercise 5: Analyzing Data from a Web Site...................................40
Exercise 6: Reviewing Miscellaneous Functions ........................... 46
Essential Skills for Using TI InterActive! ........................................ 50
Where Do I Go from Here?................................................................58
Texas Instruments (TI) Support and Service Information ........... 59
Texas Instruments (TI) End-User License Agreement.................. 60
Index.....................................................................................................62
Table of Contents
Use the hands-on exercises in this book to familiarize yourself
with the basic features of the TI InterActive! software.
4 Getting Started with TI InterActive!
TII_GettingStarted.doc Getting Started with TI InterActive! Karen Davis Revised: 8/22/03 12:20 PM Printed: 8/25/03 8:04 AM Page 4 of 64
The interactive math objects in a TI InterActive! document set it
apart from the documents that you create with other Windows®
applications. Your documents can use data from the Internet,
TI data-collection tools, and supported TI graphing handhelds—
TI-83, TI-83 Plus, TI-83 Plus Silver Edition, TI-89, TI-92, TI-92
Plus, Voyage™ 200.
Teachers can create:
¦ Compelling classroom activities — You can create
activities that encourage learning by discovery.
¦ Captivating lessons — You can design attractive lessons
that cover necessary information while allowing exploration.
¦ Homework that encourages learning — You can build printed,
conventional assignments or “live” assignments in the form of
TI InterActive! files that students can complete and return.
Students can create:
¦ Informative reports — You or your teacher can create
preformatted labs and other types of reports.
¦ Attractive, clear homework papers — You can create
homework that shows the flow of your work with your results.
Introduction
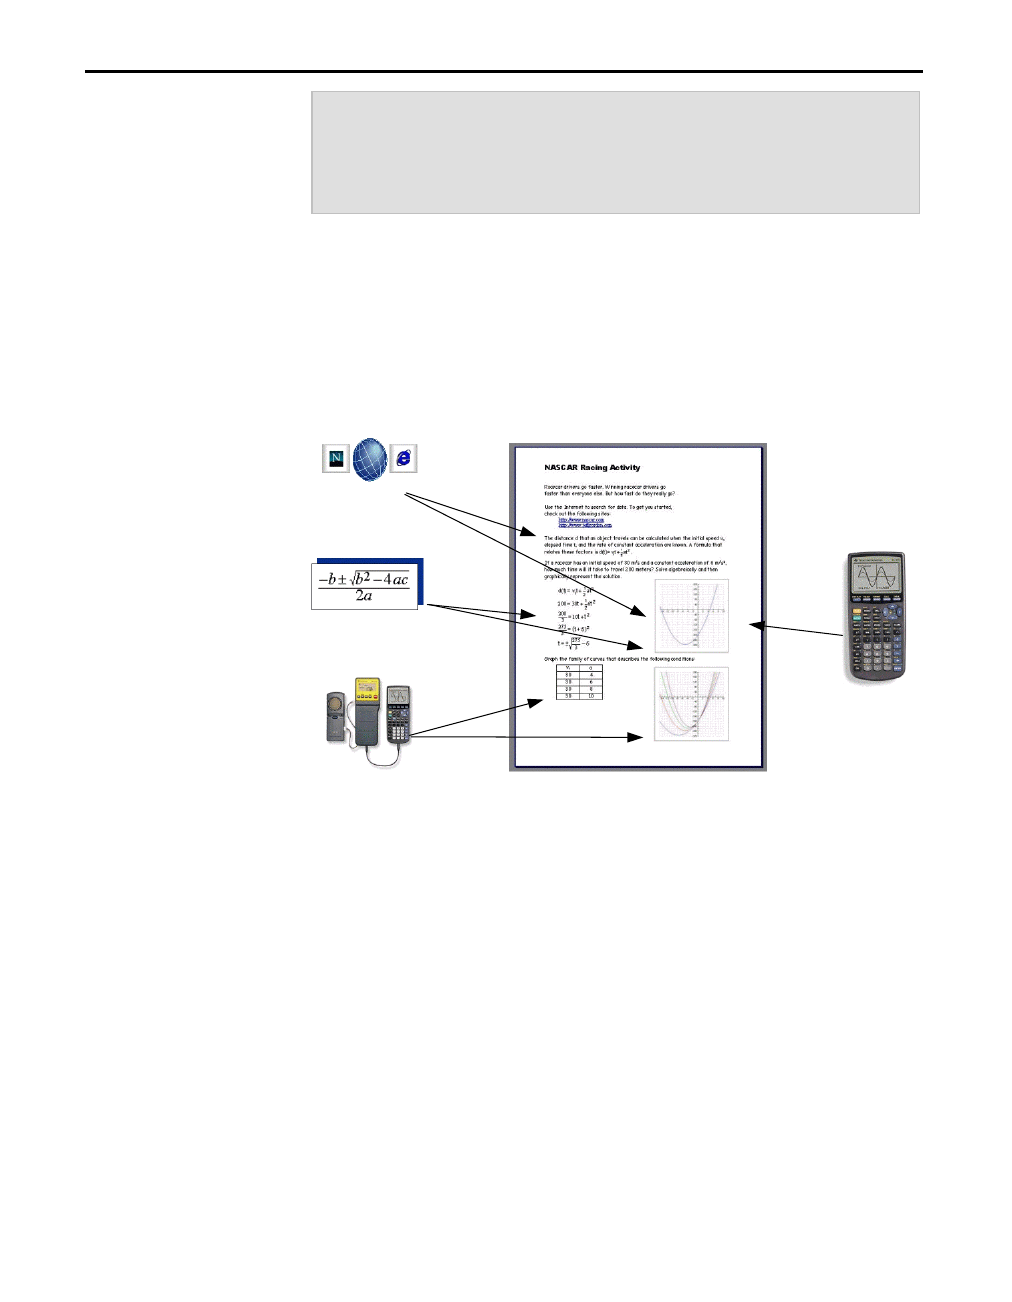
TI InterActive! is a document-creation program with the math
features of a powerful TI graphing handheld. It lets you build
documents that contain not only text and pictures but also
dynamically connected graphing and calculation objects.
What makes a
TI InterActive!
document
different?
What can I
do with
TI InterActive!?
Internet data
Math calculations
Data-collection devices
Graphing
Handheld

Getting Started with TI InterActive! 5
TII_GettingStarted.doc Getting Started with TI InterActive! Karen Davis Revised: 8/22/03 12:20 PM Printed: 8/25/03 8:04 AM Page 5 of 64
The PC that you use to run TI InterActive! must have:
• Microsoft® Windows® 98, Windows 2000, Windows ME,
Windows NT®, or Windows XP.
• Microsoft Internet Explorer 5.5 or later.
• Available RAM: 16 MB for Windows 98 (20 MB RAM
recommended), 32 MB for Windows ME or Windows NT, 64
MB for Windows 2000, or 128 MB for Windows XP.
• A hard disk with available storage space: 19 MB for
TI InterActive! and 45–111 MB for Internet Explorer
(depending on installation type).
• A CD-ROM drive (if installing from a CD).
• A video monitor with VGA or better resolution.
• A mouse or mouse-compatible pointing device.
To use the Internet features of TI InterActive!, your PC must have
a working Internet connection.
To read the electronic documentation, Acrobat Reader 3.02 or
later is also required (16 MB disk space required).
To transfer programs and data between TI InterActive! and a
supported graphing handheld, or to collect samples from a
Calculator-Based Laboratory™ (CBL™), or Calculator-Based
Laboratory 2™ (CBL 2™), or Calculator-Based Ranger™ (CBR™),
your PC must have:
• TI Connect™ 1.3.0.1 (11 MB disk space required).
• An available USB port or a serial communication port
configured as Com 1, 2, 3, or 4. You also need the appropriate
TI Connectivity Cable — USB for Mac/Windows, Serial for
Windows (black), or Serial for Mac/Windows (gray).
Installing TI InterActive!
TI InterActive! can be installed from a TI InterActive! CD-ROM
or from a file downloaded from the Web. Check the system
requirements below, and follow the steps for the installation
method that applies to you.
System
requirements

6 Getting Started with TI InterActive!
TII_GettingStarted.doc Getting Started with TI InterActive! Karen Davis Revised: 8/22/03 12:20 PM Printed: 8/25/03 8:04 AM Page 6 of 64
For more information regarding TI products and support:
• Visit the TI Education home page: education.ti.com
• Or search the TI-Cares™ KnowledgeBase and submit e-mail
inquiries: education.ti.com/support
• Or call toll-free: (800) TI-CARES (800) 842-2737
To install TI InterActive! on your computer:
1. Close all open programs. Open programs can slow the
installation process.
2. Insert the TI InterActive! CD in your CD-ROM drive.
3. If the installer does not start automatically, click the
Windows Start button, and then click Run. Type
D:\setup.exe, and then press Enter on the computer
keyboard. (Substitute the letter of your CD-ROM drive if it is
not D.)
4. Follow the installation instructions that are displayed. When
the installer has completed, it returns you to the Windows
desktop. You might need to reboot the computer before using
TI InterActive!.
After completing the installation, it’s a good idea to start
TI InterActive! and test the connections that you plan to use.
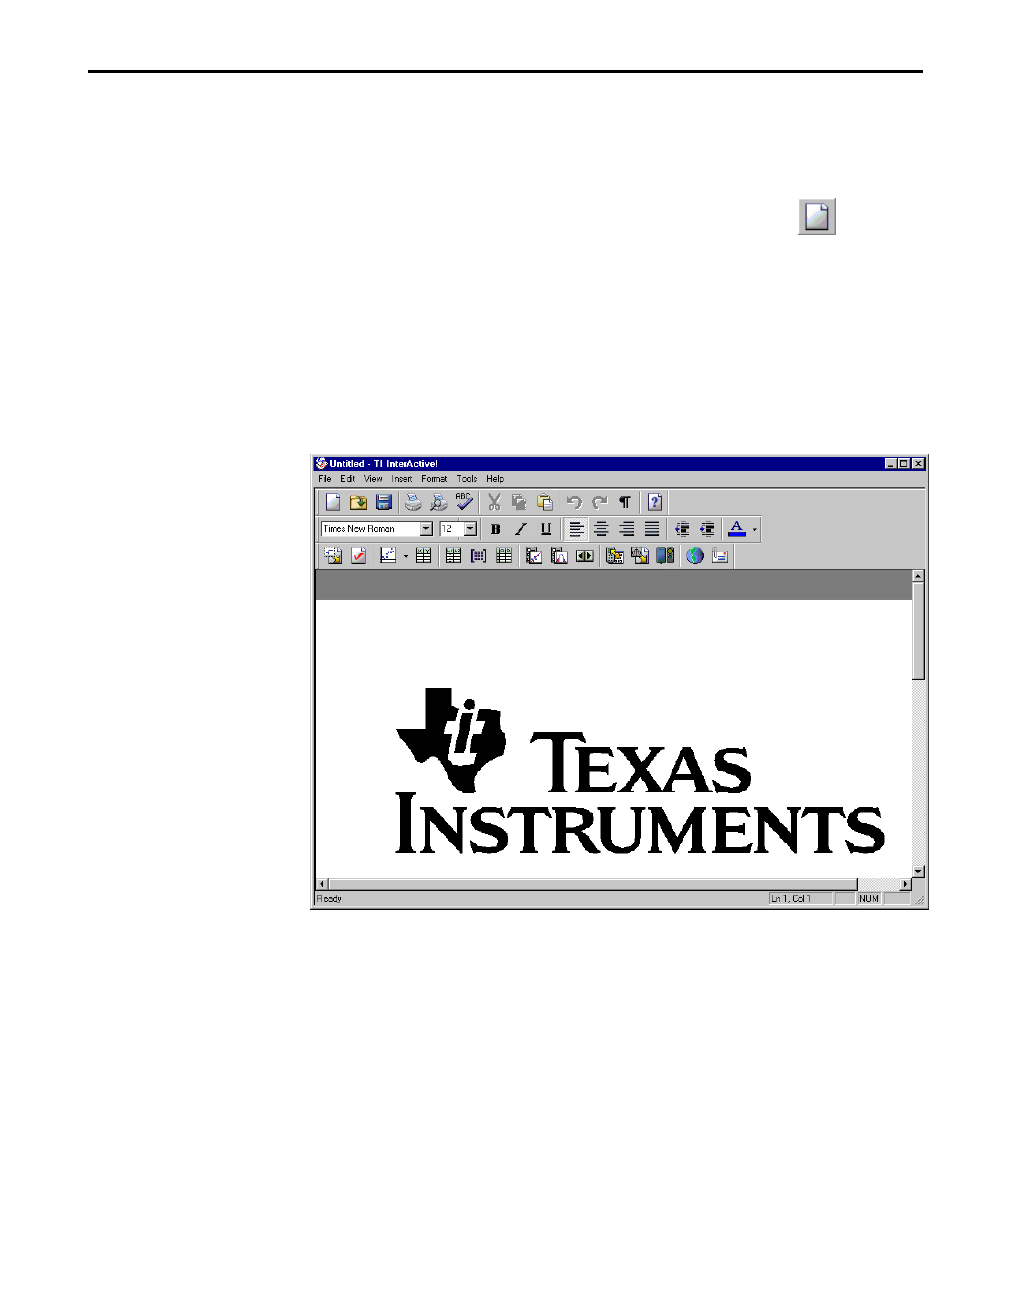
¦ There will be a new icon on your desktop. Double-click it.
Depending on your machine and its configuration, it may take
a few seconds for the application to open. TI InterActive! starts
with the cursor at the top of a blank document.
— or —
¦ Click the Windows Start button, point to Programs,
TI InterActive!, and then click TI InterActive!.
Installing the
software on your
computer
TIP: If you currently
have Display set for
Large Fonts, change to
Small Fonts before
rebooting.
Starting
TI InterActive!
Getting Started with TI InterActive! 7
TII_GettingStarted.doc Getting Started with TI InterActive! Karen Davis Revised: 8/22/03 12:20 PM Printed: 8/25/03 8:04 AM Page 7 of 64
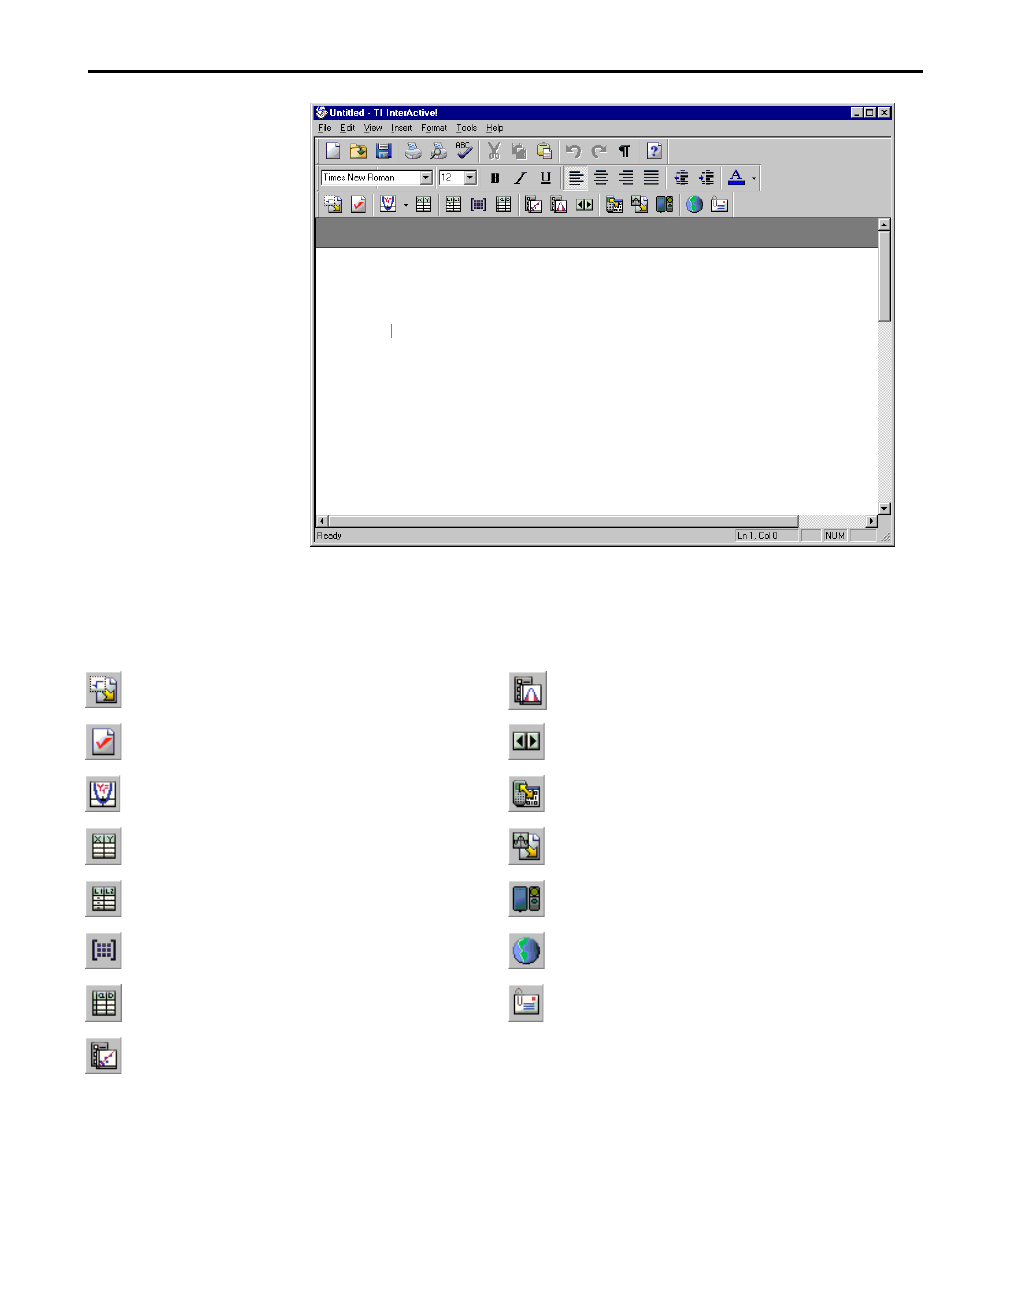
The buttons on the TI InterActive! toolbar give you quick access
to the program’s main features.
Performs calculations and defines
variables and functions.
Performs statistical tests and
intervals.
Specifies the mode settings for each
object.
Inserts a slider that lets you change
variable values.
Graphs functions and plots statistical
data.
Transfers data to/from a connected
TI device.
Generates a table of values for
defined functions.
Captures the screen of a connected
TI device.
Enters and/or edits lists of data.
Collects data from a CBL™,
CBL 2™, or CBR™.
Enters and/or edits matrices.
Browses the Web and extracts data
directly from Web pages.
Performs typical spreadsheet
operations.
Sends e-mail attachments of your
current document.
Performs statistics regression
calculations on lists of data.
TIP: You can open a
saved TI InterActive!
document from the
Windows Explorer by
double-clicking the
document.
TI InterActive!
toolbar

8 Getting Started with TI InterActive!
TII_GettingStarted.doc Getting Started with TI InterActive! Karen Davis Revised: 8/22/03 12:20 PM Printed: 8/25/03 8:04 AM Page 8 of 64
If you want to use the Internet features of TI InterActive!, your
PC must have a working Internet connection. Perform this test to
confirm that your connection is working.
1. On the toolbar, click the Web Browser button . The
built-in Web browser opens and displays the TI InterActive!
home page.
2. Click the browser’s Close button . The Internet test is
complete.
If you have problems completing this test, verify that you are
connected to an Internet Service Provider. If you are on a local
area network (LAN), check to ensure that you can access other
areas of your network or server. If you are using a dial-up
connection, check to ensure that your modem is working
properly.
Many Web sites contain a button or block of text that you can
click to send an e-mail message to support personnel. Perform
this test to make sure your e-mail program is registered as your
e-mail client.
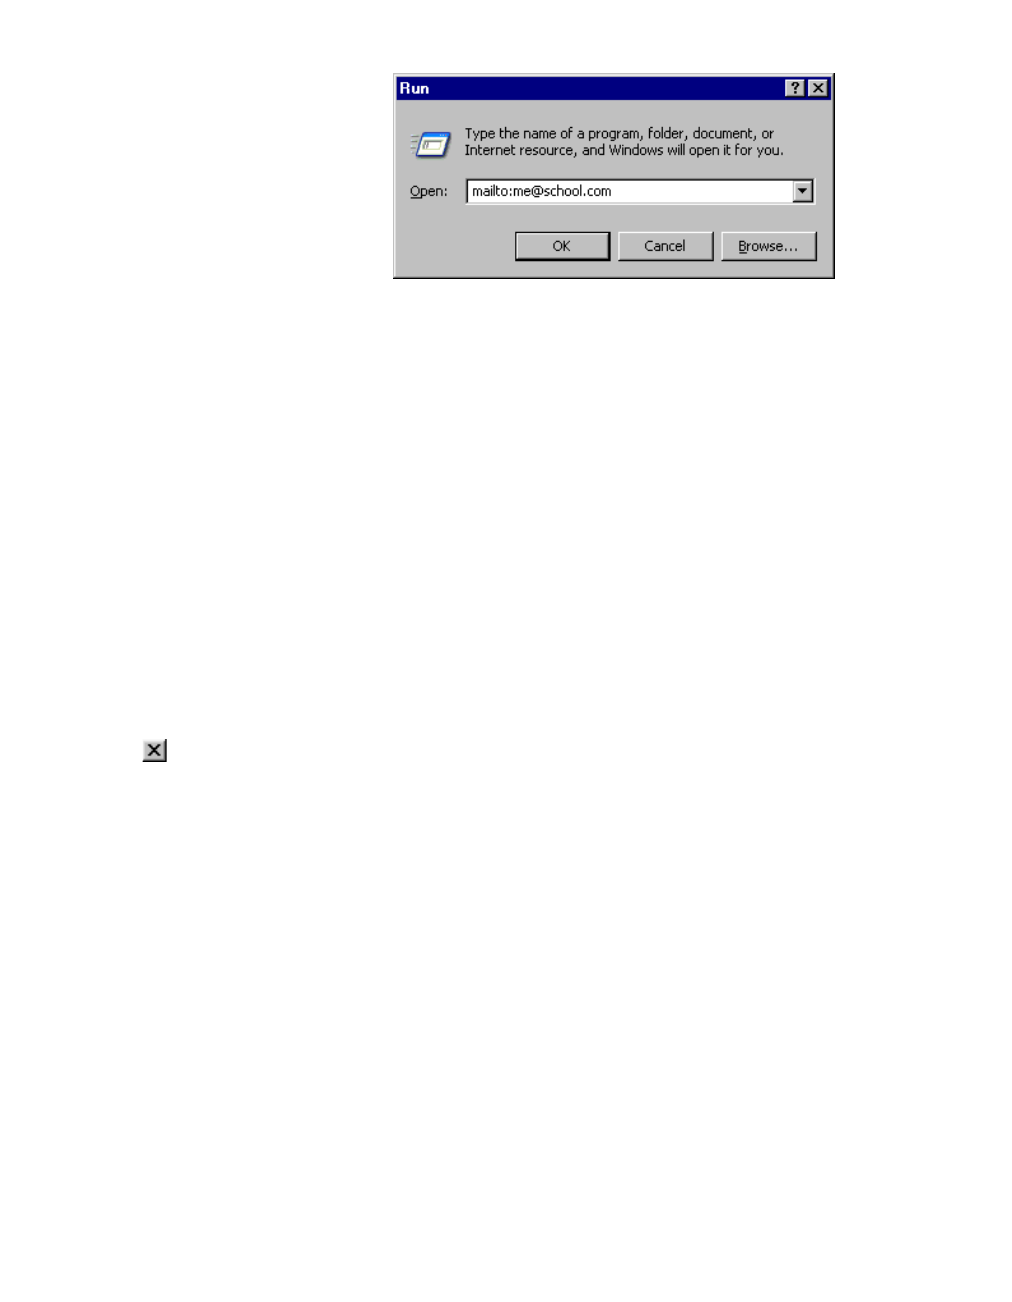
1. Click the Windows Start button, and then click Run.
2. In the text box, type mailto: followed by your own e-mail
address.
Testing your
Internet
connection
What to do if
the test fails
Testing your
e-mail
connection
Getting Started with TI InterActive! 9
TII_GettingStarted.doc Getting Started with TI InterActive! Karen Davis Revised: 8/22/03 12:20 PM Printed: 8/25/03 8:04 AM Page 9 of 64
3. Click OK. Your e-mail software should start up and open a
blank message with your address shown as the recipient.
4. Type some text in the body of the message, and send it. When
you receive the message, the e-mail test is complete.
If you have problems completing this test, verify that you have an
e-mail client installed. If you do not, contact your Internet Service
Provider for assistance.
From the menu, click File 8 Exit. When you exit TI InterActive!,
you are prompted to save any unsaved changes that you have
made. Click the No button if you do not want to save the changes.
What to do if
the test fails
Exiting
TI InterActive!
TIP: You can also exit
by pressing Alt+F4 or
clicking the Close
button .
10 Getting Started with TI InterActive!
TII_GettingStarted.doc Getting Started with TI InterActive! Karen Davis Revised: 8/22/03 12:20 PM Printed: 8/25/03 8:04 AM Page 10 of 64
This exercise shows you how to:
¦ Enter and format ordinary text.
¦ Access and use the Math Palette.
¦ Use a Math Box object to perform simple calculations in a
document.
¦ Enter math and other special functions symbols.
¦ Save a TI InterActive! document.
Exercise 1: Performing Calculations in a Document
You perform many calculations in TI InterActive! documents by
inserting a Math Box object. Data that you store and functions
that you define in a Math Box can be used by subsequent
objects, such as graphs, tables, and other Math Boxes.

Getting Started with TI InterActive! 11
TII_GettingStarted.doc Getting Started with TI InterActive! Karen Davis Revised: 8/22/03 12:20 PM Printed: 8/25/03 8:04 AM Page 11 of 64
Entering text in a TI InterActive! document is similar to entering
text in most text editors and word processors. For this exercise,
you enter a page title and then change the font and point size.
1. Type Homework on the first line of your document.
2. Highlight the typed text and select a different font type and
size from the font dialog box (Format 8 Font).
3. Place the cursor at the end of the line and press the Enter key
on the computer keyboard to start a new line.
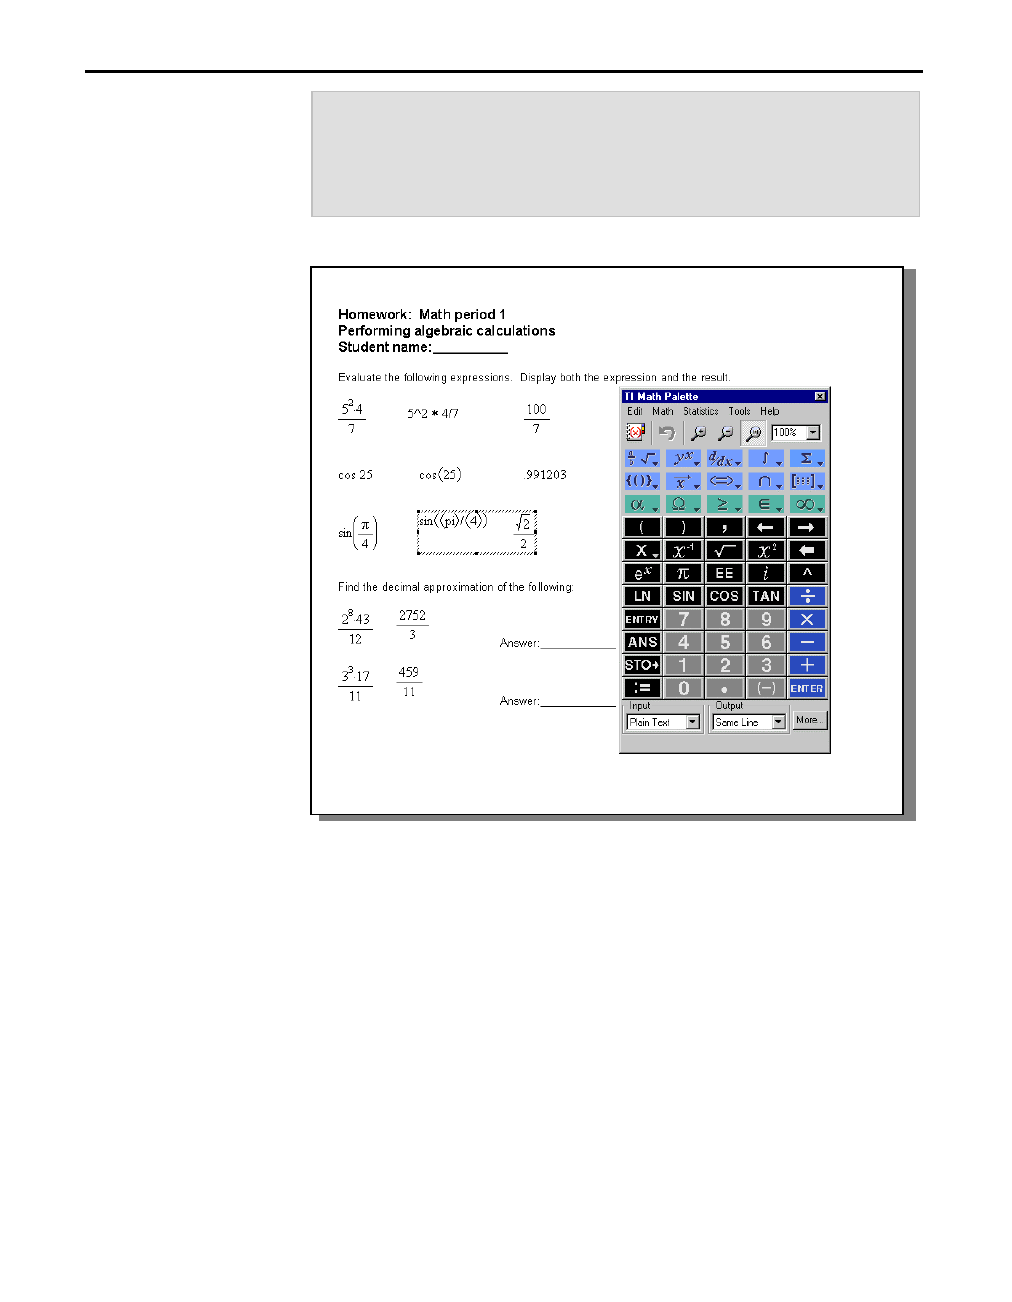
Suppose you want to evaluate an expression such as 28 • 43
12 and
display both the expression and its result within the document.
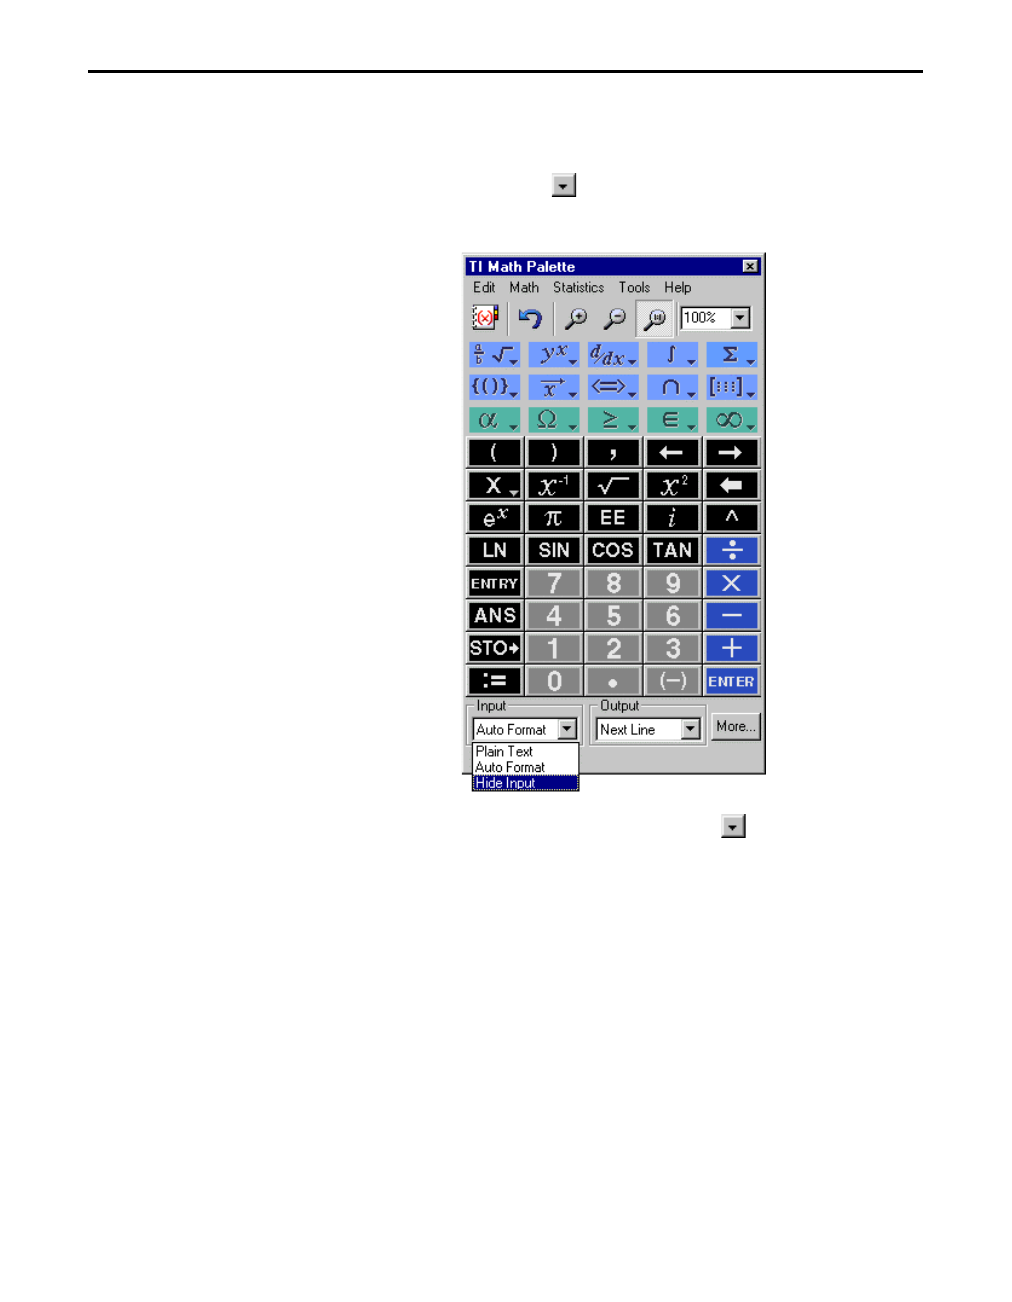
1. Click the Math Box button on the TI InterActive! toolbar.
An empty Math Box is inserted, accompanied by the TI Math
Palette.
Entering and
formatting text
Evaluating a
math expression
The Math Box looks like
this while you are editing.
Math Palette
12 Getting Started with TI InterActive!
TII_GettingStarted.doc Getting Started with TI InterActive! Karen Davis Revised: 8/22/03 12:20 PM Printed: 8/25/03 8:04 AM Page 12 of 64
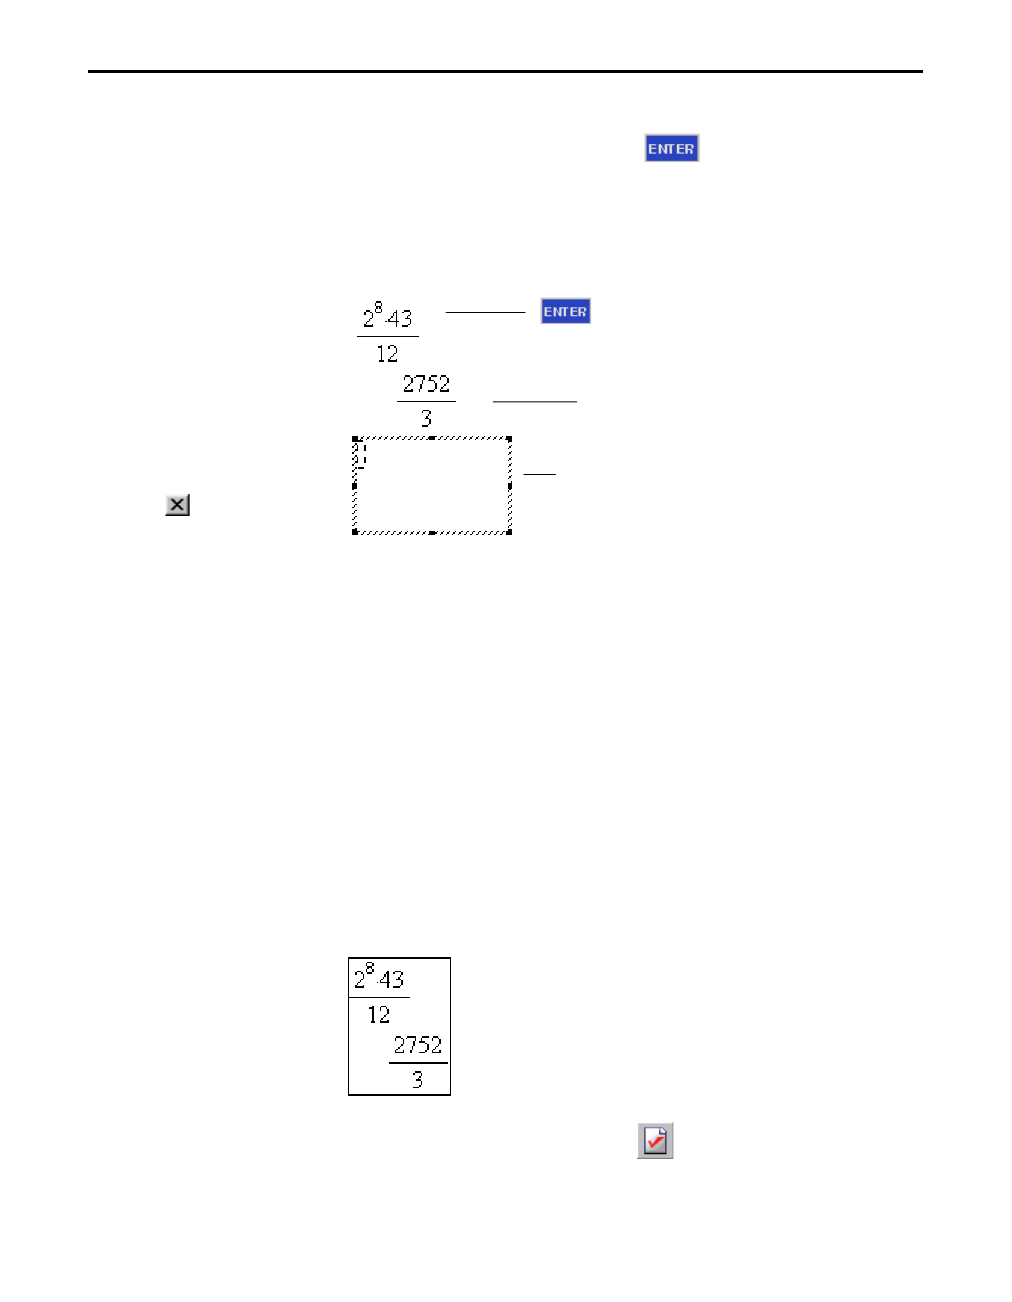
2. Type 2^8*43à12 into the Math Box. Press the Enter key on
the computer keyboard or click on the Math Palette to
evaluate the expression. TI InterActive! evaluates the
expression, displays the result, and creates another Math
Box.
3. Press the Esc key on the computer keyboard to close the
unused Math Box.
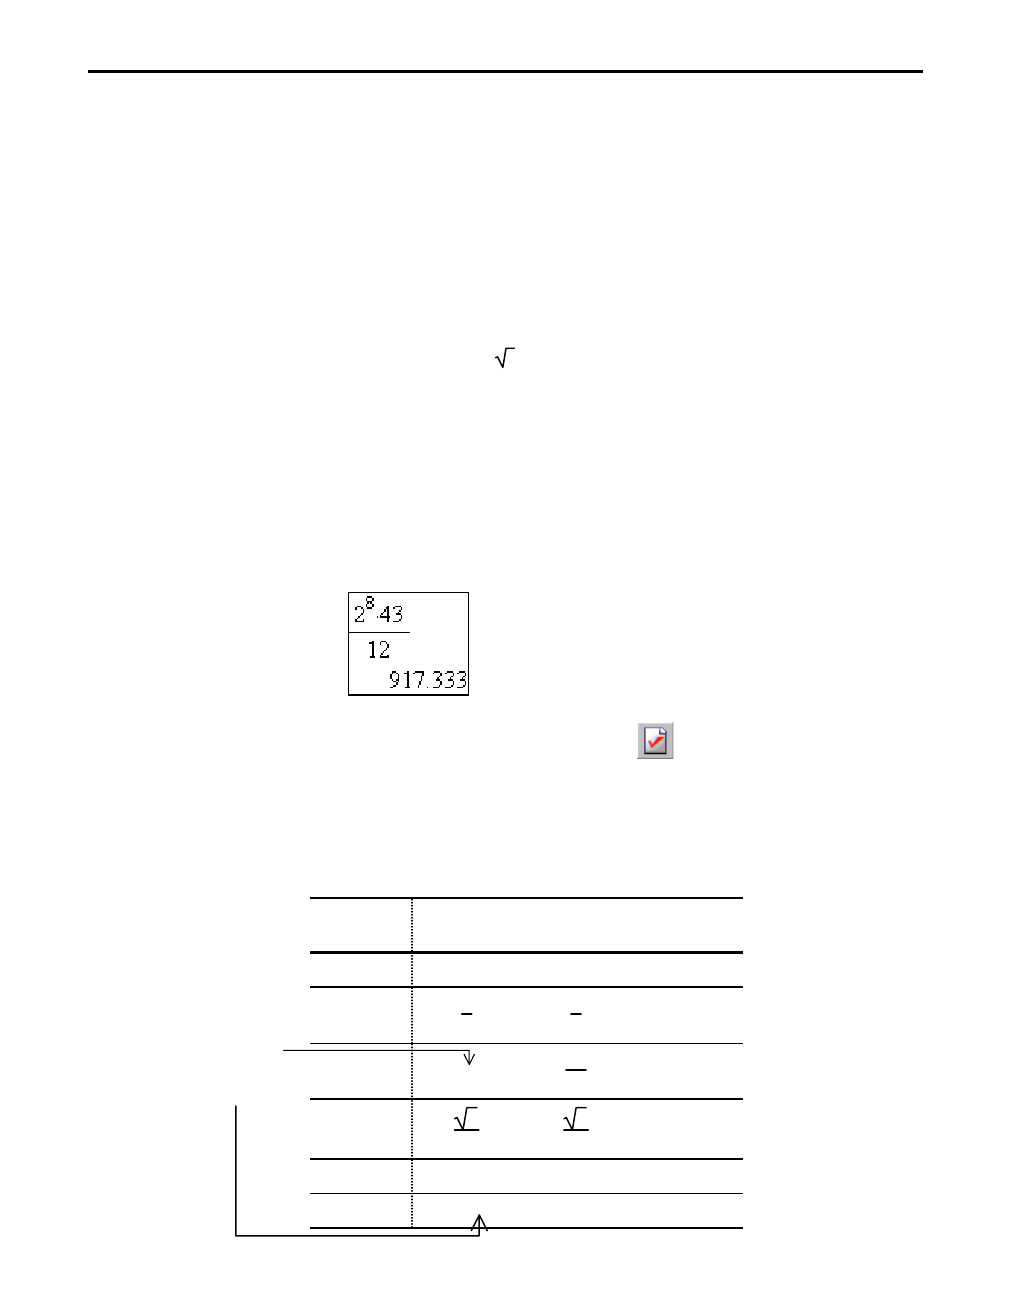
You might expect to see a decimal result instead of 2752à3 in the
preceding example. A close decimal equivalent is 917.33333..., but
that’s only an approximation. By default, TI InterActive! retains
the more precise form: 2752à3.
You can, however, change the form of any Math Box result by
setting the Computation Mode of the box.
1. Click anywhere in the existing Math Box to select it. A solid
border appears around the Math Box to show that it is
selected.
2. Click the Mode Settings button on the TI InterActive!
toolbar.
TIP: Make sure you
insert a Math Box for
the expression.
TI InterActive! cannot
evaluate expressions
that you type as
ordinary text.
TIP: You can also close
the Math Box by
selecting on the
Math Palette, or by
clicking anywhere in the
document.
Setting the form
of results
TIP: You can also right-
click on the Math Box
and select Mode from
the drop-down menu.
Expression is evaluated when you press the
Enter key on the computer keyboard, click
on the Math Palette, or click outside
of the Math Box.
Result
Empty math box for next calculation
Getting Started with TI InterActive! 13
TII_GettingStarted.doc Getting Started with TI InterActive! Karen Davis Revised: 8/22/03 12:20 PM Printed: 8/25/03 8:04 AM Page 13 of 64
Note the three options available under Computation Mode:
Automatic Uses Exact where possible, but uses
Approximate when your entry contains a
decimal point. Also, certain functions may
display Approximate results even if your entry
does not contain a decimal point.
Exact Any result that is not a whole number is
displayed in a fractional or symbolic form (1à2,
p, 2, etc.). This mode reduces rounding errors
that could be introduced by intermediate
results in chained calculations.
Approximate All numeric results, where possible, are
displayed in decimal form.
3. Click the Approximate option to select it, and click OK. The
result in the Math Box becomes a decimal approximation.
4. Click the Mode Settings button again, and change the
Computation Mode back to Automatic, the original setting,
and click OK.
This chart compares the Computation Mode settings.
Entry
Automatic
Result
Exact
Result
Approximate
Result
8à4 2 2 2.
8à6
4
3 4
3
1.33333
8.5ù3
25.5
51
2
25.5
sqrt(2)à2
2
2 2
2
.707107
pù2 2⋅p 2
⋅p 6.28319
pù2. 6.28319
2⋅p 6.28319
TIP: In Automatic mode,
you can force a decimal
result by using a
decimal in the entry.
The decimal point
in the entry forces
the Automatic
result to a decimal.
14 Getting Started with TI InterActive!
TII_GettingStarted.doc Getting Started with TI InterActive! Karen Davis Revised: 8/22/03 12:20 PM Printed: 8/25/03 8:04 AM Page 14 of 64
The TI Math Palette resembles a calculator keyboard. If you
prefer to use the mouse instead of the keyboard, you can click
the buttons on the palette.
1. Click to the right and below the Math Box that you have
already entered, and press Enter. This places the cursor at
the end of the document.
2. Click the Math Box button . An empty Math Box is
inserted beneath the previous one.
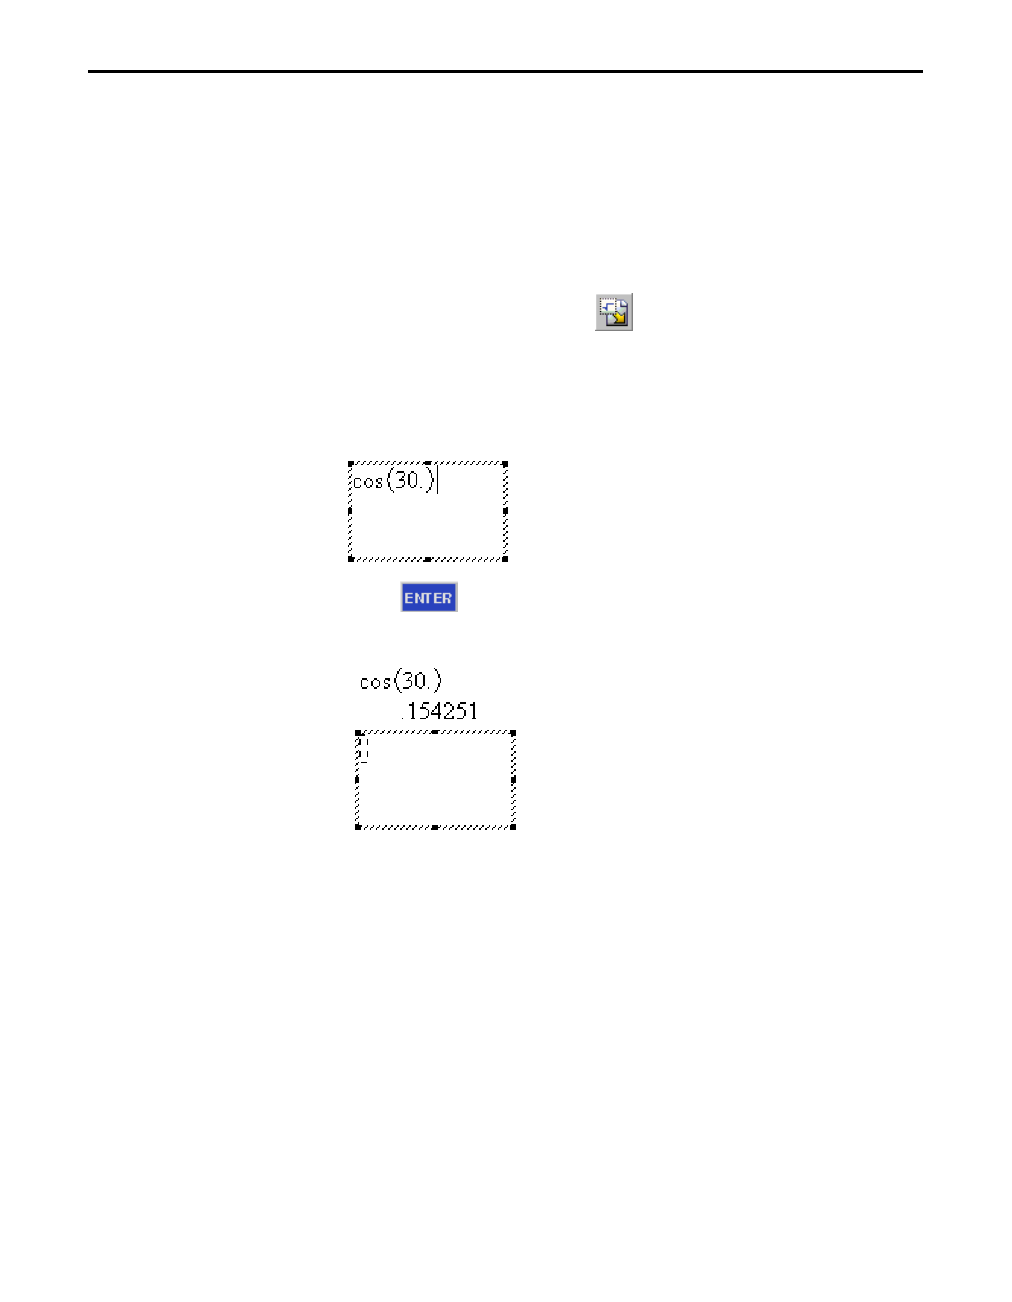
3. On the Math Palette, click X ª µ ¶ d. The entry looks
like this:
4. Click . TI InterActive! displays the result and presents a
new empty Math Box, ready to receive an entry.
5. Press the Esc key on the computer keyboard to close the
unused Math Box, or click anywhere in the document.
Entering an
expression from
the TI Math
Palette
TIP: If you type cos in
the Math Box, you have
to also type the opening
parenthesis (.
Getting Started with TI InterActive! 15
TII_GettingStarted.doc Getting Started with TI InterActive! Karen Davis Revised: 8/22/03 12:20 PM Printed: 8/25/03 8:04 AM Page 15 of 64
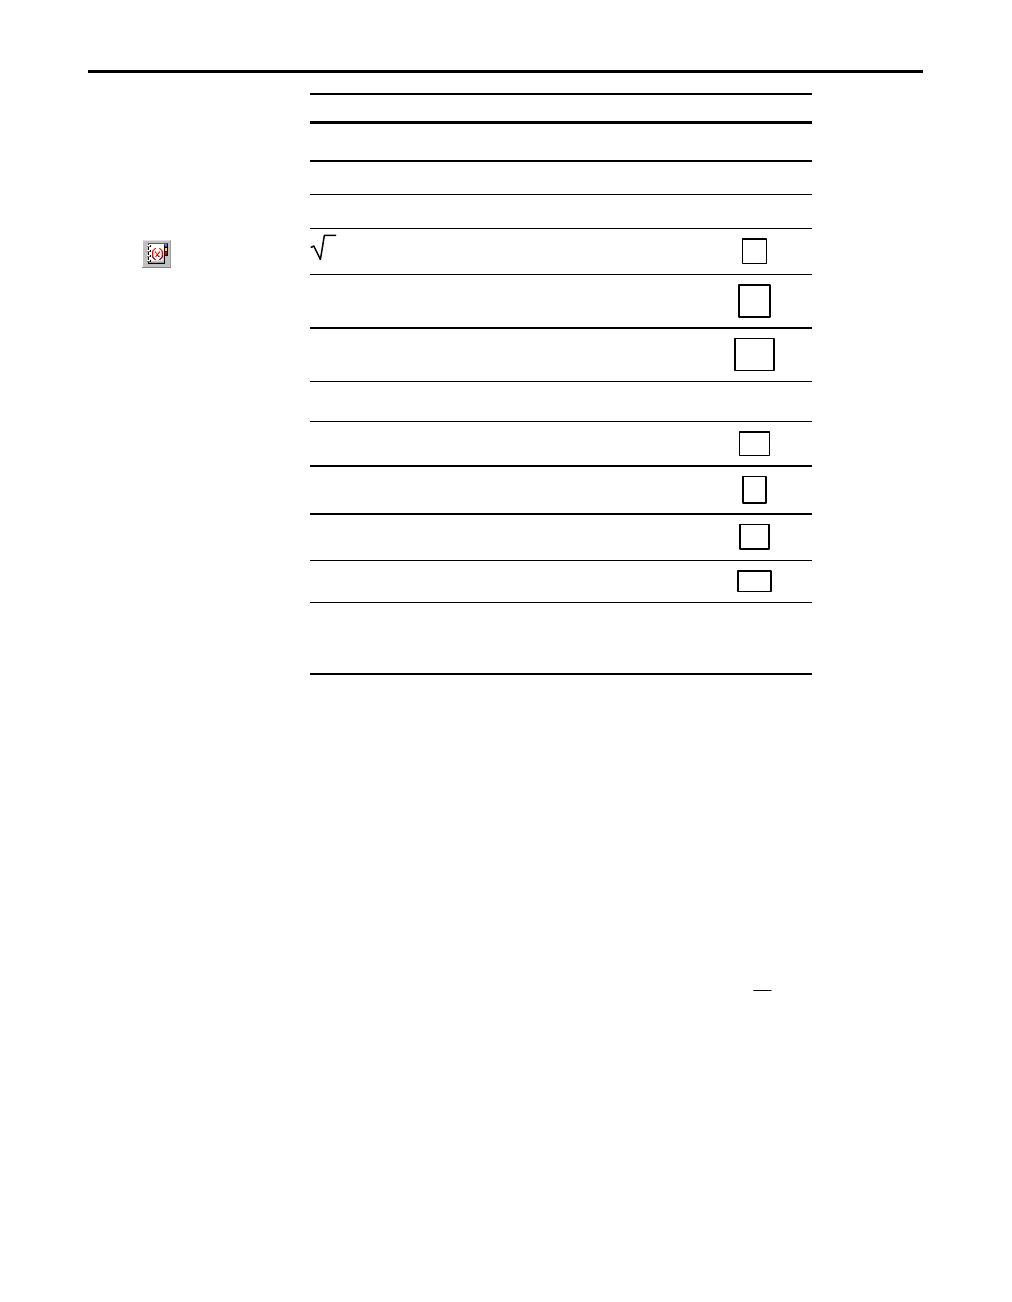
For this operation: Type this: Or click this:
× (multiply) * p
÷ à e
– (subtract or negate) – (hyphen) |
x sqrt(x) ‡
x2 x^2 x2
x–1 x^–1 x–1
yx y^x Z
ex #e^(x) ex
p pi p
i (imaginary number) #i i
Let variable x = value y x := y :=
Store value y to variable x y À x
or
y =: x
§
Using the TI Math Palette, you can change the appearance
properties of the entry and the result independently. You can
even hide the entry or its result.
Some of the properties you can control include:
¦ The font, size, and color used for the entry or result.
¦ Whether the result is displayed on the next line or the same
line as the entry.
¦ Whether the entry or result is displayed in text format,
such as (x^2)/(4y), or in math format, such as x2
4y.
¦ Whether the entry or result is shown or hidden. You cannot
hide both.
Keystroke and
Math Palette
equivalents
TIP: Click the Catalog
button on the
Math Palette for a list
of all TI InterActive!
functions and
symbols.
TIP: Click the a
drop-down menu to
find the q character.
This character is
also available from
the X key.
Appearance of
items in a Math
Box
16 Getting Started with TI InterActive!
TII_GettingStarted.doc Getting Started with TI InterActive! Karen Davis Revised: 8/22/03 12:20 PM Printed: 8/25/03 8:04 AM Page 16 of 64
In this example, you can change the appearance of items in a
Math Box. Suppose you want to hide the expression or the result.
1. Click the down arrow next to the default option in the
Input box. Click Hide Input.
2. To hide the result, click the down arrow next to the
default option in the Output box. Click Hide Output.
Changing the
appearance of
a Math Box
TIP: Once you evaluate
the expression, the Input
and Output settings
return to the default
settings.
Getting Started with TI InterActive! 17
TII_GettingStarted.doc Getting Started with TI InterActive! Karen Davis Revised: 8/22/03 12:20 PM Printed: 8/25/03 8:04 AM Page 17 of 64
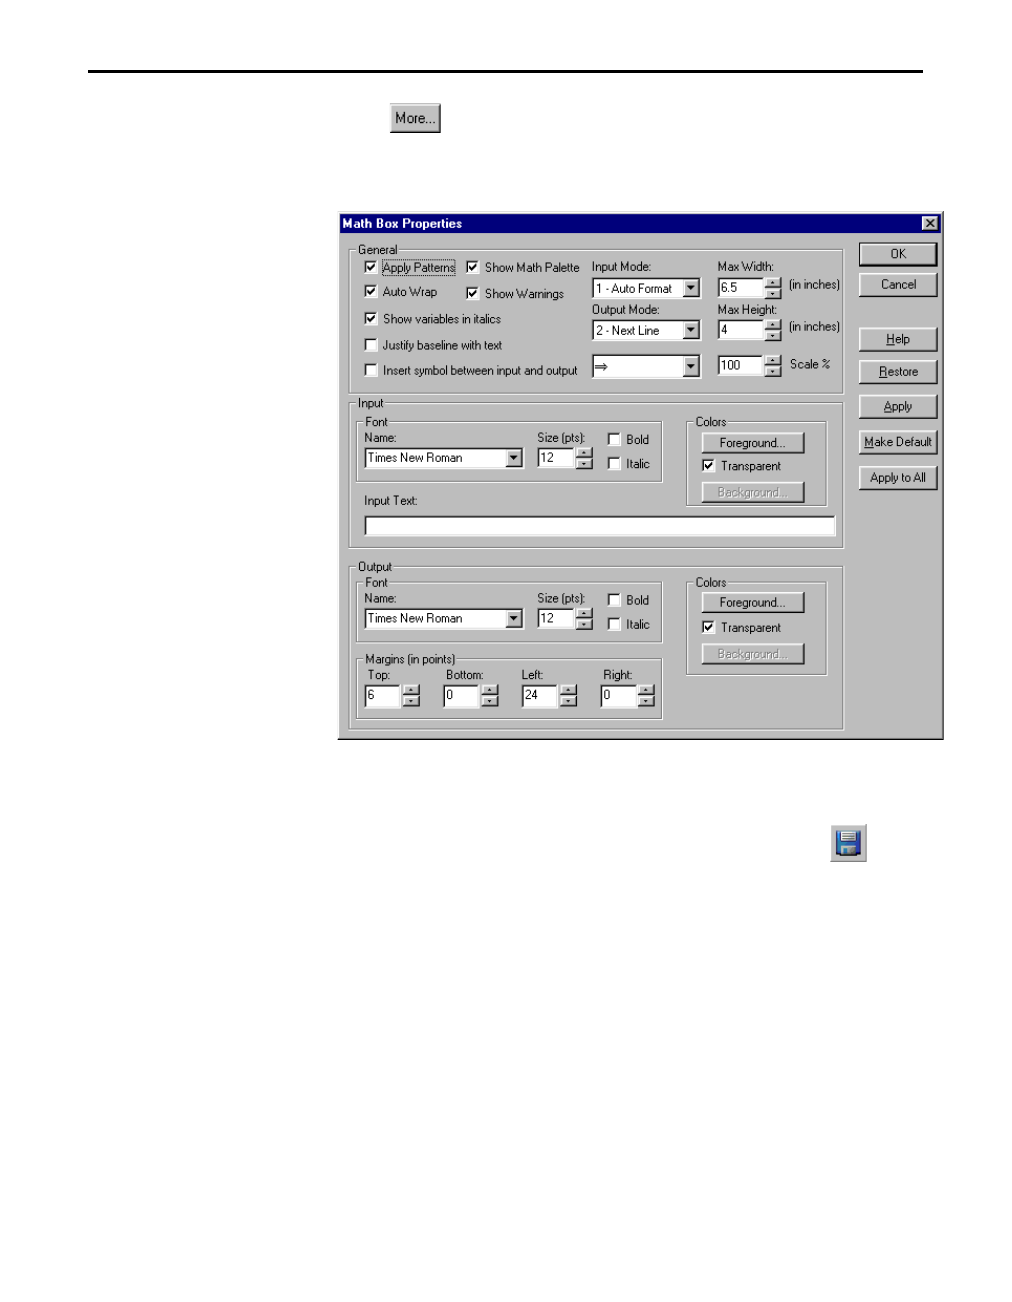
3. Click (or on the Math Palette menu, click Edit 4 Properties)
to modify properties such as scaling factors, font type, size, and
color.
TI InterActive! uses a .tii extension to identify its documents.
1. On the TI InterActive! toolbar, click the Save button .
Because you have not yet saved this document,
TI InterActive! displays the Save As dialog box.
2. If necessary, navigate to the folder where you want to store
the document.
3. In the File name box, type a name (such as first report) for
the document.
4. Click Save.
Note: You can also export a document to other formats. Choose
Export from the File menu. The options are Html Web Page, Word
Compatible, Rich Text Format, and Plain Text.
Saving a
TI InterActive!
document
18 Getting Started with TI InterActive!
TII_GettingStarted.doc Getting Started with TI InterActive! Karen Davis Revised: 8/22/03 12:20 PM Printed: 8/25/03 8:04 AM Page 18 of 64
This exercise shows you how to:
¦ Define a variable and assign a value to it.
¦ Display a variable’s value in a document.
¦ Remove a variable.
¦ Perform symbolic calculations.
¦ Reposition TI InterActive! objects in a document.
¦ Reset all variables.
Exercise 2: Storing Values as Variables
You can store a value as a named variable and then use the name
to refer to that value in subsequent Math Boxes and graphs. When
TI InterActive! evaluates an expression containing the name, it
substitutes the value stored under that name.
Getting Started with TI InterActive! 19
TII_GettingStarted.doc Getting Started with TI InterActive! Karen Davis Revised: 8/22/03 12:20 PM Printed: 8/25/03 8:04 AM Page 19 of 64
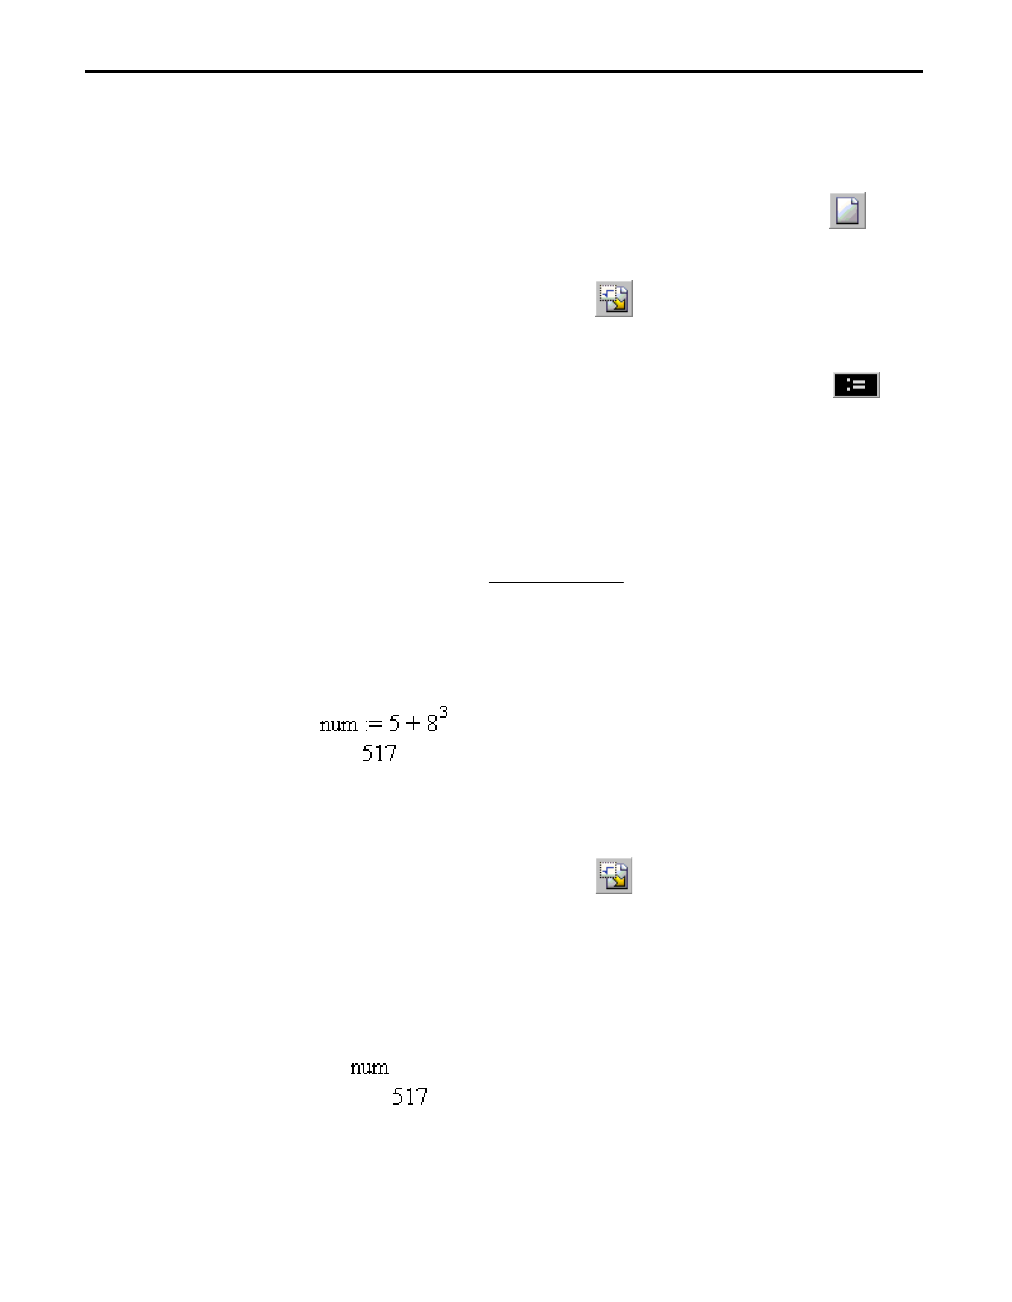
This example creates a variable named num and stores the result
of the expression 5+83 in that variable.
1. On the TI InterActive! toolbar, click the New button to
start a new, blank document.
2. Click the Math Box button to insert a new Math Box.
3. Type the variable name num and then type := (both
characters are required from the keyboard), or click on
the Math Palette.
num :=
4. Type the expression 5+8^3. The result—not the expression—
will be stored in num.
num := 5+8^3
5. Press Enter on the computer keyboard. TI InterActive!
creates the variable num and stores the result there.
You can check the value of a variable by entering its name as the
entry in a subsequent Math Box.
1. Click the Math Box button to insert a new Math Box, if
necessary.
2. Type the variable name num and press Enter on the computer
keyboard. The value currently stored in num is displayed as
the result.
Storing a value
in a variable
TIP: If you have
changed a document
and then attempt to
create a new document,
TI InterActive! gives you
the option to save the
first document before
proceeding.
Checking a
variable’s value
This means: Let the variable “num”
equal the result of 5+83.
20 Getting Started with TI InterActive!
TII_GettingStarted.doc Getting Started with TI InterActive! Karen Davis Revised: 8/22/03 12:20 PM Printed: 8/25/03 8:04 AM Page 20 of 64
After storing a value in a variable, you can use the variable name
in an expression as a substitute for the stored value.
1. Click the Math Box button to insert a new Math Box, if
necessary.
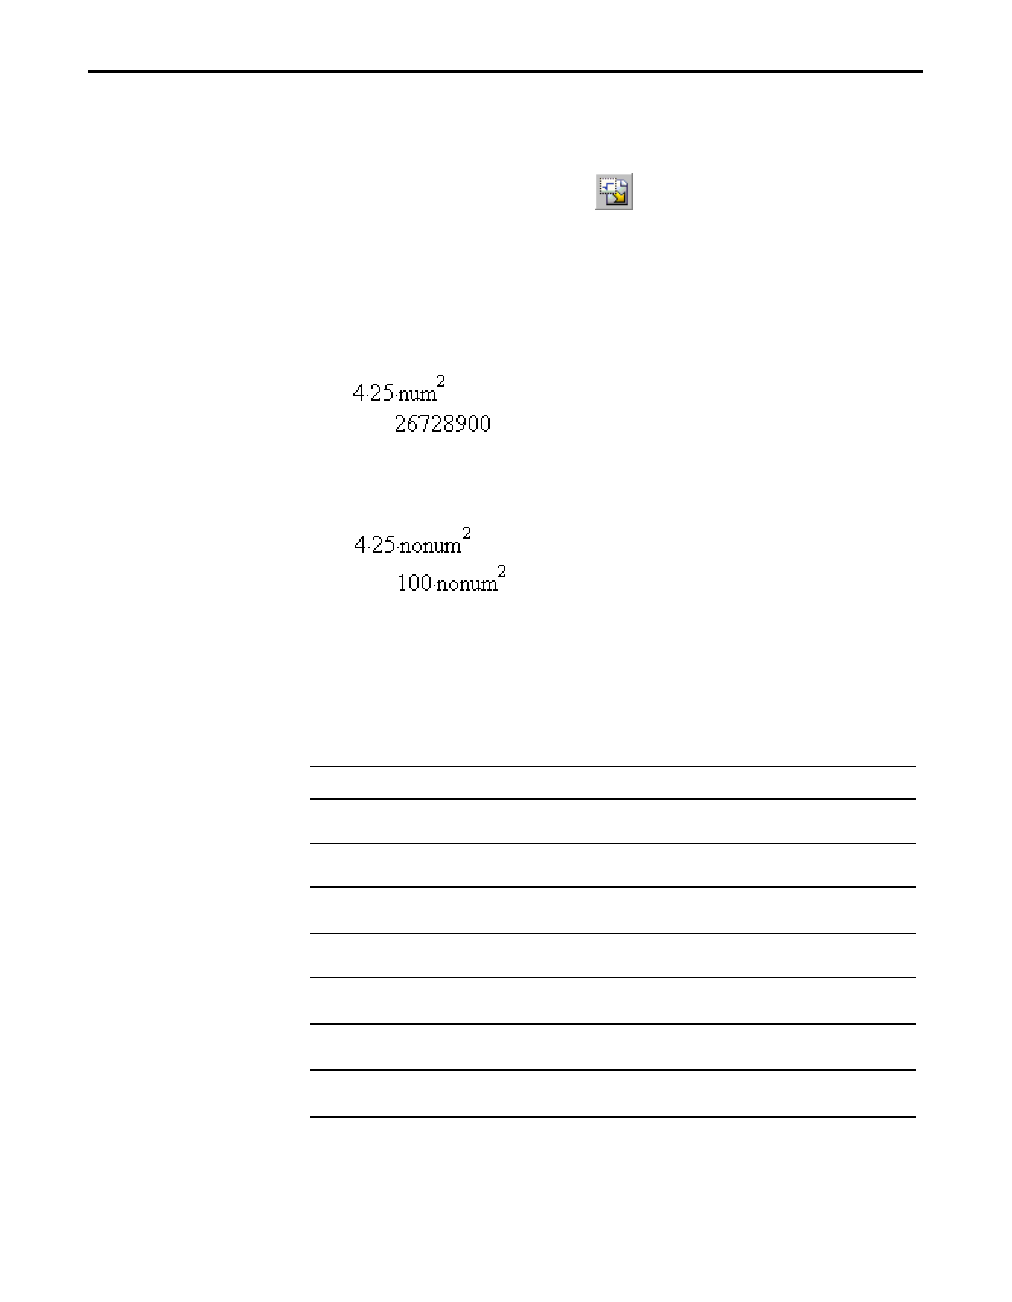
2. Type 4*25*num^2 in the Math Box, and press Enter.
TI InterActive! substitutes 517, the value assigned to num, and
evaluates the expression.
3. Type 4*25*nonum^2 in a Math Box, and press Enter.
Because the variable nonum has not been defined, it is treated
algebraically in the result.
If you want to update a variable with the result of a calculation,
you must store the result explicitly.
Entry Result Comment
a := 2 2
a^3 8 Result not stored in variable a.
a 2
a := a^3 8 Variable a updated with result.
a 8
a^2 N> a 64 Variable a updated with result.
a 64
Using a variable
in a calculation
Updating a
variable
Getting Started with TI InterActive! 21
TII_GettingStarted.doc Getting Started with TI InterActive! Karen Davis Revised: 8/22/03 12:20 PM Printed: 8/25/03 8:04 AM Page 21 of 64
You can store any TI InterActive! data type as a variable. Some
examples are:
Data type Examples
Expression 2.54 1.25í6 2
p xminà10 2+3
i
(xì2)ñ 2 à2
List {2, 4, 6, 8} {1, 1, 2}
Matrix []
1 2 3
3 6 9 This can be entered as: [1,2,3;3,6,9]
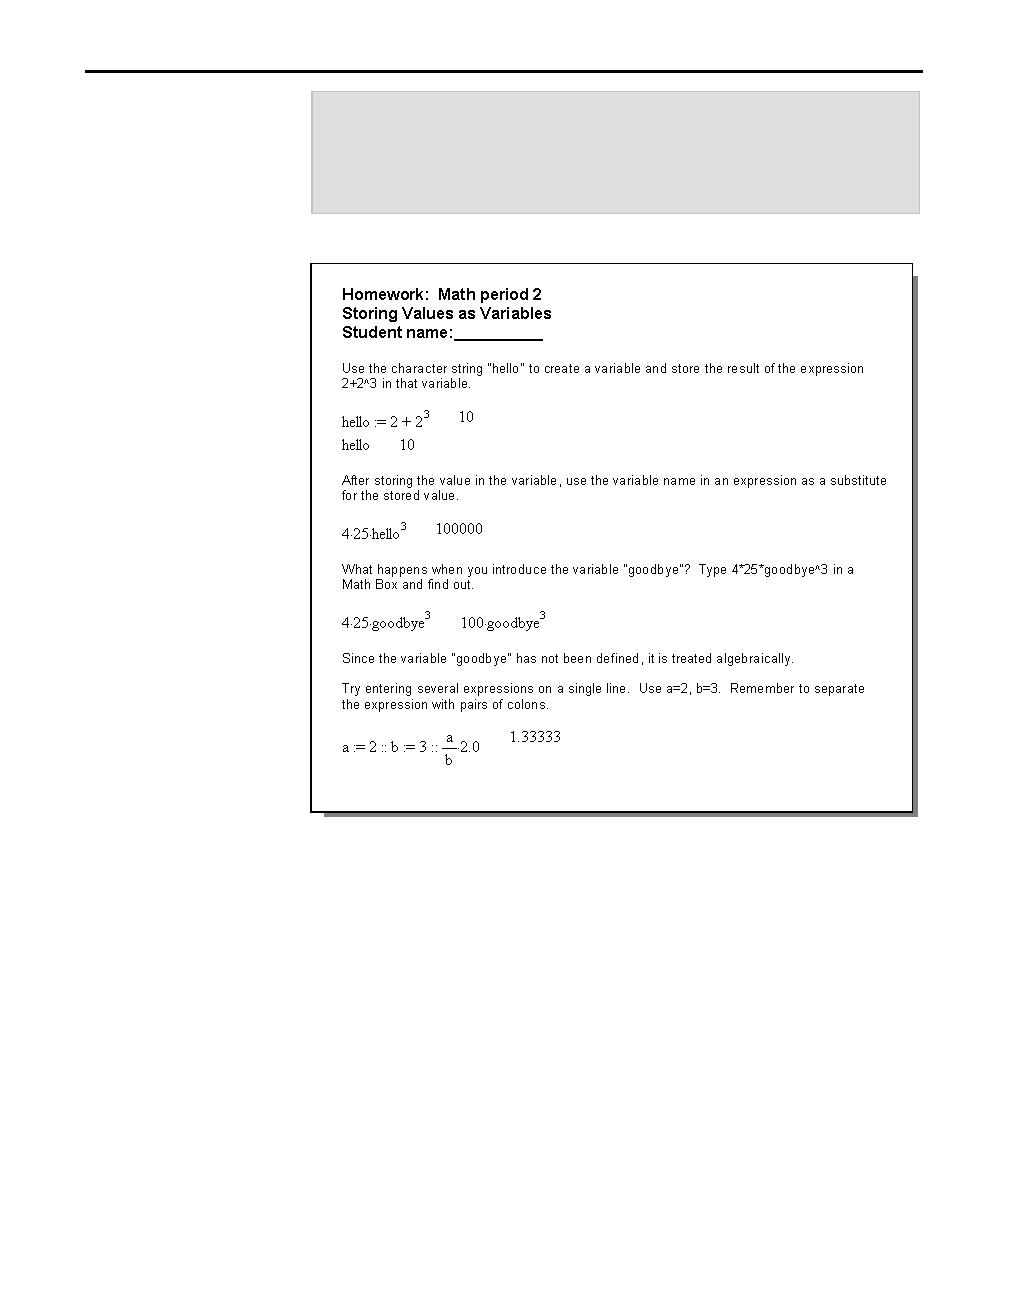
Character string “Hello” “xminà10” “The answer is:”
Function myfunc( arg ) ellipse( x, y, r1, r2 )
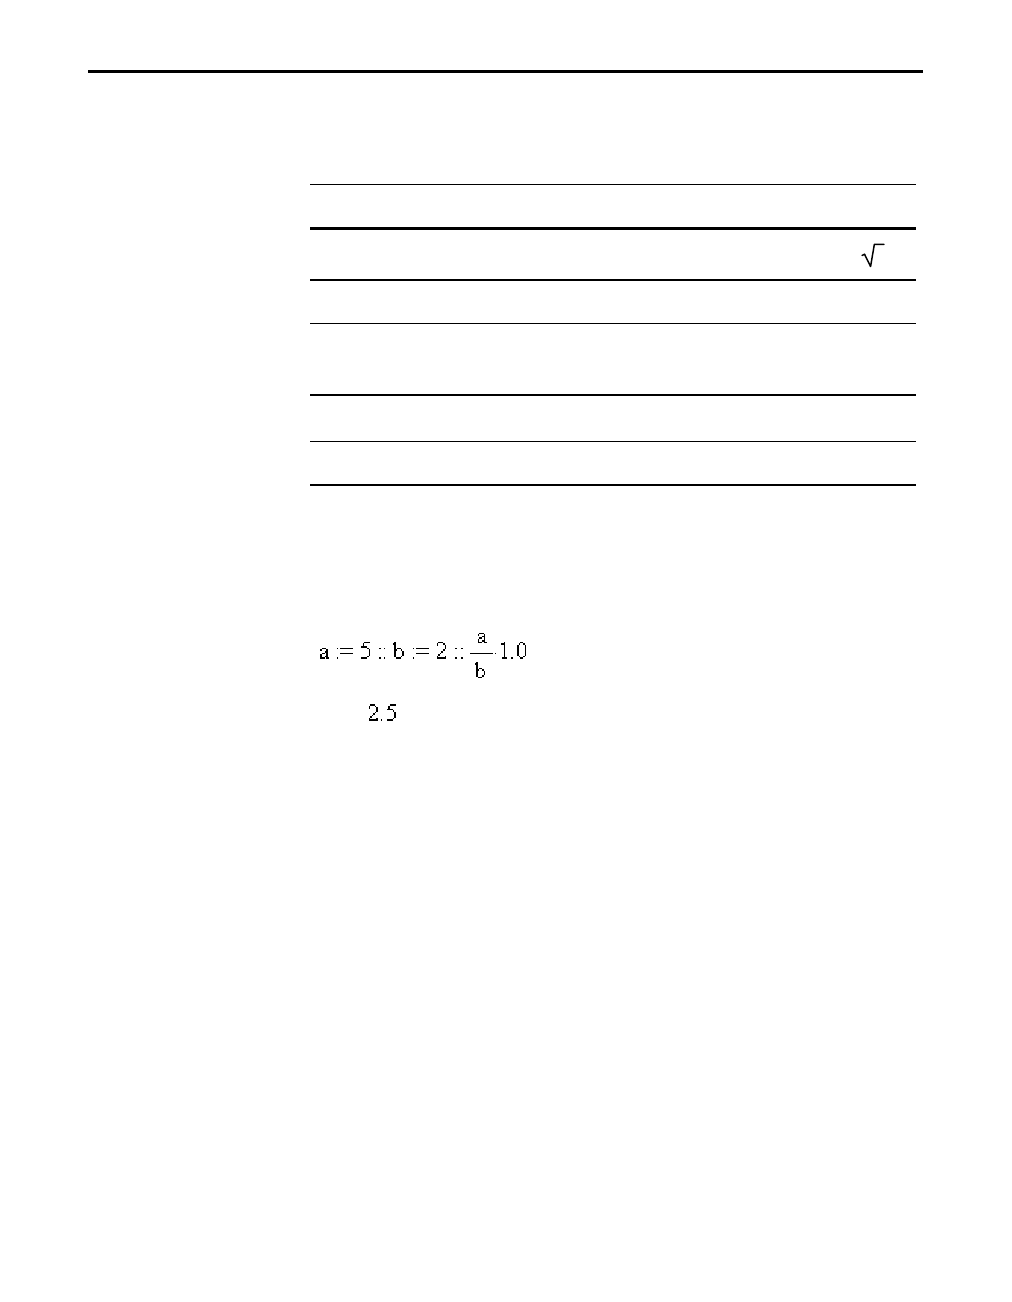
To enter several statements in a single Math Box, separate them
with pairs of colons. Only the result of the last expression is
shown.
You can delete TI InterActive! math objects (such as Math Boxes,
lists, and graphs), and you can drag them to a different position
on the page. However, deleting or moving an object can cause
results to change in the objects that follow it.
That’s because variables persist from one math object to another.
The physical positions of the objects determine the order in
which they are processed by the TI InterActive! math system. The
“math flow” is identical to the reading pattern: left-to-right along
each line of a paragraph, and top-to-bottom between paragraphs.
Types of
variables
Entering multiple
statements in a
Math Box
Effects of
repositioning or
deleting math
objects
22 Getting Started with TI InterActive!
TII_GettingStarted.doc Getting Started with TI InterActive! Karen Davis Revised: 8/22/03 12:20 PM Printed: 8/25/03 8:04 AM Page 22 of 64
Example:
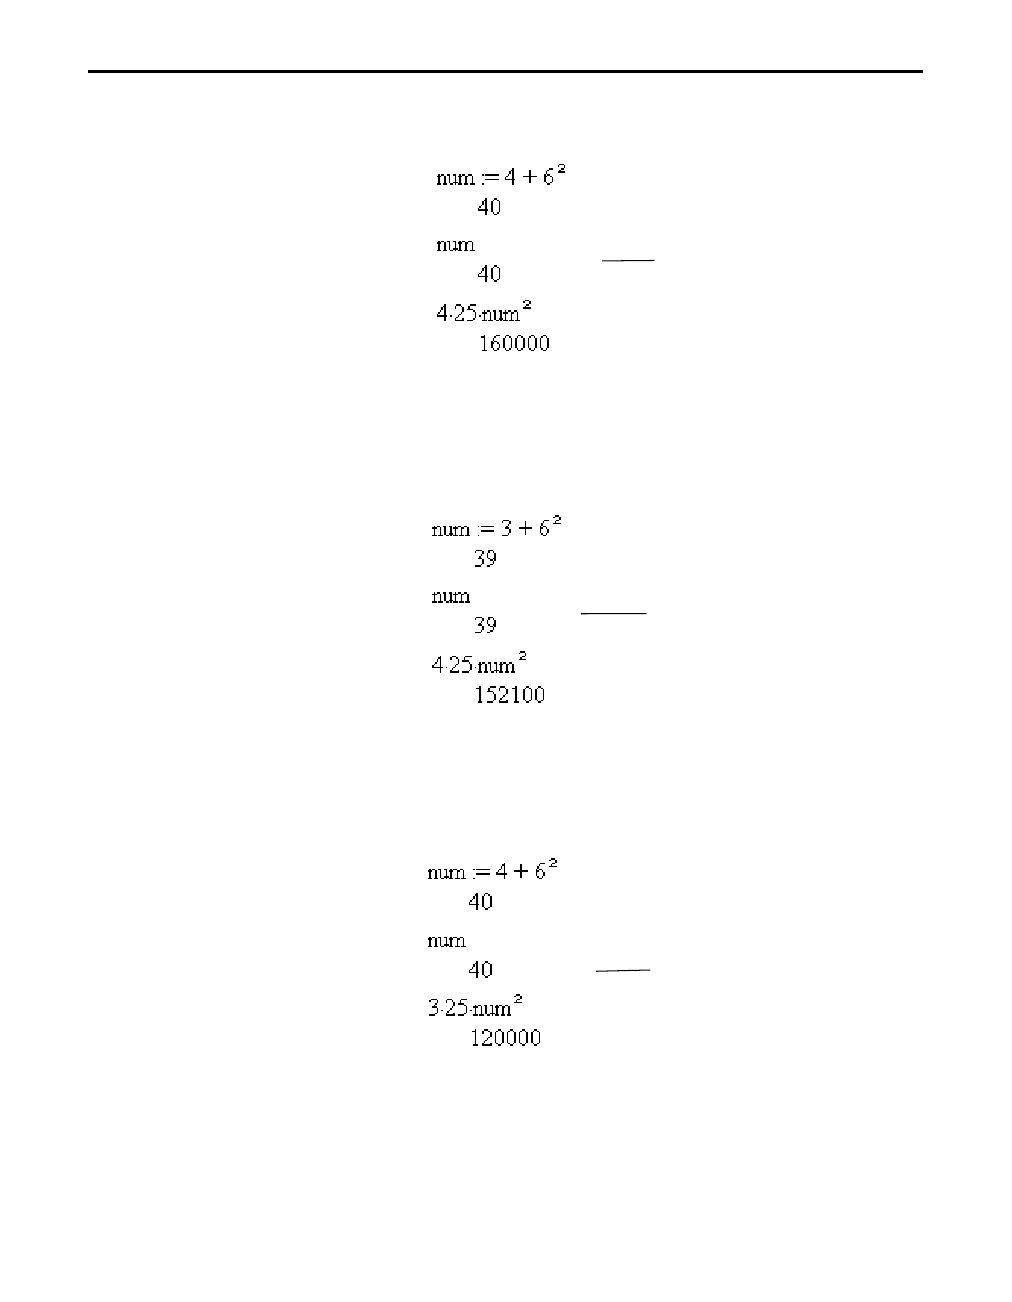
If you edit a list or variable at the beginning of the document, the
change can ripple throughout the other math objects.
But if you change the value assigned to a variable at the end of
the document, the math objects that precede it are unaffected.
Math flow
Effect of
changing 4
to 3 at the
end of the
example.
Step 1.
Step 2.
Step 3.
Effect of
changing 4 to
3 at the
beginning of
the example.

Getting Started with TI InterActive! 23
TII_GettingStarted.doc Getting Started with TI InterActive! Karen Davis Revised: 8/22/03 12:20 PM Printed: 8/25/03 8:04 AM Page 23 of 64
At times, the persistence of variables can create a problem.
Suppose, for example, that you want to change the expression
stored in num for use in a different equation.
Variable names that you create:
¦ Can use 1 to 32 characters consisting of letters and digits.
This includes Greek letters (but not p), accented letters, and
international letters.
– Do not use spaces.
– The first character cannot be a digit.
¦ Can use either uppercase or lowercase letters. The names
AB22, Ab22, aB22, and ab22 all refer to the same variable.
¦ Cannot be the same as a preassigned name. Preassigned
names include:
– Built-in functions, such as abs( ). For a list of functions,
refer to the Functions and Instructions section of the
online help.
Resetting all
variables by
inserting a math
section break
TIP: Math Section Break
is on the Insert menu.
Rules for naming
variables
Inserted math section
break shows the resetting
effect on the math flow.
24 Getting Started with TI InterActive!
TII_GettingStarted.doc Getting Started with TI InterActive! Karen Davis Revised: 8/22/03 12:20 PM Printed: 8/25/03 8:04 AM Page 24 of 64
Here are some examples:
Variable name Valid?
Myvar Yes
My var No. Contains a space.
a Yes
Log No. Name is preassigned to the log( ) function.
Log1 Yes
3rdTotal No. Starts with a digit.
TI InterActive! automatically stores the last calculated result as a
system variable named ans. You can use ans in the next Math Box
to create a chain of calculations.
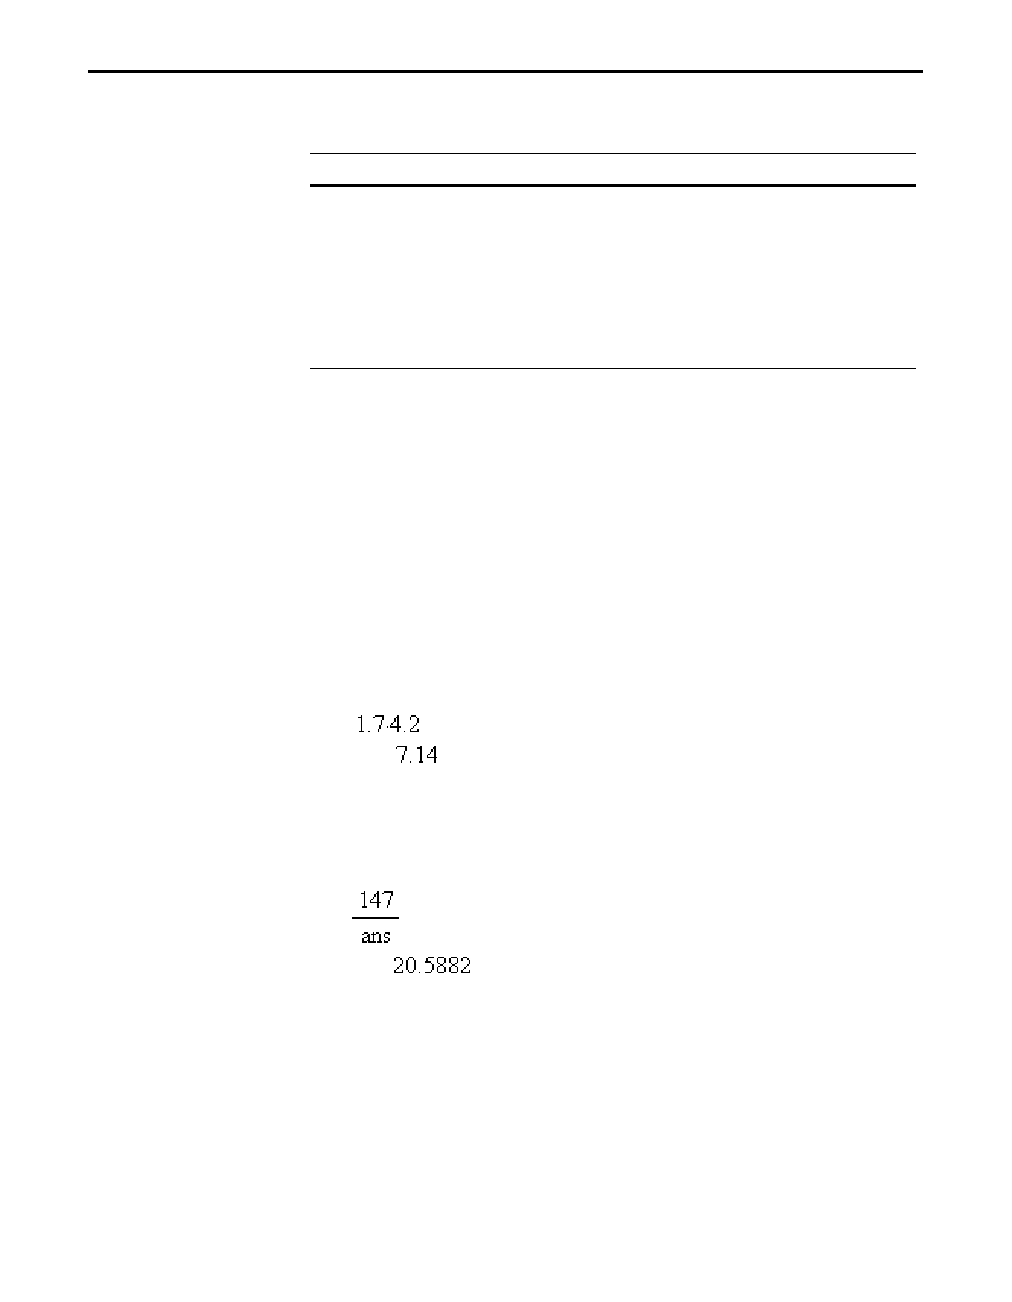
For example, calculate the area of a garden plot that is 1.7 meters
by 4.2 meters. Then calculate the yield per square meter if the
plot produces a total of 147 tomatoes.
1. In a new Math Box, type 1.7*4.2, and press Enter on the
computer keyboard.
2. Type 147àans, and press Enter on the computer keyboard to
find the yield.
Reusing the last
answer

Getting Started with TI InterActive! 25
TII_GettingStarted.doc Getting Started with TI InterActive! Karen Davis Revised: 8/22/03 12:20 PM Printed: 8/25/03 8:04 AM Page 25 of 64
As a second example, calculate 3.76
ë7.9+ 5 and then add 2 ¦ log 45.
1. Type 3.76à(-7.9+sqrt(5)), and press Enter on the computer
keyboard.
2. Type ans+2*log(45), and press Enter on the computer
keyboard.
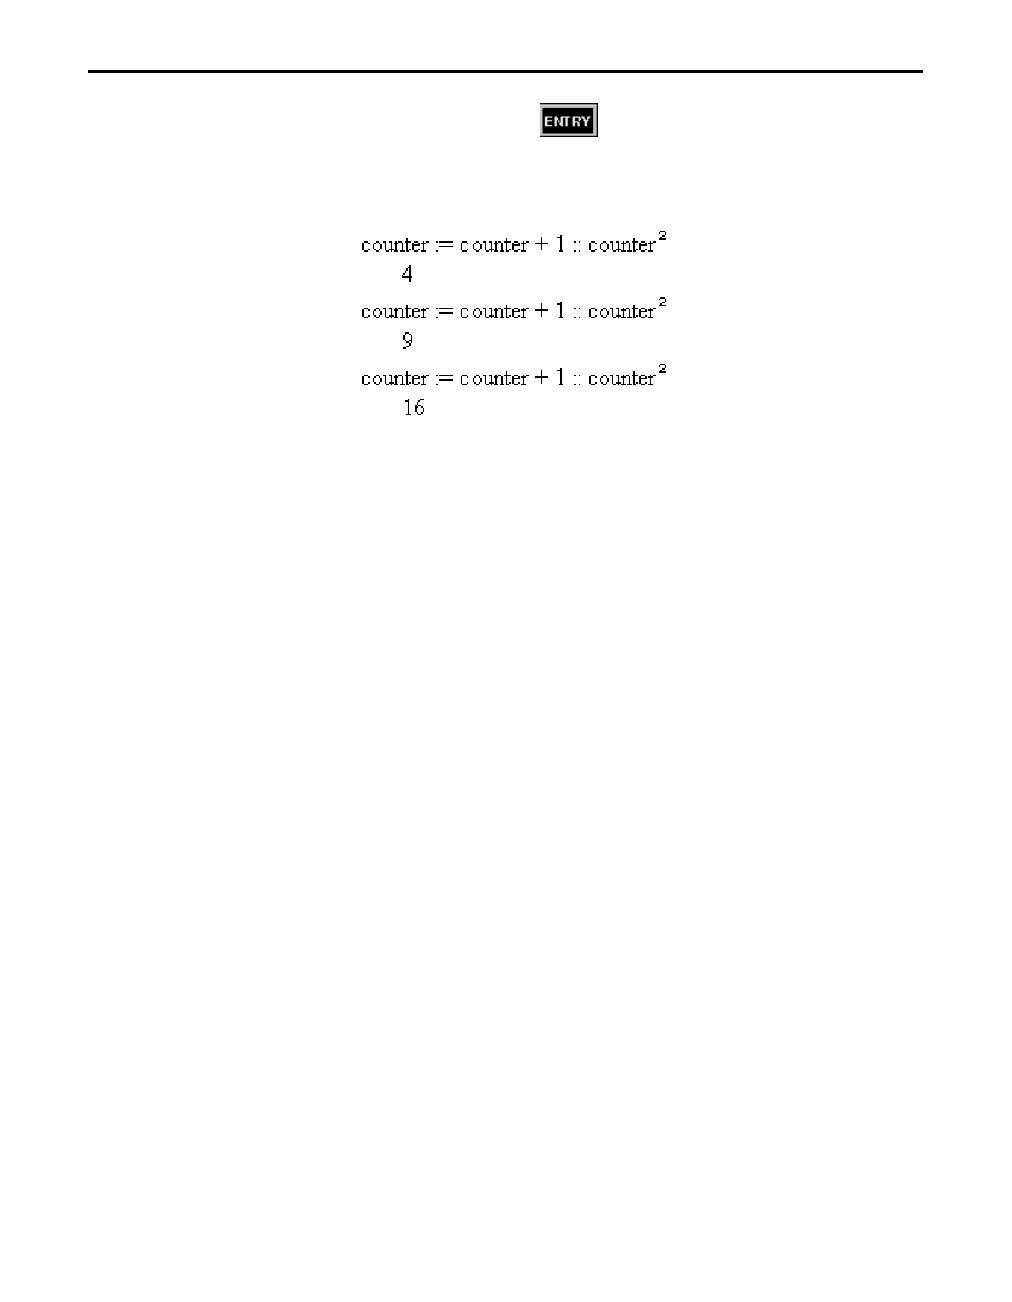
The button on the Math Palette recalls the last entry you
evaluated and places it in the entry line. You can take advantage
of this feature when you need to repeatedly evaluate an
expression that updates a variable.
For example, using a variable, find the square of 1, 2, 3, 4, etc.
1. Set the variable’s initial value. Press Enter.
2. Enter the expression that you want to repeat.
Reusing the
last entry
26 Getting Started with TI InterActive!
TII_GettingStarted.doc Getting Started with TI InterActive! Karen Davis Revised: 8/22/03 12:20 PM Printed: 8/25/03 8:04 AM Page 26 of 64
3. Repeatedly click the button on the Math Palette, and
press Enter on the computer keyboard to increment the
variable and calculate its square.
Getting Started with TI InterActive! 27
TII_GettingStarted.doc Getting Started with TI InterActive! Karen Davis Revised: 8/22/03 12:20 PM Printed: 8/25/03 8:04 AM Page 27 of 64
This exercise shows you how to:
¦ Insert and define a function graph in a TI InterActive! document.
¦ Resize a graph.
¦ Copy and paste a graph.
¦ Zoom in on a portion of the graph.
¦ Find zeros of a graphed function.
Exercise 3: Creating a Function-Graphing Assignment
In this exercise, you create an interactive homework assignment
for electronic distribution. Recipients can open their copy of the
document in TI InterActive! and use the graphing features to
complete the assignment.
28 Getting Started with TI InterActive!
TII_GettingStarted.doc Getting Started with TI InterActive! Karen Davis Revised: 8/22/03 12:20 PM Printed: 8/25/03 8:04 AM Page 28 of 64
1. At the left side of the formatting toolbar, click the down
arrow next to the font name, and click Arial as the font for
the assignment title.
2. Click the down arrow next to the text size and click 24 as
the text size for the title.
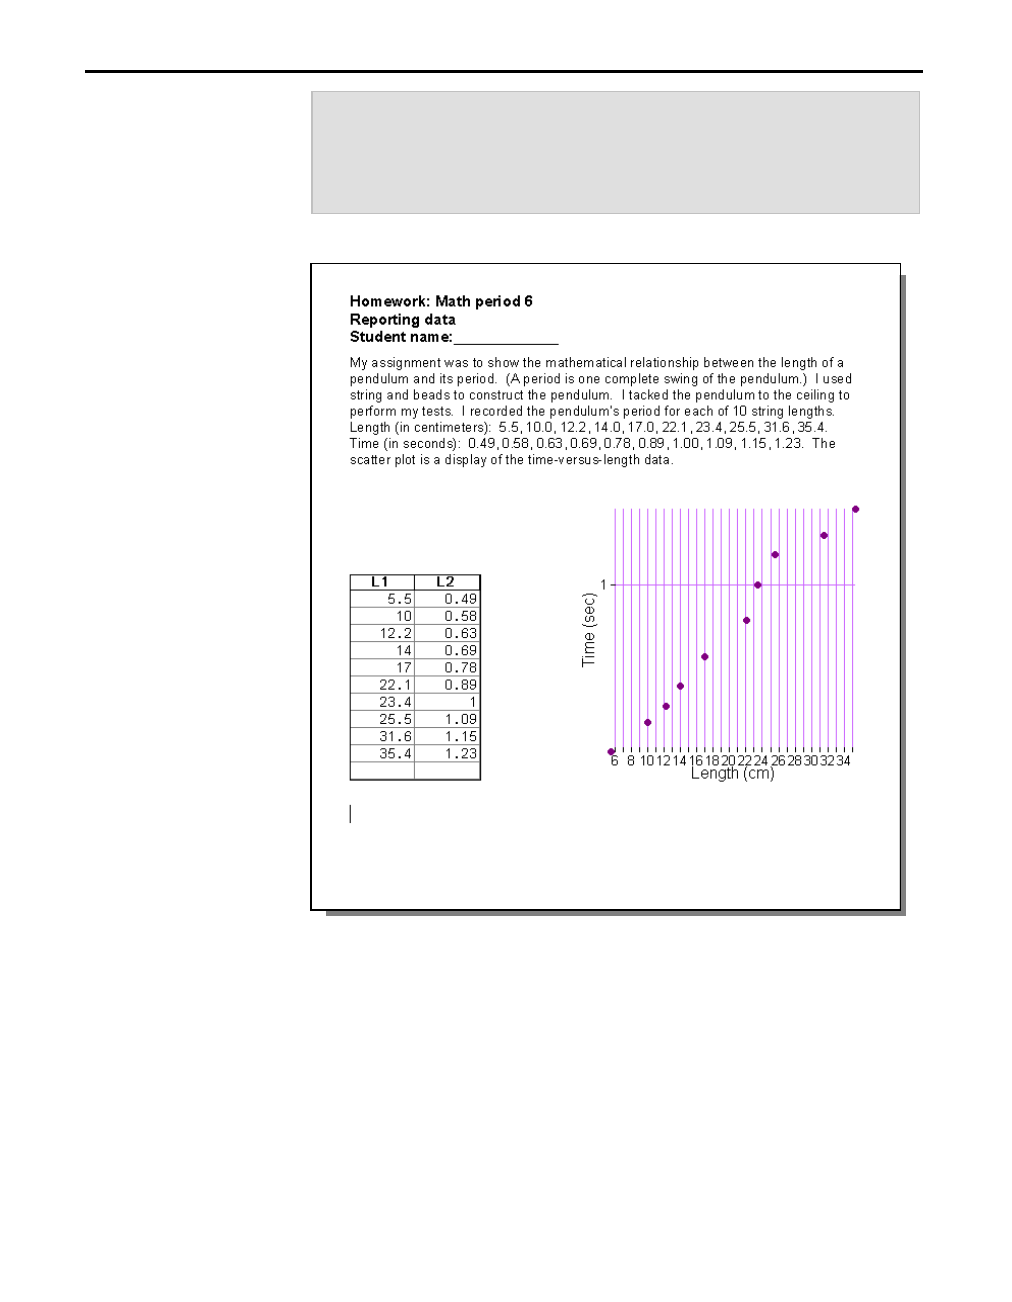
3. Type the three title lines shown at the top of the sample on
the previous page. Press the Enter key on the computer
keyboard after each line.
4. Press Enter again to leave a blank line after the title.
1. Click the down arrow next to the text size and click 10 as
the size for the document’s normal text.
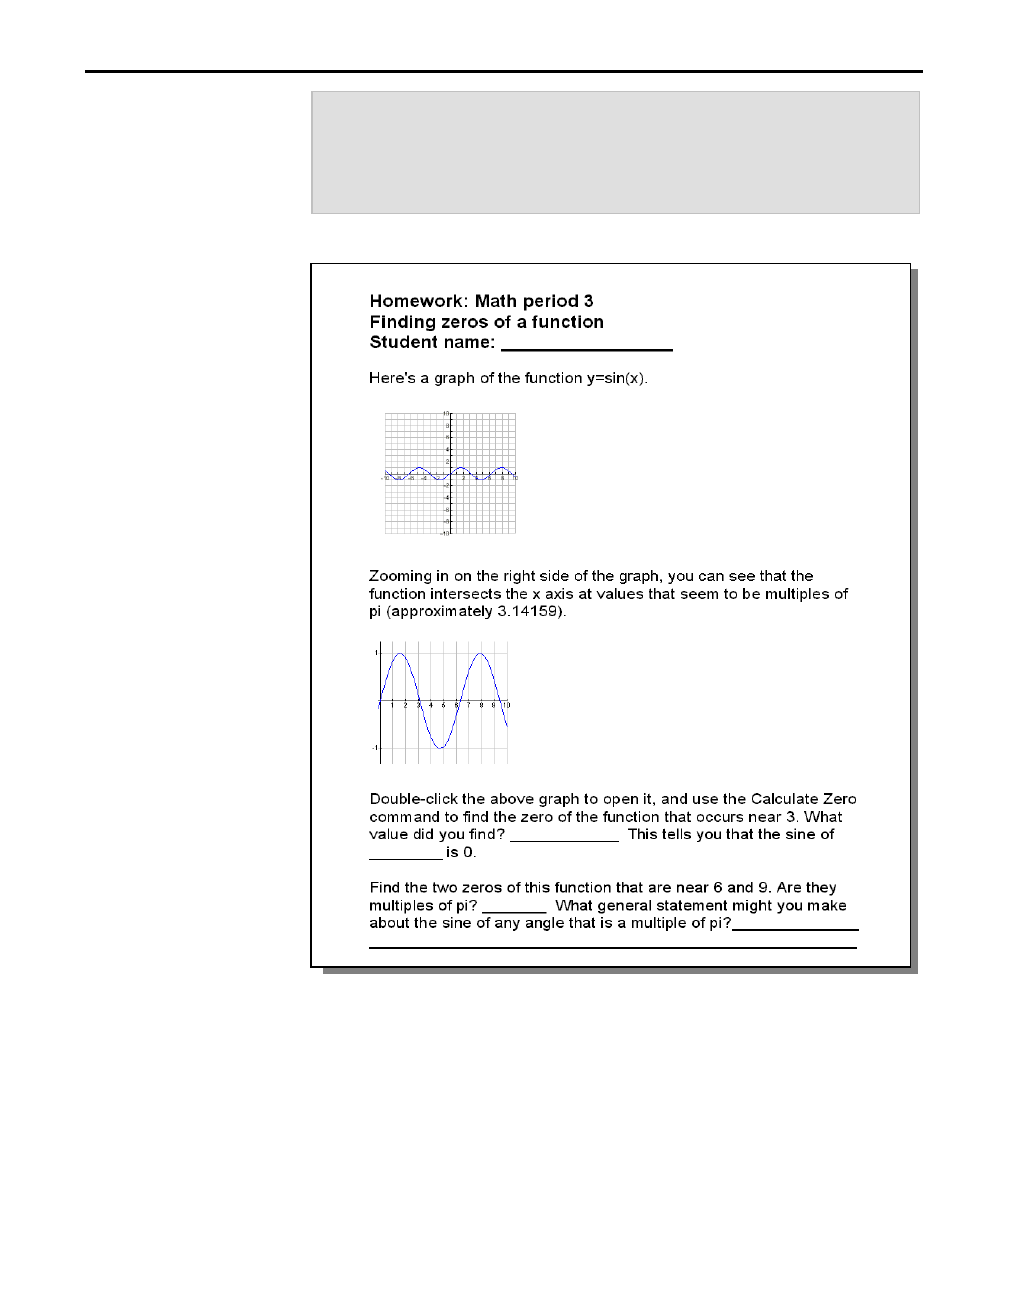
2. Type Here’s a graph of the function y=sin(x): and press Enter
on the computer keyboard.
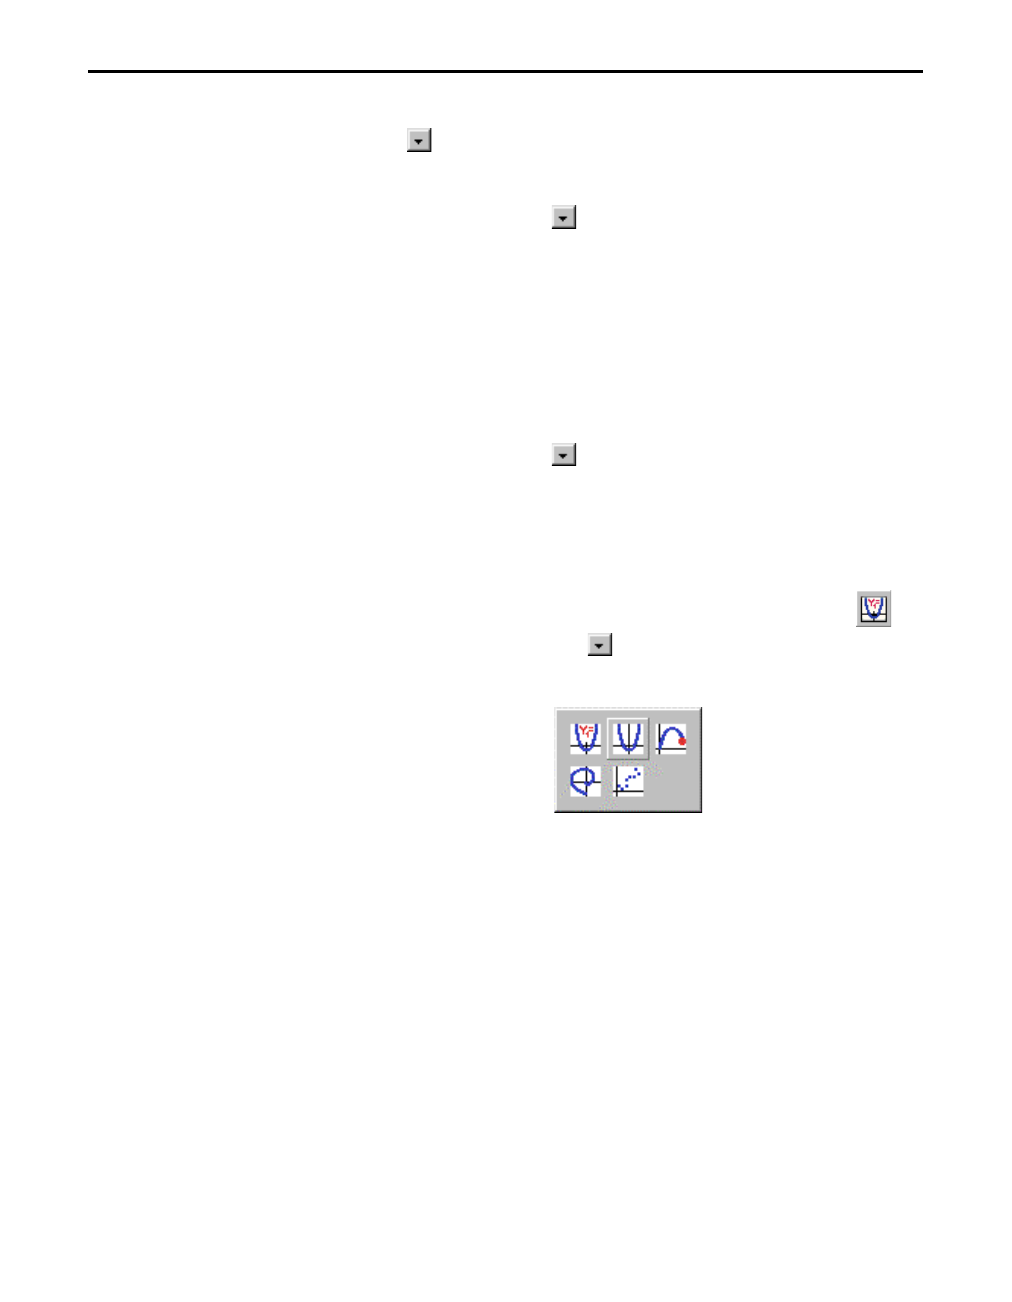
3. On the TI InterActive! toolbar, locate the Graph button
and click the down arrow next to it. A group of buttons is
displayed, representing the available graph types.
Creating a title
for the
assignment
Inserting and
defining a graph
TIP: The Graph button’s
toolbar image reflects
the most recently used
graph type. To create a
new graph of that type,
just click the button
instead of the down
arrow.
Getting Started with TI InterActive! 29
TII_GettingStarted.doc Getting Started with TI InterActive! Karen Davis Revised: 8/22/03 12:20 PM Printed: 8/25/03 8:04 AM Page 29 of 64
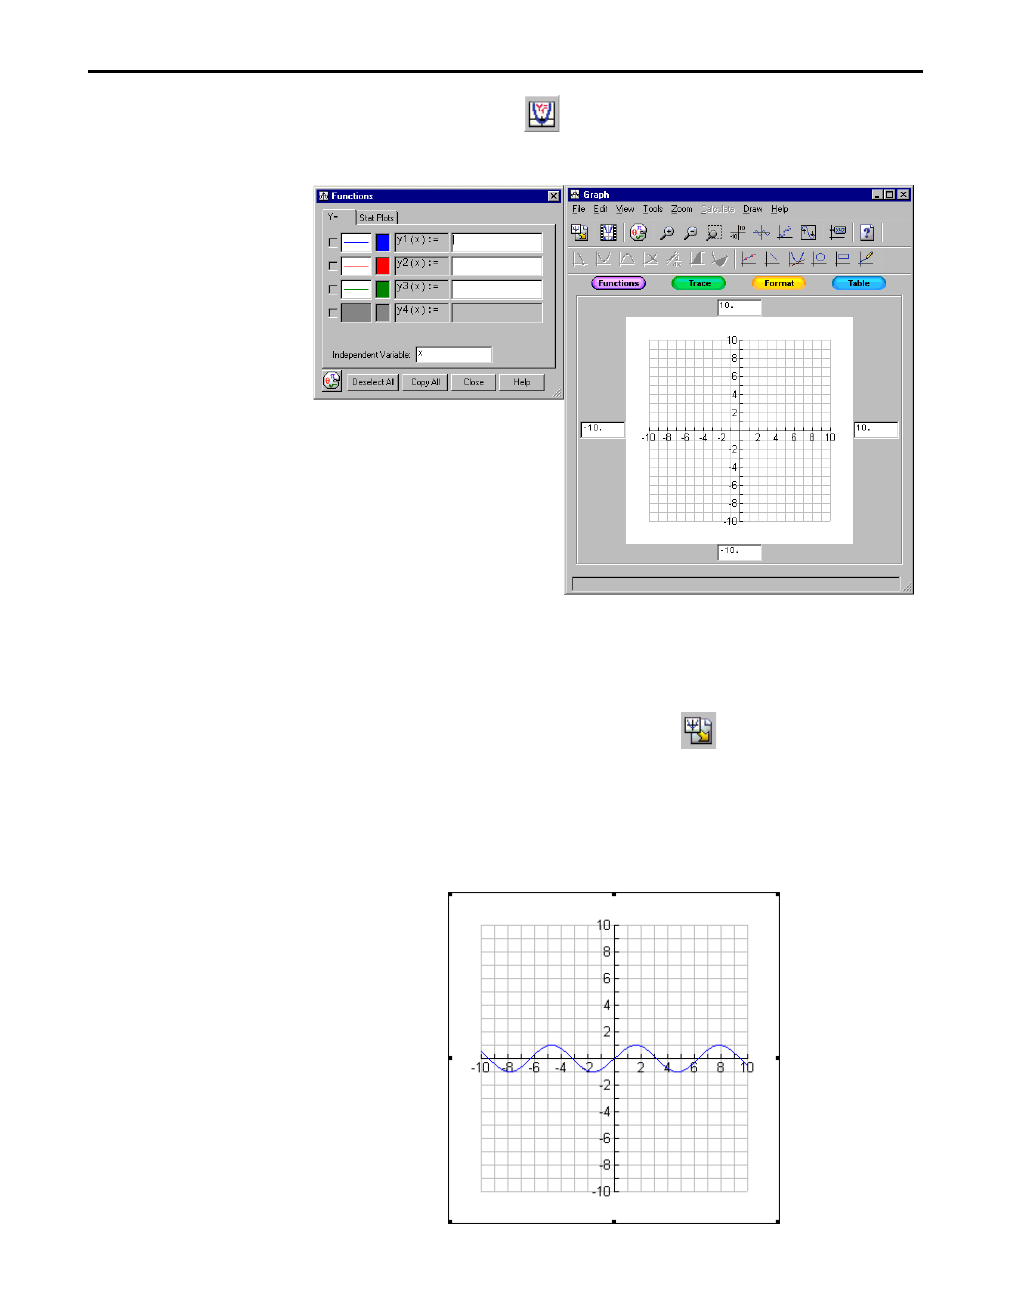
4. Click the Y= button . The Functions editor is displayed
along with the Graph window.
5. In the uppermost text box of the Y= tab, type sin(x), and then
press Enter on the computer keyboard. TI InterActive! graphs the
function.
6. Click the Save To Document button in the Graph
window to insert the graph into the document.
1. Click the graph in the document. A selection box appears
around the graph to show that it is selected.
TIP: You can define
many functions and
choose to graph
selected ones. Clear the
checkmark for those that
you don’t want to graph.
Resizing the
graph
30 Getting Started with TI InterActive!
TII_GettingStarted.doc Getting Started with TI InterActive! Karen Davis Revised: 8/22/03 12:20 PM Printed: 8/25/03 8:04 AM Page 30 of 64
2. Move the cursor to one of the corners of the selection box
until the cursor changes.
3. Using the left mouse button, drag the selection out to
increase (or in to decrease) the graph’s size.
1. Click below the graph to deselect it, and press Enter on the
computer keyboard to make sure the cursor is positioned at
the end of the document.
2. Type the paragraph from page 27 that begins with “Zooming
in on the right side...” and press Enter on the computer
keyboard.
3. Click the graph that you inserted earlier. A selection box
appears around the graph to show that it is selected.
4. On the main toolbar, click the Copy button to copy the
selected graph to the clipboard.
5. Click below the “Zooming in...” paragraph to position the
cursor where you want a copy of the graph.
6. Click the Paste button . A copy of the graph is pasted at
the end of the document.
NOTE: See page 51-54
for more details on
formatting and using
objects.
Inserting a copy
of the graph
Getting Started with TI InterActive! 31
TII_GettingStarted.doc Getting Started with TI InterActive! Karen Davis Revised: 8/22/03 12:20 PM Printed: 8/25/03 8:04 AM Page 31 of 64
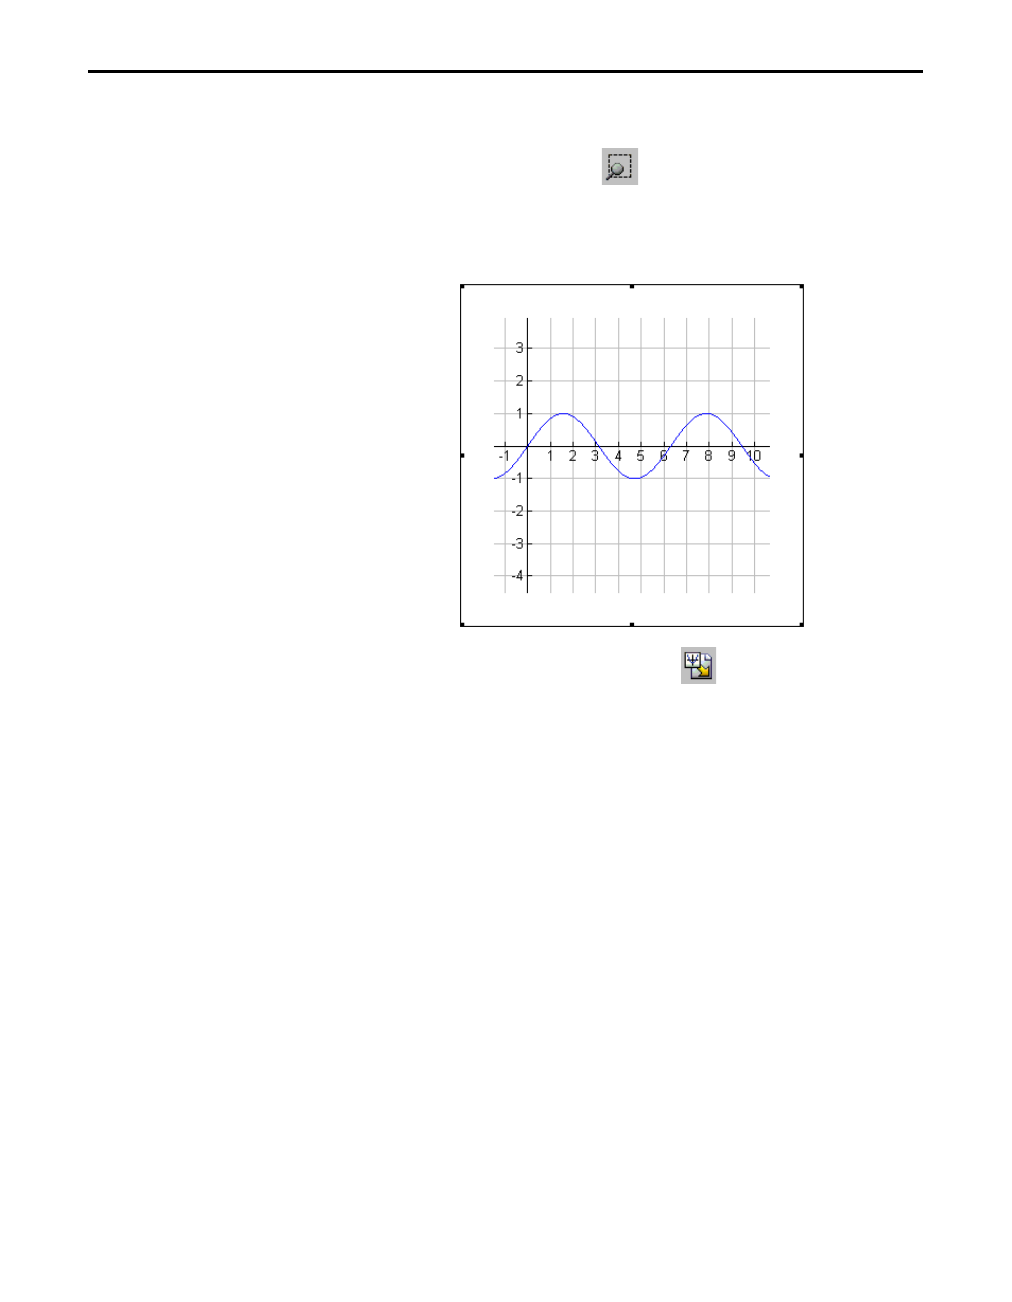
1. Double-click the graph below the “Zooming in...” paragraph.
2. Click the Zoom Box button on the Graph toolbar.
3. Click and drag the Zoom Box over the right half of the graph.
Your selection should resemble the graph below.
4. Click the Save To Document button to insert the graph
into the document.
1. Click beneath the graph and press Enter on the computer
keyboard to position the cursor at the end of the document.
2. Type the last two paragraphs from page 27 that begin with
“Double-click the above graph...” and press Enter on the
computer keyboard.
Zooming in on a
portion of the
graph
Completing the
assignment

32 Getting Started with TI InterActive!
TII_GettingStarted.doc Getting Started with TI InterActive! Karen Davis Revised: 8/22/03 12:20 PM Printed: 8/25/03 8:04 AM Page 32 of 64
To find the zeros of the graphed function:
1. Double-click the graph you just created to activate the Graph
window.
2. Click Calculate 8 Zero on the Graph toolbar. The Calculate
Zero window is displayed.
3. You will need to set a lower limit, upper limit, and an initial
guess before calculating zero.
There are two ways to set limits.
¦ You can enter numeric values in the limit entry boxes.
¦ You can click and drag the dotted limit lines on the graph
in the Graph window.
4. Type a value directly into the Guess box, or use the mouse to
click and drag your guess point on the graph.
5. After setting the initial guess and upper and lower limits,
click the Calculate button. The answer is displayed in the
Results box.
Finding zeros
of a graphed
function

Getting Started with TI InterActive! 33
TII_GettingStarted.doc Getting Started with TI InterActive! Karen Davis Revised: 8/22/03 12:20 PM Printed: 8/25/03 8:04 AM Page 33 of 64
This exercise shows you how to:
¦ Enter statistical data using the List Editor.
¦ View plotted data.
¦ Calculate a regression and display the results.
¦ Graph a regression and analyze the data.
Exercise 4: Creating a Report
In this exercise, you create a report based on observed data for
a specific airplane’s power-off glide performance at several
speeds. You then plot the data, perform a statistics regression,
and estimate the speed that will produce the minimum sink rate
for the plane.
34 Getting Started with TI InterActive!
TII_GettingStarted.doc Getting Started with TI InterActive! Karen Davis Revised: 8/22/03 12:20 PM Printed: 8/25/03 8:04 AM Page 34 of 64
You have recorded the following rates of sink after making
several timed descents at different gliding speeds. You decide to
enter the airspeeds into list L1 and the sink rates into L2.
Airspeeds (L1) Sink Rates (L2)
30 mph 600 ft./min.
40 mph 550 ft./min.
50 mph 700 ft./min.
60 mph 875 ft./min.
70 mph 1050 ft./min.
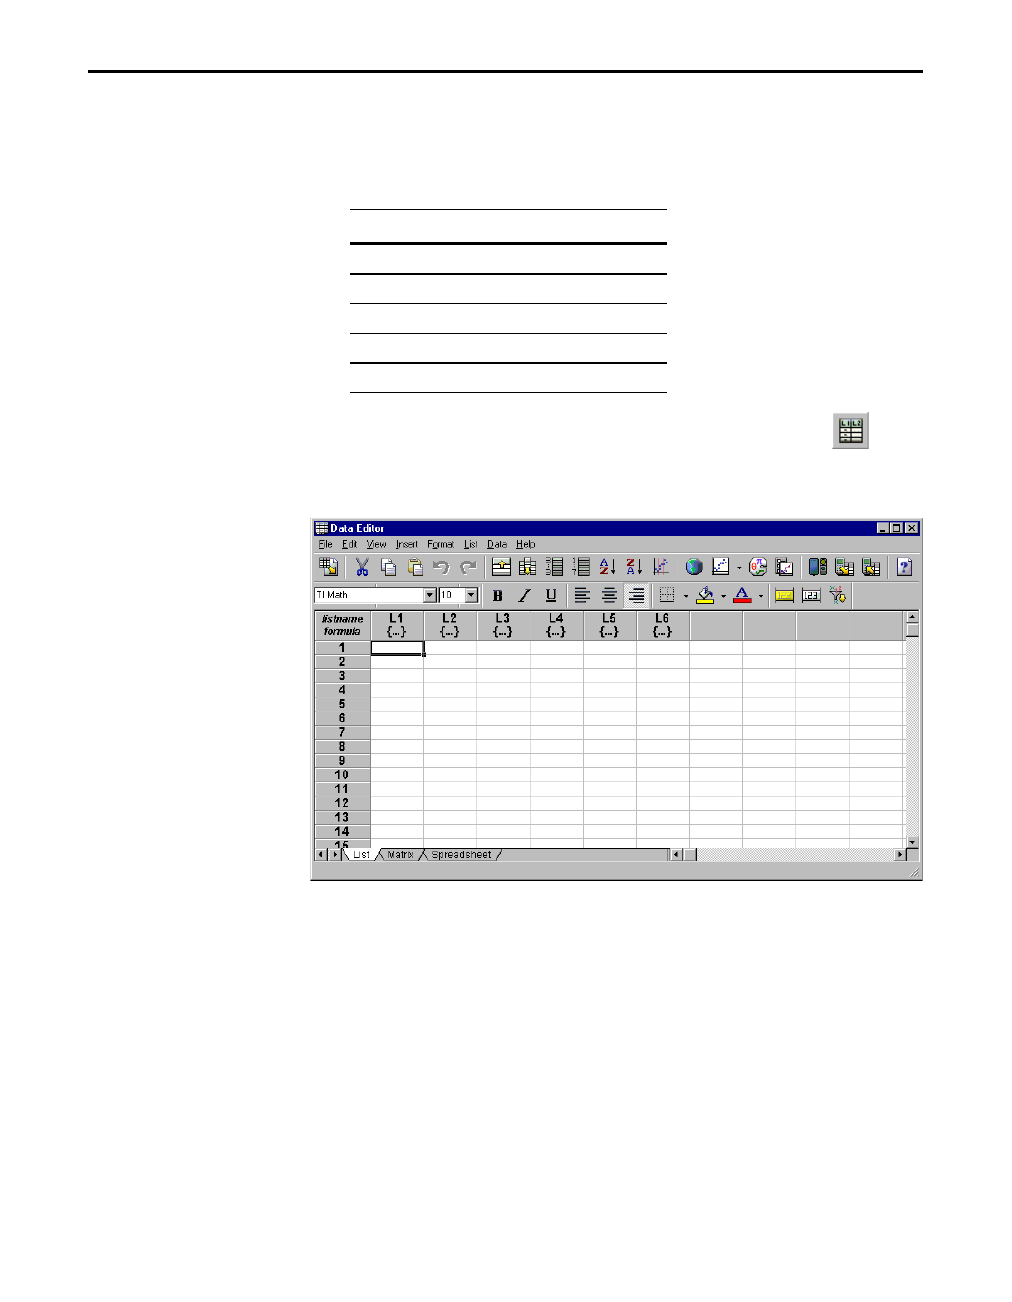
1. On the TI InterActive! toolbar, click the List button . The
List Editor is displayed, with the empty cell at the top of list L1
selected and ready for an entry.
2. Type the first airspeed, 30, and then press the down arrow key
on the computer keyboard to move to the next cell.
3. Type the next airspeed, press the down arrow key, and
continue until you have entered all the airspeeds into L1.
4. Click the empty cell at the top of list L2.
5. Type the sink rates in the second column in a similar manner,
with the number in each cell corresponding to the number in
the first column as shown in the table above.
Entering the data
TIP: The tabs at the
bottom of the editor let
you switch quickly
among list editing,
matrix editing, and
spreadsheet operations.
Getting Started with TI InterActive! 35
TII_GettingStarted.doc Getting Started with TI InterActive! Karen Davis Revised: 8/22/03 12:20 PM Printed: 8/25/03 8:04 AM Page 35 of 64
6. Click the List Editor’s Close button . The list is inserted
into the document.
L1 L2
30 600
40 550
50 700
60 875
70 1050
1. With the cursor positioned at the end of the list, press Enter
to create a new line.
2. On the TI InterActive! toolbar, locate the Graph button and
click the down arrow next to it. A group of buttons is
displayed, representing the available graph types.
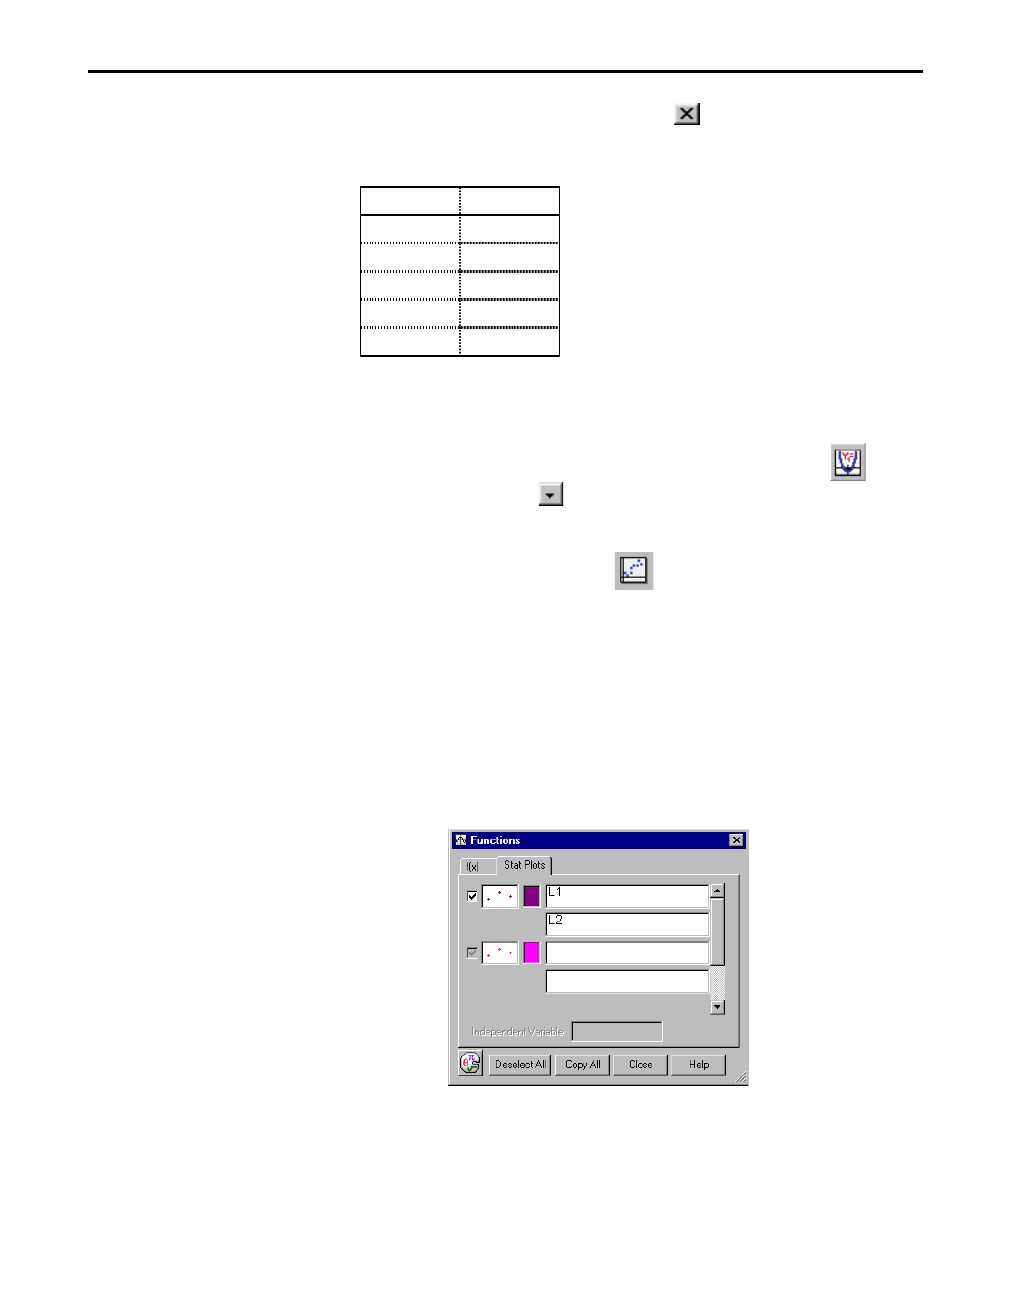
3. Click the Scatter Plot button . The Functions editor is
displayed along with a Graph window.
4. Make sure that the Stat Plots tab is selected.
5. In the uppermost text box, type L1 to specify it as the list
containing the x coordinates.
6. Press the Tab key to move to the second text box, and type L2 to
specify it as the list containing the y coordinates.
7. If it is not already checked, click the check box at the left to
select this plot. TI InterActive! plots the data points in the
Graph window. The points are not visible because they are
outside the default viewing boundaries of the Graph window.
Plotting the glide
performance

36 Getting Started with TI InterActive!
TII_GettingStarted.doc Getting Started with TI InterActive! Karen Davis Revised: 8/22/03 12:20 PM Printed: 8/25/03 8:04 AM Page 36 of 64
1. In the Graph window, click the Zoom Statistics button . The
viewing boundaries are adjusted automatically to show all the
plotted data.
2. Click the Save To Document button to close the Graph
window and insert the graph in the document.
TI InterActive! lets you calculate several types of regressions on data
stored in lists. In this exercise, you calculate a quartic regression on
the plotted pairs of airspeeds (L1) and sink rates (L2).
1. Position the cursor between the list and the graph and press
Enter on the computer keyboard.
2. Click the Stat Calculation Tool button on the
TI InterActive! toolbar. The Statistics Calculation tool is
displayed.
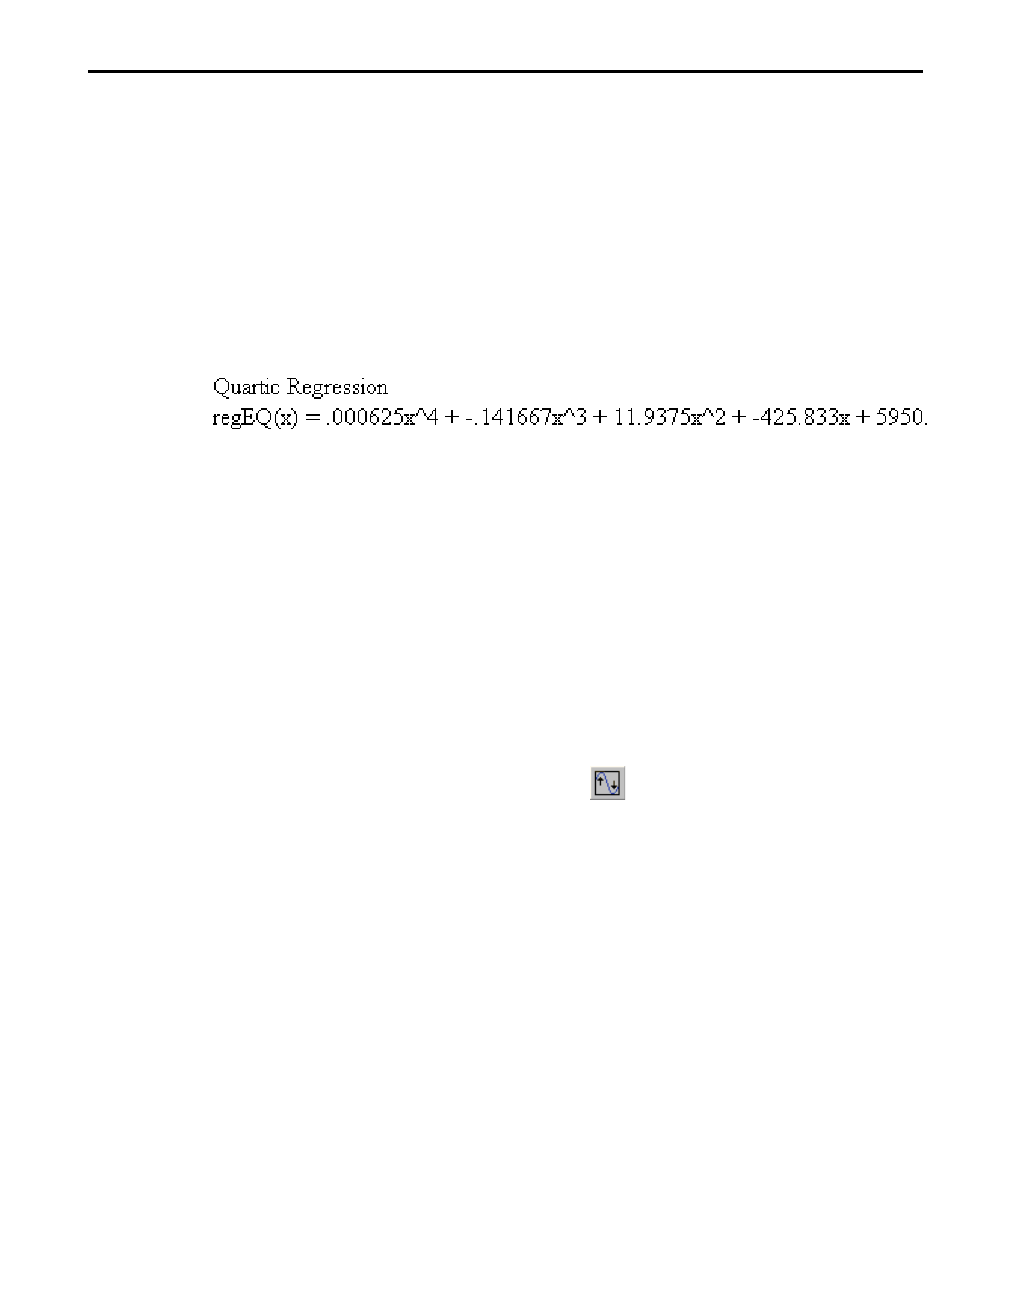
3. Click the down arrow next to Calculation Type, scroll
down through the list, and click Quartic Regression.
Viewing the
plotted data
Calculating a
regression on the
data
After
calculating
a regression
equation, you
can graph it
by entering
this name in
the graph.
Getting Started with TI InterActive! 37
TII_GettingStarted.doc Getting Started with TI InterActive! Karen Davis Revised: 8/22/03 12:20 PM Printed: 8/25/03 8:04 AM Page 37 of 64
4. In the text box labeled X List, type L1.
5. In the text box labeled Y List, type L2.
6. Click Calculate to calculate the regression equation and its
variables.
7. Click the Save Results button. TI InterActive! stores the
results in variables, closes the Statistics Calculation tool, and
displays the selected results in your document.
1. With the cursor positioned at the end of the regression
results, press Enter on the computer keyboard to move the
cursor to the next line. Type the heading Graphed regression
equation:, and then press Enter again.
2. Double-click the graph that you inserted earlier.
3. Click the f(x) tab.
4. In the uppermost text box of the f(x) tab, type regEQ(x) and
then press Enter on the computer keyboard.
5. Click the Zoom Fit button in the Graph window to adjust
the viewing boundaries.
TIP: Before saving
results to the document,
click the check boxes
next to the results you
want displayed.
Graphing the
regression
equation

38 Getting Started with TI InterActive!
TII_GettingStarted.doc Getting Started with TI InterActive! Karen Davis Revised: 8/22/03 12:20 PM Printed: 8/25/03 8:04 AM Page 38 of 64
6. In the text box for Ymin at the bottom of the graph, change
the value to 450 and press Enter. This makes it easy to see
the bottom of the regression curve.
7. Click the Save To Document button in the Graph window
to insert the graph into the document.
TI InterActive! can find the minimum value of a function between
specified starting and ending x values. For our data, the lowest
point on the function marks the speed that produces the plane’s
slowest rate of sink.
1. Double-click the graph you just created to activate the Graph
window.
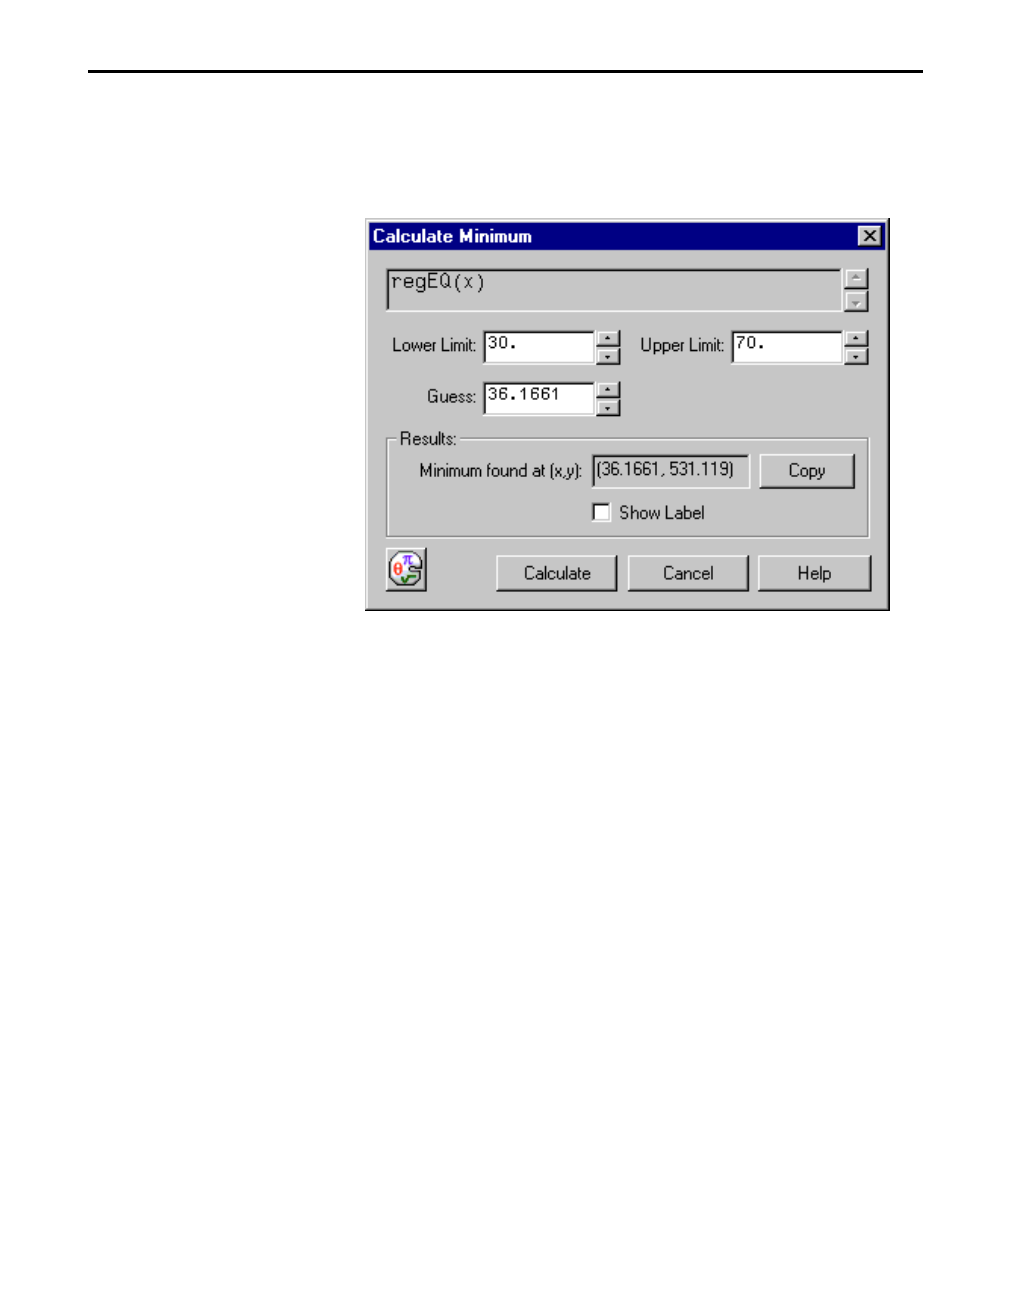
2. In the Graph window, click Calculate 8 Minimum. The
Calculate Minimum window is displayed.
Finding the
plane’s minimum
sink glide speed
Ymin text box
Getting Started with TI InterActive! 39
TII_GettingStarted.doc Getting Started with TI InterActive! Karen Davis Revised: 8/22/03 12:20 PM Printed: 8/25/03 8:04 AM Page 39 of 64
3. You can enter starting and ending x values in the limit entry
boxes or you can click and drag the limit lines on the graph.
4. Click Calculate to find the minimum x and y values.
5. Type the following sentence to complete your report. The
plane’s minimum-sink glide speed should be around 36 mph
at 531 ft./min.
Note: This is the glide
speed that will keep
the plane aloft for the
longest period of time.
However, it is not the
speed that produces
the greatest horizontal
glide distance.
40 Getting Started with TI InterActive!
TII_GettingStarted.doc Getting Started with TI InterActive! Karen Davis Revised: 8/22/03 12:20 PM Printed: 8/25/03 8:04 AM Page 40 of 64
This exercise shows you how to:
¦ Select and extract data from a Web page.
¦ Plot the extracted data and calculate a regression.
¦ Display the plotted data and the regression equation together
for visual comparison.
Exercise 5: Analyzing Data from a Web Site
You can extract data directly from a Web page into a
TI InterActive! document. This exercise is similar to the
previous one, except that in this case you extract automobile
braking distance data from a Web page and analyze it.
Data provided by Michael J.
Shepston & Associates,
http://www.scottsdalelaw.com/
shepston/braking.html
Getting Started with TI InterActive! 41
TII_GettingStarted.doc Getting Started with TI InterActive! Karen Davis Revised: 8/22/03 12:20 PM Printed: 8/25/03 8:04 AM Page 41 of 64
You don’t need a working Internet connection to perform this
exercise. The sample Web page was copied to your hard disk
during installation of TI InterActive!.
1. On the TI InterActive! toolbar, click the New button .
TI InterActive! displays a new, blank document.
2. Type the title Effect of Speed on Braking Distance at the top
of the page, and press Enter on the computer keyboard.
3. Type the heading Data extracted from braking.htm:, and
press Enter on the computer keyboard.
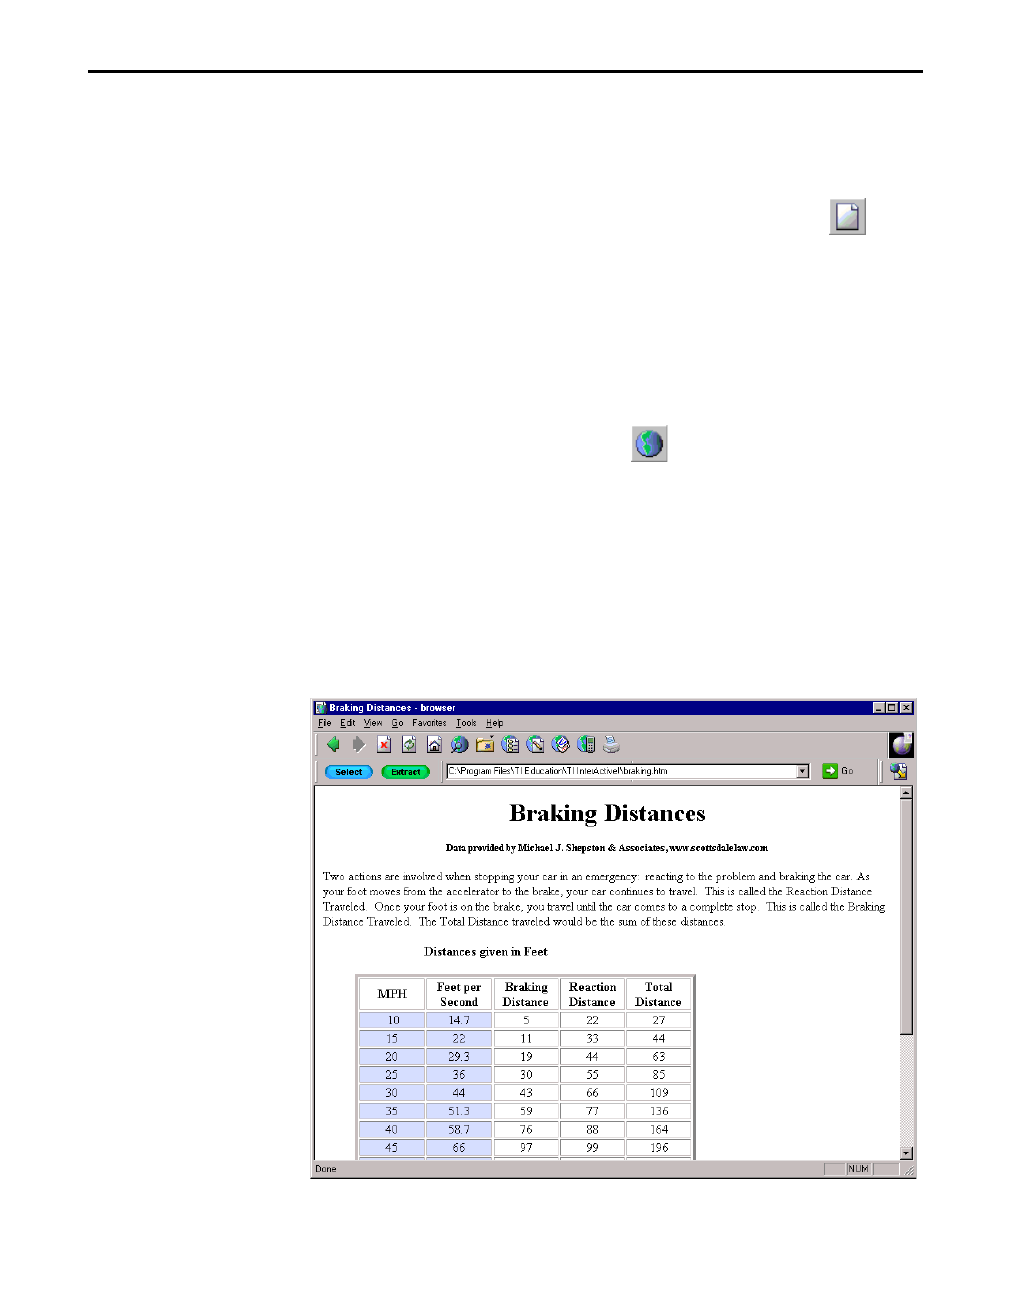
4. Click the Web Browser button . The TI InterActive!
browser opens.
5. On the browser’s menu, click File 8 Open.
6. If necessary, navigate to the folder in which you installed
TI InterActive!.
7. Click the filename braking.htm, and click Open. The browser
displays a page with a table of braking distance data.
Opening the
sample Web page
42 Getting Started with TI InterActive!
TII_GettingStarted.doc Getting Started with TI InterActive! Karen Davis Revised: 8/22/03 12:20 PM Printed: 8/25/03 8:04 AM Page 42 of 64
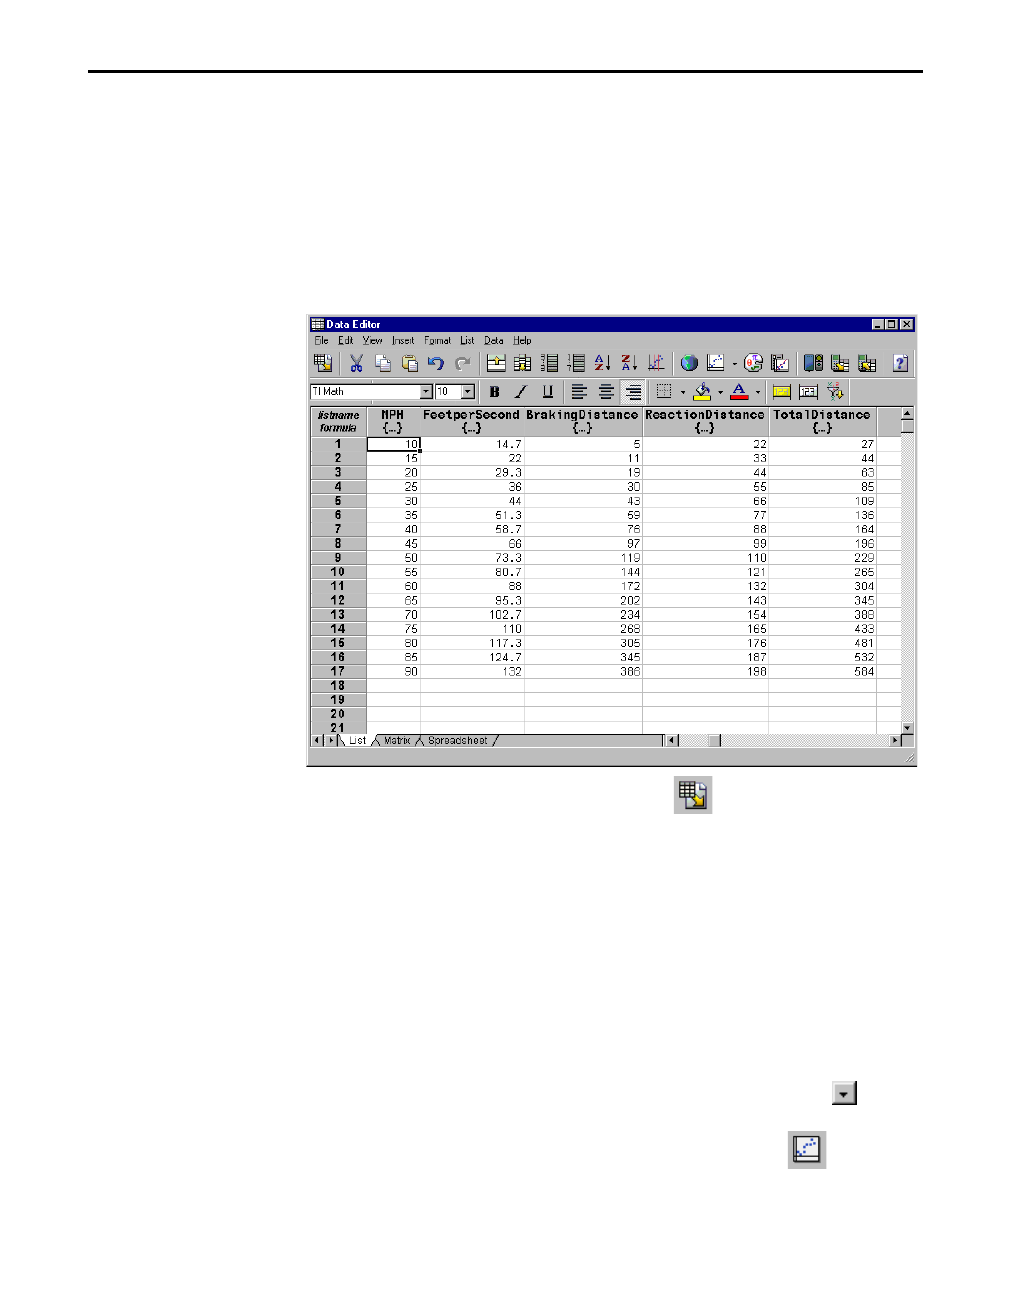
When you extract Web data, TI InterActive! creates lists in the
List Editor and places the data in those lists.
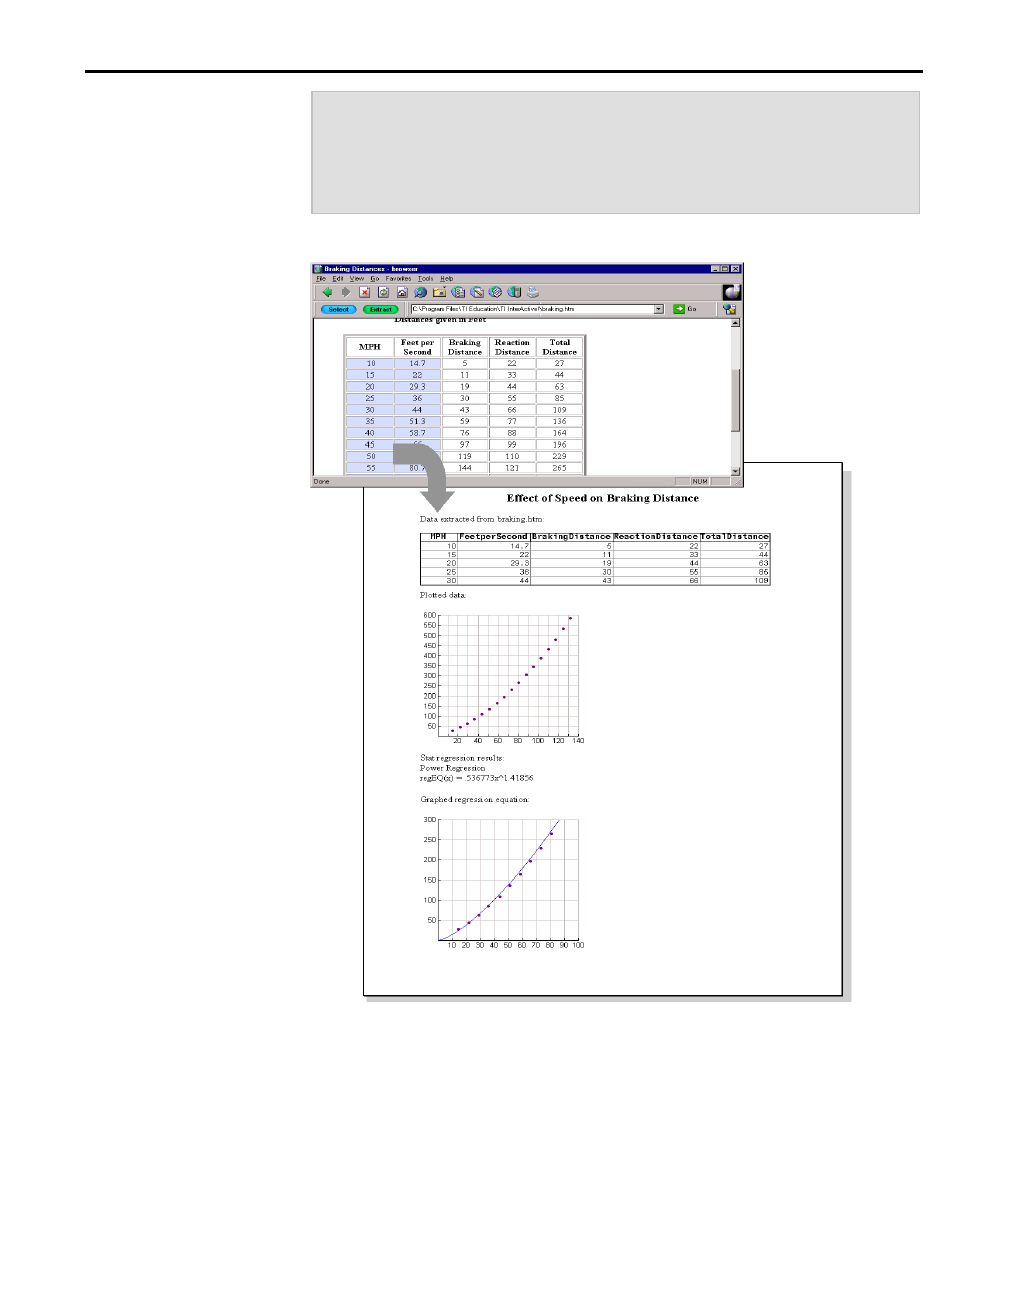
1. Click the Select button at the top of the browser window. The
browser highlights the table of braking distance data.
2. Click the Extract button. The List Editor is displayed, with
the Web data copied to lists.
3. Click the Save To Document button to insert the lists into
the document. Adjust the list screen to view all columns of
data.
Now that you have the braking distance data copied into lists,
you can create a scatter plot of the speeds (x) against the total
stopping distances (y).
1. With the cursor positioned at the end of the list, press Enter on
the keyboard, type Plotted data:, and then press Enter again to
create a heading for the regression results.
2. On the TI InterActive! toolbar, click the down arrow next
to the Graph button.
3. From the drop-down buttons, click Scatter Plot . The
Functions editor is displayed.
Extracting the
data
TIP: To select only
specific rows, drag
through the rows
instead of clicking the
Select button.
Note: See page 53 for
details about resizing
objects.
Plotting the
braking
performance
Getting Started with TI InterActive! 43
TII_GettingStarted.doc Getting Started with TI InterActive! Karen Davis Revised: 8/22/03 12:20 PM Printed: 8/25/03 8:04 AM Page 43 of 64
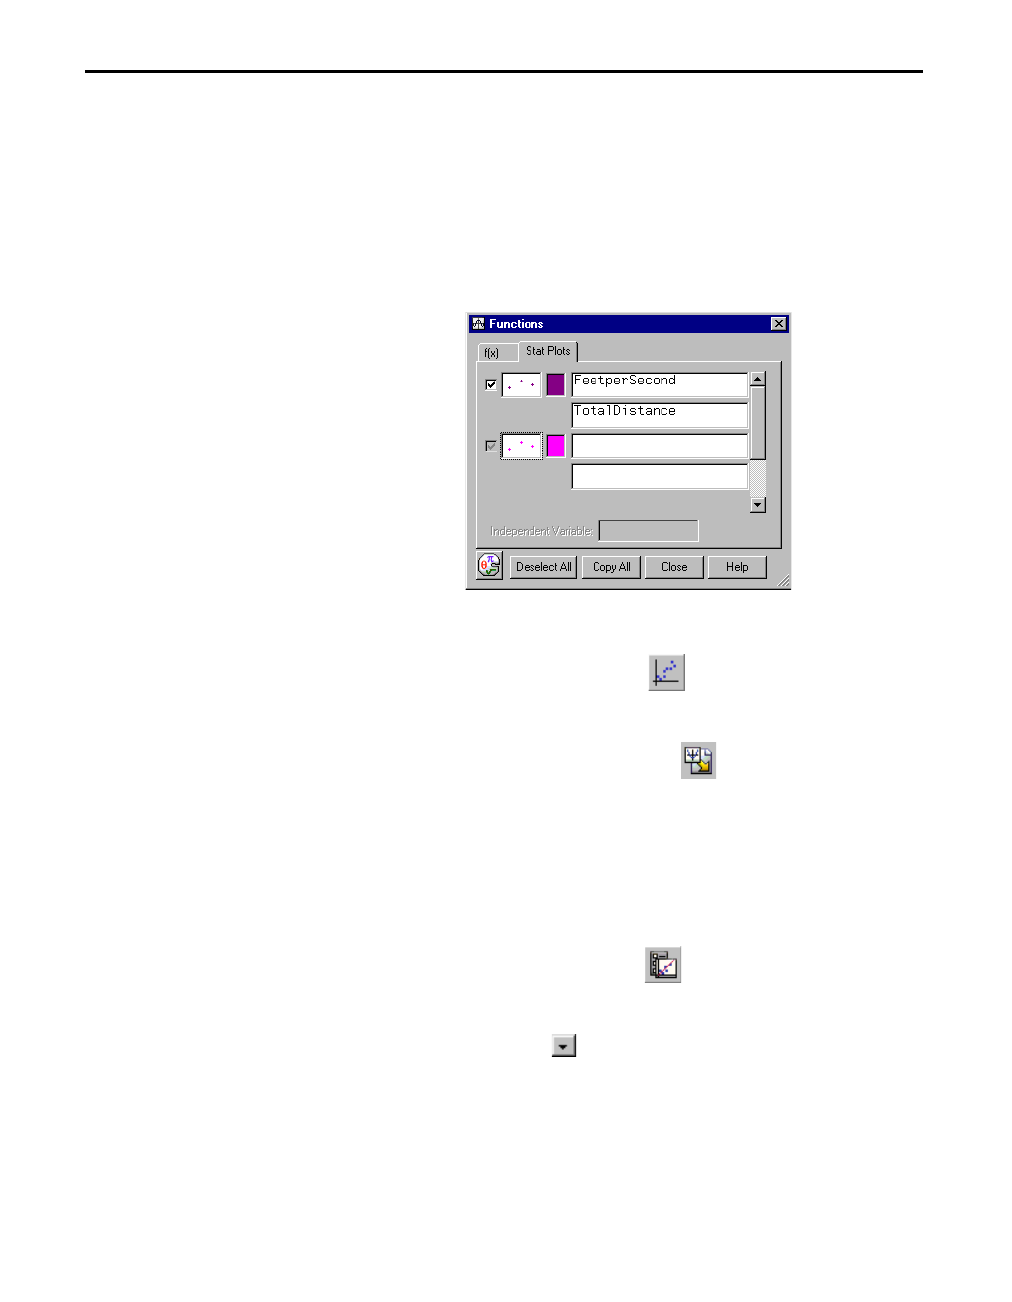
4. Make sure that the Stat Plots tab is selected. In the
uppermost text box, type FeetperSecond to specify it as the
list containing the x coordinates.
5. Press the Tab key to move to the second text box, and type
TotalDistance to specify it as the list containing the y
coordinates.
6. Press Enter on the computer keyboard.
7. Click the Zoom Statistics button in the Graph window to
adjust the viewing boundaries.
8. Click the Save To Document button to close the Graph
window and insert the graph in the document.
1. With the cursor positioned at the end of the graph, press
Enter on the computer keyboard, type the heading Stat
regression results:, and then press Enter again.
2. Click the Stat Calculation button on the TI InterActive!
toolbar. The Statistics Calculation tool is displayed.
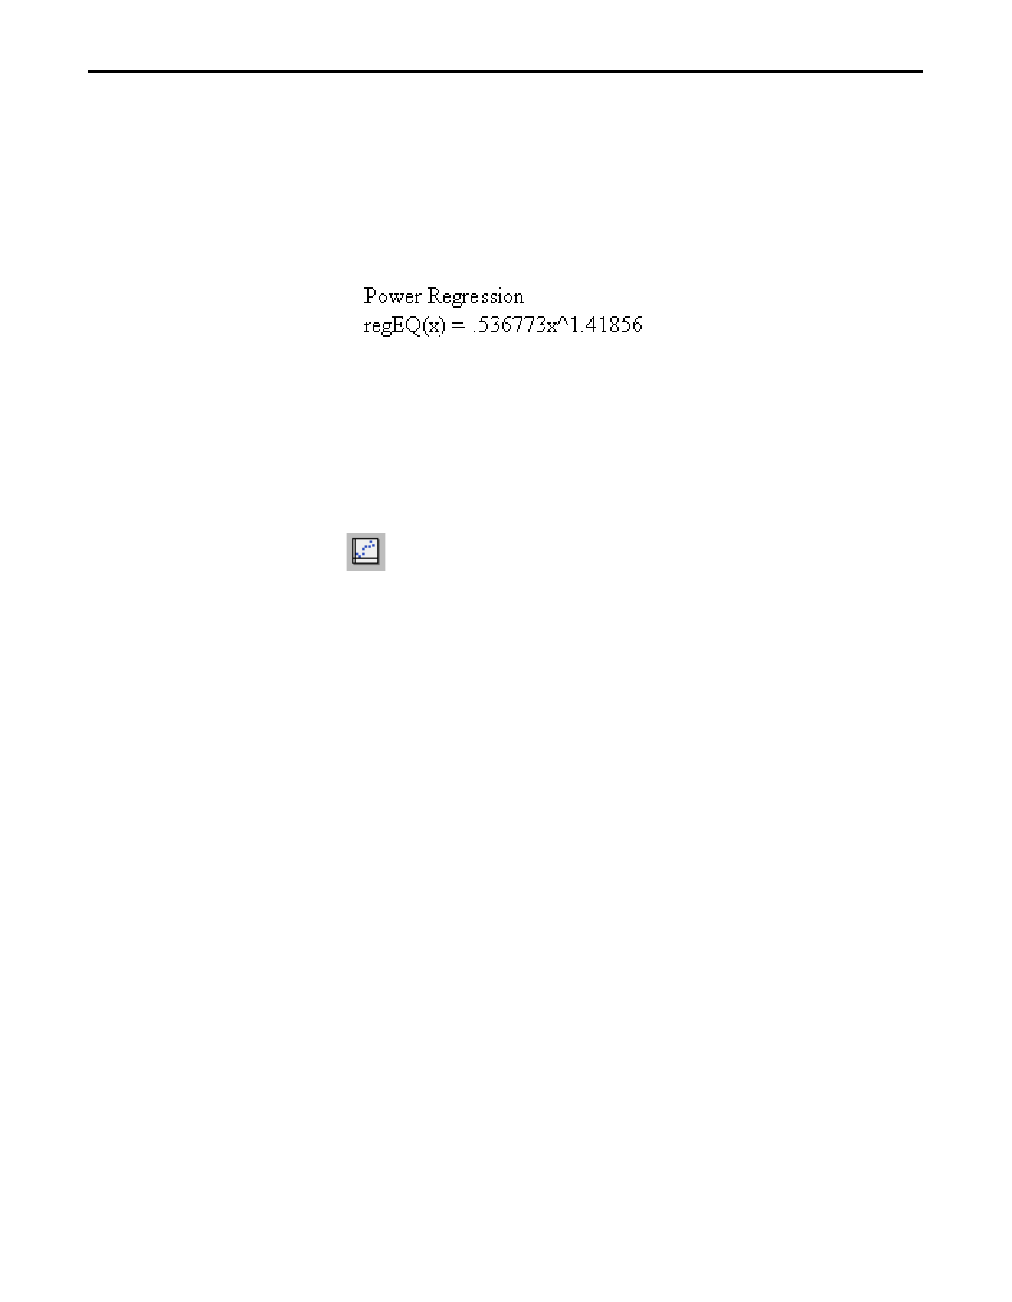
3. Click the down arrow next to Calculation Type, scroll
down through the list, and click Power Regression.
4. In the text box labeled X List, type FeetperSecond.
5. In the text box labeled Y List, type TotalDistance.
Calculating a
regression on
the data
44 Getting Started with TI InterActive!
TII_GettingStarted.doc Getting Started with TI InterActive! Karen Davis Revised: 8/22/03 12:20 PM Printed: 8/25/03 8:04 AM Page 44 of 64
6. Click Calculate to calculate the results and display the
Calculation Results tab.
7. Click the Save Results button. TI InterActive! stores the
results in variables, closes the Statistics Calculation tool, and
displays the selected results in the document.
1. With the cursor positioned at the end of the regression
results, press Enter on the computer keyboard, type the
heading Graphed regression equation:, and then press Enter
again.
2. On the TI InterActive! toolbar, click the Scatter Plot button
.
3. Click the Stat Plots tab.
4. In the uppermost text box, type FeetperSecond.
5. In the second text box, type TotalDistance.
6. Press Enter on the computer keyboard. (If it is not already
checked, click the check box at the left to select this plot.)
7. Select the f(x) tab.
8. In the uppermost text box of the f(x) tab, type regEQ(x) and
then press Enter on the computer keyboard. TI InterActive!
graphs the regression equation.
Displaying the
plotted data with
the equation
Getting Started with TI InterActive! 45
TII_GettingStarted.doc Getting Started with TI InterActive! Karen Davis Revised: 8/22/03 12:20 PM Printed: 8/25/03 8:04 AM Page 45 of 64
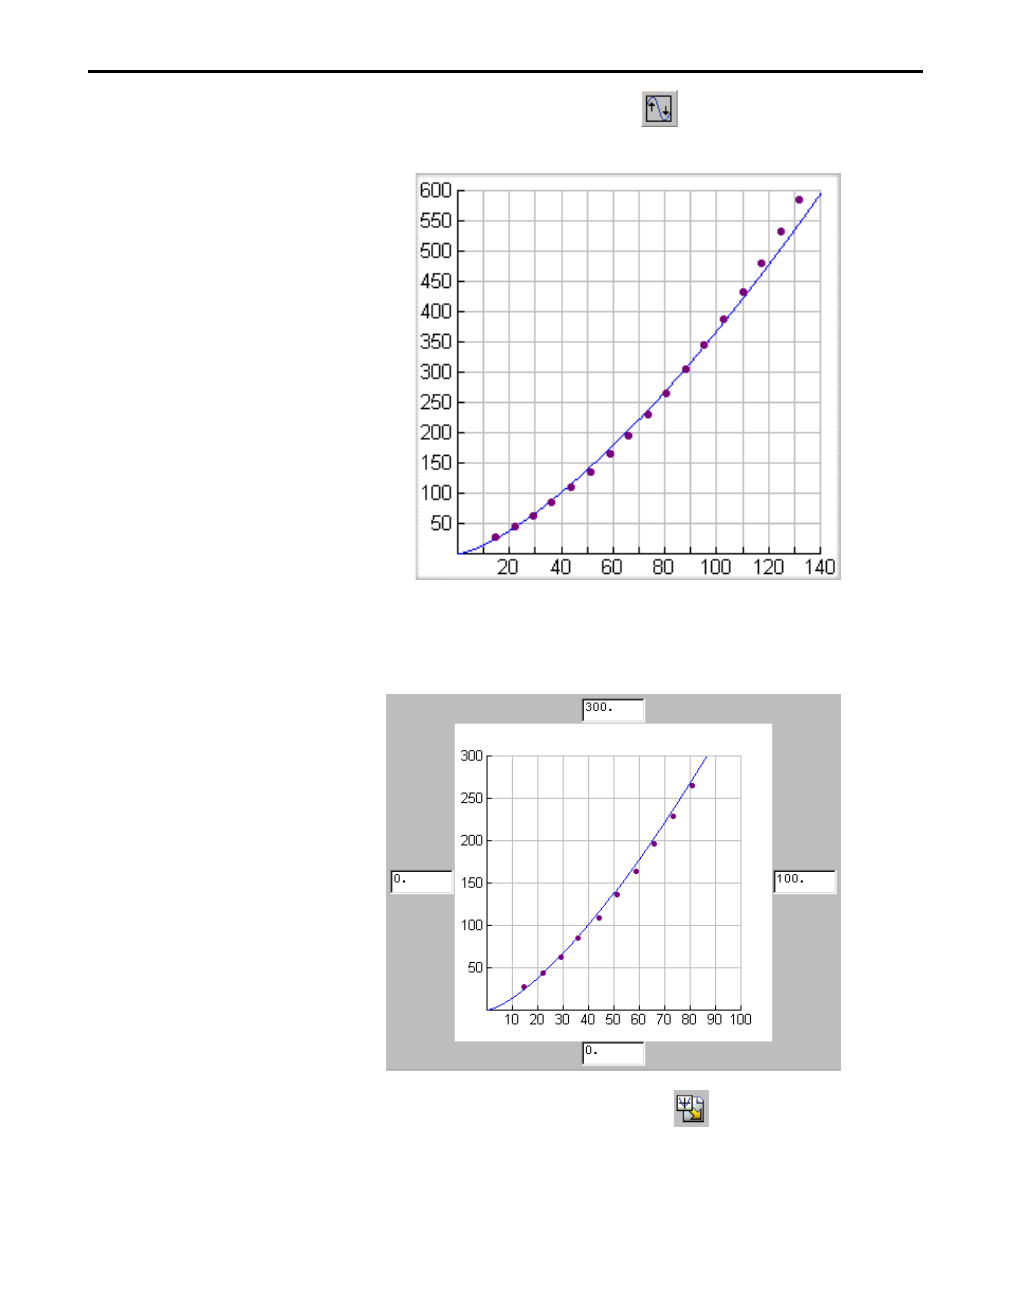
9. Click the Zoom Statistics button in the Graph window to
adjust the viewing boundaries.
10. Format the graph to show the relevant portion of the function.
(You may note that the function continues in the third
quadrant, but only positive values are relevant.)
11. Click the Save To Document button to close the Graph
window and insert the graph in the document. You can visually
compare the plotted data and the graphed regression equation.
TIP: To format this
graph, click Format.
Change Xmin to 0,
Xmax to 100, Ymin to 0,
Ymax to 300, Xscale to
10, and Yscale to 50.
TIP: You can double-
click the Stat
Regression results any
time to explore a
different regression.
46 Getting Started with TI InterActive!
TII_GettingStarted.doc Getting Started with TI InterActive! Karen Davis Revised: 8/22/03 12:20 PM Printed: 8/25/03 8:04 AM Page 46 of 64
This exercise shows you how to:
¦ Insert an image into a TI InterActive! document.
¦ Set text-wrapping options for an inserted object.
¦ Set your preferences for TI InterActive!
¦ Print a TI InterActive! document.
Exercise 6: Reviewing Miscellaneous Functions
TI InterActive! includes several features that can enhance the
quality of the report or assignment. In this exercise, you insert
images, set special features for these images, and print a
TI InterActive! document.
Getting Started with TI InterActive! 47
TII_GettingStarted.doc Getting Started with TI InterActive! Karen Davis Revised: 8/22/03 12:20 PM Printed: 8/25/03 8:04 AM Page 47 of 64
Inserting images into a TI InterActive! document is similar to
inserting images into most word processors. TI InterActive! can
accommodate .bmp, .eps, .gif, .jpg, .tif, .wmf, and .wpg file types.
1. On the TI InterActive! toolbar, click the New button to start
a new, blank document.
2. On the TI InterActive! menu bar, click Insert 8 Picture. If
necessary, navigate to the folder containing the image you
want to insert.
3. Click the file name, and then click the Open button to insert
the image in the document.
If you prefer, you can resize the images you insert in
TI InterActive! documents.
Resizing images in a TI InterActive! document is similar to
resizing images in most word processors. To resize an image,
click the image and either:
• Drag the selection handles.
– or –
• Click Edit 8 Object 8 Format.
Inserting images
in TI InterActive!
Resizing images
in TI InterActive!
48 Getting Started with TI InterActive!
TII_GettingStarted.doc Getting Started with TI InterActive! Karen Davis Revised: 8/22/03 12:20 PM Printed: 8/25/03 8:04 AM Page 48 of 64
To modify the position of text associated with an inserted object,
use TI InterActive!’s text-wrapping features.
1. Click to the right of the picture that you inserted earlier, and
press Enter on the computer keyboard. Type This is a test of
TI InterActive!’s text-wrapping options, and press Enter.
2. Click the picture. A selection box appears around the picture
to show that it is selected.
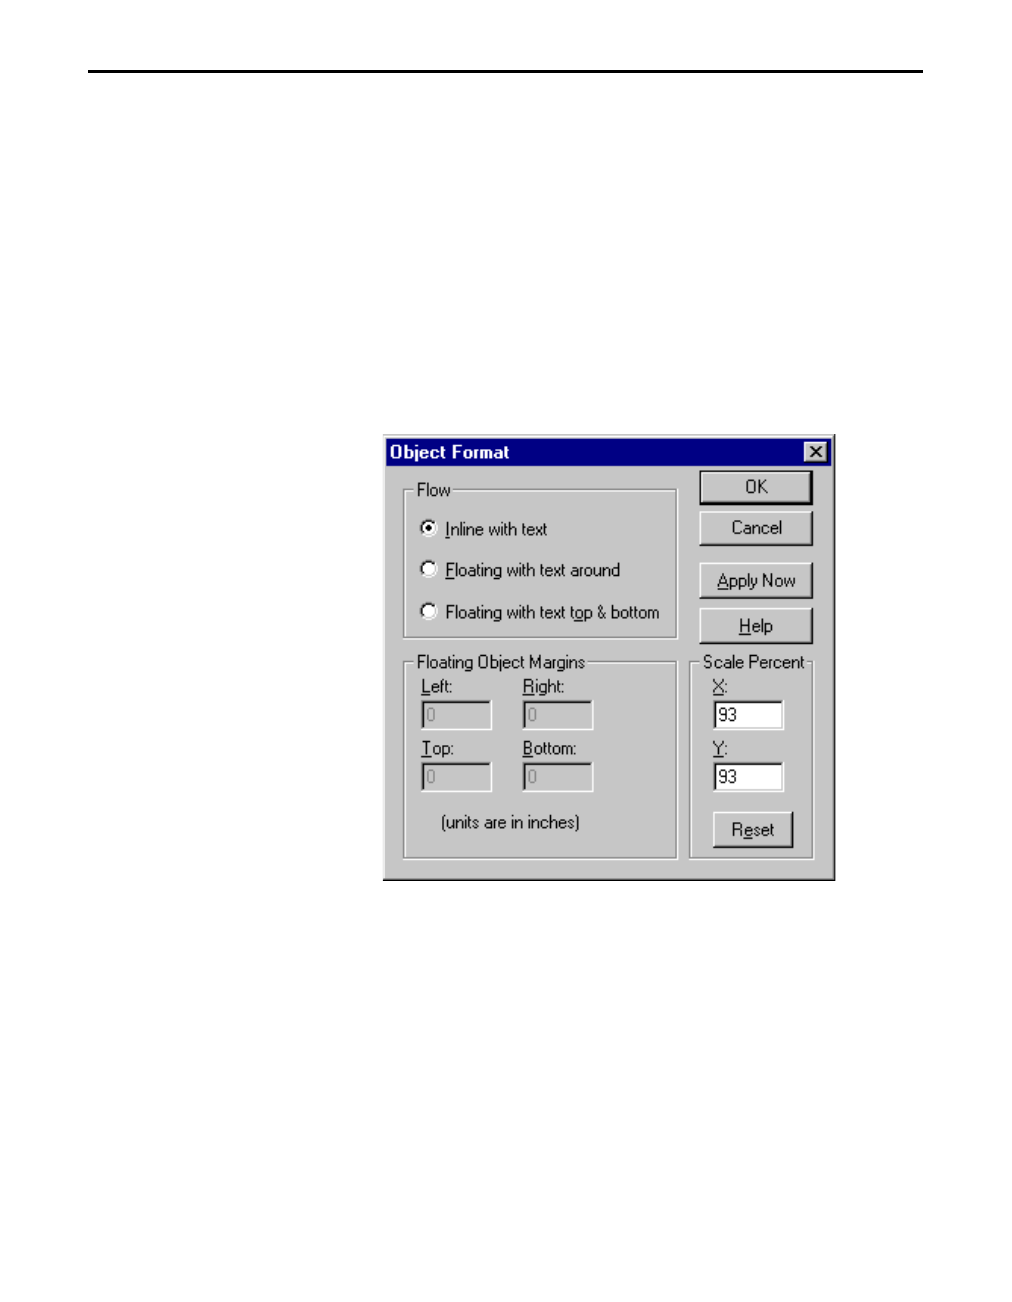
3. On the TI InterActive! menu bar, click
Edit 8 Object 8 Format. The Object Format dialog box is
displayed with its default values.
4. In the box labeled Flow, select the desired option, and
click OK.
If you select one of the two “Floating...” options, the distance
between the image and the text can be modified using the
Floating Object Margins option. Also, scaling percentages can
be applied when selecting either of the “Floating...” options.
Setting text-
wrapping options
for inserted
objects
NOTE: See page 54 for
more information about
using floating objects.

Getting Started with TI InterActive! 49
TII_GettingStarted.doc Getting Started with TI InterActive! Karen Davis Revised: 8/22/03 12:20 PM Printed: 8/25/03 8:04 AM Page 49 of 64
The Edit 8 Preferences menu provides customization options for:
Document, Math Box, Graph, List Editor, Table, Web Browser,
and Screen Capture.
For example, Math Box preferences let you specify Math Box
height and width, input and output mode, margins and scaling,
and the font type, size, or color of the input and output.
In older versions of TI InterActive!, you also set communications
preferences for the settings used to link to a connected device:
type of device, port, and cable. In this version, the auto-detect
feature determines the settings automatically. So you no longer
need to set communications preferences.
Printing in TI InterActive! is similar to most word processors. You
can also set several printing options. For example:
1. On the TI InterActive! menu bar, click File 8 Print.
2. Click the Properties button on the Print window.
3. In the Orientation box, you can choose to print pages
vertically (portrait) or horizontally (landscape).
Setting
preferences
Printing
documents in
TI InterActive!

50 Getting Started with TI InterActive!
TII_GettingStarted.doc Getting Started with TI InterActive! Karen Davis Revised: 8/22/03 12:20 PM Printed: 8/25/03 8:04 AM Page 50 of 64
¦ Document A TI InterActive! file that contains text, data,
and interactive objects that can be saved, printed, or
e-mailed.
¦ Object A specific non-text item in the document that can
be moved, edited, and updated. TI InterActive! objects include
the Math Box, Graph, List Editor, Spreadsheet, etc.
¦ Interactive objects Refers to the fact that most
TI InterActive! objects share data so that updating one object
may automatically cause subsequent objects to be updated.
¦ Integrated math system The math system contains key
tools and capabilities that work together dynamically so that
the use of multiple programs may be unnecessary.
Essential Skills for Using TI InterActive!
This section includes a list of some things that can help you use
TI InterActive! effectively.
Definitions

Getting Started with TI InterActive! 51
TII_GettingStarted.doc Getting Started with TI InterActive! Karen Davis Revised: 8/22/03 12:20 PM Printed: 8/25/03 8:04 AM Page 51 of 64
A TI InterActive! document is composed of text and objects.
Each object has unique functionality. For example, to perform a
calculation, select Insert 8 Math Box and enter an expression
into the object (Math Box) that is created. Press the Enter key,
which in this case, causes the expression to be evaluated.
Use the Insert menu or the TI InterActive! toolbar to insert objects
into the document. A description of each object follows.
Object Description
Math Box Perform calculations and evaluate expressions.
Graph Graph rectangular, polar, and parametric functions; plot
lists.
Table Perform numerical evaluations of functions.
List Create and edit lists (similar to lists on the device).
Matrix Create and edit matrices.
Spreadsheet Compute values in a spreadsheet.
Stat Calculation
Tool
Calculate a statistics regression of a data set.
Stat Tests &
Intervals Tool
Perform statistical tests and intervals.
Slider Control Insert a slider that lets you change variable values.
Hyperlink Insert a hyperlink to a Web address.
Page Break Insert a page break.
Math Section Break Reset all variables for the section following the break.
Screen Capture Insert a snapshot from an attached, supported device
such as a TI-83 or TI-83 Plus.
Picture Insert images in various formats.
Object Insert objects external to TI InterActive! such as
Microsoft Excel, video clips, etc.
Inserting objects
52 Getting Started with TI InterActive!
TII_GettingStarted.doc Getting Started with TI InterActive! Karen Davis Revised: 8/22/03 12:20 PM Printed: 8/25/03 8:04 AM Page 52 of 64
Objects can be saved to the document to preserve their
characteristics at any time. In this way, the saved information may
be modified and updated to facilitate mathematical exploration.
Some objects, such as the Math Box, are automatically saved to the
document upon entering information. Other objects, such as the
graph and list editors, require you to specifically save the
information to the document.
Look for the Save To Document item
under the File menu in each
component. A corresponding icon is
also available. The icon is usually
positioned in the leftmost position of
the toolbar for the various object
editors.
For example, is the Save To
Document icon for the List Editor.
You might want to open an object so you can view or change the
contents of the object. There are three ways to open an object
that has been saved to a document.
¦ Using the mouse, simply point to the object and then double
click.
¦ Using the mouse, point to the object and single click. Then go to
the menu and select Edit 8 Object 8 Open/Activate.
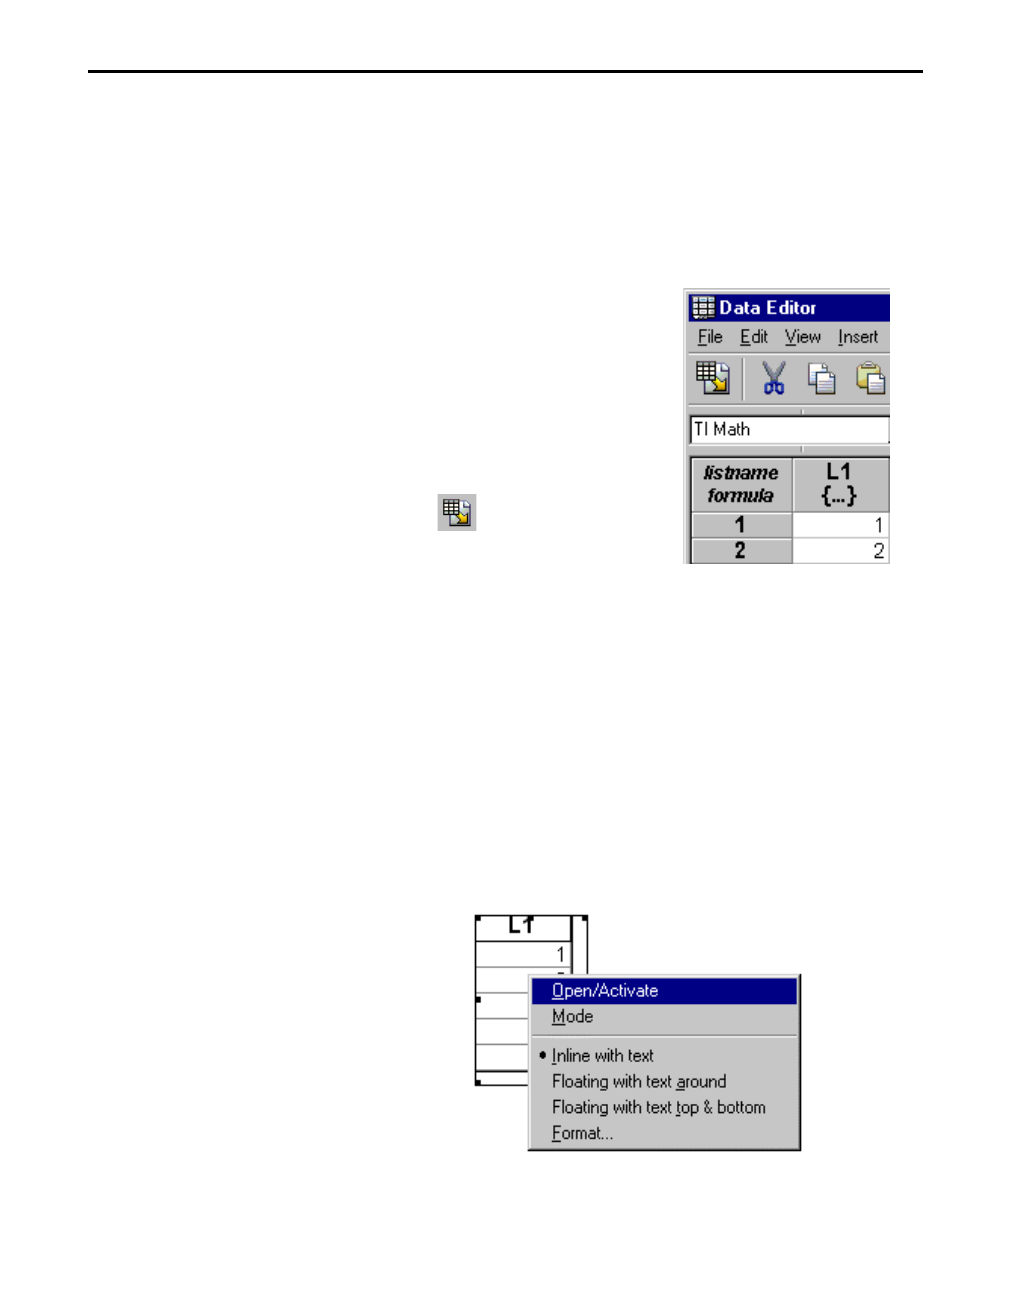
¦ Using the mouse, point to the object and then right click. A
menu appears as shown below. Click on Open/Activate.
Saving objects
Opening objects
Getting Started with TI InterActive! 53
TII_GettingStarted.doc Getting Started with TI InterActive! Karen Davis Revised: 8/22/03 12:20 PM Printed: 8/25/03 8:04 AM Page 53 of 64
There are two ways to resize an object.
¦ To resize an object that has been saved to the document,
select the object with a right mouse click, select Format from
the right-click menu, and change the resize settings as
desired.
¦ Select the object and drag the resize handles to an
appropriate size.
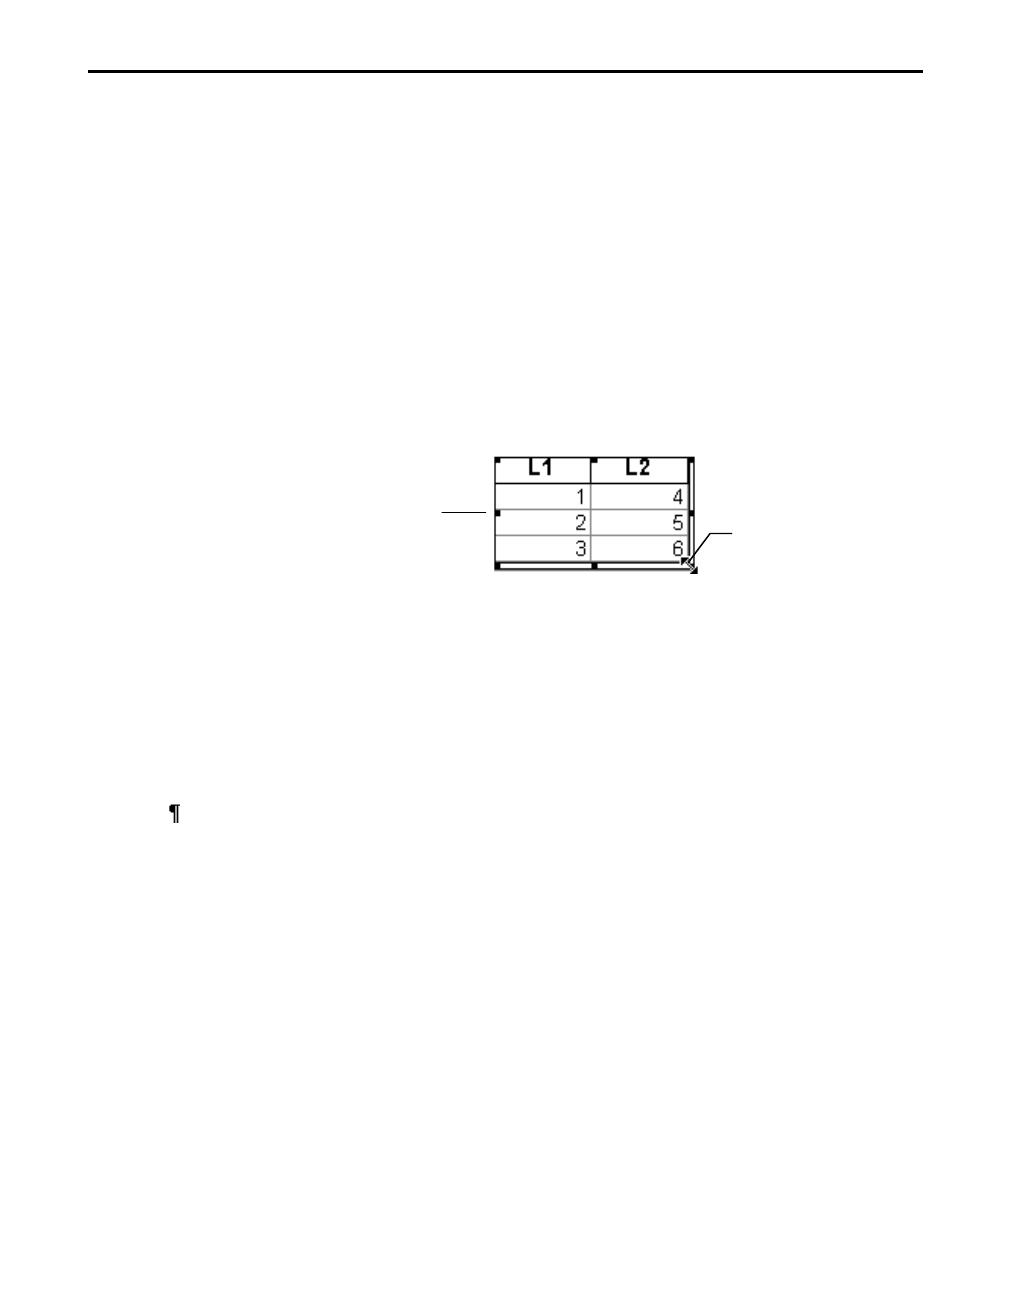
Resize handles are the small squares located on the selection
outline. In the example below, the diagonal arrow cursor next
to the 6 indicates that the list object can be resized by
dragging the mouse.
To move an object, point to the object with your mouse and drag
it to the new location. If the object does not drop at the location
you want, it may be because there isn’t an empty space or
sufficient room. Since objects are inserted into the document as
characters, there must be an empty space with sufficient room in
which to place the object. “Empty spaces” are found next to
existing objects or text and on empty lines.
Sometimes it may appear that there is an empty line at the end of
the document when there is not.
There are two ways to delete objects that have been inserted in a
TI InterActive! document.
¦ Point to the object using the mouse and single click. Then
press the Delete key on the computer keyboard.
¦ For objects that have been inserted as inline-with-text objects
(see next page), position the cursor to the right of the object and
press the Backspace key on the computer keyboard.
Resizing objects
TIP: This method is
especially useful for
resizing list and
spreadsheet objects.
Moving objects
TIP: Use View 8
Nonprinting Characters,
which displays line
breaks as , to view the
lines in a document.
Deleting objects
Resize handle Resize cursor

54 Getting Started with TI InterActive!
TII_GettingStarted.doc Getting Started with TI InterActive! Karen Davis Revised: 8/22/03 12:20 PM Printed: 8/25/03 8:04 AM Page 54 of 64
The default for TI InterActive! is to create objects as
inline-with-text objects. To place objects precisely in the
document, convert them to floating objects.
To convert objects to floating objects, select the object and then
select one of the Edit 8 Object menu items.
¦ Inline with text Causes the object to float in line with the
text.
¦ Floating with text around Causes the object to float on the
page with text or other inline objects flowing around it.
¦ Floating with text top & bottom Causes the object to float
on the page with text or another inline object above and
below it.
Inline with text Floating with
text around
Floating with text
top & bottom
To move a floating object, drag the object with the mouse to the
desired location. For additional control, select the object and use
the arrow keys on the computer keyboard to position the object
on the page.
If two or more objects are floating objects, they can be placed
adjacent to each other or overlapping. Once an object is changed
to floating and placed in the document, it does not change its
position unless you move it.
Using floating
objects
TIP: The Edit 8 Object
menu is also available
via a right-mouse-click
on the object.
Getting Started with TI InterActive! 55
TII_GettingStarted.doc Getting Started with TI InterActive! Karen Davis Revised: 8/22/03 12:20 PM Printed: 8/25/03 8:04 AM Page 55 of 64
The TI InterActive! math system is dynamic
and performs updates of all variables whenever
a new object is defined, modified, or moved.
This feature enables new ways in which to
illustrate ideas and concepts. It may also
require some experience in order to know what
to expect.
Each object has an evaluation point that determines when its
information is available for evaluation by the math system.
Evaluations occur in a specific order.
¦ Objects whose evaluation point appears above or to the left
of other objects’ evaluation points are evaluated first.
¦ Subsequent objects are evaluated in this spatial order until all
objects in the document are evaluated.
This evaluation occurs many times during the course of creating
or editing a document. The example below illustrates the
importance of the math evaluation order.
Document 1 Document 2
In Document 1, a is defined as 20 and 30 in consecutive Math
Boxes on the same line. In Document 2, the definition order is
reversed, and a is defined as 30 and 20, again in consecutive Math
Boxes on the same line. The position of the second Math Box is
significant to the evaluation of the third Math Box, which
contains the expression factor(a). In the first document, a is equal
to 30 when the third Math Box is evaluated. In the second
document, a is equal to 20 when the third Math Box is evaluated.
Math updates

56 Getting Started with TI InterActive!
TII_GettingStarted.doc Getting Started with TI InterActive! Karen Davis Revised: 8/22/03 12:20 PM Printed: 8/25/03 8:04 AM Page 56 of 64
An additional aspect of math updates is the location of the
evaluation points for each object. For all objects (except the Math
Box, graph, and matrix), the evaluation point is located at the top-
left corner of the object. For the Math Box, graph, and matrix, the
evaluation point is located at the bottom-right corner. To view the
evaluation points in a document, select the View 8 Nonprinting
Characters menu option. A small dot displayed on the object
indicates its evaluation point.
It is important to review the default preferences when you first
install TI InterActive! This will help you understand the results
that you see. Go to the Edit 8 Preferences menu to select
preferences for the following items.
¦ Document
¦ Math Box
¦ Graph
¦ List Editor
¦ Table
¦ Web Browser
¦ Screen Capture
Setting
preferences

Getting Started with TI InterActive! 57
TII_GettingStarted.doc Getting Started with TI InterActive! Karen Davis Revised: 8/22/03 12:20 PM Printed: 8/25/03 8:04 AM Page 57 of 64
The Catalog, found in the Math Palette, includes information and
examples for every TI InterActive! math command.
To open it, select the Catalog icon , or select
Tools 8 Command Catalog on the Math Palette. Click the Details
button to see examples for the selected command.
Using the catalog

58 Getting Started with TI InterActive!
TII_GettingStarted.doc Getting Started with TI InterActive! Karen Davis Revised: 8/22/03 12:20 PM Printed: 8/25/03 8:04 AM Page 58 of 64
To find out more about: Look here in online Help:
Using the math, algebra, and statistics
functions not covered in this book
Functions & Instructions
Graphing parametric and polar equations Graphing: Creating a graph: Defining
f
unctions for graphing
Creating and manipulating matrices Matrices
Performing spreadsheet operations Spreadsheets
Capturing a handheld’s screen or
transferring data between TI InterActive!
and a connected device
Linking to a Graphing Handheld, CBL,
CBL 2, or CBR
Collecting samples from a connected
CBL, CBL 2, or CBR data-collection
tool
Linking to a Graphing Handheld, CBL,
CBL 2, or CBR; Collecting and plotting
Quick Data lists
Extracting data from a Web page Web Browser: Extracting data from a web
p
age
Inserting a link to a Web page into a
TI InterActive! document
Web Browser: Inserting a hyperlink in a
document
Where Do I Go from Here?
Now that you have the skills for building TI InterActive!
documents, you might want to explore more features. The built-
in documentation, which is accessible through the Help menu
and various Help buttons, can help you master the
TI InterActive! software.

Getting Started with TI InterActive! 59
TII_GettingStarted.doc Getting Started with TI InterActive! Karen Davis Revised: 8/22/03 12:20 PM Printed: 8/25/03 8:04 AM Page 59 of 64
Home Page: education.ti.com
KnowledgeBase and
E-mail Inquiries:
education.ti.com/support
Phone: (800) TI-CARES (800) 842-2737
For U.S., Canada, Mexico, Puerto
Rico, and Virgin Islands only
International
Information:
education.ti.com/support
(Click the International Information
link.)
KnowledgeBase and
Support by E-mail:
education.ti.com/support
Phone (not toll-free): (972) 917-8324
Customers in the US, Canada, Mexico, Puerto Rico, and
Virgin Islands: Always contact TI Customer Support before
returning a product for service.
All other customers: Refer to the leaflet enclosed with this product
(hardware) or contact your local TI retailer/distributor.
Texas Instruments (TI) Support and Service Information
For general
information
For technical
support
For product
(hardware)
service

60 Getting Started with TI InterActive!
TII_GettingStarted.doc Getting Started with TI InterActive! Karen Davis Revised: 8/22/03 12:20 PM Printed: 8/25/03 8:04 AM Page 60 of 64
IMPORTANT - Read this agreement (“Agreement”) carefully before installing the
software program(s) contained on the diskette(s) / CD(s). The software program(s)
and materials accompanying this package are licensed, not sold. By installing or
otherwise using the software program(s) contained on the diskette(s) / CD(s), you
agree to be bound by the terms of this license. If you do not agree with the terms of this
license, return this package with all its contents to the place of purchase for a full
refund.
The software program(s) contained on the diskette(s) / CD(s) and any related documentation
(collectively referred to as the Program) are licensed, not sold, by Texas Instruments Incorporated (TI)
and/or any applicable licensors (collectively referred to as Licensor). Specific details of the license
granted depend upon the license fee you paid and are set forth below. For purposes of this Agreement, a
site (“Site”) consists of one entire physical campus of an educational institution accredited by an
association recognized by the U.S. Department of Education or the State Board of Education, or by their
equivalents in other countries. All additional terms of the Agreement apply regardless of the type of
license granted.
If you paid a license fee for a Single User License, Licensor grants to you a personal, non-exclusive, non-
transferable license to install and use the Program on a single computer. You may make one copy of the
software for backup and archival purposes. You agree to reproduce all copyright and proprietary notices
shown in the software and on the media. Unless otherwise expressly stated in the documentation, you
may not duplicate such documentation.
If you paid a license fee for an Educational Multiple User License, Licensor grants you a non-exclusive,
non-transferable license to install and use the Program on the number of computers specified for the
license fee you paid. You may make one copy of the software for backup and archival purposes. You
agree to reproduce all copyright and proprietary notices shown in the software and on the media.
Except as expressly stated herein or in the documentation, you may not duplicate such documentation.
In cases where TI supplies the related documentation electronically you may print the same number of
copies of the documentation as the number of computers specified for the license fee you paid. All the
computers on which the Program is used must be located at a single Site. Each member of the
institution faculty may also use a copy of the Program on an additional computer for the sole purpose of
preparing course materials.
If you paid a license fee for an Educational Site License, Licensor grants you a non-exclusive, non-
transferable license to install and use the Program on all institution owned, leased or rented computers
located at the Site for which the Program is licensed. You may make one copy of the software for
backup and archival purposes. You agree to reproduce all copyright and proprietary notices shown in
the software and on the media. Except as expressly stated herein or in the documentation, you may not
duplicate such documentation. In cases where TI supplies the related documentation electronically you
may print one copy of such documentation for each computer on which the Program is installed. Each
member of the institution faculty may also use a copy of the Program on an additional computer for the
sole purpose of preparing course materials.
Additional Terms:
Licensor does not warrant that the Program will be free from errors or will meet your specific
requirements. Any statements made concerning the utility of the Program are not to be construed as
express or implied warranties.
LICENSOR MAKES NO CONDITIONS OR WARRANTIES, EITHER EXPRESS OR IMPLIED,
INCLUDING BUT NOT LIMITED TO ANY IMPLIED CONDITIONS OR WARRANTIES OF
MERCHANTABILITY, FITNESS FOR A PARTICULAR PURPOSE, OR NON-INFRINGEMENT
REGARDING THE PROGRAM AND MAKES THE PROGRAM AVAILABLE ON AN "AS IS"
BASIS.
Although no warranty is given for the Program, the media, if the Program was delivered to you on a
diskette or CD, will be replaced if found to be defective during the first ninety (90) days of use, when the
package is returned postage prepaid to TI. THIS PARAGRAPH EXPRESSES LICENSOR'S MAXIMUM
LIABILITY AND YOUR SOLE AND EXCLUSIVE REMEDY FOR DEFECTIVE MEDIA.
Texas Instruments (TI) End-User License Agreement
END-USER
LICENSE
AGREEMENT
SINGLE-USER
LICENSE
EDUCATIONAL
MULTIPLE-USER
LICENSE
EDUCATIONAL
SITE LICENSE
WARRANTY
DISCLAIMER
AND DAMAGES
EXCLUSIONS
AND
LIMITATIONS

Getting Started with TI InterActive! 61
TII_GettingStarted.doc Getting Started with TI InterActive! Karen Davis Revised: 8/22/03 12:20 PM Printed: 8/25/03 8:04 AM Page 61 of 64
LICENSOR SHALL NOT BE RESPONSIBLE FOR ANY DAMAGES CAUSED BY THE USE OF
THE PROGRAM, OR SUFFERED OR INCURRED BY YOU OR ANY OTHER PARTY INCLUDING
BUT NOT LIMITED TO SPECIAL, INDIRECT, INCIDENTAL OR CONSEQUENTIAL
DAMAGES, EVEN IF LICENSOR HAS BEEN ADVISED OF THE POSSIBILITY OF SUCH
DAMAGES. IN JURISDICTIONS WHICH ALLOW TEXAS INSTRUMENTS TO LIMIT ITS
LIABILITY, TI’S LIABILITY IS LIMITED TO THE APPLICABLE LICENSE FEE PAID BY YOU.
Because some states do not allow the exclusion or limitation of incidental or consequential damages or
limitation on how long an implied warranty lasts, the above limitations or exclusions may not apply to
you.
This Agreement will immediately terminate if you fail to comply with its terms. Upon termination of this
Agreement, you agree to return or destroy the original package and all whole or partial copies of the
Program in your possession and so certify in writing to TI.
The export and re-export of United States original software and documentation is subject to the Export
Administration Act of 1969 as amended. Compliance with such regulations is your responsibility. You
agree that you do not intend to nor will you, directly or indirectly, export, re-export or transmit the
Program or technical data to any country to which such export, re-export or transmission is restricted
by any applicable United States regulation or statute, without the proper written consent or license, if
required of the Bureau of Export Administration of the United States Department of Commerce, or such
other governmental entity as may have jurisdiction over such export, re-export or transmission.
If the Program is provided to the U.S. Government pursuant to a solicitation issued on or after December
1, 1995, the Program is provided with the commercial license rights and restrictions described elsewhere
herein. If the Program is provided to the U.S. Government pursuant to a solicitation issued prior to
December 1, 1995, the Program is provided with "Restricted Rights" as provided for in FAR, 48 CFR
52.227-14 (JUNE 1987) or DFAR, 48 CFR 252.227-7013 (OCT 1988), as applicable.
Manufacturer is Texas Instruments Incorporated, 7800 Banner Drive, M/S 3962, Dallas, Texas 75251.
GENERAL

62 Getting Started with TI InterActive!
TII_GettingStarted.doc Getting Started with TI InterActive! Karen Davis Revised: 8/22/03 12:20 PM Printed: 8/25/03 8:04 AM Page 62 of 64
Acrobat, 5
Browser, 8, 41, 49, 58
CBL, 5, 58
CBR, 5, 58
Character string, 21
command catalog, 57
Computation Mode, 12, 13
data-collection, 4, 58
deleting objects, 53
Edit, 17, 29, 33, 34, 35, 42, 48,
49
e-mail, 7, 8, 9
entering an expression, 14
entering and formatting text,
11
evaluating a math
expression, 11
floating objects, 54
inline with text, 54
with text around, 54
with text top and bottom,
54
Font, 11, 15, 17, 28, 49
Function, 7, 10, 13, 15, 21,
23, 24, 27, 28, 29, 35, 38,
42, 45, 46, 58
Graph, 4, 10, 18, 21, 27, 28,
29, 30, 31, 32, 35, 36, 37,
38, 39, 42, 43, 44, 45, 58
inserting objects, 47, 51
installing TI InterActive!, 6
Internet, 4, 5, 8, 9, 41
Internet Explorer, 5
landscape, 49
List, 7, 15, 21, 22, 23, 33, 34,
35, 36, 37, 42, 43, 58
List Editor, 49, 50, 52, 56
Math Box, 10, 11, 12, 13, 14,
15, 16, 18, 19, 20, 21, 24, 49
changing the appearance
of, 16
math object, 4, 21, 22
Math Palette, 10, 11, 12, 14,
15, 19, 25
math updates, 55
Matrix, 21
Microsoft, 5
Minimum, 38
Mode Settings, 12, 13
mouse, 5, 14, 30, 32
moving objects, 53
Object Format, 48
objects
Index

Getting Started with TI InterActive! 63
TII_GettingStarted.doc Getting Started with TI InterActive! Karen Davis Revised: 8/22/03 12:20 PM Printed: 8/25/03 8:04 AM Page 63 of 64
deleting, 53
floating, 54
inserting, 47, 51
moving, 53
opening, 52
resizing, 53
saving, 52
opening objects, 52
Parametric equations, 58
Polar equations, 58
portrait, 49
power regression, 36
printing documents, 49
regression, 7, 33, 36, 37, 40,
42, 43, 44, 45
resizing objects, 47, 53
Save, 10, 17, 29, 31, 36, 37,
38, 42, 43, 44, 45
saving objects, 52
Scatter Plot, 35, 42
Screen Capture, 49
setting preferences, 49, 56
Stat Calculation, 37, 43
Stat Plots, 35, 43, 44
Statistics, 33, 58
support and service, 59
supported file types, 47
system requirements, 5
Table, 3, 49
Text-wrapping, 46, 48
TI Connect, 5
TI Connectivity Cable, 5
toolbar, 7, 8, 11, 12, 17, 19,
28, 30, 31, 32, 34, 35, 36,
41, 42, 43, 44, 47, 48, 49
USB, 5
Variable, 7, 15, 18, 19, 20, 21,
22, 23, 24, 25, 26, 37, 44
Web, 5, 7, 8, 40, 41, 42, 49, 58
Windows, 1, 4, 8
Windows 2000, 5
Windows 98, 5
Windows ME, 5
Windows NT, 5
Windows XP, 5
zeros, 27
Zoom, 27, 30, 31, 36, 37, 43
