Mcdata Sphereon 4500 Users Manual Fabric Switch Product Manager User
4500 to the manual ea9a2656-8ea5-4d5f-9faa-640ec4af914e
2015-02-09
: Mcdata Mcdata-Sphereon-4500-Users-Manual-554596 mcdata-sphereon-4500-users-manual-554596 mcdata pdf
Open the PDF directly: View PDF ![]() .
.
Page Count: 216 [warning: Documents this large are best viewed by clicking the View PDF Link!]
- Cover
- Contents
- Preface
- Product Manager Overview
- Monitoring and Managing the Switch
- Configuring the Switch
- Configure Identification
- Configure Switch Parameters
- Configure Fabric Parameters
- Configure Switch Binding
- Configure Ports
- Configure SNMP
- Configure Open Systems Management Server
- Configure Feature Key
- Configure Date and Time
- Configure Threshold Alerts
- Export Configuration Report
- Enable SANpilot
- Backing Up and Restoring Configuration Data
- Using Logs
- Using Maintenance Features
- Optional Features
- Product Manager Messages
- Glossary
- Index

McDATA Corporation
McDATA Corporation 380 Interlocken Crescent Broomfield, CO 80021-3464
Corporate Headquarters: 800.545.5773 Web: www.mcdata.com Sales E-mail: sales@mcdata.com
McDATA® Sphereon™ 4500 Fabric Switch
Product Manager
USER MANUAL
P/N 620-000158-000
(REV B)

McDATA® Sphereon™ 4500 Fabric Switch Product Manager User Manual
ii
Record of Revisions and Updates
Copyright © 2002 McDATA Corporation. All rights reserved.
Printed October 2002
First Edition
No part of this publication may be reproduced or distributed in any form or by any means, or stored in a
database or retrieval system, without the prior written consent of McDATA Corporation.
The information contained in this document is subject to change without notice. McDATA Corporation
assumes no responsibility for any errors that may appear.
All computer software programs, including but not limited to microcode, described in this document are
furnished under a license, and may be used or copied only in accordance with the terms of such license.
McDATA either owns or has the right to license the computer software programs described in this document.
McDATA Corporation retains all rights, title and interest in the computer software programs.
McDATA Corporation makes no warranties, expressed or implied, by operation of law or otherwise, relating
to this document, the products or the computer software programs described herein. McDATA
CORPORATION DISCLAIMS ALL IMPLIED WARRANTIES OF MERCHANTIBILITY AND FITNESS FOR
A PARTICULAR PURPOSE. In no event shall McDATA Corporation be liable for (a) incidental, indirect,
special, or consequential damages or (b) any damages whatsoever resulting from the loss of use, data or
profits, arising out of this document, even if advised of the possibility of such damages.
Revision Date Description
620-000158-000 10/2002 Initial release of Manual

McDATA® Sphereon™ 4500 Fabric Switch Product Manager User Manual iii
Preface .............................................................................................................................xi
Chapter 1 Product Manager Overview
Managing the Sphereon ES-4500 Fabric Switch ...........................1-2
EFC Management Menu Options...................................................1-3
EFC Manager..............................................................................1-3
Product Manager .......................................................................1-5
Product Manager Description.........................................................1-7
Using the Product Manager ..........................................................1-11
Keyboard Navigation..............................................................1-11
Using Dialog Boxes .................................................................1-11
Illustrations Used in this Manual..........................................1-11
Logging Into the EFC Manager .............................................1-11
Opening the Product Manager ..............................................1-13
Window Layout and Function...............................................1-14
Closing the Product Manager................................................1-33
User Rights ...............................................................................1-33
Backing Up and Restoring Product Manager Data....................1-36
Restoring Data to the EFC Server..........................................1-37
Using QuikSync .......................................................................1-38
Chapter 2 Monitoring and Managing the Switch
Hardware View .................................................................................2-2
Identifying FRUs........................................................................2-2
Monitoring Switch Operation..................................................2-2
Monitoring Hardware Operation............................................2-5
Obtaining Hardware Information...........................................2-7
Using Menu Options...............................................................2-13
Contents

McDATA® Sphereon™ 4500 Fabric Switch Product Manager User Manual
iv
Contents
Port List View..................................................................................2-20
Menu Options ..........................................................................2-22
FRU List View .................................................................................2-23
Node List View................................................................................2-24
Menu Options ..........................................................................2-26
Displaying Node Properties...................................................2-27
Performance View...........................................................................2-28
Menu Options ..........................................................................2-29
Bar Graph Display...................................................................2-30
Port Statistics............................................................................2-30
Troubleshooting Tips...............................................................2-35
Button Functions......................................................................2-35
Port Operational States..................................................................2-36
Link Incident Alerts........................................................................2-37
Threshold Alerts .............................................................................2-38
Chapter 3 Configuring the Switch
Configure Identification...................................................................3-2
Procedure....................................................................................3-2
Configure Switch Parameters .........................................................3-3
Switch Parameters.....................................................................3-4
Configure Fabric Parameters ..........................................................3-6
Fabric Parameters......................................................................3-7
Configure Switch Binding ...............................................................3-9
Configure Ports .................................................................................3-9
Procedure..................................................................................3-11
Configure SNMP.............................................................................3-13
Procedure..................................................................................3-14
Configure Open Systems Management Server ..........................3-16
Configure Feature Key...................................................................3-16
Procedure..................................................................................3-16
Configure Date and Time ..............................................................3-18
Procedure..................................................................................3-18
Configure Threshold Alerts ..........................................................3-20
Procedures ................................................................................3-21
Export Configuration Report........................................................3-27
Procedure..................................................................................3-28
Enable SANpilot .............................................................................3-29
Backing Up and Restoring Configuration Data .........................3-29

v
McDATA® Sphereon™ 4500 Fabric Switch Product Manager User Manual
Contents
Chapter 4 Using Logs
Using Logs......................................................................................... 4-2
Button Function......................................................................... 4-2
Expanding Columns................................................................. 4-3
Sorting Entries ........................................................................... 4-3
Audit Log .......................................................................................... 4-4
Event Log........................................................................................... 4-5
Hardware Log................................................................................... 4-7
Link Incident Log............................................................................. 4-8
Threshold Alert Log....................................................................... 4-10
Chapter 5 Using Maintenance Features
Run Port Diagnostics ....................................................................... 5-2
Collect Maintenance Data............................................................... 5-2
Execute an IPL .................................................................................. 5-2
Set Online State................................................................................. 5-4
Manage Firmware Versions ............................................................ 5-5
Enable E-Mail Notification ............................................................. 5-5
Enable Call-Home Notification...................................................... 5-6
Backup and Restore Configuration ............................................... 5-7
Backup ........................................................................................ 5-7
Restore ........................................................................................ 5-8
Reset Configuration......................................................................... 5-8
Procedure ................................................................................... 5-9
Chapter 6 Optional Features
Configure Open Systems Management Server............................ 6-2
Procedure ................................................................................... 6-2
SANtegrity Features ........................................................................ 6-2
Fabric Binding ........................................................................... 6-3
Switch Binding .......................................................................... 6-4
Enterprise Fabric Mode................................................................... 6-9
Features and Parameters Enabled ........................................ 6-10
For More Information............................................................. 6-11
Appendix A Product Manager Messages
A ................................................................................................. A-1
C.................................................................................................. A-3
D ............................................................................................... A-10
E................................................................................................ A-11

McDATA® Sphereon™ 4500 Fabric Switch Product Manager User Manual
vi
Contents
F.................................................................................................A-12
I..................................................................................................A-14
L.................................................................................................A-18
M ...............................................................................................A-18
N................................................................................................A-19
P.................................................................................................A-20
R ................................................................................................A-21
S.................................................................................................A-22
T.................................................................................................A-23
U................................................................................................A-27
Y ................................................................................................A-27
Glossary ........................................................................................................................g-1
Index ...............................................................................................................................i-1

McDATA® Sphereon™ 4500 Fabric Switch Product Manager User Manual vii
1-1 EFC Server and Remote Workstation Configuration (Dual Ethernet) . 1-9
1-2 EFC Manager Icon ...................................................................................... 1-12
1-3 Main EFC Manager Window .................................................................... 1-13
1-4 Sphereon ES-4500 Fabric Icon ................................................................... 1-13
1-5 Sphereon ES-4500 Fabric Product Manager Window ........................... 1-14
1-6 Hardware View .......................................................................................... 1-24
1-7 Port List View .............................................................................................. 1-26
1-8 Node List View ........................................................................................... 1-28
1-9 Performance View ...................................................................................... 1-29
1-10 FRU List View ............................................................................................. 1-31
1-11 QuikSync Icon in Windows System Tray ............................................... 1-38
1-12 Iomega QuikSync Dialog Box ................................................................... 1-38
1-13 Iomega QuikSync Dialog Box (Advanced Tab) ..................................... 1-39
2-1 Hardware Operation - Sphereon ES-4500 Fabric Hardware View ....... 2-5
2-2 FRU Properties Dialog Box ......................................................................... 2-8
2-3 Port Properties Dialog Box new graphic ................................................... 2-8
2-4 Switch Properties Dialog Box ................................................................... 2-12
2-5 Configure Date and Time Periodic Synchronization Dialog Box ........ 2-14
2-6 Configure Date and Time Manually ........................................................ 2-15
2-7 Set Online State Dialog Box (Switch is Offline) ...................................... 2-16
2-8 Set Online State Dialog Box (Switch is Online) ...................................... 2-16
2-9 Port Binding Dialog Box ............................................................................ 2-18
2-10 Clear Threshold Alert(s) Dialog Box ....................................................... 2-20
2-11 Port List View .............................................................................................. 2-20
2-12 FRU List View ............................................................................................. 2-23
2-13 Node List View ........................................................................................... 2-24
2-14 Node Properties Dialog Box ..................................................................... 2-27
2-15 Performance View ...................................................................................... 2-29
3-1 Configure Identification Dialog Box .......................................................... 3-2
3-2 Configure Switch Parameters Dialog Box ................................................. 3-4
Figures

viii McDATA® Sphereon™ 4500 Fabric Switch Product Manager User Manual
Figures
3-3 Configure Fabric Parameters Dialog Box .................................................. 3-7
3-4 Configure Ports Dialog Box ....................................................................... 3-12
3-5 Configure SNMP Dialog Box .................................................................... 3-15
3-6 Configure Feature Key Dialog Box ........................................................... 3-17
3-7 Configure Date and Time Periodic Synchronization Dialog Box ........ 3-19
3-8 Configure Date and Time Manually ........................................................ 3-20
3-9 Configure Threshold Alerts Dialog Box .................................................. 3-22
3-10 New Threshold Alerts Dialog Box - First Screen .................................... 3-22
3-11 New Threshold Alerts Dialog Box - Second Screen ............................... 3-23
3-12 New Threshold Alerts Dialog Box - Third Screen .................................. 3-24
3-13 New Threshold Alerts Dialog Box - Summary Screen .......................... 3-25
3-14 Configure Threshold Alerts Dialog Box - Alerts Activated .................. 3-26
3-15 Export Configuration Dialog Box ............................................................. 3-28
4-1 Save Dialog Box ............................................................................................. 4-3
4-2 Audit Log ....................................................................................................... 4-4
4-3 Event Log ....................................................................................................... 4-6
4-4 Hardware Log ................................................................................................ 4-7
4-5 Link Incident Log .......................................................................................... 4-8
4-6 Threshold Alert Log .................................................................................... 4-10
5-1 IPL Confirmation Dialog Box ...................................................................... 5-3
5-2 Set Online State Dialog Box (State Is Offline) ........................................... 5-4
5-3 Set Online State Dialog Box (State Is Online) ............................................ 5-5
5-4 Backup and Restore Dialog Box .................................................................. 5-7
6-1 Switch Binding State Change Dialog Box .................................................. 6-5
6-2 Switch Binding Membership List Dialog Box ........................................... 6-7

McDATA® Sphereon™ 4500 Fabric Switch Product Manager User Manual ix
1-1 Operating Status - Status Bar and Switch Status ................................... 1-32
1-2 User Rights for Product Manager Functions .......................................... 1-34
2-1 Port States and Indicators .......................................................................... 2-36
Tables

xMcDATA® Sphereon™ 4500 Fabric Switch Product Manager User Manual
Tables

McDATA® Sphereon™ 4500 Fabric Switch Product Manager User Manual xi
Preface
This publication provides details for using the Sphereon ES-4500
Fabric Switch Product Manager application to monitor, control, and
configure operation for a specific ES-4500 switch. You must access the
Product Manager application for the switch through the EFC
Manager application.
Who Should Use This
Manual This publication is intended for data center administrators, LAN
administrators, operations personnel, and customer support
personnel who must monitor and manage product operation.
Organization of This
Manual This publication is organized as follows:
Chapter 1, Product Manager Overview provides an introduction
and overview of the switch Product Manager. It is intended as a
quick reference for using features available through the main
Product Manager window.
Chapter 2, Monitoring and Managing the Switch, describes how to
monitor and manage switch operation using the Product
Manager. This includes status indicators, menu options, dialog
boxes, and performance and error data available through the
Hardware View, Port List View, FRU List View, Node List View, and
Performance View.
Chapter 3, Configuring the Switch, describes how to configure the
switch using options available through the Product Manager’s
Configure menu.
Chapter 4, Using Logs, describes how to access and use logs
through the Product Manager’s Logs menu.

xii McDATA® Sphereon™ 4500 Fabric Switch Product Manager User Manual
Preface
Chapter 5, Using Maintenance Features, describes how to use the
maintenance options available for the switch through the Product
Manager’s Maintenance menu.
Chapter 6, Optional Features, describes features that you can
configure through the product manager by enabling purchased
feature keys. Details on the Open Systems Management Server
and the SANtegrity™ features are included.
Appendix A, Product Manager Messages, lists and explains error
messages that may appear while using the Product Manager.
The Glossary defines terms, abbreviations, and acronyms used in
this manual.
An Index is also provided.
Manual Updates Check the McDATA web site at www.mcdata.com for possible
updates or supplements to this manual.
Related
Documentation Other publications that provide additional information about the
ES-4500 Switch are:
•McDATA Enterprise Fabric Connectivity Manager User Manual
(620-005001)
•McDATA Sphereon 4500 Fabric Switch Installation and Service
Manual (620-000159)
•McDATA Products in a SAN Environment - Planning Manual
(620-000124)
•McDATA FC-512 Fabricenter Equipment Cabinet Installation and
Service Manual (620-000100)
•McDATA OPENconnectors SNMP Support Manual (620-000131)
•McDATA OPENconnectors Command Line Interface User Manual
(620-000134)

McDATA® Sphereon™ 4500 Fabric Switch Product Manager User Manual xiii
Preface
Manual Conventions The following notational conventions are used in this document:
A note presents important information that is not hazard-related.
CAUTION
!
A caution statement provides essential information or instructions
for which disregard or noncompliance may result in personal
injury, equipment damage, or a loss of data.
WARNING
A warning statement provides essential information on instructions
for which disregard or noncompliance may result in death, sever
personal injury, or substantial equipment damage.
Where to Get Help For technical support, McDATA® end-user customers should call the
phone number located on the service label attached to the front or
rear of the hardware product.
McDATA’s “Best in Class” Solution Center provides a single point of
contact for customers seeking help. The Solution Center will research,
explore, and resolve inquires or service requests regarding McDATA
products and services. The Solution Center is staffed 24 hours a day,
7 days a week, including holidays.
To expedite warranty entitlement, please have your product serial number
available.
McDATA Corporation
380 Interlocken Crescent
Broomfield, CO 80021
Phone: (800) 752-4572 or (720) 566-3910
Fax: (720) 566-3851
E-mail: support@mcdata.com

xiv McDATA® Sphereon™ 4500 Fabric Switch Product Manager User Manual
Preface
Customers who purchased the hardware product from a company other than
McDATA should contact that company’s service representative for technical
support.
Forwarding
Publication
Comments
We sincerely appreciate any comments about this publication. Did
you find this manual easy or difficult to use? Did it lack necessary
information? Were there any errors? Could its organization be
improved?
Please send your comments via e-mail, our home page, or FAX.
Identify the manual, and provide page numbers and details. Thank
you.
Ordering Publications To order a paper copy of this manual, contact your McDATA
representative, or use the contact information listed below.
Phone: (800) 545-5773 and select the option for information on
our complete family of enterprise-to-edge SAN solutions.
Fax: (720) 566-3860.
Trademarks The following terms, indicated by a registered trademark symbol (®)
or trademark symbol (™) on first use in this publication, are
trademarks of McDATA Corporation in the United States, other
countries, or both:
Registered Trademarks Trademarks
McDATA®Intrepid™
Fabricenter®Sphereon™
OPENready®Fibre Channel Director™
SANavigator™
SANpilot™
SANtegrity™
OPENconnectors™
❏E-mail: pubsmgr@mcdata.com
❏Home Page: http://www.mcdata.com
❏FAX: Technical Communications Manager (303) 465-4996


Product Manager Overview 1-1
1
Invisible Body Tag
This chapter is an introduction and overview of the Sphereon ES-4500
Fabric Switch Product Manager application. It is intended as a quick
reference for using features available through the main Product
Manager window.
Product Manager
Overview
Section Page
Managing the Sphereon ES-4500 Fabric Switch 1-2
EFC Management Menu Options 1-3
Product Manager Description 1-7
Using the Product Manager 1-11
Backing Up and Restoring Product Manager Data 1-36

1
1-2 McDATA® Sphereon™ 4500 Fabric Switch Product Manager User Manual
Product Manager Overview
Managing the Sphereon ES-4500 Fabric Switch
Three options are available for managing the Sphereon ES-4500
Fabric Switch through a user interface:
•The Product Manager application installed on an EFC Server.
Access to the Product Manager must be through the EFC
Manager applications. These applications are installed on the EFC
Server as shipped from the manufacturer.
•The Product Manager application installed on a
customer-supplied server platform that meets specific
requirements. Contact your McDATA representative for these
requirements when ordering this option, called EFCM Lite.
You must also access the Product Manager through the EFC
Manager application. All three applications are shipped on a
software CD as EFCM Lite for installation on your server
platform when you order this option. In contrast to applications
installed on the EFC Server, EFCM Lite does not include support
for the following features:
—The call-home feature.
—The automatic ZIP drive backup feature through Iomega®
QuikSync.
—The ability to download remote clients from the server or a
website. You must install clients on remote workstations from
the software distribution disk provided with this management
option.
•The SANpilot™ interface. Using a browser-capable PC with an
internet connection to the switch, you can monitor and manage
the switch through the SANpilot interface embedded in the
switch firmware. The interface provides a GUI similar to the
Product Manager application, and supports switch configuration,
statistics monitoring, and basic operation.
To launch the SANpilot interface, enter the switch’s IP address as
the internet uniform resource locator (URL) into any standard
browser. Enter a user name and password at a the login screen.
The browser then becomes a management console. Refer to the
web server interface online help for details on use.

1
EFC Management Menu Options 1-3
Product Manager Overview
The default user name for the right to view status and other information
is “operator.” The default user name for the right to modify
configuration data, perform maintenance tasks, or perform other options
is “administrator.” The default password for both user names is
“password.”
•Management using simple network management protocol
(SNMP). An SNMP agent is implemented through the Product
Manager application that allows administrators on SNMP
management workstations to access product management
information using any standard network management tool.
Administrators can assign Internet Protocol (IP) addresses and
corresponding community names for up to six workstations
functioning as SNMP trap message recipients. Refer to the
McDATA OPENconnectors SNMP Support Manual (620-000131) for
more information.
This manual provides details on the Product Manager application for
the Sphereon ES-4500 Fabric Switch only. Also use this manual if you
have EFCM Lite installed on a customer-supplied server platform
(except for those features listed in the preceding paragraphs that are
not supported by this option). This manual does not cover the
SANpilot Interface.
EFC Management Menu Options
This user’s guide provides information on the McDATA Sphereon
ES-4500 Product Manager application only. Information on the EFC
Manager application is provided in the McDATA Enterprise Fabric
Connectivity Manager User Manual (620-005001). Following are lists of
options available under the menu bar in all applications. References
are provided to the correct publication for detailed information on
these options.
EFC Manager Following are options available through the EFC Manager. For more
information, refer to Chapter 3 of the McDATA Enterprise Fabric
Connectivity Manager User Manual (620-005001).
View Tabs •Products
•Fabrics
Product Menu •New

1
1-4 McDATA® Sphereon™ 4500 Fabric Switch Product Manager User Manual
Product Manager Overview
•Open
•Delete
•Modify
•Properties
•Logout
•Exit
Fabrics Menu •Rename
•Persist Fabric Topology
•Unpersist Fabric Topology
•Export Fabric Topology
•Show Route
•Hide Route
•Show Zone Members
•Show View Port
•Show Fabric Tree
•Enterprise Fabrics Mode (active if SANtegrity™ features installed)
•Fabric Binding (active if SANtegrity™ features installed)
View Menu •User Sessions
•Zoom
—In
—Out
—Default
—Fit in View
•Layout Icons
•Circular
•Spring
•Center in Topology
•Clear ISL Alert
•Clear All ISL Alerts

1
EFC Management Menu Options 1-5
Product Manager Overview
•Enable Fly Over Display
Configure Menu •Users
•Nicknames
•Sessions
•Operating Parameters (Switch and Fabric)
•SNMP Agent
•Activate Zone Set
•Zoning Library
•Advanced Zoning
Logs Menu •Audit Log
•Event Log
•Session Log
•Product Status Log
•Fabric Log
Maintenance Menu •Configure E-Mail
•Test Remote Notification
•Configure Ethernet Events
•Configure Call Home Event Notification
Help •Contents
•About
Product Manager Following are options available through the Product Manager
application for your switch. For more information on these options,
refer to Menu Bar on page 1-14 in this manual.
View Tabs •Hardware
•Port List
•Node List
•Performance
•FRU List View

1
1-6 McDATA® Sphereon™ 4500 Fabric Switch Product Manager User Manual
Product Manager Overview
Product Menu •Port (options available when port is selected)
—Port Properties
—Node Properties
—Port Technology
—Block Port
—Enable Beaconing
—Clear Link Incident Alert(s)
—Reset Port
—Port Binding
—Clear Threshold Alert(s)
•FRU
—FRU Properties
•Clear System Error Light
•Enable Unit Beaconing
•Properties
•Close
Configure Menu •Identification
•Operating Parameters
—Fabric Parameters
—Switch Parameters
•Switch Binding (These options are only available if SANtegrity is
installed)
—Change State
—Edit Membership
•Ports
•SNMP Agent
•Management Server
•Features
•Date/Time

1
Product Manager Description 1-7
Product Manager Overview
•Threshold Alerts
•Export Configuration Report
•Enable Web Server
•Enable Telnet
Logs Menu •Audit Log
•Event Log
•Hardware Log
•Link Incident Log
•Threshold Alert Log
Maintenance Menu •Port Diagnostics
•Data Collection
•IPL
•Set Online State
•Firmware Library
•Enable E-Mail Notification
•Enable Call Home
•Backup and Restore Configuration
•Reset Configuration
Help Menu •Contents
•About
Product Manager Description
The Product Manager for the Sphereon ES-4500 Fabric Switch is a
Java-based graphical user interfaces (GUI) that provides in-depth
management, configuration, and monitoring functions for individual
switches and their field-replaceable units (FRUs). Although the
Product Manager is accessed from the Enterprise Fabric Connectivity
(EFC) Manager application, it is a separate application.
In contrast to the Product Manager, the EFC Manager enables
administrators to monitor operational status for all products and

1
1-8 McDATA® Sphereon™ 4500 Fabric Switch Product Manager User Manual
Product Manager Overview
Fibre Channel fabrics managed by an EFC Server. The EFC Manager
also provides tools to administer user and product access to the EFC
Manager and Product Manager. Refer to the McDATA Enterprise
Fabric Connectivity Manager User Manual (620-005001).
The Product Manager provides graphical views of switch hardware
components and displays of component status. By positioning the
cursor on icons, graphics, panels, and other visual elements in these
views and clicking the left or right mouse button, you can quickly
manage and monitor the switch on your network.
Access the switch Product Manager by double-clicking any switch
product icon on the EFC Manager’s Products View or the Topology tab
of the Fabrics View.
You can install the EFC Manager and Product Manager applications
on remote workstations, as shown in Figure 1-1, using any standard
web browser. For instructions, refer to the appendix in the McDATA
Enterprise Fabric Connectivity Manager User Manual (620-005001) that
pertains to the operating system of your workstation.
Install the EFCM Lite on a customer-supplied server platform using
the instructions provided with the applications for that platform.

1
Product Manager Description 1-9
Product Manager Overview
Figure 1-1 EFC Server and Remote Workstation Configuration (Dual Ethernet)
Using the Product Manager, you can:
•Back up and restore configuration data.
•Clear the system error indicator.
•Configure Fibre Channel operating parameters for the fabric,
such as, R_A_TOV, E_D_TOV, switch priority, and interop mode;
and for switch, such as, preferred and insistent domain ID,
rerouting delay, and domain RSCNs.
•Configure individual ports with a port name describing the node
attached to the port.
•Configure keys for new features.
•Configure interoperability mode for open switch fabrics.
•Configure LIN alerts.
10/100 Mbps Ethernet Hub
SNMP Management
Workstation(s)
Remote User
Workstation(s)
Web Server
EFC Server
Status
12
24
TCVR
Packet
Collision
Power
SuperStackII
EntryHub
SUPER
STACK
10
22
11
23
9
21
7
19
5
17
3
15
8
20
6
18
4
16
2
1
MID
MDIX
14
13
3Com
Corporate LAN
10/100 Mbps
Internet
Connection
TM
SPHEREON
4500
Switch

1
1-10 McDATA® Sphereon™ 4500 Fabric Switch Product Manager User Manual
Product Manager Overview
•Configure nickname to display instead of WWN for switch and
attached nodes.
•Configuring Port Binding.
•Configure SNMP trap recipients and community names.
•Configure Switch Binding (if installed)
•Configure Open Systems Management Server features (if
installed).
•Configure the switch name, location, description, and contact
person.
•Control individual Fibre Channel ports by blocking/unblocking
operation, enabling LIN alerts and port binding, and running
internal and external loopback diagnostics.
•Display field replaceable unit (FRU) properties such as the FRU
name, physical position in the switch (chassis slot number), active
failed state, part number, and serial number.
•Display information for individual Fibre Channel ports, such as
the port name, port number, Fibre Channel address, operational
state, type of port, and login data.
•Display information on nodes attached to ports.
•Display port performance and statistics.
•Display vital product data for the switch, such as the system
name, description, contact person, location, status, model
number, firmware and EC level, and manufacturer.
•Enable beaconing for ports and the switch unit.
•Monitor the operational status of the switch and each of its
hardware field-replaceable units.
•Perform an initial program load (IPL).
•Perform maintenance tasks for the switch including maintaining
firmware levels, administering the Call-Home feature, accessing
the switch logs, and collecting data to support failure analysis.
Call-Home may not be available if you are using a customer-supplied
server platform for the EFC Management applications.
•Reset port operation.

1
Using the Product Manager 1-11
Product Manager Overview
•Run port diagnostics.
•Set the date and time on the switch.
Using the Product Manager
This section provides a general overview of the Product Manager and
its functions. For details on performing specific tasks and using
specific dialog boxes, refer to the appropriate chapters in this manual.
Keyboard
Navigation Use standard keyboard navigation in dialog boxes. For example, use
the Tab, arrow, and backspace keys to move through dialog box fields
and the Enter key to perform default button functions.
Using Dialog Boxes Buttons such as OK, Activate and Close or Cancel initiate functions in a
dialog box. There is a difference between the OK and Activate buttons.
The OK button saves the data you entered and closes the dialog box.
The Activate button saves the data you entered without closing the
dialog box, unless there is a Close button in which case, Activate saves
the information without closing the box. There is also a difference
between the Close and Cancel buttons. The Close button closes the
dialog box and saves the data you entered. The Cancel button cancels
the operation and closes the dialog box without saving the
information you entered.
Illustrations Used in
this Manual Figures containing EFC Manager and Product Manager screens in
this manual are included for illustration purposes only. These
illustrations may not match exactly what you see through your server
or workstation. Title bars have been removed from the illustrations
and fields in the illustrations may contain different data than in
screens displayed on your system.
Logging Into the EFC
Manager To open the Product Manager, you must first log into the EFC
Manager.
1. Perform one of the following steps:
•If you are using the EFC Server, the EFC Manager application
automatically starts when you power on or reboot the EFC
Server. If you reboot or switch on the EFC Server and the EFC
Manager login screen displays, skip to step 3 to log in.

1
1-12 McDATA® Sphereon™ 4500 Fabric Switch Product Manager User Manual
Product Manager Overview
•If you are using a remote user workstation, follow steps 2
through 5.
•If the EFC Manager window displays already, skip to Opening
the Product Manager on page 1-13.
2. Perform one of the following steps if you are using a remote user
workstation (a network PC with a remote client installed) and the
EFC Manager login screen or EFC Manager window is not
displayed. If the login screen is displayed, go to step 3.
•Start the EFC Manager and display the login screen by
double-clicking the EFC Manager icon on the desktop.
Figure 1-2 EFC Manager Icon
The EFC Manager login screen displays.
•If the EFC Manager window is open (Figure 1-3) and you need
to log in as another user or access a different EFC Server, select
Logout from the Logout or Logout/Exit menu on the menu bar to
display the login screen. Go to step 3.
3. When the EFC Manager login screen displays, enter your user
name and password. The default user name is Administrator and
password is password unless changed by your system
administrator.
The default user name for the right to view status and other information
is “operator.” The default user name for the right to modify
configuration data, perform maintenance tasks, or perform other options
is “administrator.” The default password for both user names is
“password.”
If the EFC Manager window is open (Figure 1-3) and you need to log in
as another user or access a different EFC Server, select Logout from the
Logout or Logout/Exit menu on the menu bar to display the login screen.
4. In the EFC Server box on the login screen select the EFC Server
where you want to connect. Note that if you are logging into an
EFC Server locally, localhost is the EFC Server name. Type in the
network address of the server if it is not in the list.

1
Using the Product Manager 1-13
Product Manager Overview
5. Click Activate or press the Enter key on your keyboard.
The main EFC Manager window displays showing the Product
View.
Figure 1-3 Main EFC Manager Window
Opening the
Product Manager To open the Product Manager, double-click the product icon in the
Product View or right-click the icon and select Open.
Figure 1-4 Sphereon ES-4500 Fabric Icon
The Product Manager displays showing the default Hardware View.
Figure 1-5 shows the Sphereon ES-4500 Fabric Hardware View.

1
1-14 McDATA® Sphereon™ 4500 Fabric Switch Product Manager User Manual
Product Manager Overview
Figure 1-5 Sphereon ES-4500 Fabric Product Manager Window
Note that the EFC Manager window is still available as a separate window.
You can drag the Product Manager window away from the EFC Manager
window and view both windows on your PC desktop or minimize one or
both of them to icons if desired. You can have a maximum of four Product
Manager windows open concurrently.
Window Layout and
Function The main Product Manager window is divided into four main areas
as shown in Figure 1-5 on page 1-14: menu bar, view tabs, view panel,
and status bar. Use features in these panels to configure switch
operation, monitor performance, and access maintenance features.
Menu Bar The menu bar on the Product Manager window displays tabs for the
following menus:
•Product
•Configure
•Logs
Status Bar
View PanelMenu Bar

1
Using the Product Manager 1-15
Product Manager Overview
•Maintenance
•Help
Click one of the tabs to display a list of menu options. Click an option
to open a dialog box that allows you to perform configuration and
maintenance tasks and view logs. If a menu option contains a check
box, click in the box to add a check mark and enable a function. Click
a check box containing a check mark to remove the check mark and
disable the function.
Product Menu
Select one of the following options from the Product menu.
Port
This provides a secondary port menu only when the Hardware
View, Port List View, or Performance View displays in the view
panel. To use this menu for a specific port, click a port in the
Hardware View, a port’s row in the Port List View, or a port’s bar
graph in the Performance View. The menu contains options which
are identical to those that display when you right-click the port,
port row, or port bar graph in those views. For detail on these
options refer to Port Menu on page 2-16.
FRU
Click a power supply module/fan in the Hardware View only and
select FRU from the Product menu to display the FRU Properties
menu option. These displays the properties dialog box for the
FRU. The FRU Properties dialog box can also be displayed when
you double-click the FRU in the Hardware View. For details on
these options refer to Displaying FRU Information on page 2-7.
Clear System Error Light
Select this to turn off the amber system error LED, located below
the green/blue power LED on the switch front bezel.
Enable Unit Beaconing
Click the check box to toggle unit beaconing on or off. When the
check box has a check mark, unit beaconing is on, and the amber
system error light on the switch front bezel blinks to help users
locate the actual unit in an equipment room. When you click the
check box to remove the check mark, unit beaconing is disabled
and the amber LED goes out. You can only enable beaconing if
there are no system errors (the system error light is off).

1
1-16 McDATA® Sphereon™ 4500 Fabric Switch Product Manager User Manual
Product Manager Overview
Properties
Click to display the Switch Properties dialog box. This dialog box
contains the switch name, description, location, and contact
person configured through the Configure Identification dialog box.
Also included is other product information as detailed in Switch
Properties. You can also display this dialog box by
double-clicking an area on the illustration in the Hardware View,
away from a hardware component.
Close
Select this option to close the Product Manager window.
Configure Menu
Click on the Configure menu on the menu bar to display a menu that
lists the following options. For detailed information on using these
options, refer to Chapter 3, Configuring the Switch.
Identification
Select this option to display the Configure Identification dialog box.
Enter the following information in this dialog box:
—Name - Assign a product name. Note that you can set this
name as the nickname for the switch’s WWN, using the Set
Name as Nickname check box. The nickname then displays
instead of the WWN in Product Manager views.
—Description - Assign a unique product description.
—Location - Describe the product’s location.
—Contact - Assign a contact either by name, phone number, or
e-mail address.
This information displays in the identification table at the top of the
Hardware View and in the EFC Manager Product View, if the Product View
is configured to display names.
Switch Operating Parameters
Use dialog box to set parameters on the switch for fabric
operation. Set other fabric operating parameters, such as
preferred domain ID (1 to 31) and Domain RSCNs. In addition,
you can also enable the rerouting delay feature. Refer to Configure
Switch Parameters on page 3-3 for more information on
configuring the switch priority and rerouting delay.

1
Using the Product Manager 1-17
Product Manager Overview
Fabric Operating Parameters
Use this dialog box to set parameters for fabric operation. In this
dialog box, you can set the resource allocation time-out value
(R_A_TOV) and error detect time-out value (E_D_TOV) in
tenth-of-a-second increments, as well as other fabric operating
parameters, such as switch priority level (Principal, Default, or
Never Principal) and interop mode. You must take the switch
offline through the Set Online State dialog box to configure these
parameters.
Switch Binding
This submenu provides two options if the SANtegrity feature is
installed through the Configure Feature Key dialog box: Change
State and Edit Membership List. Selecting Change State displays the
Switch Binding State Change dialog box where you can activate
Switch Binding according to a specific connection policy (Restrict
E_Ports, Restrict F_Ports, or All Ports). Edit Membership List
allows you to create a list of switches and devices that you want
to allow exclusively to attach to switch ports. For details, refer to
Configure Switch Binding on page 3-9.
Ports
Select this option to display the Configure Ports dialog box. For
each port you can provide a name, block or unblock operation,
configure port binding, enable LIN alerts for each port, enable
Fabric Address Notification (FAN), define a type (G, F, E, Gx, and
Fx), and enable port binding.
Ports are automatically configured as G_Ports if no device is connected,
F_Ports if a device is connected, E_Ports if a switch is connected, and
FL_Port if connected to a loop device.
SNMP Agent
Select this option to display the Configure SNMP dialog box. Use
this dialog box to configure network addresses and community
names for up to six SNMP trap recipients. Also authorize write
permissions to enable SNMP management stations to modify
writable MIB variables. In addition, you can enable authorization
traps to be sent to management stations when unauthorized
stations request access to switch SNMP data.

1
1-18 McDATA® Sphereon™ 4500 Fabric Switch Product Manager User Manual
Product Manager Overview
Management Server
Select this option to display the Configure Open Systems
Management Server dialog box, if this feature is enabled for the
switch. Use this to configure an open systems inband
management program to function with the switch. To use these
procedures, you must have enabled the Open Systems
Management Server through the Configure Feature Key dialog box.
Features
Displays the Configure Feature Key dialog box. Use this dialog box
to enter a feature key to enable optional features that you have
purchased for the switch.
Date and Time
Select this option to display the Configure Date and Time dialog
box. Use this option to set the current date and time in the switch.
When the Periodic Date/Time Synchronization check box is checked,
the Date and Time fields are greyed out (disabled), and the EFC
Server date and time periodically synchronizes the switch date
and time. If the Periodic Date/Time Synchronization check box is not
checked, you can set the date and time in the dialog box fields
manually.
Threshold Alert(s)
Select this option to configure threshold alerts for ports. A
threshold alert notifies users when the transmit (Tx) or receive
(Rx) throughput reaches specified values for specific switch ports
or port types (E_Ports F_Ports, or FL_Ports). Using this option,
you can configure:
—A name for the alert.
—A threshold type for the alert (Rx, Tx, or either).
—Active or inactive state of the alert.
—Threshold criteria. This includes configuring the threshold as
the percent of port traffic capacity utilized (% utilization). You
must also configure the time interval during which the
throughput is measured and the maximum cumulative time
that the throughput percentage threshold can be exceeded
during this time interval before an alert is generated.

1
Using the Product Manager 1-19
Product Manager Overview
Export Configuration Report
Select this option to display the Export Configuration Report dialog
box, which enables you to specify a file name in which to save an
ASCII text file containing all current user-definable configuration
options in a printable format. Note that this file cannot be read
back into the Product Manager in order to set configuration
parameters.
Enable SANpilot
Select this option place a check mark in the check box to enable
the SANpilot Interface on the switch. Select the option again to
remove the check mark and disable the SANpilot Interface. When
disabled, users at remote workstations cannot access the
interface.
Logs Menu
Place the cursor over the Logs menu to display a menu that lists the
following options. For detailed information on using these dialog
boxes, refer to Chapter 4, Using Logs.
Audit Log
This log provides a record of all configuration changes made on
the switch. Each entry displays the date and time of the change, a
description of the change, the source of the change (such as the
EFC Server or SNMP management station), and an identifier for
the source, such as the IP address of the EFC Server or SNMP
management station.
Event Log
Select this option to display the switch event log. This log
provides a record of significant events that have occurred on the
switch, such as hardware failures, degraded operation, and port
problems. Each entry includes the date and time of the event, a
reason code for the event, the severity level, a brief description,
and up to 32 bytes of supplementary event data. Refer to the
McDATA Sphereon 4500 Fabric Switch Installation and Service
Manual (620-000159) for more information.
Hardware Log
This log displays information on FRUs inserted and removed
from the switch. Each log entry includes the name of the FRU
inserted or removed, the slot position relative to identical FRUs

1
1-20 McDATA® Sphereon™ 4500 Fabric Switch Product Manager User Manual
Product Manager Overview
installed, whether the FRU was inserted or removed, the FRU
part number and serial number, and the date and time the FRU
was inserted or removed.
Link Incident Log
The link incident (LIN) log displays the most recent incidents
with their date and time, port number, and description of the
incident. A link incident can be one of several conditions detected
on a fiber optic link. For a list of events that may cause a link
incident to be written to the log, refer to Link Incident Log on
page 4-8.
Threshold Alert Log
This log provides notifications of threshold alerts. Besides the
date and time that the alert occurred, it also displays information
that was configured through the Configure Threshold Alert(s)
option under the Configure menu. This includes the alert name,
port for which the alert is configured, the type of alert (transmit
throughput, receive throughput, or both), threshold utilization of
traffic capacity, minutes the threshold was configured for, and the
configured time interval for the threshold. For more details on
this log, refer to Threshold Alert Log on page 4-10.
Maintenance Menu
Click on the Maintenance menu on the menu bar to display a list of the
following options. For detailed information on using these dialog
boxes, refer to Chapter 5, Using Maintenance Features.
Port Diagnostics
This option displays the Port Diagnostics dialog box. Use this
dialog box to run internal and external loopback tests on ports.
Refer to the McDATA Sphereon 4500 Fabric Switch Installation and
Service Manual (620-000159) for instructions.
Data Collection
This option displays the Save Data Collection dialog box. Use this
dialog box to collect maintenance data into a file. This file is used
by support personnel to diagnose system problems. Refer to the
McDATA Sphereon 4500 Fabric Switch Installation and Service
Manual (620-000159) for instructions.

1
Using the Product Manager 1-21
Product Manager Overview
IPL
Select this option to initiate an initial program load on the switch.
A dialog box displays to allow you to confirm the IPL. Note that
an IPL does not affect any configuration settings done through
the Product Manager. Port operation is interrupted during the
IPL.
Refer to the Execute an IPL on page 5-2 for more information.
Set Online State
Select this option to display the Set Online State dialog box. Use
this dialog box to change the online state of the switch to offline
or online.
Firmware Library
Select this option to display the Firmware Library dialog box. This
dialog box displays all firmware versions currently installed on
the EFC Server that can be downloaded to directors. Use this
dialog box to add a new firmware version to the EFC Server hard
disk, modify the description displayed for an existing version,
delete a version from the PC, or download (send) a version for
operation on a switch. For additional information on using this
option, refer to the McDATA Sphereon 4500 Fabric Switch
Installation and Service Manual (620-000159).
Enable E-Mail Notification
The Simple Mail Transfer Protocol (SMTP) server and e-mail
recipient addresses are configured in the EFC Manager
application (not in the switch’s Product Manager). E-mail
notification is also initially enabled in the EFC Manager for all
directors managed by the EFC Manager. Note, however, that the
E-Mail Notification option on the Product Manager’s Maintenance
menu must be enabled (checked) for e-mail notification to occur
for the specific switch.
The default setting for the Enable E-Mail Notification function is
enabled (checked). To disable the function, select Enable E-Mail
Notification from the Maintenance menu to clear the check box.
For additional information on using this option, refer to Enable
E-Mail Notification on page 5-5.

1
1-22 McDATA® Sphereon™ 4500 Fabric Switch Product Manager User Manual
Product Manager Overview
Enable Call Home Notification
The default setting for the Enable Call Home Notification function is
disabled (unchecked).
Select Enable Call Home Notification from the Maintenance menu to
enable the call-home function for the switch.
The parameters of the call-home feature are configured in
Windows. Refer to the McDATA Sphereon 4500 Fabric Switch
Installation and Service Manual (620-000159) for instructions.
At the bottom of the EFCM Fabric Manager window is an icon
that indicates whether the Call Home feature is enabled. An X
over the telephone icon indicates that the Call Home feature is
disabled in the product manager or in the EFC Manager.
The call-home feature may not be available if you are using a
customer-supplied server platform for the EFC Management
applications.
Backup & Restore Configuration
Select this option to save the product configuration stored on the
switch to the EFC Server hard disk or to restore the configuration
data from the EFC Server. Only a single copy of the configuration
is kept on the server.
This backup is primarily for single-CTP systems, where a backup
is needed to restore the configuration data to a replacement CTP
card. You cannot modify the location or the file name of the saved
configuration.
For additional information on using this option, refer to Backing
Up and Restoring Configuration Data on page 3-29.
You can only restore the configuration to a switch with the same IP
address.
Reset Configuration
Select this option to reset all switch configuration data back to the
factory defaults. A confirmation dialog box displays with a
warning upon selecting the option. For additional information on
using this option, refer to Reset Configuration on page 5-8.

1
Using the Product Manager 1-23
Product Manager Overview
WARNING
This operation resets all configuration including any optional
features that have been installed. You will need to re-enter your
feature key to enable all optional features after resetting the
configuration.
Help Menu
Click on the Help menu on the menu bar to display a list of the
following options.
Contents
Select this option to display the Help window. The Help window
contains Contents, Index, and Glossary buttons and hypertext--
linked items to help you quickly navigate through information.
Use the forward (>) and back (<) buttons to scroll forward and
backward through the displayed help frames. Exit the help
feature at any time by clicking the Close icon at the top of the Help
window.
About
Select this option to display the version number for the Product
Manager and copyright information.
View Tabs Click one of the view tabs across the top of the Product Manager
window to display the following views in the View panel.
•Hardware
•Port List
•Node List
•Performance
•FRU List
View Panel Views, selected from the view tabs, display under the tabs in the view
panel.
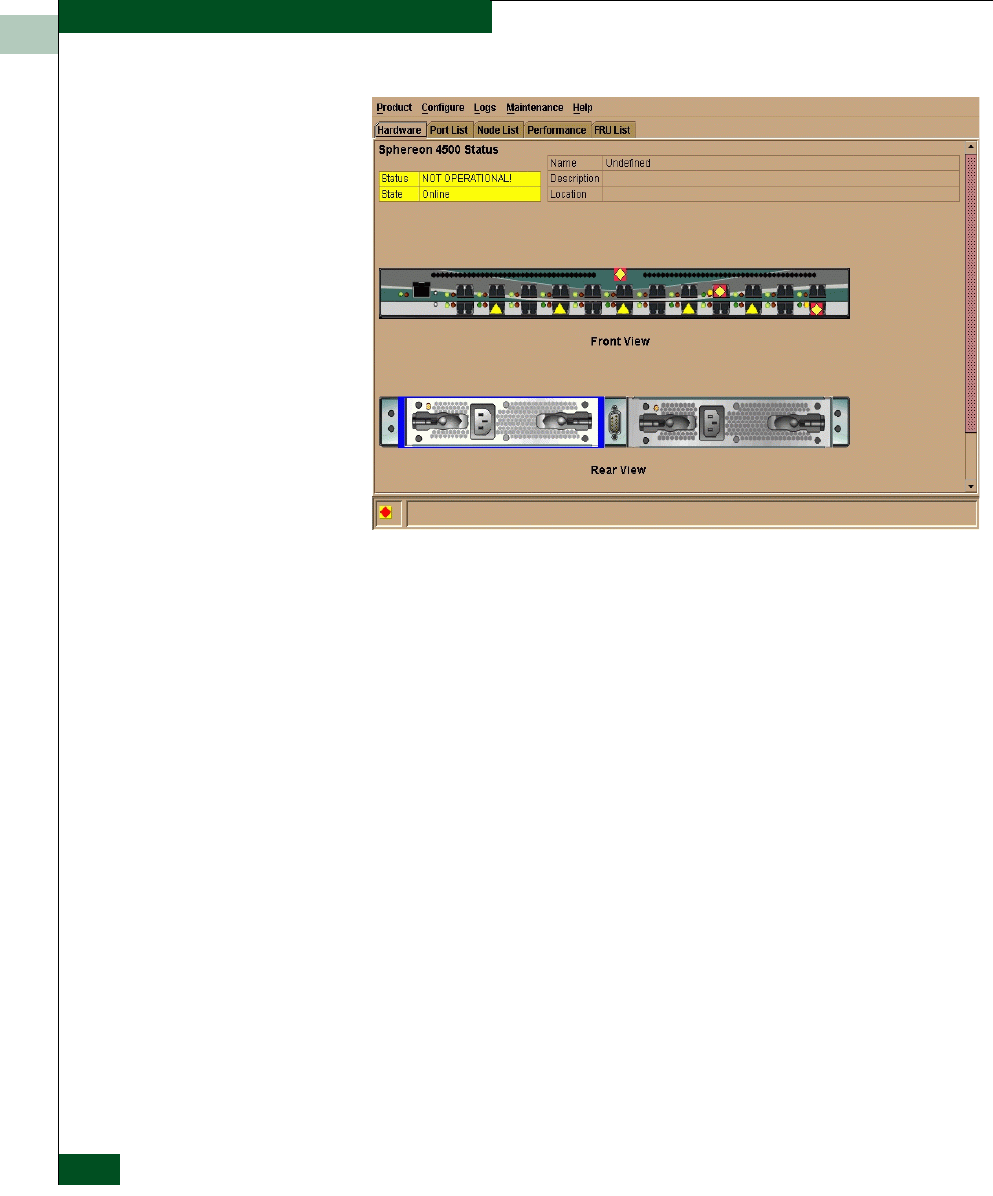
Hardware View
The Hardware View is the default view that displays in the view panel
when you open the switch Product Manager. To return to this view
from another view, click the Hardware View tab. Refer to Figure 1-6 on
page 1-24 for an example of this view.
1
1-24 McDATA® Sphereon™ 4500 Fabric Switch Product Manager User Manual
Product Manager Overview
Figure 1-6 Hardware View
In the Hardware View, colored indicators reflect the status of actual
LEDs on the switch FRUs. The status bar displays a symbol to
represent the most degraded status currently reported by any of the
switch FRUs. For example, for a port failure, indicated by a blinking
red and yellow diamond on a port, a yellow triangle displays on the
status bar to indicate a degraded condition. However, if a blinking
red and yellow diamond displays over both power supplies, the
status bar displays a blinking red and yellow diamond, which
indicates a failure requiring immediate attention. For an explanation
of the different status symbols and the reasons they display in the
Hardware View or Port List View, refer to the table under Monitoring
Hardware Operation on page 2-5.
Switch Menu
Double-click the switch graphic away from a FRU to display the
Switch Properties dialog box. Right-click a hardware graphic away
from a FRU to display the following options:
•Switch Properties
•Enable Unit Beaconing
•Clear System Error Light

1
Using the Product Manager 1-25
Product Manager Overview
•IPL Switch
•Set Switch Date and Time
•Set Switch Online State
For details on menu options, refer to Switch Menu on page 2-13.
For details on navigating and monitoring via the Hardware View, refer
to Hardware View on page 2-2.
Port Menu
Double-click a port to display the Port Properties dialog box.
Right-click a port to display the following options:
•Node Properties
•Port Technology
•Block Port
•Enable Beaconing
•Diagnostics
•Clear Link Incident Alert(s)
•Reset Port
•Port Binding
•Clear Threshold Alert(s)
Note that these same options are available when you click a port on
the Hardware View and select the port secondary menu from the
Product menu on the menu bar.
For Node Properties, if a node is not logged in a message box displays
indicating that node information is not available.
For details on menu options, refer to Port Menu on page 1-25.
For details on navigating and monitoring via the Hardware View, refer
to Hardware View on page 2-2.
Port List View
Select the Port List View tab. Displays a table (Port List View) of data
on all Fibre Channel ports in the switch. This data includes the port
number, port name, blocked configuration state, operational state
(such as online or failed), type of port, and any link incident alerts.
Figure 1-7 shows an example of the Port List View.

1
1-26 McDATA® Sphereon™ 4500 Fabric Switch Product Manager User Manual
Product Manager Overview
Figure 1-7 Port List View
The Port List View displays information about all ports installed in the
switch. All data is dynamic and updates automatically. Double-click
any row in this view to display the Port Properties dialog box for the
port.
Right-click a port row to display the same menu options that display
when you right-click a port in the Hardware View or a port’s bar graph
in the Performance View. These include:
•Port Properties
•Node Properties
•Port Technology
•Block Port
•Enable Beaconing
•Port(s) Diagnostics
•Clear Link Incident Alert(s)
•Reset Port

1
Using the Product Manager 1-27
Product Manager Overview
•Port Binding
•Clear Threshold Alert(s)
Note that these options are also available when you click a port row
and select the Port secondary menu from the Product menu on the
menu bar.
For details on these menu options, refer to Port Menu on page 2-16.
For details on navigating and monitoring via the Port List View, refer
to Port List View on page 1-25.
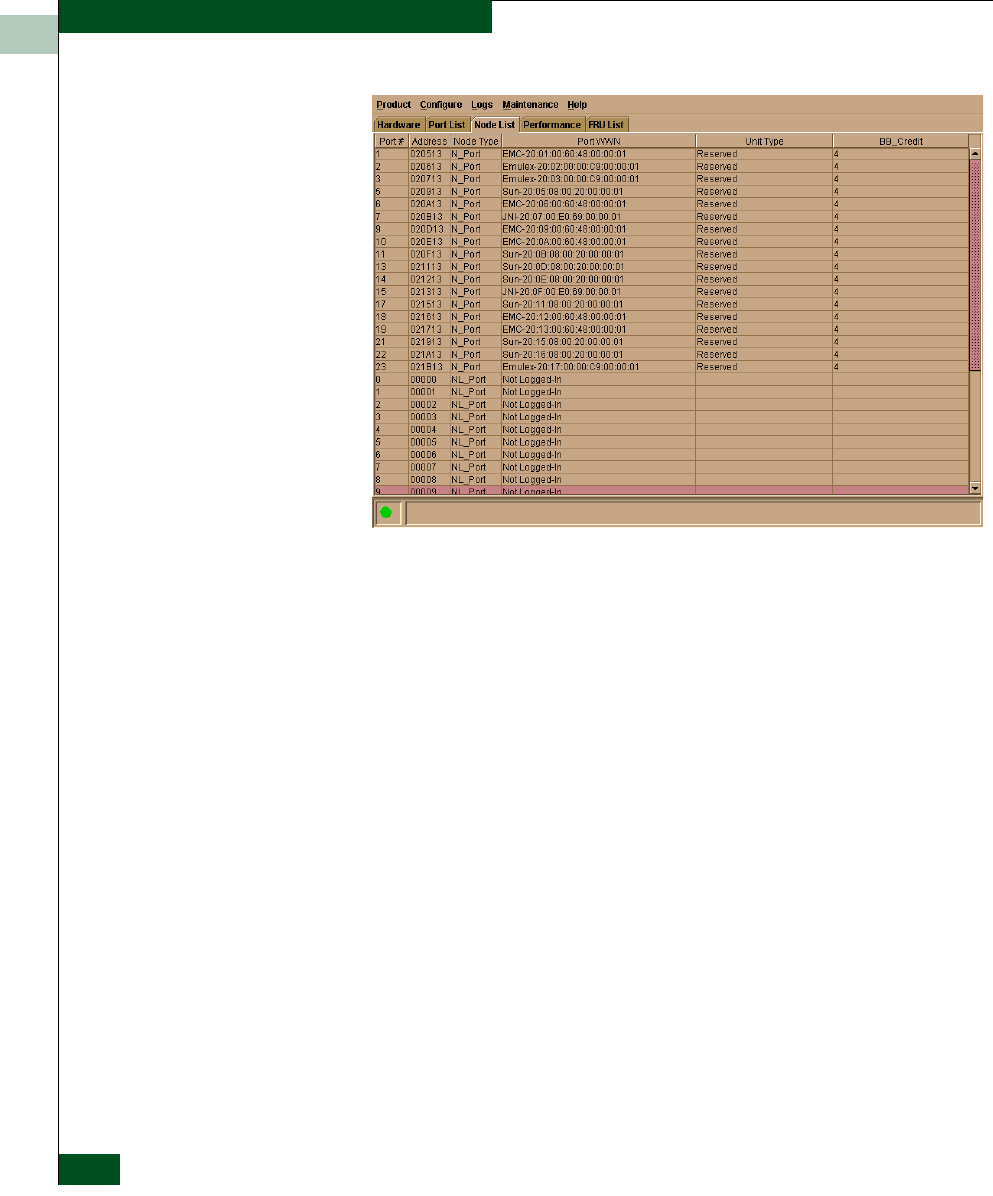
Node List View
Select Node List from view tabs. Figure 1-8 on page 1-28 shows an
example of the Node List View. Displays a table of information (Node
List View) about the node attachments to existing ports, sorted by
port number. Information includes the switch port number, port or
node addresses, node type, port world wide name, unit type, and
BB_Credit.
Double-click a port row to highlight it and display the Node Properties
dialog box for that port.
Right-click a port row to display the following menu options:
•Node Properties: Displays the Node Properties dialog box.
•Port Properties: Displays the Port Properties dialog box.
•Define Nickname. Displays the Define Nickname dialog box, where
you can define a nickname to display for the attached device
instead of the device's 8-byte WWN.
•Display options. Allows you to display attached devices listed
under the Port WWN column in the Node List View by the device’s
nickname configured through the Define Nickname menu option
or the device's WWN.
1
1-28 McDATA® Sphereon™ 4500 Fabric Switch Product Manager User Manual
Product Manager Overview
Figure 1-8 Node List View
Note that these options are also available when you click a port row,
then select the Port secondary menu from the Product tab on the menu
bar.
For details on navigating and monitoring via the Node List View, refer
to Node List View on page 1-27.
Performance View
Select the Performance view tab. Figure 1-9 shows an example of the
Performance View. This view provides a graphical display of
performance for all 24 ports. The top portion of the Performance View
displays bar graphs that show the level of transmit/receive activity
for each port. This information updates every five seconds. Each bar
graph also shows the percentage link utilization for the port. A red
arrow marks the highest utilization level reached since the
Performance View was opened. If the system detects activity on a port,
it represents minimal activity with at least one bar.
When an end device (node) is logged into a port, moving the cursor
over the port’s bar graph in the Performance View highlights the graph
and displays a message with the world-wide name of the connected
node. If the connected node has more than one port, this is the
world-wide name of the specific port on the node. When a port is

1
Using the Product Manager 1-29
Product Manager Overview
functioning as an expansion port (E_Port), the message is “E_Port.”
When a port is not logged into an end-device (not functioning as an
F_Port) or to another switch (not functioning as an E_Port), the
message is the port’s current online state. When the port is logged
into an end device (functioning as an F_Port), the message is the
WWN of the device. A port can also function as an FL_Port.
Figure 1-9 Performance View
Right-click a bar graph to display a menu of port-related actions. The
options available on this menu are the same as those that are
available when you right-click a port in the Hardware View or
right-click a row in the Port List View. These include:
•Properties
•Port Technology
•Block Port
•Enable Beaconing
•Port Diagnostics
•Clear Link Incident Alert(s)
•Reset Port

1
1-30 McDATA® Sphereon™ 4500 Fabric Switch Product Manager User Manual
Product Manager Overview
•Port Binding
•Clear Threshold Alert(s)
Note that these same options are also available when you click a
port’s graph, then select the Port secondary menu from the Product
menu on the menu bar.
For details on menu options, refer to Port Menu on page 2-16.
The bottom portion of the Performance View displays cumulative
statistical information for the port selected in the bar graph. Values
are displayed for cumulative port statistics, error count values for a
port, including traffic statistics, class 2 and 3 accounting statistics,
operational statistics, and error statistics. Click a category in the left
frame of the statistics area to display only statistics in that category or
click All to display values for all categories. Click the Refresh button to
update the data with current data from the port.
The Clear button clears all of the counters to zero. Selecting this
button displays a Clear Port Statistics dialog box. Select the
appropriate radio button and click OK to clear all counters to zero on
the selected port only or counters on all ports on the switch.
Clearing the counters clears the statistics for all users.
For more information about the Performance View, including statistics
descriptions, refer to Performance View on page 1-28.
FRU List View
Select the FRU List view tab. A table with information about each of
the FRUs installed in the switch displays in the view panel. All data is
dynamic and updates automatically. Figure 1-10 shows an example of
the FRU List View.

1
Using the Product Manager 1-31
Product Manager Overview
Figure 1-10 FRU List View
For details on navigating and monitoring via the FRU List View, refer
to FRU List View on page 1-30.
Status Bar The status bar is located along the bottom of the Product Manager
window. This includes a symbol that displays at the left side of the
bar and messages that display in the panel to the right of the symbol.
The symbol indicates the current operating status of the switch and
the messages display to provide more description of menu options as
you move the cursor over the options under menu bar menus. Refer
to Table 1-1 on page 1-32 for the meaning of these status symbols and
of the corresponding alert text that displays in the Sphereon ES-4500
Fabric Status table at the top of the Hardware View in the view panel.

1
1-32 McDATA® Sphereon™ 4500 Fabric Switch Product Manager User Manual
Product Manager Overview
If a gray square displays in the status bar (no Ethernet connection), a
reason for the status displays in the Status table at the top of the
Hardware View. Refer to No Link Status on page 2-3 for details
Messages display to the right of the status symbol as you move the
cursor over options under the menu bar menus. These messages
provide additional details about tasks that you can perform through
the menu option.
Table 1-1 Operating Status - Status Bar and Switch Status
Symbol Status Bar Switch Status Table Text Meaning
Green Circle Fully Operational All components and installed ports are
operational; no failures.
Yellow
Triangle
Redundant Failure A redundant component has failed, such
as a power supply, and the backup
component has taken over operation.
Minor Failure A failure occurred which has decreased
the switch operational ability. Normal
switching operations are not affected.
• One or more ports failed, but at least
one port is still operational.
• A fan has failed or is not rotating
sufficiently.
Red
Diamond
with Yellow
Background
NOT OPERATIONAL A critical failure prevents the switch from
performing fundamental switching
operations.
• All fans failed.
• All installed ports failed.
• Both power supplies failed.
Gray Square Never Connected
Link Timeout
Protocol Mismatch
Duplicate Session
Unknown Network Address
Incorrect Product Type
Switch status is unknown. This occurs if
the Ethernet network connection between
the EFC Server and the switch cannot be
established or if the CTP fails. Refer to No
Link Status on page 2-3 for details on
the status table text.

1
Using the Product Manager 1-33
Product Manager Overview
Closing the Product
Manager To close the Product Manager, use the following steps:
1. To close the Product Manager, do one of the following:
•Select Close from the Product menu on the menu bar.
•Click the X button at the top right corner of the Product
Manager window.
•Double-click the icon at the top left corner of the Product
Manager window, or right-click the icon and select Close from
the menu that displays.
2. Select Logout or Exit from the Product menu in the EFC Manager
application.
•If you select Logout, the EFC Manager Login dialog box
displays. You can now log in again using a user name and
password. Log into a different EFC Server by selecting a
different server from the EFC Server box.
•If you select Exit, the Product View window closes.
User Rights The EFC Manager’s system administrator can assign levels of access,
or “User Rights,” to Product Manager users through the EFC
Manager application.
Note that the EFC Manager’s system administrator only has view rights
while operating in a specific Product Manager application. Conversely, a
Product Manager’s product administrator only has view rights while
operating in the EFC Manager application.
Detailed instructions concerning the assignment of user rights for
both the EFC Manager and Product Manager applications appear in
Chapter 3 of the McDATA Enterprise Fabric Connectivity Manager User
Manual (620-005001).
There are five levels of access or “user rights” that can be assigned to
specific users:
•System Administrator
•Product Administrator
•Operator
•Maintenance

1
1-34 McDATA® Sphereon™ 4500 Fabric Switch Product Manager User Manual
Product Manager Overview
•View
By default, all users have view rights, which allow viewing of but not
the changing configurations. View rights cannot be removed.
The user(s) with system administrator rights can make all control and
configuration changes implemented through the EFC Manager
application.
User Rights for Specific
Functions Table 1-2 itemizes the specific functions available to Product Manager
users that have been assigned “user rights” of product administrator,
operator, or maintenance. If a user does not have the right to perform
a specific operation, a not authorized error box appears when the
operation is attempted.
Table 1-2 User Rights for Product Manager Functions
Product Manager Rights
Product
Administrator Operator Maintenance
Backup/Restore Configuration X oXX
Block Port X X X
Change Online State X ❏X
Clear Audit Log X ❏❏
Clear Audit Log X ❏❏
Clear Event Log X ❏X
Clear Hardware Log X ❏X
Clear LIN Alert X ❏X
Clear LIN Log X ❏❏
Clear System Error Light ❏❏X
Clear Threshold Alerts X ❏
Configure Date/Time X X X
Configure Feature Key X ❏❏
Configure Identification X ❏❏
Configure Management Server X ❏❏
Configure Switch Parameters X ❏❏

1
Using the Product Manager 1-35
Product Manager Overview
Configure Fabric Parameters X ❏❏
Modify Port Binding X ❏
Configure Ports X X ❏
Configure SNMP X ❏❏
Configure Switch Binding X ❏❏
Configure Threshold Alerts X ❏❏
Configure Zoning X ❏❏
Data Collection ❏❏X
Date/Time Sync Configuration X X X
Enable Call Home Notification X ❏X
Enable E-Mail Notification X ❏X
Enable Web Server X
Export Configuration Report X X X
IPL X ❏X
Manage Firmware ❏❏X
Port Diagnostics ❏❏X
Port Beaconing X X X
Reset Configuration ❏❏X
Reset Statistics Counters (Performance View) X X ❏
Reset Port X ❏❏
Set Online State X X X
Unit Beaconing X X X
View Event Log X X X
View Firmware ❏❏X
Table 1-2 User Rights for Product Manager Functions (continued)
Product Manager Rights
Product
Administrator Operator Maintenance

1
1-36 McDATA® Sphereon™ 4500 Fabric Switch Product Manager User Manual
Product Manager Overview
Backing Up and Restoring Product Manager Data
As long as a Zip® disk remains in the Zip drive of the EFC Server,
critical information from both the Product Manager and EFC
Manager applications automatically backs up to the Zip disk when
the data directory contents change or when you reboot the EFC
Server.
To ensure trouble-free backups; it is imperative that you leave the Zip drive
connected to the EFC Server, and leave a Zip disk in that drive at all times.
Removing the disk during a backup or restore can corrupt the database on
the disk. Make sure that data is not being written to or read from the Zip
drive before you remove the Zip disk. The Iomega QuikSync icon,
Figure 1-11 on page 1-38, in the Windows system tray spins when data is
writing to or reading from the drive.
The application used for this function is Iomega® QuikSync, a
separate application installed on the EFC Server. QuikSync is
configured to automatically mirror the contents of the EfcData
directory to the Zip drive when the contents are changed or when
you reboot the EFC Server. This directory contains all EFC Manager
and Product Manager data, so it can be copied back to a newly
restored EFC Server to fully recover the preferred operating
environment.
The QuikSync application and a Zip drive may not be available if you are
using a customer-supplied server platform for the EFC Management
applications.
The mirroring operation will only occur while a user is logged in to
Windows on the EFC Server PC (independent of the EFC Manager
login).
View Hardware Log X X X
View LIN Log X X X
View SNMP X ❏X
Table 1-2 User Rights for Product Manager Functions (continued)
Product Manager Rights
Product
Administrator Operator Maintenance

1
Backing Up and Restoring Product Manager Data 1-37
Product Manager Overview
The data contained in the EfcData directory and mirrored to the Zip
disk includes the following:
•All EFC Manager configuration including:
—Product definitions
—User names, encrypted passwords, and user rights
—Nicknames
—Session options
—EFC Manager SNMP configurations
—E-mail configuration
•All log files (both EFC Manager log files and individual Product
Manager log files).
•Zoning library (all zone sets and zone definitions).
•Firmware library.
•Call-home configuration (including phone numbers and dialing
options).
•Configuration data saved to the EfcData directory through the
Backup & Restore Configuration option on the Product Manager’s
Maintenance menu.
The QuikSync application will not backup certain Windows
configurations that need to be reconfigured on a newly restored EFC
Server, including the following:
•Windows user names and passwords.
•TCP/IP network configuration (such as IP address, gateway
address, and DNS names).
The QuikSync application will be included on the EFC Management
Applications CD. It automatically installs on the EFC Server during
the EFC Server install process. A blank Zip disk is required for each
EFC Server and is included with the EFC Server deliverables.
Restoring Data to
the EFC Server To restore data to the EFC Server, copy the: EfcData directory
from the zip disk to: C:\ (root directory on the C drive).

1
1-38 McDATA® Sphereon™ 4500 Fabric Switch Product Manager User Manual
Product Manager Overview
Using QuikSync QuikSync is functioning to back up data when the QuikSync icon
displays in the system tray in the right corner of the Windows taskbar
(Figure 1-11). This icon spins when data is writing to the Zip disk.
Figure 1-11 QuikSync Icon in Windows System Tray
If an icon does not display, you must enable the application using the
procedure outlined in Enabling QuikSync on page 1-38.
Enabling QuikSync 1. Click the Windows Start button and select Programs, then Iomega
QuikSync and choose QuikSync.
The Iomega QuikSync dialog box displays.
Figure 1-12 Iomega QuikSync Dialog Box
2. Click On to enable QuikSync.
3. Click OK.
QuikSync Settings Do not change the default settings for automatic backup of the
EfcData directory. If you feel that QuikSync is not functioning
properly, check the settings using the following steps:
1. Open the QuikSync dialog box using one of these steps:
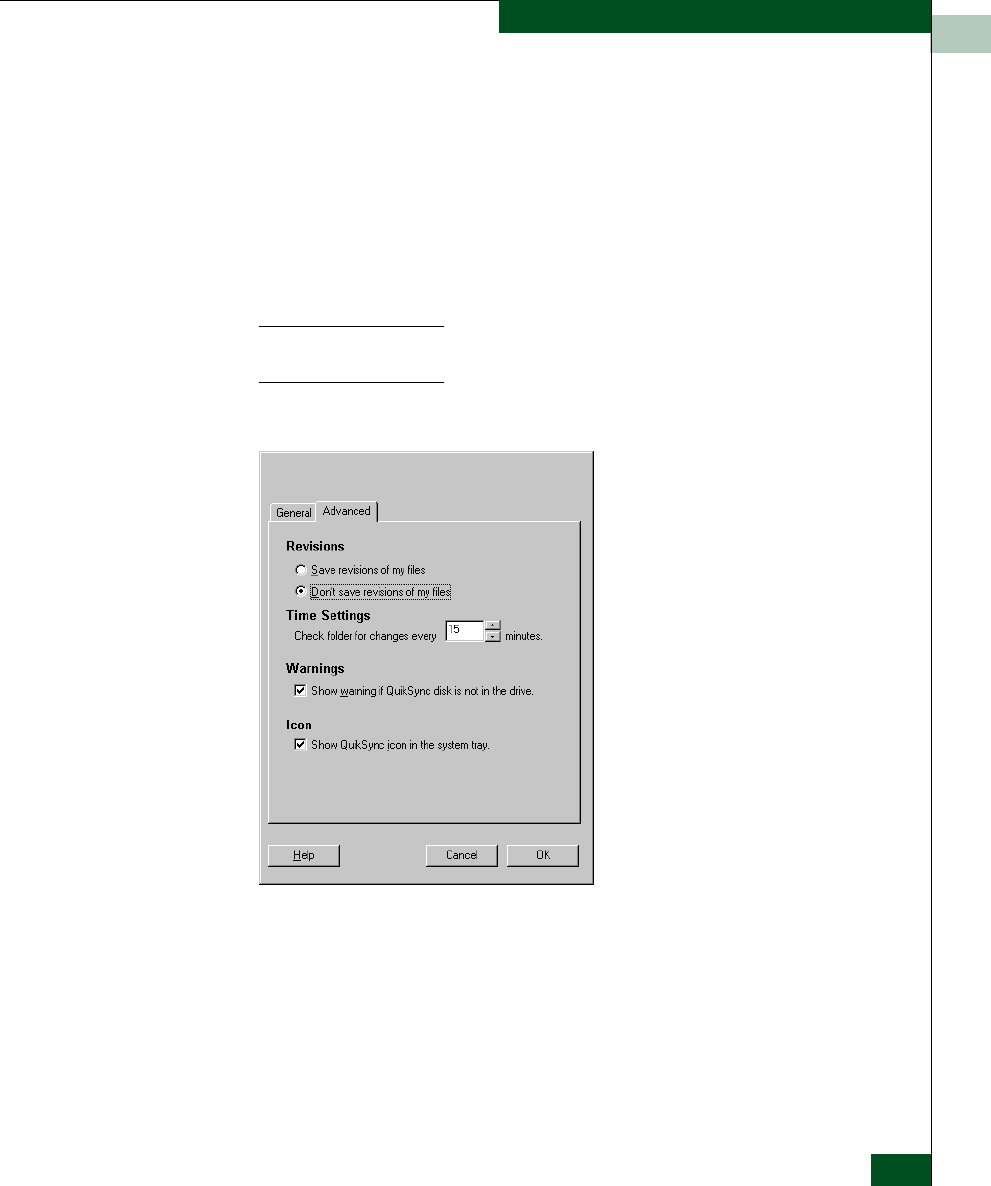
1
Backing Up and Restoring Product Manager Data 1-39
Product Manager Overview
•Click the Windows Start button and select Programs, then
Iomega QuikSync and choose QuikSync.
•Double-click the QuikSync icon on the Windows system bar in
the lower right corner of the Windows desktop.
•Right-click on the QuikSync icon and select Settings from the
menu.
2. Verify that the dialog box is configured exactly as it displays in
Figure 1-12.
The d:\EfcData\ directory is a mirrored directory of c:\EfcData\. Do not
change this location in the Source field.
3. Click the Advanced tab. The following displays:
Figure 1-13 Iomega QuikSync Dialog Box (Advanced Tab)
4. Verify that the dialog box is configured exactly as it displays in
Figure 1-13.
5. Click OK.


Monitoring and Managing the Switch 2-1
2
Invisible Body Tag
This chapter describes how to use the features available in the
Product Manager view panel to monitor and manage switch
operation. These features include status indicators, menu options,
and dialog boxes available through the Hardware View, Port List View,
FRU List View, Node List View, and Performance View.
Monitoring and
Managing the Switch
Section Page
Hardware View 2-2
Port List View 2-20
FRU List View 2-23
Node List View 2-24
Performance View 2-28
Port Operational States 2-36
Link Incident Alerts 2-37
Threshold Alerts 2-38

2
2-2 McDATA® Sphereon™ 4500 Fabric Switch Product Manager User Manual
Monitoring and Managing the Switch
Hardware View
The Hardware View is the default view when you open the Product
Manager. If another view displays, you can display the Hardware View
by selecting Hardware from view tabs on the Product Manager
window. Using this graphical view of the switch, you can view status
symbols and simulated light emitting diode (LED) indicators, display
data, and use mouse functions to monitor status and obtain vital
product information for the switch and its hardware components.
Identifying FRUs Move the cursor over parts of the switch graphic in the Hardware View
to display labels identifying each hardware component and its slot
position in the chassis relative to identical components installed in
the switch. Components include:
•Power supply module. Note that each AC connector on the rear of
the unit is the location of an internal power supply (two total).
•Ports (small form factor LC transceivers).
Monitoring Switch
Operation Monitor the operating status of the switch using the switch Status
table on the Hardware View and the status indicator on the status bar
at the bottom of the Product Manager window.
Switch Status Table The Status table at the top of the Hardware View displays the switch’s
operational status, operational state, name, description, and location.
Status
Refer to Table 2-1 on page 2-36 for the meaning of the text that
displays in the switch Status table and the corresponding status
symbols that display on the status bar.
State
The Status field displays one of the following:
•OFFLINE
When the switch is “OFFLINE,” all ports are offline. The ports
cannot accept a login from an attached device or cannot connect
to other switches. You can configure this state through the Set
Online State dialog box. Refer to Set Online State on page 5-4 for
instructions.

2
Hardware View 2-3
Monitoring and Managing the Switch
•Online
All unblocked ports are able to connect with devices. You can
configure this state through the Set Online State dialog box. Refer
to Set Online State on page 5-4 for instructions. Note that the
switch automatically goes online after a power-up, an initial
machine load (IML), or initial program load (IPL).
•Coming online
This is a transitional state that occurs just before the switch goes
online. This state normally only happens briefly, unless there is a
problem reaching the online state.
•Going offline
This is a transitional state that occurs just before the switch goes
offline. This state normally only happens briefly, unless there is a
problem reaching the offline state.
No Link Status
If the Ethernet network connection between the EFC Server and the
switch is down, the Hardware View displays the front and rear of the
unit without FRUs. The switch Status table at the top of the Hardware
View changes to display the status (No Link) and reason with a
yellow background. The name, description, and location fields are
blank.
The Reason field on the switch Status table displays one of the
following reasons when there are no links.
•Never Connected
A network connection was never established between the switch
and the EFC Server or the CTP card has failed. Check the IP
addresses, the Ethernet local area network (LAN) physical
connection between the switch and EFC Server, and other
network connection conditions.

2
2-4 McDATA® Sphereon™ 4500 Fabric Switch Product Manager User Manual
Monitoring and Managing the Switch
•Link Timeout
The network connection that was established between the switch
and EFC Server has been lost. Check the IP addresses, the
Ethernet LAN physical connection between the switch and EFC
Server, IP addresses, and other network components.
•Protocol Mismatch
The switch and the EFC Server are not at compatible software
release levels. Update the EFC Manager software version.
•Duplicate Session
A link has previously been established between the switch and
another instance of the EFC Server. Connect to the previously
established EFC Server from the EFC Manager login screen.
•Unknown Network Address
The address defined for the switch in the EFC Manager could not
be found in the domain name server (DNS). Either the name was
mistyped when the switch was added to the EFC Manager, or the
name was not available from the DNS. Check the network IP
address for the switch definition in the EFC Manager by
right-clicking the product icon and selecting Properties. The IP
address displays in the Network Address field.
•Incorrect Product Type
The product at the configured network address is not a switch.
Verify address, configuration, and product type.
Status Bar Status
Indicator The status bar displays a colored status symbol that indicates the
overall operating status of the switch unit. The operating status
depends on hardware component failures, which are indicated by
status symbols that display over component graphics in the Hardware
View. Refer to Hardware View on page 2-2 for the meanings of status
symbols in the status bar.
The status bar indicates the switch operating status based on
component failures. For example, for a single port failure, a blinking
red and yellow diamond displays on the port connector in the
Hardware View. At the same time, a yellow triangle displays in the
status bar to indicate a degraded switch. However, if a blinking red
and yellow diamond displays over both power supplies, the status
bar displays a red and yellow diamond, indicating a failure that
requires immediate attention.
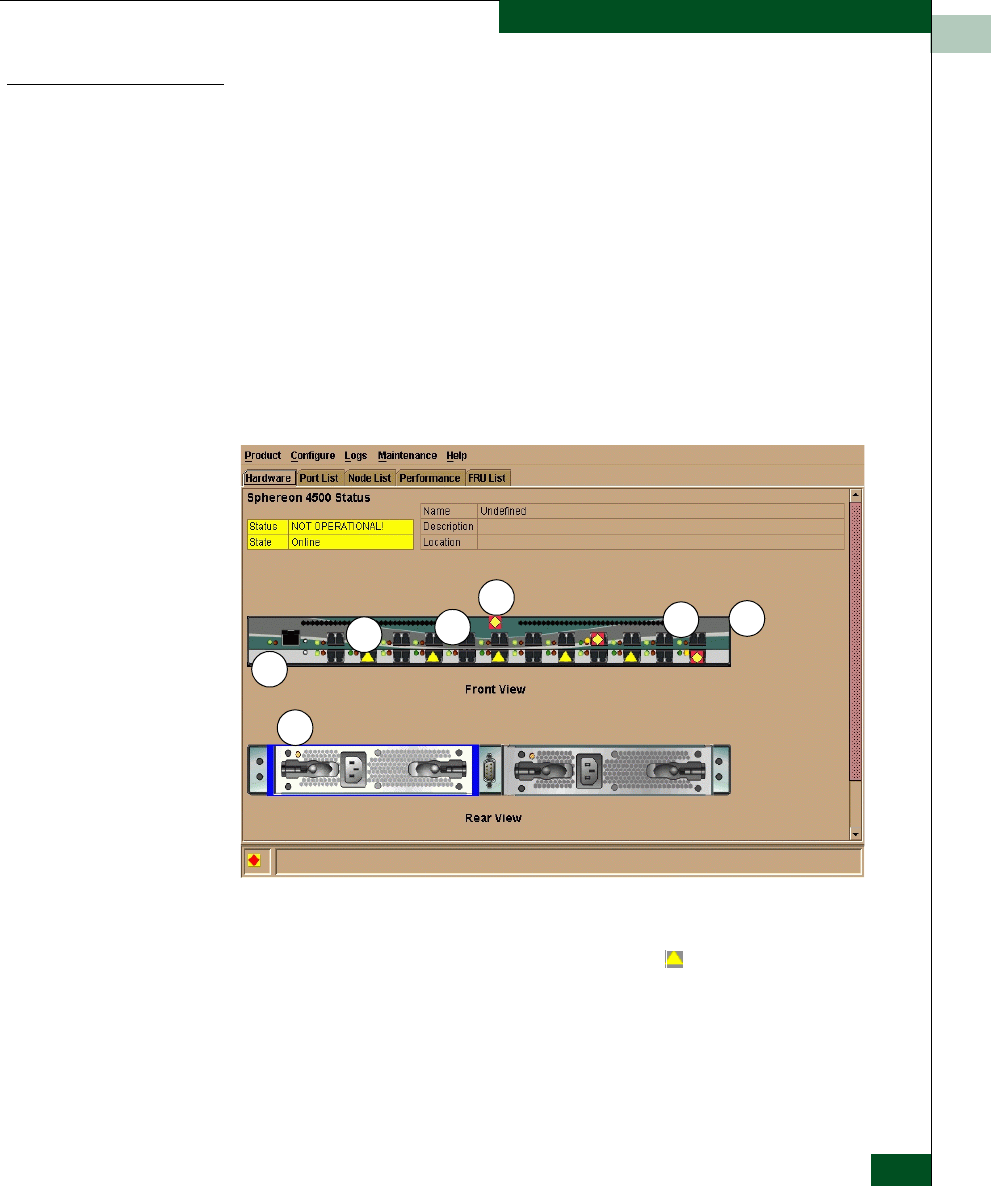
2
Hardware View 2-5
Monitoring and Managing the Switch
Monitoring
Hardware
Operation
Determine hardware component operating status and states by the
simulated light emitting diode (LED) indicators and status symbols,
such as flashing red and yellow diamonds and yellow triangles, that
appear on hardware components. These simulated LEDs and status
symbols reflect the state of the actual hardware as changes occur.
Corresponding or additional descriptions of hardware status and
states also display when you double-click components to display
Properties dialog boxes.
Figure 2-1 illustrates the Hardware View for the Sphereon ES-4500
Fabric Switch. The figure includes examples of symbols and LED
indicators that display to help you monitor hardware operation.
Numbers by the example are keyed to descriptions under Front View
and Rear View on page 2-7.
Figure 2-1 Hardware Operation - Sphereon ES-4500 Fabric Hardware View
Front View 1. Port Attention Indicator: The yellow triangle ( ) indicates that a link
incident occurred or that the port is not operational, in nonstandard
mode of operation, or has other status. For a link incident, the status
table at the top of the Hardware View changes to reflect the reason for
the alert. You can also note the reason by displaying the Port
Properties dialog box for the port. For details on status symbols, refer
6
1
2345
1

2
2-6 McDATA® Sphereon™ 4500 Fabric Switch Product Manager User Manual
Monitoring and Managing the Switch
to Table 2-1 on page 2-36. For information on link incidents, refer to
Link Incident Alerts on page 2-37.
2. Port LED Indicator: The green or blue indicator and amber indicator
to the left of each port connector simulates LED operation on the
actual switch port. A green LED indicates that the port is online with
an operating speed of 1 gigabits per second (Gbps). A blue LED
indicates that the port is online with an operating speed of 2 Gbps.
When the amber indicator illuminates steady, the port has failed and
requires service. For details on port LED indicator operation, see
Table 2-1 on page 2-36.
3. Port Failure Indicator: A blinking red and yellow diamond ( )
below a port connector indicates that the port has failed. Refer to
Table 2-1 on page 2-36 for details on port operating states and the
status symbol and indicator operation.
4. Beaconing: When a blinking amber LED indicator displays by a port
and an attention indicator ( ) displays below the port’s connector,
beaconing is enabled. Refer to Table 2-1 on page 2-36 for details on
port operating states and the status symbol and indicator operation.
5. Not Installed. The port optics are not installed, or the feature that
provides additional port function is not enabled.
6. Power, System Error, and Unit Beaconing Indicators: The green or blue
indicator and amber indicators on the far left of the front view
simulates the power and system error LEDs on the actual switch.
•Power Indicator. The green/blue indicator (PWR) simulates the
power LED on the actual switch. When the indicator
illuminates, the switch is connected to facility AC power and
is operational. The indicator will be on if either power supply
is operating.
•System Error Indicator. The amber system error light indicator
(ERR) simulates the system error light on the actual switch.
When this indicator illuminates, an event has occurred
requiring immediate attention, such as a system, power
supply/fan, or port failure. View details of system errors by
selecting Event Log from the Logs menu on the Product
Manager menu bar. The indicator in the Hardware View and the
LED on the actual unit remains illuminated until you clear the
event by right-clicking on the front or rear view away from a
hardware component and selecting Clear System Error Light
from the menu.

2
Hardware View 2-7
Monitoring and Managing the Switch
•Unit Beaconing Indicator. The amber system error indicator
blinks if unit beaconing is enabled. Enable and disable unit
beaconing by right-clicking on the front or rear view away
from a hardware component and selecting Enable Unit
Beaconing from the menu.
Rear View 1. Power Supply Status: Each AC power connector indicates the
location of an internal power supply. An amber, service-required LED
indicator is located in the upper left corner of each AC power
connector. The indicator illuminates if the power supply has failed
and requires service. The indicator is off if the power supply is active.
When a red and yellow diamond ( ) displays on a power connector,
like in Figure 2-1 on page 2-5, the internal power supply for that
connector failed. Note that the switch operates with one power
supply failure, however replace the power supply as soon as possible
to retain redundancy.
Obtaining Hardware
Information This section explains how to access the FRU Properties, Port Properties,
and Switch Properties dialog boxes.
Displaying FRU
Information Display the FRU Properties dialog box using one of the following
methods:
•Double-click on a FRU, such as a power supply module
illustrated in the Hardware View.
•Select a FRU in the Hardware View, then select FRU and FRU
Properties from the Product menu.
•Double-click on a row in the FRU List view.
The FRU Properties dialog box displays the FRU name; slot position
relative to identical FRUs installed in the chassis, active or failed
state, part number, and serial number.

2
2-8 McDATA® Sphereon™ 4500 Fabric Switch Product Manager User Manual
Monitoring and Managing the Switch
Figure 2-2 FRU Properties Dialog Box
Displaying Port
Information There are several ways to display the Port Properties dialog box:
•Double-click on a port connector in the Hardware View.
•Right-click on a port connector in the Hardware View and select
Properties from the pop-up menu.
•Double-click on the port row in the Port List View table.
•Right-click on a port connector in the Performance View and select
Properties from the pop-up menu.
•Click on a connector, port row, or bar graph in the preceding
views or select the Port menu under the Product menu on the
menu bar across the top of the Product Manager window.
Figure 2-3 Port Properties Dialog Box new graphic

2
Hardware View 2-9
Monitoring and Managing the Switch
•Port Number
The physical port number.
•Port Name
User-defined port name or description. Refer to Configure Ports on
page 3-9 for instructions.
•Type
—G_port. This displays if nothing is logged into the port.
—F_Port. This displays if a device is logged into the port.
—E_Port. This displays if the port is connected to another
switch’s E_Port via an ISL.
—FL_Port. This displays if a private loop device is logged into
the port.
•Operating Speed
Displays the current data speed for the port as 1 Gb/sec, 2
Gb/sec, or Not Established. Not Established displays if Negotiate
was set for the port through the Configure Ports dialog box and the
data speed has not been resolved between the port and the
attached device, or if the port and device are not communicating.
•Port WWN
The port’s 16-digit world-wide name (WWN).
•Block Configuration
Blocked or unblocked. Operation can be blocked or unblocked
through the Configure Ports dialog box. Refer to Configure Ports on
page 3-9 for instructions.
•LIN Alerts Configuration
This field indicates whether LIN alerts are enabled or disabled.
LIN alerts can be configured through the Configure Ports dialog
box. The default is for the LIN alerts to be enabled.
•FAN Configuration
Indicates whether Fabric Address Notification (FAN) is On or Off
when the port is operating as an FL_Port.

2
2-10 McDATA® Sphereon™ 4500 Fabric Switch Product Manager User Manual
Monitoring and Managing the Switch
•Beaconing
This field indicates the beaconing status for the port. To enable or
disable beaconing, right-click the port and select Enable Beaconing.
•Link Incident
Description of the last link incident that occurred on the port.
•Operational State
Beaconing, inactive, invalid attachment, link incident, link reset,
no light, not operational, online, offline, port failure, segmented
E_Port, testing, or not installed. Refer to Table 2-1 on page 2-36 for
definitions of operational states.
•Reason
When the port operating state is “Segmented E_Port,” “Invalid
Attachment,” or “Inactive,” this field displays the reason for that
state. When an E_Port is segmented, two fabrics are prevented
from joining. This only occurs when the switch is connected to
another switch.
The following messages display in the Reason field of the Port
Properties dialog box if an Invalid Attachment, Segmented E_Port,
or Inactive state occurs for the port.
Invalid Attachment Messages:
—01 Unknown. Invalid attachment reason cannot be determined.
—02 ISL connection not allowed on this port. Port is configured as
an F_Port, but connected to switch or switch.
—03 ELP rejected by the attached switch. This switch transmitted
an exchange link protocol (ELP) frame that was rejected by the
switch at the other end of the ISL.
—04 Incompatible switch at the other end of the ISL. Interop mode
for this switch is set to Open Fabric mode and the switch at the
other end of the ISL is a McDATA switch configured for
McDATA Fabric mode.
—05 External loopback adapter connected to the port. A loopback
plug. is connected to the port.
—06 N_Port connection not allowed on this port. The port type
configuration does not match the actual port use. Port is
configured as an E_Port, but attaches to a node device.

2
Hardware View 2-11
Monitoring and Managing the Switch
—07 Non-McDATA switch at other end of the ISL. The cable is
connected to a non-McDATA switch and interop mode is set to
McDATA fabric mode.
—08 ISL connection not allowed on this port. The port type
configuration does not match the actual port use (the port is
configured as an F_Port, but attaches to a switch or director).
—10 Port binding violation - unauthorized WWN. The WWN
entered to configure port binding is not valid or a nickname
was used that is not configured through the Product Manager
for the attached device.
—11 Unresponsive node connected to port. Possible causes are:
•Hardware problem on switch or on a connected node
where ELP frames are not delivered, the response is not
received, or a fabric login in (FLOGI) cannot be received.
There may be problems in switch SBAR.
•Faulty or dirty cable connection.
•Faulty host bus adapters that do not send out FLOGI
within reasonable time frame.
Segmented E_Port Messages:
—Incompatible operating parameters, such as resource
allocation time-out values (R_A_TOV) or error-detect time-out
values (E_D_TOV) are inconsistent. Refer to Configure Switch
Parameters on page 3-3 for more information.
—Duplicate domain IDs. Refer to Configure Switch Parameters on
page 3-3 for more information.
—Incompatible zoning configurations. Refer to sections on
joining zoned fabrics in the Sphereon 4500 Fabric Switch
Installation and Service Manual (620-000159) and the Enterprise
Fabric Connectivity User Manual (620-005001) for details.
—Build fabric protocol error.
—No principal switch (no switch in fabric is capable of being
principal switch).
—No response from an attached switch.
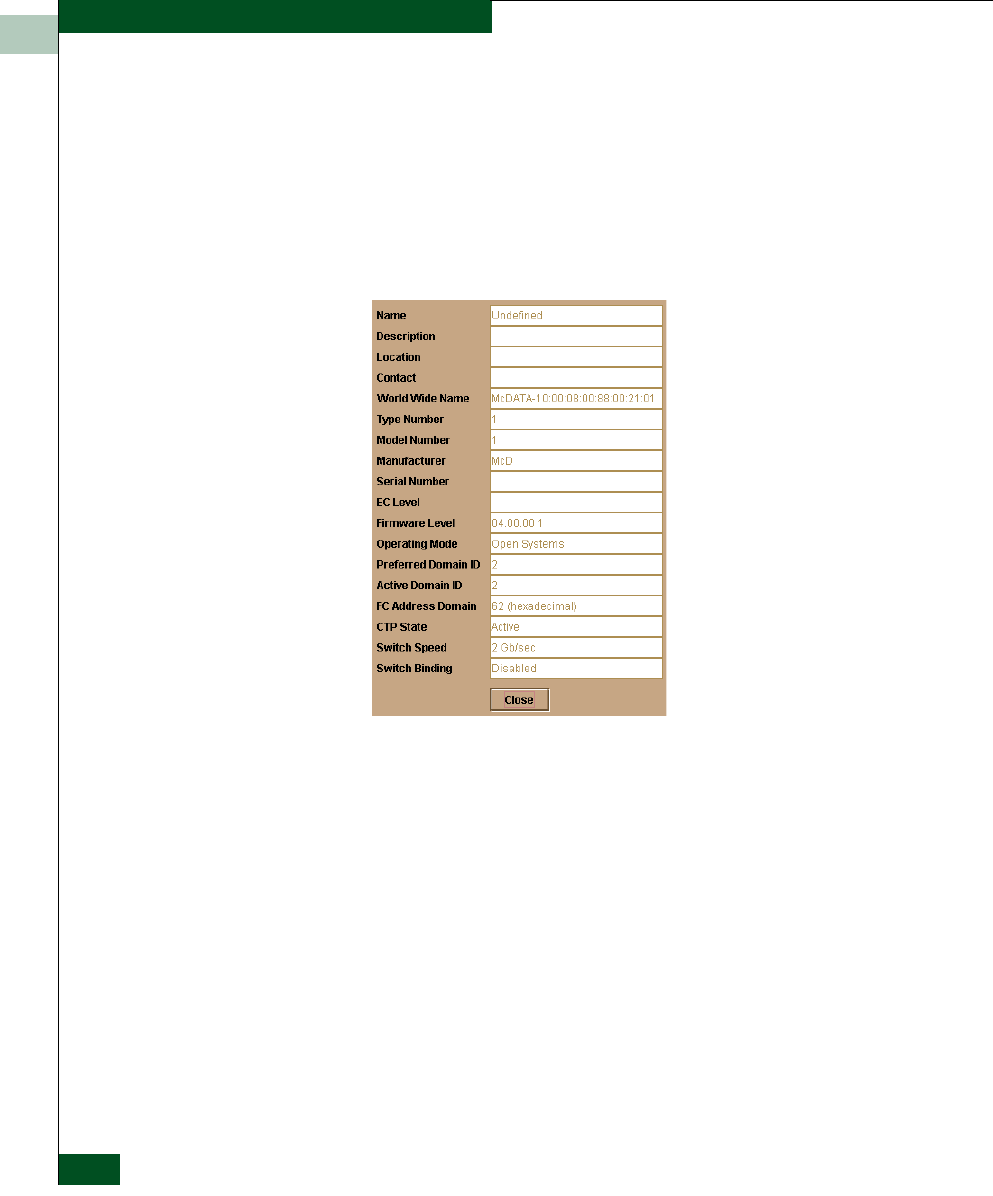
2
2-12 McDATA® Sphereon™ 4500 Fabric Switch Product Manager User Manual
Monitoring and Managing the Switch
•Threshold Alert
If a threshold alert exists for the port, an alert indicator (yellow
triangle) will appear by the Threshold Alert field, and the
configured name for the last alert received will appear in the field.
Displaying Switch
Information Double-click the switch illustration, away from a hardware
component, to display the Switch Properties dialog box as shown in
the following figure.
Figure 2-4 Switch Properties Dialog Box
The following displays in this dialog box:
•Switch Name, Description, Location, and Contact configured
through the Configure Identification dialog box.
•Fibre Channel World Wide Name (WWN) identifier for the switch.
•Product Type Number.
•Product Model Number.
•Product Manufacturer.
•Product Serial Number.
•Engineering change level (EC Level).
•Firmware Level.

2
Hardware View 2-13
Monitoring and Managing the Switch
•Operating Mode. Always in Open System Mode.
•Preferred Domain ID as set through the Configure Operating
Parameters dialog box.
•Active Domain ID. The actual domain ID assigned to the switch.
•Fibre Channel Address Domain.
•CTP State.
•Switch Speed. This is always set to 2 Gb/sec.
•Switch Binding. Enabled if the optional SANtegrity features are
installed and enabled. Otherwise, disabled displays.
Using Menu Options Right-click on various parts of the Hardware View to display menu
options for displaying status and information and for controlling the
switch and various hardware components.
Switch Menu Right-click on any area of the switch illustration where a hardware
component is not installed to display the following menu options.
Switch Properties
Click to display the Switch Properties dialog box. This dialog box
contains the switch name, description, location, and contact person
configured through the Configure Identification dialog box. Also
included is other product information as detailed in Displaying Switch
Information on page 2-12. You can also display this dialog box by
double-clicking an area on the illustration away from a hardware
component.
Enable Unit Beaconing
Click the check box to toggle unit beaconing on or off. When the
check box has a check mark, unit beaconing is on, and the system
error light (ERR) on the switch blinks to help users locate the unit
managed by the Product Manager. The amber indicator on the
Hardware View also blinks when beaconing is enabled. When you
click the check box to remove the check mark, the unit beaconing is
disabled.
You can only enable beaconing if there are no system errors (the system error
light is off).
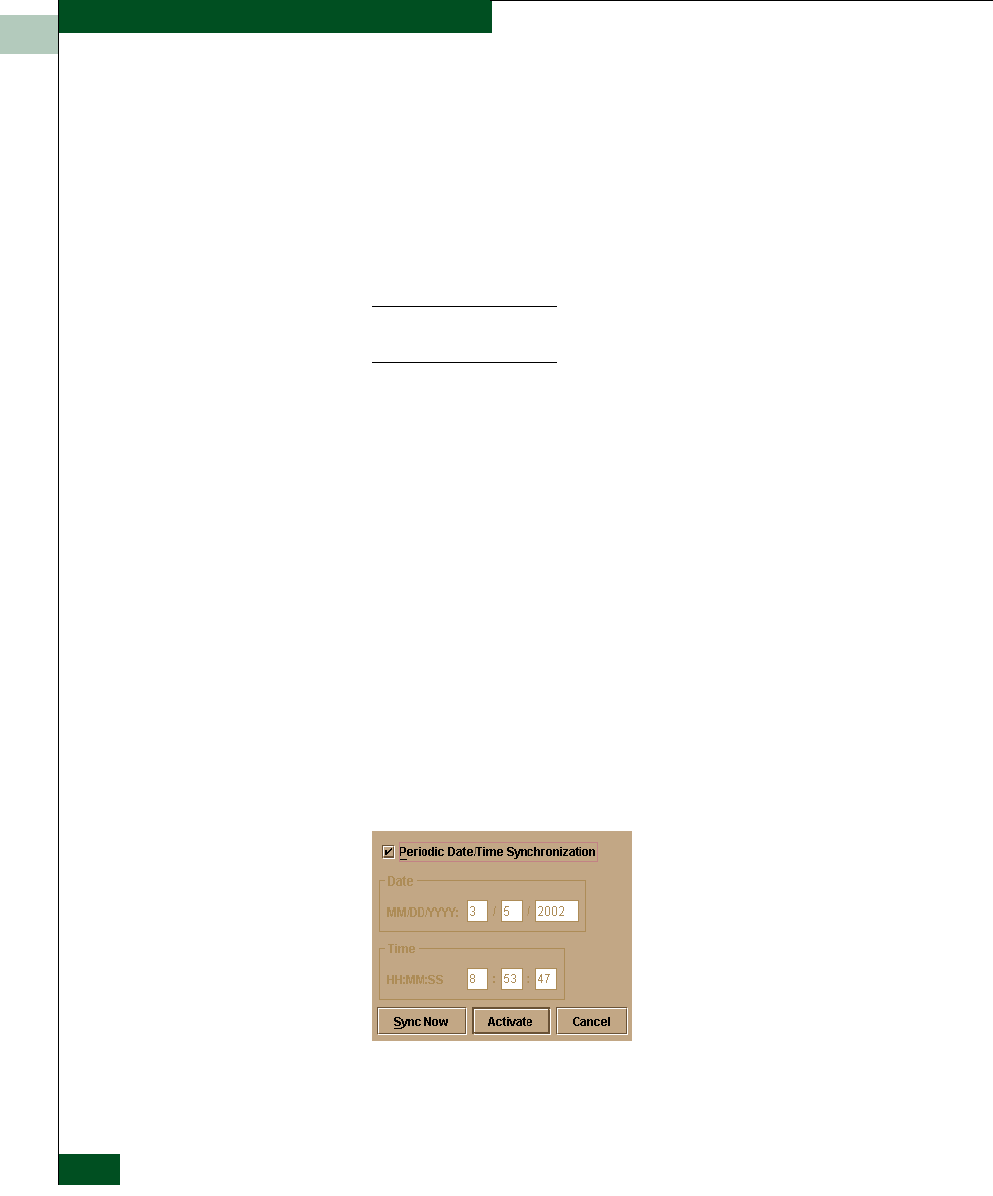
2
2-14 McDATA® Sphereon™ 4500 Fabric Switch Product Manager User Manual
Monitoring and Managing the Switch
Clear System Error Light
Select this to turn off the amber system error light (ERR), located
below the green/blue power (PWR) LED on the switch. This also
turns off the amber system error light indicator in the Hardware View
(front view)
IPL Switch
Select this option to initiate an IPL on the switch. When the dialog
box displays confirming the IPL, click Yes.
An IPL is not intended for ordinary or casual use and should only be
performed when directed by your support personnel.
Refer to Execute an IPL on page 5-2 for detailed procedures.
Set Switch Date and Time
Select this option to display the Configure Date and Time dialog box.
1. Click to display the Configure Date and Time dialog box.
The dialog box displays with a check mark (the default) in the
Periodic Date/Time Synchronization check box. If this field is
checked, the EFC Server periodically sets the switch time to
automatically synchronize with the EFC Server time. Daylight
savings time automatically updates on the switch using this
option.
The current date and time display in the Date and Time fields. If
the Periodic Date/Time Synchronization field is checked, the Date
and Time fields are disabled (grayed out).
To enable and disable Periodic Date/Time Synchronization, click the
check box and then click Activate.
Figure 2-5 Configure Date and Time Periodic Synchronization Dialog Box

2
Hardware View 2-15
Monitoring and Managing the Switch
2. Perform one of the following steps:
•To immediately synchronize the switch date and time with the
EFC Server, be sure the Periodic Date/Time Synchronization option
is enabled and then click Sync Now.
If you enable the Periodic Date/Time Synchronization feature and click
Activate, the time will synchronize at the next update period.
To set the switch with a specific date and time, make sure that the
Periodic Date/Time Synchronization field is not selected. Refer to
Figure 2-6. Enter the date and time and then click Activate.
Figure 2-6 Configure Date and Time Manually
Use the range of 0 to 23 for hours. Use the range of 0 to 59 for minutes and
seconds.
Set Switch Online State
Click to display the Set Online State dialog box. The dialog box
displays the current state (offline or online) and provides a button for
changing the state.
CAUTION
!
Before setting the switch offline, warn administrators and users
currently operating attached devices that the switch is going offline
and that there will be a disruption of port operation. Also, request
that the devices affected by an interruption of data flow be set
offline.
1. Click the Set Offline or Set Online button to toggle between the
states.
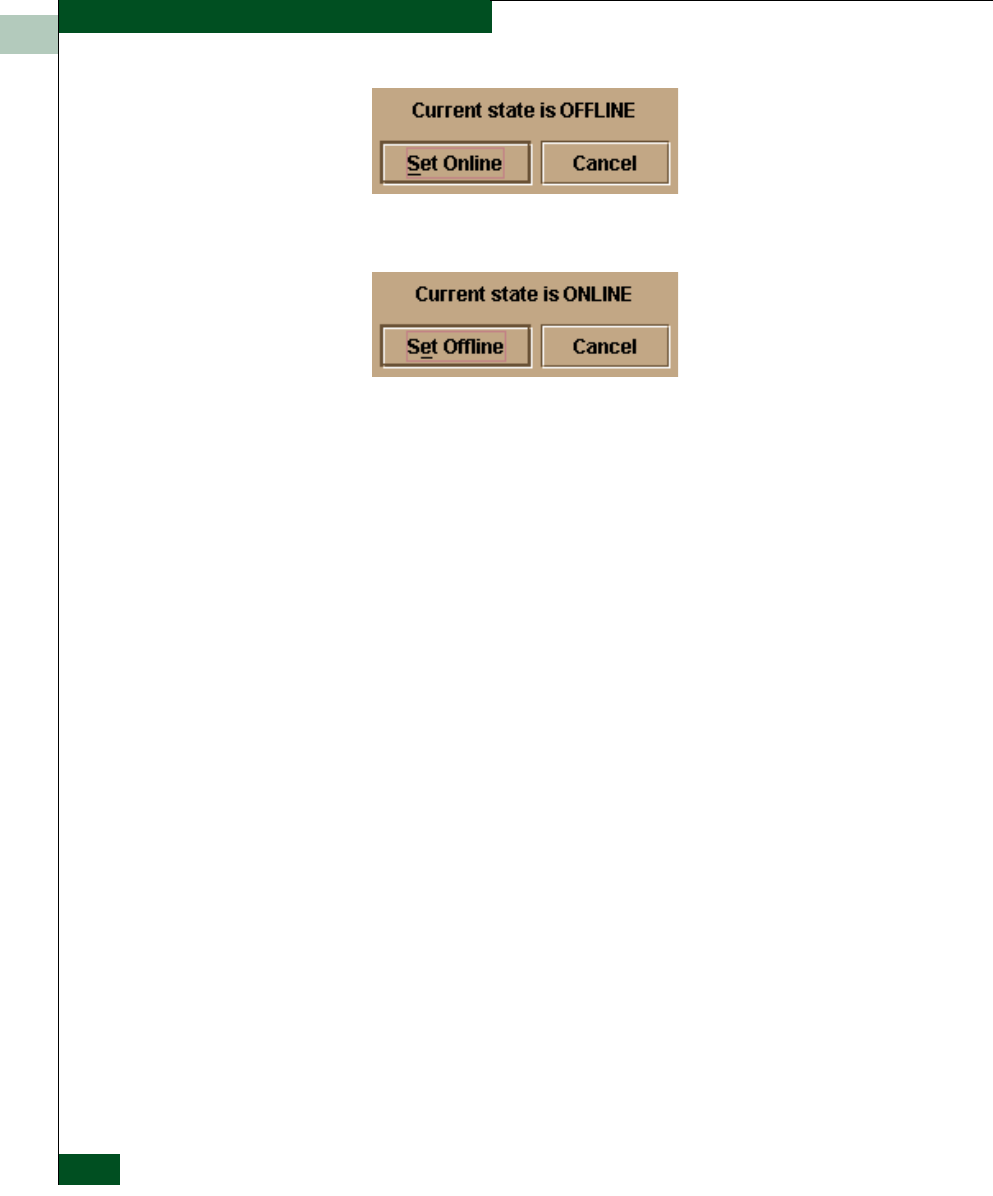
2
2-16 McDATA® Sphereon™ 4500 Fabric Switch Product Manager User Manual
Monitoring and Managing the Switch
Figure 2-7 Set Online State Dialog Box (Switch is Offline)
Figure 2-8 Set Online State Dialog Box (Switch is Online)
2. When the Set Online or Set Offline warning dialog box displays,
click OK to set the switch online or offline.
As the switch goes offline, the word, “OFFLINE,” displays in the
State field in the left corner of the Hardware View. As the switch
goes online, the word, “ONLINE,” displays in the State field in
the left corner of the Hardware View. When going offline, LED
indicators on all ports with attached devices stay green/blue, but
the switch sends offline sequences (OLS) to these devices.
Port Menu While in the Hardware View, right-click on any port to display the
following menu options.
Port Properties
Click this to display the Port Properties dialog box. This dialog box
displays technical information about the port. See Displaying Port
Information on page 2-8 for more information.
Port Technology
Click this to display the Port Technology dialog box. This dialog box
displays the following information:
•Port number.
•Connector type: Always LC.
•Transceiver type: Longwave laser LC or shortwave laser LC.

2
Hardware View 2-17
Monitoring and Managing the Switch
•Distance: General distance range for port transmission. This can
be either short to long distances for the longwave laser LC
transceiver or short distances for the shortwave laser LC
transceivers.
•Media: The Fibre Channel mode and optic size. For the longwave
laser LC transceiver, this would be singlemode 9-micron. For the
shortwave laser LC transceiver, this would be multimode
50-micron or 62.5-micron.
•Speed: This will be either 1Gbit per second or 1 Gbit, 2 Gbit per
second.
Block Port
Click to display a check mark and block port transmission If blocked,
a node attached to the port is prevented from logging into the switch
or communicating with other devices attached to switch ports. A
blocked port continuously transmits offline signals (OLS). Click to
remove the check mark and unblock the port. If unblocked, a node
attached to the port can communicate with the switch and
communicate with other nodes attached to the switch.
Enable Beaconing
Click this to make the amber LED by the port blink on the actual
switch and the amber indicator blink for the port in the Hardware
View. This enables users to locate the unit where the port is located.
When a blinking amber LED indicator displays by a port, an attention
indicator ( ) displays below the port's connector in the Hardware
View and on the port’s row in the Port List View.
Port Diagnostics
Click this option to display the Port Diagnostics dialog box. Use this
dialog box to run an internal loopback and external loopback test on
the port. The Port Diagnostics option enables you to run internal and
external loopback tests on any port. To use this option, follow the
detailed steps in the McDATA Sphereon 4500 Fabric Switch Installation
and Service Manual (620-000159).
Clear Link Incident Alert(s)
Click this to clear the attention indicator on the Hardware View, the
Port List View, and the Performance View. In addition, the procedure
clears the alert description in Port Properties dialog boxes. If there are
no link incident alerts set for a port, no actions occur. Although you
can manually clear link incidents, they may also be cleared by actions
outside of the user interface, such as when rebooting the EFC Server.

2
2-18 McDATA® Sphereon™ 4500 Fabric Switch Product Manager User Manual
Monitoring and Managing the Switch
Reset Port
Click to display a confirmation dialog box. Click Yes on that dialog
box to reset the port. If a switch is attached to the port and online, this
operation sends a link reset to the attached switch, otherwise this
action disables port beaconing for the port. If the port is in a failed
state, such as after failing a loopback test, the reset restores the port to
an operational state, clearing the service required (amber) LED. The
reset does not affect other ports in the switch.
Port Binding
Click to display the Port Binding dialog box (Figure 2-9). Use this
dialog box to allow a device with a specific WWN or nickname to
have exclusive connection to a port. To use this dialog box, refer to
the following paragraphs.
Figure 2-9 Port Binding Dialog Box
Port Binding dialog box parameters:
•Port Binding: Click this check box to place check mark in the box
and enable WWN binding for the port. When enabled, only a
specific device can communicate through the port. This device is
specified by the WWN or nickname entered into the Bound WWN
field (either the Attached WWN or WWN options). With the check
box cleared, any device can communicate through the port even if
a WWN or nickname is specified in the Bound WWN field.
•Attached WWN: Click the radio button and, if a device is logged
into the port, the device's WWN will display in the field. The
device with this WWN or nickname will have exclusive
communication privileges to the port if WWN Binding is enabled.
If you click this radio button to bind the port to a logged-in device and
there are no devices logged in, the port is essentially bound to a WWN of
“0.” This prevents any device from logging in until this button is
re-enabled to bind the WWN of a logged-in device or until you explicitly

2
Hardware View 2-19
Monitoring and Managing the Switch
bind the WWN of a device by clicking the WWN radio button and
entering a WWN or nickname (see the following). Changes only take
effect when you click the Activate button.
•WWN: Click the radio button and enter a world wide name
(WWN) in the proper format (xx.xx.xx.xx.xx.xx.xx.xx) or a
nickname configured through the Product or EFC Manager
applications. The device with this WWN or nickname will have
exclusive communication privileges through the port if WWN
Binding is enabled.
Note the following:
—If you do not enter valid WWN or nickname in this field, but
the Port Binding check box is checked (enabled), then no
devices can communicate over the port.
—If you enter a WWN or nickname in this field and do not place
a check in the Port Binding check box, the WWN or nickname
will be stored, and all devices can communicate over the port.
•Activate: Click this button to activate settings in this dialog box.
Warning and error message display:
•If one or more of the nodes logged into a port does not match the
WWN or nickname configured in the field by the WWN radio
button, a warning dialog box displays after you activate the
configuration. This warning box displays a list of all nodes that
will be logged off if you continue. If you click Continue on the
warning box, these nodes will be logged off and the port will only
attach to the device with the device with the WWN or nickname
configured in the WWN field.
•An error message displays after you activate the configuration if
the format for the WWN entered in the WWN field is not valid
(not in xx.xx.xx.xx.xx.xx.xx.xx format) or if you have entered a
nickname that was not configured through the Product Manager.
Clear Threshold Alert(s)
Click this to display the Clear Threshold Alert(s) dialog box. Select the
appropriate option to clear alerts for the selected port only or all ports
on the switch. This clears all attention indicators that notify users of
threshold alerts in dialog boxes and views. This action also restarts
the notification interval and the cumulative minutes for utilization %
interval.
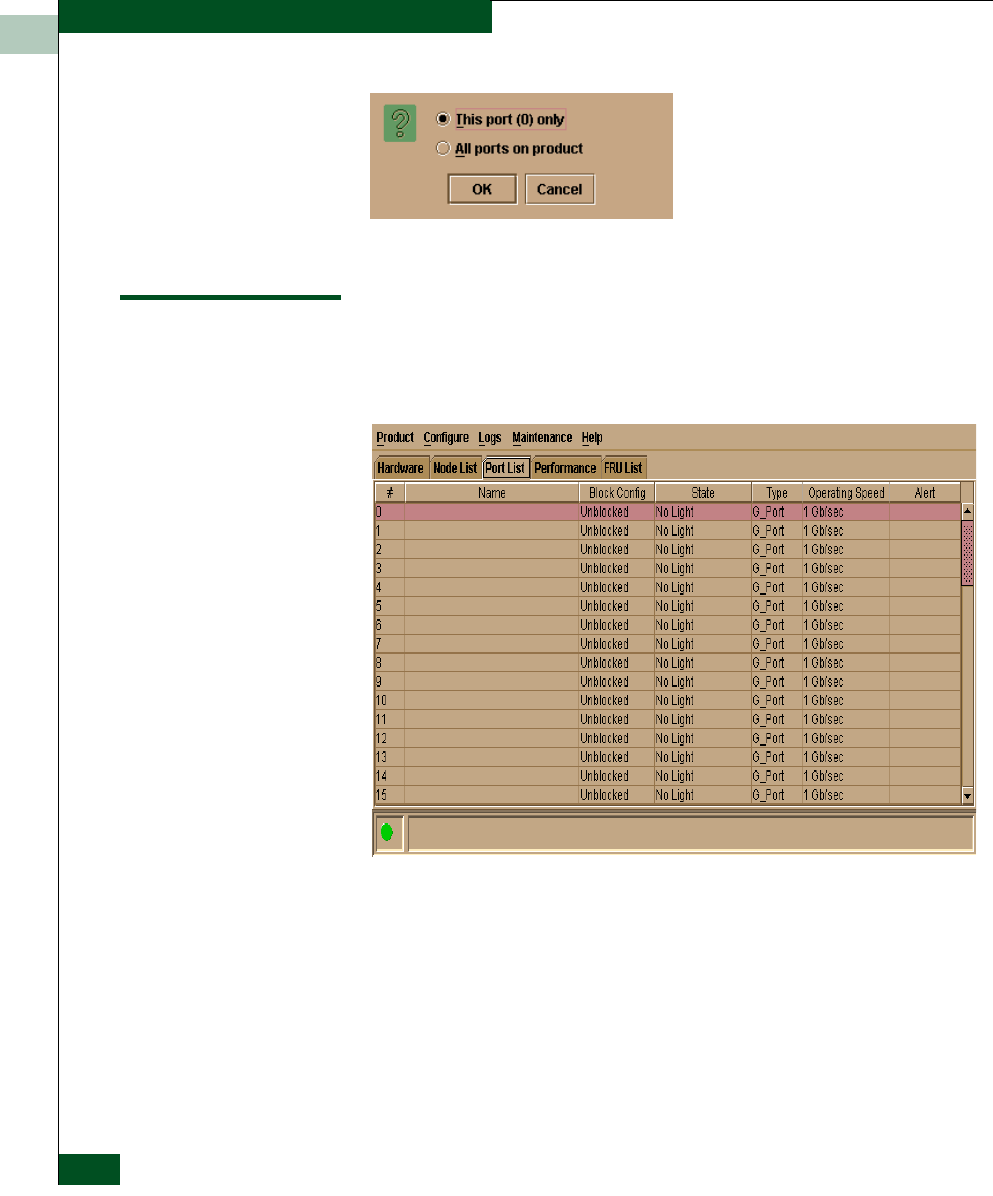
2
2-20 McDATA® Sphereon™ 4500 Fabric Switch Product Manager User Manual
Monitoring and Managing the Switch
Figure 2-10 Clear Threshold Alert(s) Dialog Box
Port List View
Display the Port List View (Figure 2-11) in the view panel by selecting
the Port List option from view tabs on the Product Manager window.
Figure 2-11 Port List View
The Port List View displays the following information on all ports that
can be installed in the switch. All information is updated
automatically.
•#
Number of the port from 0 through 23.

2
Port List View 2-21
Monitoring and Managing the Switch
•Name
Displays the port name as configured through the Configure Ports
dialog box.
•Block Config
Indicates the blocked or unblocked configuration of the port as
set through:
—The Configure Ports dialog box.
The Block Port option available through port right-click menus in
the Hardware View, port row right-click menus in the Port List
view, is also the port bar graph right-click menus in the
Performance View, and the Port secondary menu of the Product
menu on the menu bar.
Blocked states are:
—Blocked: Devices communicating with the port are prevented
from logging into the switch or communicating with other
devices attached to switch ports. A blocked port continuously
transmits OLS.
—Unblocked: Devices communicating with the port can log in
to the switch and communicate with devices attached to any
other unblocked port in the same zone.
•State
The following port operational states may display in this table.
For more information on these states and corresponding status
symbol and LED indicator operations in the Hardware View, see
Port Operational States on page 2-36.
—No Light
—Online
—Offline
—Beaconing
—Link Reset
—Not Operational
—Not Installed
—Invalid Attachment
—Port Failure

2
2-22 McDATA® Sphereon™ 4500 Fabric Switch Product Manager User Manual
Monitoring and Managing the Switch
—Segmented E_Port
—Link Incident
—Testing
—Inactive
•Type
The type of port. If the Port State is online, the available port types
are F_Port, FL_Port, and E_Port. If the Port State is not online, the
available port types are the configured type: Gx_Port, G_Port,
Fx_Port, F_Port, and E_Port.
•Operating Speed
This column indicates the speed at which the port is operating.
Possible values are 1 Gb/sec and 2 Gb/sec.
•Alert
This column displays a yellow triangle if a link incident occurs on
the port or if the port’s LED is beaconing. Blinking red and yellow
diamonds display for port failures or for ports requiring service.
Click on the row to display the reason for the alert in the Port
Properties dialog box.
Click a row to select it, highlight it, and display the Port Properties
dialog box. For an explanation of the fields on the Port Properties
dialog box, refer to Displaying Port Information on page 2-8.
Menu Options Right-click a row to select it, highlight it, and display a menu with the
following port-related action options. These are the same menu
options that display when you right-click a port in the Hardware View
and Performance View. You can also display this menu by clicking on a
port, port row, or port graph in the preceding views and selecting the
Port secondary menu from the Product menu on the menu bar.
Refer to Port Menu on page 2-16 for an explanation of these menu
options.
•Port Properties
•Port Technology
•Block Port
•Enable Beaconing
•Port Diagnostics

2
FRU List View 2-23
Monitoring and Managing the Switch
•Clear Link Incident Alert
•Reset Port
•Port Binding
•Clear Threshold Alert(s)
For Node Properties, if a node is not logged in a message displays indicating
that node information is not available.
FRU List View
Display the FRU List in the main panel by selecting the FRU List view
tab on the Product Manager window. This view displays information
about all installed FRUs on the switch. All data is dynamic and
updates automatically as the software detects changes.
Figure 2-12 FRU List View
Information on the FRU List View for each FRU includes:
•FRU Name: CTP (Control Processor), and PWR (power-supply
module). Note that the CTP is an internal component, and if it
fails completely the entire switch must be replaced.

2
2-24 McDATA® Sphereon™ 4500 Fabric Switch Product Manager User Manual
Monitoring and Managing the Switch
•Position: Slot position of FRU in the chassis relative to identical
FRUs also installed in the chassis. These consist of one CTP card
(position 0) and two power supply modules/fan (positions 0-1):
—PWR - Power supply module/fan
—CTP - Control processor
•Status: Active or failed. Active displays always unless the FRU
fails. Failed displays if the FRU is not functional.
•Part Number: Part number of the FRU.
•Serial Number: Serial number of the FRU.
Click to select a row in the FRU List View and select Properties from
the FRU submenu of the Product menu to display the Properties dialog
box for the FRU.
Click CTP to display the Switch Properties dialog box.
Node List View
Display the Node List View in the view panel by selecting Node List
from the view tabs on the Product Manager window. This view
displays information about all node attachments to any F_Ports on
the switch sorted by port number. All data is dynamic and updates
automatically as devices log in and log out.
Figure 2-13 Node List View

2
Node List View 2-25
Monitoring and Managing the Switch
Information that displays for each node includes:
•Port #
Number of the port, from 0 through 23.
•Fibre Channel Address
The 3-byte Fibre Channel address for the node or the arbitrated
loop physical address (ALPA) for private loop devices.
•Node Type
—N_Port: The switch port is operating as an F_Port.
—NL_Port: the switch port is operating as an FL_Port
•Port WWN
The port WWN of the attached node (N_Port). The 16-digit WWN
is a set of unique numbers assigned to the device attached to the
port. The WWN is prefixed by the manufacturer’s name of the
host bus adapter that attaches to the device. If there is a nickname
assigned, the nickname displays instead of the WWN. For private
loop devices, "Not Logged In" displays.
•Unit Type
The following information, if supported, is supplied by the
attached device:
—Converter
—Gateway
—HBA
—Module
—Other
—Proxy-agent
—Storage device
—Software driver
—Storage subsystem
—Switch
—Unknown

2
2-26 McDATA® Sphereon™ 4500 Fabric Switch Product Manager User Manual
Monitoring and Managing the Switch
•BB_Credit
The BB_Credit supported by the device. For private loop devices,
this field will be blank.
Double-click a row to display the Node Properties dialog box. For an
explanation of the fields on the Node Properties dialog box, refer to
Displaying Node Properties.
Private loop devices do not log into the fabric and do not provide any
additional information other than their Arbitrated Loop Physical Address
(ALPA) for private loop devices. The Port WWN field displays Not Logged
In and the Unit Type field is blank for all private loop devices.
Menu Options Double-click on a port row to highlight it and display the Node
Properties dialog box for that port.
Right-click a row to select it, highlight it, and display a menu with the
following port-related action options:
•Node Properties
Select this option to display the Node Properties dialog box. Refer
to Displaying Node Properties on page 2-27 for details.
•Port Properties
Select this option to display the Port Properties dialog box (refer to
Figure 2-3 on page 2-8).
•Define Nickname
Select this option to display the Define Nickname dialog box,
where you can define a nickname to display for the attached
device instead of the device's 8-byte WWN.
The Define Nickname dialog box displays the world wide name
(WWN) of the device attached to the port. To define a nickname,
enter a name of up to 32 characters in the Nickname field and click
OK. The nickname will display under the Port WWN column
instead of the device's WWN.

2
Node List View 2-27
Monitoring and Managing the Switch
•Display Options
Select Nickname or Worldwide Name from the submenu. Selecting
Nickname displays attached devices in the Port WWN column by
the nickname configured through the Define Nickname menu
option. Selecting Worldwide Name displays attached devices in the
Port WWN column by the device's WWN.
Note that you can also display these menu options by clicking a
port row, and selecting the Port secondary menu from the Product
menu on the Product Manager menu bar.
Displaying Node
Properties Open the Node Properties dialog box by double-clicking a row in the
Node List View or right-clicking a row and selecting Node Properties
from the menu. You can also display this dialog box by right-clicking
on a port in the Hardware View, right-clicking on a port’s row in the
Port List View, or right-clicking on a port’s bar graph in the
Performance View and selecting Node List from the menu. In addition,
you can display this dialog box by clicking to select a port, port row,
or port bar graph in the preceding views and selecting Node Properties
from the Port secondary menu on the Product menu of the Product
Manager menu bar.
If a node is not logged in, a message appears indicating that node
information is not available.
Figure 2-14 Node Properties Dialog Box

2
2-28 McDATA® Sphereon™ 4500 Fabric Switch Product Manager User Manual
Monitoring and Managing the Switch
•Port Number
The physical port number on the switch to which the node is
connected.
•Fibre Channel Address
The 3-byte address of the node or the ALPA for private loop
devices.
•Port WWN
Port world-wide name of the attached device.
•Port Nickname
Nickname for the port WWN. Must be configured to display.
•Node WWN
Node world-wide name of the attached device. Must be
configured to display.
•Node Nickname
Nickname for the node WWN.
•Unit Type
Refer to Unit Type on page 2-25 in Node List View.
•Class of Service
Class of service. This can be class 2, class 3, or both.
•Data Field Size
Data field size. This is the largest size of Fibre Channel frame the
node will process. The size is negotiated with the attached device.
Node Properties is also available from the menu that displays when you
right-click a port’s row in the Port List View or on a port’s bar graph in the
Performance View.
Performance View
Display the Performance View in the view panel by selecting
Performance from the view tabs in the Product Manager window. This
view displays a bar graph at the top of the view for each port. The

2
Performance View 2-29
Monitoring and Managing the Switch
lower portion of the view displays statistical values for the specific
port’s bar graph that you select.
Figure 2-15 Performance View
Menu Options Right-click any of the port bar graphs to display a menu with the
following port-related action options. These are the same menu
options that display when you right-click a port in the Hardware View
or on a row in the Port List View. You can also display these options by
clicking a port, port row, or port bar graph in the preceding views
and selecting the Port secondary menu from the Product menu on the
menu bar.
Refer to Port Menu on page 2-16 for an explanation of these menu
options.
•Port Properties
•Node Properties
If a node is not logged in, a message displays indicating that node
information is not available.
•Port Technology
•Block Port

2
2-30 McDATA® Sphereon™ 4500 Fabric Switch Product Manager User Manual
Monitoring and Managing the Switch
•Enable Beaconing
•Diagnostics
•Clear Link Incident Alert(s)
•Reset Port
•Port Binding
•Clear Threshold Alert(s)
Bar Graph Display The Performance View provides a graphical display of performance for
all ports. Each bar graph in the upper portion of the view panel
displays the percentage of link utilization for the port. This
information updates every five seconds. A red arrow marks the
highest utilization since the opening of the Performance View. If the
system detects activity on a port, it represents minimal activity with
one bar.
When a port is operating as an F_Port and a device is logged on,
moving the cursor over the port’s bar graph displays a message with
the attached port’s WWN. If the port is an E_Port, the message reads,
“E_Port.” If the port is an FL_Port, FL_Port displays. If the port is not
logged in, the message displays the port’s current operational state
(refer to Table 2-1 on page 2-36).
Port Statistics To select and display more detailed performance information for a
port, click the port’s bar graph. The bar graph for that port highlights
with a darker background and the lower portion of the Performance
View tab displays the statistics values for the port’s number and the
WWN decoding. The Statistics Values tables contain a menu of
specific statistics that can be displayed: All, Class 2 Statistics, Class 3
Statistics, Error Statistics, Operational Statistics, and Traffic Statistics.
Click a category in the left frame of the statistics area to display only
statistics for that category or click All to display values for all
categories. For a description of the Refresh and Clear buttons, refer to
Button Functions on page 2-35.
Statistics Description The Statistics Values tables contain statistics in the following groups.
To refresh tables with the latest data, click the Refresh button on the
upper right portion of the Statistics Values panel or click the port’s bar
graph. Clear all counters for all users using the Clear button.

2
Performance View 2-31
Monitoring and Managing the Switch
Traffic Statistics with Receive and Transmit Values
This section describes the types of statistics that display when you
click a port’s bar graph:
•Link Utilization%
There is a separate value for transmit and receive link utilization.
The larger of these two values displays on the bar graph.
The current link utilization for the port is expressed as a
percentage. Each port can transmit or receive data at 100
Megabytes (MB) per second. This statistic shows the percentage
of the maximum link utilization currently being used. Link
utilization is calculated over one-second intervals. The maximum
link utilization is 100%.
•Frames
The number of frames that the port has received or transmitted.
•Four Byte Words Rx
The number of words that the port has received.
•Four Byte Words Tx
The number of words that the port has transmitted.
•Offline Sequences
The number of offline sequence that the port has received or
transmitted.
•Link Resets
The number of link reset protocol frames received/transmitted by
this port from/to the attached switch. The switch transmits a link
reset to initiate the link reset protocol or recover from a link
timeout. The switch receives a link reset from an attached device
if the device wishes to initiate the link reset or recover from a link
timeout.
There are not thresholds for these values. You may determine that
a problem exists by the rate that the value changes.
•LIPS
The number of Loop Initialization Primitives (LIPS)
generated/detected by this port. These cause re-initialization of
the port.

2
2-32 McDATA® Sphereon™ 4500 Fabric Switch Product Manager User Manual
Monitoring and Managing the Switch
Class 2 Statistics
The Class 2 Statistics table includes:
•Received Frames
The number of Class 2 frames received by this F_Port from its
attached N_Port.
•Busied Frames
The number of F_BSY frames generated by this F_Port against
Class 2 frames. This can occur if frames are received before the
switch completes initialization or if the switch is servicing so
many requests that it can not process a new request. The port
generates frames if the switch is not ready to accept commands.
This may indicate temporary congestion.
•Rejected Frames
The number of F_RJT frames generated by this F_Port against
Class 2 frames.
These frames usually occur because of attached device errors. The
device is expected to correct the error based on the reject code,
then retry its request. If the device is able to recover, there is no
cause for concern. If not, further troubleshooting may be
necessary. There are no thresholds for this value. Typically, this
occurs because the destination is not available due to the device’s
action.
•Four Byte Words Received
The number of four-byte words received.
•Four Byte Words Transmitted
The number of four-byte words transmitted.
Class 3 Statistics
The Class 3 Statistics table includes:
•Received Frames
The number of Class 3 frames received by this F_Port from its
attached N_Port.
•Discarded Frames
The number of Class 3 frames discarded, including multicast
frames with bad D_IDs.

2
Performance View 2-33
Monitoring and Managing the Switch
The switch increments this count when it discards a frame that
cannot be routed. This occurs most frequently when a destination
becomes unavailable without the source realizing the destination
is unavailable. There are no thresholds for this value. Typically,
this occurs when the destination is not available due to the
destination device’s action.
•Four Byte Words Received
The number of four-byte words received.
•Four Byte Words Transmitted
The number of four-byte words transmitted.
Error Statistics
Port errors indicate that a port is not operating correctly. Use this data
to isolate problems with port and link operations. The statistics in this
table include:
•Link failures
A link failure was recorded in response to a not operational
sequence (NOS), protocol timeout, or port failure. At the
Hardware View, a yellow triangle appears to indicate a link
incident, or a blinking red and yellow diamond appears to
indicate a port failure.
•Sync losses
A loss of synchronization was detected because the attached
device was reset or disconnected from the port. At the Hardware
View, a yellow triangle appears to indicate a link incident.
•Signal losses
A loss of signal was detected because the attached device was
reset or disconnected from the port. At the Hardware View, a
yellow triangle appears to indicate a link incident.
•Primitive sequence errors
An incorrect primitive sequence was received from the attached
device, indicating a Fibre Channel link-level protocol violation.
At the Hardware View, a yellow triangle appears to indicate a link
incident.

2
2-34 McDATA® Sphereon™ 4500 Fabric Switch Product Manager User Manual
Monitoring and Managing the Switch
•Discarded frames
A received frame could not be routed and was discarded because
the frame timed out (insufficient buffer-to-buffer credit) or the
destination device was not logged into the switch.
•Invalid transmission words
The number of times that the switch detected invalid
transmission words from the attached device. This indicates that
a frame or primitive sequence arrived at the switch’s port
corrupted. This corruption can be due to the attached device
performing a reset, plugging or unplugging the link, bad optics at
either end of the cable, bad cable, or a dirty or poor connection.
Moving the connection around or replacing cables can isolate the
problem.
Some number of invalid transmission words are expected and
acceptable. Invalid transmission words within a frame are used to
produce the bit-error threshold link incident. If one or more
invalid transmission words are detected in 12 separate 1.5-second
samples within five minutes, a bit-error threshold link incident is
generated.
•CRC errors
A received frame failed a cyclic redundancy check (CRC)
validation, indicating the frame arrived at the switch’s port
corrupted. Frame corruption may be caused by device
disconnection, an optical transceiver failure at the device, a bad
fiber-optic cable, or a poor cable connection.
•Delimiter errors
The number of times that the switch detected an unrecognized
start-of-frame (SOF), an unrecognized end-of-frame (EOF)
delimiter, or an invalid class of service. This indicates that the
frame arrived at the switch’s port corrupted. This corruption can
be due to plugging/unplugging the link, bad optics at either end
of the cable, bad cable, or dirty or poor connections. Moving the
connection around or replacing cables can isolate the problem.
•Address ID errors
A received frame had an unavailable or invalid Fibre Channel
destination address, or an invalid Fibre Channel source address.
This typically indicates the destination device is unavailable.

2
Performance View 2-35
Monitoring and Managing the Switch
•Frames too short
A received frame exceeded the Fibre Channel frame maximum
size or was less than the Fibre Channel minimum size, indicating
the frame arrived at the switch’s port corrupted. Frame
corruption may be caused by device disconnection, an optical
transceiver failure at the device, a bad fiber-optic cable, or a poor
cable connection.
Troubleshooting Tips As a general rule, you should clear all counts after the system is
stabilized. When looking at the Performance View, roughly keep
track of the time interval when errors accumulate to judge the
presence and severity of a problem. Also, recognize that there is a
link recovery hierarchy implemented in Fibre Channel to handle
some level of “expected anomalies.” In general, only be
concerned with error counts that increment very quickly.
Button Functions The two buttons located at the right end of the title bar on the
Statistics Values table are:
•Clear
The Clear button clears all counters to zero. Selecting this button
displays a Clear Port Statistics dialog box. Select the appropriate
radio button and click OK to clear all counters to zero on the
selected port only or counters on all ports on the switch. Note that
this also clears counters for other Product Manager users.
An entry identifying when the statistics were cleared and by
whom is saved in the Audit Log.
•Refresh
The Refresh button updates the data in the statistics tables and
enables you to compare values at any given time. Note that you
can also refresh data by clicking the port’s bar graph.
Click Clear to clear the statistics counters to zero. When the
confirmation dialog box displays, select This port only or All ports
on product, then click OK to clear the counters to 0.

2
2-36 McDATA® Sphereon™ 4500 Fabric Switch Product Manager User Manual
Monitoring and Managing the Switch
Port Operational States
Table 2-1 describes the port operational states and the LED and
attention indicators that display in the Hardware View and Port List
View.
Table 2-1 Port States and Indicators
Port Indicators
Port State Green/Blue Amber Alert IndicatoraDescription
Beaconing Off or On Blink Yellow Triangle The port is beaconing. The amber port LED blinks once
every two seconds to enable users to find a specific
port. Enable beaconing through the port’s menu on the
Hardware View, Port List View, or Performance View.
Inactive Off Off Yellow Triangle The switch port is in an inactive state. Reasons for this
state appear in the Reason field of the Port Properties
dialog box.
Note that if port optics have also failed, the amber LED
will be on.
Invalid
Attachment
On Off Yellow Triangle The switch port is in an invalid attachment state.
Reasons for this state appear in the Reason field of the
Port Properties dialog box.
Link Incident Off Off Yellow Triangle A link incident occurred on one of the ports and displays
in the Port List View with a corresponding indicator
displaying for the card in the Hardware View.
Link Reset Off Off Yellow Triangle The switch and the attached device are performing a link
reset operation to recover the link connection. Ordinarily,
this is a transient state that should not persist.
No Light Off Off None No signal (light) is being received on the switch port.
This is a normal condition when there is no cable
plugged into the port or when the power of the device
attached to the other end of the link is off.
Not
Operational
Off Off Yellow Triangle The switch port is receiving the Fibre Channel not
operational sequence (NOS) indicating that the attached
device is not operational.

2
Link Incident Alerts 2-37
Monitoring and Managing the Switch
a. The status indicator displays on the port in the Hardware View. It indicates that a
corrective action is required to return the port to a normal operating state.
Link Incident Alerts
A link incident is a problem detected on a fiber optic link, like the loss
of light, invalid sequences, and other problems. When a problem
occurs, a LIN alert is sent to the Link Incident Log in the switch
Product Manager. LIN alerts warn you that there is a link incident
Online On Off None The attached device has successfully connected to the
switch and is ready to communicate or is in the process
of communicating with other attached devices. As long
as the port remains in the online state, the green/blue
port LED remains illuminated. Note that on the actual
port in the unit, the green/blue LED blinks when there is
active Fibre Channel traffic through the port.
Offline Off Off None The switch port was configured as “blocked” and is
transmitting the Fibre Channel OLS to the attached
device.
Off Off Yellow Triangle The switch port was configured as “Unblocked” and is
receiving the Fibre Channel OLS, indicating that the
attached device is offline.
Port Failure Off On Red and Yellow
Blinking
Diamond
The switch port has failed and requires service. The
amber LED for the port remains illuminated.
Segmented
E_Port
On Off Yellow Triangle The E_Port is segmented preventing the two fabrics
from joining (this only occurs when two switches are
connected to each other). Display the Port Properties
dialog box to view the segmentation reason.
Testing Off Blink Yellow Triangle Port is executing an internal loopback test.
On Blink Yellow Triangle Port is executing an external loopback test.
Note: For any loopback test, the amber LED blinks
(beacons) to help users locate the port under test.
Not Installed Off Off Yellow Triangle The port optics are not installed or the feature that
provides additional port function is not enabled.
Table 2-1 Port States and Indicators (continued)
Port Indicators
Port State Green/Blue Amber Alert IndicatoraDescription

2
2-38 McDATA® Sphereon™ 4500 Fabric Switch Product Manager User Manual
Monitoring and Managing the Switch
being detected through a port connection that may require operator
intervention to correct.
If LIN alerts are enabled for a port in the Configure Ports dialog box, a
yellow triangle (attention indicator) displays by the port connector in
the Hardware View or in the Alert column in the Port List View. A
corresponding triangle displays for the card on the Hardware View.
Double-clicking the port with the yellow triangle displays the Port
Properties dialog box.
If LIN alerts have been enabled for a port in the Configure Ports dialog
box, the Port Properties dialog box contains a short description of the
latest incident in the Link Incident field. Or, if there are no active
incidents, “None” displays. The system writes all link incidents to the
Link Incident Log.
If you enable LIN alerts for a port in the Configure Ports dialog box,
configure e-mail notification through the EFC Manager, and enable
E-Mail Notification through the Maintenance menu, you will receive
e-mail notification of LIN alerts.
The e-mail notification of LIN alerts is available to all users; no user rights are
imposed.
Although you can clear the attention indicator in the Hardware View
and the alert description in the Port Properties dialog box manually,
they may also be cleared by actions outside of your control; such as
on EFC Server reboot.
You can clear the link incident indicator in the Hardware View and the
description in the Link Incident field manually. To manually clear the
attention indicator (yellow triangle), right-click the port with the
yellow triangle and select Clear Link Incident Alert(s) from the menu.
In the Clear Link Incident Alert(s) dialog box, select the appropriate
option and click OK.
Be aware that clearing the incident indicator clears it for everyone
using the system. If there are no link incident alerts enabled for a
port, no actions occur.
Threshold Alerts
A threshold alert notifies Product Manager users when the transmit
(Tx) or receive (Rx) throughput reaches specific values for switch
ports or port types (E_Ports, F_Ports, or FL_Ports).

2
Threshold Alerts 2-39
Monitoring and Managing the Switch
Select the Threshold Alerts option on the Configure menu to display the
Configure Threshold Alerts dialog box. Use this dialog box to configure
criteria for generating a threshold alert. One criteria that you must
configure is a throughput value that equals a specific percentage of
the port’s total throughput capacity. You also provide a time interval
during which throughput is measured and a time interval during
which that throughput value must remain constant. When
throughput reaches the threshold value and remains constant for the
specified time, an alert is generated.
Threshold alerts occur as the following in the Product Manager:
•An attention indicator (yellow triangle) that displays on the port
in the Port Card View.
•An attention indicator (yellow triangle) that displays on the port
card in the Hardware View.
•An attention indicator (yellow triangle) that displays in the Alert
column of the Port List View.
•An attention indicator (yellow triangle) that displays by the
Threshold Alerts field in the Port Properties dialog box.
•Detailed threshold alert data recorded in the Threshold Alert Log.
For detailed procedures to configure threshold alerts, refer to
Configure Threshold Alerts on page 3-20.


Configuring the Switch 3-1
3
Invisible Body Tag
This chapter describes how to use the options that display on the
Product Manager’s Configure menu on the Product Manager menu
bar.
Configuring the Switch
Section Page
Configure Identification 3-2
Configure Switch Parameters 3-3
Configure Fabric Parameters 3-6
Configure Switch Binding 3-9
Configure Ports 3-9
Configure SNMP 3-13
Configure Open Systems Management Server 3-16
Configure Feature Key 3-16
Configure Date and Time 3-18
Configure Threshold Alerts 3-20
Export Configuration Report 3-27
Enable SANpilot 3-29
Backing Up and Restoring Configuration Data 3-29
Backing Up and Restoring Configuration Data 3-29

3
3-2 McDATA® Sphereon™ 4500 Fabric Switch Product Manager User Manual
Configuring the Switch
Configure Identification
Use the procedure in this section to identify the switch by its name,
description, location, and contact person. This information displays
in the following Product Manager locations:
•Product Manager window title panel (name).
•Switch Properties dialog box (name, location, contact, description).
•Identification table at the top of the Hardware View (name,
location, description).
The name also displays in the switch icon label in the Enterprise
Fabric Connectivity (EFC) Manager Product tab if the product name is
enabled through the EFC Manager Display Options.
Data entered through the following procedure is saved in nonvolatile
random access memory (NV-RAM) on the switch.
Procedure To configure identification for the switch, use the following steps:
1. Select Identification from the Configuration menu on the menu bar.
The Configure Identification dialog box displays.
Figure 3-1 Configure Identification Dialog Box
2. Click in the Name field and enter a name for the switch. The name
could reflect the switch’s Ethernet network domain name service
(DNS) host name, if assigned.
3. Click in the Description field and enter a description of the switch.
4. Click in the Location field and enter the location of the switch.
5. Click in the Contact field and enter appropriate information about
a contact person, such as a phone number, title, or e-mail address.

3
Configure Switch Parameters 3-3
Configuring the Switch
6. Click Set Name as Nickname and add a check mark to the check box
if you want to use the name in the Name field as a nickname for
the switch’s WWN. The nickname will then display instead of the
WWN in Product Manager views.
7. Click Activate to save the data and close the dialog box.
8. If you are finished configuring the switch, back up the
configuration data. For more information, refer to Backup and
Restore Configuration on page 5-7.
Configure Switch Parameters
Use procedures in this section to set parameters on the switch for
fabric operation through the Configure Switch Parameters dialog box.
These operating parameters are stored in NV-RAM on the switch.
1. The switch must be offline to change Preferred Domain ID. If it is
not and you activate values in this dialog box, a dialog box
displays prompting you to set the unit offline.
CAUTION
!
Setting the switch offline terminates all Fibre Channel connections.
To set the unit offline:
a. Select Set Online State from the Maintenance menu on the menu
bar along the top of the Product Manager window.
b. When the Set Online State dialog box displays, click Set Offline.
c. When the warning box displays asking you to confirm the
offline state, click OK.
2. Select Switch Parameters from the Operating Parameters submenu
(Configure menu tab).
3. The Configure Switch Parameters dialog box displays.

3
3-4 McDATA® Sphereon™ 4500 Fabric Switch Product Manager User Manual
Configuring the Switch
Figure 3-2 Configure Switch Parameters Dialog Box
Ordinarily, you do not need to change values in this dialog box from their
defaults. The only exception is the Preferred Domain ID. Change this value if
the switch will participate in a multiswitch fabric.
4. Use information under Switch Parameters to change settings as
required for parameters in this dialog box.
5. After you change settings, click the Activate button.
Switch Parameters Configure the following parameters as required by your fabric.
Preferred Domain ID Use this field to set each switch in the fabric to a unique preferred
domain ID. Fibre Channel addresses in the switch include this
preferred domain ID, which creates a unique identification for the
port in the fabric. The default value is 1. Set a preferred value from 1
through 31.
The preferred domain ID must be unique for each switch in a fabric.
If two switches have the same preferred domain ID, the E_Ports
segment, causing the fabric to segment.
For more information on the domain ID, refer to the section on domain ID
assignment for multiswitch fabrics in the McDATA Products in a SAN
Environment - Planning Manual (620-000124).
Insistent This option is not supported unless the SANtegrity feature is
installed. Click the check box to remove or add a check mark. The
default state is disabled (no check mark).

3
Configure Switch Parameters 3-5
Configuring the Switch
When a check mark displays, the domain ID configured in the
Preferred Domain ID field will become the active domain identification
when the fabric initializes. See the following notes:
•This option is required if Enterprise Fabric Mode (optional
SANtegrity feature) is enabled. Refer to Insistent Domain
Identification (ID) on page 6-11 for details.
•If you enable Insistent Domain while the switch or director is
online, the Preferred Domain ID will change to the current active
domain ID if the IDs are different.
CAUTION
!
If a switch with a duplicate domain ID exists in the fabric, both
switches’ E_Ports will segment when they try to join.
Rerouting Delay Placing a check mark in the check box to the left of the Rerouting Delay
option enables rerouting delay. This option is only applicable if the
configured switch is in a multiswitch fabric. The default state is
disabled.
Enabling the rerouting delay ensures that frames are delivered in
order through the fabric to their destination. If there is a change to the
fabric topology that creates a new path (for example, a new switch is
added to the fabric), frames may be routed over this new path if its
hop count is less than a previous path with a minimum hop count.
This may result in frames being delivered to a destination out of
order since frames sent over the new, shorter path may arrive ahead
of older frames still in route over the older path.
If rerouting delay is enabled, traffic ceases in the fabric for the time
specified in the E_D_TOV field of the dialog box. This delay allows
frames sent on the old path to exit to their destination before new
frames begin traversing the new path.
Domain RSCNs Use this check box to enable Domain register for state change
notifications (domain RSCNs). Domain RSCNs are sent between end
devices in a fabric to provide additional connection information to
host bus adapters (HBA) and storage devices. As an example, this
information might be that a logical path has been broken because of a
physical event, such as a fiber optic cable being disconnected from a
port. Consult with your HBA and storage device vendor to determine
if enabling Domain RSCNs will cause problems with your HBA or
storage products. If Enterprise Fabric Mode is enabled, this
parameter is automatically enabled and cannot be disabled unless the

3
3-6 McDATA® Sphereon™ 4500 Fabric Switch Product Manager User Manual
Configuring the Switch
director or switch is offline. Disabling Domain RSCNs also disables
Enterprise Fabric Mode.
Configure Fabric Parameters
Use the procedures in this section to configure the following Fibre
Channel operating parameters using the Configure Fabric Parameters
dialog box. The operating parameters are stored in NV-RAM on the
switch.
1. The switch must be offline to change parameters in this dialog
box. If it is not and you activate values in this dialog box, a dialog
box displays prompting you to set the unit offline.
CAUTION
!
Setting the switch offline terminates all Fibre Channel connections.
To set the unit offline:
a. Select Set Online State from the Maintenance menu on the menu
bar along the top of the Product Manager window.
b. When the Set Online State dialog box displays, click Set Offline.
c. When the warning box displays asking you to confirm the
offline state, click OK.
2. Select Fabric Parameters from the Operating Parameters submenu
(Configure menu tab).
3. The Configure Fabric Parameters dialog box displays.
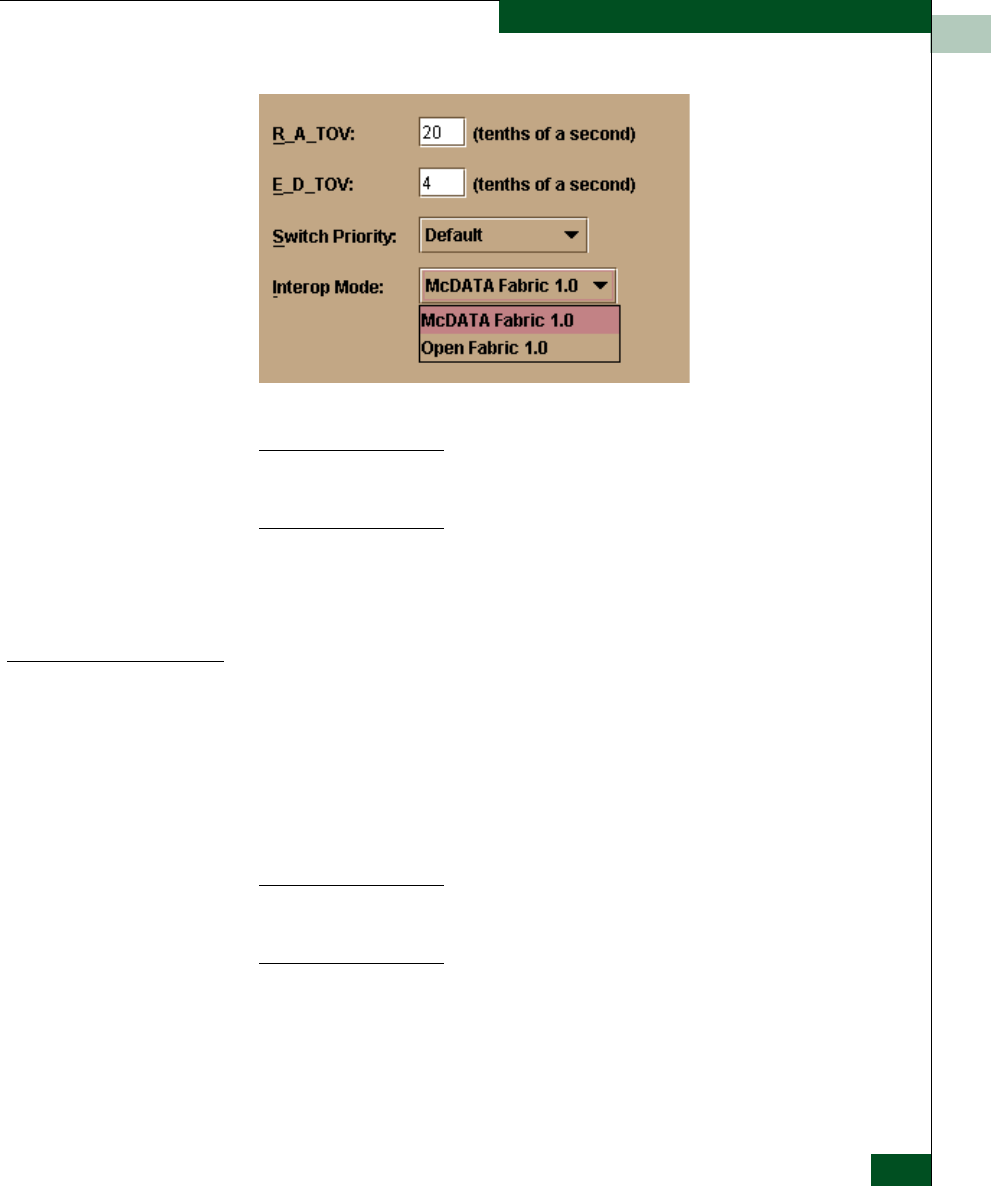
3
Configure Fabric Parameters 3-7
Configuring the Switch
Figure 3-3 Configure Fabric Parameters Dialog Box
Ordinarily, you do not need to change values in this dialog box from their
defaults. The only exception is the Preferred Domain ID. Change this value if
the switch will participate in a multiswitch fabric.
4. Use information under Switch Parameters to change settings as
required for parameters in this dialog box.
5. After you change settings, click the Activate button.
Fabric Parameters Configure the following parameters as required by your fabric.
R_A_TOV Resource allocation time-out value. This variable is used to time out
operations that depend on the maximum possible time that a frame
can be delayed in a fabric and still be delivered. Adjust the value for
R_A_TOV in tenths of a second (100 ms) increments over a range of
10 tenths (1 second) to 1200 tenths (120 seconds). The default value is
100 tenths (10 seconds).
Set the same value for R_A_TOV on all switches on a multiswitch fabric. If
the value is not the same on all units, the fabric segments. Also, the value for
R_A_TOV must be greater than the value configured for E_D_TOV.
E_D_TOV Error-detect time-out value: This defines the time that the switch
waits for an expected response before declaring an error condition.
Configure this value in tenths of a second (100 millisecond)
increments in a range of 2 tenths of a second to 600 tenths (60
seconds). The default value is 20 tenths (2 seconds).

3
3-8 McDATA® Sphereon™ 4500 Fabric Switch Product Manager User Manual
Configuring the Switch
Set the same value for E_D_TOV on all switches on a multiswitch fabric. If
the value is not the same, the fabric segments.
Switch Priority Setting this value determines the principal switch for the multiswitch
fabric. Select either Principal (highest priority), Default, or Never
Principal (lowest priority) from the Switch Priority drop-down list.
If all switches are set to Principal or Default, the switch with the
highest priority and the lowest WWN becomes the principal switch.
Following are some examples of principal switch selection when
switches have these settings.
•If you have three switches and set all to Default, the switch with
the lowest WWN become the principal switch.
•If you have three switches and set two to Principal and one to
Default, the switch with the Principal setting that has the lowest
WWN becomes the principal switch.
•If you have three switches and set two to Default and one to Never
Principal, the switch with the Default setting and the lowest WWN
becomes the principal switch.
Note that at least one switch in a multiswitch fabric needs to be set as
Principal or Default. If all of the switches are set to Never Principal, all
of the interswitch links (ISLs) will segment. If all but one switch is set
to Never Principal and the switch that was Principal goes offline, then
all of the other ISLs will segment.
We recommend configuring switch priority as Default. If you are considering
changing this value to something other than the default, refer to sections on
principal switch selection for multiswitch fabrics in the McDATA Products
in a SAN Environment - Planning Manual (620-000124) for details.
In the audit log you may notice that the Principal setting maps to a
number code of 1, Default maps to a number code of 254, and Never
Principal maps to a number code of 255. The number codes 2-253 are
no longer in use.
Interop Mode Select either McDATA Fabric 1.0 or Open Fabric 1.0 mode. Use Open
Fabric 1.0 if the fabric contains McDATA directors and switches and
other open-fabric compliant switches. Use this mode to manage
heterogeneous fabrics. McDATA recommends using this mode. Use
McDATA Fabric 1.0 if the fabric contains McDATA directors and
switches that are also operating in McDATA Fabric 1.0 mode.

3
Configure Switch Binding 3-9
Configuring the Switch
Configure Switch Binding
For complete procedures on configuring this optional feature, refer to
SANtegrity Features on page 6-2.
Configure Ports
Use the procedures in this section to configure names, blocked and
unblocked state, 10-100 km extended distance buffering, enable or
disable link incident (LIN) alerts for ports, port type, port speed, port
binding, and WWN binding name.
Port configuration data is stored in NV-RAM on the switch.
Configure data in the following columns of the Configure Ports dialog
box:
•Port #
You cannot edit this field. This column identifies the port number.
The port numbers range from 0 through 23.
•Name
Enter a name for the port. The port names display in the Port
Properties dialog box and elsewhere in the Product Manager to
identify the port.
To identify port numbers for which you want to provide names, place the
cursor over the ports in the Hardware View. As you move over a port, a
label displays that identifies the slot number where the port is installed.
•Blocked (opens systems mode only)
Placing a check mark in the check boxes of this column blocks the
operation of the port.
•LIN Alerts
A link incident (LIN) is a problem detected on a fiber optic link,
such as the loss of light or invalid sequences. When a problem
occurs, a LIN alert is sent to the Link Incident Log in the switch
Product Manager. LIN alerts warn you that there is a link incident
being detected through a port connection.

3
3-10 McDATA® Sphereon™ 4500 Fabric Switch Product Manager User Manual
Configuring the Switch
Place or remove check marks in the check boxes in this column to
enable or disable link incident alerts. The factory default is to
enable LIN alerts.
A link incident causes a yellow attention indicator (triangle) to
display for the port in the Hardware View and in the alert column
of the Port List View. Once a LIN occurs, you must acknowledge it
by selecting the Clear Link Incident Alert option from the
right-click menu for the port (Hardware View). A description of the
alert displays in the Link Incident field of the Port Properties dialog
box (refer to Figure 2-3 on page 2-8).
If the check boxes in this column are not selected, no link incident
indicators display in the Hardware View. Also, the Link Incident
field of the Port Properties dialog box is blank and a link incident is
recorded in the Link Incident Log. LINs are always logged in the
Link Incident Log, regardless of the configuration.
If LIN Alerts are enabled, you can receive e-mail notification
when a LIN occurs. In order to receive e-mail notification, you
must configure and enable this feature in the EFC Manager
(Maintenance menu) and enable e-mail notification through the
Enable E-Mail Notification option on the Product Manager’s
Maintenance menu.
For additional information about LIN alerts, refer to Link Incident
Alerts on page 2-37.
•FAN
Click to display a check mark in the check box and enable Fabric
Address Notification for loop devices attached to the port.
Right-click in this column to either clear all FANs for all ports or
set all FANs for all ports.
•Type
Select each port’s type (G_Port, E_Port, F_Port, Fx_Port, or
Gx_Port) in this column from the drop-down list. Right-click in
this column to set all ports to either, E_Ports, F_Ports, Fx_Ports,
G_Ports, or Gx_Ports.
•Port Binding
Click this check box to display a check mark and enable WWN
binding for the port. This allows only a specific device to attach to
the port. This device is specified by the WWN or nickname
entered into the Bound WWN column. With the check box cleared,

3
Configure Ports 3-11
Configuring the Switch
any device can attach to the port even if a WWN or nickname is
specified in the Bound WWN column. Port binding is allowed
only for a port that is either a G_Port, E_Port, or F_Port.
•Bound WWN
Enter a world wide name (WWN) in the proper format
(xx.xx.xx.xx.xx.xx.xx.xx) or a nickname configured through the
EFC Manager application. The device with this WWN or
nickname will have exclusive attachment to the port if WWN
Binding is enabled. If a valid WWN or nickname is not entered in
this field, but the Port Binding check box is checked (enabled),
then no devices can connect to the port. If you enter a WWN or
nickname in this field and do not place a check in the WWN
Binding check box, the WWN or nickname will be stored, and all
devices can connect to the port.
Procedure
To configure ports, use the following steps:
1. Select Ports from the Configure menu on the Product Manager
menu bar.
The Configure Ports dialog box displays.

3
3-12 McDATA® Sphereon™ 4500 Fabric Switch Product Manager User Manual
Configuring the Switch
Figure 3-4 Configure Ports Dialog Box
Ports are numbered from 0 through 23.
2. Click a Name field and type a name that reflects the end device
connected through the port. For example, use “XYZ Server,”
where XYZ is the brand name of the server.
3. Block or unblock operation for a port by clicking the check box in
the Blocked column. When a check mark displays, the port is
blocked.
4. Enable or disable LIN alerts for the port by clicking the check box
in the LIN Alerts column. When a check mark displays, LIN alerts
are enabled.
The factory default for LIN alerts is enabled.
5. Click the check box in the FAN column to enable Fabric Address
Notification for loop devices.
6. Select a port type by clicking in the Type field and selecting from
the list.

3
Configure SNMP 3-13
Configuring the Switch
7. To bind a device with a specific WWN or nickname to the port,
click the Port Binding check box to display a check mark. Then
enter the WWN or configured nickname for the device into the
Bound WWN column. The device that you bind to the port will
have exclusive connection to that port.
To configure port binding, you must enable the Port Binding feature
using the appropriate feature code through the Configure Feature Key
dialog box.
Notes:
•If you have configured port binding and click Activate, a
warning dialog box displays if one or more of the nodes
attached to a port does not match the WWN or nickname
configured in the Bound WWN column. This warning box
displays a list of all attached nodes that will be logged off if
you continue. If you click Continue, these nodes will log off
and the port will only attach to the device with the WWN or
nickname configured in the Bound WWN column.
•If you have configured port binding and click Activate, an
error message may display if the format for the WWN entered
in the Bound WWN column is not valid (not in
xx.xx.xx.xx.xx.xx.xx.xx format) or if you enter a nickname that
has not been configured through the Product or Fabric
Manager.
8. Use the scroll bar on the right side of the Configure Ports dialog
box table to display additional ports that you want to configure.
9. Activate changes and close the dialog box by clicking Activate.
10. If you are finished configuring the switch, back up the
configuration data. For more information, refer to Backing Up and
Restoring Configuration Data on page 3-29.
Configure SNMP
Use the procedures in this section to:
•Configure the SNMP agent that runs on the switch and
implements the following MIBs:

3
3-14 McDATA® Sphereon™ 4500 Fabric Switch Product Manager User Manual
Configuring the Switch
—MIB-II
—Fabric Element MIB
—Fibre Alliance (FCMGMT) MIB
—Switch private MIB
For complete information on objects defined in MIBs and steps to
download MIB variables to your SNMP workstation, refer to the
SNMP Support Manual (620-000131).
•Configure network addresses and community names for up to six
SNMP trap recipients.
An SNMP trap recipient is a network management station that
receives messages through SNMP for specific events that occur on
the switch.
To enable or disable authorization trap messages to be sent when
unauthorized management stations try to access SNMP
information through the EFC Server, select the Enable
Authorization Traps check box. A check mark in the box enables
this option.
•Define SNMP community names that SNMP managers use for
reading variables.
•Authorize write permissions for writable MIB variables.
SNMP managers may request, but will not receive, traps and SNMP data
through SNMP management stations that are not configured with
community names.
Procedure To configure SNMP traps and assign community names, use the
following steps:
1. Select SNMP from the Configure menu on the menu bar.

3
Configure SNMP 3-15
Configuring the Switch
The Configure SNMP dialog box displays.
Figure 3-5 Configure SNMP Dialog Box
2. Click the Enable Authorization Traps field to enable authorization
traps to be sent to SNMP management stations when
unauthorized stations try to access SNMP information from the
switch.
3. Click a field in the Community Name column to select the row.
Enter the SNMP community name for the trap recipient. Enter up
to 32 characters. This also defines community names from which
SNMP managers can read MIB variables from or write MIB
variables to the switch. Refer to the note under Configure SNMP
on page 3-13 for more information about assigning community
names.
4. Click the Write Authorization check box to enable write
authorization for the community name. A check mark displays in
the box to indicate that write authorization is enabled.
5. Enter the IP address for a trap recipient (SNMP management
station) by clicking in the Trap Recipient column and entering an
IP address.
Step 6 is usually are not necessary. If you do not wish to override the
default UDP number, skip to step 7.
6. Enter user datagram protocol (UDP) port numbers in the UDP
Port Number column. You can override the default UDP port
number of 162 with any legal UDP port number (1 to 65535).

3
3-16 McDATA® Sphereon™ 4500 Fabric Switch Product Manager User Manual
Configuring the Switch
7. Click Activate to activate the data and close the dialog box.
The SNMP configuration is stored in NV-RAM on the switch.
8. If you are finished configuring the switch, back up the
configuration data. For more information, refer to Backup and
Restore Configuration on page 5-7.
Configure Open Systems Management Server
For complete procedures on configuring this optional feature, refer to
refer to Configure Open Systems Management Server on page 6-2.
Configure Feature Key
A feature key is a string of alphanumeric characters consisting of both
uppercase and lowercase. The following is an example of a feature
key format: XxXx-XXxX-xxXX-xX.
The total number of characters may vary. The key is case sensitive and must
be entered exactly, including the dashes.
The feature key, which is encoded with a switch’s serial number, can
only be configured on the switch to which it is assigned.
To enable an optional feature on the switch, first set the switch offline,
then enter the feature key into the New Feature Key dialog box.
Display this dialog box by selecting Feature from the Configure menu
on the menu bar.
Procedure To configure a feature key, use the following steps:
1. Set the switch offline using the Set Online State dialog box. For
help, refer to Set Online State on page 5-4.
2. Select Features from the Configure menu on the menu bar.

3
Configure Feature Key 3-17
Configuring the Switch
The Configure Feature Key dialog box displays.
Figure 3-6 Configure Feature Key Dialog Box
3. Click New to add a new feature key.
4. In the New Feature Key dialog box, enter the switch’s feature key
and click OK.
—Feature keys are only valid for a switch with a specific serial
number. They cannot be interchanged between switches. If an
error stating “Invalid serial number” displays, verify that you
have entered the feature key that was assigned to the switch.
To verify, check the serial number of the switch through the
Switch Properties dialog box and compare it to the serial
number listed in the documentation provided with your
feature key. Refer to Displaying Switch Information on page 2-12
for instructions on displaying the Switch Properties dialog box.
—The feature key is a string of alphanumeric characters with
dashes. The key is case-sensitive, so enter the key exactly as
printed in the documentation that you received for the feature.
If an error stating “Invalid feature key” displays, verify that
you have entered the feature key correctly.
The Enable Feature Key dialog box displays with a warning, stating
that this action will override the current set of features on the
switch. The list in the left column of the dialog box is a list of
features that are active on the switch. The list on the right is a set
of features that come with the new feature key. All of the features
that are active are included in the new feature list.
5. Click Activate to activate the new feature key.
An IPL will occur, during which the Ethernet connection between
the EFC Server and switch is momentarily interrupted.

3
3-18 McDATA® Sphereon™ 4500 Fabric Switch Product Manager User Manual
Configuring the Switch
If you click Activate, all current features will be replaced with new features.
That is, if there are features shown in the current list that are not shown in the
new list, then those features will be removed from the switch.
6. Set the switch back online.
7. When you are finished configuring the switch, you can back up
the configuration data. For more information, refer to Backing Up
and Restoring Configuration Data on page 3-29.
Configure Date and Time
Use the procedures in this section to display and change the date and
time set on the switch. You must set the current date and time on the
switch using this dialog box so the correct time stamps display in the
Event Log, Audit Log, Hardware Log, Link Incident Log, and Threshold
Alerts Log.
Procedure Set the switch date and time using the following steps:
1. Select Date/Time from the Configure menu on the menu bar.
The Configure Date and Time dialog box displays.
If the Periodic Date/Time Synchronization check box in the Configure
Date and Time dialog box is selected, the EFC Server periodically
synchronizes the switch time to the EFC Server, and daylight
savings time automatically updates. When the Periodic Date/Time
Synchronization option is selected, the Date and Time fields are
disabled (grayed out).
If the Periodic Date/Time Synchronization check box is not selected,
you can set the EFC Server date and time manually.

3
Configure Date and Time 3-19
Configuring the Switch
Figure 3-7 Configure Date and Time Periodic Synchronization Dialog Box
To disable Periodic Date/Time Synchronization, click the check box
to remove the check mark, then click Activate. To re-enable
Periodic Date/Time Synchronization, click the check box to display
the check box, then click Activate.
Click Activate to synchronize the date and time at the next update period.
Click Sync Now to synchronize the date and time immediately.
2. Perform one of the following options:
Option 1: To immediately synchronize the switch date and time
with the EFC Server, click Sync Now. Make sure that a check mark
is in the Periodic Date/Time Synchronization check box.
If you click Activate, the date and time synchronize at the next update
period.
Option 2: To synchronize the switch date and time with a specific
date and time that you enter:
a. Make sure that Periodic Date/Time Synchronization is disabled
(no check). Refer to Figure 3-8.

3
3-20 McDATA® Sphereon™ 4500 Fabric Switch Product Manager User Manual
Configuring the Switch
Figure 3-8 Configure Date and Time Manually
b. Click in a Date or Time field that you want to change.
c. Delete characters and enter new ones as required or highlight
the existing character by clicking and dragging the mouse
cursor over the character and typing the new character.
When entering the hours, use the range of 0 to 23, for minutes and
seconds, use the range of 0 to 59.
d. Click Activate to set the date and time on the switch.
3. If you are finished configuring the switch, back up the
configuration data. For more information, refer to Backing Up and
Restoring Configuration Data on page 3-29.
Configure Threshold Alerts
A threshold alert notifies users when the transmit (Tx) or receive (Rx)
throughput reaches specified values for specific switch ports or port
types, (E_Ports, F_Ports, or FL_Ports).
You are notified of a threshold alert by:
•An attention indicator (yellow triangle) that displays on the port
in the Hardware View.
•An attention indicator (yellow triangle) that displays in the Alert
column of the Port List View.
•An attention indicator (yellow triangle) that displays by the
Threshold Alerts field in the Port Properties dialog box.
•Detailed threshold alert data recorded in the Threshold Alert Log.

3
Configure Threshold Alerts 3-21
Configuring the Switch
Use the Threshold Alerts option on the Configure menu to configure the
following:
•Name for the alert.
•Type of threshold for the alert (Rx, Tx, or either).
•Active or inactive state of the alert.
•Threshold criteria:
—Percent traffic capacity utilized. This is the percent of the
port’s throughput capacity achieved by the measured
throughput. This setting constitutes the threshold value. For
example the value of 50 means that the port’s threshold is
reached when throughput is 50% of capacity.
—Time interval during which throughput is measured and alert
notification can occur.
—The maximum cumulative time that the throughput
percentage can be exceeded during the set time interval before
an alert is generated.
•Ports for which you are configuring threshold alerts.
You can configure up to 16 alerts, and any number of alerts can be
active at one time.
Procedures Use the following procedures to create a new threshold alert, or to
modify, activate, deactivate, or delete an alert.
Create New Alert 1. Select Threshold Alerts from the Configure menu on the menu bar.
The Configure Threshold Alerts dialog box displays.
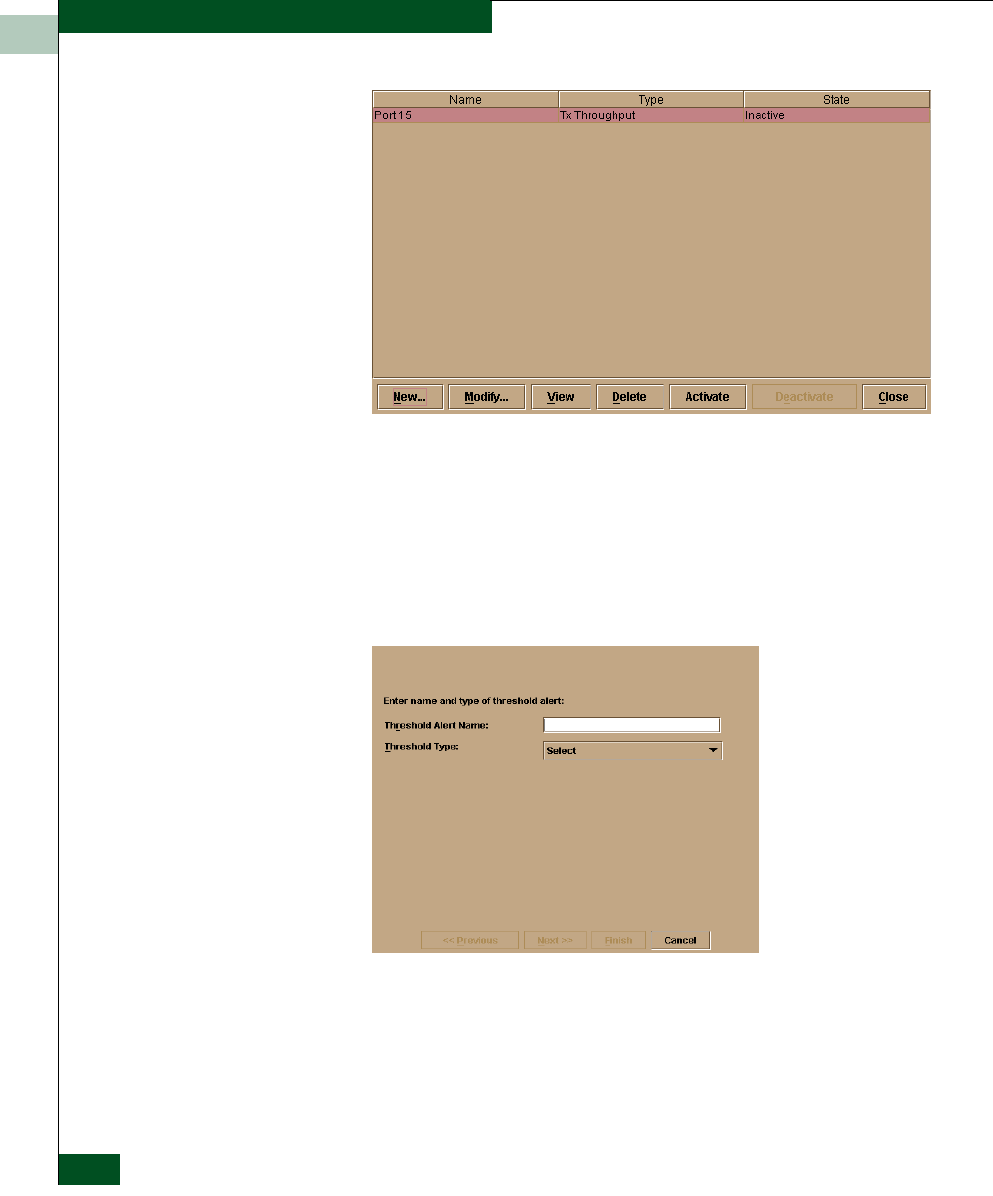
3
3-22 McDATA® Sphereon™ 4500 Fabric Switch Product Manager User Manual
Configuring the Switch
Figure 3-9 Configure Threshold Alerts Dialog Box
If alerts are configured, they will display in table format showing
the name of the alert, type of alert (Rx, Tx, or Rx or Tx), and alert
state (inactive or active).
2. Click New.
The New Threshold Alert dialog box displays.
Figure 3-10 New Threshold Alerts Dialog Box - First Screen
3. Enter a name from one to 64 characters in length. All characters in
the ISO Latin-1 character set, excluding control characters, are
allowed.

3
Configure Threshold Alerts 3-23
Configuring the Switch
4. Select one of the following from the drop-down list under the
Name field:
•Rx Throughput. An alert will occur if the threshold set for
receive throughput is reached.
•Tx Throughput. An alert will occur if the threshold set for
transmit throughput is reached.
•Rx or Tx Throughput. An alert will occur if the threshold set for
either receive or transmit throughput is reached.
5. Click Next.
A new screen appears with additional parameters. The name
configured for the alert appears at the top of the screen.
(Click Previous to return to the previous screen.)
Figure 3-11 New Threshold Alerts Dialog Box - Second Screen
6. Enter a percentage from 1 through 100 for % utilization. When
throughput reaches this percentage of port capacity, a threshold
alert will occur.
7. Enter the amount of cumulative minutes in which the %
utilization should exist during the notification interval before an
alert is generated. You can also select At any time if you want an
alert to occur whenever the set % utilization is reached. The valid
range is 1 to the interval set in step 8 (following).

3
3-24 McDATA® Sphereon™ 4500 Fabric Switch Product Manager User Manual
Configuring the Switch
8. Enter the interval in minutes in which throughput is measured
and threshold notifications can occur. The valid range is 5
minutes to 70,560 minutes.
9. Click Next.
A new screen appears for selecting ports for the alerts.
Figure 3-12 New Threshold Alerts Dialog Box - Third Screen
10. Either select Port Type or Port List.
•If you select Port Type, selecting either E_Ports, F_Ports, or
FL_Ports will cause this alert to generate for all ports
configured as E_Ports, F_Ports, or FL_Ports respectively.
•If you select Port List, you can select individual ports by
clicking the check box by each port number or set all ports.
Selecting Set All Ports places a check mark by each port
number. Selecting Clear All Ports will clear the check marks by
each port number.

3
Configure Threshold Alerts 3-25
Configuring the Switch
11. Click Next.
A final screen appears to provide a summary of your alert
configuration. To make any changes, backwards and forwards
through the configuration screens by selecting the Previous and
Next buttons.
Figure 3-13 New Threshold Alerts Dialog Box - Summary Screen
12. Select Finish.
The Configure Threshold Alerts dialog box appears listing the
name, type, and state of the alert that you just configured.
13. At this point, the alert is not active. To activate the alert, select the
alert information that displays in the Configure Threshold Alerts
table and select Activate.

3
3-26 McDATA® Sphereon™ 4500 Fabric Switch Product Manager User Manual
Configuring the Switch
Figure 3-14 Configure Threshold Alerts Dialog Box - Alerts Activated
Modify an Alert Use the following steps to modify an existing threshold alert
configuration.
1. Select Threshold Alerts from the Configure menu.
The Configure Threshold Alerts dialog box displays.
2. Select the alert that you want to modify by clicking the alert
information in the table.
3. If the alert is active, select Deactivate, then select the alert
information in the table again.
4. Select Modify.
If the alert is active, an error message displays prompting you deactivate
the alert.
An initial Modify Threshold screen appears where you can change
the threshold type.
5. Select a threshold type from the drop-down list.
6. Select Next when you are done. A Modify Threshold screen appears
where you can change the % utilization, cumulative minutes for
the threshold to occur before notification, and the time interval
for measuring throughput and for alert notification.

3
Export Configuration Report 3-27
Configuring the Switch
7. Make appropriate changes, then continue through the Modify
Threshold screens, making changes as necessary, until the
summary screen appears displaying the alert configuration.
8. Perform either of the following steps:
•If you need to change any parameters, select Previous and Next
to display the desired Modify Threshold screen.
•Select Finish when you are done.
Activate or
Deactivate Alerts Use the following steps to activate or deactivate existing threshold
alerts. In the active state, notifications are generated for the alert. In
the inactive state, notifications do not occur.
1. Select Threshold Alerts from the Configure menu.
The Configure Threshold Alerts dialog box displays. The port’s
current state, deactive or active, is listed under the State column.
2. To change the state, select the alert information in the table.
3. If the alert is active, select Deactivate to change to the deactive
state. If the alert is deactive, select Activate to change to the active
state.
Delete Alerts Use the following steps to delete existing threshold alerts.
1. Select Threshold Alerts from the Configure menu.
The Configure Threshold Alerts dialog box displays.
2. Select the alert that you want to delete by selecting the alert
information in the table.
3. Select Delete.
A message displays asking you to confirm the deletion.
4. Select Yes.
The alert is removed from the dialog box.
Export Configuration Report
Use this option to save an ASCII file of all currently saved
configuration data in switch NV_RAM to your hard drive or a
diskette. Use any desktop publishing application to import this ASCII
file for viewing or printing.

3
3-28 McDATA® Sphereon™ 4500 Fabric Switch Product Manager User Manual
Configuring the Switch
This file cannot be used to set configuration parameters through the Product
Manager.
Data in the file includes:
•Product identification
Data input into the Configure Identification dialog box.
•Operating parameters
Data input into the Operating Parameters (Switch and Fabric) dialog
box.
•Port parameters
Data input into the Configure Ports dialog box.
•SNMP parameters
Data input into the Configure SNMP dialog box.
•Active zoning configuration
This specifies the active zone and zone members, if set, and
whether the default zone is enabled or disabled.
Procedure To export a configuration report:
1. Select Export Configuration Report from the Configure menu on the
menu bar.
The Export Configuration Report dialog box displays.
Figure 3-15 Export Configuration Dialog Box
Drive List
Go Up One Level
Home
Create New
Folder
File List
Details

3
Enable SANpilot 3-29
Configuring the Switch
2. Select the folder where you want to save the file.
3. Type in a file name and extension in the File name field.
4. Click Save.
The file saves to the specified folder as an ASCII text file.
Enable SANpilot
Select this option from the Configure menu on the menu bar to
place a check mark in the check box to enable the SANpilot
Interface on the switch. Select the option again to remove the
check mark and disable the SANpilot Interface. When disabled,
users at remote workstations cannot access the interface.
Backing Up and Restoring Configuration Data
You can back up the NV-RAM configuration, which includes all of
the data you input through instructions in this chapter, using the
Backup and Restore Configuration option. This option is available
through the Maintenance menu. Selecting this option backs up the
configuration data to a file on the EFC Server hard drive. The restore
function writes this data back to NV-RAM on the switch. Using the
restore function overwrites the existing configuration. For more
information, refer to Backup and Restore Configuration on page 5-7.
In addition to the Backup and Restore Configuration option, the Iomega
QuikSync application backs up configuration and other critical data
from the EFC Server automatically. As long as a Zip disk remains in
the Zip drive of the EFC Server, data backs up to the Zip disk
whenever the directory contents change or you reboot the EFC
Server.
We do not recommend changing the default QuikSync settings.
The QuikSync application and a Zip drive may not be available if you are
using a customer-supplied server platform for the EFC Management
applications.

3
3-30 McDATA® Sphereon™ 4500 Fabric Switch Product Manager User Manual
Configuring the Switch
To ensure trouble-free backups; it is imperative that you leave the Zip drive
connected to the EFC Server, and leave a Zip disk in that drive at all times.
Removing the disk during a backup or restore can corrupt the database on
the disk. Make sure that data is not being written to or read from the Zip
drive before you remove the Zip disk. The Iomega QuikSync icon,
Figure 1-11 on page 1-38, in the Windows system tray spins when data is
writing to or reading from the drive.

4
4-2 McDATA® Sphereon™ 4500 Fabric Switch Product Manager User Manual
Using Logs
Using Logs
The Audit, Event, Hardware, and Link Incident, and Threshold Alert
logs store up to 1000 entries each. The most recent entry displays at
the top of the log. After 1000 entries are stored, new entries overwrite
the oldest entries.
Button Function Button function is the same for all logs:
•Clear
Clicking the Clear button clears all entries in the log for all users.
A Warning dialog box displays requesting confirmation that you
want to clear all entries in the log.
•Refresh
Clicking the Refresh button reads the current data and refreshes
the screen with the new display.
•Close
Closes the log and displays the switch Product Manager window.
•Export
Clicking the Export button on a log window displays the Save
dialog box shown in Figure 4-1 on page 4-3. Click the Home icon
to return to the files in your home directory. The folders that list in
the display area of the Save dialog box after clicking the Home icon
are those that are stored in your home directory. If you choose,
you may create a folder for your home directory and save the file
there.
To save a log file in American Standard Code for Information
Exchange (ASCII) format to a location on your system’s hard
drive or to a diskette, use the following steps. You can open this
file in any desktop publisher for viewing or printing.

4
Using Logs 4-3
Using Logs
Figure 4-1 Save Dialog Box
1. Click Export on the log window.
2. In the Save dialog box, select the folder where you want to save
the file.
3. Type in a file name and extension in the File name field.
4. Click Save.
The file saves to the specified folder as an ASCII text file.
Expanding Columns Expand columns in logs by placing the cursor over the line separating
column headings until a double arrow appears, then click and drag
the line to widen the column as necessary.
Sorting Entries Sort log entries in columns by clicking a column heading. A down
arrow displays in the heading, if sorting alphabetically in descending
order. An up arrow indicates sorting in ascending order. Click once to
sort. Click again to reverse the sort.
G
o Up
O
ne Level
H
ome
Create New
Folder
File List
Details
Drive List

4
4-4 McDATA® Sphereon™ 4500 Fabric Switch Product Manager User Manual
Using Logs
Audit Log
The audit log displays a history of all configuration changes applied
to the switch from any source such as Product Manager, SNMP
management stations, web server interface, host, or another switch.
Figure 4-2 Audit Log
•Date/Time
The date and time of the change on the switch.
Some actions, such as backing up configuration data and enabling
automatic date/time synchronization, are performed only by the
EFC Server without switch interaction. These actions are
indicated by the string, (EFC), following the audit log’s stamp of
the EFC Server’s date and time (refer to Figure 4-2). If the string,
(EFC), is not displayed, the time stamp is from the switch.
•Action
User action that caused the configuration change, such as offline
status, port name change, or change of address.
•Source
Identifies the user making the change through the switch Product
Manager and IP or DNS host name address of the remote user’s
workstation.
—Maintenance Port: Change was made by a user connected to
the maintenance port.
—EFC Manager: Change was made by an Product Manager user.

4
Event Log 4-5
Using Logs
—SNMP: Change was made by a remote SNMP management
station.
—Fabric: Change was initiated by another switch in the fabric
that is not managed by this EFC Server.
—Web server: Change was made by a user through the SANpilot
Interface.
—Fibre Channel Host: Change was made inband by a Fibre
Channel host through the Open Systems Management Server.
—Telnet: Change was made through a telnet connection.
•Identifier
Identifies the user making the change according to the source:
—Maintenance Port: No entry displays.
—EFC Manager: Includes user@address, where “user” is the
Product Manager user name and “address” is the network
address of the workstation (remote user workstation or EFC
Server).
—SNMP: Contains the network address of the SNMP
management station.
—Fabric: No entry displays.
—Web Server: The Identifier column contains user@address,
where “user” is the web server user name and “address” is the
network address of the web user.
—Fibre Channel Host: No entry displays.
—Telnet: Change was made through a telnet connection.
Event Log
The event log provides a record of significant events that have
occurred on the switch, such as hardware failures, degraded
operation, and port problems.

4
4-6 McDATA® Sphereon™ 4500 Fabric Switch Product Manager User Manual
Using Logs
Figure 4-3 Event Log
All detected firmware faults and hardware failures are sent to the
EFC Server for recording in the event log. The log provides a
maximum of 1000 log entries before it wraps and overwrites the
oldest entries.
For detailed information on event data and problem resolution, refer
to the McDATA Sphereon 4500 Fabric Switch Installation and Service
Manual (620-000159).
Each log entry includes the following:
•Date/Time
The date and time of the event on the switch.
•Event
Events are identified by a unique code.
Event codes include:
•Description
A short description of the event.
•Severity
There are four classifications of severity that identify the
importance of the event.
000 - 199 System events
200 - 299 Power supply events
300 - 399 Fan module events
400 - 499 CTP events
500 - 599 Port events
800-899 Thermal events

4
Hardware Log 4-7
Using Logs
Informational
Minor
Major
Severe
•FRU Position
The FRU involved in the event and the slot position in the chassis
relative to identical FRUs installed.
•Event Data
Up to 32 bytes of supplementary information for the event in
hexadecimal format. For detailed information on event data and
problem resolution, refer to the McDATA Sphereon 4500 Fabric
Switch Installation and Service Manual (620-000159).
Hardware Log
The hardware log displays information field replaceable units (FRUs)
inserted and removed from the switch.
Figure 4-4 Hardware Log
Each log entry includes the following:
•Date/Time
Date and time of the insertion or removal of the FRU.

4
4-8 McDATA® Sphereon™ 4500 Fabric Switch Product Manager User Manual
Using Logs
•FRU
The name of the inserted or removed FRU.
•Position
Slot position in the chassis relative to identical components
installed.
•Action
Inserted or removed.
•Part Number
Part number of the component.
•Serial Number
Serial number of the component.
Link Incident Log
The link incident log displays a thousand of the most recent link
incidents, the date each incident occurred, the time it occurred, and
the port where it took place.
Figure 4-5 Link Incident Log
Each log entry contains:
•Date/Time
The date and time of the incident.
PWR Power supply/fan module
SFP SFP transceiver.
CTP CTP card. Note: The CTP is not a FRU.

4
Link Incident Log 4-9
Using Logs
•Port
The number of the port on which the incident occurred.
•Link Incident
A short description of the incident. The following events may
cause a link incident to be written to the log.
—Implicit incident.
The attached node detects a condition that may cause
problems on the link.
—Bit-error threshold exceeded.
The number of code violation errors has exceeded threshold.
—Loss-of-signal or Loss-of-synchronization. This occurs if a
cable is unplugged from an attached node.
Loss-of-signal occurs when a cable is unplugged from an
attached node. Loss-of-synchronization condition has
persisted for longer than the resource allocation time out value
(R_A_TOV).
—Not-operational (NOS) primitive sequence received.
A NOS was recognized.
—Primitive sequence timeout.
•Link reset protocol timeout occurred.
•Timeout occurred for an appropriate response while in
NOS receive state and after NOS is no longer recognized.
—Invalid primitive sequence received for the current link state.
Either a link reset or a link reset response primitive sequence
was recognized while waiting for the offline sequence.

4
4-10 McDATA® Sphereon™ 4500 Fabric Switch Product Manager User Manual
Using Logs
Threshold Alert Log
This log provides details of threshold alert notifications. Besides the
date and time that the alert occurred, the log also displays details
about the alert as configured through the Configure Threshold Alert(s)
option under the Configure menu.
Figure 4-6 Threshold Alert Log
•Date/Time
Date and time stamp for when the alert occurred.
•Name
Name for the alert as configured through the Configure Threshold
Alerts dialog box.
•Port
Port number where the alert occurred.
•Type
The type of alert: transmit (Tx) or receive (Rx).

4
Threshold Alert Log 4-11
Using Logs
•Utilization %
Percent usage of traffic capacity. This is the percent of the port’s
throughput capacity achieved by the measured throughput. This
setting constitutes the threshold value and is configured through
the Configure Threshold Alerts dialog box. For example, a value of
25 means that threshold occurs when throughput reaches 25
percent of the port’s capacity.
•Alert Time
The maximum cumulative time that the throughput threshold
percentage must exist before an alert is generated.
•Interval
The time interval during which the throughput is measured and
an alert can generate. This is set through the Configure Threshold
Alerts dialog box.


Using Maintenance Features 5-1
5
Invisible Body Tag
This chapter describes how to use the options that display from the
Maintenance menu on the Product Manager menu bar.
Using Maintenance
Features
Section Page
Run Port Diagnostics 5-2
Collect Maintenance Data 5-2
Execute an IPL 5-2
Set Online State 5-4
Manage Firmware Versions 5-5
Enable E-Mail Notification 5-5
Enable Call-Home Notification 5-6
Backup and Restore Configuration 5-7
Reset Configuration 5-8

5
5-2 McDATA® Sphereon™ 4500 Fabric Switch Product Manager User Manual
Using Maintenance Features
Run Port Diagnostics
The Port Diagnostics option enables you to run internal and external
loopback tests on any port. To use this option, follow the detailed
steps in the McDATA Sphereon 4500 Fabric Switch Installation and
Service Manual (620-000159).
Collect Maintenance Data
The Collect Maintenance Data option enables you to collect
maintenance data that can help support personnel diagnose system
problems. Save this data to a zip file on a Zip disk (or other medium
with the appropriate capacity), and forward it to technical support
personnel.
To use this option, follow the detailed steps in the McDATA Sphereon
4500 Fabric Switch Installation and Service Manual (620-000159).
Execute an IPL
CAUTION
!
The Ethernet connection between the Enterprise Fabric
Connectivity (EFC) Server and switch is interrupted momentarily
during an initial program load (IPL).
CAUTION
!
An IPL is not intended for ordinary or casual use and should only
be performed if the active control processor (CTP) card is suspected
to be faulty. Do not use this option unless directed by your support
representative or if you need to reset a failed CTP card. An IPL will
disrupt port operations. Before using this option, make sure
administrators of device(s) attached to ports halt Fibre Channel
traffic through the switch and take the device offline.
If it is necessary for you to execute an IPL on the switch, use the
following steps:
1. Select IPL from the Maintenance menu on the menu bar.
A dialog box displays confirming the IPL.

5
Execute an IPL 5-3
Using Maintenance Features
Figure 5-1 IPL Confirmation Dialog Box
2. Click Yes.
Selecting IPL from the Maintenance menu causes Ethernet connection
between the switch and EFC Server to drop momentarily and the
following to occur in the Product Manager window:
•As the network connection drops, the switch Status table on the
Hardware View turns yellow.
•The Status field in the table displays “No Link” and the State field
displays the reason for no link.
•A grey square displays in the status bar. Refer to Table 1-1 on
page 1-32 for an explanation of this status bar display.
•The FRUs illustrated in the Hardware View do not display. They
display again as the connection is re-established.
An IPL initiates the following functions in the switch:
•Restarts the operational firmware on the CTP card, executes
abbreviated power on system tests (POSTs) and then, if no POST
errors are encountered, the switch resumes the active role that it
had before the IPL.
•Resets the Ethernet interface on the CTP card, causing the
connection to the EFC Server to drop momentarily. The status
icon for the switch in the Product View will change to a gray
square until the connection is reestablished.
•Stops normal switching functions for ports (functions resume
after the IPL).

5
5-4 McDATA® Sphereon™ 4500 Fabric Switch Product Manager User Manual
Using Maintenance Features
After the IPL:
•All Fabric services databases containing information about
current Fabric logins, name server registrations, and other data
remain intact, making the operation transparent to attached
devices.
•The switch returns to the online state, even if it was offline before
the operation.
•All ports configured as blocked will remain blocked.
•Modifications made to an active zone set configuration that have
not been enabled will be automatically enabled.
Set Online State
Use the procedure in this section to display the current switch
operating state (offline or online) and change the state as required.
Refer to Table 1-1 on page 1-32 for more information on the switch
operating states.
CAUTION
!
Before setting the switch offline, warn administrators and users
currently operating devices that are attached to the switch that it is
going offline and that there will be a disruption of
communications. Make sure administrators of device(s) attached to
ports halt Fibre Channel traffic through the switch.
To set the switch online or offline (depending on current state):
1. Right-click on the switch in the Hardware View and select Set
Online State from the menu or select Set Online State from the
Maintenance menu on the menu bar.
One of the following dialog boxes displays, depending on the
current operating state.
Figure 5-2 Set Online State Dialog Box (State Is Offline)

5
Manage Firmware Versions 5-5
Using Maintenance Features
Figure 5-3 Set Online State Dialog Box (State Is Online)
2. Click Set Offline or Set Online, depending on the operating state
you want to set.
3. When a warning box displays requesting you to confirm the
offline or online state, click OK.
As the switch goes offline, “OFFLINE” displays in the State field of
the Switch Status table in the Hardware View. LED indicators on all
ports with attached devices stay green, but the switch is sending
offline sequences (OLSs) to these devices.
Manage Firmware Versions
Firmware refers to the internal operating code for the switch. You can
maintain up to eight firmware versions on the EFC Server for
downloading to an switch. To use the Firmware Library option to
manage firmware versions, follow the steps in the McDATA Sphereon
4500 Fabric Switch Installation and Service Manual (620-000159).
Enable E-Mail Notification
E-mail addresses and the simple mail transfer protocol (SMTP) server
address for e-mail notification of switch events must be configured
through the EFC Manager application. Refer to the McDATA
Enterprise Fabric Connectivity Manager User Manual (620-005001) for
instructions on configuring e-mail.
E-mail recipients are configured in the EFC Manager through the Configure
E-Mail dialog box. A valid SMTP address is configured in this dialog box.
Use the Enable E-Mail Notification function on the Product Manager to
enable e-mail notification for events that occur on a selected switch.
The default state is disabled.
To enable e-mail notification, use the following steps:

5
5-6 McDATA® Sphereon™ 4500 Fabric Switch Product Manager User Manual
Using Maintenance Features
1. Select Enable E-Mail Notification from the Maintenance menu on the
menu bar.
2. To enable e-mail notification, select the option to add a check
mark to the check box.
3. To disable e-mail notification, select the option to remove the
check mark from the check box.
Enable Call-Home Notification
Call-Home may not be available if you are using a customer-supplied server
platform for the EFC Management applications.
The call-home feature enables the EFC Server to automatically dial
out to a support center to report system problems. The support center
server accepts calls from the EFC Server, logs reported events, and
notifies one or more support center representatives.
Configure telephone numbers and other information for the
call-home feature through the Windows dial-up networking
application. Refer to the McDATA Sphereon 4500 Fabric Switch
Installation and Service Manual (620-000159) for details.
You must enable Call-Home Event Notification through the EFC Manager
Maintenance menu before enabling this function through the Product
Manager for individual switches.
Use the Enable Call Home Notification function on the Product
Manager to enable call-home notification for events that occur on the
selected switch. The default state is disabled.
To enable call-home notification for system problems, use the
following steps:
1. Select Enable Call Home Notification from the Maintenance menu on
the menu bar to enable an disable call-home notification.
A check mark displays next to the menu option to indicate that
call-home notification is enabled.
2. Click the check box to add or remove the check mark.

5
Backup and Restore Configuration 5-7
Using Maintenance Features
Backup and Restore Configuration
Select this option from the Maintenance menu to save the product
configuration stored on the switch to the EFC Server hard disk or to
restore the product configuration from the EFC Server. Only a single
copy of the configuration is kept on the server.
The purpose of the backup is primarily for single-CTP systems, such
as the Sphereon ES-4500 Fabric Switch, where a backup is needed in
order to restore to a replacement CTP card. You can also use this
feature for a special purpose configuration or for temporary testing of
a configuration. You cannot modify the location and file name of the
saved configuration.
You can only restore the configuration to a switch with the same IP address.
Backup 1. Select Backup and Restore Configuration from the Maintenance menu
on the menu bar to display the Backup and Restore Configuration
dialog box.
Figure 5-4 Backup and Restore Dialog Box
The Backup and Restore dialog box consists of a short description
of the features performed when you select Backup or Restore.
Following is a list of configurations that are backed up to the EFC
Server:
•Identification data (switch name, description, and
location).
•Port configuration data (port names, blocked states, and
extended distance settings).
•Operating parameters for fabric (E_D_TOV, R_A_TOV,
switch priority, interop mode) and for switch (preferred
domain ID, rerouting delay, and domain RSCNs).

5
5-8 McDATA® Sphereon™ 4500 Fabric Switch Product Manager User Manual
Using Maintenance Features
•SNMP configuration (trap recipients, community names,
and write authorizations).
•Zoning configuration (active zone set and default zone
state).
2. To backup data, click Backup.
3. When the dialog box appears confirming that the backup of
configuration is complete, click OK.
If the backup fails, a dialog box displays to inform you that the
backup to the server failed.
Restore 1. Set the switch offline before performing the restore function.
2. Click Restore on the Backup and Restore Configuration dialog box to
restore the backed up configuration to the nonvolatile random
access memory (NV-RAM) on the switch.
Set the switch to offline before performing the restore function. If
you select Restore and the switch is online, a message dialog
displays requesting that you turn the switch offline. No action
takes place when you close the dialog box. For instructions on
setting the switch offline or online, refer to Set Online State on
page 5-4.
If the switch is already offline and you click the Restore button, a
confirmation dialog box displays indicating that the restore will
overwrite any existing configuration already on the switch. The
dialog box also displays the date of the restored backup. Click
OK.
Note that the restore operation initiates an IPL.
3. Set the switch back online when the restore completes.
Reset Configuration
You must have maintenance authorization rights to access this feature.
This option resets all configuration data input through options in the
Configuration menu, zoning configurations, and switch addressing to
factory-default values. Since the current IP address for the switch
may not match the factory default address, the Ethernet link between
the switch and the service processor may drop and not reset. Before

5
Reset Configuration 5-9
Using Maintenance Features
using this option, record the switch’s current IP address which
displays below the switch’s icon in the EFC Manager’s Product View
(view Display Options set to Network Address). You can also find the
current IP address through the SANpilot Interface.
After resetting the configuration, you must reset the original address
on the switch through the maintenance port or the SANpilot Interface
to maintain LAN connections and communication with the service
processor.
Procedure 1. Set the switch offline. For instructions, refer to Set Online State on
page 5-4.
2. Select Reset Configuration from the Maintenance menu on the
menu bar. The following warning displays:
WARNING
This operation will reset all switch configuration data and
non-volatile settings to factory default values. All optional
features will also be disabled. The switch must be offline to
continue.
If you have enabled features that add additional port function since the
switch was shipped from the factory, these features will be disabled (factory
default) when the configuration is reset. Only those ports that were enabled
at the factory will function. You will have to enable the additional port
function features again through the Configure Feature Key dialog box.
Factory-default values may vary, depending on the firmware release installed
in your switch. For a list of values, refer to the MCDATA Sphereon 4500 Fabric
Switch Installation and Service Manual (620-000159).


Optional Features 6-1
6
Invisible Body Tag
This chapter provides detailed information on using, administering,
and configuring optional EFC Manager’s features through EFC
management application. There are two types of features covered in
this chapter:
•"Keyed" features, requiring feature keys to be purchased and
enabled through the Configure Feature Key dialog box in the
product’s Product Manager application.
•Features not requiring feature keys themselves, but requiring that
specific keyed features be enabled before they can be accessed
through EFC Manager or Product Manager applications.
Optional Features
Section Page
Configure Open Systems Management Server 6-2
SANtegrity Features 6-2
Enterprise Fabric Mode 6-9

6
6-2 McDATA® Sphereon™ 4500 Fabric Switch Product Manager User Manual
Optional Features
Configure Open Systems Management Server
Use these procedures to configure the open systems inband
management program to function with the switch.
The optional Open Systems Management Server feature must be enabled in
order to perform this procedure.
Procedure To configure the Open Systems Management Server, use the
following steps:
1. Select Management Server from the Configure menu on the menu
bar.
The Configure Open Systems Management Server dialog box
displays.
2. Enable the management server by clicking the Enable Management
Server check box to add a check mark. (To disable the
management server, click the check box again to remove the
check mark.)
3. Click the check box in the Host Control Prohibited field to display a
check mark and prohibit a host management program from
changing configuration and connectivity parameters on the
switch. In this case, the host program has read-only access to
configuration and connectivity parameters. Clicking the check
box when it contains a check mark removes the check mark and
allows a host program to change configuration and connectivity
parameters on the switch.
4. Activate changes and close the dialog box by clicking Activate.
5. If you are finished configuring the switch, you can back up the
configuration data. For more information, refer to Backup and
Restore Configuration on page 5-7.
SANtegrity Features
SANtegrity includes a set of features that enhance security in SANs
(Storage Area Networks) that contain a large and mixed group of
fabrics and attached devices. Through these features you can allow or
prohibit switch attachment to fabrics and device attachment to

6
SANtegrity Features 6-3
Optional Features
switches. These features are enabled by purchasing a feature key,
then enabling the key through the Configure Feature Key dialog box.
For general instructions in enabling a feature key, refer to Configure
Feature Key on page 3-16.
SANtegrity features include:
•Fabric Binding
•Switch Binding
Enterprise Fabric Mode - Although this is not a keyed feature the
SANtegrity Fabric Binding and Switch Binding must be installed
before you can use Enterprise Fabric Mode function through the EFC
Manager Fabrics menu.
Fabric Binding This feature is managed through the Fabric Binding option, available
through the Fabrics menu in the EFC Manager when the Fabrics tab is
selected. Using Fabric Binding, you can allow specific switches to
attach to specific fabrics in the SAN. This provides security from
accidental fabric merges and potential fabric disruption when fabrics
become segmented because they cannot merge.
Enable/Disable and
Online State Functions In order for Fabric Binding to function, specific operating parameters
and optional features must be enabled. Also, there are specific
requirements for disabling these parameters and features when the
director or switch is offline or online. Be aware of the following:
•Because switches are bound to a fabric by world wide name
(WWN) and domain ID, the Insistent Domain ID option in the
Configure Switch Parameters dialog box is automatically enabled if
Fabric Binding is enabled. You cannot disable Insistent Domain
ID while Fabric Binding is active and the switch is online.
•If Fabric Binding is enabled and the switch is online, you cannot
disable Insistent Domain ID.
•If Fabric Binding is enabled and the director or switch is offline,
you can disable Insistent Domain ID, but this will disable Fabric
Binding.
•You cannot disable Fabric Binding or Switch Binding if Enterprise
Fabric Mode is enabled. However, if Enterprise Fabric Mode is
disabled, you can disable Fabric Binding, Switch Binding, or both.

6
6-4 McDATA® Sphereon™ 4500 Fabric Switch Product Manager User Manual
Optional Features
For More Information To enable, disable, and configure this option, refer to the Fabric
Binding section of Chapter 8, “Optional Features,” in the McDATA
Enterprise Fabric Manager User Manual (620-005001-600).
Switch Binding This feature is managed through the Switch Binding submenu options
available on the Product Manager Configure menu. Using Switch
Binding, you can specify devices and switches that can attach to
switch ports. This provides security in environments that include a
large number of devices by ensuring that only the intended set of
devices attach to a switch or director.
Configuring Switch Binding - Overview
To configure switch binding, you must first activate the feature using
the Switch Binding State Change dialog box while selecting the type of
port where you want to restrict connection (connection policy).
Possible selections are E_Ports, F_Ports, or all types.
If the switch is online, activating switch binding populates the
Membership List in the Switch Binding - Membership List dialog box
(Product Manager) with the following WWNs currently connected to
the switch, depending on the connection policy set in the State Change
dialog box:
•WWNs of devices connected to F_Ports (F_Port connection
policy). The WWN is the WWN of the attached device's port.
•WWNs of switches connected to E_Ports (E_Port connection
policy). The WWN is the WWN of the attached switch.
•WWNs of devices connected to F_Ports and switches connected
to E_Ports (all-ports connection policy).
Notes
•When the Switch Binding feature is first installed and has not
been enabled, the Switch Membership List is empty. When you
enable Switch Binding, the Membership List is populated with
WWNs of devices, switches, or both that are currently connected
to the switch.
•If the director is offline and you activate switch binding, the
Membership List is not automatically populated.
•Edits to the Switch Binding Membership List will be maintained
when you enable or disable Switch Binding.

6
SANtegrity Features 6-5
Optional Features
After enabling Switch Binding, you prohibit devices and/or switches
from connecting with switch ports by removing them from the
Membership List in the Switch Binding Membership List dialog box.
You allow connections by adding them to the Membership List. You
can also add detached nodes and switches as well.
Enable/Disable Switch Binding
1. Select the State Change option from the Configure menu’s Switch
Binding submenu. The Switch Binding State Change dialog box
displays.
Figure 6-1 Switch Binding State Change Dialog Box
2. Perform one of the following steps:
•To disable Switch Binding (a check mark appears in the Enable
Switch Binding check box), click the Enable Switch Binding
check box to remove the check mark, then click Activate.
•To enable Switch Binding (check mark is not in the Enable
Switch Binding check box), click the Enable Switch Binding
check box to add a check mark. Go on to step 3 to set the
Connection Policy.
3. Click one of the Connection Policy radio buttons.
•Restrict E_Ports. Select if you want to restrict connections from
specific switches to director E_Ports. Switch WWNs can be
added to the Switch Membership List to allow connection and
removed from the Membership List to prohibit connection.
Devices are allowed to connect to any F_Port.

6
6-6 McDATA® Sphereon™ 4500 Fabric Switch Product Manager User Manual
Optional Features
•Restrict F_Ports. Select if you want to restrict connections from
specific devices to director F_Ports. Device WWNs can be
added to the Switch Membership List to allow connection and
removed from the Membership List to prohibit connection.
Switches are allowed to connect to any E_Port.
•Restrict All. Select if you want to restrict connections from
specific devices to director F_Ports and switches to switch
E_Ports. Device and switch WWNs can be added to the Switch
Membership List to allow connection and removed from the
Membership List to prohibit connection.
4. Click Activate to enable the changes and close the dialog box.
5. Edit the Switch Membership List through the Switch Binding
Membership List dialog box to add or remove switches and devices
that are allowed to connect with the switch. Refer to Editing the
Switch Membership List following for procedures.
Editing the Switch Membership List
1. Select the Edit Membership List option from the Configure menu's
Switch Binding submenu in the Product Manager. The Switch
Binding Membership List dialog box displays. The WWNs of
devices and/or switches that can currently connect to switch
ports are listed in the Switch Membership List panel.

6
SANtegrity Features 6-7
Optional Features
Figure 6-2 Switch Binding Membership List Dialog Box
Refer to Configuring Switch Binding - Overview on page 6-4 for
information on how the Switch Membership List is populated with
WWNs according to options set in the Switch Binding State Change dialog
box.
2. If nicknames are configured for WWNs through the EFC Manager
and you want these to display instead of WWNs in this dialog
box, click the Display Options button at the bottom of the dialog
box. When the Display Options dialog box displays, click
Nickname, then OK.
3. To prohibit connection to a switch port from a WWN currently in
the Membership List, click the WWN or nickname in the
Membership List, then click the Remove button. The WWN or
nickname will move to the Node List panel. WWNs can only be
removed from the fabric if any of the following is true:
•The switch is offline.
•Switch Binding is disabled.
•The switch or device with the WWN is not connected to the
switch.

6
6-8 McDATA® Sphereon™ 4500 Fabric Switch Product Manager User Manual
Optional Features
•Switch Binding is not enabled for the same port type as
enabled for the Connection Policy in the Switch Binding State
Change dialog box. For example, a WWN for a switch attached
to an E_Port can be removed if the Switch Binding Connection
Policy was enabled to Restrict F_Ports.
•The switch or device with the WWN is connected to a port that
is blocked.
•The switch or device with the WWN is not currently
connected to the director (detached node).
4. WWNs can be added to the Switch Membership List (and thereby
allowed connection) when Switch Binding is either enabled or
disabled. To allow connection to a switch port from a WWN in the
Node List Panel, select the WWN or nickname in the Node List
panel, click the Add button. The WWN or nickname will move to
the Membership List panel.
5. To add a WWN for a device or switch not currently connected to
the director, click the Detached Node button. When the Add
Detached Node dialog box appears, enter the appropriate WWN or
nickname (if configured through the EFC Manager) and click OK.
The WWN or nickname appears in the Switch Membership List.
6. Click Activate to enable the changes and close the dialog box.
Enable/Disable and Online State Functions
In order for Switch Binding to function, specific operating parameters
and optional features must be enabled. Also, there are specific
requirements for disabling these parameters and features when the
director or switch is offline or online. Be aware of the following:
•Switch Binding can be enabled or disabled whether the director is
offline or online.
•Enabling Enterprise Fabric Mode automatically enables Switch
Binding.
•You cannot disable Switch Binding if Enterprise Fabric Mode is
enabled.
•If Enterprise Fabric Mode is enabled and the director or switch is
online, you cannot disable Switch Binding. However, if Enterprise
Fabric Mode is disabled, you can disable Fabric Binding, Switch
Binding, or both.

6
Enterprise Fabric Mode 6-9
Optional Features
•If Enterprise Fabric Mode is enabled and the director or switch is
offline you can disable Switch Binding, but Enterprise Fabric
Mode will also disable.
•WWNs can be added to the Switch Membership List when Switch
Binding is enabled or disabled.
•WWNs can only be removed from the Switch Membership List if
any of the following are true:
—The switch is offline.
—Switch Binding is disabled.
—The switch or device with the WWN is not connected to the
switch.
—Switch Binding is not enabled for the same port type as
enabled for the Connection Policy in the Switch Binding State
Change dialog box. For example, a WWN for a switch attached
to an E_Port can be removed if Switch Binding Connection
Policy was enabled to Restrict F_Ports.
—The switch or device with the WWN is connected to a port that
is blocked.
—The switch or device with the WWN is not currently
connected to the director or switch (detached node).
•If the director or switch is online and Switch Binding is not
enabled, all nodes and switches attached to the switch are
automatically added to the Switch Membership List.
Zoning with Switch Binding Enabled
Note that SANtegrity has no effect on existing zoning configurations.
However, note that if a device WWN is in a specific zone, but the
WWN is not in the Switch Membership List, the device cannot log in
to the director or switch port and cannot connect to other devices in
the zone with Switch Binding enabled.
Enterprise Fabric Mode
Enterprise Fabric Mode is an option available on the Fabrics menu in
the EFC Manager application if the SANtegrity feature key is
installed. This option automatically enables the following features
and operating parameters that are necessary in multiswitch
Enterprise Fabric environments. Note that there are specific

6
6-10 McDATA® Sphereon™ 4500 Fabric Switch Product Manager User Manual
Optional Features
requirements for disabling these parameters and features when the
director or switch is offline or online.
Features and Parameters Enabled
Fabric Binding This is a SANtegrity feature enabled through the Fabrics menu in the
EFC Manager that allows or prohibits switches and directors from
merging with a selected fabric. Refer to Enable/Disable and Online State
Functions on page 6-3 for details on enabling/disabling Fabric
Binding with Enterprise Fabric Mode enabled.
Switch Binding This is a SANtegrity feature enabled through the Configure menu in
the Product Manager that allows or prohibits switches and/or
directors from connecting to switch E_Ports, devices from connecting
to F_Ports. Refer to Enable/Disable and Online State Functions on
page 6-8 for details on enabling/disabling Switch Binding with
Enterprise Fabric Mode enabled.
Rerouting Delay Rerouting delay is a parameter in the Configure Switch Parameters
dialog box, available from Configure menu in the Product Manager
application.
Rerouting Delay ensures that frames are delivered through the fabric
in order to their destination. If there is a change to the fabric topology
that creates a new path (for example, a new switch is added to the
fabric), frames may be routed over this new path if its hop count is
less than a previous path with a minimum hop count. This may result
in frames being delivered to a destination out of order since frames
sent over the new, shorter path may arrive ahead of older frames still
in route over the older path. If Rerouting Delay is enabled, traffic
ceases in the fabric for the time specified in the E_D_TOV field of the
Configure Fabric Parameters dialog box (Configure menu). This
delay enables frames sent on the old path to exit to their destination
before new frames begin traversing the new path.
If Enterprise Fabric Mode is enabled, this option is automatically
enabled and cannot be disabled unless the switch is offline. In this
case, disabling Rerouting Delay also disables Enterprise Fabric Mode.
Domain RSCNs This is a parameter in the Configure Switch Parameters dialog box,
available from Configure Menu in the Product Manager application.
Domain register for state change notifications (domain RSCNs) are
sent between end devices in a fabric to provide additional connection
information to host bus adapters (HBA) and storage devices. As an

6
Enterprise Fabric Mode 6-11
Optional Features
example, this information might be that a logical path has been
broken because of a physical event, such as a fiber optic cable being
disconnected from a port.
If Enterprise Fabric Mode is enabled, this parameter is automatically
enabled and cannot be disabled unless the switch is offline. In this
case, disabling Domain RSCNs also disables Enterprise Fabric Mode.
Insistent Domain Identification (ID)
This is a parameter in the Configure Switch Parameters dialog box,
available from Configure menu in the Product Manager application.
Enabling this option sets the domain ID configured in the Preferred
Domain ID field in the Configure Switch Parameters dialog box as the
active domain identification when the fabric initializes. A static and
unique domain identification is required by the Fabric Binding
feature because the feature’s Fabric Membership list identifies
switches by WWN and Domain ID. If a duplicate preferred domain
ID is used, then insisted, warnings occur when directors and switches
are added to a Fabric Membership List.
If Fabric Binding or Enterprise Fabric Mode is enabled, this option is
automatically enabled and cannot be disabled unless these options
are disabled when the switch is offline. If the switch is online,
disabling Insistent Domain ID will disable Enterprise Fabric Mode
and Fabric Binding.
For More
Information Also refer to Enable/Disable and Online State Functions on page 6-3 for
Fabric Binding and Enable/Disable and Online State Functions on
page 6-8 for Switch Binding.
To enable and disable this option, refer to the Enterprise Fabric
section of Chapter 8, “Optional Features,” in the McDATA Enterprise
Fabric Manager User Manual (620-005001-600).


Product Manager Messages A-1
A
Ivisible Body Tag
This appendix lists and explains messages that may display in
message boxes as you use the Product Manager. Solutions to
problems implied by each message are included when applicable.
A
Message Activating this configuration will overwrite the current
configuration.
Description Confirmation to activate a new address configuration.
Action Click Yes to confirm activating the new address configuration or No to
cancel the operation.
Message All configuration names must be unique.
Description All address configurations must be saved with unique names.
Action Save the configuration with a different name that is unique to all
saved configurations.
Product Manager
Messages

A
A-2 McDATA® Sphereon™ 4500 Fabric Switch Product Manager User Manual
Product Manager Messages
Message All port names must be unique.
Description A duplicate port name was entered. Every configured port name
must be unique.
Action Reconfigure the port with a unique name.
Message Another Product Manager is currently performing a firmware
install.
Description Only one firmware install to a specific switch can take place at a time.
Action Wait for the current firmware install to complete and try again.
Message Are you sure you want to delete firmware version?
Description Requesting confirmation to delete the firmware version. Firmware
library can hold only eight firmware versions.
Action Click Yes to confirm the firmware deletion or No to cancel the
operation.
Message Are you sure you want to delete this address configuration?
Description Confirmation to delete the selected address configuration.
Action Click Yes to confirm the deletion of the address configuration or No to
cancel the operation.
Message Are you sure you want to send firmware version?
Description Confirmation to add a firmware version to the firmware library. The
firmware library can hold eight firmware versions.
Action Click Yes to confirm adding the firmware version to the firmware
library, or no to cancel the operation.

A
Product Manager Messages A-3
Product Manager Messages
C
Message Cannot disable Switch Binding while Enterprise Fabric Mode is
active and the switch is Online.
Description User attempted to disable switch binding through the Switch Binding
Change State dialog box, but Enterprise Fabric Mode is enabled.
Action You must either disable Enterprise Fabric Mode using the Enterprise
Fabric Mode dialog box in the EFC Manager application or set the
switch offline before you can disable Switch Binding.
Message Cannot disable Insistent Domain ID while Fabric Binding is active.
Description User attempted to disable the Insistent Domain ID parameter
through the Configure Switch Parameters dialog box, but Fabric
Binding is enabled.
Action Disable Fabric Binding through the Fabric Binding dialog box before
disabling these parameters.
Message Cannot enable beaconing on a failed FRU.
Description Occurs when selecting Enable Beaconing option for a failed FRU.
Action Replace FRU and enable beaconing again or enable beaconing on
operating FRU.
Message Cannot enable beaconing while the system error light is on.
Description Beaconing cannot be enabled while the system error light is on.
Action Select Clear System Error Light from Product menu to clear error light,
then enable beaconing.
Message Cannot have spaces in field.
Description Spaces are not allowed in this field.

A
A-4 McDATA® Sphereon™ 4500 Fabric Switch Product Manager User Manual
Product Manager Messages
Action Remove the spaces or retype the field without spaces.
Message Cannot install firmware to a switch with a failed CTP card.
Description Firmware cannot be installed on a switch with a defective CTP card.
Action Replace the failed CTP card and retry the firmware install to the
director.
Message Cannot perform this operation while the switch is offline.
Description This operation cannot take place while the switch is offline.
Action Configure the switch offline through the Set Online State dialog box
then retry the operation.
Message Cannot retrieve current SNMP configuration.
Description The current SNMP configuration cannot be retrieved. The link is
down or busy.
Action Retry the operation later. If the condition persists, contact support
personnel.
Message Cannot retrieve diagnostics results.
Description Diagnostics results cannot be retrieved. The link is down or busy.
Action Retry the operation later. If the condition persists, contact support
personnel.
Message Cannot retrieve information for port.
Description Information for the port cannot be retrieved. The link is down or
busy.
Action Retry the operation later. If the condition persists, contact support
personnel.

A
Product Manager Messages A-5
Product Manager Messages
Message Cannot retrieve port configuration.
Description Port configuration cannot be retrieved. The link is down or busy.
Action Retry the operation later. If the condition persists, contact support
personnel.
Message Cannot retrieve port information.
Description Port information cannot be retrieved. The link is down or busy.
Action Retry the operation later. If the condition persists, contact support
personnel.
Message Cannot retrieve port statistics.
Description Port statistics cannot be retrieved. The link is down or busy.
Action Retry the operation later. If the condition persists, contact support
personnel.
Message Cannot retrieve switch date and time.
Description Switch date and time cannot be retrieved. The link is down or busy.
Action Retry the operation later. If the condition persists, contact support
personnel.
Message Cannot retrieve switch state.
Description Switch state cannot be retrieved. The link is down or busy.
Action Retry the operation later. If the condition persists, contact support
personnel.

A
A-6 McDATA® Sphereon™ 4500 Fabric Switch Product Manager User Manual
Product Manager Messages
Message Cannot run diagnostics on a port that is failed.
Description Port diagnostics cannot be performed on a port that has failed.
Action Run diagnostics only on an operational port.
Message Cannot run diagnostics on an active E-port.
Description Port diagnostics cannot be performed on an active E-port.
Action Run diagnostics on an E-port only when it is not active.
Message Cannot run diagnostics. The port is not installed.
Description Port diagnostics cannot be performed when the port is not installed.
Action Run diagnostics only on a port that is installed.
Message Cannot save port configuration.
Description Port configuration cannot be saved. The link is down or busy.
Action Retry the operation later. If the condition persists, contact support
personnel.
Message Cannot save SNMP configuration.
Description SNMP configuration cannot be saved. The link is down or busy.
Action Retry the operation later. If the condition persists, contact support
personnel.
Message Cannot set all ports to Negotiate due to port speed restriction on
some ports.
Description Displays if you try to set all ports to Negotiate through the Configure
Ports dialog box and some ports do not support speed configuration.
Action Replace ports that do not support speed configuration with those that
do support more than one speed configuration.

A
Product Manager Messages A-7
Product Manager Messages
Message Cannot set Fibre Channel parameters.
Description Fibre Channel parameters cannot be set. The link is down or busy.
Action Retry the operation later. If the condition persists, contact support
personnel.
Message Cannot set switch date and time.
Description Switch date and time cannot be set. The link is down or busy.
Action Retry the operation later. If the condition persists, contact support
personnel.
Message Cannot set switch state.
Description Switch state cannot be set. The link is down or busy.
Action Retry the operation later. If the condition persists, contact support
personnel.
Message Cannot set write authorization without defining a community
name.
Description A community name was not defined in the Configure SNMP dialog
box for the write authorization selected.
Action Provide a name in the name field where write authorization is
checked.
Message Cannot start data collection.
Description Data collection cannot be started. The link is down or busy.
Action Retry the operation later. If the condition persists, contact support
personnel.

A
A-8 McDATA® Sphereon™ 4500 Fabric Switch Product Manager User Manual
Product Manager Messages
Message Cannot start port diagnostics.
Description Port diagnostics cannot be started. The link is down or busy.
Action Retry the operation later. If the condition persists, contact support
personnel.
Message Cannot swap an uninstalled port.
Description A port swap cannot be performed when the port is not installed.
Action Perform a swap only on a port that is installed.
Message Click OK to remove all contents from log.
Description Requesting confirmation that you want all contents removed from
the log.
Action Click OK to continue or Cancel to cancel the operation.
Message Continuing may overwrite host programming. Continue?
Description Configurations sent from the host may be overwritten by EFCM.
Action Continuing will activate the current configuration.
Message Could not export log to file.
Description A file I/O error occurred. The log file could not be saved to the
specified destination.
Action Ensure filename and drive are correct.
Message Could not find firmware file.
Description Firmware file selected was not found in the FTP directory.
Action Ensure file name and directory are correct.

A
Product Manager Messages A-9
Product Manager Messages
Message Could not find firmware file.
Description The selected file is not a firmware file.
Action Obtain a valid firmware file from your service representative.
Message Could not remove dump files from server.
Description Dump files could not be removed from server. Link may be down or
switch may be busy.
Action Retry the operation later. If the condition persists, contact support
personnel.
Message Could not stop port diagnostics.
Description Port diagnostics could not be stopped. Link may be down or switch
may be busy.
Action Retry the operation later. If the condition persists, contact support
personnel.
Message Could not write firmware to flash.
Description Firmware could not be written to flash memory.
Action Try again. If problem persists, contact support personnel.
Message CUP name and port name are identical.
Description Within the address configuration, one or more of the port names are
the same as the CUP name.
Action Make sure all names are unique for the ports and CUP name.

A
A-10 McDATA® Sphereon™ 4500 Fabric Switch Product Manager User Manual
Product Manager Messages
D
Message Date entered is invalid.
Description Date entered incorrectly.
Action Verify that the number of days in the month is valid.
Message Device applications should be terminated before starting
diagnostics. Press NEXT to continue.
Description Device application is not terminated.
Action Terminate device application before running port diagnostics.
Message [device WWN] cannot be removed from the Switch Membership
List while participating in Switch Binding. The device must be
isolated from the switch, or Switch Binding deactivated before it
can be removed.
Description User attempted to remove a device WWN from the Switch
Membership List (SANtegrityTM feature) while Switch Binding is
enabled.
Action Remove the device from the switch by blocking the port, setting the
director offline, or disabling Switch Binding through the Switch
Binding Change State dialog box before removing devices form the
Switch Membership List.
Message Disabling Insistent Domain ID will disable Fabric Binding. Do you
want to continue?
Description Fabric Binding is enabled through the EFC Manager and user
attempted to disable Insistent Domain ID in the Configure Switch
Parameters dialog box.
Action Click Yes if you want to continue and disable Fabric Binding.

A
Product Manager Messages A-11
Product Manager Messages
Message Disabling Switch Binding will disable Enterprise Fabric Mode. Do
you want to continue?
Description User attempting to disable Switch Binding through the Switch
Binding State Change dialog box, but Enterprise Fabric Mode is
enabled
Action Disable Enterprise Fabric Mode using the Enterprise Fabric Mode
dialog box in the EFC Manager before disabling Switch Binding.
Message Do you want to continue with IPL?
Description Requesting confirmation to proceed with an IPL.
Action Click Yes to confirm the IPL or Cancel to cancel the operation.
Message Duplicate community names require identical write authorizations.
Description Duplicate community names exist that have conflicting or different
write authorizations.
Action Verify community names and whether a community name is
duplicated with different write authorizations.
E
Message Enterprise Fabric Mode will be disabled if any of the following
parameters are disabled: Insistent Domain ID, Rerouting Delay,
Domain RSCN’s. Do you want to continue?
Description User attempted to disable these parameters in the Configure Switch
Parameters dialog box while the director was online, but Enterprise
Fabric Mode (SANtegrity feature) is enabled.
Action Click Yes if you want to continue, and disable Enterprise Fabric
Mode.

A
A-12 McDATA® Sphereon™ 4500 Fabric Switch Product Manager User Manual
Product Manager Messages
Message Error retrieving port information.
Description An error occurred while retrieving port information. The link is down
or busy.
Action Retry the operation later. If the condition persists, contact support
personnel.
Message Error retrieving port statistics.
Description An error occurred while retrieving port statistics. The link is down or
busy.
Action Retry the operation later. If the condition persists, contact support
personnel.
Message Error stopping port diagnostics.
Description An error occurred while attempting to stop the port diagnostics from
running. The link is down or busy.
Action Retry the operation later. If the condition persists, contact support
personnel.
Message Error transferring files <message>.
Description An error occurred while attempting to download files.
Action Retry the operation. If the condition persists, contact support
personnel.
F
Message Field cannot be blank.
Description A blank field is not allowed in this dialog.
Action Enter the required information in the blank field.

A
Product Manager Messages A-13
Product Manager Messages
Message File transfer aborted.
Description User has stopped the file transfer.
Action N/A. An informational message.
Message File transfer is in progress.
Description Firmware or data collection is being transferred.
Action N/A. An informational message.
Message Firmware download timed out.
Description The switch did not respond in the time allowed. The status of the
firmware install operation is unknown.
Action Retry the operation. If the problem persists, contact support
personnel.
Message Firmware file I/O error.
Description Firmware file input/output error occurred.
Action Contact support personnel.
Message Firmware file not found.
Description Firmware file deleted from the EFC Server.
Action Add firmware to library.

A
A-14 McDATA® Sphereon™ 4500 Fabric Switch Product Manager User Manual
Product Manager Messages
I
Message Incorrect product type.
Description When configuring a new product through the New Product dialog
box, an incorrect product was selected for the network address.
Action Select the correct product type for the product with the network
address.
Message Installing this feature key, while online, will cause an IPL
operation on the switch and a momentary loss of LAN connection.
This operation is non-disruptive to the Fibre Channel traffic. Do
you wish to continue installing this feature key?
Description If the director is online, installing the new feature key will cause an
internal program load (IPL). The LAN connection to the EFC server
will be lost momentarily, but Fibre Channel traffic will not be
affected.
Action Select Yes to install the feature key or No to not install.
Message Internal file transfer error received from switch.
Description Switch detected an internal file transfer error.
Action Contact support personnel.
Message Invalid character in field.
Description Invalid character in the input field.
Action Re-enter the field information.
Message Invalid configuration name.
Description Attempted to save an address configuration name with an invalid
name.

A
Product Manager Messages A-15
Product Manager Messages
Action Use up to 24 alphanumeric characters, including spaces, hyphens and
underscores.
Message Invalid feature key.
Description The feature key was not recognized.
Action Re-enter the feature key noting the key is case sensitive and to
include the dashes.
Message Invalid firmware file.
Description Selected file is not a firmware file.
Action Select the correct firmware file.
Message Invalid network address.
Description Network address specified is not known by the domain name server.
Action Check the input address and specify the correct network address.
Message Invalid port number.
Description Port number must be within the range of ports for the specific switch
model.
Action Enter a port number within the correct range.
Message Invalid port number. Valid ports are (0 - 23).
Description Port number must be within the range of ports for the specific switch
model. For this model, the valid port numbers are 0 - 23.
Action Enter a port number within the correct range.

A
A-16 McDATA® Sphereon™ 4500 Fabric Switch Product Manager User Manual
Product Manager Messages
Message Invalid port swap.
Description Port swap selection is not allowed.
Action Ensure that each port selected for swap has not been previously
swapped.
Message Invalid response received from switch.
Description The switch returned an invalid response.
Action Resend the firmware. If the condition persists, contact support
personnel.
Message Invalid serial number for this feature key.
Description The serial number and the feature key did not match.
Action Ensure that the feature key being installed is specifically for this
switch serial number.
Message Invalid UDP port number.
Description UDP port number must be an integer from 1 through 65535.
Action Enter a port number from 1 through 65535.
Message Invalid value for day (1 - 31).
Description Value for day must be an integer from 1 through 31.
Action Enter a value from 1 through 31.
Message Invalid value for E_D_TOV.
Description Value for E_D_TOV must be an integer from 2 through 600, measured
in tenths of a second.
Action Enter a value from 2 through 600.

A
Product Manager Messages A-17
Product Manager Messages
Message Invalid value for hour (0 - 23).
Description Value for hour must be an integer from 0 through 23.
Action Enter a value from 0 through 23.
Message Invalid value for minute (0 - 59).
Description Value for minute must be an integer from 0 through 59.
Action Enter a value from 0 through 59.
Message Invalid value for month (1 - 12).
Description Value for month must be an integer from 1 through 12.
Action Enter a value from 1 through 12.
Message Invalid value for R_A_TOV.
Description Value for R_A_TOV must be an integer from 10 through 1200.
Measured in tenths of a second.
Action Enter a value from 10 to 1200.
Message Invalid value for second (0 - 59).
Description Value for second must be an integer from 0 through 59.
Action Enter a value from 0 through 59.
Message Invalid value for year.
Description Value for year must be a four-digit year after 1980.
Action Enter a correct four-digit value for the year.

A
A-18 McDATA® Sphereon™ 4500 Fabric Switch Product Manager User Manual
Product Manager Messages
Message Invalid World Wide Name.
Description World wide name must have eight two-digit hexadecimal numbers
separated by colons (xx:xx:xx:xx:xx:xx:xx:xx).
Action Enter a worldwide name using eight two-digit hexadecimal numbers
separated by colons in the format given in the message.
L
Message Link dropped.
Description Connection between EFC Server and the switch has been lost.
Action Wait for the connection to re-establish. Link re-connects are
attempted every 30 seconds.
Message Log is currently in use.
Description Log is in use by another Product Manager.
Action Retry the operation later.
M
Message Maximum number of versions already installed.
Description The maximum number of firmware versions has been reached.
Action Delete a firmware version before adding a new firmware version.
Message McDATA SANtegrity Feature not installed. Please contact your
sales representative.
Description The user selected Switch Binding from the Configure menu, but the
optional SANtegrity feature is not installed.
Action Install the SANtegrity key through the Configure Feature Key dialog
box before using Switch Binding features.

A
Product Manager Messages A-19
Product Manager Messages
N
Message No file was selected.
Description Action requires you to select a file
Action Select a file.
Message No firmware version file was selected.
Description A file was not selected in the Firmware Library dialog box before an
action, such as modify or send was performed.
Action Click a firmware version in the dialog box to select it, then perform
the action again.
Message No firmware versions to delete.
Description There are no firmware versions in the firmware library to delete.
Action N/A. An informational message.
Message Non-redundant switch must be offline to install firmware.
Description Since the switch has only a single CTP card, it must be offline to
initiate a firmware installation.
Action Take switch offline and try again.
Message Not all of the optical transceivers are installed for this range of
ports.
Description Some ports in the specified range do not have optical transceivers
installed.
Action Use a port range that is valid for the ports installed.

A
A-20 McDATA® Sphereon™ 4500 Fabric Switch Product Manager User Manual
Product Manager Messages
P
Message Performing this operation will change the current state to Offline.
Description This operation causes the switch to go offline.
Action N/A. An informational message.
Message Performing this operation will change the current state to Online.
Description This operation causes the switch to go online.
Action N/A. An informational message.
Message Performing this action will overwrite the date/time on the switch.
Description Warning that occurs when configuring the date and time through the
Configure Date and Time dialog box, that the new time or date will
overwrite the existing time or date set for the switch.
Action Verify that you want to overwrite the current date or time.
Message Periodic Date/Time synchronization must be cleared before enabling
switch clock alert.
Description Action cannot be performed because Periodic Date/Time Synchronization
option is active.
Action Click Periodic Date/Time Synchronization check box in Configure Date and
Time dialog box (Configure menu) to clear check mark and disable periodic
date/time synchronization.
Message Port binding was removed from attached devices that are also
participating in Switch Binding.
Description Informational message. User has removed Port Binding from
attached devices, but one or more of these devices is still controlled
by Fabric Binding.

A
Product Manager Messages A-21
Product Manager Messages
Action Review the Switch Binding Membership List to determine if the
devices should be members.
Message Port diagnostics cannot be performed on an inactive port.
Description This displays when port diagnostics is run on a port in an inactive
state.
Action Run the diagnostics on an active port.
Message Port speeds cannot be configured at a higher rate than the
director/switch speed.
Description This displays when you configure a port to 2 GB/sec and the switch
speed is set to 1 Gb/sec.
Action Set the port speed to 1 Gb/sec in the Configure Ports dialog box.
Message Product Manager error <number>.
Description The switch Product Manager encountered an internal error and
cannot continue.
Action Report the problem to support personnel.
Message Product Manager instance is currently open.
Description A Product Manager window is currently open.
Action Informational message only.
R
Message R_A_TOV must be greater than E_D_TOV.
Description R_A_TOV must be greater than E_D_TOV.
Action Change one of the values so that R_A_TOV is greater than E_D_TOV.

A
A-22 McDATA® Sphereon™ 4500 Fabric Switch Product Manager User Manual
Product Manager Messages
Message Resource is unavailable.
Description The specified operation cannot be performed because the product is
unavailable.
Action Verify that the EFC Server-to-product link is up. If the link is up, the
EFC Server may be busy. Try the operation again later.
S
Message Send firmware failed.
Description Send firmware operation has failed.
Action Retry the operation. If the condition persists, contact support
personnel.
Message SNMP trap address not defined.
Description An SNMP trap address must be defined if a community name is
defined.
Action Define an SNMP address.
Message Stop diagnostics failed. The test is already running.
Description Diagnostics for the port was not running and the Stop was selected on
the Port Diagnostics dialog box. Diagnostics quit for the port for some
reason, but the Stop button remains enabled.
Action Verify port operation. Retry diagnostics for port and select Stop from
the dialog box. If problem persists, contact your service
representative.
Message Stop diagnostics failed. The test was not running.
Description The action to stop diagnostics failed because the test was not running.
Action Informational message.

A
Product Manager Messages A-23
Product Manager Messages
Message Switch Binding was removed from attached devices that are also
participating in Port Binding. Please review the Port Binding
Configuration.
Description The device WWNs were removed from the Switch Membership List
(SANtegrity Switch Binding feature), but you should note that one or
more of these devices still has security control in port binding.
Action Verify that the security level for each device is as required by
reviewing the Bound WWN list in the Configure Ports dialog box.
Message System diagnostics cannot run. The Operational Status is invalid.
Description System diagnostics cannot run on switches with failed ports.
Action Replace failed ports.
T
Message The add firmware process has been aborted.
Description User has ended the add firmware process.
Action N/A. An informational message.
Message The data collection process failed.
Description An error occurred in the data collection process.
Action Contact support personnel.
Message The data collection process has been aborted.
Description User has ended the data collection process.
Action N/A. An informational message.

A
A-24 McDATA® Sphereon™ 4500 Fabric Switch Product Manager User Manual
Product Manager Messages
Message The EFC Server is busy processing a request from another Product
Manager
Description The EFC Server could not process the current request because it is
busy handling a request from another Product Manager.
Action Retry the operation later. If the condition persists, contact support
personnel.
Message The firmware file is corrupted.
Description A firmware file has corrupt data.
Action Contact support personnel.
Message The firmware version already exists.
Description Firmware version already exists in the database.
Action N/A. An informational message.
Message The following parameters cannot be disabled while Enterprise
Fabric Mode is active: Insistent Domain ID, Rerouting Delay,
Domain RSCN’s.
Description User attempted to disable these parameters in the Configure Switch
Parameters dialog box while Enterprise Fabric Mode is enabled.
Action Disable Enterprise Fabric Mode through the Enterprise Fabric Mode
dialog box in the EFC Manager, then disable the parameters.
Message The link to the switch is not available.
Description The link from the EFC Server to the switch is not available.
Action Check Ethernet connection.

A
Product Manager Messages A-25
Product Manager Messages
Message The maximum number of address configurations has been reached.
Description The maximum number of saved address configurations has been
reached.
Action Delete configurations no longer needed to allow new configuration to
be saved.
Message The optical transceiver is not installed.
Description No information available for a port that is not installed.
Action Ensure the optical transceiver is installed and fully seated.
Message The switch did not accept the request.
Description The switch did not handle the action.
Action Try action again. If problem persists, contact your support
representative.
Message The switch did not respond in the time allowed.
Description A time out was reached waiting for the switch to respond to the
action.
Action Try action again.
Message The switch is busy saving maintenance information.
Description Switch is busy with a maintenance operation.
Action Retry the operation later. If the condition persists, contact support
personnel.

A
A-26 McDATA® Sphereon™ 4500 Fabric Switch Product Manager User Manual
Product Manager Messages
Message The switch must be offline to configure.
Description A configuration changed was attempted for a configuration requiring
offline changes.
Action Take the appropriate actions to set the switch offline before
attempting the configuration change.
Message This feature has not been installed. Please contact your sales
representative.
Description Indicator that the feature has not been installed on this switch.
Action Contact your sales representative to obtain the desired feature.
Message This feature key does not include all of the features currently
installed and cannot be activated while the switch is online.
Description The feature set currently installed for this system contains features
that are not being installed with the new feature key. To activate the
new feature key, you must set the director offline. Activating the new
feature set, however, will remove current features not in the new
feature set.
Action Set the director offline through the Set Online State dialog box, then
activate the new feature key using the Configure Feature Key dialog
box.
Message This feature key does not include all of the features currently
installed. Do you want to continue with feature key activation?
Description The feature set currently installed for this system contains features
that are not being installed with the new feature key.
Action Click Yes to activate the feature key and remove current features not
in the new feature set or No to cancel.

A
Product Manager Messages A-27
Product Manager Messages
Message Threshold alerts are not supported on firmware earlier than
01.03.00.
Description Threshold alerts are not supported in firmware releases before
1.03.00.
Action Informational message.
U
Message Unable to change to incompatible firmware release.
Description The user tried to download a firmware release that is not compatible
with the current product configuration.
Action Refer to the release notes or contact customer support.
Message Unable to save data collection file to destination.
Description Could not save data collection file to the specified drive (hard drive,
network).
Action Retry the operation. If the condition persists, contact support
personnel.
Y
Message You do not have rights to perform this action.
Description User does not have the rights to perform this action.
Action An informational message.


Glossary g-1
Glossary
The following cross-references are used in this glossary:
Contrast with. This refers to a term that has an opposite or
substantively different meaning.
See. This refers the reader to another keyword or phrase for the same
term.
See also. This refers the reader to definite additional information
contained in another entry.
A
access control List of all devices that can access other devices across the network
and the permissions associated with that access. See also persistent
binding and zoning.
active FRU A field-replaceable unit that is currently operating as the active and
not the backup FRU.
active zone set Single zone set that is active in a multiswitch fabric. It is created when
you enable a specified zone set. This zone set is compiled by checking
for undefined zones or aliases.
agent Software that processes queries on behalf of an application and
returns replies.
alarm SNMP message notifying an operator of a network or device
problem.

g-2 McDATA® Sphereon™ 4500 Fabric Switch Product Manager User Manual
Glossary
ALPA Arbitrated Loop Physical Address.
ANSI American National Standards Institute: an organization that provides
voluntary standards in the United States.
application-specific
integrated circuit
(ASIC)
A circuit designed for a specific application or purpose, such as
implementing the lower-layer Fibre Channel protocol (FC-0). ASICs
differ from general purpose devices such as memory chips or
microprocessors.
alias server Fabric software facility that supports multicast group management.
arbitrated loop One of the three connection topologies offered by Fibre Channel. Up
to 126 node ports and one fabric port can communicate without the
need for a separate switched fabric. See also point to point.
arbitration Process of selecting one device from a collection of devices that
request service simultaneously.
audit log Log summarizing actions (audit trail) made by the user.
authentication Verification of identity for a person or process.
B
backplane The backplane provides 48 VDC power distribution and connections
for all logic cards.
backup FRU When an active FRU fails, an identical backup FRU takes over
operation automatically (failover) to maintain switch and Fibre
Channel link operation.
beaconing Use of light-emitting diodes on ports, port cards, field-replaceable
units, and switches to aid in the fault-isolation process; when
enabled, active beaconing will cause LEDs to flash for faulty
components.
ber See bit error rate.
bidirectional In Fibre Channel, the capability to simultaneously communicate at
maximum speeds (100 Mbps) in both directions over a link.

Glossary g-3
Glossary
bit error rate A comparison of the number of bits received incorrectly by a device
to the total number of bits transmitted.
blocked port Devices communicating with the port are prevented from logging
into the switch or communicating with other devices attached to the
switch. A blocked port continuously transmits the offline sequence.
bridge Device that connects and passes packets between two network
segments that use the same communications protocol.
broadcast Send a transmission to all N_Ports on a fabric.
broadcast frames Data packet, also known as a broadcast packet, whose destination
address specifies all computers on a network. See also multicast.
buffer Storage area for data in transit. Buffers compensate for differences in
processing speeds between devices.
C
CHPID See channel path identifier.
call-home Product feature which enables the EFC Server to automatically dial
out to a support center and report system problems. The support
center server accepts calls from the EFC Server, logs reported events,
and can notify one or more support center representatives.
channel Point-to-point link that transports data from one point to the other.
channel path A single interface between a central processor and one or more
control units along which signals and data can be sent to perform I/O
requests.
channel path
identifier In a channel subsystem, a value assigned to each installed channel
path of the system that uniquely identifies that path to the system.
class of Fibre Channel
service Defines the level of connection dedication, acknowledgment, and
other characteristics of a connection.
Class F Fibre Channel
service Used by switches to communicate across interswitch links (ISLs) to
configure, control, and coordinate a multiswitch fabric.

g-4 McDATA® Sphereon™ 4500 Fabric Switch Product Manager User Manual
Glossary
Class 2 Fibre Channel
service Provides a connectionless (not dedicated) service with notification of
delivery or nondelivery between two N_Ports. In-order delivery of
frames is not guaranteed.
Class 3 Fibre Channel
service Provides a connectionless (not dedicated) service without notification
of delivery or nondelivery between two N_Ports. Also known as
datagram.
community profile Information that specifies which management objects are available to
what management domain or SNMP community name.
concurrent firmware
upgrade The CTP card provides two nonvolatile memory regions. Because
two firmware versions can be stored on the card, firmware is
upgraded without disrupting switch operation.
concurrent
maintenance Ability to perform maintenance tasks, such as removal or
replacement of field-replaceable units, while a hardware product is
operating.
configuration data Configuration data includes: identification data, port configuration
data, operating parameters, SNMP configuration, and zoning
configuration. A configuration backup file is required to restore
configuration data if the CTP card in a nonredundant switch or
switch is removed and replaced.
configuration report An ASCII text file containing all current user-definable configuration
options.
connectionless Nondedicated link. Typically used to describe a link between nodes
which allows the switch to forward Class 2 or Class 3 frames as
resources (ports) allow. Contrast this to the dedicated bandwidth that
is required in a Class 1 Fibre Channel Service point-to-point link.
connector See optical fiber connector.
control processor
card Circuit card that contains the switch microprocessor. The CTP card
also initializes hardware components of the system after power-on. A
10 Mbps RJ-45 twisted pair connector is located on the CTP card to
connect to the Ethernet LAN and communicate with the EFC Server
or a specific management station.
control unit A hardware unit that controls the reading, writing, or displaying of
data at one or more input/output units.

Glossary g-5
Glossary
control unit port An internal port on the CTP card that communicates with the
attached IBM S/390 or similar processor channels to report error
conditions and link initialization.
CRC See cyclical redundancy check.
CTP See control processor card.
CUP See control unit port.
cyclical redundancy
check System of error checking performed at both the sending and
receiving station using the value of a particular character generated
by a cyclic algorithm. When the values generated at each station are
identical, data integrity is confirmed.
D
DASD Direct access storage device such as a disk drive.
data directory Critical information for all managed products (including directors
and switches). Information stored here includes: all EFC Manager
configuration data (product definitions, user names, passwords, user
rights, nicknames, session options, SNMP trap recipients, e-mail
recipients, and Ethernet event notifications); all log files (EFC
manager logs and individual Product Manager logs); zoning library
(all zone sets and zone definitions); firmware library; call-home
settings (phone numbers and dialing options); configuration data for
each managed switch (stored on the EFC Server and in NV-RAM on
each switch).
datagram See Class 3 Fibre Channel service.
default Pertaining to an attribute, value, or option that is assumed when none
is explicitly specified.
default zone Contains all attached devices that are not members of a separate
zone.
destination address Address identifier that indicates the targeted destination of a data
frame.

g-6 McDATA® Sphereon™ 4500 Fabric Switch Product Manager User Manual
Glossary
device Product, connected to a managed switch, that is not controlled
directly by the Product Manager. See also node.
diagnostics Procedures used by computer users and service personnel to
diagnose hardware or software error conditions.
dialog box Dialog box is a window containing informational messages or data
fields to be modified or filled in with desired options.
D_ID See destination address.
director An intelligent Fibre Channel switching device providing any-to-any
port connectivity between nodes (end devices) on a switched fabric.
The director sends data transmissions (data frames) between nodes in
accordance with the address information present in the frame
headers of those transmissions.
DNS name Domain name system or domain name service. Host or node name
for a device or managed product that is translated to an IP address
through a domain name server.
domain ID Number (1 through 31) that uniquely identifies a switch in a
multiswitch fabric. A distinct domain ID is automatically allocated to
each switch in the fabric by the principal switch.
E
E_Port See expansion port.
E_D_TOV See error-detect time-out value.
EFC Enterprise fabric connectivity.
EFC Product Manager The applications provide a graphical user interface (GUI) and
management services, and implement web and other server
functions.
EFC Server PC shipped with a product to run the EFC Manager and EFC Product
Manager applications.
EFC Management
Services Software application that provides back-end product-independent
services to the EFC Manager application. EFC Management Services

Glossary g-7
Glossary
runs only on the EFC Server (and cannot be downloaded to remote
workstations).
EMS See EFC Management Services.
Enterprise Fabric
Connectivity
Manager
Software application that is the system management framework
providing the user interface for managing McDATA Fibre Channel
connectivity products. The EFC Manager can run both locally on the
EFC Server and remotely on a user workstation.
error-detect time-out
value E_D_TOV defines the time the switch waits for an expected response
before declaring an error condition.
error message Indication that an error has been detected. See also information
message and warning message.
Ethernet A widely implemented local area network (LAN) protocol that uses a
bus or star topology and serves as the basis for the IEEE 802.3
standard, which specifies the physical and software layers. Baseband
LAN allows multiple station access to the transmission medium at
will without prior coordination and which avoids or resolves
contention.
ethernet hub A device used to connect the EFC Server and the switches it manages.
event code A numeric code that displays in the event log. This code provides
information on system failures, such as hardware failures, failure
locations, or general information on normal system events.
event log Record of significant events that have occurred on the switch, such as
FRU failures, degraded operation, and port problems.
expansion port Physical interface on a Fibre Channel switch within a fabric that
attaches to an expansion port (E_Port) on another Fibre Channel
switch to form a multiswitch fabric. See also segmented E_Port.
explicit fabric login Data field size, supported by an F-Port, that is agreed upon during
fabric login.

g-8 McDATA® Sphereon™ 4500 Fabric Switch Product Manager User Manual
Glossary
F
fabric Entity that interconnects N_Ports and is capable of routing
(switching) Fibre Channel frames using the destination ID
information in the Fibre Channel frame header accompanying the
frames.
fabric element Any active switch or node in a switched fabric.
fabric port Physical interface within the fabric that connects to an N_Port
through a point-to-point full duplex connection.
fabric services Fabric services implements the various Fibre channel services that are
described in the standards. These services includes the Fabric
controller (login server), name server, and management server.
failover Automatic and nondisruptive transition of functions from an active
FRU that has failed to a backup FRU.
FCC-IOC See Fibre Channel I/O controller.
FE-MIB See Fibre Channel Fabric Element.
feature key A string of alphanumeric characters consisting of both uppercase and
lowercase. The following is an example of a feature key format:
XxXx-XXxX-xxXX-xX.
fiber optics Branch of optical technology concerned with the transmission of light
pulses through fibers made of transparent materials such as glass,
fused silica, and plastic.
fibre Physical media types supported by the Fibre Channel specification,
such as optical fiber, twisted pair, and coaxial cable.
Fibre Channel Integrated set of standards recognized by ANSI which defines
specific protocols for flexible information transfer. Logically, a
point-to-point serial data channel, structured for high performance.
Fibre Channel fabric
element Any device linked to a fabric. Information about these devices is
recorded in a management information base (MIB) which can be
accessed by fabric management software.
Fibre Channel I/O
controller Controls the embedded Fibre Channel port and configures the ports’
ASICs.

Glossary g-9
Glossary
fibre port module
card Each fiber port module card provides four Fibre Channel connections
through duplex small form factor pluggable (SFP) fiber-optic
transceivers.
field-replaceable unit Assembly removed and replaced in its entirety when any one of its
components fails.
firmware Embedded program code that resides and executes on the switch.
FLASH memory A computer chip with a read-only memory that retains its data when
the power is turned off and that can be electronically erased and
reprogrammed without being removed from the circuit board.
F_Port See fabric port.
frame A variable-length packet of data that is transmitted in frame relay
technology.
FRU See field-replaceable unit.
Fx_Port A configurable port type that restricts a port to operate either as an
F_Port or FL_Port.
G
gateway A multi-homed host used to route network traffic from one network
to another, and to pass network traffic from one protocol to another.
gateway address A unique string of numbers (in the format xxx.xxx.xxx.xxx) that
identifies a gateway on the network.
GBIC GigaBit Interface Converter. A removable module that converts an
electrical serial data stream to an optical or amplified electrical serial
data stream. Contains connector for attaching fiber optic cable.
generic port Also known as G_Port. Physical interface on a switch that can
function either as a fabric port (F_Port) or an extension port (E_Port)
depending on the port type to which it connects.
G_Port See generic port.

g-10 McDATA® Sphereon™ 4500 Fabric Switch Product Manager User Manual
Glossary
GUI Graphical User Interface.
Gx_Port A configurable port type that restricts a port to operate either as an
F_Port, FL_Port, or E_Port.
H
hardware log Record of FRU insertions and removals in the switch.
hardware
management console The console runs the Hardware Management Console application
(HWMCA), and is the operations and management PC platform for
S/390 and zSeries servers.
HBA See host bus adapter.
heterogeneous fabric A fabric with both McDATA and non-McDATA products.
homogeneous fabric A fabric consisting of only McDATA products.
hop count The number of hops a unit of information traverses in a fabric.
hexadecimal A number system with a base of 16.
high availability A performance feature characterized by hardware component
redundancy and hot-swappability (enabling non-disruptive
maintenance). High-availability systems maximize system uptime
while providing superior reliability, availability, and serviceability.
hop Data transfer from one node to another node.
hop count ISL connections.
host bus adapter Logic card that provides a link between the server and storage
subsystem, and that integrates the operating systems and I/O
protocols to ensure interoperability.
hot-swapping Removing and replacing a device’s components while the device
continues to operate normally.
hub In Fibre Channel, a device that connects nodes into a logical loop by
using a physical star topology.

Glossary g-11
Glossary
I
IML See initial machine load.
inband management Management of the switch through Fibre Channel connection to a
port card.
information message Message telling a user that a function is performing normally or has
completed normally. See also error message and warning message.
initial machine load Also known as IML. Hardware reset for the CTP card on the switch. It
does not affect other hardware. It is initiated by pushing the reset
(RST) button on the machine’s front panel.
initial program load Process of initializing the device and causing the operating system to
start. Initiated through a menu in the Product Manager.
input/output
configuration The collection of channel paths, control units, and I/O devices that
attaches to the S/390 or zSeries processor.
input/output
configuration
program
A program that defines all available I/O devices and channel paths to
an IBM S/390 or zSeries processor system. Replaced by the Hardware
Configuration Definition Program starting with MVS/ESA Version
4.0.
interface Hardware, software, or both, linking systems, programs, or devices.
Internet Protocol The TCP/IP standard protocol that defines the IP datagram as the
unit of information passed across an internet and provides the basis
for connectionless, best-effort packet delivery service. IP includes the
ICMP control and error message protocol as an integral part.
internet protocol
address Unique string of numbers (in the format xxx.xxx.xxx.xxx) that
identifies a device on a network.
interoperability Ability to communicate, execute programs or transfer data between
various functional units over a network.
interswitch link Also known as ISL. Physical E_Port connection between two switches
in a fabric.
I/O configuration See input/output configuration.

g-12 McDATA® Sphereon™ 4500 Fabric Switch Product Manager User Manual
Glossary
IOCDS A data set that contains an I/O configuration definition built by the
IOCP.
IOCP See input/output configuration program.
IP address See internet protocol address.
IPL See initial program load.
ISL See interswitch link.
J
jumper cable Optical cable that provides physical attachment between two devices
or between a device and a distribution panel. Contrast with trunk
cable.
L
laser Light Amplification through Simulated Emissions of Radiation. A
device that uses the oscillation of atoms or molecules between energy
levels to generate a narrow, finely focused beam of light. The light has
a single wavelength or narrow spectrum of wavelengths and is
matched in phase and frequency.
LED Light-emitting diodes (LEDs) on switch FRUs and the front bezel that
provide visual indicators of hardware status or malfunctions.
latency When used in reference to a Fibre Channel switching device, latency
refers to the amount of time elapsed between receipt of a data
transmission at a switch’s incoming F_Port (from the originating
node port) to retransmission of that data at the switch’s outgoing
F_Port (to the destination N_Port). The amount of time it takes for
data transmission to pass through a switching device.
LIN See link incident.
link Physical connection between two devices on a switched fabric.

Glossary g-13
Glossary
link incident A link incident is a problem detected on a fiber optic link, like the loss
of light, invalid sequences and other problems.
link incident alerts A user notification, such as a graphic symbol in the hardware view
that indicates that a link incident has occurred.
load balancing Ability to evenly distribute traffic over multiple interswitch links
within a fabric. Load balancing on McDATA switches takes place
automatically.
log A record, as of the performance of a machine or the progress of an
undertaking.
logical unit number Also known as LUN. In Fibre Channel addressing, a logical unit
number is a number assigned to a storage device which, in
combination with the storage device’s node port’s world-wide name,
represents a unique identifier for a logical device on a storage area
network.
loopback plug In a fiber optic environment, a type of duplex connector used to wrap
the optical output signal of a device directly to the optical input.
loopback test Test that checks attachment or control unit circuitry, without checking
the mechanism itself, by returning the output of the mechanism as
input.
LUN See logical unit number.
M
MAC address See Media Access Control address.
maintenance port Connector on the switch operator panel where a PC running an
ASCII terminal emulator can be attached or dial-up connection made
for specialized maintenance support.
managed product Hardware product that can be managed with the EFC Product
Manager. For example, the ES-3216 and ES-3232 Switches are
managed products. See also device.

g-14 McDATA® Sphereon™ 4500 Fabric Switch Product Manager User Manual
Glossary
management
information base Related set of software objects (variables) containing information
about a managed device and accessed via SNMP from a network
management station.
management session Management session exists when a user logs on to the EFC Manager.
EFC can support multiple concurrent management sessions. The user
must specify the network address of the EFC Manager’s server at
logon time.
Media Access Control
address Hardware address of a node (device) connected to a network.
MIB See management information base.
multicast Delivery of a single transmission to multiple destination N_Ports.
Can be one to many or many to many. All members of the group are
identified by one IP address.
multiswitch fabric Fibre Channel fabric created by linking more than one fabric
switching device within a fabric.
N
name server Program that translates names from one form into another. Domain
name servers (DNS) translate domain names into IP addresses.
name server zoning N_Port access management that allows N_Ports to communicate if
and only if they belong to a common name server zone.
network address Name or address that identifies a managed product, such as the
ES-3216 or ES-3232 Switches, on a TCP/IP network. The network
address can be either an IP address in dotted-decimal notation
(containing four three-digit octets in the format xxx.xxx.xxx.xxx), or a
domain name (as administered on a customer network).
nickname Alternate name assigned to a worldwide name for a node or switch in
the fabric.
node In Fibre Channel terminology, mode refers to an end device (server or
storage device) that is or can be connected to a switched fabric.

Glossary g-15
Glossary
node port Physical interface within an end device which can connect to an
F_Port on a switched fabric or directly to another N_Port (in
point-to-point communications).
nondisruptive
maintenance Ability to service FRUs (including maintenance, installation, removal
and replacement) while normal operations continue without
interruption. See also concurrent maintenance.
N_Port See node port.
O
offline sequence Sequence sent by the transmitting port to indicate that it is attempting
to initialize a link and has detected a problem in doing so.
offline state When the switch is in the offline state, all the installed ports are
offline. The ports transmit an OLS (offline sequence) and they cannot
accept a login for connection from an attached device. Contrast with
online state.
OLS See offline sequence.
online state When the switch is in the online state, all of the unblocked ports are
allowed to login to the fabric and begin communicating. Devices can
connect to the switch if the port is not blocked and can communicate
with another attached device if both devices are in the same zone or if
the default zone is enabled. Contrast with offline state.
Open Systems
Management Server An optional feature that can be enabled on the director or switch
through the Product manager application. When enabled, host
control and management of the director or switch are provided
through an open systems interconnection (OSI) device attached to a
director or switch port.
operating state
(switch) The operating states are described as follows:
Online - when the switch is set online, an attached device can log
in to the switch if the port is not blocked. Attached devices can
communicate with each other if they are configured in the same
zone.

g-16 McDATA® Sphereon™ 4500 Fabric Switch Product Manager User Manual
Glossary
Offline - when the switch is set offline, all ports are set offline.
The switch transmits the offline sequence (OLS) to attached
devices, and the devices cannot log in to the switch.
operating state (port) Can be beaconing, invalid attachment, link incidents, link resets,
LIPS, no light, not operational, online, offline, segmented E_Port, port
failure, or testing.
operating status
(switch) Can be online, offline, coming online, or going offline.
optical cable Fiber, multiple fibers, or a fiber bundle in a structure built to meet
optical, mechanical, and environmental specifications. See also jumper
cable, optical cable assembly, and trunk cable.
optical cable
assembly Optical cable that is connector-terminated. See also jumper cable and
optical cable.
optical fiber
connector Hardware component that transfers optical power between two
optical fibers or bundles and is designed to be repeatedly connected
and disconnected.
out-of-band
management Transmission of management information using frequencies or
channels other than those routinely used for information transfer.
P
packet Logical unit of information (usually in the form of a data frame)
transmitted on a network. It contains a header (with all relevant
addressing and timing information), the actual data, and a trailer
(which contains the error checking function, usually in the form of a
cyclic redundancy check), and frequently, user data.
panel The main Product Manager window is divided into four main panels:
title panel, menu bar, status bar, and view panel. Use features in these
panels to configure switch operation, monitor performance, and
access maintenance features.
password Unique string of characters known to the computer system and to a
user who must specify it to gain full or limited access to a system and
to the information stored within it.

Glossary g-17
Glossary
path In a network, any route between any two ports.
persistent binding A form of server-level access control that uses configuration
information to bind a server to a specific Fibre Channel storage
volume (or logical device) using a unit number.
point-to-point A Fibre Channel topology which involves a dedicated link that
connects only two stations. See also arbitrated loop.
port Receptacle on a device to which a cable leading to another device can
be attached.
port name Name that the user assigns to a particular port through the Product
Manager.
POST See power-on self-test.
power-on self-test Series of self-tests executed each time the unit is booted or reset.
preferred domain ID Domain ID that a switch is assigned by the principal switch in a
switched fabric. The preferred domain ID becomes the active domain
ID except when configured otherwise by the user.
preventive service
planning bucket Collected problems after early ship of an IBM product.
principal switch In a multiswitch fabric, the switch that allocates domain IDs to itself
and to all other switches in the fabric. There is always one principal
switch in a fabric. If a switch is not connected to any other switches, it
acts as its own principal switch.
product manager Application that implements the management user interface for the
switch.
product name User-configurable identifier assigned to a managed product.
Typically, this name is stored on the product itself. For the switch, the
product name can also be accessed by an SNMP manager as the
system name.
protocol A standard procedure for regulating data transmission between
computers.
PSP bucket See preventive service planning bucket.

g-18 McDATA® Sphereon™ 4500 Fabric Switch Product Manager User Manual
Glossary
R
R_A_TOV See resource allocation time-out value.
redundancy Performance characteristic of a system or product whose integral
components are backed up by identical components to which
operations will automatically failover in the event of a component
failure. Redundancy is a vital characteristic of virtually all
high-availability (24 hr./7 days per week) computer systems and
networks.
redundant FRU SFP LC transceivers, power supplies, and cooling fans that can be
removed or replaced without disrupting switch or Fibre Channel link
operation.
remote access link Connection to a device or program on a computer network via a
(geographically) remote workstation.
remote notification A process by which a system is able to inform remote users and/or
workstations of certain classes of events that occur on the system.
E-mail notification and the configuration of SNMP trap recipients are
two examples of remote notification programs that can be
implemented.
remote user
workstation Workstation, such as a PC, using EFC Manager and Product Manager
software that can access the EFC Server over a LAN connection.
rerouting delay Enabling rerouting delay ensures that frames are delivered in order
through the fabric to their destination. If there is a change to the fabric
topology that creates a new path (for example, a new switch is added
to the fabric), frames may be routed over this new path if its hop
count is less than a previous path with a minimum hop count. This
may result in frames being delivered to a destination out of order
since frames sent over the new, shorter path may arrive ahead of
older frames still in route over the older path.
resource allocation
time out value R_A_TOV is a value used to time out operations that depend on the
maximum possible time that a frame could be delayed in a fabric and
still be delivered.

Glossary g-19
Glossary
S
SAN See storage area network.
SANpilot A management interface embedded on the switch’s code which offers
features similar to, but not as robust as, the EFC Manager and
Product Manager.
SC Subscriber connectors.
segmented E_Port E_Port that has ceased to function as an E_Port within a multiswitch
fabric due to an incompatibility between the fabrics that it joins. See
also expansion port.
SEL System error light.
SFP transceivers See small form factor transceivers.
small form factor
pluggable (SFP)
transceivers
Laser-based optical transceivers for a wide range of networking
applications requiring high data rates. The transceivers, which are
designed for increased densities, performance, and reduced power,
are well-suited for Fibre Channel applications.
simple mail transfer
protocol The standard e-mail protocol on the Internet. It is a TCP/IP protocol
that defines the message format and the message transfer agent,
which stores and forwards the mail.
SMTP See simple mail transfer protocol.
SNMP Simple Network Management Protocol. Specifies a mechanism for
network management that is complete, yet simple. Information is
exchanged between agents, which are the devices on the network
being managed, and managers, which are the devices on the network
through which the management is done.
SNMP community Also known as SNMP community string. SNMP community is a
cluster of managed products (in SNMP terminology, hosts) to which
the server or managed product running the SNMP agent belongs.
SNMP community
name The name assigned to a given SNMP community. Queries from an
SNMP management station to a device running an SNMP agent will
only elicit a response if those queries are addressed with the correct
SNMP community name.

g-20 McDATA® Sphereon™ 4500 Fabric Switch Product Manager User Manual
Glossary
SNMP management
station An SNMP workstation console used to oversee the SNMP network.
SSP See system services processor.
status bar This bar, located below the navigation control panel, displays a status
symbol that indicates the current state of the switch.
storage area network A high-performance data communications environment that
interconnects computing and storage resources so that the resources
can be effectively shared and consolidated.
subnet mask A method of representing the portion of the IP network address that
is devoted to subnet addresses (as opposed to the portions of the
address that refer to individual hosts or to the organizational network
overall).
switchover Changing a backup FRU to the Active state, and the active FRU to the
Backup state.
switch priority Value configured into each switch in a fabric that determines its
relative likelihood of becoming the fabric’s principal switch.
system services
processor Controls the RS-232 maintenance port and the Ethernet port of a Fibre
Channel switch.
T
topology Logical and/or physical arrangement of stations on a network.
trap Unsolicited notification of an event originating from a SNMP
managed device and directed to an SNMP network management
station.
trap host SNMP management workstation that is configured to receive traps.
trunk cable Cable consisting of multiple fiber pairs that do not directly attach to
an active device. This cable usually exists between distribution panels
and can be located within, or external to, a building. Contrast with
jumper cable.

Glossary g-21
Glossary
U
unblocked port Devices communicating with an unblocked port can log in to the
switch and communicate with devices attached to any other
unblocked port (assuming that this is supported by the current
zoning configuration).
unicast Communication between a single sender and a single receiver over a
network. Compare to multicast (communication between a single
sender and multiple receivers) and anycast (communication between
any sender and the nearest of a group of receivers). Similar in
meaning to point-to-point communication.
uniform resource
locator A standard way of specifying the location of an object, typically a
web page, on the Internet. URLs are the form of address used on the
world-wide web. They are used in HTML documents to specify the
target of a hyperlink which is often another HTML document
(possibly stored on another computer).
URL See uniform resource locator.
user rights The EFC Manager’s system administrator can assign levels of access,
or “User Rights,” to Product Manager users through the EFC
Manager application.
V
vital product data System-level data stored by the backplane in the electrically erasable
programmable read-only memory. This data includes serial numbers
and identifies the manufacturer.
VPD See vital product data.
W
warning message Indication that a possible error has been detected. See also error
message and information message.

g-22 McDATA® Sphereon™ 4500 Fabric Switch Product Manager User Manual
Glossary
window A scrollable viewing area on screen. A window may refer to a part of
the application, such as the scrollable index window or the text
window in the electronic versions of this database, or it may refer to
the entire application in a window.
world-wide names Eight byte address that uniquely identifies a switch, or a node (end
device), even on global networks.
wrap plug See loopback plug.
WWN See world-wide names.
Z
zone Set of devices that can access one another. All connected devices may
be configured into one or more zones. Devices in the same zone can
see each other. Those devices that occupy different zones cannot.
zone member Specification of a device to be included in a zone. A zone member can
be identified by the port number of the switch to which it is attached
or by its device (or HBA) world wide name. In multiswitch fabrics,
identification of end-devices/nodes by world wide name is
preferable.
zone set See zone.
zoning Grouping of several devices by function or by location. All devices
connected to a connectivity product, such as the switch, may be
configured into one or more zones. See also zone.

Index i-1
A
alerts
threshold 1-18
clearing 2-19
alerts, link incident (LIN) 2-37
enabling 3-9
audit log 1-19, 4-4
B
backup and restore configuration 5-7
data 1-36, 3-29
backup and restore configuration option 1-22
beaconing
enabling for ports 2-17
enabling for unit 2-13
binding, port 2-18, 3-10
block a port 3-9
C
call-home
availability 1-22
enable notification 5-6
notification, enabling 1-22
clear system error light
product menu 1-15
close
product menu 1-16
closing the product manager 1-33
collect maintenance data 5-2
configuration data
backup and restore 3-29, 5-7
reset configuration data 5-8
configuration report 3-27
configuration, reset 5-8
configurations
backing up and restoring 1-22
resetting 1-22
configure date and time 3-18
dialog box 2-14
procedure 3-18
configure date and time dialog box 1-18
configure feature key
dialog box 3-17
procedure 3-16
configure feature key dialog box 1-18
configure identification
dialog box 3-2
procedure 3-2
configure identification dialog box 1-16
configure menu 1-16
backup and restore configuration data 3-29
configure threshold alert(s) 3-20
date/time 1-18
enable telnet 1-19, 3-29
enable web server 1-19
export configuration report 1-19, 3-27
features 1-18
identification 1-16
ports 1-17
SNMP agent 1-17
switch binding 6-6
threshold alert(s) 1-18
configure open systems management server
dialog box 6-2
procedure 6-2
configure operating parameters
Index

McDATA® Sphereon™ 4500 Fabric Switch Product Manager User Manual
i-2
Index
dialog box 3-6
configure ports
dialog box 3-9
procedure
open systems mode 3-11
configure ports dialog box 1-17
configure SNMP
dialog box 3-15
procedure 3-14
configure SNMP dialog box 1-17
configure threshold alerts, procedure 3-20
configuring
date and time 1-18
configuring features, menu option 1-18
conventions used in manual xiii
customer-supplied server platform 1-2
D
data collection option 1-20
defaults
call-home notification 1-22
enable e-mail notification 1-21
diagnostics (port)
running 2-17, 5-2
dialog boxes
bind WWN 2-18
configure date and time 2-14, 3-18
configure feature key 1-18, 3-17
configure identification 1-16, 3-2
configure open systems management server
6-2
configure operating parameters 3-6
configure ports 1-17, 3-9
configure SNMP 1-17, 3-15
export configuration report 1-19
firmware library 1-21
FRU properties 2-7
port diagnostics 1-20
port properties 1-25, 2-16
port technology 2-16
save 4-3
save data collection 1-20
set online state 1-21
switch binding membership list 6-6
switch binding state change 6-5
switch properties 1-24, 2-12, 2-13
using 1-11
displaying port statistics 2-30
documentation, related xii
domain ID 3-4
insistent 3-4
domain RSCNs 3-5
enterprise fabric mode 6-10
E
E_D_TOV 3-7
EFC manager
log in 1-11
SMTP server address 1-21
e-mail notification
enabling 1-21
e-mail, enable notification 5-5
enable call-home notification 5-6
enable call-home notification option 1-22
enable e-mail notification 5-5
enable e-mail notification option 1-21
enable telnet 3-29
enable telnet on switch 1-19
enable unit beaconing
product menu 1-15
enable web server on switch 1-19
enterprise fabric mode 6-9, 6-10
for more information 6-11
error light (ERR)
clearing 2-14
error statistics 2-33
ethernet no-link status 2-3
event log 1-19, 4-5
export configuration report
procedure 3-27
export configuration report dialog box 1-19
F
fabric binding 6-3
enterprise fabric mode 6-10
online state functions 6-3
feature
SANtegrity 6-2
feature key 3-17
firmware library dialog box 1-21
firmware versions 1-21, 5-5
frames too long, error statistics 2-35

i-3
Index
Index
FRU
description 1-15
product menu 1-15
FRU list view 1-30
defined 2-23
displayed 1-31, 2-23
opening 2-23
FRU properties 2-7
H
hardware log 1-19, 4-7
hardware view 1-23
alert symbol function 1-24
displayed 1-23, 1-24
displaying port information 2-8
displaying switch information 2-12
identifying FRUs 2-2
monitoring component operation 2-5
defined 2-2
monitoring switch operation 2-2
obtaining hardware status 2-7
obtaining information 2-7
status conditions 1-23
status table 2-2
switch menu 2-13
switch status table 2-2
using 1-23
using menus 2-13
help
about option 1-23
contents option 1-23
internet access 4-xiii
technical support 4-xiii
help menu 1-23
I
identification
configuring 3-2
illustrations 1-11
initial program load (IPL) 1-21
executing 5-2
insistent domain ID 3-4
enterprise fabric mode 6-11
interop mode 3-8
invalid attachment messages 2-10
IPL 1-21
executing 5-2
IPL switch 2-14
L
licensing information 1-9
link incident (LIN) alerts 2-37
clearing 2-17
enabling 3-9
link incident log 1-20
log into EFC manager 1-11
login
password 1-3, 1-12
username 1-3, 1-12
logs
audit 1-19, 4-4
event 1-19, 4-5
expanding columns 4-3
hardware 1-19, 4-7
link incident 1-20
threshold alert 4-10
using 4-2
window button function 4-2
logs menu 1-19
audit 1-19
event 1-19
hardware 1-19
link incident 1-20
M
maintenance menu 1-20
backup and restore configuration 1-22, 5-7
collect maintenance data 5-2
data collection 1-20
enable call-home notification 1-22, 5-6
enable e-mail notification 1-21, 5-5
firmware library 1-21
IPL 1-21, 5-2
port diagnostics 1-20, 5-2
reset configuration 1-22
reset configuration data 5-8
set online state 1-21, 5-4
management server option 1-18
managing the Sphereon ES-4500 1-2
manual conventions xiii
manual, organization of xi
menu bar, description 1-14

McDATA® Sphereon™ 4500 Fabric Switch Product Manager User Manual
i-4
Index
menus
configure 1-16
hardware view 2-13
help 1-23
logs 1-19
maintenance 1-20
menu bar 1-14
node list view 1-27
performance view 1-29, 2-29
port 1-25, 2-16
port list view 1-26, 2-22, 2-26
product 1-15
switch 1-24, 2-13
mode
enterprise fabric 6-9
N
node list view 1-27, 2-24
node list view menu 1-27
no-link status 2-3
O
online state
setting 5-4
open systems management server 6-2
opening product manager 1-13
operating parameters
domain RSCNs 3-5
E_D_TOV 3-7
interop mode 3-8
preferred domain ID 3-4
R_A_TOV 3-7
rerouting delay 3-5
switch priority 3-8
operating states for ports 2-36
operating status for the Sphereon ES-4500 1-32
P
password, default 1-3, 1-12
performance view 2-28
menus 2-29
performance view menu 1-29
performance view option 1-28
port
description 1-15
port binding 2-18, 3-10
port diagnostics dialog box 1-20
port list view 2-20
defined 2-20
displayed 1-26, 2-20
menus 2-22, 2-26
opening 2-20
port list view menu 1-26
port menu 1-25, 2-16
port operating states 2-36
port properties dialog box 1-25, 2-16
reason field messages 2-10
port statistics
class 2 statistics 2-32
class 3 statistics 2-32
error statistics 2-33
traffic statistics 2-31
port technology dialog box 2-16
ports
binding 2-18, 3-10
blocking 2-17, 3-9
configuring 1-17, 3-9
open systems mode 3-11
default configuration 1-17
diagnostics 1-20, 2-17, 5-2
displaying statistics 1-30, 2-30
menu 2-16
naming 3-9
open systems mode 1-17
operating states 2-36
product menu 1-15
reset 2-18
statistics description 2-30
type 2-22
WWN binding 2-18
ports list view 1-25
product manager 1-23
closing 1-33
configure 1-16
FRU list view 1-30, 2-23
hardware view 2-2
help menu 1-23
licensing 1-9
logs menu 1-19
maintenance menu 1-20
menu bar 1-14
node list view 1-27, 2-24

i-5
Index
Index
node list view menu 1-27
opening 1-13
performance view 1-28, 2-28
performance view menu 1-29
port list view 1-25, 2-20
port menu 1-25
product 1-15
status bar 1-31
switch view 1-24
view panel 1-23
view tabs 1-23
window layout and function 1-14
product menu 1-15
clear system error light 1-15
close 1-16
enable unit beaconing 1-15
FRU 1-15
port 1-15
ports 1-15
properties 1-16
properties
product menu 1-16
publication, organization of xi
R
R_A_TOV 3-7
reason field messages 2-10
remote user workstations 1-8
rerouting delay 3-5
enterprise fabric mode 6-10
reset configuration 5-8
reset configuration data 5-8
reset configuration option 1-22
reset ports 2-18
S
SANtegrity feature 6-2
fabric binding 6-3
SANtegrity features
switch binding 6-4
save data collection dialog box 1-20
save dialog box 4-3
segmented E_Port messages 2-11
server platform
customer-supplied 1-2
set online state 5-4
set online state dialog box 1-21
signal losses, error statistics 2-33
SNMP
configuring 3-14
SNMP agent option 1-17
SNTP server address 1-21
software licensing 1-9
Sphereon ES-4500
management options 1-2
managing 1-2
operating status 1-32
operational states 2-2
status 2-2
statistics
ports 2-30
statistics on ports 1-30
status bar 1-31
status symbols 1-32, 2-4
status symbols 1-32, 2-4
status table 2-2
switch
displaying information 2-12
switch binding 6-4, 6-10
enable and disable 6-5
membership list 6-6
online state functions 6-8
state change dialog box 6-5
zoning function 6-9
switch binding membership list dialog box 6-6
switch menu 1-24
switch parameters
insistent domain ID 3-4
switch priority 3-8
switch properties 2-13
switch properties dialog box 1-24, 2-12, 2-13
switch status 2-4
switch status table 2-2
T
tabs
view 1-23
telnet, enabling 3-29
threshold alert
configuring 3-20
log 4-10
port properties dialog box 2-12

McDATA® Sphereon™ 4500 Fabric Switch Product Manager User Manual
i-6
Index
threshold alerts 1-18
clearing 2-19
general information 2-38
trademarks 4-xiv
U
username, default 1-3, 1-12
V
versions, firmware 1-21
view menu
FRU list view 2-23
node list view 2-24
performance view 2-28
port list view 2-20
view panel 1-23
view tabs 1-23
W
warnings
resetting configurations 1-23
web server, enabling 1-19
WWN bind dialog box 2-18
WWN binding 3-10
WWN binding option 2-18
