Motorola Solutions 89FT7622 5.7GHz Fixed Wireless (ISM) User Manual Exhibit D Users Manual Part 7 per 2 1033 b3
Motorola Solutions, Inc. 5.7GHz Fixed Wireless (ISM) Exhibit D Users Manual Part 7 per 2 1033 b3
Contents
- 1. Exhibit D Users Manual Part 1 per 2 1033 b3
- 2. Exhibit D Users Manual Part 2 per 2 1033 b3
- 3. Exhibit D Users Manual Part 3 per 2 1033 b3
- 4. Exhibit D Users Manual Part 4 per 2 1033 b3
- 5. Exhibit D Users Manual Part 5 per 2 1033 b3
- 6. Exhibit D Users Manual Part 6 per 2 1033 b3
- 7. Exhibit D Users Manual Part 7 per 2 1033 b3
- 8. Exhibit D Users Manual Part 8 per 2 1033 b3
- 9. Exhibit D Users Manual Part 9 per 2 1033 b3
- 10. Users Manual
Exhibit D Users Manual Part 7 per 2 1033 b3
Release 8 Operations Guide
Issue 2, December 2006 Draft for Regulatory Review 413
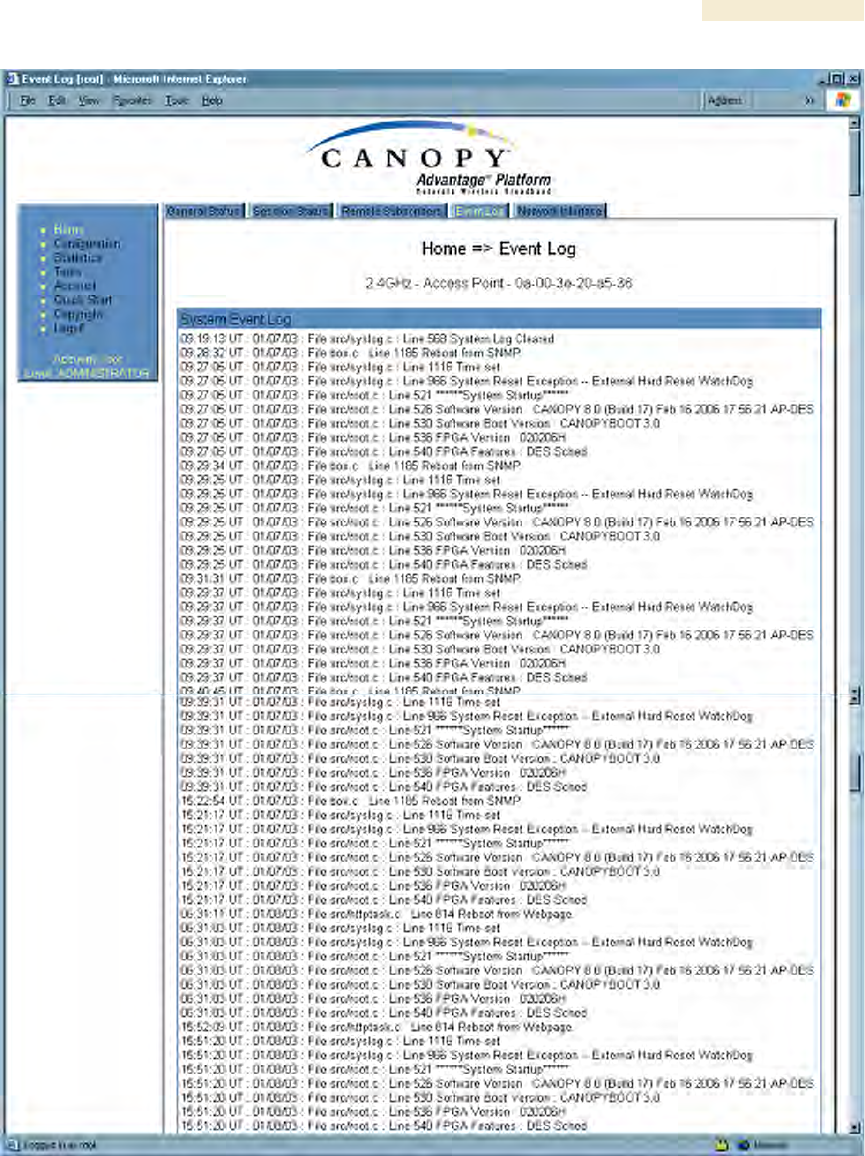
Figure 149: Event Log tab data, example

Operations Guide Release 8
414 Draft for Regulatory Review Issue 2, December 2006
26.4.3 Messages that Flag Abnormal Events
The messages listed in Table 67 flag abnormal events and, case by case, may signal the
need for corrective action or technical support. See Troubleshooting on Page 465.
Table 67: Event Log messages for abnormal events
Event Message
Meaning
Expected LUID = 6 Actual
LUID = 7
Something is interfering with the control messaging of the
module. Also ensure that you are using shielded cables to
minimize interference. Consider trying different frequency
options to eliminate or reduce interference.
FatalError()
The event recorded on the line immediately beneath this
message triggered the Fatal Error().
Loss of GPS Sync Pulse
Module has lost GPS sync signal.
Machine Check Exception
This is a symptom of a possible hardware failure. If this is
a recurring message, begin the RMA process for the
module.
RcvFrmNum = 0x00066d
ExpFrmNum = 0x000799
Something is interfering with the control messaging of the
module. Also ensure that you are using shielded cables to
minimize interference. Consider trying different frequency
options to eliminate or reduce interference.
System Reset Exception -- External
Hard Reset
The unit lost power or was power cycled.
System Reset Exception -- External
Hard Reset WatchDog
The event recorded on the preceding line triggered this
WatchDog message.
26.4.4 Messages that Flag Normal Events
The messages listed in Table 68 record normal events and typically do not signal a need
for any corrective action or technical support.
Table 68: Event Log messages for normal events
Event Message
Meaning
Acquired GPS Sync Pulse.
Module has acquired GPS sync signal.
FPGA Features
Type of encryption.
FPGA Version
FPGA (JBC) version in the module.
GPS Date/Time Set
Module is now on GPS time.
PowerOn reset from Telnet
command line
Reset command was issued from a telnet session.
Reboot from Webpage
Module was rebooted from management interface.
Software Boot Version
Boot version in the module.
Software Version
Canopy release version and authentication method for the unit.
System Log Cleared
Event log was manually cleared.
Release 8 Operations Guide
Issue 2, December 2006 Draft for Regulatory Review 415
26.5 VIEWING THE NETWORK INTERFACE TAB (ALL)
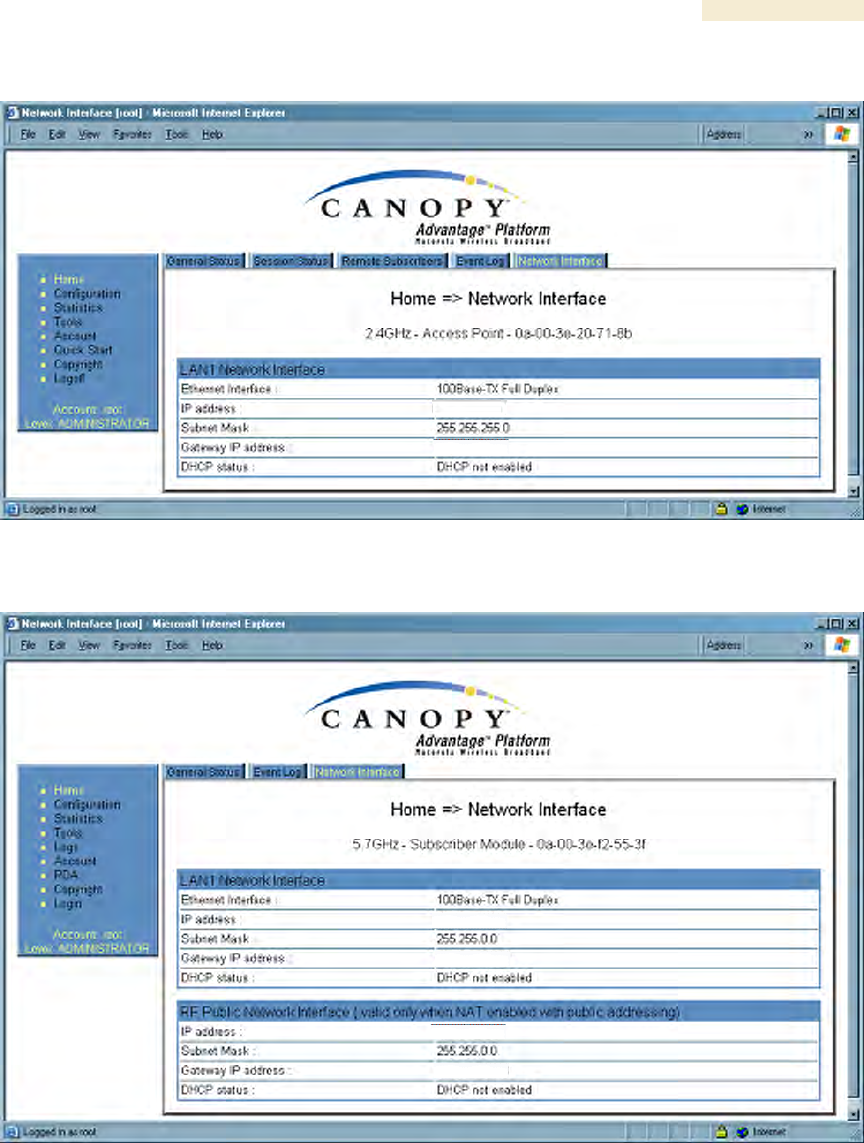
Figure 150: Network Interface tab of AP, example
Figure 151: Network Interface tab of SM, example
In any module, the LAN1 Network Interface section of this tab displays the defined
Internet Protocol scheme for the Ethernet interface to the module. In slave devices, this
tab also provides an RF Public Network Interface section, which displays the Internet
Protocol scheme defined for network access through the master device (AP or BHM).
Operations Guide Release 8
416 Draft for Regulatory Review Issue 2, December 2006
26.6 INTERPRETING RADIO STATISTICS IN THE SCHEDULER TAB
(ALL)
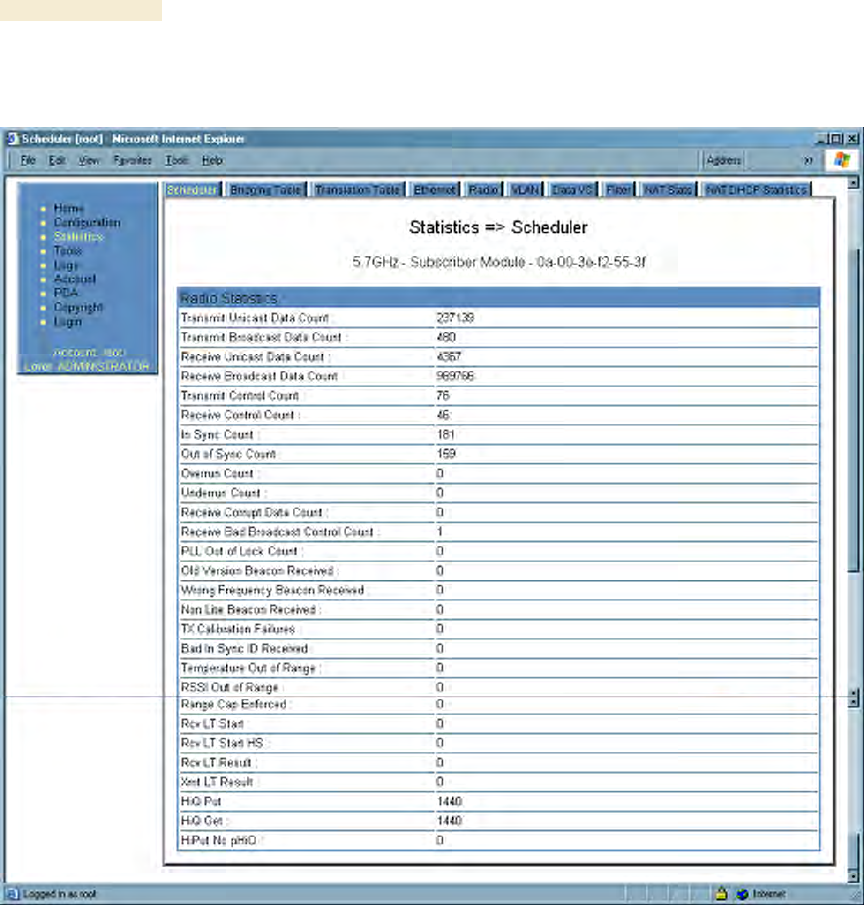
Figure 152: Scheduler tab of SM, example
Statistics for the Scheduler are displayed as shown in Figure 152.
Release 8 Operations Guide
Issue 2, December 2006 Draft for Regulatory Review 417
26.7 VIEWING THE LIST OF REGISTRATION FAILURES (AP, BHM)
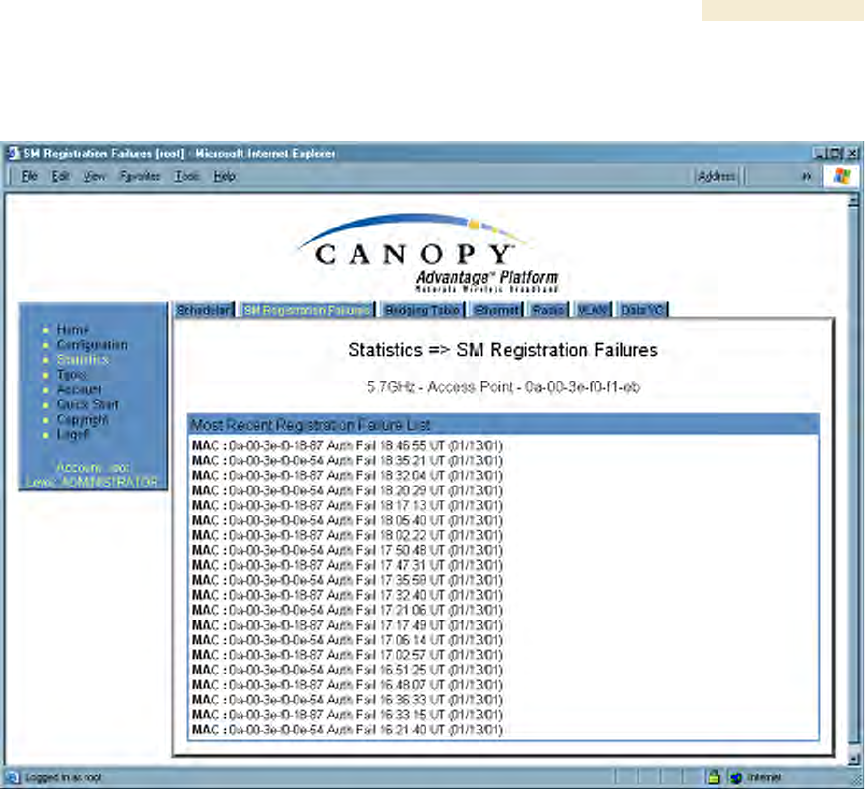
An example of the SM Registration Failures tab is displayed in Figure 153.
Figure 153: SM Registration Failures tab of AP, example
The SM Registration Failures tab identifies SMs (or BHSs) that have recently attempted
and failed to register to this AP (or BHM). With its time stamps, these instances may
suggest that a new or transient source of interference exists.
Operations Guide Release 8
418 Draft for Regulatory Review Issue 2, December 2006
26.8 INTERPRETING DATA IN THE BRIDGING TABLE (ALL)
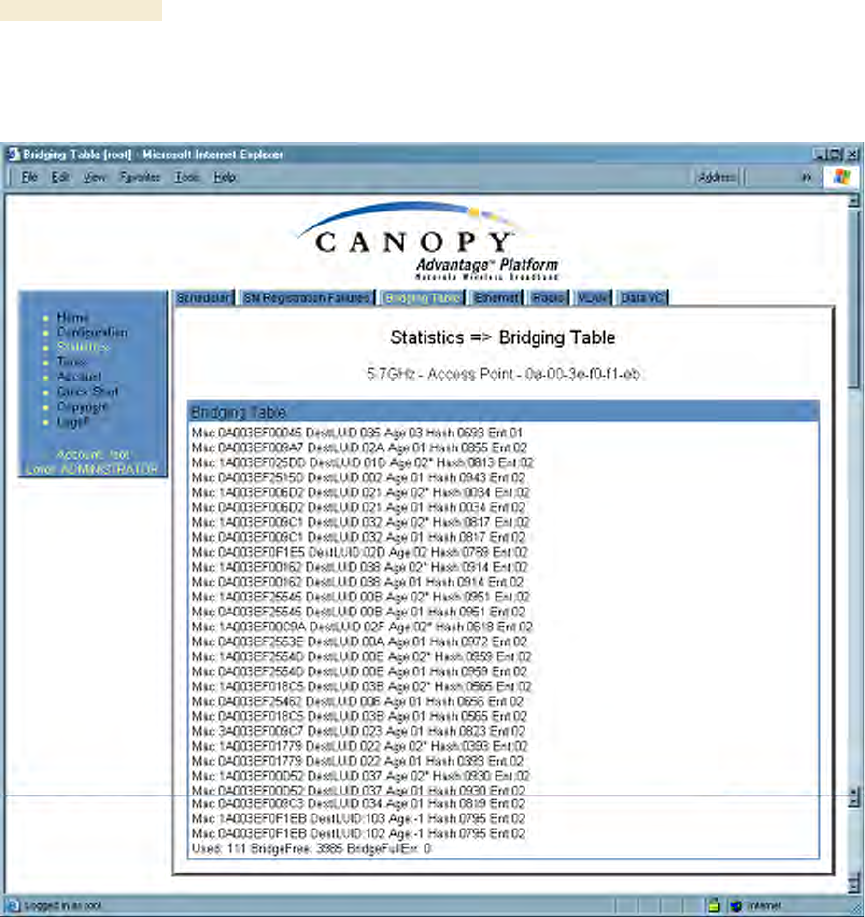
An example of the Bridging Table tab is displayed in Figure 154.
Figure 154: Bridging Table tab of AP, example
If NAT (network address translation) is not active on the SM, then the Bridging Table tab
provides the MAC address of all devices that are attached to registered SMs (identified
by LUIDs). The bridging table allows data to be sent to the correct module as follows:
◦ For the AP, the uplink is from RF to Ethernet. Thus, when a packet arrives in the
RF interface to the AP, the AP reads the MAC address from the inbound packet
and creates a bridging table entry of the source MAC address on the other end of
the RF interface.
◦ For the SM, BHM, and BHS, the uplink is from Ethernet to RF. Thus, when a
packet arrives in the Ethernet interface to one of these modules, the module
reads the MAC address from the inbound packet and creates a bridging table
entry of the source MAC address on the other end of the Ethernet interface.
Release 8 Operations Guide
Issue 2, December 2006 Draft for Regulatory Review 419
26.9 TRANSLATION TABLE (SM)
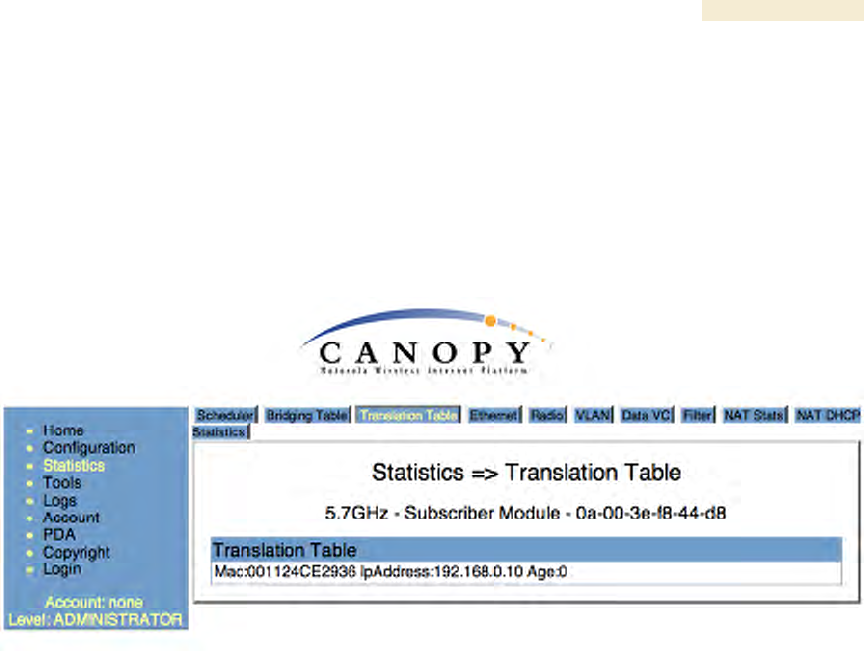
When Translation Bridging is enabled in the AP, each SM keeps a table mapping MAC
addresses of devices attached to the AP to IP addresses, as otherwise the mapping of
end-user MAC addresses to IP addresses is lost. (When Translation Bridging is enabled,
an AP modifies all uplink traffic originating from registered SM’s such that the source
MAC address of every packet will be changed to that of the SM which bridged the packet
in the uplink direction.)
An example of the Translaton Table is displayed in Figure 155.
Figure 155: Translation Table tab of SM, example
26.10 INTERPRETING DATA IN THE ETHERNET TAB (ALL)
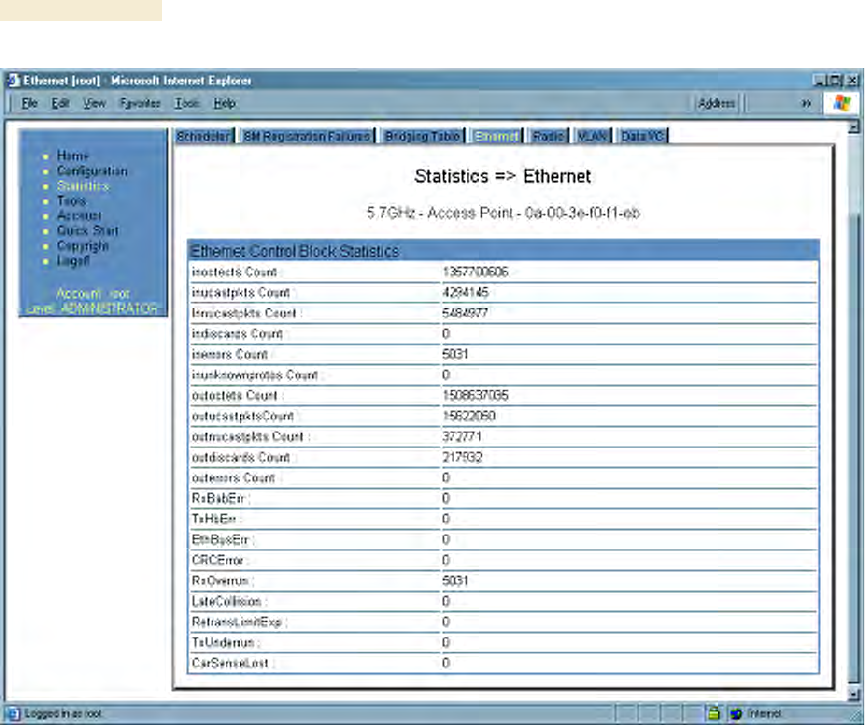
The Ethernet tab of the Statistics web page reports TCP throughput and error information
for the Ethernet connection of the module.
Operations Guide Release 8
420 Draft for Regulatory Review Issue 2, December 2006
Figure 156: Ethernet tab of AP, example
The Ethernet tab displays the following fields.
inoctets Count
This field displays how many octets were received on the interface, including those that
deliver framing information.
inucastpkts Count
This field displays how many inbound subnetwork-unicast packets were delivered to a
higher-layer protocol.
Innucastpkts Count
This field displays how many inbound non-unicast (subnetwork-broadcast or subnetwork-
multicast) packets were delivered to a higher-layer protocol.
indiscards Count
This field displays how many inbound packets were discarded without errors that would
have prevented their delivery to a higher-layer protocol. (Some of these packets may
have been discarded to increase buffer space.)
inerrors Count
This field displays how many inbound packets contained errors that prevented their
delivery to a higher-layer protocol.

Release 8 Operations Guide
Issue 2, December 2006 Draft for Regulatory Review 421
inunknownprotos Count
This field displays how many inbound packets were discarded because of an unknown or
unsupported protocol.
outoctets Count
This field displays how many octets were transmitted out of the interface, including those
that deliver framing information.
outucastpkts Count
This field displays how many packets for which the higher-level protocols requested
transmission to a subnetwork-unicast address. The number includes those that were
discarded or not sent.
outnucastpkts Count
This field displays how many packets for which the higher-level protocols requested
transmission to a non-unicast (subnetwork-broadcast or subnetwork-multicast) address.
The number includes those that were discarded or not sent.
outdiscards Count
This field displays how many outbound packets were discarded without errors that would
have prevented their transmission. (Some of these packets may have been discarded to
increase buffer space.)
outerrrors Count
This field displays how many outbound packets contained errors that prevented their
transmission.
RxBabErr
This field displays how many receiver babble errors occurred.
EthBusErr
This field displays how many Ethernet bus errors occurred on the Ethernet controller.
CRCError
This field displays how many CRC errors occurred on the Ethernet controller.
RxOverrun
This field displays how many receiver overrun errors occurred on the Ethernet controller.
Late Collision
This field displays how many late collisions occurred on the Ethernet controller. A normal
collision occurs during the first 512 bits of the frame transmission. A collision that occurs
after the first 512 bits is considered a late collision.
IMPORTANT!
A late collision is a serious network problem because the frame being
transmitted is discarded. A late collision is most commonly caused by a
mismatch between duplex configurations at the ends of a link segment.
Operations Guide Release 8
422 Draft for Regulatory Review Issue 2, December 2006
RetransLimitExp
This field displays how many times the retransmit limit has expired.
TxUnderrun
This field displays how many transmission-underrun errors occurred on the Ethernet
controller.
CarSenseLost
This field displays how many carrier sense lost errors occurred on the Ethernet controller.
26.11 INTERPRETING RF CONTROL BLOCK STATISTICS IN THE RADIO
TAB (ALL)
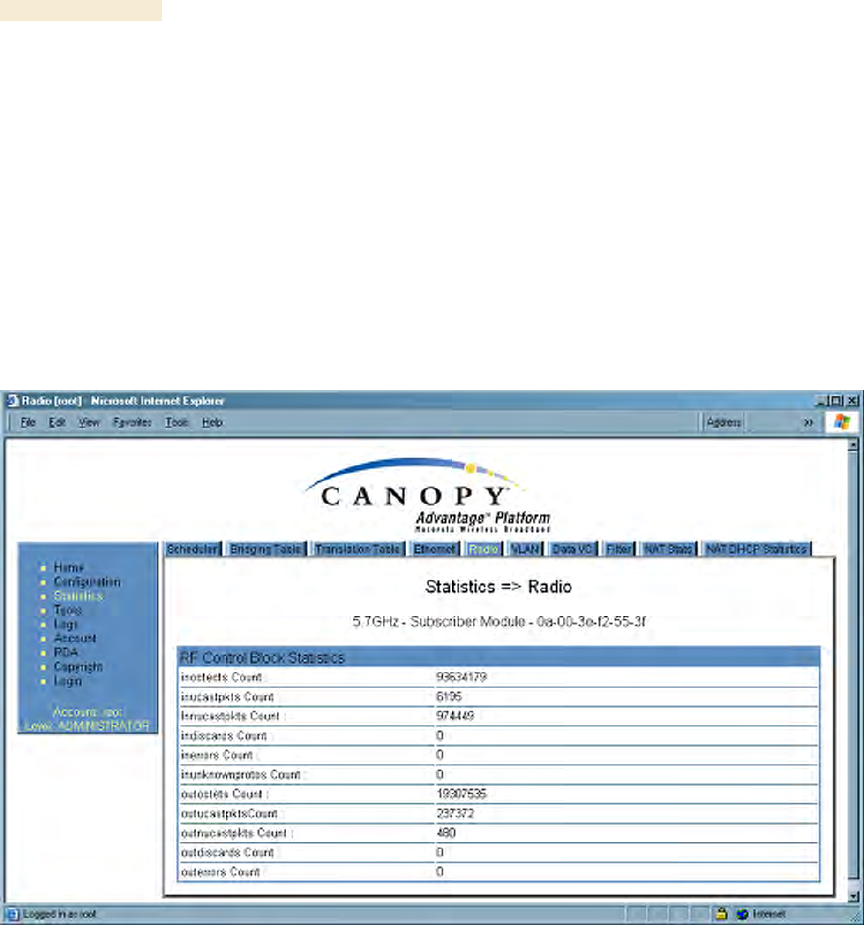
Figure 157: Radio tab of Statistics page in SM, example
The Radio tab of the Statistics page displays the following fields.
inoctets Count
This field displays how many octets were received on the interface, including those that
deliver framing information.
inucastpkts Count
This field displays how many inbound subnetwork-unicast packets were delivered to a
higher-layer protocol.
Innucastpkts Count
This field displays how many inbound non-unicast (subnetwork-broadcast or subnetwork-
multicast) packets were delivered to a higher-layer protocol.

Release 8 Operations Guide
Issue 2, December 2006 Draft for Regulatory Review 423
indiscards Count
This field displays how many inbound packets were discarded without errors that would
have prevented their delivery to a higher-layer protocol. (Some of these packets may
have been discarded to increase buffer space.)
inerrors Count
This field displays how many inbound packets contained errors that prevented their
delivery to a higher-layer protocol.
inunknownprotos Count
This field displays how many inbound packets were discarded because of an unknown or
unsupported protocol.
outoctets Count
This field displays how many octets were transmitted out of the interface, including those
that deliver framing information.
outucastpkts Count
This field displays how many packets for which the higher-level protocols requested
transmission to a subnetwork-unicast address. The number includes those that were
discarded or not sent.
outnucastpkts Count
This field displays how many packets for which the higher-level protocols requested
transmission to a non-unicast (subnetwork-broadcast or subnetwork-multicast) address.
The number includes those that were discarded or not sent.
outdiscards Count
This field displays how many outbound packets were discarded without errors that would
have prevented their transmission. (Some of these packets may have been discarded to
increase buffer space.)
outerrrors Count
This field displays how many outbound packets contained errors that prevented their
transmission.
26.12 INTERPRETING DATA IN THE VLAN TAB (AP, SM)
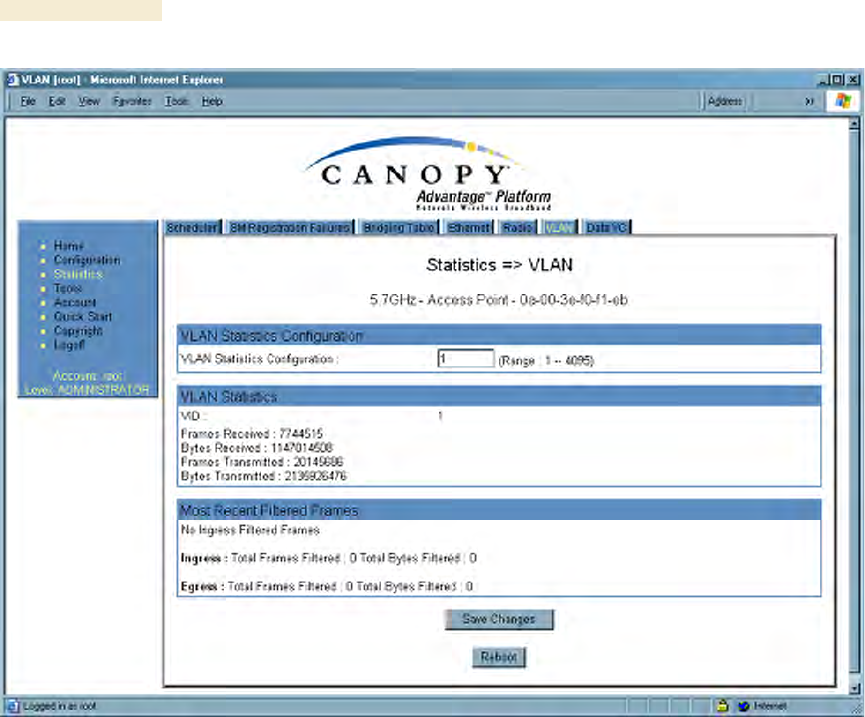
The VLAN tab in the Statistics web page provides a list of the most recent packets that
were filtered because of VLAN membership violations. An example of the VLAN tab is
shown in Figure 158.
Operations Guide Release 8
424 Draft for Regulatory Review Issue 2, December 2006
Figure 158: VLAN tab of AP, example
Interpret entries under Most Recent Filtered Frames as follows:
◦ Unknown—This should not occur. Contact Canopy Technical Support.
◦ Only Tagged—The packet was filtered because the configuration is set to
accept only packets that have an 802.1Q header, and this packet did not.
◦ Ingress—When the packet entered through the wired Ethernet interface,
the packet was filtered because it indicated an incorrect VLAN membership.
◦ Local Ingress—When the packet was received from the local TCP/IP stack,
the packet was filtered because it indicated an incorrect VLAN membership.
This should not occur. Contact Canopy Technical Support.
◦ Egress—When the packet attempted to leave through the wired Ethernet
interface, the packet was filtered because it indicated an incorrect VLAN
membership.
◦ Local Egress—When the packet attempted to reach the local TCP/IP stack,
the packet was filtered because it indicated an incorrect VLAN membership.
Release 8 Operations Guide
Issue 2, December 2006 Draft for Regulatory Review 425
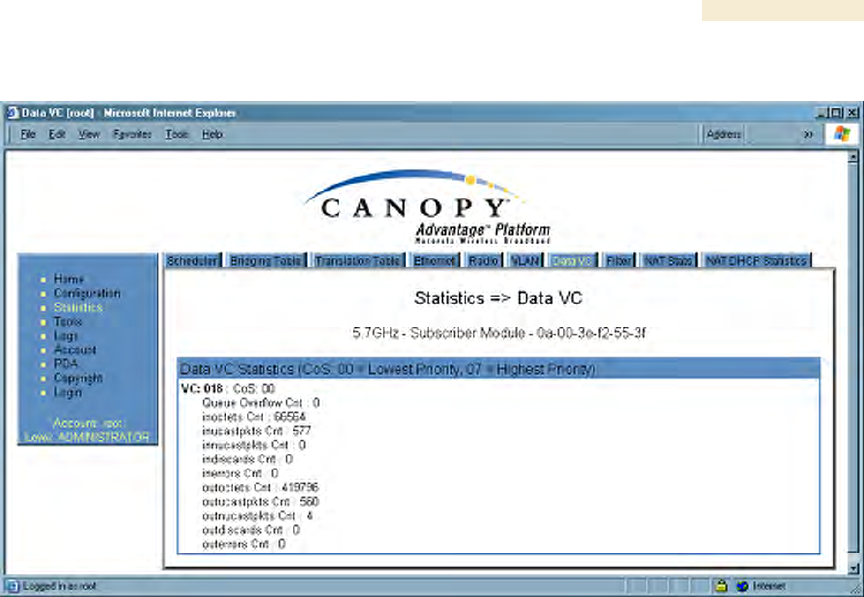
26.13 DATA VC (ALL)
Figure 159: Data VC tab of SM, example
The Data VC tab page displays the following fields.
VC
This field displays the virtual channel number. Low priority channels start at VC18 and
count up. High priority channels start at VC255 and count down. If one VC is displayed,
the high-priority channel is disabled. If two are displayed, the high-priority channel is
enabled
CoS
This field displays the Class of Service for the virtual channel. The low priority channel is
a CoS of 00, and the high priority channel is a CoS of 01. CoS of 02 through 07 are not
currently used.
Queue Overflow Cnt
This is a count of packets that were discarded because the queue for the VC was
already full.
inoctets Cnt
This field displays how many octets were received on the interface, including those that
deliver framing information.
inucastpkts Cnt
This field displays how many inbound subnetwork-unicast packets were delivered to a
higher-layer protocol.
Innucastpkts Cnt
This field displays how many inbound non-unicast (subnetwork-broadcast or subnetwork-
multicast) packets were delivered to a higher-layer protocol.

Operations Guide Release 8
426 Draft for Regulatory Review Issue 2, December 2006
indiscards Cnt
This field displays how many inbound packets were discarded without errors that would
have prevented their delivery to a higher-layer protocol. (Some of these packets may
have been discarded to increase buffer space.)
inerrors Cnt
This field displays how many inbound packets contained errors that prevented their
delivery to a higher-layer protocol.
outoctets Cnt
This field displays how many octets were transmitted out of the interface, including those
that deliver framing information.
outucastpkts Cnt
This field displays how many packets for which the higher-level protocols requested
transmission to a subnetwork-unicast address. The number includes those that were
discarded or not sent.
outnucastpkts Cnt
This field displays how many packets for which the higher-level protocols requested
transmission to a non-unicast (subnetwork-broadcast or subnetwork-multicast) address.
The number includes those that were discarded or not sent.
outdiscards Cnt
This field displays how many outbound packets were discarded without errors that would
have prevented their transmission. (Some of these packets may have been discarded to
increase buffer space.)
outerrrors Cnt
This field displays how many outbound packets contained errors that prevented their
transmission.
26.14 FILTER (SM)
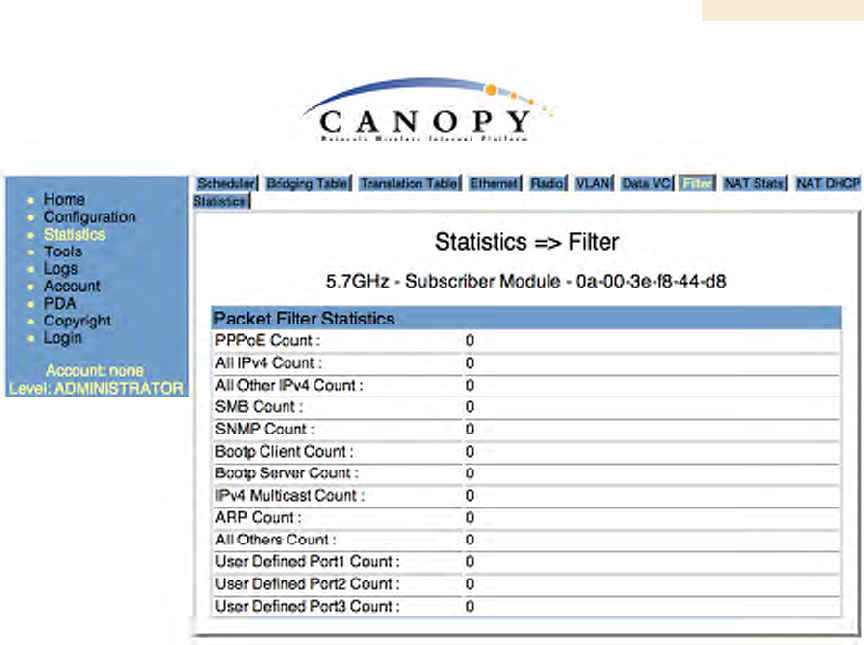
The Filter tab displays statistics on packets that have been filtered (dropped) due to the
filters set on the SM’s Protocol Filtering tab. An example of the Filter tab is shown in
Figure 160.
Release 8 Operations Guide
Issue 2, December 2006 Draft for Regulatory Review 427
Figure 160: Filter tab on SM, example
26.15 NAT STATS (SM)
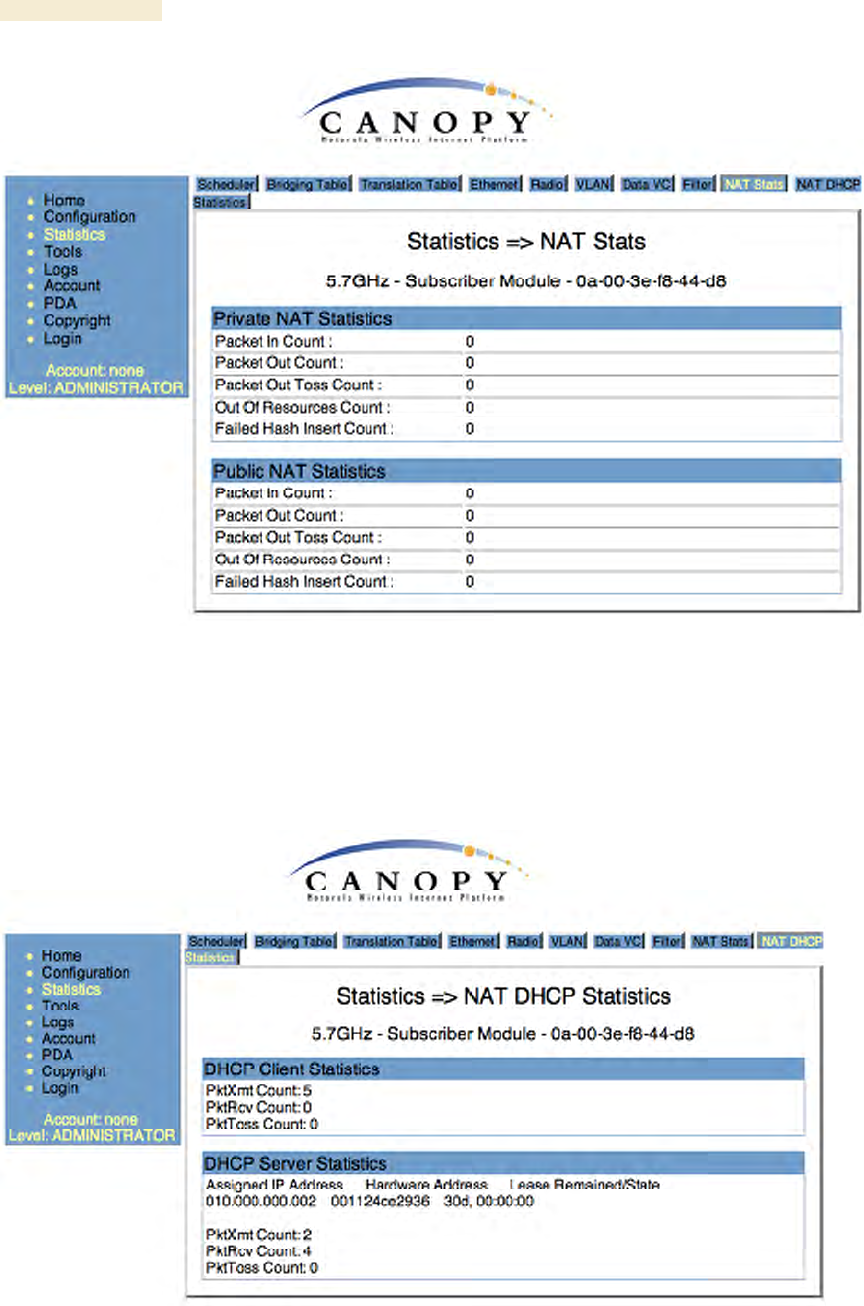
When NAT is enabled on an SM, statistics are kept on the Public and Private (WAN and
LAN) sides of the NAT, and displayed on the NAT Stats tab. An example of the NAT
Stats tab is shown in Figure 161.
Operations Guide Release 8
428 Draft for Regulatory Review Issue 2, December 2006
Figure 161: Nat Stats tab on SM, example
26.15.1 NAT DHCP Statistics (SM)
When NAT is enable on an SM with DHCP client and/or Server, statistics are kept for
packets transmitted, received, and tossed, as well as a table of lease information for the
DHCP server (Assigned IP Address, Hardware Address, and Lease Remained/State). An
example of the NAT DHCP Statistics tab is shown in Figure 162.
Figure 162: NAT DHCP Statistics tab in SM, example
Release 8 Operations Guide
Issue 2, December 2006 Draft for Regulatory Review 429
26.15.2 Interpreting Data in the GPS Status Page (AP, BHM)
The GPS Status tab is only displayed when the Sync Input is set to Sync to Received
Signal (Timing Port), which is the configuration desired when connecting an AP or BHM
to a CMM2. See Sync Input on Page 237.
The page displays information similar to that available on the web pages of a CMM3,
including Pulse Status, GPS Time and Date, Satellites Tracked, Available Satellites,
Height, Lattitude and Longitude. This page also displays the state of the antenna in the
Antenna Connection field as
◦ Unknown—Shown for early CMM2s.
◦ OK—Shown for later CMM2s where no problem is detected in the signal.
◦ Overcurrent—Indicates a coax cable or connector problem.
◦ Undercurrent—Indicates a coax cable or connector problem.
IMPORTANT!
If Unknown is displayed where a later CMM2 is deployed, then the connection is
not working but the reason is unknown.
This information may be helpful in a decision of whether to climb a tower to diagnose a
perceived antenna problem.
Release 8 Operations Guide
Issue 2, December 2006 Draft for Regulatory Review 431
27 USING TOOLS IN THE GUI
27.1 USING THE SPECTRUM ANALYZER TOOL (SM, BHS)
See Monitoring the RF Environment on Page 365.
27.2 USING THE ALIGNMENT TOOL (SM, BHS)
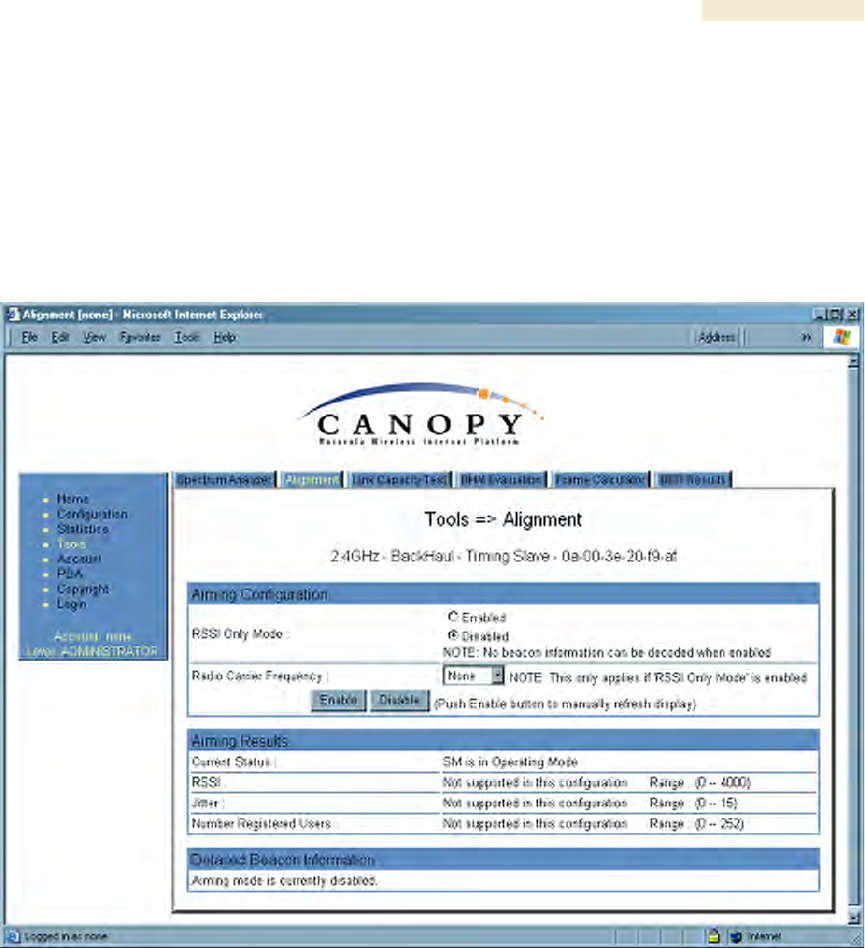
An example of the Alignment tab in an SM or BHS is displayed in Figure 163.
Figure 163: Alignment tab of BHS, example
Proper alignment must achieve all of the following indications for an acceptable link
between the modules:
◦ RSSI typically at least 10 dBM above receiver sensitivity
◦ jitter value between 0 and 4
◦ uplink and downlink efficiency greater than 90%, except as described under
Comparing Efficiency in 1X Operation to Efficiency in 2X Operation on Page 134.

Operations Guide Release 8
432 Draft for Regulatory Review Issue 2, December 2006
IMPORTANT!
If any of these values is not achieved, a link can be established but will manifest
occasional problems.
In the Alignment tab, you may set the following parameters.
RSSI Only Mode
In the RSSI Only Mode, the screen displays the signal strength based on the amount of
energy in the selected frequency, regardless of whether the module has registered. This
mode simplifies the aiming process for long links. To invoke the RSSI Only Mode, select
Enabled.
Radio Carrier Frequency
If you enabled the RSSI Only Mode, select the frequency (in MHz) for the aiming
operation.
The Alignment tab also provides the following buttons.
Enable
A click of this button launches the slave device into alignment mode. Each further click
refreshes the data in the tab to display the latest measurements collected.
Disable
A click of this button changes the slave device from alignment mode back to operating
mode.
The Alignment tab also provides the following read-only fields.
Current Status
This field indicates either SM is in Alignment Mode or SM is in Operating
Mode. This syntax is used in an SM and in a BHS.
RSSI
This field displays the Radio Signal Strength Indicator units and, in parentheses, the
current power level, of the signal received from the AP or BHM.
Jitter
This field displays the jitter level of the signal received from the AP or BHM.
Number Registered Users
This field displays how many slave devices are currently registered to the master device
whose beacon is being received during the aiming period.
In addition, the Alignment tab includes the following Detailed Beacon Information where it
is available.

Release 8 Operations Guide
Issue 2, December 2006 Draft for Regulatory Review 433
Average measured RSSI
This field displays the Radio Signal Strength Indicator units and, in parentheses, the
power level as an average of the measurements that were collected throughout the
aiming period. Try for the highest power level that you can achieve at the least amount of
jitter. For example, if you achieve a power level of −75 dBm with a jitter level of 5, and
further refine the alignment to achieve a power level of −78 dBm with a jitter level of 2
or 3, the link is better because of the further refinement.
Average measured Jitter
This field displays Jitter as an average of the measurements that were collected
throughout the aiming period. In 1X operation, jitter values of 0 to 4 are acceptable. In 2X
operation, jitter values 0 to 9 are acceptable. In either mode, 0 to 15 is the range of
possible values that the Jitter field reports. Within the acceptable range, incremental
improvements in the jitter level achieved can significantly improve link quality where
power level is not significantly diminished by re-aiming.
Users
This is a count of the number of SMs registered to the AP you are aligning to.
Frequency
This field displays the frequency in MHz of the signal that was being received during the
aiming period.
ESN
This field displays the MAC address of the AP or BHM you are aligning to.
Color Code
This field displays the color code of the AP or BHM you are aligning to.
Backhaul
This field displays a 1 if the device you are aligning to is a BHM, and a 0 if the device you
are aligning to is an AP.
Operations Guide Release 8
434 Draft for Regulatory Review Issue 2, December 2006
27.3 USING THE LINK CAPACITY TEST TOOL (ALL)
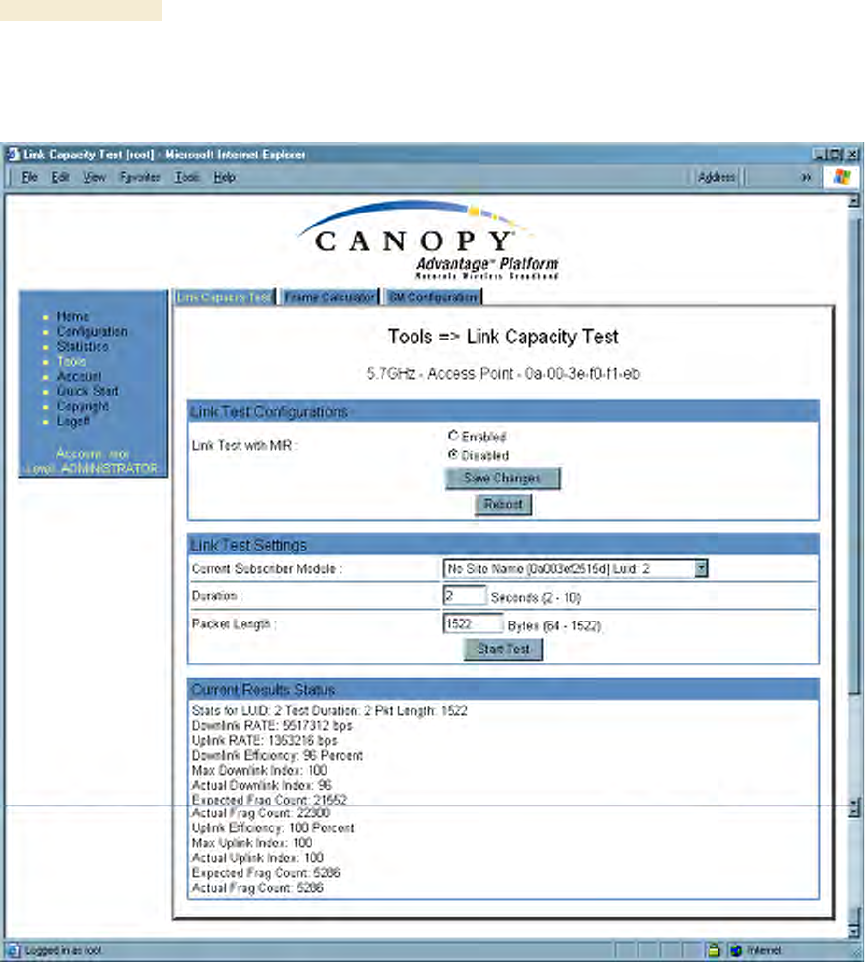
An example of the Link Capacity Test tab is displayed in Figure 164.
Figure 164: Link Capacity Test tab with 1522-byte packet length, example
The Link Capacity Test page allows you to measure the throughput and efficiency of the
RF link between two Canopy modules. Many factors, including packet length, affect
throughput. The Link Capacity Test tab contains the settable parameter Packet Length
with a range of 64 to 1522 bytes. This allows you to compare throughput levels that result
from various packet sizes.
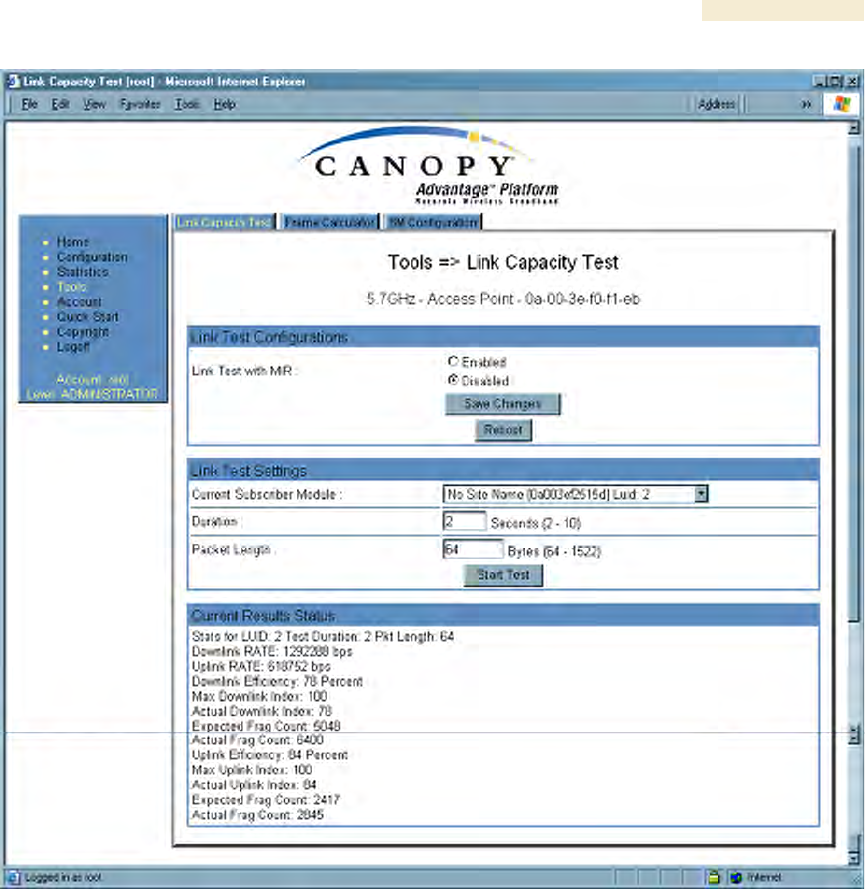
For example, the same link was measured in the same time frame at a packet length of
64 bytes. The results are shown in Figure 165.
Release 8 Operations Guide
Issue 2, December 2006 Draft for Regulatory Review 435
Figure 165: Link Capacity Test tab with 64-byte packet length, example
To test a link, perform the following steps.
Procedure 40: Performing a Link Capacity Test
1. Access the Link Capacity Test tab in the Tools web page of the module.
2. If you are running this test from an AP
a. and you want to see Maximum Information Rate (MIR) data for the SM
whose link you will be testing, then perform the following steps:
(1) For Link Test with MIR, select Enabled.
(2) Click the Save Changes button.
(3) Click the Reboot button.
b. use the drop-down list to select the SM whose link you want to test.

Operations Guide Release 8
436 Draft for Regulatory Review Issue 2, December 2006
3. Type into the Duration field how long (in seconds) the RF link should be tested.
4. Type into the Packet Length field the packet length at which you want the test
conducted.
5. Type into the Number of Packets field either
◦ the number of packets (1 to 64) for the test.
◦ 0 to flood the link for as long as the test is in progress.
6. Click the Start Test button.
7. In the Current Results Status block of this tab, view the results of the test.
8. Optionally
a. change the packet length.
b. repeat Steps 5 and 6.
c. compare the results to those of other tests.
=========================== end of procedure ===========================
The key fields in the test results are
◦ Downlink RATE and Uplink RATE, expressed in bits per second
◦ Downlink Efficiency and Uplink Efficiency, expressed as a percentage
A Canopy system link is acceptable only if the efficiencies of the link test are greater than
90% in both the uplink and downlink direction, except during 2X operation. See Using
Link Efficiency to Check Received Signal Quality on Page 134. Whenever you install a
new link, execute a link test to ensure that the efficiencies are within recommended
guidelines.
The AP downlink data percentage, slot settings, other traffic in the sector, and the quality
of the RF environment all affect throughput. However, a Maximum Information Rate
(MIR) throttle or cap on the SM does not affect throughput.
27.4 USING THE AP EVALUATION OR BHM EVALUATION TOOL
(SM, BHS)
The AP Evaluation tab in the Tools web page of the SM provides information about the
AP that the SM sees. Similarly, the BHM Evaluation tab of the BHS provides information
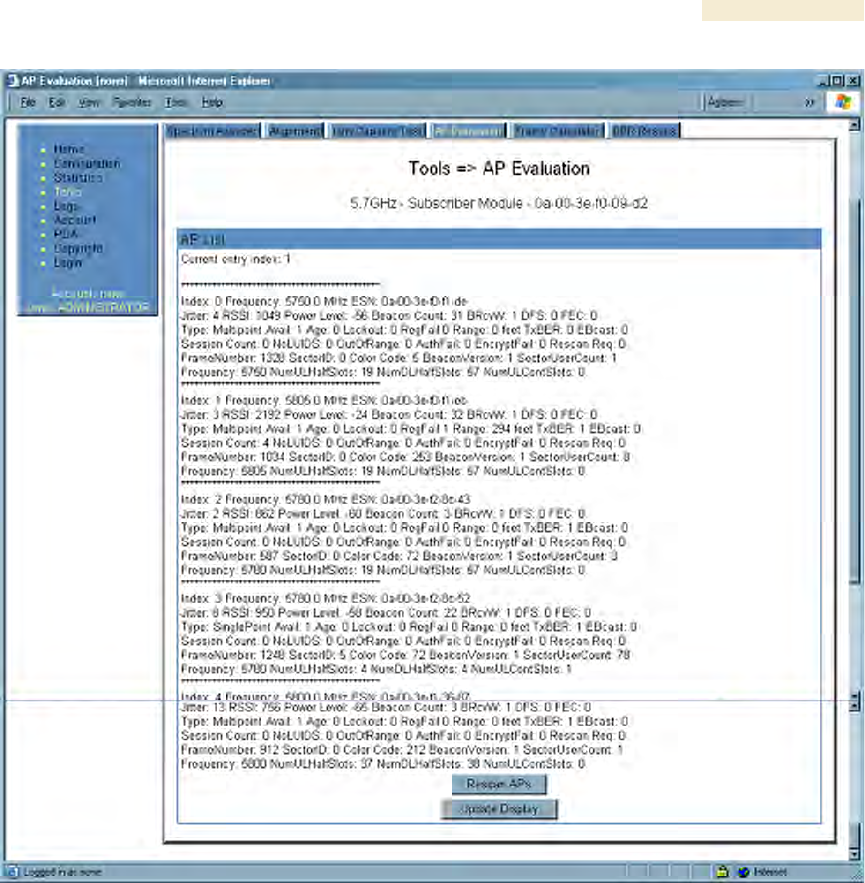
about the BHM. An example of the AP Evaluation tab is shown in Figure 166.
NOTE:
The data for this page can be suppressed by the SM Display of AP Evaluation
Data selection in the Security tab of the Configuration page in the AP.
Release 8 Operations Guide
Issue 2, December 2006 Draft for Regulatory Review 437
Figure 166: AP Evaluation tab of SM, example
The AP Evaluation tab provides the following fields that can be useful to manage and
troubleshoot a Canopy system:
Index
This field displays the index value that the Canopy system assigns (for only this page) to
the AP where this SM is registered (or to the BHM to which this BHS is registered).
Frequency
This field displays the frequency that the AP or BHM transmits.
ESN
This field displays the MAC address (electronic serial number) of the AP or BHM.
Operations Guide Release 8
438 Draft for Regulatory Review Issue 2, December 2006
Jitter, RSSI, and Power Level
The AP Evaluation tab shows the received Power Level in dBm and Jitter. Proper
alignment maximizes Power Level and minimizes Jitter. As you refine alignment, you
should favor lower jitter over higher dBm. For example, if coarse alignment gives an SM
a power level of −75 dBm and a jitter measurement of 5, and further refining
the alignment drops the power level to −78 dBm and the jitter to 2 or 3, use the refined
alignment, with the following caveats:
◦ When the receiving link is operating at 1X, the Jitter scale is 0 to 15 with desired
jitter between 0 and 4.
◦ When the receiving link is operating at 2X, the Jitter scale is 0 to 15 with desired
jitter between 0 and 9.
For historical relevance, the AP Evaluation tab also shows the RSSI, the unitless
measure of power. Use Power Level and ignore RSSI. RSSI implies more accuracy and
precision than is inherent in its measurement.
NOTE:
Unless the page is set to auto-refresh, the values displayed are from the instant
the General Status tab was selected. To keep a current view of the values,
refresh the browser screen or set to auto-refresh.
Beacon Count
A count of the beacons seen in a given time period.
BRcvW
DFS
FEC
Type
Multipoint indicates an AP, not a BHM.
Age
Lockout
This field displays how many times the SM or BHS has been temporarily locked out of
making registration attempts.
RegFail
This field displays how many registration attempts by this SM or BHS failed.
Range
This field displays the distance in feet for this link. To derive the distance in meters,
multiply the value of this parameter by 0.3048.
TxBER
A 1 in this field indicates the AP or BHM is sending Radio BER.

Release 8 Operations Guide
Issue 2, December 2006 Draft for Regulatory Review 439
EBcast
A 1 in this field indicates the AP or BHM is encrypting broadcasst packets. A 0 indicates it
is not.
Session Count
This field displays how many sessions the SM (or BHS) has had with the AP (or BHM).
Typically, this is the sum of Reg Count and Re-Reg Count. However, the result of internal
calculation may display here as a value that slightly differs from the sum.
In the case of a multipoint link, if the number of sessions is significantly greater than the
number for other SMs, then this may indicate a link problem or an interference problem.
NoLUIDs
OutOfRange
AuthFail
This field displays how many times authentication attempts from this SM have failed in
the AP.
EncryptFail
This field displays how many times an encryption mismatch has occurred between
the SM and the AP.
Rescan Req
FrameNumber
Sector ID
This field displays the value of the Sector ID field that is provisioned for the AP or BHM.
Color Code
This field displays the value of the Color Code field that is provisioned for the AP or
BHM.
BeaconVersion
Sector User Count
This field displays how many SMs are registered on the AP.
Frequency
This field displays the frequency of the received signal, expressed in MHz.
NumULHalfSlots
This is the number of uplink half slots in this AP or BHM’s frame. To get slots, just divide
by 2.
NumDLHalfSlots
This is the number of downlink half slots in this AP or BHM’s frame. To get slots, just
divide by 2.
Operations Guide Release 8
440 Draft for Regulatory Review Issue 2, December 2006
NumULContSlots
This field displays how many control slots are being used in the uplink portion of the
frame.
The AP Evaluation tab also provides the following buttons.
Rescan APs
You can click this button to force the SM or BHS to rescan the frequencies that are
selected in the Radio tab of the Configuration page. (See Custom Radio Frequency Scan
Selection List on Page 273.) This module will then register to the AP or BHM that
provides the best results for power level, jitter, and—in an SM—the number of registered
SMs.
Update Display
You can click this button to gather updated data without causing the SM or BHS to
rescan and re-register.
27.5 USING THE FRAME CALCULATOR TOOL (ALL)
Canopy avoids self-interference by syncing collocated APs (so they begin each
transmission cycle at the same time) and requiring that collocated APs have the same
transmit/receive ratio (so they stop transmitting and start receiving at the same time).
This ensures that, at any instant, they are either all receiving or all transmitting.
This avoids, for example, the problem of one AP attempting to receive from a distant SM,
while a nearby AP is transmitting and overpowering the signal from the distant SM.
Parameters that affect transmit/receive ratio include range, slots, downlink data
percentage, and high priority uplink percentage. All collocated APs must have the same
transmit/receive ratio. Additional engineering is needed for setting the parameters in a
mixed cluster – one with APs on hardware scheduler and APs on software scheduler.
A frame calculator helps to do this. The operator inputs various AP settings into the
calculator, and the calculator outputs many details on the frame including the Uplink Rcv
SQ Start. This calculation should be done for each AP that has different settings. Then
the operator varies the Downlink Data percentage in each calculation until the calculated
Uplink Rcv SQ Start for all collocated APs is within 300 time bits. The frame calculator is
accessed by clicking on Expanded Stats in the navigation column, then clicking on Frame
Calculator (at the bottom of the expanded navigation column).
The calculator does not use data on the module or populate new data. It is merely a
convenience application running on the module. For this reason, you can use any module
to do the calculations for any AP. Running the calculator on the AP in question is not
necessary.
IMPORTANT!
APs with slightly mismatched transmit/receive ratios and low levels of data traffic
may see little effect on throughput. As the data traffic increases, the impact of
mismatched transmit/receive ratios will increase. This means that a system that
was not tuned for collocation may work fine at low traffic levels, but encounter
problems at higher traffic level. The conservative practice is to tune for
collocation from the beginning, and prevent future problems as sectors are built
out and traffic increases.
Release 8 Operations Guide
Issue 2, December 2006 Draft for Regulatory Review 441
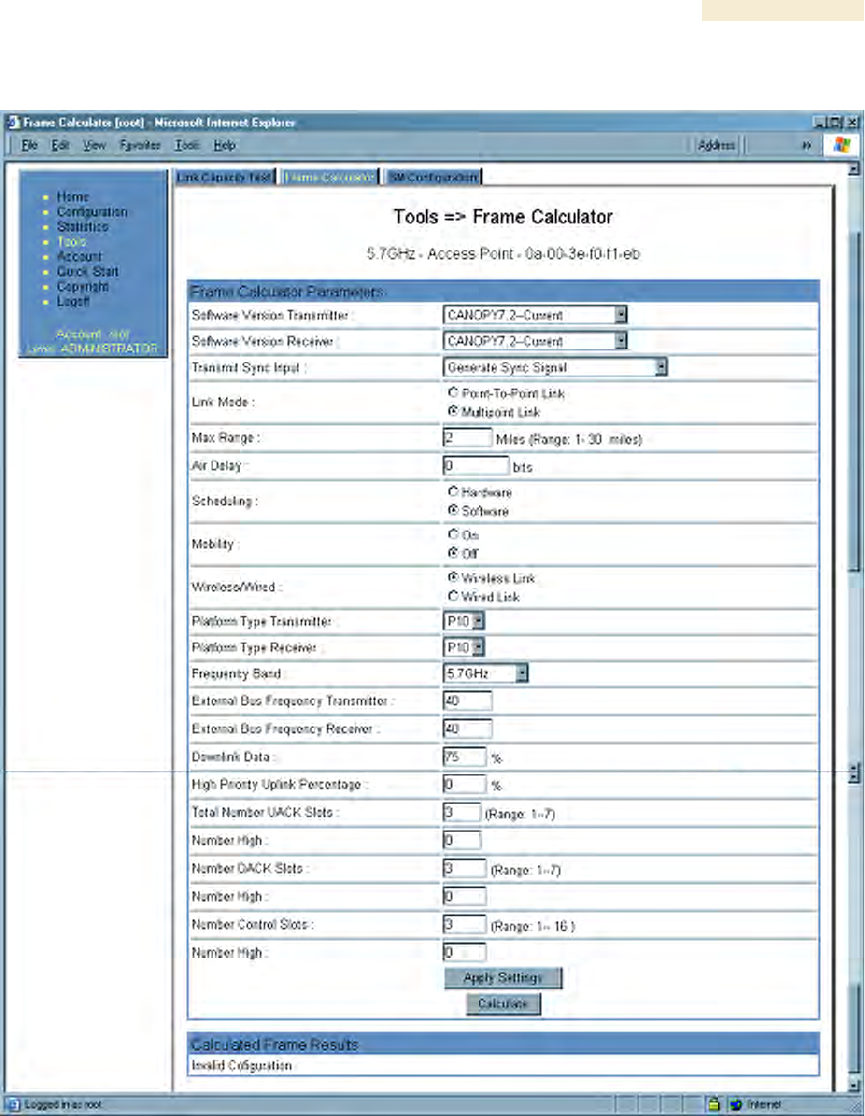
An example of the Frame Calculator tab is shown in Figure 167.
Figure 167: Frame Calculator tab, example
In the Frame Calculator tab, you may set the following parameters.
Software Version Transmitter
From the drop-down menu, select the Canopy software release that runs on the AP(s).

Operations Guide Release 8
442 Draft for Regulatory Review Issue 2, December 2006
Software Version Receiver
From the drop-down menu, select the Canopy software release that runs on the SM(s).
Transmit Sync Input
If the APs in the cluster
◦ receive sync from a CMMmicro, select Sync to Received Signal (Power Port).
◦ receive sync from a CMM2, select Sync to Received Signal (Timing Port).
◦ are self timed, select Generate Sync Signal.
Link Mode
For AP to SM frame calculations, select Multipoint Link.
Max Range
Set to the same value as the Max Range parameter is set in the AP(s).
Air Delay
Leave this parameter set to the default value of 0 bits.
Scheduling
Initially select Software.
Mobility
Leave the default value of Off selected.
Wireless/Wired
Leave the default value of Wireless Link selected.
Platform Type Transmitter
Use the drop-down list to select the hardware series (board type) of the AP.
Platform Type Receiver
Use the drop-down list to select the hardware series (board type) of the SM.
Frequency Band
Use the drop-down list to select the radio frequency band of the AP and SM.
External Bus Frequency Transmitter
Leave this parameter set to the default value of 40.
External Bus Frequency Receiver
Leave this parameter set to the default value of 40.
Downlink Data
Initially set this parameter to the same value that the AP has for its Downlink Data
parameter (percentage). Then, as you use the Frame Calculator tool in Procedure 41,
you will vary the value in this parameter to find the proper value to write into the
Downlink Data parameter of all APs in the cluster.

Release 8 Operations Guide
Issue 2, December 2006 Draft for Regulatory Review 443
High Priority Uplink Percentage
If the AP is running Canopy software earlier than Release 8, set this parameter to
the current value of the High Priority Uplink Percentage parameter in the AP.
Total Number UACK Slots
If the AP is running Canopy software earlier than Release 8, set this parameter to
the current value of the Total NumUAckSlots parameter in the AP.
Number High
If the AP is running Canopy software earlier than Release 8, set this parameter to
the current value of the Num High parameter associated with Total NumUAckSlots
in the AP.
Number DACK Slots
If the AP is running Canopy software earlier than Release 8, set this parameter to
the current value of the NumDAckSlots parameter in the AP.
Number High
If the AP is running Canopy software earlier than Release 8, set this parameter to
the current value of the Num High parameter associated with NumDAckSlots in the AP.
Number Control Slots
Set this parameter to the current value of the Control Slots (for Release 8) or
NumCtlSlots (for earlier releases) parameter in the AP. In Release 8, the Control Slots
parameter is present in the Radio tab of the Configuration web page.
Number High
If the AP is running Canopy software earlier than Release 8, set this parameter to
the current value of the Num High parameter associated with NumCtlSlots in the AP.
To use the Frame Calculator, perform the following steps.
Procedure 41: Using the Frame Calculator
1. Populate the Frame Calculator parameters with appropriate values as described
above.
2. Click the Apply Settings button.
3. Click the Calculate button.
4. Scroll down the tab to the Calculated Frame Results section.
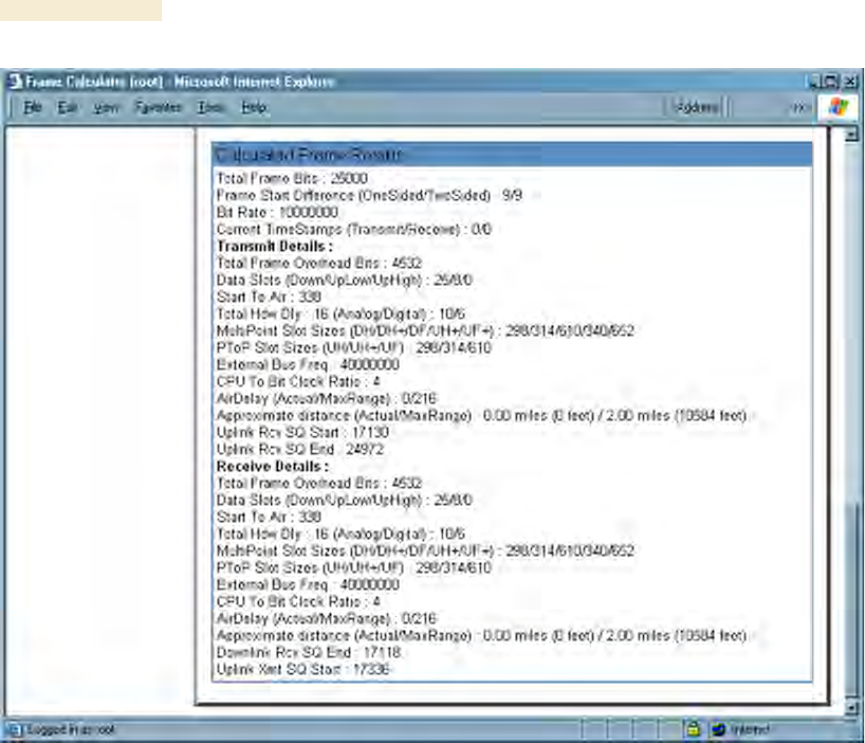
NOTE: An example of the Calculated Frame Results section is displayed in
Figure 168.
Operations Guide Release 8
444 Draft for Regulatory Review Issue 2, December 2006
Figure 168: Calculated Frame Results section of Frame Calculator tab, example
5. Record the value of the Uplink Rcv SQ Start field.
6. Scroll up to the Scheduling parameter.
7. Select Hardware.
8. Click the Apply Settings button.
RESULT: The values in the Calculated Frame Results section are updated for
hardware scheduling.
9. In the Number Control Slots parameter, type in the number needed.
10. Click the Apply Settings button.
11. Click the Calculate button.
12. Scroll down the tab to the Calculated Frame Results section.
13. Record the value of the Uplink Rcv SQ Start field.
14. If the recorded values of the Uplink Rcv SQ Start field are within 300 time bits of
each other, skip the next step.
15. Repeat this procedure, changing the value of the Downlink Data parameter until
the values that this tool calculates for the Uplink Rcv SQ Start field are within
300 time bits of each other regardless of the selection in the Scheduling
parameter.
Release 8 Operations Guide
Issue 2, December 2006 Draft for Regulatory Review 445
16. When they are within 300 time bits, access the Radio tab in the Configuration
web page of each AP in the cluster and change its Downlink Data parameter
(percentage) to the last value that you used in the Frame Calculator.
See Figure 83: Radio tab of AP (900 MHz), example on Page 241.
=========================== end of procedure ===========================
27.6 USING THE SM CONFIGURATION TOOL (AP, BHM)
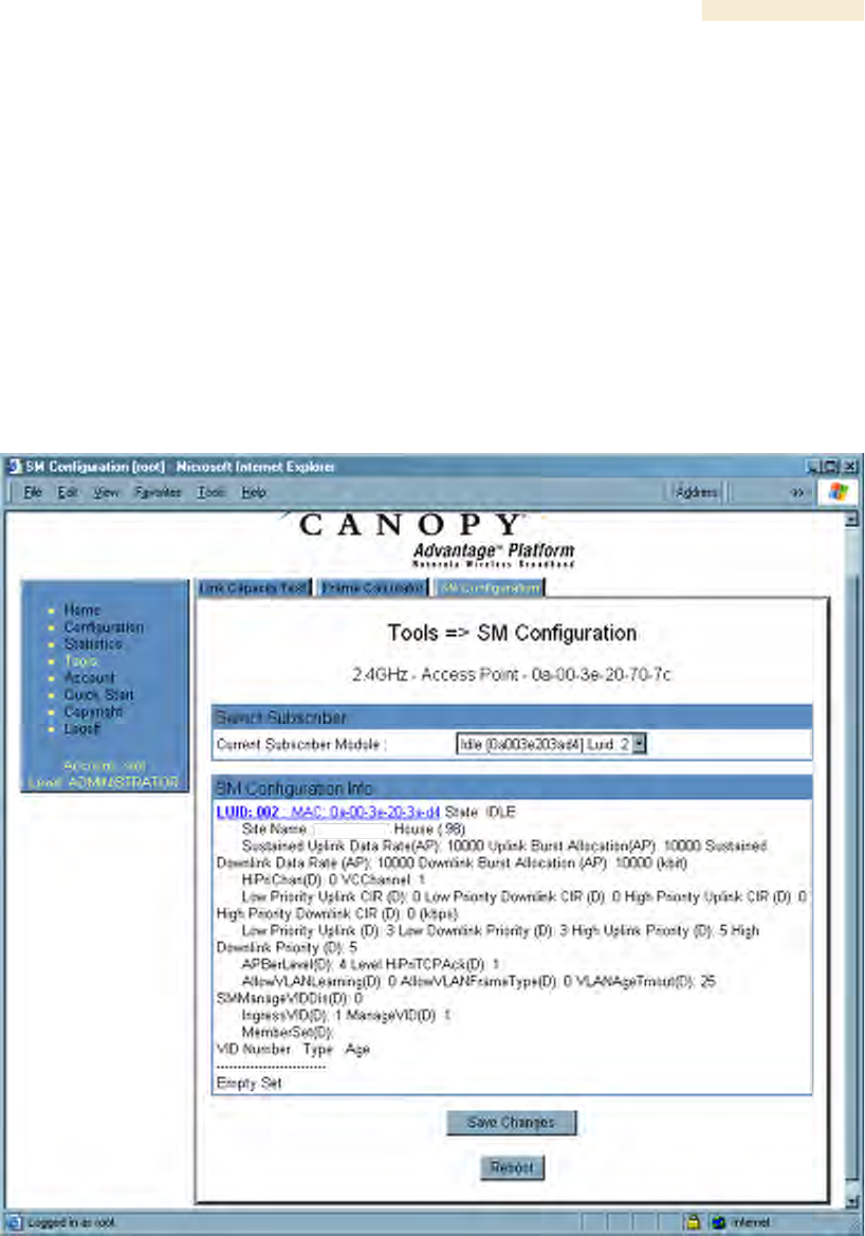
The SM Configuration tab in the Tools page of the AP or BHM displays
◦ the current values whose control may be subject to the setting in the
Configuration Source parameter.
◦ an indicator of the source for each value.
An example of the SM Configuration tab is displayed in Figure 169.
Figure 169: SM Configuration tab of AP, example
Indicators for configuration source are explained under Session Status Tab of the AP on
Page 193.
Operations Guide Release 8
446 Draft for Regulatory Review Issue 2, December 2006
27.7 USING THE BER RESULTS TOOL (SM, BHS)
Radio BER is now supported on hardware scheduling. When looking at Radio BER data
it is important to note that it represents bit errors at the RF link level. Due to CRC checks
on fragments and packets and ARQ (Automatic Repeat request), the BER of customer
data is essentially zero. Radio BER gives one indication of link quality, along with
received power level, jitter, and link tests.
BER is only instrumented on the downlink, and can be read on each SM’s Tools>BER
Results page. Each time the tab is clicked, the current results are read, and counters are
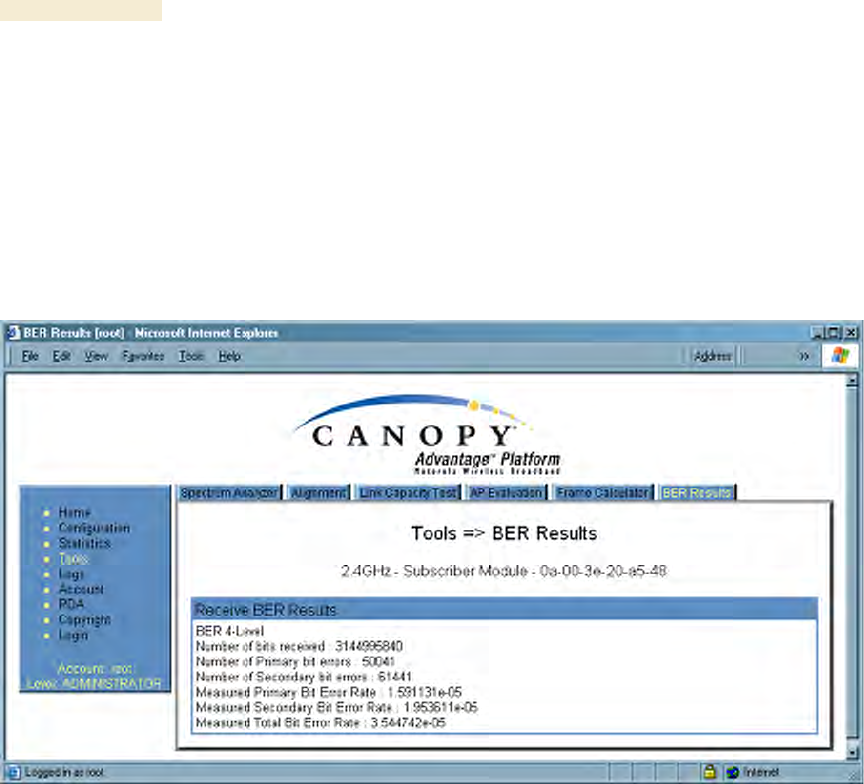
reset to zero. An example of the BER Results tab is displayed in Figure 170.
Figure 170: BER Results tab of SM, example
The BER Results tab can be helpful in troubleshooting poor link performance. The value
in the Measured Total Bit Error Rate field represents the bit error rate (BER) in the RF
link since the last time the BER Results tab was clicked.
The link is acceptable if the value of this field is less than 10−4. If the BER is greater than
10−4, re-evaluate the installation of both modules in the link.
The BER test signal is only broadcast by the AP (and compared to the expected test
signal by the SM) when capacity in the sector allows it – it is the lowest priority for AP
transmissions.

Release 8 Operations Guide
Issue 2, December 2006 Draft for Regulatory Review 447
28 MAINTAINING YOUR CANOPY SOFTWARE
Canopy provides release compatibility information and caveats about each release.
28.1 HISTORY OF SYSTEM SOFTWARE UPGRADES
28.1.1 Canopy Release 8 Features
Canopy Release 8 introduces the following new features:
◦ Scheduling Limited to Hardware Scheduler
◦ Tiered Permissions and User Accounts
◦ GUI Customizable via CSS
◦ Links to SM GUI via Session Status and Remote Subscribers Tabs of AP
◦ Dynamic Frequency Selection (DFS) v1.2.3 in All 5.4- and 5.7-GHz Modules
◦ Bit Error Rate (BER) Display with Hardware Scheduler
◦ AP SNMP Proxy to SMs
◦ Translation Bridging (MAC Address Mapping)
◦ SM Isolation
◦ Management Access Filtering for SM
◦ Source IP Management Access for AP and SM
◦ Optional DHCP Configuration of Management Interface
28.1.2 Canopy Release 8 Fixes
Canopy Release 8 includes the following fixes:
◦ Management Web (http) Access Lockup Fix
◦ Enforcement of Ethernet Link Speed Setting
◦ MIBs Support Only Applicable Objects
28.2 HISTORY OF CMMmicro SOFTWARE UPGRADES
◦ Canopy currently supports CMMmicro Releases up through Release 2.2.
28.3 TYPICAL CONTENTS OF RELEASE NOTES
Canopy supports each release with software release notes, which include
◦ description of features that are introduced in the new release.
◦ issues that the new release resolves.
◦ known issues and special notes for the new release.
◦ installation procedures for the new release.
28.4 TYPICAL UPGRADE PROCESS
In a typical upgrade process, proceed as follows:
1. Visit the software page of the Canopy web site.
2. Read the compatibility information and any caveats that Canopy associates with
the release.

Operations Guide Release 8
448 Draft for Regulatory Review Issue 2, December 2006
3. Read the software release notes from the web site.
4. On the basis of these, decide whether the release is appropriate for your
network.
5. Download the software release and associated files.
6. Use CNUT to manage the upgrade across your network.
28.4.1 Downloading Software and Release Notes
All supported software releases, the associated software release notes document, and
updated MIB files are available for download at any time from
http://motorola.motorola.com/canopy/support/software/. This web site also typically
provides a summary of the backward compatibility and any advantages or disadvantages
of implementing the release.
When you click on the release that you wish to download, you are prompted for
information that identifies yourself and your organization (such as name, address, and
e-mail address). When you complete and submit the form that prompts for this
information, the download is made available to you.

Release 8 Operations Guide
Issue 2, December 2006 Draft for Regulatory Review 449
29 REBRANDING MODULE INTERFACE SCREENS
Distinctive fonts indicate
literal user input.
variable user input.
literal system responses.
variable system responses.
The interface screens on each module display the Canopy or Canopy Advantage logo.
These logos can be replaced with other logos using Procedure 42.
The logo is a hyperlink and clicking on it takes the user to the Canopy web site.
A different site (perhaps the operator’s support site) can be made the destination using
Procedure 43.
To return a module to regular logos and hyperlinks, use Procedure 44.
The logo at the top of each page is a key indicator to the user whether a module is
Canopy or Canopy Advantage. If you choose to replace the Canopy logos, use two
noticeably different logos so that users can continue to easily distinguish between a
Canopy module and a Canopy Advantage module.
To replace logos and hyperlinks efficiently throughout your network, read the following
procedures, write a script, and execute your script through the Canopy Network Updater
Tool (CNUT).8 To replace them individually, use one of the following two procedures.
Procedure 42: Replacing the Canopy logo on the GUI with another logo
1. If the current logo is the Canopy logo, name your custom logo file on your
computer canopy.jpg and put it in your home directory.
If the current logo is the Canopy Advantage logo, name your custom logo file on
your computer advantaged.jpg and put it in your home directory.
2. Use an FTP (File Transfer Protocol) session to transfer this file to the module, as
in the example session shown in Figure 171.
8 See Using the Canopy Network Updater Tool (CNUT) on Page 409.
Operations Guide Release 8
450 Draft for Regulatory Review Issue 2, December 2006
> ftp ModuleIPAddress
Connected to ModuleIPAddress
220 FTP server ready
Name (ModuleIPAddress:none): root
331 Guest login ok
Password: <password-if-configured>
230 Guest login ok, access restrictions apply.
ftp> binary
200 Type set to I
ftp> put canopy.jpg
OR
put advantaged.jpg
OR
put top.html
ftp> quit
221 Goodbye
Figure 171: Example ftp session to transfer custom logo file
3. Use a telnet session and the addwebfile command to add the new file to the
file system, as in the example session shown in Figure 172.
NOTE:
Supported telnet commands execute the following results:
◦ addwebfile adds a custom logo file to the file system.
◦ clearwebfile clears the logo file from the file system.
◦ lsweb lists the custom logo file and display the storage
space available on the file system.

Release 8 Operations Guide
Issue 2, December 2006 Draft for Regulatory Review 451
>telnet ModuleIPAddress
/---------\
C A N O P Y
Motorola Broadband Wireless Technology Center
(Copyright 2001, 2002 Motorola Inc.)
Login: root
Password: <password-if-configured>
Telnet +> addwebfile canopy.jpg
OR
addwebfile advantaged.jpg
OR
addwebfile top.html
Telnet +> lsweb
Flash Web files
/canopy.jpg 7867
free directory entries: 31
free file space: 55331
Telnet +> exit
Figure 172: Example telnet session to activate custom logo file
=========================== end of procedure ===========================
Procedure 43: Changing the URL of the logo hyperlink
1. Browse to http://ModuleIPAddress/top.html.
2. Save the page as an html file named top.html.
3. In the editor of your choice, open the file top.html.
4. Find the expression http://www.canopywireless.com.
5. Change http://www.canopywireless.com to the URL to which you want
the browser directed when the user clicks the logo.
6. Save and close the file as top.html.
7. Use an FTP (File Transfer Protocol) session to transfer this file to the module, as
in the example session shown in Figure 171 on Page 450.
8. Use a telnet session and the addwebfile command to add the new file (top.html)
to the file system, as in the example session shown in Figure 172.
=========================== end of procedure ===========================

Operations Guide Release 8
452 Draft for Regulatory Review Issue 2, December 2006
If you ever want to restore the original logo and hyperlink in a module, perform the
following steps.
Procedure 44: Returning a module to its original logo and hyperlink
1. Use a telnet session and the clearwebfile command to clear all custom files from
the file system of the module, as in the example session shown in Figure 173
below.
>telnet ModuleIPAddress
/---------\
C A N O P Y
Motorola Broadband Wireless Technology
Center
(Copyright 2001, 2002 Motorola Inc.)
Login: root
Password: <password-if-configured>
Telnet +> lsweb
Flash Web files
canopy.jpg 7867
free directory entries: 31
free file space: 56468
Telnet +> clearwebfile
Telnet +> lsweb
Flash Web files
free directory entries: 32
free file space 64336 bytes
Telnet +> exit
Figure 173: Example telnet session to clear custom files
=========================== end of procedure ======================

Release 8 Operations Guide
Issue 2, December 2006 Draft for Regulatory Review 453
30 TOGGLING REMOTE ACCESS CAPABILITY
Based on your priorities for additional security and ease of network administration, you
can deny or permit remote access individually to any AP, SM, or BH.
30.1 DENYING ALL REMOTE ACCESS
Wherever the No Remote Access feature is enabled by the following procedure, physical
access to the module is required for
◦ any change in the configuration of the module.
◦ any software upgrade in the module.
Where additional security is more important that ease of network administration, you can
disable all remote access to a module as follows.
Procedure 45: Denying all remote access
1. Insert the override plug into the RJ-11 GPS utility port of the module.
2. Power up or power cycle the module.
3. Access the web page http://169.254.1.1/lockconfig.html.
4. Click the check box.
5. Save the changes.
6. Reboot the module.
7. Remove the override plug.
RESULT: No access to this module is possible through HTTP, SNMP, FTP,
telnet, or over an RF link.
=========================== end of procedure ======================
30.2 REINSTATING REMOTE ACCESS CAPABILITY
Where ease of network administration is more important than the additional security that
the No Remote Access feature provides, this feature can be disabled as follows:
Procedure 46: Reinstating remote access capability
1. Insert the override plug into the RJ-11 GPS utility port of the module.
2. Power up or power cycle the module.
3. Access the web page http://169.254.1.1/lockconfig.html.
4. Click the check box to uncheck the field.
5. Save the changes.
6. Reboot the module.
7. Remove the override plug.
RESULT: Access to this module is possible through HTTP, SNMP, FTP, telnet,
or over an RF link.
=========================== end of procedure ======================
Release 8 Operations Guide
Issue 2, December 2006 Draft for Regulatory Review 455
31 SETTING UP A PROTOCOL ANALYZER ON YOUR
CANOPY NETWORK
Selection of protocol analyzer software and location for a protocol analyzer depend on
both the network topology and the type of traffic to capture. However, the examples in
this section are based on free-of-charge Ethereal software, which is available at
http://ethereal.com/.
The equipment required to set up a protocol analyzer includes:
◦ 1 hub
◦ 1 laptop computer with protocol analyzer software installed
◦ 2 straight-through Ethernet cables
◦ 1 Canopy power converter (ACPS110)
31.1 ANALYZING TRAFFIC AT AN SM
The IP address of the protocol analyzer laptop computer must match the IP addressing
scheme of the SM. If the SM has DHCP enabled, then configure the laptop computer to
automatically obtain an address. If DHCP is not enabled, then ensure that the laptop
computer is configured with a static IP address in the same subnet as the SM.
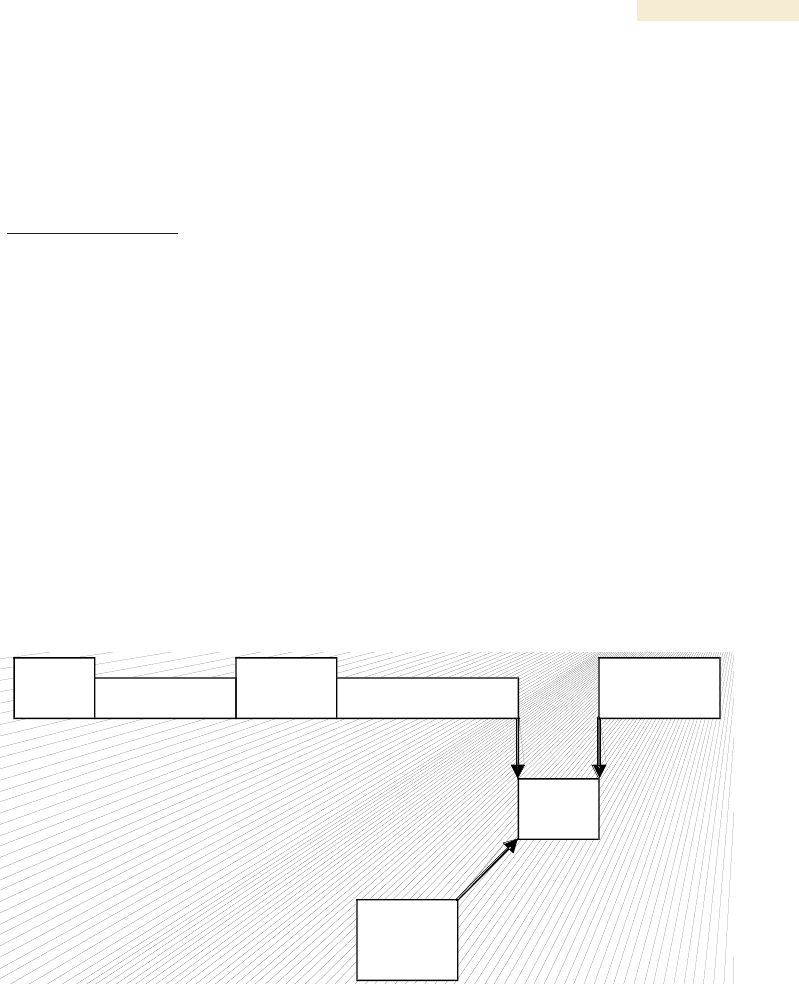
The configuration for analyzing traffic at an SM is shown in Figure 174.
Subscriber
PC
Power
Supply
SM
HUB
Sniffer
Laptop
To Computer Cable
To Radio Cable
Figure 174: Protocol analysis at SM
Operations Guide Release 8
456 Draft for Regulatory Review Issue 2, December 2006
31.2 ANALYZING TRAFFIC AT AN AP OR BH WITH NO CMM
The IP address of the protocol analyzer laptop computer must match the IP addressing
scheme of the AP/BH. If the router is configured to be a DHCP server, then configure the
laptop computer to automatically obtain an address. If DHCP is not enabled, then ensure
that the laptop computer is configured with a static IP address in the same subnet as the
AP/BH.
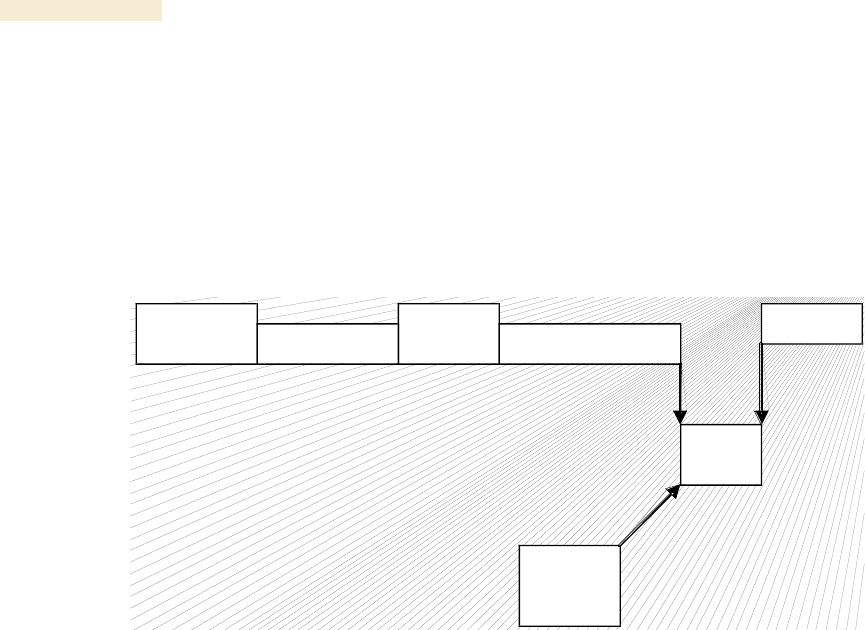
The configuration for analyzing traffic at an AP or BH that is not connected to a CMM is
shown in Figure 175.
Router
Power
Supply
AP or BH
HUB
Sniffer
Laptop
To Computer Cable
To Radio Cable
Figure 175: Protocol analysis at AP or BH not connected to a CMM
31.3 ANALYZING TRAFFIC AT AN AP OR BH WITH A CMM
The IP address of the protocol analyzer laptop computer must match the IP addressing
scheme of the AP/BH. If the router is configured to be a DHCP server, then configure the
laptop computer to automatically obtain an address. If DHCP is not enabled, ensure that
the laptop computer is configured with a static IP address in the same subnet as the
AP/BH.
Connect the hub to the J2 Ethernet to Switch of the port that is associated with the
AP/BH. This example is of capturing traffic from AP/BH 111, which is connected to
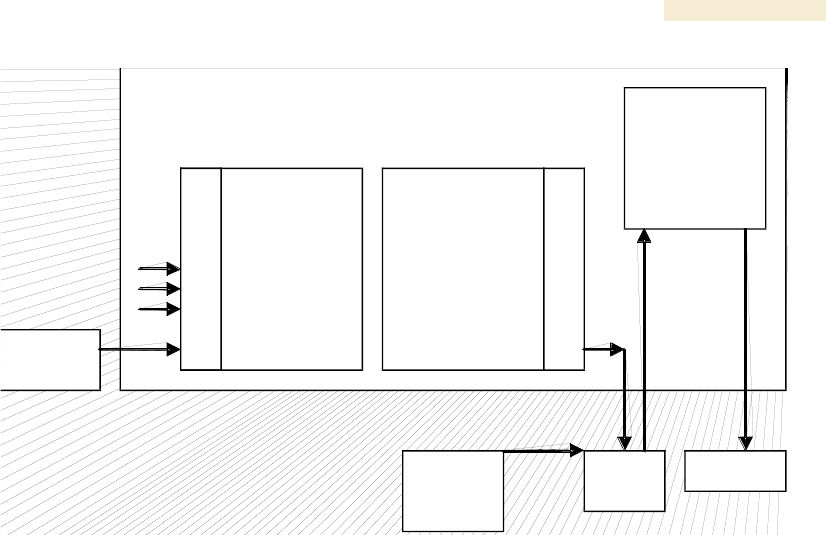
Port 1. The configuration for analyzing traffic at an AP or BH that is connected to a CMM
is shown in Figure 176.
Release 8 Operations Guide
Issue 2, December 2006 Draft for Regulatory Review 457
CMM
Route r
AP/BH
111
HUB
Sniffer
Laptop
J2 Ethernet to
Switch
J1 to Radio
8
7
6
5
4
3
2
1
8
7
6
5
4
3
2
1
Ethernet Switch
Figure 176: Protocol analysis at AP or BH connected to a CMM
31.4 EXAMPLE OF A PROTOCOL ANALYZER SETUP FOR AN SM
The following is an example of a network protocol analyzer setup using Ethereal®
software to capture traffic at the SM level. The Ethereal network protocol analyzer has
changed its name to Wireshark™, but functionality and use remains much the same. This
example is based on the following assumptions:
◦ All required physical cabling has been completed.
◦ The hub, protocol analyzer laptop computer, and subscriber PC are successfully
connected.
◦ The SM is connected
− as shown in Figure 175 on Page 456.
− to the subscriber PC and the AP.
◦ Ethereal software is operational on the laptop computer.
Although these procedures involve the SM, the only difference in the procedure for
analyzing traffic on an AP or BH is the hub insertion point.
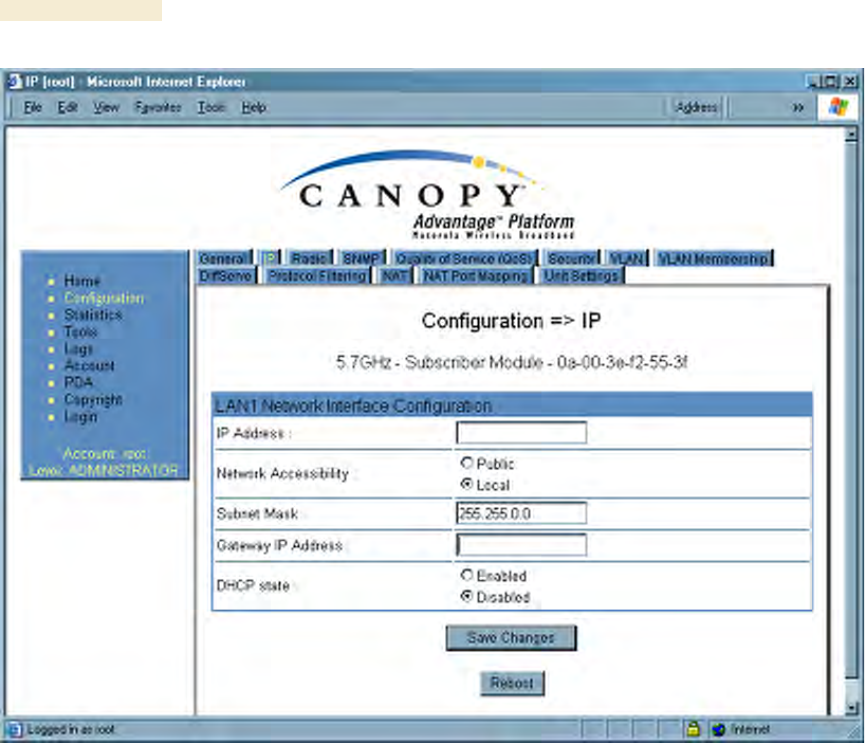
The IP Configuration screen of the example SM is shown in Figure 177.
Operations Guide Release 8
458 Draft for Regulatory Review Issue 2, December 2006
Figure 177: IP tab of SM with NAT disabled and local accessibility
Procedure 47: Setting up a protocol analyzer
1. Note the IP configuration of the SM.
2. Browse to StartMy Network PlacesNetwork and Dialup Connections.
3. For Local Area Connection, select Properties.
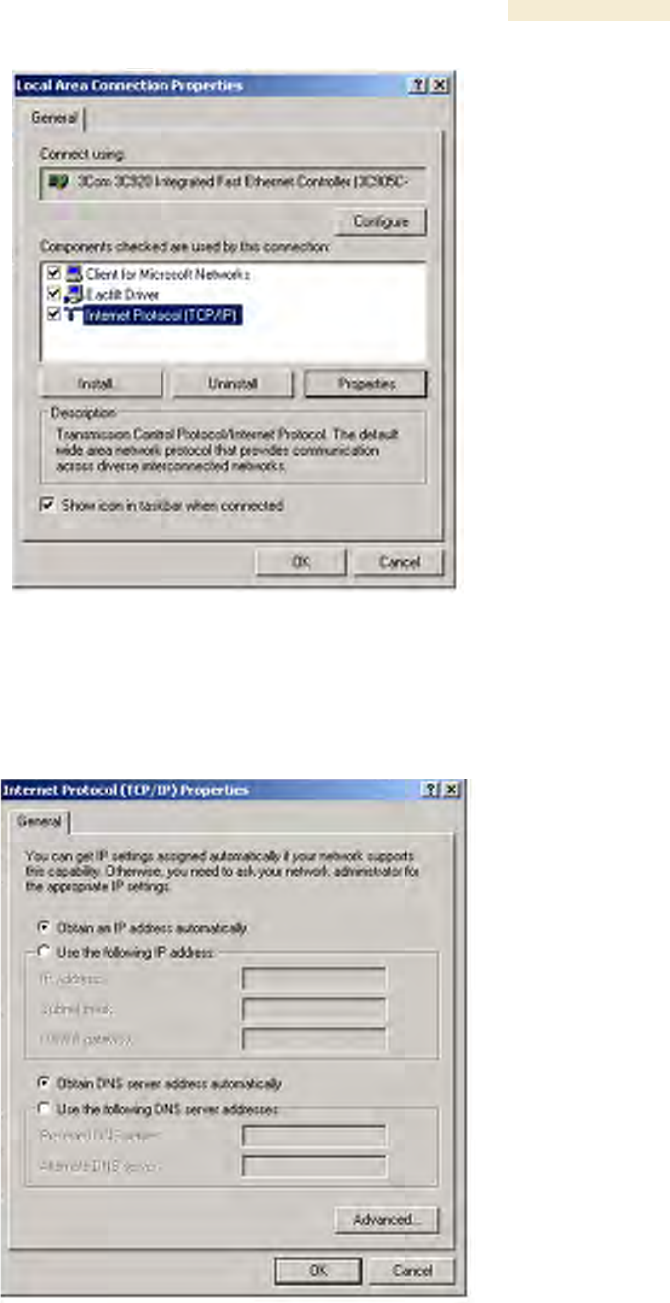
RESULT: The Local Area Connections Properties window opens, as shown in
Figure 178.
Release 8 Operations Guide
Issue 2, December 2006 Draft for Regulatory Review 459
Figure 178: Local Area Connection Properties window
4. Select Internet Protocol (TCP/IP).
5. Click the Properties button.
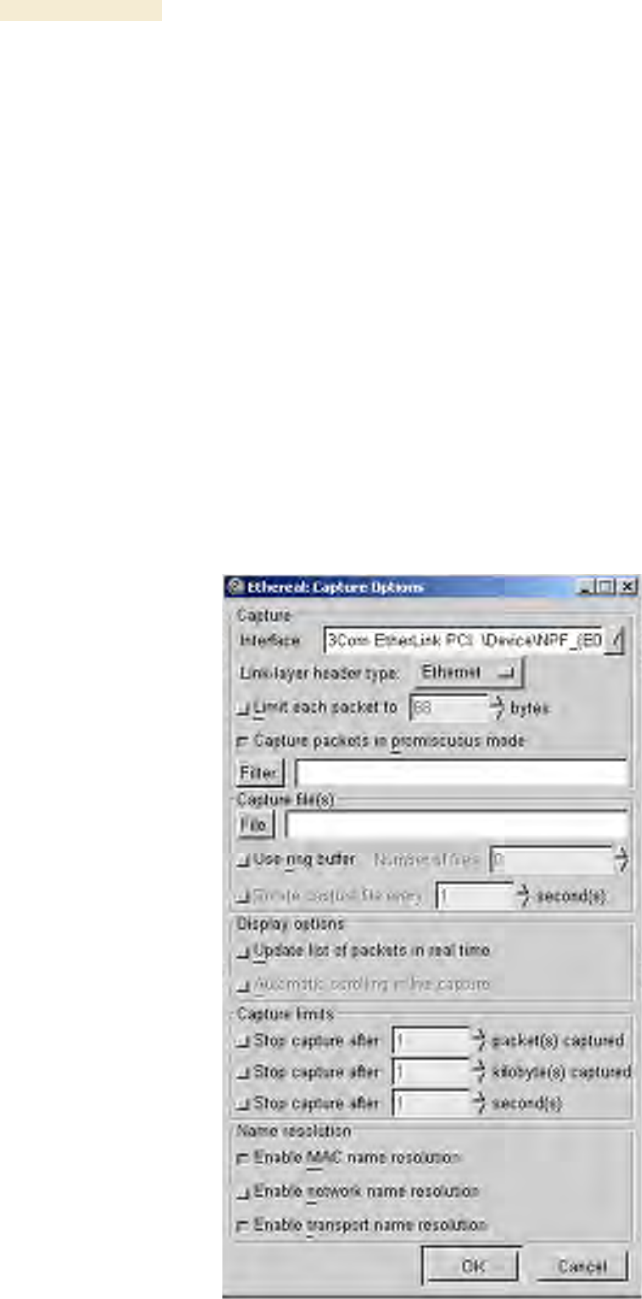
RESULT: The Internet Protocol (TCP/IP) Properties window opens, as shown in
Figure 179.
Figure 179: Internet Protocol (TCP/IP) Properties window
Operations Guide Release 8
460 Draft for Regulatory Review Issue 2, December 2006
6. Unless you have a static IP address configured on the SM, select
Obtain an IP address automatically for the protocol analyzer laptop computer,
as shown in Figure 179.
7. If you have configured a static IP address on the SM, then
a. select Use the following IP address.
b. enter an IP address that is in the same subnet as the SM.
8. Click OK.
9. Open your web browser.
10. Enter the IP address of the SM.
RESULT: The General Status tab of the SM opens, as shown in Figure 66 on
Page 198.
11. If the General Status tab did not open, reconfigure how the laptop computer
obtains an IP address.
12. Verify that you have connectivity from the laptop computer to the SM with the hub
inserted.
13. Launch the protocol analyzer software on the laptop computer.
14. In the Capture menu, select Start.
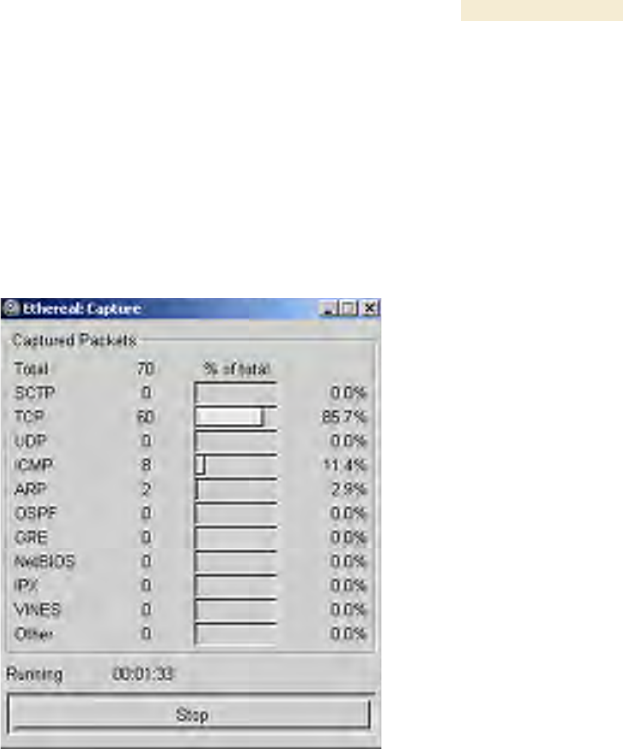
RESULT: The Ethereal Capture Options window opens, as shown in Figure 180.
Figure 180: Ethereal Capture Options window
Release 8 Operations Guide
Issue 2, December 2006 Draft for Regulatory Review 461
15. Ensure that the Interface field reflects the network interface card (NIC) that is
used on the protocol analyzer laptop computer.
NOTE: Although you can select filters based on specific types of traffic, all values
are defaults in this example.
16. If you wish to select filters, select them now.
17. Click OK.
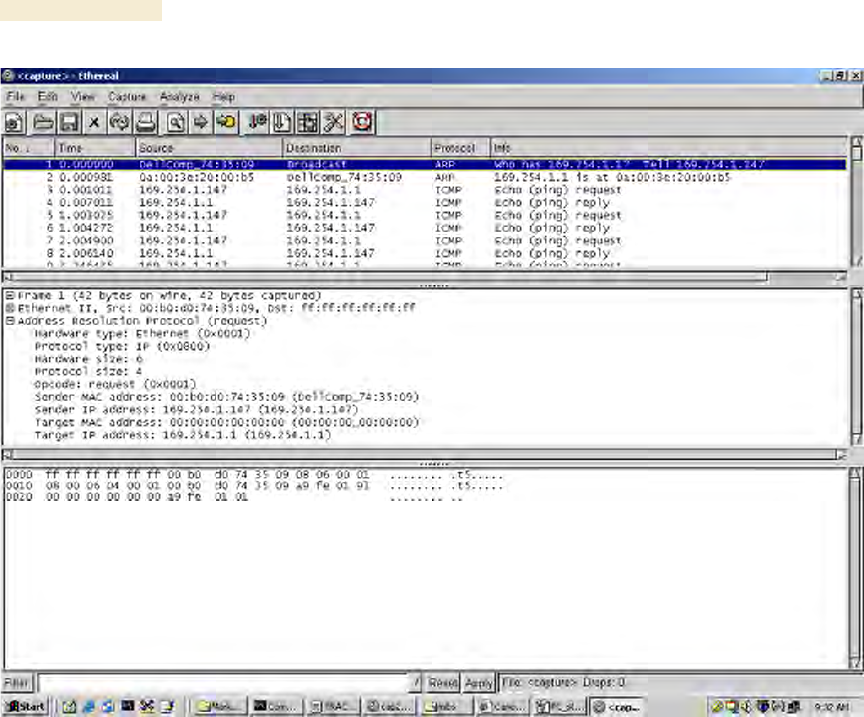
RESULT: The Ethereal Capture window opens, as shown in Figure 181.
Figure 181: Ethereal Capture window
NOTE: This window graphically displays the types of packets (by percentage)
that are being captured.
18. If all packet types are displayed with 0%, either
◦ launch your Web browser on the subscriber PC for the IP address of the SM
◦ ping the SM from the home PC.
19. If still all packet types are displayed with 0% (meaning that no traffic is being
captured), reconfigure IP addressing until you can successfully see traffic
captured on the laptop computer.
20. Whenever the desired number of packets have been captured, click Stop.
RESULT: When you stop the packet capture, the <capture> - Ethereal window
opens, as shown in Figure 182.
=========================== end of procedure ===========================
Operations Guide Release 8
462 Draft for Regulatory Review Issue 2, December 2006
Figure 182: <capture> - Ethereal window, Packet 1 selected
This window has three panes:
◦ The top pane provides a sequenced summary of the packets captured and
includes SRC/DEST address and type of protocol. What you select in this pane
determines the additional information that is displayed in the lower two panes.
◦ The lower two panes facilitate drill-down into the packet that you selected in the
top pane.
In this example, Packet 1 (a broadcast ARP request) was selected in the top pane. The
lower two panes provide further details about Packet 1.
Another example is shown in Figure 183.