Ophir Optronics QSR LASER POWER METER User Manual StarLab User Guide
Ophir Optronics Ltd LASER POWER METER StarLab User Guide
USERS MANUAL
www.ophiropt.com
OPHIR OPTRONICS
For Quasar, USBI and Pulsar Devices
StarLab User Guide
StarLab User Guide
StarLab

Table of Contents
Table of Contents
Chapter 1 – Introduction....................................................................... 1
USBI, Pulsar and Quasar Overview................................................... 1
Definition of Terms ............................................................................. 2
Software Features............................................................................... 2
Technical and System Performance Specifications........................ 3
USBI and Pulsar Specifications ..................................................... 3
Quasar Specifications.................................................................... 5
CE Compliance – USBI, Pulsar and Quasar ..................................... 6
FCC Compliance - Quasar.................................................................. 6
FCC ID: V6XQSR .......................................................................... 6
The FCC Wants you to Know ........................................................ 7
FCC Warning: ................................................................................ 7
RF EXPOSURE WARNING:.......................................................... 7
Chapter 2 – Installing StarLab.............................................................. 8
Package Contents............................................................................... 8
System Requirements ........................................................................ 8
Installing StarLab Software................................................................ 9
Connecting the USBI and Pulsar Devices ...................................... 10
Installing Bluetooth USB Adapter software (for Quasar).............. 13
Connecting the Quasar device ........................................................ 13
Chapter 3 – Getting Started................................................................ 16
Starting and Ending a StarLab Application Session..................... 16
Understanding the Application Window......................................... 17
The Display Area ......................................................................... 18
The Numeric Display Area........................................................... 18
The Graph Configuration Area..................................................... 18
The Statistics Area....................................................................... 19
The Measurement Parameters Area............................................ 19
The Logging Area ........................................................................ 19
The Right Mouse Pop-Up Menu .................................................. 20
Resizing the StarLab Window..........................................................22
Configuring the Display for Power Readings................................. 22
StarLab User Guide ii

Table of Contents
Configuring Graph Limits and Time Period.................................. 23
Configuring the Display for Energy Readings ............................... 23
Selecting the Display Type .......................................................... 23
Configuring Histogram Settings ................................................... 24
Configuring Bar Graph Settings................................................... 24
Saving Configuration Settings ........................................................ 25
Saving Configuration Settings for this Session............................ 25
Automatically Saving Configuration Settings ............................... 25
Prompt to Save Device Configuration when Closing ................... 26
Close Channel without Saving Device Configuration................... 26
Saving Measurement Readings....................................................... 27
Saving Readings for this Session ................................................ 27
Receiving a Prompt to Save Readings ........................................ 28
Printing Measurement Readings..................................................... 28
Exporting Data to a Bitmap.............................................................. 28
Refreshing Devices when Starting the Application....................... 29
Upgrading the Device’s Internal Software...................................... 30
Accessing the Help Module ............................................................. 31
Chapter 4 – Measuring with the Thermopile Head............................ 32
Overview of Thermopile Heads ....................................................... 32
Measurement Settings Configuration............................................. 32
Selecting the Measurement Mode ............................................... 33
Configuring Measurement Settings in Power Mode...................... 33
Selecting the Laser Wavelength .................................................. 33
Selecting the Range..................................................................... 34
Averaging the Measurements...................................................... 34
Disabling Averaging..................................................................... 35
Configuring Measurement Settings in Energy Mode..................... 35
Using the Ready Sign .................................................................. 35
Configuring the Energy Threshold ............................................... 35
Optimizing the Readings.................................................................. 37
Applying an Offset........................................................................ 37
Zeroing the Instrument................................................................. 37
Setting Line Frequency................................................................ 38
Calibration Factors ........................................................................... 39
Adjusting Power Calibration Factors............................................ 39
Configuring the Response Factor ................................................ 40
Adjusting Energy Calibration Factors........................................... 41
Additional Graphical Display Options ............................................ 42
StarLab User Guide iii

Table of Contents
Displaying Readings in dBm Scale.............................................. 42
Applying Normalization ................................................................ 42
Chapter 5 – Measuring with the Photodiode Head ........................... 43
Overview of Photodiode Heads....................................................... 43
Configuring Measurement Settings ................................................ 44
Configuring Laser Wavelengths................................................... 44
Filter Settings............................................................................... 46
Selecting the Range..................................................................... 47
Averaging the Measurements...................................................... 47
Optimizing the Readings.................................................................. 47
Applying an Offset........................................................................ 47
Zeroing the Instrument................................................................. 48
Setting Line Frequency................................................................ 48
Adjusting Calibration Factors.......................................................... 48
Additional Graphical Display Options ............................................ 49
Displaying Readings in dBm Scale.............................................. 49
Applying a dB Offset .................................................................... 50
Applying Normalization ................................................................ 51
Chapter 6 – Measuring with the Pyroelectric and PD10 Heads ....... 52
Overview of Pyroelectric and PD10 Heads..................................... 52
Configuring Measurement Settings ................................................ 53
Selecting the Measurement Mode ............................................... 53
Configuring Laser Wavelengths................................................... 54
Selecting the Range..................................................................... 54
Using a Diffuser ........................................................................... 55
Selecting the Pulse Width............................................................ 55
Averaging the Measurements (Power Mode Only) ...................... 56
Disabling Averaging..................................................................... 56
Controlling the External Trigger ................................................... 56
Optimizing the Readings.................................................................. 57
Zeroing the Instrument................................................................. 57
Measuring the Total Energy Exposure ........................................... 58
Adjusting Calibration Factors.......................................................... 59
Additional Graphical Display Options ............................................ 61
Displaying Readings in dBm Scale.............................................. 61
Applying Normalization ................................................................ 61
Chapter 7 – External Triggers and Missing Pulses .......................... 62
Overview of the External Trigger..................................................... 62
StarLab User Guide iv

Table of Contents
Hardware Considerations ................................................................ 62
Configuring the External Trigger Settings ..................................... 63
Configuring the External Trigger Window Time ........................... 63
Using the External Trigger for Input Mode..................................... 64
Enabling or Disabling a Channel to Work with External
Trigger.......................................................................................... 65
Using the External Trigger in Output Mode.................................... 65
Enabling the Active Channel for Output Control .......................... 66
Chapter 8 – Working with Multiple Heads ......................................... 67
Connecting More than One Head .................................................... 67
Selecting Channels...........................................................................67
Viewing the List of Active Heads..................................................... 69
Viewing Multiple Windows............................................................... 69
Chapter 9 – Working with Log Files................................................... 71
Default Location for Log Files ......................................................... 71
Configuring Log File Settings.......................................................... 71
Logging One Screen of Data Only............................................... 71
Configuring Log Duration............................................................. 72
Configuring the Number of Measurements .................................. 73
Starting and Stopping the Log ........................................................ 74
Starting the Log............................................................................ 74
Pausing the Log........................................................................... 74
Stopping the Log.......................................................................... 74
Using Turbo Mode ............................................................................ 74
Adding Notes to a Log File .............................................................. 77
Choosing the Log File Format......................................................... 78
Standard Format Log Files .......................................................... 78
Excel Friendly Format Log Files .................................................. 78
Selecting the Log File Format...................................................... 79
Chapter 10 – Viewing Log Files.......................................................... 80
Accessing the Log Viewer ............................................................... 80
Understanding the Log Viewer Window ......................................... 81
Using the Log Viewer for Power Readings..................................... 82
Configuring the Graph Limits ....................................................... 82
StarLab User Guide v

Table of Contents
Applying dBm............................................................................... 82
Toggling the Offset....................................................................... 83
Zooming In and Zooming Out ...................................................... 83
Viewing Log File Information for Power Readings....................... 84
Using the Log Viewer for Energy Readings ................................... 84
Configuring the Histogram Settings ............................................. 84
Configuring the Bar Graph Settings............................................. 85
Configuring Histogram or Bar Graph Limits ................................. 85
Setting Log Viewer Preferences .................................................. 86
Viewing Log File Information for Energy Readings...................... 87
Viewing Log Files in NotePad.......................................................... 87
Opening a Log File in NotePad.................................................... 87
Understanding Log File Entries.................................................... 88
Opening Log Files in Excel.............................................................. 89
Opening a Log File in Stored in the "Excel Friendly" Format....... 89
Opening a Log File Stored in Standard Format Using Excel ....... 90
Appendix A – Toolbar Guide .............................................................. 92
Appendix B – Calibration, Traceability, and Recalibration.............. 93
Ophir Thermopile Heads .................................................................. 93
Surface Absorbers ....................................................................... 93
Volume Absorbers ....................................................................... 93
Factory Calibration of Thermopile Heads ....................................95
Linearity and Accuracy of Thermopile Heads .............................. 95
Ophir Photodiode Heads.................................................................. 98
Factory Calibration of Photodiode Heads .................................... 98
Linearity and Accuracy of Photodiode Heads.............................. 98
User Recalibration ....................................................................... 99
Ophir Pyroelectric Heads............................................................... 100
Calibration.................................................................................. 101
Appendix C – Getting the most from the Quasar............................ 104
Different Quasar Models ................................................................ 104
Switching the Quasar On and Off.................................................. 105
Understanding the Quasar LED Indicator .................................... 105
Quasar Battery Status Indication .................................................. 106
Understanding the Battery Status Indicator ............................... 106
Charging the Quasar Battery ..................................................... 108
Getting the Best Working Range from the Quasar...................... 109
Using Thermopile Head with Integral Quasar .............................. 109
StarLab User Guide vi

Table of Contents
Troubleshooting the Quasar.......................................................... 110
Appendix D – Operation with Nova-II and Vega Devices ............... 111
Summary of Changes to Support Nova-II and Vega.................... 112
Uploading Files from the Nova-II and Vega.................................. 113
StarLab User Guide vii

Chapter 1 – Introduction
This guide describes the operation of the Ophir StarLab application software,
which supports the following Ophir devices:
SmartHead to USB Interface, referred to in this guide as USBI. •
•
•
•
•
•
•
•
•
•
•
Pulsar-4, Pulsar-2, Pulsar-1.
Quasar
Nova-II, for data-logging and log file extraction.
Vega, for data-logging and log file extraction.
This chapter provides introductory information about the USBI, Pulsar and
Quasar devices. Topics include:
USBI, Pulsar and Quasar Overview
Definition of Terms
Software Features
Technical and System Performance Specifications
CE Compliance – USBI, Pulsar and Quasar
FCC Compliance - Quasar
Note: StarLab version 1.00 supports only the Quasar device. Support for the
USBI and Pulsar devices will be added into a later release of StarLab.
Support for USBI and Pulsar devices is via Ophir USBI application
software.
Note: The only difference between the Pulsar-4 (four channel device),
Pulsar-2 (two channel device), and the Pulsar-1 (one channel device)
is the number of channels that each of the devices support. Throughout
the guide these devices are referred to collectively as the “Pulsar”.
The USBI is a different single channel device, as explained below.
Note: The Pulsar-4, Pulsar-2 and Pulsar-1 devices were previously known as
the "USBI-4", "USBI-2" and "USBI-1" devices.
USBI, Pulsar and Quasar Overview
The USBI, Pulsar and Quasar devices belong to Ophir’s line of laser power and
energy measurement instruments. Utilizing smart head technology, the devices
support the complete line of Ophir thermopile, photodiode, PD10, and
pyroelectric smart head detectors. Combining the proven microprocessor-based
measurement technology of Ophir’s Nova, Nova II, Vega and LaserStar
instruments with a USB delivery to your PC, the USBI and Pulsar devices
provide highly accurate measurements together with an easy-to-use graphical
interface. The Quasar device provides a wireless connection to your PC using
Bluetooth™ technology, allowing remote measurements in locations difficult to
reach using a direct wire USB connection.
StarLab User Guide 1

Chapter 1 – Introduction Definition of Terms
Some applications include:
Peak-to-peak stability of energy pulses. •
•
•
•
•
•
•
•
•
•
Power drift of CW lasers over time.
Graphical display of dB loss measured in a fiber optic cable.
Logging energy of rapidly pulsing lasers at 1000Hz or more.
Definition of Terms
The USBI, Pulsar or Quasar instrument is referred to in this guide as the device
or the instrument. The connection between the smart head detector, referred to
as a head, the USBI, Pulsar or Quasar device, and the StarLab application
running on your PC, is referred to as a channel. Using the StarLab system, you
can view each channel’s laser power and energy information. You can work with
multiple channels depending on the type of device you have and the number of
free USB or Bluetooth ports you have on your PC.
Software Features
The StarLab software features include:
Easy configuration of measurement parameters (range, laser, etc.).
Data logging.
User adjustable calibration factors.
Real time update of measurement statistics.
Printing of graphs and data.
Interfaces and supports data logging with Ophir’s Nova-II and Vega
(see Uploading Files from the Nova-II and Vega).
StarLab User Guide 2

Chapter 1 – Introduction Technical and System Performance Specifications
Technical and System Performance Specifications
USBI and Pulsar Specifications
The USBI and Pulsar technical and system performance specifications are
described in Table 1-1.
Table 1-1 USBI and Pulsar Technical and System Performance Specifications
Item USBI Specification Pulsar Specifications
Specifications for Thermopile and Photodiode heads:
Measurement range Varies according to head in use.
Refer to the Ophir Laser Power/Energy Measurement, at
www.ophiropt.com, for full details of each individual head.
Input range 15nA to 1.5mA in 16 ranges 15nA to 1.5mA in 16 ranges
A-to-D sampling rate 15Hz 15Hz
A-to-D resolution 17 bits plus sign (0.0009%
resolution) 17 bits plus sign
Electrical accuracy ±0.25% ±20pA new;
±0.5% ±50pA after 1 year ±0.25% ±20pA new;
±0.5% ±50pA after 1 year
Electrical input noise
level 500nV or 1.5pA +0.0015%
of input range @3Hz 500nV or 1.5pA +0.0015% of input
range @3Hz
Dynamic range 9 decades (1:10^9) 9 decades (1:10^9)
Specifications for Pyroelectric and PD10 heads:
Measurement range Varies according to head in use.
Refer to the Ophir Laser Power/Energy Measurement, at
www.ophiropt.com, for full details of each individual head.
Input range 0 – 6v full scale 0 – 6v full scale
A-to-D sampling 4kHz >20kHz
A-to-D resolution 12 bits no sign (0.025%) 12 bits no sign (0.025%)
Electrical accuracy ±0.25% new, ±0.5% after 1
year ±0.25% new, ±0.5% after 1 year
Electrical input noise 2mV 2mV
Logging rates, Turbo
mode 2kHz every pulse 20kHz, every pulse on all 4 channels
[using USB 2.0]
Logging rates,
normal log mode ~ 300Hz ~ 1kHz [using USB 2.0; varies according
to PC's CPU speed and number of
channels running]
Log file timestamp
precision 1ms (0.001s) 1us (0.001ms)
Log file timestamp
resolution ~50ms 1us (0.001ms)
StarLab User Guide 3

Chapter 1 – Introduction Technical and System Performance Specifications
Item USBI Specification Pulsar Specifications
General Specifications:
Analog output 0-1 Volt with 0.3mV
(0.03%) resolution. 100
ohms impedance
None
Analog output
accuracy ±0.4% ±2mV N/A
Number of channels 1 channel Pulsar-4: 4 channels
Pulsar-2: 2 channels
Pulsar-1: 1 channel
Dimensions
(in millimeters) 91W x 156D x 39H 191W x 116D x 33H
Mass 0.425kg 0.65kg
USB specifications • Full speed
• Bus powered
• High power device
• One interrupt IN
endpoint
• High Speed
• Self powered
• One interrupt IN endpoint
StarLab User Guide 4
Chapter 1 – Introduction Technical and System Performance Specifications
Quasar Specifications
The Quasar technical and system performance specifications are described in
Table 1-2.
Table 1-2 Quasar Technical and System Performance Specifications
Item Quasar Specifications
Specifications for Thermopile and Photodiode heads:
Measurement range Varies according to head in use.
Refer to the Ophir Laser Power/Energy Measurement, at
www.ophiropt.com, for full details of each individual head.
Input range 15nA to 1.5mA in 16 ranges
A-to-D sampling rate 15Hz
A-to-D resolution 12 bits plus oversampling, effective resolution approx 15 bits
Electrical accuracy ±0.25% ±20pA new;
±0.5% ±50pA after 1 year
Electrical input noise level 500nV or 1.5pA +0.0015% of input range @3Hz
Dynamic range 9 decades (1:10^9)
Specifications for Pyroelectric and PD10 heads:
Measurement range Varies according to head in use.
Refer to the Ophir Laser Power/Energy Measurement, at
www.ophiropt.com, for full details of each individual head.
Input range 0 – 6v full scale
A-to-D sampling 500Hz
A-to-D resolution 12 bits no sign (0.025%)
Electrical accuracy ±0.25% new, ±0.5% after 1 year
Electrical input noise 2mV
Logging rate, Turbo mode No Turbo Mode provided
Logging rate, normal log mode Up to 500Hz, every pulse.
Above 500Hz, at least 300 pulses per second.
[May vary according to PC CPU speed, Bluetooth connection
quality, and Bluetooth adapter radio type]
Log file timestamp precision 1us (0.001ms)
Log file timestamp resolution 1us (0.001ms)
General Specifications:
Analog output None
Number of channels 1 channel
Dimensions (in mm) Approx 96W x 95D x 36H
Mass 0.25kg
StarLab User Guide 5

Chapter 1 – Introduction CE Compliance – USBI, Pulsar and Quasar
Item Quasar Specifications
Battery 3x AA size, 1.8 to 2.4Ah NiMH rechargeable battery built-in
Charger Input DC 12 to 25v, 5W
Charge time approx 5-6 hours, automatically switches to
trickle charge when battery is full
Operation between charges ~ 40 hours, thermopile and photodiode heads
~ 20 hours pyroelectric and PD Energy heads
~ 100 hours with no Bluetooth connection to PC
Bluetooth Specifications Class 1 device
Working Range:
• Standard version: Up to ~30m
• Long range upgrade: Up to ~100m in open area
LED Indicator No PC connection – slow flashing blue LED
Connection made to PC – long single flash of blue LED
Connected – fast flashing blue LED
Battery low (less than ~20% capacity) – LED flashes red
(For more details see Table C-1)
CE Compliance – USBI, Pulsar and Quasar
The system, as installed on a CE compliant PC, will comply with all pertinent
CE requirements relating to safety, sensitivity to interference, EMC and
emissions.
FCC Compliance - Quasar
The Quasar is fully compliant with all relevant requirements for radio
equipment: FCC (USA), CE (Europe), TELEC (Japan). The following section
contains information required by the FCC.
FCC ID: V6XQSR
This device complies with Part 15 of the FCC Rules. Operation is subject to the
following two conditions:
1. This device may not cause harmful interference and
2. This device must accept interference received, including interference that
may cause undesired operation.
StarLab User Guide 6

Chapter 1 – Introduction FCC Compliance - Quasar
The FCC Wants you to Know
This equipment has been tested and found to comply with the limits for a Class B
digital device, pursuant to Part 15 of the FCC rules. These limits are designed to
provide reasonable protection against harmful interference in a residential
installation. This equipment generates, uses and can radiate radio frequency
energy and, if not installed and used in accordance with the instructions, may
cause harmful interference to radio communications. However, there is no
guarantee that interference will not occur in a particular installation. If this
equipment does cause harmful interference to radio or television reception,
which can be determined by turning the equipment off and on, the user is
encouraged to try to correct the interference by one or more of the following
measures:
1. Reorient or relocate the receiving antenna.
2. Increase the separation between the equipment and receiver.
3. Connect the equipment to an outlet on a circuit different from that which
the receiver is connected
4. Consult the dealer or an experienced radio/TV technician
FCC Warning:
Modifications not expressly approved by the manufacturer could void the user
authority to operate the equipment under FCC Rules.
RF EXPOSURE WARNING:
Instructions concerning human exposure to radio frequency electromagnetic
fields:
To comply with FCC Section 1.307 (b) (1) for human exposure to radio
frequency electromagnetic fields, implement the following instructions:
A distance of at least 20cm between the equipment and all persons should be
maintained during operation of the equipment.
StarLab User Guide 7

Chapter 2 – Installing StarLab
This chapter provides instructions for installing the USBI, Pulsar and Quasar
hardware and software. Topics include:
Package Contents •
•
•
•
•
•
•
•
•
•
•
•
•
•
•
•
•
System Requirements
Installing StarLab Software
Connecting the USBI and Pulsar Devices
Installing Bluetooth USB Adapter software (for Quasar)
Connecting the Quasar device
Package Contents
Inspect the equipment container before unpacking. Evidence of damage should
be noted and reported immediately.
The USBI package consists of the following items:
Smart Head to USB Interface Unit (USBI device)
USB cable
Installation CD-ROM
The Pulsar package consists of the following items:
Pulsar device
USB cable
Installation CD-ROM
12v power supply
The Quasar package consists of the following items:
Quasar device
Installation CD ROM
12v power supply
Bluetooth USB Adapter for PC + CD ROM
System Requirements
To run the StarLab software, the computer system must meet certain minimum
requirements. The system requirements are listed in Table 2-1.
StarLab User Guide 8
Chapter 2 – Installing StarLab Installing StarLab Software
Table 2-1 System Requirements
Item Requirements
CPU Pentium IV 2.8GHz (recommended).
System Ram 512MBytes (recommended).
Hard Disk 20MBytes (more for storing very large log
files).
Operating System Windows 2000/XP/Vista
USB Ports USBI: USB 1.1 ("Full Speed") or
USB 2.0 ("High Speed").
Pulsar: USB 2.0 (USB 1.1 will work with
greatly reduced performance).
PC Accessories • CD-ROM drive
• Microsoft mouse (or equivalent)
• VGA display with 1024X768
resolution (17” recommended)
• For Quasar: Bluetooth USB Adapter
(supplied) or built in Bluetooth radio
Installing StarLab Software
To install the software:
1. Start your computer.
2. Insert the CD into the CD-ROM drive.
3. The CD software should start automatically. If it does not, double-click
index.htm from the CD-ROM drive to start the software. The main CD
menu will appear.
Figure 2-1 CD Main Menu
4. Under the main heading, click on the device name USBI, Pulsar or
Quasar. The menu for that device will appear.
StarLab User Guide 9
Chapter 2 – Installing StarLab Connecting the USBI and Pulsar Devices
Figure 2-2 Pulsar device Menu
5. Click Install StarLab Application. The InstallShield™ Wizard dialog
box appears. The InstallShield™ Wizard guides you through the
installation process. At the end of the process, the StarLab icon,
appears on the desktop.
For the USBI and Pulsar, the software installation is complete. You can now
connect the USBI or Pulsar device.
For the Quasar, the Bluetooth USB adapter software should be installed.
Refer to section Installing Bluetooth USB Adapter software (for Quasar)
Connecting the USBI and Pulsar Devices
After completing the software installation, you are ready to connect the USBI or
Pulsar device.
Note: The first time the USBI or Pulsar device is connected to the PC, XP or
Windows should be running in Administrator mode.
StarLab User Guide 10
Chapter 2 – Installing StarLab Connecting the USBI and Pulsar Devices
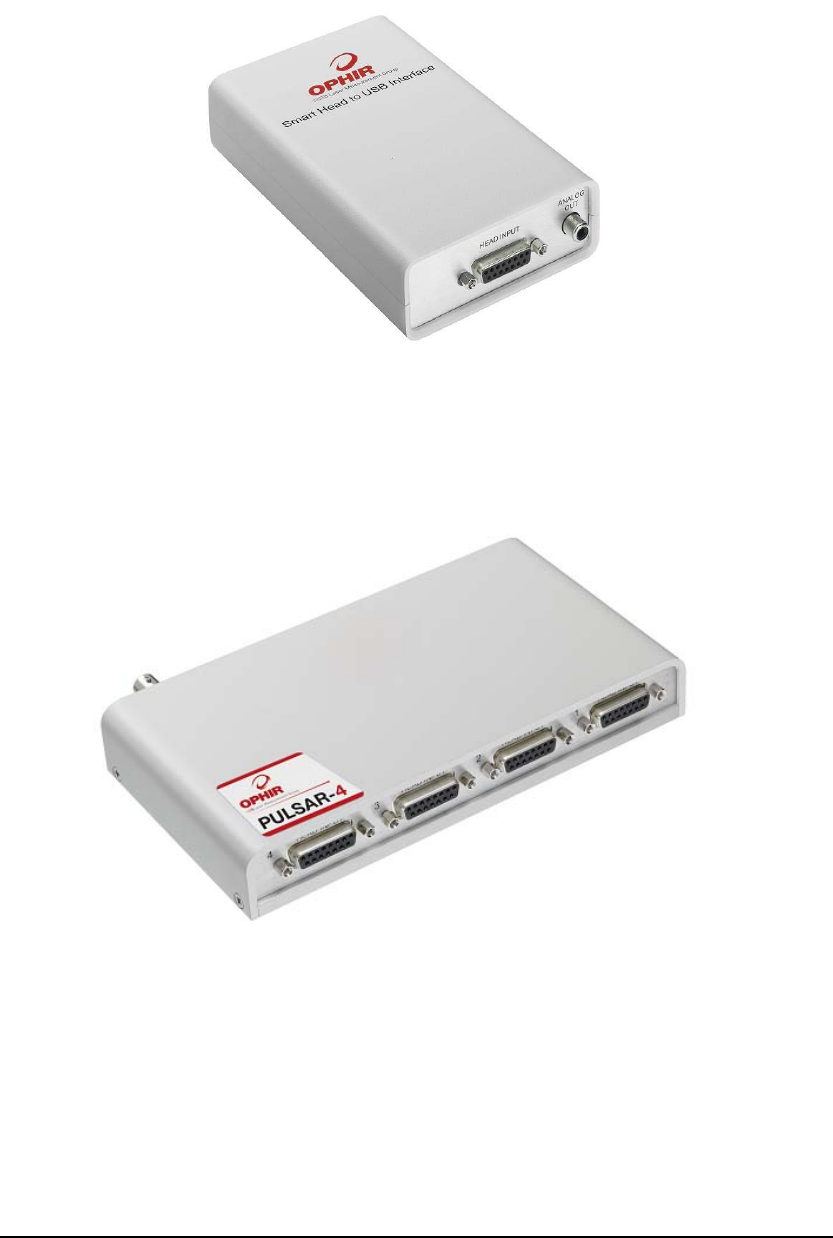
To connect the USBI or Pulsar device:
1. Connect the head to the head input on the device.
• If you are working with the USBI device, you must connect a
thermopile, photodiode, PD10, or pyroelectric head to the head input
point on the device.
Figure 2-3 USBI Box, Head Connector Side
• If you are working with the Pulsar device, you can connect up to four
heads to any one of the four head input points on the device.
Figure 2-4 Pulsar Box, Head Connector Side
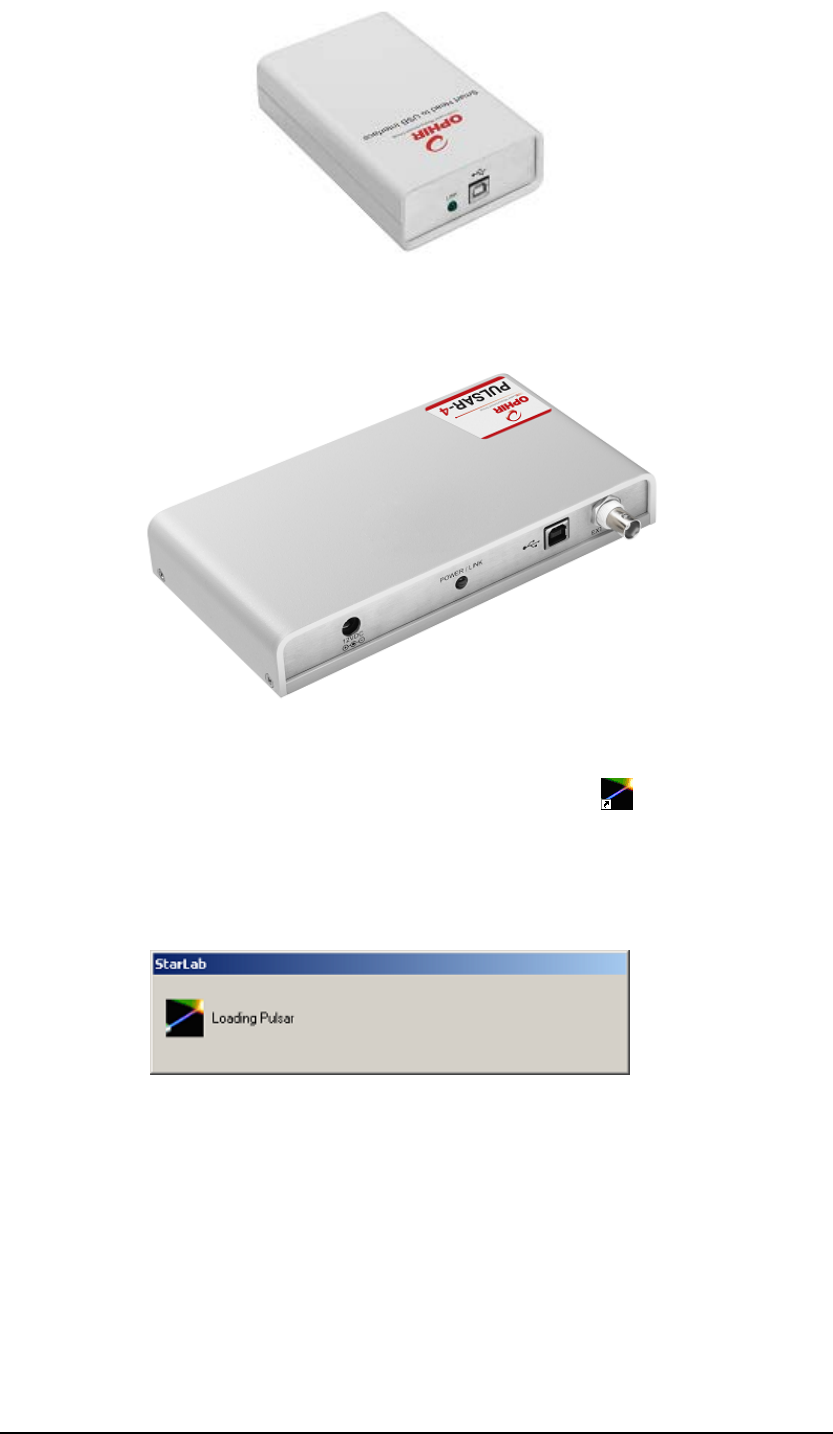
2. If you are using the Pulsar device, connect the 12v power cable to the
main line and to the 12VDC input on the device. The POWER/LINK LED
lights.
3. Connect the USB cable to the device and to the USB port of your PC. On
the USBI, the LINK LED flickers momentarily, indicating USB
enumeration of the device.
StarLab User Guide 11
Chapter 2 – Installing StarLab Connecting the USBI and Pulsar Devices
Figure 2-5 USBI Box, PC – USB Connector Side
Figure 2-6 Pulsar Box, 12 VDC, and PC – USB Connector Side
4. Start the StarLab application by clicking the StarLab icon .
5. If using the Pulsar device, the StarLab application configures the device
the first time it is powered up and connected to the PC. This takes
approximately three seconds, during which the Loading Pulsar dialog
box is displayed:
Figure 2-7 Loading Pulsar Dialog Box
The device is connected and ready for use.
StarLab User Guide 12
Chapter 2 – Installing StarLab Installing Bluetooth USB Adapter software (for Quasar)
Installing Bluetooth USB Adapter software (for
Quasar)
In order to work with the Quasar device, in addition to the StarLab software, a
Bluetooth radio device must be installed on the PC. This radio device may be a
built-in radio inside the PC, as available on many laptops, or it may be an
external USB adapter as supplied with the Quasar. This section describes the
installation of the Bluetooth to USB adapter supplied with the Quasar.
Note: The Quasar device and StarLab software are fully tested with the
Bluetooth adapter supplied by Ophir with the Quasar. While the
StarLab software is expected to function with any Bluetooth radio that
may be installed on the PC, for best results Ophir recommends using
only the radio adapter supplied with the Quasar.
To view instructions for installing the Bluetooth USB Adapter software
1. Start your computer
2. Insert the Ophir CD into the CD-ROM drive.
3. The CD software should start automatically. If it does not, double-click
index.htm from the CD-ROM drive to start the software. The main CD
menu will appear.
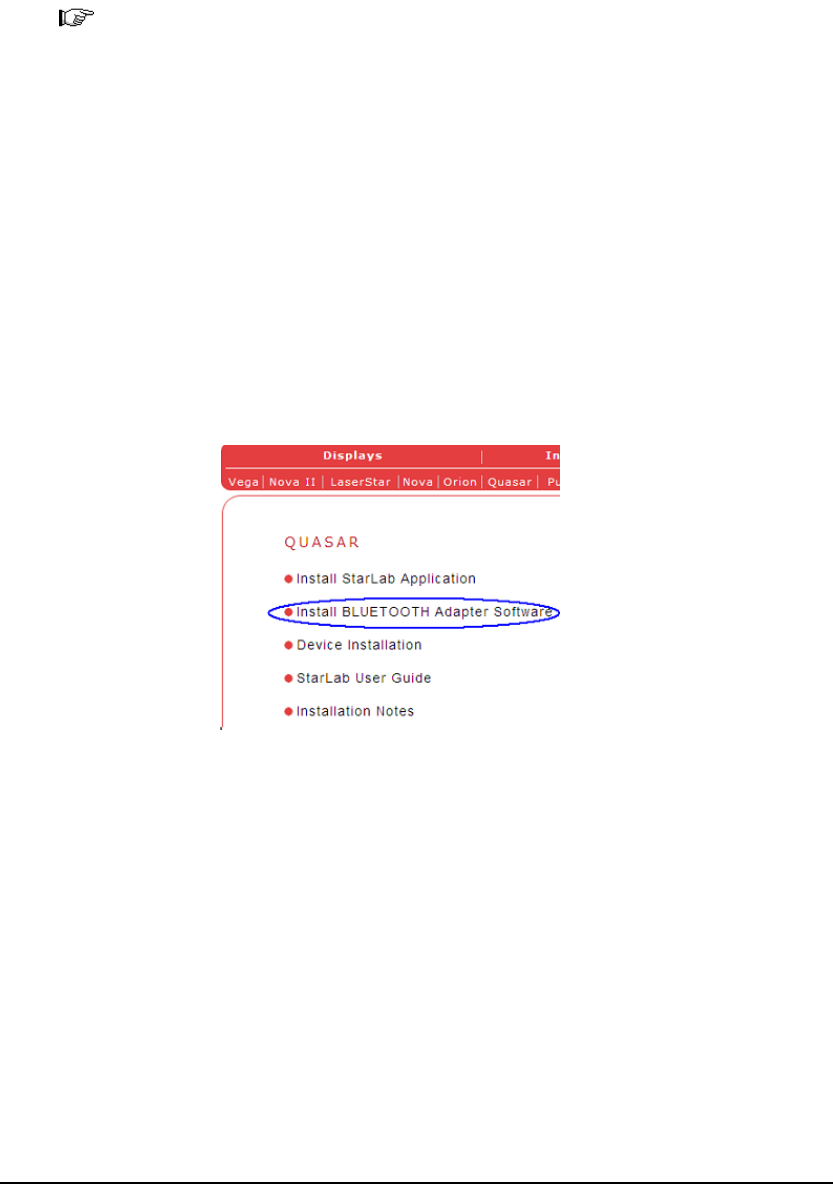
4. Under the main heading, click Quasar. The Quasar CD menu will appear.
Figure 2-8 Quasar CD menu
5. Click Install Bluetooth Adapter Software. Instructions for installing the
Bluetooth USB Adapter software will appear.
Connecting the Quasar device
After completing the StarLab software installation and the Bluetooth USB
Adapter software installation, you are ready to connect the Quasar device.
Connecting the Quasar device
1. Connect the head to the head input on the device.
StarLab User Guide 13
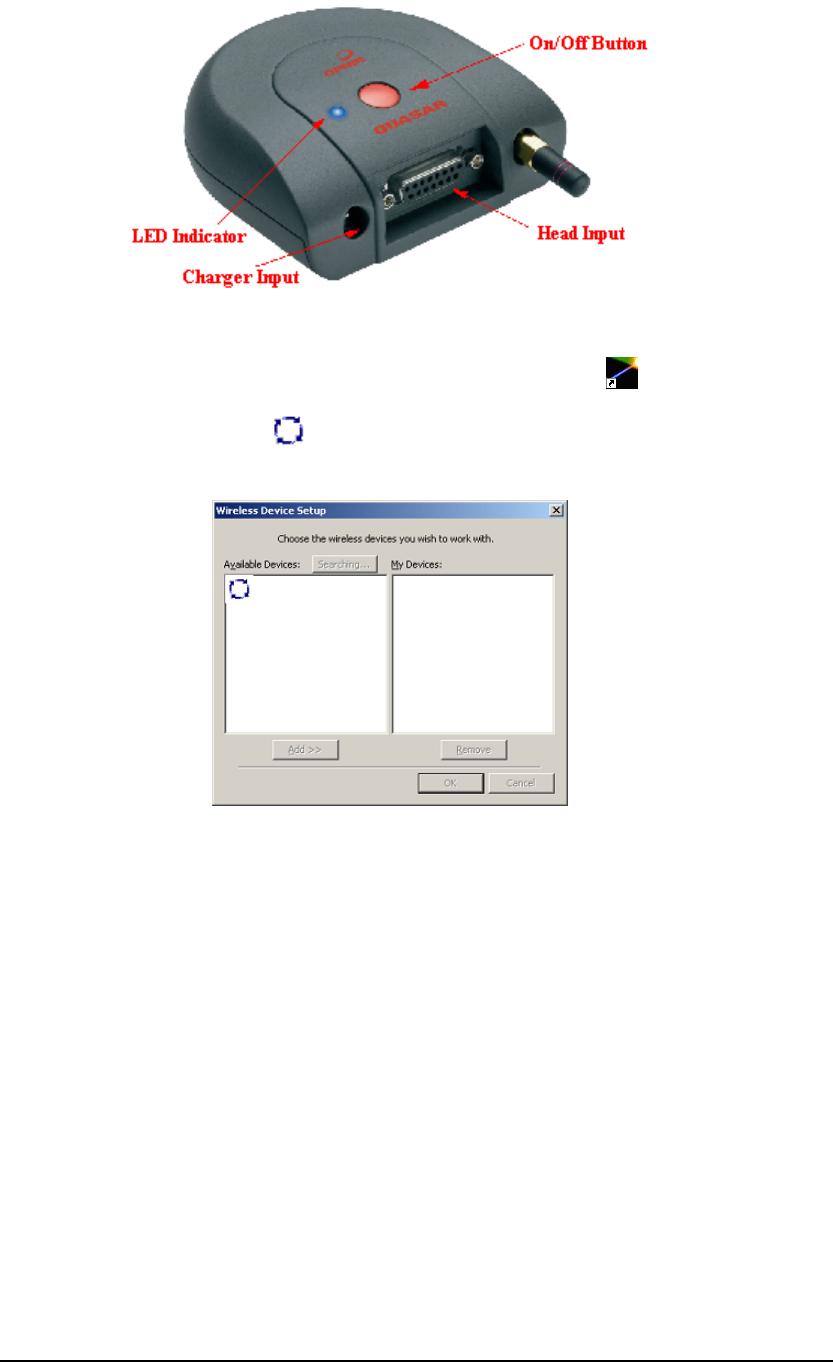
Chapter 2 – Installing StarLab Connecting the Quasar device
2. Switch on the Quasar by momentarily pressing the On/Off button. The
blue LED flashes for approximately 2 seconds, and then blinks slowly.
Figure 2-9 Quasar device
3. Start up the StarLab software by clicking the StarLab icon . The first
time StarLab starts up, the Wireless Device Setup screen is displayed.
The circular symbol shows StarLab is searching for Quasar devices
close by.
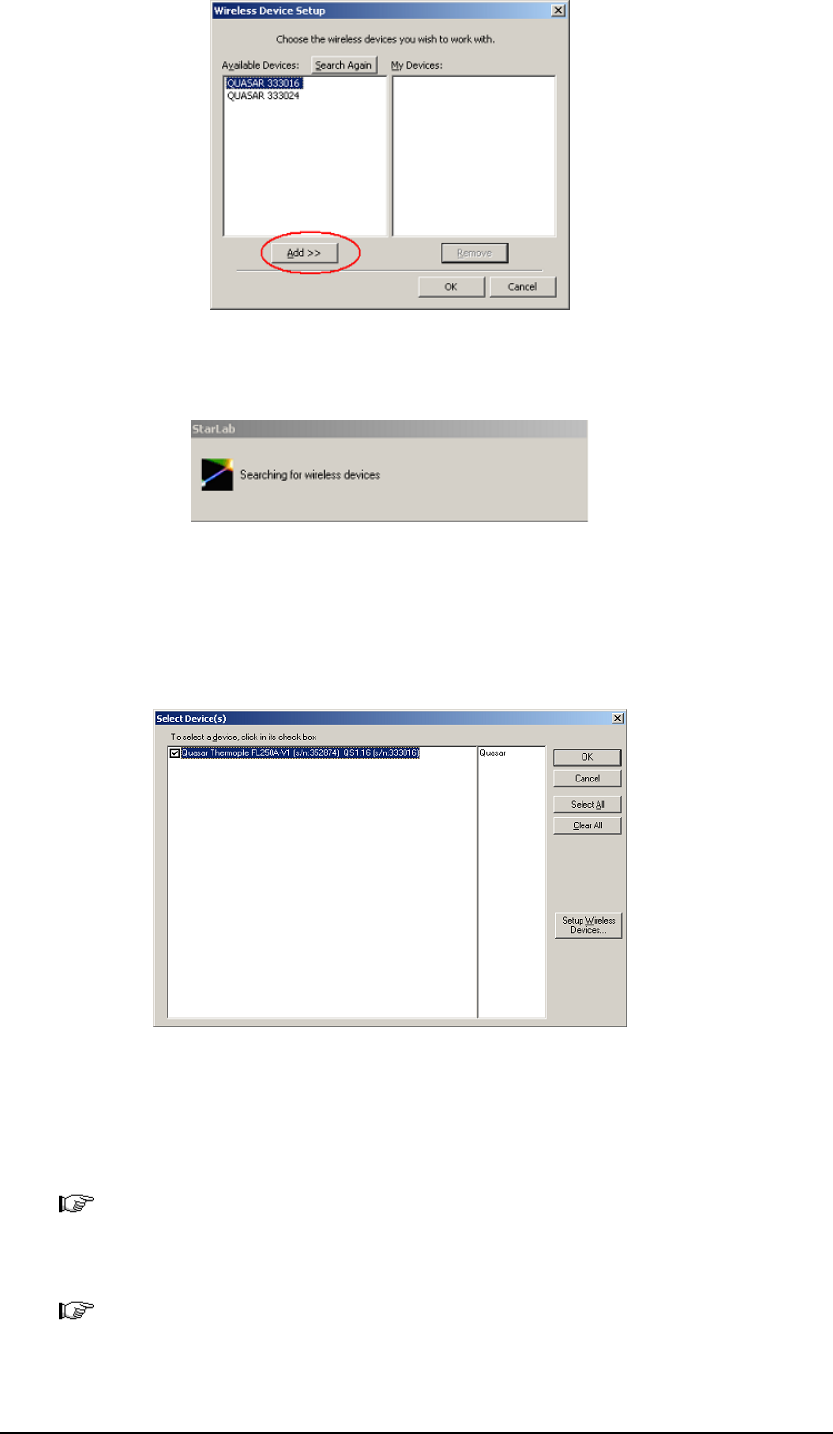
Figure 2–10 StarLab Wireless Device Setup screen
4. When StarLab finishes searching, the serial numbers of any Quasar
devices found in the vicinity are listed in the "Available Devices" window
of the Wireless Device Setup screen. Select the Quasar devices that you
want to work with and click Add. For reference, the serial number for
each Quasar is printed on a label on the under side or edge of the device.
StarLab User Guide 14
Chapter 2 – Installing StarLab Connecting the Quasar device
Figure 2-11 Choosing Quasar to work with
5. Click OK. The "Searching for wireless devices" message is displayed.
Figure 2-12 "Searching for wireless devices" message
6. The Select Devices screen is now displayed. Select the channel to be used
by clicking in the choice box or click Select All. Click OK to activate the
channel(s). For more information on using multiple channels, refer to
Chapter 8 – Working with Multiple Heads.
Figure 2-13 Select Devices screen
7. To search for new Quasar devices to add to the "My Devices" list, or to
remove devices from the list of "My Devices", click Setup Wireless
Devices from the Select Devices screen.
Note: Including unused Quasar devices in the "My Devices" list can
increase the time needed to connect to active devices. It is recommended
to remove unused devices from the list when they are not in use.
Note: See also section below Using Thermopile Head with Integral
Quasar.
StarLab User Guide 15

Chapter 3 – Getting Started
The StarLab application is used with the USBI, Pulsar and Quasar devices. The
StarLab application supports the use of multiple heads and enables you to view
each head’s information in a separate window. Each connection between the
head, the device, and the application is referred to as a channel.
Note: You can work with multiple devices and channels at the same time. For
example, you can use two USBI or Quasar devices to work with two
channels, or one Pulsar-4 device to work with one, two, three, or four
channels. For each channel a separate application window appears
displaying the head’s information. You can use multiple USBI, Pulsar
and Quasar devices to create additional channel connections.
You can use the following instructions for understanding and operating the
StarLab application. Topics include:
Starting and Ending a StarLab Application Session •
•
•
•
•
•
•
•
•
•
•
•
Understanding the Application Window
Resizing the StarLab Window
Configuring the Display for Power Readings
Configuring the Display for Energy Readings
Saving Configuration Settings
Saving Measurement Readings
Printing Measurement Readings
Exporting Data to a Bitmap
Refreshing Devices when Starting the Application
Upgrading the Device’s Internal Software
Accessing the Help Module
Starting and Ending a StarLab Application Session
To start a StarLab session:
1. From the desktop, double-click . The StarLab application opens.
On startup, StarLab searches for devices. If only one is found, StarLab
automatically opens in full screen mode (see Figure 3-2) and begins
operation. If more than one device is found, or more than one head on a single
device, refer to Chapter 8 – Working with Multiple Heads.
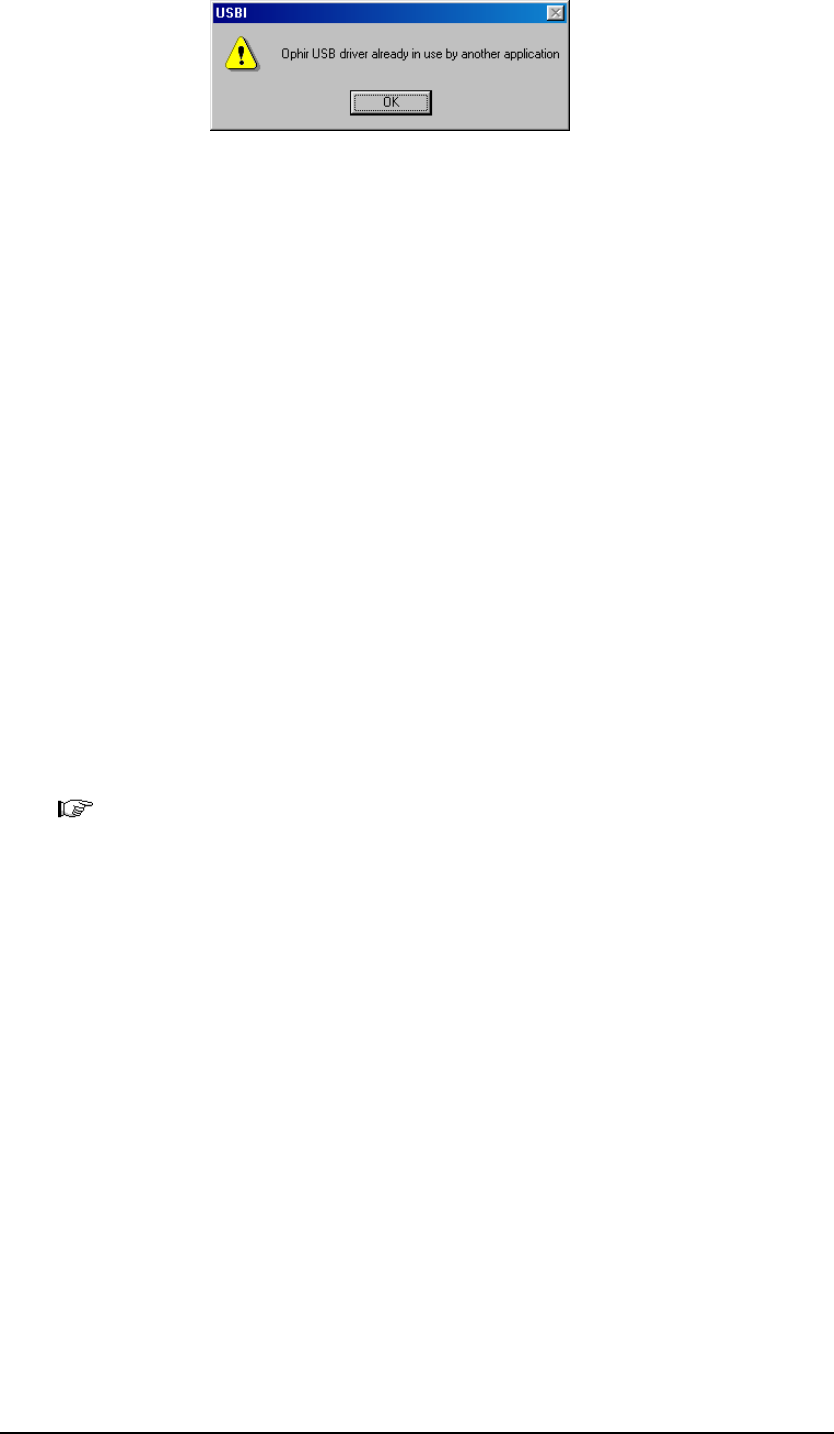
Note: If the RP-USB application is already running, the StarLab application
will not start. Click OK to close the warning box (see Figure 3-1) and
then close the RP-USB.
StarLab User Guide 16
Chapter 3 – Getting Started Understanding the Application Window
Figure 3-1 "USB driver in use" warning box
To end a StarLab session:
1. Open the File menu and select Exit. The StarLab application closes.
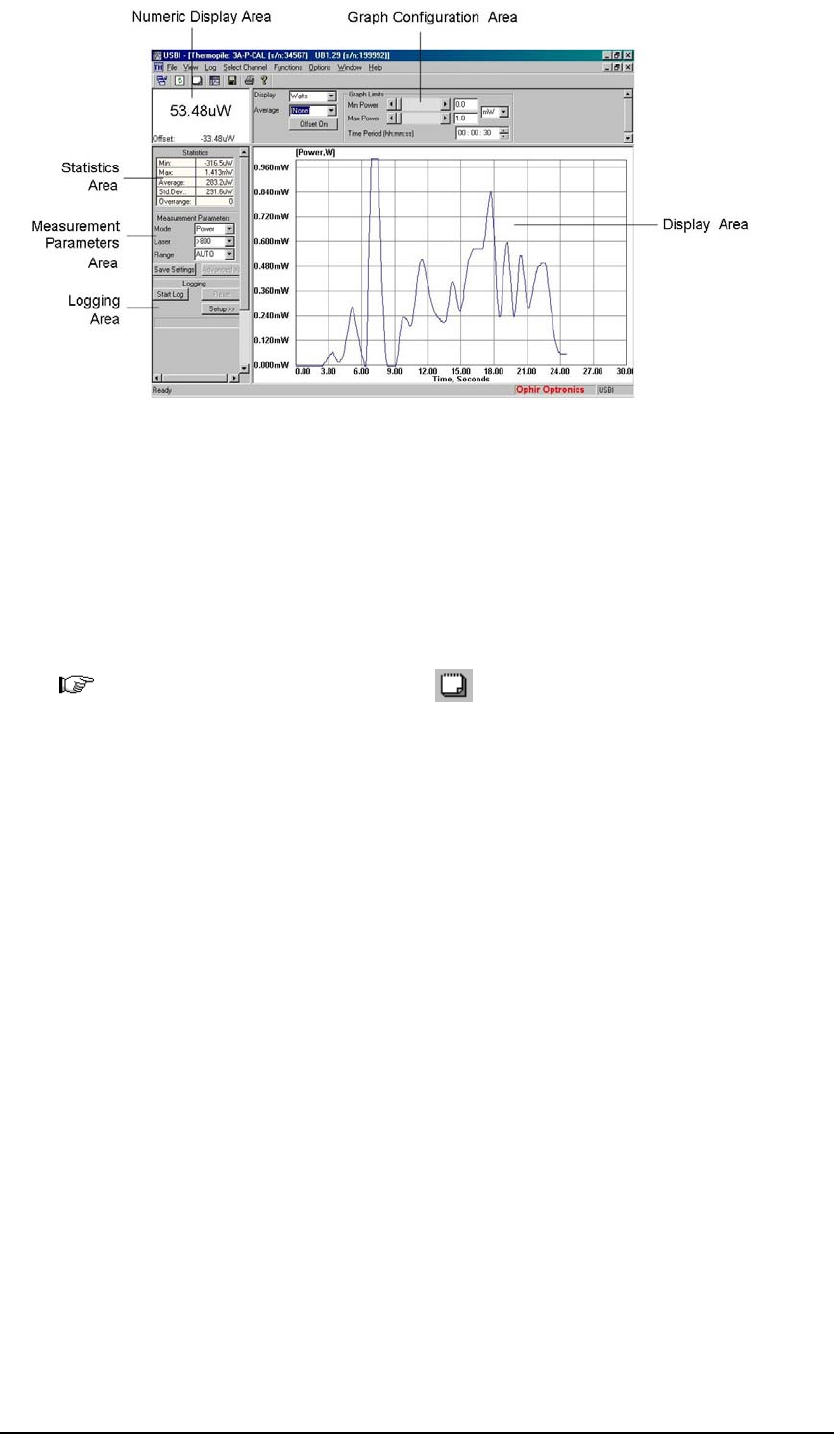
Understanding the Application Window
This section introduces you to the StarLab window and the right mouse button
functions. The application window (see Figure 3-2), contains the following areas
for all heads:
The Display Area •
•
•
•
•
•
The Numeric Display Area
The Graph Configuration Area
The Statistics Area
The Measurement Parameters Area
The Logging Area
The specific elements displayed in these areas depend on whether a photodiode,
thermopile, PD10, or pyroelectric channel is active.
Note: To hide the toolbar or the status bar, open the View menu and uncheck
Toolbar or Status Bar respectively.
StarLab User Guide 17
Chapter 3 – Getting Started Understanding the Application Window
Figure 3-2 StarLab Application Window, Thermopile Head
The Display Area
The Display Area shows the measurement readings in graph form. For
information on configuring the display, refer to Configuring the Display for
Power Readings on page 22, and Configuring the Display for Energy Readings
on page 23.
Note: To clear the Display Area, click on the toolbar.
The Numeric Display Area
The Numeric Display Area shows the measurement reading numerically.
The Graph Configuration Area
The Graph Configuration Area is used to configure graph display settings. For
information on configuring graph display settings, refer to Configuring the
Display for Power Readings on page 22, and Configuring the Display for Energy
Readings on page 23.
StarLab User Guide 18

Chapter 3 – Getting Started Understanding the Application Window
The Statistics Area
The Statistics Area displays statistics for the current session, as the
measurements are being taken. Table 3-1 lists the statistics that are shown.
Table 3-1 The Statistics Area
Statistic Description
Min Displays the minimum measurement taken.
Max Displays the maximum measurement taken.
Average Displays the average measurement taken.
Std. Dev. Displays the standard deviation.
Overrange Displays the number of readings measured that
were over the maximum value for the chosen
range.
When a reading is over the maximum value for
the chosen range, OVER is displayed in the
Numeric Display Area in blue. When the head is
in its top range OVER is displayed in red to
indicate that damage might occur to the head.
Readings
(Thermopile heads in Energy
Mode and pyroelectric and
PD10 heads in power or energy
modes)
Displays the total number of measurements
taken.
Frequency
(Pyroelectric and PD10 heads
only)
Frequency at which the laser is firing.
Missing Pulses (Pulsar with
Pyroelectric and PD10 heads
only)
Displays the number of missing pulses detected
when using External Trigger in Rising/Falling
Edge mode.
The Measurement Parameters Area
The Measurement Parameters Area is used to configure measurement settings.
For information on configuring measurement settings for the various types of
heads, refer to Chapter 4 – Measuring with the Thermopile Head, Chapter 5 –
Measuring with the Photodiode Head and Chapter 6 – Measuring with the
Pyroelectric and PD10 Heads.
The Logging Area
The Logging Area is used to configure log file settings and to start and stop the
log. For information on working with log files, refer to Chapter 9 – Working with
Log Files.
StarLab User Guide 19

Chapter 3 – Getting Started Understanding the Application Window
The Right Mouse Pop-Up Menu
To access the right mouse pop-up menu:
1. Position the cursor anywhere in the StarLab window.
2. Click the right mouse button. The pop-up menu appears.
StarLab User Guide 20

Chapter 3 – Getting Started Understanding the Application Window
Table 3-2 lists the menu items available from the pop-up menu.
Table 3-2 The Pop-Up Menu
Menu Item Description
Zeroing Enables zeroing the internal circuitry of the device.
For information on zeroing the instrument, refer to
Zeroing the Instrument in Chapter 4 – Measuring with the
Thermopile Head and Zeroing the Instrument in
Chapter 5 – Measuring with the Photodiode Head.
Note: The procedure for zeroing the instrument with
pyroelectric heads is slightly different. For more
information, refer to Zeroing the Instrument in
Chapter 6 – Measuring with the Pyroelectric and PD10
Heads.
Exposure
(Pyroelectric heads
only)
Measures the total energy exposure. For more
information, refer to Measuring the Total Energy
Exposure in Chapter 6 – Measuring with the Pyroelectric
and PD10 Heads.
Note: The exposure menu item is not available in
StarLab software version 1.00 for the Pulsar and Quasar
devices.
Response
(Thermopile heads
only)
Enables adjusting the response factor. This optimizes the
thermal response time of thermopile heads.
For information on configuring the response factor, refer
to Configuring the Response Factor in Chapter 4 –
Measuring with the Thermopile Head.
Calibrate Enables adjusting calibration factors.
For information on calibration factors, refer to
Calibration Factors in Chapter 4 – Measuring with the
Thermopile Head, Adjusting Calibration Factors in
Chapter 5 – Measuring with the Photodiode Head, and in
Adjusting Calibration Factors in Chapter 6 – Measuring
with the Pyroelectric and PD10 Heads.
Line Frequency Enables setting power line frequency.
For information on setting power line frequency, refer to
Setting Line Frequency in Chapter 4 – Measuring with
the Thermopile Head.
Ext Trig Control Enables external trigger control.
Note: The external trigger control is not relevant for
the USBI, Quasar, Nova-II or Vega devices.
Turbo Mode
(Pyroelectric and
PD10 heads only)
Logs laser readings at an accelerated rate.
For more information, refer to Using Turbo Mode in
Chapter 9 – Working with Log Files.
StarLab User Guide 21

Chapter 3 – Getting Started Resizing the StarLab Window
Resizing the StarLab Window
You can resize any area of the StarLab application window.
To resize an area of the StarLab application window:
1. Click and drag the border of the area that you wish to resize.
2. Release the mouse button when you have resized the area.
To restore the StarLab window to its default size settings:
1. Click on the toolbar. The StarLab application window reverts to its
default size settings.
Configuring the Display for Power Readings
Power readings can be taken with a photodiode head, or with a thermopile or
pyroelectric head in power mode. Thermopile heads in power mode and
photodiode heads are configured in exactly the same way. The following sections
explain the display options and how to select them.
Note: To take measurements in power mode when working with a thermopile
or pyroelectric head, select Power from the Mode drop down list in the
Measurement Parameters Area.
StarLab User Guide 22
Chapter 3 – Getting Started Configuring the Display for Energy Readings
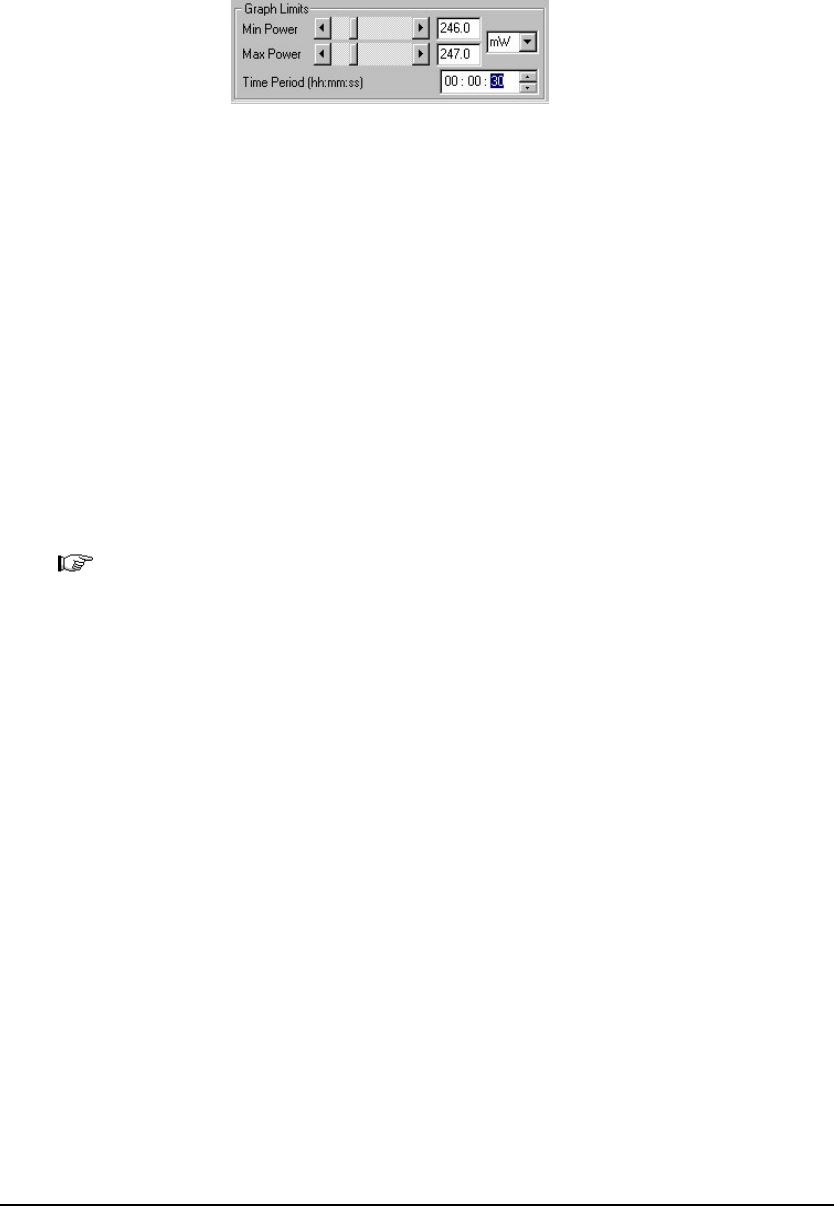
Configuring Graph Limits and Time Period
To configure graph limits and time period:
1. In the Graph Configuration Area, use the Min Power and Max Power
scroll bars to configure minimum and maximum power in the Graph
Limits area.
Figure 3-3 Configuring Graph Limits and Time Period
– Graph Configuration Area
2. From the Min Power and Max Power drop down list, select the power
scale (nanowatts, microwatts, etc.). The graph shown in the Display Area
adjusts according to your selection.
3. In the Time Period field, use the arrows to set the time period of the
Display Area in hours, minutes, and seconds. The graph shown in the
Display Area adjusts according to your selection.
Configuring the Display for Energy Readings
This section explains the display options for thermopile and pyroelectric heads in
energy mode, and how to select them.
Note: To take measurements in energy mode when working with thermopile
and pyroelectric heads, select Energy from the Mode drop down list in
the Measurement Parameters Area.
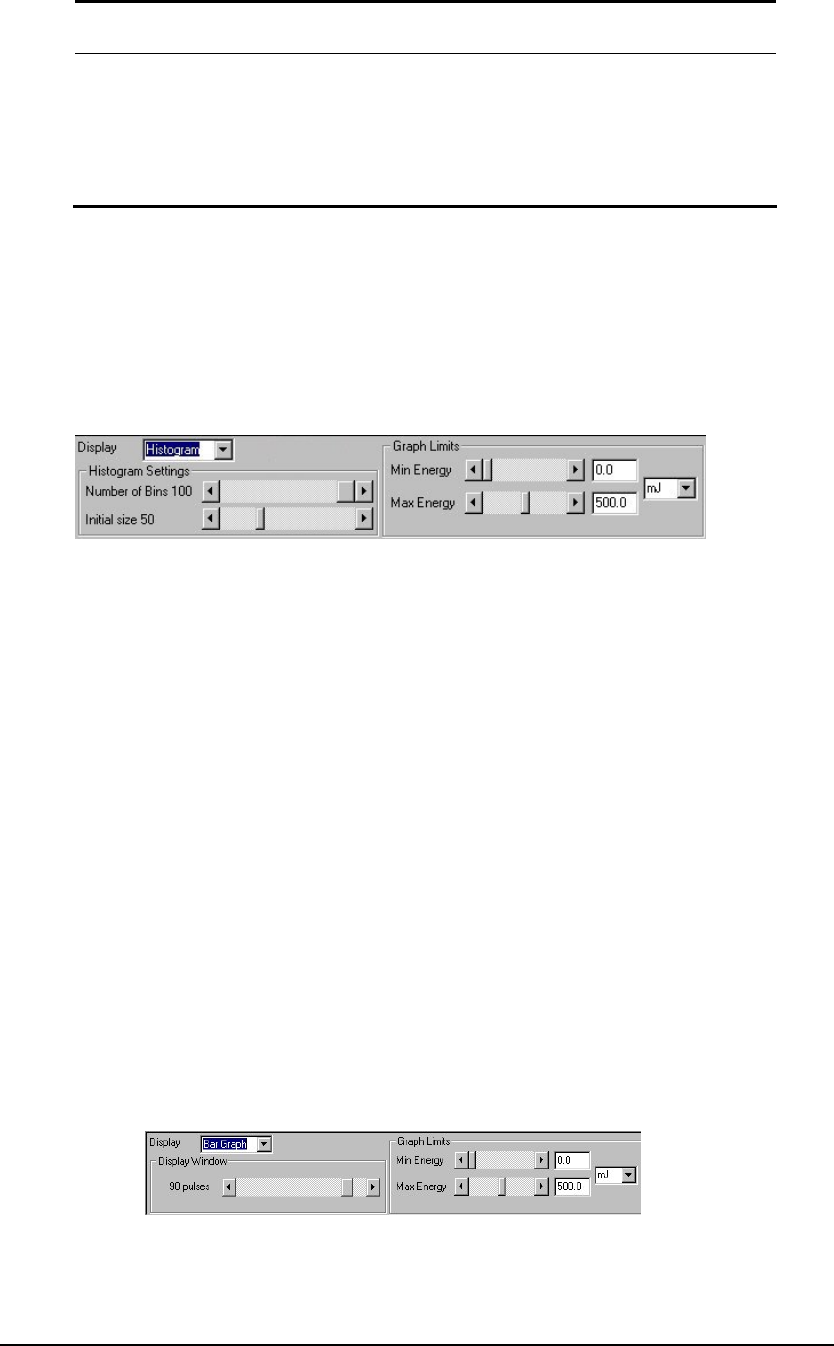
Selecting the Display Type
You can display measurement readings in histogram or bar graph format when
working in energy mode.
To select the display type in energy mode:
1. From the Display drop down list in the Graph Configuration Area, select
the desired graphic display option.
StarLab User Guide 23
Chapter 3 – Getting Started Configuring the Display for Energy Readings
Table 3-3 describes the two available graphic display types.
Table 3-3 Energy Mode – Graphic Display Types
Display Description
Histogram The histogram presents a statistical analysis of all the
measurements.
Bar Graph The bar graph presents multiple readings in a single
display and shows changes in measurement on a
pulse-to-pulse basis, showing peak-to-peak stability.
Configuring Histogram Settings
To configure histogram settings:
1. With Histogram selected in the Display drop down list, use the Min
Energy and Max Energy scroll bars to configure the minimum and
maximum energy in the Graph Configuration area.
Figure 3-4 Configuring Histogram Settings –
Graph Configuration Area
2. From the Min Energy and Max Energy drop down list, select the energy
scale. The graph shown in the Display Area adjusts according to your
selection.
3. In the Histogram Settings area, use the Number of Bins scroll bar to
configure the number of bins. The graph shown in the Display Area
adjusts according to your selection.
4. In the Histogram Settings area, use the Initial size scroll bar to configure
the initial size. The graph shown in the Display Area adjusts according to
your selection.
Configuring Bar Graph Settings
To configure bar graph settings:
1. With Bar Graph selected in the Display drop down list, use the Min
Energy and Max Energy scroll bars to configure the minimum and
maximum energy in the Graph Limits area.
Figure 3-5 Configuring Bar Graph Settings –
Graph Configuration Area
StarLab User Guide 24
Chapter 3 – Getting Started Saving Configuration Settings
2. From the Min Energy and Max Energy drop down list, select the energy
scale. The graph shown in the Display Area adjusts according to your
selection.
3. In the Display Window area, use the scroll bar to configure the number of
pulses shown in the Display Area. The graph shown in the Display Area
adjusts according to your selection.
Saving Configuration Settings
StarLab provides a range of configuration and optimization options to deliver the
most accurate readings. For more information on configuring and optimizing
measurement settings for the various head types, refer to Chapter 4 – Measuring
with the Thermopile Head, Chapter 5 – Measuring with the Photodiode Head
and Chapter 6 – Measuring with the Pyroelectric and PD10 Heads.
You can save configuration settings to appear as default settings the next time
you take measurements with that head. This section explains how to save your
configuration settings.
Saving Configuration Settings for this Session
To save the configuration settings for the current session:
1. Click in the Measurement Parameters Area.
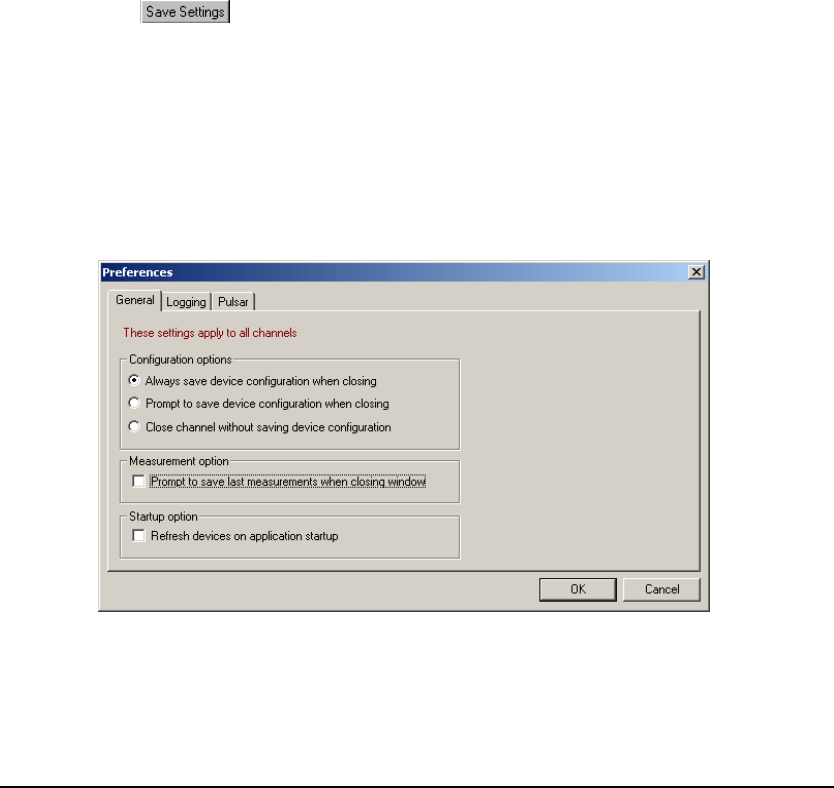
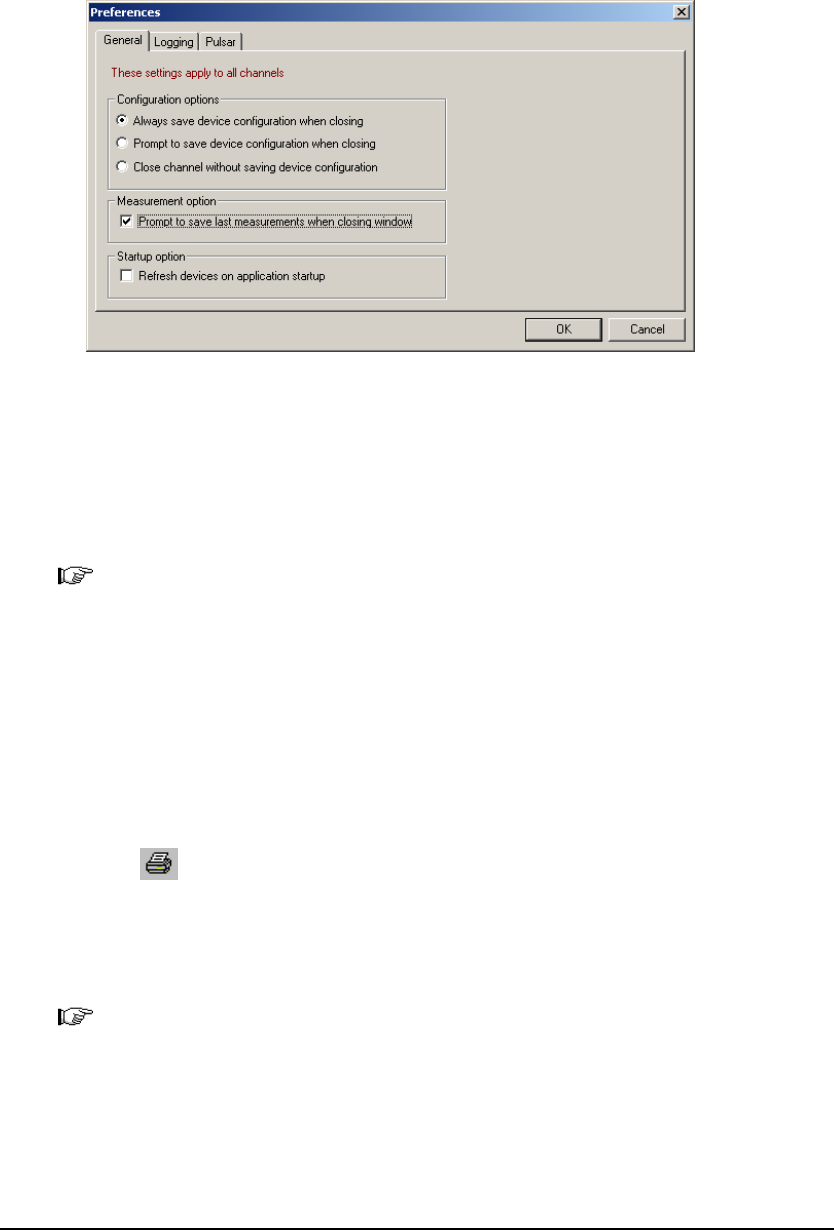
Automatically Saving Configuration Settings
To automatically save the configuration settings every time you end a
session:
1. Select Preferences from the Options menu. The Preferences dialog box
appears (see Figure 3-6).
Figure 3-6 Preferences Dialog Box –
Automatically Saving Configuration Settings
2. Select Always save device configuration when closing in the
Configuration options area of the General tab.
StarLab User Guide 25
Chapter 3 – Getting Started Saving Configuration Settings
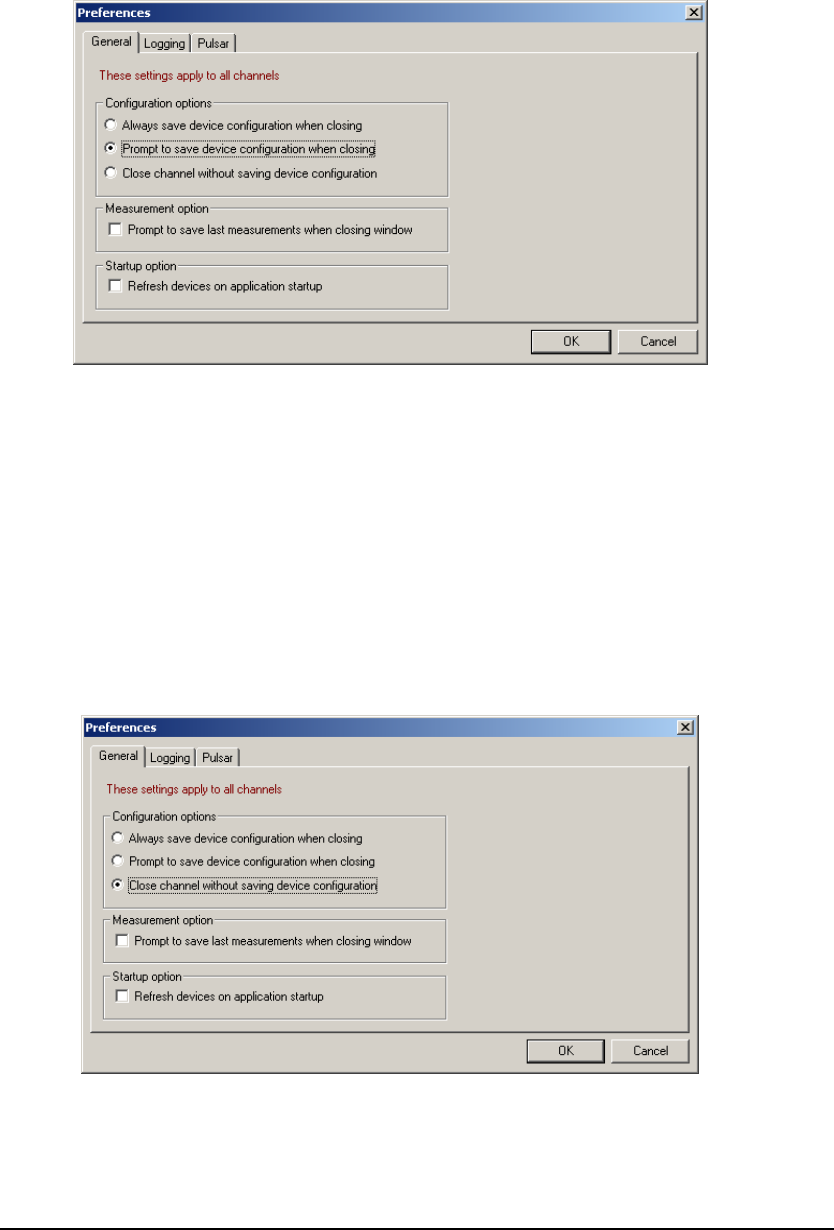
Prompt to Save Device Configuration when Closing
To receive a prompt to save device configuration settings every time you end
a session:
1. Select Preferences from the Options menu. The Preferences dialog box
appears.
Figure 3-7 Preferences Dialog Box –
Prompt to Save Device Configuration when Closing
2. Select Prompt to save device configuration when closing in the
Configuration options area of the General tab.
Close Channel without Saving Device Configuration
To close a channel without saving device configuration:
1. Select Preferences from the Options menu. The Preferences dialog box
appears.
Figure 3-8 Preferences Dialog Box –
Close Channel without saving Device Configuration
StarLab User Guide 26
Chapter 3 – Getting Started Saving Measurement Readings
2. Select Close channel without saving device configuration in the
Configuration options area of the General tab.
Saving Measurement Readings
This section describes saving measurement readings for the session, and how to
automatically receive a prompt to save readings when closing a channel window.
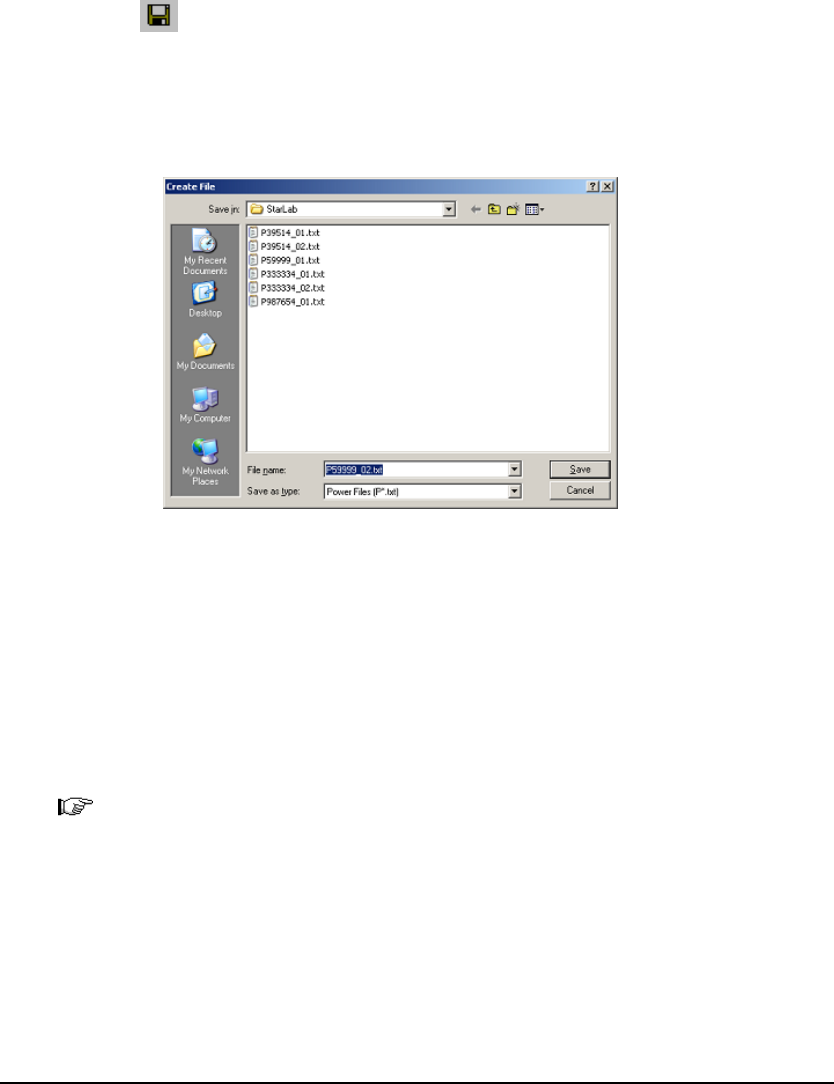
Saving Readings for this Session
To save measurement readings for the current session:
1. Click on the toolbar.
OR
Open the Log menu and select Save Last Measurements. The Create File
dialog box appears with the default StarLab folder open.
Figure 3-9 Create File Dialog Box
2. Enter the file name in the File name field.
3. Click Save to save the file to the current directory.
OR
Click the Save in drop down box and select a different directory to save the
file to a directory of your choice. Then click Save.
Note: The files are saved to the default location. For information on the
default location used by StarLab refer to section Default Location for
Log Files
StarLab User Guide 27
Chapter 3 – Getting Started Printing Measurement Readings
Receiving a Prompt to Save Readings
To receive a prompt to save measurement readings every time you close a
channel window:
1. Select Preferences from the Options menu. The Preferences dialog box
appears.
Figure 3-10 Preferences Dialog Box –
Prompt to Save Last Measurements when Closing Window
2. In the Measurement option area, select Prompt to save last
measurements when closing window of the General tab.
3. Click OK to save the preference.
Note: This provides the user with a last opportunity to save the latest
measurements taken. To set up a complete data logging session, refer
to Chapter 9 – Working with Log Files.
Printing Measurement Readings
You can print the Display Area for all types of measurements.
To print the display area:
1. Click on the toolbar.
OR
Open the File menu and select Print. The StarLab display area is printed.
Note: The default orientation is landscape, but you can change it to portrait.
The screen is adjusted to fit the orientation.
Exporting Data to a Bitmap
You can export the Display Area data as a bitmap.
StarLab User Guide 28
Chapter 3 – Getting Started Refreshing Devices when Starting the Application
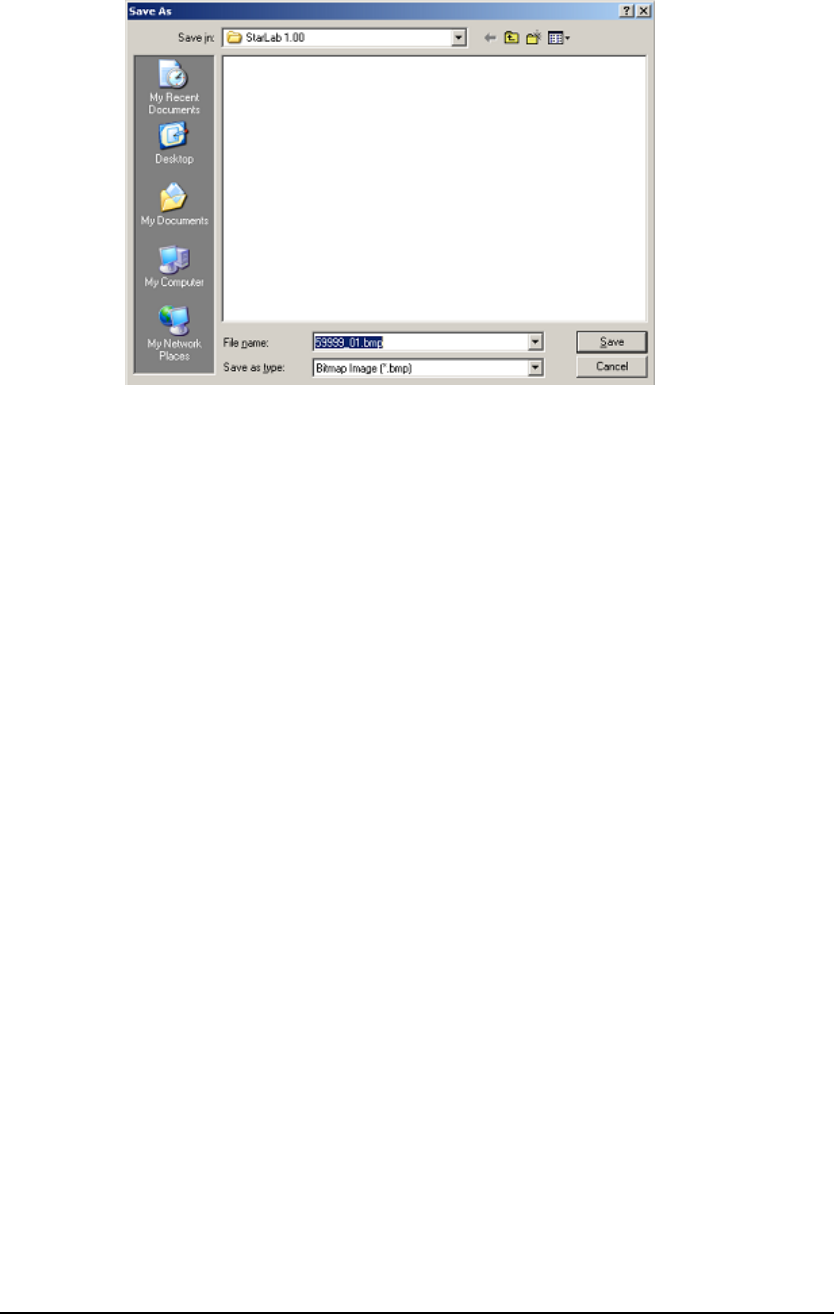
To export the data as a bitmap:
1. Open the File menu and select Export to Bitmap. The Save As dialog
box appears with the default StarLab folder open.
Figure 3-11 Save As Dialog Box
2. Enter the file name in the File name field.
3. Click Save to save the file to the current directory,
OR
Click the Save in drop down box and select a different directory to save the
file to a directory of your choice. Then click Save.
Refreshing Devices when Starting the Application
StarLab allows you to automatically refresh all attached devices each time you
start the application.
To refresh all attached devices on starting the application:
1. Open the Options menu and select Preferences. The Preferences dialog
box appears, see Figure 3-12.
StarLab User Guide 29
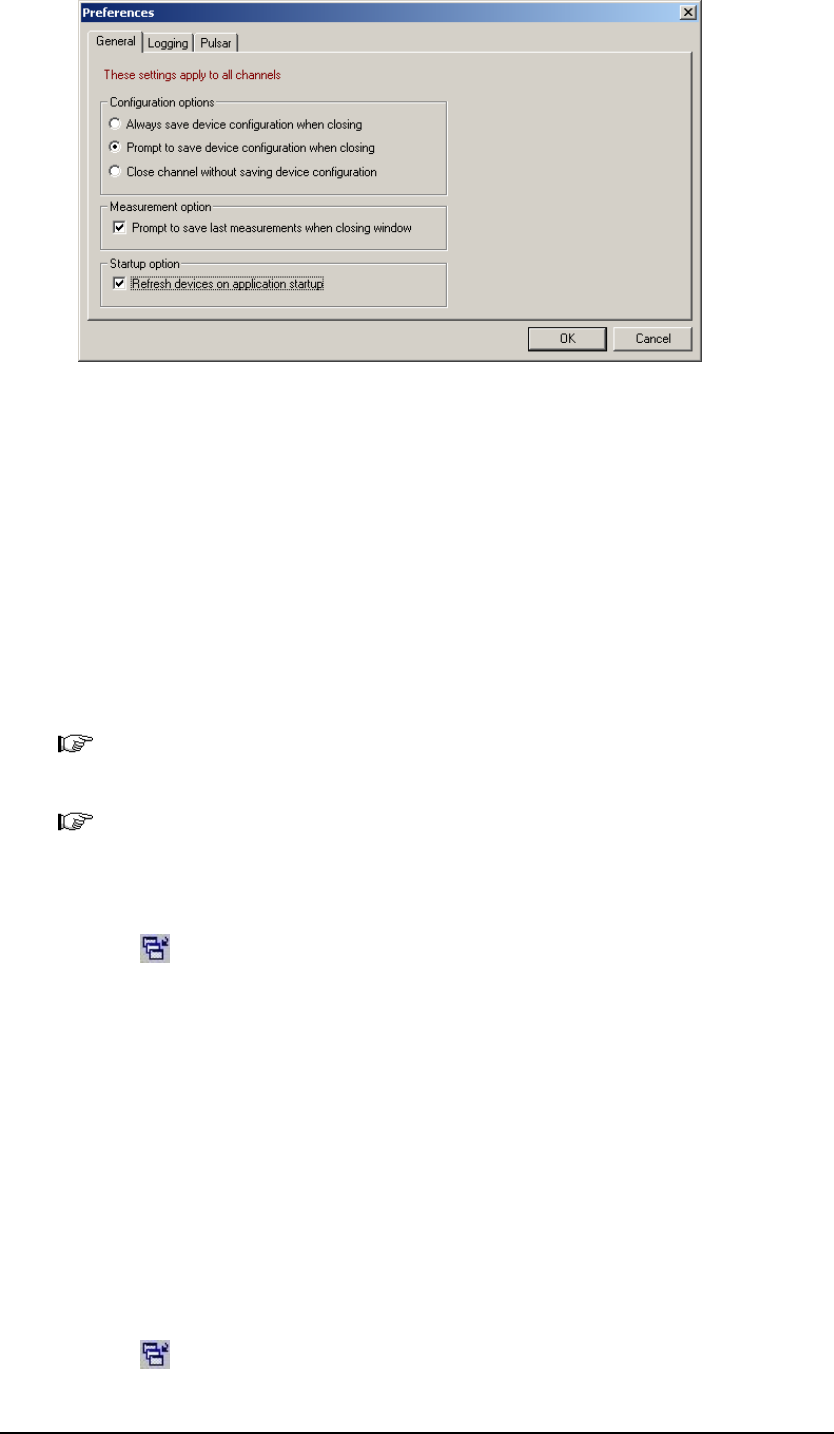
Chapter 3 – Getting Started Upgrading the Device’s Internal Software
Figure 3-12 Preferences Dialog Box –
Refresh Devices on Application Startup
2. Select Refresh devices on application startup in the Startup option area of
the General tab.
3. Click OK to save the preference.
Upgrading the Device’s Internal Software
The device’s internal software must be upgraded when a newer version of the
internal software is released.
Note: Upgrading the device’s software is only relevant when using the USBI,
the Quasar, the Nova-II or the Vega.
Note: StarLab version 1.00 does not support software upgrade for the
Quasar. The feature will be added in a later version.
To check if your device’s internal software needs upgrading:
1. Click from the StarLab application window toolbar.
OR
Click the Select Device menu. The Select Device(s) dialog box appears.
• If one of the connected devices is faulty, the following message
appears beside the device name: Faulty Device Software - Must be
Upgraded.
• If the device’s currently installed internal software is not compatible
with the latest software, the following message appears beside the
device name and version number: Must be upgraded!
To upgrade your device’s internal software:
1. Click from the StarLab application window toolbar.
StarLab User Guide 30
Chapter 3 – Getting Started Accessing the Help Module
OR
Click the Select Device menu. The Select Device(s) dialog box appears.
2. Select the channel you wish to upgrade.
3. Click Upgrade. The Upgrade Device Software dialog box appears. The
latest version of the device’s internal software is already selected in the
Select file field.
Figure 3-13 Upgrade Device Software Dialog Box
4. Click Start. The Done button becomes inactive until the upgrade is
complete. The progress bar displays the status of the upgrade. The upgrade
takes approximately 2 minutes per device upgraded.
5. When the upgrade is complete, click Done. The Upgrade Device
Software dialog box closes.
Accessing the Help Module
StarLab application offers an easy-access Help module.
To access StarLab application’s Help:
1. Click on the toolbar.
OR
Open the Help menu and select Help Topics. The StarLab Help module
appears.
OR
Select StarLab Online Help from the StarLab program group of the Start
menu of the Windows Desktop Toolbar.
StarLab User Guide 31

Chapter 4 – Measuring with the
Thermopile Head
This chapter provides an overview of thermopile heads and instructions for
taking measurements with the thermopile head. Topics include:
Overview of Thermopile Heads •
•
•
•
•
•
•
Measurement Settings Configuration
Configuring Measurement Settings in Power Mode
Configuring Measurement Settings in Energy Mode
Optimizing the Readings
Calibration Factors
Additional Graphical Display Options
Overview of Thermopile Heads
Ophir thermopile heads measure both power and single shot energy. When a
radiant heat source, such as a laser, is directed at the absorber head aperture, a
temperature gradient is created across the thermopile of the enclosed detector
disc. This generates a voltage proportional to the incident power.
The instrument amplifies this signal and indicates the power level received by
the head. At the same time, the signal-processing software enables the instrument
to respond faster than the thermal rise time of the detector disc, reducing the
response time of instrument. The energy of a single pulse is measured by
digitally integrating the pulse power over time.
For a more detailed description of the principles of operation of Ophir thermopile
heads, refer to the Ophir Optronics catalog, available for download from
http://www.ophiropt.com.
Measurement Settings Configuration
If you are planning to repeat similar measurements, you can configure the
settings for each individual head, and save them to the instrument. The saved
settings become the default configuration for that channel, and are displayed
every time the channel is opened.
The following sections describe how to select the measurement mode, how to
configure measurement settings for thermopile heads and how to save them as
the default configuration for that channel. The measurement setting fields differ
for power and energy modes.
StarLab User Guide 32
Chapter 4 – Measuring with the Thermopile Head Configuring Measurement Settings in Power Mode
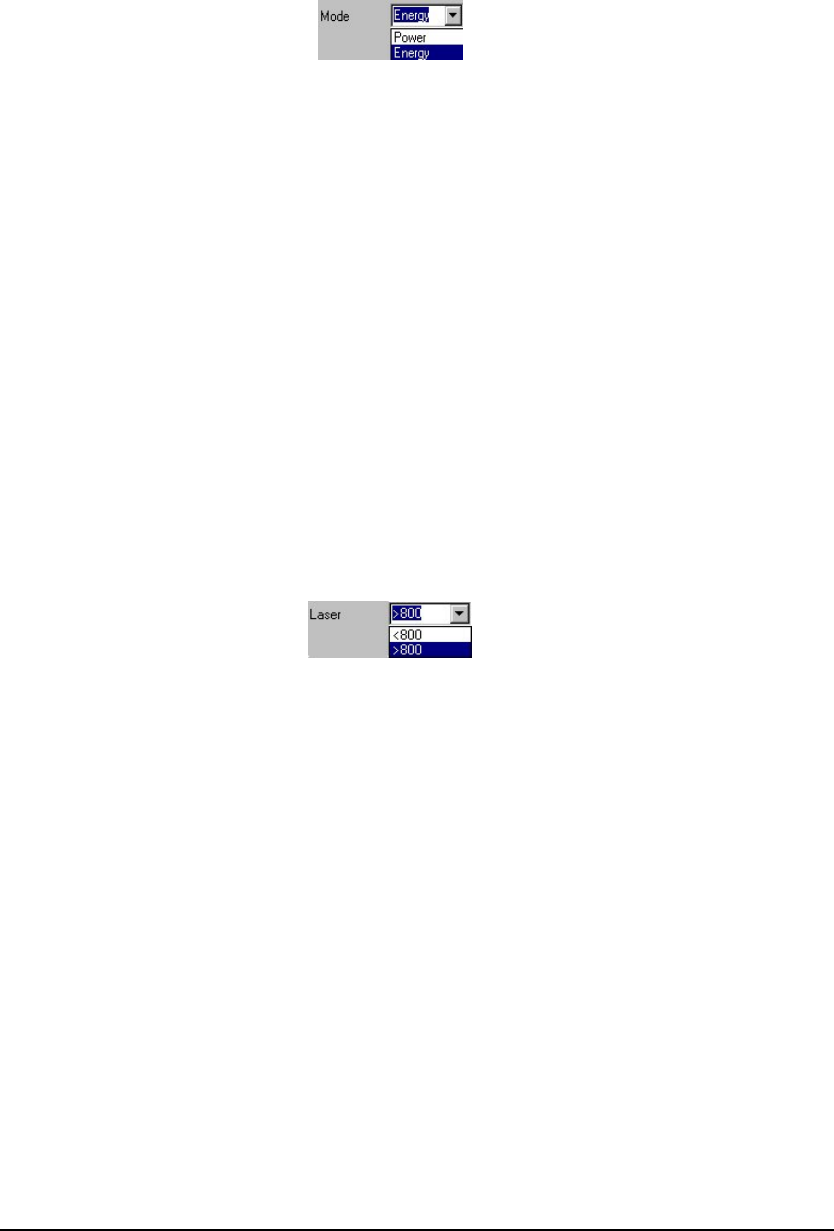
Selecting the Measurement Mode
To select the measurement mode:
1. Select Power or Energy from the Mode drop down list in the
Measurement Parameters Area. The Thermopile screen fields displayed
depend on the mode selected.
Figure 4-1 Mode Drop Down List
Configuring Measurement Settings in Power Mode
This section explains how to select the laser wavelength and configure the range
and an average reading in power mode.
Selecting the Laser Wavelength
Thermopile heads have different absorption at different wavelengths. To
compensate for these differences, each head has been calibrated by a laser at
several wavelengths. By choosing the correct laser wavelength, the correction
factor for that wavelength is automatically introduced.
To select the laser wavelength:
1. Select the laser wavelength from the Laser drop down list in the
Measurement Parameters Area.
Figure 4-2 Laser Drop Down List
LP1 Heads
For the new LP1 family of heads, the absorption of the detector coating varies
somewhat according to wavelength. The correction curve for the absorber is
stored in the head EEROM. This correction curve ensures that the power reading
is correct at all laser wavelengths.
To configure laser wavelengths, refer to Configuring Laser Wavelengths in
Chapter 5 – Measuring with the Photodiode Head
StarLab User Guide 33
Chapter 4 – Measuring with the Thermopile Head Configuring Measurement Settings in Power Mode
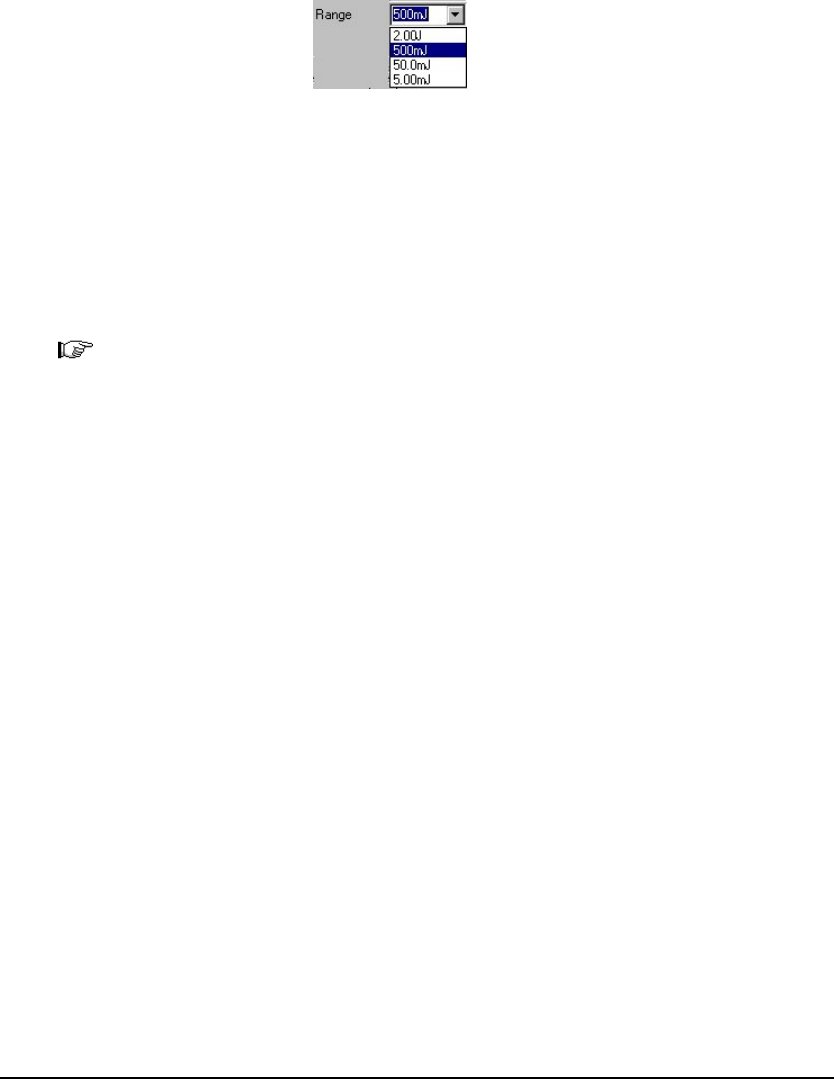
Selecting the Range
Thermopile heads cover a wide range of powers, from microwatts to 1000s of
watts, depending on the type of head in use. In order to provide accuracy at each
end of the range, the electronics of the USB Interface Unit must be configured to
work in a range that is most suited to your needs.
To configure the range when you know the approximate range of the
expected readings:
1. Select the range from the Range drop down list in the Measurement
Parameters Area. The instrument will configure itself according to the
selected range.
Figure 4-3 Range Drop Down List
To configure the range when the range of the expected readings is not
known, or if highly varying readings are expected:
1. Select AUTO from the Range drop down list in the Measurement
Parameters Area. The instrument will configure itself according to the
selected range.
Note: AUTO instructs the instrument to configure itself in the lowest range
possible that is higher than the latest readings. If the readings exceed
100% of the present range, the instrument reconfigures itself for the
next higher range. If the readings fall below 9% of the present range,
the instrument reconfigures itself for the next lower range after a short
delay. The delay prevents an infinite range-changing loop when
readings are close to the end of the scale.
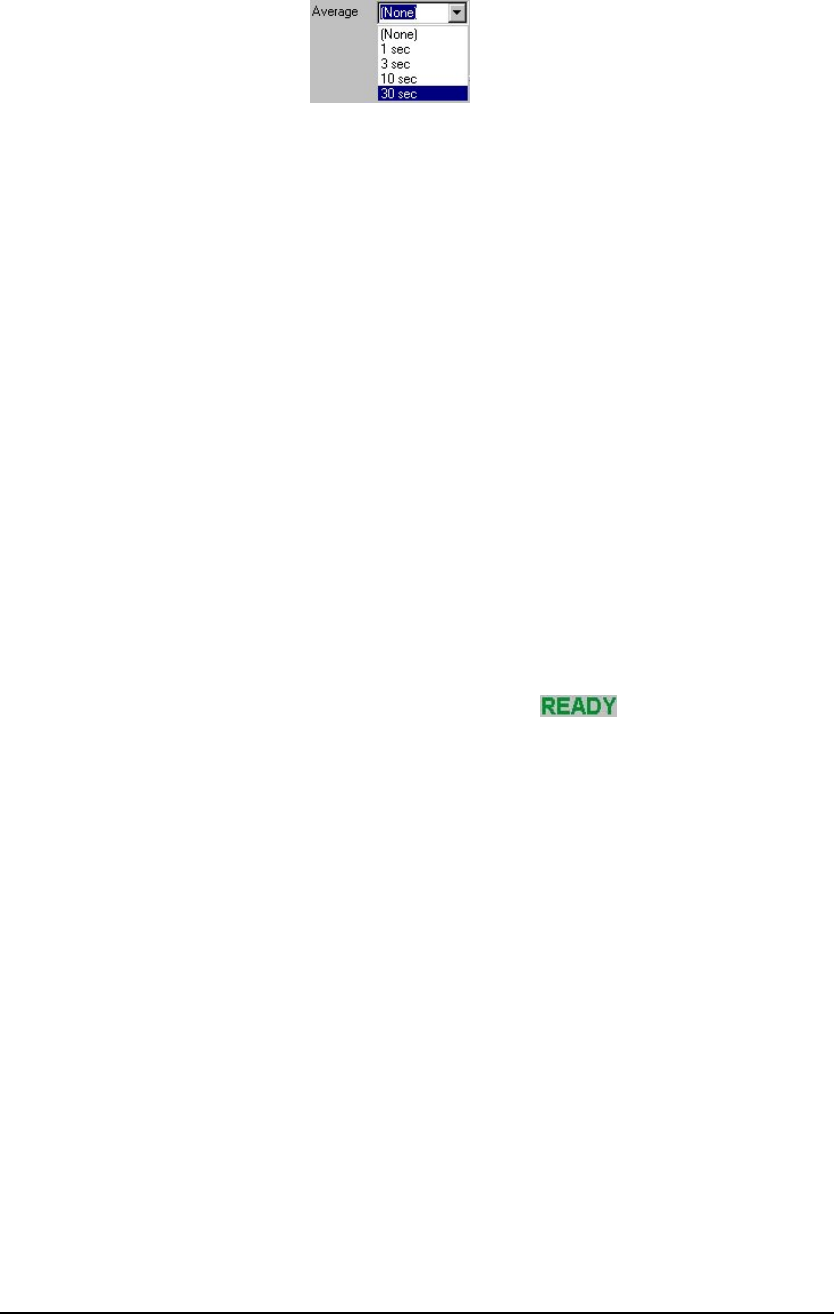
Averaging the Measurements
The thermopile head is measured 15 times a second. StarLab automatically
refines your readings and applies a moving average.
When you set the channel to average mode, StarLab displays the average of the
readings spanning from the last time average mode was activated, to the present.
Once the time period of the average is reached, the average becomes a running
average, spanning the average period backwards in time. For example, if the
average period is 30 seconds, at 15 seconds, the average is over 15 seconds; at 30
seconds, the average is over 30 seconds; at 5 minutes, it is over the period from 4
minutes and 30 seconds to 5 minutes (30 seconds back from the present).
StarLab User Guide 34
Chapter 4 – Measuring with the Thermopile Head Configuring Measurement Settings in Energy Mode
To select an average period:
1. Select the average in seconds from the Average drop down list in the
Graph Configuration Area.
Figure 4-4 Average Drop Down List
Disabling Averaging
You can disable averaging from the Average drop down list.
To disable averaging:
1. Select None from the Average drop down list in the Graph Configuration
Area.
Configuring Measurement Settings in Energy
Mode
Laser wavelength and range are configured exactly as in power mode. This
section describes the READY sign as well as the Energy Threshold setting,
which are only available in energy mode.
Using the Ready Sign
When the instrument is ready to measure a new pulse, will appear in the
Graph Configuration Area and flash on and off. The next pulse will
automatically clear the screen, and the new value will be displayed. If you fire
another pulse before READY appears, the reading may be inaccurate or may not
be displayed.
Configuring the Energy Threshold
If the instrument is used in a noisy environment, or where high levels of
background thermal radiation are present, the instrument may trigger spuriously
on the noise or background radiation. It would then fail to measure the intended
pulse. Since some degree of noise or background radiation is inevitable, the
instrument is designed not to respond to pulses below a preset minimum level.
The minimum energy threshold is typically set to 0.3% of the full scale of the
selected range. If this level is too sensitive for your particular environment, you
can alter it. Do not, however, raise the threshold higher than necessary, as this
will cause degradation in the accuracy of pulse measurements, approximately 4
times lower than the threshold level. Setting the energy threshold also enables
you to detect the onset of a pulse.
StarLab User Guide 35

Chapter 4 – Measuring with the Thermopile Head Configuring Measurement Settings in Energy Mode
To configure the energy threshold:
1. Select the energy threshold setting from the following options on the
Threshold drop down list in the Measurement Parameters Area:
LOW – Use this setting if you are measuring small energies and the
unit does not trigger.
•
•
•
•
MED – This is the default factory setting.
HIGH – Use this setting if the unit triggers when there is noise.
OPTICAL – Use this setting to enable the optical trigger for heads
with this capability.
Figure 4-5 Energy Threshold Drop Down List
Note 3A-P Head Users: The older model of the 3A-P head has special
circuitry enabling it to trigger on energy pulses of very low energy. A
special photodiode trigger alerts the instrument to start integration
when a pulse is received. The photodiode trigger enables the 3A-P
head to react to smaller pulses than are measured by other heads that
trigger on the rising thermal signal. Newer models of the 3A-P do not
need the optical trigger to achieve low energy measurement and do not
have this feature.
Selecting OPTICAL from the Threshold drop down list enables the
optical trigger. In some cases, however, the optical trigger will not
work, and one of the thermal trigger settings - LOW, MED, or HIGH
should be selected. Thermal triggering on 3A-P heads is applied when:
The wavelength is outside the range of the photodiode, i.e. outside of
0.19 - 1.064µm.
•
•
•
You are measuring the energy of a shuttered pulse of a continuous
laser. In this case, the peak power is too low to trigger the photodiode.
The instrument fails to trigger on the OPTICAL setting.
When using the optical trigger, the instrument should be able to
measure down to 0.1 - 0.2 mJ, depending on the wavelength. When
using the thermal trigger (LOW, MED, or HIGH), do not attempt to
measure less than about 1mJ.
StarLab User Guide 36

Chapter 4 – Measuring with the Thermopile Head Optimizing the Readings
Optimizing the Readings
StarLab can be optimized to achieve the most accurate and efficient results. This
section describes the most commonly used optimizations: offset, zeroing the
instrument, and setting line frequency.
Applying an Offset
When there is thermal background in the environment, thermopile heads may
show a non-zero power reading, even when there is no laser. For example, the
display reads 0.1 Watts when the laser is blocked, and 20.5 Watts when laser
power is applied. In this case, the true power is 20.5 - 0.1 = 20.4 Watts. To
subtract the background, apply an offset while the laser is blocked. The display
will now read zero, and the 0.1 Watt background will be subtracted from all
subsequent readings. The laser power reading will be 20.4 Watts.
To apply an Offset:
1. Click in the Graph Configuration Area. The Offset button
toggles to Offset On when the Offset is activated. The Offset value is
displayed under the main measurement reading in the Numeric Display
Area.
To cancel the Offset:
1. Click in the Graph Configuration Area. The Offset value is
cancelled.
Note: If you suspect that the instrument has a permanent zero offset,
disconnect the head while the head is in power measurement mode. If
StarLab still shows a similar reading even when the head is not
connected, zero the instrument. For information on zeroing the
instrument, refer to Zeroing the Instrument on page 4-37.
Zeroing the Instrument
In the USBI, Pulsar and Quasar, all adjustments, including zeroing internal
circuits, are performed from the software. This ensures simple and accurate
realignment. For best performance, it is recommended to zero the instrument
frequently.
For the USBI instrument:
With thermopile heads, it is necessary to zero the instrument with no head
attached, and then repeat with the head attached.
With photodiode heads it is only necessary to zero with the head attached.
For the Pulsar and Quasar instruments:
With all heads, it is only necessary to zero the instrument with the head attached.
To zero the USBI instrument with NO head attached:
1. Start up the instrument with no head attached: unplug the USB cable,
disconnect the head, and replace the USB cable.
StarLab User Guide 37
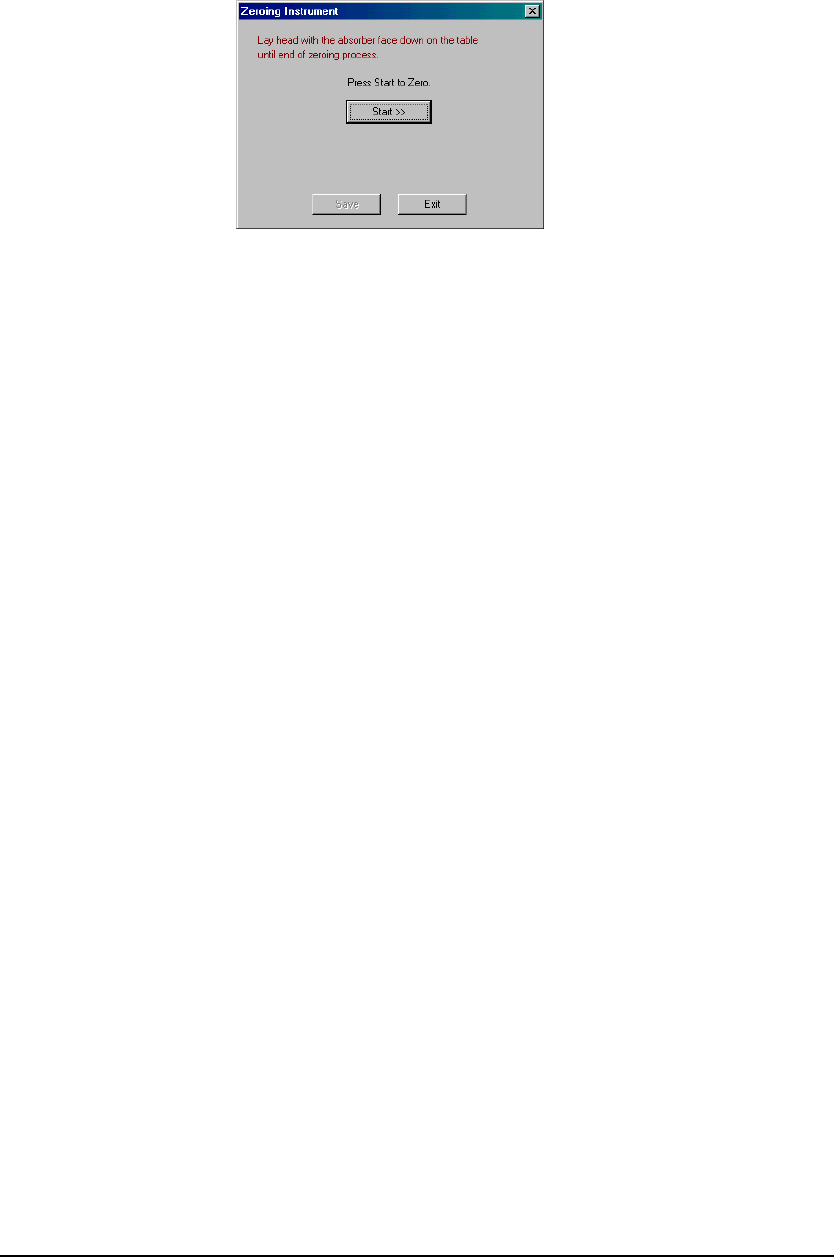
Chapter 4 – Measuring with the Thermopile Head Optimizing the Readings
2. Check that the instrument is not in an electrically noisy environment and is
undisturbed.
3. When started with no head attached, the StarLab Head Disconnected
dialog box appears.
4. Press Zeroing. The Zeroing Instrument dialog box appears.
Figure 4-6 Zeroing Instrument Dialog Box
5. Press Start. The zeroing begins.
6. Once zeroing is complete, press Save to save the zeroing.
To zero the instrument with a head attached:
1. Start up the instrument with head attached.
2. From the head control screen, click the right mouse button and select
Zeroing from the pop-up menu, OR open the Functions menu and select
Zeroing. The Zeroing Instrument dialog box appears (figure 4-6 above)
3. Press Start. The zeroing begins.
4. Once zeroing is complete, press Save to save the zeroing.
Setting Line Frequency
You can use the line frequency feature to remove interference caused by AC
electricity in the room. The USBI, Pulsar and Quasar are factory set for 50Hz. If
your country uses 60Hz, you must reset the line frequency.
To set line frequency:
1. Click the right mouse button and select Line Frequency from the pop-up
menu.
OR
Open the Functions menu and select Line Frequency.
2. From the expanded menu, check one of the following options:
50Hz – If you are in Europe. •
• 60Hz – If you are in the United States or Japan.
The line frequency is set.
StarLab User Guide 38
Chapter 4 – Measuring with the Thermopile Head Calibration Factors
Calibration Factors
StarLab allows you to adjust power calibration factors, configure the response
factor and adjust energy calibration factors.
Warning: Adjusting the calibration factor makes a permanent change in the head.
It is strongly recommended that before making any change to the factor,
the original factory setting is recorded separately. This will make it
easier to restore the value to its original setting later if needed.
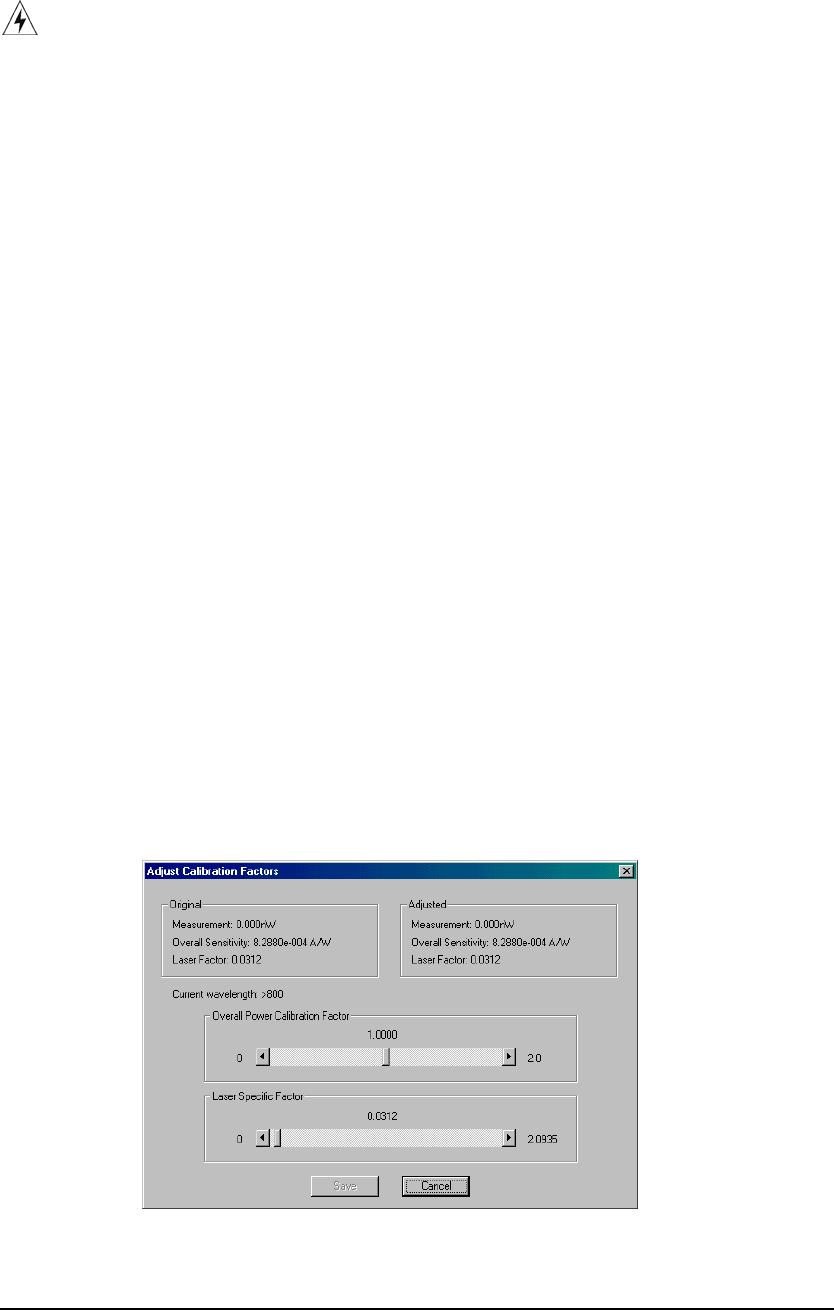
Adjusting Power Calibration Factors
The absorption of the various Ophir thermal absorbers can vary from disc to disc.
Therefore, all Ophir absorbers are individually calibrated against NIST traceable
standards. Ophir heads are individually laser-calibrated at several wavelengths,
against a NIST calibrated standard meter. For more information on Ophir head
calibration and traceability, refer to Appendix B – Calibration, Traceability, and
Recalibration.
StarLab offers two types of calibration:
Overall Calibration – Changes the calibration at all wavelengths at
once. Use Overall Calibration if your head is equipped with the Ophir
CAL resistor. For more information on the Ophir CAL resistor, refer to
Appendix B – Calibration, Traceability, and Recalibration.
•
• Laser Specific Calibration – Changes the calibration at one specific
laser wavelength. Use Laser Specific Calibration, unless your head is
equipped with the Ophir CAL resistor.
To adjust the power calibration factor:
1. Click the right mouse button and select Calibrate from the pop-up menu.
OR
Open the Functions menu and select Calibrate. The Adjust Calibration
Factors dialog box appears.
Figure 4-7 Adjust Calibration Factors Dialog Box
StarLab User Guide 39

Chapter 4 – Measuring with the Thermopile Head Calibration Factors
The Original area displays the original Measurement, Overall Sensitivity
and Laser Factor fields. The Current wavelength is displayed beneath the
Original area.
2. Use the Overall Power Calibration Factor scroll bar to attain an accurate
reading in the Overall Sensitivity field in the Adjusted area.
OR
Enter the desired factor into the text box above the scroll bar.
Note: Adjusting the overall power calibration factor effects both the
Measurement and the Overall Sensitivity values.
3. Use the Laser Specific Factor scroll bar to attain an accurate reading in
the Overall Sensitivity and Laser Factor fields in the Adjusted area.
OR
Enter the desired factor into the text box above the scroll bar.
Note: Adjusting the Laser Specific Factor effects both the Measurement and
the Laser Factor values.
4. Click Save to save the adjustment for the active channel.
Configuring the Response Factor
The response factor feature finds the optimum response time to enable an
accurate reading as quickly as possible, while minimizing the risk of overshoot,
(the erroneous reporting of readings above 100% of the full scale). Response
factor adjustment is only possible when the head is in power mode.
To set the response factor:
1. Click the right mouse button and select Response from the pop-up menu.
OR
Open the Functions menu and select Response. The Response Factor dialog
box appears.
StarLab User Guide 40
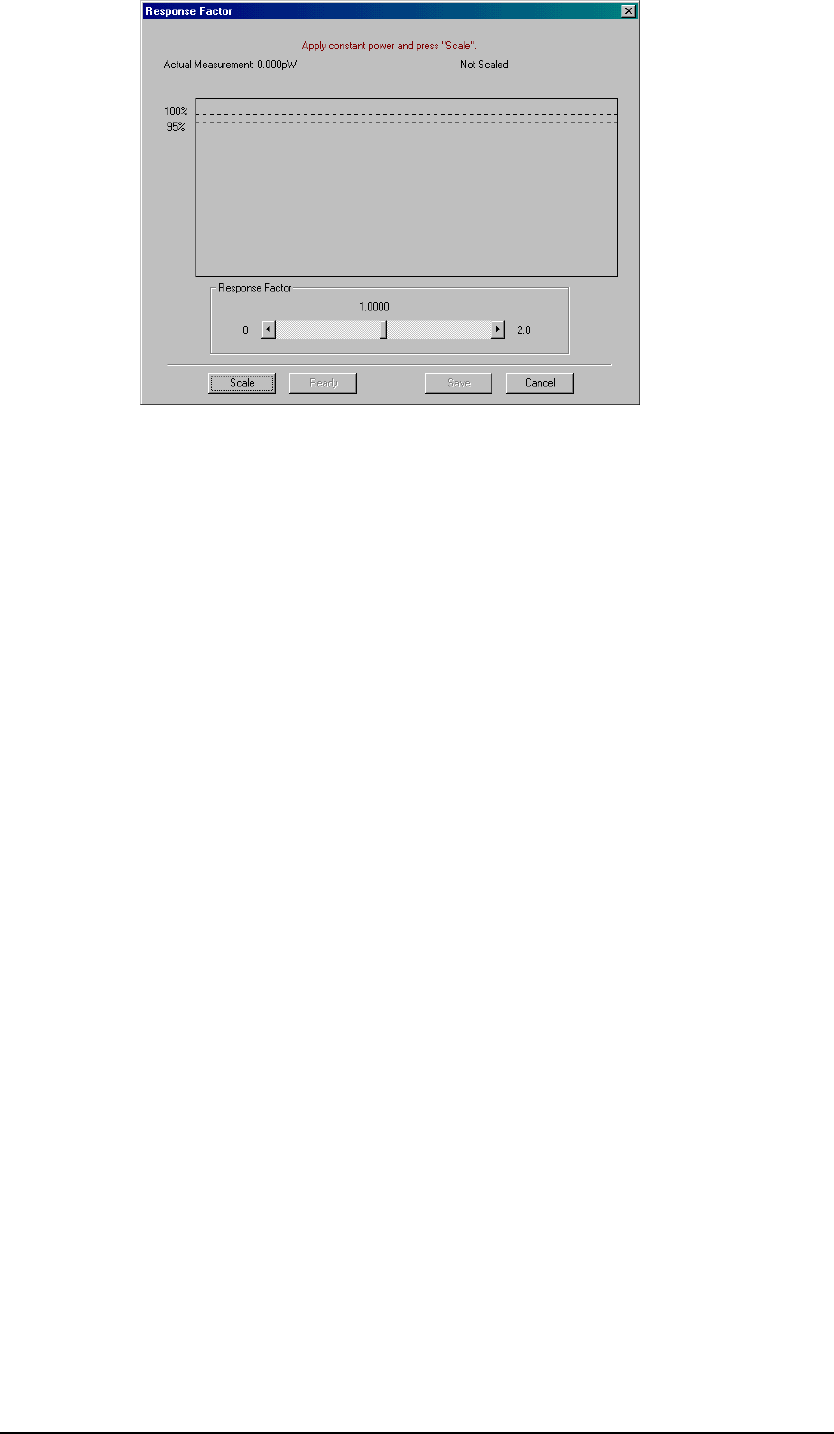
Chapter 4 – Measuring with the Thermopile Head Calibration Factors
Figure 4-8 Response Factor Dialog Box
2. Use the scroll bar to adjust the response factor in the Response Factor
area.
3. Apply constant power to the thermopile head until the graph stabilizes.
4. Click Scale.
5. Block the laser for several moments to allow the head to cool down.
6. Click Ready.
7. Unblock the thermopile head.
8. Take a second reading.
Adjusting Energy Calibration Factors
Both power and energy readings are equally affected by changes in the
absorption and/or sensitivity of the thermal disc. Therefore, changing power
calibration changes energy calibration proportionately. In addition, adjusting the
response time of the head can also affect energy calibration. For this reason,
provisions are made to adjust energy calibration without affecting power
calibration.
To adjust the energy calibration factor:
1. Click the right mouse button and select Calibrate from the pop-up menu.
OR
Open the Functions menu and select Calibrate. The Adjust Calibration
Factor dialog box appears.
StarLab User Guide 41
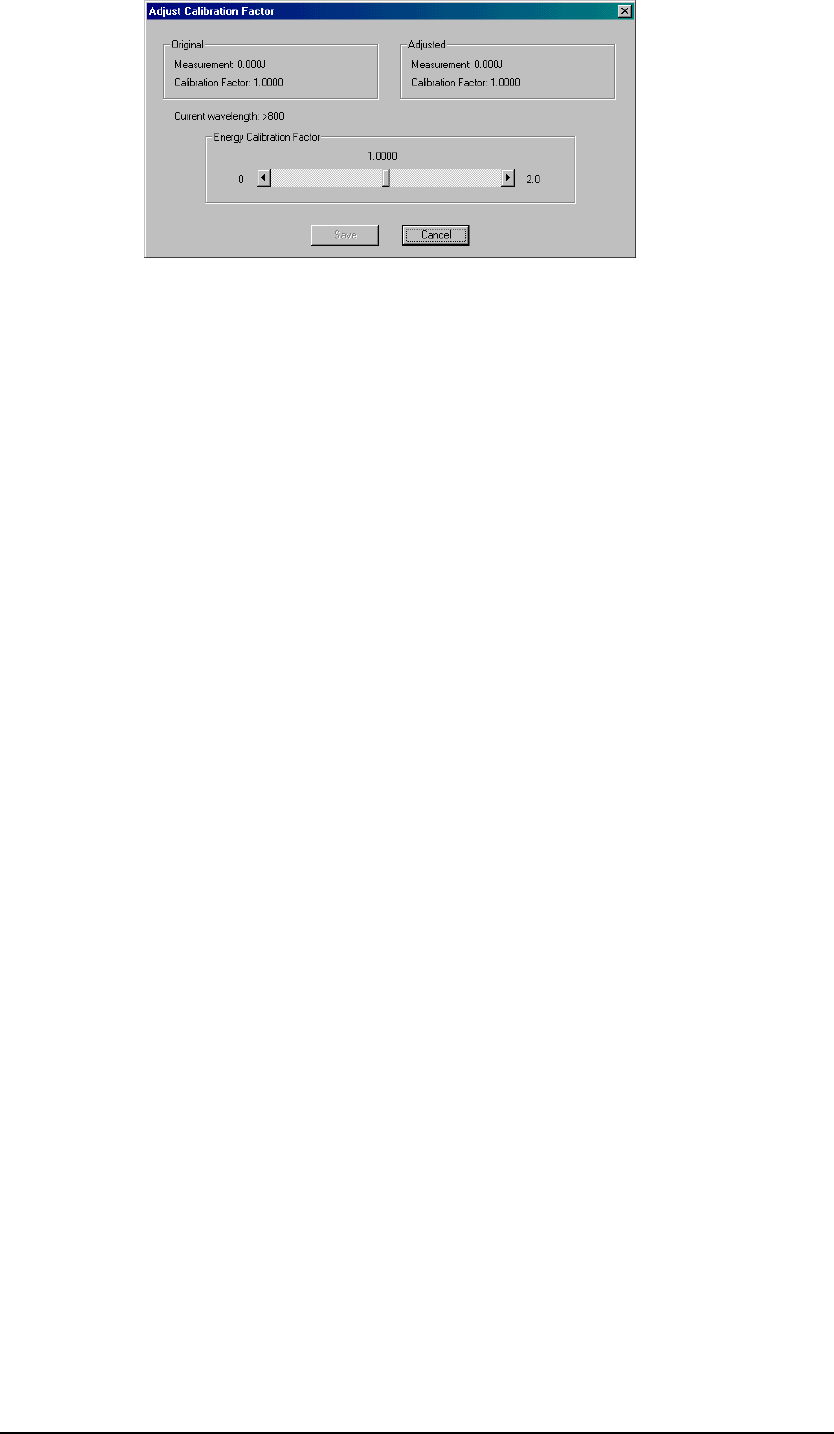
Chapter 4 – Measuring with the Thermopile Head Additional Graphical Display Options
Figure 4-9 Adjust Calibration Factor Dialog Box
2. The Original area displays the original Measurement and Calibration
Factor. The Current wavelength is displayed beneath the Original area.
3. Use the scroll bar to adjust the Energy Calibration Factor to attain an
accurate reading in the Calibration Factor field in the Adjusted area.
4. Click Save to save the adjustment for the active channel.
Additional Graphical Display Options
StarLab enables you to configure and display readings in dBm scale and how to
configure and apply normalization.
Displaying Readings in dBm Scale
To display readings in dBm scale for a thermopile head, refer to Displaying
Readings in dBm Scale in Chapter 5 – Measuring with the Photodiode Head.
Applying Normalization
To apply normalization for a thermopile head, refer to Applying Normalization in
Chapter 5 – Measuring with the Photodiode Head.
StarLab User Guide 42

Chapter 5 – Measuring with the
Photodiode Head
This chapter provides an overview of photodiode heads and instructions for
taking measurements with the photodiode head. Topics include:
Overview of Photodiode Heads •
•
•
•
•
Configuring Measurement Settings
Optimizing the Readings
Adjusting Calibration Factors
Additional Graphical Display Options
Overview of Photodiode Heads
When a photon source, such as a laser, is directed at a photodiode head, a current
is created proportional to the light intensity and dependent on the wavelength.
Ophir photodiode heads have a unique dual detector head containing two
identical detectors, connected back to back. When a uniform signal, such as
background room light, falls on the detector head, the signal from the two
detectors cancels.
Conversely, when a laser beam falls on the head, it illuminates the first detector
only and is detected. In this way, the head subtracts most of the background
while still detecting the desired signal. In general, 98% of the background signal
is eliminated. This means that the detector can be used in ordinary laboratory
lighting conditions.
The instrument amplifies this signal and indicates the power level received by
the head. Due to the superior circuitry of the Ophir instruments, the noise level is
very low, and Ophir photodiode heads have a large dynamic range, from pico
Watts to Watts.
Since many low power lasers have powers ranging from 5 to 30mW, and most
photodiode detectors saturate at about 2mW, Ophir photodiode heads have a
built in filter to allow the head to measure up to 30mW or more without
saturation. When the additional filter is applied, the maximum power can range
from 300mW to 3W. Photodiode heads saturate when the output current exceeds
1.3mA so the exact maximum power depends on the sensitivity of the detector at
the wavelength used. For a more detailed description of the principles of
operation of Ophir thermopile heads, refer to the Ophir Optronics catalog,
available for download from http://www.ophiropt.com.
StarLab User Guide 43
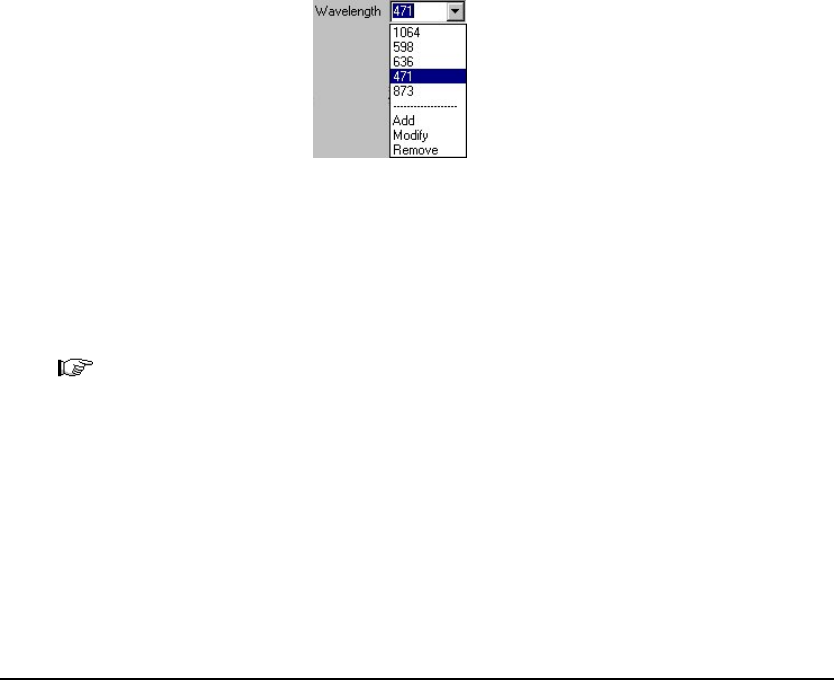
Chapter 5 – Measuring with the Photodiode Head Configuring Measurement Settings
Configuring Measurement Settings
If you are planning to repeat similar measurements, you can configure the
settings for each individual head, and save them to the instrument. The saved
settings become the default configuration for that channel, and are displayed
every time the channel is opened.
The following sections describe how to configure measurement settings for
photodiode heads and how to save them as the default configuration for that
channel. Configuration settings include: configuring laser wavelengths, range,
average readings, and inserting/removing the filter.
Configuring Laser Wavelengths
Photodiode heads have a different sensitivity at different wavelengths. Moreover,
the filters used in the head have a different transmission at different wavelengths.
When you choose the correct laser wavelength, the correction factor for that
wavelength is automatically introduced.
You can select which laser wavelength to work with from an editable drop down
list. You can configure a maximum of six wavelengths to appear in the drop
down list, to simplify changing from one laser wavelength to another. Laser
wavelengths can also be modified or removed.
To select the laser wavelength:
1. Select the laser wavelength from the Wavelength drop down list in the
Measurement Parameters Area.
Figure 5-1 Wavelength Drop Down List
To add a laser wavelength:
1. Select Add from the Wavelength drop down list in the Measurement
Parameters Area. The Set Favorite Wavelength dialog box appears.
Note: Add is only available if less than 6 wavelengths are listed in the
Wavelength drop down list.
StarLab User Guide 44
Chapter 5 – Measuring with the Photodiode Head Configuring Measurement Settings
Figure 5-2 Set Favorite Wavelength Dialog Box
2. Enter the wavelength in the text box in the Set Wavelength area.
OR
Use the scroll bar or arrows to configure the new wavelength.
3. Click OK to save the new wavelength and close the dialog box. The new
wavelength appears in the Wavelength drop down list.
To modify laser wavelengths:
1. Select Modify from the Wavelength drop down list in the Measurement
Parameters Area. The Modify Favorite Wavelength dialog box appears,
displaying the laser wavelength you wish to modify in the text box in the
Modify Wavelength area.
Figure 5-3 Modify Favorite Wavelength Dialog Box
2. Select the wavelength in the text box in the Modify Wavelength area and
enter the desired wavelength.
OR
Use the scroll bar or the arrows to modify the wavelength.
3. Click OK to save the modification and close the dialog box. The modified
wavelength appears in the Wavelength drop down list.
StarLab User Guide 45
Chapter 5 – Measuring with the Photodiode Head Configuring Measurement Settings
To remove laser wavelengths:
1. Select Remove from the Wavelength drop down list in the Measurement
Parameters Area. The Remove Favorite Wavelength dialog box appears,
displaying the wavelengths listed in the Laser Wavelength drop down
list.
Figure 5-4 Remove Favorite Wavelength Dialog Box
Note: Remove is only available if more than 1 wavelength is listed in the
Wavelength drop down list.
2. Select the wavelength you wish to remove. You can only remove one
wavelength at a time.
3. Click Remove to remove the selected wavelength and close the dialog
box. The removed wavelength no longer appears on the Wavelength drop
down list.
Filter Settings
The photodiode head is equipped with an optional filter that allows it to measure
up to 300mW or more without saturating the detector. The exact maximum
power is reached when the reading reaches full scale, or when the output current
from the head reaches 1.3mA, whichever comes first. You can work with or
without the filter, depending on which powers you wish to measure.
To configure the instrument to measure when the filter is inserted:
1. Select In from the Filter drop down list in the Measurement Parameters
Area.
Figure 5-5 Filter Drop Down List
To configure the instrument to measure when the filter is removed:
1. Select Out from the Filter drop down list in the Measurement Parameters
Area.
Note: Make sure to physically insert or remove the filter, according to the
filter setting selected. Failure to do so will result in erroneous
readings.
StarLab User Guide 46
Chapter 5 – Measuring with the Photodiode Head Optimizing the Readings
Selecting the Range
To configure the range for a photodiode head, refer to Selecting the Range in
Chapter 4 – Measuring with the Thermopile Head.
Averaging the Measurements
To configure an average reading for a photodiode head, refer to Averaging the
Measurements in Chapter 4 – Measuring with the Thermopile Head.
Optimizing the Readings
StarLab can be optimized to achieve the most accurate and efficient results. This
section describes the optimization settings available for the photodiode head:
applying an offset, zeroing the instrument, and setting line frequency.
Applying an Offset
Ophir’s unique dual-detector heads detect and subtract 98% of background light.
The residual background signal can be removed using the Offset feature. The
Offset feature subtracts background light from the signal.
For example, the display reads 0.1 µW when the laser is blocked, and 20.5 µW
when laser power is applied. In this case, the true power is 20.5 - 0.1 = 20.4 µW.
To subtract the background, apply an offset while the laser is blocked. The
display will now read zero, and the 0.1 µW background will be subtracted from
all subsequent readings. The laser power reading will be 20.4 µW.
To apply an offset:
1. Click in the Graph Configuration Area. The Offset button
toggles to Offset On when the Offset is activated.
The Offset value is displayed under the main measurement reading in the
Numeric Display Area.
To cancel the offset:
1. Click in the Graph Configuration Area. The Offset value is
cancelled.
Note: If you suspect that the instrument has a permanent zero offset,
disconnect the head while the head is in power measurement mode. If
the instrument still shows a similar reading even when the head is not
connected, zero the instrument. For information on zeroing the
instrument, refer to Zeroing the Instrument in Chapter 4 – Measuring
with the Thermopile Head.
StarLab User Guide 47

Chapter 5 – Measuring with the Photodiode Head Adjusting Calibration Factors
Zeroing the Instrument
To zero the instrument for a photodiode head, refer to Zeroing the Instrument in
Chapter 4 – Measuring with the Thermopile Head.
Note: When zeroing the instrument for photodiode heads, it is unnecessary to
disconnect the head. Turn the laser off instead, and cover the head.
Setting Line Frequency
To set the line frequency for a photodiode head, refer to Setting Line Frequency
in Chapter 4 – Measuring with the Thermopile Head.
Adjusting Calibration Factors
Warning: Adjusting the calibration factor makes a permanent change in the head.
It is strongly recommended that before making any change to the factor,
the original factory setting is recorded separately. This will make it
easier to restore the value to its original setting later if needed
Photodiode detectors are inherently very linear but do vary broadly in sensitivity
from wavelength to wavelength. In addition, Ophir PD300 models are equipped
with both a built in and a removable filter to enable measurement of higher
powers without detector saturation. The transmission of these filters depends on
wavelength. The PD300 has a built in calibration adjustment for wavelength. For
more information on the PD300 built in calibration adjustment, refer to
Appendix B – Calibration, Traceability, and Recalibration. The user cannot
recalibrate the whole calibration curve, but can adjust the overall calibration,
which in turn adjusts all wavelengths proportionately.
To adjust the power calibration factor:
1. Click the right mouse button and select Calibrate from the pop-up menu.
OR
Open the Functions menu and select Calibrate. The Adjust Calibration
Factor dialog box appears.
StarLab User Guide 48
Chapter 5 – Measuring with the Photodiode Head Additional Graphical Display Options
Figure 5-6 Adjust Calibration Factor Dialog Box
The Original area displays the original Measurement and Calibration
Factor. The Current wavelength is displayed beneath the Original area.
2. Use the Calibration Factor scroll bar to attain an accurate reading in the
Calibration Factor field in the Adjusted area.
OR
Enter the desired factor into the text box above the scroll bar.
Note: Adjusting the Calibration Factor changes the calibration of all
wavelengths by the same factor.
3. Click Save to save the adjustment for the active channel.
Additional Graphical Display Options
StarLab allows you to configure and display readings in dBm scale, and allows
you to configure and apply normalization.
Displaying Readings in dBm Scale
StarLab allows measurements to be made in units of dBm, which are
measurements in a logarithmic scale. dBm units are defined as: 10 x log (reading
in mW). At 1mW the reading will be 0dBm, at 10mW it will be 10dBm, and at
100mW it will be 20dBm, etc.
StarLab User Guide 49
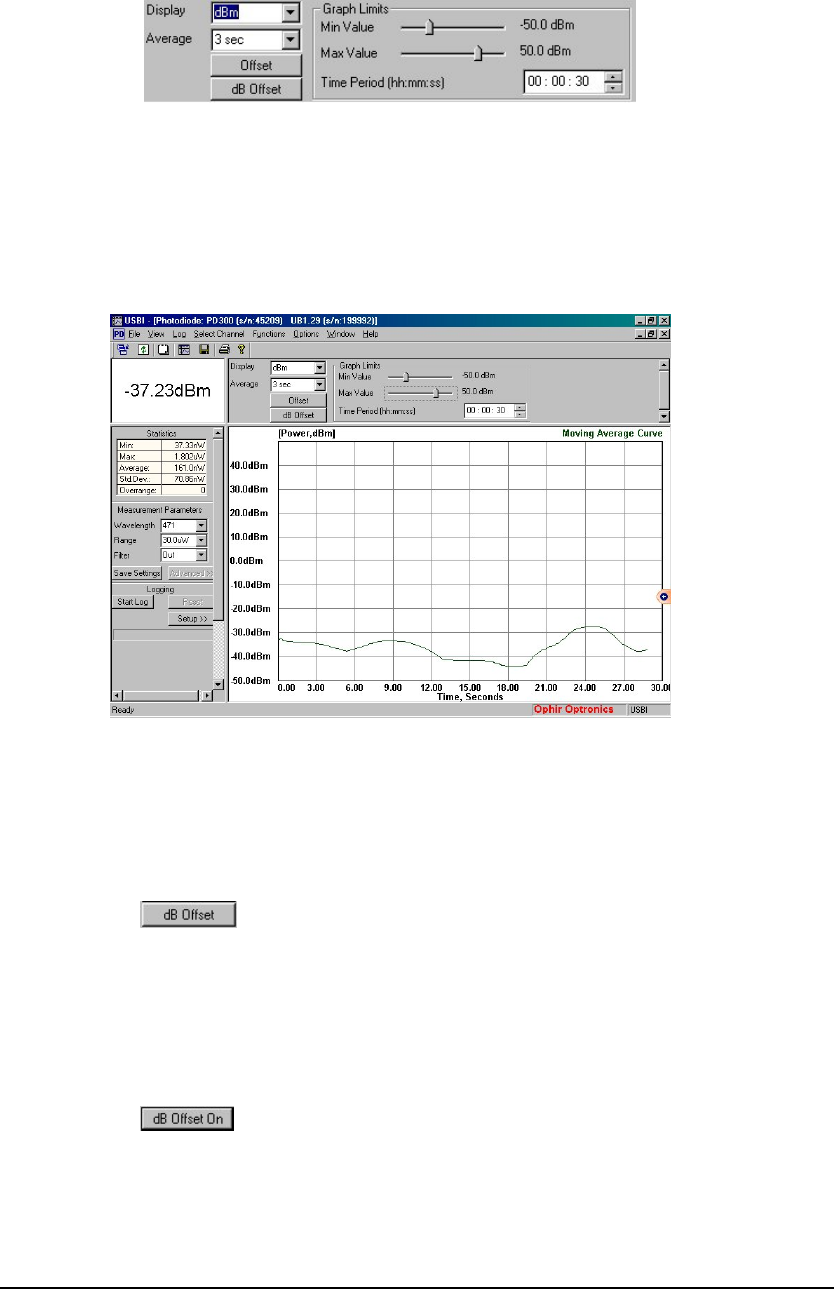
Chapter 5 – Measuring with the Photodiode Head Additional Graphical Display Options
To display readings in dBm scale:
1. Select dBm from the Display drop down list in the Graph Configuration
Area. The Graph Limits field modifies to reflect the selection, as shown in
Figure 5-7.
Figure 5-7 Graph Configuration Area
2. In the Graph Configuration Area, use the Min Value and Max Value
pointers to select the minimum and maximum dBm values.
The values you select are automatically displayed on the graph in the Display
Area, as shown in Figure 5-8
Figure 5-8 Photodiode Window Display Area in dBm Scale
Applying a dB Offset
To apply a dB offset:
3. Click in the Graph Configuration Area. The dB Offset button
toggles to dB Offset On when the Offset is activated.
The dB Offset value is displayed under the main measurement reading in the
Numeric Display Area.
To cancel the dB Offset:
1. Click in the Graph Configuration Area. The dB Offset value is
cancelled.
StarLab User Guide 50
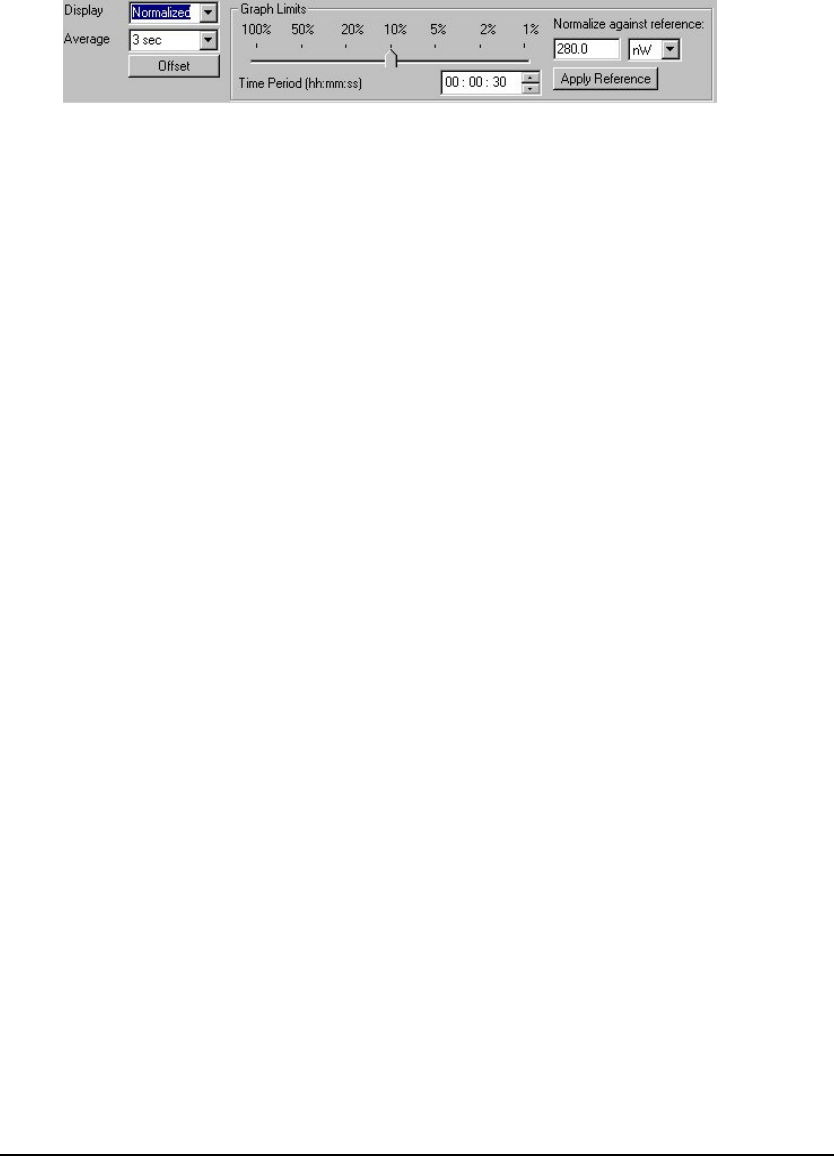
Chapter 5 – Measuring with the Photodiode Head Additional Graphical Display Options
Applying Normalization
StarLab enables you to view photodiode readings in relation to a configurable
baseline.
To apply normalization:
1. Select Normalized from the Display drop down list in the Graph
Configuration Area. The Graph Limits field modifies to reflect the
selection, as shown in Figure 5-9.
Figure 5-9 Apply Normalization Dialog Box
2. In the Graph Configuration Area, scroll the pointer to select the graph
limits expressed as a percentage of the reference value. For example, if
you want the graph to display ±20% around the present value, choose
20%.
3. In the Normalize against reference field, enter the normalization
reference value and select the power scale from the drop down list. If no
reference value is selected, StarLab uses the last power measured as its
reference value.
4. Click Apply Reference to save and apply the settings to the Display Area.
StarLab User Guide 51

Chapter 6 – Measuring with the
Pyroelectric and PD10 Heads
This chapter provides an overview of pyroelectric and PD10 heads and
instructions for taking measurements with these heads. Topics include:
Overview of Pyroelectric and PD10 Heads •
•
•
•
•
•
Configuring Measurement Settings
Optimizing the Readings
Measuring the Total Energy Exposure
Adjusting Calibration Factors
Additional Graphical Display Options
Overview of Pyroelectric and PD10 Heads
Ophir pyroelectric heads measure both frequency and energy of pulsed lasers.
When a pulsed heat source, such as a laser, is directed at the detector, a
temperature gradient is created across the pyroelectric crystal mounted in the
head. An electric charge is produced, which is proportional to the energy
absorbed. The detector head has sophisticated circuitry unique to Ophir
(patented) that determines the baseline before the pulse is received, measures the
voltage after a pre-determined interval, amplifies it, and holds it for a pre-
determined time.
Due to this innovative circuitry, Ophir pyroelectric heads can measure very long
pulses as well as short ones; low energies as well as high energies. They can also
measure at higher repetition rates than was possible before.
The device to which the head is connected converts this signal to a digital value
and indicates the energy received by the head, as well as the frequency at which
the laser is pulsing. Using the energy and frequency information, the StarLab
application is also able to display average power.
Ophir PD10 heads differ from pyroelectric heads in that their detector is a
photodiode instead of a pyroelectric crystal. They use a similar circuit to the
pyroelectric heads and offer similar functionality. Therefore, throughout this
guide, they are included in the generic term "pyroelectric" when referring to
software and control functions, even when this is not stated explicitly.
StarLab User Guide 52
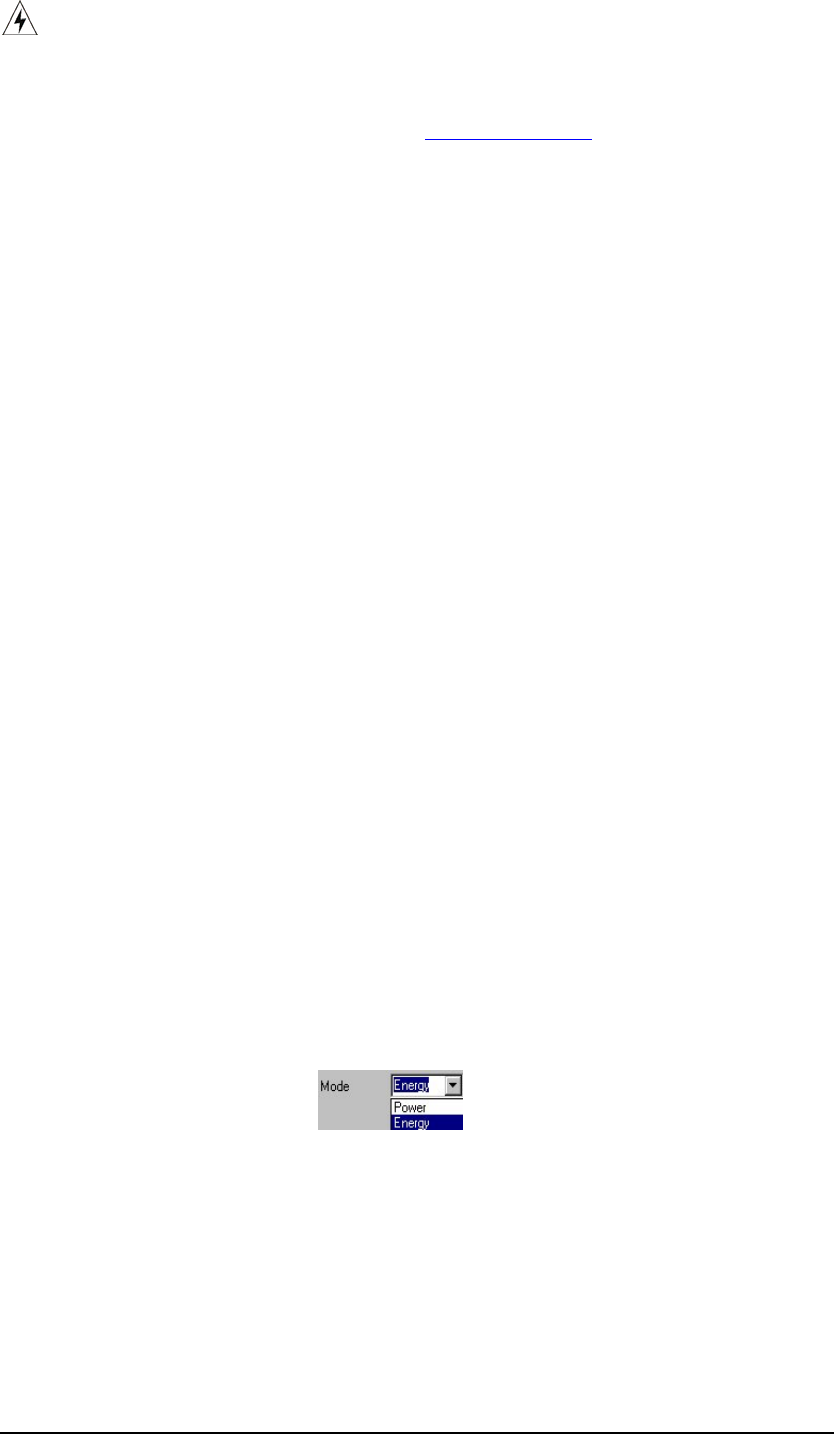
Chapter 6 – Measuring with the Pyroelectric and PD10 Heads Configuring Measurement Settings
Warning: Before using the head for frequency or energy measurements, make sure
that your laser power, energy, and energy density do not exceed the
head ratings listed in the specifications table for the specific head.
Otherwise, you may damage the absorber. Refer to the Ophir Laser
Power/Energy Measurement, at www.ophiropt.com, for full details on
each head.
A test slide is provided with each pyroelectric head, which contains the
same coating as the pyroelectric detector. (You can obtain additional
slides from your supplier.) Use this slide to test the damage threshold of
your laser pulses. If the laser pulses damage the slide, either enlarge
the beam or lower the laser energy until no damage is detected.
To measure pyroelectric energies properly, it is important that the head
is not grounded to the optical bench. Make sure that the head is isolated
electrically from the ground. Each pyroelectric head is supplied with an
insulating mounting post for this purpose.
Configuring Measurement Settings
If you are planning to repeat similar measurements, you can configure the
settings for each individual head, and save them to the USBI, Pulsar or Quasar
device. The saved settings become the default configuration for that channel, and
are displayed every time the channel is opened.
The following sections describe how to select the measurement mode, how to
configure measurement settings for pyroelectric heads and how to save them as
the default configuration for that channel. The measurement setting fields differ
for frequency and energy modes. Measurement settings include: laser
wavelength, power range, diffuser, pulse width, and average reading. In addition
to these measurement settings, the Pulsar device includes an external trigger.
Selecting the Measurement Mode
To select the measurement mode:
1. Select Power or Energy from the Mode drop down list in the
Measurement Parameters Area. The pyroelectric screen fields displayed
depend on the mode selected.
Figure 6-1 Mode Drop Down List
StarLab User Guide 53
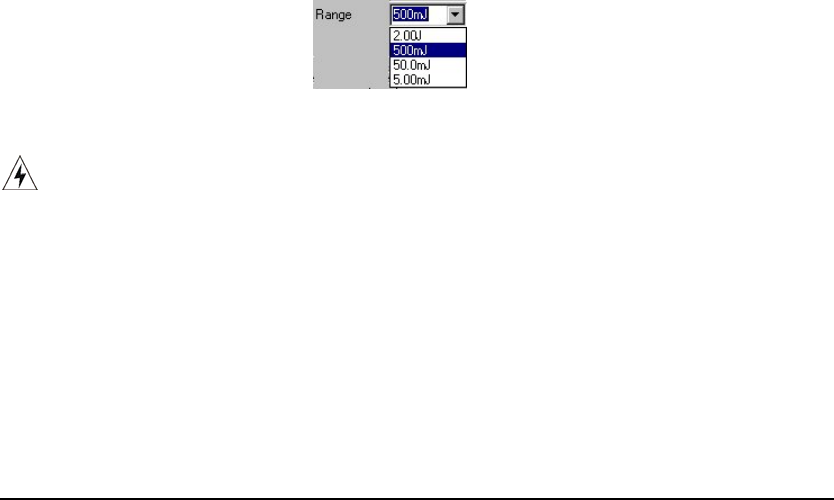
Chapter 6 – Measuring with the Pyroelectric and PD10 Heads Configuring Measurement Settings
Configuring Laser Wavelengths
Metallic and PD10 Heads
For metallic and PD10 heads, the absorption of the detector coating varies
somewhat according to wavelength. The correction curve for the absorber is
stored in the head EEROM. This correction curve ensures that the power reading
is correct at all laser wavelengths.
To configure laser wavelengths, refer to Configuring Laser Wavelengths in
Chapter 5 – Measuring with the Photodiode Head.
Broadband (BB) Heads
Broadband (BB) heads have less variation according to wavelength. For
broadband heads, fixed wavelength ranges are provided, similar to thermopile
heads.
To configure laser wavelengths, refer to Selecting the Laser Wavelength in
Chapter 4 – Measuring with the Thermopile Head.
Selecting the Range
Pyroelectric heads cover a wide range of energies (from tens of nanojoules to
tens of joules) depending on the type of head in use. In order to provide accuracy
throughout the range, the electronics of the head must be configured to work in a
range that is most suited to your needs.
To configure the range when you know the approximate range of the
expected readings:
1. Select the range from the Range drop down list in the Measurement
Parameters Area. The instrument will configure itself according to the
selected range.
Figure 6-2 Range Drop Down List
Warning: While measuring pulsing lasers, an erroneous energy reading will
result if the energy range is not set up correctly.
StarLab User Guide 54
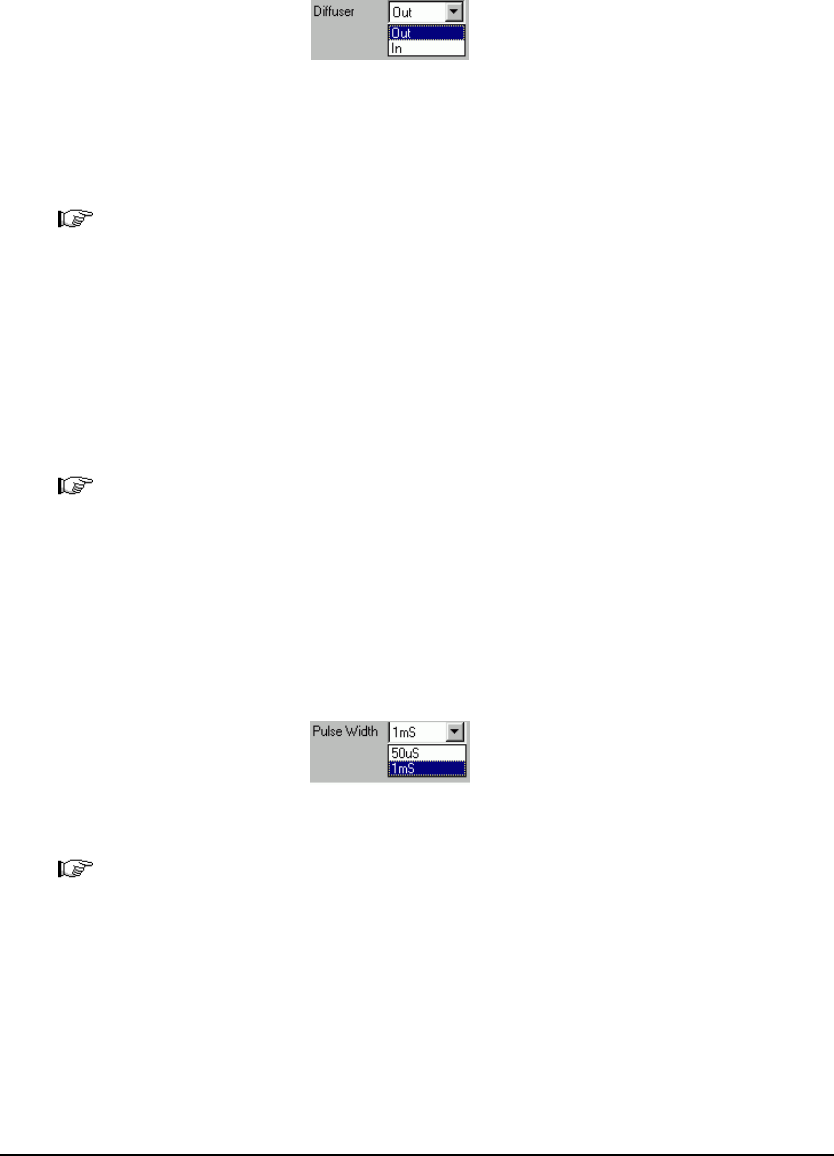
Chapter 6 – Measuring with the Pyroelectric and PD10 Heads Configuring Measurement Settings
Using a Diffuser
You can add a diffuser to some pyroelectric heads. A diffuser enables the energy
ranges to reach very high levels. When using a head that can have a diffuser,
configure the diffuser setting in the Measurement Parameters Area.
To select whether a diffuser is in use:
1. Select whether a diffuser is in use (In) or not in use (Out) from the
Diffuser drop down list in the Measurement Parameters Area.
Figure 6-3 Diffuser Drop Down List
When you change this setting, a dialog box appears reminding you to either
insert or remove the diffuser.
Note: For heads that are not equipped with a diffuser, this setting is
unavailable, and the heads are configured to measure in Diffuser Out
mode.
Selecting the Pulse Width
Some pyroelectric heads can be configured to measure long as well as short
pulses. To accomplish this, the user must configure the head for long laser pulses
or short pulses.
Note: If the pulse length is incorrectly set to the short setting for pulses
longer than that value, the reading will be erroneously low. If it is set
to the longer setting for short pulses, the reading will be correct, but
noisier.
To select a pulse width:
1. Select the pulse width from the Pulse Width drop down list in the
Measurement Parameters Area.
Figure 6-4 Pulse Width Drop Down List
Note: For heads with only one pulse width setting, the Pulse Width Drop
Down list is unavailable and the head is configured to measure in its
correct mode.
StarLab User Guide 55
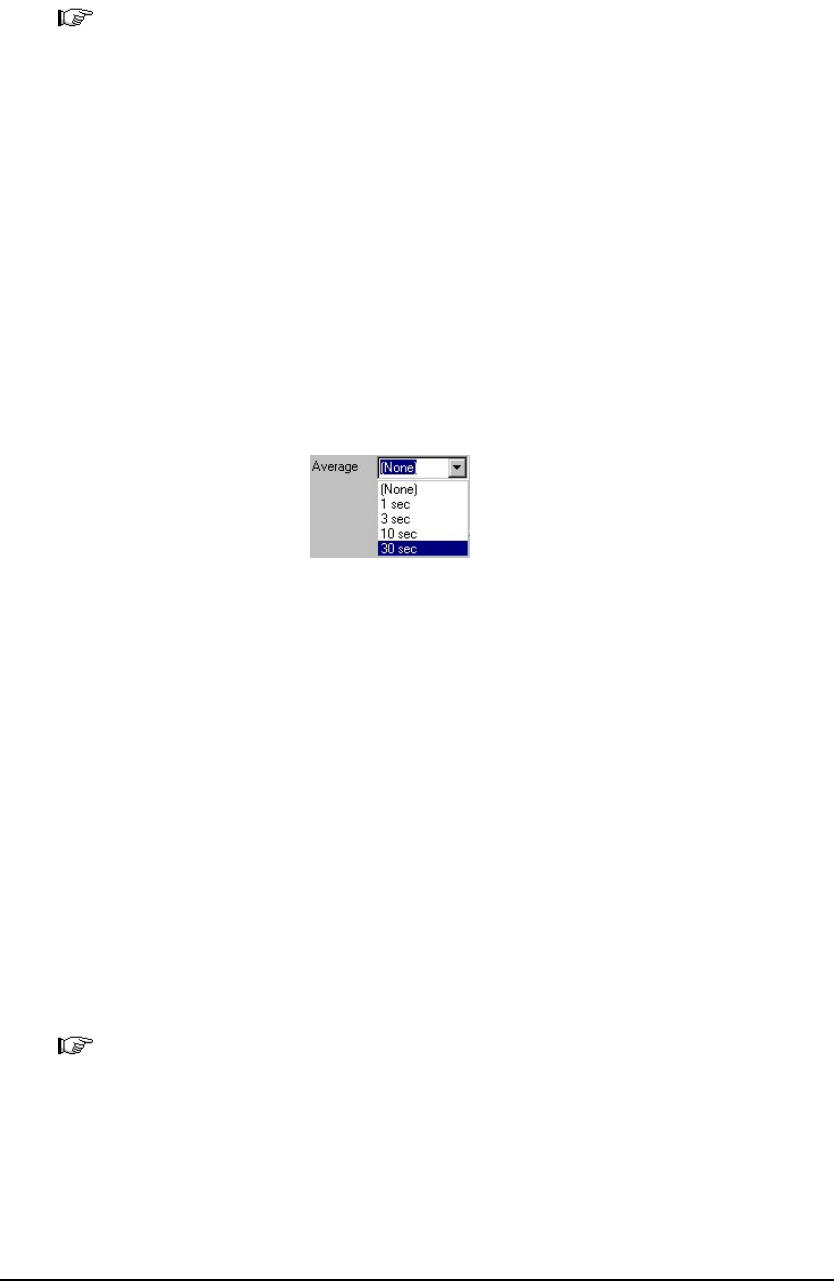
Chapter 6 – Measuring with the Pyroelectric and PD10 Heads Configuring Measurement Settings
Averaging the Measurements (Power Mode Only)
The StarLab application automatically refines your readings and applies a
moving average. For pyroelectric heads, the StarLab application averages the
number display, not the graph display.
Note: You can use the Moving Average feature only while working in Power
mode. In Energy Mode, average measurements are displayed in the
Statistics Area only.
When you activate the StarLab application’s average mode, it displays the
average of the readings spanning from the last time average mode was activated,
to the present. Once the time period of the average is reached, the average
becomes a running average, spanning the average period backwards in time. For
example, if the average period is 30 seconds, at 15 seconds, the average is over
15 seconds; at 30 seconds, the average is over 30 seconds; at 5 minutes, it is over
the period from 4 minutes and 30 seconds to 5 minutes (30 seconds back from
the present).
To select an average period:
1. Select the average in seconds from the Average drop down list in the
Graph Configuration Area.
Figure 6-5 Average Drop Down List
Disabling Averaging
You can disable averaging from the Average drop down list.
To disable averaging:
1. Select None from the Average drop down list in the Graph Configuration
Area.
Controlling the External Trigger
You can control the use of the external trigger by turning the external trigger on
or off. For more information on using the External Trigger, refer to Chapter 7 –
External Triggers and Missing Pulses.
Note: The External Trigger is only available for use with the Pulsar device.
StarLab User Guide 56

Chapter 6 – Measuring with the Pyroelectric and PD10 Heads Optimizing the Readings
To turn the external trigger on:
1. Select On from the External Trigger drop down list in the Measurement
Parameters Area.
Figure 6-6 External Trigger Drop Down List
The external trigger is turned on.
To disable the external trigger:
1. Select Off from the External Trigger drop down list in the Measurement
Parameters Area. The external trigger is disabled.
Note: In situations where External Trigger control cannot be used for a
specific head channel, the drop-down control is disabled.
Optimizing the Readings
The StarLab application can be optimized to achieve the most accurate and
efficient results. This section describes the most commonly used optimization of
zeroing the instrument with the head connected.
Zeroing the Instrument
Unlike thermopile and photodiode heads, pyroelectric readings are slightly
dependant on the instrument. Therefore, for the most accurate pyroelectric
energy measurements, it is necessary to zero the head against the instrument with
which it is being used. After this is done, the head is conditioned to work with
that specific instrument. It is not necessary repeat this procedure unless the head
will be used with a different instrument, or with a Laserstar. If this procedure is
not performed, errors of up to approximately 2% may occur.
Note: For pyroelectric, it is necessary to leave the head connected when
zeroing the instrument.
To zero the instrument:
1. Turn off the laser.
2. Check that the instrument is not in an electrically noisy environment and is
undisturbed.
3. Click the right mouse button and select Zeroing from the pop-up menu.
OR
Open the Functions menu and select Zeroing. The Zeroing Instrument
dialog box appears.
StarLab User Guide 57
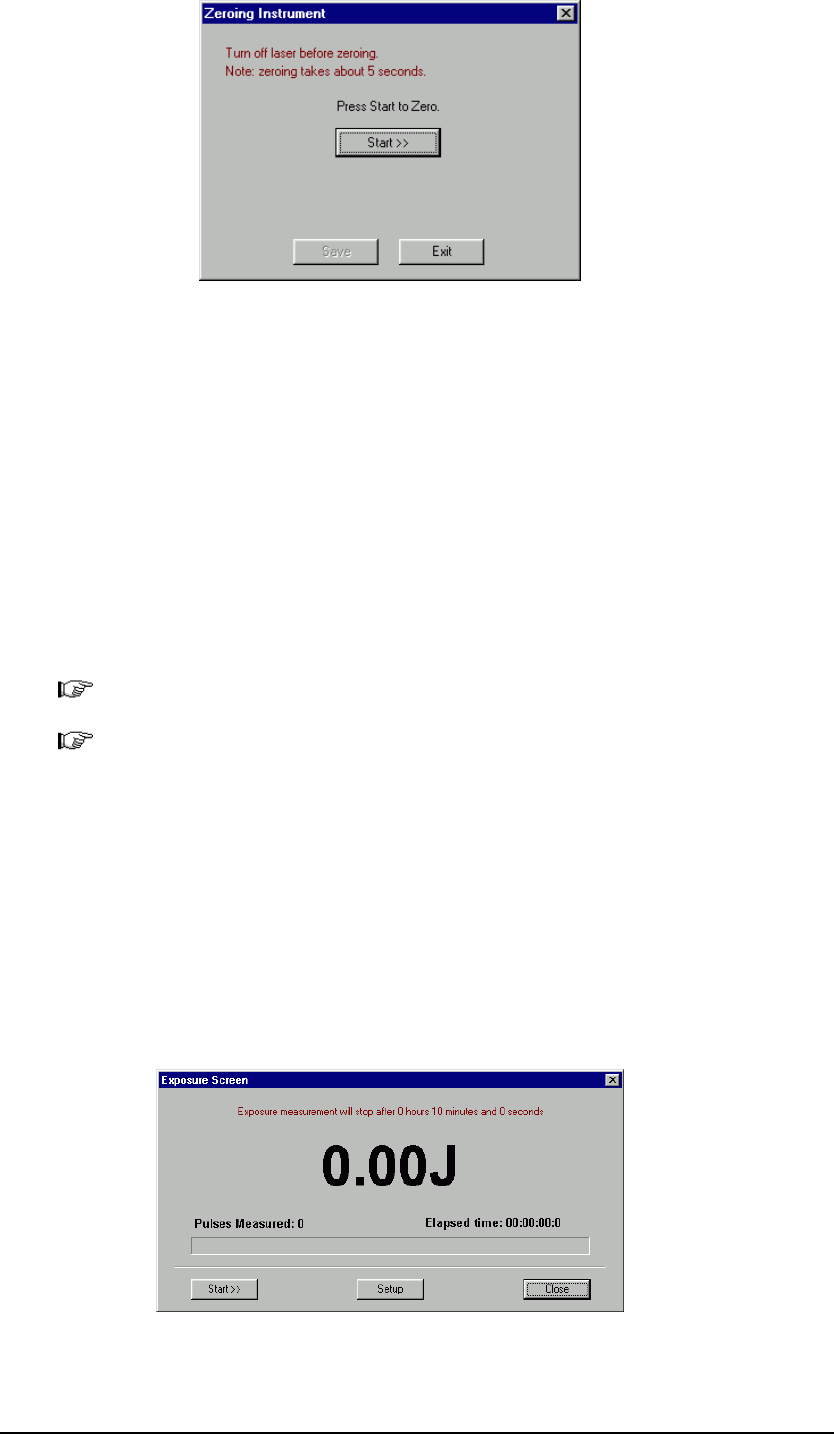
Chapter 6 – Measuring with the Pyroelectric and PD10 Heads Measuring the Total Energy Exposure
Figure 6-7 Zeroing Instrument Dialog Box
4. Press Start. The zeroing begins.
5. Once zeroing is complete, press Save to save the zeroing.
Measuring the Total Energy Exposure
For pyroelectric heads, the StarLab application has the ability to sum the total
energy of a number of pulses over a given time period or number of pulses. This
returns the total energy exposure over the selected period. For example, if the
laser is pulsing at 30 times per second, at 1mJ per pulse, and you measure the
exposure over 20 seconds, then the total exposure is 30 x 1 x 20 = 600mJ.
Note: The maximum exposure measurement time is one hour.
Note: StarLab software version 1.00 does not support exposure with the
Pulsar or Quasar devices.
To measure the total exposure:
1. Click the right mouse button and select Exposure from the pop-up menu.
OR
Open the Functions menu and select Exposure. The Exposure Screen dialog
box appears.
Figure 6-8 Exposure Screen Dialog Box
StarLab User Guide 58
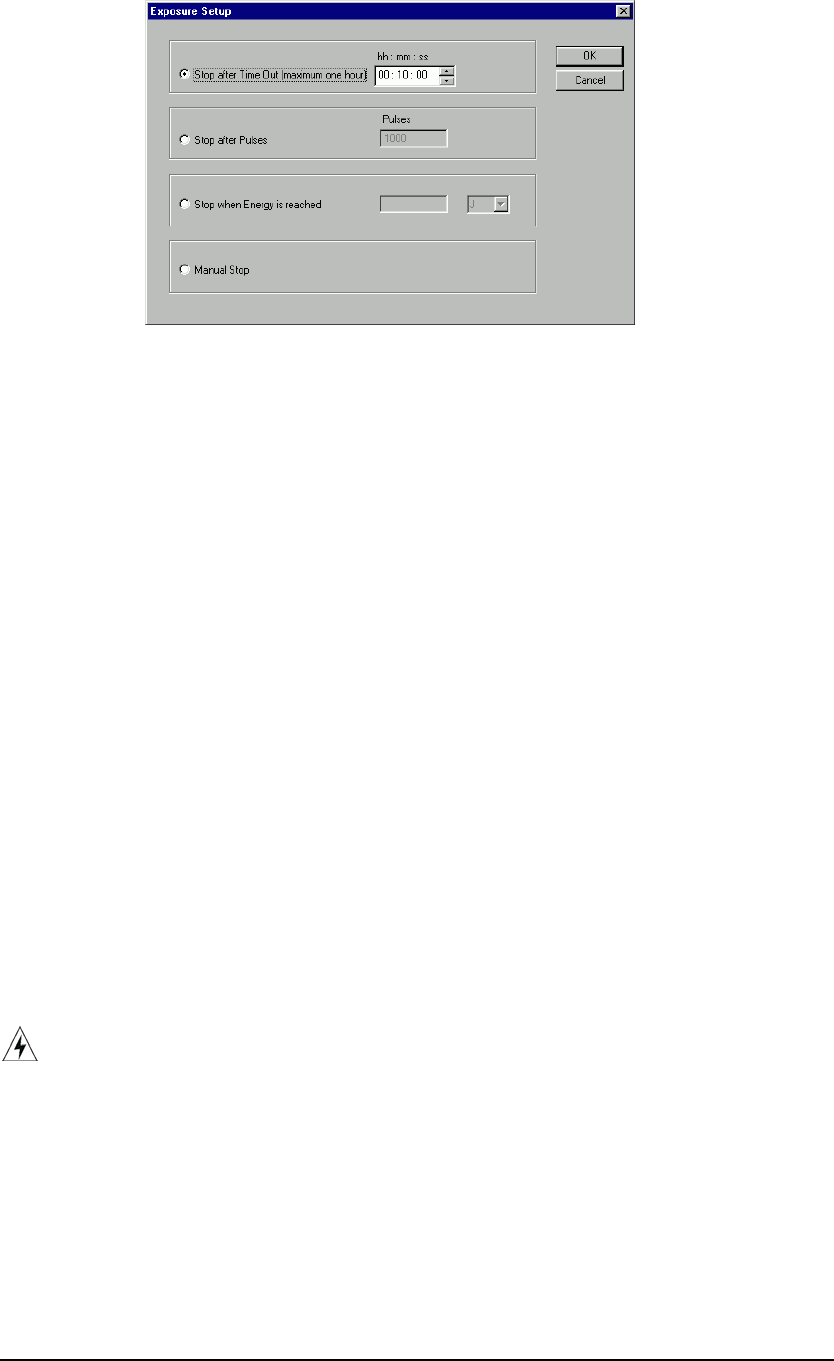
Chapter 6 – Measuring with the Pyroelectric and PD10 Heads Adjusting Calibration Factors
2. To configure when to stop taking exposure measurements, click Setup.
The Exposure Setup dialog box appears.
Figure 6-9 Exposure Setup Dialog Box
3. Perform one of the following:
• Select Stop after Time Out, and type the stop time in the text box.
• Select Stop after Pulses, and type the number of pulses in the text
box.
• Select Stop when Energy is reached, type the amount in the text box,
and then select the unit from the drop down list.
• Select Manual Stop to continue measuring the exposure until you
press Stop.
4. Click OK. The Exposure Setup dialog box closes.
5. Click Start. For all modes except Manual Stop, the progress bar shows the
continuing progress of the exposure measurements.
6. To stop the exposure measurements, click Stop, or wait for the exposure
period to complete.
7. Click Close to close the Exposure Screen dialog box.
Adjusting Calibration Factors
Warning: Adjusting the calibration factor makes a permanent change in the head.
It is strongly recommended that before making any change to the factor,
the original factory setting is recorded separately. This will make it
easier to restore the value to its original setting later if needed.
The sensitivity of the various Ophir pyroelectric sensors varies from one to
another, as well as with wavelengths. Therefore, Ophir pyroelectric detectors are
individually calibrated against NIST traceable standards. In addition, the
calibration is corrected in the devices for different wavelengths. For more
information on calibration, refer to Appendix B – Calibration, Traceability, and
Recalibration.
StarLab User Guide 59
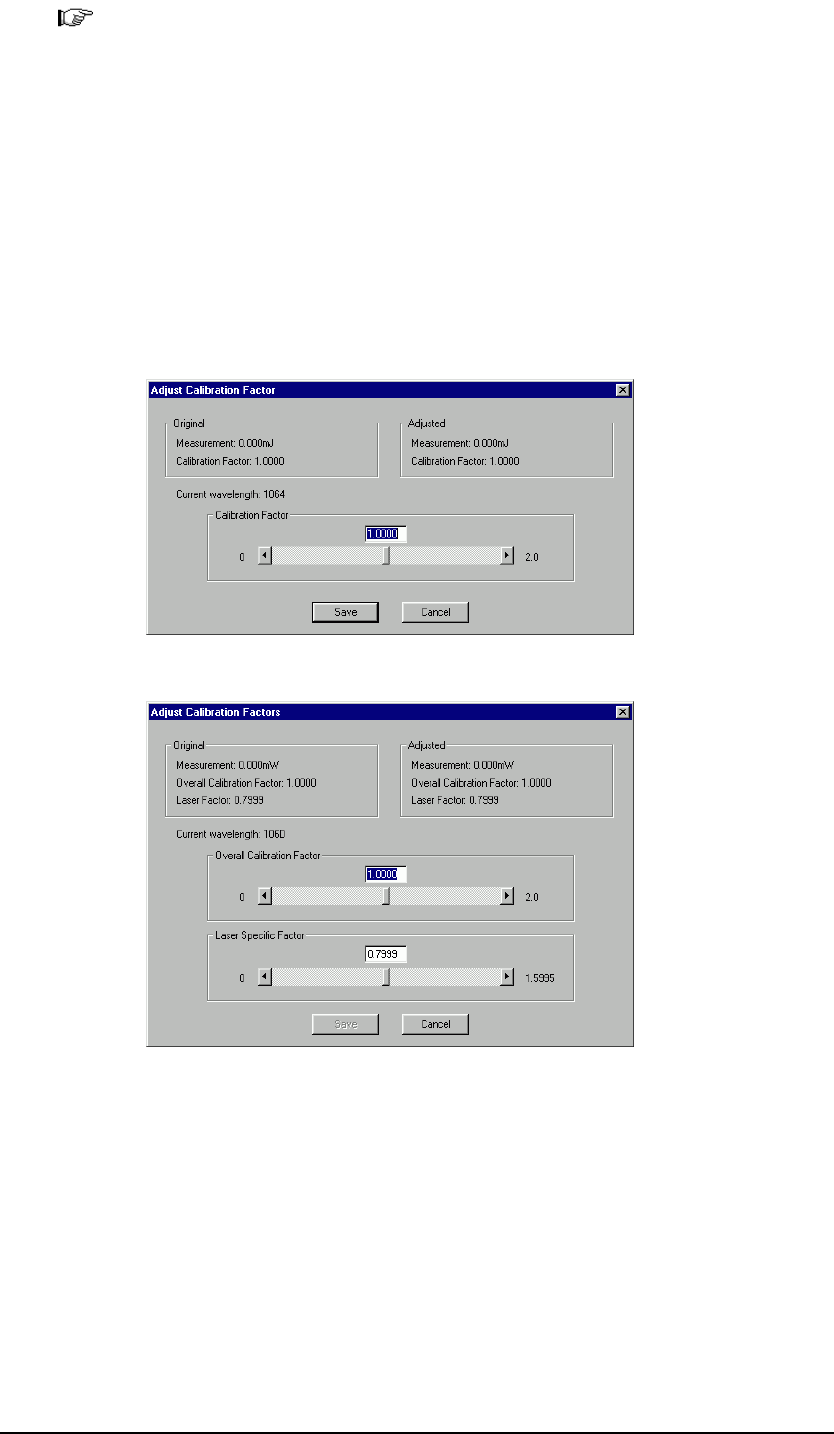
Chapter 6 – Measuring with the Pyroelectric and PD10 Heads Adjusting Calibration Factors
Note: For metallic heads, when the calibration is changed at one laser
wavelength, the overall calibration of all other wavelengths changes
proportionately. For broadband heads, there is an option to adjust the
calibration factor for all wavelengths or only for a selected
wavelength.
To adjust the energy calibration factor:
1. Click the right mouse button and select Calibrate from the pop-up menu.
OR
Open the Functions menu and select Calibrate. The Adjust Calibration
Factor dialog box appears.
Figure 6-10 Adjust Calibration Factor Dialog Box – Metallic Head
Figure 6-11 Adjust Calibration Factor Dialog Box – Broadband Head
The Original area displays the original Measurement and Calibration
Factor. The Current wavelength is displayed beneath the Original area.
2. Use the Calibration Factor scroll bar to attain an accurate reading in the
Calibration Factor field in the Adjusted area.
OR
Enter the desired factor into the text box above the scroll bar.
3. Click Save to save the adjustment for the active channel.
StarLab User Guide 60

Chapter 6 – Measuring with the Pyroelectric and PD10 Heads Additional Graphical Display Options
Additional Graphical Display Options
The StarLab application enables you to configure and display readings in dBm
scale and enables you to configure and apply normalization.
Displaying Readings in dBm Scale
To display readings in dBm scale for a pyroelectric head, refer to Displaying
Readings in dBm Scale in Chapter 5 – Measuring with the Photodiode Head.
Note: You can only display reading in dBm scale while working in Power
mode. This option is not available while working in Energy Mode.
Applying Normalization
To apply normalization for a pyroelectric head, refer to Applying Normalization
in Chapter 5 – Measuring with the Photodiode Head.
Note: You can only apply normalization for a pyroelectric head while
working in Power mode. This option is not available while working in
Energy Mode.
StarLab User Guide 61

Chapter 7 – External Triggers and
Missing Pulses
This chapter provides an overview and instructions for working with External
Triggers and Missing Pulses. These are supported only by the Pulsar device.
Topics in this chapter include:
Overview of the External Trigger •
•
•
•
•
•
•
•
•
•
•
Hardware Considerations
Configuring the External Trigger Settings
Using the External Trigger for Input Mode
Using the External Trigger in Output Mode
Overview of the External Trigger
The Pulsar device includes an External Trigger BNC connector, which can be
used as an external trigger input or output when using energy detectors
(pyroelectric or PD10 heads).
When configured as an input, a signal can be connected from the sync output of
a laser or laser-system to the BNC connector. It can be used to detect and log
missing pulses, or to lock out and ignore specific pulses or groups of pulses that
are not interesting.
When configured as an output, the signal can be used to trigger external
circuitry in sync with pulses on the head detector.
Hardware Considerations
The External Trigger input characteristics:
Can be driven by any digital signal, TTL or CMOS, 3.3v or 5v logic.
Can tolerate input voltages between 10v and -10v.
A voltage is considered high when it is 2.4v or greater.
A voltage is considered low when it is 0.6v or smaller.
The External Trigger output characteristics:
Drives ~3.3v high level.
Drives ~0v low level.
StarLab User Guide 62
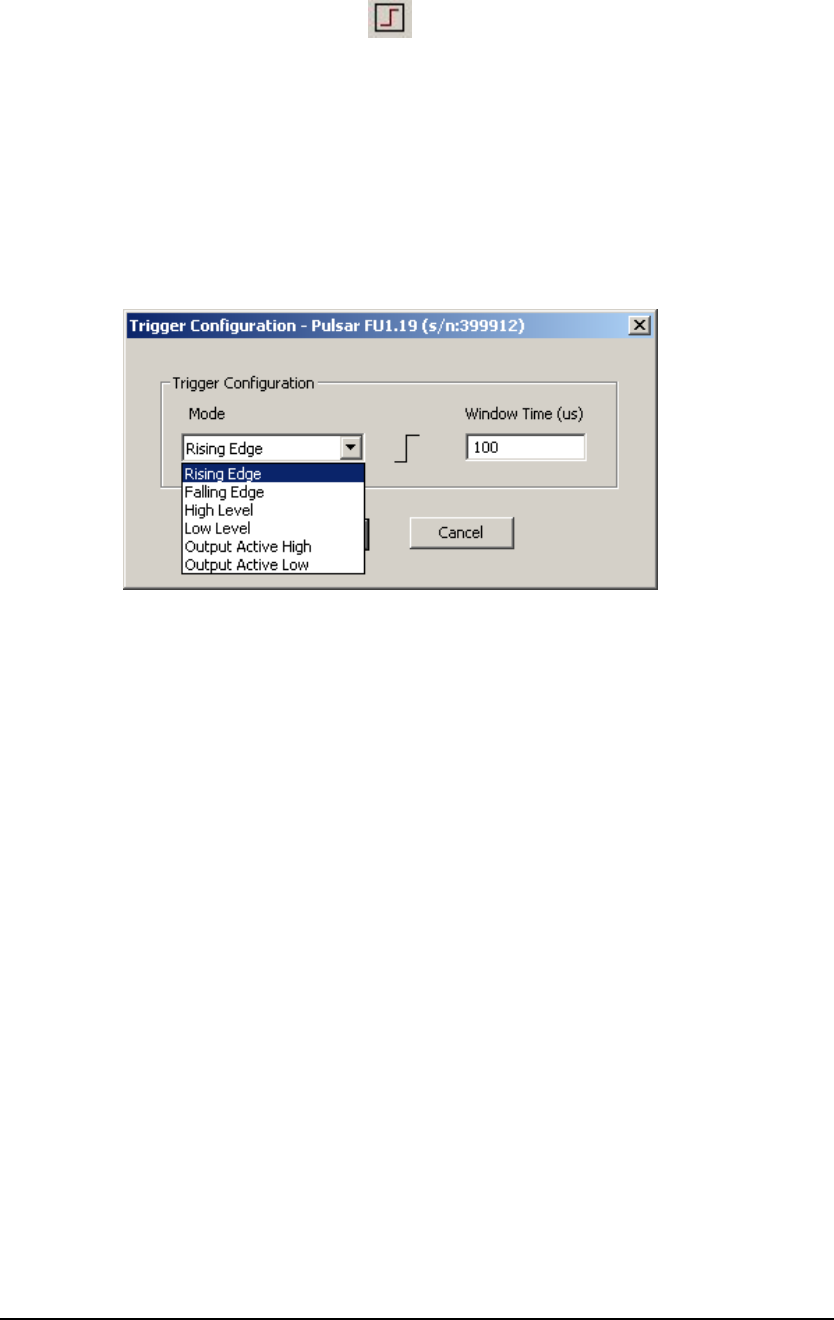
Chapter 7 – External Triggers and Missing Pulses Configuring the External Trigger Settings
Configuring the External Trigger Settings
To configure the External Trigger Mode setting:
1. Click the External Trigger icon .
Or
Select Functions from the main menu and from the sub-menu select Trigger
Configuration.
Or
Right click anywhere on the screen, and select Trigger Configuration from
the pop-up menu. The Trigger Configuration window appears.
Figure 7-1 Trigger Configuration Window
2. Select the desired setting from the Mode drop-down.
3. Click Save. The External Trigger settings are configured.
Configuring the External Trigger Window Time
You can configure the window time for the External Trigger when using the
Rising Edge or Falling Edge Trigger Configuration modes only.
Choosing the Window Time setting:
Adjust the window time to be larger than the expected delay time
between the laser pulse and the trigger signal (the trigger can be before
or after the laser).
•
• The window time setting should be less than the laser period ("1/F",
where 'F' refers to the laser frequency).
Refer to Table 7-1 and Figure 7-2 for more information on the Window Time.
To configure the Window Time setting:
1. In the Window Time text box, enter the desired Trigger Window time,
between 1us (0.001ms) and 65535us (65.535ms).
2. Click Save. The Window Time setting is configured.
StarLab User Guide 63

Chapter 7 – External Triggers and Missing Pulses Using the External Trigger for Input Mode
Using the External Trigger for Input Mode
You can set the External Trigger to use one of four available input modes: Rising
Edge, Falling Edge, High Level, or Low Level.
Table 7-1 External Trigger Input Modes
Input Mode Description
Rising Edge • The device is sensitive to a trigger on the RISING
EDGE of the input.
• The trigger is valid for a pulse arriving during a
window of time before or after the active (rising) edge
(see Figure 7-2 ).
• The inactive (falling) edge of the signal is ignored.
• Missing Pulses are recorded when an External Trigger
edge is received, but no pulse arrives within the
Window Time before or after the active edge.
• Pulses are ignored if they arrive outside the Window
Time, before or after the active edge.
• Multiple pulses within the Window Time are counted
as one pulse.
Falling Edge • The device is sensitive to a trigger on the FALLING
EDGE of the input.
• The trigger is valid for a pulse arriving during a
window of time before or after the active (falling) edge
(see Figure 7-2 ).
• The inactive (rising) edge of the signal is ignored.
• Missing Pulses are recorded when an External Trigger
edge is received, but no pulse arrives within the
Window Time before or after the active edge.
• Pulses are ignored if they arrive outside the Window
Time, before or after the active edge.
• Multiple pulses within the Window Time are counted
as one pulse.
High Level • Pulses are recorded only when the input signal is at a
HIGH LEVEL.
• Any pulse arriving while the signal is high is counted.
Any pulse arriving while the signal is low is ignored.
• No Missing Pulses are recorded in this mode.
Low Level • Pulses are recorded only when the input signal is at a
LOW LEVEL.
• Any pulse arriving while the signal is low is counted.
Any pulse arriving while the signal is high is ignored.
• No Missing Pulses are recorded in this mode.
The following figure describes the External Trigger Window Time with the Rising
Edge mode selected.
StarLab User Guide 64
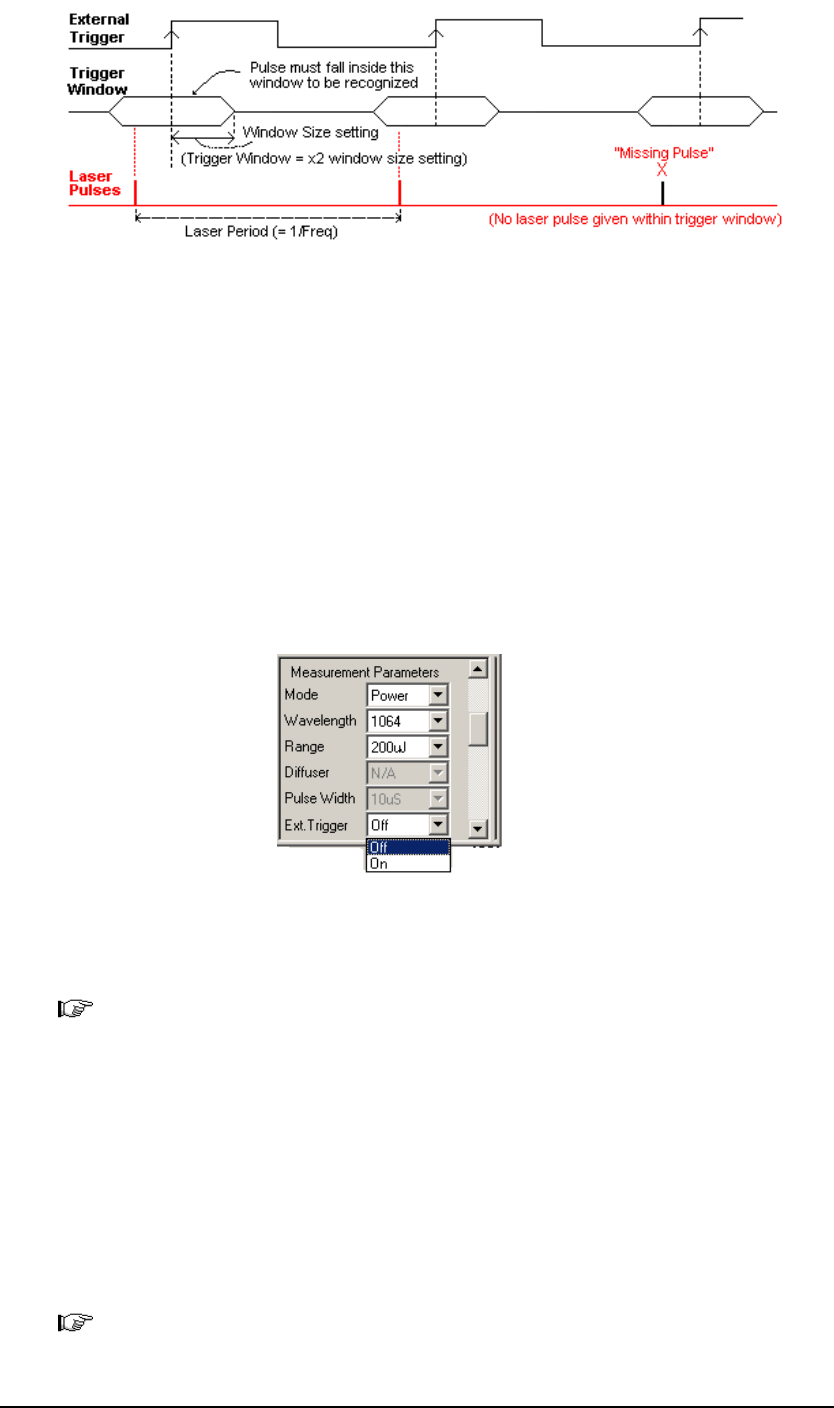
Chapter 7 – External Triggers and Missing Pulses Using the External Trigger in Output Mode
Figure 7-2 External Trigger Window Time – Rising Edge Mode
Enabling or Disabling a Channel to Work with External Trigger
Any active channel of the Pulsar can be configured to use the External Trigger,
as long as the head is pyroelectric or PD10.
To enable or disable a channel:
1. In the Measurements Parameters area, in the External Trigger drop-
down, select:
On to enable the External Trigger. •
• Off to disable the External Trigger.
Figure 7-3 Measurement Parameters – Ext. Trigger Options
The External Trigger is enabled or disabled.
Note: When the External Trigger is not in use, ensure that the Ext. Trigger
drop-down is set to Off. Otherwise the application may not function
properly.
Using the External Trigger in Output Mode
In addition to the input modes described in the previous section, the External
Trigger BNC connector can be used as an output that can trigger any external
circuitry. The output is a short digital pulse (10us), which occurs whenever a
pulse is seen on the head detector.
Note: The exact timing delay between the pulse and the output signal
depends on the type of head detector being used. For metallic
StarLab User Guide 65

Chapter 7 – External Triggers and Missing Pulses Using the External Trigger in Output Mode
pyroelectric or PD10 heads, the delay is ~5us. For Broad Band (BB)
heads, the delay may be longer.
You can set the external trigger to one of two available output modes: Active
High or Active Low.
Table 7-2 External Trigger Output Modes
Input Mode Description
Active High • Every time a pulse arrives on the head detector the output
goes high for 10us and then returns back to low.
• The default level of the output with no pulses is low.
Active Low • Every time a pulse arrives on the head detector the output
goes low for 10us and then returns back to high.
• The default level of the output with no pulses is high.
Enabling the Active Channel for Output Control
The External Trigger mode of the device applies to all four of the device’s
channels at once. However, in output mode only one of the channels can be
configured to drive the output at once. When the External Trigger is set for one
channel, the External Trigger for all other active channels is disabled by the
software.
When first entering one of the output modes, the software automatically sets the
External Trigger to the lowest active channel, and disables the External Trigger
drop-down for all other active channels (refer to Figure 7-3). For example, if
Channels 1 and 2 are active on the Pulsar device, Channel 1’s External Trigger
drop-down is automatically set to On and the External Trigger drop-down for
channel 2 is disabled.
To enable the External Trigger Output for a different channel:
1. Select Off in the Ext. Trigger drop-down, in the Measurement Parameters
panel of whichever channel is enabled. The External Trigger drop-down
for all the channels is now active.
2. Set the Ext. Trigger drop-down to On for the channel you want to enable.
The channel is enabled.
StarLab User Guide 66

Chapter 8 – Working with Multiple Heads
This chapter provides instructions for working with multiple heads and channels
from various connected devices. Topics include:
Connecting More than One Head •
•
•
•
Selecting Channels
Viewing the List of Active Heads
Viewing Multiple Windows
Connecting More than One Head
It is possible to attach more than one Ophir head to the PC in one of two ways:
by using several single channel devices (USBI, Pulsar-1 and Quasar), or by using
multiple channel devices (Pulsar-4 and Pulsar-2).
In the case of single channel USB devices (USBI, Pulsar-1) each device connects
between one head and the PC. Multiple USB devices can be attached to the PC
by using more than one USB port. Most PCs are equipped with between 2 and 6
USB ports. However, the USB standard specifies that up to 127 devices can be
attached to one USB controller. The standard therefore defines a device called a
hub. Hubs provide ports to allow multiple devices to be attached. The USBI
device requires a hub that can provide power to downstream high-power devices.
The Pulsar-4 (and Pulsar-2 and Pulsar-1) do not require power from the hub, but
require a High Speed (USB 2.0 compliant) hub for optimum performance.
In the case of the Quasar device, a single Bluetooth radio adapter attached to the
PC can connect to at least four Quasar devices at once. Operation with more than
one radio device attached to the PC is not supported.
Using a multiple channel device (Pulsar-4 or Pulsar-2) up to four heads can be
attached to the PC using a single device. Multiple heads can also be attached
using a combination of these two methods.
Selecting Channels
The StarLab application allows you to work with multiple channels from various
devices at the same time. The devices may be connected to many types of heads
including thermopile, photodiode, pyroelectric or a combination of different head
types. In addition to being able to connect the application to numerous channels
at once, you can specify which of the connected channels you wish to view.
StarLab User Guide 67
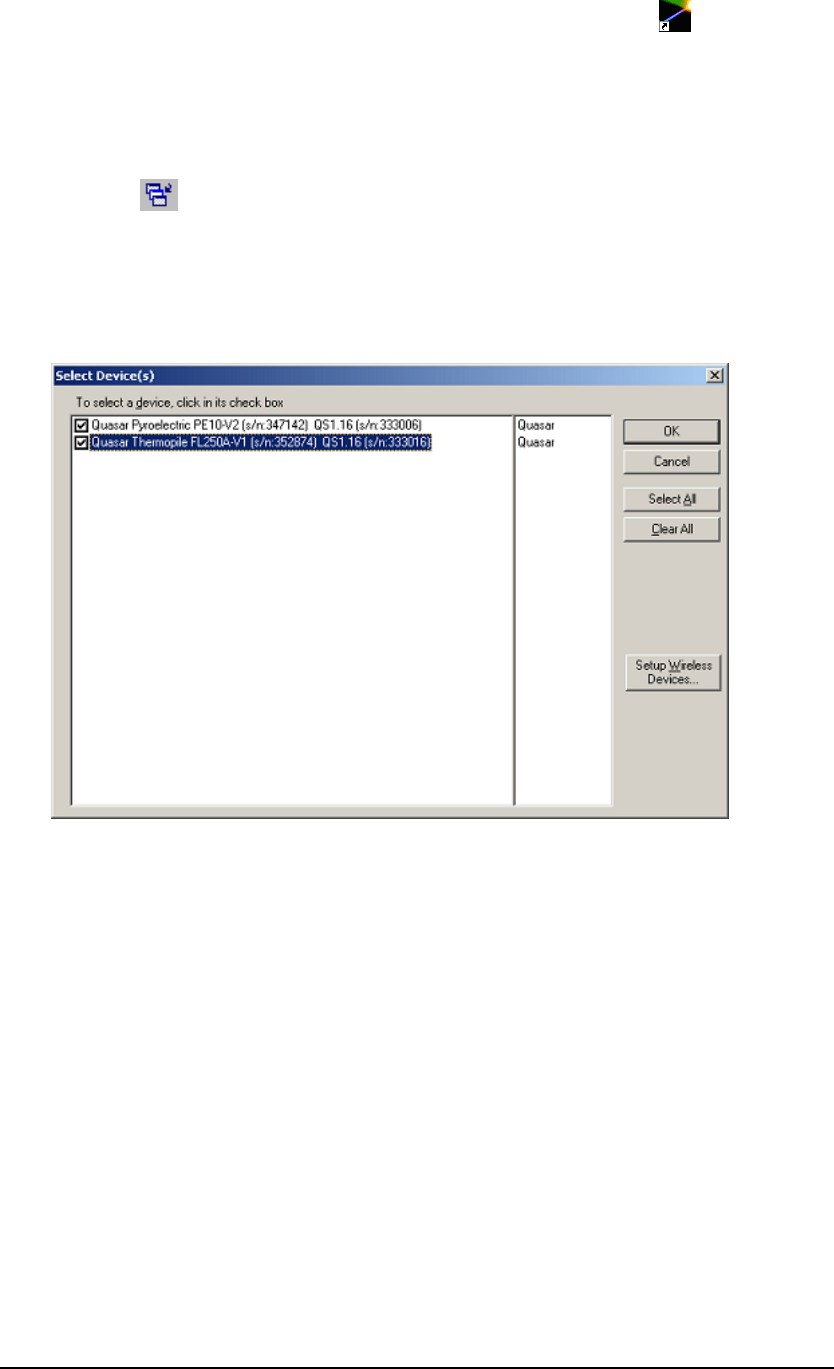
Chapter 8 – Working with Multiple Heads Selecting Channels
To select channels:
1. If the application is not yet open, from the desktop, double-click . The
StarLab interface opens, and the Select Device(s) dialog box appears. If
more than one head is connected to the device, then a list of connected
heads will display.
OR
Click on the toolbar.
OR
Click Select Device from the menu bar. The Select Device(s) dialog box
appears displaying a list of all the connected heads.
Figure 8-1 Select Device(s) Dialog Box
2. Select one or more heads with which you wish to work.
OR
Click Select All to select all the channels listed.
OR
Click Clear All to uncheck all the selected channels.
3. Click OK to save the selection and close the dialog box. The StarLab
application will open a measurement window for each head selected.
4. With the Quasar, to add to the list of devices that StarLab recognizes, click
Setup Wireless Devices from the Select Devices dialog box. Refer to
section Connecting the Quasar device.
StarLab User Guide 68

Chapter 8 – Working with Multiple Heads Viewing the List of Active Heads
Note: If the software of any selected device requires upgrading, the OK
button will be inactive until you have upgraded the device software.
For information on upgrading device software, refer to Upgrading the
Device’s Internal Software in Chapter 3 – Getting Started.
Viewing the List of Active Heads
You can view a list of all the currently active heads.
To view the list of active heads:
1. Click Select Device from the menu bar. The Select Device(s) dialog box
appears, see Figure 8-1. The checked heads are the active heads.
OR
Open the Window menu. The active heads are listed below the line in the
Window menu.
Viewing Multiple Windows
When working with more than one channel, you can arrange your window in
several ways to view all active channel windows simultaneously.
To view multiple channel windows simultaneously:
1. Open the Window menu and select one of the following options:
Cascade – Cascades the channel windows one on top of the other. •
•
•
•
Tile Horizontally – Tiles the channel windows horizontally.
Tile Vertically – Tiles the channel windows vertically.
Arrange Icons – Arranges any minimized icons at the foot of the
USBI application window.
The display refreshes automatically to reflect the selection. Figure 8-2 shows
two channel windows tiled horizontally.
StarLab User Guide 69
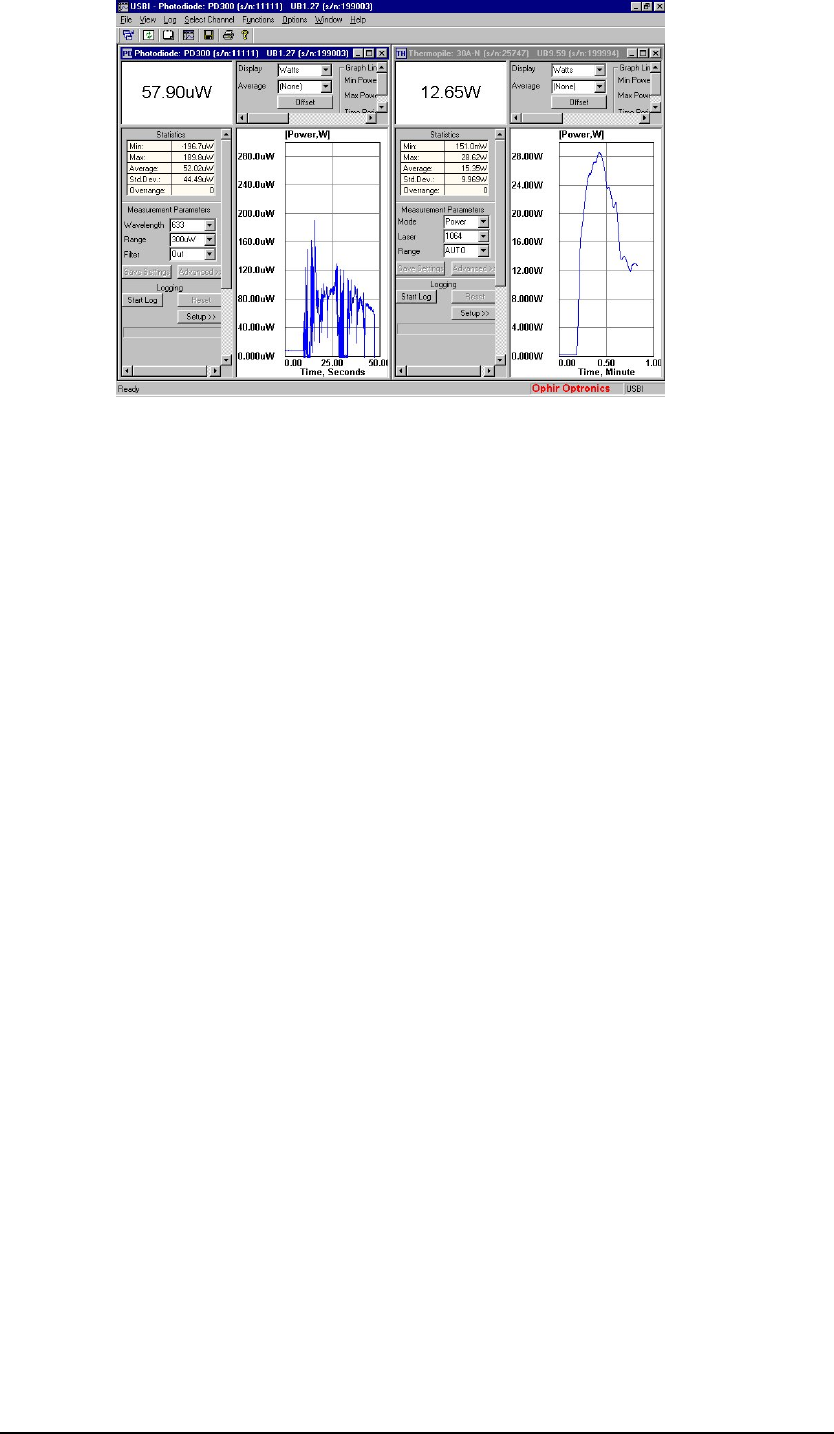
Chapter 8 – Working with Multiple Heads Viewing Multiple Windows
Figure 8-2 Two Channel Windows Tiled Horizontally
StarLab User Guide 70
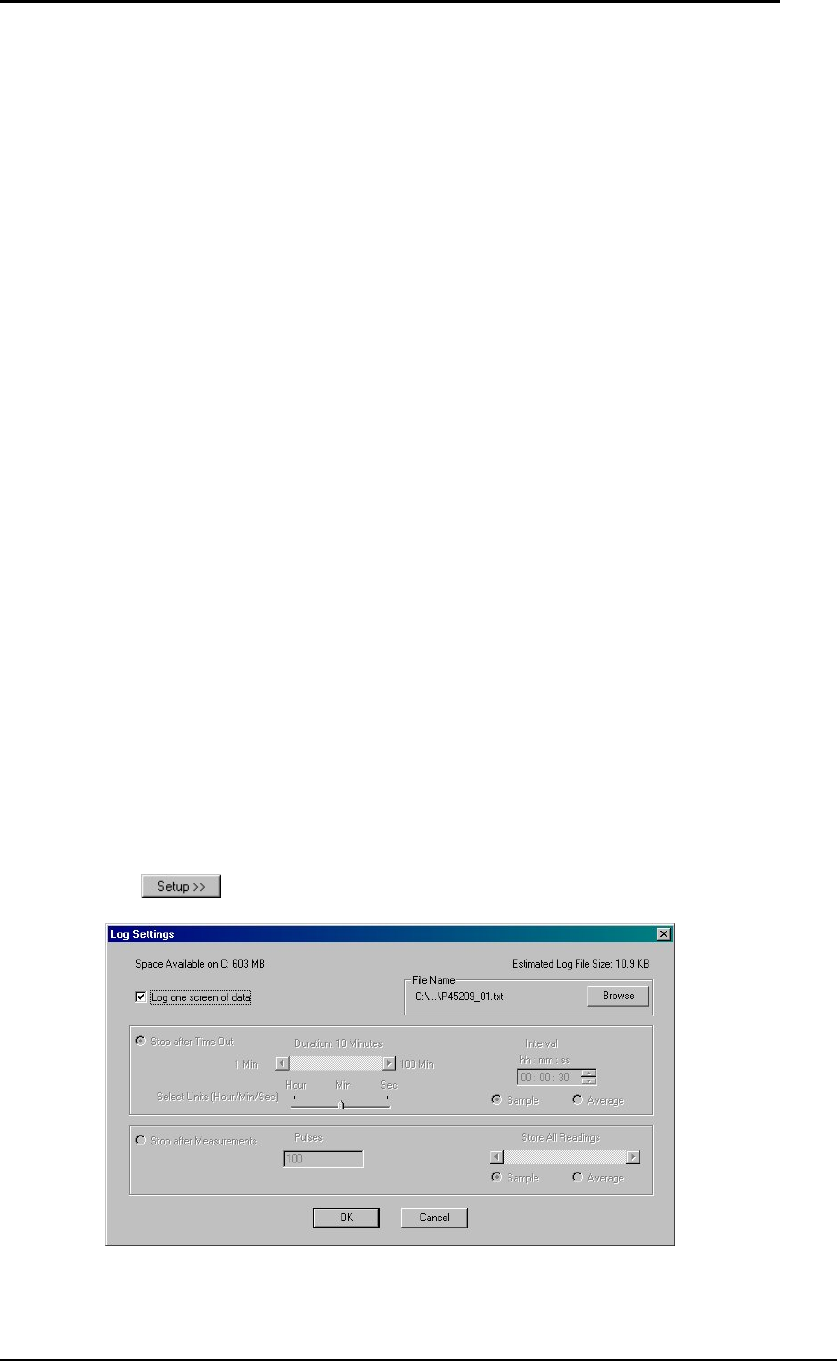
Chapter 9 – Working with Log Files
This chapter provides instructions for working with log files for thermopile,
photodiode, and pyroelectric heads. Topics include:
Default Location for Log Files •
•
•
•
•
•
Configuring Log File Settings
Starting and Stopping the Log
Using Turbo Mode
Adding Notes to a Log File
Choosing the Log File Format
Default Location for Log Files
By default, Windows XP/2000 saves log files in the application software
installation directory; and Vista saves log files in Documents\StarLab (full path –
C:\Users\<user>\Documents\StarLab). If the user changes the default file
location, the system keeps the new default location even after reinstallation of a
new version of the software.
Configuring Log File Settings
This section explains how to configure log file settings. You can log just one
screen of data or you can specify the duration of the log or the number of
measurements to be taken.
Logging One Screen of Data Only
To log one screen of data:
1. Click in the Logging Area. The Log Settings dialog box appears.
Figure 9-1 Log Settings Dialog Box – Log One Screen of Data
StarLab User Guide 71
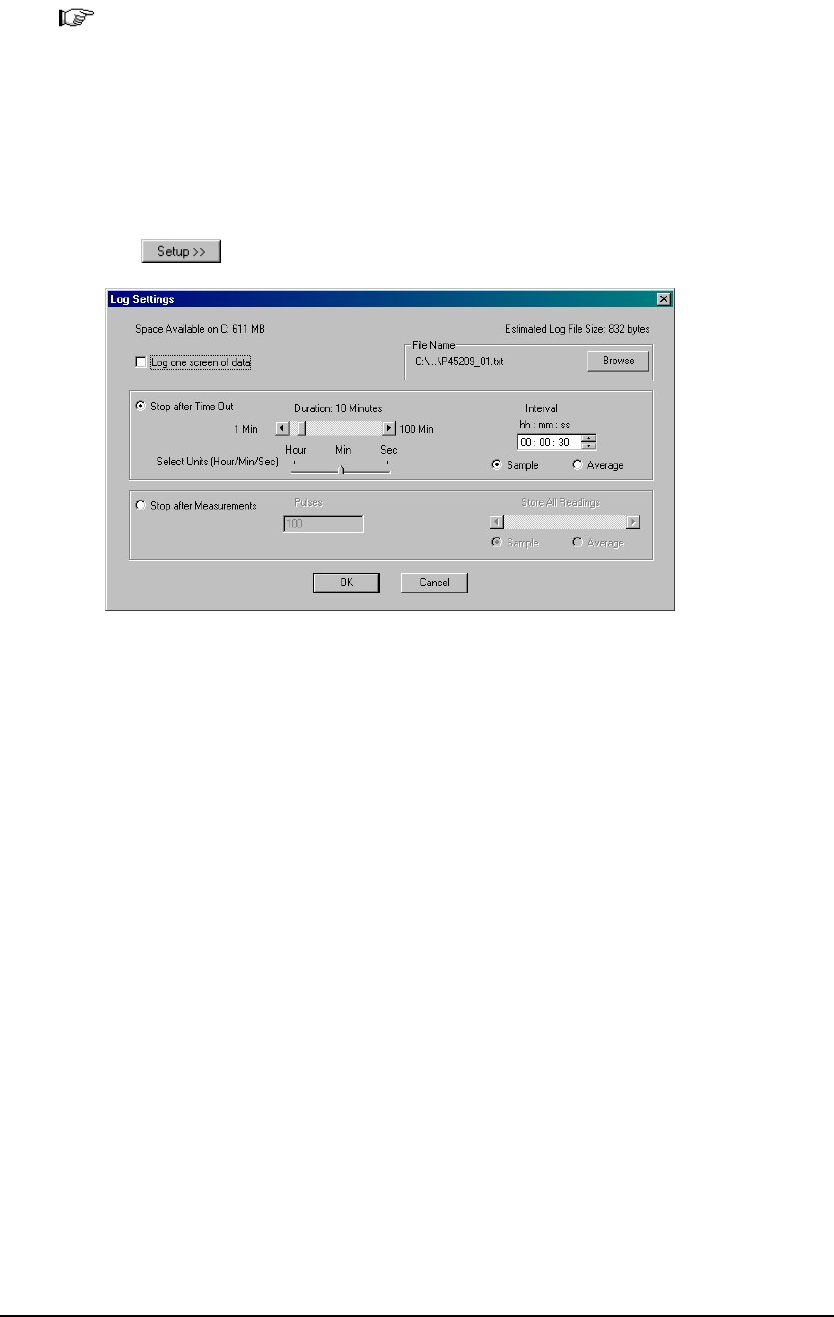
Chapter 9 – Working with Log Files Configuring Log File Settings
2. Select Log one screen of data.
3. Click Browse and select a file location to save the log data. The log data
will be saved to the default file, as displayed in the File Name area.
Note: For details of the default location for log files, see section Default
Location for Log Files.
4. Click OK to save the log settings.
Configuring Log Duration
To configure the log duration:
1. Click in the Logging Area. The Log Settings dialog box appears.
Figure 9-2 Log Settings Dialog Box – Stop after Time Out
2. Select Stop after Time Out.
3. In the Stop after Time Out area, use the Select Units pointer to select the
unit of time (hours, minutes, or seconds) you wish to work with.
4. To configure the measurement interval, in the Stop after Time Out area of
the Log Settings dialog box, use your cursor to set the hours, minutes, or
seconds in the Interval field. Use the arrows to configure the measurement
Interval.
When logging power readings, a time interval can be set for measurements
configured to stop after time out. The interval determines how often a
measurement will be taken and added to the log.
5. Use the Duration scroll bar to set the log duration.
6. Select Sample to log one sample per interval.
OR
Select Average to log an average of all the readings in an interval.
7. Click Browse and select a file location to save the log data.
OR
StarLab User Guide 72
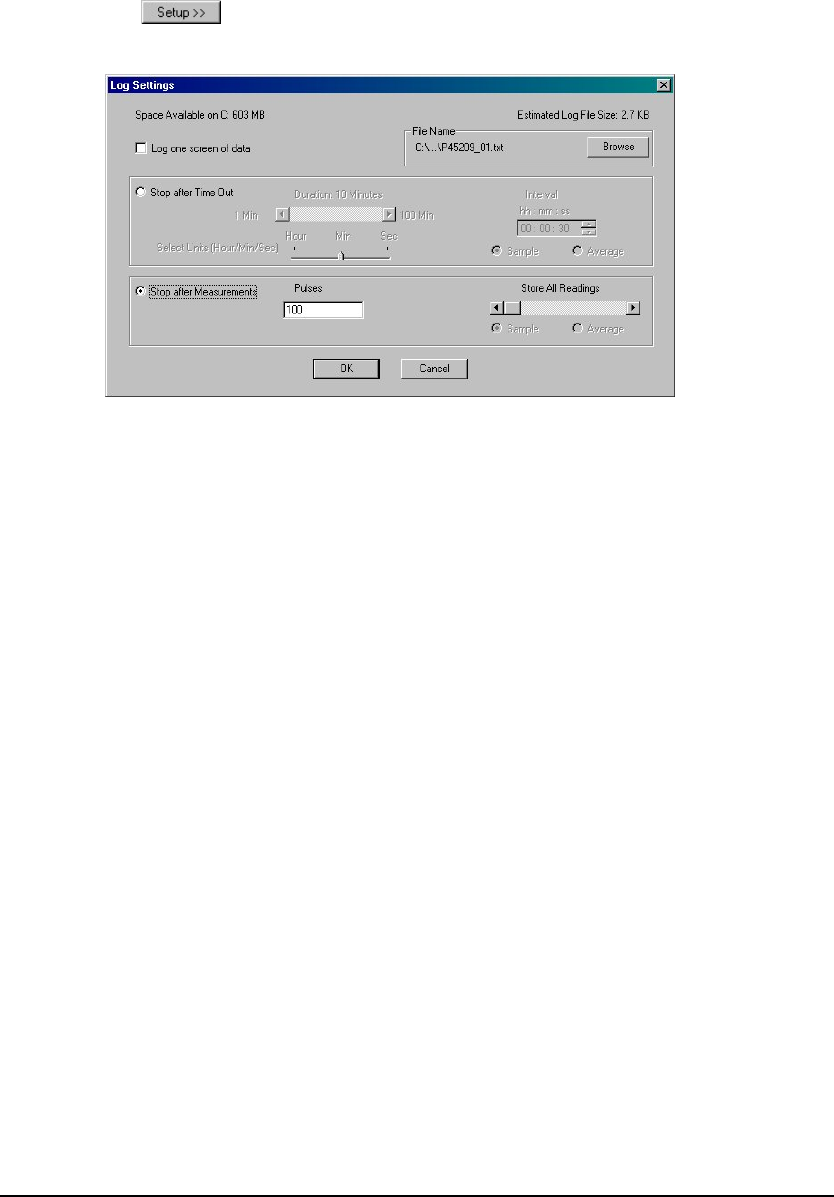
Chapter 9 – Working with Log Files Configuring Log File Settings
The log data will be saved to the default file, as displayed in the File Name
area.
8. Click OK to save the log settings.
Configuring the Number of Measurements
To configure the log to end after a specified number of pulses:
1. Click in the Logging Area. The Log Settings Dialog Box
appears.
Figure 9-3 Log Settings Dialog Box – Stop after Measurements
2. In the Log Settings dialog box select Stop after Measurements.
3. In the Stop after Measurements area, enter the number of pulses you want
to measure in the Pulses field.
4. In the Stop after Measurements area, drag the scroll bar to the right to set
the value. As you move the scroll bar, the heading above the bar changes
to One out of # pulses. You can choose one in 3, 10, 30, 100, 300, or
1000 pulses.
OR
Drag the scroll bar to the left. The heading above the bar changes to Store all
Readings.
5. Select Sample to log one sample per interval.
OR
Select Average to log an average of all the readings in an interval.
6. Click Browse and select a file location to save the log data.
Otherwise, the log data is be saved to the default file, as displayed in the File
Name area.
7. Click OK to save the log settings.
StarLab User Guide 73
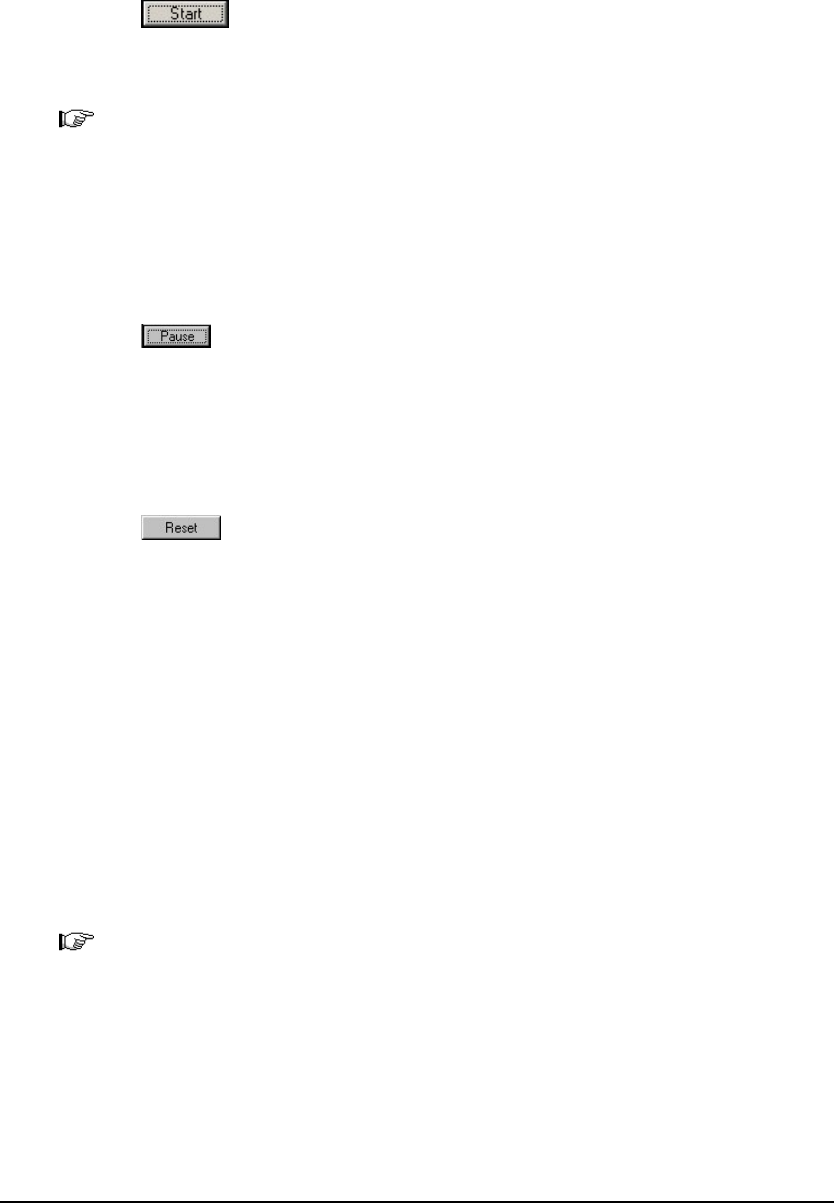
Chapter 9 – Working with Log Files Starting and Stopping the Log
Starting and Stopping the Log
This section explains how to start and stop saving data to a log file.
Starting the Log
To start the log:
1. Click in the Logging Area. The Start Log button toggles to
Pause and a logging progress bar appears at the bottom of the Logging
Area
Note: No changes can be made to the settings in the Measurement
Parameters or Graph Configuration Areas for the duration of the log
process.
Pausing the Log
To pause the log:
1. Click in the Logging Area. The Pause button toggles to Reset and
the logging progress bar freezes.
Stopping the Log
To stop the log:
1. Click in the Logging Area. StarLab will stop saving data to the
log file. The Pause button toggles to Start Log and the logging progress
bar disappears.
Using Turbo Mode
Although pyroelectric and PD10 heads can measure laser pulses fired at high
frequencies, in standard logging mode the StarLab software can measure every
pulse only when firing below a certain frequency. At higher laser frequencies,
the USBI, Pulsar and Quasar are not capable of logging every pulse, but rather
will log a sample of the measurements at a lower rate.
Therefore, the StarLab software provides a special log mode called Turbo Mode,
which allows logging every pulse up to higher pulse rates.
Note: Turbo Mode always measures energy, even if the power mode is on.
For the exact pulse rates at which every pulse can be logged using Turbo Mode,
refer to Table 1-1 and Table 1-2. When logging in Turbo Mode the rest of the
StarLab application is unavailable.
For the USBI, Nova-II and Vega devices, Turbo mode is available only for
metallic pyroelectric and PD10 heads configured for short pulse measurement.
StarLab User Guide 74
Chapter 9 – Working with Log Files Using Turbo Mode
For the Pulsar devices, Turbo Mode is always for all pyroelectric and PD10
heads, and allows synchronized data logging on all channels at the same time, by
way of the micro-second resolution timestamps stored in the log files. For more
information, see Choosing the Log File Format on page 78.
Note: For the Quasar device, Turbo Mode is not available.
To log in Turbo mode for use with the USBI, Nova-II or Vega device:
1. Click the right mouse button and select Turbo Mode from the pop-up
menu.
OR
Open the Functions menu and select Turbo Mode. The Turbo Mode dialog
box appears.
Figure 9-4 Turbo Mode Dialog Box
2. In the Expected Laser Frequency text box, type the expected laser
frequency to log. This step is optional, but improves logging accuracy for
some heads (for example, PE25).
3. To stop the logging at a specific number of measurements, type a number
in the Expected Number of Measurements text box. Otherwise, Turbo
logging continues until stopped manually.
4. Click Start. The Start button turns into a Stop button. If you typed a
number in the Expected Number of Measurements text box, the progress
bar shows the continuing progress of the logging.
The file name of the log appears above the Start/Stop button. The log file is
saved to the working directory of the StarLab application.
5. To stop Turbo logging, click Stop, or wait for the expected number of
measurements to be logged.
6. Click Exit to close the dialog box.
StarLab User Guide 75
Chapter 9 – Working with Log Files Using Turbo Mode
To log in Turbo mode for use with the Pulsar device:
1. Click the right mouse button and select Turbo Mode from the pop-up
menu.
OR
Open the Functions menu and select Turbo Mode. The Turbo Mode dialog
box appears displaying the active channels.
Figure 9-5 Turbo Mode Dialog Box
2. Check one or more of the heads to which you want to apply turbo mode.
For each head:
• In the Expected Laser Frequency text box, type the expected laser
frequency to log. This step is compulsory, since it is used to calculate
the size of the data buffer.
• In the Expected Number of Pulses text box, type the expected or
required number of pulses that are to be logged. This step is also
compulsory.
When logging a specific number of pulses with a laser that is continuously
pulsing, the software stops automatically after ~10% more pulses than
requested are logged.
StarLab User Guide 76
Chapter 9 – Working with Log Files Adding Notes to a Log File
When logging a specific number of pulses with a laser that stops after the
specific number of pulses are given, the software does not stop
automatically. When the laser has finished pulsing, stop logging
manually, by clicking Stop.
To log an indefinitely large amount of data, enter a very large number in
the text box, and stop logging manually by clicking Stop.
• Click Apply to all if you are entering the same information for all of
the heads.
3. Click Start. The Start button turns into a Stop button. The progress bar
shows the continuing progress of the logging.
The file name of the log appears above the Start/Stop button. The log file is
saved to the working directory of the StarLab application.
4. To stop Turbo logging, click Stop, or wait for the expected number of
measurements to be logged.
5. Click Exit to close the dialog box.
Note: The application allocates a buffer size to collect data from all active
heads at the same time. To allow for cases where different heads have
different expected frequencies or expected numbers of pulses, and to
allow for rounding errors in calculating the buffer size, the software
sets the buffer size 10% larger than the highest expected number of
pulses. Therefore, logging stops automatically after approximately
10% more than the expected number of pulses are logged on each
channel. If the laser stops after a fixed number of pulses, the logging
does not stop automatically, but rather must be stopped manually
using the Stop button. Conversely, when using more than one head
with different frequency lasers, entering too large of a value in the
Expected Laser Frequency text box for one head can cause Turbo
Mode to exit early without logging all the required data on each
channel.
Adding Notes to a Log File
This section describes how to add your own notes to a log file.
To add notes to a log file:
1. Open the Log menu and select Notes. The Notes dialog box appears.
Figure 9-6 Notes Dialog Box
StarLab User Guide 77

Chapter 9 – Working with Log Files Choosing the Log File Format
2. Enter a note into the text box.
3. Click OK to add the note to the log file.
Choosing the Log File Format
Log files are stored by the StarLab application as tab-delimited text files. Two
file formats are available in the software, “Standard” and “Excel Friendly”,
which differ only in the way the timestamp is recorded in the file.
Standard Format Log Files
This is the format used in older versions of the USBI application, and is retained
in newer versions of StarLab for backwards compatibility. It is the default
option. In this format, the timestamp is recorded as hours, minutes, seconds, and
fractions of a second. For example: 12:34:56.789 (for the USBI, Nova-II or Vega
devices, or with the Pulsar and Quasar devices using Thermopile and Photodiode
heads), where 12 is the hours, 34 is the minutes, 56 is the seconds, and 789 is the
fraction of a second. For the Pulsar and Quasar devices using Pyroelectric and
PD10 heads, the timestamp appears as 12:34:56.789321, where 789321 is the
fraction of a second with microsecond precision.
Excel Friendly Format Log Files
This format should be used when using Excel to process data stored in the log
files. In this format, the timestamp is recorded in seconds and fractions of a
second, in a manner more suited to Excel than the Standard format. For example:
45240.789 (for the USBI, Nova-II or Vega devices, or with the Pulsar and
Quasar devices using Thermopile and Photodiode heads) where 45240 is the
number of whole seconds (equaling 12 hours and 34 minutes), and 789 is the
fraction of a second. For the Pulsar and Quasar devices using Pyroelectric and
PD10 heads, the timestamp appears as 45240.789321, where 789321 is the
fraction of a second with microsecond precision.
StarLab User Guide 78
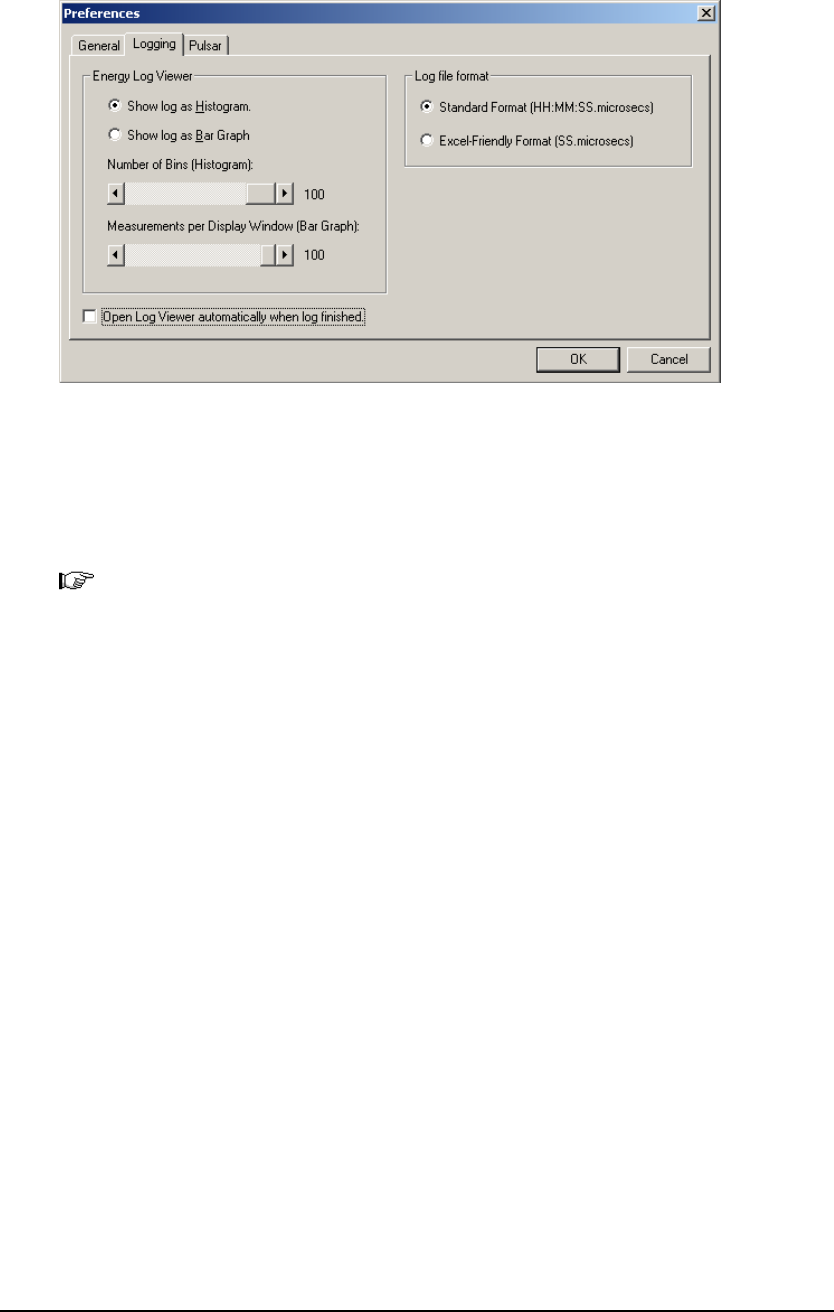
Chapter 9 – Working with Log Files Choosing the Log File Format
Selecting the Log File Format
1. Select Preferences from the Options menu. The Preferences dialog box
appears.
Figure 9-7 Preferences Dialog Box
2. Select the Logging tab.
3. In the Log file format area, select either Standard Format or Excel
Friendly Format.
Note: With the USBI, Nova-II and Vega device, timestamps are stored in the
log file with millisecond precision (three decimal places after the
decimal point) and have a resolution of approximately 50ms. With the
Pulsar and Quasar devices, using a pyroelectric or PD10 head,
timestamps are stored in the log file with microsecond precision (six
decimal places after the decimal point) and have a resolution of 1us.
Using a thermopile or photodiode heads, timestamps are stored with
millisecond precision.
StarLab User Guide 79
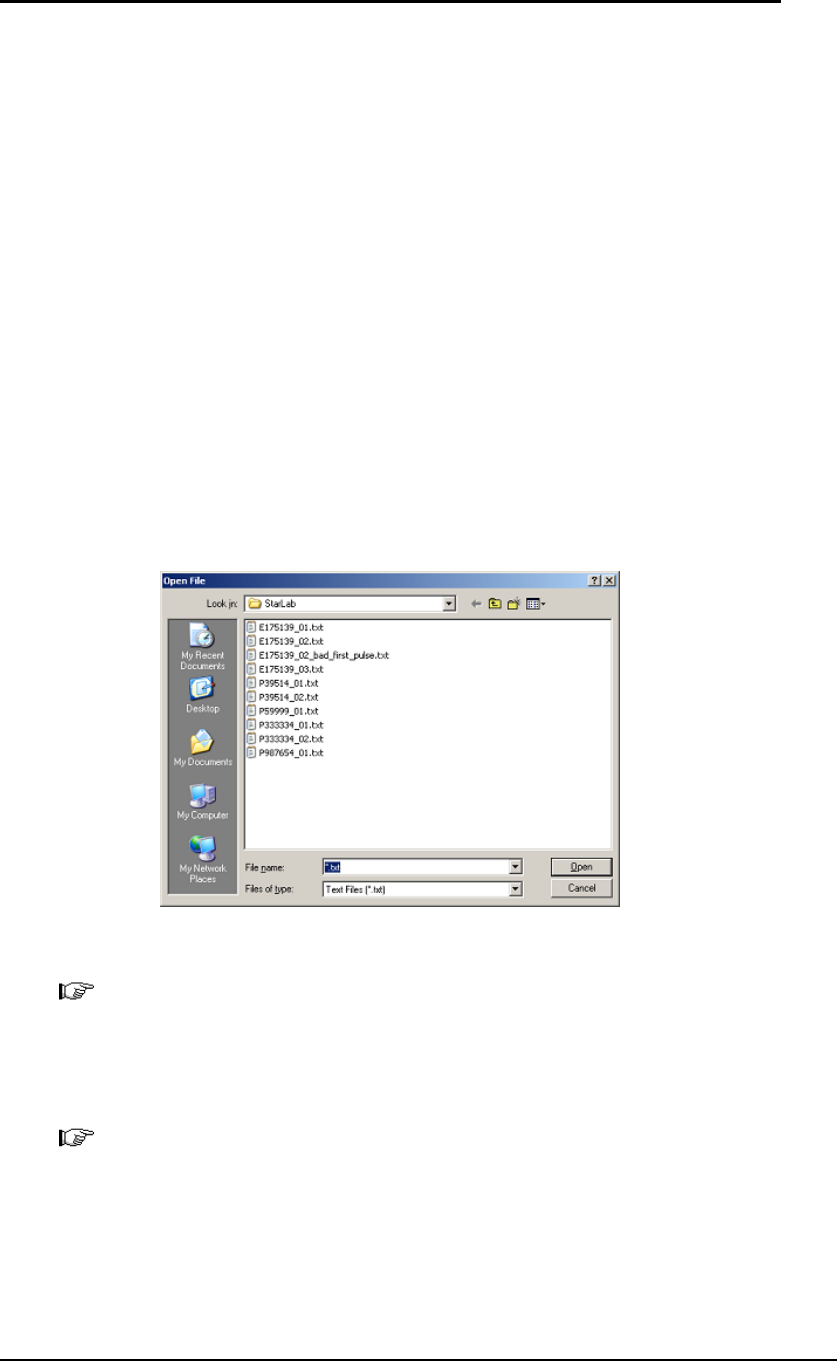
Chapter 10 – Viewing Log Files
Log files may be viewed graphically in the StarLab application’s Log Viewer, as
text in NotePad, or as a spreadsheet in Excel. This chapter provides explanations
and instructions for viewing log files. Topics include:
Accessing the Log Viewer •
•
•
•
•
•
Understanding the Log Viewer Window
Using the Log Viewer for Power Readings
Using the Log Viewer for Energy Readings
Viewing Log Files in NotePad
Opening Log Files in Excel
Accessing the Log Viewer
To open a log file in the StarLab application’s Log Viewer:
1. Open the File menu and select Open. The Open File dialog box appears
with the StarLab folder open.
Figure 10-1 Open File Dialog Box
Note: For details of the default location for log files, see section Default
Location for Log Files
2. Select the required file and click Open. The log file opens in the StarLab
application’s Log Viewer.
Note: To close the Log Viewer, open the File menu and select Cancel.
StarLab User Guide 80
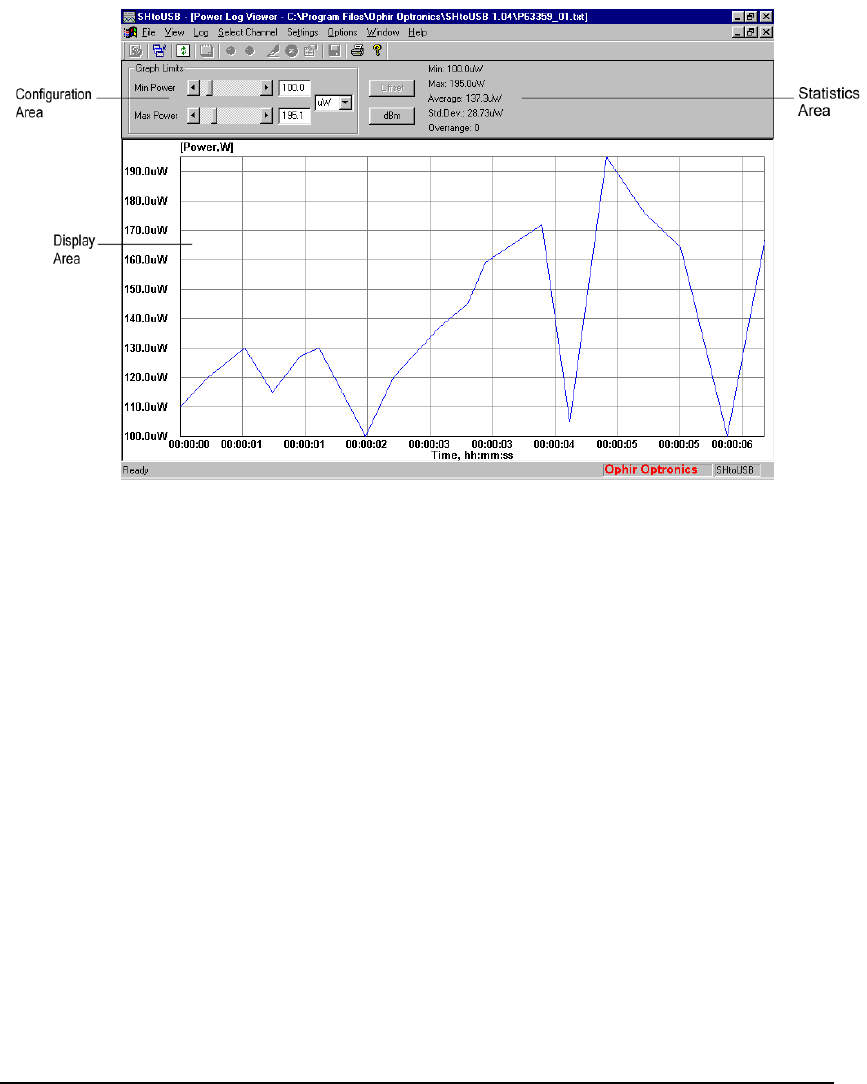
Chapter 10 – Viewing Log Files Understanding the Log Viewer Window
Understanding the Log Viewer Window
This section explains the Log Viewer window and the Log Viewer right mouse
button functions. Certain elements of the StarLab application’s Log Viewer
window change depending on whether you are viewing power or energy
readings. However, the basic layout remains the same and consists of the
following areas: the Display Area, the Configuration Area, and the Statistics
Area. In addition, the Settings menu in the Log Viewer replaces the normal
Functions menu.
Figure 10-2 shows the Log Viewer window for photodiode head measurements.
Figure 10-2 Log Viewer – Photodiode Measurements
The Display Area – The Display Area shows log file data in graph
form. The entire contents of a power log file data are displayed in one
window, while energy log file data can span multiple windows.
•
•
•
•
The Configuration Area – The Configuration Area is used to
configure the log file display.
The Statistics Area – The Statistics Area displays statistics for the
currently displayed readings. For information on the Statistics Area,
refer to The Statistics Area in Chapter 3 – Getting Started.
The Settings Menu – The Settings menu enables you to zoom in and
zoom out (for power readings only), and view log file information. The
Settings menu is also available by clicking the right mouse button.
StarLab User Guide 81
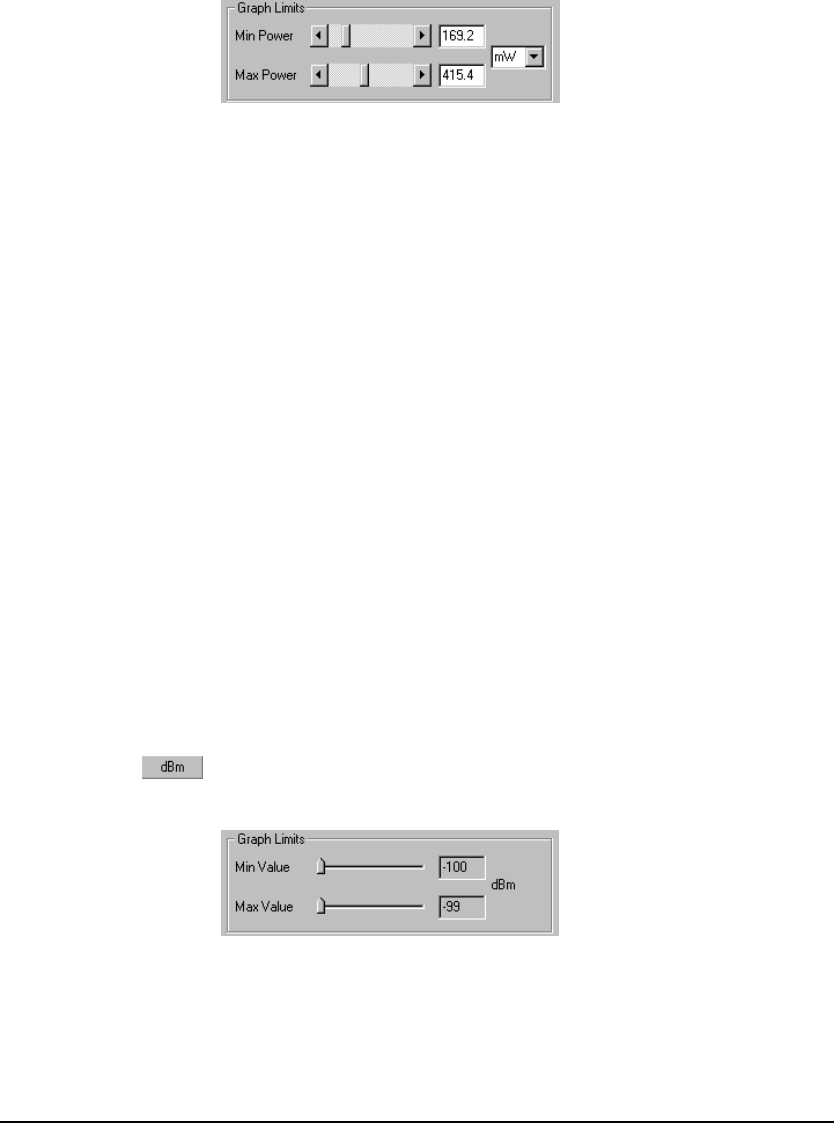
Chapter 10 – Viewing Log Files Using the Log Viewer for Power Readings
Using the Log Viewer for Power Readings
This section explains how to use the Log Viewer to view measurements taken in
power mode. Tasks include configuring the graph limits of the display, applying
dBm, toggling the offset, zooming in and out, and viewing log file information.
Configuring the Graph Limits
Graph limits are configured in the Configuration Area of the Log Viewer screen.
Figure 10-3 Log Viewer – Configuring Graph Limits
To configure the graph limits:
1. In the Graph Limits area, use the Min Power and Max Power scroll bar
or the arrows to select minimum and maximum power.
OR
Enter the minimum and maximum power in the text boxes provided in the
Graph Limits area.
The graph in the Display Area adjusts itself automatically and the selected
graph limits are displayed to the right of the scroll bars.
2. Select the power scale from the drop down list.
Applying dBm
The Log Viewer displays logged data in the mode (linear or dBm) in which the
measurements were originally taken. Even if the measurements were taken in
linear mode, dBm can be applied to the Log Viewer display.
To view the log file in dBm:
1. Click in the Configuration Area of the Log Viewer window. dBm
configuration settings appear in the Graph Limits area.
Figure 10-4 Log Viewer – Configuring Graph Limits for dBm Scale
StarLab User Guide 82

Chapter 10 – Viewing Log Files Using the Log Viewer for Power Readings
2. Use the Min Value and Max Value pointers to select the minimum and
maximum dBm values. Either drag the pointers or click to the right or left
of the pointers. The graph in the Display Area adjusts itself automatically,
and the selected dBm graph limits are displayed to the right of the
pointers.
Toggling the Offset
The Offset button in the Log Viewer is used to remove an offset that was applied
to the measurements in the log file, or to reapply the offset.
Note: If no offset was applied to the original measurements, the Offset button
is not available in the Log Viewer.
To view measurements without the offset:
1. Click . The offset feature is turned off.
To reapply the offset:
1. Click . The offset feature is turned on.
Zooming In and Zooming Out
The zoom feature allows you to magnify a section of the Display Area.
To zoom in:
1. Click and drag your mouse on the Display Area. A red box appears, which
selects the area you wish to enlarge.
2. Release the mouse button. The selected area is enlarged.
To zoom out one level:
1. Open the Settings menu and select Unzoom One Level.
OR
Right-click in the selected area and select Unzoom One Level. The selected
area returns to the size it was before it was last enlarged.
To reset the zoom:
1. Open the Settings menu and select Reset Zoom. The selected area returns
to its original size.
StarLab User Guide 83
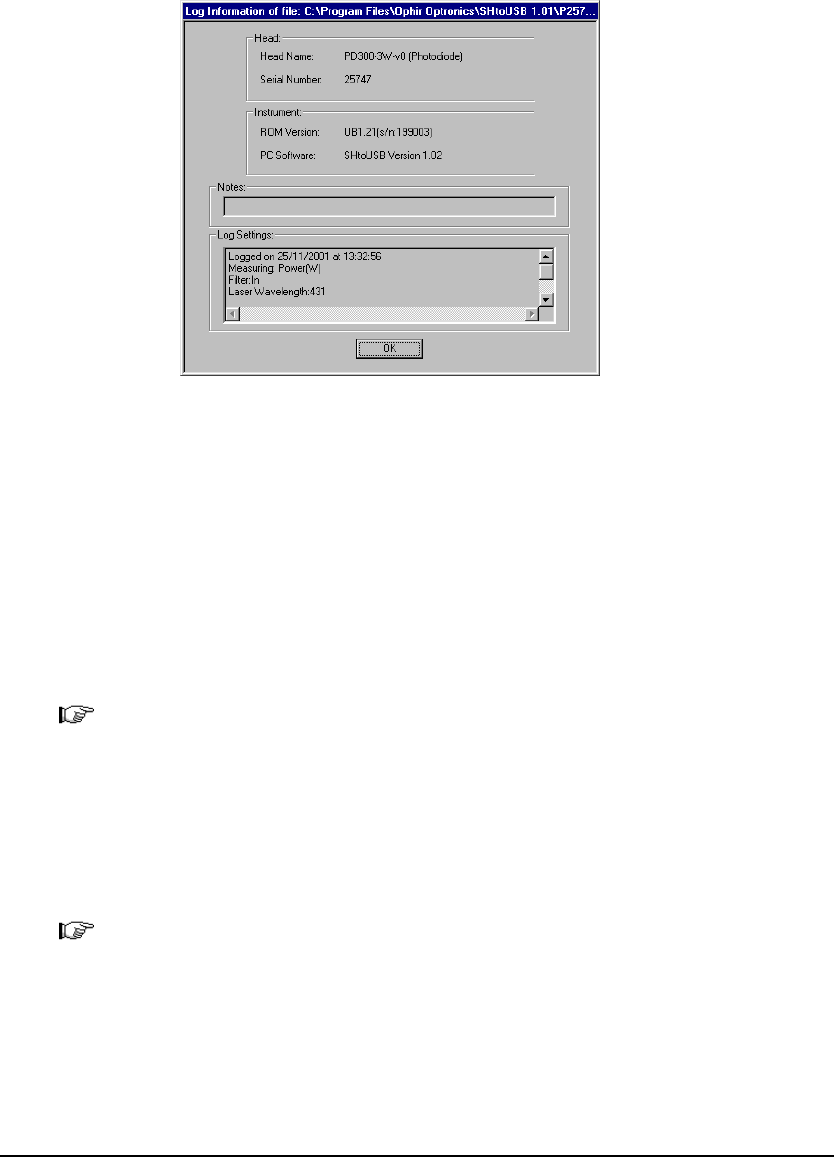
Chapter 10 – Viewing Log Files Using the Log Viewer for Energy Readings
Viewing Log File Information for Power Readings
To view information about measurements taken:
1. Open the Settings menu and select Info.
OR
Right-click and select Info. The Log Information dialog box appears
displaying log file information.
Figure 10-5 Log Information Dialog Box
2. Click OK to close the Log Information dialog box.
Using the Log Viewer for Energy Readings
This section explains how to use the Log Viewer to view energy measurements
taken with the thermopile or pyroelectric head in energy mode. Tasks include
configuring the histogram and bar graph settings, configuring the histogram and
bar graph limits, and viewing log file information.
Note: The dBm, Offset, and Zoom features are not available for energy
readings.
Configuring the Histogram Settings
An energy log file can be displayed as a histogram. Histogram settings are
configured in the Configuration Area.
Note: To configure default histogram settings, refer to Setting Log Viewer
Preferences on page 86.
StarLab User Guide 84
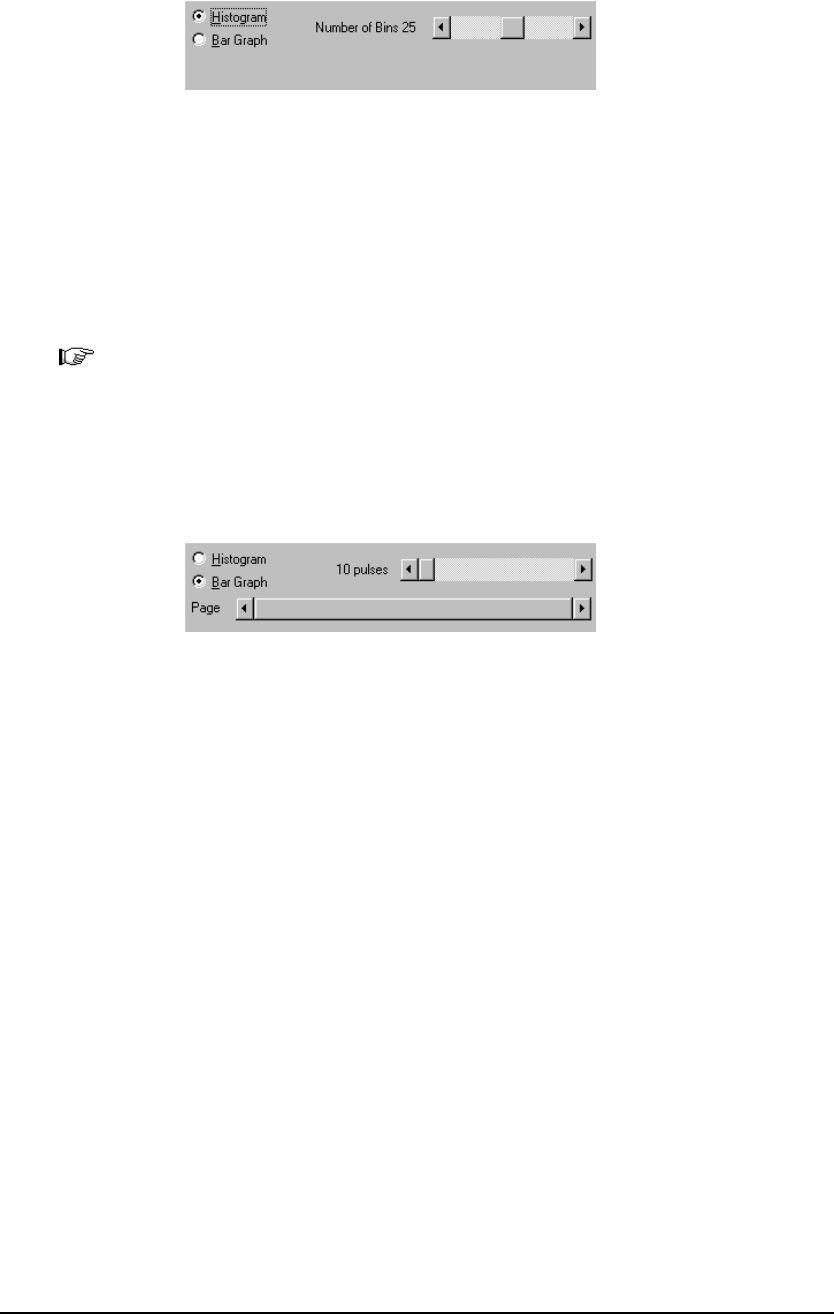
Chapter 10 – Viewing Log Files Using the Log Viewer for Energy Readings
To view the logged measurements as a histogram:
1. Click Histogram in the Configuration Area of the Log Viewer window.
The histogram configuration settings appear.
Figure 10-6 Log Viewer – Histogram Configuration Settings
2. Use the scroll bar or arrows to select the number of bins.
Configuring the Bar Graph Settings
An energy log file can be displayed as a bar graph. Bar graph settings are
configured in the Configuration Area.
Note: To configure default bar graph settings, refer to Setting Log Viewer
Preferences on page 86.
To view the logged measurements in a bar graph:
1. Click Bar Graph in the Configuration Area of the Log Viewer window.
The bar graph configuration settings appear.
Figure 10-7 Log Viewer – Bar Graph Settings
2. Use the pulses scroll bar or arrows to select the number of pulses. The
number of pulses selected is displayed to the left of the scroll bar and
beneath the bar graph.
3. Use the Page scroll bar or arrows to view the previous and next pages.
Configuring Histogram or Bar Graph Limits
Graph limits are configured in the Configuration Area of the Log Viewer
window.
To configure the graph limits:
1. In the Graph Limits area, use the Min Energy and Max Energy scroll
bars or arrows to select minimum and maximum power.
OR
Enter the minimum and maximum power in the text boxes provided in the
Graph Limits area. The graph in the Display Area adjusts itself automatically
and the selected graph limits are displayed to the right of the scroll bars.
StarLab User Guide 85
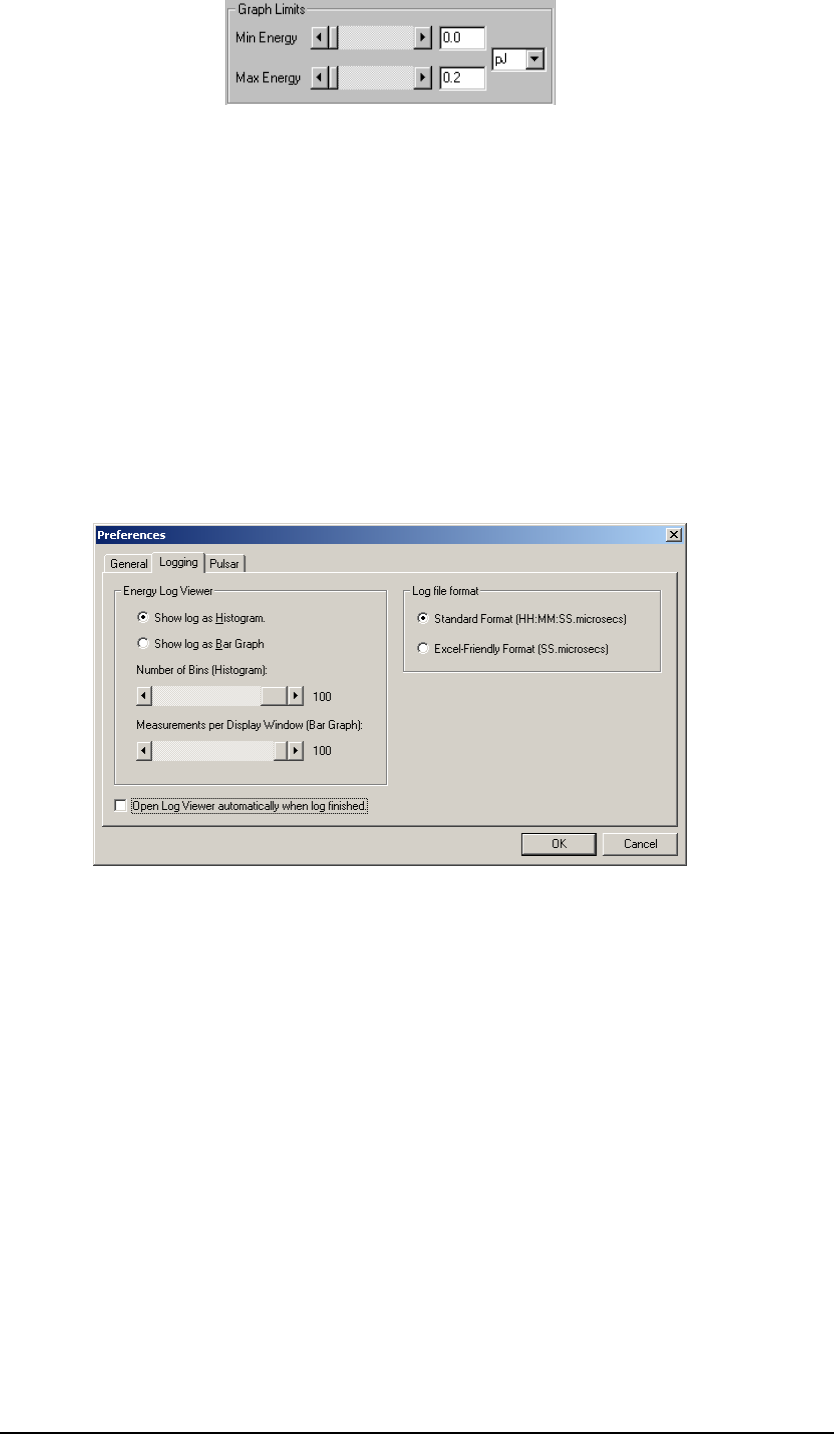
Chapter 10 – Viewing Log Files Using the Log Viewer for Energy Readings
Figure 10-8 Log Viewer – Configuring Histogram or Bar Graph Limits
2. Use the drop down list to select the energy unit.
Setting Log Viewer Preferences
The default Log Viewer display for energy readings can be set in the
Preferences dialog box.
To configure the Log Viewer to show the log as a histogram:
1. Open the Options menu and select Preferences. The Preferences dialog
box appears.
2. Select the Logging tab.
Figure 10-9 Preferences Dialog Box, Logging Tab
3. In the Energy Log Viewer area, select Show log as Histogram.
4. In the Number of Bins field, use the scroll bar or the arrows to select the
number of bins.
5. Click OK to save the setting.
To configure the Log Viewer to show the log as a bar graph:
1. From the Preferences dialog box, with the Log Viewer tab selected (see
Figure 10-9), select Show log as Bar Graph in the Energy Log Viewer
area.
2. In the Measurements per Display Window field, use the scroll bar or the
arrows to select the number of measurements per display window.
3. Click OK to save the setting.
StarLab User Guide 86
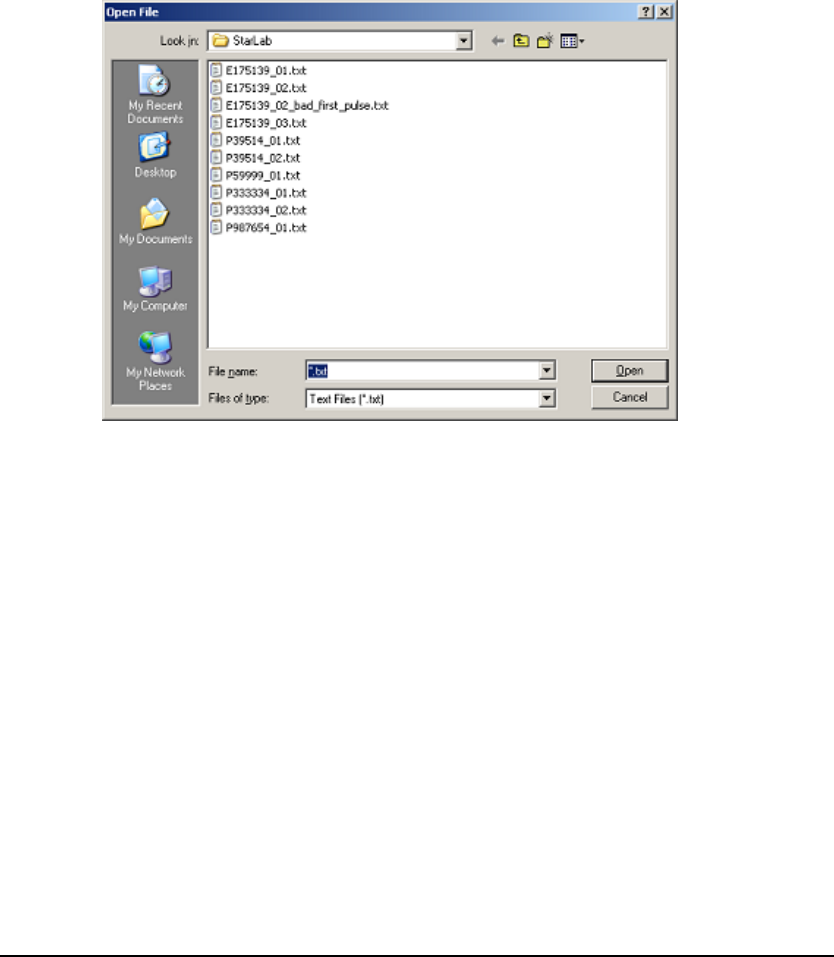
Chapter 10 – Viewing Log Files Viewing Log Files in NotePad
Viewing Log File Information for Energy Readings
To view information about energy readings, refer to Viewing Log File
Information for Power Readings on page 84.
Viewing Log Files in NotePad
This section explains how to view a log file in NotePad, and defines the log file
entries.
Opening a Log File in NotePad
To open a log file in NotePad:
1. Open the File menu and select Open File As Text. The Open File dialog
box appears with the USBI folder open.
Figure 10-10 Open File Dialog Box
2. Select the directory in which the log file is stored.
3. Select the required file and click Open. The log file opens in NotePad.
StarLab User Guide 87

Chapter 10 – Viewing Log Files Viewing Log Files in NotePad
Understanding Log File Entries
Table 10-1 lists the StarLab log file entries:
Table 10-1 Log File Entries
Log File Entry Description
Caption Serial number of the device, serial
number of the head, and head
number within the device.
Head
Head type:
• TH – Thermopile head
• PH – Photodiode head
• PY or NJ – pyroelectric head
Head name The name of the head.
Time Date and time of log on.
Mode
Mode used:
• Power
• Energy
Units
Unit measured:
• Joules
• Watts
Notes Notes added manually.
Filter
(Photodiode heads only) Filter used:
• In
• Out
Info: Laser Wavelength Laser wavelength used.
Info: Range Range used.
Info: Pulse Width Laser pulse width used
Info: Diffuser
(Pyroelectric heads equipped
with Diffuser only)
Diffuser setting:
• In
• Out
Info: Threshold
(Thermopile heads, energy
mode only)
Threshold set:
• LOW
• MED
• HIGH
• OPTICAL
Info: Offset Offset value, if set.
StarLab User Guide 88
Chapter 10 – Viewing Log Files Opening Log Files in Excel
Log File Entry Description
Info: Missing Pulses Detect • On
• Off
Note: This feature is only
supported by the Pulsar device.
Info: dBm mode dBm mode:
• On
• Off
Opening Log Files in Excel
This section explains how to open a log file using Excel, so that the log file can
be processed as a spread sheet.
Opening a Log File in Stored in the "Excel Friendly" Format
For more information on log file formats, see Choosing the Log File Format on
page 78.
To open a log file stored in Excel Friendly format from the StarLab
application:
1. Select either Open or Open File As Text from the File menu. The Open
File dialog box appears.
2. Select the directory in which the log file is stored.
3. Click the filename of the required file.
4. Right-click the file icon in the upper window.
5. From the pop-up menu select Open With – Microsoft Office Excel (see
the following figure).
Figure 10-11 Open File Dialog Box
The log file opens.
StarLab User Guide 89
Chapter 10 – Viewing Log Files Opening Log Files in Excel
To open a log file stored in Excel Friendly format outside the StarLab
application:
1. Use the Windows Explorer to locate and select the log file.
2. Right-click on the file name, select Open With from the pop-up menu,
and select Microsoft Excel from the sub menu.
The log file opens inside Excel as a spread sheet with two active columns:
Energy in joules and Timestamp in seconds.
Opening a Log File Stored in Standard Format Using Excel
A log file stored in the Standard format can also be opened using Microsoft
Excel, but it is more difficult than opening a log file stored in Excel Friendly
format. For more details, refer to the Microsoft Excel Help section.
To open a log file stored in Standard format:
1. From the Windows taskbar, select Start – All Programs – Microsoft
Excel to open Microsoft Excel from Windows. Microsoft Excel opens.
2. In Excel, from the menu select File – Open. The File Open dialog box
appears.
3. In the Files of Type area, select Text files.
4. Navigate to the directory in which the log file is located (see section
Default Location for Log Files; by default, the StarLab application
directory is under \Program Files\Ophir Optronics). Select the log file
icon and click Open. The Text Import Wizard appears.
Figure 10-12 Text Import Wizard Step 1 of 3 Dialog Box
5. In the Original data type area, select Delimited (the default) and click
Next. The second step of the Text Import Wizard appears.
StarLab User Guide 90
Chapter 10 – Viewing Log Files Opening Log Files in Excel
Figure 10-13 Text Import Wizard Step 2 of 3 Dialog Box
6. In the Delimiters area, check Tab (the default) and Other. In the text box
to the right of Other enter the colon symbol (":").
7. Click Finish.
The log file opens in a spread sheet, with four active columns.
Column A contains the energy measurements. •
•
•
•
Column B contains the hours from the timestamp.
Column C contains the minutes from the timestamp.
Column D contains the seconds and fractions of a second from the
timestamp.
8. If the log contains timestamps longer than 59 seconds and accurate
timestamps are required:
a. Calculate the total seconds in Column E. Apply the following formula to cell
E1: "= 60*60*B1 + 60*C1 + D1".
b. Drag the cell to any additional rows to apply the formula and calculate the
total seconds for those rows.
Accurate timestamps appear in the fifth column of the log file.
StarLab User Guide 91
Appendix A – Toolbar Guide
The following is a brief description of each icon on the StarLab toolbar.
Table A-1 Toolbar Guide
Icon Description
Select Channels
Restart the Application
Clear the Screen
Restore Active Window
Store Last Measurements
Trigger Configuration
Upload Nova-II or Vega Files to PC
Print
View Help
StarLab User Guide 92

Appendix B – Calibration, Traceability,
and Recalibration
Ophir develops three main types of heads: thermopile, photodiode, and
pyroelectric. Each type of head needs to be calibrated and recalibrated in a
specific way.
Ophir Thermopile Heads
Ophir develops two kinds of thermopile heads – Surface Absorbers and Volume
Absorbers. This section describes the range of Ophir thermopile heads.
Surface Absorbers
BB (Broadband) Absorber - A special refractory coating is used to provide
high absorption from the UV through to the IR on standard, high power density,
broadband monitor heads. This coating withstands very high power densities, of
up to 20 kW/cm², without changing calibration. The absorption ability of this
coating is above 90% for most of its range.
EX (Excimer) Absorber - The EX Absorber provides high absorption in the
UV, and can withstand both the pulse energies and the average power of excimer
lasers. These discs also have excellent absorption for 10.6µm and other
wavelengths. Therefore, they can also be used for other types of lasers.
LP1 (long pulse) absorber - This absorber has a very high damage threshold for
long pulse (ms) or continuous lasers and is therefore offered for use with
high power and energy lasers. It is calibrated for the spectral range 250 –
2200nm with some heads also being calibrated for 2940nm. It is not suitable for
long wavelength CO2 operation.
LP (Long Pulse) Absorber - The LP Absorber has a particularly high damage
threshold for long pulse (ms), or continuous lasers and is therefore offered for
use with high power heads. It is calibrated for use with the YAG laser at
1.064µm, or the CO2 laser at 10.6µm, and absorbs about 90% at these
wavelengths.
The absorption of the various Ophir absorbers as a function of wavelength is
shown in Figure B-1 on page 94.
Volume Absorbers
P (Pulse) Type Absorber - The models with the P suffix, are used with pulsed
lasers, and have a special absorbing glass with an absorbance of 95 +2% over the
operating range. Since the surface is glass, its reflectivity does not change even if
damaged or melted locally.
HE/HE1 (High Energy) Absorber - The HE and HE1 Absorbers have a
particularly high damage threshold for pulsed and repetitively pulsed lasers, of
StarLab User Guide 93
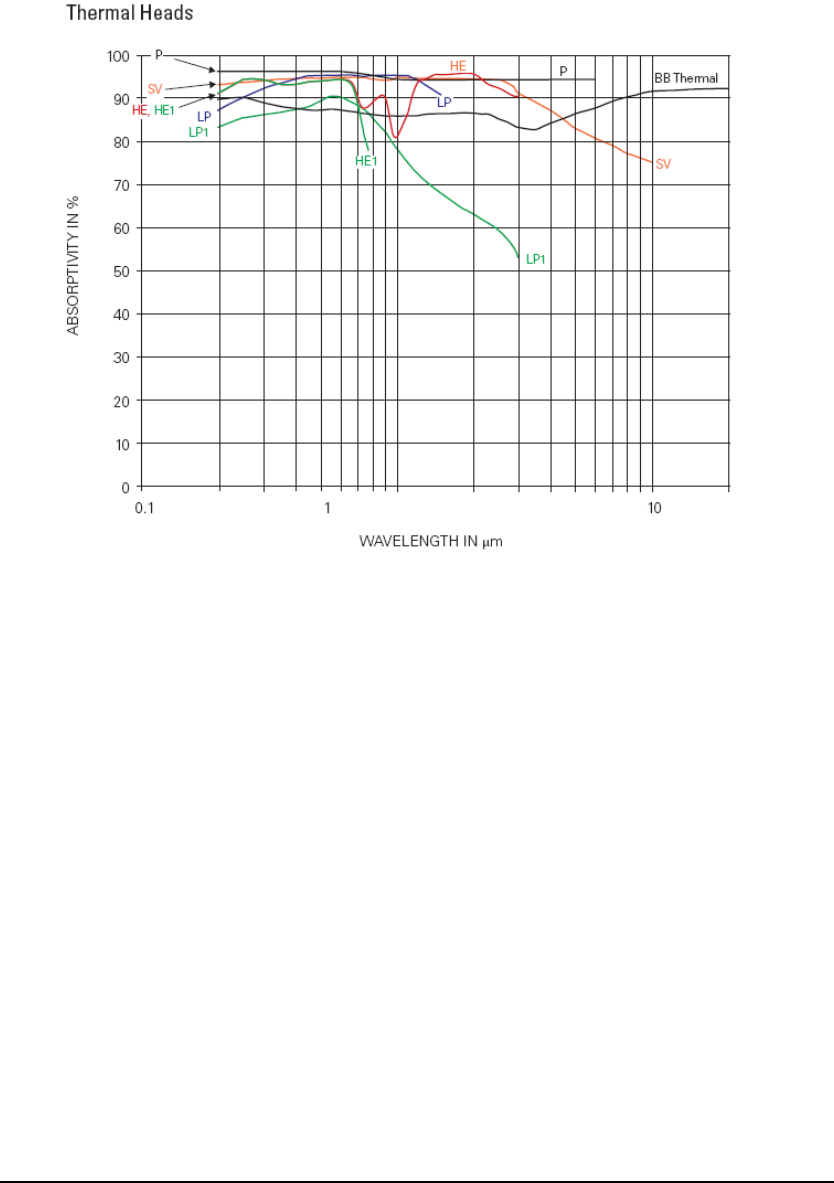
Appendix B – Calibration, Traceability, and Recalibration Ophir Thermopile Heads
both the short and long pulse variety. The HE and HE1 Absorbers are useful
where the highest pulse energies and average powers are used.
SV Absorber - The SV Absorber is the absorber of choice for difficult
applications with short pulses having both high average power density and high
energy density.
The absorption of the various Ophir absorbers as a function of wavelength is
shown in Figure B-1 on page 94.
Figure B-1 Absorption of Ophir Absorbers vs. Wavelength
StarLab User Guide 94
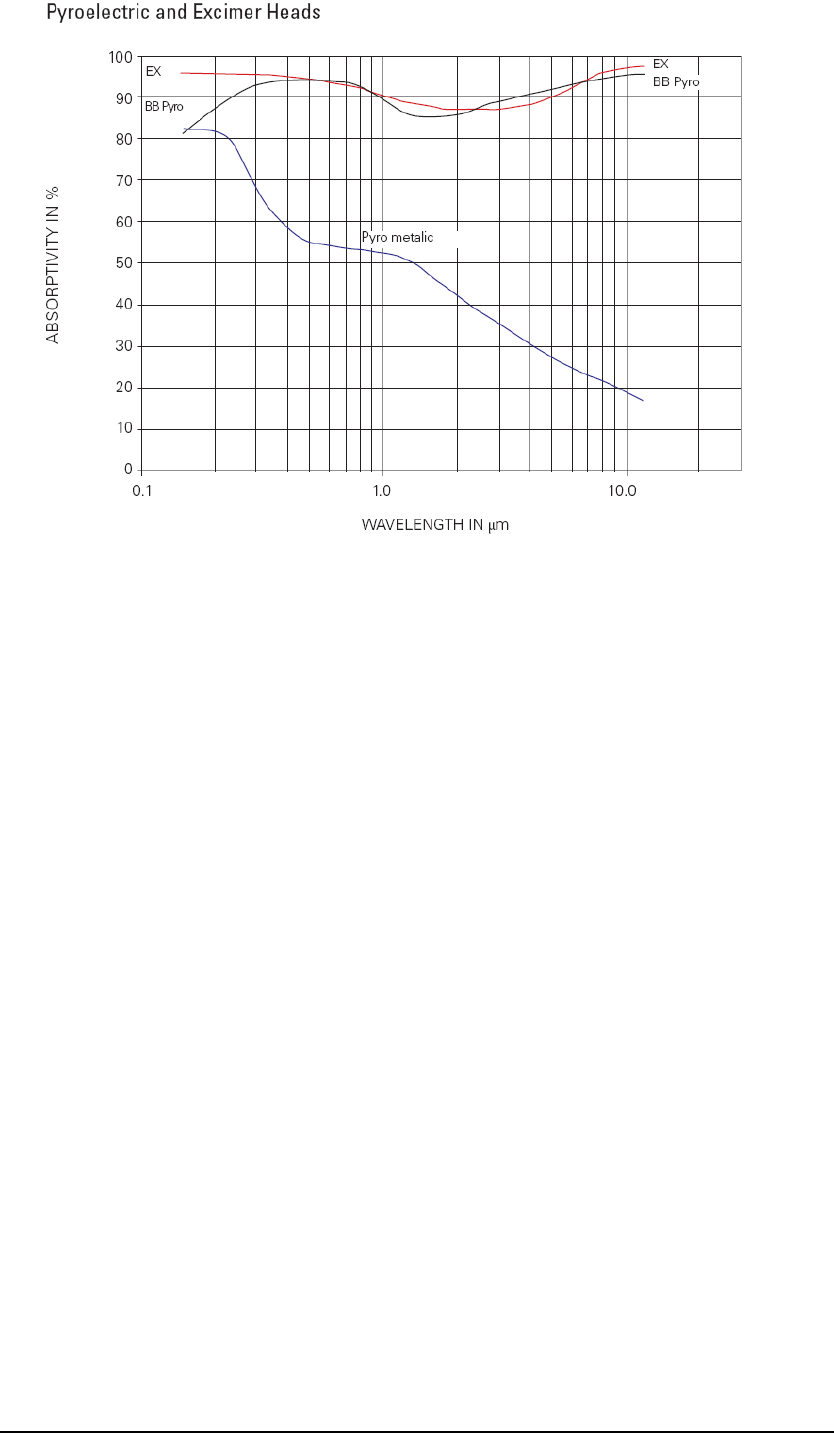
Appendix B – Calibration, Traceability, and Recalibration Ophir Thermopile Heads
Figure B-2 Absorption vs. Wavelength of Pyroelectric and Excimer Head Absorbers
Factory Calibration of Thermopile Heads
The absorption of the various Ophir thermal absorbers can vary from disc to disc.
Therefore, all Ophir absorbers are individually calibrated against NIST traceable
standards. Ophir power/energy meters with the broadband or P type absorbers
are individually calibrated by laser at several wavelengths against a NIST
calibrated standard meter. The meter can be switched to give the exact
calibration at the various wavelengths, for example, Argon, YAG, and where
applicable, CO2.
The EX type detector is calibrated by measuring the ratio of absorption in the
UV to that at 515nm. In both cases, the total absorption is measured using an
integrating sphere. The detector is then calibrated with an argon laser and given a
correction factor from this ratio.
Linearity and Accuracy of Thermopile Heads
Linearity
The linearity of most Ophir thermal detectors is specified to be 1% over the
specified power range of each particular instrument, and is periodically tested by
Ophir.
For models whose linearity is not tested over their entire range, samples are
randomly chosen and periodically tested over their entire range. The test is
performed with a high power laser that covers the entire detector range using a
rear leak detector for comparison. The rear leak detector is a low power Ophir
detector that has previously been tested for linearity. In all cases, the linearity of
the detectors is traceable to electrical standards.
StarLab User Guide 95
Appendix B – Calibration, Traceability, and Recalibration Ophir Thermopile Heads
Accuracy of Calibration
Since the instruments are calibrated against NIST standards, the accuracy is
generally 1% at the power level at which the calibration has been performed.
This accuracy has been verified by checking the scatter of the results when
several instruments are calibrated against the same standard. The maximum
measurement error is less than the sum of the specified accuracy and linearity.
Since the linearity is also 1%, the maximum error in measurement is generally
less than 2%.
Recalibration from a Known Source of Laser Power
3A Series 1 Watt 7 Volts
10A Series 10 Watts 17 Volts
30A Series 30 Watts 35 Volts
150A Series 100 Watts 65 Volts
L250A Series 200 Watts 95 Volts
300W Series 125 Watts 65 Volts
1500W Series
and above 200 Watts 95 Volts
To adjust the power calibration for one wavelength only:
1. Click the right mouse button and select Calibrate from the pop-up menu
(see Table 3-2).
OR
Open the Functions menu and select Calibrate. The Adjust Calibration
Factors dialog box appears.
Figure B-3 Adjust Calibration Factors Dialog Box
The Original area displays the original Measurement, Overall Sensitivity
and Laser Factor fields. The Current wavelength is displayed beneath the
Original area, refer to Note on page 97.
StarLab User Guide 96
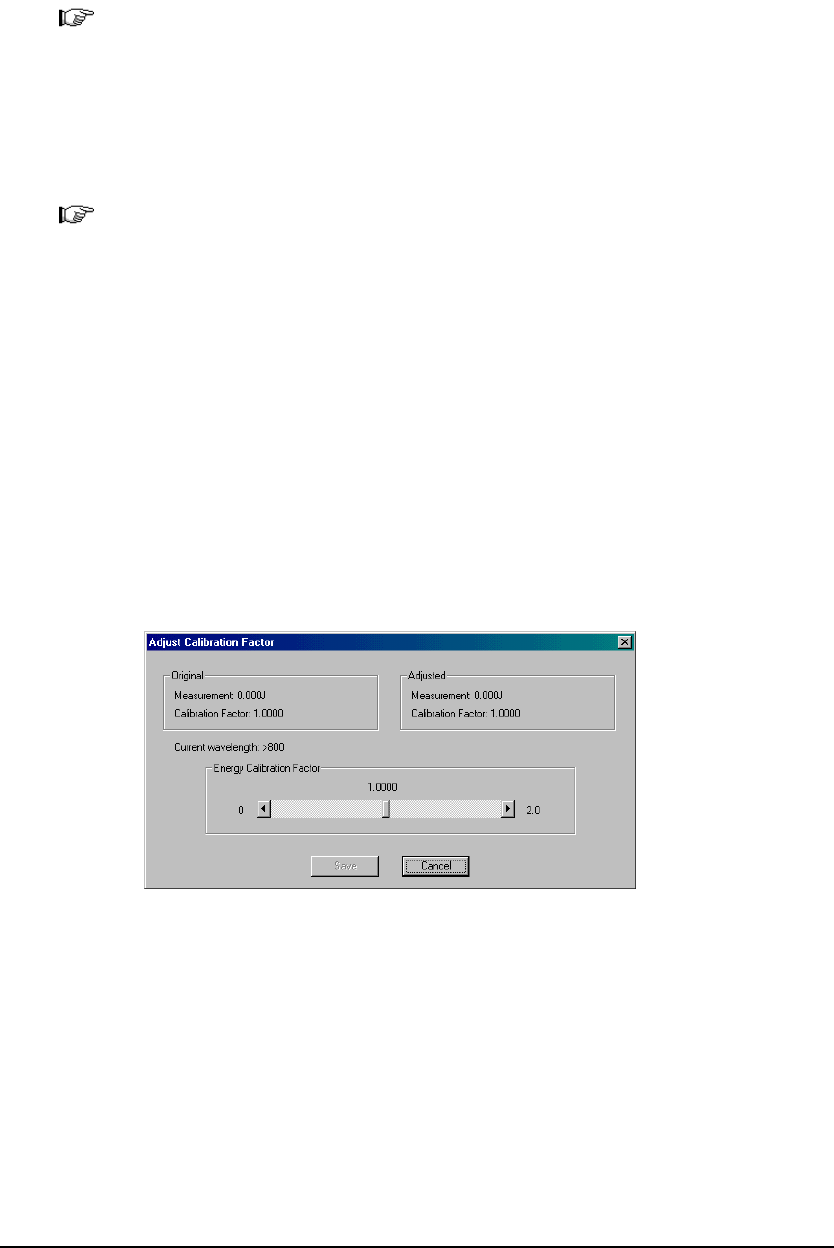
Appendix B – Calibration, Traceability, and Recalibration Ophir Thermopile Heads
2. Apply the known laser power.
3. Adjust the Laser Specific Factor until the Adjusted measurement equals
the power applied to the head. Adjusting the Laser Specific Factor effects
both the Measurement and the Laser Factor values.
4. Click Save to save the adjustment for the active channel.
Note: For units that have different calibration factors (e.g., CO2, YAG, or
VIS), select the correct laser wavelength from the main Configuration
Area before calibration. Only the calibration of the chosen laser
wavelength changes.
For more information on calibrating all wavelengths proportionately,
refer to Factory Calibration of Thermopile Heads.
Note: Changing power calibration also changes energy calibration
proportionately. However, changing the energy calibration does not
change the power calibration.
Recalibration from a Known Source of Laser Energy
Ophir heads are equipped with one overall energy calibration factor.
To recalibrate from a known source of laser energy:
1. Click the right mouse button and select Calibrate from the pop-up menu.
OR
Open the Functions menu and select Calibrate. The Adjust Calibration
Factors dialog box appears.
Figure B-4 Adjust Calibration Factors Dialog Box
The Original area displays the original Measurement and Calibration
Factor fields. The Current wavelength is displayed beneath the Original
area, refer to Note on page 98.
2. Apply the known laser energy.
3. Adjust the Calibration Factor until the Adjusted measurement equals the
energy applied to the head.
4. Click Save to save the adjustment for the active channel.
StarLab User Guide 97

Appendix B – Calibration, Traceability, and Recalibration Ophir Photodiode Heads
Note: For units that have different calibration factors (e.g., CO2, YAG, or
VIS), select the correct laser in the main Configuration Area before
calibration.
Note: Changing energy calibration at one wavelength will affect all other
wavelengths proportionately. However, changing the energy
calibration will not change the power calibration.
Ophir Photodiode Heads
This section discuses calibration of Ophir photodiode heads.
Factory Calibration of Photodiode Heads
Photodiode detectors are inherently very linear but also have a large variation in
sensitivity with wavelength. In addition, the Ophir model PD300 is equipped
with both a built in filter and removable filter to allow measurement of higher
powers without detector saturation. These filters also have a transmission that
depends on wavelength. Therefore, the PD300 has a built in calibration
adjustment for wavelength.
The sensitivity of various Ophir photodiode sensors can vary from one to another
as well as with wavelengths. Therefore, Ophir photodiode detectors are
individually calibrated against NIST traceable standards over the entire operating
range of wavelengths for both filter out and filter in. The calibration curve is
normalized to the correct absolute calibration at 632.8 nm using a HeNe laser
against a reference meter traceable to NIST.
The spectral sensitivity curve of the detector and the spectral transmission curve
of the filters are fed into the head EEROM. This information is used to set the
gain to the proper value at wavelengths other than the wavelength at which the
instrument was calibrated. When the user selects his wavelength on the
instrument, the correction factor for that wavelength is applied.
Linearity and Accuracy of Photodiode Heads
Since the instruments are calibrated against NIST standards, the accuracy is
generally ±2% at the wavelength that the calibration has been performed. The
maximum error in measurement will be less than the sum of:
calibration accuracy + linearity + inaccuracy due to errors in the
wavelength curve + variations in gain with temperature
The linearity of the photodiode detector is extremely high and errors due to this
factor can be ignored. Table B-2 shows the maximum error due to the factors
described here.
StarLab User Guide 98
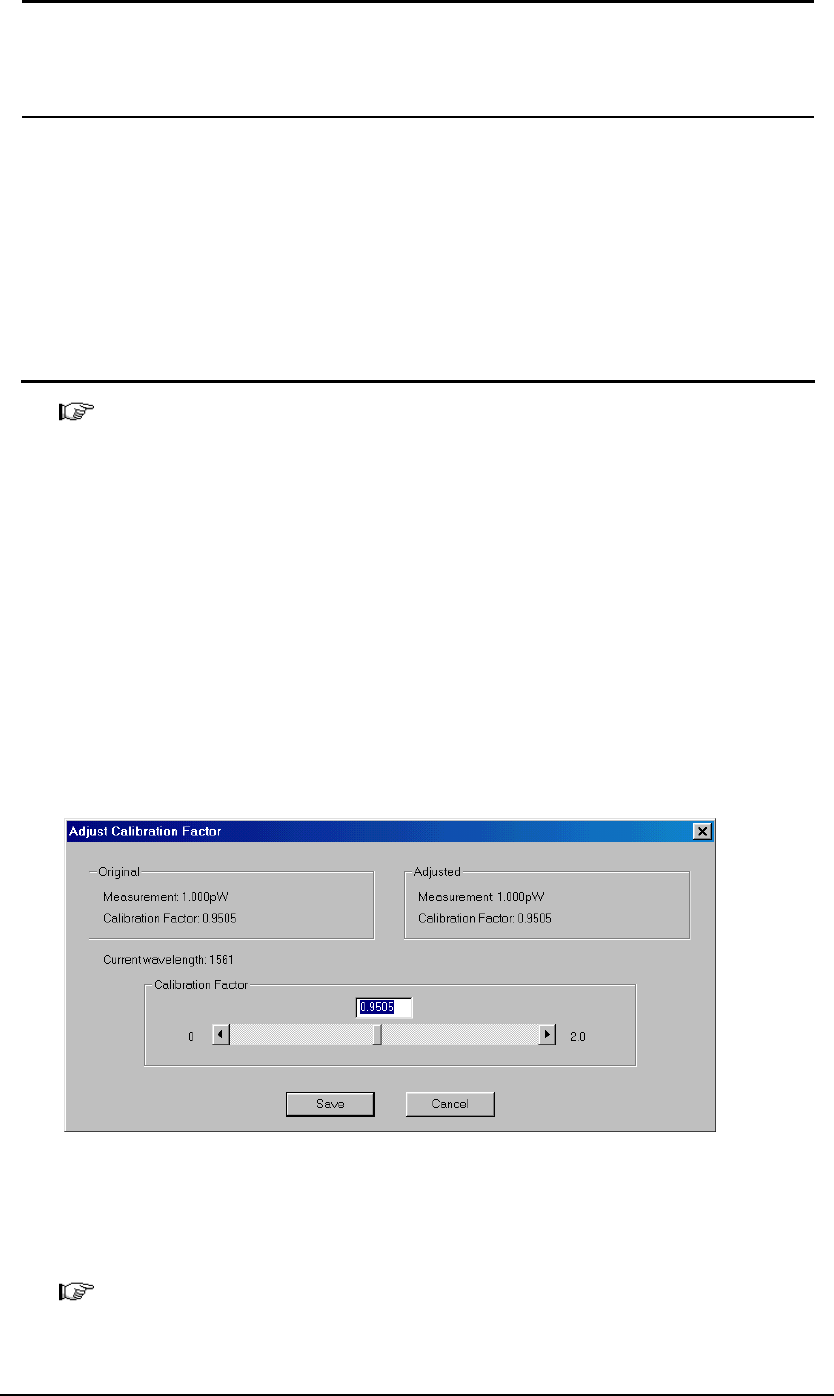
Appendix B – Calibration, Traceability, and Recalibration Ophir Photodiode Heads
Table B-2 Maximum Error as a Function of Wavelength and Filter
Wavelength Error, Filter Out
PD300
PD300 -
3W PD300 -
UV PD300 - IR 3A - IS
220-250nm ±6%
250-360nm ±3%
360-400nm ±10% ±10% ±3%
400-950nm ±3% ±3% ±3% ±5%
950-1100nm ±5% ±5% ±5% ±4% ±10%
1100-1700nm ±4%
1700-1800nm ±7%
Note: Add ±2% to error for filter in (±4% for PD300-UV from 220 to
300nm).
User Recalibration
Adjusting Calibration Factors of Photodiode Heads
To adjust the power calibration factor:
1. Click the right mouse button and select Calibrate from the pop-up menu.
OR
Open the Functions menu and select Calibrate. The Adjust Calibration
Factor dialog box appears.
Figure B-5 Adjust Calibration Factor Dialog Box
The Original area displays the original Measurement and Calibration
Factor. The Current wavelength is displayed beneath the Original area.
Note: A different wavelength can be selected in the Measurement Parameters
Area.
StarLab User Guide 99
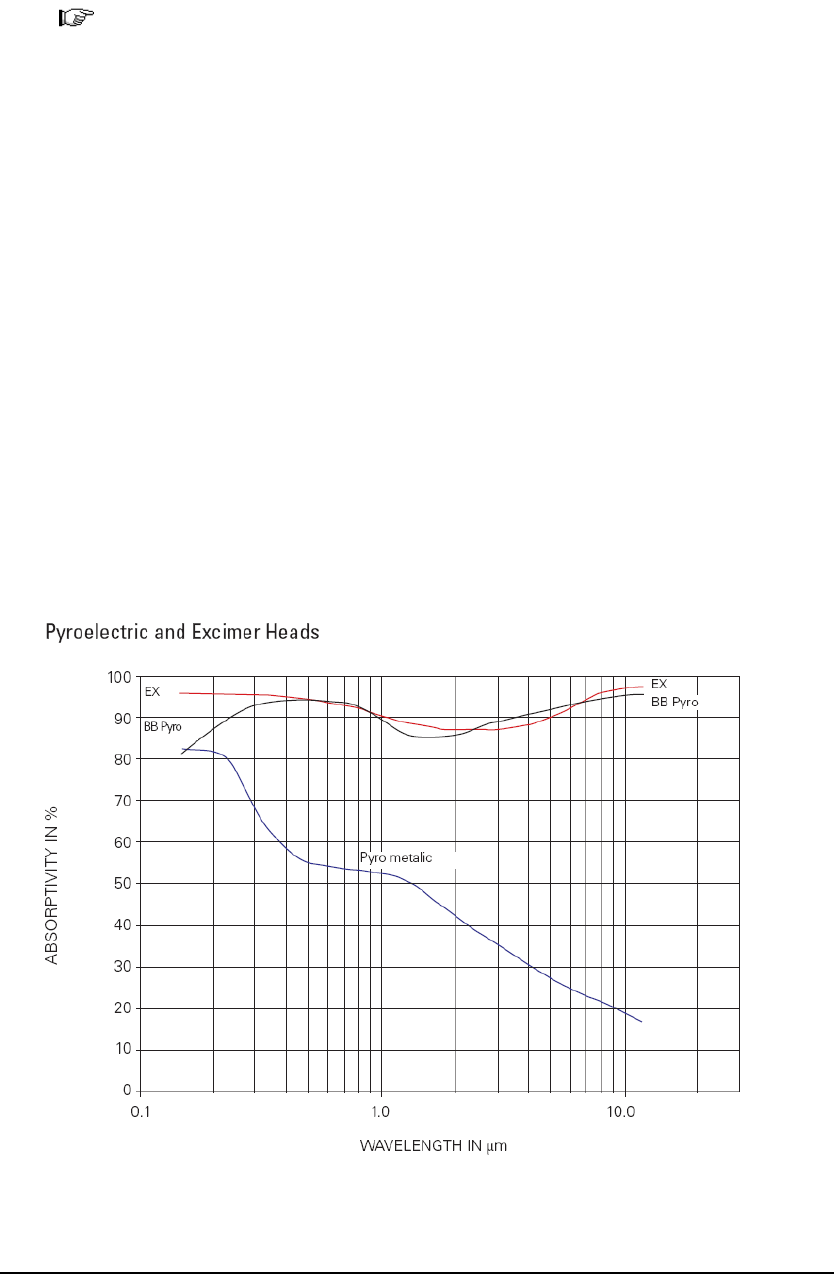
Appendix B – Calibration, Traceability, and Recalibration Ophir Pyroelectric Heads
2. Apply the known laser power.
3. Adjust the Calibration Factor until the Adjusted measurement equals the
power applied to the head.
4. Click Save to save the adjustment for the active channel.
Note: The relative readings at different wavelengths are fixed by the
wavelength calibration curve stored in the head EEROM. When
changing the calibration at one wavelength, the calibration at all
other wavelengths changes proportionately.
Ophir Pyroelectric Heads
This section discusses calibration of Ophir pyroelectric heads. Two types of
absorber surface are used in Ophir pyroelectric measuring heads:
Metallic – Metallic heads do not have a BB suffix in the head name.
They have a partially reflective multi-layer metallic coating that
absorbs approximately 50% of the laser pulse, refer to Figure B-6. The
metallic coating permits very high repetition rates, up to 5000Hz, as
well as relatively high damage threshold.
•
• Broadband – Broadband heads have a BB suffix in the head name.
They have a broadband black absorbing coating to provide high
absorptivity from the UV through the IR. This coating can withstand
energy densities, up to 0.3J/cm² for short pulses and 2J/m² for long
pulses, without changing calibration. The absorption of this coating is
above 90% for most of its range, refer to Figure B-6. This coating is
available for the PE50 and PE25.
Figure B-6 Absorption of Ophir Pyroelectric Absorbers
Absorption(%) vs. Wavelength (nm)
StarLab User Guide 100

Appendix B – Calibration, Traceability, and Recalibration Ophir Pyroelectric Heads
Calibration
The sensitivity of the various Ophir pyroelectric sensors vary from one to
another, as well as with wavelengths. Therefore, Ophir pyroelectric detectors are
individually calibrated against NIST traceable standards. In addition, the
calibration is corrected in the device for different wavelengths.
Ophir pyroelectric detectors are calibrated using a 1.06µm repetitively pulsed
laser referenced to a NIST traceable thermal power meter. The average energy is
set to the average power of the standard power meter, divided by the laser
frequency. The metallic PE25 and PE50 heads are also calibrated with an
excimer laser at 248nm to correct the rather large absorption variations in that
spectral region with those heads.
The spectral absorption of the detector coating is measured spectroscopically and
the absorption curve is used to correct the calibration for other wavelengths.
When the user selects his wavelength in the StarLab application, the correction
factor for that wavelength is applied.
Accuracy of Calibration
Since the instruments are calibrated against NIST standards, the accuracy is
generally 3% at the energy level and wavelength at which the calibration has
been performed. This accuracy has been verified by checking the scatter of the
results when several instruments are calibrated against the same standard. The
maximum error in measurement will be less than the sum of the specified
accuracy, linearity, and inaccuracy due to errors in the wavelength curve. The
non-linearity is approximately 2%. For error due to wavelength, refer to
Table B-3.
In addition to the above errors, the reading of a pyroelectric head changes with
frequency. The device has a built-in correction for this error. For frequencies
above 50% of maximum frequency, inaccuracies in this correction can increase
the total error up to 3%.
The maximum error in measurement will be less, and in general will be
considerably less, than the sum of the above mentioned errors.
StarLab User Guide 101
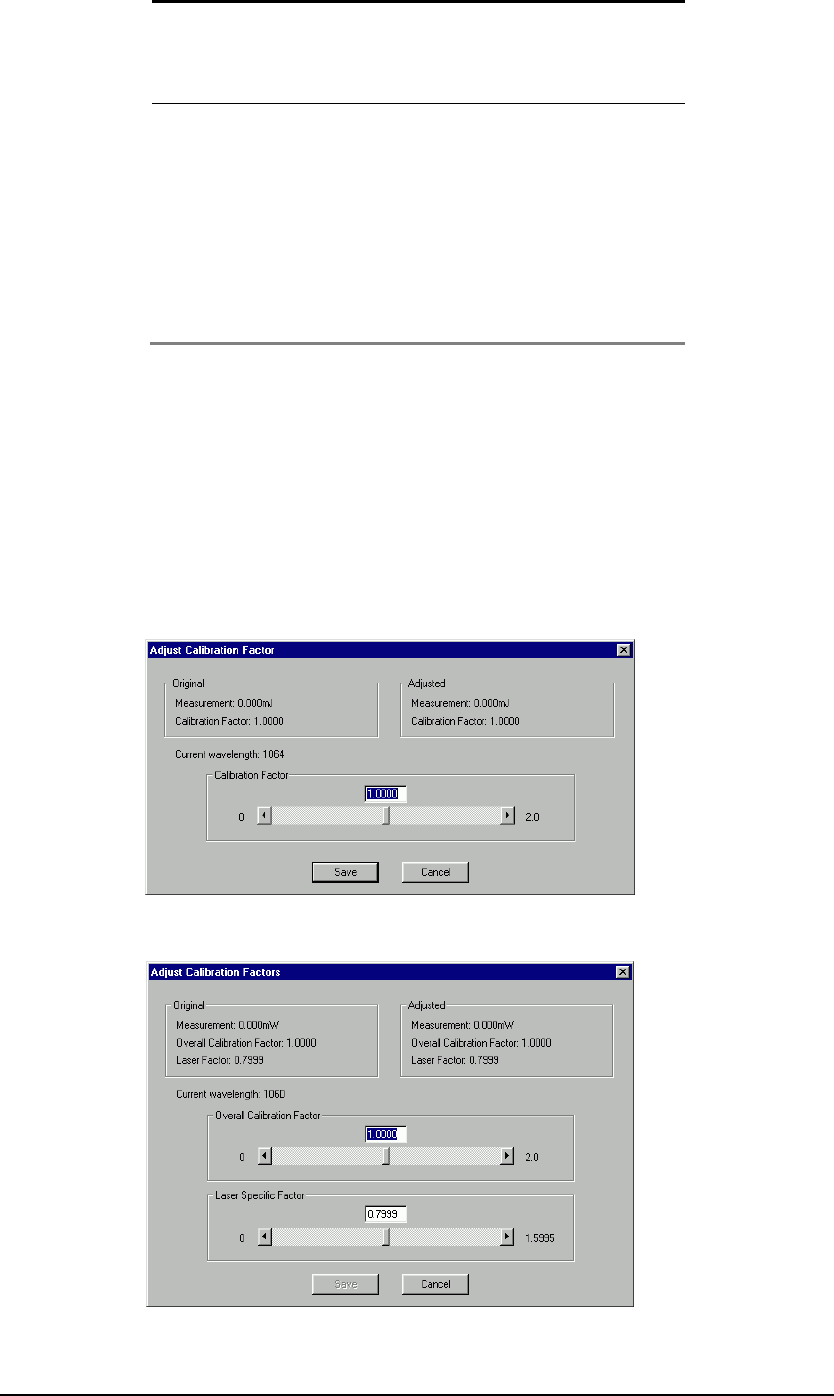
Appendix B – Calibration, Traceability, and Recalibration Ophir Pyroelectric Heads
Table B-3 Maximum Measurement Error due to Wavelength
Coating Type
Wavelength Error
Broadband Metallic
190 - 350nm ±2% ±2%
400 - 800nm ±2% ±2%
1064nm 0 0
2 - 3µm ±2% ±2%
10.6µm ±5% ±15%
Recalibration from a Known Source of Laser Energy
To recalibrate from a known source of laser energy:
1. Click the right mouse button and select Calibrate from the pop-up menu.
OR
Open the Functions menu and select Calibrate. The Adjust Calibration
Factor dialog box appears.
Figure B-7 Adjust Calibration Factor Dialog Box – Metallic Head
Figure B-8 Adjust Calibration Factor Dialog Box – Broadband Head
StarLab User Guide 102

Appendix B – Calibration, Traceability, and Recalibration Ophir Pyroelectric Heads
The Original area displays the original Measurement and Calibration
Factor. The Current wavelength is displayed beneath the Original area.
Note: A different wavelength can be selected in the Measurement Parameters
area.
2. Apply the known laser power.
3. Adjust the Calibration Factor until the Adjusted measurement equals the
power applied to the head.
4. Click Save to save the adjustment for the active channel.
Note: For metallic heads, when the calibration is changed at one laser
wavelength, the overall calibration of all other wavelengths changes
proportionately. For broadband heads, there is an option to adjust the
calibration factor for all wavelengths or only for a selected
wavelength.
StarLab User Guide 103
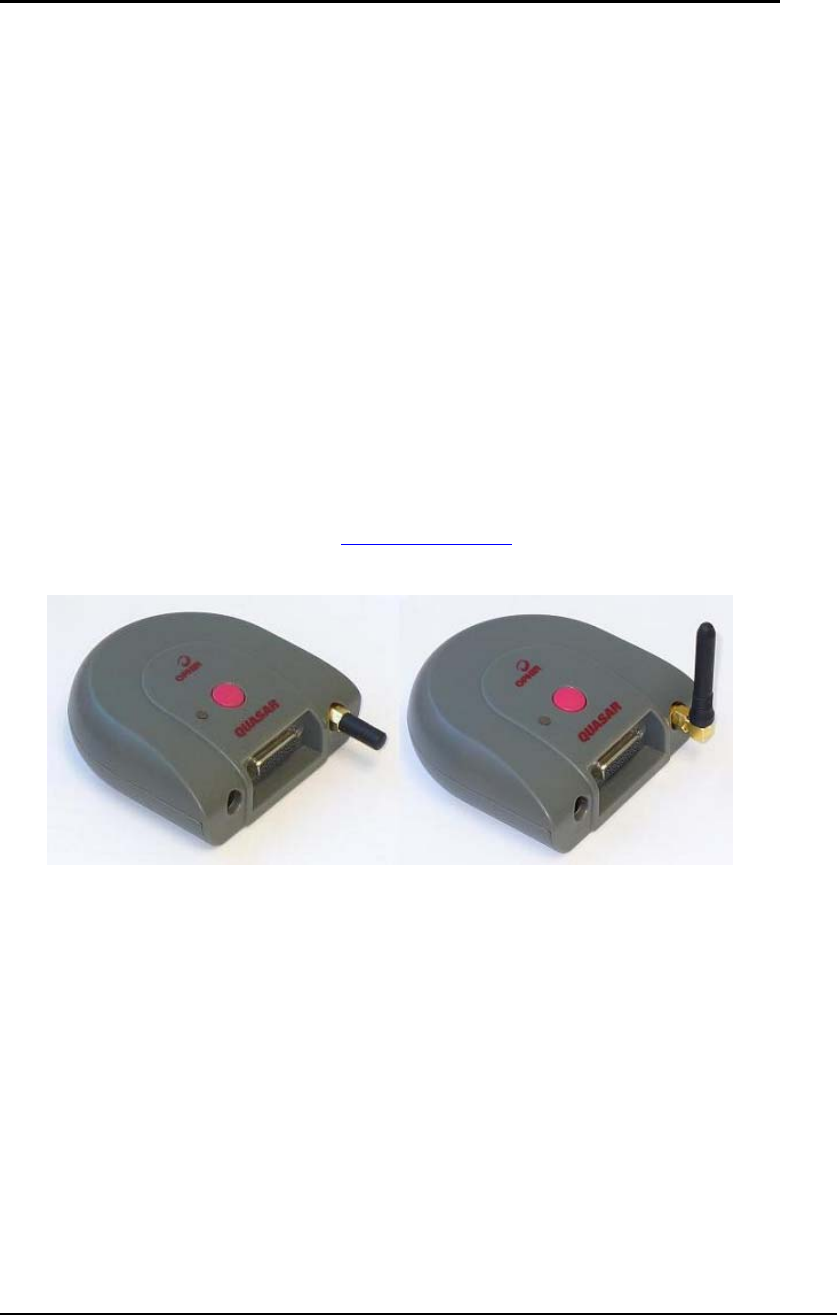
Appendix C – Getting the most from the
Quasar
The Quasar device differs from the USBI and Pulsar in several ways. This
Appendix gives some more details on how to use the Quasar most effectively.
Topics included in this Appendix:
Different Quasar Models •
•
•
•
•
•
Switching the Quasar On and Off
Understanding the Quasar LED Indicator
Quasar Battery Status Indication
Getting the Best Working Range from the Quasar
Troubleshooting the Quasar
Different Quasar Models
The Quasar device is available in two models, a standard model (Ophir p/n
7Z01300) and an "Extended Range" (ER) upgrade option (Ophir p/n 7Z01301).
See the catalog on our website (www.ophiropt.com) or on the installation CD for
more details.
Figure C-1 Quasar standard model (left) and ER upgraded model
The standard model uses a short antenna, and reaches up to approximately 30m
working range in an open environment. The "ER" option offers greater radio
output power, along with a longer right-angle antenna for working at extended
ranges. It works beyond 100m in an open environment.
See Getting the Best Working Range from the Quasar for more details about
optimizing the working range of the Quasar.
In addition, Ophir offers several thermopile heads with an integral Quasar device
mounted on the back. This option avoids having the extra wire between the
Quasar unit and the thermopile head, making the device completely "wireless".
For more details on using this type of Quasar, see below Using Thermopile Head
with Integral Quasar.
StarLab User Guide 104
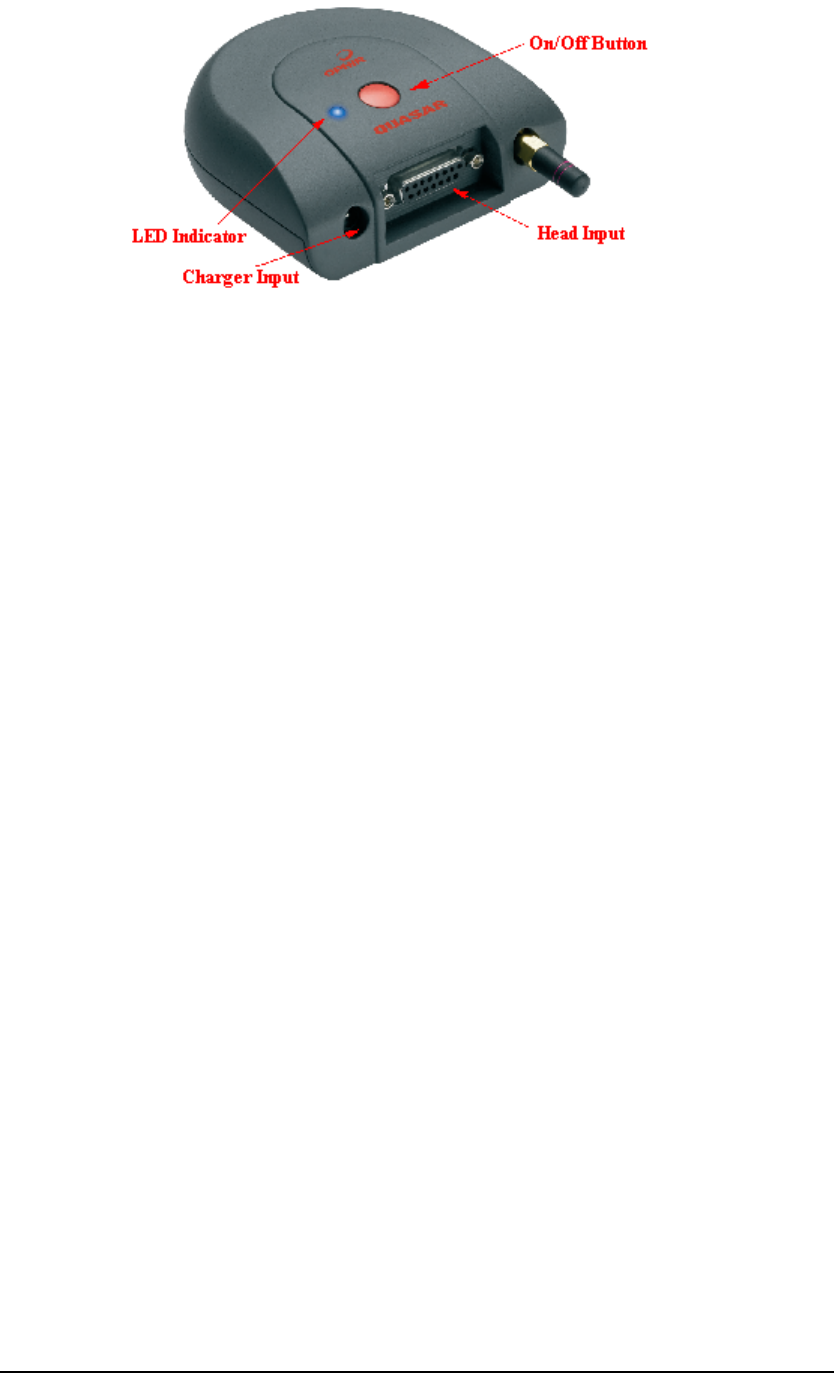
Appendix C – Getting the most from the Quasar Switching the Quasar On and Off
Switching the Quasar On and Off
Figure C-2 Quasar device
The Quasar is switched on by momentarily pressing the red on/off button. The
blue LED flashes once for approximately 2 seconds.
The Quasar is switched off by pressing and holding the red on/off button for
approximately 4 seconds. The blue LED lights while the button is pressed, and is
extinguished when the Quasar powers off.
Understanding the Quasar LED Indicator
The Quasar contains a single LED which indicates to the user the status of the
device. Refer to Table C-1 below.
StarLab User Guide 105

Appendix C – Getting the most from the Quasar Quasar Battery Status Indication
Quasar LED Indicator Information
Status Description Indication
Switching On. The Quasar is switched on by
pressing the red on/off button
momentarily.
Blue LED flashes once
for approx. 2 seconds.
Waiting for
connection. The Quasar can be detected by
any other Bluetooth device
within range, and is waiting for
a connection request.
Blue LED blinks slowly
(once every 2 seconds).
Connection
Established. StarLab software has detected
the Quasar and has established
a connection to it.
Blue LED flashes once
for approx. 2 seconds.
Connected. The Quasar is connected to the
PC and is sending data. Blue LED blinks quickly.
Battery Low. Battery voltage is low, below
approximately 20% of its full
capacity. User should connect
charger.
Red LED blinks instead
of blue LED, slowly or
quickly in depending on
connection status.
Software
Upgrade. StarLab is loading new internal
software into the Quasar
device, using "Upgrade" option
(see Upgrading the Device’s
Internal Software)
Blue LED blinks quickly
and erratically.
Software Needs
Upgrading. An error occurred while
attempting to upgrade the
internal software. The Quasar
was switched off and on again.
The software "Upgrade" must
be repeated. See Upgrading the
Device’s Internal Software.
Blue LED toggles on for
1 second and off for 1
second repeatedly, to
indicate an error status.
Switching Off. The Quasar can be switched off
by pressing and holding the red
button for approx. 4 seconds.
While pressing down the
on/off button, the Blue
LED is on. When the
Quasar powers down, the
LED is extinguished.
Quasar Off The Quasar has been powered
off. LED extinguished.
Table C-1 Quasar LED Indicator Information
Quasar Battery Status Indication
Understanding the Battery Status Indicator
The Quasar contains a rechargeable battery. The status of the battery can be
viewed in StarLab below the logging area of the head channel screen (see Figure
C-3 below).
StarLab User Guide 106
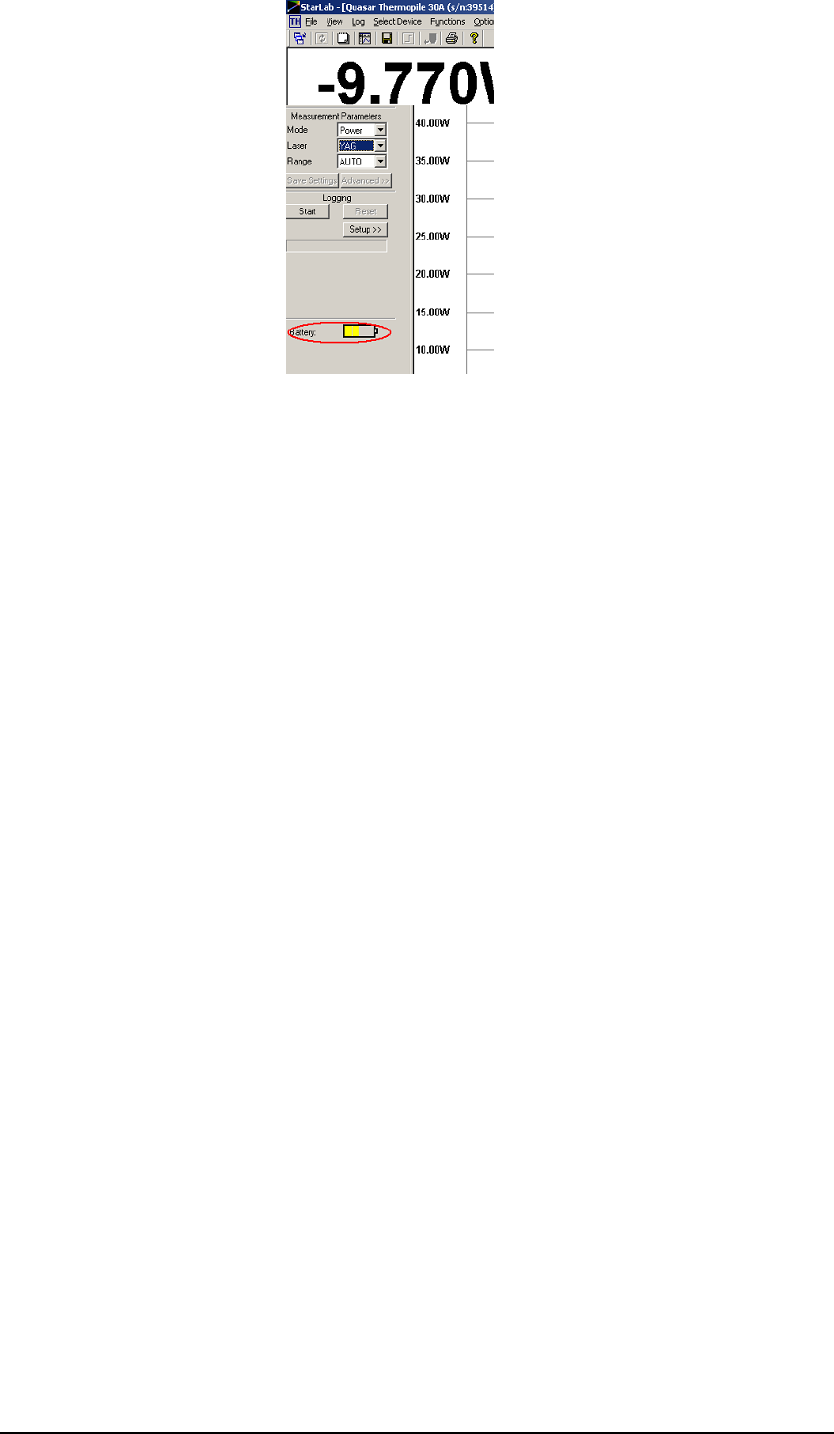
Appendix C – Getting the most from the Quasar Quasar Battery Status Indication
Figure C-3 Position of Battery Status in StarLab
The state of the battery is indicated by the number of segments lit in the battery
logo on the screen, by the color of the segments, and by the movement of the
segments. The battery status indication is approximate, and may depend on the
type of head connected and on the recent charging history of the battery: whether
the battery was fully charged or only partially charged.
The StarLab application software may take several seconds to update the battery
status on the screen after a change occurs to the battery status, for example when
the charger is inserted or removed.
StarLab User Guide 107

Appendix C – Getting the most from the Quasar Quasar Battery Status Indication
Quasar Battery Status Symbols
Status Description Picture
Battery Low "Battery LOW" displayed in
red, 1 red bar (approx. 20%
battery life remains)
Level 1 1 yellow bar
Level 2 2 yellow bars
Level 3 3 yellow bars
Battery Full 4 yellow bars
Fast Charge Green bars progressing to right
(immediately after charger
inserted). See Charging the
Quasar Battery.
Trickle Charge 4 green bars (charger inserted,
battery fully charged)
Table C-2 Quasar Battery Status information
Charging the Quasar Battery
When the charger is first inserted, the Quasar will enter a fast-charge mode. In
this mode, a fully discharged battery can be charged within approximately 5 to 6
hours. When in use, fast-charge is indicated with moving green bars on the
Battery Status indicator in the StarLab application software, see Table C-2.
When the Quasar detects that the battery is fully charged, it reverts to a "trickle-
charge" state, which keeps the battery charged even when the Quasar is in use.
The "trickle-charge" is small enough not to damage the battery even when the
charger is inserted for long periods. Trickle-charge is indicated with 4 fixed
green bars in StarLab.
If the charger is re-inserted when the battery is already fully-charged, the Quasar
will initially begin fast-charging, and after a few minutes will revert to trickle-
charge.
Fast-charge and trickle-charge function in the same way when the Quasar is in
use and switched on, or when the Quasar is not in use and switched off. The
charger can be left plugged into the Quasar indefinitely without damaging the
battery.
StarLab User Guide 108

Appendix C – Getting the most from the Quasar Getting the Best Working Range from the Quasar
Getting the Best Working Range from the Quasar
The working range given by the Quasar device depends greatly on the working
environment (walls, obstructions, other radio equipment or electrical
disturbances in the vicinity) and on the orientation of the device relative to the
receiving radio on the host PC. Here are some suggestions for getting the best
range possible.
1. For the standard model, the best range is obtained when pointing the
antenna towards the PC radio.
2. For the ER model, the best range is obtained when the antenna points
vertically, with the Quasar flat on a table-top.
3. Best working range is obtained with direct line of site between the Quasar
and radio on the host PC.
4. Walls and other nearby obstacles can cause reflections, so best results will
depend very much on the local environment. The Quasar should be
oriented until the best results are given in any given situation.
5. Operation should be possible through thin plaster-board walls or other
similar obstacles, with reduced operating range.
6. Bluetooth radio transmissions are robust, using frequency hopping
between 79 channels from 2.402GHz to 2.480GHz. If data is lost when
using one channel, the Bluetooth module inside the Quasar will try to re-
send the lost data on a different channel. However, interference from other
radio devices using the same frequency band such as cellular phones or a
WiFi internet connection may cause degradation in performance. If
interference is present, the maximum data logging rate when using
Pyroelectric or PD10 heads may be reduced. In addition, making the initial
connection between the Quasar and the PC may be more difficult.
7. When working close to the maximum operating range, reduced data
logging rates may result, in particular when using Pyroelectric or PD10
heads. To get the best possible data rate, move the Quasar closer to the PC
radio.
8. When working close to the maximum operating range, the connection
between the Quasar and the PC may be sporadic or difficult to establish. It
is recommended to make the initial connection to the PC with the Quasar
as close as possible to the PC radio, and then to move further away if
necessary while operating the Quasar.
Using Thermopile Head with Integral Quasar
Several models of thermopile head are offered with an integral Quasar device
mounted on the back. This option avoids having an extra wire between the
thermopile head and the Quasar device, making the device completely
"wireless".
See the Ophir catalog on our website (www.ophiropt.com) for more details of
heads offered with this option.
StarLab User Guide 109
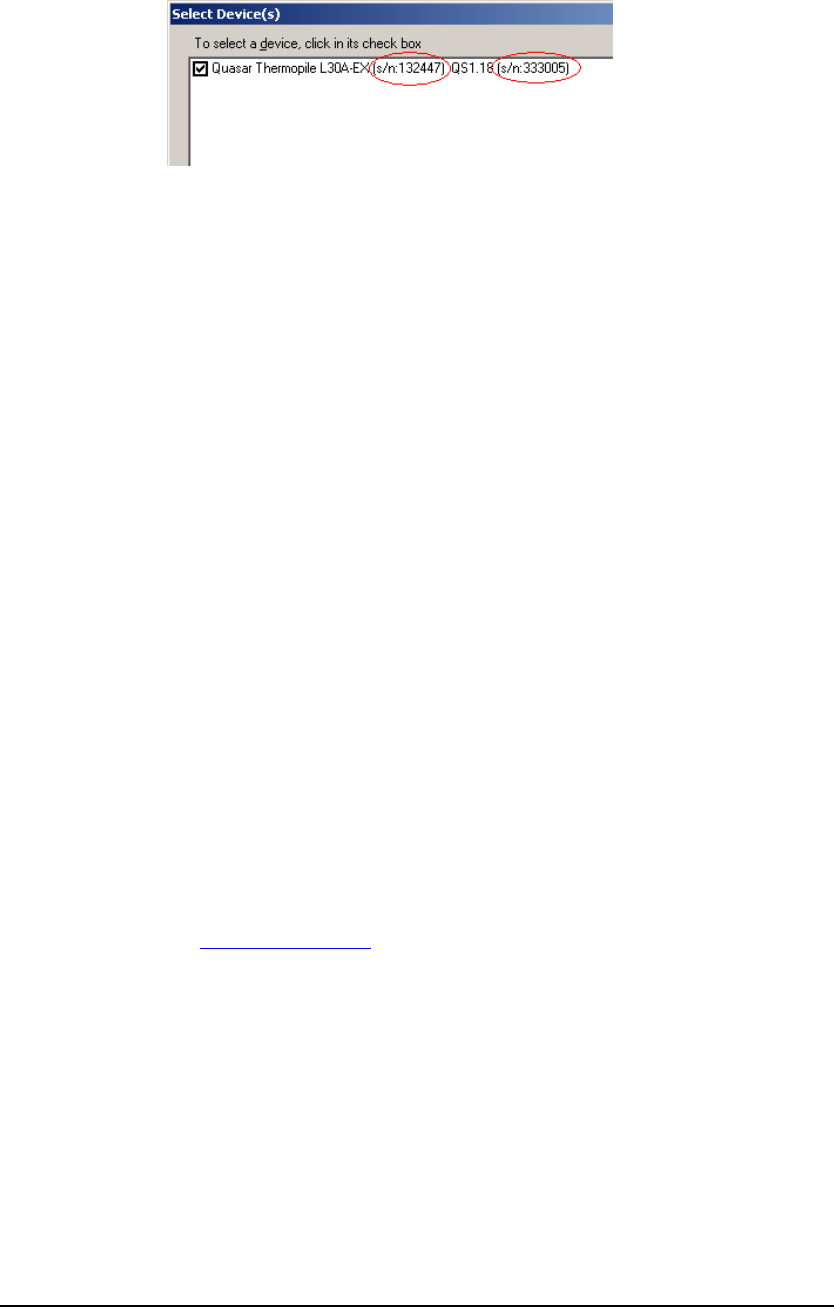
Appendix C – Getting the most from the Quasar Troubleshooting the Quasar
When using a regular Quasar device, the serial number of both the attached head,
and the Quasar device itself, are displayed in the Select Devices screen. The
serial number of the head is displayed on the left, and the serial number of the
Quasar device is displayed on the right. See below in Figure C-4 .
Figure C-4 Select Devices Screen
When using a thermo head with integral Quasar device, the serial number
displayed on the back of the combined unit will be the serial number of the head.
The Quasar device also contains an internal serial number, which is not
displayed on the combined unit. This internal serial number is also displayed in
the Select Devices screen, as it would be for a normal (non-integral) Quasar
device.
Troubleshooting the Quasar
If there are problems establishing a connection between the Quasar and the PC,
follow these steps to try and locate the problem.
Bring the Quasar closer to the PC radio and try again to connect. If the
connection is ok, you should work closer to the PC, or upgrade to the
ER option.
•
•
•
•
•
If using the Bluetooth USB Adapter, check that it is correctly plugged
into the PC. If it is already plugged in correctly, try unplugging it and
plugging it in again to refresh the control software.
If using a built-in radio in the PC, check that it is switched on
correctly. If it is already switched on correctly, try switching it off and
on again to refresh the control software.
Try closing the StarLab application and reopening it.
Click on Help – About in the StarLab application, and check the
software version that is installed on the PC. Check on the Ophir
website (www.ophiropt.com) for the latest release software version,
and if necessary upgrade to the latest version.
StarLab User Guide 110
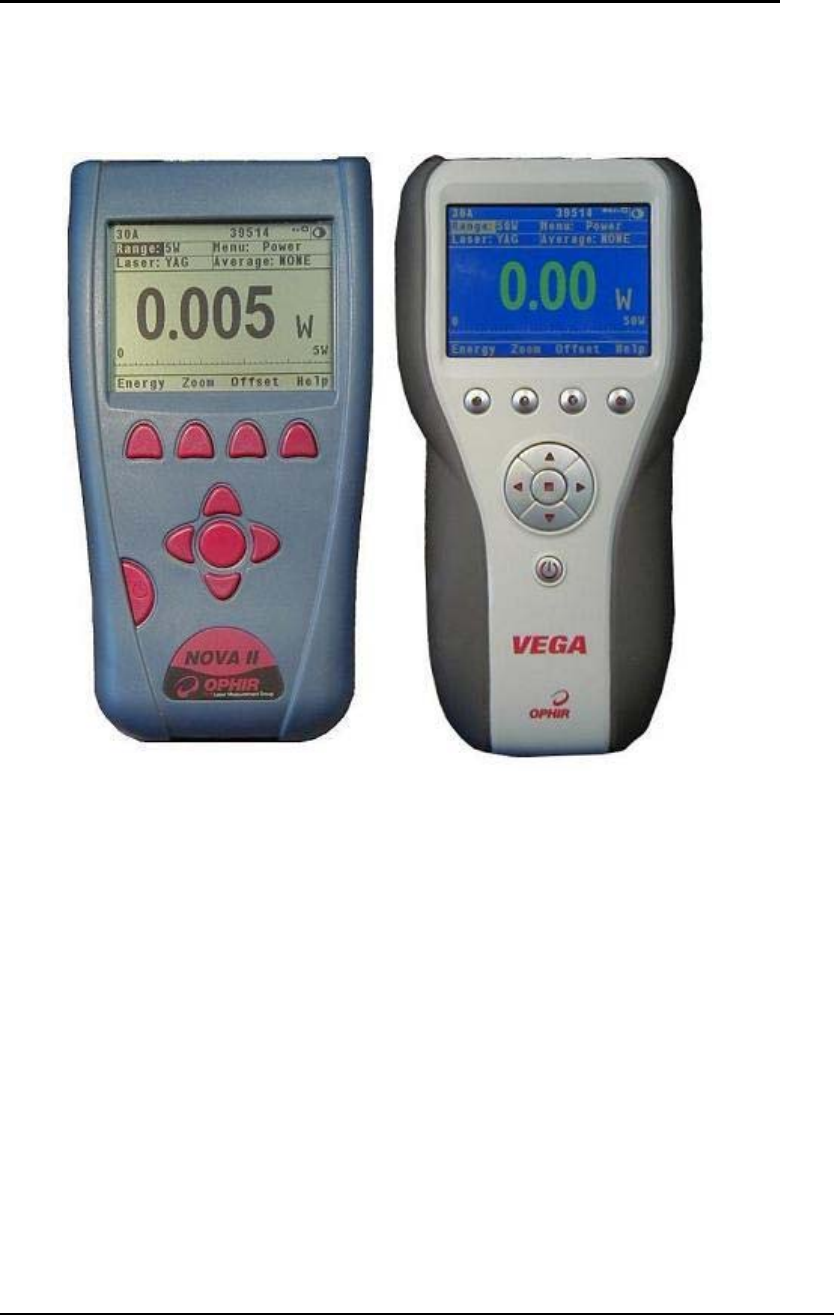
Appendix D – Operation with Nova-II and Vega Devices Troubleshooting the Quasar
Appendix D – Operation with Nova-II and
Vega Devices
The Nova-II and Vega are two of Ophir’s measurement devices. They have the
measurement capabilities of the USBI, Pulsar and Quasar devices combined with
an LCD Graphic Display for stand-alone operation. The Vega has a color TFT-
LCD Graphic Display, while the Nova-II has a Black and White LCD Display.
Figure D-1 Nova-II and Vega
StarLab User Guide 111

Appendix D – Operation with Nova-II and Vega Devices Summary of Changes to Support Nova-II and Vega
Summary of Changes to Support Nova-II and Vega
The StarLab Application supports use with the Nova-II and Vega devices. The
following features are relevant:
• Disable keypad. The Nova-II/Vega will not respond to any key press until
released from its communication session with the StarLab application. The
user interface of the StarLab application is unaffected, but the Nova-
II/Vega key pad is disabled.
• Upgrade device. The Nova-II and Vega have different internal firmware
than the USBI, Pulsar or Quasar devices. From the Select Device(s) dialog
box, you can select Upgrade USBI, Upgrade Quasar, Upgrade NOVA-II
or Upgrade Vega.
• Upload Log Files. The Nova-II and Vega can log up to ten files in their
on-board memory. You can use the StarLab Application to upload these
files and display the contents in the Log Viewer (see Chapter 10 –
Viewing Log Files).
StarLab User Guide 112
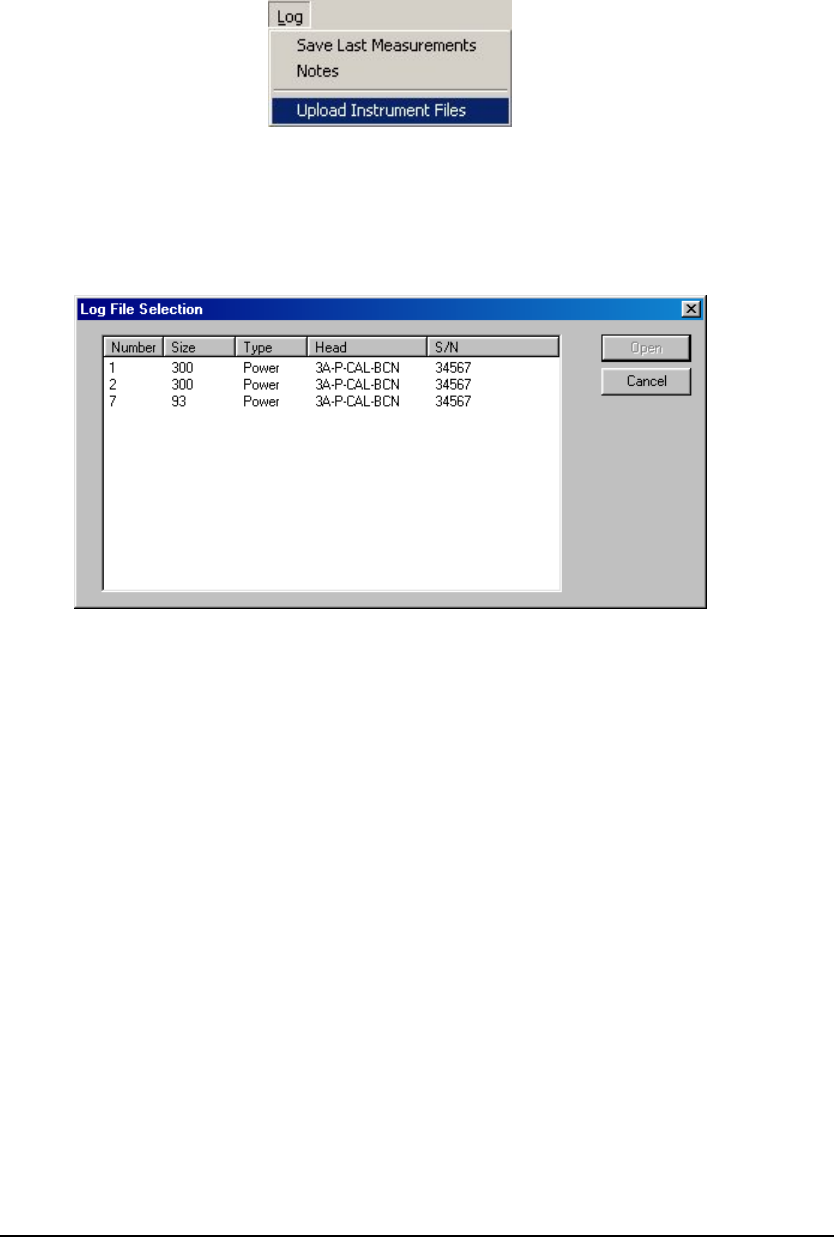
Appendix D – Operation with Nova-II and Vega Devices Uploading Files from the Nova-II and Vega
Uploading Files from the Nova-II and Vega
To upload a file from the Nova-II or Vega:
1. From the Log menu select Upload Instrument Files.
Figure D-2 Upload Instrument Files
The Log File Selection dialog box appears displaying all the files stored in
the Nova-II or Vega device, including the number of points stored, type of
file, type of head, and serial number of head with which the log was made.
Figure D-3 Log File Selection Dialog Box
2. Select the file to upload and click Open. The file is uploaded and
displayed in the Log Viewer.
StarLab User Guide
Rev 1.00-1
StarLab User Guide 113