PASCO scientific 080187 Gun Diode Microwave Transmitter User Manual 012 04630G cov p65
PASCO scientific Gun Diode Microwave Transmitter 012 04630G cov p65
Users Manual
012-04630G
MICROWAVE OPTICS
Instruction Manual and
Experiment Guide for
the PASCO scientific
Model WA-9314B
Includes
Teacher's Notes
and
Typical
Experiment Results
Phone (916) 786-3800 FAX (916) 786-8905 web: www.pasco.com
10101 Foothills Blvd. Roseville, CA 95678-9011 USA
®
better
teach science
ways to

i
012-04630G Microwave Optics
Table of Contents
Section Page
Copyright, Warranty, and Equipment Return ................................................... ii
Introduction ...................................................................................................... 1
Equipment......................................................................................................... 1
Initial Setup ...................................................................................................... 3
Accessory Equipment ....................................................................................... 3
Assembling Equipment for Experiments.......................................................... 5
Experiments
Experiment 1: Introduction to the System ............................................ 7
Experiment 2: Reflection ................................................................... 11
Experiment 3: Standing Waves - Measuring Wavelengths ............... 13
Experiment 4: Refraction Through a Prism ....................................... 17
Experiment 5: Polarization ................................................................ 19
Experiment 6: Double-Slit Interference ............................................ 21
Experiment 7: Lloyds Mirror............................................................. 23
Experiment 8: Fabry-Perot Interferometer ........................................ 25
Experiment 9: Michelson Interferometer .......................................... 27
Experiment 10: Fiber Optics.............................................................. 29
Experiment 11: Brewster's Angle ...................................................... 31
Experiment 12: Bragg Diffraction ..................................................... 33
Teacher's Guide .............................................................................................. 35
Appendix ........................................................................................................ 45
Schematic Diagrams ....................................................................................... 46
Replacement Parts List ................................................................................... 47
➤➤
➤➤
➤
This device complies with Part 15 of the FCC Rules. Operation is subject to the
following two conditions:
1. this device may not cause harmful interference.
2. this device must accept any interference received, including interference that may
cause undesired operation.
Changes or modifications not expressly approved by Pasco Scientific could void the user's author-
ity to operate the equipment.
ii
Microwave Optics 012-04630G
Copyright Notice
The PASCO scientific 012-04630E Model WA-9314B
Microwave Optics manual is copyrighted and all rights
reserved. However, permission is granted to non-profit
educational institutions for reproduction of any part of the
manual providing the reproductions are used only for their
laboratories and are not sold for profit. Reproduction
under any other circumstances, without the written
consent of PASCO scientific, is prohibited.
Limited Warranty
PASCO scientific warrants the product to be free from
defects in materials and workmanship for a period of one
year from the date of shipment to the customer. PASCO
will repair or replace at its option any part of the product
which is deemed to be defective in material or workman-
ship. The warranty does not cover damage to the product
caused by abuse or improper use. Determination of
whether a product failure is the result of a manufacturing
defect or improper use by the customer shall be made
solely by PASCO scientific. Responsibility for the return
of equipment for warranty repair belongs to the customer.
Equipment must be properly packed to prevent damage
and shipped postage or freight prepaid. (Damage caused
by improper packing of the equipment for return shipment
will not be covered by the warranty.) Shipping costs for
returning the equipment after repair will be paid by
PASCO scientific.
Copyright, Warranty, and Equipment Return
Please—Feel free to duplicate this manual
subject to the copyright restrictions below.
Equipment Return
Should the product have to be returned to PASCO
scientific for any reason, notify PASCO scientific by
letter, phone, or fax BEFORE returning the product. Upon
notification, the return authorization and shipping
instructions will be promptly issued.
➤ ➤
➤ ➤
➤ NOTE: NO EQUIPMENT WILL BE
ACCEPTED FOR RETURN WITHOUT AN
AUTHORIZATION FROM PASCO.
When returning equipment for repair, the units must be
packed properly. Carriers will not accept responsibility for
damage caused by improper packing. To be certain the
unit will not be damaged in shipment, observe the follow-
ing rules:
➀The packing carton must be strong enough for the
item shipped.
➁Make certain there are at least two inches of
packing material between any point on the
apparatus and the inside walls of the carton.
➂Make certain that the packing material cannot shift
in the box or become compressed, allowing the
instrument come in contact with the packing
carton.
Address: PASCO scientific
10101 Foothills Blvd.
Roseville, CA 95747-7100
Phone: (916) 786-3800
FAX: (916) 786-3292
email: techsupp@pasco.com
web: www.pasco.com
Credits
This manual edited by: Dave Griffith
Teacher’s guide written by: Eric Ayars
1
012-04630G Microwave Optics
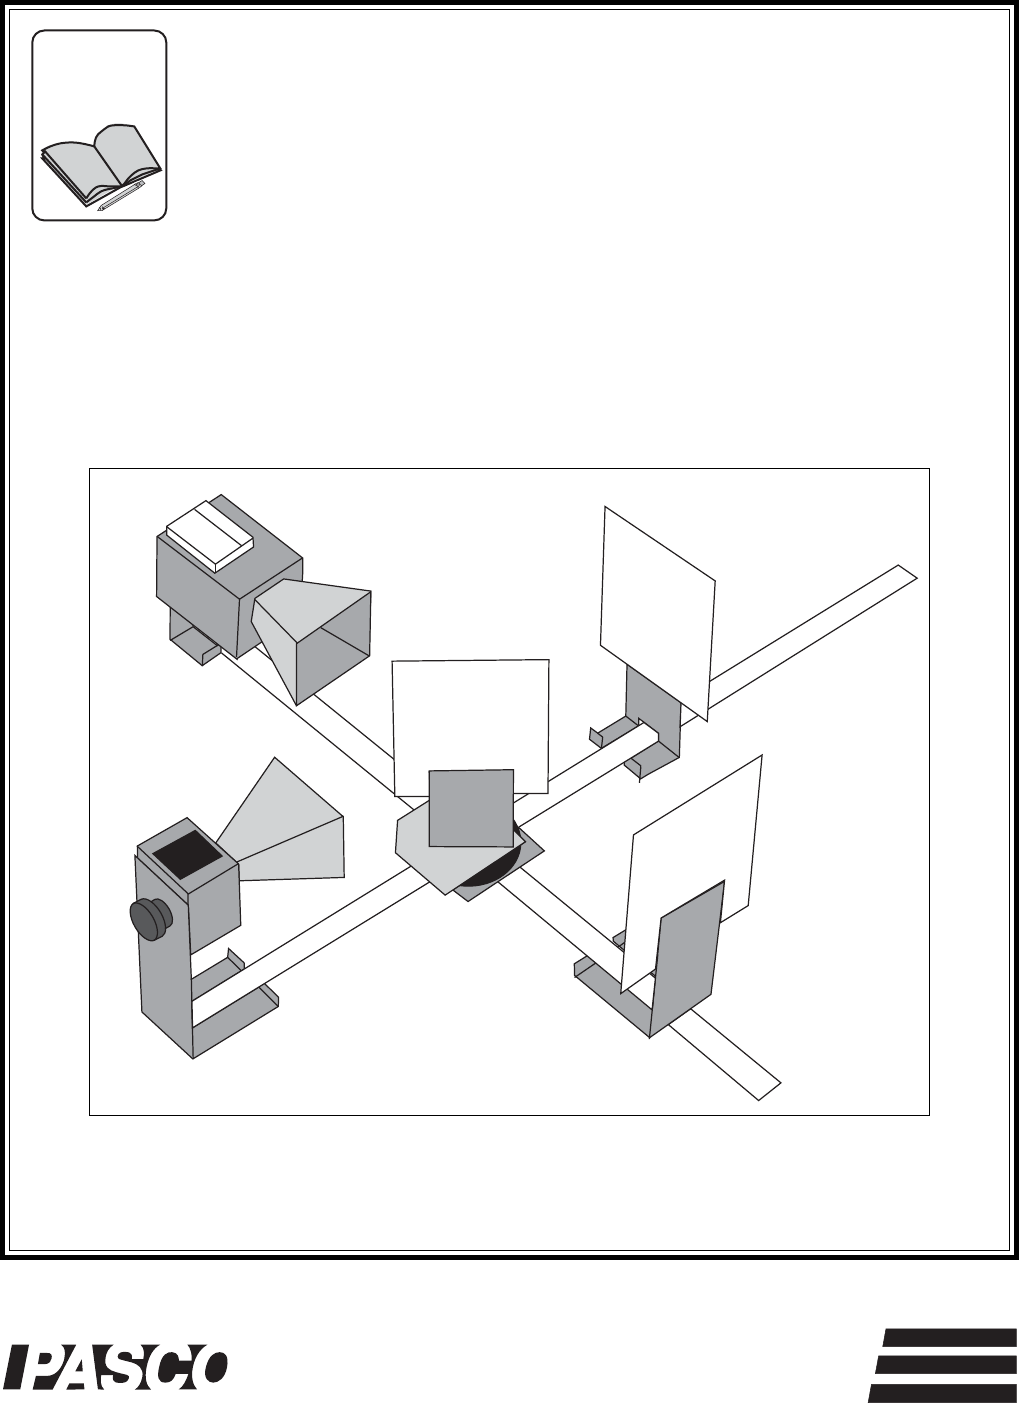
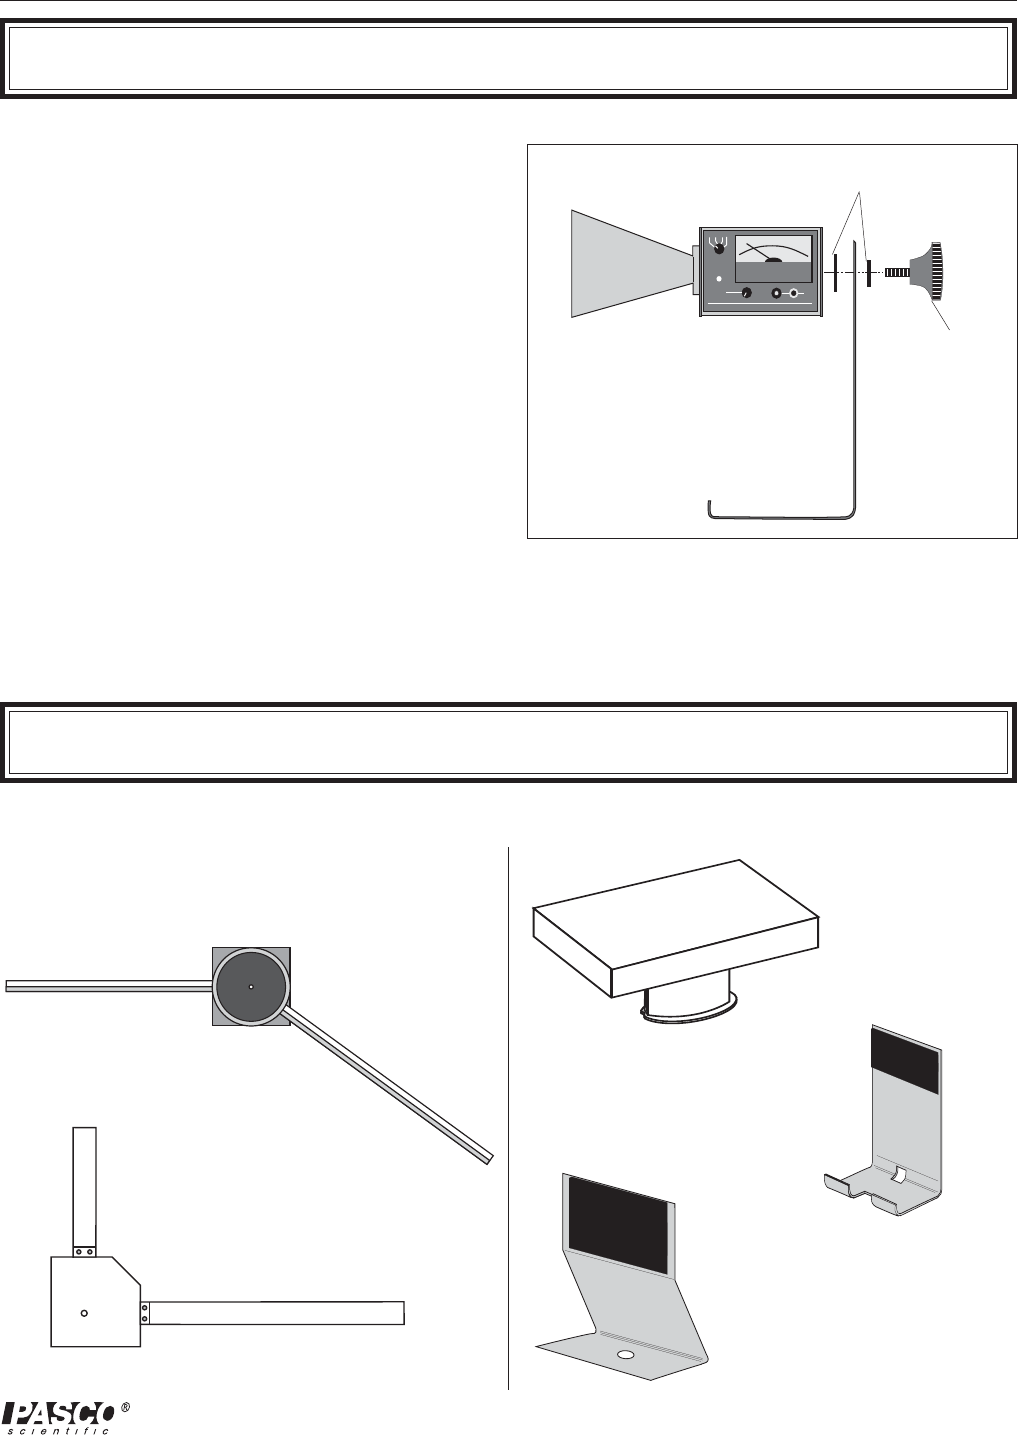
Microwave Transmitter with Power Supply
Introduction
GUNN DIODE
MICROWAVE
TRANSMITTER
PAS CO scientific
Gunn Diode Transmitter
The Gunn Diode Microwave Transmitter provides 15 mW
of coherent, linearly polarized microwave output at a
wavelength of 2.85 cm. The unit consists of a Gunn di-
ode in a 10.525 GHz resonant cavity, a microwave horn
to direct the output, and an 18 cm stand to help reduce
table top reflections. The Transmitter may be powered
directly from a standard 115 or 220/240 VAC, 50/60 Hz
outlet by using the provided power supply. Other features
include an LED power-indicator light and a rotational
scale that allows easy measurement of the angle of po-
larization.
The Gunn diode acts as a non-linear resistor that oscillates
in the microwave band. The output is linearly polarized
along the axis of the diode and the attached horn radiates
a strong beam of microwave radiation centered along the
axis of the horn.
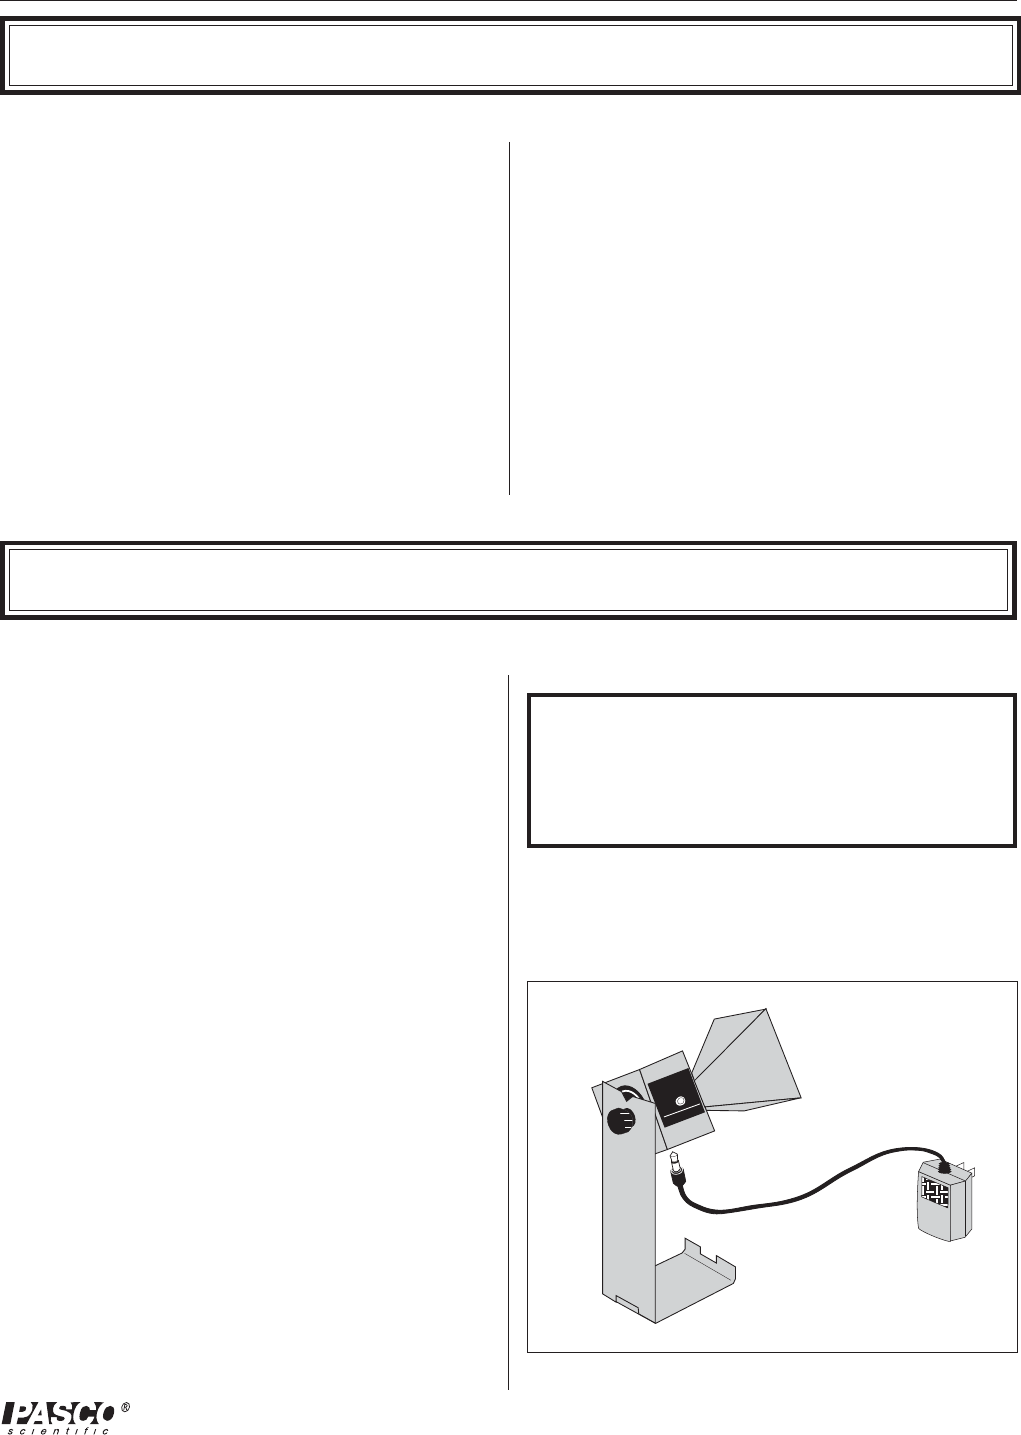
To Operate the Microwave Transmitter
Simply plug the power supply into the jack on the
Transmitter's bottom panel and plug the power supply into
a standard 115 or 220/240 VAC, 50/60 Hz outlet. The
LED will light indicating the unit is on.
➤➤
➤➤
➤
CAUTION: The output power of the Microwave
Transmitter is well within standard safety levels.
Nevertheless, one should never look directly into the
microwave horn at close range when the Transmit-
ter is on.
Power Supply Specifications:
9 Volt DC, 500 mA;
Miniature Phone Jack Connector (the tip is positive)
Equipment
There are many advantages to studying optical phenom-
ena at microwave frequencies. Using a 2.85 centimeter
microwave wavelength transforms the scale of the experi-
ment. Microns become centimeters and variables ob-
scured by the small scale of traditional optics experiments
are easily seen and manipulated. The PASCO scientific
Model WA-9314B Basic Microwave Optics System is
designed to take full advantage of these educational ben-
efits. The Basic Microwave Optics System comes with a
2.85 centimeter wavelength microwave transmitter and a
receiver with variable amplification (from 1X to 30X).
All the accessory equipment needed to investigate a vari-
ety of wave phenomena is also included.
This manual describes the operation and maintenance of
the microwave equipment and also gives detailed instruc-
tions for many experiments. These experiments range
from quantitative investigations of reflection and refrac-
tion to microwave models of the Michelson and Fabry-
Perot interferometers. For those who have either the
Complete Microwave Optics System (WA-9316) or the
Microwave Accessory Package (WA-9315), the manual
describes experiments for investigating Bragg diffraction
and Brewster's angle.
2
012-04630GMicrowave Optics
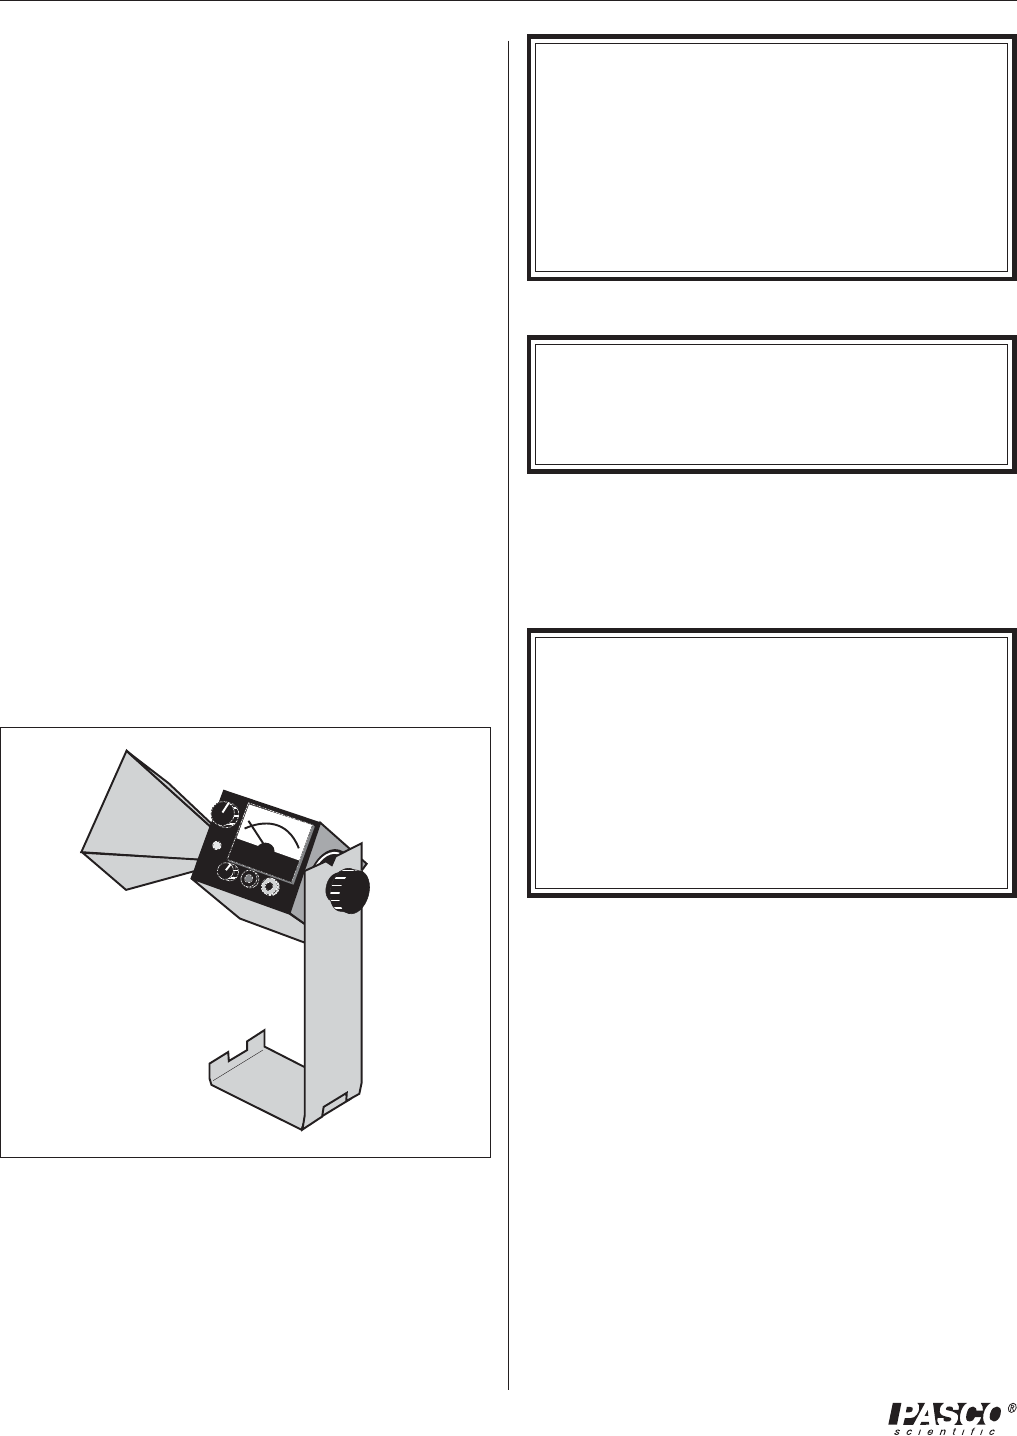
Microwave Receiver
Microwave Receiver
The Microwave Receiver provides a meter reading that,
for low amplitude signals, is approximately proportional
to the intensity of the incident microwave signal. A mi-
crowave horn identical to that of the Transmitter's collects
the microwave signal and channels it to a Schottky diode
in a 10.525 GHz resonant cavity. The diode responds
only to the component of a microwave signal that is polar-
ized along the diode axis, producing a DC voltage that
varies with the magnitude of the microwave signal.
Special features of the Receiver include four amplification
ranges—from one to thirty—with a variable sensitivity
knob that allows fine tuning of the amplification in each
range. For convenience in class demonstrations, banana
plug connectors provide for an output signal via hookup
to a projection meter (such as PASCO Model ES-9065
Projection Meter or SE-9617 DC Voltmeter). This output
can also be used for close examination of the signal using
an oscilloscope. The receiver is battery powered and has
an LED battery indicator; if the LED lights when you turn
on the Receiver , the battery is working. As with the
Transmitter, an 18 cm high mount minimizes table top
reflections, and a rotational scale allows convenient mea-
surements of polarization angle.
The female audio connector on the side of the Receiver is
for an optional Microwave Detector Probe ( PASCO
Model WA-9319). The probe works the same as the Re-
ceiver except it has no horn or resonant cavity. The Probe
is particularly convenient for examining wave patterns in
which the horn could get in the way, such as the standing
wave pattern described in Experiment 3 of this manual.
➤➤
➤➤
➤
NOTE: The detector diodes in the Receiver (and
the Probe) are non-linear devices. This non-linear-
ity will provide no problem in most experiments. It
is important however, to realize that the meter read-
ing is not directly proportional to either the electric
field (E) or the intensity (I) of the incident micro-
wave. Instead, it generally reflects some intermedi-
ate value.
To Operate The Microwave Receiver:
➤➤
➤➤
➤
NOTE: Before using the Receiver, you will need
to install the two 9-volt transistor batteries—they are
included with the system. See the instructions in the
Maintenance section at the end of this manual.
①Turn the INTENSITY selection switch from OFF to
30X, the lowest amplification level. The battery indi-
cator LED should light, indicating that the battery is
okay. If it does not, replace the battery following the
procedures in the Maintenance section of this manual.
➤➤
➤➤
➤
NOTE: The INTENSITY selection settings (30X,
10X, 3X, 1X) are the values you must multiply the
meter reading by to normalize your measurements.
30X, for example, means that you must multiply the
meter reading by 30 to get the same value you
would measure for the same signal with the INTEN-
SITY selection set to 1X. Of course, this is true
only if you do not change the position of the VARI-
ABLE SENSITIVITY knob between measurements.
②Point the microwave horn toward the incident micro-
wave signal. Unless polarization effects are under in-
vestigation, adjust the polarization angles of the Trans-
mitter and Receiver to the same orientation (e.g., both
horns vertically, or both horns horizontally).
③Adjust the VARIABLE SENSITIVITY knob to attain
a meter reading near midscale. If no deflection of the
meter occurs, increase the amplification by turning the
INTENSITY selection switch clockwise. Remember,
always multiply your meter reading by the appropriate
INTENSITY selection (30X, 10X, 3X, or 1X) if you
want to make a quantitative comparison of measure-
ments taken at different INTENSITY settings.
3
012-04630G Microwave Optics
Initial Setup
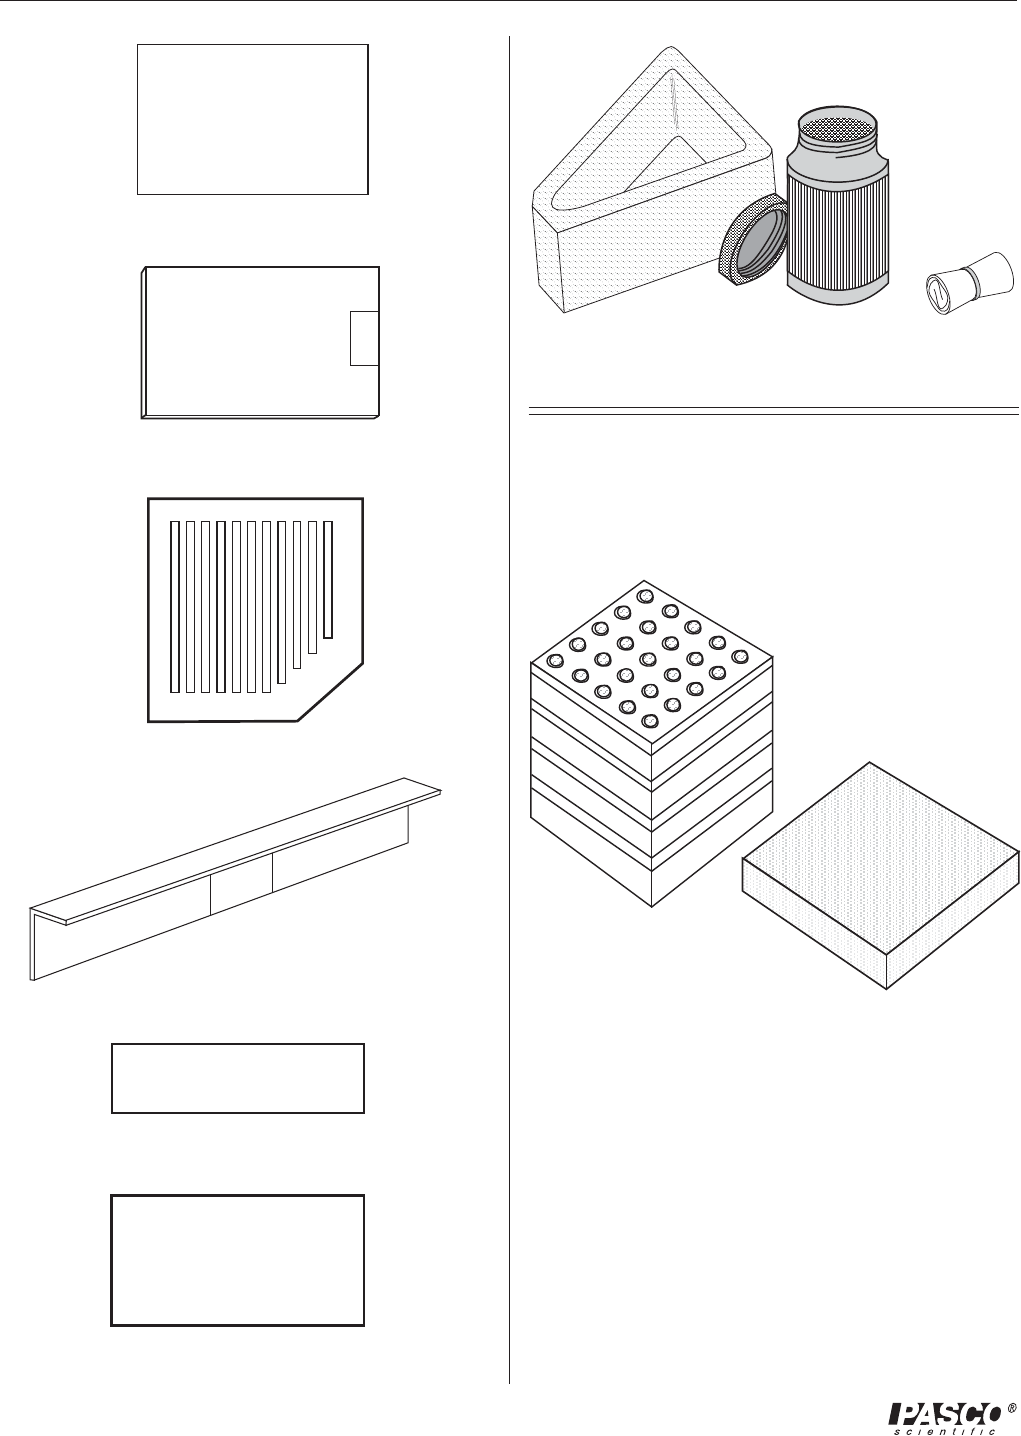
Attaching the Transmitter and Receiver Stands
Hand Screw
Washers
Fixed Arm Assembly (1)
Goniometer (1)
Accessory equipment for the Basic Microwave Optics
System includes:
Rotating Component Holder (1)
Component Holder (2)
ROTATING TABLE
Rotating Table (1)
Accessory Equipment
To attach the microwave Transmitter and Receiver to their
respective stands prior to performing experiments, pro-
ceed as follows:
①Remove the black hand screw from the back panel of
both the Transmitter and the Receiver.
②Attach both units to the stands as shown below. Ob-
serve the location of the washers.
③To adjust the polarization angle of the Transmitter
or Receiver, loosen the hand screw, rotate the unit,
and tighten the hand screw at the desired orientation.
Notice the rotational scale on the back of each unit for
measuring the angle of polarization. Be aware, how-
ever, that since the Transmitter and Receiver face each
other in most experiments it is important to match their
polarization angle. If you rotate one unit to an angle of
10-degrees, you must rotate the other to -10-degrees
(350-degrees) to achieve the proper polar alignment.
4
012-04630GMicrowave Optics
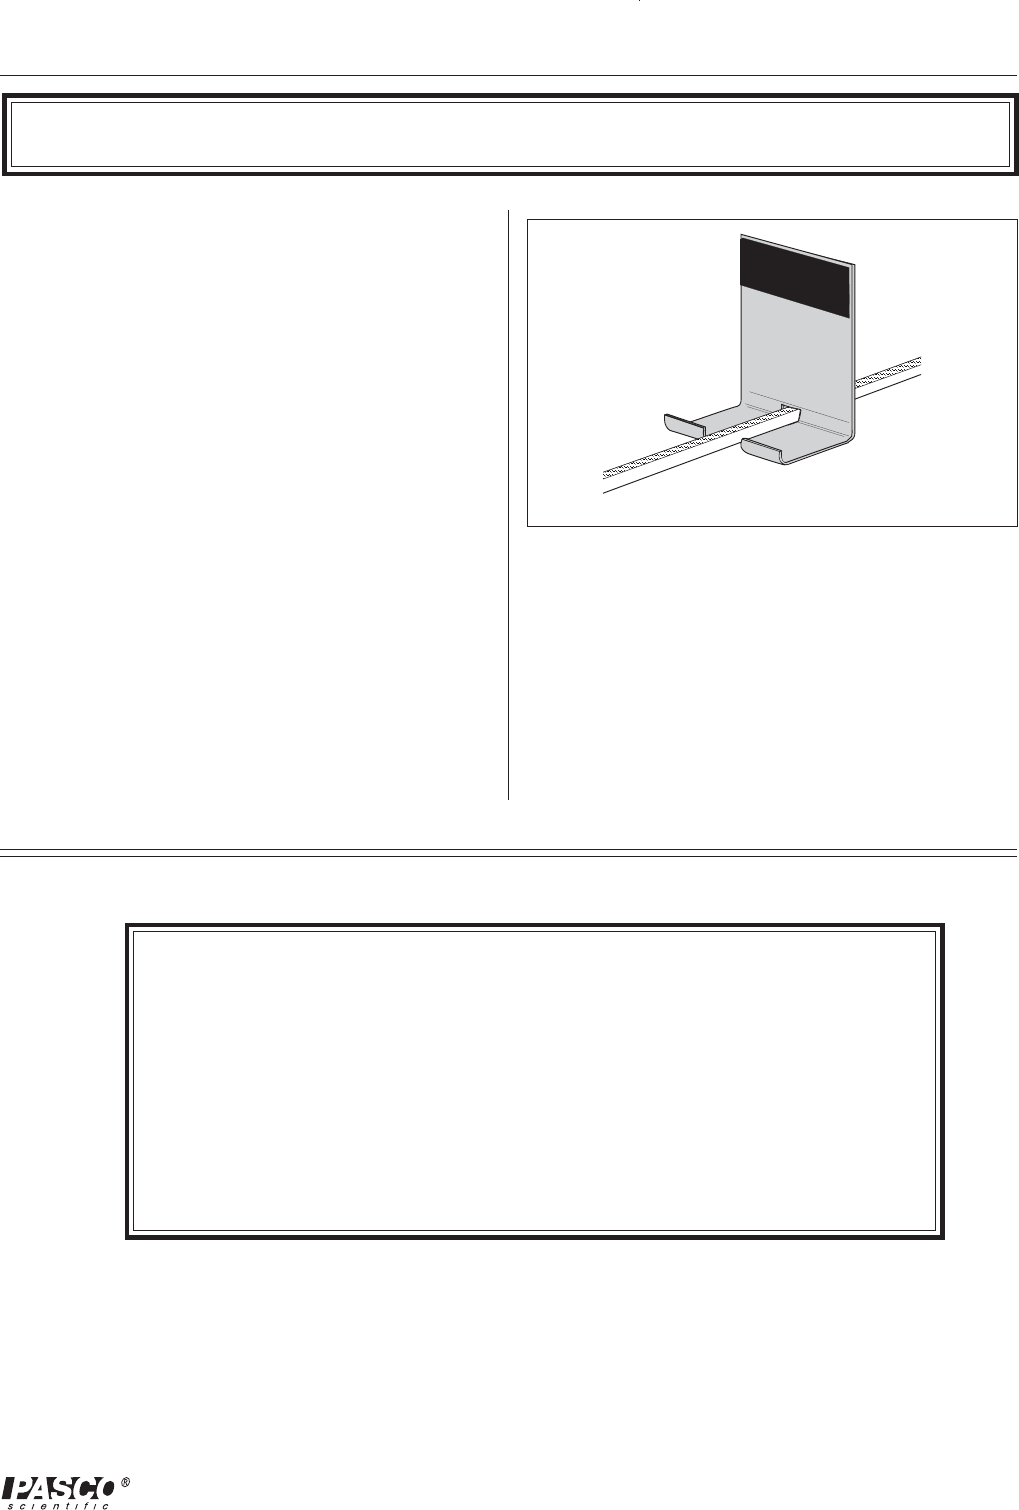
Wide Slit Spacer (1)
Narrow Slit Spacer (1)
Slit Extender Arm (1)
Metal Reflector (2)
Partial Reflector (2)
Polarizers (2)
Tubular
Plastic Bags (4)
Ethafoam Prism Mold w/
Styrene Pellets (1)
Polyethylene Panel (1)
Cubic Lattice with 100 metal
spheres—5x5x4 array (1)
The WA-9315 Microwave Accessory Package (which is
part of the Complete Microwave Optics System Model
WA-9316) includes the following:
The following components, compatible with the WA-
9314B Basic Microwave Optics System, are available
from PASCO scientific:
Model WA-9319 Microwave Detector Probe plugs di-
rectly into the Microwave Receiver. The probe is essen-
tial for experiments in which the horn of the Receiver
might otherwise interfere with the wave pattern being
measured.
Model WA-9318 Microwave Modulation Kit includes a
modulator and microphone. With this kit, you can use
your Transmitter and Receiver as a microwave communi-
cations system.
5
012-04630G Microwave Optics
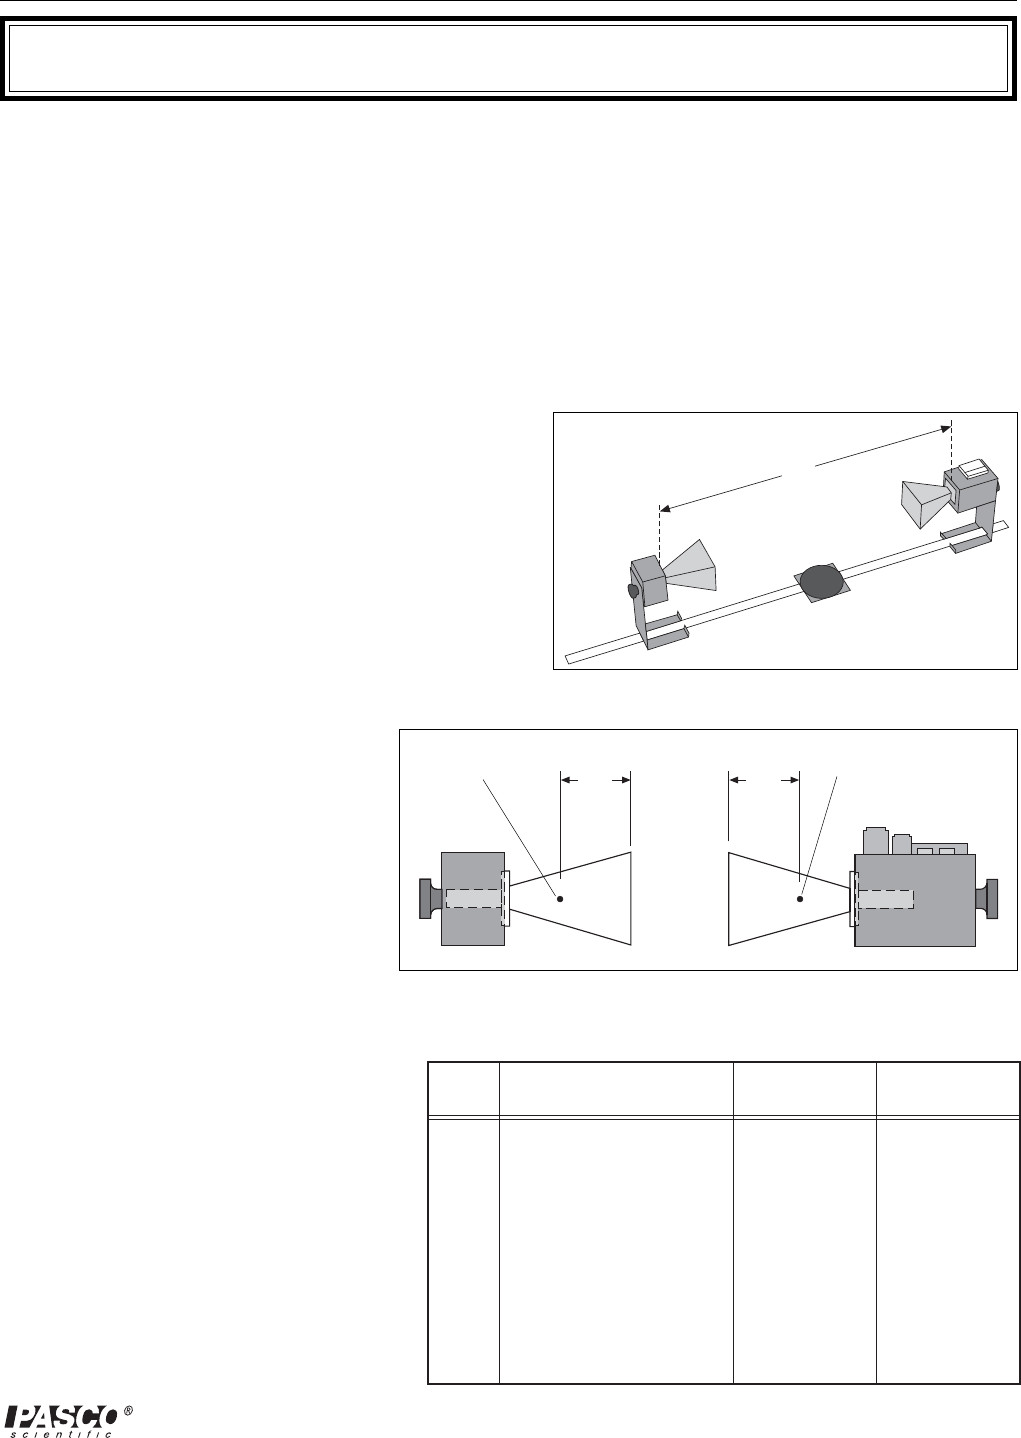
Assembling Equipment for Experiments
The arms of the Goniometer slide through the holes in the
Component Holders as shown. Make sure the magnetic
strip on the bottom of the arm grips the base of the car-
riage. To adjust the position of the holders, just slide
them along the Goniometer arms. Attach the mounting
stands of the microwave Transmitter and Receiver to the
arms of the Goniometer in the same manner.
For most experiments it is advantageous to attach the
Transmitter to the long arm of the Goniometer and the
Receiver to the shorter, rotatable arm. This maintains a
fixed relationship between the microwave beam and com-
ponents mounted on the long arm (or on the degree plate)
of the Goniometer. In turn the Receiver moves easily to
sample the output.
Reflectors, Partial Reflectors, Polarizers, Slit Spacers, and
the Slit Extender Arm all attach magnetically to the Com-
ponent Holders. The metric scale along the Goniometer
arms and the degree plate at the junction of the arms al-
low easy measurement of component placement. When
rotating the rotatable arm, hold the degree plate firmly to
the table so that it does not move.
➤➤
➤➤
➤IMPORTANT NOTES:
1. CAUTION—Under some circumstances, microwaves can interfere with elec-
tronic medical devices. If you use a pacemaker, or other electronic medical
device, check with your doctor or the manufacturer to be certain that low power
microwaves at a frequency of 10.525 GHz will not interfere with its operation.
2. Always mount the apparatus on a CLEAN, SMOOTH table. Before setting up
the equipment, brush off any material—particularly metal chips—that might
have adhered to the magnetic strips on the bottom of the Goniometer arms.
Mounting the Component Holder

6
012-04630GMicrowave Optics
Copy-Ready Experiments
The following Experiments provide a thorough introduction to wave theory using
the microwave system. We expect that the student approaches each experiment
with the appropriate theoretical background, therefore, basic principles are only
briefly discussed in each experiment.
The experiments are written in worksheet format. Feel free to photocopy them for
use in your lab.
7
012-04630G Microwave Optics
EQUIPMENT NEEDED:
– Transmitter – Goniometer
– Receiver – Reflector (1)
Purpose
This experiment gives a systematic introduction to the Microwave Optics System. This may
prove helpful in learning to use the equipment effectively and in understanding the significance of
measurements made with this equipment. It is however not a prerequisite to the following experi-
ments.
Procedure
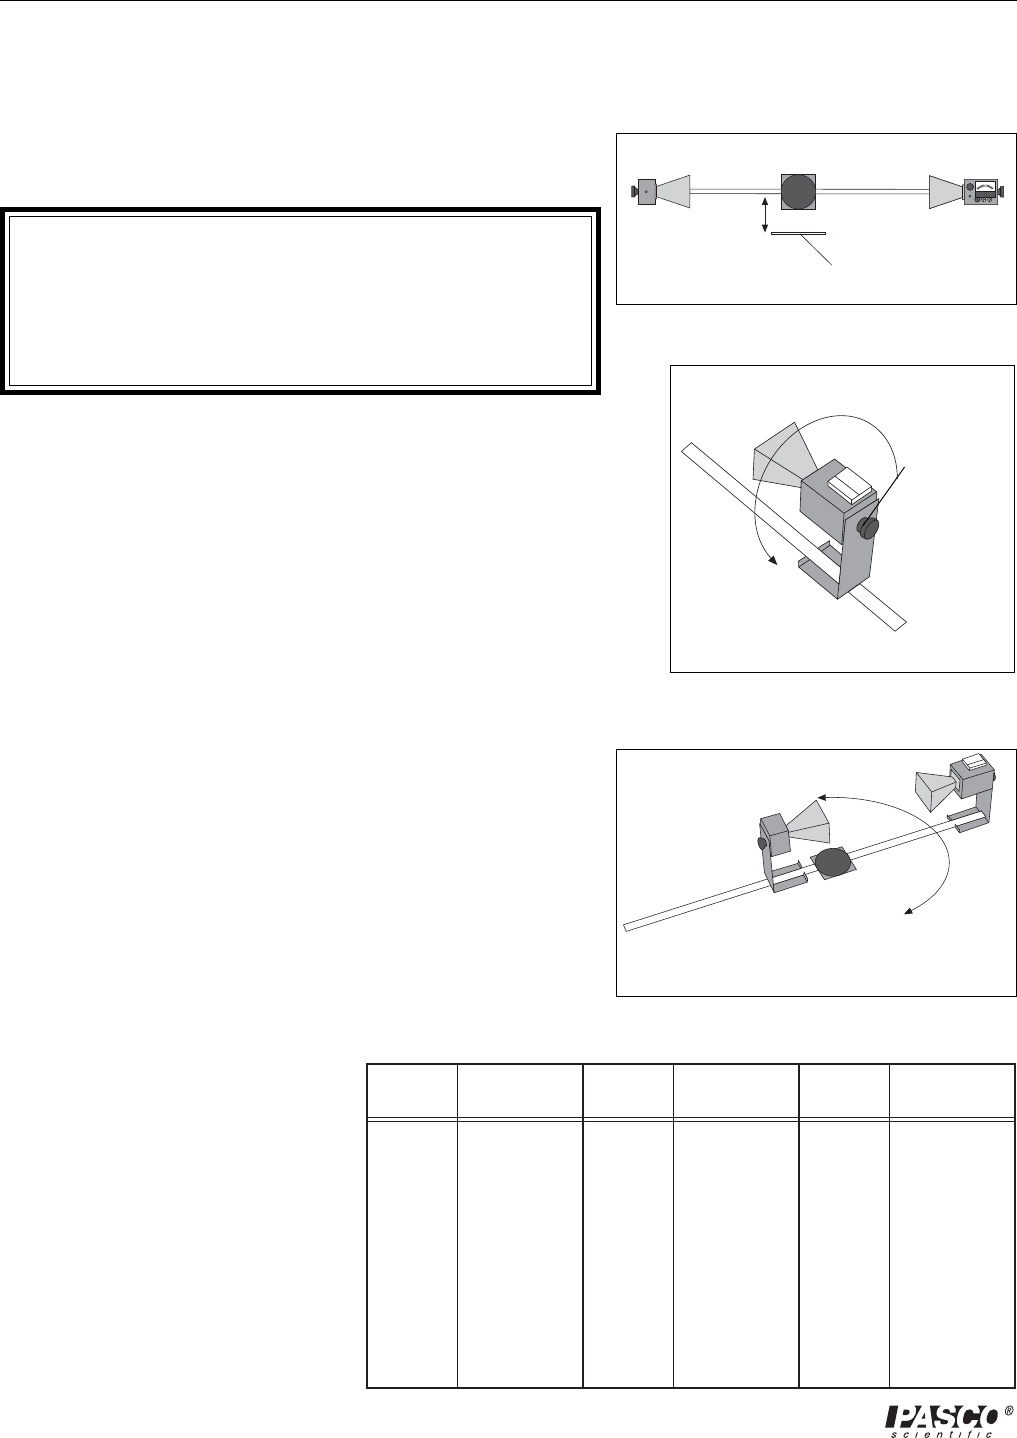
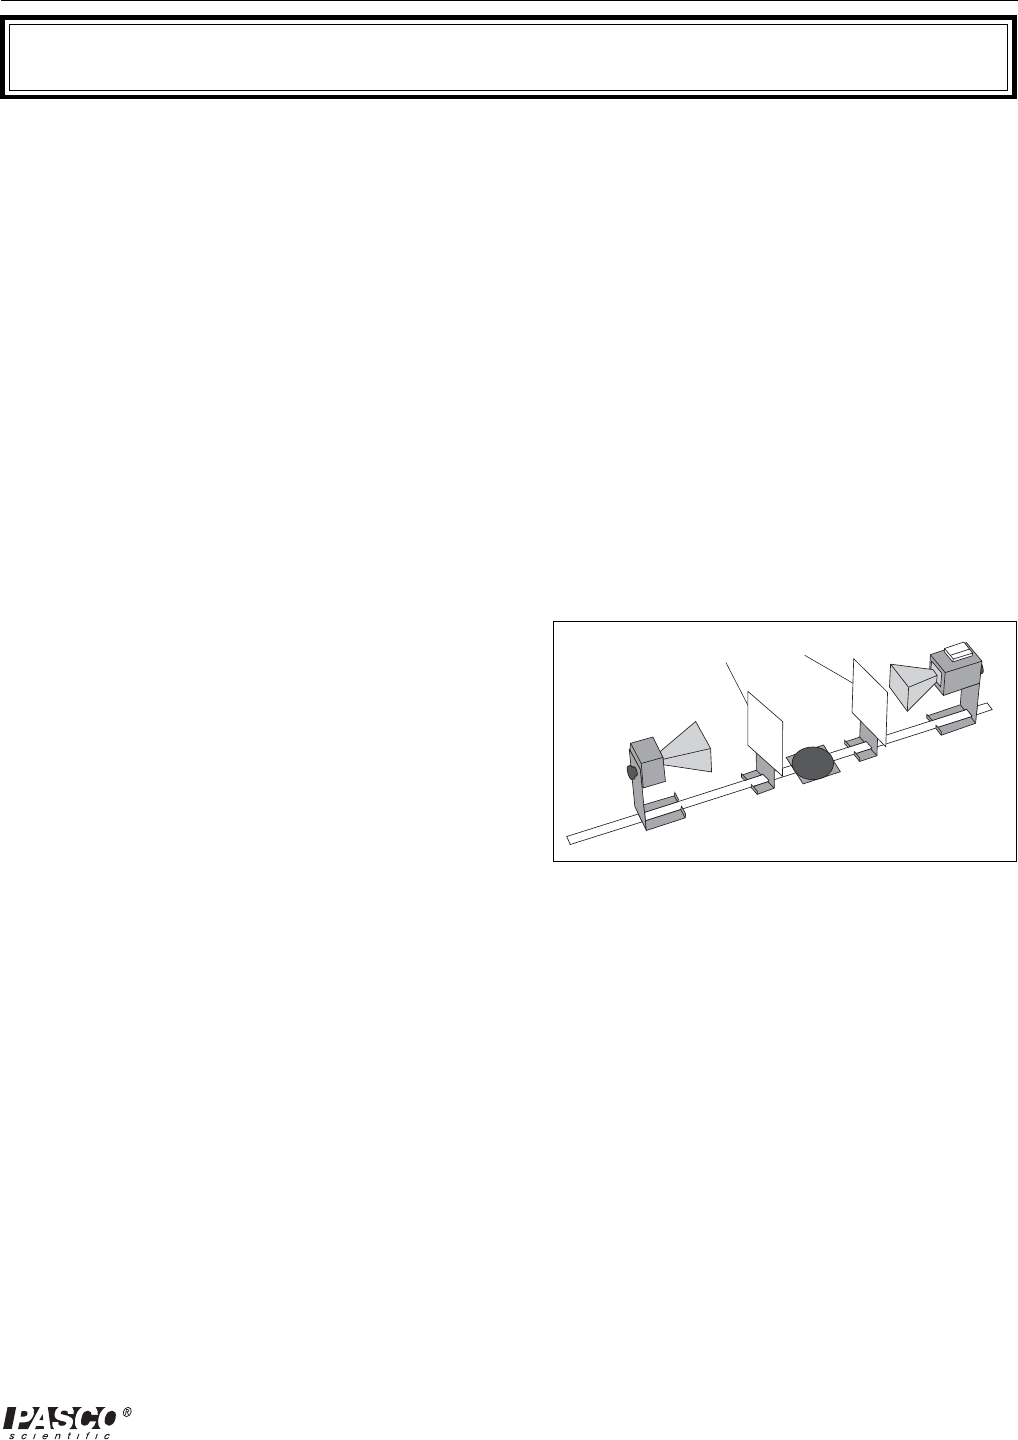
①Arrange the Transmitter and Receiver on the Goni-
ometer as shown in Figure 1.1 with the Transmitter
attached to the fixed arm. Be sure to adjust both
Transmitter and Receiver to the same polarity—the
horns should have the same orientation, as shown.
②Plug in the Transmitter and turn the INTENSITY
selection switch on the Receiver from OFF to 10X.
(The LEDs should light up on both units.)
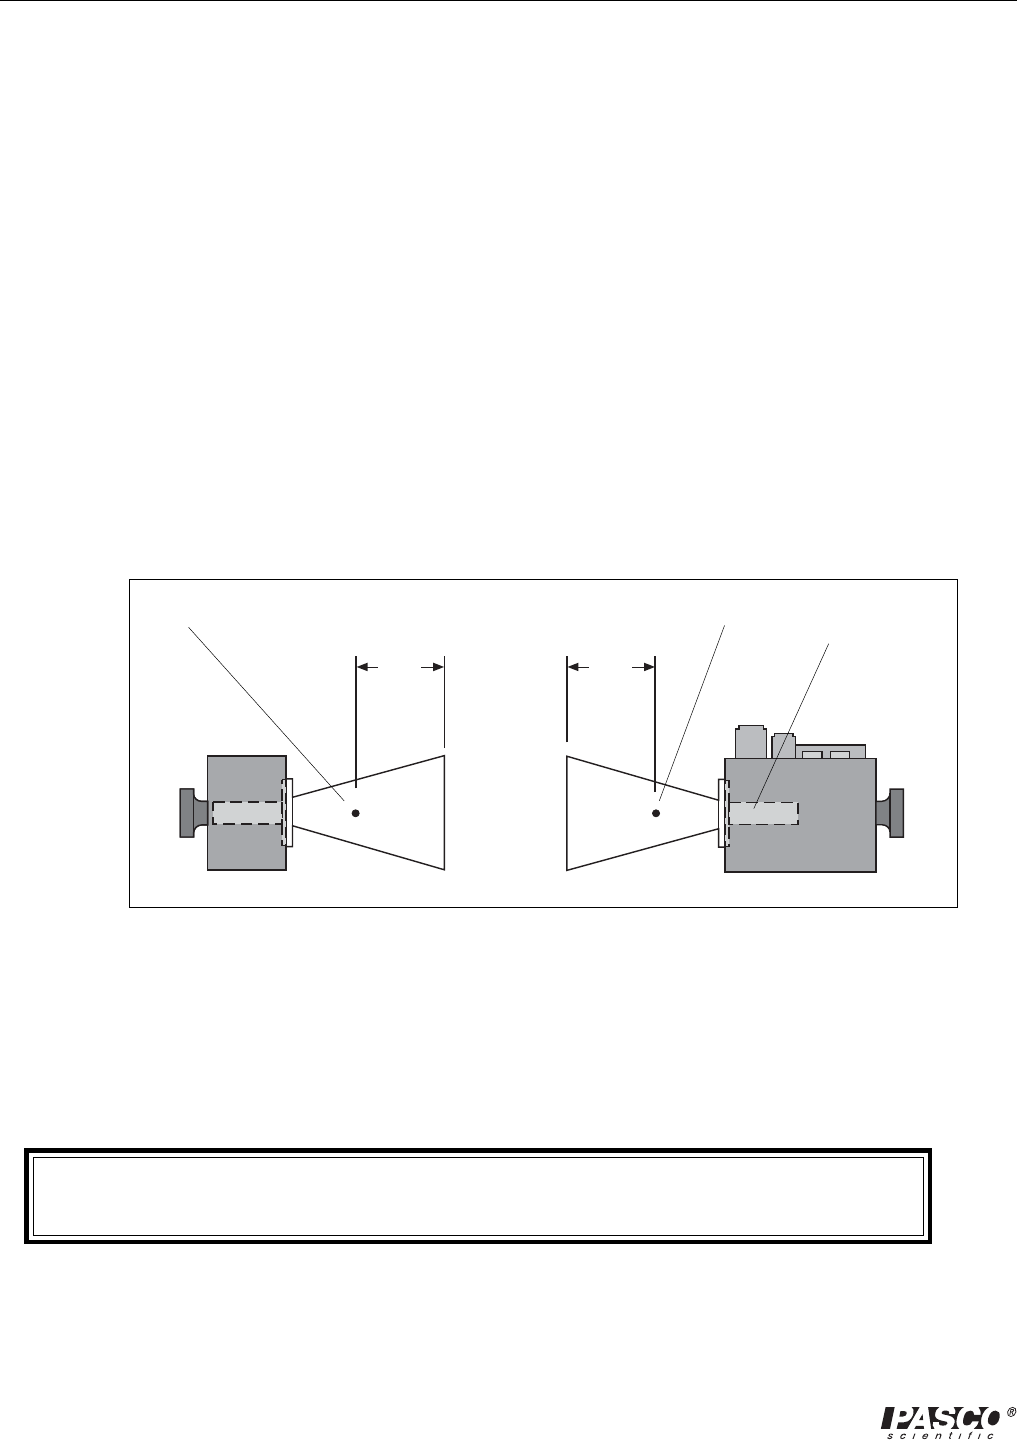
③ Adjust the Transmitter and Receiver so the distance
between the source diode in the
Transmitter and the detector diode
in the Receiver (the distance la-
beled R in Figure 1.1) is 40 cm
(see Figure 1.2 for location of
points of transmission and recep-
tion). The diodes are at the loca-
tions marked "T" and "R" on the
bases. Adjust the INTENSITY and
VARIABLE SENSITIVITY dials
on the Receiver so that the meter
reads 1.0 (full scale).
④Set the distance R to each of the
values shown in Table 1.1. For each
value of R, record the meter reading.
(Do not adjust the Receiver controls
between measurements.) After mak-
ing the measurements, perform the
calculations shown in the table.
⑤Set R to some value between 70 and
90 cm. While watching the meter,
slowly decrease the distance between
the Transmitter and Receiver. Does
the meter deflection increase steadily
as the distance decreases?
Experiment 1: Introduction to the System
R
Figure 1.1 Equipment Setup
5 cm 5 cm
Transmitter Receiver
Effective Point of Reception of
Transmitter Signal
Effective Point of Emission of
Transmitter Signal
Figure 1.2 Equipment Setup
R
(cm) Meter Reading (M) M X R
(cm)
M X R
2
(cm
2
)
40
50
60
70
80
90
100
1.0 40 1600
Table 1.1
8
012-04630G
Microwave Optics
⑥Set R to between 50 and 90 cm. Move a Reflector, its plane parallel to the axis of the microwave
beam, toward and away from the beam axis, as shown in Figure 1.3. Observe the meter read-
ings. Can you explain your observations in steps 5 and 6? Don’t worry if you can’t; you will
have a chance to investigate these phenomena more
closely in Experiments 3 and 8, later in this manual. For
now just be aware of the following:
➤➤
➤➤
➤IMPORTANT: Reflections from nearby objects, in-
cluding the table top, can affect the results of your mi-
crowave experiments. To reduce the effects of extrane-
ous reflections, keep your experiment table clear of all
objects, especially metal objects, other than those com-
ponents required for the current experiment.
⑦Loosen the hand screw on the back of the Receiver and
rotate the Receiver as shown in Figure 1.4. This varies
the polarity of maximum detection. (Look into the
receiver horn and notice the alignment of the detector
diode.) Observe the meter readings through a full 360
degree rotation of the horn. A small mirror may be
helpful to view the meter reading as the receiver is
turned. At what polarity does the Receiver detect no
signal?
Try rotating the Transmitter horn as well. When fin-
ished, reset the Transmitter and Receiver so their polari-
ties match (e.g., both horns are horizontal or both horns
are vertical).
⑧Position the Transmitter so the output surface of the horn
is centered directly over the center of the Degree Plate of
the Goniometer arm (see Figure 1.5). With the Receiver
directly facing the Transmitter and as far back on the
Goniometer arm as possible, adjust the Receiver controls
for a meter reading of 1.0. Then rotate the rotatable arm
of the Goniometer as shown in the figure. Set the angle
of rotation (measured relative to the 180-degree point on
the degree scale) to each of
the values shown in Table
1.2, and record the meter
reading at each setting.
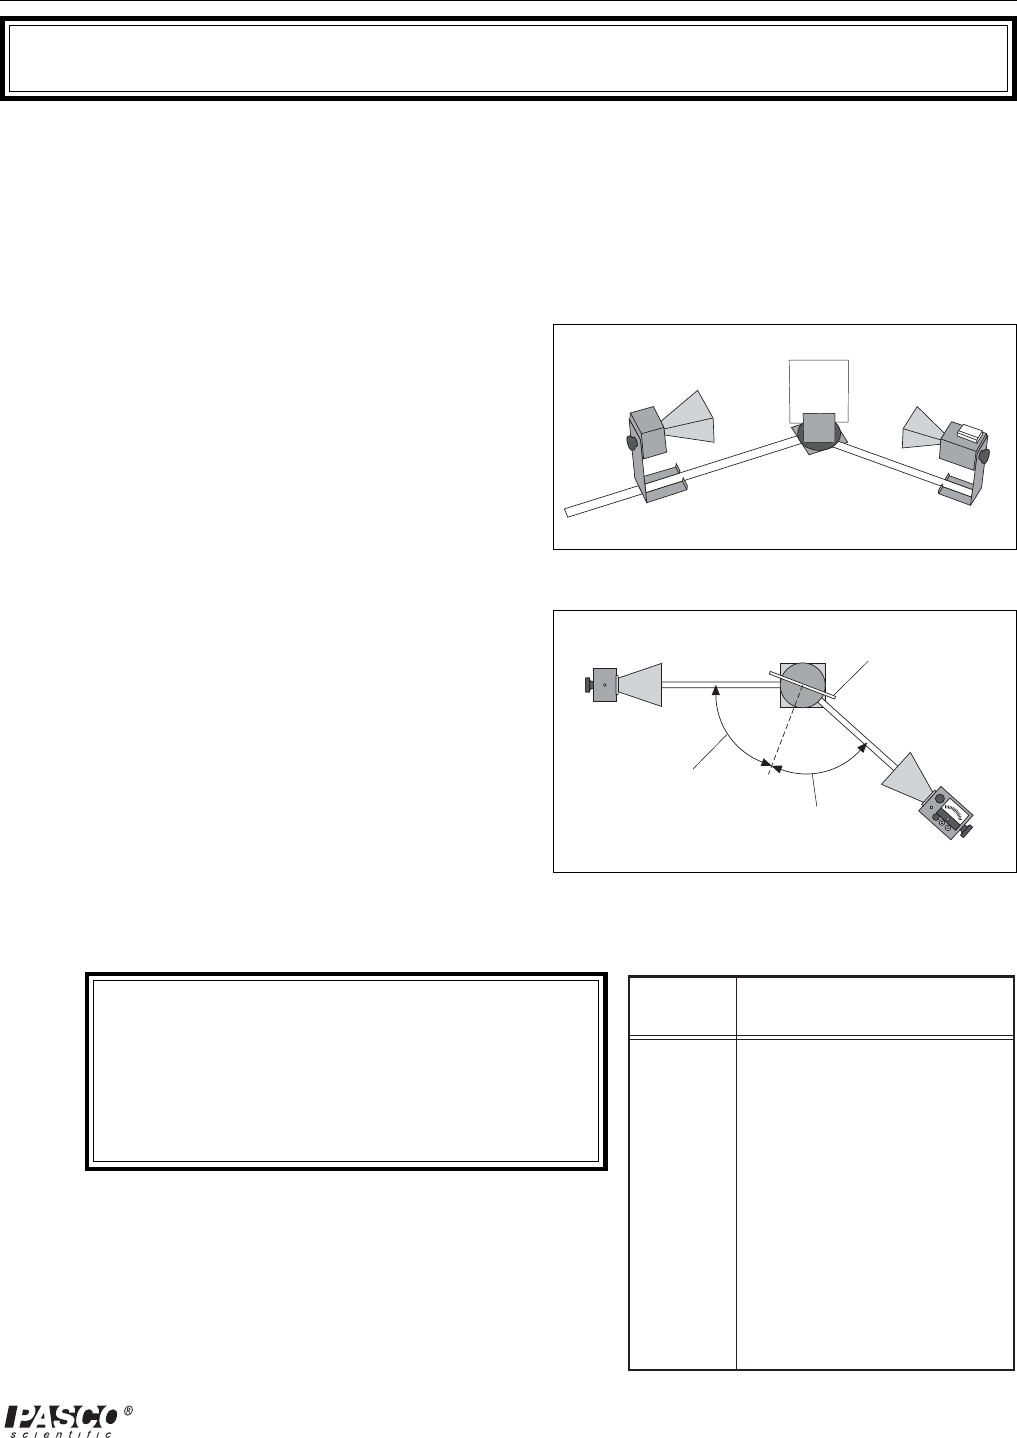
Figure 1.5 Signal Distribution
Figure 1.3 Reflections
Reflector
Figure 1.4 Polarization
Handscrew
Table 1.2
Meter
Reading
Angle of
Receiver
0°
10°
20°
30°
40°
50°
Meter
Reading
Angle of
Receiver
70°
80°
90°
100°
110°
120°
Meter
Reading
Angle of
Receiver
140°
150°
160°
170°
180°
60° 130°

9
012-04630G Microwave Optics
Questions
①The electric field of an electromagnetic wave is inversely proportional to the distance from
the wave source
(i.e., E = 1/R). Use your data from step 4 of the experiment to determine if the meter read-
ing of the Receiver is directly proportional to the electric field of the wave.
②The intensity of an electromagnetic wave is inversely proportional to the square of the distance
from the wave source (i.e., I = 1/R2). Use your data from step 4 of the experiment to determine
if the meter reading of the Receiver is directly proportional to the intensity of the wave.
③Considering your results in step 7, to what extent can the Transmitter output be considered a
spherical wave? - A plane wave?

10
012-04630G
Microwave Optics
Notes
11
012-04630G Microwave Optics
Experiment 2: Reflection
EQUIPMENT NEEDED:
– Transmitter – Goniometer
– Receiver – Metal Reflector
– Rotating Component Holder
Procedure
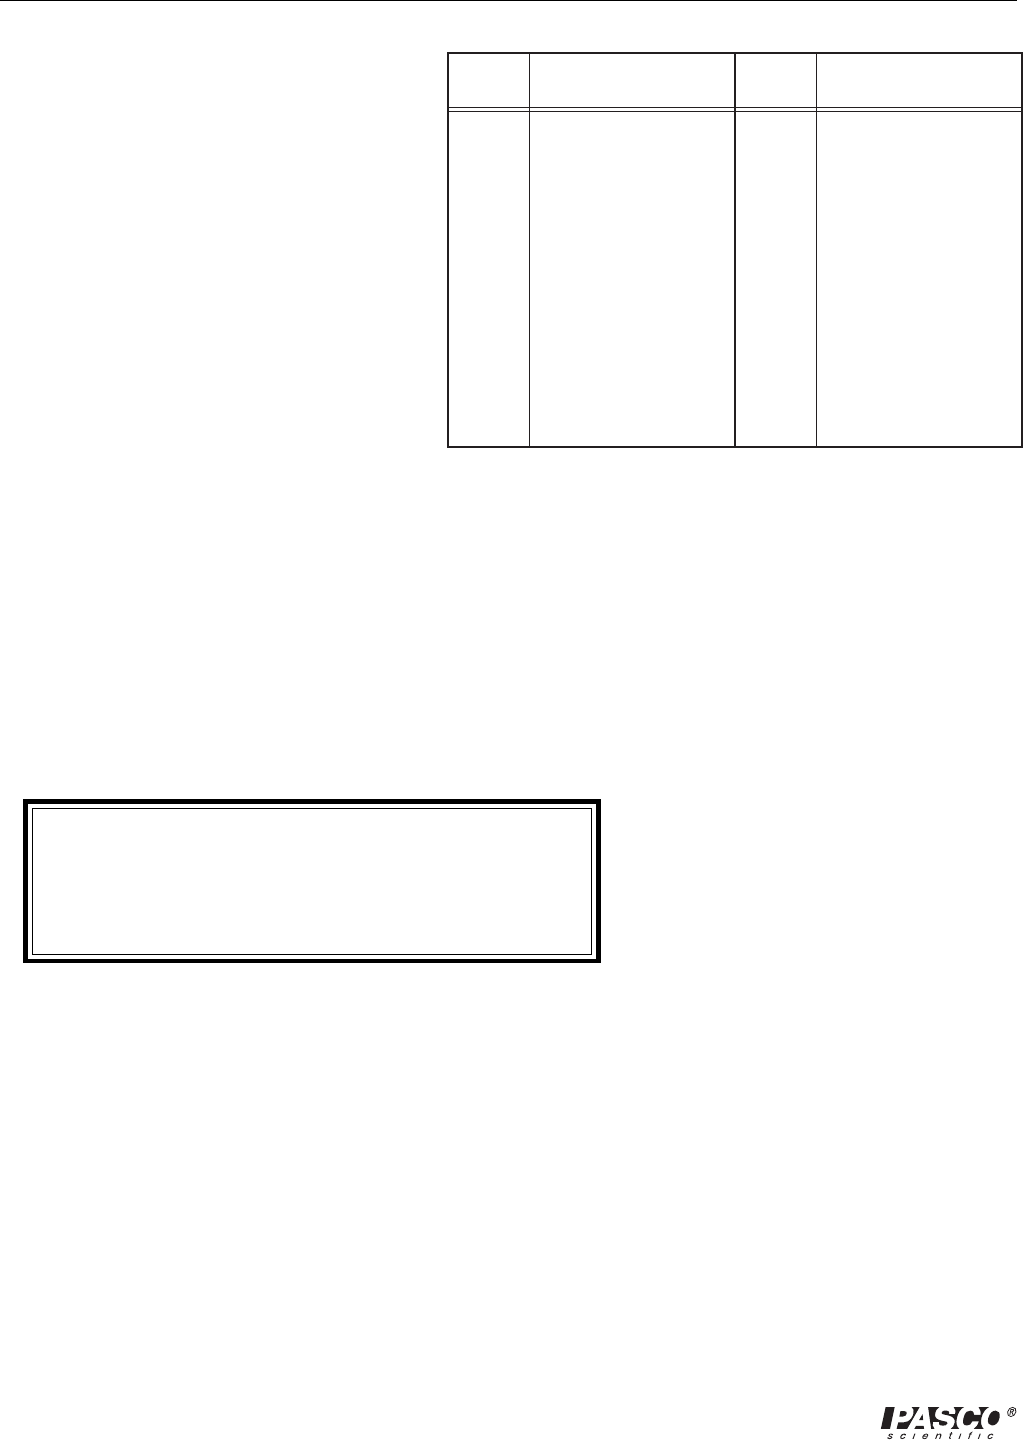
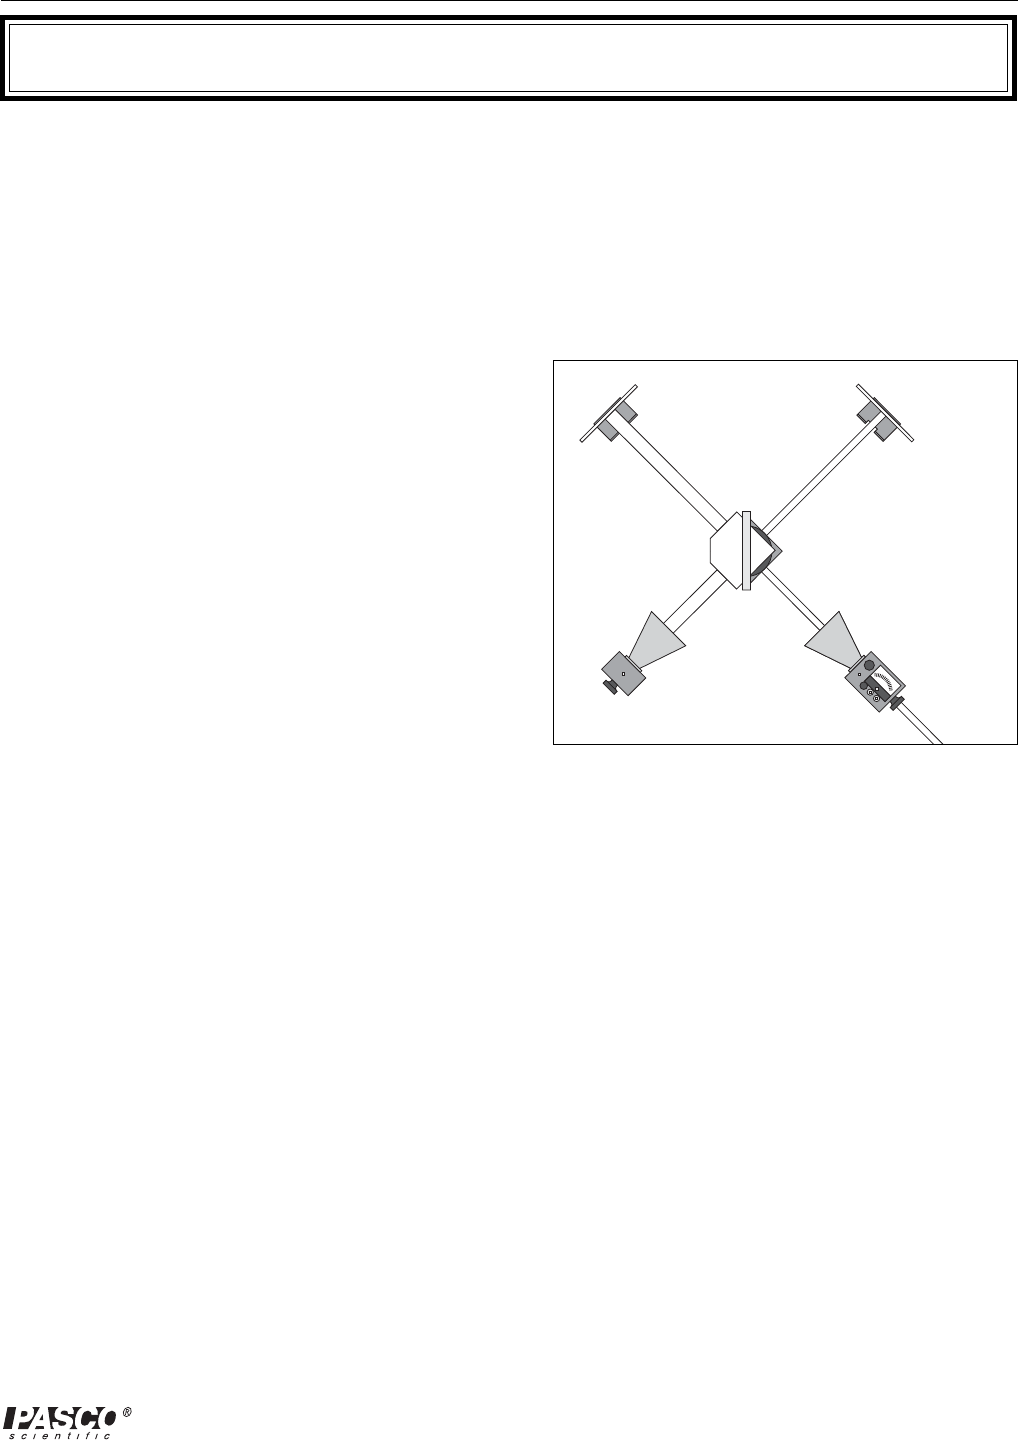
①Arrange the equipment as shown in figure 2.1
with the Transmitter attached to the fixed arm
of the Goniometer. Be sure to adjust the Trans-
mitter and Receiver to the same polarity; the
horns should have the same orientation as
shown.
②Plug in the Transmitter and turn the Receiver
INTENSITY selection switch to 30X.
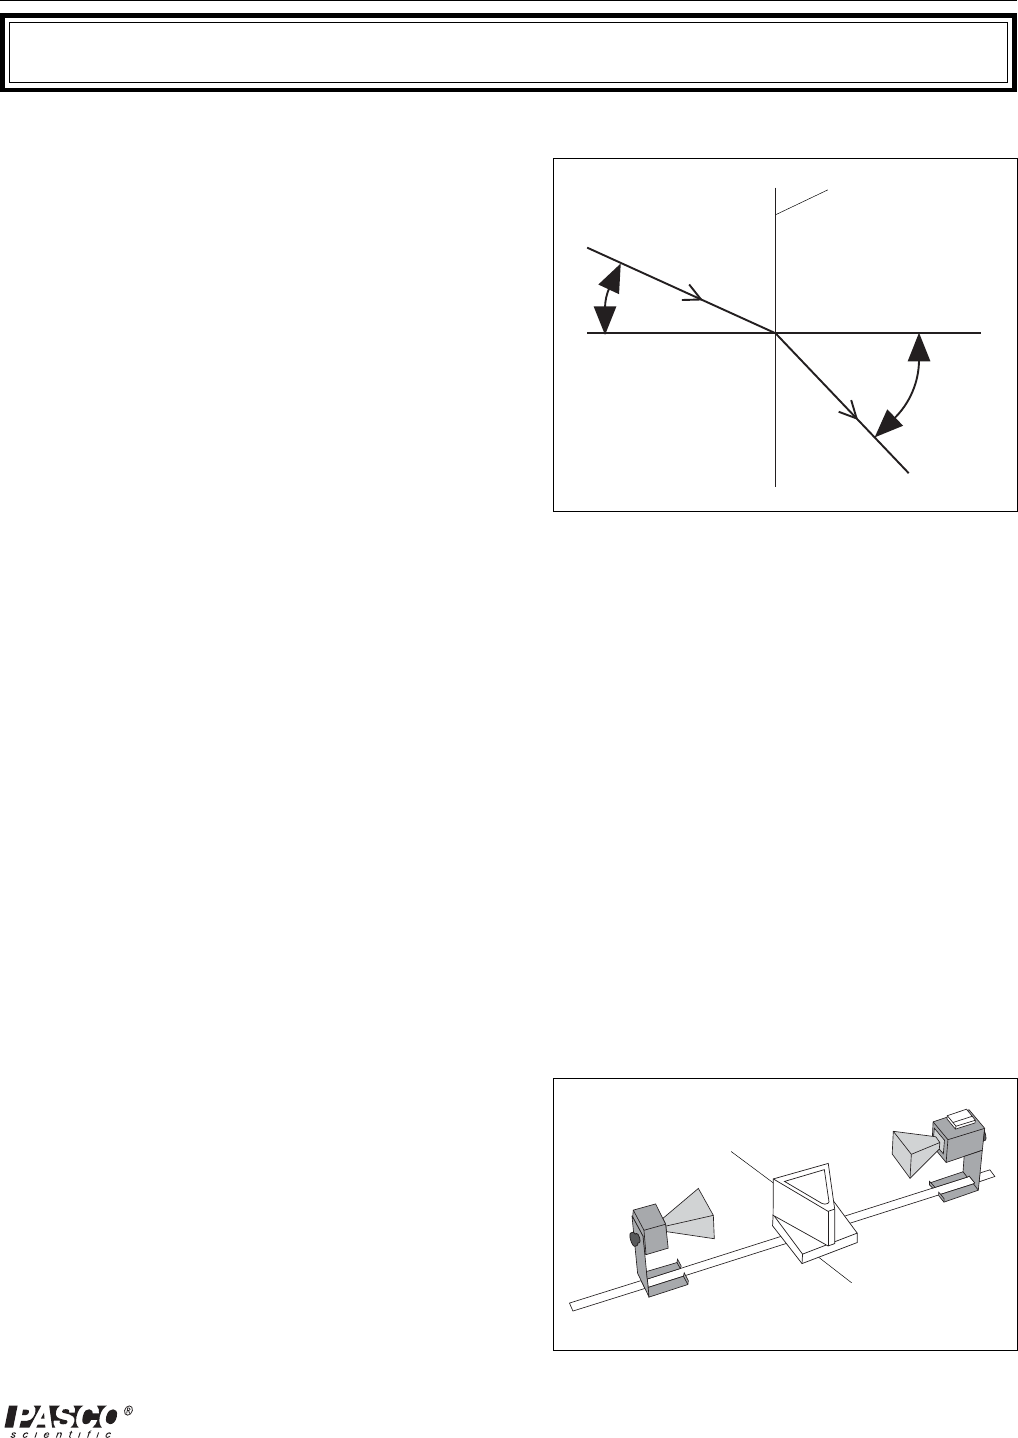
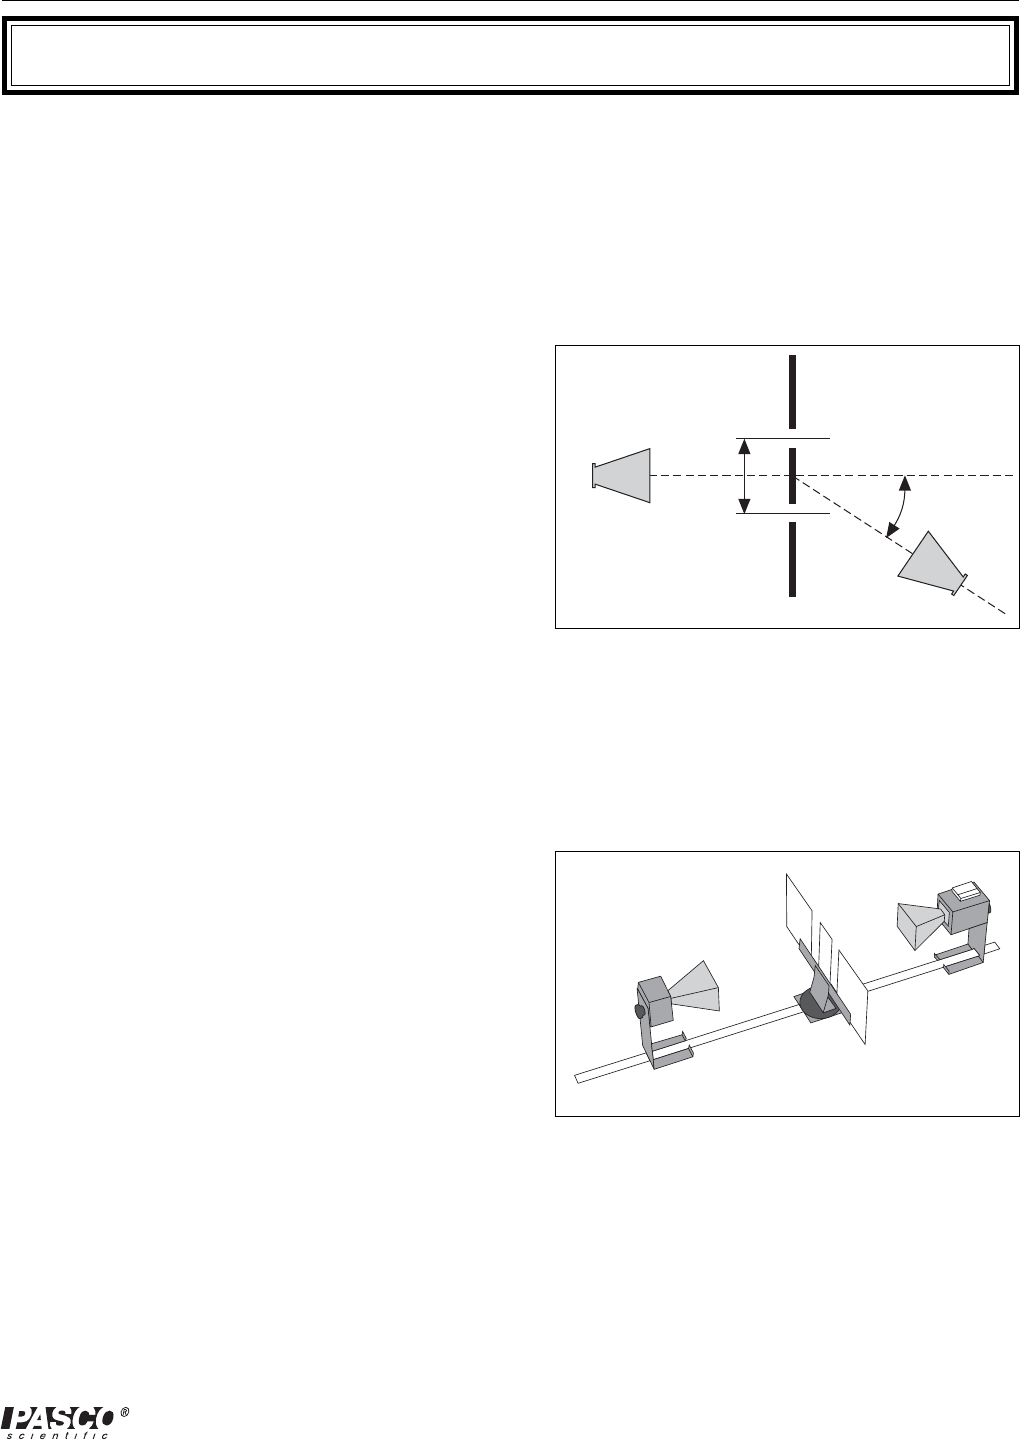
③The angle between the incident wave from the
Transmitter and a line normal to the plane of
the Reflector is called the Angle of Incidence
(see Figure 2.2). Adjust the Rotating Compo-
nent Holder so that the Angle of Incidence
equals 45-degrees.
④Without moving the Transmitter or the Reflec-
tor, rotate the movable arm of the Goniometer
until the meter reading is a maximum. The
angle between the axis of the Receiver horn and
a line normal to the plane of the Reflector is
called the Angle of Reflection.
⑤Measure and record the angle of reflection for
each of the angles of incidence shown in Table 2.1.
➤NOTE: At various angle settings the Receiver will
detect both the reflected wave and the wave coming
directly from the Transmitter, thus giving misleading
results. Determine the angles for which this is true
and mark the data collected at these angles with an
asterisk "*".
Figure 2.1 Equipment Setup
Figure 2.2 Angles of Incidence and Reflection
Angle of
Incidence
Angle of
Reflection
Reflector
Angle of
Incidence
20°
30°
40°
50°
60°
Angle of
Reflection
70°
80°
90°
Table 2.1

12
012-04630G
Microwave Optics
Questions
①What relationship holds between the angle of incidence and the angle of reflection? Does this rela-
tionship hold for all angles of incidence?
②In measuring the angle of reflection, you measured the angle at which a maximum meter reading
was found. Can you explain why some of the wave reflected into different angles? How does this
affect your answer to question 1?
③Ideally you would perform this experiment with a perfect plane wave, so that all the Transmitter
radiation strikes the Reflector at the same angle of incidence. Is the microwave from the Transmitter
a perfect plane wave (see Experiment 1, step 7)? Would you expect different results if it were a
perfect plane wave? Explain.
Questions for Additional Experimentation
①How does reflection affect the intensity of the microwave? Is all the energy of the wave striking the
Reflector reflected? Does the intensity of the reflected signal vary with the angle of incidence?
②Metal is a good reflector of microwaves. Investigate the reflective properties of other materials.
How well do they reflect? Does some of the energy pass through the material? Does the material
absorb some of it? Compare the reflective properties of conductive and non-conductive materials.
13
012-04630G Microwave Optics
Experiment 3: Standing Waves - Measuring Wavelengths
➤➤
➤➤
➤ NOTE: This experiment is best performed using the PASCO Microwave Detector Probe
(Model ME-9319), as described in Method A below. However, for those without a
probe, Method B may be used, although in this Method λ can not be measured directly
from the standing wave pattern.
EQUIPMENT NEEDED:
– Transmitter – Goniometer
– Receiver – Reflector (1)
– Component Holder (2) – Microwave Detector Probe (ME-9319 )
Introduction
When two electromagnetic waves meet in space, they superpose. Therefore, the total electric
field at any point is the sum of the electric fields created by both waves at that point. If the
two waves travel at the same frequency but in opposite direction they form a standing wave.
Nodes appear where the fields of the two waves cancel and antinodes where the superposed
field oscillates between a maximum and a minimum. The distance between nodes in the
standing wave pattern is just 1/2 the wavelength (λ) of the two waves.
Procedure
Method A
In this experiment, you will reflect the wave
from the Transmitter back upon itself, creating
a standing wave pattern. By measuring the
distance between nodes in the pattern and mul-
tiplying by two, you can determine the wave-
length of the microwave radiation.
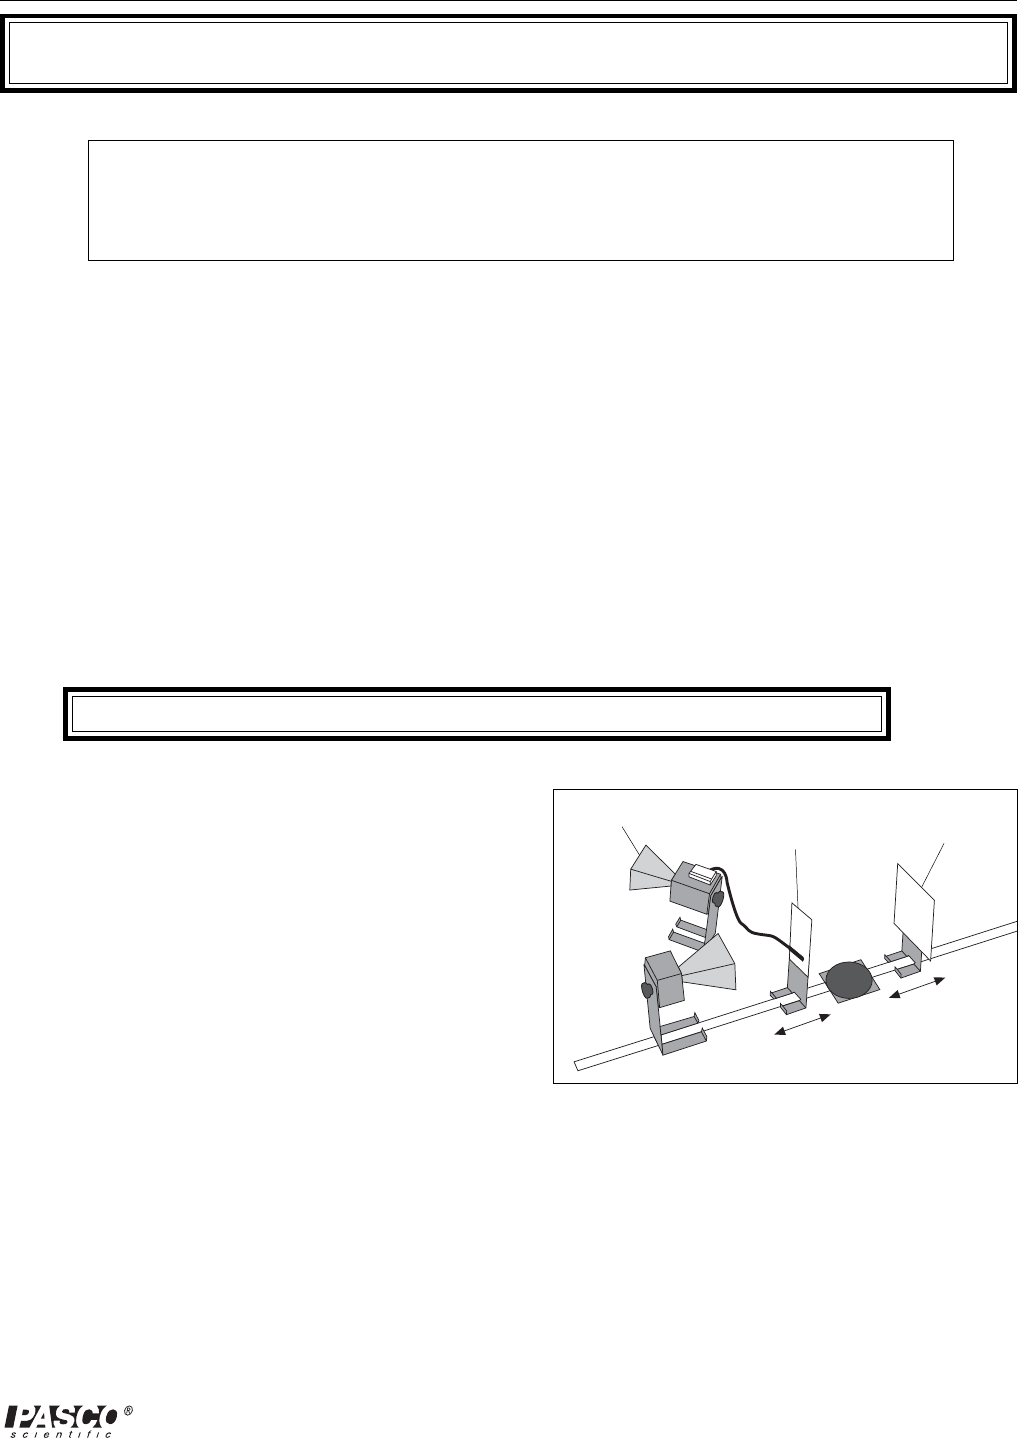
①Arrange the equipment as shown in Figure 3.1.
②Plug the Detector Probe into the side connector
on the Receiver. Face the Receiver horn di-
rectly away from the Transmitter so that none
of the microwave signal enters the horn. Adjust
the Receiver controls as needed to get a strong
meter reading.
③Slide the Probe along the Goniometer arm (no more than a centimeter or two) until the meter
shows a maximum reading. Then slide the Reflector (again, no more than a centimeter or
two) to find a maximum meter reading. Continue making slight adjustments to the Probe
and Reflector positions until the meter reading is as high as possible.
④Now find a node of the standing wave pattern by adjusting the Probe until the meter reading
is a minimum. Record the Probe Position along the metric scale on the Goniometer arm.
Initial Probe Position = _____________________.
Figure 3.1 Equipment Setup
Receiver
Reflector
Detector Probe
14
012-04630G
Microwave Optics
⑤While watching the meter, slide the Probe along the Goniometer arm until the Probe
has passed through at least 10 antinodes and returned to a node. Record the new
position of the Probe and the number of antinodes that were traversed.
Antinodes Traversed= __________________________.
Final Probe Position = _________________________.
⑥Use your data to calculate λ, the wavelength of the microwave radiation.
λ =_________________________.
⑦Repeat your measurements and recalculate λ.
Initial Probe Position =_________________________.
Antinodes Traversed =_________________________.
Final Probe Position =_________________________.
λ =_________________________.
Questions
①Use the relationship velocity = λν to calculate the frequency of the microwave signal
(assuming velocity of propagation in air is 3x10⁸ m/sec).
(ν = the expected frequency of the microwave radiation -10.525 GHz).
Method B
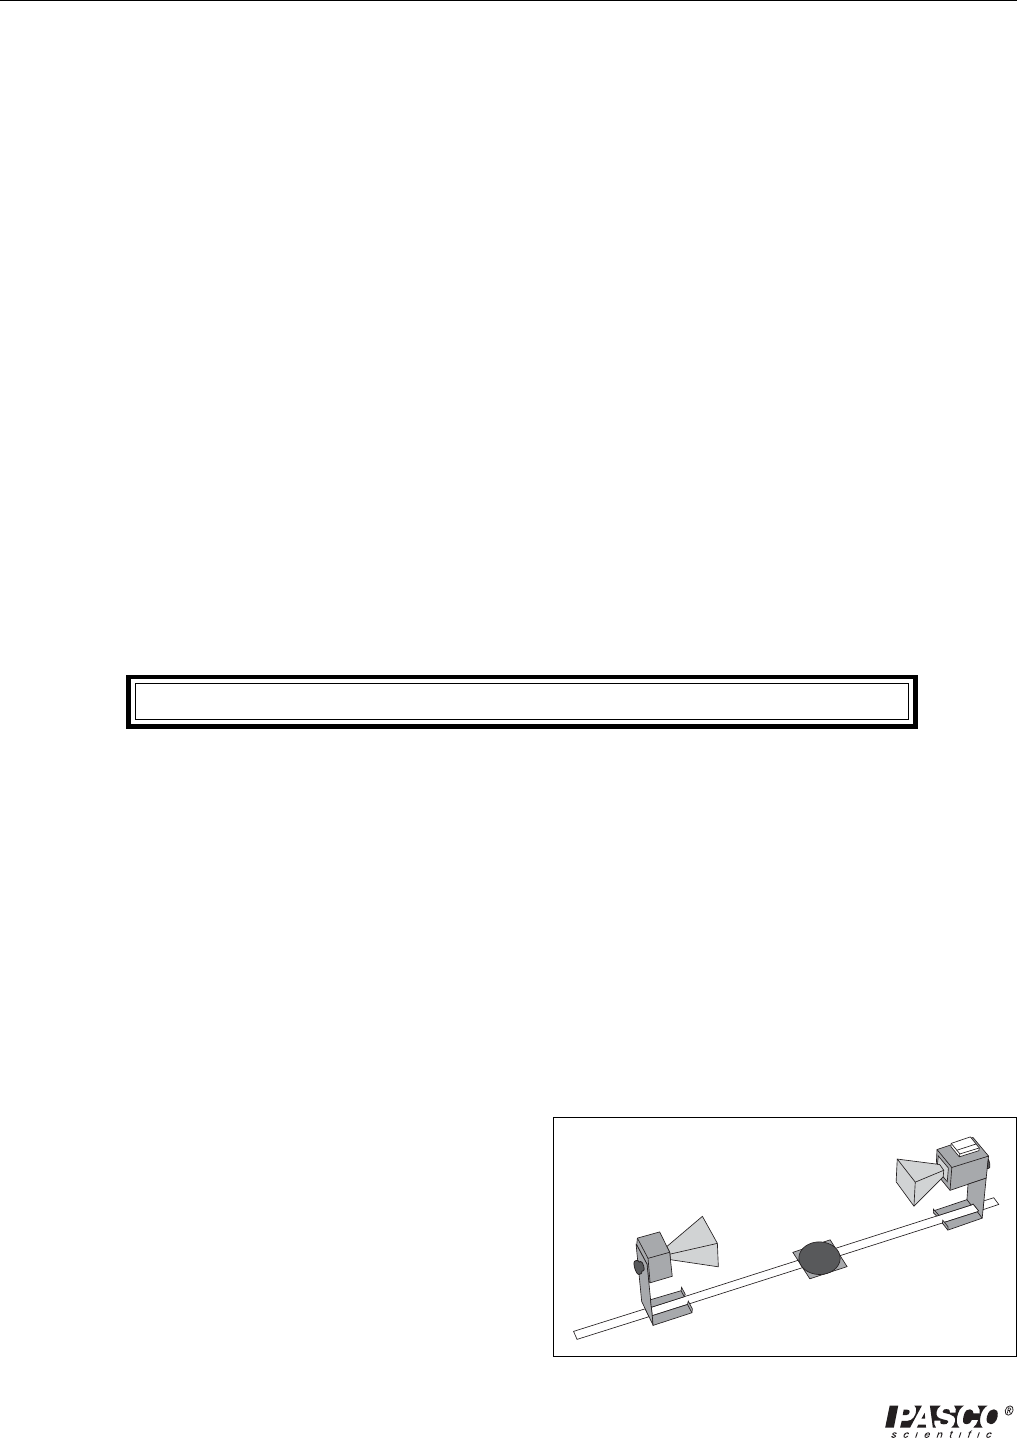
①Set up the equipment as shown in Figure 3.2. Adjust the Receiver controls to get a
full-scale meter reading with the Transmitter and Receiver as close together as pos-
sible. Slowly move the Receiver along the Goniometer arm, away from the Trans-
mitter. How does this motion effect the meter reading?
The microwave horns are not perfect collectors of microwave radiation. Instead, they
act as partial reflectors, so that the radiation from the Transmitter reflects back and
forth between the Transmitter and Reflector horns, diminishing in amplitude at each
pass. However, if the distance between the Transmitter and Receiver diodes is equal
to nλλ
λλ
λ/2, (where n is an integer and λ is the wavelength of the radiation) then all the
multiply-reflected waves entering the Receiver horn will be in phase with the primary
transmitted wave. When this occurs, the meter reading will be a maximum. (The
distance between adjacent positions in order to see a maximum is therefore λλ
λλ
λ/2.)
②Slide the Receiver one or two centime-
ters along the Goniometer arm to ob-
tain a maximum meter reading.
Record the Receiver position along the
metric scale of the Goniometer arm.
Initial Position of Receiver =
_________________________.
Figure 3.2 Equipment Setup

15
012-04630G Microwave Optics
③While watching the meter, slide the Receiver away from the Transmitter. Do not stop
until the Receiver passed through at least 10 positions at which you see a minimum meter
reading and it returned to a position where the reading is a maximum. Record the new
position of the Receiver and the number of minima that were traversed.
Minima Traversed= _________________________.
Final Receiver Position = _________________________.
④Use the data you have collected to calculate the wavelength of the microwave radiation.
λ = _________________________.
⑤Repeat your measurements and recalculate λ.
Initial Position of Receiver = _________________________.
Minima Traversed = _________________________.
Final Receiver Position = _________________________.
λ = _________________________.
Questions
①Use the relationship velocity = λν to calculate the frequency of the microwave signal
(assuming velocity of propagation in air is 3x10⁸ m/sec).
(ν = the expected frequency of the microwave radiation -10.525 GHz).

16
012-04630G
Microwave Optics
Notes
17
012-04630G Microwave Optics
Experiment 4: Refraction Through a Prism
EQUIPMENT NEEDED:
– Transmitter
– Goniometer
– Receiver
– Rotating Table
– Ethafoam Prism mold with styrene pellets
– Protractor
Introduction
An electromagnetic wave usually travels in a
straight line. As it crosses a boundary between
two different media, however, the direction of
propagation of the wave changes. This change
in direction is called Refraction, and it is sum-
marized by a mathematical relationship known
as the Law of Refraction (otherwise known as
Snell’s Law):
n1sinθθ
θθ
θ1 = n2sinθθ
θθ
θ2;
where θθ
θθ
θ1 is the angle between the direction of propagation of the incident wave and the
normal to the boundary between the two media, and θ2 is the corresponding angle for the
refracted wave (see Figure 4.1). Every material can be described by a number n, called
its Index of Refraction. This number indicates the ratio between the speed of
electromegnetic waves in vacuum and the speed of electromagnetic waves in the material,
also called the medium. In general, the media on either side of a boundary will have dif-
ferent indeces of refraction. Here they are labeled n1 and n2. It is the difference between
indeces of refraction (and the difference between wave velocities this implies) which
causes “bending”, or refraction of a wave as it crosses the boundary between two distinct
media.
In this experiment, you will use the law of refraction to measure the index of refrac-
tion for styrene pellets.
Procedure
①Arrange the equipment as shown in Figure 4.2. Rotate the empty prism mold and see
how it effects the incident wave. Does it
reflect, refract, or absorb the wave?
②Fill the prism mold with the styrene pellets.
To simplify the calculations, align the face of
the prism that is nearest to the Transmitter
perpendicular to the incident microwave
beam.
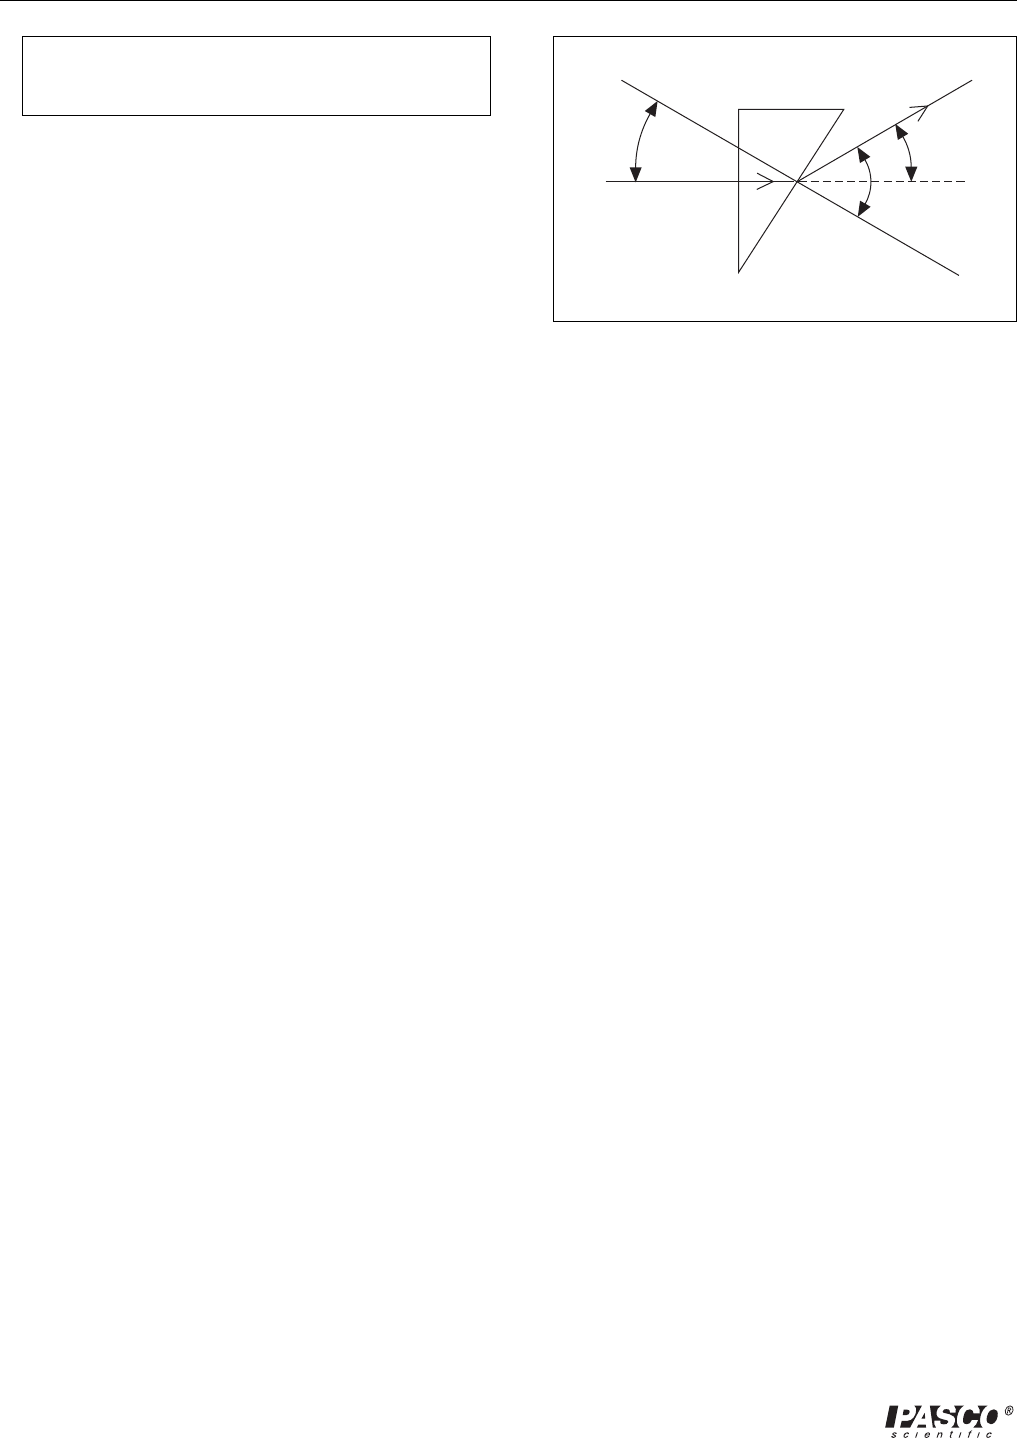
③Rotate the movable arm of the Goniometer
and locate the angle θ at which the refracted
signal is a maximum.
n1 n2
Boundary between
media
Refracted
Wave
Incident
Wave
θ1
θ2
Figure 4.1 Angles of Incidence and Refraction
Ethafoam Prism
Rotating Table
Figure 4.2 Equipment Setup
18
012-04630G
Microwave Optics
Refracted
Beam
Normal to
Boundary of
Refraction
θ2
θ
θ1
Figure 4.3 Geometry of Prism Refraction
Incident
Beam
➤ NOTE: θ is just the angle that you read directly
from the Degree Scale of the Goniometer.
θ = _________________________.
④Using the diagram shown in Figure 4.3, determine θ1
and use your value of θ to determine θ2. (You will
need to use a protractor to measure the Prism angles.)
θ1 = _________________________.
θ2 = _________________________.
⑤Plug these values into the Law of Refraction to
determine the value of n1/n2.
n1/n2 = _________________________.
⑥The index of refraction for air is equal to 1.00. Use this fact to determine n1, the index of
refraction for the styrene pellets.
Questions
①In the diagram of Figure 4.3, the assumption is made that the wave is unrefracted when it
strikes the first side of the prism (at an angle of incidence of 0°). Is this a valid assumption?
②Using this apparatus, how might you verify that the index of refraction for air is equal to one.
③Would you expect the refraction index of the styrene pellets in the prism mold to be the same as
for a solid styrene prism?
19
012-04630G Microwave Optics
Experiment 5: Polarization
EQUIPMENT NEEDED:
-Transmitter -Receiver
-Goniometer -Component Holder (1)
-Polarizer (1).
Introduction
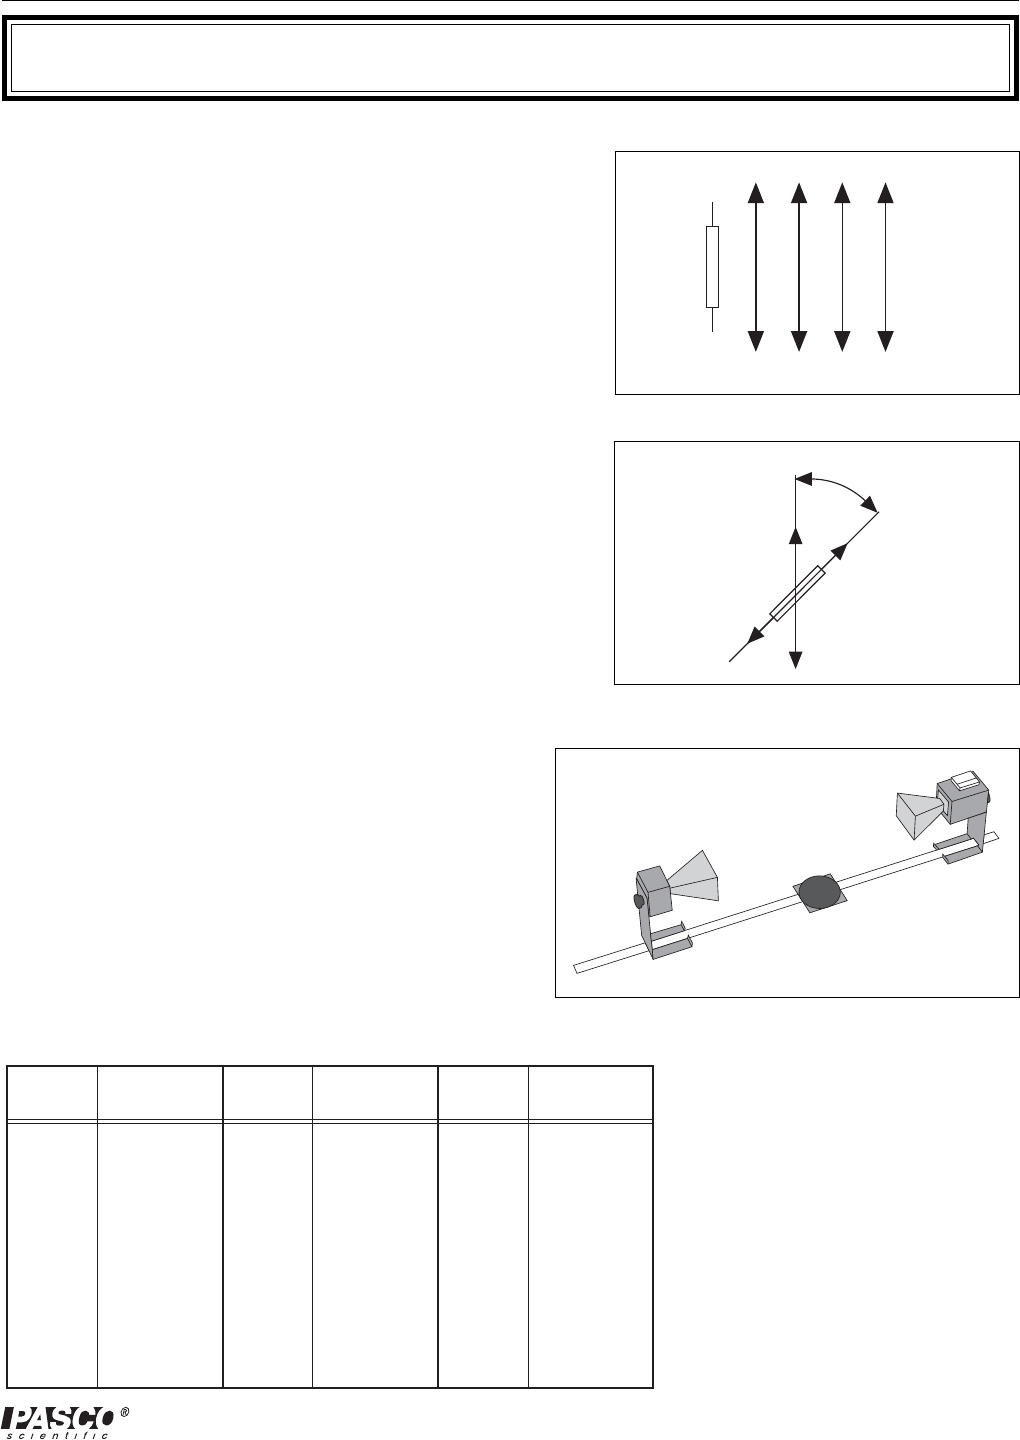
The microwave radiation from the Transmitter is linearly
polarized along the Transmitter diode axis (i.e., as the
radiation propagates through space, its electric field re-
mains aligned with the axis of the diode). If the Trans-
mitter diode were aligned vertically, the electric field of
the transmitted wave would be vertically polarized, as
shown in Figure 5.1. If the detector diode were at an
angle θ to the Transmitter diode, as shown in Figure 5.2,
it would only detect the component of the incident elec-
tric field that was aligned along its axis. In this experi-
ment you will investigate the phenomenon of polariza-
tion and discover how a polarizer can be used to alter the
polarization of microwave radiation.
Procedure
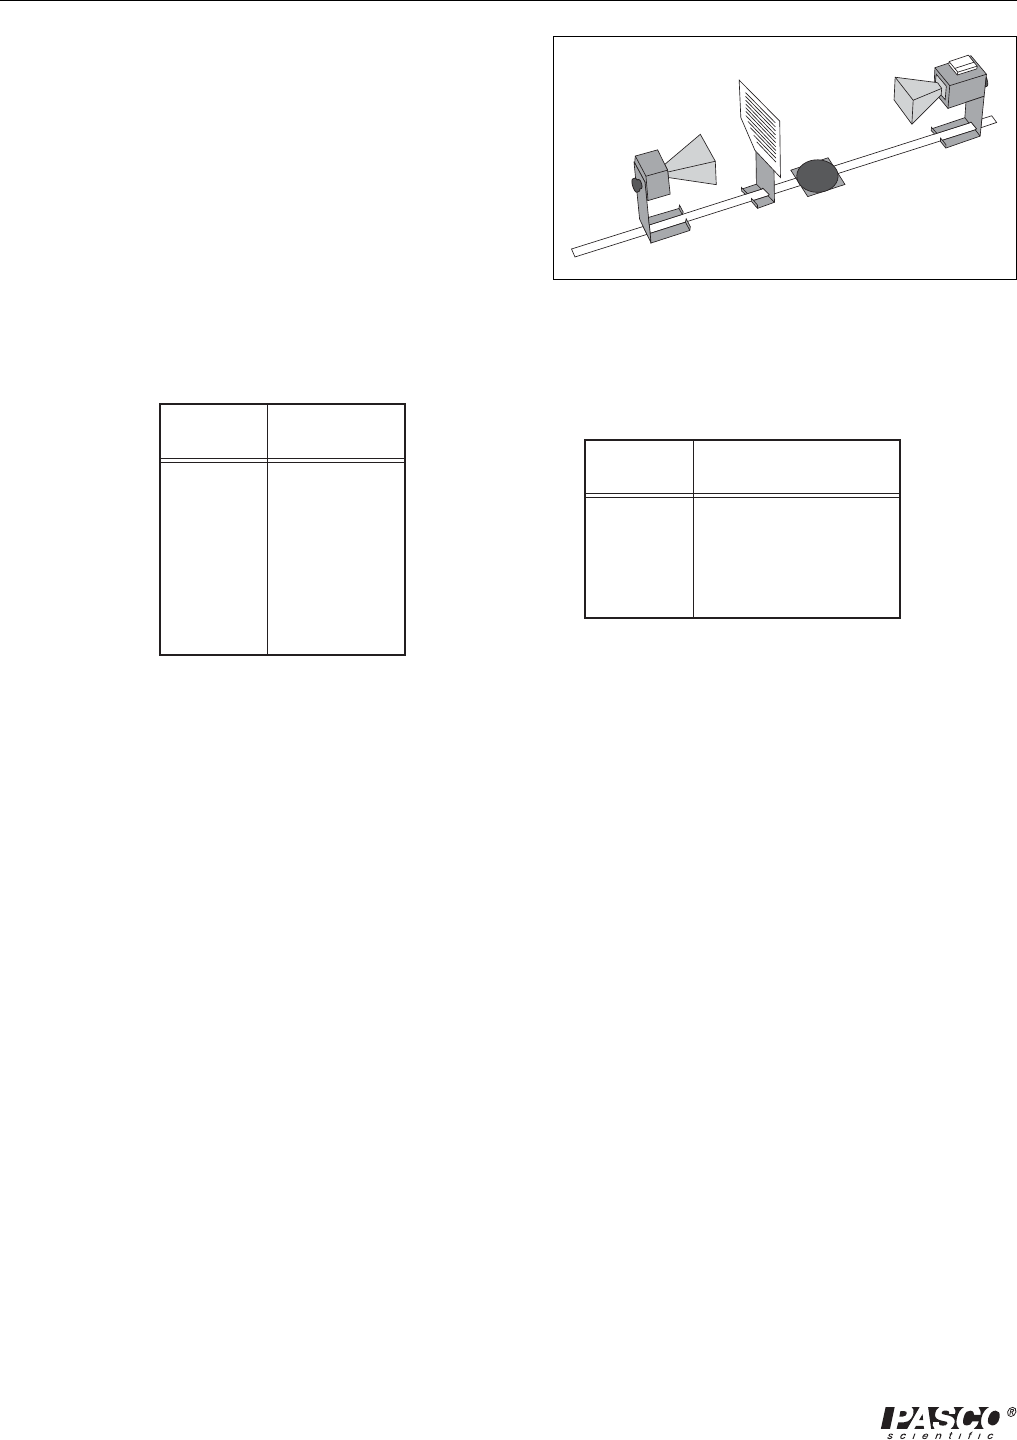
①Arrange the equipment as shown in Figure 5.3 and
adjust the Receiver controls for nearly full-scale
meter deflection.
②Loosen the hand screw on the back of the Receiver
and rotate the Receiver in increments of ten de-
grees. At each rotational position, record the meter
reading in Table 5.1.
③What happens to the meter readings if you continue
to rotate the Receiver beyond 180-degrees?
Figure 5.2 Detecting Polarized Radiation
Component
Detected
θ
Vertically
Polarized
Microwave
Detector
Diode
Figure 5.1 Vertical Polarization
Transmitter
Diode
Vertically
Polarized
Microwaves
(E field)
Figure 5.3 Equipment Setup
Meter
Reading
Angle of
Receiver
0°
10°
20°
30°
40°
50°
Meter
Reading
Angle of
Receiver
70°
80°
90°
100°
110°
120°
Meter
Reading
Angle of
Receiver
140°
150°
160°
170°
180°
60° 130°
Table 5.1
20
012-04630G
Microwave Optics
④Set up the equipment as shown in Figure 5.4. Reset
the Receivers angle to 0-degrees (the horns should
be oriented as shown with the longer side horizon-
tal).
⑤Record the meter reading when the Polarizer is aligned
at 0, 22.5, 45, 67.5 and 90-degrees with respect to the
horizontal.
⑥Remove the Polarizer slits. Rotate the Receiver so the
axis of its horn is at right angles to that of the Transmit-
ter. Record the meter reading. Then replace the Polar-
izer slits and record the meter readings with the Polarizer slits horizontal, vertical, and at 45-
Figure 5.4 Equipment Setup
Angle of
Slits
Horizontal
Vertical
45°
Meter Reading
Angle of
Polarizer
0° (Horiz.)
22.5°
45°
67.5°
90° (Vert.)
Meter Reading
degrees.
Questions
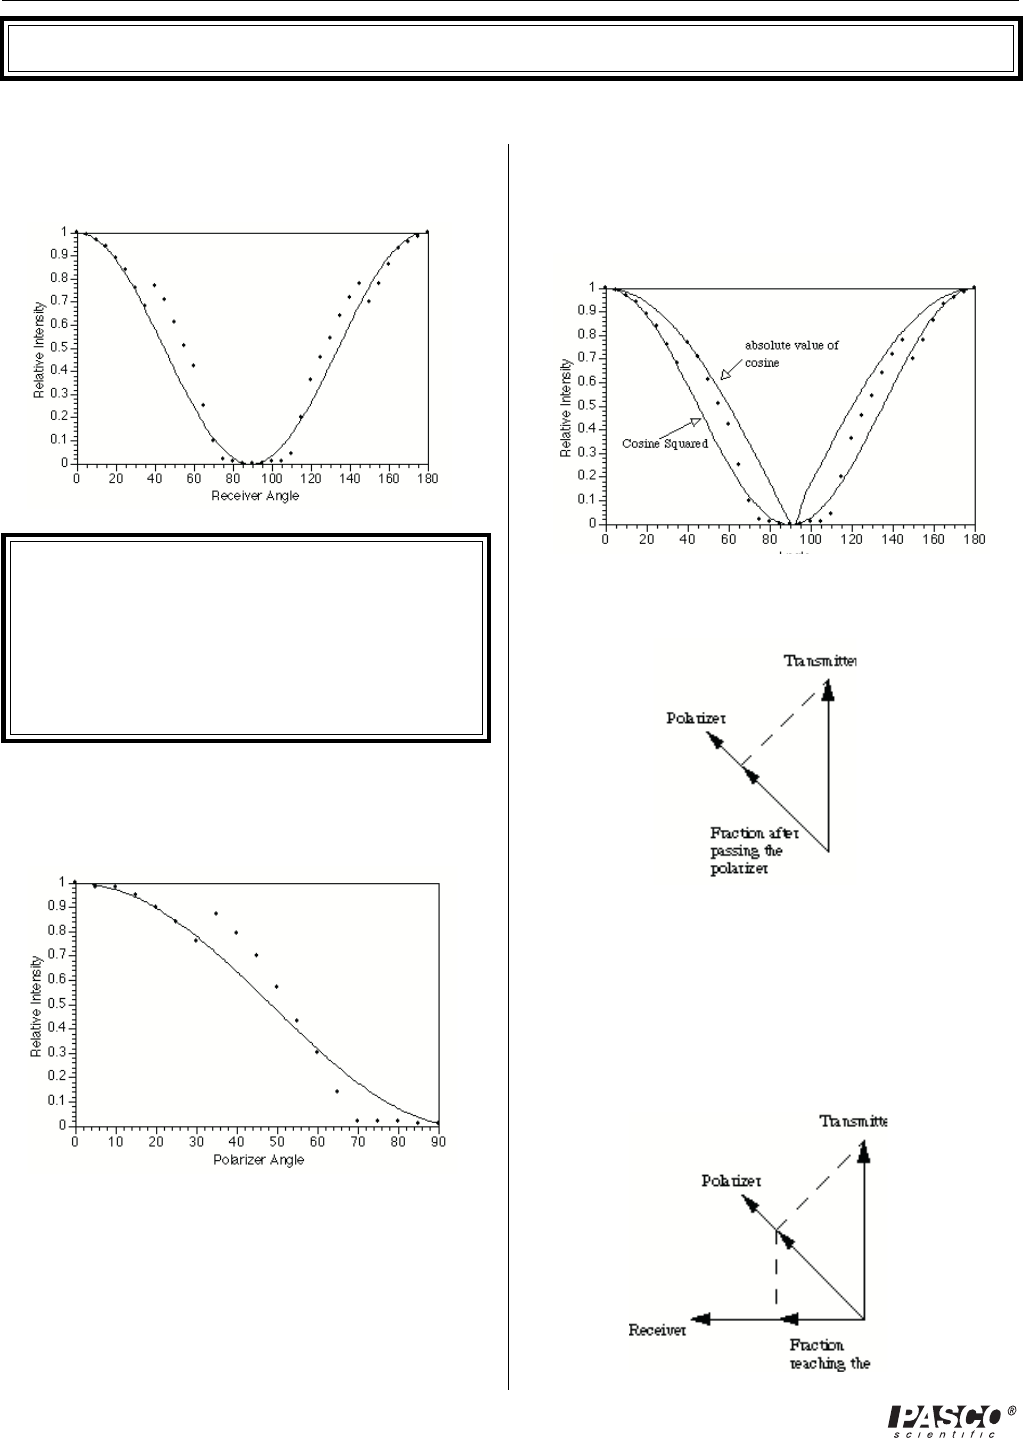
①If the Receiver meter reading (M) were directly proportional to the electric field component
(E) along its axis, the meter would read the relationship M = Mocosθθ
θθ
θ (where θθ
θθ
θ is the angle
between the detector and Transmitter diodes and Mo is the meter reading when θθ
θθ
θ = 0). (See
Figure 5.2). Graph your data from step 2 of the experiment. On the same graph, plot the
relationship Mo cosθθ
θθ
θ. Compare the two graphs.
②The intensity of a linearly polarized electromagnetic wave is directly proportional to the square of
the electric field (e.g., I = kE2 ). If the Receiver’s meter reading was directly proportional to the
incident microwave’s intensity, the meter would read the relationship M = Mocos2θθ
θθ
θ. Plot this rela-
tionship on your graph from question 1. Based on your graphs, discuss the relationship between the
meter reading of the Receiver and the polarization and magnitude of the incident microwave.
③Based on your data from step 5, how does the Polarizer affect the incident microwave?
④Can you explain the results of step 6 of the experiment. How can the insertion of an additional po-
larizer increase the signal level at the detector? ( HINT: Construct a diagram like that shown in
Figure 5.2 showing (1) the wave from the Transmitter; (2) the wave after it passes through the Polar-
izer; and (3) the component detected at the detector diode.)
21
012-04630G Microwave Optics
Experiment 6: Double-Slit Interference
EQUIPMENT NEEDED:
- Transmitter, Receiver - Goniometer, Rotating
- Component Holder - Metal Reflectors (2)
- Slit Extender Arm - Narrow Slit Spacer
- Wide Slit Spacer
Introduction
In Experiment 3, you saw how two waves moving in
opposite directions can superpose to create a standing
wave pattern. A somewhat similar phenomenon
occurs when an electromagnetic wave passes through
a two-slit aperture. The wave diffracts into two
waves which superpose in the space beyond the aper-
tures. Similar to the standing wave pattern, there are
points in space where maxima are formed and others
where minima are formed.
With a double slit aperture, the intensity of the wave
beyond the aperture will vary depending on the angle
of detection. For two thin slits separated by a dis-
tance d, maxima will be found at angles such that
d sinθθ
θθ
θ = nλλ
λλ
λ. (Where θθ
θθ
θ = the angle of detection, λλ
λλ
λ = the wavelength of the incident radiation,
and n is any integer) (See Figure 6.1). Refer to a textbook for more information about the nature
of the double-slit diffraction pattern.
Procedure
①Arrange the equipment as shown in Figure 6.2. Use
the Slit Extender Arm, two Reflectors, and the Nar-
row Slit Spacer to construct the double slit. (We
recommend a slit width of about 1.5 cm.) Be precise
with the alignment of the slit and make the setup as
symmetrical as possible.
②Adjust the Transmitter and Receiver for vertical po-
larization (0°) and adjust the Receiver controls to give
a full-scale reading at the lowest possible amplifica-
tion.
③Rotate the rotatable Goniometer arm (on which the
Receiver rests) slowly about its axis. Observe the meter readings.
④Reset the Goniometer arm so the Receiver directly faces the Transmitter. Adjust the Receiver
controls to obtain a meter reading of 1.0. Now set the angle θθ
θθ
θ to each of the values shown in
Table 6.1. At each setting record the meter reading in the table. (In places where the meter read-
ing changes significantly between angle settings, you may find it useful to investigate the signal
level at intermediate angles.)
Figure 6.1 Double-Slit Interference
d
θ
Figure 6.2 Equipment Setup
22
012-04630G
Microwave Optics
⑤Keep the slit widths the same, but change
the distance between the slits by using the
Wide Slit Spacer instead of the Narrow
Slit Spacer. Because the Wide Slit Space
is 50% wider than the Narrow Slit Spacer
(90mm vs 60mm) move the Transmitter
back 50% so that the microwave radiation
at the slits will have the same relative
intensity. Repeat the measurements.
(You may want to try other slit spacings as
well.)
Questions
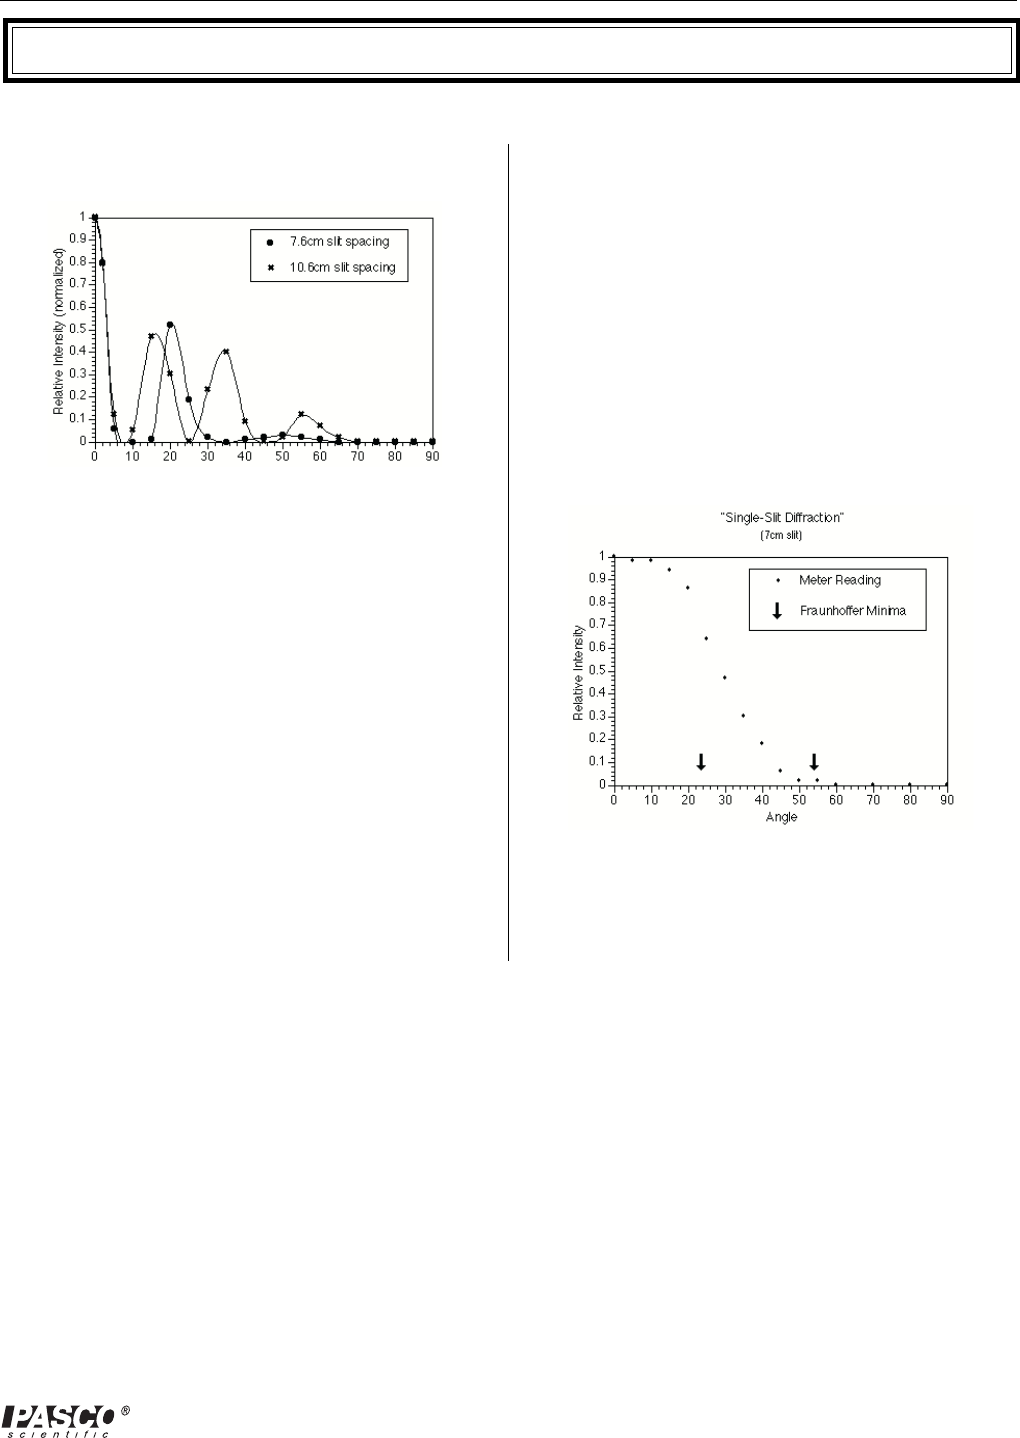
①From your data, plot a graph of meter
reading versus θθ
θθ
θ. Identify the angles at
which the maxima and minima of the
interference pattern occur.
②Calculate the angles at which you would expect the maxima and minima to occur in a standard two-
slit diffraction pattern—maxima occur wherever d sinθθ
θθ
θ = nλλ
λλ
λ, minima occur wherever
d sinθθ
θθ
θ = nλλ
λλ
λ/2. (Check your textbook for the derivation of these equations, and use the wavelength
measured in experiment 3.) How does this compare with the locations of your observed maxima and
minima? Can you explain any discrepancies? (What assumptions are made in the derivations of the
formulas and to what extent are they met in this experiment?)
③Can you explain the relative drop in intensity for higher order maxima? Consider the single-slit dif-
fraction pattern created by each slit. How do these single slit patterns affect the overall interference
pattern?
➤➤
➤➤
➤NOTE:
① Wavelength at 10.525 GHz = 2.85 cm.
② The experimenter’s body position may affect the results.
Angle Meter Reading
45°
50°
55°
60°
65°
Angle Meter Reading
0°
5°
10°
15°
20°
25°
30°
35°
40°
70°
75°
80°
85°
Table 6.1
23
012-04630G Microwave Optics
Experiment 7: Lloyd's Mirror
EQUIPMENT NEEDED:
- Transmitter - Receiver
- Goniometer - Fixed Arm Assembly
- Component Holder - Reflector (1)
- Meter Stick
Introduction
In earlier experiments, such as 3 and 6, you observed
how a single electromagnetic wave can be diffracted
into two waves and, when the two components join
back together, they form an interference pattern.
Lloyd’s Mirror is another example of this phenom-
enon. Just as with the other interference patterns you
have seen, this interference pattern provides a conve-
nient method for measuring the wavelength of the
radiation.
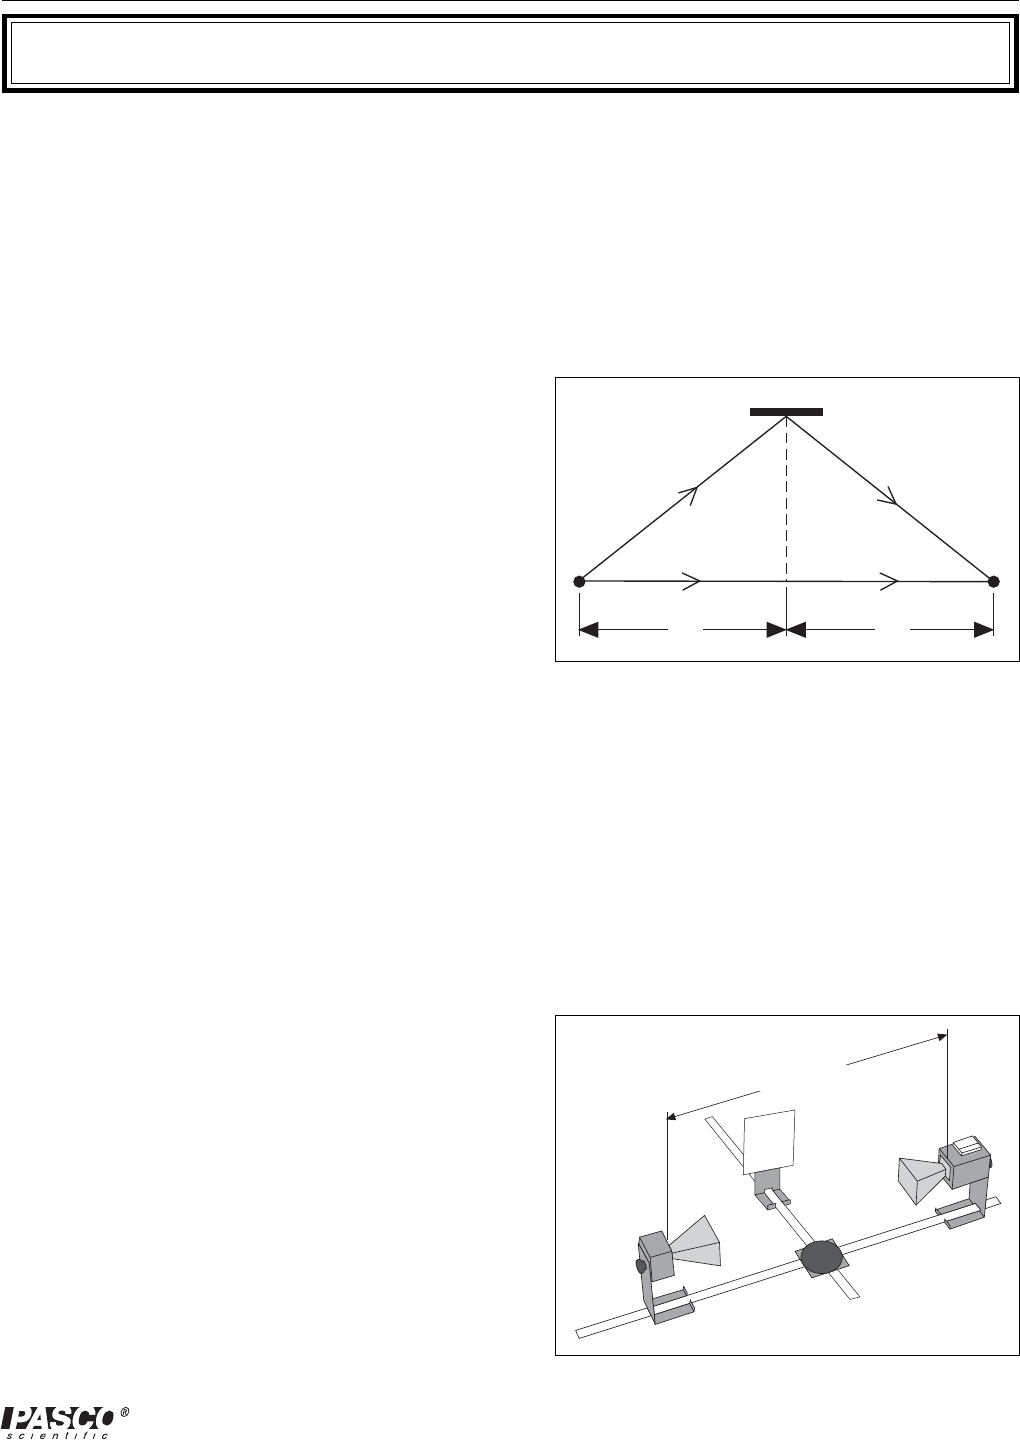
Figure 7.1 is a diagram for Lloyd’s mirror. An elec-
tromagnetic wave from point source A is detected at
point C. Some of the electromagnetic wave, of
course, propagates directly between point A and C,
but some reaches C after being reflected at point B. A maximum signal will be detected when
the two waves reach the detector in phase. Assuming that the diagram shows a setup for a maxi-
mum signal, another maximum will be found when the Reflector is moved back so the path
length of the reflected beam is AB + BC + λ λ
λ λ
λ.
Procedure
①Arrange the equipment as shown in Figure 7.2. For best results, the Transmitter and Receiver
should be as far apart as possible. Be sure the Receiver and Transmitter are equidistant (d1) from
the center of the Goniometer degree plate and that the horns are directly facing each other. (See
Figure 7.3 for location of effective points of transmission and reception). Also be sure that the
surface of the Reflector is parallel to the axis of the
Transmitter and Receiver horns.
②While watching the meter on the Receiver, slowly slide
the Reflector away from the Degree Plate. Notice how
the meter reading passes through a series of minima
and maxima.
③Find the Reflector position closest to the degree plate
which produces a minimum meter reading.
④Measure and record h1, the distance between the center
of the degree plate and the surface of the Reflector.
h1 = _________________________.
Figure 7.1 Lloyd's Mirror
B
AC
d1
d1
h
Figure 7.2 Equipment Setup
1.0 meter or more
24
012-04630G
Microwave Optics
⑤Slowly slide the Reflector away from the degree plate until the meter reading passes through a maxi-
mum and returns to a new minimum. Measure and record h2, the new distance between the center
of the degree plate and the surface of the Reflector.
h2 = _________________________.
⑥Measure d1 the distance between the center of the degree scale and the Transmitter diode.
d1 = _________________________.
⑦Use your collected data to calculate λλ
λλ
λ, the wavelength of the microwave radiation.
λ = _________________________.
⑧Change the distance between the Transmitter and Receiver and repeat your measurements.
h1 = _________________________.
h2 = _________________________.
d1 = _________________________.
λ = _________________________.
Questions
①What is the advantage in having the effective transmission and reception points equidistant from the
center of the degree plate in this experiment?
➤➤
➤➤
➤ NOTE: Don’t stand in front of the apparatus while conducting the experiment. Your body acts as
a reflector. Therefore, try to stand to one side behind the plane of the antenna horn.
5 cm 5 cm
Figure 7.3 Transmission and Reception Points
Receiver
Transmitter
Effective Point of Emission of
Transmitter Signal Receiver
Effective Point of Reception of
Transmitter Signal
25
012-04630G Microwave Optics
Experiment 8: Fabry-Perot Interferometer
EQUIPMENT NEEDED:
- Transmitter - Receiver
- Goniometer - Component Holders (2)
- Partial Reflectors (2)
Introduction
When an electromagnetic wave encounters a partial reflector, part of the wave reflects and part of
the wave transmits through the partial reflector. A Fabry-Perot Interferometer consists of two
parallel partial reflectors positioned between a wave source and a detector (see Figure 8.1).
The wave from the source reflects back and forth between the two partial reflectors. However,
with each pass, some of the radiation passes through to the detector. If the distance between the
partial reflectors is equal to nλλ
λλ
λ/2, where λλ
λλ
λ is the wavelength of the radiation and n is an integer,
then all the waves passing through to the detector at any instant will be in phase. In this case, a
maximum signal will be detected by the Receiver. If the distance between the partial reflectors is
not a multiple of λλ
λλ
λ/2, then some degree of destructive interference will occur, and the signal will
not be a maximum.
Procedure
①Arrange the equipment as shown in Figure 8.1. Plug in
the Transmitter and adjust the Receiver controls for an
easily readable signal.
②Adjust the distance between the Partial Reflectors and
observe the relative minima and maxima.
③Adjust the distance between the Partial Reflectors to
obtain a maximum meter reading. Record, d1, the
distance between the reflectors.
d1 = _________________________.
④While watching the meter, slowly move one Reflector away from the other. Move the Reflector
until the meter reading has passed through at least 10 minima and returned to a maximum.
Record the number of minima that were traversed. Also record d2, the new distance between the
Reflectors.
Minima traversed = _________________________.
d2 = _________________________.
⑤Use your data to calculate λλ
λλ
λ, the wavelength of the microwave radiation.
λ = _________________________.
⑥Repeat your measurements, beginning with a different distance between the Partial Reflectors.
d1 = _________________________. Minima traversed = _________________________.
d2 = _________________________. λ = _________________________.
Figure 8.1 Fabry-Perot Interferometer
Partial Reflectors

26
012-04630G
Microwave Optics
Questions
①What spacing between the two Partial Reflectors should cause a minimum signal to be delivered
to the Receiver?
②In an optical Fabry-Perot interferometer the interference pattern usually appears as a series
of concentric rings. Do you expect such a pattern to occur here? Why? Check to see if
there is one.
27
012-04630G Microwave Optics
Experiment 9: Michelson Interferometer
EQUIPMENT NEEDED:
- Transmitter, - Receiver
- Goniometer, - Fixed Arm Assembly
- Component Holders (2) - Rotating Table, Reflectors (2)
- Partial Reflector (1)
Introduction
Like the Fabry-Perot interferometer, the Michelson
interferometer splits a single wave, then brings the
constituent waves back together so that they superpose,
forming an interference pattern. Figure 9.1 shows the
setup for the Michelson interferometer. A and B are
Reflectors and C is a Partial Reflector. Microwaves
travel from the Transmitter to the Receiver over two
different paths. In one path, the wave passes directly
through C, reflects back to C from A, and then is re-
flected from C into the Receiver. In the other path, the
wave reflects from C into B, and then back through C
into the Receiver.
If the two waves are in phase when they reach the
Receiver, a maximum signal is detected. By moving
one of the Reflectors, the path length of one wave
changes, thereby changing its phase at the Receiver so
a maxium is no longer detected. Since each wave
passes twice between a Reflector and the Partial Re-
flector, moving a Reflector a distance λλ
λλ
λ/2 will cause a
complete 360-degree change in the phase of one wave at the Receiver. This causes the meter
reading to pass through a minimum and return to a maximum.
Procedure
①Arrange the equipment as shown in Figure 9.1. Plug in the Transmitter and adjust the Receiver
for an easily readable signal.
②Slide Reflector A along the Goniometer arm and observe the relative maxima and minima of the
meter deflections.
③Set Reflector A to a position which produces a maximum meter reading. Record, x1, the posi-
tion of the Reflector on the Goniometer arm.
x1 = _________________________.
④While watching the meter, slowly move Reflector A away from the Partial Reflector. Move the
Reflector until the meter reading has passed through at least 10 minima and returned to a maxi-
mum. Record the number of minima that were traversed. Also record x2, the new position of
Reflector A on the Goniometer arm.
Minima traversed = _________________________.
x2 = _________________________.
AB
C
Figure 9.1 Michelson Interferometer

28
012-04630G
Microwave Optics
⑤Use your data to calculate λλ
λλ
λ, the wavelength of the microwave radiation.
λ = _________________________.
⑥Repeat your measurements, beginning with a different position for Reflector A.
x1 = _________________________.
Minima traversed = _________________________.
x2 = _________________________.
λ = _________________________.
Questions
①You have used the interferometer to measure the wavelength of the microwave radiation. If you
already knew the wavelength, you could use the interferometer to measure the distance over which
the Reflector moved. Why would an optical interferometer (an interferometer using visible light
rather than microwaves) provide better resolution when measuring distance than a microwave inter-
ferometer?
An Idea for Further Investigation
Place a cardboard box between the Partial Reflector and Reflector A. Move one of the reflectors
until the meter deflection is a maximum. Slowly fill the box with styrene pellets while observing the
meter deflections. On the basis of these observations, adjust the position of Reflector A to restore the
original maximum. Measure the distance over which you adjusted the reflector. Also measure the
distance traversed by the beam through the pellets. From this data, can you determine the styrene
pellets’ index of refraction at microwave frequencies? (The wavelength of electromagnetic radiation
in a material is given by the relationship λλ
λλ
λ = λλ
λλ
λ0/n; where λλ
λλ
λ is the wavelength, λλ
λλ
λ0 is the wavelength
in a vacuum, and n is the index of refraction of the material.) Try boxes of various widths. You
might also try filling them with a different material.

29
012-04630G Microwave Optics
Experiment 10: Fiber Optics
EQUIPMENT NEEDED:
- Transmitter - Receiver
- Goniometer - Tubular Plastic Bags
- Styrene Pellets
Introduction
Light can propagate through empty space, but it can also propagate well through certain materi-
als, such as glass. In fiber optics, a thin, flexible glass tube functions as a transmission line for
light from a laser, much as a copper wire can function as a transmission line for electrical im-
pulses. In the same way that variation of the electrical impulses can carry information through
the copper wire (for example as a phone message), variation in the intensity of the laser light can
carry information through the glass tube.
Procedure
①Align the Transmitter and Receiver directly across from each other on the Goniometer, and adjust
the Receiver controls for a readable signal.
②Fill a tubular plastic bag with styrene pellets (tie the end or use a rubber band). Place one end of
the bag in the Transmitter horn. What happens to the meter reading? Now place the other end in
the Receiver horn. How does the intensity of the detected signal compare to the intensity when
the bag is not used?
③Remove the plastic bag and turn the Rotatable Goniometer arm until no meter deflection appears.
Place one end of the bag in the Transmitter horn, the other in the Receiver horn. Note the meter
reading.
④Vary the radius of curvature of the plastic bag. How does this effect the signal strength? Does
the signal vary gradually or suddenly as the radial curvature of the plastic bag changes? Find the
radius of curvature at which the signal begins to drop significantly.
Questions
①Check your textbook for information on Total Internal Reflection. Based on the radial curvature
when the signal begins to show attenuation as it passes through the plastic bag, determine the
angle of total internal reflection for the styrene pellets. Can you use this value to determine the
index of refraction of the styrene pellets?
②Would you expect the plastic bag filled with styrene pellets to work the same with radiation at
optical frequencies? Why?

30
012-04630G
Microwave Optics
Notes
31
012-04630G Microwave Optics
Experiment 11: Brewster's Angle
EQUIPMENT NEEDED:
- Transmitter - Receiver
- Goniometer - Rotating Table
- Polyethylene Panel
Introduction
When electromagnetic radiation passes from one media into another, some of the radia-
tion usually reflects from the surface of the new medium. In this experiment, you will
find that the magnitude of the reflected signal depends on the polarization of the radiation.
In fact, at a certain angle of incidence—known as Brewster’s Angle—there is an angle of
polarization for which no radiation will be reflected. (Check your textbook for more infor-
mation on Brewster’s Angle.)
Procedure
①Arrange the equipment as shown in Figure 11.1, setting
both the Transmitter and the Receiver for horizontal
polarization (90°).
②Adjust the Panel so the angle of incidence of the micro-
wave from the Transmitter is 20°. Rotate the Goniom-
eter arm until the Receiver is positioned where it can
detect the maximum signal reflected from the Panel.
Adjust the Receiver controls for a mid-scale reading,
and record the meter reading in Table 11.1.
Angle Meter Reading
(Horizontal Polarization)
Meter Reading
(Vertical Polarization)
20°
25°
30°
35°
40°
45°
50°
55°
60°
65°
70°
75°
Table 11.1
Figure 11.1 Equipment Setup
Polyethylene
Panel
Rotating
Table
Angle of
Incidence

32
012-04630G
Microwave Optics
③Without changing the angles between the transmitted beam, the Polyethylene Panel, and the Re-
ceiver, rotate both the Transmitter and the Receiver horns so they align for vertical polarization (0°).
Record the new meter reading in the table.
④Repeat steps 2 and 3, setting the angle of incidence to each of the values shown in the table below.
At each point set the Transmitter and Receiver for horizontal polarization and record the meter read-
ing; then set them for vertical polarization and record that reading as well.
⑤Plot a graph of “Meter Reading” versus “Angle of Incidence”. Plot both the vertical and horizontal
polarizations on the same graph. Label Brewster’s Angle—the angle at which the horizontally polar-
ized wave does not reflect.
Questions
①Explain how Polaroid sun-glasses can be used to reduce the glare caused by the sun setting over a
lake or the ocean. Should the glasses be designed to block vertically or horizontally polarized light?
②Could you use the microwave apparatus to locate Brewster’s Angle by examining the transmitted
wave rather than the reflected wave? How?
33
012-04630G Microwave Optics
Experiment 12: Bragg Diffraction
EQUIPMENT NEEDED:
- Transmitter - Receiver
- Goniometer - Rotating Table
- Cubic Lattice
Introduction
Bragg’s Law provides a powerful tool for investigating crystal structure by relating the
interplanar spacings in the crystal to the scattering angles of incident x-rays. In this experiment,
Bragg’s Law is demonstrated on a macroscopic scale using a cubic “crystal” consisting of 10-mm
metal spheres embedded in an ethafoam cube.
Before performing this experiment, you should understand the theory behind Bragg Diffraction.
In particular, you should understand the two criteria that must be met for a wave to be diffracted
from a crystal into a particular angle. Namely, there is a plane of atoms in the crystal oriented
with respect to the incident wave, such that:
①The angle of incidence equals the angle of reflection, and
②Bragg's equation, 2dsinθ = nλλ
λλ
λ, is satisified; where d is the spacing between the diffracting
planes, θ is the grazing angle of the incident wave, n is an integer, and λλ
λλ
λ is the wavelength of the
radiation.
Procedure
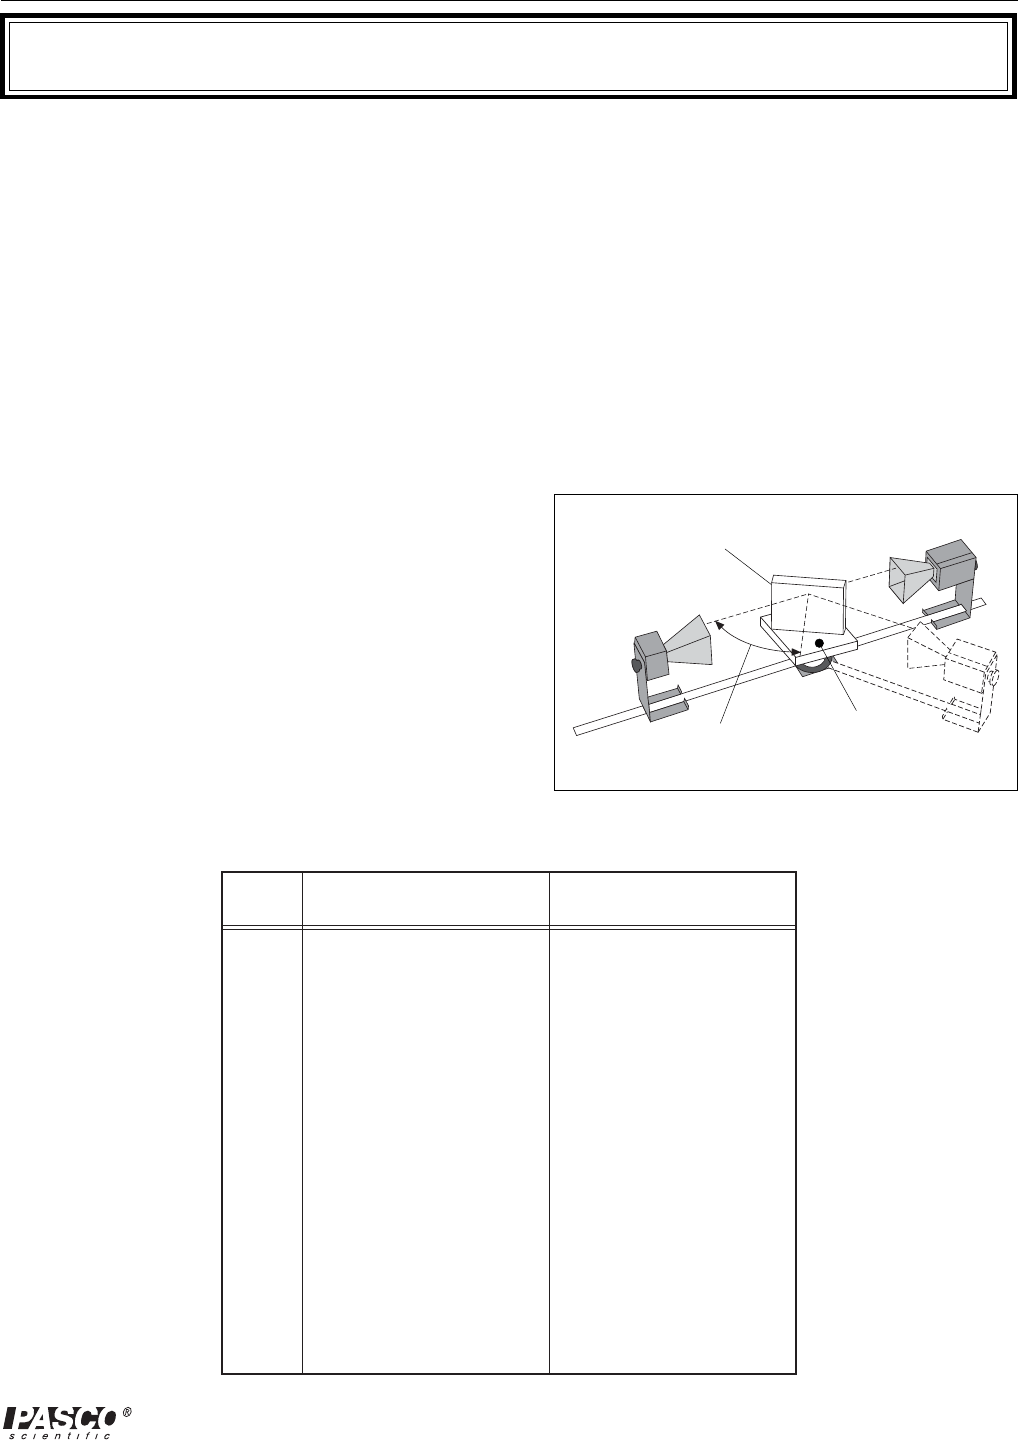
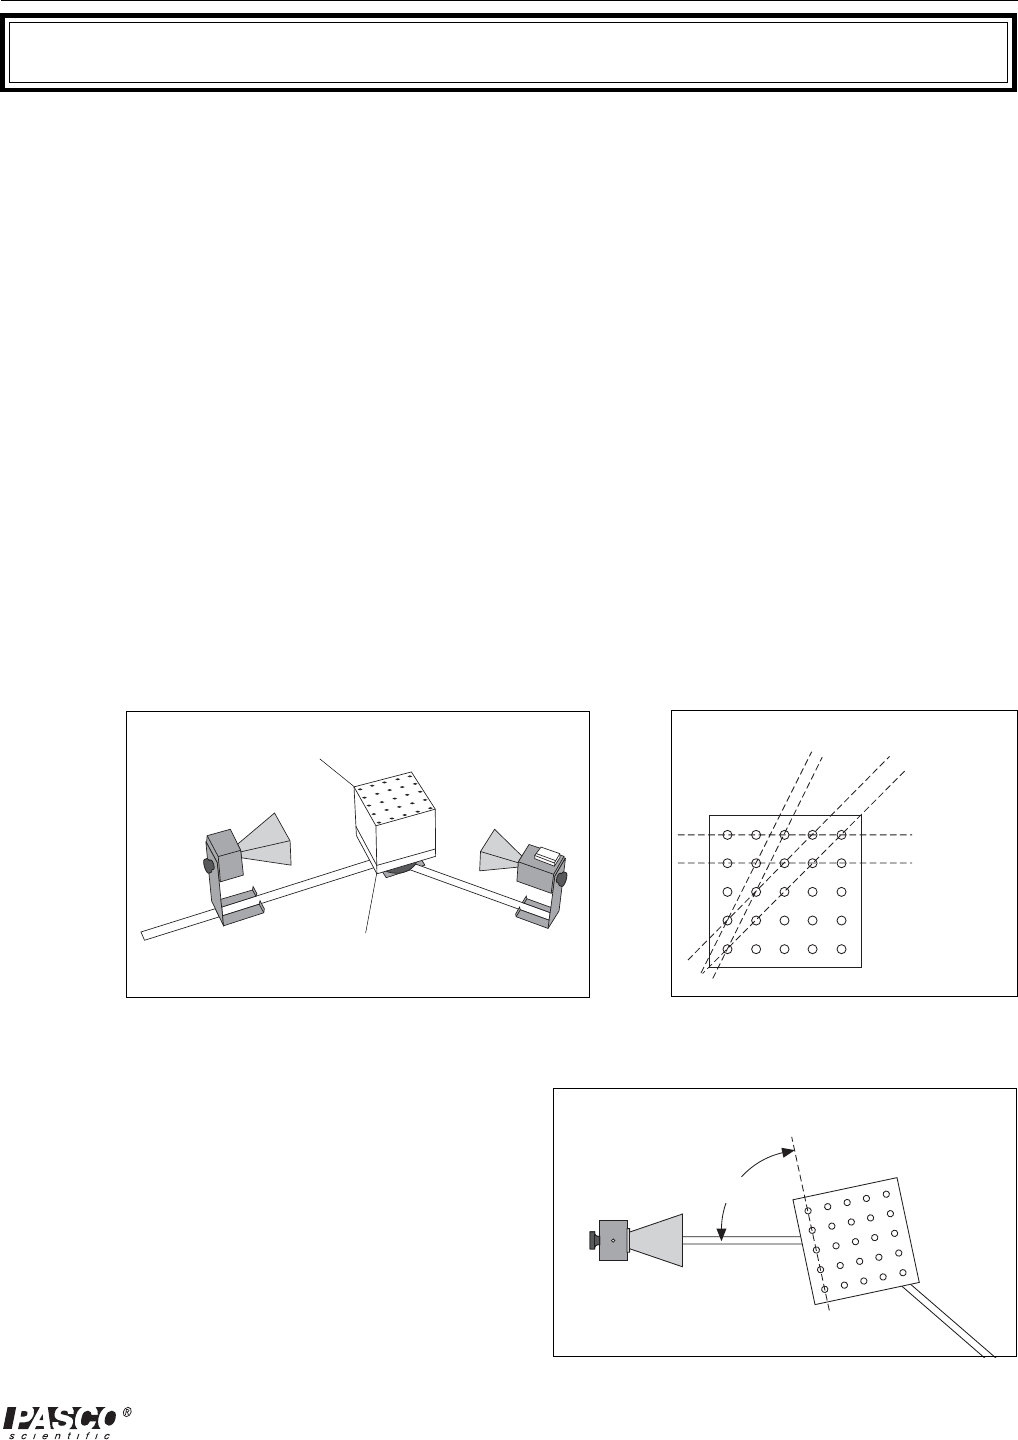
①Arrange the equipment as shown in Figure 12.1.
②Notice the three families of planes indicated in Figure
12.2. (The designations (100), (110), and (210) are
the Miller indices for these sets of planes.) Adjust the
Transmitter and Receiver so that they directly face
each other. Align the crystal so that the (100) planes
are parallel to the incident microwave beam. Adjust
the Receiver controls to provide a readable signal.
Record the meter reading.
Figure 12.1 Equipment Setup
Rotating Table
Cubic Lattice (210) (110)
(100)
Figure 12.2 "Atomic" Planes of the
Bragg Crystal
Figure 12.3 Grazing Angle
Grazing Angle
34
012-04630G
Microwave Optics
③Rotate the crystal (with the rotating table) one degree clockwise and the Rotatable Goniometer arm
two degrees clockwise. Record the grazing angle of the incident beam and the meter reading. (The
grazing angle is the complement of the angle of incidence. It is measured with respect to the plane
under investigation, NOT the face of the cube; see Figure 12.3.)
④Continue in this manner, rotating the Goniometer arm two degrees for every one degree rotation of
the crystal. Record the angle and meter reading at each position. (If you need to adjust the
INTENSITY setting on the Receiver, be sure to indicate that in your data.)
⑤Graph the relative intensity of the diffracted signal as a function of the grazing angle of the incident
beam. At what angles do definite peaks for the diffracted intensity occur?
Use your data, the known wavelength of the microwave radiation (2.85 cm), and Bragg’s Law to
determine the spacing between the (100) planes of the Bragg Crystal. Measure the spacing between
the planes directly, and compare with your experimental determination.
⑥If you have time, repeat the experiment for the (110) and (210) families of planes.
Questions
①What other families of planes might you expect to show diffraction in a cubic crystal? Would you
expect the diffraction to be observable with this apparatus? Why?
②Suppose you did not know beforehand the orientation of the “inter-atomic planes” in the crystal.
How would this affect the complexity of the experiment? How would you go about locating the
planes?
The Bragg Diffraction Experiment was developed by Dr. Harry Meiners of Rensselaer Poly-
technic Institute.
35
012-04630G Microwave Optics
Teacher's Guide
Exp 1 – Introduction to the System
Notes – on Procedure
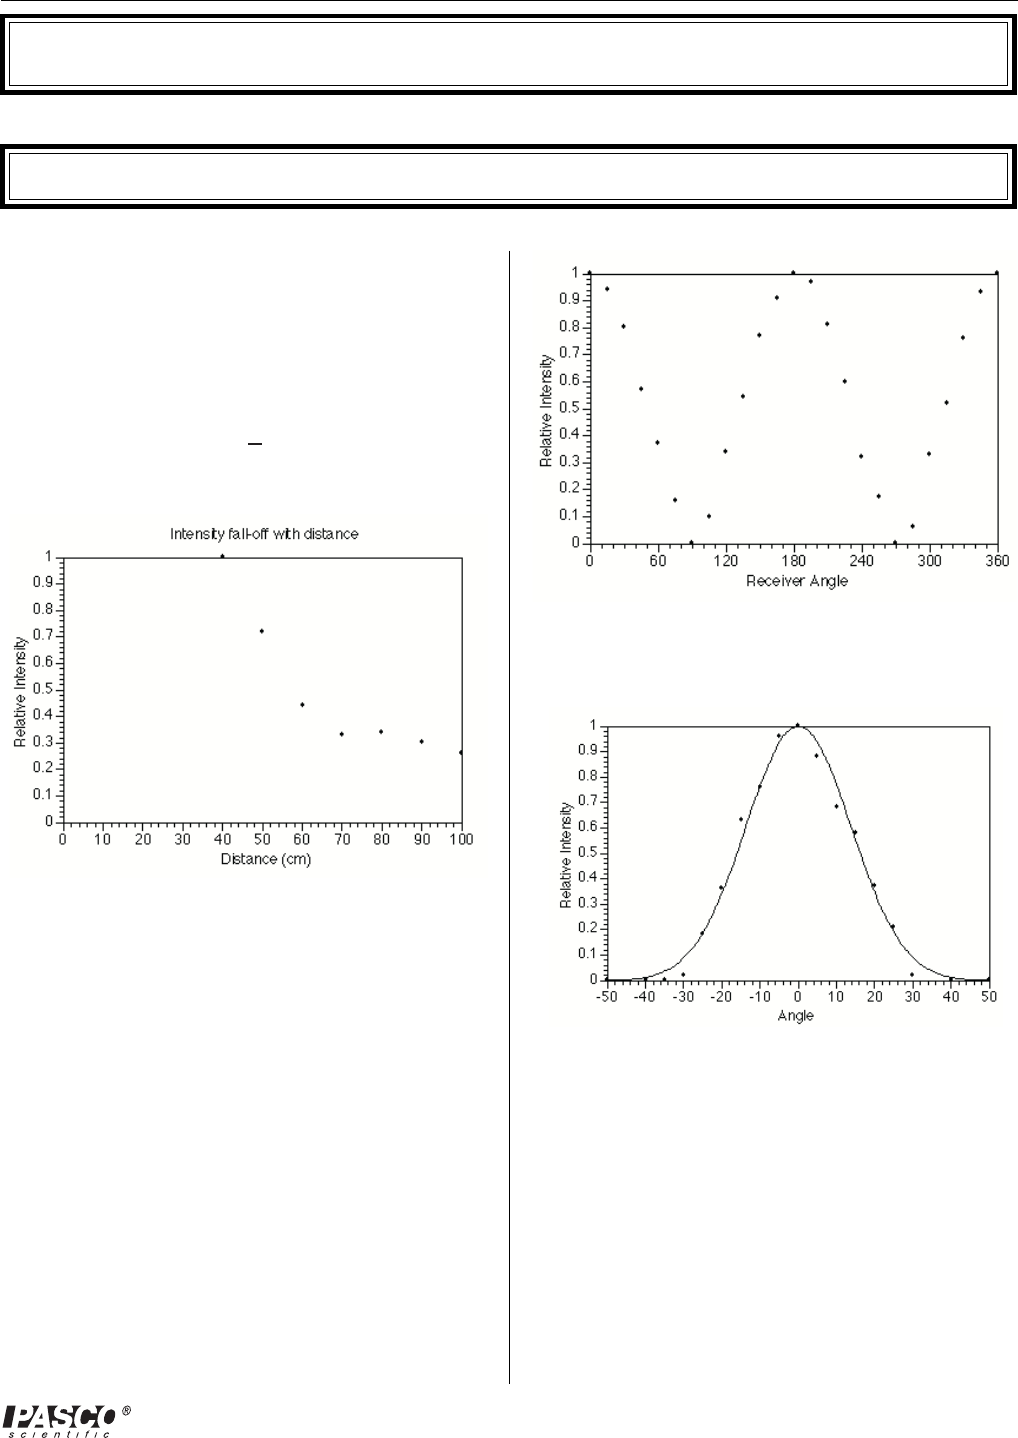
④ The meter reading does not vary with distance in an
entirely predictable way, since the microwaves form
standing waves between the transmitter and receiver at
certain distances. In addition, the meter is not directly
related to either the electric field or the intensity of the
incident beam. The meter is useful for measuring rela-
tive intensity at a constant distance, polarization, and
so on.
⑤The meter reading oscillates as the distance is de-
creased. (See experiment 3, method B)
⑥The presence of a reflector increases the meter reading.
⑦The receiver detects no signal when the transmitter
and receiver are at 90° to each other.
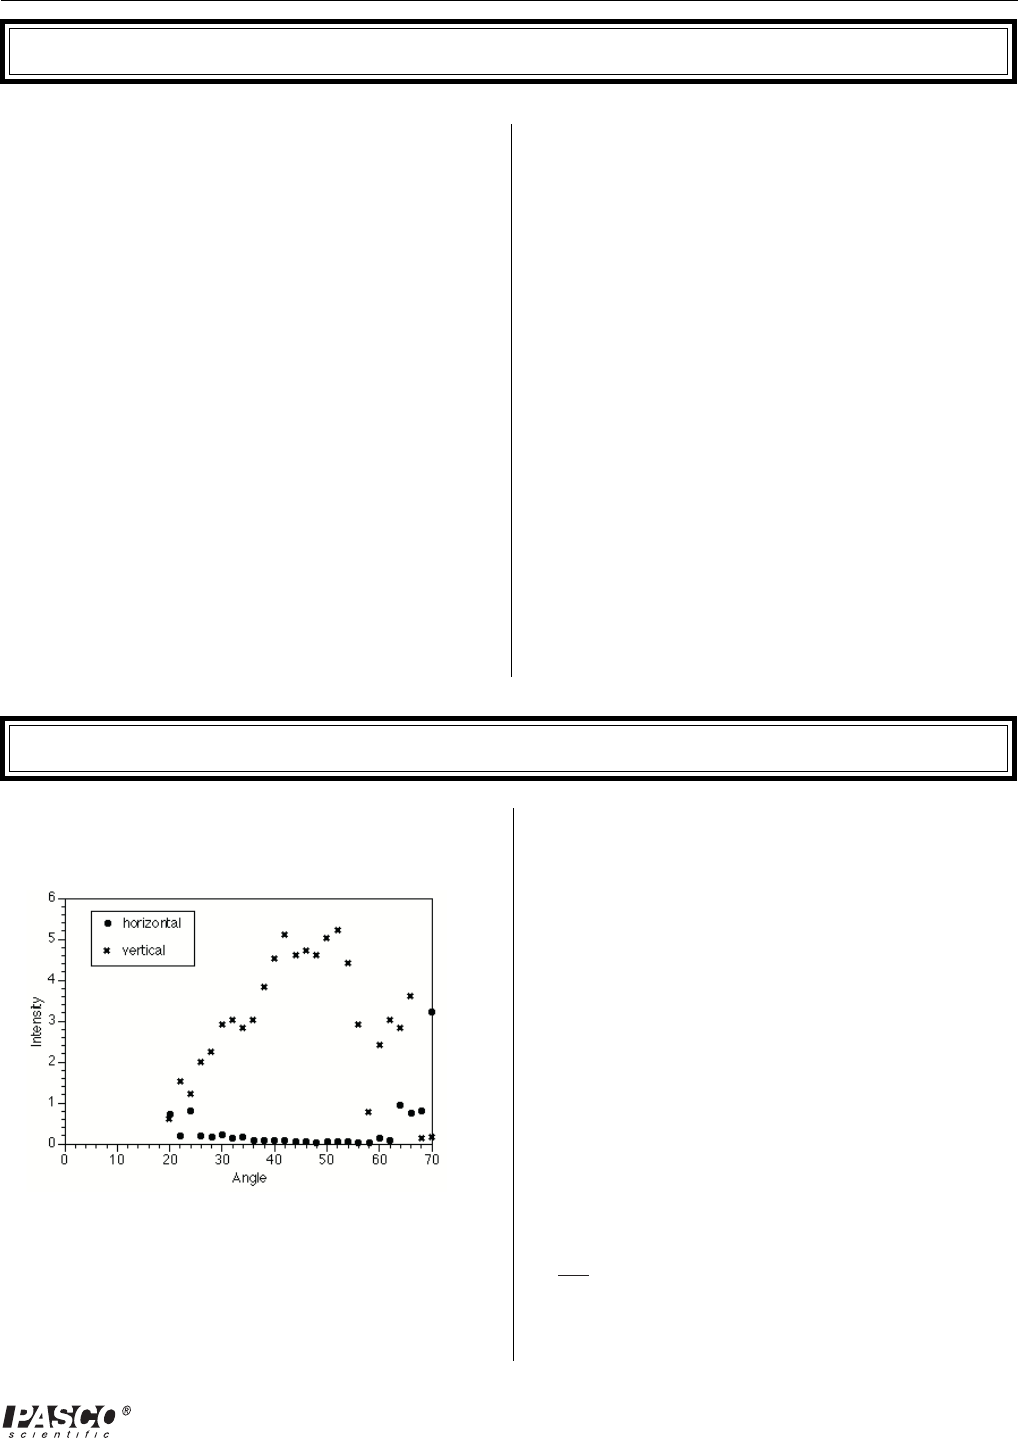
⑧The transmitter has a roughly gaussian output distribu-
tion, with the 1/e points at about ±20°.
There is no significant difference between the output
distributions in the horizontal and vertical orientations
Answers – to Questions
①/② The meter reading is not proportional to either the
electric field or the intensity.
③ The transmitter output is more plane wave than
spherical wave, but it has characteristics of both.
36
012-04630G
Microwave Optics
Notes – on Procedure
⑤
Angle of Incidence Angle of Reflection
20° 23°
30° 31°
40° 41°
50° 54°
60° 63°
70° 85°*
80° 78°*
90° 70°*
The last three points are suspect, due to the spread in the
output pattern of the transmitter. See experiment 1, part 8.
Answers – to Questions
①The angle of incidence equals the angle of reflection.
This does hold for all angles, although it is not clear in
this experiment due to the spread in the output pattern.
②Some of the wave appeared to reflect into different
angles; particularly when the angle of incidence was
70° or 90°. This is actually a diffraction effect, not re-
flection.
③The transmitter does not produce a perfect plane wave,
and this does affect the results.
Answers – to Questions for Additional
Experimentation
①Intensity of the reflection does vary with the angle of
incidence; from this we can deduce that the reflector is
not 100% efficient.
②In general, conductors will reflect the microwaves
much better than non-conductors.
Exp 3– Standing Waves - Measuring Wavelengths
Notes – on Procedure
➤ NOTE: There are two different methods
described in this lab. The first method, using the
Microwave Detector Probe, is the easier of the
two; but either will work.
Method A
# of antinode Distance Wavelength
5 7.1 2.84
10 14.1 2.82
15 20.0 2.67
19 27.5 2.89
Average: 2.81
Frequency: 1.07E+10
Method B
# of antinode Distance Wavelength
10 13.3 2.66
15 20.5 2.73
Average: 2.70
Frequency: 1.11E+10
(Fewer points were taken due to the limited resolution
of this method.)
Answers – to Questions
The value obtained by the first method was 1.5% off,
and the second was 5.6% off. If it is possible to take
more data points on the second method, you may get
better results.
Exp 2 – Reflection
37
012-04630G Microwave Optics
Exp 4– Refraction Through a Prism
Notes – on Procedure
①The empty foam prism absorbs the radiation by a very
slight amount.
③θ = 7° (± 1°)
④θ1 = 22°
θ2 = 29°
⑤/⑥ Our experimental value was: n1 = 1.3 ± 0.05
Answers – to Questions
①This assumption is valid. According to Snell’s law, if
the angle of incidence is zero, the angle of refraction is
zero also.
③The index for a solid styrene prism would be higher,
due to the greater “optical” density of the solid mate-
rial.
General Notes
①The prism mold may be filled with other materials as
well. We used water for one such test. The water ab-
sorbs most of the microwave energy (this is how a mi-
crowave oven works) but enough gets through that it
may be measured on the most sensitive scale of the
receiver. We found that n = 1.4 ± 0.05.
②The jar that the styrene pellets are shipped in has been
used as a cylindrical lens, with limited success.
38
012-04630G
Microwave Optics
Exp 5– Polarization
Notes – on Procedure
②
➤➤
➤➤
➤NOTE: There is a consistent “glitch” in the
data at a polarization angle of about 40 and 140
degrees which is not entirely explained by the
non-linearity of the receiver. (This glitch is also
present when the polarizer slits are used in part 5
of this lab.) If you have an explanation of why
this occurs, please let us know.
③Continued rotation of the receiver results in duplica-
tion of the pattern above.
⑤
⑥The meter reading is zero when the polarizer slits are
oriented vertically or horizontally. When the slits are
at 45°, the meter reads about 30% of its maximum
value for that distance.
Answers – to Questions
①/ ② The meter reading more closely matches the inten
sity than it does the electric field.
③The polarizer transmits only the component of the
wave parallel to the polarizer.
④When the transmitter and polarizer are at 90°, the
wave is completely blocked. Placing a polarizer at 45°,
however, introduces a component of the wave parallel
to the receiver so that some of the wave is then picked
up.
39
012-04630G Microwave Optics
Exp 6– Double-Slit Interference
Answers – to Questions
①/② For the 7.6 cm spacing, the maxima should occur at
22° and 48°.
For the 10.6 cm spacing, the maxima should be at 15°,
33°, and 54°.
These theoretical values are closely matched by the
experimental data. The theory assumes that the dis-
tance between slit plates and receiver are large com-
pared to the slit spacing and wavelength. This require-
ment is barely met in the experimental setup used, and
could cause trouble in some situations.
③The single-slit pattern (see experiment 7) acts as an
upper limit to the multiple-slit pattern from this experi-
ment.
General Notes
①The position of the experimenter has a definite effect
on the measurements in this experiment. Experiment
to find just how much effect there is with your particu-
lar setup, and then take your data accordingly.
②Single-slit diffraction may also be attempted on this
apparatus, though we don’t recommend it. The dis-
tances are too short, relative to the wavelength; so the
analysis requires the Fresnel/Kirchoff approach instead
of the Fraunhoffer approximation. Even with the
Fresnel approach, the “fringes” are too small to be
seen adequately.
Basically, it doesn’t work well at all.
40
012-04630G
Microwave Optics
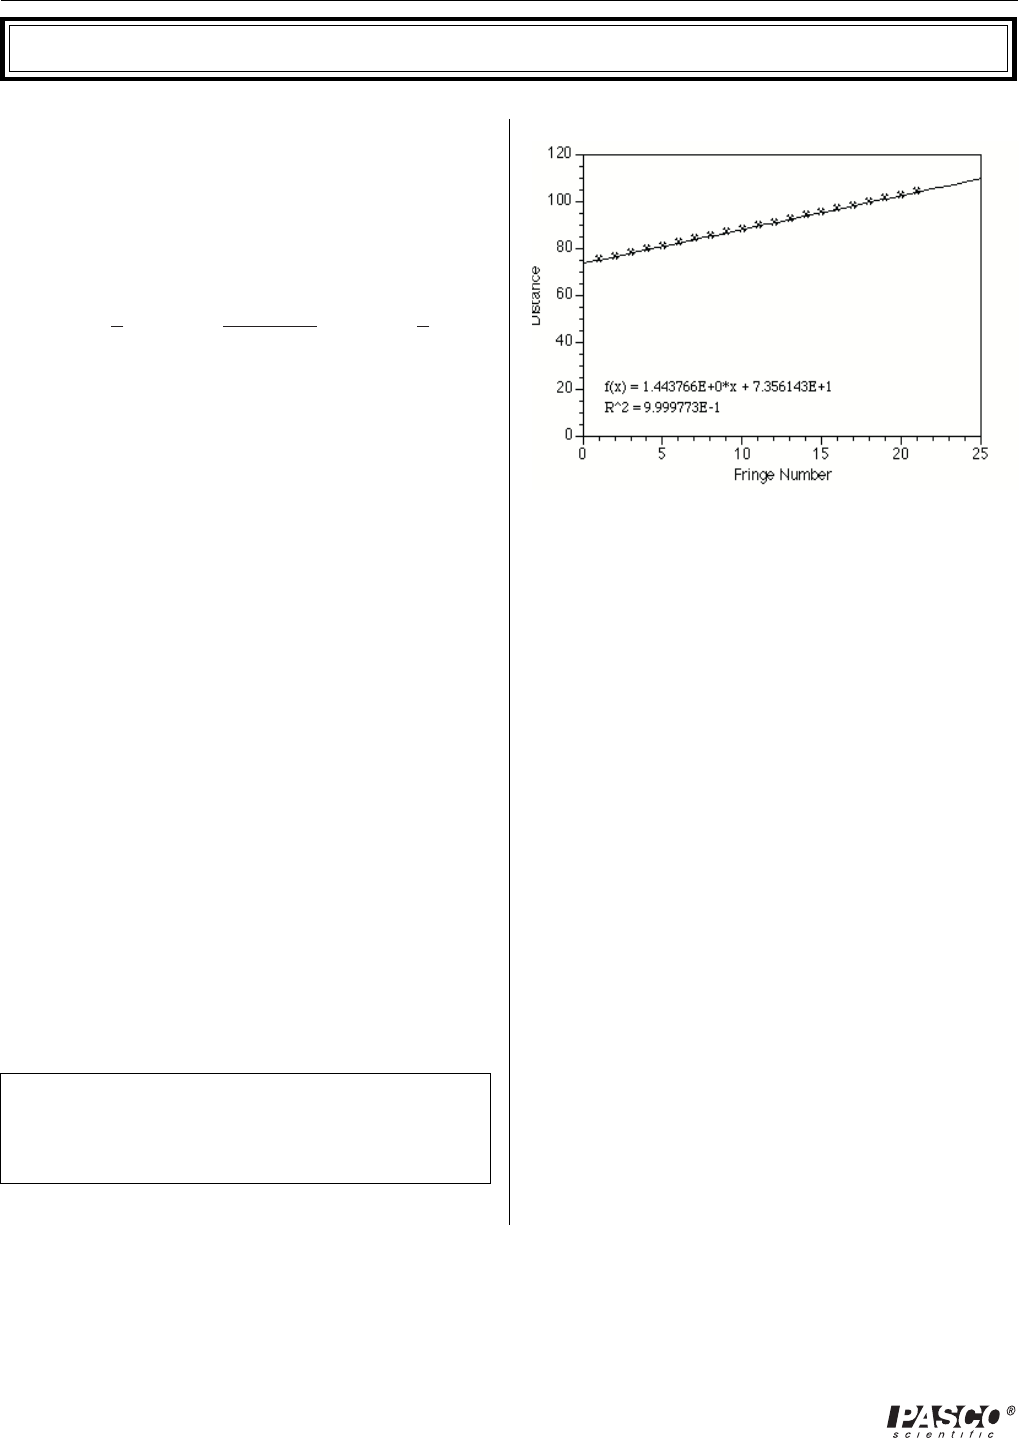
Notes – on Procedure
③-⑧
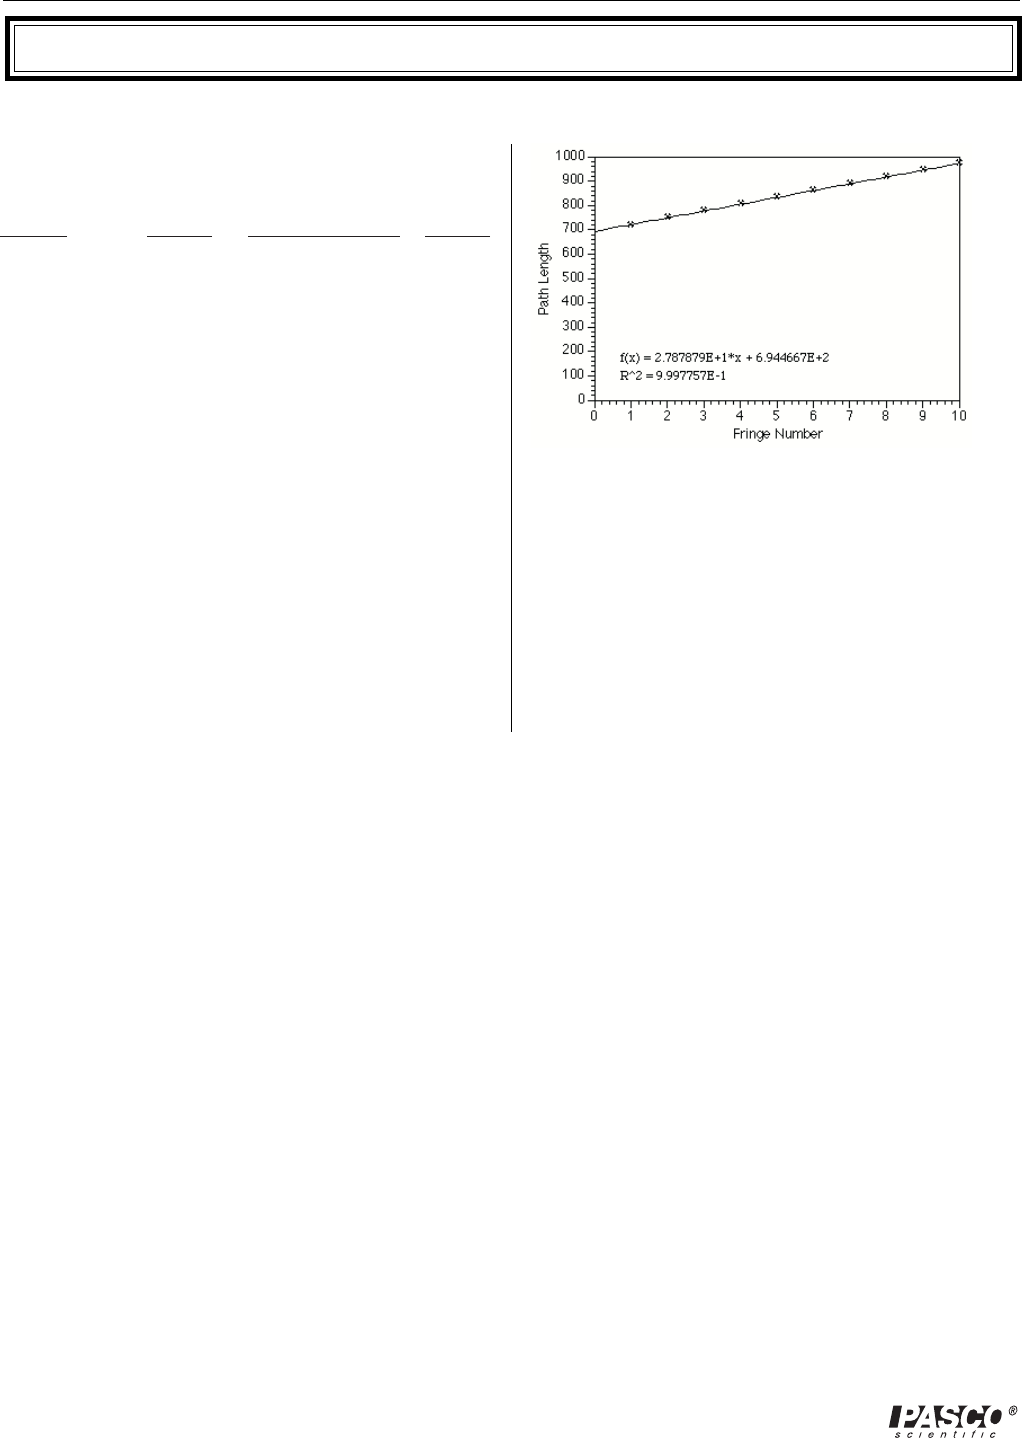
Fringe# h (mm) path length (mm) lambda
1 85 720
2 138 752 32.10
3 171 779 26.63
4 200 806 27.15
5 227 834 28.11
6 251 861 27.06
7 275 890 28.83
8 298 919 29.13
9 317 944 25.08
10 338 973 28.69
average: 27.59
stdev: 1.37
An alternate method is to graph path length versus fringe
number and take the slope of the graph. This slope will be
the wavelength.
From this, λ = 2.79 cm.
Answers – to Questions
①It simplifies the calculations.
Exp 7– Lloyd’s Mirror
41
012-04630G Microwave Optics
Exp 8– Fabry-Perot Interferometer
Notes – on Procedure
①-④ For best results, do not move the reflector closest
to the transmitter. There are actually two standing
wave patterns that may form: one between the trans-
mitter and first reflector, and one between the two re-
flectors. (There may also be others, such as between
the second reflector and the receiver or the second re-
flector and the transmitter; but these will be negli-
gible.) Moving the first reflector will change the am-
plitude of the wave coming into the region between
the reflectors, and thus give erroneous results.
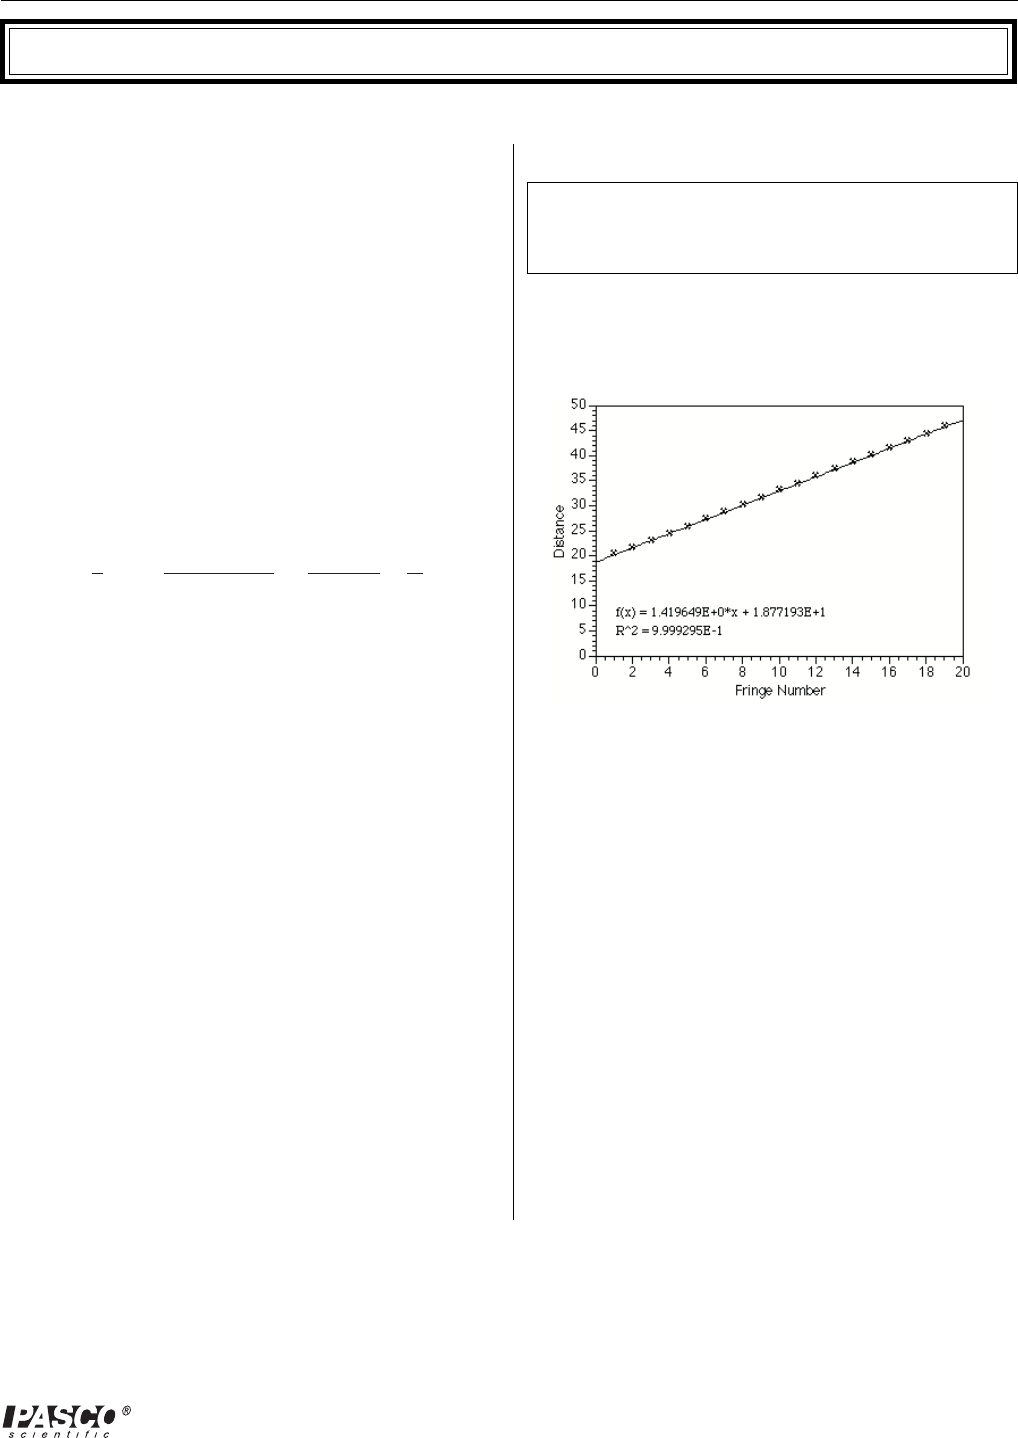
⑤/⑥ = 2.85 cm
‰ NOTE: An alternate method of analysis is to
make a graph of distance versus fringe number and
take the slope of the line to find the wavelength.
λ = 2.84 cm
Answers – to Questions
First Plate: 75.2
nsecond plate distance Ð
1 54.9 20.3
2 53.6 21.6 1.3
3 52.2 23.0 1.4
4 50.9 24.3 1.3
5 49.4 25.8 1.5
6 47.9 27.3 1.5
7 46.5 28.7 1.4
8 45.0 30.2 1.5
9 43.6 31.6 1.4
10 42.1 33.1 1.5
11 40.8 34.4 1.3
12 39.4 35.8 1.4
13 38.0 37.2 1.4
14 36.6 38.6 1.4
15 35.1 40.1 1.5
16 33.8 41.4 1.3
17 32.3 42.9 1.5
18 30.9 44.3 1.4
19 29.4 45.8 1.5
20 27.9 47.3 1.5
21 26.5 48.7 1.4
22 25.0 50.2 1.5
average: 1.42
①Minima will occur when the spacing is nλ/4, where n
is an odd integer.
② We would normally expect just such a pattern; in this
case, however, the reflectors are too small in relation
to the wavelength used; so the next “ring” is located
beyond the edge of the reflectors and may not be seen.
42
012-04630G
Microwave Optics
Exp 9– Michelson Interferometer
Notes – on Procedure
①-④ Best results are obtained when the mirrors are both
a significant distance from the central beamsplitter. If
either mirror is too close to the center, the maxima
splits into two peaks due to secondary interference ef-
fects.
nRefl. Pos. _
1 75.0
2 76.4 1.4
3 77.9 1.5
4 79.4 1.5
5 80.8 1.4
6 82.2 1.4
7 83.7 1.5
8 85.1 1.4
9 86.6 1.5
10 88.0 1.4
11 89.4 1.4
12 90.9 1.5
13 92.3 1.4
14 93.8 1.5
15 95.2 1.4
16 96.6 1.4
17 98.1 1.5
18 99.5 1.4
19 101.0 1.5
20 102.4 1.4
21 104.0 1.6
average: 1.45
From this we can calculate the wavelength as being
2.90 cm.
➤➤
➤➤
➤ NOTE: An alternate method of analysis is to
plot the reflector position versus fringe number.
The slope of this line will be half the wavelength.
By this method, we calculate the wavelength as
2.89 cm.
Answers – to Questions
①The limit of resolution for distance measurements with
a Michelson interferometer is roughly 1/4 the wave-
length of the light used. Thus with these microwaves,
we can measure distance changes of about 7 mm.
With a visible-light interferometer and a wavelength of
633 nm (HeNe laser light) we can measure distance
changes of only 158 nm.
43
012-04630G Microwave Optics
Exp 10 – Fiber Optics
Exp 11– Brewster's Angle
Notes – on Procedure
Answers – to Questions
①Glare off water from a low source is primarily hori-
zontal in polarization, so sunglasses should be de-
signed to block horizontally polarized light.
Notes – on Procedure
②The meter reading with the “optical fiber” bag in place
can more than double the unobstructed meter reading.
This is because the bag prevents the normal spreading
of the beam, and directs all the microwave radiation
into the receiver horn.
③The bag can direct the beam through a full 90° turn
without measurable attenuation, if the curvature is
gradual.
④The signal begins to be attenuated with a radius of cur-
vature of about 5 cm, and drops off rather suddenly from
there. It is difficult to get consistent results, though.
Answers – to Questions
①Theoretically one can use the radius at which the mi-
crowaves begin to “leak” to determine the index of
refraction of the material. In reality, this is quite diffi-
cult. Our values for n using this method range from
1.1 to 1.4.
②The styrene pellets are very small, compared to the
microwave wavelength. Compared to visible
wavelengths, the pellets are enormous. Because of
this size difference, optical radiation is scattered by
the pellets and microwave radiation is transmitted.
Additional Idea
This apparatus may also be used as a demonstra-
tion of how the plane of polarization can be ro-
tated by multiple reflections. Rotate the transmitter
or receiver 90° to each other, so that no signal gets
through. Now put the bag of pellets between the
two. If the bag is held straight, there will be a zero
meter reading; but if the bag is curved into a spiral,
there will be a non-zero reading.
②Theoretically, one could do this by finding the
point at which there was no transmission of verti-
cally polarized light. We have not been able to get
good results in this experiment, however.
General Notes
①The index of refraction of the polyethylene is 1.5.
(Calculated from the dielectric constant at 10 GHz)
②One must be careful on this experiment to note that
there are actually two effects which are being mea-
sured. In addition to the Brewster’s angle reflection,
there is a certain amount of interference between the
front- and rear-surface reflections from the polyethyl-
ene. This interference causes extra peaks at 13.8° and
67.2°, and a local minimum at 43.6°. The interference
is notable enough that you may want to demonstrate
that, instead of the Brewster’s angle.
①-⑤
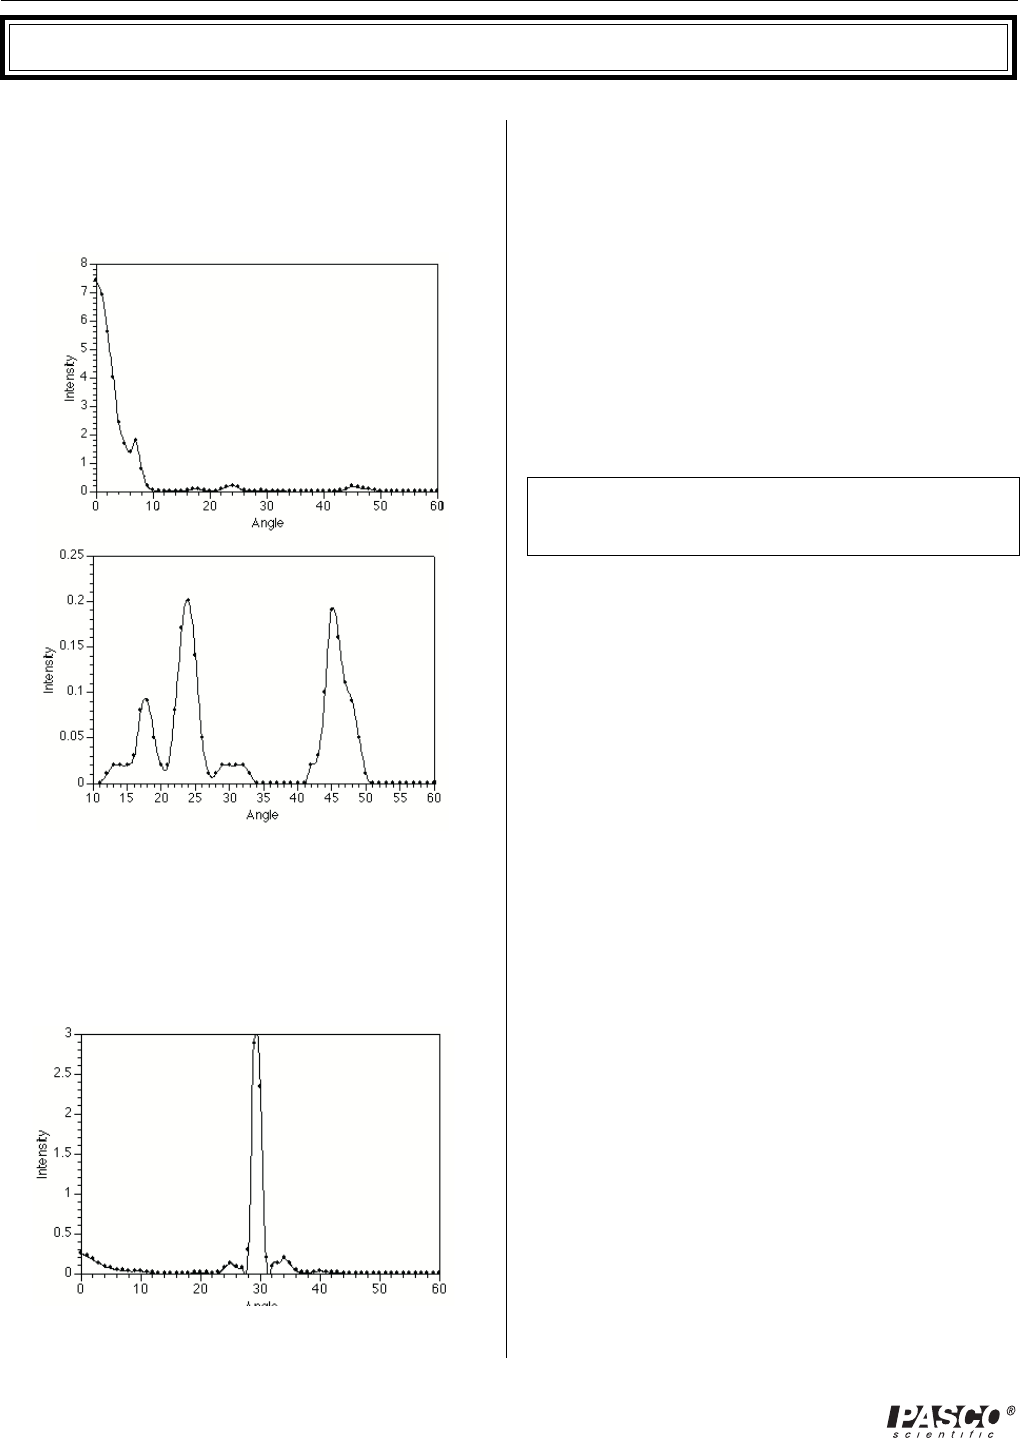
44
012-04630G
Microwave Optics
Exp 12– Bragg Diffraction
Notes – on Procedure
①The polarization angle of the transmitter and receiver
(horizontal or vertical) does not matter.
⑤
Peaks occur at 18°, 24°, and 45°. These correspond to
plane spacings of 4.6cm, 3.4cm, and 4.0 cm (n = 2 for
the 45° peak) The actual spacing is 3.8 cm The first
peak is apparently a reflection off a different plane
than the one we’re measuring.
⑥110 Plane:
The peak at 29° gives a plane spacing of 2.9 cm; the
actual spacing is 2.7 cm
Answers – to Questions
①Other families of planes would be the 111 plane, the
101 plane, and so on. These would be difficult to ob-
serve with this apparatus due to the small size of our
“crystal”.
②Not knowing the orientation of the interatomic planes
of the crystal would increase the complexity of the
analysis. We could orient the crystal so that there was
maximum transmission; this would indicate to us a
100 plane. From there, we could try different angles
until we had enough data to assemble a likely picture
of the atomic spacing in the crystal.
➤ ➤
➤ ➤
➤ NOTE: 10-15% error is reasonable for this
experiment.
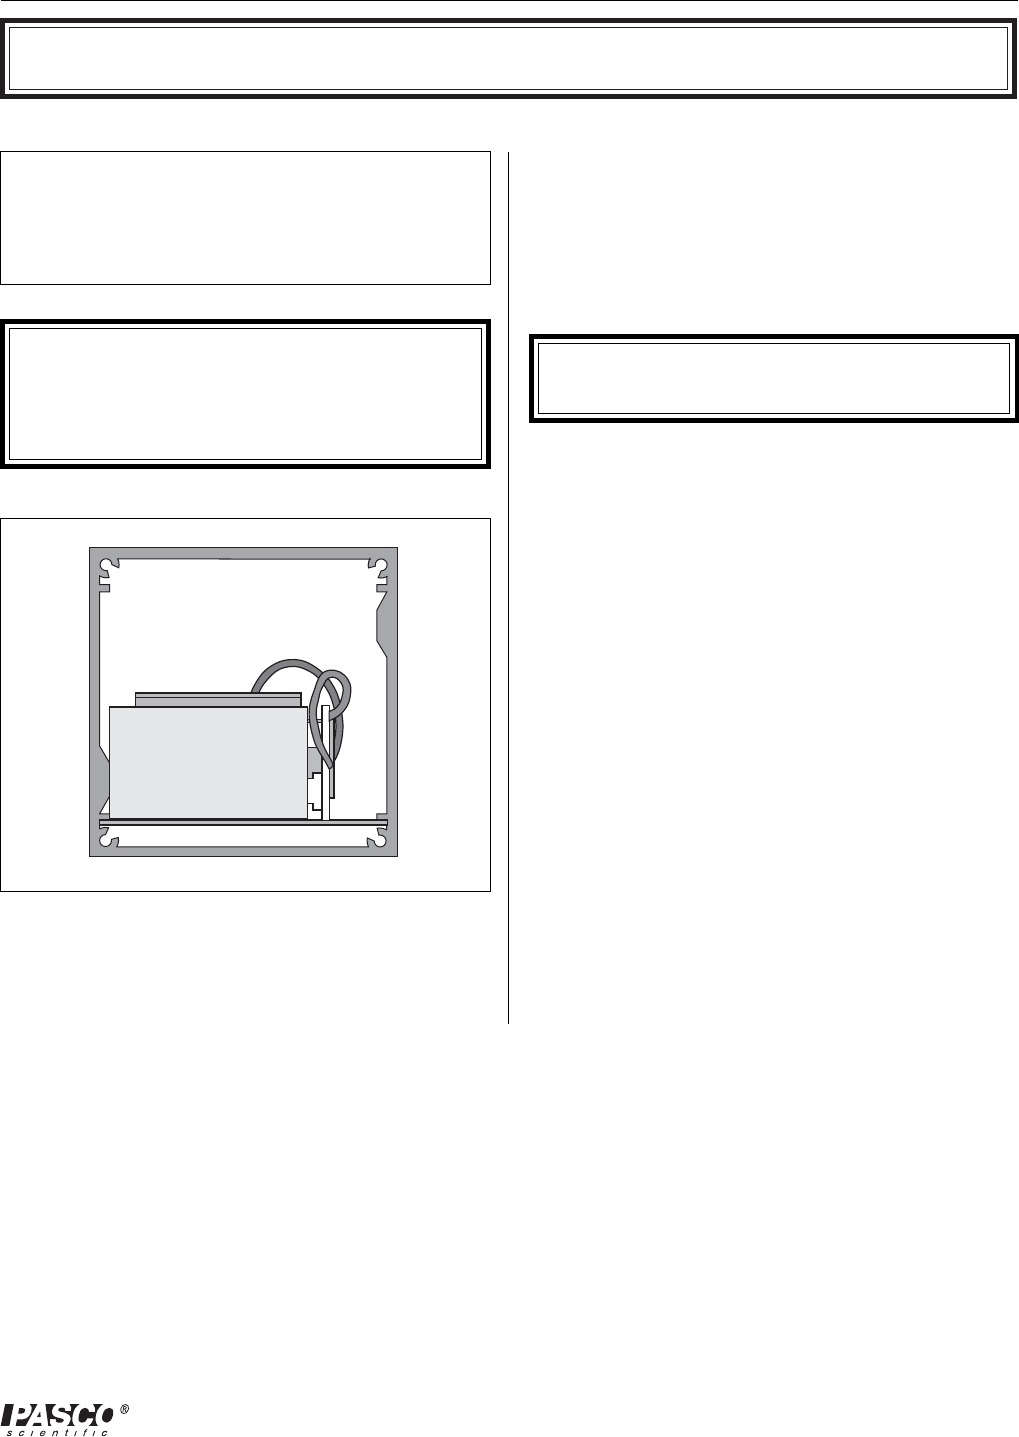
45
012-04630G Microwave Optics
Appendix
Replacing the Receiver Battery
The Receiver is powered by two 9-volt alkaline batteries.
To replace them, simply remove the back panel of the Re-
ceiver (the panel with the rotational scale) by removing
the four screws. Install the new batteries, place them into
the holder as shown below, and replace the panel.
➤➤
➤➤
➤ NOTE: We highly recommend that you use only
alkaline batteries.
Adjusting the Receiver
①Meter mechanical zero adjustment:
a. Turn the INTENSITY control to OFF.
b. The mechanical zero adjustment is located on the
meter, centered just below the meter face. With the
meter level and in the horizontal position, use a
small (1/8”) flat-blade screwdriver to adjust the
meter needle to read as close to 0 as possible.
②Electronic offset null adjustment:
a. Make sure the Transmitter is OFF by unplugging
it.
b. Turn the INTENSITY control to the 1X position.
c. Turn the VARIABLE SENSITIVITY control all
the way clockwise to its maximum setting.
d. The offset null adjustment is located through a
small hole just above the receiver antenna. Use a
small (1/8”) flat-blade screwdriver to adjust the
meter reading as close as possible to 0.
Replacing the Receiver Battery
➤➤
➤➤
➤CAUTION: The electronics of the Transmitter
and Receiver assemblies contain diodes that are not
easily repairable. An attempt to repair diode assem-
blies may void your warranty.
➤➤
➤➤
➤NOTE: Abnormal behavior (weak or erratic
meter readings, etc.) may be caused by weak batter-
ies. Please make sure your batteries are good before
giving us a call.
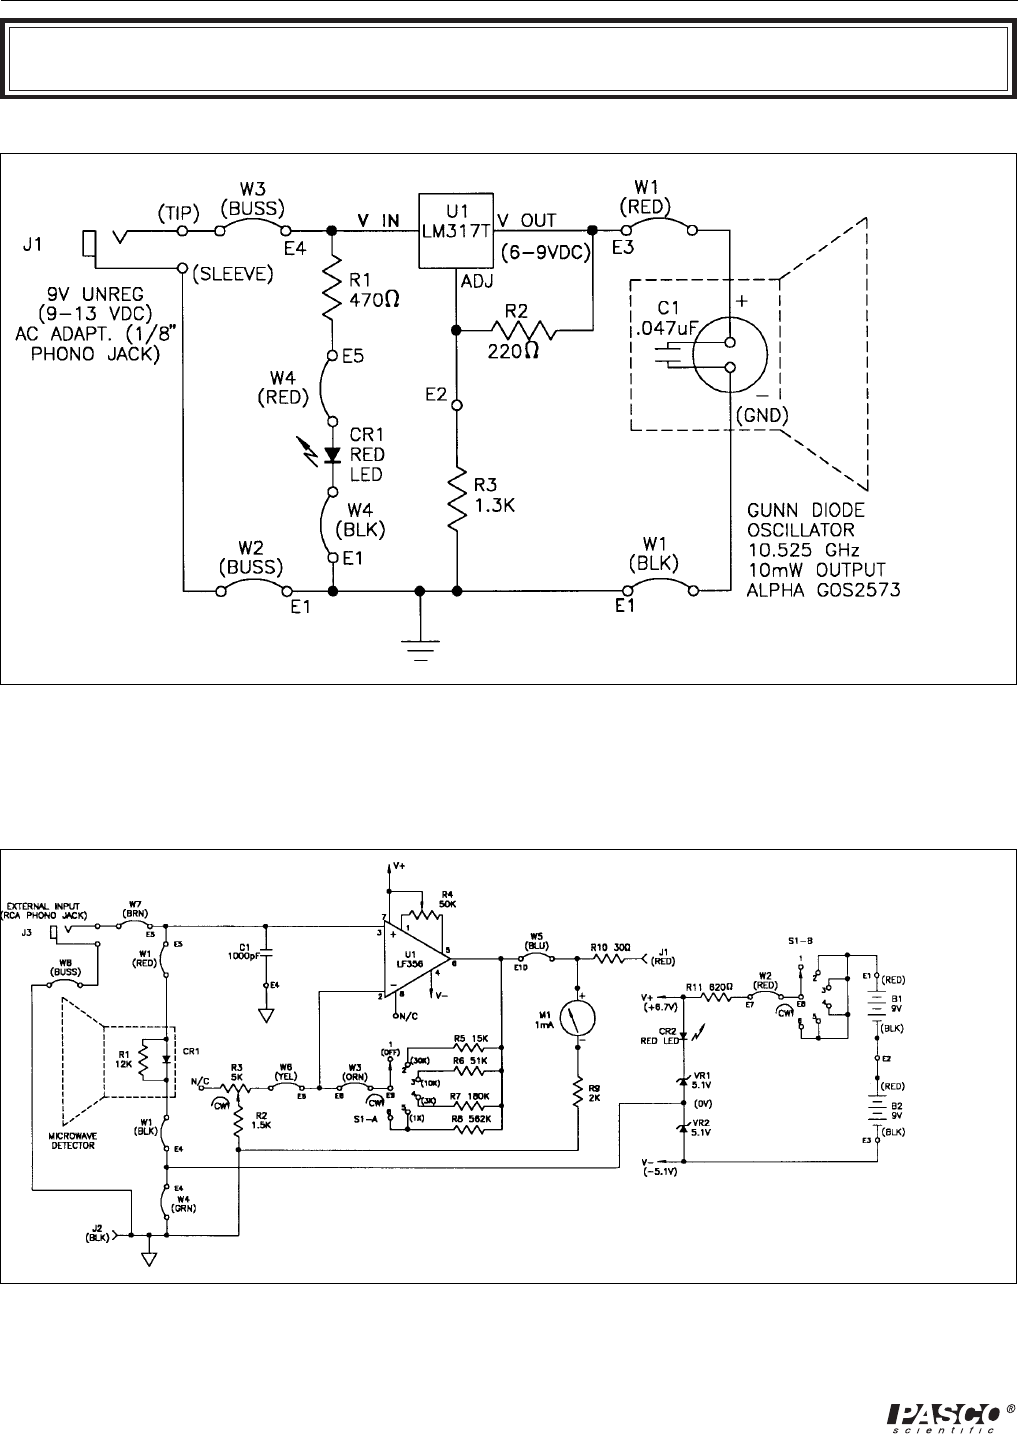
46
012-04630G
Microwave Optics
Schematic Diagram, Microwave Transmitter
Schematic Diagram, Microwave Receiver
Schematic Diagrams
47
012-04630G Microwave Optics
Replacement Parts List
Pasco Part No. Description Oty.
Transmitter
003-04319 Transmitter Assembly 1
113-132 Resistor, 1.3K, 1/4W, 5% 1
113-221 Resistor, 220 OHM, 1/4W 5% 1
113-471 Resistor, 470 OHM, 1/4W, 5% 1
430-085 IC-LM317T Positive V Reg. 1
445-005 Module, Microwave Transmitter 1
956-04311 Schematic, Microwave Transmitter 0
Receiver
003-04313 Receiver Assembly 1
004-04312 Receiver P.C.B. Assembly 1
113-153 Resistor, 15K, 1/4W, 5% 1
113-184 Resistor, 180K, 1/4W, 5% 1
113-621 Resistor,620 OHM 1/4W 5% 1
123-013 Resistor, 562K 1/4w 1% MF 1
123-016 Resistor, 51.1K 1/4w 1% MF 1
142-028 Trimpot, 50K 1T .5W CERM SA 1
216-026 Capacitor, 1000pF 5% 25V 1
412-012 Zener Diode, 1N751A 5.1V 5% .4W 2
430-086 IC-LF356N FET OP-AMP DIP 1
510-019 Switch, Rotary, 2POLE 6POS 1
527-001 L.E.D, Red 1
555-02811 Printed Circuit Board 1
113-152 Resistor, 1.5K, 1/4W, 5% 1
113-300 Resistor, 30 OHM, 1/4W, 5% 1
123-2001 Resistor, 2K 1/4W 1% MF 1
140-01716 Modified Pot - 5K 1
140-040 Pot, 5K 1
445-006 Module, Microwave Receiver 1
525-008 Meter 1
710-04313 Wire List, Microwave Receiver 0
956-04312 Schematic, Microwave Receiver 0
Components
003-01748 Assembly, Partial Reflector 2
003-02090 Assembly, Receiver/Transmitter Stand 2
003-02091 Assembly, Component Holder 2
003-02092 Assembly, Rotating Component Holder 1
003-02093 Assembly, Fixed Arm 1
003-02094 Assembly, Goniometer 1
003-02100 Assembly, Rotating Table 1
003-02116 Assembly, Styrene Pellets 1
003-02817 Assembly, Slit Extender Arm 1
540-002 Battery, 9 Volt, Alkaline 2
540-007 AC Adapter, 120VAC, 9VDC 1
or 540-013 AC Adapter, 220/240VAC, 9VDC 1
648-01749 Metal Reflector 2
648-02042 Slit Spacer, Narrow 1
648-02043 Slit Spacer, Wide 1
648-02052 Polarizer Screen 2
648-02082 Ethafoam Prism 1
735-027 Plastic Bag, 2 1/2” X 24” 4
➤ ➤
➤ ➤
➤ NOTE: Replacement
parts can be purchased
from PASCO or at most
electronic stores.

48
012-04630G
Microwave Optics
Notes

49
012-04630G Microwave Optics
Technical Support
Feedback
If you have any comments about the product or
manual, please let us know. If you have any
suggestions on alternate experiments or find a
problem in the manual, please tell us. PASCO
appreciates any customer feedback. Your input helps
us evaluate and improve our product.
To Reach PASCO
For technical support, call us at 1-800-772-8700
(toll-free within the U.S.) or (916) 786-3800.
fax: (916) 786-3292
e-mail: techsupp@pasco.com
web: www.pasco.com
Contacting Technical Support
Before you call the PASCO Technical Support staff, it
would be helpful to prepare the following information:
➤If your problem is with the PASCO apparatus,
note:
-Title and model number (usually listed on the
label);
-Approximate age of apparatus;
-A detailed description of the problem/sequence of
events (in case you can’t call PASCO right away,
you won’t lose valuable data);
-If possible, have the apparatus within reach when
calling to facilitate description of individual parts.
➤If your problem relates to the instruction manual,
note:
- Part number and revision (listed by month and
year on the front cover);
- Have the manual at hand to discuss your
questions.