Pasco Specialty And Mfg Franck Hertz Experiment Se 9639 Users Manual 012 14264A_TXT
2015-02-06
: Pasco-Specialty-And-Mfg Pasco-Specialty-And-Mfg-Franck-Hertz-Experiment-Se-9639-Users-Manual-516938 pasco-specialty-and-mfg-franck-hertz-experiment-se-9639-users-manual-516938 pasco-specialty-and-mfg pdf
Open the PDF directly: View PDF ![]() .
.
Page Count: 25
- SE-9639.pdf
- Equipment List
- Limited Warranty and Limitation of Liability
- Safety Information
- Electrical Symbols
- Installation and Maintenance
- Introduction
- Principle of the Experiment
- Experiment Procedure 1
- Experiment Procedure 2
- Appendix A: General Specifications
- Appendix B: Teacher’s Notes
- Appendix C: Technical Support
- Appendix D: Product End of Life
Instruction Manual 012-14264A
Franck-Hertz Experiment
Model SE-9639
Brolight Technology Co., Ltd

®
ii
Table of Contents
Equipment List - - - - - - - - - - - - - - - - - - - - - - - - - - - - - - - - - - - - - - - - - - - - - - - - - - - - 1
Limited Warranty and Limitation of Liability - - - - - - - - - - - - - - - - - - - - - - - - - - - - - - - - 2
Safety Information - - - - - - - - - - - - - - - - - - - - - - - - - - - - - - - - - - - - - - - - - - - - - - - - - 2
Installation and Maintenance- - - - - - - - - - - - - - - - - - - - - - - - - - - - - - - - - - - - - - - - - - 3
Introduction - - - - - - - - - - - - - - - - - - - - - - - - - - - - - - - - - - - - - - - - - - - - - - - - - - - - - - 5
Principle of the Experiment - - - - - - - - - - - - - - - - - - - - - - - - - - - - - - - - - - - - - - - - - - - 5
Experiment Procedure 1 - - - - - - - - - - - - - - - - - - - - - - - - - - - - - - - - - - - - - - - - - - - - 11
Experiment Procedure 2 - - - - - - - - - - - - - - - - - - - - - - - - - - - - - - - - - - - - - - - - - - - - 14
Appendix A: General Specifications - - - - - - - - - - - - - - - - - - - - - - - - - - - - - - - - - - - - 18
Appendix B: Teacher’s Notes - - - - - - - - - - - - - - - - - - - - - - - - - - - - - - - - - - - - - - - - 19
Appendix C: Technical Support, Copyright, Warranty - - - - - - - - - - - - - - - - - - - - - - - - 23
Product End of Life Disposal Instructions - - - - - - - - - - - - - - - - - - - - - - - - - - - - - - - - 23
Instruction Manual 012-14264A
1
012-14264A
Franck-Hertz Experiment
SE-9639
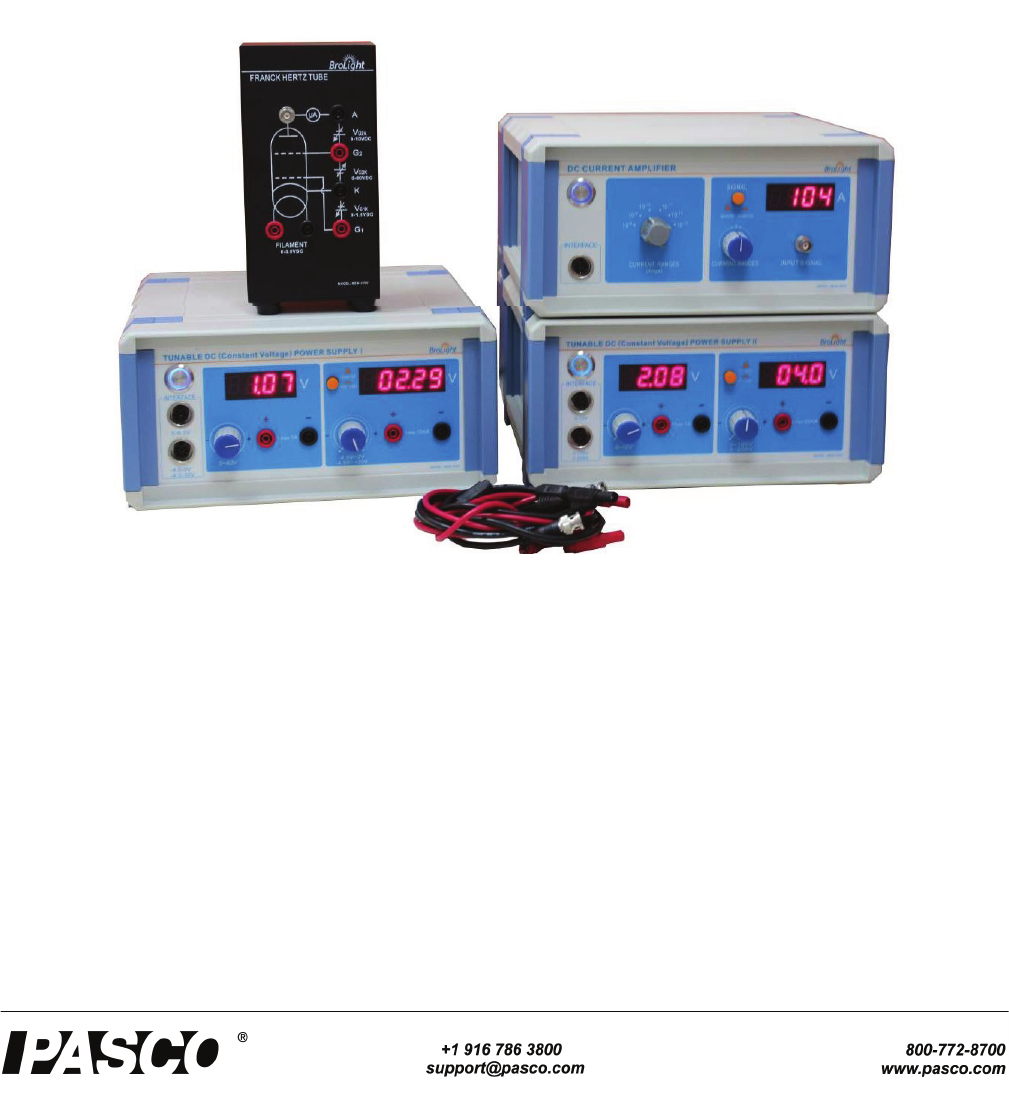
Equipment List
Included Equipment Model Quantity
1. Tunable DC (Constant Voltage) Power Supply I SE-6615 1
2. Tunable DC (Constant Voltage) Power Supply II SE-9644 1
3. DC Current Amplifier SE-6621 1
4. Argon Tube Enclosure with Argon Tube SE-9650 1
5. Connecting cable, 850 mm, red EM-9740 Set of 5
6. Connecting cable, 850 mm, black EM-9745 Set of 5
7. Power Cord - 3
8. BNC Cable - 1
9. 8-pin DIN Extension Cable UI-5218 2
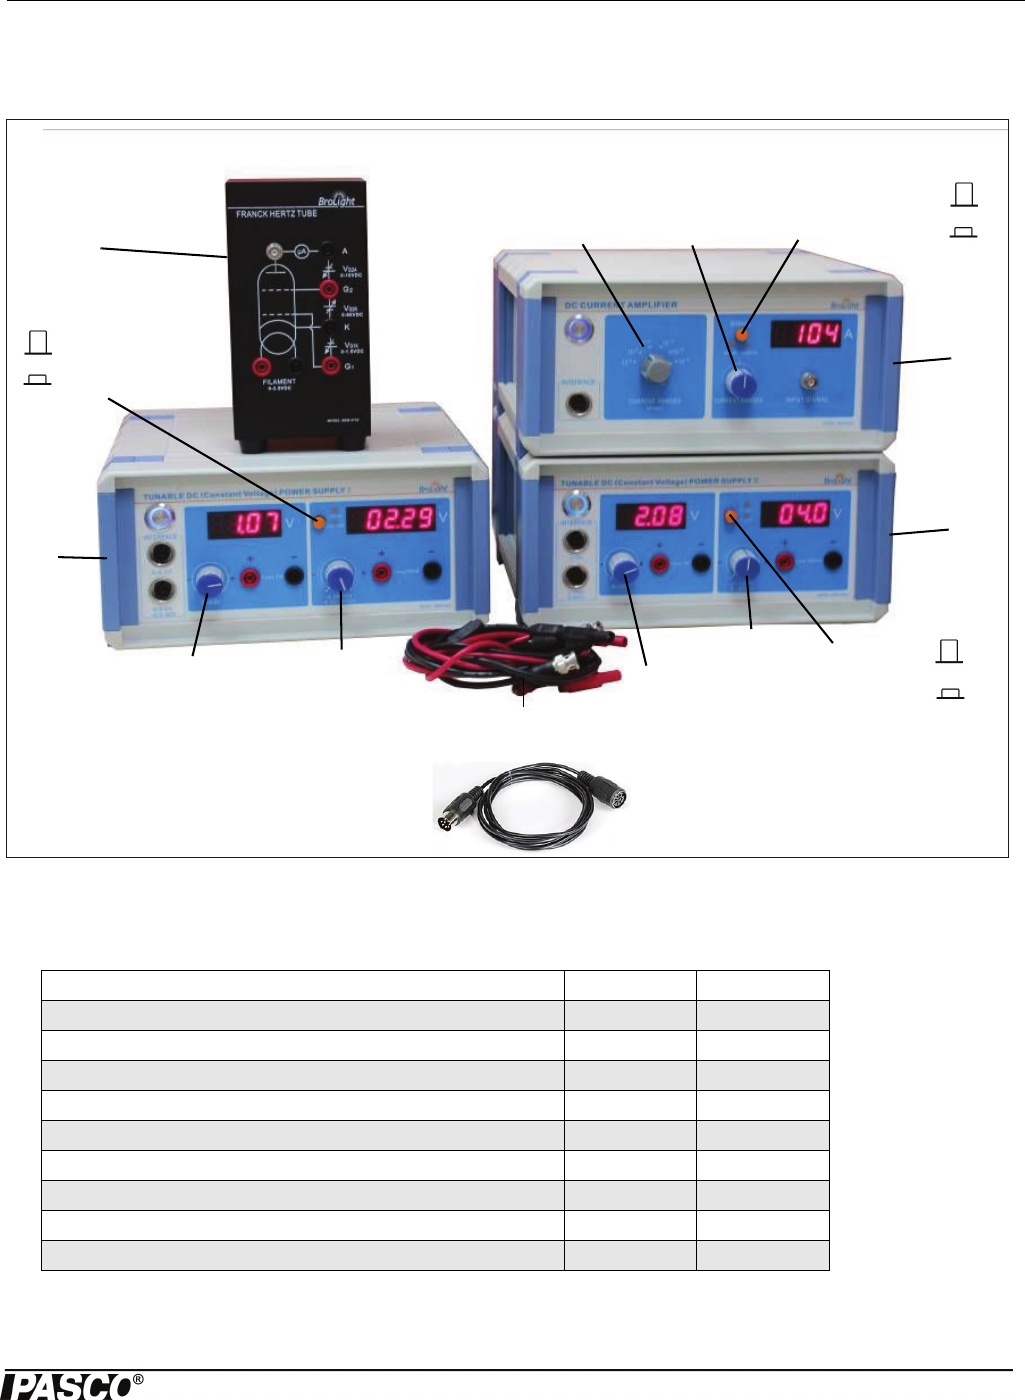
1
2
3
4
5, 6, 7, 8
Adjust:
0 – 6.3 V
Adjust:
-4.5 V – 0 V
and
-4.5 V – +30 V
Select:
-4.5 V – 0 V
-4.5 V – +30 V
Select:
0 – 100 V
0 – 200 V
Adjust:
0 – 100 V
and
0 – 200 V
Adjust:
0 – 12 V
Select:
MEASURE
CALIBRATION
Adjust:
CURRENT
Select:
CURRENT
RANGES
9
SE-9639 Franck-Hertz Experiment
2012-14264A
Recommended Items
Limited Warranty and Limitation of Liability
This Brolight product is free from defects in material and workmanship for one year from the date of purchase. This warranty
does not cover fuses, or damage from accident, neglect, misuse, alteration, contamination, or abnormal conditions of operation
or handling. Resellers are not authorized to extend any other warranty on Brolight’s behalf. To obtain service during the war-
ranty period, return the unit to point of purchase with a description of the problem.THIS WARRANTY IS YOUR ONLY
REMEDY. NO OTHER WARRANTIES, SUCH AS FITNESS FOR A PARTICULAR PURPOSE, ARE EXPRESSED OR
IMPLIED. BROLIGHT IS NOT LIABLE FOR ANY SPECIAL, INDIRECT, INCIDENTAL OR CONSEQUENTIAL DAM-
AGES OR LOSSES, ARISING FROM ANY CAUSE OR THEORY. Since some states or countries do not allow the exclusion
or limitation of an implied warranty or of incidental or consequential damages, this limitation of liability may not apply to you.
Safety Information
• Do not clean the equipment with a wet cloth.
• Before use, verify that the apparatus is not damaged.
• Do not defeat power cord safety ground feature.
• Plug into a grounded (earthed) outlet.
• Do not use the product in any manner that is not specified by the manufacturer.
• Do not install substitute parts or perform any unauthorized modification to the product.
• Line and Current Protection Fuses: For continued protection against fire, replace the line fuse and the
current-protection fuse only with fuses of the specified type and rating.
• Main Power and Test Input Disconnect: Unplug instrument from wall outlet, remove power cord, and
remove all probes from all terminals before servicing. Only qualified, service-trained personnel should
remove the cover from the instrument.
• Do not use the equipment if it is damaged. Before you use the equipment, inspect the case. Pay particular
attention to the insulation surrounding the connectors.
• Do not use the equipment if it operates abnormally. Protection may be impaired.
• When in doubt, have the equipment serviced.
• Do not operate the equipment where explosive gas, vapor, or dust is present. Don't use it under wet
conditions.
• Do not apply more than the rated voltage, as marked on the apparatus, between terminals or between any
terminal and earth ground.
• When servicing the equipment, use only specified replacement parts.
• Use caution when working with voltages above 30 V AC rms, 42 V peak, or 60 V DC. Such voltages pose
a shock hazard.
• To avoid electric shock, do not touch any bare conductor with hand or skin.
• Adhere to local and national safety codes. Individual protective equipment must be used to prevent shock
and arc blast injury where hazardous live conductors are exposed.
Item Model Quantity
850 Universal Interface UI-5000 1
PASCO Capstone Software UI-5400 1
WARNING: To avoid possible electric shock or personal history, follow these guidelines.
Franck-Hertz Experiment Electrical Symbols
3
012-14264A
• Special note: If a dangerous voltage is applied to an input terminal, then the same voltage may occur at all
other terminals.
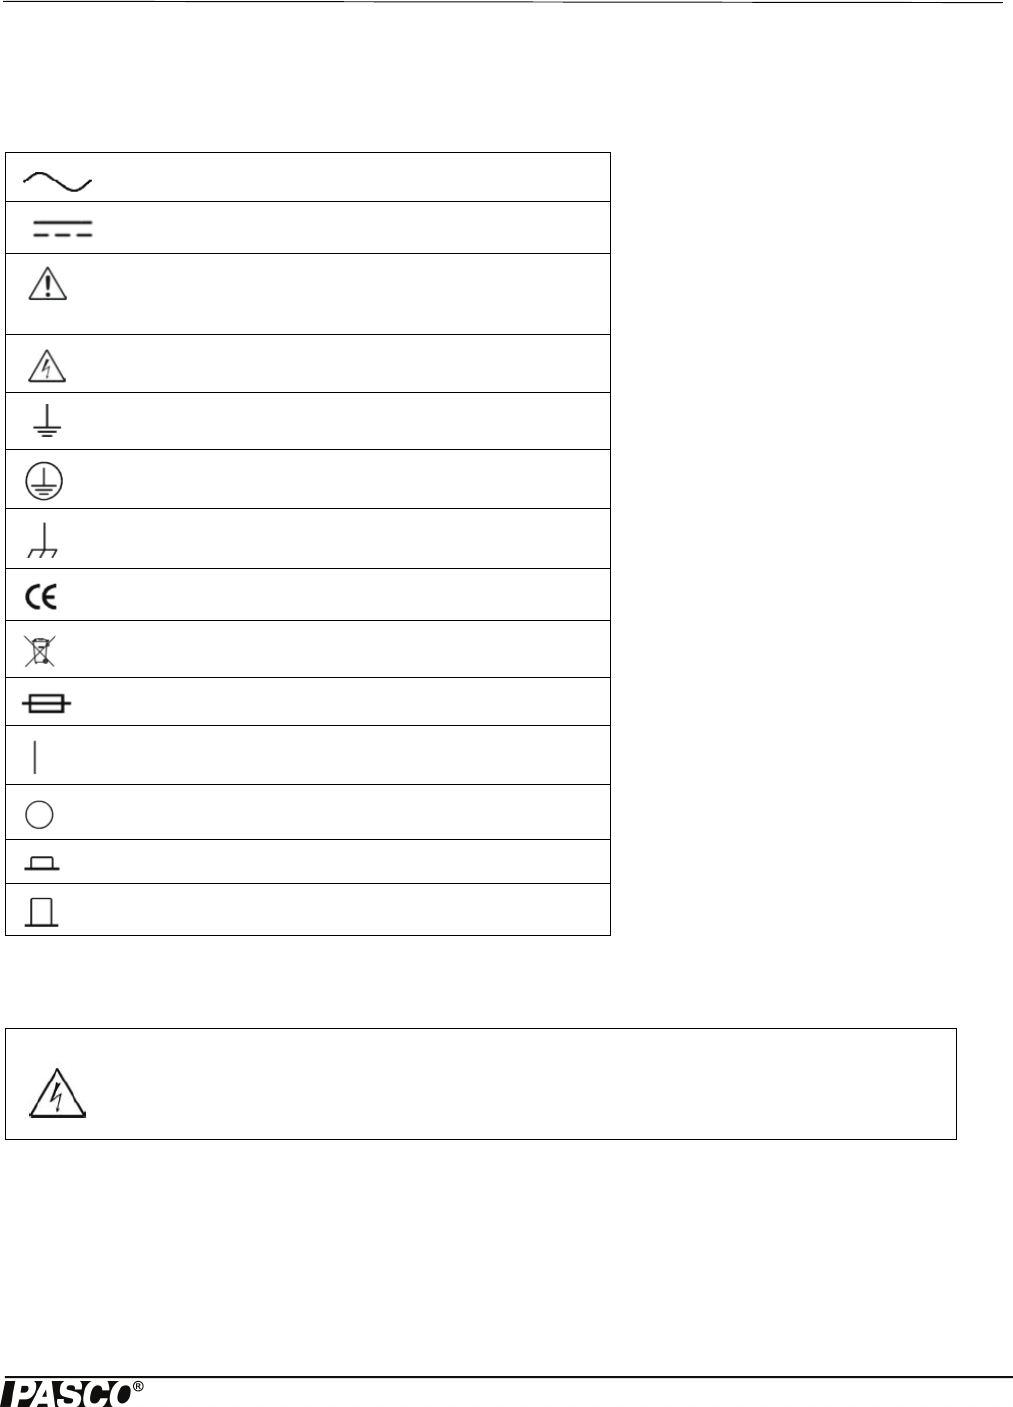
Electrical Symbols
Installation and Maintenance
Alternating Current
Direct Current
Caution, risk of danger, refer to the operating manual
before use.
Caution, possibility of electric shock
Earth (ground) Terminal
Protective Conductor Terminal
Chassis Ground
Conforms to European Union directives.
WEEE, waste electric and electronic equipment
Fuse
On (Power)
Off (Power)
In position of a bi-stable push control
Out position of a bi-stable push control
WARNING:
To reduce the risk of electric shock or damage to the instrument, turn the power switch off and
disconnect the power cord before replacing a tube.
SE-9639 Franck-Hertz Experiment
4012-14264A
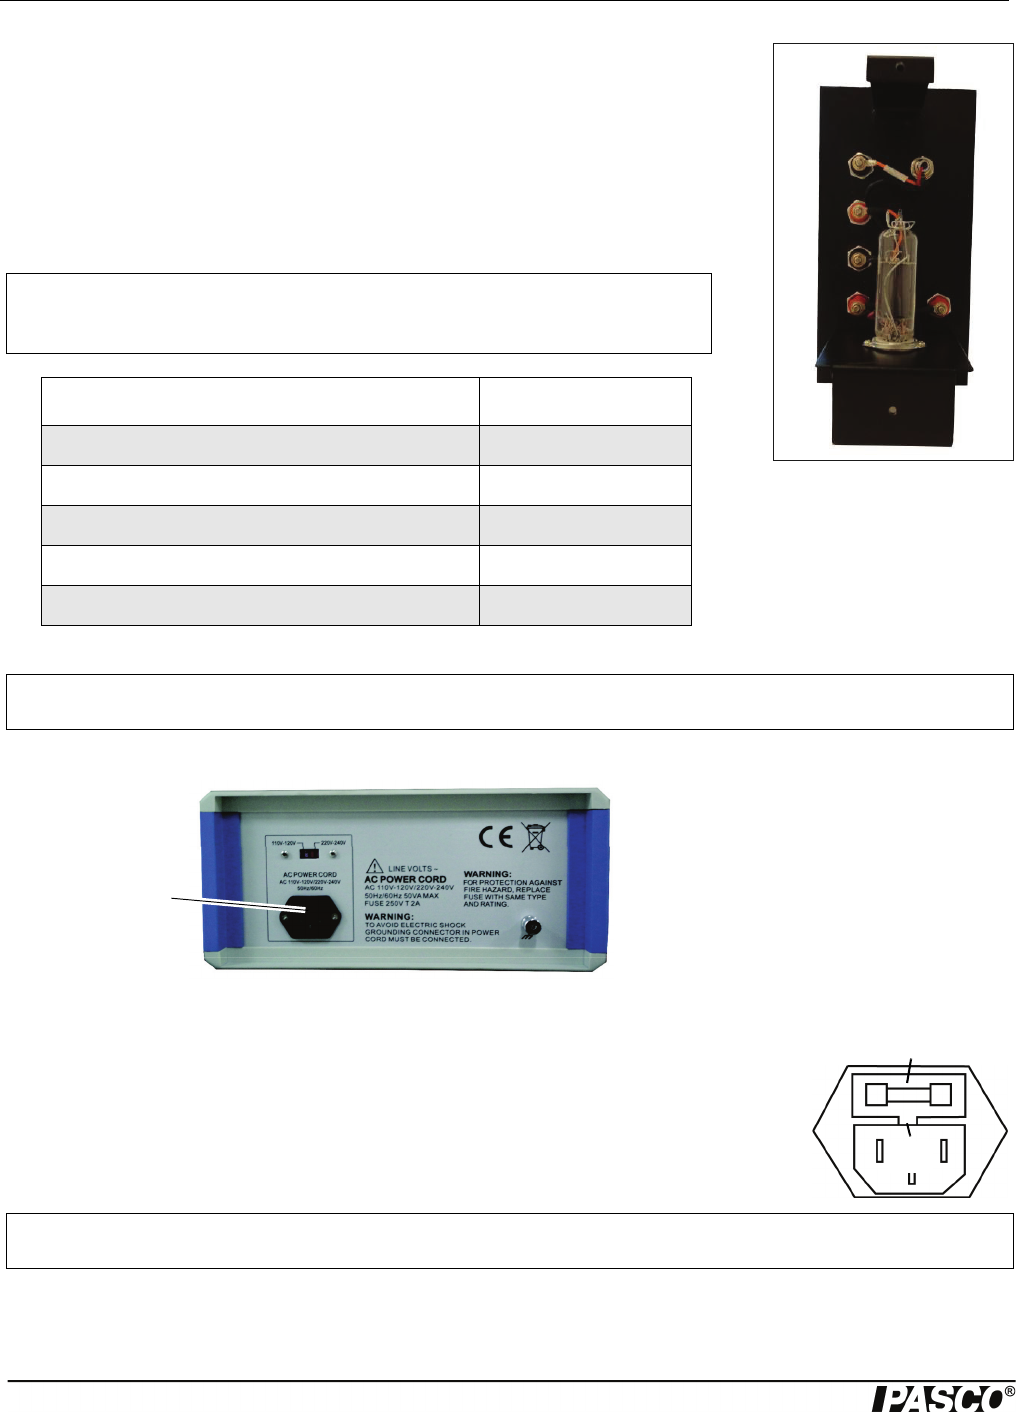
Replace the Argon Tube
• Use a flat-blade screwdriver to remove the two small screws that hold the back
plate onto the argon tube enclosure.
• Use a small flat-blade screwdriver to pry the back panel off of the enclosure.
• Pull up on the elastic pressing spring and rotate it off the argon tube.
• Gently pull out the argon tube.
• Then, install a new tube and replace the elastic pressing spring.
• Finally, close the case and replace the two small screws.
Fuse Replacement
• Disconnect the power cord from the instrument.
• Open the fuse cover and remove the fuse. (The fuse is inside a tray. Use a small
screwdriver or other tool to pry the tray open.)
• Replace the fuse(s). Use the same type of fuse (250 V T2A).
• Reconnect the power cord and turn on the instrument.
• If the problem persists, contact Brolight Corporation for service.
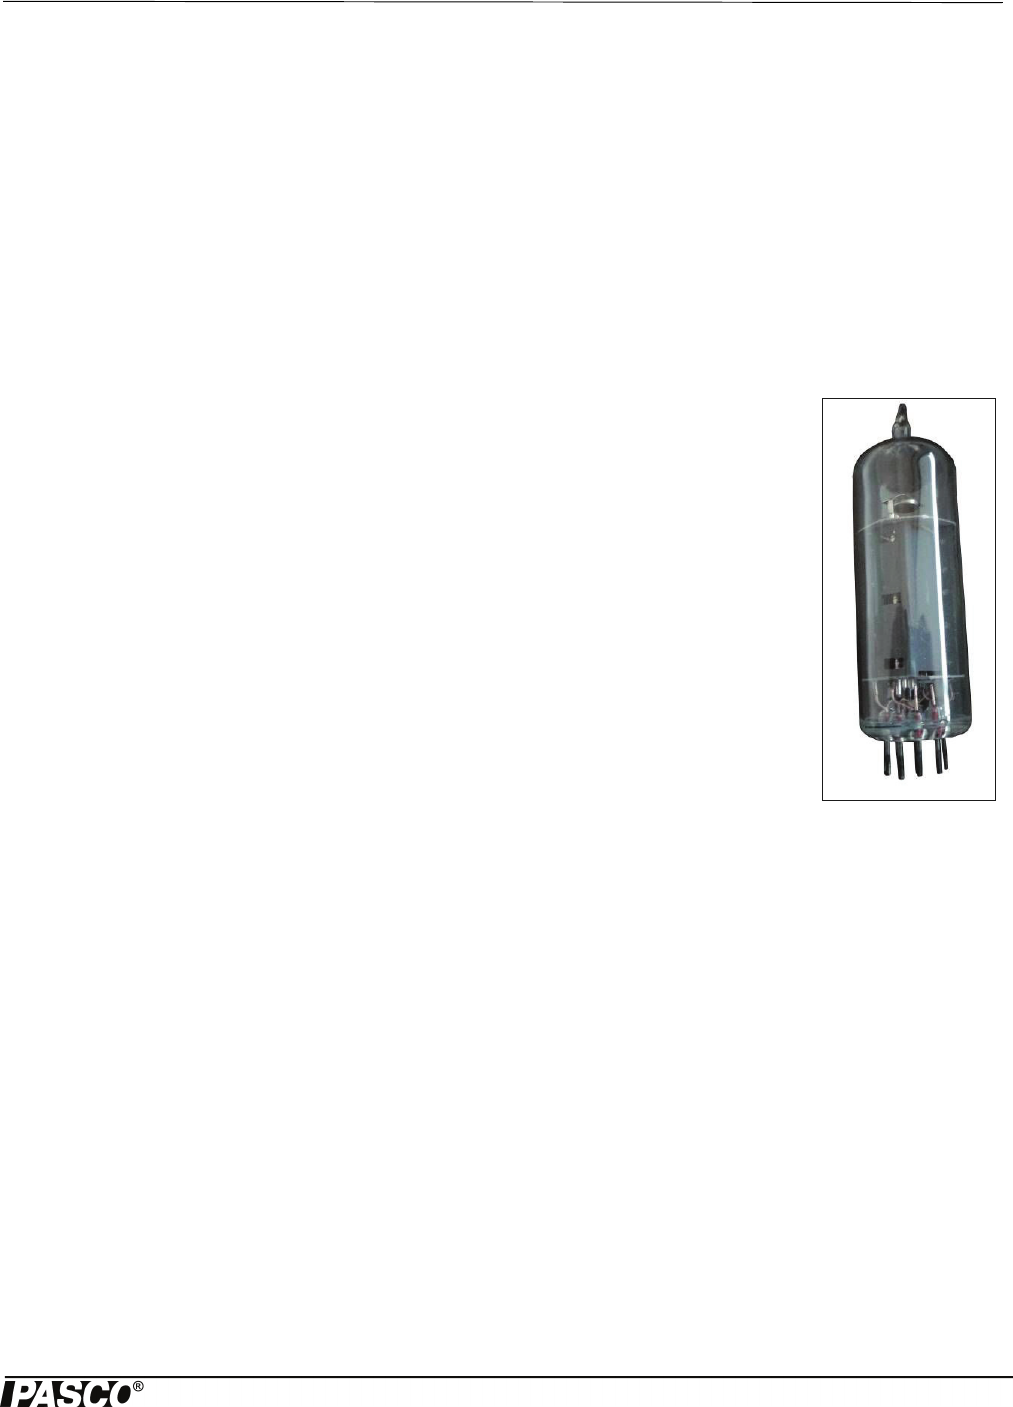
Argon Tube Specifications
Filling gas argon
Filament voltage 6.3 V DC
Accelerating voltage 100 V DC
Wave crest (or trough) number 6
Life span 2000 hours
•Note: The tube is a thin-walled, evacuated glass bulb. Handle with
care! Do not expose the tube to mechanical stress or strain.
Note: Replace the argon tube with the same type: Model SE-9645 Franck-Hertz Ar-Tube.
The fuse is inside a
tray. Open the
cover to remove
the fuse.
WARNING
To reduce the risk of electric shock or
damage to the instrument, turn the
power switch OFF and disconnect the
power cord before replacing a fuse.
Fuse Cover Tray
Pry
here
Note: Replace the burned fuses with new fuses of the same type. (One spare fuse is included.)
Franck-Hertz Experiment Introduction
5
012-14264A
Introduction
In 1914, James Franck and Gustav Hertz discovered in the course of their investigations an “energy loss in distinct steps
for electrons passing through mercury vapor”, and a corresponding emission at the ultraviolet line (-= 254 nm) of mer-
cury. As it is not possible to observe the light emission directly, demonstrating this phenomenon requires extensive and
cumbersome experiment apparatus. They performed this experiment that has become one of the classic demonstrations
of the quantization of atomic energy levels. They were awarded the Nobel Prize for this work in 1925.
In this experiment, we will repeat Franck and Hertz's energy-loss observations, using argon, and try to interpret the data
in the context of modern atomic physics. We will not attempt the spectroscopic measurements, since the emissions are
weak and in the extreme ultraviolet portion of the spectrum.
Principle of the Experiment
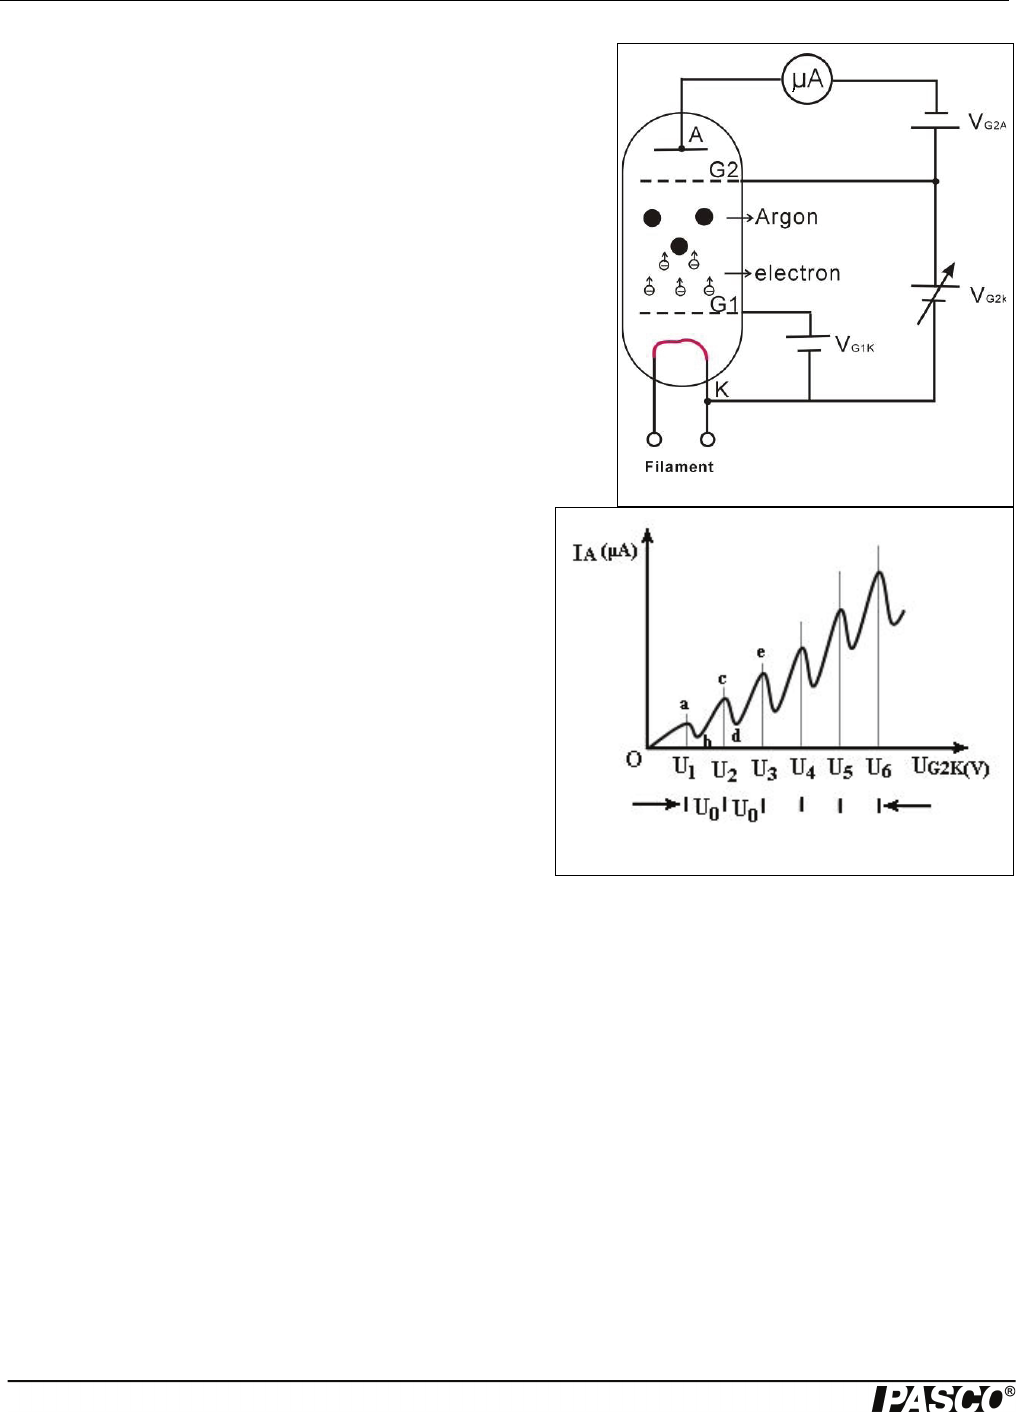
The Franck-Hertz tube is an evacuated glass cylinder with four electrodes (a “tetrode”) which
contains argon. The four electrodes are: an indirectly heated oxide-coated cathode as an electron
source, two grids G1 and G2 and a plate A which serves as an electron collector (anode A). Grid
1 (G1) is positive with respect to the cathode (K) (about 1.5 V). A variable potential difference is
applied between the cathode and Grid 2 (G2) so that electrons emitted from the cathode can be
accelerated to a range of electron energies. The distance between the cathode and the anode is
large compared with the mean free path length in the argon in order to ensure a high collision
probability. On the other hand, the separation between G2 and the collector electrode (A) is
small. A small constant negative potential UG2A (“retarding potential”) is applied between G2
and the collector plate A (i.e. A is less positive than G2). The resulting electric field between G2
and collector electrode A opposes the motion of electrons to the collector electrode, so that elec-
trons which have kinetic energy less than e•UG2A at Grid 2 cannot reach the collector plate A.
As will be shown later, this retarding voltage helps to differentiate the electrons having inelastic
collisions from those that don’t.
A sensitive current amplifier is connected to the collector electrode so that the current due to the
electrons reaching the collector plate may be measured. As the accelerating voltage is increased,
the following is expected to happen: Up to a certain voltage, say V1, the plate current IA will
increase as more electrons reach the plate. When the voltage V is reached, it is noted that the plate current, IA, takes a
sudden drop. This is due to the fact that the electrons just in front of the grid G2 have gained enough energy to collide
inelastically with the argon atoms. Having lost energy to the argon atom, they do not have sufficient energy to over-
come the retarding voltage between G2 and collector electrode A. This causes a decrease in the plate current IA. Now as
the voltage is again increased, the electrons obtain the energy necessary for inelastic collisions before they reach the
anode. After the collision, by the time they reach the grid, they have obtained enough energy to overcome the retarding
voltage and will reach the collector plate. Thus IA will increase. Again when a certain voltage V2 is reached we note
that IA drops. This means that the electrons have obtained enough energy to have two inelastic collisions before reach-
ing the grid G2, but have not had enough remaining energy to overcome the retarding voltage. Increasing the voltage
again, IA starts upward until a third value, V3, of the voltage is reached when IA drops. This corresponds to the elec-
trons having three inelastic collisions before reaching the anode, and so on. The interesting fact is that V3 - V2 equals
V2 - V1, etc., which shows that the argon atom has definite excitation levels and will absorb energy only in quantized
amounts.
SE-9639 Franck-Hertz Experiment
6012-14264A
When an electron has an inelastic collision with an argon atom, the kinetic
energy lost to the atom causes one of the outer orbital electrons to be
pushed up to the next higher energy level. This excited electron will within
a very short time fall back into the ground state level, emitting energy in
the form of photons. The original bombarding electron is again accelerated
toward the grid anode. Therefore, the excitation energy can be measured in
two ways: by the method outlined above, or by spectral analysis of the
radiation emitted by the excited atom.
Figure 2 displays a typical measurement of the anode current, IA, as
a function of the accelerating voltage. As soon as VG2K > VG2A the
current increases with rising VG2K. Notice that the current sharply
decreases for a voltage U1 and then increases up to U2, and then
this pattern recurs. The interpretation of these observations is suc-
cessful with the following assumptions:
• Having reached energy of about e•U0, electrons can transmit
their kinetic energy to a discrete excitement state of the argon
atoms.
• As a result of the inelastic collision, they pass the braking volt-
age.
• If their energy is twice the required value, or 2 e•U0, they can
collide two times inelastically and similarly for higher volt-
ages.
• As a matter of fact, a strong line can be found for emission and absorption corresponding to an energy of e•U0, the exci-
tation energy of argon, in the optical spectrum (108.1 nm).
In figure 2, the resonance voltage is denoted by U0.
e•U0 = hƒ = hc/-
or
where e is the charge on an electron, h is Planck’s Constant, and c is the speed of light.
Figure 1.1: Franck-Hertz tube
Figure 1.2: Anode current curve
he-U0
c
------
=
Franck-Hertz Experiment Connect Cables and Cords
7
012-14264A
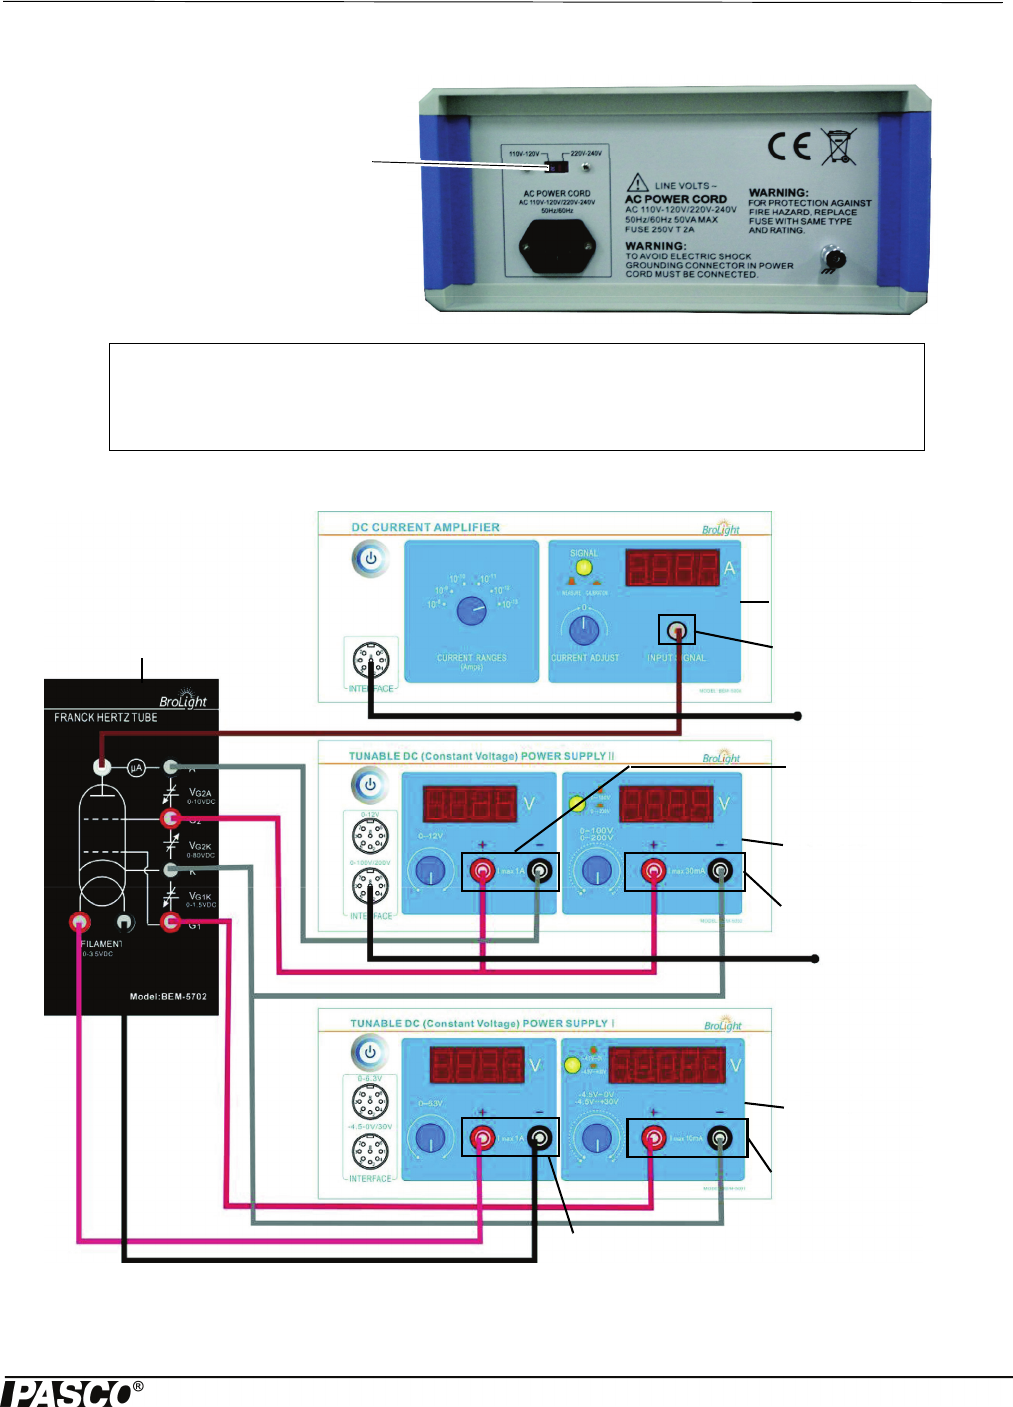
Connect Cables and Cords
See the next page for numbered instructions about connecting cables and cords.
110 - 120 V or 220 - 240 V
Please make sure that you select the
right setting according to your AC
voltage level.
Note: Before connecting any cords or cables, be sure that all power switches on the
Power Supplies and Current Amplifier are in the OFF position and all voltage con-
trols are turned fully counterclockwise.
SE-6621
Current Amplifier
Analog Port A
SE-9644
Power supply II
Analog Port B
SE-6615
Power Supply I
SE-9650
Argon Tube
Enclosure
1.
2.
100 V DC Output
12 V DC Output
2.
1.
3.
3.
4.
4.
5.
5.
-4.5 – +30 V DC Output
0 – 6.3 V DC Output

SE-9639 Franck-Hertz Experiment
8012-14264A
1. On the DC Current Amplifier, connect the special BNC-to-BNC cable between the port on the amplifier marked “INPUT
SIGNAL” and the port on the Argon Tube Enclosure marked “A”.
2. On Power Supply II, (SE-9644) connect the positive terminal of the 12 V DC output to the grid-like electrode labeled
“G2” (red sockets) on the Argon Tube Enclosure (SE-9650) and connect the negative terminal of the 12 V DC output to
the terminal labeled “A” (black sockets) on the enclosure.
3. On Power Supply II, connect the positive terminal of the 100 V DC output on the power supply to the grid-like electrode
labeled “G2” (red sockets) on the Argon Tube Enclosure and connect the negative terminal of the power supply to the ter-
minal labeled “K” (black sockets) on the enclosure.
4. On Power Supply I (SE-6615), connect the positive terminal of the -4.5 – +30 V DC output on the power supply to the
grid-like electrode labeled “G1” on the Argon Tube Enclosure and connect the negative terminal of the power supply to
the terminal labeled “K” (black sockets) on the enclosure,
5. On Power Supply I, connect the positive terminal of the 0 – 6.3 V DC output on the power supply to the red socket of the
port labeled “FILAMENT” on the Argon Tube enclosure and connect the negative terminal of the power supply to the
black socket of the “FILAMENT” port.
•Note: Before connecting the power cords, please check that the setting for the input voltage range (110 – 120 V or 220 –
240 V) matches the local AC voltage. For the two power supplies and the current amplifier, connect a power cord between
the port on the back labeled “AC POWER CORD” and an appropriate electrical outlet.
Cables and Cords Specification
Power Cord Length: 1.5 m, 16 A / 250 V
Connecting Cable, Red (EM-9740) Length: 0.85 m, 10 A / 300 V
Connecting Cable, Black (EM-9745) Length: 0.85 m, 10 A / 300 V
BNC-to-BNC Cable Length: 1.0 m, 1 A / 300 V
DANGER:
High Voltage is applied to the Argon Tube. Avoid contact with any part of the body.
• Only use safety equipment leads (shrouded patch cords) for connections.
• Make sure that the power supplies and current amplifier are OFF before making the connections.
• Make sure that the power supplies and current amplifier are OFF before installing or replacing
the argon tube in the Argon Tube Enclosure
Note: Replace the cables and power cords with the same type.
Franck-Hertz Experiment Tunable DC (Constant Voltage) Power Supply I
9
012-14264A
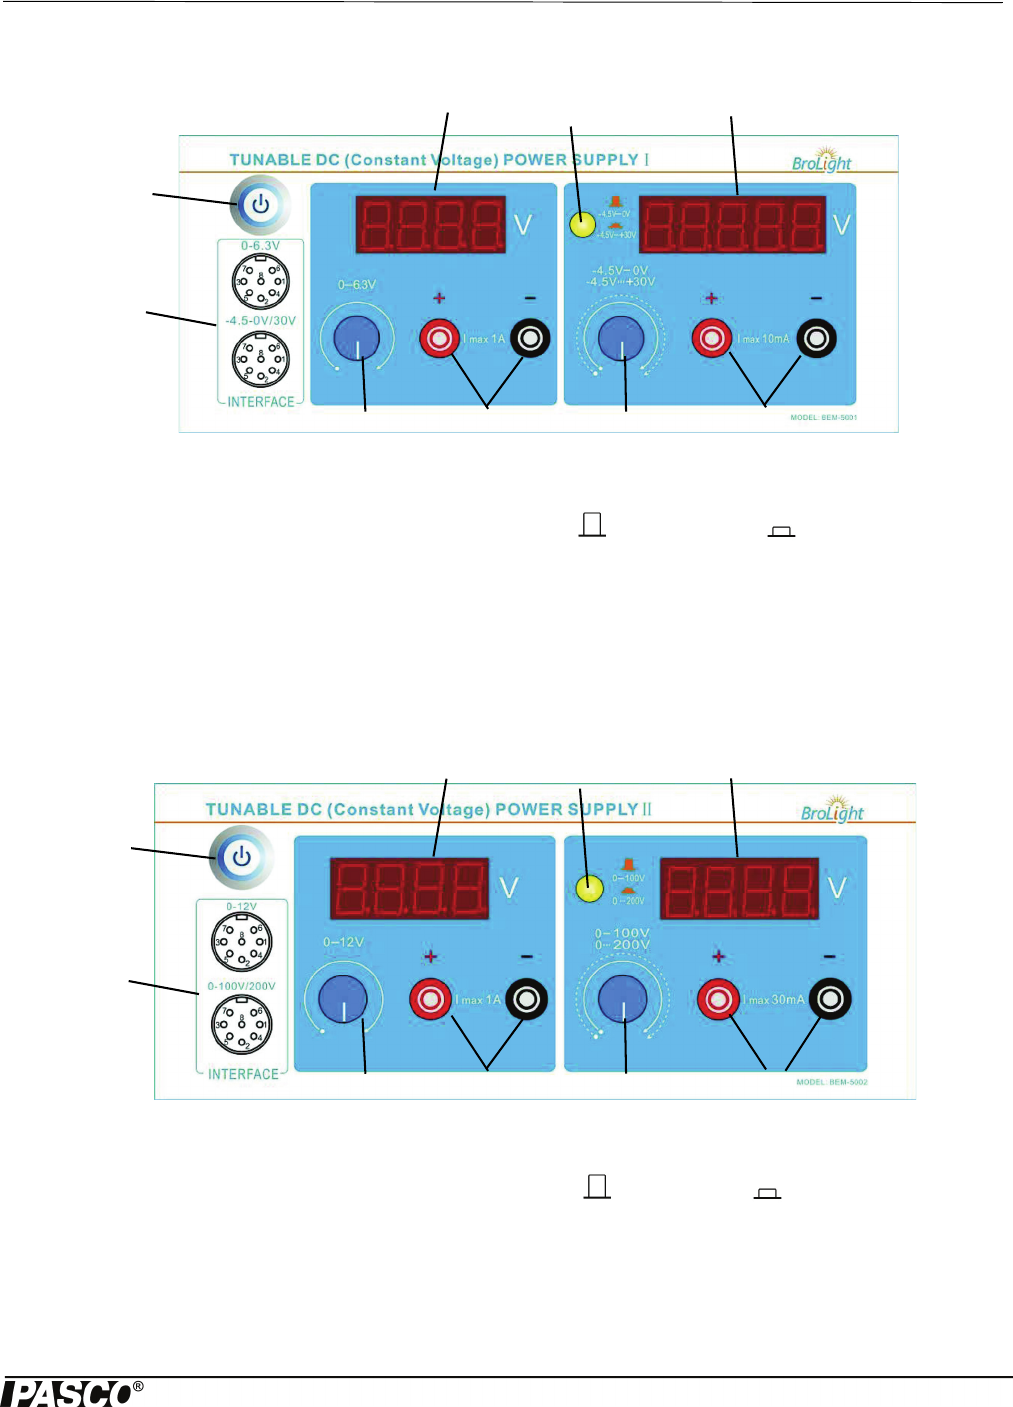
Tunable DC (Constant Voltage) Power Supply I
• Voltmeter: Displays voltage across the argon tube.
• Voltage Range Switch: Sets the voltage range as -4.5 – 0 V ( ) or -4.5 – +30 V ( ).
• Power Switch: Turns the power to the instrument ON or OFF.
• Voltage Adjust: Sets the voltage across the argon tube.
• Output: Output power.
• Data Interface: Connect to the analog channels of the PASCO 850 Universal Interface.
Tunable DC (Constant Voltage) Power Supply II
• Voltmeter: Displays voltage across the argon tube.
• Voltage Range Switch: Sets the voltage range as 0 to 100 V ( ) or 0 to 200 V ( ) for the accelerating volt-
age.
• Power Switch: Turns the power to the instrument ON or OFF.
• Voltage Adjust: Sets the voltage for both voltage ranges.
Power
Switch
PASCO 850
Universal
Interface
Ports
Voltmeter Voltmeter
Voltage
Adjust
Voltage
Adjust
Voltage Range
Switch
Output
0 – 6.3 V
Output
-4.5 – 0 V
-4.5 – +30 V
Power
Switch
PASCO 850
Universal
Interface
Ports
Voltmeter Voltmeter
Voltage
Adjust
Voltage
Adjust
Voltage Range
Switch
Output
0 – 12 V
Output
0 – 100 V
0 – 200 V
SE-9639 Franck-Hertz Experiment
10 012-14264A
• Output: Output power.
• Data Interface: Connect to the analog channels of the PASCO 850 Universal Interface.
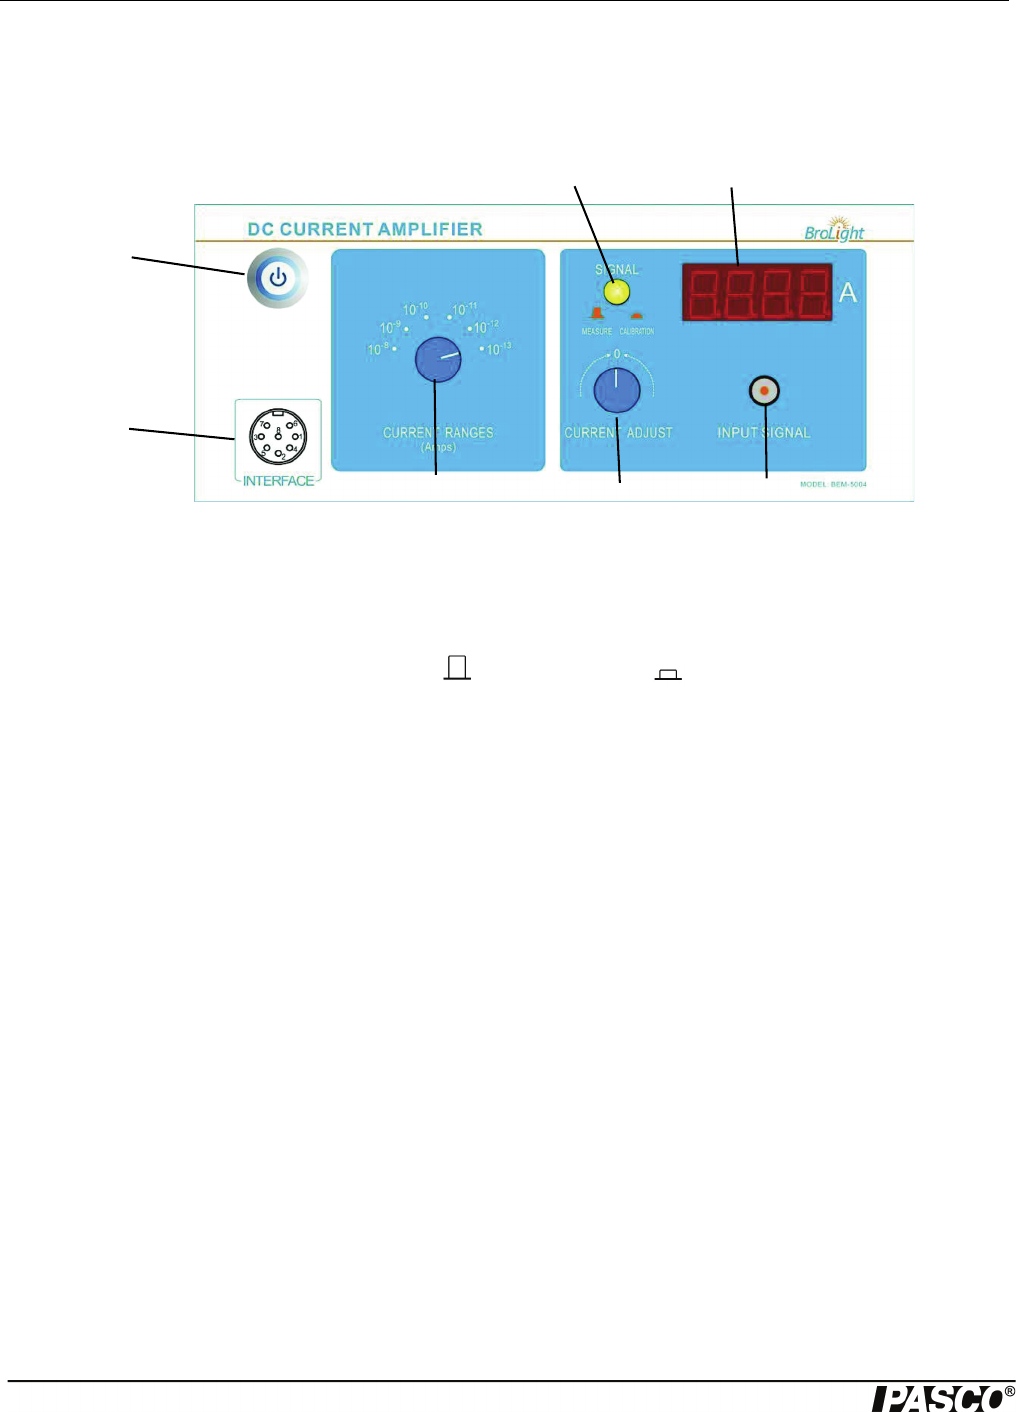
DC Current Amplifier
• Power Switch: Turns the power to the instrument ON or OFF.
• Data Interface: Connect to the analog channels of the PASCO 850 Universal Interface.
• Current Range Switch: Sets the current range for the instrument’s current amplifier (10-8 to 10-13 A).
• Signal Switch: Sets the signal to MEASURE ( ) or CALIBRATION ( ).
• Current Adjust: Sets the current through the instrument to zero.
• Ammeter: Displays the current through the argon tube.
• Input Signal: Input current signal.
Power
Switch
PASCO 850
Universal
Interface
Port
Ammeter
Current Ranges
Switch
Current
Adjust
Signal Switch
Input Signal

Franck-Hertz Experiment Experiment Procedure 1
11
012-14264A
Experiment Procedure 1
Adjust Operating Voltages
1. Connect all the cables and cords as shown in the section “Connect Cables and Cords” (page 7).
2. On the Tunable DC (Constant Voltage) Power Supply I, Tunable DC (Constant Volt-
age) Power Supply II, and the DC Current Amplifier, push in the Power Switch to the
ON position.
3. On the DC Current Amplifier, turn the CURRENT RANGES switch to 10-10 A. To set
the current amplifier to zero, press the SIGNAL button in to CALIBRATION. Adjust
the CURRENT CALIBRATION knob until the current reads zero. Press the SIGNAL
button to MEASURE.
4. On the DC (Constant Voltage) Power Supply I, set the Voltage Range switch to -4.5 –
+30 V. On Power Supply II, set the Voltage Range switch to 0 – 100 V.
5. On Power Supply I, rotate the 0 – 6.3 V adjust knob until the voltmeter reads 3.5 V. This sets VH = 3.5 V (Filament Volt-
age). Note: The Argon Tube Enclosure may have a different suggested filament voltage. If so, use it instead of 3.5 V.
6. On Power Supply I, rotate the -4.5 – +30 V adjust knob until the voltmeter reads 1.5 V. This sets VG1K = 1.5 V (the volt-
age between the first grid and the cathode)
7. Rotate the 0 – 12 V adjust knob until the voltmeter reads 10.0 V to set VG2A = 10.0 V (Retarding voltage).
8. Rotate the 0 – 100 V adjust knob until the voltmeter reads 0 V. This sets VG2K = 0 V (Accelerating voltage).
9. Remember, allow the argon tube and the apparatus to warm up for 15 minutes.
10. When you have finished the above steps, check that VH = 3.5 V (Filament voltage), VG1K = 1.5 V (the voltage between
the first grid and cathode), and VG2A = 10.0 V (voltage between the second grid and anode – “retarding voltage”). If so,
the equipment is ready to do the experiment. Note: These are suggested settings for the experiment, but other values could
be tried. You can do the experiment by parameters that are marked on the Argon Tube Enclosure.
Note: Before switching on the power, be sure that all voltage controls are
turned fully counterclockwise.
NOTE: It is very important to
allow the argon tube and
apparatus to warm up for 15
minutes prior to making any
measurements.

SE-9639 Franck-Hertz Experiment
12 012-14264A
Manual Measurements
1. Increase the accelerating voltage VG2K by a small amount (for example, 1 V). Record the new accelerating voltage VG2K
(value read on voltmeter) and current IA (read on “Ammeter”) in Table 1:1. Continue to increase the voltage by the same
small increment and record the new voltage and current each time in Table 1:1. Stop when the accelerating voltage VG2K
= 85V. (If the current IA exceeds the range, reduce the filament voltage (for example, 0.1V) and start over again.)
2. Try to identify the “peak positions”, i.e. watch for those values of the accelerating voltage VG2K for which the current
reaches a local maximum and begins to drop on further increase of the accelerating voltage. Take a few data points (VG2K,
IA) around these peak positions and record them in Table 1:2. Try to identify the “valley positions”, i.e. watch for those
values of the accelerating voltage VG2K for which the current reaches a local minimum and begins to rise on further
increase of the accelerating voltage. Take a few data points (VG2K, IA) around these valley positions and record them in
Table 1:2.
3. Take sufficiently many voltage values so as to allow you to determine the positions of the peaks and valleys.
Table 1.1: Accelerating Voltage and Tube Current
Table 1.2: Peak and Valley Voltages
Analysis
1. Plot the graphs of Current (y-axis) versus Voltage (x-axis).
VG2K (V)
IA (x 10-10 A)
V1V2V3V4V5V6
Peak
positions
VG2K (V)
IA (x 10-10 A)
Valley
positions
VG2K (V)
IA (x 10-10 A)
Note:
• During the experiment, pay attention to the output current ammeter when the voltage is over 60 V. If
the ammeter’s reading increases suddenly, decrease the voltage at once to avoid the damage to the
tube.
• If you want to change the value of VG1K, VG2A and VH during the experiment, rotate the “0 ~ 100 V”
adjust knob fully counter-clockwise before making the changes.
• The filament voltage is tunable from 0 to 6.3V. If the anode output current is too high and causes the
amplifier to overflow, the filament voltage should be decreased.
• As soon as you have finished the experiment, return the VG2A voltage to 0 V to prolong the life of the
argon tube.

Franck-Hertz Experiment Questions
13
012-14264A
2. Find the peak (or valley) positions which match the accelerating voltages labeled “V1, V2, V3, V4, V5, and V6”.
3. Obtain the value of argon atom’s first excitation potential (V0).
4. Calculate the value of Planck’s Constant, h:
where e = 1.602 x 10⁻¹⁹ C, - = 108.1 nm, and c = 3 x 10⁸ m/s.
5. Calculate the percent difference between the experimental value and the accepted value (h0 =6.626 x 10⁻³⁴ J•s)
h = | (h - h0) / h0 | x 100% =
Questions
1. Should you use the positions of the peaks or of the valleys to determine the excitation energy? Or both? Explain.
2. Why are the peaks and valleys smeared out rather than sharp?
3. How precisely can you determine the peak/valley position? Explain and justify your estimates.
4. How would molecular contaminants in the tube affect your results?
V0
V2V1
–V3V2
–V4V3
–V5V4
–V6V5
–++++
5
----------------------------------------------------------------------------------------------------------------------------------------------------
=
he-V0
c
------
=
SE-9639 Franck-Hertz Experiment
14 012-14264A
Experiment Procedure 2
Using a PASCO Interface and Data Acquisition Software
Items Needed
*See the PASCO web site at www.pasco.com for more information
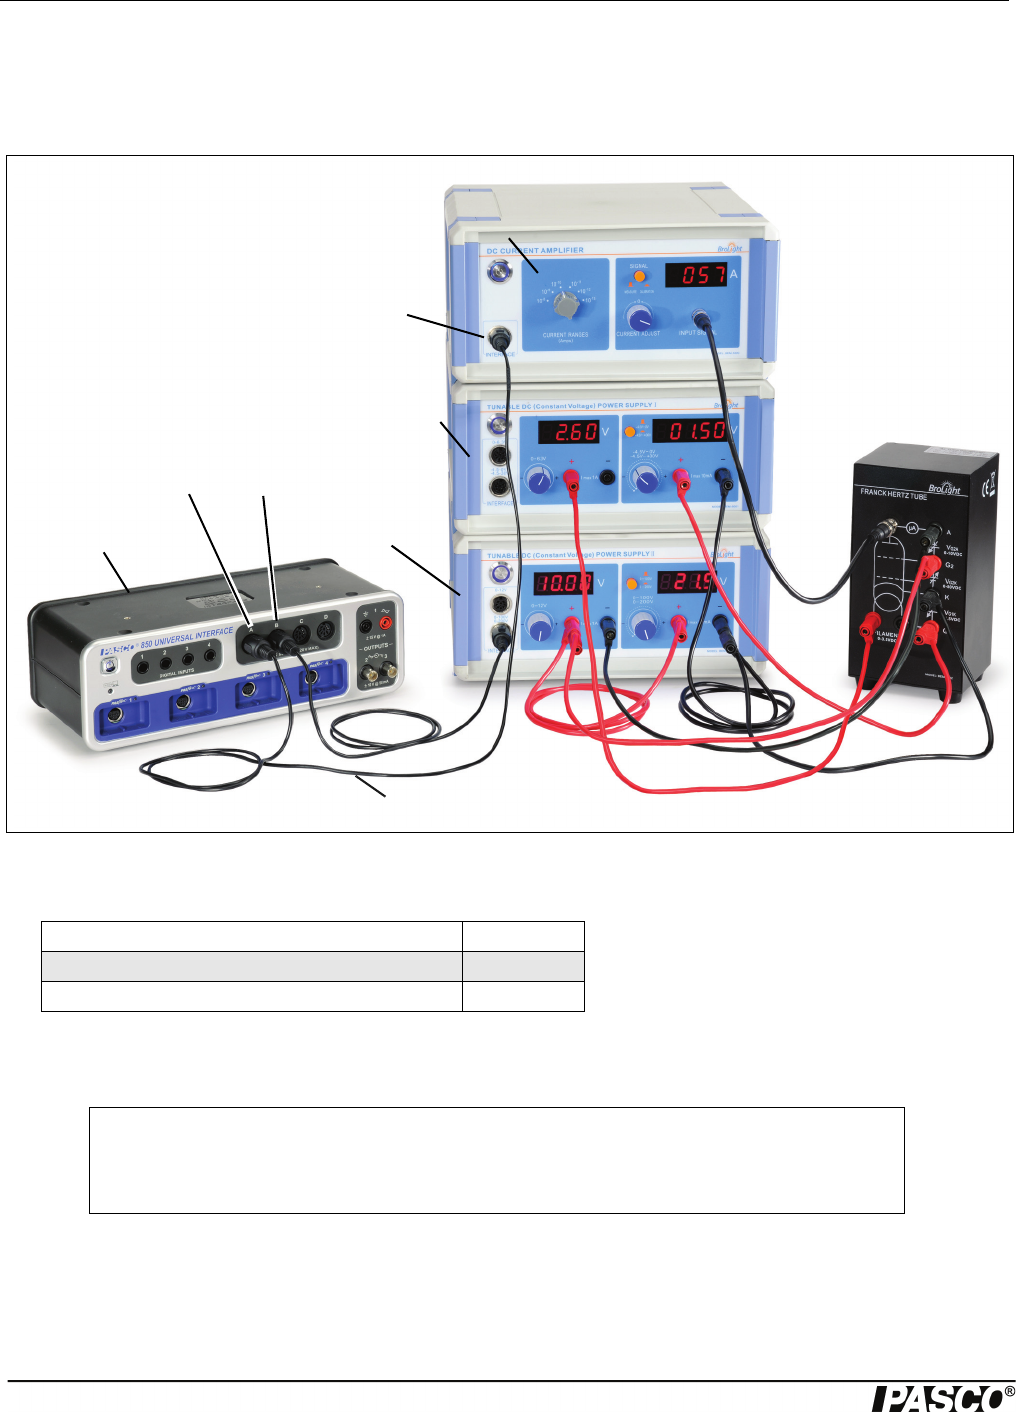
Hardware Setup: Connect Cables and Cords
1. Connect all the cables and cords between the argon tube enclosure and the power supplies and current amplifier.
2. Connect one 8-pin DIN Extension Cable (UI-5218) from the INTERFACE port on the DC Current Amplifier to ANA-
LOG INPUT A on the Universal Interface (UI-5100).
Item* Quantity
850 Universal Interface (UI-5000) 1
PASCO Capstone Software (UI-5400) 1
850 Universal
Interface Power Supply II
Current Amplifier
Power Supply I
Argon Tube
Enclosure
Analog
Input A
Analog
Input B
Interface Port
8-pin DIN Extension Cable
Note: Before connecting any cords or cables, be sure that all power switches on the
Interface, Power Supplies, and Current Amplifier are in the OFF position and all volt-
age controls are turned fully counterclockwise.

Franck-Hertz Experiment Software Setup
15
012-14264A
3. Connect a second 8-pin DIN Extension Cable from the 0 - 100V / 0 - 200V INTERFACE port on Power Supply II to
ANALOG INPUT B on the Universal Interface.
4. Turn ON the power for the Universal Interface, the power supplies, and the current
amplifier.
5. On the DC Current Amplifier, turn the CURRENT RANGES switch to 10-10 A. To set
the current amplifier to zero, press the SIGNAL button in to CALIBRATION. Adjust
the CURRENT CALIBRATION knob until the current reads zero. Press the SIGNAL
button to MEASURE.
6. On the DC (Constant Voltage) Power Supply I, set the Voltage Range switch to -4.5 –
+30 V ( ). On Power Supply II, set the Voltage Range switch to 0 – 100 V ( ).
7. On Power Supply I, rotate the 0 – 6.3 V adjust knob until the voltmeter reads 3.5 V.
This sets VH = 3.5 V (Filament Voltage). Note: The Argon Tube Enclosure may have a different suggested filament volt-
age. If so, use it instead of 3.5 V.
8. On Power Supply I, rotate the -4.5 – +30 V adjust knob until the voltmeter reads 1.5 V. This sets VG1K = 1.5 V (the volt-
age between the first grid and the cathode)
9. Rotate the 0 – 12 V adjust knob until the voltmeter reads 10.0 V to set VG2A = 10.0 V (Retarding voltage).
10. Rotate the 0 – 100 V adjust knob until the voltmeter reads 0 V. This sets VG2K = 0 V (Accelerating voltage).
11. Remember, allow the argon tube and the apparatus to warm up for 15 minutes.
12. When you have finished the above steps, check that VH = 3.5 V (Filament voltage), VG1K = 1.5 V (the voltage between
the first grid and cathode), and VG2A = 10.0 V (voltage between the second grid and anode – “retarding voltage”). If so,
the equipment is ready for the experiment. Note: These are suggested settings for the experiment, but other values could
be tried. You can do the experiment by parameters that are marked on the Argon Tube Enclosure.
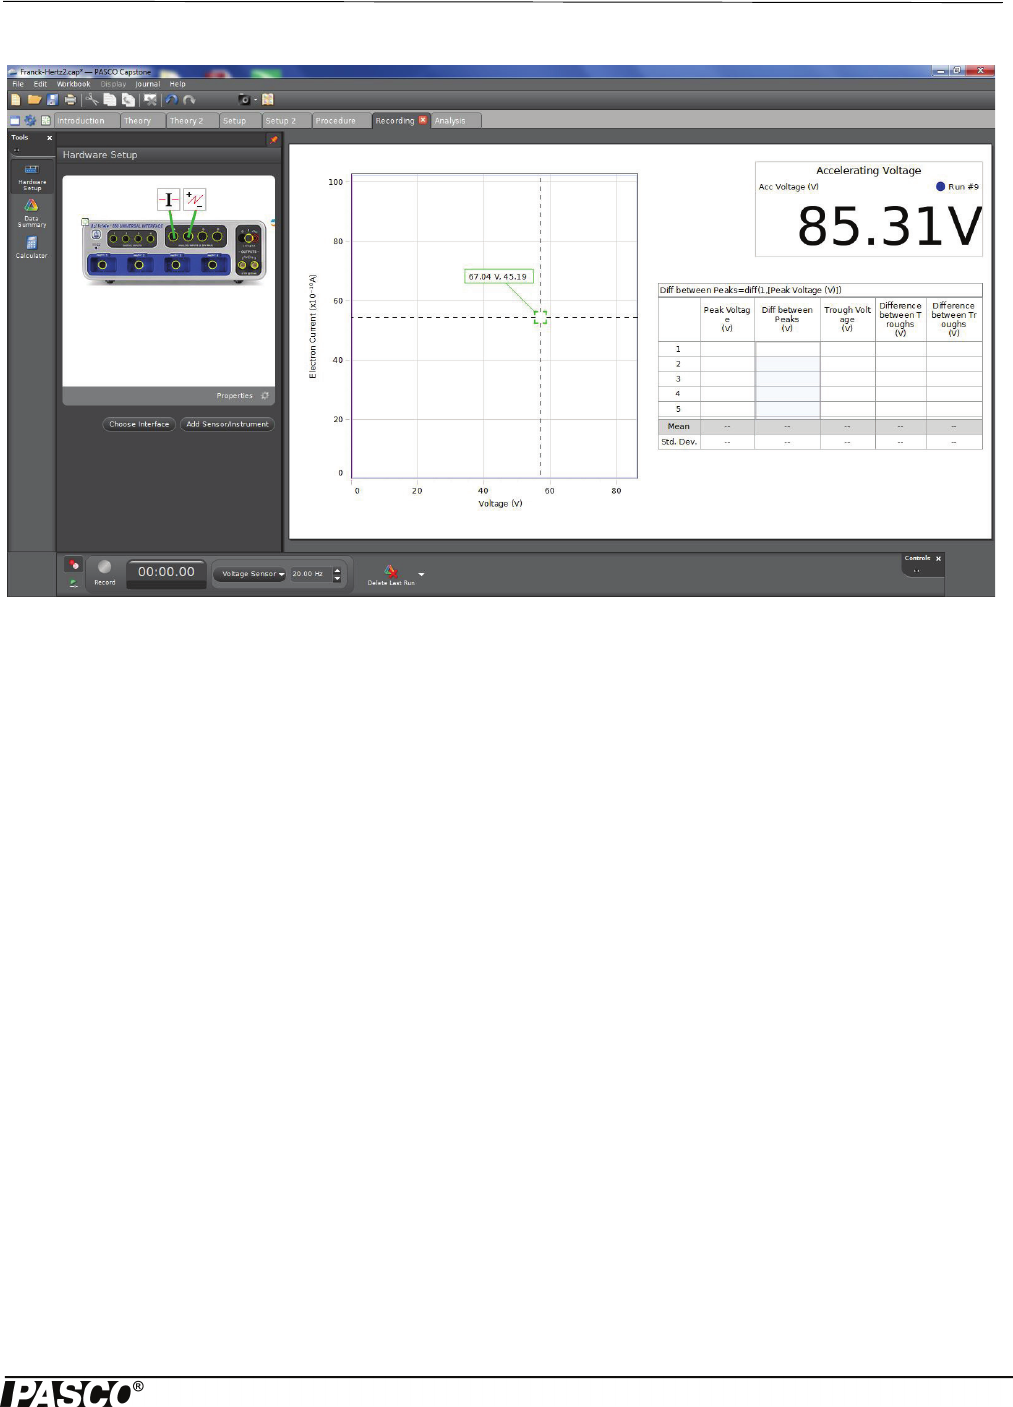
Software Setup
1. Start the PASCO Capstone software.
2. The current is a very small number, so to make the current to appear as a number between zero and 100 on the graph, cre-
ate a calculation:
•Electron Current = [Current, Ch A (A)] x 10^10 with units of (x 10^-10 A)
3. Create a graph of “Electron Current” vs. Voltage.
4. Create a digits display of the Voltage. This will clearly show you the accelerating voltage so you can monitor it to make
sure that you do not exceed 85 V.
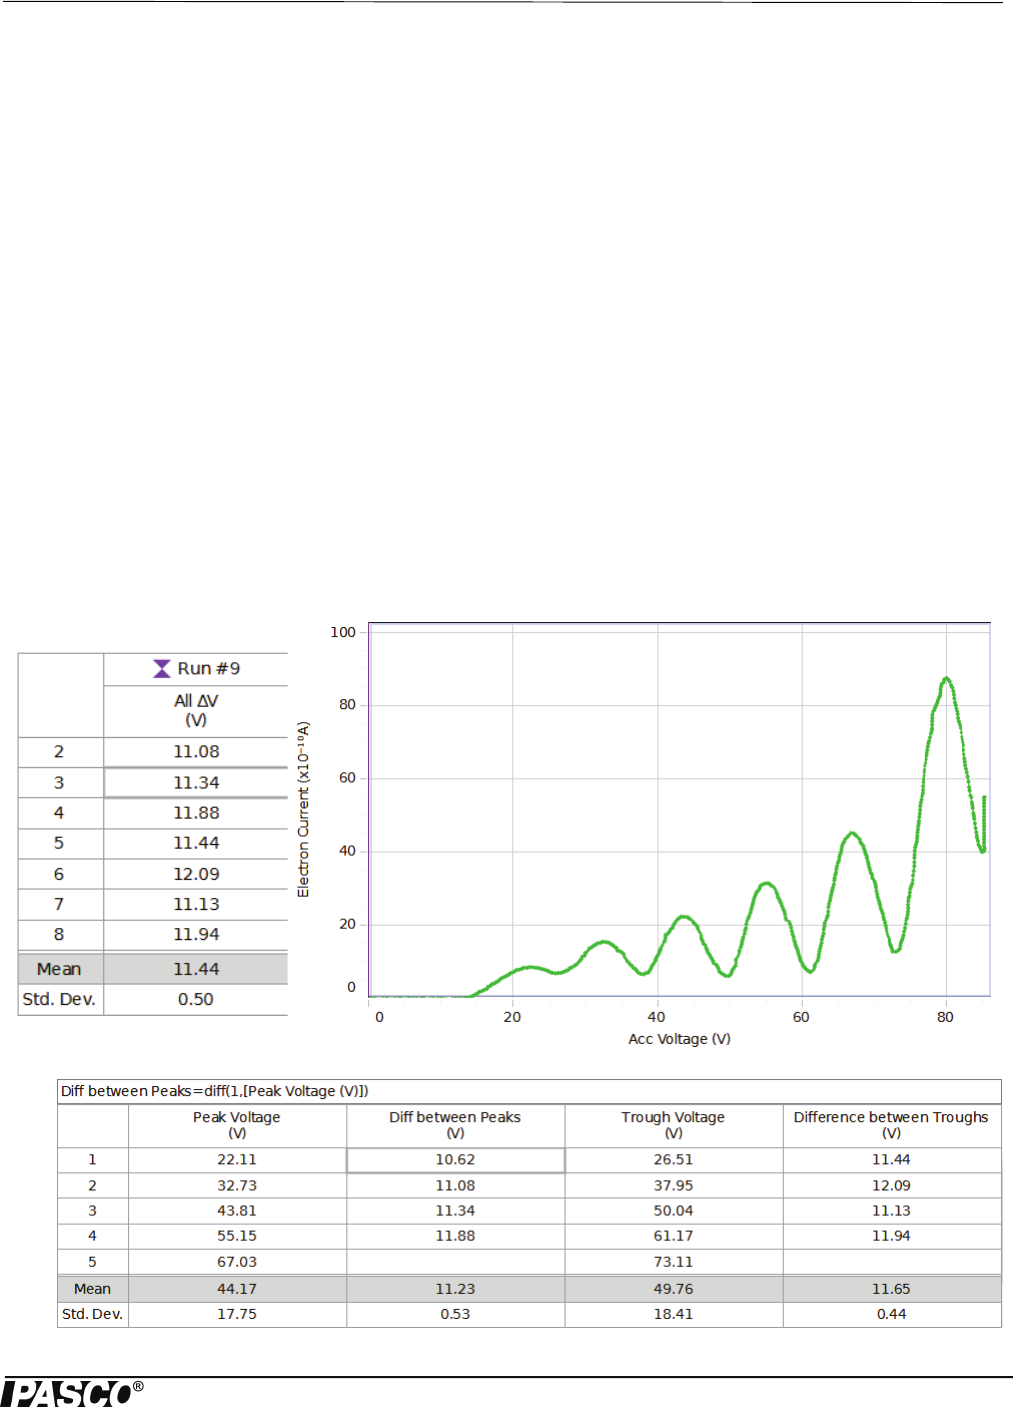
5. Create a table and create Run-tracked User-Entered Data called Peak Voltage with units of (V).
6. In the second column of the table, create a calculation:
•Diff between Peaks = diff(1,[Peak Voltage (V)]) with units of (V)
(This calculation calculates the voltage difference between adjacent current peaks.)
7. Add a column and create Run-tracked User-Entered Data called Trough Voltage with units of (V).
8. In the fourth column of the table, create a calculation:
NOTE: It is very important to
allow the argon tube and
apparatus to warm up for 15
minutes prior to making any
measurements.

SE-9639 Franck-Hertz Experiment
16 012-14264A
•Diff between Peaks = diff(1,[Trough Voltage (V)]) with units of (V)
(This calculation calculates the voltage difference between adjacent current troughs.)
9. In the table, turn on the mean and standard deviation.
Recording Data
1. Make sure the accelerating voltage VG2K is zero.
2. After the filament has warmed up for about 15 minutes, click Record and slowly increase the accelerating voltage (take
about two minutes). Do not exceed 85 V.
CAUTION: While you are increasing the voltage, if you see the current suddenly increase, immediately
return the voltage to zero and decrease the filament voltage slightly, Wait for a few minutes for it to cool,
and repeat the recording.
Analysis
1. Using the coordinates tool on the graph, find the voltage of each of the peaks and troughs and record them in the table in
the Peak Voltage and Trough Voltage columns respectively.
2. The voltage differences between adjacent peaks and the voltage differences between adjacent troughs will be calculated
automatically in the table. Record the mean and standard deviations for the differences. The standard deviations give
the uncertainties in the difference measurements.
3. Use the mean voltage difference (V0) to calculate the value of Planck's Constant, h:
where e = 1.602 x 10⁻¹⁹ C, - = 108.1 nm and c = 3 x 10⁸ m/s. The answer will be in J•s.
4. Calculate the percent difference between the experimental value and the accepted value (ho = 6.626 x 10⁻³⁴ J•s).
5. Estimate the uncertainty in the experimental value of Planck's Constant using the uncertainty in the voltage difference.
he-V0
c
------
=
Franck-Hertz Experiment Analysis
17
012-14264A

SE-9639 Franck-Hertz Experiment
18 012-14264A
Appendix A: General Specifications
Item Description
Supply voltage: 110 – 120 V or 220 – 240 V
Supply voltage fluctuations: ±10%
Fuse protection for inputs: 250 V T2A
Display: 3-1/2 or 4-1/2 digit display
Using site: Indoor use
Temperature: Operating: 0°C to 40°C, Storage: -20°C to 50°C
Relative humidity: Noncondensing < 10°C, 90% from 10°C to 30°C, 75% from 30°C to 40°C
Pollution degree: 2
Certifications CE
Safety compliance: IEC/EN 61010-1
Overvoltage category: II
Degree of protections: IP20
Normal energy protection: 5 J
Item Description
Tunable DC (Constant Voltage)
Power Supply I
0~6.3 V DC, I 1A (ripple < 1%), 3.5 Digit Display;
-4.5~0 V DC / -4.5~30 V DC (ripple < 1%) (Two ranges),
I 10mA, 4.5 Digit Display;
Tunable DC (Constant Voltage)
Power Supply II
0~12 V DC, I 1A (ripple < 1%), 3.5 Digit Display;
0~100 V DC / 0~200 V DC (ripple < 1%) (Two ranges),
I 30mA, 3.5 Digit Display
DC Current Amplifier Current range: 10-8~10-13 A, in six ranges, 3.5 Digit Display;
Zero drift ±1% of full range reading in 30 minutes at the
range of 10-13 A (after a 20 minute warm-up)
Argon Tube Filling gas: argon
Filament voltage: 6.3V DC
Accelerating voltage: 100 V DC
Wave crest (or trough) number: 6
Life span: 2000 hours

Franck-Hertz Experiment Appendix B: Teacher’s Notes
19
012-14264A
Appendix B: Teacher’s Notes
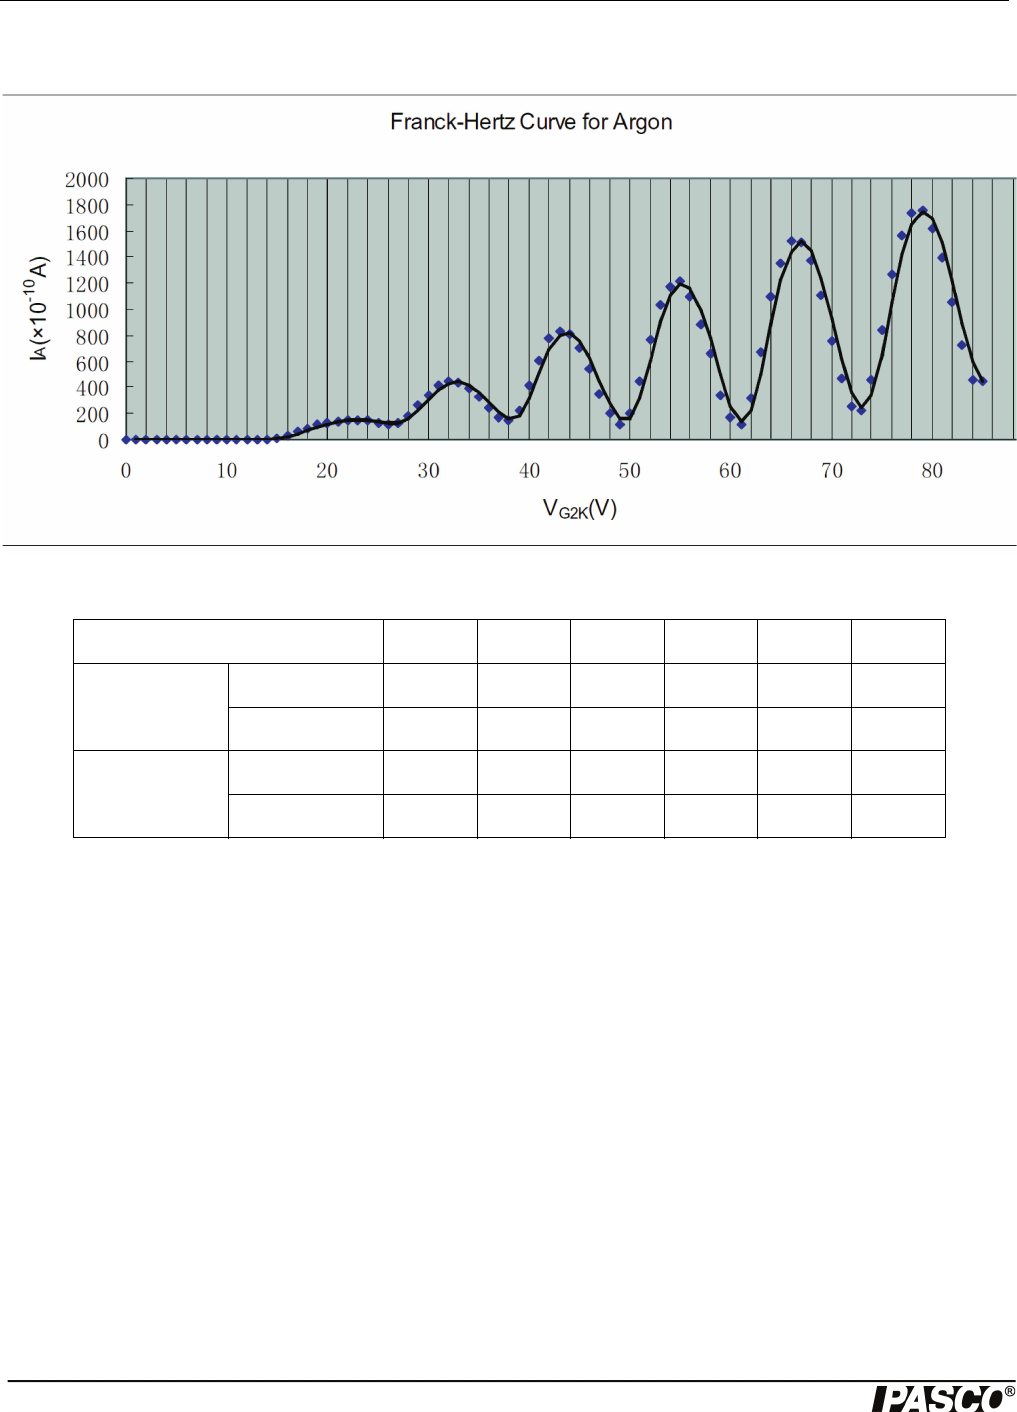
Sample Data 1: Manual Measurements
Filament voltage (V) = 3.55 V
VG1K = 1.5 V
VG2A = 11.0 V
Table 1: Accelerating Voltage and Tube Current
VG2K (V) 12345678910
IA (x 10-10 A) 0000000000
VG2K (V) 11121314151617181920
IA (x 10-10 A) 0 0 1 5 14 32 59 81 112 128
VG2K (V) 21 22 23 24 25 26 274 28 29 30
IA (x 10-10 A) 143 153 153 145 130 118 131 183 270 343
VG2K (V) 31323334353637383940
IA (x 10-10 A) 413 448 441 391 332 243 173 145 220 417
VG2K (V) 41424344454647484950
IA (x 10-10 A) 609 772 825 806 702 547 352 199 113 197
VG2K (V) 51525354555657585960
IA (x 10-10 A) 446 771 1032 1174 1216 1101 883 660 343 167
VG2K (V) 61626364656667686970
IA (x 10-10 A) 118 323 671 1093 1351 1522 1514 1369 1104 756
VG2K (V) 71727374757677787980
IA (x 10-10 A) 468 260 227 456 842 1270 1561 1730 1760 1621
VG2K (V) 8182838485
IA (x 10-10 A) 1395 1055 727 460 443
SE-9639 Franck-Hertz Experiment
20 012-14264A
Table 2: Peak and Valley Voltages
Analysis
Obtain the value of argon atom’s first excitation potential (V0):
V0(peak) = (V6- V1)/5 = 11.3 V;
V0(valley) = (V6- V1)/5 = 12.0 V;
Therefore: V0 = 11.65 V;
Calculate the value of Planck’s Constant, h
where e = 1.602 x 10⁻¹⁹ C, - = 108.1 nm, and c = 3 x 10⁸ m/s. Based on the data, Planck’s Constant, h = 6.725 x 10⁻³⁴ J•s
Calculate the percent difference between the experimental value and the accepted value (h0 =6.626 x 10⁻³⁴ J•s)
h = | (h - h0) / h0 | x 100% = 1.5%.
Questions
1. Should you use the positions of the peaks or of the valleys to determine the excitation energy? Or both? Explain.
V1V2V3V4V5V6
Peak
positions
VG2K (V) 22.53243556679
IA (x 10-10 A) 153 448 825 1216 1522 1760
Valley
positions
VG2K (V) 13 26 38 49 61 73
IA (x 10-10 A) 1 118 145 113 118 227
he-V0
c
------
=
Franck-Hertz Experiment Sample Data 2: Using a PASCO Interface
21
012-14264A
Use both. The average of the accelerating voltages matching peak positions and the valley positions is the voltage for the
approximate excitation energy, e•U0.
2. Why are the peaks and valleys smeared out rather than sharp?
The shape of the peaks and valleys in the curve is affected by the fact that there is a potential drop of 1.5 V at the cathode,
which is the source of the electrons. The cathode potential causes the peaks and valleys to occur over a space of 1.5 V, rather
than at a sharp point.
3. How precisely can you determine the peak/valley position? Explain and justify your estimates.
Note that the current fluctuations in the vicinity of the peaks, the width of the peaks, the steepness of the drop-off or rise, and
background height and shape all may play a role in this
4. How would molecular contaminants in the tube affect your results?
The molecular contaminant in the tube has a different first excitation potential (V0), so that the measurement of argon atom’s
first excitation potential would be affected.
Sample Data 2: Using a PASCO Interface
Filament voltage (V) = 3.55 V
VG1K = 1.5 V
VG2A = 11.0 V

SE-9639 Franck-Hertz Experiment
22 012-14264A
Analysis
Obtain the value of argon atom’s first excitation potential: V0 = 11.44 V;
Calculate the value of Planck’s Constant, h
where e = 1.602 x 10⁻¹⁹ C, - = 108.1 nm, and c = 3 x 10⁸ m/s.
Based on the data, Planck’s Constant, h = 6.604 x 10⁻³⁴ J•s
Calculate the percent difference between the experimental value and the accepted value (h0 =6.626 x 10⁻³⁴ J•s)
h = | (h - h0) / h0 | x 100% = 0.3%.
Using V0 = 11.44 + 0.50 V = 11.94 V gives h = 6.892 x 10⁻³⁴ J•s, which is 6.892 - 6.604 = 0.29 x 10⁻³⁴ J•s. Therefore, the
experimental value for h is (6.6±0.3) x 10-34 J•s. So the answer is accurate to 0% to as many significant figures as we have, but
the precision is only ±4.5%.
Questions
1. Should you use the positions of the peaks or of the valleys to determine the excitation energy? Or both? Explain.
Use both. The average of the accelerating voltages matching peak positions and the valley positions is the voltage for the
approximate excitation energy, e•U0.
2. Why are the peaks and valleys smeared out rather than sharp?
The shape of the peaks and valleys in the curve is affected by the fact that there is a potential drop of 1.5 V at the cathode,
which is the source of the electrons. The cathode potential causes the peaks and valleys to occur over a space of 1.5 V, rather
than at a sharp point.
3. How precisely can you determine the peak/valley position? Explain and justify your estimates.
Note that the current fluctuations in the vicinity of the peaks, the width of the peaks, the steepness of the drop-off or rise, and
background height and shape all may play a role in this
4. How would molecular contaminants in the tube affect your results?
The molecular contaminant in the tube has a different first excitation potential (V0), so that the measurement of argon atom’s
first excitation potential would be affected.
Appendix C: Technical Support
For assistance with the equipment or any other PASCO products, contact PASCO as follows:
Address: PASCO scientific
10101 Foothills Blvd.
Roseville, CA 95747-7100
Phone: +1 916 4626 8384 (worldwide)
877-373-0300 (U.S)
Web: www.pasco.com
Email: support@pasco.com
he-V0
c
------
=

Franck-Hertz Experiment Appendix D: Product End of Life
23
012-14264A
Copyright Notice
The PASCO scientific manual is copyrighted and all rights reserved. However, permission is granted to non-profit educational
institutions for reproduction of any part of the providing the reproductions are used only for their laboratories and are not sold
for profit. Reproduction under any other circumstances, without the written consent of PASCO scientific, is prohibited.
Warranty
For a description of the product warranty, see the PASCO catalog.
Appendix D: Product End of Life
Product End of Life Disposal Instructions:
This electronic product is subject to disposal and recycling regulations that vary by country and region. It is
your responsibility to recycle your electronic equipment per your local environmental laws and regulations to
ensure that it will be recycled in a manner that protects human health and the environment. To find out where
you can drop off your waste equipment for recycling, please contact your local waste recycle/disposal service,
or the place where you purchased the product.
The European Union WEEE (Waste Electronic and Electrical Equipment) symbol (above) and on the product or on its packag-
ing indicates that this product must not be disposed of in a standard waste container.
