ITQ_User_RevB 120425 USER ITQ Guide
2016-05-17
: Pdf 120425-User Itq User Guide 120425-USER ITQ User Guide ITQ Series Manuals User ation
Open the PDF directly: View PDF ![]() .
.
Page Count: 92

Xcalibur
Ion Trap Series
User Guide
120425-USER Revision B March 2012
© 2012 Thermo Fisher Scientific Inc. All rights reserved. Xcalibur™, DSQ, DSQ II, TRACE DSQ, TRACE
1300, TRACE 1310, TRACE GC, TRACE GC Ultra, FOCUS GC, PolarisQ, ISQ, and ITQ are trademarks
and/or product names of Thermo Fisher Scientific. Microsoft® is a registered trademark of Microsoft. Adobe® is
a registered trademark of Adobe Systems Incorporated in the United States and/or other countries. Septum
BTO® is a registered trademark of Chromatography Research Supplies, Inc. Swagelok® is a registered trademark
of Swagelok Company. ETP is an SGE product. All other trademarks are the property of Thermo Fisher
Scientific and its subsidiaries.
Ion Trap series refers to ITQ and PolarisQ instruments. DSQ series refers to all DSQ and DSQ II instruments.
Information about the TRACE 1300, TRACE 1310, TRACE GC, and FOCUS GC instruments is included
in this document.
Thermo Fisher Scientific Inc. provides this document to its customers with a product purchase to use in the
product operation. This document is copyright protected and any reproduction of the whole or any part of this
document is strictly prohibited, except with the written authorization of Thermo Fisher Scientific Inc.
The contents of this document are subject to change without notice. All technical information in this
document is for reference purposes only. System configurations and specifications in this document supersede
all previous information received by the purchaser.
Thermo Fisher Scientific Inc. makes no representations that this document is complete, accurate or error-
free and assumes no responsibility and will not be liable for any errors, omissions, damage or loss that might
result from any use of this document, even if the information in the document is followed properly.
This document is not part of any sales contract between Thermo Fisher Scientific Inc. and a purchaser. This
document shall in no way govern or modify any Terms and Conditions of Sale, which Terms and Conditions of
Sale shall govern all conflicting information between the two documents.
Release history: Revision A, 05/27/2009; Revision B, 02/16/2012.
Software version:
For Research Use Only. Not for use in diagnostic procedures.

Thermo Scientific Ion Trap Series User Guide i
C
Preface . . . . . . . . . . . . . . . . . . . . . . . . . . . . . . . . . . . . . . . . . . . . . . . . . . . . . . . . . . . . . vii
About Your System. . . . . . . . . . . . . . . . . . . . . . . . . . . . . . . . . . . . . . . . . . . . . . vii
Power Ratings. . . . . . . . . . . . . . . . . . . . . . . . . . . . . . . . . . . . . . . . . . . . . . . . . . .ix
Related Documentation . . . . . . . . . . . . . . . . . . . . . . . . . . . . . . . . . . . . . . . . . . .ix
System Requirements . . . . . . . . . . . . . . . . . . . . . . . . . . . . . . . . . . . . . . . . . . . . .ix
Safety and Special Notices . . . . . . . . . . . . . . . . . . . . . . . . . . . . . . . . . . . . . . . . . x
Safety Symbols and Signal Words . . . . . . . . . . . . . . . . . . . . . . . . . . . . . . . . . . x
Contacting Us . . . . . . . . . . . . . . . . . . . . . . . . . . . . . . . . . . . . . . . . . . . . . . . . . xii
Chapter 1 Getting Started. . . . . . . . . . . . . . . . . . . . . . . . . . . . . . . . . . . . . . . . . . . . . . . . . . . . . . . . .1
Using Desktop Shortcuts. . . . . . . . . . . . . . . . . . . . . . . . . . . . . . . . . . . . . . . . . . . 1
Configuring Instruments. . . . . . . . . . . . . . . . . . . . . . . . . . . . . . . . . . . . . . . . . . . 2
Chapter 2 Running Your First Sample . . . . . . . . . . . . . . . . . . . . . . . . . . . . . . . . . . . . . . . . . . . . .11
Calibrating and Tuning the Instrument. . . . . . . . . . . . . . . . . . . . . . . . . . . . . . . 12
Setting Up Methods . . . . . . . . . . . . . . . . . . . . . . . . . . . . . . . . . . . . . . . . . . . . . 14
Running Methods . . . . . . . . . . . . . . . . . . . . . . . . . . . . . . . . . . . . . . . . . . . . . . . 18
Analyzing Data: Compounds with a Known Retention Time . . . . . . . . . . . . . . 24
Analyzing Data: Compounds with a Known Ion Pattern. . . . . . . . . . . . . . . . . . 32
Analyzing Data: Peak Height and Area . . . . . . . . . . . . . . . . . . . . . . . . . . . . . . . 35
Analyzing Data: Signal-to-Noise Ratio . . . . . . . . . . . . . . . . . . . . . . . . . . . . . . . 37
Chapter 3 Using the Options . . . . . . . . . . . . . . . . . . . . . . . . . . . . . . . . . . . . . . . . . . . . . . . . . . . . .41
MSn Scan Mode . . . . . . . . . . . . . . . . . . . . . . . . . . . . . . . . . . . . . . . . . . . . . . . . 42
Chemical Ionization (CI Mode) Options . . . . . . . . . . . . . . . . . . . . . . . . . . . . . 47
ACE Options . . . . . . . . . . . . . . . . . . . . . . . . . . . . . . . . . . . . . . . . . . . . . . . . . . 51
DDS Options . . . . . . . . . . . . . . . . . . . . . . . . . . . . . . . . . . . . . . . . . . . . . . . . . . 53
PQD Options . . . . . . . . . . . . . . . . . . . . . . . . . . . . . . . . . . . . . . . . . . . . . . . . . . 55
Variable Damping Gas Option . . . . . . . . . . . . . . . . . . . . . . . . . . . . . . . . . . . . . 58
Appendix A Additional Help . . . . . . . . . . . . . . . . . . . . . . . . . . . . . . . . . . . . . . . . . . . . . . . . . . . . . . .61
Assembling Swagelok Fittings . . . . . . . . . . . . . . . . . . . . . . . . . . . . . . . . . . . . . . 62
Using a Swagelok Tee or Cross . . . . . . . . . . . . . . . . . . . . . . . . . . . . . . . . . . . . . 64
Pressure Testing the TRACE GC Ultra Inlet. . . . . . . . . . . . . . . . . . . . . . . . . . . 64
Automatic Tune Flow Chart . . . . . . . . . . . . . . . . . . . . . . . . . . . . . . . . . . . . . . . 66
Calibrating the RF Frequency . . . . . . . . . . . . . . . . . . . . . . . . . . . . . . . . . . . . . . 67
Contents
Contents
ii Ion Trap Series User Guide Thermo Scientific
Baking Out the Source . . . . . . . . . . . . . . . . . . . . . . . . . . . . . . . . . . . . . . . . . . . 68
Reviewing Cursor Actions in Browsers . . . . . . . . . . . . . . . . . . . . . . . . . . . . . . . 69
Glossary . . . . . . . . . . . . . . . . . . . . . . . . . . . . . . . . . . . . . . . . . . . . . . . . . . . . . . . . . . . . .71
Index . . . . . . . . . . . . . . . . . . . . . . . . . . . . . . . . . . . . . . . . . . . . . . . . . . . . . . . . . . . . . . . .75

Declaration
Manufacturer: Thermo Fisher Scientific
Thermo Fisher Scientific is the manufacturer of the instrument described in this manual and, as such, is responsible for
the instrument safety, reliability and performance only if:
•installation
• re-calibration
•changes and repairs
have been carried out by authorized personnel and if:
• the local installation complies with local law regulations
• the instrument is used according to the instructions provided and if its operation is only entrusted to qualified
trained personnel
Thermo Fisher Scientific is not liable for any damages derived from the non-compliance with the aforementioned
recommendations.
Regulatory Compliance
Thermo Fisher Scientific performs complete testing and evaluation of its products to ensure full compliance with
applicable domestic and international regulations. When the system is delivered to you, it meets all pertinent
electromagnetic compatibility (EMC) and safety standards as described in the next section or sections by product name.
Changes that you make to your system may void compliance with one or more of these EMC and safety standards.
Changes to your system include replacing a part or adding components, options, or peripherals not specifically
authorized and qualified by Thermo Fisher Scientific. To ensure continued compliance with EMC and safety standards,
replacement parts and additional components, options, and peripherals must be ordered from Thermo Fisher Scientific
or one of its authorized representatives. EMC Directive 89/336/EEC
EMC compliance has been evaluated by Professional Testing.
• Polaris Q, ITQ, and Ion Trap Series standards: EMC EN 61326-1:2006. Safety IEC 61010-1:2001,
IEC 61010-2-081:2001
• DSQ II standards: EMC EN 61326-1:1997 + A1:1998 + A2:2001. Safety EN 61010-1:2001
• Direct Probe Controller (DPC) standards: EMC EN 55011:1991 + EN 50082-1:1992. Safety EN 61010-1:1994
• ISQ standards: EMC EN 61326-1:2006. Safety IEC 61010-1:2001
• TSQ 8000 standards: EMC EN 61326-1:2006. Safety IEC 61010-1:2001
Low Voltage Safety Compliance

This device complies with Low Voltage Directive 2006/95/EC and harmonized standard EN 61010-1:2001.
FCC Compliance Statement
Notice on Lifting and Handling of
Thermo Scientific Instruments
For your safety, and in compliance with international regulations, the physical handling of this Thermo Fisher Scientific
instrument requires a team effort to lift and/or move the instrument. This instrument is too heavy and/or bulky for one
person alone to handle safely.
Notice on the Proper Use of
Thermo Scientific Instruments
In compliance with international regulations: Use of this instrument in a manner not specified by Thermo Fisher
Scientific could impair any protection provided by the instrument.
Notice on the Susceptibility
to Electromagnetic Transmissions
Your instrument is designed to work in a controlled electromagnetic environment. Do not use radio frequency
transmitters, such as mobile phones, in close proximity to the instrument.
THIS DEVICE COMPLIES WITH PART 15 OF THE FCC RULES. OPERATION IS SUBJECT TO
THE FOLLOWING TWO CONDITIONS: (1) THIS DEVICE MAY NOT CAUSE HARMFUL
INTERFERENCE, AND (2) THIS DEVICE MUST ACCEPT ANY INTERFERENCE RECEIVED,
INCLUDING INTERFERENCE THAT MAY CAUSE UNDESIRED OPERATION.
CAUTION Read and understand the various precautionary notes, signs, and symbols
contained inside this manual pertaining to the safe use and operation of this product before
using the device.

For manufacturing location, see the label on the instrument.
WEEE Compliance
This product is required to comply with the European Union’s Waste Electrical & Electronic Equipment (WEEE)
Directive 2002/96/EC. It is marked with the following symbol:
Thermo Fisher Scientific has contracted with one or more recycling or disposal companies in each European Union
(EU) Member State, and these companies should dispose of or recycle this product. See www.thermo.com/
WEEERoHS for further information on Thermo Fisher Scientific’s compliance with these Directives and the
recyclers in your country.
WEEE Konformität
Dieses Produkt muss die EU Waste Electrical & Electronic Equipment (WEEE) Richtlinie 2002/96/EC erfüllen.
Das Produkt ist durch folgendes Symbol gekennzeichnet:
Thermo Fisher Scientific hat Vereinbarungen mit Verwertungs-/Entsorgungsfirmen in allen EU-Mitgliedsstaaten
getroffen, damit dieses Produkt durch diese Firmen wiederverwertet oder entsorgt werden kann. Mehr Information
über die Einhaltung dieser Anweisungen durch Thermo Fisher Scientific, über die Verwerter, und weitere Hinweise,
die nützlich sind, um die Produkte zu identifizieren, die unter diese RoHS Anweisung fallen, finden sie unter
www.thermo.com/WEEERoHS.

Conformité DEEE
Ce produit doit être conforme à la directive européenne (2002/96/EC) des Déchets d'Equipements Electriques et
Electroniques (DEEE). Il est marqué par le symbole suivant:
Thermo Fisher Scientific s'est associé avec une ou plusieurs compagnies de recyclage dans chaque état membre de
l’union européenne et ce produit devrait être collecté ou recyclé par celles-ci. Davantage d'informations sur la
conformité de Thermo Fisher Scientific à ces directives, les recycleurs dans votre pays et les informations sur les
produits Thermo Fisher Scientific qui peuvent aider la détection des substances sujettes à la directive RoHS sont
disponibles sur www.thermo.com/WEEERoHS.

Thermo Scientific Ion Trap Series User Guide vii
P
Preface
This guide contains instructions for using your instrument and is designed to increase your
understanding and knowledge of the Ion Trap Series.
About Your System
Thermo Fisher Scientific systems provide the highest caliber gas chromatography/mass
spectrometry (GC/MS) instrumentation available on today’s market.
GC/MS represents a combination of two powerful analytical techniques: GC, which acts as a
separation technique and MS, which acts as a detection technique. Complex mixtures of
individual compounds can be injected into the GC, either manually or through the use of an
optional autosampler, and then separated for presentation to the MS. The MS will then
generate a mass spectrum of the GC eluent and its components, which can be used for
qualitative identification as well as accurate and precise quantification of the individual
compounds present in the sample.
Contents
•About Your System
•Power Ratings
•Related Documentation
•System Requirements
•Safety and Special Notices
•Contacting Us
IMPORTANT Thermo Fisher Scientific systems are designed to optimize both the
separation and detection capabilities of GC/MS techniques and combine them in a
synergistic fashion to provide high performance analytical capabilities for both research
and routine applications. More information on the use of this system can be found in
related documentation sources and through the provided contact information.

Preface
About Your System
viii Ion Trap Series User Guide Thermo Scientific
WARNING Thermo Fisher Scientific systems operate safely and reliably under carefully
controlled environmental conditions. If the equipment is used in manner not specified by
the manufacturer, the protections provided by the equipment may be impaired. If you
maintain a system outside the specifications listed in this guide, failures of many types,
including personal injury or death, may occur. The repair of instrument failures caused by
operation in a manner not specified by the manufacturer is specifically excluded from the
Standard Warranty and service contract coverage.
Preface
Power Ratings
Thermo Scientific Ion Trap Series User Guide ix
Power Ratings
Mass Spectrometer (MS)
• 120 V ac +6/-10%, 50/60 Hz, 15 A max
• 230 V ac ±10%, 50/60 Hz, 10 A max
Gas Chromatograph (GC)
• 120 V ac +6%/-10%, 50/60 Hz, 16 A max
• 230 V ac ±10%, 50/60 Hz, 16 A max
Detailed instrument specifications are in the Product Specification or Product Brochure.
Related Documentation
Thermo Scientific provides the following documents for the Ion Trap Series mass
spectrometer. These documents are also available on a “Print-By-Request” basis.
Ion Trap Series Preinstallation Requirements Guide PN 120425-00PI
Ion Trap Series User Guide PN 120425-USER
Ion Trap Series Hardware Manual PN 120425-00HW
Instrument Help is available from within the software.
To view product manuals
Go to Start > All Programs > Thermo Foundation 2.0 > Manuals > Ion Trap Series.
To open Help
• From the Ion Trap Series window, choose Help > Ion Trap Series Help.
• If available for a specific window or dialog box, click Help or press the F1 key for
information about setting parameters.
For more information, visit www.thermo.com.
System Requirements
Your Ion Trap Series data system must meet these minimum requirements.

Preface
Safety and Special Notices
xIon Trap Series User Guide Thermo Scientific
Safety and Special Notices
Make sure you follow the precautionary statements presented in this guide. The safety and
other special notices appear in boxes.
Safety and special notices include the following:
Safety Symbols and Signal Words
All safety symbols are followed by WARNING or CAUTION, which indicates the degree of risk
for personal injury and/or instrument damage. Cautions and warnings are following by a
descriptor. A WARNING is intended to prevent improper actions that could cause personal
injury. A CAUTION is intended to prevent improper actions that may cause personal injury
and/or instrument damage. The following safety symbols may be found on your instrument
and/or in this guide.
System Requirements
Hardware • 2.4 GHz processor with 4 GB RAM
•DVD/CD-ROM drive
• Resolution display 1280 ×1024 (XGA)
• 250 GB hard drive
•NTFS format
Software • Microsoft™ Windows™ 7 SP1 Operating System (32-bit)
• Microsoft Office™ 2010
• Thermo Foundation 2.0 or higher (Thermo Scientific software)
• Xcalibur™ 2.2 or higher
• TraceFinder™ 2.0 SP1 or higher*
*Your system will function without TraceFinder, but earlier versions of TraceFinder will not work with the
Thermo Scientific software required for this instrument.
CAUTION Highlights hazards to humans, property, or the environment. Each CAUTION
notice is accompanied by an appropriate CAUTION symbol.
IMPORTANT Highlights information necessary to prevent damage to software, loss of
data, or invalid test results; or might contain information that is critical for optimal
performance of the system.
Note Highlights information of general interest.
Tip Highlights helpful information that can make a task easier.
Preface
Safety and Special Notices
Thermo Scientific Ion Trap Series User Guide xi
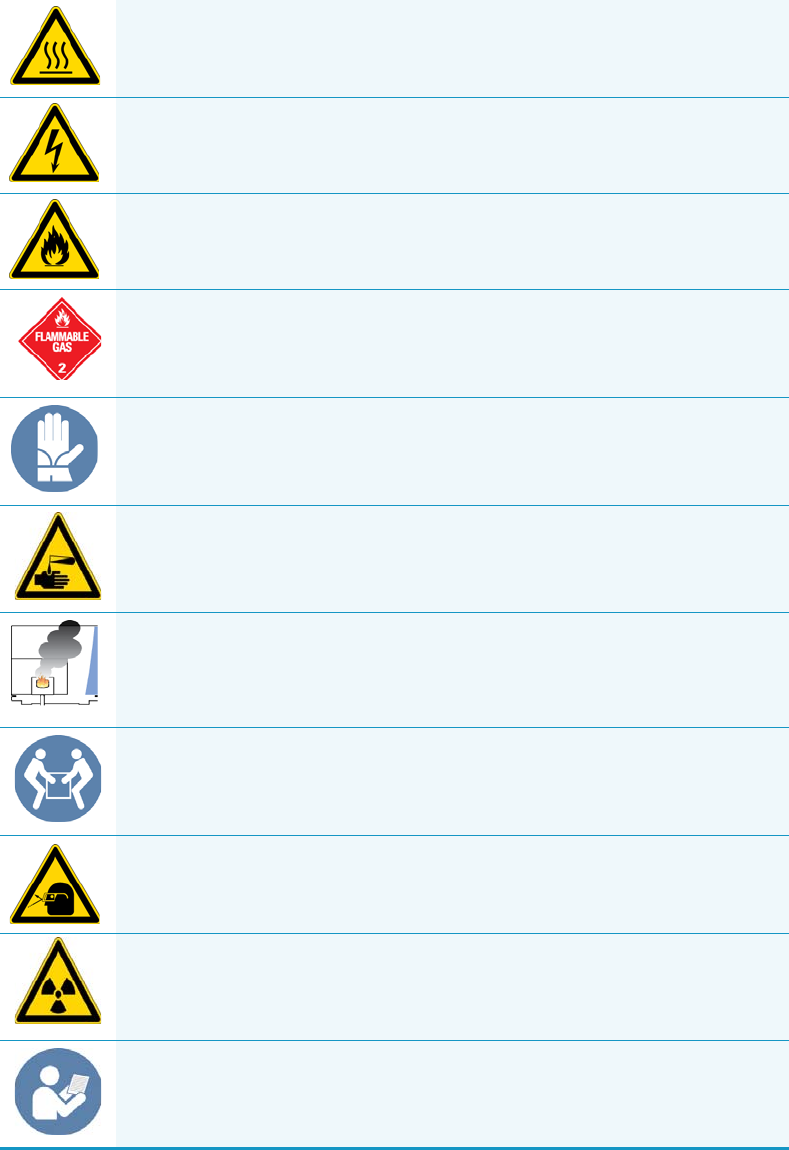
BURN HAZARD: This symbol alerts you to the presence of a hot surface that
could or may cause burn injuries.
ELECTRICAL SHOCK HAZARD: This symbol indicates that an electrical shock
could or may occur.
FIRE HAZARD: This symbol indicates a risk of fire or flammability could or
may occur.
FLAMMABLE GAS HAZARD: This symbol alerts you to gases that are
compressed, liquefied or dissolved under pressure and can ignite on contact
with an ignition source. This symbol indicates this risk could or may cause
physical injury.
GLOVES REQUIRED: This symbol indicates that you must wear gloves when
performing a task or physical injury could or may occur.
HAND AND CHEMICAL HAZARD: This symbol indicates that chemical
damage or physical injury could or may occur.
INSTRUMENT DAMAGE: This symbol indicates that damage to the
instrument or component may occur. This damage may not be covered under
the standard warranty.
LIFTING HAZARD: This symbol indicates that a physical injury could or may
occur if two or more people do not lift an object.
MATERIAL AND EYE HAZARD: This symbol indicates that eye damage could
or may occur.
RADIOACTIVE HAZARD: This symbol indicates that exposure to radioactive
material could or may occur.
READ MANUAL: This symbol alerts you to carefully read your instrument’s
documentation to ensure your safety and the instrument’s operational ability.
Failing to carefully read the documentation could or may put you at risk for a
physical injury.

Preface
Contacting Us
xii Ion Trap Series User Guide Thermo Scientific
Contacting Us
There are several ways to contact Thermo Fisher Scientific for the information you need.
To contact Technical Support
To contact Customer Service for ordering information
To get local contact information for sales or service
Go to www.thermoscientific.com/wps/portal/ts/contactus.
To suggest changes to documentation or to Help
• Fill out a reader survey online at www.surveymonkey.com/s/PQM6P62.
• Send an e-mail message to the Technical Publications Editor at
techpubsaustin@thermofisher.com.
TOXIC SUBSTANCES HAZARD: This symbol indicates that exposure to a
toxic substance could occur and that exposure could or may cause personal
injury or death.
This is the general warning symbol that the ISO 3864-2 standard uses to
prevent personal injury. This symbol precedes the WARNING safety alert
word. In the vocabulary of ANSI Z535 signs, this symbol indicates a possible
personal injury hazard exists if the instrument is improperly used or if unsafe
actions occur. We use this symbol and another appropriate safety symbol to
alert you to an imminent or potential hazard that could cause personal injury.
Phone 800-532-4752
Fax 561-688-8736
E-mail us.techsupport.analyze@thermofisher.com
Knowledge base www.thermokb.com
Phone 800-532-4752
Fax 561-688-8731
E-mail us.customer-support.analyze@thermofisher.com
Web site www.thermo.com/ms

Thermo Scientific Ion Trap Series User Guide 1
1
Getting Started
This chapter provides an introduction to the software used on your Ion Trap Series mass
spectrometer. You will also learn how to configure your instrument.
Using Desktop Shortcuts
After the instrument is connected, it’s a good idea to get acquainted with how your software is
organized on the desktop. You can access all the programs from the Windows start menu.
There are also desktop shortcuts to help you quickly access commonly used functions.
Contents
•Using Desktop Shortcuts
•Configuring Instruments
Note You might find it helpful to copy this page and keep it out to use as a quick
reference template.
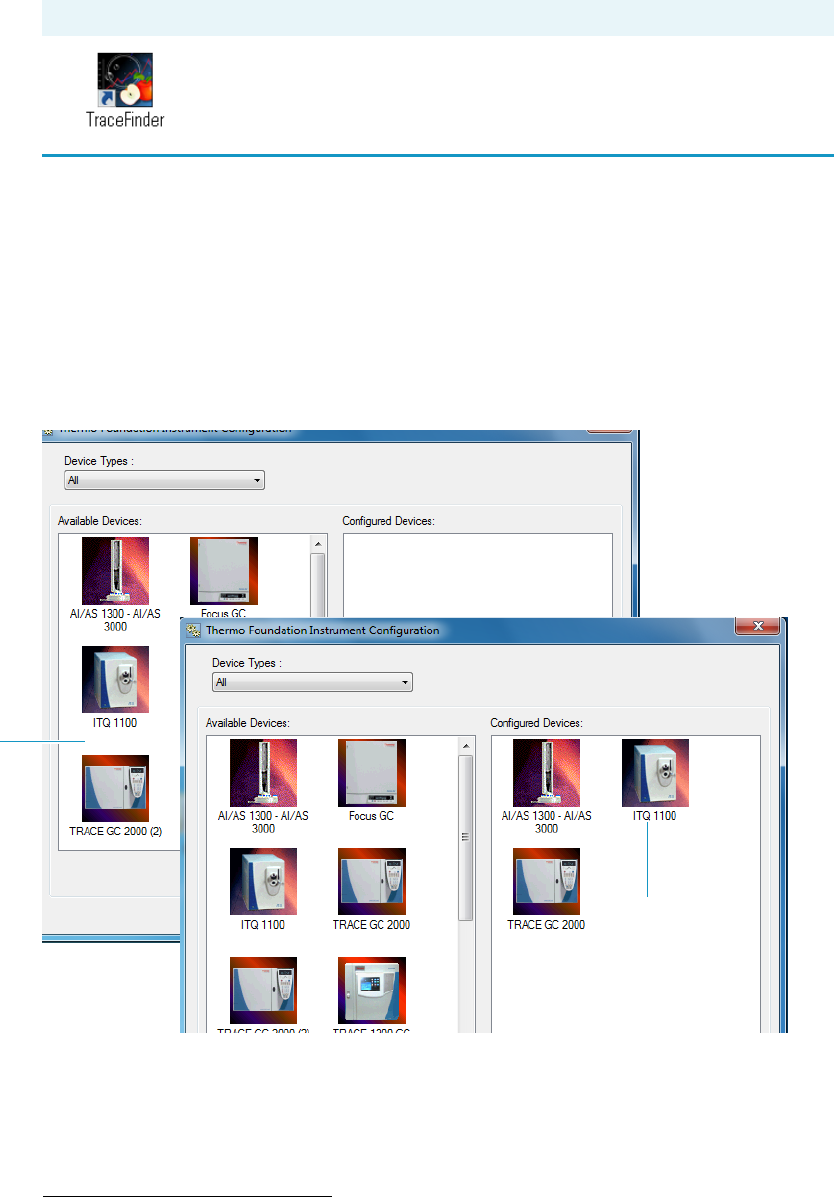
Desktop Shortcuts What it Does...
Launches the Instrument Configuration program. Use this program to
set up your instruments and connect or remove them from the data
system.
Launches the ITQ Tune Window. Use the Tune window to customize
your instrument’s tuning parameters.
Launches the Xcalibur Roadmap.
Launches the XReport Application. Use this to custom design your
reports. Files created here are templates for your reports. Templates are
saved as *.xrt files and (by default) stored in the Xcalibur\templates
folder.
1 Getting Started
Configuring Instruments
2Ion Trap Series User Guide Thermo Scientific
Configuring Instruments
1. Click the Instrument Configuration shortcut from the Windows desktop or browse to
Instrument Configuration through the Windows™ start menu. It will be in the Thermo
Foundation program group.
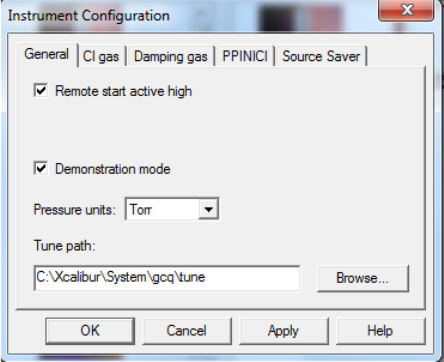
2. Configure the mass spectrometer (MS).
Figure 1. Instrument Configuration Windows1
a. Select the ITQ image located in the list of Available Devices column and click Add to
move it to the list of Configured Devices.
b. Select the ITQ image in the Configured Devices column and click Configure to
display the Instrument Configuration screen.
Launches the XReport Application. Use this to custom design your
reports. Files created here are templates for your reports. Templates are
saved as *.xrt files and (by default) stored in the Xcalibur\templates
folder.
Desktop Shortcuts What it Does...
1Your system may not be equipped with the devices shown here. You should only configure devices that are part of
your system.
After
Before
1 Getting Started
Configuring Instruments
Thermo Scientific Ion Trap Series User Guide 3
c. Use the tabs on the Instrument Configuration window to select options to display on
the Instrument setup and Tune windows.
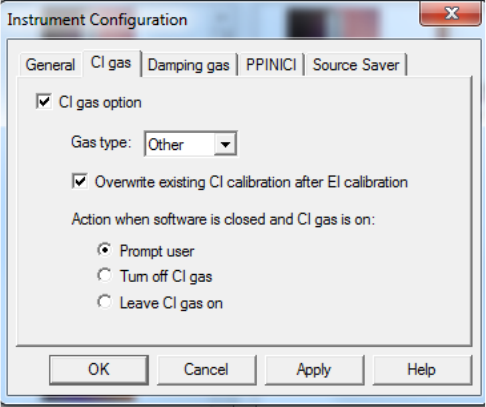
3. Configure General options.
Figure 2. Instrument Configuration: General
a. Select the General tab.
b. The default setting for Remote Start Active High is unchecked. Select this option to
start the GC with an active high signal instead of active low.
c. Demonstration Mode. Check this option to start the instrument in demonstration
mode. This mode is useful if no instrument is connected, but you would like to
demonstrate the software. But don’t select this to run your first sample.
d. Specify the Pressure Units to display in the Tune window and the Status tab.
e. Specify the Tune Path for Xcalibur to automatically retrieve stored tune files. Use the
Browse button to quickly navigate to the folder storing your tune files. The factory
default is Xcalibur | System | GCQ | Tune.
1 Getting Started
Configuring Instruments
4Ion Trap Series User Guide Thermo Scientific
4. [Option Upgrade] Configure CI Gas options.
Figure 3. Instrument Configuration: CI Gas
.
a. Click the CI Gas tab. Select the CI Gas option only if the CI option is installed.
b. CI Gas option: Select to activate all the gas options on this tab.
c. CI Gas Type: Select a gas type.
Select this option to activate chemical ionization gas controls. Options include:
Ammonia, CO2, Isobutane, Methane, and Other. Other refers to any gas type not
listed in this list. When Other is selected, the flow module is set to a pressure of
0.3–7.4 psig against a fixed flow restriction. If a specific gas is selected, the CI flow
module outputs a calibrated flow for that gas in mL/min.
d. Action when Software is closed and CI Gas is on: When Xcalibur software is closed,
these options determine what happens if the CI gas is on. You can choose to turn it
off, leave it on, or receive a prompt at the time the software is closed asking if you
want to turn the CI gas off.
If you choose to leave the CI gas on, it remains on until you restart the software.
However, as soon as you restart the software, the CI gas is turned off.
1 Getting Started
Configuring Instruments
Thermo Scientific Ion Trap Series User Guide 5
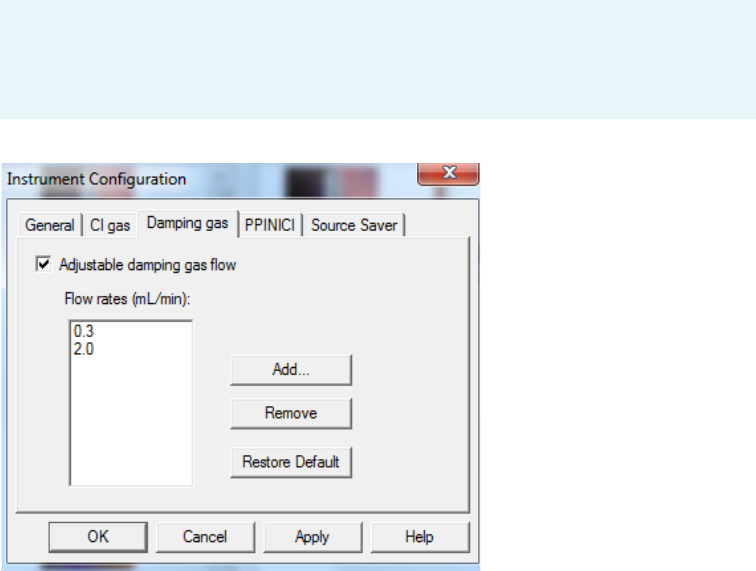
5. [Option Upgrade] Configure Damping Gas options. Options included on this tab display
adjustable damping gas options.
Figure 4. Instrument Configuration: Damping Gas
a. Select the Damping Gas tab.
b. Select Adjustable Damping Gas to allow the computer to control the damping gas
pressure in the ion trap.
By increasing the damping gas flow rate, the damping gas pressure increases
proportionally. The default flow is 0.3 mL/min, which corresponds to a pressure of
approximately 0.13 Pa (1 mTorr) inside the ion trap. Increasing this flow may
increase sensitivity, but at the expense of resolution. You can configure the instrument
for up to six damping gas flow rates (0.3 mL/min is always one of them). You can also
configure your methods to use one of these flows in Instrument setup. Before using a
flow rate, Automatic Tune must be run in the Tune window for that flow.
c. Items listed in the Flow Rates (mL/min) box indicate the default damping gas flow
rates. Use the Add or Remove buttons to enter up to six quantities of desired
damping gas flow rates. Select the Restore Default button to restore the factory
default gas flow rates.
Flow rates listed here display in the Instrument setup window and in the Tune
window. Add or delete from the list of available flows between 0.3 and 5.0 mL/min.
However, you cannot remove the default damping gas flow rate of 0.3 mL/min.
Note If the variable damping gas option is present, you must check the Adjustable
Damping Gas Flow and have at least the default value 0.3 configured. Failure to
configure the installed variable damping gas option will result in unknown damping
gas flow rates.
1 Getting Started
Configuring Instruments
6Ion Trap Series User Guide Thermo Scientific
Once the desired number of damping gas flow rates have been selected, it will be
necessary to retune the ion trap, so tune parameters can be stored for each of the
selected flow rates.
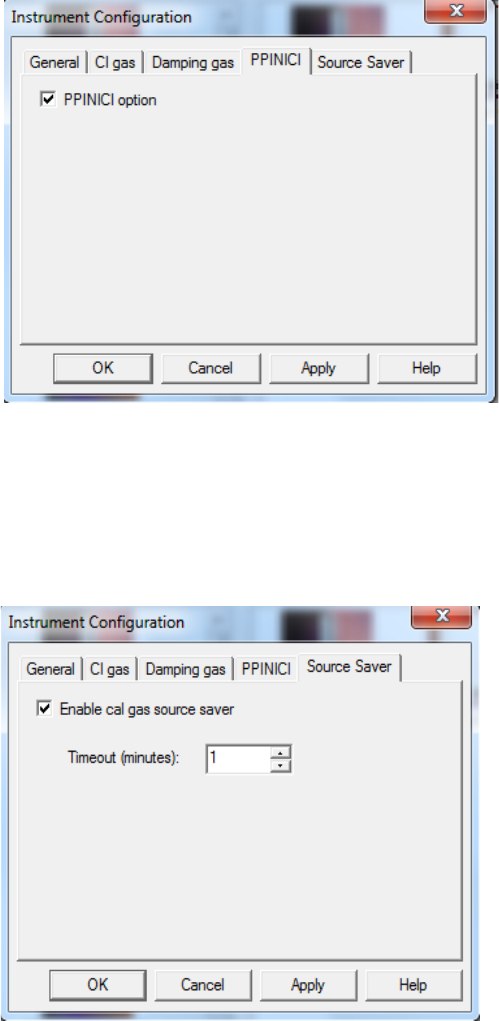
6. [Optional] Configure PPINICI options.
Figure 5. Instrument Configuration: PPINICI
a. Select the PPINICI tab.
b. Check the PPINICI option, if you have the PPINICI option installed on your mass
spectrometer.
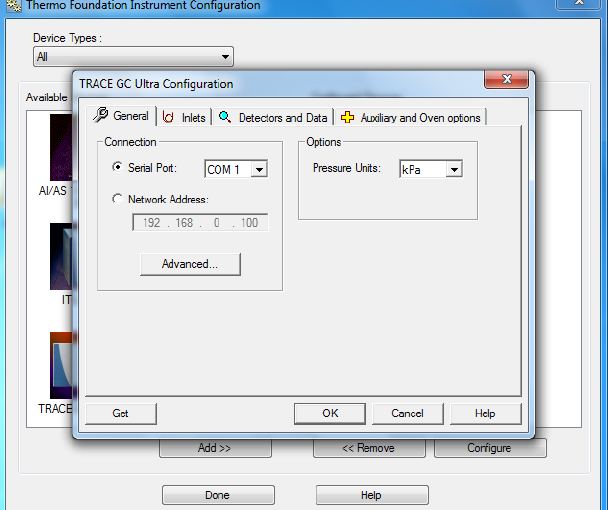
7. Configure Source Saver options.
Figure 6. Instrument Configuration: Source Saver
a. Select the Source Saver tab.
1 Getting Started
Configuring Instruments
Thermo Scientific Ion Trap Series User Guide 7
b. Enable Cal Gas Source Saver: Check this option to enable the instrument to turn off
the filament and cal gas if left unattended with the cal gas on. If the cal gas is not on,
source saver will not turn off the filament.
c. Timeout (minutes): Enter the time in minutes that the instrument must wait after
the last user action in tune before turning off the filament and cal gas.
d. Press the OK button to return to the Instrument Configuration window.
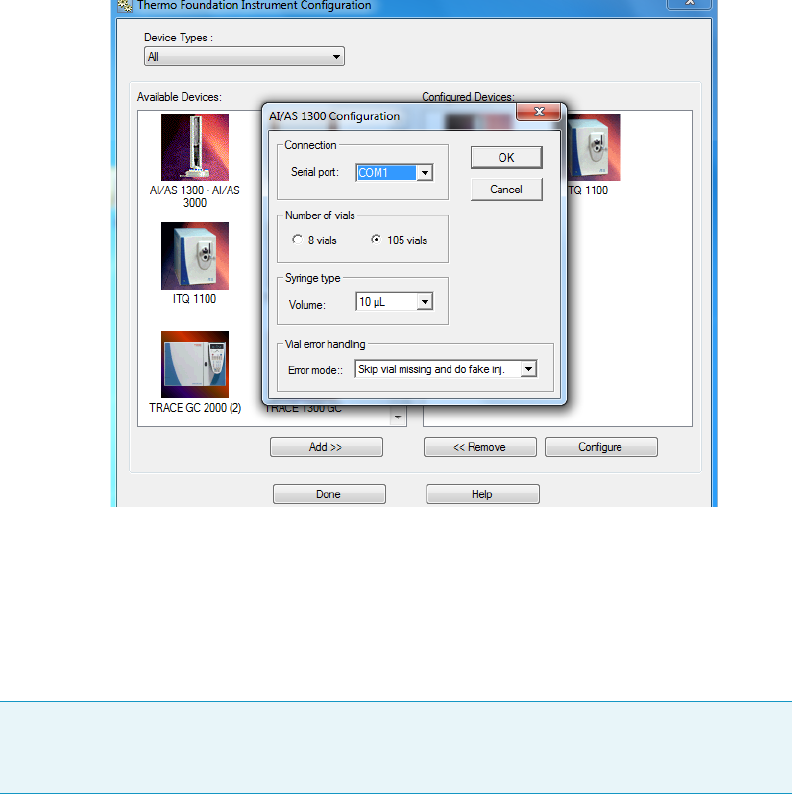
8. Configure the gas chromatograph (GC).
Figure 7. Instrument Configuration: GC
a. Select the GC image from the Available Devices column and click Add to add the
GC to the Configured Devices column.
b. Select the GC image from the Configured Devices column and click Configure to
display the Instrument Configuration screen.
c. Refer to the GC user manuals to determine the best settings for your GC.
9. Make these selections on the General tab:
a. Serial Port = COM 1. This is typically the port to which the GC is attached. Your
system may be different.
b. Set the preferred pressure units.
c. Click the Get button to retrieve the GC configuration through the serial port to
Xcalibur.
10. Verify the settings on the Inlet tab match the GC configuration.
11. Verify the settings on the Detectors and Data tab match the GC configuration.
1 Getting Started
Configuring Instruments
8Ion Trap Series User Guide Thermo Scientific
12. Verify the settings on the Auxiliary and Oven Options tab match the GC configuration
and Aux 1 Present has the MS Transfer Line selected.
Click OK, if no problems are detected and return to the Instrument Configuration
window.
13. [Optional] Configure the autosampler (AS).
Figure 8. Instrument Configuration: Autosampler
a. Select the autosampler image from the Available Devices column and click Add to
add the GC to the Configured Devices column.
b. Select the autosampler image from the Configured Devices column and click
Configure to display the Instrument Configuration screen.
14. Enter autosampler parameters in the autosampler Configuration window.
15. Set up the GC handshaking parameters by referring to the GC operation manuals for
configuration instructions.
Note The AI/AS 3000 can be connected to a COM port on the computer or through the
GC. The TriPlus RSH can only be connected via LAN on the computer. See the
autosampler user documentation if you want to connect to a network.
1 Getting Started
Configuring Instruments
Thermo Scientific Ion Trap Series User Guide 9
16. Check that all instruments are communicating with Xcalibur.
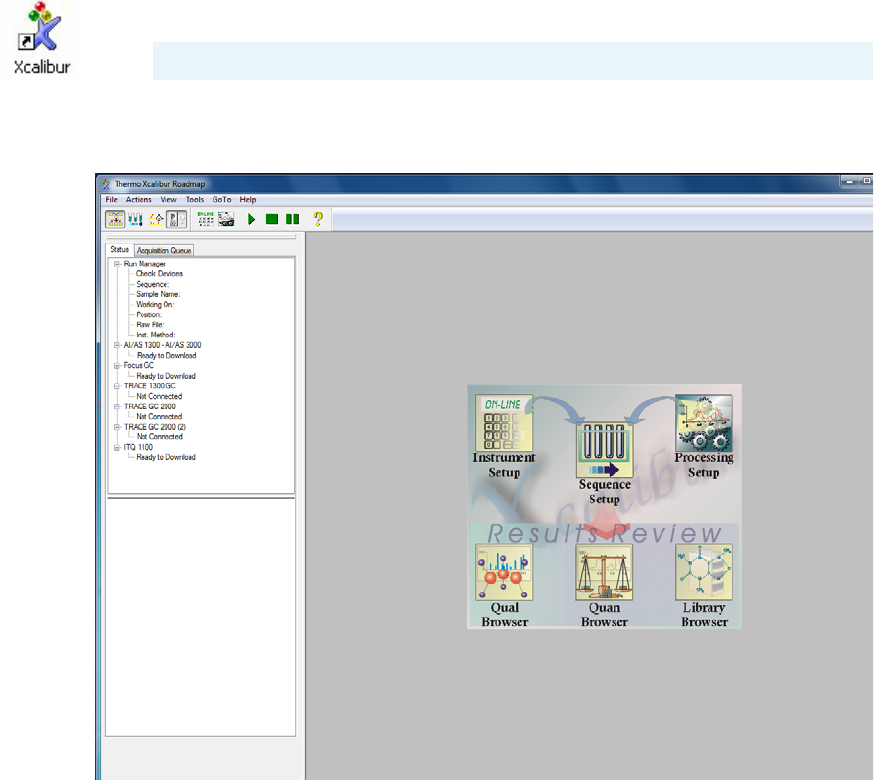
a. Click the Xcalibur shortcut to display the Xcalibur Roadmap.
b. Verify that the ITQ is listed in instrument Status as Ready to Download.
Figure 9. Xcalibur Roadmap
c. All instruments configured should report Ready to Download. If not, consult the
troubleshooting section of the instrument’s manual.
d. Go to “Running Your First Sample” on page 11 to begin running a sample.
Note The MS may take up to one minute to initialize.
1 Getting Started
Configuring Instruments
10 Ion Trap Series User Guide Thermo Scientific

Thermo Scientific Ion Trap Series User Guide 11
2
Running Your First Sample
After your instruments are configured for use they are ready to run samples. In just three easy
steps, you’ll be running your first sample using the test compound that comes with your
instrument.
After running your method, you will learn how to analyze your data from four various
perspectives:
• Compounds with Known Retention Times
• Compound with Known Ion Patterns
•Peak Height and Area
• Signal-to-Noise Ratios
Contents
•Calibrating and Tuning the Instrument
•Setting Up Methods
•Running Methods
•Analyzing Data: Compounds with a Known Retention Time
•Analyzing Data: Compounds with a Known Ion Pattern
•Analyzing Data: Peak Height and Area
•Analyzing Data: Signal-to-Noise Ratio
Note These instructions are written assuming you are using a TRACE GC Ultra and an
AI/AS 3000. If you are using a different GC or autosampler, refer to that product’s user
documentation for setup instructions.

2 Running Your First Sample
Calibrating and Tuning the Instrument
12 Ion Trap Series User Guide Thermo Scientific
Calibrating and Tuning the Instrument
Before you run a sample, you should calibrate and tune the instrument using the Tun e
application.
1. Open the Tune application using one of these methods.
• Select the Tu n e button on the instrument’s method editor
• Select the Tune shortcut on the desktop
2. Check the instrument’s basic operation by selecting Diagnostics | Run Tests to display
the Diagnostic window.
Figure 10. Diagnostics Window
a. Make sure all tests are selected.
b. Click the Run selected Tests button to run each test.
c. Click the Print Diagnostics Report button to print the results from all the tests you
ran.
d. Click the Close button to close the Diagnostic window.
3. Check the last Tune report.
a. Select Tune | View Tune Report to view the last tune report and determine when the
instrument was last calibrated.
b. Click the Print button and retain a hard copy for future reference, if desired.
Note Select online help for Tune window information.
2 Running Your First Sample
Calibrating and Tuning the Instrument
Thermo Scientific Ion Trap Series User Guide 13
c. Close the Tune report and return to the Tune window.
4. [Optional] Perform a full automatic tune if you have just performed maintenance or it is
required by your standard operating procedure.
It should not be necessary to calibrate and tune the instrument more than once a week.
However, the number and type of samples you run determine how often you must tune
your instrument.
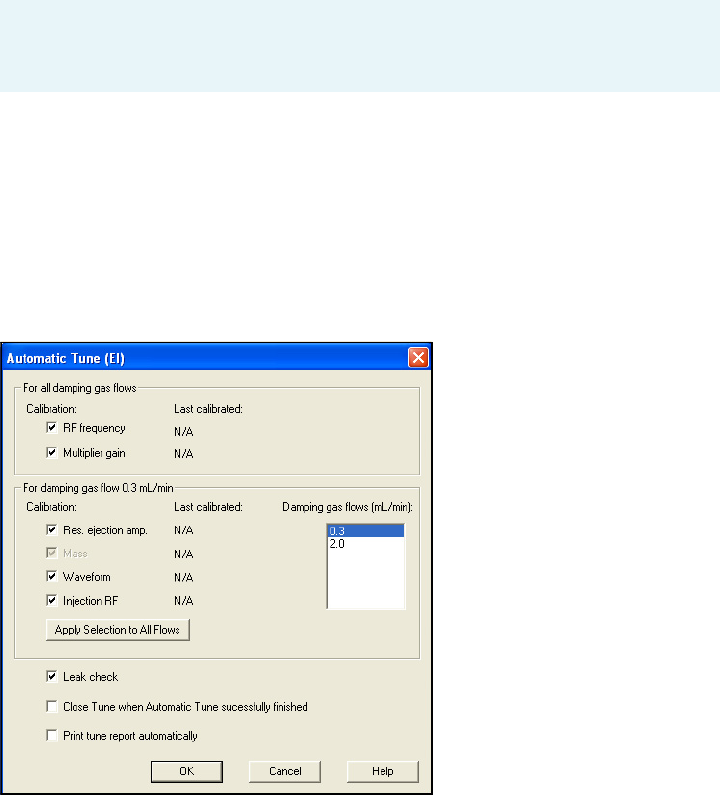
a. Select Tune | Automatic Tune to display the Automatic Tune window.
Figure 11. Automatic Tune Window: Full
b. Click OK to run the automatic tune and return to the Tune window.
c. Select File | Exit to close the Tune window.
Note How often you tune your instrument is determined by the number and
type of samples you run. See the “Automatic Tune Flow Chart” on page 66 for
information.
2 Running Your First Sample
Setting Up Methods
14 Ion Trap Series User Guide Thermo Scientific
Setting Up Methods
After your instrument is calibrated and tuned, you’re ready to set up the instrument methods
using Instrument setup. Instrument methods are created and modified in the Instrument
setup window and saved as *.meth files. Method files are stored in the \Xcalibur\Methods
folder. In this example, you will enter the method parameters for the mass spectrometer, GC,
and AS.
1. Load an instrument method.
a. Select Instrument Setup from the Xcalibur Roadmap to display the Instrument setup
window.
b. Select File | Open and navigate to Xcalibur\Methods. Alternatively, navigate to the
folder matching your GC instrument configuration.
c. Choose an existing *EI_FullScan.meth. This is the full scan method file that was used
to validate that your instrument met factory specifications and then stored for you to
acquire a test sample. The file is stored in c:\Xcalibur\Methods.
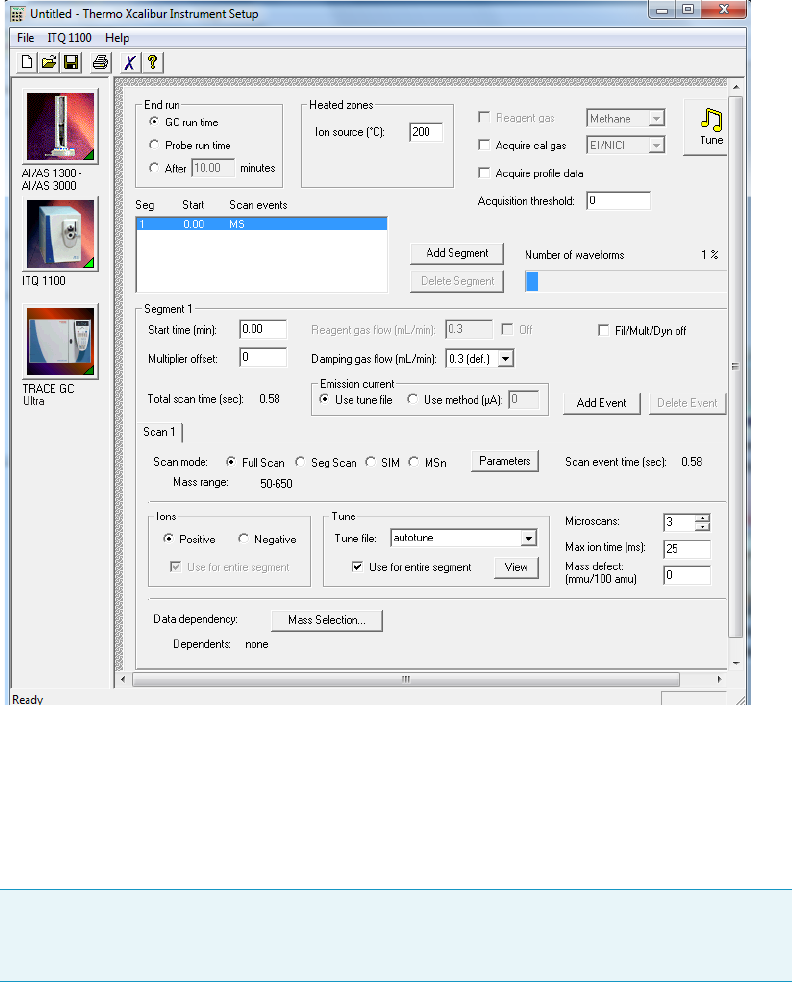
2. Review the MS method parameters by clicking the MS instrument image from the
Instrument Setup window.
2 Running Your First Sample
Setting Up Methods
Thermo Scientific Ion Trap Series User Guide 15
Figure 12. Instrument Setup: ITQ Method Editor
This method acquires m/z 50-300. It starts 4.0 min after the GC injection to allow the
solvent to elute from the GC column.
The MS run time ends when the GC run time ends. To select a different MS run time,
check the After checkbox and enter the desired MS run time. Usually a shorter MS run
time is selected when the GC program is allowing for column bakeout.
Tip It is a good idea to set the MS end run time shorter than the GC run time to preserve
filament lifetime and reduce ion source contamination caused by ion burns from column
bleed.

2 Running Your First Sample
Setting Up Methods
16 Ion Trap Series User Guide Thermo Scientific
3. Review the GC method parameters by selecting the GC instrument image from the
Instrument setup window.
Figure 13. Instrument Setup: TRACE GC Ultra Method Editor
This method holds the GC at 40 °C for 1 min, ramps it at 30 °C/min to 300 °C, and
holds the final temperature for ten minutes. The injector is 220 °C operated in splitless
mode. The column flow is 1.0 mL/min. The transfer line temperature is 300 °C.
If you have a TRACE 1300, TRACE 1310, or Focus GC instead of a TRACE GC Ultra,
the instrument parameters are the same and entered into the appropriate fields in your
GC user interface. See your GC user documentation for specific information.
IMPORTANT Vacuum Compensation must be on whenever the MS is used as a
detector.
2 Running Your First Sample
Setting Up Methods
Thermo Scientific Ion Trap Series User Guide 17
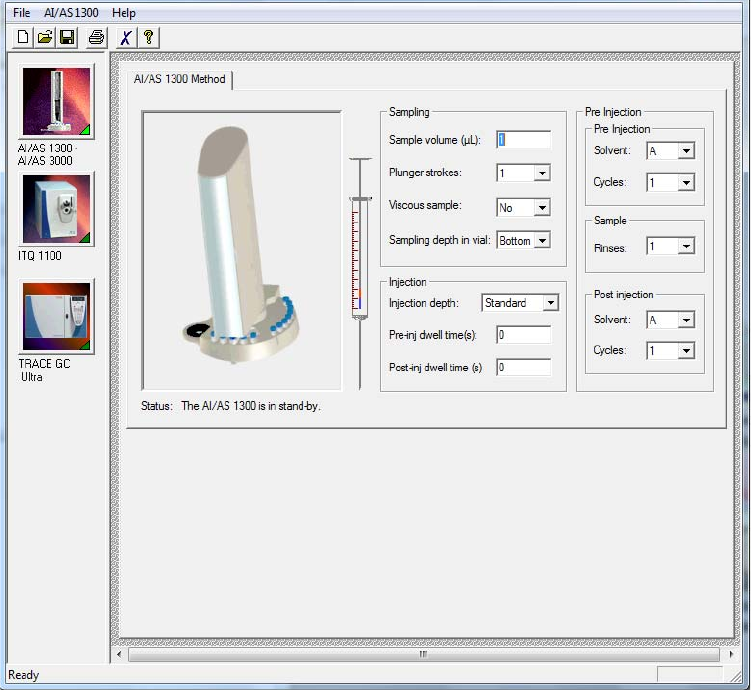
4. [Optional] Review the AS method parameters by selecting the AS instrument image.
Figure 14. Instrument Setup: AI/AS 3000 Method Editor
a. If you’re using an AI/AS 3000 you can enter the parameters shown in Figure 14. For
other autosamplers, there are several basic settings for all autosamplers for
sampling/injection and washes. All other parameters can be left at their default
values.
• Sample volume:1 μL.This is the sample volume that will be injected.
• Plunger strokes: 1. This is also called pull-ups or bubble elimination strokes. This
is the number of times the plunger is pulled up and down while in the sample
vial.
• Viscous sample: No. Select Yes to allow for slower pull up speeds.
• Sampling depth in vial: Two selections are available, bottom and center. If you
select Bottom the needle inserts to the bottom of the vial before sample is pulled
up into the syringe.
All other parameters are discussed in the AI/AS 3000 Operating Manual. If you have a
TriPlus or TriPlus RSH, then the instrument parameters are the same and are entered
into the appropriate tabs.
2 Running Your First Sample
Running Methods
18 Ion Trap Series User Guide Thermo Scientific
b. Fill Solvent vials A and B with a suitable rinse solvent such as Methylene chloride.
5. Save the instrument method for use in the next step.
Method files have the *.meth extension and are by default saved to the Xcalibur/Methods
folder. However, you can save method files to any folder you prefer.
Running Methods
After setting up the methods in Instrument Setup, you’re ready to run the method in
Sequence Setup.
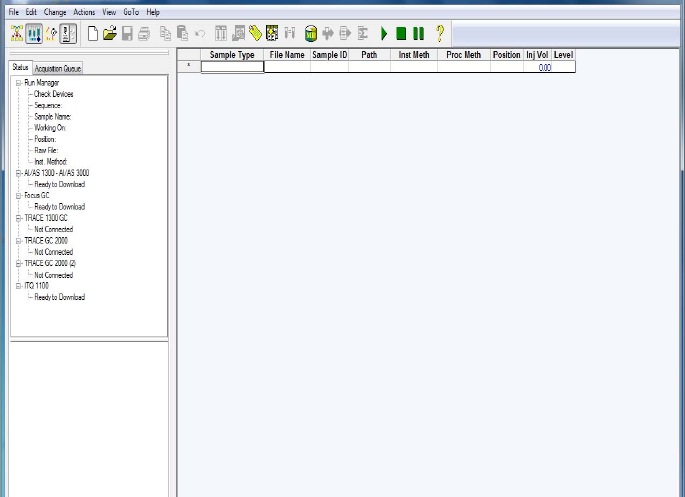
1. Create a sequence to run in the Sequence Setup window to record sample details and
determine how you want to acquire the data.
a. In Xcalibur, click the Sequence Setup icon.
Figure 15. Sequence Setup Window
Sequence setup works just like a spreadsheet, with each row representing a single
sample and each column an item of information required for a sample.
2. Change the Column Arrangement, as described in “To change the column arrangement”
on page 20.
3. Insert information in the first sequence row, which is described in “To add a sequence” on
page 21.
4. Select File | Save to save the sequence and enter an appropriate name, such as
Specification.sld.
2 Running Your First Sample
Running Methods
Thermo Scientific Ion Trap Series User Guide 19
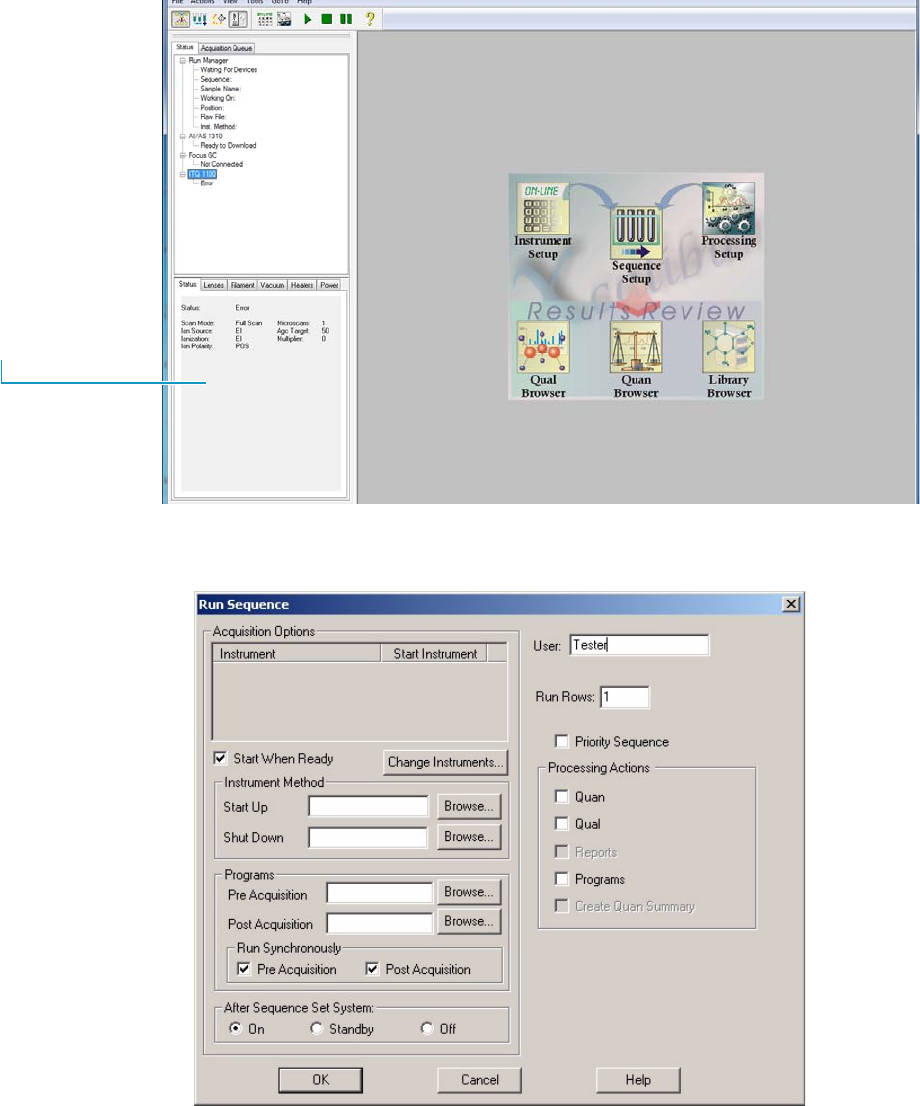
5. Run the sequence by clicking on the sequence number (this highlights the row) or * (if
you did not add any rows).
Figure 16. Sequence Setup: Running a Sequence
6. Select Action | Run Sequence to display the Run Sequence window.
Figure 17. Sequence Setup - Run Sequence Window
7. Select Start When Ready.
Status Panel

2 Running Your First Sample
Running Methods
20 Ion Trap Series User Guide Thermo Scientific
8. Press the Change Instruments button to display the Change Instrument window. This is
where you set up your instruments for an automatic injection or a manual injection.
9. Go to one of these topics: “To perform automatic injections” on page 21 or “To perform
manual injections” on page 22.
To change the column arrangement
1. Select Change | Column Arrangement if you want to change the displayed column
labels. Some of the column descriptions are in Table 1.
Table 1. Sequence Setupa Columns
aMore information about recording samples are in the online manuals.
Item Description
File Name Name of the file where to save the sample data.
Inj Vol Not used in this editor, but used instead in the AS method editor.
Inst Meth The path and file name of the Instrument Method to be used for
acquisition.
Path The path to the raw file that Xcalibur creates for the sample data.
Xcalibur creates this file with the extension *.raw. Double-click on
this field to select a directory.
Position The sample’s vial number. The format of the entry depends on the
configured autosampler. AI/AS 3000 and TriPlus use simple integers.
Sample ID An identifier unique to the sample. This field can also be used to
import a barcode identifier.
Sample Type Type of sample, selected from the following:
• Unknown (the normal choice for qualitative analysis; all other
types are only normally used for quantitative analysis)
•Blank
• QC (quality control)
•Standard Clear
• Standard Update
• Start Bracket
•End Bracket
• Standard Bracket
2 Running Your First Sample
Running Methods
Thermo Scientific Ion Trap Series User Guide 21
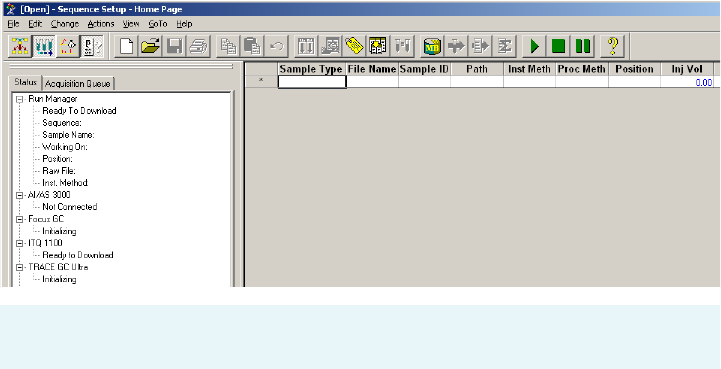
To add a sequence
1. Start entering information in the first blank row.
Figure 18. Sequence Setup: Sample Information
2. Click in the File Name field and enter sample information, such as Data01.
3. Select a *.meth file.
Click in the Inst Meth field and right-click in the field to display the drop-down menu,
choose Browse to select an existing meth file to use for existing sample information.
To insert another row
1. To insert a row within a list of samples you have already entered, right-click anywhere in
the row below the row where you want to insert the new sample.
2. Choose Edit | Insert Row to open the Insert Row window.
3. Select Yes and return to the Sequence Setup window.
To perform automatic injections
You can instruct Xcalibur when to make the automatic injection. Basically, you set the
autosampler that is listed in the In Use field to say Yes in the Start Instrument field.
1. Configure the Change Instruments In Use window for automatic injections.
a. Select a sequence row and select the sample type.
b. Select Actions | Run Sequence to open the Run Sequence window.
c. Click the Change Instruments button to open the Change Instruments In Use
window.
Note Press F2 on your computer to edit text already in a cell. Press F2 two times
to see an edit dialog box.

2 Running Your First Sample
Running Methods
22 Ion Trap Series User Guide Thermo Scientific
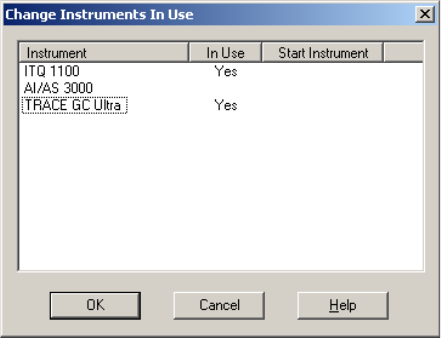
Figure 19. Sequence Setup: Change Instruments In Use (Automatic Injections)
d. Make Yes display for each instrument (AS, GC, MS) listed in the In Use fields
(Figure 19). However, if Yes is not listed, then click on the blank field to toggle Yes on.
e. Toggle Yes to display in the Start Instrument field for the AS. This makes the
autosampler start as soon as all devices are ready.
f. Select OK to return to the Run Sequence window.
2. Prepare the injection.
a. Open and transfer the highest concentration test mixture.
b. Load the sample vial into position 1 of the autosampler.
3. Start the run by clicking OK in the Run Sequence window (Figure 17).
To perform manual injections
Manual injections are necessary for those not having or using an autosampler to run this
method. Basically, make sure that the GC and MS listed in the In Use field do not read Yes in
the Start Instrument field. If you do not want to use an instrument for the current sequence,
click on the In Use Yes entry to change it to a blank space. Instruments with an In Use blank
space are not available for the current sequence.
For example, if a sample is manually injected by a syringe into the GC/MS, the In Use entries
for all instruments, except the GC/MS, must be a blank space.
All instruments used for the sequence submitted for processing, must display Yes in the In Use
column.
1. Configure the Change Instruments In Use window for manual injections.
a. Select a sequence row and select the sample type.
b. Select Actions | Run Sequence to open the Run Sequence window.
c. Click the Change Instruments button to open the Change Instruments In Use
window.
2 Running Your First Sample
Running Methods
Thermo Scientific Ion Trap Series User Guide 23
Figure 20. Sequence Setup: Change Instruments In Use Screen (Manual Injections)
d. Toggle Yes to display in the In Use fields, for both the GC and MS. However, if Yes is
not listed, then click on the blank field to toggle Yes on.
e. Make sure the GC and MS instruments start Instrument fields are empty (Figure 20).
The operator or person making the injection will start the instrument.
f. Make sure the AS (if listed) does not say Yes in both the In Use and Start Instrument
fields.
g. Select OK to return to the Run Sequence window.
2. Open the test compound that is in the GC/MS test kit.
3. Select OK in the Run Sequence window (Figure 17) to start the run and return to the
Sequence Setup window.
4. Monitor the status View located in the Sequence Setup window until the instrument is
“Waiting for Contact Closure.
5. Prepare the injection.
a. Draw 1 μL of the test compound into the supplied syringe. Be sure there are no
bubbles in the syringe.
b. Draw in 1 μL of air.
6. Make the injection and start the GC.
a. Carefully, insert the needle into the injector port.
b. Wait three seconds and push the plunger.
c. Quickly, press the Start button located on the GC.
d. Remove the syringe.
7. Watch the data while the sequence is running.
This is a good time to watch the data by selecting from one of the two views:

2 Running Your First Sample
Analyzing Data: Compounds with a Known Retention Time
24 Ion Trap Series User Guide Thermo Scientific
a. Click the Real Time Plot button to view the chromatogram and spectrum
acquisition in real time. The real-time plot starts after the filament delay has timed
out. When the run is finished this window goes blank.
b. Click the Acquisition Queue Instrument Status tab to view the list of the samples
you have selected to run. Green items indicate the sequence is running.
8. Click the Roadmap button to return to the Xcalibur Roadmap.
9. Now you’re ready to analyze your data. However, you’ll need a thorough understanding of
cursor actions, which are described in “Reviewing Cursor Actions in Browsers” on
page 70.
To analyze data
Go to any of the following topics:
•“Analyzing Data: Compounds with a Known Retention Time” on page 24
•“Analyzing Data: Compounds with a Known Ion Pattern” on page 32
•“Analyzing Data: Peak Height and Area” on page 35
•“Analyzing Data: Signal-to-Noise Ratio” on page 37
Analyzing Data: Compounds with a Known Retention Time
When you’re ready to analyze your data, use the Xcalibur browsers (Qual, Quan, and Library)
to view the data file results.
Using Qual Browser you can answer the question, “Does this sample contain compound ‘X’?
X being the test compound you used in the previous topic. Then we will determine the peak
height, area, and signal-to-noise ratio.
In this example, we used the \Xcalibur\Data\Factory Test Data\100pgEI.raw file, but you can
use any .raw file. Preferably, use the one you just acquired in Step 6, Make the injection and
start the GC., on page 23. If you did not acquire this sample, you can use the sample file
located in Xcalibur\Data\Factory Test Data\ 100pgEI.raw or any *EI.raw.
Let’s assume that you have previously carried out a GC run with a pure sample of the
compound you are interested in, compound 'X', and consequently you know the retention
time.
1. Open Qual Browser and select the *.raw file that contains the data for the sample you
want to work on.
a. Select Qual Browser from the Roadmap.
Note See the online manuals for more detailed instruction.
2 Running Your First Sample
Analyzing Data: Compounds with a Known Retention Time
Thermo Scientific Ion Trap Series User Guide 25
b. Choose File | Open and navigate to Xcalibur\Data\Factory Test Data to open the
sample file 100pgEI.raw or a *.raw file containing the data you’re interested in.
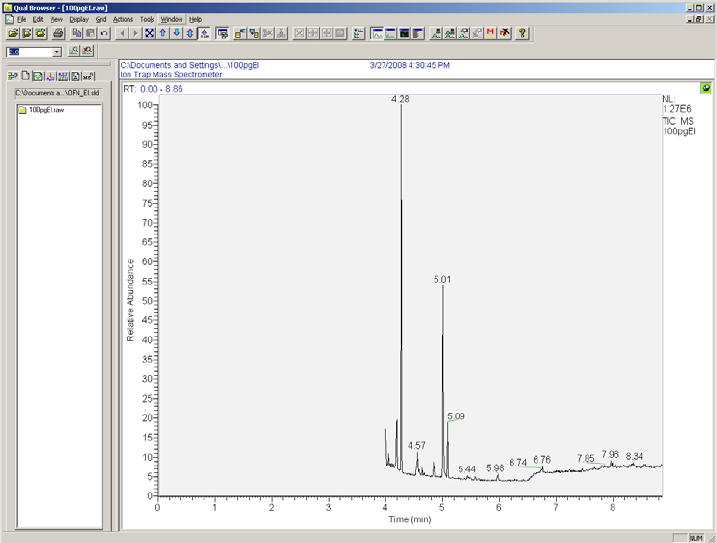
Figure 21. Qual Browser: 100pgEI.raw
Don’t be surprised if the Qual Browser window looks different than Figure 21. This
is because the default layout can be changed and saved.
2. Display a chromatogram and a mass spectrum in the same window.
If you want to identify the compound that is eluting at approximately 5 minutes, look at
the mass spectrum recorded at that time in the chromatogram.
a. Anchor your cursor in the chromatogram.
2 Running Your First Sample
Analyzing Data: Compounds with a Known Retention Time
26 Ion Trap Series User Guide Thermo Scientific
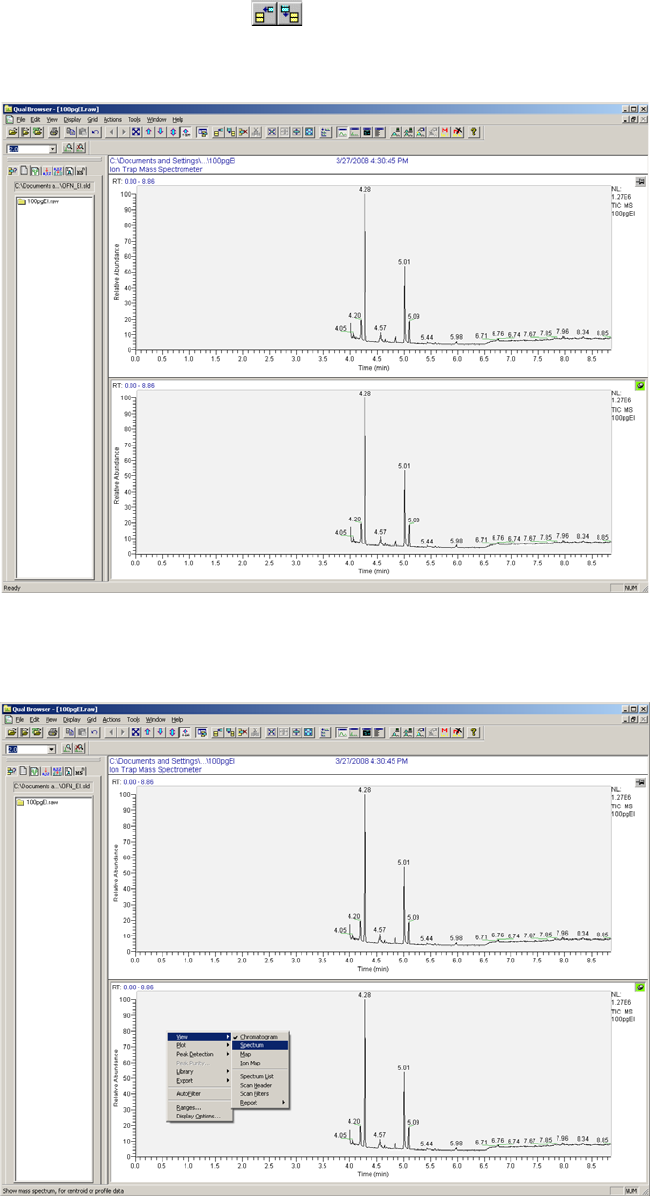
b. Click the Insert Cell button to open a new cell containing the same
information as the existing cell.
Figure 22. Qual Browser: Displaying two chromatograms
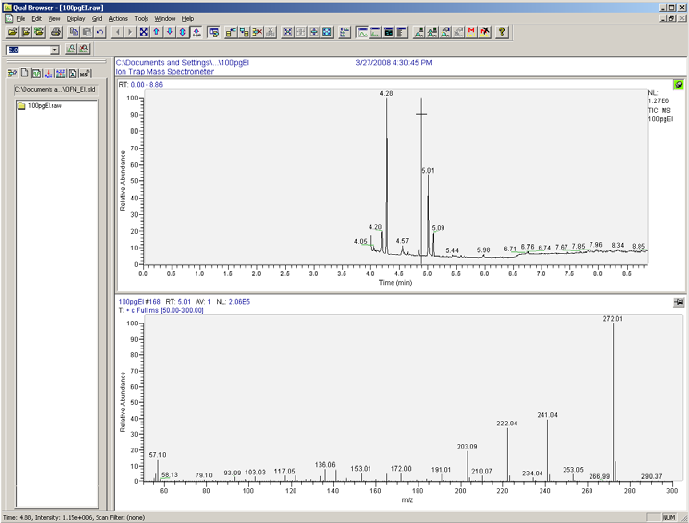
c. Select the lower cell by clicking on the pin icon in the upper right corner of the
window.
Figure 23. Qual Browser: Chromatogram drop-down menu
2 Running Your First Sample
Analyzing Data: Compounds with a Known Retention Time
Thermo Scientific Ion Trap Series User Guide 27
d. Choose View | Spectrum from this menu to change the view from chromatogram to
spectrum. The lower cell now displays spectral data.
Notice that the lower cell now displays a graph of relative abundance vs. m/z that is a
mass spectrum. Initially, you’ll see the first mass spectrum.
3. Zoom in on the time period of interest.
Although the full TIC chromatogram is currently displayed in the upper cell, only the
retention time around three or four minutes is of particular interest. Therefore, zoom in
on that part of the chromatogram and view it in more detail.
There are two ways of doing this; using mouse functions or using range functions.
To use mouse functions
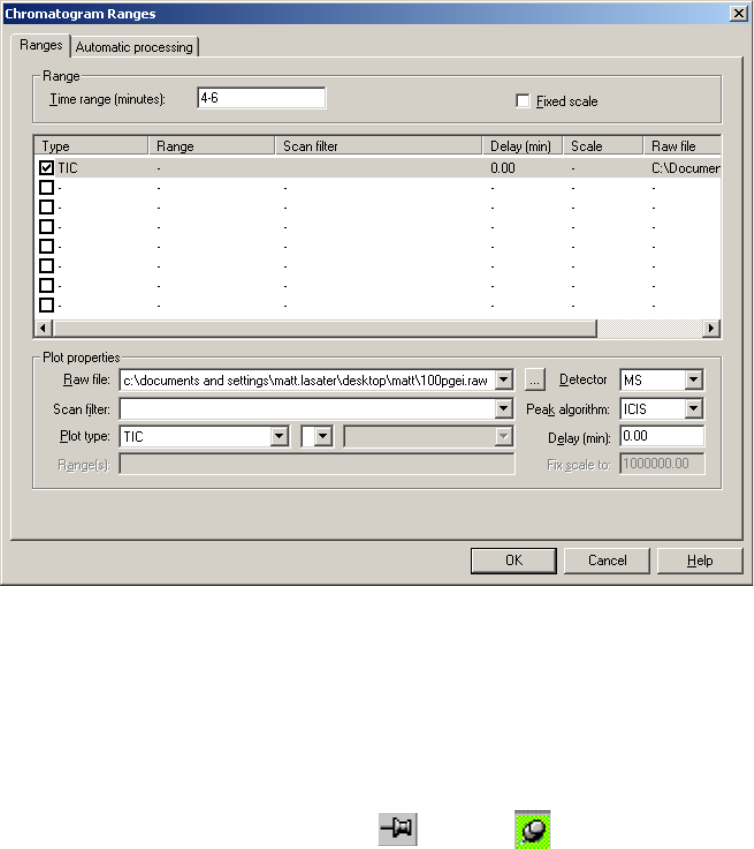
1. Click the pin icon that is located in the top right corner of a chromatogram cell, so it is
green (pinned).
Figure 24. Qual Browser: Chromatogram using Mouse
2. Position the cursor at the starting time you are interested in, at a position close to or on
the baseline.
3. Click and drag the cursor parallel to the time axis to the end of the period required.
Notice that a line is drawn on the screen as you do this. As the cell redisplays, notice that
only part of the chromatogram within the line you have just drawn.
2 Running Your First Sample
Analyzing Data: Compounds with a Known Retention Time
28 Ion Trap Series User Guide Thermo Scientific
To use range functions
1. Right-click on the chromatogram to display the context-sensitive menu and choose
Ranges to display the Chromatogram Ranges window.
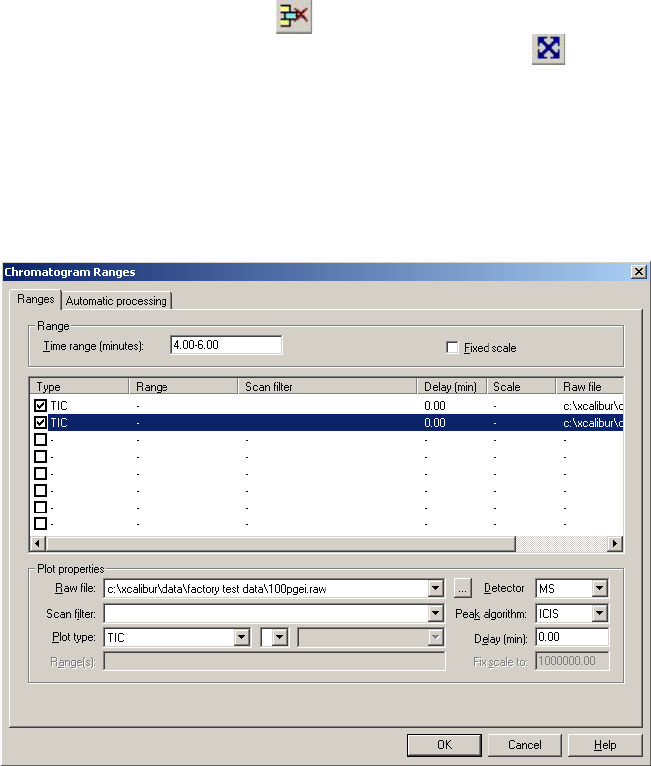
2. Enter the time range of interest in the Time Range field such as 4 to 6 minutes.
Figure 25. Qual Browser: Chromatogram Ranges
3. Click OK to return to Qual Browser.
4. View the mass spectrum for a specific chromatogram retention time.
Currently, a selected chromatogram time period is displayed in one cell and a mass
spectrum in another cell. This step describes how to select a particular retention time on
the chromatogram and view the corresponding mass spectrum.
a. Locate the pin icon shown in the top right corner of the mass spectrum cell and click
on it. The icon changes from unpinned to pinned .
b. Move the cursor over the chromatogram until it is positioned at the retention time
you are interested in and click on it to view the mass spectrum for the desired
retention time.
5. Subtract the background contamination from the spectrum.
Peaks eluting from a GC column can contain low levels of contamination due to material
bleeding from the matrix of the column. This material will have its own mass spectrum
that will be superimposed on that of the sample compound. The mass spectrum of a

2 Running Your First Sample
Analyzing Data: Compounds with a Known Retention Time
Thermo Scientific Ion Trap Series User Guide 29
chromatogram peak can therefore be made up of mass peaks resulting from the sample
compound plus mass peaks resulting from background contamination.Therefore, to
obtain a mass spectrum for the compound alone (that can be used in a Library Search),
subtract the mass spectrum of the background contamination.
a. Make sure that the mass spectrum cell is pinned.
b. Choose Actions |Subtract spectra | 2 Ranges.
You can choose between subtracting the background from either one side of the peak
you are interested in or from both sides. To get the best results you will usually want
to subtract from both sides, so choose two ranges.
c. Move the cursor into the chromatogram cell and position it slightly to one side of the
peak you are interested in.
d. Click and drag the cursor away from the peak, making sure to stop before reaching
the next discernible peak on the chromatogram. Notice a line drawn on the screen as
you do this.
e. Repeat to mark the opposite side of the peak.
In general, after background subtraction, most of the larger mass peaks in the mass
spectrum will be unchanged; these are “true” peaks, due to the sample compound.
Common contamination peaks are at m/z 207, and 281. The removal of such
contamination peaks will help you to obtain a more accurate result from a library
search.
6. Use the spectrum to perform a library search.
When you have a clean mass spectrum, you can use it to search the NIST library to
determine the nature of the compound.
Note Right-mouse click in a window to view pull-down menus.
2 Running Your First Sample
Analyzing Data: Compounds with a Known Retention Time
30 Ion Trap Series User Guide Thermo Scientific
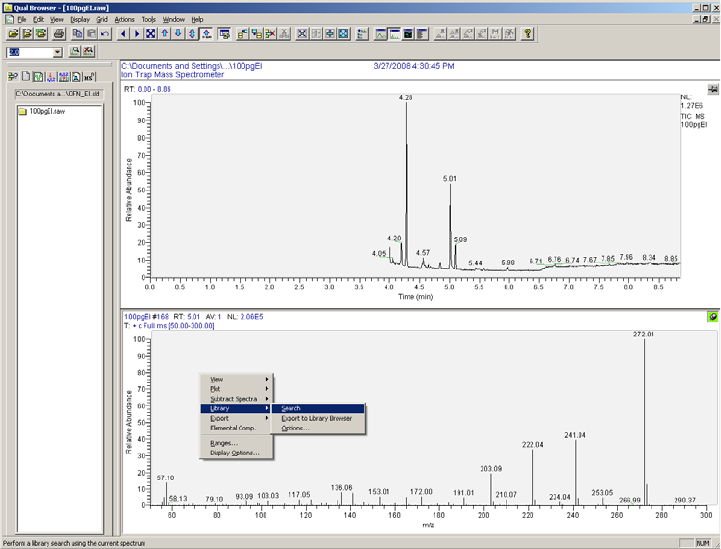
a. Right-click in the mass spectrum cell and choose Library | Search from the menu.
Figure 26. Qual Browser: Library Search Menu
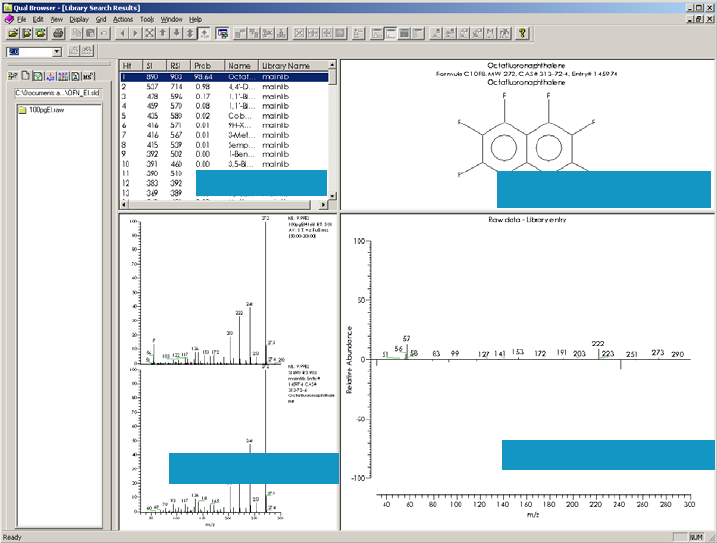
b. If you have the optional NIST library installed, look in the Hit List Cell for the most
likely compounds in decreasing order of match probability.
2 Running Your First Sample
Analyzing Data: Compounds with a Known Retention Time
Thermo Scientific Ion Trap Series User Guide 31
If the test compound is not one of the top hits, you may only have the demonstration
library loaded. The full NIST library is an option. Check which libraries are available
for search by selecting the Library Options pull-down menu.
Figure 27. Qual Browser: Library Search Results
For each compound in the hit list, Xcalibur displays a chemical structure, a library
spectrum to compare with your spectrum, and a difference spectrum, which is the
library spectrum subtracted from your spectrum.
Chemical Structure Cell
Library Spectrum Cell Difference Spectrum Cell
Hit List Cells
2 Running Your First Sample
Analyzing Data: Compounds with a Known Ion Pattern
32 Ion Trap Series User Guide Thermo Scientific
Analyzing Data: Compounds with a Known Ion Pattern
Using Qual Browser you can answer the question, “Does this sample contain compound “x”? X
being the test compound you used in the “Running Methods” on page 18. Then we will
determine the peak height, area, and signal-to-noise ratio.
In this example, we used the Xcalibur\Data\100pgEI.raw file you just acquired in Step 6,
Make the injection and start the GC., on page 23.
In this example, let’s assume that you already have some knowledge of the mass spectrum of
the compound of interest, compound 'X', and consequently you know the characteristic ions
present in its mass spectrum. For the purposes of this example, m/z 272 represents an ion,
perhaps the molecular ion of the compound, and therefore this ion represents a “marker” for
the compound.
1. Open Qual Browser.
a. Set up the cells so you have only one cell: a chromatogram. Pin the cell and then
select Grid | Delete Row from the menu. You can also anchor the cursor in the cell
you wish to delete and click the icon.
b. Reset the time range to the full range by selecting Zoom Reset from the toolbar.
2. Add a mass range chromatogram.
a. Select the chromatogram cell and then right-click your mouse to display the context
sensitive menu.
b. Select Ranges to open the Chromatogram Ranges window.
Figure 28. Qual Browser: Opening the Chromatogram Ranges Window
2 Running Your First Sample
Analyzing Data: Compounds with a Known Ion Pattern
Thermo Scientific Ion Trap Series User Guide 33
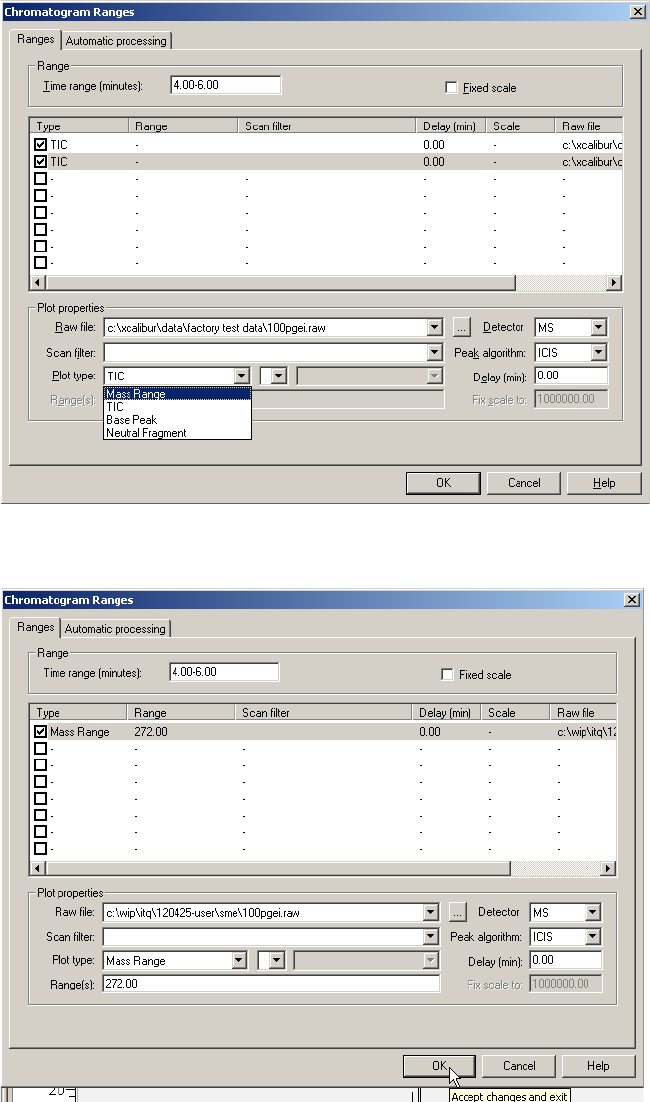
c. Add another plot by clicking the checkbox located in the Type column.
d. Select Mass Range from the Plot Type field.
Figure 29. Qual Browser: Selecting Mass Range
e. Enter 272 as the mass range in the Range(s) field.
Figure 30. Qual Browser: Entering a Mass Range
2 Running Your First Sample
Analyzing Data: Compounds with a Known Ion Pattern
34 Ion Trap Series User Guide Thermo Scientific
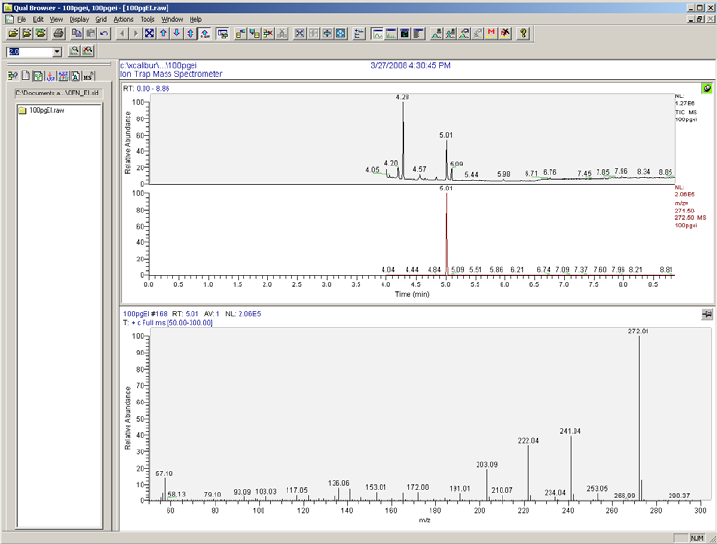
f. Click OK to return to Qual Browser where the chromatogram cell now shows a mass
TIC and a chromatogram for the selected mass, m/z 272.
Figure 31. Qual Browser: Displaying a Mass TIC and Mass Range Chromatogram
The result in this example shows that the peak at retention time 5.01 minutes is of
particular interest because it includes m/z 272, the molecular ion from the test
compound.
3. View the mass spectrum.
Having identified a particular retention time of interest, you can investigate the peak
further by looking at the mass spectrum. Follow the same procedure in the previous
section for adding a spectrum cell.

2 Running Your First Sample
Analyzing Data: Peak Height and Area
Thermo Scientific Ion Trap Series User Guide 35
Analyzing Data: Peak Height and Area
Using Qual Browser, you can analyze the data’s peak height and area. In a chromatogram, the
area of an isolated peak is directly proportional to the amount of material present. For peaks
that overlap, height may give a more accurate determination. Determining the area and/or
height of a peak is an important feature of quantitation.
1. Open Qual Browser to open a *.raw file that you stored from the Sequence Setup
window.
2. Zoom in on the part of the chromatogram that is of particular interest.
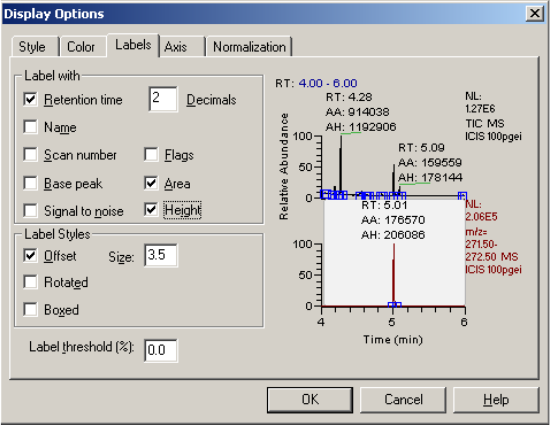
a. Right-click on the chromatogram and choose Peak Detection | Toggle Detection in
All Plots from the menu. Individual peaks are shaded and the extent of each peak is
shown in blocks on the baseline.
Figure 32. Qual Browser: Peak Detection
2 Running Your First Sample
Analyzing Data: Peak Height and Area
36 Ion Trap Series User Guide Thermo Scientific
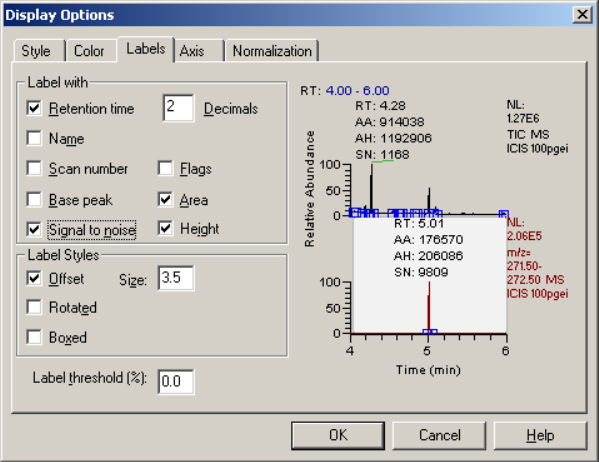
b. Right-click on the chromatogram and choose Display Options to open the Display
Options window.
Figure 33. Qual Browser: Display Options | Labels
c. Click the Labels tab.
d. Select both the Area and Height checkboxes.
e. Click OK to return to the chromatogram.
2 Running Your First Sample
Analyzing Data: Signal-to-Noise Ratio
Thermo Scientific Ion Trap Series User Guide 37
Analyzing Data: Signal-to-Noise Ratio
Determine if you want to use Qual Browser or the Signal-to-Noise Test to determine the
peak’s signal-to-noise ratio. The signal-to-noise ratio is a good measure of the performance of
the system because it defines the smallest amounts of compound that can be detected and
quantified. If the signal-to-noise ratio is low, true peaks (signals) resulting from the presence
of very small amounts of material can be lost in the background noise.
Low signal-to-noise ratios can result from:
• Poor column quality
•A dirty ion source
• Poor quality carrier gas
•Inadequate
sample cleanup (extraction)
• Poor chromatography techniques
To use Qual Browser to determine signal-to-noise ratio
1. Open the *.raw file in Qual Browser and display the signal-to-noise label on the
chromatogram.
a. Right-click on the chromatogram to access the drop-down menu.
b. Choose Display Options to open the Display Options window.
Figure 34. Qual Browser: Display Options | Labels | Signal-to-Noise
c. Click the Labels tab.
d. Select the Signal-to-Noise checkbox.
2 Running Your First Sample
Analyzing Data: Signal-to-Noise Ratio
38 Ion Trap Series User Guide Thermo Scientific
e. Click OK to return to the chromatogram.
2. Choose the baseline noise range.
3. Click the Peak Detection Settings tab located in the Info bar.
4. Pin the chromatogram cell by clicking in the top right corner.
5. Click on the chromatogram plot on which you wish to measure the signal-to-noise. It will
turn gray.
6. Check the Manual Noise Region in the Info bar.
7. Enter a noise range near the peak. Avoid choosing a region with a peak in it.
8. Click Apply to display the RMS (root mean square) signal-to-noise calculation.
9. Look for a red line in the chromatogram to view the noise range you chose.
To use the Signal-to-Noise Test
1. Use the Signal-to-Noise Test, which is provided with all versions of Xcalibur.
A shortcut for the Signal-to-Noise Test is located on the desktop. The Signal-to-Noise
Test may also be added to the Tools menu of the Xcalibur Roadmap. Select Tools |Add
Tools and specify the program location as C:\Program Files\Thermo\Signal To Noise Test
1.1\SignalToNoiseTest.exe.
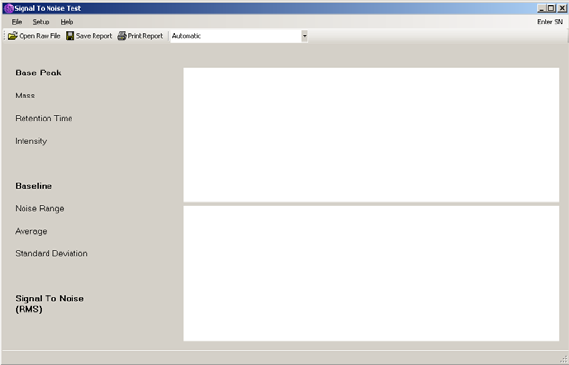
2. Run the Signal-to-Noise Test by double-clicking the shortcut located on the desktop to
open the Signal to Noise Test window.
You can also run it from C:\Program Files\Thermo\Signal To Noise Test
1.1\SignalToNoiseTest.exe if the icon is not available.
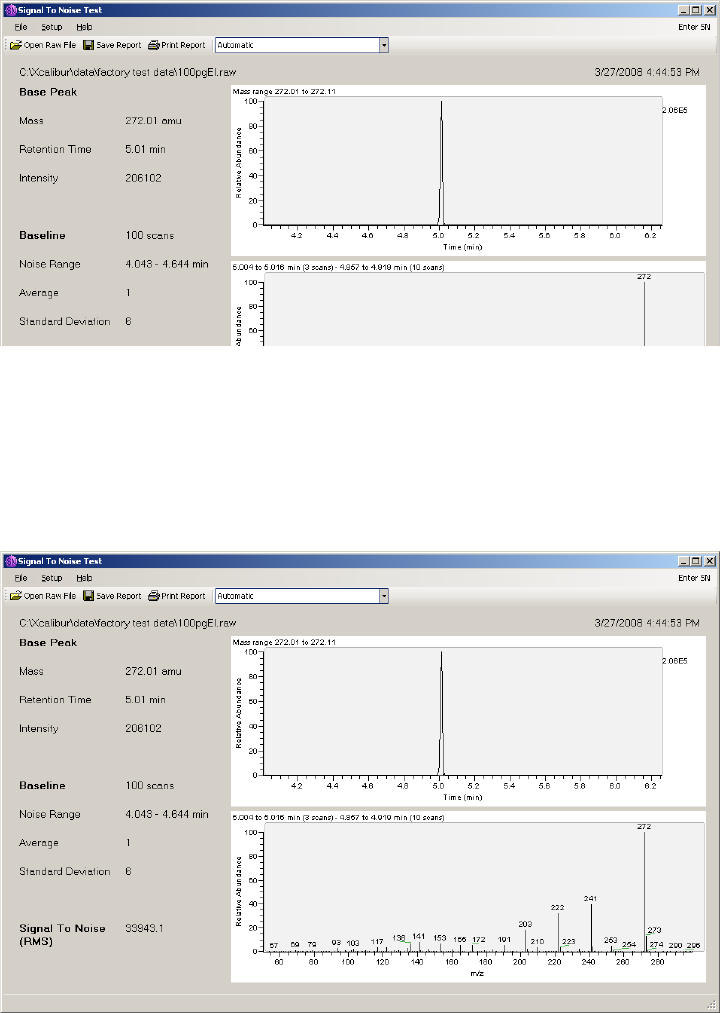
Figure 35. Opening the Signal-to-Noise Test Window
2 Running Your First Sample
Analyzing Data: Signal-to-Noise Ratio
Thermo Scientific Ion Trap Series User Guide 39
a. Select File | Open Raw File and select the 100pgEI.raw file or the data file of interest.
Xcalibur begins processing the file upon opening.
Figure 36. Opening a Raw File
The automatic processing method looks for the standard test compounds mass ranges
and retention times. If you would like to find the signal to noise ratio for a different
compound, then select the custom option from the list box.
b. Select Custom from the list box. In the custom mode, you may choose the mass and
the retention time to use.
Figure 37. Using Custom Mode
c. Press the F5 button to refresh the screen after selecting your custom parameters.
3. Reprocess the file by selecting Setup | Reprocess.
2 Running Your First Sample
Analyzing Data: Signal-to-Noise Ratio
40 Ion Trap Series User Guide Thermo Scientific

Thermo Scientific Ion Trap Series User Guide 41
3
Using the Options
This chapter discusses the Ion Trap Series options and how best to use them.
Contents
•MSn Scan Mode
•Chemical Ionization (CI Mode) Options
•ACE Options
•DDS Options
•PQD Options
•Variable Damping Gas Option
Table 2. Ion Trap Series Optionsa for ITQ Instruments
aAvailable as an upgrade option. Ask your dealer for the upgrade.
Options ITQ 700 Series ITQ 900 Series ITQ 1100 Series
Mass Ranges 10-700 amu 10-900 amu 10-1100 amu
MSn Scan Mode * * standard
ACE (Automatic Collision Energy) * * standard
DDS (Data Dependency Scanning) * * standard
PQD (Pulsed Q Dissociation) * * standard
Chemical Ionization (CI Mode) * * *
Probe System (DIP/DEP) * * *
Variable Damping Gas * * *
3 Using the Options
MSn Scan Mode
42 Ion Trap Series User Guide Thermo Scientific
MSn Scan Mode
MSn is a term used synonymously with the terms MS/MS, MSMS, and MS/MS/MS.
Multiple stages (MSn) of mass spectrometry are the core strength of an ion trap instrument.
In the ion trap, the initial capture of the ions is called the first MS stage. In an MS/MS
experiment, this initial population of ions is reduced to a precursor ion, which is then excited
and fragmented through collision-induced dissociation (CID). This isolation and
fragmentation is the second stage of MS. An MS/MS/MS experiment would be the same as an
MS/MS experiment, but with the isolation and subsequent fragmentation of one of the
fragments from the second MS stage. The ion trap can perform a maximum of five MS stages.
Each isolation and fragmentation stage makes it increasingly easier to separate a compound
away from the background matrix because the probability that the matrix shares a mass and
also fragments in the same way as the analyte is very small. Even if the matrix interferes after
one stage of isolation and fragmentation, another stage is usually enough to isolate the analyte
signal from the background. The superb selectivity of the MSn technique is very useful for
quantitation in a heavy matrix. Detection and quantitation of sub-picogram levels of target
compounds in matrices, such as milk, tissues, soils, and sludges, has been achieved. MSn may
also be used for structural elucidation and other research techniques. This powerful tool
comes standard on the ITQ 1100 system and is an available option for the ITQ 700 and
ITQ 900 instruments.
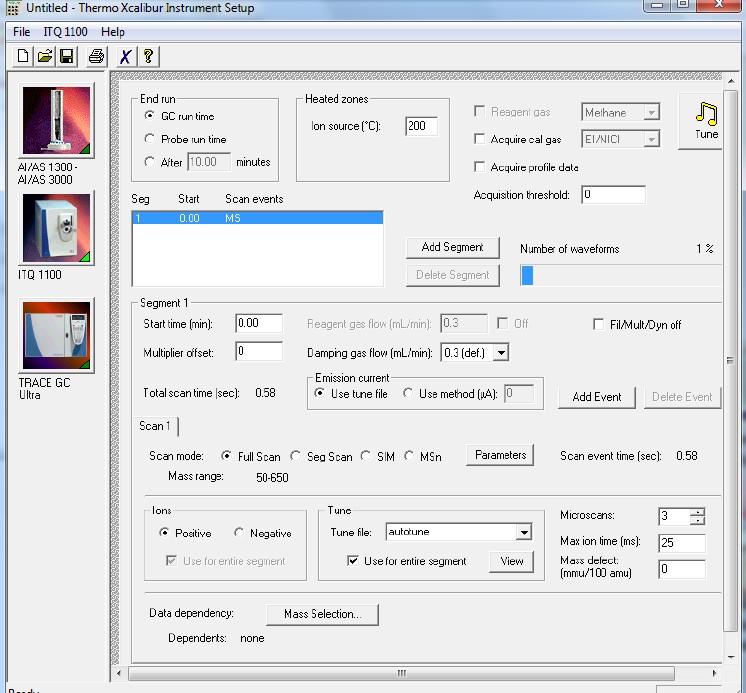
To activate ACE, DDS, and PQD options, set the method to MSn scan mode and click the
Parameters button to set the parameters in the MSn Parameters window.
3 Using the Options
MSn Scan Mode
Thermo Scientific Ion Trap Series User Guide 43
To run an MSn method
1. Select Instrument Setup from the Xcalibur Home Page to display the Instrument Setup
window.
2. Click the mass spectrometer icon to display the mass spectrometer method editor.
Figure 38. Instrument Setup: ITQ Method Editor
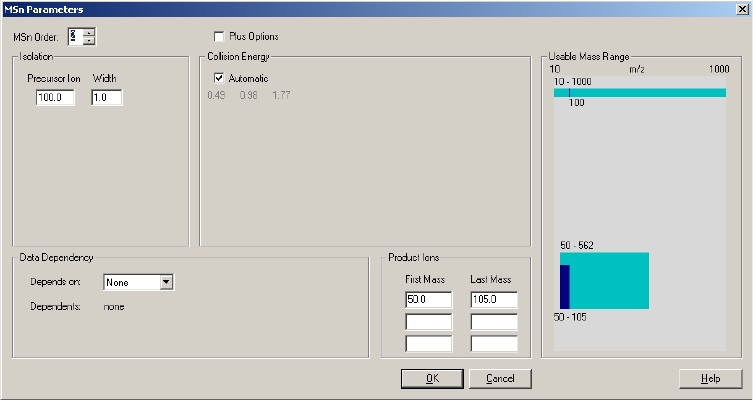
3. Set the scan mode to MSn.
3 Using the Options
MSn Scan Mode
44 Ion Trap Series User Guide Thermo Scientific
4. Click the Parameters button to open the MSn Parameters window and configure the
parameters needed to run the MSn experiment.
Figure 39. Opening the MSn Parameters Window
a. Select an MSn order by setting the order of the MSn experiment to 2 if you are
running an MS/MS experiment or 3 if you are running an MS/MS/MS experiment.
Each additional stage of MS increases the MSn order by one. For each MS stage, you
must specify the mass of the precursor in the isolation. In this example, the precursor
ion is mass 100 and will be isolated to a 1 amu width. So, ions with a mass between
99.5 and100.5 will stay in the trap and all other ions will be ejected during isolation.
b. Set the Collision Energy parameters. Specify the collision energy or select the
Automatic checkbox to have the software automatically estimate the collision energy.
To maintain full control over the collision energy, deselect the Automatic checkbox
and enter a collision energy value. The three-grayed out collision energy values
displayed in Figure 39 are the values that the automated collision energy uses. If you
are using PQD, there will only be one collision energy value displayed.
You can generally get the highest fragmentation efficiencies using an experimentally
determined value for the collision energy. However, determining the best collision
energy can be time consuming, requiring multiple injections and manual
examination of the data. The value that is estimated automatically may be sufficient
for analysis.
5. Set the Product Ions parameters by entering the product ions’ first and last mass range.
In GC/MS, the product mass-to-charge ratio is nearly always less than the precursor mass.
As a result, the last mass of the product ion range should rarely be a few amu above the
precursor. The first mass should be as low as necessary to capture the product ions.
3 Using the Options
MSn Scan Mode
Thermo Scientific Ion Trap Series User Guide 45
In Figure 39, the first mass is 50 and the last mass is 105. Narrower mass ranges result in
faster scan speeds. So, if your product ions are far apart in mass and you need faster
scanning, try using several narrow product ion ranges instead of one contiguous wide one.
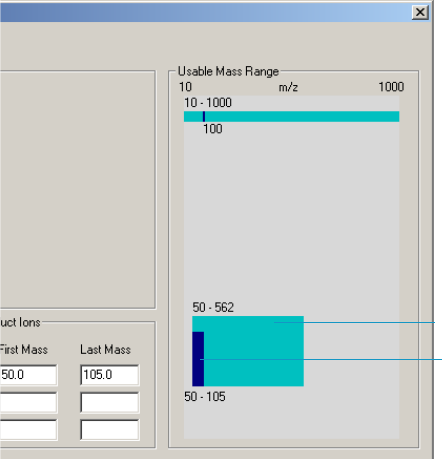
The possible product ion mass range is graphically represented by the larger aqua colored
region surrounding the dark blue product ions bar (see Figure 40).
Figure 40. MSn Parameters: Usable Mass Range
The dark blue bar indicates the selected product ion mass range. In this example, the
allowable range is 50-562 amu, and the selected range is 50-105 amu. The lower mass
range depends on the trapping voltages applied to the ion trap. The trapping voltages can
be adjusted in the Plus Options.
Aqua Region: possible product ion region
Dark Blue Region: selected product ions
mass range

3 Using the Options
MSn Scan Mode
46 Ion Trap Series User Guide Thermo Scientific
6. Select Plus Options to access more advanced parameters.
Figure 41. MSn Parameters: Plus Options
This selection allows you to set the time that the isolation and collision voltages are
applied. However, the default values are nearly always sufficient. Additionally, the
maximum excitation energy, also known as q, is accessible. The default maximum
excitation energy is set to 0.45. However, this value sets the minimum allowable mass
range to ½ the value of the precursor ion. If lower mass ranges are required, then this
value must be reduced.
As can be seen in Figure 41 on page 46, reducing the maximum excitation energy from
0.45 to 0.30 lowers the minimum allowable mass to 33, which is 1/3 the precursor ion’s
mass. If the maximum excitation energy is lowered to 0.225, then the lowest allowable
mass would drop to ¼ of the precursor ion mass. Lowering the maximum excitation
energy reduces the amount of energy that can be deposited in the precursor ion during
CID and reduces the fragmentation efficiency. The final maximum excitation energy
option is PQD (see “PQD Options” on page 55). This option allows the minimum
allowable mass to be significantly less than any of the other excitation energy options.
However, the fragmentation efficiency is significantly lower.

3 Using the Options
Chemical Ionization (CI Mode) Options
Thermo Scientific Ion Trap Series User Guide 47
Chemical Ionization (CI Mode) Options
Chemical ionization is a softer ionization technique than the standard electron ionization
(EI). CI operates by having a relatively high pressure of reagent gas in the ionization region.
Because less energy is deposited into the analyte during ionization when using CI, less
fragmentation occurs. CI can be used to produce positive ions through protonation or
negative ions through electron capture. Positive CI works well with compound containing
atoms such as nitrogen or oxygen. Negative CI is effective on compounds with highly
electronegative atoms, like fluorine and chlorine. Because this ionization technique is more
selective, especially negative CI, the matrix background may be reduced.
CI can be used for quantitation. Additionally, because the ion population is focused into the
molecular ion, MSn can give better quantitative results.The method software controls the
reagent gas flow so that any time the data system activates the analytical method, a precise
flow of the CI reagent gas is delivered to the mass spectrometer. In addition, proprietary
pulsed positive ion negative ion chemical ionization (PPINICI) allows for the acquisition of
both positive and negative chemical ionization data in a single segment. Without this option,
positive CI must be performed in a separate segment from negative CI. This restriction
prevents the simultaneous acquisition of positive and negative CI at the same GC elution time
without the PPINICI option.
WARNING FLAMMABLE OR CORROSIVE GAS HAZARD. CI typically uses flammable
gases, such as methane, or corrosive gases, such as ammonia. Care must be taken to ensure
the safe use of the CI reagent gases.
3 Using the Options
Chemical Ionization (CI Mode) Options
48 Ion Trap Series User Guide Thermo Scientific
To set CI options
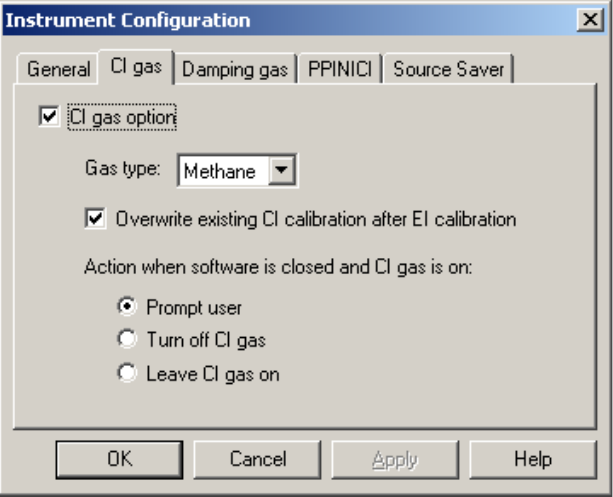
1. Configure the instrument for CI gas in Instrument Configuration.
a. Open the Instrument Configuration window and click the CI gas tab.
Figure 42. Activating CI Gas
b. Select CI gas option.
c. Once this option is activated, you may select the reagent gas type. The default values
of the other options are usually acceptable. Please consult the online help for a
discussion of these other choices.
3 Using the Options
Chemical Ionization (CI Mode) Options
Thermo Scientific Ion Trap Series User Guide 49
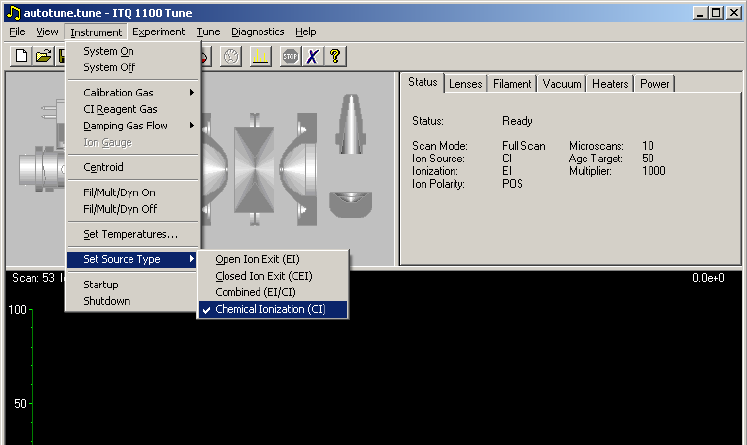
2. Tune the instrument for CI.
After the CI option is activated in Instrument Configuration, the instrument must be
tuned for use with CI.
Figure 43. Setting CI Options
a. Begin by selecting the type of ion volume that is in the instrument. In order to run
CI, either the CI ion volume or the combined EI/CI ion volume must be selected.
Because of the pressure requirements for a successful CI, a CI ion volume needs to be
more enclosed than an EI ion volume. The CI ion volume is optimal for CI. The
combination EI/CI ion volume has a slightly larger conductance limit for the reagent
gas, which decreases the CI ionization effectiveness. However, standard EI ionization
can occur with the combined EI/CI ion volume.
You must turn on the CI reagent gas before tuning in CI. If the CI ion volume is
selected, then only the CI autotune is available. If the combined EI/CI ion volume is
selected and the CI reagent gas is OFF, then only the EI autotune is available.
After tuning the system and saving the tune files then set up the method parameters
in Instrument Setup.
3. In Xcalibur, click the Instrument Setup icon.
3 Using the Options
Chemical Ionization (CI Mode) Options
50 Ion Trap Series User Guide Thermo Scientific
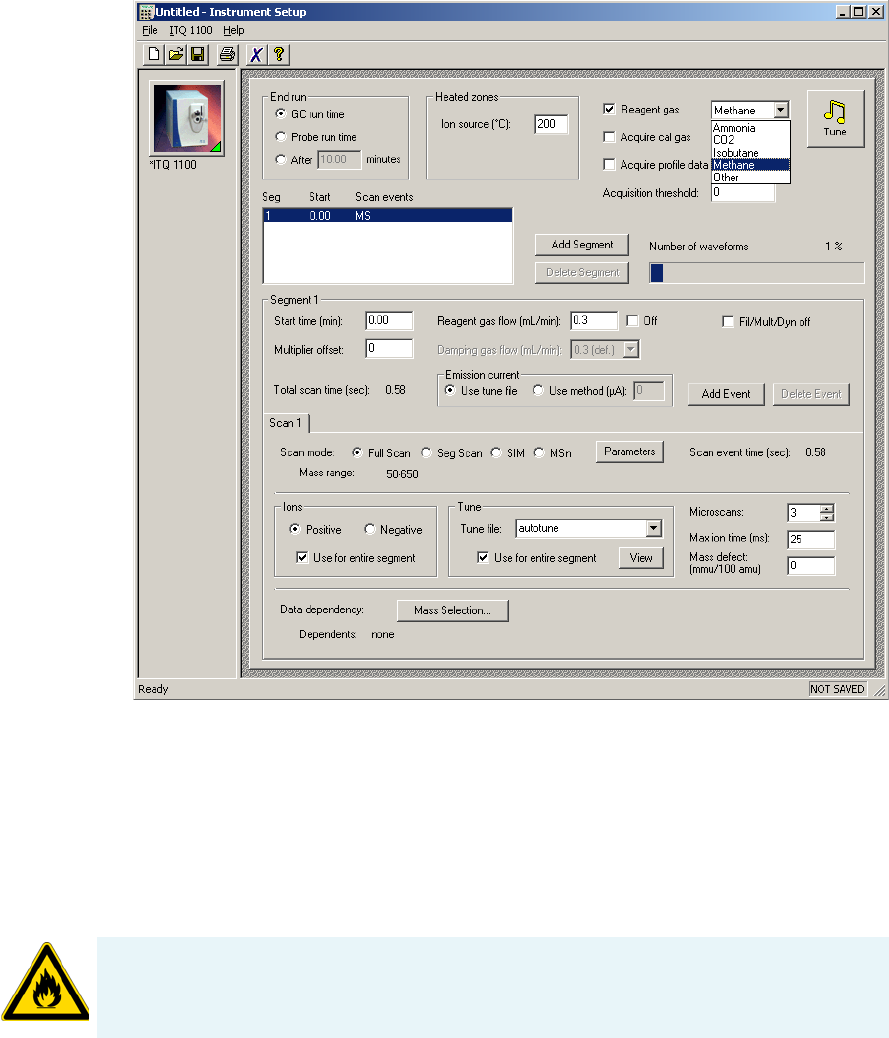
4. Click the mass spectrometer image to open the instrument’s method editor.
Figure 44. Configuring the Method Editor for CI
a. Select the Reagent Gas checkbox and select the reagent gas type.
b. Set the reagent gas flow rate, and the tune files to use for your analytical method. If
you have an EI/CI ion volume installed, then you can collect data in both EI and CI
for a given injection. However, because the reagent gas must be pumped away for EI
operation, you must have EI and CI acquisitions in separate segments. If PPINICI is
enabled, then you may elect to have scan events use different ion polarities when CI is
on.
CAUTION BURN HAZARD. PPINICI requires the use of a special high speed dynode
power supply. Activating PPINICI with the standard dynode supply may damage the
instrument. This damage is not covered under the standard warranty.
3 Using the Options
ACE Options
Thermo Scientific Ion Trap Series User Guide 51
ACE Options
ACE (Automatic Collision Energy) is an MSn scan optional upgrade. ACE automatically
calculates an estimated optimal collision energy based on the operating parameters of the scan.
Because of differences in the ease of which ions are fragmented, this calculation is an
estimated value. ACE runs three energies in a single scan to ensure optimal fragmentation and
product ion production. The optimal energy no longer needs to be determined for an MSn
run. Use when desiring a fixed collision energy, ACE calculates the estimated collision energy,
which is a starting point for further optimization.
For the ITQ, we have introduced automated collision energy (ACE), which greatly simplifies
MSn optimization. Determining the collision energy setting required to ensure maximal
product ion generation typically means performing a number of separate experiments using
different collision energy settings. The results of these experiments would then have to be
manually evaluated to determine which setting resulted in the greatest product ion intensities.
Any changes to the experimental parameters, such as column flow rates, required a repeat of
the optimization. ACE automatically calculates an estimated collision energy based on the
operating parameters of the scan. ACE runs three energies in a single scan to ensure
fragmentation and product ion production. ACE is used for qualitative and semi-quantitative
MSn analyses. A fixed collision energy will be more optimal for quantitative work, however. If
you want to run at a fixed collision energy, the estimated collision energy given by ACE is a
good starting point.
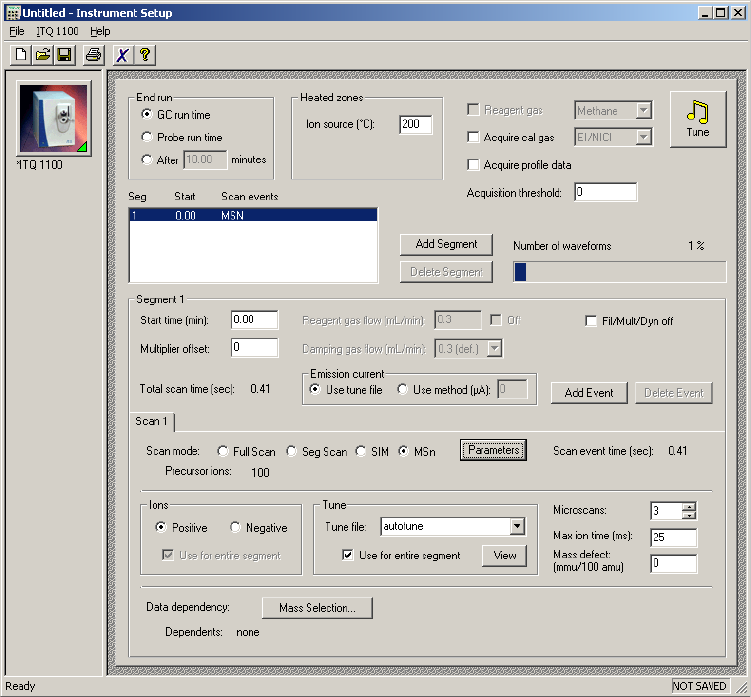
3 Using the Options
ACE Options
52 Ion Trap Series User Guide Thermo Scientific
To set up an ACE method
1. In Xcalibur, click the Instrument Setup icon.
2. Click the mass spectrometer icon to open the mass spectrometer method editor.
Figure 45. Configuring the Method Editor for Msn Options
3. Select MSn as a scan mode because ACE is an MSn scan option.

3 Using the Options
DDS Options
Thermo Scientific Ion Trap Series User Guide 53
4. Click the Parameters button to open the MSn Parameters window.
Figure 46. Configuring ACE Options in the MSn Parameters Window
5. Select the Automatic option in the Collision Energy box from within instrument setup.
6. Click OK to return to the method editor and save the method.
DDS Options
DDS (Data Dependency Scanning) is an MSn optional upgrade. It is also a powerful tool for
dynamically changing qualitative analyses. The data dependent algorithms probe mass spectra
for ions from a full scan event that match a mass selection criteria to create an intensity sorted,
dependent mass list that is used for subsequent scan events. Data dependency allows MSn
methods to be written automatically with no advance knowledge on what specific precursor
ions may be encountered during an analysis. This allows for qualitative methods to be
developed rapidly. For example, the selection criteria for a simple data dependent method may
be to isolate and fragment the largest ion from full scan event. A user benefits from library
searchable full scan data and the additional qualitative data from the MS/MS spectra.
DDS allows MSn methods to be written without knowing in advance what specific precursor
ions may be encountered during an analysis, so additional qualitative data may be obtained
without spending time running additional analyses and methods. For example, a simple data
dependent method may include a full scan event followed by a dependent scan event
performing MS/MS on the most intense ion from the previous scan. A data dependent scan
can not be the first scan in a segment and the DDS scan event must be an MSn event. A scan
can be dependant on any scan that occurred previous. For example, the third scan event in a
segment may be dependant on either the first or second scan event.

3 Using the Options
DDS Options
54 Ion Trap Series User Guide Thermo Scientific
There are many ways to modify which precursor ion the data dependent scan selects for
MS/MS. For example, the ion selected for isolation may be the most intense, or within a
certain mass range, or may be dynamically excluded for a time because that mass had already
been selected, or may be required to exceed a certain intensity. The array of options when
using DDS is discussed more fully in the online help.
To set up a DDS method
1. In Xcalibur, click the Instrument Setup icon.
2. Click the mass spectrometer icon to open the mass spectrometer method editor.
Figure 47. Configuring the DDS Options
3. Go to a second (or later) scan event that has an MSn scan mode.
Tip Click the Add Event button to add another scan event tab.
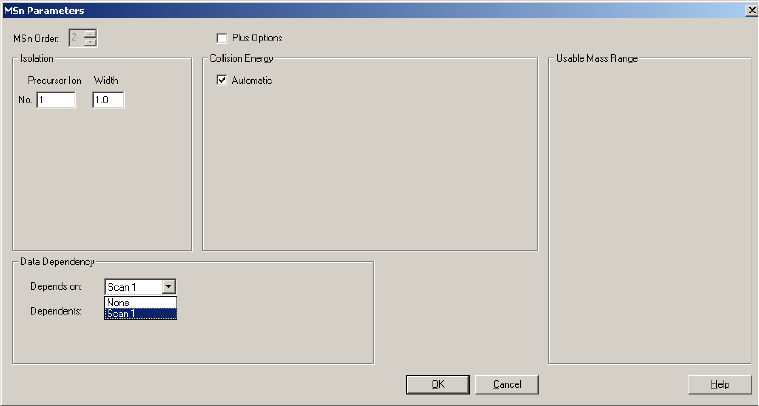
3 Using the Options
PQD Options
Thermo Scientific Ion Trap Series User Guide 55
4. Click the Parameters button to open the MSn Parameters window.
Figure 48. Configuring DDS Options in the MSn Parameters Window
5. Select the scan’s Data Dependency. In this example, the DDS scan is based on the results
of scan 1 and will select the most intense ion from scan 1, then isolate and fragment it.
6. Click OK to return to the method editor and save the method.
PQD Options
PQD (Pulsed Q Dissociation) is a technique exciting the precursor at high energy for a short
time. It is also useful as a structure elucidation qualitative tool. PQD is used to generate
spectral data that are qualitatively similar to data produced using standard collision induced
dissociation (CID). The key difference is that PQD increases the overall spectral quality,
particularly in low mass range, which lets you see low m/z fragments that are usually excluded
from CID spectra. PQD also helps you access higher energy dissociation channels. PQD is a
novel fragmentation mechanism that involves precursor ion activation at high q, a time delay
to allow the precursor to fragment, then a rapid pulse to low q where all fragment ions are
trapped. The product ions can then be scanned out of the ion trap and detected.
PQD is used to generate spectral data that are qualitatively similar to data produced using
standard CID. PQD allows for the observation of lower masses that are usually excluded from
CID spectra. PQD also helps you access higher energy dissociation channels. PQD is a novel
fragmentation mechanism that involves precursor ion activation at high q, which is also called
maximum excitation energy. After activation of the precursor ion, a time delay occurs to allow
the precursor to fragment, then a rapid pulse to low q where all fragment ions are trapped.
The product ions can then be scanned out of the ion trap and detected. The fragmentation
efficiency is not as high as a standard CID method, which makes PQD worse for quantitative
and semi-quantitative methods. This methodology is used to generate qualitative results from
MS/MS where low mass ions are needed or to access high energy fragmentation pathways for
research purposes.
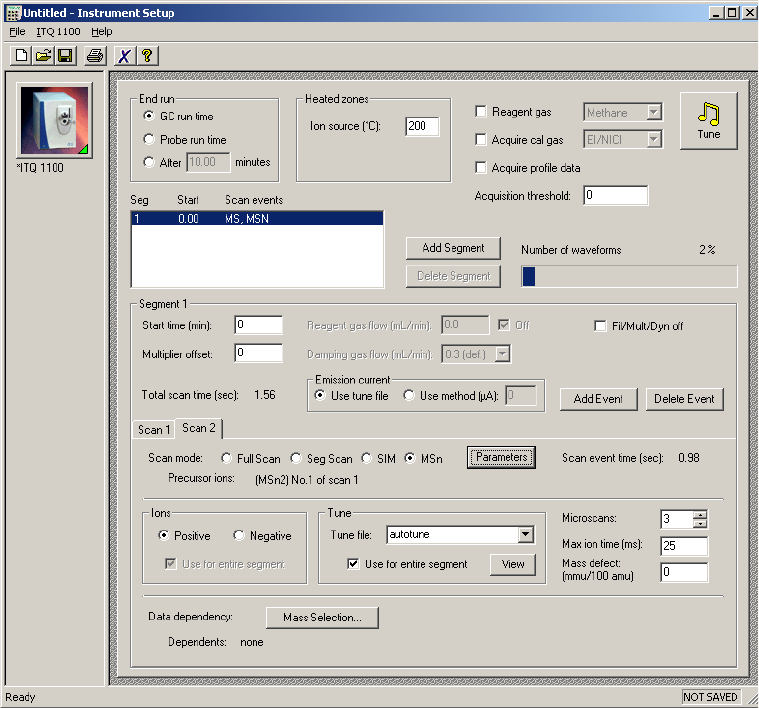
3 Using the Options
PQD Options
56 Ion Trap Series User Guide Thermo Scientific
To set up a PQD method
1. In Xcalibur, click the Instrument Setup icon.
2. Click the mass spectrometer icon to open the mass spectrometer method editor.
Figure 49. Configuring PQD Options
3. Select MSn as a scan mode because PQD is an MSn scan option.

3 Using the Options
PQD Options
Thermo Scientific Ion Trap Series User Guide 57
4. Click the Parameters button to open the MSn Parameters window.
Figure 50. Configuring PQD Options in the MSn Parameters Window
5. Select the Plus Options box to open the Maximum Excitation Energy selection.
Figure 51. Setting the High Maximum Excitation Energy (q)
3 Using the Options
Variable Damping Gas Option
58 Ion Trap Series User Guide Thermo Scientific
If the maximum excitation energy is set to 0.225, the minimum mass product ion that
can be seen is ¼ the precursor ion. When the maximum excitation energy is set to 0.30,
the minimum mass is 1/3 of the precursor ion and when the maximum excitation energy
is set to 0.45, the minimum mass is ½ the precursor ion’s mass (Figure 51 on page 57).
When the maximum excitation energy is set to 0.45, the precursor ion is mass 250
(Figure 51), and the minimum product ion is 125. However, when PQD is selected, the
minimum mass is only 19 amu as illustrated in Figure 50. If you do not want to optimize
the collision energy for your particular experiment, try using the Automated Collision
Energy option. Activate this by selecting the Automatic box in the Collision Energy
group.
6. Click OK to return to the method editor and save the method.
Variable Damping Gas Option
Variable damping gas allows computer control over the damping gas pressure in the ion trap
mass analyzer. By increasing the rate of the damping gas flow, the damping gas pressure
increases proportionally. The default flow is 0.3 mL/min, which corresponds to a pressure of
approximately 0.13 Pa (1 mTorr) inside the ion trap. Increasing this flow increases sensitivity
at the expense of resolution. Higher flow rates also affect the dissociation efficiency. If you use
the automated collision energy option, then the effect of higher damping gas flows is
accounted for when ACE calculates the energy required for fragmentation. Changing the
damping gas flow may be useful when trying to achieve the maximum signal from the trap.
To use variable damping gas
1. Configure the instrument for damping gas flow rates in Instrument Configuration.
a. Run Instrument Configuration.
b. Double-click the instrument icon you are configuring to open the Instrument
Configuration window.
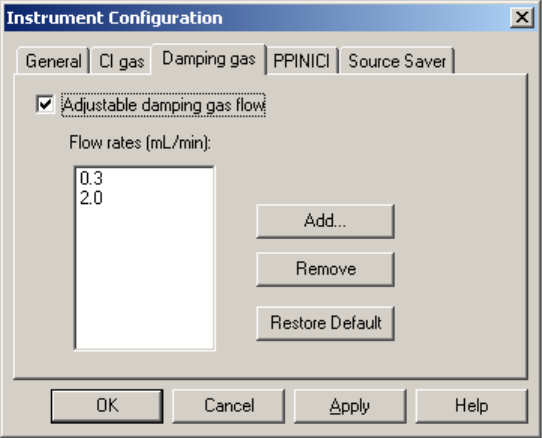
3 Using the Options
Variable Damping Gas Option
Thermo Scientific Ion Trap Series User Guide 59
c. Click the Damping Gas tab to configure variable damping gas flow rates. The ion
trap can be configured for up to six damping gas flow rates, including the
0.3 mL/min default.
Figure 52. Configuring Variable Damping Gas Flow Rates
As seen in Figure 52, the instrument has the variable damping gas option installed and set
to use either 0.3 or 2.0 mL/min of helium into the trap. Click the Add button to use
additional flow rates. Once the flow rates are in the instrument configuration, configure
your methods to use one of these flows while using the method editor in Instrument
Setup.
2. In Xcalibur, click the Instrument Setup icon.
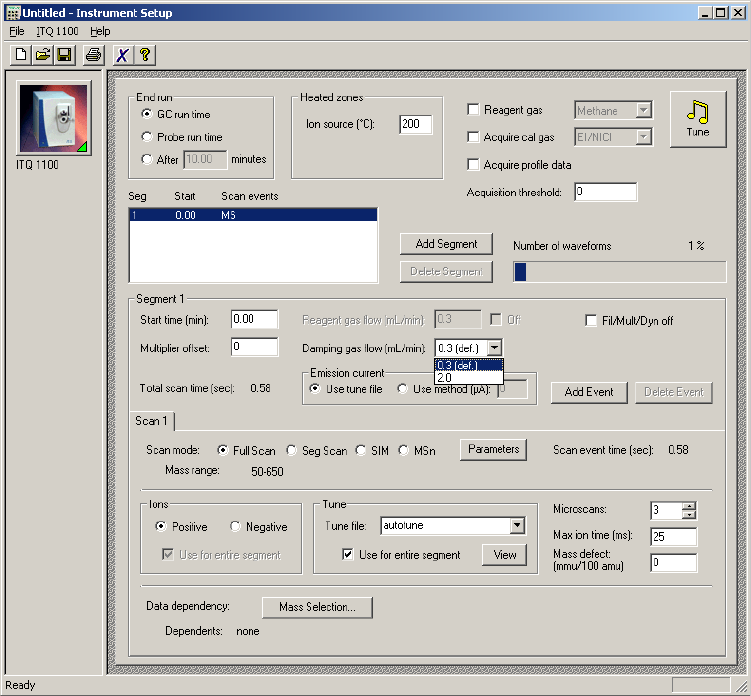
3 Using the Options
Variable Damping Gas Option
60 Ion Trap Series User Guide Thermo Scientific
3. Click the mass spectrometer icon to open the mass spectrometer method editor.
Figure 53. Configuring the Method Editor for Variable Damping Gas
a. Click the Tu n e button if you need to tune the instrument. Before using a flow rate, it
is strongly recommended that you tune the instrument at the gas flow rate you will be
using when collecting data.
b. Select the damping gas flow you wish to use.
Save the method.

Thermo Scientific Ion Trap Series User Guide 61
A
Additional Help
This section contains additional instructions for swagelok fittings and specialized situations.
Contents
•Assembling Swagelok Fittings
•Using a Swagelok Tee or Cross
•Pressure Testing the TRACE GC Ultra Inlet
•Automatic Tune Flow Chart
•Calibrating the RF Frequency
•Baking Out the Source
•Reviewing Cursor Actions in Browsers

A Additional Help
Assembling Swagelok Fittings
62 Ion Trap Series User Guide Thermo Scientific
Assembling Swagelok Fittings
Building swagelok compression fittings and connecting tees and crossings are essential to a
leak-free system. A swagelok fitting is a compression fitting that has four components—
swagelok nut, a back ferrule, a front ferrule, and an inlet body Figure 1. The assembly is
completed when the swagelok and ferrule assembly is affixed to tubing. Two ferrules merge
when the nut is tightened, forming a safe and leak-free seal between the tubing and the inlet
body.
1. Place a swagelok nut on the end of the tubing. The threads on the nut should face the
open end of the tubing as shown in Figure 1.
Figure 1. Swagelok Ferrule and Nut Assembly
2. Place a swagelok back ferrule over the tubing with the smaller side facing the open end of
the tubing.
3. Place a swagelok front ferrule over the tubing with the smaller side facing the open end of
the tubing.
4. Push the ferrules down into the swagelok nut.
5. Insert the tubing into the swagelok inlet as far as it will go as shown in Figure 2.
Tools Needed
•Swagelok® Fitting
• Wrench set (open end), 5/16-in., 7/16-in., 9/16-in.,1/2-in.,
Frequency
Fixing leaks
Note Do not put tape on the threads of a swagelok fitting.
Inlet Body
Front Ferrule
Swagelok Nut
Tubing Back Ferrule
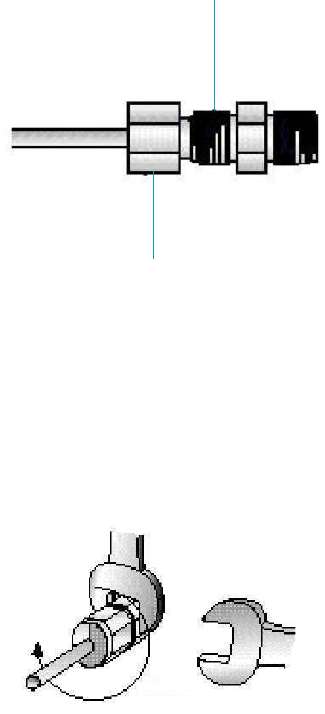
A Additional Help
Assembling Swagelok Fittings
Thermo Scientific Ion Trap Series User Guide 63
Figure 2. Swagelok and Inlet Connection
6. Slide the nut over the inlet and tighten until finger-tight.
7. Pull the tubing out from the nut very slightly (1/16-in.)
8. While holding the inlet tight with a backup wrench, tighten the nut 3/4-turn past
finger-tight as shown in Figure 3.You can make a mark on the nut before you tighten it.
This helps ensure that you have turned the nut a 3/4-turn.
Figure 3. Tightening Swagelok Fittings
Inlet Body
Tubing Ferrule and Nut Assembly

A Additional Help
Using a Swagelok Tee or Cross
64 Ion Trap Series User Guide Thermo Scientific
Using a Swagelok Tee or Cross
To use a single gas source for more than one inlet or detector module, you must use a
swagelok tee or cross to properly split the gas flow.
1. Cut the tubing with a tubing cutter where the tee or cross will go.
2. Connect the tubing to the tee or cross with a swagelok fitting. Refer to “Assembling
Swagelok Fittings” on page 62.
3. Measure the distance from the tee or cross to the inlets or detectors, and cut the tubing in
the appropriate lengths.
4. Connect the tubing to the tee or cross ends with swagelok fittings.
5. Install swagelok plugs instead of an inlet body on any open ends located on a tee or cross
that are not connected with tubing.
Pressure Testing the TRACE GC Ultra Inlet
Use this procedure to determine if any leaks exist in the inlet or carrier flow module prior to
performing a column evaluation. This procedure is written for the TRACE GC Ultra. If you
have a TRACE 1300, TRACE 1310, or FOCUS GC, refer to your GC user documentation
for the correct procedure.
1. Install an injector nut with an aluminum plug onto the GC inlet.
2. Tighten it using a 6 mm wrench.
3. Press the Left or Right Carrier button and put the inlet in the constant pressure mode.
4. Put the septum purge and split vent valve in the OFF position.
a. Press the Valve button located on the lower portion of the GC keypad.
b. Select the left or right inlet.
c. Scroll to each of the inlet valve selections and press the front panel OFF key.
Tools Needed
•Ruler or measuring tape
• Swagelok Fittings
•Swagelok Plugs
•Tubing Cutter
Frequency
Fixing leaks
A Additional Help
Pressure Testing the TRACE GC Ultra Inlet
Thermo Scientific Ion Trap Series User Guide 65
d. Allow several seconds for the display to indicate it is off.
5. Press the Left or Right Inlet button and scroll to Pressure.
a. Set the inlet pressure to 35 Psig (250 kPa) and allow the inlet several seconds to
pressurize.
b. Confirm the set point has been reached.
6. Turn the inlet pressure off and monitor the pressure. The pressure should not change
more than 1 psi (7 kPa) over 3 minutes.
7. Determine if a leak exists.
a. Use a suitable leak detector, if the pressure indicates a gradual decrease. The most
likely place is the septum nut, septum purge or split vent, injector nut with plug, or at
the terminal fitting for capillary column. It is not uncommon for a very small leak
(approximately <1mL) to exit out the split or septum purge vent.
b. Test if a small leak at one of these vents is the reason for a decrease in pressure, hold a
septum over the top of the vent, pressurize the inlet and allow several seconds for the
vent fitting to pressurize, turn the pressure off and see if the pressure holds.
c. If the pressure holds, remove the septum and see if the pressure begins to decrease. A
decrease greater than 1 psi (7 kPa) over 3 minutes may indicate a defective flow
module.
8. After completing the pressure test, set the split vent and septum purge valve to ON.
a. Set the inlet pressure to 5 psi (35 kPa).
b. Press the Left or Right Inlet Carrier button and return the inlet to the constant flow
mode.
9. Remove the injector nut with plug and continue with the column installation.
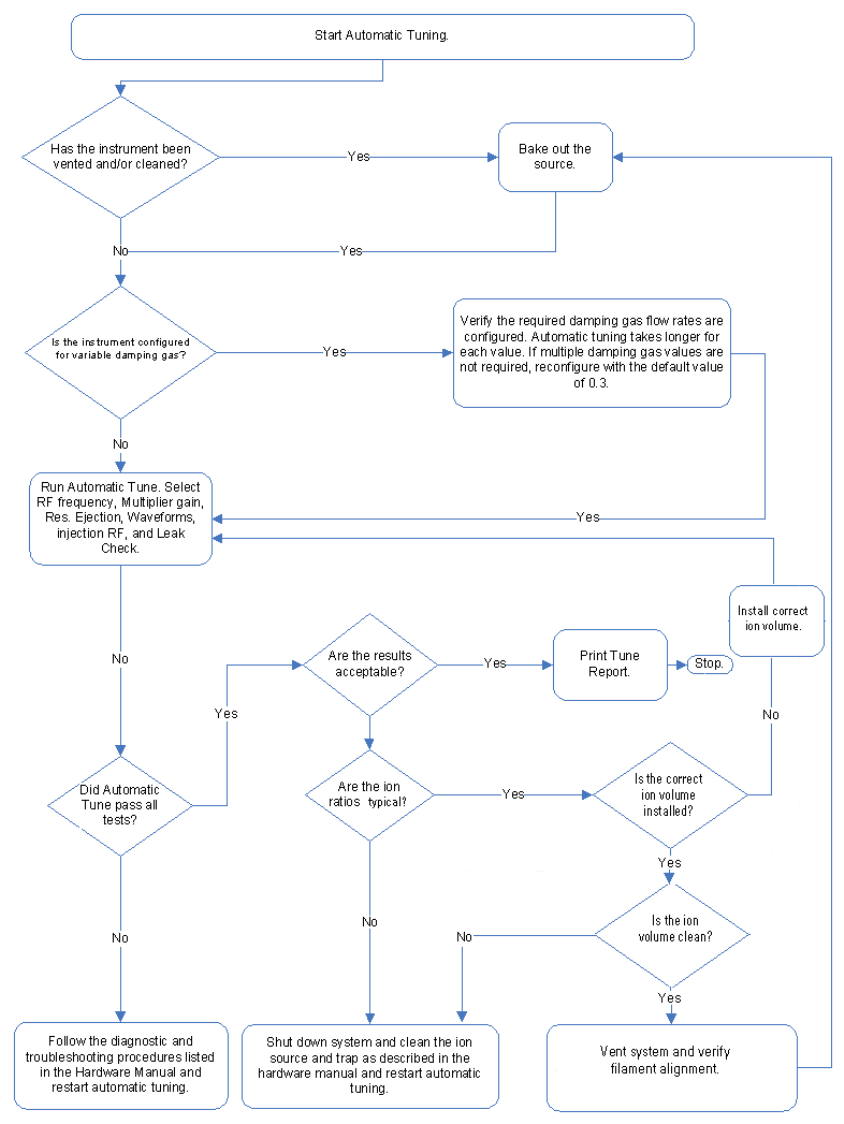
A Additional Help
Automatic Tune Flow Chart
66 Ion Trap Series User Guide Thermo Scientific
Automatic Tune Flow Chart
Refer to this chart to determine when to use various tuning features.
Figure 4. Automatic Tune Flow Chart
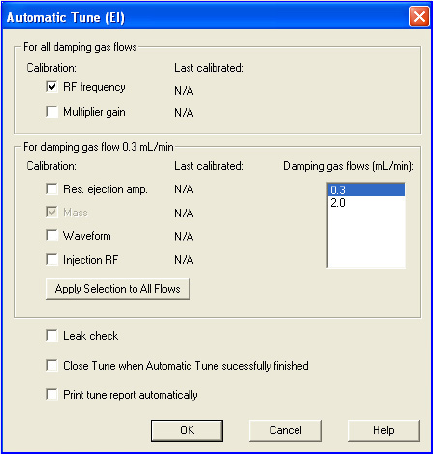
A Additional Help
Calibrating the RF Frequency
Thermo Scientific Ion Trap Series User Guide 67
Calibrating the RF Frequency
Use this procedure to adjust the RF Frequency. However, make sure you run this calibration
after the heaters and vacuum have stabilized.
1. Make sure the heaters and vacuum status readbacks have stabilized.
2. Select Tune | Automatic Tune to open the Automatic Tune window.
Figure 5. Adjusting the RF Dip Calibration
3. Select the RF Frequency option.
4. Uncheck all other options.
5. Click OK to adjust the RF Calibration automatically and return to the Tune window.Ion
Tr a p Se r ie s Us e r Gu i de
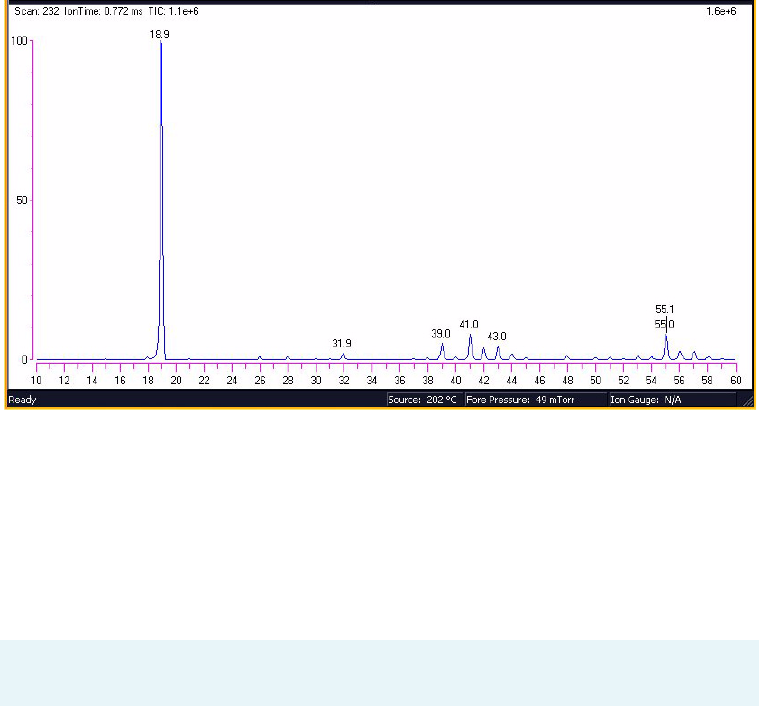
A Additional Help
Baking Out the Source
68 Ion Trap Series User Guide Thermo Scientific
Baking Out the Source
Use this procedure to bake out the source to reduce background. This is especially useful after
a system has been cleaned.
1. After startup, open the Tune window and set the source temperature to 200 °C.
2. Allow the source temperature to equilibrate and the fore pressure to decrease to less than
100 mTorr.
3. View the air/water spectra and verify water is the maximum peak. This will usually be
displayed as m/z 19.
Figure 6. Air/Water Spectra m/z 19
If the air/water spectra are typical for a system with no leaks, note the fore pressure for
future reference.
4. Increase the source temperature and MS transfer line to 275 °C. As the source
temperature rises, the pressure will begin to increase.
5. Allow the source to remain at 275 °C until the fore pressure begins to decrease to a
pressure equal to or below the fore pressure noted in the previous step.
6. Set the source temperature and transfer line to the desired operating temperature.
7. Once the operating temperature has been reached, allow the system 1 hour to stabilize.
8. Perform a tune and continue.
Note Operating the system at an elevated source temperature for an extended period
of time with an air leak will oxidize and contaminate the source.

A Additional Help
Reviewing Cursor Actions in Browsers
Thermo Scientific Ion Trap Series User Guide 69
Reviewing Cursor Actions in Browsers
Before you begin using the browsers, let’s review some of the cursor actions and effects within
the chromatogram and spectrum cells:
• A click picks a point on the cell
• A line dragged parallel to any axis picks a range
• A line dragged in any diagonal direction selects an area
The effect of these actions depends on one of these cell states:
•Inactive
• Active and unpinned. Each cell has a pin icon in its top right corner. Only one of the cells
can be active at any one time. The active cell is highlighted with a gray border.
• Active and pinned. Pinning fixes the active status of a cell.
1. Unpin an active cell by clicking once on the pin icon.
2. Make a cell active by clicking anywhere within the cell.
Xcalibur highlights the cell with a gray border. Click on its pin icon if you want to fix it as
the active cell. Cursor actions in an active cell cause the cell to be scaled according to the
dimensions of the dragged line or area (see Tab l e 1).
Table 1. Cursor Actions In Active and Unpinned Cells
Cursor Action Effect
Drag parallel to X-axis Rescale graph showing selected X range only, same Y range
Drag parallel to Y-axis Rescale graph showing selected Y range only, same X range
Dragged area Rescale graph showing both the selected X and Y ranges

A Additional Help
Reviewing Cursor Actions in Browsers
70 Ion Trap Series User Guide Thermo Scientific
The same actions in the unpinned or inactive cell have a very different effect. In this case,
the cursor actions affect the active, pinned cell (see Table 2 ).
Important points to note are:
• The cursor action is always applied to the pinned cell
• Within an active cell, cursor actions rescale the plot.
Table 2. Cursor Actions in an Inactive or Unpinned Cell
Pinned cell Cursor action Effect
Spectrum Click in a
chromatogram cell
The spectrum cell displays the mass
spectrum at that retention time.
Spectrum Drag across a time
range in a
chromatogram cell
The spectrum cell displays the averaged
mass spectrum from that retention time
range.
Chromatogram Click in a spectrum cell The chromatogram cell displays the mass
chromatogram of the selected mass. If the
Plot Type is TIC or Base Peak, it is
changed to Mass Range.
Chromatogram Drag across an m/z
range in a spectrum
cell
The chromatogram cell displays the mass
range chromatogram of the selected mass
range. If the Plot Type is TIC or Base
Peak, it is changed to Mass Range.

Thermo Scientific Glossary 71
G
Glossary
Numerics
μ micro (10-6)
Ω ohm
A
A ampere
ACE automatic collision energy
ac alternating current
amu atomic mass unit
ADC analog-to-digital converter
ASCII american standard code for information
interchange
B
baud rate data transmission speed in events per
second.
C
ºC degrees Celsius
CD-ROM compact disc read-only memory
CE (F. Conformité Européenne) European
conformity. Mandatory european marking for certain
product groups to indicate conformity with essential
health and safety requirements set out in european
directives.
cfm cubic feet per minute
CI chemical ionization
CID collision induced dissociation
CIP carriage and insurance paid to
cm centimeter
cc or cm3 cubic centimeter
CPU central processing unit (in a computer)
D
Da Dalton
DAC digital-to-analog converter
dc direct current
DDS data dependency scanning
DEP™ direct exposure probe
DIP direct insertion probe
DS data system
DSP digital signal processor
A B C D E F G H I JK L M N OP Q R S T U V W X Y Z
Glossary: EI
72 Glossary Thermo Scientific
E
EI electron ionization
ESD electrostatic discharge
eV electron volt
EN european conformity
F
F
f femto (10-15)
ºF degrees Fahrenheit
FCC federal communication commission
FOB free on board
ft. foot
FSE field service engineer
FTP file transfer protocol
G
G
g gram
G giga (109)
GB gigabytes 1024 MB (billion)
GC gas chromatograph
GC/MS gas chromatograph / mass spectrometer
GND electrical ground
GPIB general-purpose interface bus
GUI graphical user interface
H
HV high voltage
Hz hertz (cycles per second)
I
ICIS™ interactive chemical information system
IEC international electrotechnical commission
IEEE institute of electrical and electronics engineers
in. inch
I/O input/output
K
k kilo (103, 1000)
K Kelvin
kb kilobyte 1024 bytes (thousand)
kg kilogram
kPa kilopascal
kVA kilo volt amperes (1000 VA)
L
L liter
LAN local area network
lb pound
LED light-emitting diode
M
m meter; milli (10-3)
M mega (106)
MB megabyte or 1,024 kb (million)
M+ molecular ion
min minute
mL milliliter
mm millimeter
Glossary: MS
Thermo Scientific Glossary 73
MS scan power: MS1, mass spectrometer
m/z mass-to-charge ratio
N
n nano (10-9)
P
p pico (10-12)
Pa Pascal
PCB printed circuit board
PID proportional / integral / differential
PN part number
P/P peak-to-peak voltage
PPINICI pulsed positive ion negative ion chemical
ionization
ppm parts per million
PQD pulsed q dissociation
psig pounds per square inch, gauge
Q
q maximum excitation energy
R
RAM random access memory
RF radio frequency
RMS root mean square
ROM read-only memory
RS-232 industry standard for serial communications
S
s second
SCSI small computer system interface
SIM selected ion monitoring
SI international system of units
S/N signal to noise ratio
T
TIC total ion current
TCP/IP transmission control protocol / Internet
protocol
Torr torr
U
URL uniform resource locator
USB universal serial bus
V
V volt
V ac volts alternating current
V dc volts direct current
Glossary: V dc
74 Glossary Thermo Scientific

Thermo Scientific Ion Trap Series User Guide 75
I
A
ACE 42, 51
ACE (Automatic Collision Energy) 41
ACE method 52
Action when Software is closed and CI Gas is on 4
Actions | Subtract Spectra | 2 Ranges 29
Add 5
Adjustable Damping Gas 5
adjusting
RF dip 67
Ammonia 4
Area 36
AS Configuration screen 8
AS instrument icon 17
Automatic Collision Energy 51
automatic injections 20
Automatic Tune screen 13, 67
Autosampler
configuration 8
Aux 1 Present 8
Auxiliary and Oven Options tab 8
Available Devices 2
Available Devices panel 7–8
B
Background Contamination 28
bake out
baking out 68
baseline noise range 38
Browse button 3
C
carrier gas
quality 37
cell states 69
cells
pinned 70
unpinned 69
Change Instruments In Use screen 21–22
Chemical Ionization (CI Mode) 41
Chromatogram 25
zooming in on period of interest 27
chromatogram 28
Chromatogram Ranges Screen 28, 32
chromatography techniques 37
CI Gas 4
CO2, isobutane, ammonia, methane, other 4
Type 4
CI Gas tab 4
CI options 48
CID 46
CO2 4
column 15
poor quality 37
compliance
FCC iv
regulatory iii
WEEE v
Compounds
known ion pattern 32
Configuration screen 3
Configure button 2, 7–8
Configured Devices 2
Configured Devices panel 7–8
cursor
actions, effects, active, inactive, unpinned, pinned 69
active 69
pinning 69
D
Damping Gas 5
options 5
Data Dependency Scanning 53
DDS 42
DDS (Data Dependency Scanning) 41
DDS method 54
Demonstration Mode 3
Index
76 Ion Trap Series User Guide Thermo Scientific
Index: E
Detectors and Data tab 7
Diagnostic screen 12
Diagnostics | Run Test 12
Display Options 36–37
documentation survey xii
E
electromagnetic compatibility iv
EMC compliance iii
Enable Cal Gas Source Saver 7
F
FCC compliance iv
Flow Rates 5
G
gas chromatograph
configuration 7
GC injection 15
GC instrument configuration 14
GC parameters
setting up 8
General tab 3, 7
Grid 32
Grid | Delete | Row 32
H
heaters readback 67
heaters status readback 67
Height 36
I
In Use field 22–23
Insert Cells 25
Inst Meth 20
Instrument Configuration screen 2, 7–8
instrument method 18
Instrument Setup 14
Instrument Setup window 14
ion source
dirty 37
Isobutane 4
ITQ 1100 Series 41
ITQ 700 Series 41
ITQ 900 Series 41
L
Labels tab 36–37
library
Qual Browser 29
Library Options 31
Library Search 29
M
manual injections 20
Manual Noise Region 38
Mass Range 33
Mass Range Chromatogram 34
Mass Spectrum 25
maximum excitation energy 46, 58
maximum excitation energy (q) 57
Methane 4
Methylene chloride 18
Mouse
functions 27
MS method editor 12
MS Transfer Line 8
MS/MS 42
MSn experiment
running 43
MSn scan mode 41
N
noise range 38
P
path 20
peak 29
peak detection
signal-to-noise ratio 37
Peak Detection Settings 38
Peaks
eluting 28
heights
areas 35
pinned 28
Plot Type 33
Plunger strokes 17
position 20
PPINICI 47
PPINICI tab 6
PQD 42, 46
PQD (Pulsed Q Dissociation) 41
PQD method 56
Thermo Scientific Ion Trap Series User Guide 77
Index: Q
preferred pressure units 7
Print Diagnostics Report button 12
Probe System 41
Pulsed Q Dissociation 55
Q
q 46
Qual Browser 24, 28, 34
cursor actions (table) 69
determining peak areas 35
determining peak heights 35
library search 29
Library Search Results window 31
signal-to-noise ratio 37
subtracting background contamination from a spectrum
28
quantitation 35
R
Range
functions 27–28
Ranges 32
subtracting spectra 29
Ready to Download 9
Real Time Plot icon 24
recording samples 20
regulatory compliance iii
Relative Abundance vs. m/z 27
Remote Start Active High 3
Remove 5
Restore Default button 5
retention 34
retention time 28
RF Dip Calibration readback 67
RMS 38
root mean square 38
Run Sequence screen 22–23
S
safety standards iii
sample ID 20
Sample Volume 17
Samples
type 20
sampling/injection 17
Sequence
running 19
setup columns 20
sequence
running 19
Sequence Setup
Inst Meth 20
path 20
position 20
sample type 20
sample ID 20
vial number 20
Sequence Setup window 18
Serial Port 7
signal-to-noise
low ratios 37
measurement 37
solvent
elute 15
solvents
rinse 18
Source Saver tab 6
specification.sld 18
specifications 14
spectrum
subtracting background contamination 28
Start Instrument field 23
Status tab 3
Subtract Background Contamination 28
survey link xii
Swagelok fittings
inlet 62
nut 62
plugs 64
Swagelok and inlet connection 63
T
TIC 34
Time Period of Interest 27
Time Range field 28
Timeout 7
TriPlus 17
Tune 7, 12
automatic, full 13
Tune | View Tune Report 12
Tune Path 3
Tune window 3, 12–13, 67
Type 33
U
unpinned 28