12 5 16 Childhood Obesity Syllabus
2016-12-05
: Pdf 12 5 16 Childhood Obesity Syllabus 12_5_16_Childhood_Obesity_Syllabus 12 2016 pdf
Open the PDF directly: View PDF ![]() .
.
Page Count: 30

12/5/2016
1
Childhood Obesity
and Type 2
Diabetes
ILENE FENNOY, MD, MPH
COLUMBIA UNIVERSITY MEDICAL CENTER
Disclosures
I serve as a Novo Nordisk Advisory Board
Consultant
I am funded for pharmaceutical studies by
Roche-Genentech and NovoNordisk
I will discuss unapproved uses of
medications
Definition of Obesity
Organization
Overweight
Obese
US CDC
BMI 85th to < 95th percentile
BMI≥95th percentile
IOTF
Provides international BMI cut points by age and sex for
overweight and obesity for children 2 to 18 years. Cut
points correspond to an adult BMI of 25 kg/m2 (overweight)
or 30 kg/m2 (obesity)
WHO
Birth to 5yr old: BMI=2
standard deviations above
the WHO growth standard
median
5-19yr old: BMI > 1 standard
deviation above the WHO
growth standard median
Birth to 5yr old: BMI >3 SD
above the WHO growth
standard median
5-19yr old: BMI > 2SD above
the WHO growth standard
median
12/5/2016
2
Obesity Classification
Adult
Overweight- BMI= 25.00 to 29.99
kg/m2
Class 1 Obesity-BMI= 30.00 to
34.99 kg/m2
Class 2 Obesity-BMI=35.00 to
39.99 kg/m2
Class 3 Obesity- BMI≥40.00
kg/m2
Adolescent
Overweight= BMI ≥ 85th and <
95th percentile
Class 1 =BMI ≥ 95th %ile and
<120% of 95th percentile
Class 2=BMI≥ 120% of 95th
percentile
Class 3=BMI≥ 140% of 95th
percentile
Jasik CB, et al. Childhood Obes. 2015; 11,#5:
630-637
Kuczmarski RJ & Flegal KM. Am J Clin
Nutr. 2000; 72:1074-1081.
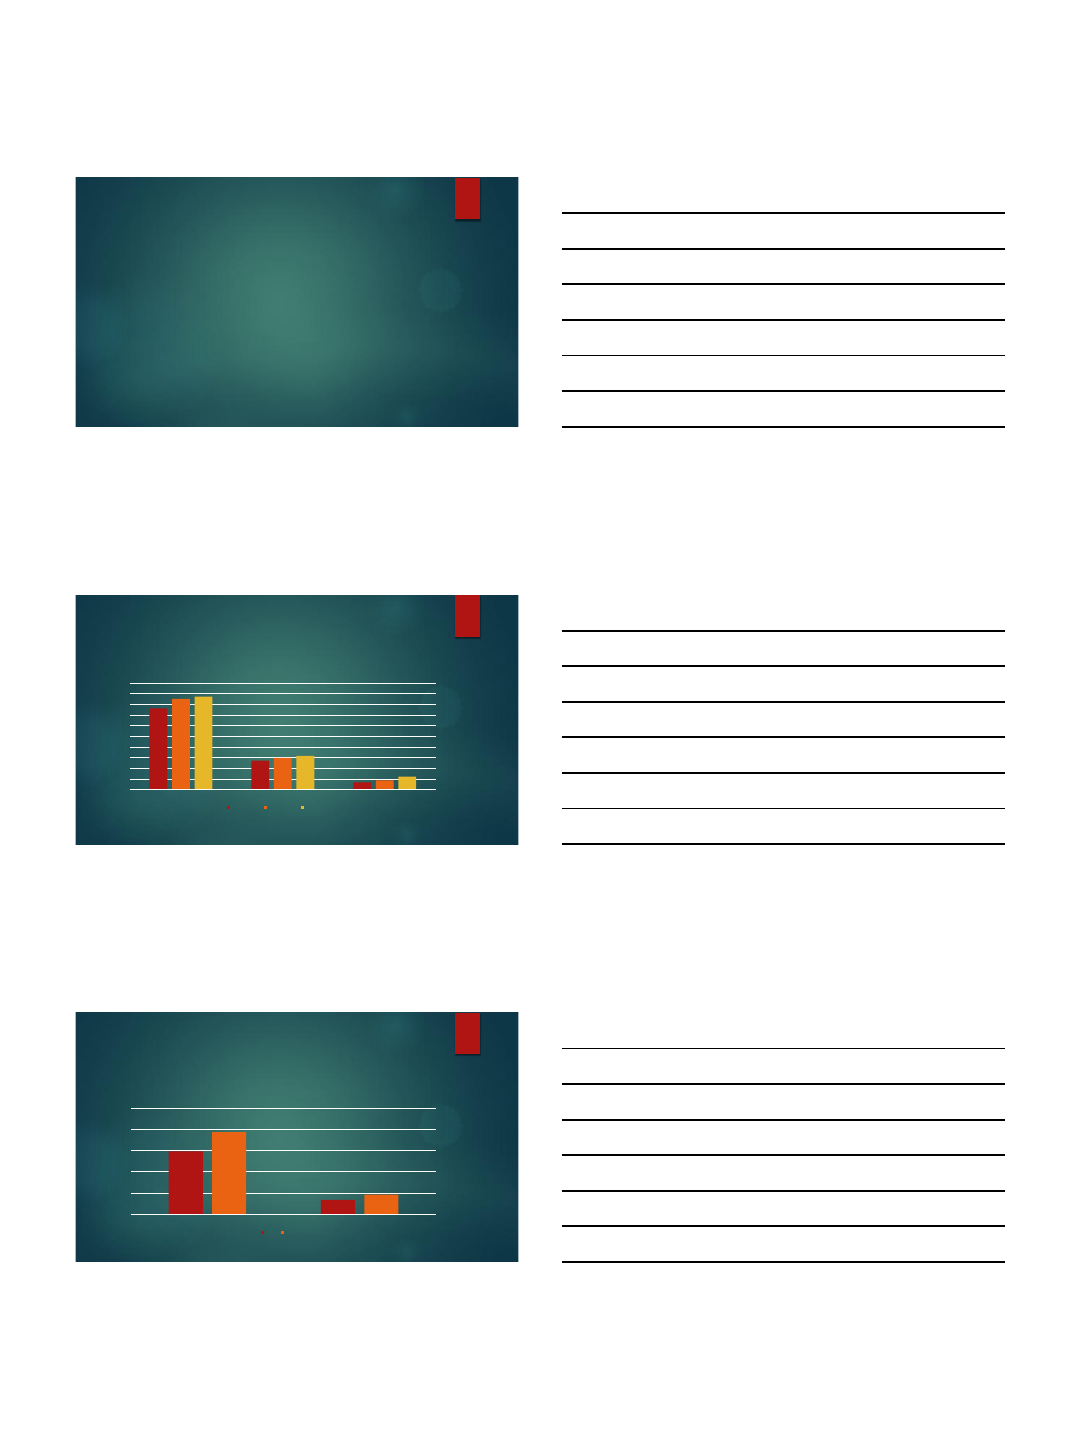
Prevalence of Obesity
0
2
4
6
8
10
12
14
16
18
20
Class 1 Obesity
Class 2 Obesity
Class 3 Obesity
Obesity in Youth 2001 vs 2014
2001-2002
2009-2010
2013-2014
Skinner A, et al. Obesity 2016; 24:1116-1123
Prevalence of Diabetes by Type,
2001-2009
0
0.5
1
1.5
2
2.5
Type 1
Type 2
Diabetes in Youth per 1000
2001
2009
Dabelea D, et al. JAMA 2014;311(17):1778-1776

12/5/2016
3
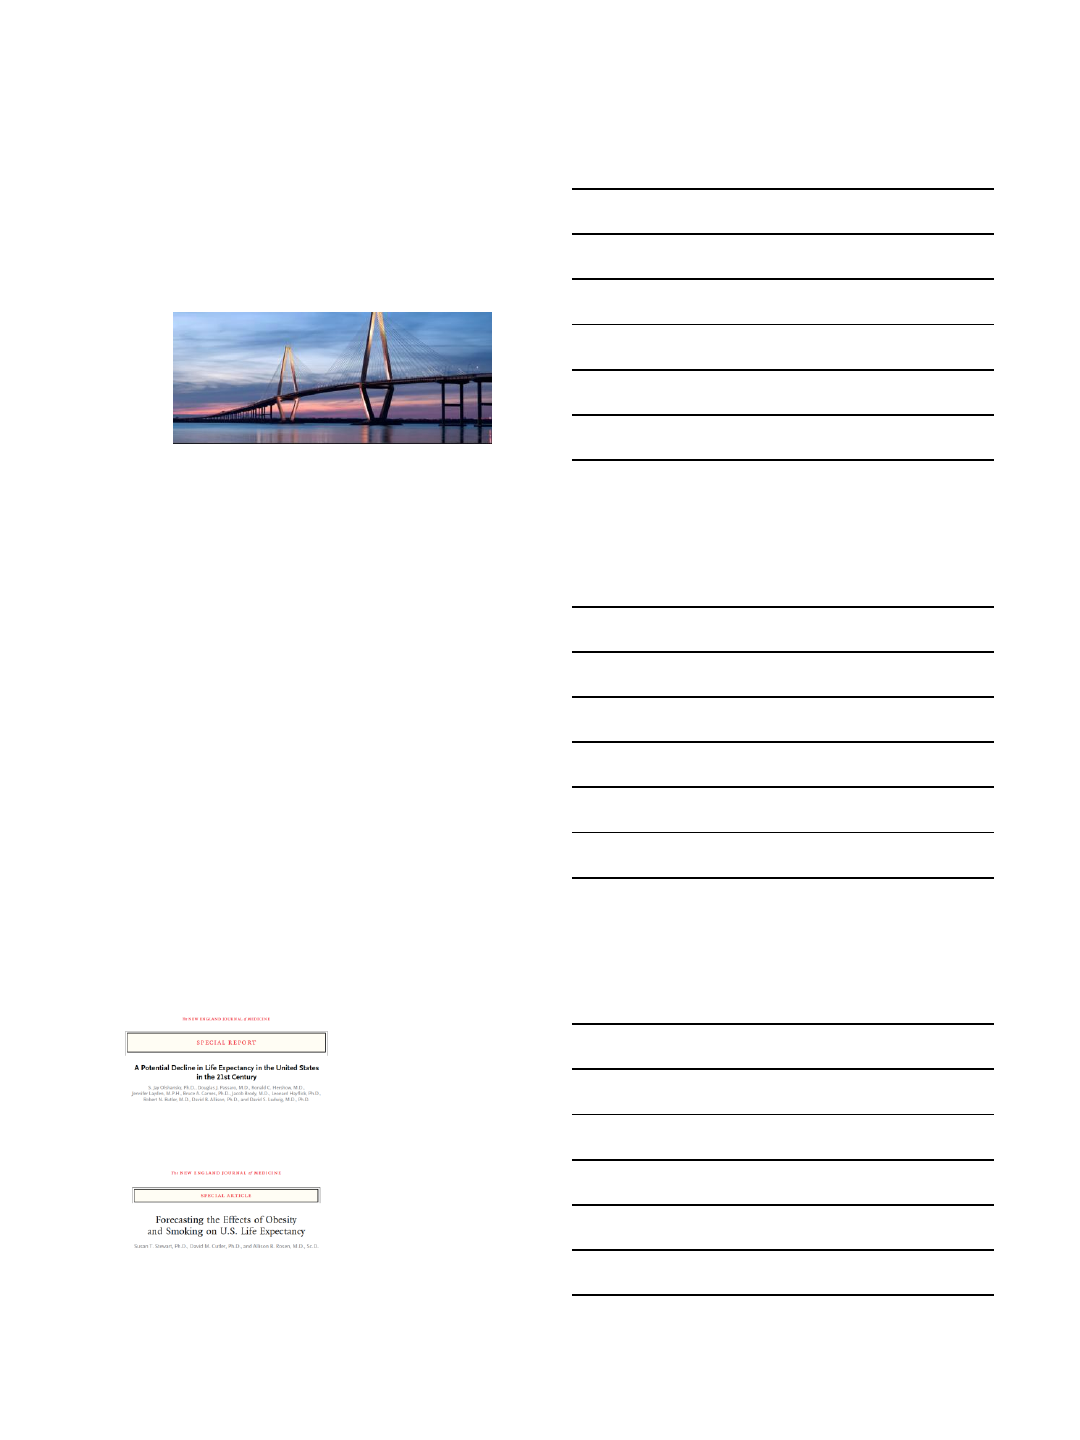
Prevalence of abnormal HgbA1c and
FBS by Weight Category, 3 -19 yrs of age
0
5
10
15
20
25
30
35
Overweight
Class 1 Obesity
Class 2 Obesity
Class 3 Obesity
Prevalence (%)
HgbA1c>5.7%
FBS>100mg%
Skinner AC et al. NEJM 2015;373, #14:1307-1317
Summary
Obesity prevalence is increasing among youth
Both Type 1 diabetes and Type 2 diabetes have increased in
prevalence during this same period making weight less useful as a
key determinant of who has Type 2 diabetes
Obesity severity is associated with progressively abnormal measures
of glucose intolerance suggesting that continued increases in
obesity are likely to lead to increasing Type 2 diabetes.
Type 2 diabetes in youth
CHILDHOOD OBESITY AND TYPE 2 DIABETES

12/5/2016
4
Testing for Type 2 DM in Children*(1)
Criteria
Severe Obesity (BMI >99th percentile, or BMI>120% of
95th%ile);
OR at onset of puberty with
Obesity (BMI≥ 95%ile)
Overweight (BMI>85th percentile but less than 95%ile with
risk factors)
Patients on second generation antipsychotics,
Or Any two for the following risk factors:
Family history of type 2 DM in first or second degree relative
Race/ethnicity (American Indian, African-American, Hispanic,
Asian/Pacific Islander)
Signs of insulin resistance or conditions associated with insulin
resistance (acanthosis nigricans, hypertension, dyslipidemia,
PCOS)
*Pediatrics 105,#3:671-680, 2000. and Haemer MA, et al. Childhood Obesity 2014; 10, #4:292-303.
Testing for Type 2 DM in Children(2)
Age of initiation: 10yrs, or
at onset of puberty
(if puberty occurs at a younger age)
Frequency: Every 2 years when normal or more often if new
risks emerge
Test: Fasting Plasma Glucose
Pediatrics 105,#3:671-680, 2000. and Haemer MA, et al. Childhood Obesity 2014; 10, #4:292-303.
Criteria for Diagnosis of DM
1. Symptoms of diabetes plus casual plasma glucose
concentration >=200 mg/dl (11.1 mmol/l).
Casual is defined as any time of day without regard to time since last meal.
The classic symptoms of diabetes include polyuria, polydipsia, and
unexplained weight loss
2. FPG >=126 mg/dl (7.0 mmol/l)*.
Fasting is defined as no caloric intake for at least 8 h.
3. 2-h PG >=200 mg/dl (11.1 mmol/l)* during an OGTT.
The test should be performed as described by WHO, using a glucose load containing the
equivalent of 75 g anhydrous glucose dissolv ed in water.
4. HgbA1c ≥ 6.5%
Performed in a lab that is NGSP certified and uses an assay
standardized to DCCT
Diagnosis and Classification of Diabetes Mellitus. Diabetes Care 37(suppl 1)L/s81-S90, 2014
*Abnormal blood glucose values should be confirmed by repeat testing on a different day

12/5/2016
5
How do we screen for Type 2
diabetes in youth
IS HGBA1C AN APPROPRIATE SCREENING TOOL IN THE CHILD OR, IS FBS
OR AN OGTT MORE APPROPRIATE?
Which test is best for diagnosis of
DM in youth?
4848 Obese Children and Adolescents aged 7 to 17yrs
oGTT & HgbA1c testing identified 2.4% of children with diabetes (n=115)
68.7% had HgbA1c>6.5%
46.1% had FPG≥126mg% and/or 2Hr glucose≥200mg%
43.5% had diabetes confirmed
Ehehalt S. et al, Eur J Pediatric Diabetes 2016: DOI 10.1007/s00431-016-2807-6
Association between oGTT measure
of IFG, IGT, and HgbA1c in children
4848 Obese Children and Adolescents aged 7 to 17yrs
Correlation entire population:
FPG and 2-hr glucose= r=0.26
FPG and HgbA1c= r=0.18
2-hr glucose and HgbA1c= r=0.17
Correlation IFG
2-Hr glucose vs HgA1c, r=0.30
Confirmed diabetes
FPG and 2-Hr glucose, r=0.73
2Hr glucose vs HgA1c, r= -0.47
Ehehalt S, et al. Pediatric Diabetes 2016:1-8, DOI 10.1111/pedi.12461

12/5/2016
6
Summary
In a general asymptomatic obese population of children, different
results are obtained as indicators of diabetes by HgbA1c and oGTT
The best correlation between values occurs in patients with
confirmed diabetes not those at risk for diabetes
How persistent is Glucose
intolerance?(1)
Weiss R, et al. Diabetes Care 2005; 28,#4:902-909
117 obese children, 4 to 18yrs of age, BMI>95%ile, mixed ethnicity had
oGTT done at baseline and 18 to 24 m later
84 wth NGT, 33 with IGT
76(90.5%) with NGT maintained NGT
8 (9.5%) with NGT progressed to IGT
15 (45.5%) with IGT reverted to NGT
10 (30.3%) with IGT persisted with IGT
8(24.2%) with IGT progressed to T2DM
7 of the 8 who progressed to T2DM were African American females with
much higher BMI than the group
How persistent is Glucose
intolerance?(2)
Kleber et al. Diabetic Medicine 2010, 27,#5:516-521.
79 obese white children, mean age 13 with IGT
32% at 1yr with persistent IGT, 66% converted to NGT
1 chld with IFG, 1 child progressed to diabetes
Libman, et al. JCEM 2008;93, #11:4231-4237
85 overwgt/obese children, mixed ethnicity, mean age=12.4yr
Repeat oGTT 1 week later
10 with IGT, 30% concordonace at 2nd oGTT
Those with discordant oGTT had more measures of insulin resistance than
those with concordant results as measured by HOMA or WBISI

12/5/2016
7
Summary
Results of oGTT are subject to change in children and adolescents
Only about 30% of those with IGT persist with IGT and an even
smaller fraction progress to Type 2 DM
Those who progress to Type 2 DM are likely to be of heavier weight
and African American Heritage.
Association of IFG and IGT with
cardiometabolic risk in children
972 children and 2116 adolescents (OW/Ob) between 2003 and
2013 received oGTT tests
Prevalence same between children and adolescents
IFG =3.2% vs 3.3% respectively
IGT= 4.6 vs 5.0% respectively
Isolated IGT vs NGT
Children: 2 to11-fold increased risk of elevated LDL-C, non-HDL-C,
Tg/HDL-C ratio and low insulin sensitivity
Adolescence: Similar increased cardiometabolic risk profile
DiBonito P, et al. J. Endocrinol Investig. 2016: DOI:10.1007/s40618-016-0576-8
What is treatment for Pre-
Diabetes?
SHOULD WE TREAT PRE-DIABETES WITH METFORMIN OR IS LIFESTYLE
SUFFICIENT?

12/5/2016
8
Pre-Diabetes
Impaired Fasting Glucose
Fasting plasma glucose ≥100 and ≤ 125mg%*
Impaired Glucose Tolerance
2-Hr glucose ≥ 140 and <200mg% in a 75gm (or 1.75mg/kg to a max of
75gm) oGTT*
Category of increased diabetic risk
HgbA1c =5.7% to 6.4% *
*Diagnosis and Classification of Diabetes Mellitus. Diabetes Care 37(suppl 1):s81-S90, 2014
Prediabetes therapy
Limited pediatric data available to determine optimum therapy
Garnett S, et al. BMC Pediatrics 2014; 14, #1:289
110 obese children, age 10 to 17, treated with metformin but randomized to
high carb diet vs high protein, moderate carb diet showed improvements
with 6.8% decrease in BMI, 2.4% decrease in percent body fat and an
increase in insulin sensitivity
There were no dietary differences in response to combined intervention
Haemer M, et al. Childhood Obesity 2014;10,#4:292-303.
Systematic review of clinical practice (25 pediatric obesity clinics), plus
literature review to come to consensus statement
“The Committee takes no position on the use of pharmacological agents to
prevent T2DM in children with prediabetes or elevated fasting insulin, given
the limited studies in children and evidence that many children ith
prediabetes may revert to normoglycemia without pharmacological
treatment (Evidence C).”
Conclusion
Increased obesity associated with increase prevalence of T2DM and
prediabetes in youth
Pre diabetes is associated with adverse cardiometabolic risk profile in
children and adolescents
Results of oGTT, either fasting or 2-Hr, have poor correlation with each
other and with HgbA1c in an asymptomatic obese population of
children,
Prediabetic results in children frequently remit to normal results
All 3 tests may be used to diagnose T2DM, but results of any one episode of
testing must be cautiously interpreted given the variability in results over
time.
More severe obesity, African American heritage and female status is
most associated with progression from pre-diabetic to diabetic state.
12/5/2016
1
Sheldon E. Litwin, M.D.
Alicia Spaulding-Paolozzi Professor of Cardiology
Medical University of South Carolina
Ralph H. Johnson VAMC
Disclosures:
None
Cardiovascular Consequences of Obesity in
Children
Key Points
•Obese children more likely to become obese adults
•Coronary risk factors increased in obese children (DM,
HTN, dyslipidemia, NAFLD, OSA)
•Childhood obesity associated with increased markers
of atherosclerosis and CV death in adulthood
•Return to normal weight in adulthood may attenuate
risk from childhood obesity
•Lifestyle modification programs disappointing
•Limited data on pharmacological therapy
•Bariatric surgery effective option for severe obesity
(long term data lacking)
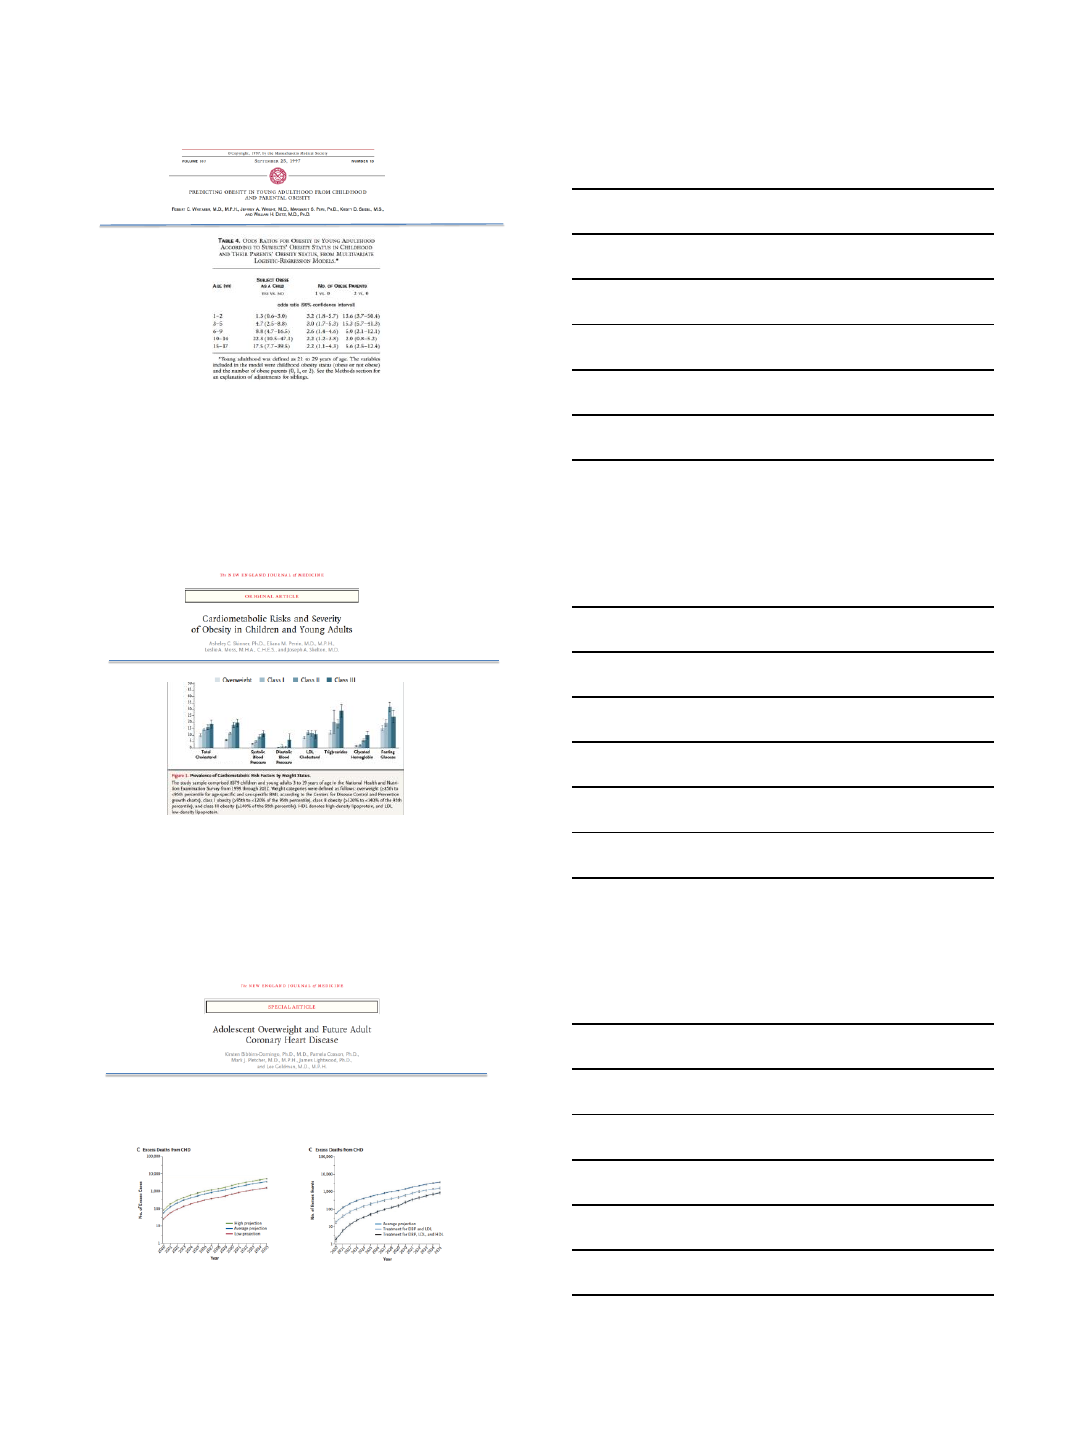
NEJM 2009; 361:2252-60
NEJM 2005; 352:1138-45
“The negative effects of increasing
BMI overwhelmed the positive
effects of declines in smoking in
multiple scenarios.”
“Assuming that current rates of death
associated with obesity remain
constant in this century, the overall
negative effect of obesity on life
expectancy in the US is a reduction of
1/3 to 3/4 of a year. This is not trivial –
it is larger than the negative effect of
all accidental deaths combined…and
there is reason to believe it could
exceed the negative effect that
ischemic heart disease or cancer has
on life expectancy.”
We all face consequences of the obesity epidemic
12/5/2016
2
NEJM 1997; 337:869-73
Obese children more likely to become obese adults. Strong parental influence.
Genetic? Behavioral? Both?
N=854
Retrospective
Born 1965-71
16% obese age 21-29
NEJM 2015; 373:1307-17
Increased CV Risk Factors in obese children and adolescents
Age 2-19, 6% severely
obese (NHANES 2011-12)
Prevalence of cardiometabo lic risk factors (%)
Low
HDL
NEJM 2007; 357:2731-9
•Adolescent overweight projected to prevalence of obese 35 yr olds in
2020 to 30-37% in men & 34-44% in women.*
•Estimated that prevalence of CHD will 5-16%
* 37.7% in all adults NHANES 2013-14
12/5/2016
3
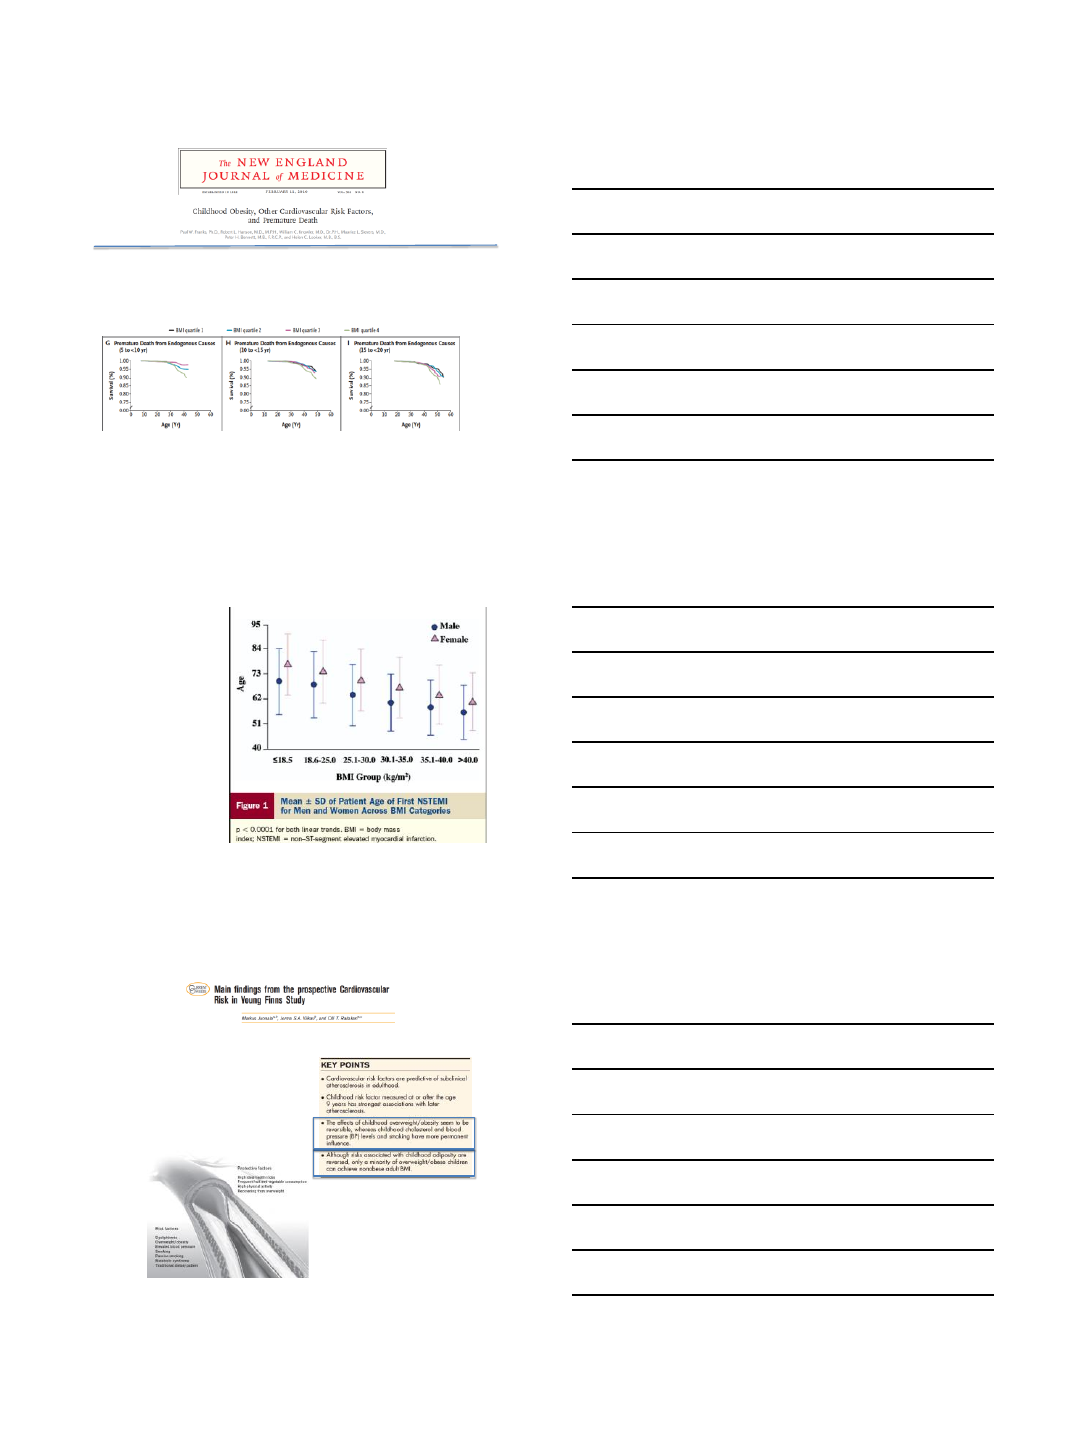
NEJM 2010; 362:485-93
•4587 American Indian children (11.3 yrs), median f/u 23.9 yrs
•Rates of death from endogenous causes in highest quartile BMI >
double that in lowest quartile
•Obesity, glucose intolerance and HTN in childhood strongly associated
with premature death
Obesity and age of first MI.
Madala et al. JACC 2008
CRUSADE registry,
189,000 patients,
2001-2007
Most obese
subgroup (BMI >
40) were 15 years
younger than
leanest subgroup
at time of first MI
Curr Opin Lipidol 2013, 24: 57-64
•3596 Finnish children & adolescents 3-18
years
•Followed up at 3-9 year intervals
•Currently at 30 year follow up (middle age)
•Intermediate phenotypes (CIMT, CAC, echo,
FMD, PWV) 2001, 2007, 2010, 2012
12/5/2016
4
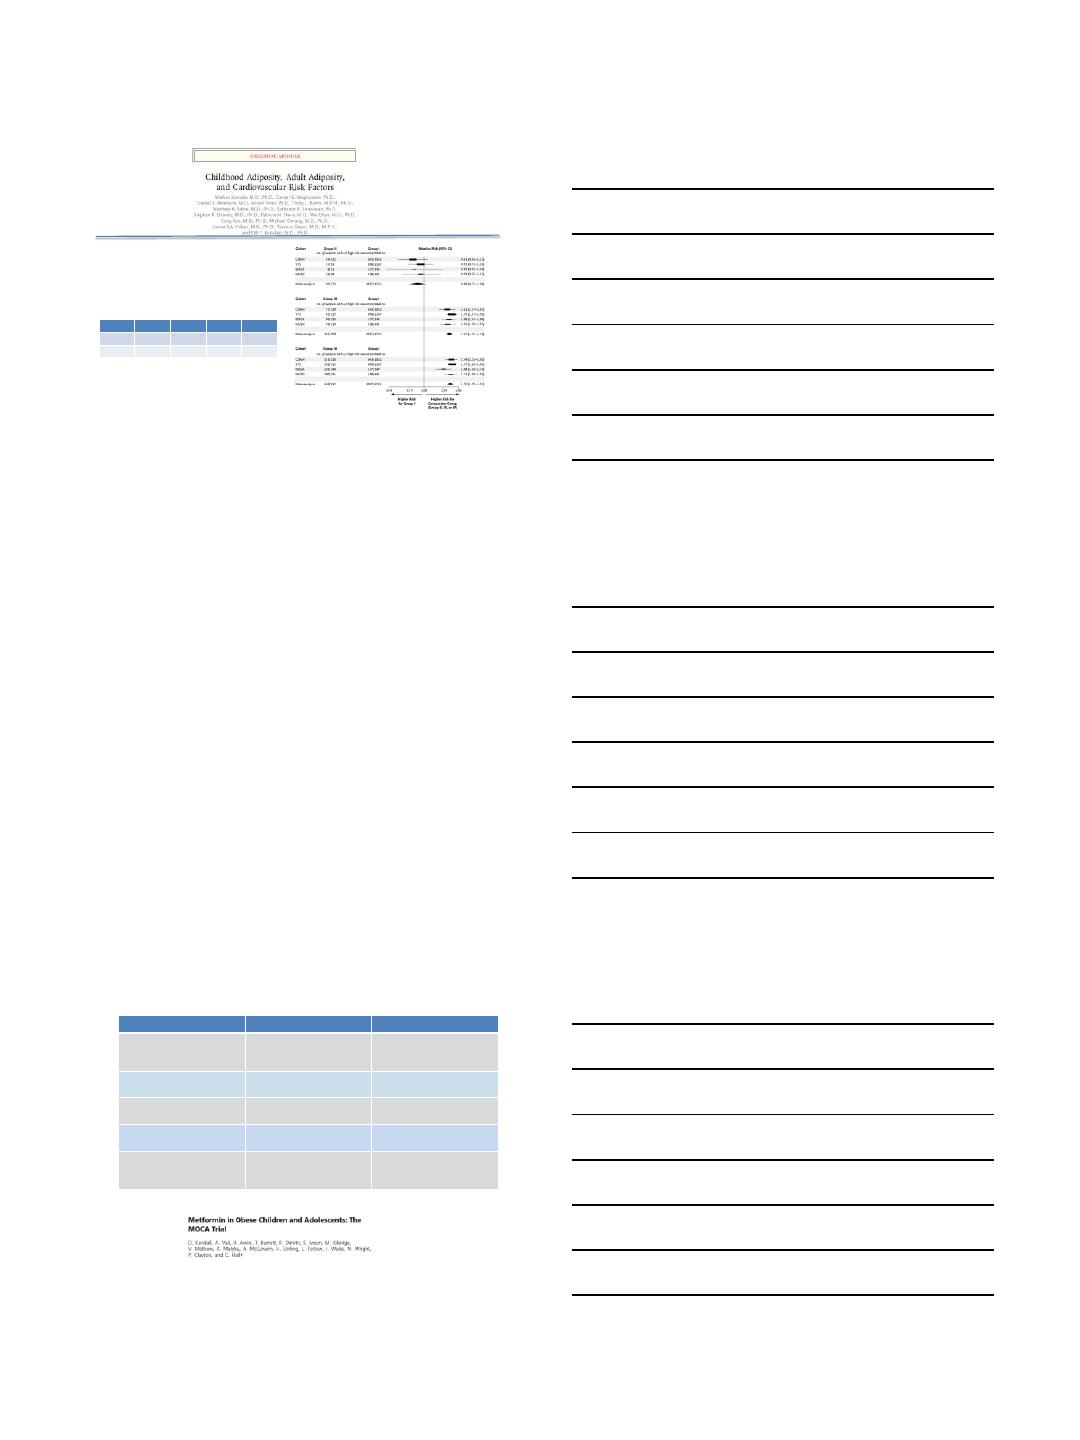
NEJM 2011;365:1876-85
•International Cardiovascular Cohort
Consortium (IC3)
•Bogalusa, Muscatine, Childhood
Determinants of Adult Health
(Australia), CV Risk Young Finns
•6238 subjects
Group 1
Group 2
Group 3
Group 4
Child
-
+
+
-
Adult
-
-
+
+
High risk outcomes:
LDL > 160, HDL < 40, TG > 200, T2DM, HTN,
CIMT > 90th %
Obese children who become normal weight adults have lower risk
Weight loss pharmacotherapy
•Perception of physicians
–Unproven
–Ineffective
–Unsafe
•Reality
–> 17,000 patients in clinical trials
–>10% weight loss~ 50% of patients
–No evidence of adverse CV effects
Pharmacological Rx of Obesity
Drug Class Current status
Orlistat Lipase inhibitor
(blocks fat absorption) OTC (small weight loss, GI
side effects)
*Approved for children*
Phentermine/Topiramate
(QsymiaTM) NE reuptake blocker
Anticonvulsant, migraine Approved for adults
Liraglutide (SandexaTM) GLP-1 agonist
Injectable Approved for adults
Lorcascerin (BelviqTM) Serotonin agonist
(selective) Approved for adults
Bupropion/Naltrexone
(ContraveTM) Dopamine reuptake
inhib/Opioid receptor
antagonist
Approved for adults
Metformin was associated with a significant reduction in BMI-SDS compared with
placebo at 6 months [mean difference 0.1 SD (95% CI 0.18 to 0.02), P 0.02].
12/5/2016
5
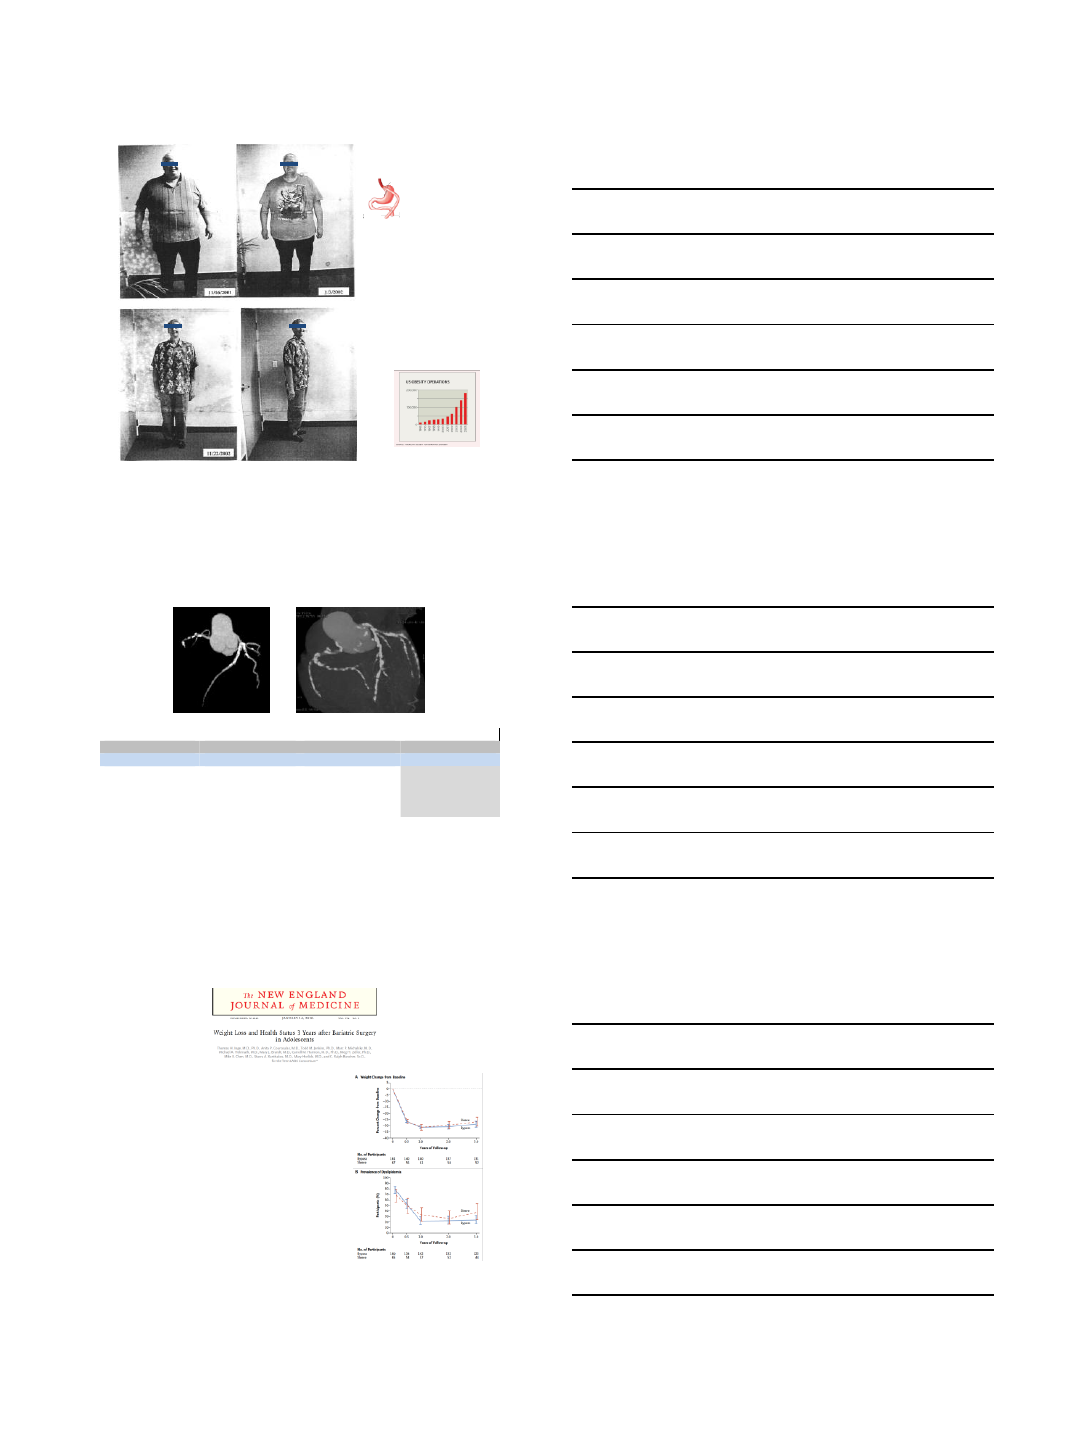
A proud and happy
participant in our study at
the time of his 2 year
follow up visit
Average weight loss in
GBS subjects at 2 years
= -100 lbs
Average change in BMI at
2 years = -15 units
Bariatric Surgery
Roux en Y GBP
Restrictive/malabsorptive
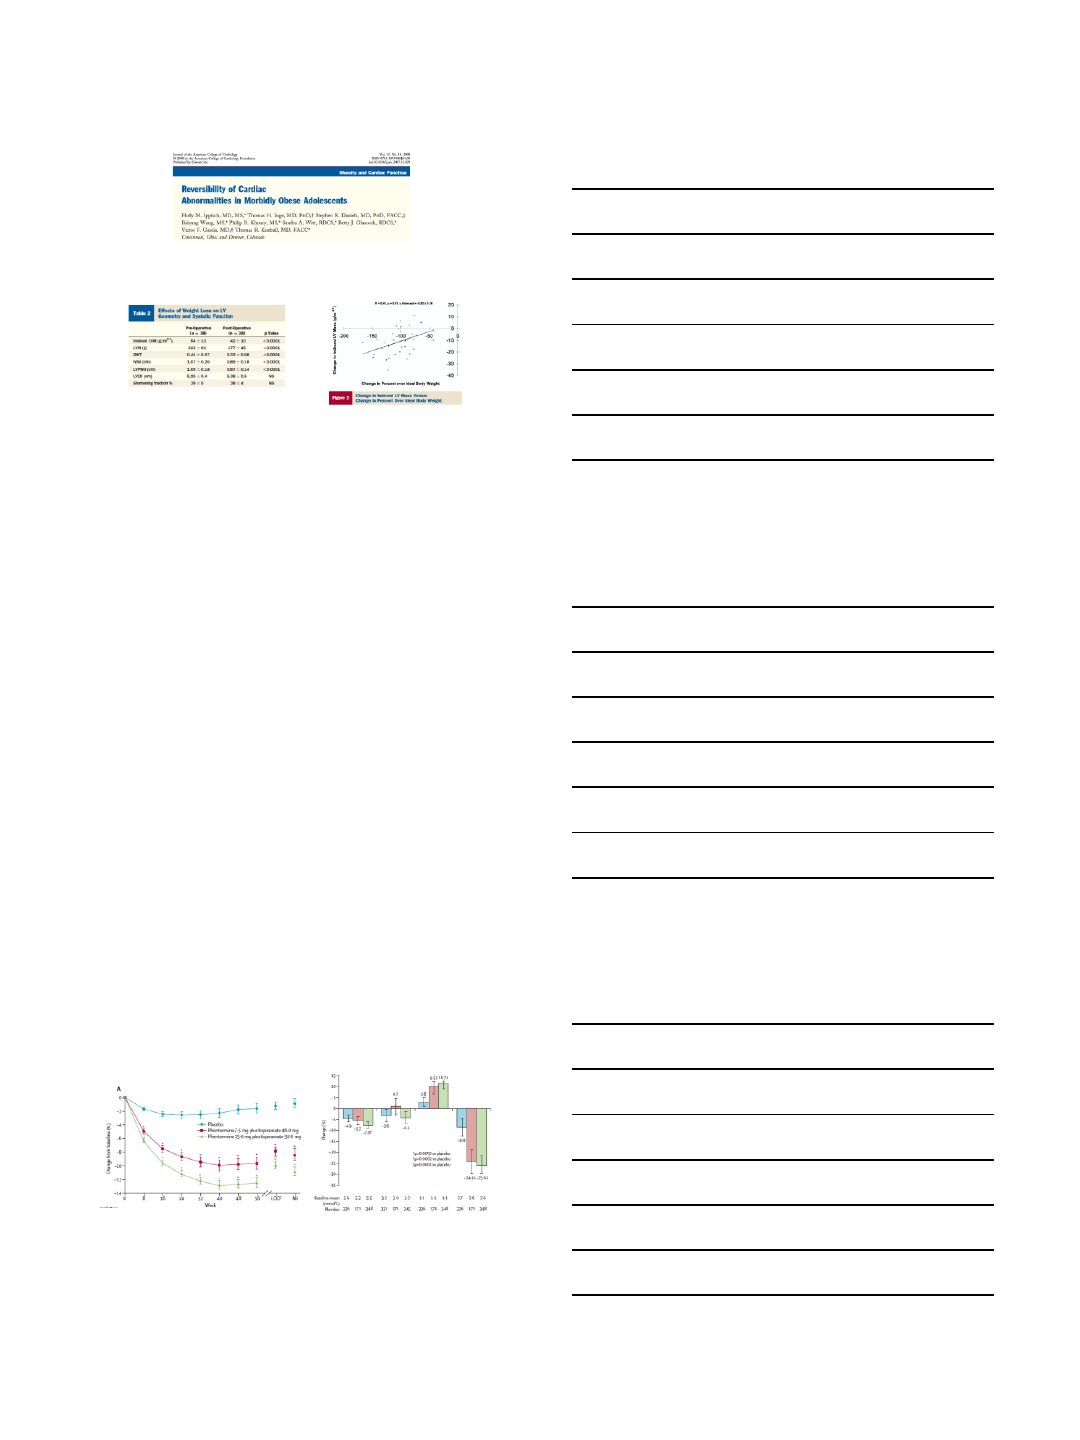
Lower coronary Calcium Scores After Bariatric Surgery
ResultsofCACSubstudy(6yearfollowup)
GBS(n=71)
NoSurgery(n=62)
Pvalue
CACscore(mean)
33+114
107+340
<0.01
CACscore=0
67%
43%
<0.01
CACscore1-10
16%
22%
CACscore11-100
10%
18%
CACscore>100
7%
17%
Priester T….Litwin SE: Coronary calcium scores 6 years after bariatric
surgery. Obes Surg 2015; 25:90-96
NEJM 2016; 374:113-23
Teen LABS (Longitudinal Assessment of Bariatric Surgery
242 adolescents (17 yrs, BMI 53, 75% female, 72% white)
3 year follow up
Remission of:
type 2 diabetes 95%
prediabetes 76%
elevated blood pressure 74%
dyslipidemia 66%
abnormal kidney function 86%
Improved weight related quality of life
Low ferritin 57%
Reduced vitamin B12, A, D levels
13% had repeat abdominal procedures
12/5/2016
6
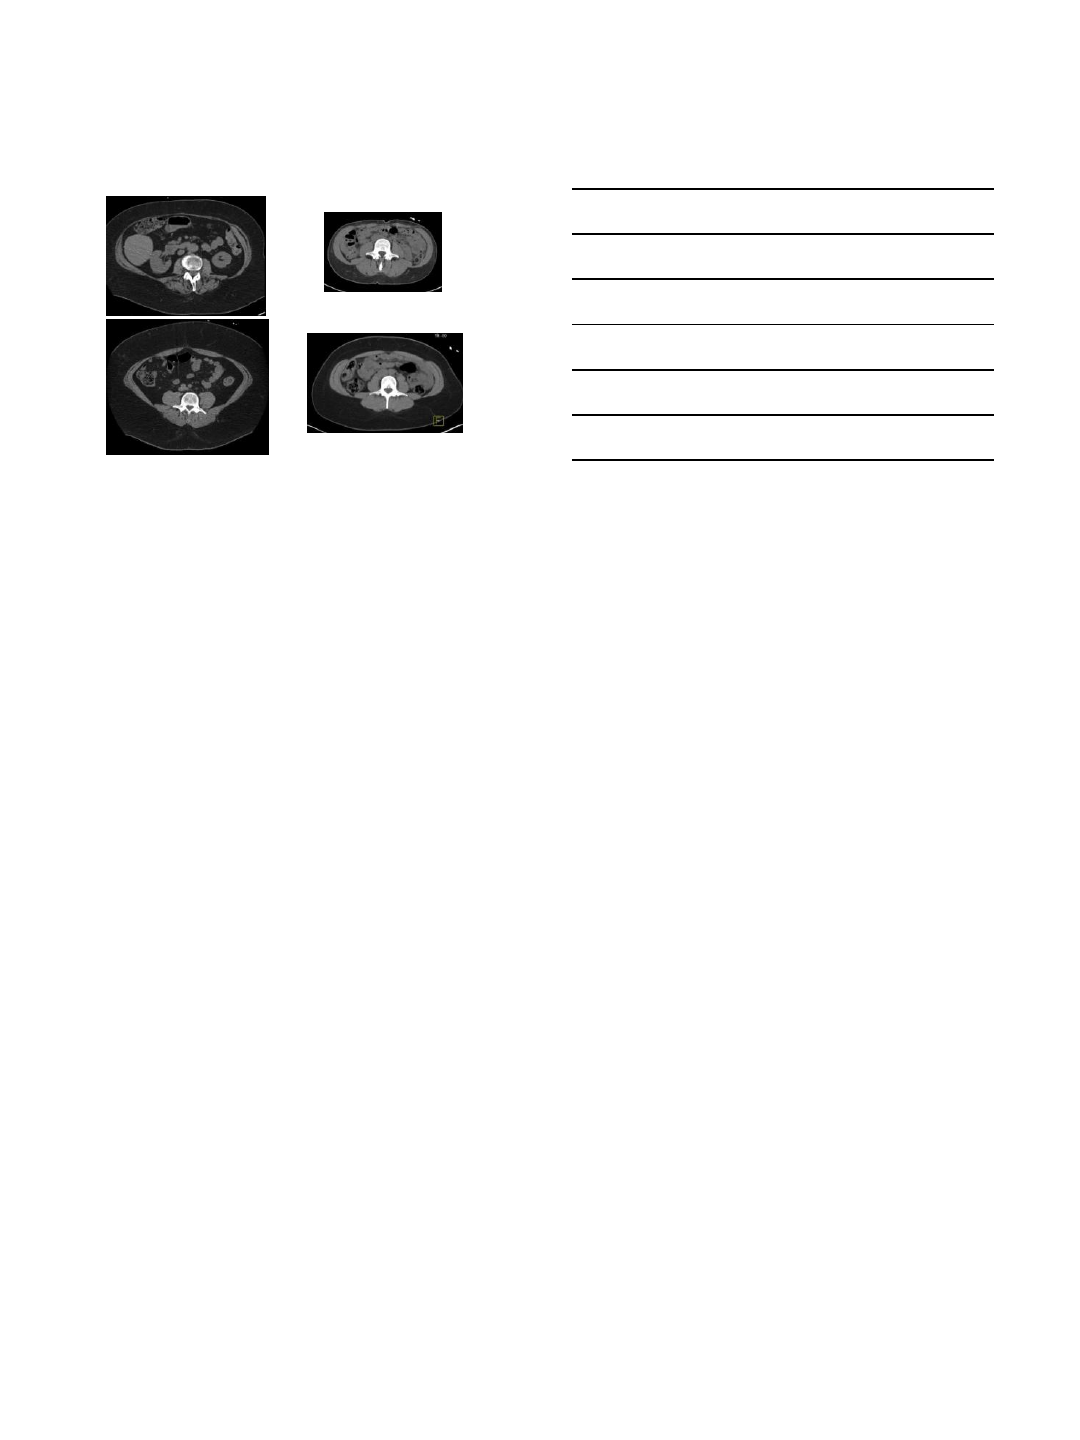
38 adolescents (13-19 yrs, 29 female, 33 white)
Pre and post bariatric surgery (mean f/u 10 months)
BMI 60 => 40 kg/m2
Summary
•Obese children more likely to become obese adults
•Coronary risk factors increased in obese children (DM,
HTN, dyslipidemia, NAFLD, OSA)
•Childhood obesity associated with increased markers
of atherosclerosis and CV death in adulthood
•Return to normal weight in adulthood may attenuate
risk from childhood obesity
•Lifestyle modification programs disappointing
•Limited data on pharmacological therapy
•Bariatric surgery effective option for severe obesity
(long term data lacking)
Effects of low dose, controlled release, phentermine plus topiramate
combination on weight and associated comorbities in overweight and obese
adults (CONQUER): A randomized, placebo-controlled phase 3 trial
Gadde KM, et al Lancet 2011; 377:1341-52
TC LDL HDL TG
12/5/2016
7
Abdominal CT Scans
Nonsurgery Subjects Surgery Subjects
11/30/2016
1
Orthopedic Implications of
Childhood Obesity
VuMedi webinar 12/5/16
Dave Shenton MD
•I have nothing to disclose
General thoughts regarding
childhood obesity and
orthopedic problems
•Disclaimer – I am not a Pediatric Orthopedic surgeon. I specialize in
Sports medicine (esp. shoulders, knees)
–However, I have seen the dramatic change in childhood obesity in my
practice over the past 30 years, became alarmed, participated in
education of parents
•Children inherently have special orthopedic risks with obesity
versus adults because they are growing and developing
–Orthopedic Conditions - Growth plate injuries (SCFE, Blounts, etc)
•Other musculoskeletal problems – Perthes, etc
–General musculoskeletal complaints and injuries
•Increased risk of injury and compromised recovery
•Back, lower extremity, ankle and foot problems

11/30/2016
2
The problem with childhood obesity:
•As a society we
Americans are
overfed and
undernourished
•Inactivity is
epidemic
–Nearly 40% of kids
physically unfit
Society has taken notice
The Causes:
•“The biggest factor for obesity in the young is
still parental overweight”!
B. Healy MD, USN&WR Sept 4, 2006
Children who are overweight or obese as preschoolers are five times
as likely as normal-weight children to be overweight or obese as
adults.

11/30/2016
3
U.S. Adults by State and Territory, BRFSS,
2015
¶ Prevalence estimates reflect BRFSS methodological changes started in 2011. These
estimates should not be
compared to prevalence estimates before 2011.
*Sample size <50 or the relative standard error (dividing the standard error by the prevalence) ≥ 30%.
The Problem:
•Health issues:
–Obesity care costs for kids more than
tripled between 1979 and 1999 in US
($127 million) Nat’l Acad of Sciences
– Kids increasingly with “adult” diseases
•Type 2 diabetes
–1 in 3 expected to develop
•High blood pressure
•Heart disease
•Respiratory ailments
•Sleep apnea
–(poor concentration and attention
problems)
–Also multiple Orthopedic
problems
11/30/2016
4
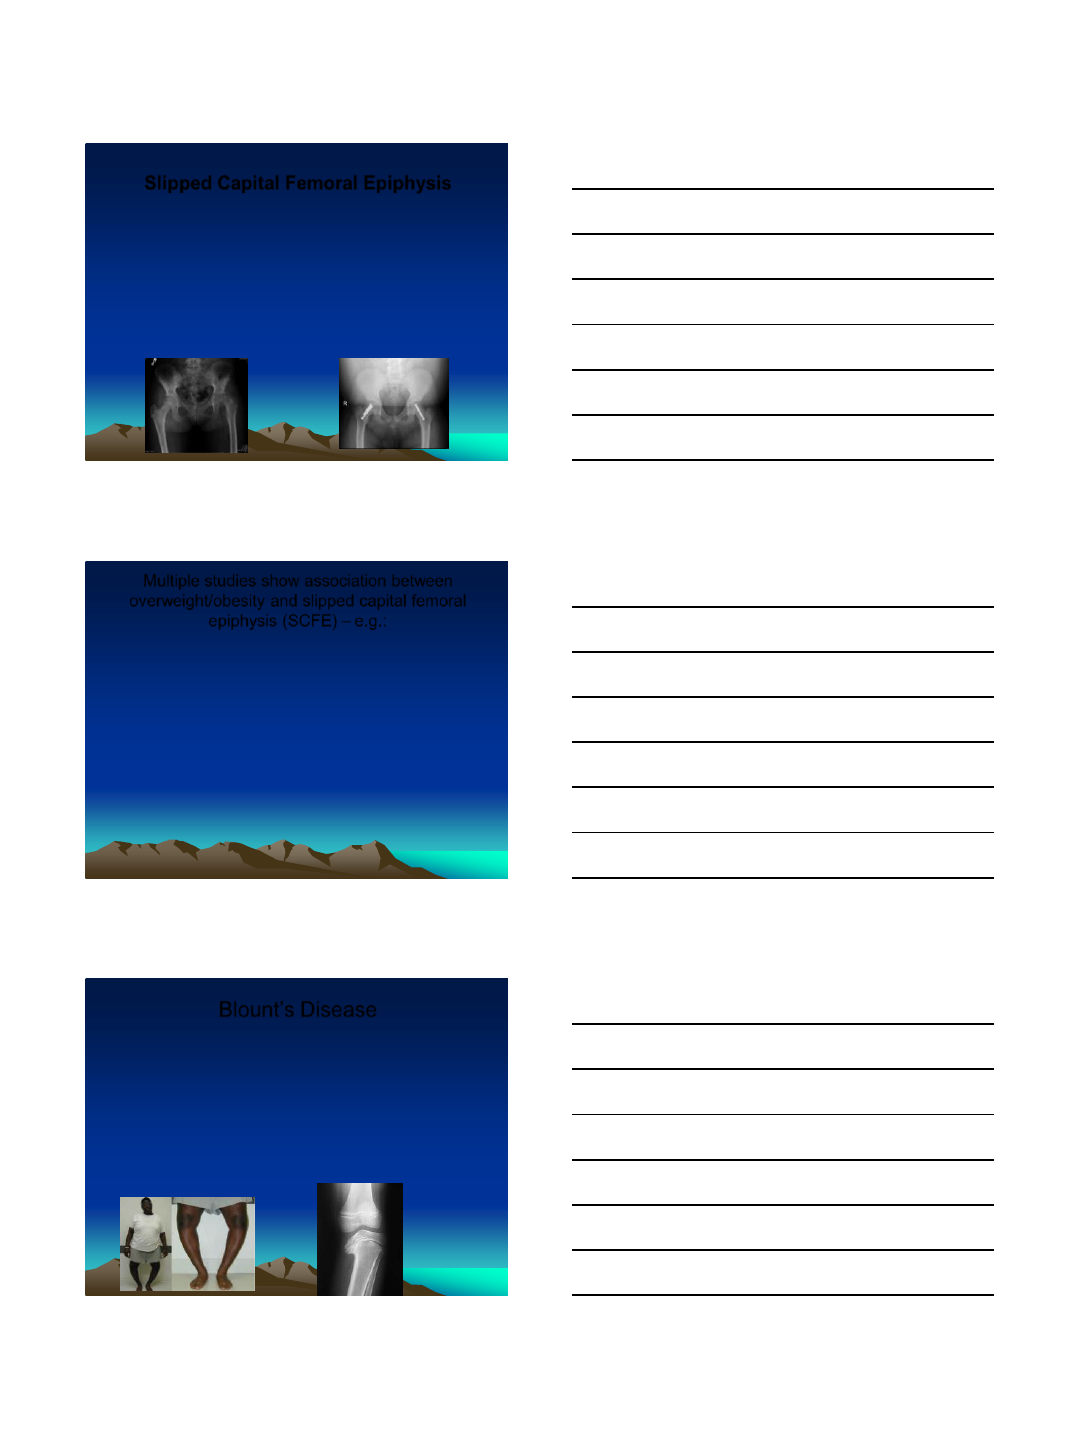
Slipped Capital Femoral Epiphysis
•Orthopedic condition in adolescence where the femoral head slips
posterior and inferior relative to the femoral neck
–This can happen either acutely or more slowly and chronically.
–Usually presents with hip and/or knee pain and limping.
–Often occurs during periods of rapid growth or shortly after adolescence
–This is a surgical problem classically requiring screws or pins to stabilize the slip
and effect healing
•Multiple complications possible including avascular process of the femoral head, chondrolysis,
persistent pain and stiffness
•The surgery is more difficult with increased risk of complications reported in obese children
–Risk factors include obesity – resulting in increased shear forces
Multiple studies show association between
overweight/obesity and slipped capital femoral
epiphysis (SCFE) – e.g.:
•Aversano MW, et al. Association between body mass index-for-age
(CDC ref) and SCFE: the long term risk for subsequent slips in
patients followed until physeal closure. J Child Orthop 2016.
–Association between obesity measured by BMI-for-age percentiles and SCFE
–All but one patient (79/80) greater than 85th percentile
•Nasreddine AY, et al. a reduction in body mass index lowers risk for
bilateral SCFE. Clin Orthop Relat Res 2013
•Loder RT. The demographics of slipped capital femoral epiphysis. Clin
Orthop. 1996; 322:8–27.
–reviewed the cases of 1630 children with 1993 SCFE.
–worldwide - 47.5% white, 24.8% black, 16.9% Amerindian, 7.4% Indonesian-Malay, 2.1%
Native American/Pacific Islands, and 1.3% Indo-Mediterranean children
– 671 were girls (41.2%) and 959 were boys (58.8%) avg age 12 and 13.5 years, respectively
– The age at diagnosis decreased with increasing obesity
–weight status (at the time of the first slip) was known for 1337 children - 51.5% were obese
(body weight >95th percentile), 11.7% were overweight (body weight in 90th to 95th
percentile
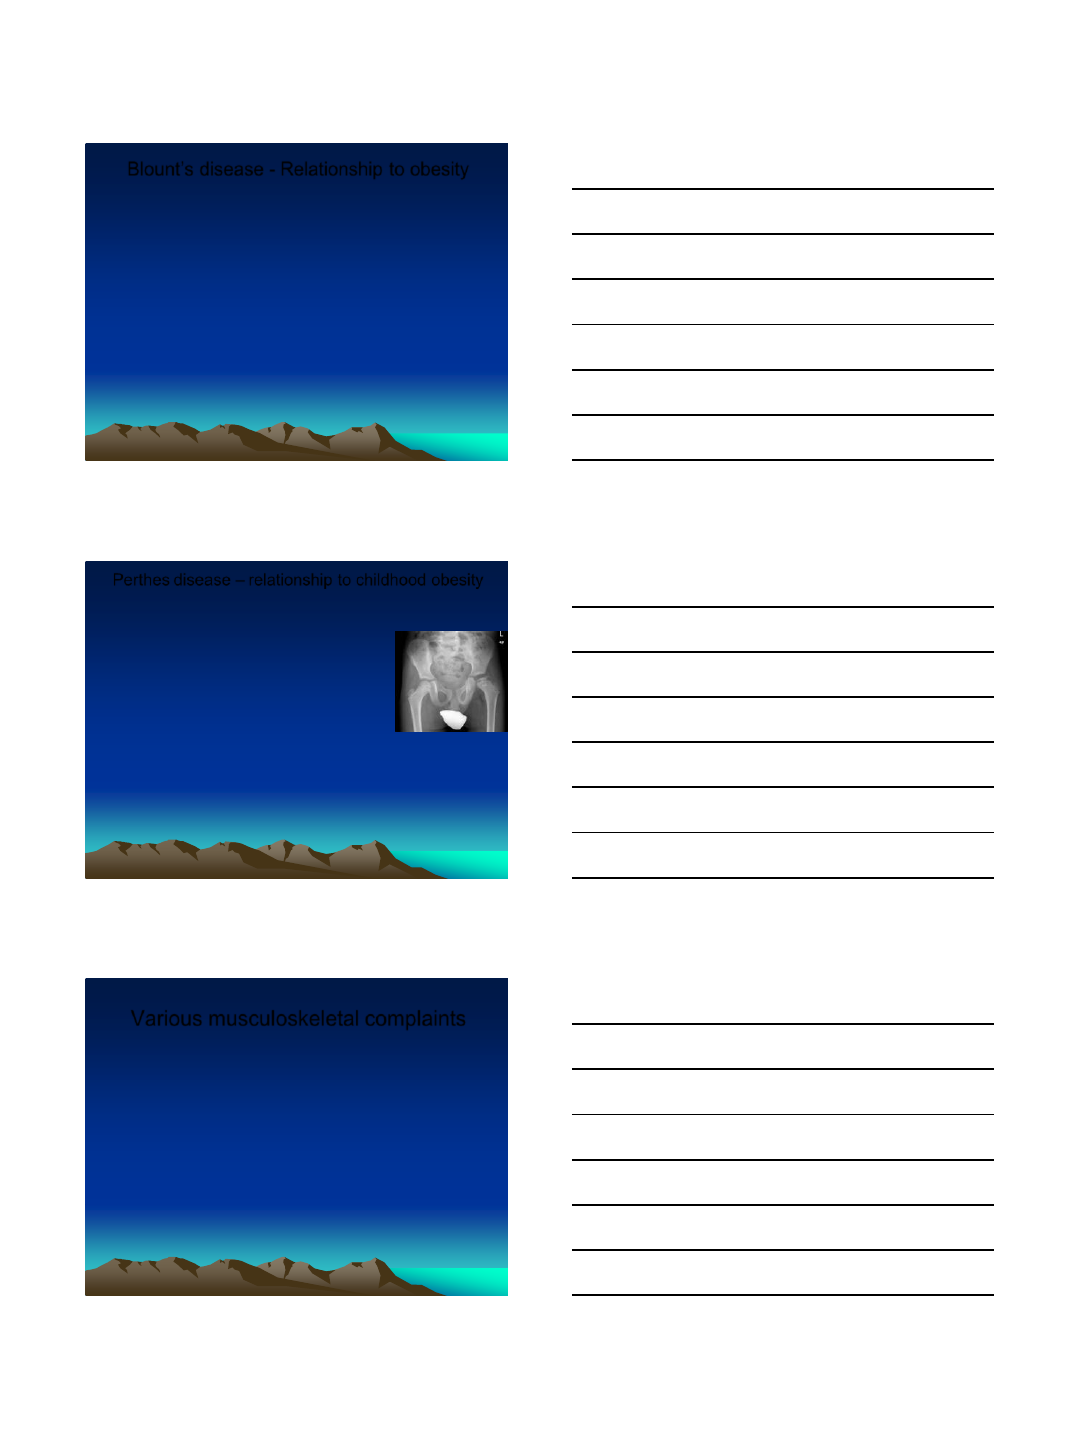
Blount’s Disease
•Orthopedic condition with severe bowing (varus deformity) of the
legs
–Thought to result from increased and uneven stress on the growth plate caused
by excess weight leading to irregular growth and deformity.
•Probably preceded by physiologic varus in the child combined with overweight
–Infantile and adolescent types (both uncommon, reported at less than 1%)
–Usual presenting complaint is the progressive deformity, rather than pain
–Treatment can consist of leg braces or orthotics in younger patients and with less
severe deformities.
–Surgery is required in older patients and those with more severe deformities.
•Complications can include malunion, gross deformity, infection, delayed healing, recurrence
•Surgery is more difficult in obese patients and a higher risk of complicationsis reported.
Radiographic features
include varus at
epiphyseal/metaphyseal
junction
• Widened irregular medial
physis
• Medial sloping of
epiphysis
• Beaking of medial
metaphysis
11/30/2016
5
Blount’s disease - Relationship to obesity
•Obesity has been linked with the prevalence and degree of
angulation of the deformity in infantile Blount disease
•Dietz WH, Gross WL, Kirkpatrick JA. Blount disease (tibia vara):
another skeletal disorder associated with childhood obesity. J
Pediatr. 1982;101:735–737
–Retrospective study of 18 cases of children with Blount disease. Of these, 16 had
infantile Blount disease, and all the patients described as obese (>120% of ideal
body weight) had infantile Blount
•the relationship of the onset of obesity and the onset of the Blount disease could not be determined
•More than 90% of the reported cases of adolescent Blount’s disease
have been in black males who are morbidly obese
•Henderson RC, Kemp GJ, Hayes PRL. Prevalence of late-onset
tibia vara. J Pediatr Orthop. 1993;13:255–258.
–Studied all boys area high-school football teams who weighed >210 lb
•(210 lb - 95th percentile for 18-year-old males - National Center for Health Statistics)
–Of the 1117 boys, 140 boys (80 black and 60 white) met the weight criteria
–Radiographs of the seven boys who clinically screened positive showed that two
boys had adolescent Blount disease. resulting prevalence was 2.5% (two of 80
boys) in the adolescent black male population described as obese
Perthes disease – relationship to childhood obesity
•Loss of blood supply to femoral head leading to necrosis
–typically occurs in children who are between 4 and 10
years old. Boys 5:1 girls. 10% to 15% bilateral.
–4 stages: necrosis, fragmentation, re-ossification,
healed -can take years
–All require prolonged bracing or traction and some
require surgery.
–Increased risk of hip osteoarthritis later in life
•Prevalence of Obesity in Patients With Legg-Calvé-
Perthes Disease.
–Neal DC, et al. J Am Acad Orthop Surg. 2016.
–Retrospective, 150 patients
–16% overweight and 32% obese
–Obese with 2.8 times likelihood of requiring bony
operation
–Obesity common in Perthes patients and associated
with a later stage of disease presentation
Various musculoskeletal complaints
•Orthopedic specialists commonly see overweight
children complaining of hip, back, knee and foot pain.
•Overweight and obesity are associated with
musculoskeletal complaints as early as childhood: a
systematic review.
–Review article Paulis WD, et al. Obes Rev. 2014.
–40 articles included
–Concluded that “overweight and obesity are associated with
musculoskeletal pain, injuries and fractures as early as
childhood”
•More high quality prospective core studies are needed.
•Krul, M et al, Ann Fam Med Jul-Aug 2009). Musculoskeletal
problems in overweight and obese children.
–Overweight/obese children with more musculoskeletal, lower extremity and ankle
and foot problems versus normal weight
11/30/2016
6
Fractures/Sprains and Related Complications
•Obese/overweight children may have a higher risk for
fractures
– Increased forces with falls
– Awkwardness, decreased coordination?
– Possibly relatively weaker bones secondary to inactivity
•Treatment of fractures can be complicated/compromised
–traditional metal implants more likely to fail –
•Guidelines for use of elastic nails for femur fractures versus IM rods etc.
•Weiss et al 2008- Increased risk complications flexible nails with increasing
BMI - wound infections, nonunion , skin ulcers, nerve palsy, re-fracture
–crutches may be difficult to use –
•mobilization of lower extremity fractures complicated (Hayashi, 2009)
–Cast/splint immobilization may be more difficult and inadequate
•E.g. hip spica cast not effective for fatter kids
•Trouble controlling fx alignment with extremity casts -soft tissue envelope
•Timm NL, et al. Arch Pediatr Adolesc Med. 2005. Chronic ankle morbidity
in obese children following an acute ankle injury. Arch Ped Adolesc
Med 2005 -Overweight children increased Sx 6 mo post ankle sprain
Multiple studies showing increased frequency or severity of
fractures with childhood obesity
•Seeley MA, et al. Obesity and its effects on pediatrics
supracondylar humeral fractures. JBJS 96A (3), Feb 2014
–354 patients
–Obesity was associated with more complex fractures, preoperative and
postoperative nerve palsies, and postoperative complications
–Obese patients were more likely to sustain complex fractures from a simple fall
on outstretched hand.
•Goulding A, Jones IE, Taylor RW, et al. More broken bones: 4-yr
double cohort study of young girls with and without distal forearm
fractures. J Bone Miner Res. 2000;15:2011–2018
–girls, aged 3 to 15 years
–100 who had each recently traumatically fractured a forearm was compared with
a group of 100 who were fracture free.
– previous fractures, low total body area bone mineral density (g/cm2), and high
body weight each independently increased the risk of new fractures in growing
children.
–Also, spinal volumetric bone mineral apparent density (g/cm3) was a predictor of
new fractures.
– Fracture group- 8 to 19 year olds 4.7 kg (~10 lb) heavier
Impairments in mobility and balance
associated with obesity?
•McGraw B, McClenaghan BA, Williams HG, et al. Gait and
postural stability in obese and nonobese prepubertal
boys. Arch Phys Med Rehabil. 2000;81:484–489.
–Boys aged 8 to 10 years who were obese spent a greater
percentage of the gait cycle in dual stance and had diminished
dynamic stability.
•A study of 93 boys aged 10 to 21 years supported that
adolescents who are overweight have poorer balance
than those of healthy weight
–Increased risk of falling
–Difficulty halting forward progress when they began the fall
–Increased force applied to bones with fall.
•Taylor MS III found that overweight children report a
significant impairment in mobility compared to non
overweight children.
• Developmental coordination disorder (DCD)?

11/30/2016
7
Back and Spine problems with childhood obesity
•Samartzis D, et al. A population-based study of juvenile distant
generation and its association with overweight and obesity, low back
pain…. JBJS 2011
–Obesity increases the risk of degenerative disc disease by 14 times.
•A review of 65 epidemiologic studies of low back pain did report that
32% of the 65 reviewed studies showed a statistically positive link
between weight and low back pain
•Milbrandt, TA – Increased complication rates following scoliosis
surgery in adolescent girls
–Overweight and obese patients had 70% complication rate.
– Most common complication was persistent wound drainage.
–heavier girls had significantly longer surgical times and hospital stay.
•Difficult bracing for scoliosis etc.
Other –foot pain, etc with childhood obesity
•Foot pain in the obese child is not uncommon.
–Contributing to fatigue and exercise tolerance
•Overweight -increased foot length/width, decreased navicular height,
lower medial arch height, and higher plantar pressure
•a rigid idiopathic flat foot that is negative for any type of coalition or
other cause has been described in obese children.
–Could be sequelae of obesity and increased pressure on the foot with midfoot
collapse and tight Achilles tendon
The Cure:
•Parents must embrace their
responsibility to raise a healthy child
–Set a good example
–Be supportive
–Create a healthy environment
•Healthy food, exercise, family time/outings
•Limit TV, video games, computer
–NO TV in child’s bedroom !
•Adequate rest (8-9 hrs min)
–ACTIVE ; hike, swim, bike, camp, wash car,
chores, sports,etc
11/30/2016
8
The Cure:
•Schools
–PE – daily, emphasize personal fitness/cardio
– “School-age youth should participate daily in 60 minutes or
more of moderate to vigorous physical activity that is
developmentally appropriate, enjoyable, and involves a
variety of activities. (J Pediatr 2005; 146:732-7)
–Youth strength training
•Safe and effective
•OK with ACSM, AAP, NSCA
•As early as 9-10 yrs
•Not = adults; emphasize:
–Safety, form, technique, lifetime fitness, FUN
–Lighter wts/ more reps
–Core, balance
–cafeterias – nutritious choices
–Vending machines – healthy snacks, no sodas
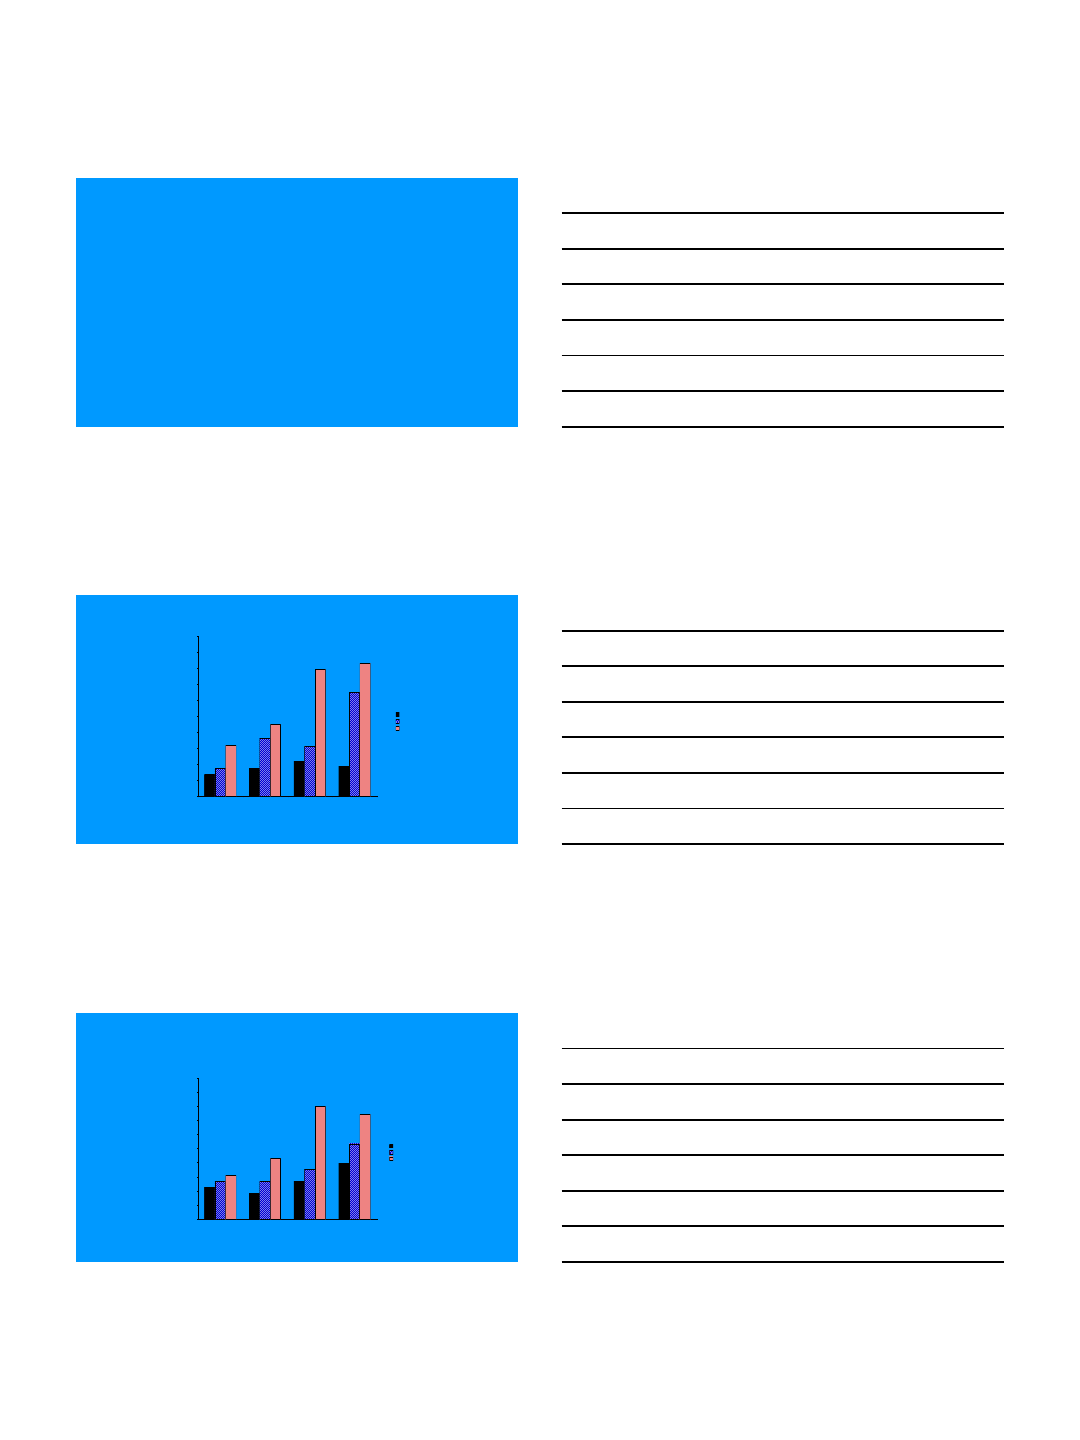
The Cure - Exercise SCUBA
?
Play
Hiking
Sports
Additional Resources
•www.supersizedkids.com
–Super Sized Kids, Larimore MD, et al.
•www.nih.gov
•www.cdc.gov
•Am Obesity Assoc
(www.obesity.org)
•US Preventative Services Task
Force (USPSTF)

11/30/2016
9
The End
12/5/2016
1
OBESITY RELATED HYPERTENSION IN CHILDREN
Bonita Falkner, MD
Thomas Jefferson University
Philadelphia
•Disclosures: None
2-5 yr 6-10 yr 11-15 yr 16-19 yr
0
5
10
15
20
25
fBMI < 85th
f85th < BMI <95th
fBMI > 95th
Prevalence of systolic hypertension -
girls
Age grouping
SBP ≥ 95th%
2-5 yr 6-10 yr 11-15 yr 16-19 yr
0
5
10
15
20
25
BMI < 85th
85th < BMI <95th
BMI > 95th
Prevalence of systolic hypertension -
boys
Age grouping
SBP ≥ 95th%
12/5/2016
2
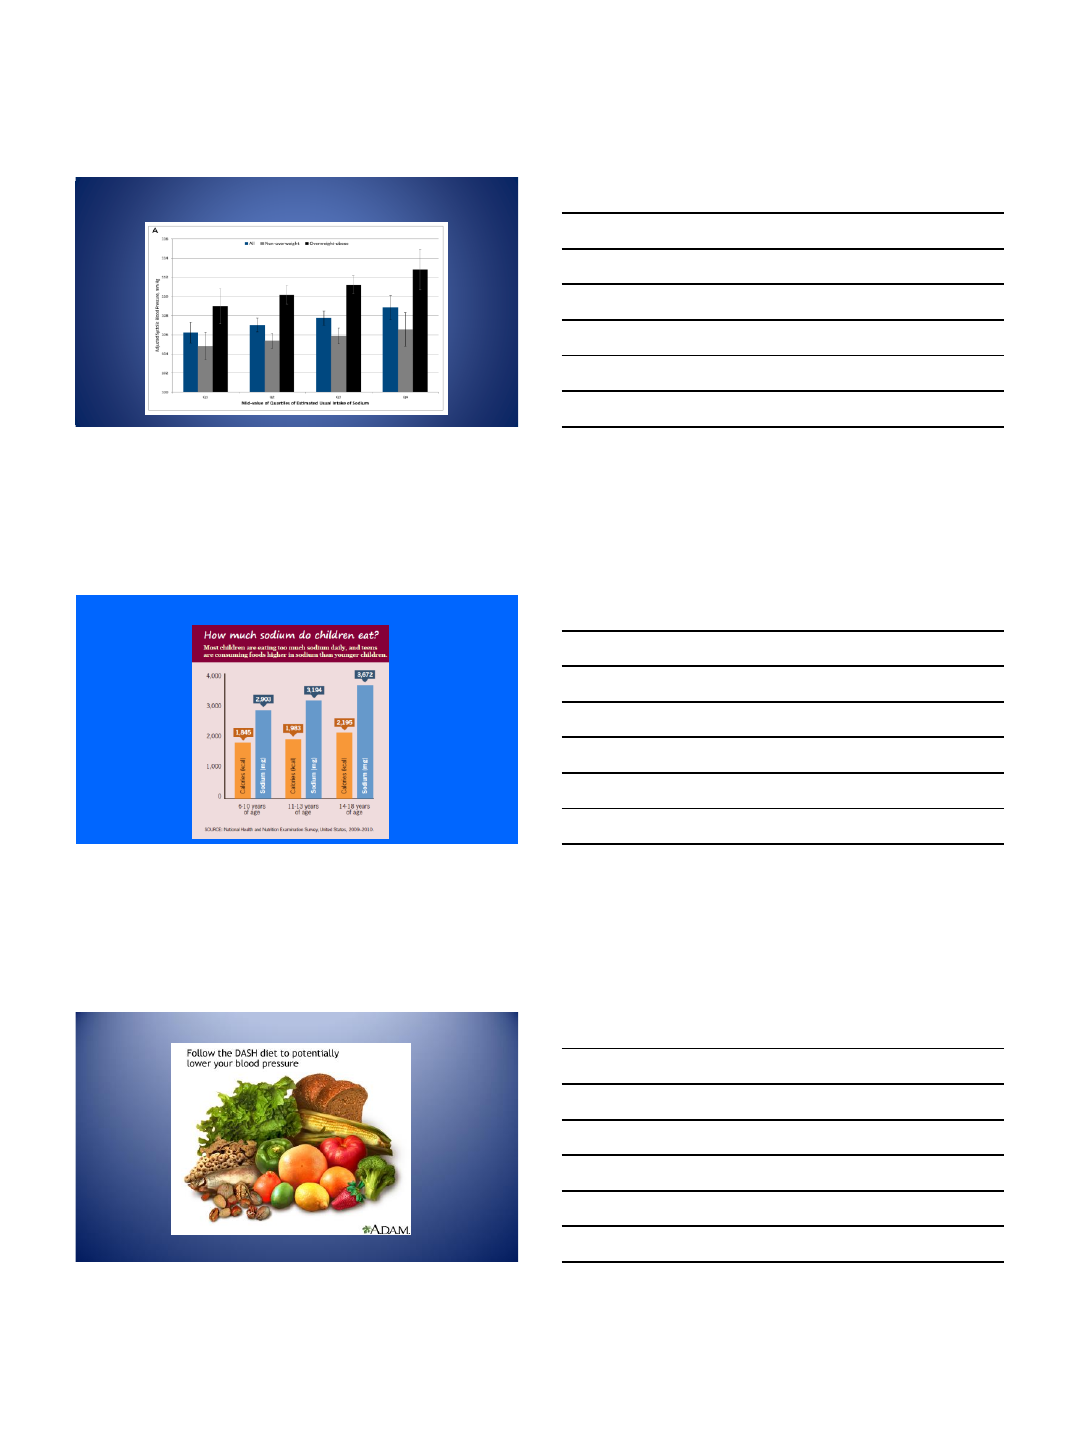
Sorof J, Daniels S. Obesity hypertension in children. Hypertension 40:441-55, 2004
Estimated Prevalance of Prehypertension-Hypertension in childhood
Relative to BMI Percentile
Tu et al;
Hypertension
2011
Systolic BP (mmHg) Diastolic BP (mmHg)
Age BP Percentile of Height Percentile of Height
(Year) Percentile 5th 10th 25th 50th 75th 90th 95th 5th 10th 25th 50th 75th 90th 95th
12 50th 102 103 104 105 107 108 109 61 61 61 62 63 64 64
90th 116 116 117 119 120 121 122 75 75 75 76 77 78 78
95th 119 120 121 123 124 125 126 79 79 79 80 81 82 82
99th 127 127 128 130 131 132 133 86 86 87 88 88 89 90
Blood Pressure Levels for Boys
by Age and Height Percentile
The fourth report; Pediatrics 2004

12/5/2016
3
Ambulatory Blood
Pressure Monitoring
Patient wears lightweight BP monitor that
takes BP at regular intervals for 24 hr
Readings are recorded by monitor and later
downloaded to a personal computer
Study is analyzed by comparing the
patient’s BP to a set threshold value
Equipment available for use in children
Validity confirmed in children
Metabolic Syndrome
(dysmetabolic syndrome)
Diagnosis (ICD-9 code 277.7) requires 3 or more of the following:
Obesity (BMI >95th %)
Elevated BP (systolic and/or diastolic >90th %)
Abnormal blood lipids (HDL-C < 40 mg/dl, and/or Triglycerides >
150mg/dl)
Impaired glucose tolerance (fasting glucose >100 mg/dl, 2 hr
glucose >140, or any glucose > 200 mg/dl)
(*source: modified for youth from JAMA 2002;287:356-359)
Metabolic Syndrome in Adolescents
0
5
10
15
20
25
30
35
NHANES
1988-92
NHANES
1999-00
NHANES
1988-92
NHANES
1999-00
All Adolescents Adolescents
BMI > 95th%
% Metabolic Syndrome
Duncan et al,
Diabetes Care 2004

12/5/2016
4
Effects of Obesity and High BP On left ventricular
mass in adolescents
Falkner J Peds 2013
Association of Risk Factors with Vessel Pathology
0
5
10
15
20
25
30
35
40
% of Aorta
with Fatty
Streaks
0 1 2 3 or 4
Number of Risk Factors
Berenson et al, N Engl J Med 1998
Causes of Obesity Associated Hypertension
Increased sympathetic nervous system activity
Blood pressure sensitivity to sodium intake
Microvascular injury
12/5/2016
5
What About Sodium?
Yang Pediatrics 2012 online
12/5/2016
6
Classification of HTN in Children &
Adolescents, With Therapy Recommendations
Pharmacologic Therapy
Normal —
Prehypertension None unless compelling indications such
as CKD, diabetes mellitus, heart failure,
LVH
Stage 1 hypertension Initiate therapy based on indications or if
compelling indications as above
Stage 2 hypertension Initiate therapy
The fourth report; Pediatrics 2004
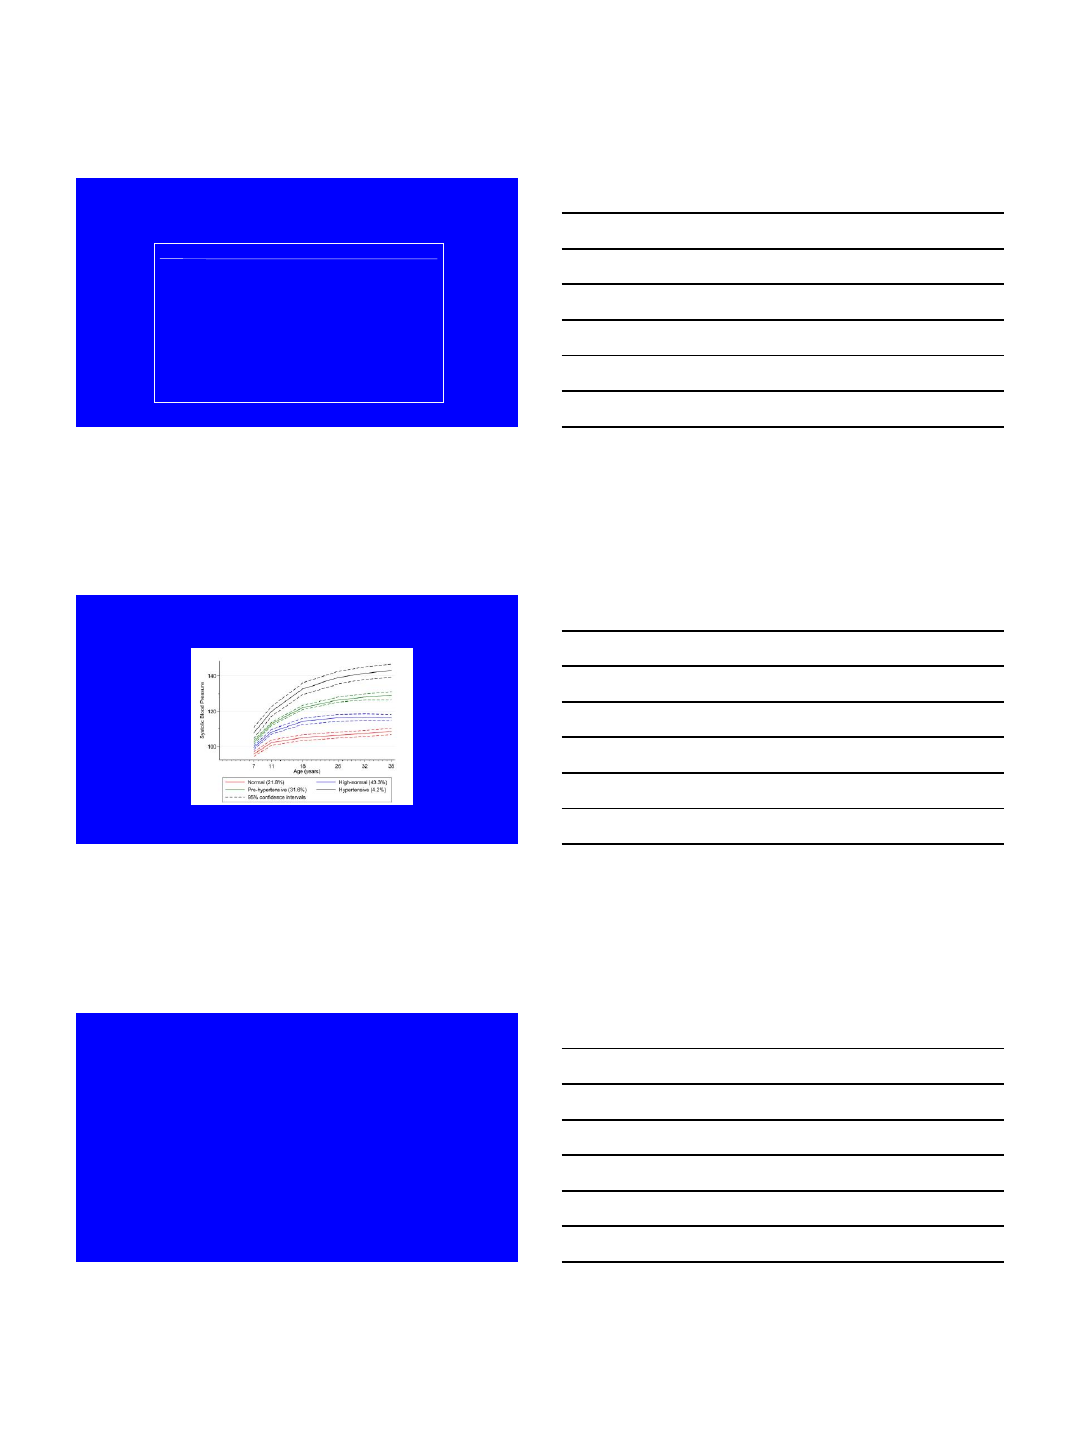
Systolic Blood Pressure Trajectories from Childhood to Early Adulthood.
Theodore et al, Hypertension, 2015
Number to Remember
120/80 mm Hg
