Product Detail Manual
127810-Catalog 127810-Catalog 127810-Catalog 662050 Batch5 unilog cesco-content 3:
145573-Attachment 145573-Attachment 145573-Attachment 662050 Batch5 unilog cesco-content 3:
145573-Attachment 145573-Attachment 145573-Attachment 037103 Batch5 unilog cesco-content 3:
101002-Attachment 101002-Attachment 101002-Attachment 043168 Batch7 unilog cesco-content 3:
2014-09-08
: Pdf 145573-Attachment 145573-Attachment 662051 Batch5 unilog
Open the PDF directly: View PDF ![]() .
.
Page Count: 146 [warning: Documents this large are best viewed by clicking the View PDF Link!]

General Electric Company
Fairfi eld, Connecticut 06828
www.ge.com
GE 2011 Annual Report
2011 Annual Report
GE Works
3.EPC055148101A.102

150
154
180
170
147
133
139
163
155 142
20082007 2009 2010 2011
CONSOLIDATED REVENUES
(In $ billions)
NBCU
GE
ex NBCU
16.8
16.0
20082007
GECS
Dividend
Industrial
CFOA
2009 2010 2011
19.1
23.3
16.4 14.7
12.1
CASH FLOW FROM OPERATING
ACTIVITIES (CFOA)
(In $ billions)
10.8
17.8
22.3
12.5 14.1
9.5
15.9
20.4
11.3 13.0
20082007 2009 2010 2011
EARNINGS ATTRIBUTABLE TO GE
(In $ billions)
NBCU
GE
ex NBCU
22%
GROWTH CONTINUES
22% increase in Operating
EPS excluding impact
of the preferred stock
redemption, and 20% rise
in Operating earnings.
$200B
RECORD INDUSTRIAL
BACKLOG
Record equipment and service
orders drove the backlog to a
record of $200 billion.
$85B
FINANCIAL FLEXIBILITY
GE had $85 billion of cash and
equivalents at year-end 2011.
70%
DIVIDEND INCREASES
GE announced two dividend
increases in 2011 following
two increases in 2010: a total
70% increase over the two years.
18%
INTERNATIONAL GROWTH
GE’s global growth initiative
helped drive 18% growth in
industrial international revenue.
$18B
U.S. EXPORTS
International sales of American-
made products totaled $18 billion
in 2011, a $1 billion increase
from 2010.
6%
R&D SPEND
GE continued its strong research
and development investment
with total spending at 6% of
industrial revenue.
13,000
U.S. JOBS
GE has announced the creation
of 13,000 jobs in the United States
since 2009.
2011 SUMMARY fi nancial and strategic highlights
Note: Financial results from continuing operations unless otherwise noted.
CONTENTS
2 Letter to Shareowners
10 Business Overview
29 Board of Directors
31 Financial Section
142 Corporate Information
ON THE COVER
Wellington Pereira dos Santos
Operator II
GE’s Wellstream facility in Niterói, Brazil,
is a leading producer of high-quality
fl exible pipe equipment for the Brazilian
offshore drilling market, part of a
$500 million expansion of operations
in the country.

GE Works
At GE, we put our ideas to work. Taking them off the paper, out
of the lab and into the world. Engineers, scientists, teachers,
leaders and doers, all sharing a belief that things can be made
to work better. It’s why we come to work every day. To build,
power, move and cure the world. We are at work making the
world work better.
Jeffrey R. Immelt
Chairman of the Board and
Chief Executive Offi cer
John Krenicki, Jr.
Vice Chairman, GE and
President & Chief Executive
Offi cer, Energy Infrastructure
Keith S. Sherin
Vice Chairman, GE and
Chief Financial Offi cer
Michael A. Neal
Vice Chairman, GE
and Chairman &
Chief Executive Offi cer,
GE Capital Corp.
John G. Rice
Vice Chairman, GE and
President & Chief Executive
Offi cer, Global Growth &
Operations
Pictured, left to right:
GE 2011 ANNUAL REPORT 1

We look at
what the
world needs
A belief
in a better
way
A relentless
drive to invent
and build things
that matter
A world
that works
better
X+=
THE GE WORKS EQUATION
Culture is the foundation for any
successful enterprise, and ours
inspires our people to improve
every day. It is why GE Works.
It starts by being “mission-based.” We have a relentless
drive to invent things that matter: innovations that
build, power, move and help cure the world. We make
things that very few in the world can, but that everyone
needs. This is a source of pride. To our employees and
customers, it defi nes GE.
We build on this mission with a belief
in a better way. We are constantly
learning and driving best practices. We
invest to train our people and develop
leaders. We learn from customers,
competitors, peers and each other.
Because we know we can get better,
we are never afraid. Competition is in
our blood.
GE is a “We Company,” not a “Me
Company.” We want people who listen
more than they talk. We want leaders
who build teams. Bob Santamoor
represents labor; he is the Chairman of
the IUE-CWA GE Aerospace Conference
Board. We have worked together for
years. We don’t agree on everything,
but we respect each other. When we
meet, we talk about jobs. We need
each other to be successful.
We made the decision to invest $1 billion
in our Appliance business, modernizing
our factories in the U.S. Our fi rst two
new products will be introduced early
in 2012, with other major launches
throughout the next two years. Most of
LETTER TO SHAREOWNERS
2 GE 2011 ANNUAL REPORT

THE ECONOMY IN 2012
Four things we’re watching
Infl ation is the
“wild card”
Prepare for
high infl ation
Prices have
moderated in
recent quarters
INFLATION
Will it derail the
recovery?
Do not believe
European
governments
will allow for a
“catastrophic
event”
Plan for a
recession
Committed for the
long term to an
important region
EUROPE
What’s the
outlook?
U.S. economy
strengthening
each day
Could be a
pleasant surprise
UNITED STATES
Will politics hurt
the consumer?
Transitioning to a
consumer-driven
economy
Government
investing in
growth
The economic
engine for most
of the emerging
markets
CHINA
Will it grow?
our appliance product manufacturing
will move back from China and Mexico
to the U.S. We think we can make
more money and serve our customers
better. We also think this will make us
a better manufacturing company in
every corner of the world. But it is only
possible because our designers, factory
workers, managers and marketers
work together. GE is a “We Company.”
We are solving problems, tough prob-
lems. We are in the seventh year of a
clean energy business strategy called
ecomagination. Clean energy goes in
and out of focus for governments and
consumers. But, at GE, we are steadfast
in our investing. In 2011, we had $21 bil-
lion of clean energy revenue, growing
twice as fast as the Company average.
Ecomagination drives growth because
we are solving problems for our custom-
ers. At coal mines, from Pennsylvania
to Peru, our water solutions allow
custom ers to operate productively
while achieving high environmental
standards. We demonstrate every day
that, through innovation, we can meet
societal needs and do it profi tably.
We deliver results. That is the ultimate
output of a strong culture. Over the
next few years, our performance will
accelerate. We aim to reward investors
by delivering a more valuable company
and returning cash. We want to earn
your trust.
We believe that culture and resiliency
count in a company. At GE we have a
quiet confi dence in our willingness to
work hard, to learn and, ultimately,
to prevail. This is how we work and how
we earn your trust. It is how we com-
pete and win. GE Works.
A POSITION OF STRENGTH
GE’s Operating EPS growth was 22%
last year. We bought back preferred
shares of stock we issued during the
fi nancial crisis and increased our
dividend twice. Our stock price fi nished
about fl at, in line with the broader
S&P 500 Index. We outperformed the
S&P Financial and Industrial sectors—
the “GE neighborhood”—which declined
by 18% and 3%, respectively, in 2011.
Despite our growth, it was tough for GE
to break away from investor concerns
about macroeconomic risk. Investor
anxiety is understandable. Europe took
center stage as a source of instability.
Daily headlines about Greece, Italy and
the volatility of the European banks
frayed nerves. And, U.S. politics and
defi cit concerns worried investors in
the second half of 2011.
I have been CEO for ten years. In that
time, we have experienced the 9/11
tragedy, Hurricane Katrina, the 2002
recession, the 2008 fi nancial crisis, the
Gulf oil spill, “Arab Spring,” the Japan
tsunami, and now the European crisis—
quite a bit.
Today, we live in what most business
commentators call a volatile world.
I would argue that when the environ-
ment is continuously unstable, it is no
longer volatile. Rather, we have entered
a new economic era. The emerging
economies grow, while the developed
world slows. Some of the world’s largest
economies face massive fi scal defi cits
and must deleverage. Interest rates are
likely to stay low for extended periods.
Material prices are moving higher. There
is broad-based social unrest. And, it
could remain this way for a long time.
I have learned that nothing is certain
except for the need to have strong risk
management, a lot of cash, the willing-
ness to invest even when the future is
unclear, and great people.
We have great fi nancial strength.
Between GE Capital and GE Parent, we
have $85 billion of cash. And we sur-
rounded the Company with a strong
enterprise risk model that has been
GE 2011 ANNUAL REPORT 3

tested. We are restructuring our
European operations to sustain our
profi tability at lower levels of growth.
We accelerated global and technical
investments, ahead of competition,
during the downturn to ensure growth
in a choppy environment. We redeployed
capital from NBCU to support $11 billion
of Energy acquisitions, which should
provide an earnings boost in 2012. We
fi nished 2011 with $200 billion of product
and service backlog, more than at any
time in our history.
We also have a talented and committed
team. In December, I had dinner with
our Aviation supply chain leaders from
around the world. I do this regularly
with different operating teams. It allows
me to “go deep” and understand chal-
lenges through their eyes. My dinner
partners are the ones who have to
meet record engine demand with high
quality and low cost. They are also the
leaders of our fi ne frontline workforce,
the best in the world. They understand
technology, globalization, innovation
and lean manufacturing. Their tough-
minded, competitive attitude inspires
me. I know that with our team, we will
succeed in this environment.
GE Works for investors, and you should
benefi t from our people and our prep-
aration. As business leaders, we cannot
create the environment, but we can
shape our own destiny. Today, GE has
a stronger portfolio, large-scale
competitive advantage, product and
technology leadership, and strength in
the growth markets. We are ready
to compete. We are positioned to win
right now.
WE HAVE BUILT A
STRONGER PORTFOLIO
We have our strongest portfolio in
recent history. This year, we expect to
have organic growth of 5 to 10% with
expanding margins. GE Capital is
smaller and focused on specialty
fi nance, particularly in mid-market
segments. We expect GE Capital’s
earnings rebound to continue in 2012.
Together, this portfolio is built to grow
earnings and return cash to investors.
Our top strategic priority has been to
build a strong, competitively advan-
taged infrastructure business that
grows ahead of our peers and faster
than the global GDP. Over the last
decade, we have refashioned GE from
an “industrial conglomerate” to an
“infrastructure leader.” This has been
disruptive at times, but it has several
advantages. Infrastructure businesses
use GE’s core strengths in technology,
globalization and services. Infra struc-
ture is also positioned to benefi t from
several long-term tailwinds, especially
growth in emerging markets. Infra-
structure requires scale and fi nancial
strength. Deep customer relationships,
built on long-term thinking, really count.
We have diversifi ed and strengthened
our core businesses, like Energy.
Historically, this business was based
largely on selling one product—heavy
duty gas turbines—in one market—the
U.S. That kind of concentration creates
volatility as markets rise and fall.
Today, we have a broad Energy portfolio,
including a range of gas power
generation products, oil and gas tech-
nology, renewables, smart grid
services, energy management tech-
nologies and controls; these products
and services are sold around the world.
As an energy leader, our earnings are
more diversifi ed, less volatile and
should grow through the cycles. This is
the same model we are using in the
rest of our businesses.
We have boosted the growth rate
of our infrastructure portfolio by
investing in adjacencies, promising
opportunities that are outside of, but
closely related to, our core businesses.
PORTFOLIO STRATEGY
Improved portfolio positioned for a variety of outcomes
Revenue ~$150B
+ $100B of cash: 2012–2016
+ Fund growth and reward investors
EARLY DECADE
Transformation
Begins
MID-DECADE
Reposition, Simplify
and Invest
GOING FORWARD
Growth and Value
Creation
GE Capital
24%
Insurance
15%
Plastics, Media
20%
Infrastructure
41%
36%
Focused Leader
Simple and Safe
64%
High Tech
Global Leader
High Margin/
Returns
15%
8%
43%
34%
4 GE 2011 ANNUAL REPORT

I have written in the past about “bets”
we have made in Aviation Systems,
Life Sciences and other industries.
Adjacencies have allowed us to grow
$35 billion of incremental revenue in a
decade, with more to come. We believe
in a long-term approach to entering
these fast growth segments. For
instance, we have about a $4 billion
position in Life Sciences that could
double in the next few years. We are
building strength in drug discovery,
molecular medicine, bioprocess
manufacturing and digital pathology.
All of these segments will grow at two to
three times global GDP.
GE Capital’s earnings grew more than
100% in 2011. It is stronger and safer.
Our Capital team has executed on
every commitment it made during the
fi nancial crisis. We have reduced
leverage, improved liquidity and shed
assets, while growing at high margins.
Commercial Real Estate, previously a
major investor concern, is positioned
for solid earnings growth in the future.
From 2008 to 2011, GE Capital’s fi nancial
performance compares favorably to
most other fi nancial services fi rms in
the world.
Financial services have been deeply
out of favor with investors.
Nonethe less, there are large segments
where GE Capital will lead and build
upon GE’s strengths. These include
mid-market lending and leasing,
fi nancing in GE domains and a few
other specialty fi nance segments.
Here, we have a clear advantage over
banks and can grow profi tably.
GE Capital has strengthened its balance
sheet immensely. Our Tier One Common
Ratio is about 10%, well in excess of the
levels set by fi nancial regulators. Now,
because of our fi nancial strength and
earnings power, and subject to Federal
Reserve review, we expect GE Capital
to resume paying a dividend this year
to GE. Ultimately, the size of GE Capital
depends on several factors: returns,
competitive advantage, dividend
capability and regulatory burdens. In
the near term, GE Capital should see
sustained earnings growth with good
margins and lower risk.
Our goal is to have GE Capital make
sense for GE investors. First and
foremost, we have more liquidity and
a safer profi le. We believe that having
the Federal Reserve as a regulator is
a positive. We are winning in the mar-
ketplace. The one area that we cannot
control is external “headline risk.” The
fi nancial services industry is still going
through transitions, and we are part
of that change. Regulators, governments
and rating agencies will have their say.
But that doesn’t change our fundamental
strength. We have successfully navigated
through this volatility, and we aim
to create value through GE Capital.
We have the world’s best infrastructure
company, positioned for multi-year
growth. We have a valuable specialty
fi nance company that is safer and
stronger than ever. Together we build,
power, move and help cure the world.
INITIATIVES DRIVE PERFORMANCE
We aspire to drive organic growth
faster than our peers, with expanding
margins. We drive company-wide
initiatives to achieve technical superiority,
growth market leadership, service
expansion based on profi table cus-
tomer relationships, and operational
action to achieve margin growth.
For each initiative we have bold
aspirations, and we utilize the
GE enterprise to achieve results.
We have a full pipeline of great new
products. Technical superiority is the
most sustainable form of competitive
advantage. We will invest $16 billion
in R&D from 2010 to 2012, more than
double our historical average and about
GE CAPITAL
TRANSFORMATION
Pre-Crisis 2011
TIER ONE
COMMON RATIO 4% 10%
LEVERAGE 8:1 4:1
CP COVERAGE 74% 292%
DEBT RATING AAA AA
GROWTH ADJACENCIES
Promising opportunities for expansion, such as in Oil & Gas
and Life Sciences, are closely related to our core businesses
and have helped fuel GE’s growth over the last decade.
FOCUS:
Life Sciences, Aviation Systems, Oil & Gas, Mining, Distributed Energy and Pathology,
among others
(Revenues)
2011 $39B
2001 $4B
GE 2011 ANNUAL REPORT 5

6% of our revenue. This has impacted
our margins in the short term, but the
bet is paying off.
Technology allows us to win in the
market. GE Aviation and its partners
are the world’s largest producers of
jet engines, and last year received
$23 billion of orders, our biggest year
in history. Together, we will launch
12 new jet engines this decade. This
will result in signifi cant future growth.
Technical strength drives growth.
Based on our industry-leading technol-
ogy, we will install about 40% of the
wind turbines in the U.S. this year. At
Healthcare, we are launching 100 new
products that lower cost, improve
quality and expand access. Over the
next fi ve years, GE will be dedicating
$1 billion to the development of new
cancer solutions. In Transportation, we
are building six new rail platforms that
capitalize on global growth. We have
launched new businesses in solar
energy and power management.
Technology adds value to our acquisi-
tions. In 2007, we acquired Smith’s
Aerospace Group to give us a small
position in aircraft avionics and energy
management. Then our researchers
went to work. We are building solutions
for integrated power management,
distributed engine control and onboard
advanced computing. These technolo-
gies will help our engines be even
more fuel-effi cient, and allow us to
develop more content on the plane. We
are building novel solutions for our
customers and should be in the top tier
of the avionics industry by the end of
the decade.
We have scale advantage in technol-
ogy. We have the fi nancial strength to
make big bets. Our Global Research
Center spreads ideas and lowers risks.
Our technical teams execute complex
projects better than anyone.
We win in growth markets. In 2012,
our growth market revenues will near
$40 billion, expanding by about 15%.
We are a reliable, high-integrity
partner and are actively investing in
our leadership, capability, coverage
and the supply chain.
Operating around the world is not
without its challenges. There is
volatility and risk. But there is also
great opportunity. In the emerging
markets, we’ve added about 1,000
infrastructure salespeople every year
for the last four years. Since 2005,
we have increased our senior leaders
outside the United States by 50%.
We are committed to serve our global
customers better and faster.
Our geographic footprint is diversifi ed.
Latin America will approach $10 billion
in revenue in 2012, and could double
again in a few years. In Russia, we are
building ventures in two important
growth markets: gas power generation
and diagnostic imaging equipment.
In Nigeria, we are building out a com-
prehensive “Company-to-Country”
approach to address infrastructure
challenges; Nigeria should be our next
billion-dollar country. In Saudi Arabia,
we will invest to localize capability,
better serve our customers and help
the government address healthcare
needs for its citizens. We are playing to
win in every corner of the world.
The best global companies are devel-
oping new business models tailored
for growth markets. For instance, in the
next 25 years, 1.5 billion people will
gain access to power, much of it “off”
the electricity grid. This will result in a
$16 trillion power opportunity. Today
we have $5 billion of revenue in distrib-
uted energy, and our revenue should
almost double in the next three years.
Similarly, there are 50,000 locomotives
around the world that are more than
25 years old. Replacing or retrofi tting
those locomotives to be more fuel-
effi cient is a $15 billion opportunity.
GE has deep relationships and operating
advantages in growth markets.
John Rice, our vice chairman, leads the
initiative to win globally. I consider the
development of growth markets to
be the most profound economic change
for this generation of GE leaders. This is
a transition where GE must win.
BUILDING COMPETITIVE
ADVANTAGE
Superior technology
Leadership in growth markets
Services & customer relationships
Margin expansion
Smart capital allocation
6 GE 2011 ANNUAL REPORT

We are building mutually profi table
relationships with our customers. Our
service business has a $147 billion
backlog and will generate $45 billion in
revenue in 2012. Service is a strength
for GE because we understand our
products and the ways in which
they are used. When we do well, our
customers benefi t. And we’re continuing
to do everything we can to increase
their productivity and help them
optimize their assets. That is why last
year we invested so heavily in
analytics, controls, monitoring and
diagnostics integration. And we are
building a new software center of
excellence in California.
I don’t see GE as a software company.
However, we will lead in the productivity
of our installed products and their
ecosystems. This will require leadership
of the “Industrial Internet,” making
infrastructure systems more intelligent.
This will show up in more profi table
Contractual Service Agreements (CSAs)
and a software business that could
double to $5 billion in the next few years.
Here is how it could work. The GE90 is
the world’s most powerful engine; it
powers the Boeing 777. Each engine has
17 sensors. These sensors constantly
take complete performance data from
the engine. From this data, we can
build sophisticated analytics that can
avoid unplanned outages, provide
repair data in real time, increase fuel
performance and optimize fl eet
performance. This analytical capability,
applied with domain expertise across
our large fl eet of engines, could save
billions for our customers.
Relationships are also a critical part of
what differentiates the smaller, more
focused GE Capital. We decided from a
strategic standpoint that we should
concentrate on the industries and
sectors where we have a strong com-
petitive advantage versus banks.
That’s the way we think about the
portfolio. Last year we helped launch a
center at The Ohio State University that
is dedicated to the middle market, the
segment that consists of companies
ranging in revenues from $10 million to
$1 billion, including almost 200,000
businesses in the U.S. We have great
origination capability, industry domain
expertise and relationships in that
segment, all of which will fuel GE Capital’s
recovery and growth.
Deep relationships are a competitive
advantage at GE. They are long-term,
and they start at the top. Our leaders
spend a lot of time in the market with
our customers. I chair our Service and
Commercial Councils so that I can
relate to our leaders, follow the metrics
and understand competition. We must
execute for our customers.
We aim to grow margins. Our margins
were about 15% in 2011; we expect
to drive them up by 50 basis points
next year. We are near the top of all
industrial companies, but we can get
even better.
It begins with the way we think about
our cost structure. In the last generation,
GE and our industrial peers began a
long-term trend to outsource our supply
==
GE90 ANALYTICS BENEFIT
90,000
fl ight records analyzed
~200
parameters per
fl ight record
~18MM
parameters per
month
Enhances asset utilization
Increases system performance
Drives strong alignment with
customers
Facilitates securing of long-term
service agreements
Provides additional revenue
streams
THE POWER OF THE INDUSTRIAL INTERNET
Advanced Analytics drives strong alignment with customers
GE 2011 ANNUAL REPORT 7

chain to other companies. This made
sense in an era when labor was expen-
sive and material was cheap. Today, our
material costs are more important. So
we have to control our supply chain to
achieve long-term productivity.
To control our product cost, we leverage
both human and technical innovation.
Human innovation comes in the form of
lean manufacturing. At Appliance Park,
in Louisville, Kentucky, we have torn
down functional silos and replaced them
with a “one team” mentality. We know
that one key to success is driving down
manufacturing hours per unit. In some
factories it takes nine hours to build a
refrigerator. Our employees in Louisville
are working to cut that to three hours.
By revamping what was a 25-year-old
dishwasher line, the Appliance Park
team has reduced the time to produce
by up to 68%, and the space required by
more than 80%.
Our Aviation business and its sophisti-
cation—in advanced manufacturing,
computer modeling, and material
sciences and composites—is a great
example of technical innovation. For
instance, the use of different qualities
of carbon fi ber and resins enabled us
to create unique fan blades, fan cases
and components that sharply reduce
engine weight compared to traditional
all-metal versions. Impact-resistant
properties make these fan blades
extremely durable. This allows us to
substantially lower engine cost and
accelerate “speed to market.”
In 2010, we launched an enterprise
initiative called “GE Advantage”
to drive operating results. We have
30 industrial projects under way,
utilizing ideas from thousands of
employees and targeting $2 billion of
margin improvements. Our team is
using classic GE tools like lean, work
out and Six Sigma. Projects have
big payoffs.
In our Oil & Gas business, our goal is to
give customers a new business quote in
a day, have a project be operational
in a year, and have our equipment
always available for customers’ use.
This would result in several hundred
million dollars of benefi t for our
customers and GE. Our Aviation supply
chain team is trying to compress the
learning curve on new engines, again
with a huge payoff in margins and
cash, with improved customer quality.
This is the GE team, fi nding a better
way. This is how we will become leaner
and more productive. This is how we
will sustain improvements in margins.
We will reward investors through
smart allocation of capital. Our busi-
ness model generates a lot of cash.
Over the next few years, thanks to
NBCU monetization, dividends from GE
Capital and solid growth, we expect to
have about $30 billion in available cash.
This will provide us with an opportunity
to reward investors while protecting us
against a volatile economy.
One of our top priorities is to grow
dividends. We’ve increased the
dividend four times in the last two
years, and we have a dedicated
focus on increasing the GE dividend
in line with future earnings. We have
found that focusing on acquisitions
between $1 billion and $3 billion in
industries we know improves our
chance for success. Don’t look for
any big deals in 2012. Ultimately, if
GE ADVANTAGE
Our rejuvenated focus on process excellence and process improvement is already delivering big returns.
Nearly 40 GE-wide projects currently under way will yield billions in margins over the next three years.
New product
introduction
Commercial
excellence
Service and Contractual
Service Agreement
excellence
Acquisition
integration
Order to
remittance
Inquiry
to order
GE Capital
deal conversion
Speed/
Bureaucracy
8 GE 2011 ANNUAL REPORT

2012: FOCUS FOR INVESTORS
you view GE as a safe growth company,
with an attractive dividend yield
that can invest and achieve returns
well above our cost of capital, we are
in a good place for investors.
Competitive advantage is about
outperforming our peers, building an
attractive fi nancial profi le and
rewarding investors. In our chosen
industries, we are ahead today. Our
fi nancial results should exceed the
S&P 500, with a more valuable profi le.
THE VALUE OF COMPETITIVENESS
We live in a tough era in which the
public discourse, in general, is negative.
I worry that the mood of the times
prevents us from moving forward.
American companies, particularly
big companies, are vilifi ed. There is
social unrest in many corners of the
world. This should not be a surprise.
Our problems are diffi cult; when
economic progress is uneven and
unemployment is high, we need to
work together to fi nd a better way.
In these times, it is diffi cult to explain
the benefi ts of globalization. GE is an
infrastructure company. The U.S. is
not investing much in infrastructure,
but most other countries are. We will
sell 140 heavy duty gas turbines in
2012; fewer than fi ve will go to the U.S.
So, we must sell in 120 countries;
we must build global capability; we
must export. In the last decade our
exports have more than doubled,
creating thousands of high-paying
American jobs. We are consistently
among America’s top exporters. Are
we “un-American” because we sell
around the world? No. Our company,
because of our great people, can win.
And, that is the American spirit.
Last year, I told you that I was asked to
lead the President’s Council on Jobs and
Competitiveness. When the President
asked, and given the state of the coun-
try, I felt that saying “yes” was the right
thing to do. I was honored to do so.
In January, we gave our year-end
report to the President. We had three
key messages: the country has lost
ground in relative global capability; we
have multiple ways to create more
jobs, but they require leadership and
teamwork; and our long-term success
must be built on a foundation of com-
petitiveness. The Council delivered
more than 80 specifi c recommenda-
tions to the President, half of which are
being implemented. I know that the
U.S. can and will do better in the future.
In the process of leading the Council,
I learned a few things. Competitiveness
comes fi rst. As a country, we must
love to compete again. As a nation,
we must love to win. We simply must
create more competitive structures
in this country, improving areas like
education, infrastructure and regulation.
If we focus again on competition and
innovation, I know we will win and
create jobs.
Words and actions count. People in this
country can work together, but only
if they are properly led. It starts by
solving tough problems together, like
the defi cit. We need to be a country of
action, not just words. We need to be
a country where we engage everyone,
the entire team.
At GE, we like working together. We see
the future as interesting, exciting and
fi lled with opportunity. We have a
better portfolio, we have invested in
competitive advantage, and we have
the culture of GE Works.
GE will compete. And we will win in
every corner of the world. We are
optimistic and ready for the future. We
are proud of our company.
GE Works. For investors, this means
solid earnings growth and a solid
dividend foundation. For employees,
it means a belief in a better way,
a relentless drive to invent and build
things that matter. For customers,
it means more profi table solutions.
And for society, GE will help create a
world that works better.
Jeffrey R. Immelt
Chairman of the Board
and Chief Executive Offi cer
February 24, 2012
1
INDUSTRIAL
GROWS 10%+
AND
RETURN CASH
FROM
GE CAPITAL
2
BUILD
SOFTWARE
AND
ANALYTICS
CAPABILITY
3
INVEST IN
GLOBAL
GROWTH
AND BUILD
SUSTAINABLE
PROCESSES
4
BEST-IN-
CLASS
OPERATING
PERFORMANCE:
GROW
MARGINS
5
CAPITAL
ALLOCATION:
ATTRACTIVE
DIVIDEND
GE 2011 ANNUAL REPORT 9

GE Model C30ACi Locomotive Assembly
Transnet Freight Rail
Pretoria, South Africa

GE works on things that matter. The best
people and the best technologies taking on the
toughest challenges. Finding solutions in energy,
health and home, transportation and fi nance.
Building, powering, moving and curing the world.
Not just imagining. Doing. GE works.
ge 2011 annual report 11

BUILDING
GE Builds the World
GE builds the world by providing capital, expertise and infrastructure for a global
economy. In the past year, GE Capital provided billions in financing so businesses
could build and grow their operations and consumers could build their financial futures.
We build appliances, lighting, power systems and other products that help millions
of homes, offices, factories and retail facilities around the world work better. We aren’t
afraid of the future. We build it.

BUILDING
GE GeoSpring™ Hybrid
Water Heater Assembly
GE Appliances
Louisville, Kentucky
Left to right:
Travis Saylor
Final Assembly Operator
Randy Barger
Replacement Operator
Kevin Moore
Final Assembly Operator

Middle market businesses lead the way in the U.S. in creating jobs and
pumping life into the economy. They can’t do it without funding, expertise
and solid business-building advice. GE Capital is a major source of funding
for the middle market, committing $122 billion in the U.S. in the past
year. For example, we helped snack manufacturer Shearer’s Foods, Inc.
with financing. Shearer’s Foods updated and expanded operations, added
359 new jobs and grew revenue to $405 million in 2011. GE works for
customers—helping them build businesses, and build them better.
Photo above and right: Shearer’s Foods, Millennium Manufacturing Facility, Massillon, Ohio
Dan Henson (third from left),
President & CEO, GE Capital, Americas,
pictured with (from left to right):
Bob Shearer, Lee Cooper, Scott W.
Smith, Sharon Garavel, Tom Quindlen
and Fritz Kohmann.
Leading from
the Middle
14 GE 2011 ANNUAL REPORT

REBUILDING
EXCELLENCE America needs investment to stay
competitive, create jobs and drive economic
opportunity. GE is investing more than $1 billion to
transform the appliances we make, leading to
the creation of 1,300 U.S. jobs. By combining
design and production in one site and using lean
manufacturing, we’re able to bring better products to
market faster and more cost-effectively, reflecting
the world-class competitiveness of our U.S. facilities. ACCESSING
GE’S EXPERTISE Through Access GE,
GE Capital brings a broad range of tools,
resources and expertise to help customers
solve their most pressing challenges and find
new ways to grow. When electronic security
provider ADT was looking to upgrade its fleet
of full-size service vans, GE Capital helped
determine the most cost-effective and fuel-
efficient replacement. The deployment of the
new vehicles will help ADT save more than
$6 million a year and reduce CO2 emissions 40%.
This year, GE Capital will launch the Access GE
online portal, a new way to deliver crucial
knowledge and expertise to our customers.
GE 2011 ANNUAL REPORT 15

Stephen Fitzgibbon
Mechanical Fitter I
Gorgon Tree
Subsea Control Systems
GE Oil & Gas
Aberdeen, Scotland

GE Powers the World
GE’s advanced technologies and energy solutions provide a powerful advantage for
millions of people. Our technology helps to deliver a quarter of the world’s electricity.
We are one of the largest clean energy companies in the world. We deliver innovation
that the world needs: from an integrated wind, solar and natural gas project, to smart
grids that help utilities manage electricity demand, to gas engines that run on organic
waste, to more accessible charging stations for electric vehicles. We don’t just imagine
a cleaner and more productive world. We power it.

PIPELINE OF
INNOVATION Competitive and
environmental challenges in the oil and gas
industry are driving energy producers to seek
better efficiency, reliability and environmental
protection. Tackling these complex challenges
takes leadership, teamwork and innovation.
The GE Oil & Gas team in Aberdeen, Scotland,
is leading many of our technology and service
solutions for the sector.
Innovations in recent years have included
next-generation valves with improved nano-
coatings for increased safety and reliability;
pipe inspection technology; and other
advances that enable oil and gas companies
to produce the energy the world needs more
safely, reliably and cost-effectively.
Rod Christie (second from left),
VP & GM, GE Advanced Subsea
Power & Processing Systems,
pictured with (from left to right):
Balazs Somogyi, Gerry McCue
and Neil Saunders.
LEADERSHIP IN
WIND POWER The world needs
clean, renewable energy, and wind power
is a big part of the answer. GE wind
turbines, among the most widely used
in the world, will soon power the largest
wind farm in the U.S. The Shepherds
Flat project in Oregon, developed by
Caithness Energy, will get its power from
338 advanced GE 2.5xl ecomagination-
qualified wind turbines, which deliver
greater efficiency, reliability and grid
connectivity. The Shepherds Flat turbines
will produce enough clean energy
to power about 235,000 households.
18 ge 2011 annual report

To integrate more renewable resources into the power grid, the world
needs a better way to obtain power when the sun isn’t shining or the wind
blowing. The ecomagination-qualified Flex family of products helps meet
this need. The FlexEfficiency 50 Heavy Duty Gas Turbine and the FlexAero
LM6000-PH Aeroderivative Gas Turbine allow for flexible, efficient and
environmentally friendly power generation day or night. The FlexAero is
the world’s most efficient combined-cycle gas turbine in its class and will
save 26 million gallons of water annually with its innovative eco-friendly
technology. The first FlexEfficiency 50 plant will go online in 2015.
Fast, Flexible
Power
Anytime
FlexAero LM6000-PH
Aeroderivative Gas Turbine,
being built in Houston, Texas.
ge 2011 annual report 19

GE Moves the World
When the world needs a better way to get there faster, we work to make the trip safer
and more cost-effective, with lower carbon emissions, too. We make the world’s largest
jet engine—and among the world’s most efficient. We build locomotives that reduce
emissions. And we provide advanced air traffic and rail freight management systems.
We don’t just dream of a world where people and goods travel more safely, quickly and
efficiently around the globe. We move it.

GE90 Aircraft Engine Testing
GE Aviation
Peebles, Ohio

Airlines are demanding record numbers of advanced aircraft
engines, including the GEnx and LEAP, to power their next-
generation fleets. Our aviation supply chain team is meeting the
challenge. New manufacturing facilities in Ellisville, Mississippi,
and Auburn, Alabama, will add capacity and create jobs. We
are also integrating suppliers into new programs and driving
big improvements in quality and delivery through a team-based
culture and lean manufacturing techniques. We do all this so
we can deliver a record number of aircraft engine orders with
maximum cost-efficiency, productivity and quality.
Photo: GE Aviation’s Evendale, Ohio, world headquarters
Strong Supply
Chain Links
Colleen Athans (third from left),
VP & GM, GE Aviation Supply Chain,
pictured with (from left to right):
Bob Briggs, Joe Allen,
Melissa Twiningdavis and
Denice Biocca.
22 ge 2011 annual report

ON TRACK FOR EXPANSION
Transnet Freight Rail (TFR), one of South
Africa’s largest rail freight operators,
is striving to meet the growing needs
of a rapidly developing region. The GE
locomotive is delivering the solution. Three
of our locomotives can do the work of
four older models, with lower costs, better
fuel efficiency and reduced emissions.
Producing the 143 locomotives ordered by
TFR will be a global effort: locomotive
components manufactured at GE plants
in the U.S. will be fully assembled in South
Africa. This will create jobs in both countries
and help TFR meet the demand for reliable
freight transportation.
A LEAP FORWARD IN AIRCRAFT
ENGINES Airlines are purchasing new
planes to update and expand their fleet
while balancing high fuel costs and new
international environmental standards.
GE and its CFM International 50/50 joint
venture partner Snecma, created the
LEAP engine to meet this demand.
Ecomagination-qualified LEAP engines use
the latest-generation materials and design
processes to reduce weight, improve
performance and lower maintenance.
This means planes are more likely to
take off and land on time and spend less
time in the shop and more time moving
passengers and cargo around the world.
ge 2011 annual report 23


William Hunn
CT Gantry Assembly Production Associate
Optima 580 CT System
GE Healthcare
Waukesha, Wisconsin
GE Helps Cure the World
GE Healthcare technology is helping doctors and caregivers save nearly 3,000 lives
every day and address the world’s biggest healthcare challenges. GE is at work providing
advanced diagnostic tools as well as systems that help researchers discover lifesaving
solutions, and patient record systems that help lower costs and enhance patient care. Our
technology is designed to help medical professionals detect disease earlier and treat it
better. And, we’re investing to create new solutions to develop groundbreaking products
and processes. We see a world where cost, quality and lack of access prevent too many
people from getting the healthcare they need. We’re helping to cure it.

A CLEAR PICTURE
OF HEALTH To help physicians provide patients
with accurate diagnoses and targeted treatments,
healthcare organizations need advanced imaging
technology. GE entered into a strategic alliance with
OhioHealth, a nationally recognized, not-for-profit
healthcare system, to bring cutting-edge computed
tomography (CT) and magnetic resonance (MR)
imaging systems to patients across central Ohio.
The GE Healthcare team listened to OhioHealth’s
needs and delivered a better way—including our
Optima CT660, Optima MR450w and Discovery
MR750w systems—that provide real-time, high-
resolution imaging.
SOLUTIONS FOR THE
PHARMA INDUSTRY Advanced medicines
create new challenges for pharmaceutical
companies. GE technology is used to manufacture
many of these medicines, which gives us the
experience to help these companies tackle key
issues such as safe and cost-effective delivery
and reducing time to market. Our innovative
ReadyToProcessTM single-use platform enables
flexible manufacturing, faster process design and
quicker changeover between production campaigns,
without compromising quality or safety. Single-use
technologies: an affordable solution that drives
medical progress and helps save lives.
HIGH DEFINITION,
LOW-DOSE SCANS Computed
tomography is widely used to help
physicians detect cancers, other
diseases and injuries. GE continues
to work to produce CT systems that
provide high image clarity for physicians
and reduced patient exposure to
radiation. Our Veo image reconstruction
technology uses modeling and complex
data analysis to enhance clinical images
even at lowered doses. GE not only
makes tools to help doctors, we also
provide entire healthcare systems with
services and technology to meet the
needs of their patients.
26 GE 2011 ANNUAL REPORT

Taking
the Fight
to Cancer
Yousef Alohali (second from
right), Director, Clinical
Education, GE Healthcare Saudi
Arabia, pictured with (from left
to right): Victor Delos Santos,
Noor Hanifa Palala (Saudi
Ministry of Health), Majed Nasser
and Golnar Kamalvand.
Cancer is among the world’s leading causes of death, and GE is committed
to helping cure it. GE’s global fight against cancer is backed by a five-
year, $1 billion commitment to improve screening and diagnosis to help
doctors fight cancer more effectively. In 2011, as part of this commitment
and in partnership with prominent venture capitalists, GE launched a
$100 million healthymagination open innovation Challenge to find the
next generation of cancer diagnostic tools and treatments, starting with
breast cancer. Innovations now in the pipeline include a mobile mammography
device and molecular diagnostics to enable patient-specific cancer
therapies. We’re also bringing new weapons to the fight against breast cancer
by increasing access to mammography screenings in underserved areas,
like Wyoming, Saudi Arabia and China.
Photo left and above: Riyadh, Saudi Arabia
GE 2011 ANNUAL REPORT 27

At GE, we aren’t afraid of the future,
we’re building it. We’re growing
global leaders, investing in new
technologies, developing advanced
manufacturing skills, applying
intelligent software to make things
work smarter, and partnering with
customers and communities around
the globe. GE works by delivering
economic growth, shareholder value
and, most of all, solutions that make
the world work better.

Board members focus on the areas that are important to
shareowners—strategy, risk management, leadership development
and regulatory and compliance matters. In 2011, they received
briefi ngs on a variety of issues, including capital allocation and
business development, risk management, technology excellence,
regulatory trends, social cost, capital market trends, service
contract performance, political contributions and lobbying
activities, and GE’s branding, marketing and operating initiatives.
At the end of the year, the Board and each of its committees
conducted a thorough self-evaluation.
The GE Board held 15 meetings during
2011, including three meetings of the
non-management directors of the Board.
Each outside Board member is expected to
visit at least two GE businesses without the
involvement of corporate management
in order to develop his or her own feel for
the Company.
Directors (left to right)
Rochelle B. Lazarus
3,4
Chairman of the Board and former
Chief Executive Offi cer, Ogilvy & Mather
Worldwide, global marketing
communications company,
New York, New York. Director since 2000.
Robert W. Lane
1,2
Former Chairman of the Board and
Chief Executive Offi cer, Deere & Company,
agricultural, construction and forestry
equipment, Moline, Illinois.
Director since 2005.
Alan G. (A.G.) Lafl ey
3,5
Former Chairman of the Board and
Chief Executive Offi cer, Procter & Gamble
Company, personal and household
products, Cincinnati, Ohio.
Director since 2002.
Roger S. Penske
4
Chairman of the Board, Penske Corporation,
diversifi ed transportation company,
and Penske Truck Leasing Corporation,
Chairman of the Board and Chief Executive
Offi cer, Penske Automotive Group, Inc.,
automotive retailer, Detroit, Michigan.
Director since 1994.
Sam Nunn
2,4
Co-Chairman and Chief Executive Offi cer,
Nuclear Threat Initiative, Washington, D.C.
Director since 1997.
Andrea Jung
2,3
Chairman of the Board and
Chief Executive Offi cer, Avon Products, Inc.,
beauty products, New York, New York.
Director since 1998.
Ann M. Fudge
4
Former Chairman of the Board and
Chief Executive Offi cer, Young & Rubicam
Brands, global marketing communications
network, New York, New York.
Director since 1999.
Ralph S. Larsen
2,3,6
Former Chairman of the Board and Chief
Executive Offi cer, Johnson & Johnson,
pharmaceutical, medical and consumer
products, New Brunswick, New Jersey.
Director since 2002.
W. Geoffrey Beattie
1,5
President, The Woodbridge Company
Limited, Toronto, Canada.
Director since 2009.
James S. Tisch
5
President and Chief Executive Offi cer,
Loews Corporation, diversifi ed holding
company, New York, New York.
Director since 2010.
Susan Hockfi eld
3,4
President, Massachusetts Institute
of Technology, Cambridge, Massachusetts.
Director since 2006.
James J. Mulva
1,4
Chairman of the Board and Chief Executive
Offi cer, ConocoPhillips, international,
integrated energy company,
Houston, Texas. Director since 2008.
Douglas A. Warner III
1,2,3
Former Chairman of the Board, J.P. Morgan
Chase & Co., The Chase Manhattan Bank,
and Morgan Guaranty Trust Company,
investment banking, New York, New York.
Director since 1992.
Robert J. Swieringa
1
Professor of Accounting and former
Anne and Elmer Lindseth Dean, Johnson
Graduate School of Management,
Cornell University, Ithaca, New York.
Director since 2002.
James I. Cash, Jr.
1,2,4
Emeritus James E. Robison
Professor of Business Administration,
Harvard Graduate School of Business,
Boston, Massachusetts.
Director since 1997.
Jeffrey R. Immelt
4
Chairman of the Board and Chief
Executive Offi cer, General Electric
Company, Fairfi eld, Connecticut.
Director since 2000.
(pictured on page 1)
1 Audit Committee
2 Management Development and
Compensation Committee
3 Nominating and Corporate
Governance Committee
4 Public Responsibilities Committee
5 Risk Committee
6 Presiding Director
GE 2011 ANNUAL REPORT 29

At its heart,
the Board believes
GE Works is about GE’s
most valuable asset:
its people.
long- and short-term incentives, we reward our
executives’ discipline in consistently making
smart decisions over the course of their careers
at GE. We particularly value those individuals
who have the good judgment and ability to
balance risk and return and deliver long-term
results for shareowners.
At the same time, we do not ignore annual
performance, because we understand that if we
don’t turn in good short-term performance,
there won’t be a long term. We evaluate annual
performance both in terms of executing on long-
term strategies and in meeting specifi c annual
objectives. What is critical to note, however, is
that because we take the long view, good years
do not result in outsized payouts.
Similarly, in off years, compensation appropriately
considers the current year’s performance, but also
aligns it in the context of long-term performance.
Furthermore, we measure executives’ contribu-
tions to the Company’s overall performance rather
than focusing only on their individual business
or function. We reward sustained fi nancial
and operating performance and leadership
excellence. In short, we use a balanced approach,
one that enables us to attract and retain the best
people for the Company’s long-term success.
All our investors should know that the directors of
GE remain committed to working on your behalf.
And we will continue to take seriously our role in
ensuring that GE has the right strategies and the
right people to help make the world work better.
Sincerely,
Ralph S. Larsen
Presiding Director
February 24, 2012
As Presiding Director and Chair of the Management
Development and Compensation Committee of
GE’s Board of Directors, I write each year to
share our perspective on how GE measures
performance, how we motivate and reward our
executives, and how we work to align both
performance measurement and compensation
with the interests of our shareowners. This year,
I will focus on three areas: fi rst, how the theme
of our annual report, GE Works, fi ts with our
governing philosophy and why we believe it
provides an important business-building
advantage; second, our commitment to developing
leaders; and fi nally, executive compensation.
At its heart, the Board believes GE Works is about
GE’s most valuable asset: its people. It provides a
valuable platform for the Company to talk about
its defi ning culture and to tell the story of the
impact our people make around the world.
Furthermore, it serves as a powerful reminder
that GE works to deliver shareholder value
by offering real and sustainable solutions to the
world’s toughest problems.
It is a fi tting way to talk about the Company,
because GE has always taken a long-term view.
Through its more than 130-year history, the
Company has successfully weathered many
economic cycles. GE has done this over and over
again by fostering innovation, making smart
investments, and, of course, hiring and training
disciplined leaders who focus on achieving our
long-term strategies.
Developing leaders has always been a hallmark of
the Company, refl ecting a commitment to
meritocracy and a belief that when one person
grows and improves, all may grow and improve—
that together, we all rise. The collaborative,
evolutionary nature of GE’s leadership culture
inspires many of our top executives to spend most
or all of their careers here. This provides the
Company with unparalleled domain expertise; it
also creates an environment of loyalty where our
leaders are deeply invested in and committed to
the Company. Today, GE’s senior management,
under the exceptional leadership of Jeff Immelt, is
a proven team that we believe is among the best
in the world.
Our compensation programs are designed and
operate to support our leadership culture and
long-term emphasis. They are not formula-driven,
nor do we reward our executives for taking
outsized risks that produce short-term gains.
Instead, with a mix of cash and equity and
TO OUR SHAREOWNERS
30 GE 2011 ANNUAL REPORT
GE 2011 ANNUAL REPORT 31
financial section
Contents
32 Management’s Discussion of Financial Responsibility ............................ We begin with a letter from our Chief Executive and Financial Offi cers
discussing our unyielding commitment to rigorous oversight, control-
lership, informative disclosure and visibility to investors.
32 Management’s Annual Report on Internal Control
Over Financial Reporting ...................................................................................... In this report our Chief Executive and Financial Offi cers provide
their assessment of the effectiveness of our internal control over
fi nancial reporting.
33 Report of Independent Registered Public Accounting Firm .................. Our independent auditors, KPMG LLP, express their opinions on our
fi nancial statements and our internal control over fi nancial reporting.
34 Management’s Discussion and Analysis (MD&A)
34 Operations ........................................................................................................... We begin the Operations section of MD&A with an overview of our
earnings, including a perspective on how the global economic
environment has affected our businesses over the last three years.
We then discuss various key operating results for GE industrial (GE)
and fi nancial services (GECS). Because of the fundamental differences
in these businesses, reviewing certain information separately for
GE and GECS offers a more meaningful analysis. Next we provide a
description of our global risk management process. Our discussion
of segment results includes quantitative and qualitative disclosure
about the factors affecting segment revenues and profi ts, and the
effects of recent acquisitions, dispositions and signifi cant trans-
actions. We conclude the Operations section with an overview of
our operations from a geographic perspective and a discussion
of environmental matters.
49 Financial Resources and Liquidity .......................................................... In the Financial Resources and Liquidity section of MD&A, we provide
an overview of the major factors that affected our consolidated
fi nancial position and insight into the liquidity and cash fl ow activities
of GE and GECS.
64 Critical Accounting Estimates .................................................................. Critical Accounting Estimates are necessary for us to prepare
our fi nancial statements. In this section, we discuss what these
estimates are, why they are important, how they are developed
and uncertainties to which they are subject.
68 Other Information .......................................................................................... We conclude MD&A with a brief discussion of new accounting
standards that will become effective for us beginning in 2012.
69 Selected Financial Data ............................................................................... Selected Financial Data provides fi ve years of fi nancial information
for GE and GECS. This table includes commonly used metrics that
facilitate comparison with other companies.
70 Audited Financial Statements and Notes
70 Statement of Earnings
70 Consolidated Statement of Changes in Shareowners’ Equity
72 Statement of Financial Position
74 Statement of Cash Flows
76 Notes to Consolidated Financial Statements
137 Supplemental Information ................................................................................... We provide Supplemental Information to reconcile certain “non-GAAP
fi nancial measures” referred to in our report to the most closely
associated GAAP fi nancial measures. We also provide information
about our stock performance over the last fi ve years.
140 Glossary ....................................................................................................................... For your convenience, we also provide a Glossary of key terms used in
our fi nancial statements.
We also present our fi nancial information electronically at
www.ge.com/investor.

32 GE 2011 ANNUAL REPORT
Management’s Discussion of Financial Responsibility
We believe that great companies are built on a foundation of
reliable fi nancial information and compliance with the spirit and
letter of the law. For General Electric Company, that foundation
includes rigorous management oversight of, and an unyielding
dedication to, controllership. The fi nancial disclosures in this
report are one product of our commitment to high-quality
fi nancial reporting. In addition, we make every effort to adopt
appropriate accounting policies, we devote our full resources
to ensuring that those policies are applied properly and consis-
tently and we do our best to fairly present our fi nancial results in a
manner that is complete and understandable.
Members of our corporate leadership team review each of our
businesses routinely on matters that range from overall strategy
and fi nancial performance to staffi ng and compliance. Our busi-
ness leaders monitor fi nancial and operating systems, enabling us
to identify potential opportunities and concerns at an early stage
and positioning us to respond rapidly. Our Board of Directors over-
sees management’s business conduct, and our Audit Committee,
which consists entirely of independent directors, oversees our
internal control over fi nancial reporting. We continually examine
our governance practices in an effort to enhance investor trust
and improve the Board’s overall effectiveness. The Board and
its committees annually conduct a performance self-evaluation
and recommend improvements. Our Presiding Director led three
meetings of non-management directors this year, helping us
sharpen our full Board meetings to better cover signifi cant top-
ics. Compensation policies for our executives are aligned with the
long-term interests of GE investors.
We strive to maintain a dynamic system of internal controls
and procedures—including internal control over fi nancial
reporting—designed to ensure reliable fi nancial recordkeeping,
transparent fi nancial reporting and disclosure, and protection of
physical and intellectual property. We recruit, develop and retain
a world-class fi nancial team. Our internal audit function, includ-
ing members of our Corporate Audit Staff, conducts thousands
of fi nancial, compliance and process improvement audits each
year. Our Audit Committee oversees the scope and evaluates the
overall results of these audits, and members of that Committee
regularly attend GE Capital Board of Directors, Corporate Audit
Staff and Controllership Council meetings. Our global integrity
policies—“The Spirit & The Letter”—require compliance with law
and policy, and pertain to such vital issues as upholding fi nan-
cial integrity and avoiding confl icts of interest. These integrity
policies are available in 31 languages, and are provided to all of
our employees, holding each of them accountable for compli-
ance. Our strong compliance culture reinforces these efforts by
requiring employees to raise any compliance concerns and by
prohibiting retribution for doing so. To facilitate open and candid
communication, we have designated ombudspersons through-
out the Company to act as independent resources for reporting
integrity or compliance concerns. We hold our directors, con-
sultants, agents and independent contractors to the same
integrity standards.
We are keenly aware of the importance of full and open
presentation of our fi nancial position and operating results, and
rely for this purpose on our disclosure controls and procedures,
including our Disclosure Committee, which comprises senior
executives with detailed knowledge of our businesses and the
related needs of our investors. We ask this committee to review
our compliance with accounting and disclosure requirements,
to evaluate the fairness of our fi nancial and non-fi nancial dis-
closures, and to report their fi ndings to us. We further ensure
strong disclosure by holding approximately 300 analyst and
investor meetings annually.
We welcome the strong oversight of our fi nancial reporting
activities by our independent registered public accounting
fi rm, KPMG LLP, engaged by and reporting directly to the Audit
Committee. U.S. legislation requires management to report on
internal control over fi nancial reporting and for auditors to
render an opinion on such controls. Our report follows and the
KPMG LLP report for 2011 appears on the following page.
Management’s Annual Report on Internal Control
Over Financial Reporting
Management is responsible for establishing and maintaining
adequate internal control over fi nancial reporting for the
Company. With our participation, an evaluation of the effective-
ness of our internal control over fi nancial reporting was
conducted as of December 31, 2011, based on the framework
and criteria established in Internal Control—Integrated Framework,
issued by the Committee of Sponsoring Organizations of the
Treadway Commission.
Based on this evaluation, our management has concluded
that our internal control over fi nancial reporting was effective as
of December 31, 2011.
Our independent registered public accounting fi rm has issued
an audit report on our internal control over fi nancial reporting.
Their report follows.
JEFFREY R. IMMELT KEITH S. SHERIN
Chairman of the Board and Vice Chairman and
Chief Executive Offi cer Chief Financial Offi cer
February 24, 2012

GE 2011 ANNUAL REPORT 33
Report of Independent Registered
Public Accounting Firm
To Shareowners and Board of Directors
of General Electric Company:
We have audited the accompanying statement of fi nancial
position of General Electric Company and consolidated affi liates
(“GE”) as of December 31, 2011 and 2010, and the related state-
ments of earnings, changes in shareowners’ equity and cash
fl ows for each of the years in the three-year period ended
December 31, 2011. We also have audited GE’s internal control
over fi nancial reporting as of December 31, 2011, based on
criteria established in Internal Control—Integrated Framework
issued by the Committee of Sponsoring Organizations of the
Treadway Commission (“COSO”). GE management is responsible
for these consolidated fi nancial statements, for maintaining
effective internal control over fi nancial reporting, and for its
assessment of the effectiveness of internal control over fi nancial
reporting. Our responsibility is to express an opinion on these
consolidated fi nancial statements and an opinion on GE’s internal
control over fi nancial reporting based on our audits.
We conducted our audits in accordance with the standards of
the Public Company Accounting Oversight Board (United States).
Those standards require that we plan and perform the audits to
obtain reasonable assurance about whether the fi nancial state-
ments are free of material misstatement and whether effective
internal control over fi nancial reporting was maintained in all
material respects. Our audits of the consolidated fi nancial state-
ments included examining, on a test basis, evidence supporting
the amounts and disclosures in the fi nancial statements, assess-
ing the accounting principles used and signifi cant estimates
made by management, and evaluating the overall fi nancial state-
ment presentation. Our audit of internal control over fi nancial
reporting included obtaining an understanding of internal control
over fi nancial reporting, assessing the risk that a material weak-
ness exists, and testing and evaluating the design and operating
effectiveness of internal control based on the assessed risk. Our
audits also included performing such other procedures as we
considered necessary in the circumstances. We believe that our
audits provide a reasonable basis for our opinions.
A company’s internal control over fi nancial reporting is a pro-
cess designed to provide reasonable assurance regarding the
reliability of fi nancial reporting and the preparation of fi nancial
statements for external purposes in accordance with generally
accepted accounting principles. A company’s internal control
over fi nancial reporting includes those policies and procedures
that (1) pertain to the maintenance of records that, in reason-
able detail, accurately and fairly refl ect the transactions and
dispositions of the assets of the company; (2) provide reasonable
assurance that transactions are recorded as necessary to permit
preparation of fi nancial statements in accordance with generally
accepted accounting principles, and that receipts and expendi-
tures of the company are being made only in accordance with
authorizations of management and directors of the company;
and (3) provide reasonable assurance regarding prevention or
timely detection of unauthorized acquisition, use, or disposition
of the company’s assets that could have a material effect on the
fi nancial statements.
Because of its inherent limitations, internal control over
fi nancial reporting may not prevent or detect misstatements.
Also, projections of any evaluation of effectiveness to future
periods are subject to the risk that controls may become inad-
equate because of changes in conditions, or that the degree of
compliance with the policies or procedures may deteriorate.
In our opinion, the consolidated fi nancial statements appear-
ing on pages 70, 72, 74, 76–136 and the Summary of Operating
Segments table on page 42 present fairly, in all material
respects, the fi nancial position of GE as of December 31, 2011
and 2010, and the results of its operations and its cash fl ows for
each of the years in the three-year period ended December 31,
2011, in conformity with U.S. generally accepted accounting
principles. Also, in our opinion, GE maintained, in all material
respects, effective internal control over fi nancial reporting as
of December 31, 2011, based on criteria established in Internal
Control—Integrated Framework issued by COSO.
As discussed in Note 1 to the consolidated fi nancial state-
ments, GE, in 2010, changed its method of accounting for
consolidation of variable interest entities; and, in 2009, changed
its method of accounting for impairment of debt securities, busi-
ness combinations and noncontrolling interests.
Our audits of GE’s consolidated fi nancial statements were
made for the purpose of forming an opinion on the consoli-
dated fi nancial statements taken as a whole. The accompanying
consolidating information appearing on pages 71, 73 and 75
is presented for purposes of additional analysis of the consoli-
dated fi nancial statements rather than to present the fi nancial
position, results of operations and cash fl ows of the individual
entities. The consolidating information has been subjected to
the auditing procedures applied in the audits of the consoli-
dated fi nancial statements and, in our opinion, is fairly stated
in all material respects in relation to the consolidated fi nancial
statements taken as a whole.
KPMG LLP
Stamford, Connecticut
February 24, 2012
34 GE 2011 ANNUAL REPORT
management’s discussion and analysis
Operations
The consolidated fi nancial statements of General Electric
Company (the Company) combine the industrial manufacturing
and services businesses of General Electric Company (GE) with
the fi nancial services businesses of General Electric Capital
Services, Inc. (GECS or fi nancial services). Unless otherwise indi-
cated by the context, we use the terms “GE,” “GECS” and “GECC”
on the basis of consolidation described in Note 1 to the consoli-
dated fi nancial statements.
In the accompanying analysis of fi nancial information, we
sometimes use information derived from consolidated fi nan-
cial information but not presented in our fi nancial statements
prepared in accordance with U.S. generally accepted account-
ing principles (GAAP). Certain of these data are considered
“non-GAAP fi nancial measures” under the U.S. Securities and
Exchange Commission (SEC) rules. For such measures, we have
provided supplemental explanations and reconciliations in the
Supplemental Information section.
We present Management’s Discussion of Operations in fi ve
parts: Overview of Our Earnings from 2009 through 2011, Global
Risk Management, Segment Operations, Geographic Operations
and Environmental Matters. Unless otherwise indicated, we
refer to captions such as revenues and earnings from continu-
ing operations attributable to the company simply as “revenues”
and “earnings” throughout this Management’s Discussion and
Analysis. Similarly, discussion of other matters in our consolidated
fi nancial statements relates to continuing operations unless
otherwise indicated.
Effective January 1, 2011, we reorganized the former
Technology Infrastructure segment into three segments—
Aviation, Healthcare and Transportation. The prior-period results
of the Aviation, Healthcare and Transportation businesses are
unaffected by this reorganization. Results for 2011 and prior
periods are reported on the basis under which we managed our
businesses in 2011.
On February 22, 2012, we merged our wholly-owned sub-
sidiary, GECS, with and into GECS’ wholly-owned subsidiary,
GECC. The merger simplifi ed our fi nancial services’ corporate
structure by consolidating fi nancial services entities and assets
within our organization and simplifying Securities and Exchange
Commission and regulatory reporting. Upon the merger, GECC
became the surviving corporation and assumed all of GECS’ rights
and obligations and became wholly-owned directly by General
Electric Company. Our fi nancial services segment, GE Capital, will
continue to comprise the continuing operations of GECC, which
now includes the run-off insurance operations previously held
and managed in GECS. References to GECS, GECC and the GE
Capital segment in this Management’s Discussion and Analysis
relate to the entities or segment as they existed during 2011 and
do not refl ect the February 22, 2012 merger.
We supplement our GAAP net earnings and earnings per share
(EPS) reporting by also reporting an operating earnings and EPS
measure (non-GAAP). Operating earnings and EPS include service
cost and plan amendment amortization for our principal pen-
sion plans as these costs represent expenses associated with
employee benefi ts earned. Operating earnings and EPS exclude
non-operating pension cost/income such as interest cost,
expected return on plan assets and non-cash amortization of
actuarial gains and losses. We believe that this reporting provides
better transparency to the employee benefi t costs of our principal
pension plans and Company operating results.
Overview of Our Earnings from 2009 through 2011
Earnings from continuing operations attributable to the Company
increased 12% in 2011 and 16% in 2010, refl ecting the stabiliza-
tion of overall economic conditions during the last two years,
following the challenging conditions of 2009. Operating earnings
(non-GAAP measure) which exclude non-operating pension costs
increased 20% to $14.8 billion in 2011 compared with $12.3 billion
in 2010. Operating earnings per share (non-GAAP measure)
increased 15% to $1.29 in 2011 compared with $1.12 in 2010.
Operating earnings per share excluding the effects of our pre-
ferred stock redemption (non-GAAP measure) increased 22% to
$1.37 in 2011 compared with $1.12 in 2010. We believe that we
are seeing continued signs of stabilization in much of the global
economy, including in fi nancial services, as GECS earnings from
continuing operations attributable to the Company increased
113% in 2011 and 157% in 2010. Net earnings attributable to the
Company increased 22% in 2011 refl ecting the lack of prior year
losses from discontinued operations and a 12% increase in earn-
ings from continuing operations, after increasing 6% in 2010, as
losses from discontinued operations in 2010 partially offset the
16% increase in earnings from continuing operations. We begin
2012 with a record backlog of $200 billion and expect to continue
our trend of revenue and earnings growth.
Energy Infrastructure (27% and 39% of consolidated three-
year revenues and total segment profi t, respectively) revenues
increased 16% in 2011 primarily as a result of acquisitions dur-
ing 2011 and higher volume due to increased sales of services at
Energy and Oil & Gas, after decreasing 8% in 2010 as the world-
wide demand for new sources of power, such as wind and thermal
declined with the overall economic conditions. Segment profi t
decreased 9% in 2011 primarily on lower productivity, driven
by the wind turbines business, acquisitions and investment in
our global organization and new technology, and lower prices.
Segment profi t increased 2% in 2010 primarily on higher prices
and lower material and other costs. We continue to invest in mar-
ket-leading technology and services at Energy and Oil & Gas.
Aviation (12% and 20% of consolidated three-year revenues
and total segment profi t, respectively) revenues and segment
profi t increased 7% and 6%, respectively, in 2011 and fell 6%
management’s discussion and analysis
GE 2011 ANNUAL REPORT 35
and 16%, respectively, in 2010. We continue to invest in market-
leading technologies and services at Aviation. Aviation revenues
and earnings increased in 2011 as a result of higher volume
and higher prices primarily driven by increased services and
equipment sales. In 2010, Aviation revenues decreased from a
reduction in volume refl ecting decreased commercial and mili-
tary equipment sales and services. Earnings decreased as a result
of lower productivity primarily due to product launch and produc-
tion costs associated with the GEnx engine shipments.
Healthcare (11% and 15% of consolidated three-year revenues
and total segment profi t, respectively) revenues and segment
profi t increased 7% and 2%, respectively, in 2011 and 6% and 13%,
respectively, in 2010. We continue to invest in market-leading
technologies and services at Healthcare. Healthcare revenues
increased over this period on increased volume from higher equip-
ment sales and services and the effects of the weaker U.S. dollar.
Healthcare earnings improved over this period on increased pro-
ductivity, higher volume and the effects of the weaker U.S. dollar.
Transportation (3% and 3% of consolidated three-year rev-
enues and total segment profi t, respectively) revenues and
segment profi t increased 45% and more than 100%, respectively,
in 2011 and fell 12% and 33%, respectively, in 2010. We con-
tinue to invest in market-leading technologies and services at
Transportation. Transportation revenues improved in 2011 due
to higher volume related to increased equipment sales and ser-
vices. Transportation earnings increased as a result of increased
productivity, refl ecting improved service margins and higher vol-
ume, while they declined in 2010 as the weakened economy had
driven overall reductions in U.S. freight traffi c and we updated our
estimates of long-term product service costs in our maintenance
service agreements.
Home & Business Solutions (6% and 2% of consolidated
three-year revenues and total segment profi t, respectively) rev-
enues have decreased 2% in 2011 and increased 2% in 2010.
Home & Business Solutions revenues trended down as a result
of lower volume in Appliances. The revenue increase in 2010 was
related to increased volume across all businesses. Segment profi t
decreased 34% in 2011 after increasing 24% in 2010 primarily as a
result of lower volume and the effects of infl ation.
GE Capital (31% and 21% of consolidated three-year revenues
and total segment profi t, respectively) net earnings increased
to $6.5 billion in 2011 and $3.2 billion in 2010 due to the contin-
ued stabilization in the overall economic environment. Over the
last several years, we tightened underwriting standards, shifted
teams from origination to collection and maintained a proactive
risk management focus. This, along with recent increased sta-
bility in the fi nancial markets, contributed to lower losses and a
signifi cant increase in segment profi t in 2011 and 2010. We also
reduced our ending net investment (ENI), excluding cash and
equivalents, from $526 billion at January 1, 2010 to $445 billion at
December 31, 2011. General Electric Capital Corporation (GECC)
is a diversely funded and smaller, more focused fi nance company
with strong positions in several commercial mid-market and con-
sumer fi nancing segments.
Overall, acquisitions contributed $4.6 billion, $0.3 billion and
$2.9 billion to consolidated revenues in 2011, 2010 and 2009,
respectively, excluding the effects of acquisition gains follow-
ing our adoption of an amendment to Financial Accounting
Standards Board (FASB) Accounting Standards Codifi cation (ASC)
810, Consolidation. Our consolidated net earnings included an
insignifi cant amount, $0.1 billion and $0.5 billion in 2011, 2010
and 2009, respectively, from acquired businesses. We integrate
acquisitions as quickly as possible. Only revenues and earnings
from the date we complete the acquisition through the end of
the fourth following quarter are attributed to such businesses.
Dispositions also affected our ongoing results through lower
revenues of $12.6 billion, $3.0 billion and $4.7 billion in 2011, 2010
and 2009, respectively. The effects of dispositions on net earnings
was a decrease of $0.3 billion in 2011 and increases of $0.1 billion
and $0.6 billion in 2010 and 2009, respectively.
DISCONTINUED OPERATIONS. Consistent with our goal of reducing
GECC ENI and focusing our businesses on selective fi nancial
services products where we have domain knowledge, broad
distribution, and the ability to earn a consistent return on capital,
while managing our overall balance sheet size and risk, in 2011,
we sold Consumer RV Marine, Consumer Mexico, Consumer
Singapore and Australian Home Lending. Discontinued operations
also includes BAC Credomatic GECF Inc. (BAC), our U.S. mortgage
business (WMC) and GE Money Japan (our Japanese personal loan
business, Lake, and our Japanese mortgage and card businesses,
excluding our investment in GE Nissen Credit Co., Ltd.). All of these
operations were previously reported in the GE Capital segment.
We reported the operations described above as discontin-
ued operations for all periods presented. For further information
about discontinued operations, see the “Segment Operations—
Discontinued Operations” section and Note 2.
WE DECLARED $7.5 BILLION IN DIVIDENDS IN 2011. Common per-
share dividends of $0.61 increased 33% from 2010, following a
25% decrease from the preceding year. In February 2009, we
announced the reduction of the quarterly GE stock dividend by
68% from $0.31 per share to $0.10 per share, effective with the
dividend approved by the Board in June 2009, which was paid in
the third quarter of 2009. In July 2010, our Board of Directors
approved a 20% increase in our regular quarterly dividend from
$0.10 per share to $0.12 per share and in December 2010,
approved an additional 17% increase from $0.12 per share to
$0.14 per share. On April 21, 2011, our Board of Directors
approved an increase in our regular quarterly dividend to $0.15
per share. On December 9, 2011, our Board of Directors approved
an increase in our regular quarterly dividend to $0.17 per share.
On February 10, 2012, our Board of Directors approved a regular
quarterly dividend of $0.17 per share of common stock, which is
payable April 25, 2012, to shareowners of record at close of busi-
ness on February 27, 2012. In 2011, 2010 and 2009, we declared
$1.0 billion (including $0.8 billion as a result of our redemption of
preferred stock), $0.3 billion and $0.3 billion in preferred stock
dividends, respectively. See Note 15 for additional information.
management’s discussion and analysis
36
GE 2011 ANNUAL REPORT
Except as otherwise noted, the analysis in the remainder of
this section presents the results of GE (with GECS included on a
one-line basis) and GECS. See the Segment Operations section for
a more detailed discussion of the businesses within GE and GECS.
Signifi cant matters relating to our Statement of Earnings are
explained below.
GE SALES OF PRODUCT SERVICES were $41.9 billion in 2011, an
increase of 14% compared with 2010, and operating profi t from
product services was $11.8 billion in 2011, an increase of 15%
compared with 2010. Both the sales and operating profi t of prod-
uct services increases were at Energy Infrastructure, Aviation,
Transportation and Healthcare.
POSTRETIREMENT BENEFIT PLANS costs were $4.1 billion, $3.0 bil-
lion and $2.6 billion in 2011, 2010 and 2009, respectively. Costs
increased in 2011 primarily due to the continued amortization of
2008 investment losses and the effects of lower discount rates
(principal pension plans discount rate decreased from 5.78% at
December 31, 2009 to 5.28% at December 31, 2010). Costs
increased in 2010 primarily due to the amortization of 2008
investment losses and the effects of lower discount rates (princi-
pal pension plans discount rate decreased from 6.11% at
December 31, 2008 to 5.78% at December 31, 2009), partially
offset by lower early retirement costs.
Our discount rate for our principal pension plans at
December 31, 2011 was 4.21%, which refl ected current histori-
cally low interest rates. Considering the current and expected
asset allocations, as well as historical and expected returns on
various categories of assets in which our plans are invested, we
have assumed that long-term returns on our principal pension
plan assets will be 8.0% for cost recognition in 2012, compared
to 8.0% in 2011 and 8.5% in both 2010 and 2009. GAAP pro-
vides recognition of differences between assumed and actual
returns over a period no longer than the average future service
of employees. See the Critical Accounting Estimates section for
additional information.
We expect the costs of our postretirement benefi ts to
increase in 2012 by approximately $1.3 billion as compared to
2011, primarily because of the effects of additional 2008 invest-
ment loss amortization and lower discount rates.
Pension expense for our principal pension plans on a GAAP
basis was $2.4 billion, $1.1 billion and $0.5 billion for 2011, 2010
and 2009, respectively. Operating pension costs (non-GAAP) for
these plans were $1.4 billion in both 2011 and 2010 and $2.0 billion
in 2009. Operating earnings include service cost and plan amend-
ment amortization for our principal pension plans as these costs
represent expenses associated with employee benefi ts earned.
Operating earnings exclude non-operating pension cost/income
such as interest cost, expected return on plan assets and non-cash
amortization of actuarial gains and losses. We expect operating
pension costs for these plans will be about $1.7 billion in 2012.
The GE Pension Plan was underfunded by $13.2 billion at the
end of 2011 as compared to $2.8 billion at December 31, 2010.
The GE Supplementary Pension Plan, which is an unfunded plan,
had projected benefi t obligations of $5.2 billion and $4.4 billion
at December 31, 2011 and 2010, respectively. The increase in
underfunding from year-end 2010 was primarily attributable to
the effects of lower discount rates and lower investment returns.
Our principal pension plans discount rate decreased from 5.28%
at December 31, 2010 to 4.21% at December 31, 2011, which
increased the pension benefi t obligation at year-end 2011 by
approximately $7.4 billion. A 100 basis point increase in our pen-
sion discount rate would decrease the pension benefi t obligation
at year end by approximately $7.0 billion. Our GE Pension Plan
assets decreased from $44.8 billion at the end of 2010 to $42.1 bil-
lion at December 31, 2011, primarily driven by benefi t payments
made during the year which were partially offset by investment
returns. Assets of the GE Pension Plan are held in trust, solely for
the benefi t of Plan participants, and are not available for general
company operations.
On an Employee Retirement Income Security Act (ERISA) basis,
the GE Pension Plan was 92% funded at January 1, 2012. We will
contribute approximately $1.0 billion to the GE Pension Plan in
2012. Funding requirements are determined as prescribed by
ERISA and for GE, are based on the Plan’s funded status as of the
beginning of the previous year and future contributions may vary
based on actual plan results. Assuming our 2012 actual experi-
ence is consistent with our current benefi t assumptions (e.g.,
expected return on assets and interest rates), we expect to make
about $2.1 billion in contributions to the GE Pension Plan in 2013.
At December 31, 2011, the fair value of assets for our other
pension plans was $3.3 billion less than the respective projected
benefi t obligations. The comparable amount at December 31,
2010, was $2.1 billion. We expect to contribute $0.7 billion to our
other pension plans in 2012, compared with actual contributions
of $0.7 billion and $0.6 billion in 2011 and 2010, respectively. We
fund our retiree health benefi ts on a pay-as-you-go basis. The
unfunded liability for our principal retiree health and life plans
was $12.1 billion and $10.9 billion at December 31, 2011 and
2010, respectively. This increase was primarily attributable to the
effects of lower discount rates (retiree health and life plans dis-
count rate decreased from 5.15% at December 31, 2010 to 4.09%
at December 31, 2011), partially offset by lower cost trends. We
expect to contribute $0.6 billion to these plans in 2012 compared
with actual contributions of $0.6 billion in both 2011 and 2010.
The funded status of our postretirement benefi ts plans and
future effects on operating results depend on economic condi-
tions and investment performance. For additional information
about funded status, components of earnings effects and actu-
arial assumptions, see Note 12.
management’s discussion and analysis
GE 2011 ANNUAL REPORT 37
GE OTHER COSTS AND EXPENSES are selling, general and adminis-
trative expenses. These costs were 18.5%, 16.3% and 14.3% of
total GE sales in 2011, 2010 and 2009, respectively. The vast major-
ity of this 2011 increase was driven by higher pension costs and
increased research and development spending. The increase in
2010 was primarily due to higher research and development
spending, increased selling expenses to support global
growth and higher pension costs, partially offset by lower restruc-
turing and other charges.
INTEREST ON BORROWINGS AND OTHER FINANCIAL CHARGES
amounted to $14.5 billion, $15.6 billion and $17.7 billion in 2011,
2010 and 2009, respectively. Substantially all of our borrowings
are in fi nancial services, where interest expense was $13.9 billion,
$14.5 billion and $16.9 billion in 2011, 2010 and 2009, respectively.
GECS average borrowings declined from 2010 to 2011 and from
2009 to 2010, in line with changes in average GECS assets.
Interest rates have decreased over the three-year period primar-
ily attributable to declining global benchmark interest rates. GECS
average borrowings were $453.2 billion, $472.6 billion and
$484.9 billion in 2011, 2010 and 2009, respectively. The GECS
average composite effective interest rate was 3.1% in 2011, 3.1%
in 2010 and 3.5% in 2009. In 2011, GECS average assets of
$592.9 billion were 3% lower than in 2010, which in turn were
3% lower than in 2009. See the Liquidity and Borrowings
section for a discussion of liquidity, borrowings and interest
rate risk management.
INCOME TAXES have a signifi cant effect on our net earnings. As a
global commercial enterprise, our tax rates are affected by many
factors, including our global mix of earnings, the extent to which
those global earnings are indefi nitely reinvested outside the
United States, legislation, acquisitions, dispositions and tax char-
acteristics of our income. Our tax rates are also affected by tax
incentives introduced in the U.S. and other countries to encour-
age and support certain types of activity. Our tax returns are
routinely audited and settlements of issues raised in these audits
sometimes affect our tax provisions.
GE and GECS fi le a consolidated U.S. federal income tax return.
This enables GE to use GECS tax deductions and credits to reduce
the tax that otherwise would have been payable by GE.
Our consolidated income tax rate is lower than the U.S. statu-
tory rate primarily because of benefi ts from lower-taxed global
operations, including the use of global funding structures, and
our 2009 decision to indefi nitely reinvest prior-year earnings out-
side the U.S. There is a benefi t from global operations as non-U.S.
income is subject to local country tax rates that are signifi cantly
below the 35% U.S. statutory rate. These non-U.S. earnings have
been indefi nitely reinvested outside the U.S. and are not subject
to current U.S. income tax. The rate of tax on our indefi nitely rein-
vested non-U.S. earnings is below the 35% U.S. statutory rate
because we have signifi cant business operations subject to tax
in countries where the tax on that income is lower than the U.S.
statutory rate and because GE funds the majority of its non-U.S.
operations through foreign companies that are subject to low
foreign taxes.
Income taxes (benefi t) on consolidated earnings from continu-
ing operations were 28.5% in 2011 compared with 7.3% in 2010
and (11.6)% in 2009.
We expect our ability to benefi t from non-U.S. income taxed
at less than the U.S. rate to continue, subject to changes of U.S. or
foreign law, including, as discussed in Note 14, the expiration of
the U.S. tax law provision deferring tax on active fi nancial services
income. In addition, since this benefi t depends on management’s
intention to indefi nitely reinvest amounts outside the U.S., our tax
provision will increase to the extent we no longer indefi nitely rein-
vest foreign earnings.
Our benefi ts from lower taxed global operations declined to
$2.1 billion in 2011 from $2.8 billion in 2010 and from $3.9 billion
in 2009 principally because of lower earnings in our operations
subject to tax in countries where the tax on that income is lower
than the U.S. statutory rate, and from losses for which there was
not a full tax benefi t. These decreases also refl ected manage-
ment’s decision in 2009 to indefi nitely reinvest prior year earnings
outside the U.S. The benefi t from lower taxed global operations
increased in 2011 by $0.1 billion and in 2010 by $0.4 billion due
to audit resolutions. To the extent global interest rates and non-
U.S. operating income increase we would expect tax benefi ts to
increase, subject to management’s intention to indefi nitely rein-
vest those earnings.
Our benefi t from lower taxed global operations included the
effect of the lower foreign tax rate on our indefi nitely reinvested
non-U.S. earnings which provided a tax benefi t of $1.5 billion in
2011, $2.0 billion in 2010 and $3.0 billion in 2009. The tax benefi t
from non-U.S. income taxed at a local country rather than the U.S.
statutory tax rate is reported in the effective tax rate reconcilia-
tion in the line “Tax on global earnings including exports.”
The increase in the consolidated effective tax rate from 2010
to 2011 was due in signifi cant part to the high effective tax rate
on the pre-tax gain on the NBC Universal (NBCU) transaction
with Comcast Corporation (Comcast) discussed in Note 2. This
gain increased the consolidated effective tax rate by 12.9 per-
centage points. The effective tax rate was also higher because
of the increase in 2011 of income in higher taxed jurisdictions.
This decreased the relative effect of our tax benefi ts from lower-
taxed global operations. In addition, the consolidated income tax
rate increased from 2010 to 2011 due to the decrease, discussed
above, in the benefi t from lower-taxed global operations and the
lower benefi t from audit resolutions.
Cash income taxes paid in 2011 were $2.9 billion, refl ecting
the effects of changes to temporary differences between the car-
rying amount of assets and liabilities and their tax bases and the
timing of tax payments to governments.

management’s discussion and analysis
38
GE 2011 ANNUAL REPORT
Our consolidated income tax rate increased from 2009 to 2010
primarily because of an increase during 2010 of income in higher-
taxed jurisdictions. This decreased the relative effect of our tax
benefi ts from lower-taxed global operations. In addition, the con-
solidated income tax rate increased from 2009 to 2010 due to the
decrease, discussed above, in the benefi t from lower-taxed global
operations. These effects were partially offset by an increase in
the benefi t from audit resolutions, primarily a decrease in the bal-
ance of our unrecognized tax benefi ts from the completion of our
2003–2005 audit with the Internal Revenue Service (IRS).
A more detailed analysis of differences between the U.S. fed-
eral statutory rate and the consolidated rate, as well as other
information about our income tax provisions, is provided in
Note 14. The nature of business activities and associated income
taxes differ for GE and for GECS and a separate analysis of each is
presented in the paragraphs that follow.
We believe that the GE effective tax rate is best analyzed in
relation to GE earnings before income taxes excluding the GECS
net earnings from continuing operations, as GE tax expense does
not include taxes on GECS earnings. GE pre-tax earnings from
continuing operations, excluding GECS earnings from continuing
operations, were $12.6 billion, $12.0 billion and $12.6 billion for
2011, 2010 and 2009, respectively. On this basis, GE’s effective tax
rate was 38.3% in 2011, 16.8% in 2010 and 21.8% in 2009.
Resolution of audit matters reduced the GE effective tax
rate throughout this period. The effects of such resolutions are
included in the following captions in Note 14.
Audit resolutions—effect on GE
tax rate, excluding GECS earnings
2011 2010 2009
Tax on global activities
including exports (0.9)% (3.3)% (0.4)%
U.S. business credits (0.4) (0.5) —
All other—net (0.7) (0.8) (0.2)
(2.0)% (4.6)% (0.6)%
The GE effective tax rate increased from 2010 to 2011 primarily
because of the high effective tax rate on the pre-tax gain on the
NBCU transaction with Comcast refl ecting the low tax basis in our
investments in the NBCU business and the recognition of deferred
tax liabilities related to our 49% investment in NBCUniversal LLC
(NBCU LLC). See Note 2. This gain increased the GE effective tax
rate by 19.7 percentage points. In addition, the effective tax rate
increased because of the 2.6 percentage point decrease in the
benefi t from audit resolutions shown above.
The GE effective tax rate decreased from 2009 to 2010 primar-
ily because of the 4.0 percentage point increase in the benefi t
from audit resolutions shown above.
The GECS effective income tax rate is lower than the U.S. stat-
utory rate primarily because of benefi ts from lower-taxed global
operations, including the use of global funding structures. There
is a tax benefi t from global operations as non-U.S. income is sub-
ject to local country tax rates that are signifi cantly below the 35%
U.S. statutory rate. These non-U.S. earnings have been indefi nitely
reinvested outside the U.S. and are not subject to current U.S.
income tax. The rate of tax on our indefi nitely reinvested non-
U.S. earnings is below the 35% U.S. statutory rate because we
have signifi cant business operations subject to tax in countries
where the tax on that income is lower than the U.S. statutory rate
and because GECS funds the majority of its non-U.S. operations
through foreign companies that are subject to low foreign taxes.
We expect our ability to benefi t from non-U.S. income taxed
at less than the U.S. rate to continue subject to changes of U.S. or
foreign law, including, as discussed in Note 14, the expiration of
the U.S. tax law provision deferring tax on active fi nancial services
income. In addition, since this benefi t depends on management’s
intention to indefi nitely reinvest amounts outside the U.S., our tax
provision will increase to the extent we no longer indefi nitely rein-
vest foreign earnings.
As noted above, GE and GECS fi le a consolidated U.S. federal
income tax return. This enables GE to use GECS tax deductions
and credits to reduce the tax that otherwise would have been
payable by GE. The GECS effective tax rate for each period refl ects
the benefi t of these tax reductions in the consolidated return.
GE makes cash payments to GECS for these tax reductions at
the time GE’s tax payments are due. The effect of GECS on the
amount of the consolidated tax liability from the formation of the
NBCU joint venture will be settled in cash when GECS tax deduc-
tions and credits otherwise would have reduced the liability of the
group absent the tax on joint venture formation.
The GECS effective tax rate was 12.0% in 2011, compared with
(48.4)% in 2010 and 144.3% in 2009. Comparing a tax benefi t to
pre-tax income resulted in a negative tax rate in 2010. Comparing
a tax benefi t to a pre-tax loss resulted in the positive tax rate in
2009. The GECS tax expense of $0.9 billion in 2011 increased by
$1.9 billion from a $1.0 billion benefi t in 2010. The higher 2011
tax expense resulted principally from higher pre-tax income
in 2011 than in 2010, which increased pre-tax income $5.4 bil-
lion and increased the expense ($1.9 billion). Also increasing the
expense was a benefi t from resolution of the 2006–2007 IRS audit
($0.2 billion) that was less than the benefi t from resolution of the
2003–2005 IRS audit ($0.3 billion) both of which are reported in
the caption “All other—net” in the effective tax rate reconciliation
in Note 14.
The GECS tax benefi t of $3.9 billion in 2009 decreased by
$2.9 billion to $1.0 billion in 2010. The lower 2010 tax benefi t
resulted in large part from the change from a pre-tax loss in
2009 to pre-tax income in 2010, which increased pre-tax income
$4.7 billion and decreased the benefi t ($1.7 billion), the non-repeat
of the one-time benefi t related to the 2009 decision to indefi nitely
reinvest undistributed prior year non-U.S. earnings ($0.7 billion),
and a decrease in lower-taxed global operations in 2010 as com-
pared to 2009 ($0.6 billion) caused in part by an increase in losses
for which there was not a full tax benefi t, including an increase
in the valuation allowance associated with the deferred tax asset
related to the 2008 loss on the sale of GE Money Japan ($0.2 billion).
These lower benefi ts were partially offset by the benefi t from the
resolution of the 2003–2005 IRS audit ($0.3 billion).
management’s discussion and analysis
GE 2011 ANNUAL REPORT 39
Global Risk Management
A disciplined approach to risk is important in a diversifi ed organi-
zation like ours in order to ensure that we are executing according
to our strategic objectives and that we only accept risk for which
we are adequately compensated. We evaluate risk at the indi-
vidual transaction level, and evaluate aggregated risk at the
customer, industry, geographic and collateral-type levels,
where appropriate.
Risk assessment and risk management are the responsibility
of management. The GE Board of Directors (Board) has oversight
for risk management with a focus on the most signifi cant risks
facing the Company, including strategic, operational, fi nancial and
legal and compliance risks. At the end of each year, management
and the Board jointly develop a list of major risks that GE plans to
prioritize in the next year. Throughout the year, the Board and the
committees to which it has delegated responsibility dedicate a
portion of their meetings to review and discuss specifi c risk top-
ics in greater detail. Strategic, operational and reputational risks
are presented and discussed in the context of the CEO’s report
on operations to the Board at regularly scheduled Board meet-
ings and at presentations to the Board and its committees by the
vice chairmen, Chief Risk Offi cer (CRO), general counsel and other
employees. The Board has delegated responsibility for the over-
sight of specifi c risks to Board committees as follows:
• In 2011, the Board established a Risk Committee. This
Committee oversees GE’s risk management of key risks,
including strategic, operational (including product risk), fi nan-
cial (including credit, liquidity and exposure to broad market
risk) and reputational risks, and the guidelines, policies and
processes for monitoring and mitigating such risks. Starting
in 2011, as part of its overall risk oversight responsibilities for
GE, the Risk Committee also began overseeing risks related
to GE Capital, which previously was subject to direct Audit
Committee oversight.
• The Audit Committee oversees GE’s and GE Capital’s policies
and processes relating to the fi nancial statements, the fi nan-
cial reporting process, compliance and auditing. The Audit
Committee monitors ongoing compliance issues and matters,
and also annually conducts an assessment of compliance
issues and programs.
• The Public Responsibilities Committee oversees risk manage-
ment related to GE’s public policy initiatives, the environment
and similar matters, and monitors the Company’s environ-
mental, health and safety compliance.
• The Management Development and Compensation
Committee oversees the risk management associated with
management resources, structure, succession planning, man-
agement development and selection processes, and includes
a review of incentive compensation arrangements to confi rm
that incentive pay does not encourage unnecessary risk taking
and to review and discuss, at least annually, the relationship
between risk management policies and practices, corporate
strategy and senior executive compensation.
• The Nominating and Corporate Governance Committee over-
sees risk related to the Company’s governance structure and
processes and risks arising from related-person transactions.
The GE Board’s risk oversight process builds upon management’s
risk assessment and mitigation processes, which include stan-
dardized reviews of long-term strategic and operational planning;
executive development and evaluation; code of conduct compli-
ance under the Company’s The Spirit & The Letter; regulatory
compliance; health, safety and environmental compliance; fi nan-
cial reporting and controllership; and information technology and
security. GE’s CRO is responsible for overseeing and coordinating
risk assessment and mitigation on an enterprise-wide basis. The
CRO leads the Corporate Risk Function and is responsible for the
identifi cation of key business risks, providing for appropriate
management of these risks within GE Board guidelines, and
enforcement through policies and procedures. Management has
two committees to further assist it in assessing and mitigating
risk. The Corporate Risk Committee (CRC) meets periodically, is
chaired by the CRO and comprises the Chairman and CEO, vice
chairmen, general counsel and other senior level business and
functional leaders. It has principal responsibility for evaluating
and addressing risks escalated to the CRO and Corporate Risk
Function. The Policy Compliance Review Board met 15 times in
2011, is chaired by the Company’s general counsel and includes
the Chief Financial Offi cer and other senior level functional lead-
ers. It has principal responsibility for monitoring compliance
matters across the Company.
GE’s Corporate Risk Function leverages the risk infrastructures
in each of our businesses, which have adopted an approach that
corresponds to the Company’s overall risk policies, guidelines and
review mechanisms. Our risk infrastructure operates at the busi-
ness and functional levels and is designed to identify, evaluate
and mitigate risks within each of the following categories:
•
STRATEGIC. Strategic risk relates to the Company’s future
business plans and strategies, including the risks associated
with the markets and industries in which we operate, demand
for our products and services, competitive threats, technol-
ogy and product innovation, mergers and acquisitions and
public policy.
•
OPERATIONAL. Operational risk relates to risks (systems, pro-
cesses, people and external events) that affect the operation
of our businesses. It includes product life cycle and execution,
product safety and performance, information management
and data protection and security, business disruption, human
resources and reputation.
•
FINANCIAL. Financial risk relates to our ability to meet fi nancial
obligations and mitigate credit risk, liquidity risk and exposure
to broad market risks, including volatility in foreign currency
exchange rates and interest rates and commodity prices.
Liquidity risk is the risk of being unable to accommodate
liability maturities, fund asset growth and meet contractual
management’s discussion and analysis
40
GE 2011 ANNUAL REPORT
obligations through access to funding at reasonable market
rates, and credit risk is the risk of fi nancial loss arising from a
customer or counterparty failure to meet its contractual obli-
gations. We face credit risk in our industrial businesses, as well
as in our GE Capital investing, lending and leasing activities
and derivative fi nancial instruments activities.
•
LEGAL AND COMPLIANCE. Legal and compliance risk relates to
risks arising from the government and regulatory environment
and action, compliance with integrity policies and procedures,
including those relating to fi nancial reporting, environmental
health and safety, and intellectual property risks. Government
and regulatory risk includes the risk that the government or
regulatory actions will impose additional cost on us or cause
us to have to change our business models or practices.
Risks identifi ed through our risk management processes are
prioritized and, depending on the probability and severity of the
risk, escalated to the CRO. The CRO, in coordination with the CRC,
assigns responsibility for the risks to the business or functional
leader most suited to manage the risk. Assigned owners are
required to continually monitor, evaluate and report on risks for
which they bear responsibility. Enterprise risk leaders within each
business and corporate function are responsible to present to the
CRO and CRC risk assessments and key risks at least annually. We
have general response strategies for managing risks, which
categorize risks according to whether the Company will avoid,
transfer, reduce or accept the risk. These response strategies are
tailored to ensure that risks are within acceptable GE Board
general guidelines.
Depending on the nature of the risk involved and the particular
business or function affected, we use a wide variety of risk mitiga-
tion strategies, including delegation of authorities, standardized
processes and strategic planning reviews, operating reviews,
insurance, and hedging. As a matter of policy, we generally hedge
the risk of fl uctuations in foreign currency exchange rates, inter-
est rates and commodity prices. Our service businesses employ
a comprehensive tollgate process leading up to and through the
execution of a contractual service agreement to mitigate legal,
fi nancial and operational risks. Furthermore, we centrally man-
age some risks by purchasing insurance, the amount of which
is determined by balancing the level of risk retained or assumed
with the cost of transferring risk to others. We manage the risk of
fl uctuations in economic activity and customer demand by moni-
toring industry dynamics and responding accordingly, including
by adjusting capacity, implementing cost reductions and engag-
ing in mergers, acquisitions and dispositions.
GE CAPITAL RISK MANAGEMENT AND OVERSIGHT
GE Capital has a robust risk infrastructure and robust processes
to manage risks related to its businesses, and the GE Corporate
Risk Function relies upon them in fulfi lling its mission.
The GE Risk Committee was established to oversee GE
Capital’s risk appetite, risk assessment and management pro-
cesses previously undertaken by the GE Audit Committee. The
GECC Board of Directors oversees the GE Capital risk manage-
ment framework, and approves all signifi cant acquisitions and
dispositions as well as signifi cant borrowings and investments.
The GECC Board of Directors exercises control over investment
activities in the business units through delegations of authority.
All participants in the GE Capital risk management process must
comply with approval limits established by the GECC Board.
The Enterprise Risk Management Committee (ERMC), which
comprises the most senior leaders in GE Capital as well as the
GE CRO, oversees the implementation of GE Capital’s risk appetite,
and senior management’s establishment of appropriate systems
(including policies, procedures, and management committees) to
ensure enterprise risks are effectively identifi ed, measured, mon-
itored, and controlled. Day-to-day risk oversight for GE Capital is
provided by an independent global risk management organiza-
tion which includes the GE Capital corporate function in addition
to risk offi cers embedded in the individual business units. The
Risk Leaders in the business units have dual reporting relation-
ships, reporting both into the local business management and
also to the GE Capital corporate-level function leader, which fur-
ther strengthens their independence.
GE Capital’s risk management approach rests upon three
major tenets: a broad spread of risk based on managed exposure
limits; senior, secured commercial fi nancings; and a hold-to-
maturity model with transactions underwritten to “on-book”
standards. Dedicated risk professionals across the businesses
include underwriters, portfolio managers, collectors, envi-
ronmental or engineering specialists, and specialized asset
managers. The senior risk offi cers have, on average, over 25 years
of experience.
GE Capital manages risk categories identifi ed in GE Capital’s
business environment, which if materialized, could prevent GE
Capital from achieving its risk objectives and/or result in losses.
These risks are defi ned as GE Capital’s Enterprise Risk Universe,
which includes the following risks: strategic (including earnings
and capital), liquidity, credit, market and operational (including
fi nancial, compliance, information technology, human resources
and legal). Reputational risk is considered and managed
across each of the categories. GE Capital has made signifi cant
investments in resources to enhance its risk management infra-
structure, in particular with regard to compliance, market and
operational risk, liquidity and capital management.
GE Capital’s Corporate Risk function, in consultation with the
ERMC, updates the Enterprise Risk Appetite Statement annually.
This document articulates the enterprise risk objectives, its key
universe of risks and the supporting limit structure. GE Capital’s
risk appetite is determined relative to its desired risk objectives,
including, but not limited to credit ratings, capital levels, liquidity
management’s discussion and analysis
GE 2011 ANNUAL REPORT 41
management, regulatory assessments, earnings, dividends and
compliance. GE Capital determines its risk appetite through
consideration of portfolio analytics, including stress testing and
economic capital measurement, experience and judgment of
senior risk offi cers, current portfolio levels, strategic planning,
and regulatory and rating agency expectations.
The Enterprise Risk Appetite is presented to the GECC Board
and the GE Risk Committee for review and approval at least annu-
ally. On a quarterly basis, the status of GE Capital’s performance
against these limits is reviewed by the GE Risk Committee.
GE Capital acknowledges risk-taking as a fundamental charac-
teristic of providing fi nancial services. It is inherent to its business
and arises in lending, leasing and investment transactions under-
taken by GE Capital. GE Capital utilizes its risk capacity judiciously
in pursuit of its strategic goals and risk objectives.
GE Capital uses stress testing for risk, liquidity and capital
adequacy assessment and management purposes, and as an
integral part of GE Capital’s overall planning processes. Stress
testing results inform key strategic portfolio decisions such
as capital allocation, assist in developing the risk appetite and
limits, and help in assessing product specifi c risk to guide the
development and modifi cation of product structures. The ERMC
approves the high-level scenarios for, and reviews the results of,
GE Capital-wide stress tests across key risk areas, such as credit
and investment, liquidity and market risk. Stress test results are
also expressed in terms of impact to capital levels and metrics,
and that information is reviewed with the GECC Board and the
GE Risk Committee at least twice a year. Stress testing require-
ments are set forth in GE Capital’s approved risk policies. Key
policies, such as the Enterprise Risk Management Policy, the
Enterprise Risk Appetite Statement and the Liquidity and Capital
Management policies are approved by the GECC Board and the
GE Risk Committee at least annually. GE Capital, in coordination
with and under the oversight of the GE CRO, provides risk reports
to the GE Risk Committee. At these meetings, which occur at least
four times a year, GE Capital senior management focuses on the
risk strategy and the risk oversight processes used to manage the
elements of risk managed by the ERMC.
Operational risks are inherent in GE Capital’s business
activities and are typical of any large enterprise. GE Capital’s
Operational Risk Management program seeks to effectively
manage operational risk to reduce the potential for signifi cant
unexpected losses, and to minimize the impact of losses experi-
enced in the normal course of business.
Additional information about our liquidity and how we man-
age this risk can be found in the Financial Resources and Liquidity
section. Additional information about our credit risk and GECS
portfolio can be found in the Financial Resources and Liquidity
and Critical Accounting Estimates sections. Additional informa-
tion about our market risk and how we manage this risk can be
found in the Financial Resources and Liquidity section.
Segment Operations
Effective January 1, 2011, we reorganized the former Technology
Infrastructure segment into three segments—Aviation,
Healthcare, and Transportation. The prior-period results of the
Aviation, Healthcare and Transportation businesses are unaf-
fected by this reorganization. Results of our formerly consolidated
subsidiary, NBCU, and our current equity method investment in
NBCU LLC are reported in the Corporate items and eliminations
line on the Summary of Operating Segments.
Our six segments are focused on the broad markets they
serve: Energy Infrastructure, Aviation, Healthcare, Transportation,
Home & Business Solutions and GE Capital. In addition to pro-
viding information on segments in their entirety, we have also
provided supplemental information for certain businesses within
the segments for greater clarity.
Segment profi t is determined based on internal performance
measures used by the Chief Executive Offi cer to assess the per-
formance of each business in a given period. In connection with
that assessment, the Chief Executive Offi cer may exclude matters
such as charges for restructuring; rationalization and other simi-
lar expenses; in-process research and development and certain
other acquisition-related charges and balances; technology and
product development costs; certain gains and losses from acqui-
sitions or dispositions; and litigation settlements or other charges,
responsibility for which preceded the current management team.
Segment profi t excludes results reported as discontinued
operations, earnings attributable to noncontrolling interests of
consolidated subsidiaries and accounting changes. Segment
profi t excludes or includes interest and other fi nancial charges
and income taxes according to how a particular segment’s man-
agement is measured—excluded in determining segment profi t,
which we sometimes refer to as “operating profi t,” for Energy
Infrastructure, Aviation, Healthcare, Transportation and Home &
Business Solutions; included in determining segment profi t, which
we sometimes refer to as “net earnings,” for GE Capital. Prior to
January 1, 2011, segment profi t excluded the effects of principal
pension plans. Beginning January 1, 2011, we began allocating
service costs related to our principal pension plans and no longer
allocate the retiree costs of our postretirement healthcare ben-
efi ts to our segments. This revised allocation methodology better
aligns segment operating costs to the active employee costs,
which are managed by the segments. This change does not sig-
nifi cantly affect reported segment results.
To better serve Oil & Gas customers, Energy’s Measurement
& Control business was moved to Oil & Gas in October 2011.
Measurement & Control addresses sensor-based measurement,
inspection, asset condition monitoring and controls needs. In
addition, three business units from Energy’s acquisition of Dresser
were also transferred to Oil & Gas in 2011. We have reclassifi ed
certain prior-period amounts to conform to the current-period
presentation. For additional information about our segments,
see Note 28.

management’s discussion and analysis
42
GE 2011 ANNUAL REPORT
Summary of Operating Segments
General Electric Company and consolidated affiliates
(In millions) 2011 2010 2009 2008 2007
REVENUES
Energy Infrastructure $ 43,694 $ 37,514 $ 40,648 $ 43,046 $ 34,880
Aviation 18,859 17,619 18,728 19,239 16,819
Healthcare 18,083 16,897 16,015 17,392 16,997
Transportation 4,885 3,370 3,827 5,016 4,523
Home & Business Solutions 8,465 8,648 8,443 10,117 11,026
Total industrial revenues 93,986 84,048 87,661 94,810 84,245
GE Capital 45,730 46,422 48,906 65,900 65,625
Total segment revenues 139,716 130,470 136,567 160,710 149,870
Corporate items and eliminations (a) 7,584 19,123 17,871 19,127 20,094
CONSOLIDATED REVENUES $147,300 $149,593 $154,438 $179,837 $169,964
SEGMENT PROFIT
Energy Infrastructure $ 6,650 $ 7,271 $ 7,105 $ 6,497 $ 5,238
Aviation 3,512 3,304 3,923 3,684 3,222
Healthcare 2,803 2,741 2,420 2,851 3,056
Transportation 757 315 473 962 936
Home & Business Solutions 300 457 370 365 983
Total industrial segment profit 14,022 14,088 14,291 14,359 13,435
GE Capital 6,549 3,158 1,325 7,841 12,179
Total segment profit 20,571 17,246 15,616 22,200 25,614
Corporate items and eliminations (a) (359) (1,105) (593) 1,184 1,441
GE interest and other financial charges (1,299) (1,600) (1,478) (2,153) (1,993)
GE provision for income taxes (4,839) (2,024) (2,739) (3,427) (2,794)
Earnings from continuing operations 14,074 12,517 10,806 17,804 22,268
Earnings (loss) from discontinued operations, net of taxes 77 (873) 219 (394) (60)
CONSOLIDATED NET EARNINGS ATTRIBUTABLE TO THE COMPANY $ 14,151 $ 11,644 $ 11,025 $ 17,410 $ 22,208
(a) Includes the results of NBCU, our formerly consolidated subsidiary, and our current equity method investment in NBCUniversal LLC.
See accompanying notes to consolidated financial statements.

management’s discussion and analysis
GE 2011 ANNUAL REPORT 43
ENERGY INFRASTRUCTURE
(In millions) 2011 2010 2009
REVENUES $43,694 $37,514 $40,648
SEGMENT PROFIT $ 6,650 $ 7,271 $ 7,105
REVENUES
Energy $31,080 $29,040 $31,858
Oil & Gas 13,663 9,483 9,701
SEGMENT PROFIT
Energy $ 4,992 $ 5,887 $ 5,736
Oil & Gas 1,872 1,553 1,532
Energy Infrastructure revenues increased 16% or $6.2 billion
(including $4.1 billion from acquisitions) in 2011 as higher volume
($5.8 billion) and the effects of the weaker U.S. dollar ($0.9 billion)
were partially offset by lower prices ($0.5 billion). Higher volume
was mainly driven by acquisitions and an increase in sales of
services at both Energy and Oil & Gas. The effects of the weaker
U.S. dollar and lower prices were at both Energy and Oil & Gas.
Segment profi t decreased 9%, or $0.6 billion, as lower produc-
tivity ($1.4 billion), driven primarily by the wind turbines business,
acquisitions and investment in our global organization and new
technology, and lower prices ($0.5 billion), driven primarily by the
wind turbines business, were partially offset by higher volume
($1.1 billion), and the effects of defl ation ($0.1 billion). Lower pro-
ductivity, lower prices, higher volume and the effects of defl ation
were at both Energy and Oil & Gas.
Energy Infrastructure segment revenues decreased 8%, or
$3.1 billion, in 2010 as lower volume ($3.3 billion) and the stron-
ger U.S. dollar ($0.4 billion) were partially offset by higher prices
($0.5 billion) and higher other income ($0.1 billion). Lower volume
primarily refl ected decreases in thermal and wind equipment
sales at Energy. The effects of the stronger U.S. dollar were at
both Energy and Oil & Gas. Higher prices at Energy were partially
offset by lower prices at Oil & Gas. The increase in other income at
Energy was partially offset by lower other income at Oil & Gas.
Segment profi t increased 2% to $7.3 billion in 2010, compared
with $7.1 billion in 2009 as higher prices ($0.5 billion), the effects
of defl ation ($0.4 billion) and higher other income ($0.1 billion)
were partially offset by lower volume ($0.6 billion), the stronger
U.S. dollar ($0.1 billion) and decreased productivity ($0.1 billion).
Higher prices at Energy were partially offset by lower prices at
Oil & Gas. The effects of defl ation primarily refl ected decreased
material costs at both Energy and Oil & Gas. An increase in other
income at Energy was partially offset by lower other income at Oil
& Gas. Lower volume primarily refl ected decreases in wind and
thermal equipment sales at Energy and was partially offset by
higher volume at Oil & Gas. The effects of the stronger U.S. dollar
were at both Energy and Oil & Gas. The effects of decreased pro-
ductivity were primarily at Energy.
Energy Infrastructure equipment orders increased 39% to
$25.6 billion at December 31, 2011. Total Energy Infrastructure
backlog increased 8% to $72.7 billion at December 31, 2011, com-
posed of equipment backlog of $23.0 billion and services backlog
of $49.7 billion. Comparable December 31, 2010 equipment
and service order backlogs were $18.3 billion and $48.8 billion,
respectively. See Corporate Items and Eliminations for a discus-
sion of items not allocated to this segment.
AVIATION revenues of $18.9 billion in 2011 increased $1.2 billion,
or 7%, due primarily to higher volume ($1.1 billion) and higher
prices ($0.2 billion), partially offset by lower other income ($0.1 bil-
lion). Higher volume and higher prices were driven by increased
services ($0.9 billion) and equipment sales ($0.4 billion). The
increase in services revenue was primarily due to higher commer-
cial spares sales while the increase in equipment revenue was
primarily due to commercial engines.
Segment profi t of $3.5 billion in 2011 increased $0.2 billion, or
6%, due primarily to higher volume ($0.2 billion) and higher prices
($0.2 billion), partially offset by higher infl ation, primarily non-
material related ($0.1 billion), and lower other income ($0.1 billion).
Incremental research and development and GEnx product launch
costs offset higher productivity.
Aviation revenues of $17.6 billion in 2010 decreased $1.1 bil-
lion, or 6%, as lower volume ($1.2 billion) and lower other income
($0.1 billion), refl ecting lower transaction gains, were partially
offset by higher prices ($0.2 billion). The decrease in volume
refl ected decreased commercial and military equipment sales
and services. Lower transaction gains refl ect the absence of gains
related to the Airfoils Technologies International—Singapore
Pte. Ltd. (ATI) acquisition and the Times Microwave Systems dis-
position in 2009, partially offset by a gain on a partial sale of a
materials business and a franchise fee.
Segment profi t of $3.3 billion in 2010 decreased $0.6 billion,
or 16%, due to lower productivity ($0.4 billion), lower volume
($0.2 billion) and lower other income ($0.2 billion), refl ecting lower
transaction gains, partially offset by higher prices ($0.2 billion).
Lower productivity was primarily due to product launch and pro-
duction costs associated with the GEnx engine shipments.
Aviation equipment orders increased 33% to $11.9 billion
at December 31, 2011. Total Aviation backlog increased 24%
to $99.0 billion at December 31, 2011, composed of equipment
backlog of $22.5 billion and services backlog of $76.5 billion.
Comparable December 31, 2010 equipment and service order
backlogs were $20.0 billion and $59.5 billion, respectively. See
Corporate Items and Eliminations for a discussion of items not
allocated to this segment.
management’s discussion and analysis
44
GE 2011 ANNUAL REPORT
HEALTHCARE revenues of $18.1 billion in 2011 increased $1.2 bil-
lion, or 7%, due to higher volume ($1.0 billion) and the weaker U.S.
dollar ($0.4 billion), partially offset by lower prices ($0.3 billion). The
revenue increase was split between equipment sales ($0.7 billion)
and services ($0.5 billion). Revenue increased in the U.S. and inter-
national markets, with the strongest growth in emerging markets.
Segment profi t of $2.8 billion in 2011 increased 2%, or $0.1 bil-
lion, refl ecting increased productivity ($0.3 billion), higher volume
($0.2 billion) and the weaker U.S. dollar ($0.1 billion), partially offset
by lower prices ($0.3 billion) and higher infl ation ($0.1 billion), pri-
marily non-material related.
Healthcare revenues of $16.9 billion in 2010 increased $0.9 billion,
or 6%, refl ecting higher volume ($1.0 billion) and the weaker U.S.
dollar ($0.1 billion), partially offset by lower prices ($0.2 billion). The
increase in volume refl ected increased equipment sales ($0.7 billion)
and services ($0.2 billion).
Segment profi t of $2.7 billion in 2010 increased $0.3 billion,
or 13%, due to higher productivity ($0.3 billion), higher volume
($0.2 billion) and the weaker U.S. dollar ($0.1 billion), partially offset
by lower prices ($0.2 billion).
Healthcare equipment orders increased 7% to $10.5 billion
at December 31, 2011. Total Healthcare backlog increased 1%
to $13.5 billion at December 31, 2011, composed of equip-
ment backlog of $3.9 billion and services backlog of $9.6 billion.
Comparable December 31, 2010 equipment and service order
backlogs were $3.9 billion and $9.5 billion, respectively. See
Corporate Items and Eliminations for a discussion of items not
allocated to this segment.
TRANSPORTATION revenues of $4.9 billion in 2011 increased
$1.5 billion, or 45%, due to higher volume ($1.5 billion) related to
increased equipment sales ($0.9 billion) and services ($0.6 billion).
The increase in equipment revenue was primarily driven by an
increase in U.S. and international locomotive sales and growth in
our global mining equipment business. The increase in service
revenue was due to higher overhauls and increased
service productivity.
Segment profi t of $0.8 billion in 2011 increased $0.4 billion,
or over 100%, as a result of increased productivity ($0.4 billion),
refl ecting improved service margins, and higher volume ($0.1 bil-
lion), partially offset by higher infl ation ($0.1 billion).
Transportation revenues of $3.4 billion in 2010 decreased
$0.5 billion, or 12%, primarily due to lower volume ($0.5 billion).
The decrease in volume refl ected decreased equipment sales
($0.3 billion) and services ($0.1 billion).
Segment profi t of $0.3 billion in 2010 decreased $0.2 billion,
or 33%, due to lower productivity ($0.1 billion) and lower volume
($0.1 billion). Lower productivity was primarily due to higher
service costs.
Transportation equipment orders decreased 31% to $2.2 bil-
lion at December 31, 2011. Total Transportation backlog
decreased 1% to $15.1 billion at December 31, 2011, composed
of equipment backlog of $3.3 billion and services backlog of
$11.8 billion. Comparable December 31, 2010 equipment and
service order backlogs were $3.7 billion and $11.6 billion, respec-
tively. See Corporate Items and Eliminations for a discussion of
items not allocated to this segment.
HOME & BUSINESS SOLUTIONS revenues of $8.5 billion decreased
$0.2 billion, or 2%, in 2011 refl ecting a decrease in Appliances
partially offset by higher revenues at Lighting and Intelligent
Platforms. Overall, revenues decreased primarily as a result of
lower volume ($0.3 billion) principally in our appliances business,
partially offset by the weaker U.S. dollar ($0.1 billion) and
increased prices.
Segment profi t of $0.3 billion in 2011 decreased 34%, or
$0.2 billion, as the effects of infl ation ($0.3 billion) and lower vol-
ume were partially offset by the effects of the weaker U.S. dollar,
increased productivity and increased prices.
Home & Business Solutions revenues increased 2%, or
$0.2 billion, to $8.6 billion in 2010 compared with 2009 as higher
volume ($0.4 billion) and higher other income ($0.1 billion) was
partially offset by lower prices ($0.2 billion). The increase in vol-
ume refl ected increased sales across all businesses. The decrease
in price was primarily at Appliances.
Segment profi t increased 24%, or $0.1 billion, to $0.5 bil-
lion in 2010, primarily as a result of the effects of productivity
($0.2 billion) and increased other income primarily related to
associated companies ($0.1 billion), partially offset by lower prices
($0.2 billion).

management’s discussion and analysis
GE 2011 ANNUAL REPORT 45
GE CAPITAL
(In millions) 2011 2010 2009
REVENUES $ 45,730 $ 46,422 $ 48,906
SEGMENT PROFIT $ 6,549 $ 3,158 $ 1,325
December 31 (In millions) 2011 2010
TOTAL ASSETS $552,514 $565,337
(In millions) 2011 2010 2009
REVENUES
Commercial Lending and
Leasing (CLL) $ 18,178 $ 18,447 $ 20,762
Consumer 16,781 17,204 16,794
Real Estate 3,712 3,744 4,009
Energy Financial Services 1,223 1,957 2,117
GE Capital Aviation
Services (GECAS) 5,262 5,127 4,594
SEGMENT PROFIT (LOSS)
CLL $ 2,720 $ 1,554 $ 963
Consumer 3,551 2,523 1,282
Real Estate (928) (1,741) (1,541)
Energy Financial Services 440 367 212
GECAS 1,150 1,195 1,016
December 31 (In millions) 2011 2010
TOTAL ASSETS
CLL $193,869 $202,650
Consumer 139,000 147,327
Real Estate 60,873 72,630
Energy Financial Services 18,357 19,549
GECAS 48,821 49,106
GE Capital revenues decreased 1% and net earnings increased
favorably in 2011 as compared with 2010. Revenues for 2011 and
2010 included $0.3 billion and $0.2 billion, respectively, from
acquisitions and were reduced by $1.1 billion and $2.3 billion,
respectively, as a result of dispositions. Revenues also increased
as a result of the gain on sale of a substantial portion of our
Garanti Bank equity investment (the Garanti Bank transaction),
the weaker U.S. dollar and higher gains and investment income,
partially offset by reduced revenues from lower ENI. Net earnings
increased by $3.4 billion in 2011, primarily due to lower provisions
for losses on fi nancing receivables, the gain on the Garanti Bank
transaction and lower impairments. GE Capital net earnings in
2011 also included restructuring, rationalization and other
charges of $0.1 billion and net losses of $0.2 billion related to our
Treasury operations.
During 2011, GE Capital provided approximately $104 billion
of new fi nancings in the U.S. to various companies, infrastruc-
ture projects and municipalities. Additionally, we extended
approximately $87 billion of credit to approximately 56 million U.S.
consumers. GE Capital provided credit to approximately 19,600
new commercial customers and 37,000 new small businesses
in the U.S. during 2011 and ended the period with outstanding
credit to more than 284,000 commercial customers and 191,000
small businesses through retail programs in the U.S.
GE Capital revenues decreased 5% and net earnings increased
favorably in 2010 as compared with 2009. Revenues for 2010
and 2009 included $0.2 billion and $0.1 billion of revenues
from acquisitions, respectively, and in 2010 were increased by
$0.1 billion and in 2009 were reduced by $2.3 billion as a result
of dispositions, including the effects of the 2010 deconsolida-
tion of Regency Energy Partners L.P. (Regency) and the 2009
deconsolidation of Penske Truck Leasing Co., L.P. (PTL). The 2010
deconsolidation of Regency included a $0.1 billion gain on the
sale of our general partnership interest in Regency and remea-
surement of our retained investment (the Regency transaction).
Revenues for 2010 also decreased $0.6 billion compared with
2009 as a result of organic revenue declines primarily driven by a
lower asset base and a lower interest rate environment, partially
offset by the weaker U.S. dollar. Net earnings increased for 2010
compared with 2009, primarily due to lower provisions for losses
on fi nancing receivables, lower selling, general and administrative
costs and the gain on the Regency transaction, offset by higher
marks and impairments, mainly at Real Estate, the absence of
the fi rst quarter 2009 tax benefi t from the decision to indefi nitely
reinvest prior-year earnings outside the U.S., and the absence of
the fi rst quarter 2009 gain related to the PTL sale. GE Capital net
earnings in 2010 also included restructuring, rationalization and
other charges of $0.2 billion and net losses of $0.1 billion related
to our Treasury operations.
Additional information about certain GE Capital businesses
follows.
CLL 2011 revenues decreased 1% and net earnings increased
75% compared with 2010. Revenues decreased as a result of
organic revenue declines ($1.1 billion), primarily due to lower ENI,
partially offset by the weaker U.S. dollar ($0.5 billion) and higher
gains and investment income ($0.4 billion). Net earnings increased in
2011, refl ecting lower provisions for losses on fi nancing receivables
($0.6 billion), higher gains and investment income ($0.3 billion), core
increases ($0.2 billion) and lower impairments ($0.1 billion).
CLL 2010 revenues decreased 11% and net earnings increased
61% compared with 2009. Revenues in 2010 and 2009 included
$0.2 billion and $0.1 billion, respectively, from acquisitions, and
in 2010 were reduced by $1.2 billion from dispositions, primarily
related to the 2009 deconsolidation of PTL. Revenues in 2010 also
decreased $1.2 billion compared with 2009 as a result of organic
revenue declines ($1.4 billion), partially offset by the weaker U.S.
dollar ($0.2 billion). Net earnings increased by $0.6 billion in 2010,
refl ecting lower provisions for losses on fi nancing receivables
($0.6 billion), higher gains ($0.2 billion) and lower selling, gen-
eral and administrative costs ($0.1 billion). These increases were
partially offset by the absence of the gain on the PTL sale and
remeasurement ($0.3 billion) and declines in lower-taxed earnings
from global operations ($0.1 billion).
Consumer 2011 revenues decreased 2% and net earnings
increased 41% compared with 2010. Revenues included $0.3 bil-
lion from acquisitions and were reduced by $0.4 billion as a result
of dispositions. Revenues in 2011 also decreased $0.3 billion as a

management’s discussion and analysis
46
GE 2011 ANNUAL REPORT
result of organic revenue declines ($1.4 billion), primarily due to
lower ENI, and higher impairments ($0.1 billion), partially offset by
the gain on the Garanti Bank transaction ($0.7 billion), the weaker
U.S. dollar ($0.5 billion) and higher gains ($0.1 billion). The increase
in net earnings resulted primarily from lower provisions for losses
on fi nancing receivables ($1.0 billion), the gain on the Garanti Bank
transaction ($0.3 billion) and acquisitions ($0.1 billion), partially
offset by lower Garanti results ($0.2 billion), and core decreases
($0.2 billion).
Consumer 2010 revenues increased 2% and net earnings
increased 97% compared with 2009. Revenues in 2010 were
reduced by $0.3 billion as a result of dispositions. Revenues in
2010 increased $0.7 billion compared with 2009 as a result of
the weaker U.S. dollar ($0.4 billion) and organic revenue growth
($0.4 billion). The increase in net earnings resulted primarily from
core growth ($1.3 billion) and the weaker U.S. dollar ($0.1 bil-
lion), partially offset by the effects of dispositions ($0.1 billion).
Core growth included lower provisions for losses on fi nancing
receivables across most platforms ($1.5 billion) and lower selling,
general and administrative costs ($0.2 billion), partially offset by
declines in lower-taxed earnings from global operations ($0.7 bil-
lion) including the absence of the fi rst quarter 2009 tax benefi t
($0.5 billion) from the decision to indefi nitely reinvest prior-year
earnings outside the U.S. and an increase in the valuation allow-
ance associated with Japan ($0.2 billion).
Real Estate 2011 revenues decreased 1% and net earnings
increased 47% compared with 2010. Revenues decreased as
organic revenue declines ($0.4 billion), primarily due to lower
ENI, were partially offset by increases in net gains on property
sales ($0.2 billion) and the weaker U.S. dollar ($0.1 billion). Real
Estate net earnings increased compared with 2010, as lower
impairments ($0.7 billion), a decrease in provisions for losses
on fi nancing receivables ($0.4 billion) and increases in net
gains on property sales ($0.2 billion) were partially offset by
core declines ($0.4 billion). Depreciation expense on real estate
equity investments totaled $0.9 billion and $1.0 billion in 2011
and 2010, respectively.
Real Estate 2010 revenues decreased 7% and net earn-
ings decreased 13% compared with 2009. Revenues for 2010
decreased $0.3 billion compared with 2009 as a result of
organic revenue declines and a decrease in property sales,
partially offset by the weaker U.S. dollar. Real Estate net earn-
ings decreased $0.2 billion compared with 2009, primarily from
an increase in impairments related to equity properties and
investments ($0.9 billion), partially offset by a decrease in provi-
sions for losses on fi nancing receivables ($0.4 billion), and core
increases ($0.3 billion). Depreciation expense on real estate
equity investments totaled $1.0 billion and $1.2 billion for 2010
and 2009, respectively.
Energy Financial Services 2011 revenues decreased 38%
and net earnings increased 20% compared with 2010. Revenues
decreased primarily as a result of the deconsolidation of Regency
($0.7 billion) and organic revenue declines ($0.3 billion), primarily
from an asset sale in 2010 by an investee. These decreases were
partially offset by higher gains ($0.2 billion). The increase in net
earnings resulted primarily from higher gains ($0.2 billion), partially
offset by the deconsolidation of Regency ($0.1 billion) and core
decreases, primarily from an asset sale in 2010 by an investee.
Energy Financial Services 2010 revenues decreased 8% and
net earnings increased 73% compared with 2009. Revenues in
2010 included a $0.1 billion gain related to the Regency trans-
action and in 2009 were reduced by $0.1 billion of gains from
dispositions. Revenues in 2010 decreased compared with 2009 as
a result of organic revenue growth ($0.4 billion), primarily increases
in associated company revenues resulting from an asset sale by an
investee ($0.2 billion), more than offset by the deconsolidation of
Regency. The increase in net earnings resulted primarily from core
increases ($0.1 billion), primarily increases in associated company
earnings resulting from an asset sale by an investee ($0.2 billion)
and the gain related to the Regency transaction ($0.1 billion).
GECAS 2011 revenues increased 3% and net earnings decreased
4% compared with 2010. Revenues for 2011 increased compared
with 2010 as a result of organic revenue growth ($0.1 billion). The
decrease in net earnings resulted primarily from core decreases
($0.1 billion), refl ecting the 2010 benefi t from resolution of the 2003–
2005 IRS audit, partially offset by lower impairments ($0.1 billion).
GECAS 2010 revenues increased 12% and net earnings increased
18% compared with 2009. Revenues in 2010 increased compared
with 2009 as a result of organic revenue growth ($0.5 billion), includ-
ing higher investment income. The increase in net earnings resulted
primarily from core increases ($0.2 billion), including the benefi t from
resolution of the 2003–2005 IRS audit, lower credit losses and higher
investment income, partially offset by higher impairments related to
our operating lease portfolio of commercial aircraft.
CORPORATE ITEMS AND ELIMINATIONS
(In millions) 2011 2010 2009
REVENUES
Gains on disposed businesses $ 3,705 $ 105 $ 303
Insurance activities 3,437 3,596 3,383
NBCU/NBCU LLC 1,981 16,901 15,436
Eliminations and other (1,539) (1,479) (1,251)
Total $ 7,584 $19,123 $17,871
OPERATING PROFIT (COST)
Gains on disposed businesses $ 3,705 $ 105 $ 303
NBCU/NBCU LLC 830 2,261 2,264
Insurance activities (58) (58) (79)
Principal retirement plans (a) (1,898) (493) (230)
Underabsorbed corporate
overhead and other costs (2,938) (2,920) (2,851)
Total $ (359) $ (1,105) $ (593)
(a) Included non-operating (non-GAAP) pension income (cost) of $(1.1) billion,
$0.3 billion and $1.5 billion in 2011, 2010 and 2009, respectively, which includes
interest costs, expected return on plan assets and non-cash amortization of
actuarial gains and losses. Also included operating (non-GAAP) pension income
(costs) of $(1.4) billion, $(1.4) billion and $(2.0) billion in 2011, 2010 and 2009,
respectively, which includes service cost and plan amendment amortization.
See the Supplemental Information section.

management’s discussion and analysis
GE 2011 ANNUAL REPORT 47
Corporate items and eliminations revenues of $7.6 billion in 2011
decreased $11.5 billion as a $14.9 billion reduction in revenues
from NBCU LLC operations resulting from the deconsolidation of
NBCU effective January 28, 2011 and $0.3 billion of lower rev-
enues from other disposed businesses were partially offset by a
$3.7 billion pre-tax gain related to the NBCU transaction.
Corporate items and eliminations costs decreased by $0.7 billion
as $3.6 billion of higher gains from disposed businesses, primarily
the NBCU transaction, and a $0.6 billion decrease in restructuring,
rationalization, acquisition-related and other charges were par-
tially offset by $1.4 billion of higher costs of our principal
retirement plans, $1.4 billion of lower earnings from NBCU/NBCU
LLC operations and a $0.6 billion increase in research and devel-
opment spending and global corporate costs.
Certain amounts included in Corporate items and eliminations
cost are not allocated to GE operating segments because they are
excluded from the measurement of their operating performance
for internal purposes. For 2011, these included $0.4 billion at
Energy Infrastructure for acquisition-related costs and $0.4 billion
at Healthcare, $0.3 billion at Energy Infrastructure, $0.2 billion at
Aviation and $0.1 billion at both Home & Business Solutions and
Transportation, primarily for technology and product develop-
ment costs and restructuring, rationalization and other charges.
In 2011, underabsorbed corporate overhead and other costs
was fl at compared with 2010, as increased costs at our global
research centers and global corporate costs were offset by lower
restructuring and other charges (including acquisition-related
costs) of $0.6 billion. In 2010, underabsorbed corporate overhead
and other costs increased by $0.1 billion as compared with 2009,
as increased costs at our global research centers and staff costs
and lower income from operations of disposed businesses were
partially offset by lower restructuring and other charges (includ-
ing environmental remediation costs related to the Hudson River
dredging project) of $0.6 billion.
DISCONTINUED OPERATIONS
(In millions) 2011 2010 2009
Earnings (loss) from discontinued
operations, net of taxes $77 $(873) $219
Discontinued operations primarily comprised BAC, GE Money
Japan, WMC, Consumer RV Marine, Consumer Mexico, Consumer
Singapore and Australian Home Lending. Associated results of
operations, fi nancial position and cash fl ows are separately
reported as discontinued operations for all periods presented.
In 2011, earnings from discontinued operations, net of taxes,
included a $0.3 billion gain related to the sale of Consumer
Singapore and earnings from operations at Australian Home
Lending of $0.1 billion, partially offset by incremental reserves for
excess interest claims related to our loss-sharing arrangement
on the 2008 sale of GE Money Japan of $0.2 billion and the loss on
the sale of Australian Home Lending of $0.1 billion.
In 2010, loss from discontinued operations, net of taxes, primar-
ily refl ected incremental reserves for excess interest claims related
to our loss-sharing arrangement on the 2008 sale of GE Money
Japan of $1.7 billion and estimated after-tax losses of $0.2 billion
and $0.1 billion on the planned sales of Consumer Mexico and
Consumer RV Marine, respectively, partially offset by an after-tax
gain on the sale of BAC of $0.8 billion and earnings from operations
at Consumer Mexico of $0.2 billion and at BAC of $0.1 billion.
In 2009, earnings from discontinued operations, net of taxes,
primarily refl ected earnings from operations of BAC of $0.3 billion,
Australian Home Lending of $0.1 billion and Consumer Mexico
of $0.1 billion, partially offset by incremental reserves for excess
interest claims related to our loss-sharing arrangement on the
2008 sale of GE Money Japan of $0.2 billion and loss from opera-
tions at Consumer RV Marine of $0.1 billion.
For additional information related to discontinued operations,
see Note 2.
Geographic Operations
Our global activities span all geographic regions and primarily
encompass manufacturing for local and export markets, import
and sale of products produced in other regions, leasing of aircraft,
sourcing for our plants domiciled in other global regions and
provision of fi nancial services within these regional economies.
Thus, when countries or regions experience currency and/or
economic stress, we often have increased exposure to certain
risks, but also often have new profi t opportunities. New profi t
opportunities include, among other things, more opportunities
for expansion of industrial and fi nancial services activities
through purchases of companies or assets at reduced prices and
lower U.S. debt fi nancing costs.
Revenues are classifi ed according to the region to which prod-
ucts and services are sold. For purposes of this analysis, the U.S.
is presented separately from the remainder of the Americas. We
classify certain operations that cannot meaningfully be associated
with specifi c geographic areas as “Other Global” for this purpose.
GEOGRAPHIC REVENUES
(In billions) 2011 2010 2009
U.S. $ 69.8 $ 75.1 $ 75.8
Europe 29.1 31.0 36.3
Pacific Basin 23.2 20.8 19.3
Americas 13.2 11.7 11.3
Middle East and Africa 9.8 9.0 9.8
Other Global 2.2 2.0 1.9
Total $147.3 $149.6 $154.4
Global revenues increased 4% to $77.5 billion in 2011, compared
with $74.5 billion and $78.6 billion in 2010 and 2009, respectively.
Global revenues to external customers as a percentage of con-
solidated revenues were 53% in 2011, compared with 50% in

management’s discussion and analysis
48
GE 2011 ANNUAL REPORT
2010 and 51% in 2009. The effects of currency fl uctuations on
reported results increased revenues by $2.5 billion in 2011,
increased revenues by $0.5 billion in 2010 and decreased rev-
enues by $3.9 billion in 2009.
GE global revenues, excluding GECS, in 2011 were $54.3 bil-
lion, up 9% over 2010. Increases in growth markets of 29% in
Latin America, 28% in China and 46% in Australia more than off-
set decreases of 12% in Western Europe. These revenues as a
percentage of GE total revenues, excluding GECS, were 55% in
2011, compared with 50% and 52% in 2010 and 2009, respec-
tively. GE global revenues, excluding GECS, were $49.8 billion in
2010, down 6% from 2009, primarily resulting from decreases
in Europe, Middle East and Africa, partially offset by an increase in
Latin America.
GECS global revenues decreased 6% to $23.2 billion in 2011,
compared with $24.7 billion and $25.7 billion in 2010 and 2009,
respectively, primarily as a result of decreases in Western Europe.
GECS global revenues as a percentage of total GECS revenues
were 47% in 2011, compared with 50% in both 2010 and 2009.
GECS global revenue decreased by 4% in 2010 from $25.7 billion
in 2009, primarily as a result of decreases in Europe, partially off-
set by an increase in Australia.
TOTAL ASSETS (CONTINUING OPERATIONS)
December 31 (In billions) 2011 2010
U.S. $335.6 $322.8
Europe 213.0 250.2
Pacific Basin 62.3 62.6
Americas 46.7 41.9
Other Global 58.4 57.9
Total $716.0 $735.4
Total assets of global operations on a continuing basis were
$380.4 billion in 2011, a decrease of $32.2 billion, or 8%, from
2010. GECS global assets on a continuing basis of $319.3 billion at
the end of 2011 were 1% lower than at the end of 2010, refl ecting
declines in Europe, primarily due to dispositions and portfolio
run-off in various businesses at Consumer and lower fi nancing
receivables and equipment leased to others at CLL.
Financial results of our global activities reported in U.S. dollars
are affected by currency exchange. We use a number of tech-
niques to manage the effects of currency exchange, including
selective borrowings in local currencies and selective hedging of
signifi cant cross-currency transactions. Such principal currencies
are the pound sterling, the euro, the Japanese yen, the Canadian
dollar and the Australian dollar.
Environmental Matters
Our operations, like operations of other companies engaged in
similar businesses, involve the use, disposal and cleanup of sub-
stances regulated under environmental protection laws. We are
involved in a number of remediation actions to clean up hazard-
ous wastes as required by federal and state laws. Such statutes
require that responsible parties fund remediation actions regard-
less of fault, legality of original disposal or ownership of a disposal
site. Expenditures for site remediation actions amounted to
approximately $0.3 billion in 2011, $0.2 billion in 2010 and $0.3 bil-
lion in 2009. We presently expect that such remediation actions
will require average annual expenditures of about $0.4 billion for
each of the next two years.
In 2006, we entered into a consent decree with the
Environmental Protection Agency (EPA) to dredge PCB-containing
sediment from the upper Hudson River. The consent decree
provided that the dredging would be performed in two phases.
Phase 1 was completed in May through November of 2009.
Between Phase 1 and Phase 2 there was an intervening peer
review by an independent panel of national experts. The panel
evaluated the performance of Phase 1 dredging operations with
respect to Phase 1 Engineering Performance Standards and rec-
ommended proposed changes to the standards. On December 17,
2010, EPA issued its decision setting forth the fi nal performance
standards for Phase 2 of the Hudson River dredging project,
incorporating aspects of the recommendations from the inde-
pendent peer review panel and from GE. In December 2010, we
agreed to perform Phase 2 of the project in accordance with the
fi nal performance standards set by EPA and increased our reserve
by $0.8 billion in the fourth quarter of 2010 to account for the
probable and estimable costs of completing Phase 2. In 2011, we
completed the fi rst year of Phase 2 dredging and commenced
work on planned upgrades to the Hudson River wastewater pro-
cessing facility. Based on the results from 2011 dredging and
our best professional engineering judgment, we believe that our
current reserve continues to refl ect our probable and estimable
costs for the remainder of Phase 2 of the dredging project.
management’s discussion and analysis
GE 2011 ANNUAL REPORT 49
Financial Resources and Liquidity
This discussion of fi nancial resources and liquidity addresses the
Statement of Financial Position, Liquidity and Borrowings, Debt
and Derivative Instruments, Guarantees and Covenants, the
Consolidated Statement of Changes in Shareowners’ Equity, the
Statement of Cash Flows, Contractual Obligations, and Variable
Interest Entities.
Overview of Financial Position
Major changes to our shareowners’ equity are discussed in the
Consolidated Statement of Changes in Shareowners’ Equity
section. In addition, other signifi cant changes to balances in our
Statement of Financial Position follow.
Statement of Financial Position
Because GE and GECS share certain signifi cant elements of their
Statements of Financial Position—property, plant and equipment
and borrowings, for example—the following discussion addresses
signifi cant captions in the “consolidated” statement. Within the
following discussions, however, we distinguish between GE and
GECS activities in order to permit meaningful analysis of each
individual consolidating statement.
INVESTMENT SECURITIES comprise mainly investment grade debt
securities supporting obligations to annuitants, policyholders and
holders of guaranteed investment contracts (GICs) in our run-off
insurance operations and Trinity, and investment securities at our
treasury operations and investments held in our CLL business
collateralized by senior secured loans of high-quality, middle-
market companies in a variety of industries. The fair value of
investment securities increased to $47.4 billion at December 31,
2011 from $43.9 billion at December 31, 2010. Of the amount at
December 31, 2011, we held debt securities with an estimated fair
value of $46.3 billion, which included corporate debt securities,
asset-backed securities (ABS), residential mortgage-backed secu-
rities (RMBS) and commercial mortgage-backed securities (CMBS)
with estimated fair values of $26.1 billion, $5.0 billion, $2.6 billion
and $2.8 billion, respectively. Net unrealized gains on debt securi-
ties were $3.0 billion and $0.6 billion at December 31, 2011 and
December 31, 2010, respectively. This amount included unrealized
losses on corporate debt securities, ABS, RMBS and CMBS of
$0.6 billion, $0.2 billion, $0.3 billion and $0.2 billion, respectively, at
December 31, 2011, as compared with $0.4 billion, $0.2 billion,
$0.4 billion and $0.2 billion, respectively, at December 31, 2010.
We regularly review investment securities for impairment
using both qualitative and quantitative criteria. We presently
do not intend to sell the vast majority of our debt securities and
believe that it is not more likely than not that we will be required
to sell these securities that are in an unrealized loss position
before recovery of our amortized cost. We believe that the unreal-
ized loss associated with our equity securities will be recovered
within the foreseeable future.
Our RMBS portfolio is collateralized primarily by pools of indi-
vidual, direct mortgage loans (a majority of which were originated
in 2006 and 2005), not other structured products such as collateral-
ized debt obligations. Substantially all of our RMBS are in a senior
position in the capital structure of the deals and more than 75% are
agency bonds or insured by Monoline insurers (on which we con-
tinue to place reliance). Of our total RMBS portfolio at December 31,
2011 and December 31, 2010, approximately $0.5 billion and
$0.7 billion, respectively, relate to residential subprime credit, pri-
marily supporting our guaranteed investment contracts. A majority
of exposure to residential subprime credit related to investment
securities backed by mortgage loans originated in 2006 and 2005.
Substantially all of the subprime RMBS were investment grade at
the time of purchase and approximately 70% have been subse-
quently downgraded to below investment grade.
Our CMBS portfolio is collateralized by both diversifi ed pools
of mortgages that were originated for securitization (conduit
CMBS) and pools of large loans backed by high quality properties
(large loan CMBS), a majority of which were originated in 2007 and
2006. Substantially all of the securities in our CMBS portfolio have
investment grade credit ratings and the vast majority of the secu-
rities are in a senior position in the capital structure.
Our ABS portfolio is collateralized by senior secured loans of
high-quality, middle-market companies in a variety of industries,
as well as a variety of diversifi ed pools of assets such as student
loans and credit cards. The vast majority of our ABS are in a senior
position in the capital structure of the deals. In addition, substan-
tially all of the securities that are below investment grade are in
an unrealized gain position.
If there has been an adverse change in cash fl ows for RMBS,
management considers credit enhancements such as Monoline
insurance (which are features of a specifi c security). In evaluating
the overall creditworthiness of the Monoline insurer (Monoline),
we use an analysis that is similar to the approach we use for cor-
porate bonds, including an evaluation of the suffi ciency of the
Monoline’s cash reserves and capital, ratings activity, whether
the Monoline is in default or default appears imminent, and the
potential for intervention by an insurance or other regulator.
Monolines provide credit enhancement for certain of our
investment securities, primarily RMBS and municipal securities.
The credit enhancement is a feature of each specifi c security that
guarantees the payment of all contractual cash fl ows, and is not
purchased separately by GE. The Monoline industry continues to
experience fi nancial stress from increasing delinquencies and
defaults on the individual loans underlying insured securities. We
continue to rely on Monolines with adequate capital and claims
paying resources. We have reduced our reliance on Monolines
that do not have adequate capital or have experienced regula-
tor intervention. At December 31, 2011, our investment securities
insured by Monolines on which we continue to place reliance
were $1.6 billion, including $0.3 billion of our $0.5 billion invest-
ment in subprime RMBS. At December 31, 2011, the unrealized loss
management’s discussion and analysis
50
GE 2011 ANNUAL REPORT
associated with securities subject to Monoline credit enhance-
ment, for which there is an expected credit loss, was $0.3 billion.
Total pre-tax, other-than-temporary impairment losses dur-
ing 2011 were $0.5 billion, of which $0.4 billion was recognized
in earnings and primarily relates to credit losses on non-U.S.
government and non-U.S. corporate securities and other-than-
temporary losses on equity securities and $0.1 billion primarily
relates to non-credit related losses on RMBS and is included
within accumulated other comprehensive income.
Total pre-tax, other-than-temporary impairment losses dur-
ing 2010 were $0.5 billion, of which $0.3 billion was recognized
in earnings and primarily relates to credit losses on RMBS, non-
U.S. government securities, non-U.S. corporate securities and
other-than-temporary losses on equity securities, and $0.2 bil-
lion primarily relates to non-credit related losses on RMBS and is
included within accumulated other comprehensive income.
Our qualitative review attempts to identify issuers’ securi-
ties that are “at-risk” of other-than-temporary impairment, that
is, for securities that we do not intend to sell and it is not more
likely than not that we will be required to sell before recovery of
our amortized cost, whether there is a possibility of credit loss
that would result in an other-than-temporary impairment recog-
nition in the following 12 months. Securities we have identifi ed
as “at-risk” primarily relate to investments in RMBS and non-U.S.
corporate debt securities across a broad range of industries.
The amount of associated unrealized loss on these securities
at December 31, 2011, is $0.6 billion. Unrealized losses are not
indicative of the amount of credit loss that would be recognized
as credit losses are determined based on adverse changes in
expected cash fl ows rather than fair value. For further informa-
tion relating to how credit losses are calculated, see Note 3.
Uncertainty in the capital markets may cause increased levels of
other-than-temporary impairments.
At both December 31, 2011 and December 31, 2010, unrealized
losses on investment securities totaled $1.6 billion, including
$1.2 billion aged 12 months or longer at December 31, 2011
and $1.3 billion aged 12 months or longer at December 31, 2010.
Of the amount aged 12 months or longer at December 31, 2011,
more than 70% are debt securities that were considered to be
investment grade by the major rating agencies. In addition, of
the amount aged 12 months or longer, $0.7 billion and $0.3 billion
related to structured securities (mortgage-backed, asset-backed
and securitization retained interests) and corporate debt secu-
rities, respectively. With respect to our investment securities
that are in an unrealized loss position at December 31, 2011, the
majority relate to debt securities held to support obligations
to holders of GICs. We presently do not intend to sell the vast
majority of our debt securities and believe that it is not more likely
than not that we will be required to sell these securities that are in
an unrealized loss position before recovery of our amortized cost.
For additional information, see Note 3.
FAIR VALUE MEASUREMENTS. For fi nancial assets and liabilities
measured at fair value on a recurring basis, fair value is the price
we would receive to sell an asset or pay to transfer a liability in an
orderly transaction with a market participant at the measurement
date. In the absence of active markets for the identical assets or
liabilities, such measurements involve developing assumptions
based on market observable data and, in the absence of such
data, internal information that is consistent with what market
participants would use in a hypothetical transaction that occurs
at the measurement date. Additional information about our appli-
cation of this guidance is provided in Notes 1 and 21. At
December 31, 2011, the aggregate amount of investments that
are measured at fair value through earnings totaled $5.9 billion
and consisted primarily of various assets held for sale in the
ordinary course of business, as well as equity investments.
WORKING CAPITAL, representing GE current receivables and
inventories, less GE accounts payable and progress collections,
increased $1.6 billion at December 31, 2011, compared to
December 31, 2010 due to increases in receivables and inventory,
and lower progress collections, partially offset by increased
accounts payable. As Energy Infrastructure and Aviation deliver
units out of their backlogs over the next few years, progress
collections of $11.3 billion at December 31, 2011, will be earned,
which, along with progress collections on new orders, will impact
working capital. Throughout the last fi ve years, we have executed
a signifi cant number of initiatives through our Operating Council,
such as lean cycle time projects, which have resulted in a more
effi cient use of working capital. The Operating Council meets at
least eight times per year and is led by our Chairman. We discuss
current receivables and inventories, two important elements of
working capital, in the following paragraphs.
CURRENT RECEIVABLES for GE totaled to $11.8 billion at the end of
2011 and $10.4 billion at the end of 2010, and included $9.0 billion
due from customers at the end of 2011 compared with $8.1 billion
at the end of 2010. GE current receivables turnover was 8.3 in
2011, compared with 8.6 in 2010. The overall increase in current
receivables was primarily due to the higher volume and acquisi-
tions at Energy Infrastructure ($1.1 billion).
management’s discussion and analysis
GE 2011 ANNUAL REPORT 51
INVENTORIES for GE totaled to $13.7 billion at December 31, 2011,
up $2.3 billion from the end of 2010. This increase refl ected higher
inventories at Energy Infrastructure, partially due to acquisitions
($1.0 billion), Aviation and Transportation. GE inventory turnover
was 7.0 and 7.2 in 2011 and 2010, respectively. See Note 5.
FINANCING RECEIVABLES is our largest category of assets and
represents one of our primary sources of revenues. Our portfolio
of fi nancing receivables is diverse and not directly comparable to
major U.S. banks. A discussion of the quality of certain elements
of the fi nancing receivables portfolio follows.
Our consumer portfolio is largely non-U.S. and primarily com-
prises mortgage, sales fi nance, auto and personal loans in various
European and Asian countries. Our U.S. consumer fi nancing
receivables comprise 16% of our total portfolio. Of those, approxi-
mately 65% relate primarily to credit cards, which are often
subject to profi t and loss-sharing arrangements with the retailer
(the results of which are refl ected in revenues), and have a smaller
average balance and lower loss severity as compared to bank
cards. The remaining 35% are sales fi nance receivables, which
provide electronics, recreation, medical and home improvement
fi nancing to customers. In 2007, we exited the U.S. mortgage
business and we have no U.S. auto or student loans.
Our commercial portfolio primarily comprises senior, secured
positions with comparatively low loss history. The secured receiv-
ables in this portfolio are collateralized by a variety of asset
classes, which for our CLL business primarily include: industrial-
related facilities and equipment, vehicles, corporate aircraft, and
equipment used in many industries, including the construction,
manufacturing, transportation, media, communications, entertain-
ment and healthcare industries. The portfolios in our Real Estate,
GECAS and Energy Financial Services businesses are collateral-
ized by commercial real estate, commercial aircraft and operating
assets in the global energy industry, respectively. We are in a
secured position for substantially all of our commercial portfolio.
Losses on fi nancing receivables are recognized when they are
incurred, which requires us to make our best estimate of probable
losses inherent in the portfolio. The method for calculating the
best estimate of losses depends on the size, type and risk char-
acteristics of the related fi nancing receivable. Such an estimate
requires consideration of historical loss experience, adjusted for
current conditions, and judgments about the probable effects of
relevant observable data, including present economic conditions
such as delinquency rates, fi nancial health of specifi c custom-
ers and market sectors, collateral values (including housing price
indices as applicable), and the present and expected future lev-
els of interest rates. The underlying assumptions, estimates and
assessments we use to provide for losses are updated periodi-
cally to refl ect our view of current conditions. Changes in such
estimates can signifi cantly affect the allowance and provision for
losses. It is possible to experience credit losses that are different
from our current estimates.
Our risk management process includes standards and policies
for reviewing major risk exposures and concentrations, and eval-
uates relevant data either for individual loans or fi nancing leases,
or on a portfolio basis, as appropriate.
Loans acquired in a business acquisition are recorded at fair
value, which incorporates our estimate at the acquisition date
of the credit losses over the remaining life of the portfolio. As a
result, the allowance for losses is not carried over at acquisition.
This may have the effect of causing lower reserve coverage ratios
for those portfolios.
For purposes of the discussion that follows, “delinquent” receiv-
ables are those that are 30 days or more past due based on their
contractual terms; and “nonearning” receivables are those that
are 90 days or more past due (or for which collection is otherwise
doubtful). Nonearning receivables exclude loans purchased at a
discount (unless they have deteriorated post acquisition). Under
FASB ASC 310, Receivables, these loans are initially recorded at
fair value and accrete interest income over the estimated life of
the loan based on reasonably estimable cash fl ows even if the
underlying loans are contractually delinquent at acquisition. In
addition, nonearning receivables exclude loans that are paying on
a cash accounting basis but classifi ed as nonaccrual and impaired.
“Nonaccrual” fi nancing receivables include all nonearning receiv-
ables and are those on which we have stopped accruing interest.
We stop accruing interest at the earlier of the time at which col-
lection of an account becomes doubtful or the account becomes
90 days past due. Recently restructured fi nancing receivables are
not considered delinquent when payments are brought current
according to the restructured terms, but may remain classifi ed as
nonaccrual until there has been a period of satisfactory payment
performance by the borrower and future payments are reasonably
assured of collection.
Further information on the determination of the allowance
for losses on fi nancing receivables and the credit quality and cat-
egorization of our fi nancing receivables is provided in the Critical
Accounting Estimates section and Notes 1, 6 and 23.

management’s discussion and analysis
52
GE 2011 ANNUAL REPORT
Financing receivables Nonearning receivables Allowance for losses
December 31 (In millions) 2011 2010 2011 2010 2011 2010
COMMERCIAL
CLL
Americas (a) $ 80,505 $ 88,558 $1,862 $ 2,573 $ 889 $1,288
Europe 36,899 37,498 1,167 1,241 400 429
Asia 11,635 11,943 269 406 157 222
Other (a) 436 664 11 646
Total CLL 129,475 138,663 3,309 4,226 1,450 1,945
Energy Financial Services 5,912 7,011 22 62 26 22
GECAS 11,901 12,615 55 —17 20
Other 1,282 1,788 65 102 37 58
Total Commercial 148,570 160,077 3,451 4,390 1,530 2,045
REAL ESTATE
Debt (b) 24,501 30,249 541 961 949 1,292
Business Properties (c) 8,248 9,962 249 386 140 196
Total Real Estate 32,749 40,211 790 1,347 1,089 1,488
CONSUMER
Non-U.S. residential mortgages (d) 36,170 40,011 3,349 3,738 706 803
Non-U.S. installment and revolving credit 18,544 20,132 263 289 717 937
U.S. installment and revolving credit 46,689 43,974 990 1,201 2,008 2,333
Non-U.S. auto 5,691 7,558 43 46 101 168
Other 7,244 8,304 419 478 199 259
Total Consumer 114,338 119,979 5,064 5,752 3,731 4,500
Total $295,657 $320,267 $9,305 $11,489 $6,350 $8,033
(a) During 2011, we transferred our Railcar lending and leasing portfolio from CLL Other to CLL Americas. Prior-period amounts were reclassified to conform to the current-
period presentation.
(b) Financing receivables included $0.1 billion and $0.2 billion of construction loans at December 31, 2011 and December 31, 2010, respectively.
(c) Our Business Properties portfolio is underwritten primarily by the credit quality of the borrower and secured by tenant and owner-occupied commercial properties.
(d) At December 31, 2011, net of credit insurance, approximately 25% of our secured Consumer non-U.S. residential mortgage portfolio comprised loans with introductory,
below market rates that are scheduled to adjust at future dates; with high loan-to-value ratios at inception (greater than 90%); whose terms permitted interest-only
payments; or whose terms resulted in negative amortization. At origination, we underwrite loans with an adjustable rate to the reset value. Of these loans, 79% are in our
U.K. and France portfolios, which comprise mainly loans with interest-only payments and introductory below market rates, have a delinquency rate of 15%, have a loan-to-
value ratio at origination of 76% and have re-indexed loan-to-value ratios of 84% and 56%, respectively. At December 31, 2011, 6% (based on dollar values) of these loans in
our U.K. and France portfolios have been restructured.
The portfolio of fi nancing receivables, before allowance for losses,
was $295.7 billion at December 31, 2011, and $320.3 billion at
December 31, 2010. Financing receivables, before allowance for
losses, decreased $24.6 billion from December 31, 2010, primarily
as a result of collections exceeding originations ($14.9 billion)
(which includes sales), write-offs ($7.2 billion) and the stronger
U.S. dollar ($1.5 billion), partially offset by acquisitions ($3.6 billion).
The $24.6 billion decline in fi nancing receivables excludes fi nanc-
ing receivables of $11.5 billion, previously reported in
Discontinued operations or Assets of businesses held for sale
(primarily non-U.S. residential mortgages and non-U.S. install-
ment and revolving credit) associated with 2011 business and
portfolio dispositions. See Note 2.
Related nonearning receivables totaled $9.3 billion (3.1% of
outstanding receivables) at December 31, 2011, compared with
$11.5 billion (3.6% of outstanding receivables) at December 31,
2010. Nonearning receivables decreased from December 31, 2010,
primarily due to write-offs and discounted payoffs in Real Estate,
improved performance in Commercial and improvements in our
entry rates in Consumer.
The allowance for losses at December 31, 2011 totaled
$6.4 billion compared with $8.0 billion at December 31, 2010,
representing our best estimate of probable losses inherent in
the portfolio. Allowance for losses decreased $1.7 billion from
December 31, 2010, primarily because provisions were lower than
write-offs, net of recoveries by $1.5 billion, which is attributable
to a reduction in the overall fi nancing receivables balance and an
improvement in the overall credit environment. The allowance
for losses as a percent of total fi nancing receivables decreased
from 2.5% at December 31, 2010 to 2.1% at December 31, 2011
primarily due to a decrease in the allowance for losses as dis-
cussed above, partially offset by a decline in the overall fi nancing
receivables balance as collections exceeded originations. Further
information surrounding the allowance for losses related to each
of our portfolios is detailed below.
The following table provides information surrounding selected
ratios related to nonearning fi nancing receivables and the allow-
ance for losses.

management’s discussion and analysis
GE 2011 ANNUAL REPORT 53
Nonearning financing
receivables as a percent of
financing receivables
Allowance for losses as a
percent of nonearning
financing receivables
Allowance for losses as a
percent of total
financing receivables
December 31 2011 2010 2011 2010 2011 2010
COMMERCIAL
CLL
Americas 2.3% 2.9% 47.7% 50.1% 1.1% 1.5%
Europe 3.2 3.3 34.3 34.6 1.1 1.1
Asia 2.3 3.4 58.4 54.7 1.3 1.9
Other 2.5 0.9 36.4 100.0 0.9 0.9
Total CLL 2.6 3.0 43.8 46.0 1.1 1.4
Energy Financial Services 0.4 0.9 118.2 35.5 0.4 0.3
GECAS 0.5 —30.9 —0.1 0.2
Other 5.1 5.7 56.9 56.9 2.9 3.2
Total Commercial 2.3 2.7 44.3 46.6 1.0 1.3
REAL ESTATE
Debt 2.2 3.2 175.4 134.4 3.9 4.3
Business Properties 3.0 3.9 56.2 50.8 1.7 2.0
Total Real Estate 2.4 3.3 137.8 110.5 3.3 3.7
CONSUMER
Non-U.S. residential mortgages 9.3 9.3 21.1 21.5 2.0 2.0
Non-U.S. installment and revolving credit 1.4 1.4 272.6 324.2 3.9 4.7
U.S. installment and revolving credit 2.1 2.7 202.8 194.3 4.3 5.3
Non-U.S. auto 0.8 0.6 234.9 365.2 1.8 2.2
Other 5.8 5.8 47.5 54.2 2.7 3.1
Total Consumer 4.4 4.8 73.7 78.2 3.3 3.8
Total 3.1 3.6 68.2 69.9 2.1 2.5
Included below is a discussion of fi nancing receivables, allowance
for losses, nonearning receivables and related metrics for each of
our signifi cant portfolios.
CLL—AMERICAS. Nonearning receivables of $1.9 billion repre-
sented 20.0% of total nonearning receivables at December 31,
2011. The ratio of allowance for losses as a percent of nonearning
receivables decreased from 50.1% at December 31, 2010, to 47.7%
at December 31, 2011, refl ecting an overall improvement in the
credit quality of the remaining portfolio and an overall decrease in
nonearning receivables. The ratio of nonearning receivables as a
percent of fi nancing receivables decreased from 2.9% at
December 31, 2010, to 2.3% at December 31, 2011, primarily due
to reduced nonearning exposures in our healthcare, media, fran-
chise and inventory fi nancing portfolios, which more than offset
deterioration in our corporate aircraft portfolio. Collateral sup-
porting these nonearning fi nancing receivables primarily includes
assets in the restaurant and hospitality, trucking and industrial
equipment industries and corporate aircraft and, for our lever-
aged fi nance business, equity of the underlying businesses.
CLL—EUROPE. Nonearning receivables of $1.2 billion represented
12.5% of total nonearning receivables at December 31, 2011. The
ratio of allowance for losses as a percent of nonearning receiv-
ables decreased from 34.6% at December 31, 2010, to 34.3% at
December 31, 2011, primarily due to an increase in nonearning
receivables in our senior secured lending portfolio, partially offset
by a reduction in nonearning receivables related to account
restructuring in our asset-backed lending portfolio and improved
delinquency in our equipment fi nance portfolio. The majority of
nonearning receivables are attributable to the Interbanca S.p.A.
portfolio, which was acquired in 2009. The loans acquired with
Interbanca S.p.A. were recorded at fair value, which incorporates
an estimate at the acquisition date of credit losses over their
remaining life. Accordingly, these loans generally have a lower
ratio of allowance for losses as a percent of nonearning receiv-
ables compared to the remaining portfolio. Excluding the
nonearning loans attributable to the 2009 acquisition of
Interbanca S.p.A., the ratio of allowance for losses as a percent of
nonearning receivables decreased from 65.7% at December 31,
2010, to 55.9% at December 31, 2011, for the reasons described
above. The ratio of nonearning receivables as a percent of fi nanc-
ing receivables decreased from 3.3% at December 31, 2010, to
3.2% at December 31, 2011, as a result of a decrease in nonearning
receivables across our equipment fi nance and asset-backed
lending portfolios, partially offset by the increase in nonearning
receivables in our senior secured lending portfolio, for the reasons
described above. Collateral supporting these secured nonearning
fi nancing receivables are primarily equity of the underlying busi-
nesses for our senior secured lending and Interbanca S.p.A.
businesses, and equipment for our equipment fi nance portfolio.
CLL—ASIA. Nonearning receivables of $0.3 billion represented 2.9%
of total nonearning receivables at December 31, 2011. The ratio of
allowance for losses as a percent of nonearning receivables
increased from 54.7% at December 31, 2010, to 58.4% at
management’s discussion and analysis
54
GE 2011 ANNUAL REPORT
December 31, 2011, primarily as a result of collections and write-
offs of nonearning receivables in our asset-based fi nancing
businesses in Japan, Australia and New Zealand. The ratio of
nonearning receivables as a percent of fi nancing receivables
decreased from 3.4% at December 31, 2010, to 2.3% at
December 31, 2011, primarily due to the decline in nonearning
receivables related to our asset-based fi nancing businesses in
Japan, Australia and New Zealand, partially offset by a lower
fi nancing receivables balance. Collateral supporting these non-
earning fi nancing receivables is primarily commercial real estate,
manufacturing equipment, corporate aircraft, and assets in the
auto industry.
REAL ESTATE—DEBT. Nonearning receivables of $0.5 billion repre-
sented 5.8% of total nonearning receivables at December 31,
2011. The decrease in nonearning receivables from December 31,
2010, was driven primarily by the resolution of U.S. multi-family
and offi ce nonearning loans, as well as European hotel and retail
loans, through restructurings, payoffs and foreclosures, partially
offset by new European multi-family delinquencies. The ratio of
allowance for losses as a percent of nonearning receivables
increased from 134.4% to 175.4% refl ecting resolution of non-
earning loans as mentioned above. The ratio of allowance for
losses as a percent of total fi nancing receivables decreased from
4.3% at December 31, 2010 to 3.9% at December 31, 2011, driven
primarily by write-offs related to settlements and payoffs from
impaired loan borrowers and improvement in collateral values.
The Real Estate fi nancing receivables portfolio is collateralized
by income-producing or owner-occupied commercial properties
across a variety of asset classes and markets. At December 31,
2011, total Real Estate fi nancing receivables of $32.7 billion were
primarily collateralized by owner-occupied properties ($8.2 billion),
offi ce buildings ($7.2 billion), apartment buildings ($4.5 billion) and
hotel properties ($3.8 billion). In 2011, commercial real estate mar-
kets showed signs of improved stability and liquidity in certain
markets; however, the pace of improvement varies signifi cantly
by asset class and market and the long term outlook remains
uncertain. We have and continue to maintain an intense focus on
operations and risk management. Loan loss reserves related to our
Real Estate—Debt fi nancing receivables are particularly sensitive to
declines in underlying property values. Assuming global property
values decline an incremental 1% or 5%, and that decline occurs
evenly across geographies and asset classes, we estimate incre-
mental loan loss reserves would be required of less than $0.1 billion
and approximately $0.2 billion, respectively. Estimating the impact
of global property values on loss performance across our portfolio
depends on a number of factors, including macroeconomic condi-
tions, property level operating performance, local market dynamics
and individual borrower behavior. As a result, any sensitivity
analyses or attempts to forecast potential losses carry a high
degree of imprecision and are subject to change. At December 31,
2011, we had 119 foreclosed commercial real estate properties
totaling $0.7 billion.
CONSUMER—NON-U.S. RESIDENTIAL MORTGAGES. Nonearning
receivables of $3.3 billion represented 36.0% of total nonearn-
ing receivables at December 31, 2011. The ratio of allowance for
losses as a percent of nonearning receivables decreased from
21.5% at December 31, 2010, to 21.1% at December 31, 2011. In
the year ended 2011, our nonearning receivables decreased
primarily due to improving portfolio quality in the U.K. Our non-
U.S. mortgage portfolio has a loan-to-value ratio of approximately
75% at origination and the vast majority are fi rst lien positions.
Our U.K. and France portfolios, which comprise a majority of our
total mortgage portfolio, have reindexed loan-to-value ratios of
84% and 56%, respectively. About 4% of these loans are without
mortgage insurance and have a reindexed loan-to-value ratio
equal to or greater than 100%. Loan-to-value information is
updated on a quarterly basis for a majority of our loans and con-
siders economic factors such as the housing price index. At
December 31, 2011, we had in repossession stock 461 houses in
the U.K., which had a value of approximately $0.1 billion. The ratio
of nonearning receivables as a percent of fi nancing receivables
remained constant at 9.3% at December 31, 2011.
CONSUMER—NON-U.S. INSTALLMENT AND REVOLVING CREDIT.
Nonearning receivables of $0.3 billion represented 2.8% of total
non earning receivables at December 31, 2011. The ratio of allow-
ance for losses as a percent of nonearning receivables decreased
from 324.2% at December 31, 2010 to 272.6% at December 31,
2011, refl ecting the effects of loan repayments and reduced
originations primarily in our European platforms.
CONSUMER—U.S. INSTALLMENT AND REVOLVING CREDIT. Nonearn-
ing receivables of $1.0 billion represented 10.6% of total non earning
receivables at December 31, 2011. The ratio of allowance for losses
as a percent of nonearning receivables increased from 194.3% at
December 31, 2010, to 202.8% at December 31, 2011, as a result
of lower entry rates and improved collections resulting in reduc-
tions in our nonearning receivables balance. The ratio of
nonearning receivables as a percentage of fi nancing receivables
decreased from 2.7% at December 31, 2010 to 2.1% at
December 31, 2011, primarily due to lower delinquencies refl ect-
ing an improvement in the overall credit environment.

management’s discussion and analysis
GE 2011 ANNUAL REPORT 55
Nonaccrual Financing Receivables
The following table provides details related to our nonaccrual and
nonearning fi nancing receivables. Nonaccrual fi nancing receiv-
ables include all nonearning receivables and are those on which
we have stopped accruing interest. We stop accruing interest at
the earlier of the time at which collection becomes doubtful
or the account becomes 90 days past due. Substantially all of the
differences between nonearning and nonaccrual fi nancing
receivables relate to loans which are classifi ed as nonaccrual
fi nancing receivables but are paying on a cash accounting basis,
and therefore excluded from nonearning receivables. Of our
$17.0 billion nonaccrual loans at December 31, 2011, $7.5 billion
are currently paying in accordance with their contractual terms.
December 31, 2011 (In millions)
Nonaccrual
financing
receivables
Nonearning
financing
receivables
Commercial
CLL $ 4,512 $3,309
Energy Financial Services 22 22
GECAS 69 55
Other 115 65
Total Commercial 4,718 3,451
Real Estate 6,949 790
Consumer 5,316 5,064
Total $16,983 $9,305
Impaired Loans
“Impaired” loans in the table below are defi ned as larger balance
or restructured loans for which it is probable that the lender will be
unable to collect all amounts due according to original contractual
terms of the loan agreement. The vast majority of our Consumer
and a portion of our CLL nonaccrual receivables are excluded from
this defi nition, as they represent smaller balance homogeneous
loans that we evaluate collectively by portfolio for impairment.
Impaired loans include nonearning receivables on larger balance
or restructured loans, loans that are currently paying interest under
the cash basis (but are excluded from the nonearning category), and
loans paying currently but which have been previously restructured.
Specifi c reserves are recorded for individually impaired loans
to the extent we have determined that it is probable that we will
be unable to collect all amounts due according to original con-
tractual terms of the loan agreement. Certain loans classifi ed as
impaired may not require a reserve because we believe that we
will ultimately collect the unpaid balance (through collection or
collateral repossession).
Further information pertaining to loans classifi ed as impaired
and specifi c reserves is included in the table below.
December 31 (In millions) 2011 2010
LOANS REQUIRING ALLOWANCE FOR LOSSES
Commercial (a) $ 2,357 $ 2,733
Real Estate 4,957 6,812
Consumer 3,036 2,446
Total loans requiring allowance for losses 10,350 11,991
LOANS EXPECTED TO BE FULLY RECOVERABLE
Commercial (a) 3,305 3,087
Real Estate 3,790 3,005
Consumer 69 102
Total loans expected to be fully recoverable 7,164 6,194
TOTAL IMPAIRED LOANS $17,514 $18,185
ALLOWANCE FOR LOSSES (SPECIFIC RESERVES)
Commercial (a) $ 812 $ 1,031
Real Estate 822 1,150
Consumer 717 555
Total allowance for losses (specific reserves) $ 2,351 $ 2,736
Average investment during the period $18,384 $15,538
Interest income earned while impaired (b) 733 391
(a) Includes CLL, Energy Financial Services, GECAS and Other.
(b) Recognized principally on a cash basis.
We regularly review our Real Estate loans for impairment using
both quantitative and qualitative factors, such as debt service
coverage and loan-to-value ratios. We classify Real Estate loans
as impaired when the most recent valuation refl ects a projected
loan-to-value ratio at maturity in excess of 100%, even if the loan
is currently paying in accordance with contractual terms.
Of our $8.7 billion impaired loans at Real Estate at
December 31, 2011, $7.9 billion are currently paying in accordance
with the contractual terms of the loan and are typically loans
where the borrower has adequate debt service coverage to meet
contractual interest obligations. Impaired loans at CLL primarily
represent senior secured lending positions.
Our impaired loan balance at December 31, 2011 and 2010,
classifi ed by the method used to measure impairment was
as follows.
December 31 (In millions) 2011 2010
METHOD USED TO MEASURE IMPAIRMENT
Discounted cash flow $ 8,981 $ 7,644
Collateral value 8,533 10,541
Total $17,514 $18,185
See Note 1 for further information on collateral dependent loans
and our valuation process.
management’s discussion and analysis
56
GE 2011 ANNUAL REPORT
Our loss mitigation strategy is intended to minimize economic
loss and, at times, can result in rate reductions, principal forgive-
ness, extensions, forbearance or other actions, which may cause
the related loan to be classifi ed as a Troubled Debt Restructuring
(TDR), and also as impaired. Changes to Real Estate’s loans primar-
ily include maturity extensions, principal payment acceleration,
changes to collateral terms and cash sweeps, which are in addi-
tion to, or sometimes in lieu of, fees and rate increases. The
determination of whether these changes to the terms and con-
ditions of our commercial loans meet the TDR criteria includes
our consideration of all relevant facts and circumstances. At
December 31, 2011, TDRs included in impaired loans were
$13.7 billion, primarily relating to Real Estate ($7.0 billion), CLL
($3.6 billion) and Consumer ($2.9 billion).
Real Estate TDRs increased from $4.9 billion at December 31,
2010 to $7.0 billion at December 31, 2011, primarily driven by
loans scheduled to mature during 2011, some of which were
modifi ed during 2011 and classifi ed as TDRs upon modifi ca-
tion. For borrowers with demonstrated operating capabilities,
we work to restructure loans when the cash fl ow and projected
value of the underlying collateral support repayment over the
modifi ed term. We deem loan modifi cations to be TDRs when we
have granted a concession to a borrower experiencing fi nancial
diffi culty and we do not receive adequate compensation in the
form of an effective interest rate that is at current market rates
of interest given the risk characteristics of the loan or other con-
sideration that compensates us for the value of the concession.
For the year ended December 31, 2011, we modifi ed $4.0 billion
of loans classifi ed as TDRs, substantially all in our Debt portfolio.
Changes to these loans primarily included maturity extensions,
principal payment acceleration, changes to collateral or covenant
terms and cash sweeps, which are in addition to, or sometimes
in lieu of, fees and rate increases. The limited liquidity and higher
return requirements in the real estate market for loans with
higher loan-to-value (LTV) ratios has typically resulted in the con-
clusion that the modifi ed terms are not at current market rates
of interest, even if the modifi ed loans are expected to be fully
recoverable. We received the same or additional compensation in
the form of rate increases and fees for the majority of these TDRs.
Of our modifi cations classifi ed as TDRs in the last twelve months,
$0.1 billion have subsequently experienced a payment default.
The substantial majority of the Real Estate TDRs have reserves
determined based upon collateral value. Our specifi c reserves
on Real Estate TDRs were $0.6 billion at December 31, 2011 and
$0.4 billion at December 31, 2010, and were 8.4% and 8.9%,
respectively, of Real Estate TDRs. Although we experienced an
increase in TDRs over this period, in many situations these loans
did not require a specifi c reserve as collateral value adequately
covered our recorded investment in the loan. While these modi-
fi ed loans had adequate collateral coverage, we were still required
to complete our TDR classifi cation evaluation on each of the mod-
ifi cations without regard to collateral adequacy.
We utilize certain short-term (three months or less) loan modi-
fi cation programs for borrowers experiencing temporary fi nancial
diffi culties in our Consumer loan portfolio. These loan modifi cation
programs are primarily concentrated in our non-U.S. residential
mortgage and non-U.S. installment and revolving portfolios. We
sold our U.S. residential mortgage business in 2007 and as such,
do not participate in the U.S. government-sponsored mortgage
modifi cation programs. For the year ended December 31, 2011, we
provided short-term modifi cations of approximately $1.0 billion
of consumer loans for borrowers experiencing fi nancial diffi cul-
ties, substantially all in our non-U.S. residential mortgage, credit
card and personal loan portfolios, which are not classifi ed as TDRs.
For these modifi ed loans, we provided insignifi cant interest rate
reductions and payment deferrals, which were not part of the
terms of the original contract. We expect borrowers whose loans
have been modifi ed under these short-term programs to continue
to be able to meet their contractual obligations upon the conclu-
sion of the short-term modifi cation. In addition, we have modifi ed
$2.0 billion of Consumer loans for the year ended December 31,
2011, which are classifi ed as TDRs. Further information on
Consumer impaired loans is provided in Note 23.
Delinquencies
For additional information on delinquency rates at each of our
major portfolios, see Note 23.

management’s discussion and analysis
GE 2011 ANNUAL REPORT 57
GECS Selected European Exposures
At December 31, 2011, we had $92 billion in fi nancing receivables to consumer and commercial customers in Europe. The GECS fi nancing
receivables portfolio in Europe is well diversifi ed across European geographies and customers. Approximately 85% of the portfolio is
secured by collateral and represents approximately 500,000 commercial customers. Several European countries, including Spain, Portugal,
Ireland, Italy, Greece and Hungary (“focus countries”), have been subject to credit deterioration due to weaknesses in their economic and
fi scal situations. The carrying value of GECS funded exposures in these focus countries and in the rest of Europe comprised the following at
December 31, 2011.
December 31, 2011 (In millions) Spain Portugal Ireland Italy Greece Hungary
Rest of
Europe
Total
Europe
Financing receivables, net of allowance for loan
losses (a) (b) $2,316 $601 $881 $7,231 $ 88 $3,060 $78,208 $92,385
Investments (c) (d) 2 — 24 611 36 152 2,650 3,475
Derivatives, net of collateral (c) (e) 47 — — 86 — — 177 310
Total funded exposures (f) $2,365 $601 $905 $7,928 $124 $3,212 $81,035 $96,170
Unfunded commitments $ — $ — $ — $ 311 $ — $ 557 $ 8,168 $ 9,036
(a) Financing receivable amounts are classified based on the location or nature of the related obligor.
(b) Substantially all relates to non-sovereign obligors. Includes residential mortgage loans of approximately $35.4 billion before consideration of purchased credit protection.
We have third-party mortgage insurance for approximately 28% of these residential mortgage loans, substantially all of which were originated in the U.K., Poland and
France.
(c) Investments and derivatives are classified based on the location of the parent of the obligor or issuer.
(d) Includes $1.1 billion related to financial institutions, $0.5 billion related to non-financial institutions and $1.9 billion related to sovereign issuers. Sovereign issuances totaled
$0.1 billion, $0.1 billion and $0.1 billion related to Italy, Hungary and Greece, respectively. We held no investments issued by sovereign entities in the other focus countries.
(e) Net of cash collateral, entire amount is non-sovereign.
(f) Excludes other GECS funded assets in European countries, which comprise cash and equivalents ($41.6 billion), ELTO ($11.9 billion), real estate held for investment ($7.3 billion),
and cost and equity method investments ($2.5 billion). GECS cash and equivalents in European countries include cash on short-term placement with highly rated global
financial institutions based in Europe, sovereign central banks and agencies or supranational entities ($24.2 billion) and the remaining $17.4 billion of cash and equivalents is
placed with highly rated European financial institutions on a short-term basis and is secured by U.S. Treasury securities ($9.6 billion) and sovereign bonds of non-focus
countries ($7.8 billion), where the value of our collateral exceeds the amount of our cash exposure.
We manage counterparty exposure, including credit risk, on an
individual counterparty basis. We place defi ned risk limits around
each obligor and review our risk exposure on the basis of both the
primary and parent obligor, as well as the issuer of securities held
as collateral. These limits are adjusted on an ongoing basis based
on our continuing assessment of the credit risk of the obligor or
issuer. In setting our counterparty risk limits, we focus on high
quality credits and diversifi cation through spread of risk in an
effort to actively manage our overall exposure. We actively moni-
tor each exposure against these limits and take appropriate
action when we believe that risk limits have been exceeded or
there are excess risk concentrations. Our collateral position and
ability to work out problem accounts has historically mitigated
our actual loss experience. Delinquency experience has been
improving in our European commercial and consumer platforms
in the aggregate, and we actively monitor and take action to
reduce exposures where appropriate. Uncertainties surrounding
European markets could have an impact on the judgments and
estimates used in determining the carrying value of these assets.
OTHER GECS RECEIVABLES totaled $13.4 billion at December 31,
2011 and $12.9 billion at December 31, 2010, and consisted pri-
marily of amounts due from GE (primarily related to material
procurement programs of $3.5 billion and $2.7 billion at
December 31, 2011 and December 31, 2010, respectively), insur-
ance receivables, nonfi nancing customer receivables, amounts
due under operating leases, amounts accrued from investment
income, tax receivables and various sundry items.
PROPERTY, PLANT AND EQUIPMENT totaled $65.7 billion at
December 31, 2011, down $0.5 billion from 2010, primarily refl ect-
ing a reduction in equipment leased to others principally as a
result of the disposal of our CLL marine container leasing busi-
ness. GE property, plant and equipment consisted of investments
for its own productive use, whereas the largest element for GECS
was equipment provided to third parties on operating leases.
Details by category of investment are presented in Note 7.
GE additions to property, plant and equipment totaled
$3.0 billion and $2.4 billion in 2011 and 2010, respectively. Total
expenditures, excluding equipment leased to others, for the past
fi ve years were $13.1 billion, of which 40% was investment for
growth through new capacity and product development; 24%
was investment in productivity through new equipment and pro-
cess improvements; and 36% was investment for other purposes
such as improvement of research and development facilities and
safety and environmental protection.
GECS additions to property, plant and equipment were
$9.9 billion and $7.7 billion during 2011 and 2010, respectively, pri-
marily refl ecting additions of commercial aircraft at GECAS.
GOODWILL AND OTHER INTANGIBLE ASSETS totaled $84.7 billion
and $74.4 billion, respectively, at December 31, 2011. Goodwill
increased $8.2 billion from 2010, primarily from the acquisitions of
Converteam, the Well Support division of John Wood Group PLC,
Dresser, Inc., Wellstream PLC and Lineage Power Holdings, Inc.,
partially offset by the stronger U.S. dollar. Other intangible assets
increased $2.1 billion from 2010, primarily from acquisitions,
management’s discussion and analysis
58
GE 2011 ANNUAL REPORT
partially offset by amortization expense. Goodwill and intangible
assets were reduced by $19.6 billion and $2.6 billion in 2010 in
connection with our decision to transfer the assets of the NBCU
business to a joint venture. See Note 8.
ALL OTHER ASSETS comprise mainly real estate equity properties
and investments, equity and cost method investments, derivative
instruments and assets held for sale, and totaled $111.7 billion at
December 31, 2011, an increase of $17.4 billion, primarily related
to our investment in NBCU LLC ($18.0 billion), increases in the fair
value of derivative instruments ($4.6 billion) and our investment in
PTL ($1.2 billion), partially offset by a decrease in real estate equity
investments ($3.3 billion) and the sale of a substantial portion of
our equity investment in Garanti Bank ($3.0 billion). During 2011,
we recognized other-than-temporary impairments of cost and
equity method investments, excluding those related to real
estate, of $0.1 billion.
Included in other assets are Real Estate equity investments
of $23.9 billion and $27.2 billion at December 31, 2011 and
December 31, 2010, respectively. Our portfolio is diversifi ed, both
geographically and by asset type. We review the estimated values
of our commercial real estate investments at least annually, or
more frequently as conditions warrant. Based on the most recent
valuation estimates available, the carrying value of our Real Estate
investments exceeded their estimated value by about $2.6 bil-
lion. Commercial real estate valuations in 2011 showed signs of
improved stability and liquidity in certain markets, primarily in
the U.S.; however, the pace of improvement varies signifi cantly
by asset class and market. Accordingly, there continues to be
risk and uncertainty surrounding commercial real estate values.
Declines in estimated value of real estate below carrying amount
result in impairment losses when the aggregate undiscounted
cash fl ow estimates used in the estimated value measurement
are below the carrying amount. As such, estimated losses in the
portfolio will not necessarily result in recognized impairment
losses. During 2011, Real Estate recognized pre-tax impairments
of $1.2 billion in its real estate held for investment, which were
driven by declining cash fl ow projections for properties in certain
markets, most notably Japan and Spain, as well as properties
we have identifi ed for short-term disposition based upon our
updated outlook of local market conditions. Real Estate invest-
ments with undiscounted cash fl ows in excess of carrying value
of 0% to 5% at December 31, 2011 had a carrying value of $1.6 bil-
lion and an associated estimated unrealized loss of approximately
$0.2 billion. Continued deterioration in economic conditions or
prolonged market illiquidity may result in further impairments
being recognized.
Contract costs and estimated earnings refl ect revenues
earned in excess of billings on our long-term contracts to con-
struct technically complex equipment (such as power generation,
aircraft engines and aeroderivative units) and long-term prod-
uct maintenance or extended warranty arrangements. Our total
contract costs and estimated earnings balances at December 31,
2011 and 2010, were $9.0 billion and $8.1 billion, respectively,
refl ecting the timing of billing in relation to work performed,
as well as changes in estimates of future revenues and costs.
Our total contract costs and estimated earnings balance at
December 31, 2011, primarily related to customers in our Energy,
Aviation and Transportation businesses. Further information is
provided in the Critical Accounting Estimates section.
LIQUIDITY AND BORROWINGS
We maintain a strong focus on liquidity. At both GE and GECS we
manage our liquidity to help ensure access to suffi cient funding to
meet our business needs and fi nancial obligations throughout
business cycles.
Our liquidity and borrowing plans for GE and GECS are estab-
lished within the context of our annual fi nancial and strategic
planning processes. At GE, our liquidity and funding plans take
into account the liquidity necessary to fund our operating com-
mitments, which include primarily purchase obligations for
inventory and equipment, payroll and general expenses (including
pension funding). We also take into account our capital allocation
and growth objectives, including paying dividends, repurchas-
ing shares, investing in research and development and acquiring
industrial businesses. At GE, we rely primarily on cash generated
through our operating activities and also have historically main-
tained a commercial paper program that we regularly use to fund
operations in the U.S., principally within fi scal quarters.
GECS’ liquidity position is targeted to meet our obligations
under both normal and stressed conditions. GECS establishes a
funding plan annually that is based on the projected asset size
and cash needs of the Company, which over the past few years,
has included our strategy to reduce our ending net investment in
GE Capital. GECS relies on a diversifi ed source of funding, includ-
ing the unsecured term debt markets, the global commercial
paper markets, deposits, secured funding, retail funding prod-
ucts, bank borrowings and securitizations to fund its balance
sheet, in addition to cash generated through collection of princi-
pal, interest and other payments on our existing portfolio of loans
and leases to fund its operating and interest expense costs.
Our 2012 GECS funding plan anticipates repayment of princi-
pal on outstanding short-term borrowings, including the current
portion of its long-term debt ($82.7 billion at December 31, 2011,
which includes $2.7 billion of alternative and other funding),
through issuance of long-term debt and reissuance of com-
mercial paper, cash on hand, collections of fi nancing receivables
exceeding originations, dispositions, asset sales, and deposits
and other alternative sources of funding. Interest on borrowings
is primarily repaid through interest earned on existing fi nancing
receivables. During 2011, GECS earned interest income on fi nanc-
ing receivables of $22.4 billion, which more than offset interest
expense of $13.9 billion.
We maintain a detailed liquidity policy for GECS which includes
a requirement to maintain a contingency funding plan. The
liquidity policy defi nes GECS’ liquidity risk tolerance under dif-
ferent stress scenarios based on its liquidity sources and also
establishes procedures to escalate potential issues. We actively
monitor GECS’ access to funding markets and its liquidity profi le
through tracking external indicators and testing various stress
scenarios. The contingency funding plan provides a framework
for handling market disruptions and establishes escalation proce-
dures in the event that such events or circumstances arise.
management’s discussion and analysis
GE 2011 ANNUAL REPORT 59
GECS is a savings and loan holding company under U.S. law
and became subject to Federal Reserve Board (FRB) supervision
on July 21, 2011, the one-year anniversary of the Dodd-Frank
Wall Street Reform and Consumer Protection Act. The FRB has
recently fi nalized a regulation that requires certain organizations
it supervises to submit annual capital plans for review, including
institutions’ plans to make capital distributions, such as divi-
dend payments. The applicability and timing of this proposed
regulation to GECS is not yet determined; however, the FRB has
indicated that it expects to extend these requirements to large
savings and loan holding companies through separate rulemak-
ing or by order. We expect that GECS capital allocation planning
will be subject to FRB review, which could affect the timing of the
GE Capital dividend to the parent.
Actions taken to strengthen and maintain our liquidity are
described in the following section.
Liquidity Sources
We maintain liquidity sources that consist of cash and equivalents
and a portfolio of high-quality, liquid investments (Liquidity
Portfolio) and committed unused credit lines.
We have consolidated cash and equivalents of $84.5 billion
at December 31, 2011, which is available to meet our needs. See
Statement of Financial Position. At GECS, about $9 billion is in
regulated bank and insurance entities and is subject to regulatory
restrictions. Most of GE’s cash is held outside the U.S. and is avail-
able to fund operations and other growth of non-U.S. subsidiaries;
it is also available to fund our needs in the U.S. on a short-term
basis without being subject to U.S. tax. Under current tax laws,
should GE or GECS determine to repatriate cash and equivalents
held outside the U.S., we may be subject to additional U.S. income
taxes and foreign withholding taxes. Less than $1 billion is held in
restricted countries.
In addition to our $84.5 billion of cash and equivalents, we
have a centrally-managed portfolio of high-quality, liquid invest-
ments with a fair value of $3.6 billion at December 31, 2011. The
Liquidity Portfolio is used to manage liquidity and meet the oper-
ating needs of GECS under both normal and stress scenarios.
The investments consist of unencumbered U.S. government
securities, U.S. agency securities, securities guaranteed by the
government, supranational securities, and a select group of non-
U.S. government securities. We believe that we can readily obtain
cash for these securities, even in stressed market conditions.
We have committed, unused credit lines totaling $52.4 bil-
lion that have been extended to us by 58 fi nancial institutions at
December 31, 2011. These lines include $35.1 billion of revolving
credit agreements under which we can borrow funds for peri-
ods exceeding one year. Additionally, $16.7 billion are 364-day
lines that contain a term-out feature that allows us to extend
borrowings for one year from the date of expiration of the
lending agreement.
At December 31, 2011, our aggregate cash and equivalents
and committed credit lines were more than twice GECS’ commer-
cial paper borrowings balance.
Funding Plan
We have reduced our GE Capital ending net investment, exclud-
ing cash and equivalents, from $526 billion at January 1, 2010 to
$445 billion at December 31, 2011.
In 2011, we completed issuances of $26.9 billion of senior
unsecured debt and $2.0 billion of subordinated notes with
maturities up to 25 years (and subsequent to December 31, 2011,
an additional $11.6 billion). Average commercial paper borrow-
ings for GECS and GE during the fourth quarter were $42.4 billion
and $15.6 billion, respectively, and the maximum amount of com-
mercial paper borrowings outstanding for GECS and GE during
the fourth quarter was $45.0 billion and $18.7 billion, respectively.
GECS commercial paper maturities are funded principally through
new issuances and at GE are substantially repaid by quarter-end
using overseas cash which is available for use in the U.S. on a
short-term basis without being subject to U.S. tax.
Under the Federal Deposit Insurance Corporation’s (FDIC)
Temporary Liquidity Guarantee Program (TLGP), the FDIC guaran-
teed certain senior, unsecured debt issued by GECC on or before
October 31, 2009 for which we paid $2.3 billion of fees to the FDIC
for our participation. Our TLGP-guaranteed debt has remaining
maturities of $35 billion in 2012. We anticipate funding these and
our other long-term debt maturities through a combination of
existing cash, new debt issuances, collections exceeding origi-
nations, dispositions, asset sales, deposits and other alternative
sources of funding. GECC and GE are parties to an Eligible Entity
Designation Agreement and GECC is subject to the terms of a
Master Agreement, each entered into with the FDIC. The terms
of these agreements include, among other things, a requirement
that GE and GECC reimburse the FDIC for any amounts that the
FDIC pays to holders of GECC debt that is guaranteed by the FDIC.
We securitize fi nancial assets as an alternative source of fund-
ing. During 2011, we completed $11.8 billion of non-recourse
issuances and had maturities of $12.0 billion. At December 31,
2011, consolidated non-recourse borrowings were $29.3 billion.
We anticipate that securitization will remain a part of our overall
funding capabilities notwithstanding the changes in consolida-
tion rules described in Notes 1 and 24.
Our issuances of securities repurchase agreements are
insignifi cant and are limited to activities at certain of our for-
eign banks. At December 31, 2011 and December 31, 2010, we
were party to repurchase agreements totaling $0.1 billion and
$0.2 billion, respectively, which were accounted for as on-book
fi nancings. We have had no repurchase agreements which were
not accounted for as fi nancings and we do not engage in securi-
ties lending transactions.
We have deposit-taking capability at 11 banks outside of the
U.S. and two banks in the U.S.—GE Capital Retail Bank (formerly
GE Money Bank), a Federal Savings Bank (FSB), and GE Capital
Financial Inc., an industrial bank (IB). The FSB and IB currently
issue certifi cates of deposit (CDs) in maturity terms from three
months to ten years.
Total alternative funding at December 31, 2011 was $66 bil-
lion, composed mainly of $43 billion bank deposits, $9 billion
of funding secured by real estate, aircraft and other collateral
and $8 billion GE Interest Plus notes. The comparable amount at
December 31, 2010 was $60 billion.
management’s discussion and analysis
60
GE 2011 ANNUAL REPORT
Preferred Share Redemption
On October 16, 2008, we issued 30,000 shares of 10% cumulative
perpetual preferred stock (par value $1.00 per share) having an
aggregate liquidation value of $3.0 billion, and warrants to pur-
chase 134,831,460 shares of common stock (par value $0.06 per
share) to Berkshire Hathaway Inc. (Berkshire Hathaway) for net
proceeds of $3.0 billion in cash. The proceeds were allocated to
the preferred shares ($2.5 billion) and the warrants ($0.5 billion) on
a relative fair value basis and recorded in other capital. The war-
rants are exercisable for fi ve years at an exercise price of $22.25
per share of common stock and settled through physical
share issuance.
The preferred stock was redeemable at our option three
years after issuance at a price of 110% of liquidation value plus
accrued and unpaid dividends. On September 13, 2011, we
provided notice to Berkshire Hathaway that we would redeem
the shares for the stated redemption price of $3.3 billion, plus
accrued and unpaid dividends. In connection with this notice,
we recognized a preferred dividend of $0.8 billion (calculated as
the difference between the carrying value and redemption value
of the preferred stock), which was recorded as a reduction to
our third quarter earnings attributable to common shareown-
ers and common shareowners’ equity and a related EPS charge
of $0.08. As a result and beginning in the fourth quarter of 2011,
we are no longer required to pay the preferred share dividends
of $0.3 billion annually. The preferred shares were redeemed on
October 17, 2011.
EXCHANGE RATE AND INTEREST RATE RISKS are managed with a
variety of techniques, including match funding and selective use
of derivatives. We use derivatives to mitigate or eliminate certain
fi nancial and market risks because we conduct business in
diverse markets around the world and local funding is not always
effi cient. In addition, we use derivatives to adjust the debt we are
issuing to match the fi xed or fl oating nature of the assets we are
originating. We apply strict policies to manage each of these risks,
including prohibitions on speculative activities. Following is an
analysis of the potential effects of changes in interest rates and
currency exchange rates using so-called “shock” tests that seek
to model the effects of shifts in rates. Such tests are inherently
limited based on the assumptions used (described further below)
and should not be viewed as a forecast; actual effects would
depend on many variables, including market factors and the
composition of the Company’s assets and liability portfolio at
that time.
• It is our policy to minimize exposure to interest rate changes.
We fund our fi nancial investments using debt or a combina-
tion of debt and hedging instruments so that the interest rates
of our borrowings match the expected interest rate profi le on
our assets. To test the effectiveness of our fi xed rate positions,
we assumed that, on January 1, 2012, interest rates increased
by 100 basis points across the yield curve (a “parallel shift” in
that curve) and further assumed that the increase remained
in place for 2012. We estimated, based on the year-end 2011
portfolio and holding all other assumptions constant, that our
2012 consolidated net earnings would decline by less than
$0.1 billion as a result of this parallel shift in the yield curve.
• It is our policy to minimize currency exposures and to con-
duct operations either within functional currencies or using
the protection of hedge strategies. We analyzed year-end
2011 consolidated currency exposures, including derivatives
designated and effective as hedges, to identify assets and
liabilities denominated in other than their relevant functional
currencies. For such assets and liabilities, we then evaluated
the effects of a 10% shift in exchange rates between those
currencies and the U.S. dollar, holding all other assumptions
constant. This analysis indicated that our 2012 consolidated
net earnings would decline by less than $0.1 billion as a result
of such a shift in exchange rates.
Debt and Derivative Instruments, Guarantees and Covenants
PRINCIPAL DEBT AND DERIVATIVE CONDITIONS are described below.
Certain of our derivative instruments can be terminated if speci-
fi ed credit ratings are not maintained and certain debt and
derivatives agreements of other consolidated entities have provi-
sions that are affected by these credit ratings. As of December 31,
2011, GE and GECC’s long-term unsecured debt credit rating from
Standard and Poor’s Ratings Service (S&P) was “AA+” with a stable
outlook and from Moody’s Investors Service (“Moody’s”) was “Aa2”
with a stable outlook. As of December 31, 2011, GE, GECS and
GECC’s short-term credit rating from S&P was “A-1+” and from
Moody’s was “P-1”. We are disclosing these ratings to enhance
understanding of our sources of liquidity and the effects of our
ratings on our costs of funds. Although we currently do not
expect a downgrade in the credit ratings, our ratings may be
subject to revision or withdrawal at any time by the assigning
rating organization, and each rating should be evaluated indepen-
dently of any other rating.
Fair values of our derivatives can change signifi cantly from
period to period based on, among other factors, market move-
ments and changes in our positions. We manage counterparty
credit risk (the risk that counterparties will default and not make
payments to us according to the terms of our standard master
agreements) on an individual counterparty basis. Where we have
agreed to netting of derivative exposures with a counterparty,
we offset our exposures with that counterparty and apply the
value of collateral posted to us to determine the net exposure.
Accordingly, we actively monitor these net exposures against
defi ned limits and take appropriate actions in response, including
requiring additional collateral.
Swap, forward and option contracts are executed under stan-
dard master agreements that typically contain mutual downgrade
provisions that provide the ability of the counterparty to require
termination if the long-term credit rating of the applicable GE
entity were to fall below A-/A3. In certain of these master agree-
ments, the counterparty also has the ability to require termination
if the short-term rating of the applicable GE entity were to fall
below A-1/P-1. The net derivative liability after consideration
of netting arrangements, outstanding interest payments and
management’s discussion and analysis
GE 2011 ANNUAL REPORT 61
collateral posted by us under these master agreements was esti-
mated to be $1.2 billion at December 31, 2011. See Note 22.
Other debt and derivative agreements of consolidated entities:
• Trinity comprises two consolidated entities that hold invest-
ment securities, the majority of which are investment grade,
and are funded by the issuance of GICs. Since 2004, GECC
has fully guaranteed repayment of these entities’ GIC obliga-
tions. If the long-term credit rating of GECC were to fall below
AA-/Aa3 or its short-term credit rating were to fall below
A-1+/P-1, certain GIC holders could require immediate repay-
ment of their investment. To the extent that amounts due
exceed the ultimate value of proceeds realized from Trinity
assets, GECC would be required to provide such excess
amount. As of December 31, 2011, the carrying value of the
liabilities of these entities was $5.6 billion and the fair value
of their assets was $4.7 billion (which included net unrealized
losses on investment securities of $0.7 billion). With respect
to these investment securities, we intend to hold them at
least until such time as their individual fair values exceed their
amortized cost. We have the ability to hold all such debt secu-
rities until maturity.
• Another consolidated entity also had issued GICs where pro-
ceeds are loaned to GECC. If the long-term credit rating of
GECC were to fall below AA-/Aa3 or its short-term credit rat-
ing were to fall below A-1+/P-1, GECC could be required to
provide up to approximately $1.7 billion as of December 31,
2011, to repay holders of GICs, compared to $2.3 billion at
December 31, 2010. These obligations are included in long-
term borrowings in our Statement of Financial Position.
• If the short-term credit rating of GECC were reduced below
A-1/P-1, GECC would be required to partially cash collateral-
ize certain covered bonds. The maximum amount that would
be required to be provided in the event of such a downgrade
is determined by contract and amounted to $0.7 billion and
$0.8 billion at December 31, 2011 and December 31, 2010,
respectively. These obligations are included in long-term bor-
rowings in our Statement of Financial Position.
RATIO OF EARNINGS TO FIXED CHARGES, INCOME MAINTENANCE
AGREEMENT AND SUBORDINATED DEBENTURES.
On March 28,
1991, GE entered into an agreement with GECC to make payments
to GECC, constituting additions to pre-tax income under the
agreement, to the extent necessary to cause the ratio of earnings
to fi xed charges of GECC and consolidated affi liates (determined
on a consolidated basis) to be not less than 1.10:1 for the period,
as a single aggregation, of each GECC fi scal year commencing
with fi scal year 1991. GECC’s ratio of earnings to fi xed charges
was 1.52:1 for 2011. No payment is required in 2012 pursuant to
this agreement.
Any payment made under the Income Maintenance Agreement
will not affect the ratio of earnings to fi xed charges as determined
in accordance with current SEC rules because it does not constitute
an addition to pre-tax income under current U.S. GAAP.
In addition, in connection with certain subordinated deben-
tures for which GECC receives equity credit by rating agencies, GE
has agreed to promptly return dividends, distributions or other
payments it receives from GECC during events of default or inter-
est deferral periods under such subordinated debentures. There
were $7.2 billion of such debentures outstanding at December 31,
2011. See Note 10.
Consolidated Statement of Changes in Shareowners’ Equity
GE shareowners’ equity decreased by $2.5 billion in 2011, com-
pared with an increase of $1.6 billion in 2010 and an increase of
$12.6 billion in 2009.
Net earnings increased GE shareowners’ equity by $14.2 bil-
lion, $11.6 billion and $11.0 billion, partially offset by dividends
declared of $7.5 billion (including $0.8 billion related to our pre-
ferred stock redemption), $5.2 billion and $6.8 billion in 2011, 2010
and 2009, respectively.
Elements of other comprehensive income (OCI) decreased
shareowners’ equity by $6.1 billion in 2011 and $2.3 billion in 2010,
respectively, compared with an increase of $6.6 billion in 2009,
inclusive of changes in accounting principles. The components of
these changes are as follows:
• Changes in benefi t plans decreased shareowners’ equity by
$7.0 billion in 2011, primarily refl ecting lower discount rates
used to measure pension and postretirement benefi t obliga-
tions and lower asset values, partially offset by amortization
of actuarial losses and prior service costs out of accumulated
other comprehensive income (AOCI). This compared with
an increase of $1.1 billion and a decrease of $1.8 billion in
2010 and 2009, respectively. The increase in 2010 primarily
refl ected prior service cost and net actuarial loss amortiza-
tion out of AOCI and higher fair value of plans assets, partially
offset by lower discount rates used to measure pension and
postretirement benefi t obligations. The decrease in 2009
primarily related to lower discount rates used to measure
pension and postretirement benefi t obligations. Further infor-
mation about changes in benefi t plans is provided in Note 12.
• Currency translation adjustments increased shareowners’
equity by $0.2 billion in 2011, decreased equity by $3.9 billion
in 2010 and increased equity by $4.1 billion in 2009. Changes
in currency translation adjustments refl ect the effects of
changes in currency exchange rates on our net investment
in non-U.S. subsidiaries that have functional currencies other
than the U.S. dollar. At year end 2011 and 2010, the U.S. dol-
lar strengthened against most major currencies, including
the pound sterling and the euro, and weakened against the
Australian dollar and the Japanese yen. Releases from AOCI
related to dispositions and changes in deferred taxes more
than offset the effect in 2011. At year end 2009, the dollar
weakened against most major currencies.
• The change in fair value of investment securities increased
shareowners’ equity by $0.6 billion in 2011, refl ecting lower
interest rates and improved market conditions related to U.S.
corporate securities, partially offset by adjustments to refl ect
the effect of the unrealized gains on insurance-related assets
and equity. The change in fair value of investment securities
increased shareowners’ equity by an insignifi cant amount and
$2.7 billion in 2010 and 2009, respectively. Further information
about investment securities is provided in Note 3.

management’s discussion and analysis
62
GE 2011 ANNUAL REPORT
• Changes in the fair value of derivatives designated as cash
fl ow hedges increased shareowners’ equity by $0.1 billion
in 2011, primarily refl ecting lower fair values of interest rate
and cross-currency hedges which were more than offset
by releases from AOCI contemporaneous with the earnings
effects of the related hedged items, principally as an adjust-
ment of interest expense on borrowings. The change in the
fair value of derivatives designated as cash fl ow hedges
increased shareowners’ equity by $0.5 billion and $1.6 billion
in 2010 and 2009, respectively. Further information about the
fair value of derivatives is provided in Note 22.
Statement of Cash Flows—Overview from 2009 through 2011
Consolidated cash and equivalents were $84.5 billion at
December 31, 2011, an increase of $5.6 billion from December 31,
2010. Cash and equivalents totaled $78.9 billion at December 31,
2010, an increase of $7.1 billion from December 31, 2009.
We evaluate our cash fl ow performance by reviewing our
industrial (non-fi nancial services) businesses and fi nancial ser-
vices businesses separately. Cash from operating activities (CFOA)
is the principal source of cash generation for our industrial busi-
nesses. The industrial businesses also have liquidity available via
the public capital markets. Our fi nancial services businesses use
a variety of fi nancial resources to meet our capital needs. Cash for
fi nancial services businesses is primarily provided from the issu-
ance of term debt and commercial paper in the public and private
markets and deposits, as well as fi nancing receivables collections,
sales and securitizations.
GE Cash Flow
GE cash and equivalents were $8.4 billion at December 31, 2011,
compared with $19.2 billion at December 31, 2010. GE CFOA
totaled $12.1 billion in 2011 compared with $14.7 billion and
$16.4 billion in 2010 and 2009, respectively. With respect to GE
CFOA, we believe that it is useful to supplement our GE Statement
of Cash Flows and to examine in a broader context the business
activities that provide and require cash.
GE CFOA decreased $2.7 billion compared with 2010, primar-
ily due to the impact of the disposal of NBCU. In 2010, GE CFOA
decreased $1.7 billion compared with 2009, primarily refl ecting
a decrease in progress collections.
(In billions) 2011 2010 2009
Operating cash collections (a) $ 93.6 $ 98.2 $104.1
Operating cash payments (81.5) (83.5) (87.7)
GE cash from operating
activities (GE CFOA) (a) $ 12.1 $ 14.7 $ 16.4
(a) GE sells customer receivables to GECS in part to fund the growth of our industrial
businesses. These transactions can result in cash generation or cash use. During
any given period, GE receives cash from the sale of receivables to GECS. It also
foregoes collection of cash on receivables sold. The incremental amount of cash
received from sale of receivables in excess of the cash GE would have otherwise
collected had those receivables not been sold, represents the cash generated or
used in the period relating to this activity. The incremental cash generated in GE
CFOA from selling these receivables to GECS increased GE CFOA by $0.9 billion in
2011, decreased GE CFOA by $0.4 billion in 2010 and increased GE CFOA by an
insignificant amount in 2009. See Note 27 for additional information about the
elimination of intercompany transactions between GE and GECS.
The most signifi cant source of cash in GE CFOA is customer-
related activities, the largest of which is collecting cash following
a product or services sale. GE operating cash collections
decreased by $4.6 billion in 2011 and decreased by $5.9 billion in
2010. These changes are consistent with the changes in compa-
rable GE operating segment revenues, including the impact of the
disposal of NBCU. Analyses of operating segment revenues dis-
cussed in the preceding Segment Operations section are the best
way of understanding their customer-related CFOA.
The most signifi cant operating use of cash is to pay our sup-
pliers, employees, tax authorities and others for a wide range of
material and services. GE operating cash payments decreased in
2011 and 2010 by $2.0 billion and $4.2 billion, respectively. These
changes are consistent with the changes in GE total costs and
expenses, including the impact of the disposal of NBCU.
Dividends from GECS represented the distribution of a por-
tion of GECS retained earnings and are distinct from cash from
continuing operating activities within the fi nancial services busi-
nesses. The amounts included in GE CFOA are the total dividends,
including normal dividends as well as any special dividends from
excess capital, primarily resulting from GECS business sales.
Beginning in the fi rst quarter of 2009, GECS suspended its normal
dividend to GE. There were no special dividends received from
GECS in 2011, 2010 or 2009.
GECS Cash Flow
GECS cash and equivalents were $76.7 billion at December 31,
2011, compared with $60.3 billion at December 31, 2010. GECS
cash from operating activities totaled $21.1 billion for 2011, com-
pared with cash from operating activities of $21.6 billion for the
same period of 2010. This was primarily due to increases, com-
pared to the prior year, in cash paid for income taxes of $0.7 billion
and decreases in accrued expenses of $1.4 billion, partially offset
by increases in net cash collateral held from counterparties on
derivative contracts of $1.2 billion.
Consistent with our plan to reduce GECS asset levels, cash
from investing activities was $29.2 billion in 2011, resulting from a
$14.4 billion reduction in fi nancing receivables due to collections
exceeding originations. We received proceeds of $11.6 billion
from sales of GE Capital’s Australian Home Lending operations
($4.6 billion), Consumer businesses in Mexico ($1.9 billion), Canada
($1.4 billion) and Singapore ($0.7 billion), Consumer RV Marine
($1.8 billion), our Real Estate Interpark business ($0.7 billion), our
CLL marine container leasing business ($0.4 billion) and our CLL
trailer fl eet services business in Mexico ($0.1 billion). Additionally,
we received proceeds of $4.4 billion from the sale of our equity
method investments in Garanti Bank ($3.8 billion) and Banco
Colpatria ($0.6 billion). These increases are partially offset by
an increase in equipment purchases, mainly at our GECAS and
CLL businesses.
GECS cash used for fi nancing activities in 2011 of $33.1 billion
related primarily to a $37.8 billion reduction in total borrowings,
consisting primarily of reductions in long-term borrowings and
commercial paper, partially offset by an increase in deposits at
our banks.
GECS pays dividends to GE through a distribution of its
retained earnings, including special dividends from proceeds of
certain business sales.

management’s discussion and analysis
GE 2011 ANNUAL REPORT 63
Intercompany Eliminations
Effects of transactions between related companies are made on an arms-length basis, are eliminated and consist primarily of GECS
dividends to GE or capital contributions from GE to GECS; GE customer receivables sold to GECS; GECS services for trade receivables
management and material procurement; buildings and equipment (including automobiles) leased between GE and GECS; information
technology (IT) and other services sold to GECS by GE; aircraft engines manufactured by GE that are installed on aircraft purchased by
GECS from third-party producers for lease to others; and various investments, loans and allocations of GE corporate overhead costs.
For further information related to intercompany eliminations, see Note 27.
Contractual Obligations
As defi ned by reporting regulations, our contractual obligations for future payments as of December 31, 2011, follow.
Payments due by period
(In billions) Total 2012 2013–2014 2015–2016
2017 and
thereafter
Borrowings and bank deposits (Note 10) $453.4 $173.8 $104.5 $52.6 $122.5
Interest on borrowings and bank deposits 116.1 12.2 17.5 12.8 73.6
Purchase obligations (a) (b) 57.3 32.5 15.1 4.7 5.0
Insurance liabilities (Note 11) (c) 23.7 2.9 3.6 2.5 14.7
Operating lease obligations (Note 19) 4.5 1.0 1.4 0.9 1.2
Other liabilities (d) 73.6 23.5 12.5 8.0 29.6
Contractual obligations of discontinued operations (e) 1.4 1.4 — — —
(a) Included all take-or-pay arrangements, capital expenditures, contractual commitments to purchase equipment that will be leased to others, contractual commitments
related to factoring agreements, software acquisition/license commitments, contractual minimum programming commitments and any contractually required cash
payments for acquisitions.
(b) Excluded funding commitments entered into in the ordinary course of business by our financial services businesses. Further information on these commitments and other
guarantees is provided in Note 25.
(c) Included contracts with reasonably determinable cash flows such as structured settlements, certain property and casualty contracts, and guaranteed investment
contracts.
(d) Included an estimate of future expected funding requirements related to our pension and postretirement benefit plans and included liabilities for unrecognized tax
benefits. Because their future cash outflows are uncertain, the following non-current liabilities are excluded from the table above: deferred taxes, derivatives, deferred
revenue and other sundry items. For further information on certain of these items, see Notes 14 and 22.
(e) Included payments for other liabilities.
Variable Interest Entities (VIEs)
We securitize fi nancial assets and arrange other forms of asset-
backed fi nancing in the ordinary course of business as an
alternative source of funding. The securitization transactions we
engage in are similar to those used by many fi nancial institutions.
The assets we securitize include: receivables secured by
equipment, commercial real estate, credit card receivables, fl oor-
plan inventory receivables, GE trade receivables and other assets
originated and underwritten by us in the ordinary course of
business. The securitizations are funded with asset-backed com-
mercial paper and term debt.
Substantially all of our securitization VIEs are consolidated
because we are considered to be the primary benefi ciary of the
entity. Our interests in other VIEs for which we are not the primary
benefi ciary are accounted for as investment securities, fi nanc-
ing receivables or equity method investments depending on the
nature of our involvement.
At December 31, 2011, consolidated variable interest entity
assets and liabilities were $46.7 billion and $35.2 billion, respectively,
a decrease of $4.1 billion and $3.1 billion from 2010, respectively.
Assets held by these entities are of equivalent credit quality to
our on-book assets. We monitor the underlying credit quality in
accordance with our role as servicer and apply rigorous controls to
the execution of securitization transactions. With the exception of
credit and liquidity support discussed below, investors in these enti-
ties have recourse only to the underlying assets.
At December 31, 2011, investments in unconsolidated VIEs,
including our noncontrolling interest in PTL, were $16.5 billion, an
increase of $3.9 billion from 2010, primarily related to an increase
of $2.1 billion in an investment in asset-backed securities issued
by a senior secured loan fund and $1.2 billion in PTL. In addition to
our existing investments, we have contractual obligations to fund
additional investments in the unconsolidated VIEs to fund new
asset origination. At December 31, 2011, these contractual obliga-
tions were $4.3 billion, a decrease of $0.7 billion from 2010.
We do not have implicit support arrangements with any VIE.
We did not provide non-contractual support for previously trans-
ferred fi nancing receivables to any VIE in either 2011 or 2010.
management’s discussion and analysis
64
GE 2011 ANNUAL REPORT
Critical Accounting Estimates
Accounting estimates and assumptions discussed in this section
are those that we consider to be the most critical to an under-
standing of our fi nancial statements because they involve
signifi cant judgments and uncertainties. Many of these estimates
include determining fair value. All of these estimates refl ect our
best judgment about current, and for some estimates future,
economic and market conditions and their effects based on
information available as of the date of these fi nancial statements.
If these conditions change from those expected, it is reasonably
possible that the judgments and estimates described below could
change, which may result in future impairments of investment
securities, goodwill, intangibles and long-lived assets, incremen-
tal losses on fi nancing receivables, increases in reserves for
contingencies, establishment of valuation allowances on deferred
tax assets and increased tax liabilities, among other effects. Also
see Note 1, Summary of Signifi cant Accounting Policies, which
discusses the signifi cant accounting policies that we have
selected from acceptable alternatives.
LOSSES ON FINANCING RECEIVABLES are recognized when they are
incurred, which requires us to make our best estimate of probable
losses inherent in the portfolio. The method for calculating the
best estimate of losses depends on the size, type and risk charac-
teristics of the related fi nancing receivable. Such an estimate
requires consideration of historical loss experience, adjusted for
current conditions, and judgments about the probable effects of
relevant observable data, including present economic conditions
such as delinquency rates, fi nancial health of specifi c customers
and market sectors, collateral values (including housing price
indices as applicable), and the present and expected future levels
of interest rates. The underlying assumptions, estimates and
assessments we use to provide for losses are updated periodi-
cally to refl ect our view of current conditions. Changes in such
estimates can signifi cantly affect the allowance and provision for
losses. It is possible that we will experience credit losses that are
different from our current estimates. Write-offs in both our con-
sumer and commercial portfolios can also refl ect both losses that
are incurred subsequent to the beginning of a fi scal year and
information becoming available during that fi scal year which may
identify further deterioration on exposures existing prior to the
beginning of that fi scal year, and for which reserves could not
have been previously recognized. Our risk management process
includes standards and policies for reviewing major risk expo-
sures and concentrations, and evaluates relevant data either for
individual loans or fi nancing leases, or on a portfolio basis,
as appropriate.
Further information is provided in the Global Risk Management
section and Financial Resources and Liquidity—Financing
Receivables sections, the Asset Impairment section that follows
and in Notes 1, 6 and 23.
REVENUE RECOGNITION ON LONG-TERM PRODUCT SERVICES
AGREEMENTS
requires estimates of profi ts over the multiple-year
terms of such agreements, considering factors such as the fre-
quency and extent of future monitoring, maintenance and
overhaul events; the amount of personnel, spare parts and other
resources required to perform the services; and future billing rate
and cost changes. We routinely review estimates under product
services agreements and regularly revise them to adjust for
changes in outlook. We also regularly assess customer credit risk
inherent in the carrying amounts of receivables and contract
costs and estimated earnings, including the risk that contractual
penalties may not be suffi cient to offset our accumulated invest-
ment in the event of customer termination. We gain insight into
future utilization and cost trends, as well as credit risk, through
our knowledge of the installed base of equipment and the close
interaction with our customers that comes with supplying critical
services and parts over extended periods. Revisions that affect a
product services agreement’s total estimated profi tability result
in an adjustment of earnings; such adjustments increased earn-
ings by $0.4 billion in 2011, decreased earnings by $0.2 billion in
2010 and increased earnings by $0.2 billion in 2009. We provide
for probable losses when they become evident.
Further information is provided in Notes 1 and 9.
ASSET IMPAIRMENT assessment involves various estimates and
assumptions as follows:
Investments. We regularly review investment securities for
impairment using both quantitative and qualitative criteria.
Effective April 1, 2009, the FASB amended ASC 320 and modifi ed
the requirements for recognizing and measuring other-than-
temporary impairment for debt securities. If we do not intend to
sell the security and it is not more likely than not that we will be
required to sell the security before recovery of our amortized
cost, we evaluate other qualitative criteria to determine whether
a credit loss exists, such as the fi nancial health of and specifi c
prospects for the issuer, including whether the issuer is in compli-
ance with the terms and covenants of the security. Quantitative
criteria include determining whether there has been an adverse
change in expected future cash fl ows. For equity securities, our
criteria include the length of time and magnitude of the amount
that each security is in an unrealized loss position. Our other-
than-temporary impairment reviews involve our fi nance, risk and
asset management functions as well as the portfolio manage-
ment and research capabilities of our internal and third-party
asset managers. See Note 1, which discusses the determination
of fair value of investment securities.
Further information about actual and potential impairment
losses is provided in the Financial Resources and Liquidity—
Investment Securities section and in Notes 1, 3 and 9.
management’s discussion and analysis
GE 2011 ANNUAL REPORT 65
Long-Lived Assets. We review long-lived assets for impairment
whenever events or changes in circumstances indicate that the
related carrying amounts may not be recoverable. Determining
whether an impairment has occurred typically requires various
estimates and assumptions, including determining which undis-
counted cash fl ows are directly related to the potentially impaired
asset, the useful life over which cash fl ows will occur, their
amount, and the asset’s residual value, if any. In turn, measure-
ment of an impairment loss requires a determination of fair value,
which is based on the best information available. We derive the
required undiscounted cash fl ow estimates from our historical
experience and our internal business plans. To determine fair
value, we use quoted market prices when available, our internal
cash fl ow estimates discounted at an appropriate interest rate
and independent appraisals, as appropriate.
Our operating lease portfolio of commercial aircraft is a sig-
nifi cant concentration of assets in GE Capital, and is particularly
subject to market fl uctuations. Therefore, we test recoverabil ity
of each aircraft in our operating lease portfolio at least annually.
Additionally, we perform quarterly evaluations in circumstances
such as when aircraft are re-leased, current lease terms have
changed or a specifi c lessee’s credit standing changes. We
consider market conditions, such as global demand for com-
mercial aircraft. Estimates of future rentals and residual values
are based on historical experience and information received rou-
tinely from independent appraisers. Estimated cash fl ows from
future leases are reduced for expected downtime between leases
and for estimated technical costs required to prepare aircraft to
be redeployed. Fair value used to measure impairment is based
on manage ment’s best estimate. In determining its best estimate,
management evaluates average current market values (obtained
from third parties) of similar type and age aircraft, which are
adjusted for the attributes of the specifi c aircraft under lease.
We recognized impairment losses on our operating lease port-
folio of commercial aircraft of $0.3 billion and $0.4 billion in 2011
and 2010, respectively. Provisions for losses on fi nancing receiv-
ables related to commercial aircraft were an insignifi cant amount
for both 2011 and 2010.
Further information on impairment losses and our exposure to
the commercial aviation industry is provided in the Operations—
Overview section and in Notes 7 and 25.
Real Estate. We review the estimated value of our commercial real
estate investments at least annually, or more frequently as condi-
tions warrant. The cash fl ow estimates used for both estimating
value and the recoverability analysis are inherently judgmental,
and refl ect current and projected lease profi les, available industry
information about expected trends in rental, occupancy and
capitalization rates and expected business plans, which include
our estimated holding period for the asset. Our portfolio is diversi-
fi ed, both geographically and by asset type. However, the global
real estate market is subject to periodic cycles that can cause
signifi cant fl uctuations in market values. Based on the most recent
valuation estimates available, the carrying value of our Real Estate
investments exceeded their estimated value by about $2.6 billion.
Commercial real estate valuations in 2011 showed signs of
improved stability and liquidity in certain markets, primarily in the
U.S.; however, the pace of improvement varies signifi cantly by
asset class and market. Accordingly, there continues to be risk and
uncertainty surrounding commercial real estate values. Declines
in the estimated value of real estate below carrying amount result
in impairment losses when the aggregate undiscounted cash fl ow
estimates used in the estimated value measurement are below the
carrying amount. As such, estimated losses in the portfolio will not
necessarily result in recognized impairment losses. When we
recognize an impairment, the impairment is measured using the
estimated fair value of the underlying asset, which is based upon
cash fl ow estimates that refl ect current and projected lease pro-
fi les and available industry information about capitalization rates
and expected trends in rents and occupancy and is corroborated
by external appraisals. During 2011, Real Estate recognized pre-
tax impairments of $1.2 billion in its real estate held for
investment, as compared to $2.3 billion in 2010. Continued dete-
rioration in economic conditions or prolonged market illiquidity
may result in further impairments being recognized. Furthermore,
signifi cant judgment and uncertainty related to forecasted valua-
tion trends, especially in illiquid markets, results in inherent
imprecision in real estate value estimates. Further information is
provided in the Global Risk Management and the All Other Assets
sections and in Note 9.
Goodwill and Other Identifi ed Intangible Assets. We test good-
will for impairment annually and more frequently if circumstances
warrant. We determine fair values for each of the reporting units
using an income approach. When available and appropriate, we
use comparative market multiples to corroborate discounted
cash fl ow results. For purposes of the income approach, fair value
is determined based on the present value of estimated future
cash fl ows, discounted at an appropriate risk-adjusted rate. We
use our internal forecasts to estimate future cash fl ows and include
an estimate of long-term future growth rates based on our most
recent views of the long-term outlook for each business. Actual
results may differ from those assumed in our forecasts. We derive
our discount rates using a capital asset pricing model and analyz-
ing published rates for industries relevant to our reporting units to
estimate the cost of equity fi nancing. We use discount rates that
are commensurate with the risks and uncertainty inherent in the
respective businesses and in our internally developed forecasts.
Discount rates used in our reporting unit valuations ranged from
9.0% to 13.75%. Valuations using the market approach refl ect
prices and other relevant observable information generated by
market transactions involving comparable businesses.
management’s discussion and analysis
66
GE 2011 ANNUAL REPORT
Compared to the market approach, the income approach
more closely aligns each reporting unit valuation to our business
profi le, including geographic markets served and product offer-
ings. Required rates of return, along with uncertainty inherent
in the forecasts of future cash fl ows, are refl ected in the selec-
tion of the discount rate. Equally important, under this approach,
reasonably likely scenarios and associated sensitivities can be
developed for alternative future states that may not be refl ected
in an observable market price. A market approach allows for
comparison to actual market transactions and multiples. It can
be somewhat more limited in its application because the popula-
tion of potential comparables is often limited to publicly-traded
companies where the characteristics of the comparative business
and ours can be signifi cantly different, market data is usually not
available for divisions within larger conglomerates or non-public
subsidiaries that could otherwise qualify as comparable, and the
specifi c circumstances surrounding a market transaction (e.g.,
synergies between the parties, terms and conditions of the trans-
action, etc.) may be different or irrelevant with respect to our
business. It can also be diffi cult, under certain market conditions,
to identify orderly transactions between market participants in
similar businesses. We assess the valuation methodology based
upon the relevance and availability of the data at the time we per-
form the valuation and weight the methodologies appropriately.
Estimating the fair value of reporting units requires the use of
estimates and signifi cant judgments that are based on a number
of factors including actual operating results. If current conditions
persist longer or deteriorate further than expected, it is reason-
ably possible that the judgments and estimates described above
could change in future periods.
We review identifi ed intangible assets with defi ned use-
ful lives and subject to amortization for impairment whenever
events or changes in circumstances indicate that the related car-
rying amounts may not be recoverable. Determining whether
an impairment loss occurred requires comparing the carrying
amount to the sum of undiscounted cash fl ows expected to be
generated by the asset. We test intangible assets with indefi nite
lives annually for impairment using a fair value method such as
discounted cash fl ows. For our insurance activities remaining in
continuing operations, we periodically test for impairment our
deferred acquisition costs and present value of future profi ts.
Further information is provided in the Financial Resources and
Liquidity—Goodwill and Other Intangible Assets section and in
Notes 1 and 8.
PENSION ASSUMPTIONS are signifi cant inputs to the actuarial mod-
els that measure pension benefi t obligations and related effects on
operations. Two assumptions—discount rate and expected return
on assets—are important elements of plan expense and asset/
liability measurement. We evaluate these critical assumptions at
least annually on a plan and country-specifi c basis. We periodically
evaluate other assumptions involving demographic factors, such
as retirement age, mortality and turnover, and update them to
refl ect our experience and expectations for the future. Actual
results in any given year will often differ from actuarial assump-
tions because of economic and other factors.
Accumulated and projected benefi t obligations are measured
as the present value of expected payments. We discount those
cash payments using the weighted average of market-observed
yields for high-quality fi xed-income securities with maturities
that correspond to the payment of benefi ts. Lower discount rates
increase present values and subsequent-year pension expense;
higher discount rates decrease present values and subsequent-
year pension expense.
Our discount rates for principal pension plans at December 31,
2011, 2010 and 2009 were 4.21%, 5.28% and 5.78%, respectively,
refl ecting market interest rates.
To determine the expected long-term rate of return on pension
plan assets, we consider current and expected asset allocations,
as well as historical and expected returns on various categories
of plan assets. In developing future long-term return expecta-
tions for our principal benefi t plans’ assets, we formulate views
on the future economic environment, both in the U.S. and abroad.
We evaluate general market trends and historical relationships
among a number of key variables that impact asset class returns
such as expected earnings growth, infl ation, valuations, yields and
spreads, using both internal and external sources. We also take
into account expected volatility by asset class and diversifi cation
across classes to determine expected overall portfolio results
given current and expected allocations. Asset earnings in our
principal pension plans were fl at in 2011, and had average annual
earnings of 4.7%, 6.7% and 8.7% per year in the 10-, 15- and
25-year periods ended December 31, 2011, respectively. These
average historical returns were signifi cantly affected by invest-
ment losses in 2008. Based on our analysis of future expectations
of asset performance, past return results, and our current and
expected asset allocations, we have assumed an 8.0% long-term
expected return on those assets for cost recognition in 2012 com-
pared to 8.0% in 2011 and 8.5% in both 2010 and 2009.
Changes in key assumptions for our principal pension plans
would have the following effects.
• Discount rate—A 25 basis point increase in discount rate
would decrease pension cost in the following year by $0.2 bil-
lion and would decrease the pension benefi t obligation at
year-end by about $1.9 billion.
• Expected return on assets—A 50 basis point decrease in the
expected return on assets would increase pension cost in the
following year by $0.2 billion.
Further information on our pension plans is provided in the
Operations—Overview section and in Note 12.
INCOME TAXES. Our annual tax rate is based on our income, statu-
tory tax rates and tax planning opportunities available to us in the
various jurisdictions in which we operate. Tax laws are complex and
subject to different interpretations by the taxpayer and respective
governmental taxing authorities. Signifi cant judgment is required
in determining our tax expense and in evaluating our tax positions,
including evaluating uncertainties. We review our tax positions
quarterly and adjust the balances as new information becomes
available. Our income tax rate is signifi cantly affected by the tax
rate on our global operations. In addition to local country tax laws
and regulations, this rate depends on the extent earnings are
management’s discussion and analysis
GE 2011 ANNUAL REPORT 67
indefi nitely reinvested outside the United States. Indefi nite rein-
vestment is determined by management’s judgment about and
intentions concerning the future operations of the Company. At
December 31, 2011 and 2010, $102 billion and $94 billion of earn-
ings, respectively, have been indefi nitely reinvested outside the
United States. Most of these earnings have been reinvested in
active non-U.S. business operations, and we do not intend to
repatriate these earnings to fund U.S. operations. Because of the
availability of U.S. foreign tax credits, it is not practicable to deter-
mine the U.S. federal income tax liability that would be payable if
such earnings were not reinvested indefi nitely. Deferred income
tax assets represent amounts available to reduce income taxes
payable on taxable income in future years. Such assets arise
because of temporary differences between the fi nancial report-
ing and tax bases of assets and liabilities, as well as from net
operating loss and tax credit carryforwards. We evaluate the
recoverability of these future tax deductions and credits by
assessing the adequacy of future expected taxable income from
all sources, including reversal of taxable temporary differences,
forecasted operating earnings and available tax planning strate-
gies. These sources of income rely heavily on estimates. We use
our historical experience and our short and long-range business
forecasts to provide insight. Further, our global and diversifi ed
business portfolio gives us the opportunity to employ various
prudent and feasible tax planning strategies to facilitate the
recoverability of future deductions. Amounts recorded for
deferred tax assets related to non-U.S. net operating losses, net
of valuation allowances, were $4.8 billion and $4.4 billion at
December 31, 2011 and 2010, respectively, including $0.9 billion
and $1.0 billion at December 31, 2011 and 2010, respectively, of
deferred tax assets, net of valuation allowances, associated with
losses reported in discontinued operations, primarily related to
our loss on the sale of GE Money Japan. Such year-end 2011
amounts are expected to be fully recoverable within the appli-
cable statutory expiration periods. To the extent we do not
consider it more likely than not that a deferred tax asset will be
recovered, a valuation allowance is established.
Further information on income taxes is provided in the
Operations—Overview section and in Note 14.
DERIVATIVES AND HEDGING. We use derivatives to manage a
variety of risks, including risks related to interest rates, foreign
exchange and commodity prices. Accounting for derivatives as
hedges requires that, at inception and over the term of the
arrangement, the hedged item and related derivative meet the
requirements for hedge accounting. The rules and interpretations
related to derivatives accounting are complex. Failure to apply this
complex guidance correctly will result in all changes in the fair
value of the derivative being reported in earnings, without regard
to the offsetting changes in the fair value of the hedged item.
In evaluating whether a particular relationship qualifi es for
hedge accounting, we test effectiveness at inception and each
reporting period thereafter by determining whether changes in
the fair value of the derivative offset, within a specifi ed range,
changes in the fair value of the hedged item. If fair value changes
fail this test, we discontinue applying hedge accounting to that
relationship prospectively. Fair values of both the derivative
instrument and the hedged item are calculated using internal
valuation models incorporating market-based assumptions, sub-
ject to third-party confi rmation, as applicable.
At December 31, 2011, derivative assets and liabilities were
$10.0 billion and $0.7 billion, respectively. Further information
about our use of derivatives is provided in Notes 1, 9, 21 and 22.
FAIR VALUE MEASUREMENTS. Assets and liabilities measured at fair
value every reporting period include investments in debt and
equity securities and derivatives. Assets that are not measured at
fair value every reporting period but that are subject to fair value
measurements in certain circumstances include loans and long-
lived assets that have been reduced to fair value when they are
held for sale, impaired loans that have been reduced based on the
fair value of the underlying collateral, cost and equity method
investments and long-lived assets that are written down to fair
value when they are impaired and the remeasurement of retained
investments in formerly consolidated subsidiaries upon a change
in control that results in deconsolidation of a subsidiary, if we sell
a controlling interest and retain a noncontrolling stake in the
entity. Assets that are written down to fair value when impaired
and retained investments are not subsequently adjusted to fair
value unless further impairment occurs.
A fair value measurement is determined as the price we would
receive to sell an asset or pay to transfer a liability in an orderly
transaction between market participants at the measurement
date. In the absence of active markets for the identical assets or
liabilities, such measurements involve developing assumptions
based on market observable data and, in the absence of such
data, internal information that is consistent with what market
participants would use in a hypothetical transaction that occurs
at the measurement date. The determination of fair value often
involves signifi cant judgments about assumptions such as deter-
mining an appropriate discount rate that factors in both risk and
liquidity premiums, identifying the similarities and differences
in market transactions, weighting those differences accordingly
and then making the appropriate adjustments to those market
transactions to refl ect the risks specifi c to our asset being valued.
Further information on fair value measurements is provided in
Notes 1, 21 and 22.
OTHER LOSS CONTINGENCIES are uncertain and unresolved matters
that arise in the ordinary course of business and result from events
or actions by others that have the potential to result in a future loss.
Such contingencies include, but are not limited to environmental
obligations, litigation, regulatory proceedings, product quality and
losses resulting from other events and developments.
When a loss is considered probable and reasonably estimable,
we record a liability in the amount of our best estimate for the
ultimate loss. When there appears to be a range of possible costs
with equal likelihood, liabilities are based on the low-end of such
range. However, the likelihood of a loss with respect to a par-
ticular contingency is often diffi cult to predict and determining
a meaningful estimate of the loss or a range of loss may not be
practicable based on the information available and the potential
effect of future events and decisions by third parties that will
determine the ultimate resolution of the contingency. Moreover,
it is not uncommon for such matters to be resolved over many
years, during which time relevant developments and new
management’s discussion and analysis
68
GE 2011 ANNUAL REPORT
information must be continuously evaluated to determine both
the likelihood of potential loss and whether it is possible to rea-
sonably estimate a range of possible loss. When a loss is probable
but a reasonable estimate cannot be made, disclosure is provided.
Disclosure also is provided when it is reasonably possible that
a loss will be incurred or when it is reasonably possible that the
amount of a loss will exceed the recorded provision. We regularly
review all contingencies to determine whether the likelihood of
loss has changed and to assess whether a reasonable estimate
of the loss or range of loss can be made. As discussed above,
development of a meaningful estimate of loss or a range of poten-
tial loss is complex when the outcome is directly dependent on
negotiations with or decisions by third parties, such as regulatory
agencies, the court system and other interested parties. Such fac-
tors bear directly on whether it is possible to reasonably estimate
a range of potential loss and boundaries of high and low estimates.
Further information is provided in Notes 13 and 25.
Other Information
New Accounting Standards
In June 2011, the FASB issued amendments to existing standards
for reporting comprehensive income. Accounting Standards
Update (ASU) 2011-05 rescinds the requirement to present a
Consolidated Statement of Changes in Shareowners’ Equity and
introduces a new statement, the Consolidated Statement of
Comprehensive Income. The new statement begins with net
income and adds or deducts other recognized changes in assets
and liabilities that are not included in net earnings under GAAP.
For example, unrealized changes in currency translation adjust-
ments are included in the measure of comprehensive income but
are excluded from net earnings. The amendments are effective
for our fi rst quarter 2012 fi nancial statements. The amendments
affect only the display of those components of equity categorized
as other comprehensive income and do not change existing
recognition and measurement requirements that determine
net earnings.
In May 2011, the FASB issued amendments to existing stan-
dards for fair value measurement and disclosure, which are
effective in the fi rst quarter of 2012. The amendments clarify
or change the application of existing fair value measurements,
including: that the highest and best use and valuation premise in
a fair value measurement are relevant only when measuring the
fair value of nonfi nancial assets; that a reporting entity should
measure the fair value of its own equity instrument from the per-
spective of a market participant that holds that instrument as
an asset; to permit an entity to measure the fair value of certain
fi nancial instruments on a net basis rather than based on its gross
exposure when the reporting entity manages its fi nancial instru-
ments on the basis of such net exposure; that in the absence of
a Level 1 input, a reporting entity should apply premiums and
discounts when market participants would do so when pricing
the asset or liability consistent with the unit of account; and that
premiums and discounts related to size as a characteristic of the
reporting entity’s holding are not permitted in a fair value mea-
surement. The impact of adopting these amendments is expected
to be immaterial to the fi nancial statements.
Research and Development
GE-funded research and development expenditures were $4.6 bil-
lion, $3.9 billion and $3.3 billion in 2011, 2010 and 2009,
respectively. In addition, research and development funding from
customers, principally the U.S. government, totaled $0.8 billion,
$1.0 billion and $1.1 billion in 2011, 2010 and 2009, respectively.
Aviation accounts for the largest share of GE’s research and devel-
opment expenditures with funding from both GE and customer
funds. Energy Infrastructure’s Energy business and Healthcare
also made signifi cant expenditures funded primarily by GE.
Orders and Backlog
GE Infrastructure equipment orders increased 24% to $50.1 billion
at December 31, 2011. Total GE Infrastructure backlog increased
14% to $200.2 billion at December 31, 2011, composed of equip-
ment backlog of $52.7 billion and services backlog of $147.5 billion.
Orders constituting backlog may be cancelled or deferred by
customers, subject in certain cases to penalties. See the Segment
Operations section for further information.

management’s discussion and analysis
GE 2011 ANNUAL REPORT 69
Selected Financial Data
The following table provides key information for Consolidated, GE and GECS.
(Dollars in millions; per-share amounts in dollars) 2011 2010 2009 2008 2007
GENERAL ELECTRIC COMPANY AND CONSOLIDATED AFFILIATES
Revenues $147,300 $149,593 $154,438 $179,837 $169,964
Earnings from continuing operations attributable to the Company 14,074 12,517 10,806 17,804 22,268
Earnings (loss) from discontinued operations, net of taxes,
attributable to the Company 77 (873) 219 (394) (60)
Net earnings attributable to the Company 14,151 11,644 11,025 17,410 22,208
Dividends declared (a) 7,498 5,212 6,785 12,649 11,713
Return on average GE shareowners’ equity (b) 11.9% 12.1% 11.6% 17.0% 22.0%
Per common share
Earnings from continuing operations—diluted $ 1.23 $ 1.14 $ 0.99 $ 1.76 $ 2.18
Earnings (loss) from discontinued operations—diluted 0.01 (0.08) 0.02 (0.04) (0.01)
Net earnings—diluted 1.23 1.06 1.01 1.72 2.17
Earnings from continuing operations—basic 1.23 1.14 0.99 1.76 2.19
Earnings (loss) from discontinued operations—basic 0.01 (0.08) 0.02 (0.04) (0.01)
Net earnings—basic 1.24 1.06 1.01 1.72 2.18
Dividends declared 0.61 0.46 0.61 1.24 1.15
Stock price range 21.65–14.02 19.70–13.75 17.52–5.87 38.52–12.58 42.15–33.90
Year-end closing stock price 17.91 18.29 15.13 16.20 37.07
Cash and equivalents 84,501 78,943 70,479 48,378 15,553
Total assets of continuing operations 715,987 735,368 756,943 773,531 756,526
Total assets 717,242 747,793 781,949 797,876 795,758
Long-term borrowings 243,459 293,323 336,172 320,522 314,977
Common shares outstanding—average (in thousands) 10,591,146 10,661,078 10,613,717 10,079,923 10,182,083
Common shareowner accounts—average 570,000 588,000 605,000 604,000 608,000
Employees at year end
United States (c) 131,000 121,000 122,000 139,000 141,000
Other countries (c) 170,000 152,000 168,000 169,000 170,000
NBCU —14,000 14,000 15,000 16,000
Total employees 301,000 287,000 304,000 323,000 327,000
GE DATA
Short-term borrowings $ 2,184 $ 456 $ 504 $ 2,375 $ 4,106
Long-term borrowings 9,405 9,656 11,681 9,827 11,656
Noncontrolling interests 1,006 4,098 5,797 6,678 6,503
GE shareowners’ equity 116,438 118,936 117,291 104,665 115,559
Total capital invested $129,033 $133,146 $135,273 $123,545 $137,824
Return on average total capital invested (b) 11.6% 11.8% 10.6% 15.7% 20.2%
Borrowings as a percentage of total capital invested (b) 9.0% 7.6% 9.0% 9.9% 11.4%
Working capital (b) $ (10) $ (1,618) $ (1,596) $ 3,904 $ 6,433
GECS DATA
Revenues $ 49,081 $ 49,881 $ 51,818 $ 68,609 $ 69,412
Earnings from continuing operations attributable to GECS 6,432 3,023 1,177 7,489 12,227
Earnings (loss) from discontinued operations, net of taxes,
attributable to GECS 78 (868) 238 (434) (1,926)
Net earnings attributable to GECS 6,510 2,155 1,415 7,055 10,301
GECS shareowner’s equity 77,110 68,984 70,833 53,279 57,676
Total borrowings and bank deposits 443,097 470,520 493,324 512,745 497,431
Ratio of debt to equity at GECS 5.75:1 (d) 6.82:1 (d) 6.96:1 (d) 9.62:1 8.62:1
Total assets $584,536 $605,255 $650,372 $661,009 $646,560
Transactions between GE and GECS have been eliminated from the consolidated information.
(a) Included $1,031 million of preferred stock dividends ($806 million related to our preferred stock redemption) in 2011, $300 million in both 2010 and 2009 and $75 million in 2008.
(b) Indicates terms are defined in the Glossary.
(c) Excludes NBCU.
(d) Ratios of 4.23:1, 5.25:1 and 5.39:1 for 2011, 2010 and 2009, respectively, net of cash and equivalents and with classification of hybrid debt as equity.

70 GE 2011 ANNUAL REPORT
audited financial statements
Statement of Earnings
General Electric Company
and consolidated affiliates
For the years ended December 31 (In millions; per-share amounts in dollars) 2011 2010 2009
REVENUES
Sales of goods $ 66,875 $ 60,812 $ 65,067
Sales of services 27,648 39,625 38,710
Other income (Note 17) 5,063 1,151 1,006
GECS earnings from continuing operations ———
GECS revenues from services (Note 18) 47,714 48,005 49,655
Total revenues 147,300 149,593 154,438
COSTS AND EXPENSES (Note 19)
Cost of goods sold 51,455 46,005 50,580
Cost of services sold 16,823 25,708 25,341
Interest and other financial charges 14,545 15,553 17,697
Investment contracts, insurance losses and insurance annuity benefits 2,912 3,012 3,017
Provision for losses on financing receivables (Notes 6 and 23) 4,083 7,176 10,585
Other costs and expenses 37,384 38,054 37,354
Total costs and expenses 127,202 135,508 144,574
EARNINGS (LOSS) FROM CONTINUING OPERATIONS BEFORE INCOME TAXES 20,098 14,085 9,864
Benefit (provision) for income taxes (Note 14) (5,732) (1,033) 1,142
EARNINGS FROM CONTINUING OPERATIONS 14,366 13,052 11,006
Earnings (loss) from discontinued operations, net of taxes (Note 2) 77 (873) 219
NET EARNINGS 14,443 12,179 11,225
Less net earnings attributable to noncontrolling interests 292 535 200
NET EARNINGS ATTRIBUTABLE TO THE COMPANY 14,151 11,644 11,025
Preferred stock dividends declared (1,031) (300) (300)
NET EARNINGS ATTRIBUTABLE TO GE COMMON SHAREOWNERS $ 13,120 $ 11,344 $ 10,725
AMOUNTS ATTRIBUTABLE TO THE COMPANY
Earnings from continuing operations $ 14,074 $ 12,517 $ 10,806
Earnings (loss) from discontinued operations, net of taxes 77 (873) 219
NET EARNINGS ATTRIBUTABLE TO THE COMPANY $ 14,151 $ 11,644 $ 11,025
PER-SHARE AMOUNTS (Note 20)
Earnings from continuing operations
Diluted earnings per share $ 1.23 $ 1.14 $ 0.99
Basic earnings per share 1.23 1.14 0.99
Net earnings
Diluted earnings per share 1.23 1.06 1.01
Basic earnings per share 1.24 1.06 1.01
DIVIDENDS DECLARED PER SHARE 0.61 0.46 0.61
See Note 3 for other-than-temporary impairment amounts.
See accompanying notes.
Consolidated Statement of Changes in Shareowners’ Equity
(In millions) 2011 2010 2009
CHANGES IN SHAREOWNERS’ EQUITY (Note 15)
GE shareowners’ equity balance at January 1 $118,936 $117,291 $104,665
Dividends and other transactions with shareowners (10,530) (5,701) (5,049)
Other comprehensive income (loss)
Investment securities—net 606 16 2,659
Currency translation adjustments—net 219 (3,874) 4,135
Cash flow hedges—net 104 454 1,598
Benefit plans—net (7,048) 1,079 (1,804)
Total other comprehensive income (loss) (6,119) (2,325) 6,588
Increases from net earnings attributable to the Company 14,151 11,644 11,025
Comprehensive income (loss) 8,032 9,319 17,613
Cumulative effect of changes in accounting principles (a) —(1,973) 62
Balance at December 31 116,438 118,936 117,291
Noncontrolling interests (b) 1,696 5,262 7,845
Total equity balance at December 31 $118,134 $124,198 $125,136
(a) On January 1, 2010, we adopted amendments to Accounting Standards Codification (ASC) 860, Transfers and Servicing and ASC 810, Consolidation, and recorded a
cumulative effect adjustment. See Notes 15 and 24. We adopted amendments to ASC 320, Investments—Debt and Equity Securities, and recorded a cumulative effect
adjustment to increase retained earnings as of April 1, 2009. See Notes 3 and 15.
(b) See Note 15 for further information about the changes in noncontrolling interests.
See accompanying notes.

GE 2011 ANNUAL REPORT 71
statement of earnings
GE (a) GECS
2011 2010 2009 2011 2010 2009
$ 67,012 $ 60,345 $ 64,211 $ 148 $ 533 $ 970
28,024 39,875 39,246 ———
5,269 1,285 1,179 ———
6,432 3,023 1,177 ———
———48,933 49,348 50,848
106,737 104,528 105,813 49,081 49,881 51,818
51,605 45,570 49,886 135 501 808
17,199 25,958 25,878 ———
1,299 1,600 1,478 13,883 14,526 16,870
———3,059 3,197 3,193
———4,083 7,176 10,585
17,556 16,340 14,841 20,469 22,433 23,051
87,659 89,468 92,083 41,629 47,833 54,507
19,078 15,060 13,730 7,452 2,048 (2,689)
(4,839) (2,024) (2,739) (893) 991 3,881
14,239 13,036 10,991 6,559 3,039 1,192
77 (873) 219 78 (868) 238
14,316 12,163 11,210 6,637 2,171 1,430
165 519 185 127 16 15
14,151 11,644 11,025 6,510 2,155 1,415
(1,031) (300) (300) ———
$ 13,120 $ 11,344 $ 10,725 $ 6,510 $ 2,155 $ 1,415
$ 14,074 $ 12,517 $ 10,806 $ 6,432 $ 3,023 $ 1,177
77 (873) 219 78 (868) 238
$ 14,151 $ 11,644 $ 11,025 $ 6,510 $ 2,155 $ 1,415
(a) Represents the adding together of all affiliated companies except General Electric Capital
Services, Inc. (GECS or financial services), which is presented on a one-line basis. See Note 1.
In the consolidating data on this page, “GE” means the basis of consolidation as described in Note 1
to the consolidated financial statements; “GECS” means General Electric Capital Services, Inc. and
all of its affiliates and associated companies. Separate information is shown for “GE” and “GECS.”
Transactions between GE and GECS have been eliminated from the “General Electric Company and
consolidated affiliates” columns on the prior page.

72 GE 2011 ANNUAL REPORT
audited financial statements
Statement of Financial Position
General Electric Company
and consolidated affiliates
At December 31 (In millions, except share amounts) 2011 2010
ASSETS
Cash and equivalents $ 84,501 $ 78,943
Investment securities (Note 3) 47,374 43,938
Current receivables (Note 4) 19,531 18,621
Inventories (Note 5) 13,792 11,526
Financing receivables—net (Notes 6 and 23) 280,378 303,012
Other GECS receivables 7,561 7,571
Property, plant and equipment—net (Note 7) 65,739 66,212
Investment in GECS ——
Goodwill (Note 8) 72,625 64,388
Other intangible assets—net (Note 8) 12,068 9,971
All other assets (Note 9) 111,707 94,299
Assets of businesses held for sale (Note 2) 711 36,887
Assets of discontinued operations (Note 2) 1,255 12,425
Total assets (a) $717,242 $747,793
LIABILITIES AND EQUITY
Short-term borrowings (Note 10) $137,611 $117,959
Accounts payable, principally trade accounts 16,400 14,656
Progress collections and price adjustments accrued 10,402 11,142
Dividends payable 1,797 1,563
Other GE current liabilities 14,796 11,396
Non-recourse borrowings of consolidated securitization entities (Note 10) 29,258 30,018
Bank deposits (Note 10) 43,115 37,298
Long-term borrowings (Note 10) 243,459 293,323
Investment contracts, insurance liabilities and insurance annuity benefits (Note 11) 29,774 29,582
All other liabilities (Note 13) 70,647 55,271
Deferred income taxes (Note 14) (131) 2,753
Liabilities of businesses held for sale (Note 2) 345 16,047
Liabilities of discontinued operations (Note 2) 1,635 2,587
Total liabilities (a) 599,108 623,595
Preferred stock (0 and 30,000 shares outstanding at year-end 2011 and 2010, respectively) ——
Common stock (10,573,017,000 and 10,615,376,000 shares outstanding at year-end 2011 and 2010, respectively) 702 702
Accumulated other comprehensive income—net (b)
Investment securities (30) (636)
Currency translation adjustments 133 (86)
Cash flow hedges (1,176) (1,280)
Benefit plans (22,901) (15,853)
Other capital 33,693 36,890
Retained earnings 137,786 131,137
Less common stock held in treasury (31,769) (31,938)
Total GE shareowners’ equity 116,438 118,936
Noncontrolling interests (c) 1,696 5,262
Total equity (Notes 15 and 16) 118,134 124,198
Total liabilities and equity $717,242 $747,793
(a) Our consolidated assets at December 31, 2011 include total assets of $45,514 million of certain variable interest entities (VIEs) that can only be used to settle the liabilities
of those VIEs. These assets include net financing receivables of $37,120 million and investment securities of $5,320 million. Our consolidated liabilities at December 31, 2011
include liabilities of certain VIEs for which the VIE creditors do not have recourse to GE. These liabilities include non-recourse borrowings of consolidated securitization
entities (CSEs) of $28,758 million. See Note 24.
(b) The sum of accumulated other comprehensive income—net was $(23,974) million and $(17,855) million at December 31, 2011 and 2010, respectively.
(c) Included accumulated other comprehensive income—net attributable to noncontrolling interests of $(168) million and $(153) million at December 31, 2011 and
2010, respectively.
See accompanying notes.

GE 2011 ANNUAL REPORT 73
statement of financial position
GE (a) GECS
2011 2010 2011 2010
$ 8,382 $ 19,241 $ 76,702 $ 60,257
18 19 47,359 43,921
11,807 10,383 ——
13,741 11,460 51 66
——289,307 312,234
——13,390 12,919
14,283 12,444 51,419 53,768
77,110 68,984 ——
45,395 36,880 27,230 27,508
10,522 8,088 1,546 1,883
36,675 17,454 75,618 77,197
—33,760 711 3,127
52 50 1,203 12,375
$217,985 $218,763 $584,536 $605,255
$ 2,184 $ 456 $136,333 $118,797
14,209 11,620 7,239 7,035
11,349 11,841 ——
1,797 1,563 ——
14,796 11,396 ——
——29,258 30,018
——43,115 37,298
9,405 9,656 234,391 284,407
——30,198 29,993
53,826 37,815 17,328 17,554
(7,183) (4,237) 7,052 6,990
—15,455 345 592
158 164 1,477 2,423
100,541 95,729 506,736 535,107
————
702 702 11
(30) (636) (33) (639)
133 (86) (399) (1,411)
(1,176) (1,280) (1,101) (1,281)
(22,901) (15,853) (563) (380)
33,693 36,890 27,627 27,626
137,786 131,137 51,578 45,068
(31,769) (31,938) ——
116,438 118,936 77,110 68,984
1,006 4,098 690 1,164
117,444 123,034 77,800 70,148
$217,985 $218,763 $584,536 $605,255
(a) Represents the adding together of all affiliated companies
except General Electric Capital Services, Inc. (GECS or
financial services), which is presented on a one-line basis.
See Note 1.
In the consolidating data on this page, “GE” means the basis of
consolidation as described in Note 1 to the consolidated
financial statements; “GECS” means General Electric Capital
Services, Inc. and all of its affiliates and associated companies.
Separate information is shown for “GE” and “GECS.” Transactions
between GE and GECS have been eliminated from the “General
Electric Company and consolidated affiliates” columns on the
prior page.

74 GE 2011 ANNUAL REPORT
audited financial statements
Statement of Cash Flows
General Electric Company
and consolidated affiliates
For the years ended December 31 (In millions) 2011 2010 2009
CASH FLOWS—OPERATING ACTIVITIES
Net earnings $ 14,443 $ 12,179 $ 11,225
Less net earnings attributable to noncontrolling interests 292 535 200
Net earnings attributable to the Company 14,151 11,644 11,025
(Earnings) loss from discontinued operations (77) 873 (219)
Adjustments to reconcile net earnings attributable to the
Company to cash provided from operating activities
Depreciation and amortization of property, plant and equipment 9,185 9,786 10,617
Earnings from continuing operations retained by GECS ———
Deferred income taxes (203) 930 (2,778)
Decrease (increase) in GE current receivables (466) (126) 3,273
Decrease (increase) in inventories (1,168) 342 1,101
Increase (decrease) in accounts payable 1,235 883 (464)
Increase (decrease) in GE progress collections (1,394) (1,177) (500)
Provision for losses on GECS financing receivables 4,083 7,176 10,585
All other operating activities 7,255 5,925 (9,828)
Cash from (used for) operating activities—continuing operations 32,601 36,256 22,812
Cash from (used for) operating activities—discontinued operations 758 (132) 1,605
CASH FROM (USED FOR) OPERATING ACTIVITIES 33,359 36,124 24,417
CASH FLOWS—INVESTING ACTIVITIES
Additions to property, plant and equipment (12,650) (9,800) (8,636)
Dispositions of property, plant and equipment 5,896 7,208 6,479
Net decrease (increase) in GECS financing receivables 14,652 21,773 36,665
Proceeds from sales of discontinued operations 8,950 2,510 —
Proceeds from principal business dispositions 8,877 3,062 9,978
Payments for principal businesses purchased (11,202) (1,212) (7,842)
Capital contribution from GE to GECS ———
All other investing activities 6,094 10,249 3,758
Cash from (used for) investing activities—continuing operations 20,617 33,790 40,402
Cash from (used for) investing activities—discontinued operations (735) (1,354) 1,976
CASH FROM (USED FOR) INVESTING ACTIVITIES 19,882 32,436 42,378
CASH FLOWS—FINANCING ACTIVITIES
Net increase (decrease) in borrowings (maturities of 90 days or less) 5,951 (1,228) (26,114)
Net increase (decrease) in bank deposits 6,748 4,603 (3,784)
Newly issued debt (maturities longer than 90 days) 43,847 47,643 82,846
Repayments and other reductions (maturities longer than 90 days) (85,706) (99,933) (83,290)
Repayment of preferred stock (3,300) ——
Net dispositions (purchases) of GE shares for treasury (1,456) (1,263) 623
Dividends paid to shareowners (6,458) (4,790) (8,986)
Capital contribution from GE to GECS ———
Purchases of subsidiary shares from noncontrolling interests (4,578) (2,633) —
All other financing activities (1,867) (3,648) (3,204)
Cash from (used for) financing activities—continuing operations (46,819) (61,249) (41,909)
Cash from (used for) financing activities—discontinued operations (44) (337) (1,604)
CASH FROM (USED FOR) FINANCING ACTIVITIES (46,863) (61,586) (43,513)
Effect of exchange rate changes on cash and equivalents (841) (333) 795
Increase (decrease) in cash and equivalents 5,537 6,641 24,077
Cash and equivalents at beginning of year 79,085 72,444 48,367
Cash and equivalents at end of year 84,622 79,085 72,444
Less cash and equivalents of discontinued operations at end of year 121 142 1,965
Cash and equivalents of continuing operations at end of year $ 84,501 $ 78,943 $ 70,479
SUPPLEMENTAL DISCLOSURE OF CASH FLOWS INFORMATION
Cash paid during the year for interest $(15,571) $(17,132) $(19,601)
Cash recovered (paid) during the year for income taxes (2,919) (2,671) (2,535)
See accompanying notes.

GE 2011 ANNUAL REPORT 75
statement of cash flows
GE (a) GECS
2011 2010 2009 2011 2010 2009
$ 14,316 $ 12,163 $ 11,210 $ 6,637 $ 2,171 $ 1,430
165 519 185 127 16 15
14,151 11,644 11,025 6,510 2,155 1,415
(77) 873 (219) (78) 868 (238)
2,068 2,034 2,311 7,117 7,752 8,306
(6,432) (3,023) (1,177) ———
(327) (377) (460) 124 1,307 (2,318)
(390) (963) 3,056 ———
(1,122) 409 1,188 15 5 (6)
1,938 1,052 (918) 50 (116) (363)
(1,146) (1,158) (257) ———
———4,083 7,176 10,585
3,394 4,255 1,856 3,281 2,487 (11,558)
12,057 14,746 16,405 21,102 21,634 5,823
——2758 (132) 1,603
12,057 14,746 16,407 21,860 21,502 7,426
(2,957) (2,418) (2,429) (9,882) (7,674) (6,445)
———5,896 7,208 6,479
———14,392 23,061 36,927
———8,950 2,510 —
6,254 1,721 890 2,623 1,171 9,088
(11,152) (653) (428) (50) (559) (7,414)
—— (9,500) ———
(384) (550) (198) 7,300 9,947 4,592
(8,239) (1,900) (11,665) 29,229 35,664 43,227
—— (2) (735) (1,354) 1,978
(8,239) (1,900) (11,667) 28,494 34,310 45,205
1,058 (671) 317 4,393 (652) (27,255)
———6,748 4,603 (3,784)
177 9,474 1,883 43,267 37,971 81,073
(270) (2,554) (1,675) (85,436) (97,379) (81,615)
(3,300) —————
(1,456) (1,263) 623 ———
(6,458) (4,790) (8,986) ———
————— 9,500
(4,303) (2,000) — (275) (633) —
(75) (330) (514) (1,792) (3,318) (2,691)
(14,627) (2,134) (8,352) (33,095) (59,408) (24,772)
———(44) (337) (1,604)
(14,627) (2,134) (8,352) (33,139) (59,745) (26,376)
(50) (125) 176 (791) (208) 619
(10,859) 10,587 (3,436) 16,424 (4,141) 26,874
19,241 8,654 12,090 60,399 64,540 37,666
8,382 19,241 8,654 76,823 60,399 64,540
———121 142 1,965
$ 8,382 $ 19,241 $ 8,654 $ 76,702 $ 60,257 $ 62,575
$ (553) $ (731) $ (768) $(15,018) $(16,401) $(18,833)
(2,303) (2,775) (3,078) (616) 104 543
(a) Represents the adding together of all affiliated companies except General Electric Capital
Services, Inc. (GECS or financial services), which is presented on a one-line basis. See Note 1.
In the consolidating data on this page, “GE” means the basis of consolidation as described in Note 1
to the consolidated financial statements; “GECS” means General Electric Capital Services, Inc. and
all of its affiliates and associated companies. Separate information is shown for “GE” and “GECS.”
Transactions between GE and GECS have been eliminated from the “General Electric Company and
consolidated affiliates” columns on the prior page and are discussed in Note 27.

76 GE 2011 ANNUAL REPORT
Note 1.
Summary of Significant Accounting Policies
Accounting Principles
Our fi nancial statements are prepared in conformity with U.S.
generally accepted accounting principles (GAAP).
Consolidation
Our fi nancial statements consolidate all of our affi liates—entities
in which we have a controlling fi nancial interest, most often
because we hold a majority voting interest. To determine if we
hold a controlling fi nancial interest in an entity we fi rst evaluate if
we are required to apply the variable interest entity (VIE) model to
the entity, otherwise the entity is evaluated under the voting
interest model.
Where we hold current or potential rights that give us the
power to direct the activities of a VIE that most signifi cantly impact
the VIE’s economic performance combined with a variable inter-
est that gives us the right to receive potentially signifi cant benefi ts
or the obligation to absorb potentially signifi cant losses, we have
a controlling fi nancial interest in that VIE. Rights held by others
to remove the party with power over the VIE are not considered
unless one party can exercise those rights unilaterally. When
changes occur to the design of an entity we reconsider whether it
is subject to the VIE model. We continuously evaluate whether we
have a controlling fi nancial interest in a VIE.
We hold a controlling fi nancial interest in other entities where
we currently hold, directly or indirectly, more than 50% of the
voting rights or where we exercise control through substantive
participating rights or as a general partner. Where we are a gen-
eral partner we consider substantive removal rights held by other
partners in determining if we hold a controlling fi nancial interest.
We reevaluate whether we have a controlling fi nancial interest
in these entities when our voting or substantive participating
rights change.
Associated companies are unconsolidated VIEs and other enti-
ties in which we do not have a controlling fi nancial interest, but
over which we have signifi cant infl uence, most often because we
hold a voting interest of 20% to 50%. Associated companies are
accounted for as equity method investments. Results of associ-
ated companies are presented on a one-line basis. Investments
in, and advances to, associated companies are presented on a
one-line basis in the caption “All other assets” in our Statement of
Financial Position, net of allowance for losses, that represents our
best estimate of probable losses inherent in such assets.
Financial Statement Presentation
We have reclassifi ed certain prior-year amounts to conform to the
current-year’s presentation.
Financial data and related measurements are presented in the
following categories:
• GE—This represents the adding together of all affi liates other
than General Electric Capital Services, Inc. (GECS), whose oper-
ations are presented on a one-line basis.
• GECS—This affi liate owns all of the common stock of General
Electric Capital Corporation (GECC). GECC and its respective
affi liates are consolidated in the accompanying GECS columns
and constitute the majority of its business.
• Consolidated—This represents the adding together of GE and
GECS, giving effect to the elimination of transactions between
GE and GECS.
• Operating Segments—These comprise our six busi-
nesses, focused on the broad markets they serve: Energy
Infrastructure, Aviation, Healthcare, Transportation, Home &
Business Solutions and GE Capital. Prior-period information
has been reclassifi ed to be consistent with how we managed
our businesses in 2011.
Unless otherwise indicated, information in these notes to consoli-
dated fi nancial statements relates to continuing operations.
Certain of our operations have been presented as discontinued.
See Note 2.
On February 22, 2012, we merged our wholly-owned sub-
sidiary, GECS, with and into GECS’ wholly-owned subsidiary,
GECC. The merger simplifi ed our fi nancial services’ corporate
structure by consolidating fi nancial services entities and assets
within our organization and simplifying Securities and Exchange
Commission and regulatory reporting. Upon the merger, GECC
became the surviving corporation and assumed all of GECS’ rights
and obligations and became wholly-owned directly by General
Electric Company. Our fi nancial services segment, GE Capital, will
continue to comprise the continuing operations of GECC, which
now includes the run-off insurance operations previously held
and managed in GECS. References to GECS, GECC and the GE
Capital segment in these consolidated fi nancial statements relate
to the entities or segment as they existed during 2011 and do not
refl ect the February 22, 2012 merger.
The effects of translating to U.S. dollars the fi nancial state-
ments of non-U.S. affi liates whose functional currency is the
local currency are included in shareowners’ equity. Asset and
liability accounts are translated at year-end exchange rates, while
revenues and expenses are translated at average rates for the
respective periods.
Preparing fi nancial statements in conformity with U.S. GAAP
requires us to make estimates based on assumptions about
current, and for some estimates future, economic and market
conditions (for example, unemployment, market liquidity, the real
estate market, etc.), which affect reported amounts and related
disclosures in our fi nancial statements. Although our current esti-
mates contemplate current conditions and how we expect them to
change in the future, as appropriate, it is reasonably possible that
in 2012 actual conditions could be worse than anticipated in those
estimates, which could materially affect our results of operations
and fi nancial position. Among other effects, such changes could
result in future impairments of investment securities, goodwill,
intangibles and long-lived assets, incremental losses on fi nancing
receivables, establishment of valuation allowances on deferred tax
assets and increased tax liabilities.
notes to consolidated financial statements
GE 2011 ANNUAL REPORT 77
notes to consolidated financial statements
Sales of Goods and Services
We record all sales of goods and services only when a fi rm sales
agreement is in place, delivery has occurred or services have
been rendered and collectibility of the fi xed or determinable sales
price is reasonably assured.
Arrangements for the sale of goods and services sometimes
include multiple components. Most of our multiple component
arrangements involve the sale of goods and services in the
Healthcare segment. Our arrangements with multiple compo-
nents usually involve an upfront deliverable of large machinery
or equipment and future service deliverables such as installa-
tion, commissioning, training or the future delivery of ancillary
products. In most cases, the relative values of the undelivered
components are not signifi cant to the overall arrangement and
are typically delivered within three to six months after the core
product has been delivered. In such agreements, selling price is
determined for each component and any difference between the
total of the separate selling prices and total contract consideration
(i.e. discount) is allocated pro rata across each of the components
in the arrangement. The value assigned to each component is
objectively determined and obtained primarily from sources such
as the separate selling price for that or a similar item or from com-
petitor prices for similar items. If such evidence is not available,
we use our best estimate of selling price, which is established
consistent with the pricing strategy of the business and considers
product confi guration, geography, customer type, and other mar-
ket specifi c factors.
Except for goods sold under long-term agreements, we rec-
ognize sales of goods under the provisions of U.S. Securities and
Exchange Commission (SEC) Staff Accounting Bulletin (SAB) 104,
Revenue Recognition. We often sell consumer products and com-
puter hardware and software products with a right of return. We
use our accumulated experience to estimate and provide for such
returns when we record the sale. In situations where arrange-
ments include customer acceptance provisions based on seller
or customer-specifi ed objective criteria, we recognize revenue
when we have reliably demonstrated that all specifi ed accep-
tance criteria have been met or when formal acceptance occurs,
respectively. In arrangements where we provide goods for trial
and evaluation purposes, we only recognize revenue after cus-
tomer acceptance occurs. Unless otherwise noted, we do not
provide for anticipated losses before we record sales.
We recognize revenue on agreements for sales of goods and
services under power generation unit and uprate contracts;
nuclear fuel assemblies; larger oil drilling equipment projects;
aeroderivative unit contracts; military development contracts;
locomotive production contracts; and long-term construction
projects, using long-term construction and production contract
accounting. We estimate total long-term contract revenue net of
price concessions as well as total contract costs. For goods sold
under power generation unit and uprate contracts, nuclear fuel
assemblies, aeroderivative unit contracts, military development
contracts and locomotive production contracts, we recognize
sales as we complete major contract-specifi ed deliverables, most
often when customers receive title to the goods or accept the
services as performed. For larger oil drilling equipment projects
and long-term construction projects, we recognize sales based
on our progress towards contract completion measured by
actual costs incurred in relation to our estimate of total expected
costs. We measure long-term contract revenues by applying our
contract-specifi c estimated margin rates to incurred costs. We
routinely update our estimates of future costs for agreements in
process and report any cumulative effects of such adjustments
in current operations. We provide for any loss that we expect to
incur on these agreements when that loss is probable.
We recognize revenue upon delivery for sales of aircraft engines,
military propulsion equipment and related spare parts not sold
under long-term product services agreements. Delivery of com-
mercial engines, non-U.S. military equipment and all related spare
parts occurs on shipment; delivery of military propulsion equip-
ment sold to the U.S. Government or agencies thereof occurs upon
receipt of a Material Inspection and Receiving Report, DD Form
250 or Memorandum of Shipment. Commercial aircraft engines
are complex equipment manufactured to customer order under a
variety of sometimes complex, long-term agreements. We measure
sales of commercial aircraft engines by applying our contract-spe-
cifi c estimated margin rates to incurred costs. We routinely update
our estimates of future revenues and costs for commercial aircraft
engine agreements in process and report any cumulative effects of
such adjustments in current operations. Signifi cant components of
our revenue and cost estimates include price concessions, perfor-
mance-related guarantees as well as material, labor and overhead
costs. We measure revenue for military propulsion equipment and
spare parts not subject to long-term product services agreements
based on the specifi c contract on a specifi cally measured output
basis. We provide for any loss that we expect to incur on these
agreements when that loss is probable; consistent with industry
practice, for commercial aircraft engines, we make such provision
only if such losses are not recoverable from future highly probable
sales of spare parts for those engines.
We sell product services under long-term product main-
tenance or extended warranty agreements in our Aviation,
Transportation and Energy Infrastructure segments, where costs
of performing services are incurred on other than a straight-line
basis. We also sell product services in our Healthcare segment,
where such costs generally are expected to be on a straight-line
basis. For the Aviation, Energy and Transportation agreements,
we recognize related sales based on the extent of our progress
towards completion measured by actual costs incurred in rela-
tion to total expected costs. We routinely update our estimates
of future costs for agreements in process and report any cumu-
lative effects of such adjustments in current operations. For the
Healthcare agreements, we recognize revenues on a straight-line
basis and expense related costs as incurred. We provide for any
loss that we expect to incur on any of these agreements when
that loss is probable.
NBC Universal (NBCU), which we deconsolidated on January 28,
2011, recorded broadcast and cable television and Internet adver-
tising sales when advertisements were aired, net of provision for
any viewer shortfalls (make goods). Sales from theatrical distri-
bution of fi lms were recorded as the fi lms were exhibited; sales
of home videos, net of a return provision, when the videos were
delivered to and available for sale by retailers; fees from cable/
satellite operators when services were provided; and licensing of
fi lm and television programming when the material was available
for airing.
78 GE 2011 ANNUAL REPORT
notes to consolidated financial statements
GECS Revenues from Services (Earned Income)
We use the interest method to recognize income on loans. Interest
on loans includes origination, commitment and other non-refund-
able fees related to funding (recorded in earned income on the
interest method). We stop accruing interest at the earlier of the
time at which collection of an account becomes doubtful or the
account becomes 90 days past due. Previously recognized interest
income that was accrued but not collected from the borrower is
evaluated as part of the overall receivable in determining the
adequacy of the allowance for losses. Although we stop accruing
interest in advance of payments, we recognize interest income as
cash is collected when appropriate, provided the amount does not
exceed that which would have been earned at the historical effec-
tive interest rate; otherwise, payments received are applied to
reduce the principal balance of the loan.
We resume accruing interest on nonaccrual, non-restructured
commercial loans only when (a) payments are brought current
according to the loan’s original terms and (b) future payments are
reasonably assured. When we agree to restructured terms with the
borrower, we resume accruing interest only when it is reasonably
assured that we will recover full contractual payments, and such
loans pass underwriting reviews equivalent to those applied to new
loans. We resume accruing interest on nonaccrual consumer loans
when the customer’s account is less than 90 days past due and
collection of such amounts is probable. Interest accruals on modi-
fi ed consumer loans that are not considered to be troubled debt
restructurings (TDRs) may return to current status (re-aged) only
after receipt of at least three consecutive minimum monthly pay-
ments or the equivalent cumulative amount, subject to a re-aging
limitation of once a year, or twice in a fi ve-year period.
We recognize fi nancing lease income on the interest method
to produce a level yield on funds not yet recovered. Estimated
unguaranteed residual values are based upon management’s
best estimates of the value of the leased asset at the end of the
lease term. We use various sources of data in determining this
estimate, including information obtained from third parties, which
is adjusted for the attributes of the specifi c asset under lease.
Guarantees of residual values by unrelated third parties are con-
sidered part of minimum lease payments. Signifi cant assumptions
we use in estimating residual values include estimated net cash
fl ows over the remaining lease term, anticipated results of future
remarketing, and estimated future component part and scrap
metal prices, discounted at an appropriate rate.
We recognize operating lease income on a straight-line basis
over the terms of underlying leases.
Fees include commitment fees related to loans that we do
not expect to fund and line-of-credit fees. We record these fees
in earned income on a straight-line basis over the period to
which they relate. We record syndication fees in earned income
at the time related services are performed, unless signifi cant
contingencies exist.
Depreciation and Amortization
The cost of GE manufacturing plant and equipment is depreciated
over its estimated economic life. U.S. assets are depreciated using
an accelerated method based on a sum-of-the-years digits formula;
non-U.S. assets are generally depreciated on a straight-line basis.
The cost of GECS equipment leased to others on operating
leases is depreciated on a straight-line basis to estimated residual
value over the lease term or over the estimated economic life of
the equipment.
The cost of GECS acquired real estate investments is depreci-
ated on a straight-line basis to the estimated salvage value over
the expected useful life or the estimated proceeds upon sale
of the investment at the end of the expected holding period if that
approach produces a higher measure of depreciation expense.
The cost of individually signifi cant customer relationships
is amortized in proportion to estimated total related sales; cost
of other intangible assets is generally amortized on a straight-
line basis over the asset’s estimated economic life. We review
long-lived assets for impairment whenever events or changes in
circumstances indicate that the related carrying amounts may
not be recoverable. See Notes 7 and 8.
NBC Universal Film and Television Costs
Prior to our deconsolidation of NBCU in 2011, our policies were to
defer fi lm and television production costs, including direct costs,
production overhead, development costs and interest. We did not
defer costs of exploitation, which principally comprised costs of
fi lm and television program marketing and distribution. We amor-
tized deferred fi lm and television production costs, as well as
associated participation and residual costs, on an individual
production basis using the ratio of the current period’s gross
revenues to estimated total remaining gross revenues from all
sources; we stated such costs at the lower of amortized cost or
fair value. Estimates of total revenues and costs were based on
anticipated release patterns, public acceptance and historical
results for similar products. We deferred the costs of acquired
broadcast material, including rights to material for use on NBC
Universal’s broadcast and cable/satellite television networks, at
the earlier of acquisition or when the license period began
and the material was available for use. We amortized acquired
broadcast material and rights when we broadcast the associated
programs; we stated such costs at the lower of amortized cost or
net realizable value.
Losses on Financing Receivables
Losses on fi nancing receivables are recognized when they are
incurred, which requires us to make our best estimate of probable
losses inherent in the portfolio. The method for calculating the
best estimate of losses depends on the size, type and risk charac-
teristics of the related fi nancing receivable. Such an estimate
requires consideration of historical loss experience, adjusted for
current conditions, and judgments about the probable effects of
relevant observable data, including present economic conditions
such as delinquency rates, fi nancial health of specifi c customers
GE 2011 ANNUAL REPORT 79
notes to consolidated financial statements
and market sectors, collateral values (including housing price
indices as applicable), and the present and expected future levels
of interest rates. The underlying assumptions, estimates and
assessments we use to provide for losses are updated periodi-
cally to refl ect our view of current conditions. Changes in such
estimates can signifi cantly affect the allowance and provision for
losses. It is possible that we will experience credit losses that are
different from our current estimates. Write-offs are deducted
from the allowance for losses when we judge the principal to be
uncollectible and subsequent recoveries are added to the allow-
ance at the time cash is received on a written-off account.
“Impaired” loans are defi ned as larger balance or restructured
loans for which it is probable that the lender will be unable to col-
lect all amounts due according to the original contractual terms
of the loan agreement.
“Troubled debt restructurings” (TDRs) are those loans for
which we have granted a concession to a borrower experiencing
fi nancial diffi culties where we do not receive adequate compen-
sation. Such loans are classifi ed as impaired, and are individually
reviewed for specifi c reserves.
“Nonaccrual fi nancing receivables” are those on which we
have stopped accruing interest. We stop accruing interest at the
earlier of the time at which collection of an account becomes
doubtful or the account becomes 90 days past due. Although
we stop accruing interest in advance of payments, we recognize
interest income as cash is collected when appropriate provided
the amount does not exceed that which would have been earned
at the historical effective interest rate. Recently restructured
fi nancing receivables are not considered delinquent when pay-
ments are brought current according to the restructured terms,
but may remain classifi ed as nonaccrual until there has been a
period of satisfactory payment performance by the borrower and
future payments are reasonably assured of collection.
“Nonearning fi nancing receivables” are a subset of nonac-
crual fi nancing receivables for which cash payments are not
being received or for which we are on the cost recovery method
of accounting (i.e., any payments are accounted for as a reduc-
tion of principal). This category excludes loans purchased at a
discount (unless they have deteriorated post acquisition). Under
Accounting Standards Codifi cation (ASC) 310, Receivables, these
loans are initially recorded at fair value and accrete interest
income over the estimated life of the loan based on reasonably
estimable cash fl ows even if the underlying loans are contractu-
ally delinquent at acquisition.
“Delinquent” receivables are those that are 30 days or more
past due based on their contractual terms.
The same fi nancing receivable may meet more than one of the
defi nitions above. Accordingly, these categories are not mutually
exclusive and it is possible for a particular loan to meet the defi ni-
tions of a TDR, impaired loan, nonaccrual loan and nonearning loan
and be included in each of these categories. The categorization of
a particular loan also may not be indicative of the potential for loss.
Our consumer loan portfolio consists of smaller-balance,
homogeneous loans, including credit card receivables, install-
ment loans, auto loans and leases and residential mortgages.
We collectively evaluate each portfolio for impairment quarterly.
The allowance for losses on these receivables is established
through a process that estimates the probable losses inherent
in the portfolio based upon statistical analyses of portfolio data.
These analyses include migration analysis, in which historical
delinquency and credit loss experience is applied to the current
aging of the portfolio, together with other analyses that refl ect
current trends and conditions. We also consider overall portfolio
indicators including nonearning loans, trends in loan volume and
lending terms, credit policies and other observable environmental
factors such as unemployment rates and home price indices.
Our commercial loan and lease portfolio consists of a variety
of loans and leases, including both larger-balance, non-homoge-
neous loans and leases and smaller-balance homogeneous loans
and leases. Losses on such loans and leases are recorded when
probable and estimable. We routinely evaluate our entire portfolio
for potential specifi c credit or collection issues that might indicate
an impairment.
For larger-balance, non-homogeneous loans and leases, we
consider the fi nancial status, payment history, collateral value,
industry conditions and guarantor support related to specifi c
customers. Any delinquencies or bankruptcies are indications of
potential impairment requiring further assessment of collectibil-
ity. We routinely receive fi nancial as well as rating agency reports
on our customers, and we elevate for further attention those
customers whose operations we judge to be marginal or deterio-
rating. We also elevate customers for further attention when we
observe a decline in collateral values for asset-based loans. While
collateral values are not always available, when we observe such
a decline, we evaluate relevant markets to assess recovery alter-
natives—for example, for real estate loans, relevant markets are
local; for commercial aircraft loans, relevant markets are global.
Measurement of the loss on our impaired commercial loans
is based on the present value of expected future cash fl ows dis-
counted at the loan’s effective interest rate or the fair value of
collateral, net of expected selling costs, if the loan is determined
to be collateral dependent. We determine whether a loan is col-
lateral dependent if the repayment of the loan is expected to be
provided solely by the underlying collateral. Our review process
can often result in reserves being established in advance of a
modifi cation of terms or designation as a TDR. After providing
for specifi c incurred losses, we then determine an allowance for
losses that have been incurred in the balance of the portfolio but
cannot yet be identifi ed to a specifi c loan or lease. This estimate is
based upon various statistical analyses considering historical and
projected default rates and loss severity and aging, as well as our
view on current market and economic conditions. It is prepared
by each respective line of business. For Real Estate, this includes
converting economic indicators into real estate market indicators
that are calibrated by market and asset class and which are used
to project expected performance of the portfolio based on spe-
cifi c loan portfolio metrics.
We consider multiple factors in evaluating the adequacy of
our allowance for losses on Real Estate fi nancing receivables,
including loan-to-value ratios, collateral values at the individual
loan level, debt service coverage ratios, delinquency status, and
economic factors including interest rate and real estate market
80 GE 2011 ANNUAL REPORT
notes to consolidated financial statements
forecasts. In addition to evaluating these factors, we deem a Real
Estate loan to be impaired if its projected loan-to-value ratio at
maturity is in excess of 100%, even if the loan is currently pay-
ing in accordance with its contractual terms. The allowance for
losses on Real Estate fi nancing receivables is based on a dis-
counted cash fl ow methodology, except in situations where the
loan is within 24 months of maturity or foreclosure is deemed
probable, in which case reserves are based on collateral values.
If foreclosure is deemed probable or if repayment is dependent
solely on the sale of collateral, we also include estimated selling
costs in our reserve. Collateral values for our Real Estate loans are
determined based upon internal cash fl ow estimates discounted
at an appropriate rate and corroborated by external appraisals,
as appropriate. Collateral valuations are updated at least annu-
ally, or more frequently for higher risk loans. A majority of our Real
Estate impaired loans have specifi c reserves that are determined
based on the underlying collateral values. Further discussion
on determination of fair value is in the Fair Value Measurements
section below.
Experience is not available for new products; therefore, while
we are developing that experience, we set loss allowances based
on our experience with the most closely analogous products in
our portfolio.
Our loss mitigation strategy intends to minimize economic
loss and, at times, can result in rate reductions, principal forgive-
ness, extensions, forbearance or other actions, which may cause
the related loan to be classifi ed as a TDR.
We utilize certain loan modifi cation programs for borrowers
experiencing temporary fi nancial diffi culties in our Consumer
loan portfolio. These loan modifi cation programs are primarily
concentrated in our non-U.S. residential mortgage and non-U.S.
installment and revolving portfolios and include short-term (three
months or less) interest rate reductions and payment deferrals,
which were not part of the terms of the original contract. We
sold our U.S. residential mortgage business in 2007 and as such,
do not participate in the U.S. government-sponsored mortgage
modifi cation programs.
Our allowance for losses on fi nancing receivables on these
modifi ed consumer loans is determined based upon a formulaic
approach that estimates the probable losses inherent in the port-
folio based upon statistical analyses of the portfolio. Data related
to redefault experience is also considered in our overall reserve
adequacy review. Once the loan has been modifi ed, it returns to
current status (re-aged) only after receipt of at least three consec-
utive minimum monthly payments or the equivalent cumulative
amount, subject to a re-aging limitation of once a year, or twice
in a fi ve-year period in accordance with the Federal Financial
Institutions Examination Council guidelines on Uniform Retail
Credit Classifi cation and Account Management policy issued in
June 2000. We believe that the allowance for losses would not be
materially different had we not re-aged these accounts.
For commercial loans, we evaluate changes in terms and
conditions to determine whether those changes meet the
criteria for classifi cation as a TDR on a loan-by-loan basis. In
Commercial Lending and Leasing (CLL), these changes primarily
include: changes to covenants, short-term payment deferrals and
maturity extensions. For these changes, we receive economic
consideration, including additional fees and/or increased inter-
est rates, and evaluate them under our normal underwriting
standards and criteria. Changes to Real Estate’s loans primar-
ily include maturity extensions, principal payment acceleration,
changes to collateral terms, and cash sweeps, which are in
addition to, or sometimes in lieu of, fees and rate increases. The
determination of whether these changes to the terms and condi-
tions of our commercial loans meet the TDR criteria includes our
consideration of all of the relevant facts and circumstances. When
the borrower is experiencing fi nancial diffi culty, we carefully eval-
uate these changes to determine whether they meet the form of
a concession. In these circumstances, if the change is deemed to
be a concession, we classify the loan as a TDR.
When we repossess collateral in satisfaction of a loan, we
write down the receivable against the allowance for losses.
Repossessed collateral is included in the caption “All other assets”
in the Statement of Financial Position and carried at the lower of
cost or estimated fair value less costs to sell.
For Consumer loans, we write off unsecured closed-end
installment loans when they are 120 days contractually past due
and unsecured open-ended revolving loans at 180 days con-
tractually past due. We write down consumer loans secured by
collateral other than residential real estate when such loans are
120 days past due. Consumer loans secured by residential real
estate (both revolving and closed-end loans) are written down to
the fair value of collateral, less costs to sell, no later than when
they become 360 days past due. Unsecured consumer loans in
bankruptcy are written off within 60 days of notifi cation of fi ling
by the bankruptcy court or within contractual write-off periods,
whichever occurs earlier.
Write-offs on larger balance impaired commercial loans are
based on amounts deemed uncollectible and are reviewed quar-
terly. Write-offs on Real Estate loans are recorded upon initiation
of foreclosure or early settlement by the borrower, or in some
cases, based on the passage of time depending on specifi c facts
and circumstances. In CLL, loans are written off when deemed
uncollectible (e.g., when the borrower enters restructuring, collat-
eral is to be liquidated or at 180 days past due for smaller balance,
homogeneous loans).
Partial Sales of Business Interests
Gains or losses on sales of affi liate shares where we retain a
controlling fi nancial interest are recorded in equity. Gains or
losses on sales that result in our loss of a controlling fi nancial
interest are recorded in earnings along with remeasurement
gains or losses on any investments in the entity that we retained.
GE 2011 ANNUAL REPORT 81
notes to consolidated financial statements
Cash and Equivalents
Debt securities and money market instruments with original
maturities of three months or less are included in cash equiva-
lents unless designated as available-for-sale and classifi ed as
investment securities.
Investment Securities
We report investments in debt and marketable equity securities,
and certain other equity securities, at fair value. See Note 21 for
further information on fair value. Unrealized gains and losses on
available-for-sale investment securities are included in shareown-
ers’ equity, net of applicable taxes and other adjustments. We
regularly review investment securities for impairment using both
quantitative and qualitative criteria.
For debt securities, if we do not intend to sell the security or it
is not more likely than not that we will be required to sell the secu-
rity before recovery of our amortized cost, we evaluate qualitative
criteria to determine whether we do not expect to recover the
amortized cost basis of the security, such as the fi nancial health of
and specifi c prospects for the issuer, including whether the issuer
is in compliance with the terms and covenants of the security. We
also evaluate quantitative criteria including determining whether
there has been an adverse change in expected future cash fl ows.
If we do not expect to recover the entire amortized cost basis of
the security, we consider the security to be other-than-temporar-
ily impaired, and we record the difference between the security’s
amortized cost basis and its recoverable amount in earnings and
the difference between the security’s recoverable amount and
fair value in other comprehensive income. If we intend to sell the
security or it is more likely than not we will be required to sell the
security before recovery of its amortized cost basis, the security
is also considered other-than-temporarily impaired and we rec-
ognize the entire difference between the security’s amortized
cost basis and its fair value in earnings. For equity securities, we
consider the length of time and magnitude of the amount that
each security is in an unrealized loss position. If we do not expect
to recover the entire amortized cost basis of the security, we con-
sider the security to be other-than-temporarily impaired, and we
record the difference between the security’s amortized cost basis
and its fair value in earnings.
Prior to April 1, 2009, unrealized losses that were other-than-
temporary were recognized in earnings at an amount equal to the
difference between the security’s amortized cost and fair value.
In determining whether the unrealized loss was other-than-tem-
porary, we considered both quantitative and qualitative criteria.
Quantitative criteria included the length of time and magnitude
of the amount that each security was in an unrealized loss posi-
tion and, for securities with fi xed maturities, whether the issuer
was in compliance with terms and covenants of the security.
For structured securities, we evaluated whether there was an
adverse change in the timing or amount of expected cash fl ows.
Qualitative criteria included the fi nancial health of and specifi c
prospects for the issuer, as well as our intent and ability to hold
the security to maturity or until forecasted recovery.
Realized gains and losses are accounted for on the specifi c
identifi cation method. Unrealized gains and losses on investment
securities classifi ed as trading and certain retained interests are
included in earnings.
Inventories
All inventories are stated at the lower of cost or realizable values.
Cost for a signifi cant portion of GE U.S. inventories is determined
on a last-in, fi rst-out (LIFO) basis. Cost of other GE inventories is
determined on a fi rst-in, fi rst-out (FIFO) basis. LIFO was used for
38% and 41% of GE inventories at December 31, 2011 and 2010,
respectively. GECS inventories consist of fi nished products held
for sale; cost is determined on a FIFO basis.
Intangible Assets
We do not amortize goodwill, but test it at least annually for
impairment at the reporting unit level. A reporting unit is the
operating segment, or a business one level below that operating
segment (the component level) if discrete fi nancial information is
prepared and regularly reviewed by segment management.
However, components are aggregated as a single reporting unit if
they have similar economic characteristics. We recognize an
impairment charge if the carrying amount of a reporting unit
exceeds its fair value and the carrying amount of the reporting
unit’s goodwill exceeds the implied fair value of that goodwill. We
use discounted cash fl ows to establish fair values. When available
and as appropriate, we use comparative market multiples to
corroborate discounted cash fl ow results. When all or a portion of
a reporting unit is disposed, goodwill is allocated to the gain or
loss on disposition based on the relative fair values of the busi-
ness disposed and the portion of the reporting unit that will
be retained.
We amortize the cost of other intangibles over their estimated
useful lives unless such lives are deemed indefi nite. The cost of
intangible assets is generally amortized on a straight-line basis
over the asset’s estimated economic life, except that individually
signifi cant customer-related intangible assets are amortized in
relation to total related sales. Amortizable intangible assets are
tested for impairment based on undiscounted cash fl ows and, if
impaired, written down to fair value based on either discounted
cash fl ows or appraised values. Intangible assets with indefi nite
lives are tested annually for impairment and written down to fair
value as required.
GECS Investment Contracts, Insurance Liabilities and
Insurance Annuity Benefits
Certain entities, which we consolidate, provide guaranteed
investment contracts, primarily to states, municipalities and
municipal authorities.
Our insurance activities also include providing insurance and
reinsurance for life and health risks and providing certain annuity
products. Three product groups are provided: traditional insur-
ance contracts, investment contracts and universal life insurance
contracts. Insurance contracts are contracts with signifi cant
82 GE 2011 ANNUAL REPORT
notes to consolidated financial statements
mortality and/or morbidity risks, while investment contracts are
contracts without such risks. Universal life insurance contracts
are a particular type of long-duration insurance contract whose
terms are not fi xed and guaranteed.
For short-duration insurance contracts, including accident
and health insurance, we report premiums as earned income
over the terms of the related agreements, generally on a pro-rata
basis. For traditional long-duration insurance contracts including
term, whole life and annuities payable for the life of the annuitant,
we report premiums as earned income when due.
Premiums received on investment contracts (including annui-
ties without signifi cant mortality risk) and universal life contracts
are not reported as revenues but rather as deposit liabilities. We
recognize revenues for charges and assessments on these con-
tracts, mostly for mortality, contract initiation, administration
and surrender. Amounts credited to policyholder accounts are
charged to expense.
Liabilities for traditional long-duration insurance contracts
represent the present value of such benefi ts less the present
value of future net premiums based on mortality, morbidity, inter-
est and other assumptions at the time the policies were issued
or acquired. Liabilities for investment contracts and universal life
policies equal the account value, that is, the amount that accrues
to the benefi t of the contract or policyholder including credited
interest and assessments through the fi nancial statement date.
Liabilities for unpaid claims and estimated claim settlement
expenses represent our best estimate of the ultimate obliga-
tions for reported and incurred-but-not-reported claims and
the related estimated claim settlement expenses. Liabilities for
unpaid claims and estimated claim settlement expenses are con-
tinually reviewed and adjusted through current operations.
Fair Value Measurements
For fi nancial assets and liabilities measured at fair value on a
recurring basis, fair value is the price we would receive to sell an
asset or pay to transfer a liability in an orderly transaction with a
market participant at the measurement date. In the absence of
active markets for the identical assets or liabilities, such measure-
ments involve developing assumptions based on market
observable data and, in the absence of such data, internal infor-
mation that is consistent with what market participants would
use in a hypothetical transaction that occurs at the
measurement date.
Observable inputs refl ect market data obtained from inde-
pendent sources, while unobservable inputs refl ect our market
assumptions. Preference is given to observable inputs. These two
types of inputs create the following fair value hierarchy:
Level 1— Quoted prices for identical instruments in
active markets.
Level 2— Quoted prices for similar instruments in active markets;
quoted prices for identical or similar instruments in
markets that are not active; and model-derived valua-
tions whose inputs are observable or whose signifi cant
value drivers are observable.
Level 3— Signifi cant inputs to the valuation model
are unobservable.
We maintain policies and procedures to value instruments using
the best and most relevant data available. In addition, we have risk
management teams that review valuation, including independent
price validation for certain instruments. With regards to Level 3
valuations (including instruments valued by third parties), we
perform a variety of procedures to assess the reasonableness of
the valuations. Such reviews, which may be performed quarterly,
monthly or weekly, include an evaluation of instruments whose
fair value change exceeds predefi ned thresholds (and/or does
not change) and consider the current interest rate, currency and
credit environment, as well as other published data, such as rating
agency market reports and current appraisals. These reviews are
performed within each business by the asset and risk managers,
pricing committees and valuation committees. A detailed review
of methodologies and assumptions is performed by individuals
independent of the business for individual measurements with a
fair value exceeding predefi ned thresholds. This detailed review
may include the use of a third-party valuation fi rm.
The following section describes the valuation methodologies
we use to measure different fi nancial instruments at fair value on
a recurring basis.
INVESTMENTS IN DEBT AND EQUITY SECURITIES. When available, we
use quoted market prices to determine the fair value of invest-
ment securities, and they are included in Level 1. Level 1
securities primarily include publicly-traded equity securities.
For large numbers of investment securities for which market
prices are observable for identical or similar investment secu-
rities but not readily accessible for each of those investments
individually (that is, it is diffi cult to obtain pricing information for
each individual investment security at the measurement date), we
obtain pricing information from an independent pricing vendor.
The pricing vendor uses various pricing models for each asset
class that are consistent with what other market participants
would use. The inputs and assumptions to the model of the pric-
ing vendor are derived from market observable sources including:
benchmark yields, reported trades, broker/dealer quotes, issuer
spreads, benchmark securities, bids, offers, and other market-
related data. Since many fi xed income securities do not trade on a
daily basis, the methodology of the pricing vendor uses available
information as applicable such as benchmark curves, benchmark-
ing of like securities, sector groupings, and matrix pricing. The
pricing vendor considers available market observable inputs in
determining the evaluation for a security. Thus, certain securities
may not be priced using quoted prices, but rather determined
from market observable information. These investments are
included in Level 2 and primarily comprise our portfolio of corpo-
rate fi xed income, and government, mortgage and asset-backed
securities. In infrequent circumstances, our pricing vendors may
provide us with valuations that are based on signifi cant unob-
servable inputs, and in those circumstances we classify the
investment securities in Level 3.
Annually, we conduct reviews of our primary pricing vendor
to validate that the inputs used in that vendor’s pricing process
are deemed to be market observable as defi ned in the standard.
GE 2011 ANNUAL REPORT 83
notes to consolidated financial statements
While we are not provided access to proprietary models of the
vendor, our reviews have included on-site walk-throughs of the
pricing process, methodologies and control procedures for each
asset class and level for which prices are provided. Our reviews
also include an examination of the underlying inputs and assump-
tions for a sample of individual securities across asset classes,
credit rating levels and various durations, a process we perform
each reporting period. In addition, the pricing vendor has an
established challenge process in place for all security valuations,
which facilitates identifi cation and resolution of potentially erro-
neous prices. We believe that the prices received from our pricing
vendor are representative of prices that would be received to sell
the assets at the measurement date (exit prices) and are classifi ed
appropriately in the hierarchy.
We use non-binding broker quotes and other third-party
pricing services as our primary basis for valuation when there
is limited, or no, relevant market activity for a specifi c instru-
ment or for other instruments that share similar characteristics.
We have not adjusted the prices we have obtained. Investment
securities priced using non-binding broker quotes and other
third-party pricing services are included in Level 3. As is the case
with our primary pricing vendor, third-party brokers and other
third-party pricing services do not provide access to their pro-
prietary valuation models, inputs and assumptions. Accordingly,
our risk management personnel conduct reviews of vendors, as
applicable, similar to the reviews performed of our primary pric-
ing vendor. In addition, we conduct internal reviews of pricing for
all such investment securities quarterly to ensure reasonable-
ness of valuations used in our fi nancial statements. These reviews
are designed to identify prices that appear stale, those that have
changed signifi cantly from prior valuations, and other anomalies
that may indicate that a price may not be accurate. Based on the
information available, we believe that the fair values provided by
the brokers and other third-party pricing services are represen-
tative of prices that would be received to sell the assets at the
measurement date (exit prices).
DERIVATIVES. We use closing prices for derivatives included in
Level 1, which are traded either on exchanges or liquid over-the-
counter markets.
The majority of our derivatives are valued using internal mod-
els. The models maximize the use of market observable inputs
including interest rate curves and both forward and spot prices
for currencies and commodities. Derivative assets and liabilities
included in Level 2 primarily represent interest rate swaps, cross-
currency swaps and foreign currency and commodity forward
and option contracts.
Derivative assets and liabilities included in Level 3 primarily
represent equity derivatives and interest rate products that con-
tain embedded optionality or prepayment features.
Non-Recurring Fair Value Measurements
Certain assets are measured at fair value on a non-recurring
basis. These assets are not measured at fair value on an ongoing
basis, but are subject to fair value adjustments only in certain
circumstances. These assets can include loans and long-lived
assets that have been reduced to fair value when they are held for
sale, impaired loans that have been reduced based on the fair
value of the underlying collateral, cost and equity method invest-
ments and long-lived assets that are written down to fair value
when they are impaired and the remeasurement of retained
investments in formerly consolidated subsidiaries upon a change
in control that results in deconsolidation of a subsidiary, if we sell
a controlling interest and retain a noncontrolling stake in the
entity. Assets that are written down to fair value when impaired
and retained investments are not subsequently adjusted to fair
value unless further impairment occurs.
The following describes the valuation methodologies we use
to measure fi nancial and non-fi nancial instruments accounted for
at fair value on a non-recurring basis and for certain assets within
our pension plans and retiree benefi t plans at each reporting
period, as applicable.
LOANS. When available, we use observable market data, including
pricing on recent closed market transactions, to value loans that
are included in Level 2. When this data is unobservable, we use
valuation methodologies using current market interest rate data
adjusted for inherent credit risk, and such loans are included in
Level 3. When appropriate, loans may be valued using collateral
values as a practical expedient (see Long-Lived Assets below).
COST AND EQUITY METHOD INVESTMENTS. Cost and equity method
investments are valued using market observable data such as
quoted prices when available. When market observable data is
unavailable, investments are valued using a discounted cash fl ow
model, comparative market multiples or a combination of both
approaches as appropriate and other third-party pricing sources.
These investments are generally included in Level 3.
Investments in private equity, real estate and collective funds
are valued using net asset values. The net asset values are deter-
mined based on the fair values of the underlying investments in
the funds. Investments in private equity and real estate funds are
generally included in Level 3 because they are not redeemable
at the measurement date. Investments in collective funds are
included in Level 2.
LONG-LIVED ASSETS. Fair values of long-lived assets, including
aircraft and real estate, are primarily derived internally and are
based on observed sales transactions for similar assets. In other
instances, for example, collateral types for which we do not have
comparable observed sales transaction data, collateral values are
developed internally and corroborated by external appraisal
information. Adjustments to third-party valuations may be per-
formed in circumstances where market comparables are not
specifi c to the attributes of the specifi c collateral or appraisal
information may not be refl ective of current market conditions
due to the passage of time and the occurrence of market events
since receipt of the information. For real estate, fair values are
84 GE 2011 ANNUAL REPORT
notes to consolidated financial statements
based on discounted cash fl ow estimates which refl ect current
and projected lease profi les and available industry information
about capitalization rates and expected trends in rents and occu-
pancy and are corroborated by external appraisals. These
investments are generally included in Level 3.
RETAINED INVESTMENTS IN FORMERLY CONSOLIDATED
SUBSIDIARIES.
Upon a change in control that results in deconsoli-
dation of a subsidiary, the fair value measurement of our retained
noncontrolling stake in the former subsidiary is valued using an
income approach, a market approach, or a combination of both
approaches as appropriate. In applying these methodologies, we
rely on a number of factors, including actual operating results,
future business plans, economic projections, market observable
pricing multiples of similar businesses and comparable transac-
tions, and possible control premium. These investments are
included in Level 1 or Level 3, as appropriate, determined at the
time of the transaction.
Accounting Changes
On January 1, 2011, we adopted Financial Accounting Standards
Board (FASB) ASU 2009-13 and ASU 2009-14, amendments to
ASC 605, Revenue Recognition and ASC 985, Software, respec-
tively, (ASU 2009-13 & 14). ASU 2009-13 requires the allocation of
consideration to separate components of an arrangement based
on the relative selling price of each component. ASU 2009-14
requires certain software-enabled products to be accounted for
under the general accounting standards for multiple component
arrangements. These amendments are effective for new revenue
arrangements entered into or materially modifi ed on or subse-
quent to January 1, 2011.
Although the adoption of these amendments eliminated the
allocation of consideration using residual values, which was
applied primarily in our Healthcare segment, the overall impact of
adoption was insignifi cant to our fi nancial statements. In addition,
there are no signifi cant changes to the number of components or
the pattern and timing of revenue recognition following adoption.
On July 1, 2011, we adopted FASB ASU 2011-02, an amend-
ment to ASC 310, Receivables. ASU 2011-02 provides guidance
for determining whether a restructuring of a debt constitutes a
TDR. ASU 2011-02 requires that a restructuring be classifi ed as a
TDR when it is both a concession and the debtor is experiencing
fi nancial diffi culties. The amendment also clarifi es the guidance
on a creditor’s evaluation of whether it has granted a concession.
The amendment applies to restructurings that have occurred
subsequent to January 1, 2011. As a result of adopting these
amendments on July 1, 2011, we have classifi ed an additional
$271 million of fi nancing receivables as TDRs and have recorded
an increase of $77 million to our allowance for losses on fi nancing
receivables. See Note 23.
On January 1, 2010, we adopted ASU 2009-16 and ASU
2009-17, amendments to ASC 860, Transfers and Servicing, and
ASC 810, Consolidation, respectively (ASU 2009-16 & 17). ASU
2009-16 eliminated the Qualifi ed Special Purpose Entity (QSPE)
concept, and ASU 2009-17 required that all such entities be evalu-
ated for consolidation as VIEs. Adoption of these amendments
resulted in the consolidation of all of our sponsored QSPEs. In
addition, we consolidated assets of VIEs related to direct invest-
ments in entities that hold loans and fi xed income securities, a
media joint venture and a small number of companies to which
we have extended loans in the ordinary course of business and
subsequently were subject to a TDR.
We consolidated the assets and liabilities of these entities at
amounts at which they would have been reported in our fi nancial
statements had we always consolidated them. We also decon-
solidated certain entities where we did not meet the defi nition
of the primary benefi ciary under the revised guidance; however,
the effect was insignifi cant at January 1, 2010. The incremen-
tal effect on total assets and liabilities, net of our investment in
these entities, was an increase of $31,097 million and $33,042 mil-
lion, respectively, at January 1, 2010. The net reduction of total
equity (including noncontrolling interests) was $1,945 million at
January 1, 2010, principally related to the reversal of previously
recognized securitization gains as a cumulative effect adjustment
to retained earnings. See Note 24 for additional information.
We adopted amendments to ASC 320, Investments—Debt and
Equity Securities, and recorded a cumulative effect adjustment to
increase retained earnings as of April 1, 2009, of $62 million.

GE 2011 ANNUAL REPORT 85
notes to consolidated financial statements
Note 2.
Assets and Liabilities of Businesses Held for Sale and
Discontinued Operations
Assets and Liabilities of Businesses Held for Sale
NBC UNIVERSAL
In December 2009, we entered into an agreement with Comcast
Corporation (Comcast) to transfer the assets of the NBCU busi-
ness to a newly formed entity, comprising our NBCU business and
Comcast’s cable networks, regional sports networks, certain
digital properties and certain unconsolidated investments, in
exchange for cash and a 49% interest in the newly-formed entity.
On March 19, 2010, NBCU entered into a three-year credit
agreement and a 364-day bridge loan agreement. On April 30,
2010, NBCU issued $4,000 million of senior, unsecured notes with
maturities ranging from 2015 to 2040 (interest rates ranging from
3.65% to 6.40%). On October 4, 2010, NBCU issued $5,100 million
of senior, unsecured notes with maturities ranging from 2014 to
2041 (interest rates ranging from 2.10% to 5.95%). Subsequent
to these issuances, the credit agreement and bridge loan agree-
ments were terminated, with a $750 million revolving credit
agreement remaining in effect. Proceeds from these issuances
were used to repay $1,678 million of existing debt and pay a divi-
dend of $7,394 million to GE.
On September 26, 2010, we acquired approximately 38% of
Vivendi S.A.’s (Vivendi) 20% interest in NBCU (7.7% of NBCU’s
outstanding shares) for $2,000 million. In January 2011 and prior
to the transaction with Comcast, we acquired the remaining
Vivendi interest in NBCU (12.3% of NBCU’s outstanding shares) for
$3,673 million and made an additional payment of $222 million
related to the previously purchased shares.
On January 28, 2011, we transferred the assets of the NBCU
business and Comcast transferred certain of its assets to a newly
formed entity, NBCUniversal LLC (NBCU LLC). In connection with
the transaction, we received $6,176 million in cash from Comcast
(which included $49 million of transaction-related cost reim-
bursements) and a 49% interest in NBCU LLC. Comcast holds the
remaining 51% interest in NBCU LLC.
With respect to our 49% interest in NBCU LLC, we hold
redemption rights, which, if exercised, would require NBCU LLC
or Comcast to purchase (either directly or indirectly by GE trans-
ferring common stock of our holding company that owns 49%
of NBCU LLC) half of our ownership interest after three and a half
years and the remaining half after seven years, subject to cer-
tain exceptions, conditions and limitations. Our interest in NBCU
LLC also is subject to call provisions, which, if exercised, allow
Comcast to purchase our interest (either directly or indirectly) at
specifi ed times subject to certain exceptions. The redemption
prices for such transactions are determined based on a contrac-
tually specifi ed formula.
In connection with the transaction, we also entered into a
number of agreements with Comcast governing the operation
of the venture and transitional services, employee, tax and other
matters. Under the operating agreement, excess cash generated
by the operations of NBCU LLC will be used to reduce borrow-
ings, except for distributions in amounts necessary to pay taxes
on NBCU LLC’s profi ts. In addition, Comcast is obligated to share
with us potential tax savings associated with Comcast’s purchase
of its NBCU LLC member interest, if realized. We did not recognize
these potential future payments as consideration for the sale, but
will record such payments in income as they are received.
Following the transaction, we deconsolidated NBCU and we
account for our investment in NBCU LLC under the equity method.
We recognized a pre-tax gain on the sale of $3,705 million
($526 million after tax). In connection with the sale, we recorded
income tax expense of $3,179 million, refl ecting the low tax basis
in our investment in the NBCU business and the recognition of
deferred tax liabilities related to our 49% investment in NBCU LLC.
As our investment in NBCU LLC is structured as a partnership for
U.S. tax purposes, U.S. taxes are recorded separately from the
equity investment.
At December 31, 2011, the carrying amount of our equity
investment in NBCU LLC was $17,955 million, reported in the
“All other assets” caption in our Statement of Financial Position.
Deferred tax liabilities related to our NBCU LLC investment
were $4,880 million at December 31, 2011 and were reported
in the “Deferred income taxes” caption in our Statement of
Financial Position.
We valued the initial carrying value of our investment in NBCU
LLC based on a combination of income and market approaches.
An income approach was used to determine the fair values of
NBCU LLC’s underlying businesses and, when available and
appropriate, an analysis of comparative market multiples was
also undertaken. The resulting fair values were weighted equally
between the two approaches. For purposes of the income
approach, fair value was determined based on the present values
of estimated future cash fl ows discounted at appropriate risk-
adjusted rates. We used NBCU LLC management projections to
estimate future cash fl ows and included an estimate of long-term
future growth rates based on management’s most recent views
of the long-term outlook for its businesses. We believe that these
assumptions are consistent with market participant assump-
tions. We derived discount rates using a weighted average cost of
capital. The cost of equity was determined using the capital asset
pricing model and the cost of debt fi nancing was based on pub-
lished rates for industries relevant to NBCU LLC. Under the market
approach, the most signifi cant assumption was the price multiple,
which was selected based on the operating performance and
fi nancial condition of comparable publicly traded companies in
industries similar to those of the NBCU LLC businesses. As NBCU
LLC is a partnership, the fair value of our investment in NBCU LLC
was determined based upon the amount a market participant
would pay for the partnership interest taking into consideration
the tax benefi t associated with such a purchase. The value of our
investment also incorporates the fair value of the redemption fea-
tures described above, which was determined based on an option
pricing framework that incorporates the specifi c contractual
terms of the redemption features.

86 GE 2011 ANNUAL REPORT
notes to consolidated financial statements
At December 31, 2010, we classifi ed the NBCU assets and
liabilities of $33,758 million and $15,455 million, respectively, as
held for sale. The major classes of assets at December 31, 2010
were current receivables ($2,572 million), property, plant and
equipment—net ($2,082 million), goodwill and other intangible
assets—net ($22,263 million) and all other assets ($6,841 million),
including fi lm and television production costs of $4,423 mil-
lion. The major classes of liabilities at December 31, 2010 were
accounts payable ($492 million), other GE current liabilities
($3,983 million), long-term debt ($9,906 million) and all other liabil-
ities ($1,073 million).
OTHER
In the third quarter of 2011, we committed to sell our GE Capital
CLL marine container leasing business, which consists of our
controlling interests in the GE SeaCo joint venture along with
other owned marine container assets, and our CLL trailer fl eet
services business in Mexico. In the fourth quarter of 2011, we
completed the sale of our interest in the CLL marine container
leasing business and our CLL trailer fl eet services business in
Mexico for proceeds of $500 million and $111 million, respectively.
In the second quarter of 2011, we committed to sell our GE
Capital Consumer business banking operations in Latvia.
In 2010, we committed to sell our GE Capital Consumer busi-
nesses in Argentina, Brazil, and Canada, a CLL business in South
Korea, and our Real Estate Interpark business. The GE Capital
Consumer Canada disposition was completed during the fi rst
quarter of 2011 for proceeds of $1,429 million. The GE Capital
Consumer Brazil and Real Estate Interpark business dispositions
were completed during the second quarter of 2011 for proceeds
of $22 million and $704 million, respectively. The GE Capital
Consumer Argentina disposition was completed during the third
quarter of 2011 for proceeds of $41 million.
Summarized fi nancial information for businesses held for sale
is shown below.
December 31 (In millions) 2011 2010
ASSETS
Cash and equivalents $149 $ 63
Current receivables —2,572
Financing receivables—net 412 1,917
Property, plant and equipment—net 81 2,185
Goodwill 20 19,606
Other intangible assets—net 72,844
All other assets 87,560
Other 34 140
Assets of businesses held for sale $711 $36,887
LIABILITIES
Short-term borrowings $252 $ 146
Accounts payable 21 538
Other GE current liabilities 93,994
Long-term borrowings 810,134
All other liabilities 55 1,235
Liabilities of businesses held for sale $345 $16,047
Discontinued Operations
Discontinued operations primarily comprised BAC Credomatic
GECF Inc. (BAC) (our Central American bank and card business), GE
Money Japan (our Japanese personal loan business, Lake, and our
Japanese mortgage and card businesses, excluding our invest-
ment in GE Nissen Credit Co., Ltd.), our U.S. mortgage business
(WMC), our U.S. recreational vehicle and marine equipment
fi nancing business (Consumer RV Marine), Consumer Mexico,
Consumer Singapore and our Consumer home lending operations
in Australia and New Zealand (Australian Home Lending).
Associated results of operations, fi nancial position and cash fl ows
are separately reported as discontinued operations for all
periods presented.
Summarized fi nancial information for discontinued operations
is shown below.
(In millions) 2011 2010 2009
OPERATIONS
Total revenues $ 316 $ 2,035 $2,341
Earnings (loss) from discontinued
operations before income taxes $ (30) $ 215 $ 340
Benefit (provision) for income taxes 85 96 (18)
Earnings (loss) from discontinued
operations, net of taxes $ 55 $ 311 $ 322
DISPOSAL
Gain (loss) on disposal before
income taxes $(329) $(1,420) $ (196)
Benefit (provision) for income taxes 351 236 93
Gain (loss) on disposal, net of taxes $ 22 $(1,184) $ (103)
Earnings (loss) from discontinued
operations, net of taxes
(a) $ 77 $ (873) $ 219
(a) The sum of GE industrial earnings (loss) from discontinued operations, net of
taxes, and GECS earnings (loss) from discontinued operations, net of taxes, is
reported as GE earnings (loss) from discontinued operations, net of taxes, on the
Statement of Earnings.
December 31 (In millions) 2011 2010
ASSETS
Cash and equivalents $ 121 $ 142
Financing receivables—net 61 10,589
All other assets —168
Other 1,073 1,526
Assets of discontinued operations $1,255 $12,425
LIABILITIES
Accounts payable, principally trade accounts $ 7 $ 110
Deferred income taxes 205 230
All other liabilities 1,423 2,205
Other —42
Liabilities of discontinued operations $1,635 $ 2,587
Assets at December 31, 2011 and December 31, 2010, primarily
comprised cash, fi nancing receivables and a deferred tax asset
for a loss carryforward, which expires principally in 2017 and in
part in 2019, related to the sale of our GE Money Japan business.
GE 2011 ANNUAL REPORT 87
notes to consolidated financial statements
BAC CREDOMATIC GECF INC.
During the fourth quarter of 2010, we classifi ed BAC as discontin-
ued operations and completed the sale of BAC for $1,920 million.
Immediately prior to the sale, and in accordance with terms of a
previous agreement, we increased our ownership interest in BAC
from 75% to 100% for a purchase price of $633 million. As a result
of the sale of our interest in BAC, we recognized an after-tax gain
of $780 million in 2010.
BAC revenues from discontinued operations were $983 million
and $943 million in 2010 and 2009, respectively. In total, BAC earn-
ings from discontinued operations, net of taxes, were $854 million
and $292 million in 2010 and 2009, respectively.
GE MONEY JAPAN
During the third quarter of 2007, we committed to a plan to sell
our Japanese personal loan business, Lake, upon determining
that, despite restructuring, Japanese regulatory limits for interest
charges on unsecured personal loans did not permit us to earn an
acceptable return. During the third quarter of 2008, we com-
pleted the sale of GE Money Japan, which included Lake, along
with our Japanese mortgage and card businesses, excluding our
investment in GE Nissen Credit Co., Ltd. In connection with the
sale, we reduced the proceeds from the sale for estimated inter-
est refund claims in excess of the statutory interest rate. Proceeds
from the sale were to be increased or decreased based on the
actual claims experienced in accordance with loss-sharing terms
specifi ed in the sale agreement, with all claims in excess of
258 billion Japanese yen (approximately $3,000 million) remaining
our responsibility. The underlying portfolio to which this obliga-
tion relates is in runoff and interest rates were capped for all
designated accounts by mid-2009. In the third quarter of 2010, we
began making reimbursements under this arrangement.
Our overall claims experience developed unfavorably through
2010. We believe that the level of excess interest refund claims
was impacted by the challenging global economic conditions,
in addition to Japanese legislative and regulatory changes. In
September 2010, a large independent personal loan company
in Japan fi led for bankruptcy, which precipitated a signifi cant
amount of publicity surrounding excess interest refund claims in
the Japanese marketplace, along with substantial legal advertis-
ing. We observed an increase in claims during September 2010
and higher average daily claims in the fourth quarter of 2010 and
the fi rst two months of 2011. Since February and through the end
of 2011, we have experienced substantial declines in the rate of
incoming claims, though the overall rate of reduction, including
fourth quarter experience, has been slower than we expected.
During the fourth quarter of 2011, we recorded an increase to
our reserve of $243 million to refl ect our revised estimates of the
assumed daily incoming claims reduction rate and severity. At
December 31, 2011, our reserve for reimbursement of claims in
excess of the statutory interest rate was $692 million.
The amount of these reserves is based on analyses of recent
and historical claims experience, pending and estimated future
excess interest refund requests, the estimated percentage of
customers who present valid requests, and our estimated pay-
ments related to those requests. Our estimated liability for excess
interest refund claims at December 31, 2011 assumes the pace
of incoming claims will continue to decelerate, average expo-
sure per claim remains consistent with recent experience, and
we continue to see the impact of our loss mitigation efforts.
Estimating the pace of decline in incoming claims can have a sig-
nifi cant effect on the total amount of our liability. Holding all other
assumptions constant, a 20% adverse change in assumed incom-
ing daily claim rate reduction would result in an increase to our
reserves of approximately $110 million.
Uncertainties around the likelihood of consumers to present
valid claims, the runoff status of the underlying book of business,
the fi nancial status of other personal lending companies in Japan,
challenging economic conditions and the impact of laws and reg-
ulations make it diffi cult to develop a meaningful estimate of the
aggregate possible claims exposure. Recent trends, including the
effect of consumer activity, market activity regarding other per-
sonal loan companies and higher claims severity, may continue to
have an adverse effect on claims development.
GE Money Japan losses from discontinued operations, net of
taxes, were $238 million, $1,671 million and $158 million in 2011,
2010 and 2009, respectively.
WMC
During the fourth quarter of 2007, we completed the sale of WMC,
our U.S. mortgage business. WMC substantially discontinued all
new loan originations by the second quarter of 2007, and is not a
loan servicer. In connection with the sale, WMC retained certain
representation and warranty obligations related to loans sold to
third parties prior to the disposal of the business and contractual
obligations to repurchase previously sold loans as to which there
was an early payment default. All claims received for early pay-
ment default have either been resolved or are no longer
being pursued.
Pending repurchase claims based upon representations and
warranties made in connection with loan sales were $705 mil-
lion at December 31, 2011, $347 million at December 31, 2010
and $783 million at December 31, 2009. Reserves related to these
contractual representations and warranties were $143 million
and $101 million at December 31, 2011 and December 31, 2010,
respectively. We recorded adjustments to our reserve of $42 mil-
lion in 2011 to refl ect the higher amount of pending claims and
an increase in our reserve for unidentifi ed claims. The amount
of these reserves is based upon pending and estimated future
loan repurchase requests, the estimated percentage of loans val-
idly tendered for repurchase, and our estimated losses on loans
repurchased. A ten percent adverse change in these key assump-
tions would result in an increase to our reserves of approximately
$35 million. Historically, a small percentage of the total loans
88 GE 2011 ANNUAL REPORT
notes to consolidated financial statements
WMC originated and sold has been tendered for repurchase,
and of those loans tendered, only a limited amount has quali-
fi ed as “validly tendered,” meaning the loans sold did not satisfy
contractual obligations. In the second half of 2011, a lawsuit was
fi led against WMC relating to representations and warranties on
$321 million of mortgages. Uncertainties surrounding economic
conditions, the ability and propensity of mortgage holders to
present valid claims, governmental actions, pending and threat-
ened litigation against WMC and other activity in the mortgage
industry make it diffi cult to develop a meaningful estimate of
aggregate possible claim exposure. Actual losses could exceed
the reserve amount if actual claim rates, investigative or litiga-
tion activity, valid tenders or losses WMC incurs on repurchased
loans are higher than we have historically observed with respect
to WMC.
WMC revenues (loss) from discontinued operations were
$(42) million, $(4) million and $2 million in 2011, 2010 and 2009,
respectively. In total, WMC’s losses from discontinued operations,
net of taxes, were $34 million, $7 million and $1 million in 2011,
2010 and 2009, respectively.
OTHER FINANCIAL SERVICES
In the second quarter of 2011, we entered into an agreement to
sell our Australian Home Lending operations and classifi ed it as
discontinued operations. As a result, we recognized an after-tax
loss of $148 million in 2011. We completed the sale in the third
quarter of 2011 for proceeds of approximately $4,577 million.
Australian Home Lending revenues from discontinued operations
were $250 million, $510 million and $727 million in 2011, 2010 and
2009, respectively. Australian Home Lending earnings (loss) from
discontinued operations, net of taxes, were $(65) million, $70 mil-
lion and $113 million in 2011, 2010 and 2009, respectively.
In the fi rst quarter of 2011, we entered into an agreement to
sell our Consumer Singapore business for $692 million. The sale
was completed in the second quarter of 2011 and resulted in the
recognition of a gain on disposal, net of taxes, of $319 million.
Consumer Singapore revenues from discontinued operations
were $30 million, $108 million and $113 million in 2011, 2010 and
2009, respectively. Consumer Singapore earnings from discon-
tinued operations, net of taxes, were $333 million, $36 million and
$25 million in 2011, 2010 and 2009, respectively.
In the fourth quarter of 2010, we entered into agreements
to sell our Consumer RV Marine portfolio and Consumer Mexico
business. The Consumer RV Marine and Consumer Mexico dispo-
sitions were completed during the fi rst quarter and the second
quarter of 2011, respectively, for proceeds of $2,365 million
and $1,943 million, respectively. Consumer RV Marine revenues
from discontinued operations were $11 million, $210 million and
$260 million in 2011, 2010 and 2009, respectively. Consumer RV
Marine earnings (loss) from discontinued operations, net of taxes,
were $2 million, $(99) million and $(83) million in 2011, 2010 and
2009, respectively. Consumer Mexico revenues from discontin-
ued operations were $67 million, $228 million and $303 million
in 2011, 2010 and 2009, respectively. Consumer Mexico earnings
(loss) from discontinued operations, net of taxes, were $30 million,
$(59) million and $66 million in 2011, 2010 and 2009, respectively.
GE INDUSTRIAL
GE industrial earnings (loss) from discontinued operations, net of
taxes, were $(1) million, $(5) million and $(19) million in 2011, 2010
and 2009, respectively. The sum of GE industrial earnings (loss)
from discontinued operations, net of taxes, and GECS earnings
(loss) from discontinued operations, net of taxes, is reported as GE
industrial earnings (loss) from discontinued operations, net of
taxes, on the Statement of Earnings.
Assets of GE industrial discontinued operations were $52 mil-
lion and $50 million at December 31, 2011 and December 31,
2010, respectively. Liabilities of GE industrial discontinued opera-
tions were $158 million and $164 million at December 31, 2011,
and December 31, 2010, respectively, and primarily represent
taxes payable and pension liabilities related to the sale of our
Plastics business in 2007.

GE 2011 ANNUAL REPORT 89
notes to consolidated financial statements
Note 3.
Investment Securities
Substantially all of our investment securities are classifi ed as available-for-sale. These comprise mainly investment grade debt securities
supporting obligations to annuitants, policyholders and holders of guaranteed investment contracts (GICs) in our run-off insurance operations
and Trinity, and investment securities at our treasury operations and investments held in our CLL business collateralized by senior secured
loans of high-quality, middle-market companies in a variety of industries. We do not have any securities classifi ed as held to maturity.
2011 2010
December 31 (In millions)
Amortized
cost
Gross
unrealized
gains
Gross
unrealized
losses
Estimated
fair value
Amortized
cost
Gross
unrealized
gains
Gross
unrealized
losses
Estimated
fair value
GE
Debt—U.S. corporate $ — $ — $ — $ — $ 1 $ — $ — $ 1
Equity—available-for-sale 18 — — 18 18 — — 18
18 — — 18 19 — — 19
GECS
Debt
U.S. corporate 20,748 3,432 (410) 23,770 20,815 1,576 (237) 22,154
State and municipal 3,027 350 (143) 3,234 2,961 45 (282) 2,724
Residential mortgage-backed (a) 2,711 184 (286) 2,609 3,092 95 (378) 2,809
Commercial mortgage-backed 2,913 162 (247) 2,828 3,009 145 (230) 2,924
Asset-backed 5,102 32 (164) 4,970 3,407 16 (193) 3,230
Corporate—non-U.S. 2,414 126 (207) 2,333 2,883 116 (132) 2,867
Government—non-U.S. 2,488 129 (86) 2,531 2,242 82 (58) 2,266
U.S. government and
federal agency 3,974 84 — 4,058 3,776 57 (47) 3,786
Retained interests 25 10 — 35 55 10 (26) 39
Equity
Available-for-sale 713 75 (38) 750 500 213 (8) 705
Trading 241 — — 241 417 — — 417
44,356 4,584 (1,581) 47,359 43,157 2,355 (1,591) 43,921
ELIMINATIONS (3) — — (3) (2) — — (2)
Total $44,371 $4,584 $(1,581) $47,374 $43,174 $2,355 $(1,591) $43,938
(a) Substantially collateralized by U.S. mortgages. Of our total residential mortgage-backed securities (RMBS) portfolio at December 31, 2011, $1,060 million relates to securities
issued by government-sponsored entities and $1,549 million relates to securities of private label issuers. Securities issued by private label issuers are collateralized
primarily by pools of individual direct mortgage loans of financial institutions.
The fair value of investment securities increased to $47,374 million at December 31, 2011, from $43,938 million at December 31, 2010,
primarily due to the impact of lower interest rates and funding in our CLL business of investments collateralized by senior secured loans
of high-quality, middle-market companies in a variety of industries.
The following tables present the estimated fair values and gross unrealized losses of our available-for-sale investment securities.
2011 2010
In loss position for
Less than 12 months 12 months or more Less than 12 months 12 months or more
December 31 (In millions)
Estimated
fair value
Gross
unrealized
losses (a) Estimated
fair value
Gross
unrealized
losses (a) Estimated
fair value
Gross
unrealized
losses
Estimated
fair value
Gross
unrealized
losses
Debt
U.S. corporate $1,435 $(241) $ 836 $ (169) $2,375 $ (81) $1,519 $ (156)
State and municipal 87 (1) 307 (142) 949 (43) 570 (239)
Residential mortgage-backed 219 (9) 825 (277) 188 (4) 1,024 (374)
Commercial mortgage-backed 244 (23) 1,320 (224) 831 (104) 817 (126)
Asset-backed 100 (7) 850 (157) 113 (5) 910 (188)
Corporate—non-U.S. 330 (28) 607 (179) 448 (12) 804 (120)
Government—non-U.S. 906 (5) 203 (81) 661 (6) 107 (52)
U.S. government and federal agency 502———1,822 (47) — —
Retained interests ————— — 34 (26)
Equity 440 (38) — — 49 (8) — —
Total $4,263 $(352) $4,948 $(1,229) $7,436 $(310) $5,785 $(1,281)
(a) Includes gross unrealized losses at December 31, 2011 of $(272) million related to securities that had other-than-temporary impairments recognized in a prior period.
90 GE 2011 ANNUAL REPORT
notes to consolidated financial statements
We regularly review investment securities for impairment using
both qualitative and quantitative criteria. We presently do not
intend to sell the vast majority of our debt securities and believe
that it is not more likely than not that we will be required to sell
these securities that are in an unrealized loss position before
recovery of our amortized cost. We believe that the unrealized
loss associated with our equity securities will be recovered within
the foreseeable future.
The vast majority of our U.S. corporate debt securities are
rated investment grade by the major rating agencies. We evaluate
U.S. corporate debt securities based on a variety of factors, such
as the fi nancial health of and specifi c prospects for the issuer,
including whether the issuer is in compliance with the terms and
covenants of the security. In the event a U.S. corporate debt secu-
rity is deemed to be other-than-temporarily impaired, we isolate
the credit portion of the impairment by comparing the present
value of our expectation of cash fl ows to the amortized cost of
the security. We discount the cash fl ows using the original effec-
tive interest rate of the security.
The vast majority of our RMBS have investment grade credit
ratings from the major rating agencies and are in a senior posi-
tion in the capital structure of the deal. Of our total RMBS at
December 31, 2011 and 2010, approximately $515 million and
$673 million, respectively, relate to residential subprime credit,
primarily supporting our guaranteed investment contracts. These
are collateralized primarily by pools of individual, direct mortgage
loans (a majority of which were originated in 2006 and 2005), not
other structured products such as collateralized debt obligations.
In addition, of the total residential subprime credit exposure at
December 31, 2011 and 2010, approximately $277 million and
$343 million, respectively, was insured by Monoline insurers
(Monolines) on which we continue to place reliance.
Our commercial mortgage-backed securities (CMBS) portfo-
lio is collateralized by both diversifi ed pools of mortgages that
were originated for securitization (conduit CMBS) and pools of
large loans backed by high-quality properties (large loan CMBS), a
majority of which were originated in 2006 and 2007. Substantially
all of the securities in our CMBS portfolio have investment grade
credit ratings and the vast majority of the securities are in a senior
position in the capital structure.
Our asset-backed securities (ABS) portfolio is collateralized by
senior secured loans of high-quality, middle-market companies
in a variety of industries, as well as a variety of diversifi ed pools of
assets such as student loans and credit cards. The vast majority
of our ABS are in a senior position in the capital structure of the
deals. In addition, substantially all of the securities that are below
investment grade are in an unrealized gain position.
For ABS and RMBS, we estimate the portion of loss attribut-
able to credit using a discounted cash fl ow model that considers
estimates of cash fl ows generated from the underlying collateral.
Estimates of cash fl ows consider credit risk, interest rate and
prepayment assumptions that incorporate management’s best
estimate of key assumptions of the underlying collateral, includ-
ing default rates, loss severity and prepayment rates. For CMBS,
we estimate the portion of loss attributable to credit by evalu-
ating potential losses on each of the underlying loans in the
security. Collateral cash fl ows are considered in the context of
our position in the capital structure of the deals. Assumptions can
vary widely depending upon the collateral type, geographic con-
centrations and vintage.
If there has been an adverse change in cash fl ows for RMBS,
management considers credit enhancements such as monoline
insurance (which are features of a specifi c security). In evaluating
the overall credit worthiness of the Monoline, we use an analy-
sis that is similar to the approach we use for corporate bonds,
including an evaluation of the suffi ciency of the Monoline’s cash
reserves and capital, ratings activity, whether the Monoline is in
default or default appears imminent, and the potential for inter-
vention by an insurance or other regulator.
During 2011, we recorded pre-tax, other-than-temporary
impairments of $467 million, of which $387 million was recorded
through earnings ($81 million relates to equity securities) and
$80 million was recorded in accumulated other comprehensive
income (AOCI). At January 1, 2011, cumulative impairments rec-
ognized in earnings associated with debt securities still held were
$500 million. During 2011, we recognized fi rst-time impairments
of $58 million and incremental charges on previously impaired
securities of $230 million. These amounts included $62 million
related to securities that were subsequently sold.
During 2010, we recorded pre-tax, other-than-temporary
impairments of $460 million, of which $253 million was recorded
through earnings ($35 million relates to equity securities) and
$207 million was recorded in AOCI. At January 1, 2010, cumulative
impairments recognized in earnings associated with debt securities
still held were $340 million. During 2010, we recognized fi rst-time
impairments of $164 million and incremental charges on previously
impaired securities of $38 million. These amounts included $41 mil-
lion related to securities that were subsequently sold.
During 2009, we recorded pre-tax, other-than-temporary
impairments of $1,078 million, of which $753 million was
recorded through earnings ($42 million relates to equity secu-
rities) and $325 million was recorded in AOCI. At April 1, 2009,
$33 million was reclassifi ed to retained earnings as a result of
the amendments to ASC 320. Subsequent to April 1, 2009, fi rst-
time and incremental credit impairments were $109 million and
$257 million, respectively. Previous credit impairments related to
securities sold were $124 million.

GE 2011 ANNUAL REPORT 91
notes to consolidated financial statements
CONTRACTUAL MATURITIES OF GECS INVESTMENT IN AVAILABLE-
FOR-SALE DEBT SECURITIES (EXCLUDING MORTGAGE-BACKED AND
ASSET-BACKED SECURITIES)
(In millions)
Amortized
cost
Estimated
fair value
Due in
2012 $ 2,641 $ 2,664
2013–2016 7,497 7,666
2017–2021 4,679 4,810
2022 and later 17,805 20,757
We expect actual maturities to differ from contractual maturi-
ties because borrowers have the right to call or prepay
certain obligations.
Supplemental information about gross realized gains and
losses on available-for-sale investment securities follows.
(In millions) 2011 2010 2009
GE
Gains $ — $ — $ 4
Losses, including impairments —— (173)
Net —— (169)
GECS
Gains 205 190 164
Losses, including impairments (402) (281) (637)
Net (197) (91) (473)
Total $(197) $ (91) $(642)
Although we generally do not have the intent to sell any specifi c
securities at the end of the period, in the ordinary course of man-
aging our investment securities portfolio, we may sell securities
prior to their maturities for a variety of reasons, including diversi-
fi cation, credit quality, yield and liquidity requirements and the
funding of claims and obligations to policyholders. In some of our
bank subsidiaries, we maintain a certain level of purchases and
sales volume principally of non-U.S. government debt securities.
In these situations, fair value approximates carrying value for
these securities.
Proceeds from investment securities sales and early redemp-
tions by issuers totaled $15,606 million, $16,238 million and
$7,823 million in 2011, 2010 and 2009, respectively, principally
from the sales of short-term securities in our bank subsidiaries
and treasury operations.
We recognized pre-tax gains (losses) on trading securities of
$22 million, $(7) million and $408 million in 2011, 2010 and 2009,
respectively.
Note 4.
Current Receivables
Consolidated (a) GE (b)
December 31 (In millions) 2011 2010 2011 2010
Energy Infrastructure $ 8,845 $ 7,377 $ 6,499 $ 5,349
Aviation 4,348 3,554 2,658 2,009
Healthcare 4,306 4,164 1,943 2,053
Transportation 441 440 347 440
Home & Business Solutions 1,493 1,426 243 240
Corporate items and
eliminations 550 2,088 563 713
19,983 19,049 12,253 10,804
Less allowance for losses (452) (428) (446) (421)
Total $19,531 $18,621 $11,807 $10,383
(a) Included GE industrial customer receivables factored through a GECS affiliate
and reported as financing receivables by GECS. See Note 27.
(b) GE current receivables balances at December 31, 2011 and 2010, before allowance
for losses, included $8,994 million and $8,134 million, respectively, from sales of
goods and services to customers, and $65 million and $24 million at December 31,
2011 and 2010, respectively, from transactions with associated companies.
GE current receivables of $112 million and $193 million at
December 31, 2011 and 2010, respectively, arose from sales,
principally of Healthcare and Aviation goods and services, on
open account to various agencies of the U.S. government. As a
percentage of GE revenues, approximately 4% of GE sales of
goods and services were to the U.S. government in 2011, com-
pared with 5% in both 2010 and 2009.
Note 5.
Inventories
December 31 (In millions) 2011 2010
GE
Raw materials and work in process $ 8,735 $ 6,973
Finished goods 4,971 4,435
Unbilled shipments 485 456
14,191 11,864
Less revaluation to LIFO (450) (404)
13,741 11,460
GECS
Finished goods 51 66
Total $13,792 $11,526

92 GE 2011 ANNUAL REPORT
notes to consolidated financial statements
Note 6.
GECS Financing Receivables and Allowance for Losses
on Financing Receivables
December 31 (In millions) 2011 2010
Loans, net of deferred income (a) $257,515 $275,877
Investment in financing leases, net of
deferred income 38,142 44,390
295,657 320,267
Less allowance for losses (6,350) (8,033)
Financing receivables—net (b) $289,307 $312,234
(a) Deferred income was $2,319 million and $2,351 million at December 31, 2011 and
December 31, 2010, respectively.
(b) Financing receivables at December 31, 2011 and December 31, 2010 included
$1,062 million and $1,503 million, respectively, relating to loans that had been
acquired in a transfer but have been subject to credit deterioration since
origination per ASC 310, Receivables.
GECS fi nancing receivables include both loans and fi nancing
leases. Loans represent transactions in a variety of forms, includ-
ing revolving charge and credit, mortgages, installment loans,
intermediate-term loans and revolving loans secured by business
assets. The portfolio includes loans carried at the principal
amount on which fi nance charges are billed periodically, and
loans carried at gross book value, which includes fi nance charges.
Investment in fi nancing leases consists of direct fi nancing and
leveraged leases of aircraft, railroad rolling stock, autos, other
transportation equipment, data processing equipment, medi-
cal equipment, commercial real estate and other manufacturing,
power generation, and commercial equipment and facilities.
For federal income tax purposes, the leveraged leases and the
majority of the direct fi nancing leases are leases in which GECS
depreciates the leased assets and is taxed upon the accrual of rental
income. Certain direct fi nancing leases are loans for federal income
tax purposes. For these transactions, GECS is taxed only on the por-
tion of each payment that constitutes interest, unless the interest is
tax-exempt (e.g., certain obligations of state governments).
Investment in direct fi nancing and leveraged leases represents
net unpaid rentals and estimated unguaranteed residual values
of leased equipment, less related deferred income. GECS has no
general obligation for principal and interest on notes and other
instruments representing third-party participation related to lev-
eraged leases; such notes and other instruments have not been
included in liabilities but have been offset against the related rent-
als receivable. The GECS share of rentals receivable on leveraged
leases is subordinate to the share of other participants who also
have security interests in the leased equipment. For federal income
tax purposes, GECS is entitled to deduct the interest expense
accruing on non-recourse fi nancing related to leveraged leases.
NET INVESTMENT IN FINANCING LEASES
Total financing leases Direct financing leases (a) Leveraged leases (b)
December 31 (In millions) 2011 2010 2011 2010 2011 2010
Total minimum lease payments receivable $44,157 $52,180 $33,667 $40,037 $10,490 $12,143
Less principal and interest on third-party non-recourse debt (6,812) (8,110) ——(6,812) (8,110)
Net rentals receivables 37,345 44,070 33,667 40,037 3,678 4,033
Estimated unguaranteed residual value of leased assets 7,592 8,495 5,140 5,991 2,452 2,504
Less deferred income (6,795) (8,175) (5,219) (6,438) (1,576) (1,737)
Investment in financing leases, net of deferred income 38,142 44,390 33,588 39,590 4,554 4,800
Less amounts to arrive at net investment
Allowance for losses (294) (396) (281) (378) (13) (18)
Deferred taxes (6,718) (6,168) (2,938) (2,266) (3,780) (3,902)
Net investment in financing leases $31,130 $37,826 $30,369 $36,946 $ 761 $ 880
(a) Included $413 million and $452 million of initial direct costs on direct financing leases at December 31, 2011 and 2010, respectively.
(b) Included pre-tax income of $116 million and $133 million and income tax of $35 million and $51 million during 2011 and 2010, respectively. Net investment credits
recognized on leveraged leases during 2011 and 2010 were insignificant.

GE 2011 ANNUAL REPORT 93
notes to consolidated financial statements
CONTRACTUAL MATURITIES
(In millions) Total loans
Net rentals
receivable
Due in
2012 $ 64,548 $10,353
2013 22,689 7,434
2014 22,829 5,500
2015 16,133 4,081
2016 16,869 2,402
2017 and later 60,436 7,575
203,504 37,345
Consumer revolving loans 54,011 —
Total $257,515 $37,345
We expect actual maturities to differ from contractual maturities.
The following tables provide additional information about our
fi nancing receivables and related activity in the allowance for
losses for our Commercial, Real Estate and Consumer portfolios.
FINANCING RECEIVABLES—NET
The following table displays our fi nancing receivables balances.
December 31 (In millions) 2011 2010
COMMERCIAL
CLL
Americas (a) $ 80,505 $ 88,558
Europe 36,899 37,498
Asia 11,635 11,943
Other (a) 436 664
Total CLL 129,475 138,663
Energy Financial Services 5,912 7,011
GE Capital Aviation Services (GECAS) 11,901 12,615
Other 1,282 1,788
Total Commercial financing receivables 148,570 160,077
REAL ESTATE
Debt 24,501 30,249
Business Properties 8,248 9,962
Total Real Estate financing receivables 32,749 40,211
CONSUMER
Non-U.S. residential mortgages 36,170 40,011
Non-U.S. installment and revolving credit 18,544 20,132
U.S. installment and revolving credit 46,689 43,974
Non-U.S. auto 5,691 7,558
Other 7,244 8,304
Total Consumer financing receivables 114,338 119,979
Total financing receivables 295,657 320,267
Less allowance for losses (6,350) (8,033)
Total financing receivables—net $289,307 $312,234
(a) During 2011, we transferred our Railcar lending and leasing portfolio from CLL
Other to CLL Americas. Prior-period amounts were reclassified to conform to the
current-period presentation.

94 GE 2011 ANNUAL REPORT
notes to consolidated financial statements
ALLOWANCE FOR LOSSES ON FINANCING RECEIVABLES
The following tables provide a roll-forward of our allowance for losses on fi nancing receivables.
(In millions)
Balance at
January 1,
2011
Provision
charged to
operations (a) Other (b) Gross
write-offs (c) Recoveries (c)
Balance at
December 31,
2011
COMMERCIAL
CLL
Americas $1,288 $ 281 $ (96) $ (700) $ 116 $ 889
Europe 429 195 (5) (286) 67 400
Asia 222 105 13 (214) 31 157
Other 6 3 (3) (2) — 4
Total CLL 1,945 584 (91) (1,202) 214 1,450
Energy Financial Services 22 — (1) (4) 9 26
GECAS 20 — — (3) — 17
Other 58 23 — (47) 3 37
Total Commercial 2,045 607 (92) (1,256) 226 1,530
REAL ESTATE
Debt 1,292 242 2 (603) 16 949
Business Properties 196 82 — (144) 6 140
Total Real Estate 1,488 324 2 (747) 22 1,089
CONSUMER
Non-U.S. residential mortgages 803 249 (20) (381) 55 706
Non-U.S. installment and revolving credit 937 490 (30) (1,257) 577 717
U.S. installment and revolving credit 2,333 2,241 1 (3,095) 528 2,008
Non-U.S. auto 168 30 (4) (216) 123 101
Other 259 142 (20) (272) 90 199
Total Consumer 4,500 3,152 (73) (5,221) 1,373 3,731
Total $8,033 $4,083 $(163) $(7,224) $1,621 $6,350
(a) Included a provision of $77 million at Consumer related to the July 1, 2011 adoption of ASU 2011-02. See Note 23.
(b) Other primarily included transfers to held for sale and the effects of currency exchange.
(c) Net write-offs (write-offs less recoveries) in certain portfolios may exceed the beginning allowance for losses as our revolving credit portfolios turn over more than once
per year or, in all portfolios, can reflect losses that are incurred subsequent to the beginning of the fiscal year due to information becoming available during the current
year, which may identify further deterioration on existing financing receivables.
(In millions)
Balance at
December 31,
2009
Adoption of
ASU 2009 16
& 17 (a)
Balance at
January 1,
2010
Provision
charged to
operations Other (b) Gross
write-offs (c) Recoveries (c)
Balance at
December 31,
2010
COMMERCIAL
CLL
Americas $1,180 $ 66 $1,246 $1,059 $ (11) $ (1,136) $ 130 $1,288
Europe 575 — 575 269 (37) (440) 62 429
Asia 244 (10) 234 153 (6) (181) 22 222
Other 10 — 10 (2) (1) (1) — 6
Total CLL 2,009 56 2,065 1,479 (55) (1,758) 214 1,945
Energy Financial Services 28 — 28 65 — (72) 1 22
GECAS 104 — 104 12 — (96) — 20
Other 34 — 34 33 — (9) — 58
Total Commercial 2,175 56 2,231 1,589 (55) (1,935) 215 2,045
REAL ESTATE
Debt 1,358 (3) 1,355 764 10 (838) 1 1,292
Business Properties 136 45 181 146 (8) (126) 3 196
Total Real Estate 1,494 42 1,536 910 2 (964) 4 1,488
CONSUMER
Non-U.S. residential mortgages 892 — 892 256 (41) (381) 77 803
Non-U.S. installment and
revolving credit 1,106 — 1,106 1,047 (68) (1,733) 585 937
U.S. installment and revolving credit 1,551 1,602 3,153 3,018 (6) (4,300) 468 2,333
Non-U.S. auto 292 — 292 91 (61) (313) 159 168
Other 292 — 292 265 5 (394) 91 259
Total Consumer 4,133 1,602 5,735 4,677 (171) (7,121) 1,380 4,500
Total $7,802 $1,700 $9,502 $7,176 $(224) $(10,020) $1,599 $8,033
(a) Reflects the effects of our adoption of ASU 2009-16 & 17 on January 1, 2010.
(b) Other primarily included the effects of currency exchange.
(c) Net write-offs (write-offs less recoveries) in certain portfolios may exceed the beginning allowance for losses as our revolving credit portfolios turn over more than once
per year or, in all portfolios, can reflect losses that are incurred subsequent to the beginning of the fiscal year due to information becoming available during the current
year, which may identify further deterioration on existing financing receivables.

GE 2011 ANNUAL REPORT 95
notes to consolidated financial statements
(In millions)
Balance at
January 1,
2009
Provision
charged to
operations Other (a) Gross
write-offs (b) Recoveries (b)
Balance at
December 31,
2009
COMMERCIAL
CLL
Americas $ 846 $ 1,400 $ (42) $(1,117) $ 93 $1,180
Europe 311 625 (14) (431) 84 575
Asia 163 257 3 (203) 24 244
Other 1 8 5 (4) — 10
Total CLL 1,321 2,290 (48) (1,755) 201 2,009
Energy Financial Services 58 33 4 (67) — 28
GECAS 58 65 (3) (16) — 104
Other 28 29 — (24) 1 34
Total Commercial 1,465 2,417 (47) (1,862) 202 2,175
REAL ESTATE
Debt 282 1,295 13 (232) — 1,358
Business Properties 19 147 — (32) 2 136
Total Real Estate 301 1,442 13 (264) 2 1,494
CONSUMER
Non-U.S. residential mortgages 328 883 69 (469) 81 892
Non-U.S. installment and revolving credit 1,000 1,741 39 (2,235) 561 1,106
U.S. installment and revolving credit 1,616 3,367 (975) (2,612) 155 1,551
Non-U.S. auto 187 389 30 (510) 196 292
Other 225 346 45 (389) 65 292
Total Consumer 3,356 6,726 (792) (6,215) 1,058 4,133
Total $5,122 $10,585 $(826) $(8,341) $1,262 $7,802
(a) Other primarily included the effects of securitization activity and currency exchange.
(b) Net write-offs (write-offs less recoveries) in certain portfolios may exceed the beginning allowance for losses as our revolving credit portfolios turn over more than once
per year or, in all portfolios, can reflect losses that are incurred subsequent to the beginning of the fiscal year due to information becoming available during the current
year, which may identify further deterioration on existing financing receivables.
See Note 23 for supplemental information about the credit quality of fi nancing receivables and allowance for losses on
fi nancing receivables.

96 GE 2011 ANNUAL REPORT
notes to consolidated financial statements
Note 7.
Property, Plant and Equipment
December 31 (Dollars in millions)
Depreciable
lives—new
(in years) 2011 2010
ORIGINAL COST
GE
Land and improvements 8 (a) $ 611 $ 573
Buildings, structures and
related equipment 8–40 7,823 7,468
Machinery and equipment 4–20 22,071 20,833
Leasehold costs and
manufacturing plant
under construction 1–10 2,538 1,986
33,043 30,860
GECS (b)
Land and improvements,
buildings, structures and
related equipment 1–37 (a) 3,110 3,510
Equipment leased to others
Aircraft 19–21 46,240 45,674
Vehicles 1–28 15,278 17,216
Railroad rolling stock 4–50 4,324 4,331
Construction and manufacturing 1–30 2,644 2,586
All other (c) 3–30 3,438 5,855
75,034 79,172
ELIMINATIONS 40 —
Total $108,117 $110,032
NET CARRYING VALUE
GE
Land and improvements $ 584 $ 550
Buildings, structures and
related equipment 3,827 3,617
Machinery and equipment 7,648 6,551
Leasehold costs and manufacturing
plant under construction 2,224 1,726
14,283 12,444
GECS (b)
Land and improvements,
buildings, structures and
related equipment 1,499 1,665
Equipment leased to others
Aircraft (d) 34,271 34,665
Vehicles 8,772 9,077
Railroad rolling stock 2,853 2,960
Construction and manufacturing 1,670 1,454
All other (c) 2,354 3,947
51,419 53,768
ELIMINATIONS 37 —
Total $ 65,739 $ 66,212
(a) Depreciable lives exclude land.
(b) Included $1,570 million and $1,571 million of original cost of assets leased
to GE with accumulated amortization of $470 million and $531 million at
December 31, 2011 and 2010, respectively.
(c) Included $2,404 million of original cost and $1,670 million of carrying value at
December 31, 2010 related to our CLL marine container leasing business, which
was disposed during 2011.
(d) The GECAS business of GE Capital recognized impairment losses of $301 million
in 2011 and $438 million in 2010 recorded in the caption “Other costs and
expenses” in the Statement of Earnings to reflect adjustments to fair value based
on an evaluation of average current market values (obtained from third parties)
of similar type and age aircraft, which are adjusted for the attributes of the
specific aircraft under lease.
Consolidated depreciation and amortization related to property,
plant and equipment was $9,185 million, $9,786 million and
$10,617 million in 2011, 2010 and 2009, respectively.
Amortization of GECS equipment leased to others was
$6,253 million, $6,786 million and $7,179 million in 2011, 2010 and
2009, respectively. Noncancellable future rentals due from cus-
tomers for equipment on operating leases at December 31, 2011,
are as follows:
(In millions)
Due in
2012 $ 7,345
2013 5,995
2014 4,916
2015 3,772
2016 3,025
2017 and later 8,779
Total $33,832
Note 8.
Goodwill and Other Intangible Assets
December 31 (In millions) 2011 2010
GOODWILL
GE $45,395 $36,880
GECS 27,230 27,508
Total $72,625 $64,388
December 31 (In millions) 2011 2010
OTHER INTANGIBLE ASSETS
GE
Intangible assets subject to amortization $10,317 $ 7,984
Indefinite-lived intangible assets 205 104
10,522 8,088
GECS
Intangible assets subject to amortization 1,546 1,883
Total $12,068 $ 9,971

GE 2011 ANNUAL REPORT 97
notes to consolidated financial statements
Changes in goodwill balances follow.
2011 2010
(In millions)
Balance at
January 1 Acquisitions
Dispositions,
currency
exchange
and other
Balance at
December 31
Balance at
January 1 Acquisitions
Dispositions,
currency
exchange
and other
Balance at
December 31
Energy Infrastructure $12,893 $8,730 $(533) $21,090 $12,777 $ 53 $ 63 $12,893
Aviation 6,073 — (77) 5,996 6,099 — (26) 6,073
Healthcare 16,338 305 (12) 16,631 15,998 434 (94) 16,338
Transportation 554 — (3) 551 551 1 2 554
Home & Business Solutions 1,022 114 (9) 1,127 1,188 — (166) 1,022
GE Capital 27,508 6 (284) 27,230 28,382 19 (893) 27,508
Total $64,388 $9,155 $(918) $72,625 $64,995 $507 $(1,114) $64,388
Upon closing an acquisition, we estimate the fair values of assets
and liabilities acquired and consolidate the acquisition as quickly as
possible. Given the time it takes to obtain pertinent information to
fi nalize the acquired company’s balance sheet, then to adjust the
acquired company’s accounting policies, procedures, and books
and records to our standards, it is often several quarters before we
are able to fi nalize those initial fair value estimates. Accordingly, it is
not uncommon for our initial estimates to be subsequently revised.
Goodwill balances increased $8,237 million in 2011, primarily as
a result of the acquisitions of Converteam ($3,411 million), Dresser,
Inc. ($2,178 million), the Well Support division of John Wood Group
PLC ($2,036 million), Wellstream PLC ($810 million) and Lineage
Power Holdings, Inc. ($256 million) at Energy Infrastructure, partially
offset by the stronger U.S. dollar ($650 million).
Goodwill related to new acquisitions in 2010 was $507 mil-
lion and included the acquisition of Clarient, Inc. ($425 million) at
Healthcare. Goodwill balances decreased $603 million during 2010,
primarily as a result of the deconsolidation of Regency Energy
Partners L.P. (Regency) at GE Capital ($557 million) and the stronger
U.S. dollar ($260 million).
On September 2, 2011, we purchased a 90% interest in
Converteam for $3,586 million. In connection with the transaction,
we entered into an arrangement to purchase the remaining 10%
at the two-year anniversary of the acquisition date for 343 million
euros (approximately $470 million). This amount was recorded as a
liability at the date of acquisition.
On May 26, 2010, we sold our general partnership interest in
Regency, a midstream natural gas services provider, and retained
a 21% limited partnership interest. This resulted in the decon-
solidation of Regency and the remeasurement of our limited
partnership interest to fair value. We recorded a pre-tax gain of
$119 million, which is reported in GECS revenues from services.
On June 25, 2009, we increased our ownership in BAC from
49.99% to 75% for a purchase price of $623 million following
the terms of our 2006 investment agreement (BAC Investment
Agreement) with the then controlling shareholder. At that time,
we remeasured our previously held equity investment to fair
value, resulting in a pre-tax gain of $343 million. This transaction
required us to consolidate BAC, which was previously accounted
for under the equity method.
We test goodwill for impairment annually and more frequently
if circumstances warrant. We determine fair values for each of
the reporting units using an income approach. When available
and appropriate, we use comparative market multiples to cor-
roborate discounted cash fl ow results. For purposes of the income
approach, fair value is determined based on the present value of
estimated future cash fl ows, discounted at an appropriate risk-
adjusted rate. We use our internal forecasts to estimate future cash
fl ows and include an estimate of long-term future growth rates
based on our most recent views of the long-term outlook for each
business. Actual results may differ from those assumed in our fore-
casts. We derive our discount rates using a capital asset pricing
model and analyzing published rates for industries relevant to our
reporting units to estimate the cost of equity fi nancing. We use dis-
count rates that are commensurate with the risks and uncertainty
inherent in the respective businesses and in our internally devel-
oped forecasts. Discount rates used in our reporting unit valuations
ranged from 9.0% to 13.75%. Valuations using the market approach
refl ect prices and other relevant observable information generated
by market transactions involving comparable businesses.
Compared to the market approach, the income approach
more closely aligns each reporting unit valuation to our business
profi le, including geographic markets served and product offer-
ings. Required rates of return, along with uncertainty inherent
98 GE 2011 ANNUAL REPORT
notes to consolidated financial statements
in the forecasts of future cash fl ows, are refl ected in the selec-
tion of the discount rate. Equally important, under this approach,
reasonably likely scenarios and associated sensitivities can be
developed for alternative future states that may not be refl ected
in an observable market price. A market approach allows for
comparison to actual market transactions and multiples. It can
be somewhat more limited in its application because the popula-
tion of potential comparables is often limited to publicly-traded
companies where the characteristics of the comparative business
and ours can be signifi cantly different, market data is usually not
available for divisions within larger conglomerates or non-public
subsidiaries that could otherwise qualify as comparable, and the
specifi c circumstances surrounding a market transaction (e.g.,
synergies between the parties, terms and conditions of the trans-
action, etc.) may be different or irrelevant with respect to our
business. It can also be diffi cult, under certain market conditions,
to identify orderly transactions between market participants in
similar businesses. We assess the valuation methodology based
upon the relevance and availability of the data at the time we per-
form the valuation and weight the methodologies appropriately.
We performed our annual impairment test of goodwill for all
of our reporting units in the third quarter using data as of July 1,
2011. The impairment test consists of two steps: in step one, the
carrying value of the reporting unit is compared with its fair value;
in step two, which is applied when the carrying value is more
than its fair value, the amount of goodwill impairment, if any, is
derived by deducting the fair value of the reporting unit’s assets
and liabilities from the fair value of its equity, and comparing that
amount with the carrying amount of goodwill. In performing the
valuations, we used cash fl ows that refl ected management’s
forecasts and discount rates that included risk adjustments con-
sistent with the current market conditions. Based on the results
of our step one testing, the fair values of each of the GE industrial
reporting units and the CLL, Consumer, Energy Financial Services
and GECAS reporting units exceeded their carrying values; there-
fore, the second step of the impairment test was not required to
be performed and no goodwill impairment was recognized.
Our Real Estate reporting unit had a goodwill balance of
$1,001 million at December 31, 2011. As of July 1, 2011, the carry-
ing amount exceeded the estimated fair value of our Real Estate
reporting unit by approximately $0.7 billion. The estimated fair
value of the Real Estate reporting unit is based on a number of
assumptions about future business performance and investment,
including loss estimates for the existing fi nance receivable and
investment portfolio, new debt origination volume and margins,
and stabilization of the real estate market allowing for sales of real
estate investments at normalized margins. Our assumed discount
rate was 11.25% and was derived by applying a capital asset pric-
ing model and corroborated using equity analyst research reports
and implied cost of equity based on forecasted price to earnings
per share multiples for similar companies. Given the volatility and
uncertainty in the current commercial real estate environment,
there is uncertainty about a number of assumptions upon which
the estimated fair value is based. Different loss estimates for the
existing portfolio, changes in the new debt origination volume
and margin assumptions, changes in the expected pace of the
commercial real estate market recovery, or changes in the equity
return expectation of market participants may result in changes
in the estimated fair value of the Real Estate reporting unit.
Based on the results of the step one testing, we performed the
second step of the impairment test described above as of July 1,
2011. Based on the results of the second step analysis for the Real
Estate reporting unit, the estimated implied fair value of goodwill
exceeded the carrying value of goodwill by approximately $3.9 bil-
lion. Accordingly, no goodwill impairment was required. In the
second step, unrealized losses in an entity’s assets have the effect of
increasing the estimated implied fair value of goodwill. The results
of the second step analysis were attributable to several factors.
The primary driver was the excess of the carrying value over the
estimated fair value of our Real Estate Equity Investments, which
approximated $4.1 billion at that time. Other drivers for the favor-
able outcome include the unrealized losses in the Real Estate fi nance
receivable portfolio and the fair value premium on the Real Estate
reporting unit allocated debt. The results of the second step analy-
sis are highly sensitive to these measurements, as well as the key
assumptions used in determining the estimated fair value of the Real
Estate reporting unit.
Estimating the fair value of reporting units requires the use of
estimates and signifi cant judgments that are based on a number
of factors including actual operating results. If current conditions
persist longer or deteriorate further than expected, it is reason-
ably possible that the judgments and estimates described above
could change in future periods.

GE 2011 ANNUAL REPORT 99
notes to consolidated financial statements
INTANGIBLE ASSETS SUBJECT TO AMORTIZATION
December 31 (In millions)
Gross
carrying
amount
Accumulated
amortization Net
GE
2011
Customer-related $ 5,638 $(1,117) $ 4,521
Patents, licenses and trademarks 5,797 (2,104) 3,693
Capitalized software 4,743 (2,676) 2,067
All other 176 (140) 36
Total $16,354 $(6,037) $10,317
2010
Customer-related $ 4,386 $ (902) $ 3,484
Patents, licenses and trademarks 4,778 (2,063) 2,715
Capitalized software 4,230 (2,449) 1,781
All other 45 (41) 4
Total $13,439 $(5,455) $ 7,984
GECS
2011
Customer-related $ 1,186 $ (697) $ 489
Patents, licenses and trademarks 250 (208) 42
Capitalized software 2,048 (1,597) 451
Lease valuations 1,470 (944) 526
Present value of future profits (a) 491 (491) —
All other 327 (289) 38
Total $ 5,772 $(4,226) $ 1,546
2010
Customer-related $ 1,112 $ (588) $ 524
Patents, licenses and trademarks 599 (532) 67
Capitalized software 2,026 (1,528) 498
Lease valuations 1,646 (917) 729
Present value of future profits (a) 461 (461) —
All other 333 (268) 65
Total $ 6,177 $(4,294) $ 1,883
(a) Balance at December 31, 2011 and December 31, 2010 reflects an adjustment of
$391 million and $423 million, respectively, to the present value of future profits
in our run-off insurance operations to reflect the effects that would have been
recognized had the related unrealized investment securities holding gains and
losses actually been realized in accordance with ASC 320-10-S99-2.
During 2011, we recorded additions to intangible assets subject
to amortization of $3,609 million, primarily as a result of the acqui-
sition of Dresser, Inc. ($844 million), Converteam ($814 million), the
Well Support division of John Wood Group PLC ($571 million),
Wellstream PLC ($258 million) and Lineage Power Holdings, Inc.
($122 million). The components of fi nite-lived intangible assets
acquired during 2011 and their respective weighted-average
amortizable period are: $1,427 million—Customer-related
(20.0 years); $1,366 million—Patents, licenses and trademarks
(17.2 years); $785 million—Capitalized software (4.0 years); and
$31 million—All other (11.4 years).
Consolidated amortization related to intangible assets was
$1,732 million, $1,747 million and $2,083 million for 2011, 2010
and 2009, respectively. We estimate annual pre-tax amortiza-
tion for intangible assets over the next fi ve calendar years to be
as follows: 2012—$1,647 million; 2013—$1,491 million; 2014—
$1,326 million; 2015—$1,189 million; and 2016—$1,070 million.
Note 9.
All Other Assets
December 31 (In millions) 2011 2010
GE
Investments
Associated companies (a) $ 20,463 $ 2,092
Other 607 535
21,070 2,627
Contract costs and estimated earnings (b) 9,008 8,061
Long-term receivables, including notes (c) 1,316 1,098
Derivative instruments 370 412
Other 4,911 5,256
36,675 17,454
GECS
Investments
Real estate (d)(e) 28,255 31,555
Associated companies 23,589 25,662
Assets held for sale (f) 4,525 3,540
Cost method (e) 1,882 1,937
Other 1,722 2,251
59,973 64,945
Derivative instruments 9,671 5,034
Advances to suppliers 1,560 1,853
Deferred borrowing costs (g) 1,327 1,982
Deferred acquisition costs (h) 55 60
Other 3,032 3,323
75,618 77,197
ELIMINATIONS (586) (352)
Total $111,707 $94,299
(a) Included our investment in NBCU LLC of $17,955 million at December 31, 2011. At
December 31, 2011, we also had $4,880 million of deferred tax liabilities related
to this investment. See Note 14.
(b) Contract costs and estimated earnings reflect revenues earned in excess of
billings on our long-term contracts to construct technically complex equipment
(such as power generation, aircraft engines and aeroderivative units) and
long-term product maintenance or extended warranty arrangements.
(c) Included loans to GECS of $388 million and $856 million at December 31, 2011
and 2010, respectively.
(d) GECS investments in real estate consisted principally of two categories: real estate
held for investment and equity method investments. Both categories contained a
wide range of properties including the following at December 31, 2011: office
buildings (46%), apartment buildings (14%), industrial properties (10%), retail
facilities (8%), franchise properties (8%) and other (14%). At December 31, 2011,
investments were located in the Americas (48%), Europe (27%) and Asia (25%).
(e) The fair value of and unrealized loss on cost method investments in a continuous
loss position for less than 12 months at December 31, 2011, were $425 million
and $61 million, respectively. The fair value of and unrealized loss on cost
method investments in a continuous loss position for 12 months or more at
December 31, 2011, were $65 million and $3 million, respectively. The fair value
of and unrealized loss on cost method investments in a continuous loss position
for less than 12 months at December 31, 2010, were $396 million and $55 million,
respectively. The fair value of and unrealized loss on cost method investments in
a continuous loss position for 12 months or more at December 31, 2010, were
$16 million and $2 million, respectively.
(f) Assets were classified as held for sale on the date a decision was made to
dispose of them through sale or other means. At December 31, 2011 and 2010,
such assets consisted primarily of loans, aircraft, equipment and real estate
properties, and were accounted for at the lower of carrying amount or estimated
fair value less costs to sell. These amounts are net of valuation allowances of
$122 million and $115 million at December 31, 2011 and 2010, respectively.
(g) Included $329 million and $916 million at December 31, 2011 and 2010,
respectively, of unamortized fees related to our participation in the Temporary
Liquidity Guarantee Program.
(h) Balance at December 31, 2011 and December 31, 2010 reflects an adjustment of
$810 million and $860 million, respectively, to deferred acquisition costs in our
run-off insurance operations to reflect the effects that would have been
recognized had the related unrealized investment securities holding gains and
losses actually been realized in accordance with ASC 320-10-S99-2.

100 GE 2011 ANNUAL REPORT
notes to consolidated financial statements
Note 10.
Borrowings and Bank Deposits
SHORT-TERM BORROWINGS
2011 2010
December 31 (Dollars in millions) Amount Average rate (a) Amount Average rate (a)
GE
Commercial paper $ 1,801 0.13% $ — —%
Payable to banks 88 1.81 73 2.44
Current portion of long-term borrowings 41 4.89 21 8.35
Other 254 362
Total GE short-term borrowings 2,184 456
GECS
Commercial paper
U.S. 33,591 0.23 32,547 0.28
Non-U.S. 10,569 1.63 9,497 1.42
Current portion of long-term borrowings (b)(c)(d)(f) 82,650 2.72 65,612 3.24
GE Interest Plus notes (e) 8,474 1.32 9,058 1.59
Other (d) 1,049 2,083
Total GECS short-term borrowings 136,333 118,797
ELIMINATIONS (906) (1,294)
Total short-term borrowings $137,611 $117,959
LONG-TERM BORROWINGS
2011 2010
December 31 (Dollars in millions) Maturities Amount Average rate (a) Amount Average rate (a)
GE
Senior notes 2013–2017 $ 8,976 5.21% $ 8,971 5.21%
Payable to banks, principally U.S. 2013–2023 18 2.89 25 3.10
Other 411 660
Total GE long-term borrowings 9,405 9,656
GECS
Senior unsecured notes (b)(c) 2013–2055 210,154 3.49 262,789 3.29
Subordinated notes (f) 2014–2037 4,862 3.42 2,575 5.48
Subordinated debentures (g) 2066–2067 7,215 6.66 7,298 6.63
Other (d)(h) 12,160 11,745
Total GECS long-term borrowings 234,391 284,407
ELIMINATIONS (337) (740)
Total long-term borrowings $243,459 $293,323
NON-RECOURSE BORROWINGS OF CONSOLIDATED SECURITIZATION ENTITIES (i) 2012–2022 $ 29,258 1.40% $ 30,018 1.20%
BANK DEPOSITS
(j) $ 43,115 $ 37,298
TOTAL BORROWINGS AND BANK DEPOSITS $453,443 $478,598
(a) Based on year-end balances and year-end local currency effective interest rates, including the effects from hedging.
(b) GECC had issued and outstanding $35,040 million and $53,495 million of senior, unsecured debt that was guaranteed by the Federal Deposit Insurance Corporation (FDIC)
under the Temporary Liquidity Guarantee Program at December 31, 2011 and 2010, respectively. Of the above amounts, $35,040 million and $18,455 million are included in
current portion of long-term borrowings at December 31, 2011 and 2010, respectively.
(c) Included in total long-term borrowings were $1,845 million and $2,395 million of obligations to holders of GICs at December 31, 2011 and 2010, respectively. If the long-
term credit rating of GECC were to fall below AA-/Aa3 or its short-term credit rating were to fall below A-1+/P-1, GECC could be required to provide up to $1,718 million as of
December 31, 2011, to repay holders of GICs.
(d) Included $8,538 million and $11,135 million of funding secured by real estate, aircraft and other collateral at December 31, 2011 and 2010, respectively, of which
$2,983 million and $4,671 million is non-recourse to GECS at December 31, 2011 and 2010, respectively.
(e) Entirely variable denomination floating-rate demand notes.
(f) Included $417 million of subordinated notes guaranteed by GE at both December 31, 2011 and 2010, of which $117 million is included in current portion of long-term
borrowings at December 31, 2011.
(g) Subordinated debentures receive rating agency equity credit and were hedged at issuance to the U.S. dollar equivalent of $7,725 million.
(h) Included $1,955 million and $1,984 million of covered bonds at December 31, 2011 and 2010, respectively. If the short-term credit rating of GECC were reduced below
A-1/P-1, GECC would be required to partially cash collateralize these bonds in an amount up to $727 million at December 31, 2011.
(i) Included at December 31, 2011 and 2010 were $10,714 million and $10,499 million of current portion of non-recourse borrowings of CSEs, respectively, and $18,544 million
and $19,519 million of long-term non-recourse borrowings of CSEs, respectively. See Note 18.
(j) Included $16,281 million and $18,781 million of deposits in non-U.S. banks at December 31, 2011 and 2010, respectively, and $17,201 million and $11,606 million of
certificates of deposits with maturities greater than one year at December 31, 2011 and 2010, respectively.
Additional information about borrowings and associated swaps can be found in Note 22.

GE 2011 ANNUAL REPORT 101
notes to consolidated financial statements
LIQUIDITY is affected by debt maturities and our ability to repay or
refi nance such debt. Long-term debt maturities over the next fi ve
years follow.
(In millions) 2012 2013 2014 2015 2016
GE $ 41 $ 5,166 $ 35 $ 35 $ 28
GECS 82,650 (a) 38,334 36,542 23,450 21,199
(a) Fixed and floating rate notes of $444 million contain put options with exercise
dates in 2012, and which have final maturity beyond 2016.
Committed credit lines totaling $52.4 billion had been extended to
us by 58 banks at year-end 2011. Availability of these lines is
shared between GE and GECS with $12.4 billion and $52.4 billion
available to GE and GECS, respectively. The GECS lines include
$35.1 billion of revolving credit agreements under which we can
borrow funds for periods exceeding one year. Additionally,
$16.7 billion are 364-day lines that contain a term-out feature that
allows GE or GECS to extend the borrowings for one year from the
date of expiration of the lending agreement.
Note 11.
GECS Investment Contracts, Insurance Liabilities and
Insurance Annuity Benefits
GECS investment contracts, insurance liabilities and insurance
annuity benefi ts comprise mainly obligations to annuitants and
policyholders in our run-off insurance operations and holders of
guaranteed investment contracts.
December 31 (In millions) 2011 2010
Investment contracts $ 3,493 $ 3,726
Guaranteed investment contracts 4,226 5,502
Total investment contracts 7,719 9,228
Life insurance benefits (a) 19,257 17,640
Unpaid claims and claims adjustment expenses 2,597 2,437
Unearned premiums 370 426
Universal life benefits 255 262
Total $30,198 $29,993
(a) Life insurance benefits are accounted for mainly by a net-level-premium method
using estimated yields generally ranging from 3.0% to 8.5% in both 2011 and
2010.
When insurance affi liates cede insurance to third parties, such as
reinsurers, they are not relieved of their primary obligation to
policyholders. Losses on ceded risks give rise to claims for recov-
ery; we establish allowances for probable losses on such
receivables from reinsurers as required. Reinsurance recover-
ables are included in the caption “Other GECS receivables” on our
Statement of Financial Position, and amounted to $1,411 million
and $1,284 million at December 31, 2011 and 2010, respectively.
We recognize reinsurance recoveries as a reduction of the
Statement of Earnings caption “Investment contracts, insurance
losses and insurance annuity benefi ts.” Reinsurance recover-
ies were $224 million, $174 million and $219 million for the years
ended December 31, 2011, 2010 and 2009, respectively.
Note 12.
Postretirement Benefit Plans
Pension Benefits
We sponsor a number of pension plans. Principal pension plans,
together with affi liate and certain other pension plans (other
pension plans) detailed in this note, represent about 99% of our
total pension assets. We use a December 31 measurement date
for our plans.
PRINCIPAL PENSION PLANS are the GE Pension Plan and the GE
Supplementary Pension Plan.
The GE Pension Plan provides benefi ts to certain U.S. employ-
ees based on the greater of a formula recognizing career earnings
or a formula recognizing length of service and fi nal average
earnings. Certain benefi t provisions are subject to collective bar-
gaining. Salaried employees who commence service on or after
January 1, 2011 and any employee who commences service on
or after January 1, 2012 will not be eligible to participate in the
GE Pension Plan, but will participate in a defi ned contribution
retirement program.
The GE Supplementary Pension Plan is an unfunded plan
providing supplementary retirement benefi ts primarily to higher-
level, longer-service U.S. employees.
OTHER PENSION PLANS in 2011 included 36 U.S. and non-U.S.
pension plans with pension assets or obligations greater than
$50 million. These defi ned benefi t plans provide benefi ts to
employees based on formulas recognizing length of service
and earnings.
PENSION PLAN PARTICIPANTS
December 31, 2011 Total
Principal
pension
plans
Other
pension
plans
Active employees 139,000 105,000 34,000
Vested former employees 237,000 195,000 42,000
Retirees and beneficiaries 254,000 225,000 29,000
Total 630,000 525,000 105,000

102 GE 2011 ANNUAL REPORT
notes to consolidated financial statements
COST OF PENSION PLANS
Total Principal pension plans Other pension plans
(In millions) 2011 2010 2009 2011 2010 2009 2011 2010 2009
Service cost for benefits earned $ 1,498 $ 1,426 $ 1,906 $ 1,195 $ 1,149 $ 1,609 $ 303 $ 277 $ 297
Prior service cost amortization 207 252 437 194 238 426 (a) 13 14 11
Expected return on plan assets (4,543) (4,857) (4,943) (3,940) (4,344) (4,505) (603) (513) (438)
Interest cost on benefit obligations 3,176 3,179 3,129 2,662 2,693 2,669 514 486 460
Net actuarial loss amortization 2,486 1,546 482 2,335 1,336 348 151 210 134
Pension plans cost $ 2,824 $ 1,546 $ 1,011 $ 2,446 $ 1,072 $ 547 $ 378 $ 474 $ 464
(a) In 2009, included a $103 million loss as a result of our agreement with Comcast Corporation to transfer the NBCU business to a newly formed entity in which we own a
49% interest.
ACTUARIAL ASSUMPTIONS are described below. The actuarial assumptions at December 31 are used to measure the year-end benefi t
obligations and the pension costs for the subsequent year.
Principal pension plans Other pension plans (weighted average)
December 31 2011 2010 2009 2008 2011 2010 2009 2008
Discount rate 4.21% 5.28% 5.78% 6.11% 4.42% 5.11% 5.31% 6.03%
Compensation increases 3.75 4.25 4.20 4.20 4.31 4.44 4.56 4.47
Expected return on assets 8.00 8.00 8.50 8.50 7.09 7.25 7.29 7.41
To determine the expected long-term rate of return on pension
plan assets, we consider current and expected asset allocations, as
well as historical and expected returns on various categories of
plan assets. In developing future return expectations for our prin-
cipal benefi t plans’ assets, we formulate views on the future
economic environment, both in the U.S. and abroad. We evaluate
general market trends and historical relationships among a num-
ber of key variables that impact asset class returns such as
expected earnings growth, infl ation, valuations, yields and spreads,
using both internal and external sources. We also take into account
expected volatility by asset class and diversifi cation across classes
to determine expected overall portfolio results given current and
expected allocations. Based on our analysis of future expectations
of asset performance, past return results, and our current and
expected asset allocations, we have assumed an 8.0% long-term
expected return on those assets for cost recognition in 2012. For
the principal pension plans, we apply our expected rate of return to
a market-related value of assets, which stabilizes variability in the
amounts to which we apply that expected return.
We amortize experience gains and losses as well as the effects
of changes in actuarial assumptions and plan provisions over a
period no longer than the average future service of employees.
FUNDING POLICY for the GE Pension Plan is to contribute amounts
suffi cient to meet minimum funding requirements as set forth in
employee benefi t and tax laws plus such additional amounts as we
may determine to be appropriate. We will contribute approximately
$1,040 million to the GE Pension Plan in 2012. In addition, we expect
to pay approximately $210 million for benefi t payments under our
GE Supplementary Pension Plan and administrative expenses of
our principal pension plans and expect to contribute approximately
$710 million to other pension plans in 2012. In 2011, comparative
amounts were $201 million and $713 million, respectively.
BENEFIT OBLIGATIONS are described in the following tables.
Accumulated and projected benefi t obligations (ABO and PBO)
represent the obligations of a pension plan for past service as of
the measurement date. ABO is the present value of benefi ts
earned to date with benefi ts computed based on current
compensation levels. PBO is ABO increased to refl ect expected
future compensation.
PROJECTED BENEFIT OBLIGATION
Principal pension plans Other pension plans
(In millions) 2011 2010 2011 2010
Balance at January 1 $51,999 $48,117 $ 9,907 $9,597
Service cost for benefits
earned 1,195 1,149 303 277
Interest cost on benefit
obligations 2,662 2,693 514 486
Participant contributions 167 166 37 33
Plan amendments 804 —(58) 23
Actuarial loss (gain) 6,803(a) 2,799 (a) 1,344 (a) (12)
Benefits paid (3,120) (2,925) (424) (421)
Acquisitions (dispositions)/
other—net ——122 50
Exchange rate adjustments ——(108) (126)
Balance at December 31 (b) $60,510 $51,999 $11,637 $9,907
(a) Principally associated with discount rate changes.
(b) The PBO for the GE Supplementary Pension Plan, which is an unfunded plan, was
$5,203 million and $4,430 million at year-end 2011 and 2010, respectively.
ACCUMULATED BENEFIT OBLIGATION
December 31 (In millions) 2011 2010
GE Pension Plan $53,040 $46,046
GE Supplementary Pension Plan 3,643 3,296
Other pension plans 10,722 9,134
PLANS WITH ASSETS LESS THAN ABO
December 31 (In millions) 2011 2010
Funded plans with assets less than ABO
Plan assets $49,284 $51,286
Accumulated benefit obligations 61,852 53,350
Projected benefit obligations 64,879 55,502
Unfunded plans (a)
Accumulated benefit obligations $ 4,563 $ 4,086
Projected benefit obligations 6,161 5,247
(a) Primarily related to the GE Supplementary Pension Plan.

GE 2011 ANNUAL REPORT 103
notes to consolidated financial statements
PLAN ASSETS
The fair value of the classes of the pension plans’ investments is
presented below. The inputs and valuation techniques used to
measure the fair value of the assets are consistently applied and
described in Note 1.
FAIR VALUE OF PLAN ASSETS
Principal pension plans Other pension plans
(In millions) 2011 2010 2011 2010
Balance at January 1 $44,801 $42,097 $7,803 $6,919
Actual gain on plan assets 88 5,280 227 749
Employer contributions 201 183 713 573
Participant contributions 167 166 37 33
Benefits paid (3,120) (2,925) (424) (421)
Acquisitions (dispositions)
and other—net ——101 41
Exchange rate adjustments ——(76) (91)
Balance at December 31 $42,137 $44,801 $8,381 $7,803
ASSET ALLOCATION
Principal pension plans
Other pension plans
(weighted average)
2011
Target
allocation
2011
Actual
allocation
2011
Target
allocation
2011
Actual
allocation
Equity securities 34–74% (a) 45% (b) 47% 56%
Debt securities
(including cash equivalents) 10–40 27 33 33
Private equities 5–15 16 2 2
Real estate 4–14 8 6 4
Other 1–14 4 12 5
(a) Target allocations were 17–37% for both U.S. equity securities and non-U.S.
equity securities.
(b) Actual allocations were 26% for U.S. equity securities and 19% for non-U.S.
equity securities.
Plan fi duciaries of the GE Pension Plan set investment policies and
strategies for the GE Pension Trust and oversee its investment
allocation, which includes selecting investment managers, com-
missioning periodic asset-liability studies and setting long-term
strategic targets. Long-term strategic investment objectives take
into consideration a number of factors, including the funded
status of the plan, a balance between risk and return and the
plan’s liquidity needs. Target allocation percentages are estab-
lished at an asset class level by plan fi duciaries. Target allocation
ranges are guidelines, not limitations, and occasionally plan
fi duciaries will approve allocations above or below a target range.
Plan fi duciaries monitor the GE Pension Plan’s liquidity position
in order to meet the near term benefi t payment and other cash
needs. The GE Pension Plan holds short-term debt securities to
meet its liquidity needs.
GE Pension Trust assets are invested subject to the following
additional guidelines:
• Short-term securities must generally be rated A-1/P-1 or
better, except for 15% of such securities that may be rated
A-2/P-2 and other short-term securities as may be approved
by the plan fi duciaries.
• Real estate investments may not exceed 25% of total assets.
• Investments in restricted securities (excluding real estate invest-
ments) that are not freely tradable may not exceed 30% of total
assets (actual was 21% of trust assets at December 31, 2011).
According to statute, the aggregate holdings of all qualifying
employer securities (e.g., GE common stock) and qualifying
employer real property may not exceed 10% of the fair value of trust
assets at the time of purchase. GE securities represented 3.8%
and 3.6% of trust assets at year-end 2011 and 2010, respectively.
The GE Pension Plan has a broadly diversifi ed portfolio of
investments in equities, fi xed income, private equities, real estate
and hedge funds; these investments are both U.S. and non-U.S. in
nature. As of December 31, 2011, no one sector concentration of
assets exceeded 15% of total GE Pension Plan assets.
The following tables present GE Pension Plan investments
measured at fair value.
December 31, 2011 (In millions) Level 1 Level 2 Level 3 Total
EQUITY SECURITIES
U.S. equity securities $10,645 $ 191 $ — $10,836
Non-U.S. equity
securities 7,360 644 — 8,004
DEBT SECURITIES
Fixed income and
cash investment funds — 2,057 62 2,119
U.S. corporate (a) — 2,126 3 2,129
Residential mortgage-
backed — 1,276 5 1,281
U.S. government and
federal agency — 3,872 — 3,872
Other debt securities (b) — 1,566 146 1,712
PRIVATE EQUITIES (c) — — 6,786 6,786
REAL ESTATE (c) — — 3,274 3,274
OTHER INVESTMENTS (d) — — 1,709 1,709
TOTAL INVESTMENTS $18,005 $11,732 $11,985 $41,722
CASH AND OTHER 415
TOTAL ASSETS $42,137
December 31, 2010 (In millions) Level 1 Level 2 Level 3 Total
EQUITY SECURITIES
U.S. equity securities $11,388 $ 195 $ — $11,583
Non-U.S. equity
securities 9,662 801 — 10,463
DEBT SECURITIES
Fixed income and cash
investment funds — 2,712 65 2,777
U.S. corporate (a) — 2,377 5 2,382
Residential mortgage-
backed — 1,225 21 1,246
U.S. government and
federal agency — 3,192 — 3,192
Other debt securities (b) — 1,578 283 1,861
PRIVATE EQUITIES
(c) — — 6,014 6,014
REAL ESTATE
(c) — — 3,373 3,373
OTHER INVESTMENTS
(d) — 53 1,687 1,740
TOTAL INVESTMENTS $21,050 $12,133 $11,448 $44,631
CASH AND OTHER 170
TOTAL ASSETS $44,801
(a) Primarily represented investment grade bonds of U.S. issuers from diverse
industries.
(b) Primarily represented investments in non-U.S. corporate bonds and commercial
mortgage-backed securities.
(c) Included direct investments and investment funds.
(d) Substantially all represented hedge fund investments.

104 GE 2011 ANNUAL REPORT
notes to consolidated financial statements
The following tables present the changes in Level 3 investments for the GE Pension Plan.
CHANGES IN LEVEL 3 INVESTMENTS FOR THE YEAR ENDED DECEMBER 31, 2011
(In millions)
January 1,
2011
Net realized
gains (losses)
Net unrealized
gains (losses)
Purchases,
issuances and
settlements
Transfers in
and/or out
of Level 3 (a) December 31,
2011
DEBT SECURITIES
Fixed income and cash investment funds $ 65 $ (1) $ (4) $ 2 $ — $ 62
U.S. corporate 5 — — (5) 3 3
Residential mortgage-backed 21 (1) (1) (4) (10) 5
Other debt securities 283 4 6 (145) (2) 146
PRIVATE EQUITIES 6,014 311 701 (240) — 6,786
REAL ESTATE 3,373 (70) 320 (217) (132) 3,274
OTHER INVESTMENTS 1,687 (41) (87) 150 — 1,709
$11,448 $202 $ 935 $(459) $(141) $11,985
(a) Transfers in and out of Level 3 are considered to occur at the beginning of the period.
CHANGES IN LEVEL 3 INVESTMENTS FOR THE YEAR ENDED DECEMBER 31, 2010
(In millions)
January 1,
2010
Net realized
gains (losses)
Net unrealized
gains (losses)
Purchases,
issuances and
settlements
Transfers in
and/or out of
Level 3 (a) December 31,
2010
DEBT SECURITIES
Fixed income and cash investment funds $ 46 $ 1 $ 15 $ 3 $ — $ 65
U.S. corporate 6 6 1 (9) 1 5
Residential mortgage-backed 220 5 1 (211) 6 21
Other debt securities 231 2 15 41 (6) 283
PRIVATE EQUITIES 5,339 54 694 (73) — 6,014
REAL ESTATE 2,775 130 251 217 — 3,373
OTHER INVESTMENTS 1,537 (24) 156 65 (47) 1,687
$10,154 $174 $1,133 $ 33 $ (46) $11,448
(a) Transfers in and out of Level 3 are considered to occur at the beginning of the period.
Other pension plans’ assets were $8,381 million and $7,803 million at December 31, 2011 and 2010, respectively. Equity and debt securities
amounting to $7,284 million and $6,938 million represented approximately 89% and 90% of total investments at December 31, 2011 and
2010, respectively. The plans’ investments were classifi ed as 13% Level 1, 76% Level 2 and 11% Level 3 at December 31, 2011. The plans’
investments were classifi ed as 15% Level 1, 75% Level 2 and 10% Level 3 at December 31, 2010. The changes in Level 3 investments were
insignifi cant for the years ended December 31, 2011 and 2010.
PENSION ASSET (LIABILITY)
Principal pension plans Other pension plans
December 31 (In millions) 2011 2010 2011 2010
Funded status (a)(b) $(18,373) $ (7,198) $(3,256) $(2,104)
Pension asset (liability)
recorded in the Statement
of Financial Position
Pension asset $ — $ — $ 158 $ 202
Pension liabilities
Due within one year (c) (148) (141) (52) (52)
Due after one year (18,225) (7,057) (3,362) (2,254)
Net amount recognized $(18,373) $ (7,198) $(3,256) $(2,104)
Amounts recorded in
shareowners’ equity
(unamortized)
Prior service cost $ 1,685 $ 1,075 $ 4 $ 72
Net actuarial loss 26,923 18,603 3,294 1,772
Total $ 28,608 $19,678 $ 3,298 $ 1,844
(a) Fair value of assets less PBO, as shown in the preceding tables.
(b) The GE Pension Plan was underfunded by $13.2 billion and $2.8 billion at
December 31, 2011 and 2010, respectively.
(c) For principal pension plans, represents the GE Supplementary Pension Plan liability.
In 2012, we estimate that we will amortize $280 million of prior
service cost and $3,435 million of net actuarial loss for the princi-
pal pension plans from shareowners’ equity into pension cost. For
other pension plans, the estimated prior service cost and net
actuarial loss to be amortized in 2012 will be $5 million and
$275 million, respectively. Comparable amortized amounts in
2011, respectively, were $194 million and $2,335 million for the
principal pension plans and $13 million and $151 million for other
pension plans.
ESTIMATED FUTURE BENEFIT PAYMENTS
(In millions) 2012 2013 2014 2015 2016
2017–
2021
Principal pension
plans $3,000 $3,025 $3,090 $3,160 $3,205 $17,225
Other pension
plans $ 415 $ 425 $ 435 $ 445 $ 455 $ 2,465

GE 2011 ANNUAL REPORT 105
notes to consolidated financial statements
Retiree Health and Life Benefits
We sponsor a number of retiree health and life insurance benefi t
plans (retiree benefi t plans). Principal retiree benefi t plans are
discussed below; other such plans are not signifi cant individually
or in the aggregate. We use a December 31 measurement date for
our plans.
PRINCIPAL RETIREE BENEFIT PLANS provide health and life insur-
ance benefi ts to certain eligible participants and these
participants share in the cost of healthcare benefi ts. These plans
cover approximately 210,000 retirees and dependents.
COST OF PRINCIPAL RETIREE BENEFIT PLANS
(In millions) 2011 2010 2009
Service cost for benefits earned $ 216 $ 241 $ 442
Prior service cost amortization (a) 647 631 836
Expected return on plan assets (97) (116) (129)
Interest cost on benefit obligations 604 699 709
Net actuarial gain amortization (a) (110) (22) (225)
Retiree benefit plans cost (a) $1,260 $1,433 $1,633
(a) In 2009, we recognized a $45 million loss as a result of our agreement with
Comcast Corporation to transfer the NBCU business to a newly formed entity in
which we own a 49% interest. Prior service cost amortization increased by
$164 million and net actuarial gain amortization increased by $119 million as a
result of this agreement.
ACTUARIAL ASSUMPTIONS are described below. The actuarial
assumptions at December 31 are used to measure the year-end
benefi t obligations and the retiree benefi t plan costs for the
subsequent year.
December 31 2011 2010 2009 2008
Discount rate 4.09% 5.15% 5.67% 6.15%
Compensation increases 3.75 4.25 4.20 4.20
Expected return on assets 7.00 8.00 8.50 8.50
Initial healthcare trend rate (a) 7.00 7.00 7.40 7.00
(a) For 2011, ultimately declining to 5% for 2030 and thereafter.
To determine the expected long-term rate of return on retiree life
plan assets, we consider current and expected asset allocations,
historical and expected returns on various categories of plan assets,
as well as expected benefi t payments and resulting asset levels. In
developing future return expectations for retiree benefi t plan
assets, we formulate views on the future economic environment,
both in the U.S. and abroad. We evaluate general market trends and
historical relationships among a number of key variables that
impact asset class returns such as expected earnings growth,
infl ation, valuations, yields and spreads, using both internal and
external sources. We also take into account expected volatility by
asset class and diversifi cation across classes to determine expected
overall portfolio results given current and expected allocations.
Based on our analysis of future expectations of asset performance,
past return results, anticipated changes in our asset allocations
and shorter time horizon for retiree life plan assets, we have
assumed a 7.0% long-term expected return on those assets for
cost recognition in 2012. This is a reduction from the 8.0% we
had assumed in 2011 and the 8.5% we had assumed in both 2010
and 2009. We apply our expected rate of return to a market-
related value of assets, which stabilizes variability in the amounts
to which we apply that expected return.
We amortize experience gains and losses as well as the effects
of changes in actuarial assumptions and plan provisions over a
period no longer than the average future service of employees.
FUNDING POLICY. We fund retiree health benefi ts on a pay-as-
you-go basis. We expect to contribute approximately $615 million
in 2012 to fund such benefi ts. We fund retiree life insurance
benefi ts at our discretion.
Changes in the accumulated postretirement benefi t obligation
for retiree benefi t plans follow.
ACCUMULATED POSTRETIREMENT BENEFIT OBLIGATION (APBO)
(In millions) 2011 2010
Balance at January 1 $12,010 $12,775
Service cost for benefits earned 216 241
Interest cost on benefit obligations 604 699
Participant contributions 55 55
Plan amendments 25 —
Actuarial loss (gain) 911 (a) (942) (b)
Benefits paid (765) (818)
Balance at December 31 (c) $13,056 $12,010
(a) Primarily associated with discount rate change.
(b) For 2010, included the effects of healthcare reform provisions on our Medicare-
approved prescription drug plan.
(c) The APBO for the retiree health plans was $10,286 million and $9,566 million at
year-end 2011 and 2010, respectively.
A one percentage point change in the assumed healthcare cost
trend rate would have the following effects.
(In millions) 1% increase 1% decrease
APBO at December 31, 2011 $1,135 $(958)
Service and interest cost in 2011 82 (68)
PLAN ASSETS
The fair value of the classes of retiree benefi t plans’ investments
is presented below. The inputs and valuation techniques used to
measure the fair value of assets are consistently applied and
described in Note 1.
FAIR VALUE OF PLAN ASSETS
(In millions) 2011 2010
Balance at January 1 $1,125 $1,138
Actual gain on plan assets 15 139
Employer contributions 574 611
Participant contributions 55 55
Benefits paid (765) (818)
Balance at December 31 $1,004 $1,125
ASSET ALLOCATION
December 31
2011 Target
allocation
2011 Actual
allocation
Equity securities 37–77% (a) 35% (b)
Debt securities (including cash equivalents) 11–41 39
Private equities 3–13 16
Real estate 2–12 7
Other 0–10 3
(a) Target allocations were 19–39% for U.S. equity securities and 18–38% for
non-U.S. equity securities.
(b) Actual allocations were 20% for U.S. equity securities and 15% for non-U.S.
equity securities.

106 GE 2011 ANNUAL REPORT
notes to consolidated financial statements
Plan fi duciaries set investment policies and strategies for the trust
and oversee its investment allocation, which includes selecting
investment managers and setting long-term strategic targets.
The primary strategic investment objectives are balancing invest-
ment risk and return and monitoring the plan’s liquidity position in
order to meet the near term benefi t payment and other cash
needs. Target allocation percentages are established at an asset
class level by plan fi duciaries. Target allocation ranges are guide-
lines, not limitations, and occasionally plan fi duciaries will approve
allocations above or below a target range.
Trust assets invested in short-term securities must generally
be invested in securities rated A-1/P-1 or better, except for 15%
of such securities that may be rated A-2/P-2 and other short-term
securities as may be approved by the plan fi duciaries. According
to statute, the aggregate holdings of all qualifying employer
securities (e.g., GE common stock) and qualifying employer real
property may not exceed 10% of the fair value of trust assets at
the time of purchase. GE securities represented 4.7% and 4.5% of
trust assets at year-end 2011 and 2010, respectively.
Retiree life plan assets were $1,004 million and $1,125 mil-
lion at December 31, 2011 and 2010, respectively. Equity and
debt securities amounting to $760 million and $942 million
represented approximately 74% and 78% of total investments
at December 31, 2011 and 2010, respectively. The plans’ invest-
ments were classifi ed as 32% Level 1, 42% Level 2 and 26% Level
3 at December 31, 2011. The plans’ investments were classifi ed as
39% Level 1, 39% Level 2 and 22% Level 3 at December 31, 2010.
The changes in Level 3 investments were insignifi cant for the
years ended December 31, 2011 and 2010.
RETIREE BENEFIT ASSET (LIABILITY)
December 31 (In millions) 2011 2010
Funded status (a) $(12,052) $(10,885)
Liability recorded in the Statement
of Financial Position
Retiree health plans
Due within one year $ (602) $ (644)
Due after one year (9,684) (8,922)
Retiree life plans (1,766) (1,319)
Net liability recognized $(12,052) $(10,885)
Amounts recorded in shareowners’
equity (unamortized)
Prior service cost $ 2,901 $ 3,523
Net actuarial loss (gain) 401 (671)
Total $ 3,302 $ 2,852
(a) Fair value of assets less APBO, as shown in the preceding tables.
In 2012, we estimate that we will amortize $575 million of prior
service cost from shareowners’ equity into retiree benefi t plans
cost. Estimated 2012 retiree health plan gain amortization offsets
the expected amortization of retiree life plans losses. As such, the
amount of actuarial loss (gain) to be recycled from shareowners’
equity into retiree benefi t plans cost is expected to be insignifi -
cant. Comparable amortized amounts in 2011 were $647 million
of prior service cost and $110 million of net actuarial gains.
ESTIMATED FUTURE BENEFIT PAYMENTS
(a)
(In millions) 2012 2013 2014 2015 2016
2017–
2021
$800 $815 $830 $840 $840 $4,180
(a) Net of expected Medicare Part D subsidy of about $5 million annually.
Postretirement Benefit Plans
2011 COST OF POSTRETIREMENT BENEFIT PLANS AND CHANGES IN
OTHER COMPREHENSIVE INCOME
Total
postretirement
(In millions) benefit plans
Principal
pension
plans
Other
pension
plans
Retiree
benefit
plans
Cost of postretirement
benefit plans $ 4,084 $ 2,446 $ 378 $1,260
Changes in other
comprehensive income
Net actuarial loss (gain)—
current year 13,293 10,655 1,676 962
Prior service cost (credit)—
current year 771 804 (58) 25
Prior service cost
amortization (854) (194) (13) (647)
Net actuarial gain (loss)
amortization (2,376) (2,335) (151) 110
Total changes in other
comprehensive income 10,834 8,930 1,454 450
Cost of postretirement
benefit plans and
changes in other
comprehensive income $14,918 $11,376 $1,832 $1,710
Note 13.
All Other Liabilities
This caption includes liabilities for various items including non-
current compensation and benefi ts, deferred income, interest on
tax liabilities, unrecognized tax benefi ts, environmental remedia-
tion, asset retirement obligations, derivative instruments, product
warranties and a variety of sundry items.
Accruals for non-current compensation and benefi ts amounted
to $39,430 million and $25,356 million at December 31, 2011 and
2010, respectively. These amounts include postretirement benefi ts,
pension accruals, and other compensation and benefi t accruals
such as deferred incentive compensation. See Note 12.
We are involved in numerous remediation actions to clean up
hazardous wastes as required by federal and state laws. Liabilities
for remediation costs exclude possible insurance recoveries and,
when dates and amounts of such costs are not known, are not
discounted. When there appears to be a range of possible costs
with equal likelihood, liabilities are based on the low end of such
range. It is reasonably possible that our environmental remedia-
tion exposure will exceed amounts accrued. However, due to
uncertainties about the status of laws, regulations, technology
and information related to individual sites, such amounts are not
reasonably estimable. Total reserves related to environmental
remediation, including asbestos claims, were $3,361 million at
December 31, 2011.

GE 2011 ANNUAL REPORT 107
notes to consolidated financial statements
In 2006, we entered into a consent decree with the
Environmental Protection Agency (EPA) to dredge PCB-containing
sediment from the upper Hudson River. The consent decree pro-
vided that the dredging would be performed in two phases. Phase
1 was completed in May through November of 2009. Between
Phase 1 and Phase 2 there was an intervening peer review by
an independent panel of national experts. The panel evaluated
the performance of Phase 1 dredging operations with respect to
Phase 1 Engineering Performance Standards and recommended
proposed changes to the standards. On December 17, 2010, EPA
issued its decision setting forth the fi nal performance standards
for Phase 2 of the Hudson River dredging project, incorporat-
ing aspects of the recommendations from the independent
peer review panel and from GE. In December 2010, we agreed
to perform Phase 2 of the project in accordance with the fi nal
performance standards set by EPA and increased our reserve
by $845 million in the fourth quarter of 2010 to account for the
probable and estimable costs of completing Phase 2. In 2011, we
completed the fi rst year of Phase 2 dredging and commenced
work on planned upgrades to the Hudson River wastewater pro-
cessing facility. Based on the results from 2011 dredging and
our best professional engineering judgment, we believe that our
current reserve continues to refl ect our probable and estimable
costs for the remainder of Phase 2 of the dredging project.
Note 14.
Income Taxes
PROVISION FOR INCOME TAXES
(In millions) 2011 2010 2009
GE
Current tax expense $ 5,166 $ 2,401 $ 3,199
Deferred tax expense (benefit) from
temporary differences (327) (377) (460)
4,839 2,024 2,739
GECS
Current tax expense (benefit) 769 (2,298) (1,563)
Deferred tax expense (benefit) from
temporary differences 124 1,307 (2,318)
893 (991) (3,881)
CONSOLIDATED
Current tax expense 5,935 103 1,636
Deferred tax expense (benefit) from
temporary differences (203) 930 (2,778)
Total $ 5,732 $ 1,033 $(1,142)
GE and GECS fi le a consolidated U.S. federal income tax return. This
enables GE to use GECS tax deductions and credits to reduce the
tax that otherwise would have been payable by GE. The GECS
effective tax rate for each period refl ects the benefi t of these tax
reductions in the consolidated return. GE makes cash payments to
GECS for these tax reductions at the time GE’s tax payments are
due. The effect of GECS on the amount of the consolidated tax
liability from the formation of the NBCU joint venture will be settled
in cash when GECS tax deductions and credits otherwise would
have reduced the liability of the group absent the tax on formation.
Consolidated U.S. earnings (loss) from continuing operations
before income taxes were $10,244 million in 2011, $5,444 million
in 2010 and $286 million in 2009. The corresponding amounts
for non-U.S. based operations were $9,854 million in 2011,
$8,641 million in 2010 and $9,578 million in 2009.
Consolidated current tax expense includes amounts appli-
cable to U.S. federal income taxes of an expense of $1,032 million
in 2011, and a benefi t of $3,027 million and $649 million in 2010
and 2009, respectively, including the benefi t from GECS deduc-
tions and credits applied against GE’s current U.S. tax expense.
Consolidated current tax expense amounts applicable to non-U.S.
jurisdictions were $4,657 million, $3,132 million and $2,192 mil-
lion in 2011, 2010 and 2009, respectively. Consolidated deferred
taxes related to U.S. federal income taxes were an expense of
$1,529 million and $1,993 million in 2011 and 2010, respectively,
and a benefi t of $2,489 million in 2009, and amounts applicable to
non-U.S. jurisdictions of a benefi t of $2,076 million, $1,178 million
and $261 million in 2011, 2010 and 2009, respectively.
Deferred income tax balances refl ect the effects of temporary
differences between the carrying amounts of assets and liabilities
and their tax bases, as well as from net operating loss and tax credit
carryforwards, and are stated at enacted tax rates expected to be in
effect when taxes are actually paid or recovered. Deferred income
tax assets represent amounts available to reduce income taxes
payable on taxable income in future years. We evaluate the recov-
erability of these future tax deductions and credits by assessing
the adequacy of future expected taxable income from all sources,
including reversal of taxable temporary differences, forecasted
operating earnings and available tax planning strategies. To the
extent we do not consider it more likely than not that a deferred tax
asset will be recovered, a valuation allowance is established.
Our businesses are subject to regulation under a wide variety
of U.S. federal, state and foreign tax laws, regulations and policies.
Changes to these laws or regulations may affect our tax liability,
return on investments and business operations. For example,
GE’s effective tax rate is reduced because active business income
earned and indefi nitely reinvested outside the United States is
taxed at less than the U.S. rate. A signifi cant portion of this reduc-
tion depends upon a provision of U.S. tax law that defers the
imposition of U.S. tax on certain active fi nancial services income
until that income is repatriated to the United States as a divi-
dend. This provision is consistent with international tax norms
and permits U.S. fi nancial services companies to compete more
effectively with foreign banks and other foreign fi nancial institu-
tions in global markets. This provision, which expired at the end
of 2011, had been scheduled to expire and had been extended
by Congress on six previous occasions, including in December
of 2010, but there can be no assurance that it will be extended,
including retroactively. In the event the provision is not extended
after 2011, the current U.S. tax imposed on active fi nancial ser-
vices income earned outside the United States would increase,
making it more diffi cult for U.S. fi nancial services companies to
compete in global markets. If this provision is not extended, we
expect our effective tax rate to increase signifi cantly after 2012.

108 GE 2011 ANNUAL REPORT
notes to consolidated financial statements
We have not provided U.S. deferred taxes on cumulative earn-
ings of non-U.S. affi liates and associated companies that have been
reinvested indefi nitely. These earnings relate to ongoing operations
and, at December 31, 2011 and December 31, 2010, were approxi-
mately $102 billion and $94 billion, respectively. Most of these
earnings have been reinvested in active non-U.S. business opera-
tions and we do not intend to repatriate these earnings to fund U.S.
operations. Because of the availability of U.S. foreign tax credits, it
is not practicable to determine the U.S. federal income tax liability
that would be payable if such earnings were not reinvested indefi -
nitely. Deferred taxes are provided for earnings of non-U.S. affi liates
and associated companies when we plan to remit those earnings.
During 2009, following the change in our external credit rat-
ings, funding actions taken and review of our operations, liquidity
and funding, we determined that undistributed prior-year earnings
of non-U.S. subsidiaries of GECS, on which we had previously pro-
vided deferred U.S. taxes, would be indefi nitely reinvested outside
the U.S. This change increased the amount of prior-year earnings
indefi nitely reinvested outside the U.S. by approximately $2 billion,
resulting in an income tax benefi t of $700 million in 2009.
Annually, we fi le over 6,500 income tax returns in over
250 global taxing jurisdictions. We are under examination or
engaged in tax litigation in many of these jurisdictions. During
2011, the Internal Revenue Service (IRS) completed the audit of our
consolidated U.S. income tax returns for 2006–2007, except for
certain issues that remain under examination. During 2010, the IRS
completed the audit of our consolidated U.S. income tax returns for
2003–2005. At December 31, 2011, the IRS was auditing our consol-
idated U.S. income tax returns for 2008–2009. In addition, certain
other U.S. tax defi ciency issues and refund claims for previous
years were unresolved. The IRS has disallowed the tax loss on our
2003 disposition of ERC Life Reinsurance Corporation. We expect
to contest the disallowance of this loss. In January 2012, the U.S.
Court of Appeals for the Second Circuit reversed the district court
decision which allowed GE’s $62 million refund claim with the IRS
regarding the taxation of the Castle Harbour aircraft leasing part-
nership from 1993–1998. Because a liability had been provided for
this matter, this decision has no effect on our results of operations
for 2011 or 2012. It is reasonably possible that the unresolved items
could be resolved during the next 12 months, which could result
in a decrease in our balance of “unrecognized tax benefi ts”—that
is, the aggregate tax effect of differences between tax return posi-
tions and the benefi ts recognized in our fi nancial statements. We
believe that there are no other jurisdictions in which the outcome
of unresolved issues or claims is likely to be material to our results
of operations, fi nancial position or cash fl ows. We further believe
that we have made adequate provision for all income tax uncer-
tainties. Resolution of audit matters, including the IRS audit of
our consolidated U.S. income tax returns for 2006–2007, reduced
our 2011 consolidated income tax rate by 2.4 percentage points.
Resolution of audit matters, including the IRS audit of our consoli-
dated U.S. income tax returns for 2003–2005, reduced our 2010
consolidated effective tax rate by 5.9 percentage points.
The balance of unrecognized tax benefi ts, the amount of
related interest and penalties we have provided and what we
believe to be the range of reasonably possible changes in the next
12 months, were:
December 31 (In millions) 2011 2010
Unrecognized tax benefits $5,230 $6,139
Portion that, if recognized, would reduce
tax expense and effective tax rate (a) 3,938 4,114
Accrued interest on unrecognized tax benefits 1,033 1,200
Accrued penalties on unrecognized tax benefits 121 109
Reasonably possible reduction to the balance
of unrecognized tax benefits in succeeding
12 months 0–900 0–1,600
Portion that, if recognized, would reduce
tax expense and effective tax rate (a) 0–500 0–650
(a) Some portion of such reduction might be reported as discontinued operations.
A reconciliation of the beginning and ending amounts of unrecog-
nized tax benefi ts is as follows:
(In millions) 2011 2010
Balance at January 1 $ 6,139 $ 7,251
Additions for tax positions of the current year 305 316
Additions for tax positions of prior years 817 596
Reductions for tax positions of prior years (1,828) (1,788)
Settlements with tax authorities (127) (152)
Expiration of the statute of limitations (76) (84)
Balance at December 31 $ 5,230 $ 6,139
We classify interest on tax defi ciencies as interest expense; we
classify income tax penalties as provision for income taxes. For
the years ended December 31, 2011, 2010 and 2009, $197 million
and $75 million of interest income and $172 million of interest
expense, respectively, and $10 million, $5 million and $14 million
of tax expenses related to penalties, respectively, were recog-
nized in the Statement of Earnings.

GE 2011 ANNUAL REPORT 109
notes to consolidated financial statements
A reconciliation of the U.S. federal statutory income tax rate to the actual income tax rate is provided below.
RECONCILIATION OF U.S. FEDERAL STATUTORY INCOME TAX RATE TO ACTUAL INCOME TAX RATE
Consolidated GE GECS
2011 2010 2009 2011 2010 2009 2011 2010 2009
U.S. federal statutory income tax rate 35.0% 35.0% 35.0% 35.0% 35.0% 35.0% 35.0% 35.0% 35.0%
Increase (reduction) in rate resulting
from inclusion of after-tax earnings
of GECS in before-tax earnings of GE ———(11.8) (7.0) (3.0) ———
Tax on global activities including exports (a) (10.4) (19.7) (39.7) (5.2) (10.8) (11.0) (14.7) (56.1) 89.4
NBCU gain 9.4 ——9.9 —————
U.S. business credits (b) (3.2) (4.4) (4.6) (1.5) (2.2) (1.0) (4.8) (14.2) 11.8
All other—net (2.3) (3.6) (2.3) (1.0) (1.6) (0.1) (3.5) (13.1) 8.1
(6.5) (27.7) (46.6) (9.6) (21.6) (15.1) (23.0) (83.4) 109.3
Actual income tax rate 28.5% 7.3% (11.6)% 25.4% 13.4% 19.9% 12.0% (48.4)% 144.3%
(a) 2009 included (7.1)% and 26.0% from indefinite reinvestment of prior-year earnings for consolidated and GECS, respectively.
(b) U.S. general business credits, primarily the credit for manufacture of energy efficient appliances, the credit for energy produced from renewable sources, the non-
conventional fuel tax credit, the low-income housing credit and the credit for research performed in the U.S.
DEFERRED INCOME TAXES
Aggregate deferred income tax amounts are summarized below.
December 31 (In millions) 2011 2010
ASSETS
GE $(19,769) $(14,843)
GECS (10,919) (12,867)
(30,688) (27,710)
LIABILITIES
GE 12,586 10,606
GECS 17,971 19,857
30,557 30,463
Net deferred income tax liability (asset) $ (131) $ 2,753
Principal components of our net liability (asset) representing
deferred income tax balances are as follows:
December 31 (In millions) 2011 2010
GE
Investment in NBCU LLC $ 4,880 $ —
Contract costs and estimated earnings 2,834 2,671
Intangible assets 1,701 2,772
Investment in global subsidiaries 780 1,934
Depreciation 574 951
Provision for expenses (a) (6,745) (5,991)
Principal pension plans (6,431) (2,519)
Retiree insurance plans (4,218) (3,814)
Non-U.S. loss carryforwards (b) (1,039) (1,115)
Other—net 481 874
(7,183) (4,237)
GECS
Financing leases 6,718 6,168
Operating leases 5,030 4,812
Intangible assets 1,689 1,567
Investment in global subsidiaries 85 1,321
Allowance for losses (2,949) (2,807)
Non-U.S. loss carryforwards (b) (2,861) (2,320)
Cash flow hedges (104) (612)
Net unrealized losses on securities (64) (276)
Other—net (492) (863)
7,052 6,990
Net deferred income tax liability (asset) $ (131) $ 2,753
(a) Represented the tax effects of temporary differences related to expense
accruals for a wide variety of items, such as employee compensation and
benefits, other pension plan liabilities, interest on tax liabilities, product
warranties and other sundry items that are not currently deductible.
(b) Net of valuation allowances of $1,183 million and $902 million for GE and
$613 million and $419 million for GECS, for 2011 and 2010, respectively. Of the
net deferred tax asset as of December 31, 2011, of $3,900 million, $45 million
relates to net operating loss carryforwards that expire in various years ending
from December 31, 2012, through December 31, 2014; $173 million relates to net
operating losses that expire in various years ending from December 31, 2015,
through December 31, 2026 and $3,682 million relates to net operating loss
carryforwards that may be carried forward indefinitely.

110 GE 2011 ANNUAL REPORT
notes to consolidated financial statements
Note 15.
Shareowners’ Equity
(In millions) 2011 2010 2009
PREFERRED STOCK ISSUED (a)(b) $ — $ — $ —
COMMON STOCK ISSUED
(a) $ 702 $ 702 $ 702
ACCUMULATED OTHER COMPREHENSIVE INCOME
Balance at January 1 (c) $ (17,855) $ (15,530) $ (21,853)
Investment securities—net of deferred taxes of $341, $72 and $1,001 (d) 575 (43) 2,678
Currency translation adjustments—net of deferred taxes of $(717), $3,208 and $(560) (162) (3,937) 4,202
Cash flow hedges—net of deferred taxes of $238, $(515) and $933 (874) (603) 986
Benefit plans—net of deferred taxes of $(5,022), $(260) and $(538) (e) (9,140) (490) (2,802)
Reclassification adjustments
Investment securities—net of deferred taxes of $1, $32 and $494 31 59 (19)
Currency translation adjustments—net of deferred taxes of $357, $22 and $(51) 381 63 (67)
Cash flow hedges—net of deferred taxes of $202, $706 and $428 978 1,057 612
Benefit plans—net of deferred taxes of $1,152, $832 and $533 (f) 2,092 1,569 998
Balance at December 31 $ (23,974) $ (17,855) $ (15,265)
OTHER CAPITAL
Balance at January 1 $ 36,890 $ 37,729 $ 40,390
Gains (losses) on treasury stock dispositions and other (a) (703) (839) (2,661)
Preferred stock redemption (2,494) ——
Balance at December 31 $ 33,693 $ 36,890 $ 37,729
RETAINED EARNINGS
Balance at January 1 (g) $131,137 $124,655 $122,185
Net earnings attributable to the Company 14,151 11,644 11,025
Dividends (a)(h) (7,498) (5,212) (6,785)
Other (a)(i) (4) 50 (62)
Balance at December 31 $137,786 $131,137 $126,363
COMMON STOCK HELD IN TREASURY
Balance at January 1 $ (31,938) $ (32,238) $ (36,697)
Purchases (a) (2,067) (1,890) (214)
Dispositions (a) 2,236 2,190 4,673
Balance at December 31 $ (31,769) $ (31,938) $ (32,238)
TOTAL EQUITY
GE shareowners’ equity balance at December 31 $116,438 $118,936 $117,291
Noncontrolling interests balance at December 31 1,696 5,262 7,845
Total equity balance at December 31 $118,134 $124,198 $125,136
(a) Total dividends and other transactions with shareowners decreased equity by $10,530 million in 2011, $5,701 million in 2010 and $5,049 million in 2009.
(b) GE has 50 million authorized shares of preferred stock ($1.00 par value). No such shares were issued as of December 31, 2011. 30,000 shares were issued at December 31,
2010 and December 31, 2009.
(c) The 2010 opening balance was adjusted as of January 1, 2010, for the cumulative effect of changes in accounting principles of $265 million related to the adoption of
ASU 2009-16 & 17.
(d) Includes adjustments of $786 million and $1,171 million in 2011 and 2010, respectively, to deferred acquisition costs, present value of future profits, and investment
contracts, insurance liabilities and insurance annuity benefits in our run-off insurance operations to reflect the effects that would have been recognized had the related
unrealized investment securities holding gains and losses actually been realized in accordance with ASC 320-10-S99-2.
(e) For 2011, included $(495) million of prior service costs for plan amendments and $(8,645) million of gains (losses) arising during the year—net of deferred taxes of
$(276) million and $(4,746) million, respectively. For 2010, included $(3) million of prior service costs for plan amendments, $(487) million of actuarial gains (losses) arising
during the year—net of deferred taxes of $1 million and $(261) million, respectively. For 2009, included $(9) million of prior service costs for plan amendments and
$(2,793) million of actuarial gains (losses) arising during the year—net of deferred taxes of $(10) million and $(528) million, respectively.
(f) For 2011, included $514 million of amortization of prior costs and $1,578 million of amortization of actuarial gains and losses—net of deferred taxes of $341 million and
$811 million, respectively. For 2010, included $513 million of amortization of prior service costs and $1,056 million of amortization of actuarial gains and losses—net of
deferred taxes of $346 million and $486 million, respectively. For 2009, included $814 million of amortization of prior service costs and $184 million of amortization of
actuarial gains and losses—net of deferred taxes of $434 million and $99 million, respectively.
(g) The 2010 opening balance was adjusted as of January 1, 2010, for the cumulative effect of changes in accounting principles of $1,708 million related to the adoption of
ASU 2009-16 & 17. The 2009 opening balance was adjusted as of April 1, 2009, for the cumulative effect of changes in accounting principles of $62 million related to
adopting amendments on impairment guidance in ASC 320, Investments—Debt and Equity Securities.
(h) Included $1,031 million ($806 million related to our preferred stock redemption), $300 million and $300 million of dividends on preferred stock in 2011, 2010 and
2009, respectively.
(i) Included the effects of accretion of redeemable securities to their redemption value of $38 million and $(62) million in 2010 and 2009, respectively.

GE 2011 ANNUAL REPORT 111
notes to consolidated financial statements
SHARES OF GE PREFERRED STOCK
On October 16, 2008, we issued 30,000 shares of 10% cumulative
perpetual preferred stock (par value $1.00 per share) having an
aggregate liquidation value of $3,000 million, and warrants to
purchase 134,831,460 shares of common stock (par value $0.06
per share) to Berkshire Hathaway Inc. (Berkshire Hathaway) for
net proceeds of $2,965 million in cash. The proceeds were allo-
cated to the preferred shares ($2,494 million) and the warrants
($471 million) on a relative fair value basis and recorded in other
capital. The warrants are exercisable for fi ve years at an exercise
price of $22.25 per share of common stock and settled through
physical share issuance.
The preferred stock was redeemable at our option three years
after issuance at a price of 110% of liquidation value plus accrued
and unpaid dividends. On September 13, 2011, we provided notice
to Berkshire Hathaway that we would redeem the shares for the
stated redemption price of $3,300 million, plus accrued and unpaid
dividends. In connection with this notice, we recognized a preferred
dividend of $806 million (calculated as the difference between the
carrying value and redemption value of the preferred stock), which
was recorded as a reduction to our third quarter earnings attribut-
able to common shareowners and common shareowners’ equity.
The preferred shares were redeemed on October 17, 2011.
SHARES OF GE COMMON STOCK
On July 23, 2010, we extended our $15 billion share repurchase
program (which would have otherwise expired on December 31,
2010) through 2013 and we resumed purchases under the program
in the third quarter of 2010. Under this program, on a book basis, we
repurchased 111.3 million shares for a total of $1,968 million during
2011 and 111.2 million shares for a total of $1,814 million during 2010.
GE has 13.2 billion authorized shares of common stock ($0.06
par value).
Common shares issued and outstanding are summarized in
the following table.
December 31 (In thousands) 2011 2010 2009
Issued 11,693,841 11,693,841 11,693,833
In treasury (1,120,824) (1,078,465) (1,030,758)
Outstanding 10,573,017 10,615,376 10,663,075
NONCONTROLLING INTERESTS
Noncontrolling interests in equity of consolidated affi liates
includes common shares in consolidated affi liates and preferred
stock issued by affi liates of GECC. Preferred shares that we are
required to redeem at a specifi ed or determinable date are classi-
fi ed as liabilities. The balance is summarized as follows:
December 31 (In millions) 2011 2010
Noncontrolling interests in consolidated affiliates
NBC Universal $ — $3,040
Others (a) 1,696 1,947
Preferred stock (b)
GECC affiliates —275
Total $1,696 $5,262
(a) Consisted of a number of individually insignificant noncontrolling interests in
partnerships and consolidated affiliates.
(b) The preferred stock paid cumulative dividends at an average rate of 6.81% in
2010 and was retired in 2011.
Changes to noncontrolling interests are as follows.
Years ended December 31
(In millions) 2011 2010 2009
Beginning balance $5,262 $7,845 $8,947
Net earnings 292 535 200
Repurchase of NBCU shares (a) (3,070) (1,878) —
Dispositions (b) (609) (979) (707)
Dividends (34) (317) (548)
AOCI and other (c) (145) 56 (47)
Ending balance $1,696 $5,262 $7,845
(a) In January 2011 and prior to the transaction with Comcast, we acquired 12.3% of
NBCU’s outstanding shares from Vivendi for $3,673 million and made an
additional payment of $222 million related to previously purchased shares. Of
these amounts, $3,070 million reflects a reduction in carrying value of
noncontrolling interests. The remaining amount of $825 million represents the
amount paid in excess of our carrying value, which was recorded as an increase
in our basis in NBCU.
(b) Includes noncontrolling interests related to the sale of GE SeaCo of $(311) million
and the redemption of Heller Financial preferred stock of $(275) million in 2011,
as well as the deconsolidation of Regency of $(979) million in 2010 and Penske
Truck Leasing Co., L.P. (PTL) of $(331) million in 2009.
(c) Changes to the individual components of AOCI attributable to noncontrolling
interests were insignificant.
Note 16.
Other Stock-Related Information
We grant stock options, restricted stock units (RSUs) and perfor-
mance share units (PSUs) to employees under the 2007
Long-Term Incentive Plan. This plan replaced the 1990 Long-Term
Incentive Plan. In addition, we grant options and RSUs in limited
circumstances to consultants, advisors and independent contrac-
tors under a plan approved by our Board of Directors in 1997 (the
Consultants’ Plan). There are outstanding grants under one share-
owner-approved option plan for non-employee directors. Share
requirements for all plans may be met from either unissued or
treasury shares. Stock options expire 10 years from the date they
are granted and vest over service periods that range from one to
fi ve years. RSUs give the recipients the right to receive shares of
our stock upon the vesting of their related restrictions.
Restrictions on RSUs vest in various increments and at various
dates, beginning after one year from date of grant through
grantee retirement. Although the plan permits us to issue RSUs
settleable in cash, we have only issued RSUs settleable in shares
of our stock. PSUs give recipients the right to receive shares of
our stock upon the achievement of certain performance targets.
All grants of GE options under all plans must be approved by
the Management Development and Compensation Committee,
which consists entirely of independent directors.

112 GE 2011 ANNUAL REPORT
notes to consolidated financial statements
STOCK COMPENSATION PLANS
December 31, 2011 (Shares in thousands)
Securities
to be
issued
upon
exercise
Weighted
average
exercise
price
Securities
available
for future
issuance
APPROVED BY SHAREOWNERS
Options 449,517 $18.86 (a)
RSUs 15,412 (b) (a)
PSUs 700 (b) (a)
NOT APPROVED BY SHAREOWNERS
(CONSULTANTS’ PLAN)
Options 344 26.94 (c)
RSUs 132 (b) (c)
Total 466,105 $18.87 113,963
(a) In 2007, the Board of Directors approved the 2007 Long-Term Incentive Plan (the
Plan). The Plan replaced the 1990 Long-Term Incentive Plan. The maximum
number of shares that may be granted under the Plan is 500 million shares, of
which no more than 250 million may be available for awards granted in any form
provided under the Plan other than options or stock appreciation rights. The
approximate 105.9 million shares available for grant under the 1990 Plan were
retired upon approval of the 2007 Plan. Total shares available for future issuance
under the 2007 Plan amounted to 85.6 million shares at December 31, 2011.
(b) Not applicable.
(c) Total shares available for future issuance under the Consultants’ Plan amount to
28.3 million shares.
Outstanding options expire on various dates through
December 9, 2021.
The following table summarizes information about stock
options outstanding at December 31, 2011.
STOCK OPTIONS OUTSTANDING
(Shares in thousands) Outstanding Exercisable
Exercise price range Shares
Average
life (a)
Average
exercise
price Shares
Average
exercise
price
Under $10.00 59,344 6.8 $ 9.57 28,440 $ 9.57
10.01–15.00 78,001 7.1 11.98 37,521 11.97
15.01–20.00 202,808 8.9 17.42 24,366 16.20
20.01–25.00 1,270 8.9 20.57 49 22.49
25.01–30.00 45,788 3.3 27.62 38,748 27.51
30.01–35.00 47,396 3.1 33.22 47,291 33.22
Over $35.00 15,254 5.1 38.67 12,934 38.66
Total 449,861 7.0 $18.87 189,349 $22.47
At year-end 2010, options with a weighted average exercise price of $29.76 were
exercisable on 158 million shares.
(a) Average contractual life remaining in years.
STOCK OPTION ACTIVITY
Shares
(In thousands)
Weighted
average
exercise price
Weighted
average
remaining
contractual
term (In years)
Aggregate
intrinsic value
(In millions)
Outstanding at
January 1, 2011 400,439 $20.82
Granted 105,944 18.59
Exercised (7,994) 11.13
Forfeited (8,739) 15.73
Expired (39,789) 39.98
Outstanding at
December 31, 2011 449,861 $18.87 7.0 $1,140
Exercisable at
December 31, 2011 189,349 $22.47 5.0 $ 505
Options expected
to vest 230,694 $16.23 8.4 $ 576
We measure the fair value of each stock option grant at the date of
grant using a Black-Scholes option pricing model. The weighted
average grant-date fair value of options granted during 2011, 2010
and 2009 was $4.00, $4.11 and $3.81, respectively. The following
assumptions were used in arriving at the fair value of options
granted during 2011, 2010 and 2009, respectively: risk-free inter-
est rates of 2.6%, 2.9% and 3.2%; dividend yields of 3.9%, 3.9% and
3.9%; expected volatility of 30%, 35% and 49%; and expected lives
of seven years and eight months, six years and eleven months, and
six years and ten months. Risk-free interest rates refl ect the yield
on zero-coupon U.S. Treasury securities. Expected dividend yields
presume a set dividend rate and we used a historical fi ve-year
average for the dividend yield. Expected volatilities are based on
implied volatilities from traded options and historical volatility of
our stock. The expected option lives are based on our historical
experience of employee exercise behavior.
The total intrinsic value of options exercised during 2011, 2010
and 2009 amounted to $65 million, $23 million and an insignifi -
cant amount, respectively. As of December 31, 2011, there was
$765 million of total unrecognized compensation cost related to
nonvested options. That cost is expected to be recognized over
a weighted average period of two years, of which approximately
$189 million after tax is expected to be recognized in 2012.
Stock option expense recognized in net earnings during
2011, 2010 and 2009 amounted to $230 million, $178 million and
$120 million, respectively. Cash received from option exercises
during 2011, 2010 and 2009 was $89 million, $37 million and an
insignifi cant amount, respectively. The tax benefi t realized from
stock options exercised during 2011, 2010 and 2009 was $21 mil-
lion, $7 million and an insignifi cant amount, respectively.
OTHER STOCK-BASED COMPENSATION
Shares
(In thousands)
Weighted
average
grant date
fair value
Weighted
average
remaining
contractual
term (In years)
Aggregate
intrinsic
value
(In millions)
RSUs outstanding at
January 1, 2011 21,571 $29.16
Granted 3,145 16.74
Vested (8,559) 31.92
Forfeited (613) 27.78
RSUs outstanding at
December 31, 2011 15,544 $25.18 2.7 $278
RSUs expected to vest 14,223 $25.22 2.6 $255

GE 2011 ANNUAL REPORT 113
notes to consolidated financial statements
The fair value of each restricted stock unit is the market price of
our stock on the date of grant. The weighted average grant date
fair value of RSUs granted during 2011, 2010 and 2009 was $16.74,
$15.89 and $13.63, respectively. The total intrinsic value of RSUs
vested during 2011, 2010 and 2009 amounted to $154 million,
$111 million and $139 million, respectively. As of December 31,
2011, there was $210 million of total unrecognized compensation
cost related to nonvested RSUs. That cost is expected to be rec-
ognized over a weighted average period of two years, of which
approximately $72 million after tax is expected to be recognized
in 2012. As of December 31, 2011, 0.7 million PSUs with a
weighted average remaining contractual term of three years, an
aggregate intrinsic value of $13 million and $2 million of unrecog-
nized compensation cost were outstanding. Other share-based
compensation expense for RSUs and PSUs recognized in net
earnings amounted to $84 million, $116 million and $127 million in
2011, 2010 and 2009, respectively.
The income tax benefi t recognized in earnings based on the
compensation expense recognized for all share-based compen-
sation arrangements amounted to $163 million, $143 million and
$118 million in 2011, 2010 and 2009, respectively. The excess of
actual tax deductions over amounts assumed, which are recognized
in shareowners’ equity, were insignifi cant in 2011, 2010 and 2009.
When stock options are exercised and restricted stock vests,
the difference between the assumed tax benefi t and the actual
tax benefi t must be recognized in our fi nancial statements. In
circumstances in which the actual tax benefi t is lower than the
estimated tax benefi t, that difference is recorded in equity, to
the extent there are suffi cient accumulated excess tax benefi ts.
At December 31, 2011, our accumulated excess tax benefi ts
are suffi cient to absorb any future differences between actual
and estimated tax benefi ts for all of our outstanding option and
restricted stock grants.
Note 17.
Other Income
(In millions) 2011 2010 2009
GE
Purchases and sales of business
interests (a) $3,804 $ 319 $ 363
Associated companies (b) 894 413 667
Licensing and royalty income 304 364 217
Interest income from GECS 206 133 173
Marketable securities and bank deposits 52 40 54
Other items 916 (295)
5,269 1,285 1,179
ELIMINATIONS (206) (134) (173)
Total $5,063 $1,151 $1,006
(a) Included a pre-tax gain of $3,705 million ($526 million after tax) related to our
transfer of the assets of our NBCU business to a newly formed entity, NBCU
LLC, in 2011. See Note 2.
(b) Included income of $789 million from our equity method investment in NBCU
LLC in 2011 and a gain of $552 million related to dilution of our interest in A&E
Television Network from 25% to 15.8% in 2009.
Note 18.
GECS Revenues from Services
(In millions) 2011 2010 2009
Interest on loans (a) $20,069 $20,835 $18,518
Equipment leased to others 11,343 11,116 12,231
Fees (a) 4,698 4,734 4,432
Investment income (a)(b) 2,500 2,185 3,379
Financing leases (a) 2,378 2,749 3,255
Associated companies (c) 2,337 2,035 1,006
Premiums earned by insurance
activities 1,905 2,014 2,065
Real estate investments 1,625 1,240 1,543
Net securitization gains (a) —— 1,589
Other items (d) 2,078 2,440 2,830
Total $48,933 $49,348 $50,848
(a) On January 1, 2010, we adopted ASU 2009-16 & 17, which required us to
consolidate substantially all of our former QSPEs. As a result, 2011 and 2010
GECS revenues from services include interest, investment and fee income from
these entities, which were not presented on a consolidated basis in 2009. During
2011 and 2010, we did not recognize gains from securitization transactions, as
they were recorded as on-book financings. See Note 24.
(b) Included net other-than-temporary impairments on investment securities of
$387 million, $253 million and $581 million in 2011, 2010 and 2009, respectively.
See Note 3.
(c) During 2011, we sold an 18.6% equity interest in Garanti Bank and recorded a
pre-tax gain of $690 million. Following the sale, we hold a 2.25% equity interest,
which is classified as an available-for-sale security.
(d) Included a gain on the sale of a limited partnership interest in PTL and a related
gain on the remeasurement of the retained investment to fair value totaling
$296 million in the first quarter of 2009. See Note 24.
Note 19.
Supplemental Cost Information
We funded research and development expenditures of
$4,601 million in 2011, $3,939 million in 2010 and $3,288 million in
2009. Research and development costs are classifi ed in cost of
goods sold in the Statement of Earnings. In addition, research and
development funding from customers, principally the U.S. gov-
ernment, totaled $788 million, $979 million and $1,050 million in
2011, 2010 and 2009, respectively.
Rental expense under operating leases is shown below.
(In millions) 2011 2010 2009
GE $968 $1,073 $1,012
GECS 615 637 801
At December 31, 2011, minimum rental commitments under
noncancellable operating leases aggregated $2,387 million and
$2,119 million for GE and GECS, respectively. Amounts payable
over the next fi ve years follow.
(In millions) 2012 2013 2014 2015 2016
GE $519 $450 $381 $307 $263
GECS 505 332 253 197 167

114 GE 2011 ANNUAL REPORT
notes to consolidated financial statements
GE’s selling, general and administrative expenses totaled
$17,556 million in 2011, $16,340 million in 2010 and $14,841 million
in 2009. The increase in 2011 is primarily due to higher pension
costs, increased acquisition-related costs, higher research and
development spending and increased costs to support global
growth, partially offset by the disposition of NBCU and lower
restructuring and other charges. The increase in 2010 is primarily
due to higher research and development spending, increased
selling expenses to support global growth and higher pension
costs, partially offset by lower restructuring and other charges.
Our Aviation segment enters into collaborative arrangements
with manufacturers and suppliers of components used to build and
maintain certain engines, under which GE and these participants
share in risks and rewards of these product programs. Under these
arrangements, participation fees earned and recorded as other
income totaled $12 million, $4 million and $1 million for the years
2011, 2010 and 2009, respectively. Payments to participants are
recorded as costs of services sold ($612 million, $563 million and
$504 million for the years 2011, 2010 and 2009, respectively) or as
cost of goods sold ($1,996 million, $1,751 million and $1,731 million
for the years 2011, 2010 and 2009, respectively).
Note 20.
Earnings Per Share Information
2011 2010 2009
(In millions; per-share amounts in dollars) Diluted Basic Diluted Basic Diluted Basic
AMOUNTS ATTRIBUTABLE TO THE COMPANY:
CONSOLIDATED
Earnings from continuing operations for per-share calculation (a)(b) $14,053 $14,053 $12,492 $12,492 $10,777 $10,776
Preferred stock dividends declared (c) (1,031) (1,031) (300) (300) (300) (300)
Earnings from continuing operations attributable to common
shareowners for per-share calculation (a)(b) 13,022 13,021 12,192 12,192 10,477 10,476
Earnings (loss) from discontinued operations for per-share calculation (a)(b) 78 78 (868) (869) 220 219
Net earnings attributable to common shareowners for
per-share calculation (a)(b) $13,098 $13,098 $11,322 $11,322 $10,695 $10,694
AVERAGE EQUIVALENT SHARES
Shares of GE common stock outstanding 10,591 10,591 10,661 10,661 10,614 10,614
Employee compensation-related shares, including stock options 29 — 17— 1—
Total average equivalent shares 10,620 10,591 10,678 10,661 10,615 10,614
PER-SHARE AMOUNTS
Earnings from continuing operations $ 1.23 $ 1.23 $ 1.14 $ 1.14 $ 0.99 $ 0.99
Earnings (loss) from discontinued operations 0.01 0.01 (0.08) (0.08) 0.02 0.02
Net earnings 1.23 1.24 1.06 1.06 1.01 1.01
Our unvested restricted stock unit awards that contain non-forfeitable rights to dividends or dividend equivalents are considered participating securities and, therefore, are
included in the computation of earnings per share pursuant to the two-class method. Application of this treatment has an insignificant effect.
(a) Included an insignificant amount of dividend equivalents in each of the three years presented.
(b) Included an insignificant amount related to accretion of redeemable securities in 2010 and 2009.
(c) Included $806 million related to the redemption of our 10% cumulative preferred stock in 2011. See Note 15.
For the years ended December 31, 2011, 2010 and 2009, there were approximately 321 million, 325 million and 328 million, respectively, of
outstanding stock awards that were not included in the computation of diluted earnings per share because their effect was antidilutive.
Earnings-per-share amounts are computed independently for earnings from continuing operations, earnings (loss) from discontinued
operations and net earnings. As a result, the sum of per-share amounts from continuing operations and discontinued operations may not
equal the total per-share amounts for net earnings.

GE 2011 ANNUAL REPORT 115
notes to consolidated financial statements
Note 21.
Fair Value Measurements
For a description of how we estimate fair value, see Note 1.
The following tables present our assets and liabilities measured at fair value on a recurring basis. Included in the tables are investment
securities primarily supporting obligations to annuitants and policyholders in our run-off insurance operations, supporting obligations
to holders of GICs in Trinity (which ceased issuing new investment contracts beginning in the fi rst quarter of 2010) and investment secu-
rities held at our treasury operations and investments held in our CLL business collateralized by senior secured loans of high-quality,
middle-market companies in a variety of industries. Such securities are mainly investment grade.
(In millions) Level 1 (a) Level 2 (a) Level 3 (b) Netting
adjustment (c) Net balance
DECEMBER 31, 2011
ASSETS
Investment securities
Debt
U.S. corporate $ — $20,535 $ 3,235 $ — $23,770
State and municipal — 3,157 77 — 3,234
Residential mortgage-backed — 2,568 41 — 2,609
Commercial mortgage-backed — 2,824 4 — 2,828
Asset-backed (d) — 930 4,040 — 4,970
Corporate—non-U.S. 71 1,058 1,204 — 2,333
Government—non-U.S. 1,003 1,444 84 — 2,531
U.S. government and federal agency — 3,805 253 — 4,058
Retained interests — — 35 — 35
Equity
Available-for-sale 730 18 17 — 765
Trading 241 — — — 241
Derivatives (e) — 15,252 393 (5,604) 10,041
Other (f) — — 817 — 817
Total $2,045 $51,591 $10,200 $(5,604) $58,232
LIABILITIES
Derivatives $ — $ 5,010 $ 27 $(4,308) $ 729
Other (g) — 863 — — 863
Total $ — $ 5,873 $ 27 $(4,308) $ 1,592
DECEMBER 31, 2010
ASSETS
Investment securities
Debt
U.S. corporate $ — $18,956 $ 3,199 $ — $22,155
State and municipal — 2,499 225 — 2,724
Residential mortgage-backed 47 2,696 66 — 2,809
Commercial mortgage-backed — 2,875 49 — 2,924
Asset-backed — 690 2,540 — 3,230
Corporate—non-U.S. 89 1,292 1,486 — 2,867
Government—non-U.S. 777 1,333 156 — 2,266
U.S. government and federal agency — 3,576 210 — 3,786
Retained interests — — 39 — 39
Equity
Available-for-sale 677 20 24 — 721
Trading 417 — — — 417
Derivatives (e) — 10,997 359 (5,910) 5,446
Other (f) — — 906 — 906
Total $2,007 $44,934 $ 9,259 $(5,910) $50,290
LIABILITIES
Derivatives $ — $ 6,553 $ 103 $(5,242) $ 1,414
Other (g) — 920 — — 920
Total $ — $ 7,473 $ 103 $(5,242) $ 2,334
(a) The fair value of securities transferred between Level 1 and Level 2 was $67 million in 2011.
(b) Level 3 investment securities valued using non-binding broker quotes and other third parties totaled $2,386 million and $1,054 million at December 31, 2011 and 2010,
respectively, and were classified as available-for-sale securities.
(c) The netting of derivative receivables and payables is permitted when a legally enforceable master netting agreement exists and when collateral is posted to us.
(d) Includes investments in our CLL business in asset-backed securities collateralized by senior secured loans of high-quality, middle-market companies in a variety of industries.
(e) The fair value of derivatives included an adjustment for non-performance risk. The cumulative adjustment was a loss of $13 million at December 31, 2011 and $10 million at
December 31, 2010. See Note 22 for additional information on the composition of our derivative portfolio.
(f) Included private equity investments and loans designated under the fair value option.
(g) Primarily represented the liability associated with certain of our deferred incentive compensation plans.

116 GE 2011 ANNUAL REPORT
notes to consolidated financial statements
The following tables present the changes in Level 3 instruments measured on a recurring basis for the years ended December 31, 2011
and 2010, respectively. The majority of our Level 3 balances consist of investment securities classifi ed as available-for-sale with changes
in fair value recorded in shareowners’ equity.
CHANGES IN LEVEL 3 INSTRUMENTS FOR THE YEAR ENDED DECEMBER 31, 2011
(In millions)
Balance at
January 1,
2011
Net realized/
unrealized
gains (losses)
included in
earnings (a)
Net realized/
unrealized
gains (losses)
included in
accumulated
other
compre hensive
income Purchases Sales Settlements
Transfers
into Level 3 (b)
Transfers
out of
Level 3 (b)
Balance at
December 31,
2011
Net change in
unrealized
gains (losses)
relating to
instruments
still held at
December 31,
2011 (c)
Investment securities
Debt
U.S. corporate $3,199 $ 78 $(157) $ 235 $(183) $(112) $182 $ (7) $ 3,235 $ —
State and municipal 225 — — 12 — (8) — (152) 77 —
Residential
mortgage-backed 66 (3) 1 2 (5) (1) 71 (90) 41 —
Commercial
mortgage-backed 49 — — 6 — (4) 3 (50) 4 —
Asset-backed 2,540 (10) 61 2,157 (185) (11) 1 (513) 4,040 —
Corporate—non-U.S. 1,486 (47) (91) 25 (55) (118) 85 (81) 1,204 —
Government—non-U.S. 156 (100) 48 41 (1) (27) 107 (140) 84 —
U.S. government and
federal agency 210 — 43 500 — — — (500) 253 —
Retained interests 39 (28) 26 8 (5) (5) — — 35 —
Equity
Available-for-sale 24 — — — — — 4 (11) 17 —
Trading — — ——— — —— — —
Derivatives (d)(e) 265 151 2 (2) — (207) 150 10 369 130
Other 906 95 (9) 152 (266) (6) — (55) 817 34
Total $9,165 $136 $ (76) $3,136 $(700) $(499) $603 $(1,589) $10,176 $164
(a) Earnings effects are primarily included in the “GECS revenues from services” and “Interest and other financial charges” captions in the Statement of Earnings.
(b) Transfers in and out of Level 3 are considered to occur at the beginning of the period. Transfers out of Level 3 were a result of increased use of quotes from independent
pricing vendors based on recent trading activity.
(c) Represented the amount of unrealized gains or losses for the period included in earnings.
(d) Represented derivative assets net of derivative liabilities and included cash accruals of $3 million not reflected in the fair value hierarchy table.
(e) Gains (losses) included in net realized/unrealized gains (losses) included in earnings were offset by the earnings effects from the underlying items that were economically
hedged. See Note 22.

GE 2011 ANNUAL REPORT 117
notes to consolidated financial statements
CHANGES IN LEVEL 3 INSTRUMENTS FOR THE YEAR ENDED DECEMBER 31, 2010
(In millions)
Balance at
January 1,
2010 (a)
Net realized/
unrealized
gains (losses)
included in
earnings (b)
Net realized/
unrealized
gains (losses)
included in
accumulated
other
comprehensive
income
Purchases,
Issuances and
Settlements
Transfers in
and/or out
of Level 3 (c)
Balance at
December 31,
2010
Net change in
unrealized
gains (losses)
relating to
instruments
still held at
December 31,
2010 (d)
Investment securities
Debt
U.S. corporate $3,068 $ 79 $276 $ (215) $ (9) $3,199 $ —
State and municipal 205 — 25 (5) — 225 —
Residential mortgage-backed 123 (1) 13 2 (71) 66 —
Commercial mortgage-backed 1,041 30 (2) (1,017) (3) 49 —
Asset-backed 1,872 25 14 733 (104) 2,540 —
Corporate—non-U.S. 1,331 (38) (39) 250 (18) 1,486 —
Government—non-U.S. 163 — (8) — 1 156 —
U.S. government and federal agency 256 — (44) (2) — 210 —
Retained interests 45 (1) 3 (8) — 39 —
Equity
Available-for-sale 19 — 3 — 2 24 1
Trading ———————
Derivatives (e)(f) 236 220 15 (79) (127) 265 41
Other 891 5 (30) 40 — 906 3
Total $9,250 $319 $226 $ (301) $(329) $9,165 $45
(a) Included $1,015 million in debt securities, a reduction in retained interests of $8,782 million and a reduction in derivatives of $365 million related to adoption of ASU 2009-16 & 17.
(b) Earnings effects are primarily included in the “GECS revenues from services” and “Interest and other financial charges” captions in the Statement of Earnings.
(c) Transfers in and out of Level 3 are considered to occur at the beginning of the period. Transfers out of Level 3 were a result of increased use of quotes from independent
pricing vendors based on recent trading activity.
(d) Represented the amount of unrealized gains or losses for the period included in earnings.
(e) Represented derivative assets net of derivative liabilities and included cash accruals of $9 million not reflected in the fair value hierarchy table.
(f) Gains (losses) included in net realized/unrealized gains (losses) included in earnings were offset by the earnings effects from the underlying items that were
economically hedged. See Note 22.
Non-Recurring Fair Value Measurements
The following table represents non-recurring fair value amounts
(as measured at the time of the adjustment) for those assets
remeasured to fair value on a non-recurring basis during the fi scal
year and still held at December 31, 2011 and 2010. These assets
can include loans and long-lived assets that have been reduced to
fair value when they are held for sale, impaired loans that have
been reduced based on the fair value of the underlying collateral,
cost and equity method investments and long-lived assets that
are written down to fair value when they are impaired and the
remeasurement of retained investments in formerly consolidated
subsidiaries upon a change in control that results in deconsolida-
tion of a subsidiary, if we sell a controlling interest and retain a
noncontrolling stake in the entity. Assets that are written down to
fair value when impaired and retained investments are not subse-
quently adjusted to fair value unless further impairment occurs.
Remeasured during the year ended December 31
2011 2010
(In millions) Level 2 Level 3 Level 2 Level 3
Financing receivables
and loans held for sale $ 158 $5,348 $ 54 $ 6,833
Cost and equity method
investments (a) — 403 — 510
Long-lived assets,
including real estate 1,343 3,288 1,025 5,811
Retained investments in
formerly consolidated
subsidiaries (b) ——— 113
Total $1,501 $9,039 $1,079 $13,267
(a) Includes the fair value of private equity and real estate funds included in Level 3
of $123 million and $296 million at December 31, 2011 and 2010, respectively.
(b) Excluded our retained investment in Regency, a formerly consolidated subsidiary,
that was remeasured to a Level 1 fair value of $549 million in 2010.
The following table represents the fair value adjustments to
assets measured at fair value on a non-recurring basis and still
held at December 31, 2011 and 2010.
Year ended December 31
(In millions) 2011 2010
Financing receivables
and loans held for sale $ (925) $(1,745)
Cost and equity method
investments (a) (274) (274)
Long-lived assets,
including real estate (b) (1,431) (2,958)
Retained investments in
formerly consolidated subsidiaries —184
Total $(2,630) $(4,793)
(a) Includes fair value adjustments associated with private equity and real estate
funds of $(24) million and $(198) million during 2011 and 2010, respectively.
(b) Includes impairments related to real estate equity properties and investments
recorded in other costs and expenses of $976 million and $2,089 million during
2011 and 2010, respectively.

118 GE 2011 ANNUAL REPORT
notes to consolidated financial statements
Note 22.
Financial Instruments
The following table provides information about the assets and liabilities not carried at fair value in our Statement of Financial Position.
Consistent with ASC 825, Financial Instruments, the table excludes fi nance leases and non-fi nancial assets and liabilities. Apart from
certain of our borrowings and certain marketable securities, few of the instruments discussed below are actively traded and their fair
values must often be determined using fi nancial models. Realization of the fair value of these instruments depends upon market forces
beyond our control, including marketplace liquidity.
2011 2010
Assets (liabilities) Assets (liabilities)
December 31 (In millions)
Notional
amount
Carrying
amount (net)
Estimated fair
value
Notional
amount
Carrying
amount (net)
Estimated fair
value
GE
Assets
Investments and notes receivable $ (a) $ 285 $ 285 $ (a) $ 414 $ 414
Liabilities
Borrowings (b) (a) (11,589) (12,535) (a) (10,112) (10,953)
GECS
Assets
Loans (a) 251,459 251,587 (a) 268,239 264,550
Other commercial mortgages (a) 1,494 1,537 (a) 1,041 1,103
Loans held for sale (a) 496 497 (a) 287 287
Other financial instruments (c) (a) 2,071 2,534 (a) 2,103 2,511
Liabilities
Borrowings and bank deposits (b)(d) (a) (443,097) (449,403) (a) (470,520) (482,724)
Investment contract benefits (a) (3,493) (4,240) (a) (3,726) (4,264)
Guaranteed investment contracts (a) (4,226) (4,266) (a) (5,502) (5,524)
Insurance—credit life (e) 1,944 (106) (88) 1,825 (103) (69)
(a) These financial instruments do not have notional amounts.
(b) See Note 10.
(c) Principally cost method investments.
(d) Fair values exclude interest rate and currency derivatives designated as hedges of borrowings. Had they been included, the fair value of borrowings at December 31, 2011
and 2010 would have been reduced by $9,051 million and $4,298 million, respectively.
(e) Net of reinsurance of $2,000 million and $2,800 million at December 31, 2011 and 2010, respectively.
A description of how we estimate fair values follows.
Loans
Based on a discounted future cash fl ows methodology, using
current market interest rate data adjusted for inherent credit risk
or quoted market prices and recent transactions, if available.
Borrowings and bank deposits
Based on valuation methodologies using current market interest
rate data which are comparable to market quotes adjusted for our
non-performance risk.
Investment contract benefits
Based on expected future cash fl ows, discounted at currently
offered rates for immediate annuity contracts or the income
approach for single premium deferred annuities.
Guaranteed investment contracts
Based on valuation methodologies using current market interest
rate data, adjusted for our non-performance risk.
All other instruments
Based on observable market transactions and/or valuation meth-
odologies using current market interest rate data adjusted for
inherent credit risk.
Assets and liabilities that are refl ected in the accompanying
fi nancial statements at fair value are not included in the above
disclosures; such items include cash and equivalents, investment
securities and derivative fi nancial instruments.
Additional information about certain categories in the table
above follows.
INSURANCE—CREDIT LIFE
Certain insurance affi liates, primarily in Consumer, issue credit life
insurance designed to pay the balance due on a loan if the bor-
rower dies before the loan is repaid. As part of our overall risk
management process, we cede to third parties a portion of this
associated risk, but are not relieved of our primary obligation
to policyholders.

GE 2011 ANNUAL REPORT 119
notes to consolidated financial statements
LOAN COMMITMENTS
Notional amount
December 31 (In millions) 2011 2010
Ordinary course of business
lending commitments (a) $ 3,756 $ 3,853
Unused revolving credit lines (b)
Commercial (c) 18,757 21,314
Consumer—principally credit cards 257,646 227,006
(a) Excluded investment commitments of $2,064 million and $1,990 million as of
December 31, 2011 and 2010, respectively.
(b) Excluded inventory financing arrangements, which may be withdrawn at our
option, of $12,354 million and $12,303 million as of December 31, 2011 and 2010,
respectively.
(c) Included commitments of $14,057 million and $16,243 million as of December 31,
2011 and 2010, respectively, associated with secured financing arrangements
that could have increased to a maximum of $17,344 million and $20,268 million
at December 31, 2011 and 2010, respectively, based on asset volume under the
arrangement.
DERIVATIVES AND HEDGING
As a matter of policy, we use derivatives for risk management
purposes, and we do not use derivatives for speculative pur-
poses. A key risk management objective for our fi nancial services
businesses is to mitigate interest rate and currency risk by seek-
ing to ensure that the characteristics of the debt match the
assets they are funding. If the form (fi xed versus fl oating) and
currency denomination of the debt we issue do not match the
related assets, we typically execute derivatives to adjust the
nature and tenor of funding to meet this objective. The determi-
nation of whether we enter into a derivative transaction or issue
debt directly to achieve this objective depends on a number of
factors, including market related factors that affect the type of
debt we can issue.
The notional amounts of derivative contracts represent the
basis upon which interest and other payments are calculated
and are reported gross, except for offsetting foreign currency
forward contracts that are executed in order to manage our
currency risk of net investment in foreign subsidiaries. Of the
outstanding notional amount of $328,000 million, approximately
89% or $292,000 million, is associated with reducing or eliminat-
ing the interest rate, currency or market risk between fi nancial
assets and liabilities in our fi nancial services businesses. The
remaining derivative activities primarily relate to hedging against
adverse changes in currency exchange rates and commodity
prices related to anticipated sales and purchases and contracts
containing certain clauses which meet the accounting defi ni-
tion of a derivative. The instruments used in these activities are
designated as hedges when practicable. When we are not able to
apply hedge accounting, or when the derivative and the hedged
item are both recorded in earnings currently, the derivatives are
deemed economic hedges and hedge accounting is not applied.
This most frequently occurs when we hedge a recognized foreign
currency transaction (e.g., a receivable or payable) with a deriva-
tive. Since the effects of changes in exchange rates are refl ected
currently in earnings for both the derivative and the transaction,
the economic hedge does not require hedge accounting.
The following table provides information about the fair value
of our derivatives by contract type, separating those accounted
for as hedges and those that are not.
2011 2010
Fair value Fair value
December 31 (In millions) Assets Liabilities Assets Liabilities
DERIVATIVES ACCOUNTED
FOR AS HEDGES
Interest rate contracts $ 9,446 $ 1,049 $ 5,959 $ 2,675
Currency exchange
contracts 4,189 3,174 2,965 2,533
Other contracts 1 11 5—
13,636 4,234 8,929 5,208
DERIVATIVES NOT
ACCOUNTED FOR
AS HEDGES
Interest rate contracts 319 241 294 552
Currency exchange
contracts 1,309 425 1,602 846
Other contracts 381 137 531 50
2,009 803 2,427 1,448
NETTING ADJUSTMENTS (a) (3,294) (3,281) (3,867) (3,857)
CASH COLLATERAL (b)(c) (2,310) (1,027) (2,043) (1,385)
Total $10,041 $ 729 $ 5,446 $ 1,414
Derivatives are classified in the captions “All other assets” and “All other liabilities”
in our financial statements.
(a) The netting of derivative receivables and payables is permitted when a legally
enforceable master netting agreement exists. Amounts included fair value
adjustments related to our own and counterparty non-performance risk. At
December 31, 2011 and 2010, the cumulative adjustment for non-performance
risk was a loss of $13 million and $10 million, respectively.
(b) Excludes excess collateralization of $579 million at December 31, 2011 and an
insignificant amount at December 31, 2010.
(c) Excludes securities pledged to us as collateral of $10,574 million and
$5,577 million at December 31, 2011 and 2010, respectively.
Fair Value Hedges
We use interest rate and currency exchange derivatives to hedge
the fair value effects of interest rate and currency exchange rate
changes on local and non-functional currency denominated
fi xed-rate debt. For relationships designated as fair value hedges,
changes in fair value of the derivatives are recorded in earnings
within interest and other fi nancial charges, along with offsetting
adjustments to the carrying amount of the hedged debt. The
following table provides information about the earnings effects of
our fair value hedging relationships for the years ended
December 31, 2011 and 2010.
2011 2010
(In millions)
Gain (loss)
on hedging
derivatives
Gain (loss)
on hedged
items
Gain (loss)
on hedging
derivatives
Gain (loss)
on hedged
items
Interest rate contracts $5,888 $(6,322) $2,387 $(2,924)
Currency exchange
contracts 119 (144) 47 (60)
Fair value hedges resulted in $(459) million and $(550) million of ineffectiveness
in 2011 and 2010, respectively. In both 2011 and 2010, there were insignificant
amounts excluded from the assessment of effectiveness.

120 GE 2011 ANNUAL REPORT
notes to consolidated financial statements
Cash Flow Hedges
We use interest rate, currency exchange and commodity derivatives
to reduce the variability of expected future cash fl ows associated
with variable rate borrowings and commercial purchase and sale
transactions, including commodities. For derivatives that are desig-
nated in a cash fl ow hedging relationship, the effective portion of the
change in fair value of the derivative is reported as a component of
AOCI and reclassifi ed into earnings contemporaneously and in the
same caption with the earnings effects of the hedged transaction.
The following table provides information about the amounts
recorded in AOCI, as well as the gain (loss) recorded in earnings,
primarily in interest and other fi nancial charges, when reclassifi ed
out of AOCI, for the years ended December 31, 2011 and 2010.
Gain (loss)
recognized in AOCI
Gain (loss) reclassified
from AOCI into earnings
(In millions) 2011 2010 2011 2010
Interest rate contracts $(302) $ (571) $ (820) $(1,356)
Currency exchange
contracts (292) (550) (370) (445)
Commodity contracts (13) 10 10 2
Total $(607) $(1,111) $(1,180) $(1,799)
The total pre-tax amount in AOCI related to cash flow hedges of forecasted
transactions was a $1,400 million loss at December 31, 2011. We expect to transfer
$693 million to earnings as an expense in the next 12 months contemporaneously
with the earnings effects of the related forecasted transactions. In 2011, we
recognized insignificant gains and losses related to hedged forecasted transactions
and firm commitments that did not occur by the end of the originally specified
period. At December 31, 2011 and 2010, the maximum term of derivative instruments
that hedge forecasted transactions was 21 years and 22 years, respectively.
For cash fl ow hedges, the amount of ineffectiveness in the hedging
relationship and amount of the changes in fair value of the deriva-
tives that are not included in the measurement of ineffectiveness
are both refl ected in earnings each reporting period. These amounts
are primarily reported in GECS revenues from services and totaled
$29 million and $19 million for the years ended December 31, 2011
and 2010, respectively.
Net Investment Hedges in Foreign Operations
We use currency exchange derivatives to protect our net invest-
ments in global operations conducted in non-U.S. dollar
currencies. For derivatives that are designated as hedges of net
investment in a foreign operation, we assess effectiveness based
on changes in spot currency exchange rates. Changes in spot
rates on the derivative are recorded as a component of AOCI until
such time as the foreign entity is substantially liquidated or sold.
The change in fair value of the forward points, which refl ects the
interest rate differential between the two countries on the deriva-
tive, is excluded from the effectiveness assessment.
The following table provides information about the amounts
recorded in AOCI for the years ended December 31, 2011 and
2010, as well as the gain (loss) recorded in GECS revenues from
services when reclassifi ed out of AOCI.
Gain (loss)
recognized in CTA
Gain (loss)
reclassified from CTA
(In millions) 2011 2010 2011 2010
Currency exchange contracts $1,232 $(2,023) $(716) $56
The amounts related to the change in the fair value of the forward
points that are excluded from the measure of effectiveness were
$(1,345) million and $(906) million for the years ended December 31,
2011 and 2010, respectively, and are recorded in interest and other
fi nancial charges.
Free-Standing Derivatives
Changes in the fair value of derivatives that are not designated
as hedges are recorded in earnings each period. As discussed
above, these derivatives are typically entered into as economic
hedges of changes in interest rates, currency exchange rates,
commodity prices and other risks. Gains or losses related to the
derivative are typically recorded in GECS revenues from services
or other income, based on our accounting policy. In general, the
earnings effects of the item that represent the economic risk
exposure are recorded in the same caption as the derivative.
Losses for the year ended December 31, 2011 on derivatives not
designated as hedges were $(876) million composed of amounts
related to interest rate contracts of $(5) million, currency
exchange contracts of $(817) million, and other derivatives of
$(54) million. These losses were more than offset by the earnings
effects from the underlying items that were economically
hedged. Losses for the year ended December 31, 2010 on deriva-
tives not designated as hedges, without considering the offsetting
earnings effects from the item representing the economic risk
exposure, were $(302) million composed of amounts related to
interest rate contracts of $185 million, currency exchange contracts
of $(666) million, and other derivatives of $179 million.
Counterparty Credit Risk
Fair values of our derivatives can change signifi cantly from period
to period based on, among other factors, market movements and
changes in our positions. We manage counterparty credit risk (the
risk that counterparties will default and not make payments to us
according to the terms of our agreements) on an individual coun-
terparty basis. Where we have agreed to netting of derivative
exposures with a counterparty, we net our exposures with that
counterparty and apply the value of collateral posted to us to
determine the exposure. We actively monitor these net exposures
against defi ned limits and take appropriate actions in response,
including requiring additional collateral.

GE 2011 ANNUAL REPORT 121
notes to consolidated financial statements
As discussed above, we have provisions in certain of our mas-
ter agreements that require counterparties to post collateral
(typically, cash or U.S. Treasuries) when our receivable due from
the counterparty, measured at current market value, exceeds
a specifi ed limit. At December 31, 2011, our exposure to coun-
terparties, including interest due, net of collateral we hold, was
$900 million. The fair value of such collateral was $12,907 mil-
lion, of which $2,333 million was cash and $10,574 million was in
the form of securities held by a custodian for our benefi t. Under
certain of these same agreements, we post collateral to our coun-
terparties for our derivative obligations, the fair value of which
was $1,111 million at December 31, 2011.
Additionally, our master agreements typically contain mutual
downgrade provisions that provide the ability of each party to
require termination if the long-term credit rating of the coun-
terparty were to fall below A-/A3. In certain of these master
agreements, each party also has the ability to require termina-
tion if the short-term rating of the counterparty were to fall below
A-1/P-1. The net amount relating to our derivative liability sub-
ject to these provisions, after consideration of collateral posted
by us, and outstanding interest payments, was $1,199 million at
December 31, 2011.
Note 23.
Supplemental Information about the Credit Quality
of Financing Receivables and Allowance for Losses on
Financing Receivables
We provide further detailed information about the credit quality
of our Commercial, Real Estate and Consumer fi nancing receiv-
ables portfolios. For each portfolio, we describe the
characteristics of the fi nancing receivables and provide informa-
tion about collateral, payment performance, credit quality
indicators, and impairment. We manage these portfolios using
delinquency and nonearning data as key performance indicators.
The categories used within this section such as impaired loans,
TDR and nonaccrual fi nancing receivables are defi ned by the
authoritative guidance and we base our categorization on the
related scope and defi nitions contained in the related standards.
The categories of nonearning and delinquent are defi ned by us
and are used in our process for managing our fi nancing receiv-
ables. Defi nitions of these categories are provided in Note 1.
Commercial
FINANCING RECEIVABLES AND ALLOWANCE FOR LOSSES
The following table provides further information about general
and specifi c reserves related to Commercial fi nancing receivables.
COMMERCIAL
Financing receivables
December 31 (In millions) 2011 2010
CLL
Americas (a) $ 80,505 $ 88,558
Europe 36,899 37,498
Asia 11,635 11,943
Other (a) 436 664
Total CLL 129,475 138,663
Energy Financial Services 5,912 7,011
GECAS 11,901 12,615
Other 1,282 1,788
Total Commercial financing receivables,
before allowance for losses $148,570 $160,077
Non-impaired financing receivables $142,908 $154,257
General reserves 718 1,014
Impaired loans 5,662 5,820
Specific reserves 812 1,031
(a) During 2011, we transferred our Railcar lending and leasing portfolio from CLL
Other to CLL Americas. Prior-period amounts were reclassified to conform to the
current-period presentation.
PAST DUE FINANCING RECEIVABLES
The following table displays payment performance of Commercial
fi nancing receivables.
COMMERCIAL
2011 2010
December 31
Over 30 days
past due
Over 90 days
past due
Over 30 days
past due
Over 90 days
past due
CLL
Americas 1.3% 0.8% 1.2% 0.8%
Europe 3.8 2.1 4.2 2.3
Asia 1.3 1.0 2.2 1.4
Other 2.0 0.1 2.4 1.2
Total CLL 2.0 1.2 2.1 1.3
Energy Financial
Services 0.3 0.3 0.9 0.8
GECAS ————
Other 3.7 3.5 5.8 5.5
Total 2.0 1.1 2.0 1.2

122 GE 2011 ANNUAL REPORT
notes to consolidated financial statements
NONACCRUAL FINANCING RECEIVABLES
The following table provides further information about Commercial fi nancing receivables that are classifi ed as non accrual. Of our
$4,718 million and $5,463 million of nonaccrual fi nancing receivables at December 31, 2011 and December 31, 2010, respectively,
$1,227 million and $1,016 million are currently paying in accordance with their contractual terms, respectively.
COMMERCIAL
Nonaccrual financing
receivables
Nonearning financing
receivables
December 31 (Dollars in millions) 2011 2010 2011 2010
CLL
Americas $2,417 $3,208 $1,862 $2,573
Europe 1,599 1,415 1,167 1,241
Asia 428 616 269 406
Other 68 711 6
Total CLL 4,512 5,246 3,309 4,226
Energy Financial Services 22 78 22 62
GECAS 69 —55 —
Other 115 139 65 102
Total $4,718 $5,463 $3,451 $4,390
Allowance for losses percentage 32.4% 37.4% 44.3% 46.6%
IMPAIRED LOANS
The following table provides information about loans classifi ed as impaired and specifi c reserves related to Commercial.
COMMERCIAL(a)
With no specific allowance With a specific allowance
December 31 (In millions)
Recorded
investment
in loans
Unpaid
principal
balance
Average
investment
in loans
Recorded
investment
in loans
Unpaid
principal
balance
Associated
allowance
Average
investment
in loans
2011
CLL
Americas $2,136 $2,219 $2,128 $1,367 $1,415 $ 425 $1,468
Europe 936 1,060 1,001 730 717 263 602
Asia 85 83 94 156 128 84 214
Other 54 58 13 11 11 2 5
Total CLL 3,211 3,420 3,236 2,264 2,271 774 2,289
Energy Financial Services 4 4 20 18 18 9 87
GECAS 28 28 59 — — — 11
Other 62 63 67 75 75 29 97
Total $3,305 $3,515 $3,382 $2,357 $2,364 $ 812 $2,484
2010
CLL
Americas $2,030 $2,127 $1,547 $1,699 $1,744 $ 589 $1,754
Europe 802 674 629 566 566 267 563
Asia 119 117 117 338 303 132 334
Other —— 9————
Total CLL 2,951 2,918 2,302 2,603 2,613 988 2,651
Energy Financial Services 54 61 76 24 24 6 70
GECAS 24 24 50 — — — 31
Other 58 57 30 106 99 37 82
Total $3,087 $3,060 $2,458 $2,733 $2,736 $1,031 $2,834
(a) We recognized $193 million and $88 million of interest income, including $59 million and $39 million on a cash basis, for the years ended December 31, 2011 and 2010,
respectively, principally in our CLL Americas business. The total average investment in impaired loans for the years ended December 31, 2011 and 2010 was $5,866 million
and $5,292 million, respectively.

GE 2011 ANNUAL REPORT 123
notes to consolidated financial statements
Impaired loans classifi ed as TDRs in our CLL business were
$3,642 million and $2,911 million at December 31, 2011 and 2010,
respectively, and were primarily attributable to CLL Americas
($2,746 million and $2,347 million, respectively). For the year
ended December 31, 2011, we modifi ed $1,856 million of loans
classifi ed as TDRs, primarily in CLL Americas ($1,105 million) and
CLL EMEA ($646 million). Changes to these loans primarily
included debt to equity exchange, extensions, interest only pay-
ment periods and forbearance or other actions, which are in
addition to, or sometimes in lieu of, fees and rate increases. Of our
modifi cations classifi ed as TDRs in the last year, $101 million have
subsequently experienced a payment default.
CREDIT QUALITY INDICATORS
Substantially all of our Commercial fi nancing receivables portfolio
is secured lending and we assess the overall quality of the portfo-
lio based on the potential risk of loss measure. The metric
incorporates both the borrower’s credit quality along with any
related collateral protection.
Our internal risk ratings process is an important source of
information in determining our allowance for losses and rep-
resents a comprehensive, statistically validated approach to
evaluate risk in our fi nancing receivables portfolios. In deriving
our internal risk ratings, we stratify our Commercial portfolios
into twenty-one categories of default risk and/or six categories
of loss given default to group into three categories: A, B and
C. Our process starts by developing an internal risk rating for
our borrowers, which are based upon our proprietary models
using data derived from borrower fi nancial statements, agency
ratings, payment history information, equity prices and other
commercial borrower characteristics. We then evaluate the
potential risk of loss for the specifi c lending transaction in the
event of borrower default, which takes into account such fac-
tors as applicable collateral value, historical loss and recovery
rates for similar transactions, and our collection capabilities. Our
internal risk ratings process and the models we use are subject to
regular monitoring and validation controls. The frequency of rat-
ing updates is set by our credit risk policy, which requires annual
Audit Committee approval. The models are updated on a regular
basis and statistically validated annually, or more frequently as
circumstances warrant.
The table below summarizes our Commercial fi nancing receiv-
ables by risk category. As described above, fi nancing receivables
are assigned one of twenty-one risk ratings based on our process
and then these are grouped by similar characteristics into three
categories in the table below. Category A is characterized by
either high credit quality borrowers or transactions with signifi -
cant collateral coverage which substantially reduces or eliminates
the risk of loss in the event of borrower default. Category B is
characterized by borrowers with weaker credit quality than those
in Category A, or transactions with moderately strong collateral
coverage which minimizes but may not fully mitigate the risk of
loss in the event of default. Category C is characterized by bor-
rowers with higher levels of default risk relative to our overall
portfolio or transactions where collateral coverage may not fully
mitigate a loss in the event of default.
COMMERCIAL
Secured
December 31 (In millions) A B C Total
2011
CLL
Americas (a) $ 73,103 $2,816 $4,586 $ 80,505
Europe 33,481 1,080 1,002 35,563
Asia 10,644 116 685 11,445
Other (a) 345 — 91 436
Total CLL 117,573 4,012 6,364 127,949
Energy Financial
Services 5,727 24 18 5,769
GECAS 10,881 970 50 11,901
Other 1,282 — — 1,282
Total $135,463 $5,006 $6,432 $146,901
2010
CLL
Americas (a) $ 78,939 $4,103 $5,516 $ 88,558
Europe 33,642 840 1,262 35,744
Asia 10,777 199 766 11,742
Other (a) 544 66 54 664
Total CLL 123,902 5,208 7,598 136,708
Energy Financial
Services 6,775 183 53 7,011
GECAS 11,034 1,193 388 12,615
Other 1,788 — — 1,788
Total $143,499 $6,584 $8,039 $158,122
(a) During 2011, we transferred our Railcar lending and leasing portfolio from CLL
Other to CLL Americas. Prior-period amounts were reclassified to conform to the
current-period presentation.
For our secured fi nancing receivables portfolio, our collateral
position and ability to work out problem accounts mitigates our
losses. Our asset managers have deep industry expertise that
enables us to identify the optimum approach to default situations.
We price risk premiums for weaker credits at origination, closely
monitor changes in creditworthiness through our risk ratings and
watch list process, and are engaged early with deteriorating
credits to minimize economic loss. Secured fi nancing receivables
within risk Category C are predominantly in our CLL businesses
and are primarily composed of senior term lending facilities and
factoring programs secured by various asset types including
inventory, accounts receivable, cash, equipment and related
business facilities as well as franchise fi nance activities secured
by underlying equipment.
Loans within Category C are reviewed and monitored regu-
larly, and classifi ed as impaired when it is probable that they will
not pay in accordance with contractual terms. Our internal risk
rating process identifi es credits warranting closer monitoring;
and as such, these loans are not necessarily classifi ed as non-
earning or impaired.
Substantially all of our unsecured Commercial fi nancing
receivables portfolio is attributable to our Interbanca S.p.A. and
GE Sanyo Credit acquisitions in Europe and Asia, respectively.
At December 31, 2011 and December 31, 2010, these fi nanc-
ing receivables included $325 million and $208 million rated
A, $748 million and $964 million rated B, and $596 million and
$783 million rated C, respectively.

124 GE 2011 ANNUAL REPORT
notes to consolidated financial statements
Real Estate
FINANCING RECEIVABLES AND ALLOWANCE FOR LOSSES
The following table provides further information about general
and specifi c reserves related to Real Estate fi nancing receivables.
REAL ESTATE
Financing receivables
December 31 (In millions) 2011 2010
Debt $24,501 $30,249
Business Properties 8,248 9,962
Total Real Estate financing receivables,
before allowance for losses $32,749 $40,211
Non-impaired financing receivables $24,002 $30,394
General reserves 267 338
Impaired loans 8,747 9,817
Specific reserves 822 1,150
PAST DUE FINANCING RECEIVABLES
The following table displays payment performance of Real Estate
fi nancing receivables.
REAL ESTATE
2011 2010
December 31
Over 30 days
past due
Over 90 days
past due
Over 30 days
past due
Over 90 days
past due
Debt 2.4% 2.3% 4.3% 4.1%
Business Properties 3.9 3.0 4.6 3.9
Total 2.8 2.5 4.4 4.0
NONACCRUAL FINANCING RECEIVABLES
The following table provides further information about Real Estate fi nancing receivables that are classifi ed as nonaccrual. Of our
$6,949 million and $9,719 million of nonaccrual fi nancing receivables at December 31, 2011 and December 31, 2010, respectively,
$6,061 million and $7,888 million are currently paying in accordance with their contractual terms, respectively.
REAL ESTATE
Nonaccrual financing
receivables
Nonearning financing
receivables
December 31 (Dollars in millions) 2011 2010 2011 2010
Debt $6,351 $9,039 $541 $ 961
Business Properties 598 680 249 386
Total $6,949 $9,719 $790 $1,347
Allowance for losses percentage 15.7% 15.3% 137.8% 110.5%
IMPAIRED LOANS
The following table provides information about loans classifi ed as impaired and specifi c reserves related to Real Estate.
REAL ESTATE
(a)
With no specific allowance With a specific allowance
December 31 (In millions)
Recorded
investment
in loans
Unpaid
principal
balance
Average
investment
in loans
Recorded
investment
in loans
Unpaid
principal
balance
Associated
allowance
Average
investment
in loans
2011
Debt $3,558 $3,614 $3,568 $4,560 $4,652 $ 717 $5,435
Business Properties 232 232 215 397 397 105 460
Total $3,790 $3,846 $3,783 $4,957 $5,049 $ 822 $5,895
2010
Debt $2,814 $2,873 $1,598 $6,323 $6,498 $1,007 $6,116
Business Properties 191 213 141 489 476 143 382
Total $3,005 $3,086 $1,739 $6,812 $6,974 $1,150 $6,498
(a) We recognized $399 million and $189 million of interest income, including $339 million and $189 million on a cash basis, for the years ended December 31, 2011 and 2010,
respectively, principally in our Real Estate-Debt portfolio. The total average investment in impaired loans for the years ended December 31, 2011 and 2010 was
$9,678 million and $8,237 million, respectively.

GE 2011 ANNUAL REPORT 125
notes to consolidated financial statements
Real Estate TDRs increased from $4,866 million at December 31,
2010 to $7,006 million at December 31, 2011, primarily driven by
loans scheduled to mature during 2011, some of which were
modifi ed during 2011 and classifi ed as TDRs upon modifi cation.
We deem loan modifi cations to be TDRs when we have granted a
concession to a borrower experiencing fi nancial diffi culty and we
do not receive adequate compensation in the form of an effective
interest rate that is at current market rates of interest given the
risk characteristics of the loan or other consideration that com-
pensates us for the value of the concession. The limited liquidity
and higher return requirements in the real estate market for loans
with higher loan-to-value (LTV) ratios has typically resulted in the
conclusion that the modifi ed terms are not at current market
rates of interest, even if the modifi ed loans are expected to be
fully recoverable. For the year ended December 31, 2011, we
modifi ed $3,965 million of loans classifi ed as TDRs, substantially
all in our Debt portfolio. Changes to these loans primarily included
maturity extensions, principal payment acceleration, changes to
collateral or covenant terms and cash sweeps, which are in addi-
tion to, or sometimes in lieu of, fees and rate increases. Of our
modifi cations classifi ed as TDRs in the last year, $140 million have
subsequently experienced a payment default.
CREDIT QUALITY INDICATORS
Due to the primarily non-recourse nature of our Debt portfolio,
loan-to-value ratios provide the best indicators of the credit qual-
ity of the portfolio. By contrast, the credit quality of the Business
Properties portfolio is primarily infl uenced by the strength of the
borrower’s general credit quality, which is refl ected in our internal
risk rating process, consistent with the process we use for our
Commercial portfolio.
Loan-to-value ratio
December 31 (In millions)
Less
than 80% 80% to 95%
Greater
than 95%
2011
Debt $14,454 $4,593 $5,454
2010
Debt $12,362 $9,392 $8,495
Internal Risk Rating
December 31 (In millions) A B C
2011
Business Properties $ 7,628 $ 110 $ 510
2010
Business Properties $ 8,746 $ 437 $ 779
Within Real Estate-Debt, these fi nancing receivables are primarily
concentrated in our North American and European Lending plat-
forms and are secured by various property types. A substantial
majority of the Real Estate-Debt fi nancing receivables with loan-
to-value ratios greater than 95% are paying in accordance with
contractual terms. Substantially all of these loans and substantially
all of the Real Estate-Business Properties fi nancing receivables
included in Category C are impaired loans which are subject to the
specifi c reserve evaluation process described in Note 1. The ulti-
mate recoverability of impaired loans is driven by collection
strategies that do not necessarily depend on the sale of the under-
lying collateral and include full or partial repayments through
third-party refi nancing and restructurings.
Consumer
At December 31, 2011, our U.S. consumer fi nancing receivables
included private-label credit card and sales fi nancing for approxi-
mately 56 million customers across the U.S. with no metropolitan
area accounting for more than 5% of the portfolio. Of the total U.S.
consumer fi nancing receivables, approximately 65% relate to
credit card loans, which are often subject to profi t and loss-sharing
arrangements with the retailer (which are recorded in revenues),
and the remaining 35% are sales fi nance receivables, which pro-
vide fi nancing to customers in areas such as electronics,
recreation, medical and home improvement.
FINANCING RECEIVABLES AND ALLOWANCE FOR LOSSES
The following table provides further information about general
and specifi c reserves related to Consumer fi nancing receivables.
CONSUMER
Financing receivables
December 31 (In millions) 2011 2010
Non-U.S. residential mortgages $ 36,170 $ 40,011
Non-U.S. installment and revolving credit 18,544 20,132
U.S. installment and revolving credit 46,689 43,974
Non-U.S. auto 5,691 7,558
Other 7,244 8,304
Total Consumer financing receivables, before
allowance for losses $114,338 $119,979
Non-impaired financing receivables $111,233 $117,431
General reserves 3,014 3,945
Impaired loans 3,105 2,548
Specific reserves 717 555
PAST DUE FINANCING RECEIVABLES
The following table displays payment performance of Consumer
fi nancing receivables.
CONSUMER
2011 2010
December 31
Over 30 days
past due
Over 90 days
past due (a) Over 30 days
past due
Over 90 days
past due (a)
Non-U.S. residential
mortgages 13.4% 8.8% 13.7% 8.8%
Non-U.S. installment
and revolving credit 4.1 1.2 4.5 1.3
U.S. installment and
revolving credit 5.0 2.2 6.2 2.8
Non-U.S. auto 3.1 0.5 3.3 0.6
Other 3.5 2.0 4.2 2.3
Total 7.3 4.0 8.1 4.4
(a) Included $45 million and $65 million of loans at December 31, 2011 and
December 31, 2010, respectively, which are over 90 days past due and accruing
interest, mainly representing accretion on loans acquired at a discount.

126 GE 2011 ANNUAL REPORT
notes to consolidated financial statements
NONACCRUAL FINANCING RECEIVABLES
The following table provides further information about Consumer fi nancing receivables that are classifi ed as nonaccrual.
CONSUMER
Nonaccrual financing receivables Nonearning financing receivables
December 31 (Dollars in millions) 2011 2010 2011 2010
Non-U.S. residential mortgages $3,475 $3,986 $3,349 $3,738
Non-U.S. installment and revolving credit 321 302 263 289
U.S. installment and revolving credit 990 1,201 990 1,201
Non-U.S. auto 43 46 43 46
Other 487 600 419 478
Total $5,316 $6,135 $5,064 $5,752
Allowance for losses percentage 70.2% 73.3% 73.7% 78.2%
IMPAIRED LOANS
The vast majority of our Consumer nonaccrual fi nancing receiv-
ables are smaller balance homogeneous loans evaluated
collectively, by portfolio, for impairment and therefore are outside
the scope of the disclosure requirement for impaired loans.
Accordingly, impaired loans in our Consumer business represent
restructured smaller balance homogeneous loans meeting the
defi nition of a TDR, and are therefore subject to the disclosure
requirement for impaired loans, and commercial loans in our
Consumer–Other portfolio. The recorded investment of these
impaired loans totaled $3,105 million (with an unpaid principal
balance of $2,679 million) and comprised $69 million with no
specifi c allowance, primarily all in our Consumer–Other portfolio,
and $3,036 million with a specifi c allowance of $717 million at
December 31, 2011. The impaired loans with a specifi c allowance
included $369 million with a specifi c allowance of $102 million in
our Consumer–Other portfolio and $2,667 million with a specifi c
allowance of $615 million across the remaining Consumer busi-
ness and had an unpaid principal balance and average investment
of $2,244 million and $2,343 million, respectively, at December 31,
2011. We recognized $141 million and $114 million of interest
income, including $15 million and $30 million on a cash basis, for
the years ended December 31, 2011 and 2010, respectively, prin-
cipally in our Consumer—Non-U.S. and U.S. installment and
revolving credit portfolios. The total average investment in
impaired loans for the years ended December 31, 2011 and 2010
was $2,840 million and $2,009 million, respectively.
Impaired loans classifi ed as TDRs in our Consumer busi-
ness were $2,935 million and $2,256 million at December 31,
2011 and 2010, respectively. We utilize certain loan modifi cation
programs for borrowers experiencing fi nancial diffi culties in our
Consumer loan portfolio. These loan modifi cation programs pri-
marily include interest rate reductions and payment deferrals
in excess of three months, which were not part of the terms of
the original contract, and are primarily concentrated in our Non-
U.S. residential mortgage and U.S. credit card portfolios. For the
year ended December 31, 2011, we modifi ed $1,970 million of
consumer loans for borrowers experiencing fi nancial diffi culties,
which are classifi ed as TDRs, and included $1,020 million of non-
U.S. consumer loans, primarily residential mortgages, credit cards
and personal loans and approximately $950 million of credit card
loans in the U.S. We expect borrowers whose loans have been
modifi ed under these programs to continue to be able to meet
their contractual obligations upon the conclusion of the modifi ca-
tion. For loans modifi ed as TDRs in the last year, $251 million have
subsequently experienced a payment default, primarily in our U.S.
credit card and Non-U.S. residential mortgage portfolios.
CREDIT QUALITY INDICATORS
Our Consumer fi nancing receivables portfolio comprises both
secured and unsecured lending. Secured fi nancing receivables
comprise residential loans and lending to small and medium-
sized enterprises predominantly secured by auto and equipment,
inventory fi nance and cash fl ow loans. Unsecured fi nancing
receivables include private-label credit card fi nancing. A substan-
tial majority of these cards are not for general use and are limited
to the products and services sold by the retailer. The private label
portfolio is diverse with no metropolitan area accounting for more
than 5% of the related portfolio.

GE 2011 ANNUAL REPORT 127
notes to consolidated financial statements
NON-U.S. RESIDENTIAL MORTGAGES
For our secured non-U.S. residential mortgage book, we assess
the overall credit quality of the portfolio through loan-to-value
ratios (the ratio of the outstanding debt on a property to the value
of that property at origination). In the event of default and repos-
session of the underlying collateral, we have the ability to
remarket and sell the properties to eliminate or mitigate the
potential risk of loss. The table below provides additional informa-
tion about our non-U.S. residential mortgages based on
loan-to-value ratios.
Loan-to-value ratio
December 31 (In millions) 80% or less
Greater than
80% to 90%
Greater
than 90%
2011
Non-U.S. residential
mortgages $20,379 $6,145 $ 9,646
2010
Non-U.S. residential
mortgages $22,403 $7,023 $10,585
The majority of these fi nancing receivables are in our U.K. and
France portfolios and have re-indexed loan-to-value ratios of 84%
and 56%, respectively. We have third-party mortgage insurance
for approximately 68% of the balance of Consumer non-U.S.
residential mortgage loans with loan-to-value ratios greater than
90% at December 31, 2011. Such loans were primarily originated in
the U.K. and France.
INSTALLMENT AND REVOLVING CREDIT
For our unsecured lending products, including the non-U.S. and
U.S. installment and revolving credit and non-U.S. auto portfolios,
we assess overall credit quality using internal and external credit
scores. Our internal credit scores imply a probability of default
which we consistently translate into three approximate credit
bureau equivalent credit score categories, including (a) 681 or
higher, which are considered the strongest credits; (b) 615 to 680,
considered moderate credit risk; and (c) 614 or less, which are
considered weaker credits.
Internal ratings translated to approximate
credit bureau equivalent score
December 31 (In millions) 681 or higher 615 to 680 614 or less
2011
Non-U.S. installment and
revolving credit $ 9,913 $4,838 $3,793
U.S. installment and revolving
credit 28,918 9,398 8,373
Non-U.S. auto 3,927 1,092 672
2010
Non-U.S. installment and
revolving credit $10,192 $5,749 $4,191
U.S. installment and revolving
credit 25,940 8,846 9,188
Non-U.S. auto 5,379 1,330 849
Of those fi nancing receivable accounts with credit bureau equiva-
lent scores of 614 or less at December 31, 2011, 95% relate to
installment and revolving credit accounts. These smaller balance
accounts have an average outstanding balance less than one
thousand U.S. dollars and are primarily concentrated in our retail
card and sales fi nance receivables in the U.S. (which are often
subject to profi t and loss-sharing arrangements), and closed-end
loans outside the U.S., which minimizes the potential for loss in
the event of default. For lower credit scores, we adequately price
for the incremental risk at origination and monitor credit migra-
tion through our risk ratings process. We continuously adjust our
credit line underwriting management and collection strategies
based on customer behavior and risk profi le changes.
CONSUMER—OTHER
Secured lending in Consumer—Other comprises loans to small and
medium-sized enterprises predominantly secured by auto and
equipment, inventory fi nance and cash fl ow loans. We develop our
internal risk ratings for this portfolio in a manner consistent with
the process used to develop our Commercial credit quality indica-
tors, described above. We use the borrower’s credit quality and
underlying collateral strength to determine the potential risk of
loss from these activities.
At December 31, 2011, Consumer—Other fi nancing receiv-
ables of $5,580 million, $757 million and $907 million were rated
A, B, and C, respectively. At December 31, 2010, Consumer—
Other fi nancing receivables of $6,415 million, $822 million and
$1,067 million were rated A, B, and C, respectively.

128 GE 2011 ANNUAL REPORT
notes to consolidated financial statements
Note 24.
Variable Interest Entities
We securitize fi nancial assets and arrange other forms of asset-
backed fi nancing in the ordinary course of business. The
securitization transactions we engage in are similar to those used
by many fi nancial institutions. These securitization transactions
serve as alternative funding sources for a variety of diversifi ed
lending and securities transactions. Historically, we have used
both GE-supported and third-party VIEs to execute off-balance
sheet securitization transactions funded in the commercial paper
and term markets. The largest group of VIEs that we are involved
with are former QSPEs, which under guidance in effect through
December 31, 2009 were excluded from the scope of consolida-
tion standards based on their characteristics. Except as noted
below, investors in these entities only have recourse to the assets
owned by the entity and not to our general credit. We do not have
implicit support arrangements with any VIE. We did not provide
non-contractual support for previously transferred fi nancing
receivables to any VIE in 2011 or 2010.
In evaluating whether we have the power to direct the
activities of a VIE that most signifi cantly impact its economic
performance, we consider the purpose for which the VIE was
created, the importance of each of the activities in which it is
engaged and our decision-making role, if any, in those activities
that signifi cantly determine the entity’s economic performance
as compared to other economic interest holders. This evaluation
requires consideration of all facts and circumstances relevant to
decision-making that affects the entity’s future performance and
the exercise of professional judgment in deciding which decision-
making rights are most important.
In determining whether we have the right to receive benefi ts
or the obligation to absorb losses that could potentially be signifi -
cant to the VIE, we evaluate all of our economic interests in the
entity, regardless of form (debt, equity, management and servic-
ing fees, and other contractual arrangements). This evaluation
considers all relevant factors of the entity’s design, including: the
entity’s capital structure, contractual rights to earnings (losses),
subordination of our interests relative to those of other investors,
contingent payments, as well as other contractual arrangements
that have potential to be economically signifi cant. The evalua-
tion of each of these factors in reaching a conclusion about the
potential signifi cance of our economic interests is a matter that
requires the exercise of professional judgment.
Consolidated Variable Interest Entities
We consolidate VIEs because we have the power to direct the
activities that signifi cantly affect the VIEs economic performance,
typically because of our role as either servicer or manager for the
VIE. Our consolidated VIEs fall into three main groups, which are
further described below:
• Trinity comprises two consolidated entities that hold invest-
ment securities, the majority of which are investment grade,
and are funded by the issuance of GICs. These entities were
consolidated in 2003. Since 2004, GECC has fully guaranteed
repayment of these entities’ GIC obligations. If the long-term
credit rating of GECC were to fall below AA-/Aa3 or its short-
term credit rating were to fall below A-1+/P-1, certain GIC
holders could require immediate repayment of their invest-
ment. To the extent that amounts due exceed the ultimate
value of proceeds realized from Trinity assets, GECC would be
required to provide such excess amount. The entities ceased
issuing new investment contracts beginning in the fi rst quarter
of 2010. In 2011, we determined that the letters of credit were
no longer required and were terminated on December 6, 2011.
• Consolidated Securitization Entities (CSEs) comprise primar-
ily our former off-book QSPEs that were consolidated on
January 1, 2010 in connection with our adoption of ASU 2009-
16 & 17. These entities were created to facilitate securitization
of fi nancial assets and other forms of asset-backed fi nancing
which serve as an alternative funding source by providing
access to the commercial paper and term markets. The secu-
ritization transactions executed with these entities are similar
to those used by many fi nancial institutions and substantially
all are non-recourse. We provide servicing for substantially all
of the assets in these entities.
• The fi nancing receivables in these entities have similar risks
and characteristics to our other fi nancing receivables and
were underwritten to the same standard. Accordingly, the
performance of these assets has been similar to our other
fi nancing receivables; however, the blended performance of
the pools of receivables in these entities refl ects the eligibil-
ity criteria that we apply to determine which receivables are
selected for transfer. Contractually the cash fl ows from these
fi nancing receivables must fi rst be used to pay third-party
debt holders as well as other expenses of the entity. Excess
cash fl ows are available to GE. The creditors of these entities
have no claim on other assets of GE.
• Other remaining assets and liabilities of consolidated VIEs
relate primarily to four categories of entities: (1) enterprises we
acquired that had previously created asset-backed fi nancing
entities to fund commercial, middle-market and equipment
loans; we are the collateral manager for these entities; (2) joint
ventures that lease light industrial equipment; (3) insurance
entities that, among other lines of business, provide property
and casualty and workers’ compensation coverage for GE; and
(4) other entities that are involved in power generating and
leasing activities.

GE 2011 ANNUAL REPORT 129
notes to consolidated financial statements
The table below summarizes the assets and liabilities of consolidated VIEs described above.
Consolidated Securitization Entities(a)
(In millions) Trinity
Credit
Cards (b)(c) Equipment (c)(d) Real Estate
Trade
Receivables Other (d) Total
DECEMBER 31, 2011
ASSETS (e)
Financing receivables, net $ — $19,229 $10,523 $3,521 $1,614 $2,973 $37,860
Investment securities 4,289 ————1,031 5,320
Other assets 389 17 283 210 — 2,636 3,535
Total $4,678 $19,246 $10,806 $3,731 $1,614 $6,640 $46,715
LIABILITIES (e)
Borrowings $ — $ — $ 2 $ 25 $ — $ 821 $ 848
Non-recourse borrowings — 14,184 8,166 3,659 1,769 980 28,758
Other liabilities 4,456 37 — 19 23 1,071 5,606
Total $4,456 $14,221 $ 8,168 $3,703 $1,792 $2,872 $35,212
DECEMBER 31, 2010
ASSETS (e)
Financing receivables, net $ — $20,570 $ 9,431 $4,233 $1,882 $3,356 $39,472
Investment securities 5,706 ————9646,670
Other assets 283 17 234 209 99 3,672 4,514
Total $5,989 $20,587 $ 9,665 $4,442 $1,981 $7,992 $50,656
LIABILITIES (e)
Borrowings $ — $ — $ 184 $ 25 $ — $ 949 $ 1,158
Non-recourse borrowings — 12,824 8,091 4,294 2,970 1,265 29,444
Other liabilities 5,690 132 8 4 — 1,861 7,695
Total $5,690 $12,956 $ 8,283 $4,323 $2,970 $4,075 $38,297
(a) Includes entities consolidated on January 1, 2010 by the initial application of ASU 2009-16 & 17. On January 1, 2010, we consolidated financing receivables of
$39,463 million and investment securities of $1,015 million and non-recourse borrowings of $36,112 million. At December 31, 2011, financing receivables of $30,730 million
and non-recourse borrowings of $24,502 million remained outstanding in respect of those entities.
(b) In February 2011, the capital structure of one of our consolidated credit card securitization entities changed and it is now consolidated under the voting interest model and
accordingly is no longer reported in the table above. The entity’s assets and liabilities at December 31, 2010 were $2,875 million and $525 million, respectively.
(c) We provide servicing to the CSEs and are contractually permitted to commingle cash collected from customers on financing receivables sold to investors with our own cash
prior to payment to a CSE provided our short-term credit rating does not fall below levels specified in our securitization agreements. We are also owed amounts from the
CSEs related to purchased financial assets which have yet to be funded or available excess cash flows due to GE. At December 31, 2011, the amounts owed to the CSEs and
receivable from the CSEs were $5,655 million and $5,165 million, respectively.
(d) In certain transactions entered into prior to December 31, 2004, we provided contractual credit and liquidity support to third parties who funded the purchase of
securitized or participated interests in assets. In December 2011, a third party required that we pay $816 million under these arrangements to purchase an asset. At
December 31, 2011, we have no remaining credit or liquidity support obligations to these entities.
(e) Asset amounts exclude intercompany receivables for cash collected on behalf of the entities by GE as servicer, which are eliminated in consolidation. Such receivables
provide the cash to repay the entities’ liabilities. If these intercompany receivables were included in the table above, assets would be higher. In addition, other assets,
borrowings and other liabilities exclude intercompany balances that are eliminated in consolidation.
Total revenues from our consolidated VIEs were $6,326 million and
$7,122 million in 2011 and 2010, respectively. Related expenses
consisted primarily of provisions for losses of $1,146 million
and $1,596 million in 2011 and 2010, respectively, and interest
and other fi nancial charges of $594 million and $767 million
in 2011 and 2010, respectively. These amounts do not include
intercompany revenues and costs, principally fees and interest
between GE and the VIEs, which are eliminated in consolidation.

130 GE 2011 ANNUAL REPORT
notes to consolidated financial statements
Investments in Unconsolidated Variable Interest Entities
Our involvement with unconsolidated VIEs consists of the following
activities: assisting in the formation and fi nancing of the entity,
providing recourse and/or liquidity support, servicing the assets
and receiving variable fees for services provided. We are not
required to consolidate these entities because the nature of our
involvement with the activities of the VIEs does not give us power
over decisions that signifi cantly affect their economic performance.
The largest unconsolidated VIE with which we are involved is
Penske Truck Leasing (PTL), a joint venture and limited partnership
formed in 1988 between Penske Truck Leasing Corporation (PTLC)
and GE. PTLC is the sole general partner of PTL and an indirect
wholly-owned subsidiary of Penske Corporation. PTL is engaged
in truck leasing and support services, including full-service
leasing, dedicated logistics support and contract maintenance
programs, as well as rental operations serving commercial and
consumer customers. At December 31, 2011, our investment of
$7,038 million primarily comprised a 49.9% partnership interest
of $889 million and loans and advances of $6,113 million. GECC
continues to provide loans under long-term revolving credit and
letter of credit facilities to PTL.
Other signifi cant exposures to unconsolidated VIEs at
December 31, 2011 include an investment in asset-backed
securities issued by a senior secured loan fund ($4,009 million);
investments in real estate entities ($2,515 million), which generally
consist of passive limited partnership investments in tax-
advantaged, multi-family real estate and investments in various
European real estate entities; and exposures to joint ventures that
purchase factored receivables ($1,823 million). The vast majority
of our other unconsolidated entities consist of passive invest-
ments in various asset-backed fi nancing entities.
The classifi cation of our variable interests in these entities in
our fi nancial statements is based on the nature of the entity and
the type of investment we hold. Variable interests in partnerships
and corporate entities are classifi ed as either equity method or
cost method investments. In the ordinary course of business,
we also make investments in entities in which we are not the pri-
mary benefi ciary but may hold a variable interest such as limited
partner interests or mezzanine debt investments. These invest-
ments are classifi ed in two captions in our fi nancial statements:
“All other assets” for investments accounted for under the equity
method, and “Financing receivables—net” for debt fi nancing pro-
vided to these entities. Our investments in unconsolidated VIEs at
December 31, 2011 and December 31, 2010 follow.
December 31 (In millions) PTL All other Total
2011
Other assets and investment
securities $7,038 $ 6,954 $13,992
Financing receivables—net — 2,507 2,507
Total investments 7,038 9,461 16,499
Contractual obligations to
fund investments or
guarantees 600 2,253 2,853
Revolving lines of credit 1,356 92 1,448
Total $8,994 $11,806 $20,800
2010
Other assets and investment
securities $5,790 $ 4,585 $10,375
Financing receivables—net — 2,240 2,240
Total investments 5,790 6,825 12,615
Contractual obligations to
fund investments or
guarantees 600 1,990 2,590
Revolving lines of credit 2,431 — 2,431
Total $8,821 $ 8,815 $17,636
In addition to the entities included in the table above, we also hold
passive investments in RMBS, CMBS and ABS issued by VIEs. Such
investments were, by design, investment grade at issuance and
held by a diverse group of investors. Further information about
such investments is provided in Note 3.
Note 25.
Commitments and Guarantees
Commitments
In our Aviation segment, we had committed to provide fi nancing
assistance on $2,059 million of future customer acquisitions of
aircraft equipped with our engines, including commitments made
to airlines in 2011 for future sales under our GE90 and GEnx
engine campaigns. The GECAS business of GE Capital had placed
multiple-year orders for various Boeing, Airbus and other aircraft
with list prices approximating $20,577 million and secondary
orders with airlines for used aircraft of approximately $1,621 mil-
lion at December 31, 2011.
Product Warranties
We provide for estimated product warranty expenses when we
sell the related products. Because warranty estimates are fore-
casts that are based on the best available information—mostly
historical claims experience—claims costs may differ from
amounts provided. An analysis of changes in the liability for prod-
uct warranties follows.
(In millions) 2011 2010 2009
Balance at January 1 $1,451 $1,641 $1,675
Current-year provisions 935 537 780
Expenditures (881) (710) (794)
Other changes 117 (17) (20)
Balance at December 31 $1,622 $1,451 $1,641

GE 2011 ANNUAL REPORT 131
notes to consolidated financial statements
Guarantees
At December 31, 2011, we were committed under the following
guarantee arrangements beyond those provided on behalf of
VIEs. See Note 24.
• CREDIT SUPPORT. We have provided $5,184 million of credit sup-
port on behalf of certain customers or associated companies,
predominantly joint ventures and partnerships, using arrange-
ments such as standby letters of credit and performance
guarantees. These arrangements enable these customers
and associated companies to execute transactions or obtain
desired fi nancing arrangements with third parties. Should the
customer or associated company fail to perform under the
terms of the transaction or fi nancing arrangement, we would
be required to perform on their behalf. Under most such
arrangements, our guarantee is secured, usually by the asset
being purchased or fi nanced, or possibly by certain other
assets of the customer or associated company. The length of
these credit support arrangements parallels the length of the
related fi nancing arrangements or transactions. The liability
for such credit support was $51 million at December 31, 2011.
• INDEMNIFICATION AGREEMENTS. We have agreements that
require us to fund up to $165 million at December 31, 2011
under residual value guarantees on a variety of leased
equipment. Under most of our residual value guarantees,
our commitment is secured by the leased asset. The liabil-
ity for these indemnifi cation agreements was $27 million at
December 31, 2011.
In connection with the transfer of the NBCU business to
Comcast, we have provided guarantees, on behalf of NBCU
LLC, for the acquisition of sports programming that are trig-
gered only in the event NBCU LLC fails to meet its payment
commitments. At December 31, 2011, our indemnifi cation
under these arrangements was $9,290 million. This amount
was determined based on our current ownership share of
NBCU LLC and will change proportionately based on any
future changes to our ownership share. Comcast has agreed
to indemnify us for their proportionate ownership share of
NBCU LLC relating to our guarantees that existed prior to the
transfer of the NBCU business to Comcast of $1,311 million.
The liability for our NBCU LLC indemnifi cation agreements was
$181 million at December 31, 2011.
At December 31, 2011, we also had $2,185 million of other
indemnifi cation commitments, substantially all of which relate
to standard representations and warranties in sales of other
businesses or assets.
• CONTINGENT CONSIDERATION. These are agreements to provide
additional consideration to a buyer or seller in a business
combination if contractually specifi ed conditions related to
the acquisition or disposition are achieved. Adjustments to
the proceeds from our sale of GE Money Japan are further
discussed in Note 2. All other potential payments related to
contingent consideration are insignifi cant.
Our guarantees are provided in the ordinary course of business.
We underwrite these guarantees considering economic, liquidity
and credit risk of the counterparty. We believe that the likelihood
is remote that any such arrangements could have a signifi cant
adverse effect on our fi nancial position, results of operations or
liquidity. We record liabilities for guarantees at estimated fair
value, generally the amount of the premium received, or if we do
not receive a premium, the amount based on appraisal, observed
market values or discounted cash fl ows. Any associated expected
recoveries from third parties are recorded as other receivables,
not netted against the liabilities.
Note 26.
Supplemental Cash Flows Information
Changes in operating assets and liabilities are net of acquisitions
and dispositions of principal businesses.
Amounts reported in the “Proceeds from sales of discontinued
operations” and “Proceeds from principal business dispositions”
lines in the Statement of Cash Flows are net of cash disposed.
Amounts reported in the “Payments for principal businesses pur-
chased” line is net of cash acquired and included debt assumed
and immediately repaid in acquisitions.
Amounts reported in the “All other operating activities” line in the
Statement of Cash Flows consists primarily of adjustments to cur-
rent and noncurrent accruals and deferrals of costs and expenses,
adjustments for gains and losses on assets and adjustments to
assets. GECS had non-cash transactions related to foreclosed prop-
erties and repossessed assets totaling $865 million, $1,915 million
and $1,364 million in 2011, 2010 and 2009, respectively.

132 GE 2011 ANNUAL REPORT
notes to consolidated financial statements
Certain supplemental information related to GE and GECS cash fl ows is shown below.
(In millions) 2011 2010 2009
GE
NET DISPOSITIONS (PURCHASES) OF GE SHARES FOR TREASURY
Open market purchases under share repurchase program $ (2,065) $ (1,715) $ (85)
Other purchases (100) (77) (129)
Dispositions 709 529 837
$ (1,456) $ (1,263) $ 623
GECS
ALL OTHER OPERATING ACTIVITIES
Net change in other assets $ 215 $ 28 $ (344)
Amortization of intangible assets 566 653 905
Net realized losses on investment securities 197 91 473
Cash collateral on derivative contracts 1,247 — (6,858)
Change in other liabilities (1,229) (2,705) (4,818)
Other 2,285 4,420 (916)
$ 3,281 $ 2,487 $ (11,558)
NET DECREASE (INCREASE) IN GECS FINANCING RECEIVABLES
Increase in loans to customers $(322,870) $(309,590) $(276,140)
Principal collections from customers—loans 332,587 327,196 275,320
Investment in equipment for financing leases (9,610) (10,065) (9,403)
Principal collections from customers—financing leases 12,431 14,743 17,130
Net change in credit card receivables (6,263) (4,554) (28,535)
Sales of financing receivables 8,117 5,331 58,555
$ 14,392 $ 23,061 $ 36,927
ALL OTHER INVESTING ACTIVITIES
Purchases of securities by insurance activities $ (1,786) $ (1,712) $ (3,106)
Dispositions and maturities of securities by insurance activities 2,856 3,136 3,962
Other assets—investments 4,242 2,686 (286)
Change in other receivables (128) 524 722
Other 2,116 5,313 3,300
$ 7,300 $ 9,947 $ 4,592
NEWLY ISSUED DEBT (MATURITIES LONGER THAN 90 DAYS)
Short-term (91 to 365 days) $ 10 $ 2,496 $ 5,801
Long-term (longer than one year) 43,257 35,475 75,224
Proceeds—non-recourse, leveraged leases —— 48
$ 43,267 $ 37,971 $ 81,073
REPAYMENTS AND OTHER REDUCTIONS (MATURITIES LONGER THAN 90 DAYS)
Short-term (91 to 365 days) $ (81,918) $ (95,170) $ (77,444)
Long-term (longer than one year) (2,786) (1,571) (3,491)
Principal payments—non-recourse, leveraged leases (732) (638) (680)
$ (85,436) $ (97,379) $ (81,615)
ALL OTHER FINANCING ACTIVITIES
Proceeds from sales of investment contracts $ 4,396 $ 5,337 $ 7,840
Redemption of investment contracts (6,230) (8,647) (10,713)
Other 42 (8) 182
$ (1,792) $ (3,318) $ (2,691)

GE 2011 ANNUAL REPORT 133
notes to consolidated financial statements
Note 27.
Intercompany Transactions
Effects of transactions between related companies are made on
an arms-length basis, are eliminated and consist primarily of
GECS dividends to GE or capital contributions from GE to GECS; GE
customer receivables sold to GECS; GECS services for trade
receivables management and material procurement; buildings
and equipment (including automobiles) leased between GE and
GECS; information technology (IT) and other services sold to GECS
by GE; aircraft engines manufactured by GE that are installed on
aircraft purchased by GECS from third-party producers for lease
to others; and various investments, loans and allocations of GE
corporate overhead costs.
These intercompany transactions are reported in the GE and
GECS columns of our fi nancial statements, but are eliminated
in deriving our consolidated fi nancial statements. Effects of
these eliminations on our consolidated cash fl ows from operat-
ing, investing and fi nancing activities include the following. Net
decrease (increase) in activity related to GE customer receivables
sold to GECS of $(353) million, $81 million and $(157) million have
been eliminated from consolidated cash from operating and
investing activities at December 31, 2011, 2010 and 2009, respec-
tively. Capital contributions from GE to GECS of $9,500 million
have been eliminated from consolidated cash from investing and
fi nancing activities at December 31, 2009. There were no such
capital contributions at December 31, 2011 or December 31, 2010.
Eliminations of intercompany borrowings (includes GE investment
in GECS short-term borrowings, such as commercial paper) of
$903 million, $293 million and $715 million have been eliminated
from fi nancing activities at December 31, 2011, 2010 and 2009,
respectively. Other reclassifi cations and eliminations of $(205) mil-
lion, $(205) million and $741 million have been eliminated from
consolidated cash from operating activities and $(726) million,
$107 million and $(817) million have been eliminated from consoli-
dated cash from investing activities at December 31, 2011, 2010
and 2009, respectively.
Note 28.
Operating Segments
Basis for presentation
Our operating businesses are organized based on the nature of
markets and customers. Segment accounting policies are the
same as described in Note 1. Segment results for our fi nancial
services businesses refl ect the discrete tax effect of transactions.
Effective January 1, 2011, we reorganized the former
Technology Infrastructure segment into three segments—
Aviation, Healthcare and Transportation. The prior-period results
of the Aviation, Healthcare and Transportation businesses are
unaffected by this reorganization. Also, beginning January 1,
2011, we allocate service costs related to our principal pension
plans and we no longer allocate the retiree costs of our post-
retirement healthcare benefi ts to our segments. This revised
allocation methodology better aligns segment operating costs to
active employee costs that are managed by the segments. This
change did not signifi cantly affect our reported segment results.
On January 28, 2011, we sold the assets of our NBCU business
in exchange for cash and a 49% interest in a new entity, NBCU LLC
(see Note 2). Results of our formerly consolidated subsidiary,
NBCU, and our current equity method investment in NBCU LLC
are reported in the Corporate items and eliminations line on the
Summary of Operating Segments.
On February 22, 2012, we merged our wholly-owned subsid-
iary, GECS, with and into GECS’ wholly-owned subsidiary, GECC.
Our fi nancial services segment, GE Capital, will continue to com-
prise the continuing operations of GECC, which now includes the
run-off insurance operations previously held and managed in
GECS. References to the GE Capital segment in these consolidated
fi nancial statements relate to the segment as it existed during
2011 and do not refl ect the February 22, 2012 merger.
A description of our operating segments as of December 31,
2011, can be found below, and details of segment profi t by
operating segment can be found in the Summary of Operating
Segments table in Management’s Discussion and Analysis of
Financial Condition and Results of Operations.
Energy Infrastructure
Power plant products and services, including design, installation,
operation and maintenance services are sold into global markets.
Gas, steam and aeroderivative turbines, generators, combined
cycle systems, controls and related services, including total asset
optimization solutions, equipment upgrades and long-term
maintenance service agreements are sold to power generation
and other industrial customers. Renewable energy solutions
include wind turbines and solar technology. Water treatment
services and equipment include specialty chemical treatment
programs, water purifi cation equipment, mobile treatment sys-
tems and desalination processes. In addition, it provides
protection and control, communications, power sensing and
power quality products and services that increase the reliability of
electrical power networks and critical equipment and offering
wireless data transmission. Electrical equipment and control
products include power panels, switchgear and circuit breakers.
The GE Oil & Gas business sells advanced technology equip-
ment and services for all segments of the offshore and onshore
oil and gas industry, from subsea, drilling and production, LNG,
pipelines and storage to industrial power generation, refi ning
and petrochemicals. We also provide pipeline integrity solutions,
sensor-based measurement, inspection, asset condition moni-
toring, controls, and radiation measurement solutions. Oil & Gas
also offers integrated solutions using sensors for temperature,
pressure, moisture, gas and fl ow rate as well as non-destructive
testing inspection equipment, including radiographic, ultrasonic,
remote visual and eddy current.
134 GE 2011 ANNUAL REPORT
notes to consolidated financial statements
Aviation
Aviation products and services include jet engines, aerospace
systems and equipment, replacement parts and repair and main-
tenance services for all categories of commercial aircraft; for a
wide variety of military aircraft, includ ing fi ghters, bombers,
tankers and helicopters; for marine appli cations; and for executive
and regional aircraft. Products and services are sold worldwide to
airframe manufacturers, airlines and government agencies.
Healthcare
Healthcare products include diagnostic imaging systems such as
Magnetic Resonance (MR), Computed Tomography (CT) and
Positron Emission Tomography (PET) scanners, X-ray, nuclear
imaging, digital mammography, and Molecular Imaging technolo-
gies. Healthcare-manufactured technologies include patient and
resident monitoring, diagnostic cardiology, ultrasound, bone
densitometry, anesthesiology and oxygen therapy, and neonatal
and critical care devices. Related services include equipment
monitoring and repair, information technologies and customer
productivity services. Products also include diagnostic imaging
agents used in medical scanning procedures, drug discovery,
biopharmaceutical manufacturing and purifi cation, and tools for
pro tein and cellular analysis for pharmaceutical and academic
research, including a pipeline of precision molecular diagnostics
in development for neurology, cardiology and oncology applica-
tions. Products and services are sold worldwide to hospitals,
medical facilities, pharmaceutical and biotechnology companies,
and to the life science research market.
Transportation
Transportation products and maintenance services include diesel
electric locomotives, transit propulsion equipment, motorized
wheels for off-highway vehicles, drill motors, marine and station-
ary power generation, railway signaling and offi ce systems.
Home & Business Solutions
Products include major appliances and related services for prod-
ucts such as refrigerators, freezers, electric and gas ranges,
cooktops, dishwashers, clothes washers and dryers, microwave
ovens, room air conditioners, residential water systems for fi ltra-
tion, softening and heating, and hybrid water heaters. These
products are distributed both to retail outlets and direct to con-
sumers, mainly for the replacement market, and to building
contractors and distributors for new installations. Lighting prod-
ucts include a wide variety of lamps and lighting fi xtures,
including light-emitting diodes. Plant automation hardware,
software and embedded computing systems including control-
lers, embedded systems, advanced software, motion control,
operator interfaces and industrial computers are also provided
by Home & Business Solutions. Products and services are sold in
North America and in global markets under various GE and pri-
vate-label brands.
GE Capital
CLL has particular mid-market expertise, and primarily offers
collateralized loans, leases and other fi nancial services to custom-
ers, includ ing manufacturers, distributors and end-users for a
variety of equipment and major capital assets. These assets
include: indus trial-related facilities and equipment; vehicles;
corporate aircraft; and equipment used in many industries, includ-
ing the construction, manufacturing, transportation, media,
communications, entertainment and healthcare industries.
Consumer offers a full range of fi nancial products including:
private-label credit cards; personal loans; bank cards; auto loans
and leases; mortgages; debt consolidation; home equity loans;
deposits and other savings products; and small and medium
enterprise lending on a global basis.
Real Estate offers a comprehensive range of capital and
investment solutions and fi nances, with both equity and loan
structures, the acquisition, refi nancing and renovation of offi ce
buildings, apartment buildings, retail facilities, hotels, parking
facilities and industrial properties.
Energy Financial Services offers fi nancial products to the
global energy industry including structured equity, debt, leas-
ing, partnership fi nancing, product fi nance and broad-based
commercial fi nance.
GECAS provides fi nancial products to: airlines, aircraft opera-
tors, owners, lend ers and investors, including leases, and secured
loans on commercial passenger aircraft, freighters and regional
jets; engine leasing and fi nancing services; aircraft parts solu-
tions; and airport equity and debt fi nancing.

GE 2011 ANNUAL REPORT 135
notes to consolidated financial statements
Total revenues (a) Intersegment revenues (b) External revenues
(In millions) 2011 2010 2009 2011 2010 2009 2011 2010 2009
Energy Infrastructure $ 43,694 $ 37,514 $ 40,648 $ 325 $ 316 $ 633 $ 43,369 $ 37,198 $ 40,015
Aviation 18,859 17,619 18,728 417 155 234 18,442 17,464 18,494
Healthcare 18,083 16,897 16,015 65 30 40 18,018 16,867 15,975
Transportation 4,885 3,370 3,827 33 77 72 4,852 3,293 3,755
Home & Business Solutions 8,465 8,648 8,443 58 49 33 8,407 8,599 8,410
Total industrial 93,986 84,048 87,661 898 627 1,012 93,088 83,421 86,649
GE Capital 45,730 46,422 48,906 1,072 1,208 1,469 44,658 45,214 47,437
Corporate items and eliminations (c) 7,584 19,123 17,871 (1,970) (1,835) (2,481) 9,554 20,958 20,352
Total $147,300 $149,593 $154,438 $ — $ — $ — $147,300 $149,593 $154,438
(a) Revenues of GE businesses include income from sales of goods and services to customers and other income.
(b) Sales from one component to another generally are priced at equivalent commercial selling prices.
(c) Includes the results of NBCU (our formerly consolidated subsidiary) and our current equity method investment in NBCUniversal LLC.
Revenues from customers located in the United States were $69,820 million, $75,104 million and $75,782 million in 2011, 2010 and 2009,
respectively. Revenues from customers located outside the United States were $77,480 million, $74,489 million and $78,656 million in
2011, 2010 and 2009, respectively.
Assets (a)(b) Property, plant and equipment additions
(c) Depreciation and amortization
At December 31 For the years ended December 31 For the years ended December 31
(In millions) 2011 2010 2009 2011 2010 2009 2011 2010 2009
Energy Infrastructure $ 54,389 $ 38,606 $ 36,663 $ 2,078 $ 954 $1,012 $ 1,235 $ 911 $ 994
Aviation 23,567 21,175 20,377 699 471 442 569 565 539
Healthcare 27,981 27,784 27,163 378 249 302 869 994 876
Transportation 2,633 2,515 2,714 193 69 68 88 85 82
Home & Business Solutions 4,645 4,280 4,955 278 229 201 287 354 366
GE Capital 552,514 565,337 597,877 9,882 7,674 6,442 7,636 8,367 9,175
Corporate items and eliminations 51,513 88,096 92,200 56 175 203 233 257 668
Total $717,242 $747,793 $781,949 $13,564 $9,821 $8,670 $10,917 $11,533 $12,700
(a) Assets of discontinued operations, NBCU (our formerly consolidated subsidiary) and our current equity method investment in NBCUniversal LLC are included in Corporate
items and eliminations for all periods presented.
(b) Total assets of the Energy Infrastructure, Aviation, Healthcare, Transportation, Home & Business Solutions and GE Capital operating segments at December 31, 2011, include
investment in and advances to associated companies of $907 million, $420 million, $532 million, $11 million, $439 million and $23,589 million, respectively. Investments in
and advances to associated companies contributed approximately $46 million, $70 million, $(38) million, $1 million, $23 million and $2,337 million to segment pre-tax
income of Energy Infrastructure, Aviation, Healthcare, Transportation, Home & Business Solutions and GE Capital operating segments, respectively, for the year ended
December 31, 2011. Aggregate summarized financial information for significant associated companies assuming a 100% ownership interest included: total assets of
$161,913 million, primarily financing receivables of $57,617 million; total liabilities of $102,066 million, primarily debt of $56,596 million; revenues totaling $42,323 million;
and net earnings totaling $3,963 million.
(c) Additions to property, plant and equipment include amounts relating to principal businesses purchased.
Interest and other financial charges Provision (benefit) for income taxes
(In millions) 2011 2010 2009 2011 2010 2009
GE Capital $13,845 $14,494 $16,878 $ 984 $ (949) $(3,807)
Corporate items and eliminations (a) 700 1,059 819 4,748 1,982 2,665
Total $14,545 $15,553 $17,697 $5,732 $1,033 $(1,142)
(a) Included amounts for Energy Infrastructure, Aviation, Healthcare, Transportation, Home & Business Solutions and NBCU (prior to its deconsolidation in 2011), for which our
measure of segment profit excludes interest and other financial charges and income taxes.
Property, plant and equipment—net associated with operations based in the United States were $19,672 million, $17,596 million and
$19,798 million at year-end 2011, 2010 and 2009, respectively. Property, plant and equipment—net associated with operations based
outside the United States were $46,067 million, $48,616 million and $49,169 million at year-end 2011, 2010 and 2009, respectively.

136 GE 2011 ANNUAL REPORT
notes to consolidated financial statements
Note 29.
Quarterly Information (Unaudited)
First quarter Second quarter Third quarter Fourth quarter
(In millions; per-share amounts in dollars) 2011 2010 2011 2010 2011 2010 2011 2010
CONSOLIDATED OPERATIONS
Earnings from continuing operations $ 3,471 $ 2,351 $ 3,621 $ 3,306 $ 3,264 $ 3,264 $ 4,010 $ 4,131
Earnings (loss) from discontinued operations 56 (353) 217 (101) 1(1,052) (197) 633
Net earnings 3,527 1,998 3,838 3,205 3,265 2,212 3,813 4,764
Less net earnings attributable to
noncontrolling interests (94) (53) (74) (96) (41) (157) (83) (229)
Net earnings attributable to the Company 3,433 1,945 3,764 3,109 3,224 2,055 3,730 4,535
Preferred stock dividends declared (75) (75) (75) (75) (881) (75) —(75)
Net earnings attributable to GE
common shareowners $ 3,358 $ 1,870 $ 3,689 $ 3,034 $ 2,343 $ 1,980 $ 3,730 $ 4,460
Per-share amounts—earnings
from continuing operations
Diluted earnings per share $ 0.31 $ 0.21 $ 0.33 $ 0.29 $ 0.22 $ 0.28 $ 0.37 $ 0.36
Basic earnings per share 0.31 0.21 0.33 0.29 0.22 0.28 0.37 0.36
Per-share amounts—earnings (loss)
from discontinued operations
Diluted earnings per share 0.01 (0.03) 0.02 (0.01) —(0.10) (0.02) 0.06
Basic earnings per share 0.01 (0.03) 0.02 (0.01) —(0.10) (0.02) 0.06
Per-share amounts—net earnings
Diluted earnings per share 0.32 0.17 0.35 0.28 0.22 0.18 0.35 0.42
Basic earnings per share 0.32 0.17 0.35 0.28 0.22 0.18 0.35 0.42
SELECTED DATA
GE
Sales of goods and services $22,102 $23,509 $22,961 $24,403 $23,230 $23,593 $26,743 $28,715
Gross profit from sales 5,290 6,146 5,404 7,295 6,520 6,973 9,018 8,278
GECS
Total revenues 13,041 12,633 12,443 12,632 12,018 11,954 11,579 12,662
Earnings from continuing operations
attributable to the Company 1,768 502 1,593 734 1,453 780 1,618 1,007
For GE, gross profi t from sales is sales of goods and services less costs of goods and services sold.
Earnings-per-share amounts are computed independently each quarter for earnings from continuing operations, earnings (loss) from
discontinued operations and net earnings. As a result, the sum of each quarter’s per-share amount may not equal the total per-share
amount for the respective year; and the sum of per-share amounts from continuing operations and discontinued operations may not
equal the total per-share amounts for net earnings for the respective quarters.

GE 2011 ANNUAL REPORT 137
supplemental information
Financial Measures that Supplement Generally
Accepted Accounting Principles
We sometimes use information derived from consolidated fi nan-
cial information but not presented in our fi nancial statements
prepared in accordance with U.S. generally accepted accounting
principles (GAAP). Certain of these data are considered “non-
GAAP fi nancial measures” under U.S. Securities and Exchange
Commission rules. Specifi cally, we have referred, in various sec-
tions of this Annual Report, to:
• Industrial cash fl ow from operating activities (Industrial CFOA)
• Operating earnings, Operating EPS and Operating EPS exclud-
ing the effects of the preferred stock redemption
• Operating and non-operating pension costs (income)
• Average GE shareowners’ equity, excluding effects of
discontinued operations
• Ratio of debt to equity at GECS, net of cash and equivalents
and with classifi cation of hybrid debt as equity
• GE Capital ending net investment (ENI), excluding cash
and equivalents
• GE pre-tax earnings from continuing operations, excluding
GECS earnings from continuing operations, the correspond-
ing effective tax rates and the reconciliation of the U.S. federal
statutory rate to those effective tax rates
The reasons we use these non-GAAP fi nancial measures and the
reconciliations to their most directly comparable GAAP fi nancial
measures follow.
Industrial Cash Flow from Operating Activities
(Industrial CFOA)
(In millions) 2011 2010 2009 2008 2007
Cash from GE’s
operating activities,
as reported $12,057 $14,746 $16,405 $19,138 $23,301
Less dividends
from GECS —— — 2,351 7,291
Cash from GE’s
operating activities,
excluding dividends
from GECS
(Industrial CFOA) $12,057 $14,746 $16,405 $16,787 $16,010
We refer to cash generated by our industrial businesses as
“Industrial CFOA,” which we defi ne as GE’s cash from operating
activities less the amount of dividends received by GE from
GECS. This includes the effects of intercompany transactions,
including GE customer receivables sold to GECS; GECS services for
trade receivables management and material procurement; build-
ings and equipment (including automobiles) leased between GE and
GECS; information technology (IT) and other services sold to GECS by
GE; aircraft engines manufactured by GE that are installed on air-
craft purchased by GECS from third-party producers for lease to
others; and various investments, loans and allocations of GE corpo-
rate overhead costs. We believe that investors may fi nd it useful to
compare GE’s operating cash fl ows without the effect of GECS
dividends, since these dividends are not representative of the oper-
ating cash fl ows of our industrial businesses and can vary from
period to period based upon the results of the fi nancial services
businesses. Management recognizes that this measure may not be
comparable to cash fl ow results of companies which contain both
industrial and fi nancial services businesses, but believes that this
comparison is aided by the provision of additional information about
the amounts of dividends paid by our fi nancial services business
and the separate presentation in our fi nancial statements of the
Financial Services (GECS) cash fl ows. We believe that our measure of
Industrial CFOA provides management and investors with a useful
measure to compare the capacity of our industrial operations to
generate operating cash fl ow with the operating cash fl ow of other
non-fi nancial businesses and companies and as such provides a
useful measure to supplement the reported GAAP CFOA measure.
Operating Earnings, Operating EPS and Operating EPS
Excluding the Effects of the Preferred Stock Redemption
(In millions; except earnings per share) 2011 2010 V%
Earnings from continuing
operations attributable to GE $14,074 $12,517 12%
Less: Non-operating pension costs
(income), net of tax 688 (204)
Operating earnings $14,762 $12,313 20%
Earnings per share—diluted (a)
Continuing earnings per share $ 1.23 $ 1.14 8%
Less: Non-operating pension costs
(income), net of tax 0.06 (0.02)
Operating earnings per share 1.29 1.12 15%
Less: Effects of the preferred stock
redemption 0.08 —
Operating EPS excluding the
effects of the preferred stock
redemption $ 1.37 $ 1.12 22%
(a) Earnings-per-share amounts are computed independently. As a result, the sum
of per-share amounts may not equal the total.

138 GE 2011 ANNUAL REPORT
supplemental information
Operating earnings excludes non-service related pension costs
of our principal pension plans comprising interest cost,
expected return on plan assets and amortization of actuarial
gains/losses. The service cost and prior service cost compo-
nents of our principal pension plans are included in operating
earnings. We believe that these components of pension cost
better refl ect the ongoing service-related costs of providing
pension benefi ts to our employees. As such, we believe that our
measure of Operating earnings provides management and
investors with a useful measure of the operational results of our
business. Other components of GAAP pension cost are mainly
driven by market performance, and we manage these separately
from the operational performance of our businesses. Neither
GAAP nor operating pension costs are necessarily indicative of
the current or future cash fl ow requirements related to our
pension plan. We also believe that this measure, considered
along with the corresponding GAAP measure, provides manage-
ment and investors with additional information for comparison
of our operating results to the operating results of other compa-
nies. We also believe that Operating EPS excluding the effects of
the $0.8 billion preferred dividend related to the redemption of
our preferred stock (calculated as the difference between the
carrying value and the redemption value of the preferred stock)
is a meaningful measure because it increases the comparability
of period-to-period results.
Operating and Non-Operating Pension Costs (Income)
(In millions) 2011 2010 2009
Service cost for benefits earned $ 1,195 $ 1,149 $ 1,609
Prior service cost amortization 194 238 426
Operating pension costs 1,389 1,387 2,035
Expected return on plan assets (3,940) (4,344) (4,505)
Interest cost on benefit obligations 2,662 2,693 2,669
Net actuarial loss amortization 2,335 1,336 348
Non-operating pension costs
(income) 1,057 (315) (1,488)
Total principal pension plans costs $ 2,446 $ 1,072 $ 547
We have provided the operating and non-operating components
of cost for our principal pension plans. Operating pension costs
comprise the service cost of benefi ts earned and prior service
cost amortization for our principal pension plans. Non-operating
pension costs (income) comprise the expected return on plan
assets, interest cost on benefi t obligations and net actuarial loss
amortization for our principal pension plans. We believe that the
operating components of pension costs better refl ects the ongo-
ing service-related costs of providing pension benefi ts to our
employees. We believe that the operating and non-operating
components of cost for our principal pension plans, considered
along with the corresponding GAAP measure, provide manage-
ment and investors with additional information for comparison of
our pension plan costs and operating results with the pension
plan costs and operating results of other companies.
Average GE Shareowners’ Equity, Excluding Effects of Discontinued Operations(a)
December 31 (In millions) 2011 2010 2009 2008 2007
Average GE shareowners’ equity (b) $122,289 $116,179 $110,535 $113,387 $113,842
Less the effects of the average net investment in
discontinued operations 4,340 13,137 17,092 8,859 12,830
Average GE shareowners’ equity, excluding effects of
discontinued operations (a) $117,949 $103,042 $ 93,443 $104,528 $101,012
(a) Used for computing return on average GE shareowners’ equity and return on average total capital invested (ROTC).
(b) On an annual basis, calculated using a five-point average.
Our ROTC calculation excludes earnings (losses) of discontinued
operations from the numerator because U.S. GAAP requires us to
display those earnings (losses) in the Statement of Earnings. Our
calculation of average GE shareowners’ equity may not be directly
comparable to similarly titled measures reported by other compa-
nies. We believe that it is a clearer way to measure the ongoing
trend in return on total capital for the continuing operations of
our businesses given the extent that discontinued operations
have affected our reported results. We believe that this results in
a more relevant measure for management and investors to evalu-
ate performance of our continuing operations, on a consistent
basis, and to evaluate and compare the performance of our con-
tinuing operations with the ongoing operations of other
businesses and companies.
Defi nitions indicating how the above-named ratios are calcu-
lated using average GE shareowners’ equity, excluding effects of
discontinued operations, can be found in the Glossary.
Ratio of Debt to Equity at GECS, Net of Cash and Equivalents
and with Classification of Hybrid Debt as Equity
December 31 (Dollars in millions) 2011 2010 2009
GECS debt $443,097 $470,520 $493,324
Less cash and equivalents 76,702 60,257 62,575
Less hybrid debt 7,725 7,725 7,725
$358,670 $402,538 $423,024
GECS equity $ 77,110 $ 68,984 $ 70,833
Plus hybrid debt 7,725 7,725 7,725
$ 84,835 $ 76,709 $ 78,558
Ratio 4.23:1 5.25:1 5.39:1
We have provided the GECS ratio of debt to equity on a basis that
refl ects the use of cash and equivalents to reduce debt, and with
long-term debt due in 2066 and 2067 classifi ed as equity. We
believe that this is a useful comparison to a GAAP-based ratio of
debt to equity because cash balances may be used to reduce
debt and because this long-term debt has equity-like characteris-
tics. The usefulness of this supplemental measure may be limited,
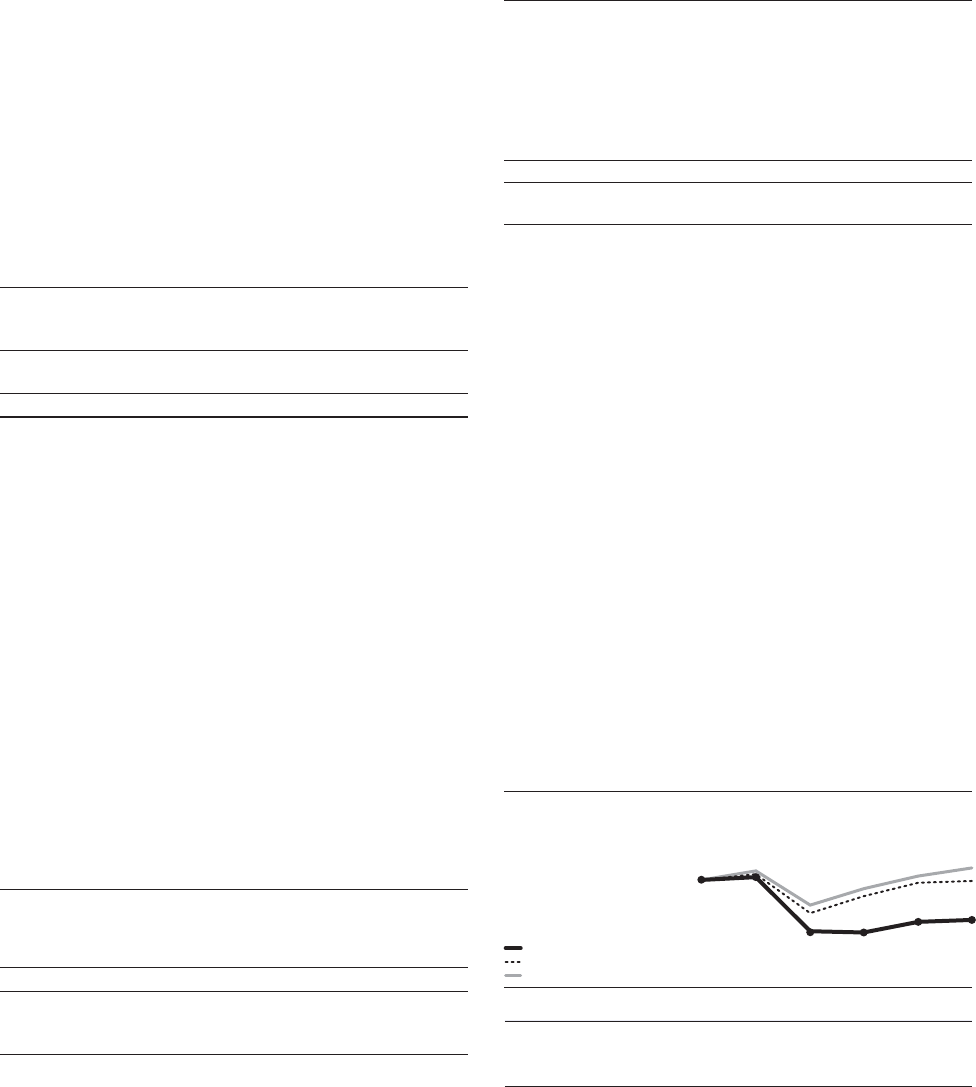
GE 2011 ANNUAL REPORT 139
supplemental information
however, as the total amount of cash and equivalents at any point
in time may be different than the amount that could practically be
applied to reduce outstanding debt, and it may not be advanta-
geous or practical to replace certain long-term debt with equity.
In the fi rst quarter of 2009, GE made a $9.5 billion payment to
GECS (of which $8.8 billion was further contributed to GECC
through capital contribution and share issuance). Despite these
potential limitations, we believe that this measure, considered
along with the corresponding GAAP measure, provides investors
with additional information that may be more comparable to
other fi nancial institutions and businesses.
GE Capital Ending Net Investment (ENI), Excluding Cash and
Equivalents
December 31,
(In billions) 2011
January 1,
2010 (a)
GECC total assets $553.7 $653.6
Less assets of discontinued operations 1.1 15.1
Less non-interest bearing liabilities 32.3 50.3
GE Capital ENI 520.3 588.2
Less cash and equivalents 75.7 61.9
GE Capital ENI, excluding cash and equivalents $444.6 $526.3
(a) As originally reported.
We use ENI to measure the size of our GE Capital segment. We
believe that this measure is a useful indicator of the capital (debt
or equity) required to fund a business as it adjusts for non-interest
bearing current liabilities generated in the normal course of
business that do not require a capital outlay. We also believe that
by excluding cash and equivalents, we provide a meaningful
measure of assets requiring capital to fund our GE Capital seg-
ment, as a substantial amount of this cash and equivalents
resulted from debt issuances to pre-fund future debt maturities
and will not be used to fund additional assets. Providing this
measure will help investors measure how we are performing
against our previously communicated goal to reduce the size of
our fi nancial services segment.
GE Pre-Tax Earnings from Continuing Operations, Excluding
GECS Earnings from Continuing Operations and the
Corresponding Effective Tax Rates
(Dollars in millions) 2011 2010 2009
GE earnings from continuing
operations before income taxes $19,078 $15,060 $13,730
Less GECS earnings from
continuing operations 6,432 3,023 1,177
Total $12,646 $12,037 $12,553
GE provision for income taxes $ 4,839 $ 2,024 $ 2,739
GE effective tax rate, excluding
GECS earnings 38.3% 16.8% 21.8%
Reconciliation of U.S. Federal Statutory Income Tax Rate to
GE Effective Tax Rate, Excluding GECS Earnings
2011 2010 2009
U.S. federal statutory
income tax rate 35.0% 35.0% 35.0%
Reduction in rate resulting from
Tax on global activities
including exports (7.9) (13.5) (12.0)
U.S. business credits (2.3) (2.8) (1.1)
NBCU gain 14.9 ——
All other—net (1.4) (1.9) (0.1)
3.3 (18.2) (13.2)
GE effective tax rate, excluding
GECS earnings 38.3% 16.8% 21.8%
We believe that the GE effective tax rate is best analyzed in relation
to GE earnings before income taxes excluding the GECS net earn-
ings from continuing operations, as GE tax expense does not include
taxes on GECS earnings. Management believes that in addition to
the Consolidated and GECS tax rates shown in Note 14, this supple-
mental measure provides investors with useful information as it
presents the GE effective tax rate that can be used in comparing the
GE results to other non-fi nancial services businesses.
Five-year Financial Performance Graph: 2007–2011
COMPARISON OF FIVE-YEAR CUMULATIVE RETURN AMONG GE,
S&P 500 AND DOW JONES INDUSTRIAL AVERAGE
The annual changes for the fi ve-year period shown in the graph on
this page are based on the assumption that $100 had been
invested in GE stock, the Standard & Poor’s 500 Stock Index (S&P
500) and the Dow Jones Industrial Average (DJIA) on December 31,
2006, and that all quarterly dividends were reinvested. The total
cumulative dollar returns shown on the graph represent the value
that such investments would have had on December 31, 2011.
FIVE-YEAR FINANCIAL
PERFORMANCE
(In dollars)
GE
S&P 500
DJIA
57
46
47
103
100
58
2006 2007 2008 2009 2010 2011
GE $100 $103 $47 $46 $ 57 $ 58
S&P 500 100 105 66 84 97 99
DJIA 100 109 74 91 104 112
2006 2007 2008 2009 2010 2011
140 GE 2011 ANNUAL REPORT
BACKLOG Unfi lled customer orders for products and product ser-
vices (12 months for product services).
BORROWING Financial liability (short or long-term) that obligates us
to repay cash or another fi nancial asset to another entity.
BORROWINGS AS A PERCENTAGE OF TOTAL CAPITAL INVESTED For GE,
the sum of borrowings and mandatorily redeemable preferred stock,
divided by the sum of borrowings, mandatorily redeemable preferred
stock, noncontrolling interests and total shareowners’ equity.
CASH EQUIVALENTS Highly liquid debt instruments with original
maturities of three months or less, such as commercial paper.
Typically included with cash for reporting purposes, unless desig-
nated as available-for-sale and included with investment securities.
CASH FLOW HEDGES Qualifying derivative instruments that we use
to protect ourselves against exposure to variability in future cash
fl ows. The exposure may be associated with an existing asset or
liability, or with a forecasted transaction. See “Hedge.”
COMMERCIAL PAPER Unsecured, unregistered promise to repay
borrowed funds in a specifi ed period ranging from overnight to
270 days.
COMPREHENSIVE INCOME The sum of Net Income and Other
Comprehensive Income. See “Other Comprehensive Income.”
DERIVATIVE INSTRUMENT A fi nancial instrument or contract with
another party (counterparty) that is designed to meet any of a
variety of risk management objectives, including those related to
fl uctuations in interest rates, currency exchange rates or commod-
ity prices. Options, forwards and swaps are the most common
derivative instruments we employ. See “Hedge.”
DISCONTINUED OPERATIONS Certain businesses we have sold or
committed to sell within the next year and therefore will no longer
be part of our ongoing operations. The net earnings, assets and
liabilities, and cash fl ows of such businesses are separately classi-
fi ed on our Statement of Earnings, Statement of Financial Position
and Statement of Cash Flows, respectively, for all periods presented.
EFFECTIVE TAX RATE Provision for income taxes as a percentage of
earnings from continuing operations before income taxes and
accounting changes. Does not represent cash paid for income
taxes in the current accounting period. Also referred to as “actual
tax rate” or “tax rate.”
ENDING NET INVESTMENT (ENI) is the total capital we have invested
in the fi nancial services business. It is the sum of short-term bor-
rowings, long-term borrowings and equity (excluding non control ling
interests) adjusted for unrealized gains and losses on investment
securities and hedging instruments. Alternatively, it is the amount
of assets of continuing operations less the amount of non-interest
bearing liabilities.
EQUIPMENT LEASED TO OTHERS Rental equipment we own that is
available to rent and is stated at cost less accumulated depreciation.
FAIR VALUE HEDGE Qualifying derivative instruments that we use to
reduce the risk of changes in the fair value of assets, liabilities or
certain types of fi rm commitments. Changes in the fair values of
derivative instruments that are designated and effective as fair value
hedges are recorded in earnings, but are offset by corresponding
changes in the fair values of the hedged items. See “Hedge.”
FINANCING RECEIVABLES Investment in contractual loans and
leases due from customers (not investment securities).
FORWARD CONTRACT Fixed price contract for purchase or sale of a
specifi ed quantity of a commodity, security, currency or other
fi nancial instrument with delivery and settlement at a specifi ed
future date. Commonly used as a hedging tool. See “Hedge.”
GOODWILL The premium paid for acquisition of a business.
Calculated as the purchase price less the fair value of net assets
acquired (net assets are identifi ed tangible and intangible
assets, less liabilities assumed).
GUARANTEED INVESTMENT CONTRACTS (GICS) Deposit-type prod-
ucts that guarantee a minimum rate of return, which may be fi xed
or fl oating.
HEDGE A technique designed to eliminate risk. Often refers to the
use of derivative fi nancial instruments to offset changes in interest
rates, currency exchange rates or commodity prices, although
many business positions are “naturally hedged”—for example,
funding a U.S. fi xed-rate investment with U.S. fi xed-rate borrowings
is a natural interest rate hedge.
INTANGIBLE ASSET A non-fi nancial asset lacking physical sub-
stance, such as goodwill, patents, licenses, trademarks and
customer relationships.
INTEREST RATE SWAP Agreement under which two counterparties
agree to exchange one type of interest rate cash fl ow for another.
In a typical arrangement, one party periodically will pay a fi xed
amount of interest, in exchange for which that party will receive
variable payments computed using a published index. See “Hedge.”
INVESTMENT SECURITIES Generally, an instrument that provides an
ownership position in a corporation (a stock), a creditor relationship
with a corporation or governmental body (a bond), rights to con-
tractual cash fl ows backed by pools of fi nancial assets or rights to
ownership such as those represented by options, subscription
rights and subscription warrants.
MATCH FUNDING A risk control policy that provides funding for a
particular fi nancial asset having the same currency, maturity and
interest rate characteristics as that asset. Match funding is exe-
cuted directly, by issuing debt, or synthetically, through a
combination of debt and derivative fi nancial instruments. For
example, when we lend at a fi xed interest rate in the U.S., we can
borrow those U.S. dollars either at a fi xed rate of interest or at a
fl oating rate executed concurrently with a pay-fi xed interest rate
swap. See “Hedge.”
MONETIZATION Sale of fi nancial assets to a third party for cash.
For example, we sell certain loans, credit card receivables and
trade receivables to third-party fi nancial buyers, typically provid-
ing at least some credit protection and often agreeing to provide
collection and processing services for a fee. Monetization nor-
mally results in gains on interest-bearing assets and losses on
non-interest bearing assets. See “Securitization” and “Variable
Interest Entity.”
NONCONTROLLING INTEREST Portion of shareowner’s equity in a
subsidiary that is not attributable to GE.
OPERATING PROFIT GE earnings from continuing operations before
interest and other fi nancial charges, income taxes and effects of
accounting changes.
glossary
GE 2011 ANNUAL REPORT 141
OPTION The right, not the obligation, to execute a transaction at a
designated price, generally involving equity interests, interest rates,
currencies or commodities. See “Hedge.”
OTHER COMPREHENSIVE INCOME Changes in assets and liabilities
that do not result from transactions with shareowners and are not
included in net income but are recognized in a separate component
of shareowners’ equity. Other Comprehensive Income includes the
following components:
• INVESTMENT SECURITIES—Unrealized gains and losses on securi-
ties classifi ed as available-for-sale
• CURRENCY TRANSLATION ADJUSTMENTS—The result of translating
into U.S. dollars those amounts denominated or measured in a
different currency
• CASH FLOW HEDGES—The effective portion of the fair value of
cash fl ow hedges. Such hedges relate to an exposure to vari-
ability in the cash fl ows of recognized assets, liabilities or
forecasted transactions that are attributable to a specifi c risk
• BENEFIT PLANS—Unamortized prior service costs and net actu-
arial losses (gains) related to pension and retiree health and
life benefi ts
• RECLASSIFICATION ADJUSTMENTS—Amounts previously recog-
nized in Other Comprehensive Income that are included in net
income in the current period
PRODUCT SERVICES For purposes of the fi nancial statement display
of sales and costs of sales in our Statement of Earnings, “goods” is
required by U.S. Securities and Exchange Commission regulations to
include all sales of tangible products, and “services” must include all
other sales, including broadcasting and other services activities. In
our Management’s Discussion and Analysis of Operations we refer
to sales under product service agreements and sales of both goods
(such as spare parts and equipment upgrades) and related services
(such as monitoring, maintenance and repairs) as sales of “product
services,” which is an important part of our operations.
PRODUCT SERVICES AGREEMENTS Contractual commitments, with
multiple-year terms, to provide specifi ed services for products in
our Energy Infrastructure, Aviation and Transportation installed
base—for example, monitoring, maintenance, service and spare
parts for a gas turbine/generator set installed in a customer’s
power plant.
PRODUCTIVITY The rate of increased output for a given level of
input, with both output and input measured in constant currency.
PROGRESS COLLECTIONS Payments received from customers as
deposits before the associated work is performed or product
is delivered.
QUALIFIED SPECIAL PURPOSE ENTITIES (QSPEs) A type of variable
interest entity whose activities are signifi cantly limited and entirely
specifi ed in the legal documents that established it. There also are
signifi cant limitations on the types of assets and derivative instru-
ments such entities may hold and the types and extent of activities
and decision-making they may engage in.
RETAINED INTEREST A portion of a transferred fi nancial asset
retained by the transferor that provides rights to receive portions
of the cash infl ows from that asset.
RETURN ON AVERAGE GE SHAREOWNERS’ EQUITY Earnings from
continuing operations before accounting changes divided by
average GE shareowners’ equity, excluding effects of discontinued
operations (on an annual basis, calculated using a fi ve-point aver-
age). Average GE shareowners’ equity, excluding effects of
discontinued operations, as of the end of each of the years in the
fi ve-year period ended December 31, 2011, is described in the
Supplemental Information section.
RETURN ON AVERAGE TOTAL CAPITAL INVESTED For GE, earnings
from continuing operations before accounting changes plus the
sum of after-tax interest and other fi nancial charges and noncon-
trolling interests, divided by the sum of the averages of total
shareowners’ equity (excluding effects of discontinued operations),
borrowings, mandatorily redeemable preferred stock and noncon-
trolling interests (on an annual basis, calculated using a fi ve-point
average). Average total shareowners’ equity, excluding effects of
discontinued operations as of the end of each of the years in the
fi ve-year period ended December 31, 2011, is described in the
Supplemental Information section.
SECURITIZATION A process whereby loans or other receivables are
packaged, underwritten and sold to investors. In a typical trans-
action, assets are sold to a special purpose entity, which
purchases the assets with cash raised through issuance of ben-
efi cial interests (usually debt instruments) to third-party investors.
Whether or not credit risk associated with the securitized assets
is retained by the seller depends on the structure of the securiti-
zation. See “Monetization” and “Variable Interest Entity.”
SUBPRIME For purposes of Consumer related discussion, sub-
prime includes consumer fi nance products like mortgage, auto,
cards, sales fi nance and personal loans to U.S. and global borrow-
ers whose credit score implies a higher probability of default
based upon GECC’s proprietary scoring models and defi nitions,
which add various qualitative and quantitative factors to a base
credit score such as a FICO score or global bureau score. Although
FICO and global bureau credit scores are a widely accepted rating
of individual consumer creditworthiness, the internally modeled
scores are more refl ective of the behavior and default risks in the
portfolio compared to stand-alone generic bureau scores.
TURNOVER Broadly based on the number of times that working
capital is replaced during a year. Current receivables turnover is
total sales divided by the fi ve-point average balance of GE current
receivables. Inventory turnover is total sales divided by a fi ve-
point average balance of inventories. See “Working Capital.”
VARIABLE INTEREST ENTITY An entity that must be consolidated by
its primary benefi ciary, the party that holds a controlling fi nancial
interest. A variable interest entity has one or both of the following
characteristics: (1) its equity at risk is not suffi cient to permit the
entity to fi nance its activities without additional subordinated
fi nancial support from other parties, or (2) as a group, the equity
investors lack one or more of the following characteristics: (a) the
power to direct the activities that most signifi cantly affect the
economic performance of the entity, (b) obligation to absorb
expected losses, or (c) right to receive expected residual returns.
WORKING CAPITAL Represents GE current receivables and inven-
tories, less GE accounts payable and progress collections.
glossary

142 GE 2011 ANNUAL REPORT
corporate information
CORPORATE HEADQUARTERS
General Electric Company
3135 Easton Turnpike, Fairfi eld, CT 06828
(203) 373-2211
ANNUAL MEETING
GE’s 2012 Annual Meeting of Shareowners will be held on Wednesday,
April 25, 2012, at the Detroit Marriott at the Renaissance Center in
Detroit, Michigan.
SHAREOWNER INFORMATION
To transfer securities, write to GE Share Owner Services, c/o
Computershare, P.O. Box 358010, Pittsburgh, PA 15252-8010.
For shareowner inquiries, including enrollment information and a
prospectus for the Direct Purchase and Reinvestment Plan, “GE Stock
Direct,” write to GE Share Owner Services, c/o Computershare,
P.O. Box 358016, Pittsburgh, PA 15252-8016; or call (800) 786-2543
(800-STOCK-GE) or (201) 680-6848; or send an e-mail to
shrrelations@bnymellon.com.
For Internet access to general shareowner information and certain
forms, including transfer instructions or stock power, visit the Web site
at www.bnymellon.com/shareowner.
STOCK EXCHANGE INFORMATION
In the United States, GE common stock is listed on the New York Stock
Exchange (NYSE), its principal market. It also is listed on certain non-U.S.
exchanges, including the London Stock Exchange and Euronext Paris.
TRADING AND DIVIDEND INFORMATION
(In dollars)
Common Stock
Market Price Dividends
declaredHigh Low
2011
Fourth quarter $18.28 $14.02 $0.17
Third quarter 19.53 14.72 0.15
Second quarter 20.85 17.97 0.15
First quarter 21.65 18.12 0.14
2010
Fourth quarter $18.49 $15.63 $0.14
Third quarter 16.70 13.75 0.12
Second quarter 19.70 14.27 0.10
First quarter 18.94 15.15 0.10
As of January 31, 2012, there were approximately 561,000 shareowner
accounts of record.
FORM 10-K AND OTHER REPORTS; CERTIFICATIONS
The fi nancial information in this report, in the opinion of management,
substantially conforms with information required in the “Form 10-K
Report” fi led with the U.S. Securities and Exchange Commission (SEC)
in February 2012. However, the Form 10-K Report also contains addi-
tional information, and it can be viewed at www.ge.com/secreports.
Copies also are available, without charge, from GE Corporate
Investor Communications, 3135 Easton Turnpike, Fairfi eld, CT 06828.
General Electric Capital Corporation fi led a Form 10-K Report with
the SEC, and this can also be viewed at www.ge.com/secreports.
GE has included as exhibits to its Annual Report on Form 10-K for
fi scal year 2011 fi led with the SEC, certifi cations of GE’s Chief Executive
Offi cer and Chief Financial Offi cer certifying the quality of the Company’s
public disclosure. GE’s Chief Executive Offi cer has also submitted to the
NYSE a certifi cation certifying that he is not aware of any violations by
GE of the NYSE corporate governance listing standards.
INTERNET ADDRESS INFORMATION
Visit us online at www.ge.com for more information about GE and its
products and services. For information about GE’s consumer products
and services, visit us at www.geconsumerandindustrial.com.
Information on the GE Foundation, GE’s philanthropic organization,
can be viewed at www.gefoundation.com.
The 2011 GE Annual Report is available online at www.ge.com/
annualreport. For detailed news and information regarding our
strategy and our businesses, please visit our Press Room online at
www.genewscenter.com, our Investor Information site at
www.ge.com/investor or our corporate blog at www.gereports.com.
CORPORATE OMBUDSPERSON
To report concerns related to compliance with the law, GE policies or
government contracting requirements, write to GE Corporate
Ombudsperson, P.O. Box 911, Fairfi eld, CT 06825; or call (800) 227-5003 or
(203) 373-2603; or send an e-mail to ombudsperson@corporate. ge.com.
CONTACT THE GE BOARD OF DIRECTORS
The Audit Committee and the non-management directors have estab-
lished procedures to enable anyone who has a concern about GE’s conduct,
or any employee who has a concern about the Company’s accounting,
internal accounting controls or auditing matters, to communicate that
concern directly to the presiding director or to the Audit Committee.
Such communications may be confi dential or anonymous, and may be
submitted in writing to: GE Board of Directors, General Electric Company
(W2E), 3135 Easton Turnpike, Fairfi eld, CT 06828; or call (800) 417-0575 or
(203) 373-2652; or send an e-mail to Directors@corporate.ge.com.
©2012 General Electric Company. Printed in U.S.A.
GE, , ecomagination, healthymagination and Imagination at Work are trade-
marks and service marks of the General Electric Company. Other marks used
throughout are trademarks and service marks of their respective owners.
Patent applications fi led in 2011 by GE include U.S. original and other
applications.
Caution Concerning Forward-Looking Statements: This document contains “for-
ward-looking statements”—that is, statements related to future, not past, events.
In this context, forward-looking statements often address our expected future
business and fi nancial performance and fi nancial condition, and often contain
words such as “expect,” “anticipate,” “intend,” “plan,” “believe,” “seek,” “see,” or
“will.” Forward-looking statements by their nature address matters that are, to dif-
ferent degrees, uncertain. For us, particular uncertainties that could cause our
actual results to be materially different than those expressed in our forward-look-
ing statements include: current economic and fi nancial conditions, including
volatility in interest and exchange rates, commodity and equity prices and the
value of fi nancial assets; potential market disruptions or other impacts arising in
the United States or Europe from developments in the European sovereign debt
situation; the impact of conditions in the fi nancial and credit markets on the avail-
ability and cost of General Electric Capital Corporation’s (GECC) funding and on our
ability to reduce GECC’s asset levels as planned; the impact of conditions in the
housing market and unemployment rates on the level of commercial and con-
sumer credit defaults; changes in Japanese consumer behavior that may affect
our estimates of liability for excess interest refund claims (Grey Zone); our ability to
maintain our current credit rating and the impact on our funding costs and com-
petitive position if we do not do so; the adequacy of our cash fl ow and earnings
and other conditions which may affect our ability to pay our quarterly dividend at
the planned level; the level of demand and fi nancial performance of the major
industries we serve, including, without limitation, air and rail transportation, energy
generation, real estate and healthcare; the impact of regulation and regulatory,
investigative and legal proceedings and legal compliance risks, including the
impact of fi nancial services regulation; strategic actions, including acquisitions,
joint ventures and dispositions and our success in completing announced transac-
tions and integrating acquired businesses; the impact of potential information
technology or data security breaches; and numerous other matters of national,
regional and global scale, including those of a political, economic, business and
competitive nature. These uncertainties may cause our actual future results to be
materially different than those expressed in our forward-looking statements. We
do not undertake to update our forward-looking statements.

2011 Annual Report
GE Works
2011 Annual Report
GE Works
2011 Annual Report
GE Works
2011 Annual Report
GE Works
The paper used in this report was supplied
by participants of the Sustainable Initiative
Programs. The majority of the power utilized
to manufacture this paper was renewable
energy, produced with GE’s wind and biogas
technologies, and powered by GE steam
engines and turbine engines.
GE is consistently ranked as one of the world’s leading corporations:
Visit our interactive online annual report
at www.ge.com/annualreport
Thanks to the customers, partners and GE employees
who appear in this annual report for contributing their time
and support.
FORTUNE is a registered trademark
of Time Inc. and is used under
license. From FORTUNE Magazine,
March 21, 2011 © 2011 Time Inc.
FORTUNE and Time Inc. are not
affi liated with, and do not endorse
products or services of, Licensee.
BARRON’S
Most Respected
Companies
FAST COMPANY
50 Most Innovative
Companies
FORTUNE
World’s Most
Admired Companies®
BLOOMBERG
BUSINESSWEEK
Best Companies
for Leaders
ETHISPHERE
World’s Most
Ethical Companies
10.8
17.8
22.3
12.5 14.1
9.5
15.9
20.4
11.3 13.0
20082007 2009 2010 2011
EARNINGS ATTRIBUTABLE TO GE
(In $ billions)
NBCU
GE
ex NBCU
GE’s 2011 Annual Report was printed with four
different cover designs. The covers represent
the many ways GE works to build, power, move
and cure the world.
150
154
180
170
147
133
139
163
155 142
20082007 2009 2010 2011
CONSOLIDATED REVENUES
(In $ billions)
NBCU
GE
ex NBCU
16.8
16.0
20082007
GECS
Dividend
Industrial
CFOA
2009 2010 2011
19.1
23.3
16.4 14.7
12.1
CASH FLOW FROM OPERATING
ACTIVITIES (CFOA)
(In $ billions)
22%
GROWTH CONTINUES
22% increase in Operating
EPS excluding impact
of the preferred stock
redemption, and 20% rise
in Operating earnings.
$200B
RECORD INDUSTRIAL
BACKLOG
Record equipment and service
orders drove the backlog to a
record of $200 billion.
$85B
FINANCIAL FLEXIBILITY
GE had $85 billion of cash and
equivalents at year-end 2011.
70%
DIVIDEND INCREASES
GE announced two dividend
increases in 2011 following
two increases in 2010: a total
70% increase over the two years.
18%
INTERNATIONAL GROWTH
GE’s global growth initiative
helped drive 18% growth in
industrial international revenue.
$18B
U.S. EXPORTS
International sales of American-
made products totaled $18 billion
in 2011, a $1 billion increase
from 2010.
6%
R&D SPEND
GE continued its strong research
and development investment
with total spending at 6% of
industrial revenue.
13,000
U.S. JOBS
GE has announced the creation
of 13,000 jobs in the United States
since 2009.
2011 SUMMARY fi nancial and strategic highlights
Note: Financial results from continuing operations unless otherwise noted.
CONTENTS
2 Letter to Shareowners
10 Business Overview
29 Board of Directors
31 Financial Section
142 Corporate Information
ON THE COVER
Fabio Dominguez de Freitas
Mechanic Inspector
GE Aviation’s Celma facility in Petrópolis,
Brazil, provides engine services to
aircraft customers in Latin America,
the U.S. and Europe.
Design by Addison www.addison.com Printing by Cenveo

General Electric Company
Fairfi eld, Connecticut 06828
www.ge.com
3.EPC055148101A.102
2011 Annual Report
GE 2011 Annual Report
GE Works
