Android Memory Leak Analysis Guide 80 NJ221 1
User Manual: Pdf
Open the PDF directly: View PDF ![]() .
.
Page Count: 55
- Android Memory Leak Analysis Guide
- Contents
- Objectives
- What’s Memory Leak ~
- What’s Memory Leak
- What’s Memory Leak for Android
- What’s Memory Leak for Android
- What’s Memory Leak Dump ~
- What’s Memory Leak Dump
- HPROF Binary Heap Dumps
- What’s Garbage Collection Roots (GC roots)
- What’s Garbage Collection Roots(GC roots)
- How to Get Memory Dump?
- How to Get Memory Dump?
- How to Get Memory Dump?
- DDMS Memory Tool~
- DDMS Memory Tool
- Viewing Heap Usage for a Process
- Viewing Heap Usage for a Process
- Viewing Heap Usage for a Process
- Tracking Memory Allocation of Objects
- Tracking Memory Allocation of Objects
- MAT (Memory Analyzer Tool)~
- MAT (Memory Analyzer Tool)~
- Install MAT
- Load Dump File
- The Leak Suspects Report
- The Leak Suspects Report
- The Leak Suspects Report
- The Leak Suspects Report
- Histogram View
- Histogram View
- Histogram View
- Dominator Tree
- Dominator Tree
- Dominator Tree
- What to Do?
- What to Do?
- What to Do?
- Detecting a Memory Leak
- Check the logcat Output Message
- Check the logcat Output Message
- Check the logcat Output Message
- Check the logcat Output Message
- Check the logcat Output Message
- Comparing Heap Dumps with MAT
- Comparing Heap Dumps with MAT
- Useful Information
- ServiceConnection Leak
- StrictMode
- References
- References
- Questions?
Confidential and Proprietary – Qualcomm Technologies, Inc.
Restricted Distribution: Not to be distributed to anyone who is not an employee of either Qualcomm or its subsidiaries without the express approval of Qualcomm’s Configuration Management.
Android Memory Leak Analysis Guide
80-NJ221-1 A

Confidential and Proprietary – Qualcomm Technologies, Inc. | MAY CONTAIN U.S. AND INTERNATIONAL EXPORT CONTROLLED INFORMATION
PAGE 2 80-NJ221-1 A Jul 2013
Confidential and Proprietary – Qualcomm Technologies, Inc.
NO PUBLIC DISCLOSURE PERMITTED: Please report postings of this document on public servers or websites to: DocCtrlAgent@qualcomm.com.
Restricted Distribution: Not to be distributed to anyone who is not an employee of either Qualcomm or its subsidiaries without the express approval of Qualcomm’s
Configuration Management.
Not to be used, copied, reproduced, or modified in whole or in part, nor its contents revealed in any manner to others without the express written permission of
Qualcomm Technologies, Inc.
Qualcomm reserves the right to make changes to the product(s) or information contained herein without notice. No liability is assumed for any damages arising directly
or indirectly by their use or application. The information provided in this document is provided on an “as is” basis.
This document contains confidential and proprietary information and must be shredded when discarded.
Qualcomm is a trademark of QUALCOMM Incorporated, registered in the United States and other countries. All QUALCOMM Incorporated trademarks are used with
permission. Other product and brand names may be trademarks or registered trademarks of their respective owners.
This technical data may be subject to U.S. and international export, re-export, or transfer (“export”) laws. Diversion contrary to U.S. and international law is strictly
prohibited.
Qualcomm Technologies, Inc.
5775 Morehouse Drive
San Diego, CA 92121
U.S.A.
© 2013 Qualcomm Technologies, Inc.
All rights reserved.
Confidential and Proprietary – Qualcomm Technologies, Inc.
Confidential and Proprietary – Qualcomm Technologies, Inc. | MAY CONTAIN U.S. AND INTERNATIONAL EXPORT CONTROLLED INFORMATION
PAGE 3 80-NJ221-1 A Jul 2013
Revision History
Note: There is no Rev. I, O, Q, S, X, or Z per Mil. standards.
Revision Date Description
A Jul 2013 Initial release

Confidential and Proprietary – Qualcomm Technologies, Inc. | MAY CONTAIN U.S. AND INTERNATIONAL EXPORT CONTROLLED INFORMATION
PAGE 4 80-NJ221-1 A Jul 2013
Contents
Objectives
What’s Memory Leak?
What’s Memory Leak Dump?
DDMS Memory Tool
MAT(Memory Analyzer Tool)
References
Questions?

Confidential and Proprietary – Qualcomm Technologies, Inc. | MAY CONTAIN U.S. AND INTERNATIONAL EXPORT CONTROLLED INFORMATION
PAGE 5 80-NJ221-1 A Jul 2013
Objectives
At the end of this presentation, you will understand:
What memory leak is.
What memory leak dump is and how to get it.
HPROF Binary Heap Dumps
What Garbage Collection Roots(GC roots) is
How to get memory leak dump for Android
What DDMS memory tool is and how to use it to detect memory leak.
What MAT is and how to use it to analyze memory leak.

Confidential and Proprietary – Qualcomm Technologies, Inc. | MAY CONTAIN U.S. AND INTERNATIONAL EXPORT CONTROLLED INFORMATION
PAGE 6 80-NJ221-1 A Jul 2013
What’s Memory Leak

Confidential and Proprietary – Qualcomm Technologies, Inc. | MAY CONTAIN U.S. AND INTERNATIONAL EXPORT CONTROLLED INFORMATION
PAGE 7 80-NJ221-1 A Jul 2013
What’s Memory Leak
In computer science, a memory leak occurs when a computer program
incorrectly manages memory allocations.
In object-oriented programming, a memory leak may happen when an
object is stored in memory but cannot be accessed by the running code.

Confidential and Proprietary – Qualcomm Technologies, Inc. | MAY CONTAIN U.S. AND INTERNATIONAL EXPORT CONTROLLED INFORMATION
PAGE 8 80-NJ221-1 A Jul 2013
What’s Memory Leak for Android
For Android (Java), "memory leak" in your code is when you keep a
reference to an object that is no longer needed. Sometimes a single
reference can prevent a large set of objects from being collected as
garbage.
The memory allocated by Android application can be retrieved by the
Dalvik (Android process virtual machine) after the application exits. So
even the application has memory leak, after the application exits, the
leaked memory also can be retrieved.

Confidential and Proprietary – Qualcomm Technologies, Inc. | MAY CONTAIN U.S. AND INTERNATIONAL EXPORT CONTROLLED INFORMATION
PAGE 9 80-NJ221-1 A Jul 2013
What’s Memory Leak for Android
If the Android application needs to run for a long time without exiting, or
the application needs to allocate large memory, the memory leak will be a
problem.
Every Android application is running in a separate thread. And every
application has the memory limitation.
If the used memory is near the limitation, out of memory will appear, the
application will be killed.
There are two most common memory leak types.
The first one is a static reference to a non-static inner class, which will keep a
reference to the Activity and prevent it from being GC. Upon every screen
orientation change, the onCreate method will be invoked and a new MainActivity
instance will be created. Due to old references, the old Activities will not be
collected as garbage .
The second case is known as a “context leak”. This case is hard to spot as the
main issue lies within the application’s context passed to a static class that
keeps it as a field – which of course is a hard reference.

Confidential and Proprietary – Qualcomm Technologies, Inc. | MAY CONTAIN U.S. AND INTERNATIONAL EXPORT CONTROLLED INFORMATION
PAGE 10 80-NJ221-1 A Jul 2013
What’s Memory Leak Dump

Confidential and Proprietary – Qualcomm Technologies, Inc. | MAY CONTAIN U.S. AND INTERNATIONAL EXPORT CONTROLLED INFORMATION
PAGE 11 80-NJ221-1 A Jul 2013
What’s Memory Leak Dump
A memory dump is a snapshot of the memory of a Java process at a
certain point of time.
There are different formats for persisting this data. Depending on the
format, it may contain different pieces of information. But in general the
snapshot contains information about the java objects and classes in the
memory at the moment the snapshot is triggered.
As it is just a snapshot at a given moment, a memory dump does not
contain information such as when and where (in which method) an object
is allocated.

Confidential and Proprietary – Qualcomm Technologies, Inc. | MAY CONTAIN U.S. AND INTERNATIONAL EXPORT CONTROLLED INFORMATION
PAGE 12 80-NJ221-1 A Jul 2013
HPROF Binary Heap Dumps
Information about all loaded classes. For every class, the HPROF dump
contains its name, its super-class, its class loader, the defined fields for
the instances (name and type), the static fields of the class and their
values.
Information about all objects. For every object, one can find the class and
the values of all fields – both references and primitive fields. The
possibility to look at the names and the content of certain objects, e.g. the
char[ ] within a huge StringBuilder, the size of a collection, etc. can be
very helpful when performing memory analysis
A list of GC roots.
The call stacks of all threads.

Confidential and Proprietary – Qualcomm Technologies, Inc. | MAY CONTAIN U.S. AND INTERNATIONAL EXPORT CONTROLLED INFORMATION
PAGE 13 80-NJ221-1 A Jul 2013
What’s Garbage Collection Roots (GC roots)
The Garbage Collector (GC) is responsible for removing objects that will
never be accessed.
Objects cannot be accessed if they are not reachable through any
reference chain.
The starting point of this analysis is the Garbage Collection Roots, i.e.
objects that are assumed reachable by the virtual machine itself.
Objects that are reachable from the GC roots remain in memory, objects
that are not reachable are garbage collected.

Confidential and Proprietary – Qualcomm Technologies, Inc. | MAY CONTAIN U.S. AND INTERNATIONAL EXPORT CONTROLLED INFORMATION
PAGE 14 80-NJ221-1 A Jul 2013
What’s Garbage Collection Roots(GC roots)
Common GC Roots are objects on the call stack of the current thread (e.g.
method parameters and local variables), the thread itself, classes loaded
by the system class loader and objects kept alive due to native code.
GC Roots are very important when determining why an object is still kept
in memory: The reference chain from an arbitrary object to the GC roots
(Path to GC Roots...) tells who accidentally keeps a reference.

Confidential and Proprietary – Qualcomm Technologies, Inc. | MAY CONTAIN U.S. AND INTERNATIONAL EXPORT CONTROLLED INFORMATION
PAGE 15 80-NJ221-1 A Jul 2013
How to Get Memory Dump?
We can get the *.hprof (memory dump file) with one of the ways below:
In DDMS, select ‘Update Heap’ and ‘Dump HPROF file’ can get the *.hprof file.
Call the function ‘adroid.os.Debug.dumpHprofData("/data/temp/myapp.hprof");’
can save the *.hprof file to a folder in the device.
Dalvik VM will dump hprof file within /data/misc folder if SIGUSR1 and/or
SIGQUIT signal is received. Manually send SIGUSR1 to process: kill -10 pid.
(Before Android 2.3)
The Android provides monkey tool (random testing tool), with --hprof option will
generate hprof file within /data/misc folder.
The folder /data/misc shall have 777 permissions.
Confidential and Proprietary – Qualcomm Technologies, Inc. | MAY CONTAIN U.S. AND INTERNATIONAL EXPORT CONTROLLED INFORMATION
PAGE 16 80-NJ221-1 A Jul 2013
How to Get Memory Dump?

Confidential and Proprietary – Qualcomm Technologies, Inc. | MAY CONTAIN U.S. AND INTERNATIONAL EXPORT CONTROLLED INFORMATION
PAGE 17 80-NJ221-1 A Jul 2013
How to Get Memory Dump?
If the *.hprof can’t be recognize by the MAT(Memory Analyzer Tool), we
need to convert it as below:
sdk\tools\hprof-conv a.hprof b.hprof
Now the ‘b.hprof’ can be used in the MAT.
‘hprof-conv’ is a tool including in Android SDK.

Confidential and Proprietary – Qualcomm Technologies, Inc. | MAY CONTAIN U.S. AND INTERNATIONAL EXPORT CONTROLLED INFORMATION
PAGE 18 80-NJ221-1 A Jul 2013
DDMS Memory Tool

Confidential and Proprietary – Qualcomm Technologies, Inc. | MAY CONTAIN U.S. AND INTERNATIONAL EXPORT CONTROLLED INFORMATION
PAGE 19 80-NJ221-1 A Jul 2013
DDMS Memory Tool
Android ships with a debugging tool called the Dalvik Debug Monitor
Server (DDMS), which provides port-forwarding services, screen capture
on the device, thread and heap information on the device, logcat, process,
and radio state information, incoming call and SMS spoofing, location data
spoofing, and more.

Confidential and Proprietary – Qualcomm Technologies, Inc. | MAY CONTAIN U.S. AND INTERNATIONAL EXPORT CONTROLLED INFORMATION
PAGE 20 80-NJ221-1 A Jul 2013
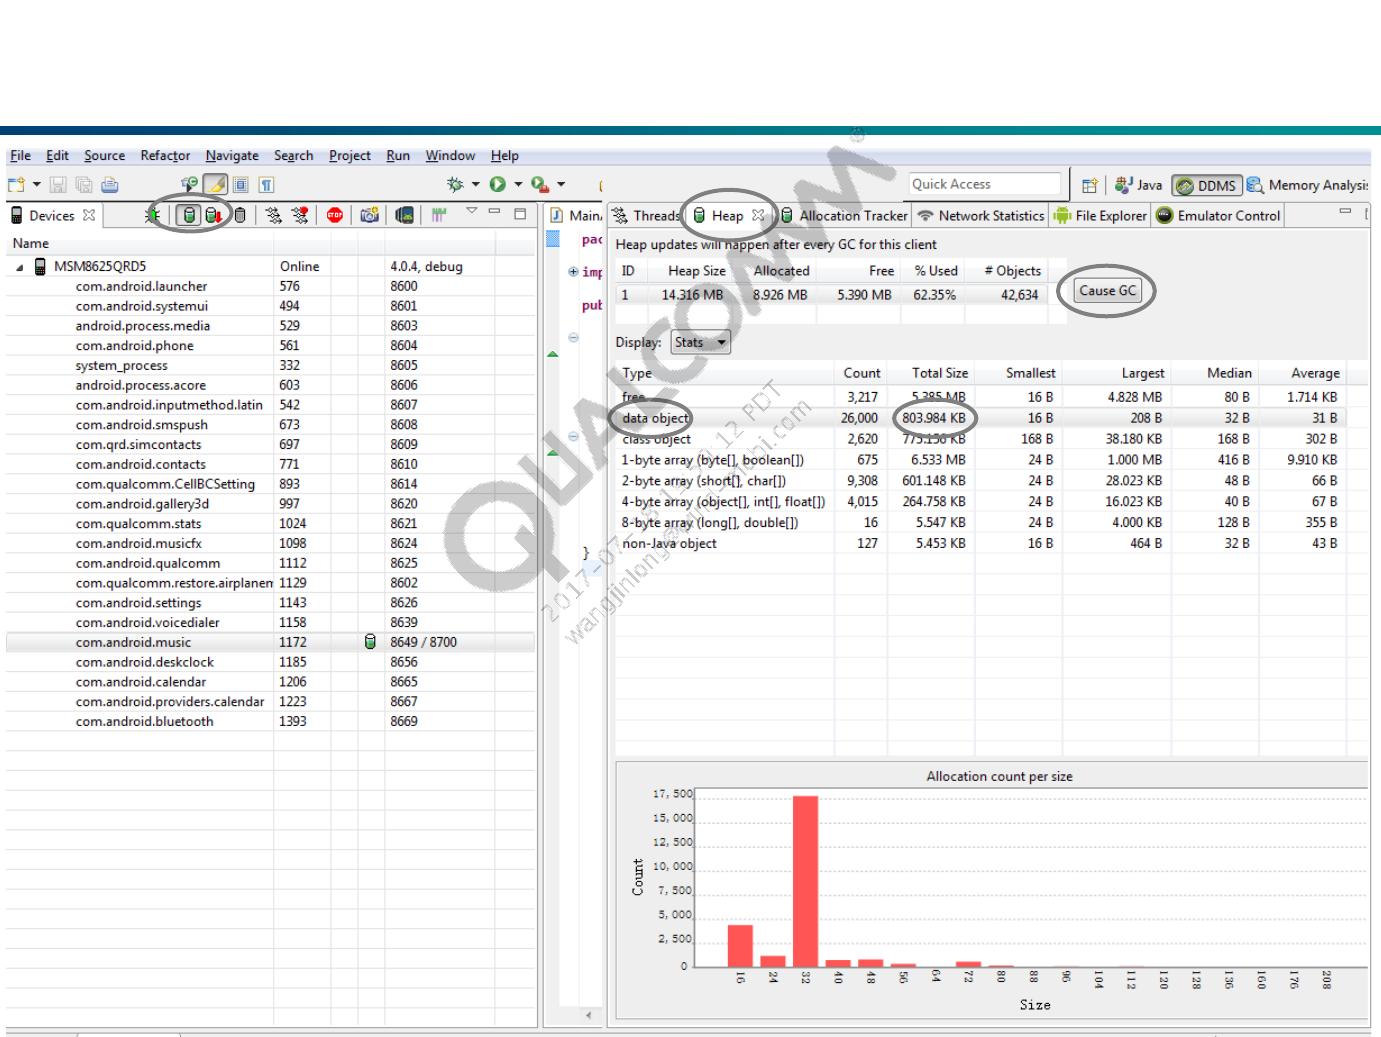
Viewing Heap Usage for a Process
DDMS allows you to view how much heap memory a process is using.
This information is useful in tracking heap usage at a certain point of time
during the execution of your application.
To view heap usage for a process:
1) In the Devices tab, select the process that you want to see the heap
information for.
2) Click the Update Heap button to enable heap information for the process.
3) In the Heap tab, click Cause GC to invoke garbage collection, which enables
the collection of heap data. When the operation completes, you will see a
group of object types and the memory that has been allocated for each type.
You can click Cause GC again to refresh the data.
4) Click on an object type in the list to see a bar graph that shows the number of
objects allocated for a particular memory size in bytes.
Confidential and Proprietary – Qualcomm Technologies, Inc. | MAY CONTAIN U.S. AND INTERNATIONAL EXPORT CONTROLLED INFORMATION
PAGE 21 80-NJ221-1 A Jul 2013
Viewing Heap Usage for a Process

Confidential and Proprietary – Qualcomm Technologies, Inc. | MAY CONTAIN U.S. AND INTERNATIONAL EXPORT CONTROLLED INFORMATION
PAGE 22 80-NJ221-1 A Jul 2013
Viewing Heap Usage for a Process
In this heap view, there is a type called ‘data object’, we should pay
attention to the ‘Total Size’ of this type.
We can make different operations in our application and check the size.
If there is no memory leak, the size will keep in a range.
If the size increases continuously, there should be memory leak.

Confidential and Proprietary – Qualcomm Technologies, Inc. | MAY CONTAIN U.S. AND INTERNATIONAL EXPORT CONTROLLED INFORMATION
PAGE 23 80-NJ221-1 A Jul 2013
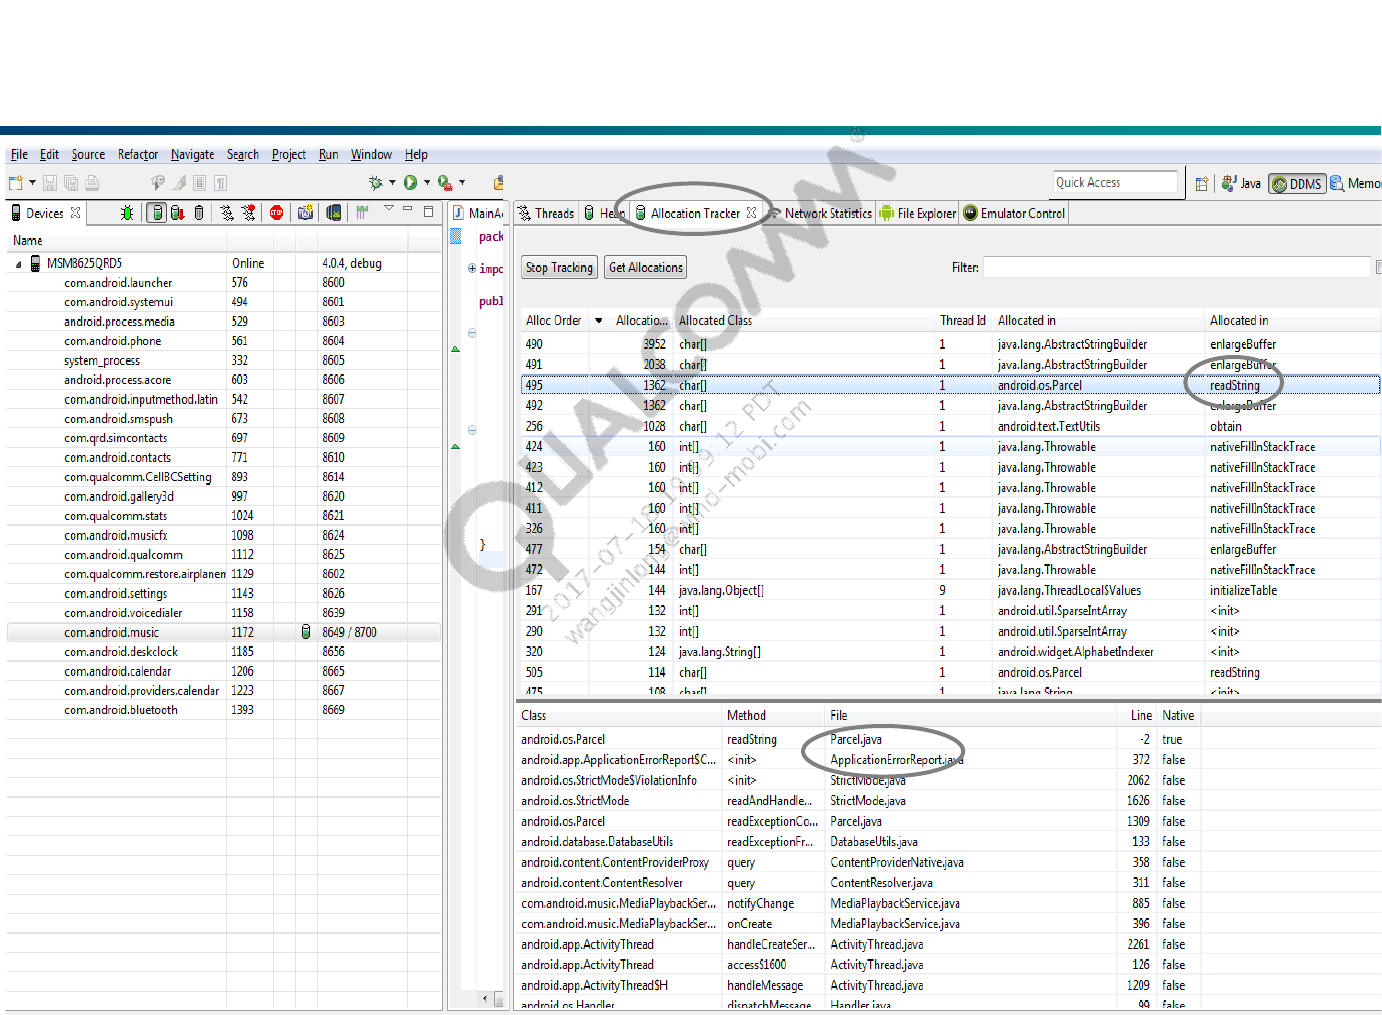
Tracking Memory Allocation of Objects
DDMS provides a feature to track objects that are being allocated to
memory and to see which classes and threads are allocating the objects.
This allows you to track, in real time, where objects are being allocated
when you perform certain actions in your application. This information is
valuable for assessing memory usage that can affect application
performance.
To track memory allocation of objects:
1) In the Devices tab, select the process that you want to enable allocation
tracking for.
2) In the Allocation Tracker tab, click the Start Tracking button to begin
allocation tracking. At this point, anything you do in your application will be
tracked.
3) Click Get Allocations to see a list of objects that have been allocated since
you clicked on the Start Tracking button. You can click on Get
Allocations again to append to the list new objects that that have been
allocated.
4) To stop tracking or to clear the data and start over, click the Stop Tracking
button.
5) Click on a specific row in the list to see more detailed information such as the
method and line number of the code that allocated the object.
Confidential and Proprietary – Qualcomm Technologies, Inc. | MAY CONTAIN U.S. AND INTERNATIONAL EXPORT CONTROLLED INFORMATION
PAGE 24 80-NJ221-1 A Jul 2013
Tracking Memory Allocation of Objects
Confidential and Proprietary – Qualcomm Technologies, Inc. | MAY CONTAIN U.S. AND INTERNATIONAL EXPORT CONTROLLED INFORMATION
PAGE 25 80-NJ221-1 A Jul 2013
MAT (Memory Analyzer Tool)

Confidential and Proprietary – Qualcomm Technologies, Inc. | MAY CONTAIN U.S. AND INTERNATIONAL EXPORT CONTROLLED INFORMATION
PAGE 26 80-NJ221-1 A Jul 2013
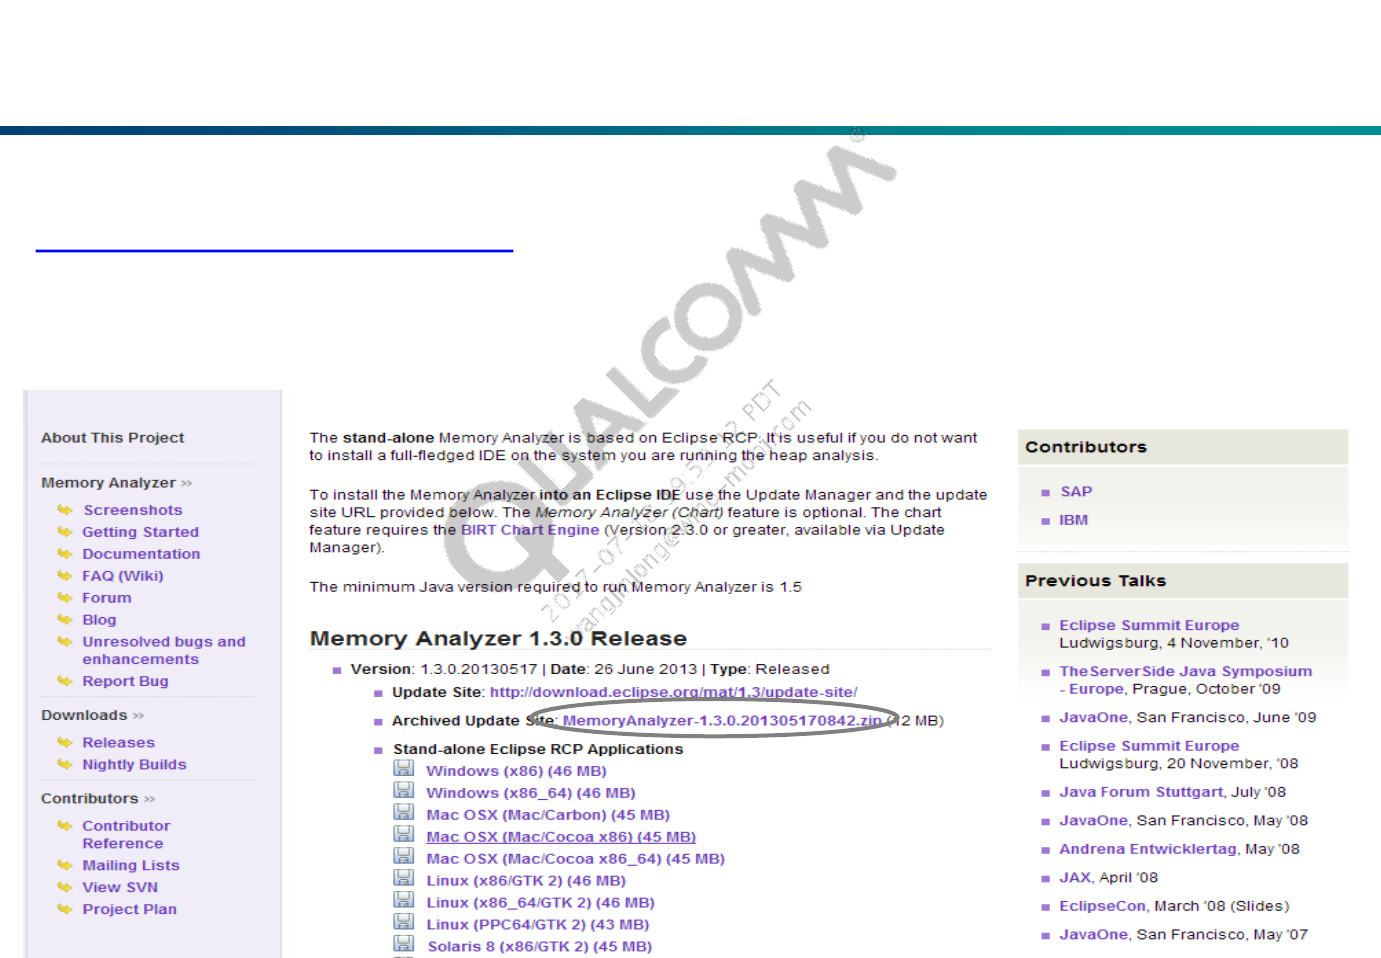
MAT (Memory Analyzer Tool)
The Eclipse Memory Analyzer Tool is a fast and feature-rich Java heap
analyzer that helps you find memory leaks and reduce memory
consumption.
Use the Memory Analyzer Tool to analyze productive heap dumps with
hundreds of millions of objects, quickly calculate the retained sizes of
objects, see who is preventing the Garbage Collector from collecting
objects, run a report to automatically extract leak suspects.
The Dalvik virtual machine can produce a complete dump of the contents
of the virtual heap. This is very useful for debugging memory usage and
looking for memory leaks.
Confidential and Proprietary – Qualcomm Technologies, Inc. | MAY CONTAIN U.S. AND INTERNATIONAL EXPORT CONTROLLED INFORMATION
PAGE 28 80-NJ221-1 A Jul 2013
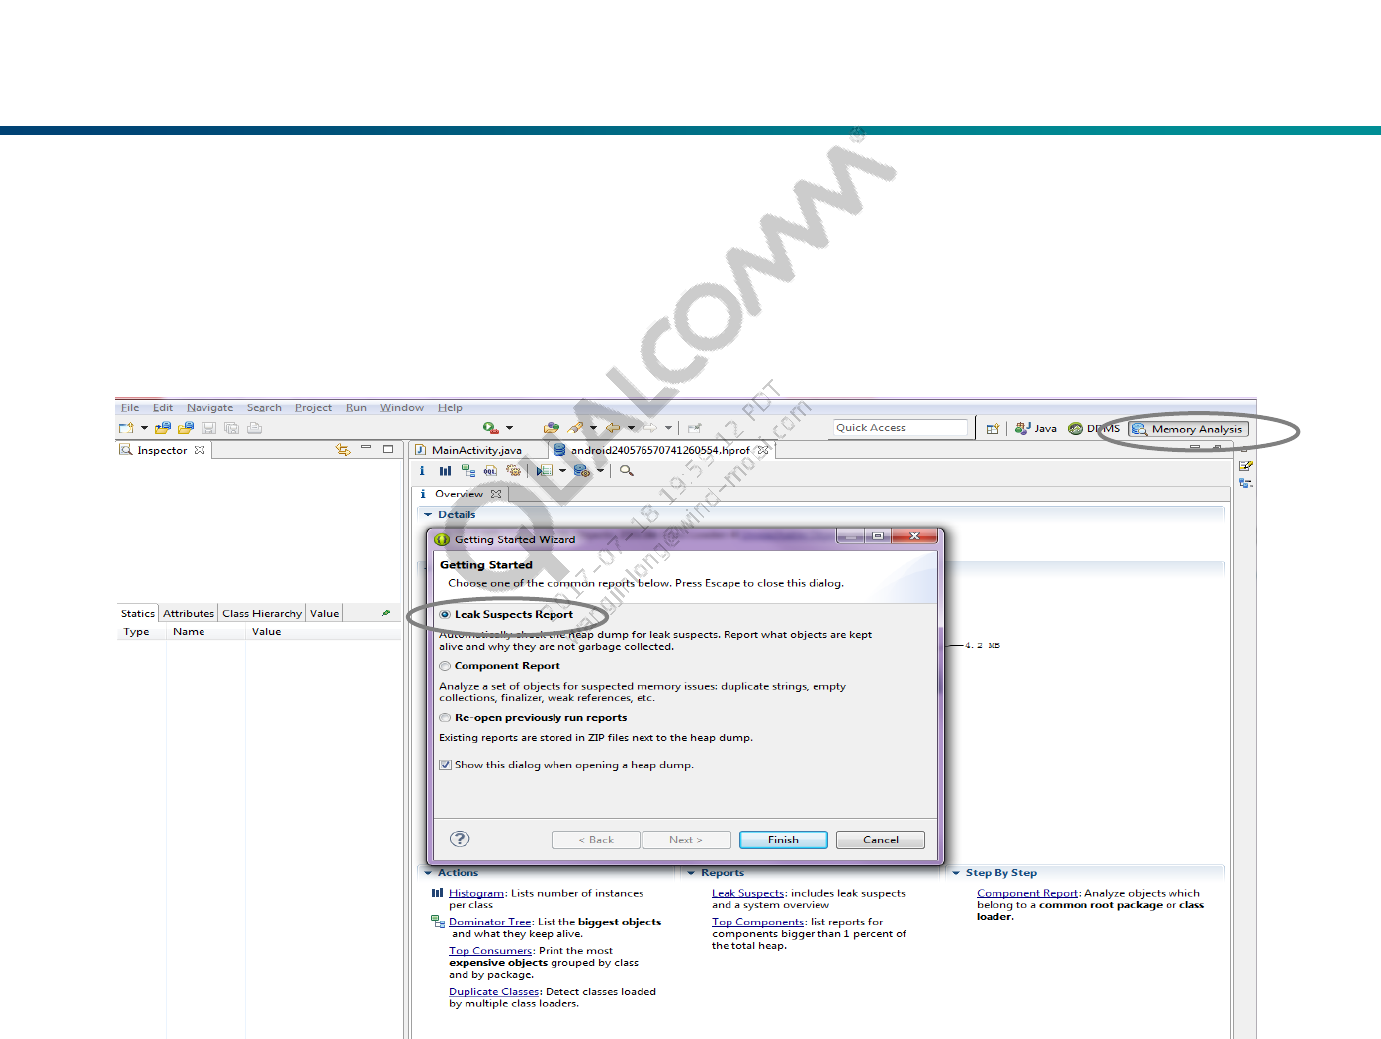
Load Dump File
In eclipse, select ‘Memory Analysis’ tool, select the dump file by click the
menu ‘File > Open Heap Dump’, select the ‘Leak Suspects Report’ in the
‘Wizard’ dialog as below and click ‘Finish’, after a delay, the Leak
Suspects report will appear.

Confidential and Proprietary – Qualcomm Technologies, Inc. | MAY CONTAIN U.S. AND INTERNATIONAL EXPORT CONTROLLED INFORMATION
PAGE 29 80-NJ221-1 A Jul 2013
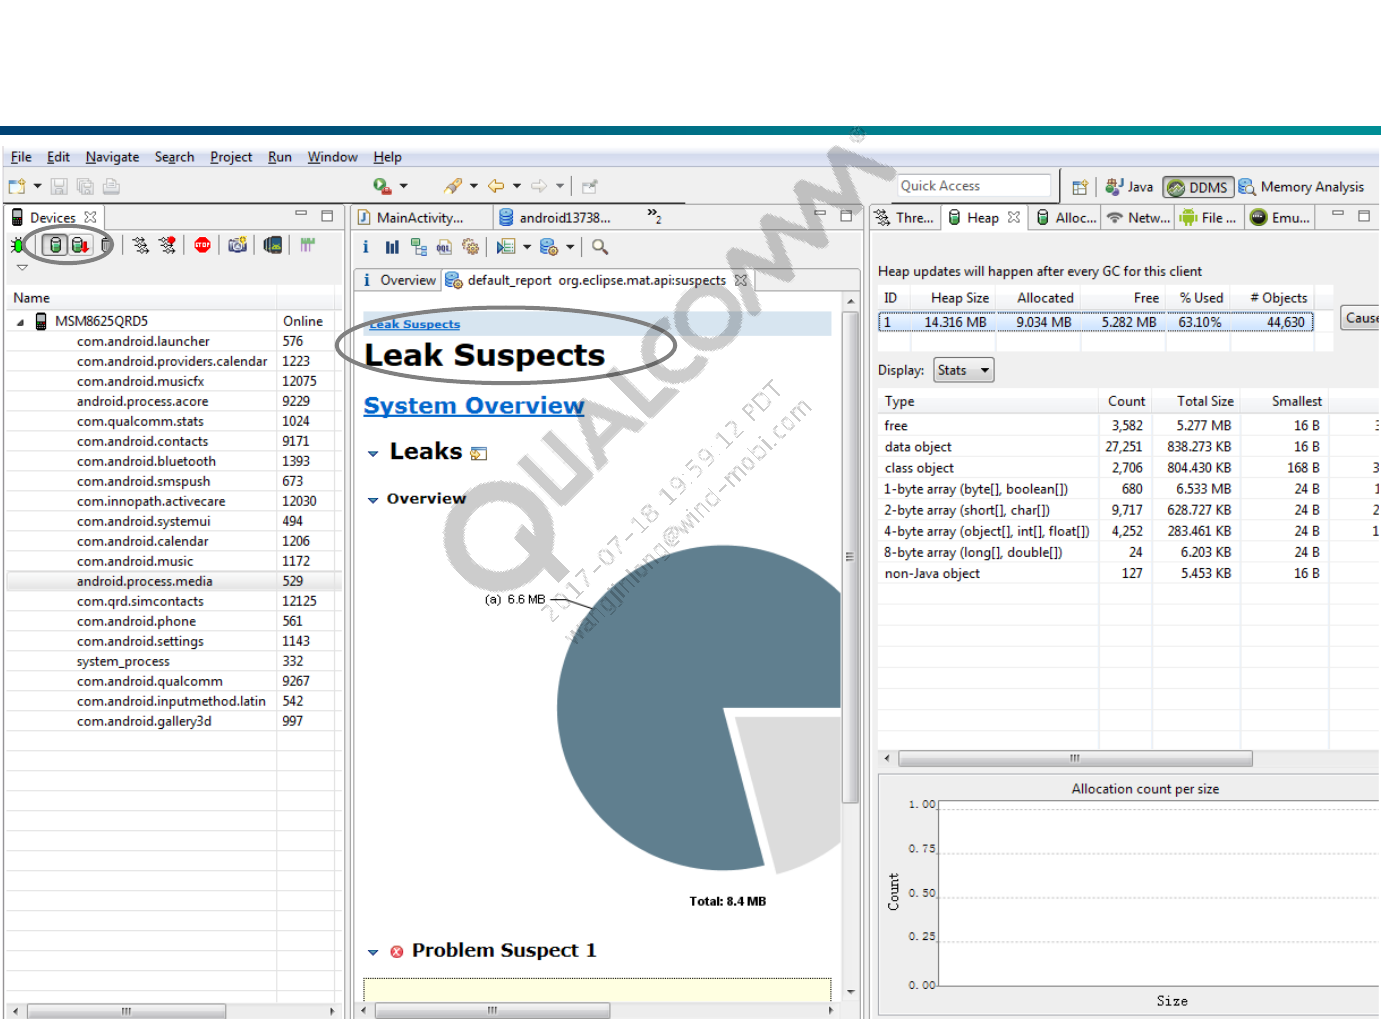
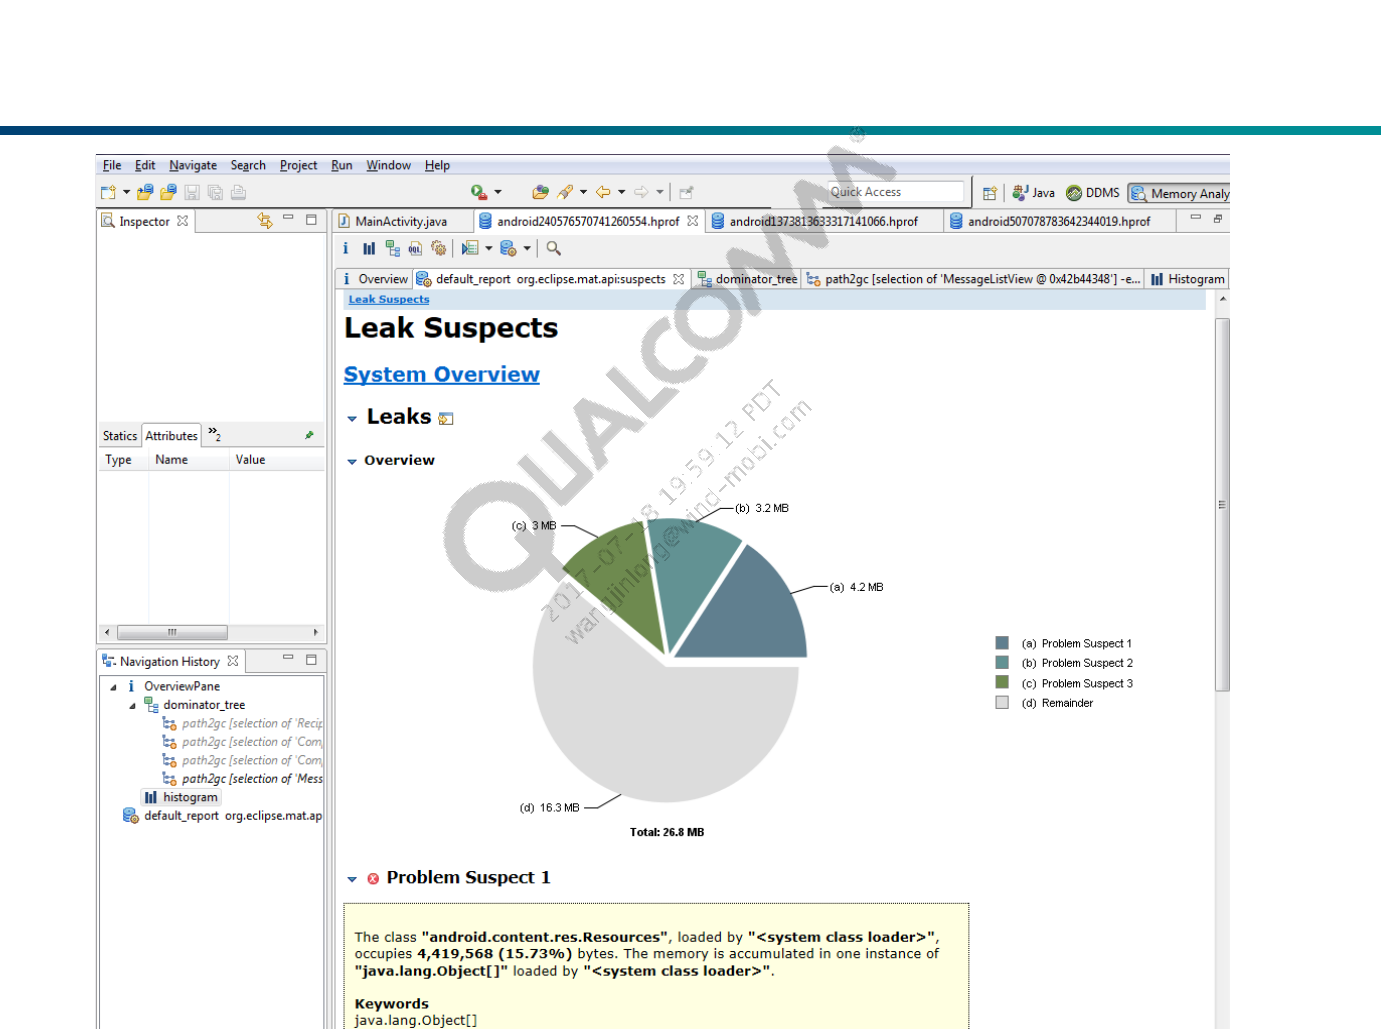
The Leak Suspects Report
The report will generate a graph indicating things it thinks may be memory
leaks.
Leak Suspects include leak suspects and a system overview.
Not everything it thinks may be a leak actually is.
What you really need to suspect is things that have multiple instances
allocated or things which are using huge amounts of memory.
Confidential and Proprietary – Qualcomm Technologies, Inc. | MAY CONTAIN U.S. AND INTERNATIONAL EXPORT CONTROLLED INFORMATION
PAGE 30 80-NJ221-1 A Jul 2013
The Leak Suspects Report

Confidential and Proprietary – Qualcomm Technologies, Inc. | MAY CONTAIN U.S. AND INTERNATIONAL EXPORT CONTROLLED INFORMATION
PAGE 31 80-NJ221-1 A Jul 2013
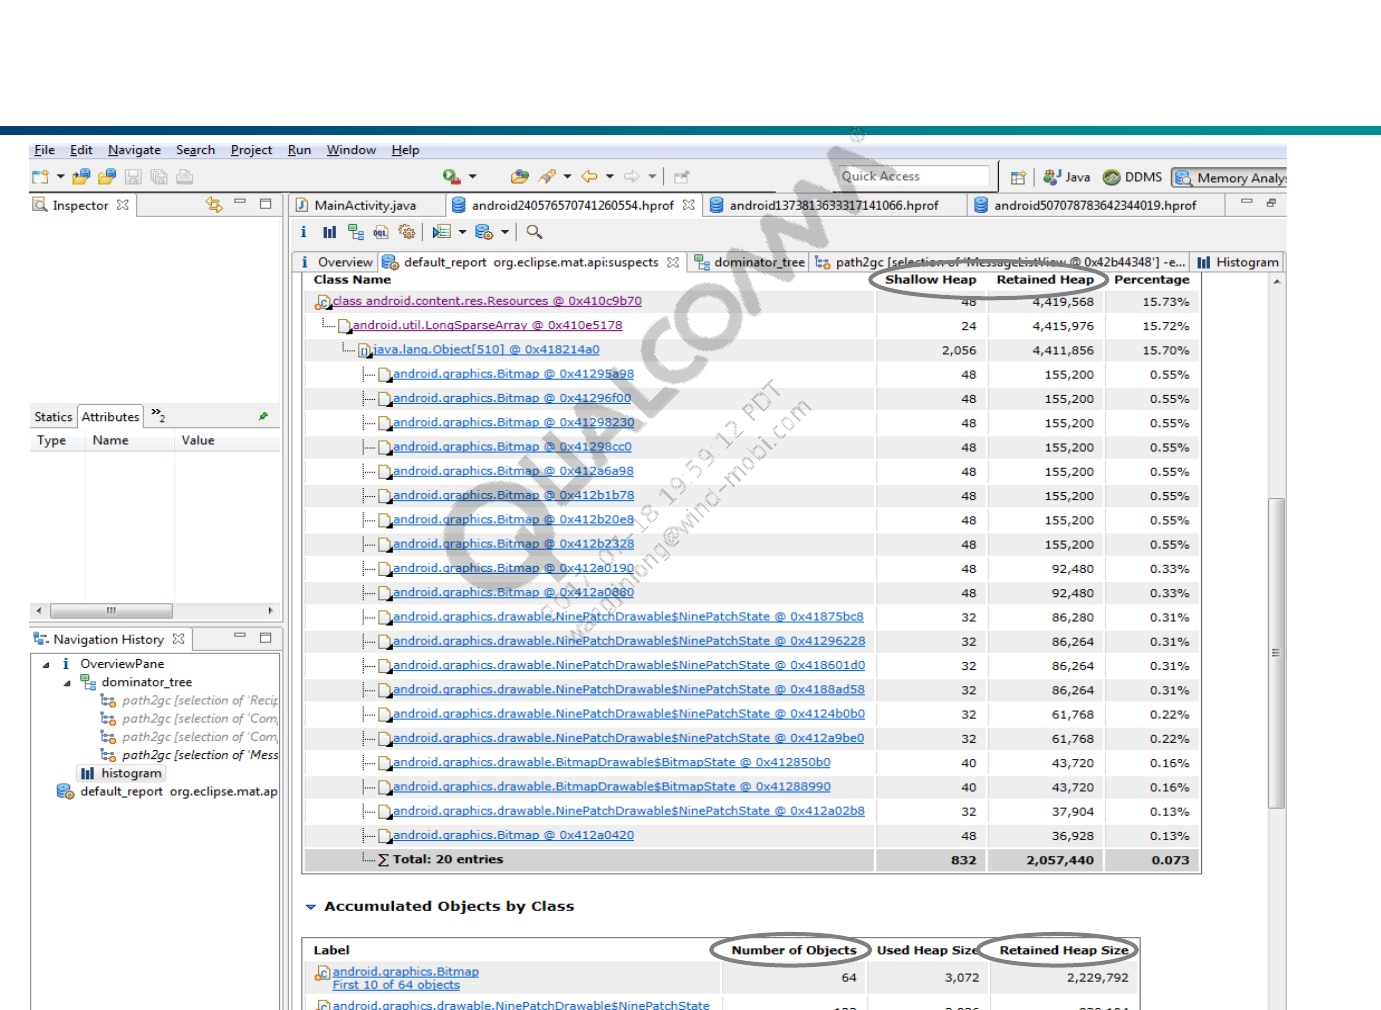
The Leak Suspects Report
Clicked on the Details link. This causes three more reports to appear:
‘Shortest Paths To the Accumulation Point’, ‘Accumulated Objects’,
‘Accumulated Objects by Class’.
Shallow size of an object is the amount of memory allocated to store the
object itself, not taking into account the referenced objects. Shallow size
of a regular (non-array) object depends on the number and types of its
fields. Shallow size of an array depends on the array length and the type
of its elements (objects, primitive types). Shallow size of a set of objects
represents the sum of shallow sizes of all objects in the set.
Retained size of an object is its shallow size plus the shallow sizes of the
objects that are accessible, directly or indirectly, only from this object. In
other words, the retained size represents the amount of memory that will
be freed by the garbage collector when this object is collected.
Confidential and Proprietary – Qualcomm Technologies, Inc. | MAY CONTAIN U.S. AND INTERNATIONAL EXPORT CONTROLLED INFORMATION
PAGE 32 80-NJ221-1 A Jul 2013
The Leak Suspects Report

Confidential and Proprietary – Qualcomm Technologies, Inc. | MAY CONTAIN U.S. AND INTERNATIONAL EXPORT CONTROLLED INFORMATION
PAGE 33 80-NJ221-1 A Jul 2013
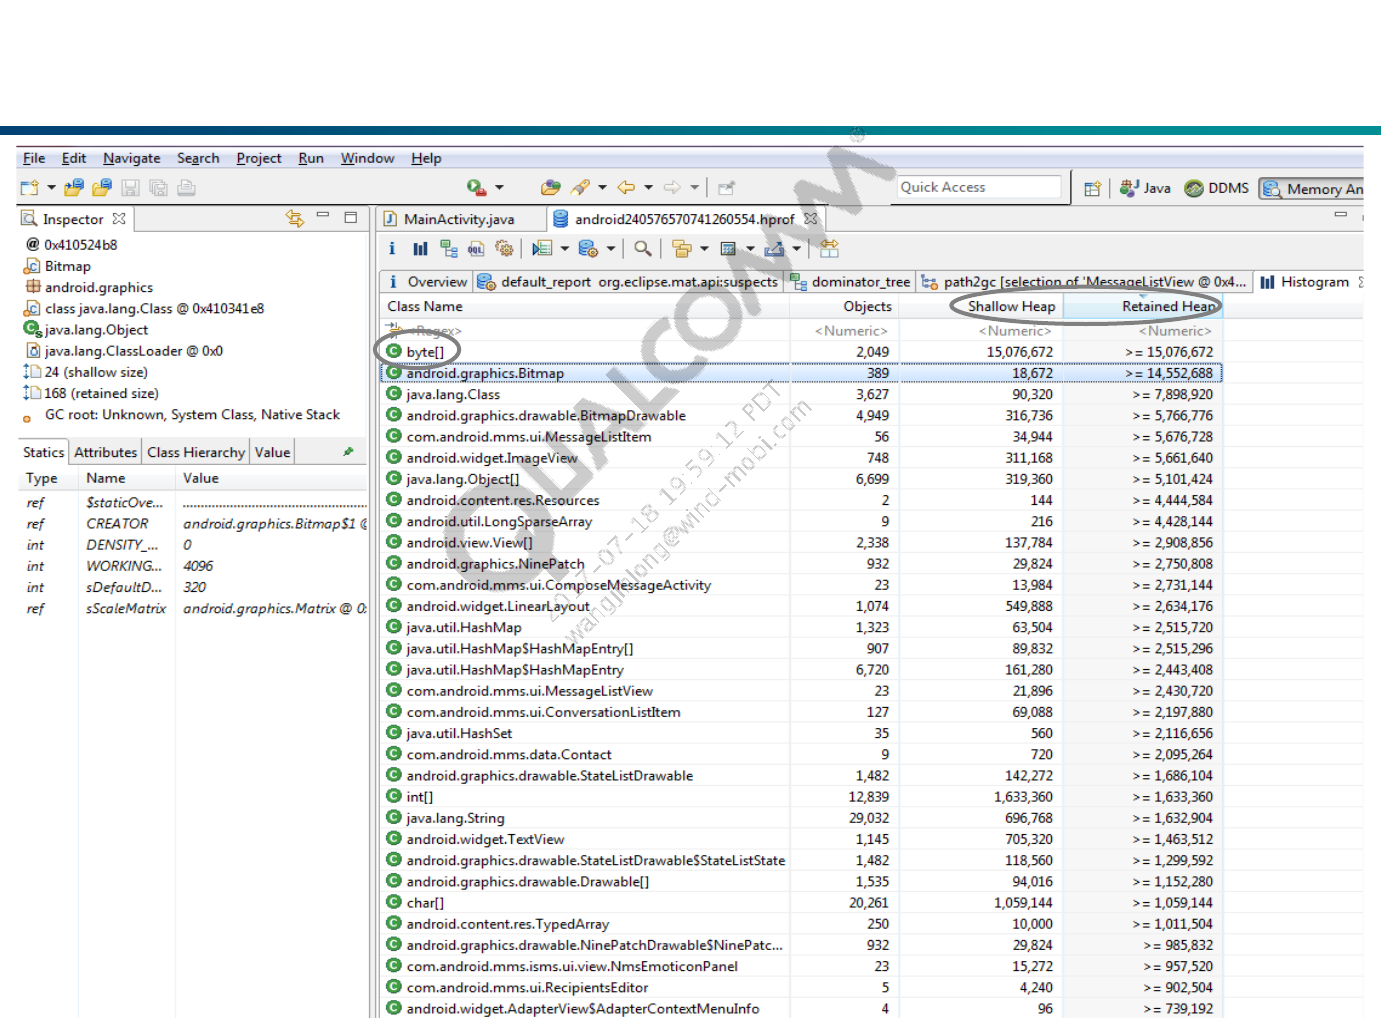
Histogram View
Analyze the results using the Histogram view.
Histogram lists number of instances per class.
Identifies types of objects allocated.
Doesn't know whether they will eventually be freed.
We must compare two HPROF snapshots to identify which objects are
responsible for a leak.
Confidential and Proprietary – Qualcomm Technologies, Inc. | MAY CONTAIN U.S. AND INTERNATIONAL EXPORT CONTROLLED INFORMATION
PAGE 34 80-NJ221-1 A Jul 2013
Histogram View
Confidential and Proprietary – Qualcomm Technologies, Inc. | MAY CONTAIN U.S. AND INTERNATIONAL EXPORT CONTROLLED INFORMATION
PAGE 35 80-NJ221-1 A Jul 2013
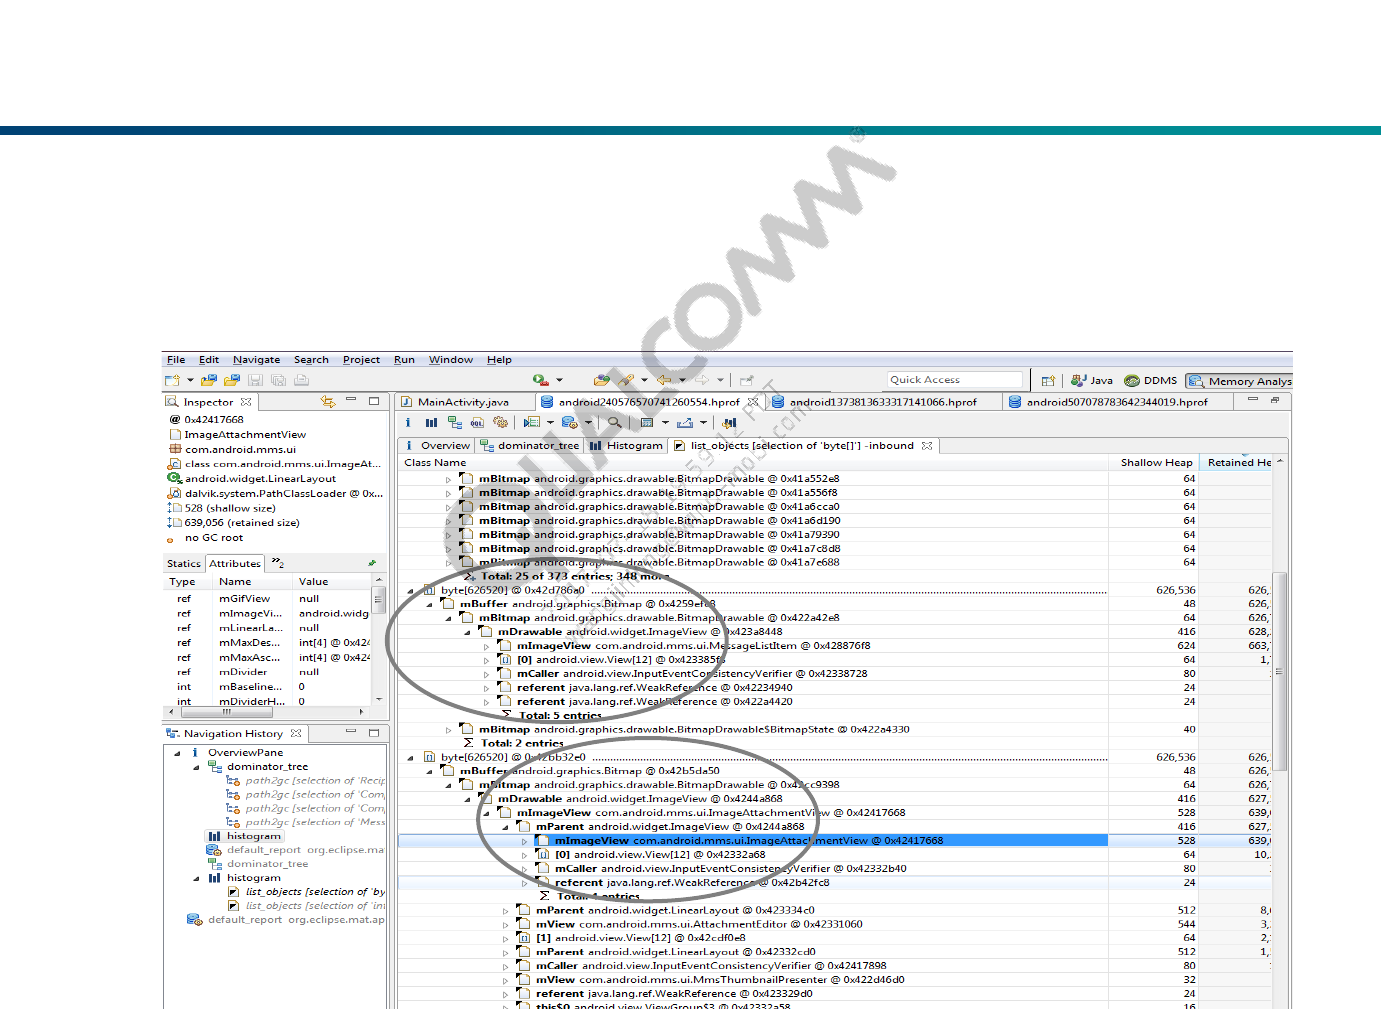
Histogram View
The ‘byte[ ]’ costs most of the heap, so right click on it and select ‘List
Objects > with incoming references’, from this, we can find which object
the data belong to.
Confidential and Proprietary – Qualcomm Technologies, Inc. | MAY CONTAIN U.S. AND INTERNATIONAL EXPORT CONTROLLED INFORMATION
PAGE 36 80-NJ221-1 A Jul 2013
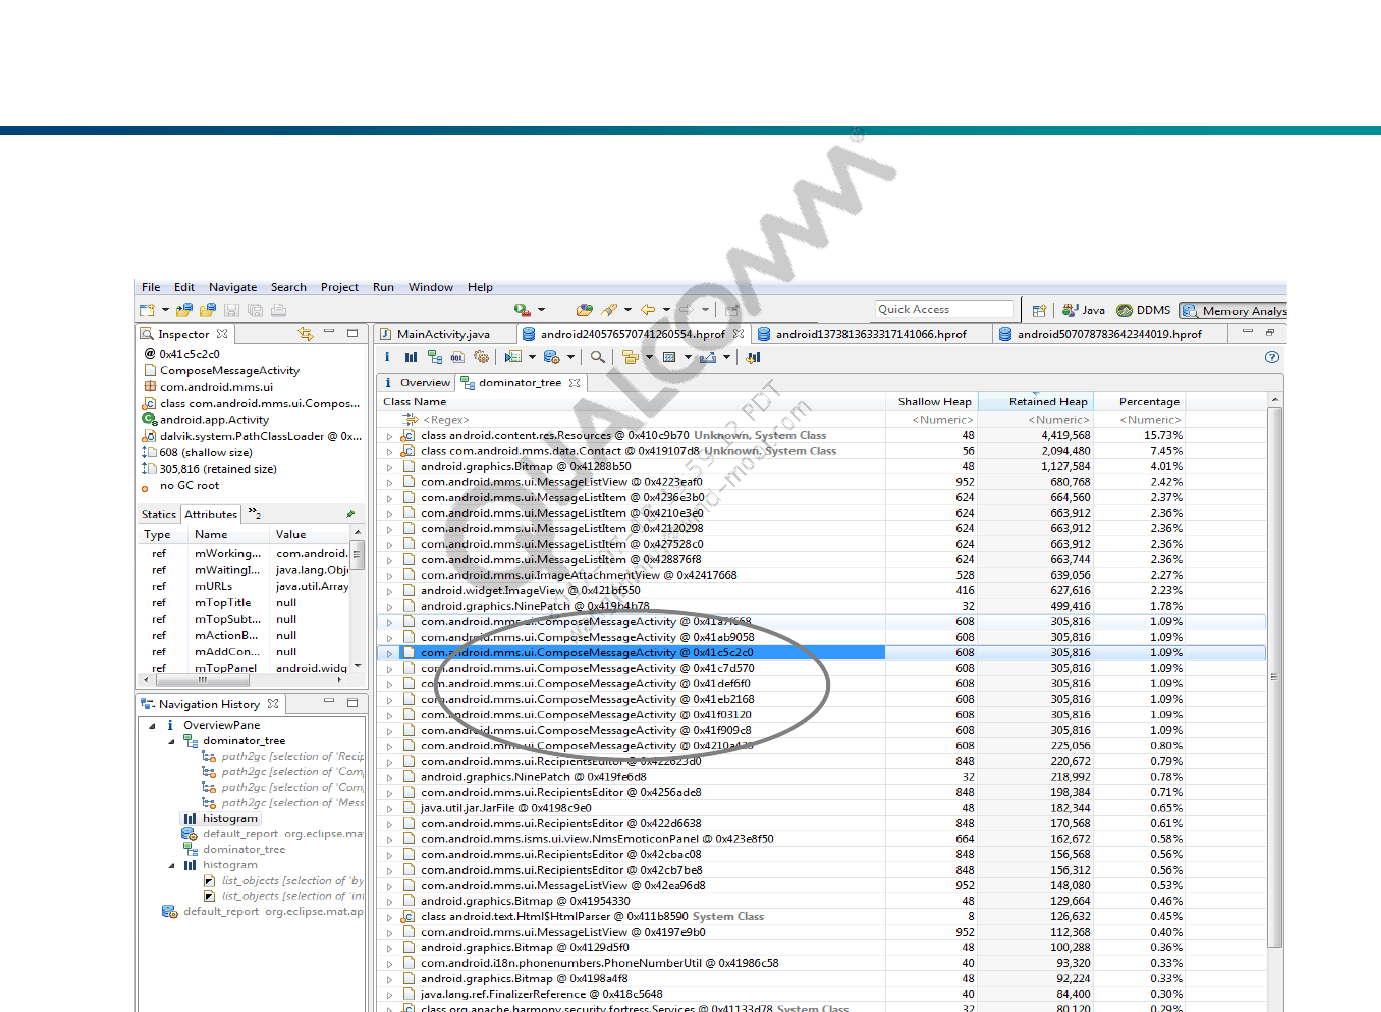
Dominator Tree
Dominator Tree will list the biggest objects and what they keep alive.

Confidential and Proprietary – Qualcomm Technologies, Inc. | MAY CONTAIN U.S. AND INTERNATIONAL EXPORT CONTROLLED INFORMATION
PAGE 37 80-NJ221-1 A Jul 2013
Dominator Tree
From this list we can find potential leaked object, so many instances of
‘ComposeMessageActivity’ for this case, it’s abnormal.
Right click on it and select:
List Objects > with incoming references: Shows objects that have an incoming
reference to the selected object. If there is a class that has many unwanted
instances it is good practice to find incoming references that are keeping it from
being GC.
Path To GC Roots > exclude weak/soft references: Shows the reference path
from the object to GC roots excluding weak/soft references
Merge Shortest Paths to GC Roots – Finds the common paths from garbage
collection roots to an object or a set of objects.

Confidential and Proprietary – Qualcomm Technologies, Inc. | MAY CONTAIN U.S. AND INTERNATIONAL EXPORT CONTROLLED INFORMATION
PAGE 38 80-NJ221-1 A Jul 2013
Dominator Tree
Right click on it and select:
Show Retained Set - Calculates the retained set of an arbitrary set of objects.
Java Basics > Class Loader Explorer: Show the defined classes and the
number of live instances. If one and the same component is loaded multiple
times, the number of live instances can indicate which class loaders is more
alive and which one should be garbage collected
Confidential and Proprietary – Qualcomm Technologies, Inc. | MAY CONTAIN U.S. AND INTERNATIONAL EXPORT CONTROLLED INFORMATION
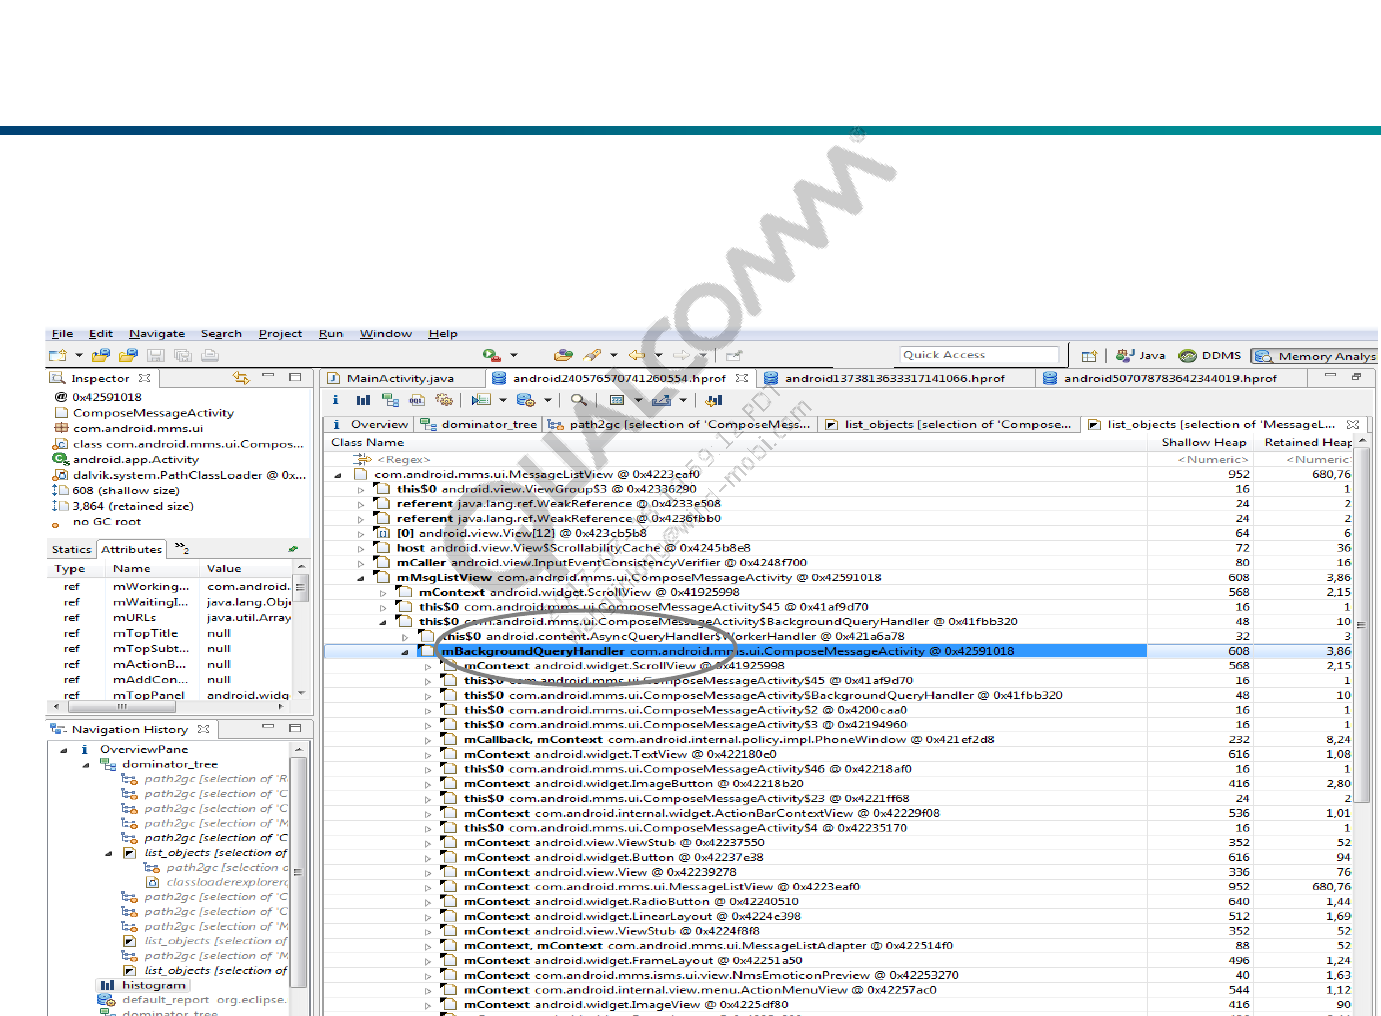
PAGE 39 80-NJ221-1 A Jul 2013
What to Do?
Perhaps it’s because the ‘mBackgroundQueryHandler’ hasn’t be released
before this activity is finished which cause this activity can’t be released.
Confidential and Proprietary – Qualcomm Technologies, Inc. | MAY CONTAIN U.S. AND INTERNATIONAL EXPORT CONTROLLED INFORMATION
PAGE 40 80-NJ221-1 A Jul 2013
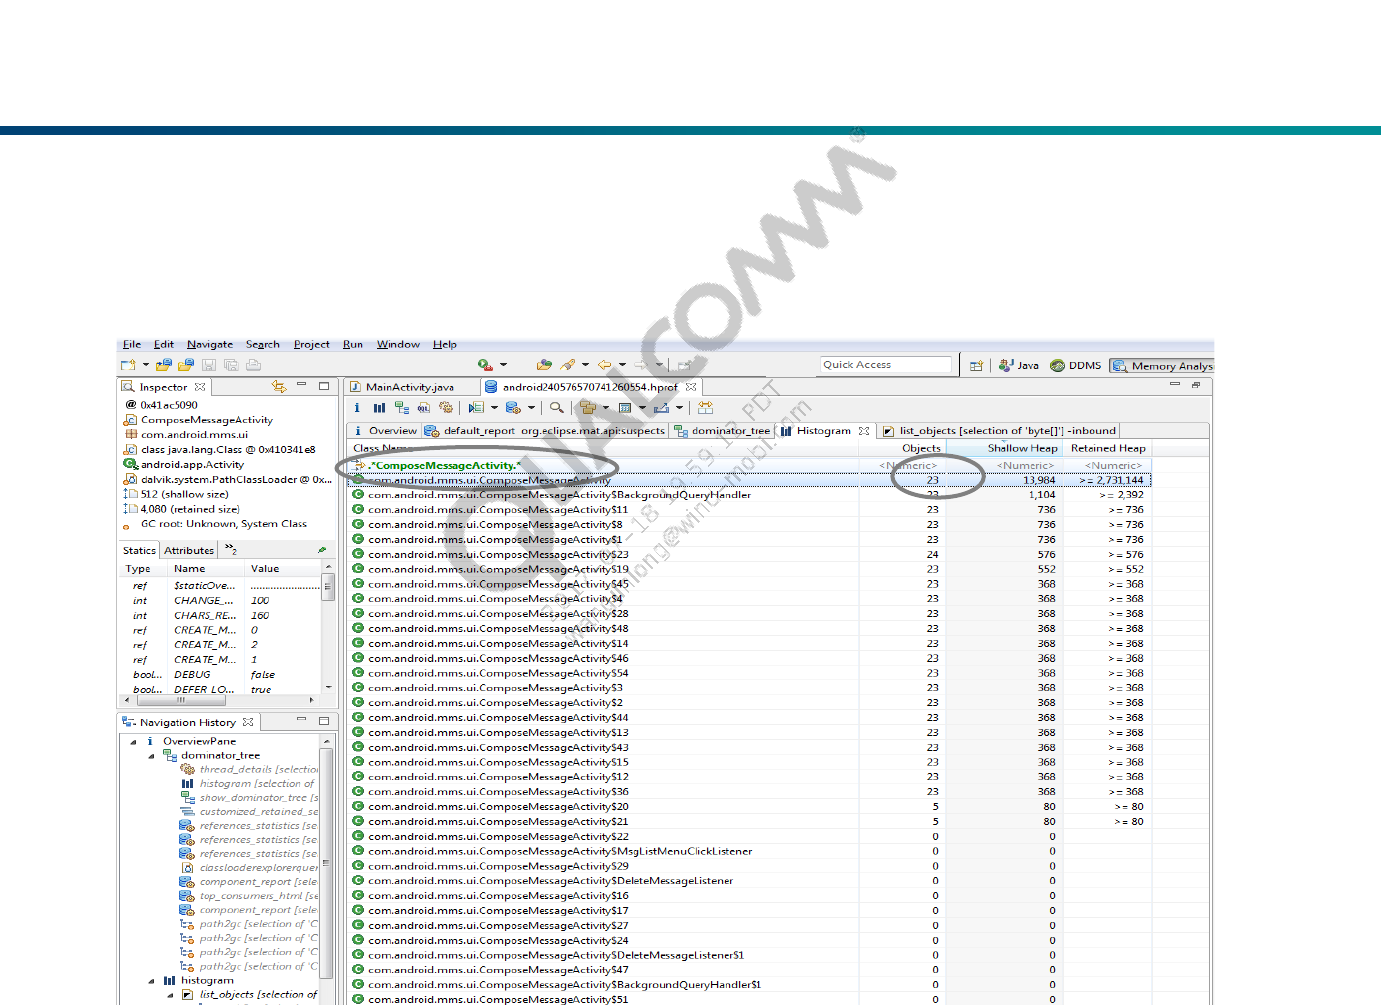
What to Do?
Use the Regex filter to find ‘ComposeMessageActivity’ objects inside the
Histogram view. There are 23 instances of ‘ComposeMessageActivity’.

Confidential and Proprietary – Qualcomm Technologies, Inc. | MAY CONTAIN U.S. AND INTERNATIONAL EXPORT CONTROLLED INFORMATION
PAGE 41 80-NJ221-1 A Jul 2013
What to Do?
What we can do now is just check the related code to see if there are any
bugs.
Refer to [R5] for Android Memory Leaks and the solutions.
To avoid context-related memory leaks, remember the followings:
Do not keep long-lived references to a context-activity (a reference to an activity
should have the same life cycle as the activity itself)
Try using the context-application instead of a context-activity
Avoid non-static inner classes in an activity if you don't control their life cycle,
use a static inner class and make a weak reference to the activity inside.
A garbage collector is not an insurance against memory leaks.

Confidential and Proprietary – Qualcomm Technologies, Inc. | MAY CONTAIN U.S. AND INTERNATIONAL EXPORT CONTROLLED INFORMATION
PAGE 42 80-NJ221-1 A Jul 2013
Detecting a Memory Leak
Confidential and Proprietary – Qualcomm Technologies, Inc. | MAY CONTAIN U.S. AND INTERNATIONAL EXPORT CONTROLLED INFORMATION
PAGE 43 80-NJ221-1 A Jul 2013
Check the logcat Output Message
Your application crashes with an ‘Out of memory’ error after running for a
long time.
You can see frequent GC_ lines in logcat before the crash.

Confidential and Proprietary – Qualcomm Technologies, Inc. | MAY CONTAIN U.S. AND INTERNATIONAL EXPORT CONTROLLED INFORMATION
PAGE 44 80-NJ221-1 A Jul 2013
Check the logcat Output Message
Out of memory message from the logcat output:
I/dalvikvm-heap( 3088): Clamp target GC heap from 103.616MB to 96.000MB
D/dalvikvm( 3088): GC_CONCURRENT freed 165K, 1% free 97769K/98148K,
paused 7ms+80ms, total 483ms
D/dalvikvm( 3088): WAIT_FOR_CONCURRENT_GC blocked 147ms
I/dalvikvm-heap( 3088): Forcing collection of SoftReferences for 376296-byte
allocation
I/dalvikvm-heap( 3088): Clamp target GC heap from 103.600MB to 96.000MB
D/dalvikvm( 3088): GC_BEFORE_OOM freed 16K, 1% free 97753K/98148K,
paused 392ms, total 392ms
E/dalvikvm-heap( 3088): Out of memory on a 376296-byte allocation
Confidential and Proprietary – Qualcomm Technologies, Inc. | MAY CONTAIN U.S. AND INTERNATIONAL EXPORT CONTROLLED INFORMATION
PAGE 45 80-NJ221-1 A Jul 2013
Check the logcat Output Message
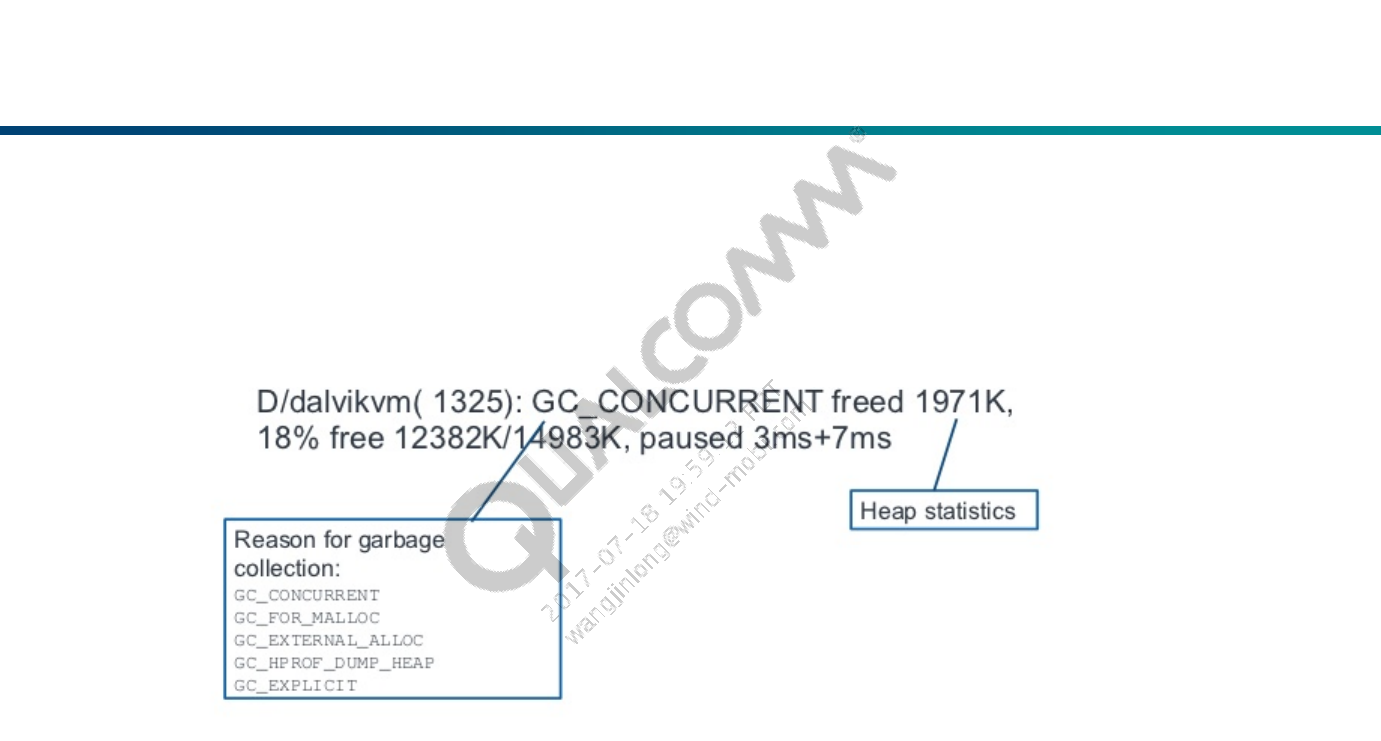
D/dalvikvm( 3088): GC_CONCURRENT freed 165K, 1% free
97769K/98148K, paused 7ms+80ms, total 483ms
The first part of message indicates the type of GC (reason of GC). There are
four different types:
GC_CONCURRENT Invoked when the heap gets too large to prevent
overflow.
GC_FOR_MALLOC Invoked when GC_CONCURENT was not run on
time and the application had to allocate more
memory.
GC_EXTERNAL_ALLOC Used before Honeycomb for freeing external
allocated memory. In Honeycomb and higher there is
no external allocation.
GC_EXPLICIT Invoked when System.gc is called.

Confidential and Proprietary – Qualcomm Technologies, Inc. | MAY CONTAIN U.S. AND INTERNATIONAL EXPORT CONTROLLED INFORMATION
PAGE 46 80-NJ221-1 A Jul 2013
Check the logcat Output Message
D/dalvikvm( 3088): GC_CONCURRENT freed 165K, 1% free
97769K/98148K, paused 7ms+80ms, total 483ms
“freed 165K” – indicates how much memory is freed.
“1% free 97769K/98148K” – indicates the percentage of free memory left,
the size of live objects and the total heap size.
“paused 7ms+80ms” – indicates how much time it takes the GC to finish
collection.
With this information, it is possible to tell after a few collections if the GC
successfully frees the memory. If the allocated memory does not go down
after some period of time (and keeps growing), it is clear that there is a
memory leak.

Confidential and Proprietary – Qualcomm Technologies, Inc. | MAY CONTAIN U.S. AND INTERNATIONAL EXPORT CONTROLLED INFORMATION
PAGE 47 80-NJ221-1 A Jul 2013
Check the logcat Output Message
E/dalvikvm-heap( 3088): Out of memory on a 376296-byte allocation
When the available resources are exhausted, an OutOfMemoryError
exception is thrown. It may indicate that there is a memory leak. This
method is not the best way to know if there is a leak as the exception may
occur when the developer tries to allocate a large amount of memory (ex.
bitmap) and the total heap size will exceed the platform limit. It surely
indicates that the developer should rethink his memory management
method.

Confidential and Proprietary – Qualcomm Technologies, Inc. | MAY CONTAIN U.S. AND INTERNATIONAL EXPORT CONTROLLED INFORMATION
PAGE 48 80-NJ221-1 A Jul 2013
Comparing Heap Dumps with MAT
When debugging memory leaks, sometimes it's useful to compare the
heap state at two different points in time. To do this, you'll need to:
Create two separate HPROF files (don't forget to convert them using hprof-
conv).
Open the first HPROF file (using File > Open Heap Dump).
Open the Histogram view.
In the Navigation History view (use Window > Navigation History if it's not
visible), right click on histogram and select Add to Compare Basket.
Open the second HPROF file and repeat steps 2 and 3.
Switch to the Compare Basket view, and click Compare the Results (the red "!"
icon in the top right corner of the view).

Confidential and Proprietary – Qualcomm Technologies, Inc. | MAY CONTAIN U.S. AND INTERNATIONAL EXPORT CONTROLLED INFORMATION
PAGE 49 80-NJ221-1 A Jul 2013
Comparing Heap Dumps with MAT
Compare the number of instances and sizes of each type of object
between the two snapshots.
An unexplained increase in the number of objects may indicate a leak!

Confidential and Proprietary – Qualcomm Technologies, Inc. | MAY CONTAIN U.S. AND INTERNATIONAL EXPORT CONTROLLED INFORMATION
PAGE 50 80-NJ221-1 A Jul 2013
Useful Information

Confidential and Proprietary – Qualcomm Technologies, Inc. | MAY CONTAIN U.S. AND INTERNATIONAL EXPORT CONTROLLED INFORMATION
PAGE 51 80-NJ221-1 A Jul 2013
ServiceConnection Leak
Usually ServiceConnection leak is caused by client try to bind to service
but the service still not ready. For example, the service hasn’t been started
or the service can’t be started successfully.
06-13 10:23:15.672 W/ActivityManager( 654): Unable to start service Intent { act=com.zte.zgesture.IGestureService }: not found
06-13 10:23:15.762 E/ActivityThread( 1009): Activity com.android.phone.InCallScreen has leaked ServiceConnection android.view.ViewRootGestureDispatcher$1@41e2e730
that was originally bound here
06-13 10:23:15.762 E/ActivityThread( 1009): android.app.ServiceConnectionLeaked: Activity com.android.phone.InCallScreen has leaked ServiceConnection
android.view.ViewRootGestureDispatcher$1@41e2e730 that was originally bound here
06-13 10:23:15.762 E/ActivityThread( 1009): at android.app.LoadedApk$ServiceDispatcher.<init>(LoadedApk.java:969)
06-13 10:23:15.762 E/ActivityThread( 1009): at android.app.LoadedApk.getServiceDispatcher(LoadedApk.java:863
)06-13 10:23:15.762 E/ActivityThread( 1009): at android.app.ContextImpl.bindService(ContextImpl.java:1263)
06-13 10:23:15.762 E/ActivityThread( 1009): at android.app.ContextImpl.bindService(ContextImpl.java:1255)
06-13 10:23:15.762 E/ActivityThread( 1009): at android.content.ContextWrapper.bindService(ContextWrapper.java:394)
06-13 10:23:15.762 E/ActivityThread( 1009): at android.view.ViewRootGestureDispatcher.<init>(ViewRootGestureDispatcher.java:32)
06-13 10:23:15.762 E/ActivityThread( 1009): at android.view.ViewRootImpl.<init>(ViewRootImpl.java:415)
06-13 10:23:15.762 E/ActivityThread( 1009): at android.view.WindowManagerImpl.addView(WindowManagerImpl.java:300)
06-13 10:23:15.762 E/ActivityThread( 1009): at android.view.WindowManagerImpl.addView(WindowManagerImpl.java:232)
06-13 10:23:15.762 E/ActivityThread( 1009): at android.view.WindowManagerImpl$CompatModeWrapper.addView(WindowManagerImpl.java:149)
06-13 10:23:15.762 E/ActivityThread( 1009): at android.view.Window$LocalWindowManager.addView(Window.java:547)
06-13 10:23:15.762 E/ActivityThread( 1009): at android.app.ActivityThread.handleResumeActivity(ActivityThread.java:2641)
06-13 10:23:15.762 E/ActivityThread( 1009): at android.app.ActivityThread.handleLaunchActivity(ActivityThread.java:2092)
06-13 10:23:15.762 E/ActivityThread( 1009): at android.app.ActivityThread.access$600(ActivityThread.java:133)
06-13 10:23:15.762 E/ActivityThread( 1009): at android.app.ActivityThread$H.handleMessage(ActivityThread.java:1198)
06-13 10:23:15.762 E/ActivityThread( 1009): at android.os.Handler.dispatchMessage(Handler.java:99)
06-13 10:23:15.762 E/ActivityThread( 1009): at android.os.Looper.loop(Looper.java:137)
06-13 10:23:15.762 E/ActivityThread( 1009): at android.app.ActivityThread.main(ActivityThread.java:4777)
06-13 10:23:15.762 E/ActivityThread( 1009): at java.lang.reflect.Method.invokeNative(Native Method)
06-13 10:23:15.762 E/ActivityThread( 1009): at java.lang.reflect.Method.invoke(Method.java:511)
06-13 10:23:15.762 E/ActivityThread( 1009): at com.android.internal.os.ZygoteInit$MethodAndArgsCaller.run(ZygoteInit.java:789)
06-13 10:23:15.762 E/ActivityThread( 1009): at com.android.internal.os.ZygoteInit.main(ZygoteInit.java:556)
06-13 10:23:15.762 E/ActivityThread( 1009): at dalvik.system.NativeStart.main(Native Method)
06-13 10:23:15.762 W/ActivityManager( 654): Unbind failed: could not find connection for android.os.BinderProxy@42127e18

Confidential and Proprietary – Qualcomm Technologies, Inc. | MAY CONTAIN U.S. AND INTERNATIONAL EXPORT CONTROLLED INFORMATION
PAGE 52 80-NJ221-1 A Jul 2013
StrictMode
Enable ‘StrictMode’ also can find some object leak.
Please refer to [R10] for more information about ‘StrictMode’
Confidential and Proprietary – Qualcomm Technologies, Inc. | MAY CONTAIN U.S. AND INTERNATIONAL EXPORT CONTROLLED INFORMATION
PAGE 53 80-NJ221-1 A Jul 2013
References
Ref. Document
Qualcomm Technologies
Q1 Application Note: Software Glossary for Customers CL93-V3077-1
Resources
R1 http://memoryanalyzer.blogspot.com/ Memory Analyzer Blog
R2 http://developer.android.com/tools/debugging/ddms.html Using DDMS
R3 http://www.eclipse.org/mat/ Memory Analyzer Tool (MAT)
R4 http://milk.com/kodebase/dalvik-docs-mirror/docs/heap-profiling.html Dalvik Heap Profiling
R5 http://blog.evendanan.net/2013/02/Android-Memory-Leaks-OR-Different-
Ways-to-Leak Android Memory Leak
R6 http://www.youtube.com/watch?v=_CruQY55HOk Google I/O 2011: Memory
management for Android Apps
R7 http://www.yourkit.com/docs/90/help/sizes.jsp Shallow and retained sizes
R8 http://kohlerm.blogspot.com/2009/07/eclipse-memory-analyzer-10-
useful.html Eclipse Memory Analyzer, 10
useful tips/articles
R9 http://developer.samsung.com/android/technical-docs/Memory-Profiler-
Identifying-Potential-Problems Memory Profiler - Identifying
Potential Problems
R10 http://developer.android.com/reference/android/os/StrictMode.html Strict Mode
Confidential and Proprietary – Qualcomm Technologies, Inc. | MAY CONTAIN U.S. AND INTERNATIONAL EXPORT CONTROLLED INFORMATION
PAGE 54 80-NJ221-1 A Jul 2013
References
Ref. Document
Resources
R11 http://help.eclipse.org/indigo/index.jsp?topic=%2Forg.eclipse.mat.ui.help%
2Fconcepts%2Fheapdump.html Memory Analyzer Online Help

