An Introductory Guide To Scientific Visualization
User Manual: Pdf
Open the PDF directly: View PDF ![]() .
.
Page Count: 169 [warning: Documents this large are best viewed by clicking the View PDF Link!]
An
Introductory
Guide
to
Scientific
Visualization
R.
A.
Earnshaw
N.Wiseman
An
Introductory Guide
to
Scientific Visualization
With
72 Figures
Springer-V erlag Berlin Heidelberg GmbH
De.
Rae
A.
Eamshaw
Head
of
Computer
Graphics
University
of
Leeds
Leeds
I.S2
9JT,
U. K .
Nonnan
Wiseman
NERC
Computer
Services
Kingsley Dunham
Cent~
Keyworth
Notts
NG12 5GG, U. K.
Front
covrr
plate
$hoW$
an image
of
Saa
Frandsco
with
sc:vc:ntl
multi-$pcctntl
analy5c:S
bc:1ng
c:mied
out.
Counesy
of
Silicon Graphlcslnc.,
AVIRlS
data, and
the
Jet Propulsion lJIbonnory.
ISBN
978-~2-63470-3
libnuy
of
Congress CatalogiJlg·in-Publication Data
Earnshaw,RaeA.
An
introductO!:")'
gulde
to
sclcntlficvlsualization/RA.Eamshaw,
N. Wlseman. p .
cm.
Includa
bibliographical refcrences
and
Index.
ISBN 978-3-642-63470-3 ISBN 978-3-642-58101-4 (eBook)
DOI 10.1007/978-3-642-58101-4
1. Science-Methodology. 2. YisuaUzation-Data proces!lng.
1.
Wlsc:maa, N.
(No
rman)
II
. Title. Q175.
E2H
1992
502.8-dc20
92-10987 CIP
This
work
is
subject
10
copyright
.
AlI
rights are reserved,
whether
the
whole
OI
part
of
the
material
is
concemed,
spcclfically
the
rtghts
of
translatlon,
reprinting, reusc:
of
ilIustrations, recitation, broadcasting,
rcproductlon
on
microfilms
or
in
aay
other
way,
and
storage
in
data banks. Duplication
of
this
publication
or
pans
thereof
ls
pcrmitted
only
under
the
provlsiofl5
of
the
~rman
Copyright
Law
of
Septembc:r
9,
1965,
In
II.!;
currcnt
version
,
and
pcrmission for
usc:
must
always
bc:
obtained
(rom
Springer-Yerlag. Yiolations
are llable for prose<:ution
under
the
~rman
Copyright
Law.
CI
Springer·Yerlag Berlin Heideibc:rg 1992
Originally
pub
li
.~hed
by Spri nger-
Yerlag
Berlin Heidclberg
New
York
in
1992
Softcovcr
repri
nI
of
lhe
hardcovt.'T
I
st
edilion
199
2
The
usc:
of
registercd names. trademarks,
etc.
In thls publlcation
does
nOI
imply,even
in
the
absence
of
a specific
statement
,
that
such
names
are
c:xempt
(rom
the
relevant
protectiv
e
bws
and
regulations
and
there!ore
free for general
"~
.
Cover
Design: H. l.oplca, Iiv
eshe
im
Typnctti.og:
K + Y
~'otosaIZ
GmbH,
Be
erfc1dcn
3313140-5432 -
Printed
on
acid-frec
paper
Foreword
Visualization has been the cornerstone of scientific progress
throughout history. Much of modern physics
is
the result of
the superior abstract visualization abilities of a
few
brilliant
men. Newton visualized the effect of gravitationa.l force
fields in three dimensional space acting
on
the center of
mass.
And Einstein visualized the geometric effects of ob-
jects in relative uniform and accelerated motion, with the
speed of light a constant, time part of space, and accelera-
tion indistinguishable from gravity. Virtually all com-
prehension in science, technology and even art calls on
our
ability to visualize. In fact, the ability to visualize
is
almost
synonymous with understanding.
We
have all used the
ex-
pression "I
see"
to mean "I understand".
Modern science part departs from the closed theories of
the last century and demands computer simulations
to
understand real world situations. Scientific Visualization
is
the
eyes
through which these simulations
are
viewed, from
electrochemical bonds to simulated interstellar jets associat-
ed with black holes.
Scientific Visualization
is
of value beyond strictly scien-
tific applications, however. The same technology
is
now
used in such diverse applications
as
clothing design, in-
dustrial design, automobile and airplane design, genetic
engineering, chemical and drug design, oil and mineral
ex-
ploration, chemical and nuclear power plant design, and
motion picture special effects and animation. It
is
rapidly
becoming a requirement for virtually all disciplines that
deal with geometric things.
What
is
Scientific Visualization?
It
is
a set of software
tools coupled with a powerful 3D graphical computing envi-
VI
Foreword
ronment that allows any geometric object
or
concept to
be
visualized by anyone. The software provides an easy to use
interface for the user. The hardware must
be
able to manip-
ulate complex, geometrically described, 3D environments
in motion, color and with any
level
of "realism" called for
to better communicate the essence of the computation.
Scientific Visualization
is
in its infancy, but the technol-
ogy
is
sure to revolutionize scientific education. I believe
that the requisite 3D graphical processing capability will
be
built into all personal computes within the next
five
years.
And by the year 2000, I am confident that even the home
digital television will combine such 3D graphical processing
capability with digital video and audio. Then, even complex
scientific textbooks will
be
viewed interactively
on
the
home screen, with video clips depicting a lecturer, mathe-
matical experiments run in and visualized on the "TV" and
the student able to guide the learning process. But until
then, such books
as
this will guide the
way.
May
1992
James
H.
Clark
Chairman, Silicon Graphics Inc
Mountain View
California, USA
Preface
Scientific visualization
is
concerned with exploring data
and information in such a way
as
to gain understanding and
insight into the data. This
is
a fundamental objective
of
much scientific investigation.
To
achieve this goal, scientific
visualization involves aspects in the areas
of
computer
graphics, user-interface methodology, image processing,
sys-
tem design, and signal processing.
This guide
is
intended for readers new
to
the field
who
require a quick and easy-to-read summary
of
what scientific
visualization
is
and what it can do. Written in a popular and
journalistic style
with
many illustrations, it will enable read-
ers to appreciate the benefits
of
scientific visualization and
how current tools can be exploited in many application ar-
eas.
It
will be invaluable for scientists and research workers
who
have never used computer graphics
or
other visual
tools before, and
who
wish to find out the benefits and
ad-
vantages
of
the new approaches.
This guide
is
concerned to answer the questions which
the newcomer to visualization may wish to ask concerning
what
it
is,
what it can do, what facilities are available, and
how much it costs. Points
of
contact for further informa-
tion
are also provided.
VIII
Dr.
R.
A.
Earnshaw
University
of
Leeds
UK
Mr.
Norman
Wiseman
Natural Environ-
ment Research
Council, UK
About the Authors
About
the
Authors
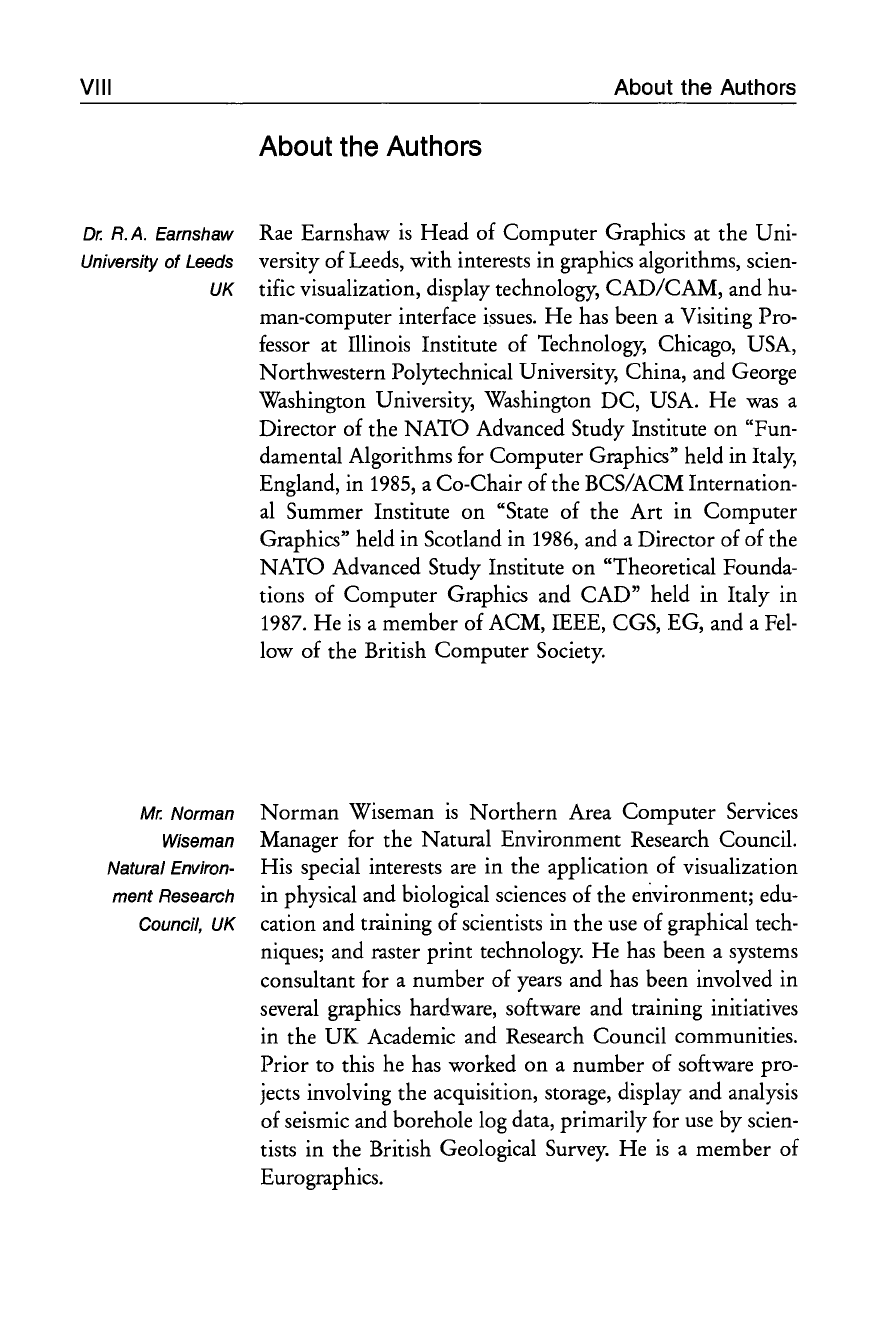
Rae Earnshaw
is
Head of Computer Graphics at the Uni-
versity of
Leeds,
with interests in graphics algorithms, scien-
tific visualization, display technology, CAD/CAM, and hu-
man-computer interface
issues.
He
has been a Visiting Pro-
fessor at Illinois Institute of Technology, Chicago, USA,
Northwestern Polytechnical University, China, and George
Washington University, Washington DC, USA.
He
was
a
Director
of
the NATO Advanced Study Institute on "Fun-
damental Algorithms for Computer Graphics" held in Italy,
England, in
1985,
a Co-Chair of the BCS/ACM Internation-
al
Summer Institute on "State of the
Art
in Computer
Graphics" held in Scotland in
1986,
and a Director of
of
the
NATO Advanced Study Institute on "Theoretical Founda-
tions of Computer Graphics and CAD" held in Italy in
1987.
He
is
a member
of
ACM, IEEE, CGS, EG, and a
Fel-
low
of
the British Computer Society.
Norman Wiseman
is
Northern Area Computer Services
Manager for the Natural Environment Research Council.
His special interests
are
in the application
of
visualization
in physical and biological sciences of the environment; edu-
cation and training
of
scientists in the
use
of graphical tech-
niques; and raster print technology.
He
has
been a systems
consultant for a number of
years
and
has
been involved in
several graphics hardware, software and training initiatives
in the
UK
Academic and Research Council communities.
Prior to this he has worked
on
a number of software pro-
jects involving the acquisition, storage, display and analysis
of seismic and borehole log data, primarily for
use
by scien-
tists in the British Geological
Survey.
He
is
a member of
Eurographics.
Contents
Acknowledgements
.................
XIII
Disclaimer . . . . . . . . . . . . . . . . . . . . . . .
..
XIV
Copyright Material
.................
XIV
Trademarks
........................
XV
Part I
Basics
of Scientific Visualization
Chapter 1 Introduction and Background
1.1
Introduction.
. . . . . . . . . . . . . . . . . 3
1.2
Background
..................
3
Chapter 2 What Scientific Visualization
can
do!
2.1
What
is
Scientific Visualization? 5
2.2
How
to do Scientific Visualization 7
2.3
Some Examples of Scientific
Visualization
.................
8
2.3.1
The March of Napoleon's Army 8
2.3.2 Cholera Outbreak
.............
9
2.3.3 Weather Maps from Meteorology
10
2.3.4 Molecular Modeling
...........
12
2.3.5 Pelvic Reconstruction
..........
12
2.3.6 Oil Exploration
...............
14
2.3.7 Designing Ship Propellors
......
16
2.3.8 Visualization of Forest Growth
18
Chapter 3 Explanation of Scientific
Visualization Terminology
3.1
Techniques...................
20
3.2
Volume Visualization
..........
25
3.3
Data Types
...................
27
3.3.1
Overview of Facilities. . . . . . . . . .
27
3.3.2
HDF
........................
29
3.3.3
NetCDF
.....................
30
3.3.4 Databases
....................
31
3.4 Current Application Areas
.....
31
x
Contents
3.4.1 Cartography
..................
31
3.4.2 Statistics
.....................
32
3.4.3 Remote Sensing
...............
32
3.4.4 Archeological Reconstruction
...
32
3.4.5 Molecular Modeling
...........
33
3.4.6 Medical Science
...............
33
3.4.7 Oceanography
................
34
3.4.8 Computational Fluid
Dynamics.
34
Chapter 4 Facilities for Scientific Visualization
4.1
Visualization Software Categories
35
4.1.1
Graphics Libraries and
Presentation Packages
..........
35
4.1.2 Turnkey Visualization
Applications
..................
36
4.1.3 Application Builders
...........
37
4.1.4 Choosing a Package
...........
37
4.2 Software Costs
................
38
4.2.1
Subroutine Libraries and
Presentation Packages
..........
38
4.2.2 Turnkey Visualization Systems
..
39
4.2.3 Application Builders
...........
39
4.3
Hardware Considerations
(including Hardcopy)
..........
39
4.4 Vendor Systems Versus Public
Domain Systems
..............
40
4.5 Summary
....................
4~
Chapter 5 Outputting Results
5.1
Hardcopy.
. . . . . . . . . . . . . . . . . . .
44
5.2
Video.
. . . . . . . . . . . . . . . . . . . . . . .
45
5.3
Other
Media
.................
46
Chapter 6 Current Developments
and Activities
6.1
USA.........................
47
6.2
UK..........................
49
6.3
Europe.
. . . . . . . . . . . . . . . . . . . . . .
50
Contents
XI
Part II Overview
of
Current
Systems
and Developments
Chapter 7 Current Vendor Systems in Use
7.1
Wavefront Technologies, Inc.
...
.
53
7.2 UNIRAS
A.S.
................
58
7.3
Precision Visuals, Inc. . . . . . . . . . .
63
7.4 Stardent Computer, Inc.
...
. . . . .
67
7.5 Silicon Graphics, Inc.
..........
72
7.6 Sun Microsystems, Inc.
....
. . . . .
79
7.6.1
Sun Vision -Sun's Visualization
Software Package
..............
79
7.6.2 Sun Vision Programming
Interfaces
..
. . . . . . . . . . . . . . . . . . .
79
7.6.3 Sun Vision Window-based Tools
80
7.6.4 The VX and MVX -Sun's
Visualization Accelerators
......
82
7.7 Sterling Federal Systems, Inc.
...
88
7.7.1
FAST (Flow Analysis Software
Toolkit)
......................
88
7.8
Dynamic Graphics Ltd.
........
89
7.9
Spyglass,
Inc.
.................
96
7.9.1
Spyglass
Transform
............
96
7.9.2
Spyglass
Dicer
................
97
7.10
LightWork Design Ltd. . . . . . . . . .
98
7.11
Ricoh Company Ltd.
..........
100
7.12
Vital Images, Inc.
.............
105
Chapter 8 Current Public Domain Systems
in Use
8.1
Khoros
......................
106
8.1.1
Overview
....................
106
8.1.2 Subsystem Component
Descriptions
..................
107
8.1.3
Current Status of Khoros
......
112
8.2
apE: A Dataflow Toolkit
for Scientific Visualization . . . .
..
117
XII
Contents
8.3
National Center for Super-
computing Applications (NCSA)
127
8.4
GPLOT, DRAWCGM, P3D
(Pittsburgh Supercomputer
Center)
......................
128
8.4.1
The GPLOT CGM Interpreter
..
129
8.4.2 The DrawCGM Graphics
Subroutine Library
............
131
8.4.3
The P3D Three-Dimensional
Metafile Project
...............
133
8.4.4 Software Availability
...........
135
8.5
RAYSHADE.
. . . . . . . . . . . . . .
..
135
8.6
NASA Ames Software
.........
137
8.6.1
PLOT3D
.....................
137
8.6.2 SURF
.......................
137
8.6.3
Graphics Animation
System
(GAS)
.......................
138
8.6.4 Applications in Computational
Fluid Dynamics (CFD)
........
138
8.7
Irisplot
......................
140
8.8
ISVAS.
. . . . . . . . . . . .
..
. . . . . .
..
140
Chapter
9
Other
Uses
of
Visualization Tools
9.1
Art and Design
...............
142
9.2
The 5th Dimension Animation
System.......................
142
9.3
Multimedia Environments
146
Chapter
10
Conclusions
10.1
Strategic Importance of Scientific
Visualization
.................
149
10.2
Current Developments
.........
150
10.3
More User-Friendly Facilities
...
150
10.4
Further Information
...........
151
10.5
What to do
next?
.............
151
References . . . . . . . . . . . . . . . . . . . . . . . . . . . . . . . . . .
..
152
Sources
of
Figures
............................
155
Acknowledgements
Acknowledgements
Phil Andrews (Pittsburgh Supercomputer Center), Mike
Bundred (UNlRAS Ltd.), Tat-Seng Chua (National Univer-
sity of Singapore), D. Scott Dyer (Ohio Supercomputer
Center), Basem EI-Haddadeh (University of Leeds), Todd
Elvins (San Diego Supercomputer Center), Mark Goossens
(Silicon Graphics Ltd.), Chris Green (British Geological
Survey), Simon Hansford (Precision Visuals), Dee Holmes
(Stardent Computer Ltd.), Peter Irwin (Dynamic Graphics
Ltd.), Teruaki Ito (Ricoh Company Ltd.), Tosiyasu L. Kunii
(University of Tokyo), Hideko
S.
Kunii (Ricoh Company
Ltd.), Chris Little (Meteorological Office),
Donna
McMil-
lan (Sun Microsystems Inc.), Nadia Magnenat-Thalmann
(University of Geneva), Eihachiro Nakamae (Hiroshima
University), Gordon Oliver (LightWork Design Ltd.),
Ai-
dan
O'Neill
(Ricoh Company Ltd.), Peter Quarendon (IBM
UK
Scientific Centre),
John
Rasure (University of New
Mexico), David
F.
Rogers (US Naval Academy), Peter Stot-
hart (Wavefront Technologies Ltd.), Yasuhito Suenaga
(NTT
Human
Interface Laboratories), Daniel Thalmann
(Swiss
Federal Institute of Technology), Hiroshi Toriya (Ri-
coh Company Ltd.), Craig Upson (Silicon Graphics Inc.),
Joel Welling (Pittsburgh Supercomputer Center), Jane
Wheelwright (Dynamic Graphics Ltd.), Michael Wood
(University of Aberdeen), Brian Wyvill (University of Cal-
gary), Geoff Wyvill (University of Otago).
The contributions of members of the the
AGOCG
Workshop
on
Scientific Visualization held in the UK,
22-25
February 1991, are gratefully acknowledged.
We
par-
ticularly appreciated
the
comments of the following
on
a
first draft of this guide: Ken Brodlie, Lesley Carpenter, Kate
Crennell, Todd Elvins, Hilary Hearnshaw, Roger Hubbold,
Chris Little, Anne Mumford, Howard Watkins, and Mike
Wood. However, responsibility for the final text remains
with the authors.
XIII
Many people have
supplied informa-
tion on their uses
and
applications
of
visualization
systems. Many de-
signers
and
imple-
mentors have sup-
plied details
of
their systems
and
also illustrations.
Others have sup-
plied details
of
as-
pects
of
visualiza-
tion, as well as sli-
des.
We
express
our thanks
and
appreCiation to:
XIV
We
are indebted
to
the following for
the use
of
copy-
right material and
illustrations:
Disclaimer I
Copyright
Material
Some companies were unable to supply information
or
illustrations of their products, despite being invited to do
so.
They
have
therefore been omitted from the information
on
current vendor systems. The list
of
vendor systems
is
not
therefore claimed to cover
all
the systems in the market
place
at
the time of writing. Those that
are
covered are the
ones where information
was
obtainable.
Disclaimer
The
views
expressed by the contributors of information on
products
is
believed to
be
accurate and given in good faith.
However, authors and publisher do not hold themselves
re-
sponsible for the views expressed in this volume in connec-
tion with vendor products
or
public domain products. In
addition, the authors and publisher do not hold themselves
responsible for the accuracy
or
otherwise of data extracted
from vendor specifications.
Copyright
Material
Chris Little, UK Meterological Office (UK Government),
Peter Quarendon,
IBM
UK Scientific Centre, David
F.
Rog-
ers,
US
Naval Academy, Regional Geophysics Research
Group, British Geological
Survey,
Peter Stothart, Wavefront
Technologies Ltd., Mike Bundred, UNIRAS Ltd., Precision
Visuals Ltd., Stardent Computer Ltd., Silicon Graphics Inc.,
Spyglass
Inc., Ricoh Company Ltd.,
San
Diego Supercom-
puter Center, Donna McMillan, Sun Microsystems Inc.,
Gordon Oliver, LightWork Design Ltd., Nadia Magnenat-
Thalmann, University
of
Geneva, Daniel Thalmann,
Swiss
Federal Institute
of
Technology.
Trademarks
Trademarks
UNIX
is
a trademark of AT & T Inc.,
OPEN
LOOK
is
a
trademark of AT & T Inc., X Window
is
a trademark
of
Massachusetts Institute
of
Technology,
Xll
is
a trademark
of
Massachusetts Institute
of
Technology,
Motif
is
a trade-
mark
of
the
Open
Software Foundation Inc., PostScript
is
a registered trademark
of
Adobe Systems Inc., Ethernet
is
a
trademark
of
Xerox Corporation, MS-DOS
is
a trademark
of
Microsoft Corporation, Stardent
is
a trademark
of
Star-
dent
Computer
Inc.,
AVS
is
a trademark
of
Stardent Com-
puter Inc.,
DORE
is
a trademark
of
Stardent
Computer
Inc., Silicon Graphics
is
registered trademark
of
Silicon
Graphics Inc., IRIS
is
a registered trademark
of
Silicon
Graphics Inc.,
POWER
series
is
a trademark of Silicon
Graphics Inc., Graphics Library
is
a trademark
of
Silicon
Graphics Inc., Image Vision Library
is
a trademark
of
Sili-
con
Graphics Inc., IL
is
a trademark
of
Silicon Graphics
Inc.,
GL
is
a trademark of Silicon Graphics Inc., Live Video
Digitizer
is
a trademark of Silicon Graphics Inc., Stereo View
is
a trademark
of
Silicon Graphics Inc., Explorer
is
a trade-
mark
of Silicon Graphics Inc
..
, Personal Visualizer
is
a
trademark
of
Wavefront Technologies Inc., Data Visualizer
is
a trademark
of
Wavefront Technologies Inc., Advanced
Visualizer
is
a trademark of Wavefront Technologies Inc.,
Sun Vision
is
a trademark of Sun Microsystems Inc., Sun-
View
is
a registered trademark
of
Sun Microsystems, Open-
Windows
is
a trademark
of
Sun Microsystems Inc.,
XDR
is
a trademark
of
Sun Microsystems Inc., XGL
is
a trademark
of
Sun Microsystems Inc., SPARC
is
a registered trademark
of SPARC International Inc., SPARCstation
is
a trademark
of SPARC International Inc., IBM,
PC,
PS/2 are trademarks
of
IBM Corporation,
PV-WAVE
is
a trademark
of
Precision
Visuals Inc.,
NAG
is
a registered trademark
of
Numerical
Algorithms Group Ltd. and, Numerical Algorithms Group,
Inc., RenderMan
is
a registered trademark
of
PIXAR, RIB
is
a trademark
of
Pixar, Spyglass
is
a trademark
of
Spyglass
Inc., MacIntosh
is
a trademark of Apple
Computer
Inc.,
xv
This
is an aggre-
gated list
of
regis-
tered trademarks
and trademarks
used
in
the
vol-
ume.
In order
to
identify products
unambiguously
it
is necessary
to
use these terms.
The
following are
known
to
be trade-
marks
or
regis-
tered trademarks
of
the companies
concerned.
We
trust that others
that may not be
noted are known
to
readers and are
referenced
in
a
manner accept-
able
to
the com-
panies concerned.
XVI
Trademarks
Laserwriter
is
a trademark of Apple Computer Inc.,
LightWorks
is
a trademark of LightWork Design Ltd.,
NeXT
Cube
is
a trademark of
NeXT
Computers, SpaceBall
is
a trademark of Spatial Systems Inc., DataGlove
is
a trade-
mark of VPL, 3D Polhemus Digitizer
is
a trademark of
Polhemus, EyePhone
is
a trademark of VPL Research Inc.,
VoxelView
is
a trademark of Vital Images Inc., VoxelLab
is
a trademark of Vital Images Inc.
Part I
Basics of
Scientific
Visualization
Chapter
1
Introduction
and
Background
1.1
Introduction
This guide seeks to answer the following questions:
• What
is
scientific visualization?
• What can it
do?
• What do the technical terms and the jargon really mean?
• What products are currently available?
• What kind
of
hardware do I need?
• What are the costs?
• What do I
get?
• Where do I
go
next to find out more,
or
to explore cur-
rent possibilities?
• What are the prospects for the future?
The first part of this volume
is
concerned with introducing
the topic, definitions, terminology, techniques, methodolo-
gy,
and equipment. The second part contains an overview
of current systems and developments.
1.2
Background
The area encompassed by scientific visualization
is
defined
Information
in this guide, with the range of possible applications, and
the potential for the future. Considerable advances have
been made in the USA by dissemination of information and
by coordinated initiatives from industry and professional
organisations such
as
the Association for Computing
Ma-
chinery (ACM).
4 Introduction and Background
Objectives
The
objective
of
this guide
is
to inform the general reader
about scientific visualization, what it offers, and what it can
do.
It
should be useful to scientists and engineers
who
are
not
specialists in computing matters, but nonetheless wish
to use effective computer-based tools to further research ob-
jectives.
Developments and initiatives in the USA
are
summa-
rized. These demonstrate the relevance and importance
of
scientific visualization.
Facilities Software products are outlined and summarised -for
purposes
of
general information. These are indicative
of
the
kind
of
products available in the market place, and that are
supported
on
a variety of platforms. However, this
is
not
in-
tended to
be
exhaustive, and in certain application areas a
wide variety of software has been developed.
Current developments in animation are summarized be-
cause it
is
likely to become increasingly important for scien-
tific visualization.
Summary This guide provides an overall summary
of
the benefits
that accrue from scientific visualization and the methods,
tools and strategies that comprise its domain.
Chapter
2
What
Scientific
Visualization
Can
Do!
2.1
What
is
Scientific
Visualization?
"The purpose
of
computing
is
insight,
not
numbers" wrote
the much-cited Richard Hamming in Numerical
Methods
for
Scientists and
Engineers
(McGraw-Hill, 1962). Scientific
vi-
sualization
is
an amalgam
of
tools and techniques that seeks
to promote new dimensions
of
insight into problem-solving
using current technology.
Scientific visualization
is
concerned with exploring data
and information graphically -
as
a means
of
gaining under-
standing and insight into the data. Scientific visualization
is
a graphical process analogous to numerical analysis, and
is
often referred
to
as
visual data analysis. Scientific visualiza-
tion
systems are combinations
of
hardware and software
sys-
tems and techniques.
By displaying multi-dimensional data in an easily under-
standable form
on
a 2D screen, it enables insights into 3D
and higher-dimensional data and data sets that were
not
for-
merly possible.
Often data sets are very large, and this
gives
rise to prob-
lems
of
scale and
of
finding correlations and relationships
between different parts
of
the data.
Visualization
is
also a means
of
gaining a quick under-
standing
of
processes. This could
be
done in more classical
ways, but might take much longer.
The difference between scientific visualization and pre-
sentation graphics
is
that the latter
is
primarily concerned
with
the communication
of
information and results that
are
already understood. In scientific visualization
we
are seek-
ing to understand the data.
Insight not
numbers
What is it?
Multidimensional
Large volumes
Speed
Not presentation
graphics
6 What Scientific Visualization
Can
Do!
Lots
of
tools Visualization involves aspects in the
areas
of computer
graphics, user interface, cognitive science, image processing,
design, and signal processing. Formerly these were indepen-
dent fields, but convergence
is
being brought about by the
use of analogous techniques in the different
areas.
Visualiza-
tion
is
thus an additional tool for scientific research and in-
vestigation.
Help for Visualization highlights applications and application ar-
applications
eas
because it
is
concerned with providing the means for a
user to achieve greater exploitation of computing tools now
available. In a number of instances visualization has been
used to analyze and display large volumes of multi-dimen-
sional data in such a way
as
to allow the user to extract
sig-
nificant features and results quickly and
easily.
Tools and
techniques in this area are therefore concerned with data
analysis and data display, perhaps with provision for the
dis-
play of data changes with respect
to
time.
Examples Non-destructive and non-invasive examination of the in-
ternal structures of living organisms (e.g., reconstructions
from brain scan data), turbulence effects in fluid
flow,
and
genetic engineering are
all
examples that have caught the
public attention, and where scientific visualization has
brought substantial benefits. However, this
is
but one aspect
of the whole field,
as
indicated above.
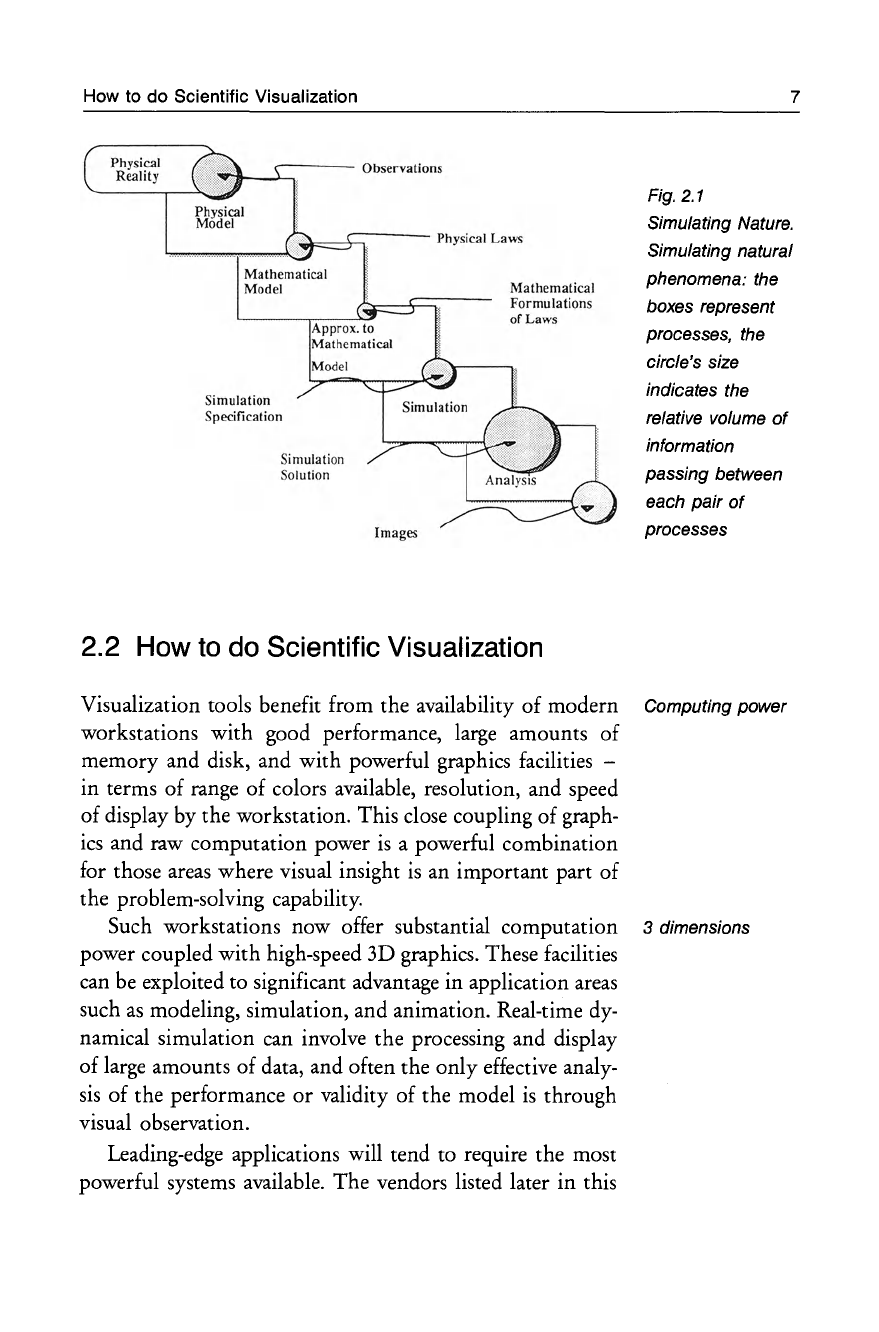
Simulating nature Visualization fits into the overall process of numerical
simulation
as
indicated in Figure
2.1
below.
In the computational sciences the main goal
is
to under-
stand the workings of nature.
In
order to accomplish this,
the scientist proceeds through a number of steps from ob-
serving a natural event
or
phenomena to analyzing the
re-
sults of a simulation of the phenomena. Visual representa-
tion of this data
is
often indispensible in gaining an under-
standing of the processes involved.
Interactive steering Visualization systems can be used for the interactive
steering of computations. The user observes the progress of
the computation visually and alters parameter values accord-
ingly. These in
turn
determine the future computation.
How
to
do Scientific Visualization
~I--_r-l-
-,
,
---
Observations
~_~---
Physical
Laws
l""".=~==""
'"
Mathematica l
Model
Approx. to
Mathematical
Simulation
Specification
Simulation
SOlution
Images
Mathematical
Formulation
of
Laws
2.2
How
to
do
Scientific
Visualization
7
Fig,
2,1
Simulating Nature,
Simulating natural
phenomena: the
boxes represent
processes, the
circle's size
indicates the
relative volume
of
information
passing between
each
pair
of
processes
Visualization tools benefit from the availability of modern Computing power
workstations with good performance, large amounts of
memory and disk, and with powerful graphics facilities -
in terms of range of colors available, resolution, and speed
of
display by the workstation. This close coupling of graph-
ics
and raw computation power
is
a powerful combination
for those
areas
where visual insight
is
an
important part of
the problem-solving capability.
Such workstations now offer substantial computation 3 dimensions
power coupled with high-speed 3D graphics. These facilities
can
be
exploited to significant advantage in application
areas
such
as
modeling, simulation, and animation. Real-time dy-
namical simulation can involve the processing and display
of large amounts of data, and often the only effective analy-
sis
of the performance
or
validity of the model
is
through
visual observation.
Leading-edge applications will tend to require the most
powerful systems available. The vendors listed later in this
8 What Scientific Visualization Can
Do!
volume provide a range
of
systems to match a wide variety
of
applications, and are continuously improving computa-
tion power and graphics capabilities.
Supercomputers Such workstations provide the computation power to
process the data, and the high-speed graphics pipeline can
transform this into graphical images, often in real time. In
those
cases
where additional computational resources are
re-
quired, the calculation can be off-loaded onto a supercom-
puter,
or
other advanced workstations
with
spare capacity,
and the resulting image down-loaded for viewing (and per-
haps even interaction)
when
it
is
ready.
Output
Output
is
often most useful
as
information
on
the work-
station screen, especially when the process
is
interactive.
More permanent copies
of
screen images can be printed in
full color
on
A4
to
AO
plotters and printers and
on
video
or
slides. However, this requires additional hardware and
software. Generally, the higher the cost the greater the vari-
ety
of
colors and quality
of
the final images.
2.3
Some Examples of Scientific
Visualization
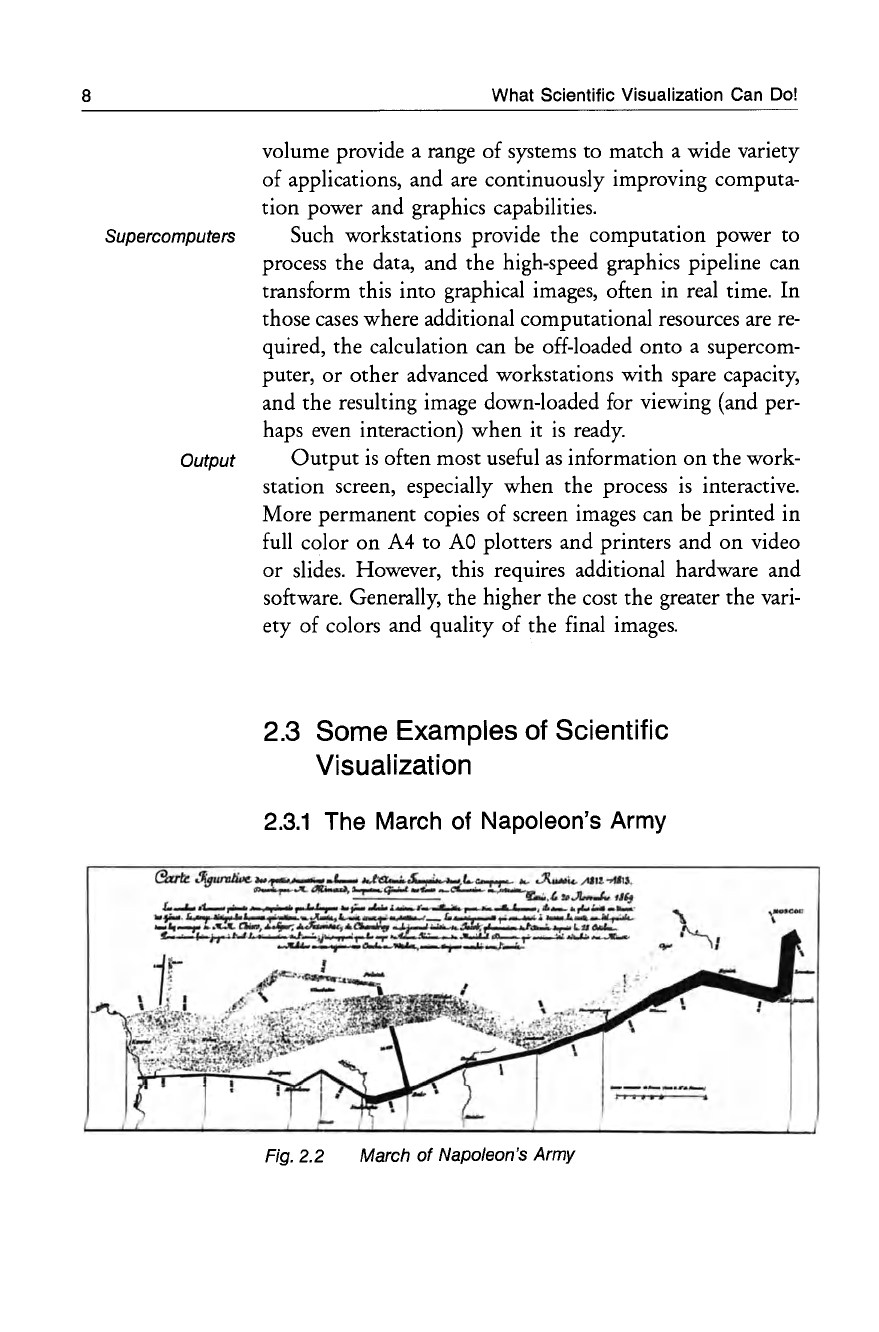
2.3.1
The March of Napoleon's Army
Fig. 2.2 March
of
Napo/eon's Army
----_.'.-"
, -
,--
,
Some Examples
of
Scientific Visualization
The
classic
map/chart
of
Napoleon's march in Russia, and
the
retreat
of
1812, drawn
by
Charles Joseph Minard.
This
is
a good example
of
visualization
which
clearly
pre-dates scientific visualization!
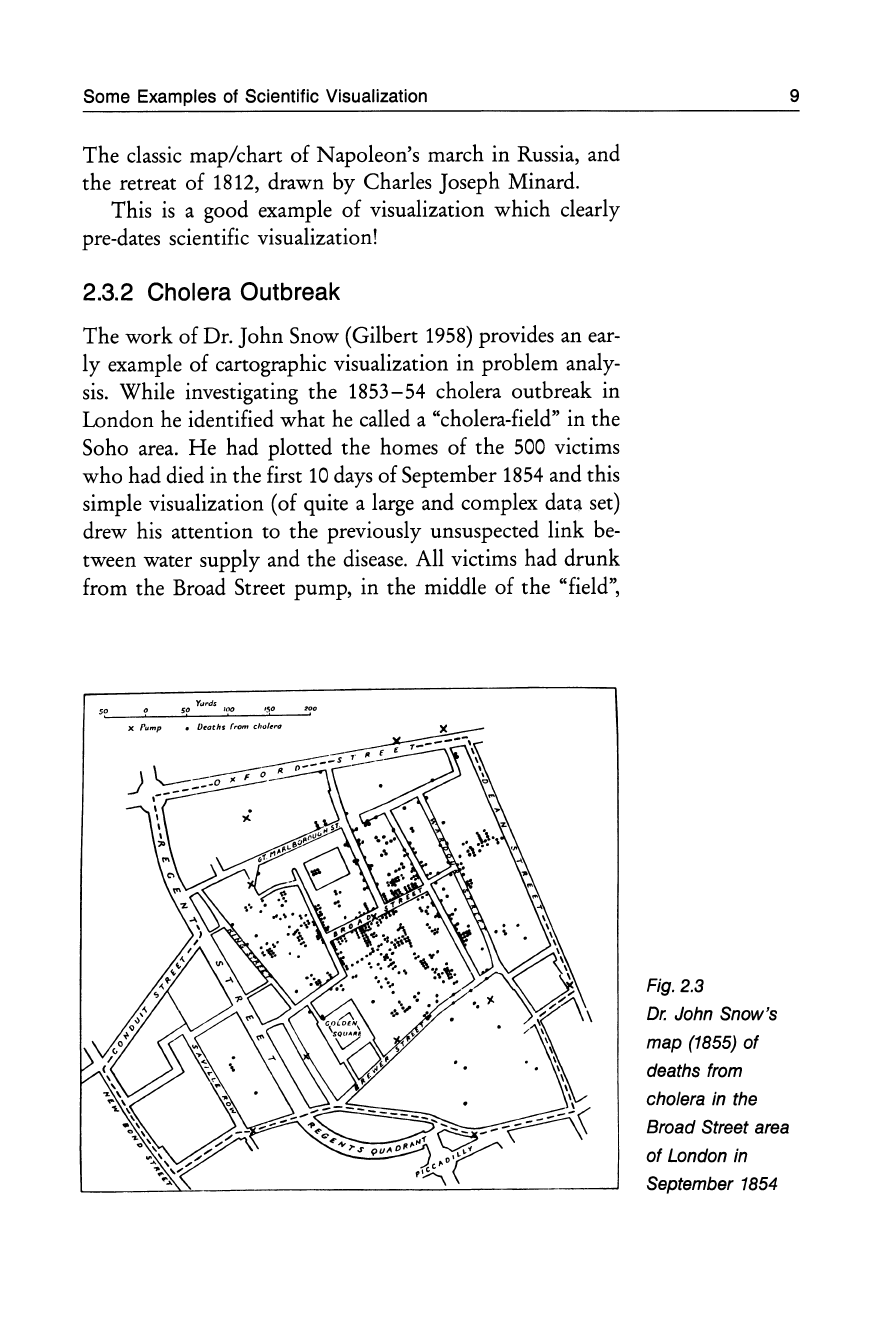
2.3.2 Cholera Outbreak
The
work
of
Dr.
John
Snow (Gilbert 1958) provides an ear-
ly example
of
cartographic visualization
in
problem analy-
sis. While investigating
the
1853-54
cholera outbreak
in
London
he identified
what
he called a "cholera-field" in
the
Soho area.
He
had plotted
the
homes
of
the
500 victims
who
had died in
the
first
10
days
of
September 1854 and this
simple visualization (of quite a large and complex data set)
drew his attention to
the
previously unsuspected
link
be-
tween water supply and
the
disease. All victims had
drunk
from the Broad Street pump, in the middle
of
the
"field",
Fig. 2.3
Dr.
John Snow's
map (1855)
of
deaths from
cholera in the
Broad Street area
of
London in
September 1854
9
10
What Scientific Visualization
Can
Do!
which, it
was
later established, was being polluted by a leak-
ing cesspool. The "link"
was
confirmed by noting that a vir-
tually disease-free area
(a
large workhouse) within this zone
had its own clean water supply.
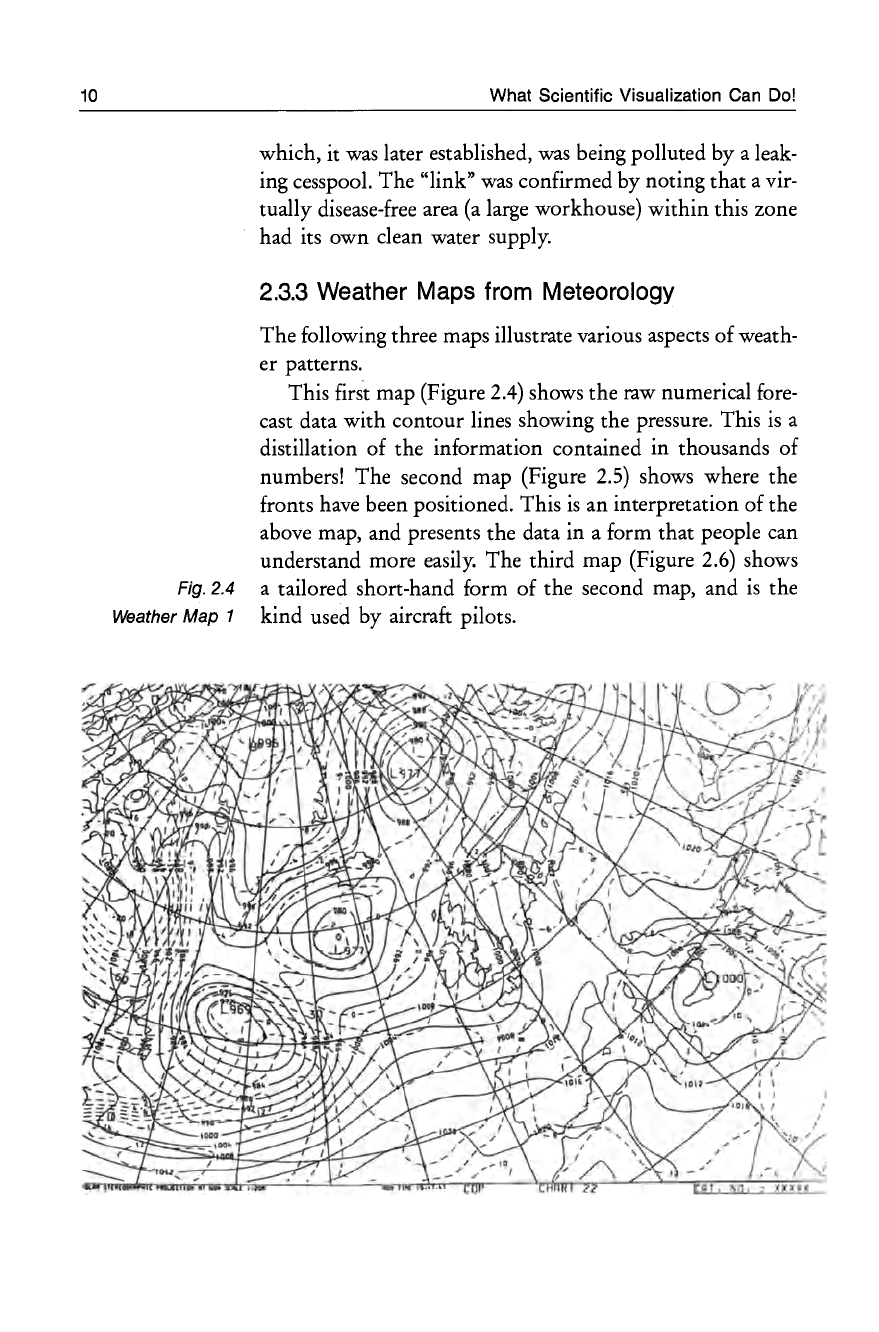
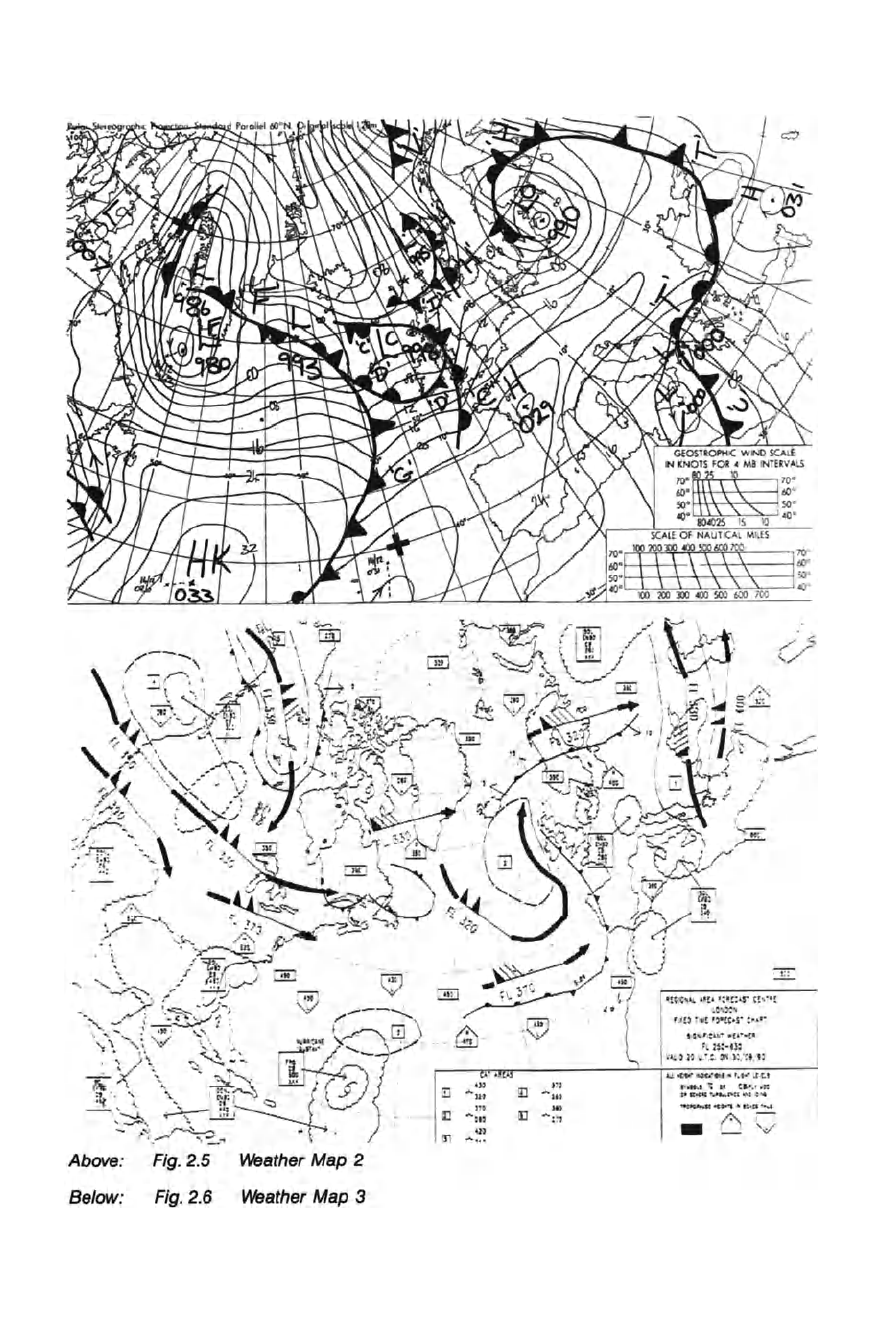
2.3.3
Weather
Maps
from
Meteorology
The
following three maps illustrate various aspects
of
weath-
er patterns.
This first map (Figure 2.4) shows the raw numerical fore-
cast data with contour lines showing the pressure. This
is
a
distillation
of
the information contained in thousands
of
numbers!
The
second map (Figure
2.5)
shows where the
fronts have been positioned. This
is
an interpretation
of
the
above map, and presents the data in a form that people can
understand more easily. The third map (Figure 2.6) shows
Fig. 2.4 a tailored short-hand form
of
the second map, and
is
the
Weather
Map
1 kind used by aircraft pilots.
12
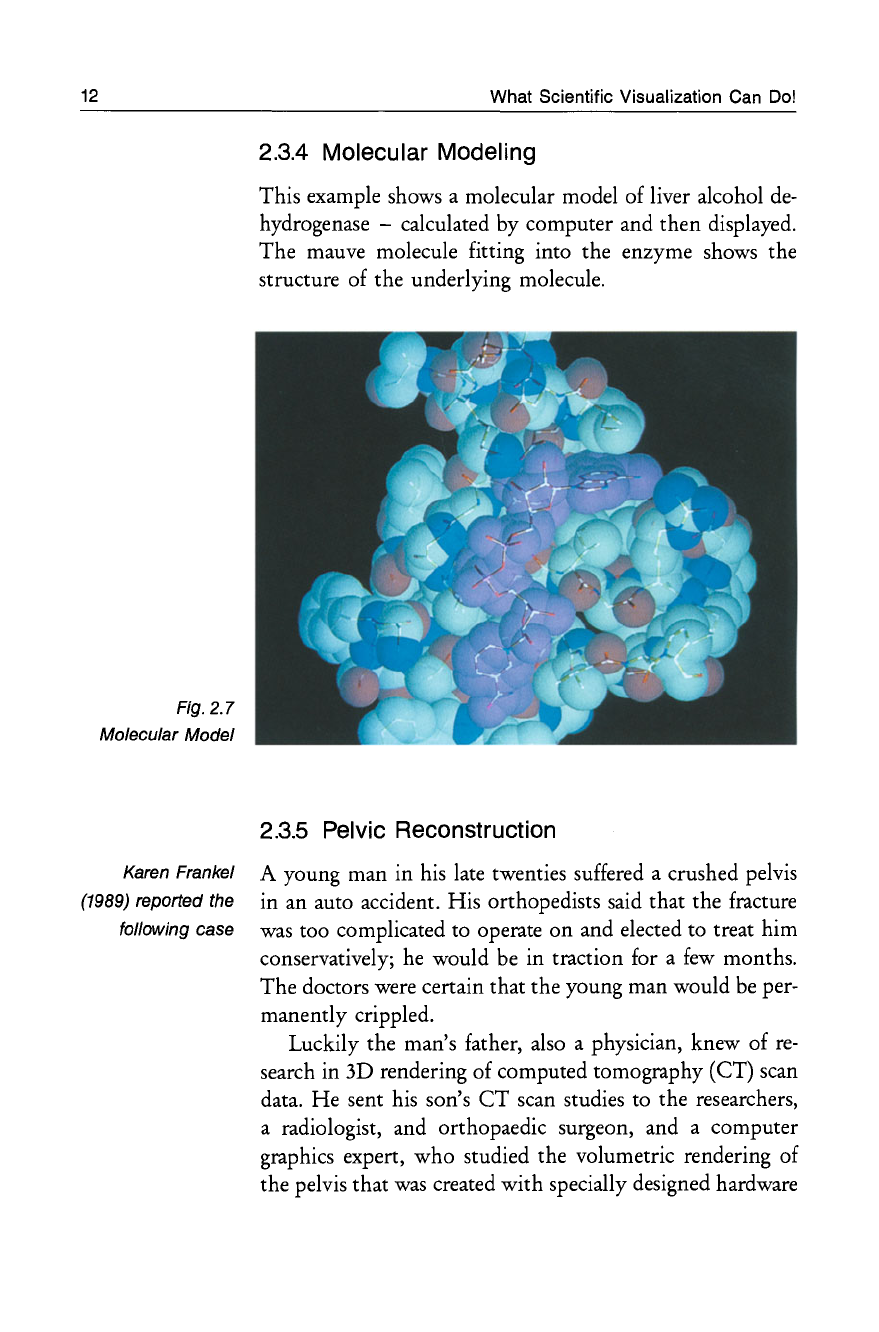
Fig.
2.7
Molecular Model
What Scientific Visualization
Can
Do!
2.3.4
Molecular Modeling
This example shows a molecular model
of
liver alcohol
de-
hydrogenase -calculated by computer and
then
displayed.
The
mauve molecule fitting into the enzyme shows the
structure of the underlying molecule.
2.3.5
Pelvic Reconstruction
Karen Frankel A young man in his late twenties suffered a crushed pelvis
(1989) reported the in an auto accident. His orthopedists said that the fracture
following case
was
too complicated to operate
on
and elected to treat him
conservatively; he would be in traction for a
few
months.
The
doctors were certain that the young man would
be
per-
manently crippled.
Luckily the man's father, also a physician, knew
of
re-
search in 3D rendering of computed tomography (CT) scan
data.
He
sent his son's
CT
scan studies to the researchers,
a radiologist, and orthopaedic surgeon, and a computer
graphics expert,
who
studied the volumetric rendering
of
the pelvis that
was
created with specially designed hardware
Some Examples
of
Scientific Visualization
and software. Able
to
see
it from all angles, they determined
the extent
of
the fracture and locations of several key
frag-
ments.
The
pelvis was operable and the next day the sur-
geons set the fragments. Three
months
later the patient
re-
turned
for a check up and demonstrated full-range hip mo-
non.
13
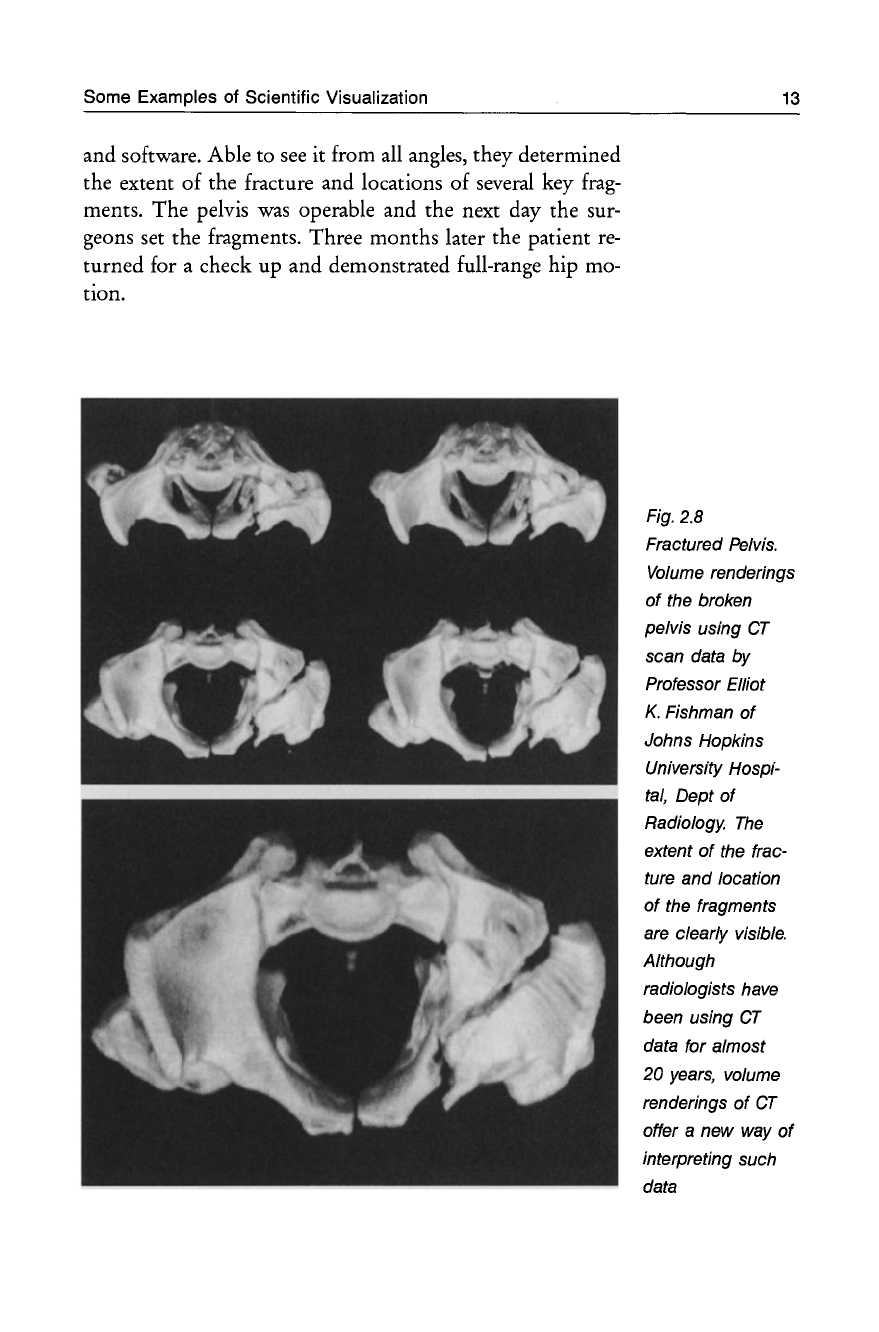
Fig. 2.8
Fractured Pelvis.
Volume
renderings
of
the broken
pelvis using
CT
scan data by
Professor Elliot
K.
Fishman
of
Johns Hopkins
University Hospi-
tal, Dept
of
Radiology.
The
extent
of
the frac-
ture and location
of
the fragments
are clearly visible.
Although
radiologists have
been using
CT
data for almost
20 years, volume
renderings
of
CT
offer a new way
of
interpreting such
data
14 What Scientific Visualization Can
Do!
This
case
coupled great medicine and great computer
sci-
ence. The technique of volume rendering changed the
course of treatment by providing the physicians with more
data. This data ultimately
gave
them the confidence to oper-
ate
and thereby improve the patient's quality of
life.
While
volume rendering helped manage the medical complexities,
this
case
also represents departures from tradition for both
disciplines.
Text:
courtesy
of
ACM
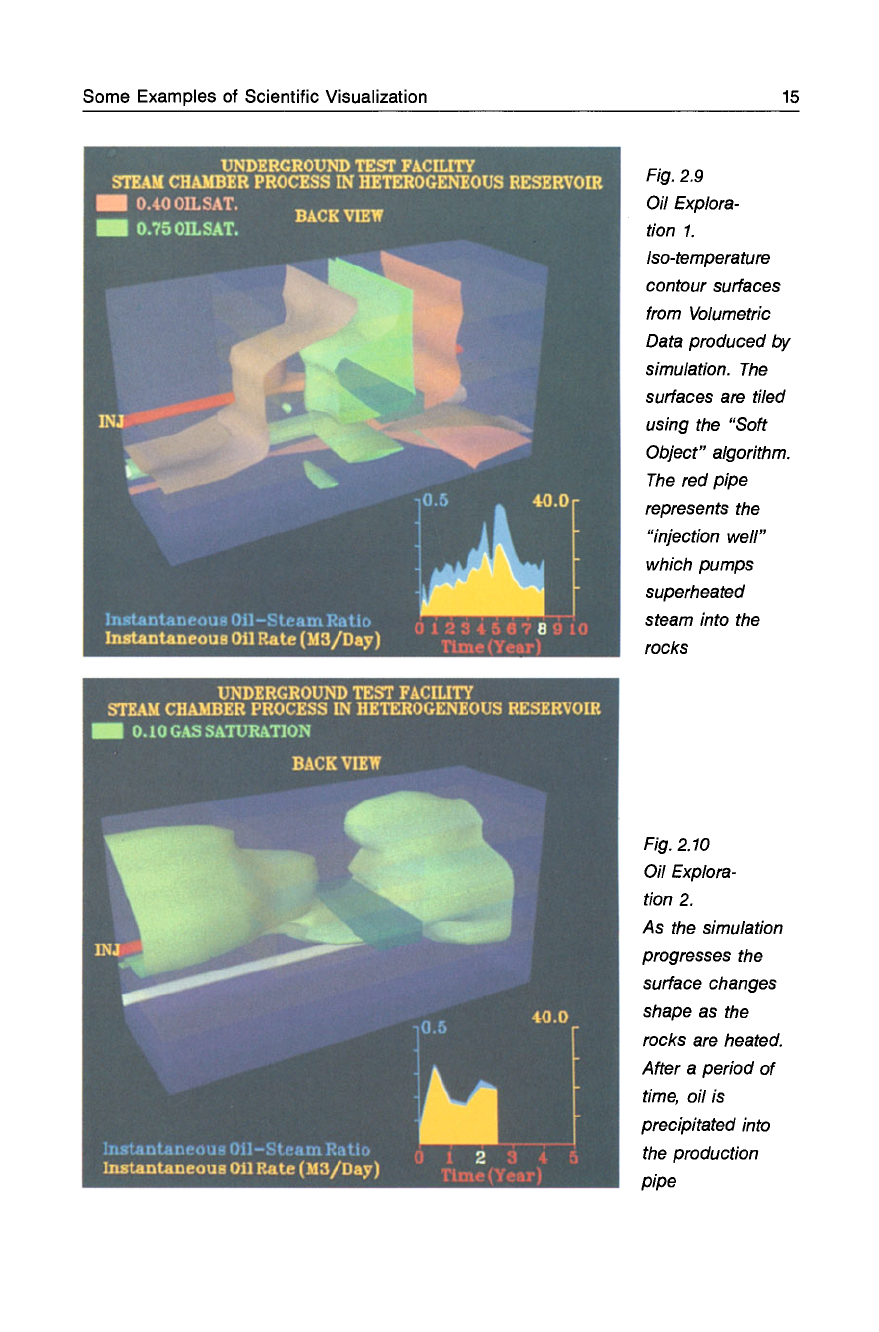
2.3.6
Oil
Exploration
This example shows the
use
of
visualization in oil explora-
tion. The volumetric data
was
produced
as
part of a simula-
tion of a method for recovering oil from the tar sands of
northern Alberta, Canada.
This process
was
simulated by the Alberta Oil Sands
Technology Research Authority and the visualization
was
computed by Geoff Wyvill and Brian Wyvill.
Courtesy
of
Geoff Wyvill and Brian Wyvill.
Some Examples of Scientific Visualization
15
Fig.
2.9
Oil Explora-
tion
1.
Iso-temperature
contour surfaces
from Volumetric
Data produced by
simulation.
The
surfaces are tiled
using the "Soft
Object" algorithm.
The
red pipe
represents the
"injection well"
which pumps
superheated
steam into the
rocks
Fig.
2.10
Oil Explora-
tion
2.
As the simulation
progresses the
surface changes
shape as the
rocks are heated.
After a period
of
time,
oil is
precipitated into
the production
pipe
16
What Scientific Visualization
Can
Do!
2.3.7 Designing Ship Propellors
Sculptured Surface Fitting and Fairing
Shape design
The
fairness of a sculptured surface
is
important for design
applications
as
diverse
as
modern artistic sculptures and air-
craft
or
automobiles.
The
requirement for fairness can be
based
on
either aesthetic
or
technical considerations. Cur-
rently there
is
no universally accepted mathematical defini-
tion of fairness.
One
technique that aids in evaluating sur-
face
fairness
is
to look at the Gaussian curvature
of
the sur-
Visualizing the
face.
The Gaussian curvature
of
a surface
is
visualized by
us-
surface ing the values
of
Gaussian curvature to color encode the sur-
face.
If
the surface
is
fair, then the color hue smoothly tran-
sitions across the surface. U nfairnesses show up
as
splotches
or
lines
of
color within the surface.
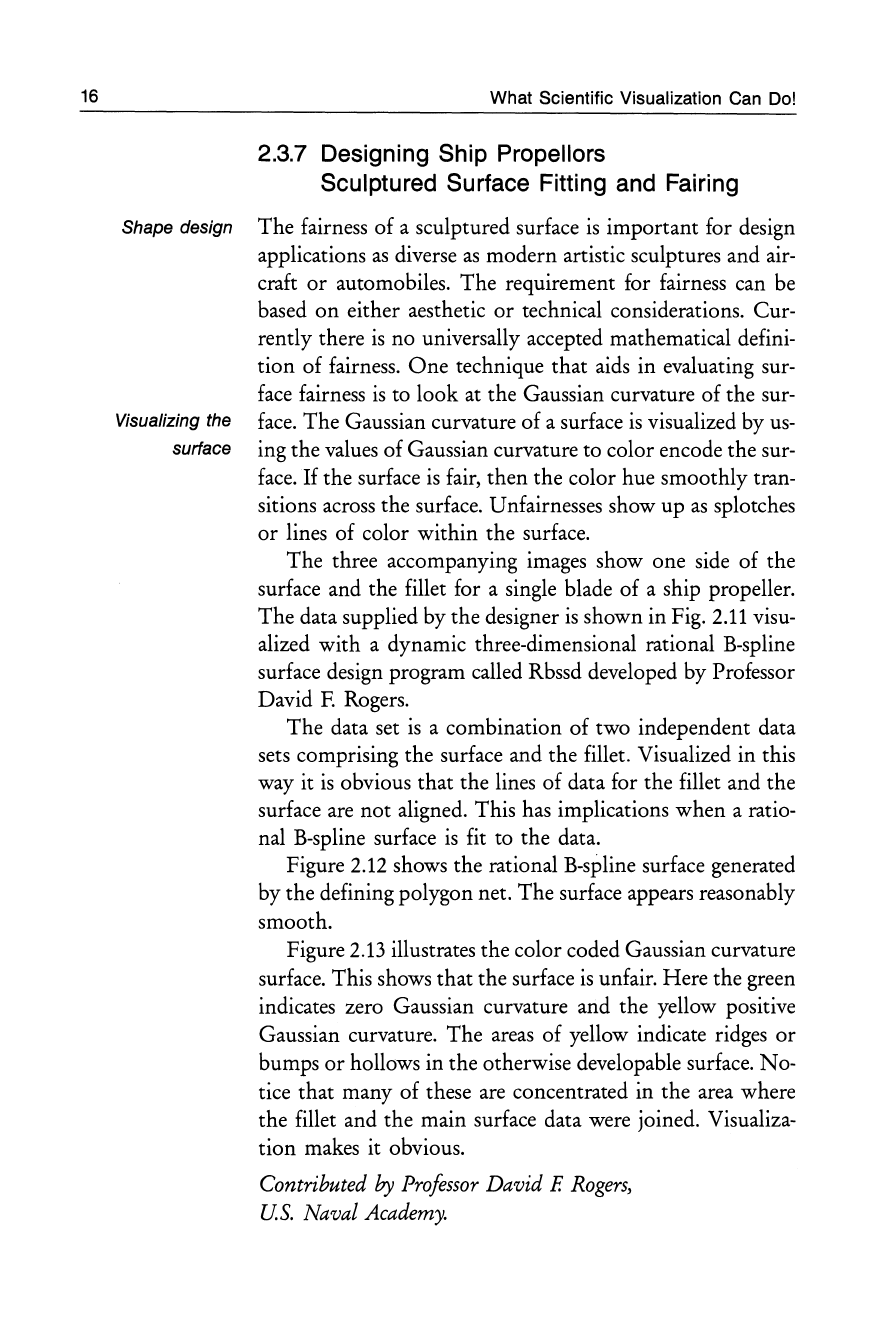
The
three accompanying images show one side
of
the
surface and the fillet for a single blade of a ship propeller.
The
data supplied by the designer
is
shown in Fig. 2.11 visu-
alized with a dynamic three-dimensional rational B-spline
surface design program called Rbssd developed by Professor
David
F.
Rogers.
The data set
is
a combination of two independent data
sets comprising the surface and the fillet. Visualized in this
way it
is
obvious that the lines
of
data for the fillet and the
surface
are
not
aligned. This has implications
when
a ratio-
nal B-spline surface
is
fit to the data.
Figure 2.12 shows the rational B-spline surface generated
by the defining polygon net. The surface appears reasonably
smooth.
Figure 2.13 illustrates the color coded Gaussian curvature
surface. This shows that the surface
is
unfair. Here the green
indicates zero Gaussian curvature and the yellow positive
Gaussian curvature.
The
areas
of
yellow indicate ridges
or
bumps
or
hollows in the otherwise developable surface. No-
tice that many
of
these
are
concentrated in the area where
the fillet and the main surface data were joined. Visualiza-
tion
makes it obvious.
Contributed
by
Professor
David E
Rogers,
US. Naval Academy.
Some Examples of Scientific Visualization 17
Fig. 2.
11
Designer's Data
Visualized wi
th
Rbssd
Fig. 2.
12
Rational a-spline
Surface
Fig. 2.13
Color Coded
Gaussian
Curvature Surface
18
Growth
of
forest
Choice
of
forest
to
model
Physical properties
What Scientific Visualization
Can
Do!
Supporting
References
Rogers,
D.
F.
and Adlum,
L.:
Dynamic Rational B-spline
Surfaces. Computer Aided Design Journal, invited paper
in the commemorative
issue
honoring Pierre Bezier on
his 80th birthday, Computer Aided Design Journal,
Vo1.22,
pp.609-616,
1990.
Dill, ].c., and Rogers,
D.F.:
Color Graphics and Ship Hull
Surface Curvature. Proceedings of International Confer-
ence on Computer Application in the Automation of
Shipyard Operation and Ship Design
IV
(ICCAS '82),
7-10
June
1982,
Annapolis, Maryland, pp.197-205,
North-Holland.
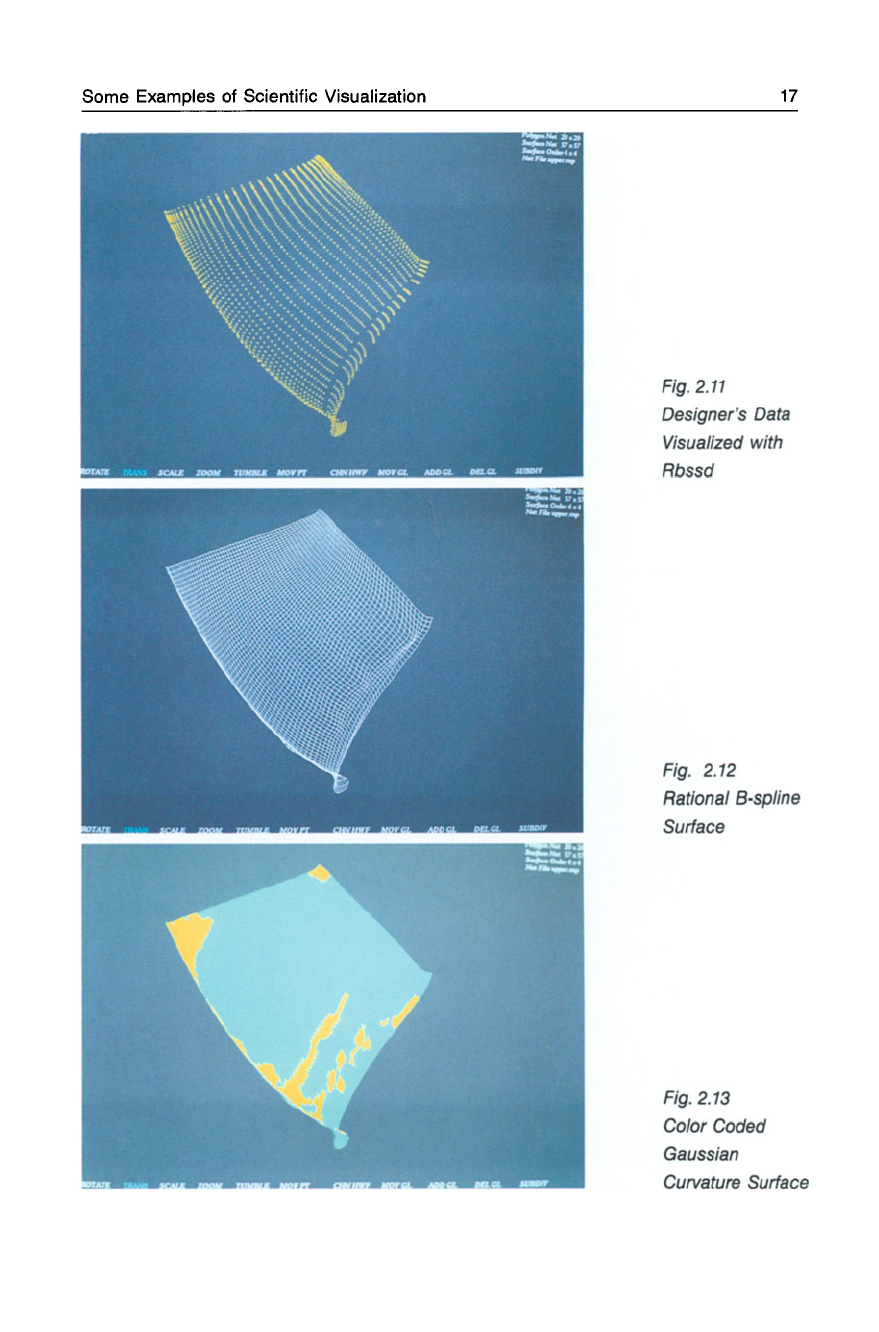
2.3.8
Visualization
of
Forest
Growth
An
interactive tree model, FOREST,
has
been developed
at
the University of Tokyo to enable the processes of forest for-
mation to
be
visualized. The model includes a parallel
algo-
rithm of individual tree growth which considers both the
differences between the species and also the time-dependent
interactions among the trees through mutual shading.
A tropical rain forest in the equatorial zone
is
chosen
as
a typical
case
because other types of forest can
be
derived
from it by imposing a set of constraints, such
as
diminished
rain
fall
and lower tempratures, which slow down the speed
of growth processes. The results of the visualization of
algo-
rithmically animating a
few
hundred years
of
forest growth
processes using this model
have
been validated against the
data obtained in experimental observations in Pasoh on the
Malaysian peninsula.
The model of individual trees considers the internal
properties of trees such
as
the rate of the light/photosynthe-
sis
relationship, the death rate of the branches, and the pro-
portion of the foliage active in photosynthesis.
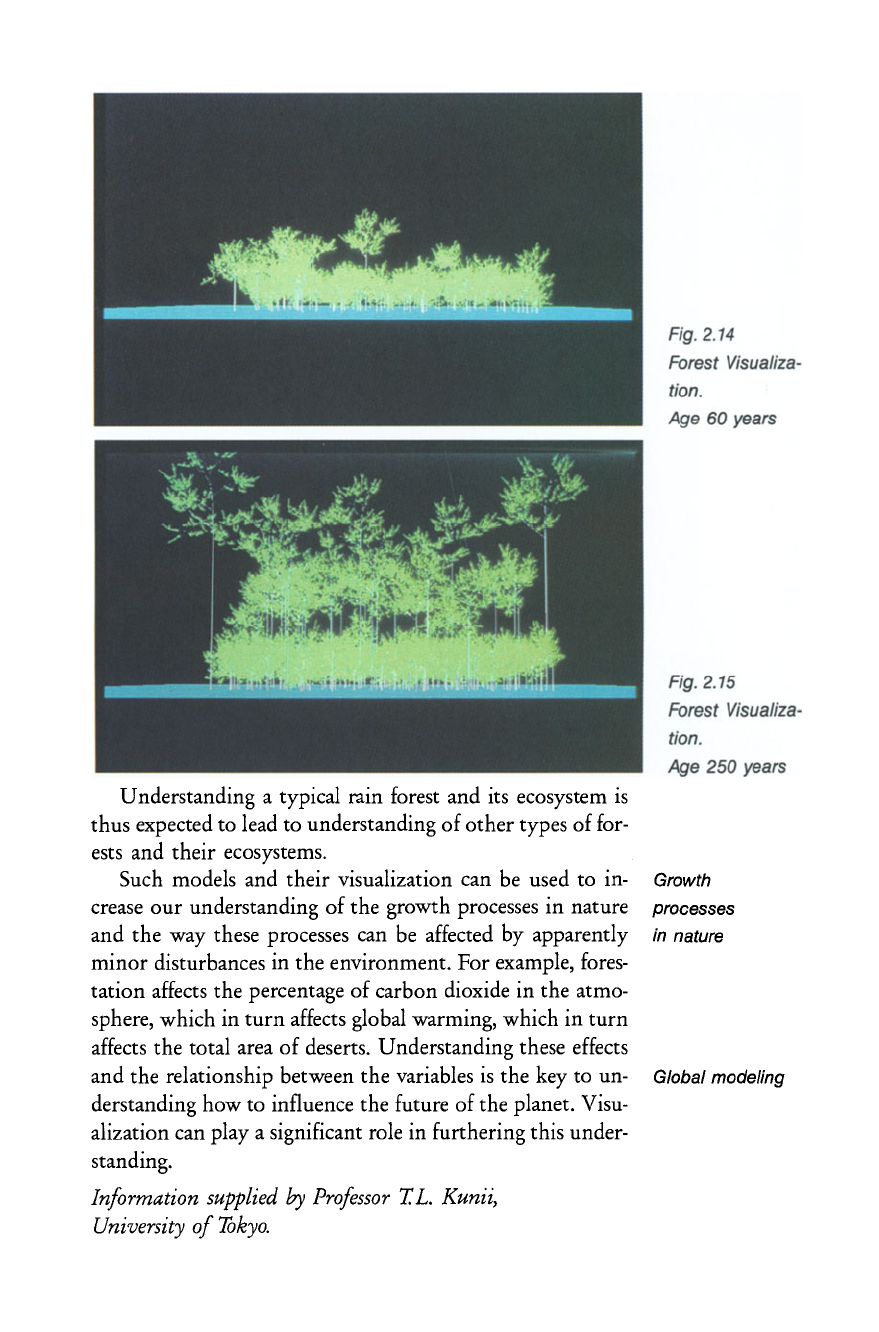
Figures
2.14
and
2.15
show two frames from a sequence
which show the entire
life
history of
the
forest. The first
shows the initial growth period
(1-60
years)
and the second
shows the higher layer formation processes starting
at
age
60.
Understanding a typical rain forest and its ecosystem
is
thus expected to lead to understanding
of
other types
of
for-
ests and their ecosystems.
Fig. 2.
14
Forest Visualiza-
tion.
Age 60 years
Fig. 2.15
Forest Visualiza-
tion.
Age 250 years
Such models and their visualization can be used to in- Growth
crease
our
understanding of the growth processes in nature processes
and the way these processes can
be
affected by apparently in nature
minor
disturbances in the environment. For example, fores-
tation affects the percentage
of
carbon dioxide in the atmo-
sphere, which in
turn
affects global warming, which in
turn
affects the total area
of
deserts. Understanding these effects
and the relationship between the variables
is
the key to un- Global modeling
derstanding how to influence the future of the planet. Visu-
alization can
playa
significant role in furthering this under-
standing.
In/ormation
supplied
by
Professor
T.
L.
Kunii,
University
0/
Tokyo.
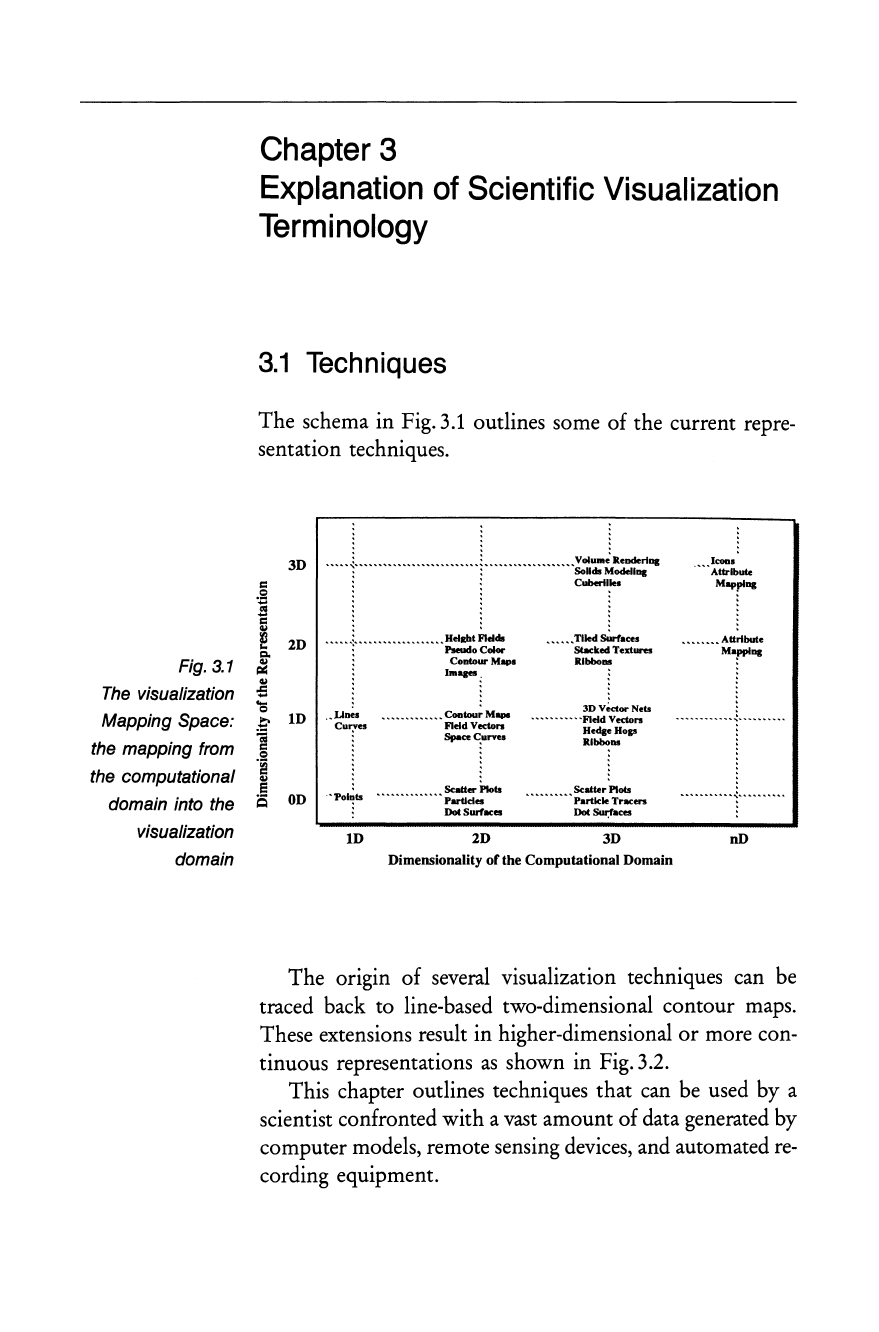
Fig.
3.1
The
visualization
Mapping Space:
the mapping from
the computational
domain into the
visualization
domain
Chapter
3
Explanation
of
Scientific
Visualization
Terminology
3.1
Techniques
The schema in Fig.
3.1
outlines some of the current repre-
sentation techniques.
3D
<:
•
S!
11
<:
..
~
2D
....
~
..
<5
"5
.~
1D
OJ
<:
.S!
;g
..
. 5
~
OD
. , '
,
.......
~
....................................................
!
.............
"
......................
VolulII~
ReDderiDi
: : Solids Modellog
: :
C~11es
.....
1.
.................
HoI
....
ioldo
......
Tlied
Surr
...
.
: Pseudo Color Stacked Textures
: Contour Maps Rlbboas
~
Images
.•
Llnel
CUr:
flS
1D
........................
ContourM..,.
Field
Vectors
Space
C,unes
............................ Scatter Plots
Partldes
DotSurfKeI
2D
3DVKtor
Nets
..
.. .. .. .. .. .. .. .. ..
"Field Vectors
HedgeHop
Rlbbo
...
Scatter Plots
Particle Tracers
Dot
Sur:faces
3D
Dimensionality
of
the Computational Domain
lcoa,
Attribute
Maprog
................ AUribute
M.,pplog
....................
~
..............
.
nD
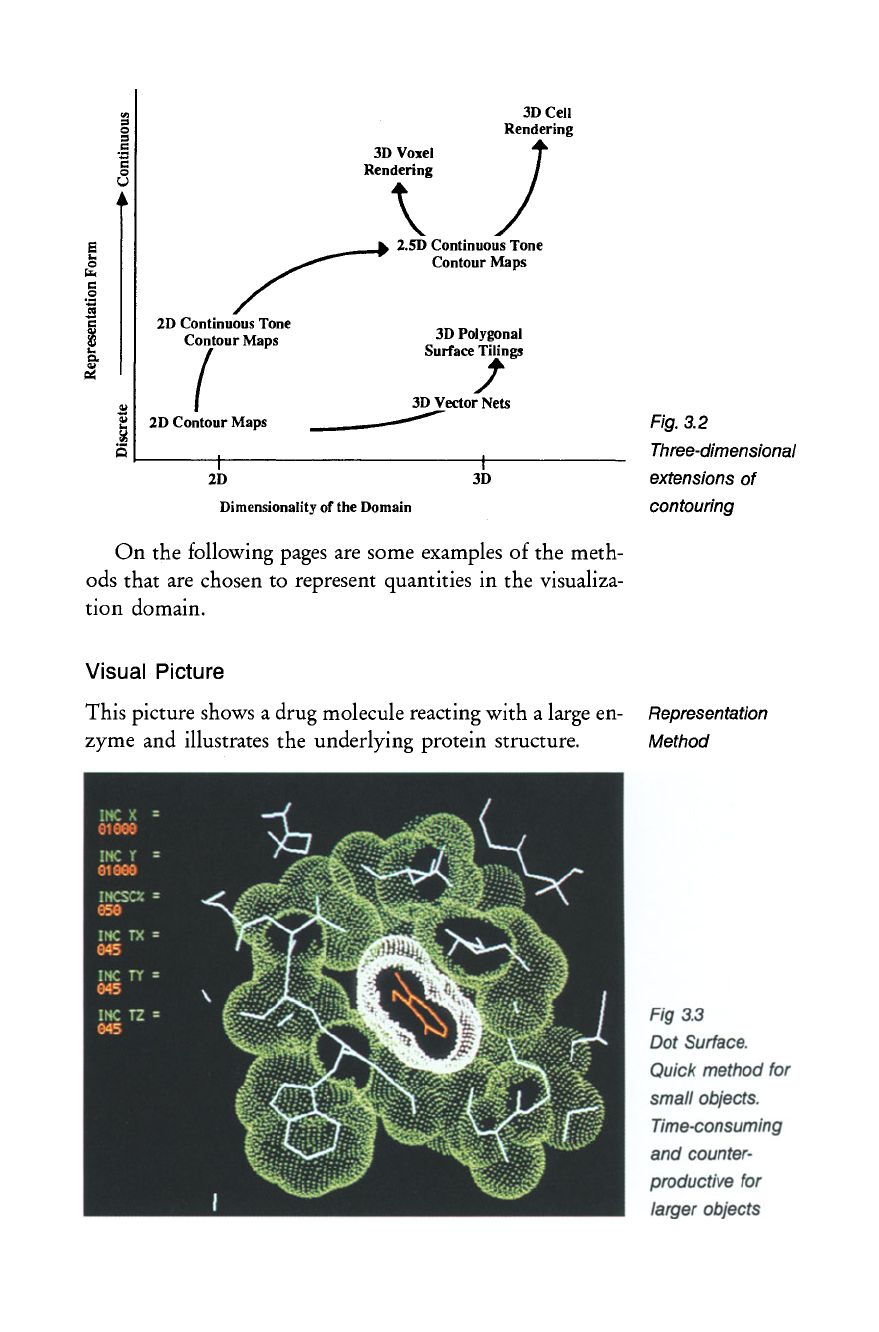
The
ongm
of several visualization techniques can be
traced back to line-based two-dimensional contour maps.
These extensions result in higher-dimensional
or
more con-
tinuous representations
as
shown in Fig. 3.2.
This chapter outlines techniques that can be used by a
scientist confronted with a
vast
amount of data generated by
computer models, remote sensing devices, and automated
re-
cording equipment.
'"
=
0
=
I:
--g
0
U
.!l
~
3D Cell
Rendering
3DVoxel )
Rendering
\
~
2.50
Continuous Tone
/'
Contour Maps
2D Continuous Tone
7"''''''''
2D Contour Maps
3D Polygonal
Surface Tilings
/
3D
Vector Nets
~
Q~------r------------------------r-------------
2D 3D
Dimensionality of the Domain
On
the following pages are some examples
of
the meth-
ods that are chosen to represent quantities in the visualiza-
tion domain.
Visual
Picture
This picture shows a drug molecule reacting
with
a large en-
zyme and illustrates the underlying protein structure.
Fig. 3.2
Three-dimensional
extensions
of
contouring
Representation
Method
Fig 3.3
Dot Surface.
Quick method for
small objects.
Time-consuming
and
counter-
productive for
larger objects
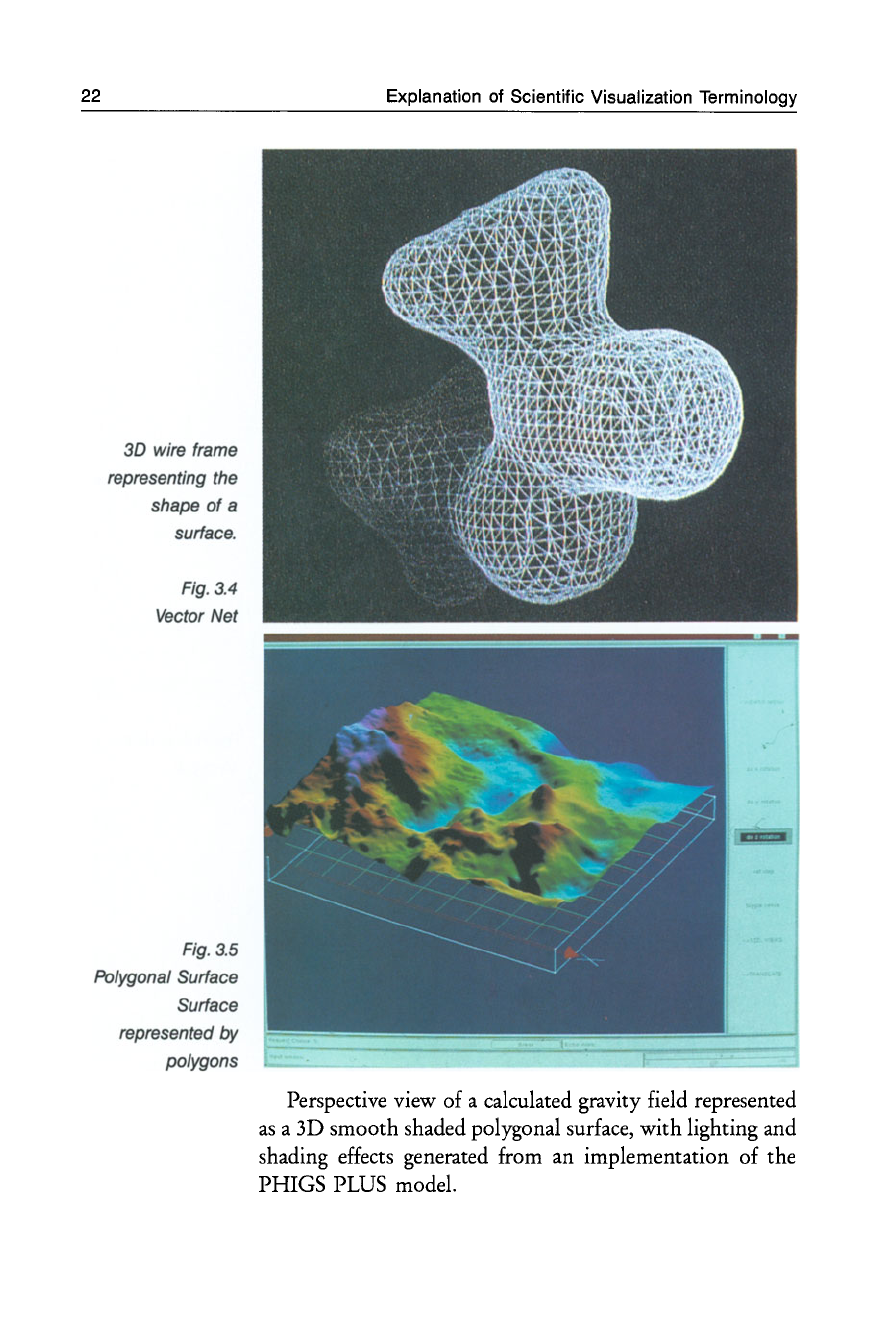
22
3D wire frame
representing the
shape
of
a
surface.
Fig.
3.4
Vector Net
Fig. 3.5
Polygonal Surface
Surface
represented
by
polygons
Explanation of Scientific Visualization Terminology
Perspective view
of
a calculated gravity field represented
as
a 3D smooth shaded polygonal surface, with lighting and
shading effects generated from an implementation of the
PHIGS PLUS model.
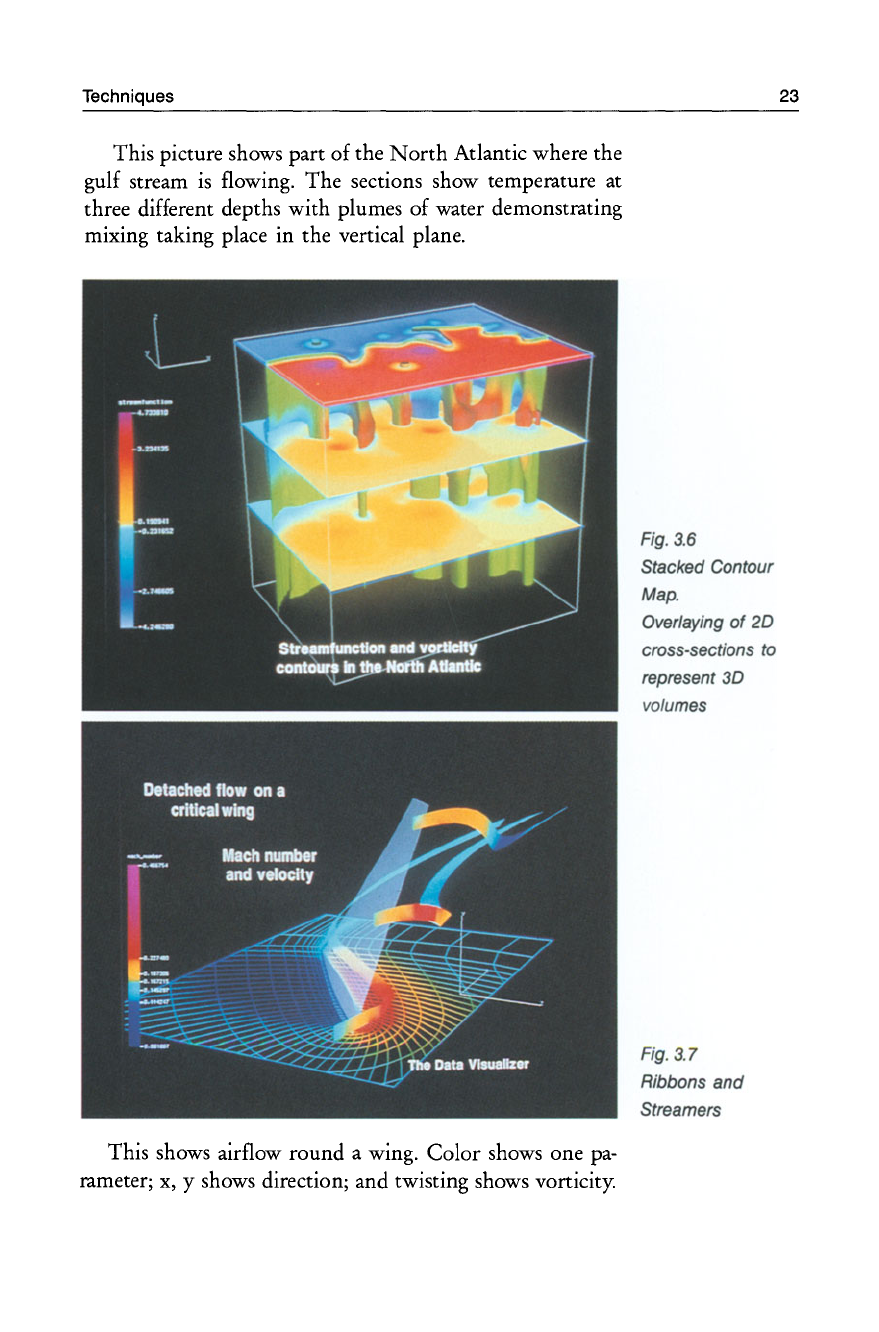
Techniques
This picture shows part
of
the
North
Atlantic where the
gulf stream
is
flowing.
The
sections show temperature at
three different depths
with
plumes
of
water demonstrating
mixing taking place in the vertical plane.
This shows airflow round a wing.
Color
shows one pa-
rameter; x, y shows direction; and twisting shows vorticity.
Fig.
3.6
Stacked
Contour
Map
.
Overlaying
of
20
cross·sections
to
represent
3D
volumes
Fig. 3.7
Ribbons
and
Streamers
23
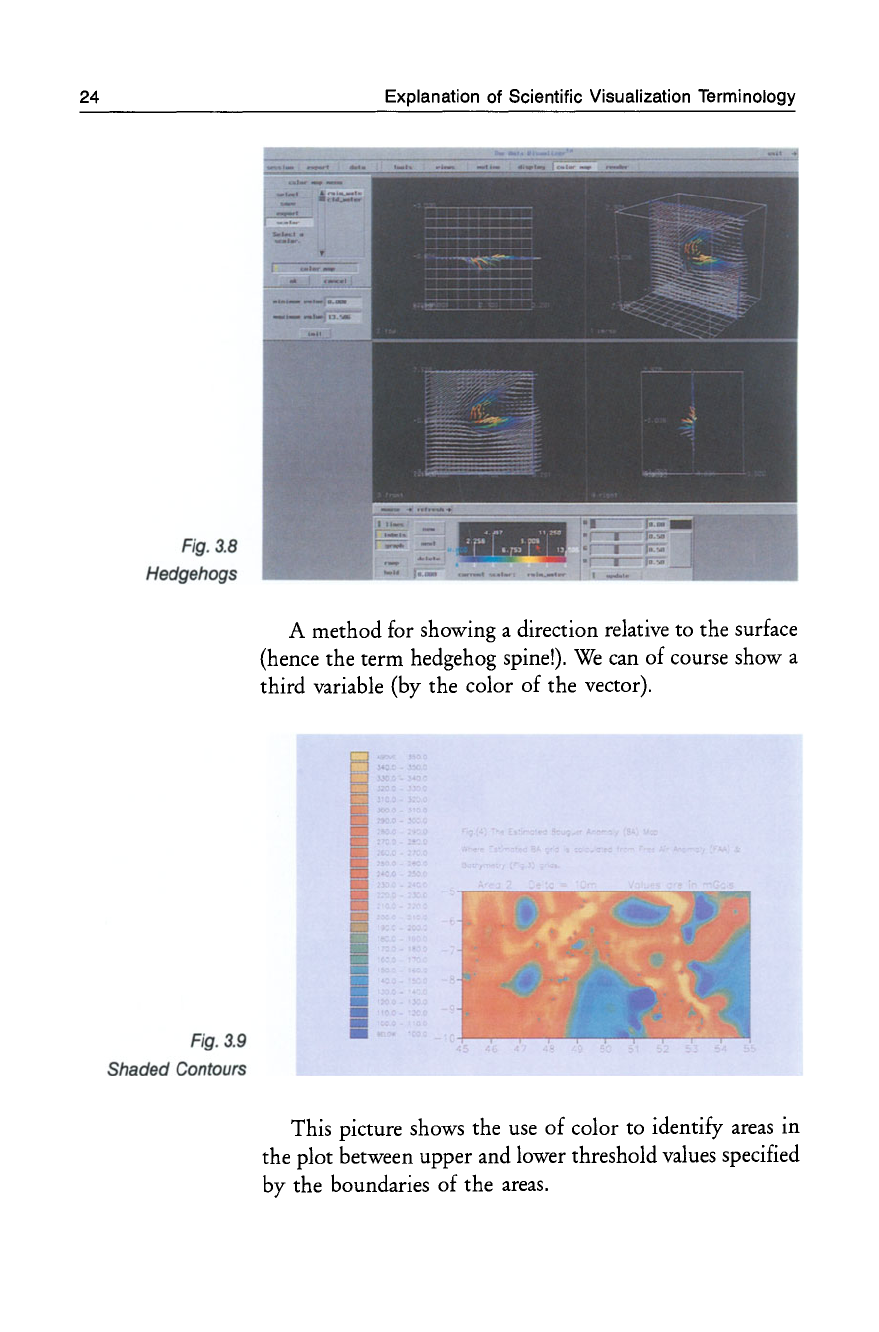
24
Fig. 3.8
Hedgehogs
Fig.
3.9
Shaded
Contours
Explanation of Scientific Visualization Terminology
A method for showing a direction relative to the surface
(hence the term hedgehog spine!).
We
can of course show a
third variable (by the color
of
the vector).
This picture shows the
use
of
color to identify
areas
in
the plot between upper and lower threshold values specified
by the boundaries of the
areas.
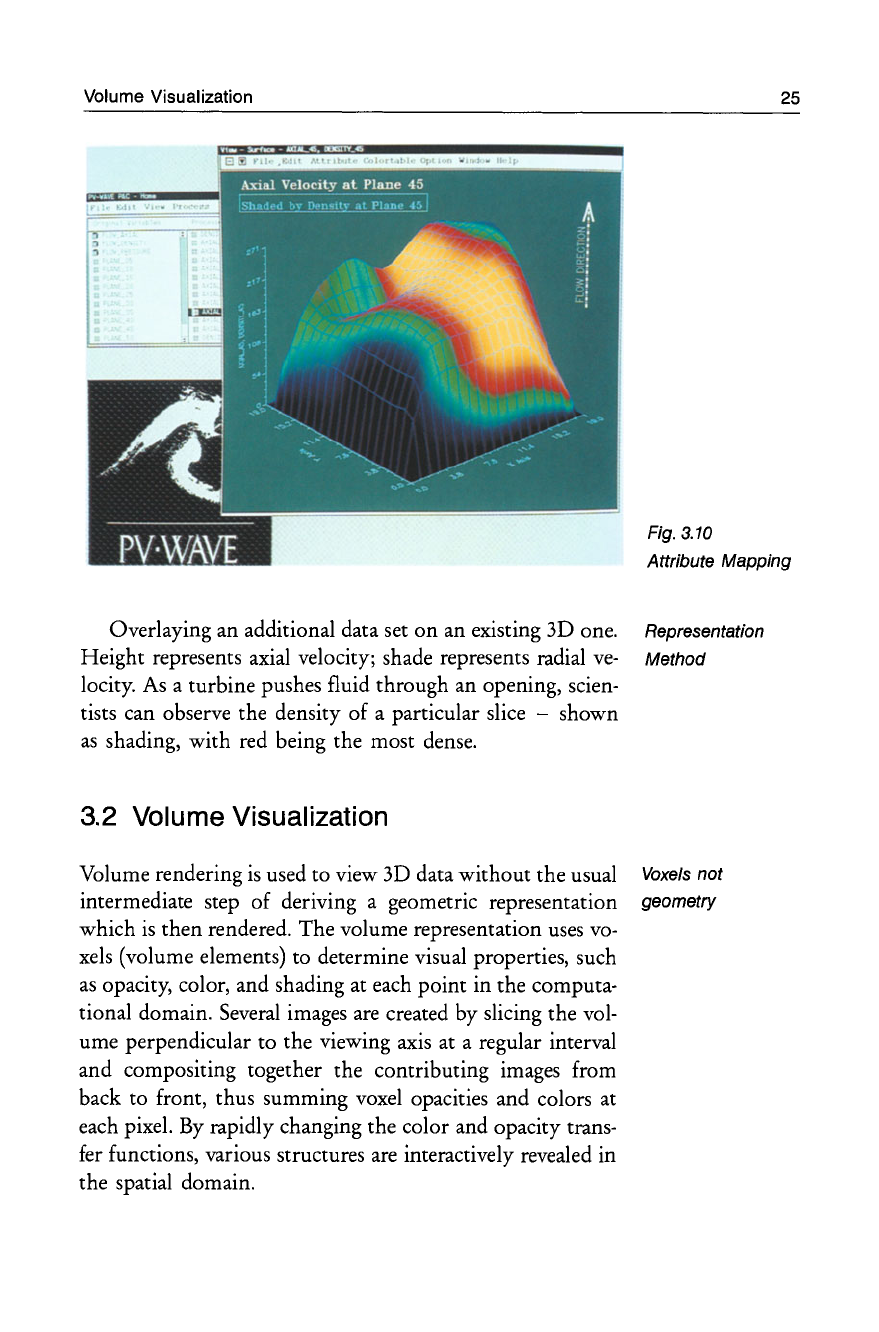
Volume Visualization
Overlaying an additional data set
on
an existing 3D one.
Height represents axial velocity; shade represents radial
ve-
locity. As a turbine pushes fluid through an opening, scien-
tists can observe the density of a particular slice -shown
as
shading, with red being the most dense.
3.2 Volume Visualization
Volume rendering
is
used to view 3D data without the usual
intermediate step of deriving a geometric representation
which
is
then rendered. The volume representation
uses
vo-
xels (volume elements) to determine visual properties, such
as
opacity, color, and shading at each point in the computa-
tional domain. Several images are created by slicing the vol-
ume perpendicular to the viewing axis at a regular interval
and compositing together the contributing images from
back to front, thus summing voxel opacities and colors at
each pixel.
By
rapidly changing the color and opacity trans-
fer functions, various structures are interactively revealed in
the spatial domain.
25
Fig.
3.10
Attribute Mapping
Representation
Method
Voxe/s
not
geometry
26
Explanation of Scientific Visualization Terminology
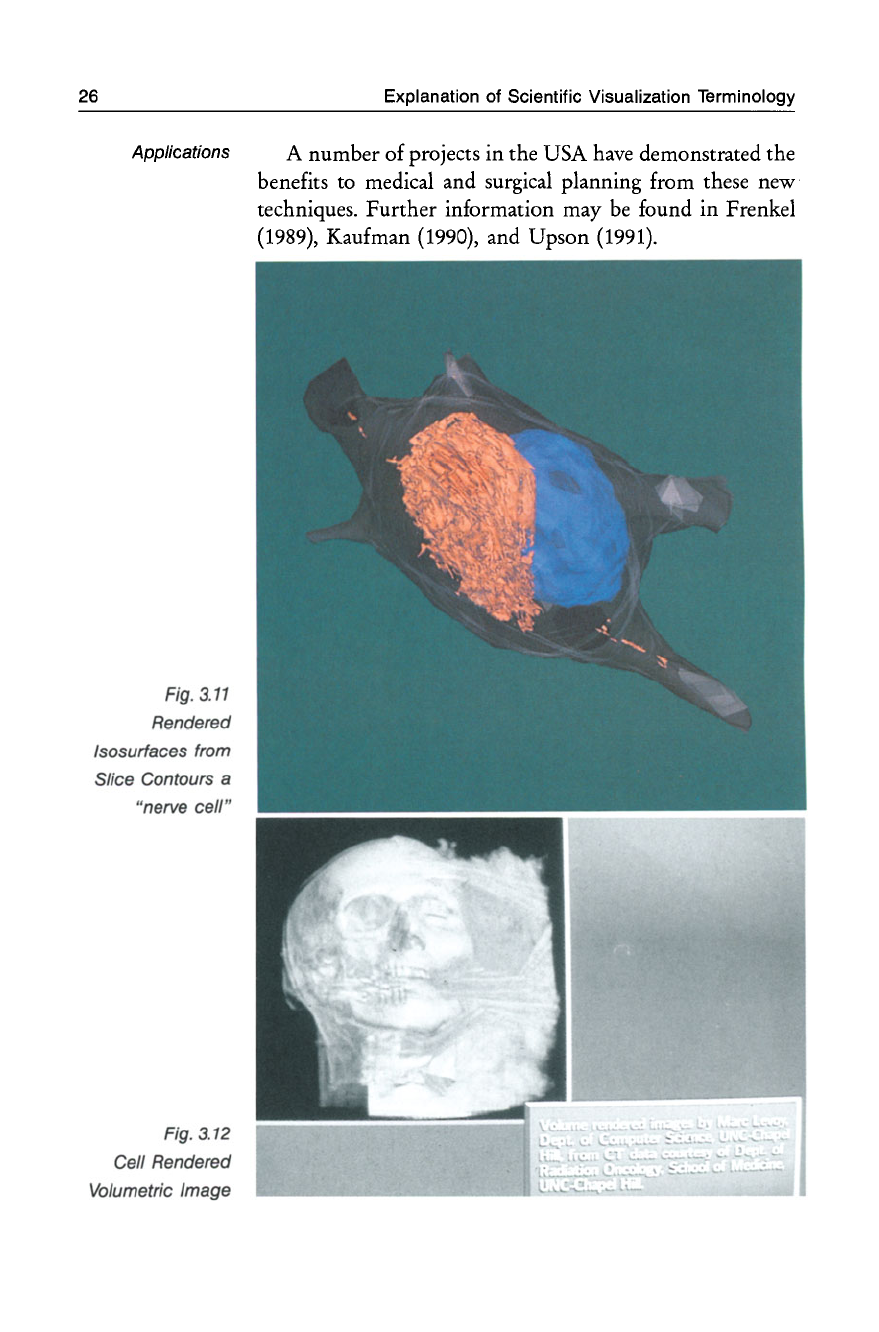
Applications A
number
of
projects
in
the
USA have demonstrated
the
Fig. 3.
11
Rendered
Isosurfaces from
Slice Contours a
"nerve cell"
Fig. 3.
12
Cell Rendered
Volumetric Image
benefits to medical and surgical planning from these new
techniques.
Further
information may be found in Frenkel
(1989), Kaufman (1990), and
Upson
(1991).
Data Types
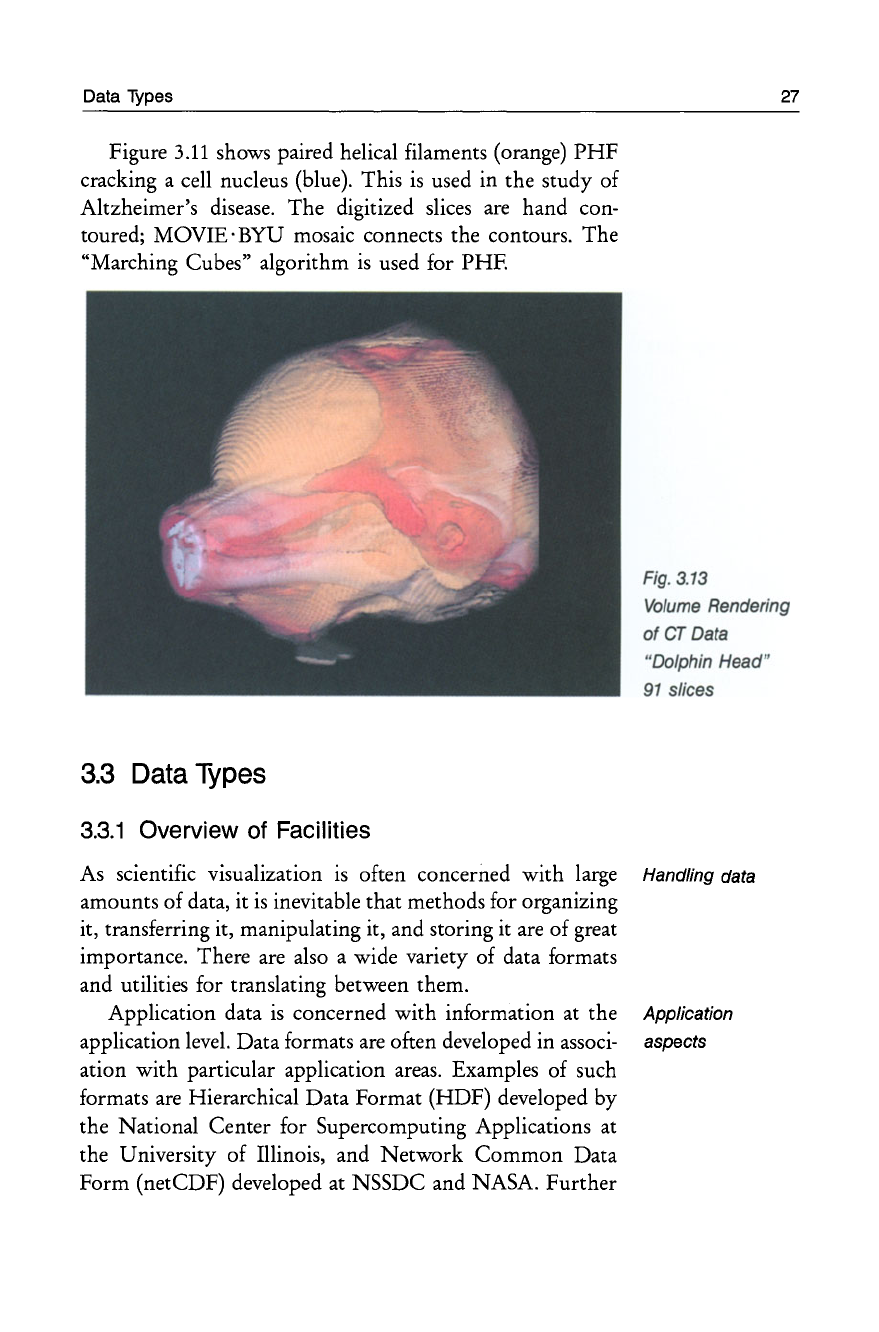
Figure 3.11 shows paired helical filaments (orange)
PHF
cracking a cell nucleus (blue). This
is
used in the study of
Altzheimer's
disease.
The digitized
slices
are
hand con-
toured; MOVIE· BYU mosaic connects the contours. The
"Marching Cubes" algorithm
is
used for PHF.
27
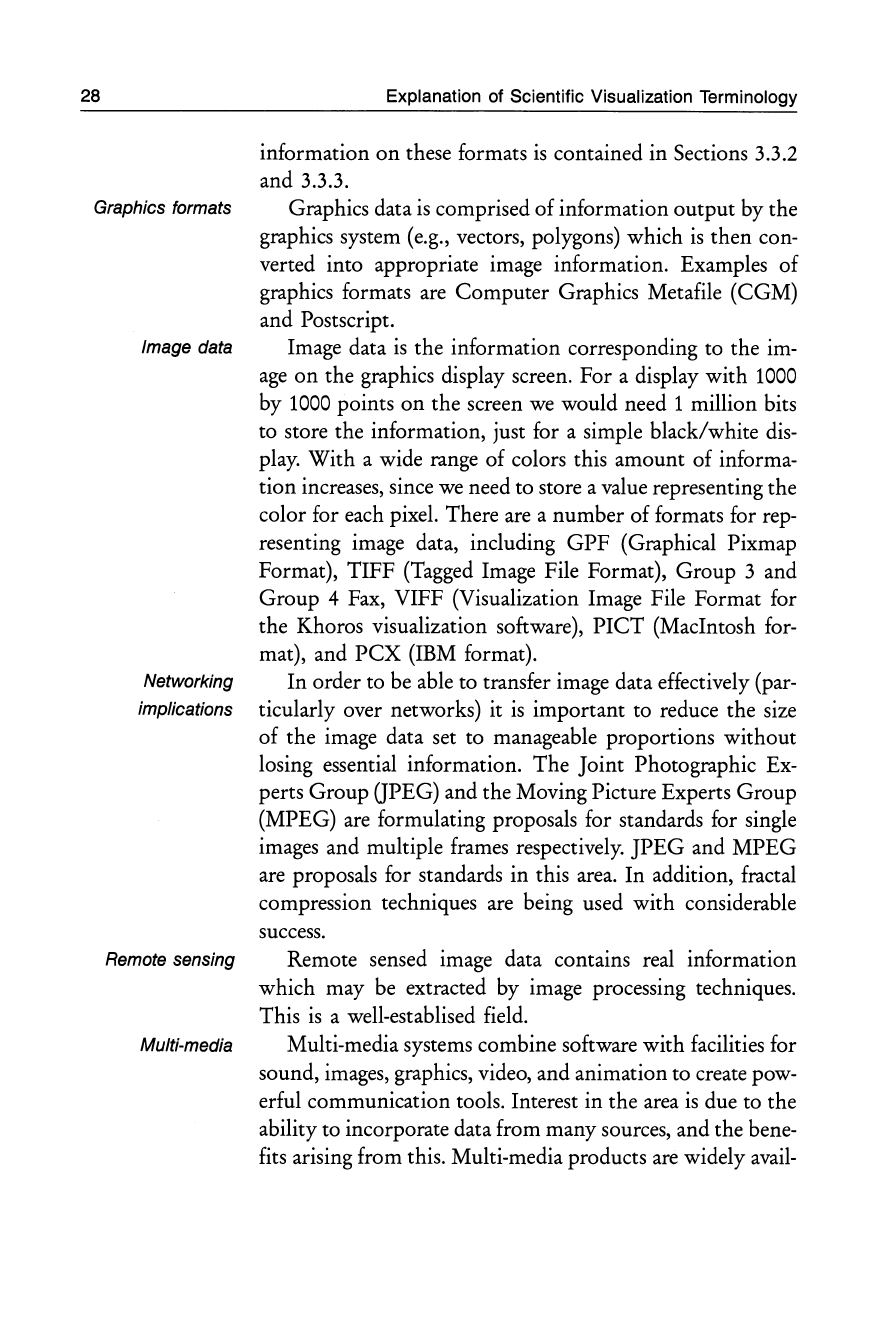
Fig. 3.13
Volume
Rendering
of
CT
Data
"Dolphin Head"
91
slices
3.3
Data
Types
3.3.1
Overview of Facilities
As
scientific visualization
is
often concerned with large Handling data
amounts of data, it
is
inevitable that methods for organizing
it, transferring it, manipulating it, and storing it
are
of great
importance. There
are
also
a wide variety of data formats
and utilities for translating between them.
Application data
is
concerned with information at the Application
application
level.
Data formats
are
often developed in
associ-
aspects
ation with particular application
areas.
Examples of such
formats
are
Hierarchical Data Format (HDF) developed by
the National Center for Supercomputing Applications
at
the University of Illinois, and Network Common Data
Form (netCDF) developed
at
NSSDC and NASA. Further
28
Explanation of Scientific Visualization Terminology
information
on
these formats
is
contained in Sections 3.3.2
and 3.3.3.
Graphics formats Graphics data
is
comprised of information output by the
graphics system (e.g., vectors, polygons) which
is
then con-
verted into appropriate image information. Examples of
graphics formats are Computer Graphics Metafile (CGM)
and Postscript.
Image data Image data
is
the information corresponding to the im-
age
on
the graphics display screen. For a display with
1000
by
1000
points
on
the screen
we
would need 1 million bits
to store the information, just for a simple black/white
dis-
play. With a wide range of colors this amount of informa-
tion increases, since
we
need to store a value representing the
color for each pixel. There
are
a number of formats for rep-
resenting image data, including GPF (Graphical Pixmap
Format), TIFF (Tagged Image File Format), Group 3 and
Group 4 Fax, VIFF (Visualization Image File Format for
the Khoros visualization software),
PICT
(MacIntosh for-
mat), and
PCX
(IBM format).
Networking In order
to
be able to transfer image data effectively (par-
implications ticularly over networks) it
is
important
to
reduce the size
of the image data set
to
manageable proportions without
losing essential information. The Joint Photographic Ex-
perts Group GPEG) and the Moving Picture Experts Group
(MPEG)
are
formulating proposals for standards for single
images and multiple frames respectively.
JPEG
and
MPEG
are proposals for standards in this area. In addition, fractal
compression techniques are being used with considerable
success.
Remote sensing Remote sensed image data contains real information
which may be extracted by image processing techniques.
This
is
a well-establised field.
Multi-media Multi-media systems combine software with facilities for
sound, images, graphics, video, and animation to create pow-
erful communication tools. Interest in the area
is
due to the
ability to incorporate data from many sources, and the bene-
fits arising from this. Multi-media products are widely
avail-
Data
Types
29
able
on
personal computers and are moving into the
UNIX
workstation environment.
In view of the wide variety of data formats currently in Choice
of
system
use, potential purchasers of scientific visualization systems
are advised to check that a given system will handle the data
formats required, and also have sufficient capability to han-
dle the volumes of data required.
3.3.2 HDF
The Hierarchical Data Format (HDF)
was
developed by the
National Centre for Supercomputing Application (NCSA)
and
is
available via anonymous ftp.
Hierarchical Data Format (HDF)
is
a multi-object
file
File format
format for the transfer of graphical and floating-point data
between different hardware platforms.
FORTRAN
and C
calling interfaces for storing and retrieving 8-bit and 24-bit
raster images, palettes (color tables), scientific data and
ac-
companying annotations have been developed.
HDF
allows
for the self-definition of data content and aims
to
be
extensi- Extensible
ble, thereby allowing for the inclusion of future enhance-
ments
or
compatibility with other standard formats.
HDF
provides a general purpose
file
structure that en- Facilities
compasses the following:
-makes it possible for the programs
to
obtain information
about the data directly from the
file,
rather than from
an-
other source
(e.g.
look-up table),
-enables the storage of arbitrary mixtures of data and relat-
ed information in different
files,
even when the
files
are
processed by the same application program,
standardizes the formats and descriptions of many types
of commonly used datasets, such
as
raster images and
sci-
entific data,
encourages the use of a common data format by all
ma-
chines and programs that produce
files
containing a spe-
cific dataset,
can be adapted to accommodate virtually any kind of
da-
ta
by defining new tags
or
a new combination of tags.
30
Explanation of Scientific Visualization Terminology
HDF
currently supports sharing data across machines and
systems such
as
CRAY (UNICOS), Silicon Graphics
(UNIX), Alliant (CONCENTRIX), Sun (UNIX),
VAX
(UNIX), Macintosh (MacOS), and IBM
PC
(MS-DOS).
3.3.3
NetCDF
National The Network
Common
Data Form (netCDF)
was
devel-
cooperation oped
as
part of U nidata - a U.
S.
national effort sponsered
by the Division of Atmospheric Sciences of
NSF.
The initia-
tive
is
managed by the University Corporation for Atmo-
spheric Research. The software
is
available via anonymous
ftp.
Storage
and
NetCDF
is
a data abstraction for the storing and retrieval
retrieval
of
data of scientific data, in particular multi-dimensional data.
NetCDF
is
a distributed, machine-independant software
li-
brary based upon this data abstraction which allows the
cre-
ation,
access
and sharing of data in a form that
is
self-de-
scribing and network-transparent. Both C and
FORTRAN
interfaces
are
supported.
Architecture
NetCDF
software utilizes the concept of an abstract data
type, which means that all operations to
access
and manipu-
late data in a netCDF
file
must
be
via a defined set of func-
tions provided by the C library interface.
As
the actual rep-
resentation of the data
is
hidden from the application, inter-
nal data representations can
be
changed without affecting
the program.
Network
To
achieve network transparency, netCDF
is
implement-
transparency ed
on
top of a layer of software for external data representa-
tion known
as
XDR.
XDR
is
a nonproprietary standard for
describing and encoding data developed by Sun Micro-
systems, Inc.
Availability The netCDF software provides common C and FOR-
TRAN
interfaces for applications and data. The C interface
library
is
available for many common computing platforms,
including UNIX,
VMS,
MSDOS, and MacOS environ-
ments. The
FORTRAN
interface
is
available
on
a smaller
set of environments (due to the lack of a standard for calling
C from FORTRAN).
Current Application Areas
XDR
has been implemented
on
a variety of platforms,
including SUNs,
VAXs,
Apple Macintoshes, IBM-PCs, IBM
mainframes, and
CRAYs.
3.3.4 Databases
The currently accepted storage method for most scientific Storage
of
data
data
is
the Relational Database Management System. Many
commercial examples are available (e.g., Oracle, Ingres). Da-
ta can be extracted using Standard
Query
Language (SQL)
based commands. Some scientific visualization systems have
these command interfaces built in (e.g., UNIRAS).
3.4
Current
Application
Areas
This section provides an overview of application areas
where visualization techniques
are
being used
on
input data Input data
from the real world, processed data, and computer-generated
data.
3.4.1
Cartography
Cartography
is
rapidly moving from a discipline concerned
with the presentation of data (the map) to one concerned
with the storage and analysis of spatial data via Geographic
Information Systems (GIS). These systems may be used to
to store large amounts of information in a database and
al-
low retrieval and display based
on
user-specified criteria.
The visualization
is
used to select spatial features based
on
their attributes,
or
to observe topological relationships with
other features. For example, the user may wish to make
re-
quests such
as
the the following:
• Show me all the regions where forests are adjacent to
lakes and which have
access
by road.
• Show me all the principal roads which have houses with-
in
50
meters.
Analysis
of
spatial data
Interrogating
the data
31
32
Explanation of Scientific Visualization Terminology
• Display all the houses which have
not
had their
gas
ser-
vice supplies and electricity supplies renewed in the last
30 years.
Data relationships Obviously, there
is
more information stored in the database
than just the terrain. In particular, it illustrates how useful
it can be to have other information to do with the same ter-
ritory available so that it can be interrogated and overlaid
on
the terrain map.
Project planning The visualization can then be used
to
plan for work to
be done (e.g., by the service industries) in such a way
as
to
minimize costs. Equipment can be moved
to
an appropriate
point in the area and used to supply all the requirements for
the work to
be
done.
3.4.2
Statistics
Visual representation of statistical data
is
very useful for
providing insight and understanding into the data.
3.4.3
Remote Sensing
Satellite and other imaging
devices
are
producing
large
amounts of data. Many two-dimensional processing methods
exist for analyzing this data. New methods
are
being
devel-
Increasing oped to allow for increasing the dimensionality of the data
dimensionality
as
the number of frequency bands increases. Visualization
methods allow horizontal (two dimensions of
space
at
a
giv-
en frequency value) and vertical (one dimension of
space
and
one of frequency) sections through the data.
An
example of
the kind of picture produced
is
shown in Fig. 7.7.
3.4.4
Archeological Reconstruction
Rebuilding history Data from archeological excavations has been entered into
visualization systems to enable partial
or
major reconstruc-
tion to be done, and the resulting constructs to be viewed
interactively
on
a computer display screen. This enables the
archeologist to build up a picture of the original buildings,
objects, and their relationships.
Current Application Areas
3.4.5 Molecular Modeling
Chemists and biologists have been using physical models
of
Physical models
molecules for many years to enable the relationships
be-
tween the various components to be understood. This
is
33
now more easily and and effectively done by using a com- Computer models
puter-based model and interacting
with
it
on
a graphics dis-
play screen.
An
example
of
such a molecule
is
shown in
Fig. 2.7. Such molecules can be rotated and viewed from var- Studying the
ious angles,
as
well
as
providing relevant quantitative infor- molecule
mation (e.g., potential energies,
bond
distances, etc.). Analy-
zing X-ray diffraction maps
is
greatly facilitated by visualiza- Refining the model
tion
methods.
The
atomic positions in protein structures
can be adjusted by interaction until they best fit a given elec-
tron
density map.
In
the design
of
new drugs, existing mole- Design
of
cules can be modified by introducing new molecules into new drugs
the overall structure. Such systems often provide a stereo
view capability, where by means
of
special glasses the user
is
able to view the molecule
on
the screen in full 3D. This
can provide further understanding and insight into the over-
all structure.
3.4.6 Medical Science
Historically, radiologists have looked at a series
of
two-di-
mensional cross-sections and built up mental pictures
of
three dimensional structures. However, these are subjective
and can vary from one radiologist to another.
In
many
cases
more detailed and accurate three-dimensional information
can be very useful
when
planning surgical procedures for
complex
and/or
intricate structures,
or
in radiation treat-
ment
planning. Volume visualization techniques are increas-
ingly being used to provide three-dimensional information
from a series
of
two-dimensional slices. A
case
of
pelvic
re-
construction
is
outlined in Section 2.3.5, and volume meth-
ods are shown in Fig. 3.11-3.13.
From 2D to 3D
Accuracy in
planning
procedures
Visualizing
volumes
34
Explanation of Scientific Visualization Terminology
3.4.7
Oceanography
Large and Modeling the behavior of oceans
is
increasingly being done
complex natural using visualization techniques. Often there
are
a large num-
systems ber of variables involved,
such.
as
temperature, salinity,
depth, vorticity,
etc.
Representations are chosen to enable
Simulating this multi-dimensional data to
be
viewed on a display
ocean behavior screen. Internal structures can
be
shown and simulations
performed. This leads to an increase in overall understand-
ing of ocean behavior. Areas such
as
these are becoming in-
creasingly important
as
attention shifts from interplanetary
Protection
of
the investigations to earth-environment matters such
as
global
earth's resources warming and the ozone layer. Examples in the area of ocean-
ography
are
shown in Figs. 3.6 and 7.21.
3.4.8
Computational Fluid Dynamics (CFD)
Air flow over Visualization
is
being used
to
analyse complex flow systems.
aircraft wings Numerical simulations produce values of velocity, tempera-
ture, pressure, vorticity, and even tensor fields. A variety
of
techniques exist for displaying this data. Particle tracers
are
Fluid flow used in real-time to show aspects
of
the
flow.
Interactive
CFD
is
important for tracking and steering solutions.
Fig-
ures 3.7 and 7.21 show examples.
For further information on application
areas,
readers
are
referred to the more detailed reference work Scientific
Visu-
alization -
Techniques
and
Applications edited by
K.
W
Brodlie, L.A. Carpenter, R.A. Earnshaw, J.R. Gallop, R.J.
Hubbold, A.
M.
Mumford,
C.
D.
Osland,
P.
Quarendon,
also published by Springer-Verlag,
1992.
This volume also
has
more detailed reference information
on
data formats.
Chapter
4
Facilities
for
Scientific
Visualization
4.1
Visualization
Software
Categories
Visualization software has evolved over a period of time and Evolution
of
three distinct categories can
be
identified which appeared in facilities
succession. In general the older the category the
less
the
power, memory and storage required to
run
them. This
makes the software in the first category suitable for use in
PC
or
terminal-mainframe environments, and the most
re-
cent developments only suitable for the most modern
supercomputers
or
supercomputer workstations. At the
same time, because the first and second categories have been
around longer, more applications have been developed using
them and many products in the market
fall
into these
class-
es.
It
is
likely in the future that tools using the most modern
techniques will appear, but at the present time these tech-
niques
are
very much in the experimental and developmen-
tal stage and will need some time to mature.
4.1.1
Graphics
Libraries
and
Presentation
Packages
This
is
the traditional method for creating
ways
to view and
analyse data.
The libraries interface directly to graphics hardware
or
Libraries
of
provide graphics functionality in software. The user has to routines
supply nearly all the pieces of the application: the main pro-
gram, the user interface, data handling and geometry map-
ping. The most basic libraries only supply an interface to
the graphics devices (e.g., PLOT10 for Tektronix terminals,
HCBS for Calcomp plotters) and some higher-level libraries
36
Facilities for Scientific Visualization
handle more sophisticated graphic entities such
as
axes,
curve drawing, and
so
on. Typical examples in common use
are
the UNIRAS subroutine libraries, DISSPLA, GL (from
. Silicon Graphics), GKS(2D), PHIGS,
DORE
(Stardent),
and
NAG
Graphical Supplement.
Pros and cons The advantage of this type of software
is
its flexibility
and direct control but it suffers from the disadvantage of the
large amount of time necessary to write and support code.
PC
Graphics Many PC-based packages such
as
Harvard Graphics,
Slidewrite and CricketGraph
have
taken
on
board user-in-
terface functions to provide friendlier software, but still
re-
quire a great deal of user effort to achieve good results.
4.1.2
Turnkey
Visualization
Applications
These offer a fixed functionality to solve a limited range of
specific problems. The user supplies the data and the com-
putational instructions to the main program and possibly
some geometric mapping. The application supplies the
main program and rendering and usually
has
an attractive
user interface.
Dedicated
to
Many products in this category
are
extremely applica-
applications tion-specific and examples in oil exploration, molecular
modeling, and architectural modeling
are
common but of
limited
use
in other fields. They
are
also
very often only
available on a very
few
hardware platforms in common
use
in these industries -for commercial reasons. More general
examples
are
the UNIRAS interactives,
PV-Wave
(PVI), Data
Visualiser (Wavefront), Sun Vision (SUN) and VoxelView
(Vital Images).
No
programming The user does not
have
to program these packages and
needed! can obtain results very quickly. Their disadvantage
is
that
they
have
limited extensibility and therefore may often only
provide a part of the solution a user requires. They
have
all
reached a high
level
of maturity and many users applying
vi-
sualization to their work will probably
be
using one of the-
se
packages.
Visualization Software Categories
4.1.3 Application Builders
These offer a series
of
modules linked by interfaces which
are connected interactively at runtime.
It
combines features
from
both
of
the
other
two categories by providing turnkey
solutions for individual parts
of
the program and the flexibi-
lity to customise the final solution adopted.
The
supplied
modules can be replaced by user-written modules
as
re-
quired, providing they conform to the data
input/output
in-
terface requirements, therefore giving greater extensibility.
37
In these systems virtually everything the user needs
is
Select the options
provided by the program. The user has only to direct the
ex-
you need
ecution path
of
the program, provide the data, and optional-
ly,
their own computational modules if required.
Applications are constructed by a mouse-driven inter- Constructing
face,
manipulating icons
on
screens and linking them with applications
data paths. Once the required modules have been connected
and built the program can be executed.
New
applications
can be prototyped very quickly by connecting modules in
different ways but the user needs to know how to manage
the flow
of
data through the network, and how to extend
the module set.
Examples are
AVS3
(Stardent), Explorer (Silicon Graph- Some examples
ics
Inc.), apE (Ohio Supercomputer Centre) and Khoros
(University
of
New
Mexico). More advanced application
builders are currently under development and new advances
in visualization techniques and software will extend and im-
prove the application builder functionality. At the present
time these products are
not
mature enough to have had sub-
stantial numbers
of
packages built around them, but these
products should be appearing in the future.
4.1.4 Choosing a Package
Current work in scientific visualization tends to be done What should I
with
turnkey application tools -because
of
their function- use?
ality and their ability to process large data sets. However,
this does
not
mean that good visualization work cannot be

38
Facilities for Scientific Visualization
done with software libraries and
PC
packages, but merely
reflects the good understanding of these systems that exists
in the graphics community. Application builders
are
still
primarily used
as
research tools, but it
is
anticipated that
more applications will utilize them.
PC graphics PCs
are
more widely available in the academic/Research
survey Laboratory sphere than any other type of hardware and a
thorough review
of
currently available graphics software
has
recently been completed by the
UK
Inter-University Soft-
ware Committee Working Party and published
as
a Report.
Data transfer
It
is
probable that restrictions
on
internal data transfer
limitations bandwidth and graphics display facilities would limit the
usefulness of the current
PC
products
as
hardware platforms
for the majority
of
applications.
Access via X For those without workstations, PCs can
be
utilized
as
X-servers for such software running on superworkstations,
supercomputers,
or
mainframes, and connected via ethernet
or
X25
OANET). Users of PCs therefore can
have
access
to
visualization systems remotely and view the results at their
desks, albeit
at
lower graphics resolution and with a time
penalty introduced by current network performance.
4.2 Software Costs
4.2.1
Subroutine Libraries and Presentation
Packages
You
get what Costs of subroutine libaries and packages
are
related
to
their
you pay for functionality and degree of sophistication. Those which on-
ly provide interfaces to graphics
devices
(HCBS, PLOT10,
HPGL,
Xll)
are
bundled with the hardware. Packages with
a wide range of higher-level functionality, such
as
the UNI-
RAS subroutine libraries, can be fairly expensive. Packages
for PC-based operations reflect the prices that
PC
software
can command, and
are
typically in the range 100-500
pounds sterling. Much of this software
is
covered by educa-
tional
deals
and
is
available to the
UK
community and
Re-
Hardware Considerations (including Hardcopy)
search Councils under bulk discount arrangements (e.g., via
the
UK
Combined Higher Educational Software Team -
CHEST).
4.2.2
Turnkey
Visualization
Systems
The cost of these systems reflects the complexity of the
sys-
High-cost areas
terns and the comparative affluence of the targeted applica-
tion
areas!
For example, volume rendering products for the
petroleum industry are very expensive, but the users can
usually afford to
pay.
At the other extreme, products bun-
dled with,
or
designed for, particular hardware platforms
are
very reasonable. Educational deals exist for some of these
products.
4.2.3
Application
Builders
At present these systems are either available free (or almost Public domain,
free) in the public domain (e.g., Khoros, apE)
or
tend to be
or
proprietary
expensive if they are mainly machine-dependent and bun-
dled in with their hardware platforms (e.g.,
AVS).
In the
fu-
ture, more sophisticated systems may follow this scenario
or
may become more expensive, if unbundling takes place.
4.3
Hardware
Considerations
(including
Hardcopy)
Useful visualization work has been performed
on
very inex- Functionality
pensive equipment, but there
is
a growing requirement to needed
perform more complex analysis of increasingly large vol-
umes of data, using more and more sophisticated graphic
display techniques. When this
is
coupled with a demand for
much faster response it
is
obvious that hardware costs for
'ideal' systems could escalate. Although much valuable
work
has been done
on
superworkstations attached to a
su-
percomputer (e.g., CRAY) -this
is
a solution which
is
not
available to many people.
39
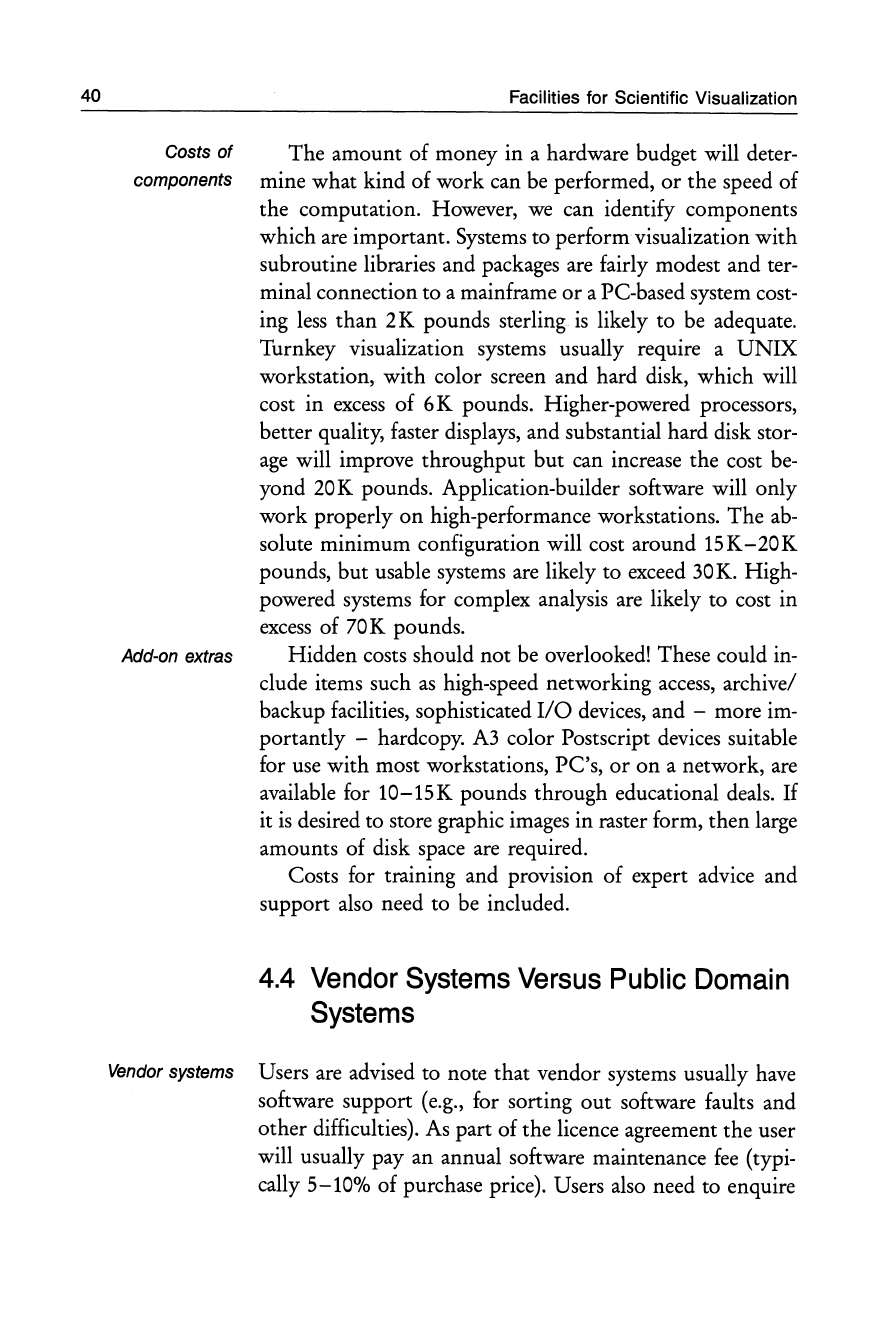
40
Facilities for Scientific Visualization
Costs
of
The amount of money in a hardware budget will deter-
components mine what kind of work can be performed,
or
the speed of
the computation. However,
we
can identify components
which are important. Systems
to
perform visualization with
subroutine libraries and packages are fairly modest and ter-
minal connection to a mainframe
or
a PC-based system cost-
ing
less
than 2 K pounds sterling
is
likely to be adequate.
Turnkey visualization systems usually require a
UNIX
workstation, with color screen and hard disk, which will
cost in
excess
of 6 K pounds. Higher-powered processors,
better quality, faster displays, and substantial hard disk stor-
age
will improve throughput but can increase the cost
be-
yond
20
K pounds. Application-builder software will only
work
properly
on
high-performance workstations. The
ab-
solute minimum configuration will cost around
15K-20K
pounds, but usable systems are likely to exceed
30
K.
High-
powered systems for complex analysis
are
likely to cost in
excess
of
70
K pounds.
Add-on extras Hidden costs should not be overlooked! These could in-
clude items such
as
high-speed networking
access,
archive/
backup facilities, sophisticated
I/O
devices, and -more im-
portantly -hardcopy.
A3
color Postscript devices suitable
for use with most workstations, PC's,
or
on
a network, are
available for
10-15K
pounds through educational deals.
If
it
is
desired to store graphic images in raster form, then large
amounts of disk space
are
required.
Costs for training and provision of expert advice and
support also need to be included.
4.4
Vendor
Systems
Versus
Public
Domain
Systems
Vendor systems Users are advised to note that vendor systems usually have
software support (e.g., for sorting out software faults and
other difficulties). As part of the licence agreement the user
will usually pay an annual software maintenance
fee
(typi-
cally
5-10%
of purchase price). Users also need to enquire
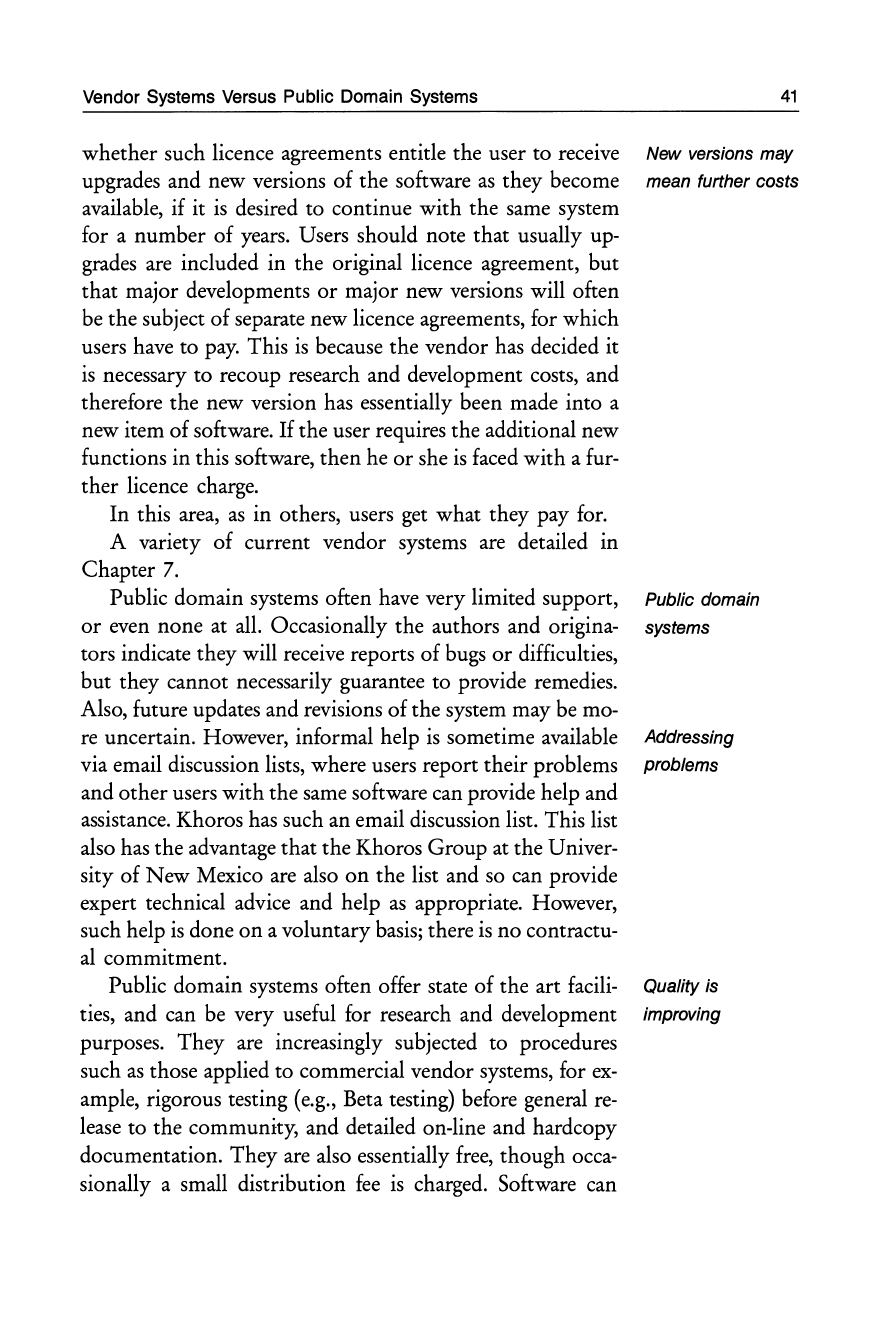
Vendor Systems Versus Public Domain Systems
whether such licence agreements entitle the user to receive
upgrades and new versions of the software
as
they become
available, if it
is
desired to continue with the same system
for a number
of
years. Users should note that usually up-
grades are included in the original licence agreement, but
that major developments
or
major new versions will often
be the subject
of
separate new licence agreements, for which
users have to
pay.
This
is
because the vendor has decided it
is
necessary to recoup research and development costs, and
therefore the new version has essentially been made into a
new item
of
software.
If
the user requires the additional new
functions in this software, then he
or
she
is
faced with a fur-
ther
licence charge.
In this area,
as
in others, users get what they pay for.
A variety
of
current vendor systems are detailed in
Chapter
7.
Public domain systems often have very limited support,
or
even none at all. Occasionally the authors and origina-
tors indicate they will receive reports
of
bugs
or
difficulties,
but
they cannot necessarily guarantee to provide remedies.
Also, future updates and revisions
of
the system may
be
mo-
re
uncertain. However, informal help
is
sometime available
via email discussion lists, where users report their problems
and
other
users
with
the same software can provide help and
assistance. Khoros has such an email discussion list. This list
also has the advantage that the Khoros Group at the U niver-
sity
of
New
Mexico are also
on
the list and so can provide
expert technical advice and help
as
appropriate. However,
such help
is
done
on
a voluntary basis; there
is
no contractu-
al
commitment.
Public domain systems often offer state
of
the art facili-
ties, and can be very useful for research and development
purposes. They are increasingly subjected to procedures
such
as
those applied to commercial vendor systems, for
ex-
ample, rigorous testing (e.g., Beta testing) before general
re-
lease to the community, and detailed on-line and hardcopy
documentation. They are also essentially free, though occa-
sionally a small distribution
fee
is
charged. Software can
41
New versions may
mean further costs
Public domain
systems
Addressing
problems
Quality is
improving
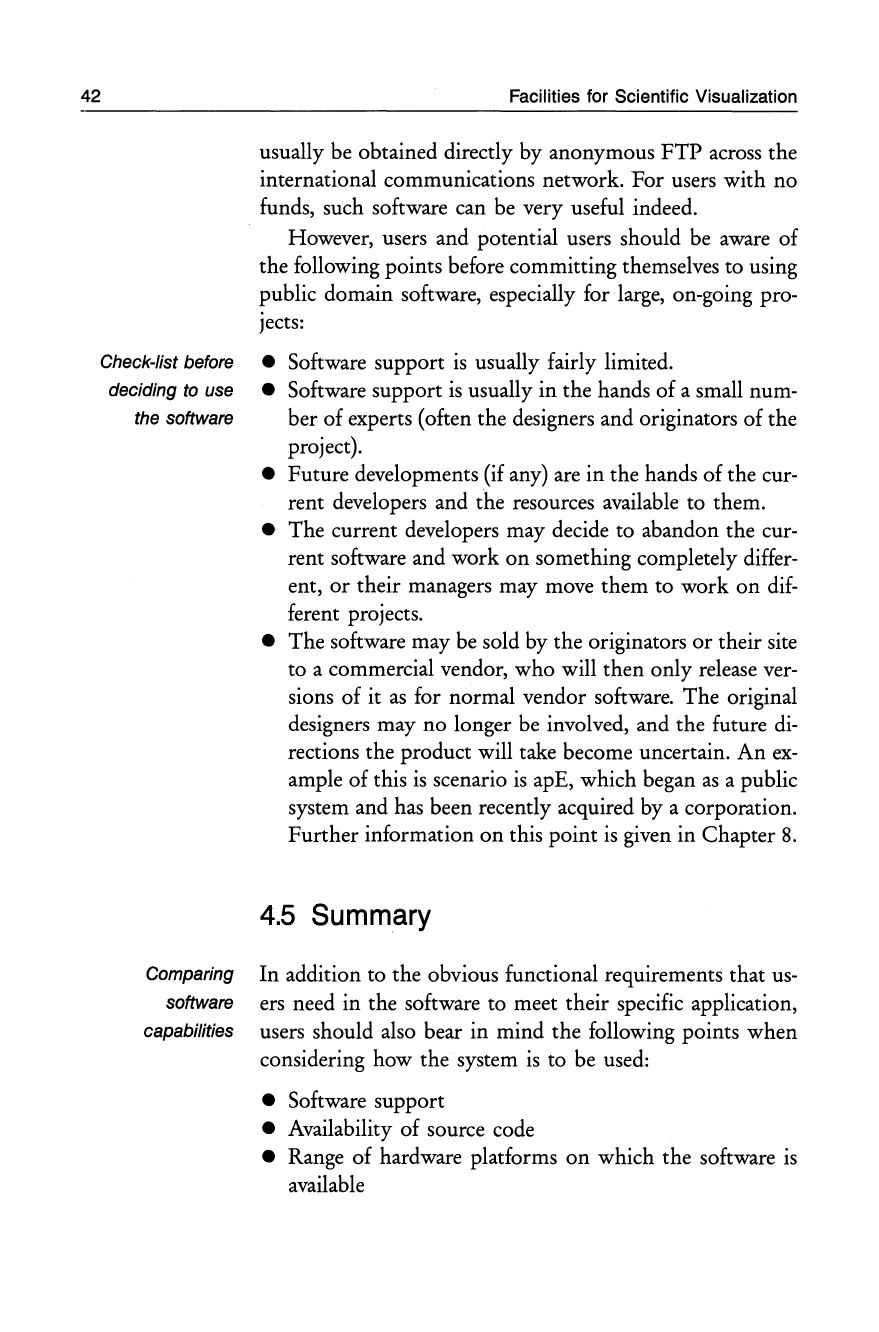
42 Facilities for Scientific Visualization
usually be obtained directly by anonymous
FTP
across the
international communications network. For users
with
no
funds, such software can be very useful indeed.
However, users and potential users should be aware
of
the following points before committing themselves to using
public domain software, especially for . large, on-going pro-
jects:
Check-list before • Software support
is
usually fairly limited.
deciding
to
use • Software support
is
usually in the hands
of
a small num-
the software ber
of
experts (often the designers and originators
of
the
project).
• Future developments (if any) are in the hands
of
the cur-
rent developers and the resources available to them.
•
The
current developers may decide to abandon the cur-
rent software and work
on
something completely differ-
ent,
or
their managers may move
them
to work
on
dif-
ferent projects.
•
The
software may be sold by the originators
or
their site
to a commercial vendor,
who
will then only release ver-
sions
of
it
as
for normal vendor software. The original
designers may no longer be involved, and the future
di-
rections the product will take become uncertain.
An
ex-
ample
of
this
is
scenario
is
apE, which began
as
a public
system and has been recently acquired by a corporation.
Further
information
on
this point
is
given in Chapter
8.
4.5
Summary
Comparing In addition to the obvious functional requirements that
us-
software ers need in the software to meet their specific application,
capabilities users should also bear in mind the following points
when
considering how the system
is
to be used:
• Software support
• Availability
of
source code
• Range
of
hardware platforms
on
which the software
is
available
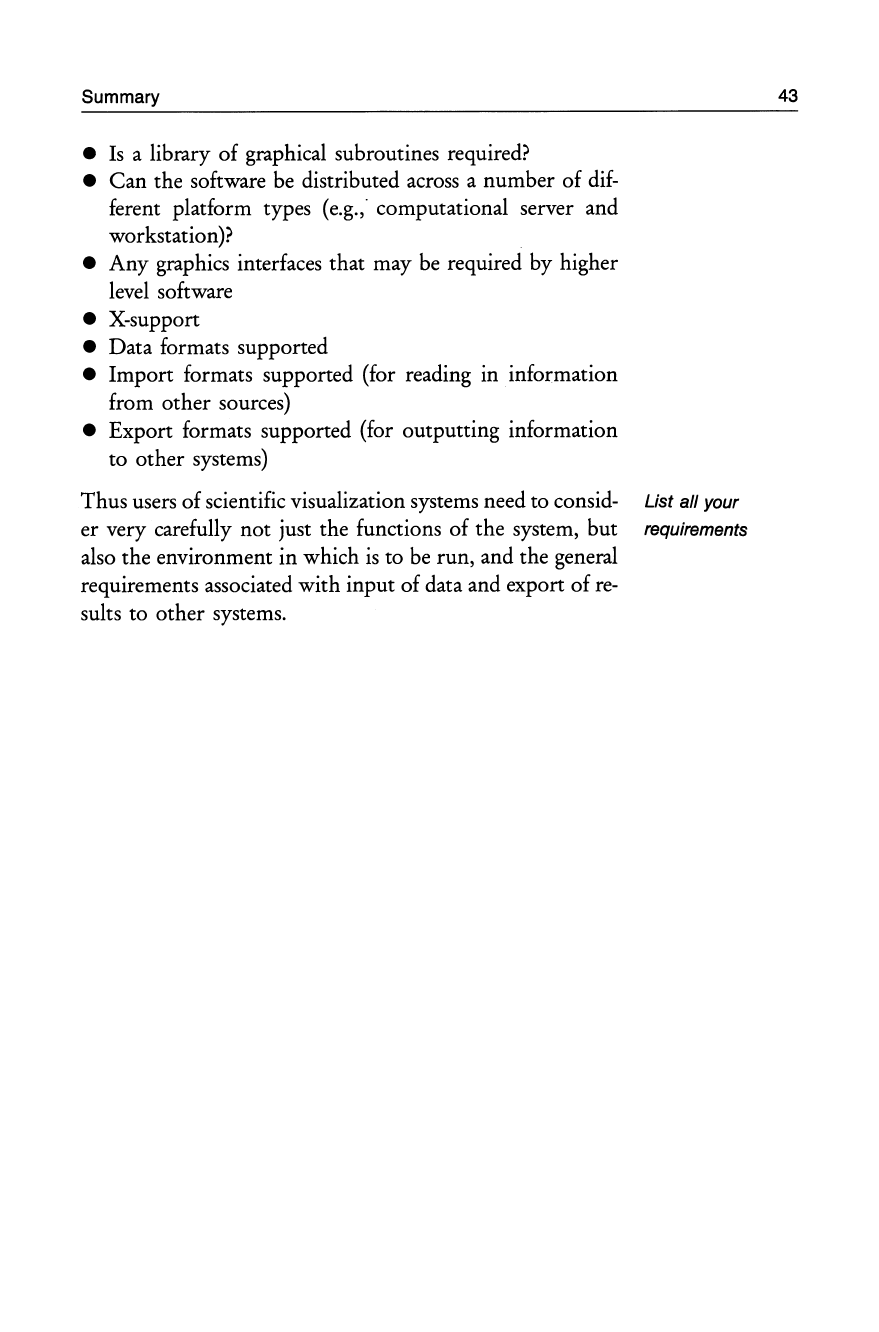
Summary
•
Is
a library
of
graphical subroutines required?
•
Can
the software be distributed across a number
of
dif-
ferent platform types (e.g.; computational server and
workstation)?
•
Any
graphics interfaces that may be required by higher
level software
• X-support
• Data formats supported
•
Import
formats supported (for reading in information
from other sources)
• Export formats supported (for outputting information
to other systems)
Thus
users
of
scientific visualization systems need to consid- List al/ your
er very carefully
not
just the functions
of
the system, but requirements
also the environment in which
is
to be run, and the general
requirements associated with input
of
data and export
of
re-
sults to other systems.
43
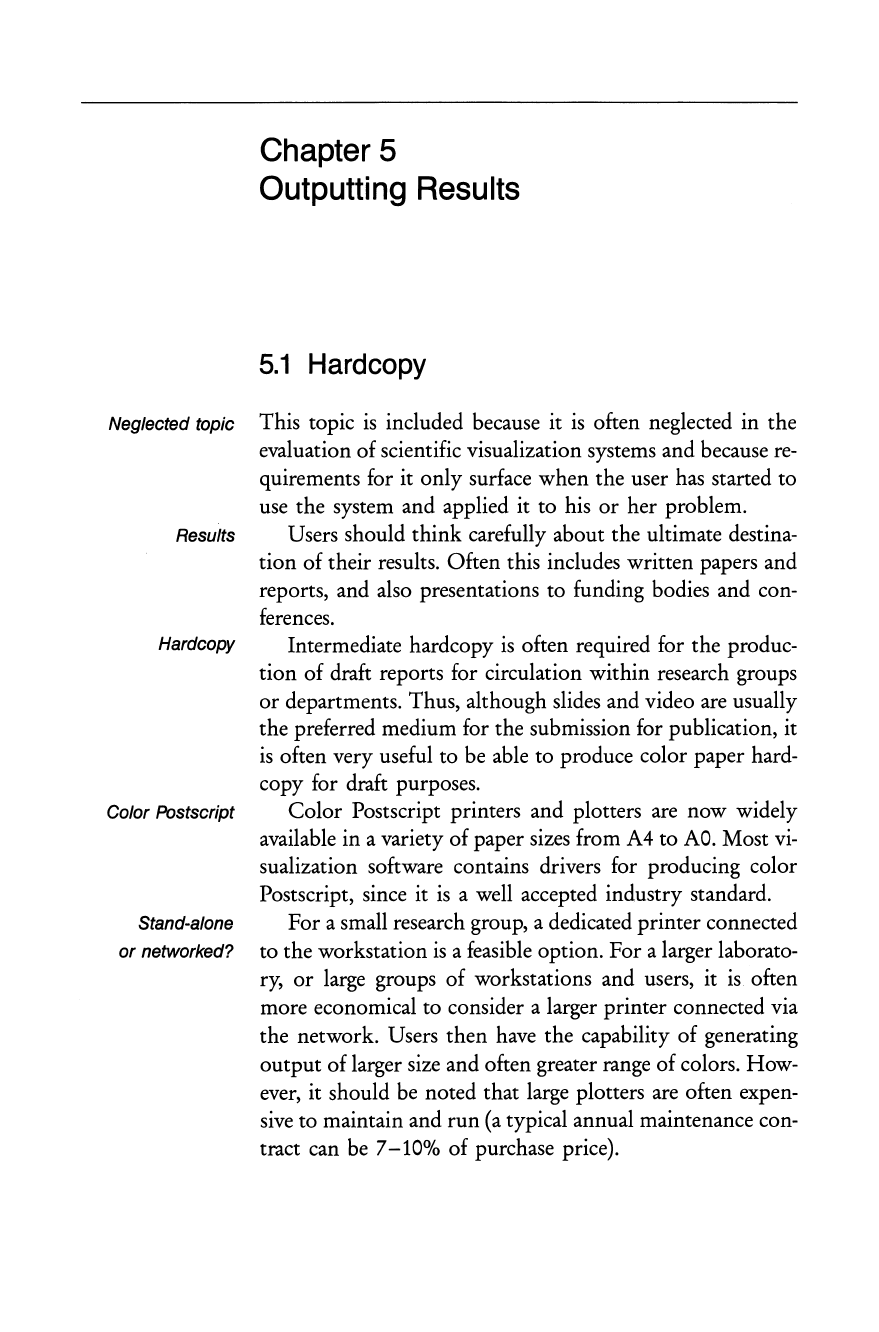
Chapter
5
Outputting
Results
5.1
Hardcopy
Neglected topic This topic
is
included because it
is
often neglected in the
evaluation
of
scientific visualization systems and because
re-
quirements for it
only
surface
when
the user has started to
use the system and applied it to his
or
her problem.
Results Users should
think
carefully about the ultimate destina-
tion
of
their results. Often this includes written papers and
reports, and also presentations to funding bodies and con-
ferences.
Hardcopy Intermediate hardcopy
is
often required for the produc-
tion
of
draft reports for circulation within research groups
or
departments. Thus, although slides and video
are
usually
the preferred medium for the submission for publication, it
is
often very useful to be able to produce color paper hard-
copy for draft purposes.
Color Postscript
Color
Postscript printers and plotters are now widely
available in a variety
of
paper sizes from
A4
to
AO.
Most
vi-
sualization software contains drivers for producing color
Postscript, since it
is
a well accepted industry standard.
Stand-alone For a small research group, a dedicated printer connected
or
networked? to the workstation
is
a feasible option. For a larger laborato-
ry,
or
large groups
of
workstations and users, it
is
often
more economical to consider a larger printer connected via
the network. Users then have the capability
of
generating
output
of
larger size and often greater range
of
colors. How-
ever, it should be noted that large plotters are often expen-
sive to maintain and
run
(a
typical annual maintenance con-
tract can
be
7-10%
of
purchase price).
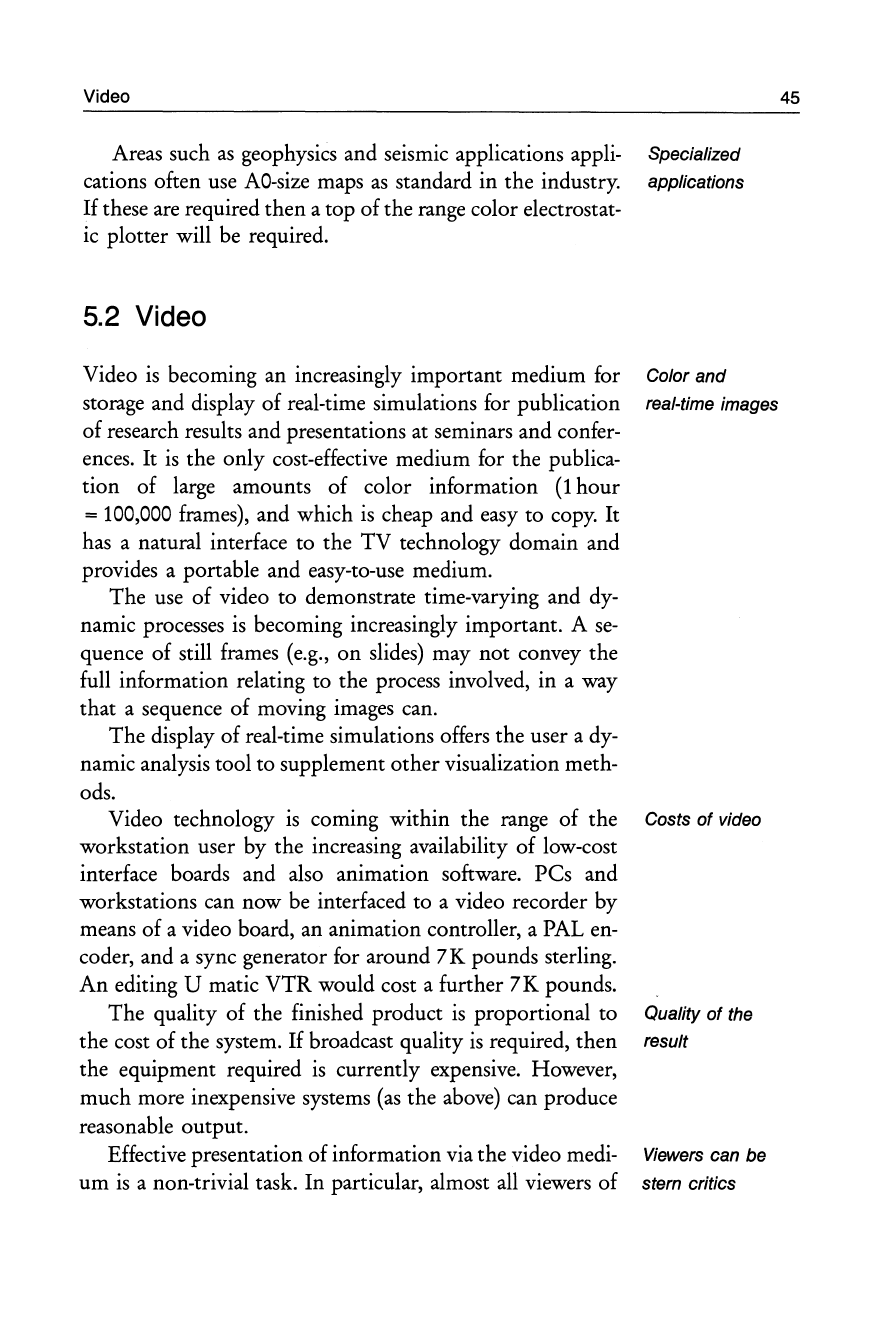
Areas such
as
geophysics and seismic applications appli- Specialized
cations often use
AO-size
maps
as
standard in the industry. applications
If
these are required
then
a top
of
the range color electrostat-
ic plotter will be required.
5.2 Video
Video
is
becoming an increasingly important medium for Color and
storage and display
of
real-time simulations for publication real-time images
of
research results and presentations at seminars and confer-
ences.
It
is
the
only
cost-effective medium for the publica-
tion
of
large amounts
of
color information
(1
hour
= 100,000 frames), and which
is
cheap and easy to copy.
It
has a natural interface to the
TV
technology domain and
provides a portable and easy-to-use medium.
The
use of video to demonstrate time-varying and dy-
namic processes
is
becoming increasingly important. A
se-
quence
of
still frames (e.g.,
on
slides) may
not
convey the
full information relating to
the
process involved, in a way
that
a sequence
of
moving images can.
The
display
of
real-time simulations offers
the
user a dy-
namic analysis tool to supplement
other
visualization meth-
ods.
Video technology
is
coming
within
the range
of
the Costs of video
workstation user by
the
increasing availability
of
low-cost
interface boards and also animation software.
pes
and
workstations can now be interfaced to a video recorder by
means
of
a video board, an animation controller, a PAL en-
coder, and a sync generator for around
7K
pounds sterling.
An
editing U matic
VTR
would cost a further 7 K pounds.
The
quality
of
the
finished product
is
proportional to Quality
of
the
the cost
of
the system.
If
broadcast quality
is
required,
then
result
the equipment required
is
currently expensive. However,
much more inexpensive systems
(as
the above) can produce
reasonable output.
Effective presentation
of
information via
the
video medi-
Viewers
can be
urn
is
a non-trivial task.
In
particular, almost all viewers
of
stern critics
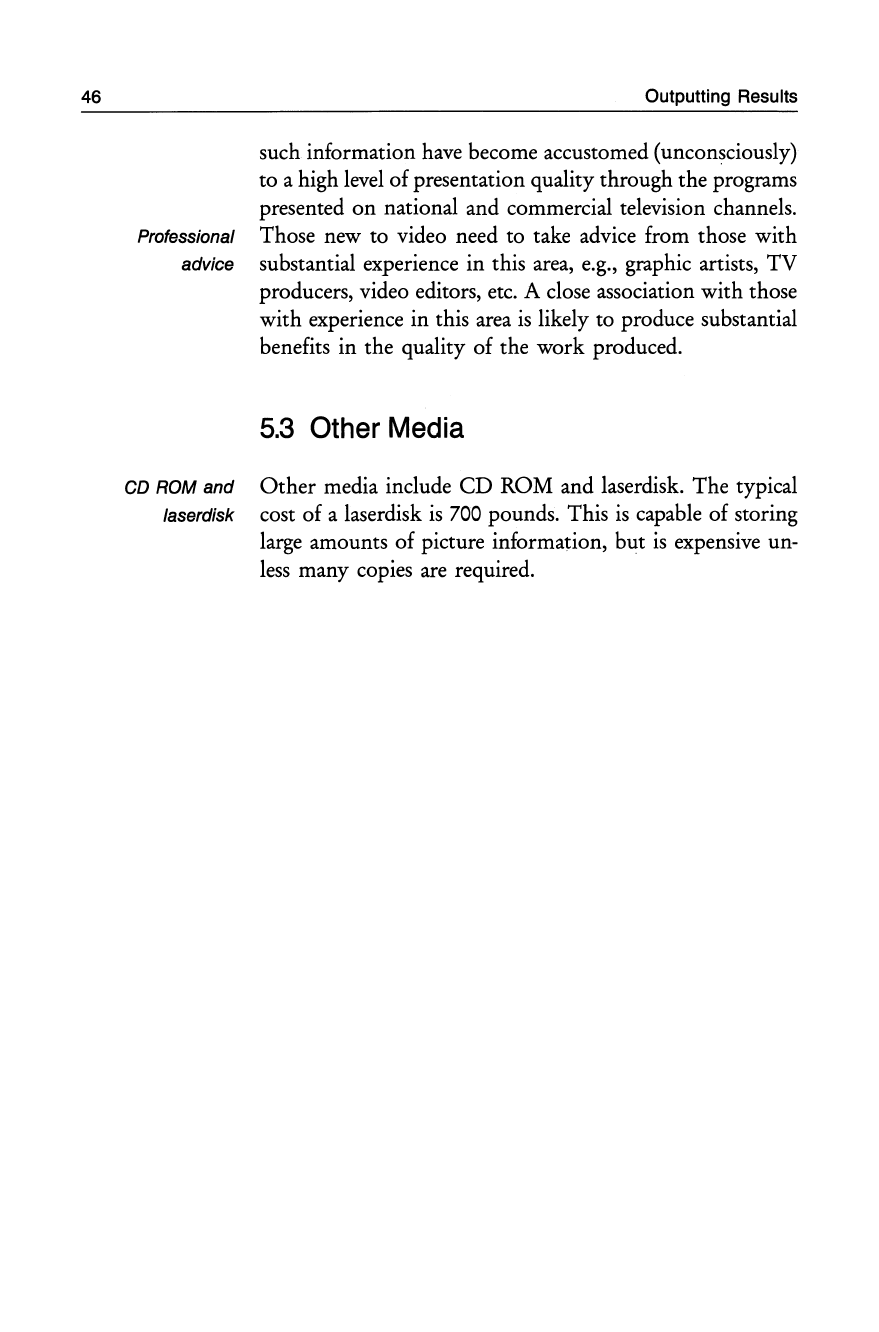
46
Outputting Results
such information have become accustomed (unconsciously)
to a high level
of
presentation quality through the programs
presented
on
national and commercial television channels.
Professional Those new to video need to take advice from those with
advice substantial experience in this area, e.g., graphic artists,
TV
producers, video editors, etc. A close association with those
with experience in this area
is
likely to produce substantial
benefits in the quality of the work produced.
5.3
Other Media
CD
ROM
and
Other
media include
CD
ROM
and laserdisk. The typical
laserdisk cost of a laserdisk
is
700
pounds. This
is
capable of storing
large amounts
of
picture information, but
is
expensive un-
less
many copies are required.
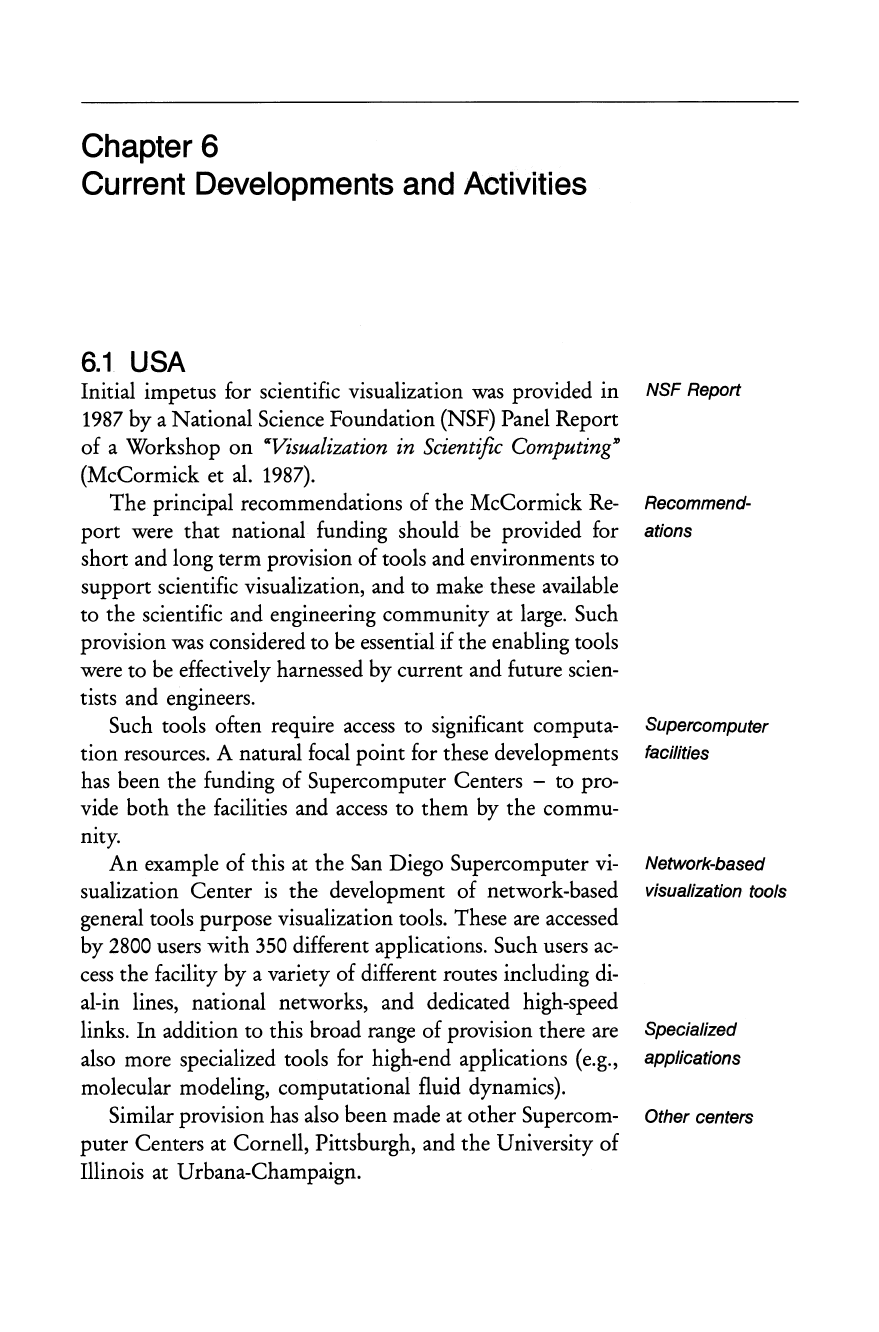
Chapter
6
Current
Developments
and
Activities
6.1
USA
Initial impetus for scientific visualization
was
provided in NSF Report
1987 by a National Science Foundation (NSF) Panel Report
of a Workshop
on
"'Visualization in Scientific Computing»
(McCormick et
al.
1987).
The principal recommendations of the McCormick
Re-
Recommend-
port
were that national funding should
be
provided for ations
short and long term provision of tools and environments to
support scientific visualization, and to make these available
to the scientific and engineering community
at
large.
Such
provision
was
considered to
be
essential if the enabling tools
were to
be
effectively harnessed by current and future scien-
tists and engineers.
Such tools often require
access
to significant computa- Supercomputer
tion resources. A natural
focal
point for these developments facilities
has
been the funding of Supercomputer Centers -to pro-
vide both the facilities and
access
to them
by
the commu-
nity.
An
example of this
at
the
San
Diego Supercomputer
vi-
Network-based
sualization Center
is
the development of network-based visualization tools
general tools purpose visualization tools. These
are
accessed
by 2800 users with 350 different applications. Such users
ac-
cess
the facility by a variety
of
different routes including
di-
al-in lines, national networks, and dedicated high-speed
links.
In
addition to this broad range of provision there
are
Specialized
also more specialized tools for high-end applications (e.g., applications
molecular modeling, computational fluid dynamics).
Similar provision
has
also been made
at
other Supercom- Other centers
puter Centers
at
Cornell, Pittsburgh, and the University of
Illinois at Urbana-Champaign.
48 Current Developments and Activities
Workshops Workshops
on
scientific visualization
have
been estab-
lished by ACM SIGGRAPH and IEEE to address specific
as-
pects such
as
data facilities (to facilitate
ease
of
use
and trans-
fer
of information), and volume visualization (to enable rep-
resentation of
real
3 D information and to
give
inside views).
Representatives from the Department of Defense and the De-
partment of Energy
have
initiated a Working Group to
de-
fine a Visualization Reference Model. A conference of
CG
International
was
held at MIT, Media Laboratory, in June
1991
with the theme
"Scientific
Visualization
of
Physical
Phe-
nomena
~
The proceedings have been published
as
a book by
Springer-Verlag
(see
Chapter
11
-References).
Visualization A large number of major universities are establishing
vi-
laboratories sualization laboratories, and often such installations receive
supplementary funding for further proposals in specific
ap-
plication
areas.
Funding
is
provided by such bodies
as
NSF,
DARPA, and NASA. State supercomputers and associated
visualization facilities exist in Ohio,
North
Carolina, Min-
nesota, Utah, Alaska, and Florida.
Visualization
To
provide a forum for the presentation and discussion
conference of the latest advances in scientific visualization, the IEEE
Technical Committee
on
Computer Graphics has estab-
lished an international visualization conference, which
is
held
on
an annual basis.
NSF support In addition, the National Science Foundation
is
provid-
ing funds for the support and promotion of educational ini-
tiatives in scientific visualization by means of institutes,
workshops, and summer schools.
Network support Fast networks are required for distributed and remote
vi-
sualization. Developments in networking infrastructure are
planned to provide faster communication, interconnection,
and the ability to aggregate computing resources at different
locations
on
to one particular problem. For example, the
CASA test bed project
is
funded by the NSF to develop a
1 Gbit/sec network link between
Los
Alamos National Lab-
oratory, the California Institute of Technology, and
San
Die-
go
Supercomputer Center, to enable all three resources to be
concentrated
on
one application simultaneously.
UK
A multi-million-dollar grant
has
recently been awarded
by NSF to California Institute of Technology, Brown U ni-
versity, University of Utah, Cornell University, and the
University of
North
Carolina
at
Chapel Hill, to explore the
foundations of computer graphics and visualization.
6.2 UK
Foundation
aspects
49
A number of centers in UK academic institutions
are
con- Application areas
cerned with application
areas
such
as
molecular modeling
and computational fluid dynamics (CFD). There
are
a num-
ber of collaborative projects between academia and industry
in the
areas
of parallel processing and scientific visualiza-
tion.
One
example, GRASPARC, a Graphical Environment
for Supporting Parallel Computing,
is
a joint project
be-
tween
NAG
Ltd., the University of
Leeds
(School of Com-
puter Studies), and Quintek Ltd. The major objective
of
the
work
is
to improve the interaction between the computa-
tional scientist and the parallel computer through the
devel-
opment of interactive visualization software.
Vis
Lab at Sheffield University
is
engaged in
five
projects: VisLab
extending surface reconstruction to irregularly sampled
fields; rendering vector and tensor fields; building radiother-
apy planning tools; reconstructing cerebral blood
vessels
from a pair of x-ray projections; and
issues
surrounding per-
ception.
The
IBM
UK Scientific Centre in Winchester
is
primari- Industry and
ly concerned with scientific visualization and has a Visual- academia
ization Group, a European Visualization Group, a Medical
Imaging Group, and a Parallel Programming and Visualiza-
tion Group. There
are
a number of collaborative projects
with academia and industry in the
areas
of parallel process-
ing, user-interface aspects, and medical informatics.
Natural Environment Research Council (NERC)
has
a Research councils
Visualization Advisory Group concerned with evaluating
products for the
areas
of geological surveys and oceanogra-
phy. Science and Engineering Research Council Engineer-
50
Current Developments and Activities
ing Board has evaluated superworkstations in the
areas
of
hardware and software. The present
AGOCG
Scientific
Vi-
sualization Workshop which initiated this guide and the
Status Report arose out of proposals by the
UK
Universities
funding body for computing (the Computer Board) and the
Advisory Group on Computer Graphics (AGOCG).
Video facility The Rutherford Appleton Laboratory of the SERC,
Central Computing Division, has developed a video facility
for use by the academic and research community in the UK,
and
is
involved in projects in the
areas
of oceanography,
at-
mospheric physics, laser design, mechanical engineering,
ecological simulation, and CFD.
University
of
Leeds The University of
Leeds
has an interdisciplinary Scienti-
fic
Visualisation Group and promotes a wide range of soft-
ware on state of the art hardware platforms to support a
va-
riety of applications. (Reference: ACM SIGGRAPH Com-
puter Graphics, June
1992)
Other projects There
are
numerous other projects underway in this
field -the above
is
only an indication of the range of work
being done.
6.3
Europe
European centers IBM
has
a number of European centers actively involved in
projects involving Scientific Visualization. These include
the European Petroleum Applications Centre (EPAC) in
Stavanger, the Paris Scientific Centre which
is
involved in
visualization in the medical area, and the European Scientif-
ic
Centre in Rome which
is
involved in engineering and
modelling turbulent
flow.
IBM
also has a joint project with
the Centre of Competence in Visualization at the Universi-
ty
of Aix-Marseilles.
Volume FhG-AGD in Darmstadt
is
working
on
a number of
ar-
visualization
eas,
including tools for volume visualization
on
a variety of
platforms, and handling different kinds of data sets.
Workshops Eurographics arranged a Workshop on Scientific Visual-
ization in April
1990.
The proceedings will
be
available
from Springer-Verlag. Further workshops
are
planned.

Part
II
Overview of
Current Systems
and Developments
Chapter
7
Current
Vendor
Systems
in
Use
Readers
are
recommended to read Chapter 4 for a classifica-
tion and categorisation of scientific visualization systems
before reading this chapter. Chapter 4 sets out the overall
framework into which the products outlined in Chapters 7
and 8 fit.
Contact addresses
are
provided for each product at the
end of each section.
7.1
Wavefront
Technologies,
Inc.
Wavefront
was
founded in 1984 in California and provides
graphics products for
use
on a wide range of
UNIX
work-
stations including Silicon Graphics, IBM, Hewlett Packard,
DEC
and SUN. The company has a well established world-
wide
sales
and support network with its own offices in all
the key European countries, including the UK.
Wavefront's Visualizer software
is
designed to help engi-
neers, scientists, designers and graphic artists use the power
of today's 3D graphics workstations. There
are
three prod-
ucts providing professional visual communication to aid
rapid understanding.
-The Data Visualizer
is
designed to speed up the analysis
of
large volumes
of
3D data on any type of grid.
It
dis-
plays many variables at once and
uses
color and dynam-
ics
to create easily understandable images
or
animation
sequences of of complex processes.
-The Personal Visualizer
is
an
easy-
to-use image renderer
for
CAD
geometry.
It
provides photo-realistic images for
product designers, engineers and marketing groups.
Founded
in 1984
Visual
communication
Summary
of
Visualization
Products
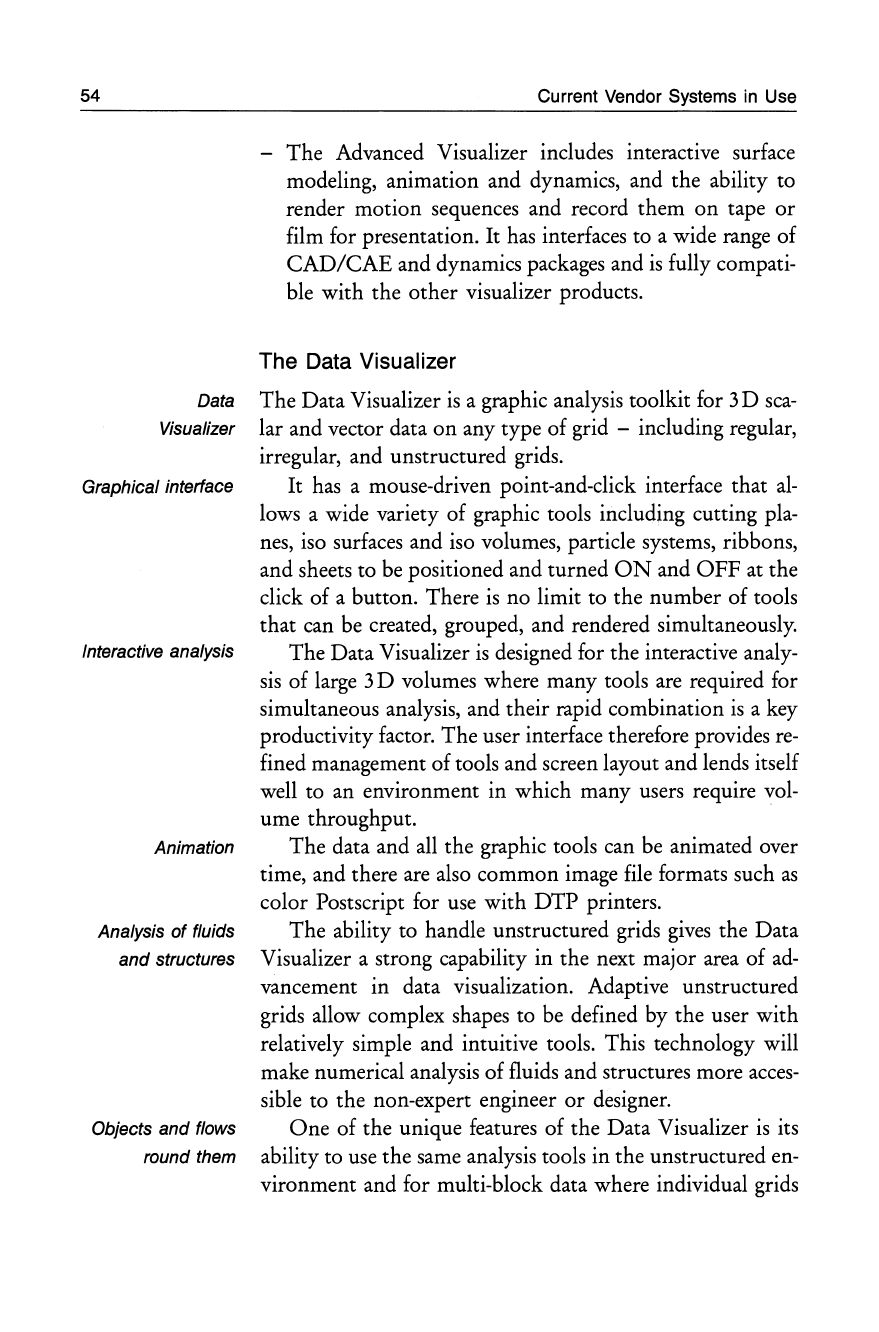
54
Current Vendor Systems
in
Use
The
Advanced Visualizer includes interactive surface
modeling, animation and dynamics, and the ability to
render motion sequences and record them
on
tape
or
film for presentation.
It
has interfaces to a wide range of
CAD/CAE
and dynamics packages and
is
fully compati-
ble
with
the
other
visualizer products.
The Data Visualizer
Data
The
Data Visualizer
is
a graphic analysis toolkit for 3 D
sca-
Visualizer lar and vector data
on
any type
of
grid -including regular,
irregular, and unstructured grids.
Graphical interface
It
has a mouse-driven point-and-click interface that
al-
lows a wide variety
of
graphic tools including cutting pla-
nes, iso surfaces and iso volumes, particle systems, ribbons,
and sheets to
be
positioned and turned
ON
and
OFF
at the
click
of
a button. There
is
no limit to the number
of
tools
that can be created, grouped, and rendered simultaneously.
Interactive analysis
The
Data Visualizer
is
designed for the interactive analy-
sis
of
large 3 D volumes where many tools are required for
simultaneous analysis, and their rapid combination
is
a key
productivity factor. The user interface therefore provides
re-
fined management
of
tools and screen layout and lends itself
well to an environment in which many users require vol-
ume throughput.
Animation The data and all the graphic tools can be animated over
time, and there are also common image file formats such
as
color Postscript for use with
DTP
printers.
Analysis
of
fluids
The
ability to handle unstructured grids gives the Data
and
structures Visualizer a strong capability in the next major area
of
ad-
vancement in data visualization. Adaptive unstructured
grids allow complex shapes to be defined by the user
with
relatively simple and intuitive tools. This technology will
make numerical analysis
of
fluids and structures more
acces-
sible to the non-expert engineer
or
designer.
Objects and flows
One
of
the unique features
of
the Data Visualizer
is
its
round them ability to use the same analysis tools in the unstructured en-
vironment and for multi-block data where individual grids
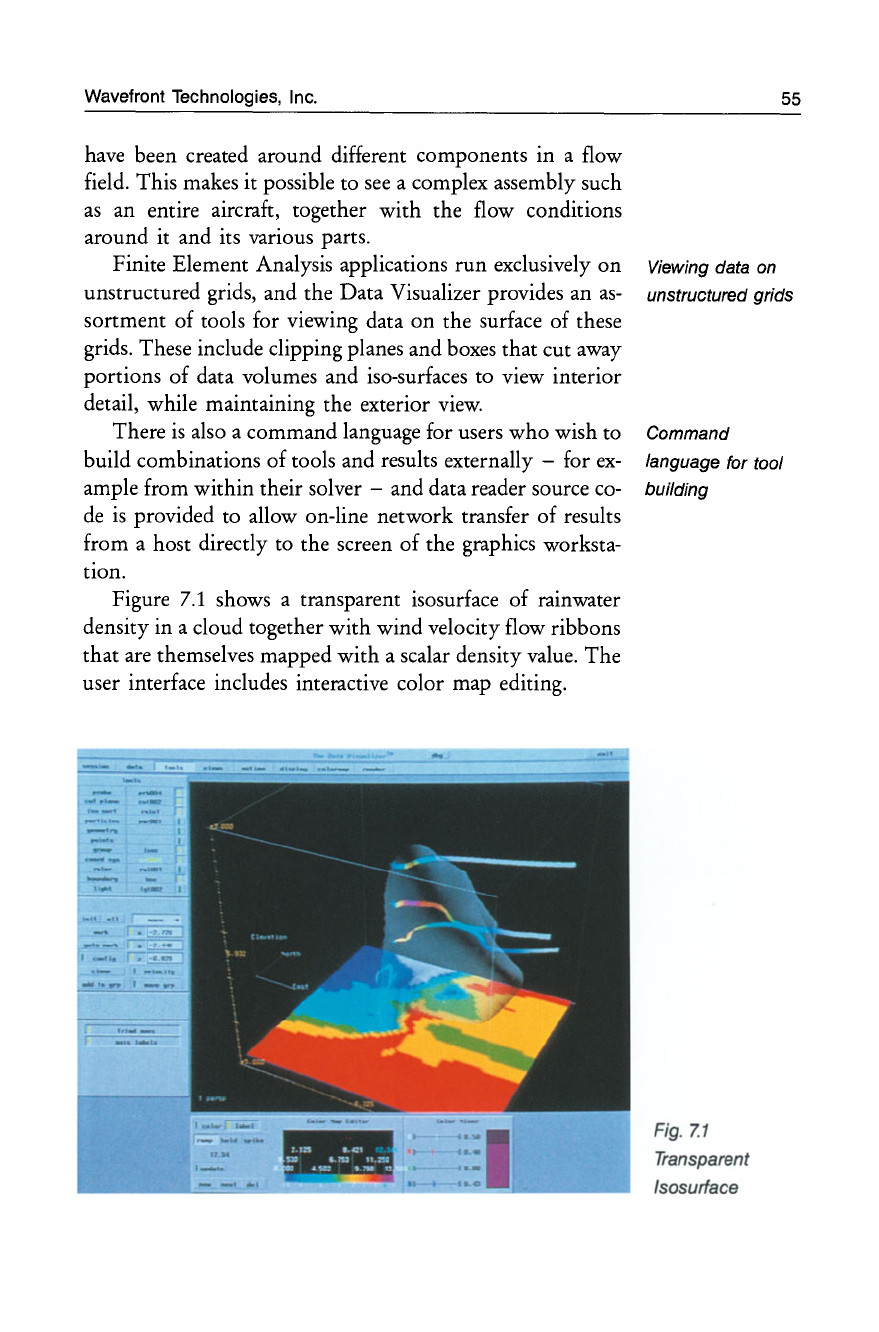
Wavefront Technologies, Inc.
have been created around different components in a flow
field. This makes it possible to
see
a complex assembly such
as
an entire aircraft, together
with
the flow conditions
around it and its various parts.
Finite Element Analysis applications
run
exclusively
on
unstructured grids, and the Data Visualizer provides an
as-
sortment of tools for viewing data
on
the surface of these
grids. These include clipping planes and boxes that cut away
portions
of
data volumes and iso-surfaces to view interior
detail, while maintaining the exterior
view.
There
is
also a command language for users
who
wish to
build combinations
of
tools and results externally -for
ex-
ample from within their solver -and data reader source
co-
de
is
provided to allow on-line network transfer
of
results
from a host directly to the screen
of
the graphics worksta-
tion.
Figure
7.1
shows a transparent isosurface of rainwater
density in a cloud together with wind velocity flow ribbons
that are themselves mapped with a scalar density value. The
user interface includes interactive color map editing.
55
Viewing data on
unstructured grids
Command
language for tool
building
Fig.
7.1
Transparent
Isosurface
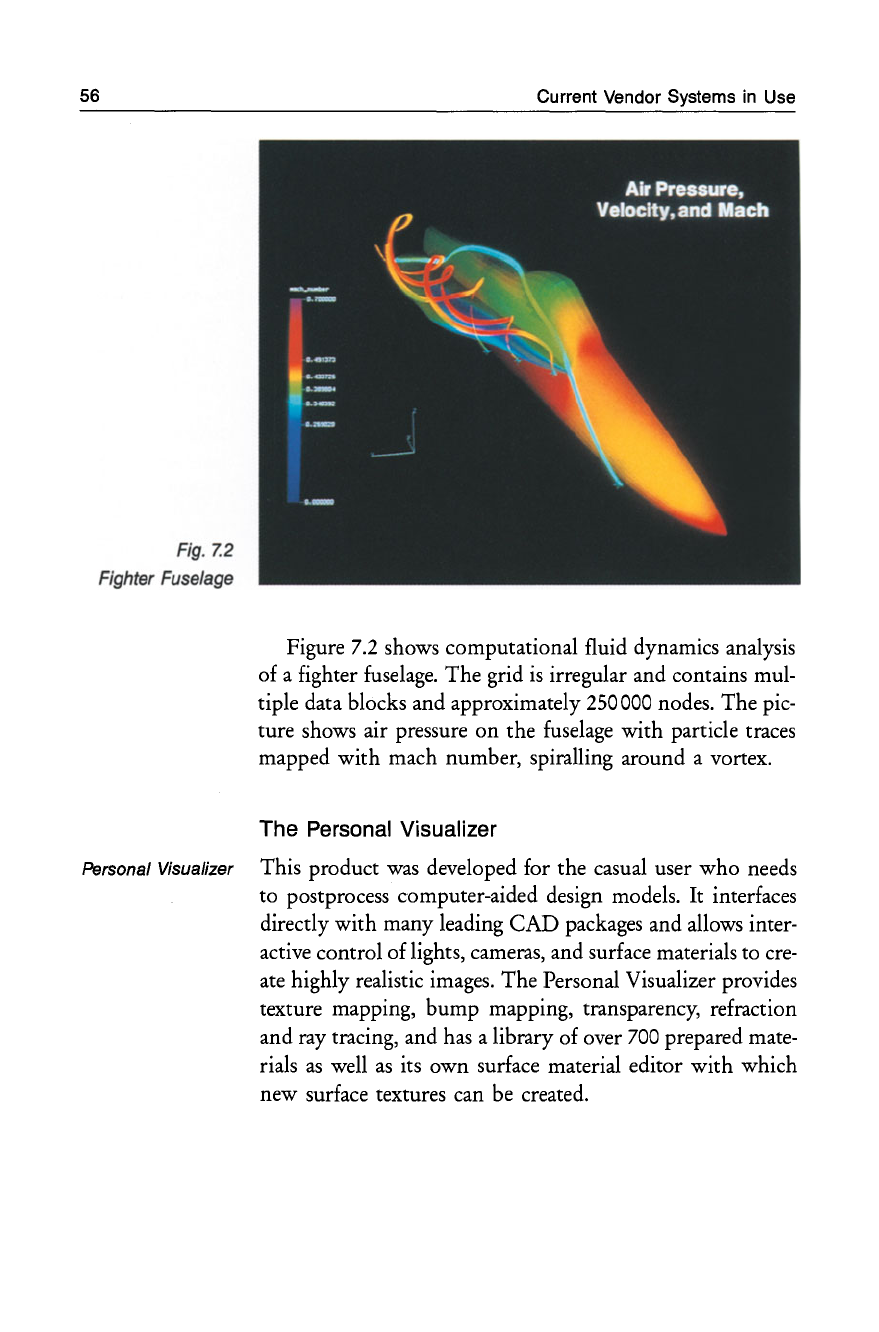
56
Fig.
Z2
Fighter
Fuselage
Current Vendor Systems
in
Use
Figure 7.2 shows
computational
fluid dynamics analysis
of
a fighter fuselage.
The
grid
is
irregular
and
contains mul-
tiple data blocks
and
approximately 250000 nodes.
The
pic-
ture
shows air pressure
on
the
fuselage
with
particle traces
mapped
with
mach
number,
spiralling
around
a vortex.
The Personal Visualizer
Personal
Visualizer
This
product
was developed for
the
casual user
who
needs
to
postprocess computer-aided design models.
It
interfaces
directly
with
many
leading
CAD
packages
and
allows inter-
active
control
of
lights, cameras,
and
surface materials
to
cre-
ate highly realistic images.
The
Personal Visualizer provides
texture mapping,
bump
mapping, transparency, refraction
and
ray tracing,
and
has a library
of
over 700 prepared mate-
rials
as
well
as
its
own
surface material
editor
with
which
new
surface textures can be created.
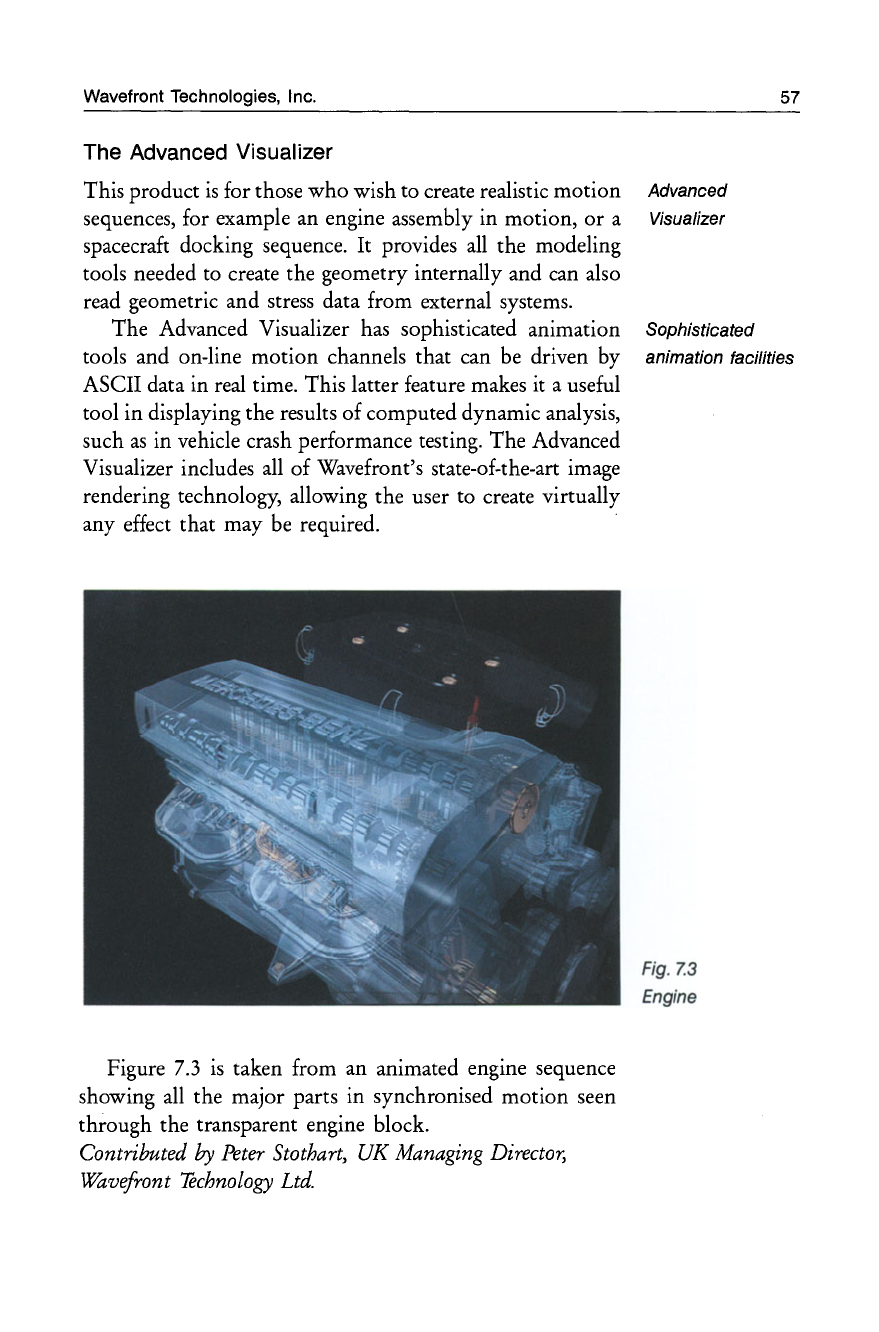
Wavefront Technologies, Inc.
The Advanced Visualizer
This product
is
for those
who
wish to create realistic motion Advanced
sequences, for example an engine assembly in motion,
or
a Visualizer
spacecraft docking sequence. It provides
all
the modeling
tools needed to create the geometry internally and can also
read geometric and stress data from external systems.
57
The Advanced Visualizer has sophisticated animation Sophisticated
tools and on-line motion channels that can be driven by animation facilities
ASCII data in real time. This latter feature makes it a useful
tool in displaying the results of computed dynamic analysis,
such
as
in vehicle crash performance testing. The Advanced
Visualizer includes all of Wavefront's state-of-the-art image
rendering technology, allowing the user to create virtually
any effect that may be required.
Figure
7.3
is
taken from an animated engine sequence
showing all the major parts in synchronised motion seen
through the transparent engine block.
Contributed
by
Peter Stothart,
UK
Managing Director,
Wavefront
Technology
Ltd.
Fig. Z3
Engine
58
High quality color
graphics
Raster based
Pioneering
developments
Real world
application
of
visualization tools
Current Vendor Systems
in
Use
For further information contact:
US.A.
Wavefront Technologies, Inc.
530
East Montecito Street
Santa Barbara
CA
93103
US.A.
Tel:
805-962-8117
Fax:
805-963-0410
United Kingdom
Europe
Wavefront Technologies
Guldenspoorstraat
21-
23
B-9000
Gent Belgium
Tel:
32-91-254555
Fax:
32-91-234456
Wavefront Technologies Ltd.
Oakridge House; Wellington Road
High Wycombe
Bucks HP12 3PR
UK.
Tel:
0494-441273
Fax: 0494-464904
7.2 UNIRAS
A.
S.
UNIRAS
was
established in
1980
with the objective of satis-
fying the growing need among computer users for a range
of high-quality color graphics software. This need arose
partly from current requirements to analyse ever increasing
volumes of data and partly to utilize fully the high perfor-
mance graphical output devices coming
on
to the market.
UNIRAS software
uses
raster techniques to deliver a
broader spectrum of colors, improved resolution, and great-
er throughput. UNIRAS therefore makes the most of new
hardware technology, while still effectively supporting the
traditional vector output devices of an earlier generation.
Key management and development people at UNIRAS
have worked with color raster graphics since the early
1970s
and were closely involved in the design of software for the
first inkjet plotters. The current UNIRAS product range
has evolved from this pioneering work.
Reflecting the rapid growth of the offshore oil industry
at that time, UNIRAS' first commercially available product
was
a software package to aid exploration companies in their
UNIRAS A.S.
search for oil and
gas.
This
was
an early example of the
use
of
scientific visualization tools in real-world applications
with considerable strategic benefits. Since then UNIRAS
has taken its technology into a number of other application
areas, including automotive and aerospace manufacturing,
pharmaceutical industry, communications, defense, energy
generation and distribution, and environmental manage-
ment.
UNIRAS software technology comes in two forms. In-
teractive, user-friendly packages permit non-specialist com-
puter users -scientists, engineers, and managers -to learn
to use the extensive facilities quickly and easily; while the
range of subroutines provides a choice of powerful tools to
help the application programmer integrate high quality
graphics with new and existing applications. All UNIRAS
products are computer and device independent and comply
with accepted international standards.
Today UNIRAS
is
a truly international organization and
can list many famous companies, research institutions, and
universities among its hundreds of customers. UNIRAS has
its headquarters in Denmark, with wholly owned subsidiar-
ies
in the USA, UK, France, Germany and Italy, a
sales
of-
fice
in Tokyo, and representatives in other parts of the
world. Research and development takes place in Denmark
and the USA. The major shareholders in UNIRAS
are
the
Danish financial services group Hafnia, the Dutch invest-
ment company Halder Holdings, and UNIRAS' own man-
agement.
UNIGRAPH
+ 2000
is
a powerful, fully interactive data
visualization system which enables users
to:
• retrieve their technical and scientific data from a
file
or
database,
• edit and operate
on
it in a variety of ways,
• analyse and visualize it quickly and in many forms, from
very simple charts to advanced multidimensional sur-
faces,
•
give
plots an extra touch of professional presentation
quality,
• present the information graphically
as
hardcopies of the
highest quality.
59
Interactive
modules
or
library
routines
International
vendor and clients
UNIGRAPH
facilities
60
Visualizing
datasets
Wide
variety
of
output
devices
Integrating
visualization
and
presentation
Windowing
environments
Networked
facilities
Platforms
Benefits
and
advantages
Current Vendor Systems
in
Use
Datasets can
be
accessed, edited, and analyzed using mathe-
matical, logical,
or
statistical operators. A comprehensive set
of interpolation techniques correctly handles such complex-
ities
as
regions and barriers, allowing datasets to
be
visual-
ized
as
2
D,
3
D,
or
4 D surfaces in color
or
monochrome.
The
UNIGRAPH
+
2000
hardcopy system produces
high-resolution hardcopies on a wide variety of output
de-
vices
including raster and vector
devices
as
well
as
the new
generation of Postscript printers. Pictures can
also
be
saved
for later
use
or
exported to other systems by the creation of
ISO Standard Computer Graphics Metafiles (CGM)
or
en-
capsulated Postscript
files.
agX/TOOLMASTER
is
a suite of high-level graphics
tools which allows the software developer to easily integrate
visualization and presentation techniques into application
programs.
agX/TOOLMASTER programming tools
are
callable
from C and
have
been developed and optimized for
use
in
an X Window environment. The open systems architecture
of agX/TOOLMASTER allows it to
be
fully integrated
with the X Window, OSF/MOTIF and
OPEN
LOOK win-
dowing environments.
With agX/TOOLMASTER the application program-
mer can combine high-level graphics functions with the best
features of X such
as
multiple windows and event handling
for interactivity, pixmap generation for animation, and
cli-
ent/server techniques for network computing.
agX/TOOLMASTER runs on
all
major
UNIX
worksta-
tions and supercomputers
as
well
as
the VAX/VMS environ-
ment, making applications portable across the network.
The virtual color system in agX/TOOLMASTER provides
X-server independence with its support of monochrome
and color displays and various bitplane depths.
The benefits of building an application with agX/
TOOLMASTER
are:
• The amount of time and code required for building
ap-
plications in the X environment
is
greatly reduced,
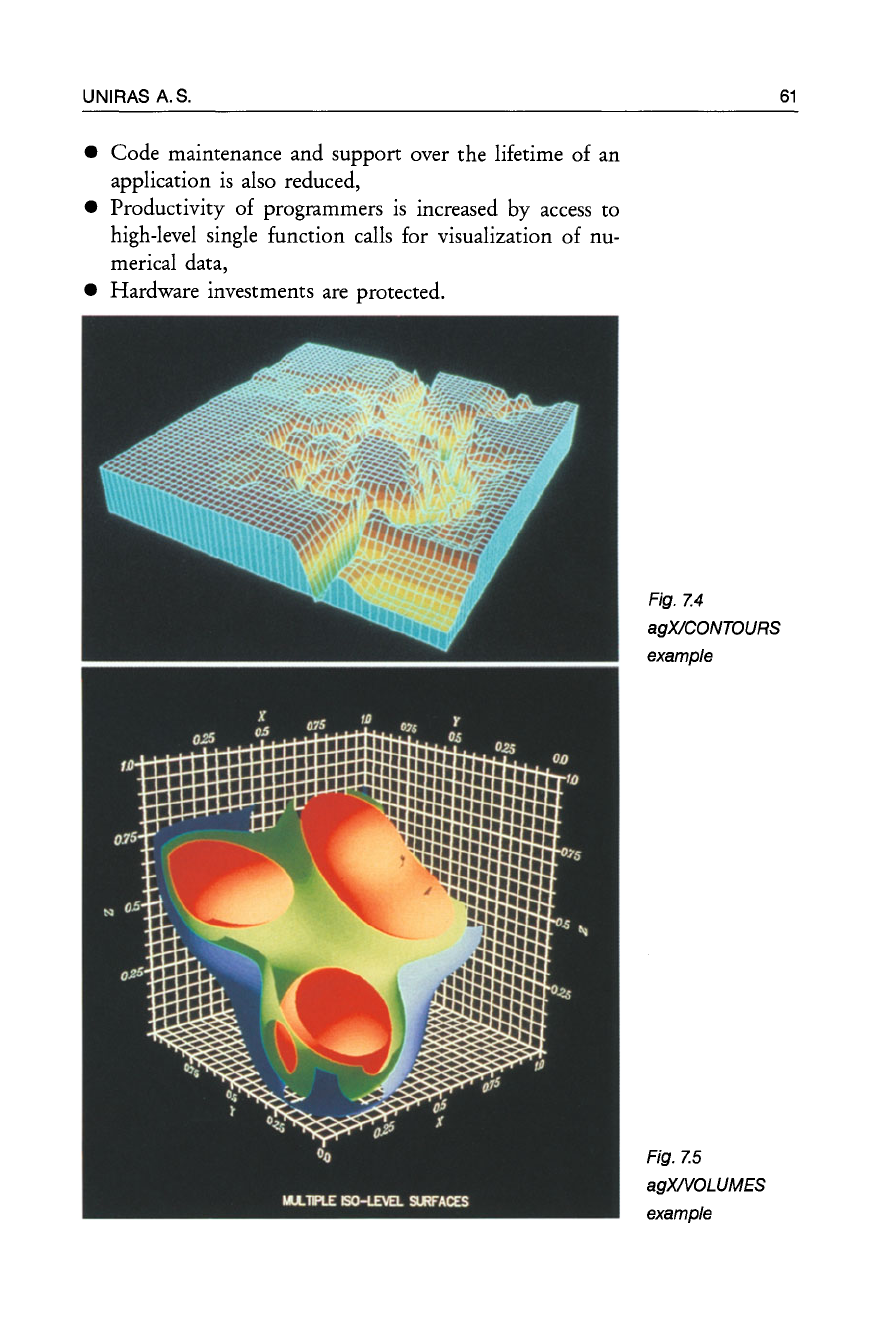
UNIRAS A.S.
• Code maintenance and support over the lifetime
of
an
application
is
also reduced,
• Productivity
of
programmers
is
increased by
access
to
high-level single function calls for visualization
of
nu-
merical data,
• Hardware investments are protected.
61
Fig. Z4
agXJCONTOURS
example
Fig. Z5
agXJVOLUMES
example
62
Current Vendor Systems
in
Use
Commitment
to
UNIRAS technology
is
based on standards, and in the
standards future UNIRAS will continue to develop products that
of-
fer
flexibility together with computer and device indepen-
dence. The further development and enhancement of both
the UNlRAS interactive packages and subroutine libraries
will continue to provide high-quality graphics solutions to
both
end users and application programmers.
Ongoing Research and development now takes place in both Eu-
developments rope and the USA in order to reinforce the global scope of
the company's products. Future developments will also take
place with the cooperation of both UNIRAS users and the
computer hardware vendors. The UNIRAS network of lo-
cal
subsidiaries in Europe, USA, and Japan will enable the
company to continuously strengthen local
sales
and support
activities.
Contributed
by
Mike Bundred,
General Manager UNlRAS Ltd.
For further information contact:
Denmark
UNIRAS A.S.
376 Gladsaxevej
DK-2860 Soborg
Denmark
Tel:
45-31-672288
Fax:
45-31-676045
United Kingdom
UNlRAS Ltd.
Ambassador House
181
Farnham Road
Slough SLl 4XP
u.K.
Tel:
0753-579293
Fax:
0753-821231
Germany
UNIRAS
GmbH
Niederkasseler Lohweg 8
W-4000
Dusseldorf
11
Federal Republic of Germany
Tel:
0211-5961017
Fax:
0211-5961019
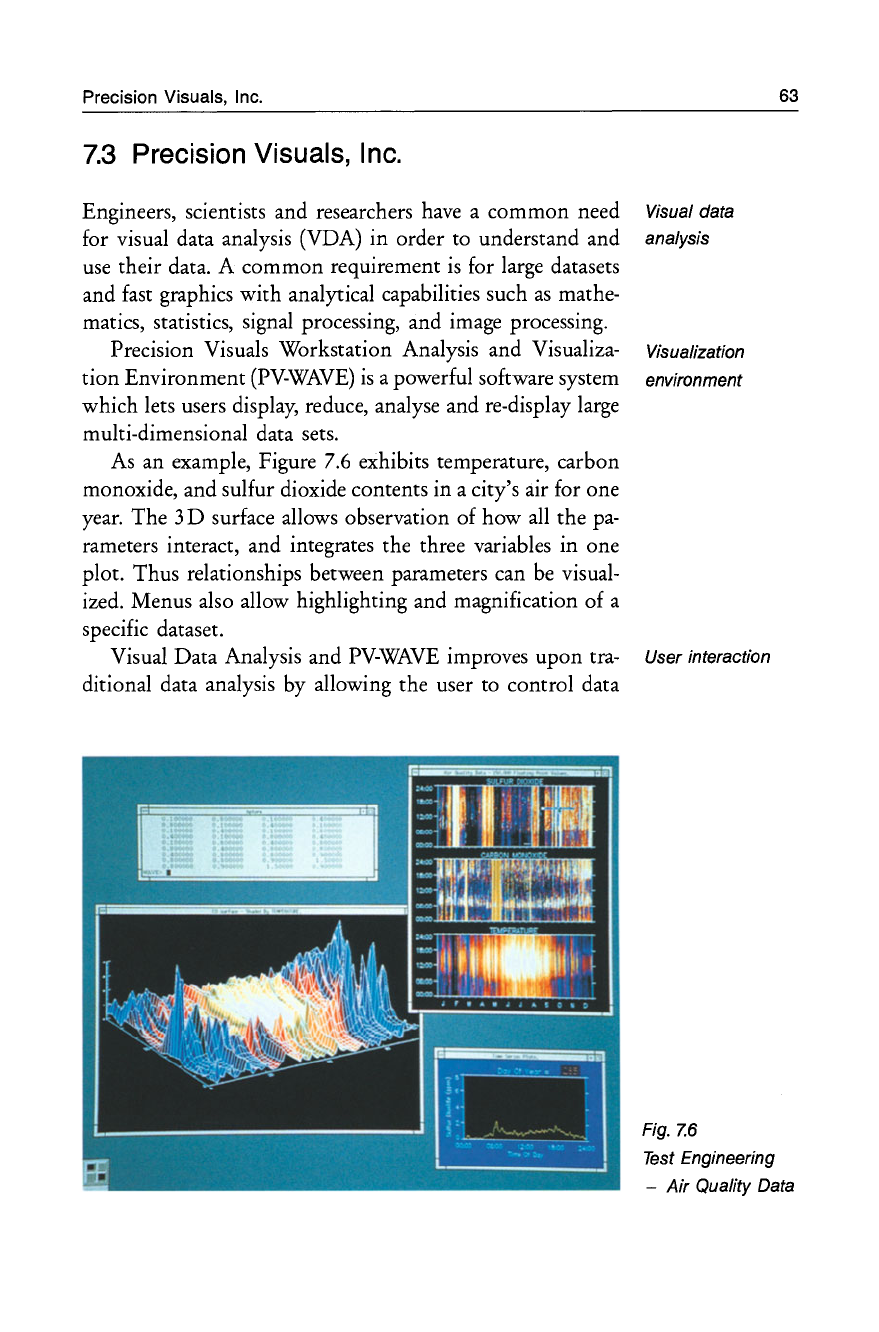
Precision Visuals,
Inc.
7.3
Precision
Visuals,
Inc.
Engineers, scientists and researchers have a common need Visual data
for visual data analysis (VDA) in order to understand and analysis
use their data. A common requirement
is
for large datasets
and fast graphics
with
analytical capabilities such
as
mathe-
matics, statistics, signal processing, and image processing.
Precision Visuals Workstation Analysis and Visualiza- Visualization
tion Environment
(PV-WAVE)
is
a powerful software system environment
which lets users display, reduce, analyse and re-display large
multi-dimensional data sets.
As an example, Figure 7.6 exhibits temperature, carbon
monoxide, and sulfur dioxide contents in a city's air for one
year.
The
3 D surface allows observation of how all the pa-
rameters interact, and integrates the three variables in one
plot. Thus relationships between parameters can be visual-
ized. Menus also allow highlighting and magnification of a
specific dataset.
Visual Data Analysis and
PV-WAVE
improves
upon
tra- User interaction
ditional data analysis by allowing the user
to
control data
Fig. Z6
Test
Engineering
63
-
Air
Quality Data
64 Current Vendor Systems
in
Use
analysis by user interaction with visual representations. The
features of
PV-WAVE
are:
• Reads and defines large, multi-dimensienal datasets
• Tools for fast manipulation and subsetting
• Quick graphical displays of immediate results
• Immediate user interaction
• Advanced graphic tools for animating and displaying
multidimensional data
Increase
in
VDA techniques
are
invaluable for scientific discovery and
productivity engineering analysis. They offer impressive advantages, in-
cluding increases in productivity and a means for visual
communication with colleagues.
PV-WAVE
PV-WAVE
is
interactive software for visualizing and ana-
lyzing technical data.
It
consists of a set of high-level, inter-
pretive commands and procedures that provide:
Features • Data
access,
reduction and analysis
• 2 D and 3 D graphics
• Dynamic graphics
• Image processing and manipulation
• Application development
Application areas
PV-WAVE
is
being successfully applied in the following
ap-
plication
areas:
Laboratory Science
to visualize and analyze data from analytical instruments
to develop instrument automation systems
to create custom laboratory information systems
Test
Engineering
to visualize vibration, heat transfer, and emissions test
data
to compare prototype performance with theoretical
ex-
pectations
-to implement quality control systems in manufacturing
environments
Precision Visuals,
Inc.
Real-time Data Acquisition and Control
-
to
build automated remote sensing systems
to
manage water quality and
sewage
systems
to
monitor atmospheric conditions
to create simulations based
on
real data
Space Exploration and Astrophysics
-to reconstruct planetary and stellar environments
-to study geodynamics in planets and satellites
-to study seismology
to simulate astronomical events and objects
Computational Fluid Dynamics
to identify flow patterns such
as
shock
waves,
vortices,
and shear layers
to
apply
CFD
research to aeronautics, automotive
de-
sign, weather forecasting, and oceanography
-to analyze data from thermal dynamics, fluid dynamics
and nuclear reactions
Finite element modeling and analysis
-to assure quality and reliability in computations involv-
ing field equations
to apply finite element pre- and postprocessing methods
to such areas
as
aircraft design and stress analysis in build-
ing components
Imaging -medical and remote sensing
-to postprocess remote sensing data
-to display and analyse bioscience imagery, including
NMR/MRI,
X-Ray, CAT, and electron microscopy
Earth Resources
to interpret seismic data
to analyze well logs for locating mineral deposits
-to make meteorological predictions
-to compile and combine raw data for mapping
65
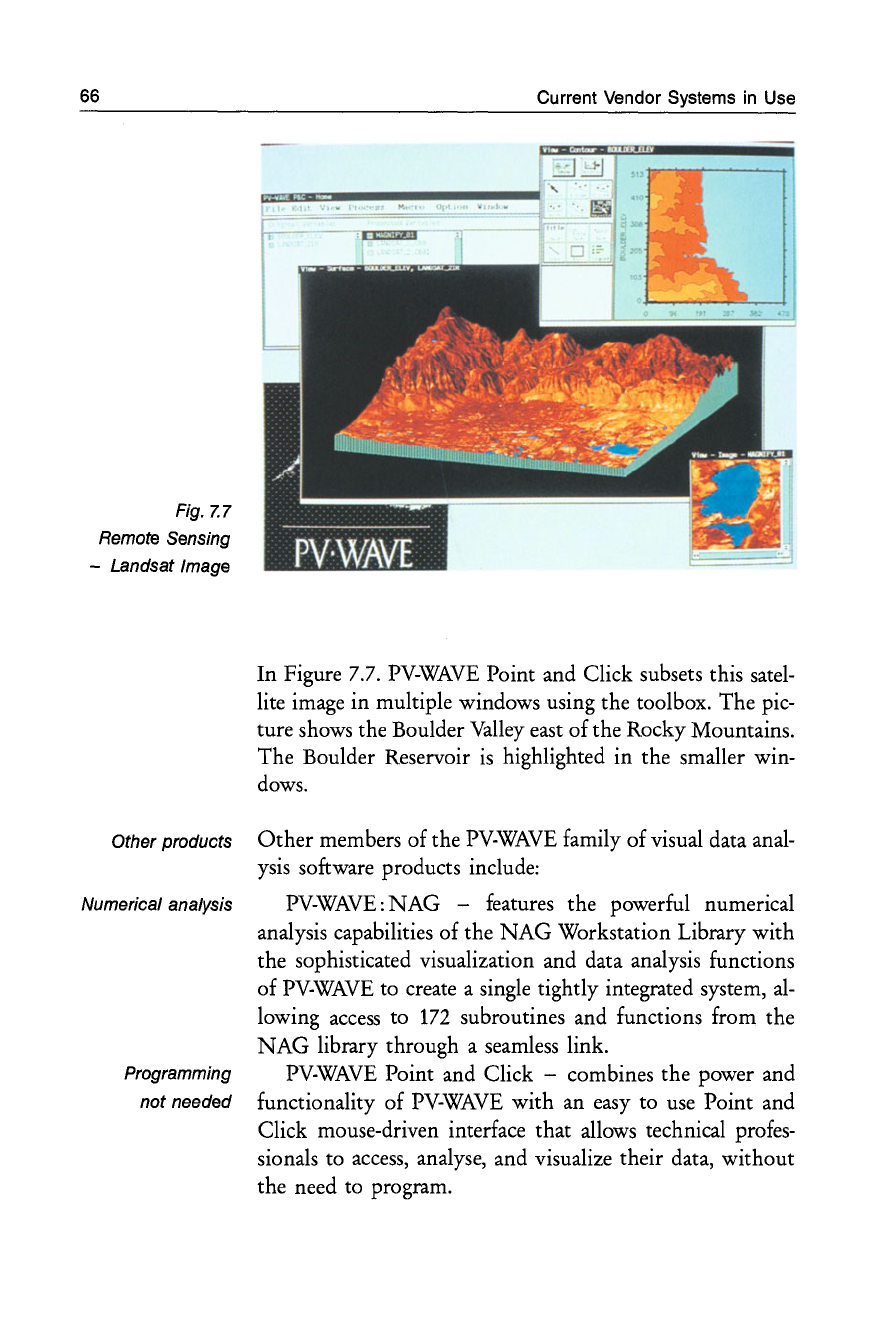
66 Current Vendor Systems
in
Use
. ..
[-
Fig. 7.7
Remote Sensing
-Landsat Image
In
Figure 7.7.
PV-WAVE
Point and Click subsets this satel-
lite image in multiple windows using the toolbox. The pic-
ture shows the Boulder
Valley
east of the Rocky Mountains.
The Boulder Reservoir
is
highlighted in the smaller win-
dows.
Other products
Other
members
of
the
PV-WAVE
family of visual data anal-
ysis software products include:
Numerical analysis
PV-WAVE:
NAG
-features the powerful numerical
analysis capabilities of the
NAG
Workstation Library with
the sophisticated visualization and data analysis functions
of
PV-WAVE
to create a single tightly integrated system,
al-
lowing
access
to
172
subroutines and functions from the
NAG
library through a seamless link.
Programming
PV-WAVE
Point and Click -combines the power and
not needed functionality of
PV-WAVE
with an easy to use Point and
Click mouse-driven interface that allows technical profes-
sionals to
access,
analyse, and visualize their data, without
the need to program.
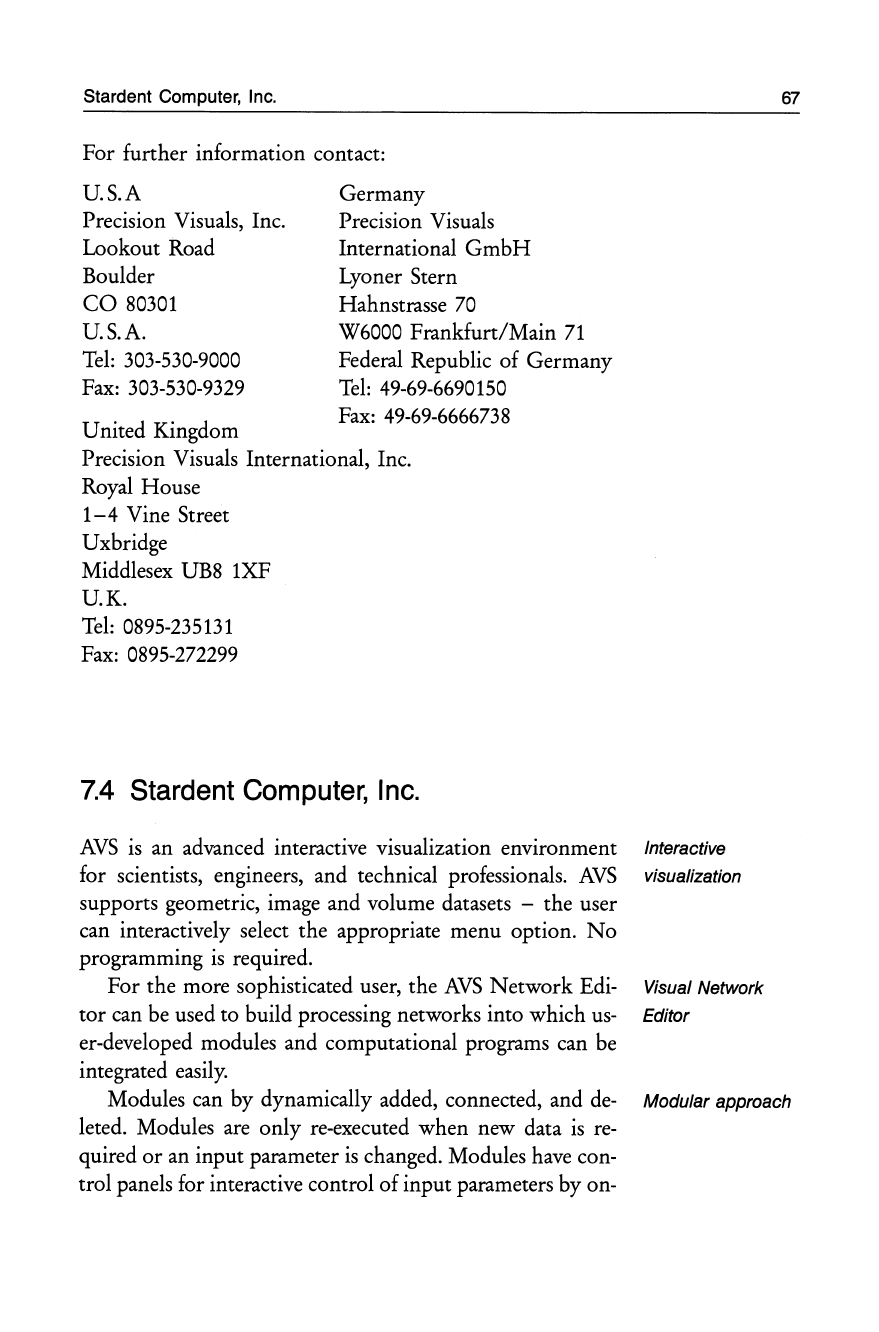
Stardent Computer, Inc.
For
further information contact:
US.A
Precision Visuals, Inc.
Lookout Road
Boulder
CO
80301
US.A.
Tel: 303-530-9000
Fax: 303-530-9329
United
Kingdom
Germany
Precision Visuals
International
GmbH
Lyoner Stern
Hahnstrasse
70
W 6000 F
rankfurt/Main
71
Federal Republic
of
Germany
Tel:
49-69-6690150
Fax: 49-69-6666738
Precision Visuals International, Inc.
Royal House
1-4
Vine Street
Uxbridge
Middlesex UB8 1XF
UK.
Tel: 0895-235131
Fax: 0895-272299
7.4
Stardent
Computer,
Inc.
AVS
is
an advanced interactive visualization environment
for scientists, engineers, and technical professionals.
AVS
supports geometric, image and volume datasets -
the
user
can interactively select the appropriate menu option.
No
programming
is
required.
For
the
more sophisticated user, the
AVS
Network
Edi-
tor
can be used to build processing networks into which us-
er-developed modules and computational programs can be
integrated easily.
Modules can by dynamically added, connected, and de-
leted. Modules are
only
re-executed
when
new data
is
re-
quired
or
an
input
parameter
is
changed. Modules have con-
trol panels for interactive control
of
input
parameters by on-
Interactive
visualization
Visual Network
Editor
67
Modular approach
68
Current Vendor Systems
in
Use
screen sliders,
file
browsers, dials and buttons. The control
panel
is
automatically generated when a module
is
connect-
ed into the network.
Building The complete network can be
saved
with all the user
de-
applications fined interactive controls and layout specifications
as
a com-
plete application. This can then
be
invoked directly, bypass-
ing the standard
AVS
menus and the Network Editor.
Integration
of
User programs can
be
coupled into the network to allow
user programs real-time visualization of dynamic simulations. This allows
the user to transform existing batch programs into interac-
tive visual applications.
Further modules
AVS
has a wide range of data input, filter, mapper and
renderer modules. User-written programs
or
subroutines in
FORTRAN
or
C can
be
easily converted into
AVS
modules.
Filters Filters transform data into data
or
geometry into geome-
try. Some filters convert the output data of widely-used
ap-
plications into displayable form.
AVS
includes filters for
ap-
plications in engineering analysis, computational fluid dy-
namics (CFD), chemistry and other fields.
Other
filters pro-
cess
commonly used data formats such
as
the Brookhaven
Protein Databank (PDB) molecular structure format,
or
graphics formats such
as
MOVIE.BYU and Wavefront
Tech-
nologies.
New filters New filters can be developed by means of templates and
geometric conversion utilities.
Mapping Mappers transform data into geometry. Multiple visual-
ization techniques can
be
selected to suit the problem being
studied. Examples of mappers include: isosurfaces of a 3 D
field;
2D
slices
of a
3D
data volume;
3D
meshes from
2D
elevation datasets.
Renderers Renderers display geometry, images, and volumes on
screen.
AVS
networks can incorporate multiple rendering
modules, including a fully-featured 3 D geometry renderer,
an image display renderer, and a range of volume renderers.
Graphic images may also
be
output to hardcopy devices
or
video tape.
Image processing
AVS
provides a complete image display capability, in-
cluding real-time pan and zoom, rotation and transforma-
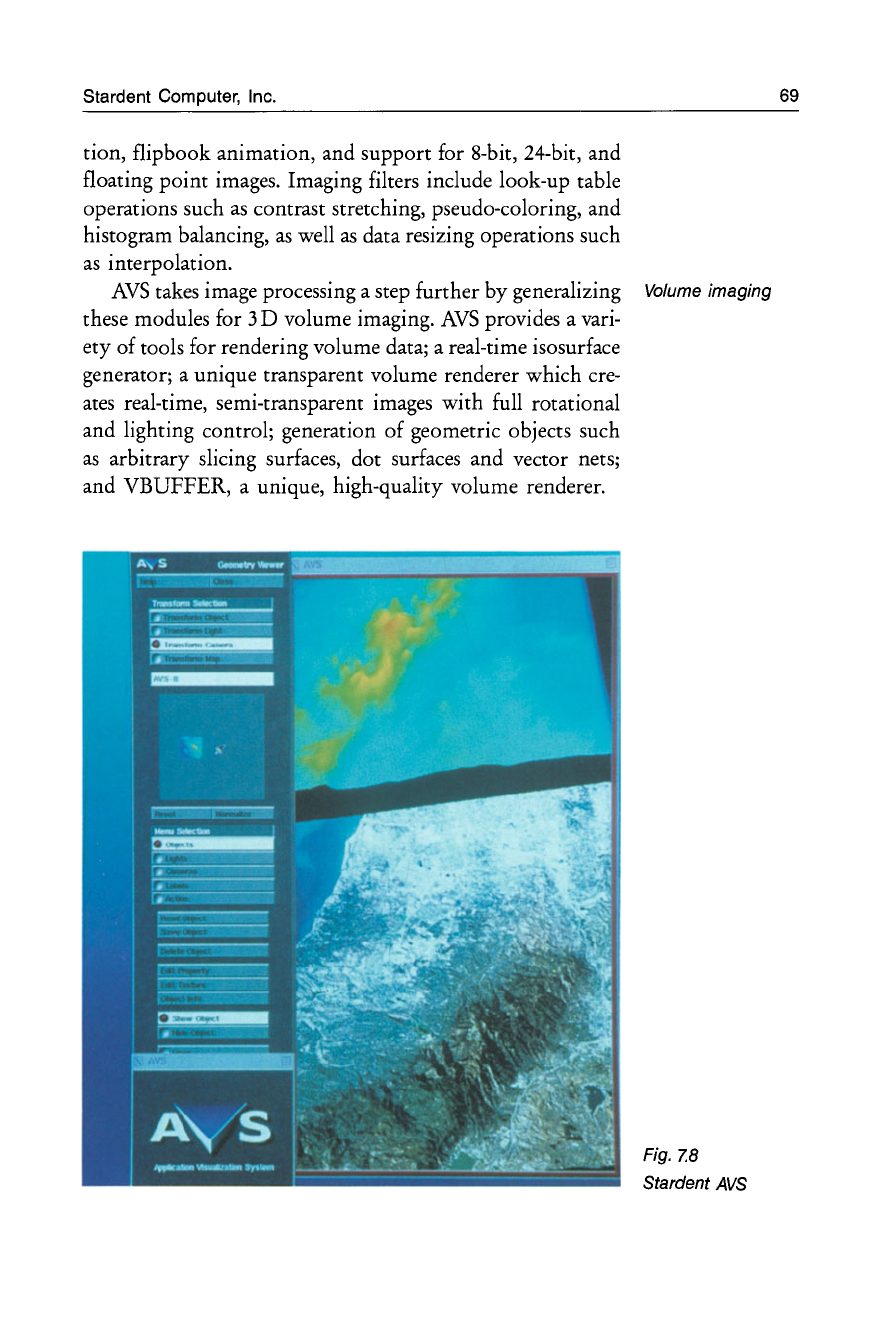
Stardent Computer,
Inc.
69
tion,
flip
book
animation, and
support
for 8-bit, 24-bit, and
floating
point
images. Imaging filters include look-up table
operations such
as
contrast stretching, pseudo-coloring, and
histogram balancing,
as
well
as
data resizing operations such
as
interpolation.
AVS
takes image processing a step further
by
generalizing Volume imaging
these modules for 3 D volume imaging.
AVS
provides a vari-
ety
of
tools for rendering volume data; a real-time isosurface
generator; a unique transparent volume renderer
which
cre-
ates real-time, semi-transparent images
with
full rotational
and lighting control; generation
of
geometric objects such
as
arbitrary slicing surfaces,
dot
surfaces and vector nets;
and VBUFFER, a unique, high-quality volume renderer.
Fig. Z8
Stardent
AVS
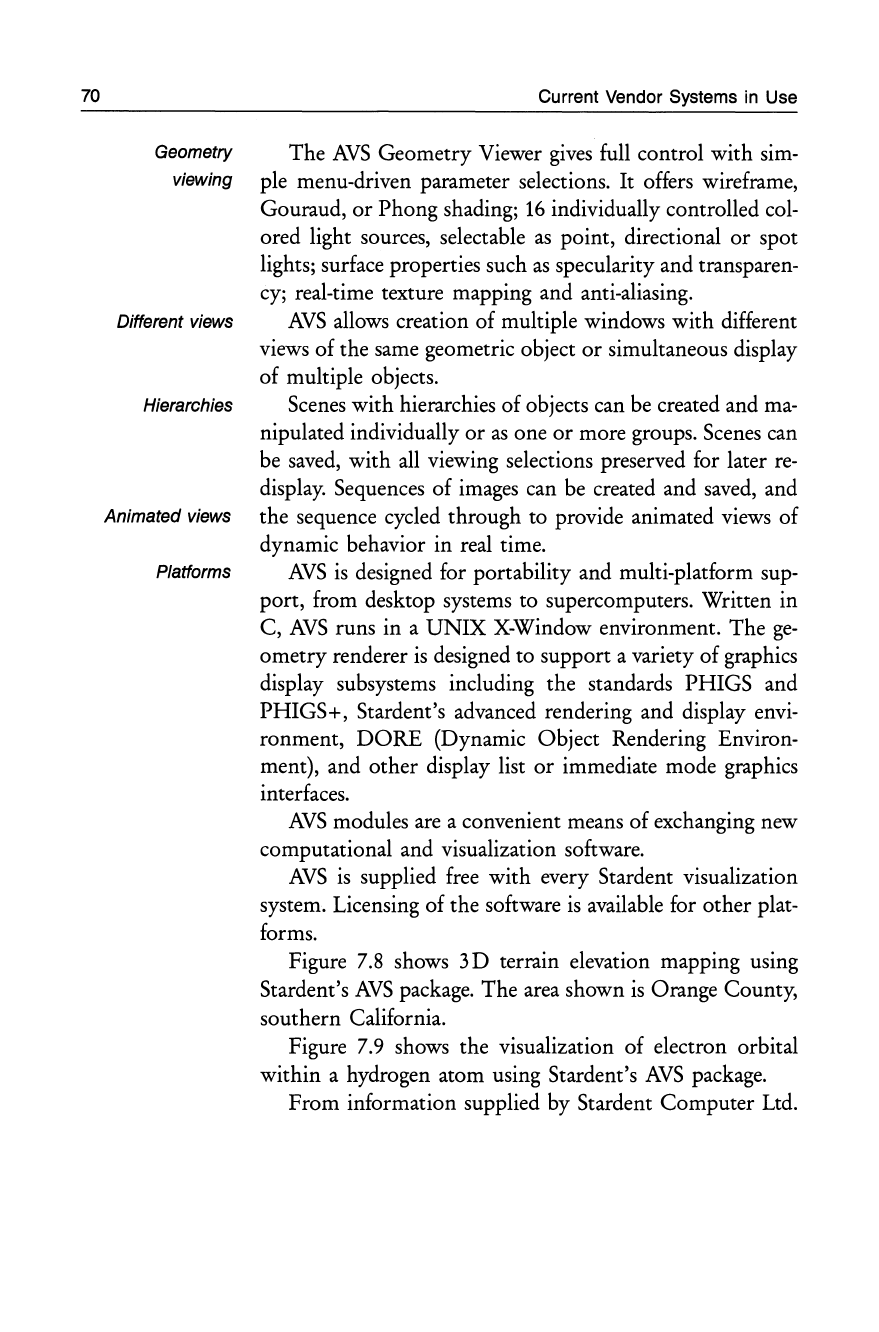
70
Current Vendor Systems
in
Use
Geometry The
AVS
Geometry Viewer
gives
full control with sim-
viewing
pIe
menu-driven parameter selections.
It
offers wireframe,
Gouraud,
or
Phong shading;
16
individually controlled
col-
ored light sources, selectable
as
point, directional
or
spot
lights; surface properties such
as
specularity and transparen-
cy;
real-time texture mapping and anti-aliasing.
Different views
AVS
allows creation of multiple windows with different
views of the same geometric object
or
simultaneous display
of
multiple objects.
Hierarchies
Scenes
with hierarchies of objects can
be
created and
ma-
nipulated individually
or
as
one
or
more groups.
Scenes
can
be
saved,
with
all
viewing selections preserved for later
re-
display. Sequences of images can
be
created and
saved,
and
Animated views the sequence cycled through to provide animated views of
dynamic behavior in real time.
Platforms
AVS
is
designed for portability and multi-platform sup-
port, from desktop systems to supercomputers. Written in
C,
AVS
runs in a
UNIX
X-Window environment. The
ge-
ometry renderer
is
designed to support a variety of graphics
display subsystems including the standards PHIGS and
PHIGS+, Stardent's advanced rendering and display envi-
ronment,
DORE
(Dynamic Object Rendering Environ-
ment), and other display list
or
immediate mode graphics
interfaces.
AVS
modules
are
a convenient means of exchanging new
computational and visualization software.
AVS
is
supplied
free
with every Stardent visualization
system. Licensing of the software
is
available for other plat-
forms.
Figure
7.8
shows
3D
terrain elevation mapping using
Stardent's
AVS
package. The area shown
is
Orange County,
southern California.
Figure
7.9
shows the visualization of electron orbital
within a hydrogen atom using Stardent's
AVS
package.
From information supplied by Stardent Computer Ltd.
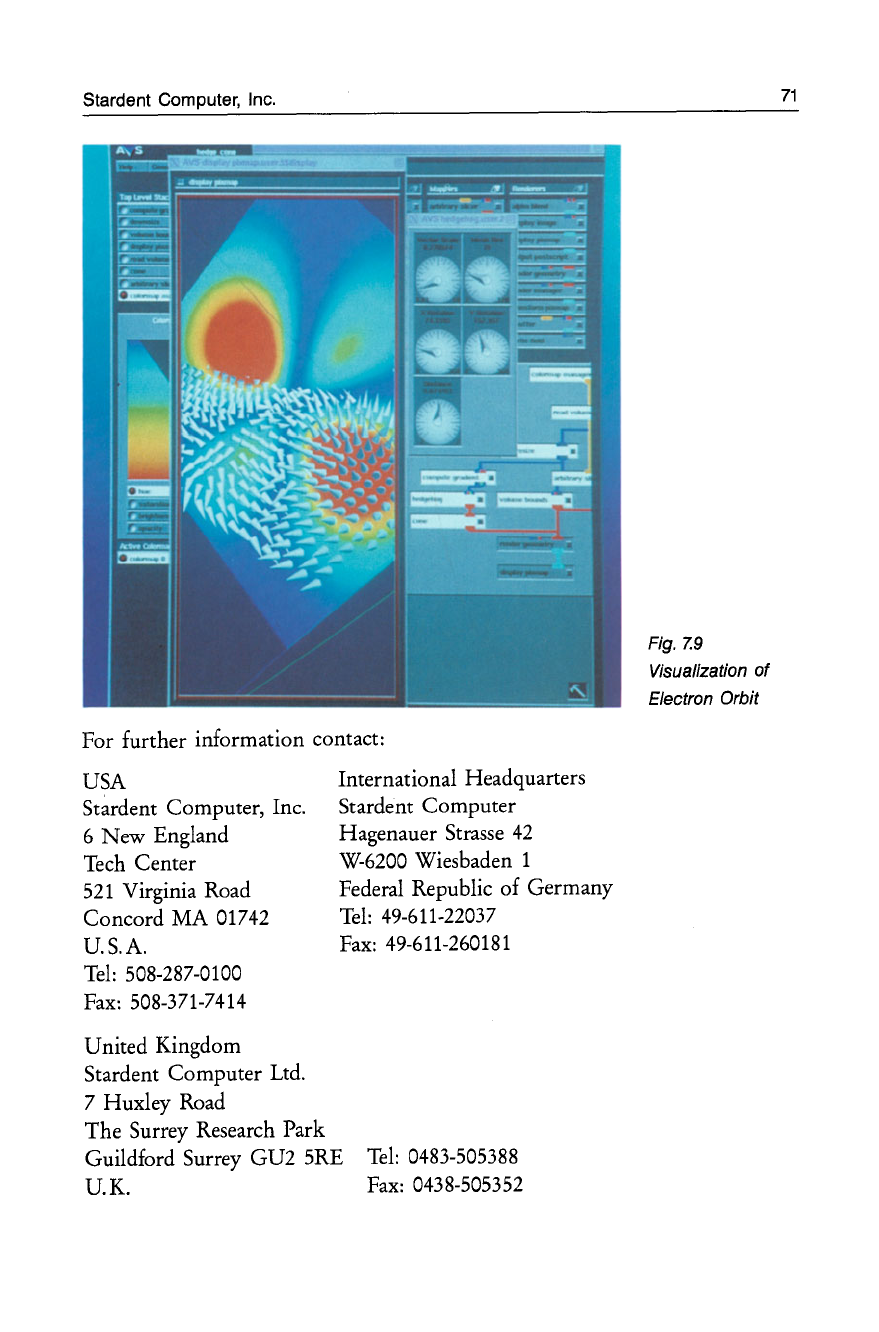
Stardent Computer, Inc.
For further information contact:
USA
Stardent Computer, Inc.
6
New
England
Tech Center
521
Virginia Road
Concord
MA
01742
U.S.A.
Tel:
508-287-0100
Fax: 508-371-7414
United Kingdom
Stardent Computer Ltd.
7 Huxley Road
The
Surrey Research Park
International Headquarters
Stardent Computer
Hagenauer Strasse
42
W-6200
Wiesbaden 1
Federal Republic
of
Germany
Tel:
49-611-22037
Fax: 49-611-260181
Guildford Surrey
GU2
5RE
Tel:
0483-505388
U.
K.
Fax: 0438-505352
Fig.
7.9
Visualization
of
Electron Orbit
71
72
Visual processing
Four levels
of
products
Upper
and
lower levels
Graphics
Library GL
Current Vendor Systems
in
Use
7.5
Silicon
Graphics,
Inc.
Silicon Graphics
is
the world's leading manufacturer of
vi-
sual processing systems. Visual processing allows staff and
researchers to work with data in a more natural, intuitive
way -graphically. In addition, Silicon Graphics designs,
manufactures and markets computational systems used by
engineers, scientists and animation professionals for design
and analysis of 3D objects and for general purpose technical
computing. By employing
RIse
technology and propri-
etary VLSI components to provide both high-performance
computing and high-performance graphics, Silicon Graph-
ics
continues to deliver amongst the most powerful systems
available for engineering and scientific applications.
As
part of its visual processing software, Silicon Graphics
is
offering four modular software products which fit into
different
levels
between application and source code. Figure
7.10 shows how these products relate to each other. Moving
up the chart shown in Fig. 7.10 away from the source code
and toward the application makes it easier for the user to
use
a product without specialist knowledge, but this
loses
some
of
the flexibility at the source level.
Often this difference between the upper and lower
levels
is
partly
or
wholly obscured by the proliferation of tools
and facilities currently available in the market place.
The products depicted in Fig. 7.10
are
as
follows: GL
is
the Graphics Library that has been available from Silicon
Graphics for a number of years, and
is
now gaining accep-
tance with other hardware suppliers. This provides the basic
system calls required to address the 3D graphics hardware in-
corporated into every Silicon Graphics system.
It
is
a set of
calls that can
be
included into source code, which may
be
written in a programming language. Above this
level
is
a
graphics toolkit which provides a library of standalone GL
calls that have been developed to address a wide range of
graphics problems and which
is
available to be incorporated
into software developers' products.
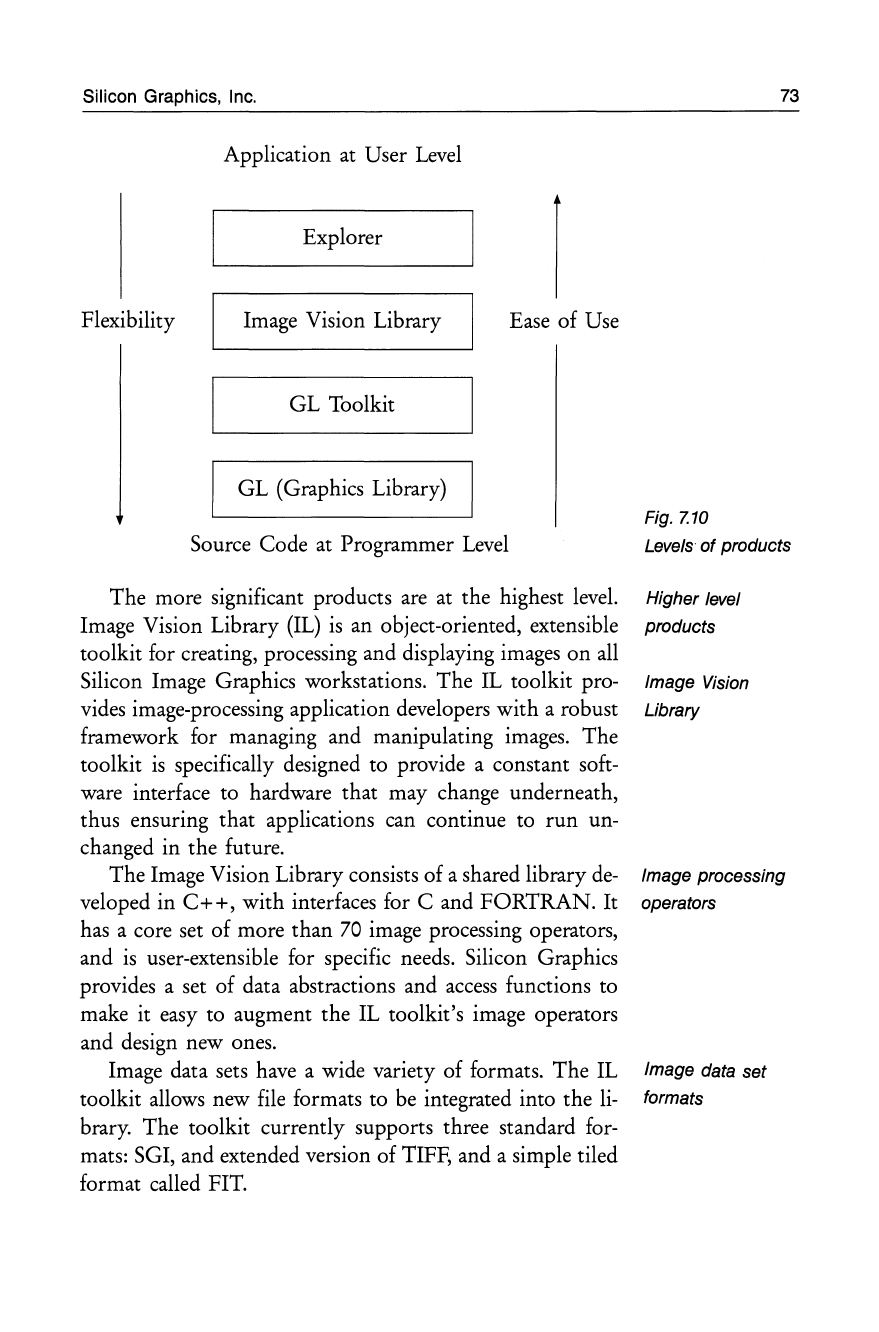
Silicon Graphics,
Inc.
Application at User
Level
Explorer )
Flexibility Image Vision Library Ease of Use
GL Toolkit
GL (Graphics Library)
Source Code at Programmer
Level
The more significant products
are
at the highest
level.
Image Vision Library
(IL)
is
an object-oriented, extensible
toolkit for creating, processing and displaying images on all
Silicon Image Graphics workstations. The
IL
toolkit pro-
vides image-processing application developers with a robust
framework for managing and manipulating images. The
toolkit
is
specifically designed to provide a constant soft-
ware interface to hardware that may change underneath,
thus ensuring that applications can continue to
run
un-
changed in the future.
The Image Vision Library consists of a shared library
de-
veloped in
C++,
with interfaces for C and FORTRAN.
It
has a core set of more than
70
image processing operators,
and
is
user-extensible for specific needs. Silicon Graphics
provides a set of data abstractions and
access
functions to
make it easy to augment the IL toolkit's image operators
and design new ones.
Image data sets have a wide variety of formats. The IL
toolkit allows new
file
formats to
be
integrated into the
li-
brary. The toolkit currently supports three standard
for-
mats: SGI, and extended version of TIFF, and a simple tiled
format called FIT.
73
Fig.
Z10
Levels
of
products
Higher level
products
Image Vision
Library
Image processing
operators
Image data set
formats
74
Image
manipulation
Data processed
on demand
Visualization
facilities
Customised
application
building
Modular approach
Current Vendor Systems
in
Use
The
IL toolkit provides an efficient model for the manip-
ulation
of
image data and image attributes. The toolkit's im-
age
model includes a configurable cache
to
allow
access
to,
and processing of, the very large images
common
in many
disciplines. IL provides a
common
interface for image ma-
nipulations, while requiring little
or
no programmer knowl-
edge
of
the image's internal structure
of
format. IL imple-
ments a demand driven execution model, such that data
is
processed only
on
demand. This model
is
based
on
the same
cached-image model
as
file images. This technique enables
an application to process just the area
of
interest, providing
significant benefits in terms
of
reduced
I/O
and improved
system performance.
The
fourth product
is
called Explorer. This
is
a true
ap-
plications developer package.
It
provides visualization and
analysis functionality for users whose needs are
not
met by
commercial software packages,
or
who
want to extend exist-
ing systems with their own algorithms and techniques.
The
software environment falls into the category
of
Ap-
plication Builders -environments that consist
of
function-
al
program pieces called modules which
are
visually con-
nected together through a point-and-click user interface into
a data flow style network. This flexible and interactive envi-
ronment
of
building application programs by choosing
from a suite
of
functional modules
is
the true power
of
the
system.
Modules
are
the building blocks
of
the visualization soft-
ware and cover a wide range
of
functionality. Because the
software environment encompasses a distributed execution
model, modules may execute
on
the local workstation
or
on
other
platforms
on
the network. Users can easily integrate
their existing algorithms into the system in the form
of
new
modules. Through point-and-click selections, a model-
building facility
is
provided which generates the code need-
ed
to
make the user's algorithm into a visualization software
module. Modules generally fall into the following catego-
nes:
Silicon Graphics,
Inc.
• Input
Modules that read data files
• Feature Extraction and Analysis
Modules that produce data from data (e.g., extract a pla-
nar slice from a volumetric dataset)
• Geometric Representation
Modules that produce geometry-based display lists from
data
• Renderers
Modules that produce images from geometry, volumes
or
Images
•
Output
Modules that write to disk
System Data Types are the data formats for passing data Data types
through the system.
The
system data types are powerful and
abstracted, and each can represent an entire
class
of
data
as
well
as
a very specific instantiation
of
the data. Date types
are
as
follows:
• Parameter
This data type conveys widget interaction to the module.
Parameters are scalar quantities including long integer,
double precision, floating point, and character string.
• Lattice
This
is
the most widely used data type.
It
is
essentially
a multi-dimensional array
with
two major components:
data stored at nodes
of
the lattice, and a coordinate map-
pmg.
• Pyramid
This data type combines lattices with connectivity in a
hierarchical structure. The depth
of
this structure
is
arbi-
trary.
• Geometry
This data type contains a hierarchical geometrical scene
description. The geometric description contains all in-
formation concerning geometric objects and their attri-
butes, cameras, lights, etc.
75
76 Current Vendor Systems
in
Use
•
Unknown
The unknown type
is
an uninterpreted array of bytes.
The organisation and interpretation
is
left to the pro-
grammer.
Widening the use IRIS Explorer
is
a key part of Silicon Graphics' new techni-
of
visualization
cal
computation environment, aimed at making the compa-
ny's industry-leading visualization technology more
accessi-
ble to the broad range of workstation users. With IRIS Ex-
plorer, users view data and create applications by visually
connecting software modules into flow chart configurations
called module maps. Modules, the building blocks of IRIS
Explorer, perform specific program functions such
as
data
reading, data analysis, image processing, geometric and vol-
ume rendering, and many other tasks. Modules can be
exe-
cuted across heterogeneous platforms, delivering powerful,
resource-efficient distributed computing capabilities to
ap-
plication users and developers.
The following pictures were created by Silicon Graphics
using
AVIRIS
data, courtesy of the Jet Propulsion Laborato-
ry.
AVIRIS
data
is
made up of 224 spectral bands. The imag-
es
were created by traversing through the data in the spectral
dimension, and show spectral responses and histograms of
the data.
Figure 7.11
is
a general view of the user-interface show-
ing an image of San Francisco with several multi-spectral
an-
alyses being carried out. (Created by Silicon Graphics using
AVIRIS
data, courtesy of the Jet Propulsion Laboratory.)
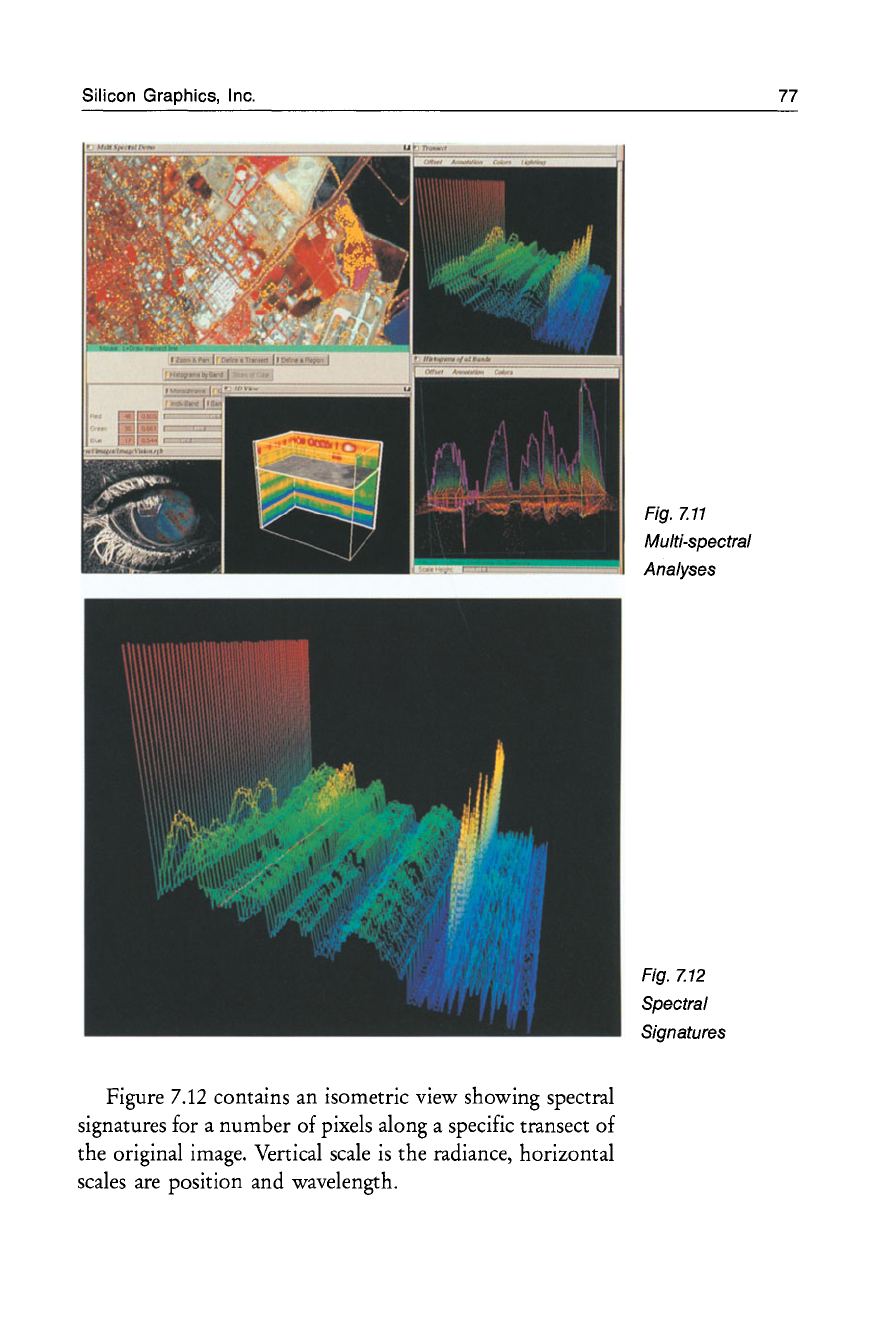
Silicon Graphics,
Inc.
Figure
7.12
contains an isometric view showing spectral
signatures for a number of pixels along a specific transect of
the original image. Vertical scale
is
the radiance, horizontal
scales
are position and wavelength.
Fig.
Z11
Multi-spectral
Analyses
Fig. Z12
Spectral
Signatures
77
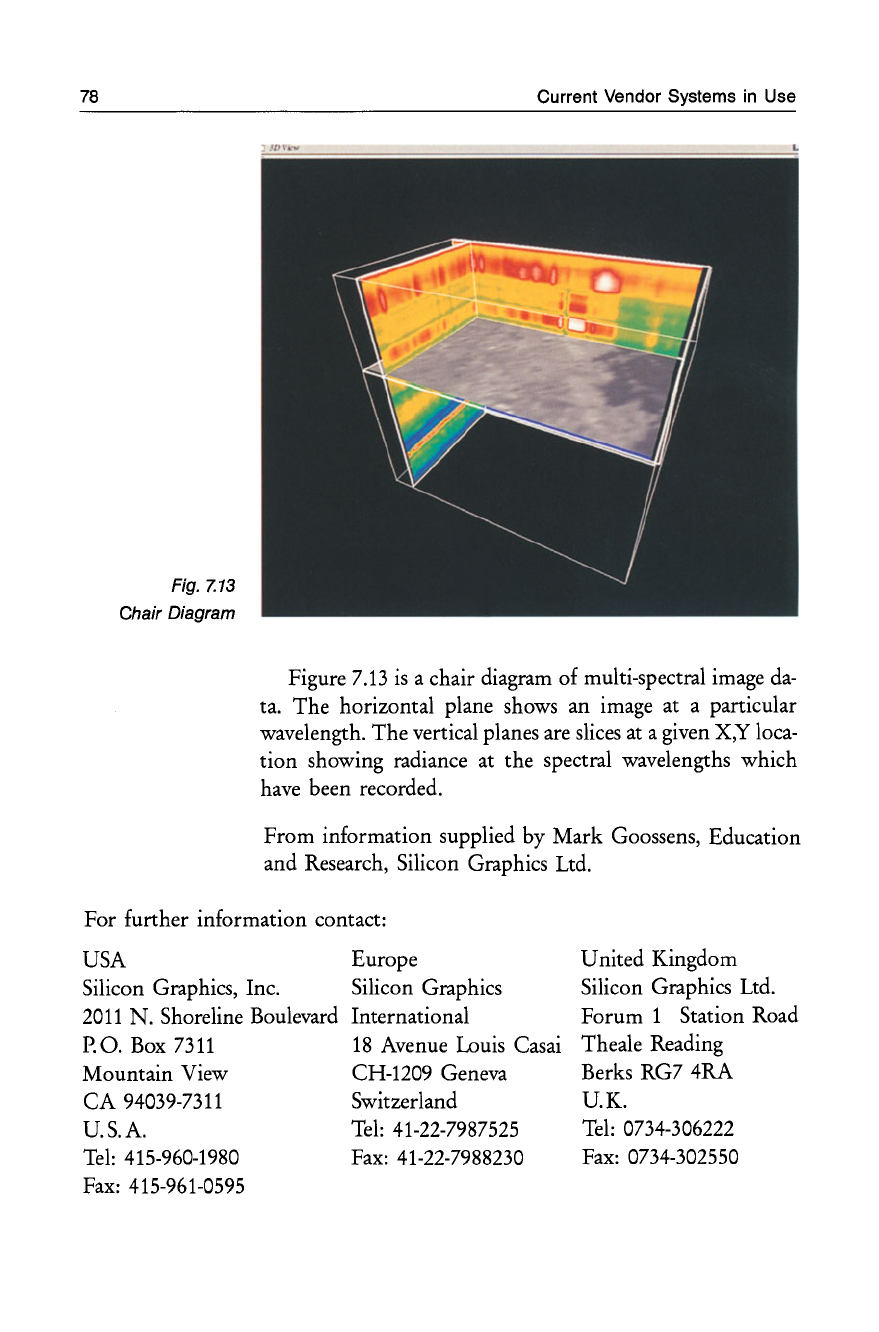
78
Fig. Z13
Chair Diagram
Current Vendor Systems
in
Use
Figure
7.13
is
a chair diagram
of
multi-spectral image
da-
ta.
The
horizontal plane shows an image at a particular
wavelength. The vertical planes are slices at a given X,Y loca-
tion
showing radiance at the spectral wavelengths which
have been recorded.
From information supplied by
Mark
Goossens, Education
and Research, Silicon Graphics Ltd.
For further information contact:
USA
Silicon Graphics, Inc.
2011
N.
Shoreline Boulevard
P.O. Box
7311
Mountain View
CA
94039-7311
U.S.A.
Tel:
415-960-1980
Fax: 415-961-0595
Europe
Silicon Graphics
International
18
Avenue Louis Casai
CH-1209 Geneva
Switzerland
Tel:
41-22-7987525
Fax: 41-22-7988230
United Kingdom
Silicon Graphics Ltd.
Forum 1 Station Road
Theale Reading
Berks RG7 4RA
U.K.
Tel:
0734-306222
Fax: 0734-302550
Sun Microsystems, Inc.
7.6
Sun
Microsystems,
Inc.
7.6.1
SunVision
-
Sun's
Visualization
Software
Package
Sun Vision
is
a software platform with which application
de-
velopers and sophisticated end users can develop visualiza-
tion applications.
It
includes two programming interfaces
(for image processing and high-quality rendering), and
Open
Windows-based tools for image processing, volume
rendering, manipulation of 3 D geometric data, high-quality
rendering and movie loop display. The tools and libraries
are highly integrated so that data and images can
be
shared
among them.
SunVision
1.1
runs
on
any 8-bit color SPARCsta-
tion/Sun-4 Workstation and
on
Sun workstations equipped
with the true color
VX/MVX
visualization accelerators.
No
special purpose hardware
is
required.
If
a VX
or
VX + MVX visualization accelerator
is
present in the
sys-
tem, the Sun Vision applications
are
transparently acceler-
ated.
7.6.2
SunVision
Programming
Interfaces
Visualization
applications
79
No
special
purpose hardware
add-ons required
Sun Vision provides two libraries for visualization tasks (im- Libraries
age
processing and high-quality rendering), and one utility
library. Future releases will include an additional library in-
terface for volume rendering. In addition, Sun Vision
is
de-
signed to work in an integrated fashion with XGL, Sun's
3 D interactive graphics library.
SunIPLib
is
Sun's image processing library, providing
ex-
Image processing
tensive image processing functionality. It consists of C-call-
able functions for:
• arithmetic and logical operations
• spatial filtering
• Fourier domain processing
• image analysis
• geometric operations
80
Current Vendor Systems
in
Use
In addition, there
are
library functions to create and manip-
ulate subimages and regions of interest.
Images can have multiple bands, and can
have
unsigned
byte, signed 16-bit short,
or
32-bit floating point data types.
Additional imaging functions can
be
added to the library.
High-quality For high-quality rendering, Sun Vision provides a Ren-
pictures derMan function library and a
RIB
(Renderman Interface
Bytestream) protocol interpreter. The RenderMan interface
provides a way to describe geometry, scenes, the camera, and
lights so that computer images can
be
generated from this
information.
RenderMan Users of the RenderMan interface specify a set of proce-
dures that describe a scene. Object color and location, light-
ing, and viewer perspective can all
be
specified. The Render-
Man shading language provides a way to create shaders
spe-
cific
to
a given scene.
The SunVision RenderMan function library
is
compliant
with version
3.1
of the RenderMan Interface Specification.
It
also supports the following optional features:
• solid modeling
• programmable shading
• displacements
• texture mapping
• environmental mapping (partial implementation)
• bump mapping
• volume shading (partial implementation)
The following surface shader options
are
also provided:
• general (the default)
• the 6 standard RenderMan surface shaders (plastic, paint-
ed plastic, metal, shiny metal, matte, and constant)
• the 2 standard RenderMan atmosphere shaders (depth
cue and
fog)
7.6.3
SunVision
Window-based
Tools
Visualization tools Sun Vision also provides Open Windows-based visualization
tools for image processing (SunIP), volume rendering (Sun-
Voxel)
, 3 D graphics manipulation (SunGV), high quality
Sun Microsystems,
Inc.
81
rendering (SunART), and movie loop display (SunMovie).
Additionally, there
is
an interactive colormap editor that
is
accessible by each tool. These tools can
be
used
"as
is" by
sophisticated end users,
or
as
"application prototypes"
which developers can tailor to a specific application.
Each window-based tool
is
an independent program that Shared information
communicates with a shared parameter database program
(PMGR), which, in turn, communicates with a user inter-
face
management program (SunVIF). The user interface for
each tool can
be
changed
at
run
time, with no program-
ming. Additional programs can
be
easily added to the Sun-
Vision user interface.
SunIP and SunART
are
tools that implement the image
processing and RenderMan functions described above. The
source code for SunIP and SunART
is
provided in the form
of examples for using these libraries, along with SunVIF and
PMGR.
SunVoxel
is
an interactive tool for the generation of imag- Images from
es
from volume data.
It
consists of window-based rendering volume data
and analysis functions. With
SunVoxel,
volume data can
be
manipulated and viewed in two modes:
(1)
manipulate the entire volume, using orthogonal
or
obli-
que slicing planes where needed, and view internal
structures using ray-casting, and
(2)
extract and view
2D
slices
of
the volume data in a "light
box" mode. There
is
also
a "cloud" mode for displaying
data stored in point cloud format.
SunVoxel
supports unsigned byte data on uniform rect-
angular grids. Data filters
are
provided to convert
TAAC-1
volume data to the Sun Vision data format.
SunGV
is
used to interactively view 3D geometric data. Viewing
3D
It
can also
be
used to edit scenes that can be input to
Su-
geometric data
nART for final rendering. SunGV provides wire frame and interactively
Gouraud shaded display of polygon and patch data types.
Scenes can
be
composed of a series of objects which
are
or-
ganized hierarchically in a tree structure. Editing functions
allow the user to select,
copy,
paste, cut, and delete objects
82 Current Vendor Systems
in
Use
in the hierarchy. Objects can be transformed and assigned
attributes, such
as
color, opacity, specularity, texture,
etc.
Functions
are
also
provided for changing the viewing and
projection parameters, and for defining the lighting model,
which supports up to
32
light sources. The source code for
SunGV
is
provided
as
an example for using the XGL graph-
ics
library along with SunVIF and PMGR.
Movies
SunMovie
is
a tool for the display of image and movie
loop data. Images and sequences of images generated by oth-
er components of Sun Vision can be viewed using this tool.
7.6.4
The VX and MVX -
Sun's Visualization Accelerators
Accelerators Sun's new visualization workstations
are
powered by the
new VX and MVX accelerator boards. The VX accelerator
is
a successor to the TAAC-l, incorporating added features,
including twice the memory, double the performance, mul-
tiple windows, and a lower price.
The MVX
is
a multi-processor accelerator that can
be
added to a VX system, providing performance of more than
4-6
times the TAAC-1. Both accelerate SunVision's visual-
ization tools and libraries, and XGL, Sun's graphics library.
Applicatioh
areas
VX and MVX systems
are
for developers who require a
combination of imaging and graphics to develop
visualiza~
tion software. Target markets include medical imaging,
re-
mote sensing, earth resources, scientific visualization, and
AEC.
7.6.4.1
Features and Benefits
VX
Characteristics • Accelerates SunVision and XGL.
• High-performance Intel
i860
processor
(40
MIPS,
80
MFLOPS) for high-speed integer and floating point com-
putation required by visualization applications.
• Dual frame buffer architecture with 32-bit VX and 8-bit
GX
accelerated frame buffers
on
one board; a digital
key-
ing technique
is
used to cleanly integrate the VX win-
dows into the system display.
Sun Microsystems, Inc.
• Transparent integration of multiple VX windows into
the
GX
Open
Windows environment; four independent
colormaps
are
available for use by the multiple VX win-
dows, with a fifth colormap allocated for the GX.
• Reconfigurable VX frame buffer can
be
used to display
24-bit true color plus 8-bit alpha, or four independent
8-bit channels.
• Supports Sun's new
1280x1024
@
67Hz
format
as
well
as
the existing 1152x900 @
66
Hz
format.
• Single 9U VME board.
MVX
• Provides additional acceleration of SunVision and XGL.
• Four Intel i860 processors, offering a total of
160
MIPs
and
320
peak single-precision MFLOPS
(240
peak dou-
ble-precision MFLOPS).
• Four Mbytes of memory per processor for
fast
data and
Image
access.
• High-speed data bus for fast, smooth data and image
transfer between the MVX and VX.
• High-speed control bus for transfer of commands
be-
tween the MVX and VX, eliminating VME overhead.
Software
Included
• SunVision and XGL for the most integrated, easy-to-use
visualization environment, with the widest range of
graphics and imaging functionality, in the industry.
• Complete set of C-development tools, including compil-
er and debuggers, for application developers.
For further information, contact:
Doug Schiff
Sun Vision Product Manager
p.
O.
Box
13447
Research Triangle Park
NC
27709
U.S.A.
Tel:
919-469-8300
Email: doug.schiff@East.Sun.COM
83
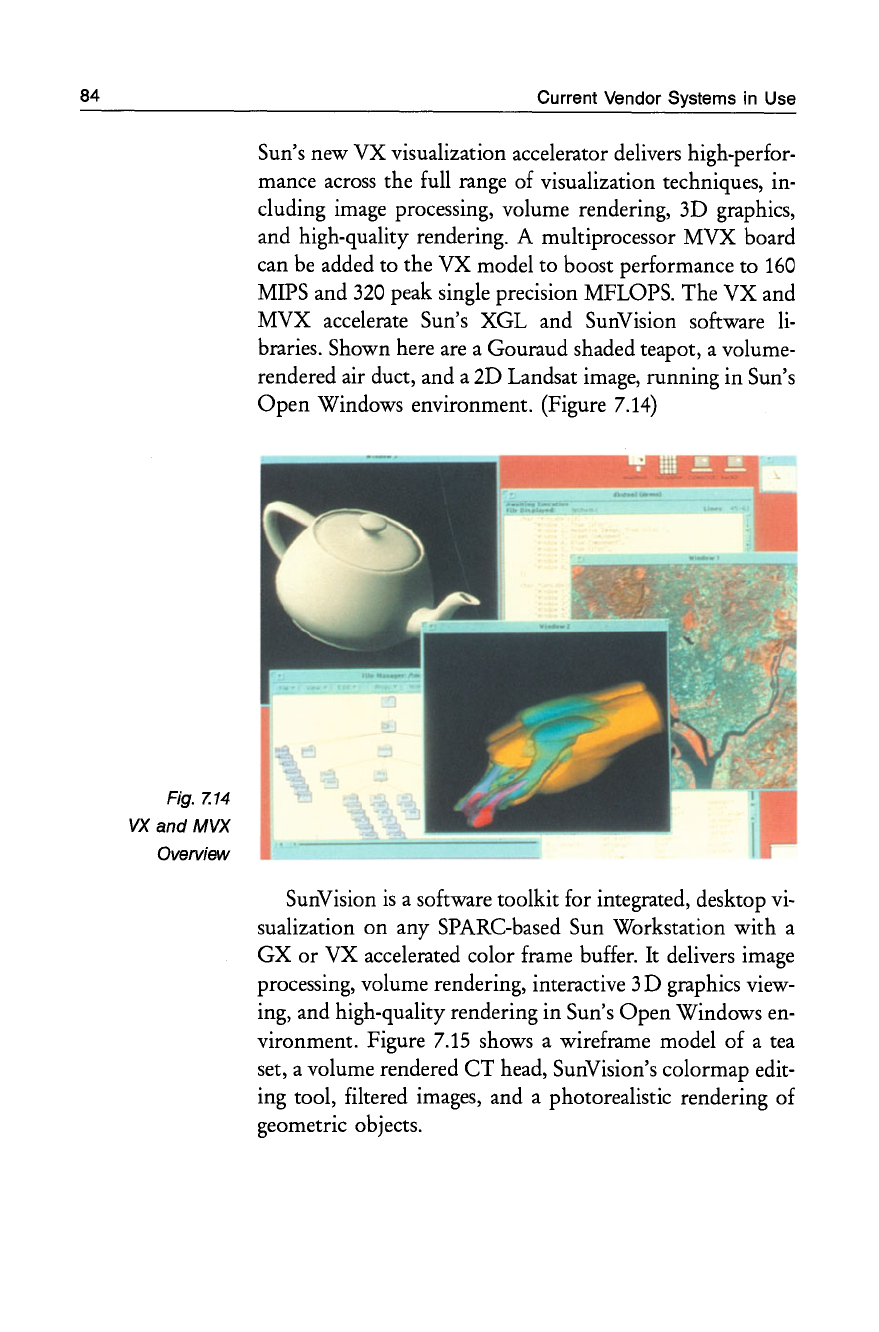
84
Fig. Z14
VX
and
MVX
Overview
Current Vendor Systems in Use
Sun's new VX visualization accelerator delivers high-perfor-
mance across the full range of visualization techniques, in-
cluding image processing, volume rendering, 3D graphics,
and high-quality rendering. A multiprocessor MVX board
can be added to the VX model to boost performance to
160
MIPS and
320
peak single precision MFLOPS. The VX and
MVX accelerate Sun's XGL and Sun Vision software
li-
braries. Shown here are a Gouraud shaded teapot, a volume-
rendered air duct, and a 2D Landsat image, running in Sun's
Open
Windows environment. (Figure
7.14)
Sun Vision
is
a software toolkit for integrated, desktop vi-
sualization
on
any SPARC-based Sun Workstation with a
GX
or
VX accelerated color frame buffer. It delivers image
processing, volume rendering, interactive 3 D graphics view-
ing, and high-quality rendering in Sun's
Open
Windows en-
vironment. Figure
7.15
shows a wireframe model of a tea
set, a volume rendered
CT
head, Sun Vision's colormap edit-
ing tool, filtered images, and a photorealistic rendering of
geometric objects.
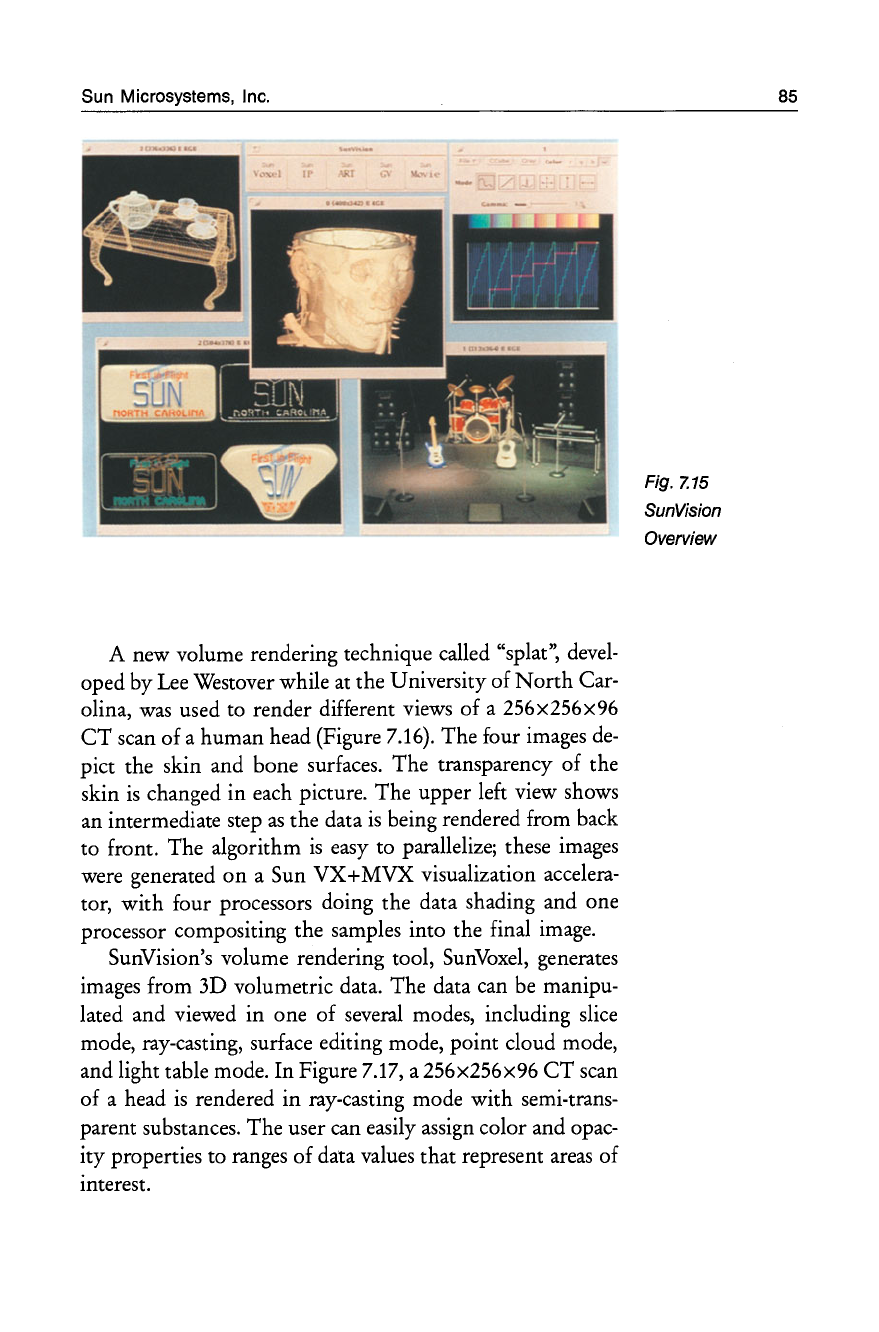
Sun Microsystems, Inc.
......
-.
-----
A new volume rendering technique called "splat",
devel-
oped by
Lee
Westover while at the University of
North
Car-
olina,
was
used to render different views of a 256x256x96
CT
scan of a human head (Figure 7.16). The four images
de-
pict the skin and bone surfaces. The transparency of the
skin
is
changed in each picture. The upper left view shows
an intermediate step
as
the data
is
being rendered from back
to front. The algorithm
is
easy to parallelize; these images
were generated
on
a Sun VX + MVX visualization accelera-
tor, with four processors doing the data shading and one
processor compositing the samples into the final image.
Sun Vision's volume rendering tool,
SunVoxel,
generates
images from 3D volumetric data. The data can be manipu-
lated and viewed in one of several modes, including slice
mode, ray-casting, surface editing mode, point cloud mode,
and light table mode. In Figure 7.17, a 256x256x96
CT
scan
of a head
is
rendered in ray-casting mode with semi-trans-
parent substances. The user can easily assign color and opac-
ity properties to ranges of data values that represent
areas
of
interest.
Fig.
7.15
SunVision
Overview
85
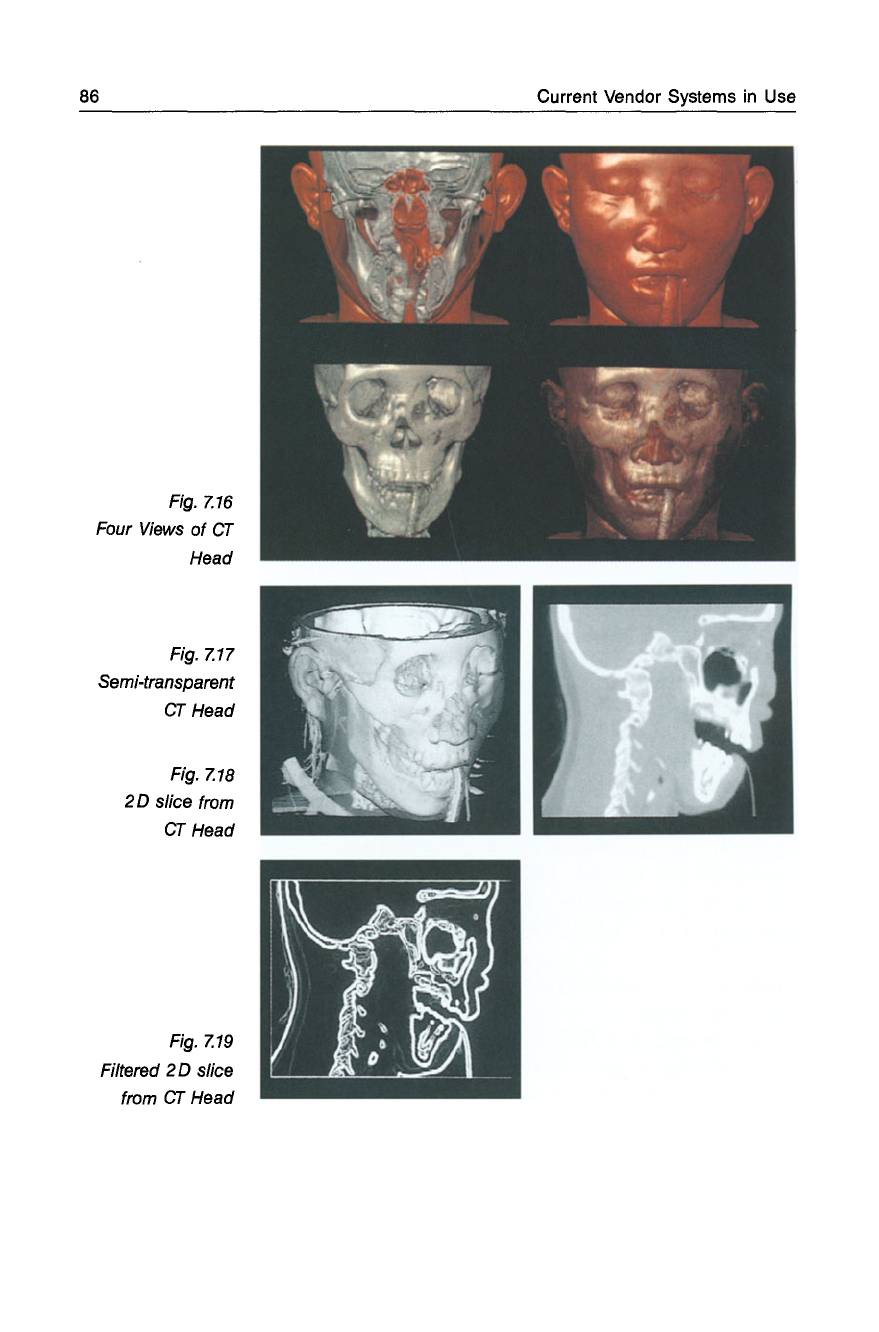
86
Fig.
7.16
Four Views
of
CT
Head
Fig. 7.17
Semi-transparent
CT
Head
Fig.
7.18
2 D slice from
CT
Head
Fig.
7.19
Filtered 2 D slice
from
CT
Head
Current Vendor Systems
in
Use
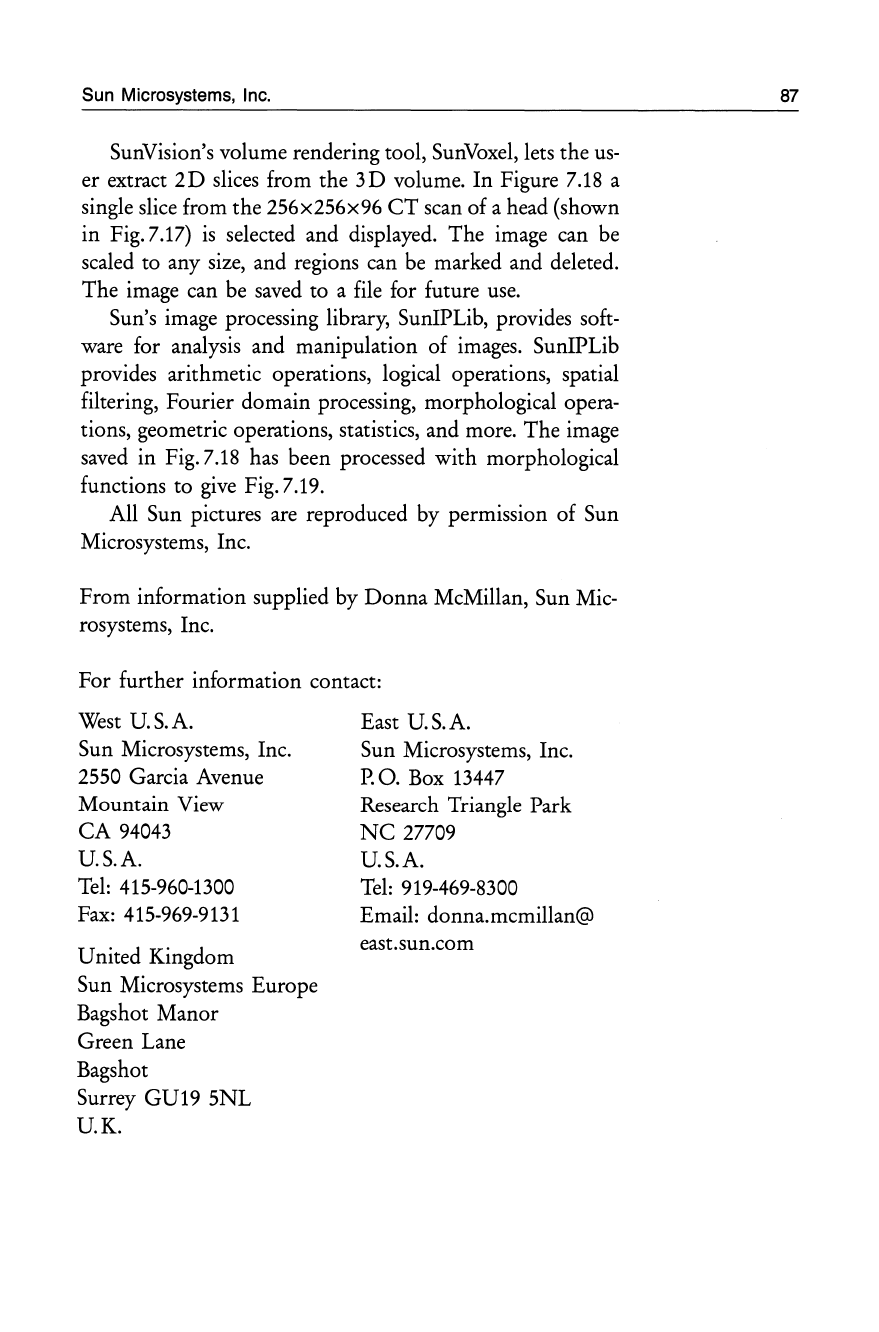
Sun Microsystems, Inc.
SunVision's volume rendering tool,
SunVoxel,
lets the
us-
er extract
2D
slices from the
3D
volume. In Figure
7.18
a
single slice from the 256x256x96
CT
scan of a head (shown
in Fig.7.17)
is
selected and displayed. The image can be
scaled to any size, and regions can be marked and deleted.
The image can be saved to a file for future
use.
Sun's image processing library, SunIPLib, provides soft-
ware for analysis and manipulation of images. SunIPLib
provides arithmetic operations, logical operations, spatial
filtering, Fourier domain processing, morphological opera-
tions, geometric operations, statistics, and more. The image
saved in Fig.7.18 has been processed with morphological
functions to
give
Fig.7.19.
All Sun pictures are reproduced by permission of Sun
Microsystems, Inc.
From information supplied by
Donna
McMillan, Sun Mic-
rosystems, Inc.
For further information contact:
West
US.A.
Sun Microsystems, Inc.
2550 Garcia Avenue
Mountain View
CA
94043
US.A.
Tel:
415-960-1300
Fax:
415-969-9131
United Kingdom
Sun Microsystems Europe
Bagshot Manor
Green Lane
Bagshot
Surrey GU19 5NL
UK.
East
US.A.
Sun Microsystems, Inc.
P.
O. Box 13447
Research Triangle Park
NC
27709
US.A.
Tel:
919-469-8300
Email: donna.mcmillan@
east.sun.com
87
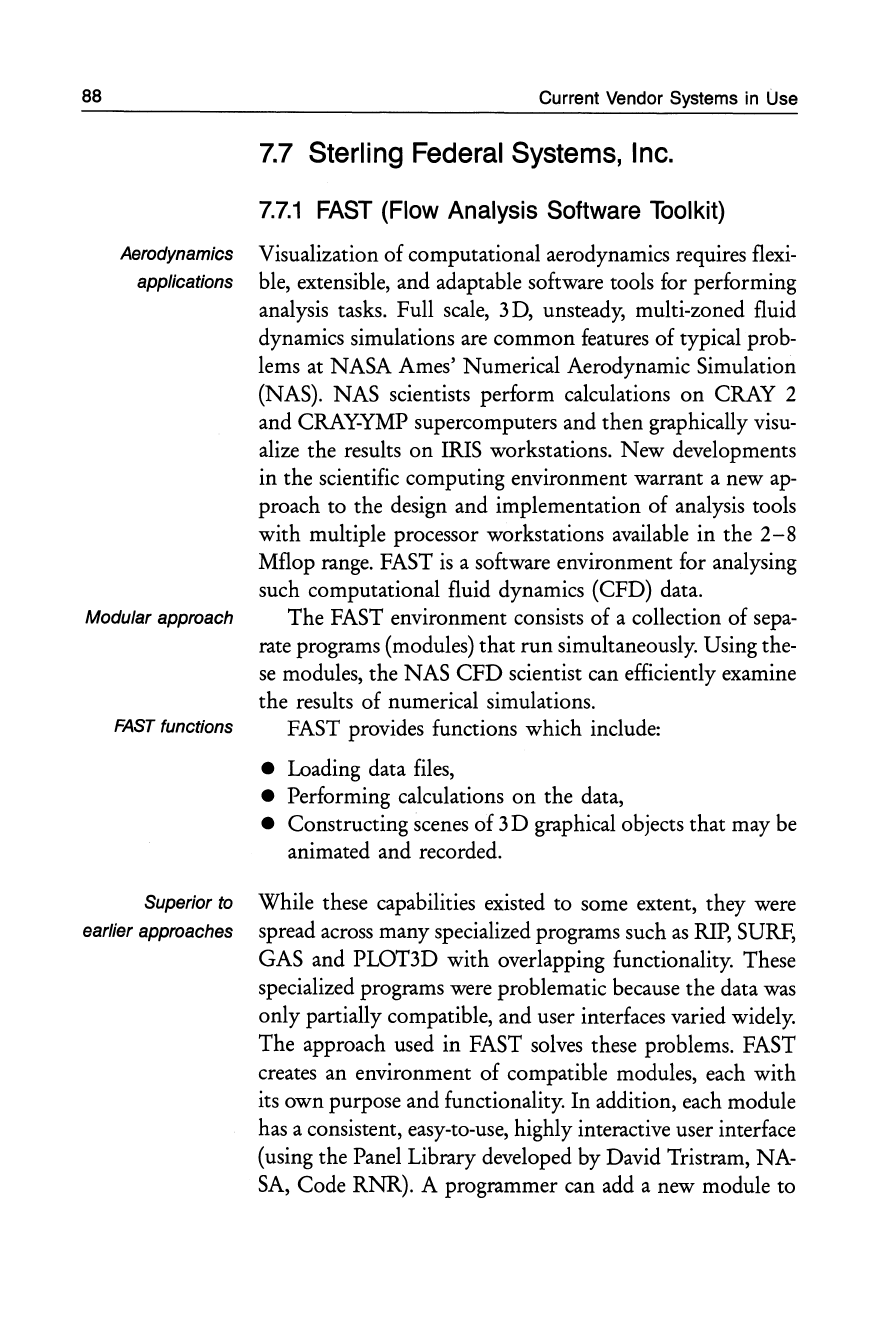
88 Current Vendor Systems
in
Use
7.7
Sterling
Federal
Systems,
Inc.
7.7.1
FAST
(Flow
Analysis
Software
Toolkit)
Aerodynamics Visualization of computational aerodynamics requires
flexi-
applications ble, extensible, and adaptable software tools for performing
analysis tasks. Full
scale,
3
D,
unsteady, multi-zoned fluid
dynamics simulations
are
common features of typical prob-
lems
at
NASA Ames' Numerical Aerodynamic Simulation
(NAS). NAS scientists perform calculations on CRAY 2
and
CRAY-YMP
supercomputers and then graphically visu-
alize the results
on
IRIS workstations. New developments
in the scientific computing environment warrant a new
ap-
proach to the design and implementation of analysis tools
with multiple processor workstations available in the
2-8
Mflop
range.
FAST
is
a software environment for analysing
such computational fluid dynamics (CFD) data.
Modular approach The FAST environment consists of a collection of
sepa-
rate programs (modules) that run simultaneously. Using the-
se
modules, the NAS
CFD
scientist can efficiently examine
the results of numerical simulations.
FAST
functions FAST provides functions which include:
• Loading data
files,
• Performing calculations on the data,
• Constructing scenes of 3 D graphical objects that may be
animated and recorded.
Superior to While these capabilities existed to some extent, they were
earlier approaches spread across many specialized programs such
as
RIP,
SURF,
GAS and PLOT3D with overlapping functionality. These
specialized programs were problematic because the data
was
only partially compatible, and user interfaces varied widely.
The approach used in FAST solves these problems. FAST
creates an environment of compatible modules, each with
its own purpose and functionality. In addition, each module
has a consistent, easy-to-use, highly interactive user interface
(using the Panel Library developed by David Tristram, NA-
SA,
Code RNR). A programmer can add a new module to

Dynamic Graphics
Ltd.
89
FAST by making use of the data in shared memory, the
PANEL LIBRARY interface, and the NAS (input/output)
module. With these features, the FAST team has worked to
make the environment
as
extensible
as
possible.
Complex fluid dynamic simulation problems created a Enhanced
need for new visualization techniques not possible with the techniques
existing software programs. These techniques will change
as
the supercomputing environment (and hence the scientific
methods employed) evolve even further. Flexibility means Flexibility
the ability to handle a diverse range of problems. Extensi- Extensibility
bility means the ability to interact at
all
levels
of the soft-
ware hierarchy, either through existing built-in functional-
ity
or
through the implementation of custom 'plug-in'
modules. Adaptability means the ability to adapt to new Adaptability
software and hardware configurations through the use of
modular structured programming methods, a graphics
li-
brary standard, and common network communication pro-
tocols (like
UNIX
sockets) for distributed processing.
For further information contact:
Sterling Federal Systems, Inc.
1121
San
Antonio Avenue
Palo Alto,
CA
94303, U.S.A.
Tel:
415-964-9900
7.8
Dynamic Graphics
Ltd.
Interactive Volume Modeling (IVM)
is
a product from Dy-
namic Graphics, Inc., which models, displays, and interac-
tively manipulates measured property values P in three
di-
mensions located by X,
Y,
and Z.
The modeling procedure in IVM takes scattered data
points of a physical property value (e.g., porosity, tempera-
ture, salinity, chemical concentration) and calculates a three-
dimensional grid. This grid represents the modeled distribu-
tion of the property in three-dimensional space.
Multi-dimensional
modeling
Data pOints
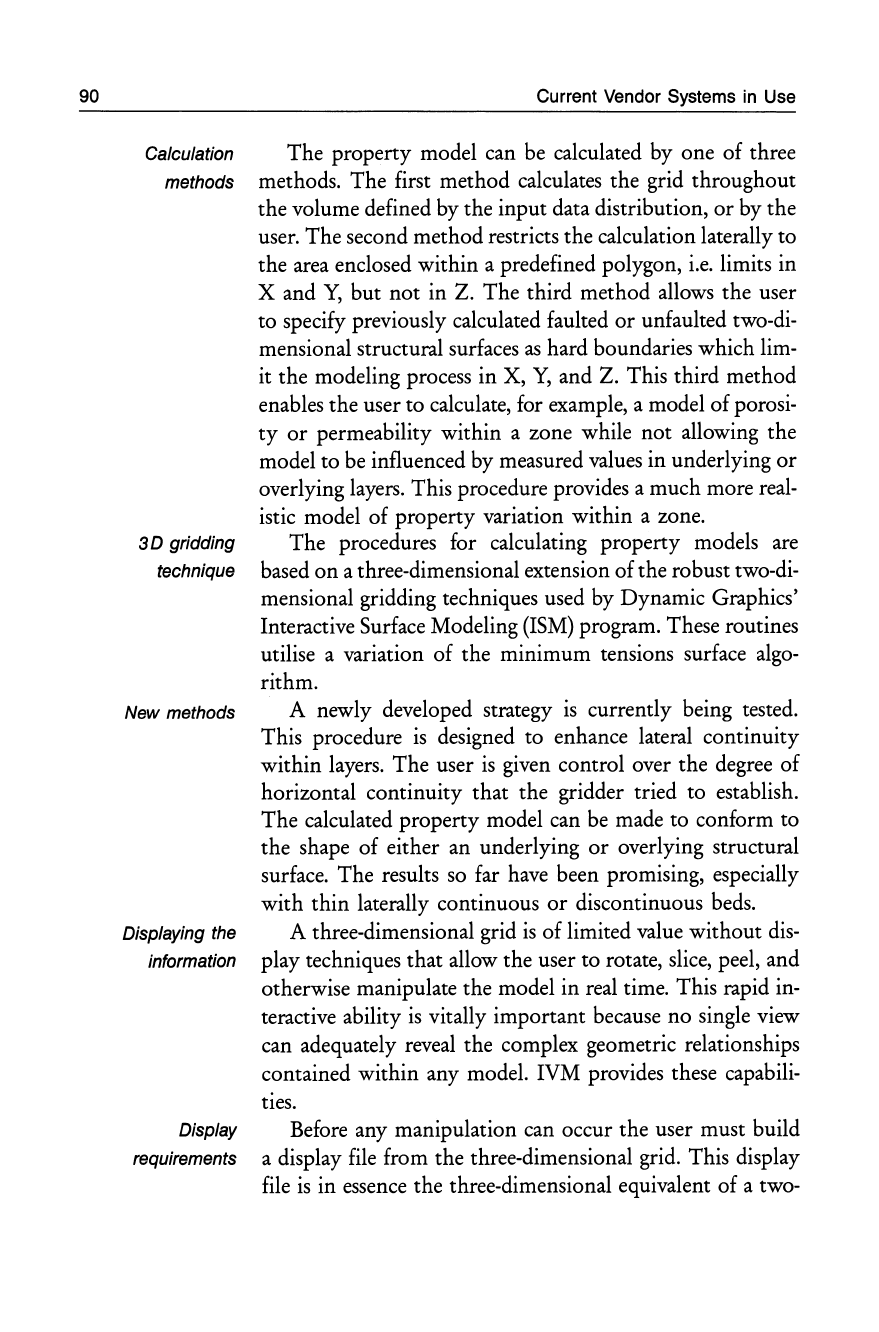
90
Calculation
methods
3D
gridding
technique
New methods
Displaying the
information
Display
requirements
Current Vendor Systems
in
Use
The property model can be calculated by one of three
methods. The first method calculates the grid throughout
the volume defined by the input data distribution,
or
by the
user. The second method restricts the calculation laterally to
the area enclosed within a predefined polygon,
i.e.
limits in
X and
Y,
but not in Z. The third method allows the user
to specify previously calculated faulted
or
unfaulted two-di-
mensional structural surfaces
as
hard boundaries which lim-
it the modeling process in X,
Y,
and Z. This third method
enables the user to calculate, for example, a model of porosi-
ty
or
permeability within a zone while not allowing the
model to
be
influenced by measured values in underlying
or
overlying
layers.
This procedure provides a much more
real-
istic model of property variation within a zone.
The procedures for calculating property models are
based
on
a three-dimensional extension of the robust two-di-
mensional gridding techniques used by Dynamic Graphics'
Interactive Surface Modeling
(ISM)
program. These routines
utilise a variation
of
the minimum tensions surface
algo-
rithm.
A newly developed strategy
is
currently being tested.
This procedure
is
designed to enhance lateral continuity
within layers. The user
is
given control over the degree of
horizontal continuity that the gridder tried to establish.
The calculated property model can be made to conform to
the shape of either an underlying
or
overlying structural
surface. The results
so
far
have
been promising, especially
with thin laterally continuous
or
discontinuous beds.
A three-dimensional grid
is
of limited value without
dis-
play techniques that allow the user to rotate, slice, peel, and
otherwise manipulate the model in real time. This rapid in-
teractive ability
is
vitally important because no single view
can adequately reveal the complex geometric relationships
contained within any model. IVM provides these capabili-
ties.
Before any manipulation can occur the user must build
a display
file
from the three-dimensional grid. This display
file
is
in
essence
the three-dimensional equivalent of a two-
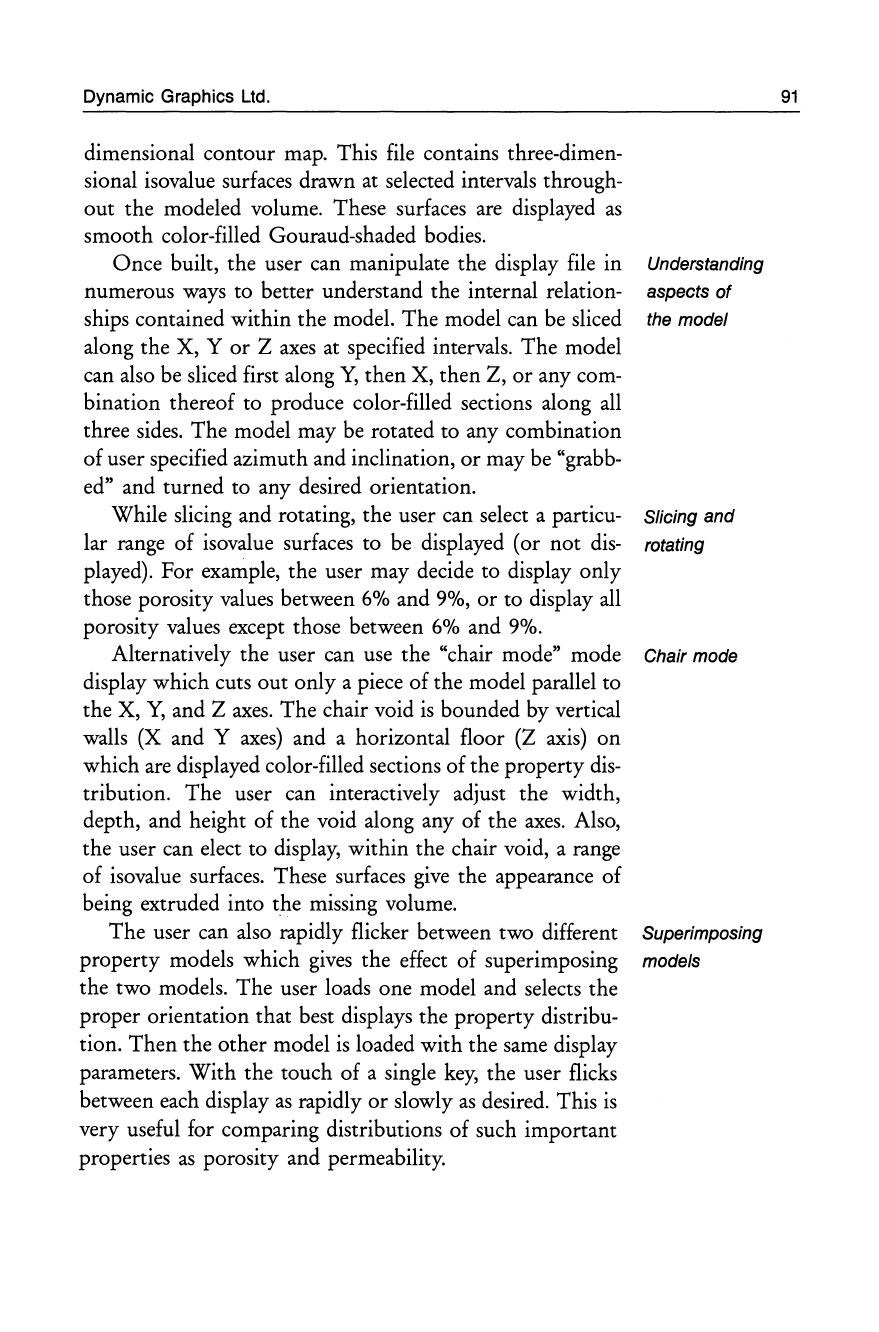
Dynamic Graphics
Ltd.
dimensional contour map. This
file
contains three-dimen-
sional isovalue surfaces drawn at selected intervals through-
out the modeled volume. These surfaces
are
displayed
as
smooth color-filled Gouraud-shaded bodies.
Once built, the user can manipulate the display
file
in
numerous
ways
to better understand the internal relation-
ships contained within the model. The model can
be
sliced
along the X, Y
or
2
axes
at
specified intervals. The model
can also
be
sliced first along
Y,
then
X,
then
2,
or
any com-
bination thereof to produce color-filled sections along
all
three
sides.
The model may
be
rotated to any combination
of user specified azimuth and inclination, or may
be
"grabb-
ed" and turned to any desired orientation.
While slicing and rotating, the user can select a particu-
lar range of isovalue surfaces to
be
displayed (or not
dis-
played). For example, the user may decide to display only
those porosity values between 6% and 9%,
or
to display
all
porosity values except those between 6% and 9%.
Alternatively the user can
use
the "chair mode" mode
display which cuts out only a piece of the model parallel to
the X,
Y,
and 2
axes.
The chair void
is
bounded by vertical
walls (X and Y
axes)
and a horizontal floor
(2
axis)
on
which
are
displayed color-filled sections of the property
dis-
tribution. The user can interactively adjust the width,
depth, and height of the void along any of the
axes.
Also,
the user can elect to display, within the chair void, a range
of isovalue surfaces. These surfaces
give
the appearance of
being extruded into the missing volume.
The user can also rapidly flicker between two different
property models which
gives
the effect of superimposing
the two models. The user loads one model and selects the
proper orientation that best displays the property distribu-
tion. Then the other model
is
loaded with the same display
parameters. With the touch of a single
key,
the user flicks
between each display
as
rapidly
or
slowly
as
desired. This
is
very useful for comparing distributions of such important
properties
as
porosity and permeability.
Understanding
aspects
of
the model
Slicing and
rotating
Chair mode
Superimposing
models
91
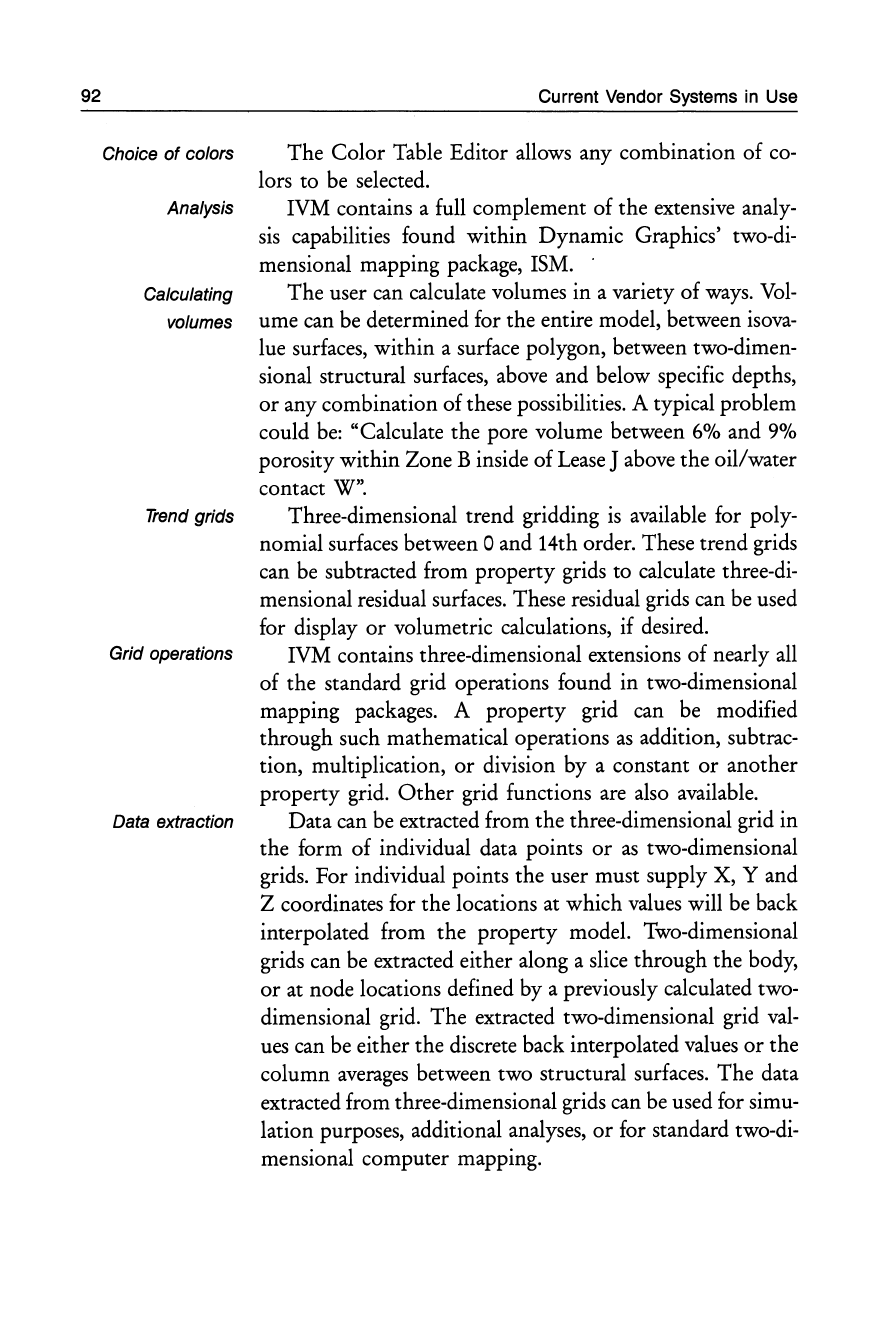
92 Current Vendor Systems
in
Use
Choice
of
colors
The
Color
Table
Editor
allows any
combination
of
co-
lors
to
be selected.
Analysis
IVM
contains a full
complement
of
the
extensive analy-
sis capabilities
found
within
Dynamic
Graphics' two-di-
mensional
mapping
package, ISM. .
Calculating
The
user can calculate volumes
in
a variety
of
ways. Vol-
volumes
ume
can be
determined
for
the
entire model, between isova-
lue surfaces,
within
a surface polygon, between two-dimen-
sional structural surfaces, above
and
below specific depths,
or
any
combination
of
these possibilities. A typical
problem
could
be: "Calculate
the
pore volume between 6%
and
9%
porosity
within
Zone
B inside
of
Lease J above
the
oil/water
contact
W".
Trend
grids Three-dimensional
trend
gridding
is
available for poly-
nomial
surfaces between 0
and
14th order. These
trend
grids
can be subtracted
from
property
grids
to
calculate three-di-
mensional residual surfaces. These residual grids can be used
for display
or
volumetric calculations, if desired.
Grid operations
IVM
contains three-dimensional extensions
of
nearly all
of
the
standard grid operations
found
in
two-dimensional
mapping
packages. A
property
grid can be modified
through
such mathematical operations
as
addition, subtrac-
tion,
multiplication,
or
division
by
a constant
or
another
property
grid.
Other
grid functions are also available.
Data extraction
Data
can be extracted
from
the
three-dimensional grid
in
the
form
of
individual data
points
or
as
two-dimensional
grids.
For
individual
points
the
user
must
supply
X, Y
and
Z coordinates for
the
locations at
which
values will be back
interpolated
from
the
property
model. Two-dimensional
grids can be extracted
either
along a slice
through
the
body,
or
at
node
locations defined
by
a previously calculated two-
dimensional grid.
The
extracted two-dimensional grid val-
ues can be
either
the
discrete back interpolated values
or
the
column
averages between
two
structural surfaces.
The
data
extracted from three-dimensional grids can be used for simu-
lation
purposes, additional analyses,
or
for standard two-di-
mensional
computer
mapping.

Dynamic Graphics
Ltd.
93
IVM has been successfully used to display, verify, and
ed-
Applications
it three-dimensional seismic velocity
files.
IVM
is
being
used with reservoir simulators both
as
a front-end processor
(build and verify geometric relationships) and
as
a back-end
processor (display and manipulate results from time steps).
IVM
is
being used to monitor and evaluate various thermal
and chemical enhanced oil recovery projects, and
is
being
used to better understand reservoir geometries and proper-
ties.
One
key area that
is
being studied
is
the distribution of Studies
in
permeability within a reservoir. Within certain reservoirs the environment
tilted permeability barriers have been well defined and stud-
ied. This knowledge can lead to changes in established drill-
ing programs, and hopefully, significantly increased oil pro-
duction. IVM
is
also used to monitor distribution and
movement of pollutants within aquifers, and to assist in
cle-
an-up efforts. Concentrations of ozone within the Earth's
atmosphere are being studied with IVM,
as
well
as
salinity
and temperature distributions within oceans.
Distribution
and
concentration
lev-
els
of
PCE organic
solvent contamina-
tion below a
WW11
airbase site.
Data from test
boreholes.
Fig. Z20
PCE Plume
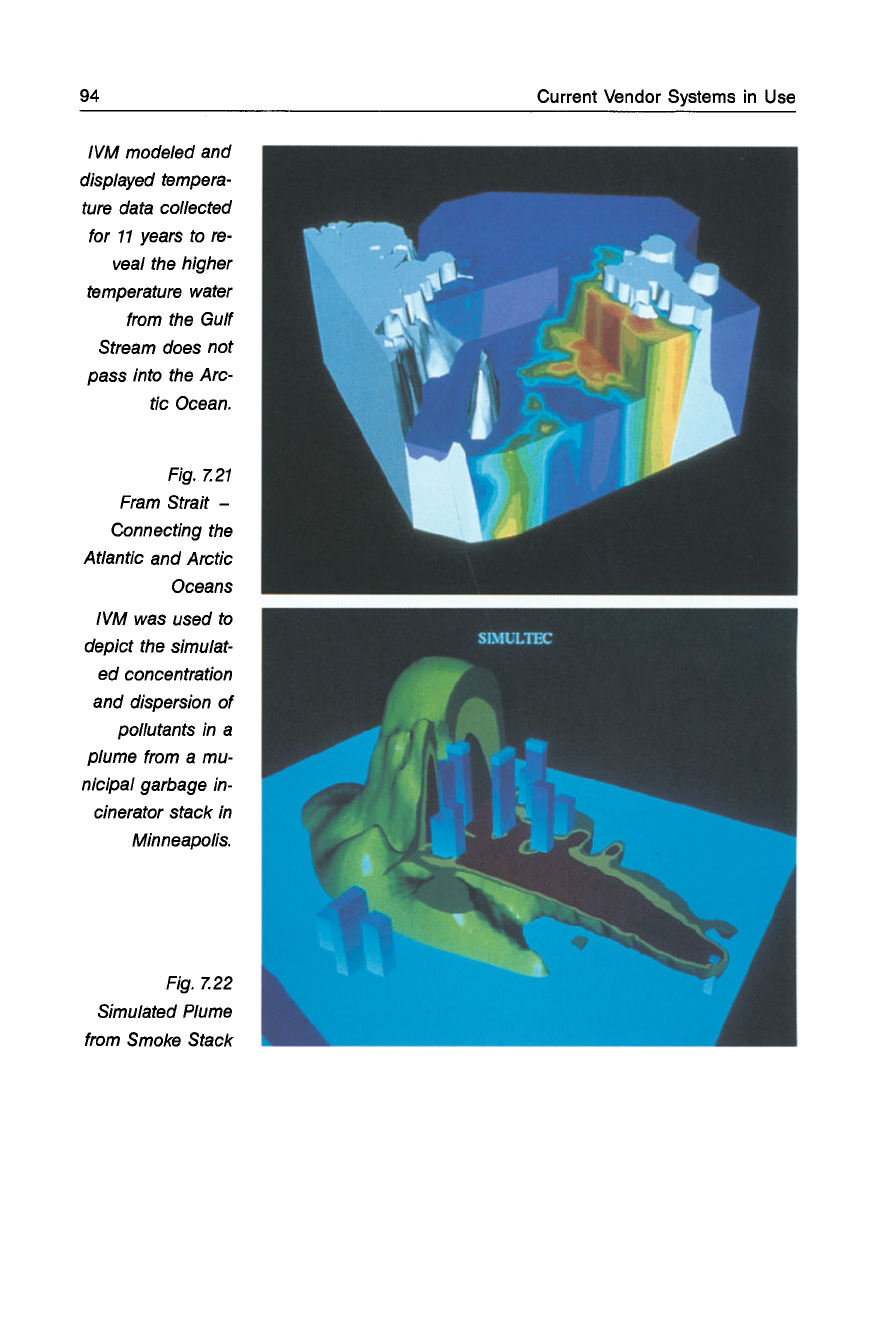
94
IVM modeled and
displayed tempera-
ture data collected
for
11
years
to
re-
veal the higher
temperature water
from the Gulf
Stream does not
pass into the Arc-
tic Ocean.
Fig.
Z21
Fram Strait -
Connecting the
Atlantic and Arctic
Oceans
IVM was used
to
depict the simulat-
ed
concentration
and dispersion
of
pollutants in a
plume from a mu-
nicipal garbage in-
cinerator stack in
Minneapolis.
Fig.
Z22
Simulated Plume
from Smoke Stack
Current Vendor Systems
in
Use
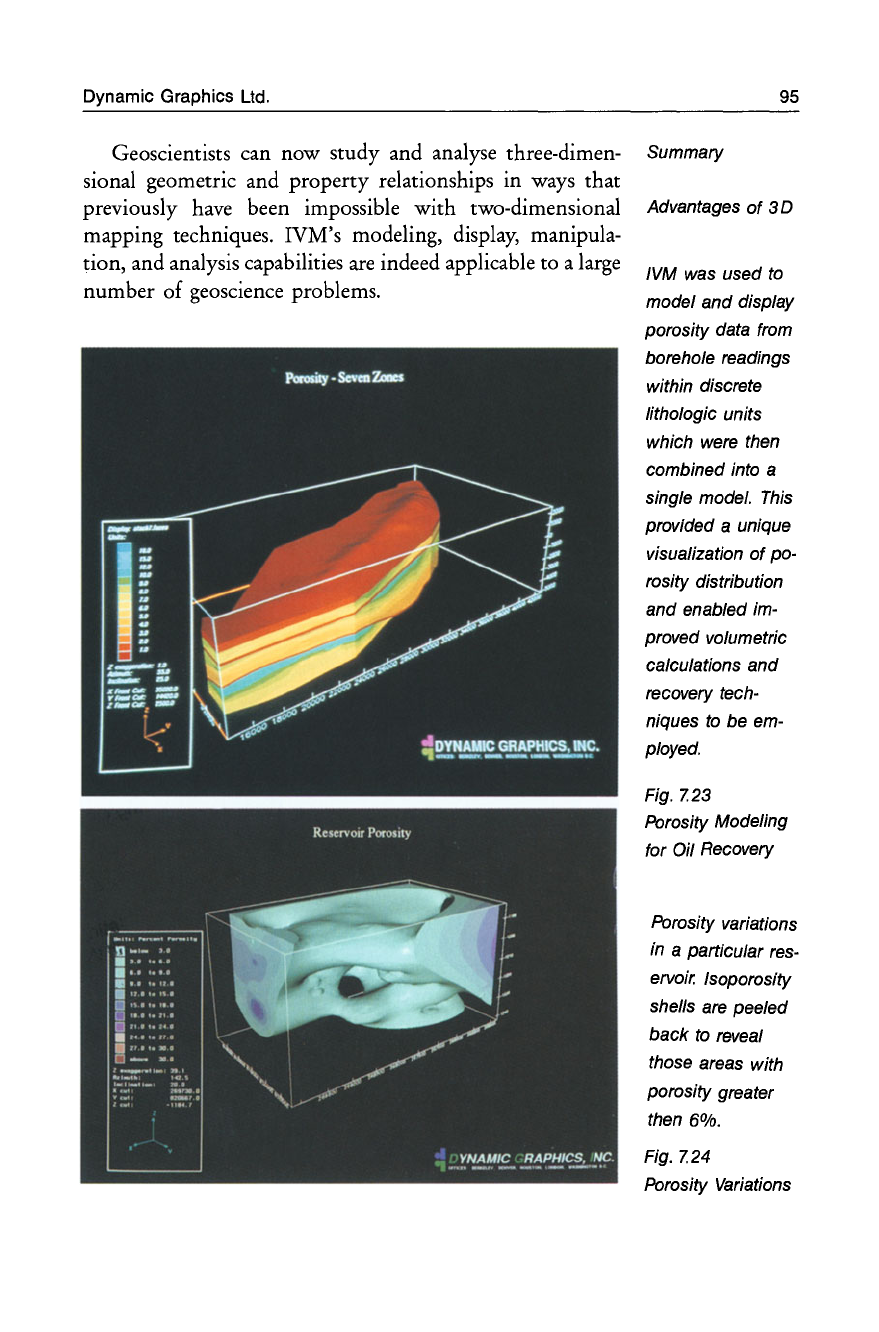
Dynamic Graphics
Ltd.
Geoscientists can now study and analyse three-dimen-
sional geometric and property relationships in ways that
previously have been impossible with two-dimensional
mapping techniques. IVM's modeling, display, manipula-
tion, and analysis capabilities are indeed applicable to a large
number
of
geoscience problems.
95
Summary
Advantages
of
3D
IVM was used
to
model and display
porosity data from
borehole readings
within discrete
lithologic units
which were then
combined into a
single model.
This
provided a unique
visualization
of
po-
rosity distribution
and enabled im-
proved volumetric
calculations and
recovery tech-
niques
to
be em-
ployed.
Fig.
7.23
Porosity Modeling
for Oil Recovery
Porosity variations
in a particular res-
ervoir.
Isoporosity
shells are peeled
back
to
reveal
those areas with
porosity greater
then 6%.
Fig.
7.24
Porosity Variations
96 Current Vendor Systems
in
Use
From information supplied by Peter Irwin, Dynamic
Graphics Ltd.
For further information contact:
US.A.
Dynamic Graphics, Inc.
1015
Atlantic Avenue
Alameda,
CA
94501, US.A.
Tel:
415-522-0700
Fax: 415-522-5670
7.9
Spyglass,
Inc.
7.9.1
Spyglass
Transform
United Kingdom
Dynamic Graphics Ltd.
Addison
Wesley
Building
Finchampstead Road
Wokingham
Berks RG
11
2NZ,
UK.
Tel:
0734-774755
Fax: 0734-774721
Analysis and Transform
is
a comprehensive tool for analysis and visuali-
visualization zation of two-dimensional data
on
the Macintosh. It can
generate contour plots, surface plots, vector plots, line
graphs, polar images, animations, overlays, and raster images
(assigning colors to data values).
Data input The Import command reads and converts
2D
and
3D
HDF
datasets,
2D
and
3D
generic datasets (byte, integer,
long integer, float),
HDF
image
files,
PICT
files,
TIFF
files,
FITS
files,
2 D ASCII data, and
X-Y
column data not already
in array form. Transform reads 3 D data one slice at a time.
Output
of
results Every image, plot,
or
dataset can be printed to any color
or
black-and-white Postscript printer,
or
any Macintosh-
compatible color printer. Exporting graphics to other Mac-
intosh applications,
or
to produce
35
mm
slides
is
easy.
Data
and images created in Transform can be exported
as
PICT
or
HDF
files,
or
via the Clipboard.
Spyglass, Inc.
7.9.2 Spyglass Dicer
Dicer
is
a comprehensive tool for visualizing volumetric
da-
Visualizing
ta
on
the Macintosh.
It
can perform 3 D blocks, slices in volume data
three planes, 3 D cubes and cutouts, variable orientation,
da-
ta re-sampling, variable color maps, and animation
se-
quences.
Dicer reads 3 D
HDF
(float and byte), netCDF, and
ge-
Data input
neric (byte, short and long integer, single- and double-preci-
sion floating point) file formats directly. A utility can con-
vert and import folders of
2D
files
in ASCII byte, integer,
and floating-point formats, and construct 3 D datasets from
the
2D
files.
The utility also imports
3D
ASCII data
files,
as
well
as
PICT, TIFF, FITS, and
HDF
image
files.
Dicer offers a menu of over
20
color tables,
or
user tables Color options
can be imported. Interactive tools enable any color to be
made transparent
to
enable the user to 'see through' the vol-
ume it previously occupied,
or
to substitute colors in select-
ed regions.
Any configuration created
on
screen can be saved with Output
or
without corresponding data, and snapshot images can be
saved alone
as
PICT
or
HDF
image
files.
Dicer images can
be exported
as
PICT
files
using the Macintosh Clipboard,
and 2 D slices can be exported to Spyglass Transform for fur-
ther manipulation. Data sets can be re-sampled and saved
as
either
HDF
or
netCDF. Any image created
on
screen can
be printed to color (or black and white) Postscript printers,
or
to Macintosh-compatible color printers.
Dicer also offers two
ways
to create and
save
animations. Animations
After defining parameters, the user can generate and
save
se-
quences
of
3 D frames,
or
a sequence of 2 D slices from 3 D
frames created in Dicer. The sequenced images are saved in
folders and can be viewed
as
animations using Spyglass
View.
Information courtesy of Digital Studio.
97
98 Current Vendor Systems
in
Use
For further information contact:
US.A.
Spyglass,
Inc.
701
Devonshire Drive,
C-17
Champaign
IL 61820,
US.A.
Tel:
217-355-1665
Fax:
217-398-0413
United Kingdom
Spyglass,
clo
Digital Studio
Clifton
Mews
Saffron Walden
Essex
CB10
lEE,
UK.
Tel:
0799-513773
Fax:
0799-513454
7.10
LightWork
Design
Ltd.
High-quality LightWorks
is
a powerful new image generation system
images from LightWork Design Ltd. that enables users of modeling
software to create high-quality images
of
their models,
showing accurate surface finishes and lighting effects. It
is
optimised for interactive operation in computer-aided
de-
sign environments.
Natural Images of photographic quality are produced by simulat-
phenomena ing natural phenomena such
as
reflective surfaces, transpar-
ency and shadows from any number of light sources. Arbi-
trarily complex material characteristics can be defined to
create realistic finishes such
as
marble, wood, brick, chrome
and steel. A wide range of geometric modeling primitives
are supported
on
to which scanned images can
be
mapped.
Applications LightWorks can be used in many application
areas.
Ex-
amples
are
visualization for product designers; visualizing
simulation data for scientists and engineers; building
de-
signs for architects; accurate simulations of color and light-
ing schemes for interior designers; print and animation for
graphic designers.
User interface The system has an interactive mouse and window-based
scene editor module which presents an easy-to-use yet pow-
erful user interface with which the visual characteristics of
a model can be controlled. Incremental rendering tech-
niques enable many color and lighting combinations to
be
compared in a short time.
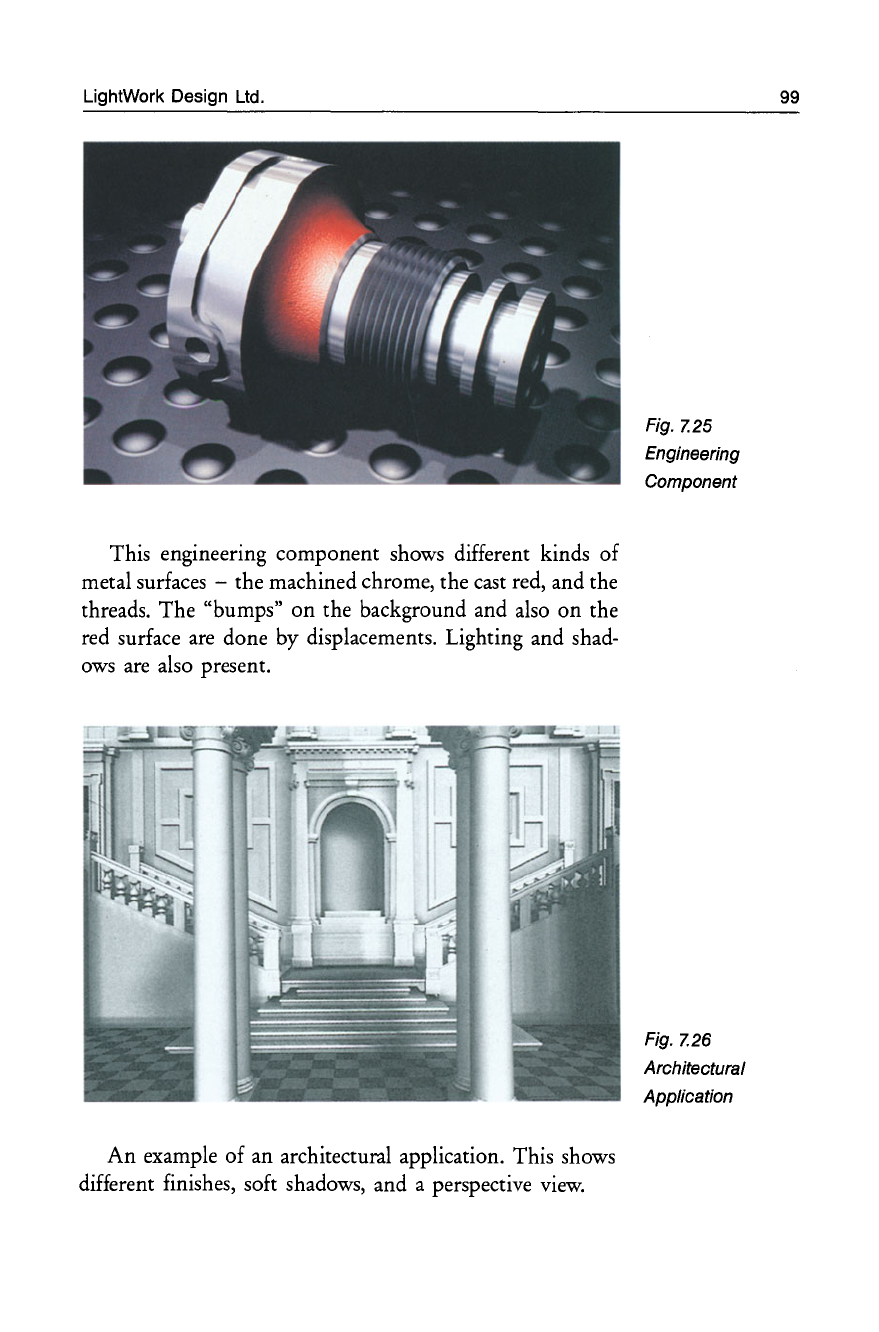
LightWork Design Ltd.
This engineering component shows different kinds of
metal surfaces -the machined chrome, the cast red, and the
threads. The "bumps"
on
the background and also
on
the
red surface are done by displacements. Lighting and shad-
ows are also present.
An
example of an architectural application. This shows
different finishes, soft shadows, and a perspective
view.
Fig. Z25
Engineering
Component
Fig. Z26
Architectural
Application
99
100
Representing
3D
shapes
3D
modeling
Current Vendor Systems
in
Use
Written in C, LightWorks has been designed to
be
easily
ported across a wide variety of computer platforms includ-
ing
UNIX
workstations, MS-DOS PCs, and cost-effective
parallel processing computers. LightWorks
is
supported on
Sun-4/SPARC, IBM RISC System/6000, Silicon Graphics
IRIS/4D, Hewlett Packard 9000 300/400/700/800, Sony
NEWS, and
80386
and
80486
IBM
PC
compatibles running
MS-DOS with Phar Lap's 386/Dos-Extender
or
Microsoft's
Windows 3.0.
Information supplied by
Dr
R. Gordon Oliver,
LightWork Design Ltd.
For further information contact:
Lightwork Design Ltd.
Sheffield Science Park
Arundel Street
Sheffield S 1 2NS,
U.
K.
Tel:
0742-724126
Fax: 0742-720379
7.11
Ricoh
Company
Ltd.
Use
of
Visualization
in
Modeling
and
CAD/CAM
Solid modelers, designed
to
represent 3 D shapes
as
solids,
have become essential tools in computer-aided design and
manufacturing (CAD/CAM) systems. The benefits of solid
modelers vary from designing to molding, and from struc-
tural analysis to robot simulations. Unlike surface modelers,
however, existing solid modelers
have
had limitations in the
representation of complex surfaces.
DESIGNBASE
is
a 3 D solid modeling system developed
by Ricoh Company Ltd. This
is
designed to represent com-
plex free-form surfaces in
UNIX
workstation environ-
ments. Using a surface representation method called the
"Gregory patch", DESIGNBASE enables free-form surfaces
to
be
smoothly connected and locally operated.
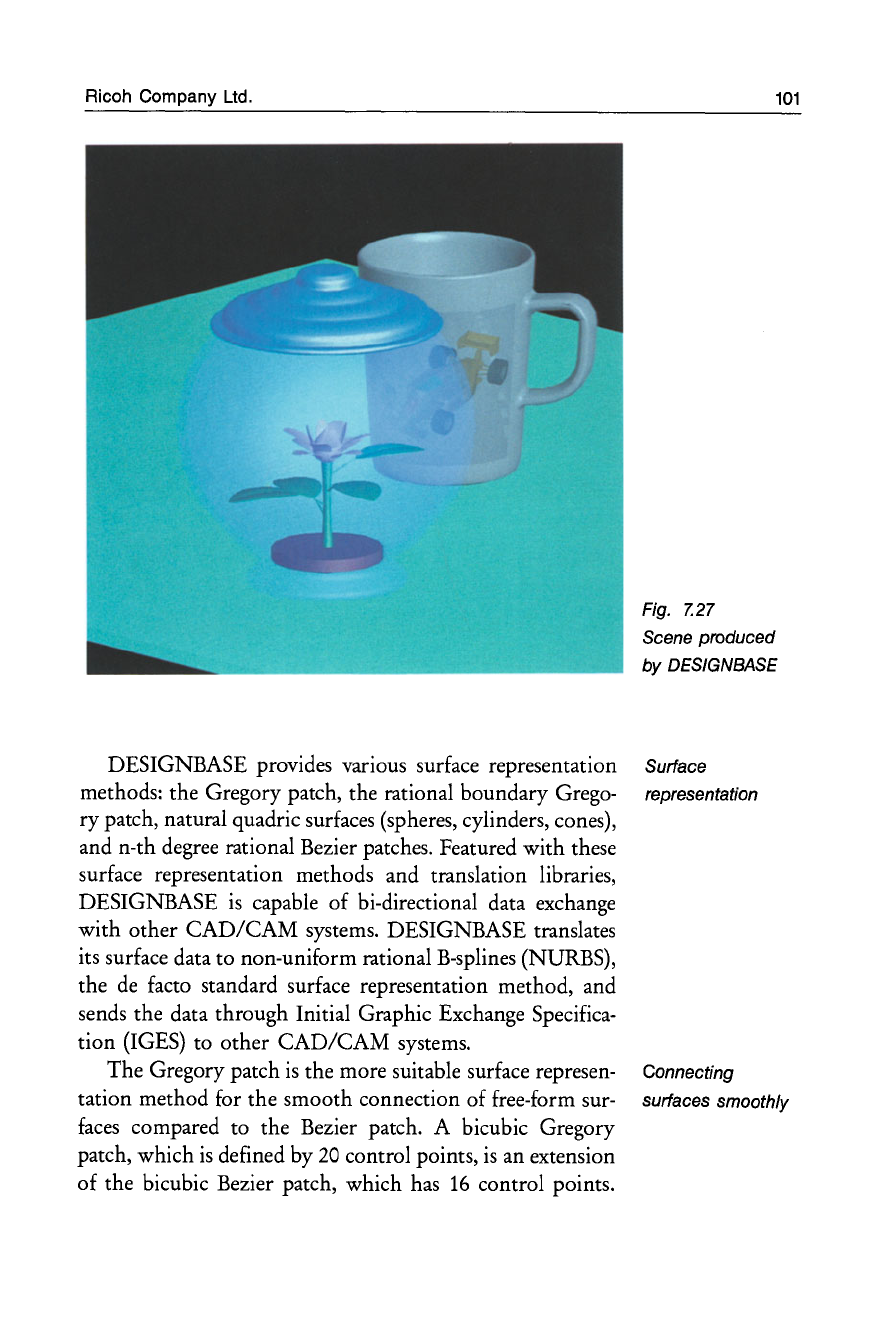
Ricoh Company
Ltd.
DESIGNBASE provides various surface representation
methods: the Gregory patch, the rational boundary Grego-
ry
patch, natural quadric surfaces (spheres, cylinders, cones),
and n-th degree rational Bezier patches. Featured with these
surface representation methods and translation libraries,
DESIGNBASE
is
capable of bi-directional data exchange
with other
CAD/CAM
systems. DESIGNBASE translates
its surface data to non-uniform rational B-splines (NURBS),
the
de
facto standard surface representation method, and
sends the data through Initial Graphic Exchange Specifica-
tion (IGES) to other
CAD/CAM
systems.
The Gregory patch
is
the more suitable surface represen-
tation method for the smooth connection of free-form sur-
faces
compared to the Bezier patch. A bicubic Gregory
patch, which
is
defined by
20
control points,
is
an extension
of the bicubic Bezier patch, which has
16
control points.
101
Fig. Z27
Scene produced
by
DESIGNBASE
Surface
representation
Connecting
surfaces smoothly
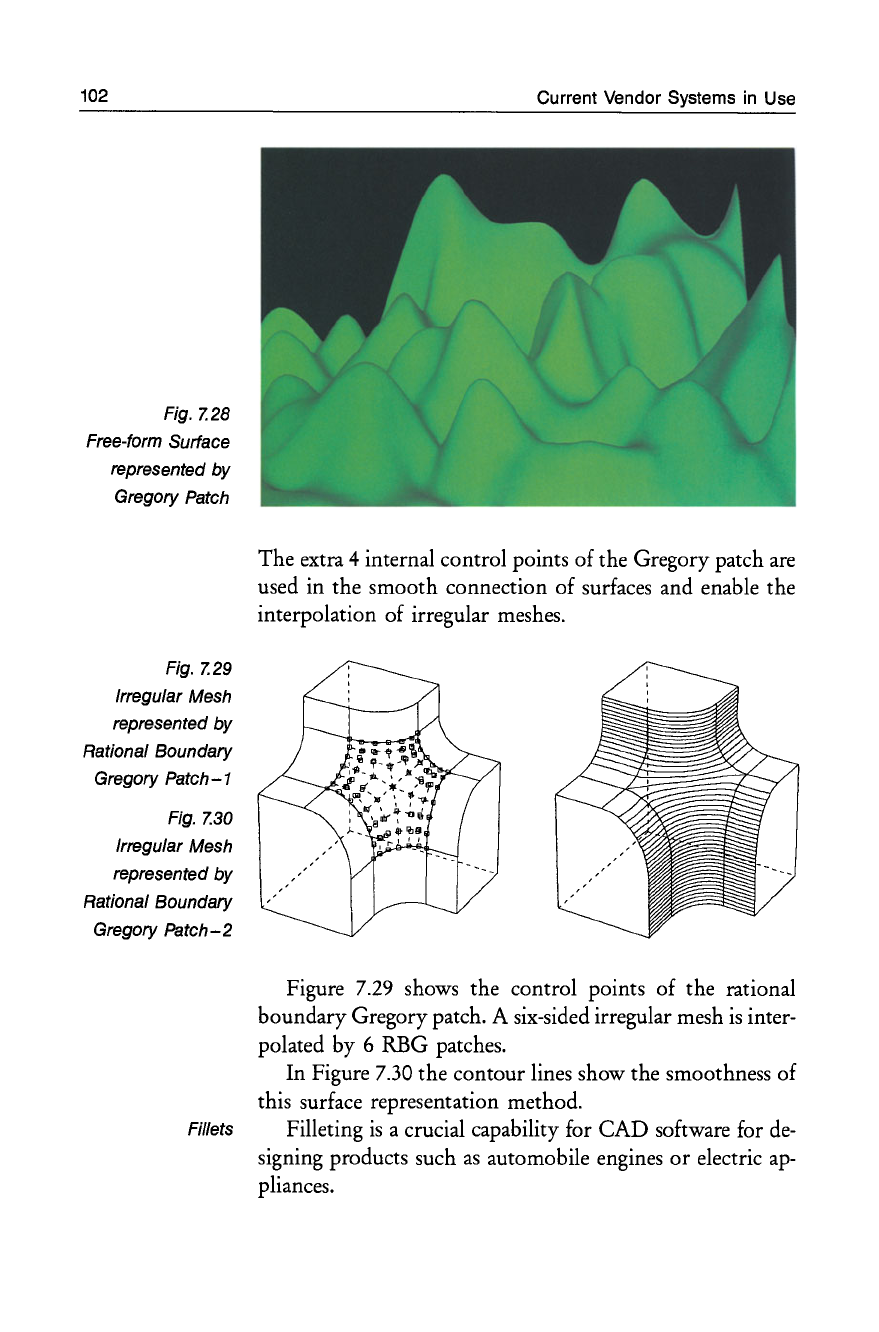
102
Fig.
Z28
Free-form Surface
represented
by
Gregory Patch
Fig.
Z29
Irregular Mesh
represented
by
Rational Boundary
Gregory
Patch-1
Fig.
Z30
Irregular Mesh
represented
by
Rational Boundary
Gregory
Patch-2
Current Vendor Systems
in
Use
The extra 4 internal control points of the Gregory patch are
used in the smooth connection of surfaces and enable the
interpolation of irregular meshes.
Figure 7.29 shows the control points of the rational
boundary Gregory patch. A six-sided irregular mesh
is
inter-
polated by 6 RBG patches.
In Figure 7.30 the contour lines show the smoothness of
this surface representation method.
Fillets Filleting
is
a crucial capability for
CAD
software for
de-
signing products such
as
automobile engines
or
electric
ap-
pliances.
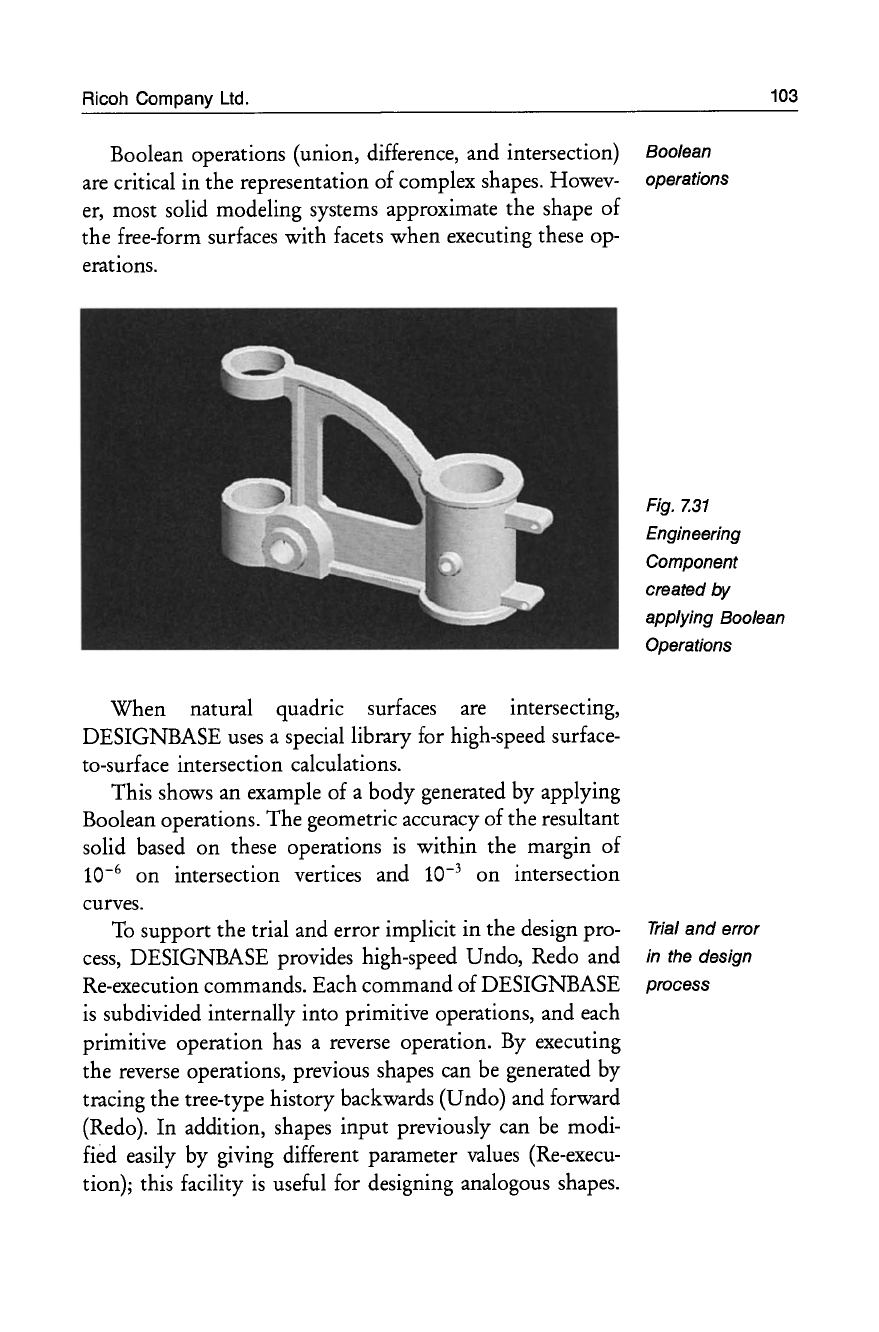
Ricoh Company
Ltd.
103
Boolean operations (union, difference, and intersection) Boolean
are critical in the representation
of
complex shapes. Howev- operations
er, most solid modeling systems approximate the shape of
the free-form surfaces with facets when executing these op-
erations.
When natural quadric surfaces are intersecting,
DESIGNBASE uses a special library for high-speed surface-
to-surface intersection calculations.
This shows an example of a body generated by applying
Boolean operations. The geometric accuracy
of
the resultant
solid based
on
these operations
is
within the margin of
10-6
on
intersection vertices and 10-3
on
intersection
curves.
To
support the trial and error implicit in the design pro-
cess,
DESIGNBASE provides high-speed Undo, Redo and
Re-execution commands. Each command of DESIGNBASE
is
subdivided internally into primitive operations, and each
primitive operation
has
a reverse operation. By executing
the reverse operations, previous shapes can be generated by
tracing the tree-type history backwards (Undo) and forward
(Redo). In addition, shapes input previously can be modi-
fied easily by giving different parameter values (Re-execu-
tion); this facility
is
useful for designing analogous shapes.
Fig.
7.31
Engineering
Component
created by
applying Boolean
Operations
Trial
and
error
in the design
process
104
Current Vendor Systems
in
Use
Summary Computer-aided design (CAD) began with
2D
systems
which replaced drafting instruments. However, total
CAD/CAM
or
computer-aided engineering (CAE) systems
require the facility to process 3 D data, and it must be possi-
ble to freely exchange this data between systems.
Solid modeling systems
are
assuming a more significant
role
as
industry introduces
CAD/CAM/CAE
systems.
High powered workstations enable such systems to perform
efficiently and also cost-effectively.
Applications DESIGNBASE has been applied to the automobile and
electricity industries
as
the basis of
CAD/CAM/CAE
re-
quirements.
It
has also been used for rendering, stereo
li-
thography, and pre-processing for the production of finite
element meshes.
Reference
Chiyokura H.: Solid Modeling with DESIGNBASE: Theory
and Implementation. Addison
Wesley,
Reading, MA,
1988.
Information supplied by
T.
Ito, A. O'Neill, and
H.
Toriya,
Ricoh Company Ltd.
For further information contact:
Ricoh Company Ltd.
1-1-17
Koishikawa
Bunkyo-ku
Tokyo
112
Japan
Tel:
81-3-3815-7261
Fax:
81-3-3818-0348
Vital Images, Inc.
7.12
Vital Images,
Inc.
Vital Images began developing software
as
part of a research
VoxelView
project at Maharishi International University to visualize
la-
ser-scan confocal microscope data of living nerve cells. This
research
was
funded by Iowa Department of Economic De-
velopment and the National Science Foundation.
VoxelView
is
a general purpose, high-performance vol-
ume rendering package. Data values of voxels can be map-
ped to corresponding opacity values. This enables the user
to view faint
or
small details inside the volume. It
is
also
possible to do thresholding to remove voxels,
or
redistribute
voxel values from one range to another. Sequences
of
render-
ings can be stored and then played back in real time. The
following features
are
also included:
• graphical data
base
system,
• full surface shading with lighting,
• user control of animation parameters,
• gradient operations to extract and selectively display
nested surfaces within the volume,
• autoconfiguring for multiprocessor systems.
VoxelLab
is
an entry-level version of VoxelView and
is
avail-
VoxelLab
able
on
the Silicon Graphics workstation.
It
enables begin-
ning users to appreciate the power and potential of volume
rendering systems.
For further information contact:
Vital Images, Inc.
P.O. Box
551
Fairfield
10
52556
U.S.A.
Tel:
515-472-7726
Fax:
515-472-1661
105
Tool
for
research
and
development
Chapter
8
Current
Public
Domain
Systems
in
Use
Readers are recommended to read Chapter 4 for a classifica-
tion and categorisation of scientific visualization systems
before reading this present chapter. Chapter 4 sets out the
overall framework into which the products outlined in
Chapters 7 and 8 fit.
In
addition, readers should note the points
on
public do-
main systems that are set out in Chapter 4 (Section 4.4).
Contact addresses
are
provided for each product at the
end of each section.
8.1
Khoros
Khoros
is
an open environment for data processing, visual-
ization, and software development. This summary describes
how the Khoros software system can be utilized
as
a founda-
tion
or
platform to improve productivity and promote soft-
ware reuse in data processing applications. First, a high-level
description of Khoros
is
given, then the current status of
Khoros
is
discussed.
8.1.1
Overview
The Khoros system integrates multiple user interface modes,
code generators, instructional aids, data visualization, and
information processing. The result
is
a comprehensive tool
for computational research and development. The Khoros
infrastructure consists of
five
major subsystems:
• a general visual language,
• a user-interface development system (UIDS),
Khoros
• an interoperable data exchange format
(vif£),
• application-specific data processing libraries,
• interactive data display/manipulation programs and a
vi-
sualization toolkit.
The software structure that embodies this system provides Portable
and
for extensibility and portability, and allows for easy tailor- extensible
ing to target specific application domains and processing
en-
vironments. Khoros
is
a successful example of how research
programming, end-user applications programming, infor-
mation processing, data visualization, instruction, docu-
mentation, and maintenance can
be
integrated to build a
state-of-the-art software environment.
8.1.2
Subsystem Component Descriptions
a)
X Windows Applications
The interactive graphical user interface programs
are
based
on
MIT
XllR4
and the Athena widgets. They
are
all
de-
signed to
have
a simple and consistent look and
feel.
Program Name
cantata
editimage
animate
xprism2 and xprism3
vlewlmage
warplmage
concert
Description
extensible visual programming
language
interactive image display and
manipulation
interactive image sequence
dis-
play
comprehensive
2D
and
3D
plotting packages
surface visualization (imagery
draped over elevation data)
image registration and warping
distributed user interface con-
troller
107
108 Current Public Domain Systems
in
Use
b)
Visual Language
Dataflow graphs The visual language of Khoros, cantata,
is
a graphically
ex-
pressed, dataflow-oriented language. The user builds a canta-
ta application program by connecting processing nodes
to
form a dataflow graph. Nodes are selected from an applica-
tion specific library of routines created using the Khoros
UIDS, and may have arbitrary granularity, from fine to large
grain. Control nodes and a parser extend the functionality
of the underlying data flow methodology. Visual proce-
dures, representing a hierarchy of subgraphs, add structure
to the visual language and help
to
manage the complexity
often associated with visual programming. A dynamic
exe-
cution scheduler allows the user to interactively execute the
entire flow graph across a heterogeneous computer network.
The execution can be set to either a demand-driven
or
data-
driven model depending on the application and desired level
of interactivity.
Many applications Cantata has been targeted at a variety of application do-
mains: a visual language interface has been completed for
the LINPACK/EISPACK libraries, an image processing
li-
brary, a digital signal processing library and a remote sens-
ing/geographical information system. The design of cantata
promotes code reuse and modular design of libraries.
c)
User Interface Development System
The Khoros system combines interactive graphical user in-
terface specification/editing and code generation to
give
the
user a programmer's assistant. This UIDS can be used to
cre-
ate general X Windows applications
or
to extend cantata.
Dialog The central component of the UIDS
is
a high-level user
interface specification that represents a formal description
of the dialog between the user and the application, indepen-
dent of the user interface mode. The specification
is
used
di-
rectly to generate the code for either a graphical
or
com-
mand-line user interface. When the user interface specifica-
tion
is
combined with a formal Khoros program specifica-
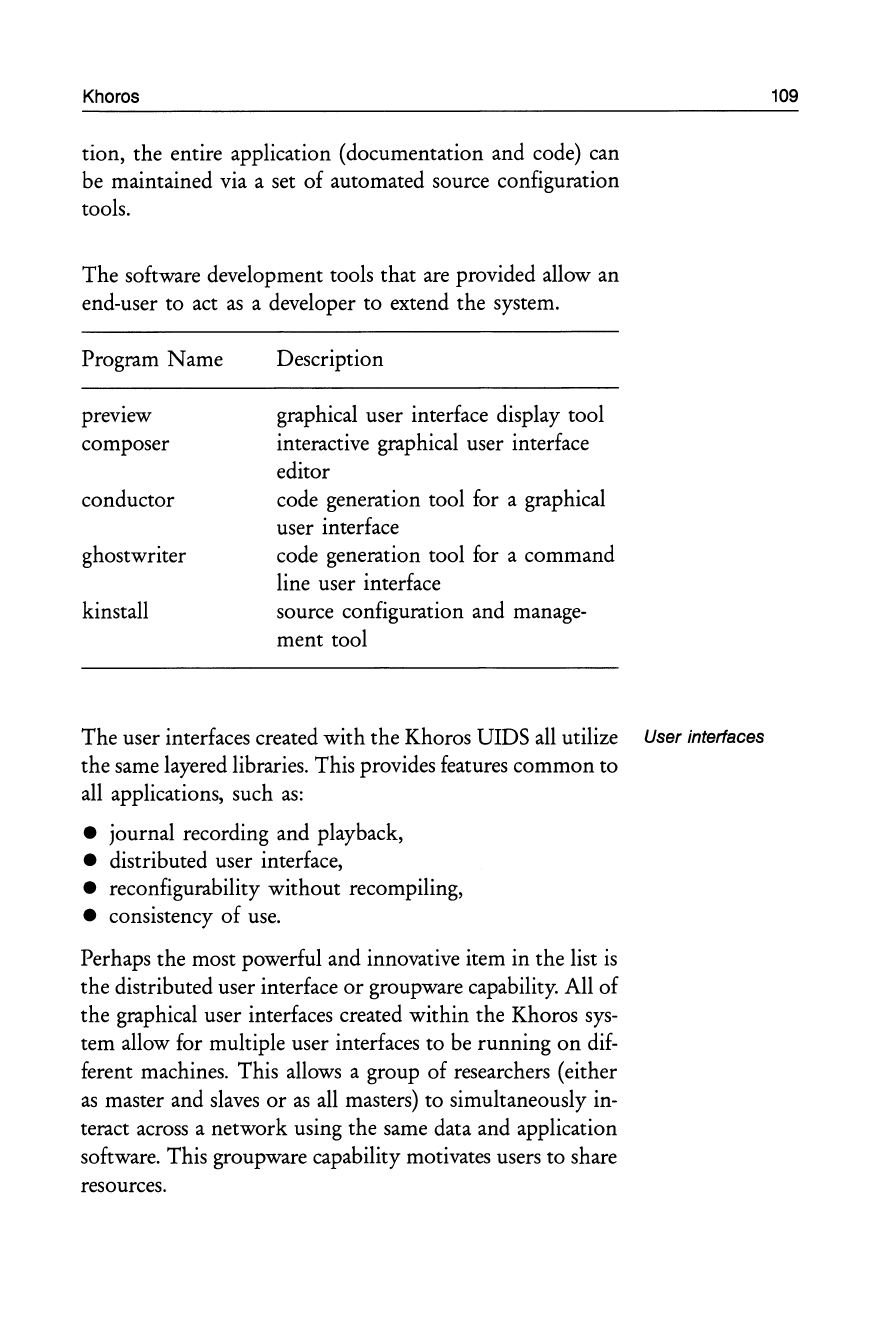
Khoros
tion, the entire application (documentation and code) can
be maintained via a set
of
automated source configuration
tools.
The software development tools that are provided allow an
end-user to act
as
a developer to extend the system.
Program Name
preVIew
composer
conductor
ghostwriter
kinstall
Description
graphical user interface display tool
interactive graphical user interface
editor
code generation tool for a graphical
user interface
code generation tool for a command
line user interface
source configuration and manage-
ment tool
The user interfaces created with the Khoros UIDS
all
utilize User interfaces
the same layered libraries. This provides features common to
all applications, such
as:
• journal recording and playback,
• distributed user interface,
• reconfigurability without recompiling,
• consistency
of
use.
Perhaps the most powerful and innovative item in the list
is
the distributed user interface
or
groupware capability. All
of
the graphical user interfaces created within the Khoros
sys-
tem allow for multiple user interfaces to be running
on
dif-
ferent machines. This allows a group
of
researchers (either
as
master and slaves
or
as
all
masters) to simultaneously in-
teract across a network using the same data and application
software. This groupware capability motivates users to share
resources.
109
110
Current Public Domain Systems
in
Use
The
UillS
also promotes consistent structured program-
ming methodology and styles
as
well
as
code reuse. The ho-
pe
is
that
as
Khoros
evolves,
many reusable libraries can
be
provided in various languages for various applications that
have
a consistent and powerful user interface.
d)
Interoperable Data Exchange
Data formats The Khoros data structure
or
visualization model supports
general geometric objects, multidimensional data, and a ro-
bust mapping scheme. Storage type conversion between
dif-
ferent architecture platforms
is
automatically performed by
the read/write utilities,
i.e.,
DEC
VAX
floating-point data
is
automatically converted to IEEE format if read
on
a
SUN
computer. The consistent
use
of
the Khoros data structure
promotes an algorithm library that can
be
used in many
dis-
ciplines and supports data sharing.
Standard formats
It
is
important to state that
as
Khoros expands, there will
be
a need to support a set of "standard"
file
formats. Cur-
rently, Khoros provides for data interchange with other
sys-
tems via
file
format converters. Khoros supports the follow-
ing
file
formats: TIFF, pbm, BIG, DEM, DLG,
ELAS,
FITS,
Matlab, sun raster, TGA, and xbm.
e)
Data Processing Libraries
Functions Khoros includes a library of programs that can operate on
point data, one-dimensional data, two-dimensional data and
multi band
or
vector data. These operators
are
designed to
be
polymorphic,
i.e.,
they function on bit, byte, short, integer,
float and complex data types. This also implies that the
functions will operate differently depending
on
the dimen-
sionality of the data.
Interface levels There
are
two interface
levels
defined in the library
levels
functions in Khoros; the program
or
process interface and
the function
call
or
procedure interface. The program inter-
face
is
determined completely by the high-level user inter-
face
specification described
above.
The procedure interface
is
currently not
as
well defined, but allows the procedures
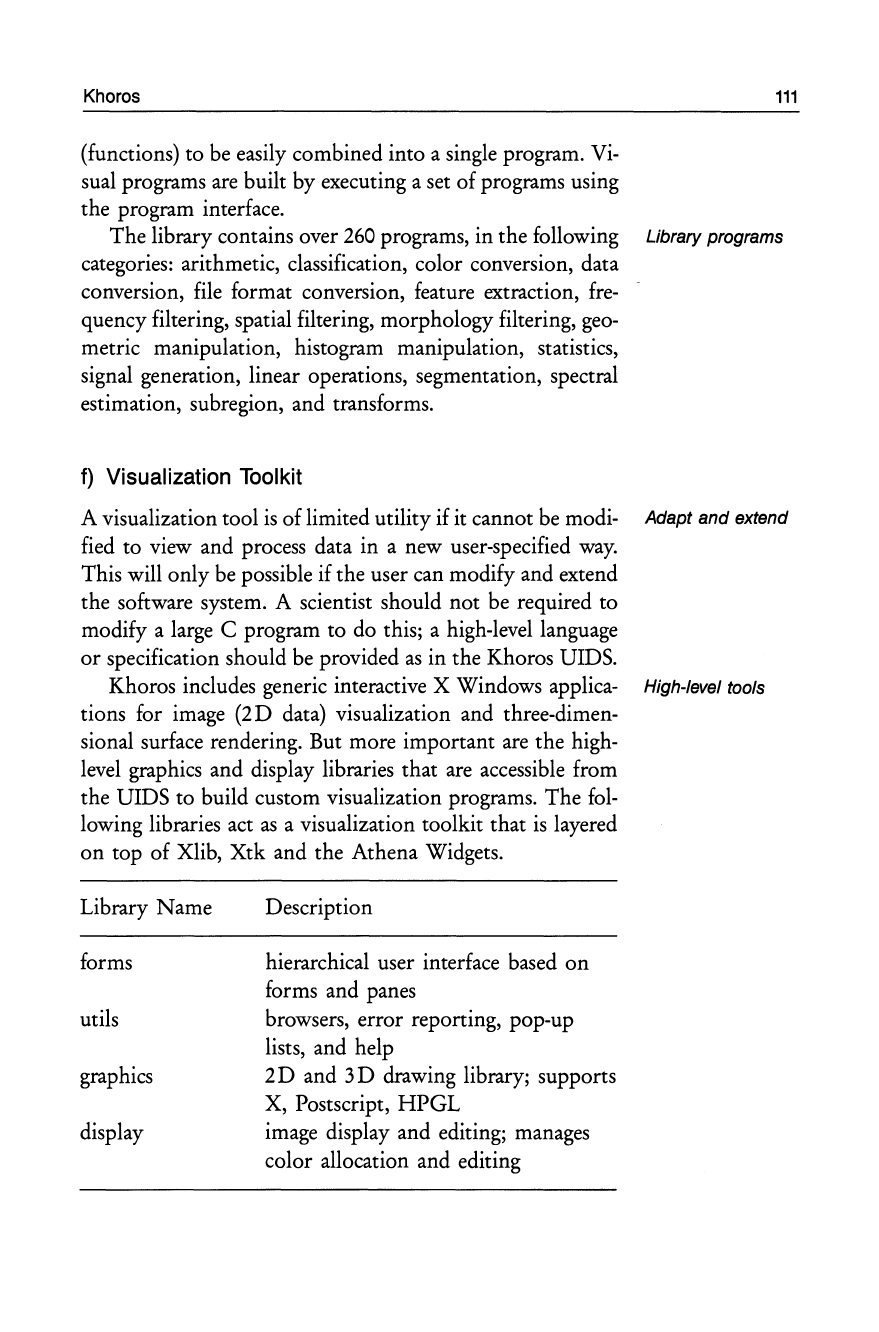
Khoros
111
(functions) to
be
easily combined into a single program.
Vi-
sual programs
are
built by executing a set of programs using
the program interface.
The library contains over
260
programs, in the following Library programs
categories: arithmetic, classification, color conversion, data
conversion,
file
format conversion, feature extraction,
fre-
quency filtering, spatial filtering, morphology filtering,
geo-
metric manipulation, histogram manipulation, statistics,
signal generation, linear operations, segmentation, spectral
estimation, subregion, and transforms.
f)
Visualization
Toolkit
A visualization tool
is
of limited utility if it cannot
be
modi- Adapt
and
extend
fied to view and process data in a new user-specified
way.
This will only
be
possible if the user can modify and extend
the software system. A scientist should not
be
required to
modify a
large
C program to do this; a high-level language
or
specification should
be
provided
as
in the Khoros UIDS.
Khoros includes generic interactive X Windows applica- High-level tools
tions for image (2D data) visualization and three-dimen-
sional surface rendering. But more important
are
the high-
level
graphics and display libraries that
are
accessible from
the UIDS to build custom visualization programs. The
fol-
lowing libraries
act
as
a visualization toolkit that
is
layered
on top of Xlib, Xtk and the Athena Widgets.
Library Name
forms
utils
graphics
display
Description
hierarchical user interface based
on
forms and panes
browsers, error reporting, pop-up
lists, and help
2D
and
3D
drawing library; supports
X, Postscript,
HPGL
image display and editing; manages
color allocation and editing
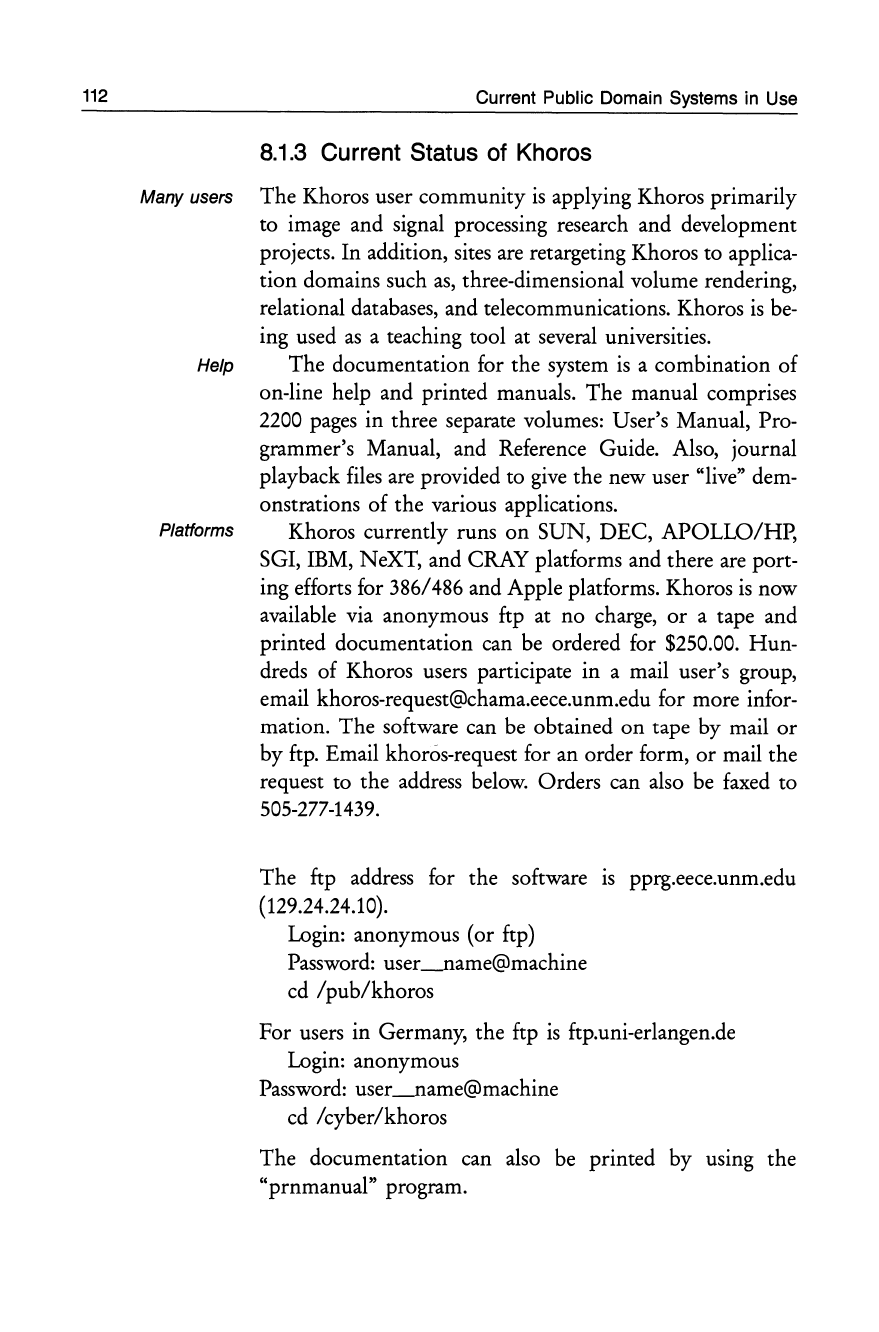
112 Current Public Domain Systems
in
Use
8.1.3
Current Status
of
Khoros
Many users The Khoros user community
is
applying Khoros primarily
to image and signal processing research and development
projects. In addition, sites
are
retargeting Khoros to applica-
tion domains such
as,
three-dimensional volume rendering,
relational databases, and telecommunications. Khoros
is
be-
ing used
as
a teaching tool at several universities.
Help The documentation for the system
is
a combination of
on-line help and printed manuals. The manual comprises
2200
pages
in three separate volumes: User's Manual, Pro-
grammer's Manual, and Reference Guide. Also, journal
playback
files
are
provided to
give
the new user "live" dem-
onstrations of the various applications.
Platforms Khoros currently runs on SUN, DEC, APOLLO/HP,
SGI, IBM, NeXT, and CRAY platforms and there
are
port-
ing efforts for 386/486 and Apple platforms. Khoros
is
now
available via anonymous ftp at no charge,
or
a tape and
printed documentation can
be
ordered for $250.00. Hun-
dreds of Khoros users participate in a mail user's group,
email khoros-request@chama.eece.unm.edu for more infor-
mation. The software can
be
obtained on tape by mail
or
by ftp. Email khoros-request for an order form,
or
mail the
request to the address below. Orders can also
be
faxed to
505-277-1439.
The ftp address for the software IS pprg.eece.unm.edu
(129.24.24.10).
Login: anonymous (or ftp)
Password:
user~ame@machine
cd
/pub/khoros
For users in Germany, the ftp
is
ftp.uni-erlangen.de
Login: anonymous
Password:
user~ame@machine
cd /cyber/khoros
The documentation can also
be
printed by usmg the
"prnmanual" program.
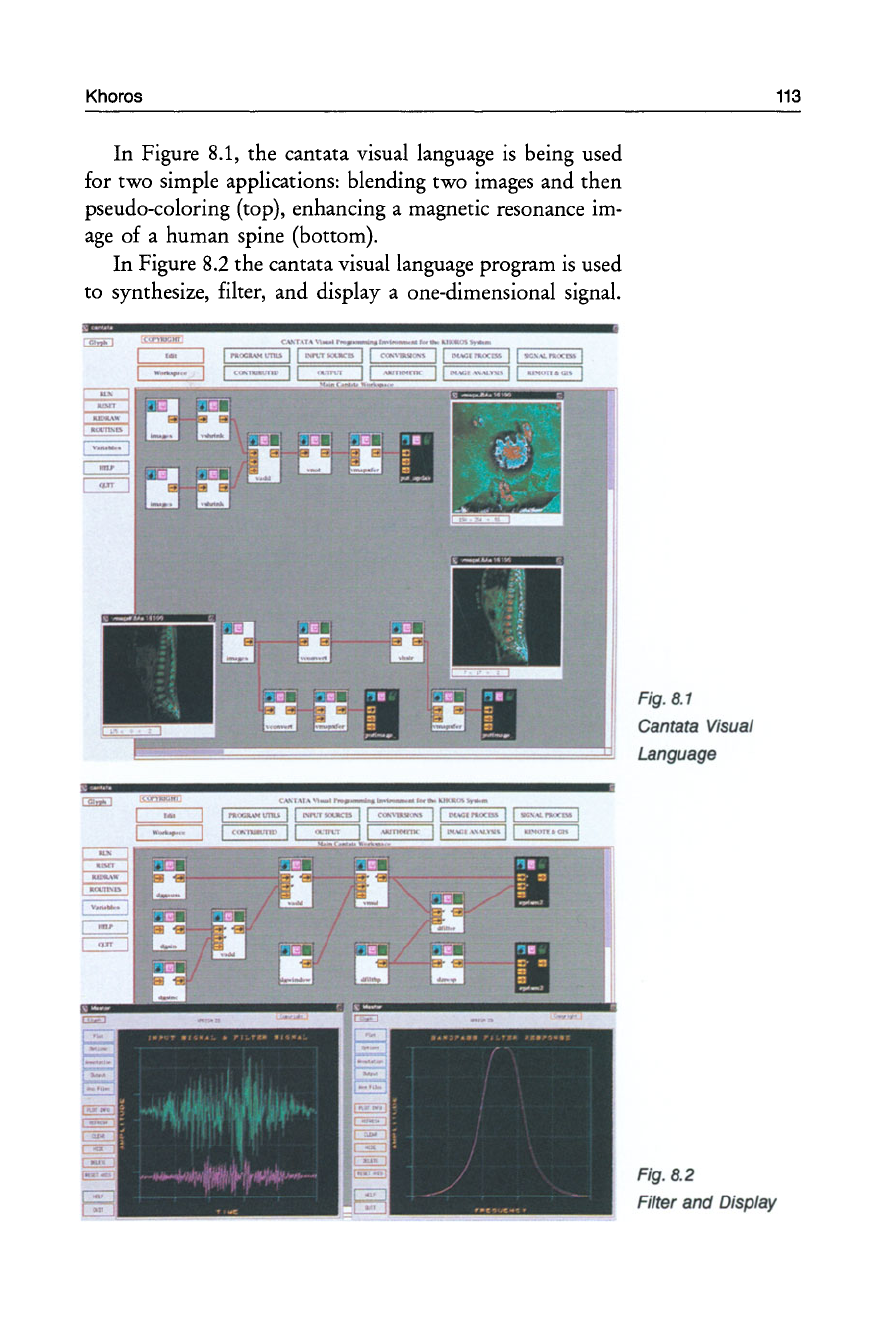
Khoros
In Figure 8.1, the cantata visual language
is
being used
for two simple applications: blending two images and then
pseudo-coloring (top), enhancing a magnetic resonance im-
age
of a human spine (bottom).
In
Figure
8.2
the cantata visual language program
is
used
to synthesize, filter, and display a one-dimensional signal.
C
1\1\~""""'
___
"'_
__
jr"
...
-_-u.u---'111
...
" II
CO"
II
..
· DO
II
I
I
~~-
II
II II
..
'V"
II .. - I
Fig. 8.1
Cantata Visual
Language
113
Fig. 8.2
Filter
and
Display
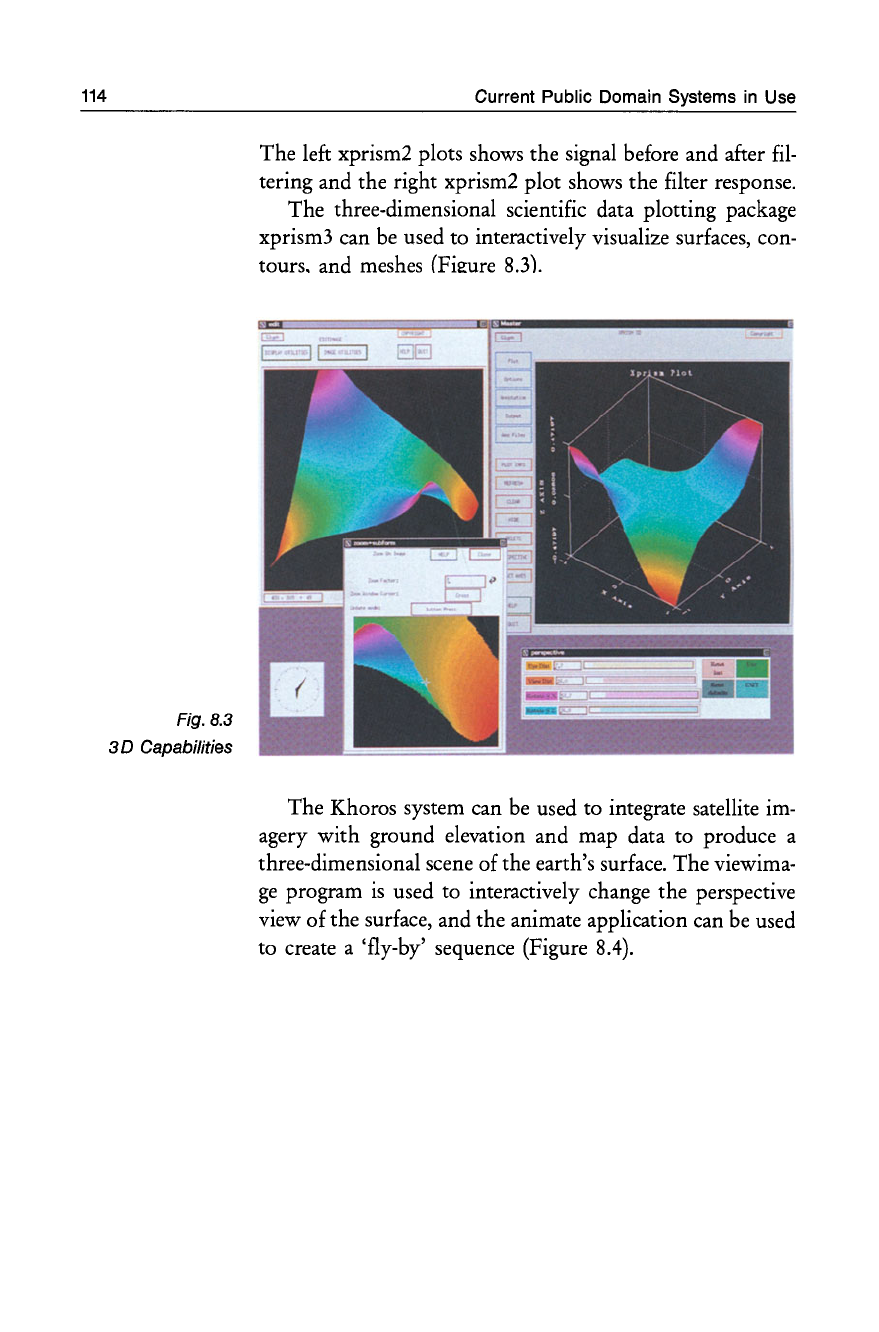
114
Fig. 8.3
3D
Capabilities
Current Public Domain Systems
in
Use
The left xprism2 plots shows the signal before and after
fil-
tering and the right xprism2 plot shows the filter response.
The three-dimensional scientific data plotting package
xprism3 can be used to interactively visualize surfaces, con-
tours. and meshes (Fie:ure 8.3).
The Khoros system can
be
used to integrate satellite im-
agery with ground elevation and map data to produce a
three-dimensional scene of the earth's surface. The viewima-
ge
program
is
used to interactively change the perspective
view of the surface, and the animate application can
be
used
to create a 'fly-by' sequence (Figure 8.4).
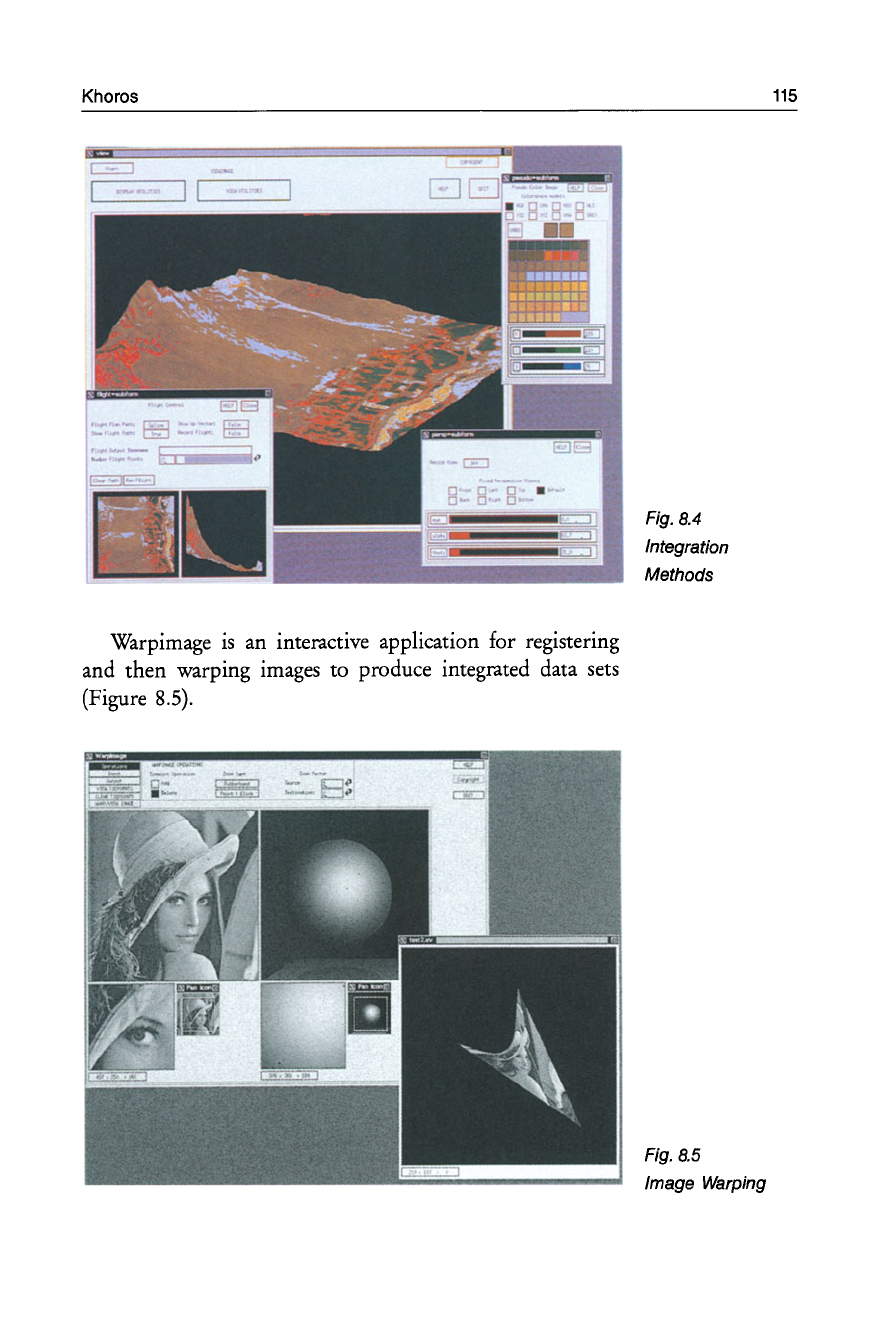
Khoros
Warp image
is
an interactive application for registering
and then warping images to produce integrated data sets
(Figure
8.5).
Fig. 8.4
Integration
Methods
Fig. 8.5
Image Warping
115
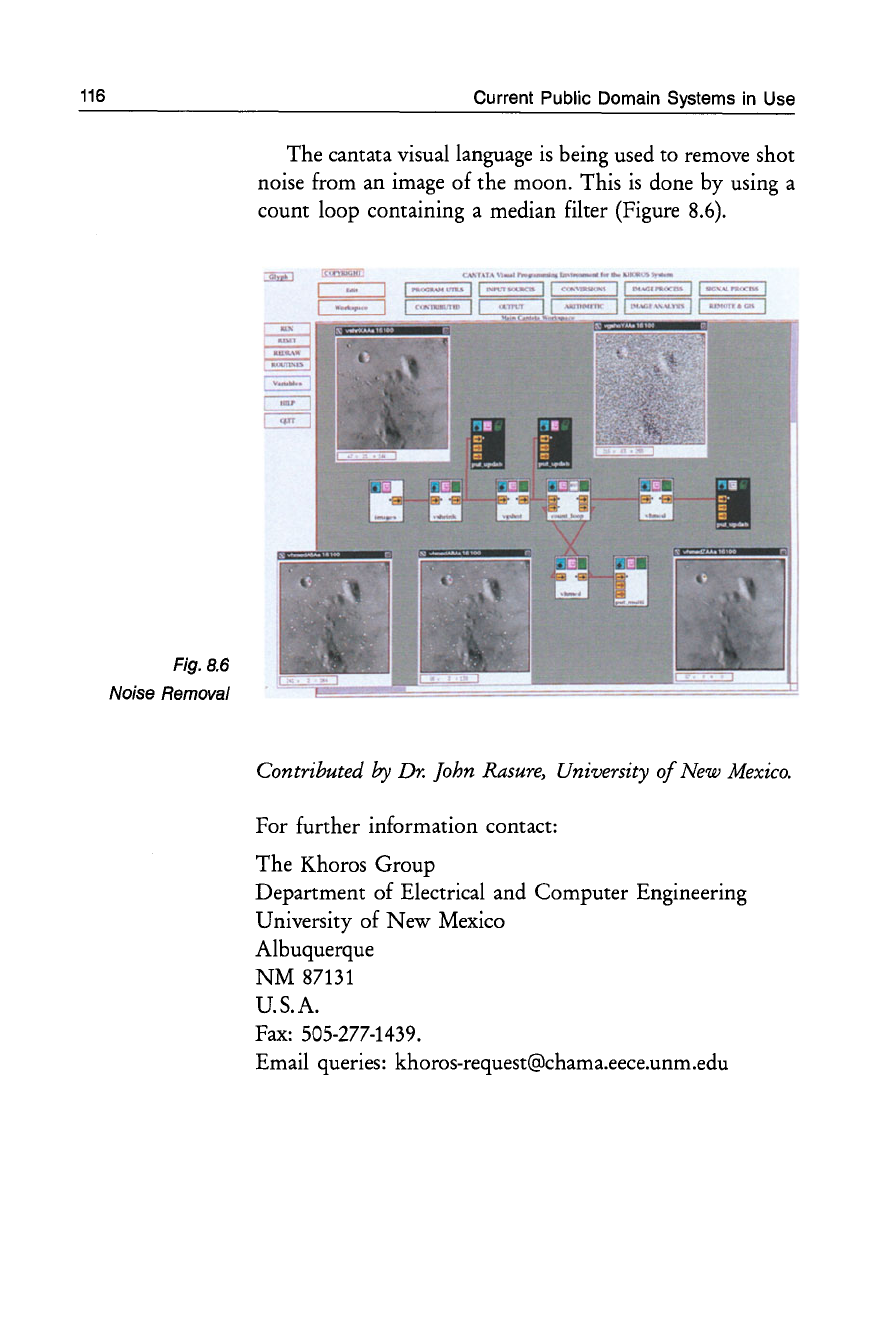
116
Fig. 8.6
Noise
Removal
Current Public Domain Systems
in
Use
The cantata visual language
is
being used to remove shot
noise from an image of the moon. This
is
done by using a
count loop containing a median filter (Figure
8.6).
~
~
-...
(
'.14~"'_---"''''';:==---.
.-_----,
~
......
I I
~:".
'''I'
'"
,
..
I
I
0"
1'1. I . -
.,,.,,.
I·
.•
an I
Contributed
by
Dr.
John Rasure, University
of
New
Mexico.
For further information contact:
The Khoros Group
Department of Electrical and Computer Engineering
University of New Mexico
Albuquerque
NM
87131
U.S.A.
Fax:
505-277-1439.
Email queries: khoros-request@chama.eece.unm.edu
apE: A Dataflow Toolkit for Scientific Visualization
8.2
apE:
A
Dataflow
Toolkit
for
Scientific
Visualization
In
1984,
the Ohio State University competed with institu-
tions across the United States to host a National Supercom-
puter Center. While its proposal
was
highly ranked, Ohio
State lost its bid for National Science Foundation funding
to obtain a center. However, the highly motivated group of
computational chemists who spearheaded Ohio State's
chemistry efforts then received help from the state. In
1987,
the legislature appropriated funds for the Ohio Board of
Re-
gents' supercomputer initiative to create a center serving
ac-
ademic and industrial users in the state of Ohio. In June
1987,
a Cray
X-MP
was
installed
at
the Ohio Supercompu-
ter Center, followed by a Cray
Y-MP
in June
1989.
One
of the early supporters of the
Ohio
Supercomputer
Center
was
Professor Charles Csuri, a pioneer in the field
of
computer graphics and Director of the Advanced Com-
puting Center for the Arts and Design
at
Ohio
State.
He
foresaw the rise of scientific visualization in the early
1980s
and built a significant graphics research component into the
base
of the then-fledgling Ohio Supercomputer Center.
Thus in late
1987,
the newly formed Ohio Supercomputer
Graphics Project set out to design an effective software
sys-
tem for visualization, apE.
Rather than dictate to the scientific community a partic-
ular methodology, extensive time
was
spent with potential
users to understand the
real
needs
of
scientific research. The
apE group listened to users of
all
kinds of current graphics
software and hardware, discovered the realities of fixed bud-
gets that permit only modest hardware acquisition and the
effects of slow network connections
on
high speed comput-
ing. In short, they tried to
face
the
real
world, and to design
and build a product that would outlast current hardware
platforms while providing a high degree of flexibility to to-
day's users.
Background
Computational
chemistry
117
Developments
in
computer graphics
Tools
for
supercomputers
What do potential
users really need
from computers?
Hardware
independence
and
flexibility
118
Current Public Domain Systems
in
Use
Dataflow model Efforts in the mid-1980s at the Computer Graphics
Re-
search Group (now known
as
the Advanced Computing
Center for the Arts and Design) at the
Ohio
State Universi-
ty
led to selection of a dataflow model for the apE system.
Steps in A dataflow system maps very well to the general steps
fol-
understanding lowed in visualizing scientific data. Most researchers follow
scientific data a five-step process, beginning with a computational
or
ex-
perimental simulation, and concluding with interpretation.
Intermediate steps include preparation, mapping, and ren-
dering (the preparation stage
is
occasionally omitted
or
merged with the map stage). Ideally, the results of interpre-
Feedback tation can be
fed
back into the original experiment
or
simu-
lation. This kind of feedback
is
known
as
steering, and has
been used with great success in some limited applications.
New
software technology, beyond the reach of apE,
is
need-
ed
to
investigate the steering issue completely.
Utilizing The dataflow abstraction
is
ideal for remote execution
networked and parallel operation.
Network
computing environments
computers are commonplace, and distributed computation
is
a require-
ment for maximum resource utilization. Dataflow systems
can naturally distribute each execution element
on
a
sepa-
rate machine
or
processor. The apE dataflow
is
data-driven
and not demand-driven, which offers the benefit
of
parallel
execution for time-dependent
or
multi-frame data sets. Each
element operates not under the control of some central
au-
thority
but instead only
as
input data, frame boundaries,
Local
and
and other local conditions dictate. Successive elements in a
centralized visualization pipeline can
be
operating
on
separate groups of
computers data, all in concert, without any additional user interaction.
This notion of distributed computing maps well to the reali-
ties encountered among researchers,
as
they are often located
at distant sites, far from their supercomputing resource, but
may have some local computing power available.
Dataflow language Once the group
was
firmly committed to the data flow
concept, they examined the requirements for a data lan-
guage.
Incompatible binary formats are common in a heter-
ogeneous network environment. While transmission of data
as
text
files
would mitigate this problem, the operational
apE: A Dataflow Toolkit for Scientific Visualization
overhead for such transmission
was
out of the question in
an interactive system. Thus a dataflow language
was
born,
designed to represent not only common data elements from
the scientific domain (such
as
grids and variables) but
also
common graphical forms, such
as
objects, images, and
ge-
ometries.
There
is
a great difference between writing a small piece
of personal software and constructing a
large
software envi-
ronment. Additional complexity appears when consider-
ation
is
given to machine and device independence and por-
tability. Still more demands come from software which
is
to
be distributed not
as
a closed system but
as
source code, to
be
modified, improved, and extended
as
required. The
group tried to build
as
portable a graphics environment
as
is
possible using existing software and hardware technology.
Clearly, the analysis of this requirement results in a different
answer today than it did in
1987
when this project
was
be-
gun. However, many of the design decisions faced then
are
also faced today by large
scale
developers. These decisions
can
be
summarized
as
three primary turning points: the
se-
lection of an operating system, the selection of a graphics
li-
brary, and the selection of a user interface.
The apE system
is
built on the
UNIX
platform. The
mid-1980s
saw
an explosive growth in a new breed of per-
sonal computer known
as
the "workstation". Performance,
power, and software resources that were once only part of
large mainframe systems rapidly became available on the
desktop, and the
UNIX
operating system quickly became
the
de
facto standard operating system. Manufacturers that
did not respond to this trend
saw
their
sales
diminish.
The group chose not to embed any graphics library in
the
basis
of the system. They were criticized for not build-
ing their software upon a graphics software layer such
as
CORE,
GKS,
PHIGS, PHIGS+, PEX,
or
others. In late
1987,
when this decision
was
made, the number
of
compet-
ing standards
was
large, and no clear winner had emerged.
None of the standards available then were really sufficient
for scientific visualization. Constructing the software on
119
Representing data
elements
and
graphical forms
Software
engineering
principles
Extensibility
by users
Portability
Design decisions
UNIX platform
De facto standard
Independent
of
graphics libraries
Proliferating
standards
Visualization
requirements
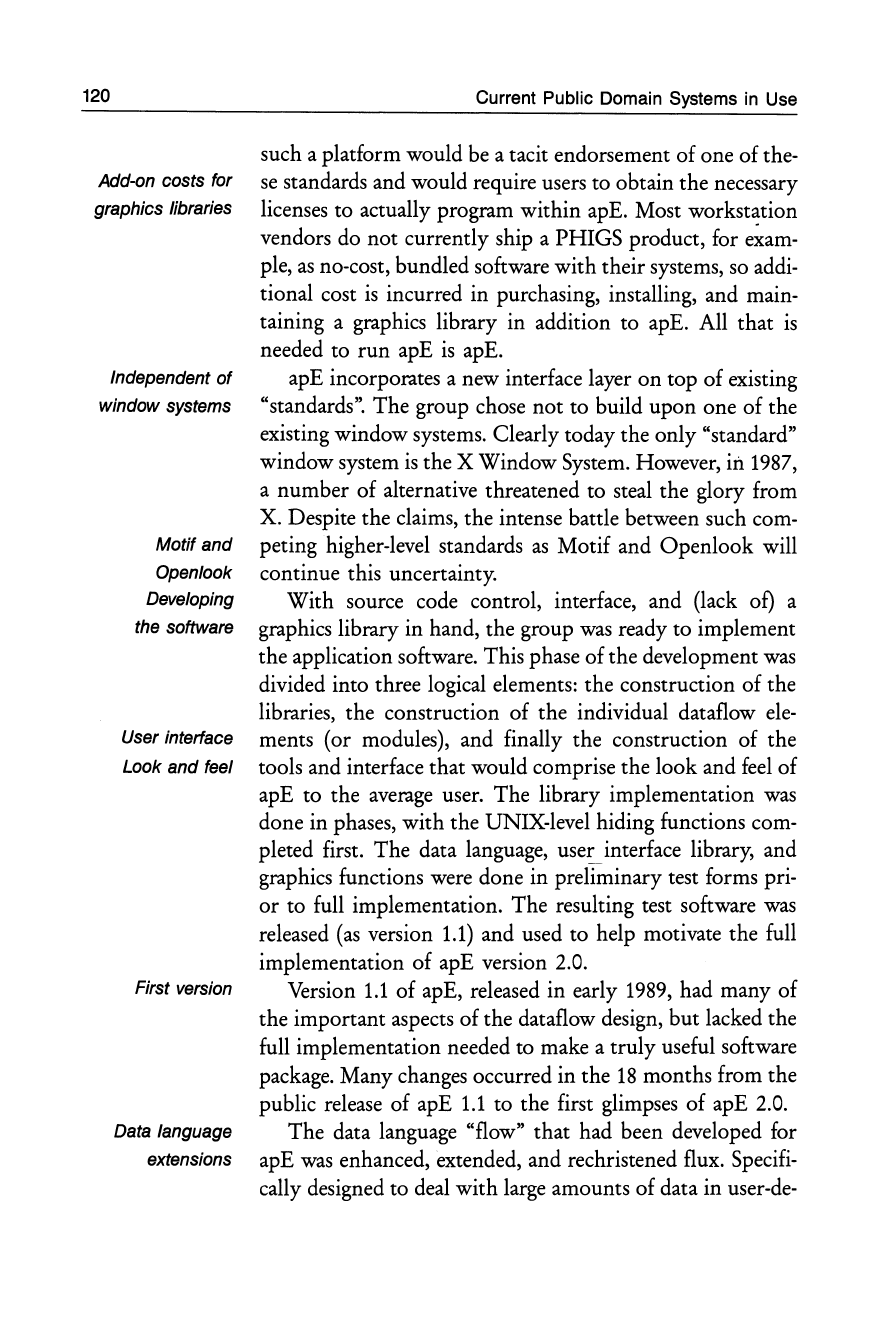
120
Current Public Domain Systems
in
Use
such a platform would be a tacit endorsement of one of the-
Add-on costs for
se
standards and would require users to obtain the necessary
graphics libraries licenses to actually program within apE. Most workstation
vendors do not currently ship a PHIGS product, for
e~am
pIe,
as
no-cost, bundled software with their systems,
so
addi-
tional cost
is
incurred in purchasing, installing, and main-
taining a graphics library in addition to apE. All that
is
needed to run apE
is
apE.
Independent
of
apE incorporates a new interface layer on top of existing
window systems "standards". The group chose not to build upon one of the
existing window systems. Clearly today the only "standard"
window system
is
the X Window System. However, in
1987,
a number
of
alternative threatened to steal the glory from
X. Despite the claims, the intense battle between such com-
Motif and peting higher-level standards
as
Motif and Openlook will
Openlook continue this uncertainty.
Developing With source code control, interface, and (lack of) a
the software graphics library in hand, the group
was
ready to implement
the application software. This phase of the development
was
divided into three logical elements: the construction of the
libraries, the construction of the individual dataflow
ele-
User interface ments (or modules), and finally the construction of the
Look
and
feel tools and interface that would comprise the look and
feel
of
apE to the
average
user. The library implementation
was
done in phases, with the UNIX-level hiding functions com-
pleted first. The data language,
usel"_
interface library, and
graphics functions were done in preliminary test forms pri-
or
to full implementation. The resulting test software
was
released
(as
version
1.1)
and used to help motivate the full
implementation of apE version 2.0.
First version Version
1.1
of apE, released in early
1989,
had many of
the important aspects of the dataflow design, but lacked the
full implementation needed to make a truly useful software
package. Many changes occurred in the
18
months from the
public release of apE
1.1
to the first glimpses of apE 2.0.
Data language The data language "flow" that had been developed for
extensions apE
was
enhanced, extended, and rechristened flux. Specifi-
cally designed to deal with
large
amounts of data in user-de-
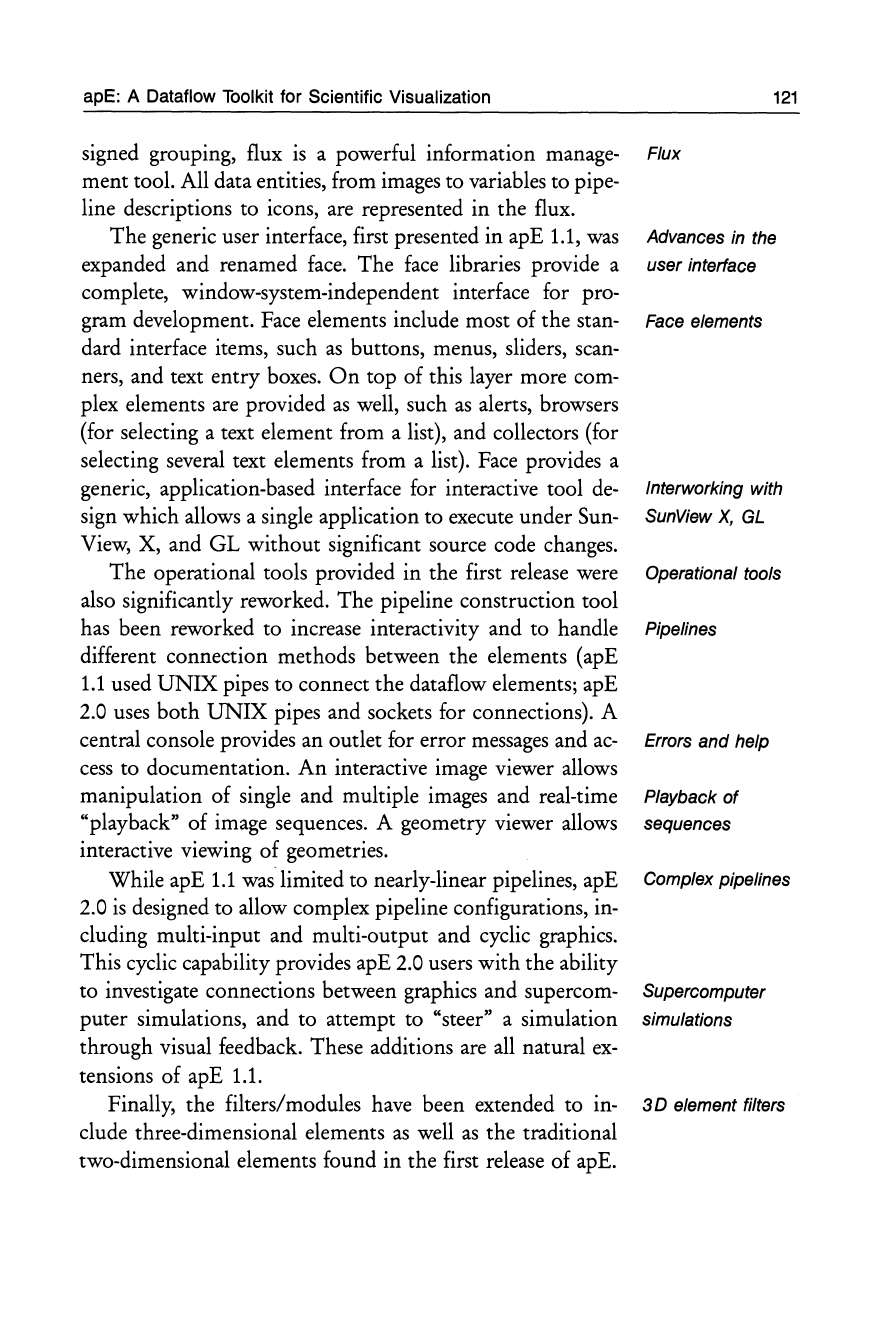
apE: A Dataflow Toolkit for Scientific Visualization
signed grouping, flux
is
a powerful information manage-
ment tool. All data entities, from images to variables to pipe-
line descriptions to icons, are represented in the flux.
The generic user interface, first presented in apE 1.1,
was
expanded and renamed
face.
The
face
libraries provide a
complete, window-system-independent interface for pro-
gram development.
Face
elements include most of the stan-
dard interface items, such
as
buttons, menus, sliders, scan-
ners, and text
entry
boxes.
On
top of this layer more com-
plex elements are provided
as
well, such
as
alerts, browsers
(for selecting a text element from a list), and collectors (for
selecting several text elements from a list). Face provides a
generic, application-based interface for interactive tool
de-
sign which allows a single application to execute under Sun-
View, X, and GL without significant source code changes.
The operational tools provided in the first release were
also significantly reworked. The pipeline construction tool
has been reworked to increase interactivity and to handle
different connection methods between the elements (apE
1.1
used
UNIX
pipes to connect the dataflow elements; apE
2.0 uses both
UNIX
pipes and sockets for connections). A
central console provides an outlet for error
messages
and
ac-
cess
to documentation.
An
interactive image viewer allows
manipulation of single and multiple images and real-time
"playback" of image sequences. A geometry viewer allows
interactive viewing of geometries.
While apE
1.1
was
limited to nearly-linear pipelines, apE
2.0
is
designed to allow complex pipeline configurations, in-
cluding multi-input and multi-output and cyclic graphics.
This cyclic capability provides apE 2.0 users with the ability
to investigate connections between graphics and supercom-
puter simulations, and to attempt to "steer" a simulation
through visual feedback. These additions are all natural
ex-
tensions of apE
1.1.
Finally, the filters/modules have been extended to in-
clude three-dimensional elements
as
well
as
the traditional
two-dimensional elements found in the first release of apE.
121
Flux
Advances
in
the
user interface
Face elements
Interworking with
SunView
X,
GL
Operational tools
Pipelines
Errors
and
help
Playback
of
sequences
Complex pipelines
Supercomputer
simulations
3 D element filters
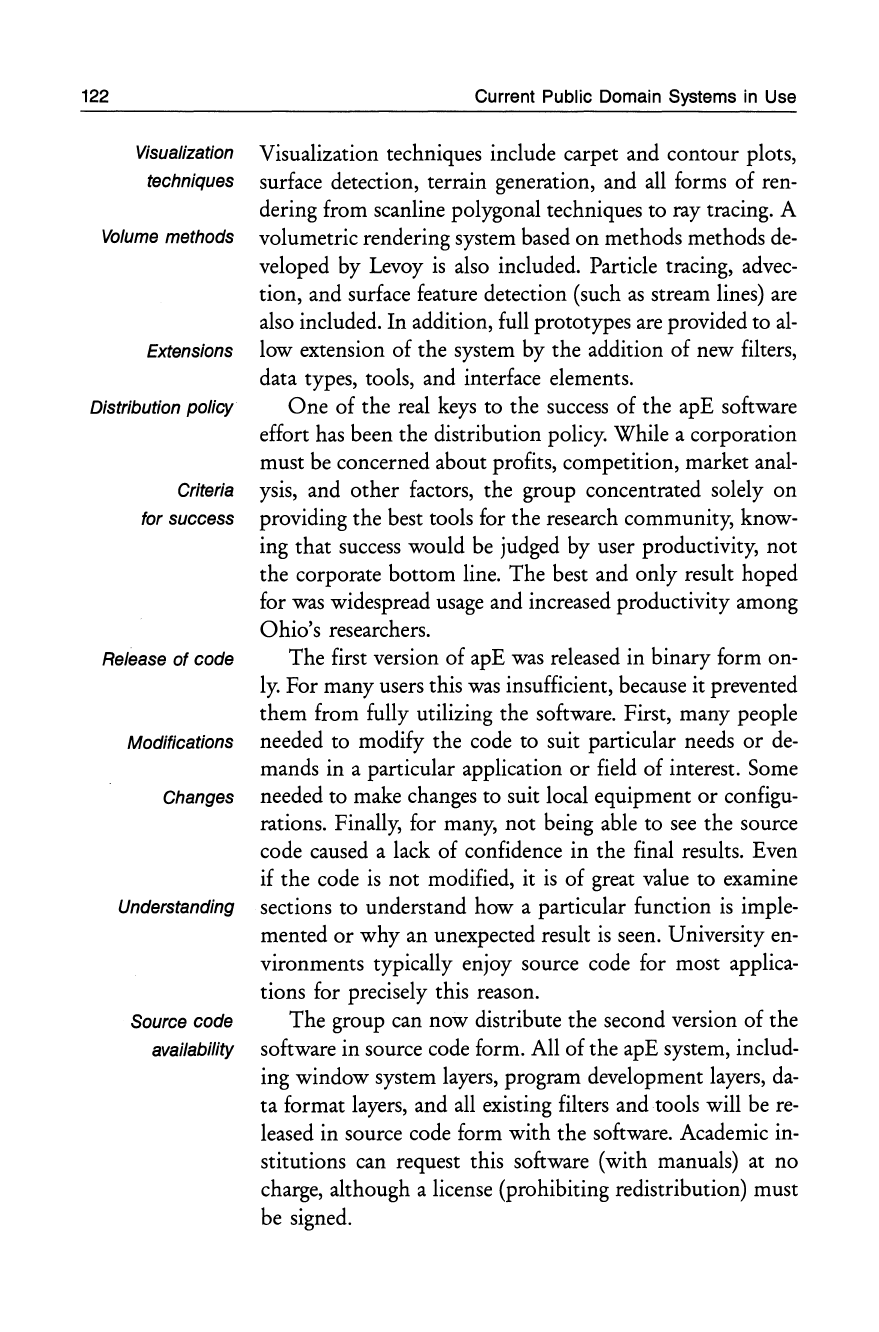
122
Visualization
techniques
Volume methods
Extensions
Distribution policy
Criteria
for success
Release
of
code
Modifications
Changes
Understanding
Source code
availability
Current Public Domain Systems
in
Use
Visualization techniques include carpet and contour plots,
surface detection, terrain generation, and
all
forms of ren-
dering from scanline polygonal techniques to ray tracing. A
volumetric rendering system based on methods methods
de-
veloped by
Levoy
is
also included. Particle tracing,
advec-
tion, and surface feature detection (such
as
stream lines)
are
also included. In addition, full prototypes
are
provided to
al-
low extension of the system by the addition
of
new filters,
data types, tools, and interface elements.
One
of the real
keys
to the
success
of the apE software
effort
has
been the distribution policy. While a corporation
must
be
concerned about profits, competition, market anal-
ysis, and other factors, the group concentrated solely on
providing the best tools for the research community, know-
ing that
success
would
be
judged by user productivity, not
the corporate bottom line. The best and only result hoped
for
was
widespread
usage
and increased productivity among
Ohio's researchers.
The first version of apE
was
released in binary form on-
ly.
For many users this
was
insufficient, because it prevented
them from fully utilizing the software. First, many people
needed to modify the code to suit particular needs
or
de-
mands in a particular application
or
field of interest. Some
needed to make changes to suit local equipment
or
configu-
rations. Finally, for many, not being able to
see
the source
code caused a lack of confidence in the final results. Even
if the code
is
not modified, it
is
of great value to examine
sections to understand how a particular function
is
imple-
mented
or
why an unexpected result
is
seen. University
en-
vironments typically enjoy source code for most applica-
tions for precisely this reason.
The group can now distribute the second version of the
software in source code form. All of the apE system, includ-
ing window system layers, program development layers,
da-
ta format layers, and
all
existing filters and tools will
be
re-
leased in source code form with the software. Academic in-
stitutions can request this software (with manuals) at no
charge, although a license (prohibiting redistribution) must
be
signed.
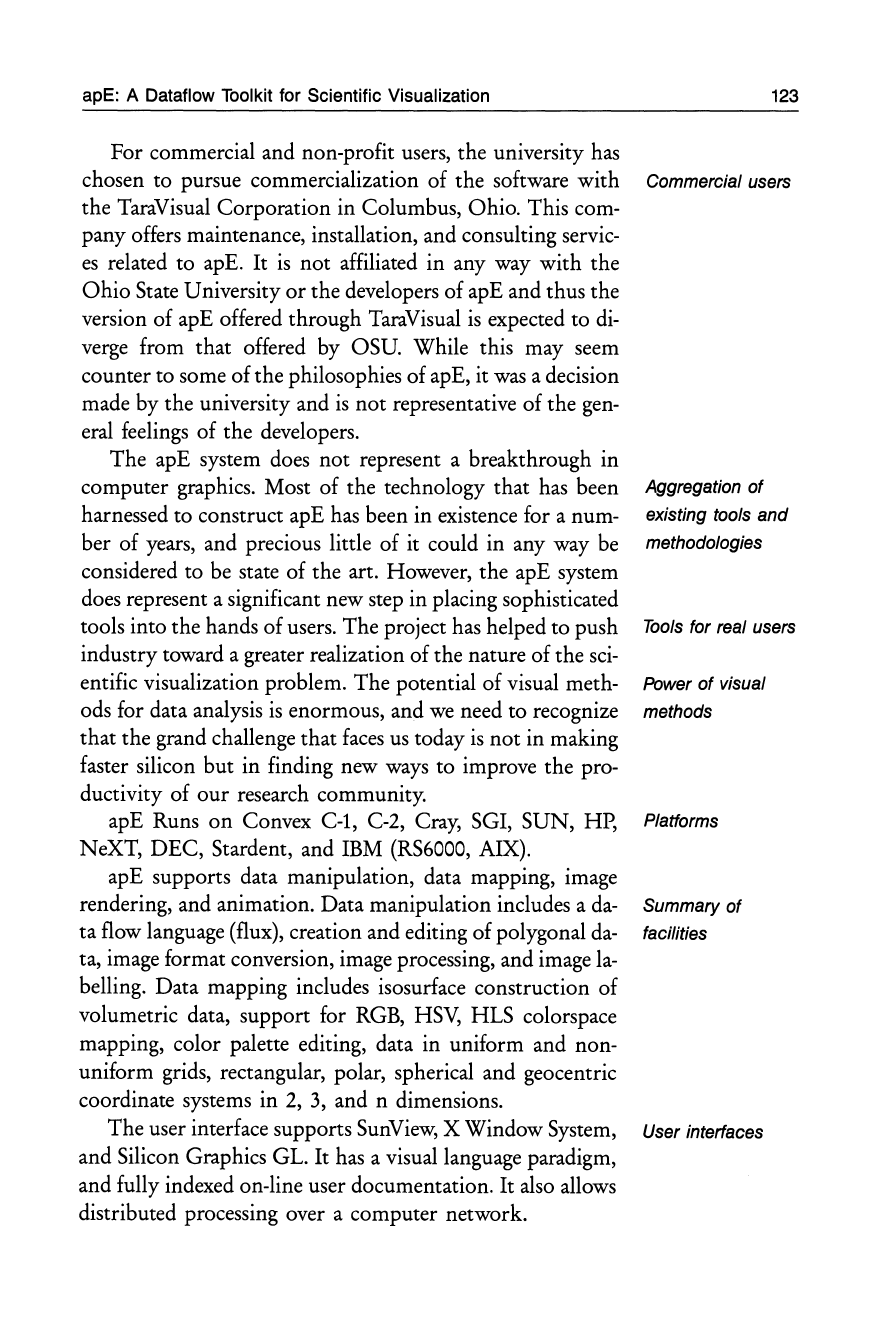
apE: A Dataflow Toolkit for Scientific Visualization
For commercial and non-profit users, the university has
chosen to pursue commercialization of the software with
the TaraVisual Corporation in Columbus, Ohio. This com-
pany offers maintenance, installation, and consulting servic-
es
related to apE.
It
is
not
affiliated in any way with the
Ohio
State University
or
the developers of apE and thus the
version of apE offered through TaraVisual
is
expected to
di-
verge
from that offered by
Osu.
While this may seem
counter to some of the philosophies of apE, it
was
a decision
made by the university and
is
not representative of the
gen-
eral feelings of the developers.
The apE system does not represent a breakthrough in
computer graphics. Most of the technology that
has
been
harnessed to construct apE has been in existence for a num-
ber of years, and precious little of it could in any way
be
considered to
be
state of the art. However, the apE system
does represent a significant new step in placing sophisticated
tools into the hands of users. The project has helped to push
industry toward a greater realization of the nature of the
sci-
entific visualization problem. The potential of visual meth-
ods for data analysis
is
enormous, and
we
need to recognize
that the grand challenge that
faces
us
today
is
not in making
faster silicon but in finding new
ways
to improve the pro-
ductivity of
our
research community.
apE Runs
on
Convex C-l, C-2, Cray, SGI, SUN, HP,
NeXT, DEC, Stardent, and IBM (RS6000, AIX).
apE supports data manipulation, data mapping, image
rendering, and animation. Data manipulation includes a
da-
ta flow language (flux), creation and editing of polygonal
da-
ta, image format conversion, image processing, and image
la-
belling. Data mapping includes isosurface construction of
volumetric data, support for
RGB,
HSV,
HLS colorspace
mapping, color palette editing, data in uniform and non-
uniform grids, rectangular, polar, spherical and geocentric
coordinate systems in 2,
3,
and n dimensions.
The user interface supports Sun
View,
X Window System,
and Silicon Graphics GL.
It
has a visual language paradigm,
and fully indexed on-line user documentation.
It
also allows
distributed processing over a computer network.
123
Commercial users
Aggregation
of
existing tools
and
methodologies
Tools
for real users
Power
of
visual
methods
Platforms
Summary
of
facilities
User interfaces
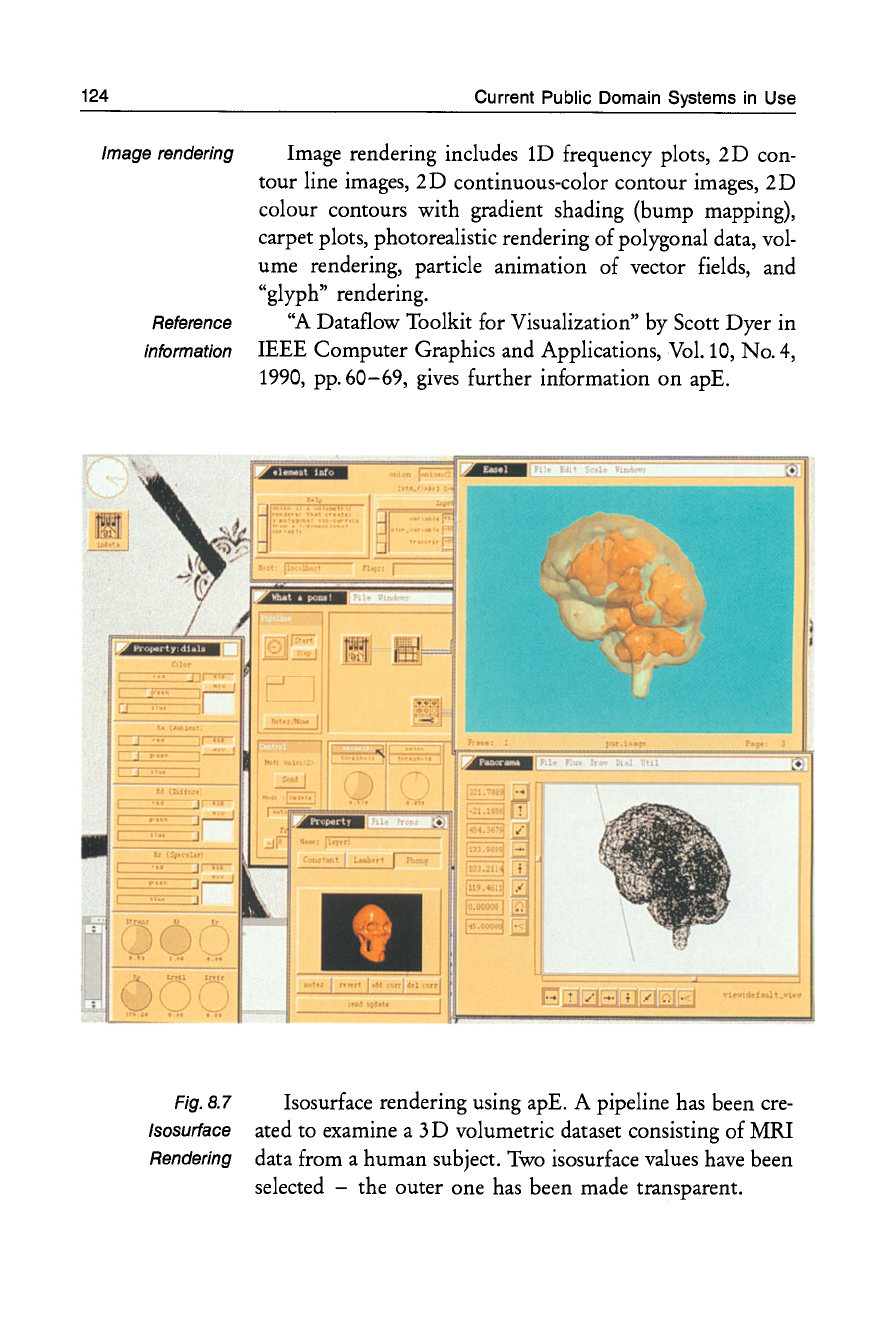
124
Current Public Domain Systems
in
Use
Image rendering Image rendering includes
lD
frequency plots,
2D
con-
tour line images,
2D
continuous-color contour images,
2D
colour contours with gradient shading (bump mapping),
carpet plots, photorealistic rendering of polygonal data,
vol-
ume rendering, particle animation of vector fields, and
"glyph" rendering.
Reference
"A
Dataflow Toolkit for Visualization" by Scott Dyer in
information IEEE Computer Graphics and Applications,
Vol.
10,
No.4,
1990,
pp.60-69
,
gives
further information on apE .
Fig.B.7
Isosurface
Rendering
mCb'O' .
~
I •
Isosurface rendering using apE. A pipeline has been
cre-
ated to examine a 3 D volumetric dataset consisting of MRI
data from a human subject.
Two
isosurface values
have
been
selected -the outer one
has
been made transparent.
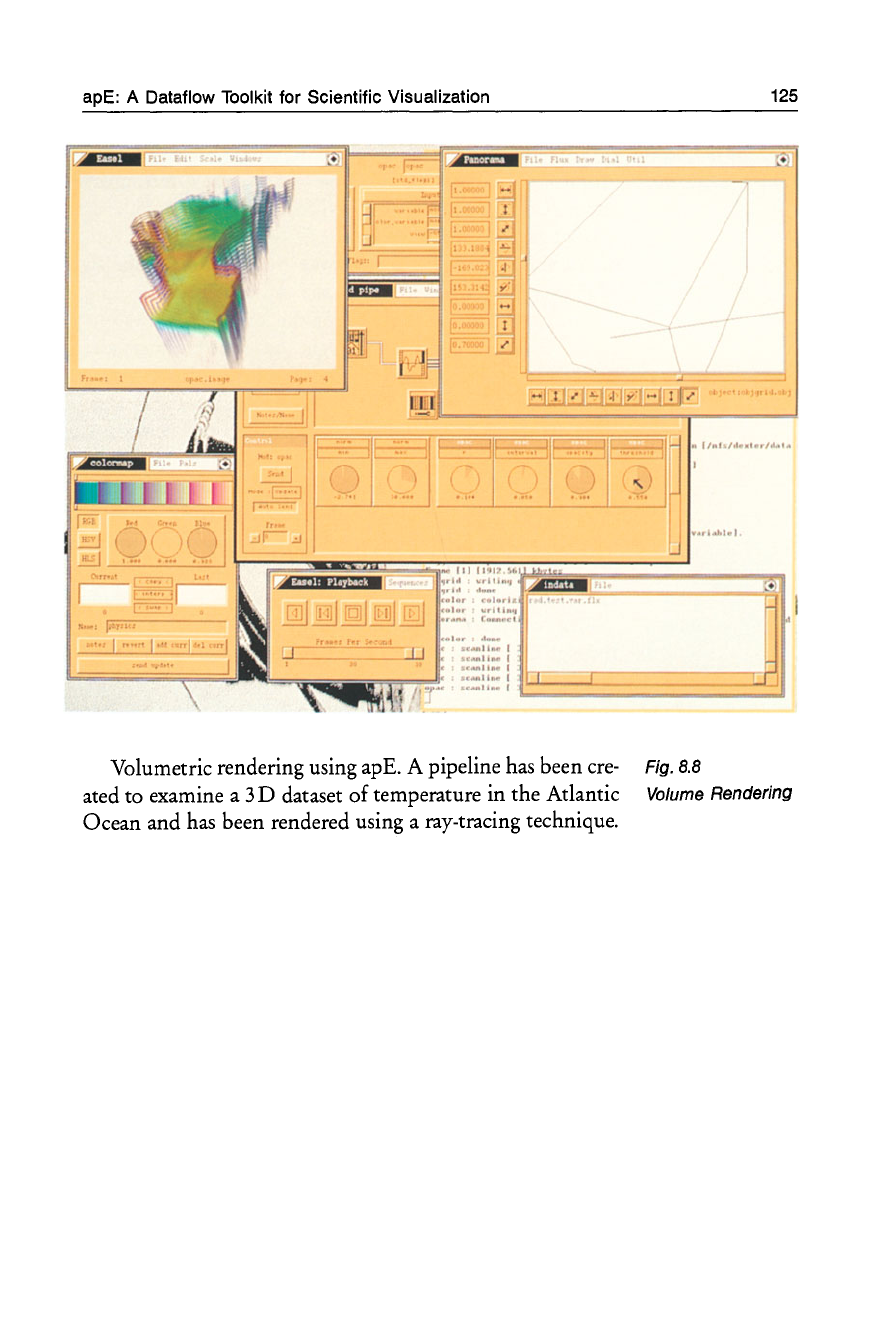
apE: A Dataflow Toolkit for Scientific Visualization
11111",,,
~
.1.,
~I'III
...
,
....
(_.-t
~.I.I'
"""-
...
_11-1
...
-'.-1
125
.111'."'"
I
r=====~:::::::::::=~
_,,_I
,.,.
..
"-"-I
Volumetric rendering using apE. A pipeline has been cre-
Fig.
B.B
ated to examine a 3 D dataset
of
temperature in the Atlantic
Volume
Rendering
Ocean and has been rendered using a ray-tracing technique.
126
Current Public Domain Systems
in
Use
Acknowl- This project has been possible only because of the dedi-
edgements cation and commitment of the members of the
Ohio
Super-
computer Graphics Project. The listed authors would like to
thank Barb Dean, Manager of the
Ohio
Visualization Labo-
ratory, and Michelle Messenger, our Project Coordinator. In
addition, the participation
of
the Advanced Computing
Center for the Arts and Design, in the form of graphics
spe-
cialists
Steve
Spencer and Jeff Light, has added features and
capabilities to apE that would have otherwise been absent.
The authors also thank Prof. Charles Csuri, who mar-
shalled the resources to bring this project into being and
supported it throughout its history, Dr. William McCurdy,
for providing the resources and being the catalyst for many
of
apE's scientific concepts, and Dr. Charlie Bender, Direc-
tor of the
Ohio
Supercomputer Center, for believing in the
project, and continuing to supporting it, during its most
crucial hours.
Support This work
was
supported by the
Ohio
Board of Regents,
through the
Ohio
Supercomputer Center, and by the
Ohio
State University. This work
was
supported in part by a grant
from Cray Research, Inc., by an equipment grant from Ap-
ple Computer, Inc., and by an equipment loan from Silicon
Graphics, Inc.
Contributed by the
Ohio
Supercomputer Graphics Project:
Scott Dyer, Project Leader
Steve
Anderson
John Berton
Pete Carswell
John Donkin
Jeff Faust
Jill Kempf
Robert Marshall
Since this information
was
submitted, apE has been taken
over by TaraVisual Corporation, who
are
now responsible
for its distribution and support. Although it
was
initially
made available
as
a public domain product from
Ohio
Su-
National Center for Supercomputing Applications (NCSA)
percomputer Center, this
is
no longer the
case
at the time
of writing. However, discounts on the software
are
available
for academic
use.
All enquiries on apE should now
be
di-
rected to the address below, and not to Ohio Supercomputer
Center.
TaraVisual Corporation
929
Harrison Avenue
Columbus
OH
43215
U.S.A.
Tel:
(800)
458-8731
Tel:
614-291-2912
Fax: 614-291-2867
8.3
National
Center
for
Supercomputing
Applications
(NCSA)
The NCSA
Tools
for
the Macintosh
The National Center for Supercomputing Applications Interactive data
(NCSA) offers a number of tools that
are
available in the analysis
public domain. NCSA Distributed DataScope
is
an interac-
tive data analysis tool that displays 32-bit scientific data
val-
ues
in spreadsheet form
or
as
simple scaled, interpolated,
or
polar color raster images. NCSA Image
is
a color imaging Color imaging
and analysis application that permits manipulation of two-
and
analysis
and three-dimensional image data sets. Distributed capabili-
ties across TCP/IP network connections allow image pro-
cessing on powerful computers such
as
a CRAY
1.
Specific
data manipulation features in NCSA Image include histo-
gram equalizations, contrast enhancements, and useful utili-
ty
functions. NCSA Layout
is
a presentation tool that
al-
Layout and
lows the and user to display and annotate two-dimensional annotation
data annotation images so that users can photograph their
Macintosh screen display with a
35
mm camera and produce
presentation-quality slides. NCSA Telnet provides a link
be-
127
128
Current Public Domain Systems
in
Use
tween the Macintosh and the TCP/IP networks. It includes
File transfer a standard
file
transfer server (FTP), which allows
file
shar-
ing with other machines.
All these tools
are
available
free
via the Internet. The
software and documentation are also available for purchase
through the NCSA Technical Resources Catalog.
Contact:
NCSA Documentation Orders
152
Computing Applications Building
605
East Springfield Avenue
Champaign, IL 61820, U.S.A.
Tel:
217-244-0072.
(This information
is
supplied courtesy of visualization
Technology: an Introduction", by Anne Kaplan-Neher, in
Syllabus, Summer
1991,
Number
17,
P.O.
Box
2716, Sunny-
vale,
CA
94087-
0716, AppleLink: SYLLABUS, Internet:
SYLLABUS@APPLELINK.APPLE.COM; Phone and
Fax:
408-773-0670.
It
was
initially obtained from the "Arti-
cles
database of CCNEWS, the Electronic Forum for Cam-
pus Computing Newsletter Editors, a BITNET-based ser-
vice of EDUCOM").
8.4
GPLOT,
DRAWCGM, P3D
(Pittsburgh
Supercomputer
Center)
GPLOT can interpret
CGM
metafiles and can
run
anima-
tion hardware. DRAWCGM produces rasters from
2D
ar-
rays of integers
or
reals. P3D creates and views 3 D models.
Such models can
be
viewed on SUNs and SGIs.
It
can build
isosurface models and molecular models, and create anima-
tions directly
on
video tape.
It
is
available via anonymous
FTP
from calpe.psc.edu. Further information
is
given
be-
low.
GPLOT, DRAWCGM, P3D
8.4.1
The GPLOT CGM Interpreter
The Pittsburgh Supercomputing Center began in 1986
as
Supercomputer
one
of
several sites charged by the U.
S.
National Science center
Foundation with providing supercomputer (and other)
ca-
pabilities to NSF researchers. Unlike other such sites, the
us-
er base (over 2000 researchers)
is
very diverse, both
geo-
graphically and technologically, with almost all users physi- Remote access
cally remote.
Providing a graphical capability to these users
was
prob- Graphics
lematic; but being a new center provided the option to
de-
standards
sign systems from scratch.
It
was
decided to standardise
completely
on
the Computer Graphics Metafile (CGM) for-
CGM
mat for two-dimensional image storage. Accordingly only
graphics packages that could produce
CGM
files
were pur-
chased. Each of these packages came with a
CGM
translator,
but it
was
found that these translators could only reliably
translate
CGM
files
from the corresponding graphics pack- Which
CGM?
age!
It
was
unacceptable to distinguish between types of
CGM
files
and it
was
decided to write a
CGM
translator:
GPLOT. In addition to homogenizing the
CGM
file popu-
GPLOT
lation there were several other advantages to using this soft-
ware. Firstly, GPLOT could be freely distributed to remote Distributed
sites and users were encouraged to produce their
CGM
files
software
at the PSC and ship them home for viewing with a local
co-
py
of
GPLOT. This improved response for the users dramat-
ically compared to viewing the
CGM
files
across their net- Reduced
work connection and also reduced the load
on
the network network load
connections. Secondly it allowed the rapid addition of new
output devices and facilities.
GPLOT
was
more successful than expected; there are 275 sites
now over
275
sites
on
the list of users, including most of the
major universities and research laboratories in the USA and
several sites in other countries. GPLOT now supports out-
put
to many different output devices with three different
us-
er interfaces.
129
130
Current Public Domain Systems
in
Use
Video GPLOT
was
also used to greatly facilitate the creation of
videos by remote users. Users
are
encouraged to create
CGM
Frame checking
files
with many (possibly very many) frames. They can
ex-
amine individual frames
at
their home site using their copy
of
GPLOT and when satisfied with their "look" submit
them for animation. A local copy
of
GPLOT at the PSC
is
Animation then used to create a full animation either on a Sony U matic
sequences recorder
or
on
a Sony laser disk recorder.
It
can then
be
dubbed to VHS tape and mailed to the user, with a turn-
around time of a
few
days.
In fact this
is
the only output
that PSC mails to users. In this manner
several
minutes of
animation can
be
produced, possibly spanning
several
indi-
vidual animations, a night. Presently there are three parallel
animation systems, two U matics and one laser disk
re-
corder.
Cost savings In addition
to
purely remote
use,
three of the heaviest
an-
imation users decided to purchase their own hardware, and
used GPLOT software
to
produce their own animation
sys-
tems. Since
all
necessary software
was
provided, the cost to
these users
was
much
less
than a commercial system.
Random access The size of the
CGM
files
required for animations
(fre-
quently close to a gigabyte) motivated extension
of
the
CGM
standard to include a random
access
capability. This
was
done in cooperation with the SLATEC supercompu-
ting community and it
has
worked very well to date.
The original GPLOT system
was
written entirely in the
C programming language, compilable under either the
UNIX
or
VMS
operating systems.
As
the move began to-
Graphical user wards sophisticated graphical user interfaces and users began
interface to request more capabilities for GPLOT (including on-
screen animations for workstations) it
was
decided to com-
Object oriented pletely rewrite GPLOT in an object-oriented fashion using
the
C+
+ language. This greatly simplified the addition of
some features, including on-screen animations using the
X-
Window system and a Motif user interface.
Port
to
This
C+
+ version also simplified the
port
to the Apple
Apple Macintosh Macintosh operating system. The great majority of the code
is
common with two Macintosh specific modules, one for
GPLOT, DRAWCGM, P3D
the user interface and one for the Quickdraw imaging
sys-
tem.
The object-oriented design
was
also intended to allow
the easy integration
of
all
of
GPLOT's capabilities into oth-
er packages. Work
is
underway to perform this in combina-
tion with a documentation system to allow true text-graph-
ics
integration in a single system.
8.4.2 The DrawCGM Graphics
Subroutine Library
Access
to
other packages
During the development of GPLOT, it became necessary to
Test
facilities
generate
CGM
files
for test purposes. A simple library called
CGMGen
was
written to do this. It had the ability to pro-
duce indexed
or
direct color
CGM
files,
the interface being
set up
so
that a single call generally produced a single
CGM
element.
At the same time it
was
becoming obvious that graphics Graphics from
packages available then, like Disspla, DI-3000, and the supercomputers
NCAR
Graphics Library, lacked features needed to do some
of the graphics required in a supercomputing environment.
In particular, it
is
very common for a supercomputer user
to wish to produce a color image from a two-dimensional
regular array
of
data. This
is
done simply by mapping the
data into a range of integer values, and drawing the image
using those values
as
indices into a color
map.
It
was
re-
quired to provide this functionality to the users in a simple
way.
This led to the development
of
the DrawCGM graphics Raster images
library, which
is
particularly well suited to the generation of
raster images. The package provides facilities for manipulat-
ing color maps, scaling and quantizing rasters of reals, and
drawing multiple images within a single
CGM
frame. The
ability to produce other
CGM
primitives
was
added, such
as
markers, lines, polygons, and text
as
well, because these
functions were readily available in CGMGen. Utilities to
easily draw color bars and labels were
also
included.
Because
the primary task of DrawCGM
was
to handle color mapped
131
132 Current Public Domain Systems
in
Use
images, only the indexed color facilities in CGMGen
were used. DrawCGM
is
written in FORTRAN, while
CGMGen
is
written in
C.
Eventually confidence in the interpretation of the
CGM
standard increased
so
that support for the independent
CGM
generator in CGMGen could
be
dropped. This
CGM
Interface
to
GPLOT generator
was
replaced with a direct interface to the GPLOT
device driver library, making it possible to
use
the
CGMGen interface to do graphics interactively
on
any
de-
vice supported by GPLOT. Since GPLOT
also
supports
de-
vice drivers which create binary
or
clear CGM, the ability
to produce metafiles from DrawCGM
was
not lost. Thus
DrawCGM became an interactive package, supporting a
wide range of devices.
DrawCGM and CGMGen
are
distributed with the
GPLOT library, and
are
now quite widely used. DrawCGM
Applications has been particularly successful for producing animations,
for example of hydrodynamic systems. Users will preview
animations either interactively
or
via a
CGM
metafile and
GPLOT, and will
pass
a
CGM
file
containing the entire ani-
mation for recording when their results
are
satisfactory.
DrawCGM provides the ability to
have
multiple images
with distinct color maps on screen simultaneously, which
can greatly improve the information content of this sort of
animation. The underlying CGMGen layer still supports
the ability to
use
direct color, so it
has
been used to interface
a number of 24-bit color applications to the GPLOT device
driver library.
One
feature which DrawCGM does not currently sup-
port
is
the ability to
have
multiple output devices open
si-
multaneously. It
is
hoped to correct this when CGMGen
is
recoded to interface to the new object-oriented version of
GPLOT.
GPLOT, DRAWCGM, P3D
8.4.3 The P3D Three-Dimensional
Metafile Project
Success with a metafile-based environment for
2D
graphics
2D
to
3D
led to the consideration of a similar system for three-dimen-
sional models. The goal would be
to
produce a format
which all programs generating 3 D models at the PSC would
produce, and which could be rendered in three dimensions
on
a wide variety
of
platforms. The existence
of
this format
would allow models to be transferred between the central
si-
te and user sites, and would simplify the software support
situation analogous to the simplification provided by CGM.
This
is
not
to belittle the importance of interactive 3 D
graphics; it
is
simply believed that a complete environment
requires both interactive and metafile forms and that it
is
ap-
propriate to investigate the metafile approach.
Unfortunately, unlike the
2D
case
in which the standard Format for 3D
CGM
format already existed, there
was
and
is
no standard
format for 3 D scientific graphical models. The available
non-standard formats were examined and none of them
were found very satisfactory for current needs. Therefore a
further format
was
developed, called P3D -the P denoting
'Programmable'.
P3D
is
based
on
a subset of the
Common
Lisp language,
3D
language
with a small number of extensions to describe geometry.
This makes P3D a complete programming language in itself,
allowing it the same flexibility which programmability pro-
vides to the Postscript page description language. Like Post-
script, it
is
never necessary for a user to actually write a pro-
gram in P3D. A model generating program (for example a
molecular modeler) produces a P3D model, and a P3D
viewer translates the model into images which the user can
view.
The P3D viewer includes a locally written Lisp inter-
preter; there
is
no
need for the site using P3D to license an
interpreter from a third party. Because the full 3 D structure
of
the model
is
stored in the P3D
file,
the model can be
viewed from any direction
or
incorporated into more com-
plex models.
133
134
Current Public Domain Systems
in
Use
Needs
of
scientific P3D
was
designed to support the needs of scientific visu-
visualization alization, rather than those of photorealism or, for example,
computer aided design. The current implementation sup-
ports ten geometrical primitives, fairly complete lighting
and camera information, arbitrary transformations, and a
very extensible attribute structure in a hierarchical model
environment.
Rendering options P3D models can
be
viewed
on
seven different renderers,
with more under development. These range from a simple
mouse-driven renderer for the X Window System environ-
ment to renderers for solid modeling workstations and a ray
tracer. A number of generators for P3D models now exist,
including translators for molecular dynamics output,
marching cubes algorithms, a general purpose subroutine
li-
brary, and a simple tool for generating fly-bys of P3D mod-
els.
The programmability of P3D makes it easy to modify
existing codes to produce models in P3D format, since the
metafile can essentially
be
tailored to the needs of the code
rather than the other way round.
Animation
As
with CGM, it
is
possible to produce animation from
a P3D model
file
in which a number of
views
are
specified.
This allows animations to
be
previewed on a user's worksta-
tion, and then nicely rendered (possibly ray-traced) and
re-
corded
as
high quality video animation. The animation
sys-
tem
uses
the same hardware and some of the same software
as
the CGM-based system.
Exchange
of
3D
It would
be
useful for the P3D format to become a com-
mode/ data mon medium
of
exchange for 3D models. There
are
current-
ly about
40
sites
on
the mailing list of those using
or
inter-
ested in P3D,
so
some progress
is
being made toward this
goal. Current work
is
on
designing interfaces which will
al-
low general interactive visualization packages like Stardent's
AVS
and the Ohio Supercomputer Center's apE to read and
write P3D models, and to incorporate additional renderer
interfaces such
as
Pixar's Renderman.
Other
development
projects include a translator to generate P3D from finite
ele-
ment models, and general modifications to improve the
functioning of the P3D renderers.
RAYSHADE
8.4.4
Software Availability
Software developed at the Pittsburgh Supercomputing Cen- Free
of
charge
ter, including GPLOT, DrawCGM, and the P3D software
suite,
is
available
free
of
charge by anonymous
FTP
from
the machine ftp.psc.edu. DrawCGM
is
included in the
GPLOT package; the P3D software
is
a separate distribution
but (depending
on
the configuration chosen) may require
the GPLOT software.
If
you take GPLOT, please send mail
to Anjana Kar (kar@psc.edu) to be added to the appropriate
mailing list. Advanced questions regarding GPLOT,
as
op- Information
posed to simply taking and installing the software, can
be
directed to Phil Andrews (andrews@psc.edu).
If
you take
P3D, please send mail to Joel Welling (welling@psc.edu)
to
be
added to that mailing list.
Contributed
by
Joel
Welling
and
Phil Andrews.
Further information from:
Dr. Joel Welling
Pittsburgh Supercomputer Center
4400
Fifth Avenue
Pittsburgh,
PA
15213,
U.
S.
A.
Tel:
412-268-6352
Email: welling@psc.edu
8.5
RAYS
HADE
135
This
is
an excellent ray-tracing program for scene rendering. Scene rendering
It handles many different kinds of object.
It
is
available from
the University of
Yale
and the University
of
Utah.
Rayshade reads a multi-line ASCII
file
describing a scene Format
to
be
rendered and produces a
Utah
Raster RLE format
file
of the raytraced image.
136
Facilities Features include:
• Primitives:
boxes
cones
cylinders
height fields
planes
polygons
spheres
Current Public Domain Systems
in
Use
triangles (flat-
or
Phong-shaded),
• Composite objects,
• Point, directional, and extended
(area)
light sources,
• Solid texturing and bump mapping of primitives, ob-
jects, and individual instances of objects,
• Antialiasing through adaptive supersampling
or
"jit-
tered" sampling,
• Arbitrary linear transformations of primitives, instances
of objects, and texture/bump maps,
• Use of uniform spatial subdivision and/or hierarchy of
bounding volumes to speed rendering,
• Options to facilitate rendering of stereo pairs,
• Support for the Linda parallel programming language.
An
awk script
is
provided
to
translate
NFF
format scripts
to rayshade format.
C language Rayshade
is
written in C with parsing support provided
through
lex
and
yacc.
The C,
lex
and
yacc
files
comprise
ap-
proximately
8000
lines of code.
Sites
without lex and
yacc
can make
use
of the C source
files
produced by
lex
and
yacc
which
are
included in this distribution.
Platforms Rayshade
has
been tested on a number of UNIX-based
machines, including
Vaxes,
Sun Workstations, Iris 4D Work-
stations, Encore Multimax,
AT&T
3B2/310, CRAY
XMP,
and
IBM
RTs.
In addition, support
is
provided for the Ami-
ga
using the Aztec C compiler.
Getting a copy Rayshade makes
use
of the Utah Raster toolkit, a pack-
age
consisting
of
a large number of useful image manipula-
tion programs, test images, and a library to read and write
NASA Ames Software
images written using the toolkit's RLE format. The toolkit
is
available via anonymous FTP from cs.utah.edu
or
from
weedeater.math.yale.edu.
Those sites that cannot
or
do not want to
use
the Utah
Raster toolkit can make
use
of a compile-time option to
produce images written using a generic
file
format identical
to that used in Mark
Van
de
Wettering's "MTV" raytracer.
Rayshade
is
copyrighted in a "Gnu-like" manner.
Rayshade
is
available via anonymous ftp from
weedea-
ter.math.yale.edu (192.26.88.42) in pub/Rayshade.2.21.tar.Z.
The Utah Raster toolkit
is
available in pub/UtahTool-
kit.tar.Z.
8.6
NASA
Ames
Software
8.6.1
PLOT3D
PLOT3D
is
a computer graphics program designed to visual- Computational
ize the grids and solutions of computational fluid dynamics. fluid dynamics
Eighty-five functions
are
available, and versions
are
available
for many systems. PLOT3D can handle multiple grids with
many grid points, and can produce varieties of model ren-
derings, such
as
wireframe
or
flat shaded.
Output
from
PLOT3D can be used in animation programs.
PLOT3D User's Manual and PLOT3D software can
be
Availability
distributed
free
of charge and without copyright to any in-
stitution
or
business in the USA.
Contact:
Workstation Applications Office
NASA Ames Research Center,
MS258-2
Moffett Field,
CA
94035,
U.
S.
A.
8.6.2 SURF
137
A further program, SURF, allows the user to input
PLOT3D grid and solution
files
and interactively create wi-
reframe, shaded, and function mapped parts to
view,
and
Interactive viewing
of
PLOT 3D files
138
Current Public Domain Systems
in
Use
then output to ARCGraph
files
which can
be
animated
us-
ing the Graphics Animation System (GAS). Shaded parts
are
created based
on
user specified lightsources (at least
20),
viewpoint, and the ambient light level. The function map-
ped parts can have their color spectrum adjusted interactive-
ly.
Legends can be created to show the correlation
of
color
and normalised function values (i.e., pressure, density, tem-
perature, and mach number). Also, function-mapped parts
can
be
clipped so that they only show contours within a
specified range of function values (e.g., normalised pressure
between 1 and
2).
Further facilities
Other
features
of
SURF include the ability to work with
several grids and solutions, grid/solution deletion, support
of multi-grid
files,
input/output for colormaps, matrices,
light sources, function extrema, screen dump pixel in-
put/output, display of current grid and part attribute data,
and a
UNIX
shell
escape.
8.6.3
Graphics Animation System
(GAS)
Animation system GAS
is
a graphics animation software system that
is
menu-
driven and provides fast, simple viewing capability
as
well
as
more complex rendering and animation features.
It
is
used to display two- and three-dimensional objects along
with computed data, and also to record animation sequenc-
es
on
video digital disks, videotape, and
16
mm
film.
8.6.4
Applications in Computational
Fluid Dynamics (CFD)
Illustrations
of
use Some example applications
have
been the following: pres-
sure distribution inside the space shuttle main engine, vor-
tex
flows
over the wing/strake surface of
F-16
aircraft, pres-
sure distribution on an oscillating
F-5
wing, simulation of
turbine engine rotor-stator interaction, particle traces over
the space shuttle orbiter, and pressure distributions over the
high-speed National Aerospace Plane.
Getting a solution The
CFD
software analysis cycle begins with the design
of
a test geometry 'grid' (e.g., forward-swept wing model
NASA Ames Software
with surrounding airspace), specification of simulation con-
ditions (e.g., angle of attack, mach number, reynolds num-
ber) and coding and execution
on
supercomputers of 'flow
solver' programs that solve the higher-order mathematical
equations governing the flight characteristics. Then the nu-
merical solution data
is
collected and converted to graphics
images of fluid
flows,
pressure distributions, shock
waves,
and particle traces using workstations running PLOT3D
and other specialised graphics programs. Then SURF can
be
used to add shadinglcoloring enhancements to the
images.
Finally, animation sequences
are
generated and recorded
with
GAS.
The results produced
are
animated
16
mm films and vid-
eotapes showing solid, pressure mapped aircraft models
with wing/body vortices, particle traces, temperature distri-
butions and shock
waves.
The ability to display the physical
properties in aerodynamic flight
is
a tremendous aid in un-
derstanding and designing aircraft geometries for specific
flight characteristics.
By
using interactive computer graphics
in the aerodynamics study, the critical
areas
(e.g., high tur-
bulence, high temperature, reverse
flow)
immediately
be-
come obvious
so
they can
be
studied more closely using a
finer grid, more particle traces, and higher-resolution map-
ping of pressure
or
temperature contours. For example,
graphical studies revealed high turbulence and pressure in-
side the
Space
Shuttle Orbiter main engine hot
gas
mani-
fold, and further analysis led
to
a redesign
of
the engine
with reduced decisions internal pressure and turbulence.
(Courtesy of PLOT3D User's Manual by
P.
P.
Walatka and
P.
G. Buning, SURF User's Guide by
T.
Plessel, and GAS
User's Manual by
T.
Plessel).
Contact:
NASA Ames Research Center
Mail Stop
258-2
Moffett Field,
CA
94035,
U.
S.
A.
Tel:
415-694-4052
139
Use
of
computer
graphics
Animation
Visualization aids
understanding
Studying physical
properties
Design decisions
140 Current Public Domain Systems in Use
8.7
IRISPLOT
Display
of
surfaces IRISPLOT
is
an extended version of
GNUpiot
for the
Sili-
con Graphics workstation that allows algebraic surfaces to
be displayed, shaded, etc.
IRISPLOT allows the user to define some of the graphi-
cal objects built from surfaces and curves, which in
turn
are
defined from mathematical functions, discrete maps, differ-
ential equations and data
files.
The
user has full control
of
Viewing the the graphical attributes, which includes viewing, orthogonal
surface
or
perspective projection, object transformation, object slic-
ing, 8 different light sources with different color and loca-
tion, and different material properties for each object in
plot.
It
also allows contouring
on
the surfaces.
Interactive
visualization
Finite element
data
For more information, contact system@math.arizo-
na.edu
8.8
ISVAS
FhG-AGD in Darmstadt provides a tool called
ISVAS,
an in-
teractive volume visualizer for
SUN
(Xll/0SF
Motif) and
SGI (GL/Motif).
ISVAS
stands for Interactive Software for
Visual AnalysiS of fracture mechanics. The system has been
developed for the visualization of the results of three-dimen-
sional finite element simulations in fracture mechanics and
other application areas.
The main aim in the development of
ISVAS
is
interact
i-
vity. Finite element analysis produces large amounts of data
and the graphical presentation
of
the data
is
a computer-in-
tensive process. Therefore there
is
a need for presenting data
at speed, but with low amounts of detail. The tools allow
a rough preview of the data and interactive specification of
parameters, such
as
viewpoint and cut planes. The user can
thus produce a quick picture
of
what the data looks like,
specify the parameters of the required image,
then
render it
for a higher-quality presentation.
ISVAS
141
The
Xll
version, which
is
running on SUN, DEC, and
other machines, has already been installed at the Technical
University of Munich, the University of Lisbon, and the
University of Mexico. Sun (SPARe) code
is
available, and
al-
so
source code
of
the data filters for adaption to the user's
own volume data. Data filters for
several
FE-data types
are
provided. Version
1.2
of
ISVAS
allows the user to visualize
scalar volume data. The next version will
also
allow vector
data to be displayed.
ISVAS
is
built upon X Windows and
OSF/Motif
toolkit Portability
to
be
portable to any
UNIX
colour workstation.
Further information:
Dr. Martin Goebel
Fraunhofer-Arbeitsgruppe
fur Graphische Datenverarbeitung
Wilhelminenstrasse 7
W-6100
Darmstadt
Federal Republic of Germany
Tel:
49-6151-155123
Fax:
49-6151-155199
Email: goebel@de.fhg.agd
Creative and
artistic
applications
Artists and
designers
Chapter
9
Other
Uses
of
Visualization
Tools
9.1
Art
and
Design
Tools such
as
those described in this guide can
be
also used
by those whose primary interest
is
not in the scientific con-
tent
of
the information presented, but rather the creative
or
aesthetic value.
Barlow et
al.
(1990) outlines how artists create effects and
explores
issues
at the interface between art and science.
Artists and sculptors
have
been using computer-assisted
tools for a number
of
years (Lansdown, 1989) and these
tools often promote new and unexpected
ways
of creating
and developing images and objects. Architects, designers and
engineers also use these methods. Thus visualization tools
are
not
confined to scientific visualization but can be used
in all
areas
where the user
is
seeking to create and manipu-
late information via visual means.
9.2
The
5th
Dimension
Animation
System
3D
animation and The 5th Dimension Project
is
a large research project in
visualization three-dimensional animation and visualization. The main
objective of the project
is
the animation of synthetic actors
in their environment, which involves a number of related
areas
of
computer animation and scientific visualization. In
Applications particular, the following applications
are
being developed:
• animation of articulated bodies based
on
mechanical
laws,
• vision-based behavioural animation,
The 5th Dimension Animation System 143
• hair rendering and animation,
• object grasping,
• facial animation,
• personification in walking models,
• synchronization in task-level animation,
• deformation of flexible and elastic objects,
• cloth animation with detection of collision.
To
coordinate efforts and allow good communication
be-
High-level toolkit
tween the various applications, a toolkit of high-level dy-
namic
classes,
both two- and three-dimensional,
has
been
constructed. This toolkit, called the 5th Dimension Toolkit,
uses
a uniformly object-oriented design for
all
its data struc- Object oriented
tures, resulting in a high degree
of
integration between vari-
ous applications.
The 5th Dimension animation system
is
intended to
of-
3D
interaction
fer to the animator a full 3 D interaction including the possi-
bility of entering into the virtual world and communicating Virtual worlds
with the synthetic actors. The hardware used consists of
21
Silicon Graphics IRIS Workstations including three Power-
vision (VGX) models. Most 5th Dimension applications
take advantage of visual 3 D interfaces using the various 3 D
devices
available in the laboratories: two datagloves, several
SpaceBalls, an EyePhone, a 3-D Polhemus digitizer, a
Live
Video Digitizer, a Stereo View station, and a synthesizer
key-
board controlled by a NeXT Cube workstation.
In the current version, six applications provide a user in-
3D
devices
terface based on 3 D
devices:
• the sculpting program SURFMAN,
• the Muscle and Expression editor in the SMILE Facial
Animation system,
• the cloth design software,
• the hand gesture recording system GESTURE
LAB,
• the program to create 3 D paths for cameras, objects and
light sources,
• a communication program animator-actor (in develop-
ment).
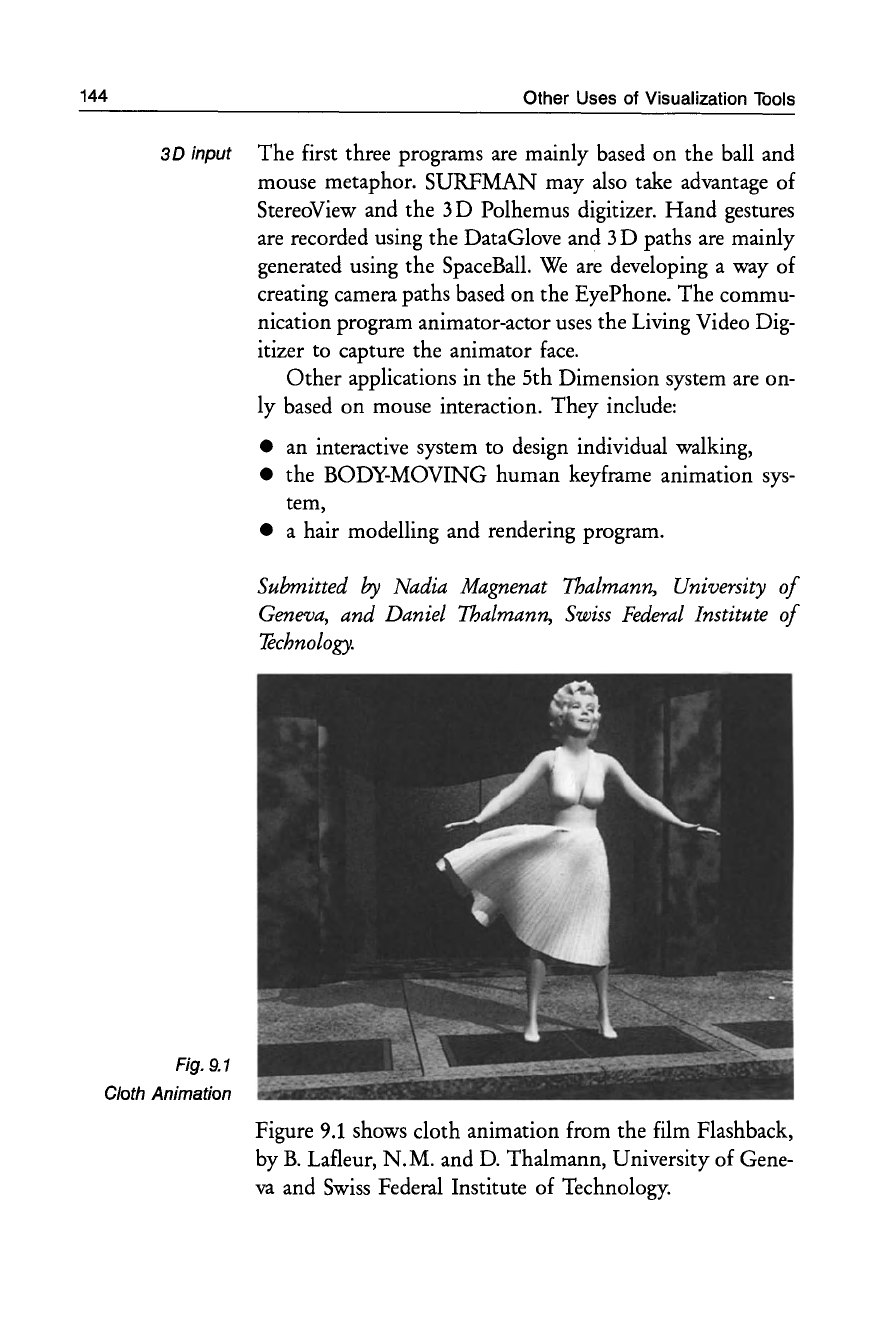
144
Other Uses of Visualization
Tools
3D
input The first three programs
are
mainly based
on
the ball and
mouse metaphor. SURFMAN may
also
take advantage of
Stereo View and the 3 D Polhemus digitizer. Hand gestures
are recorded using the DataGlove and 3 D paths
are
mainly
generated using the
SpaceBall.
We
are
developing a way of
creating camera paths based on the EyePhone. The commu-
nication program animator-actor
uses
the Living Video Dig-
itizer to capture the animator
face.
Fig.
9.1
Cloth Animation
Other
applications in the 5th Dimension system
are
on-
ly based
on
mouse interaction. They include:
• an interactive system to design individual walking,
• the BODY-MOVING human keyframe animation
sys-
tem,
• a hair modelling and rendering program.
Submitted
by
Nadia Magnenat Thalmann, University
of
Geneva, and Daniel Thalmann,
Swiss
Federal
Institute
of
Technology.
Figure
9.1
shows cloth animation from the film Flashback,
by
B.
Lafleur,
N.M.
and
D.
Thalmann, University of Gene-
va
and
Swiss
Federal Institute of Technology.
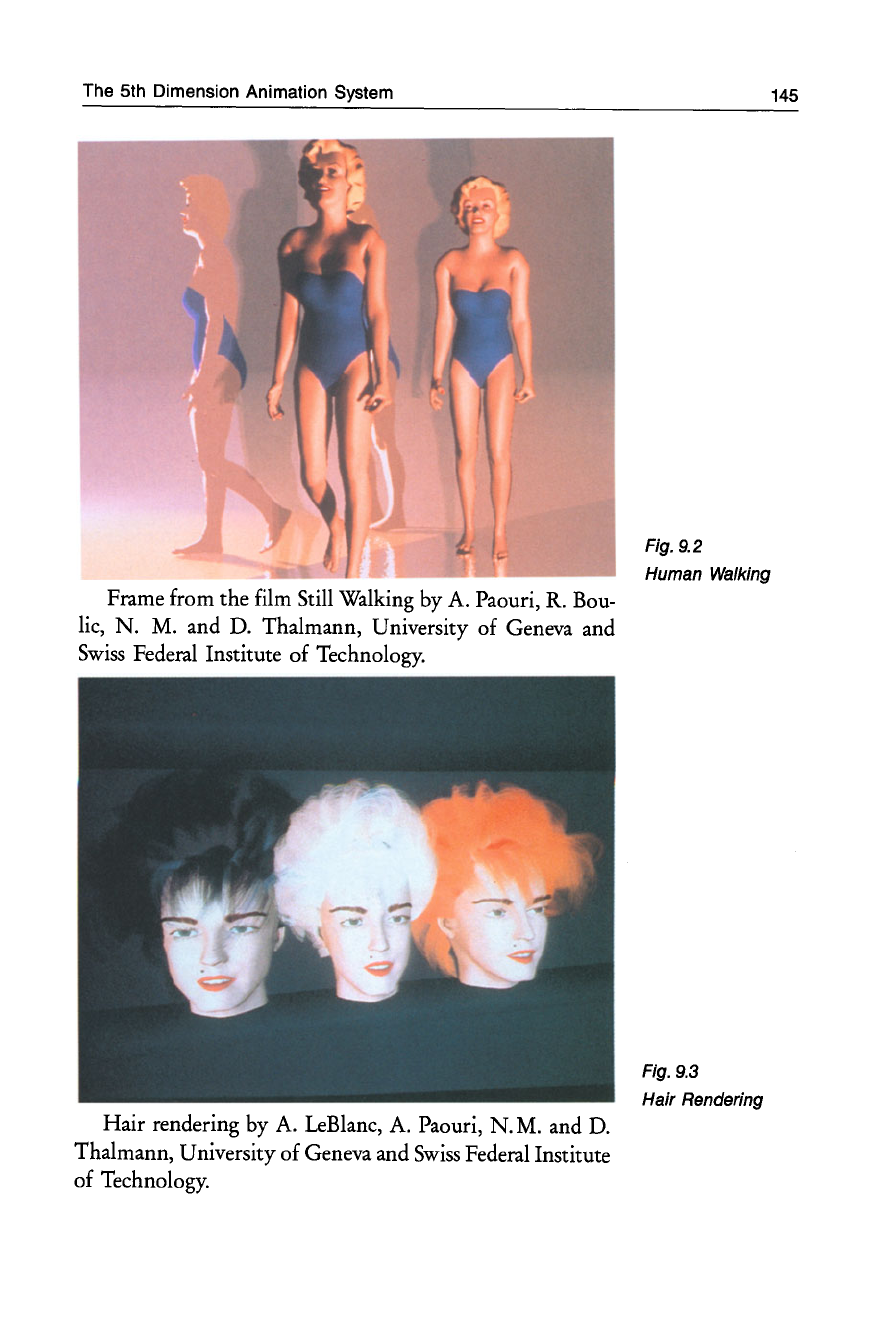
The 5th Dimension Animation System
Frame from the
film
Still
Walking
by
A.
Paouri,
R.
Bou-
lie,
N.
M.
and
D.
Thalmann, University of
Geneva
and
Swiss
Federal
Institute of
Technology.
Hair rendering
by
A.
leBlanc,
A.
Paouri, N.M.
and
D.
Thalmann, University of
Geneva
and
Swiss
Federal
Institute
of
Technology.
145
Fig. 9.2
Human Walking
Fig. 9.3
Hair Rendering
146 Other Uses of Visualization
Tools
9.3
Multimedia
Environments
Project
KICK
Multi-media KICK
is
an interactive multimedia environment designed to
support industrial training applications (Serra et
al.
1991).
The main component of KICK
is
an authoring environ-
ment for the designers to organize the contents and orches-
trate the presentation of multimedia information. The
me-
dium types supported include text, image, 3 D graphics, and
video.
Hierarchy The effective organization of multimedia information
for interactive
access
is
of major concern.
In
KICK, multi-
media information
is
organized primarily using the natural
hierarchy of the physical objects to be modeled. In order to
permit associative
access
to information
as
advocated in hy-
permedia, auxiliary
access
paths are provided by means of
other media, such
as
text, image, and video. The resulting
information structure thus facilitates both structured and
associative
access
to information.
In KICK, the same direct manipulation interface
is
used
to manipulate information of any medium type.
To
achieve
Video
and
image this for video and image media, techniques have been
devel-
oped to allow the synchronization of 3 D graphics models
and animation of video sequences and images. In addition,
techniques to model object motions, constraints and rela-
tionships have also been developed.
Training The system developed
is
intended for training applica-
tions, where users can learn about the structure and opera-
tions of a complex mechanism by interactively:
-accessing its component hierarchy,
experimenting with how various components interact
with each other in dynamic operating conditions,
-studying the effects of various externally applied forces
on
different parts of the mechanism.
Examples
To
demonstrate the usability of system KICK, two applica-
tions for industrial training have been developed.
One
is
ba-
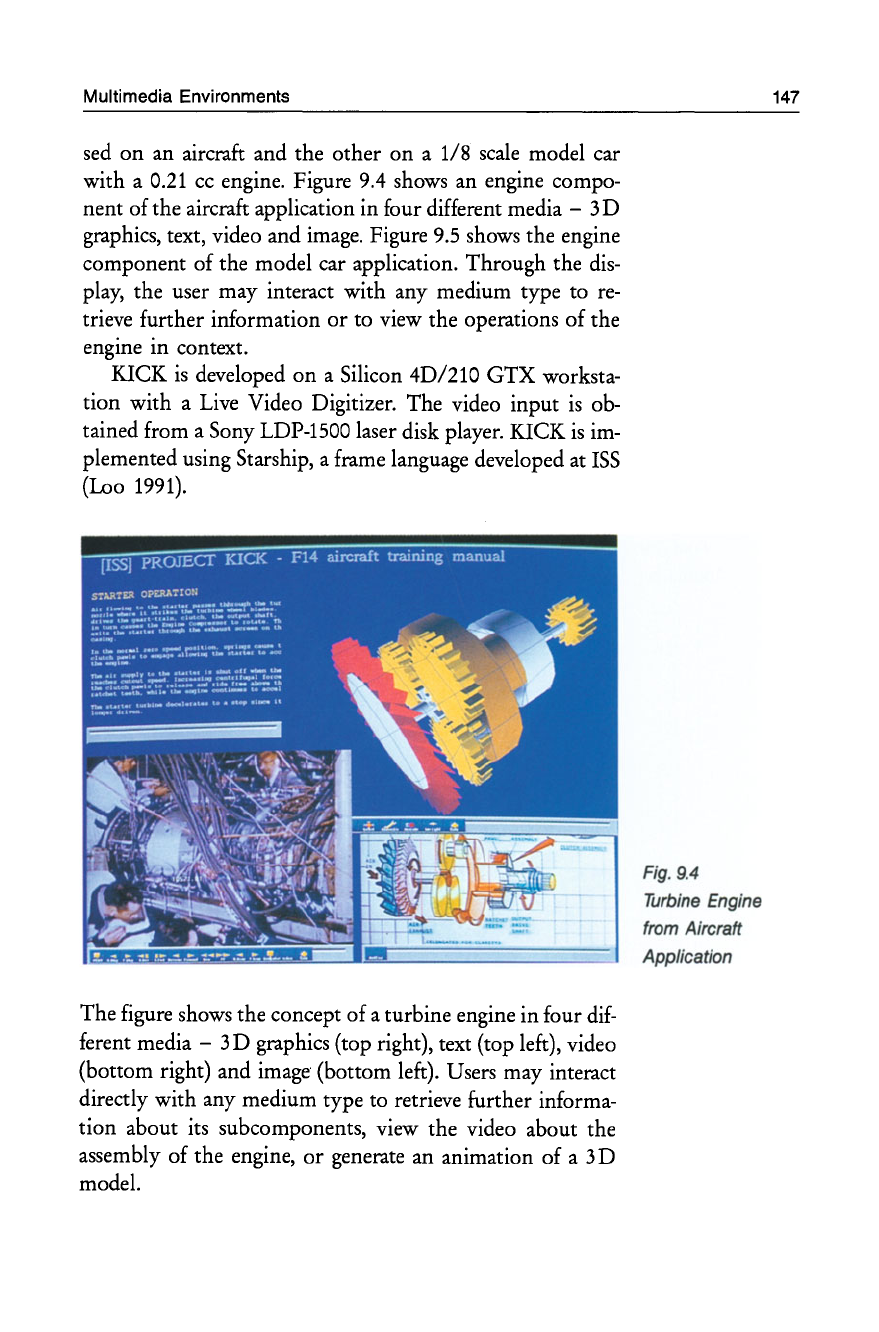
Multimedia Environments
sed on an aircraft and the other
on
a
1/8
scale model car
with a
0.21
cc
engine. Figure 9.4 shows an engine compo-
nent of the aircraft application in four different media -3 D
graphics, text, video and image. Figure 9.5 shows the engine
component of the model car application. Through the
dis-
play, the user may interact with any medium type to
re-
trieve further information
or
to view the operations of the
engine in context.
KICK
is
developed
on
a Silicon 4D/210
GTX
worksta-
tion with a Live Video Digitizer. The video input
is
ob-
tained from a Sony LDP-1S00 laser disk player. KICK
is
im-
plemented using Starship, a frame language developed at
ISS
(Loo
1991).
The figure shows the concept of a turbine engine in four
dif-
ferent media - 3 D graphics (top right), text (top left), video
(bottom right) and image (bottom left). Users may interact
directly with any medium type to retrieve further informa-
tion about its subcomponents, view the video about the
assembly of the engine,
or
generate an animation of a 3 D
model.
Fig.
9.4
Turbine Engine
from Aircraft
Application
147
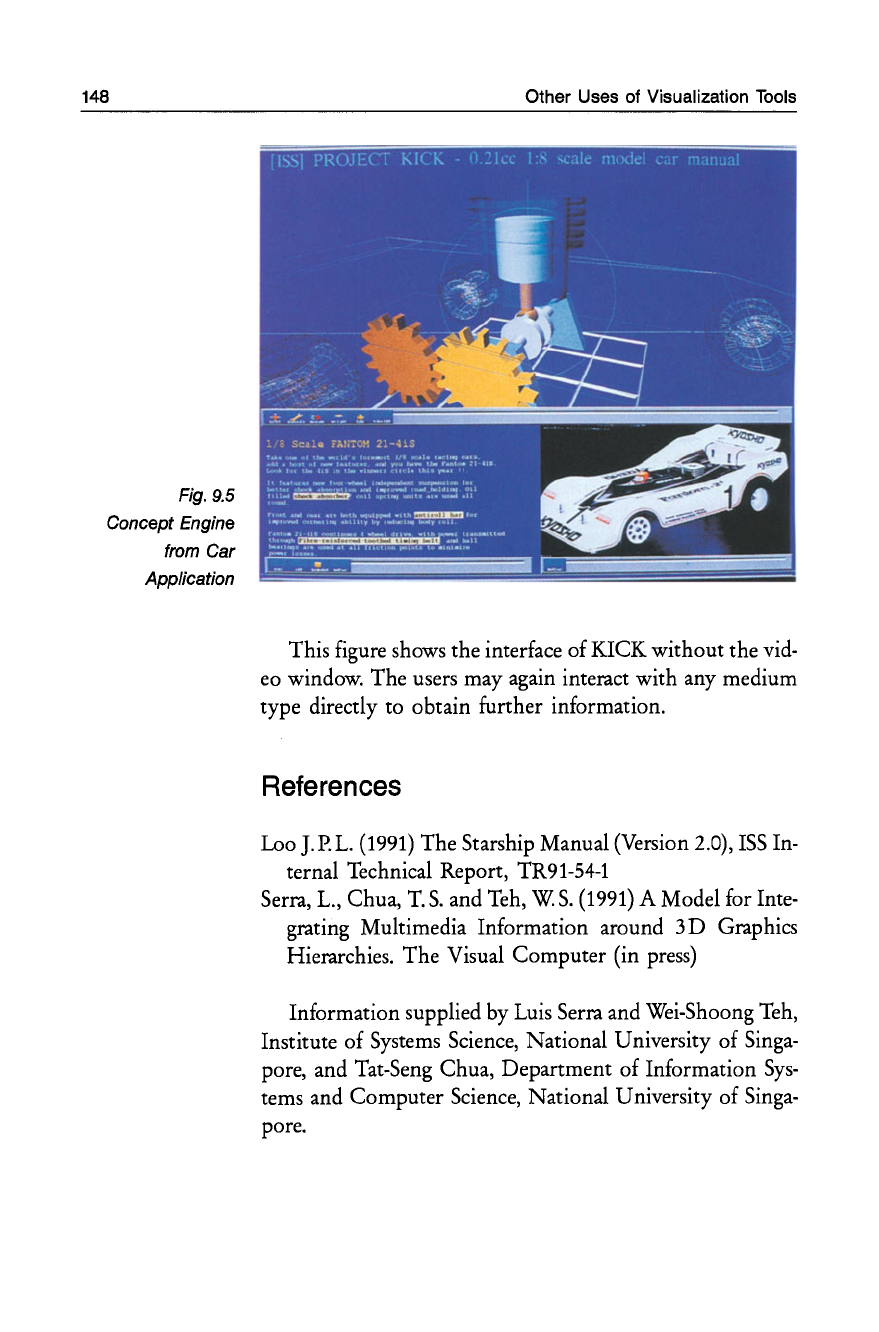
148
Fig. 9.5
Concept Engine
from Car
Application
Other Uses of Visualization
Tools
This figure shows the interface of KICK without the vid-
eo window. The users may again interact with any medium
type directly to obtain further information.
References
Loo J.p.L.
(1991)
The Starship Manual (Version 2.0),
ISS
In-
ternal Technical Report,
TR91-54-1
Serra, L., Chua,
T.
S.
and Teh,
W.
S.
(1991)
A Model for Inte-
grating Multimedia Information around 3 D Graphics
Hierarchies. The Visual Computer (in press)
Information supplied by Luis Serra and Wei-Shoong Teh,
Institute of Systems Science, National University of Singa-
pore, and Tat-Seng Chua, Department of Information
Sys-
tems and Computer Science, National University of Singa-
pore.
Chapter
10
Conclusions
10.1
Strategic
Importance
of
Scientific
Visualization
In view of the believed strategic importance of scientific
vi-
Tools
and
sualization it
is
timely to consider what tools and tech- techniques
niques should
be
provided in this
area
for the community, needed
and also what kind of initiatives and objectives should be
supported and promoted.
It
is
important that scientific visualization
be
developed Promotion
and promoted. Here
are
some of the strategic
issues
that
need addressing if scientific visualization tools
are
to
be
ef-
fectively utilised.
Forum for:
• Planning, discussion, and problem-solving,
• Coordinate developments that may
be
required in the
area,
• Exchange experiences in different application
areas,
• Share common software tools, where available,
• Disseminate information,
• Assist with teaching materials,
• Education and training
issues.
Plan for:
• Any new products that may
be
needed,
• Any general network developments that may
be
needed,
• Any general video facilities that may
be
needed,
• Providing visualization tools for the community,
• Supporting research into scientific visualization.
150 Conclusions
10.2
Current
Developments
More detailed These advances will allow mathematical models and simula-
modeling tions to become increasingly complex and detailed. This
re-
sults in a closer approximation
to
reality, thus enhancing the
possibility
of
acquiring new knowledge and understanding.
Scientific visualization
is
concerned with methods of under-
standing
large
collections of numerical
values
containing a
great deal
of
information. The scientist
has
to be able to
make effective
use
of this information for analytic purposes.
Interactive A further aspect
is
that increases in computer perfor-
3D
design mance allow
3D
problems in simulation and design to be
done interactively. In addition, processes that formerly
sepa-
rated out simulation and design can now bring them togeth-
er (e.g., in CAD,
or
in the design of new drugs). This in turn
moves the user into a new
era
of methods of design.
Handling mUlti- Control over fine simulations, interactivity, and comput-
dimensional data er performance mean that
vast
amounts of multidimension-
al
data can
be
generated. Superworkstations allow this data
to be displayed in optimum
ways.
These features and
capa-
bilities
are
driving the current
wave
of
interest in scientific
visualization.
New techniques Work
is
proceeding in evolving new techniques for data
for analysis display
as
the data
is
being analysed.
What you drive is
what you see
(WYDIWYS)
10.3
More
User-Friendly
Facilities
A further current trend
is
to make software tools for visual-
ization more user-friendly and accessible to a wide variety
of
application
areas,
thus increasing their potential and
us-
ability.
Improvements to the graphical user interface and the
way the user interacts with the model
are
likely to provide
more effective
ways
of communicating relationships and
other aspects of data to the user.
What to do next?
10.4
Further
Information
The book by Nielson et
aI.
(1990) contains a wide variety Applications
of current applications of scientific visualization and also an
excellent bibliography of scientific papers. A 2-hour video
tape
is
available with the book. This tape
gives
effective
demonstrations of the projects described in the book. The
format
is
NTSC but can
be
played
on
a dual-format player
(such
as
Panasonic
J35)
in the
UK
without any problem.
This player can take both PAL and NTSC formats.
Frenkel (1988) provides a general introduction to basic Introduction
visualization techniques.
Thalmann (1990) contains a number of papers in the
ar-
eas
of scientific visualization and graphical simulation.
For further details of any of the software mentioned
ear-
lier, please contact the local office of the vendor. In addi-
tion, Chapter
11
contains a list of references which may
be
of further interest.
There
are
numerous electronic mail subscription lists
and bulletin boards on topics in scientific visualization and
also on specific items of software.
10.5
What
to
do
next?
The majority of users
have
some experience of tools for pre-
sentation graphics. Some users are currently using visualiza-
tion tools of one kind
or
another, in that the
use
of such
tools facilitates the process of understanding more about the
data. However, very
few
users
have
access
to visualization
systems of the kind described in this guide.
It
is
expected
that
access
to such systems will become more common
as
costs decrease and experience in application
areas
increases.
The developments in the U.
S.
A.
outlined in Chapter 6
indicate the trends
as
of 1991, of course!
A more detailed reference volume
on
scientific visualiza-
tion
is
available entitled
Scientific
Visualization
-
Techniques
and
Applications
edited by Brodlie et
aI.,
Springer-Verlag,
1991.
Understanding
data
151
References
H. Barlow,
C.
Blakemore,
M.
Weston-Smith (eds.): Images
and Understanding: Thoughts about Images, Ideas and
Understanding. Cambridge University Press, 1990
Outlines how artists create effects and explores
issues
at the inter-
face
between art and science.
K.
W Brodlie, L. A. Carpenter,
R.
A. Earnshaw,
J.
R.
Gallop,
R.J. Hubbold, A.M. Mumford,
c.D.
Osland,
P.
Quaren-
don
(eds.):
Scientific Visualization -Techniques and Ap-
plications. Springer-Verlag,
1991
This volume represents a full consideration of the subject of scien-
tific visualization and
is
intended to be a reference guide for the
community on the technical aspects of the subject. The topics
covered include: the framework, visualization techniques, data
fa-
cilities, human computer interface, applications, products, a
glos-
sary of terms, enabling technologies, and an extensive bibliogra-
phy.
D.
Scott Dyer: A Dataflow Toolkit for Visualization. IEEE
Computer Graphics and Applications, 10:4,
60-69
Ouly
1990)
This article describes the design principles behind the apE visual-
ization software (apE stands for Animation Production Environ-
ment).
E.J. Farrell (ed.): Visual Interpretation of Complex Data.
IBM Journal
of
Research and Development, 35:1/2
Oan-
March 1991)
A special issue of the
IBM
Journal of Research and Development
on visualization. There
are
papers on visualization of volumetric
data, image display and interpretation, and animation for data in-
terpretation. There
is
also a companion video "Understanding
Complex Data with Computer Animation".
References
K.A. Frenkel: The Art and Science of Visualizing Data.
Communications of the ACM, 31:2, 110-121 (1988)
An
introductory paper which looks at a range of application
areas
and the
uses
of visualization tools and techniques. A wide range
of pictures illustrate some of the techniques currently being used.
K.A. Frenkel: Volume Rendering. Communications of the
ACM, 32:4,
426-435
(1989)
Outline of volume visualization, with application areas.
A.
Kaufman (ed.): Volume Visualisation. IEEE Press, 1990
A collection of most of the key papers in the area of volume visu-
alization.
R.J. Lansdown, R.A. Earnshaw
(eds.):
Computers in Art,
Design and Animation. Springer-Verlag, 1989
Collection of papers
on
the area of creative uses of computer
graphics and associated tools and techniques.
B.H. McCormick, T.A. DeFanti, M.D. Brown
(eds.):
Visu-
alization in Scientific Computing. ACM SIGGRAPH
Computer Graphics, 21:6 (November 1987)
The original Panel Report which outlines the political, economic,
educational, and technological aspects of scientific visualization
as
an emerging discipline.
B.H. McCormick, T.A. DeFanti, M.D. Brown
(eds.):
Visu-
alization in Scientific Computing. IEEE Computer, 23:8
(August 1989)
An
updated version of the original McCormick
(1987)
report,
outlining current progress and advances in scientific visualization.
G.M. Nielson,
B.
Shriver, L. Rosenblum
(eds.):
Visualiza-
tion in Scientific Computing. IEEE Press, 1990
A collection of papers in the
areas
of techniques and applications
of scientific visualization from a variety of academic, government,
and industrial organisations in the USA.
153
154 References
N.
M.
Patrikalakis (ed.): Scientific Visualization of Physical
Phenomena. Springer-Verlag,
1991
Proceedings of the 9th International Conference of the Computer
Graphics Society on the theme
of
scientific visualization. This
volume contains a number of key invited papers in the areas of
applications of scientific visualization, including engineering
de-
sign, spacecraft exploration of the solar system, and remote subsea
exploration.
D.
Thalmann (ed.): Scientific Visualisation and Graphics
Simulation. Wiley, 1990
Computational and graphical techniques that
are
necessary to
vi-
sualize scientific experiments
are
surveyed in this volume, with a
number of
case
studies in particular application
areas.
N.
Magnenat-Thalmann,
D.
Thalmann
(eds.):
New Trends
in Animation and Visualization.
Wiley,
1991
A collection of papers covering state-of-the-art topics in the areas
of scientific visualization, animation, graphical simulation, mod-
eling, hypermedia, facial animation, natural phenomena, human
modeling, and applications.
E.
R. Tufte: The Visual Display of Quantitative Informa-
tion. Graphics Press, USA, 1983
E.
R.
Tufte:
Envisioning Information. Graphics Press, USA,
1990
Two
introductory texts with guidelines
on
displaying information
effectively.
C.
Upson,
T.
Faulhaber,
D.
Kamins,
D.
Laidlaw,
D.
Schle-
gel,
J.
Vroom, R. Gurwitz,
A.
van Dam: The Application
Visualization System: A Computational Environment
for Scientific Visualization. IEEE Computer Graphics
and Applications, 9:4,
30-42
(1989)
This paper describes the design principles of
AVS.
C.
Upson: Volumetric Visualization Techniques. In:
D.E
Rogers, R.A. Earnshaw
(eds):
State of the
Art
in Com-
puter Graphics -Visualization and Modeling. Springer-
Verlag,
1991
Description of volumetric techniques from one of the designers
of
AVS
and the designer of Explorer.
Sources
of
Figures
Rendered by DESIGNBASE
Reproduced by permission
of
Dynamics Graphics Ltd.
Reproduced by permission
©
IBM
UK Scientific Centre
Reproduced by permission
© LightWork Design Ltd.
Reproduced by permission
© Precison Visuals Ltd.
Reproduced by permission
© Regional Geophysics Research Group,
British Geological Survey
Reproduced by permission
Ricoh Company Ltd.
Reproduced by permission
© David
F.
Rogers,
1991
Reproduced by permission
of
Stardent Computer Ltd.
© 1990
SUN
Microsystems, Inc.
Rendered
on
a
SUN
SPARCstation
470VX+MVX
©
1990
SUN
Microsystems, Inc.
Rendered
on
a
SUN
SPARCstation
using SunVision software
©SUN
Microsystems, Inc.
Rendered
on
a
SUN
SPARCstation
VX+MVX using Westover's splat software
Data courtesy
of
Frank Bryan
at
NCAR
Figure 7.27
Figure 7.20,
-7.24
Figure 2.7,
3.3
Figure 7.25, 7.26
Figure 3.10, 7.6,
7.7
Figure 3.5
Figure 7.27, 7.28,
7.29,
7.31
Figure 2.11-2.13
Figure
3.12
Figure
7.14
Figure 7.15,
7.17-7.19
Figure
7.16
Figure
8.8
156 Sources
of
Figures
Courtesy of Dr.
B.
EI-Haddadeh, Figure
3.9
University of
Leeds,
and UNIRAS software
Courtesy of Todd Elvins,
San
Diego Figure
3.11
Supercomputer Center (SDSC)j
Data: Mark Ellisman, University of
California,
San
Diegoj Visualization:
Dave Hessler, SDSCj Software: SYNU
from SDSC
Courtesy of Todd Elvins,
San
Diego
Supercomputer Center (SDSC)j
Data:
Ted
Cranford, University of Califor-
nia, Santa Cruzj Visualization: Todd
Elvins, Phil Mercurio, SDSC, Software:
SUN
Microsystems
Voxvu
Courtesy of Prof. Elliot
K.
Fishman MD
Courtesy of Prof.
T.
L. Kunii
Courtesy of the Lamont Doherty
Geologic Observatory
Courtesy of the Lawrence Livermore
National Laboratory
Courtesy of Silicon Graphics Ltd.
Courtesy of Simultec, Switzerland
Data courtesy of Dr. Michael Torello
Courtesy of Craig Upson
Reproduced by permission
© Nadia
M.
Thalman,
D.
Thalman,
1991
Reproduced by permission of
©
u.
K.
Meteorological Office
Reproduced by permission of
© UNlRAS Ltd.
Reproduced by permission of
© Wavefront Technologies Ltd.
Courtesy of Geoff Wyvill &
Brian Wyvill
Figure
3.13
Figure
2.8
Figure 2.14,
2.15
Figure
7.21
Figure 7.20
Figure 7.11-7.13
Figure 7.22
Figure
8.7
Figure
2.1,
3.1,
3.2, 3.4
Figure 9.1-9.3
Figure 2.4-2.6
Figure 7.4,
7.5
Figure 3.6-3.8,
7.1-7.3
Figure 2.9,
2.10
