Animal Tracking Toolbox User Manual V6
Animal%20Tracking%20Toolbox%20User%20Manual_V6
User Manual: Pdf
Open the PDF directly: View PDF ![]() .
.
Page Count: 12

!
Supplementary!Materials:!
Animal!Tracking!Toolbox!User!Manual!
!
!
Vinay!Udyawer*,!Russel!C.!Babcock,!Stephanie!Brodie,!Hamish!A.!Campbell,!Fabrice!Jaine,!Robert!G.!Harcourt,!
Xavier!Hoenner,!Charlie!Huveneers,!Colin!A.!Simpfendorfer,!Matthew!D.!Taylor,!Michelle!R.!Heupel!
*!corresponding!author!email:!v.udyawer@aims.gov.au!!
!
!
Passive!telemetry!studies!use!detection!patterns!of!a!tagged!animal!within!a!fixed!array!to!understand!
movement!patterns,!habitat!use!and!activity!space.!Raw!detection!data!are!typically!used!to!calculate!
metrics!of!detection!(i.e.!number!of!detections,!number!of!days!detected,!number!of!receivers!tag!was!
detected!on,!index!of!residence),!dispersal!(e.g.!distances!and!bearings!between!consecutive!
detections;!step!distances!and!turning!angles,!distances!and!bearings!between!each!detection!and!
release!site)!and!activity!space!(e.g.!Minimum!Convex!Polygon![MCP]!area,!Kernel!Utilisation!
Distribution!area),!however!the!techniques!and!parameters!used!to!calculate!these!metrics!are!often!
customised!to!each!study!making!cross-study!comparisons!unreliable.!Here!we!provide!a!tool!to!
enable!standardisation!of!the!calculation!of!these!commonly!used!metrics!and!provide!an!analytical!
tool!to!facilitate.!
The!Animal!Tracking!Toolbox!(ATT)!is!a!wrapper!function!created!in!the!R!statistical!environment!(R!
Development!Core!Team!2016)!that!calculates!standardised!metrics!of!movement!and!activity!space!
from!passive!telemetry!to!enable!direct!comparisons!between!animals!tracked!within!the!same!study!
and!between!studies!or!locations.!The!function!uses!individual!detection!data!files!alongside!tag!
metadata!with!user-defined!parameters!to!calculate!a!range!of!standardised!movement!and!activity!
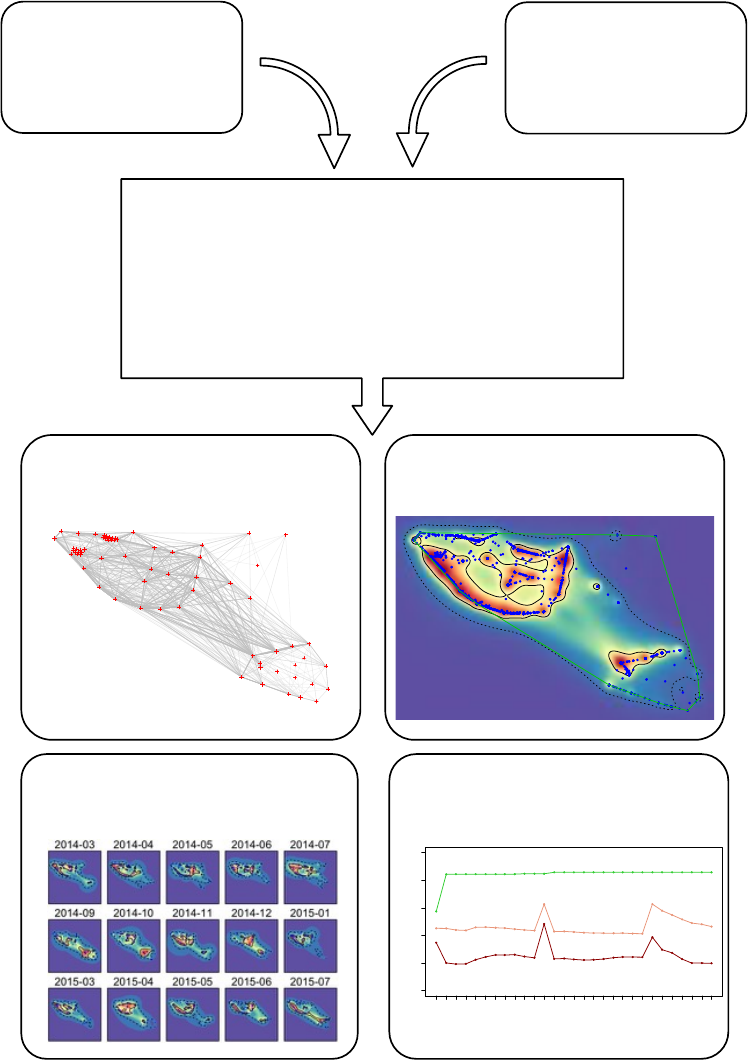
space!metrics!(Fig!S1).!This!function!can!be!used!to!calculate!and!visualise!standardised!metrics!of!
movement!and!activity!space!within!and!between!species!tracked!at!multiple!locations!(e.g.!Fig!S2).!
The!ATT!was!developed!to!pre-process!and!calculate!standardised!metrics!of!movement!and!activity!
space!from!large-scale!detection!data!housed!in!the!Integrated!Marine!Observing!System’s!Animal!
Tracking!Facility!(IMOS!ATF)!national!data!repository.!The!ATT!accepts!detection!data!(referred!to!as!
‘tagdata’!in!the!function)!exported!from!the!IMOS!ATF!database!(can!be!accessed!through!the!AODN!
portal:!https://portal.aodn.org.au),!however!can!also!be!configured!to!accept!export!formats!from!the!
VEMCO!data!management!software!VUE!(see!input!data!section).!This!manual!will!outline!the!required!
data!formats!for!input!‘tagdata’!and!associated!tag!metadata!(referred!to!as!‘taginfo’!in!the!function).!
This!manual!will!also!demonstrate!how!to!run!the!function!for!a!single!tag!as!well!as!running!the!
function!for!a!large!number!of!tags!within!a!coded!loop!and!in!parallel!on!a!multi-core!system.!
! !
!
!
!
!
!
!
!
!
Figure!S1.!Visual!summary!of!types!of!standardised!metrics!that!can!be!calculated!using!the!Animal!
Tracking!Toolbox!
!
!
Passive telemetry
detection data
VEMCO export format or
IMOS ATF export format
Tagged animal
Metadata information
(e.g. sex, size, tag life, etc.)
d) Cumulative activity spaces
16.5
17.0
17.5
18.0
18.5
19.0
Date
Log activity space
Aug
2013
Oct
2013
Dec
2013
Feb
2014
Apr
2014
Jun
2014
Aug
2014
Oct
2014
Dec
2014
Feb
2015
Apr
2015
Jun
2015
Aug
2015
Oct
2015
Dec
2015
c) Temporal patterns in
movement and activity space
Animal Tracking Toolbox
User defined arguments:
• sub: Level of temporal subset (e.g. monthly, yearly, weekly)
• timestep: Centre of Activity (COA) timestep
• sig2: Smoothing factor for BB-KUD estimation
• extent: Extent of area used for BB-KUD estimation
• grid: Grid resolution for BB-KUD estimation
2005000 2010000 2015000 2020000 2025000
-2700000 -2695000 -2690000 -2685000 -2680000
0
20
40
60
80
100
2005000 2010000 2015000 2020000 2025000
-2700000 -2695000 -2690000 -2685000 -2680000
BBKUD95%
BBKUD50%
MCP
COA
b) Overall movement and
activity space metrics
a) Dispersal distances and
bearings
!
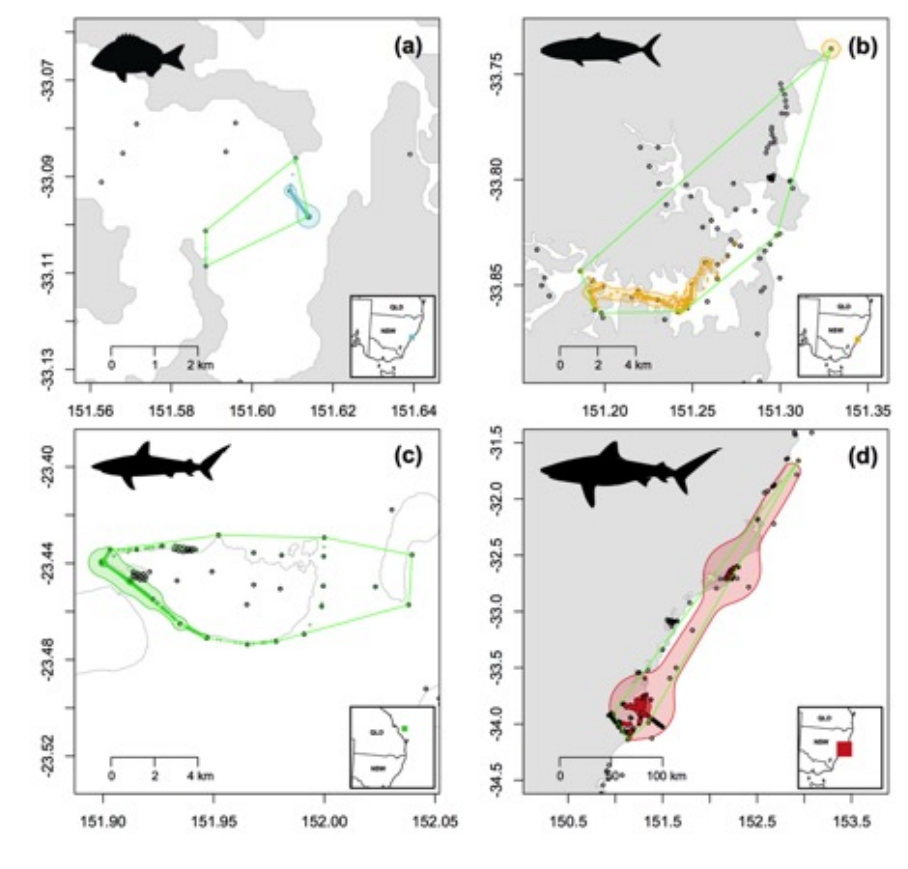
Figure!S2.!Overall!activity!space!metric!plots!for!multiple!species!tagged!at!multiple!locations!(a)!
Yellowfin!Bream![n=1],!(b)!Yellowtail!Kingfish![n=1],!(c)!Grey!Reef!Shark![n=1]!and!(d)!Bull!Shark![n=1]!
output!using!the!ATT.!Coloured!points!represent!Centres!of!Activity!(60!min!time!steps)!with!darker!
shapes!representing!core!activity!space!(50%!contour!of!Brownian!bridge!kernel!utilisation!distribution!
[BBKUD])!and!lighter!shapes!representing!the!extent!of!activity!space!(95%!contour!of!BBKUD).!Green!
polygons!represent!overall!Minimum!Convex!Polygons!from!detection!data.!Open!circles!represent!
locations!of!VR2W!receivers!deployed!within!the!IMOS!ATF!infrastructure!and!associated!research!
installations.!
!
! !

Input!data!formats!
There!are!two!files!associated!with!detection!and!tag!information!required!to!run!the!ATT,!the!input!
detection!data!(‘tagdata’)!obtained!from!passive!telemetry!datasets!and!tag!metadata!information!
(‘taginfo’).!The!ATT!was!developed!to!recognise!field!names!from!the!IMOS!ATF!database!and!more!
generally!from!a!VEMCO!VUE!database!that!is!commonly!used!in!the!field!of!passive!telemetry.!These!
data!formats!are!detailed!below!(Table!S1),!and!can!be!used!as!a!guide!to!configure!the!‘tagdata’!input!
if!the!VEMCO!or!IMOS!ATF!data!formats!are!not!used.!The!‘taginfo’!data!format!conforms!to!the!
metadata!information!stored!on!the!IMOS!ATF!database!(Table!S2),!and!similar!formats!should!be!used!
to!store!metadata!information!on!animals!tagged!for!analysing!passive!telemetry!data.!!
Input&detection&data&format:&‘tagdata’&
Table!S1.!Input!data!format!follow!standard!VEMCO!or!IMOS!ATF!detection!data!output!formats!
Data!field!
Description!
VEMCO&data&format&
Date%and%Time%(UTC)%
Date!and!time!of!tag!detection!(yyyy-mm-dd!HH:MM:SS)!
Receiver%
Name!of!static!receiver,!combines!receiver!model!with!its!serial!number!(e.g.!
VR2W-123456)!
Transmitter%
Combination!of!code!map!and!ping!ID!(eg.!A69-1303-14503)!
Transmitter%Name%
Ping!ID!of!transmitter!deployed!(e.g.!14503)!
Transmitter%Serial%
Manufacturers!serial!number!for!deployed!transmitter!(e.g.!1126413)!
Sensor%Value%
Physical!measurement!recorded!by!a!tag’s!sensor,!if!applicable!(If!sensor!data!
hasn’t!been!converted!then!sensor_unit!=!‘ADC’!and!values!range!from!0!to!255.)!
Sensor%Unit%
Physical!unit!associated!with!sensor!values!(Either!‘ADC’,!‘°C’,!‘m’!or!‘m/s2’)!
Station%Name%
Name!of!receiving!station!on!which!the!transmitter!was!detected.!Receivers!
typically!gets!deployed!multiple!times!at!the!same!station!
Latitude%
Latitude!at!which!receiver!was!deployed!and!tag!was!detected!(d.ddd˚)!
Longitude%
Longitude!at!which!receiver!was!deployed!and!tag!was!detected!(d.ddd˚)!
IMOS&ATF&data&format&
transmitter_id%
Combination!of!code!map!and!ping!ID.!Dual!sensor!tags!are!associated!with!
multiple!transmitter!IDs!(e.g.!A69-9002-12345)!
installation_name%
Name!of!installation!on!which!the!transmitter!was!detected.!An!installation!
typically!consists!of!multiple!receiving!stations!
station_name%
Name!of!receiving!station!on!which!the!transmitter!was!detected.!Receivers!
typically!gets!deployed!multiple!times!at!the!same!station!
receiver_name%
Name!of!receiver!station,!combines!receiver!model!with!its!serial!number!(e.g.!
VR2W-123456)!
detection_timestamp%
Date!and!time!of!tag!detection!(yyyy-mm-dd!HH:MM:SS)!
longitude%
Longitude!at!which!receiver!was!deployed!and!tag!was!detected!(d.ddd˚)!
latitude%
Latitude!at!which!receiver!was!deployed!and!tag!was!detected!(d.ddd˚)!
sensor_value%
Physical!measurement!recorded!by!a!tag’s!sensor,!if!applicable!(If!sensor!data!

hasn’t!been!converted!then!sensor_unit!=!‘ADC’!and!values!range!from!0!to!255.)!
sensor_unit%
Physical!unit!associated!with!sensor!values!(Either!‘ADC’,!‘°C’,!‘m’!or!‘m/s2’)!
FDA_QC%
Quality!control!flag!for!the!false!detection!algorithm!(1:passed,!2:failed)!
Velocity_QC%
Velocity!from!previous!and!next!detections!both!10!m.s-1?!(1:yes,!2:no)!
Distance_QC%
Distance!from!previous!and!next!detections!both!<!1000!km?!(1:yes,!2:no)!
DetectionDistribution_QC%
Detection!occurred!within!expert!distribution!area?!(1:yes,!2:no,!3:test!not!
performed)!
DistanceRelease_QC%
Detection!occurred!within!500!km!of!release!location?!(1:yes,!2:no)!
ReleaseDate_QC%
Detection!occurred!before!the!tag!release!date?!(1:yes,!2:no)!
ReleaseLocation_QC%
Tag!release!lat/long!coordinates!within!expert!distribution!area!and/or!within!500!
km!from!first!detection?!(1:yes,!2:no)!
Detection_QC%
Composite!detection!flag!indicating!the!likely!validity!of!detections!(1:valid!
detection,!2:probably!valid!detection,!3:probably!bad!detection,!4:bad!detection)!
!
Tag&Metadata&format:&‘taginfo’&
Table!S2.!Format!of!tag!metadata!format!of!IMOS!ATF!database!and!required!for!the!ATT!function!
(‘taginfo’!file)!
Data!field!
Description!
transmitter_id%
Combination!of!code!map!and!ping!ID!(e.g.!.%A69-9002-12345)!
tag_id%
Unique!tag!ID.!Dual!sensor!tags!have!different!transmitter!IDs!but!the!same!tag!ID.!
release_id%
Unique!tag!release!ID.!A!given!tag!ID!may!be!associated!with!several!release!IDs!if!
it!has!been!re-deployed.!
tag_project_name%
Project!name!under!which!a!tag!was!registered!
scientific_name%
Tagged!species!scientific!name!
common_name%
Tagged!species!common!name!
release_longitude%
Longitude!at!which!tag!was!deployed!(d.ddd˚)!
release_latitude%
Latitude!at!which!tag!was!deployed!(d.ddd˚)!
ReleaseDate%
Date!and!time!at!which!tag!was!deployed!(yyyy-mm-dd!HH:MM:SS)!
sensor_slope%
Slope!used!in!the!linear!equation!to!convert!raw!sensor!measurements!
sensor_intercept%
Intercept!used!in!the!linear!equation!to!convert!raw!sensor!measurements!
sensor_type%
Type!of!sensor!(Can!be!pinger,!temperature,!pressure,!or!accelerometer)!
sensor_unit%
Physical!unit!associated!with!sensor!values!(Either!‘ADC’,!‘°C’,!‘m’!or!‘m/s2’)!
tag_model_name%
Tag!model!(e.g.!V9,!V13-TP,!V16-P,!V9-A)!
tag_serial_number%
Manufacturers!serial!number!for!deployed!transmitter!(e.g.!1126413)!
tag_expected_life_time_days%
Tag!expected!life!time!(days)!
tag_status%
Tag!status!(e.g.!deployed,!lost,!etc)!
sex%
Sex!of!tagged!animal!(if!recorded)!
measurement%
Morphometric!information!of!tagged!animal!(if!recorded;!e.g.!Total!length,!weight)!
dual_sensor_tag%
Is!the!tag!a!dual!sensor!tag!(TRUE/FALSE)!
&

Animal&Tracking&Toolbox¶meters:&
The!ATT!provides!users!with!the!flexibility!to!customise!aspects!of!temporal!subsetting!for!movement!
and!activity!space!metric!calculations!and!smoothing!factor!selection!for!Brownian!bridge!Kernel!
Utilisation!Distribution!estimation!(BBKUD;!Horne%et%al.!2007).!Although!the!ATT!allows!customisation,!
default!values!are!provided!for!all!arguments!to!ensure!standardisation!of!estimated!metrics!of!
movement!and!activity!space.!!
!
Table!S3.!Summary!of!user-defined!input!parameters!for!the!Animal!Tracking!Toolbox!
Parameter!name!
Description!
tagdata%
Individual!detection!data!(IMOS/AODN!or!VEMCO!output)![required]!
taginfo%
Tag!metadata!(e.g.!sex,!size,!tag!life,!etc.)[reqired]!
IMOSdata%
(TRUE/FALSE)!Sets!column!names!based!on!data!source![default!=!FALSE]!
sub%
Level!of!sub-setting!for!temporal!analyses![default!=!“%Y-%m”]!
timestep%
Centre!of!Activity!(COA)!time!step![default!=!60]!
sig2%
Smoothing!factor!for!BBKUD!estimation!related!to!imprecision!of!relocation![default!=!200]!
extent%
Extent!of!area!used!for!BB-KUD!estimation![default!=!2]!
grid%
Grid!resolution!for!BB-KUD!estimation![default!=!200]!
storepoly%
(TRUE/FALSE)!Store!output!polygons!of!overall!activity!space![default!=!FALSE]!
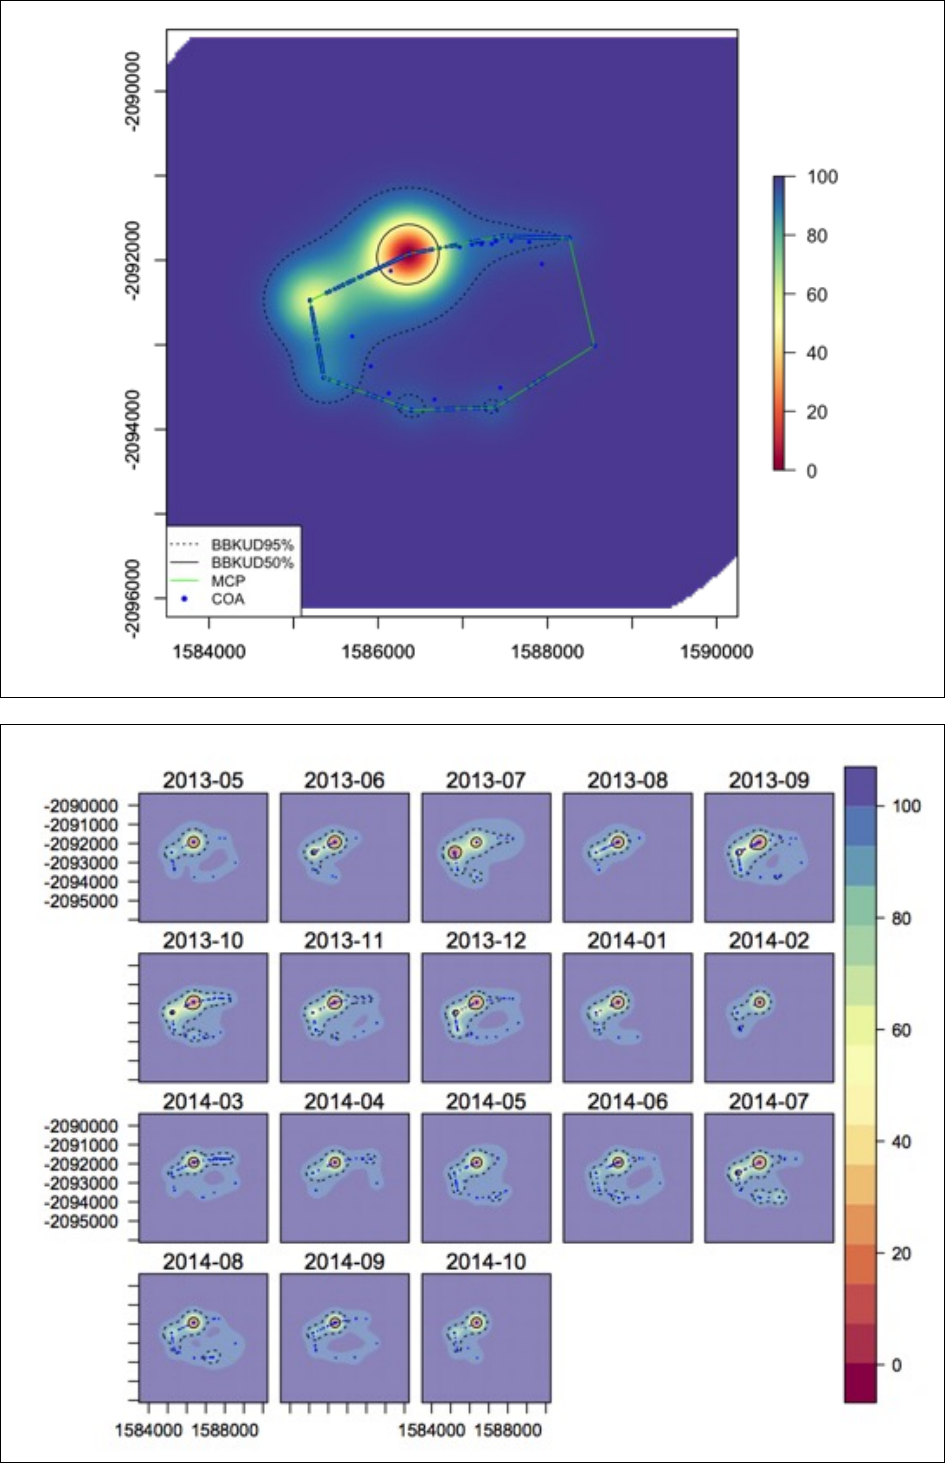
plotfull%
(TRUE/FALSE)!Output!plot!showing!overall!activity!space![default!=!FALSE]!
plotsub%
(TRUE/FALSE)!Output!plot!showing!temporally!sub-setted!activity!space![default!=!FALSE]!
!
! !

Script!Usage!
Package%requirements:!!
The!following!R!packages!are!required!to!run!the!ATT!
• adehabitatHR
• sp
• raster
• rasterVis
• plyr
• lubridate
• maptools
• maps
Running&ATT&for&a&single&tag&
## Source the Animal Tracking Toolbox R script to load the function
source(“…/Animal Tracking Toolbox.R”)
## Upload tagdata file from IMOS ATF database
IMOS_data<- read.csv (“…/IMOSdata.csv”, header=TRUE)
## Upload detection data from VEMCO VUE software
VUE_data<-read.csv(“…/VUEoutput.csv”, header=TRUE)
## Upload Tag metadata file (format should follow Table S2 above)
metadata<- read.csv(“…/TagMetadataFile.csv”, header=TRUE)
## Run Animal Tracking Toolbox when using VEMCO VUE export format
VUE_output<-ATT(tagdata=VUE_data, taginfo=metadata)
## Run Animal Tracking Toolbox when using IMOS ATF export data
IMOS_output<-ATT(tagdata=IMOS_data, taginfo=metadata, IMOSdata=TRUE)
## Running the ATT to include calculation of cumulative metrics
## Warning: calculating cumulative metrics will increase the time taken
## to run the full function if the tag has a large number of detections
IMOS_output<-ATT(tadata=IMOS_data, taginfo=metadata, IMOSdata=TRUE,
cumulative=TRUE)
## Storing MCP polygon and BBKUD estimates as raster files
IMOS_output<-ATT(tagdata=IMOS_data, taginfo=metadata, IMOSdata=TRUE,
storepoly=TRUE)
## Running the ATT to produce plots of overall and subsetted activity
## space metrics
IMOS_output<-ATT(tagdata=IMOS_data, taginfo=metadata, IMOSdata=TRUE,
plotfull=TRUE, plotsub=TRUE)
## This will produce two pop-up windows with overall and subsetted plots:

Running&ATT&for&multiple&animals&in&a&loop&
## Identify folder with multiple input files
indi<-list.files(“…/folder with input files”, full.names=TRUE)
## Upload Tag metadata file (format should follow Table S2 above)
metadata<- read.csv(“…/TagMetadataFile.csv”)
## Set up empty list to fill with ATT output
loop_output<-list(full=data.frame(matrix(ncol=12, nrow=0)),
subset=data.frame(matrix(ncol=17, nrow=0)),
COA=data.frame(matrix(ncol=7, nrow=0)),
disp=data.frame(matrix(ncol=15, nrow=0)))
## Run ATT function for all files in folder and compile in loop_output
for(n in 1:length(indi)){
tag<-read.csv(indi[n], header=T)
tryCatch({
a<-ATT(tagdata=tag, taginfo=metadata, cumulative=TRUE)
}, error=function(e){cat("ERROR within ATT function ( n =", n, "):\n",
indi[n],"\n",conditionMessage(e), "\n")})
loop_output<-mapply(rbind, loop_output, a, SIMPLIFY=F)
a<-list(full=NA, subset=NA, COA=NA, disp=NA)
setTxtProgressBar(txtProgressBar(min = 0, max = length(indi), style = 3), n)
}
## Summarise output
summary(loop_output)
&
Working&in¶llel%
## load libraries needed to run script in parallel
library(doParallel)
library(foreach)
## Identify folder with multiple input files
indi<-list.files(“…/folder with input files”, full.names=TRUE)
## Upload Tag metadata file (format should follow Table S2 above)
metadata<- read.csv(“…/TagMetadataFile.csv”)
## Set up back end for parallel computing
cl <- makeCluster(detectCores())
registerDoParallel(cl)

## Create function to combine parallel output
combfun <- function(x, ...) {
mapply(rbind,x,...,SIMPLIFY=FALSE)
}
## Run ATT function for all file in folder and compile in loop_output
par_output<-foreach(n=1:length(indi), .combine='combfun',
.multicombine=TRUE,
.init=list(full=data.frame(matrix(ncol=12, nrow=0)),
subset=data.frame(matrix(ncol=17, nrow=0)),
COA=data.frame(matrix(ncol=7, nrow=0)),
disp=data.frame(matrix(ncol=15, nrow=0))))
%dopar% {
tag<-read.csv(indi[n], header=T)
ATT(tagdata=tag, taginfo=metadata)
}
stopCluster(cl)
## Summarise output
summary(par_output)
!
Outputs!
Standardised!metrics!calculated!by!the!ATT!function!are!output!as!a!list!consisting!of!five!objects:!
i. full:!a!data!frame!consisting!of!summary!information!on!detection!performance,!overall!
activity!space!areas!(MCP,!50%!and!95%!BBKUD)!
ii. subset:!a!data!frame!consisting!of!summary!information!on!detection!performance!and!
activity!space!metrics!(MCP,!50%!and!95%!BBKUD)!temporally!subsetted!(e.g.!Monthly,!
weekly,!etc).!Temporal!subset!is!determined!by!the!sub!argument!of!the!ATT!function!
(defaulted!as!month!of!the!year:!“%Y-%m”).!Cumulative!metrics!are!included!in!this!data!
frame!if!the!argument!cumulative=TRUE!in!the!ATT!function.!
iii. COA:!a!data!frame!consisting!of!Centre!of!Activity!positions!calculated!within!a!defined!
timestep.!Time!step!defined!by!the!timestep!argument!of!the!ATT!function!(defaulted!to!
60!min!time!step).!
iv. disp:!a!data!frame!consisting!of!dispersal!distances!and!bearings.!Dispersal!distances!and!
bearings!are!calculated!between!consecutive!detections!and!from!dispersal!from!release!
site!(if!recorded!in!the!taginfo!metadata!file).!
v. sp:!a!list!of!three!spatial!objects!consisting!of:!
• mcpcont:!Spatial!polygon!of!overall!Minimum!Convex!Polygon!(in!latitude!and!longitude)!
• raster_full:!Raster!object!of!overall!BBKUD!(in!latitude!and!longitude)!
• raster_sub:!Raster!stack!object!of!subsetted!BBKUD!(in!latitude!and!longitude)!
!

Table!S4.!Summary!of!user-defined!input!parameters!for!the!Animal!Tracking!Toolbox,!and!summary!of!
subsequent!output!list!
List!title!
Data!field!
Description!
$full!
tag_id%
Unique!tag!identification!number!
!
transmitter_id%
Combination!of!code!map!and!ping!ID!(eg.!A69-1303-14503)!
!
species%
Species!of!tagged!animal!(if!recorded!in!taginfo!file)!
!
sex%
Sex!of!tagged!animal!(if!recorded!in!taginfo!file)!
!
bio%
Biological!attributes!recorded!in!taginfo!file!
!
num_det%
Number!of!detected!on!full!array!
!
days_det%
Number!of!days!detected!on!full!array!
!
num_stat%
Number!of!receiver!stations!detected!on!within!full!array!
!
DI%
Detection!Index!(num_det/days_det)!
!
mcp%
Minimum!Convex!Polygon!area!(m2)!
!
bbk50%
Brownian!bridge!Kernel!Utilisation!Distribution!50%!contour!area!(m2)!
!
bbk50%
Brownian!bridge!Kernel!Utilisation!Distribution!95%!contour!area!(m2)!
$subset!
yearmon%
Temporal!subset,!month!of!the!year!(yyyy-mm)!
!
tag_id%
Unique!tag!identification!number!
!
transmitter_id%
Combination!of!code!map!and!ping!ID!(eg.!A69-1303-14503)!
!
species%
Species!of!tagged!animal!(if!recorded!in!taginfo!file)!
!
sex%
Sex!of!tagged!animal!(if!recorded!in!taginfo!file)!
!
bio%
Biological!attributes!recorded!in!taginfo!file!
!
num_det%
Number!of!detection!during!each!temporal!subset!
!
days_det%
Number!of!days!detected!during!each!temporal!subset!
!
num_stat%
Number!of!receiver!stations!detected!on!during!each!temporal!subset!
!
num_new_stat%
Number!of!new!receiver!stations!detected!on!since!last!subset!
!
DI%
Detection!Index!calculated!for!each!temporal!subset!
!
mcp%
MCP!area!for!each!temporal!subset!(m2)!
!
bbk50%
BBKUD!50%!contour!area!for!each!temporal!subset!(m2)!
!
bbk95%
BBKUD!95%!contour!area!for!each!temporal!subset!(m2)!
!
cmcp%
Cumulative!MCP!area!since!last!temporal!subset!(m2)!
!
ck50%
Cumulative!BBKUD!50%!area!since!last!temporal!subset!(m2)!
!
ck95%
Cumulative!BBKUD!95%!area!since!last!temporal!subset!(m2)!
$COA!
DateTime%
Date!time!for!calculated!Centre!of!Activity!record!(yyyy-mm-dd!
HH:MM:SS)!
!
tag_id%
Unique!tag!identification!number!
!
transmitter_id%
Combination!of!code!map!and!ping!ID!(eg.!A69-1303-14503)!
!
species%
Species!of!tagged!animal!(if!recorded!in!taginfo!file)!
!
meanlat%
Mean!latitude!coordinate!during!COA!timestep!(d.dddd˚)!
!
meanlon%
Mean!longitude!coordinate!during!COA!timestep!(d.dddd˚)!
$disp!
tag_id%
Unique!tag!identification!number!
!
transmitter_id%
Combination!of!code!map!and!ping!ID!(eg.!A69-1303-14503)!
!
species%
Species!of!tagged!animal!(if!recorded!in!taginfo!file)!
!
installation_name%
Name!of!researcher!installation!(if!recorded)!
!
station_name%
Name!of!receiver!station!(if!recorded)!
!
ReleaseDate%
Date!and!time!of!tag!release!(yyyy-mm-dd!HH:MM:SS;!if!recorded)!
!
ReleaseLat%
Latitude!coordinate!of!tag!release!(d.dddd˚;!if!recorded)!
!
ReseaseLon%
Longitude!coordinate!of!tag!release!(d.dddd˚;!if!recorded)!
!
detection_timestamp%
Timestamp!of!raw!detection!(yyyy-mm-dd!HH:MM:SS)!
!
lat%
Latitude!coordinate!of!raw!detection!(d.dddd˚)!
!
lon%
Longitude!coordinate!of!raw!detection!(d.dddd˚)!
!
disrel%
Dispersal!distance!from!release!site!(m;!if!release!coordinates!recorded)!
!
Azrel%
Bearing!of!detection!from!release!site!(ddd.d˚;!if!release!site!recorded)!

!
discon%
Dispersal!distance!from!consecutive!detections!(m)!
!
azcon%
Bearing!between!consecutive!detections!(ddd.d˚)!
$sp!
$mcpcont!
Spatial!polygon!of!calculated!overall!MCP!
!
$raster_full!
Gridded!raster!of!full!BBKUD!estimation!
!
$raster_sub!
Gridded!raster!stack!of!BBKUD!estimates!for!all!temporal!subsets!
!
!
!
!
!
!
!
!
!
!
!
!
!
!
!
!
!
!
!
!
!
!
!
!
!
!
!
!
!
!
!
!
!
!
!
!
!
References!
!
Horne,!J.S.,!Garton,!E.O.,!Krone,!S.M.!&!Lewis,!J.S.!(2007)!Analysing!animal!movements!using!brownian!
bridges.!Ecology,!88,!2354-2363.!
R!Development!Core!Team!(2016)!R:!A!language!and!environment!for!statistical!computing.%R!
Foundation!for!Statistical!Computing,!Vienna,!Austria.!
!
