Atmel Studio 7 User Guide
User Manual: Pdf
Open the PDF directly: View PDF ![]() .
.
Page Count: 359 [warning: Documents this large are best viewed by clicking the View PDF Link!]
- Preface
- Table of Contents
- 1. Introduction
- 2. Getting Started
- 2.1. AVR® and SAM Development Tools Overview
- 2.2. AVR® and SAM HW Tools and Debuggers
- 2.3. Data Visualizer and Power Debugging Demo
- 2.4. Installation and Updates
- 2.5. Microchip Gallery and Studio Extensions
- 2.6. Atmel START Integration
- 2.7. Creating a New Project
- 2.8. Creating From Arduino Sketch
- 2.9. In-System Programming and Kit Connection
- 2.10. I/O View and Other Bare-Metal Programming References
- 2.11. Editor: Writing and Re-Factoring Code (Visual Assist)
- 2.12. AVR Simulator Debugging
- 2.13. Debugging 1: Break Points, Stepping, and Call Stack
- 2.14. Debugging 2: Conditional- and Action-Breakpoints
- 2.15. Debugging 3: I/O View Memory View and Watch
- 3. Project Management
- 3.1. Introduction
- 3.2. GCC Projects
- 3.2.1. New Project Wizard
- 3.2.2. Starting a New GCC Project for AVR Device
- 3.2.3. Libraries Options
- 3.2.4. Starting a New GCC Project for SAM (ARM) Device
- 3.2.5. Code Editing
- 3.2.6. Starting a New GCC Static Library Project
- 3.2.7. GCC Project Options and Configuration
- 3.3. Assembler Projects
- 3.4. Import of Projects
- 3.5. Debug Object File in Atmel Studio
- 4. Debugging
- 4.1. Introduction
- 4.2. Starting a Debug Session
- 4.3. Ending a Debug Session
- 4.4. Attaching to a Target
- 4.5. Start without Debugging
- 4.6. Debug Control
- 4.7. Breakpoints
- 4.7.1. General Information on Breakpoints
- 4.7.2. Operations with Breakpoints
- 4.7.2.1. To Set a Breakpoint
- 4.7.2.2. To Set an Address Breakpoint
- 4.7.2.3. To Edit a Breakpoint Location
- 4.7.2.4. Hit Count Keeps Track of How Many Times a Breakpoint is Hit
- 4.7.2.5. To Specify a Hit Count
- 4.7.2.6. To Enable or Disable a Single Breakpoint
- 4.7.2.7. To Delete a Breakpoint
- 4.7.2.8. To Delete all Breakpoints
- 4.7.3. Breakpoint Window
- 4.7.3.1. To Open the Breakpoints Window
- 4.7.3.2. To Go to the Location of a Breakpoint
- 4.7.3.3. To Display Additional Columns
- 4.7.3.4. To Export all Breakpoints that Match the Current Search Criteria
- 4.7.3.5. To Export Selected Breakpoints
- 4.7.3.6. To Import Breakpoints
- 4.7.3.7. To View Breakpoints that Match a Specified String
- 4.7.3.8. To View all Breakpoints after a Search
- 4.7.3.9. Breakpoint Labels
- 4.7.3.10. To Label Breakpoints
- 4.7.3.11. To Search for Breakpoints that have a Specified Label
- 4.7.3.12. To Remove Labels from Breakpoints
- 4.7.3.13. To Sort the Breakpoint List by Label
- 4.8. Data Breakpoints
- 4.8.1. Adding Data Breakpoint
- 4.8.2. Data Breakpoints Window
- 4.8.2.1. Data Breakpoints Tool Window
- 4.8.2.2. Data Breakpoint Configuration Window for AVR ATmega
- 4.8.2.3. Data Breakpoint Configuration Window for XMEGA
- 4.8.2.4. Data Breakpoint Configuration Window for UC3
- 4.8.2.5. Data Breakpoint Configuration Window for SAM
- 4.8.2.6. Data Breakpoint Configuration Window for Simulator Tool
- 4.8.2.7. How to: Specify a Data Breakpoint Hit Count
- 4.8.2.8. When Breakpoint is Hit Dialog Box
- 4.8.3. General Information on Data Breakpoint
- 4.8.4. Data Breakpoint Usage
- 4.9. QuickWatch, Watch, Locals, and Autos Windows
- 4.10. DataTips
- 4.11. Disassembly View
- 4.12. I/O View
- 4.13. Processor View
- 4.14. Register View
- 4.15. Memory View
- 4.16. Call Stack Window
- 4.17. Object File Formats
- 4.18. Trace
- 4.19. Trace View
- 5. Programming Dialog
- 5.1. Introduction
- 5.2. Interface Settings
- 5.3. Tool Information
- 5.4. Board Settings/Tool Settings
- 5.5. Card Stack
- 5.6. Device Information
- 5.7. Oscillator Calibration
- 5.8. Memories
- 5.9. Fuse Programming
- 5.10. Lock Bits
- 5.11. Production Signatures
- 5.12. Production Files
- 5.13. Security
- 5.14. Automatic Firmware Upgrade Detection
- 6. Miscellaneous Windows
- 7. GNU Toolchains
- 7.1. GNU Compiler Collection (GCC)
- 7.2. ARM Compiler and Toolchain Options: GUI
- 7.3. ARM GNU Toolchain Options
- 7.4. Binutils
- 7.5. AVR Compiler and Toolchain Options: GUI
- 7.6. Commonly Used Options
- 7.7. 8-bit Specific AVR GCC Command Line Options
- 7.8. 32-bit Specific AVR GCC Command Line Options
- 7.9. Binutils
- 8. Extending Atmel Studio
- 9. Menus and Settings
- 9.1. Customizing Existing Menus and Toolbars
- 9.2. Reset Your Settings
- 9.3. Options Dialog Box
- 9.3.1. Environment Options
- 9.3.1.1. General Environment Settings
- 9.3.1.2. Add-in/Macros Security
- 9.3.1.3. AutoRecover
- 9.3.1.4. Find and Replace
- 9.3.1.5. Fonts and Colors
- 9.3.1.6. Language and International Settings
- 9.3.1.7. Keyboard Settings
- 9.3.1.8. Start-up Page — to Change the Default UI Displayed when You Start Atmel Studio
- 9.3.1.9. Import and Export Settings
- 9.3.1.10. Task List
- 9.3.1.11. Web Browser Options
- 9.3.1.12. Custom Start Pages
- 9.3.2. Project Options
- 9.3.3. Source Control
- 9.3.4. Text Editor Options
- 9.3.5. Debugger
- 9.3.6. Advanced Software Framework Settings
- 9.3.7. Builder
- 9.3.8. Device and Tool Libraries
- 9.3.9. Status Management
- 9.3.10. Text Templating
- 9.3.11. Toolchain
- 9.3.12. GDB Settings
- 9.3.1. Environment Options
- 9.4. Code Snippet Manager
- 9.5. External Tools
- 9.6. Predefined Keyboard Shortcuts
- 10. Command Line Utility (CLI)
- 11. Frequently Asked Questions
- 11.1. Compatibility with Legacy AVR Software and Third-party Products
- 11.2. Atmel Studio Interface
- 11.2.1. How can I Start Debugging My Code? What is the Keyboard Shortcut for Debugging?
- 11.2.2. What is a Solution?
- 11.2.3. What is a Project
- 11.2.4. How can I use an External Makefile for my Project?
- 11.2.5. When Watching a Variable, the Debugger says Optimized away
- 11.2.6. When Starting a Debug Session, I get an Error Stating that Debug Tool is not Set
- 11.3. Performance Issues
- 11.3.1. Atmel Studio Takes a Very Long Time to Start on My PC but Runs Well in a VM Environment. Is there Something I Can Do With This?
- 11.3.2. Verification and Programming often Fails with a Serial Port Buffer Overrun Error Message when using STK500
- 11.3.3. I've connected my Tool through a USB Hub, and now I get Error Messages and Inconsistent Results while Programming and Debugging
- 11.4. Driver and USB Issues
- 12. Document Revision History
- The Microchip Web Site
- Customer Change Notification Service
- Customer Support
- Microchip Devices Code Protection Feature
- Legal Notice
- Trademarks
- Quality Management System Certified by DNV
- Worldwide Sales and Service
- Index

Atmel Studio 7 User Guide
Atmel Studio 7
Preface
Atmel Studio is an Integrated Development Environment (IDE) for writing and debugging AVR®/ARM®
applications in Windows® XP/Windows Vista®/Windows 7/8 environments. Atmel Studio provides a project
management tool, source file editor, simulator, assembler, and front-end for C/C++, programming, and
on-chip debugging.
Atmel Studio supports the complete range of Microchip AVR tools. Each new release contains the latest
updates for the tools as well as support for new AVR/ARM devices.
Atmel Studio has a modular architecture, which allows interaction with 3rd party software vendors. GUI
plugins and other modules can be written and hooked to the system. Contact Microchip for more
information.
© 2018 Microchip Technology Inc. User Guide DS50002718A-page 1

Table of Contents
Preface............................................................................................................................ 1
1. Introduction................................................................................................................5
1.1. Features....................................................................................................................................... 5
1.2. New and Noteworthy....................................................................................................................5
1.3. Installation.................................................................................................................................. 12
1.4. Contact Information....................................................................................................................13
2. Getting Started........................................................................................................ 15
2.1. AVR® and SAM Development Tools Overview........................................................................... 17
2.2. AVR® and SAM HW Tools and Debuggers.................................................................................18
2.3. Data Visualizer and Power Debugging Demo............................................................................20
2.4. Installation and Updates.............................................................................................................22
2.5. Microchip Gallery and Studio Extensions...................................................................................24
2.6. Atmel START Integration............................................................................................................25
2.7. Creating a New Project.............................................................................................................. 30
2.8. Creating From Arduino Sketch...................................................................................................36
2.9. In-System Programming and Kit Connection............................................................................. 37
2.10. I/O View and Other Bare-Metal Programming References ....................................................... 44
2.11. Editor: Writing and Re-Factoring Code (Visual Assist)...............................................................56
2.12. AVR Simulator Debugging..........................................................................................................65
2.13. Debugging 1: Break Points, Stepping, and Call Stack............................................................... 70
2.14. Debugging 2: Conditional- and Action-Breakpoints ...................................................................80
2.15. Debugging 3: I/O View Memory View and Watch.......................................................................87
3. Project Management............................................................................................... 95
3.1. Introduction.................................................................................................................................95
3.2. GCC Projects............................................................................................................................. 98
3.3. Assembler Projects.................................................................................................................. 131
3.4. Import of Projects..................................................................................................................... 136
3.5. Debug Object File in Atmel Studio........................................................................................... 145
4. Debugging............................................................................................................. 151
4.1. Introduction...............................................................................................................................151
4.2. Starting a Debug Session.........................................................................................................151
4.3. Ending a Debug Session..........................................................................................................151
4.4. Attaching to a Target................................................................................................................ 152
4.5. Start without Debugging...........................................................................................................152
4.6. Debug Control.......................................................................................................................... 153
4.7. Breakpoints.............................................................................................................................. 155
4.8. Data Breakpoints......................................................................................................................160
4.9. QuickWatch, Watch, Locals, and Autos Windows....................................................................174
4.10. DataTips................................................................................................................................... 180
4.11. Disassembly View ................................................................................................................... 183
Atmel Studio 7 User Guide
© 2018 Microchip Technology Inc. User Guide DS50002718A-page 2

4.12. I/O View....................................................................................................................................184
4.13. Processor View ....................................................................................................................... 185
4.14. Register View........................................................................................................................... 187
4.15. Memory View............................................................................................................................187
4.16. Call Stack Window................................................................................................................... 187
4.17. Object File Formats..................................................................................................................190
4.18. Trace........................................................................................................................................ 191
4.19. Trace View................................................................................................................................193
5. Programming Dialog..............................................................................................200
5.1. Introduction...............................................................................................................................200
5.2. Interface Settings..................................................................................................................... 203
5.3. Tool Information........................................................................................................................207
5.4. Board Settings/Tool Settings.................................................................................................... 207
5.5. Card Stack................................................................................................................................210
5.6. Device Information....................................................................................................................211
5.7. Oscillator Calibration................................................................................................................ 212
5.8. Memories..................................................................................................................................213
5.9. Fuse Programming...................................................................................................................215
5.10. Lock Bits...................................................................................................................................216
5.11. Production Signatures..............................................................................................................216
5.12. Production Files........................................................................................................................217
5.13. Security.................................................................................................................................... 220
5.14. Automatic Firmware Upgrade Detection.................................................................................. 221
6. Miscellaneous Windows........................................................................................ 222
6.1. Device Pack Manager.............................................................................................................. 222
6.2. User Interface Profile Selection................................................................................................224
6.3. Available Tools View.................................................................................................................225
6.4. Tool Info Window......................................................................................................................228
6.5. Firmware Upgrade....................................................................................................................230
6.6. Find and Replace Window....................................................................................................... 231
6.7. Export Template Wizard........................................................................................................... 235
6.8. Kit Mode Setting.......................................................................................................................238
7. GNU Toolchains.....................................................................................................239
7.1. GNU Compiler Collection (GCC)..............................................................................................239
7.2. ARM Compiler and Toolchain Options: GUI ............................................................................ 239
7.3. ARM GNU Toolchain Options...................................................................................................244
7.4. Binutils......................................................................................................................................249
7.5. AVR Compiler and Toolchain Options: GUI .............................................................................249
7.6. Commonly Used Options......................................................................................................... 254
7.7. 8-bit Specific AVR GCC Command Line Options.....................................................................258
7.8. 32-bit Specific AVR GCC Command Line Options...................................................................259
7.9. Binutils......................................................................................................................................262
8. Extending Atmel Studio......................................................................................... 263
8.1. Extension Manager UI..............................................................................................................263
Atmel Studio 7 User Guide
© 2018 Microchip Technology Inc. User Guide DS50002718A-page 3

8.2. Registering at the Microchip Gallery........................................................................................ 264
8.3. Installing New Extensions in Atmel Studio............................................................................... 267
8.4. Visual Assist.............................................................................................................................272
8.5. Overview of QTouch Composer and Library............................................................................ 273
8.6. Scripting Extensions.................................................................................................................277
9. Menus and Settings...............................................................................................280
9.1. Customizing Existing Menus and Toolbars...............................................................................280
9.2. Reset Your Settings..................................................................................................................281
9.3. Options Dialog Box...................................................................................................................282
9.4. Code Snippet Manager............................................................................................................ 324
9.5. External Tools...........................................................................................................................326
9.6. Predefined Keyboard Shortcuts............................................................................................... 329
10. Command Line Utility (CLI)................................................................................... 344
11. Frequently Asked Questions................................................................................. 345
11.1. Compatibility with Legacy AVR Software and Third-party Products.........................................347
11.2. Atmel Studio Interface..............................................................................................................347
11.3. Performance Issues................................................................................................................. 349
11.4. Driver and USB Issues.............................................................................................................349
12. Document Revision History................................................................................... 354
The Microchip Web Site.............................................................................................. 356
Customer Change Notification Service........................................................................356
Customer Support....................................................................................................... 356
Microchip Devices Code Protection Feature............................................................... 356
Legal Notice.................................................................................................................357
Trademarks................................................................................................................. 357
Quality Management System Certified by DNV...........................................................358
Worldwide Sales and Service......................................................................................359
Atmel Studio 7 User Guide
© 2018 Microchip Technology Inc. User Guide DS50002718A-page 4

1. Introduction
1.1 Features
Atmel Studio provides a large set of features for project development and debugging. The most notable
features are listed below.
• Rich code editor for C/C++ and Assembly featuring the powerful Visual Assist extension
• Cycle correct simulator with advanced debug functionality
• Advanced Software Framework allowing creation of modular applications and providing building
blocks for a prototype on any AVR platform
• Debugging on actual devices using Debugging Tools
• Rich SDK to enable tight integration of customer plugins
• Compatible with many Microsoft® Visual Studio® plugins
1.2 New and Noteworthy
New features available.
1.2.1 Atmel Studio 7.0
Atmel Studio 7.0.1645
Atmel Studio 7.0.1645 contains:
• Advanced Software Framework 3.35.1.898
• Support for devices:
– ATmega4808, ATmega4809
– ATtiny1614, ATtiny3214, ATtiny3216, ATtiny3217
– ATSAMC[20|21][J|N][15|17|18]A
– ATSAMD20[E|G|J][14|15|16]B
– ATSAMD51[G|J|N|P][18|19|20]A
– ATSAME[51|53|54][J|N][18|19|20]
– ATSAME70[N|Q][19|20|21]B
– ATSAMS70[J|N|Q][19|20|21]B
• AVR 8-bit GCC Toolchain 3.6.1
• ARM GCC Toolchain 6.3.1 with upstream versions: gcc (ARM/embedded-6-branch revision
249437), GNU ARM Embedded Toolchain: 6-2017-q2-update
• Atmel Studio 7.0.1645 contains fixes for the following issues that were present in 7.0.1417:
– AVRSV-7798: ATtiny817 fuse programming from ELF issue fixed.
– AVRSV-7742: Compiling an imported Arduino sketch for Arduino zero shows error.
– AVRSV-7903: Studio automatically sets GPNVM bits [7:8] thereby enabling TCM.
– AVRSV-7892: Writing SAML22 RWW flash fails.
– AVRSV-7889: Skewed debug info for AVR 8-bit in AS 7.0.1417.
– AVRSV-7883: Incorrect warning message for KB2978092 during installation of AS 7.0.1417.
Atmel Studio 7 User Guide
Introduction
© 2018 Microchip Technology Inc. User Guide DS50002718A-page 5

– AVRSV-7106: Hex parser fails on UNIX® line endings.
– AVRSV-4914: Add support for new avr-gcc __int24 and __uint24 types.
– AVRSV-7877: Devices with external SRAM fails to calculate available SRAM.
– AVRSV-7845: Crash in _ReallyTerminateAfterLaunchFinished.
– AVRSV-7834: Pack manager fails to download CMSIS DFPs.
– AVRSV-7876: Add checksum fields to http header for KitsDatabase.xml.
– AVRSV-7854: NaN values not handled by atprogram.
– AVRSV-7911: Problems reading device ID on ATmega4809.
– AVRSV-7202: Arduino Library Grouping can have better representation.
– AVRSV-7927: Security Bit Window in Device Programming should not always be available
depending on the MCUs.
– AVRSV-7973: Chip erase outside prog session fails on SAM4L.
– AVRSV-7961: FUSE configuration warning for BOD( BODCFG.LVL) is incorrect in Atmel
Studio.
Note: QTouch Composer extension must be updated to version 5.9.122 or later to work with Atmel
Studio 7.0.1645.
Atmel Studio 7.0.1417
Atmel Studio 7.0.1417 contains a fix for the following issue that was present in 7.0.1416:
• AVRSV-7827: New WinUSB driver fails to install on 32-bit Windows
Atmel Studio 7.0.1416
The following changes are done in Atmel Studio 7.0.1416:
• Changed driver to WinUSB for AVR Dragon™, AVRISP mkII, JTAGICE mkII, JTAGICE3, AVR ONE!,
STK®600, and QT600
• Installer improvements
• Improved support for installing older device family packs
• AVR 8-bit GCC Toolchain 3.6.0 with upstream versions:
– gcc 5.4.0
– Binutils 2.26.20160125
– avr-libc 2.0.0
– gdb 7.8
• ARM GCC Toolchain 6.2.1 with upstream versions:
– gcc (ARM/embedded-6-branch revision 243739), GNU ARM Embedded Toolchain: 6-2016-
q4-major
– Binutils 2.27
– gdb 7.12
• Advanced Software Framework 3.34.1
Atmel Studio 7.0.1416 contains a fix for the following issues that were present in 7.0.1188:
• AVRSV-7492: Illegal PC value after a few resume-suspend cycles on SAMD10.
• AVRSV-7486: Debugging may fail in Cortex-M0+ SAM devices at high clock.
• AVRSV-7693: Go to source from Watch window crashes studio.
Atmel Studio 7 User Guide
Introduction
© 2018 Microchip Technology Inc. User Guide DS50002718A-page 6

• AVRSV-7741: Writing Flash or EEPROM with size of 0x100 or 0x1000 fails on ISP/SPI
programming.
Atmel Studio 7.0.1188
The following changes are done in Atmel Studio 7.0.1188:
• Added support for new AVR8X architecture
• Installer improvements
• Improved Arduino import
• Change how fuses are listed in the programming dialog
• AVR 8-bit GCC Toolchain 3.5.4 with upstream versions:
– gcc 4.9.2
– Binutils 2.26
– avr-libc 2.0.0
– gdb 7.8
Atmel Studio 7.0.1188 contains a fix for the following issues that were present in 7.0.1006:
• AVRSV-7149: When writing EEPROM, bytes that are 0xFF are wrongly skipped.
• AVRSV-7393: Atmel Studio backend crashes when debugging a COFF object file.
• AVRSV-7564: Atmel Studio installation is hanging.
• AVRSV-7580: Atmel Studio not handling DCACHE properly on SAM Cortex® M7 devices.
• AVRSV-7582: Remove white spaces while saving file does not show the anticipated effect.
• AVRSV-7594: Atmel Studio crashes in some cases when you stop debugging.
• AVRSV-7602: Cannot find bounds of the current function.
• AVRSV-7607: Invalid MTB buffer start address for SAML2x and SAMC2x devices.
Atmel Studio 7.0.1006
The following changes are done in Atmel Studio 7.0.1006:
• New Atmel START extension that allows the user to create and configure Atmel START projects
within Atmel Studio
• Ability to load multiple modules in a debug session (experimental)
• AVR 8-bit GCC Toolchain 3.5.3 with upstream versions:
– gcc 4.9.2
– Binutils 2.26
– avr-libc 2.0.0
– gdb 7.8
• ARM GCC Toolchain 5.3.1 with upstream versions:
– gcc (ARM/embedded-5-branch revision 234589)
– Binutils 2.26
– gdb 7.10
Atmel Studio 7.0.1006 contains a fix for the following issues that were present in 7.0.943:
• AVRSV-6878: Atmel Studio write the write-once wdt registers on some SAM devices.
• AVRSV-7470: SAM Cortex®-M7 devices fails launch occasionally.
• AVRSV-7471: Devices with external and internal RAM lists all the RAM as available.
• AVRSV-7473: Atmel Studio hangs during startup.
Atmel Studio 7 User Guide
Introduction
© 2018 Microchip Technology Inc. User Guide DS50002718A-page 7

• AVRSV-7474: Kits connected to Atmel Studio are not getting enumerated in the QTouch Start Page.
• AVRSV-7477: Show all files does not work from solution explorer.
• AVRSV-7482: Exception when adding a breakpoint on SAM4L.
• AVRSV-7486: Debugging may fail in Cortex-M0+ SAM devices at high clock speeds.
Atmel Studio 7.0.943
Atmel Studio 7.0.943 contains a fix for the following issue:
• AVRSV-7459: Projects containing files with uppercase file names can fail to build. Saving files with
uppercase file names convert file names to lower case.
Atmel Studio 7.0.934
The following changes are done in Atmel Studio 7.0.934:
• AVR 8-bit GCC Toolchain 3.5.2 with upstream versions:
– gcc 4.9.2
– Binutils 2.26
– avr-libc 2.0.0
– gdb 7.8
• AVR 32-bit GCC Toolchain 3.4.3 with upstream versions:
– gcc 4.4.7
– Binutils 2.23.1
– Newlib 1.16.0
• ARM GCC Toolchain 4.9.3 with upstream versions:
– gcc (ARM/embedded-4_9-branch revision 224288)
– Binutils 2.24
– gdb 7.8.0.20150304-cvs
Atmel Studio 7.0.934 resolves the following issues present in Atmel Studio 7.0.790:
• AVRSV-7376: Atmel-ICE slow programming.
• AVRSV-7379: Unhandled exception when writing fuses or lock bits when Auto Read is turned off.
• AVRSV-7396: Some machines shows an error regarding 'Exception in MemoryPressureReliever'.
• AVRSV-7400: When in Standard mode, Disable debugWire and Close are not visible in the
Debug menu.
• AVRSV-7408: When using Atmel Studio in Standard mode, the Set Startup Project menu is
missing.
Atmel Studio 7.0.790
The following features are added in Atmel Studio 7.0.790:
• Support for mass storage mode in embedded debugger (EDBG), enabling drag and drop
programming
• Introduction of user interface profiles. The user can choose an interface where some of the toolbar
buttons and menu items are removed.
• Support for importing libraries to previously imported sketches. Added support for Arduino Zero and
Zero Pro.
• Parallel build turned on by default
Atmel Studio 7 User Guide
Introduction
© 2018 Microchip Technology Inc. User Guide DS50002718A-page 8

Atmel Studio 7.0.790 resolves the following issues present in Atmel Studio 7.0.634:
• AVRSV-7084: Persist user settings during the upgrade.
• AVRSV-7014: Some ATmega and ATtiny devices failed to start debugging with the Simulator.
• AVRSV-7230: 'Show all files' in Solution Explorer not consistent.
• AVRSV-7062: Firmware upgrade of Xplained Mini kits not detected.
• AVRSV-7164: Reading flash to .bin file created incorrect .bin file.
• AVRSV-7106: Hex files with UNIX or mixed file endings fail to load.
• AVRSV-7126: Data breakpoints for ARM should not be limited to RAM.
Atmel Studio 7.0.634
This release adds device support for the SAM B11 device family.
Atmel Studio 7.0.634 resolves the following issues present in Atmel Studio 7.0.594:
• AVRSV-6873: Jungo Driver issue with Windows 10.
• AVRSV-6676: Launching debugging fails due to an issue with Intel graphics driver.
Atmel Studio 7.0.594
Atmel Studio 7.0.594 resolves the following issues present in Atmel Studio 7.0.582:
• AVRSV-7008: Opening a 6.2 project in Atmel Studio 7.0.582 persists Debug configuration settings
for all the other configurations.
• AVRSV-6983: Uninstalling Studio extensions does not work in some cases.
• AVRSV-7018: Project Creation fails with some culture-specific user-names.
• AVRSV-7019: Help Viewer does not work on 32-bit machines.
• Issues with getting tools/debuggers recognized or visible see section 2.4 in ‘Atmel Studio 7.0.594-
readme.pdf’ for workarounds.
Atmel Studio 7.0.582
• Updated to Visual Studio Isolated Shell 2015
• Integration with Atmel START
– This tool will help you select and configure software components, drivers, middle-ware, and
example projects to tailor your embedded application in a usable and optimized manner
• New device support system, CMSIS Pack compliant
• Data Visualizer, used for processing and visualizing data
• Updated help system, improved context-sensitive help
• Advanced Software Framework version 3.27.3. ASF is an extensive software library of software
stacks and examples.
• A major upgrade of the Visual Assist extension to Atmel Studio that assists with reading, writing, re-
factoring, navigating code fast
• Import Arduino Sketch projects into Atmel Studio
• Support for Flip-compatible bootloaders in atprogram and programming dialogue. The connected
device appears as a tool.
• AVR 8-bit GCC Toolchain 3.5.0 with upstream versions1:
– gcc 4.9.2
– Binutils 2.25
– avr-libc 1.8.0svn
Atmel Studio 7 User Guide
Introduction
© 2018 Microchip Technology Inc. User Guide DS50002718A-page 9

– gdb 7.8
• AVR 32-bit GCC Toolchain 3.4.3 with upstream versions1:
– gcc 4.4.7
– Binutils 2.23.1
– Newlib 1.16.0
• ARM GCC Toolchain 4.9.3 with upstream versions1:
– gcc 4.9 (revision 221220)
– Binutils 2.24
– gdb 7.8.0.20150304-cvs
1.2.2 Atmel Studio 6.2 Service Pack 2
• Advanced Software Framework 3.21.0
• Added support for the ATSAML21 device family
• Added support for the ATSAMV7 device family, based on the ATM Cortex-M7 core
1.2.3 Atmel Studio 6.2 Service Pack 1
• Advanced Software Framework 3.19.0
• AVR 8-bit Toolchain 3.4.5 with upstream versions:
– GCC 4.8.1
– Binutils 2.41
– avr-libc 1.8.0svn
– gdb 7.8
• AVR 32-bit Toolchain 3.4.2 with upstream versions:
– GCC 4.4.7
– Binutils 2.23.1
• ARM GCC Toolchain 4.8.4 with upstream versions:
– GCC 4.8.4
– Binutils 2.23.1
– gdb 7.8
• Support for trace buffers for ARM (MTB) and 32-bit AVR UC3 (NanoTrace)
• Support for attaching to targets
1.2.4 Atmel Studio 6.2
• Advanced Software Framework 3.17.0
• AVR 8-bit Toolchain 3.4.4 (with upstream GCC 4.8.1)
• AVR 32-bit Toolchain 3.4.2 (with upstream GCC 4.4.7)
• ARM GCC Toolchain 4.8.3
• Support for Atmel-ICE
1For more information, see the readme that is installed as part of the toolchain.
2For more information, see the readme that is installed as part of the toolchain.
Atmel Studio 7 User Guide
Introduction
© 2018 Microchip Technology Inc. User Guide DS50002718A-page 10

• Support for Xplained Mini
• Support for data breakpoints
• Read OSCCAL calibration for tinyAVR® and megaAVR®
• Create ELF production files for AVR 8-bit using the programming dialogue
• Live Watch
• Non-intrusive trace support for SAM3 and SAM4 family of devices including
– Interrupt trace and monitoring
– Data trace
– FreeRTOS™ awareness
– Statistical code profiling
• Polled Data trace support for Cortex M0+
• Default debugger for SAM devices is now GDB. GDB does in some scenarios handle debugging of
optimized code better.
• Support to create a GCC Board project (Atmel board\User board) for ALL the installed versions of
ASF
• New ASF Board Wizard, to Add or Remove Board Project Template
• Improved loading time of New Example Project dialog, by loading only one ASF version by default
• IDR events now gets displayed in a separate pane in the output window
• LSS file syntax highlighting
1.2.5 Atmel Studio 6.1 Update 2
• Support for SAM D20 devices on the JTAGICE3
• Advanced Software Framework 3.11.0
1.2.6 Atmel Studio 6.1 Update 1.1
• Fix programming of boot section for XMEGA devices introduced in 6.1 update 1
• Fix SAM4LSP32 bare-bone project setup
1.2.7 Atmel Studio 6.1 Update 1
• Advanced Software Framework 3.9.1
• Extension Development Kit (XDK). Support for packaging an Embedded Application project into an
Atmel Gallery Extension.
• Support for SAM D20 and SAM4N devices
• ARM GCC Toolchain 4.7.3 with experimental newlib-nano and multilibs
1.2.8 Atmel Studio 6.1
• Support for Embedded Debugger platform
• Support for Xplained Pro kits
• Advanced Software Framework 3.8.0
• AVR 8-bit Toolchain 3.4.2 (with upstream GCC 4.7.2)
• AVR 32-bit Toolchain 3.4.2 (with upstream GCC 4.4.7)
• ARM GCC Toolchain 4.7.3
• CMSIS 3.20
• Updated Visual Assist
Atmel Studio 7 User Guide
Introduction
© 2018 Microchip Technology Inc. User Guide DS50002718A-page 11

• Command line utility for firmware upgrade
• Stimulus for simulator. Create a stimuli file to write register values while executing simulation.
1.2.9 Atmel Studio 6.0
• Support for ARM-based MCUs with SAM-ICE
• Advanced Software Framework 3.1.3
• AVR Toolchain 3.4.0
• ARM Toolchain 3.3.1
• Advanced Software Framework Explorer
• Support for QTouch Composer as extension
• Updated Visual Assist
• New extension gallery
1.2.10 AVR Studio 5.1
• New version of AVR Software Framework (ASF)
• Availability and installation of new ASF versions through extension manager, without having to
upgrade Studio 5
• Support for side by side versioning of ASF, with the ability to upgrade projects
• Syntax highlighting and better debugging support for C++ projects
• Support for importing AVR 32 Studio C++ projects
• New version of AVR Toolchain
• New command line utility (atprogram) with support for all Microchip AVR tools and devices
• Enhancements to programming dialog including support for ELF programming
• New version of Visual Assist with several enhancements and bugfixes
1.3 Installation
Installation instructions.
Supported Operating Systems
• Windows 7 Service Pack 1 or higher
• Windows Server 2008 R2 Service Pack 1 or higher
• Windows 8/8.1
• Windows Server 2012 and Windows Server 2012 R2
• Windows 10
Supported Architectures
• 32-bit (x86)
• 64-bit (x64)
Hardware Requirements
• Computer that has a 1.6 GHz or faster processor
• RAM
– 1 GB RAM for x86
Atmel Studio 7 User Guide
Introduction
© 2018 Microchip Technology Inc. User Guide DS50002718A-page 12

– 2 GB RAM for x64
– An additional 512 MB RAM if running in a Virtual Machine
• 6 GB of available hard disk space
Downloading and Installing
• Download the latest Atmel Studio installer
• Atmel Studio can be run side-by-side with older versions of Atmel Studio and AVR Studio.
Uninstallation of previous versions is not required.
• Verify the hardware and software requirements from the 'System Requirements' section
• Make sure your user has local administrator privileges
• Save all your work before starting. The installation might prompt you to restart if required.
• Disconnect all USB/Serial hardware devices
• Double-click the installer executable file and follow the installation wizard
• Once finished, the installer displays an option to Start Atmel Studio after completion. If you
choose to open, then note that Atmel Studio will launch with administrative privileges, since the
installer was either launched as administrator or with elevated privileges.
1.4 Contact Information
Report any problems you experience with this version of Atmel Studio. We would also like to receive good
ideas and requests that can help to improve further development and releases of Atmel Studio.
Check out the Microchip Support for any issues that you might encounter. From this page it is possible to
contact Microchip Support through the support portal.
For the latest updates visit the Atmel Studio 7 product page on the Microchip web site.
Reporting Bugs
Copy the information from the version dialog (see the figure below) and include it in the email to
Microchip. Also, make sure to provide a detailed description of the problem:
1. Describe how to recreate the problem.
2. Attach any test program that causes the problem.
3. Check that the copied version information contains used debug platform and device.
The version dialog is opened by the file menu Help → About Atmel Studio. Debug platform and device
are only displayed if you are in debug mode. Push the copy button to copy the contents to the clipboard.
Atmel Studio 7 User Guide
Introduction
© 2018 Microchip Technology Inc. User Guide DS50002718A-page 13
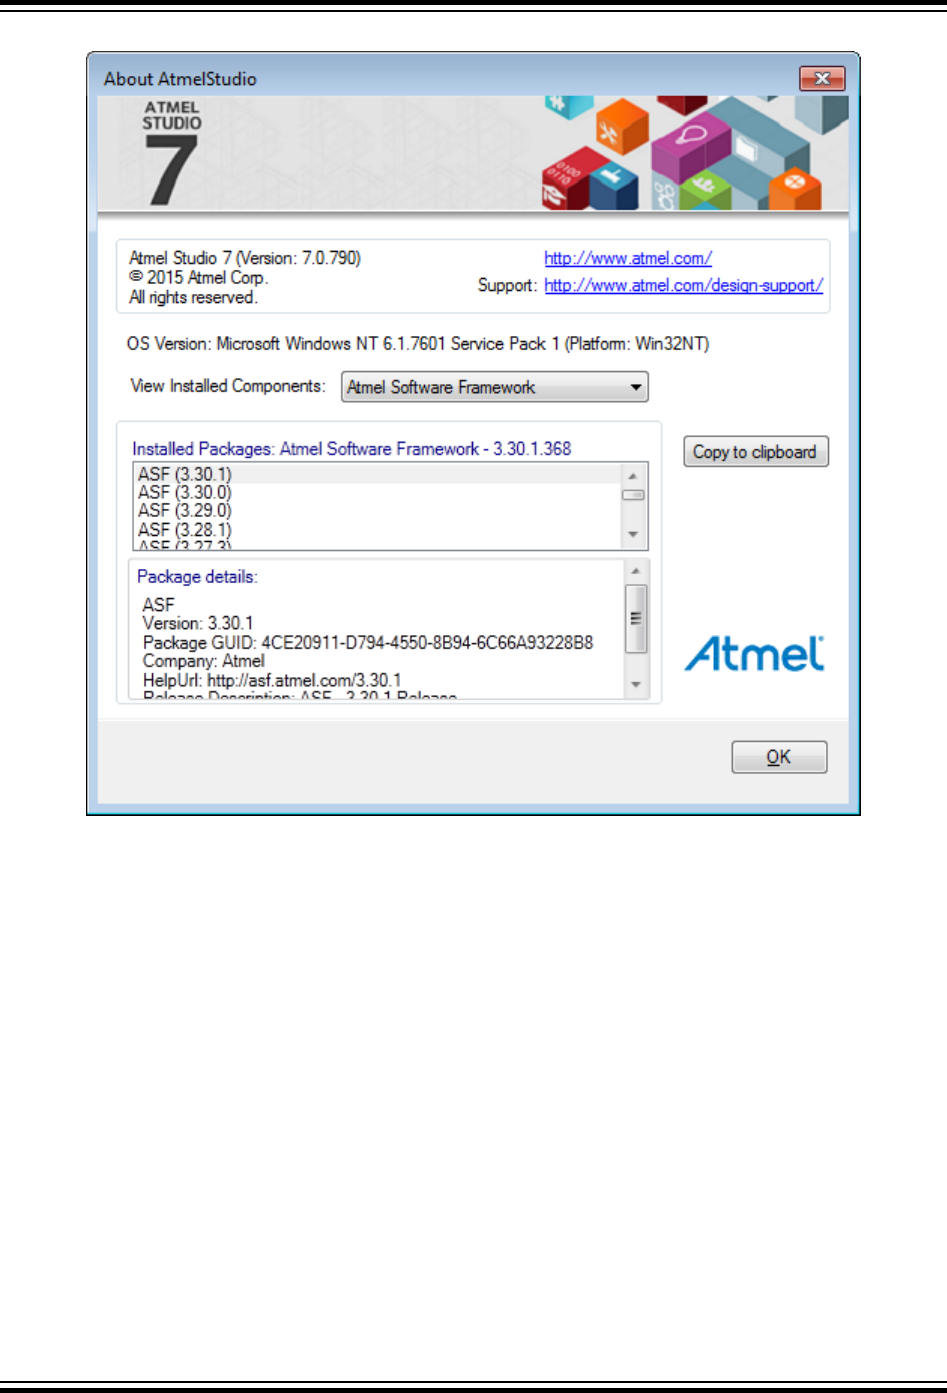
Figure 1-1. Atmel Studio About Box
Atmel Studio 7 User Guide
Introduction
© 2018 Microchip Technology Inc. User Guide DS50002718A-page 14
2. Getting Started
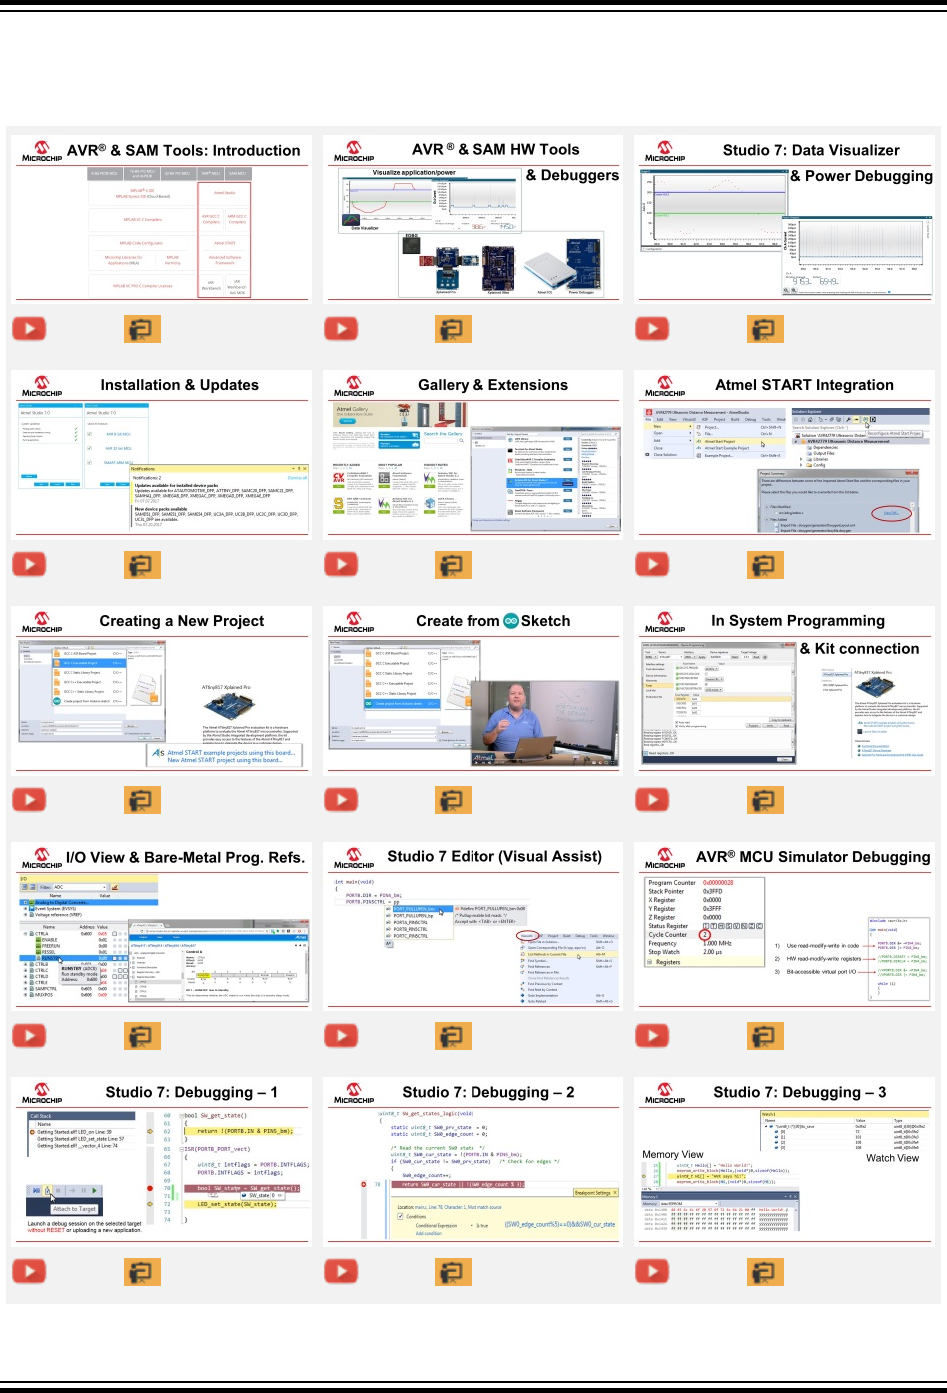
Getting Started Atmel Studio 7 - playlist.
Video Description Video Description Video Demo code
Video Hands-on Video Hands-on Video Hands-on
Video Hands-on Video Hands-on Video Hands-on
Video Hands-on Video Hands-on Video Hands-on
Video Hands-on Video Hands-on Video Hands-on
Atmel Studio 7 User Guide
Getting Started
© 2018 Microchip Technology Inc. User Guide DS50002718A-page 15
This Getting Started training for Atmel Studio 7 will guide you through all the major features of the IDE. It
is designed as a video series with accompanying hands-ons. Each section starts with a video, which
covers that section.
Prerequisites
Much of the training could be completed by using the editor and simulator, however, in order to cover
everything the following is recommended.
Hardware prerequisites:
• ATtiny817 Xplained Pro
• Standard-A to Micro-B USB cable
Software prerequisites:
• Atmel Studio 7.0
• avr-gcc toolchain
• Latest Part Pack for tinyAVR® devices
Atmel Studio 7.0 plugins used:
• Atmel START 1.0.113.0 or later
• Data Visualizer Extension 2.14.709 or later
Icon Key Identifiers
The following icons are used in this document to identify different assignment sections and to reduce
complexity.
Info: Delivers contextual information about a specific topic.
Tip: Highlights useful tips and techniques.
To do: Highlights objectives to be completed.
Result: Highlights the expected result of an assignment step.
WARNING
Indicates important information.
Atmel Studio 7 User Guide
Getting Started
© 2018 Microchip Technology Inc. User Guide DS50002718A-page 16
Execute: Highlights actions to be executed out of the target when necessary.
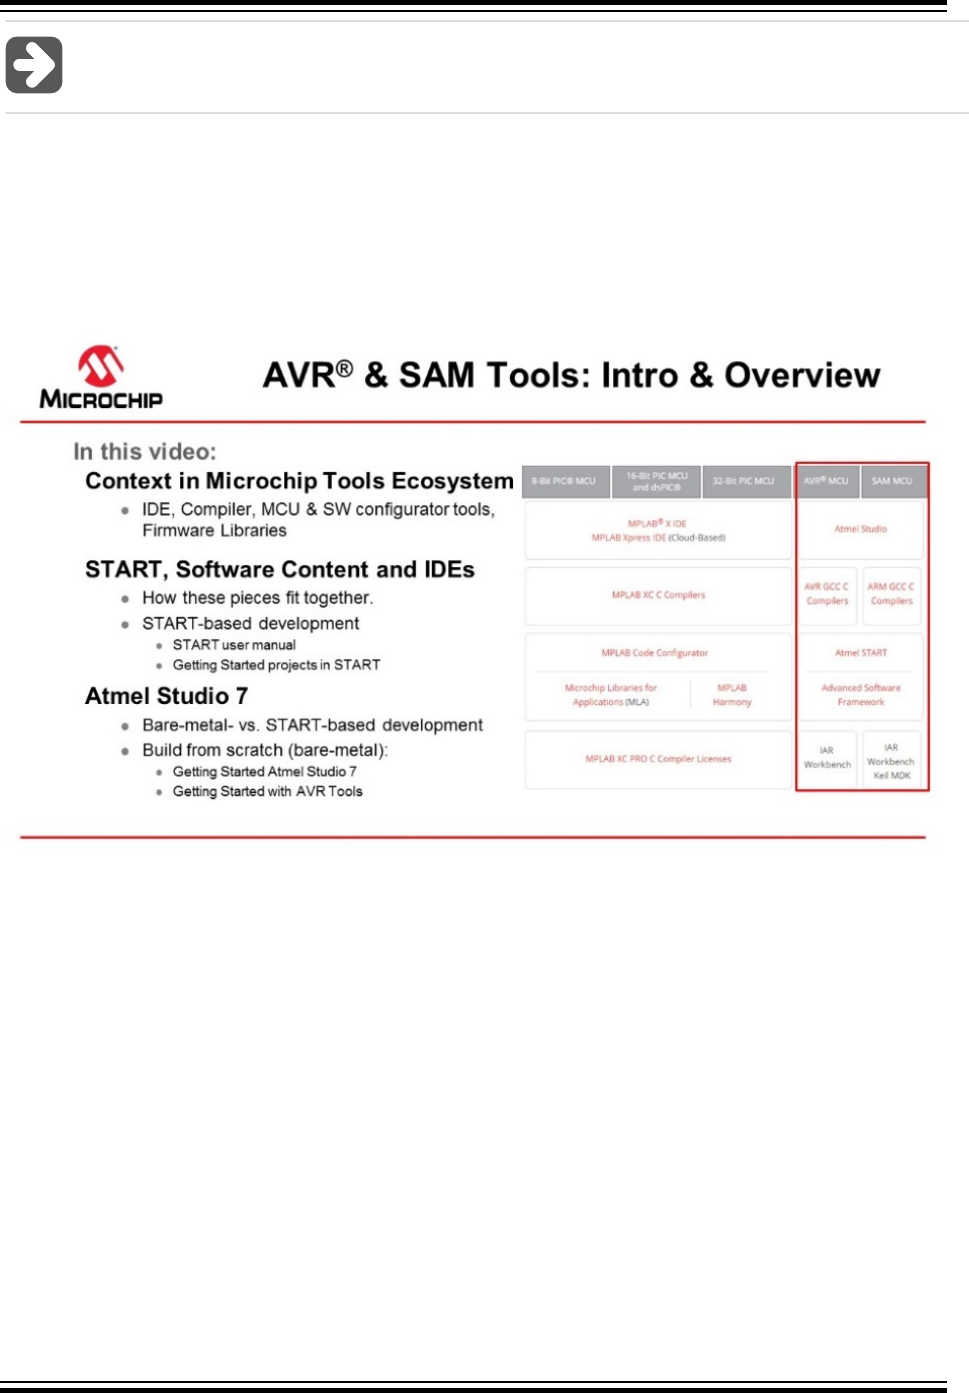
2.1 AVR® and SAM Development Tools Overview
This section gives an overview of the various pieces in the AVR® and SAM Tools ecosystem and how they
relate to each other.
Getting Started Topics
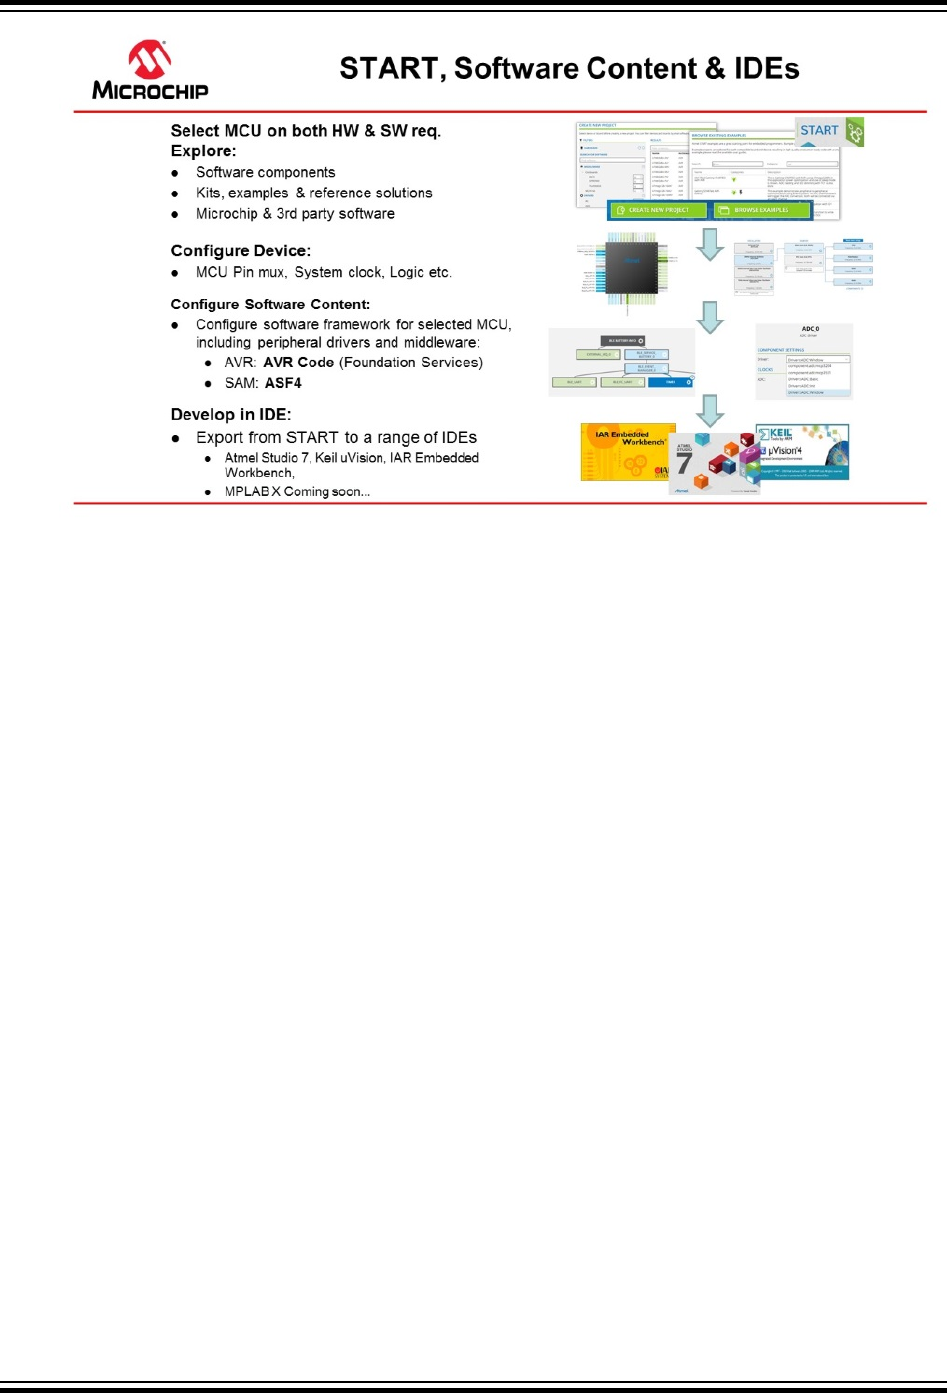
Video: AVR and SAM Tools ecosystem overview
Atmel START is a web-based software configuration tool, for various software frameworks, which helps
you getting started with MCU development. Starting from either a new project or an example project,
Atmel START allows you to select and configure software components (from ASF4 and Foundation
Services), such as drivers and middleware to tailor your embedded application in a usable and optimized
manner. Once an optimized software configuration is done, you can download the generated code
project and open it in the IDE of your choice, including Studio 7, IAR Embedded Workbench®, Keil®
μVision®, or simply generate a make file.
Atmel START enables you to:
• Get help with selecting an MCU, based on both software and hardware requirements
• Find and develop examples for your board
• Configure drivers, middleware, and example projects
• Get help with setting up a valid PINMUX layout
• Configure system clock settings
Atmel Studio 7 User Guide
Getting Started
© 2018 Microchip Technology Inc. User Guide DS50002718A-page 17
ASF, the Advanced Software Framework, provides a rich set of proven drivers and code modules
developed by experts to reduce customer design-time. It simplifies the usage of microcontrollers by
providing an abstraction to the hardware through drivers and high-value middlewares. ASF is a free and
open-source code library designed to be used for evaluation, prototyping, design, and production phases.
ASF4, supporting the SAM product line, is the fourth major generation of ASF. ASF4 represents a
complete re-design and -implementation of the whole framework, to improve the memory footprint, code
performance, as well as to better integrate with the Atmel START web user interface. ASF4 must be used
in conjunction with Atmel START, which replaces the ASF Wizard of ASF2 and 3.
Foundation Services, supporting the AVR product line, is a simple firmware framework for AVR 8-bit
MCUs, equivalent to Foundation Services, which supports 8- and 16-bit PIC MCUs. Foundation
Services is optimized for code-size and -speed, as well as simplicity and readability of code. Foundation
Services is configured by Atmel START.
An IDE (Integrated Development Environment) is used to develop an application (or further develop an
example application) based on the software components, such as drivers and middlewares, configured in
and exported from Atmel START.
Atmel Studio 7 is the integrated development platform (IDP) for developing and debugging all AVR and
SAM microcontroller applications. The Atmel Studio 7 IDP gives you a seamless and easy-to-use
environment to write, build, and debug your applications written in C/C++ or assembly code. It also
connects seamlessly to the debuggers, programmers, and development kits that support AVR and SAM
devices. The development experience between Atmel START and Studio 7 has been optimized. Iterative
development of START-based projects in Studio 7 is supported through re-configure and merge
functionality.
2.2 AVR® and SAM HW Tools and Debuggers
This section describes the HW Tools ecosystem for AVR® and SAM MCUs.
Getting Started Topics
Atmel Studio 7 User Guide
Getting Started
© 2018 Microchip Technology Inc. User Guide DS50002718A-page 18
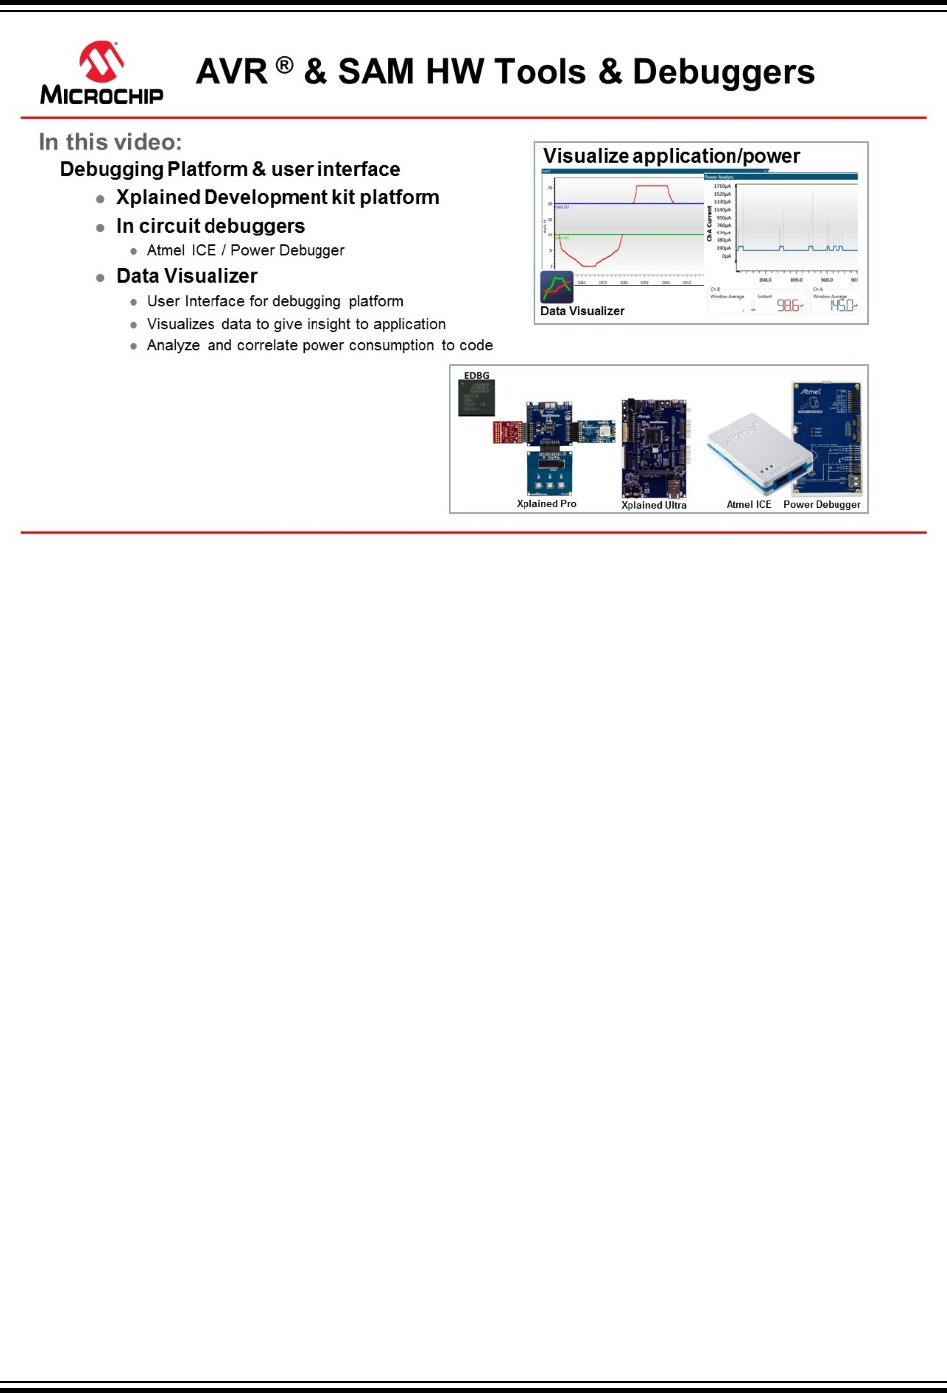
Video: AVR & SAM HW Tools & Debuggers
Data Visualizer
The Data Visualizer is a program to process and visualize data. The Data Visualizer is capable of
receiving data from various sources such as the Embedded Debugger Data Gateway Interface (DGI) and
COM ports. Track your application’s run-time using a terminal or graph, or analyze the power
consumption of your application through correlation of code execution and power consumption, when
used together with a supported probe or board. Having full control of your codes’ run-time behavior has
never been easier.
Both a stand-alone and a plug-in version for Atmel Studio 7 are available at the website link below.
Website: Data Visualizer.
Atmel-ICE
Atmel-ICE is a powerful development tool for debugging and programming AVR microcontrollers using
UPDI, JTAG, PDI, debugWIRE, aWire, TPI, or SPI target interfaces and ARM® Cortex®-M based SAM
microcontrollers using JTAG or SWD target interfaces.
Atmel-ICE is a powerful development tool for debugging and programming ARM Cortex-M based SAM
and AVR microcontrollers with on-chip debug capability.
Website: Atmel-ICE
Power Debugger:
Power Debugger is a powerful development tool for debugging and programming AVR microcontrollers
using UPDI, JTAG, PDI, debugWIRE, aWire, TPI, or SPI target interfaces and ARM Cortex-M based SAM
microcontrollers using JTAG or SWD target interfaces.
In addition, the Power Debugger has two independent current sensing channels for measuring and
optimizing the power consumption of a design.
Atmel Studio 7 User Guide
Getting Started
© 2018 Microchip Technology Inc. User Guide DS50002718A-page 19
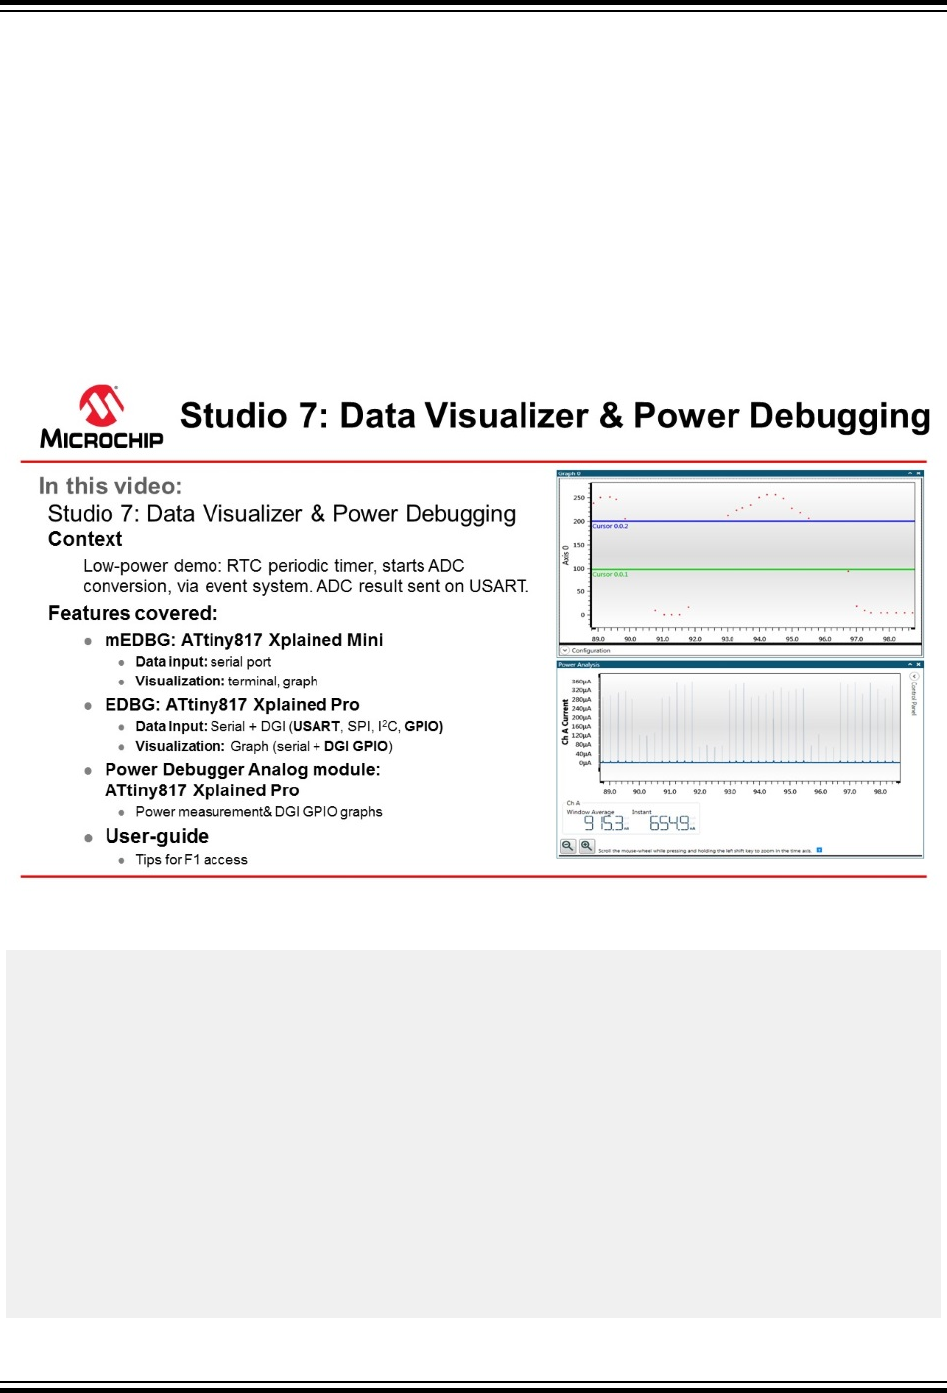
Power Debugger also includes a CDC virtual COM port interface as well as Data Gateway Interface
channels for streaming application data to the host computer from an SPI, USART, TWI, or GPIO source.
The Power Debugger is a CMSIS-DAP compatible debugger which works with Studio 7.0 or later, or other
frontend software capable of connecting to a generic CMSIS-DAP unit. The Power Debugger streams
power measurements and application debug data to the Data Visualizer for real-time analysis.
Website: Power Debugger
2.3 Data Visualizer and Power Debugging Demo
This section shows a demo using the Data Visualizer including Power Debugging.
Getting Started Topics
Video: Data Visualizer and Power Debugging Demo
/*
* Power_Demo_ADC_SleepWalking.c
* Device/board: ATtiny817 Xplained Pro
* Created: 8/6/2017 3:15:21 PM
*/
#include <avr/io.h>
#include <avr/interrupt.h>
#include <avr/sleep.h>
#define F_CPU (20E6/2)
void sys_init(void)
{
_PROTECTED_WRITE(CLKCTRL.MCLKCTRLB, CLKCTRL_PEN_bm | CLKCTRL_PDIV_2X_gc);
}
void rtc_pit_init(void)
{
RTC.CLKSEL = RTC_CLKSEL_INT1K_gc;
RTC.PITCTRLA = RTC_PITEN_bm | RTC_PERIOD_CYC256_gc;
Atmel Studio 7 User Guide
Getting Started
© 2018 Microchip Technology Inc. User Guide DS50002718A-page 20

}
//picoPower 4: Event system vs. IRQ. Compare to not using IRQ
void evsys_init(void)
{
EVSYS.ASYNCCH3 = EVSYS_ASYNCCH3_PIT_DIV128_gc;
EVSYS.ASYNCUSER1 = EVSYS_ASYNCUSER1_ASYNCCH3_gc;
}
//picoPower 3: Evaluate own sample, e.g. window mode.
// Significantly reduce awake time.
void adc_init(void)
{
ADC0.CTRLC = ADC_PRESC_DIV8_gc | ADC_REFSEL_VDDREF_gc;
ADC0.CTRLA = ADC_ENABLE_bm | ADC_RESSEL_8BIT_gc;
ADC0.MUXPOS = ADC_MUXPOS_AIN6_gc;
ADC0.CTRLA |= ADC_RUNSTBY_bm; //picoPower 1: So can run in sleep.
ADC0.CTRLE = ADC_WINCM_OUTSIDE_gc; //picoPower 3: So can evaluate own sample.
ADC0.INTCTRL = ADC_WCMP_bm;
ADC0.WINHT = 200;
ADC0.WINLT = 100;
ADC0.EVCTRL = ADC_STARTEI_bm; //picoPower 4: So event can trigger conversion
}
uint8_t adc_get_result(void)
{
return ADC0.RESL;
}
//picoPower 5: Send quickly, then back to sleep: compare 9600, 115200, 1250000 baud rates
//note only sending 1 byte
#define BAUD_RATE 57600
void usart_init()
{
USART0.CTRLB = USART_TXEN_bm;
USART0.BAUD = (F_CPU * 64.0) / (BAUD_RATE * 16.0);
}
void usart_put_c(uint8_t c)
{
VPORTB.DIR |= PIN2_bm | PIN6_bm; //picoPower 2b: see Disable Tx below
USART0.STATUS = USART_TXCIF_bm;
VPORTB.OUT |= PIN6_bm;
USART0.TXDATAL = c;
while(!(USART0.STATUS & USART_TXCIF_bm));
VPORTB.OUT &= ~PIN6_bm;
VPORTB.DIR &= ~PIN2_bm | PIN6_bm;
//picoPower 2b: Disable Tx pin in-between transmissions
}
//picoPower 2: Disable unused GPIO
// compare: Nothing, PORT_ISC_INPUT_DISABLE_gc, PORT_PULLUPEN_bp
void io_init(void)
{
for (uint8_t pin=0; pin < 8; pin++)
{
(&PORTA.PIN0CTRL)[pin] = PORT_ISC_INPUT_DISABLE_gc;
(&PORTB.PIN0CTRL)[pin] = PORT_ISC_INPUT_DISABLE_gc;
(&PORTC.PIN0CTRL)[pin] = PORT_ISC_INPUT_DISABLE_gc;
}
}
int main(void)
{
sys_init();
rtc_pit_init();
evsys_init();
adc_init();
io_init();
usart_init();
VPORTB.DIR |= PIN6_bm;
Atmel Studio 7 User Guide
Getting Started
© 2018 Microchip Technology Inc. User Guide DS50002718A-page 21
VPORTB.OUT &= ~PIN6_bm;
sei();
//picoPower 1: Go to sleep. Compare with no sleep, IDLE and STANDBY
set_sleep_mode(SLEEP_MODE_STANDBY);
while (1)
{
sleep_mode();
}
}
ISR(ADC0_WCOMP_vect) //picoPower 3: Only called if relevant sample
{
ADC0.INTFLAGS = ADC_WCMP_bm;
usart_put_c(adc_get_result());
}
2.4 Installation and Updates
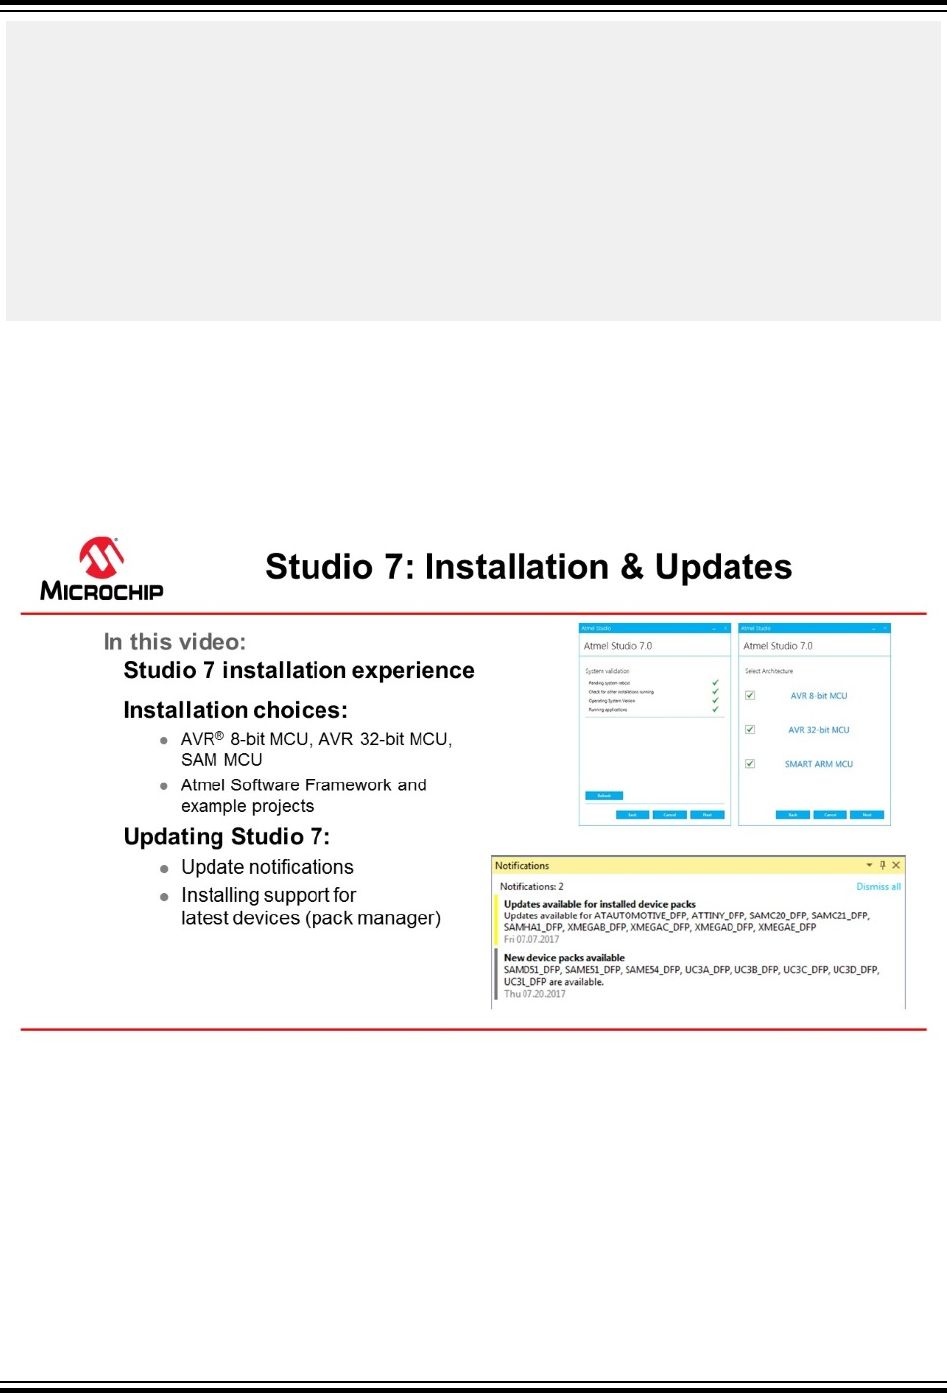
This section describes the process of installing Atmel Studio 7, installing updates for Studio or plugins, as
well as adding support for new devices.
Getting Started Topics
Video: Installation and Updates
2.4.1 Installation
Supported Operating Systems
• Windows 7 Service Pack 1 or higher
• Windows Server 2008 R2 Service Pack 1 or higher
• Windows 8/8.1
• Windows Server 2012 and Windows Server 2012 R2
Atmel Studio 7 User Guide
Getting Started
© 2018 Microchip Technology Inc. User Guide DS50002718A-page 22
• Windows 10
Supported Architectures
• 32-bit (x86)
• 64-bit (x64)
Hardware Requirements
• A computer that has a 1.6 GHz or faster processor
• RAM
– 1 GB RAM for x86
– 2 GB RAM for x64
– An additional 512 MB RAM if running in a Virtual Machine
• 6 GB available hard disk space
Downloading and Installing
• Download the latest Atmel Studio installer: Atmel Studio 7
– The web installer is a small file (<10 MB) and will download specified components as needed
– The offline installer has all components embedded
• Atmel Studio can be run side-by-side with older versions of Atmel Studio and AVR Studio®.
Uninstallation of any previous versions is not required.
• Verify the hardware and software requirements from the 'System Requirements' section
• Make sure your user has local administrator privileges
• Save all your work before starting. The installation might prompt you to restart if required.
• Disconnect all USB/Serial hardware devices
• Double-click the installer executable file and follow the installation wizard
• Once finished, the installer displays an option to Start Atmel Studio after completion. If you
choose to open, then note that Atmel Studio will launch with administrative privileges, since the
installer was either launched as administrator or with elevated privileges.
• In Atmel Studio you may see an update notification (flag symbol) next to the Quick Launch field in
the title bar. Here you may select and install updated components or device support.
2.4.2 Downloading Offline Documentation
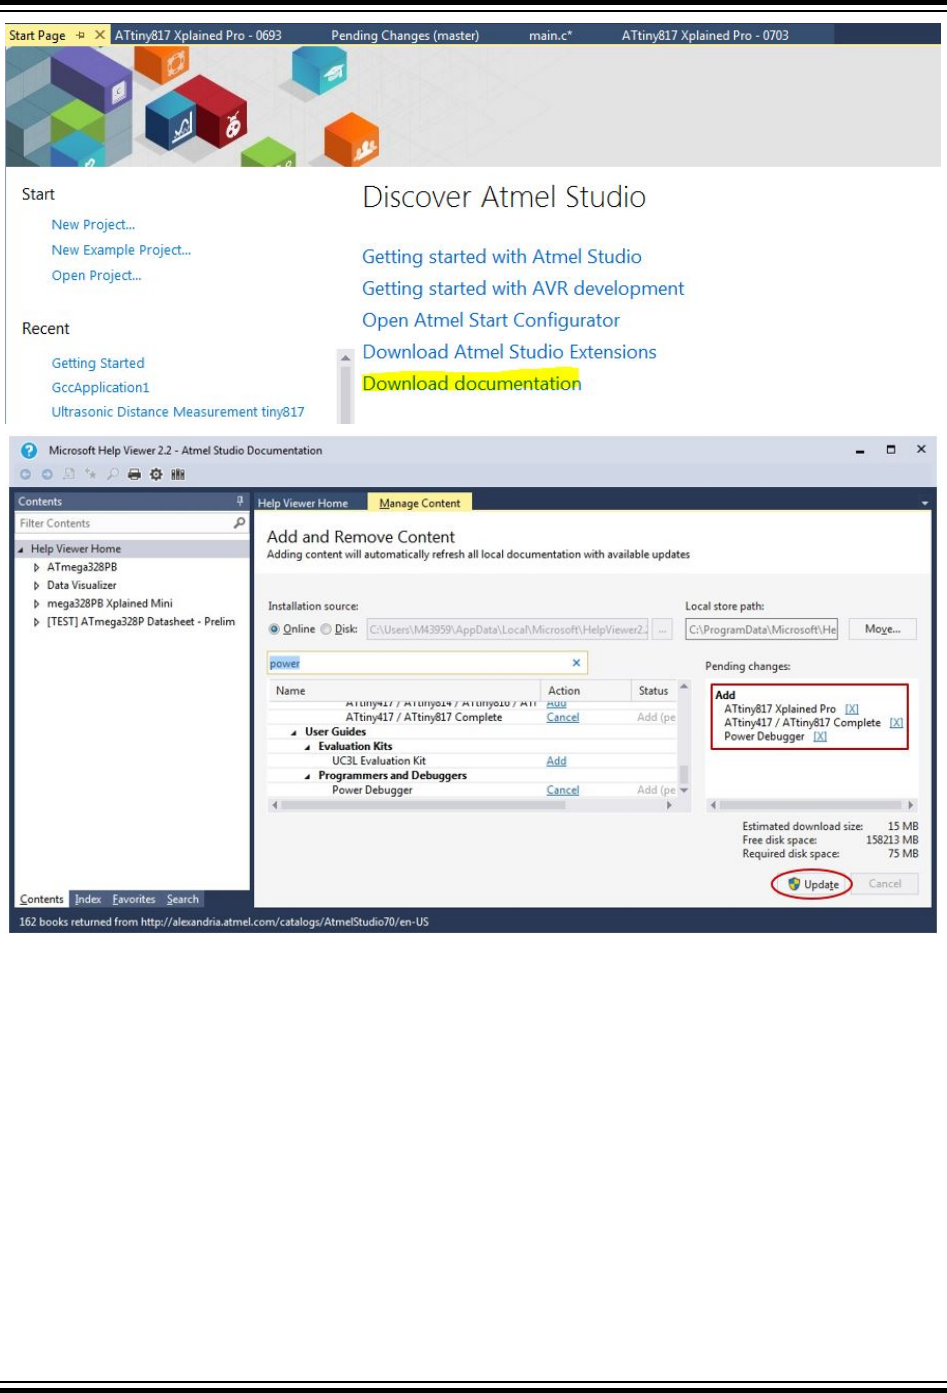
If you would like to work offline, it would be advisable to use the offline documentation for Studio 7.
To do this, from the Studio 7 Start Page, click on Download documentation. When the help viewer pops
up, first click the Online button and search for documentation of interest, such as data sheets, user
manuals, and application notes (wait for the available documents to show up).
In the example below, we are choosing to download the Power Debugger user manual, the ATtiny817
Xplained Pro user manual, as well as the ATtiny817 Complete data sheet. Clicking update will then
initiate the download.
Atmel Studio 7 User Guide
Getting Started
© 2018 Microchip Technology Inc. User Guide DS50002718A-page 23
2.5 Microchip Gallery and Studio Extensions
This section describes how Atmel Studio can be extended and updated through the Microchip Gallery.
Some of the most useful and popular extensions are described.
Getting Started Topics
Atmel Studio 7 User Guide
Getting Started
© 2018 Microchip Technology Inc. User Guide DS50002718A-page 24

Video: Gallery, Studio Extensions, and Updates
This short video describes the process of adding extensions to Atmel Studio. It covers extensions
included by default, what these are used for. Popular extensions are also covered, as well as how to
modify Extension Options and Settings.
See Registering at the Microchip Gallery for more information about how to get started.
Website: Microchip Gallery.
2.6 Atmel START Integration
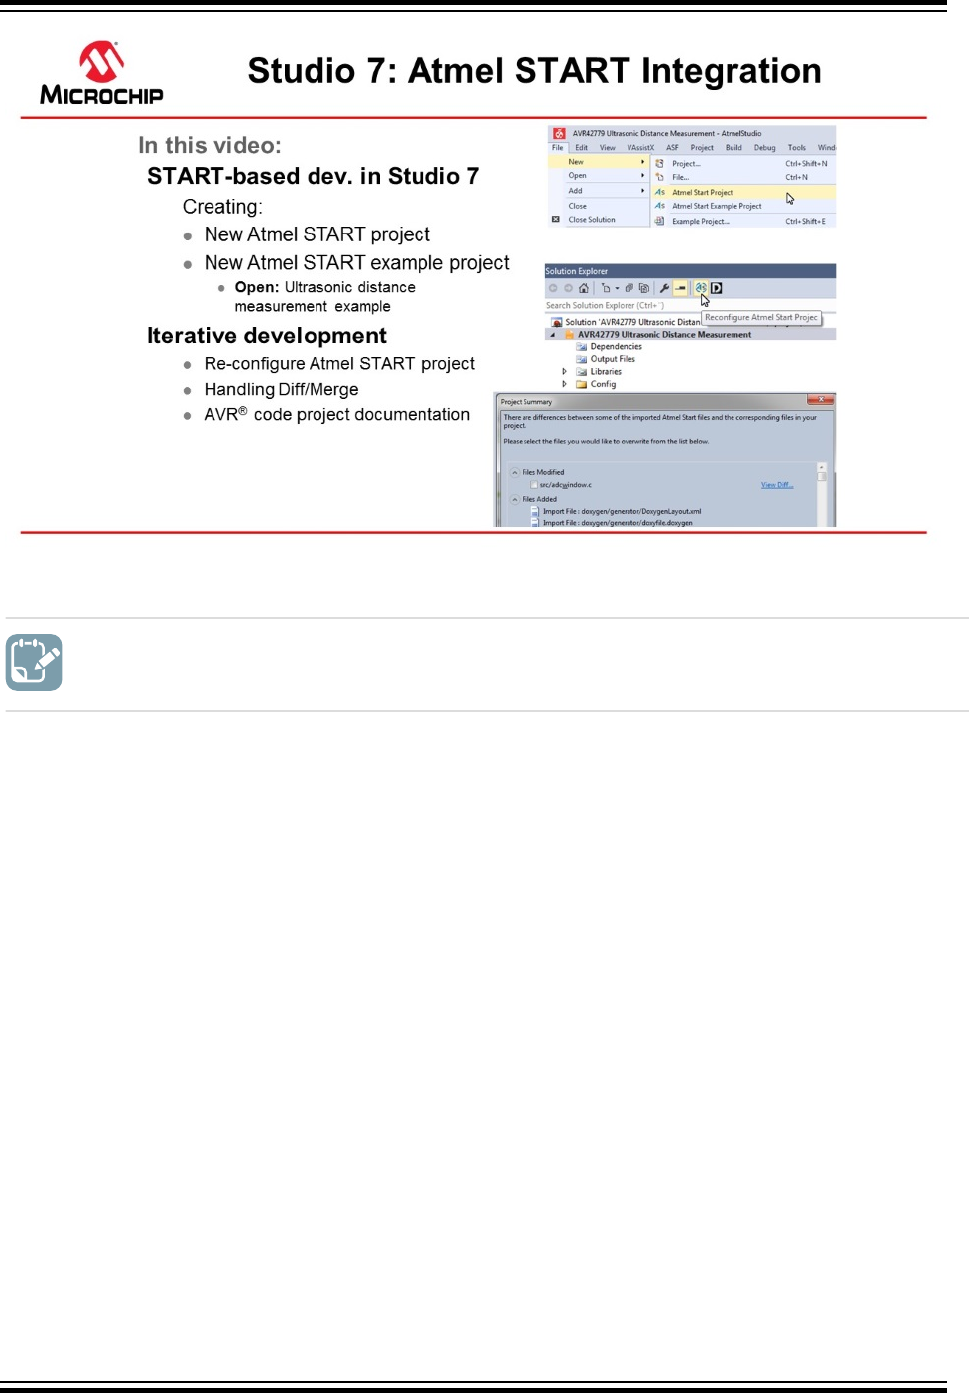
The development experience between Atmel START and Studio 7 has been optimized. This section
demonstrates the iterative development process of START-based projects in Studio 7, through the re-
configure and merge functionality.
Getting Started Topics
Atmel Studio 7 User Guide
Getting Started
© 2018 Microchip Technology Inc. User Guide DS50002718A-page 25
Video: Atmel START Integration
To do: Exporting the Project from Atmel START.
1. On the Atmel START website, create a new project (Example or Board).
2. Click on the Export Software Component button. Make sure the Atmel Studio check-box is
checked.
3. Click on Download pack. An atmelstart.atzip pack file will be downloaded.
Atmel Studio 7 User Guide
Getting Started
© 2018 Microchip Technology Inc. User Guide DS50002718A-page 26
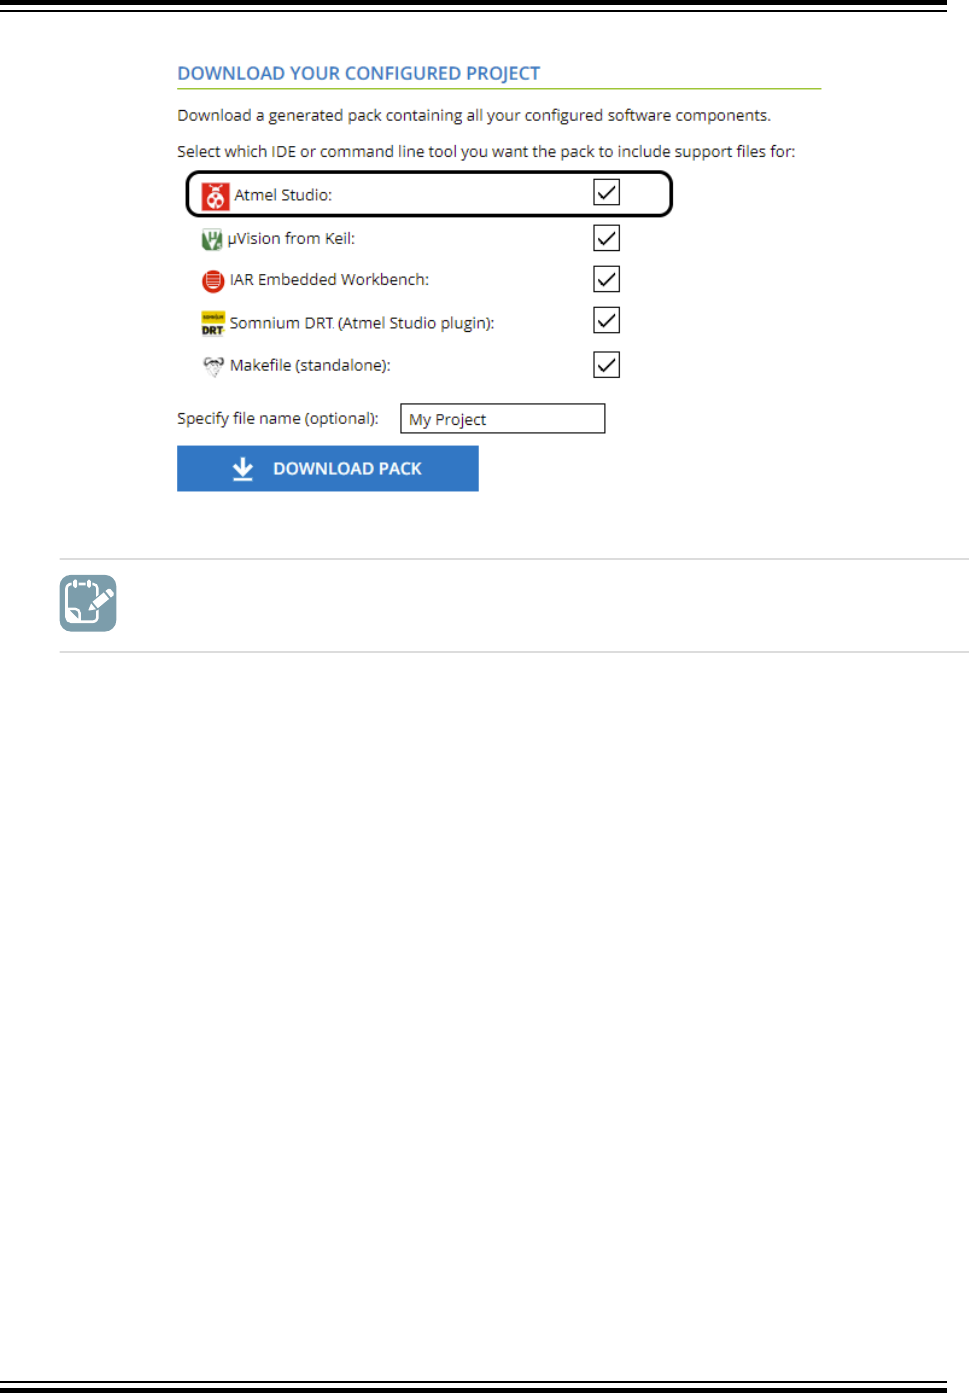
Figure 2-1. Download Your Configured Project
To do: Import the Atmel START Output into Atmel Studio.
4. Launch Atmel Studio.
5. Select File > Import > Atmel START Project.
Atmel Studio 7 User Guide
Getting Started
© 2018 Microchip Technology Inc. User Guide DS50002718A-page 27
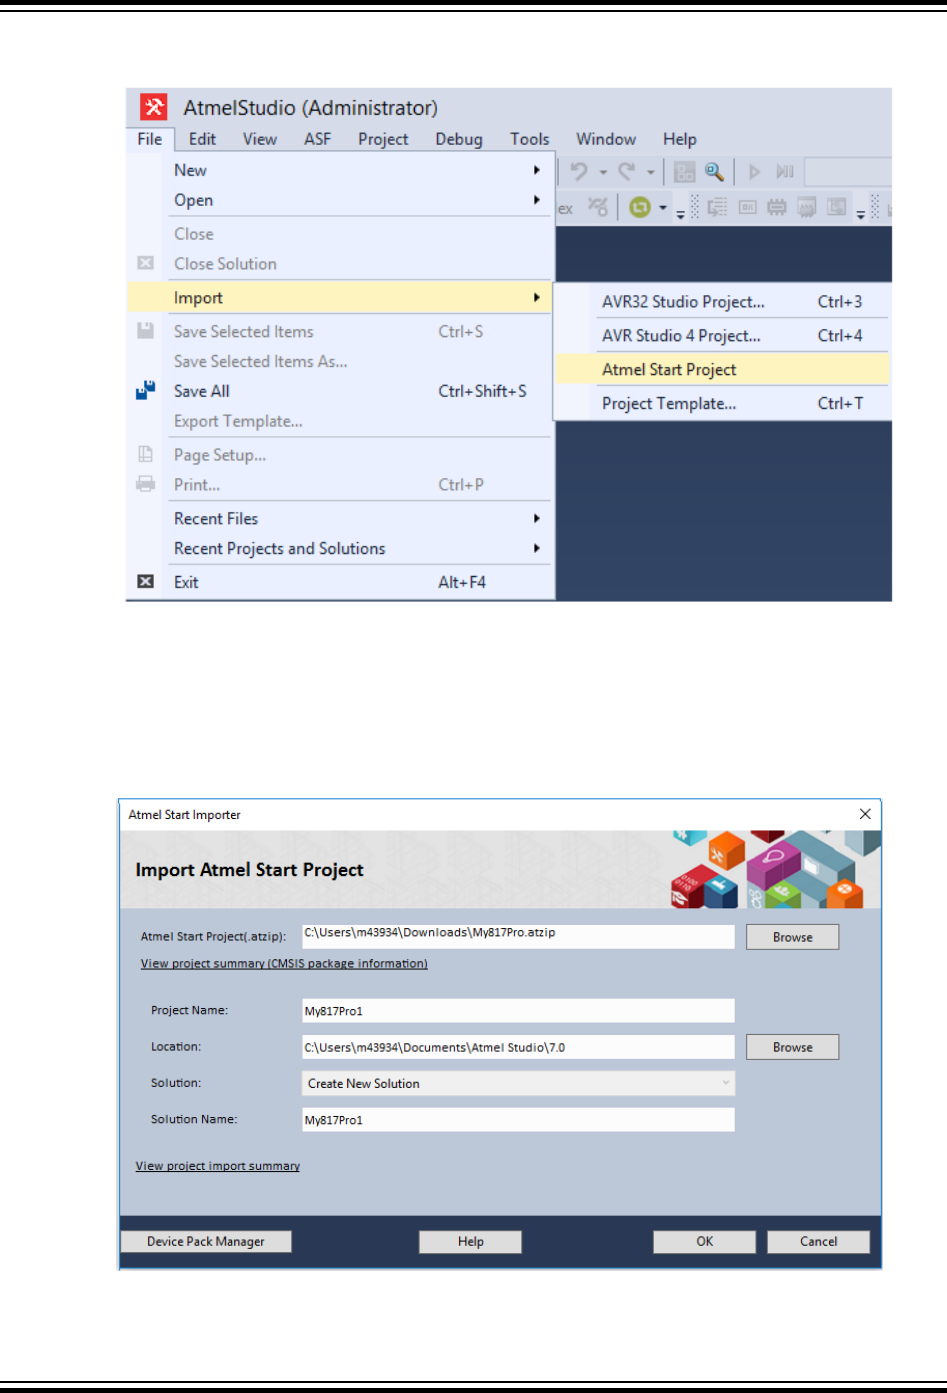
Figure 2-2. Import Atmel START Project
6. Browse and select the downloaded atmelstart.atzip file.
7. The Atmel START Importer dialog box will open. Enter the project details as Project name,
Location, and Solution name. Click OK.
Figure 2-3. START Project Importer
Atmel Studio 7 User Guide
Getting Started
© 2018 Microchip Technology Inc. User Guide DS50002718A-page 28
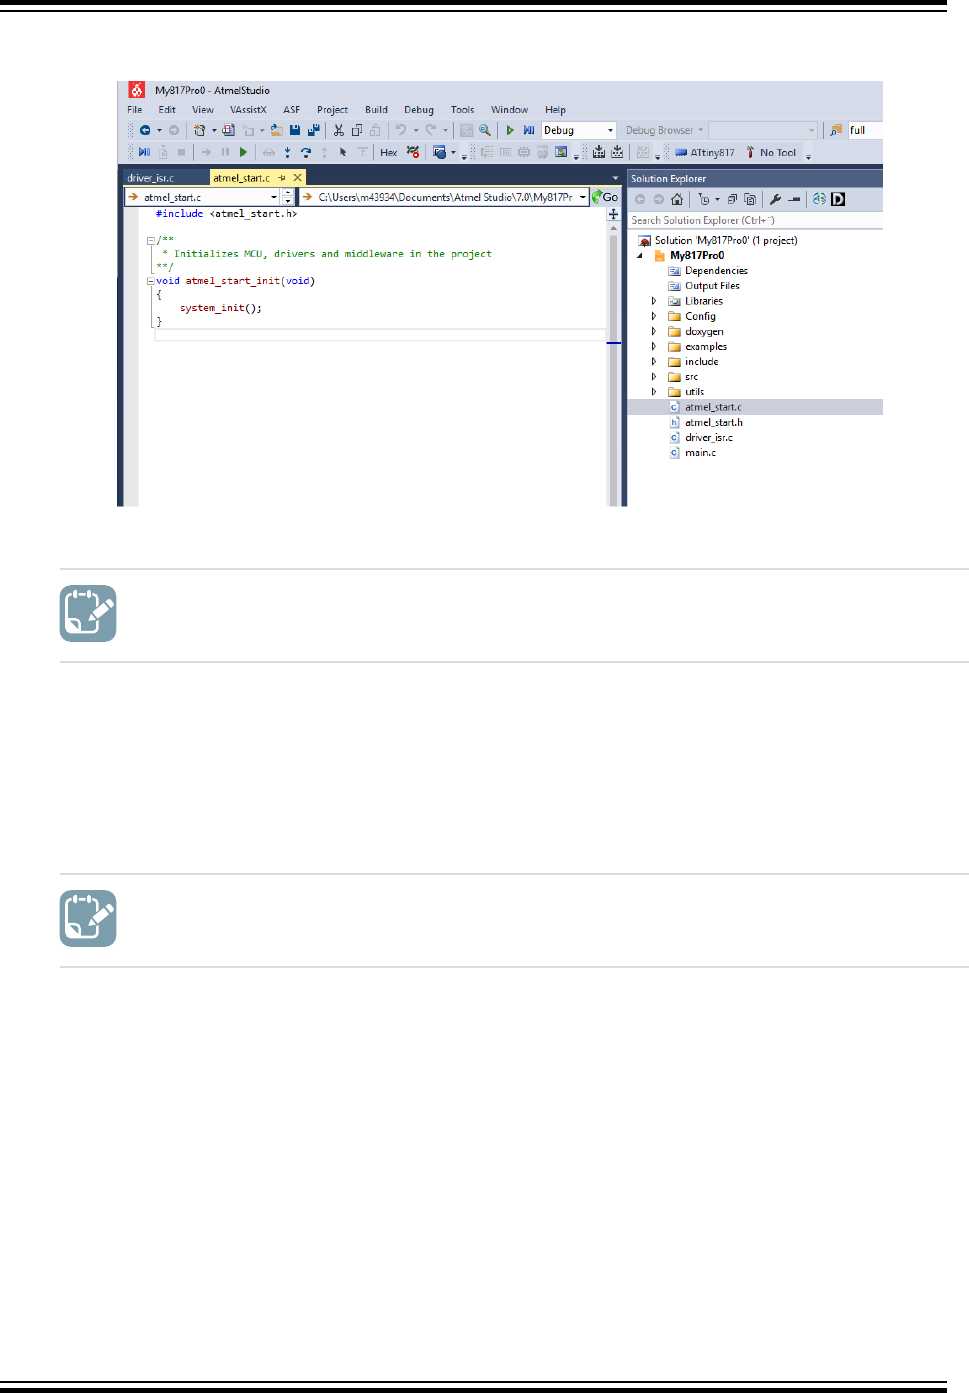
8. A new Atmel Studio project will be created and the files will be imported.
To do: Import the Atmel START Output into Atmel Studio.
9. Some projects contain documentation formatted for Doxygen.
Note: Doxygen must be downloaded from http://www.doxygen.org and installed. You will be asked
to configure Studio to locate Doxygen executable, this defaults to C:\Program Files\doxygen\bin
\doxygen.exe.
10. Click on the Doxygen button to generate the documentation. Doxygen will run and the generated
documentation will open in a new window.
To do: Reconfigure the project using Atmel START.
11. Click on the Reconfigure button or right-click on the project node in the Solution Explorer, and, from
the menu, select Reconfigure Atmel START Project.
12. Atmel START will open in a window inside Atmel Studio.
Atmel Studio 7 User Guide
Getting Started
© 2018 Microchip Technology Inc. User Guide DS50002718A-page 29

Figure 2-4. Reconfigure START Project and Doxygen Buttons
13. Do the necessary changes to the project. Click the GENERATE PROJECT button at the bottom of
the Atmel START window.
2.7 Creating a New Project
This section will outline the process of creating a new Atmel Studio project.
Getting Started Topics
Atmel Studio 7 User Guide
Getting Started
© 2018 Microchip Technology Inc. User Guide DS50002718A-page 30

Video: Create New Project
To do: Create a new bare-metal GCC C Executable project for the ATtiny817 device.
1. Open Atmel Studio.
2. In Atmel Studio, go to File → New → Project as depicted in Figure 2-5.
Atmel Studio 7 User Guide
Getting Started
© 2018 Microchip Technology Inc. User Guide DS50002718A-page 31
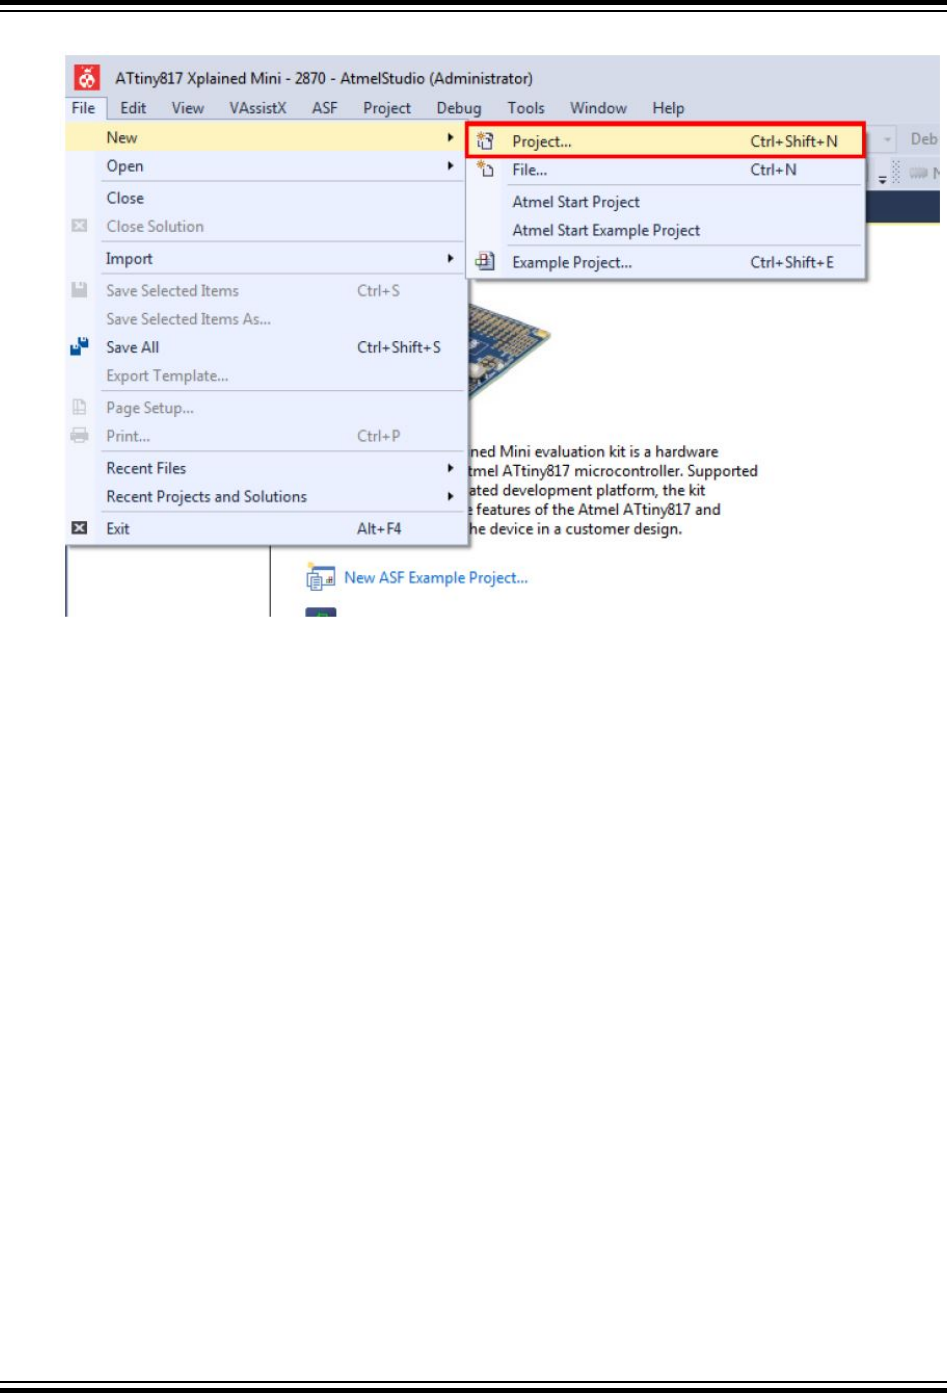
Figure 2-5. Creating a New Project in Atmel Studio
3. The project generation wizard will appear. This dialog provides the option to specify the
programming language and project template to be used. This project will use C, so make sure C/C+
+ is selected in the upper left corner. Select the GCC C Executable Project option from the
template list to generate a bare-bones executable project. Give the project a Name and click OK.
See Figure 2-6.
Atmel Studio 7 User Guide
Getting Started
© 2018 Microchip Technology Inc. User Guide DS50002718A-page 32
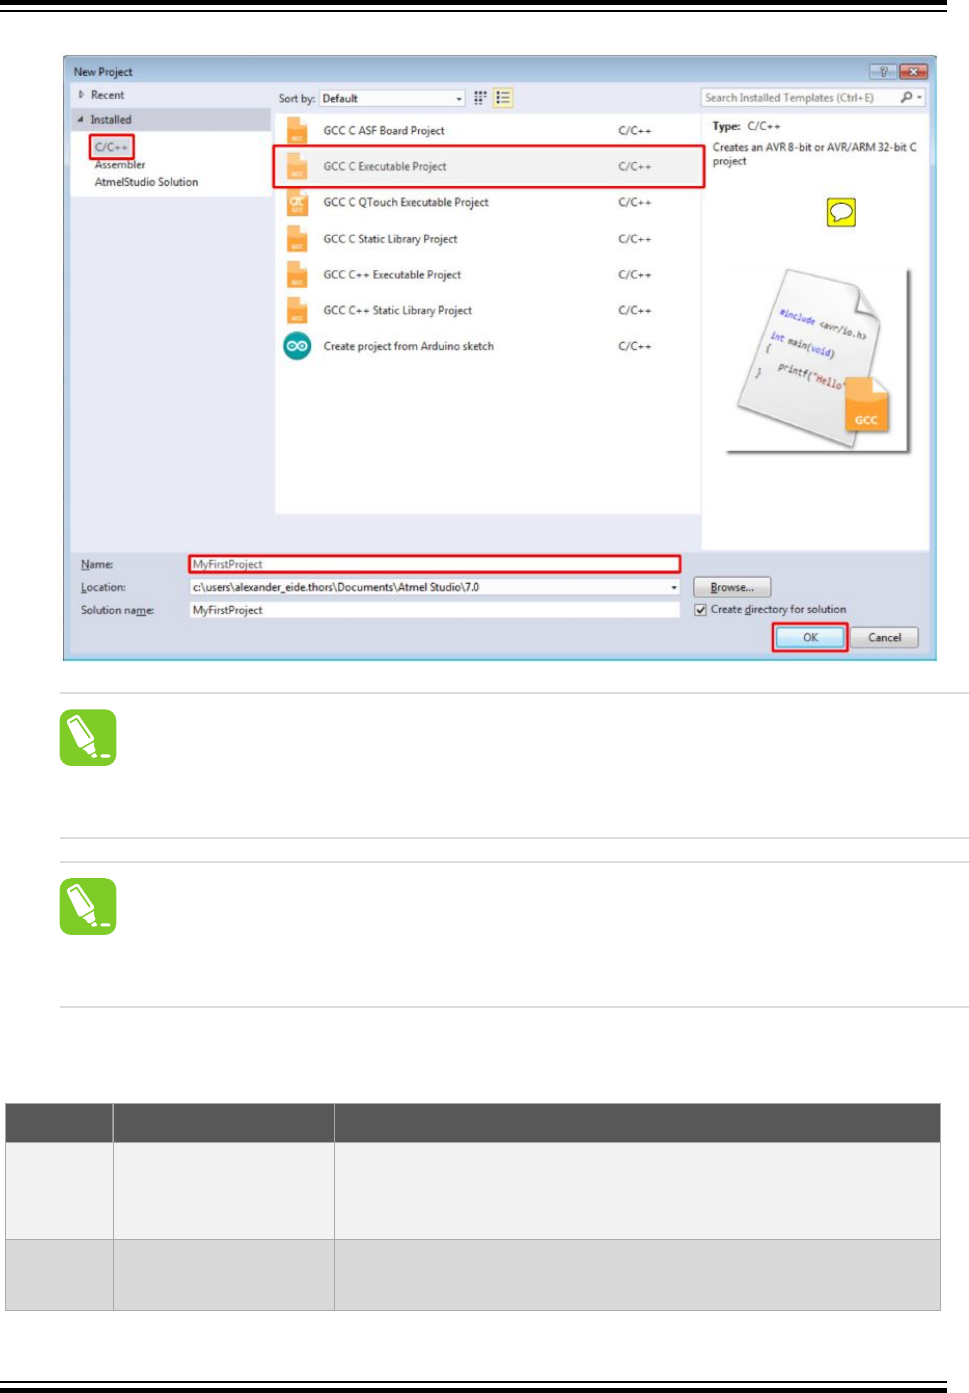
Figure 2-6. New Project Programming Language and Template Selection
Tip: All Atmel Studio projects belong to a solution, and by default, Atmel Studio will use
the same name for both the newly created solution and the project. The solution name
field can be used to manually specify the solution name.
Tip: The create directory for solution check-box is checked by default. When this box is
ticked, Atmel Studio will generate a new folder with the specified solution name at the
location specified by the Location field.
About Project Types
Table 2-1. Project Types
Category Project Templates Description
C/C++ GCC C ASF Board
Project
Select this template to create an AVR 8-bit or AVR/ARM 32-bit
ASF3 Board project. Choose between the different boards
supported by ASF3.
C/C++ GCC C Executable
Project
Select this template to create an AVR 8-bit or AVR/ARM 32-bit
GCC project.
Atmel Studio 7 User Guide
Getting Started
© 2018 Microchip Technology Inc. User Guide DS50002718A-page 33
Category Project Templates Description
C/C++ GCC C Static Library
Project
Select this template to create an AVR 8-bit or AVR/ARM 32-bit
GCC static library(LIB) project. This pre-compiled library (.a) can
be used to link to other projects (closed source) or referenced from
applications that need the same functionality (code reuse).
C/C++ GCC C++ Executable
Project
Select this template to create an AVR 8-bit or AVR/ARM 32-bit C++
project.
C/C++ GCC C++ Static
Library Project
Select this template to create an AVR 8-bit or AVR/ARM 32-bit C++
static library (LIB) project. This pre-compiled library (.a) can be
used to link to other projects (closed source) or referenced from
applications that need the same functionality (code reuse).
Assembler Assembler Project Select this template to create an AVR 8-bit Assembler project.
Category Project Templates Description
Attention: This table only lists the default project types. Other project types may be
added by extensions.
4. Next, it is necessary to specify which device the project will be developed for. A list of devices will
be presented in the Device Selection dialog, which can be scrolled through, as depicted in Figure
2-7. It is possible to narrow the search by using the Device Family drop-down menu or by using the
search box. This project will be developed for the ATtiny817 AVR device, so enter '817' in the
search box in the top right corner. Select the ATtiny817 entry in the device list and confirm the
device selection by clicking OK.
Atmel Studio 7 User Guide
Getting Started
© 2018 Microchip Technology Inc. User Guide DS50002718A-page 34

Figure 2-7. New Project Device Selection
Tip: A search for 'tiny' will provide a list of all supported ATtiny devices. A search for
'mega' will provide a list of all supported ATmega devices. Tools → Device Pack
Manager can be used to install support for additional devices.
Atmel Studio 7 User Guide
Getting Started
© 2018 Microchip Technology Inc. User Guide DS50002718A-page 35
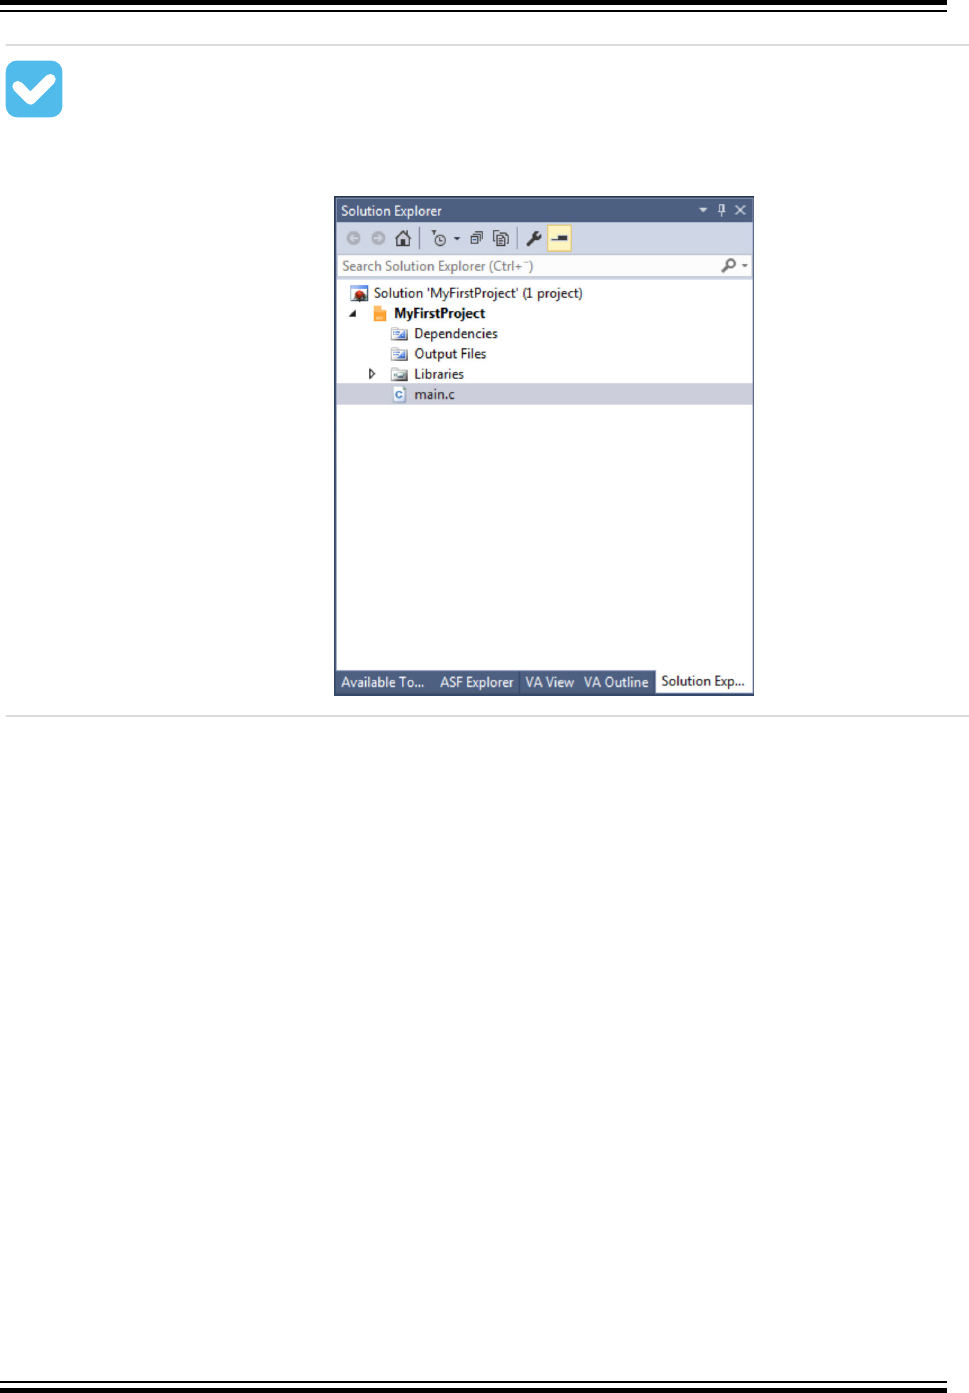
Result: A new GCC C Executable project has now been created for the ATtiny817 device. The
Solution Explorer will list the content of the newly generated solution, as depicted in Figure
2-8. If not already open, it can be accessed through View → Solution Explorer or by pressing
Ctrl+Alt+L.
Figure 2-8. Solution Explorer
2.8 Creating From Arduino Sketch
This section will outline the process of creating a new Atmel Studio project from an Arduino Sketch.
Getting Started Topics
Atmel Studio 7 User Guide
Getting Started
© 2018 Microchip Technology Inc. User Guide DS50002718A-page 36
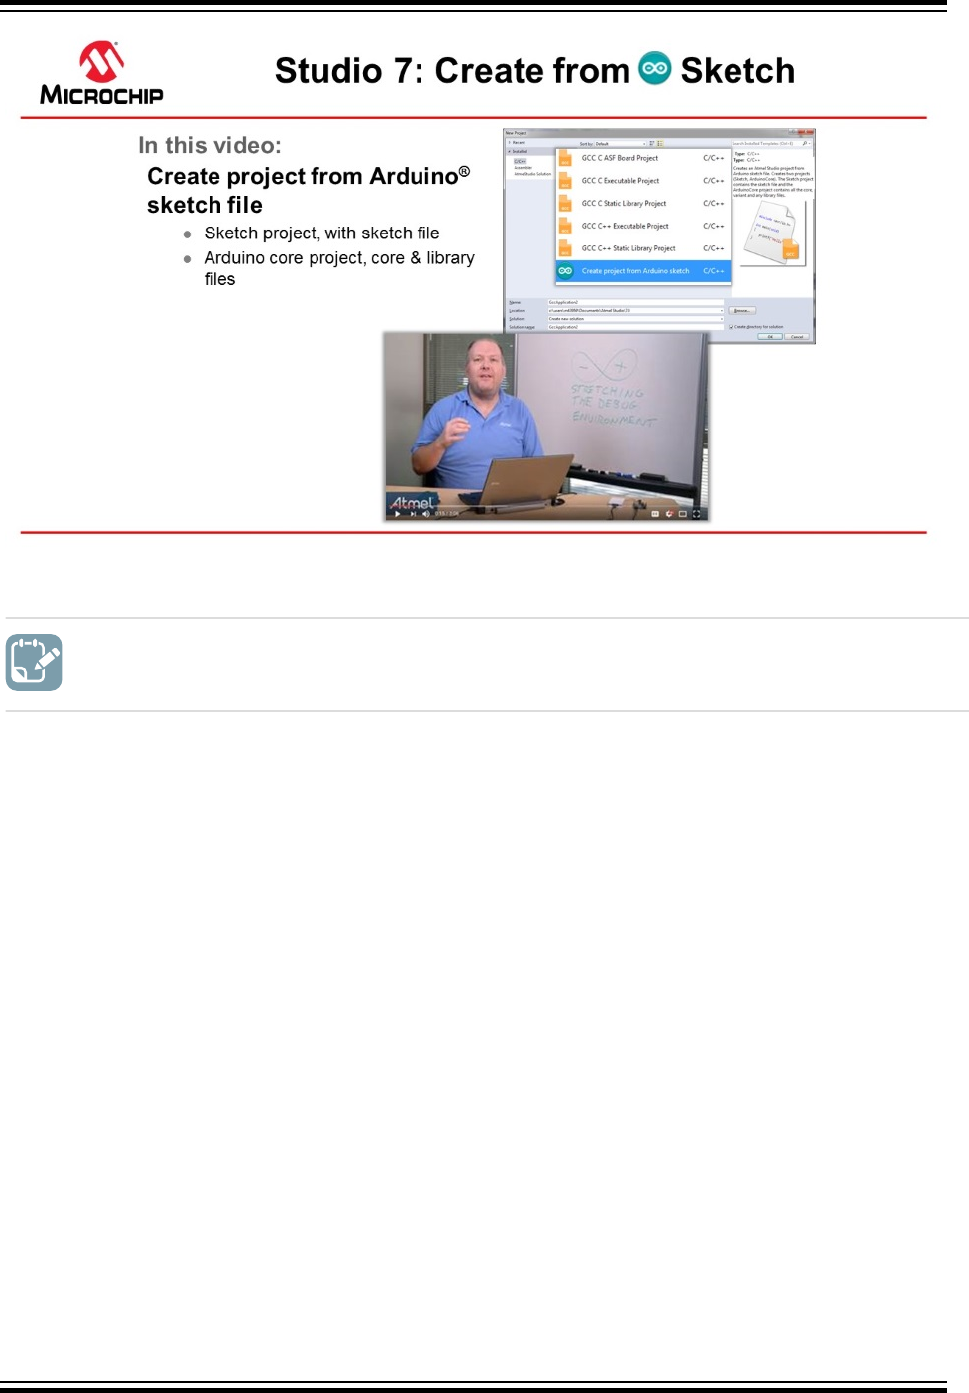
Video: Create from Arduino Sketch
To do: Create a new project from an Arduino Sketch.
2.9 In-System Programming and Kit Connection
This video gives an overview of the Device Programming dialog box, to check the kit connection. The
ATtiny817 Xplained Pro kit has an on-board embedded debugger (EDBG) which eliminates the need for a
dedicated programmer/debugger. This section will also go through the process of associating the EDBG
with your project.
Getting Started Topics
Atmel Studio 7 User Guide
Getting Started
© 2018 Microchip Technology Inc. User Guide DS50002718A-page 37
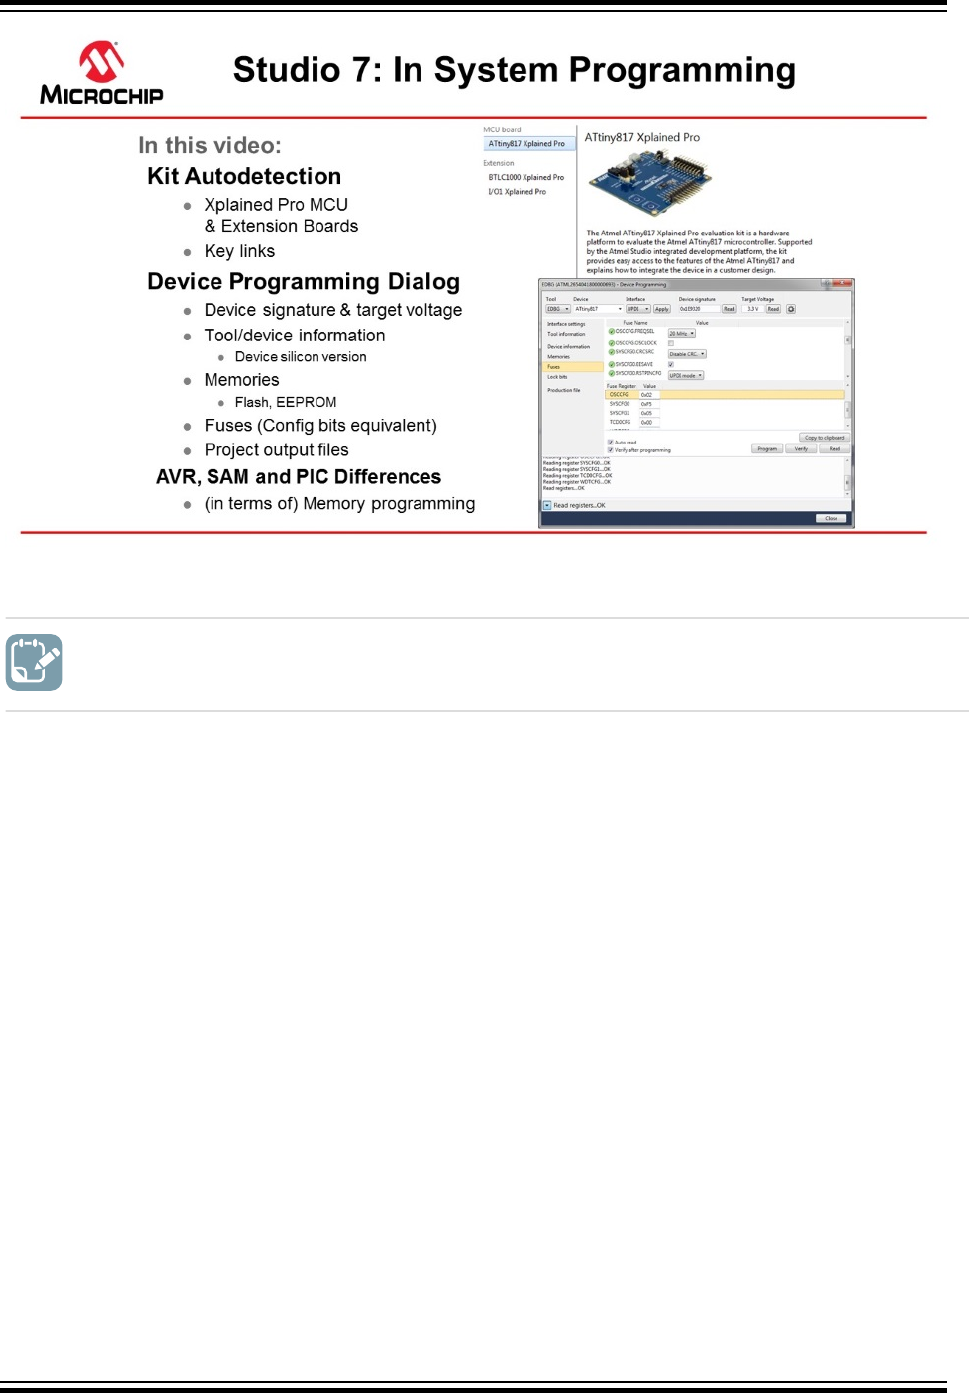
Video: Kit Connection and In-System Programming
To do: Associate the EDBG on your ATtiny817 Xplained Pro kit with your project.
1. Connect the ATtiny817 Xplained Pro board to the computer using the provided Micro-USB cable.
The kit page should be present in Atmel Studio as in the figure below.
Atmel Studio 7 User Guide
Getting Started
© 2018 Microchip Technology Inc. User Guide DS50002718A-page 38
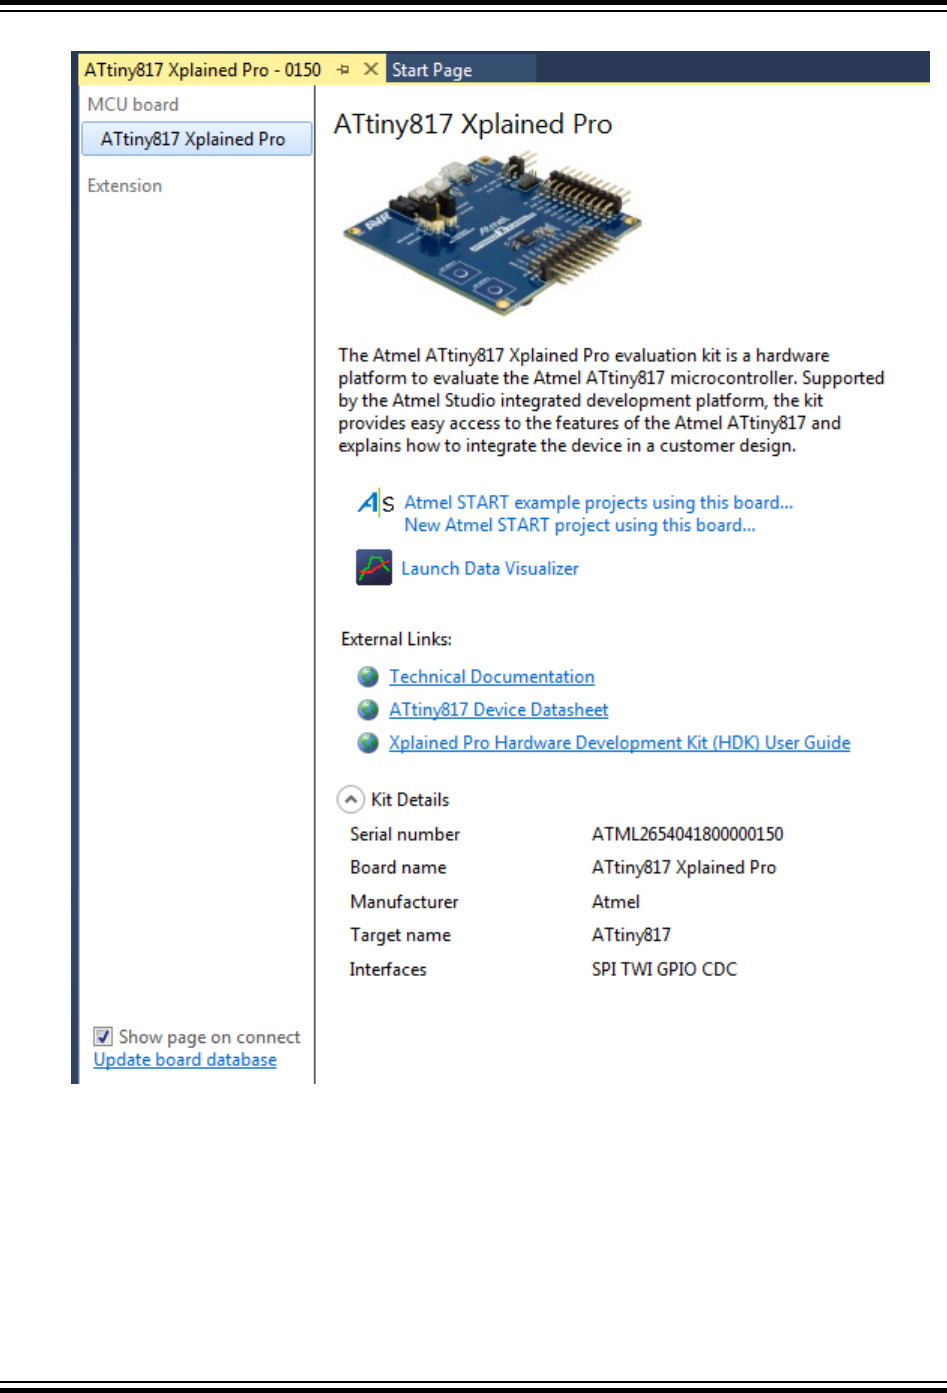
Figure 2-9. ATtiny817 Xplained Pro Start Page
1.1. There are links to documentation for the board and data sheet for the device.
1.2. It is possible to create an Atmel START project for the board. Clicking on the Atmel START
links project links will bring you into Atmel START where you get options for this specific
board.
2. Opening the Programming Dialog by Tools → Device Programming.
2.1. Select EDBG Tool and assure that Device = ATtiny817, then you may read Device
Signature and Target Voltage.
Atmel Studio 7 User Guide
Getting Started
© 2018 Microchip Technology Inc. User Guide DS50002718A-page 39
2.2. Interface settings: You may see and change the interface clock frequency.
2.3. Tool information: Shows information about the EDBG tool.
2.4. Device information: Shows information about the device. Note that you can also see the
silicon revision of the device. This may be useful in customer support cases.
2.5. Memories: May program the flash, EEPROM, and user signature separately from the files.
2.6. Fuses: Read and set fuses, for instance, oscillator frequency (16 or 20 MHz), brown-out
voltage detection etc.
2.7. Lock bits: Lock memory.
2.8. Production file: Program the device using a production file to program flash, EEPROM, and
user signatures.
2.9. Note that AVR has flash in the HEX file and EEPROM in the EEP files, while PIC has
everything, even fuses, in a HEX file.
2.10. For instance, SAML21J devices don't have EEPROM (may be emulated in flash). It also
has a security bit option to lock the device.
3. Create a new project by selecting File → New project, select for instance C executable project,
select the device by filtering on the device name. Different project types are discussed in another
Getting Started video.
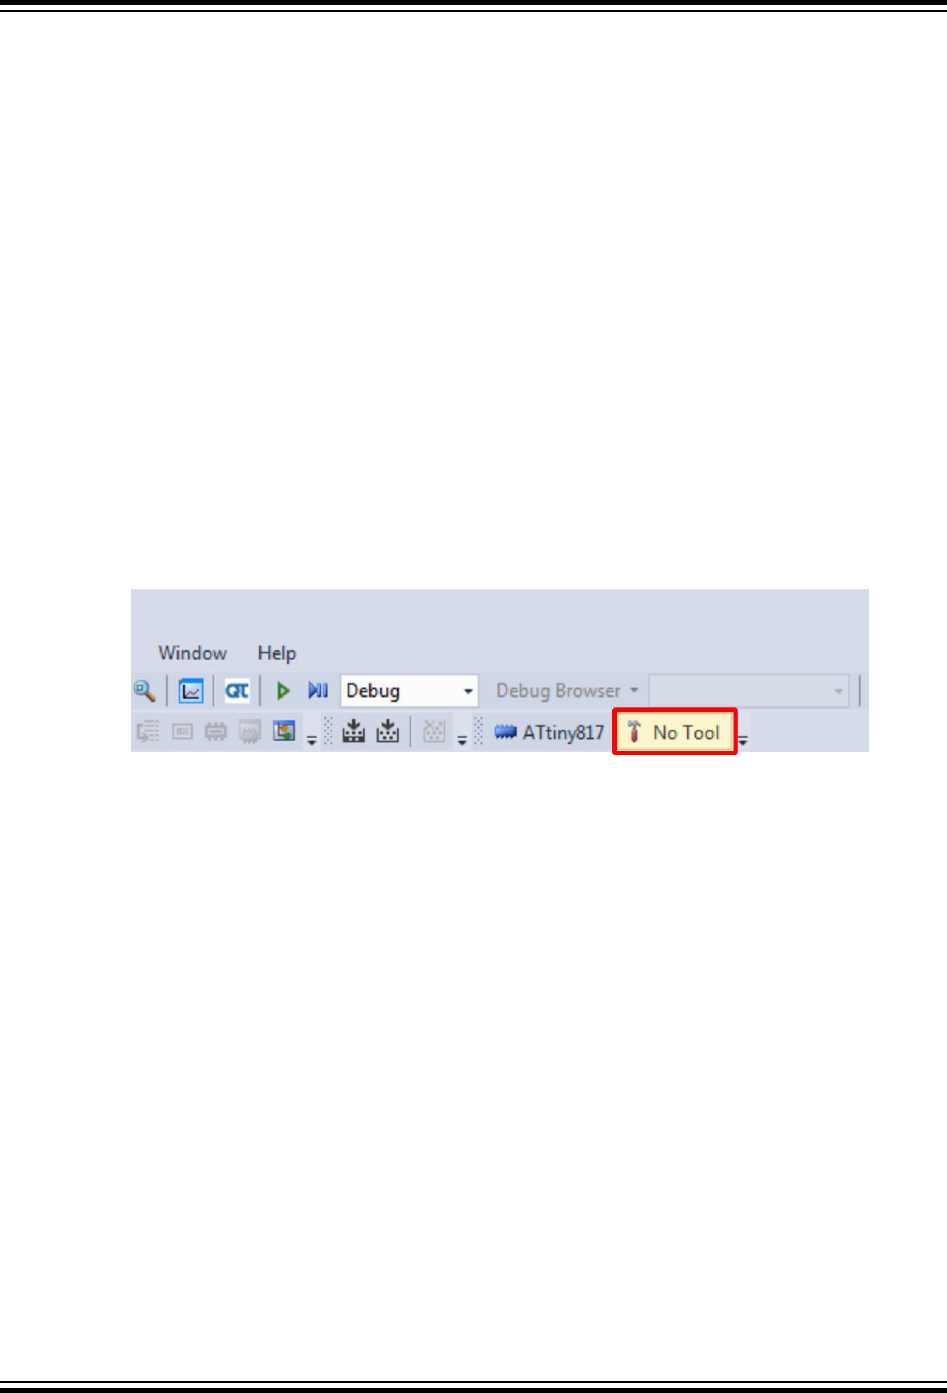
4. If a project is selected, click the Tool button located in the top menu bar to open the tool dialog as
indicated in the figure below.
Figure 2-10. Tool Button
5. The Tool tab of the Project Properties will open. In the drop-down menu, select the EDBG tool, as
indicated in the figure below. The interface should automatically initiate to UPDI (Unified
Programming Debugging Interface).
Atmel Studio 7 User Guide
Getting Started
© 2018 Microchip Technology Inc. User Guide DS50002718A-page 40
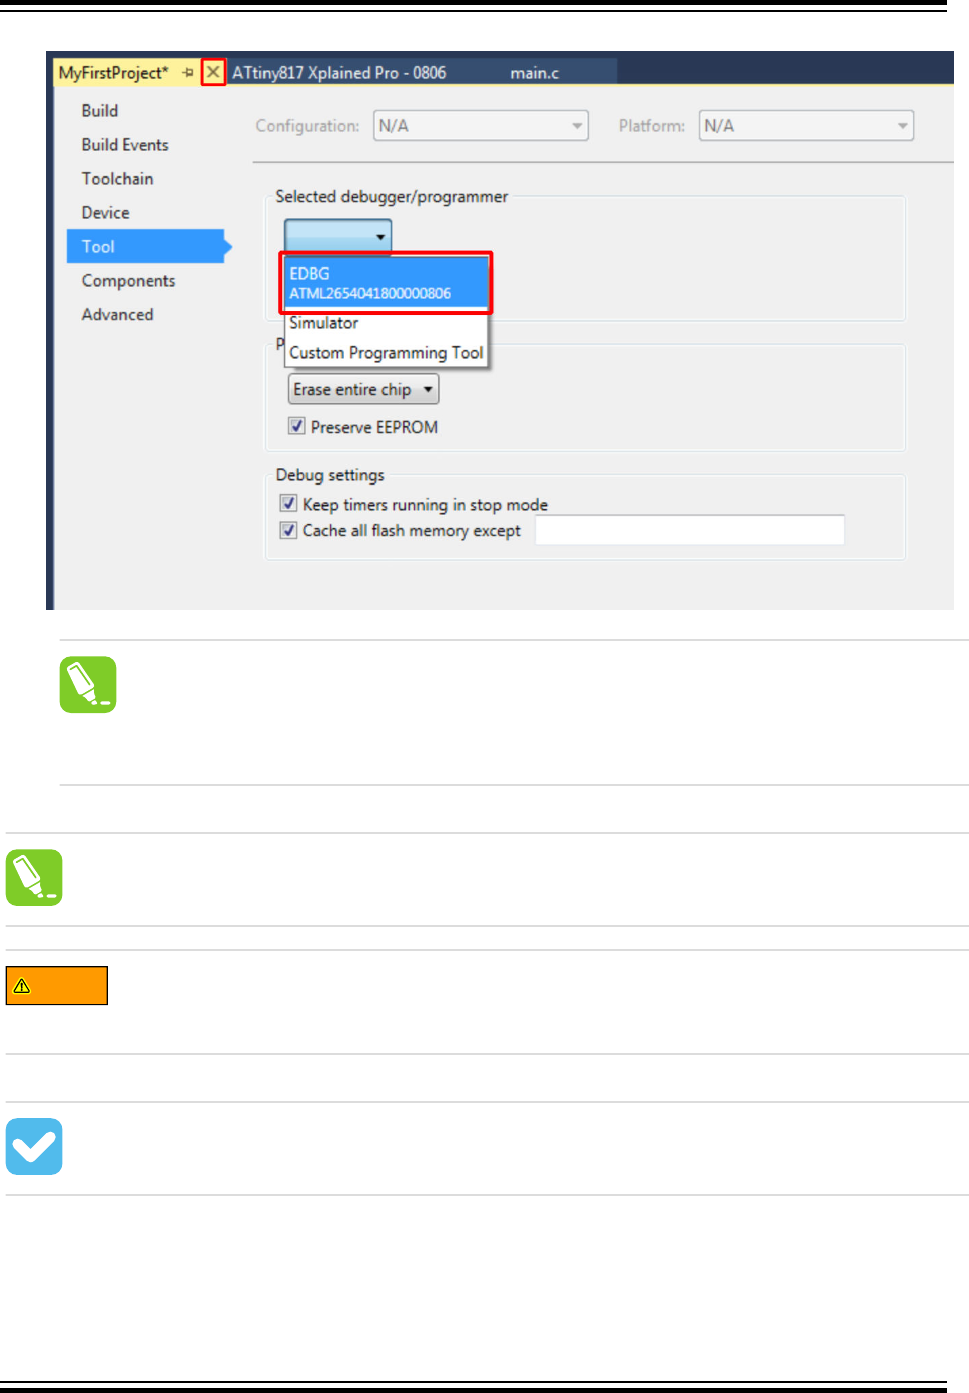
Figure 2-11. Select Debugger/Programmer in Project Properties
Tip: The serial number of the tool will accompany its name in the drop-down menu. This
serial number is printed on the backside of each tool, allowing differentiation when more
than one is connected.
Tip: These steps can always be repeated if a different tool should be used for the next debug/
program session.
WARNING
On the ATtiny817 Xplained Pro, the EDBG is permanently connected to the target MCU, but for
a custom hardware solution it is necessary to ensure the target device is powered and properly
connected before a debug session can be launched.
Result: The tool to be used by Atmel Studio when a debug/programming session is launched,
has now been specified.
Atmel Studio 7 User Guide
Getting Started
© 2018 Microchip Technology Inc. User Guide DS50002718A-page 41
2.9.1 Settings Verification
This section is a guide to verifying the tool and project configuration setup by compiling the empty project
and writing it to the ATtiny817.
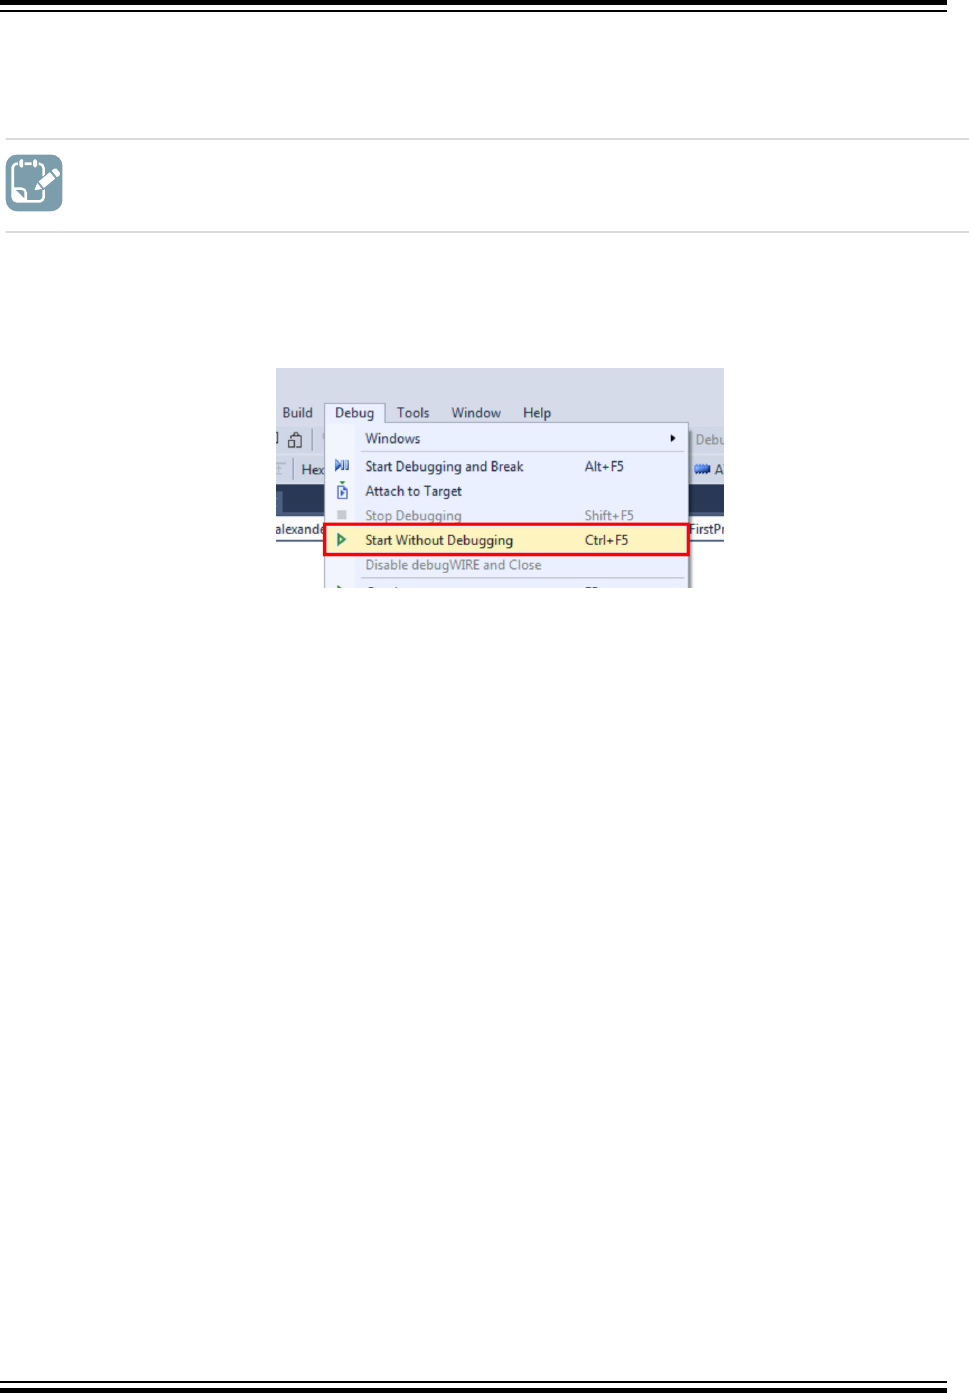
To do: Verify the tool and project configuration setup done in the previous sections.
1. Click the Start Without Debugging button located in the Debug menu, as shown in the figure
below. This will compile the project and write it to the specified target MCU using the configured
tool.
Figure 2-12. Start Without Debugging
2. When Atmel Studio 7 builds the project (automatically done when pressing Start Without
Debugging), several generated output files will show up in the Solution Explorer window. The
following output files are generated:
2.1. EEP file: EEPROM content written to the device.
2.2. ELF file: Contains everything written to the device, including program, EEPROM, and
fuses.
2.3. HEX file: Flash content written to the device.
2.4. LSS file: Disassembled ELF file.
2.5. MAP file: Linker info, what did the linker do, decisions about where to put things.
2.6. SREC file: Same as HEX but in Motorola format.
Atmel Studio 7 User Guide
Getting Started
© 2018 Microchip Technology Inc. User Guide DS50002718A-page 42
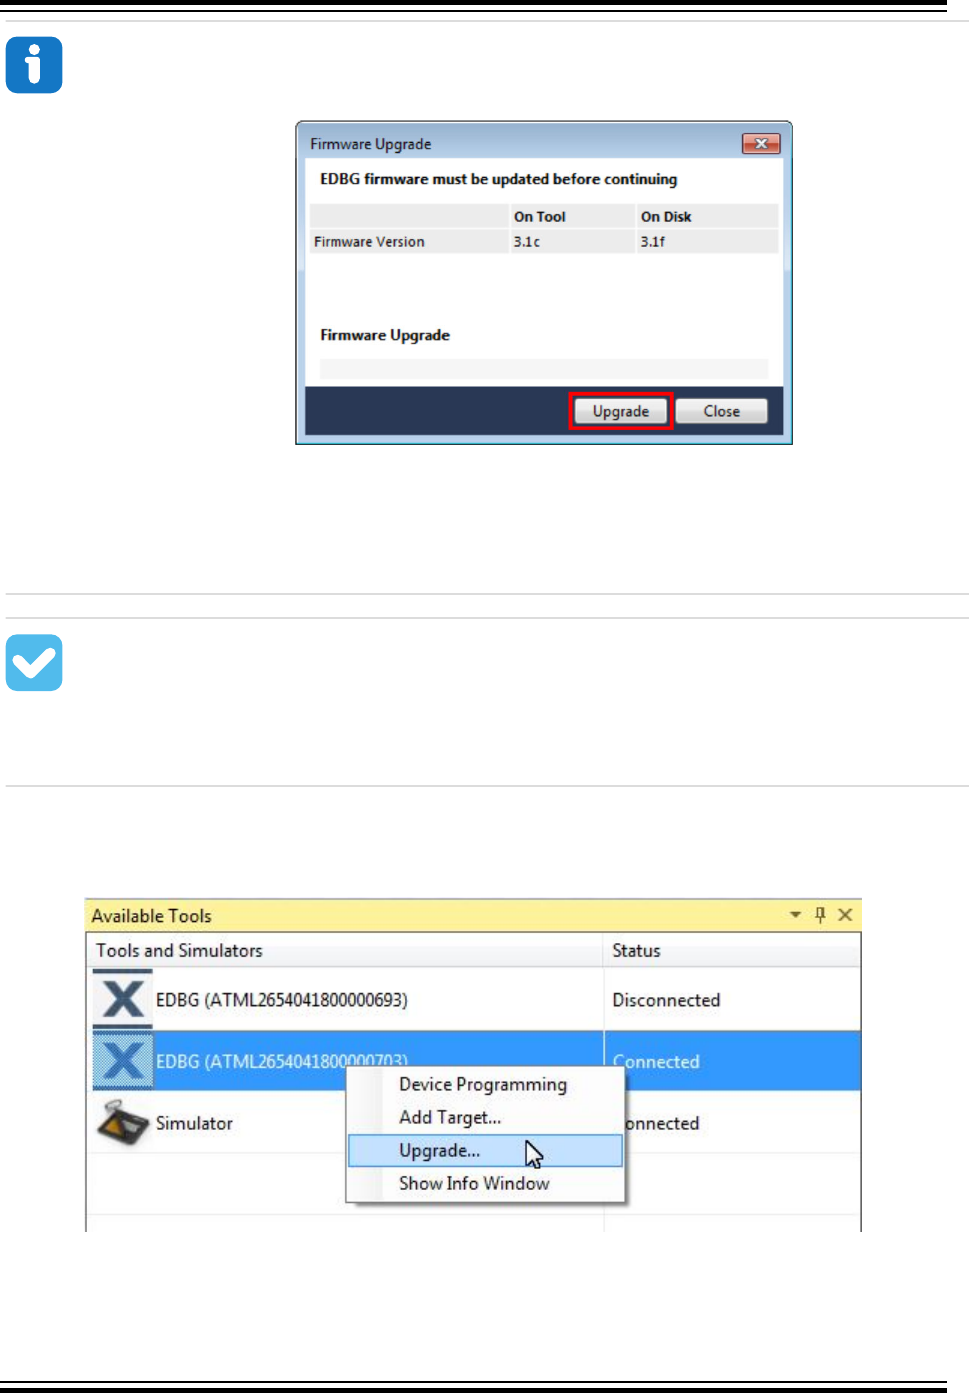
Info: If there is new firmware available for the selected tool, the Firmware Upgrade dialog will
appear, as depicted in Figure 2-13. Click the Upgrade button to start the firmware upgrade.
Figure 2-13. Firmware Upgrade Dialog
Depending on the state of the connected tool and the actual firmware upgrade, the upgrade
may fail on the first attempt. This is normal and can be resolved by disconnecting and
reconnecting the kit before clicking Upgrade again. After the upgrade has completed, the dialog
should say 'EDBG Firmware Successfully Upgraded'. Close the dialog box and make a new
attempt at programming the kit by clicking the Start Without Debugging button again.
Result: By compiling the empty project and writing it to the ATtiny817 the following has been
verified:
• The project is configured for the correct MCU
• The correct tool has been selected
• The tool's firmware is up-to-date
Under View > Available Tools you are able to see a list of available or recently used Tools. Here you can
specifically ask Atmel Studio 7 to upgrade the firmware for a tool.
Figure 2-14. Atmel Studio 7 Available Tools (on view menu)
Atmel Studio 7 User Guide
Getting Started
© 2018 Microchip Technology Inc. User Guide DS50002718A-page 43
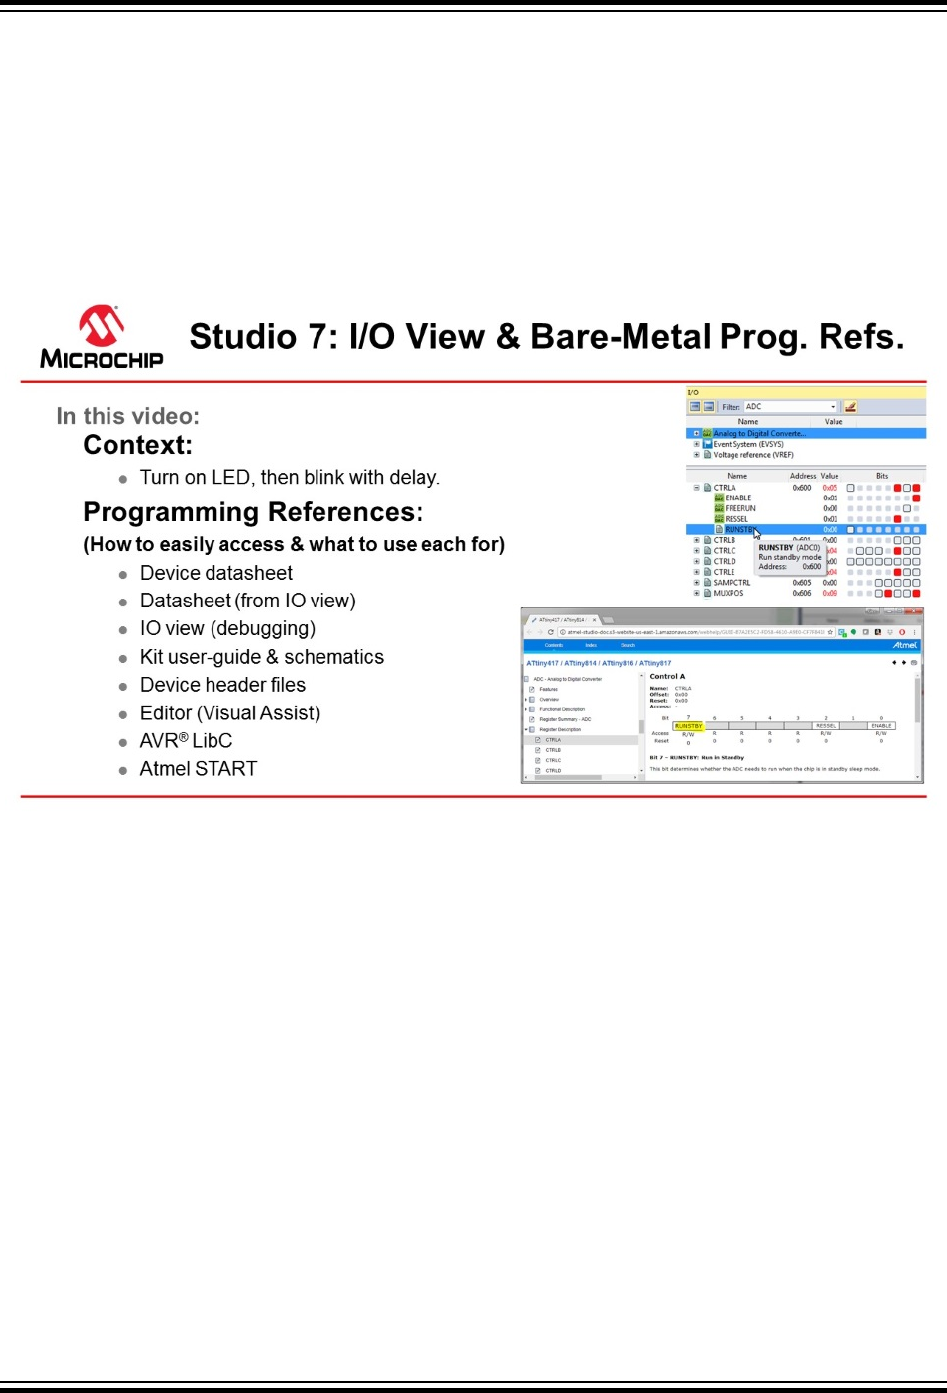
2.10 I/O View and Other Bare-Metal Programming References
This section describes how you would typically write code in Studio 7, independent of a software
configuration tool or framework, i.e. bare-metal. This is covered both as video (linked below) and hands-
on document. The main focus is on each of the relevant programming references, how each is accessed,
and what each is used for. The project context is to turn ON an LED, then blink with a delay. Although the
ATtiny817 Xplained Pro is used the principles are general enough to use with any kit in Studio 7, though
the principles apply to most devices supported in Studio 7.
Getting Started Topics
Video: I/O View and Bare-metal programming references
The list below is an overview of the programming references which are typically used. Particular
emphasis is placed on I/O View, which provides a way to navigate data sheet register descriptions when
editing or debugging, as well as to understand the current configuration when debugging. This second
use of I/O view when debugging is also used to test new register configurations.
This topic is closely related to both Debugging 3: I/O View Memory View and Watch as well as Editor:
Writing and Re-Factoring Code (Visual Assist).
• Device data sheet
• Data sheet (from I/O view)
• Kit user guide and schematics
• I/O View (debugging)
• Editor (Visual Assist)
• Device header files
• AVR Libc (AVR specific)
• Atmel START: ATtiny817 project
Atmel Studio 7 User Guide
Getting Started
© 2018 Microchip Technology Inc. User Guide DS50002718A-page 44

In the process the following code is written. Although the code is simple, the decision process, using the
list of programming references above, is described.
#include <avr/io.h>
#define F_CPU 3333333
#include <util/delay.h>
int main(void)
{
PORTB.DIR = PIN4_bm;
while (1)
{
_delay_ms(500);
PORTB.OUTTGL = PIN4_bm;
}
}
WARNING
Be sure to keep the #include <avr/io.h> line at the top of main.c. This header file will
include the correct register map for the selected device, and without this statement, the compiler
will not recognize any of the macros referenced in the code above.
Device Data Sheet (PDF)
Although I/O View allows easy access to navigate the data sheet at a register level, the PDF version still
has a role. The device data sheet, in PDF format, tends to be used at least to get an understanding of the
peripheral, through the block diagram and functional description. For example, to understand the
PORT peripheral of the ATtiny817, we consulted the PORT Block Diagram and Functional Description >
Principle of operation sections of the data sheet. These two sections together, connecting the description
to the diagram, give a basic understanding of the PORT peripheral.
Atmel Studio 7 User Guide
Getting Started
© 2018 Microchip Technology Inc. User Guide DS50002718A-page 45
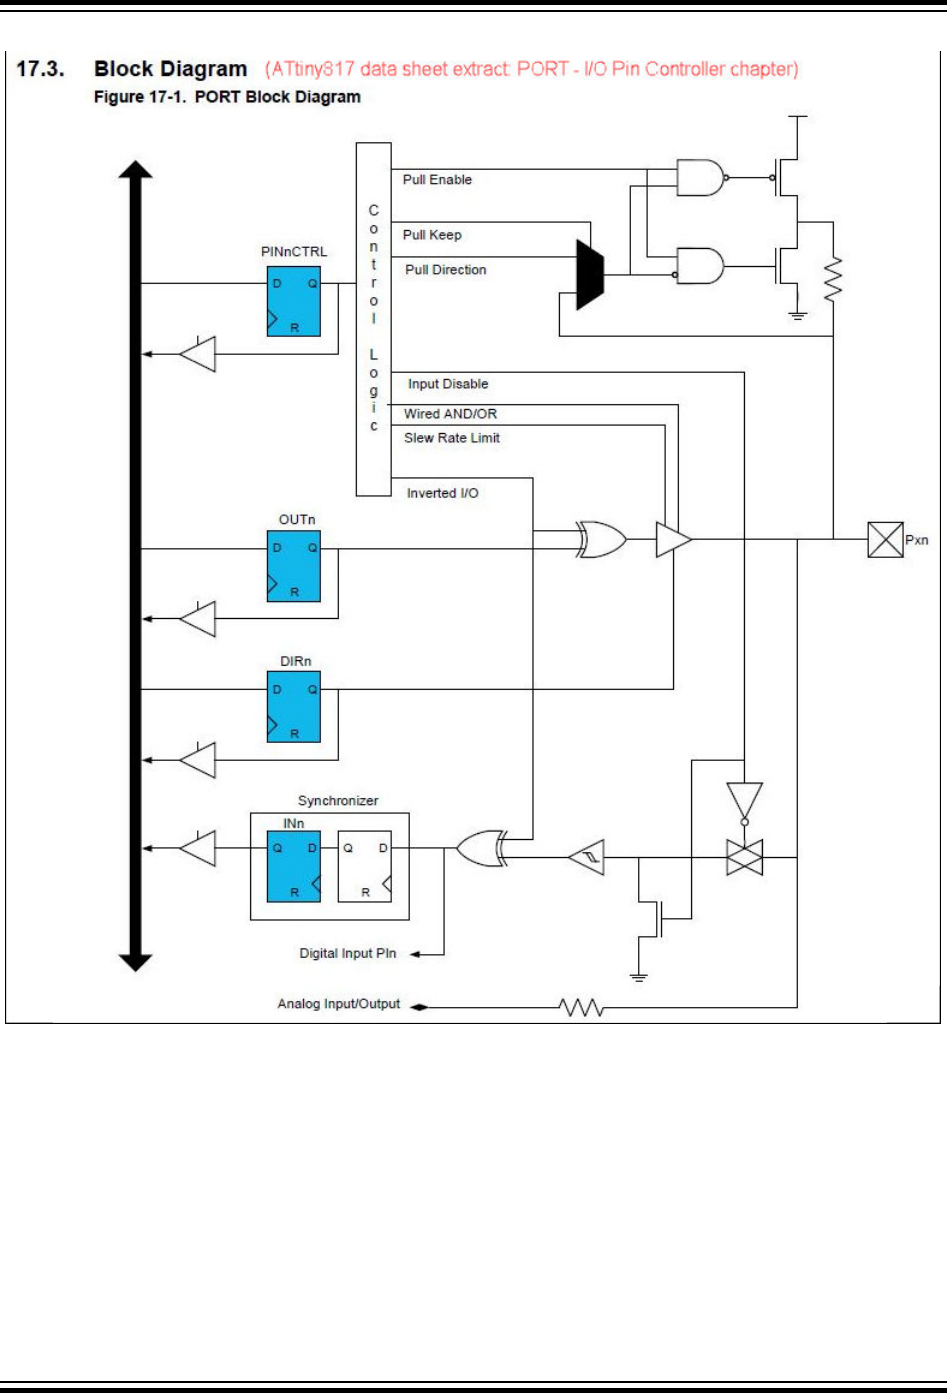
Figure 2-15. PORT Block Diagram from the PDF Data Sheet
Atmel Studio 7 User Guide
Getting Started
© 2018 Microchip Technology Inc. User Guide DS50002718A-page 46

Figure 2-16. Principle of Operation from the PDF Data Sheet of ATtiny817
Note: We used the device data sheet for the peripheral block diagram, as well as a description of the
PORT DIR and OUT registers.
I/O View Data Sheet
Studio 7 allows to easily access the data sheet register descriptions by clicking F1 on the relevant
register description. The HTML version of the data sheet opens online (by default). The data sheet will
open in the context of the relevant register description.
Note: In this way we use the Data sheet from I/O View to understand that:
1. Writing a '1' to PORT.DIR[n] configures and enables pin n as an output pin.
2. If OUT[n] is written to '0', pin n is driven low.
Figure 2-17. Opening an Online Data Sheet from I/O View
Atmel Studio 7 User Guide
Getting Started
© 2018 Microchip Technology Inc. User Guide DS50002718A-page 47
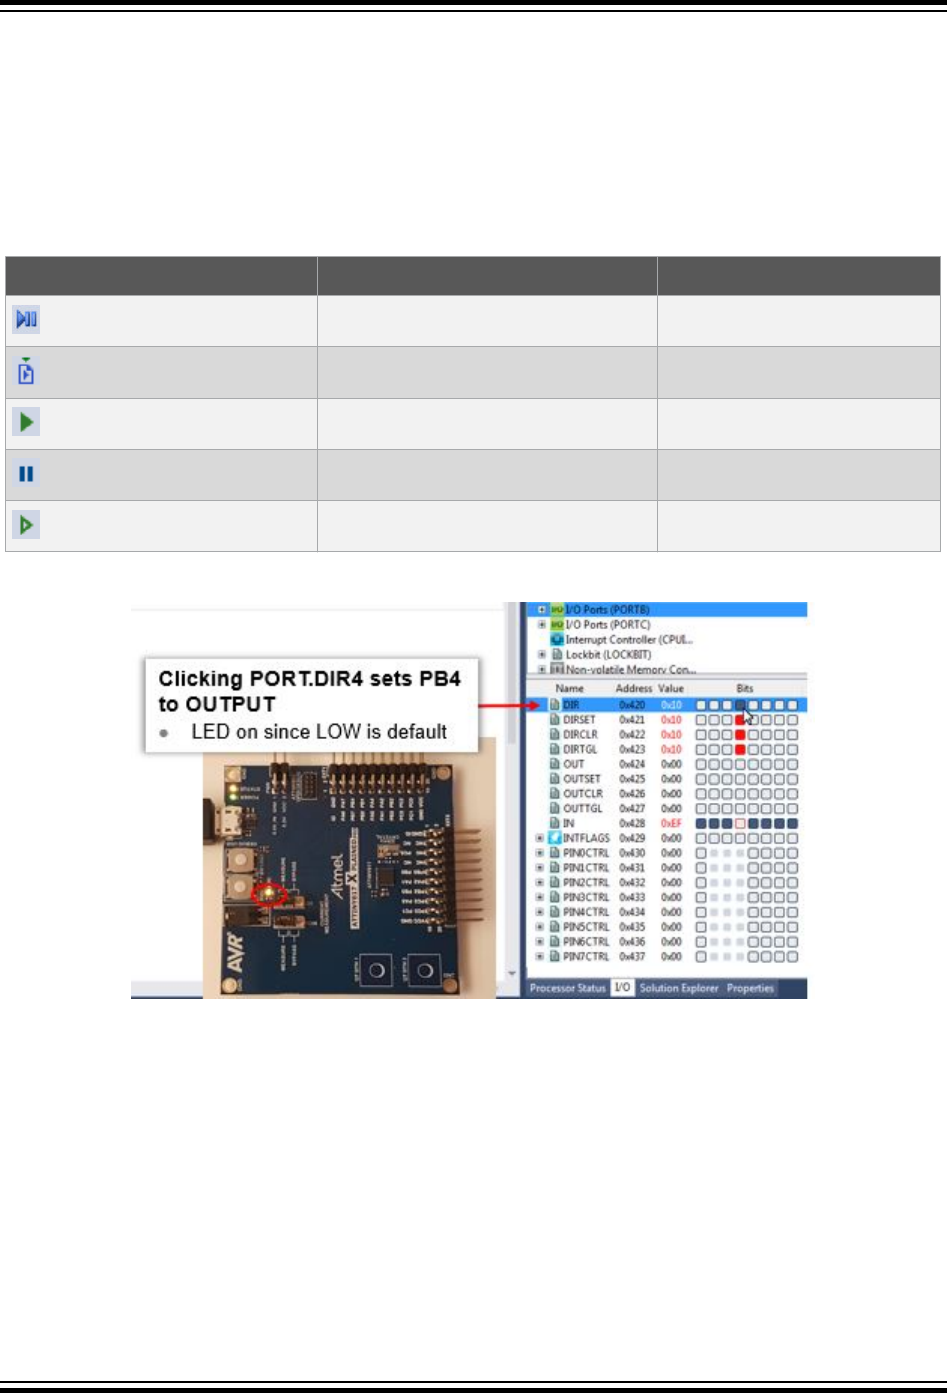
I/O View (Debugging)
This functionality can directly be tested by starting a debug session, using Start Debugging and Break. So
we are now able to begin testing functionality, as shown in the image below.
I/O View is covered in more detail in Debugging 3: I/O View Memory View and Watch.
Note: I/O View when debugging is used to:
1. Verify that writing a '1' to PORT.DIR4, sets pin as OUTPUT, LOW by default to LED turns ON.
2. Verify that writing a '1' to PORT.OUT4, turns OFF the LED.
Table 2-2. Atmel Studio Button Functionality (Programming and Launching Debug Sessions)
Button Functionality Keyboard Shortcut
Start Debugging and Break Alt + F5
Attach to Target
Start Debugging F5
Break All Ctrl + Alt + Break
Start Without Debugging Ctrl + F5
Figure 2-18. Turning ON/OFF Kit LEDs Through Manipulating I/O View Registers when Debugging
Downloading Studio 7 Documentation
The data sheet can also be downloaded by using the Studio 7 help system. In this case, a similar
functionality will work offline. This is described here: Downloading Offline Documentation.
Atmel Studio 7 Editor (Visual Assist)
The Studio 7 Editor, powered by Visual Assist has powerful features to help you write and refactor code,
as well as easily navigate large projects. Suggestion functionality is shown in Figure 2-19, while an
overview of the code navigation is shown in Figure 2-20. In the next section, Editor: Writing and Re-
Factoring Code (Visual Assist), the editor features are covered in more detail.
Atmel Studio 7 User Guide
Getting Started
© 2018 Microchip Technology Inc. User Guide DS50002718A-page 48
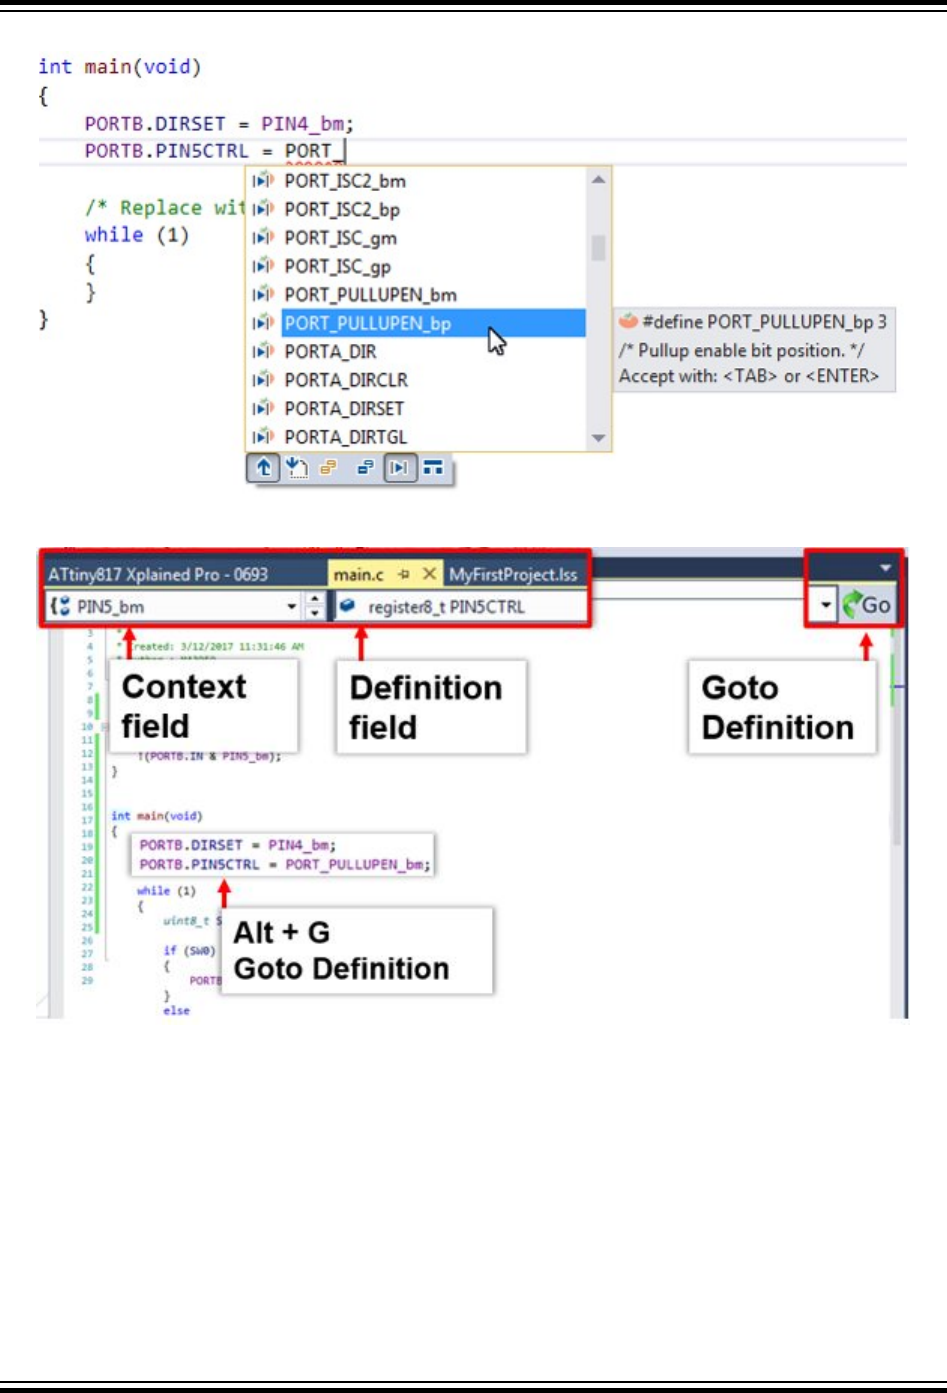
Figure 2-19. Suggestion Functionality in the Studio 7 Editor for Writing Code
Figure 2-20. Atmel Studio 7 Editor Navigation Overview
Specifically in the video related to this section, the editor is used for the following.
Device Header Files
Through the Goto Definition functionality of the editor, it is easy to access the MCU device header files,
i.e. by clicking on any register and then clicking on the goto button, or typing Alt+G. Writing PORTB. gives
a suggestion list of potential registers, from the PORT structure, shown in figure Suggestion lists and the
MCU device header files. For more information about how the AVR header files are structured, see
AVR1000 for more information.
Atmel Studio 7 User Guide
Getting Started
© 2018 Microchip Technology Inc. User Guide DS50002718A-page 49
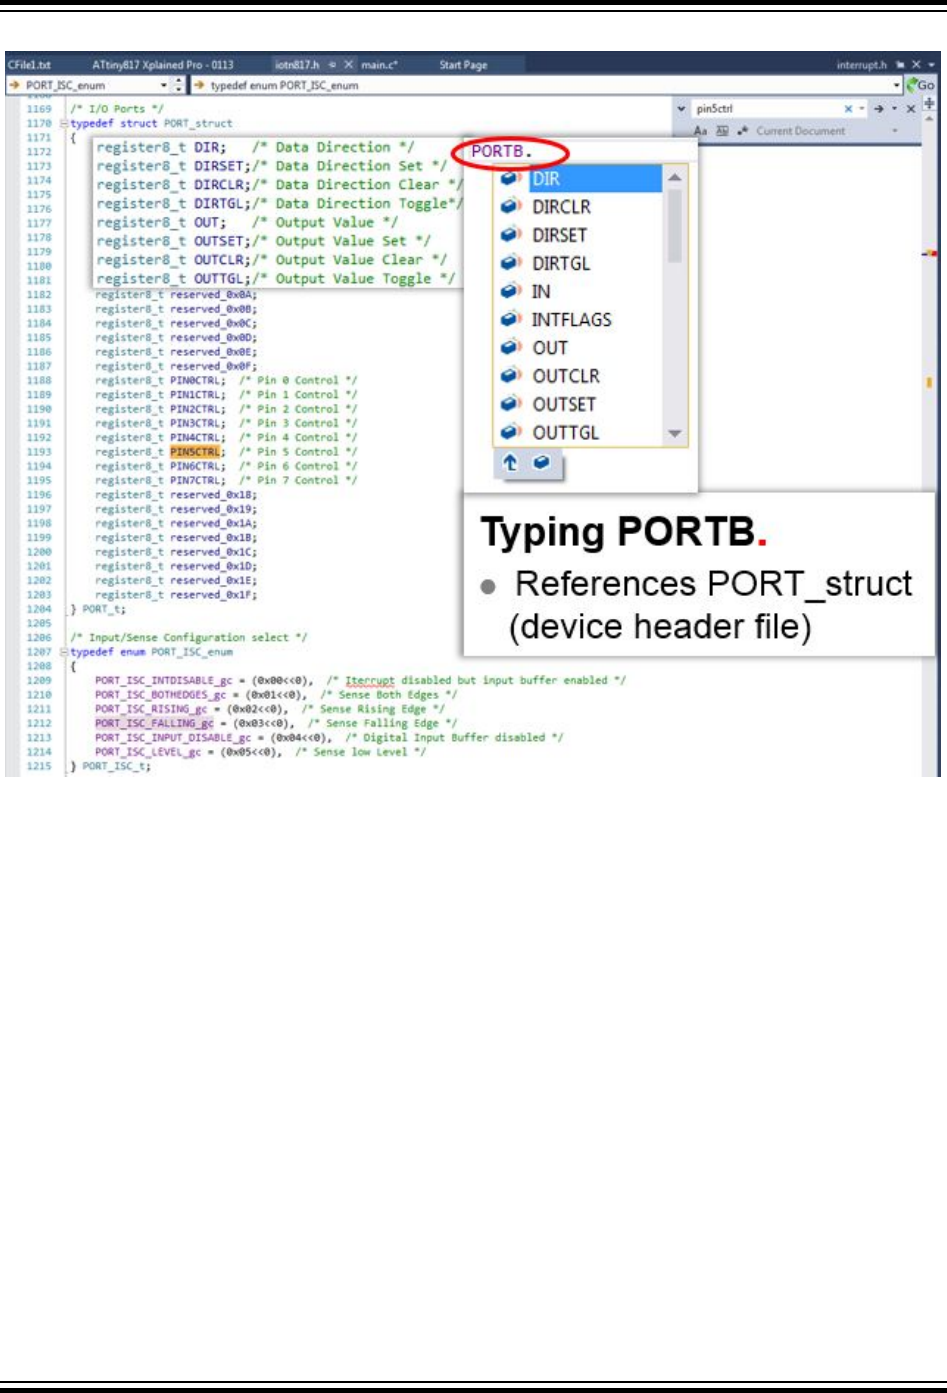
Figure 2-21. Suggestion lists and the MCU device header files
Kit Schematics and User Guide
The kit schematics and user guide are useful to understand the MCU pin connections on the kit. Full
schematics and kit design files, such as Gerbers, are available on www.microchip.com, on the kit's
product page.
Atmel Studio 7 User Guide
Getting Started
© 2018 Microchip Technology Inc. User Guide DS50002718A-page 50
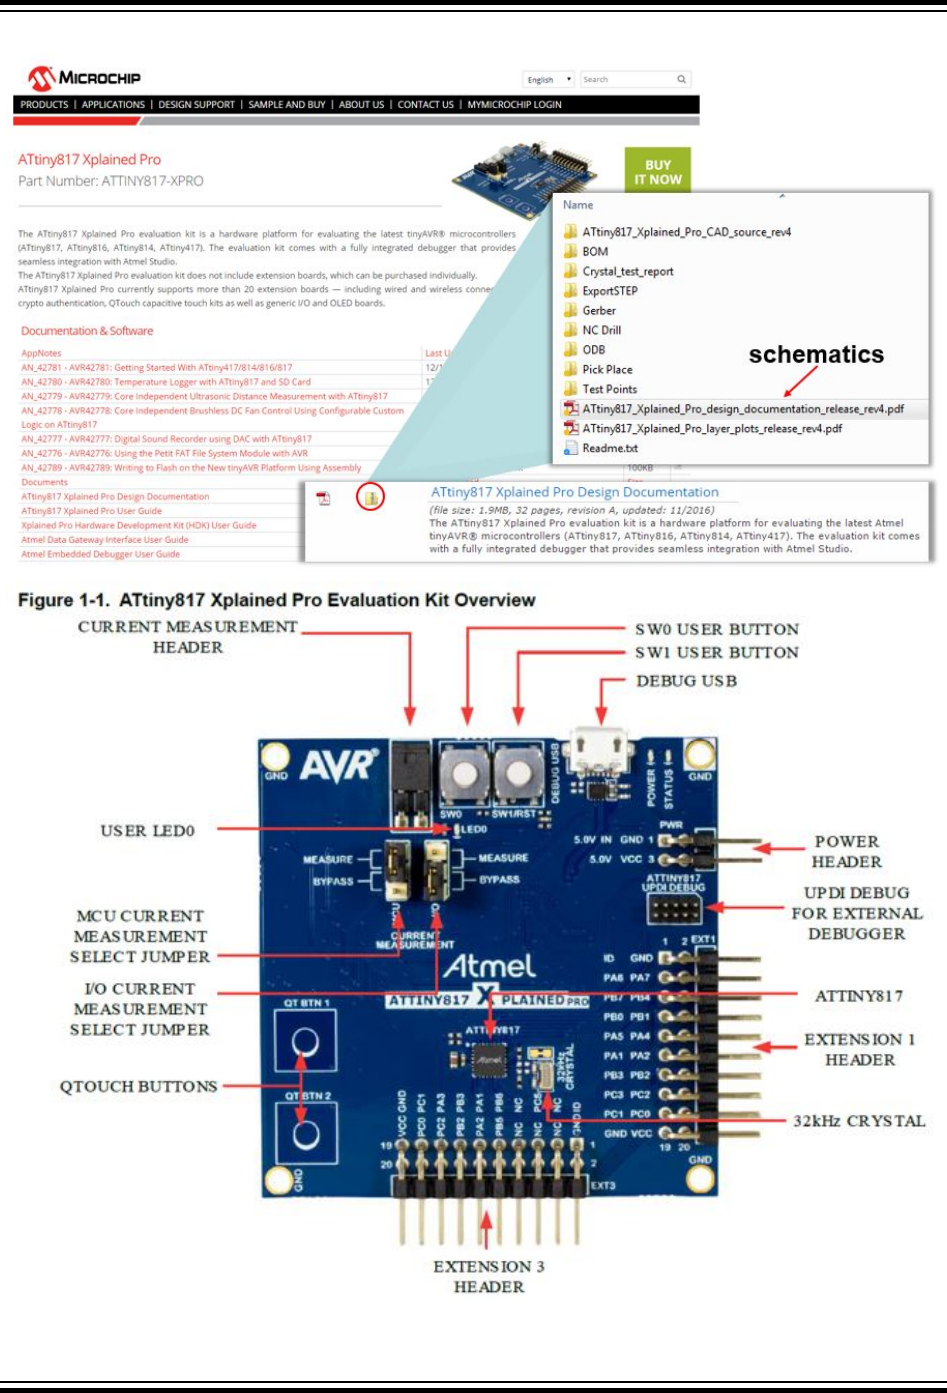
Figure 2-22. How to Find Schematics for a Particular Development Board
Atmel Studio 7 User Guide
Getting Started
© 2018 Microchip Technology Inc. User Guide DS50002718A-page 51
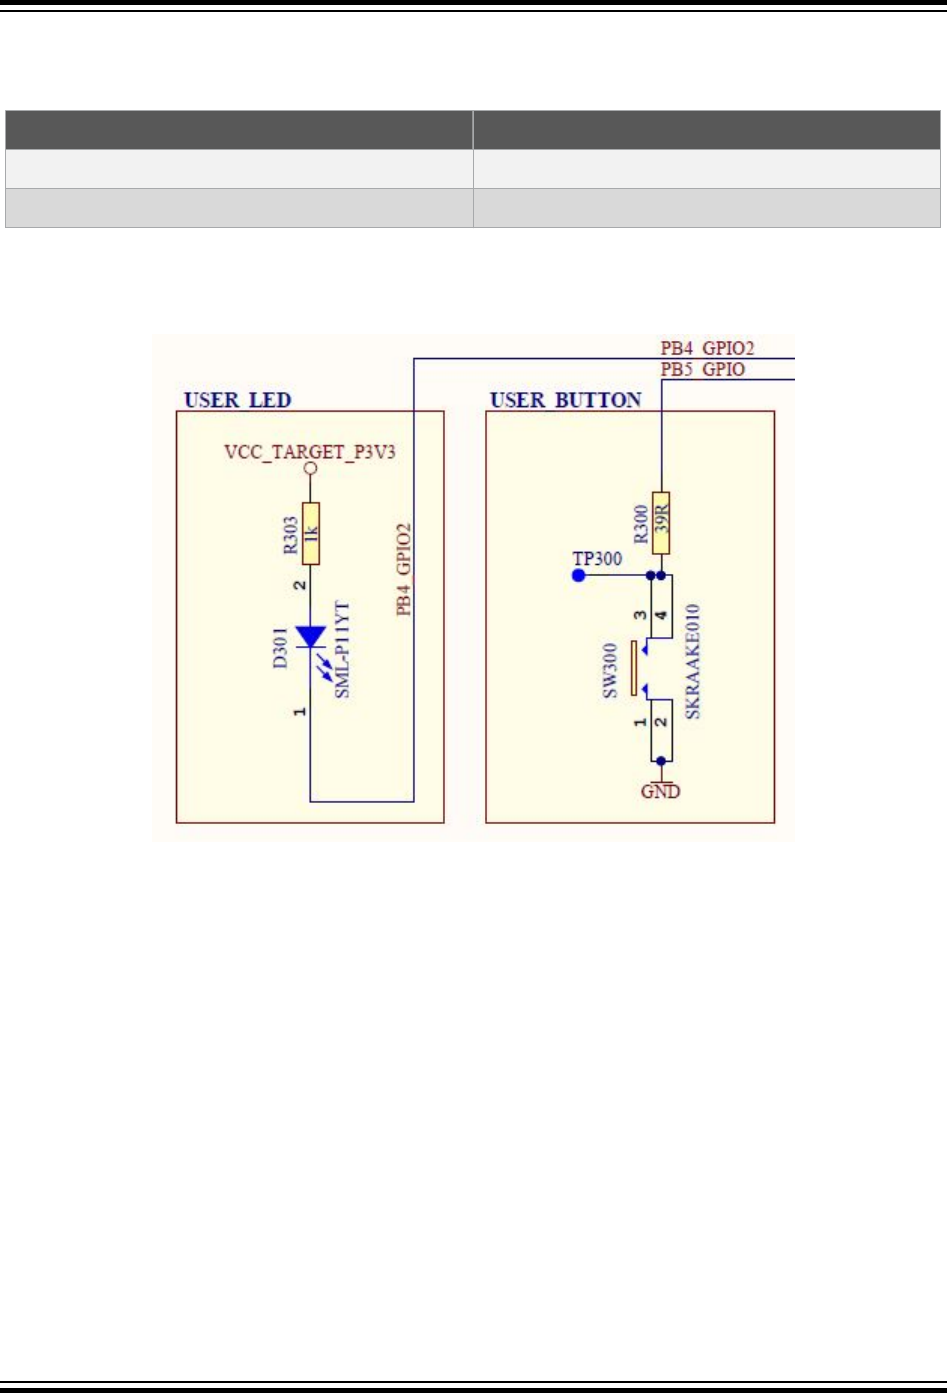
The LED and button are connected to the pins as per the table below, from the ATtiny817 Xplained Pro
User Guide.
Table 2-3. ATtiny817 Xplained Pro GPIO Connections
Silkscreen Text ATtiny817 GPIO Pin
LED0 PB4
SW0 PB5
The ATtiny817 Xplained Pro design documentation schematic shows the connections for the LED and
button, as in the figure below.
Figure 2-23. ATtiny827 Xplained Pro GPIO Connection Schematics
From the schematics, it is concluded that:
• The LED can be turned ON by driving PB4 low.
• SW0 is connected directly to GND and to PB5 through a current limiting resistor.
• SW0 does not have an external pull-up resistor.
• SW0 will be read as '0' when pushed and as '1' when released, if the ATtiny817 internal pull-up is
enabled.
AVR Libc
All the references covered to this point are just as relevant for SAM as for AVR, however, as the name
suggests, this one is specific to AVR. AVR Libc is a Free Software project whose goal is to provide a high-
quality C library for use with GCC on AVR microcontrollers. Together, avr-binutils, avr-gcc, and avr-libc
form the heart of the Free Software toolchain for the AVR microcontrollers. Further, they are accompanied
by projects for in-system programming software (avrdude), simulation (simulavr), and debugging (avr-
gdb, AVaRICE).
The library reference is usually a quick interface into AVR Libc, as shown in Figure 2-24. One can quickly
search the page for a relevant library. Relevant header files, which should be added to the project, are
Atmel Studio 7 User Guide
Getting Started
© 2018 Microchip Technology Inc. User Guide DS50002718A-page 52
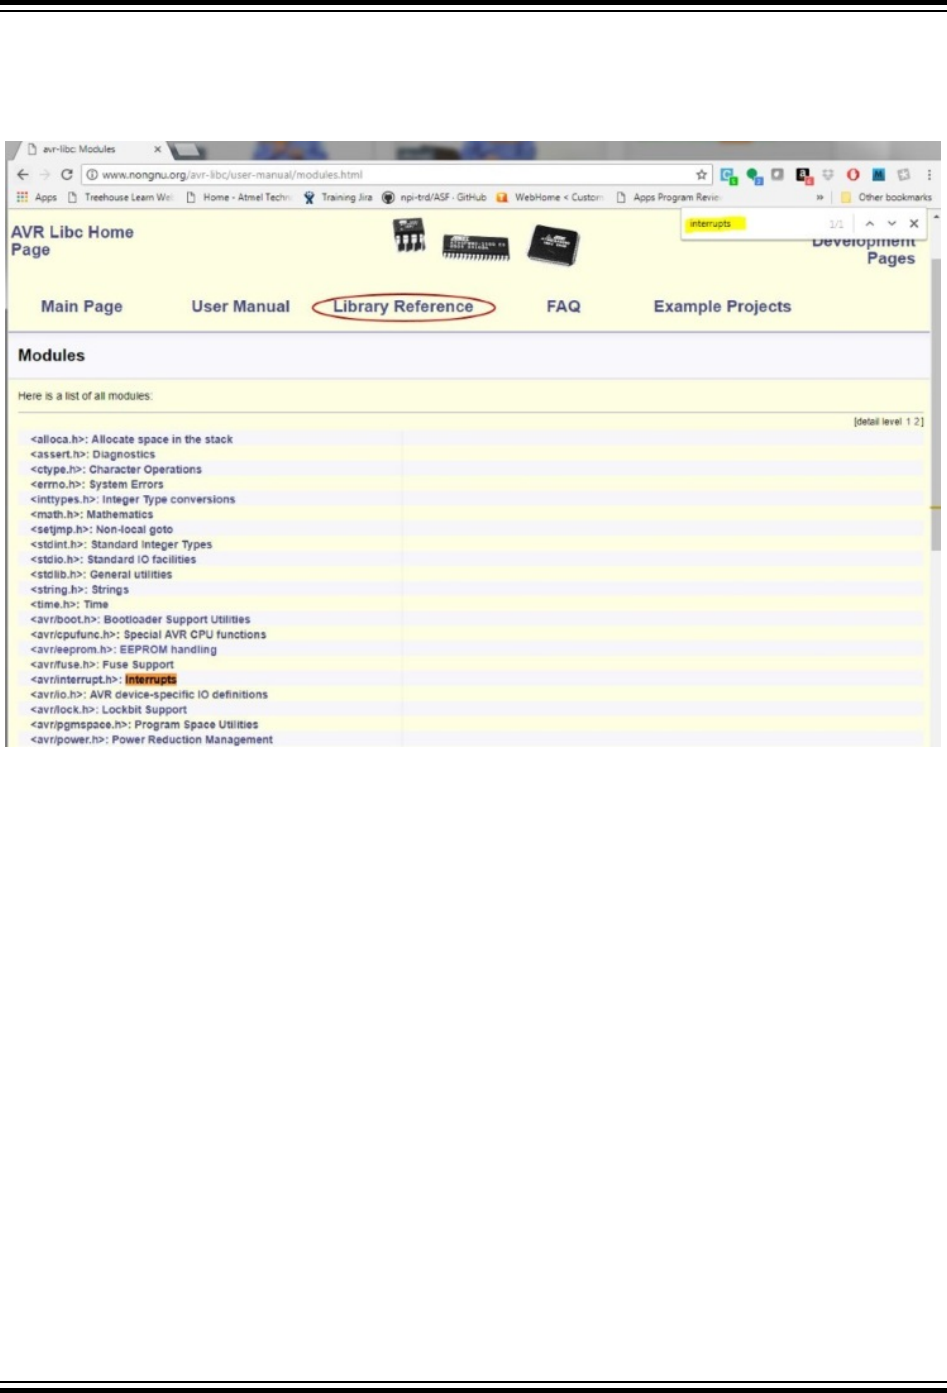
indicated in the module name. For example searching for 'interrupts', the relevant include will be #include
<avr/interrupt.h>. Clicking into the module, a list of available functions and relevant interrupt callbacks
can be found, as shown in Figure 2-25.
Figure 2-24. AVR Libc Library Reference
Atmel Studio 7 User Guide
Getting Started
© 2018 Microchip Technology Inc. User Guide DS50002718A-page 53
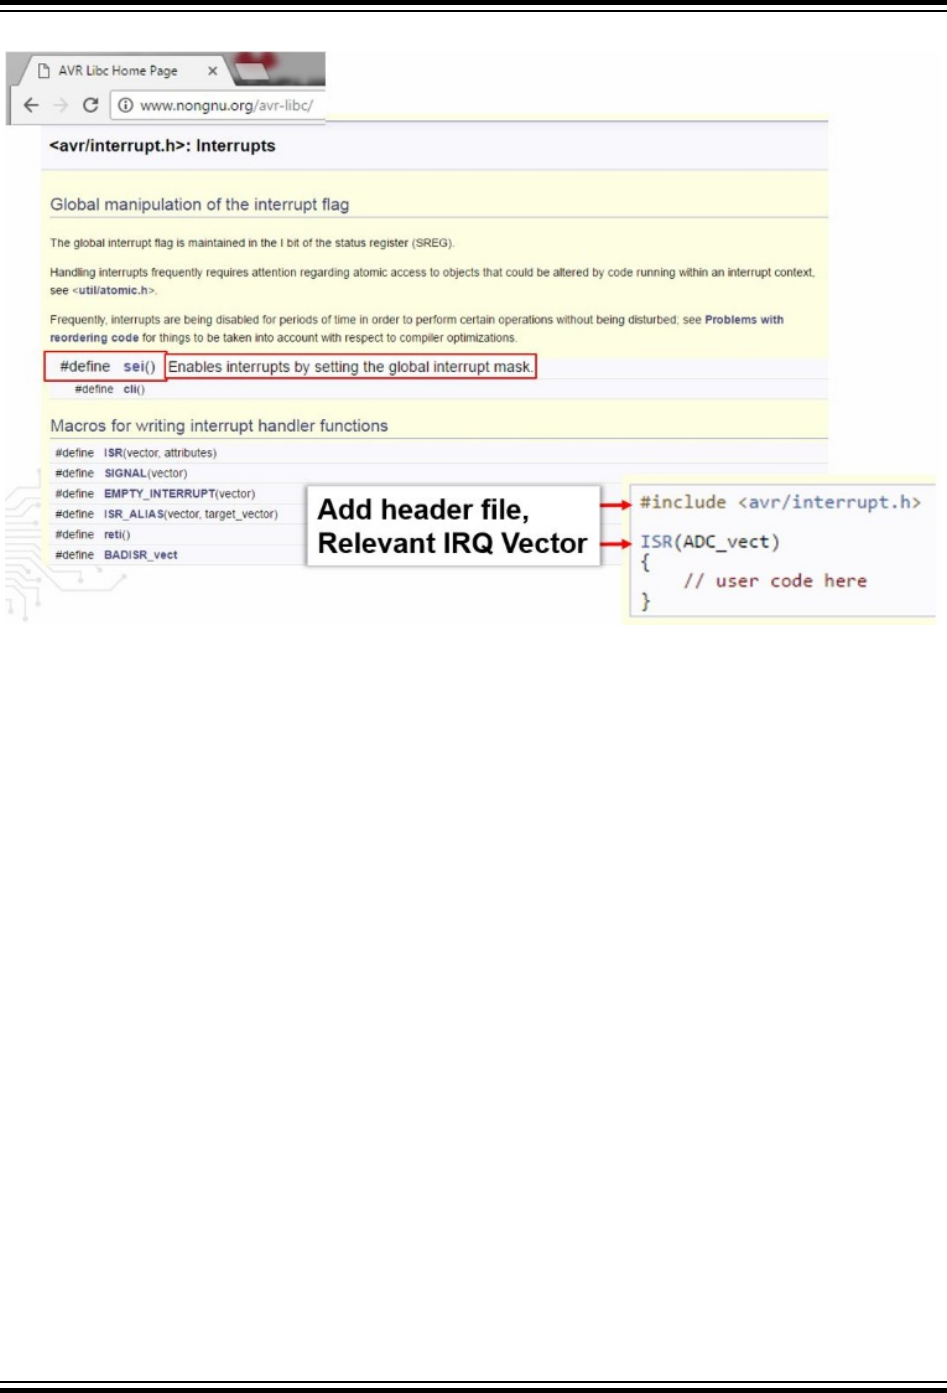
Figure 2-25. Using Interrupts with AVR Libc
Atmel START
Atmel START is a web-based software configuration tool, for various software frameworks, which helps
you getting started with MCU development. Starting from either a new project or an example project,
Atmel START allows you to select and configure software components (from ASF4 and AVR Code), such
as drivers and middleware to tailor your embedded application in a usable and optimized manner. Once
an optimized software configuration is done, you can download the generated code project and open it in
the IDE of your choice, including Studio 7, IAR Embedded Workbench, Keil μVision, or simply generate a
make-file.
Although Atmel START is a tool for MCU and software configuration, it can still be useful even in bare-
metal development, i.e. writing code from scratch using the list of programming references described in
this section. Creating a new project for the kit you are using, can be a useful alternative to the board
schematic, using the PINMUX view. In addition, the CLOCKS view can be useful to check the default
clocks of a device. Furthermore, viewing the configuration code, useful pieces can be pasted back into
your project. For example, the AVR Libc delay functions require that the clock frequency is defined, as
shown in Figure 2-28. For the ATtiny817 this default value would be: #define F_CPU 3333333.
Atmel Studio 7 User Guide
Getting Started
© 2018 Microchip Technology Inc. User Guide DS50002718A-page 54
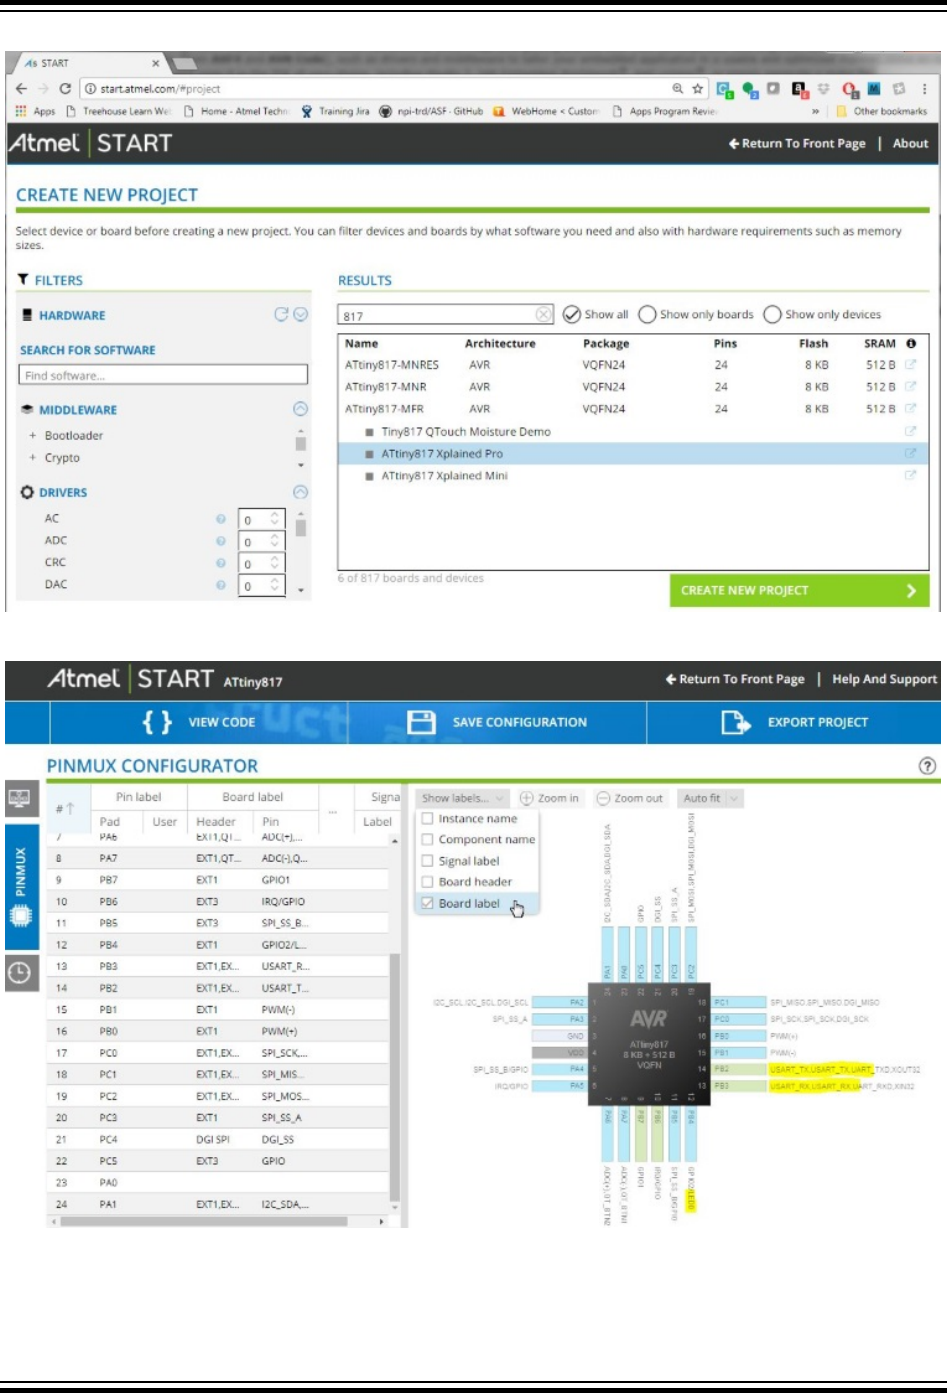
Figure 2-26. Using START to Creating a New Project for a Relevant Board
Figure 2-27. Showing Board Labels in START as an Alternative to the Kit Schematic
Atmel Studio 7 User Guide
Getting Started
© 2018 Microchip Technology Inc. User Guide DS50002718A-page 55
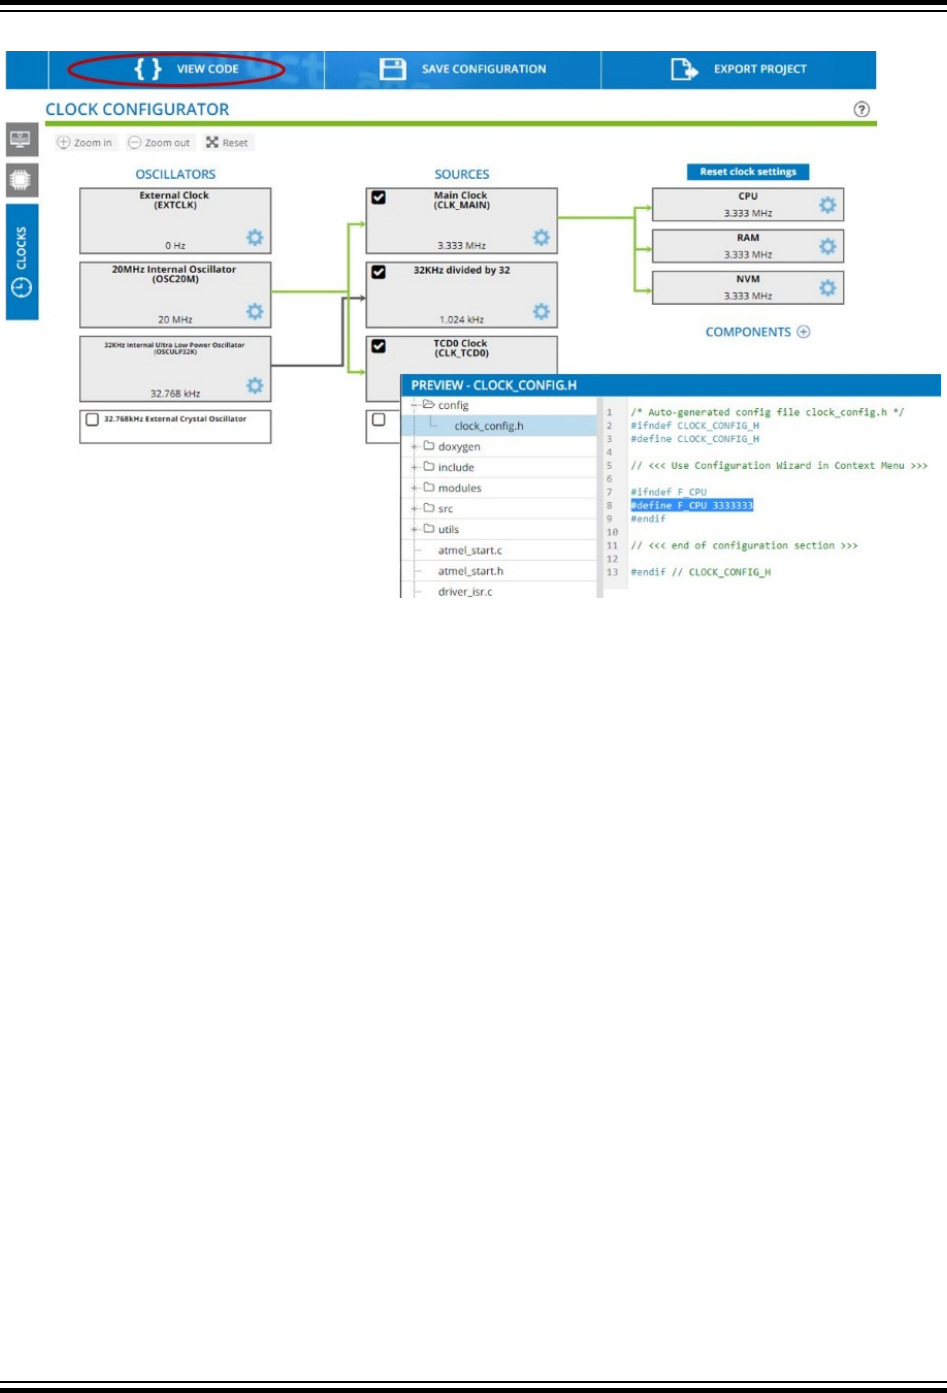
Figure 2-28. Checking Default Clock Configuration and Using VIEW CODE to Find F_CPU Define
2.11 Editor: Writing and Re-Factoring Code (Visual Assist)
The Studio 7 Editor is powered by an extension called Visual Assist, a productivity tool for re-factoring,
reading, writing, and navigating C and C++ code.
Getting Started Topics
Atmel Studio 7 User Guide
Getting Started
© 2018 Microchip Technology Inc. User Guide DS50002718A-page 56

Video: Studio 7 Editor (Visual Assist)
1. Starting with the basic functionality from I/O View and Other Bare-Metal Programming References ,
main.c has the following code:
#include <avr/io.h>
int main(void)
{
PORTB.DIR = PIN4_bm;
while (1)
{
}
}
The ATtiny817 Xplained Pro design documentation schematic shows the connections for the LED and
button, as in the figure below.
Atmel Studio 7 User Guide
Getting Started
© 2018 Microchip Technology Inc. User Guide DS50002718A-page 57

Figure 2-29. ATtiny827 Xplained Pro GPIO Connection Schematics
From the schematics, it is concluded that:
• The LED can be turned ON by driving PB4 low.
• SW0 is connected directly to GND and to PB5 through a current limiting resistor.
• SW0 does not have an external pull-up resistor.
• SW0 will be read as '0' when pushed and as '1' when released, if the ATtiny817 internal pull-up is
enabled.
1. Enable the pull-up on PORTB5, using suggestion list and enhanced list box. Note that
suggestion lists support acronyms, so typing 'pp' PORT_PULLUPEN is the top suggestion.
2. However, before hitting enter, first type 'POR', then hit CTRL+SPACE. This will bring up the
Enhanced Listbox with all possible options.
Now it is possible to filter suggestions by type, as indicated in the picture below.
Atmel Studio 7 User Guide
Getting Started
© 2018 Microchip Technology Inc. User Guide DS50002718A-page 58
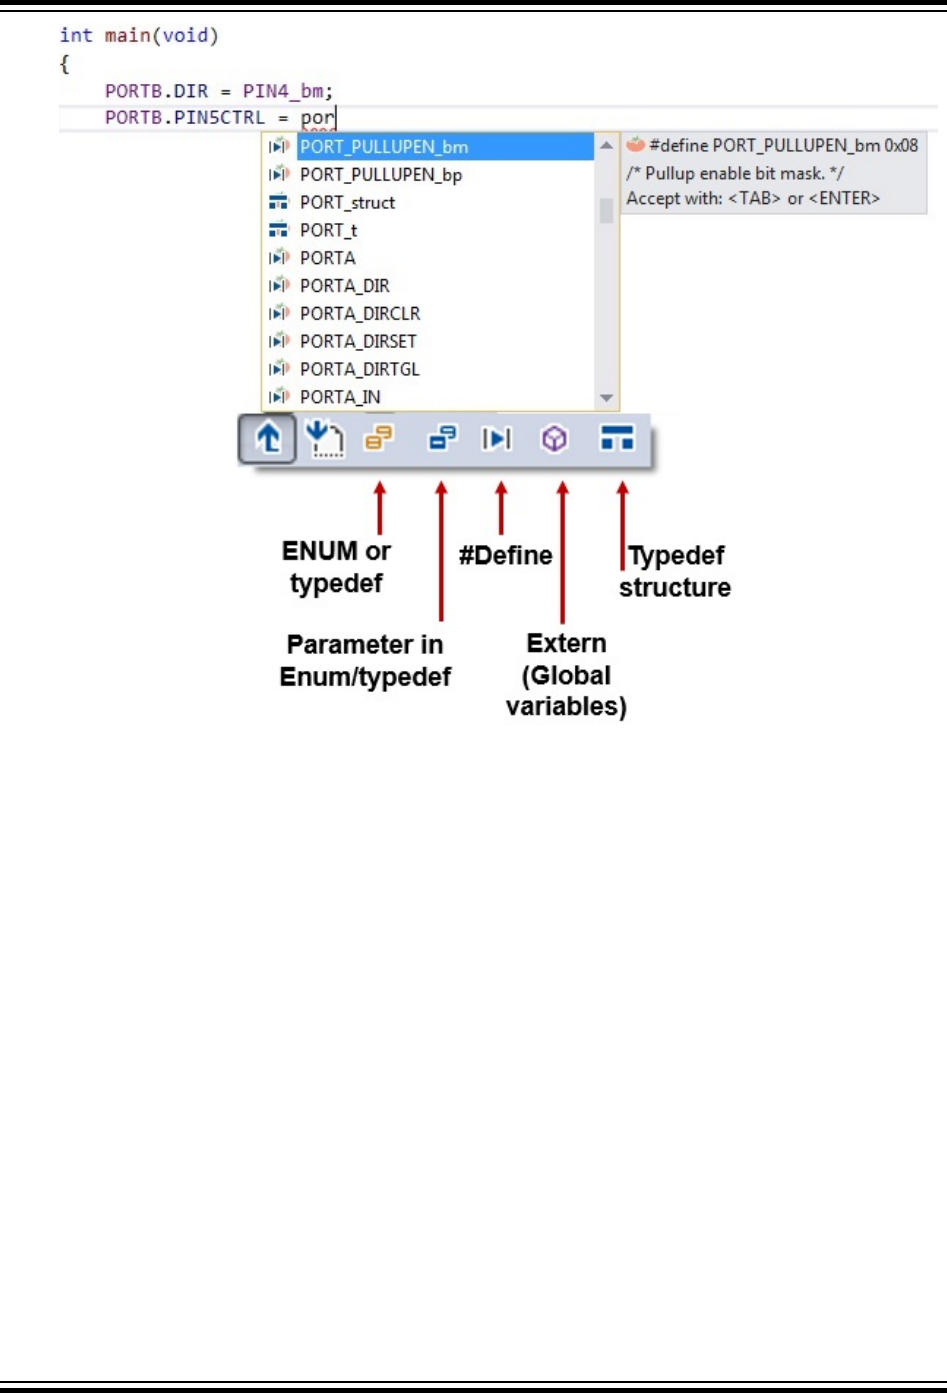
3. Test if SW0 is pressed, using if( ){...}else{...} visual assist code snippet.
Simply typing 'if' will bring up the option. Or, you could R-click and choose Surround With (VA),
which gives a full list of snippets. This is an editable list, so you can add your own snippets.
Atmel Studio 7 User Guide
Getting Started
© 2018 Microchip Technology Inc. User Guide DS50002718A-page 59
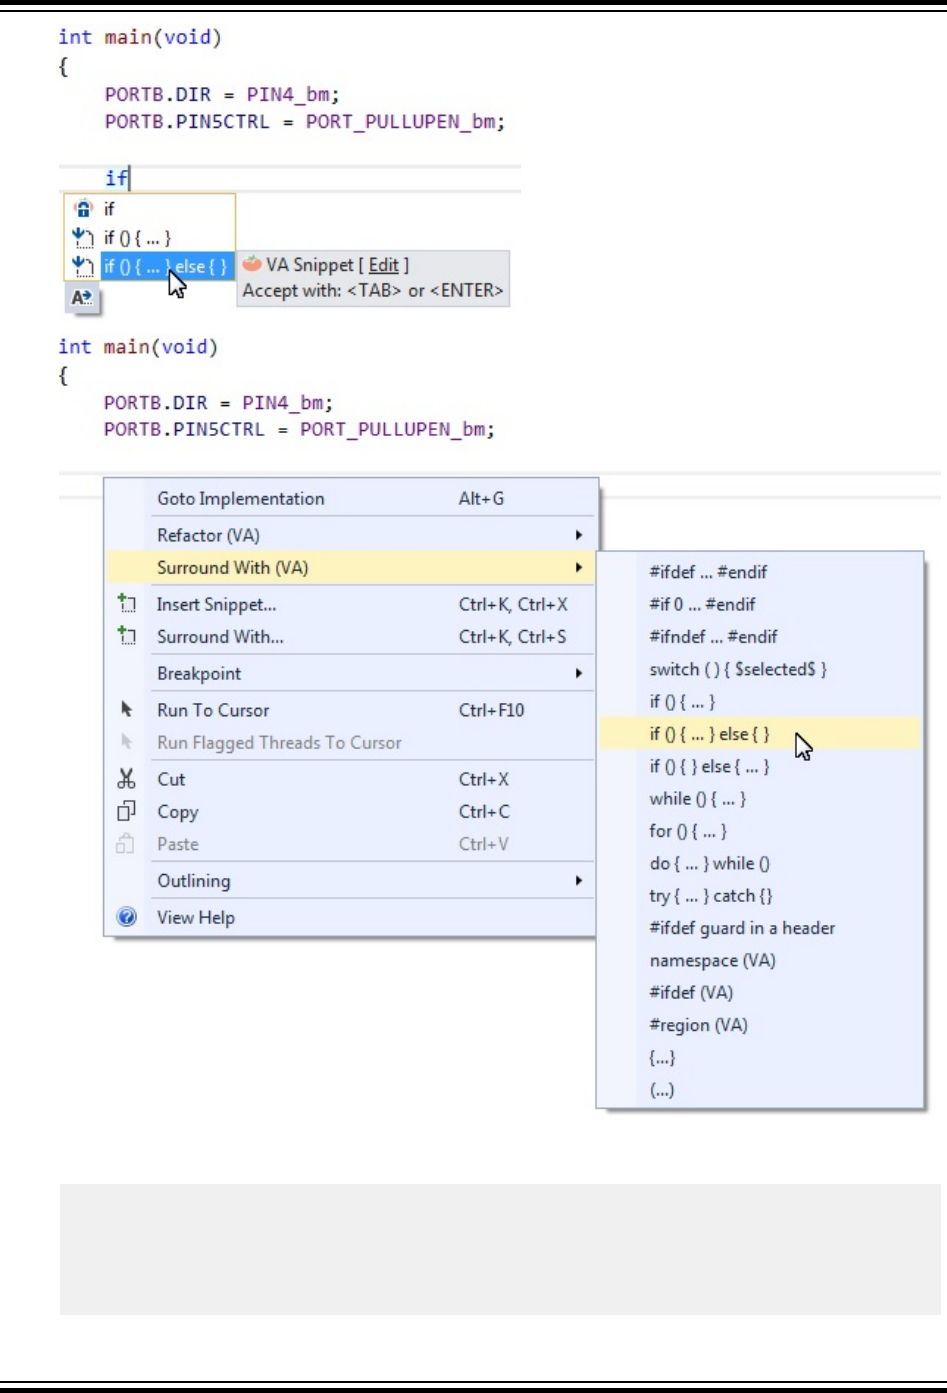
4. Test if the switch is pressed, as the if( ){...}else{...} condition, turn the LED ON if pressed and OFF
if not. main.c should now look as follows:
#include<avr/io.h>
int main(void)
{
PORTB.DIRSET = PIN4_bm; /* Configure LED Pin as output */
PORTB.PIN5CTRL = PORT_PULLUPEN_bm; /* Enable pull-up for SW0 pin */
Atmel Studio 7 User Guide
Getting Started
© 2018 Microchip Technology Inc. User Guide DS50002718A-page 60
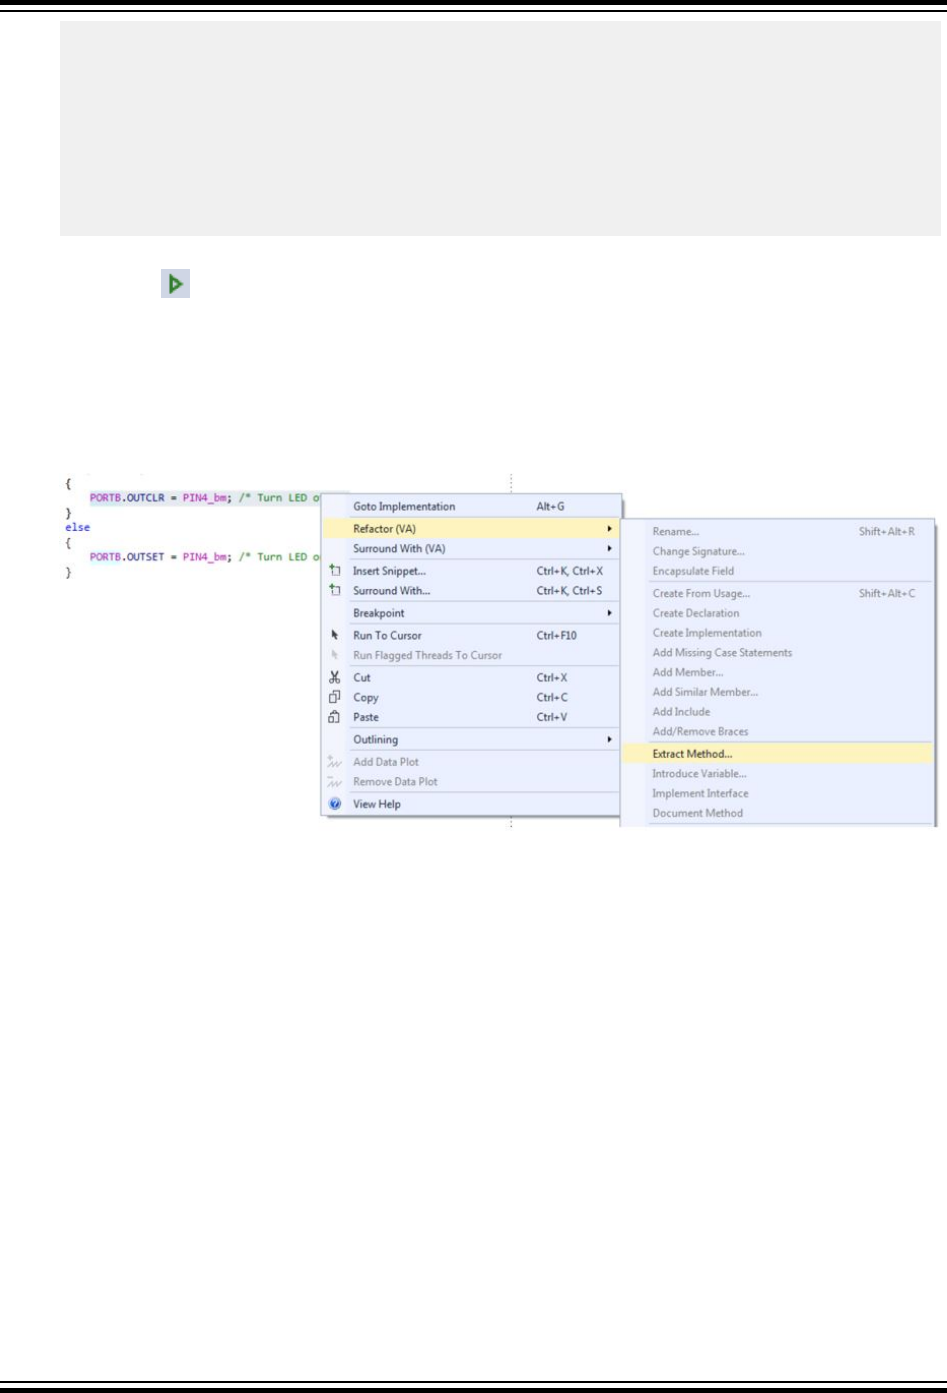
while(1)
{
if (!(PORTB.IN & PIN5_bm)) /* Check switch state */
{
PORTB.OUTCLR = PIN4_bm; /* Turn LED off */
}
else
{
PORTB.OUTSET = PIN4_bm; /* Turn LED on */
}
}
}
5. Verify that LED0 lights up when pushing SW0. Run the code by clicking Start Without
Debugging (Ctrl+Alt+F5), to verify that LED0 lights up when pushing SW0 on the ATtiny817
Xplained Pro kit.
Now that the basic functionality is in place, let's refactor the code to make it more readable.
6. Create functions LED_on( ) and LED_off( ) using Refactor → Extract Method The line of code
to turn the LED ON is executed when SW0 is pressed. Highlight this line of code, right-click and go
to it, as indicated in the figure below.
Figure 2-30. Extract Method
A Extract Method dialog will appear. Name the function 'LED_on', as indicated in the following
figure.
Atmel Studio 7 User Guide
Getting Started
© 2018 Microchip Technology Inc. User Guide DS50002718A-page 61
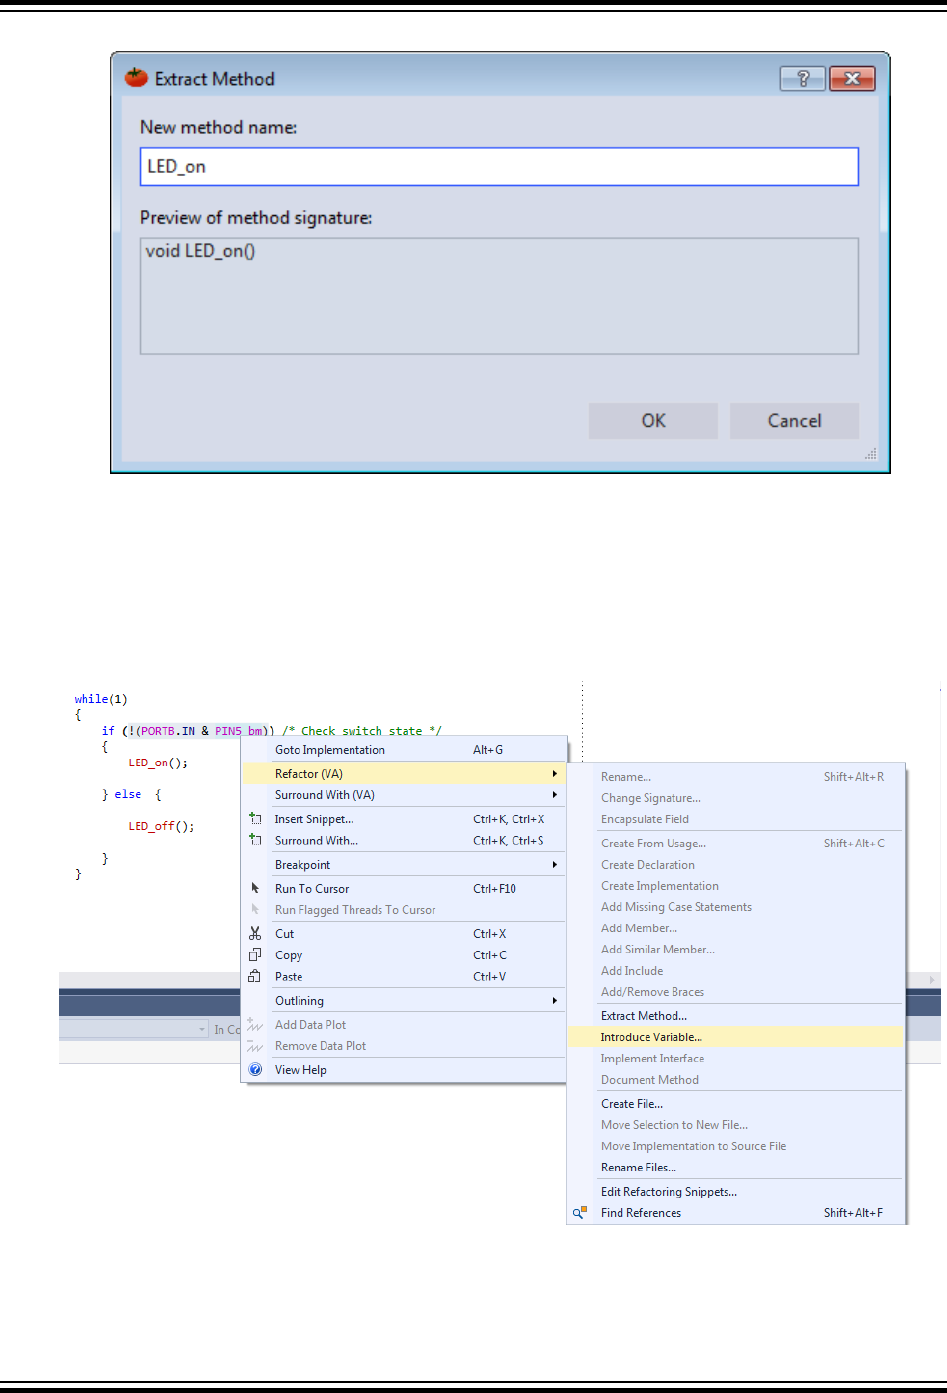
Figure 2-31. Extract Method Dialog
Click OK, and the code should change. A new function called LED_on() should appear at the top
of the file, with a function call where the line of code used to be. Use the same method to
implement LED_off().
7. Create a variable for SW0 state, using Refactor → Introduce Variable. Next, it is necessary to
create a variable for the SW0 state. Highlight the condition inside the if() in the main()
while(1) loop. Right-click and go to it, as indicated in the figure below.
Figure 2-32. Introduce Variable
The Introduce Variable dialog will appear, as depicted in Figure 2-33. Name the variable 'uint8_t
SW0_state'.
Atmel Studio 7 User Guide
Getting Started
© 2018 Microchip Technology Inc. User Guide DS50002718A-page 62
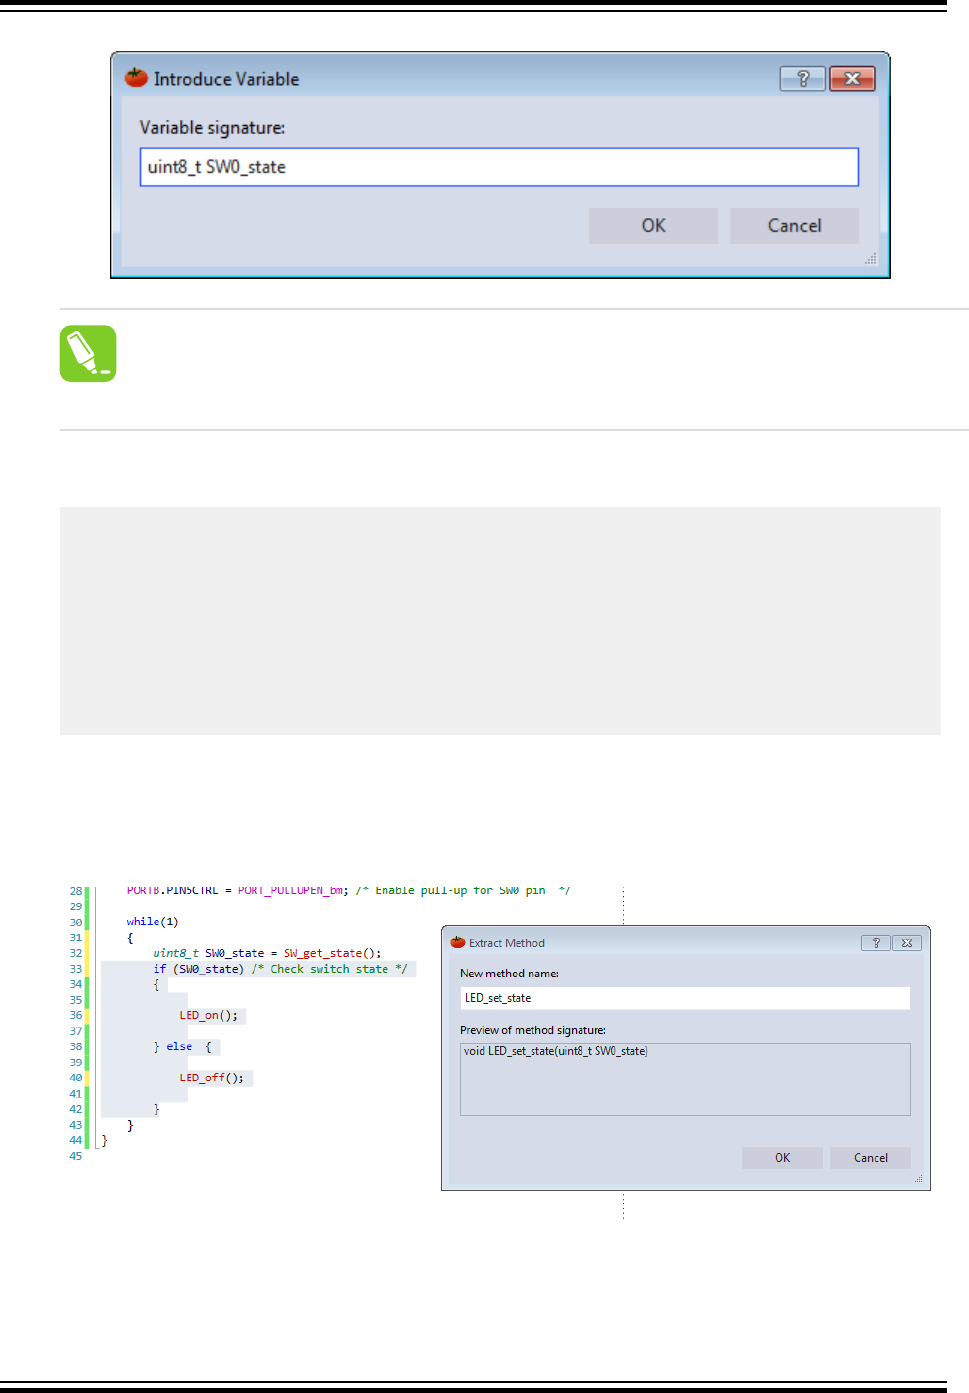
Figure 2-33. Introduce Variable Dialog
tip: Change the automatically generated bool return value to uint8_t to avoid having
to include an extra header to deal with Boolean values.
Click OK and the code should change. The condition inside the if() statement should now
reference a variable assigned to the variable on the line above it, as shown in the code block below.
while (1)
{
uint8_t SW0_state = !(PORTB.IN & PIN5_bm);
if (SW0_state)
{
LED_on();
}
else
{
LED_off();
}
}
8. Create a function SW_get_state, using Refactor → Extract Method. Select the right side of
the SW0_state assignment and extract a method for SW_get_state.
9. Implement a function void LED_set_state(uint8_t state). Extract the method. Atmel
Studio will detect the argument SW0_state, as indicated in Figure 2-34.
Figure 2-34. Extract Method with Argument
Click OK and the code should change. Now, there is a separate method for setting the LED state.
10. In function void LED_set_state(uint8_t state) rename SW0_state to state using Refactor →
Rename. In a larger application, this function may be used for setting the LED state in a context
Atmel Studio 7 User Guide
Getting Started
© 2018 Microchip Technology Inc. User Guide DS50002718A-page 63

that is irrelevant to the SW0 state. Atmel Studio is capable of contextual renaming, so this feature
can be used to easily rename the argument and avoid confusion. Inside the LED_set_state()
function, right-click on the SW0_state variable and go to Refactor → Rename, as indicated in
Figure 2-35.
Figure 2-35. Contextual Rename
The Rename dialog will appear, as depicted in Figure 2-36. Rename the SW0_state variable to
'state'. Atmel Studio will detect all occurrences of the variable with the same context as the one
which has been selected, and which are presented in a list and able to be individually selected or
deselected.
Figure 2-36. Contextual Renaming Dialog
Click Rename and the code should change. Observe that the argument of LED_set_state() and
all of its references inside the function have been renamed, but the references to SW0_state in
main() have remained the same.
11. Create function definitions, moving created functions below main().
main.c should now look as follows:
#include <avr/io.h>
void LED_on(void);
void LED_off(void);
void LED_set_state(uint8_t state);
uint8_t SW_get_state(void);
Atmel Studio 7 User Guide
Getting Started
© 2018 Microchip Technology Inc. User Guide DS50002718A-page 64

int main(void)
{
PORTB.DIRSET = PIN4_bm; /* Configure LED Pin as output */
PORTB.PIN5CTRL = PORT_PULLUPEN_bm; /* Enable pull-up for SW0 pin */
while(1)
{
uint8_t SW0_state = SW_get_state(); /* Read switch state */
LED_set_state(SW0_state); /* Set LED state */
}
}
uint8_t SW_get_state(void)
{
return !(PORTB.IN & PIN5_bm); /* Read switch state */
}
void LED_off(void)
{
PORTB.OUTSET = PIN4_bm; /* Turn LED off */
}
void LED_on(void)
{
PORTB.OUTCLR = PIN4_bm; /* Turn LED on */
}
void LED_set_state(uint8_t state)
{
if (state)
{
LED_on();
}
else
{
LED_off();
}
}
2.12 AVR Simulator Debugging
This section will demonstrate the use of the AVR Simulator key features, such as: Cycle Counter,
Stopwatch (only available in the simulator), and basic debugging (setting breakpoints and stepping
through code). We will also show how to simulate interrupts.
Getting Started Topics
Atmel Studio 7 User Guide
Getting Started
© 2018 Microchip Technology Inc. User Guide DS50002718A-page 65
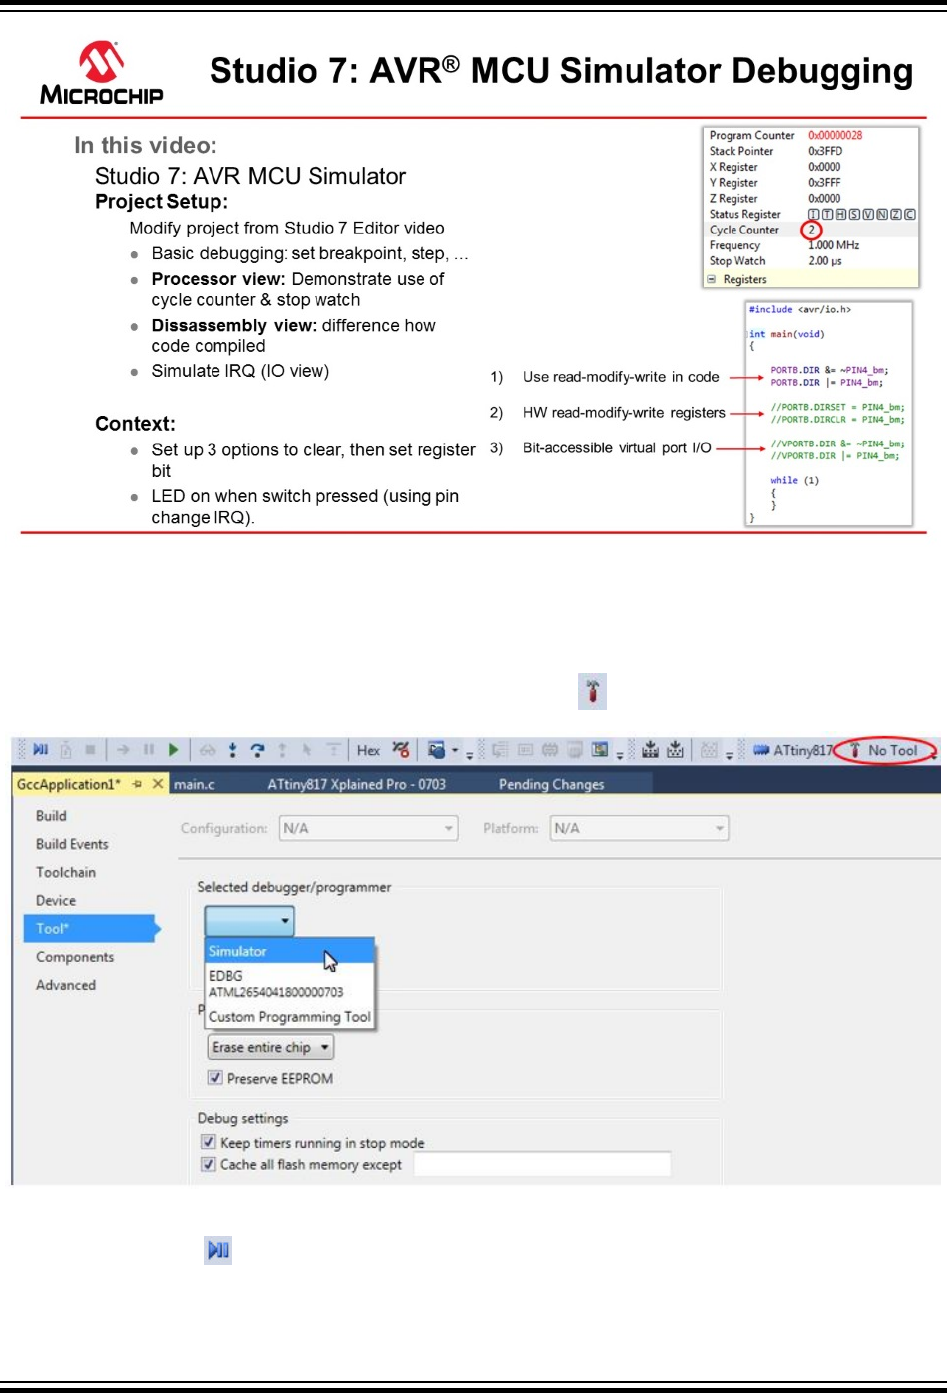
Video: AVR Simulator Debugging
The code used in the video above was written in the video: Editor: Writing and Re-Factoring Code (Visual
Assist).
To associate the simulator with the project, click on the Tool icon , then select Simulator.
The Cycle Counter and Stopwatch is only available with the simulator. To use these, first, click Start
Debugging and Break to start a debug session and then open the Processor Status window by
Atmel Studio 7 User Guide
Getting Started
© 2018 Microchip Technology Inc. User Guide DS50002718A-page 66
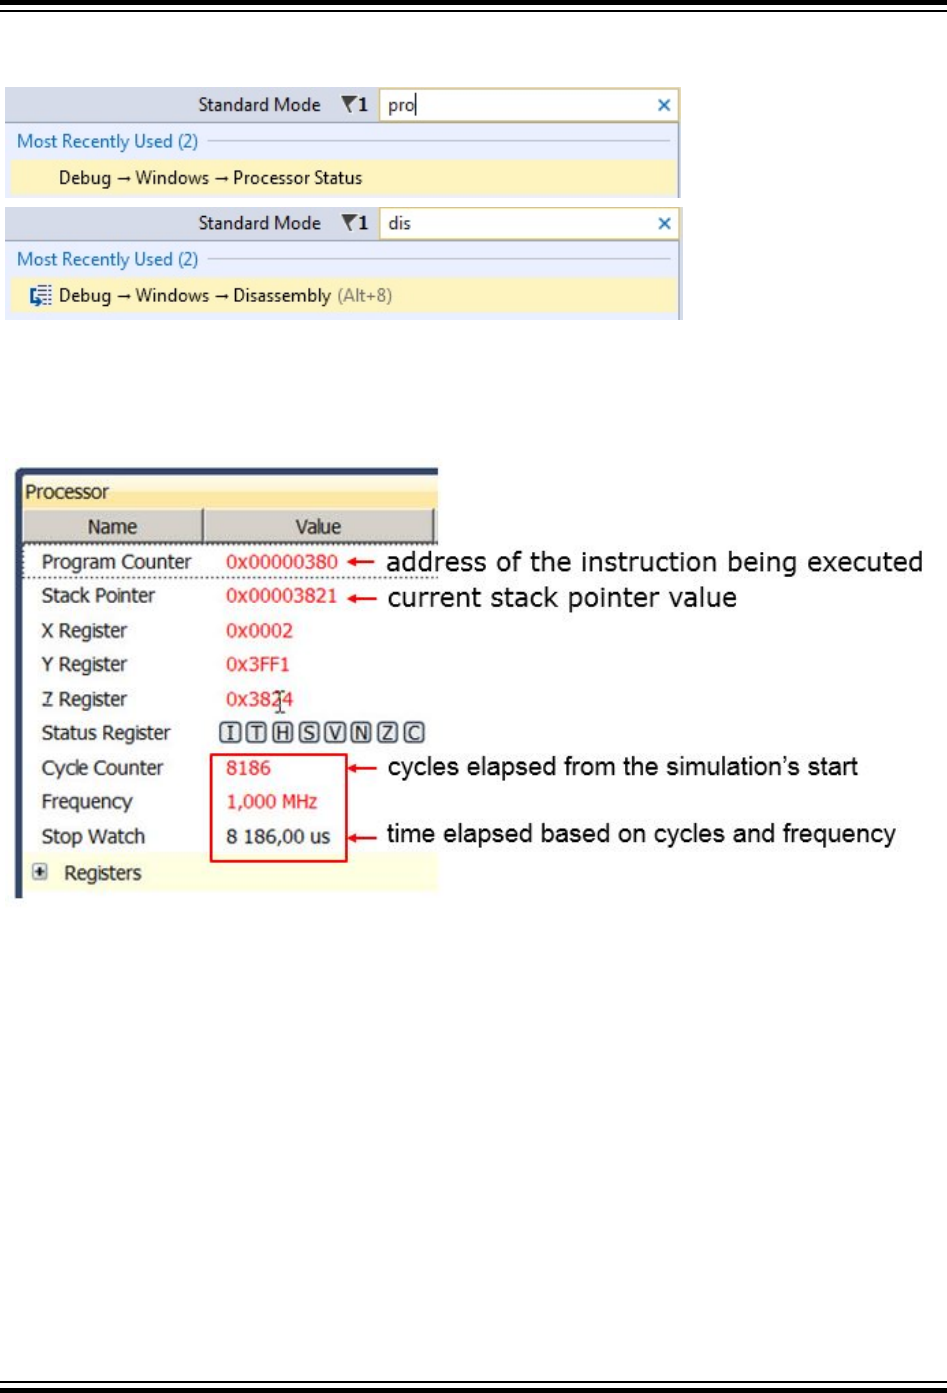
typing 'Processor' into the quick-launch bar and hitting enter (or this can be found under Debug >
Windows > Processor Status). Similarly, the Disassembly window can also be opened.
The AVR Simulator is using models based on the same RTL code used to make the real device. This
makes the Cycle Counter both bug and delay accurately. Note that the Stop Watch is related to the
Frequency, which you can set by double-clicking on the value and entering the clock frequency you
would like to use.
The Cycle Counter can be reset by clicking on the value and entering 0. Values in the Processor Status
window are updated every time the program breaks, similar to the I/O view. Then running to a breakpoint.
Atmel Studio 7 User Guide
Getting Started
© 2018 Microchip Technology Inc. User Guide DS50002718A-page 67
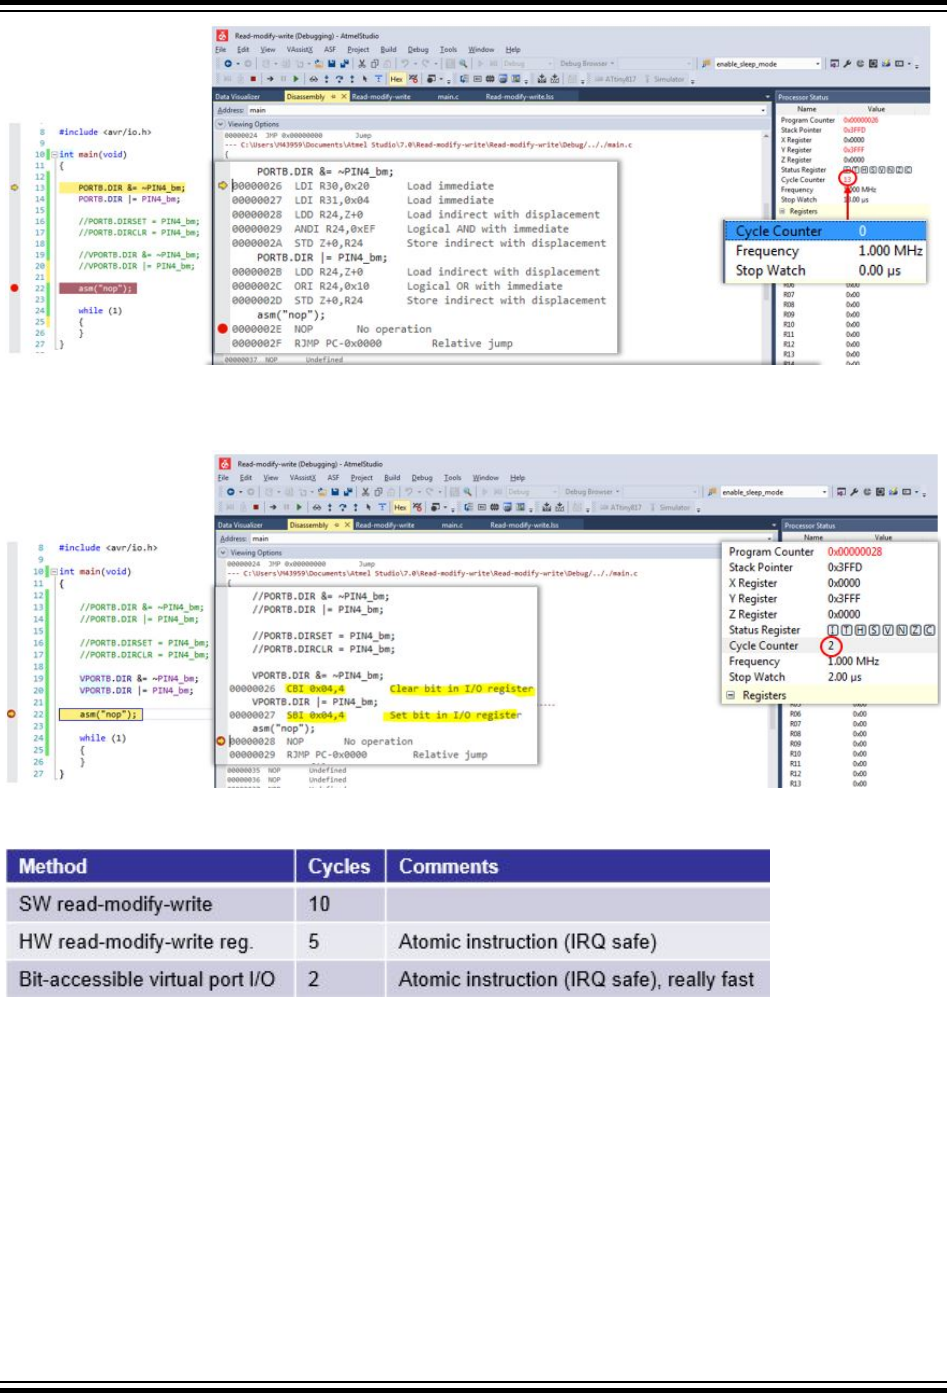
Note the difference in generated assembly code between the SW read-modify-write (above) and the
virtual port registers (see below).
The result of comparing these three methods are summarized in the table below:
Next, we would like to simulate a pin change IRQ. We can do this by setting the relevant IRQ flag in the
I/O view when debugging.
Atmel Studio 7 User Guide
Getting Started
© 2018 Microchip Technology Inc. User Guide DS50002718A-page 68
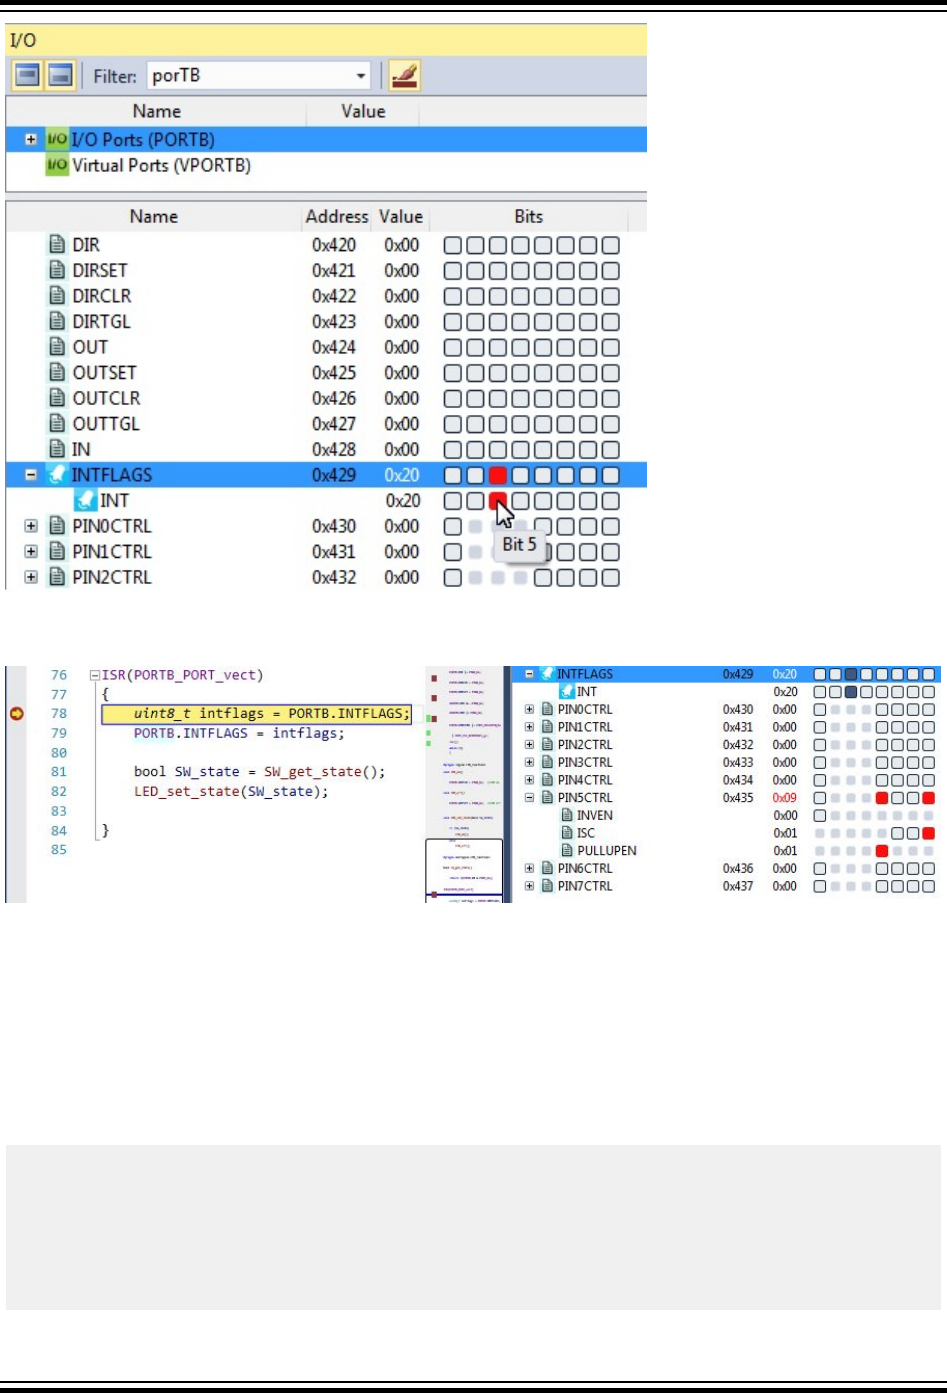
As shown below the ISR is hit. Note that the INTERRUPT still needs to be enabled, as shown in the write
to PORTB.PIN5CTRL in the code below.
The pin change IRQ could also have been triggered by writing to the Port Input register in the I/O view.
Writing a bit in the Port Input register is the same as applying that value to the physical pin of the device
package. The internal Port logic will then trigger the interrupt if it is configured accordingly.
Most of the standard debugging features of Studio 7 are available when using the simulator, and those
features will also be available on devices that lack on-chip debugging capabilities and cannot be
debugged using hardware debuggers. See the debugging sections of this Getting Started guide.
Code Used to Demonstrate AVR Simulator (Written for ATtiny187)
#include <avr/io.h>
#include <stdbool.h>
#include <avr/interrupt.h>
void LED_on();
void LED_off();
bool SW_get_state();
void LED_set_state(bool SW_state);
Atmel Studio 7 User Guide
Getting Started
© 2018 Microchip Technology Inc. User Guide DS50002718A-page 69

int main(void)
{
PORTB.DIR &= ~PIN4_bm;
PORTB.DIR |= PIN4_bm;
PORTB.DIRCLR = PIN4_bm;
PORTB.DIRSET = PIN4_bm;
VPORTB.DIR &= ~PIN4_bm;
VPORTB.DIR |= PIN4_bm;
PORTB.PIN5CTRL |= PORT_PULLUPEN_bm | PORT_ISC_BOTHEDGES_gc;
sei();
while (1)
{
}
}
#pragma region LED_functions
void LED_on()
{
PORTB.OUTCLR = PIN4_bm; //LED on
}
void LED_off()
{
PORTB.OUTSET = PIN4_bm; //LED off
}
void LED_set_state(bool SW_state)
{
if (SW_state)
{
LED_on();
}
else
{
LED_off();
}
}
#pragma endregion LED_functions
bool SW_get_state()
{
return !(PORTB.IN & PIN5_bm);
}
ISR(PORTB_PORT_vect)
{
uint8_t intflags = PORTB.INTFLAGS;
PORTB.INTFLAGS = intflags;
bool SW_state = SW_get_state();
LED_set_state(SW_state);
}
2.13 Debugging 1: Break Points, Stepping, and Call Stack
This section will introduce the debugging capabilities of Studio 7, both as video (linked below) and hands-
on document. The main topics are breakpoints, basic code stepping using the Breakpoint, and Callstack-
Windows, as well as adjusting project compiler optimization settings.
Getting Started Topics
Atmel Studio 7 User Guide
Getting Started
© 2018 Microchip Technology Inc. User Guide DS50002718A-page 70
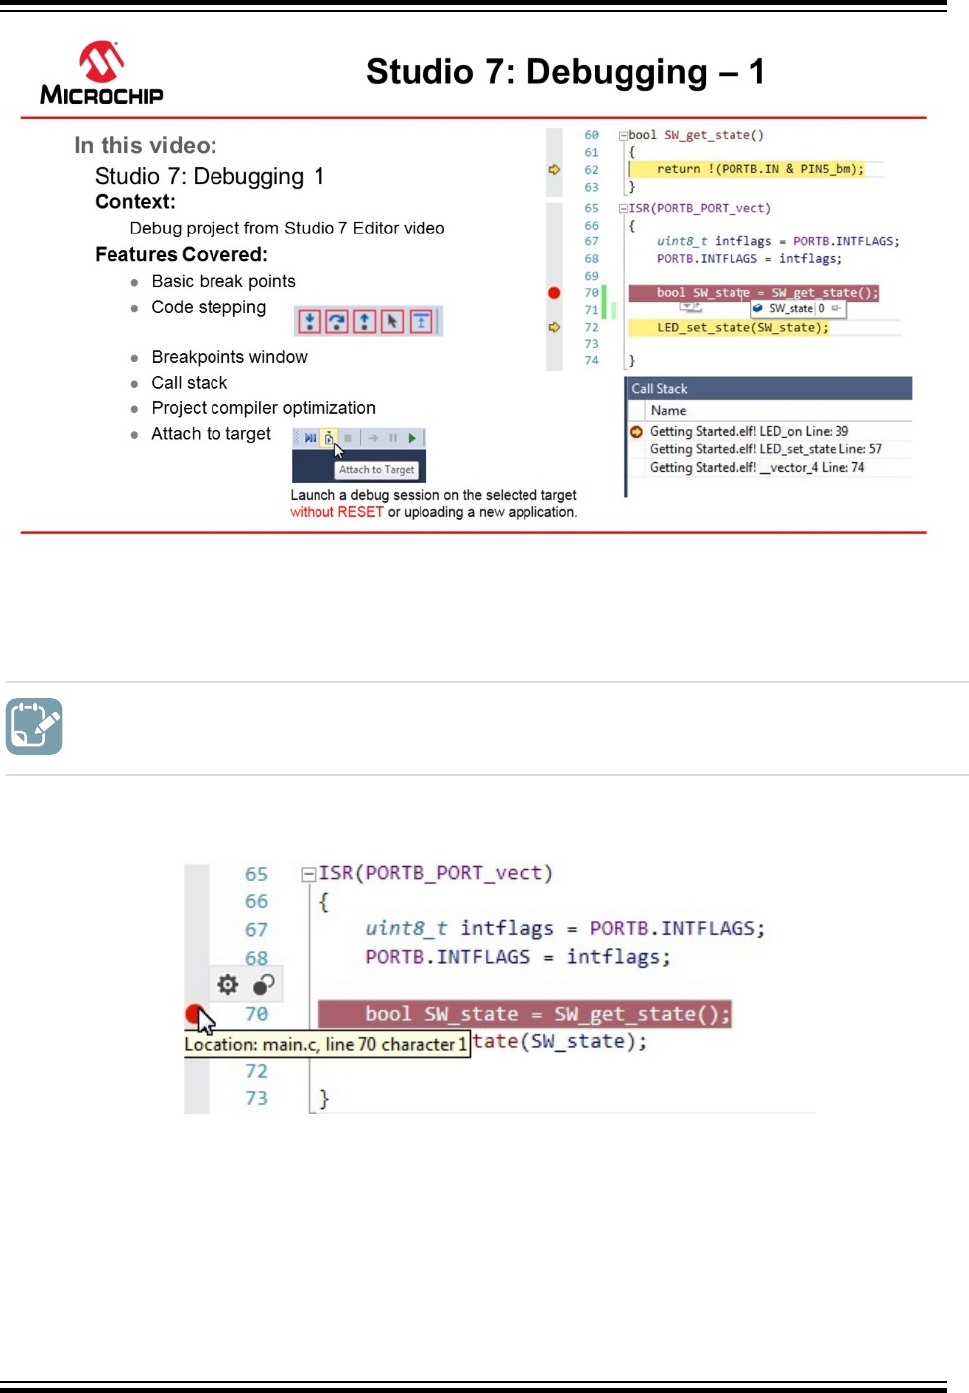
Video: Studio 7 Debugging-1
The same code as the one created in section Editor: Writing and Re-Factoring Code (Visual Assist), is
used.
To do: Place a breakpoint and inspect a list of all breakpoints in the project.
1. Set a breakpoint on the line getting the switch state, as indicated in Figure 2-37.
Figure 2-37. Placing a Breakpoint
Atmel Studio 7 User Guide
Getting Started
© 2018 Microchip Technology Inc. User Guide DS50002718A-page 71
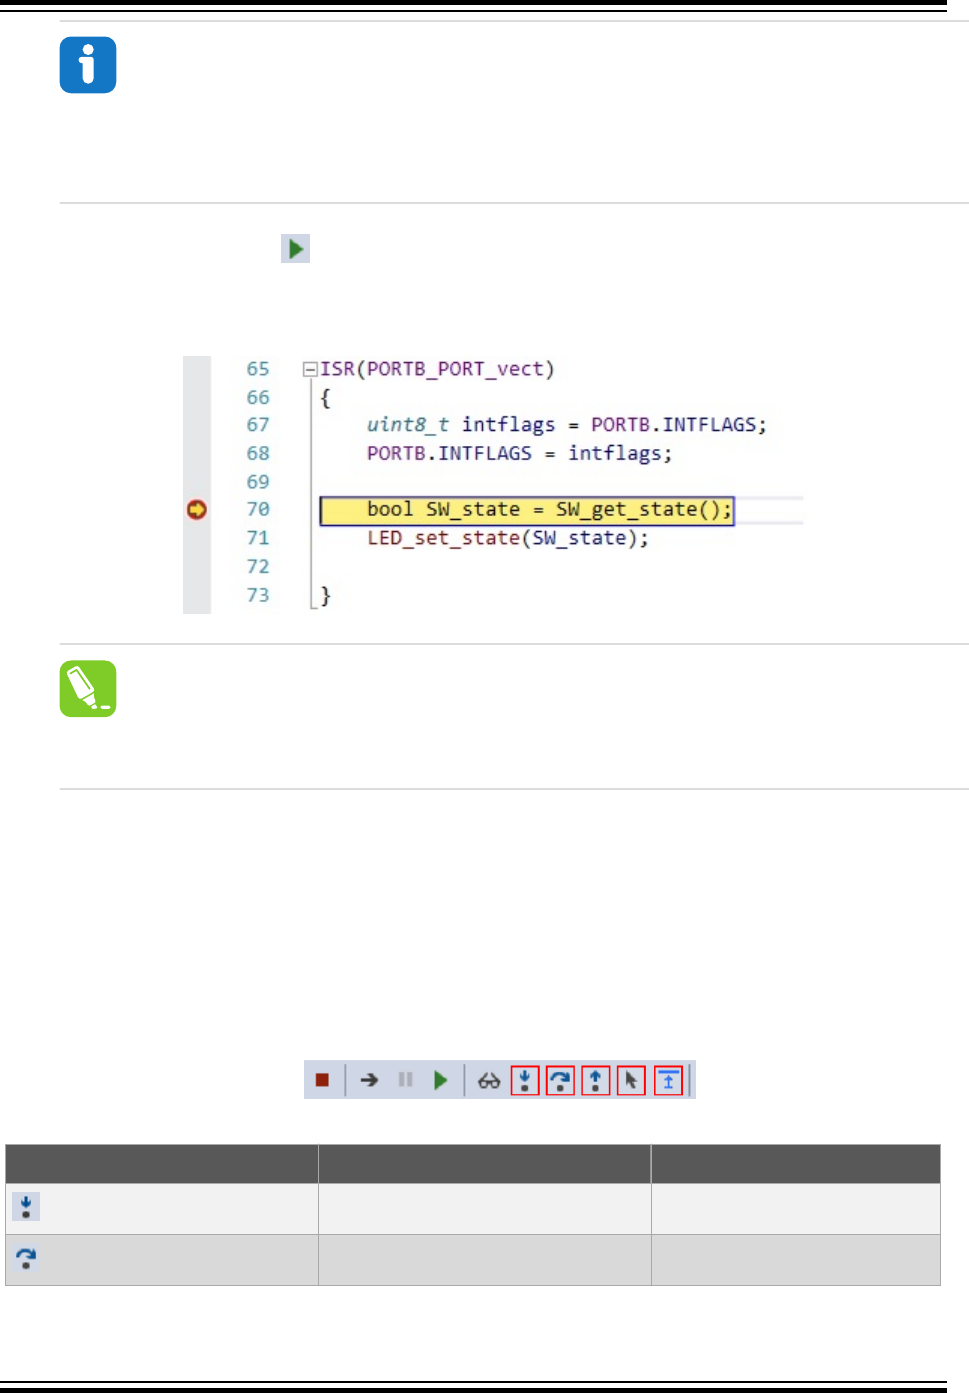
Info: A breakpoint can be placed at a line of code by:
• Clicking the gray bar on the left edge of the editor window.
• In the top menu bar, go to Debug → Toggle Breakpoint.
• By pressing F9 on the keyboard.
2. Launch a debug session . The breakpoint will be hit when the switch (SW0) on the Xplained Pro
kit is pressed. Observe that execution is halted when the breakpoint is hit, and the execution arrow
indicates that the line of code where the breakpoint is placed is about to execute. See Figure 2-38.
Figure 2-38. Execution Halting when a Breakpoint is Hit
tip: If a breakpoint is hit in a file that is not currently open, Atmel Studio will open the file
in a temporary pane. A file containing a breakpoint that is hit in a debug session will
always be brought to focus.
3. Since most of the logic of the program is handled only when an ISR is processed, it is now possible
to check the logical flow of the program. If the switch is pressed and then released when the ISR is
hit - what will be the state of the switch that the function returns? The assumption is that since
pressing the switch triggered the interrupt, that switch will be set as pressed, and the LED will thus
be turned ON.
Code stepping can be used to check this assumption. The key buttons used for code stepping are
illustrated in the table below, found in the top menu bar or in the Debug menu. The corresponding
functionality and keyboard shortcuts are outlined in the figure below.
Figure 2-39. Atmel Studio Buttons for Code Stepping
Table 2-4. Atmel Studio Button Functionality (Code Stepping)
Button Functionality Keyboard Shortcut
Step Into Function Call F11
Step Over F10
Atmel Studio 7 User Guide
Getting Started
© 2018 Microchip Technology Inc. User Guide DS50002718A-page 72
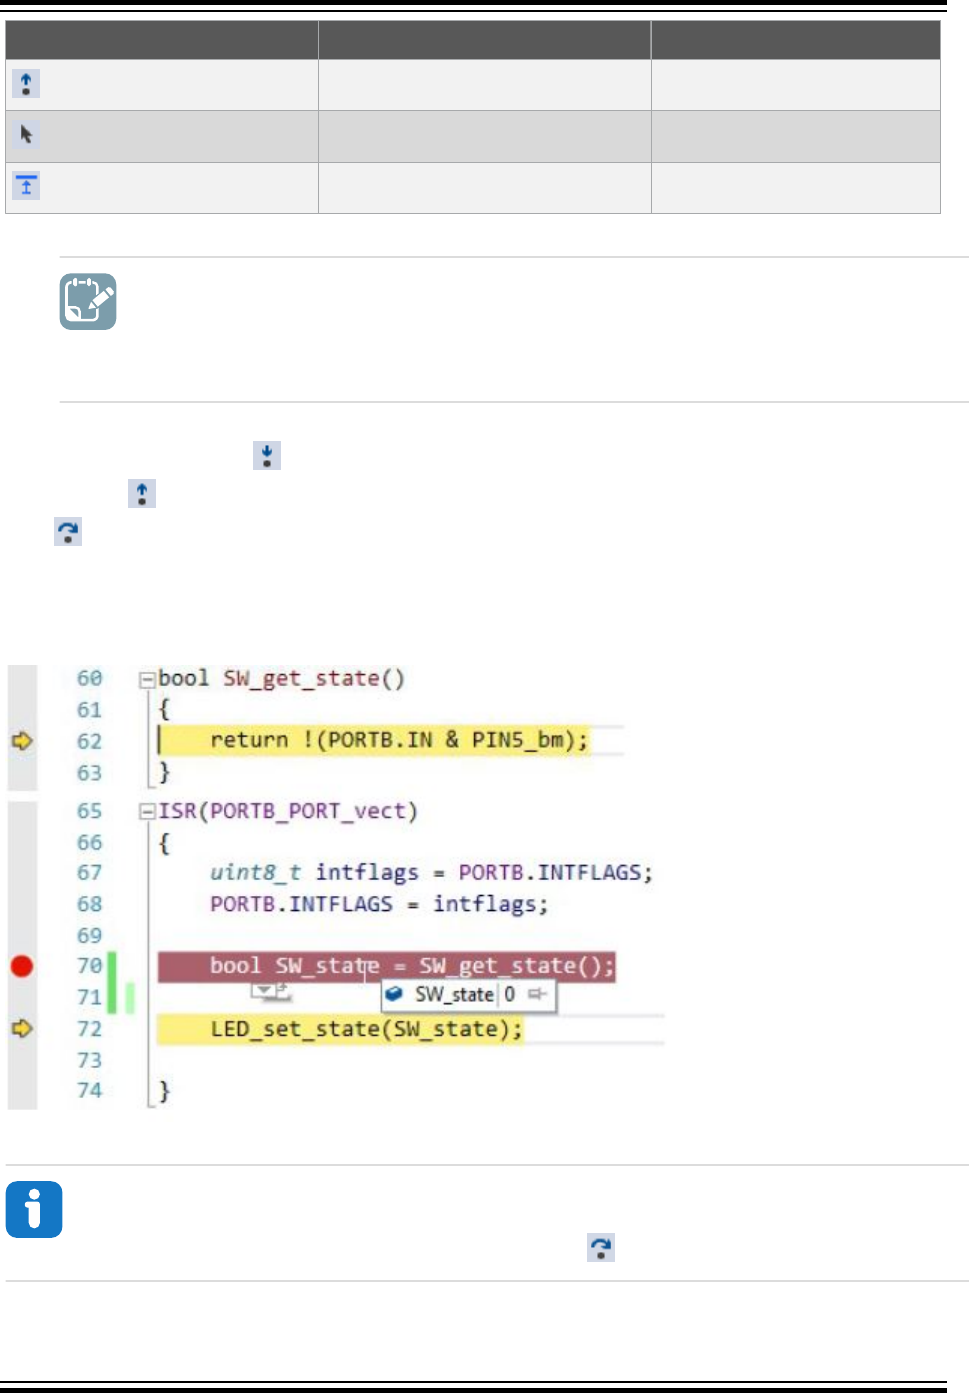
Button Functionality Keyboard Shortcut
Step Out of Function Call Shift + F11
Run to Cursor Ctrl + F10
Issue System Reset
To do: Find out what state is returned if the switch is pressed and then released when
the ISR is hit. Is our assumption correct that since pressing the switch triggered the
interrupt, it will be set as pressed, and the LED will thus be turned ON?
The Step Into Function Call can be used first. To go into the SW_get_state( ) function, the Step Out of
Function Call can be used to move to the next line after returning from the function. Pressing Step
Over from the breakpoint would land us at this same point directly. Note that we could step further into
the function LED_set_state(SW_state) to determine if the LED is turned ON or not. However, we could
simply hover the mouse pointer over the SW_state variable to see that it is now set to 0, i.e. the LED will
be turned OFF. Verify this by stepping further.
Figure 2-40. Checking Value of SW_state Using Mouse Hover
Info: Although the breakpoint was triggered by the falling edge by pressing the switch, only
when calling the SW_get_state( ) function the switch state is recorded. Verify that SW_state will
read 1 if the switch is held down when stepping over this line.
Atmel Studio 7 User Guide
Getting Started
© 2018 Microchip Technology Inc. User Guide DS50002718A-page 73
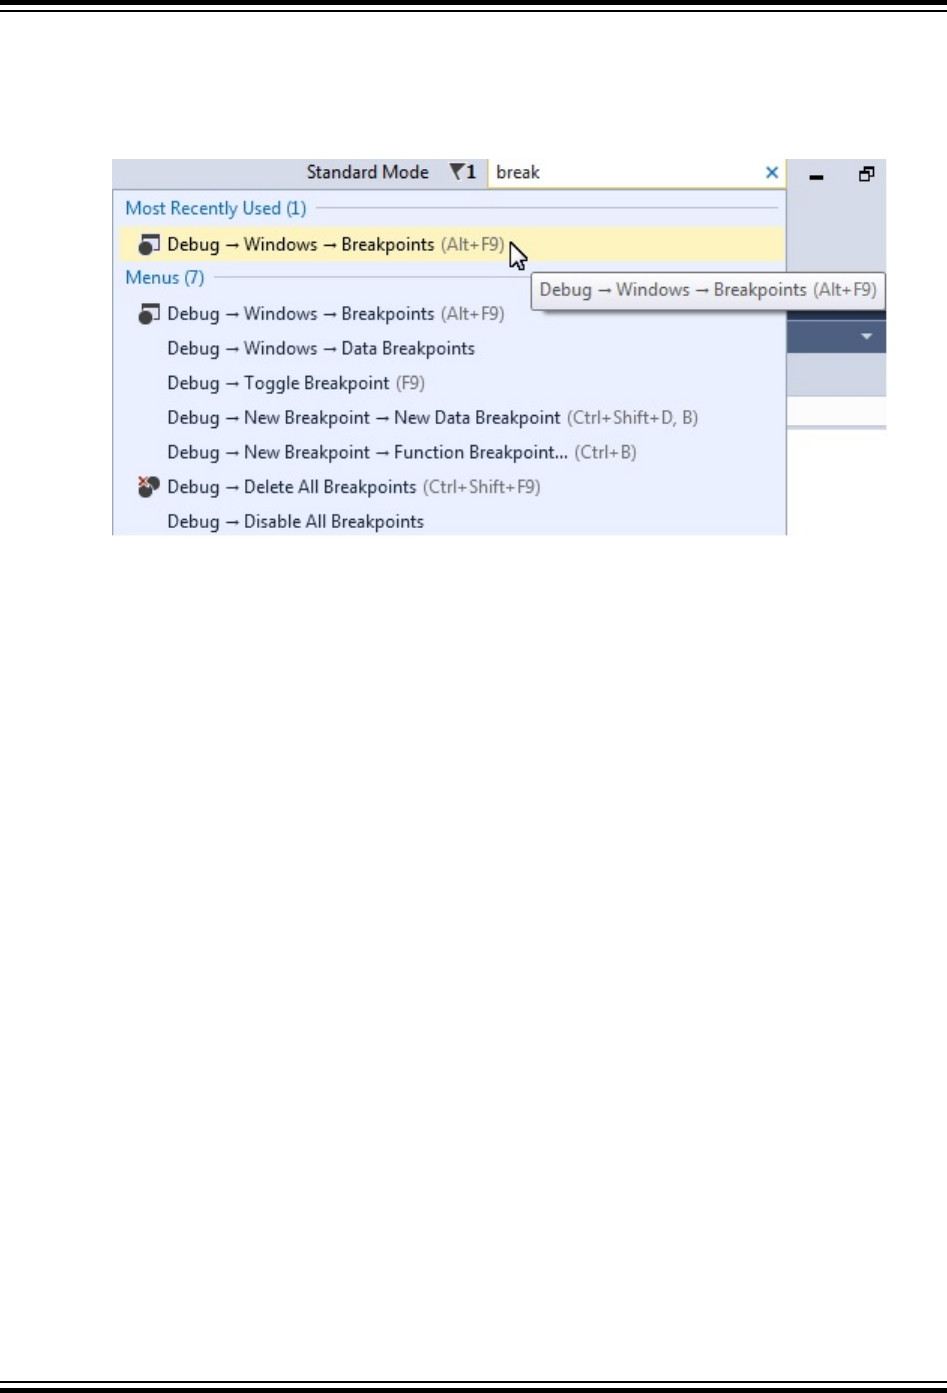
1. A window or view to keep track of the breakpoints in a program is needed. The Quick Launch bar
performs a search of the Studio 7 user interface menus. This is demonstrated below, by comparing
the two figures Figure 2-41 and Figure 2-42. Note that each of the hits in the Quick Launch bar is
from 'break' related entries in the Debug menu.
Figure 2-41. 'Break' Search in the Quick Launch Bar
Atmel Studio 7 User Guide
Getting Started
© 2018 Microchip Technology Inc. User Guide DS50002718A-page 74

Figure 2-42. 'Break' Hits in Debug Menu
Open the Breakpoints Window by clicking on the top result (Debug → Windows → Breakpoints).
The Breakpoints Window lists all the breakpoints in the project, along with the current hit count, as
depicted in Figure 2-43.
tip: A breakpoint can temporarily be disabled by unchecking the checkbox next to a
breakpoint in the list.
Atmel Studio 7 User Guide
Getting Started
© 2018 Microchip Technology Inc. User Guide DS50002718A-page 75
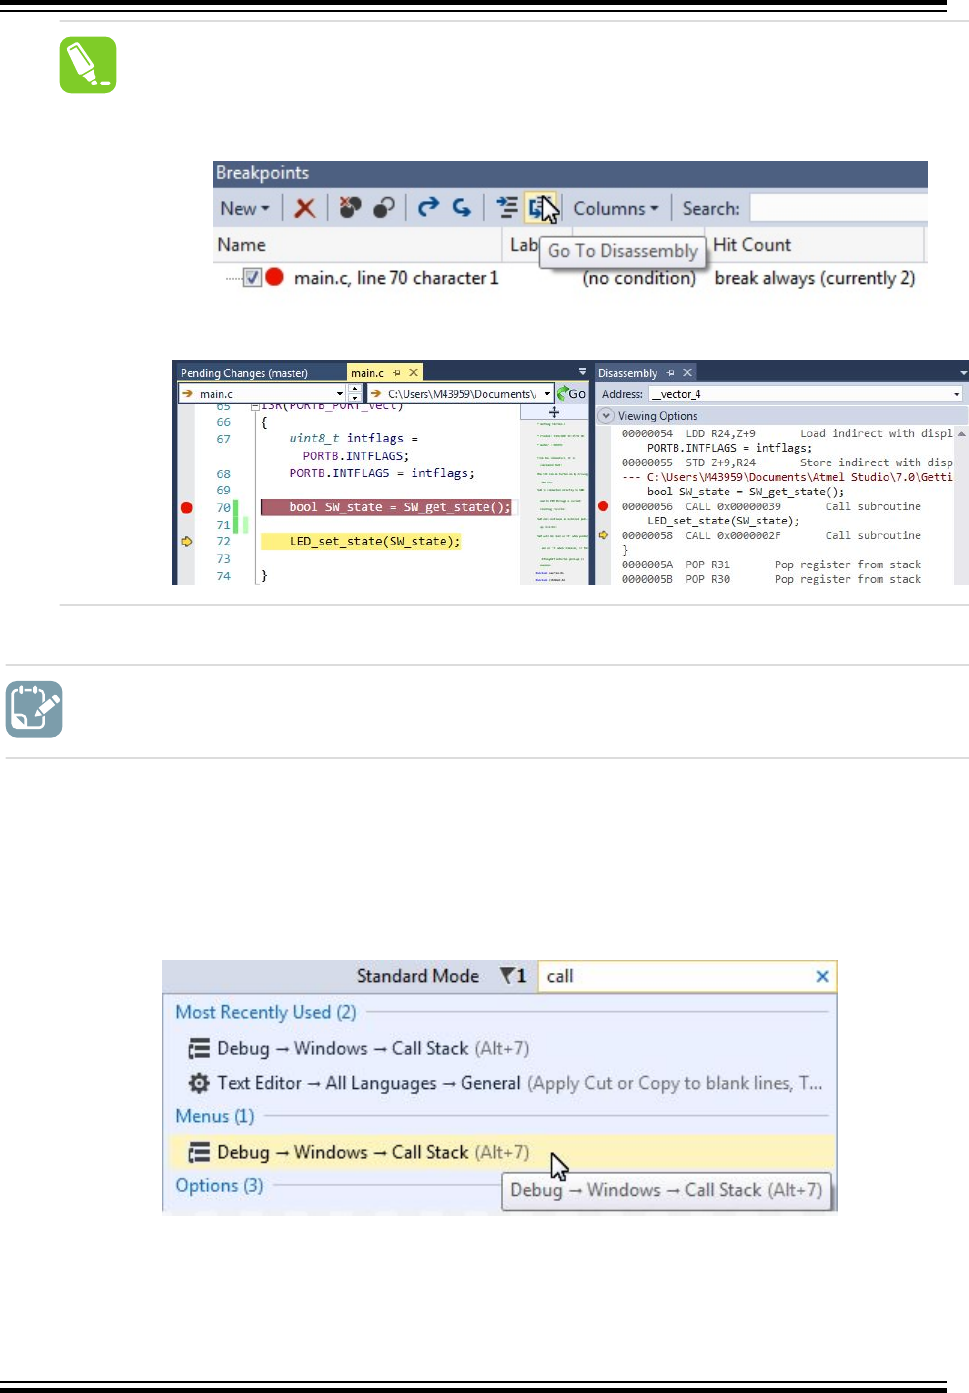
tip: The Disassembly view can be conveniently displayed alongside the source code, as
demonstrated in the Figure 2-44 section.
Figure 2-43. Breakpoints Window
Figure 2-44. Disassembly View
To do: Examine the Call Stack and the effect on it when optimizations are disabled.
1. Following from the previous section, set a breakpoint on the LED_on() function, then trigger the
breakpoint so that it is hit.
2. Open the Call Stack window by typing 'Call' in the Quick Launch bar, selecting Debug → Windows
→ Call Stack, as represented in Figure 2-45.
Note: A debug session needs to be active to open this window.
Figure 2-45. Open the Call Stack Window
3. It would be expected that the Call Stack shows LED_set_state() as the caller of LED_on(),
since that's how the code is written. However, in the Call Stack window, _vector_4 is listed as the
caller (as in Figure 2-46); this is because of compiler optimization.
Atmel Studio 7 User Guide
Getting Started
© 2018 Microchip Technology Inc. User Guide DS50002718A-page 76
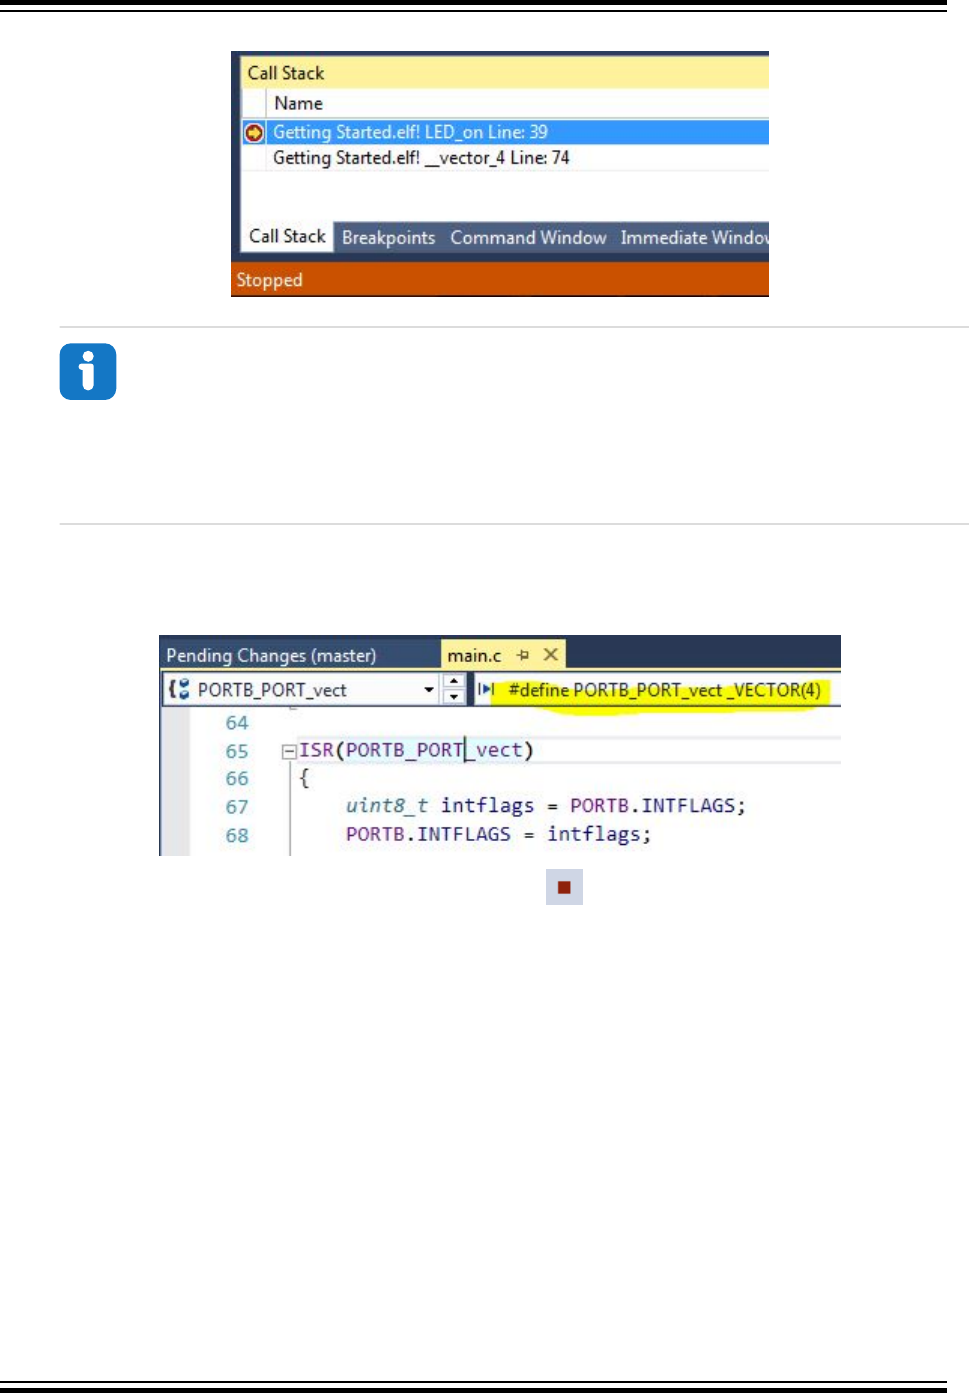
Figure 2-46. Call Stack with Optimization
Info: The call order is different because of the compiler optimization. This code is
relatively simple to follow and it is possible to understand what is going on even though
the compiler has optimized and made subtle changes to what is expected. In a more
complex project, it can sometimes be helpful to disable the compiler optimization to track
down a bug.
Note: To see why the Call Stack shows that it comes from _vector_4 initially, click on
PORTB_PORT_vect and look in the context field for the definition, as shown in Figure 2-47.
Figure 2-47. __vector_4 is the PORTB ISR Vector
4. Stop debugging by clicking the Stop Debugging button or pressing Shift + F5.
5. Open the project settings by going to Project → <project_name> properties or pressing Alt + F7.
Go to the Toolchain tab on the left menu, as in Figure 2-48.
6. Under AVR/GNU C Compiler → Optimization, set the Optimization Level to None (-O0) using
the drop-down menu.
Atmel Studio 7 User Guide
Getting Started
© 2018 Microchip Technology Inc. User Guide DS50002718A-page 77
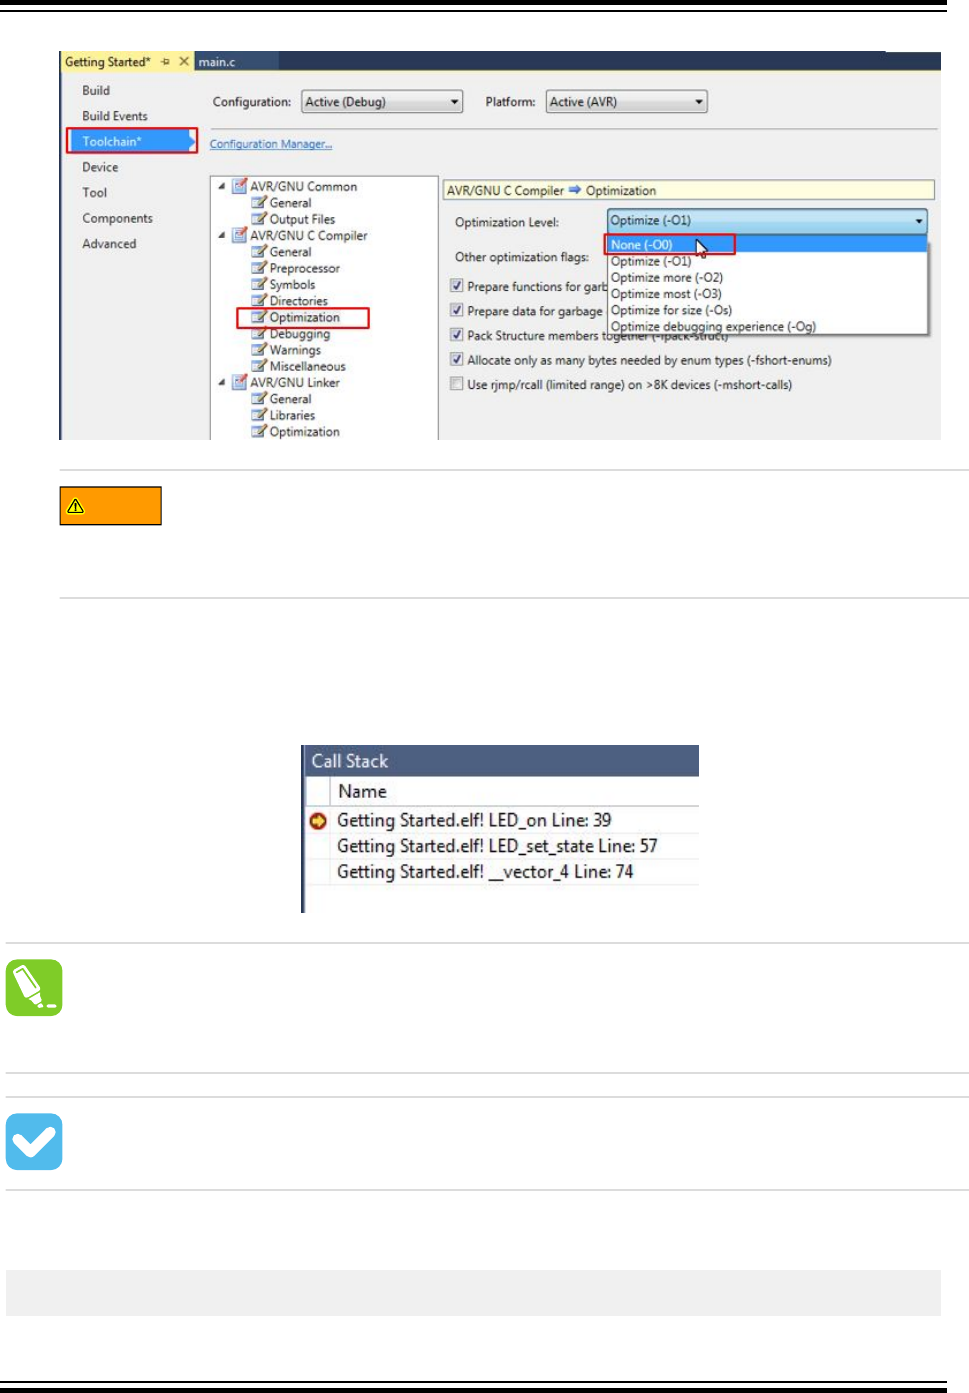
Figure 2-48. Disabling Compiler Optimizations
WARNING
Disabling compiler optimization will result in increased memory consumption and can
result in changes in execution timing. This can be important to consider when debugging
time is a critical code.
7. Launch a new debug session and break code execution inside LED_on().
8. Observe the Call Stack. It should now adhere to how the code is actually written and list
LED_set_state() as the caller of LED_on(), as shown in Figure 2-49.
Figure 2-49. Call Stack Without Optimization
tip: Atmel Studio will try to link the compiled code to the source-code as best it can, but the
compiler optimization can make this challenging. Disabling compiler optimization can help if
breakpoints seem to be ignored during debugging, or if the execution flow is hard to follow
during code stepping.
Result: The call stack has now been examined both with and without optimization enabled.
Code used for Debugging 1
/*
LED is turned on when switch is pressed, LED is turned on (via a pin change interrupt).
Atmel Studio 7 User Guide
Getting Started
© 2018 Microchip Technology Inc. User Guide DS50002718A-page 78

MY_mistake() written to demonstrate Attach to Target, is commented out, to avoid hanging
project unintentionally.
From the schematics, it is concluded that:
The LED can be turned on by driving PB4 low.
SW0 is connected directly to GND and to PB5 through a current limiting resistor.
SW0 does not have an external pull-up resistor.
SW0 will be read as '0' when pushed and as '1' when released, if the ATtiny817 internal pull-
up is enabled.
*/
#include <avr/io.h>
#include <stdbool.h>
#include <avr/interrupt.h>
void LED_on();
void LED_off();
bool SW_get_state();
void LED_set_state(bool SW_state);
int main(void)
{
PORTB.DIRSET = PIN4_bm;
PORTB.OUTSET = PIN4_bm;
PORTB.PIN5CTRL |= PORT_PULLUPEN_bm | PORT_ISC_BOTHEDGES_gc;
sei();
while (1)
{
}
}
#pragma region LED_functions
void LED_on()
{
PORTB.OUTCLR = PIN4_bm; //LED on
}
void LED_off()
{
PORTB.OUTSET = PIN4_bm; //LED off
}
void LED_set_state(bool SW_state)
{
if (SW_state)
{
LED_on();
}
else
{
LED_off();
}
}
#pragma endregion LED_functions
bool SW_get_state()
{
return !(PORTB.IN & PIN5_bm);
}
/*
void My_mistake()
{
while(1)
{
asm("nop");
}
}
*/
ISR(PORTB_PORT_vect)
{
uint8_t intflags = PORTB.INTFLAGS;
PORTB.INTFLAGS = intflags;
//My_mistake();
Atmel Studio 7 User Guide
Getting Started
© 2018 Microchip Technology Inc. User Guide DS50002718A-page 79
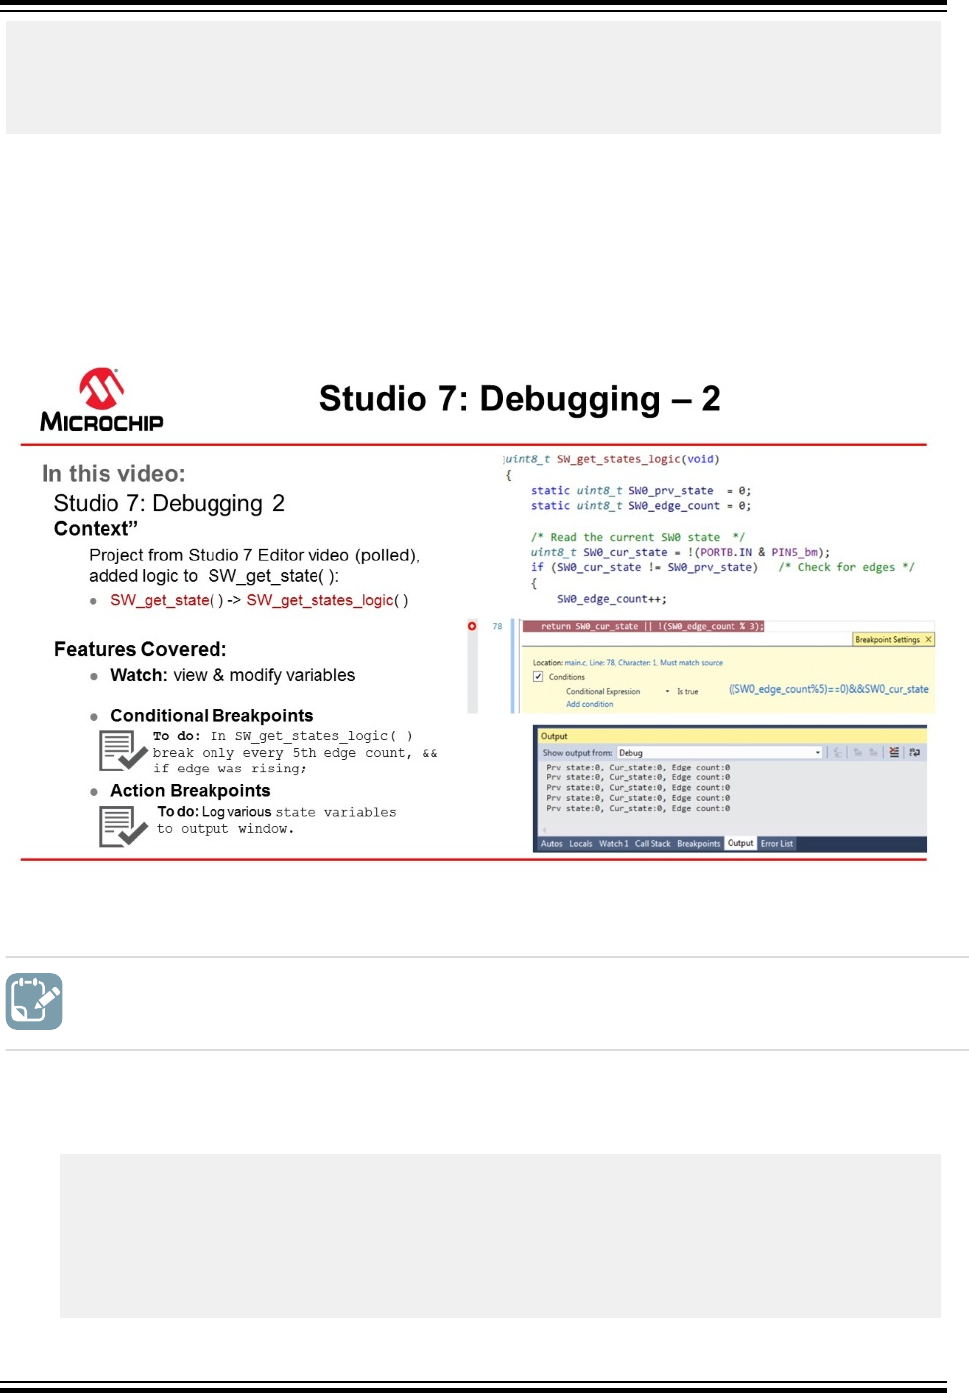
bool SW_state = SW_get_state();
LED_set_state(SW_state);
}
2.14 Debugging 2: Conditional- and Action-Breakpoints
This section covers more advanced debugging topics with Studio 7 both as video (linked below) and
hands-on document. The main topics are how to modify variables in the code, conditional- and action-
breakpoints, as well as memory view.
Getting Started Topics
Video: Debugging - 2
To do: Use Atmel Studio to inspect and modify the contents of variables in the code.
1. The code (see below) used is the same as the one developed in section Editor: Writing and Re-
Factoring Code (Visual Assist). The SW_get_state() function has just been replaced with the
following code (note also the change in return value type):
uint8_t SW_get_state(void)
{
static uint8_t SW0_prv_state = 0;
static uint8_t SW0_edge_count = 0;
uint8_t SW0_cur_state = !(PORTB.IN & PIN5_bm); /* Read the current SW0 state */
if (SW0_cur_state != SW0_prv_state) /* Check for edges */
{
SW0_edge_count++;
Atmel Studio 7 User Guide
Getting Started
© 2018 Microchip Technology Inc. User Guide DS50002718A-page 80

}
SW0_prv_state = SW0_cur_state; /* Keep track of previous state */
/*
* Report the switch as pushed when it is pushed or the edge counter is a
* multiple of 3
*/
return SW0_cur_state || !(SW0_edge_count % 3);
}
Info: This code will count how many times the SW0 push button has been pressed or
released. The return statement has also been modified to always report the button as
pushed if the SW0_edge_count variable is a multiple of three.
2. Go to Debug → Disable All Breakpoints to disable all breakpoints. This should be reflected by all
the checkboxes becoming unchecked in the Breakpoints window.
3. Launch a new debug session by clicking the Start Debugging button .
4. Push SW0 on the kit several times and observe how the changes to the code have affected the
LED's behavior.
5. Break execution by placing a breakpoint at the return line of the SW_get_state function.
6. Hover over the SW0_edge_count variable to observe the current value, as indicated in Figure
2-50.
Figure 2-50. Hover Over Variable to See Current Value
Info: When the cursor hovers over a variable that is in scope at the point where
execution is halted, Atmel Studio will present the content of the variable in a pop-up.
7. Right-click the SW0_edge_count variable and select Add Watch from the context menu to add the
variable to the data Watch window. The Watch window should appear, with the SW0_edge_count
variable listed, with the variable value, data type, and memory address, as in Figure 2-51.
Atmel Studio 7 User Guide
Getting Started
© 2018 Microchip Technology Inc. User Guide DS50002718A-page 81
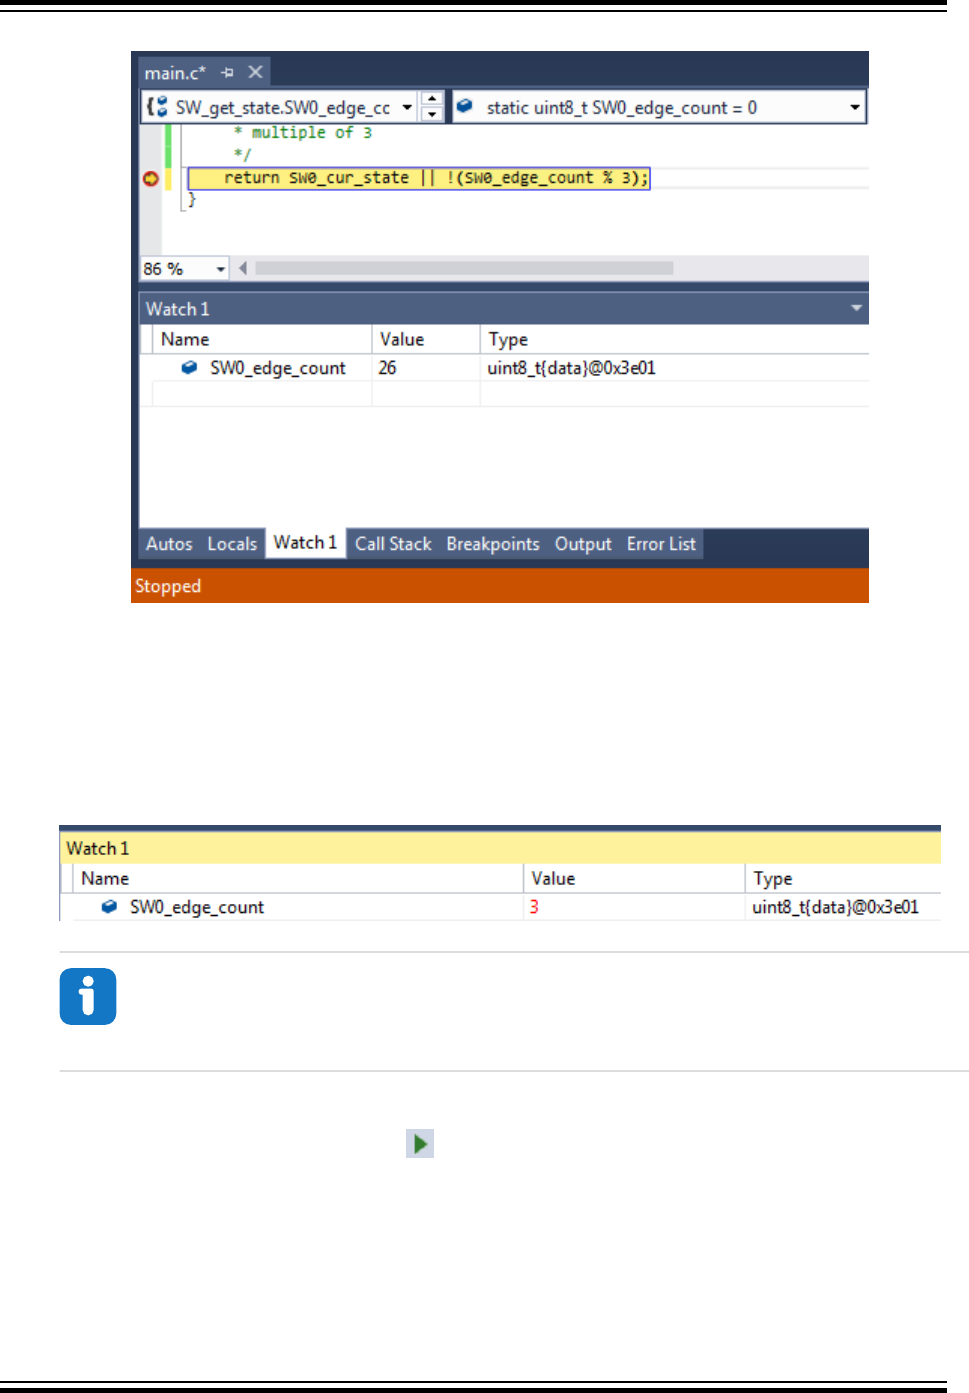
Figure 2-51. Add Variable to Watch Window
8. Modify the contents of a Watch Window variable, using the process described below. Assign the
value '3' to the SW0_edge_count variable. The value will reflect as updated by turning red, as
indicated in Figure 2-52.
– Double-click a variable value in the Watch window
– Type in the desired new value of the variable
– Press Enter to confirm
Figure 2-52. Newly Updated Variable Value in the Watch Window
Info: The Value column in the Watch window can be displayed in hex by right-clicking in
the Watch window and selecting Hexadecimal Display from the context menu.
9. To have the device evaluate the new value of SW0_edge_count, disable all breakpoints and
continue the debug session by clicking or pressing F5. Observe how the LED stays ON as a
result of the change made to SW0_edge_count.
Atmel Studio 7 User Guide
Getting Started
© 2018 Microchip Technology Inc. User Guide DS50002718A-page 82

Info:
A variable can also be added to the Watch window by clicking on an empty field name and
typing the variable name. This way, it is even possible to cast a variable to a different data type
for better readability in the Watch window. This is especially useful if it is required to look at an
array that is passed to a function as a pointer.
For example, if an array is passed to a function, it will be passed to the function as a pointer.
This makes it impossible for Atmel Studio to know the length of the array. If the length of the
array is known, and it needs to be examined in the Watch window, the pointer can be cast to an
array using the following cast:
*(uint8_t (*)[<n>])<name_of_array_pointer>
Where <n> is the number of elements in the array and <name_of_array_pointer> is the
name of the array to be examined.
This can be tested on the SW0_edge_count variable by entering the following in an empty
name field in the Watch window:
*(uint8_t (*)[5])&SW0_edge_count
Note that the '&' symbol must be used in this case to obtain a pointer to the variable.
Result: Atmel Studio has now been used to inspect and modify the contents of variables in the
code.
2.14.1 Conditional Breakpoints
This section is a guide to using Atmel Studio to place conditional breakpoints.
Conditional breakpoints are those which will only halt code execution if a specified condition is met, and
can be useful if it is required to break if certain variables have given values. Conditional breakpoints can
also be used to halt code execution according to the number of times a breakpoint has been hit.
To do: Place a conditional breakpoint inside SW_get_state() to halt execution for
debugging at every 5th edge count, but only if the edge was rising, and check its functionality.
1. Clear all breakpoints from the project using the Breakpoints window.
2. Place a breakpoint at the return line of SW_get_state(), as in Figure 2-53.
3. Right-click the breakpoint and select Conditions... from the context menu.
4. Enter the following in the condition textbox:
((SW0_edge_count % 5) == 0) && SW0_cur_state
Atmel Studio 7 User Guide
Getting Started
© 2018 Microchip Technology Inc. User Guide DS50002718A-page 83
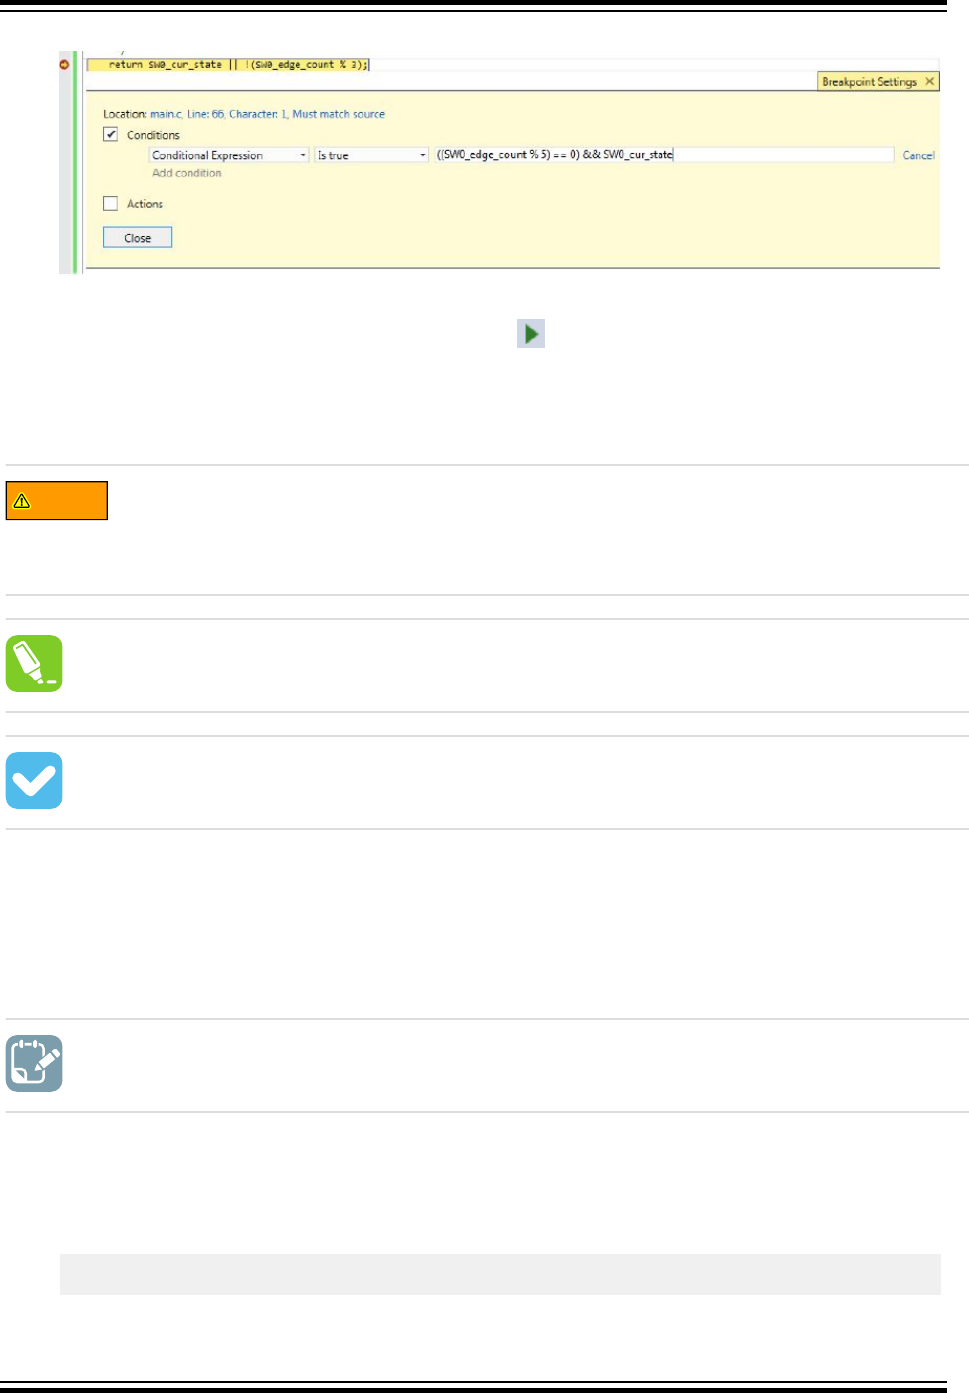
Figure 2-53. Conditional Breakpoint Expression Example
5. Press Enter to confirm the break condition.
6. Continue/Start a new debug session by clicking the button or pressing F5.
7. Push SW0 on the kit several times and observe how code execution is halted when the condition is
fulfilled.
8. Verify that the condition is met by double-checking the variable values in the Watch window.
WARNING
Even though code execution is completely halted only if the specified break condition is met,
Atmel Studio temporarily breaks code execution each time the breakpoint is hit to read the
variable content and determine if the break condition is met. Conditional breakpoints will,
therefore, have an impact on execution timing, even if the actual break condition is never met.
tip: Use the Hit Count condition if execution needs to break based on how many times a
breakpoint has been hit.
Result: Atmel Studio has been used to halt execution when the specified break condition is
satisfied.
2.14.2 Action Breakpoints
This section is a guide to using Atmel Studio to place action breakpoints.
Action breakpoints can be useful if variable contents or execution flow needs to be logged without having
to halt code execution and manually record the required data.
To do: Place an action breakpoint to log SW0_cur_state, SW0_prv_state and
SW0_edge_count, and check the output for the relevant variable states.
1. Stop the ongoing debug session and clear all the breakpoints from the Breakpoints window.
2. Place a breakpoint at the SW0_prv_state = SW0_cur_state; line, as in Figure 2-54.
3. Right-click the breakpoint and select Actions... from the context menu.
4. Enter the following in the output message text box:
Prv state:{SW0_prv_state}, Cur_state:{SW0_cur_state}, Edge count:{SW0_edge_count}
Atmel Studio 7 User Guide
Getting Started
© 2018 Microchip Technology Inc. User Guide DS50002718A-page 84
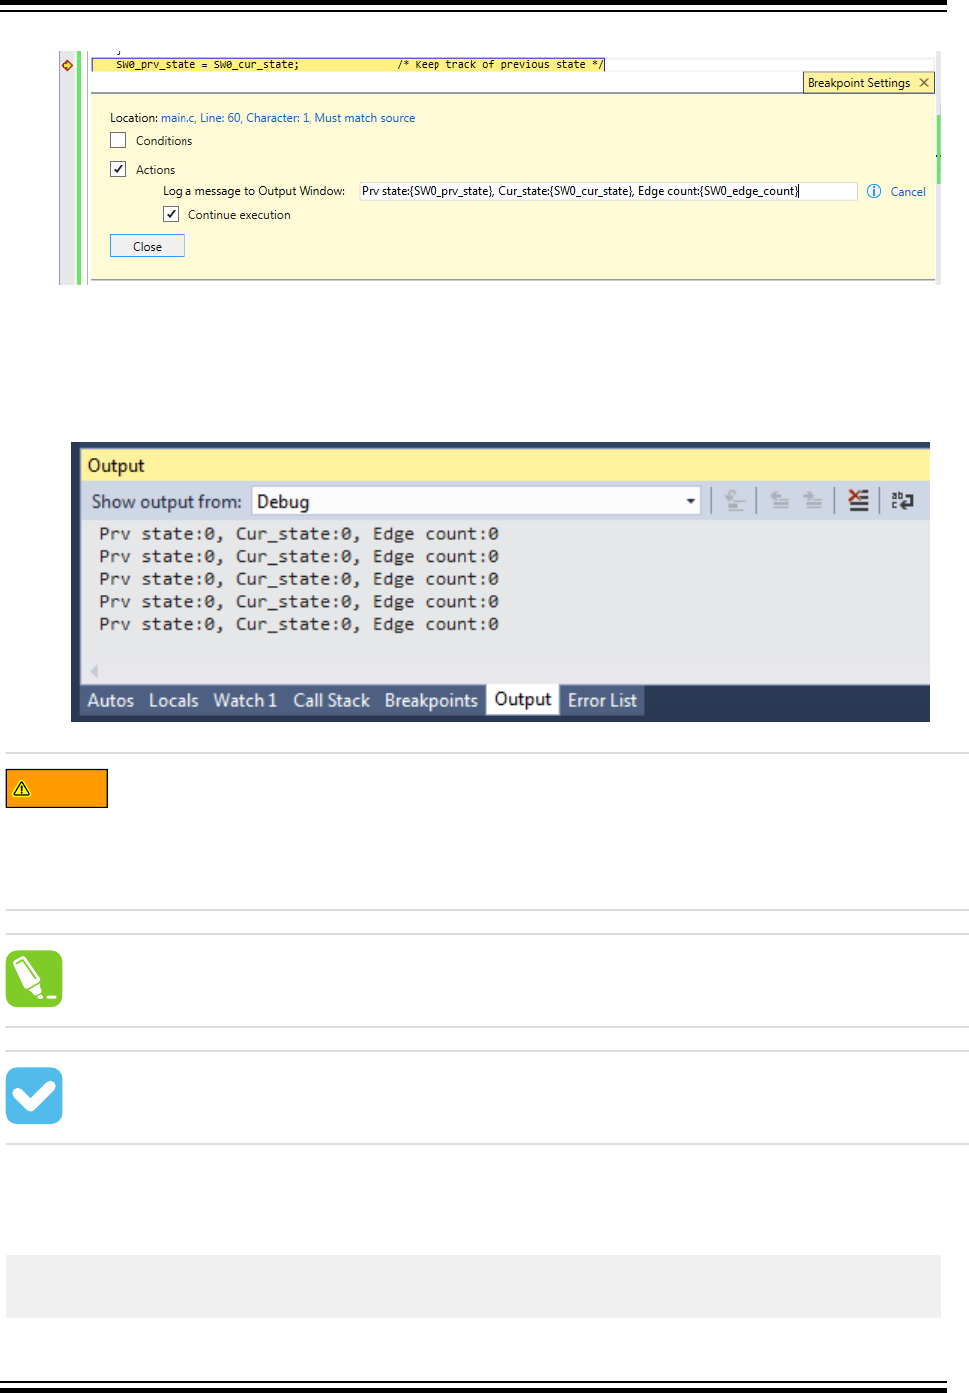
Figure 2-54. Action Breakpoint Example
5. Press Enter to confirm.
6. Start a debug session.
7. Open the Debug Output window by going to Debug → Windows → Output. It should list the
variable contents as in Figure 2-55. If SW0 is pushed on the kit, the content is updated.
Figure 2-55. Debug Output Window Showing Variable Contents
WARNING
When using action breakpoints, Atmel Studio will temporarily halt code execution in order to
read out variable content. As a result, execution timing will be affected. A less intrusive
approach would be to place the action breakpoint at the SW0_edge_count++ line, which is
only executed upon SW0 edge detection. This will cause a temporary halt only when SW0 is
pressed, but will also cause the debug window output to be delayed by one line of code.
tip: Action and Conditional breakpoints can be used together in order to log data only if a
condition is satisfied.
Result: Atmel Studio has been used to log variable data using an action breakpoint.
2.14.3 Code used (for ATtiny817 Xplained Pro)
Code used for conditional- and action-breakpoints.
#include <avr/io.h>
#include <avr/interrupt.h>
Atmel Studio 7 User Guide
Getting Started
© 2018 Microchip Technology Inc. User Guide DS50002718A-page 85

void LED_on();
void LED_off();
uint8_t SW_get_state();
void LED_set_state(uint8_t SW_state);
int main(void)
{
PORTB.DIRSET = PIN4_bm;
PORTB.OUTSET = PIN4_bm;
PORTB.PIN5CTRL |= PORT_PULLUPEN_bm | PORT_ISC_BOTHEDGES_gc;
sei();
while (1)
{
}
}
#pragma region LED_functions
void LED_on()
{
PORTB.OUTCLR = PIN4_bm; //LED on
}
void LED_off()
{
PORTB.OUTSET = PIN4_bm; //LED off
}
void LED_set_state(uint8_t SW_state)
{
if (SW_state)
{
LED_on();
}
else
{
LED_off();
}
}
#pragma endregion LED_functions
uint8_t SW_get_state(void)
{
static uint8_t SW0_prv_state = 0;
static uint8_t SW0_edge_count = 0;
uint8_t SW0_cur_state = !(PORTB.IN & PIN5_bm); /* Read the current SW0 state */
if (SW0_cur_state != SW0_prv_state) /* Check for edges */
{
SW0_edge_count++;
}
SW0_prv_state = SW0_cur_state; /* Keep track of previous state */
/*
* Report the switch as pushed when it is pushed or the edge counter is a
* multiple of 3
*/
return SW0_cur_state || !(SW0_edge_count % 3);
}
ISR(PORTB_PORT_vect)
{
uint8_t intflags = PORTB.INTFLAGS;
PORTB.INTFLAGS = intflags;
uint8_t SW_state = SW_get_state();
LED_set_state(SW_state);
}
Atmel Studio 7 User Guide
Getting Started
© 2018 Microchip Technology Inc. User Guide DS50002718A-page 86
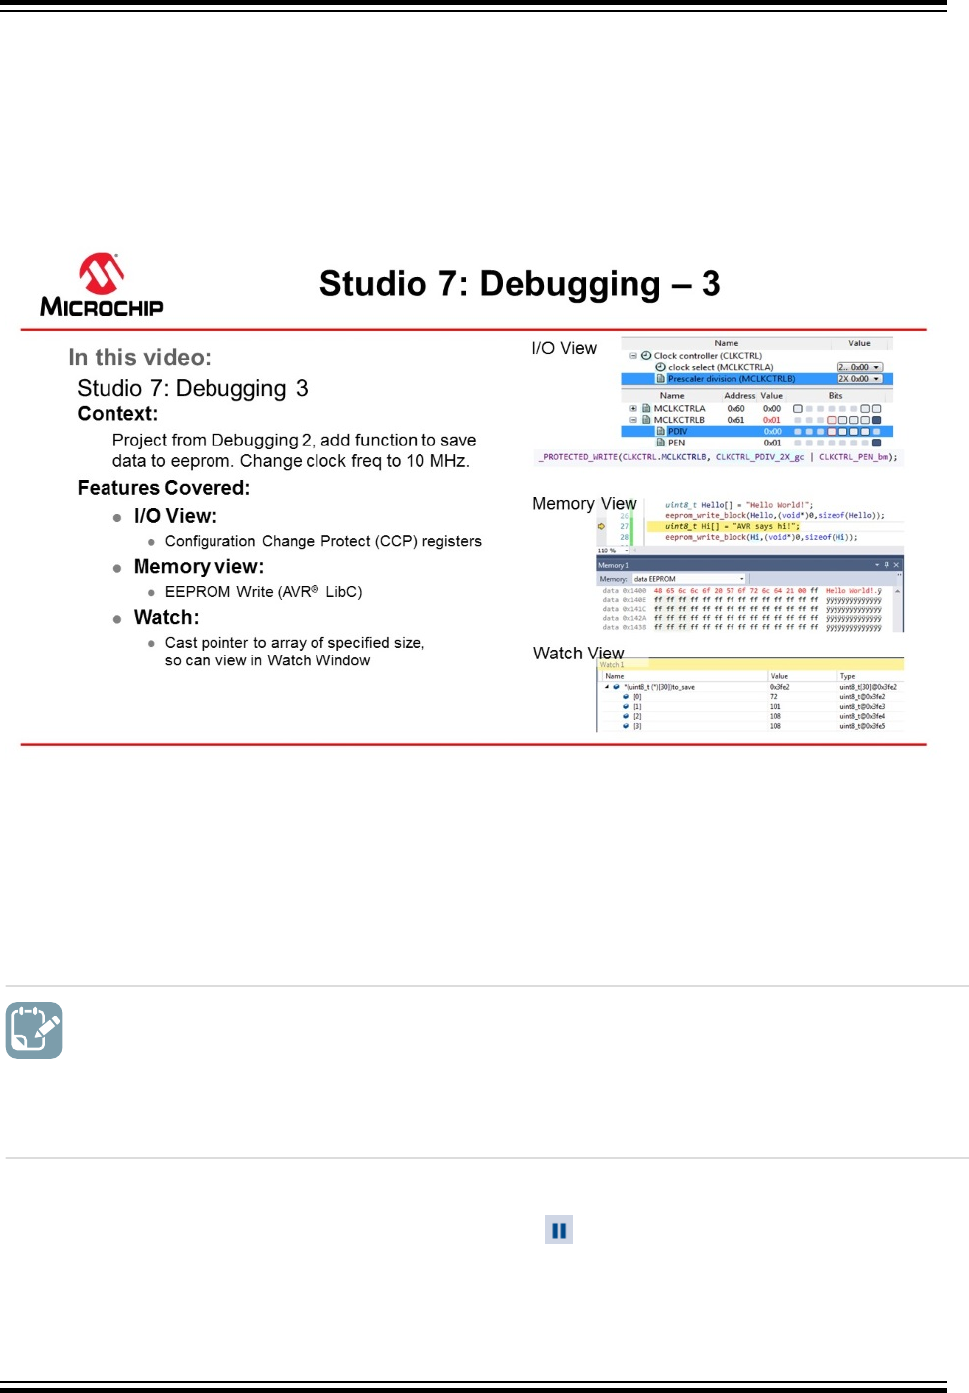
2.15 Debugging 3: I/O View Memory View and Watch
This section covers more advanced debugging topics with Studio 7 both as video (linked below) and
hands-on document. The main topics are using I/O View to work with Configuration Change Protected
(CCP) registers, Memory View to validate EEPROM writes, as well as using the Watch window to cast
pointers as an array.
Getting Started Topics
Video: Debugging - 3
2.15.1 I/O View
The I/O view provides a graphical view of the I/O memory map of the device associated with the active
project. This debug tool will display the actual register content when debugging, allowing verification of
peripheral configurations. It can also be used to modify the content of a register without having to
recompile.
To do: Use I/O view to:
• Get an overview of the device memory map.
• Check current peripheral configurations.
• Modify peripheral configurations.
• Validate configuration changes.
1. Remove all breakpoints and start a new debug session.
2. Break code execution by pressing the Break All button .
3. Open the I/O view from the top menu bar by going to Debug → Windows → I/O.
Atmel Studio 7 User Guide
Getting Started
© 2018 Microchip Technology Inc. User Guide DS50002718A-page 87

4. Scroll through the list of peripherals and select I/O Ports (PORTB). Find the OUT register and click
on Bit 4 in the Bits column, so the corresponding square changes color, as depicted in Figure 2-56.
Observe that clicking Bit 4 in the PORTB.OUT register toggles the output level on GPIO pin PB4,
which controls the LED on the ATtiny817 Xplained Pro.
Figure 2-56. Manipulate Bit Value in Register Using I/O View
Info: The I/O view is refreshed after any register has been modified, and all detected
changes are highlighted in red.
tip: Multiple bits can be modified simultaneously by double-clicking the value field and
typing in the desired value to be assigned to the register.
5. Expand the Clock controller (CLKCTRL) in the I/O view, and answer the following questions:
Atmel Studio 7 User Guide
Getting Started
© 2018 Microchip Technology Inc. User Guide DS50002718A-page 88
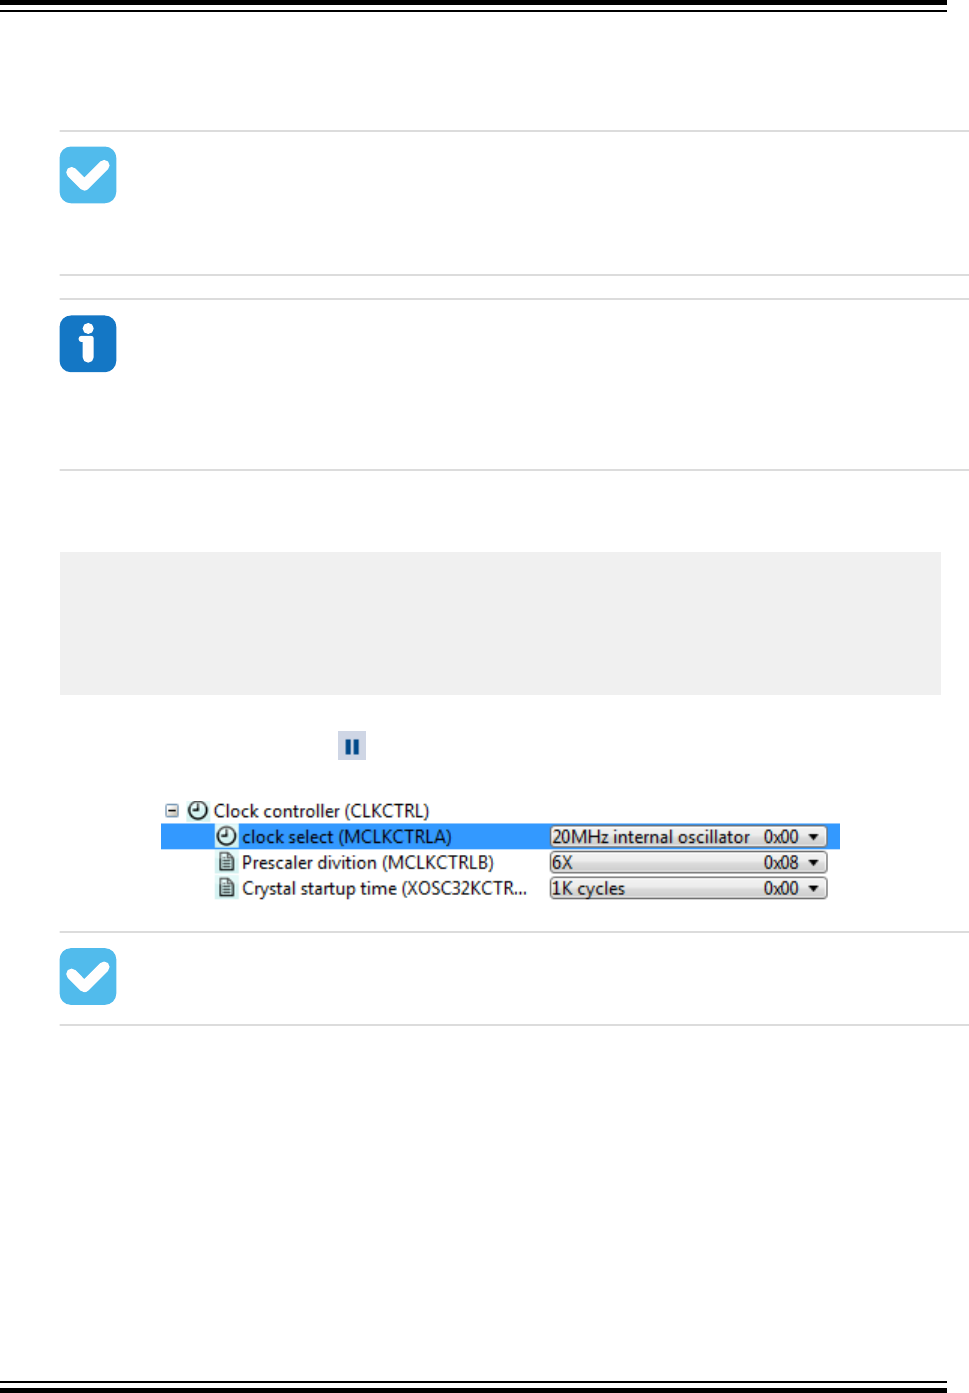
– What is the currently selected clock source (Clock select)?
– What is the configured prescaler value (Prescaler division)?
– Is the main clock prescaler enabled (MCLKCTRLB.PEN)?
Result: The Clock controller should be configured with the ATtiny817 default clock
settings; the main clock is running from the internal RC oscillator with prescaler enabled
and a division factor of six.
Info: The default clock configuration guarantees that the device will execute code
reliably over the entire supported operating voltage range, 1.8V to 5.5V. The Xplained Pro
kit powers the ATtiny817 at 3.3V. According to the 'General Operating Ratings' section in
the device data sheet, the device can be safely run at 10 MHz with a 3.3V supply.
6. The code will now be changed to run the ATtiny817 at 10 MHz. Modify the start of main() as
below:
int main(void)
{
/*
* Set the Main clock division factor to 2X,
* and keep the Main clock prescaler enabled.
*/
CLKCTRL.MCLKCTRLB = CLKCTRL_PDIV_2X_gc | CLKCTRL_PEN_bm;
7. Start a new debug session in order to recompile the project and program the device.
8. Halt code execution by clicking . Examine the clock settings in I/O view, depicted in Figure 2-57.
Figure 2-57. Clock Settings in I/O View Remain Unchanged
Result: There is a problem! The prescaler remains unchanged.
9. Select the MCLKCTRLB register in I/O view, as indicated in Figure 2-58.
Atmel Studio 7 User Guide
Getting Started
© 2018 Microchip Technology Inc. User Guide DS50002718A-page 89
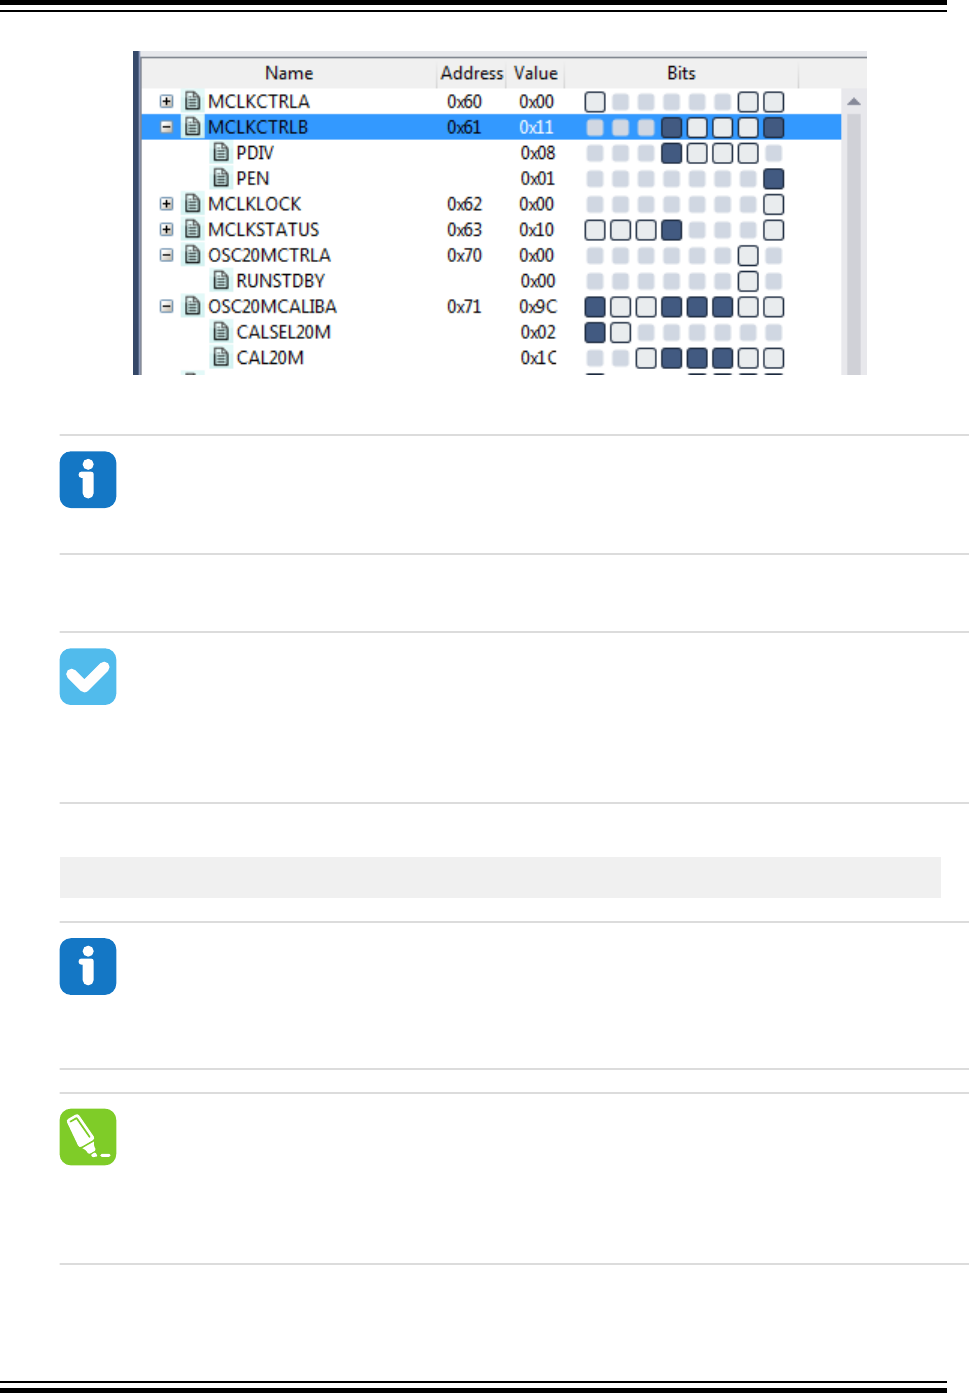
Figure 2-58. Select MCLKCTRLB in I/O View
10. Push F1 on the keyboard to bring up a web-based register description.
Info: Internet access is required to use the web-based register description. Refer to an
offline version of the ATtiny817 data sheet if internet access is not available.
11. Find out if any access restrictions apply to the MCLKCTRLB register.
Result: The register is protected by the Configuration Change Protection (CCP)
mechanism. Critical registers are configuration change protected to prevent unintended
changes. These registers can only be modified if the correct unlock sequence is followed,
as described in the data sheet.
12. Replace the line of code, which was just added, with the following:
_PROTECTED_WRITE(CLKCTRL.MCLKCTRLB, CLKCTRL_PDIV_2X_gc | CLKCTRL_PEN_bm);
Info: _PROTECTED_WRITE() is an assembly macro that guarantees timing
requirements for unlocking protected registers are met. It is recommended to use this
macro when modifying protected registers.
tip: Right-click the macro name in the code and select Goto Implementation to
navigate to the implementation of the macro. This is also possible by placing the cursor at
the macro name in the code and pressing Alt+G on the keyboard. The same process can
also be used for variable declarations and function implementations.
Atmel Studio 7 User Guide
Getting Started
© 2018 Microchip Technology Inc. User Guide DS50002718A-page 90
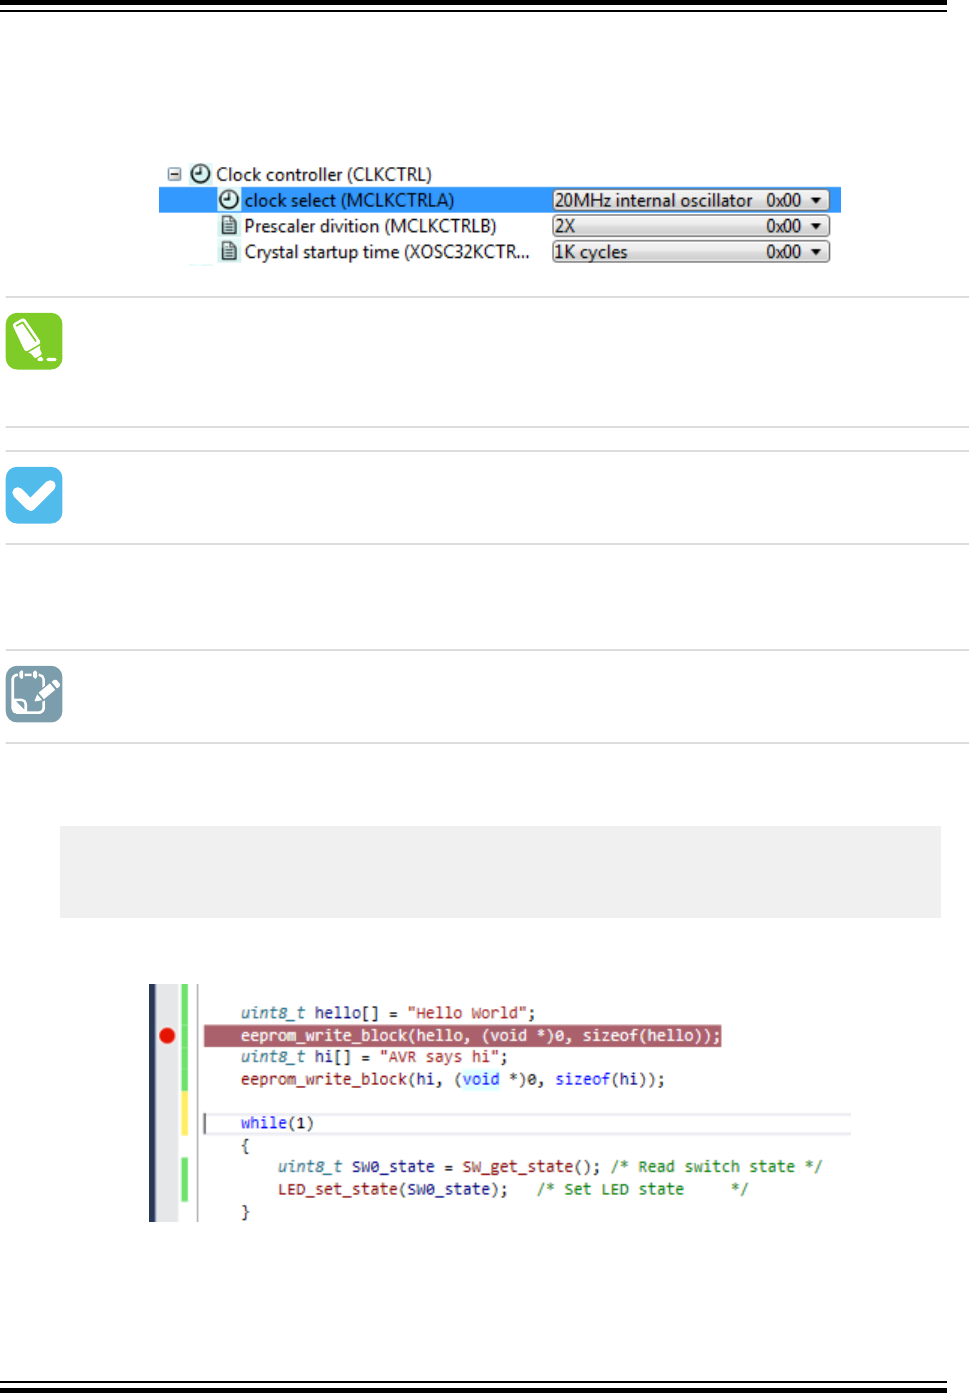
13. Stop the previous debug session and launch a new session to program the device with the
changes.
14. Break code execution and use the I/O view to verify that the prescaler is now successfully set to
2X, as indicated in Figure 2-59.
Figure 2-59. Clock Settings in I/O View Changed Successfully
tip: The Processor Status window is the register view tool for the AVR Core. This tool can be
opened from the top menu bar by going to Debug → Windows → Processor Status. This
window will provide a detailed view of the status of the internal AVR Core registers. This view
can be used to check if global interrupts are enabled; look for the I-bit in the status register.
Result: The capabilities of the I/O view have been used to find and fix a bug in the project.
2.15.2 Memory View
To do: Write two strings to the beginning of the ATtiny817 EEPROM and use Memory view to
verify the EEPROM contents.
1. Add #include <avr/eeprom.h> after the #include <avr/io.h> line.
2. Add the following code before the while(1) loop in main():
uint8_t hello[] = "Hello World";
eeprom_write_block(hello, (void *)0, sizeof(hello));
uint8_t hi[] = "AVR says hi";
eeprom_write_block(hi, (void *)0, sizeof(hi));
3. Place a breakpoint next to the first call to eeprom_write_block() as in Figure 2-60.
Figure 2-60. Breakpoint to Halt for Checking EEPROM
4. Start a new debug session in order to program the device with the updated code.
5. After the breakpoint has been hit, open the memory window from the top menu bar by going to
Debug → Windows → Memory → Memory 1. Look at the current content of the EEPROM.
Atmel Studio 7 User Guide
Getting Started
© 2018 Microchip Technology Inc. User Guide DS50002718A-page 91
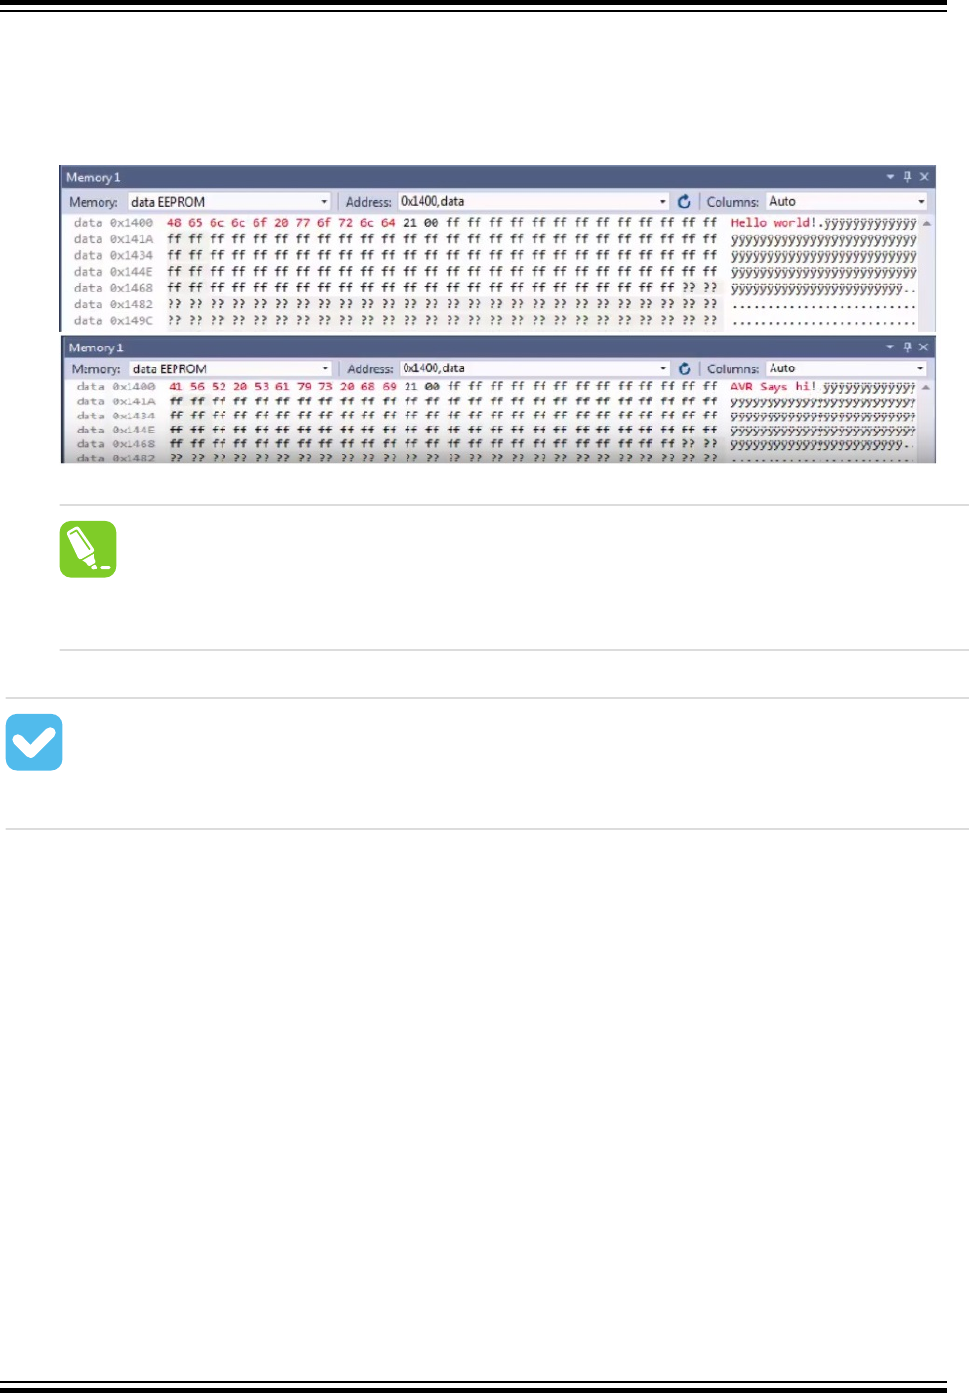
6. Push F10 on the keyboard to step over the eeprom_write_block() call and verify the EEPROM
write.
7. Allow the ATtiny817 to execute the next EEPROM write before verifying the write using the Memory
view. The view should appear as in Figure 2-61 at each interval respectively.
Figure 2-61. Memory View Updating After EEPROM Writes
tip: The Memory view tool can also be used to investigate the contents of other AVR
memory sections, including the program memory. This can be useful when debugging
bootloaders.
Result: The content of the EEPROM is updated after each call to eeprom_write_block().
The updated content is highlighted in red, and the ASCII interpretation of the EEPROM content
matches the written strings. Therefore, the contents of EEPROM after writing to it have been
verified using Memory view.
2.15.3 Watch Window
This is covered in more detail in section Debugging 2: Conditional- and Action-Breakpoints , however, the
note on how to cast pointers as an array in the Watch window is repeated here.
Atmel Studio 7 User Guide
Getting Started
© 2018 Microchip Technology Inc. User Guide DS50002718A-page 92

Info: A variable can also be added to the Watch window by clicking on an empty field name
and typing the variable name. This way, it is even possible to cast a variable to a different data
type for better readability in the Watch window. This is especially useful if it is required to look at
an array that is passed to a function as a pointer.
For example, if an array is passed to a function, it will be passed to the function as a pointer.
This makes it impossible for Atmel Studio to know the length of the array. If the length of the
array is known, and it needs to be examined in the Watch window, the pointer can be cast to an
array using the following cast:
*(uint8_t (*)[<n>])<name_of_array_pointer>
Where <n> is the number of elements in the array and <name_of_array_pointer> is the
name of the array to be examined.
This can be tested on the SW0_edge_count variable by entering the following in an empty
name field in the Watch window:
*(uint8_t (*)[5])&SW0_edge_count
Note that the '&' symbol must be used in this case to obtain a pointer to the variable.
Result: Atmel Studio has now been used to inspect and modify the contents of variables in the
code.
Code used for Debugging 3
#include <avr/io.h>
#include <avr/eeprom.h>
void LED_on(void);
void LED_off(void);
void LED_set_state(uint8_t state);
uint8_t SW_get_state(void);
uint8_t SW_get_state_logic(void);
int main(void)
{
PORTB.DIRSET = PIN4_bm; /* Configure LED Pin as output */
PORTB.PIN5CTRL = PORT_PULLUPEN_bm; /* Enable pull-up for SW0 pin */
_PROTECTED_WRITE(CLKCTRL.MCLKCTRLB, CLKCTRL_PDIV_2X_gc | CLKCTRL_PEN_bm);
uint8_t Hello[] = "Hello World!";
save(Hello,sizeof(Hello));
uint8_t Hi[] = "AVR says hi!";
save(Hi,sizeof(Hi));
while(1)
{
uint8_t SW0_state = SW_get_state_logic(); /* Read switch state */
LED_set_state(SW0_state); /* Set LED state */
}
}
void save(const uint8_t* to_save, uint8_t size)
{
eeprom_write_block(to_save,(void*)0,size);
}
uint8_t SW_get_state()
Atmel Studio 7 User Guide
Getting Started
© 2018 Microchip Technology Inc. User Guide DS50002718A-page 93

{
return !(PORTB.IN & PIN5_bm);
}
uint8_t SW_get_state_logic(void)
{
static uint8_t SW0_prv_state = 0;
static uint8_t SW0_edge_count = 0;
uint8_t SW0_cur_state = !(PORTB.IN & PIN5_bm); /* Read the current SW0 state */
if (SW0_cur_state != SW0_prv_state) /* Check for edges */
{
SW0_edge_count++;
}
SW0_prv_state = SW0_cur_state; /* Keep track of previous state */
/*
* Report the switch as pushed when it is pushed or the edge counter is a
* multiple of 3
*/
return SW0_cur_state || !(SW0_edge_count % 3);
}
void LED_off(void)
{
PORTB.OUTSET = PIN4_bm; /* Turn LED off */
}
void LED_on(void)
{
PORTB.OUTCLR = PIN4_bm; /* Turn LED on */
}
void LED_set_state(uint8_t state)
{
if (state)
{
LED_on();
}
else
{
LED_off();
}
}
Atmel Studio 7 User Guide
Getting Started
© 2018 Microchip Technology Inc. User Guide DS50002718A-page 94

3. Project Management
3.1 Introduction
Atmel Studio is an Integrated Development Environment (IDE) for writing and debugging applications for
AVR/ARM platforms. Currently, as a code writing environment, it supports the included AVR Assembler
and any external AVRGCC/ARMGCC compiler in a complete IDE environment.
Using Atmel Studio as an IDE gives you several advantages:
1. Editing and debugging in the same application window allows for a faster error tracking.
2. Breakpoints are saved and restored between sessions, even if the code was edited in the
meantime.
3. Project item management is made convenient and portable.
3.1.1 The Solution Container
With AVR Studio 5, the concept of 'solution' is introduced. The solution is a container that may contain
several projects. A project cannot exist outside a solution. If you try to open a project file ( .cproj
or .asmproj extension) a solution will be created for you. This allows you to keep for example a
bootloader project and several application projects in the same solution. In practice, the Solution is stored
as an .atsln file. In general, projects that are added to the solution are placed in a separate folder
inside the folder that the .atsln file resides in.
3.1.2 Save and Open Projects
All projects are saved under a chosen name with the .cproj extension for GCC projects and .asmproj
extension for 8-bit assembler projects. The user can reopen a project, either from the file menu, from the
recently used projects list, or from the Project menu, under Open project.
3.1.3 Project Output View
After building, assembling, or compiling the project, the operation result will be shown in the build output
window. If any errors occur, the user can double-click on the message, which will position the marker over
the corresponding line in the source window.
3.1.4 Solution Explorer
Solution Explorer allows you to view items and perform item management tasks in a solution or a project.
It also allows you to use the Atmel Studio editors to work on files outside the context of a solution or
project. By default, it appears on the right side of the Atmel Studio GUI.
Atmel Studio 7 User Guide
Project Management
© 2018 Microchip Technology Inc. User Guide DS50002718A-page 95
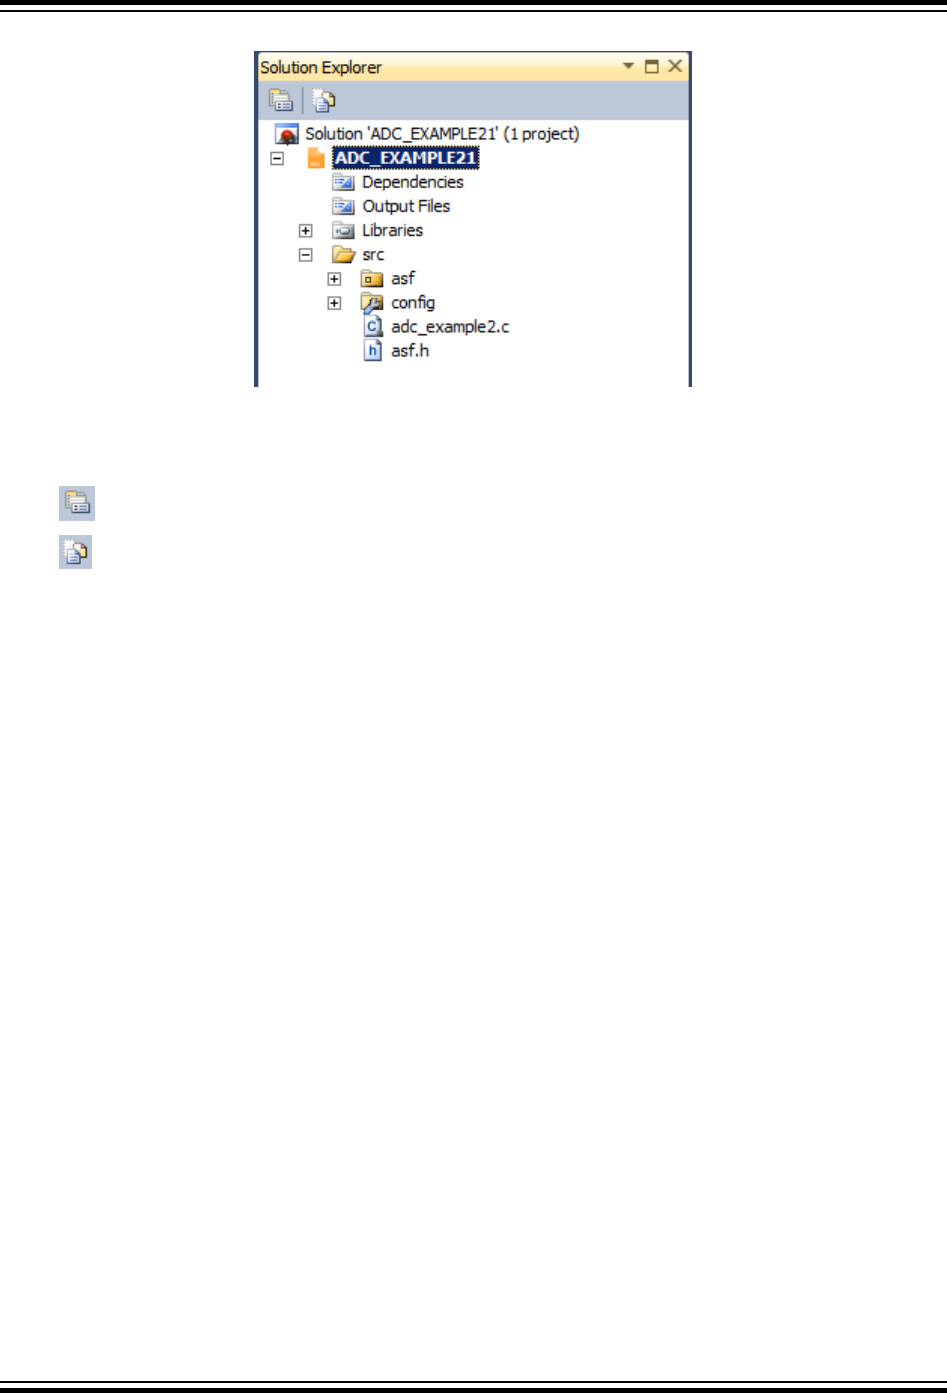
Figure 3-1. The Solution Explorer Pane
3.1.5 Toolbar Icons
Buttons specific to the item selected in the tree view appear on the Solution Explorer.
• Displays the appropriate property user interface for the selected item in the tree view.
• Shows all project items, including those that have been excluded in the project and those that
are hidden.
3.1.6 Hierarchical Display
A single solution and all its projects appear in a hierarchical display. This allows you to work on several
projects at the same time and at the same time keep track of all projects and items. Most source control
system extensions (such as AnkhSVN) will also add icon overlays to the item icons, to signal the up-to-
date status of the project items that are under revision control.
3.1.7 Item Management Commands
Solution Explorer supports a variety of management commands for each project or solution item. Right
click on any item to get a menu with the available commands for that particular item.
3.1.8 Project Components
A project will contain a set of device specific components. This includes startup code, linker scripts, and
other support libraries.
Components are small pieces of code or other supporting files that are included in any project.
Atmel Studio 7 User Guide
Project Management
© 2018 Microchip Technology Inc. User Guide DS50002718A-page 96
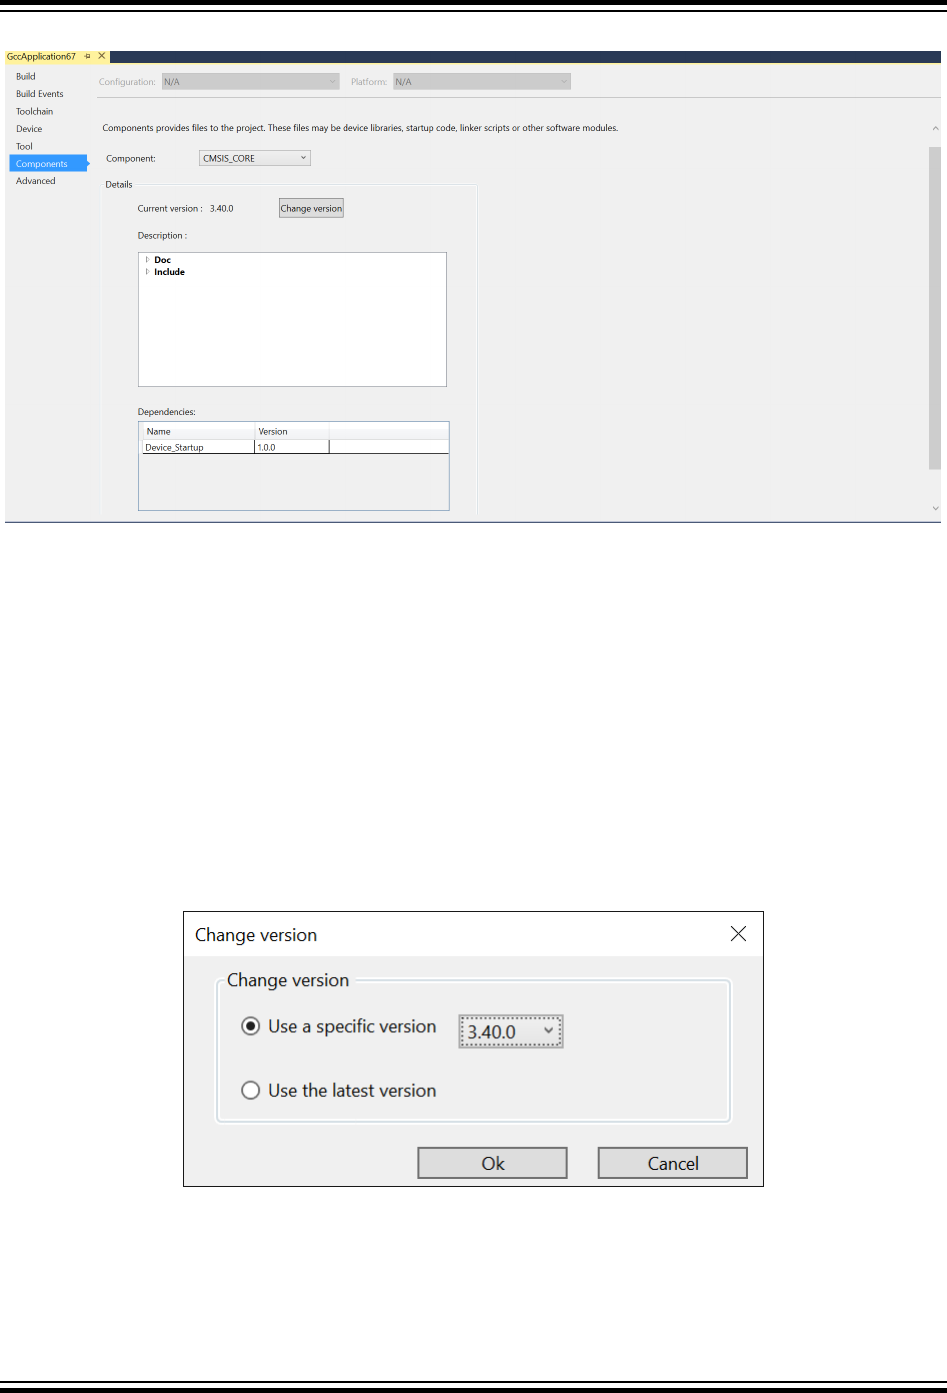
Figure 3-2. Project Components
Components that are included in a project are listed in the Component drop-down menu. Selecting a
component from the drop-down menu shows the component version, the files that the component is
contributing with, and the dependencies that the component has.
The version of the component can be changed by clicking the Change version button.
3.1.8.1 Change Version
Components are versioned when added to the project. To change the version that is used, use this
dialog.
There are two options when choosing the version of a component
Use a specific version Lock the project to a specific version of the component.
Use the latest version Choose the most recent version of the component that is available.
Figure 3-3. Change Version
Components are part of the device packs in Atmel Studio. These device packs are managed using the
Device Pack Manager.
Related Links
Device Pack Manager
Atmel Studio 7 User Guide
Project Management
© 2018 Microchip Technology Inc. User Guide DS50002718A-page 97
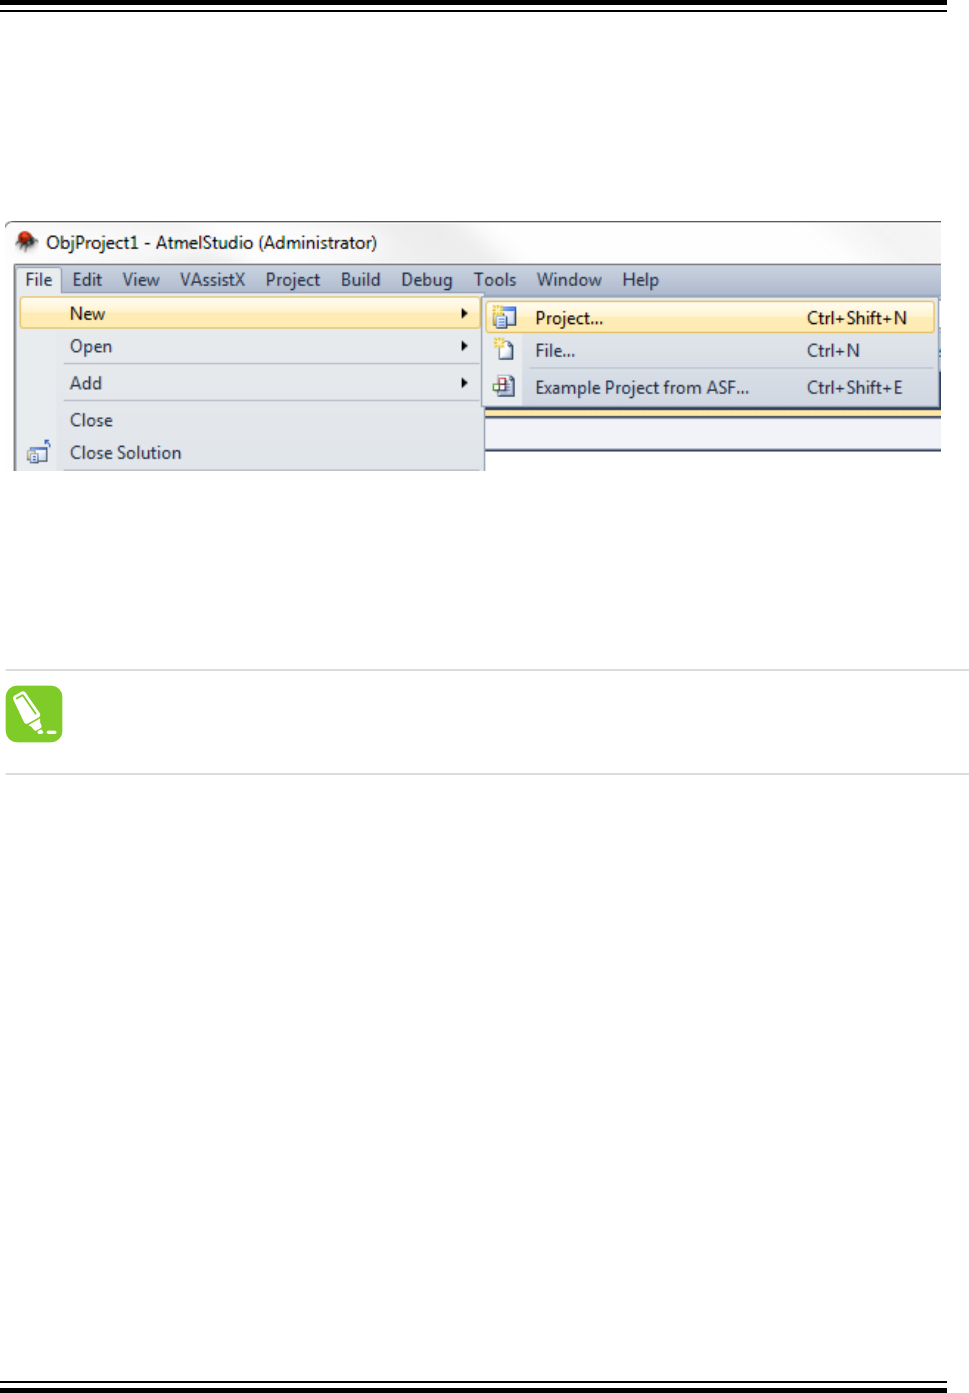
3.2 GCC Projects
3.2.1 New Project Wizard
Select File → New from the menu, and the dialog below will appear. The startup wizard will also have an
option to start a new project.
Figure 3-4. New Project
Project types
Currently, several project types are available in the Project Type box. AVR board examples - to guide
you through the usage of the AVR boards, User board project - if you have created your own product with
the AVR tools, and a general AVR GCC project - a board independent project with a GNU compiler. It is
also possible to create an AVR Assembler project and a general AVR Solution, which may include any
supported source code type.
Tip:
Projects can also be created by loading supported object files. If you want to create such a
project, you should use the File → Open file menu.
Project name and initial file
Input the project name. The project main file, which is generated automatically, will be named with the
same name by default (ASM or C). If you wish, you can change this name. It is possible to check a box to
create a new folder, bearing the project name. This box is unchecked by default.
You can choose to create a new solution in the Solution drop-down menu or to reuse existing code. Input
the solution name in the Solution Name field.
If you are satisfied with the project name and type, press OK and proceed to the debugging platform
selection stage. You can also leave the platform undefined for now, but then you will have to select the
debug platform and device upon starting a debug session. See also Assembler Projects and Object File
Formats.
3.2.2 Starting a New GCC Project for AVR Device
1. Create a new project by selecting New Project from the Project menu. This will open the Project
Wizard.
Atmel Studio 7 User Guide
Project Management
© 2018 Microchip Technology Inc. User Guide DS50002718A-page 98
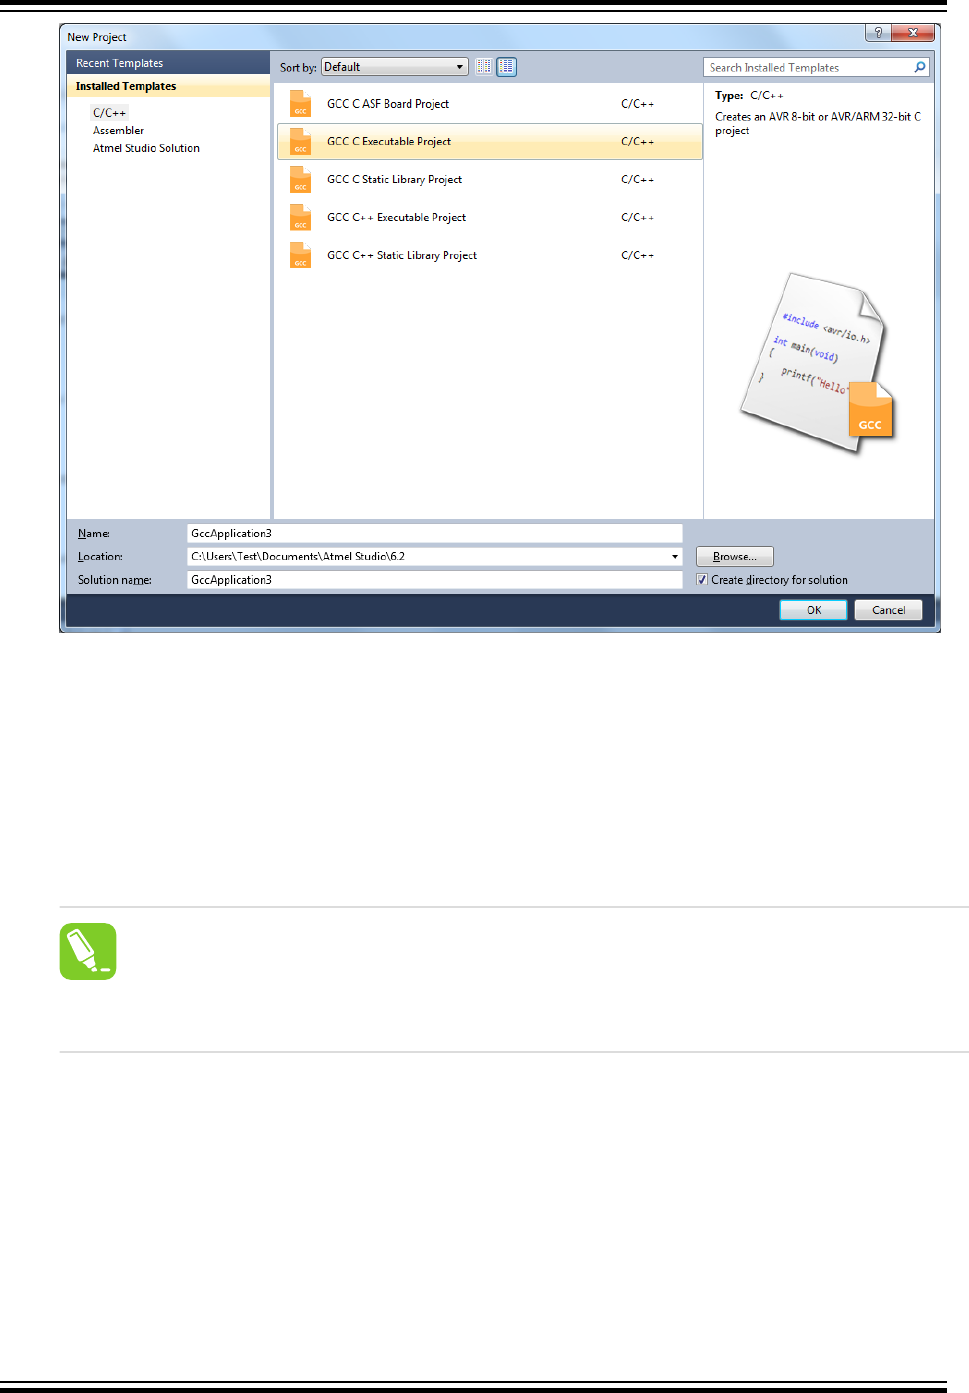
2. Select C/C++→GCC C Executable Project as a template, then specify a project name, select a
location, and write a solution name for the project. A file with the same name as the project will be
created and added to the project by default. It will contain an empty main() function. If you want to
change the name of the initial file, just edit the main file name afterward. Press OK when you are
satisfied with the settings.
3. Select C/C++→GCC C Static Library Project as a template, then specify a project name, select a
location, and write a solution name for the project. This creates a Static Library (LIB) project, which
is a good way to reuse code.
Tip:
See section Starting a New GCC Static Library Project to learn more about Static Library
projects.
4. A device selection table will appear. Choose the appropriate target platform for your project. To start
you can select the ATxmega128A1 device.
Atmel Studio 7 User Guide
Project Management
© 2018 Microchip Technology Inc. User Guide DS50002718A-page 99
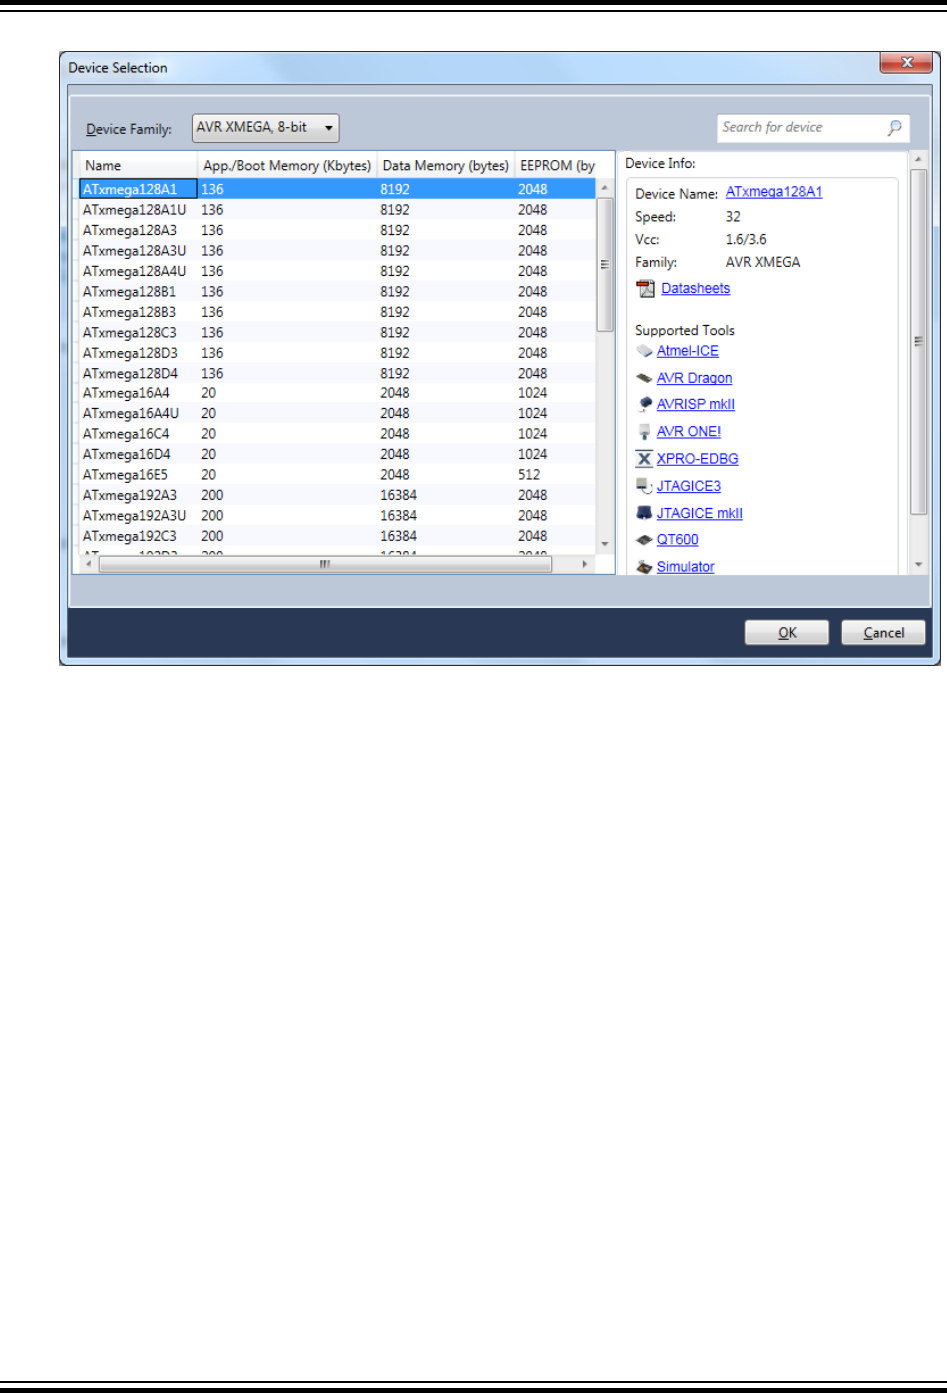
Figure 3-5. Device Selection
5. The project tree will be set up. Notice that the initial file created in step 2 has been added to the
project node. Also, the initial file will be opened in the editor.
6. In order to facilitate applications development and verification, you can also use the Driver
Selection Wizard, invoked from Project → ASF Wizard...
Atmel Studio 7 User Guide
Project Management
© 2018 Microchip Technology Inc. User Guide DS50002718A-page 100
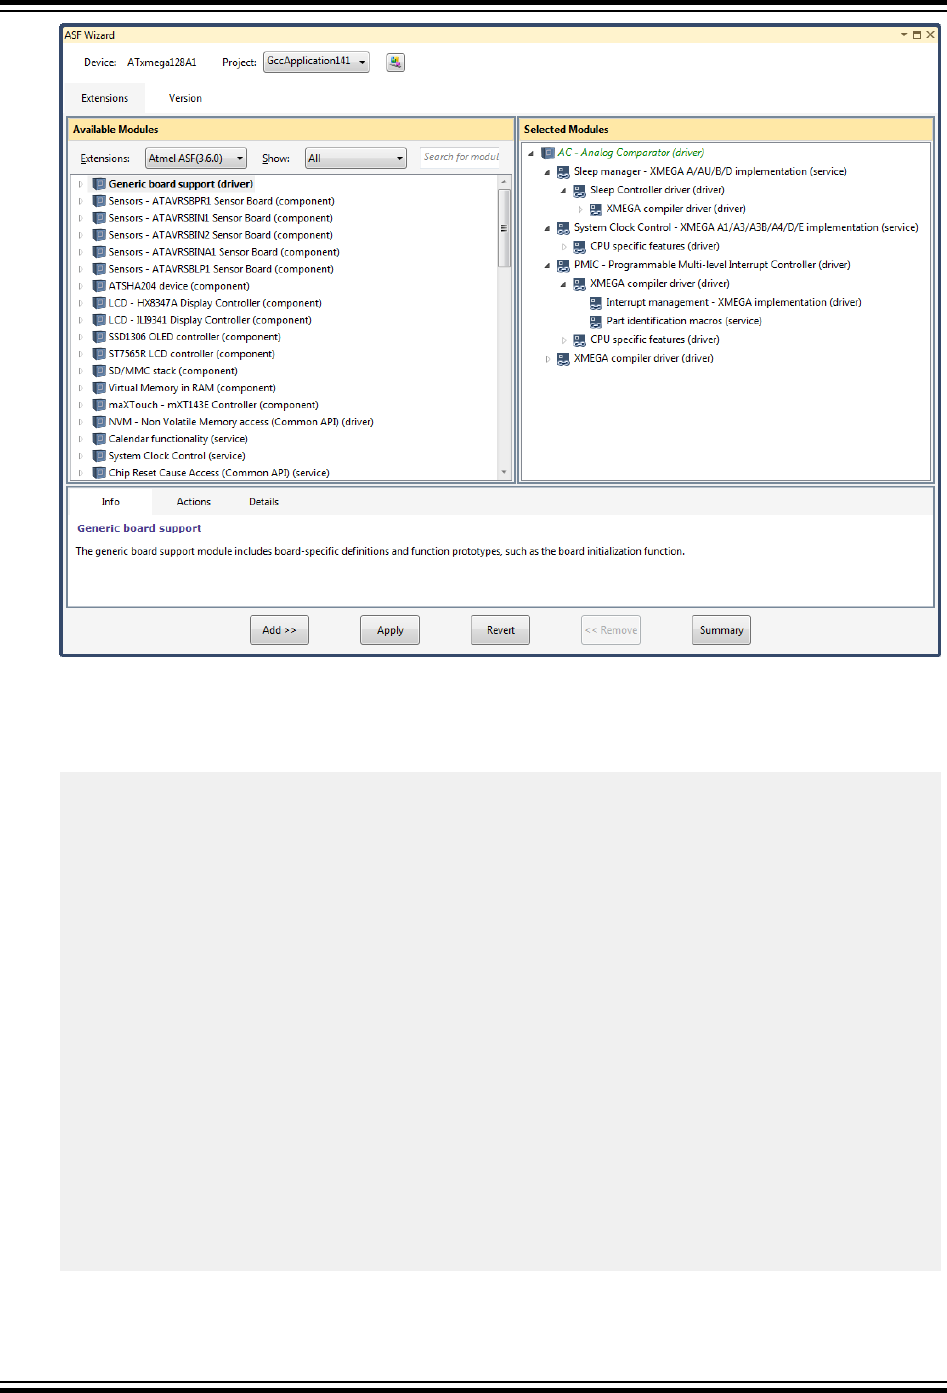
In the ASF Wizard you can select which Drivers, Components, and Services you would like to use
in the project for current build architecture and board.
7. Now, write the following code into the open editor window.
#define MAXINT 200000
int main(void)
{
unsigned int t=1000, k=0, l=5, pn=2;
unsigned int primes[t];
primes[0]=2;
primes[1]=3;
while (pn < t || primes[pn] < MAXINT)
{
for ( k = 0; k <= pn; k++)
{
if (l % primes[k] == 0)
{
goto otog;
}
else
{
if (k == pn)
primes[pn++]=l;
}
}
otog:
l += 2;
}
return 0;
}
8. Build the project.
Atmel Studio 7 User Guide
Project Management
© 2018 Microchip Technology Inc. User Guide DS50002718A-page 101
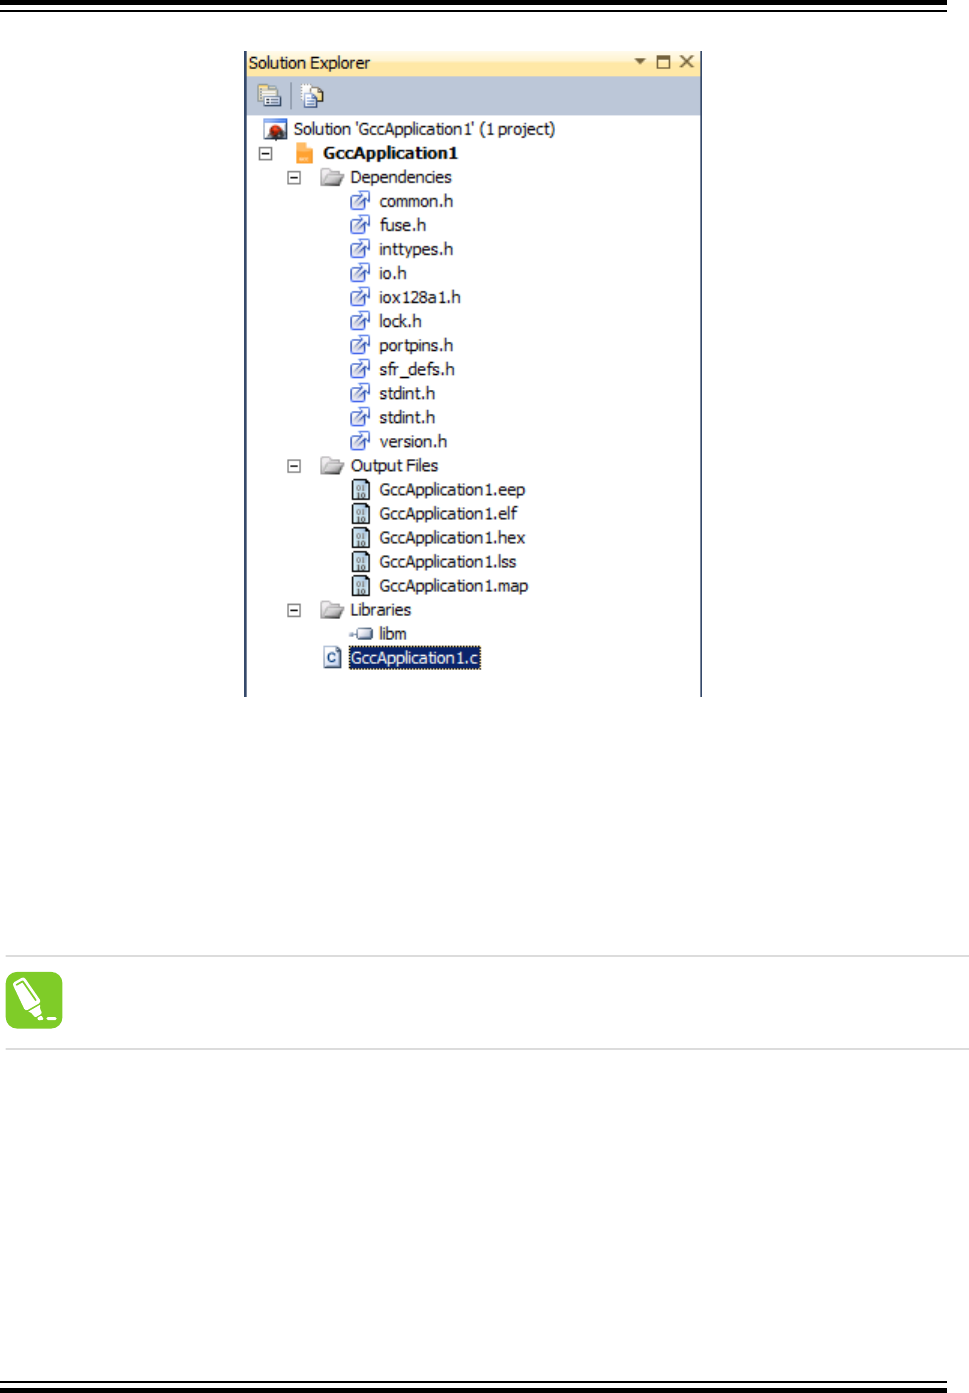
Figure 3-6. View of a GCC Project after Build Completed
Dependencies
All the included files are listed here. Double-click on any file to open it in the editor.
Output Files
All output files will be displayed below this item.
Libraries
All Static Library files, Toolchain Library, and other Library Files will be displayed below this item.
Tip:
See section Library Options to know more about Library options.
3.2.3 Libraries Options
All Static Library files, Toolchain Library, and other Library Files will be displayed below this item.
Atmel Studio 7 User Guide
Project Management
© 2018 Microchip Technology Inc. User Guide DS50002718A-page 102
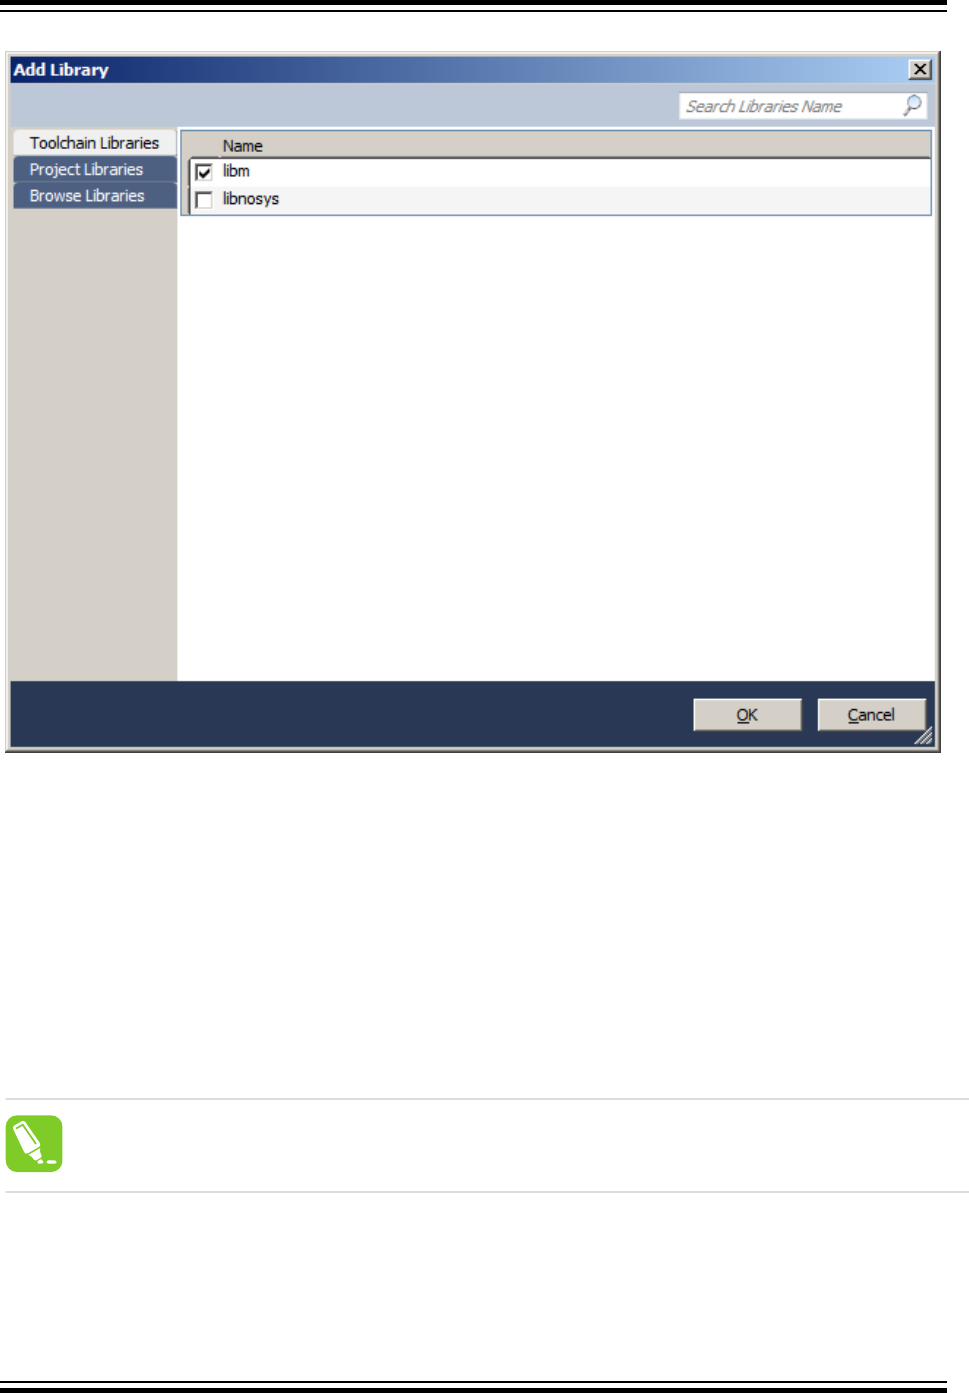
Figure 3-7. Libraries
3.2.3.1 Toolchain Libraries
The toolchain libraries would be listed here.
The Library search path provided by the toolchain would be enumerated to form the library list.
3.2.3.2 Project Libraries
The projects available at the current Solution would be enumerated and the static libraries would be listed
here.
3.2.3.3 Browse Libraries
You can browse for other libraries.
3.2.3.4 How to Add Project Library
Tip:
Ensure you have static library projects in the current solution.
Right click on Project or Libraries Node in the project to invoke 'Add Library' Wizard.
Select Project Libraries Tab; here you will see all the static libraries in the current solution listed.
Select the Static Library which you would like to add.
Atmel Studio 7 User Guide
Project Management
© 2018 Microchip Technology Inc. User Guide DS50002718A-page 103
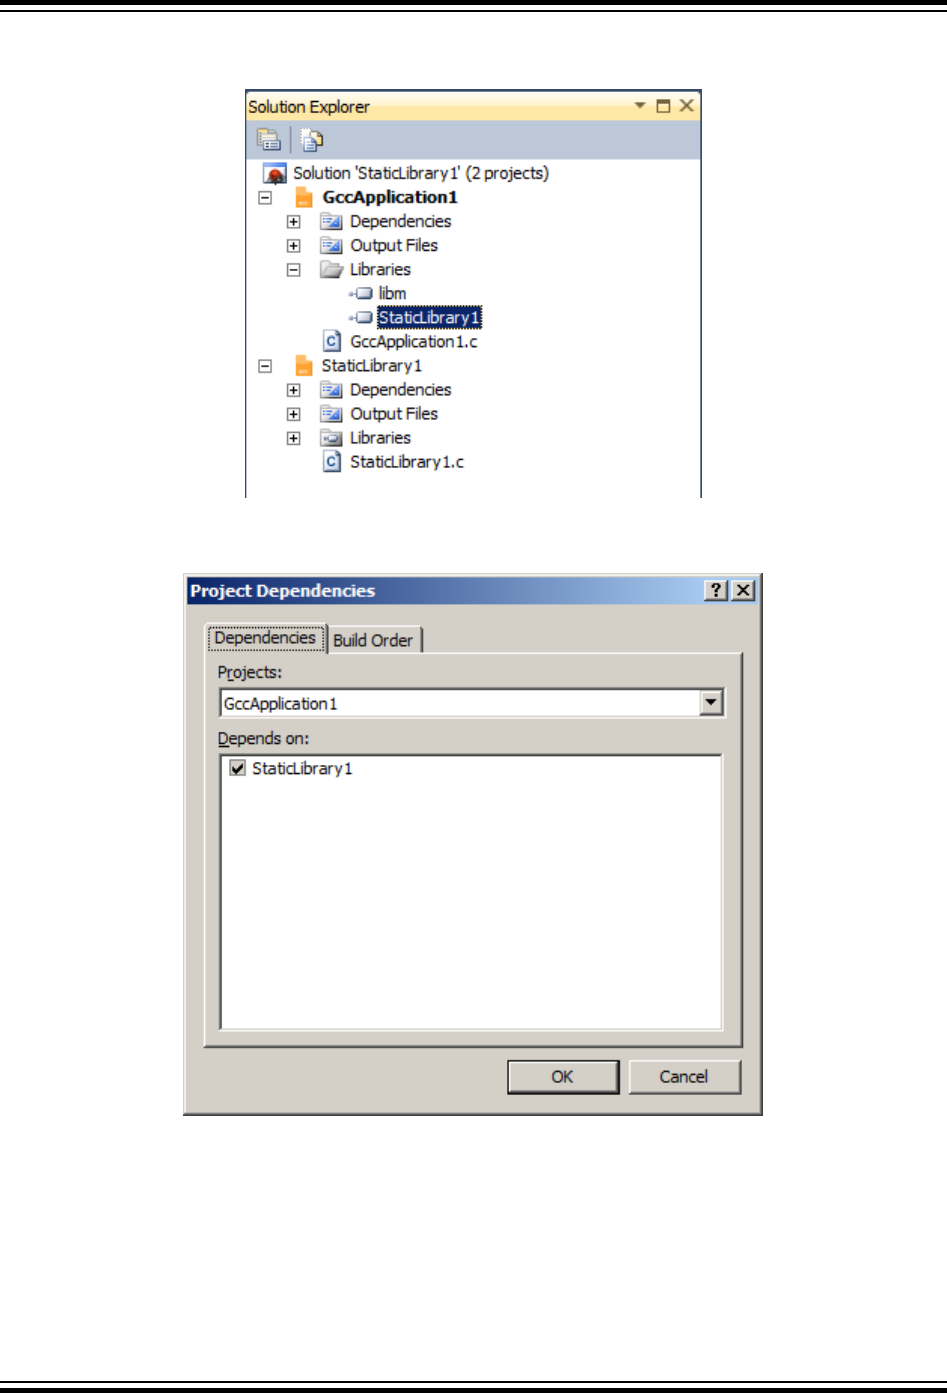
Click OK.
Figure 3-8. View of a Project after Adding Libraries
Also, you will see that Project → Project Dependencies Static Library is added.
Figure 3-9. View of a Project Dependencies after Adding Libraries
3.2.3.5 How to Add Toolchain Library
Right click on Project or Libraries Node in the project to invoke 'Add Library' Wizard.
Select Toolchain Libraries Tab; here you will see the available toolchain libraries for the currently selected
toolchain for the project.
Select the libraries which you like to add.
Atmel Studio 7 User Guide
Project Management
© 2018 Microchip Technology Inc. User Guide DS50002718A-page 104
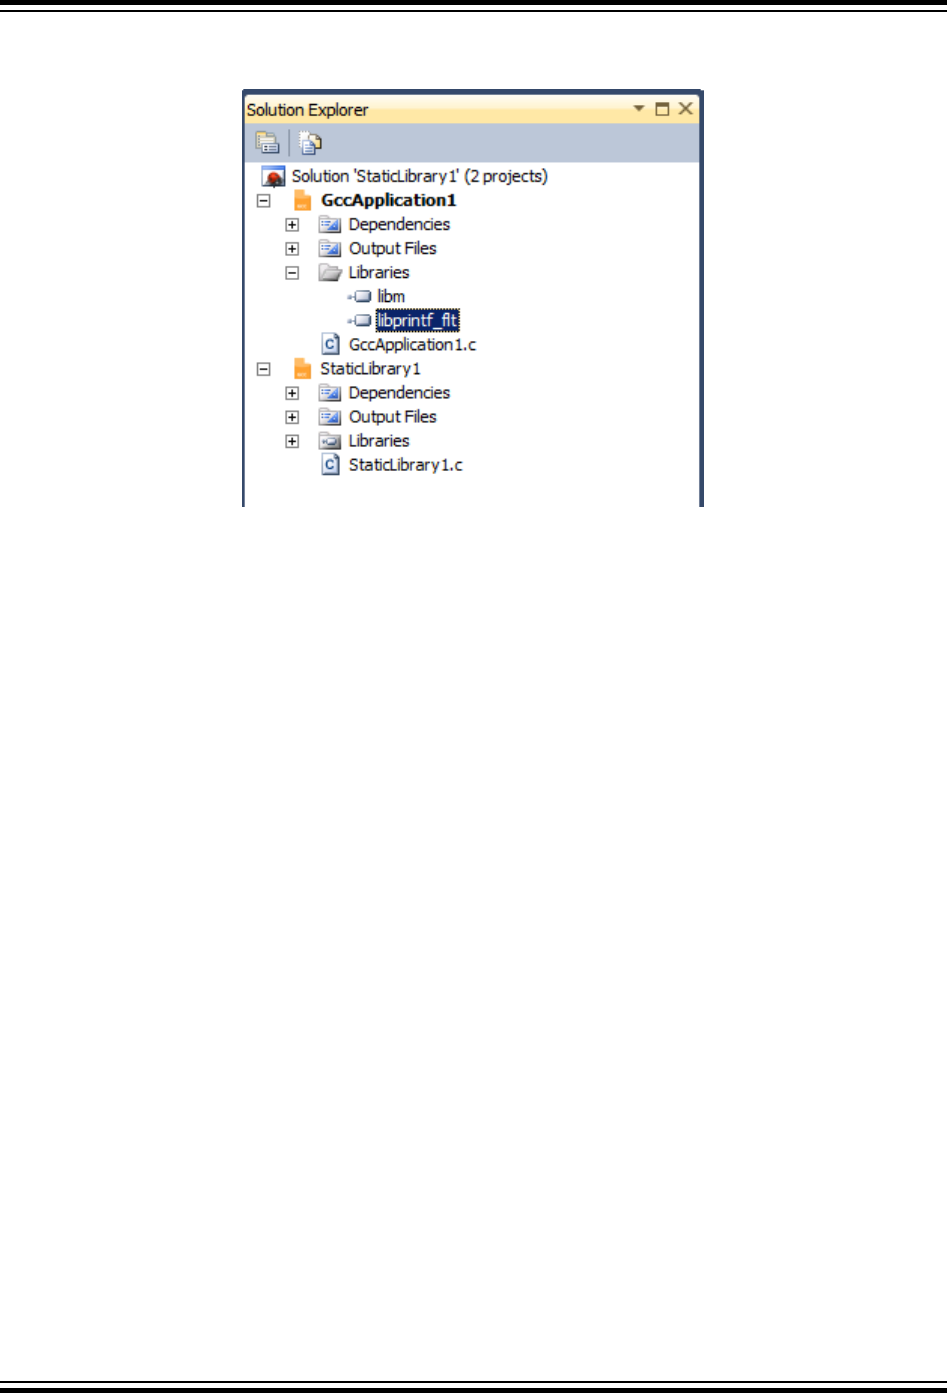
Click OK.
Figure 3-10. View of a Project after Adding Libraries
You will also be able to see the new library added in the Toolchain Linker Settings.
Atmel Studio 7 User Guide
Project Management
© 2018 Microchip Technology Inc. User Guide DS50002718A-page 105
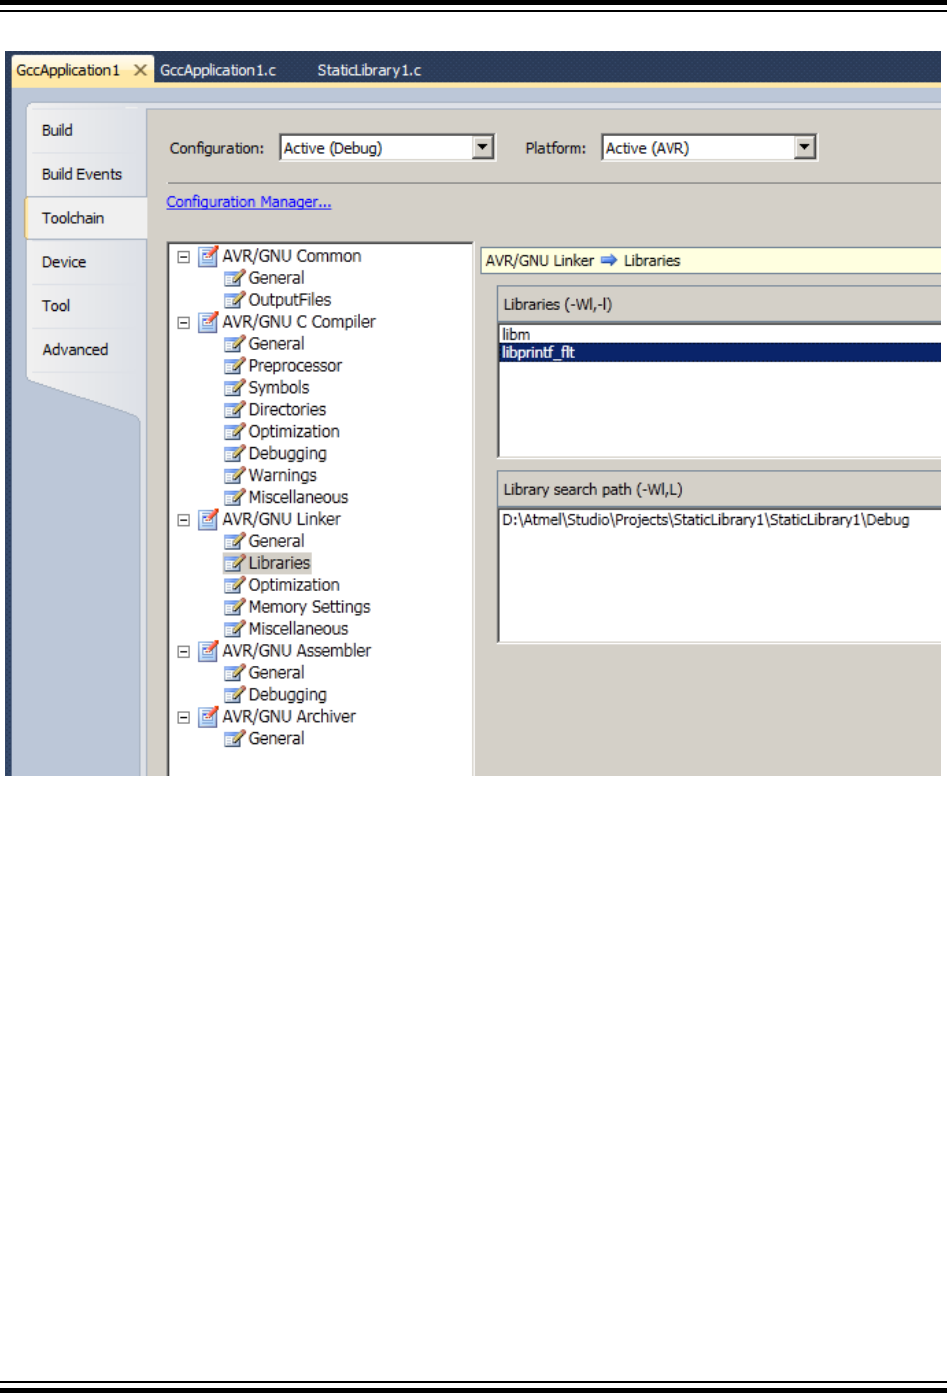
Figure 3-11. View of a Linker Option after Adding Libraries
3.2.4 Starting a New GCC Project for SAM (ARM) Device
1. Create a new project by selecting New Project from the Project menu. This will open the Project
Wizard.
Atmel Studio 7 User Guide
Project Management
© 2018 Microchip Technology Inc. User Guide DS50002718A-page 106
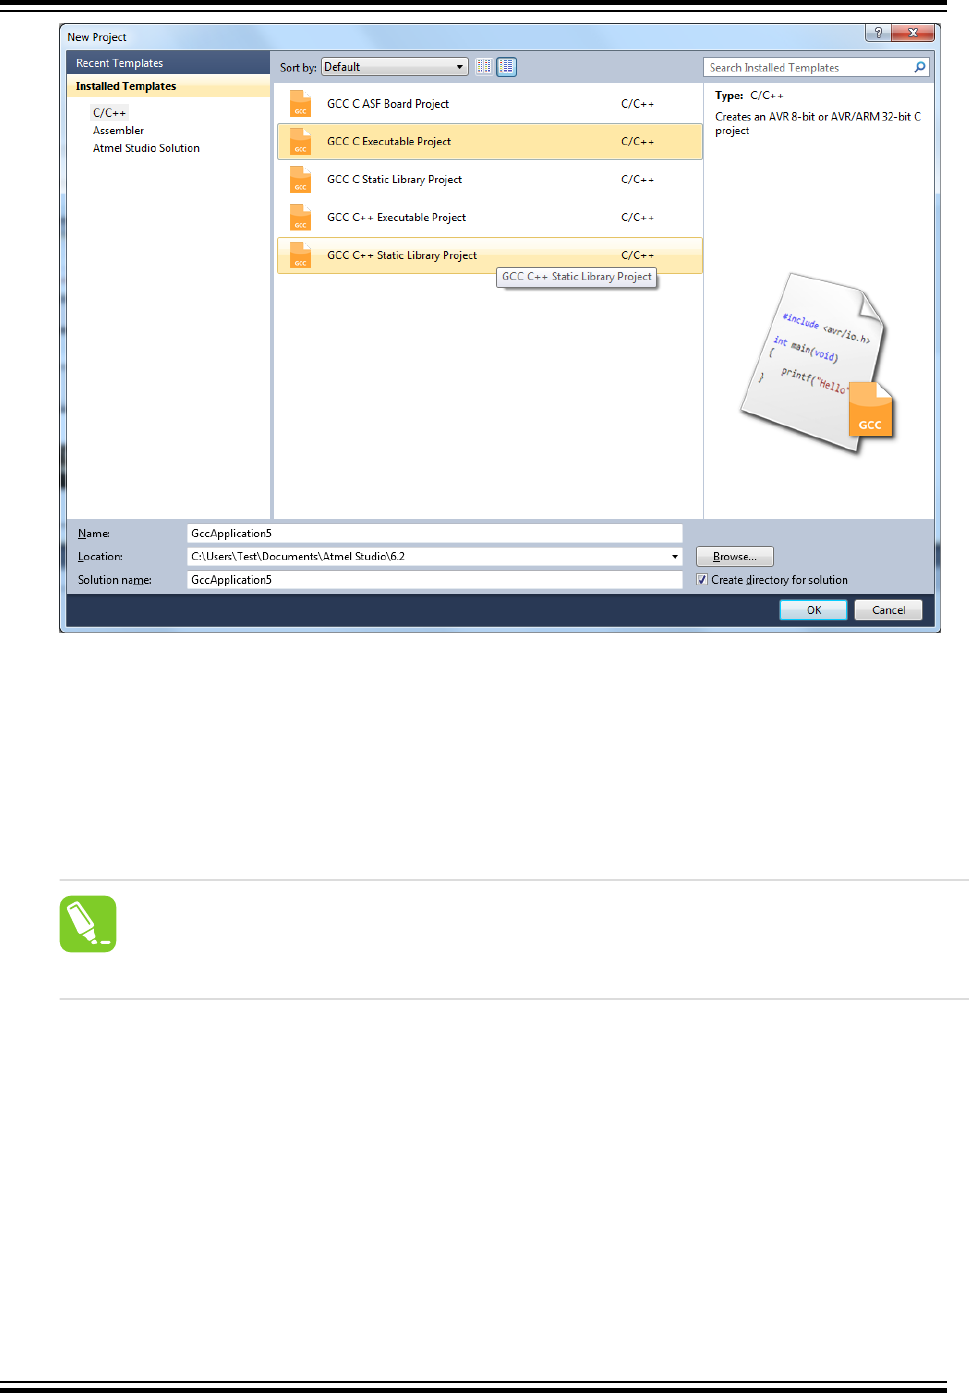
2. Select C/C++ → GCC C Executable Project as a template, then specify a project name, select a
location, and write a solution name for the project. Some start-up files will be added to the project
by default, which will contain some device specific functions and libraries. Press OK when you are
satisfied with the settings.
3. Select C/C++ → GCC C Static Library Project as a template, then specify a project name, select
a location, and write a solution name for the project. This creates a Static Library (LIB) project,
which is a good way to reuse code.
Tip:
See section Static Library Project to learn more about Static Library projects.
4. A device selection table will appear. Choose the device family as SAM3 or SAM4 and select the
target platform for your project. To start you can select the ATSAM3S1A device.
Atmel Studio 7 User Guide
Project Management
© 2018 Microchip Technology Inc. User Guide DS50002718A-page 107
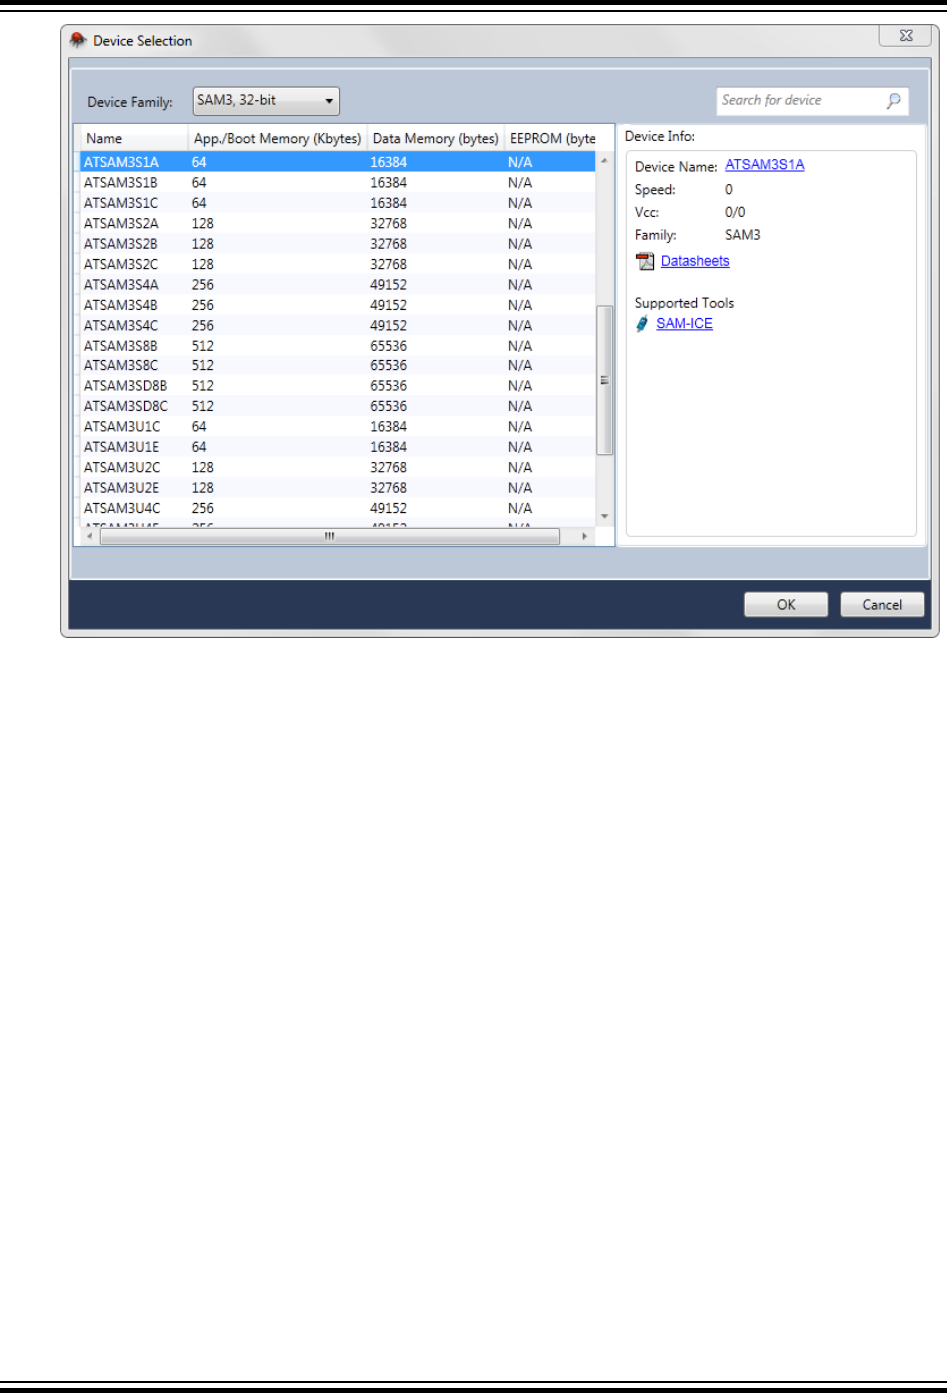
5. The project tree will be set up. Notice that the initial files created in step 2 have been added to the
project node. Also, the file containing main() function will be opened in the editor.
Here is a list of files that will be created:
– A file with the same name as the project will be created and added to the project by default. It
will contain the main() function.
– A startup file(startup_*.c) will be available at 'cmsis\src' directory. It contains the default
interrupt handlers for all the peripherals.
– A system file(system_*.c) available at 'cmsis\src' provides the system level initialization
functions that are called on start-up
– Linker scripts with appropriate sections based on the device will be created at 'cmsis
\LinkerScripts' directory in the project folder
– In case if you have deleted any files in cmsis folder and want to revert it back or if you have
changed the device, just right click the Project and click 'CMSIS Update from Atmel' to get the
appropriate files.
Atmel Studio 7 User Guide
Project Management
© 2018 Microchip Technology Inc. User Guide DS50002718A-page 108
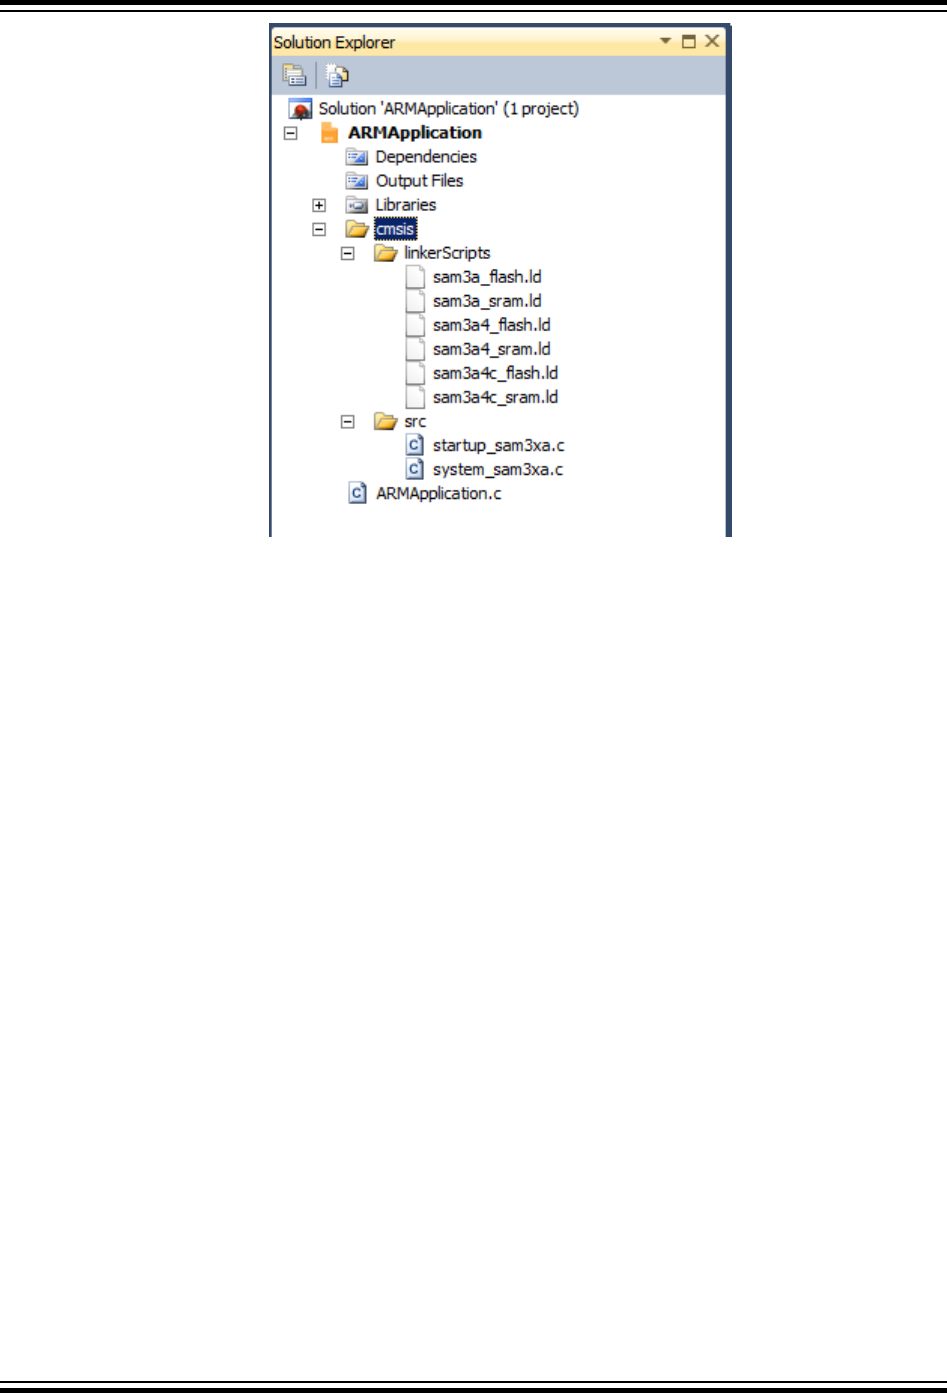
Note: It is recommended not to change the contents of the startup_*.c and system_*.c files unless
you have no other choice. These startup, system, and linker scripts will not be created for ARM
static library projects.
6. In order to facilitate applications development and verification, you can also use the Driver
Selection Wizard, invoked from Project → ASF Wizard.
Atmel Studio 7 User Guide
Project Management
© 2018 Microchip Technology Inc. User Guide DS50002718A-page 109

In the ASF Wizard you can select which Drivers, Components, and Services you would like to use
in the project for current build architecture and board.
7. Now, write the following code into the open editor window:
#define MAXINT 200000
int main(void)
{
unsigned int t=1000, k=0, l=5, pn=2;
unsigned int primes[t];
primes[0]=2;
primes[1]=3;
while (pn < t || primes[pn] < MAXINT)
{
for ( k = 0; k <= pn; k++)
{
if (l % primes[k] == 0)
{
goto otog;
}
else
{
if (k == pn)
primes[pn++]=l;
}
}
otog:
l += 2;
}
return 0;
}
8. Build the project.
Atmel Studio 7 User Guide
Project Management
© 2018 Microchip Technology Inc. User Guide DS50002718A-page 110

3.2.5 Code Editing
For the following part of the introduction, we will reuse the same code as you have previously seen.
#define MAXINT 200000
int main(void)
{
unsigned int t=1000, k=0, l=5, pn=2;
unsigned int primes[t];
primes[0]=2;
primes[1]=3;
while (pn < t || primes[pn] < MAXINT)
{
for ( k = 0; k <= pn; k++)
{
if (l % primes[k] == 0)
{
goto otog;
}
else
{
if (k == pn)
primes[pn++]=l;
}
}
otog:
l += 2;
}
return 0;
}
Atmel Studio has a rich editor that is made even richer by Microchip and third-party plugins. Atmel Studio
has an automatic code generation faculty for snippets of C source code. To use it select and right click
the part of the code you wish to enclose in a conditional structure (like for,while,if … etc).
Using the code snippets you can add parts to your core source. In some snippets the variable names and
exit conditions are parametric within the IDE, so as if only one instance is changed all instances within the
snippet will also change, such is the case of for loop.
Table 3-1. Using 'Surround With'
⇒
⇒
Atmel Studio 7 User Guide
Project Management
© 2018 Microchip Technology Inc. User Guide DS50002718A-page 111

3.2.6 Starting a New GCC Static Library Project
3.2.6.1 Why Static Libraries
Static Libraries (LIB) is a good way to reuse code. Rather than re-creating the same routines/functions in
all the programs, the user can write them once and reference from the applications that need the
functionality.
3.2.6.2 Create New Static Library Project
Figure 3-12. New Static Library Project
Click OK to create the Static Library project. A default source file with the same name as the project will
be added to the solution. You may then write and compile your routines/functions. You can also add new
source files or header files into the project.
Open the Project Properties on the menu Project → 'Your_project_name Properties'. This menu item
is only available when a Static Library project is open. Select the Build property page. Here you will see
that the Artifact Type is selected as Static Library.
Atmel Studio 7 User Guide
Project Management
© 2018 Microchip Technology Inc. User Guide DS50002718A-page 112
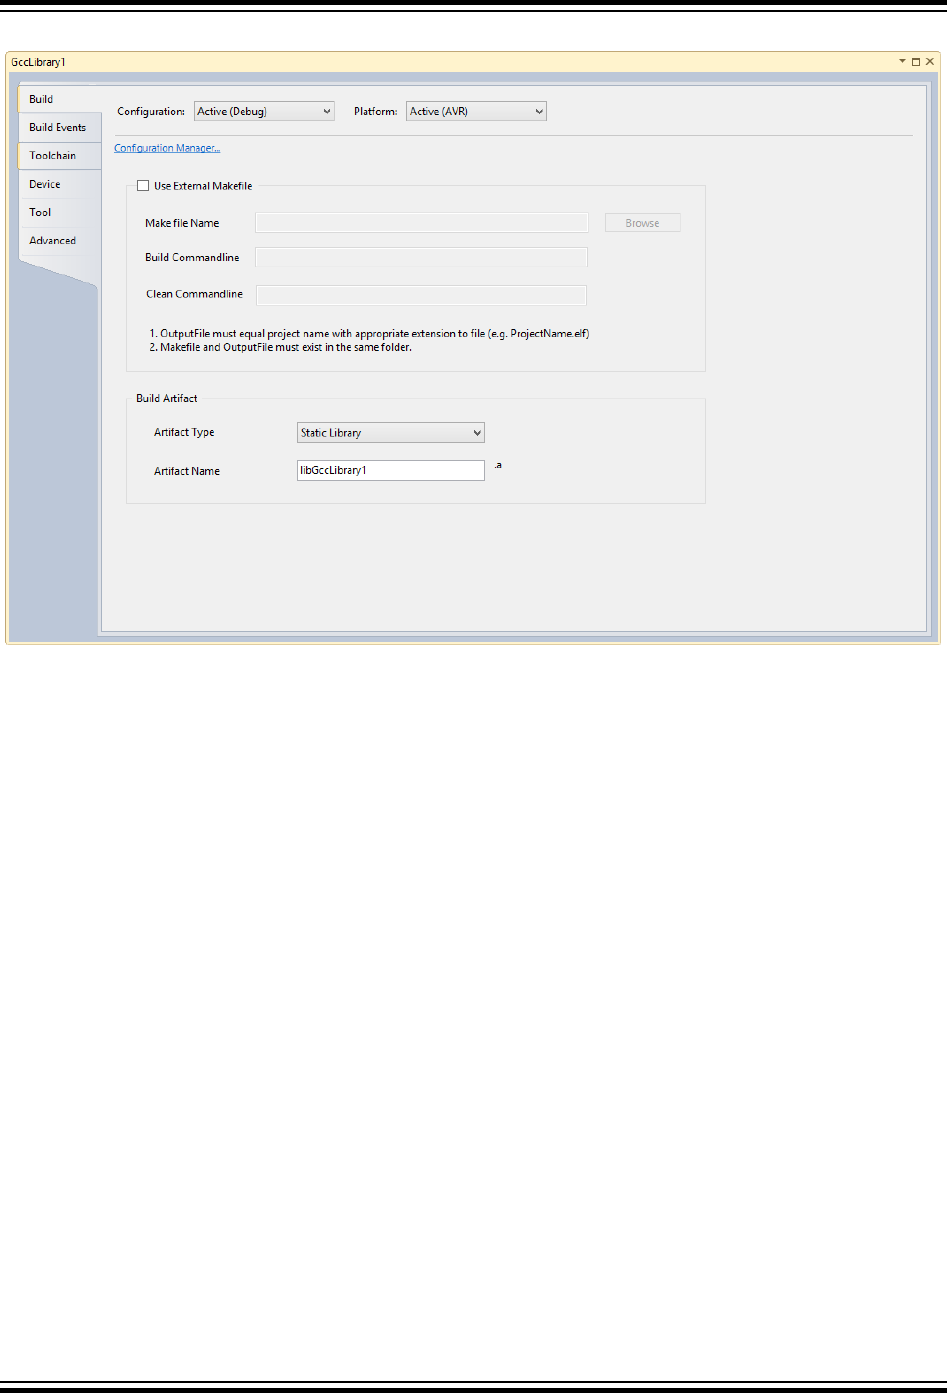
Figure 3-13. Static Library Build Properties
Compile the project by selecting Build Solution from the Build menu. This creates a Static Library, which
can be used by other programs.
3.2.6.3 Static Library Project Options (AVR/GNU Archiver)
The AVR/GNU archiver, avr-ar, combines a collection of object files into a single archive file, also known
as a library.
Open the Project Properties on the menu Project → 'Your_project_name Properties'. This menu item
is only available when a Static Library project is open. In order to configure Static Library options, click on
the Toolchain property tab.
In the Toolchain property page, you will see AVR/GNU Archiver active and enabled. You may also see
that the AVR/GNU Linker is disabled for a static library project.
Atmel Studio 7 User Guide
Project Management
© 2018 Microchip Technology Inc. User Guide DS50002718A-page 113
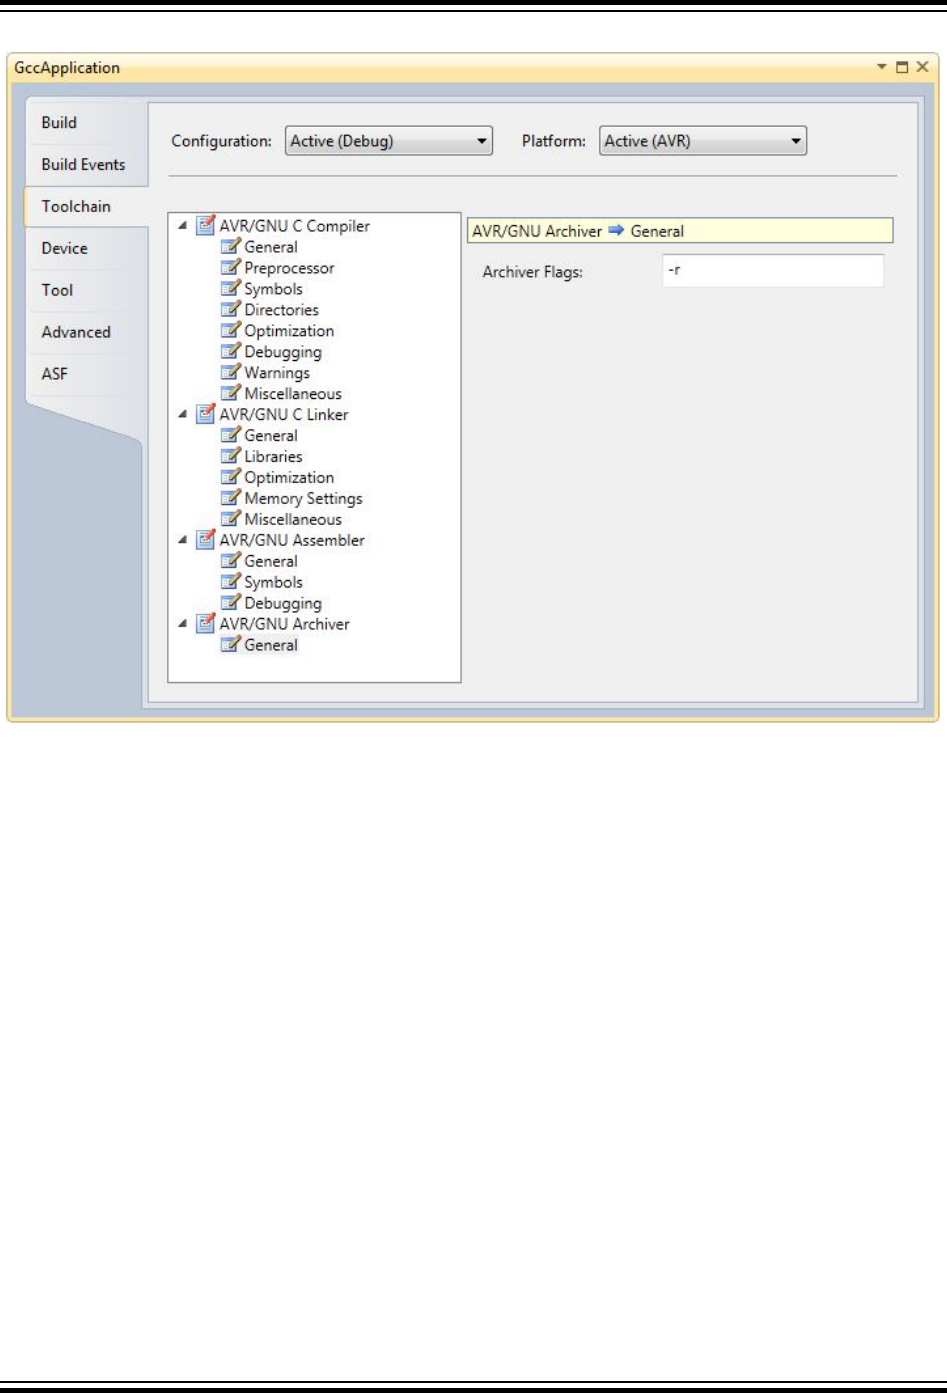
Figure 3-14. AVR/GNU Archiver Setup Dialog, Command Line Shown
You can set the AVR/GNU Archiver flags at the Archiver Flags textbox in the above General options.
Now, save the project and compile by selecting Build Solution from the Build menu.
3.2.7 GCC Project Options and Configuration
Project options and configuration can be set up by either right clicking on the Solution Explorer → Project
Properties, or by pressing Alt Enter .
This will call up the Project properties window, which has seven tabs.
If a tab supports properties that are configuration specific, then the tab has two slide-down menus. The
Configuration field defines the project configurations to modify. By default, two configurations are
provided in each project - Debug and Release. The Platform field is set to AVR. If a tab supports
configuration independent properties, then the Configuration and Platform fields are disabled.
Note: Use the 'Save All (Ctrl Shift S)' from the File menu or toolbar to update the changes in the project
file whenever changes are made.
Atmel Studio 7 User Guide
Project Management
© 2018 Microchip Technology Inc. User Guide DS50002718A-page 114

3.2.7.1 Build Options
Figure 3-15. Build Configuration
In the Build tab page, you can configure whether you want to use an external Makefile for your project. In
that case, just tick the Use External Makefile checkbox and browse to select the correct path of
makefile.
Build Commandline will be provided to the external makefile when build is invoked for the project. The
default build target is 'all'.
Clean Commandline will be provided to the external makefile when clean is invoked for the project. The
default clean target is 'clean'.
Besides the external makefile configuration, you can also specify the type of application to build. The
options are Executable or Static Library, which can be selected using the Artifact Type combo box.
Note: Custom makefile must fulfill these conditions:
1. Target name must the same as the project name.
2. Makefile and target must exist in the same folder (can be referenced with NTFS links too).
Atmel Studio 7 User Guide
Project Management
© 2018 Microchip Technology Inc. User Guide DS50002718A-page 115
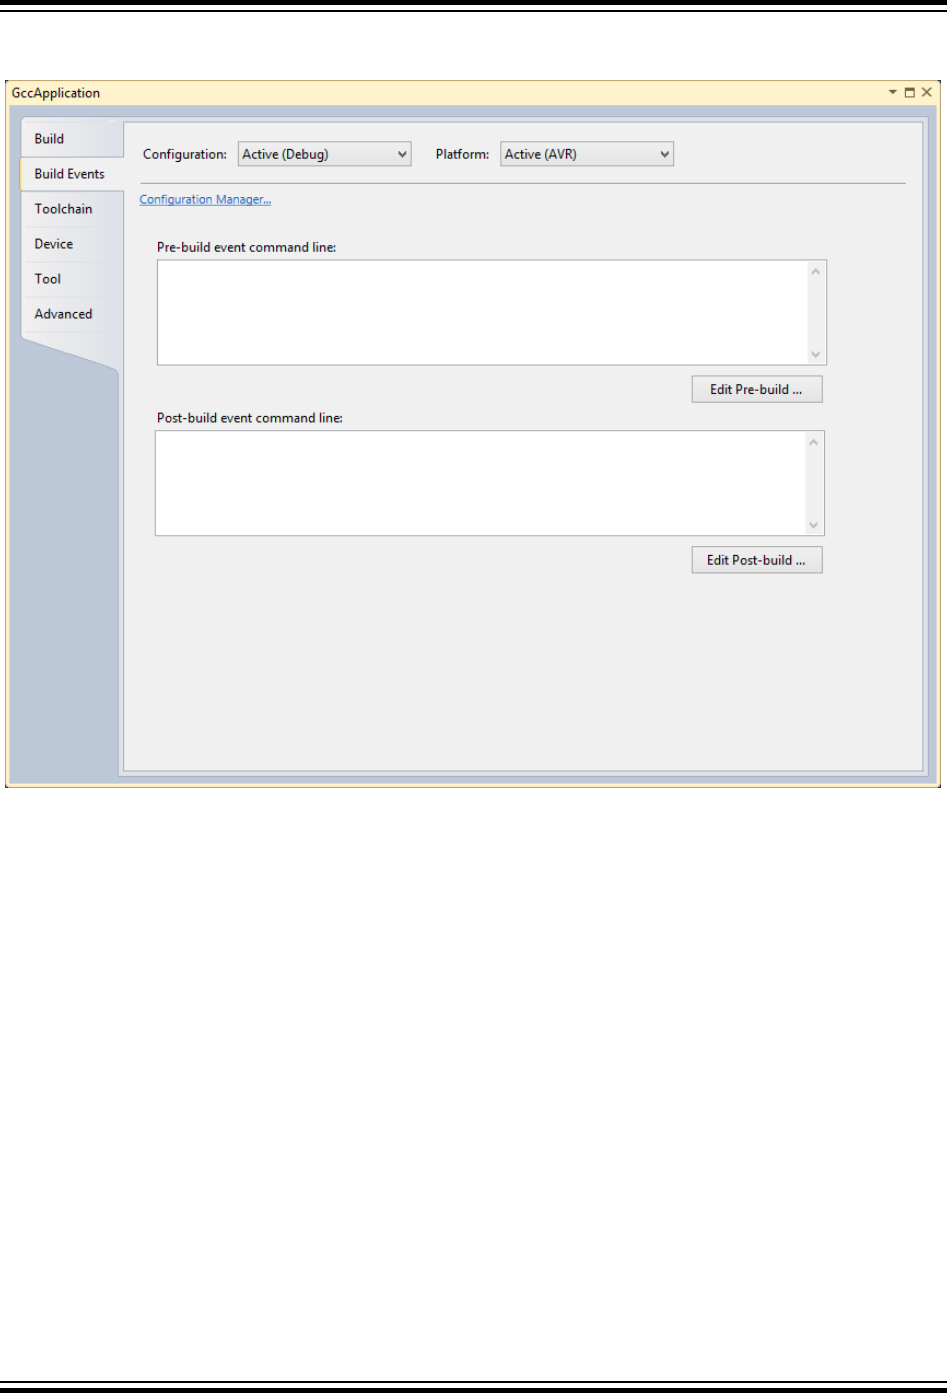
3.2.7.2 Build Events
Figure 3-16. Build Events Options
The Build events tab contains a list of scheduled events for each configuration, launched by the pre-
build and post-build scripts. These events can be added, deleted, or modified by clicking either the Edit
pre-build... or Edit post-build... buttons. Upon clicking these buttons, you should manually add your
commands in the following dialog. As of the current release, it is possible to use environment variables
and values declared within them as a link with other available applications. In order to use that function
press the Show Macros button.
Atmel Studio 7 User Guide
Project Management
© 2018 Microchip Technology Inc. User Guide DS50002718A-page 116
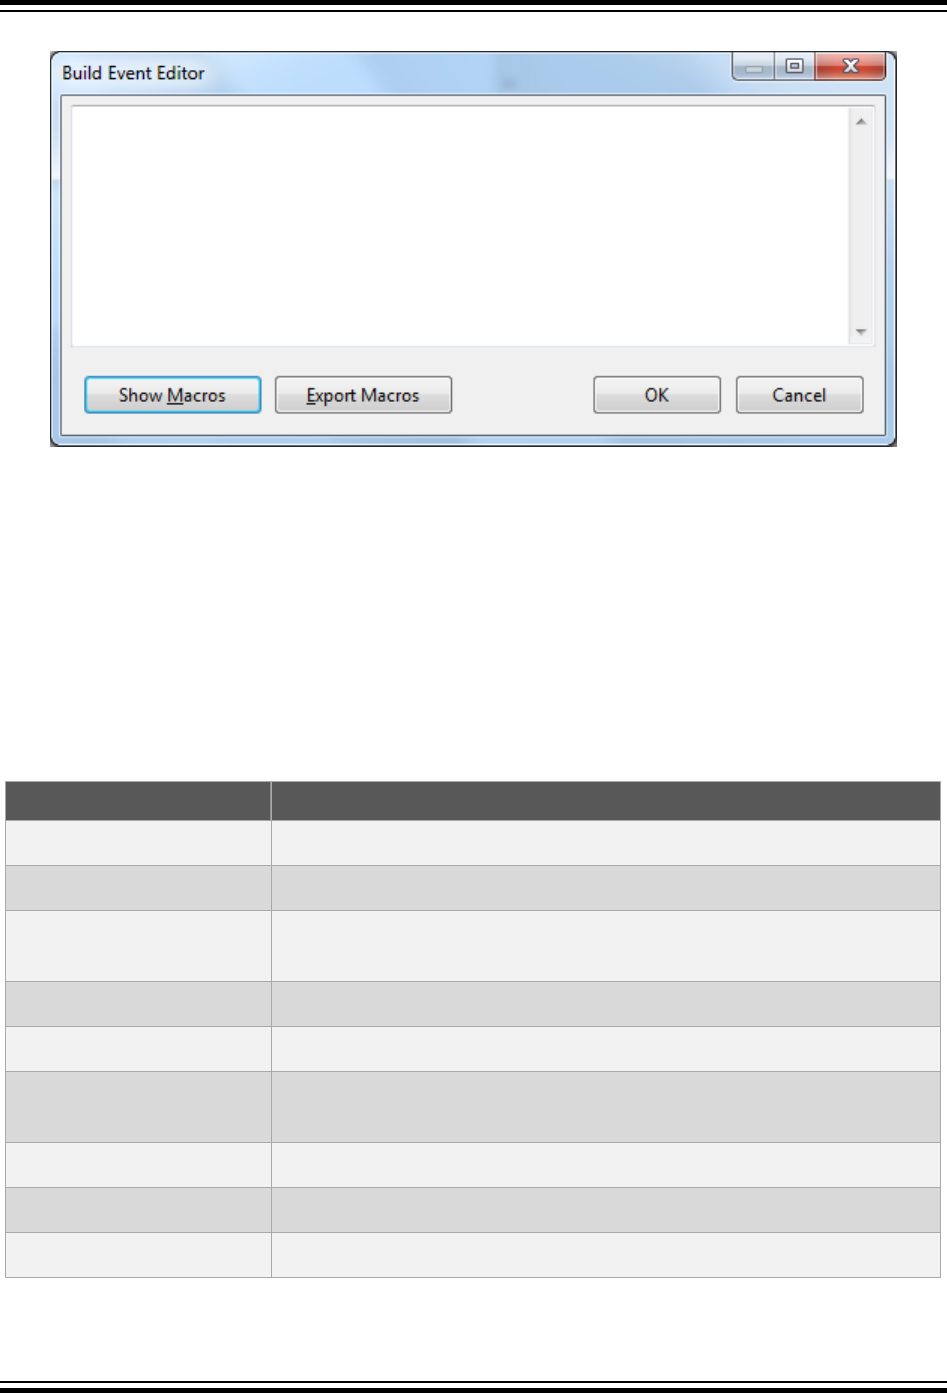
Figure 3-17. Build Event Editor
Macros
Expands the edit box to display the list of macros/environment variables to insert in the command line edit
box.
Macro Table
List the available macros/environment variables and its value. You can select only one macro at a time to
insert into the command line edit box. MSBuild also provides a set of reserved properties that store
information about the project file and the MSBuild binaries. These properties may also be listed in the edit
box.
See Macros/environment variables below for a description which are specific to Atmel Studio.
Table 3-2. Atmel Studio Build Macro Table
Macro Description
$(AVRSTUDIO_EXE_PATH) The installation directory of Atmel Studio (defined with drive and path)
$(SolutionDir) The directory of the solution (defined with drive and path)
$(SolutionPath) The absolute path name of the solution (defined with drive, path, base
name, and file extension)
$(SolutionFileName) The file name of the solution
$(SolutionName) The base name of the solution
$(SolutionExt) The file extension of the solution. It includes the '.' before the file
extension.
$(Configuration) The name of the current project configuration, for example, 'Debug'
$(Platform) The name of the currently targeted platform, for example, 'AVR'
$(DevEnvDir) The installation directory of Atmel Studio (defined with drive and path)
Atmel Studio 7 User Guide
Project Management
© 2018 Microchip Technology Inc. User Guide DS50002718A-page 117
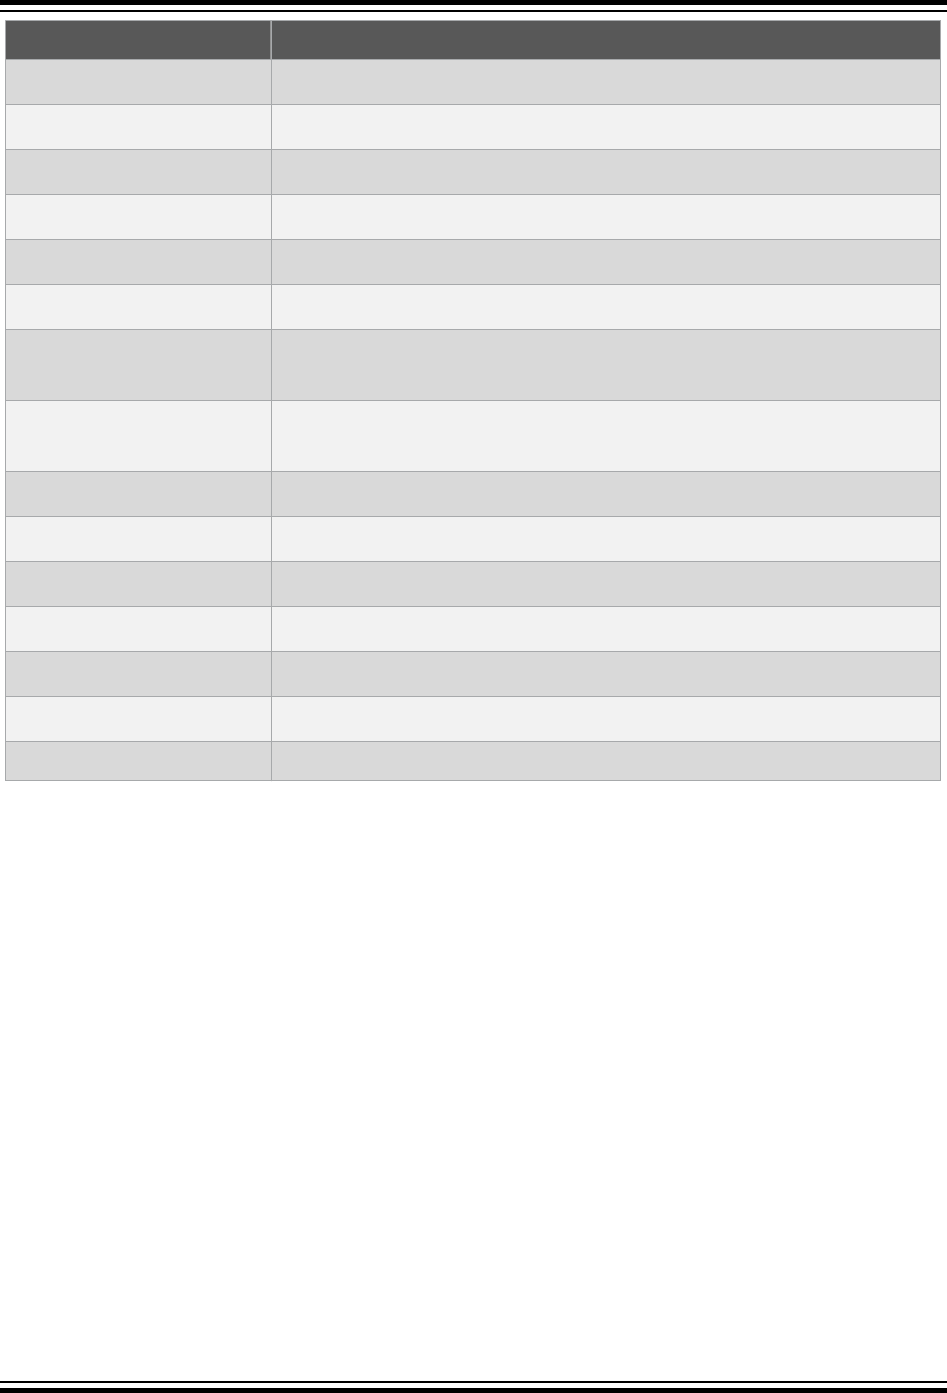
Macro Description
$(ProjectVersion) The version of the project
$(ProjectGuid) A unique identifier of the project
$(avrdevice) The name of the currently selected device
$(avrdeviceseries) The series of the selected device. Used internally by the Atmel Studio.
$(OutputType) Defines if the current project is an Executable or a Static Library type
$(Language) Language of the current project; for example, C, CPP, or Assembler
$(OutputFileName) The file name of the primary output file for the build (defined as base file
name)
$(OutputFileExtension) The file extension of the primary output file for the build. It includes the '.'
before the file extension
$(OutputDirectory) The absolute path of the output file directory
$(AssemblyName) The assembly name of the primary output for the build
$(Name) The base name of the project
$(RootNamespace) The base name of the project
$(ToolchainName) The name of the toolchain
$(ToolchainFlavour) The name of the toolchain's compiler
Macro Description
Atmel Studio 7 User Guide
Project Management
© 2018 Microchip Technology Inc. User Guide DS50002718A-page 118
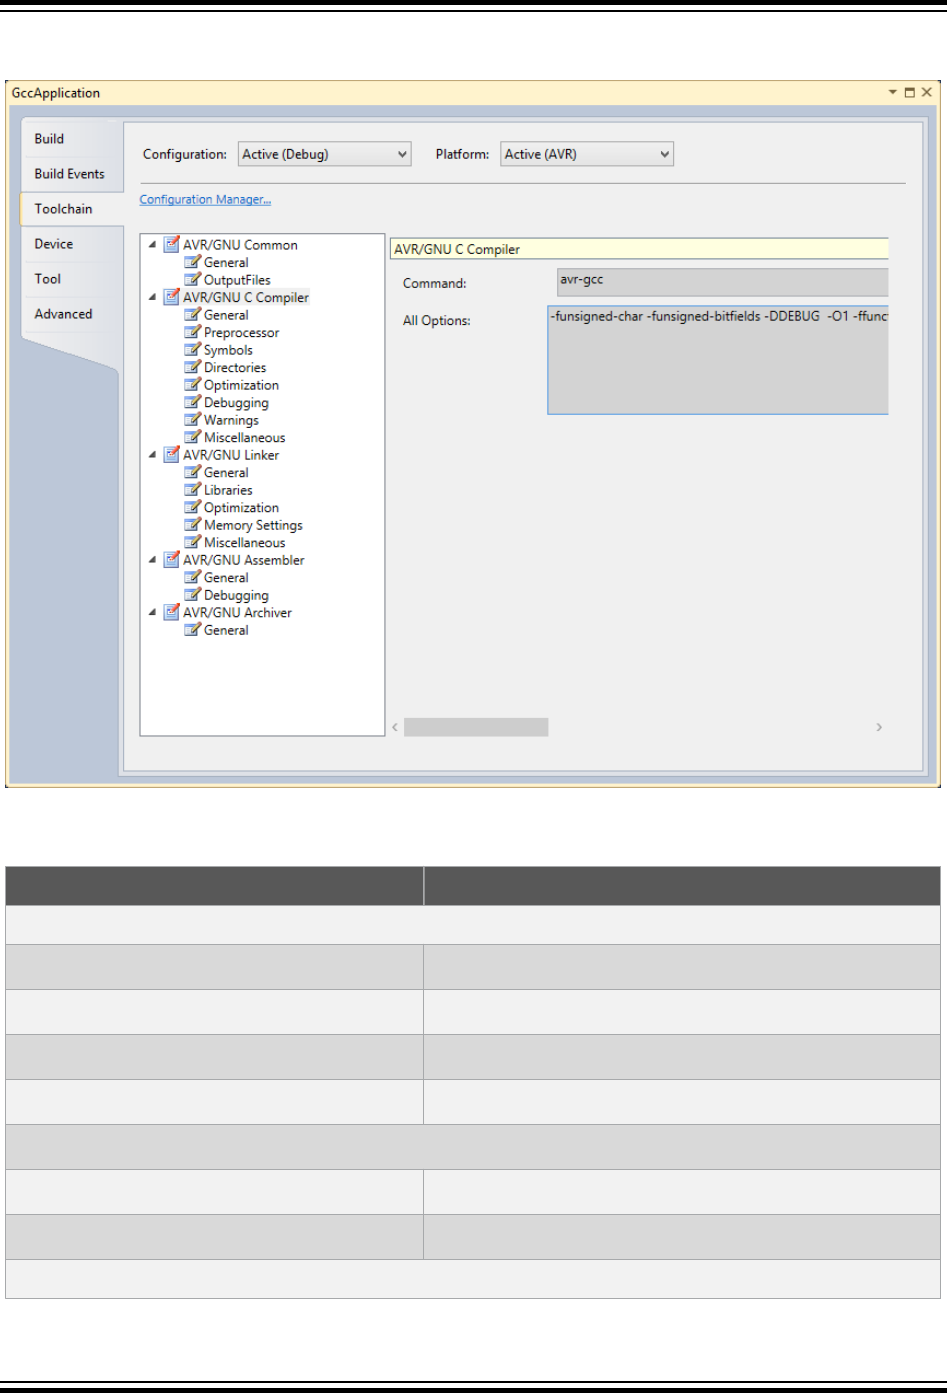
3.2.7.3 Compiler and Toolchain Options
Figure 3-18. Compiler and Toolchain Options
AVR GNU C Compiler Options
Table 3-3. AVR GNU C compiler Options
Option Description
General options
-mcall-prologues Use subroutines for functions prologues and epilogues
-mno-interrupts Change stack pointer without disabling interrupts
-funsigned-char Default char type is unsigned
-funsigned-bitfield Default bit field is unsigned
Preprocessor options
-nostdinc Do not search system directories
-F Preprocess only
Symbols options
Atmel Studio 7 User Guide
Project Management
© 2018 Microchip Technology Inc. User Guide DS50002718A-page 119
Option Description
Symbols in source can be defined (-D) or undefined (-U). New symbol declarations can be added,
modified, or reordered, using the interface buttons below:
•
Add a new symbol. This and all following icons are reused with the same meaning in other
parts of Atmel Studio interface.
•
Remove a symbol.
•
Edit symbol.
•
Move the symbol up in the parsing order.
•
Move the symbol down in the parsing order.
Include directories
Contains all the included header and definition directories, can be modified, using the same interface as
symbols.
Optimization options
Optimization level (drop-down menu): -O0, -
O1, -O2, -O3, -Os
No optimization, optimize for speed (level 1 - 3), optimize
for size
Other optimization flags (manual input form) Here you should write optimization flags specific for the
platform and your requirements
-ffunction-sections Prepare functions for garbage collection, if a function is
never used, its memory will be scrapped
-fpack-struct Pack structure members together
-fshort-enums Allocate only as many bytes as needed by the
enumerated types
-mshort-calls Use rjmp/rcall limited range instructions on the >8K
devices
Debug options
Debug level (drop-down menu): none, -g1, -
g2, -g3
Specifies the level of tracing and debugging code and
headers left or inserted in the source code
Other debug options (form field) Architecture specific debug options
Warning messages output options
-Wall All warnings
-Werror Escalate warnings to errors
-fsyntax-only Check syntax only
Atmel Studio 7 User Guide
Project Management
© 2018 Microchip Technology Inc. User Guide DS50002718A-page 120
Option Description
-pedantic Check conformity to GNU, raise warnings on non-
standard programming practice
-pedantic-errors Same as above, plus escalate warnings to errors
Miscellaneous options
Other flags (form field) Input other project-specific flags
-v Verbose
-ansi Support ANSI programs
-save-temps Do not delete temporary files
Option Description
AVR GCC Linker Options
Table 3-4. AVR GCC Linker Options
Option Description
-Wl -nostartfiles Do not use standard files
-Wl -nodefault Do not use default libraries
-Wl -nostdlib No start-up or default libraries
-Wl -s Omit all symbol information
-Wl -static Link statically
Libraries options
Libraries -Wl, -l (form field) You can add, prioritize, or edit library names here, using these
buttons: , , , ,
Library search path -Wl,-L (form field) You can add, prioritize or edit path where the linker will search for
dynamically linked libraries, same interface as above
Optimization options
-Wl, -gc-sections Garbage collect unused sections
--rodata-writable Put read-only data in writable spaces
-mrelax Relax branches
Miscellaneous options
Other linker flags (form field) Input other project-specific flags
Atmel Studio 7 User Guide
Project Management
© 2018 Microchip Technology Inc. User Guide DS50002718A-page 121
AVR Assembler Options
Table 3-5. AVR Assembler Options
Option Description
Optimization options
Assembler flags (form field) Miscellaneous assembler flags
Include path (form field) You can add, prioritize or edit path to the architecture
and platform specific included files here
-v Announce version in the assembler output
Debugging options
Debugging level (drop down menu) -Wa -g1, -
Wa, -g2, -Wa, -g3
Defines a level of debugging symbol and debugging
source insertion
3.2.7.4 Device Options
This tab allows you to select and change the device for the current project and is similar to the device
selector, see Figure 3-5.
Tip:
Click on the Device button on the Device and Debugger toolbar to get to this tab quickly while
editing.
Atmel Studio 7 User Guide
Project Management
© 2018 Microchip Technology Inc. User Guide DS50002718A-page 122
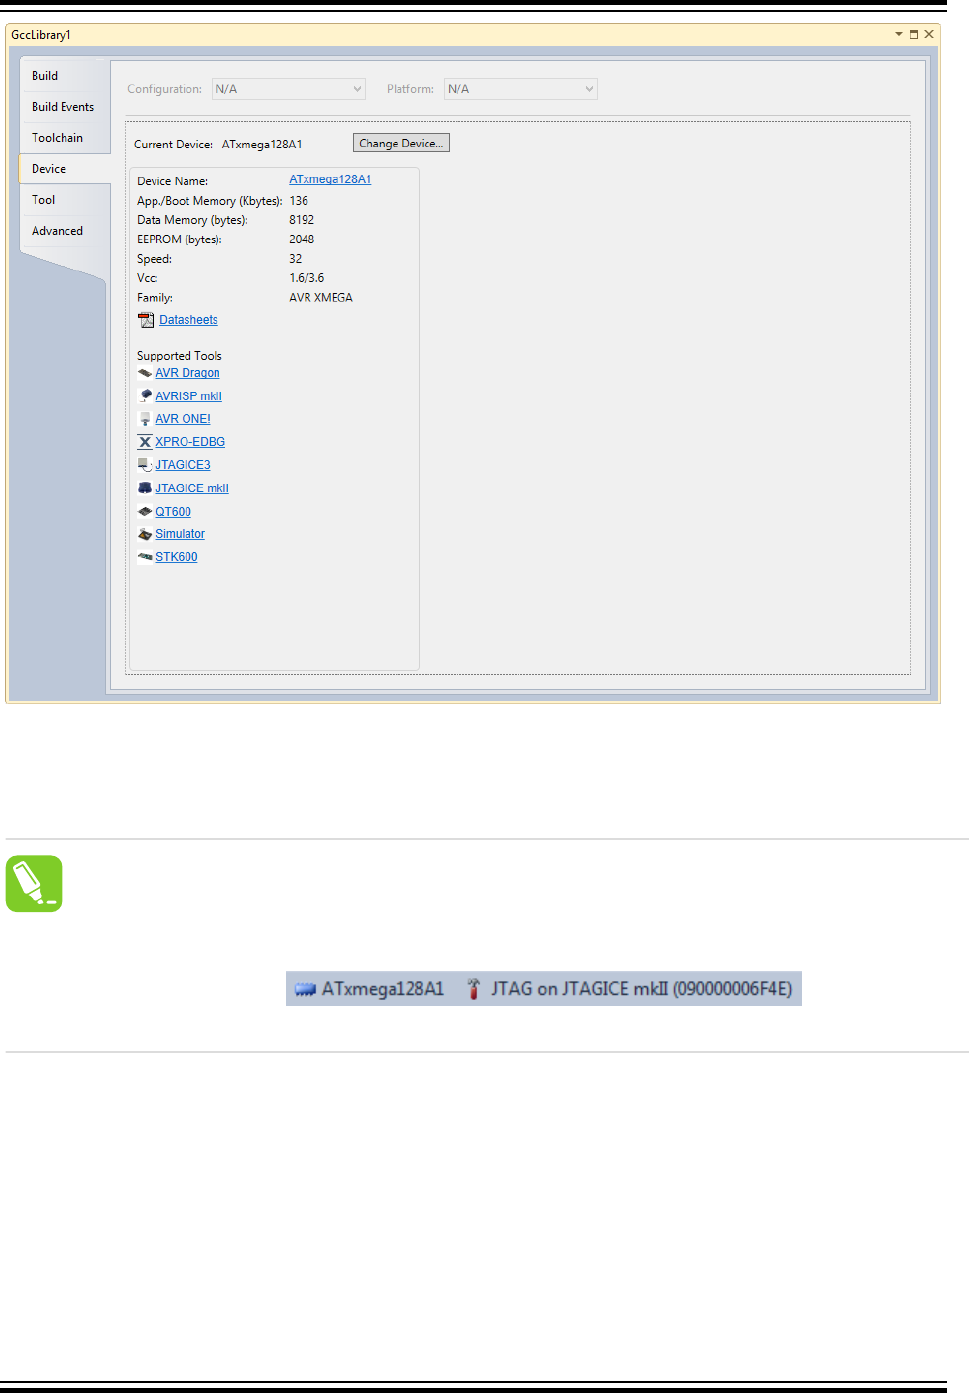
3.2.7.5 Tool Options
This tab allows you to select and change the debugger platform for the current project.
Tip:
Click on the Device button on the Device and Debugger toolbar to get to this tab quickly while
editing.
Atmel Studio 7 User Guide
Project Management
© 2018 Microchip Technology Inc. User Guide DS50002718A-page 123
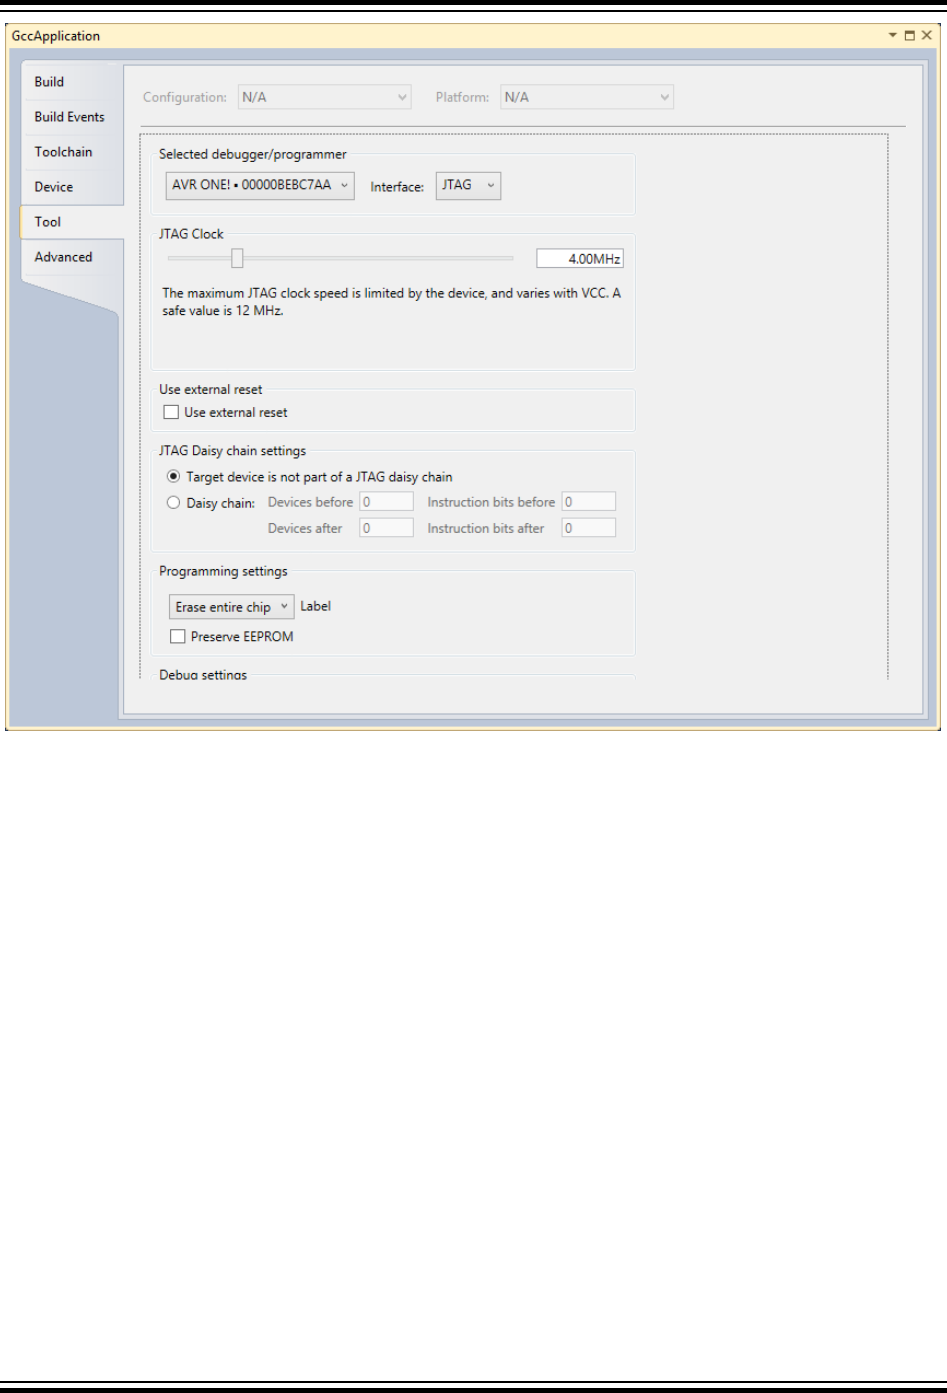
Select tool/debugger from the drop-down list. The current selection is shown.
Select Interface from the drop-down list. The current selection is shown.
Note: Only tools and interfaces valid for the current device selection are shown.
Further Properties are dependent on the tool and interface selected.
JTAG
If you have selected JTAG as the programming interface clock speed, use external reset - and daisy-
chain setting may be available. This depends on the tool and device.
JTAG clock
JTAG clock is the maximum speed the tool will try to clock the device at. The clock range is different for
different tools and devices. If there are restrictions, they will be stated in a message below the clock
slider.
The clock can be set to Manual (all tools), Auto (SAM-ICE only), or Adaptive (SAM-ICE only).
Use external reset
If checked, the tool will pull the external reset line low when trying to connect to the device.
JTAG daisy-chain settings
Atmel Studio 7 User Guide
Project Management
© 2018 Microchip Technology Inc. User Guide DS50002718A-page 124
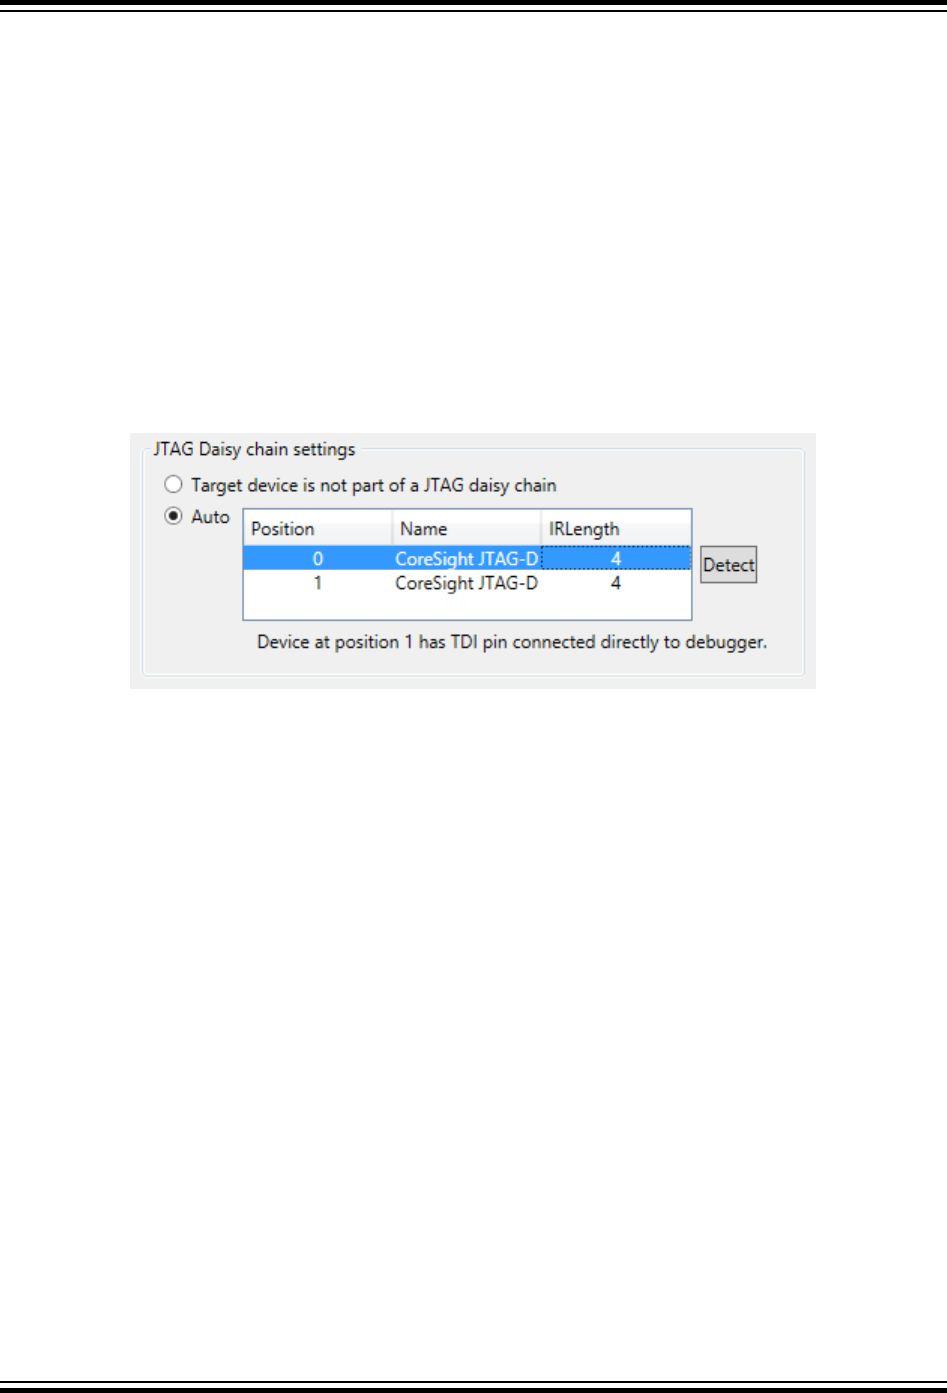
Specify the JTAG daisy-chain settings relevant to the device to program.
Target is not part of a daisy-chain. Select this option when the target device is not part of a daisy-chain.
Daisy chain - Manual. Allows you to manually configure the JTAG daisy-chain in case you are
programming in a system-on-board.
•Devices before - specifies the number of devices preceding the target device.
•Instruction bits before - specifies the total size of the instruction registers of all devices, preceding
the target device.
•Devices after - specifies the number of devices following the target device.
•Instruction bits after - specifies the total size of the instruction registers of all devices, following
the target device.
Daisy chain-Auto. Automatically detects the devices in the JTAG daisy-chain. Allows you to select the
device in the JTAG daisy-chain. Auto-detection is supported only for SAM devices.
PDI
The PDI interface has only one setting – the PDI clock speed.
PDI Clock is the maximum speed the tool will try to clock the device at. The clock range is different for
different tools and devices. If there are restrictions, they will be stated in a message below the clock
slider.
The clock cannot be adjusted on all tools, so an empty Interface settings page will be presented.
Programming and debug settings
In the drop-down menu, it is possible to specify which parts of memory that should be erased during a
programming/debug cycle.
•Skip programming - specifies that no programming should occur. The tool will try to attach to the
program already in memory.
•Erase only program area - specifies that only the program area of memory should be erased.
•Erase entire chip - specifies that the entire chip is to be erased.
The 'Preserve Eeprom' option lets you decide whether EEPROM data should be written when launching a
debug session. The EESAVE fuse will be set and cleared accordingly.
When a device is programmed at the start of a debug session, the default behavior is to erase the content
of the device (chip erase, if available). This can be changed by selecting a different option from the drop-
down box under 'Programming settings'.
Atmel Studio 7 User Guide
Project Management
© 2018 Microchip Technology Inc. User Guide DS50002718A-page 125

Keep timers running in stop mode
When checked, the timers set in the program will continue to run even when the program breaks at
breakpoint or is halted
This setting is enabled for only certain tool/interfaces.
Override Vector Table Offset Register
At reset, load PC and SP from the specified address.
Note: The tool you select on this page is also used with the command Start without Debugging. That
is why you can also select tools that do not have debugging capabilities. See Start without Debugging for
more information.
3.2.7.6 Advanced Options
Setting Toolchain Flavours
The Toolchain path configured in the flavor is used for building the projects. It is possible to add a new
toolchain flavour to the current project. For configuring and adding new flavors see Toolchain.
Use GDB
This section allows you to select whether GDB has to be used for the current project. The Current GDB
Path will be computed by the following
1. The Current GDB Path is taken from 'Tools → Options → Debugger → GDB Settings.
2. Otherwise, it is taken from selected Toolchain Flavor if GDB is found there.
The Current GDB Path will be overridden when we use the option 'Override Current GDB Path' in the
'Advanced' project property page, see figure below.
Atmel Studio 7 User Guide
Project Management
© 2018 Microchip Technology Inc. User Guide DS50002718A-page 126

Note: The option 'Use GDB' is enabled by default for ARM-based devices and also the following
warning will be shown for AVR 32-bit devices if GDB is enabled.
3.2.7.7 Creating ELF Files with Other Memory Types
ELF files that contain data for all memory types can be made with the GCC compiler. The data sections
are specified in code as shown in following code examples.
Creating ELF Files for tinyAVR, megaAVR, and XMEGA devices
This code shows how to add memory sections for tinyAVR, megaAVR, and XMEGA devices (except
ATtiny4/5/9/10). This example is for an ATxmega128A1 device. For other devices, it has to be modified
accordingly.
#include <avr/io.h>
// Example data for ATxmega128A1
const char eeprdata[] __attribute__ ((section (".eeprom"))) =
"Hello EEPROM";
// The order of the fuse values is from low to high. 0xA2 is written to Fuse byte 0, 0x00 to
byte 1...
Atmel Studio 7 User Guide
Project Management
© 2018 Microchip Technology Inc. User Guide DS50002718A-page 127
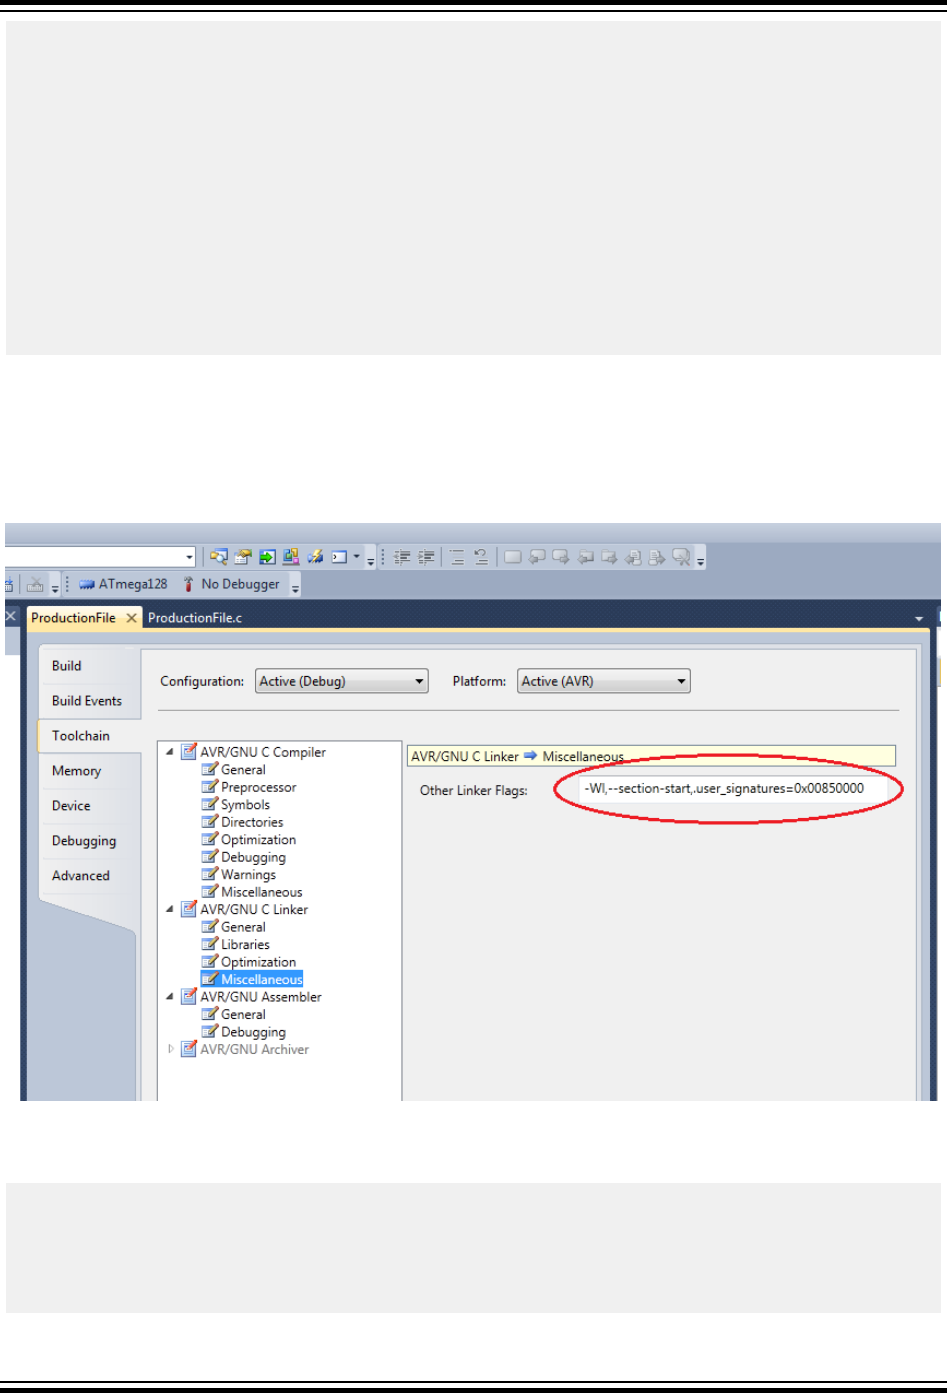
const uint8_t fusedata[] __attribute__ ((section (".fuse"))) =
{0xA2, 0x00, 0xFF, 0xFF, 0xFF, 0xF5};
const uint8_t lockbits[] __attribute__ ((section (".lockbits"))) =
{0xFC};
const char userdata[] __attribute__ ((section (".user_signatures"))) =
"Hello User Signatures";
// Remember to set the following Toolchain project options,
// under AVR/GNU -> Miscellaneous:
//
// -Wl,--section-start,.user_signatures=0x00850000
int main(void)
{
while(1)
{
// TODO:: Please write your application code
}
}
Linker setup for User Signature section
The User Signatures section must have a specific Linker Setup, as shown below. This is necessary to get
the correct address offset for the User Signature section in the elf file. Other memory sections get the
correct address automatically.
Figure 3-19. Linker Setup for User Signature Section
Creating ELF Files for ATtiny4/5/9/10
This code shows how to add memory sections for ATtiny10.
#include <avr/io.h>
typedef struct _tagConfig
{
unsigned char f1;
} Config;
Atmel Studio 7 User Guide
Project Management
© 2018 Microchip Technology Inc. User Guide DS50002718A-page 128

typedef struct _tagLock
{
unsigned char f1;
} Lock;
typedef struct _tagSig
{
unsigned char f1;
unsigned char f2;
unsigned char f3;
} Signature;
Config __config __attribute__((section(".config"))) =
{
f1 : 0xfb, // Set CKOUT
};
Lock __lock __attribute__((section(".lock"))) =
{
f1 : 0xfc, // Further programming and verification disabled
};
Signature __sig __attribute__((section(".signature"))) =
{
f1 : 0x03,
f2 : 0x90,
f3 : 0x1e,
};
int main(void)
{
while(1)
{
// TODO:: Write your application code
}
}
Creating ELF Files for UC3
The example below shows how to add data for the user page in UC3 devices.
#include <avr/io.h>
const char userdata[] __attribute__((section(".userpage"))) = "Hello Page";
int main(void)
{
while(1)
{
//TODO:: Write your application code
}
}
Project Properties
If the memory sections are defined but not referenced in the application code, the 'Garbage collect
unused sections' option in Project Properties → Linker → Optimization must be unchecked. Otherwise,
the linker will not include the sections in the .elf file.
Atmel Studio 7 User Guide
Project Management
© 2018 Microchip Technology Inc. User Guide DS50002718A-page 129
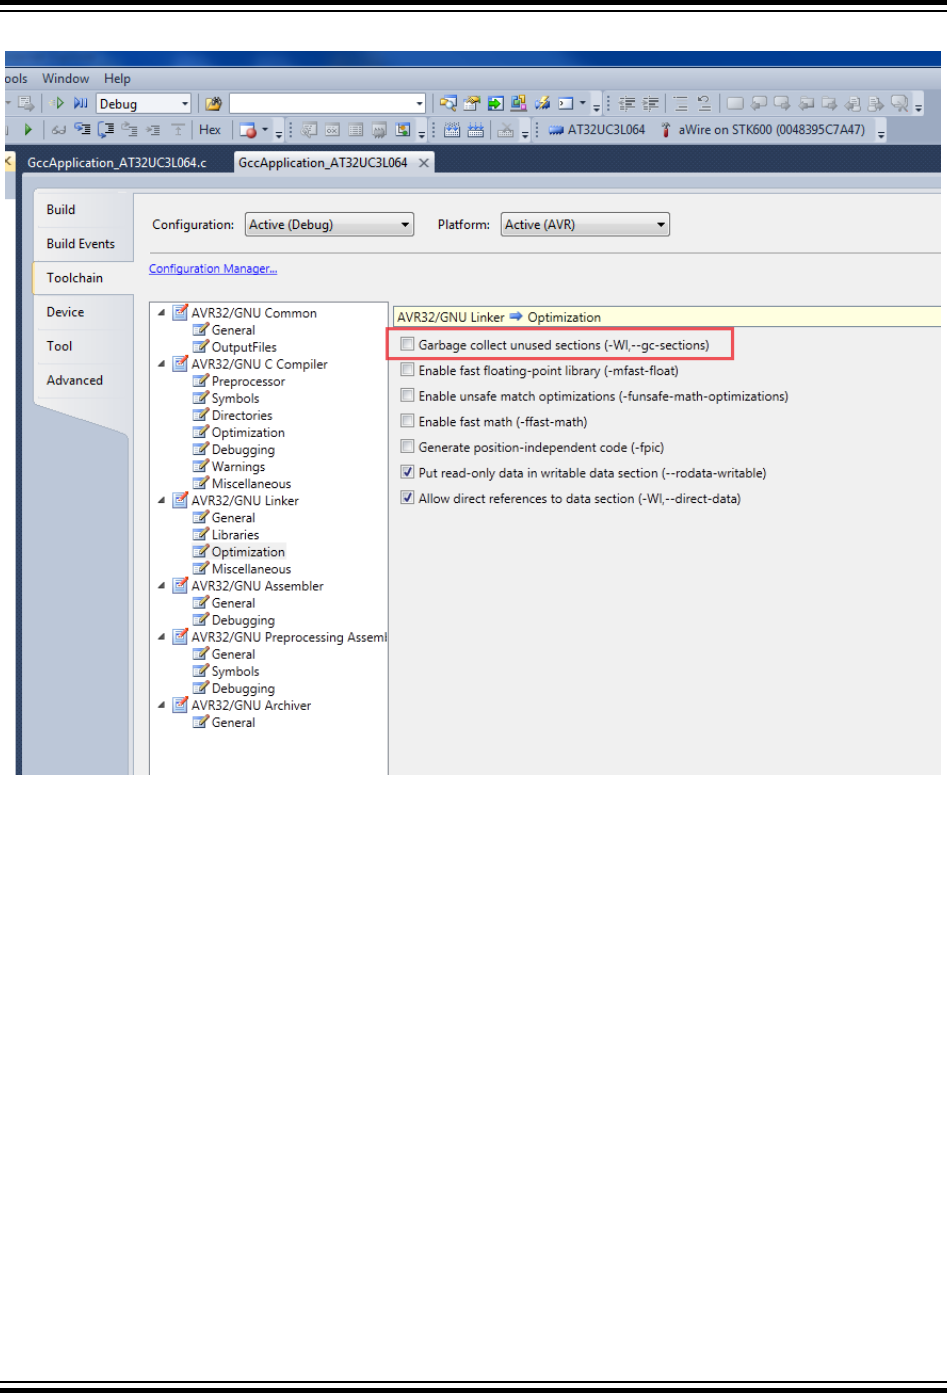
Figure 3-20. Project Properties
Atmel Studio 7 User Guide
Project Management
© 2018 Microchip Technology Inc. User Guide DS50002718A-page 130
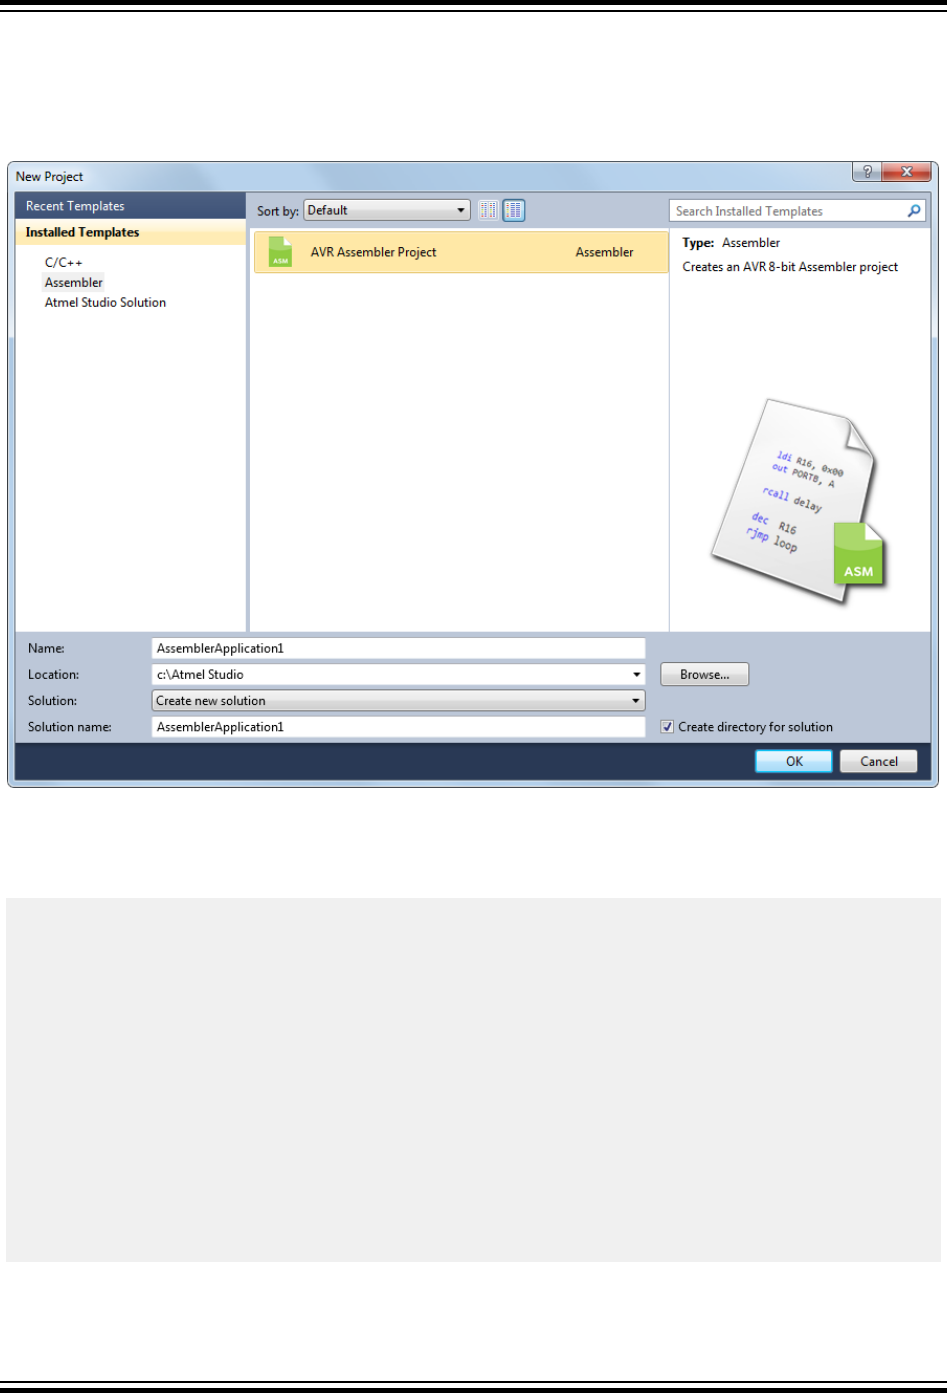
3.3 Assembler Projects
3.3.1 Create New Assembler Project
Figure 3-21. New Assembler Project
After pressing OK, you are asked to select your microcontroller.
You can try out the Assembler build and code debugging, using a simple LED-chaser code, given below.
It should fit any AVR 8-bit microcontroller, simply change the port (in this case E) to your hardware.
start:
nop
ldi R16, 0xff
sts PORTE_DIR, r16
ldi r17, 0x80
output:
sts PORTE_OUT, r17
rol r17
ldi r16, 0x00
delay:
ldi r18, 0x00
delay1:
inc r18
brne delay1
inc r16
brne delay
break
rjmp output
Atmel Studio 7 User Guide
Project Management
© 2018 Microchip Technology Inc. User Guide DS50002718A-page 131
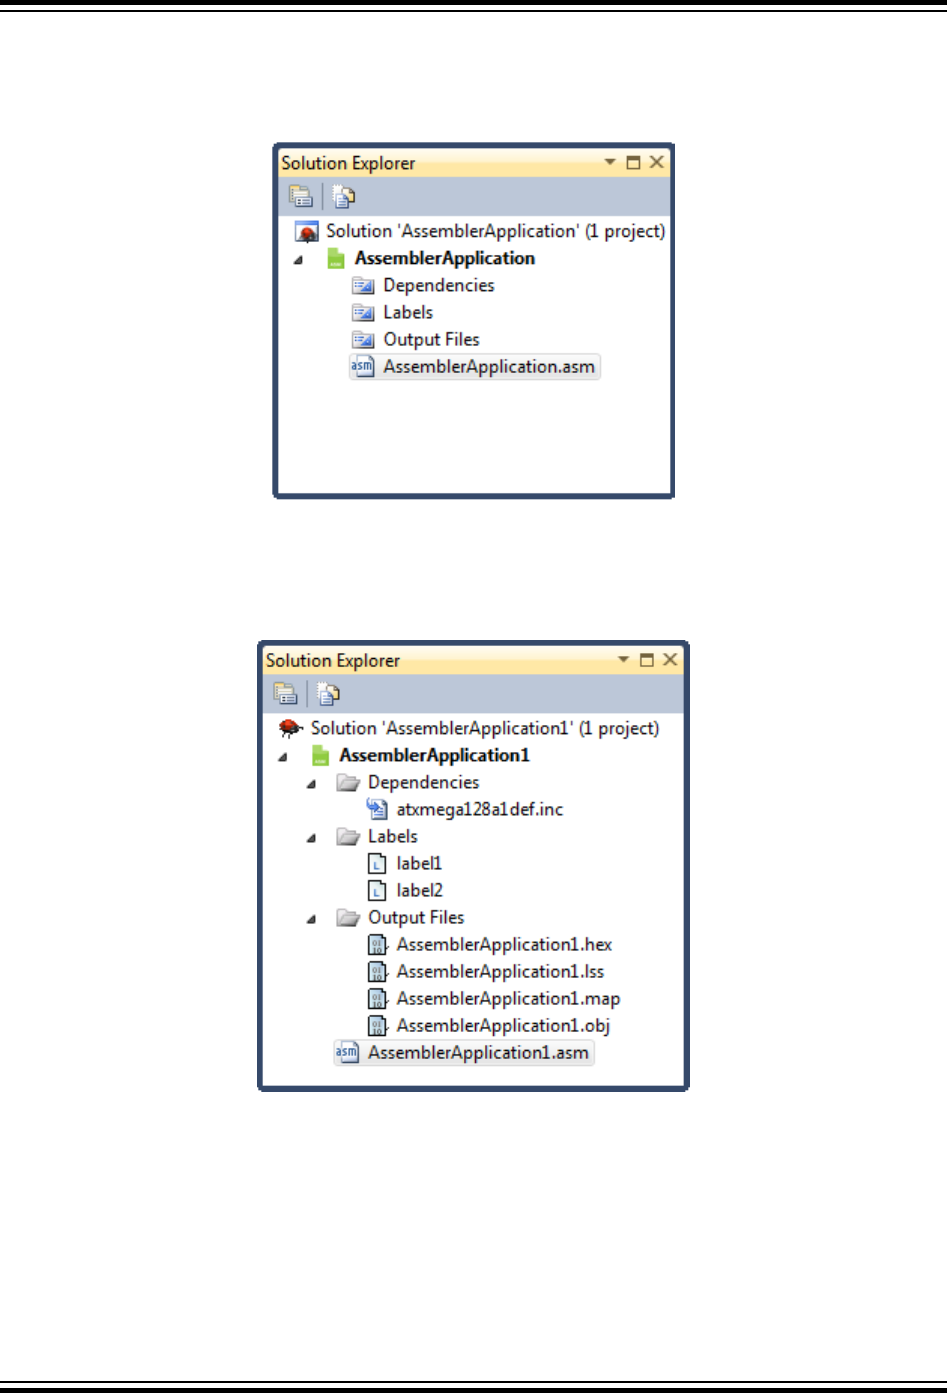
When a new project is created or an old project is loaded, the project view will be displayed with all the
project files. Files can be added, created, or removed from the project list using the context menu in the
Solution Explorer window.
Figure 3-22. View of an Assembler Project
All the source files will be listed at the end of the list. Double-click on any file to open it in the editor.
All custom include files will be listed directly under the project name item unless you create a new folder
in the project.
Figure 3-23. View of an Assembler Project after Build Completed
Dependencies: All include files are listed here. Double-click on any file to open it in the editor.
Labels: All labels in your assembler program are listed here. Double-click on any item to show its location
in the source. A marker will point to the correct line.
Output Files: All output files will be displayed below this item.
Atmel Studio 7 User Guide
Project Management
© 2018 Microchip Technology Inc. User Guide DS50002718A-page 132
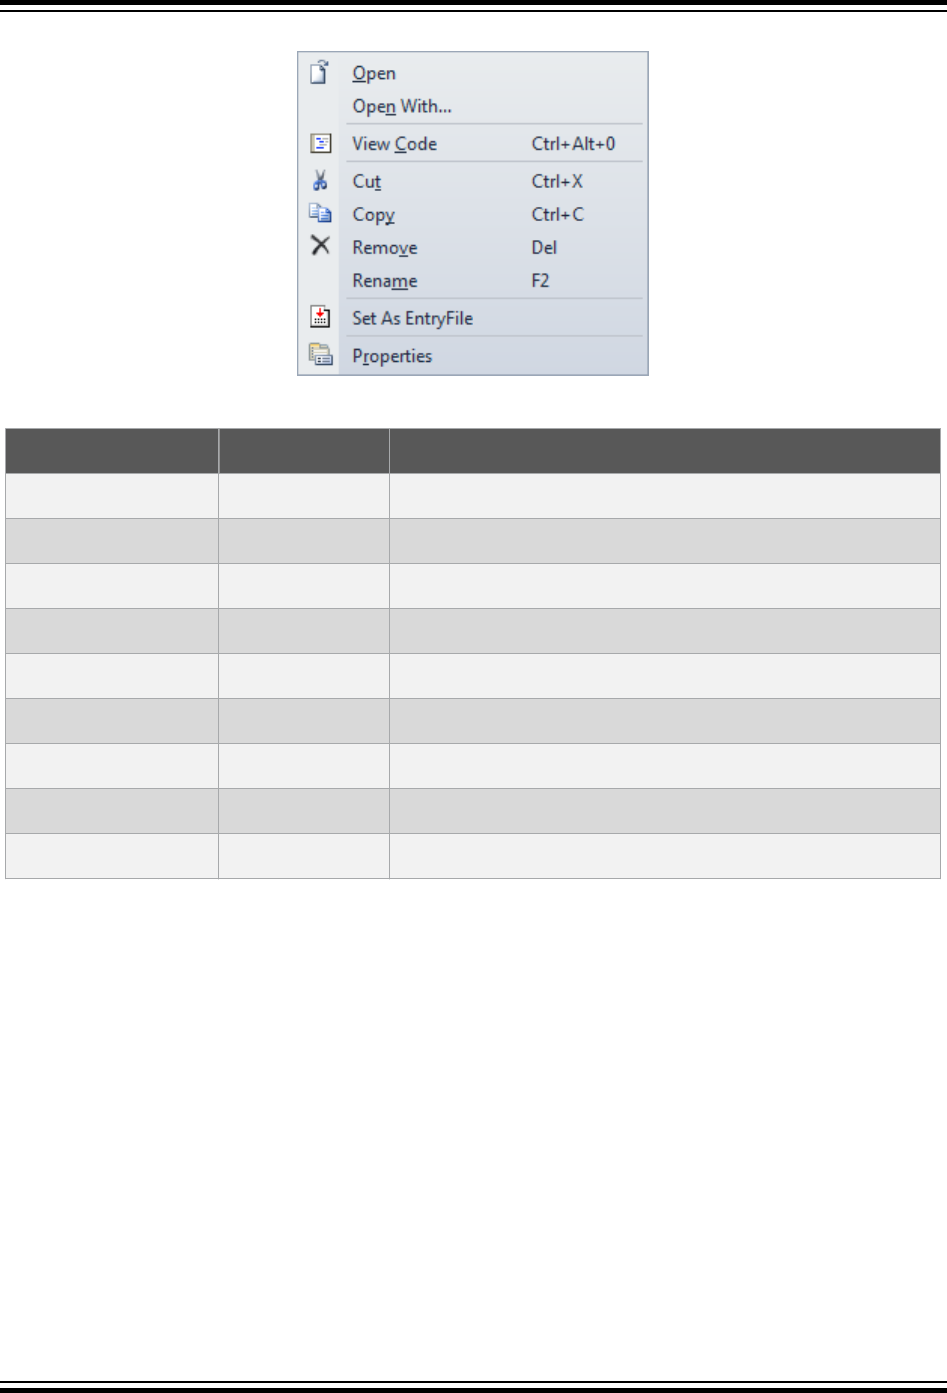
Figure 3-24. File Context Menu
Table 3-6. File Context Menu
Menu Text Shortcut Description
Open Right click O Open the selected file
Open With... Right click n Open selected file with another editor or tool
Cut Ctrl X Cut the file from current category
Copy Ctrl C Copy the file from current category
Remove DEL Remove the selected file from the project
Rename F2 Rename the selected file
Set As EntryFile Set the selected file as entry file
Properties Alt ENTER Current file properties
Menu text Shortcut Description
All the interface views are docked by default. You can switch between docked and undocked views by
dragging windows around to a desirable location, or by dragging and dropping a window on a quick
docking menu of the Visual Studio IDE. The quick docking menu will appear every time you start dragging
an interface view or window.
3.3.1.1 Project Context Menu
Several build commands are available from the menu and the toolbars. There is also a context menu for
the project:
Atmel Studio 7 User Guide
Project Management
© 2018 Microchip Technology Inc. User Guide DS50002718A-page 133
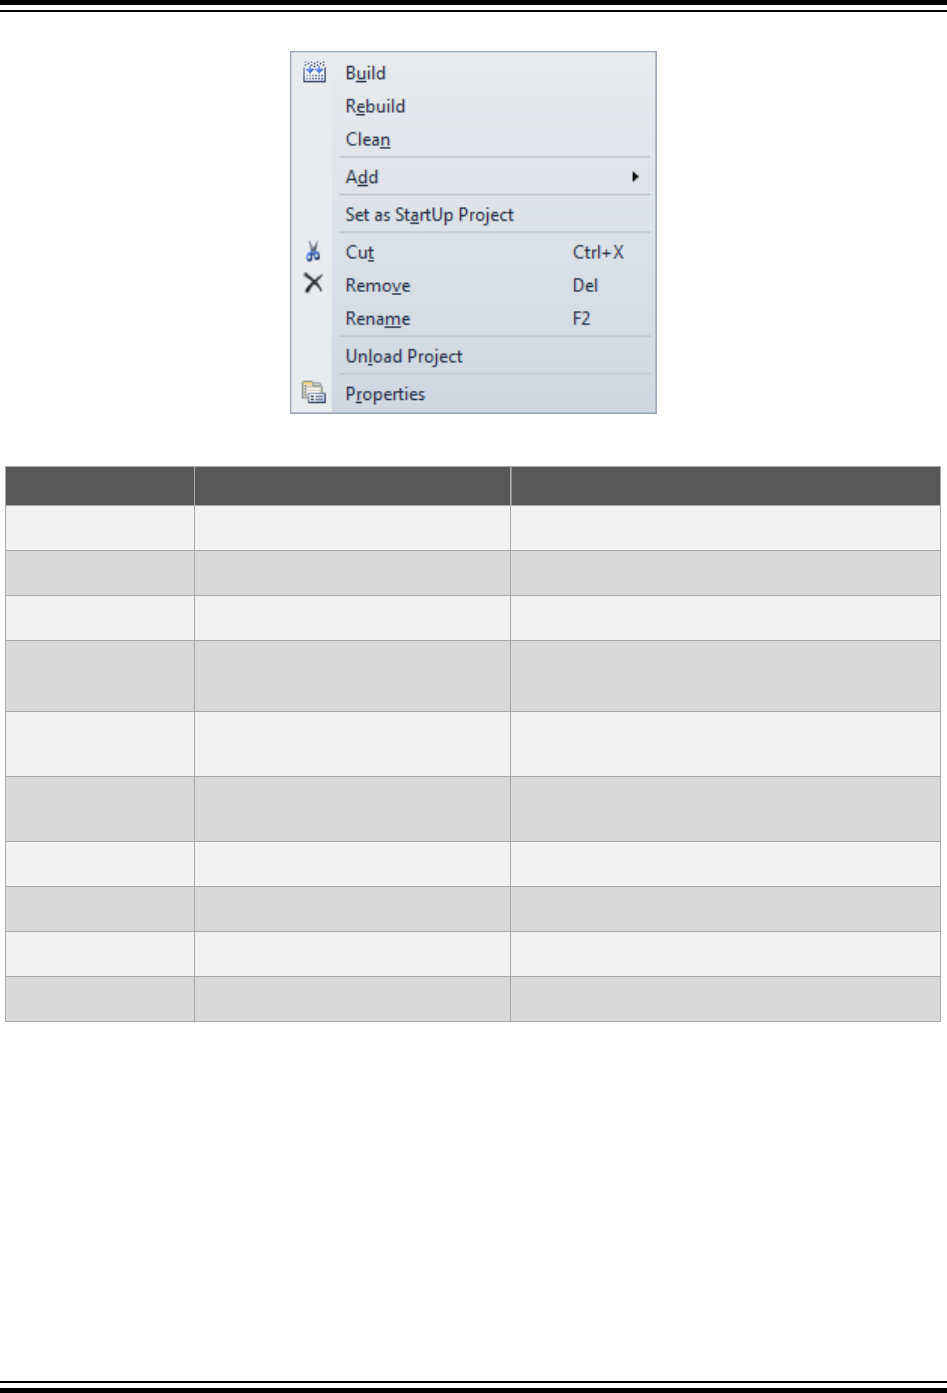
Figure 3-25. Project Context Menu
Table 3-7. Project Context Menu
Menu Text Shortcut Description
Build Right click+u Build the selected project
Rebuild Right click e Will clean the project and build it
Clean Right click n Clean up and erase artifacts
Add Ctrl Shift A/Shift Alt A (existing
item)
Add new files or existing files to the project
Set as StartUp
Project
Right click + a Will set up to automatically open current
project at start-up
Cut Ctrl X Cut project to paste it as a sub-project to
another solution
Remove Del Remove project or sub-project under cursor
Rename F2 Rename current project
Unload Project Right click l Unload active project files from the IDE
Properties Alt Enter Project properties
3.3.2 Assembler Options
Open the options window on the menu Project → 'Your_project_name Properties'. This menu item is
only available when an assembler project is open. After opening the Project properties window, you will
see six tabs, in order to configure assembler options click on the Toolchain.
Atmel Studio 7 User Guide
Project Management
© 2018 Microchip Technology Inc. User Guide DS50002718A-page 134

Figure 3-26. Assembler Setup Dialog, Command Line Shown
Figure 3-27. Assembler Setup Dialog, General Options Shown
3.3.2.1 Description of the Various Settings
Configuration menu allows choosing which stages of project maturity are going to be affected by the
modifications to the project properties. By default, Debug is the initial stage and initially active
configuration. The following options are available:
1. Debug.
2. Release.
Atmel Studio 7 User Guide
Project Management
© 2018 Microchip Technology Inc. User Guide DS50002718A-page 135

3. All configurations.
Platform menu shows compatible target platforms available for prototyping.
Hex Output format. The following file formats can be selected as additional output format:
1. Intel Hex.
2. Generic Hex.
3. Motorola Hex (S-record).
Wrap relative jumps. The AVR RJMP/RCALL instructions allow a 12-bit PC-relative offset,
corresponding to ±2k words. For devices having 4k words (8 kB) or less FLASH program memory, the
Wrap option causes the assembler's offset calculation to wrap around over the addressable program
memory range, enabling the entire program memory to be addressed using these instructions.
For devices with more than 4k words of program memory, using this option may cause unpredictable
results and it should be turned OFF. If it is left ON, the assembler will produce a warning when wrap takes
effect:
Attention:
Wrap rjmp/rcall illegal for device > 4k words - Turn off wrap option and use jmp/call.
This diagnostic is given as a warning and not an error to retain compatibility with earlier versions of the
assembler, but should be treated as an error by the user. The JMP/CALL 2-word instructions take 22-bit
absolute addresses and should be used instead.
Unsupported Instructions. By default, this option is set to give a warning when the assembler finds
unsupported instructions for the actual device. Optionally, you can output an error.
Include Paths (-I). Additional include paths can be set here when using third-party modules or your own
IP.
Other optimization flags can be set to tailor optimization to your specific needs, see Assembler help for
more information (Help > View Help > AVR Assembler Help).
3.4 Import of Projects
3.4.1 Introduction
Atmel Studio allows import of projects from several pre-existing project sources. This section details how
to import existing projects.
3.4.2 Import AVR Studio 4 Project
Click the menu File → Import → AVR Studio 4 Project.. or Ctrl+4.
Atmel Studio 7 User Guide
Project Management
© 2018 Microchip Technology Inc. User Guide DS50002718A-page 136
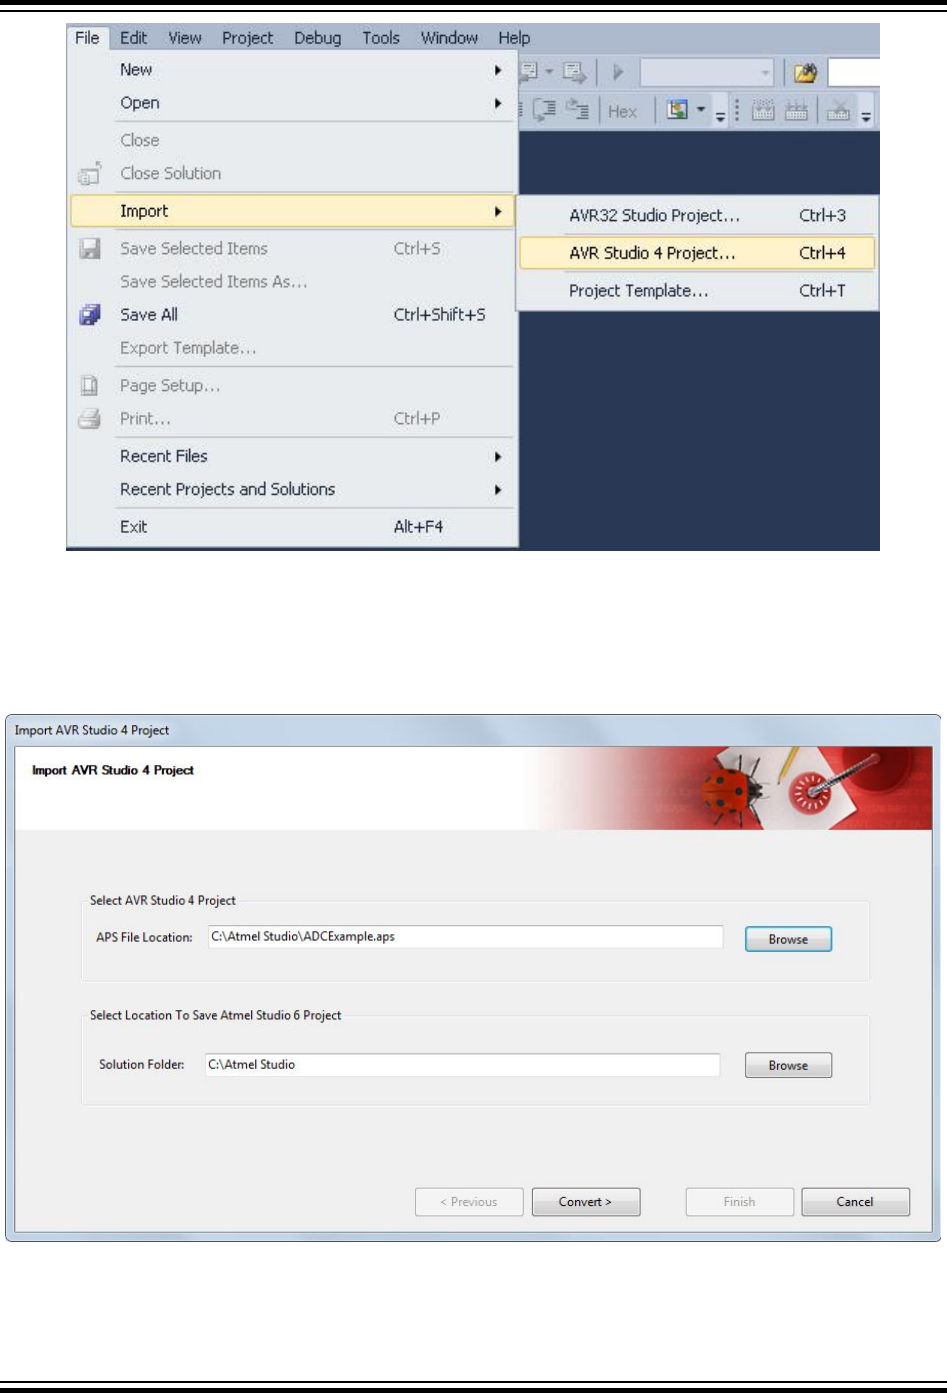
An Import AVR Studio 4 Project dialog will appear.
Type the name of your project or browse to the project location by clicking the Browse button of the APS
File location Tab.
Atmel Studio 7 User Guide
Project Management
© 2018 Microchip Technology Inc. User Guide DS50002718A-page 137

Atmel Studio will proceed with conversion, giving updates the progress. Warnings and errors will be
shown in the Summary window.
Check Show conversion log after this page is closed to view the complete conversion log.
Click Finish to access your newly converted project.
Atmel Studio 7 User Guide
Project Management
© 2018 Microchip Technology Inc. User Guide DS50002718A-page 138
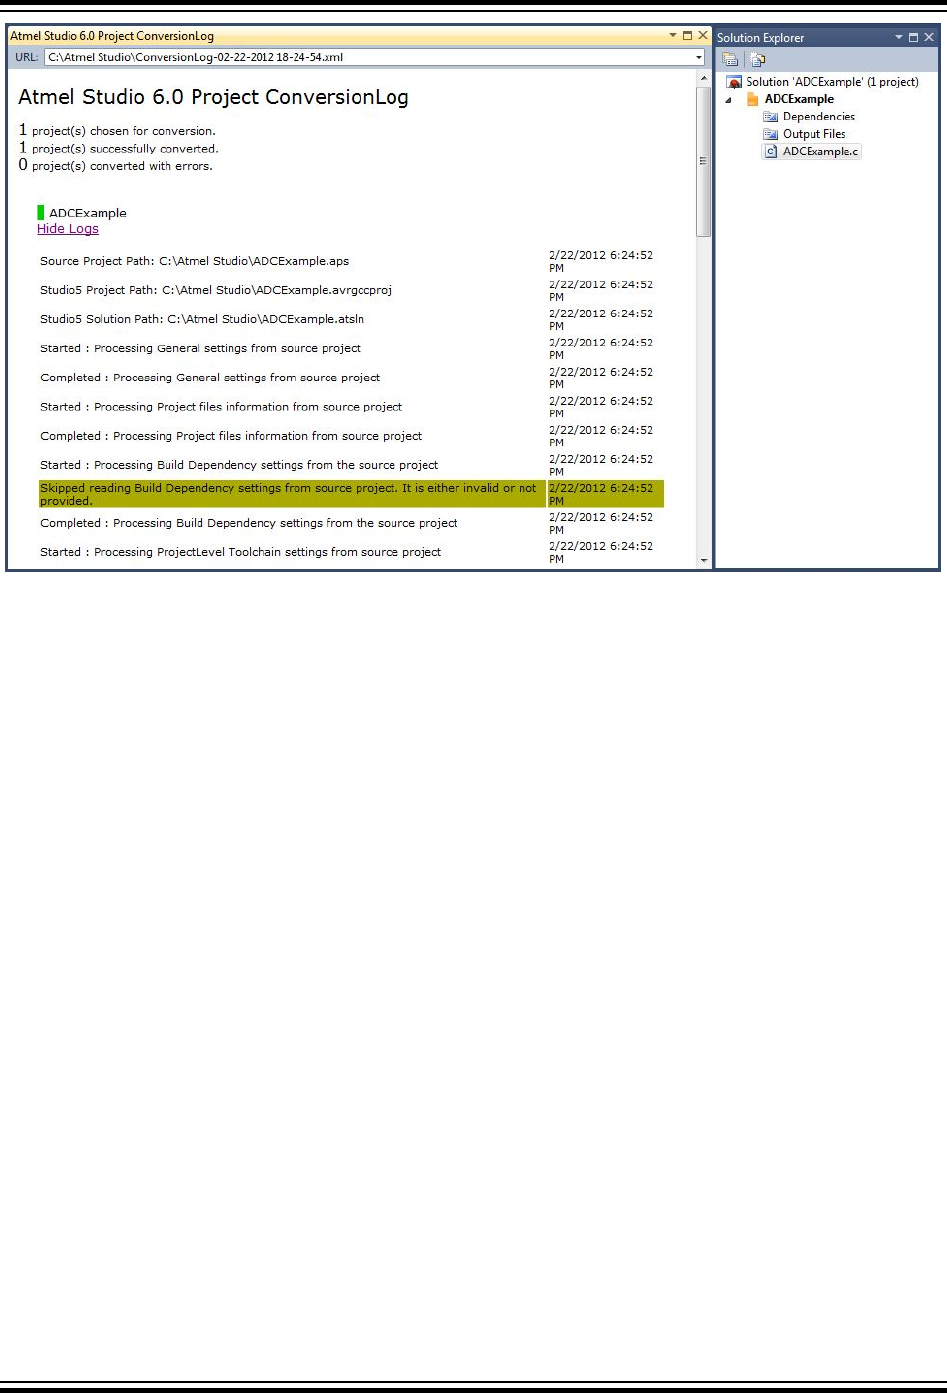
Note: Currently, conversion only adds a project file and solution file if the Solution Folder is the same as
the APS File Location. No other files will be modified.
3.4.3 Import AVR 32 Studio Project
Click the menu File → Import → AVR Studio 32 Project.. or Ctrl+3.
Atmel Studio 7 User Guide
Project Management
© 2018 Microchip Technology Inc. User Guide DS50002718A-page 139
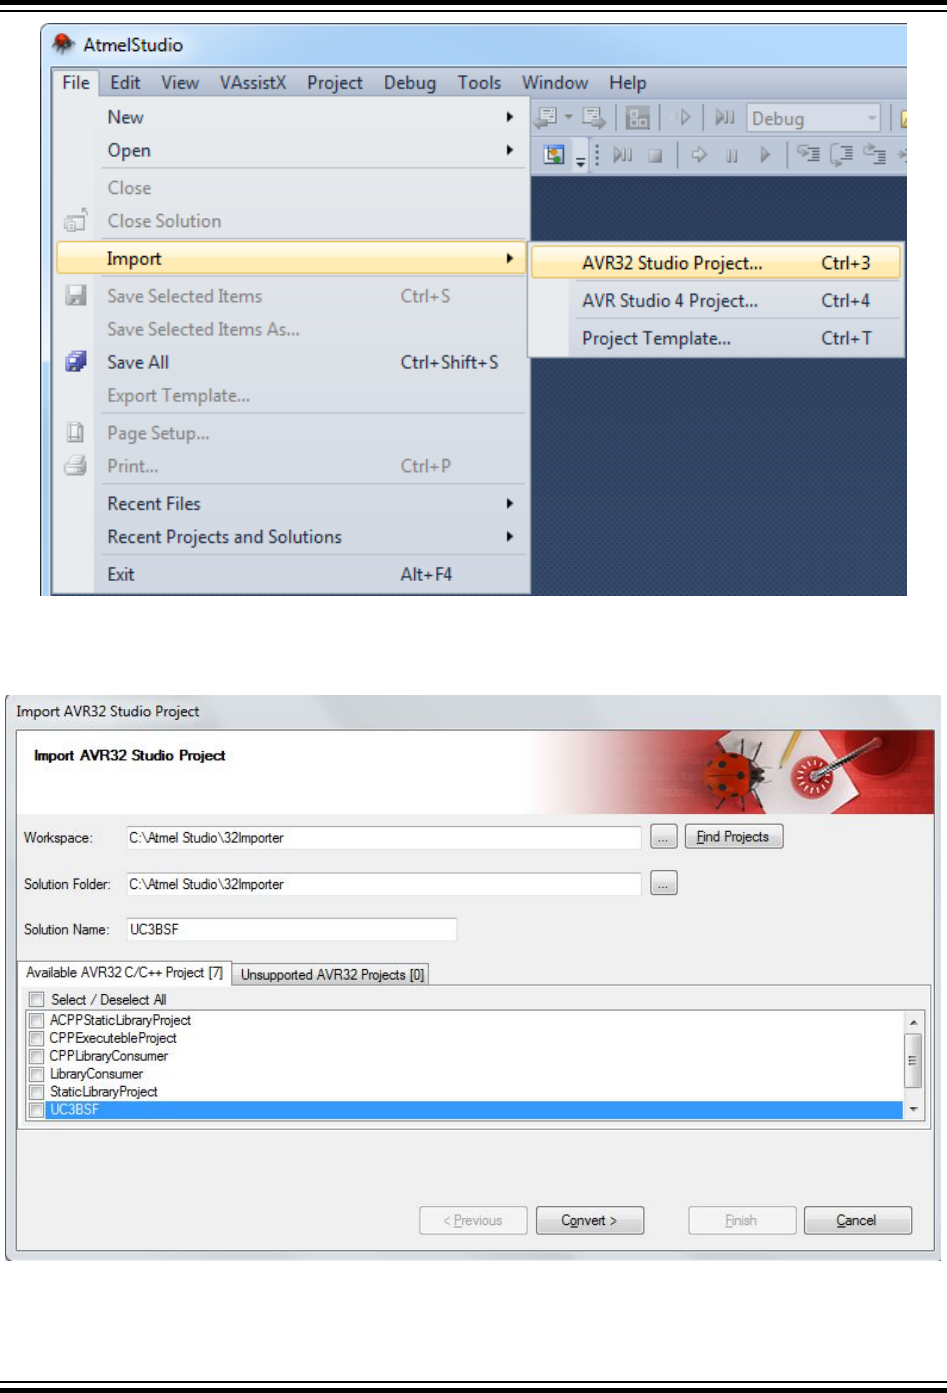
An 'Import AVR Studio 32 Project' dialog will appear.
Atmel Studio 7 User Guide
Project Management
© 2018 Microchip Technology Inc. User Guide DS50002718A-page 140

Type the name of your workspace or browse to the workspace location by clicking the ... (Browse button)
of the Workspace Tab. Click Find Projects to find all the project files and populate other folders available
in the workspace.
The Available AVR32 C/C++ Projects tab will be populated with all AVR32 C/C++ Projects that can be
imported and it will also display the total number of available projects.
The Invalid AVR32 Projects tab will be populated with all Unsupported AVR32 Projects that cannot be
imported and it will also display the total number of nonconvertible projects along with the reason.
Atmel Studio will proceed with conversion, giving updates the progress. Warnings and errors will be
shown in the Summary window.
Check 'Show conversion log after this page is closed' to view the complete conversion log.
Click Finish to access your newly converted project.
Atmel Studio 7 User Guide
Project Management
© 2018 Microchip Technology Inc. User Guide DS50002718A-page 141
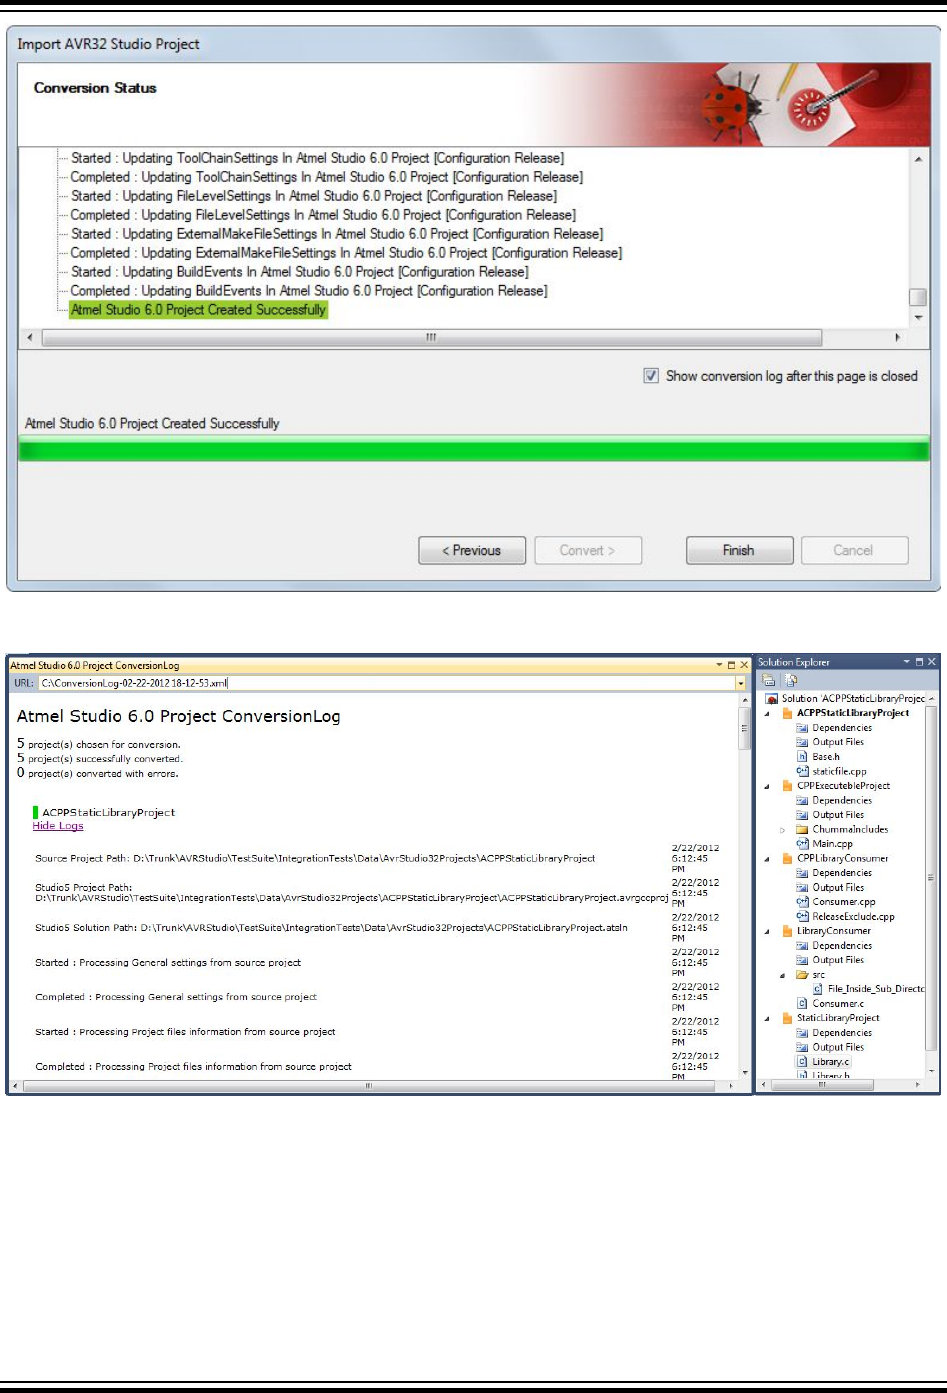
Note:
• The current version of AVR32 Importer supports AVR32 C/C++ Projects
• AP7 device family is currently not supported by Atmel Studio
• Currently, conversion only adds project files and solution file if the Solution Folder is the same as
the Workspace folder. No other files will be modified.
• Pre/Post builds settings are not imported
Atmel Studio 7 User Guide
Project Management
© 2018 Microchip Technology Inc. User Guide DS50002718A-page 142
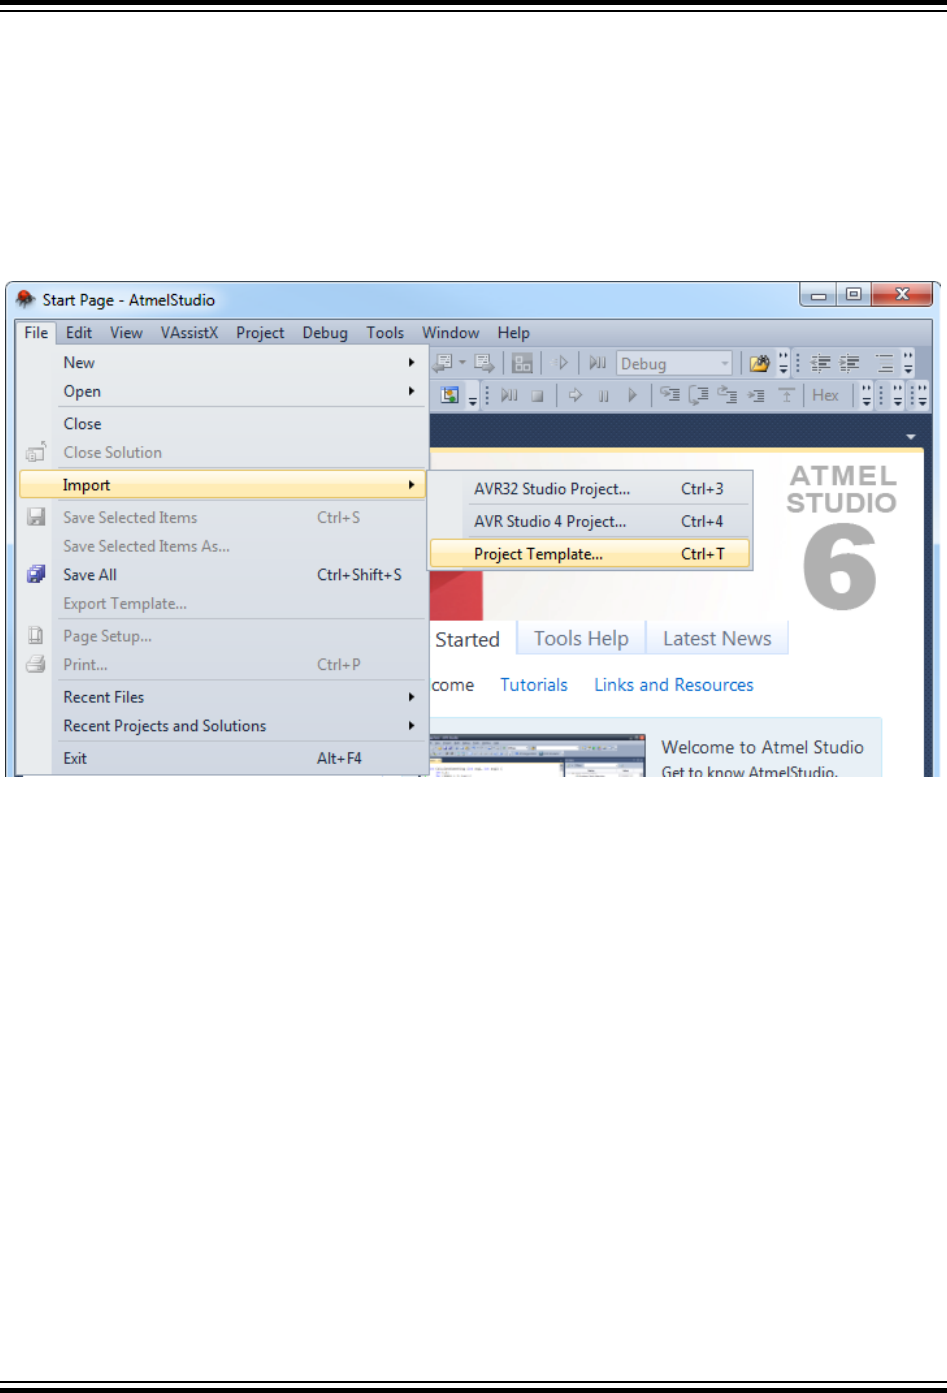
• Automatically generate listing (*.lss) files setting is not imported
3.4.4 Import Project Template
A number of predefined projects can be imported to Atmel Studio by File → Import → Project
Template..or Ctrl+T
These templates provide a starting point to begin creating new projects or expanding current projects.
Project templates provide the basic files needed for a particular project type, include standard assembly
references, and set default project properties and compiler options.
In the ' Import Project Template ' window, specify the following:
• The location of your project template
• The save location. The combo box will show installed templates that are available in the New
Project → Installed Templates.
Select any template under which you would like to add your template. You can also add your
template at the root by selecting <root> in 'Add to folder'.
Atmel Studio 7 User Guide
Project Management
© 2018 Microchip Technology Inc. User Guide DS50002718A-page 143
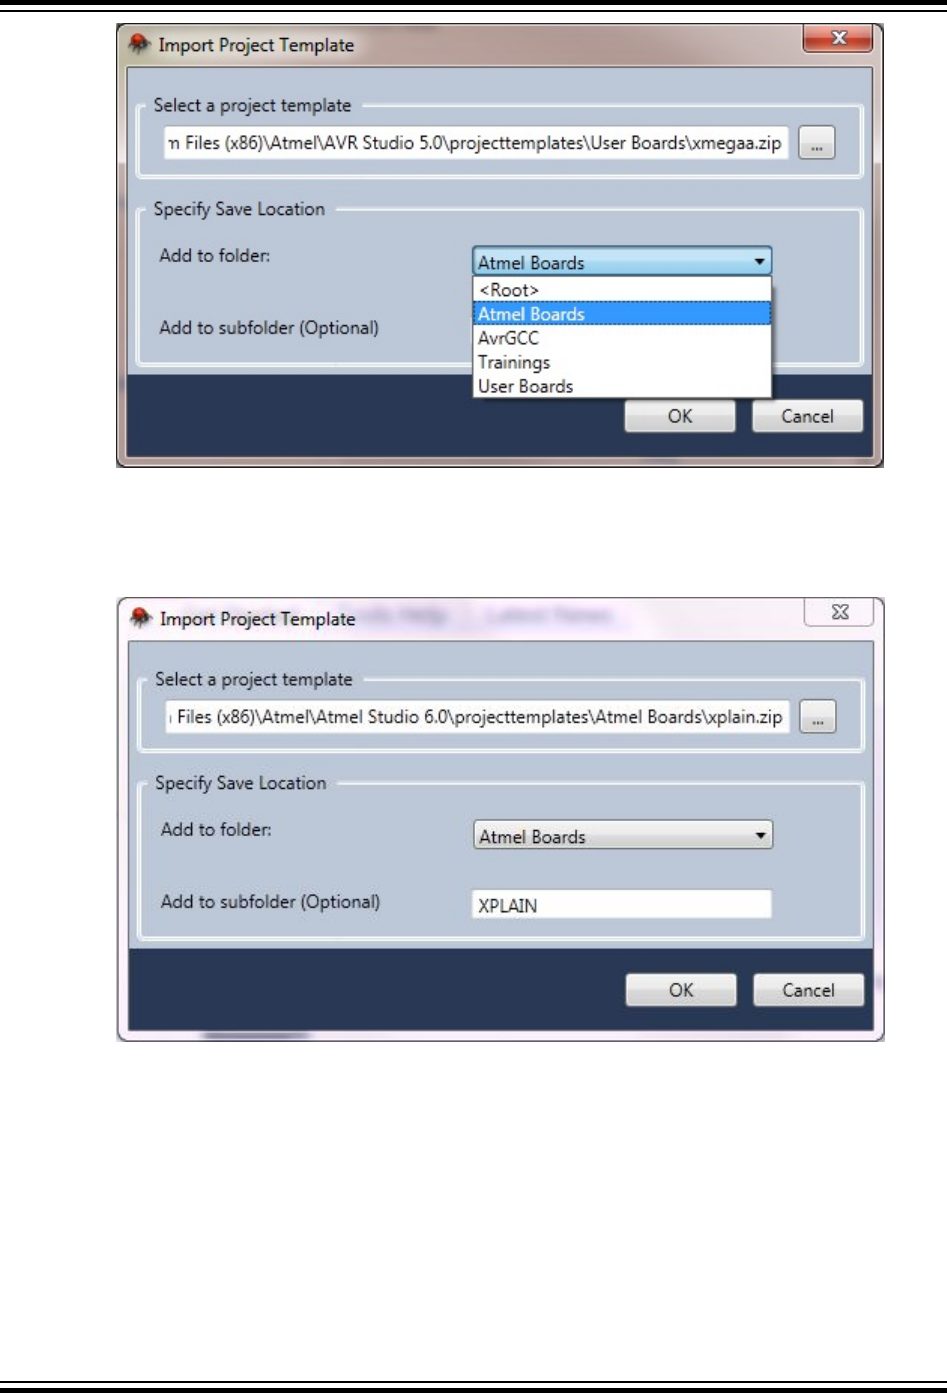
• You can create a separate folder by specifying the name of the folder under the specified 'Add to
Folder (Optional)', where you want to add your project template.
The resulting project template will be added to the existing installed templates and can be accessed from
File → New → Project .. or Ctrl+Shift+N.
Atmel Studio 7 User Guide
Project Management
© 2018 Microchip Technology Inc. User Guide DS50002718A-page 144
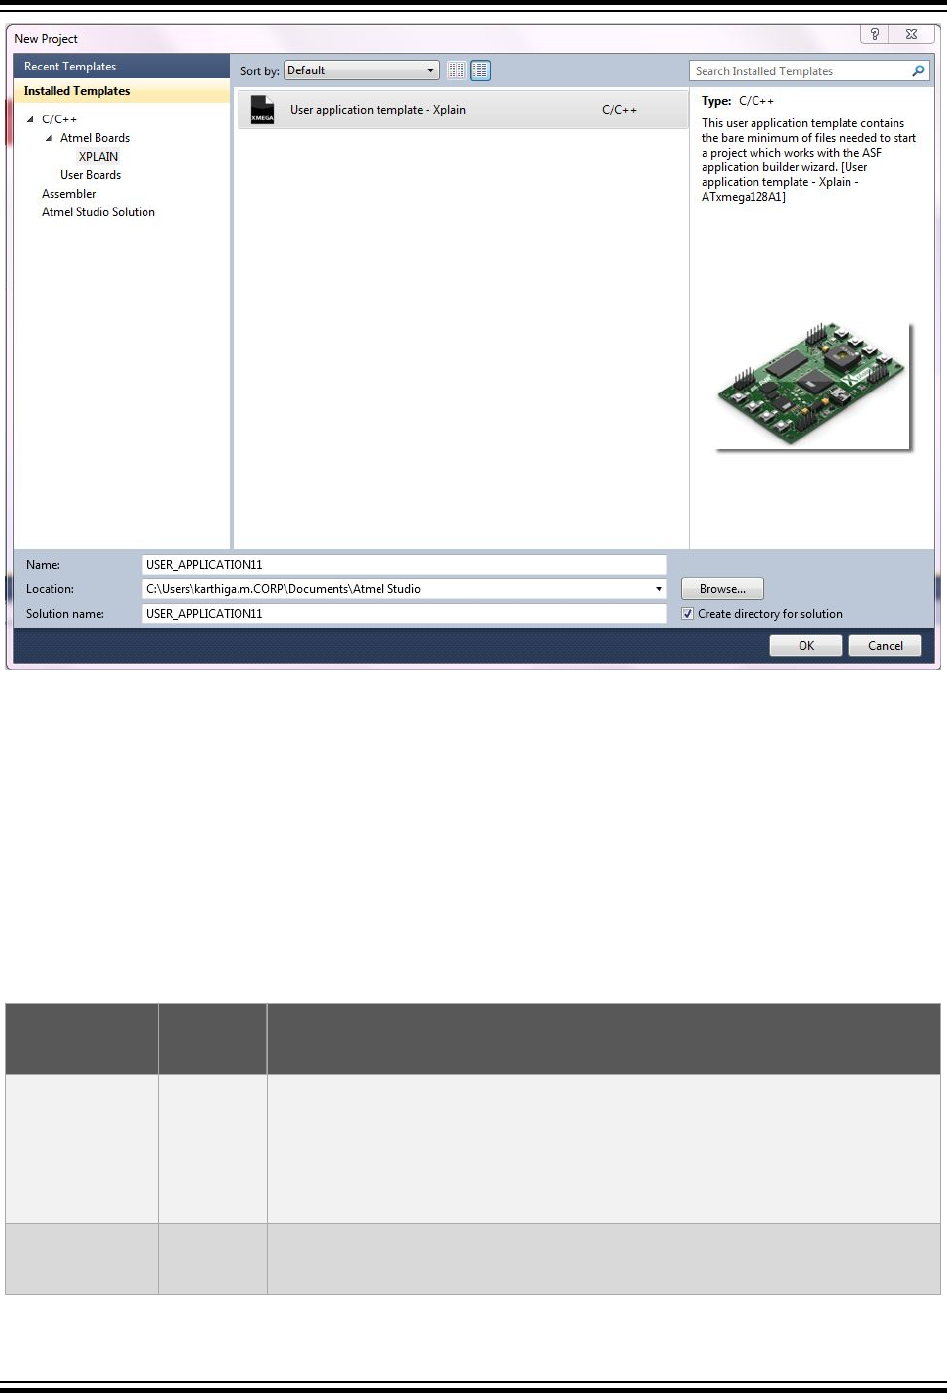
Note: 'Import Project Template Importer' will work with a template created for the same version.
3.5 Debug Object File in Atmel Studio
3.5.1 Introduction
Debug session requires you to load an object file which is supported by Atmel Studio. The debug file
contains symbolic information for debugging.
3.5.2 Atmel Studio Supported Debug Formats
Table 3-8. Object File Formats Supported by Atmel Studio
Object File
Format
Extension Description
UBROF .d90 UBROF is an IAR proprietary format. The debug output file contains a
complete set of debug information and symbols to support all types of
watches. UBROF8 and earlier versions are supported. This is the default
output format of IAR EW 2.29 and earlier versions. See below how to force
IAR EW 3.10 and later versions to generate UBROF8.
ELF/DWARF .elf ELF/DWARF debug information is an open standard. The debug format
supports a complete set of debug information and symbols to support all
Atmel Studio 7 User Guide
Project Management
© 2018 Microchip Technology Inc. User Guide DS50002718A-page 145
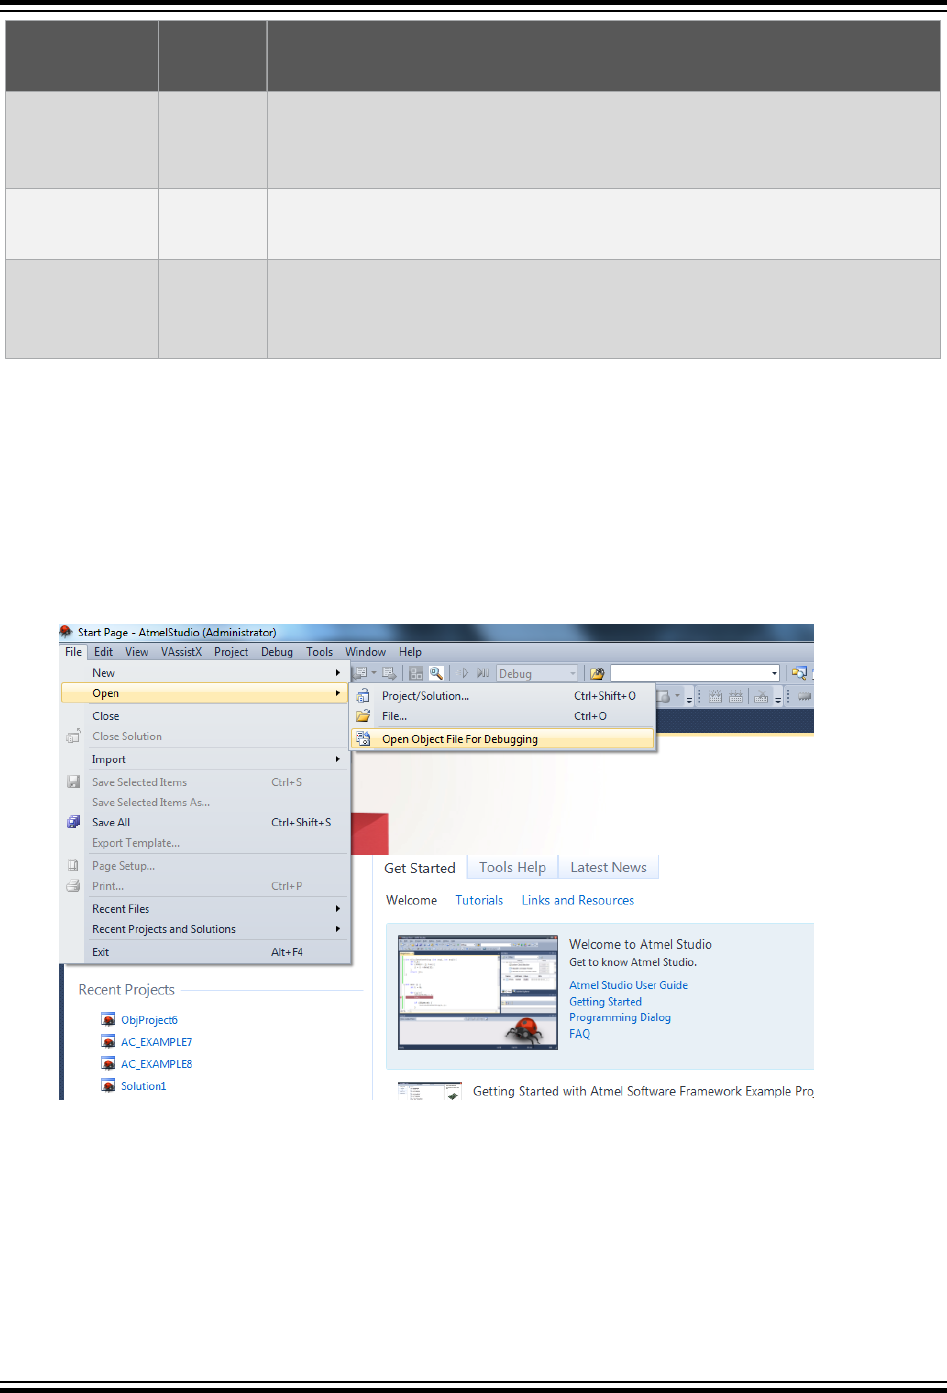
Object File
Format
Extension Description
types of watches. The version of the format read by Atmel Studio is
DWARF2. AVR-GCC versions configured for DWARF2 output can
generate this format.
AVRCOFF .cof COFF is an open standard intended for 3rd party vendors creating
extensions or tools supported by the Atmel Studio.
AVR Assembler
format
.obj The AVR assembler output file format contains source file info for source
stepping. It is a Microchip internal format only. The .map file is
automatically parsed to get some watch information.
Before debugging, make sure you have set up your compiler/assembler to generate a debug file like one
of the formats above. 3rd party compiler vendors should output the ELF/DWARF object file format.
3.5.3 Opening Object File for Debugging
Steps to create an Object Project
• On the File menu, click Open, and then click Open Object File For Debugging.
Open Object File For Debugging wizard will appear.
• – In the Select the object file to debug, select your object file to debug. The object file must
be supported by Atmel Studio.
Atmel Studio 7 User Guide
Project Management
© 2018 Microchip Technology Inc. User Guide DS50002718A-page 146
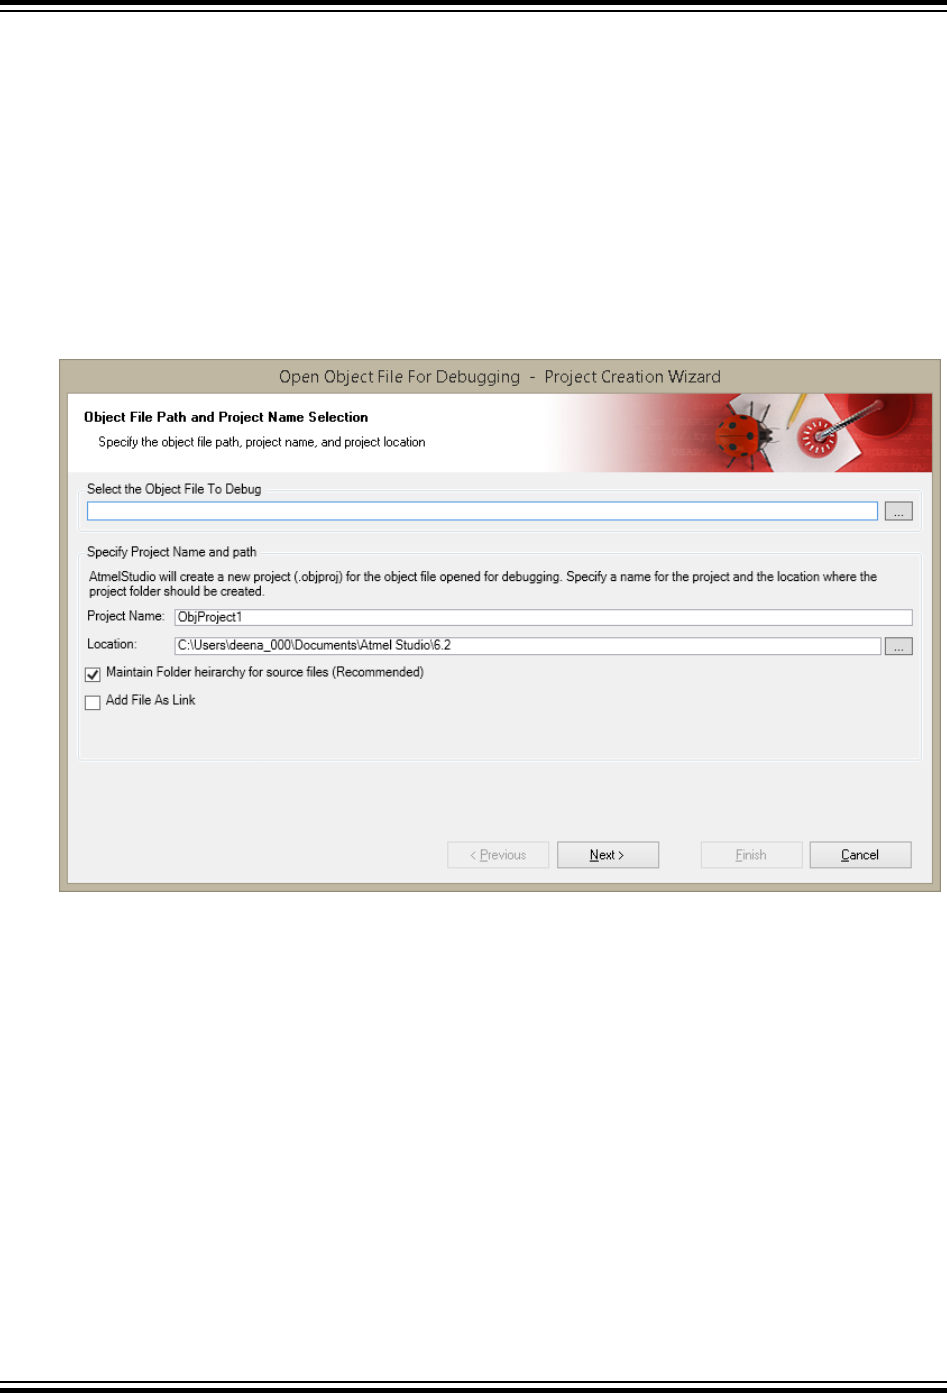
– In the Project Name, type a name for the project. Atmel Studio will suggest a name, which
you can override if wanted.
– In the Location, select a save location. Atmel Studio will suggest a name, which you can
override if wanted.
–Maintain Folder Hierarchy for Source Files option is selected by default which would create
a similar folder structure in the Solution Explorer as that of the source project i.e. the project
used to create the object file. Otherwise, all the files are added to the root folder of the project
file i.e. the user would not see any folder in the Solution Explorer.
–Add File As Link option is selected by default in which the object project shall refer the files
from its original location without a local copy into the project directory. If the option is not
selected, Atmel Studio would copy the files into the object project directory.
• Click Next. The Device Selection dialog will appear.
– Choose the appropriate target device. The target device should be the same, which was
originally chosen to create the object file.
Atmel Studio 7 User Guide
Project Management
© 2018 Microchip Technology Inc. User Guide DS50002718A-page 147
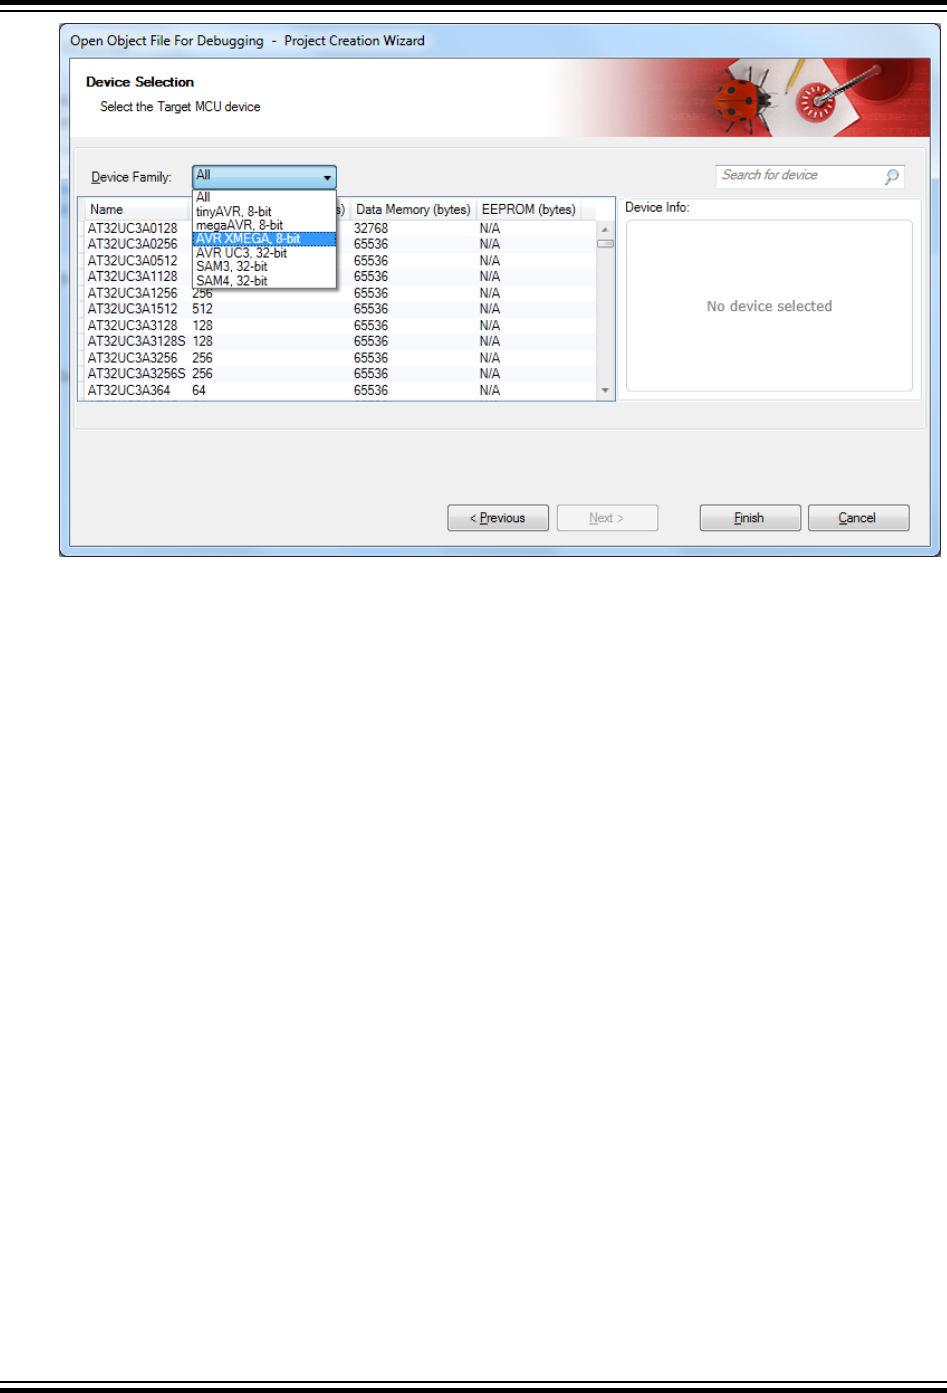
• Click Finish. The object project files re-mapper appears (see screen-shot below). This dialog
enables you to remap the location of the project files.
If the user resolves the parent folder for any original file, all other files in the subsequent directory
will be remapped recursively. So, it is useful for the user to remap the number of files by just
remapping only one.
Atmel Studio 7 User Guide
Project Management
© 2018 Microchip Technology Inc. User Guide DS50002718A-page 148
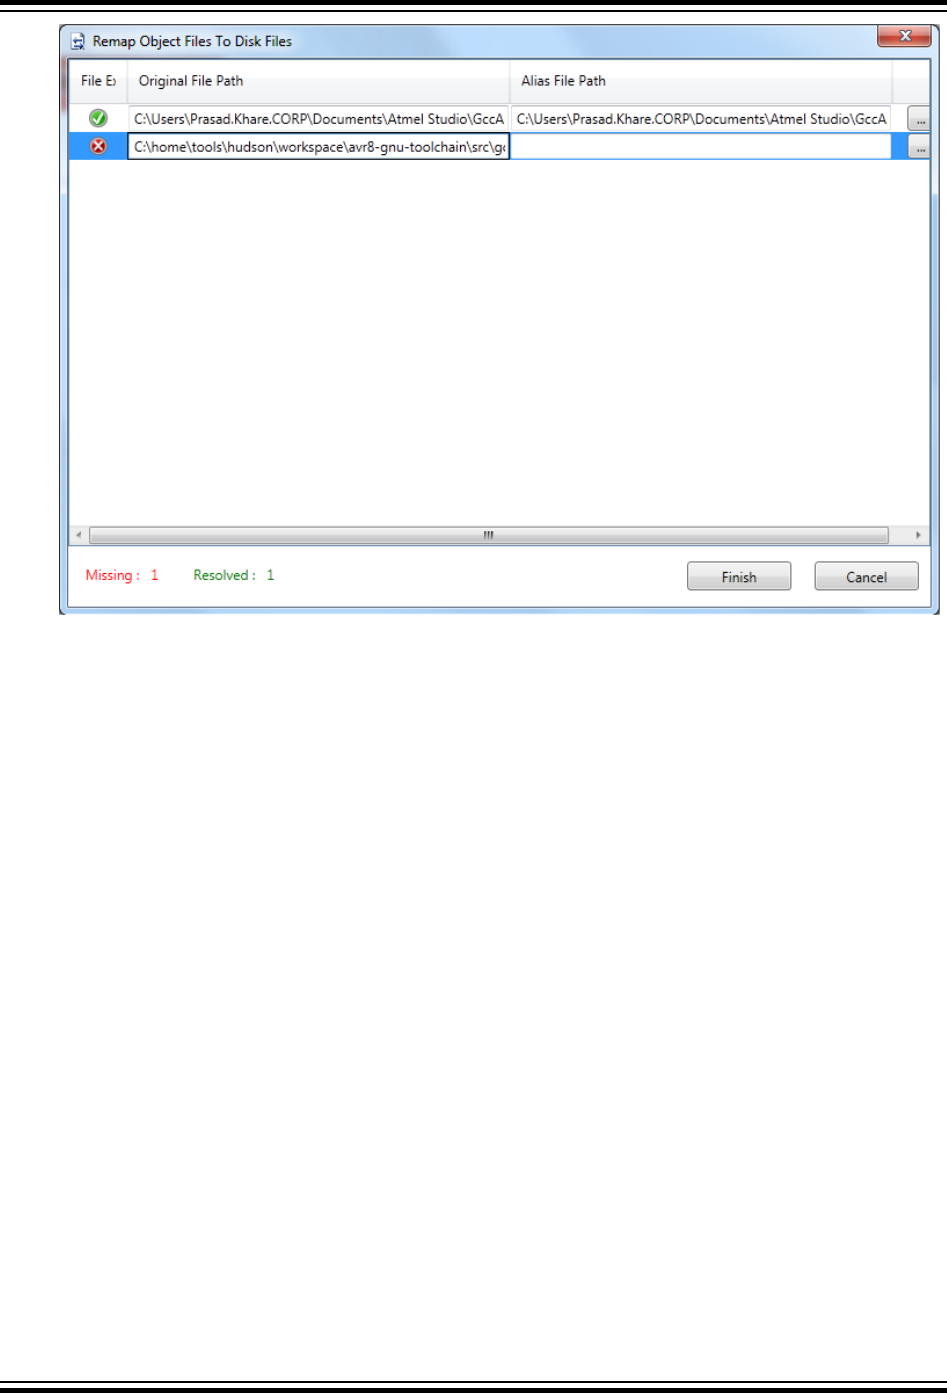
• Now the Object Project is Created. The files that are not remapped properly are shown in solution
explorer like 'libgcc.S', with a warning sign. Press F5 to debug this Project.
Atmel Studio 7 User Guide
Project Management
© 2018 Microchip Technology Inc. User Guide DS50002718A-page 149
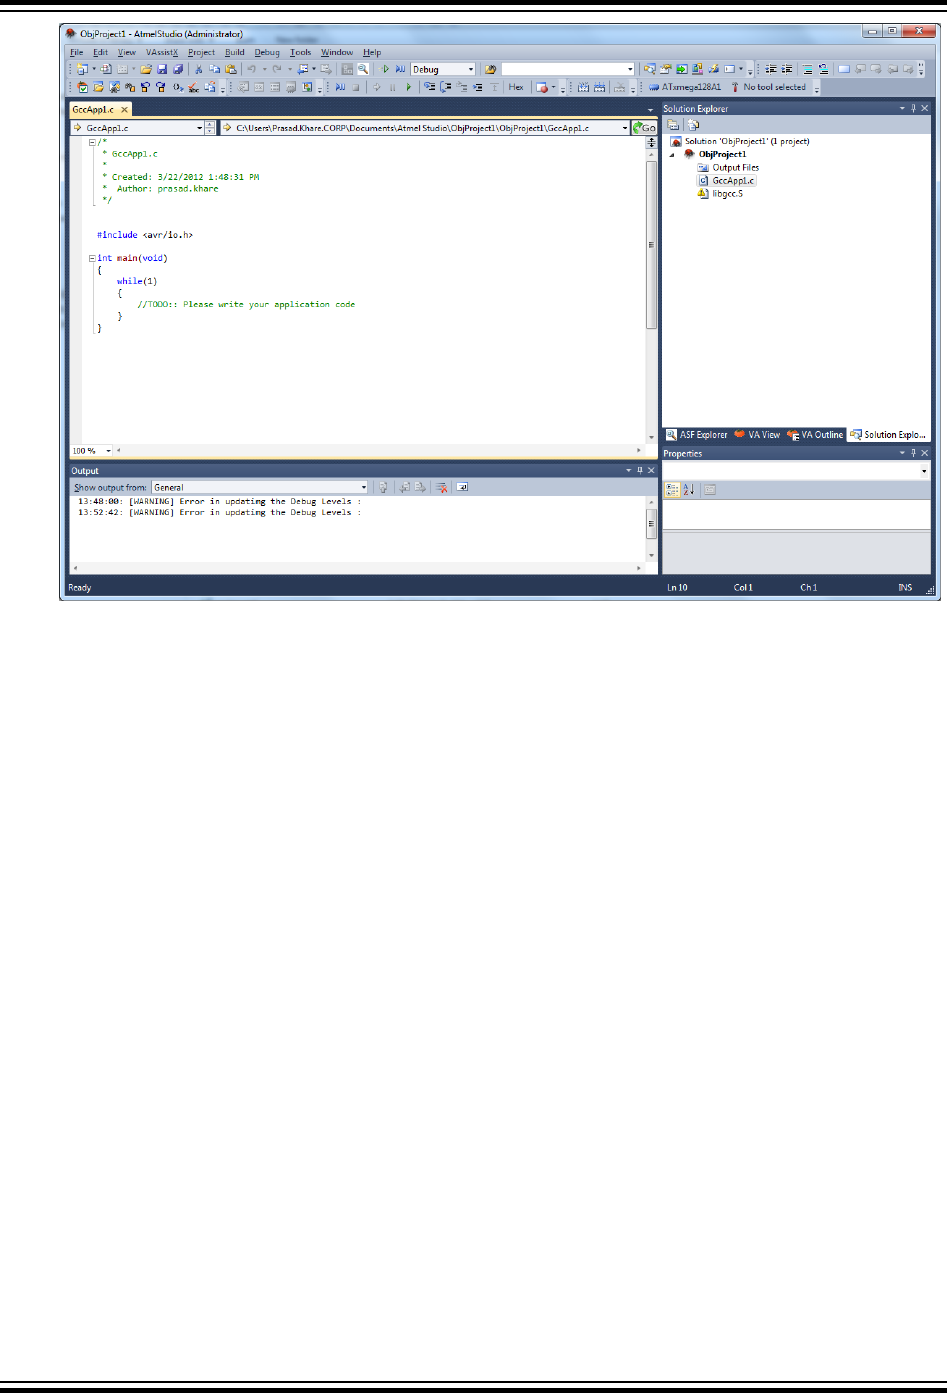
Atmel Studio 7 User Guide
Project Management
© 2018 Microchip Technology Inc. User Guide DS50002718A-page 150
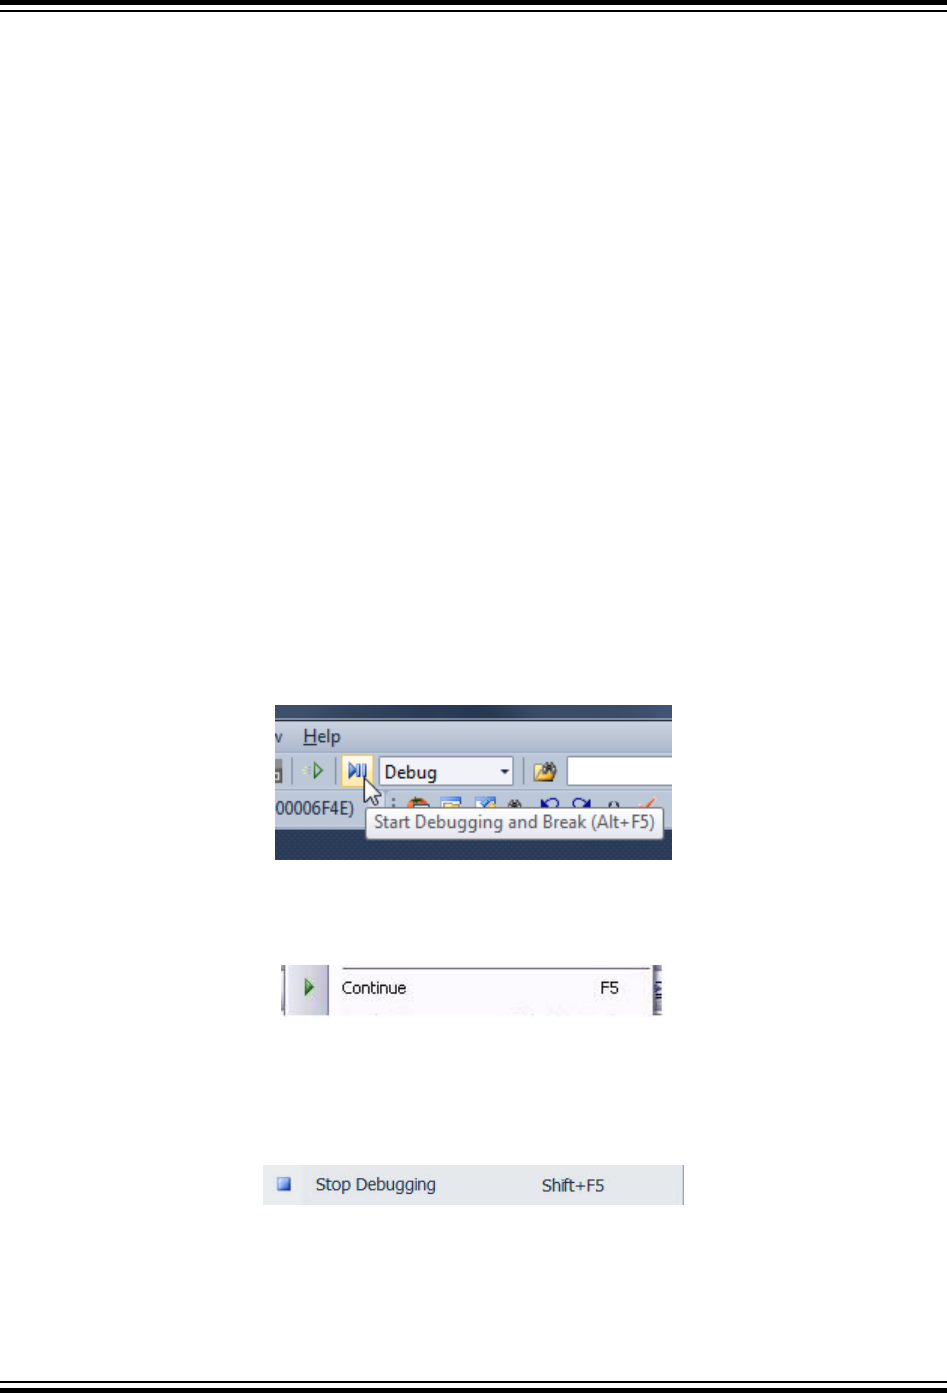
4. Debugging
4.1 Introduction
Atmel Studio can be targeted towards the built-in Simulator, or a variety of tools (see Available Tools
View), for example, AVR ONE!, JTAGICE mkII, or JTAGICE3 (bought separately).
4.1.1 Debug Platform Independent Debug Environment
Independent of which debug platform is running, the Atmel Studio environment will appear identical.
When switching between debug platforms, all environment options are kept for the new platform. Some
platforms have unique features, and new functionality/windows will appear.
4.1.2 Differences Between Platforms
Although all debug platforms appear identical in the debug environment there will be small differences
between them. A real-time emulator will be significantly faster than the simulator for large projects. An
emulator will also allow debugging while the system is connected to the actual hardware environment,
while the simulator only allows predefined stimulus to be applied. In the simulator, all registers are always
potentially available for display, which might not be the case with an emulator.
4.2 Starting a Debug Session
To start a debug session and halt, press Alt+F5 or choose Debug → Start Debugging and Break from
the menu, alternatively, press the toolbar button as illustrated below:
Figure 4-1. Starting a Debug Session
To start a debug session and keep executing, press F5 or press the toolbar button with the continue
symbol, or choose Debug → Continue from the menu as illustrated below:
Figure 4-2. Starting a Debug Session
4.3 Ending a Debug Session
To end the debug session use the Stop Debugging button or keyboard shortcut Shift F5.
Atmel Studio 7 User Guide
Debugging
© 2018 Microchip Technology Inc. User Guide DS50002718A-page 151
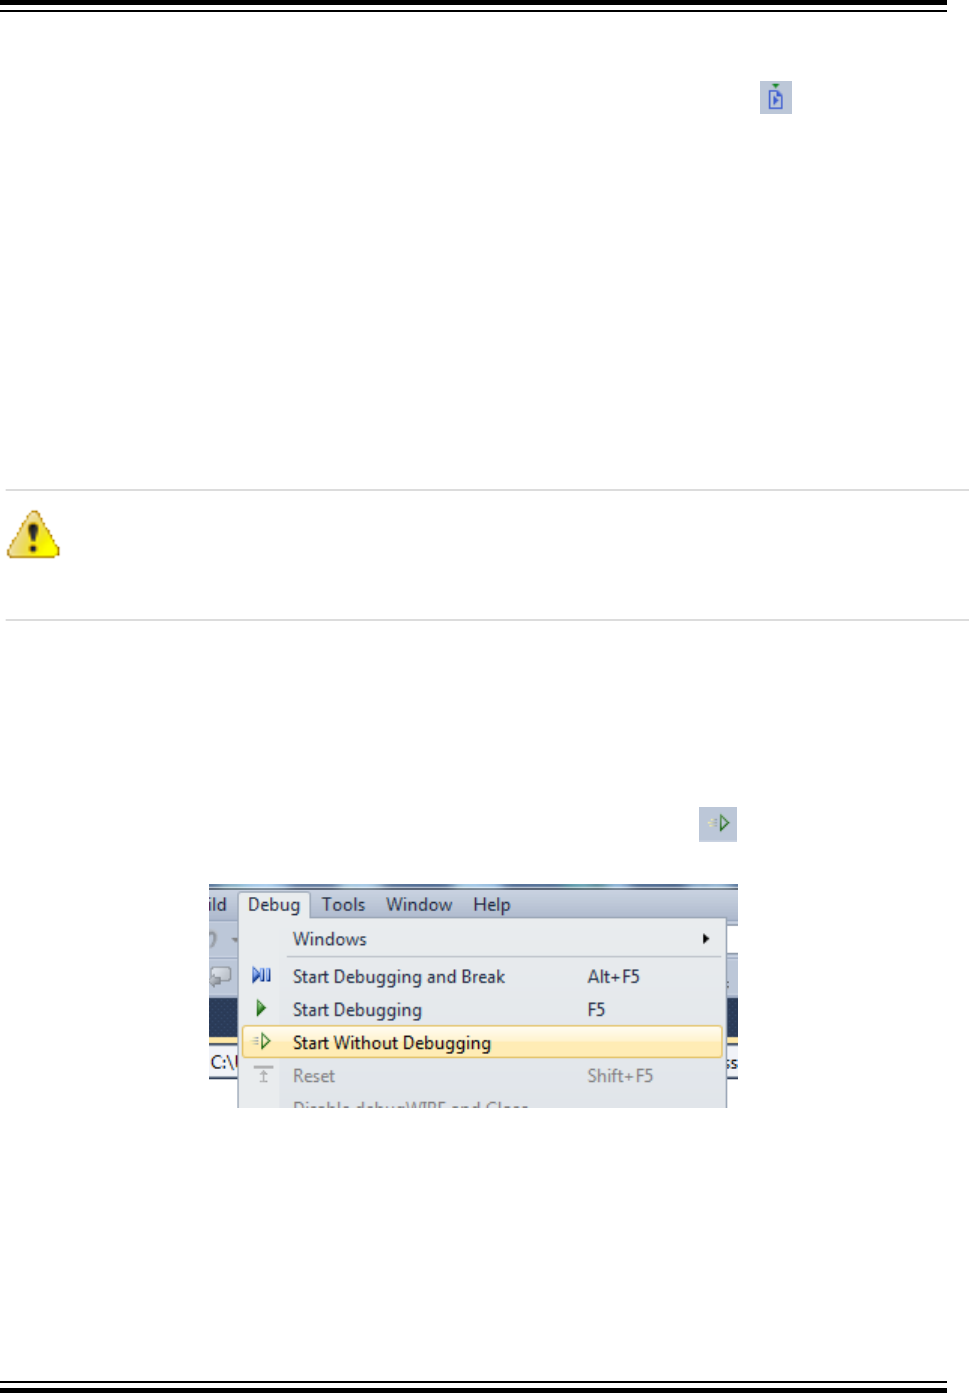
4.4 Attaching to a Target
To attach a target, use the Attach to Target option in the Debug menu, or the attach icon in the
debug toolbar. This causes Atmel Studio to launch a debug session on the selected target without
uploading a new application or causing a reset. Once the debug session is established, the core of the
target is halted and the current execution position of the target is mapped to the code in the project. This
means that the state of the target is kept and is possible to inspect with normal debug techniques, and
the program halts in the current position. Full run control and symbolic debugging should be available
after a successful attach.
Note:
• The code in the project is mapped to the content of the running target, without any possibility to
verify the correctness of this mapping. This means that if the project contains code that is not on
the target, then the state and run control might not reflect the truth, as variables and functions might
have different code locations on the target than in the project.
• The ability to activate a debug session without resetting a target is architecture dependent. Not all
architectures support this feature.
Attention:
Physically connecting a debug probe to a target might cause the target to reset, as most debug
probes need an electrical connection to the reset line of the device. Normal electrical
precautions need to be taken to avoid this.
4.5 Start without Debugging
4.5.1 One Click Programming - Program and Run
The Start without Debugging command is a one-click alternative to the programming dialog. Execute it
by selecting Debug → Start without Debugging from the menu, or press the button on the toolbar.
Figure 4-3. Start without Debugging
This will build the solution (if any changes are made) and program the target device without starting a
debug session.
Start without Debugging uses the tool and interface settings specified in the project options. This is
different from what takes place when using the stand-alone Programming Dialog, which is not related to
the project at all.
Atmel Studio 7 User Guide
Debugging
© 2018 Microchip Technology Inc. User Guide DS50002718A-page 152
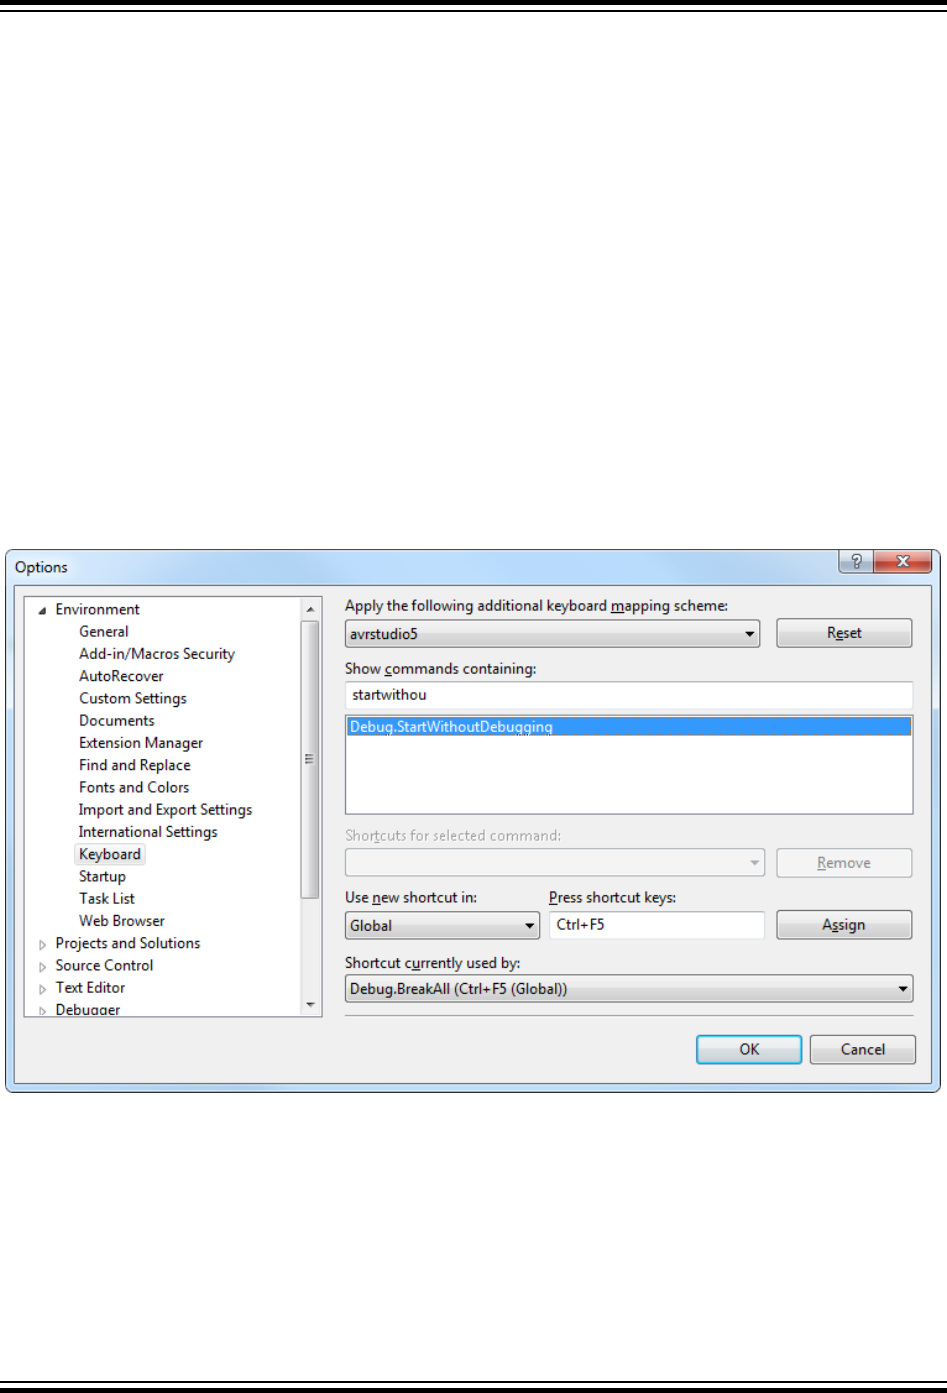
Note: Programmers and starter kits can also be used with the Start without Debugging command, not
only debuggers.
The Start without Debugging command will also program the EEPROM, fuses, lockbits, and user
signature (XMEGA only) segments if they are present in the object file. The GCC compiler can generate
ELF object format files with such segments. See Creating ELF Files with Other Memory Types for more
information.
Note: The user signature is not erased by Start without Debugging. The programmed user signature
from the ELF file will be AND-ed with the content in the device. If you want to replace the signatures with
what is in the file, you must perform a user signature erase manually.
4.5.2 Keyboard Shortcut
By default, there is no keyboard shortcut to this function, but you might want to add one if you use it a lot.
To add one, simply click the Tools → Options menu button and go to Environment → Keyboard. Start
typing startwithouttdebugging in the Show commands containing input field, and select
Debug.StartWithoutDebugging in the list. Then select the Press shortcut keys input field, and press
the desired key combination. You can, for example, press Ctrl+F5. Note that this shortcut is already
assigned to the BreakAll command. If you choose to override it, press the Assign button to assign the
new keyboard shortcut. Or, you can select an unused key combination.
Figure 4-4. Add Keyboard Shortcut
4.6 Debug Control
Several commands are available for controlling the debugger. They are available from both the Debug
menu and several toolbars. The Atmel Studio Integrated Development Environment (IDE) has two major
operating modes; design mode and debug mode. Design mode is when you are editing the source code
project, while debug mode is when you debug your project. The IDE adapts to modes, menus, and
toolbar changes.
Atmel Studio 7 User Guide
Debugging
© 2018 Microchip Technology Inc. User Guide DS50002718A-page 153
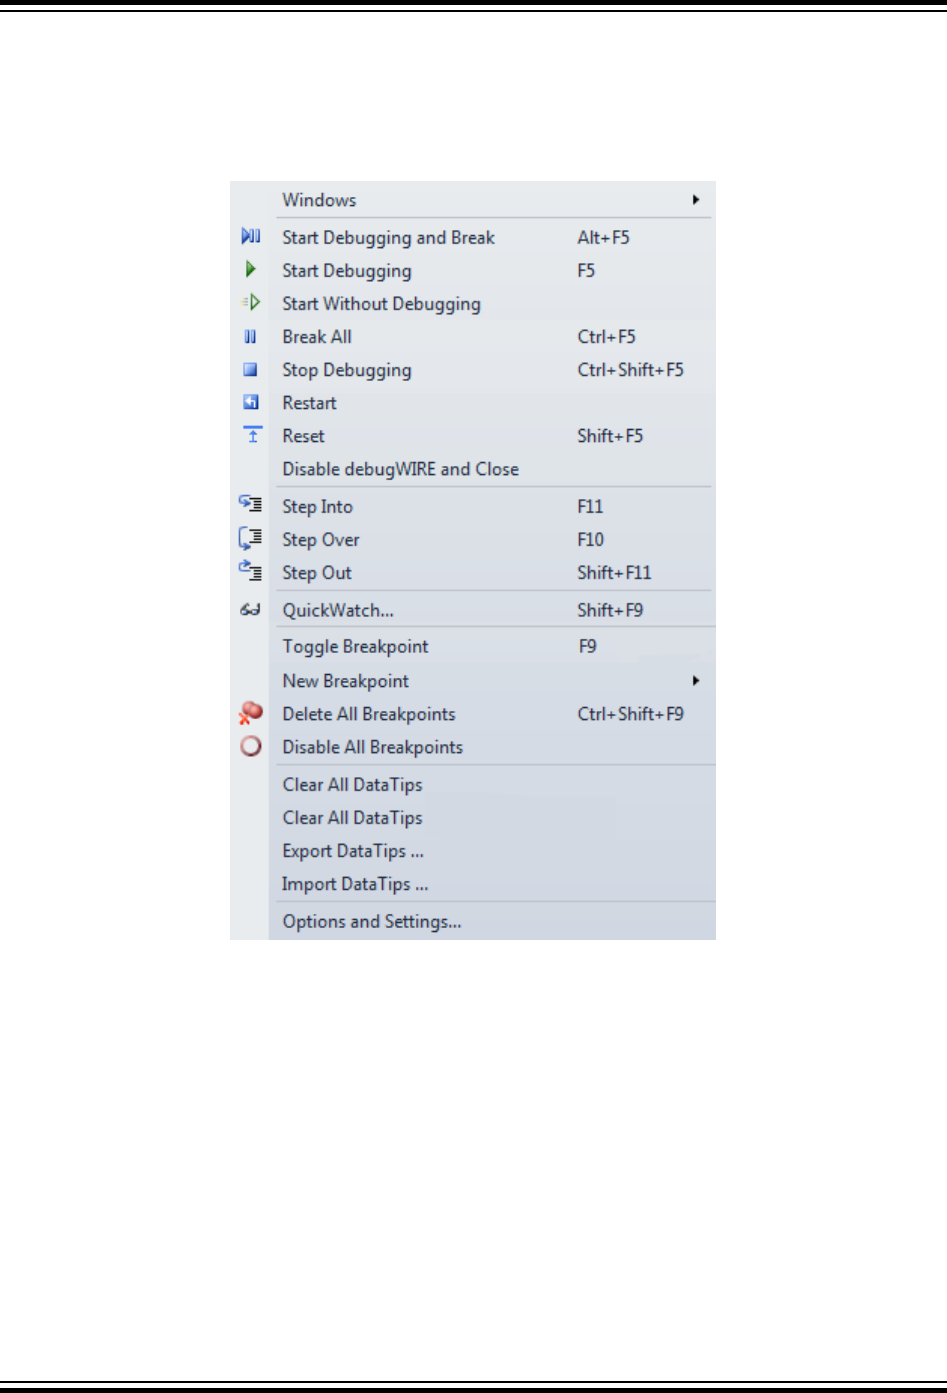
Note: Some debug commands are available in design mode, some in debug mode.
• In design mode, the available debug commands are those that will start the debug session, e.g.
Start Debugging and Break, Start Debugging, Start without Debugging.
• In debug mode, you will find commands like Break All, Step Out, and Reset.
Start Debugging and
Break
Starts the debugger and breaks the execution on the first statement of the
program.
Start Debugging Starts the debugger and runs the program. In debug mode and stopped, it
resumes execution.
Start Without
Debugging
Programs the project without starting debugging. For details, see Start without
Debugging.
Break All Halts the debugger.
Stop Debugging Stops and terminates the debug session, and returns to design mode.
Atmel Studio 7 User Guide
Debugging
© 2018 Microchip Technology Inc. User Guide DS50002718A-page 154

Restart Restarts the debugger and reloads the program.
Reset Resets the program to the first statement.
Disable debugWire
and Close
Available when debugging a device using the debugWire interface. The
command disables the debugWire interface (enabling the use of the ISP
interface) and terminates the debug session.
Step Into Executes one instruction. When in disassembly level, one assembly level
instruction is executed, otherwise, one source level instruction is executed.
Step Over Similar to Step Into, Step Over executes one instruction. However, if the
instruction contains a function call/subroutine call, the function/subroutine is
executed as well. If a user breakpoint is encountered during Step Over,
execution is halted.
Step Out Continue execution until the current function has completed. If a user
breakpoint is encountered during Step Over, execution is halted. If a Step Out
command is issued when the program is on the top level, the program will
continue executing until it reaches a breakpoint or it is stopped by the user.
Quick Watch Adds a Quick Watch for the variable or expression under the cursor. For
details, see QuickWatch and Watches.
Toggle Breakpoint Toggle the breakpoint status for the instruction where the cursor is placed.
Note that this function is available only when the source window or
disassembly window is the active view.
New Breakpoint Create a new breakpoint at the location of the cursor. For more information,
see Breakpoints.
Disable All
Breakpoints
This function clears all set program breakpoints, including breakpoints which
have been disabled.
Clear All DataTips Clear all marked Data Tips. For more information, see DataTips.
Export Data Tips Save all marked Data Tips to a file in Visual Studio Shell format.
Import DataTips Load Data Tips from a Visual Studio Shell file.
Options and Settings Debug options and settings, see Debugger.
4.7 Breakpoints
4.7.1 General Information on Breakpoints
A breakpoint tells the debugger to temporarily suspend execution of a program when a specific condition
takes place, e.g. when a certain instruction is about to be executed.
Breakpoints provide a powerful tool that enables you to suspend execution where and when you need to.
Rather than stepping through your code line by line or instruction by instruction, you can allow your
program to run until it hits a breakpoint, and then start to debug. This speeds up the debugging process.
Atmel Studio 7 User Guide
Debugging
© 2018 Microchip Technology Inc. User Guide DS50002718A-page 155
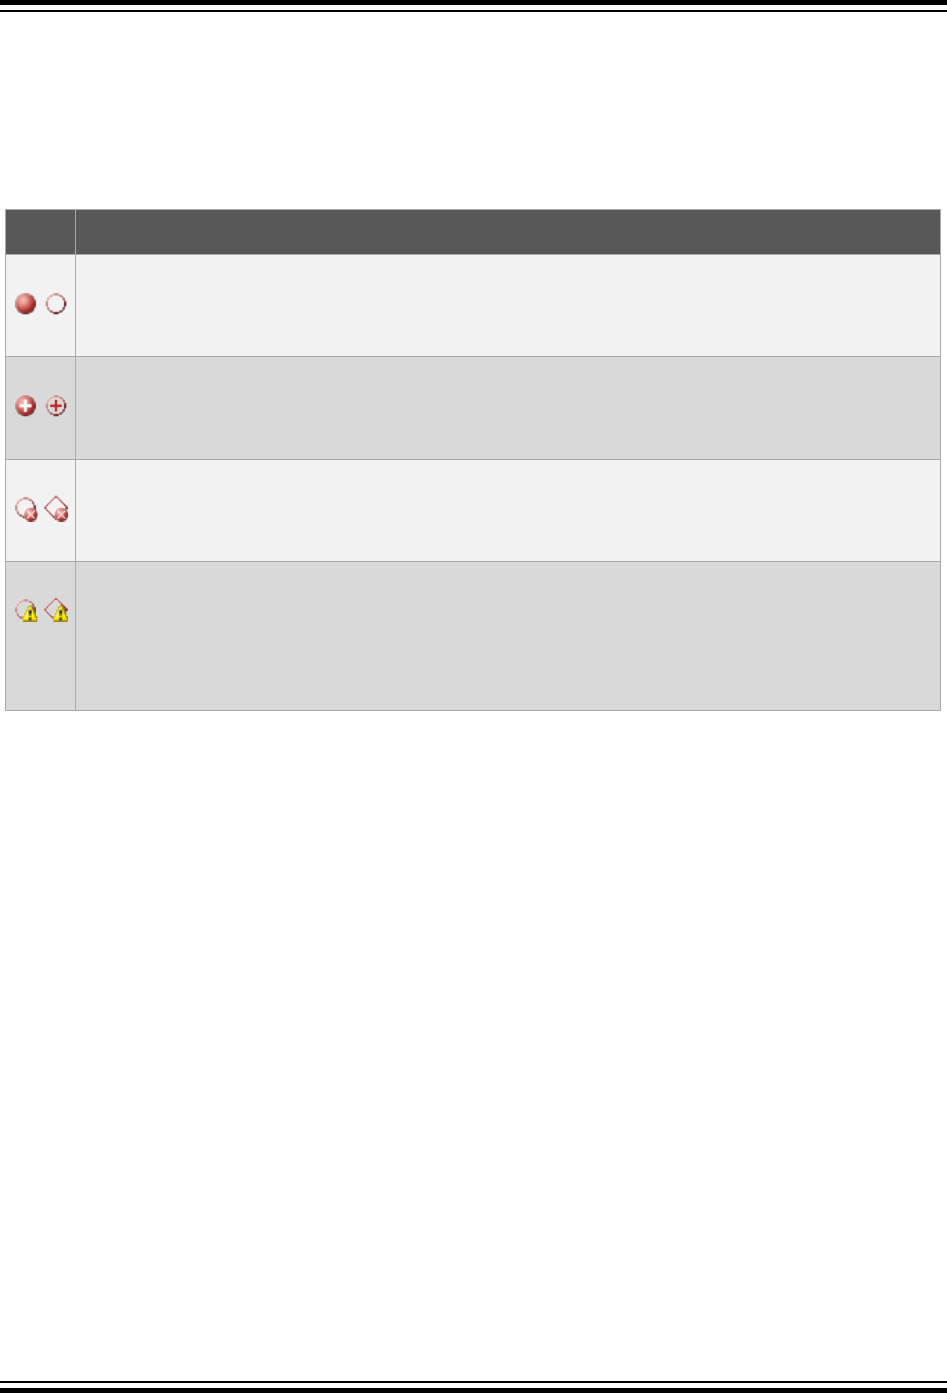
4.7.1.1 Breakpoint Glyphs
The source windows and the disassembly window show breakpoint locations by displaying symbols
called glyphs in the left margin. The following table describes these glyphs.
If you rest the mouse on a breakpoint glyph, a breakpoint tip appears with more information. This
information is especially useful for error and warning breakpoints.
Table 4-1. Breakpoint Glyphs
Glyph Description
Normal breakpoint. The solid glyph indicates that the breakpoint is enabled. The hollow glyph
indicates that it is disabled.
Advanced breakpoint. Active/disabled. The + sign indicates that the breakpoint has at least one
advanced feature (such as condition, hit count, or filter) attached to it.
Breakpoint error. The X indicates that the breakpoint could not be set because of an error
condition.
Breakpoint warning. The exclamation mark indicates that a breakpoint could not be set because
of a temporary condition. Usually, this means that the code at the breakpoint or tracepoint
location has not been loaded. It can also be seen if you attach to a process and the symbols for
that process are not loaded. When the code or symbols are loaded, the breakpoint will be
enabled and the glyph will change.
4.7.2 Operations with Breakpoints
4.7.2.1 To Set a Breakpoint
1. In a source window, click a line of executable code where you want to set a breakpoint. On the right
click menu, click Breakpoint, and then click Insert Breakpoint.
—or—
In a source window, click a line of executable code where you want to set a breakpoint.
On the Debug menu, click Toggle Breakpoint.
4.7.2.2 To Set an Address Breakpoint
1. On the Debug menu, point to Windows, and then click Disassembly if the Disassembly window is
not already visible. You need to be in a debug session for this option to be visible.
2. In the Disassembly window, click a line of code, and then click Toggle Breakpoint on the Debug
menu.
—or—
Right click a line of code, and then select Insert Breakpoint.
4.7.2.3 To Edit a Breakpoint Location
1. In the Breakpoints window, right click a breakpoint, then click Location on the right click menu.
—or—
Atmel Studio 7 User Guide
Debugging
© 2018 Microchip Technology Inc. User Guide DS50002718A-page 156

In a source, Disassembly, or Call Stack window, right click a line that contains a breakpoint glyph
and then click Location from Breakpoints on the right click menu.
Note:
In a source window, you might have to right click the exact character where the breakpoint is set.
This is necessary if the breakpoint is set on a specific character within a line of source code.
4.7.2.4 Hit Count Keeps Track of How Many Times a Breakpoint is Hit
By default, execution breaks every time that a breakpoint is hit. You can choose to:
• Break always (the default)
• Break when the hit count equals a specified value
• Break when the hit count equals a multiple of a specified value
• Break when the hit count is greater than or equal to a specified value
If you want to keep track of the number of times a breakpoint is hit but never break execution, you can set
the hit count to a very high value so that the breakpoint is never hit.
The specified hit count is retained only for the debugging session. When the debugging session ends, the
hit count is reset to zero.
4.7.2.5 To Specify a Hit Count
1. In the Breakpoints window, right click a breakpoint and then click Hit Count on the right click menu.
—or—
In a source, Disassembly, or Call Stack window, right click a line that contains a breakpoint, and
then click Hit Count from the Breakpoints sub-menu on the right click menu.
2. In the Hit Count dialog box, select the behavior you want from the When the breakpoint is hit list.
If you choose any setting other than Break always, a text box appears next to the list. Edit the
integer that appears in the text box to set the hit count you want.
3. Click OK.
4.7.2.6 To Enable or Disable a Single Breakpoint
In a source, Disassembly, or Call Stack window, right click a line that contains a breakpoint glyph, point to
Breakpoint, then click Enable Breakpoint or Disable Breakpoint.
—or—
In the Breakpoints window, select or clear the checkbox next to the breakpoint.
To enable or disable all breakpoints
From the Debug menu, click Enable All Breakpoints.
4.7.2.7 To Delete a Breakpoint
In the Breakpoints window, right click a breakpoint, and then click Delete on the right click menu.
—or—
In a source window or a Disassembly window, click the breakpoint glyph.
4.7.2.8 To Delete all Breakpoints
From the Debug menu, click Delete All Breakpoints.
Confirmation Prompt
When you delete all breakpoints, a prompt requesting confirmation of the action might appear, depending
on options settings.
Atmel Studio 7 User Guide
Debugging
© 2018 Microchip Technology Inc. User Guide DS50002718A-page 157

4.7.3 Breakpoint Window
Figure 4-5. Breakpoint Window
You can open the Breakpoints window from the Debug menu.
4.7.3.1 To Open the Breakpoints Window
On the Debug menu, point to Windows, and then click Breakpoints.
4.7.3.2 To Go to the Location of a Breakpoint
In the Breakpoints window, double-click a breakpoint.
—or—
In the Breakpoints window, right click a breakpoint and choose Go To Source Code or Go To
Disassembly.
—or—
Click a breakpoint, and then click the Go To Source Code or Go To Disassembly tool.
4.7.3.3 To Display Additional Columns
In the toolbar at the top of the Breakpoints window, click the Columns tool, and then select the name of
the column you want to display.
4.7.3.4 To Export all Breakpoints that Match the Current Search Criteria
In the Breakpoints window toolbar, click the Export all breakpoints matching current search criteria icon.
1. The Save As dialog box appears.
2. In the Save As dialog box, type a name in the File name box.
3. This is the name of the XML file that will contain the exported breakpoints. Note the folder path
shown at the top of the dialog box. To save the XML file to a different location, change the folder
path shown in that box, or click Browse Folders to browse for a new location.
4. Click Save.
4.7.3.5 To Export Selected Breakpoints
1. In the Breakpoints window, select the breakpoints you want to export.
To select multiple breakpoints, hold down the Ctrl key and click additional breakpoints.
2. Right click in the breakpoints list, and choose Export selected.
3. The Save As dialog box appears.
4. In the Save As dialog box, type a name in the File name box.
This is the name of the XML file that will contain the exported breakpoints.
The folder path is shown at the top of the dialog box. To save the XML file to a different location,
change the folder path shown in that box, or click Browse Folders to browse for a new location.
5. Click Save.
Atmel Studio 7 User Guide
Debugging
© 2018 Microchip Technology Inc. User Guide DS50002718A-page 158

4.7.3.6 To Import Breakpoints
1. In the Breakpoints window toolbar, click the Import breakpoints from a file icon.
2. The Open dialog box appears.
3. In the Open dialog box, browse to the directory where your file is located, and then type the file
name or select the file from the file list.
4. Click OK.
4.7.3.7 To View Breakpoints that Match a Specified String
In the Search box, perform one of the following actions:
1. Type your search string in the Search box and press ENTER.
—or—
2. Click the Search drop-down list and select a string from the list of previous search strings.
To limit the search to a specified column, click the In Column drop-down list and then click the name of
the column that you want to search in.
4.7.3.8 To View all Breakpoints after a Search
In the Search box, select and delete the search string and then press ENTER.
4.7.3.9 Breakpoint Labels
In Atmel Studio, you can use labels to help keep track of your breakpoints. A label is a name that you can
attach to a breakpoint or a group of breakpoints. You can create a name for a label or you can choose
from a list of existing labels. You can attach multiple labels to each breakpoint.
Labels are useful when you want to mark a group of breakpoints that are related in some way. After you
have labeled the breakpoints, you can use the search function in the Breakpoints window to find all
breakpoints that have a specified label.
The search function searches all columns of information that are visible in the Breakpoints window. To
make your labels easy to search for, avoid using label names that might conflict with strings that appear
in another column. For example, if you have a source file that is named 'Program.c', 'Program.c' will
appear in the name of any breakpoint set in that file. If you use 'Prog' as a label name, all breakpoints set
in Program.c will appear when you search for breakpoints labeled 'Prog'.
4.7.3.10 To Label Breakpoints
1. In the Breakpoints window, select one or more breakpoints.
2. To select multiple breakpoints, use the Ctrl key when selecting breakpoints.
3. Right click the selected breakpoints, and then click Edit labels.
4. The Edit breakpoint labels dialog box appears.
5. Select one or more labels in the Choose among existing labels box.
—or—
Type a new label name in the Type a new label box, and then click Add.
4.7.3.11 To Search for Breakpoints that have a Specified Label
1. In the Breakpoints window toolbar, click the In Column box and select Labels from the drop-down
list.
2. In the Search box, type the name of the label you want to search for and press Enter.
4.7.3.12 To Remove Labels from Breakpoints
1. In the Breakpoints window, select one or more breakpoints.
Press Ctrl left click to select multiple breakpoints.
Atmel Studio 7 User Guide
Debugging
© 2018 Microchip Technology Inc. User Guide DS50002718A-page 159

2. Right click the selected breakpoints, and then click Edit labels.
3. The Edit breakpoint labels dialog box appears.
4. In the Choose among existing labels box, clear the checkboxes for labels that you want to
remove from the selected breakpoints.
4.7.3.13 To Sort the Breakpoint List by Label
1. In the Breakpoints window, right click the breakpoint list.
2. Point to Sort by and then click Label.
(Optional) To change the sort order, right click the breakpoint list again, point to Sort by, and then click
Sort Ascending or Sort Descending.
4.8 Data Breakpoints
Data breakpoints allow you to break execution when the value stored at a specified memory location is
accessed (read/write). In general, Data Breakpoint hardware module listens on the data address and data
value lines between the CPU and the data cache and can halt the CPU, if the address and/or value
meets a stored compare value. Unlike program breakpoints, data breakpoints halt on the next instruction
after the load/store instruction that caused the breakpoint has completed.
4.8.1 Adding Data Breakpoint
Adding Data Breakpoint using code editor context menu
You can add Data breakpoint from code editor. Select the variable in code editor and select Breakpoint
→ Add Databreakpoint from the context menu. This adds data breakpoint for a given variable address.
Default access mode is write and default mask is none. You can invoke the same command using
shortcut key Ctrl + Shift + R.
Atmel Studio 7 User Guide
Debugging
© 2018 Microchip Technology Inc. User Guide DS50002718A-page 160
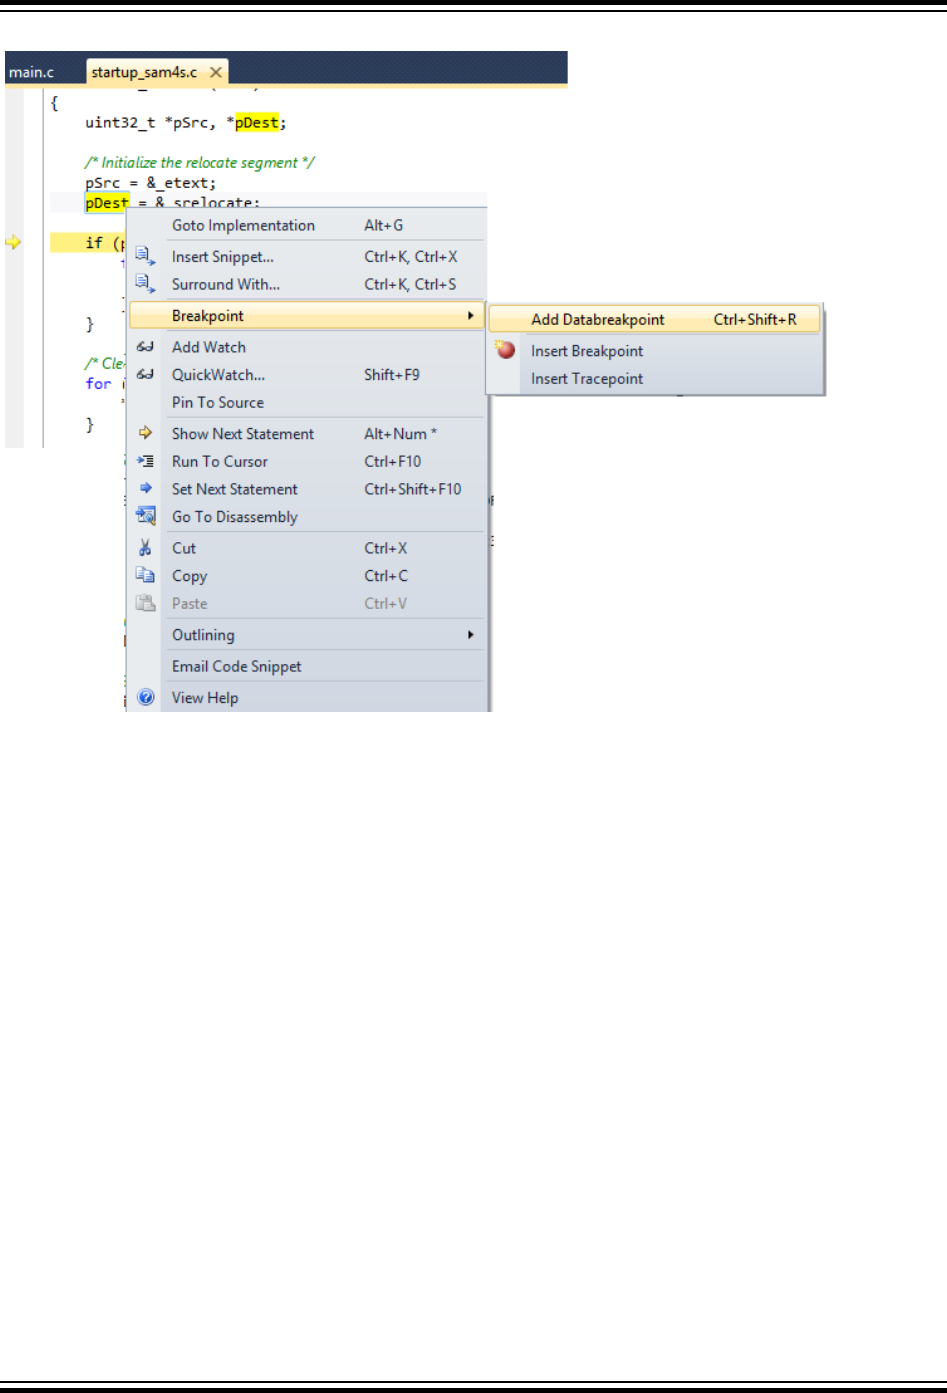
Figure 4-6. Adding Data Breakpoint from the Context Menu
Adding Data Breakpoint from Debug menu
You can add new Data breakpoint from Debug → New Breakpoint → New Data Breakpoint. This
opens the Data Breakpoint Configuration window.
Adding Data Breakpoint from Data Breakpoints tool window
You can add new Data breakpoint using the New button in Data Breakpoints tool window. This opens the
Data Breakpoint Configuration window.
Note: You can add or modify Data breakpoint only in debug mode.
4.8.2 Data Breakpoints Window
4.8.2.1 Data Breakpoints Tool Window
The Data Breakpoint window provides the options to set data breakpoint and lists the added data
breakpoints. Enable this window by choosing Debug → Windows → Data Breakpoints.
Atmel Studio 7 User Guide
Debugging
© 2018 Microchip Technology Inc. User Guide DS50002718A-page 161
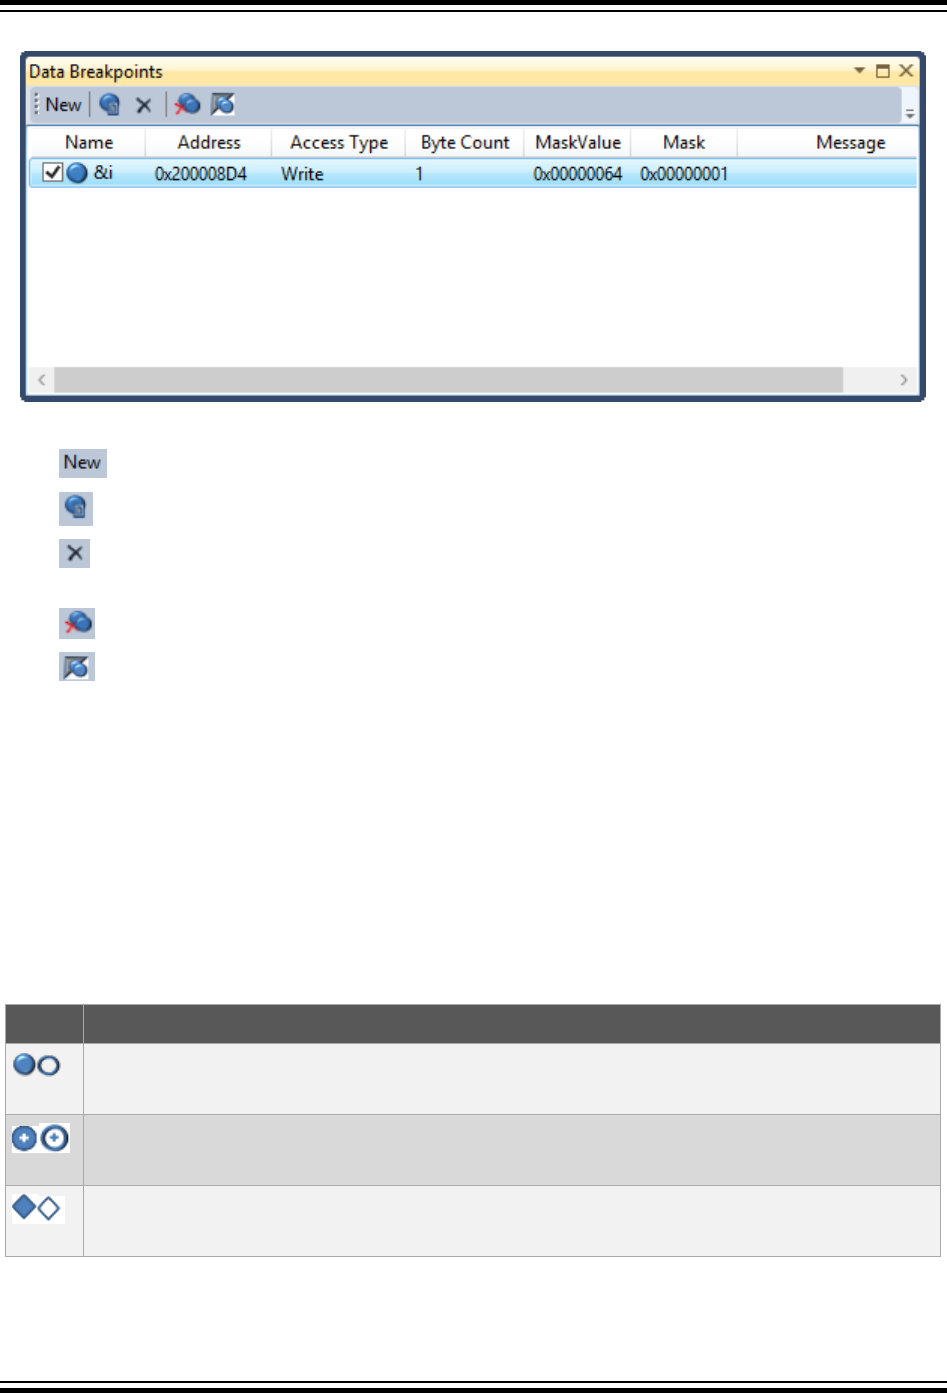
Figure 4-7. Data Breakpoint Window
The Data Breakpoints toolbar has the following elements:
• - provides the data breakpoint configuration window to add a new data breakpoint.
• - provides the data breakpoint configuration window to edit the selected data breakpoint.
• - removes the selected data breakpoint. You can invoke the same command using the Delete
key.
• - removes all the data breakpoints.
• - enable or disable all the data breakpoints.
The Data Breakpoints window displays several columns related to breakpoint configuration. Some of the
columns are dynamically hidden based on the breakpoints configuration. E.g.: if none of the breakpoints
has Mask configured, then Mask related columns are not displayed.
Name column has three parts:
•Checkbox - Use Checkbox to enable or disable the breakpoint.
•Icon - Glyph to represent the current state of the breakpoint. The following table describes these
glyphs. If you rest the mouse on a breakpoint glyph, a breakpoint tip appears with more information.
This information is especially useful for error and warning breakpoints.
•Text - Displays the configured location expression for the breakpoint.
Table 4-2. Breakpoint Icons
Icon Description
Normal breakpoint. The solid glyph indicates that the breakpoint is enabled. The hollow glyph
indicates that it is disabled.
Advanced breakpoint. Active/disabled. The + sign indicates that the breakpoint has hit count
attached to it.
Tracepoint. Active/disabled. Hitting this point performs a specified action but doesn't break
program execution.
Atmel Studio 7 User Guide
Debugging
© 2018 Microchip Technology Inc. User Guide DS50002718A-page 162
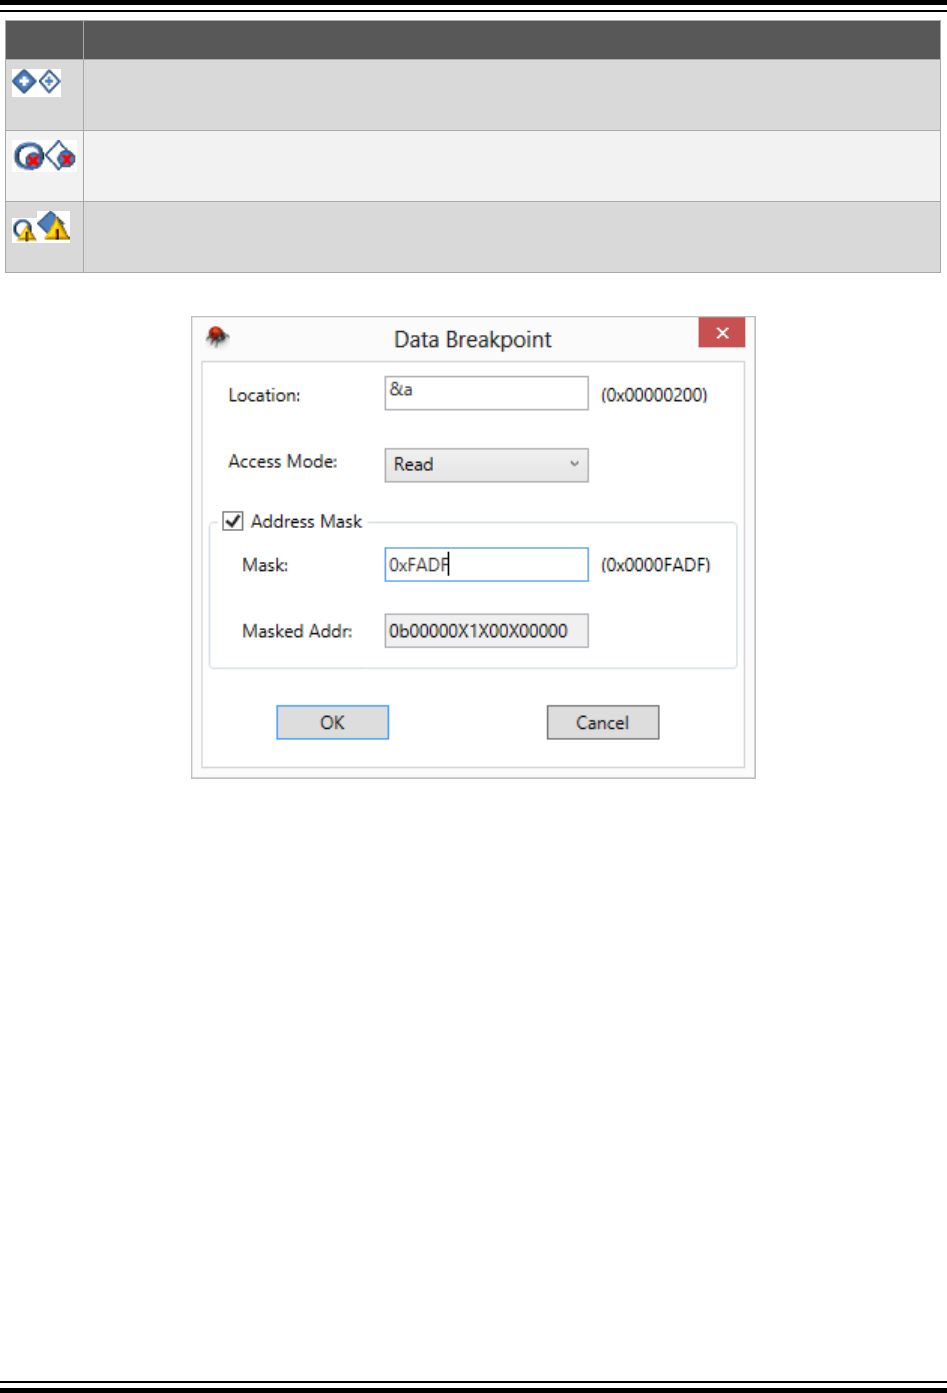
Icon Description
Advanced tracepoint. Active/disabled. The + sign indicates that the tracepoint has hit count
attached to it.
Breakpoint or tracepoint error. The X indicates that the breakpoint or tracepoint couldn't be set
because of an error condition. Check Message column for more details on the error message.
Breakpoint or tracepoint is set but with a warning. Check Message column for more details on
the warning message.
4.8.2.2 Data Breakpoint Configuration Window for AVR ATmega
This window provides configuration options related to data breakpoint for ATmega devices. Address mask
is optional.
Location
You can enter a specific address in RAM (e.g.: 0x8004) directly or an expression that evaluates to an
address in RAM (e.g.: &x). Make sure the expression you enter represents the address of the data to
monitor.
Note: Data breakpoints on local variables can result in false hits due to reuse of stack memory.
Suggestion to declare it as static for debugging purpose.
Access Mode
You can configure the breakpoint to break on a specific Access Mode. Three types of access modes are
supported:
•Read - Program breaks on read at a specified location.
•Write (Default) - Program breaks on write at a specified location.
•Read/Write - Program breaks on read or write at a specified location.
Address Mask
Atmel Studio 7 User Guide
Debugging
© 2018 Microchip Technology Inc. User Guide DS50002718A-page 163
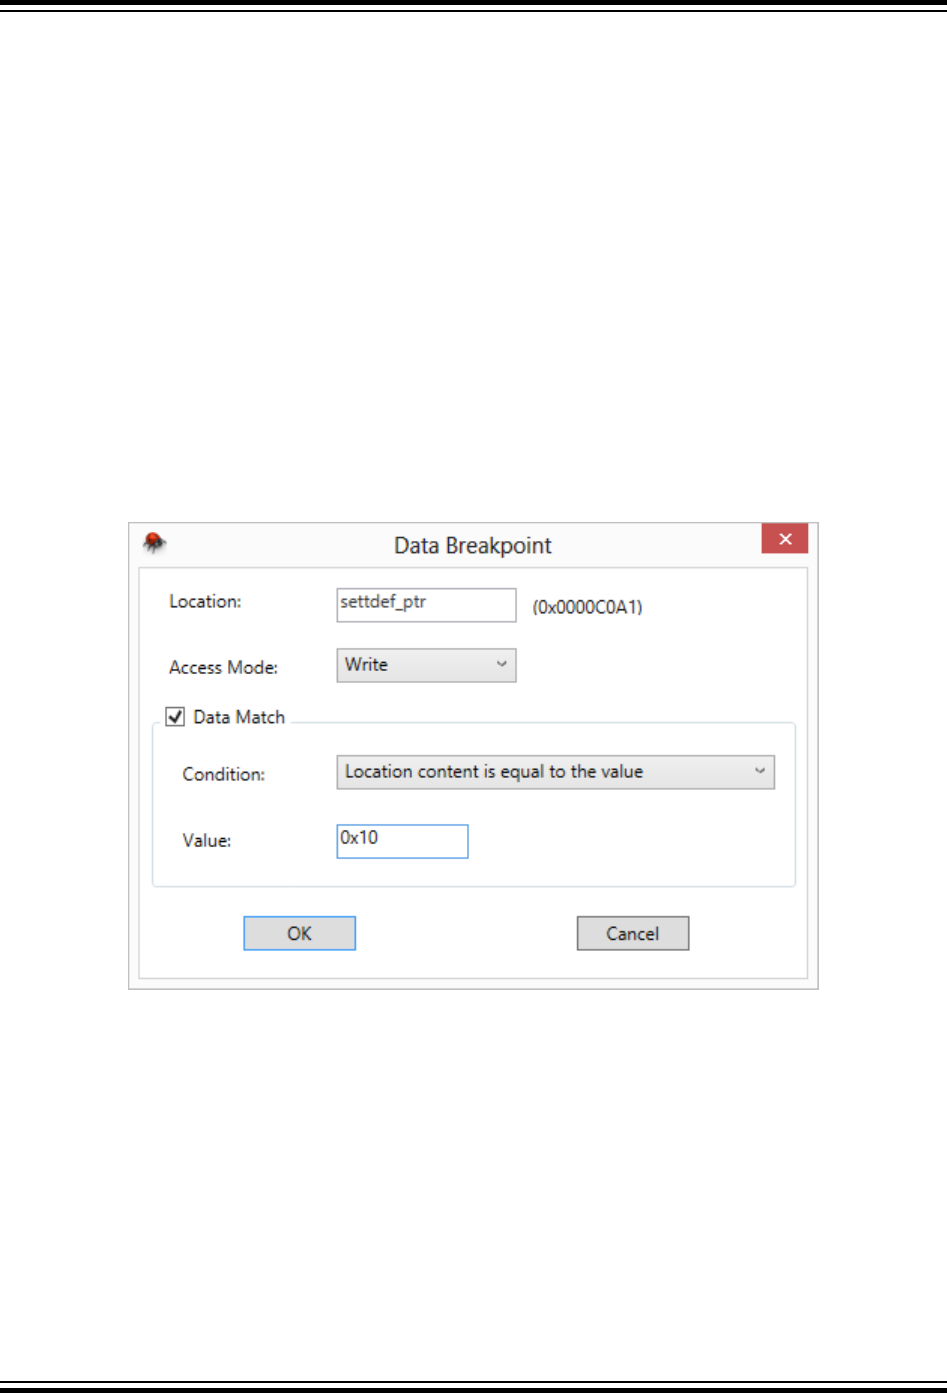
Address Mask on Mega Data Breakpoints is optional. Use address mask to break on more than one
address or a range of addresses on particular access.
Mask Mask value to mask the Location address to define more than one address or range of
addresses. Bits with value 1 in the mask are significant bits and 0 are don't care bits.
In general, for a given address A and mask M, an address B successfully matches when:
(A) & (M) == (B) & (M), where A is resolved address for the expression entered in Location,
M is mask value entered in Mask and B is any address in RAM.
Masked
Address
This is a read-only field which shows the range of matching addresses on which the
program can break. The masked address is shown in the binary format for simplicity. 'X'
represents don't care bits, remaining bits are expected to match.
E.g. 0b000000010XX000XX means it can break as per access mode, at addresses which
have all bits as per this string except X bits. In this case 0th, 1st, 5th, and 6th bit (LSb) can be
anything since these bits are don't care (X).
Note: ATmega devices don't support Data Masks.
4.8.2.3 Data Breakpoint Configuration Window for XMEGA
This window provides configuration options related to data breakpoint for XMEGA devices.
Location
You can enter a specific address in RAM (e.g.: 0x8004) directly or an expression that evaluates to an
address in RAM (e.g.: &x). Make sure the expression you enter represents the address of the data to
monitor.
Note: Data breakpoints on local variables can result in false hits due to reuse of stack memory.
Suggestion to declare it as static for debugging purpose.
Access Mode
Atmel Studio 7 User Guide
Debugging
© 2018 Microchip Technology Inc. User Guide DS50002718A-page 164

You can configure the breakpoint to break on specific Access Mode. Three types of access modes are
supported:
•Read - Program breaks on read at a specified location.
•Write (Default) - Program breaks on write at a specified location.
•Read/Write - Program breaks on read or write at a specified location.
Data Match
Use the Data Match option to configure Data Breakpoint to compare the data at a specified location
based on one of the following conditions:
• Location content is equal to the value
• Location content is greater than the value
• Location content is less than or equal to the value
• Location content is within the range
• Location content is outside the range
• Bits of the location is equal to the value
Note: Bit Mask: This is an 8-bit value where bits with '1' are significant and the bits with '0' are
don't care.
In general, for a given value V and bit mask M, the break event is triggered when the value in the
location field VL satisfies the following condition:
(V) & (M) == (VL) & (M)
For example, using Value = 0xA0 and Bit Mask = 0xF0 will trigger a break event when the
location field has any of the values between 0xA0 to 0xAF.
Note: The Condition Value field has to be 1 byte.
Atmel Studio 7 User Guide
Debugging
© 2018 Microchip Technology Inc. User Guide DS50002718A-page 165
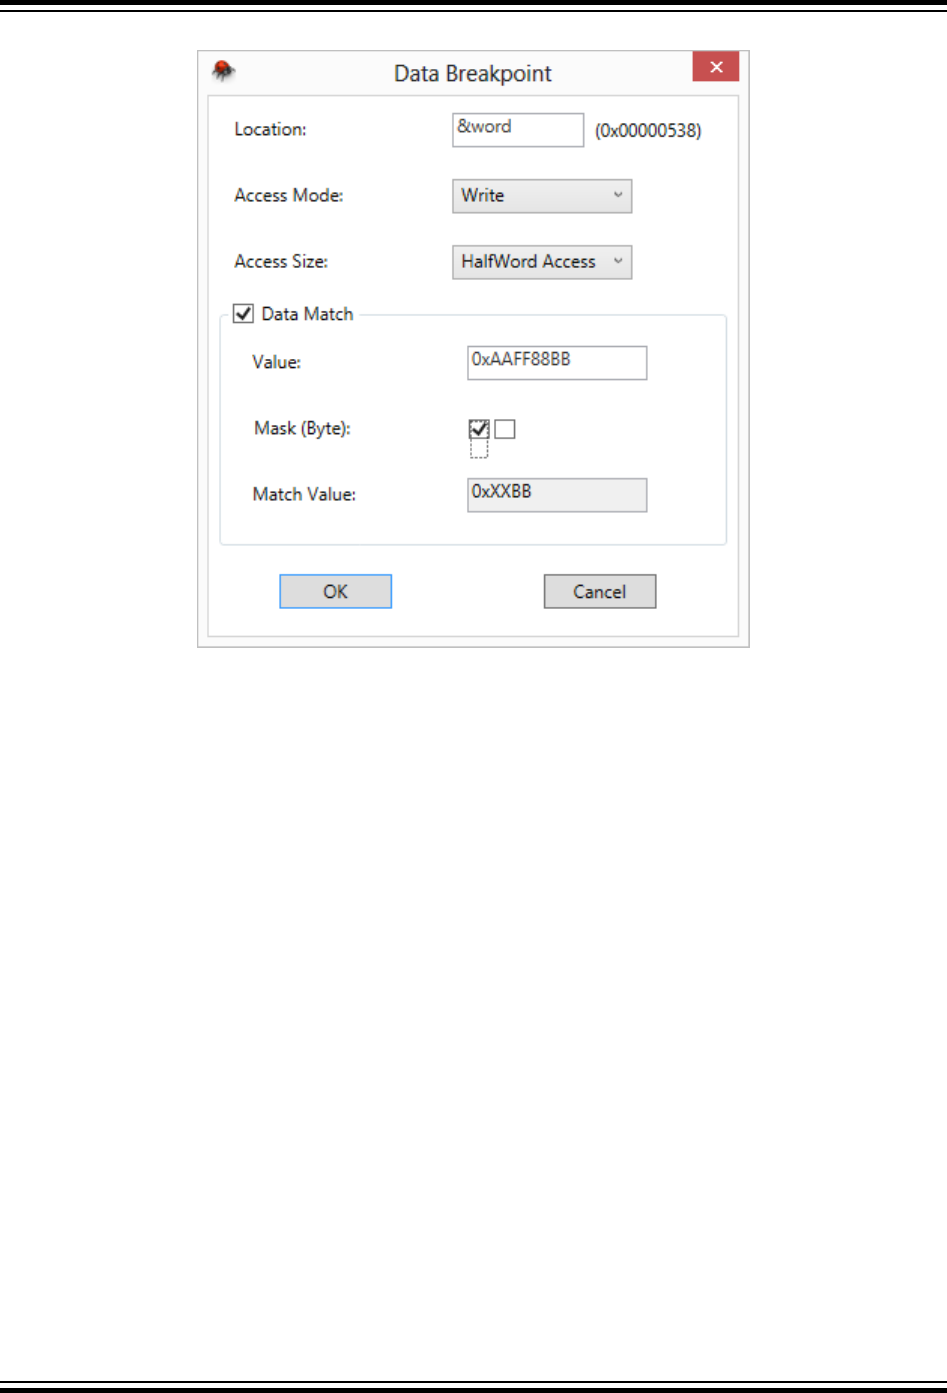
4.8.2.4 Data Breakpoint Configuration Window for UC3
This window provides configuration options related to data breakpoint for UC3 devices.
Location
You can enter a specific address in RAM (e.g.: 0x8004) directly or an expression that evaluates to an
address in RAM (e.g.: &x). Make sure the expression you enter represents the address of the data to
monitor.
Note: Data breakpoints on local variables can result in false hits due to reuse of stack memory.
Suggestion to declare it as static for debugging purpose.
Access Mode
You can configure the breakpoint to break on a specific Access Mode. Three types of access modes are
supported:
•Read - Program breaks on read at a specified location.
•Write (Default) - Program breaks on write at a specified location.
•Read/Write - Program breaks on read or write at a specified location.
Access Size
You can configure the breakpoint to break on a specific Access Size. Four types of access size are
supported:
•Any Access (Default) - Program breaks on any access size at a specified location.
•Byte Access - Program breaks on Byte access at a specified location.
•HalfWord Access - Program breaks on HalfWord access at a specified location.
•Word Access - Program breaks on Word access at a specified location.
Atmel Studio 7 User Guide
Debugging
© 2018 Microchip Technology Inc. User Guide DS50002718A-page 166
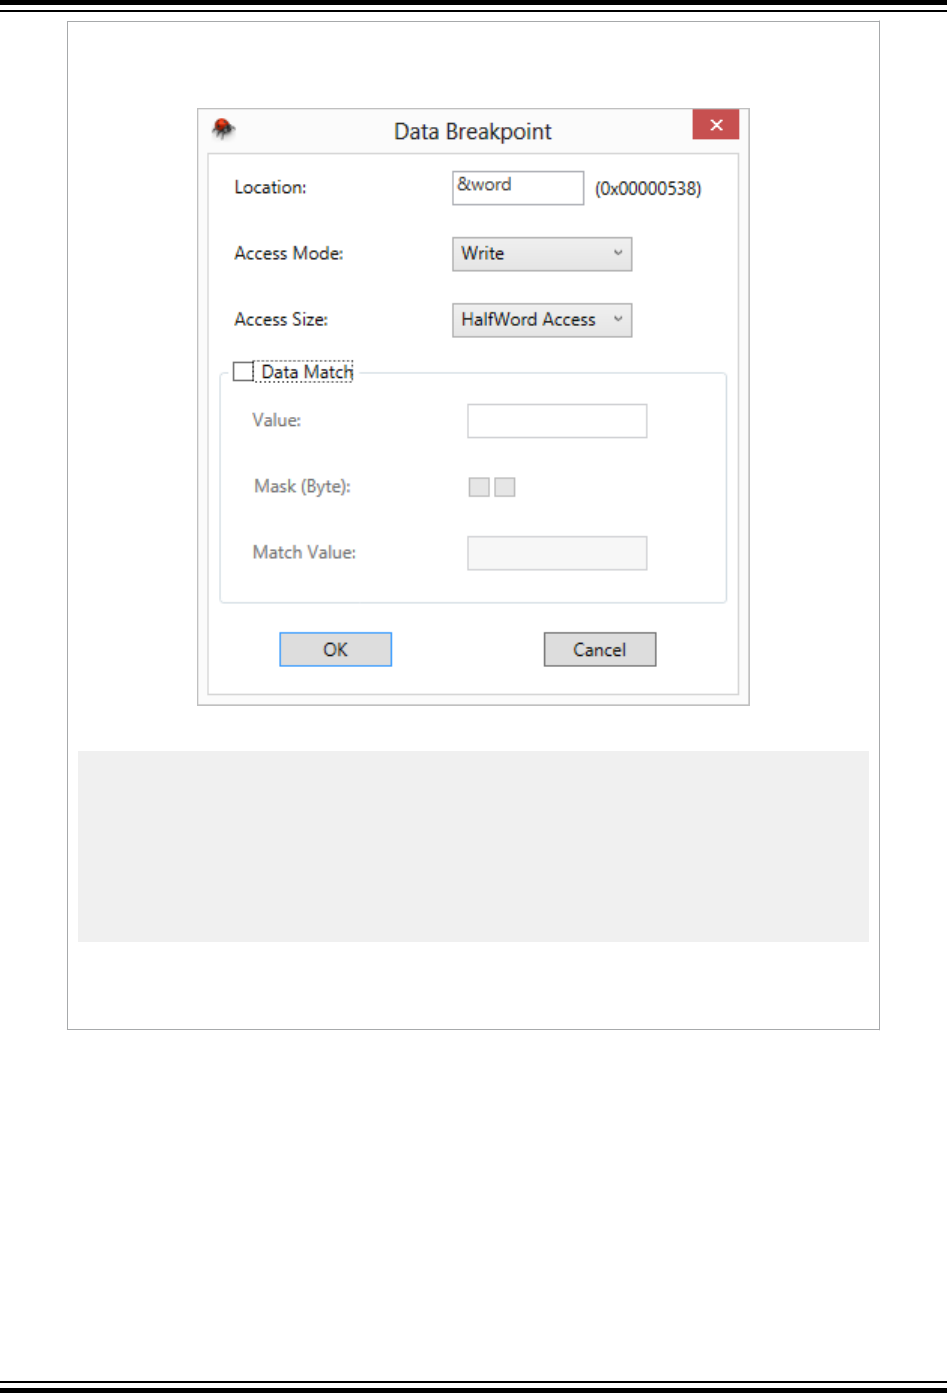
Example for setting access size
Configuration:
Code:
1: int word = 0;
2: short *halfWord = (short*)&word;
3:
4: int main(void)
5: {
6: word = 0xAABBCCFF;
7: *halfWord = 0xDDEE;
8: }
For the above configuration and code, program breaks at line eight after halfWord
access.
Data Match
Use the Data Match option to configure Data Breakpoint to compare the data at a specified location with
a 32-bit value. Break event is triggered by a successful match.
Value 32-bit (4-byte) value to compare with data at Location address. The value can be decimal or
hexadecimal (e.g.: 100 or 0x64). Based on Access Size, respective bytes are used for data
comparison. For example, if you select 'HalfWord Access' as Access Size and enter
0xAABBCCDD as Value, then only the last two bytes (0xCCDD) are used for data comparison.
Further, you could refine the Value by specifying Mask.
Atmel Studio 7 User Guide
Debugging
© 2018 Microchip Technology Inc. User Guide DS50002718A-page 167

Mask
(Byte)
Each checkbox controls the significance of respective byte in the Value field. Select the
appropriate checkbox to mask specific byte in the Value field. The number of checkboxes
displayed is decided based on Access Size. Four checkboxes (one per byte) are displayed
for 'Any' and 'Word Access', two checkboxes for 'HalfWord Access', and one checkbox for
'Byte Access'.
Match
Value
A read-only field, which displays masked value based on Access Size, Value, and Mask
(Byte) field. A masked byte is represented as 'XX', which means that byte is insignificant in
data comparison.
4.8.2.5 Data Breakpoint Configuration Window for SAM
Provides the configuration options related to data breakpoint for SAM devices. Address mask and Data
match are optional.
Location
You can enter a specific address (e.g.: 0x8004) directly or an expression that evaluates to an address
(e.g.: &x). Make sure the expression you enter represents the address of the data to monitor.
Note: Data breakpoints on local variables can result in false hits due to reuse of stack memory.
Suggestion to declare it as static for debugging purpose.
Access Mode
You can configure the breakpoint to break on a specific Access Mode. Three types of access modes are
supported:
•Read - Program breaks on read at a specified location.
•Write (Default) - Program breaks on write at a specified location.
•Read/Write - Program breaks on read or write at a specified location.
Address Mask
Atmel Studio 7 User Guide
Debugging
© 2018 Microchip Technology Inc. User Guide DS50002718A-page 168

Use this setting to define the range of addresses to monitor for access.
Byte Count You can enter a number of address locations to monitor starting at the Location address.
The actual range of monitored addresses can be wider than the expected range. E.g.: if
the Location is 0x23FA and the Byte Count is 5, then the actual range of the monitored
addresses is [0x23F8 to 0x23FF]. The way the actual range is computed is by calculating
the number of least significant bits that have to be masked in the Location address
(0x23FA) in order to cover the expected range [0x23FA to 0x23FA + 5]. In this case, the
number of bits to be masked is three. As a result, the actual range [0x23F8 to 0x23FF] is
wider than the expected range [0x23FA to 0x23FF].
Mask Size This is a read-only field, which displays the number of least significant bits masked in the
Location address. Mask Size is calculated based on the Byte Count and Location
addresses.
Address
Range
This is a read-only field, which displays the actual range of address monitored for access.
Range is closed interval including both minimum and maximum address.
Data Match
Use the Data Match option to configure Data Breakpoint to compare the data at a specified location with
a 32-bit value. The Break event is triggered by a successful match.
Value 32-bit (4-byte) value to compare with data at the Location address. The value can be
decimal or hexadecimal (e.g.: 100 or 0x64). You could further refine the Value by specifying
Mask.
Mask You can use Mask to extract the appropriate bytes from Value to use for data comparison.
E.g.: if the Value is 0xAABBCCDD and Mask is HalfWord, then the last two bytes (0xCCDD)
are extracted from Value and used for data comparison. This means data comparison would
succeed for the following matches 0xXXXXCCDD, 0xXXCCDDXX, and 0xCCDDXXXX, where X
is a don't care hexadecimal digit (0 to F). Three types of Mask's are supported:
•Byte - Last byte extracted from Value is used for data comparison.
•HalfWord - Last two bytes extracted from Value is used for data comparison.
•Word (Default) - Whole four bytes from Value is used for data comparison.
Match
Value
This is a read-only field which displays match values.
Data Match Example
Byte matching example
•Location = 0x200008D4
•Value = 0x0000CCAA
•Mask = Byte
The program breaks when Location0x200008D4 has any of the following values:
• 0xXXXXXXAA
• 0xXXXXAAXX
• 0xXXAAXXXX
Atmel Studio 7 User Guide
Debugging
© 2018 Microchip Technology Inc. User Guide DS50002718A-page 169
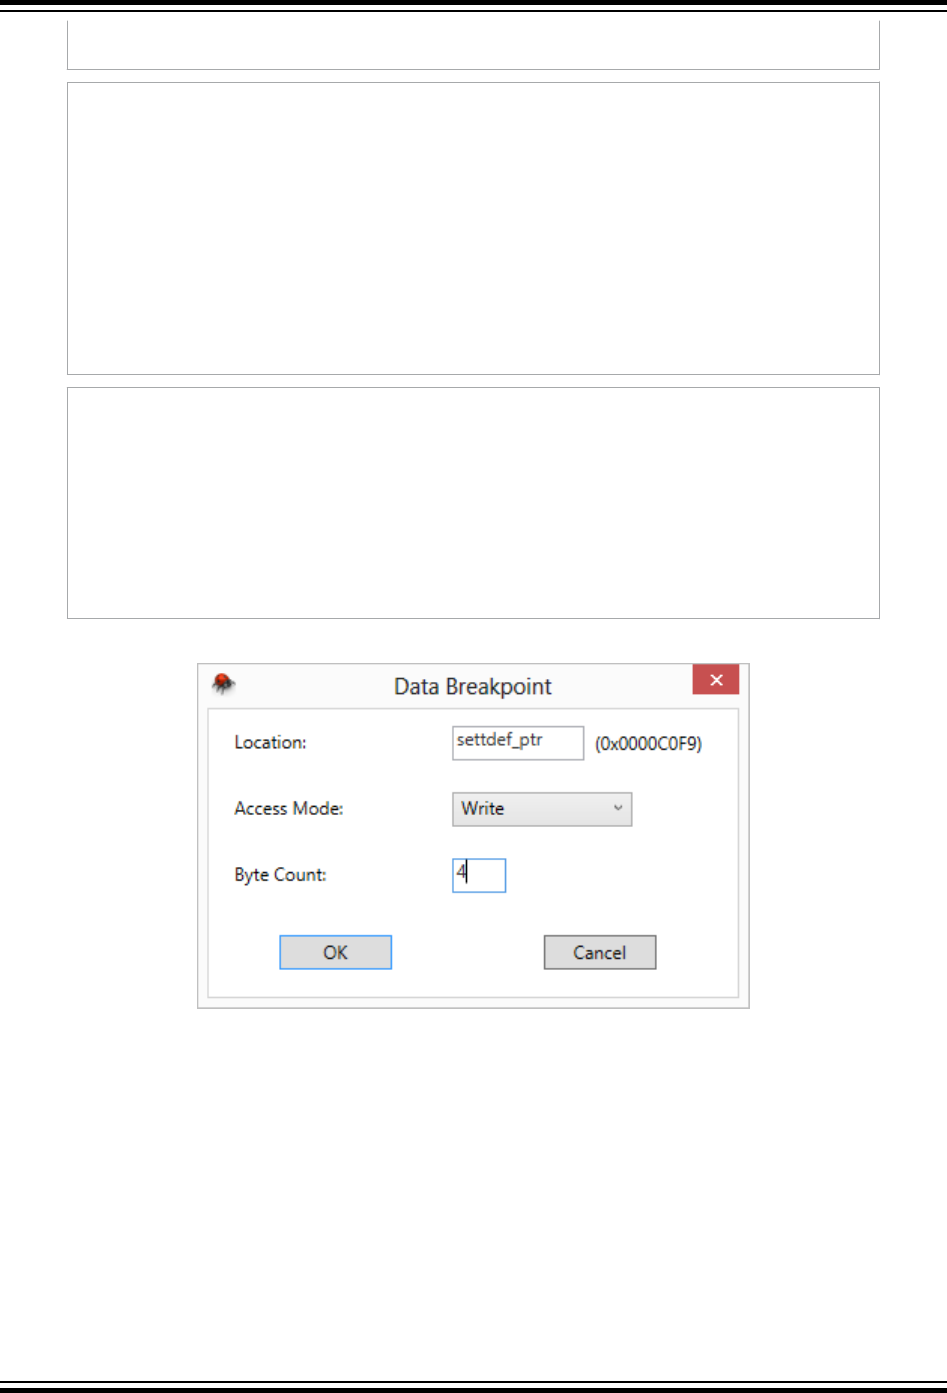
• 0xAAXXXXXX
HalfWord matching example
•Location = 0x200008D4
•Value = 0x0000CCAA
•Mask = HalfWord
The program breaks when Location0x200008D4 has any of the following values:
• 0xXXXXCCAA
• 0xXXCCAAXX
• 0xCCAAXXXX
Word matching example
•Location = 0x200008D4
•Value = 0x0000CCAA
•Mask = Word
The program breaks when Location 0x200008D4 has the following value:
• 0x00000CCAA
4.8.2.6 Data Breakpoint Configuration Window for Simulator Tool
The above configuration window is displayed for any device architecture when a simulator tool is
selected.
Location
You can enter a specific address in RAM (e.g.: 0x8004) directly or an expression that evaluates to an
address in RAM (e.g.: &x). Make sure the expression you enter represents the address of the data to
monitor.
Note: Data breakpoints on local variables can result in false hits due to reuse of stack memory.
Suggestion to declare it as static for debugging purpose.
Access Mode
Atmel Studio 7 User Guide
Debugging
© 2018 Microchip Technology Inc. User Guide DS50002718A-page 170
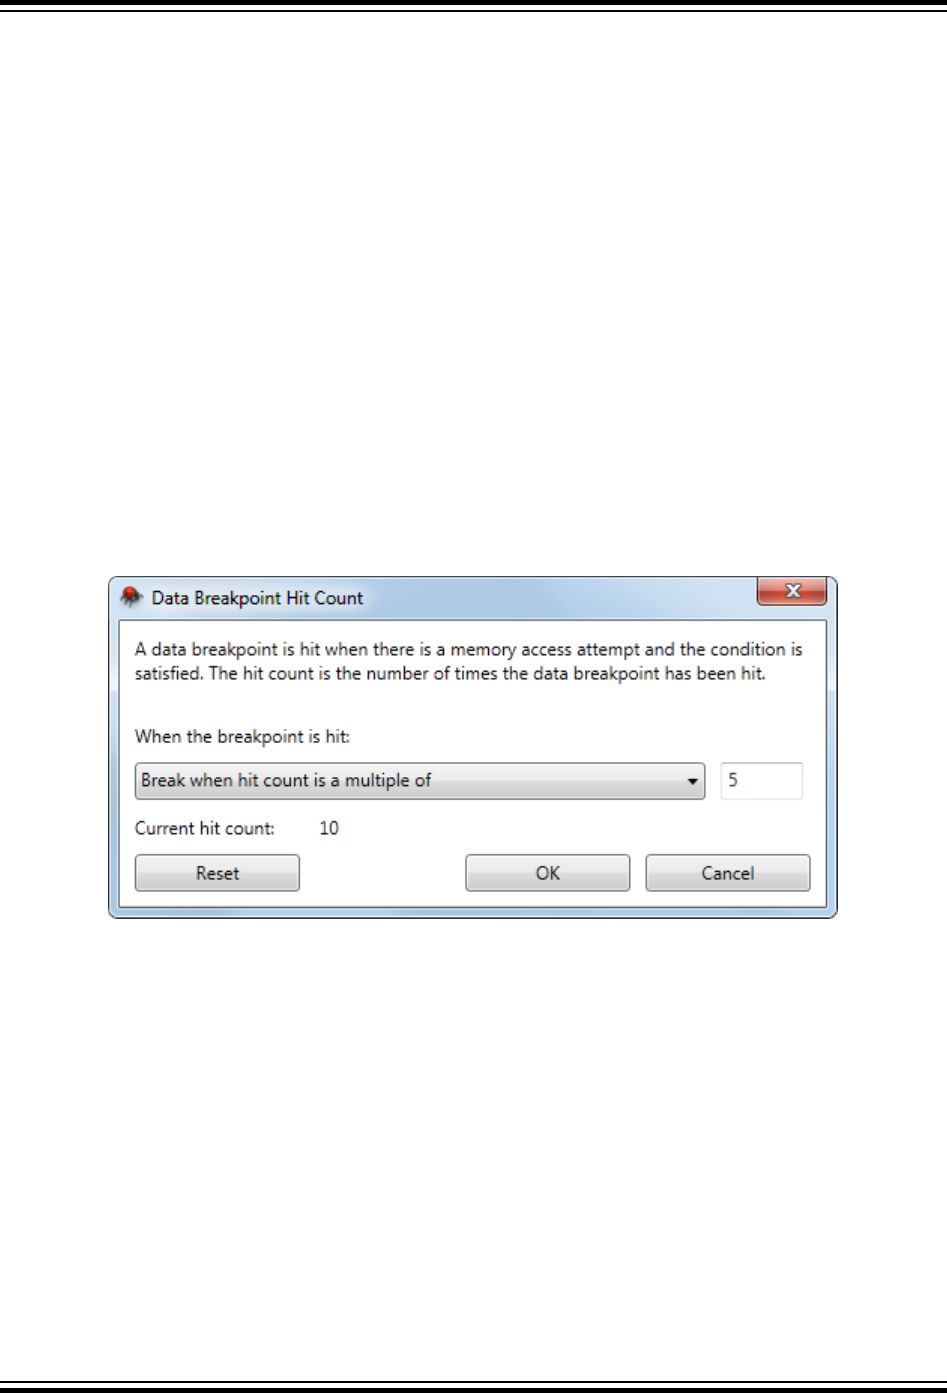
You can configure the breakpoint to break on a specific Access Mode. Three types of access modes are
supported:
•Read - Program breaks on read at a specified location.
•Write (Default) - Program breaks on write at a specified location.
•Read/Write - Program breaks on read or write at a specified location.
Byte Count
You can enter a number of address locations to monitor starting at the Location address.
Note:
• The Simulator supports an unlimited number of data breakpoints
4.8.2.7 How to: Specify a Data Breakpoint Hit Count
Hit count
The number of times the value stored in the specified memory location is accessed (read/write).
To specify a hit count
To specify or edit the Hit Count property, you must open the Hit Count Dialog Box.
In Data Breakpoints window, select a breakpoint row, and then choose Hit Count on the context menu.
Figure 4-8. Hit Count Dialog Box
To set or modify a hit count property, use the following controls:
•When the breakpoint is hit: This setting determines how the breakpoint should behave when it is
hit. You can choose to:
• Break always (the default)
• Break when the hit count equals a specified value
• Break when the hit count equals a multiple of a specified value
• Break when the hit count is greater or equal to a specified value
•Current hit count: This value shows the number of times the data breakpoint has been hit. A read/
write data for a variable will be converted into multiple instructions, resulting in several memory
accesses. So the data breakpoint hits multiple times for the same variable and the hit count will be
updated accordingly.
•Reset: This button resets the value shown for the Current hit count to 0.
Atmel Studio 7 User Guide
Debugging
© 2018 Microchip Technology Inc. User Guide DS50002718A-page 171
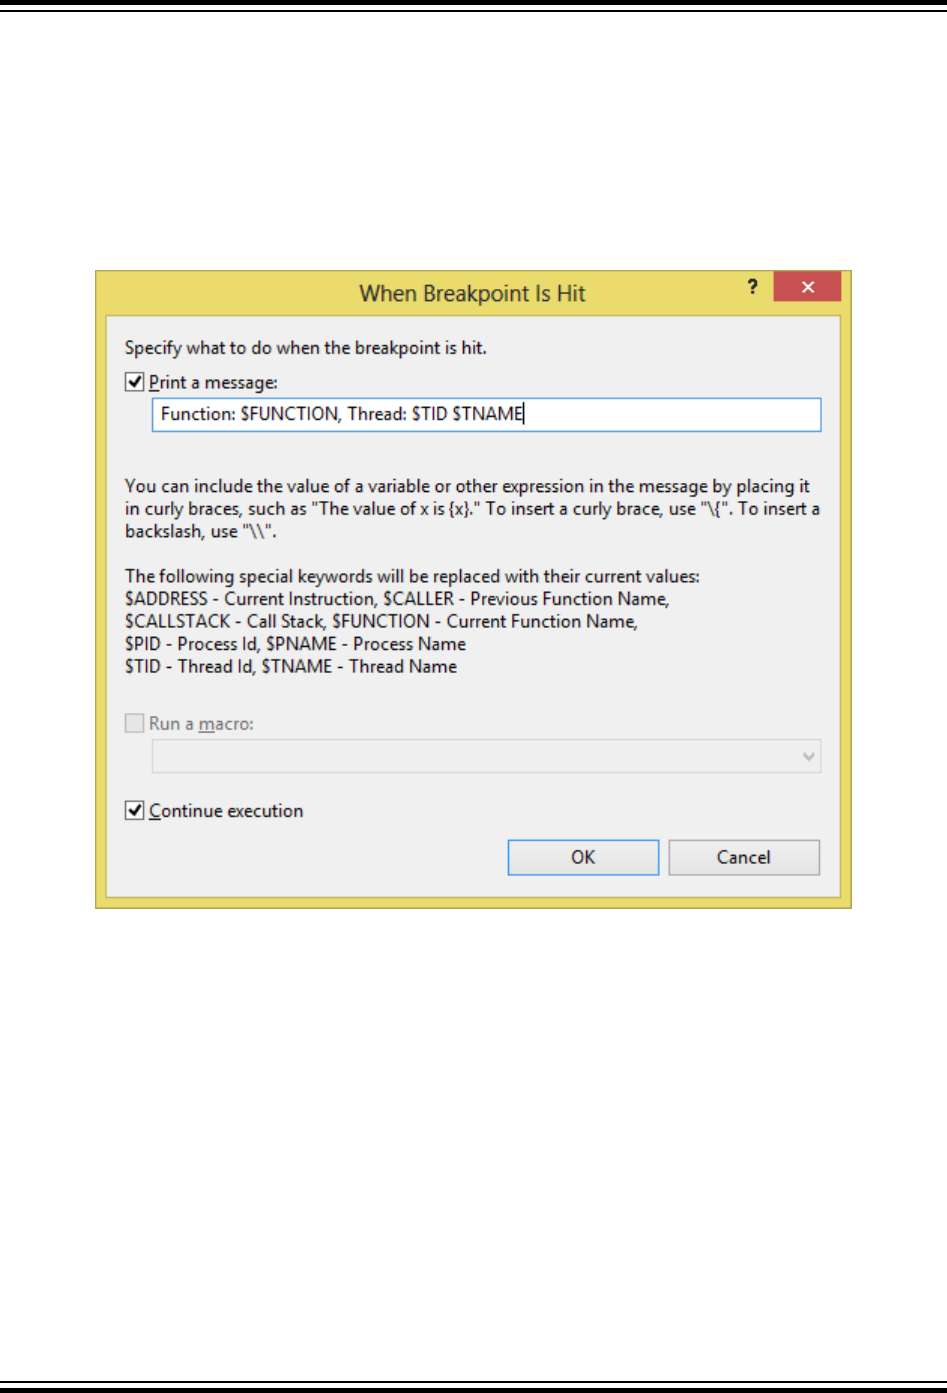
If you choose any option other than the default in When the breakpoint is hit list control, an edit box
appears next to it. Edit the value in this edit box to set the hit count value. For example, you might choose
break when hit count is equal to and enter 5. This causes execution to stop the 5th time the breakpoint is
hit, not on any other hit.
4.8.2.8 When Breakpoint is Hit Dialog Box
With this dialog box, you can print a message in the output window when a data breakpoint is hit.
To open the When Breakpoint Is Hit Dialog Box, go to the Data Breakpoints window, select a
breakpoint row, and then choose When Hit on the context menu.
Specify the message
• You can use any of the keywords that are described on the When Breakpoint Is Hit dialog box.
E.g.: Process Id : $PID.
• You can also specify expressions in the message by placing it in the curly braces, such as sum={a
+b}
Specify the breakpoint behavior
To break execution when the breakpoint is hit, clear the Continue Execution checkbox. When Continue
Execution is checked, execution is not halted. In both cases, the message is printed.
4.8.3 General Information on Data Breakpoint
• Data Breakpoint can be edited/added only in debug mode
• Local variables must always be qualified with the function name. This is also the case if the user
wants to add a variable from the function that the program has stopped in.
Atmel Studio 7 User Guide
Debugging
© 2018 Microchip Technology Inc. User Guide DS50002718A-page 172
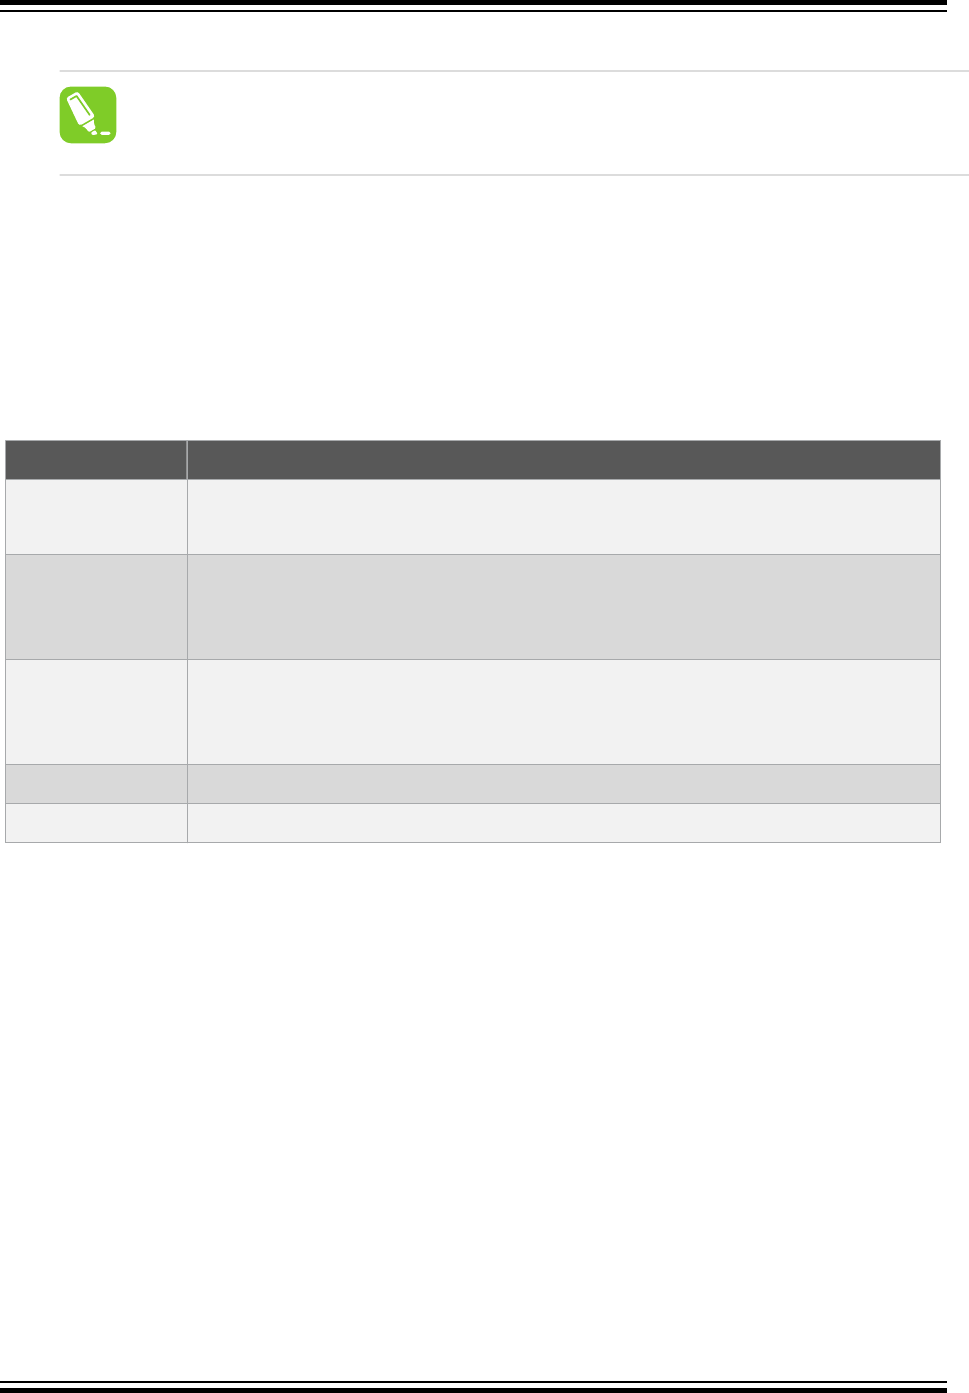
Data breakpoints on local variables can result in false hits due to reuse of stack memory.
Tip:
Declare local variables as static and provide the static variable's address in the location
field, the address of the static variable is fixed during compilation/linking.
• Global variables are initialized with default values during the start-up, the valid data breakpoint for
global variables will hit in the disassembly or initialization code during the start-up
• There can be several instructions to perform read/write data for a variable, for example, 'int' data
type can have two individual bytes read/write instructions so the data breakpoint hits twice for the
same variable
• Data breakpoint event can occur when the bus access happens for the specific address
• Maximum number of data breakpoint supported: (this may vary based on specific device/family
refer data sheet)
Architecture Maximum Data Breakpoint Supported
ATmega • Two without Data Mask (OR)
• One without Data Mask and one with Data Mask
XMEGA • Two without Data Mask (OR)
• One without Data Mask and one with Data Mask (OR)
• Two with Data Mask
UC3 • Two without Data Mask (OR)
• One without Data Mask and one with Data Mask (OR)
• Two with Data Mask
SAM Device dependent refer data sheet
Tiny Does not support data breakpoint
Most of the devices conform to the above limit.
Note: ATmega and SAM device uses multiple hardware resources when a data breakpoint with data
mask is set. Hence, using data mask can reduce the number of data breakpoint that can be set.
4.8.4 Data Breakpoint Usage
4.8.4.1 Stack Overflow Detection Using Data Breakpoint
You can decide on maximum stack size for your application and calculate the approximate end address
for the stack.
In the end address, set the data breakpoint for address range by applying address mask and access type
as Read/Write.
Note: The above method may cause a false break when heap memory tries to access the specified
stack end address.
Atmel Studio 7 User Guide
Debugging
© 2018 Microchip Technology Inc. User Guide DS50002718A-page 173

4.9 QuickWatch, Watch, Locals, and Autos Windows
The Atmel Studio debugger provides several windows, collectively known as variable windows, for
displaying variable information while you are debugging.
Each variable window has a grid with three columns: Name, Value, and Type. The Name column shows
the names of variables added automatically in the Auto and Locals windows.
In the Watch window, the Name column is where you can add your own variables or expressions. See
how to watch an expression in the Debugger.
The Value and Type columns display the value and data type of the corresponding variable or expression
result.
You can edit the value of a variable in the Value column.
The variable windows, Autos, Locals, and Watch display the values of certain variables during a
debugging session. The QuickWatch dialog box can also display variables. When the debugger is in
break mode, you can use the variable windows to edit the values of most variables that appear in these
locations.
Note: Editing floating-point values can result in minor inaccuracies because of decimal-to-binary
conversion of fractional components. Even a seemingly harmless edit can result in changes to some of
the least significant bits in the floating-point variable.
When an expression is evaluated in the Watch window, you might see a refresh icon. This indicates an
error or out-of-date value.
If you want to, you can enter an expression for a value. The debugger will evaluate the expression and
replace it with the resulting value. The debugger accepts most valid language expressions in a Watch
window. For more information, see Expression Formatting.
If you are programming in native code, you might sometimes have to qualify the context of a variable
name or an expression that contains a variable name. The context means the function, source file, and
module where a variable is located. If you have to do this, you can use the context operator syntax.
Evaluating some expressions can change the value of a variable or otherwise affect the state of your
program. For example, evaluating the following expression changes the value of var1 and var2:
var1 = var2++
var1 = var2++
Expressions that change data are said to have side effects, which can produce unexpected results if you
are not aware of them. Therefore, make sure you understand the effect of an expression before you
execute it.
To edit a value in a variable window
1. The debugger must be in break mode.
2. If the variable is an array or an object, a tree control appears next to the name in the Name box. In
the Name column, expand the variable, if necessary, to find the element whose value you want to
edit.
3. In the row you want to change, double-click the Value column.
4. Type the new value.
5. Press ENTER.
To display a variable window
Atmel Studio 7 User Guide
Debugging
© 2018 Microchip Technology Inc. User Guide DS50002718A-page 174
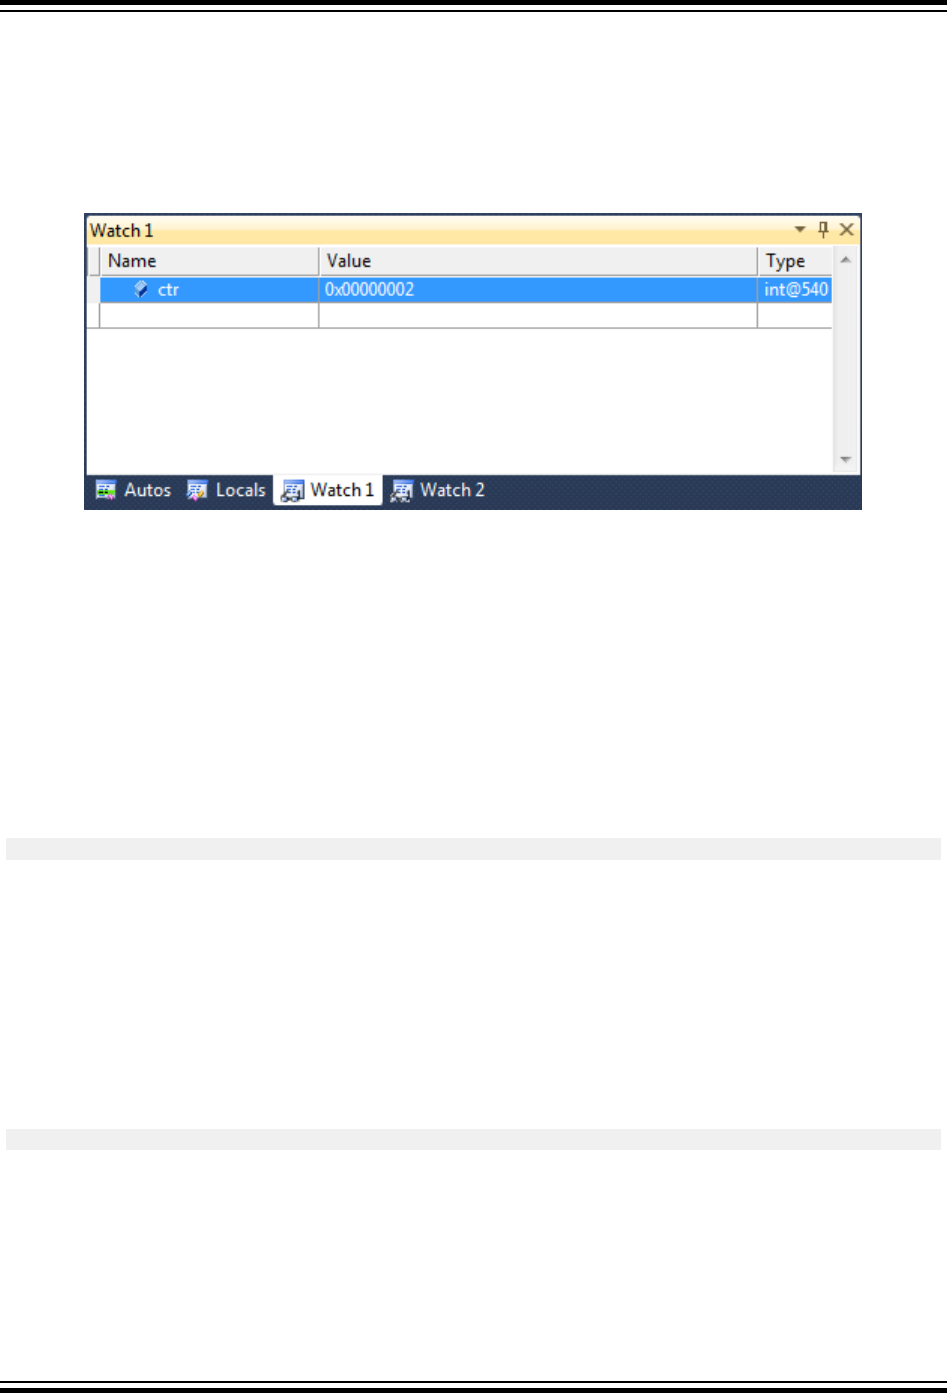
On the Debug menu, choose Windows, then choose the name of the variable window you want to display
(Autos, Locals, Watch, or Watch1 through Watch4).
You cannot access these menu items or display these windows in design mode. To display these menu
items, the debugger must be running or in break mode.
4.9.1 Watch Window
The Watch window and QuickWatch dialog box are places where you can enter variable names and
expressions that you want to watch during a debugging session.
The QuickWatch dialog box enables you to examine a single variable or expression at a time. It is useful
for taking a quick look at one value or a larger data structure. The Watch window can store several
variables and expressions that you want to view over the course of the debugging session. Atmel Studio
has multiple Watch windows, which are numbered Watch1 through Watch4.
A variable name is the simplest expression you can enter. If you are debugging native code, you can use
register names as well as variable names. The debugger can accept much more complex expressions
than that, however. For example, you could enter the following expression to find the average value of
three variables:
(var1 + var2 + var3) / 3
The debugger accepts most valid language expressions in a Watch window. For more information, see
Expression Formatting.
If you are programming in native code, you may sometimes need to qualify the context of a variable name
or an expression containing a variable name. The context means the function, source file, and module
where a variable is located. If you have to do this, you can use the context operator syntax.
Expressions that Affect the State of Your Program
Evaluating some expressions can change the value of a variable or otherwise affect the state of your
program. For example, evaluating the following expression changes the value of var1:
var1 = var2
Expressions that change data are said to have side effects. If you enter an expression that has a side
effect into the Watch window, the side effect will occur every time the expression is evaluated by the
Watch window. This can produce unexpected results if you are unaware that the expression has side
effects. An expression that is known to have side effects is only evaluated one time when you first enter it.
Subsequent evaluations are disabled. You can manually override this behavior by clicking an update icon
that appears next to the value.
Atmel Studio 7 User Guide
Debugging
© 2018 Microchip Technology Inc. User Guide DS50002718A-page 175

Unexpected side effects are frequently the result of function evaluation. For example, you could enter the
following function call into the Watch window:
PrintFunc1(var1)
Func1(var1)
If you call a function from the Watch window or QuickWatch, the function you are calling might change
data, creating a side effect. One way to avoid possible unexpected side effects from function evaluation is
to turn OFF automatic function evaluation in the Options dialog box. This disables automatic evaluation of
newer language features, such as properties. However, it is safer.
Note: When you examine an expression in the Watch window, you might see an update icon, which
resembles two green arrows, circling in opposite directions within a green circle. This is especially likely if
you have turned OFF automatic function evaluation. The update icon indicates an error or out-of-date
value.
The Atmel Studio debugger automatically expands common data types to show their most important
elements. You can also add expansions for custom data types.
Note: The dialog boxes and menu commands you see might differ from those described in Help
depending on your active settings or edition. To change your settings, choose Import and Export
Settings on the Tools menu. For more information, see Menus and Settings.
To evaluate an expression in the Watch window
1. In the Watch window, click an empty row in the Name column. The debugger must be in break
mode at this point. Type or paste the variable name or expression you want to watch.
—or—
Drag a variable to a row in the Watch window.
2. Press ENTER.
3. The result appears in the Value column. If you type the name of an array or object variable, a tree
control appears next to the name in the Name column. Expand or collapse the variable in the Name
column.
4. The expression remains in the Watch window until you remove it.
To evaluate an expression in QuickWatch
1. In the QuickWatch dialog box, type or paste the variable, register, or expression into the Expression
text box.
2. Click Reevaluate or press ENTER.
3. The value appears in the Current value box.
4. If you type the name of an array or object variable in the Expression box, a tree control appears
next to the name in the Current value box. Expand or collapse the variable in the Name column.
To reevaluate a previous expression in QuickWatch
1. In the QuickWatch dialog box, click the down arrow that appears to the right of the Expression box.
2. Choose one of the previous expressions from the drop-down list.
3. Click Reevaluate.
4.9.2 Locals Window
Atmel Studio 7 User Guide
Debugging
© 2018 Microchip Technology Inc. User Guide DS50002718A-page 176
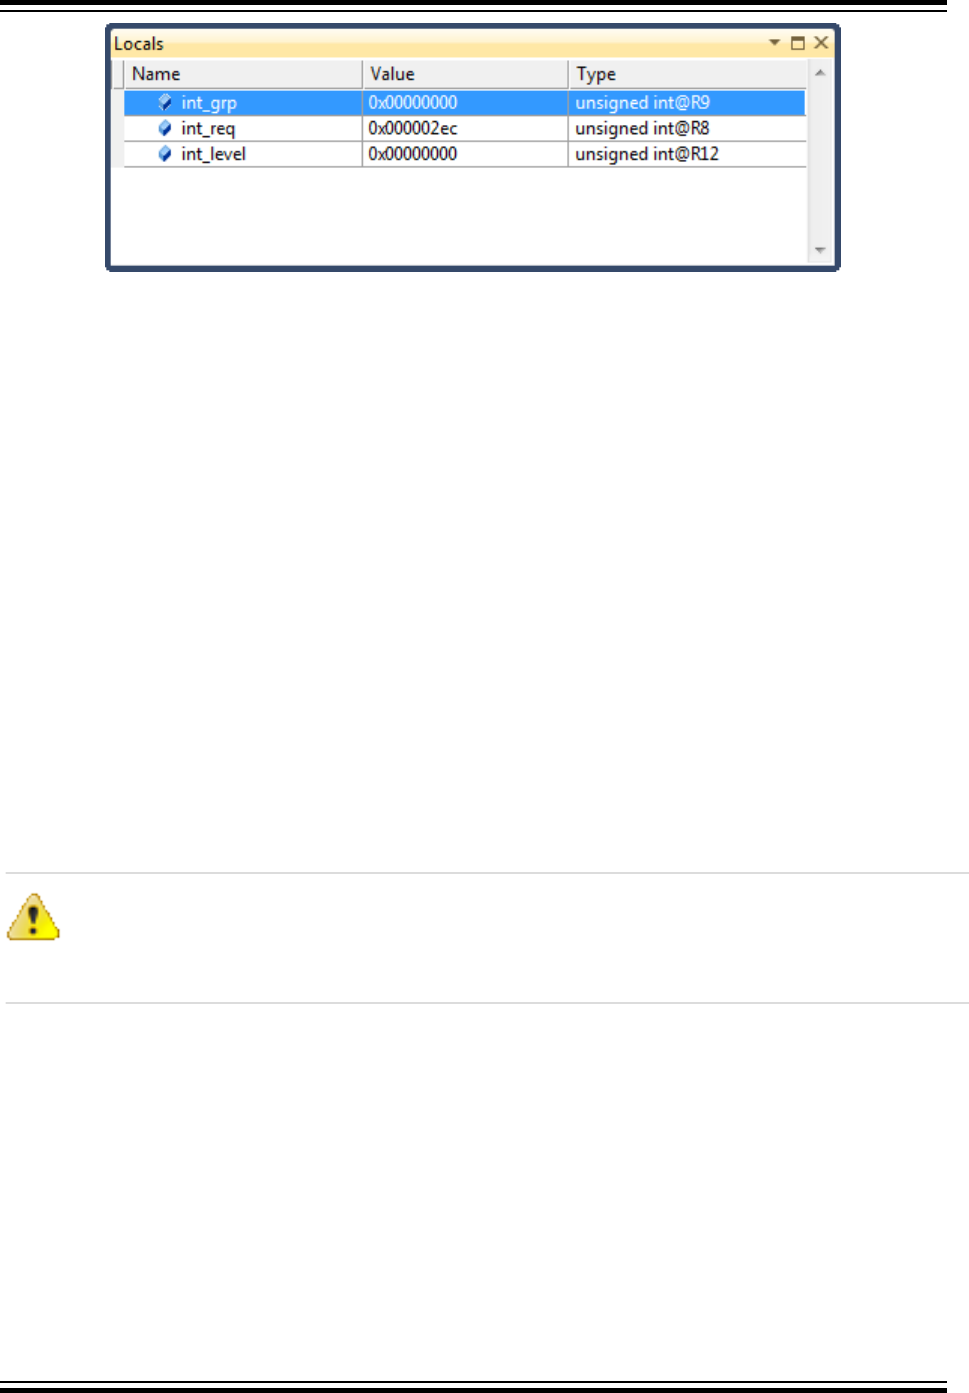
The Locals window displays variables local to the current context.
4.9.2.1 To Display the Locals Window
From the Debug menu, choose Windows and click Locals. (The debugger must be running or in break
mode.)
4.9.2.2 To Choose an Alternative Context
The default context is the function containing the current execution location. You can choose an alternate
context to display in the Locals window:
• Use the Debug Location toolbar to select the desired function, thread, or program
• Double-click on an item in the Call Stack or Threads window
To view or modify information in the Locals window, the debugger must be in break mode. If you choose
Continue, some information may appear in the Locals window while your program executes, but it will not
be current until the next time your program breaks (in other words, it hits a breakpoint or you choose
Break All from the Debug menu).
4.9.2.3 To Modify the Value of a Variable in the Locals Window
1. The debugger must be in break mode.
2. In the Locals window, select the value you want to edit by double-clicking on it or by using the TAB
key.
3. Type the new value and press ENTER.
Attention:
Editing floating-point values can result in minor inaccuracies because of decimal-to-binary
conversion of fractional components. Even a seemingly harmless edit can result in changes to
some of the least significant bits in the floating-point variable.
Setting Numeric Format
You can set the numeric format used in the debugger windows to decimal or hexadecimal. Right click
inside the Locals window, and check/uncheck the Hexadecimal display menu item.
4.9.3 Autos Window
The Autos window displays variables used in the current statement and the previous statement.
The current statement is the statement at the current execution location (the statement that will be
executed next if execution continues). The debugger identifies these variables for you automatically,
hence the window name.
Structure and array variables have a tree control that you can use to display or hide the elements.
Atmel Studio 7 User Guide
Debugging
© 2018 Microchip Technology Inc. User Guide DS50002718A-page 177

To display the Autos window
From the Debug menu, choose Windows and click Autos. (The debugger must be running or in break
mode.)
4.9.3.1 To Modify the Value of a Variable in the Autos Window
1. The debugger must be in break mode.
2. Display the Autos window, if necessary.
3. In the Value column, double-click the value you want to change.
-or-
Single-click to select the line, then press the TAB key.
4. Type the new value and press ENTER.
Attention:
Editing floating-point values can result in minor inaccuracies because of decimal-to-binary
conversion of fractional components. Even a seemingly harmless edit can result in changes to
some of the least significant bits in the floating-point variable.
4.9.3.2 Setting Numeric Format
You can set the numeric format used in the debugger windows to decimal or hexadecimal. Right click
inside the Autos window, and check/uncheck the Hexadecimal display menu item.
4.9.4 QuickWatch and Watches
While debugging you might want to track a value of a variable or an expression. To do so you can right
click on the expression under the cursor and select Add a Watch or Quickwatch.
The QuickWatch dialog box lets you examine and evaluate variables and expressions. Because
QuickWatch is a modal dialog box, you have to close it before you can continue to debug. You can also
edit the value of a variable in QuickWatch. For more information on how to watch a variable, see Watch
Window.
Some users might wonder why QuickWatch is useful. Why not add the variable or expression to the
Watch window? That is possible, but if you just want to do a quick scratch calculation that involves one or
Atmel Studio 7 User Guide
Debugging
© 2018 Microchip Technology Inc. User Guide DS50002718A-page 178

more variables, you do not want to clutter the Watch window with such calculations. That is when the
QuickWatch dialog box is especially useful.
Another feature of the QuickWatch dialog box is that it is resizeable. If you want to examine the
members of a large object, it is frequently easier to expand and examine the tree QuickWatch than it is in
the Watch, Locals, or Autos window.
The QuickWatch dialog box does not allow you to view more than one variable or expression at a time.
Also, because QuickWatch is a modal dialog box, you cannot perform operations such as stepping
through your code while QuickWatch is open. If you want to do these things, use the Watch window
instead.
Some expressions have side effects that change the value of a variable or otherwise change the state of
your program when they are executed. Evaluating an expression in the QuickWatch dialog box will have
the same effect as executed the expression in your code. This can produce unexpected results if you do
not consider the side effects of the expression.
Note: In Atmel Studio, you can view a variable's value by placing the cursor over the variable. A small
box called a DataTip appears and shows the value.
To open the QuickWatch dialog box
While in break mode, choose QuickWatch on the Debug menu.
To open the QuickWatch dialog box with a variable added
While in break mode, right click a variable name in the source window name and choose QuickWatch.
This automatically places the variable into the QuickWatch dialog box.
To add a QuickWatch expression to the Watch window
In the QuickWatch dialog box, click Add Watch.
Whatever expression that was displayed in the QuickWatch dialog box is added to the list of expressions
in the Watch window. The expression will normally be added to the Watch1 window.
4.9.5 Expression Formatting
The Atmel Studio debugger includes expression evaluators that work when you enter an expression in
the QuickWatch and Watches, Memory View, Watch Window, or Immediate window. The expression
evaluators are also at work in the Breakpoints window and many other places in the debugger.
General Syntax:
Val, formatString
Format Specifier for values
The following tables show the format specifiers recognized by the debugger.
Table 4-3. Debug Format Specifiers for Values
Specifier Format Expression Value Displayed
d,i Signed decimal integer 0xF000F065, d -268373915
u Unsigned decimal integer 0x0065, u 101
b Unsigned binary number 0xaa,b2 0b10101010
Atmel Studio 7 User Guide
Debugging
© 2018 Microchip Technology Inc. User Guide DS50002718A-page 179
Specifier Format Expression Value Displayed
o Unsigned octal integer 0xF065, o 0170145
x,X Hexadecimal integer 61541, x 0x0000F065
1,2,4,8 As a suffix specifying number of bytes for: d, i, u, o, x, X. 00406042,x2 0x0c22
s String 0x2000, s 'Hello World'
f Signed floating point (3./2.), f 1.500000
e Signed scientific notation (3./2.), e 1.500000e+000
g Signed floating point or signed scientific notation,
whichever is shorter
(3./2.), g 1.5
c Single character 0x0065, c 101 'e'
Size Specifier for Pointers as Arrays
If you have a pointer to an object you want to view as an array, you can use an integer to specify the
number of array elements:
ptr,10 or array,20
Memory type specifier
The following memory type specifiers will force the memory reference to a specific memory type. To be
used in the memory window in the address field, you should have a pointer to an object you want to view
as an array. You can use an integer to specify the number of the array elements:
Table 4-4. Debug Memory Type Specifiers
Specifier Expression Value Displayed
flash or program Program memory 0,flash
data Data memory 0x2000,data
sram SRAM 0x100,sram
reg or registers Registers 1,reg
io, eeprom, fusebytes, lockbytes, signature,
usersign, prodsign
Memory types with same names
4.10 DataTips
DataTips provide a convenient way to view information about variables in your program during
debugging. DataTips work only in break mode and only with variables that are in the current scope of
execution.
In Atmel Studio, DataTips can be pinned to a specific location in a source file, or they can float on top of
all Atmel Studio windows.
Atmel Studio 7 User Guide
Debugging
© 2018 Microchip Technology Inc. User Guide DS50002718A-page 180
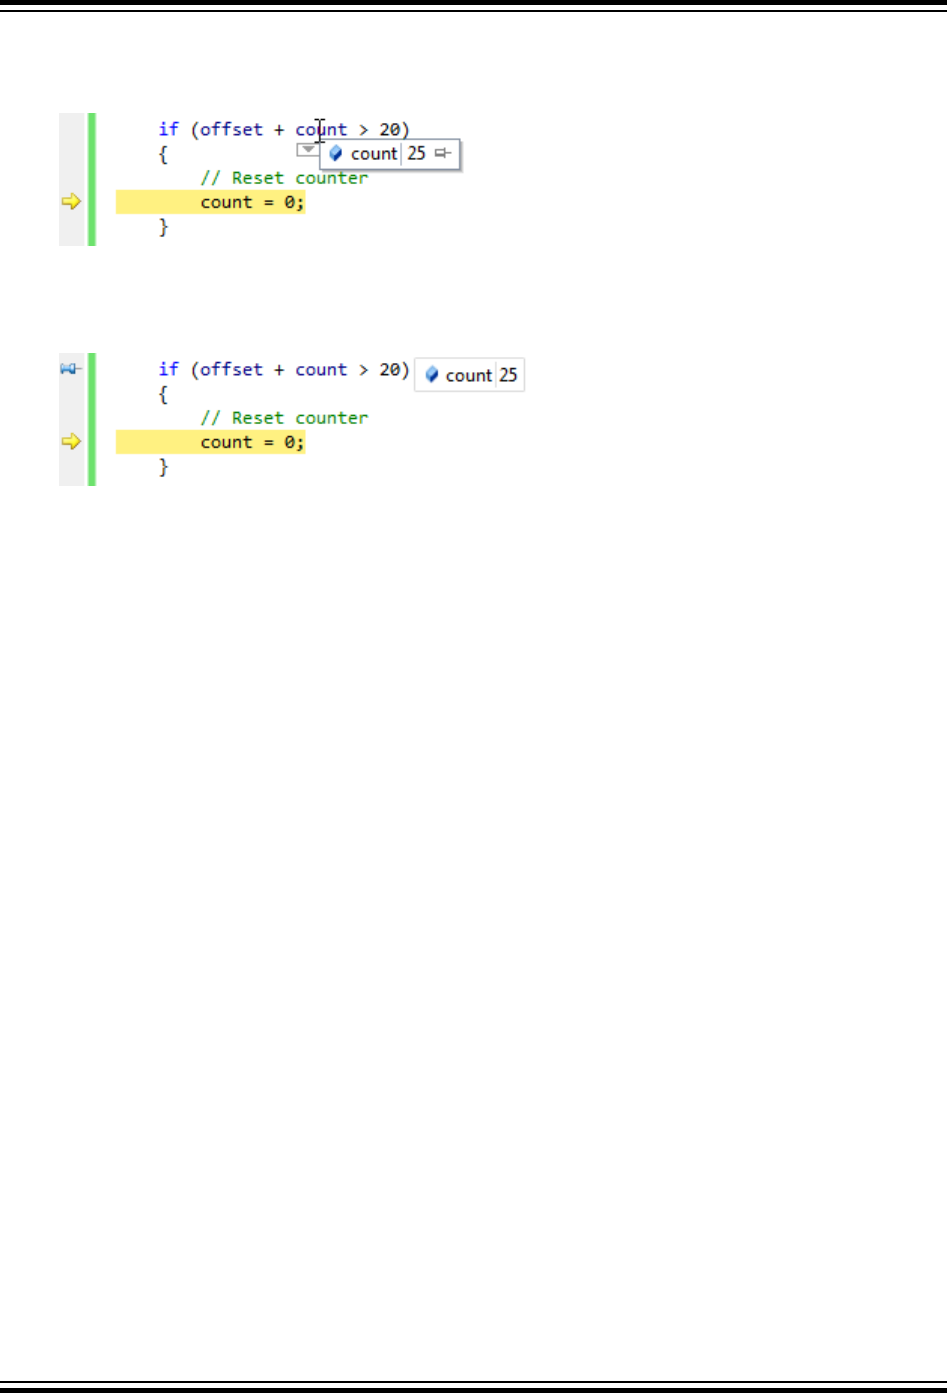
To display a DataTip (in break mode only)
1. In a source window, place the mouse pointer over any variable in the current scope. A DataTip
appears.
2. The DataTip disappears when you remove the mouse pointer. To pin the DataTip so that it remains
open, click the Pin to source icon, or
– Right click on a variable, then click Pin to source
The pinned DataTip closes when the debugging session ends.
To unpin a DataTip and make it float
• In a pinned DataTip, click the Unpin from source icon
The pin icon changes to the unpinned position. The DataTip now floats above any open windows.
The floating DataTip closes when the debugging session ends.
To repin a floating DataTip
• In a DataTip, click the pin icon
The pin icon changes to the pinned position. If the DataTip is outside a source window, the pin icon
is disabled and the DataTip cannot be pinned.
To close a DataTip
• Place the mouse pointer over a DataTip, and then click the Close icon
To close all DataTips
• On the Debug menu, click Clear All DataTips
To close all DataTips for a specific file
• On the Debug menu, click Clear All DataTips Pinned to File
4.10.1 Expanding and Editing Information
You can use DataTips to expand an array, a structure, or an object to view its members. You can also edit
the value of a variable from a DataTip.
To expand a variable to see its elements:
• In a DataTip, put the mouse pointer over the + sign that comes before the variable name
The variable expands to show its elements in tree form.
When the variable is expanded, you can use the arrow keys on your keyboard to move up and down.
Alternatively, you can use the mouse.
Atmel Studio 7 User Guide
Debugging
© 2018 Microchip Technology Inc. User Guide DS50002718A-page 181

To edit the value of a variable using a DataTip
1. In a DataTip, click the value. This is disabled for read-only values.
2. Type a new value and press ENTER.
4.10.2 Making a DataTip Transparent
If you want to see the code that is behind a DataTip, you can make the DataTip temporarily transparent.
This does not apply to DataTips that are pinned or floating.
To make a DataTip transparent
• In a DataTip, press CTRL
The DataTip will remain transparent as long as you hold down the CTRL key.
4.10.3 Visualizing Complex Data Types
If a magnifying glass icon appears next to a variable name in a DataTip, one or more Visualizers are
available for variables of that data type. You can use a visualizer to display the information in a more
meaningful, usually graphical, manner.
To view the contents of a variable using a visualizer
• Click the magnifying glass icon to select the default visualizer for the data type
-or-
Click the pop-up arrow next to the visualizer to select from a list of appropriate visualizers for the
data type.
A visualizer displays the information.
4.10.4 Adding Information to a Watch Window
If you want to continue to watch a variable, you can add the variable to the Watch window from a DataTip.
To add a variable to the Watch window
• Right click a DataTip, and then click Add Watch
The variable is added to the Watch window. If you are using an edition that supports multiple Watch
windows, the variable is added to Watch 1.
4.10.5 Importing and Exporting DataTips
You can export DataTips to an XML file, which can be shared with a colleague or edited using a text
editor.
To Export DataTips
1. On the Debug menu, click Export DataTips.
The Export DataTips dialog box appears.
2. Use standard file techniques to navigate to the location where you want to save the XML file, type a
name for the file in the File name box, and then click OK.
To Import DataTips
1. On the Debug menu, click Import DataTips.
The Import DataTips dialog box appears.
2. Use the dialog box to find the XML file that you want to open and click OK.
Atmel Studio 7 User Guide
Debugging
© 2018 Microchip Technology Inc. User Guide DS50002718A-page 182
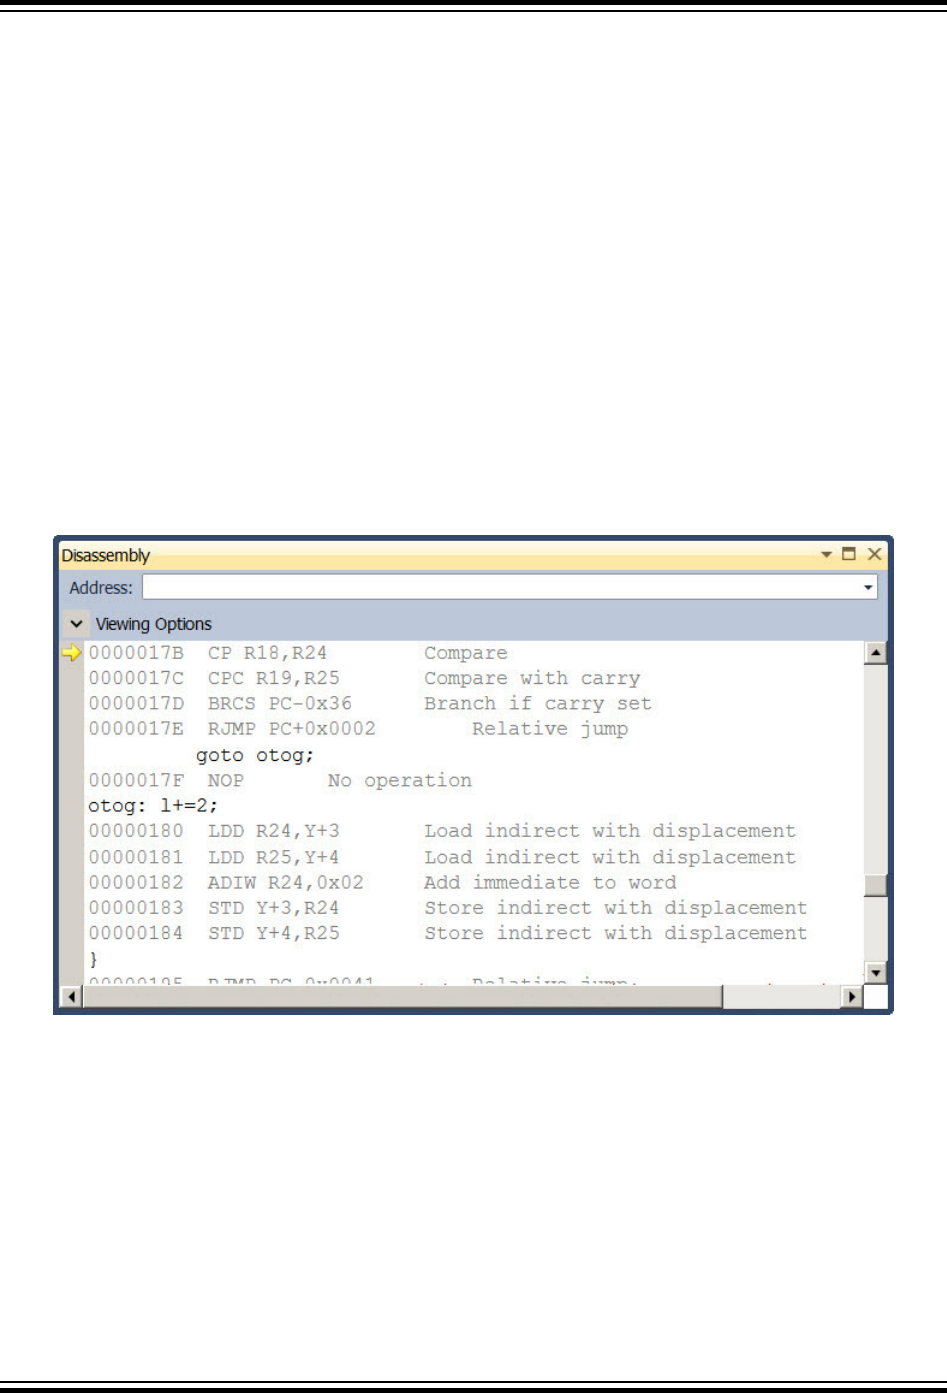
4.11 Disassembly View
The Disassembly window is only available when debugging. When any supported high-level language is
used, the source window is automatically displayed and the disassembly window is OFF. Enable it by
choosing Debug → Windows → Disassembly or Ctrl Alt D during a debugging session.
The disassembly window shows your program code disassembled. Program execution and AVR
instructions can be followed in this view. By right clicking inside the Disassembly window, you will be able
to set breakpoints, run to the position of the cursor, or go to the source code. You cannot modify the
source code from the Disassembly window.
In addition to assembly instructions, the Disassembly window can show the following optional information:
• Memory address where each instruction is located. For native applications, this is the actual
memory address.
• Source code from which the assembly code derives
• Code bytes byte representations of the actual machine
• Symbol names for the memory addresses
• Line numbers corresponding to the source code
Assembly-language instructions consist of mnemonics, which are abbreviations for instruction names,
and symbols that represent variables, registers, and constants. Each machine-language instruction is
represented by one assembly-language mnemonic, usually followed by one or more variables, registers,
or constants.
Because assembly code relies heavily on processor registers or, in the case of managed code, common
language runtime registers, you will often find it useful to use the Disassembly window in conjunction with
the Registers window, which allows you to examine register contents.
Note: You may see inconsistencies in instructions that work on explicit addresses. This stems from the
historic difference between the AVR Assembler and Assembly Language and the GCC Assembler and
Atmel Studio 7 User Guide
Debugging
© 2018 Microchip Technology Inc. User Guide DS50002718A-page 183
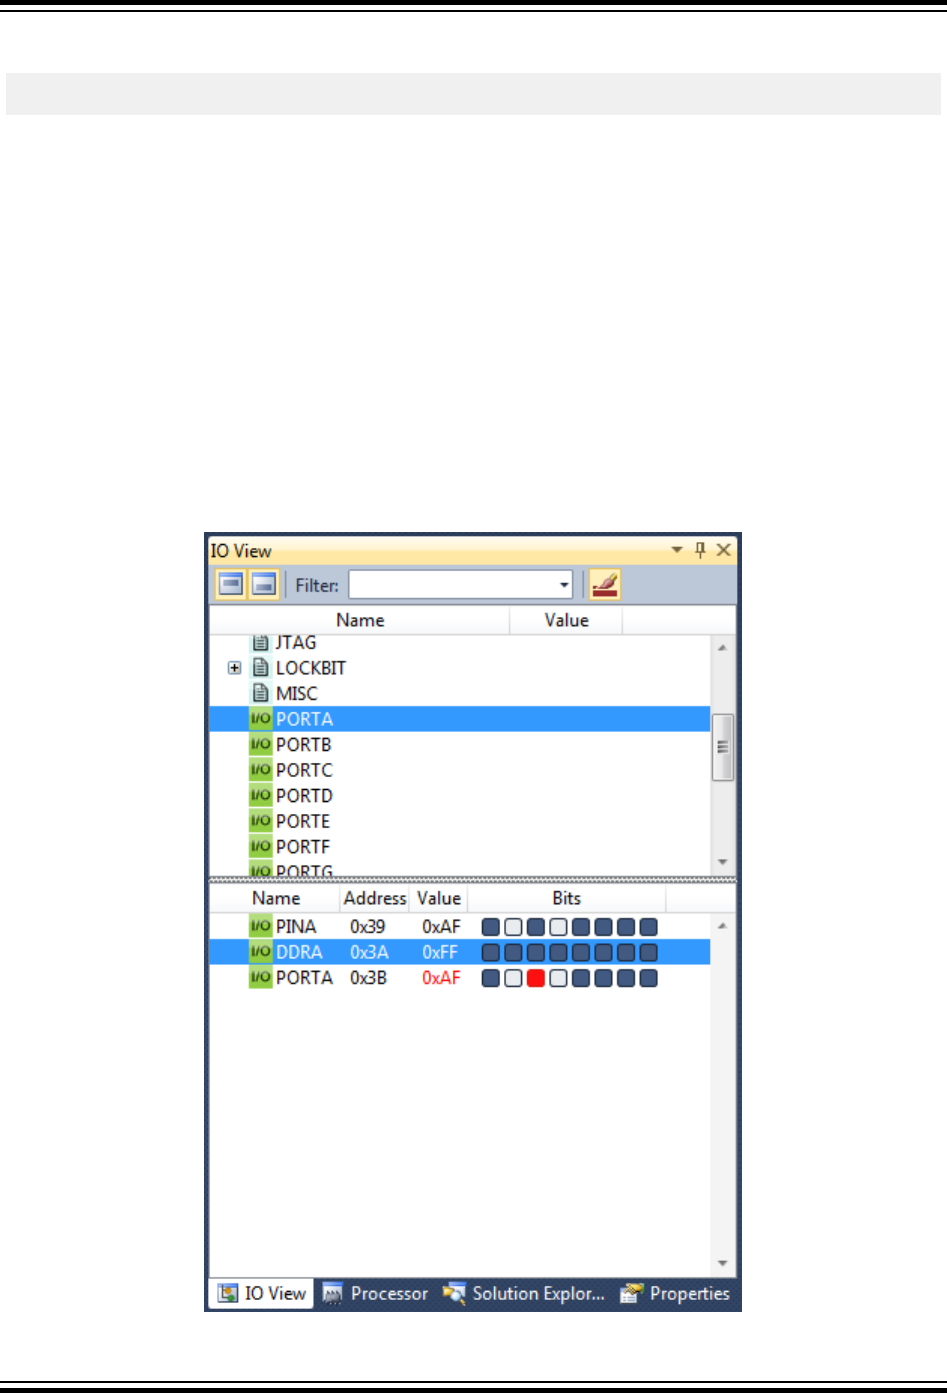
the assembly used on bigger computer systems. You might, therefore, encounter disassemblies that look
like the one below.
13: asm volatile ("JMP 0x0001778A");
0000007D 0c.94.c5.bb JMP 0x0000BBC5 Jump >
Here, the assembly instruction JMP 0x0001778A is being assembled by the GCC Assembler and
disassembled using the built-in disassembler in Atmel Studio, which resolves the jump to 0x0000BBC5,
which is exactly half of the address in the initial assembly.
It should be noted that the addresses are always of the same dimension as the line addresses shown in
the disassembly, so the code is functionally similar.
4.12 I/O View
4.12.1 About the I/O View
The purpose of the I/O View is to provide an overview of the registers of the target device for the current
project. It serves as a quick reference during design and is capable of displaying register values when the
project is in debug mode. The view supports both 32- and 8-bit devices equally.
Atmel Studio 7 User Guide
Debugging
© 2018 Microchip Technology Inc. User Guide DS50002718A-page 184

The default view of the tool window is a vertically split window with peripheral groups in the top section
and registers in the bottom section. Each peripheral typically has a set of defined settings and value
enumerations, which can be displayed by expanding a register in the peripheral view (top section). The
register view (bottom section) will display all registers which belong to a selected peripheral group. If no
peripheral is selected, the view is empty. Each register can also be expanded to display the pre-defined
value groupings which belong to the register.
4.12.2 Using the I/O View Tool
The I/O View is confined to a single tool window in the development environment. There can only be one
instance of the I/O view at a time. To open the window, select Debug → Windows → I/O View. When in
design mode, the I/O View will be disabled for inputs. It is still possible to change the layout or filters and
to navigate the view, but no values can be set or read. To read or change a value in the registers, AVR
Studio must be in debug break mode (execution paused). In this mode, all the controls of the I/O View will
be enabled and values can be read and updated in the view.
In addition to simply displaying the value of a register, the I/O View will display each bit in the register in a
separate column. Bits which are set will have a dark color by default, and cleared bits will have no color
(default white). To change a bit, simply click it, and the value will be toggled.
4.12.3 Editing Values and Bits in Break Mode
When the project is in debug break mode, any value can be changed by clicking the value field and
writing a new value. Some values and bits cannot be modified as they are read-only, and some bits may
be write-only. See the documentation for each device for more information. When a bit or value is set, it is
immediately read back from the device, ensuring that the I/O View displays only actual values from the
device. If a new value is set, but the I/O view does not update as expected, the register might be write-
only or simply not accessible.
When a register has changed since last time it was displayed, it will indicate so with a red colored value
and bits in the display. If a bit has been set since last time, it will be solid red. If it has been cleared it will
simply have a red border. This feature can be toggled ON or OFF in the toolbar.
4.13 Processor View
Atmel Studio 7 User Guide
Debugging
© 2018 Microchip Technology Inc. User Guide DS50002718A-page 185

Debug → Processor View. The processor view offers a simulated or direct view of the current target
device MPU or MCU. On the picture above you can see a partial list of the simulated device's
ATxmega128U1 registers.
The program counter shows the address of the instruction being executed. The stack pointer shows the
application's current stack pointer value. The X, Y, and Z registers are temporary pointers that can be
used in indirect passing or retrieving arguments or objects to and from functions. The Cycle counter
counts the cycles elapsed from the simulation’s start. Status register or SREG shows the currently set
flags. Further on you will be able to toggle a setting for displaying the flag names.
The stopwatch field allows you to make rudimentary profiling of your application. It is influenced by the
frequency set in the Frequency field, which defines the target MCU/MPU frequency, in the case when the
prototyping board is connected.
Each register can be displayed in hexadecimal, decimal, octal, and binary (flag) format by right clicking
and choosing Display in binary, etc., or Display in.... Each field can also be modified as shown in the
below image. If a field is a status or flags register, composed of a number of the one-bit flags, you can
toggle individual flags by clicking on them - .
The processor view is only active in the debug mode.
Atmel Studio 7 User Guide
Debugging
© 2018 Microchip Technology Inc. User Guide DS50002718A-page 186
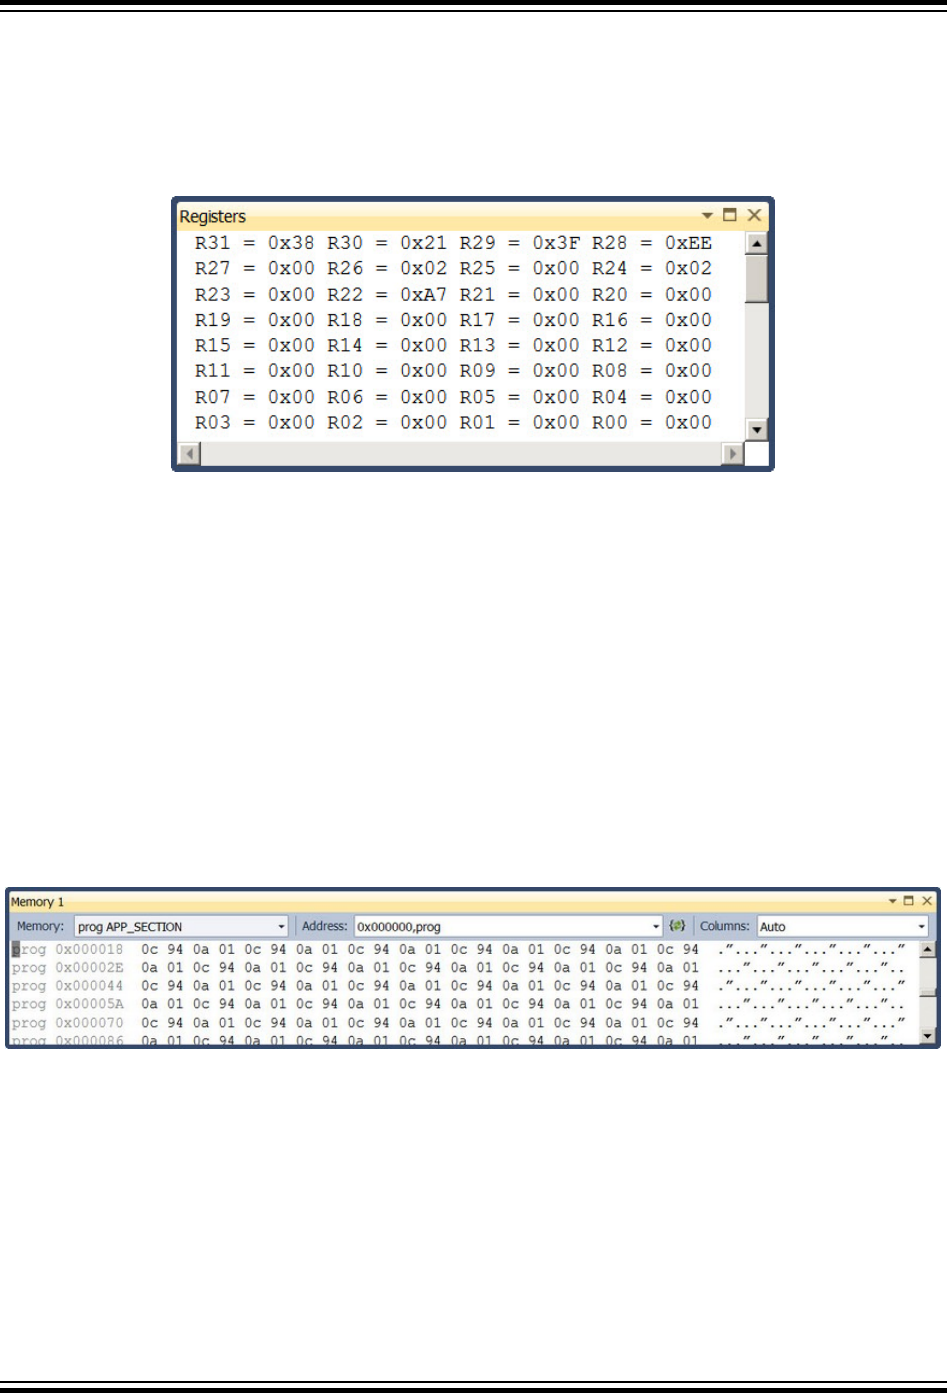
4.14 Register View
Debug → Windows → Register View or Ctrl Alt G. The register view offers a simple way to see the data
and system registers of your target or simulated device. You cannot modify the registers' contents from
the Register view.
4.15 Memory View
Debug → Windows → Memory view, or Ctrl Alt M n where n is the memory's number. The memory view
gives you an outline of the memory. It is possible to select among the attached memories to see all the
segments by switching between them in a Segment drop-down menu on top of the memory view. You
can also specify the starting address for the memory view window in the Address form field on top of the
memory view. In order to specify the address, you can use either a normal hexadecimal entry or an
expression. See Expression Formatting. The Columns drop-down menu allows you to specify how many
byte-aligned memory columns you wish to see at one time, most often this should be left at Auto setting,
but if you have to manually check a fixed-length type values and you know how many words or bytes
those values occupy, you could align the memory view so that each row will correspond to a desired
number of values.
4.16 Call Stack Window
Note: Call Stack Window is currently only supported for 32-bit devices.
Call Stack shows the hierarchical information of callers of the current method. By default, the Call Stack
window displays the name of each function. To display Call Stack, Click the menu, Debug → Windows →
Call Stack.
Atmel Studio 7 User Guide
Debugging
© 2018 Microchip Technology Inc. User Guide DS50002718A-page 187
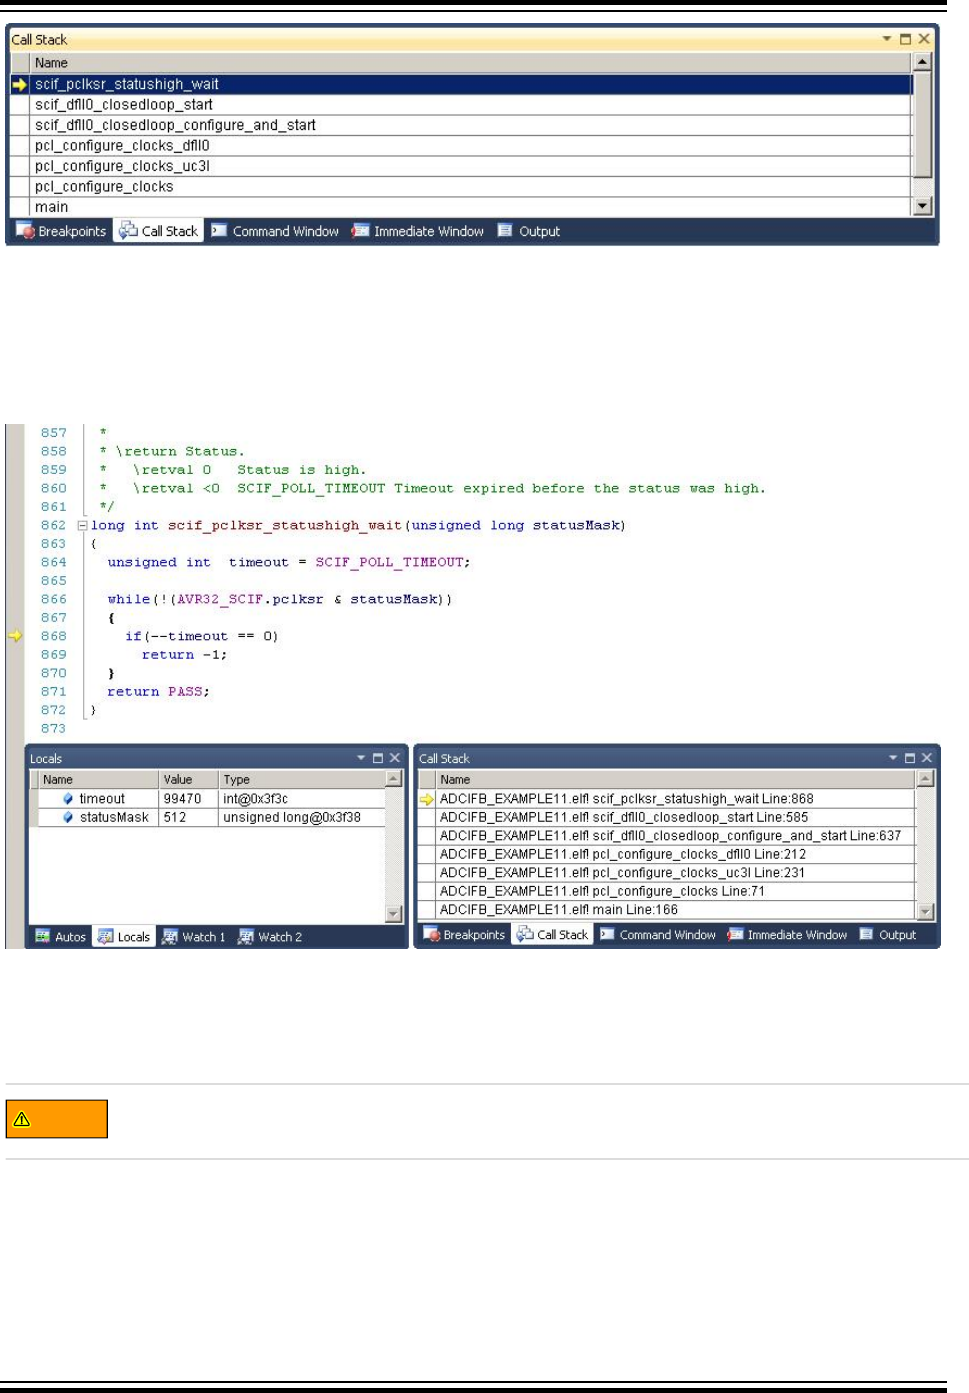
Along with function name, optional information such as module name, line number, etc. may also be
displayed. The display of this optional information can be turned ON or OFF. To switch ON/OFF the
optional information displayed, right click the Call Stack window and select or deselect Show <the
information that you want>
Stack frame of the current execution pointer is indicated by a yellow arrow. By default, this is the frame
whose information appears in the source, Disassembly, Locals, Watch, and Auto windows. The stack
frame context can also be changed to be another frame displayed in the Call Stack window.
WARNING
Call Stack may not show all the call frames with Optimization levels -O1 and higher.
To switch to another stack frame
1. In the Call Stack window, right click the frame whose code and data you want to view.
2. Select Switch to Frame.
Atmel Studio 7 User Guide
Debugging
© 2018 Microchip Technology Inc. User Guide DS50002718A-page 188
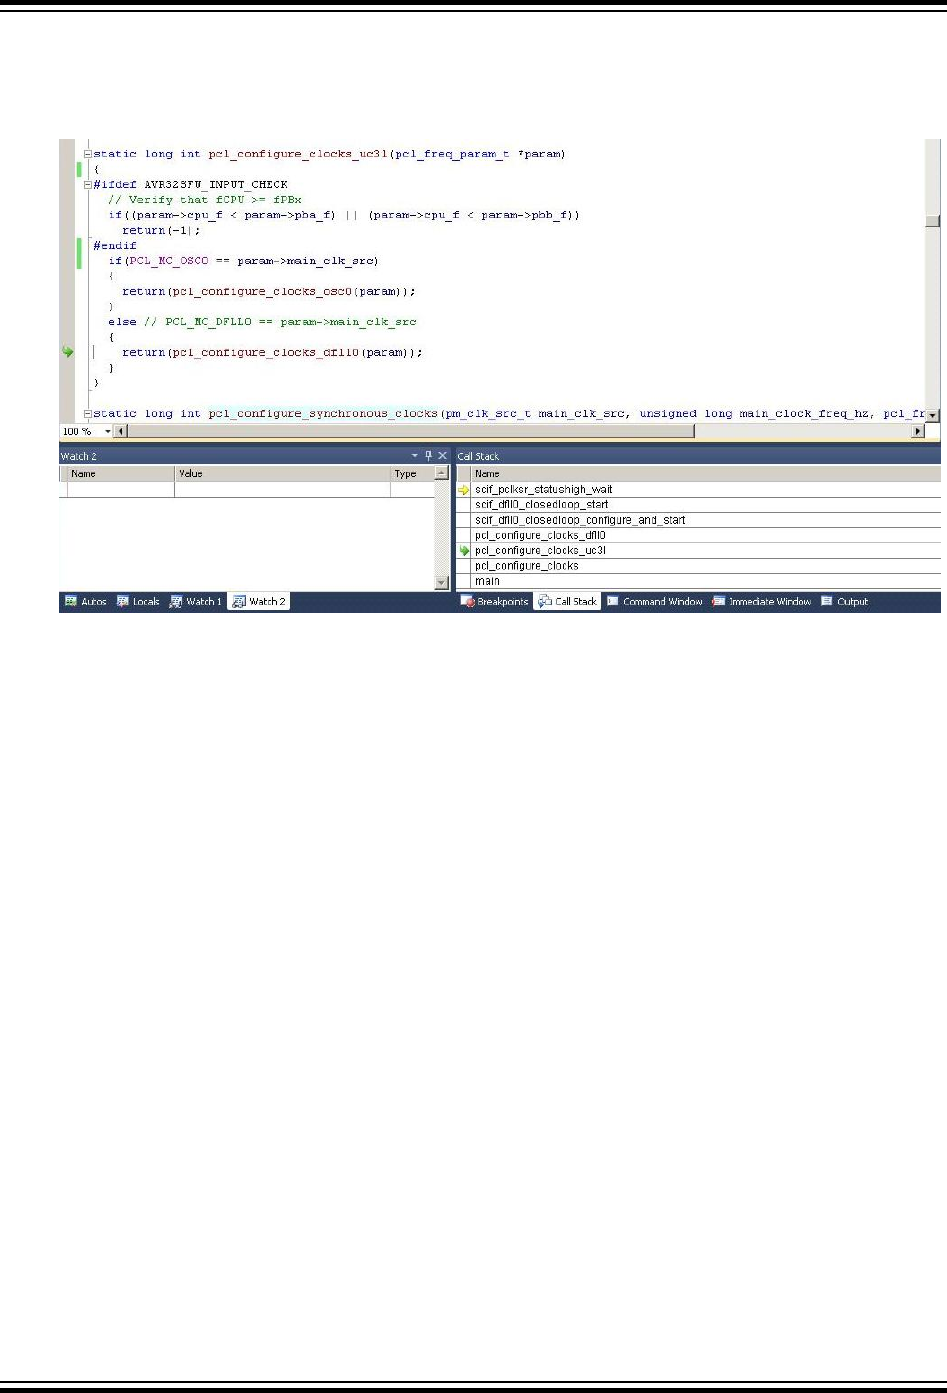
A green arrow with a curly tail indicates the changed stack context. The execution pointer remains
in the original frame, which is still marked with the yellow arrow. If you select Step or Continue from
the Debug menu, the execution will be continued from the yellow arrow, not the frame you selected.
To view the source/disassembly code for a function on the call stack
1. In the Call Stack window, right click the function whose source code you want to see and select Go
To Source Code.
2. In the Call Stack window, right click the function whose disassembly code you want to see and
select Go To Disassembly.
To set a breakpoint at the exit point of a function call
In the Call Stack window, right click the stack frame to which you would like to add the breakpoint. Select
'BreakPoint → Insert Breakpoint' to add the breakpoint.
Atmel Studio 7 User Guide
Debugging
© 2018 Microchip Technology Inc. User Guide DS50002718A-page 189
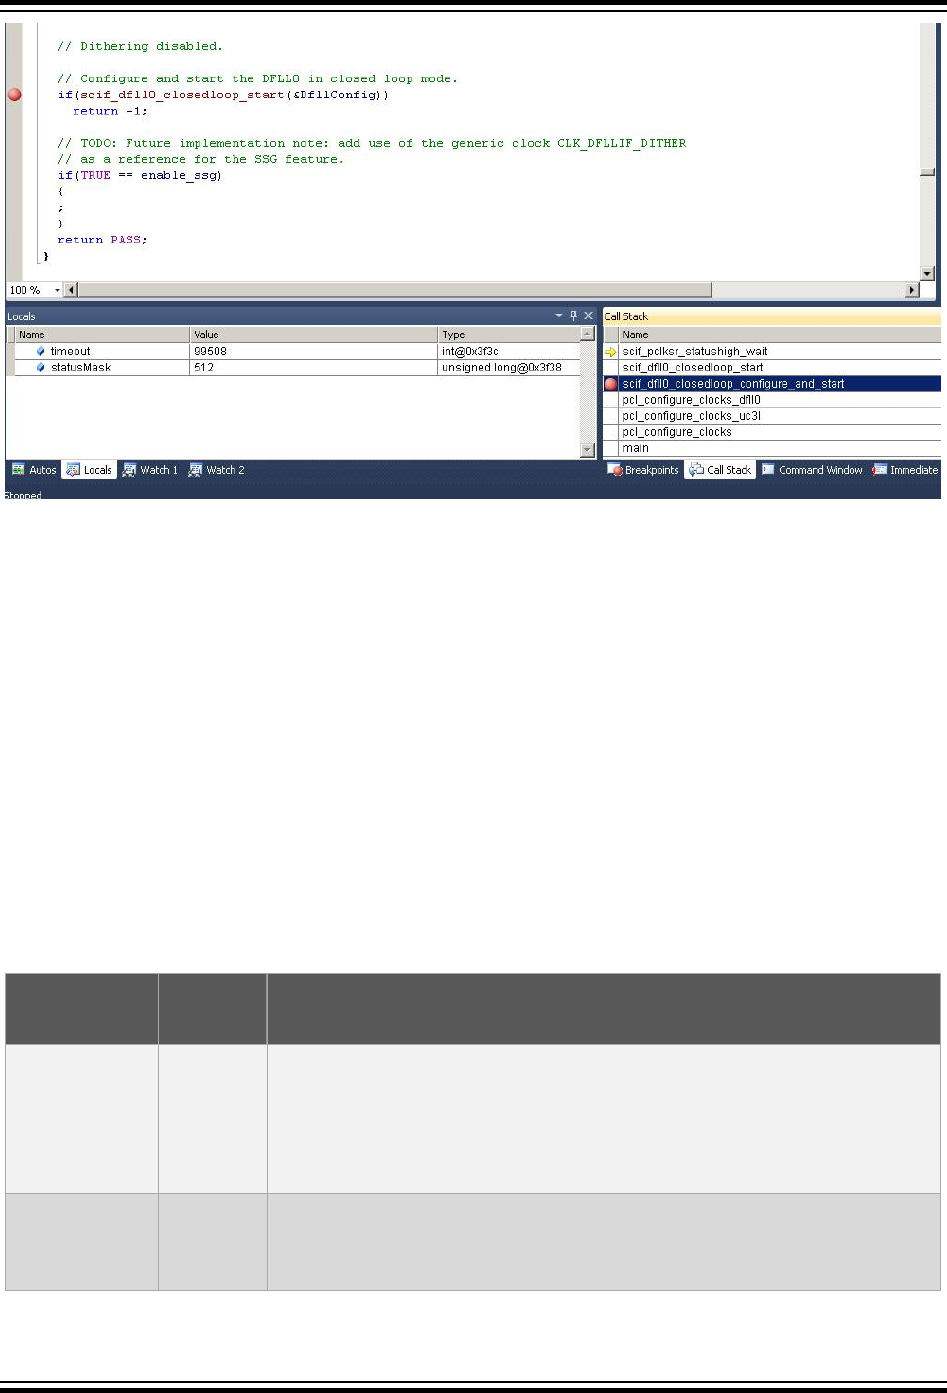
4.17 Object File Formats
While Atmel Studio uses ELF/DWARF as the preferred object file-/debug info-format, you may debug
other formats. Several object file formats from various compiler vendors are supported. You can open and
debug these files, but you may not be able to edit the code from within Atmel Studio. Using your own
editor to edit code and Atmel Studio to debug (use the reload button), you will still have a powerful code/
debug environment.
All external debug sessions require you to load an object file supported by Atmel Studio. An object file for
debugging usually contains symbolic information which is not included in a release file. The debug
information enables Atmel Studio to give extended possibilities when debugging, e.g. Source file stepping
and breakpoints set in a high-level language like C.
Precompiled object files can be opened by using the menu command Open file → Open Object File for
Debugging. See section Debug Object File in Atmel Studio for more info.
Table 4-5. Object File Formats Supported by Atmel Studio
Object File
Format
Extension Description
UBROF .d90 UBROF is an IAR proprietary format. The debug output file contains a
complete set of debug information and symbols to support all types of
watches. UBROF8 and earlier versions are supported. This is the default
output format of IAR EW 2.29 and earlier versions. See below how to force
IAR EW 3.10 and later versions to generate UBROF8.
ELF/DWARF .elf ELF/DWARF debug information is an open standard. The debug format
supports a complete set of debug information and symbols to support all
types of watches. The version of the format read by Atmel Studio is
Atmel Studio 7 User Guide
Debugging
© 2018 Microchip Technology Inc. User Guide DS50002718A-page 190
Object File
Format
Extension Description
DWARF2. AVR-GCC versions configured for DWARF2 output can
generate this format.
AVRCOFF .cof COFF is an open standard intended for 3rd party vendors creating
extensions or tools supported by the Atmel Studio.
AVR Assembler
format
.obj The AVR assembler output file format contains source file info for source
stepping. It is a Microchip internal format only. The .map file is
automatically parsed to get some watch information.
Before debugging, make sure you have set up your external compiler/assembler to generate an object file
with debug information in one of the formats above.
3rd party compiler vendors should output the ELF/DWARF object file format to ensure support in Atmel
Studio. Optionally, you could provide an extension to have both debugging and compile support. See
Contact Information for more information.
Tip:
How to generate AVR-compatible ELF file in IARW32:
In the Project options → Output format dialog, choose elf/dwarf, and in the Project options
→ Format variant, select ARM-compatible '-yes'.
Tip:
How to force IAR EW 3.10 and later versions to generate UBROF8:
By default IAR EW 3.10 and later versions output UBROF9. Currently, Atmel Studio cannot read
this format. To force the debug format to UBROF8, open the project options dialog and change
the Output format setting to ubrof 8 (forced). Note that the default file name extension is
changed from '.d90' to '.dbg' when selecting this option. To keep the '.d90' extension, click the
Override default check button and change the extension.
4.18 Trace
In Atmel Studio, the Trace is provided on a plug-in basis. This means that different plugins separate from
the core of Atmel Studio will be the provider of the different graphics view to visualize Trace.
In the realm of the Trace, there is some terminology that describes the different Trace sources that a
device and tool combination supports. These high-level source names are mapped to different
architecture specific Trace sources.
The following sections will describe some of the high-level Trace sources that might be available, and
how it is mapped to the target architecture. Only a high-level description of the different sources will be
given, as the device-specific details are available in the respective data sheet.
Atmel Studio 7 User Guide
Debugging
© 2018 Microchip Technology Inc. User Guide DS50002718A-page 191
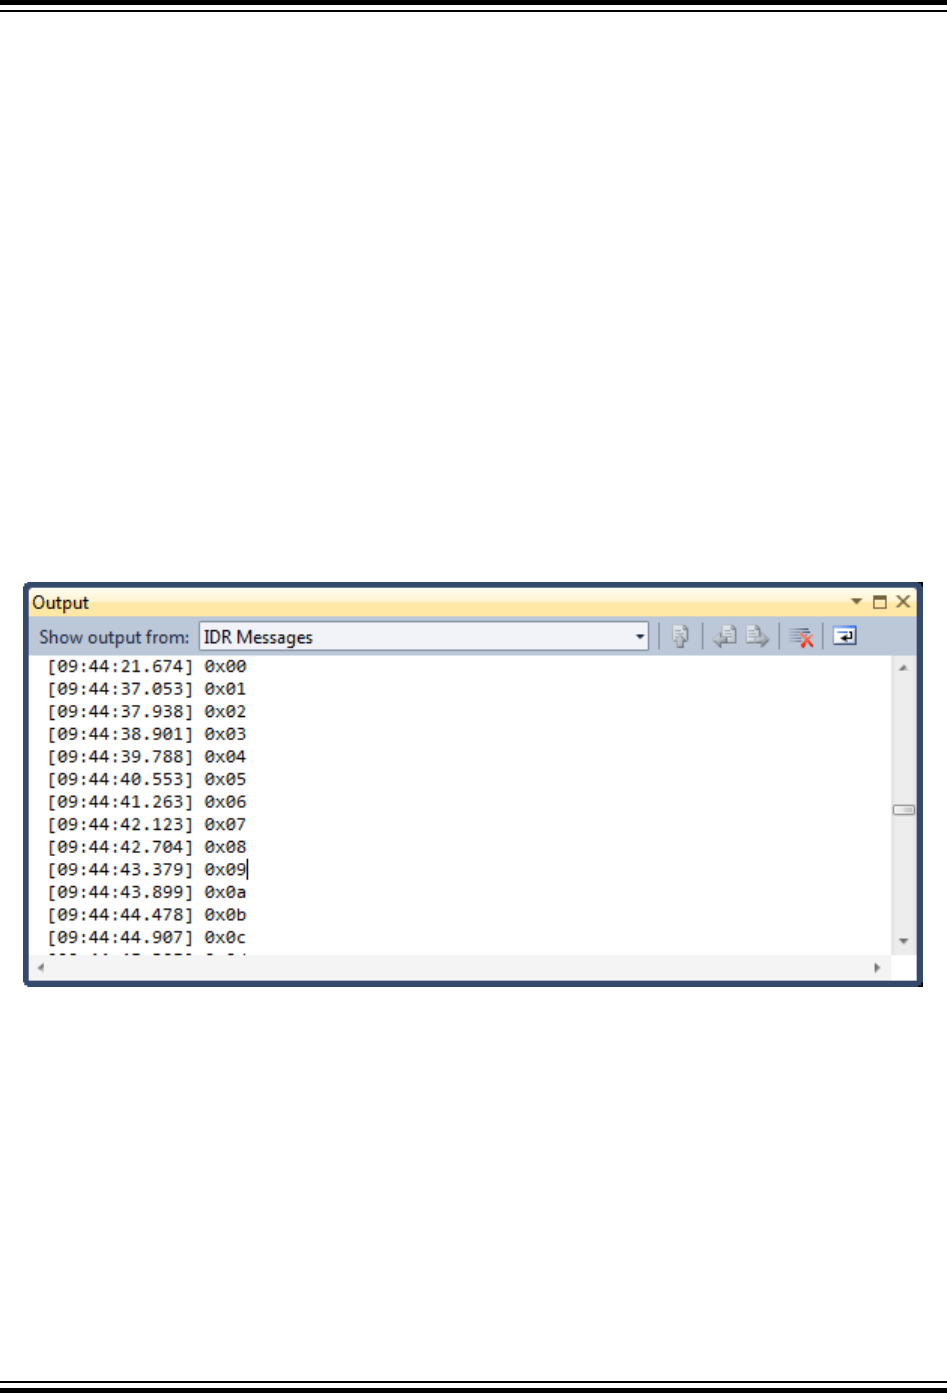
Note: The architecture for discovering Trace capabilities in Atmel Studio is based on what the chip itself
reports. This means that a debug session needs to be running so that the capabilities can be probed.
This means that when activating a Trace source, Atmel Studio might fail if the device does not support the
source that was asked for during launch.
4.18.1 Application Output
Application output is a common name for a technique that provides what is known as a stimuli port. This
implies some mean for the application running on the device to output data to a debugger that is
connected.
4.18.1.1 ITM
ITM is an optional part of the debug system on ARM cores. The module provides a set of registers that an
application can write data to, that will be streamed out to the debugger.
4.18.1.2 IDR Events
When the application program writes a byte of data to the OCDR register of an AVR device while being
debugged, the debugger reads this value out and displays it as IDR events in the output window as
shown in the figure below. The OCDR register is polled at a given interval, so writing to it at a higher
frequency than the one specified for the debugger will not yield reliable results. The data sheet of the
device will explain how to check that a given value has been read.
Figure 4-9. IDR Events
Note that the Output window does not have the “IDR Messages” drop-down if no IDR events have been
sent from the debugger.
4.18.2 Program Counter Sampling
This trace source involves some sort of sample system that reads out the program counter of the device
periodically. This can then be used to graph where execution time is being spent, based on some
statistical average.
4.18.2.1 ARM Implementations
There are two ways of sampling the program counter on an ARM Cortex core. The first is using an
optional module in the debug system that emits the program counter to the debugger without any impact
on the core itself. The program counter is emitted on the SWO pin.
Atmel Studio 7 User Guide
Debugging
© 2018 Microchip Technology Inc. User Guide DS50002718A-page 192
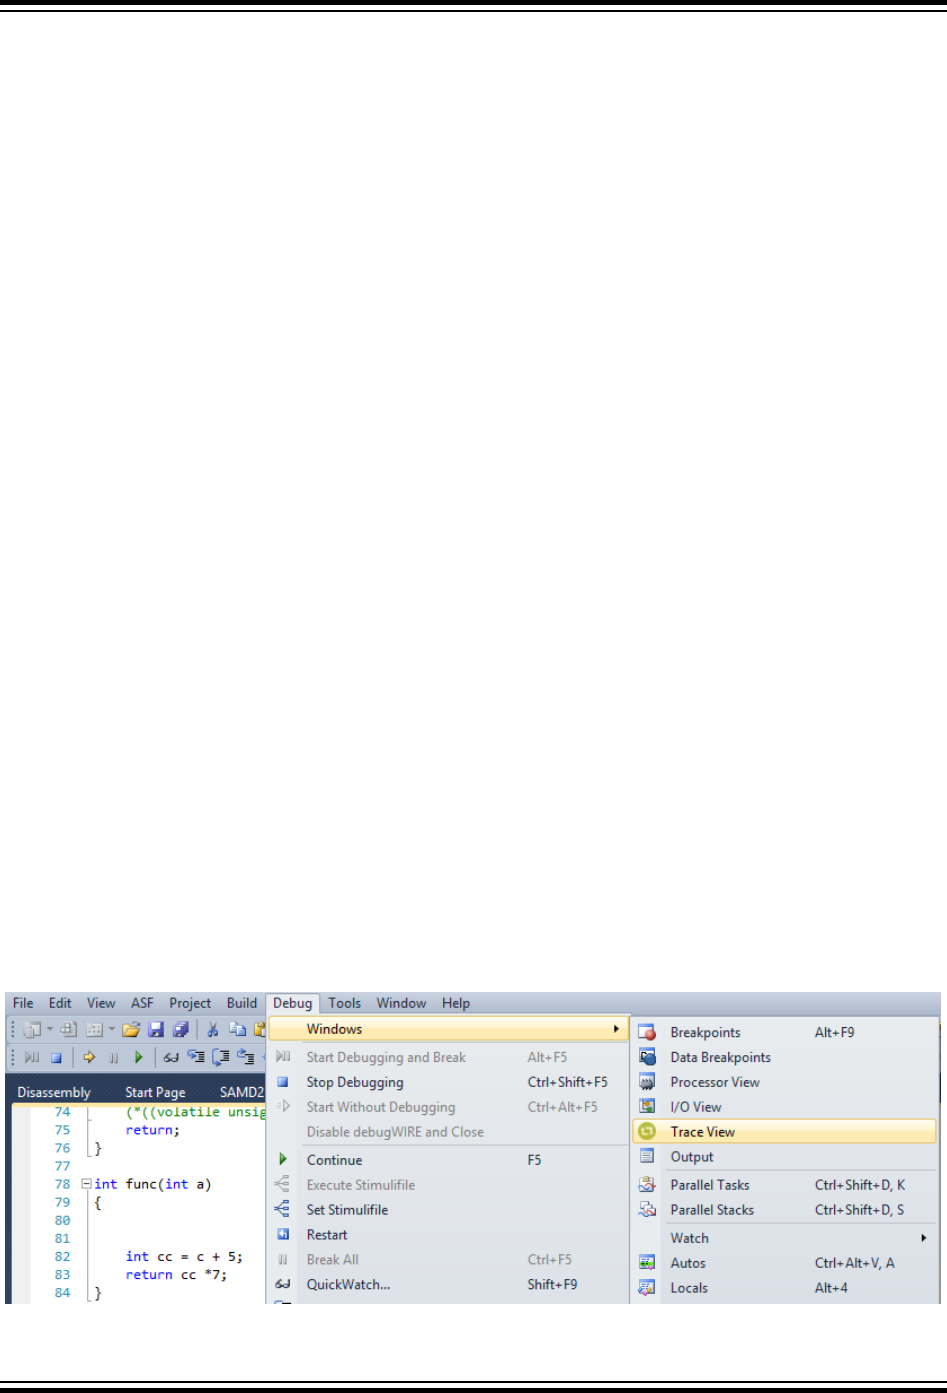
As not all Cortex implementation can emit the program counter, Atmel Studio also supports doing a
periodical readout of the program counter while the core is running. This is possible as most Cortex
devices support readout of memory while the core is running, with a small impact on the running
application as the debug system needs to access the memory bus.
4.18.2.2 AVR 32-bit Implementation
Reading the program counter on the AVR 32-bit core is possible in the same way as mentioned in ARM
Implementations, as the core supports live readout of memory while the core is running.
4.18.3 Variable Watching
Watching variables are usually covered by data breakpoints, see Data Breakpoints. However, on some
systems it is also possible to make a data breakpoint emit the information to the debugger without halting
the core, meaning that it is possible to watch variables in applications that for instance has some sort of
external timing requirement that a data breakpoint would cause to fail.
4.18.3.1 ARM Implementations
Data breakpoints on a Cortex core can be changed to emit a trace packet if the debug system
implements the needed modules. This means that it is possible to get information about reads or writes to
a specific memory location without an interference with the execution on the core.
As a fallback to this, it is also possible to read a memory location at a given interval while the core is
executing. This will not be any specific event data but means that if the core supports live memory
readout, it is possible to sample some parts of the memory. This has a minor impact on the execution, as
the debug system needs to have access to the memory bus.
4.18.3.2 AVR 32-bit Implementation
The AVR 32-bit core also supports live readout of memory locations. This means that Atmel Studio can
poll a memory location while the core is executing, giving a statistical view of how the variable is changing
over time.
4.19 Trace View
The Trace View allows you to record the program counter trace when a target is running. The program
counter branches are mapped with the respective source line information. It also contains coverage and
statistics for the source lines executed. To open the Trace View, go to Debug → Windows → Trace
View. To use the functionality of the Trace View, a project has to be opened in Atmel Studio.
Figure 4-10. Opening Trace View From the Menu
Atmel Studio 7 User Guide
Debugging
© 2018 Microchip Technology Inc. User Guide DS50002718A-page 193

4.19.1 Trace View Options
The Trace View toolbar has the following elements:
• - Starts the program trace
• - Stops the program trace
• - Clears the program trace
• - Toggles the highlighting of source code
• - Configures the device to record the program trace
• - Finds the exception record in the Trace Stack view
• - Exports coverage statistics into an xml/xslt report
4.19.1.1 Starting the Program Trace
The Program Trace can be started by clicking the play button in the Trace View Window. The start button
is enabled during debug. Trace can be started and stopped any number of times in a debug session.
Starting a new trace session clears all trace information of the previous trace session.
Note: A region of SRAM has to be allocated to let the device record the trace. Refer to Trace View
Settings for more information.
Figure 4-11. Trace View Window
4.19.1.2 Stop Trace
Trace can be stopped in run or debug mode. The trace session will be ended automatically without user
intervention when the debugging session ends.
4.19.1.3 Clear Trace
The clear button clears the trace in the Trace View Window. New trace information will be logged in the
same tool window with a continuous sequence number. Clear can be done any number of times within a
trace session. Once cleared, the trace data cannot be recovered.
4.19.1.4 Highlight Source Code
Highlight is a toggle button which toggles between highlighting and non-highlighting of the source code.
The source code that is covered is highlighted with a green color and remaining source lines with a red
color representing the uncovered source code for the current execution.
Atmel Studio 7 User Guide
Debugging
© 2018 Microchip Technology Inc. User Guide DS50002718A-page 194

Figure 4-12. Code Highlight
Note: Only the compilable lines are taken into consideration. For example, lines with comments and
variable declaration are ignored.
4.19.1.5 Trace View Settings
The device has to be configured to record the trace information in SRAM. The allocated size for recording
the program trace can be configured from this setting. The memory can be allocated in:
• Source code, allocating a global array
• Linker scripts, reserving an amount of the memory map
Select the memory size to be allocated for recording the program trace. Copy the snippet of code
displayed in configuration window by clicking on the CopyToClipBoard button and paste into your source
code. Follow the instructions given in the dialog to enable the tracing capability.
Atmel Studio 7 User Guide
Debugging
© 2018 Microchip Technology Inc. User Guide DS50002718A-page 195
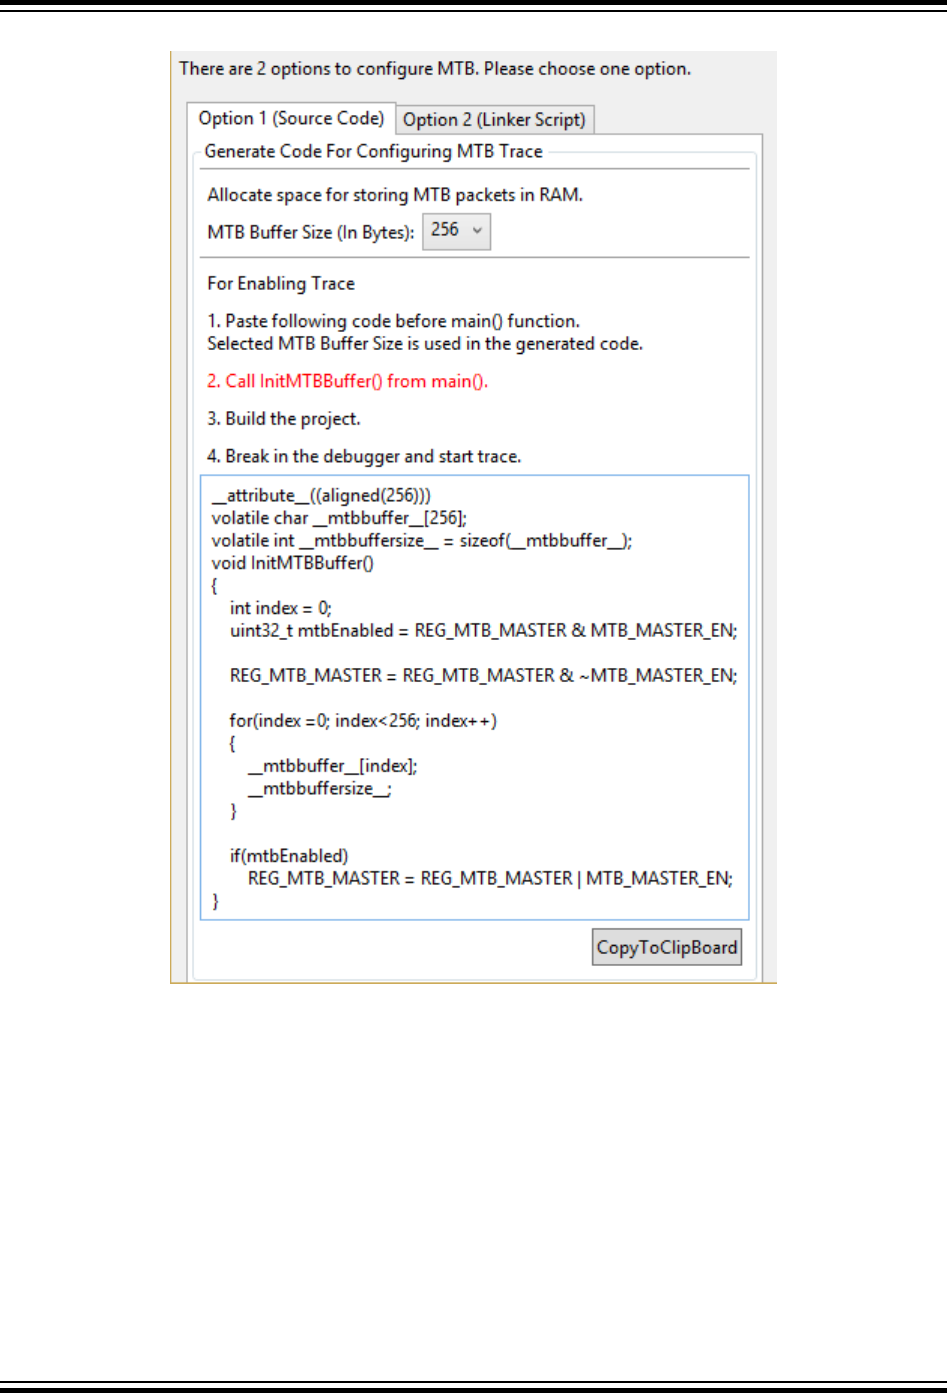
Figure 4-13. Trace Settings Window Through Source Code
Note: If both the linker script and the source code is configured for trace, the linker script settings takes
the higher precedence over source code settings.
Atmel Studio 7 User Guide
Debugging
© 2018 Microchip Technology Inc. User Guide DS50002718A-page 196

Figure 4-14. Trace Settings Window through Linker Script
4.19.2 Trace View Interpretation
The Trace View window contains the following items:
• Trace Stack View
• Coverage View
4.19.2.1 Trace Stack View
Trace Stack View is populated with program trace information while the target is in a running or
debugging state.
Trace Stack View contains a sequence number, source and destination address, and a repeat count. A
new program trace record is shown when a branching instruction happens on the target, for example as a
function call or a return from a function.
• Sequence Number - Number that keeps track of the order of the record. This number is reset for
every trace session. This number will be continued without a break when the trace is cleared using
the clear button from the toolbar.
• Source - Represents the instruction/source line from which the branch happened. For example, in a
function call, Source is the source line from where the function is being called.
• Destination - Represents the instruction/source line to which the branching happened. For example,
in a function call, Destination is the source code of the starting line of the function.
Atmel Studio 7 User Guide
Debugging
© 2018 Microchip Technology Inc. User Guide DS50002718A-page 197
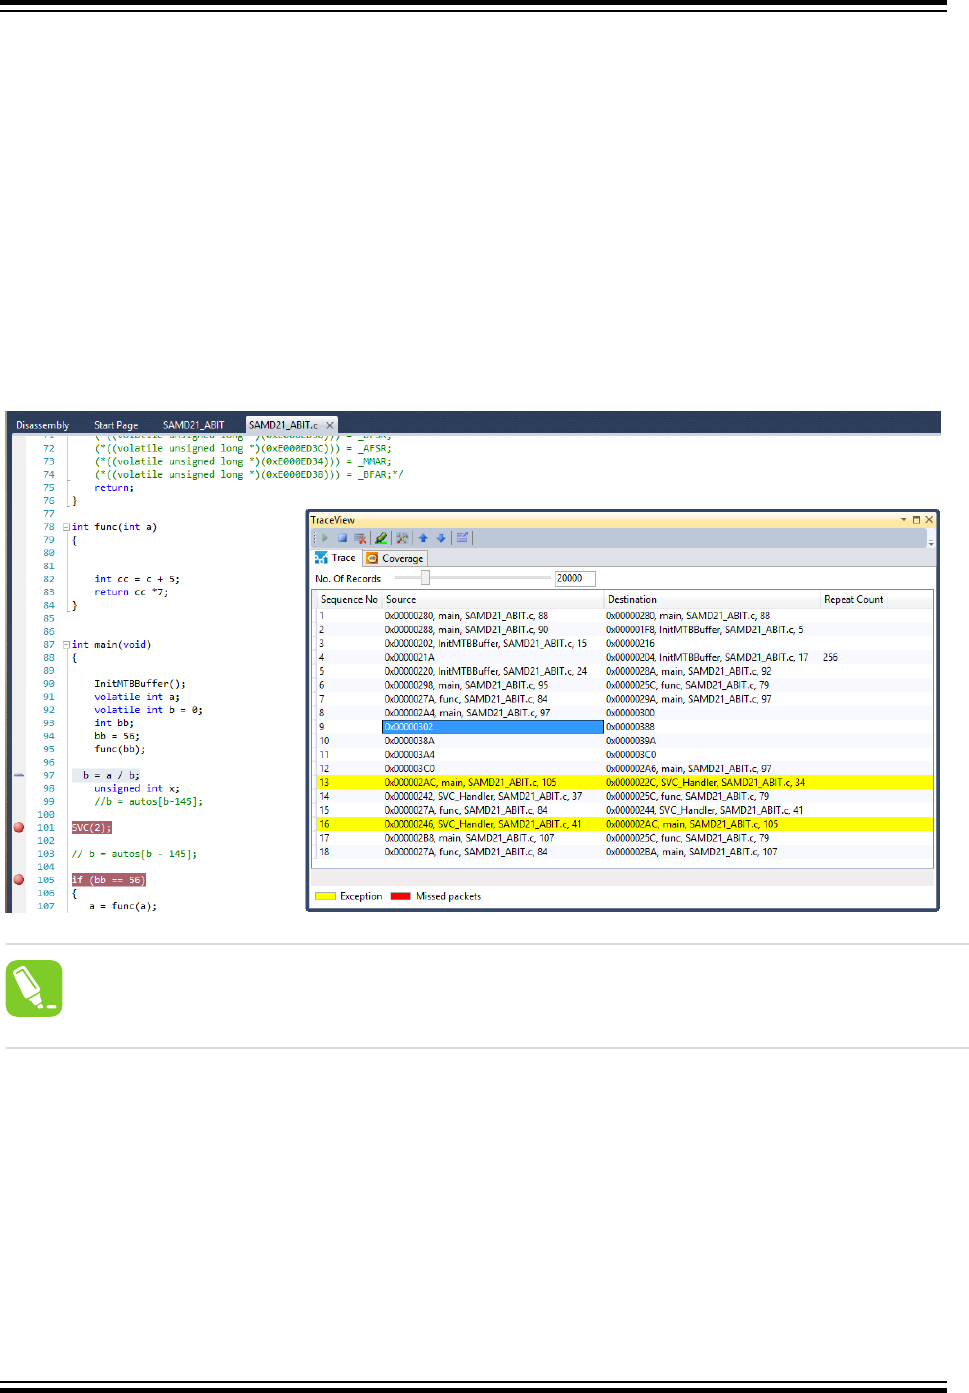
• Repeat Count - Represents the number of times the same source and destination combination
occurred consecutively. For example, if there is a delay which is logging the same packets, it will be
grouped together and number of times record occurrence is termed as repeat count.
The source and destination contain instruction address, function name, source file name, and line
number. If the source line cannot be mapped only the instruction address is given. Double-clicking on the
source or destination navigates the cursor in the editor to the appropriate line. Navigation keys Up, Down,
Left, Right, and Tab can be used to locate the source/disassembly view for the trace records.
The program trace that is shown in the TraceStack view is cut down to the latest 20,000 records by
default. The threshold value can be changed using the slider.
The program trace records are highlighted with a yellow color when the branching instruction was not an
expected one. Unexpected branches usually happen due to some exception, and the entry and exit of the
exception handler are highlighted with yellow color. The branching inside the exception is not highlighted.
Figure 4-15. Exception Record
Tip:
The next and previous exception records can be easily navigated to by using the up and down
arrow buttons in the trace view window toolbar.
There are some exceptional cases where some program traces could be missed. In that case, there will
be a packet with red color which represents that there is some discontinuation of the program trace
information in the sequence. Since the number of missed packets is unknown, the sequence number
shown in the Trace Stack view will be continued without any break except adding a red colored packet
with a sequence number for it.
Note: The disassembly view is not supported when navigation keys are used, but it is supported when
the record is double-clicked using a mouse.
Atmel Studio 7 User Guide
Debugging
© 2018 Microchip Technology Inc. User Guide DS50002718A-page 198
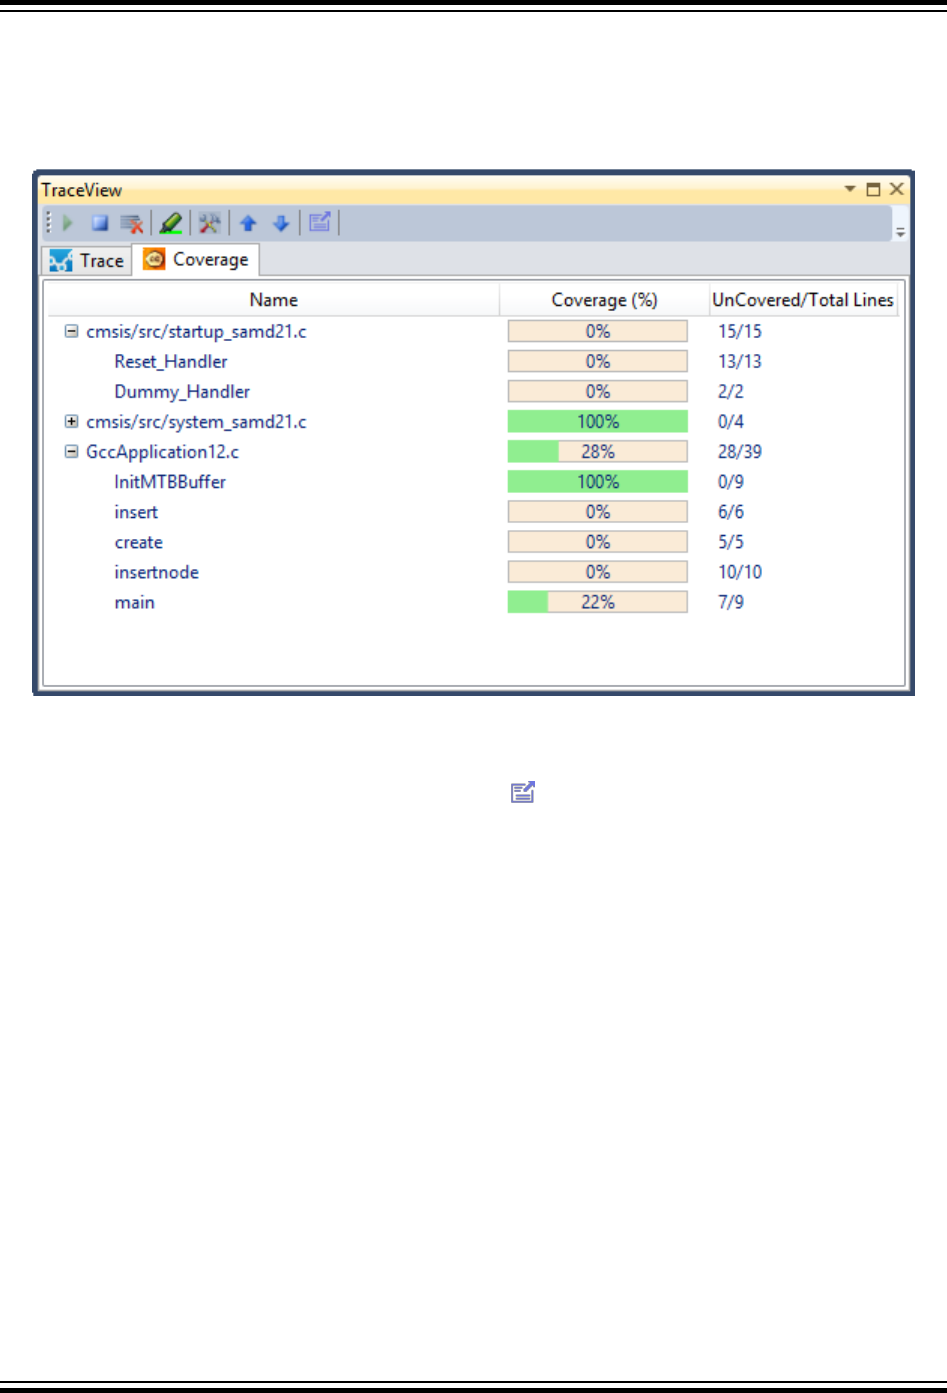
4.19.2.2 Coverage View
The coverage view shows statistics on the source covered as part of the current target execution. All the
files and functions are listed in the coverage view with the information of the number of lines covered or
uncovered against the total number of lines in the source file.
Figure 4-16. Code Coverage
Note: Only the compilable lines are taken into consideration for the statistics. For example, lines with
comments and variable declaration are not taken into account.
A coverage report can be exported. Click the export icon in the trace view toolbar to invoke the export
operation.
Atmel Studio 7 User Guide
Debugging
© 2018 Microchip Technology Inc. User Guide DS50002718A-page 199
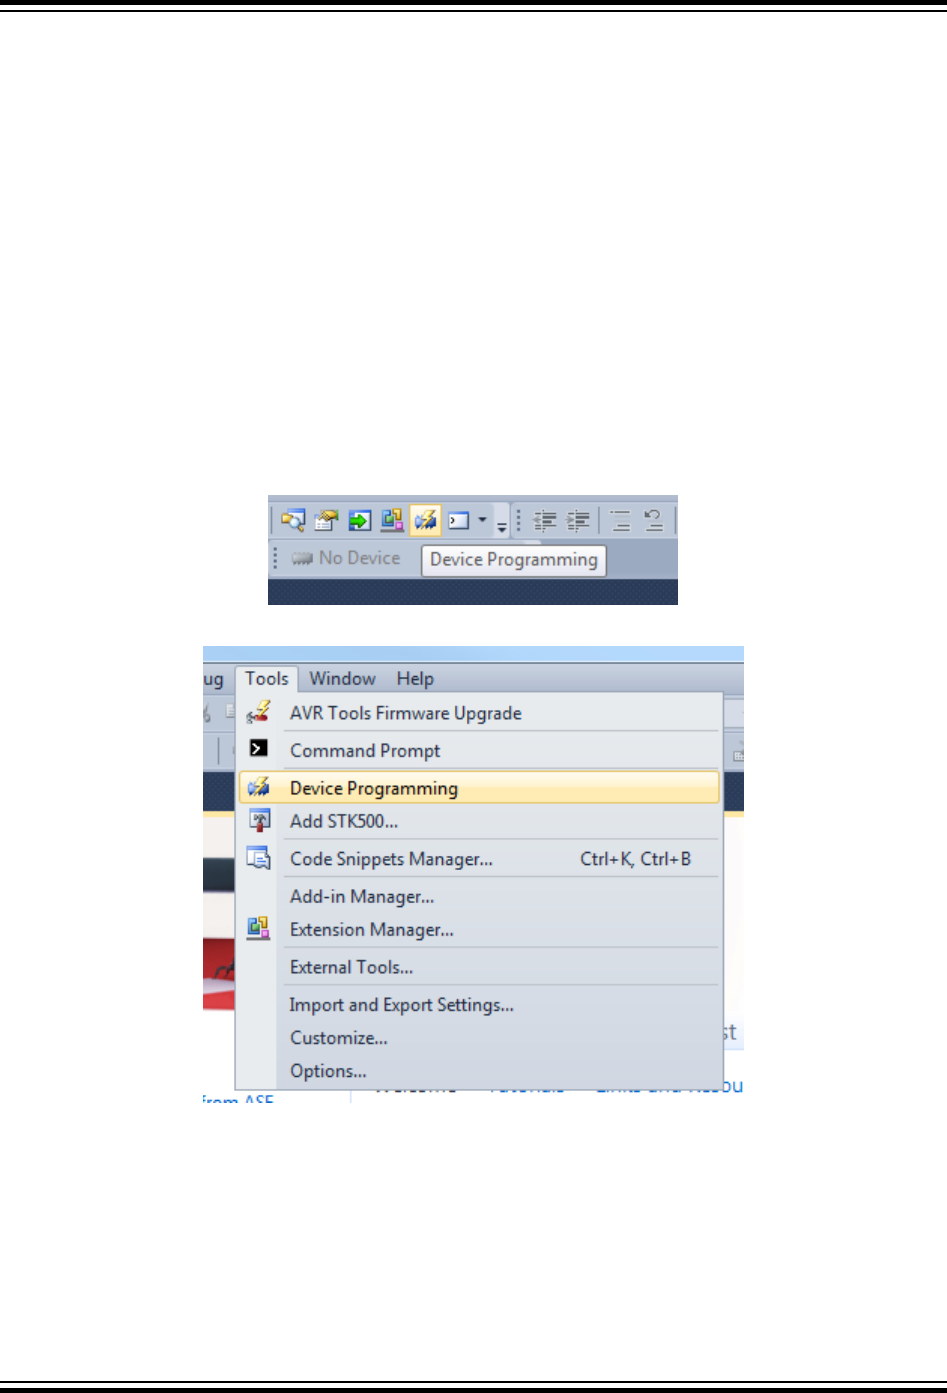
5. Programming Dialog
5.1 Introduction
The Device Programming window (also known as the programming dialog), gives you the most low-level
control of the debugging and programming tools. With it, you can program the device's different
memories, fuses, and lockbits, erase memories, and write user signatures. It can also adjust some of the
starter kit properties such as voltage and clock generators.
Note: If you are editing a code project in Atmel Studio and want to see the results of a compilation by
downloading the code into the device, take a look at the Start without Debugging command. It is a sort of
one-click programming alternative to the programming dialog. See section Start without Debugging for
more information.
The programming dialog is accessible from a button on the standard toolbar or the menu Tools →
Device Programming.
Figure 5-1. Device Programming Icon
Figure 5-2. Opening Device Programming Dialog
Atmel Studio 7 User Guide
Programming Dialog
© 2018 Microchip Technology Inc. User Guide DS50002718A-page 200
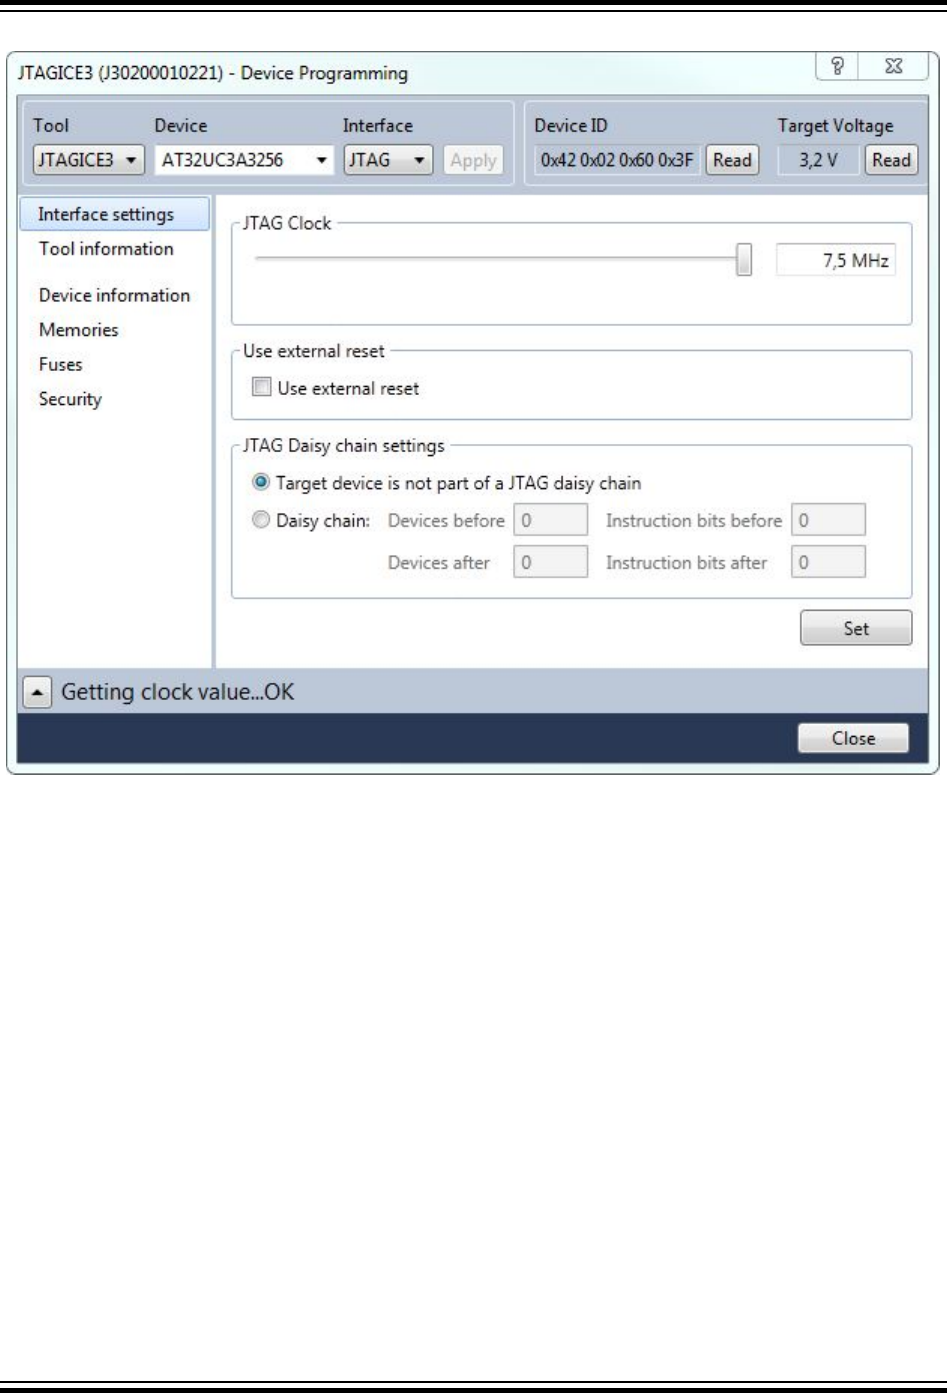
Figure 5-3. Device Programming
The programming dialog contains the following options and tabs:
Top status bar
Tool
You can choose which tool you want to use from this drop-down menu. Only tools connected to the
machine are listed. Also, if a tool is used in a debug session, it will not be listed. Several tools of the same
type can be connected at the same time. In order to identify them, the serial number will be shown below
the tool name in the list.
When a tool is selected, the name (and serial number) will be shown in the title bar of the Device
Programming dialog.
Note: The Simulator will only offer limited support for the programming dialog features. The Simulator
has no persistent memory, so you will not be able to make permanent changes to any simulated devices.
Device
As soon as a tool is selected, the device list will show all devices supported by that tool. There are two
ways to select a device:
• Select from the list
Atmel Studio 7 User Guide
Programming Dialog
© 2018 Microchip Technology Inc. User Guide DS50002718A-page 201
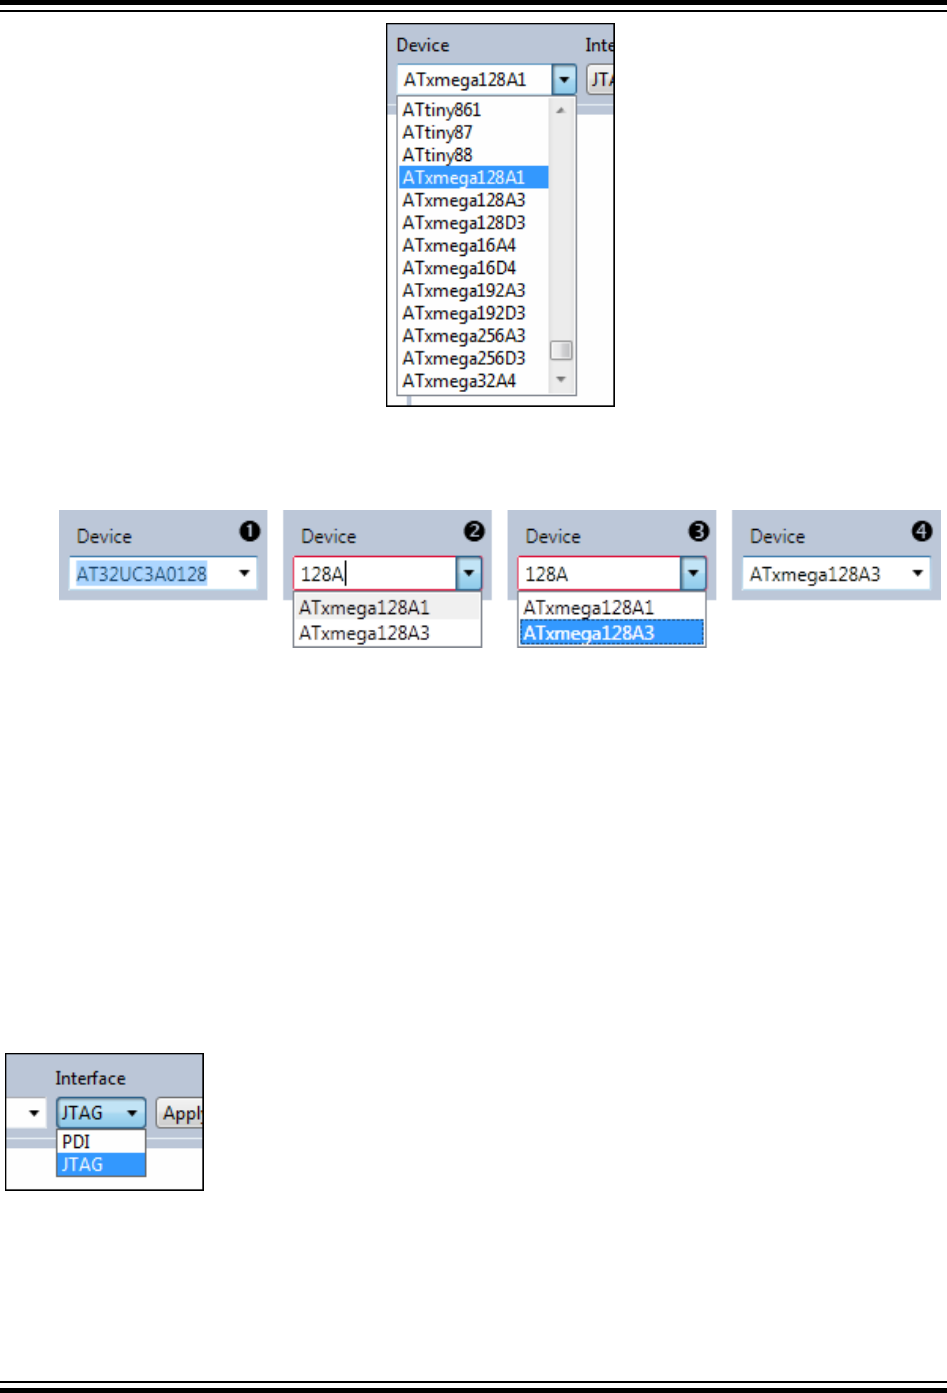
Click on the arrow. This will reveal the list of supported devices. Click to select.
• Select by typing. In this example, we will select the ATxmega128A3:
2.1. Double-click in the text field to select the text already present.
2.2. Start typing some part of the device's name, in this example 128A. The list updates while
you type, showing all devices containing what is typed.
2.3. Press the Arrow Down keyboard button to move the selection into the list. Use the up and
down keys to navigate. Press ENTER to make a selection.
2.4. The ATxmega128A3 is now selected.
Note: A red border around the device selector indicates that the text entered is not a valid device
name. Continue typing until the device name is complete, or select from the list.
Interface
When a tool and a device is selected, the interface list will show the available interfaces. Only interfaces
available on both the tool and the device will appear in this menu.
Select the interface to use to program the AVR.
Apply button
Atmel Studio 7 User Guide
Programming Dialog
© 2018 Microchip Technology Inc. User Guide DS50002718A-page 202

When tool, device, and interface are selected, press the Apply button to make the selections take effect.
This will establish a connection to the tool. The list on the left side of the window will be updated with the
relevant pages for the selected tool.
If a different tool, device, or interface is selected, the Apply button must be pressed again, to make the
new selections take effect.
Device ID
Press the Read button to read the signature bytes from the device. The device's unique tag will appear in
this field and can be used for tool compatibility checking and to obtain help either from customer support
or from the people at AVR Freaks®.
Target voltage
All tools are capable of measuring the target's operating voltage. Press the refresh button to make a new
measurement.
A warning message will appear if the measured voltage is outside the operating range for the selected
device, and the target voltage box will turn red.
5.2 Interface Settings
The programming interfaces have different settings. Some interfaces have no settings at all, some
interfaces settings are only available on some tools. This section will describe all settings, but they are
not available for all tools and devices.
JTAG
If you have selected JTAG as the programming interface, clock speed, use external reset and daisy-chain
setting may be available. This depends on the tool and device.
Atmel Studio 7 User Guide
Programming Dialog
© 2018 Microchip Technology Inc. User Guide DS50002718A-page 203

JTAG Clock
JTAG clock is the maximum speed the tool will try to clock the device at. The clock range is different for
different tools and devices. If there are restrictions, they will be stated in a message below the clock
slider.
Use external reset
If checked, the tool will pull the external reset line low when trying to connect to the device.
JTAG daisy-chain settings
Specify the JTAG daisy-chain settings relevant to the device to program.
Target is not part of a daisy-chain. Select this option when the target device is not part of a daisy-chain.
Daisy chain-Manual. Allows you to manually configure the JTAG daisy-chain in case you are
programming in a system-on-board.
•Devices before - specifies the number of devices preceding the target device.
•Instruction bits before - specifies the total size of the instruction registers of all devices, preceding
the target device.
•Devices after - specifies the number of devices following the target device.
Atmel Studio 7 User Guide
Programming Dialog
© 2018 Microchip Technology Inc. User Guide DS50002718A-page 204
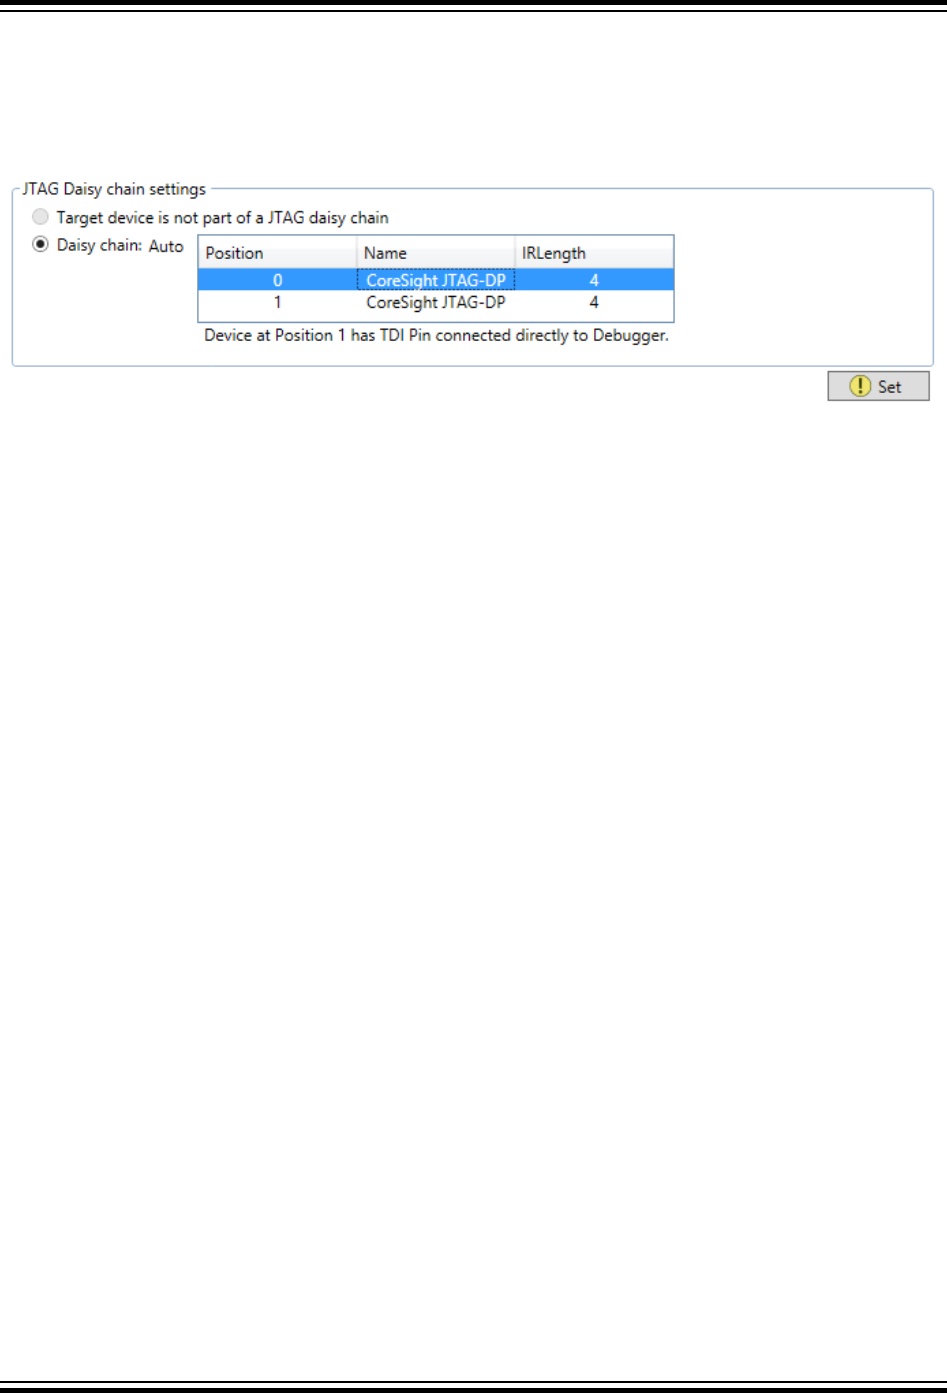
•Instruction bits after - specifies the total size of the instruction registers of all devices, following
the target device.
Daisy chain-Auto. Automatically detects the devices in the JTAG daisy-chain. Allows you to select the
device in the JTAG daisy-chain. Auto-detection is supported only for SAM devices.
To accept the changes and configure the tool, press the Set button.
PDI
The PDI interface has only one setting – the PDI clock speed.
Atmel Studio 7 User Guide
Programming Dialog
© 2018 Microchip Technology Inc. User Guide DS50002718A-page 205

PDI Clock is the maximum speed the tool will try to clock the device at. The clock range is different for
different tools and devices. If there are restrictions, they will be stated in a message below the clock
slider.
To apply the changes and configure the tool, press the Set button.
The clock cannot be adjusted on all tools, so an empty Interface settings page will be presented.
Atmel Studio 7 User Guide
Programming Dialog
© 2018 Microchip Technology Inc. User Guide DS50002718A-page 206

5.3 Tool Information
Figure 5-4. Tool Info
The Tool information page contains a number of useful tool parameters.
Tool Name denotes the common name for the connected tool.
Debug Host is the debug session's host IP address for the remote debugging case. If the tool is
connected to your machine, then the loopback interface IP (127.0.0.1) will show.
Debug Port is the port opened specifically for the remote debugging access to the debugging tool. The
port is automatically assigned when Atmel Studio starts and is usually 4711.
Serial number - tool serial number.
Connection - Microsoft Driver Framework Method's name used to connect the Tool to your PC.
xxx version - Firmware, hardware, and FPGA file versions are listed here.
Using the link on the bottom of the dialog you can access extensive information on your tool online.
5.4 Board Settings/Tool Settings
Some tools (Power Debugger, STK500, STK600, QT600) have on-board voltage and clock generators.
They can be controlled from the Board settings/Tool settings page.
Atmel Studio 7 User Guide
Programming Dialog
© 2018 Microchip Technology Inc. User Guide DS50002718A-page 207
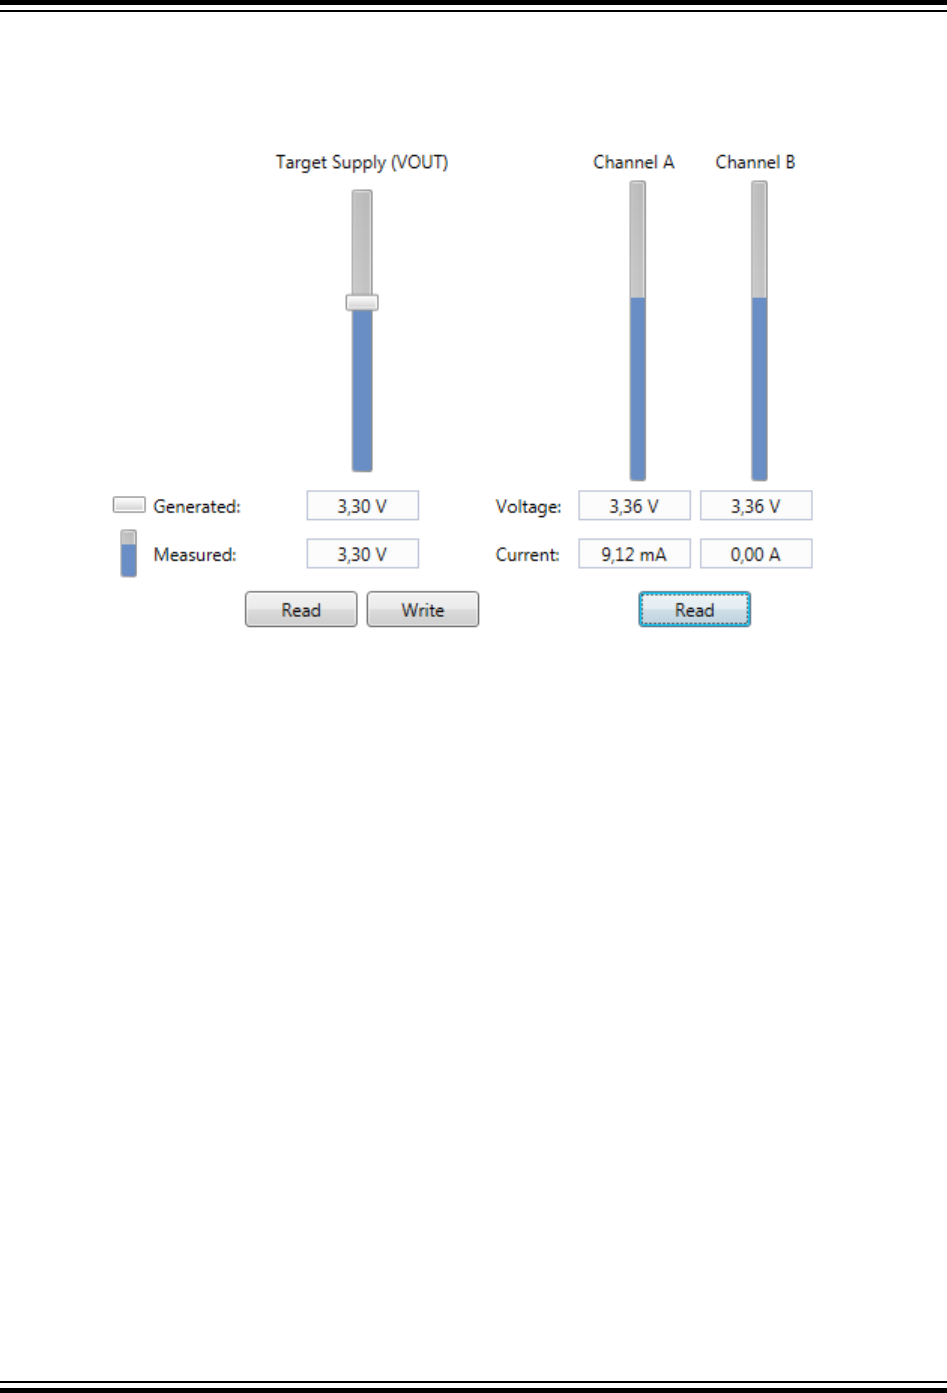
5.4.1 Power Debugger
The Power Debugger has a single voltage source and two channels of voltage/current measurement.
Figure 5-5. Power Debugger Tool Settings
The voltage output (VOUT) is adjusted by the slider, or by typing a voltage in the Generated text boxes
below the slider.
After adjusting the set-point, press the Write button to apply the changes. The value is then sent to the
tool, and the measured value is read back.
Press the Read button to read both the set-point (Generated) and the Measured values from the Power
Debugger.
Note: There may be slight differences between the Generated and the Measured voltages.
The output voltage range is 1.6V to 5.5V.
The Channel A and Channel B measurements are snapshots of analog readings taken by the Power
Debugger. The tool is optimized for real-time monitoring of voltage and current, and this snapshot is thus
approximate. It does not perform calibration compensation, and readings are locked in the highest-current
range. For best results, use the Atmel Data Visualizer.
Note: When no load is connected to a measurement channel, non-zero measurements can be
expected.
5.4.2 STK600
The STK600 has three voltage sources and one clock generator.
Atmel Studio 7 User Guide
Programming Dialog
© 2018 Microchip Technology Inc. User Guide DS50002718A-page 208
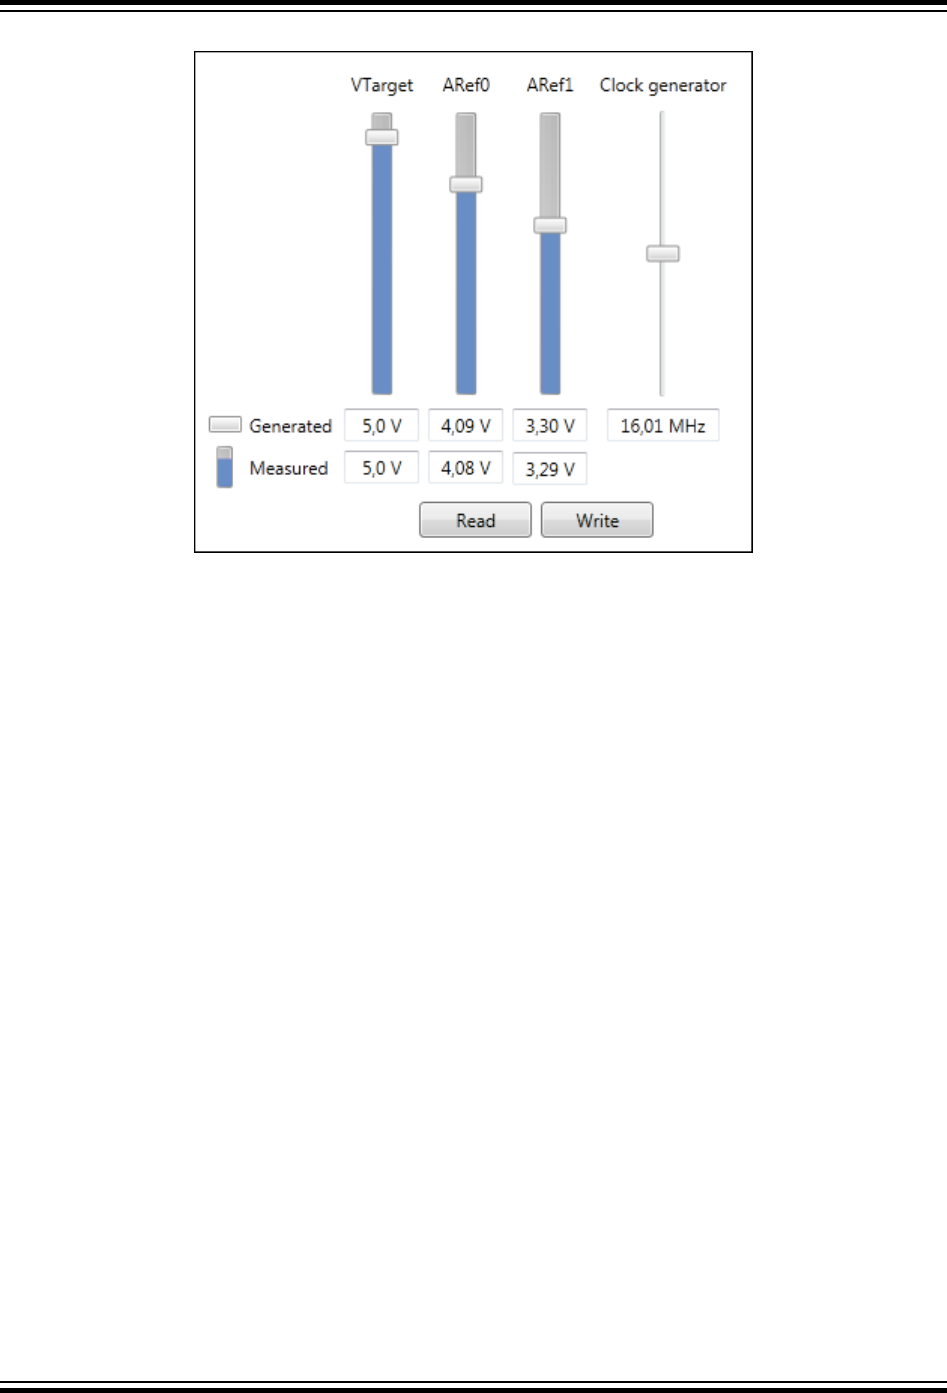
Figure 5-6. STK600 Board Settings
The set-points of the three voltage sources (VTG, ARef0, and ARef1) are adjusted by the means of three
sliders. It is also possible to type a voltage in the Generated text boxes below the sliders. When you drag
the sliders, the text boxes will update. And when you type a value in the text box, the slider will move.
After adjusting the set-points, press the Write button to apply the changes. The values are sent to the
tool, and measured values are read back.
Measurements are shown in the Measured row and shown as blue columns as part of the slider controls.
The measured values cannot be edited.
Press the Read button to read both the set-point (Generated) and the Measured values from the
STK600.
Note: What is the difference between the Generated and the Measured voltages? The generated
voltage is the setting on the adjustable power supply, the measured voltage is the readout from the built-
in voltmeter. If the measured value is different from the generated voltage, this may indicate that the
target circuitry draws a lot of current from the generator.
Note: If the VTARGET jumper on STK600 is not mounted, the measured voltage will be 0, unless an
external voltage is applied to the VTARGET net.
The Clock generator is also adjusted by dragging the slider or typing into the text box below. Press the
Write button to apply the new value.
5.4.3 QT600
The QT600 has only one setting, the VTarget voltage. This voltage can be set to five fixed voltages: 0,
1.8, 2.7, 3.3, and 5V. Press the Write button to apply the changes.
The actual VTarget value is read back automatically when pressing the Write button. It is also possible to
read it back manually using the Read button.
Atmel Studio 7 User Guide
Programming Dialog
© 2018 Microchip Technology Inc. User Guide DS50002718A-page 209

5.4.4 STK500
STK500 has settings similar to the STK600, but only one Aref voltage and combined generated/
measured values.
5.5 Card Stack
The STK600 uses a combination of routing and socket cards to let all AVR devices to be mounted. Given
the device, only certain combinations of routing and socket cards are valid. The Card stack page has
information about this.
Figure 5-7. Card Stack
The card stack page tells which cards are mounted on the STK600 and if they support the selected
device. If they do match, a list of devices supported by that card combination is listed.
If the mounted cards do not match, a list of suggested card combinations will be listed.
Atmel Studio 7 User Guide
Programming Dialog
© 2018 Microchip Technology Inc. User Guide DS50002718A-page 210
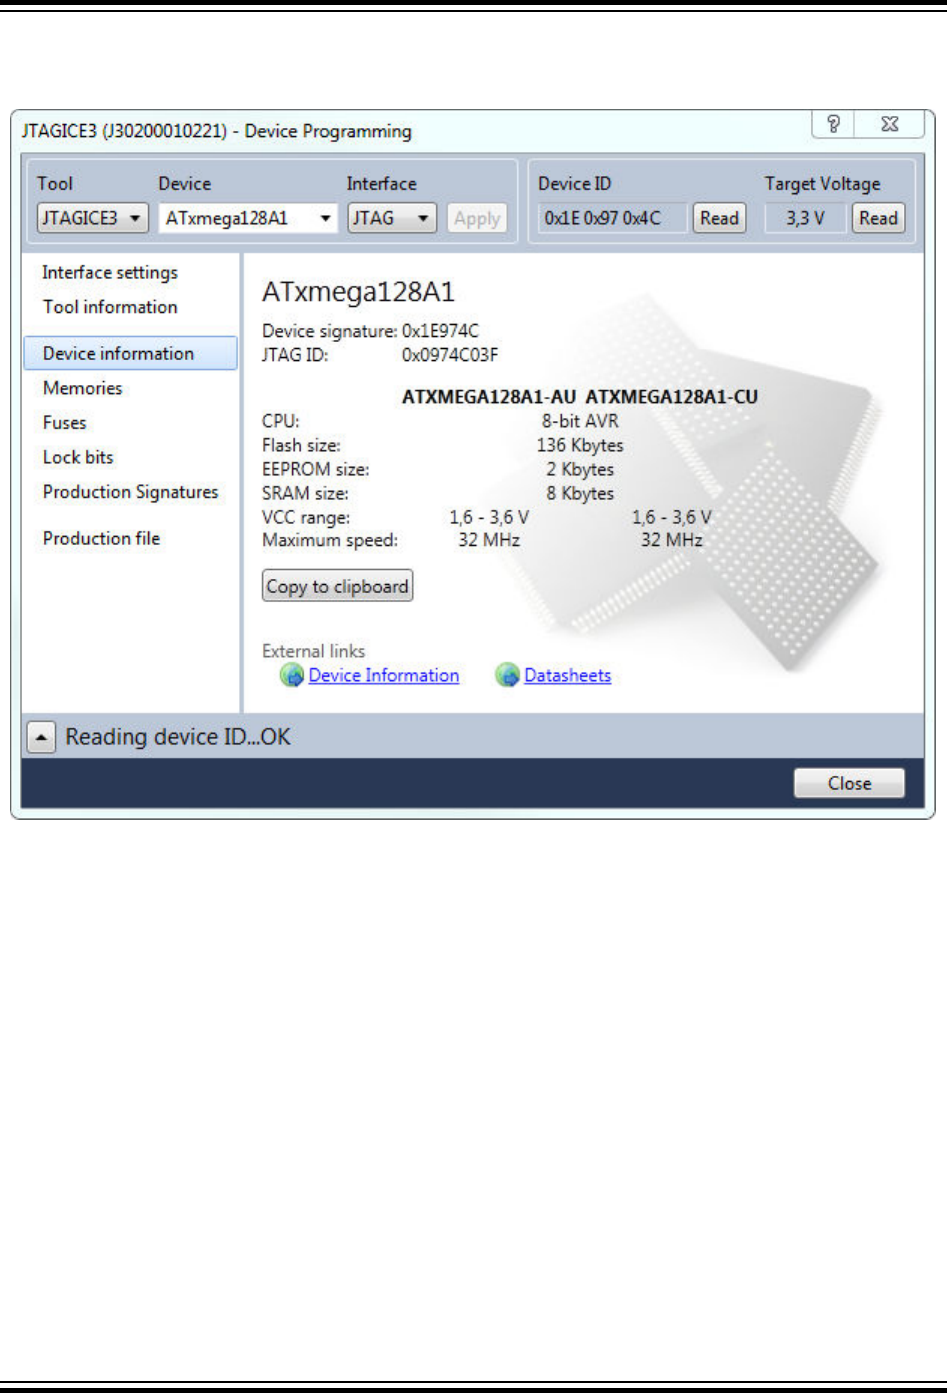
5.6 Device Information
Figure 5-8. Device Information
The device information page contains basic information on the selected device. When the page is
accessed, it will try to read the JTAG (or device) signature from the connected device.
In the upper part of the dialog, you can see the device name, its signature, the JTAG part identification
number, and the device revision (extracted from the JTAG signature).
In the lower part of the dialog, you can see the device variants and characteristics of each variant.
Acceptable voltage range, followed by maximum operating clock speed, and the sizes of on-chip
memories.
The two links on the bottom of the dialog offer you to see a slightly more detailed device information in the
purchase catalog online or to download a complete data sheet of the target device.
Atmel Studio 7 User Guide
Programming Dialog
© 2018 Microchip Technology Inc. User Guide DS50002718A-page 211
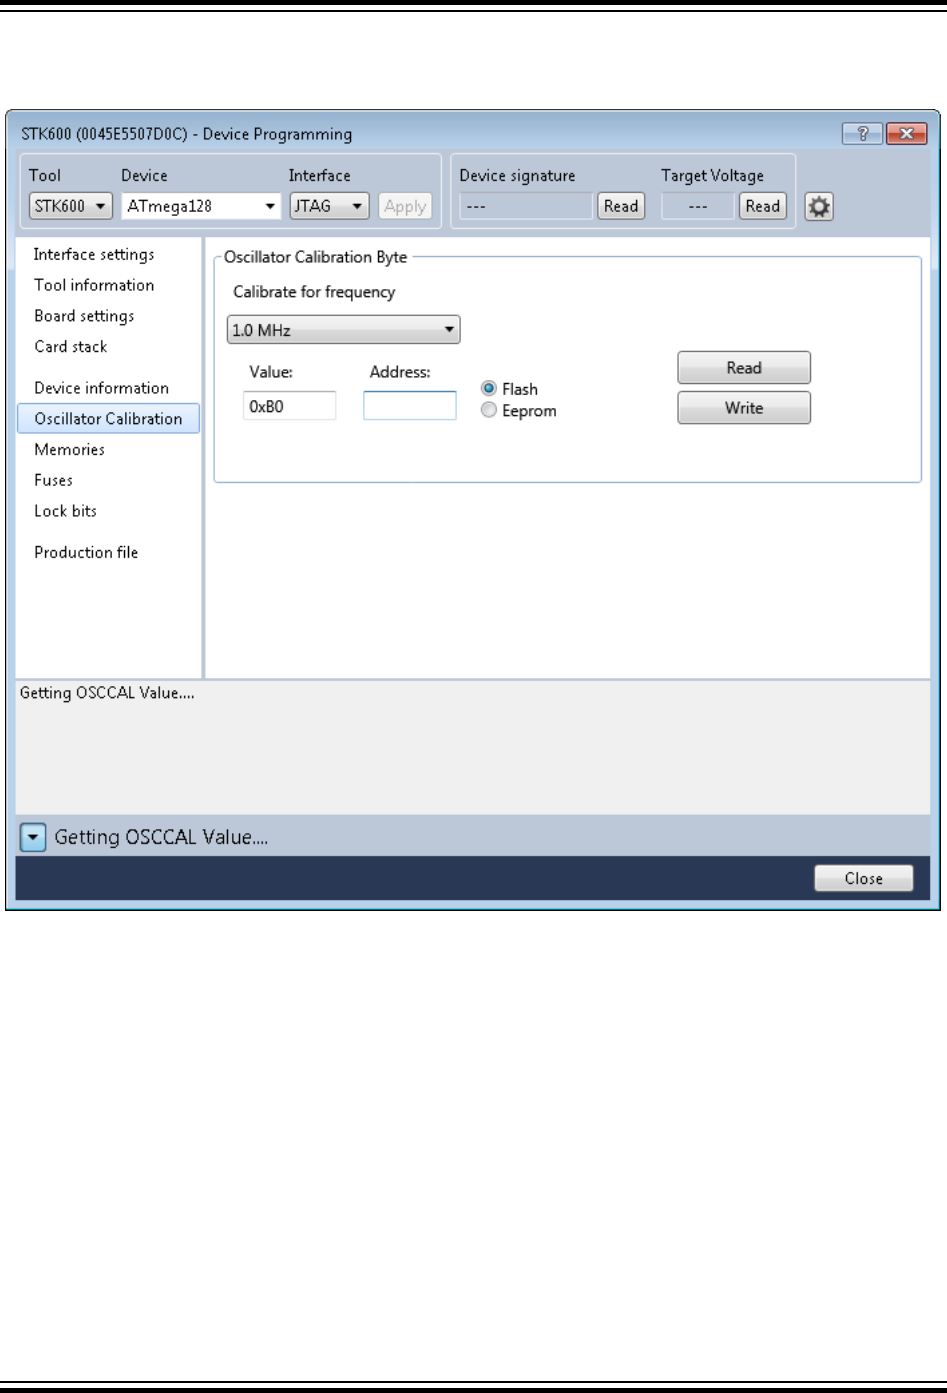
5.7 Oscillator Calibration
Figure 5-9. Oscillator Calibration
Oscillator Calibration Byte(s) for ATtiny and ATmega parts
From the Advanced tab, you can read the Oscillator Calibration Byte(s) for ATtiny and ATmega parts.
The oscillator calibration byte is a value that can be written to the OSCCAL register found in selected
devices, in order to tune the internal RC Oscillator to run as close to a chosen clock frequency as
possible.
Program
The oscillator calibration byte is stored in the device during manufacturing and can not be erased or
altered by the user. It is automatically transferred to the OSCCAL register during device start-up, or set
during program initialization, depending on the device. On devices where the application sets it during
program initialization, it must be transferred to FLASH or EEPROM first, using the programming dialog or
the command line tools.
Reading and Writing the Oscillator Calibration Byte for ATtiny and ATmega parts
Atmel Studio 7 User Guide
Programming Dialog
© 2018 Microchip Technology Inc. User Guide DS50002718A-page 212
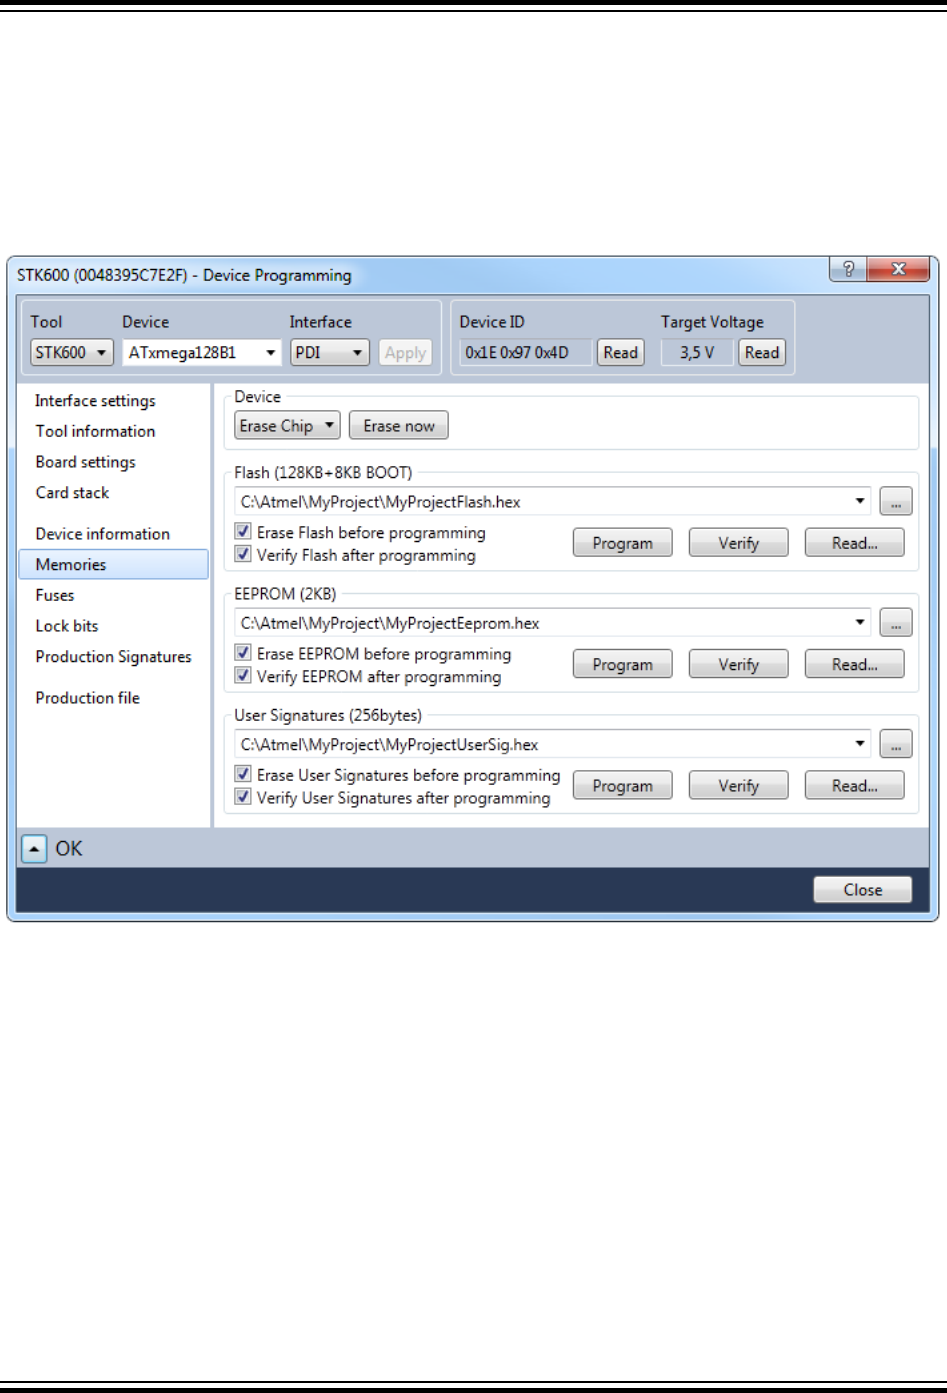
The calibration value is read from the storage in the device and shown in the Value text box by pressing
the Read button.
The calibration byte is programmed into FLASH or EEPROM memory by pressing the Write button.
Memory type and address must be specified first.
5.8 Memories
Figure 5-10. Memories Programming
From the Memories tab, you can access all the programmable memories on the target device. Memory is
erased by first selecting the memory type and then clicking on the Erase button. Selecting Erase Chip
will erase the entire contents of the device, including FLASH, EEPROM (unless the EESAVE fuse is
programmed), and lock-bits, but not Userpages if the device contains this.
Program
To program a file into the device's Flash memory, write the full path and file name in the combo box in the
flash section. Or, select the file by pressing the browse button (...).
Now, press the Program button to program the file into the memory.
If the Erase device before programming checkbox is checked, a chip erase operation will be
performed before the programming operation starts.
If the Verify device after programming checkbox is checked, the content will be verified after the
programming operation is done.
Atmel Studio 7 User Guide
Programming Dialog
© 2018 Microchip Technology Inc. User Guide DS50002718A-page 213

Some devices can also be programmed through a flashloader. This is mainly an advanced technique, but
it will usually give a significant speedup in the programming speed. For devices where this is supported, a
checkbox named Program flash from RAM will be shown. If this box is checked, the base address of the
location of the flashloader needs to be given.
Verify
To verify the flash content of the device, first, select the file you want to verify against, then, press the
Verify button.
Read
The contents of the Flash memory can be read out in Intel® hexadecimal file format, using the Read
button. Pressing the Read button will bring up a dialog offering you to specify where the file will be saved.
EEPROM
The device's EEPROM memory can be programmed in a similar way.
User Signatures
The XMEGA device's User Signature memory can be programmed the same way.
Atmel Studio 7 User Guide
Programming Dialog
© 2018 Microchip Technology Inc. User Guide DS50002718A-page 214
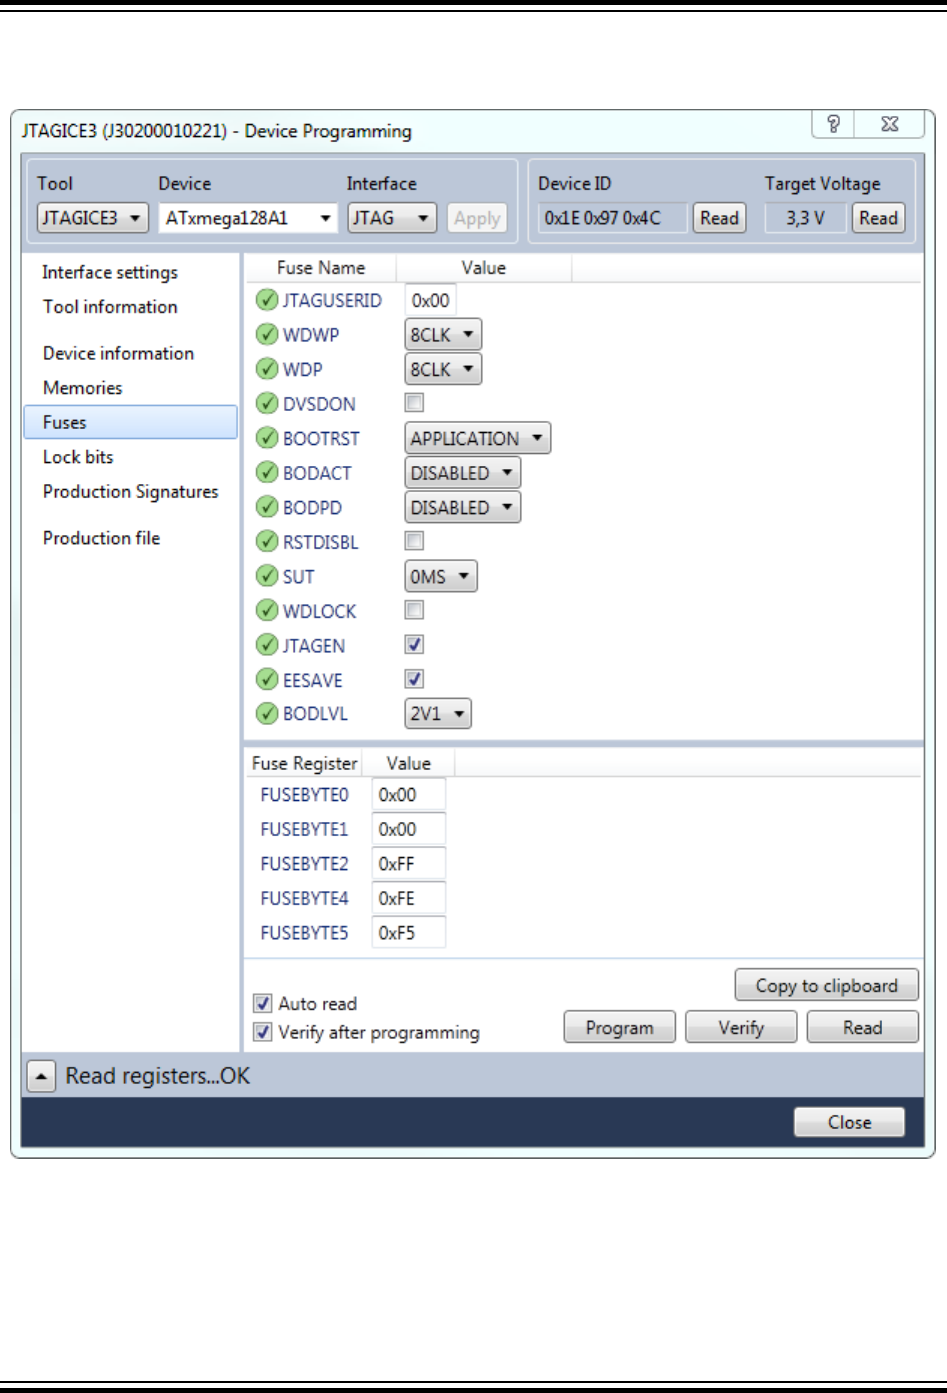
5.9 Fuse Programming
Figure 5-11. Fuse Programming
The Fuses page presents the fuses of the selected device.
Press the Read button to read the current value of the fuses, and the Program button to write the current
fuse setting to the device. Fuse settings are presented as checkboxes or as drop-down lists.
Atmel Studio 7 User Guide
Programming Dialog
© 2018 Microchip Technology Inc. User Guide DS50002718A-page 215

Detailed information on which fuses are available in the different programming modes and their functions
can be found in the device data sheet. Note that the selected fuse setting is not affected by erasing the
device with a chip-erase cycle (i.e. pressing the Chip Erase button on the Memories page).
Fuse values can also be written directly into the fuse registers in the lower pane as hexadecimal values.
Auto read If this check box is checked, the fuse settings will be read from the device
each time you enter the fuse page.
Verify after
programming
When this check box is checked, the settings will be verified after a
programming operation is completed.
The appearance of the fuse glyph describes whether the fuse information is up-to-date compared to the
state of the device.
The fuse value is up-to-date, i.e the same state as in the device.
The fuse has been modified by the user and it is not yet programmed into the device.
The fuse state is unknown, it has not been read from the device, nor modified by the user.
5.10 Lock Bits
The lock bit page is similar to the fuse page. For usage, see section Fuse Programming.
5.11 Production Signatures
The production signature page is only visible for AVR XMEGA devices and shows factory programmed
data in the production signature row. It contains calibration data for functions such as oscillators and
analog modules. The production signature row cannot be written or erased.
Atmel Studio 7 User Guide
Programming Dialog
© 2018 Microchip Technology Inc. User Guide DS50002718A-page 216
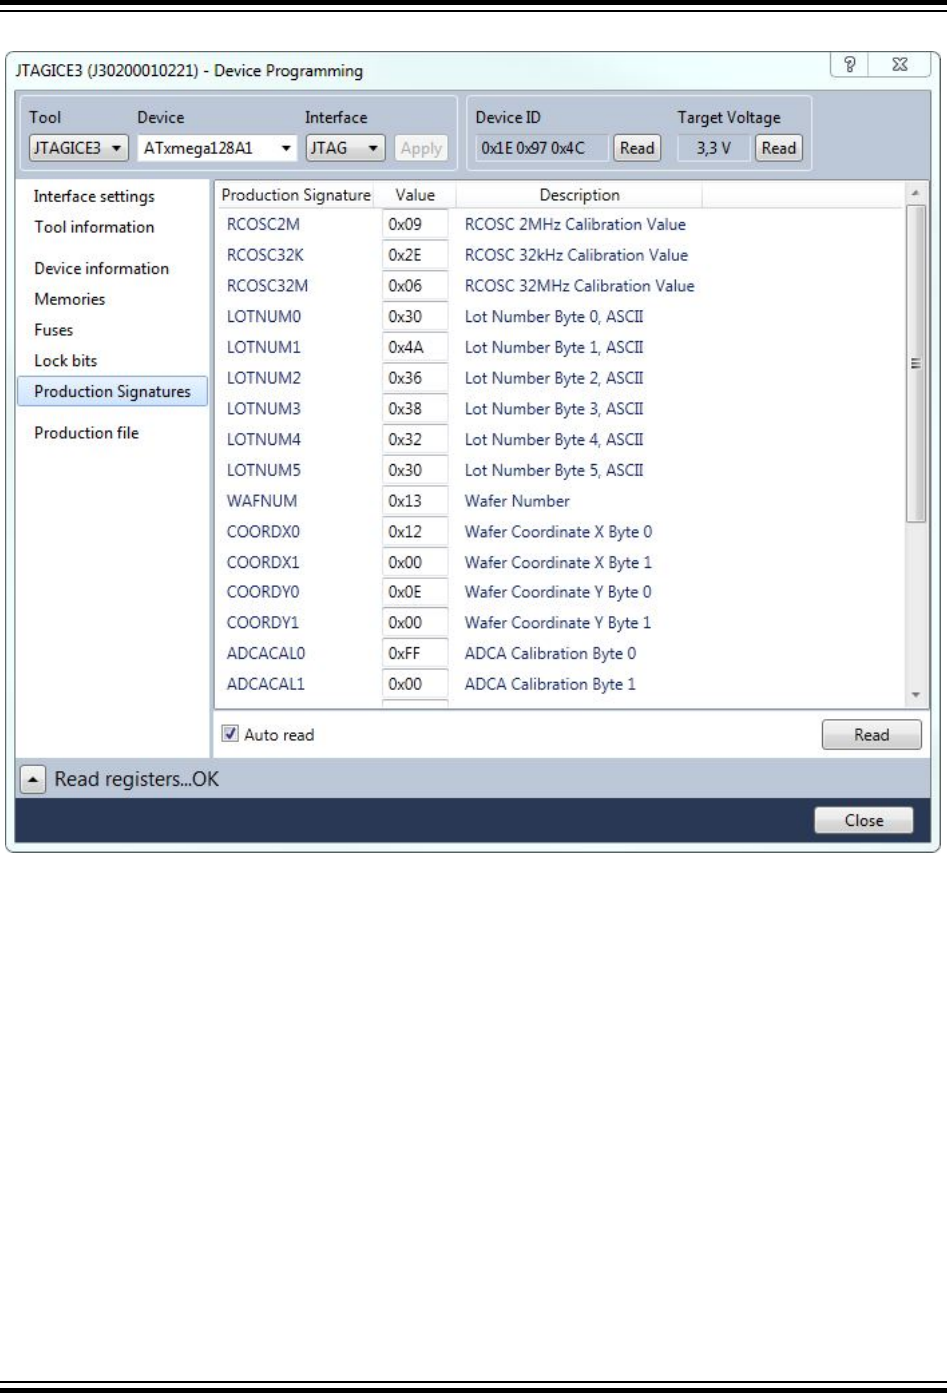
Figure 5-12. Production Signatures
5.12 Production Files
The ELF production file format can hold the contents of both Flash, EEPROM, and User Signatures
(XMEGA devices only) as well as the Fuse- Lockbit configuration in one single file. The format is based
on the Executable and Linkable Format (ELF).
The production file format is currently supported for tinyAVR, megaAVR, and XMEGA. See Creating ELF
Files with Other Memory Types for a description on how to configure the project in order to generate such
files.
Atmel Studio 7 User Guide
Programming Dialog
© 2018 Microchip Technology Inc. User Guide DS50002718A-page 217
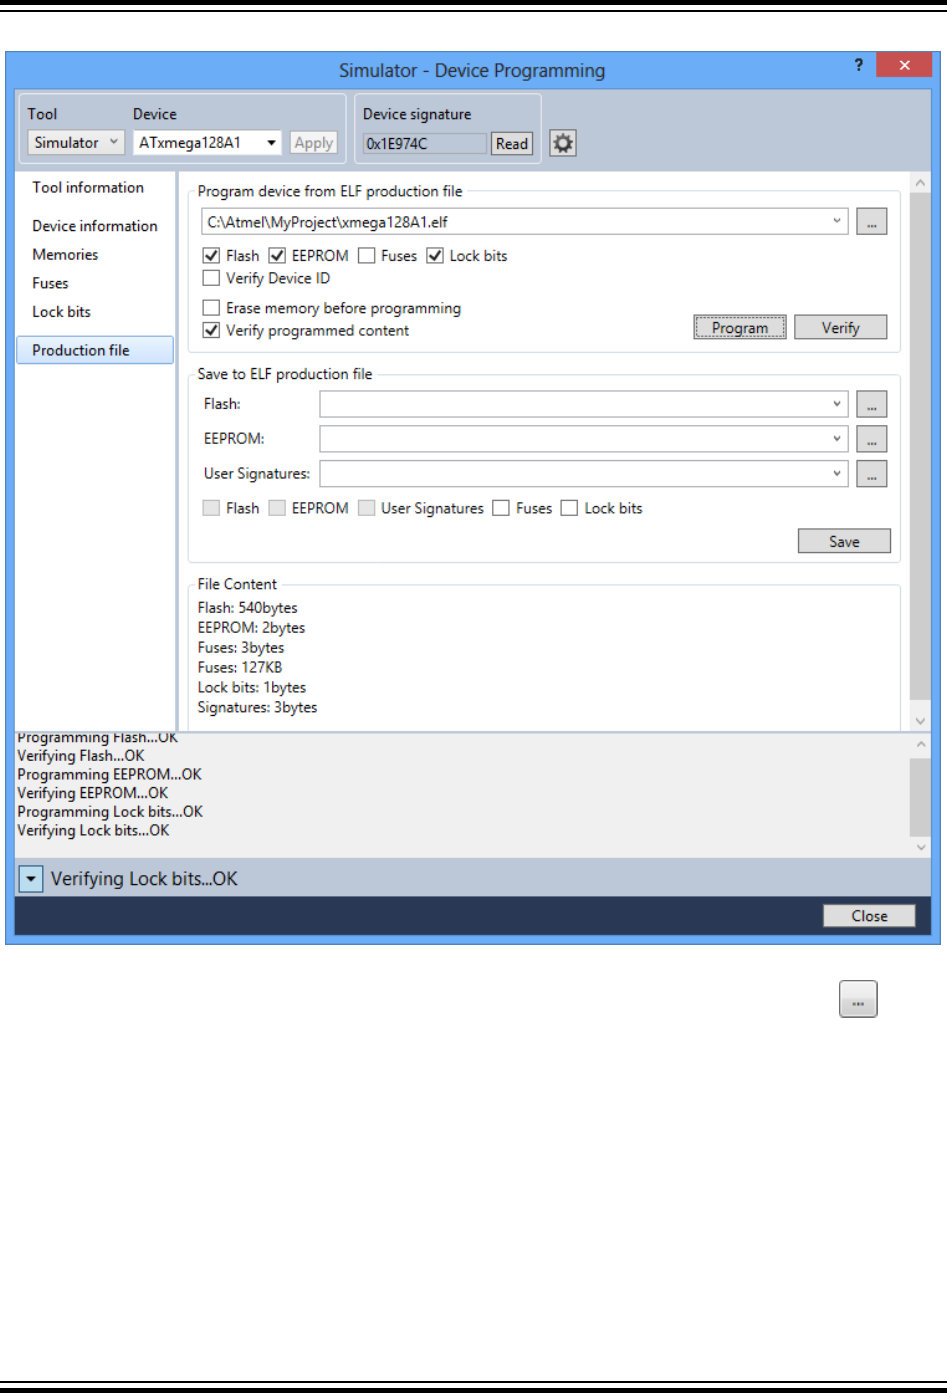
Figure 5-13. Production Files Programming
Program device from ELF production file: To program your device from an ELF file, you must first
select a source file by typing its full path into the combo box, or by pressing the browse button .
Depending on the contents of your file, checkboxes for the different memory segments will be activated.
It is possible to select one or several of the memory segments that the ELF production file contains. You
can then program and verify the device with the content of these segments in one single operation. Select
which memory segments you want to program by ticking off the corresponding checkboxes.
Select the Erase memory before programming check box, if you want an erase operation to be
performed before the programming operation.
Note: The erase memory operation will depend on the device selection. For tinyAVR and megaAVR,
both Flash, EEPROM, and lockbits will be erased (chip erase) independent of which memories are
selected, while for XMEGA only the selected memories will be erased.
Atmel Studio 7 User Guide
Programming Dialog
© 2018 Microchip Technology Inc. User Guide DS50002718A-page 218
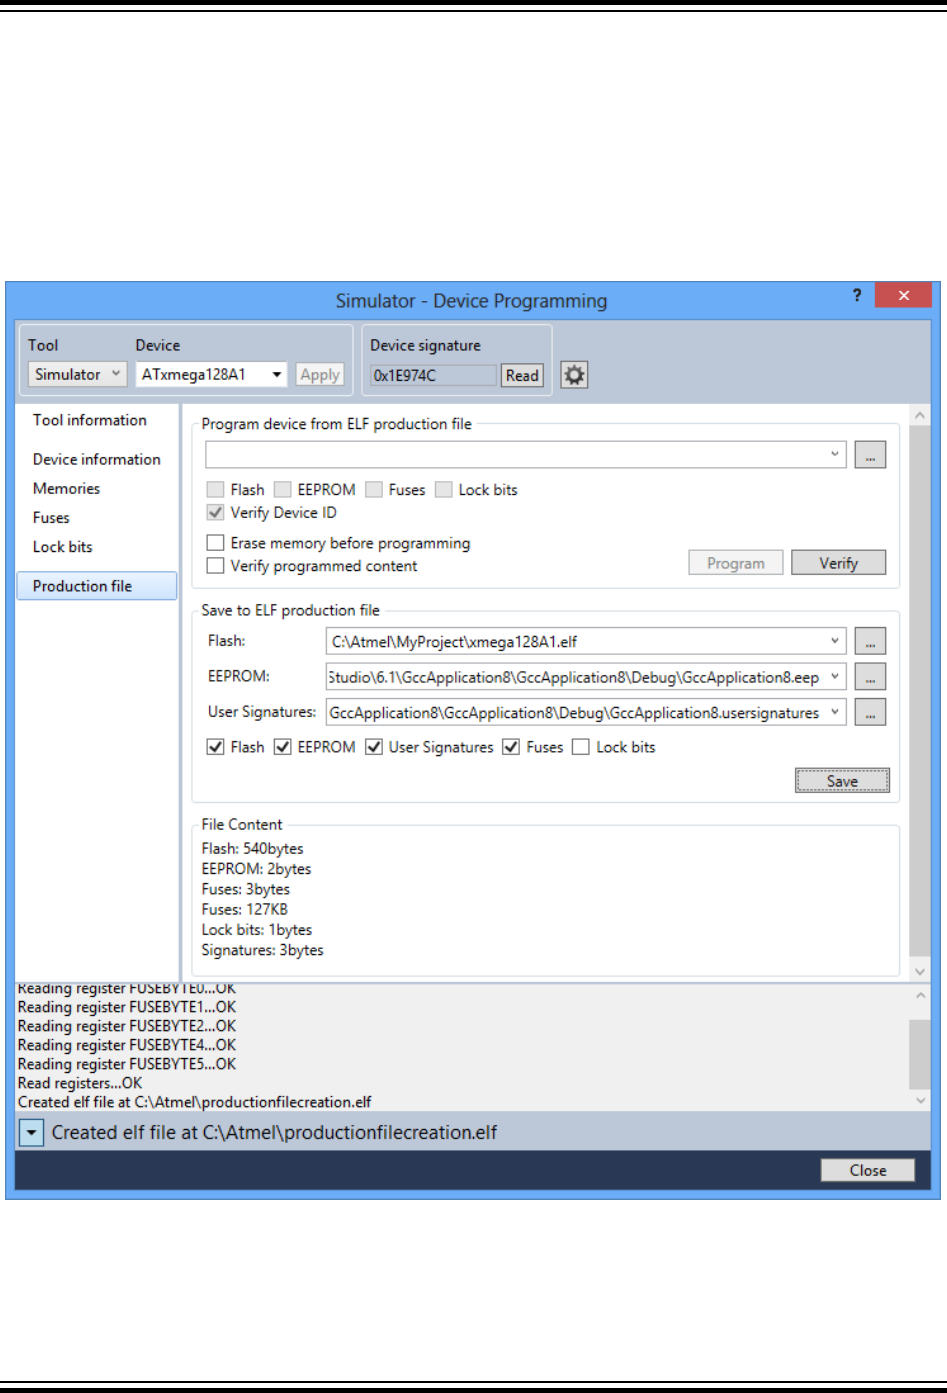
Select the Verify device after programming checkbox, if you want the contents to be verified after the
programming operation is done.
Select the Verify Device ID checkbox, if you want to verify the device id stored in the file (signature
bytes) with the connected device.
Now, press the Program button to program the file into the memory.
You can verify the contents of the device against an ELF file by pressing the Verify button. The
verification will only verify the contents of the selected memory segments.
Figure 5-14. Production Files Creation
Save to ELF production file: Prior to creating the ELF file, specify the input file path for FLASH,
EEPROM, and Usersignature on the production file tab. Then configure the Fuse and Lockbits on the
corresponding tab and program it. The Fuse and Lockbits, which are programmed in the device will be
Atmel Studio 7 User Guide
Programming Dialog
© 2018 Microchip Technology Inc. User Guide DS50002718A-page 219

taken as input while creating ELF file. Back on the production file tab, press the 'Save' button to generate
the ELF file.
You must specify which segments are to be present in the production ELF file by ticking the
corresponding checkboxes.
5.13 Security
The security bit allows the entire chip to be locked from external JTAG or other debug access for code
security. Once set, the only way to clear the security bit is through the Chip Erase command.
Figure 5-15. Security Page
To check the state of the security bit, press the Read button on the Security page of the programming
dialog. The value should now read Cleared or Set. Set meaning that the security bit is set, and Cleared
meaning that it is not set. If the Auto Read checkbox is ticked off, the Read operation will be performed
automatically when the Security page is opened.
To set the security bit, simply press the Set button on the Security page of the programming dialog. Now
the device is locked for all further JTAG or aWire access except for the Chip Erase command.
Locked device
When the security bit is set, the device is locked for most external debug access. Attempts to program or
read any memories or fuses will cause an error message to appear.
Atmel Studio 7 User Guide
Programming Dialog
© 2018 Microchip Technology Inc. User Guide DS50002718A-page 220
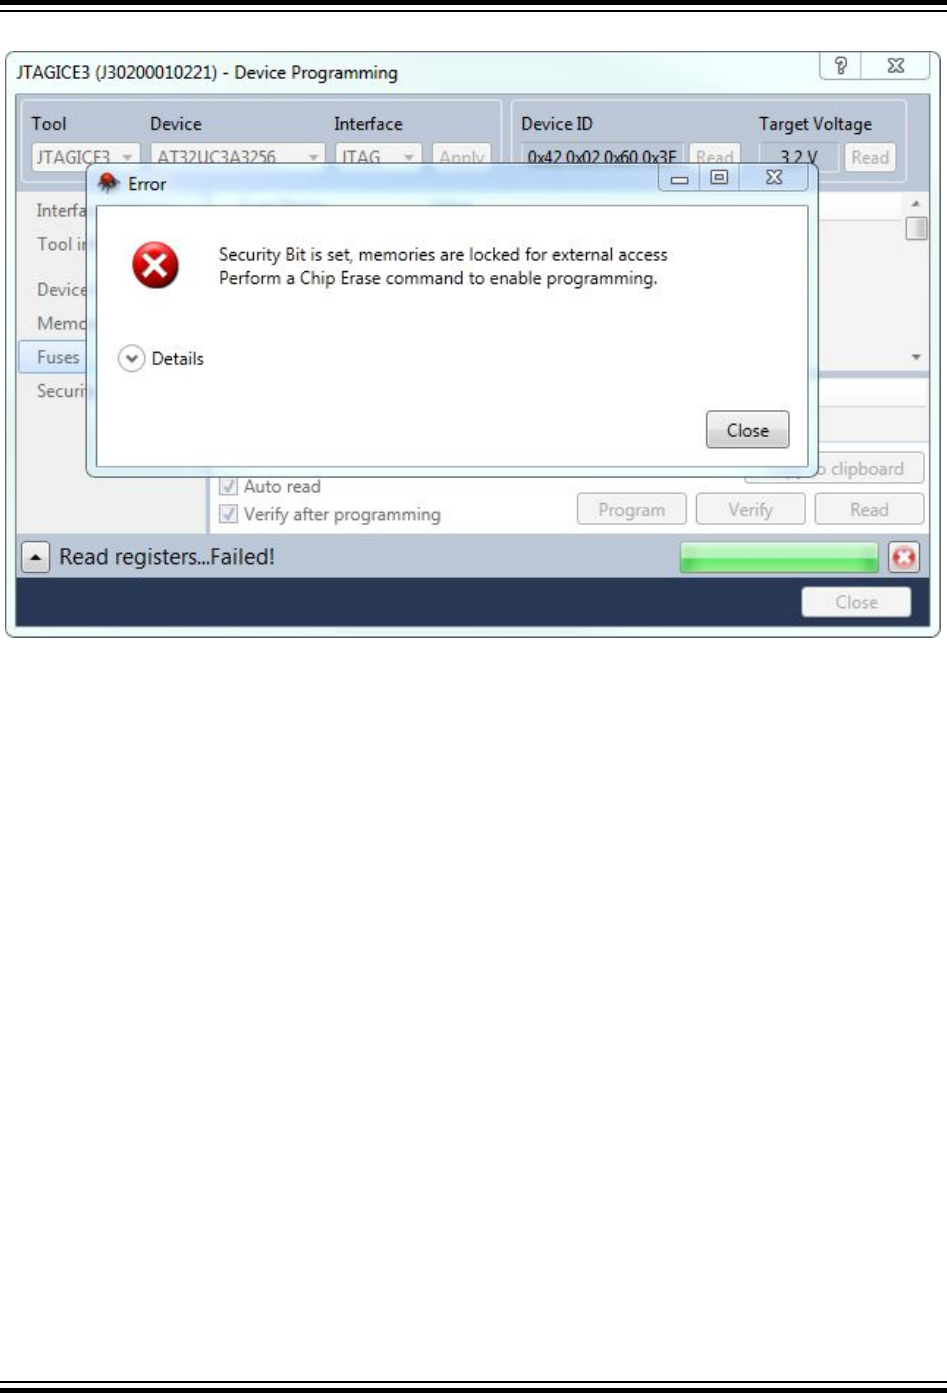
Figure 5-16. Security Bit Error
To unset the security bit, issue the Chip Erase command. This can be done from the Memories page,
see Memories.
5.14 Automatic Firmware Upgrade Detection
As mentioned in the Firmware Upgrade section, you may encounter a dialog stating that your tool's
firmware is out of date when you open the Device Programming dialog.
Atmel Studio 7 User Guide
Programming Dialog
© 2018 Microchip Technology Inc. User Guide DS50002718A-page 221
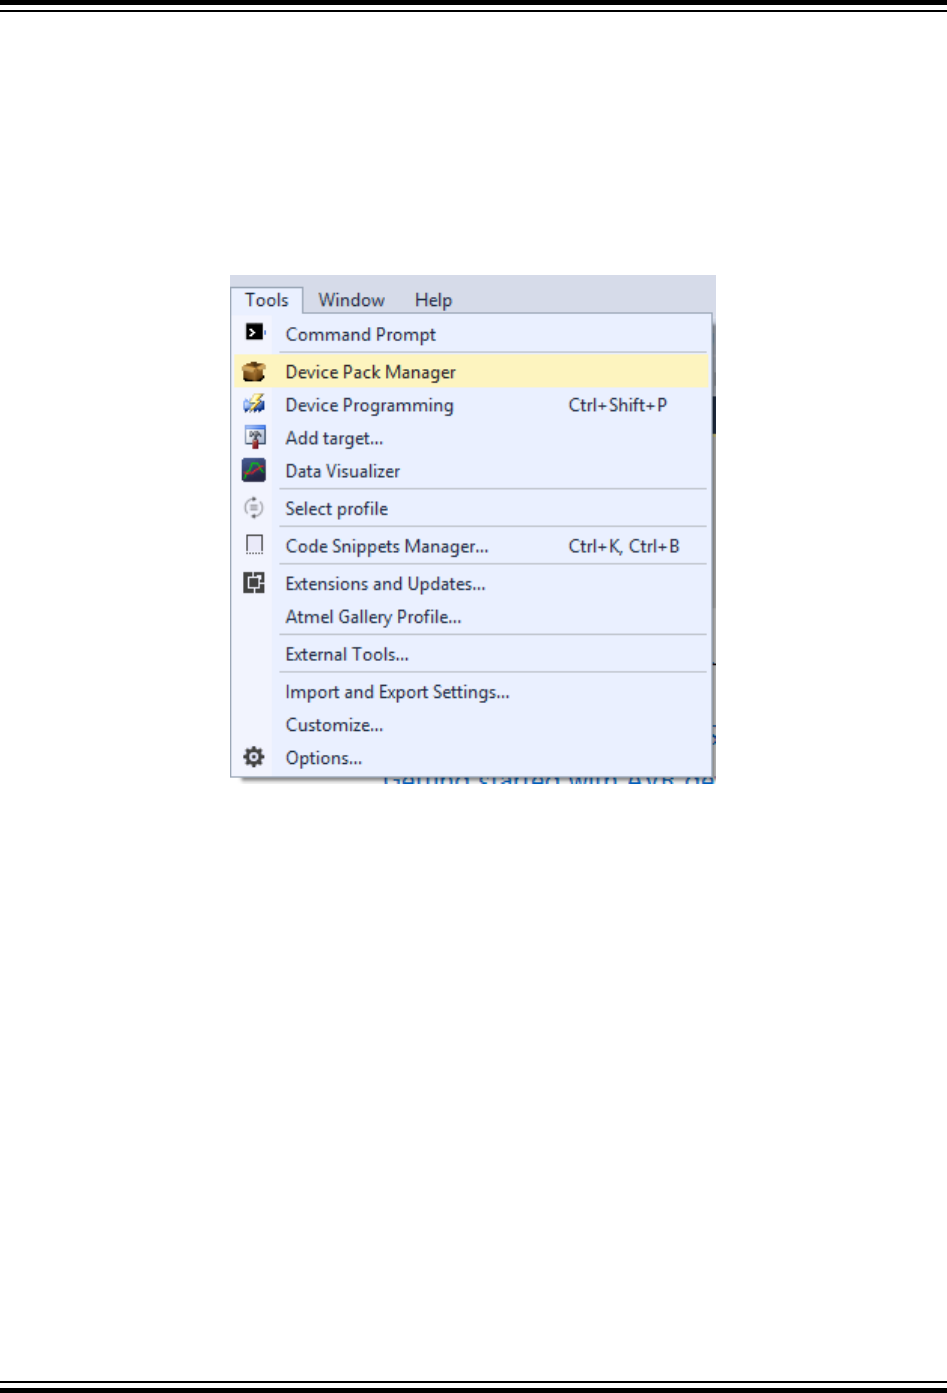
6. Miscellaneous Windows
6.1 Device Pack Manager
The Device Pack Manager is used to manage the devices supported by Atmel Studio.
The Device Pack Manager is launched from Tools → Device Pack Manager.
Figure 6-1. Device Pack Manager Menu
Atmel Studio 7 User Guide
Miscellaneous Windows
© 2018 Microchip Technology Inc. User Guide DS50002718A-page 222
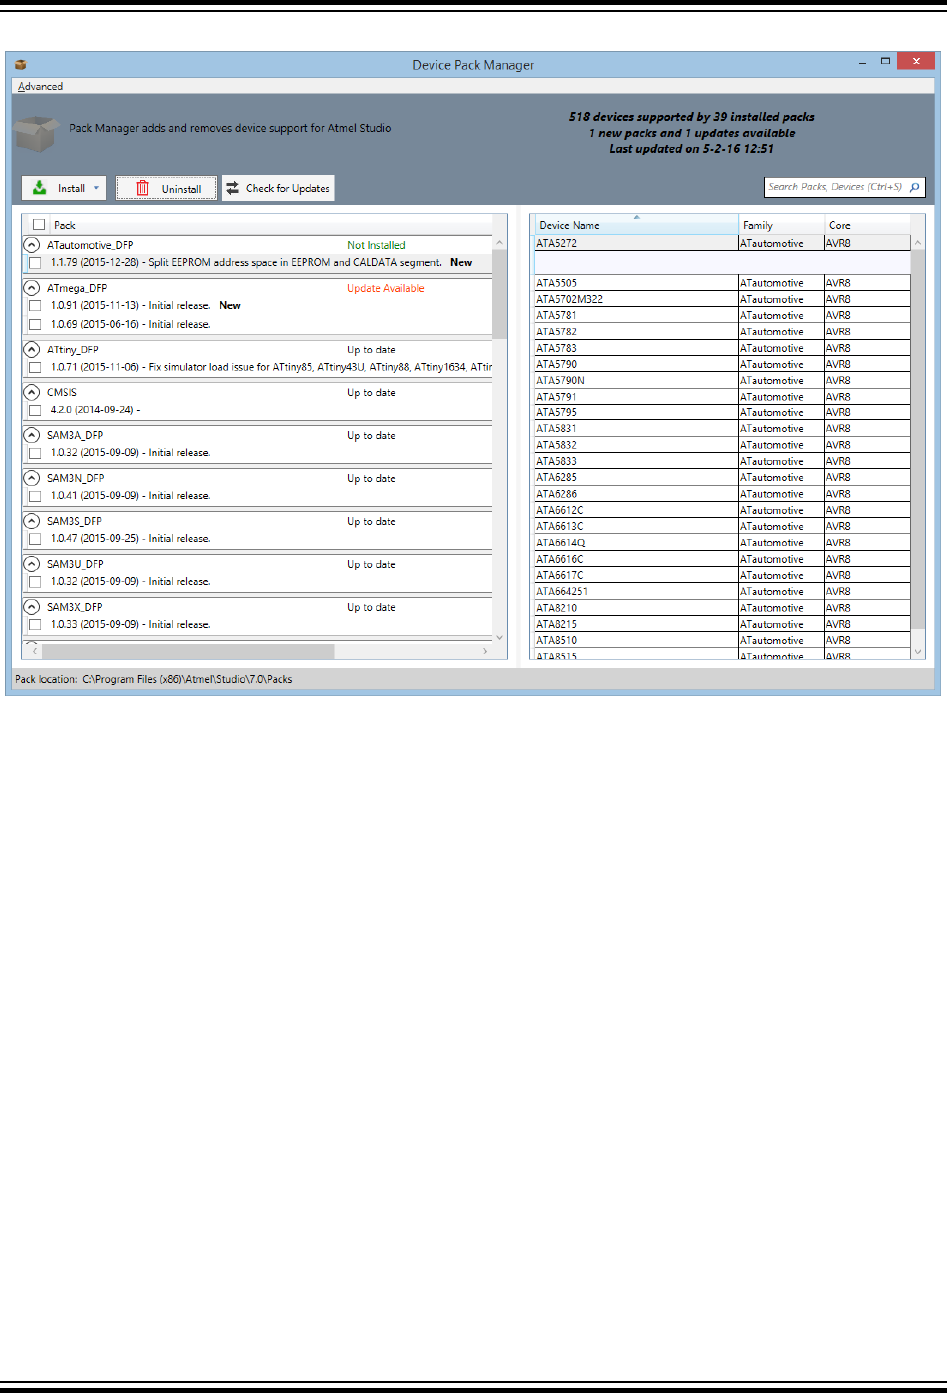
Figure 6-2. Device Pack Manager
The Device Pack Manager consists of two panes. The left pane shows the list of packs that are installed.
The right pane shows the devices that are provided by the pack selected in the left pane.
Packs can have any of the following statuses:
Up to date Pack is already up-to-date and latest.
Update Available New update is available.
Not Installed Pack is not installed but can be downloaded.
Actions
Install selected packs Download and install all packs that have been selected using the check-boxes
besides the version.
Install all updates Download and install all available updates.
Browse pack file Install an already downloaded pack file.
Uninstall Uninstalls all packs that have been selected using the checkboxes besides the
version.
Check for Updates Check for new and updated packs.
Search The search box can be used to search for a specific pack or a device in any of
the packs.
Atmel Studio 7 User Guide
Miscellaneous Windows
© 2018 Microchip Technology Inc. User Guide DS50002718A-page 223
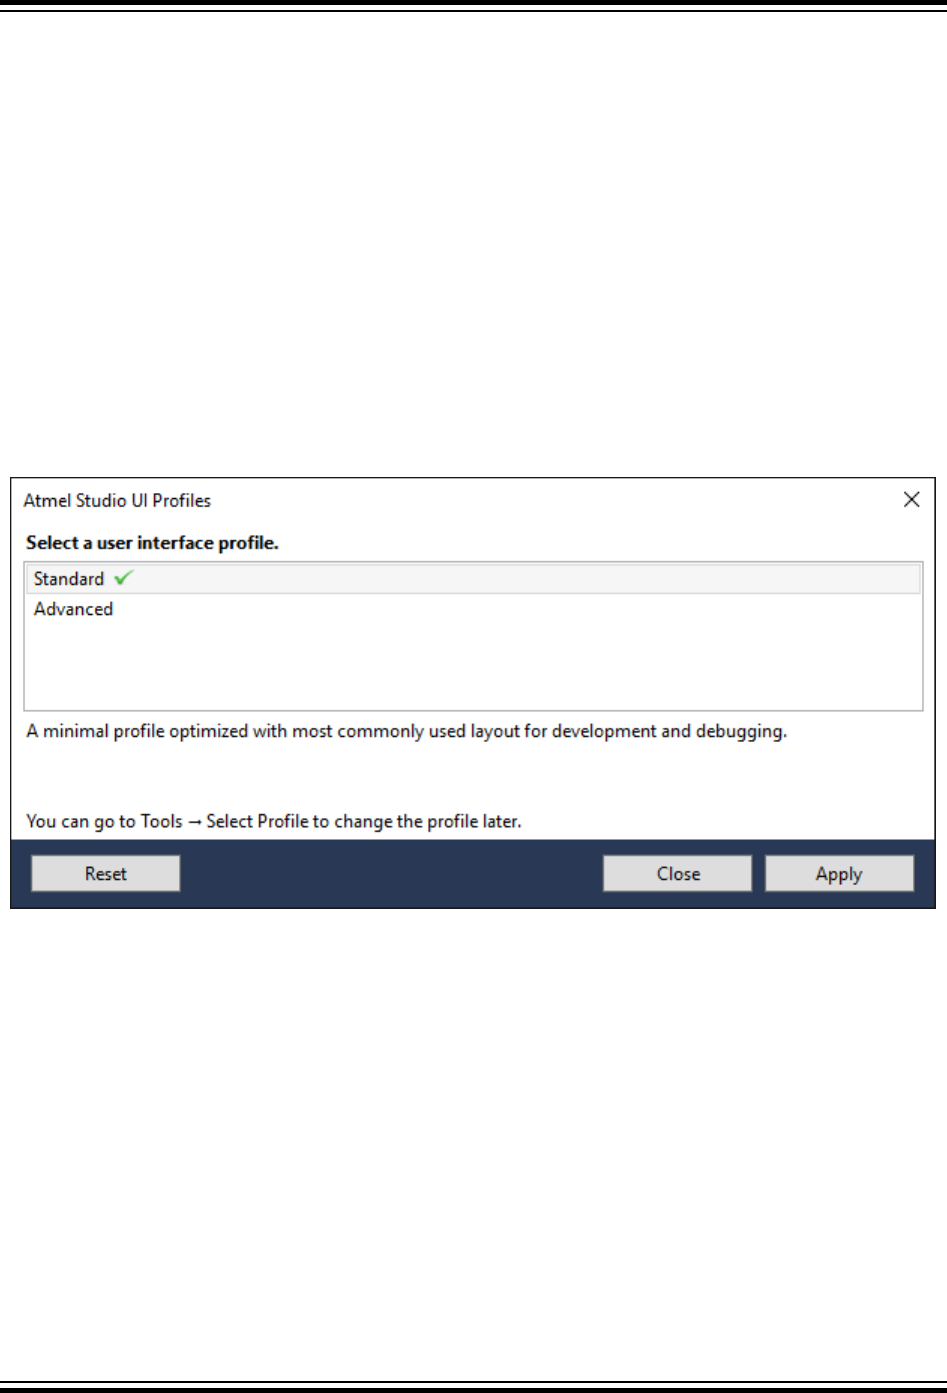
Reset cache Resetting the cache will re-index all installed packs. This does not uninstall or
remove anything. It is in the Advanced menu.
Note: After installing, updating, or removing packs, Atmel Studio has to be restarted before the changes
become visible.
6.2 User Interface Profile Selection
Different user interface profiles targeted for different use are available in Atmel Studio.
The user interface profile controls the visibility of menus, window layouts, toolbars, context menus, and
other elements of Atmel Studio. The following modes are available:
Standard The default profile. Includes the most used windows and menus.
Advanced The profile used in previous versions of Atmel Studio. This profile includes advanced
debugging and refactoring tools.
Figure 6-3. Profile Selection
The profile selection window is shown the first time Atmel Studio is started. Selecting a profile in the list
will show a description of the profile. Clicking the Apply button applies the profile to Atmel Studio.
The profile can be changed at any time by navigating to Tools → Select Profile, or by clicking the profile
name that is displayed in the top right corner of Atmel Studio.
Atmel Studio 7 User Guide
Miscellaneous Windows
© 2018 Microchip Technology Inc. User Guide DS50002718A-page 224

Figure 6-4. Selected Profile
When switching profiles, any changes done to the active profile is saved. Going back to the previous
profile will restore the changes as well as the profile.
Using the Reset option discards any changes saved to the profile and restores it to the default profile.
6.3 Available Tools View
6.3.1 Introduction
The Available Tools view (View → Available Atmel Tools) contains a list of all connected tools such as
programmers, debuggers, and starter kits. The Simulator is always present. Other tools will show up
when they are connected to the PC.
Atmel Studio 7 User Guide
Miscellaneous Windows
© 2018 Microchip Technology Inc. User Guide DS50002718A-page 225
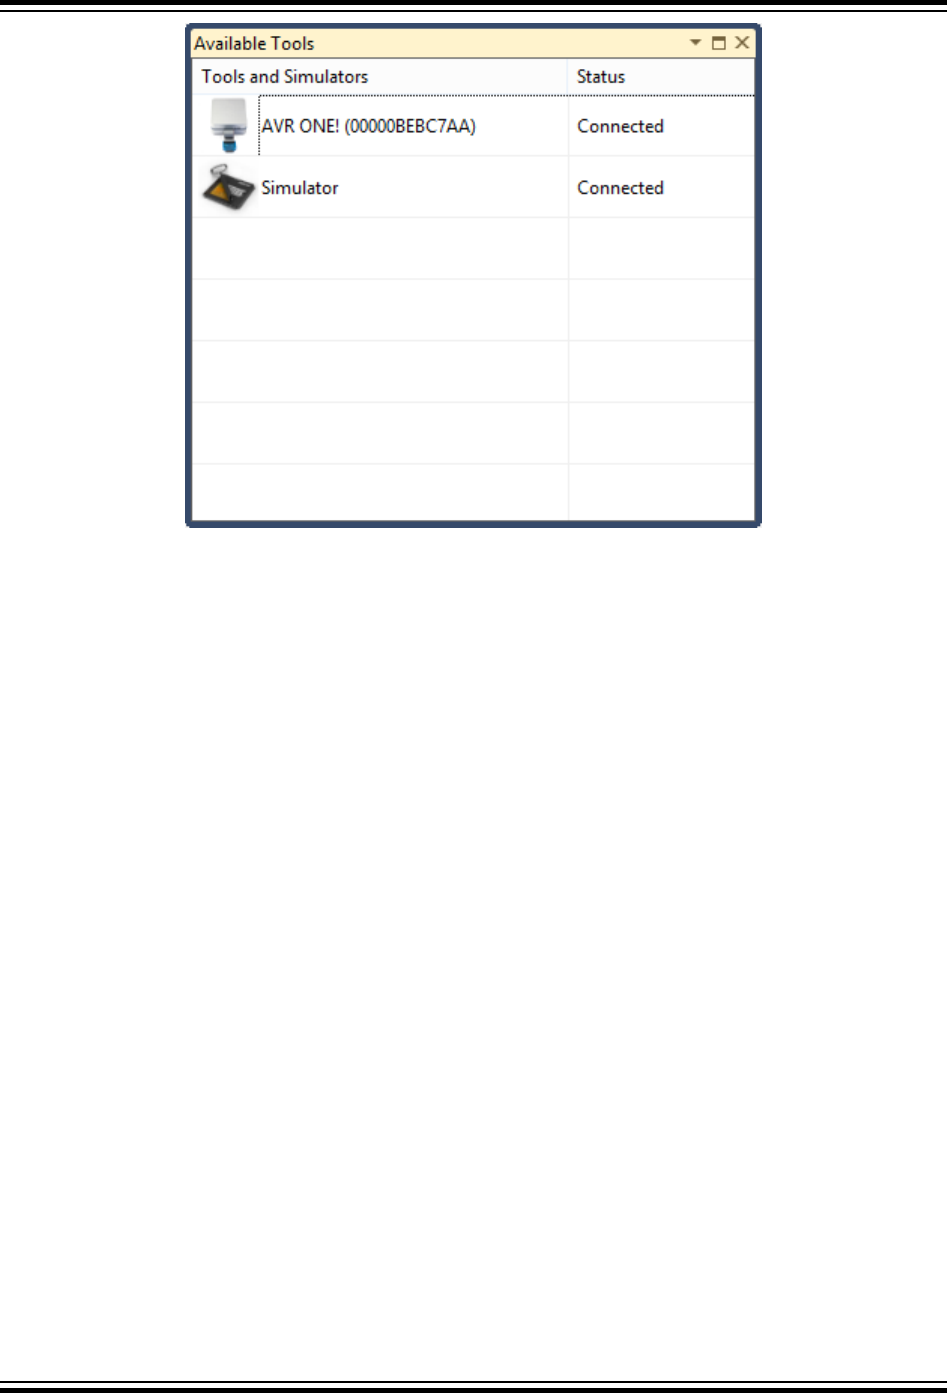
6.3.2 Tool Actions
The following actions can be selected by right clicking tools in the Available Tools view:
Device Programming Opens the Device Programming window with the tool preselected.
Self-test Some tools are capable of performing a self-test. Follow the displayed
instructions.
Add target Adds a tool to the list of available tools that is not auto-detectable. See Add a
Non-Detectable Tool for more information.
Upgrade Starts the firmware upgrade tool with the selected tool.
Show Info Window Shows the Tool Info window. Not all tools support this feature. See Tool Info
Window for more information.
6.3.3 Add a Non-Detectable Tool
The STK500 does not have a USB connection, and cannot be automatically detected by Atmel Studio. So
it must be added to the list of available tools before it can be used by the Device Programming window.
To add an STK500, right click inside the Available Tools view, select Add target, and select the STK500
as the tool and the COM port your STK500 will be connected to.
Atmel Studio 7 User Guide
Miscellaneous Windows
© 2018 Microchip Technology Inc. User Guide DS50002718A-page 226

Press the Apply button and the STK500 will be displayed in the list of available tools.
Note: An STK500 that has been added will be visible in the Available Tools view event even if no
STK500 is connected to the specified COM port.
If you want to remove STK500 from the list, you can right click on it and select Remove from the context
menu.
6.3.3.1 Add J-Link over IP
In the Add target dialog, it is possible to add a remote Segger J-Link debug probe. Both using a debug
probe with built-in ethernet such as the J-Link PRO3 and any other Segger probe by using the J-Link
Remote Server software4.
Figure 6-5. Add J-Link over IP
3See https://www.segger.com/jlink-pro.html
4See https://www.segger.com/jlink-remoteserver.html
Atmel Studio 7 User Guide
Miscellaneous Windows
© 2018 Microchip Technology Inc. User Guide DS50002718A-page 227

To add a debug probe that is connected to a J-Link Remote Server, choose Connect by hostname and
enter the IP address or the hostname of the computer running the J-Link Remote Server. If the J-Link
Remote server is running on a non-standard port5 then the port also needs to be entered. If the J-Link
Remote Server is running on the default port, the port can be left empty.
To add a debug probe that has built-in ethernet, choose Connect by serial number in the Add target
dialog, and enter the serial number of the debug probe.
6.4 Tool Info Window
The Tools Info window shows information about connected tools. At the moment, only the Xplained Pro
series is supported.
5The standard port of the J-Link Remote Server is port 19020
Atmel Studio 7 User Guide
Miscellaneous Windows
© 2018 Microchip Technology Inc. User Guide DS50002718A-page 228
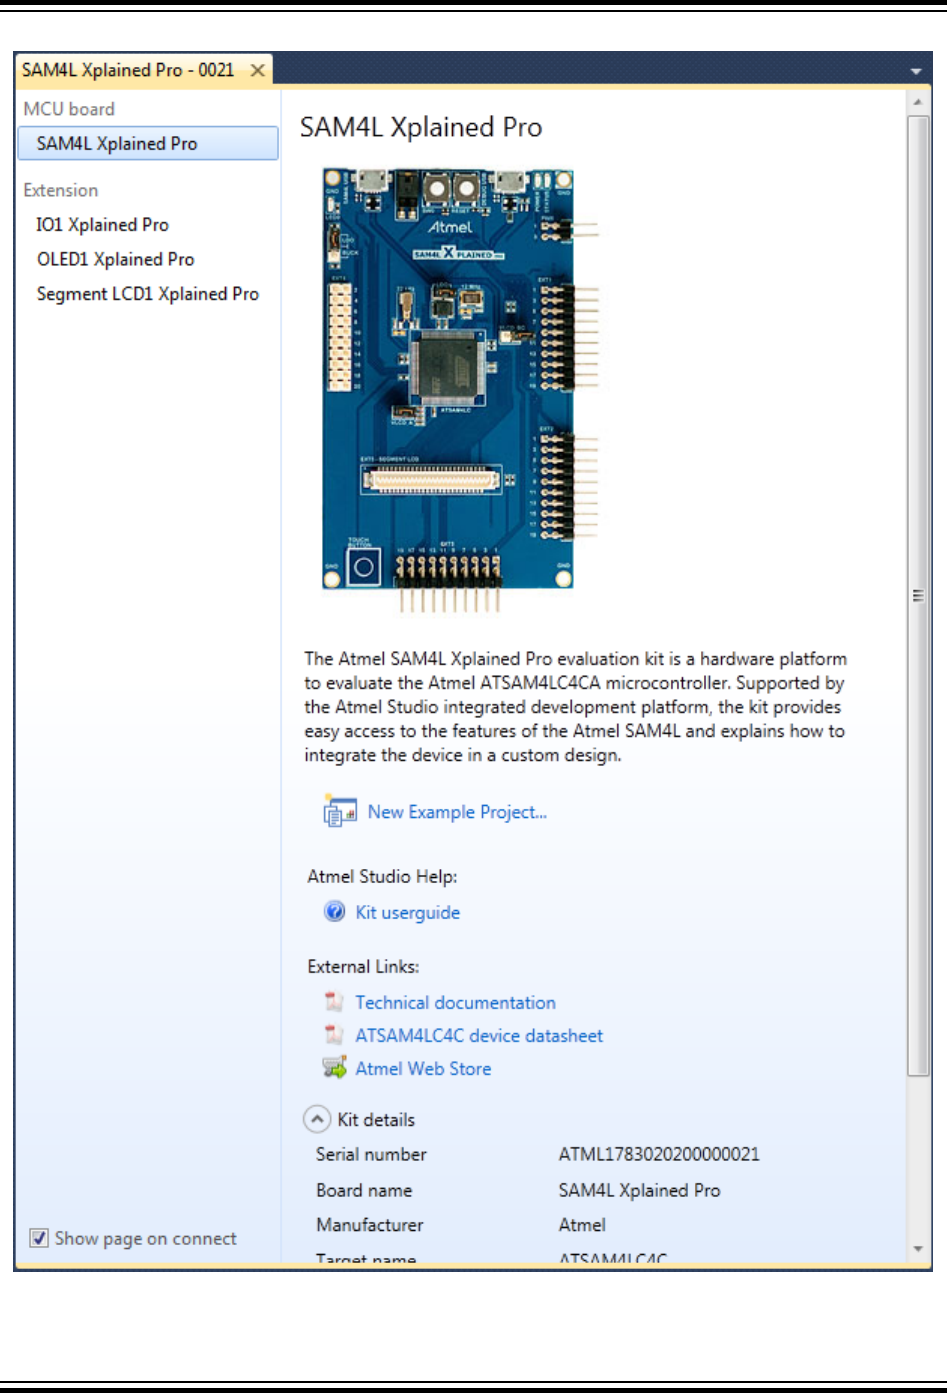
Figure 6-6. The Tool Info Window
Atmel Studio 7 User Guide
Miscellaneous Windows
© 2018 Microchip Technology Inc. User Guide DS50002718A-page 229

When a tool is connected, the window will open. It has a short description of the tool, an image of the tool,
and a section of links to the user guide, relevant data sheets on the internet, etc.
There is also a table with technical details about the tool, such as firmware version, serial number, etc.
6.4.1 Xplained Pro Kits
The Xplained Pro family of boards supports a range of expansion boards. When an Xplained Pro board is
connected, the Tool Info window will show a list on the left side of the window, containing the main board
and all connected expansions. Click on the main board and the expansion to see details about the
different boards.
6.4.2 Disable the Tools Info Window
By deselecting the Show page on connect check box, the window will not automatically open when
Atmel Studio is open and you connect the kit.
This feature works on a per-tool basis, which means you can select for every tool you have if they should
show the Tool Info window when connected.
6.4.3 Manually Showing the Window
If you want to see the Tool Info window again after it has been closed, you can right click on the tool in
the Available Tools view and select Show Info Window.
Figure 6-7. Show Tool Info Window
See also Available Tools View.
6.5 Firmware Upgrade
6.5.1 Introduction
Atmel Studio will include the latest firmware for all Microchip tools. New firmware may provide support for
new devices and bugfixes.
6.5.2 Automatic Upgrade
Atmel Studio will automatically upgrade the tool's firmware when needed. A potential firmware upgrade is
triggered once you start using a tool. Examples: the first time you launch a debug session or the first time
you select the tool in the Device Programming dialog.
The tool cannot be used by Atmel Studio if the user chooses not to upgrade.
Atmel Studio 7 User Guide
Miscellaneous Windows
© 2018 Microchip Technology Inc. User Guide DS50002718A-page 230

You can also check for firmware upgrades by using the Available Tools view (View → Available Atmel
Tools). Right click on a tool and select Upgrade.
For a description on how to do a manual upgrade, downgrade, and upgrade with a custom firmware
image, see Manual Upgrade.
6.5.3 Manual Upgrade
Atmel Studio includes a command line utility called atfw.exe which can be used to do a manual
upgrade of most Microchip tools. atfw.exe is installed in the atbackend subfolder.
atfw.exe can be used to:
• Perform upgrade from a script
• Upgrade using a custom firmware file
• Read out firmware version
For details on how to upgrade using this utility, execute atfw.exe -h.
Note: If a tool is locked in firmware upgrade mode, and normal reset does not restore normal operation,
a forced firmware upgrade should reset the tool to a working state.
To do a firmware upgrade on a tool already in upgrade mode, invoke atfw the same way as a normal
firmware upgrade. Some warnings may be displayed as the tool is unable to switch the tool to upgrade
mode, but should proceed with the upgrade.
If a tool listing is done, the tool will have a name that is related to the mode it is in. atfw should, however,
be invoked with the tool name as it is presented to the user in normal operation.
6.6 Find and Replace Window
You can use the Find and Replace window to search for text strings, expressions, or entity names within
the code of your documents. To access this window, from the Edit menu, click Find and Replace, and
then select one of the options listed.
The Find and Replace window contains a toolbar with two drop-downs, one for find operations and one
for replace operations. When you select an operation, the corresponding options for the operation are
displayed. You can search and replace in one or more files or an entire solution for text, code, or symbols.
Atmel Studio 7 User Guide
Miscellaneous Windows
© 2018 Microchip Technology Inc. User Guide DS50002718A-page 231
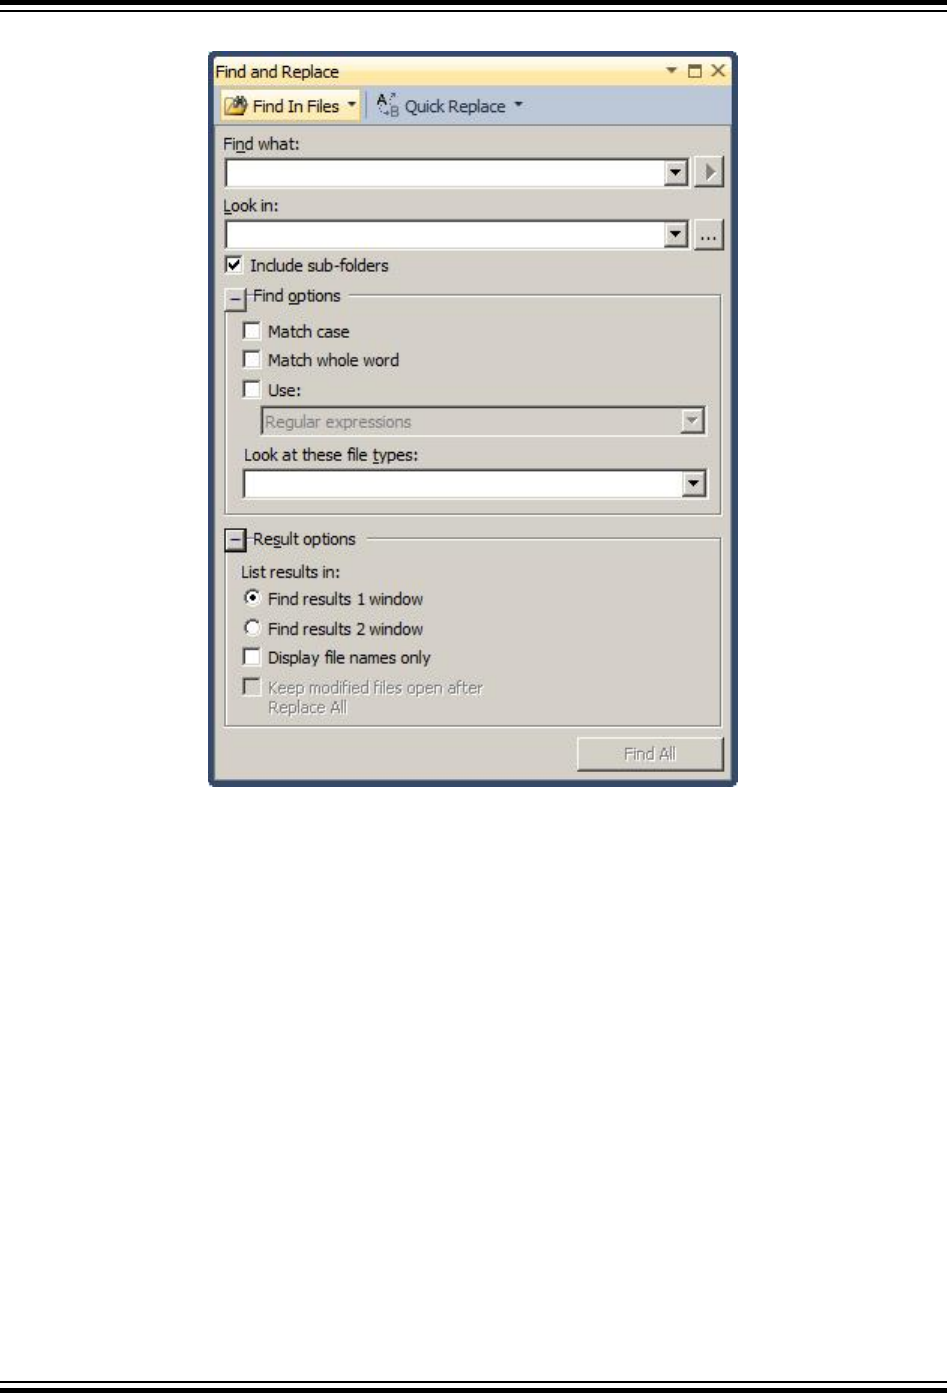
Figure 6-8. Find and Replace
Quick Find allows you to search the code of one or more open documents for a string or expression. The
selection moves from match to match, allowing you to review each match in its surrounding context.
Note: The matches found are not listed in the Find Results window.
You can use any of the following methods to display Quick Find in the Find and Replace window.
To display Quick Find
1. On the Edit menu, expand Find and Replace.
2. Choose Quick Find.
-or-
If the Find and Replace window is already open, on the toolbar, click the triangular View button on
the left drop-down and then choose Quick Find.
Quick Find can search through a document either forward or backward from the insertion point. The
search automatically continues past the end or start of the document into the unsearched portion. A
message appears when the entire document has been searched.
Find what
These controls allow you to specify the string or expression that will be matched.
Atmel Studio 7 User Guide
Miscellaneous Windows
© 2018 Microchip Technology Inc. User Guide DS50002718A-page 232
Reuse one of the last 20 search strings by selecting it from this drop-down list, or type a new text string or
expression to find.
Table 6-1. Quick Find
Option Description
[string with
wildcards]
If you want to use wildcards such as asterisks (*) and question marks (?) in your
search string, select the Use checkbox under Find options and then choose
Wildcards.
[regular expression] To instruct the search engine to expect regular expressions, select the Use
checkbox under Find options and then choose Regular expressions.
Expression Builder
This triangular button next to the Find what field becomes available when the Use Checkbox is selected
in Find options and Regular Expressions appears in the drop-down list. Click this button to display a list
of wildcards or regular expressions, depending upon the Use option selected. Choosing any item from
this list adds it into the Find what string.
Find Next
Click this button to find the next instance of the Find what string within the search scope chosen in Look
in.
Bookmark All
Click this button to display blue bookmarks at the left edge of the code editor to indicate each line where
an instance of the Find what string occurs.
Look in
The option chosen from the Look in the drop-down list determines whether Quick Find searches only in
currently active files.
Look in
Select a predefined search scope from this list.
Table 6-2. Look in Scopes
Option Description
Selection This option is available when text is selected in the code editor. Searches only the
selected text in the currently active document.
<Current Block> The name of this option indicates the location of the insertion point in the code
editor. Searches within the current procedure, module, paragraph, or code block.
Current
Document
This option is available when a document is open in an editor. Searches only the
active document for the Find what string.
Current Window This option is available when a searchable tool window, such as the View in Browser
window, has focus. Searches all content displayed in this window for the Find what
string.
Atmel Studio 7 User Guide
Miscellaneous Windows
© 2018 Microchip Technology Inc. User Guide DS50002718A-page 233

Option Description
All Open
Documents
Searches all files currently open for editing as if they were one document. When the
starting point of the search is reached in the current file, the search automatically
moves to the next file and continues until the last open file has been searched for
the Find what string.
Current Project Searches all files in the current project as if they were one document. When the
starting point of the search is reached in one file, the search continues in the next
until the last file in the project has been searched.
Find options
You can expand or collapse the Find options section. The following options can be selected or cleared:
Match case
Only displays instances of the Find what string that are matched both by content and by case. For
example, a search for 'MyObject' with Match case selected will return 'MyObject' but not 'myobject' or
'MYOBJECT'.
Match whole word
Only displays instances of the Find what string that are matched in complete words. For example, a
search for 'MyObject' will return 'MyObject' but not 'CMyObject' or 'MyObjectC'.
Search up
When selected, files are searched from the insertion point to the top of the file.
Search hidden text
When selected, the search will also include concealed and collapsed text, such as the metadata of a
design-time control; a hidden region of an outlined document; or a collapsed class or method.
Use
Indicates how to interpret special characters entered in the Find what or Replace with text boxes. The
options include:
Table 6-3. Search with Special Characters
Option Description
Wildcards Special characters such as asterisks (*) and question marks (?) represent one or
more characters. For a list, see Wildcards (Visual Studio).
Regular Expressions Special notations define patterns of text to match. For a list, see Regular
Expressions (Visual Studio).
Toolbar
A toolbar, with two drop-downs, appears at the top of the Find and Replace window. These drop-downs
allow you to choose the type of search or replace you intend to perform and changes the options
displayed in the window to match.
Atmel Studio 7 User Guide
Miscellaneous Windows
© 2018 Microchip Technology Inc. User Guide DS50002718A-page 234
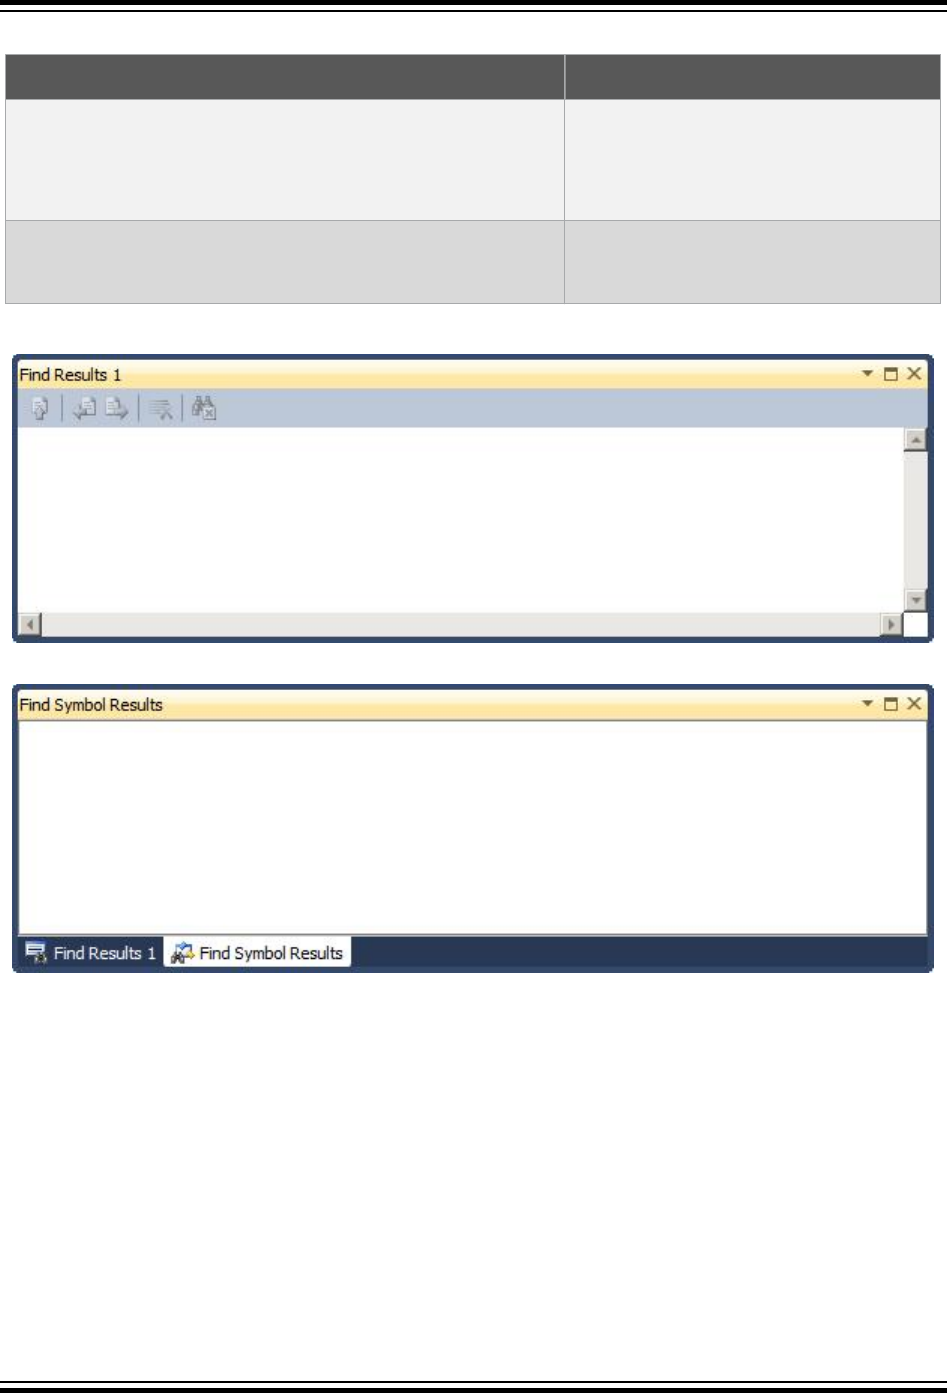
Table 6-4. Find and Replace Toolbar
Drop-Down View Menu
Find (left drop-down) Quick Find
Find in Files
Find Symbol
Replace (right drop-down) Quick Replace
Replace in Files
Figure 6-9. Find Results
Figure 6-10. Find Symbol Results
6.7 Export Template Wizard
Atmel Studio project and item templates provide reusable and customizable project and item stubs that
accelerate the development process because users do not have to create new projects and items from
scratch.
Note: This functionality is inherited from Microsoft Visual Studio® and the documentation from Microsoft
goes beyond what is mentioned in this section.
Open the Export Template Wizard by clicking File → Export Template.... This opens the Export Template
Wizard shown in the figure below.
Atmel Studio 7 User Guide
Miscellaneous Windows
© 2018 Microchip Technology Inc. User Guide DS50002718A-page 235

Figure 6-11. Export Template Wizard...
6.7.1 Project Template
A Project template is a template that contains a whole project. This template can be redistributed to other
users to ease the setup of a default project. The code, which is to be the template, can contain
parameters that are substituted on creation. See Default Template Parameters for information on this.
The template wizard is mostly self-explanatory, and on completion, the created template will be available
in the File → File → New Project... dialog.
6.7.2 Item Template
An Item template is a template that contains a single file or collection of files. The code, which is to be the
template can contain parameters that are substituted on creation. See Default Template Parameters for
information on this.
The template wizard is mostly self-explanatory, and on completion, the created template will be available
as a file type when files are added to the project.
6.7.3 Template Parameters
All templates support parameter substitution to enable replacement of key parameters, such as class
names and namespaces, when the template is instantiated. These parameters are replaced by the
Atmel Studio 7 User Guide
Miscellaneous Windows
© 2018 Microchip Technology Inc. User Guide DS50002718A-page 236

template wizard that runs in the background when a user clicks OK in the New Project or Add New Item
dialog boxes.
6.7.3.1 Declaring and Enabling Template Parameters
Template parameters are declared in the format $parameter$.
6.7.3.2 Default Template Parameters
The table below lists the reserved template parameters that can be used by any template.
Note: Template parameters are case-sensitive.
Table 6-5. Template Parameters
Parameter Description
$itemname$ The name provided by the user in the Add New Item dialog box
$machinename$ The current computer name
$projectname$ The name provided by the user in the New Project dialog box
$registeredorganization$ The registry key value from HKLM\Software\Microsoft\Windows NT
\CurrentVersion\RegisteredOrganization
$safeitemname$ The name provided by the user in the Add New Item dialog box, with all
unsafe characters and spaces removed
$safeprojectname$ The name provided by the user in the New Project dialog box, with all unsafe
characters and spaces, removed
$time$ The current time in the format DD/MM/YYYY 00:00:00
$userdomain$ The current user domain
$username$ The current username
$year$ The current year in the format YYYY
$guid[1-10]$ A GUID used to replace the project GUID in a project file. You can specify up
to 10 unique GUIDs (for example, guid1)
6.7.3.3 Custom Template Parameters
You can use the CustomParameter element in your .vstemplate file to add new parameters to a
template.
1. Locate the TemplateContent element in the .vstemplate file for the template.
2. Add a CustomParameters element and one or more CustomParameter child elements as
children of the TemplateContent element.
Figure 6-12. Adding Custom Parameters
<TemplateContent>
...
<CustomParameters>
<CustomParameter Name="$MyParameter1$" Value="MyValue2"/>
<CustomParameter Name="$MyParameter2$" Value="MyValue2"/>
</CustomParameters>
</TemplateContent>
3. Use the parameter in one or more of the code files in the template as shown in Default Template
Parameters.
Atmel Studio 7 User Guide
Miscellaneous Windows
© 2018 Microchip Technology Inc. User Guide DS50002718A-page 237
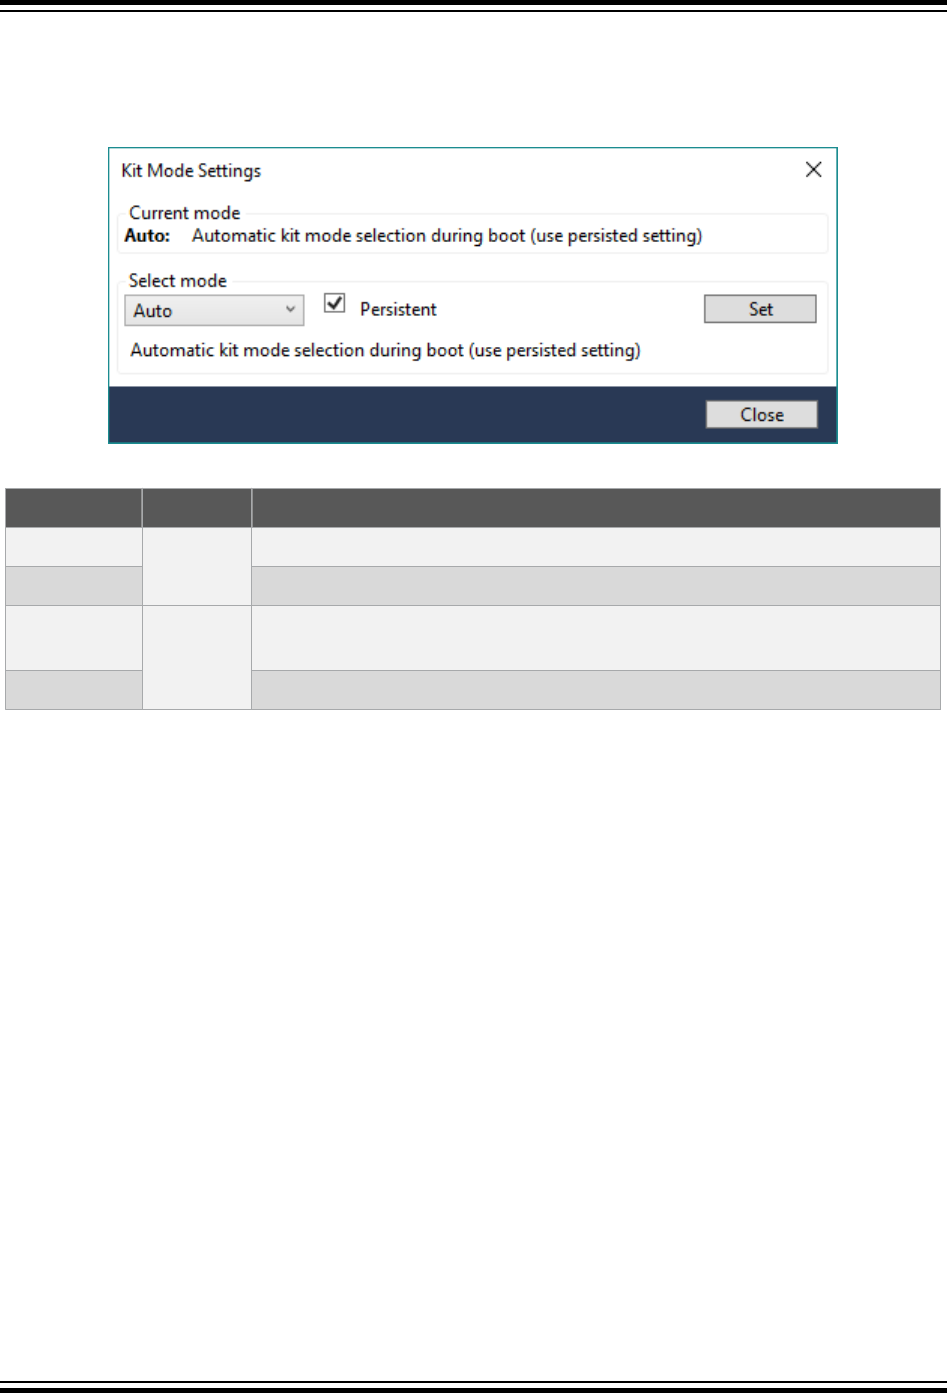
6.8 Kit Mode Setting
Some kits operate with different modes. This window can be used to change the mode.
Figure 6-13. Kit Mode Settings
Some examples of the choices that can be made are listed in the following table.
Select mode Persistent Resulting mode
Mass Storage Yes Auto, enumerating as a Mass Storage Device kit
DGI Auto, enumerating as a DGI kit
Mass Storage
No
Mass Storage, enumerating once as a Mass Storage Device kit before
returning to the previous mode
DGI DGI, enumerating once as a DGI kit before return to the previous mode
Note: When the persistent mode is used, the kit will reboot into Auto mode, since the persistent choice
changes the kit default.
Atmel Studio 7 User Guide
Miscellaneous Windows
© 2018 Microchip Technology Inc. User Guide DS50002718A-page 238

7. GNU Toolchains
GNU Toolchains are a set of standalone command line programs used to create applications for SAM and
AVR microcontrollers.
7.1 GNU Compiler Collection (GCC)
The GNU Compiler Collection is used by Atmel Studio at the build stage. The architecture specific
versions of the GNU Compiler Collection supports C-code compilation, assembly and linking of C and
C++.
The AVR GNU compiler collection is distributed under the terms of the GNU General Public License,
http://www.gnu.org/licenses/gpl.html. A copy of this license is also found in the installation folder of Atmel
Studio.
7.2 ARM Compiler and Toolchain Options: GUI
To get help about ARM GCC Toolchain, you can do the following:
• For general information about GCC, visit the official GNU GCC web site
• Alternatively, you can write arm-none-eabi-gcc --help and see the explanation of some of the
parameters in the command output
This section illustrates the GUI options that are available for the ARM GNU Toolchain in Atmel Studio.
Atmel Studio 7 User Guide
GNU Toolchains
© 2018 Microchip Technology Inc. User Guide DS50002718A-page 239
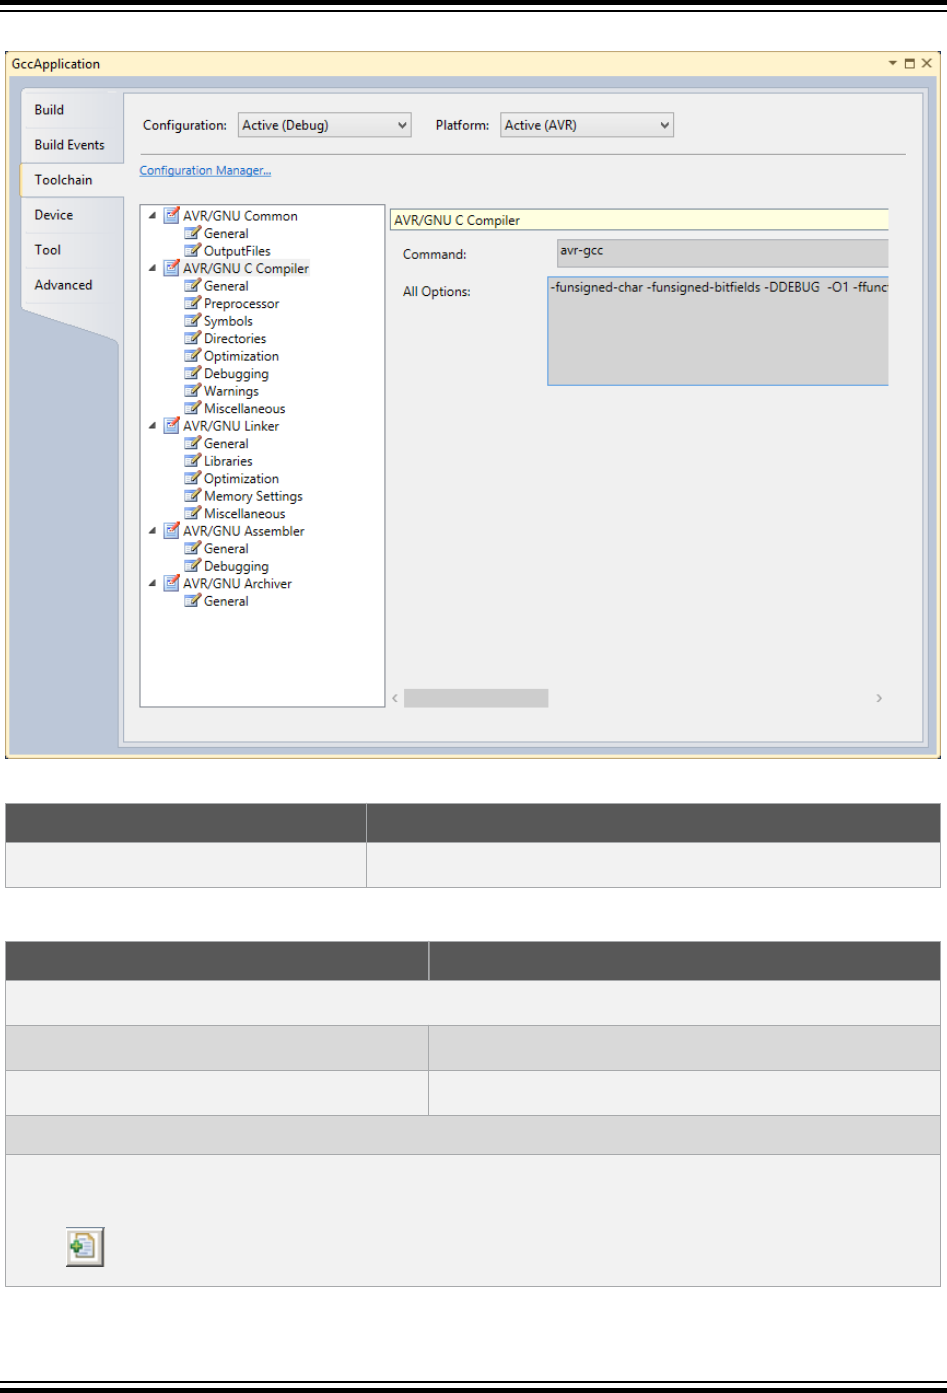
Figure 7-1. ARM GNU Toolchain Properties
Table 7-1. ARM GNU Common Options
Option Description
Thumb(-mthumb)/ARM(-marm) Switch between ARM and Thumb processor mode
Table 7-2. ARM GNU C Compiler Options
Option Description
Preprocessor options
-nostdinc Do not search system include directories
-E Preprocess only; Do not compile, Assemble, or link
Symbols options
There one can define (-D) or undefine (-U) a number of in-source symbols. New symbol declarations
can be added, modified, or reordered, using the interface buttons below:
•
Atmel Studio 7 User Guide
GNU Toolchains
© 2018 Microchip Technology Inc. User Guide DS50002718A-page 240
Option Description
Add a new symbol. This and all following icons are reused with the same meaning in other parts
of Atmel Studio interface.
•
Remove a symbol.
•
Edit symbol.
•
Move the symbol up in the parsing order.
•
Move the symbol down in the parsing order.
Include directories
Default Include Path Enabling this option will add the include path that is
specific to the selected SAM device
Contains all the included header and definition directories, can be modified, using the same interface as
symbols
Optimization options
Optimization level (drop-down menu): -O0, -
O1, -O2, -O3, -Os
No optimization, optimize for speed (level 1 - 3),
optimize for size
Other optimization flags (manual input form) Here you should write optimization flags specific to the
platform and your requirements
-ffunction-sections Place each function into its own section
-funsafe-math-optimizations Enable unsafe match optimizations
-ffast-math Enable fast math
-fpic Generate position independent code
Debug options
Debug level (drop-down menu): none, -g1, -
g2, -g3
Specifies the level of tracing and debugging code and
headers left or inserted in the source code
Other debug options (form field) Architecture-specific debug options
-pg Generate gprof information
-p Generate prof information
Atmel Studio 7 User Guide
GNU Toolchains
© 2018 Microchip Technology Inc. User Guide DS50002718A-page 241

Option Description
Warning messages output options
-Wall All warnings
-Werror Treat all warnings as errors
-fsyntax-only Check syntax only
-pedantic Check conformity to GNU, raise warnings on non-
standard programming practice
-pedantic-errors Same as above, plus escalate warnings to errors
-w Inhibits all warnings
Miscellaneous options
Other flags (form field) Input other project-specific flags
-v Verbose (Display the programs invoked by the compiler)
-ansi Support ANSI programs
-save-temps Do not delete intermediate files
Option Description
Table 7-3. ARM GCC Linker Options
Option Description
-Wl -nostartfiles Do not use standard files
-Wl -nodefault Do not use default libraries
-Wl -nostdlib No start-up or default libraries
-Wl -s Omit all symbol information
-Wl -static Link statically
-Map Generates Map file
Libraries options
Libraries -Wl, -l (form field) You can add, prioritize, or edit library names here, using those
buttons: , , , ,
Library search path -Wl, -L (form field) You can add, prioritize, or edit path where the linker will search
for dynamically linked libraries. Same interface as above.
Optimization options
-Wl, -gc-sections Garbage collect unused sections
Atmel Studio 7 User Guide
GNU Toolchains
© 2018 Microchip Technology Inc. User Guide DS50002718A-page 242
Option Description
-funsafe-math-optimizations Enable unsafe math optimizations
-ffast-math Enable fast math
-fpic Generate position independent code
Miscellaneous options
Other linker flags (form field) Input other project-specific flags
Option Description
Linker Scripts
• In 'linker->miscellaneous->linker flags' ($LinkerScript_FLASH) is added by
default. It will be replaced with the appropriate (device_name)_flash.ld file during Build. Similarly
($LinkerScript_SRAM) will be replaced with the appropriate (device_name)_sram.ld file.
• You can always override the default flash linker scripts by replacing ($LinkerScript_FLASH) or
($LinkerScript_SRAM) with your custom linker script option -
T'custom_linker_script.ld'.
Note: These device-specific linker scripts will be available in the 'ProjectFolder/Linkerscripts' directory. In
case of changing the device after project creation, Atmel Studio will automatically add the correct linker
scripts for the selected device.
ARM Assembler Options
Table 7-4. Arm Assembler Options
Option Description
Optimization options
Assembler flags (form field) Miscellaneous assembler flags
Include path (form field) You can add, prioritize, or edit path to the architecture and
platform specific included files here
-v Announce version in the assembler output
-W Suppress Warnings
Debugging options
Debugging level (drop-down menu) None,
(-g).
Enable debugging symbols and debugging source insertion
Option Description
ARM Preprocessing Assembler Options
Atmel Studio 7 User Guide
GNU Toolchains
© 2018 Microchip Technology Inc. User Guide DS50002718A-page 243

Table 7-5. ARM Preprocessing Assembler Options
Option Description
Optimization options
Assembler flags (form field) Miscellaneous assembler flags
Include path (form field) You can add, prioritize, or edit path to the architecture and
platform specific included files here
-v Announce version in the assembler output
-W Suppress Warnings
Debugging options
Debugging level (drop-down menu) None, -
Wa -g.
Enables debugging symbols and debugging source
insertion
Option Description
7.3 ARM GNU Toolchain Options
7.3.1 ARM/GNU Common Options
•Thumb(-mthumb)/Arm(-marm)
Allows you to select the processor mode.
7.3.2 Compiler Options
7.3.2.1 Preprocessor
•-nostdinc
Do not search the standard system directories for header files. Only the directories you have
specified with -I options (and the directory of the current file, if appropriate) are searched.
•-E
Stop after the preprocessing stage; do not run the compiler proper. The output is in the form of
preprocessed source code, which is sent to the standard output. Input files which don't require
preprocessing are ignored.
7.3.2.2 Symbols
•-D
• -D name
Predefine name as a macro, with definition 1.
Eg:
• -D name=value
Predefine name as a macro, with definition value. The contents of definition are tokenized
and processed as if they appeared during translation phase three in a #define directive. In
particular, the definition will be truncated by embedded newline characters.
Atmel Studio 7 User Guide
GNU Toolchains
© 2018 Microchip Technology Inc. User Guide DS50002718A-page 244

•-U
Cancel any previous definition of name, either built in or provided with a -D option.
-D and -U options are processed in the order they are given on the command line. All -imacros file and -
include file options are processed after all -D and -U options.
7.3.2.3 Directories
•-I dir
Add the directory dir to the list of directories to be searched for header files. Directories named by -I
are searched before the standard system include directories. If the directory dir is a standard
system include directory, the option is ignored to ensure that the default search order for system
directories and the special treatment of system headers are not defeated.
7.3.2.4 Optimization
• There is a general switch ‘-O<optimization_level>’ which specifies the level of optimization used
when generating the code:
–-Os
Signal that the generated code should be optimized for code size. The compiler will not care
about the execution performance of the generated code.
–-O0
No optimization. GCC will generate code that is easy to debug but slower and larger than with
the incremental optimization levels outlined below.
–-O1 or -O
This will optimize the code for both speed and size. Most statements will be executed in the
same order as in the C/C++ code and most variables can be found in the generated code.
This makes the code quite suitable for debugging. This is default.
–-O2
Turn on most optimizations in GCC except for some optimizations that might drastically
increase code size. This also enables instruction scheduling, which allows instructions to be
shuffled around to minimize CPU stall cycles because of data hazards and dependencies, for
CPU architectures that might benefit from this. Overall this option makes the code quite small
and fast, but hard to debug.
–-O3
Turn on some extra performance optimizations that might drastically increase code size but
increase performance compared to the -O2 and -O1 optimization levels. This includes
performing function inlining
• Other optimization options
–-ffunction-sections
–-fdata-sections
Place each function or data item into its own section in the output file if the target supports
arbitrary sections. The name of the function or the name of the data item determines the
section's name in the output file.
Only use these options when there are significant benefits from doing so. When you specify
these options, the assembler and linker will create larger object and executable files and will
also be slower.
Atmel Studio 7 User Guide
GNU Toolchains
© 2018 Microchip Technology Inc. User Guide DS50002718A-page 245

–-funroll-loops
Perform loop unrolling when iteration count is known. If code size is not a concern then some
extra performance might be obtained by making gcc unroll loops by using the ‘-funroll-loops’’
switch in addition to the ‘-O3’ switch.
7.3.2.5 Debugging
•-g level (Debugging level)
•-g1
It produces minimal information, enough for making backtraces in parts of the program that
you don't plan to debug. This includes descriptions of functions and external variables, but no
information about local variables and no line numbers.
•-g2
It is the default debugging level.
•-g3
It includes extra information, such as all the macro definitions present in the program. Some
debuggers support macro expansion when you use -g3.
7.3.2.6 Warnings
•-Wall
Show all warnings.
•-Werror
Show warnings as errors.
•-fsyntax-only
Check the code for syntax errors, but don't do anything beyond that.
•-pedantic
Issue all the warnings demanded by strict ISO C, reject all programs that use forbidden extensions,
and some other programs that do not follow ISO C. Valid ISO C programs should compile properly
with or without this option (though a rare few will require -ansi or a -std option specifying the
required version of ISO C). However, without this option, certain GNU extensions and traditional C
features are supported as well. With this option, they are rejected.
•-pedantic-errors
Pedantic warnings are produced as errors.
•-w
Inhibit all warning messages.
7.3.2.7 Miscellaneous
•-v
Verbose option. It prints (on standard error output) the commands executed to run the stages of
compilation. Also, print the version number of the compiler driver program and of the preprocessor
and the compiler proper.
•-ansi
Support ANSI programs. This turns off certain features of GCC that are incompatible with ISO C90
(when compiling C code). For the C compiler, it disables recognition of C++ style // comments as
Atmel Studio 7 User Guide
GNU Toolchains
© 2018 Microchip Technology Inc. User Guide DS50002718A-page 246

well as the inline keyword. The -ansi option does not cause non-ISO programs to be rejected
gratuitously. For that, -pedantic is required in addition to -ansi.
7.3.3 Linker Options
7.3.3.1 General
•-Wl,option
Pass option as an option to the linker. If option contains commas, it is split into multiple options
at the commas. You can use this syntax to pass an argument to the option. For example, `-Wl,-
Map,output.map' passes `-Map output.map' to the linker.
•-Wl, -nostartfiles
Do not use the standard system startup files when linking. The standard system libraries are used
normally, unless -nostdlib or -nodefaultlibs is used.
•-Wl,-nodefault
Do not use the standard system libraries when linking. Only the libraries you specify will be passed
to the linker, options specifying linkage of the system libraries, such as -static-libgcc or -
shared-libgcc, will be ignored. The standard start-up files are used normally, unless -
nostartfiles is used. The compiler may generate calls to memcmp, memset, memcpy, and
memmove. These entries are usually resolved by entries in libc. These entry points should be
supplied through some other mechanism when this option is specified.
•-Wl,-nostdlib
Do not use the standard system start-up files or libraries when linking.
One of the standard libraries bypassed by -nostdlib and -nodefaultlibs is libgcc.a, a
library of internal subroutines that GCC uses to overcome shortcomings of particular machines, or
special needs for some languages. In most cases, you need libgcc.a even when you want to avoid
other standard libraries. In other words, when you specify -nostdlib or -nodefaultlibs you
should usually specify -lgcc as well. This ensures that you have no unresolved references to
internal GCC library subroutines.
•-Wl,-s
Remove all symbol table and relocation information from the executable.
•-Wl,-static
On systems that support dynamic linking, this prevents linking with the shared libraries. On other
systems, this option has no effect.
•-Wl,-Map
Generates Map file.
7.3.3.2 Libraries
•-Wl,-llibrary
Search the library named library when linking.
It makes a difference where in the command you write this option; the linker searches and
processes libraries and object files in the order they are specified. Thus, foo.o -lz bar.o searches
library z after file foo.o but before bar.o.
The linker searches a standard list of directories for the library, which is actually a file named
liblibrary.a. The linker then uses this file as if it had been specified precisely by name.
Atmel Studio 7 User Guide
GNU Toolchains
© 2018 Microchip Technology Inc. User Guide DS50002718A-page 247

•-Wl, Ldir
Add directory dir to the list of directories to be searched for -l.
7.3.3.3 Optimization
•-Wl, --gc-sections
Garbage collect unused sections.
Enable garbage collection of unused input sections. It is ignored on targets that do not support this
option. The default behavior (of not performing this garbage collection) can be restored by
specifying `--no-gc-sections' on the command line. `--gc-sections' decides which input sections are
used by examining symbols and relocations. The section containing the entry symbol and all
sections containing symbols undefined on the command-line will be kept, as will sections containing
symbols referenced by dynamic objects.
•-funsafe-math-optimizations
Enable unsafe math optimizations.
•-ffast-math
Enable fast math
•-fpic
Generate position independent code.
7.3.4 Assembler Options
•-I
Use this option to add a path to the list of directories as searches for files specified in .include
directives (see .include). You may use -I as many times as necessary to include a variety of paths.
The current working directory is always searched first; after that, as searches any `-I' directories in
the same order as they were specified (left to right) on the command line.
•-v
Announce version.
•Debugging(-g)
Use this option to enable the debug level.
7.3.5 Preprocessing Assembler Options
•-I
Use this option to add a path to the list of directories as searches for files specified in .include
directives (see .include). You may use -I as many times as necessary to include a variety of paths.
The current working directory is always searched first; after that directories are searched in the
same order they are specified (left to right) on the command line.
•-v
Announce version.
•Debugging(Wa,-g)
Use this option to enable the debug level.
7.3.6 Archiver Options
•-r
Atmel Studio 7 User Guide
GNU Toolchains
© 2018 Microchip Technology Inc. User Guide DS50002718A-page 248

Replace existing or insert new file(s) into the archive.
7.4 Binutils
The following ARM GNU Binutils are available:
• arm-none-eabi-ld - GNU linker.
• arm-none-eabi-as - GNU assembler.
• arm-none-eabi-addr2line - Converts addresses into filenames and line numbers.
• arm-none-eabi-ar - A utility for creating, modifying, and extracting from archives.
• arm-none-eabi-c++filt - Filter to demangle encoded C++ symbols.
• arm-none-eabi-nm - Lists symbols from object files.
• arm-none-eabi-objcopy - Copies and translates object files.
• arm-none-eabi-objdump - Displays information from object files.
• arm-none-eabi-ranlib - Generates an index to the contents of an archive.
• arm-none-eabi-readelf - Displays information from any ELF format object file.
• arm-none-eabi-size - Lists the section sizes of an object or archive file.
• arm-none-eabi-strings - Lists printable strings from files.
• arm-none-eabi-strip - Discards symbols.
For more information about each util, use the built-in help command: <util name here> --help.
7.5 AVR Compiler and Toolchain Options: GUI
To get help about AVR GNU toolchain, you can do the following:
• For information about avr32-gcc usage in Atmel Studio and general parameters, consult the GCC
Project Options and Configuration section
• The API reference for the AVR libc implementation can be found here
The API Alphabetical index can be consulted here
• For general information about GCC, visit the official GNU GCC web site
• Alternatively, you can write avr32-gcc --help and see explanations on some of the parameters
in the command output
This section illustrates the GUI options that are available for the AVR GNU toolchain from the Atmel
Studio frontend.
Atmel Studio 7 User Guide
GNU Toolchains
© 2018 Microchip Technology Inc. User Guide DS50002718A-page 249
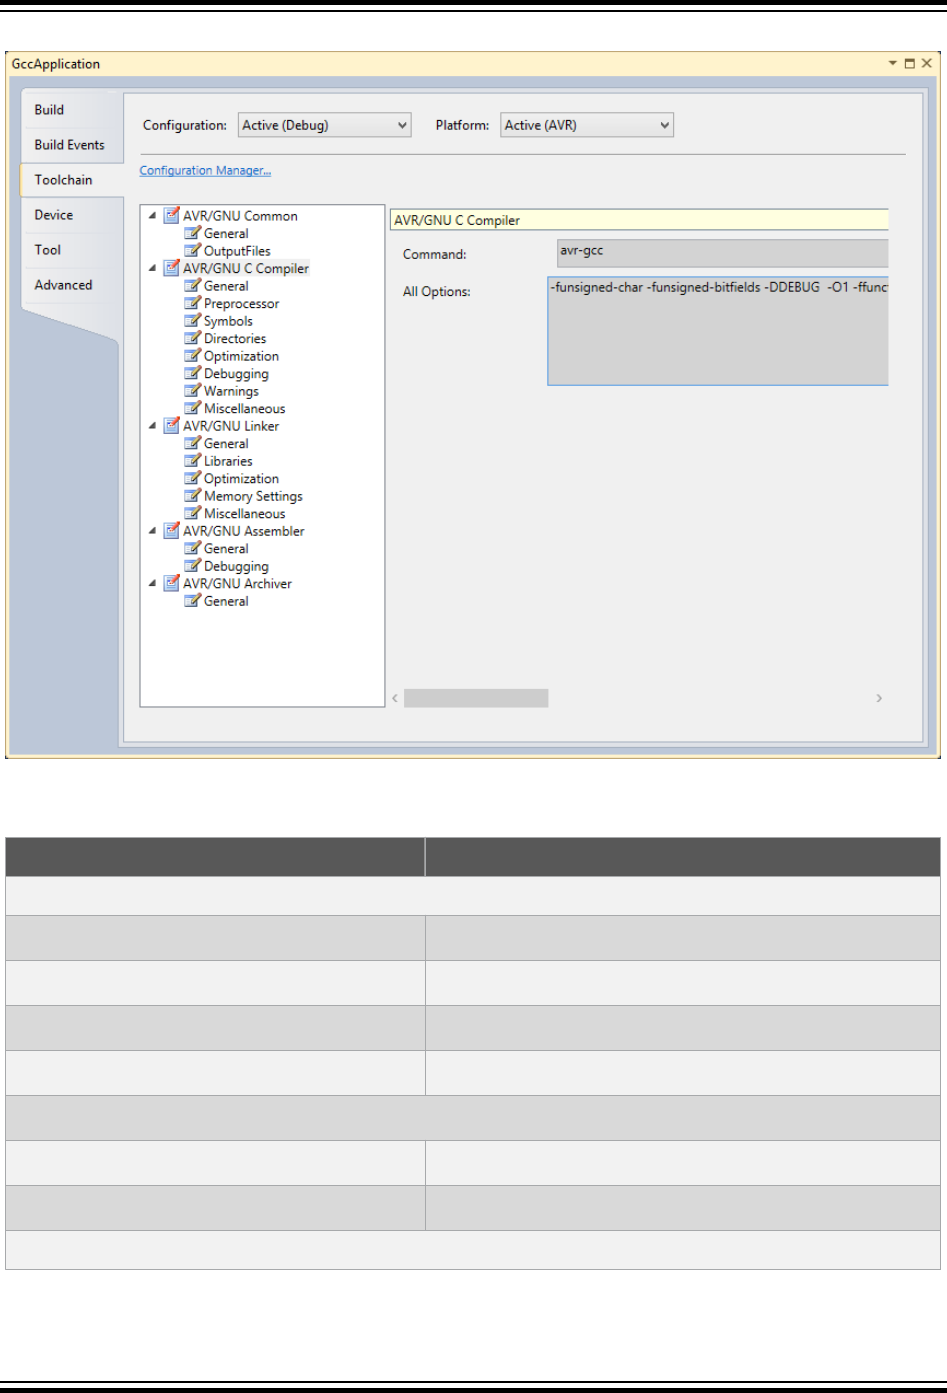
Figure 7-2. AVR GNU Toolchain Options
AVR GNU C Compiler Options
Table 7-6. AVR GNU C Compiler Options
Option Description
General options
-mcall-prologues Use subroutines for functions prologues and epilogues
-mno-interrupts Change stack pointer without disabling interrupts
-funsigned-char Default char type is unsigned
-funsigned-bitfield Default bit field is unsigned
Preprocessor options
-nostdinc Do not search system directories
-E Preprocess only
Symbols options
Atmel Studio 7 User Guide
GNU Toolchains
© 2018 Microchip Technology Inc. User Guide DS50002718A-page 250
Option Description
One can define (-D) or undefine (-U) a number of in-source symbols. New symbol declarations can be
added, modified, or reordered, using the interface buttons below:
•
Add a new symbol. This and all following icons are reused with the same meaning in other parts
of Atmel Studio interface.
•
Remove a symbol.
•
Edit symbol.
•
Move the symbol up in the parsing order.
•
Move the symbol down in the parsing order.
Include directories
Contains all the included header and definition directories, can be modified, using the same interface as
symbols.
Optimization options
Optimization level (drop-down menu): -O0, -
O1, -O2, -O3, -Os
No optimization, optimize for speed (level 1 - 3),
optimize for size
Other optimization flags (manual input form) Here you should write optimization flags specific to the
platform and your requirements
-ffunction-sections Prepare functions for garbage collection, if a function is
never used, its memory will be scrapped
-fpack-struct Pack structure members together
-fshort-enums Allocate only as many bytes needed by the enumerated
types
-mshort-calls Use rjmp/rcall limited range instructions on the >8K
devices
Debug options
Debug level (drop-down menu): none, -g1, -
g2, -g3
Specifies the level of tracing and debugging code and
headers left or inserted in the source code
Atmel Studio 7 User Guide
GNU Toolchains
© 2018 Microchip Technology Inc. User Guide DS50002718A-page 251
Option Description
Other debug options (form field) Architecture-specific debug options
Warning messages output options
-Wall All warnings
-Werror Escalate warnings to errors
-fsyntax-only Check syntax only
-pedantic Check conformity to GNU, raise warnings on non-
standard programming practice
-pedantic-errors Same as above, plus escalate warnings to errors
Miscellaneous options
Other flags (form field) Input other project-specific flags
-v Verbose
-ansi Support ANSI programs
-save-temps Do not delete temporary files
AVR GCC Linker Options
Table 7-7. AVR GCC Linker Options
Option Description
-Wl -nostartfiles Do not use standard files
-Wl -nodefault Do not use default libraries
-Wl -nostdlib No start-up or default libraries
-Wl -s Omit all symbol information
-Wl -static Link statically
Libraries options
Libraries -Wl, -l (form field) You can add, prioritize, or edit library names here, using those
buttons: , , , ,
Library search path -Wl,-L (form field) You can add, prioritize, or edit path where the linker will search
for dynamically linked libraries, same interface as above
Optimization options
-Wl, -gc-sections Garbage collect unused sections
--rodata-writable Put read-only data in writable spaces
Atmel Studio 7 User Guide
GNU Toolchains
© 2018 Microchip Technology Inc. User Guide DS50002718A-page 252
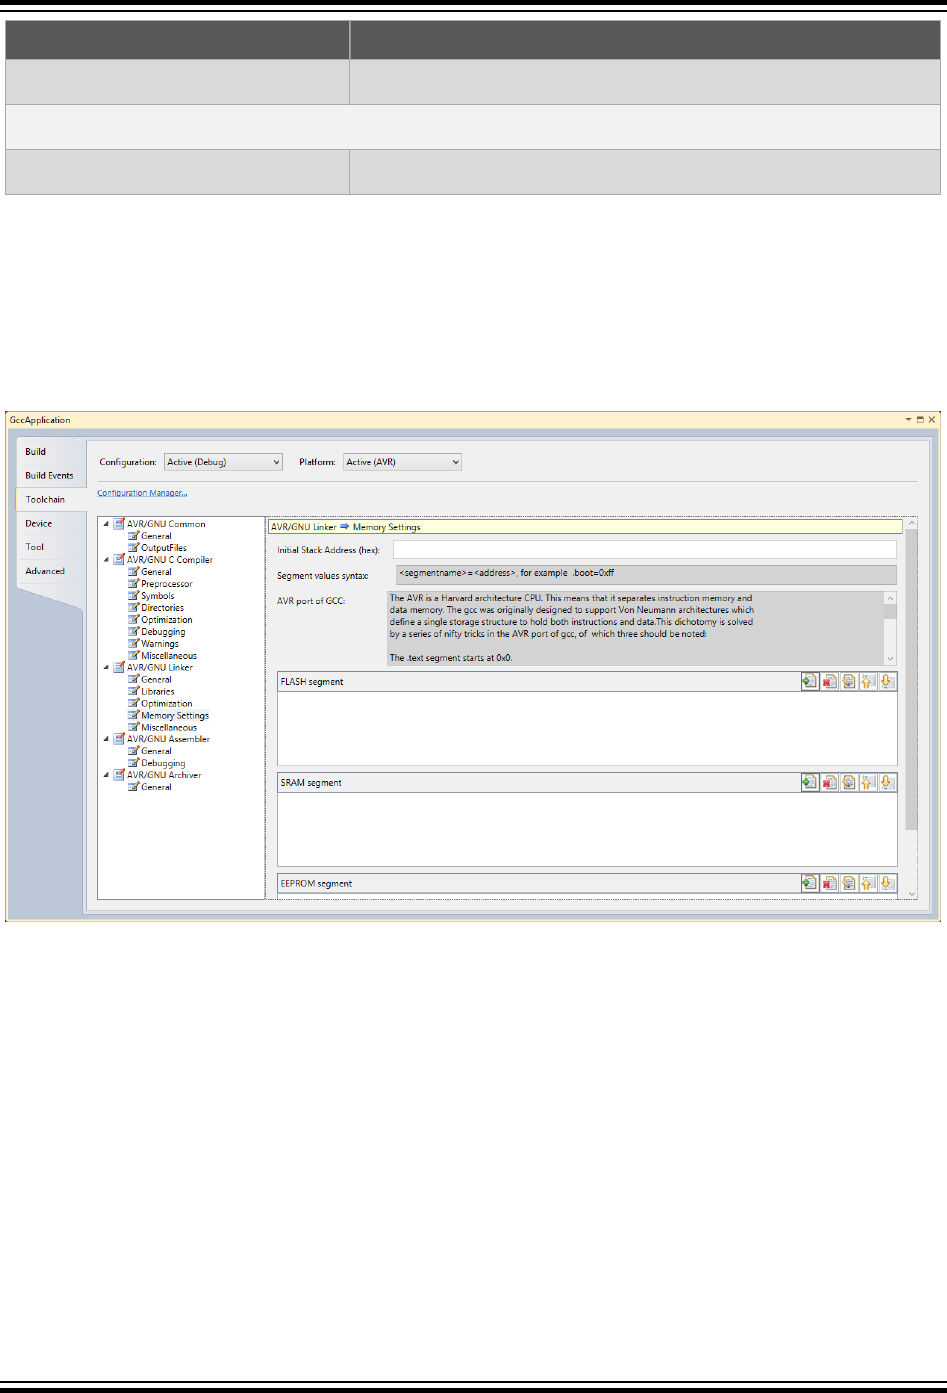
Option Description
-mrelax Relax branches
Miscellaneous options
Other linker flags (form field) Input other project-specific flags
Memory Settings
Displays a dialog where it is possible to configure memory segments. (Syntax for specifying segment
values: <segmentname> = <address>, for example boot=0xff)
The address must be given as a hexadecimal number prefixed with 0x. It is interpreted as a word address
for flash memory and a byte address for SRAM and EEPROM memory.
Figure 7-3. Memory Settings
Notes about the AVR port of GCC
The AVR is a Harvard architecture CPU. This means that it separates instruction memory and data
memory. The GCC was originally designed to support Von Neumann architectures which define a single
storage structure to hold both instructions and data. This dichotomy is solved by a series of nifty tricks in
the AVR port of GCC, of which three should be noted:
• The .text segment starts at 0x0
• The .data segment starts at 0x800000
• The .eeprom segment starts at 0x810000
These peculiarities have been abstracted away by the GUI, but users will see the truth when building
projects with relocated segments.
A relocation definition for flash will be passed to the GNU linker via avr-gcc as the option:
•-Wl,-section-start=bootloader=0x1fc00
Atmel Studio 7 User Guide
GNU Toolchains
© 2018 Microchip Technology Inc. User Guide DS50002718A-page 253

Note that the address has been multiplied by 2 to get the byte address.
A relocation definition for the .data section will be passed as:
•-Wl,-section-start=anewdatasegment=0x800
AVR Assembler Options
Table 7-8. AVR Assembler Options
Option Description
Optimization options
Assembler flags (form field) Miscellaneous assembler flags
Include path (form field) You can add, prioritize, or edit path to the architecture and
platform specific included files here
-v Announce version in the assembler output
Debugging options
Debugging (drop-down menu) None, -Wa
-g
Enables debugging symbol and debugging source insertion
7.6 Commonly Used Options
7.6.1 Compiler Options
7.6.1.1 General
•-funsigned-char
Each kind of machine has a default for what char should be. It is either like unsigned char by
default or like signed char by default. This option says that the default char type is unsigned.
•-funsigned-bitfields
These options control whether a bit-field is signed or unsigned when the declaration does not use
either signed or unsigned. These options say that the default bitfield type is unsigned.
7.6.1.2 Preprocessor
•-nostdinc
Do not search the standard system directories for header files. Only the directories you have
specified with -I options (and the directory of the current file, if appropriate) are searched.
•-E
Stop after the preprocessing stage; do not run the compiler proper. The output is in the form of
preprocessed source code, which is sent to the standard output. Input files which don't require
preprocessing are ignored.
7.6.1.3 Symbols
•-D
• -D name
Predefine name as a macro, with definition 1.
Atmel Studio 7 User Guide
GNU Toolchains
© 2018 Microchip Technology Inc. User Guide DS50002718A-page 254

E.g.:
• -D name=value
Predefine name as a macro, with definition value. The contents of definition are tokenized
and processed as if they appeared during translation phase three in a #define directive. In
particular, the definition will be truncated by embedded newline characters.
•-U
Cancel any previous definition of name, either built-in or provided with a -D option.
-D and -U options are processed in the order they are given on the command line. All -imacros file and -
include file options are processed after all -D and -U options.
7.6.1.4 Directories
•-I dir
Add the directory dir to the list of directories to be searched for header files. Directories named by -I
are searched before the standard system include directories. If the directory dir is a standard
system include directory, the option is ignored to ensure that the default search order for system
directories and the special treatment of system headers are not defeated.
7.6.1.5 Optimization
• There is a general switch ‘-O<optimization_level>’ which specifies the level of optimization used
when generating the code:
–-Os
Signal that the generated code should be optimized for code size. The compiler will not care
about the execution performance of the generated code.
–-O0
No optimization. This is the default. GCC will generate code that is easy to debug but slower
and larger than with the incremental optimization levels outlined below.
–-O1 or -O
This will optimize the code for both speed and size. Most statements will be executed in the
same order as in the C/C++ code and most variables can be found in the generated code.
This makes the code quite suitable for debugging.
–-O2
Turn on most optimizations in GCC except for some optimizations that might drastically
increase code size. This also enables instruction scheduling, which allows instructions to be
shuffled around to minimize CPU stall cycles because of data hazards and dependencies, for
CPU architectures that might benefit from this. Overall this option makes the code quite small
and fast, but hard to debug.
–-O3
Turn on some extra performance optimizations that might drastically increase code size but
increase performance compared to the -O2 and -O1 optimization levels. This includes
performing function inlining
• Other optimization options
–-ffunction-sections
–-fdata-sections
Atmel Studio 7 User Guide
GNU Toolchains
© 2018 Microchip Technology Inc. User Guide DS50002718A-page 255

Place each function or data item into its own section in the output file if the target supports
arbitrary sections. The name of the function or the name of the data item determines the
section's name in the output file.
Only use these options when there are significant benefits from doing so. When you specify
these options, the assembler and linker will create a larger object and executable files and will
also be slower.
–-funroll-loops
If code size is not a concern then some extra performance might be obtained by making gcc
unroll loops by using the ‘-funroll-loops’’ switch in addition to the ‘-O3’ switch.
7.6.1.6 Debugging
•-g level (Debugging level)
•-g1
It produces minimal information, enough for making back-traces in parts of the program that
you don't plan to debug. This includes descriptions of functions and external variables, but no
information about local variables and no line numbers.
•-g2
It is the default debugging level.
•-g3
It includes extra information, such as all the macro definitions present in the program. Some
debuggers support macro expansion when you use -g3.
7.6.1.7 Warnings
•-Wall
Show all warnings.
•-Werror
Show warnings as errors.
•-fsyntax-only
Check the code for syntax errors, but don't do anything beyond that.
•-pedantic
Issue all the warnings demanded by strict ISO C, reject all programs that use forbidden extensions,
and some other programs that do not follow ISO C. Valid ISO C programs should compile properly
with or without this option (though a rare few will require -ansi or a -std option specifying the
required version of ISO C). However, without this option, certain GNU extensions and traditional C
features are supported as well. With this option, they are rejected.
•-pedantic-errors
Pedantic warnings are produced as errors.
•-w
Inhibit all warning messages.
7.6.1.8 Miscellaneous
•-v
Atmel Studio 7 User Guide
GNU Toolchains
© 2018 Microchip Technology Inc. User Guide DS50002718A-page 256

Verbose option. It prints (on standard error output) the commands executed to run the stages of
compilation. Also, print the version number of the compiler driver program and of the preprocessor
and the compiler proper.
•-ansi
Support ANSI programs. This turns off certain features of GCC that are incompatible with ISO C90
(when compiling C code). For the C compiler, it disables recognition of C++ style // comments as
well as the inline keyword. The -ansi option does not cause non-ISO programs to be rejected
gratuitously. For that, -pedantic is required in addition to -ansi.
7.6.2 Linker Options
7.6.2.1 General
•-Wl,option
Pass option as an option to the linker. If option contains commas, it is split into multiple options
at the commas. You can use this syntax to pass an argument to the option. For example, `-Wl,-
Map,output.map' passes `-Map output.map' to the linker.
•-Wl, -nostartfiles
Do not use the standard system startup files when linking. The standard system libraries are used
normally, unless -nostdlib or -nodefaultlibs is used.
•-Wl,-nodefault
Do not use the standard system libraries when linking. Only the libraries you specify will be passed
to the linker, options specifying linkage of the system libraries, such as -static-libgcc or -
shared-libgcc, will be ignored. The standard start-up files are normally used, unless -
nostartfiles is used. The compiler may generate calls to memcmp, memset, memcpy, and
memmove. These entries are usually resolved by entries in libc. These entry points should be
supplied through some other mechanism when this option is specified.
•-Wl,-nostdlib
Do not use the standard system start-up files or libraries when linking.
One of the standard libraries bypassed by -nostdlib and -nodefaultlibs is libgcc.a, a
library of internal subroutines that GCC uses to overcome shortcomings of particular machines, or
special needs for some languages. In most cases, you need libgcc.a even when you want to avoid
other standard libraries. In other words, when you specify -nostdlib or -nodefaultlibs you
should usually specify -lgcc as well. This ensures that you have no unresolved references to
internal GCC library subroutines.
•-Wl,-s
Remove all symbol table and relocation information from the executable.
•-Wl,-static
On systems that support dynamic linking, this prevents linking with the shared libraries. On other
systems, this option has no effect.
7.6.2.2 Libraries
•-Wl,-llibrary
Search the library named library when linking.
Atmel Studio 7 User Guide
GNU Toolchains
© 2018 Microchip Technology Inc. User Guide DS50002718A-page 257

It makes a difference where in the command you write this option; the linker searches and
processes libraries and object files in the order they are specified. Thus, foo.o -lz bar.o searches
library z after file foo.o but before bar.o.
The linker searches a standard list of directories for the library, which is actually a file named
liblibrary.a. The linker then uses this file as if it had been specified precisely by name.
•-Wl, Ldir
Add directory dir to the list of directories to be searched for -l.
7.6.2.3 Optimization
•-Wl, --gc-sections
Garbage collect unused sections.
Enable garbage collection of unused input sections. It is ignored on targets that do not support this
option. The default behavior (of not performing this garbage collection) can be restored by
specifying `--no-gc-sections' on the command line. `--gc-sections' decides which input sections are
used by examining symbols and relocations. The section containing the entry symbol and all
sections containing symbols undefined on the command-line will be kept, as will sections containing
symbols referenced by dynamic objects.
•--rodata-writable
Put read-only data in writable data section.
7.6.3 Assembler Options
•-I
Use this option to add a path to the list of directories as searches for files specified in .include
directives (see .include). You may use -I as many times as necessary to include a variety of paths.
The current working directory is always searched first; after that, as searches any `-I' directories in
the same order as they were specified (left to right) on the command line.
•-v
Announce version.
7.7 8-bit Specific AVR GCC Command Line Options
This section describes the options specific to AVR 8-bit Toolchain.
7.7.1 AVR C Compiler
7.7.1.1 General
•-mcall-prologues
Functions prologues/epilogues are expanded as call to appropriate subroutines. Code size will be
smaller.
•-mno-interrupts
Change the stack pointer without disabling interrupts. Generated code is not compatible with
hardware interrupts. Code size will be smaller.
•-mno-tablejump
Do not generate table jump instructions (removed from GCC 4.5.1 coz same as -fno-jump-tables).
Atmel Studio 7 User Guide
GNU Toolchains
© 2018 Microchip Technology Inc. User Guide DS50002718A-page 258

• -msize
Output instruction sizes to the asm file (removed from avr-gcc coz same as using -dp switch which
prints the instruction length).
7.7.1.2 Optimization
•-fpack-struct
Without a value specified, pack all structure members together without holes. When a value is
specified (which must be a small power of two), pack structure members according to this value,
representing the maximum alignment (that is, objects with default alignment requirements larger
than this will be output potentially unaligned at the next fitting location).
•-fshort-enums
Allocate to an enum type only as many bytes as it needs for the declared range of possible values.
Specifically, the enum type will be equivalent to the smallest integer type which has enough room.
•-mshort-calls
Use rjmp/rcall (limited range) on >8K devices.
7.7.1.3 Miscellaneous
•-save-temps
Do not delete temporary files. Store the usual 'temporary' intermediate files permanently; place
them in the current directory and name them based on the source file. Thus, compiling foo.c with -c
-save-temps would produce files foo.i and foo.s, as well as foo.o. This creates a preprocessed foo.i
output file even though the compiler now normally uses an integrated preprocessor.
7.7.2 AVR C Linker
7.7.2.1 Optimization
•-mrelax
Relax branches. Linker relaxing is enabled in the linker by passing the ‘—relax’ option to the linker.
Using GCC as a frontend for the linker, this option is automatically passed to the linker when using
‘-O2’ or ‘-O3’ or explicitly using the ‘-mrelax’ option. When this option is used, GCC outputs pseudo
instructions like lda.w, call etc. The linker can then if the input file is tagged as relaxable, convert a
pseudo instruction into the best possible instruction with regards to the final symbol address.
7.8 32-bit Specific AVR GCC Command Line Options
7.8.1 Optimization
•-mfast-float
The switch, causes fast, non-ieee compliant versions of some of the optimized AVR 32-bit floating-
point library functions to be used. This switch is by default enabled if the ‘-ffast-math’ switch is
used.
•-funsafe-math-optimizations
Allow optimizations for floating-point arithmetic that (a) assume that arguments and results are valid
and (b) may violate IEEE or ANSI standards. When used at link-time, it may include libraries or
start-up files that change the default FPU control word or other similar optimizations. This option is
not turned ON by any ‘-O’ option since it can result in incorrect output for programs which depend
on an exact implementation of IEEE or ISO rules/specifications for math functions. It may, however,
Atmel Studio 7 User Guide
GNU Toolchains
© 2018 Microchip Technology Inc. User Guide DS50002718A-page 259

yield faster code for programs that do not require the guarantees of these specifications. Enables ‘-
fno-signed-zeros’, ‘-fno-trapping-math’, ‘-fassociative-math’ and ‘-freciprocal-math’.
•-ffast-math
This option causes the preprocessor macro __FAST_MATH__ to be defined. This option is not
turned on by any ‘-O’ option since it can result in incorrect output for programs which depend on an
exact implementation of IEEE or ISO rules/specifications for math functions. It may, however, yield
faster code for programs that do not require the guarantees of these specifications. It sets ‘-fno-
math-errno’, ‘-funsafe-math-optimizations’, ‘-ffinite-math-only’, ‘-fno-rounding-math’, ‘-fno-signaling-
nans’ and ‘-fcx-limited-range’.
•-fpic
Generate position-independent code (PIC) suitable for use in a shared library, if supported for the
target machine. Such code accesses all constant addresses through a global offset table (GOT).
The dynamic loader resolves the GOT entries when the program starts (the dynamic loader is not
part of GCC; it is part of the operating system). If the GOT size for the linked executable exceeds a
machine-specific maximum size, you get an error message from the linker indicating that ‘-fpic’
does not work; in that case, recompile with ‘-fPIC’ instead. (These maximums are 8k on the SPARC
and 32k on the m68k and RS/6000. The 386 has no such limit.) Position-independent code requires
special support, and therefore works only on certain machines. For the 386, GCC supports PIC for
System V but not for the Sun 386i. Code generated for the IBM RS/6000 is always position-
independent. When this flag is set, the macros __pic__ and __PIC__ are defined to 1.
•-mno-init-got
Do not initialize GOT register before using it when compiling PIC code.
•-masm-addr-pseudos
This option is enabled by default and causes GCC to output the pseudo instructions call and lda.w
for calling direct functions and loading symbol addresses respectively. It can be turned OFF by
specifying the switch ‘-mno-asm-addr-pseudos’. The advantage of using these pseudo-instructions
is that the linker can optimize these instructions at link time if linker relaxing is enabled. The ‘-
mrelax’ option can be passed to GCC to signal to the assembler that it should generate a relaxable
object file.
•-mforce-double-align
Force double-word alignment for double-word memory accesses.
•-mimm-in-const-pool
When GCC needs to move immediate values not suitable for a single move instruction into a
register, it has two possible choices; it can put the constant into the code somewhere near the
current instruction (the constant pool) and then use a single load instruction to load the value or it
can use two immediate instruction for loading the value directly without using a memory load. If a
load from the code memory is faster than executing two simple one-cycle immediate instructions,
then putting these immediate values into the constant pool will be most optimal for speed. This is
often true for MCU architectures implementing an instruction cache, whereas architectures with
code executing from the internal flash will probably need several cycles for loading values from
code memory. By default, GCC will use the constant pool for AVR 32-bit products with an
instruction cache and two immediate instructions for flash-based MCUs. This can be overridden by
using the option ‘-mimm-in-const-pool’ or its negated option ‘-mno-imm-in-const-pool’.
•-muse-rodata-sections
Atmel Studio 7 User Guide
GNU Toolchains
© 2018 Microchip Technology Inc. User Guide DS50002718A-page 260

By default GCC will output read-only data into the code (.text) section. If the code memory is slow it
might be more optimal for performance to put read-only data into another faster memory, if
available. This can be done by specifying the switch ‘-muse-rodata-section’, which makes GCC put
read-only data into the .rodata section. Then the linker file can specify where the content of
the .rodata section should be placed. For systems running code from flash, this might, however,
mean that the read-only data must be placed in flash and then copied over to another memory at
start-up, which means that extra memory usage is required with this scheme.
7.8.2 Debugging
•-pg
Generate extra code to write profile information suitable for the analysis program gprof. You must
use this option when compiling the source files you want data about, and you must also use it when
linking.
•-p
Generate extra code to write profile information suitable for the analysis program prof. You must
use this option when compiling the source files you want data about, and you must also use it when
linking.
7.8.3 AVR32 C Linker
7.8.3.1 Optimization
•-mfast-float
Enable fast floating-point library. Enabled by default if the -funsafe-math-optimizations switch is
specified.
•-funsafe-math-optimizations
Allow optimizations for floating-point arithmetic that (a) assume that arguments and results are valid
and (b) may violate IEEE or ANSI standards. When used at link-time, it may include libraries or
start-up files that change the default FPU control word or other similar optimizations. This option is
not turned on by any ‘-O’ option since it can result in incorrect output for programs which depend on
an exact implementation of IEEE or ISO rules/specifications for math functions. It may, however,
yield faster code for programs that do not require the guarantees of these specifications. Enables ‘-
fno-signed-zeros’, ‘-fno-trapping-math’, ‘-fassociative-math’, and ‘-freciprocal-math’. The default is ‘-
fno-unsafe-math-optimizations’.
•-ffast-math
This option causes the preprocessor macro __FAST_MATH__ to be defined. This option is not
turned on by any ‘-O’ option since it can result in incorrect output for programs which depend on an
exact implementation of IEEE or ISO rules/specifications for math functions. It may, however, yield
faster code for programs that do not require the guarantees of these specifications. It sets ‘-fno-
math-errno’, ‘-funsafe-math-optimizations’, ‘-ffinite-math-only’, ‘-fno-rounding-math’, ‘-fno-signaling-
nans’, and ‘-fcx-limited-range’.
•-fpic
Generate position-independent code (PIC) suitable for use in a shared library, if supported for the
target machine. Such code accesses all constant addresses through a global offset table (GOT).
The dynamic loader resolves the GOT entries when the program starts (the dynamic loader is not
part of GCC; it is part of the operating system). If the GOT size for the linked executable exceeds a
machine-specific maximum size, you get an error message from the linker indicating that ‘-fpic’
does not work; in that case, recompile with ‘-fPIC’ instead. (These maximums are 8k on the SPARC
Atmel Studio 7 User Guide
GNU Toolchains
© 2018 Microchip Technology Inc. User Guide DS50002718A-page 261

and 32k on the m68k and RS/6000. The 386 has no such limit.) Position-independent code requires
special support and, therefore, works only on certain machines. For the 386, GCC supports PIC for
System V but not for the Sun 386i. Code generated for the IBM RS/6000 is always position-
independent. When this flag is set, the macros __pic__ and __PIC__ are defined to 1.
•-Wl,--direct-data
Allow direct data references when optimizing. To enable the linker to convert an lda.w into an
immediate move instruction, i.e. linker relaxing, the option ‘—direct-data’ must be given to the
linker.
7.8.3.2 Miscellaneous
•-Xlinker[option]
Pass option as an option to the linker. You can use this to supply system-specific linker options
which GCC does not know how to recognize. If you want to pass an option that takes a separate
argument, you must use -Xlinker twice; once for the option and once for the argument. For
example, to pass -assert definitions, you must write `-Xlinker -assert -Xlinker definitions'. It does not
work to write -Xlinker '-assert definitions', because this passes the entire string as a single
argument, which is not what the linker expects. When using the GNU linker, it is usually more
convenient to pass arguments to linker options using the option=value syntax than as separate
arguments. For example, you can specify `-Xlinker -Map=output.map' rather than `-Xlinker -Map -
Xlinker output.map'. Other linkers may not support this syntax for command-line options.
7.9 Binutils
The following AVR 32-bit GNU Binutils are available:
• avr32-ld- GNU linker.
• avr32-as - GNU assembler.
• avr32-addr2line - Converts addresses into filenames and line numbers.
• avr32-ar - A utility for creating, modifying and extracting from archives.
• avr32-c++filt - Filter to demangle encoded C++ symbols.
• avr32-nm - Lists symbols from object files.
• avr32-objcopy - Copies and translates object files.
• avr32-objdump - Displays information from object files.
• avr32-ranlib - Generates an index to the contents of an archive.
• avr32-readelf - Displays information from any ELF format object file.
• avr32-size - Lists the section sizes of an object or archive file.
• avr32-strings - Lists printable strings from files.
• avr32-strip - Discards symbols.
For more information about each util, use the built-in help command: avr32-<util name here> --
help.
• For general information about GNU Assembler (GAS), GNU linker and other binutils, visit the
official GNU Binutils web site.
Atmel Studio 7 User Guide
GNU Toolchains
© 2018 Microchip Technology Inc. User Guide DS50002718A-page 262
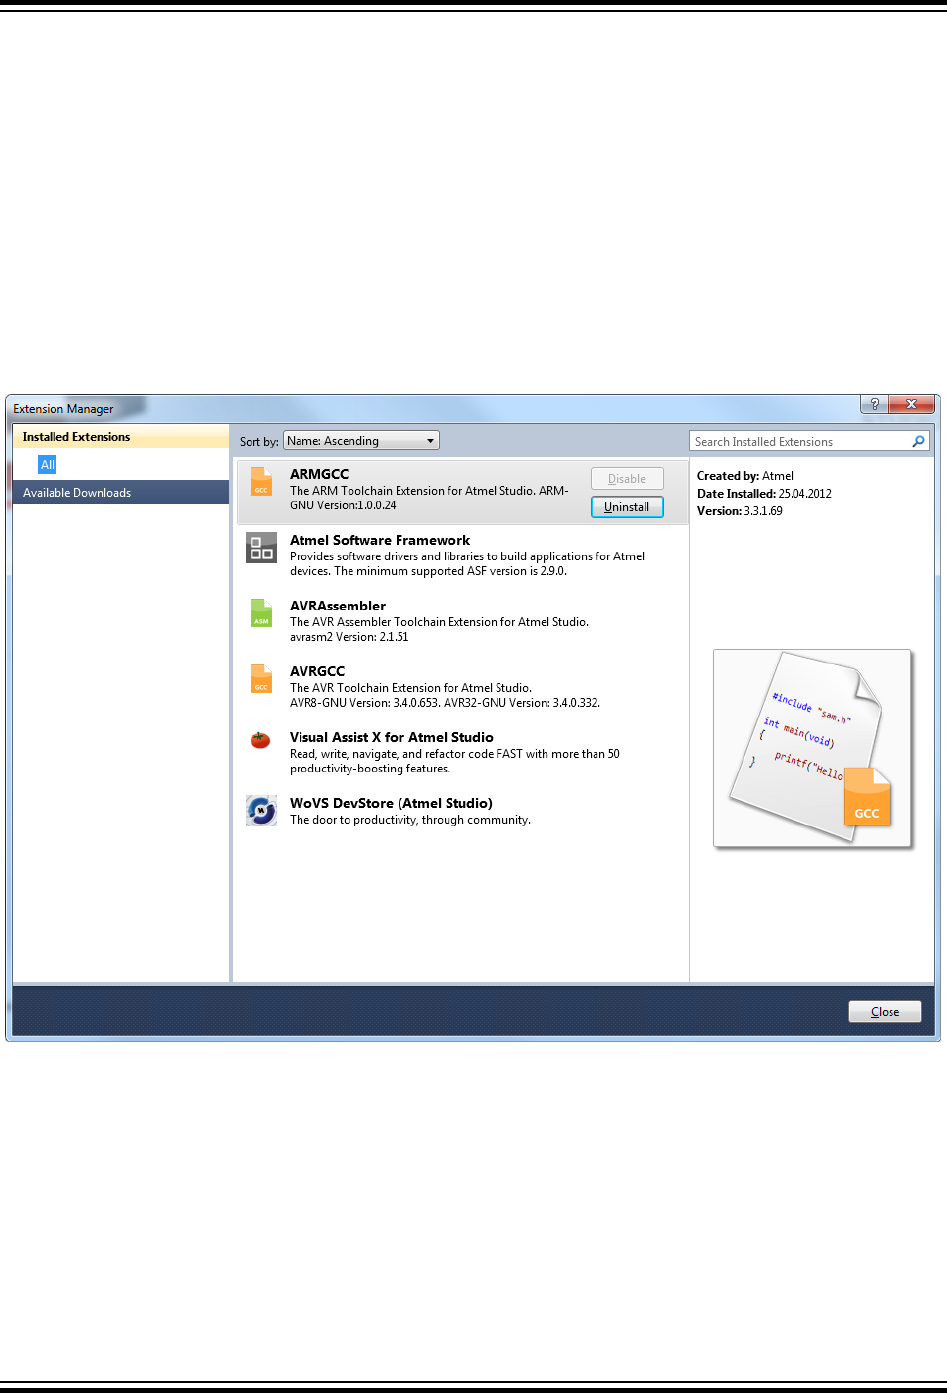
8. Extending Atmel Studio
Atmel Studio includes a tool named Extension Manager that lets you add, remove, enable, and disable
Atmel Studio extensions. To open Extension Manager, on the Tools menu, click Extension Manager.
Extension developers are advised to uninstall previous versions of extensions in progress and uninstall or
disable potentially conflicting extensions to prevent conflicts during development.
8.1 Extension Manager UI
The Extension Manager window is divided into three panes. The left pane lets you select by group:
installed extensions and new extensions from the online gallery.
Figure 8-1. Extension Manager
The extensions are displayed in the middle pane. You can sort the list by name or author from the
combobox above the list.
When you select an extension in the middle pane, information about it appears in the right pane.
Extension installed by the current user can be uninstalled or disabled, extensions distributed with Atmel
Studio cannot be changed.
The Extension Manager window also includes a search box. Depending on the selection in the left pane,
you can search installed extensions, the online gallery, or available updates.
Online Gallery Extension Manager can install extensions from the Atmel Studio Gallery. These extensions
may be packages, templates, or other components that add functionality to Atmel Studio.
Atmel Studio 7 User Guide
Extending Atmel Studio
© 2018 Microchip Technology Inc. User Guide DS50002718A-page 263
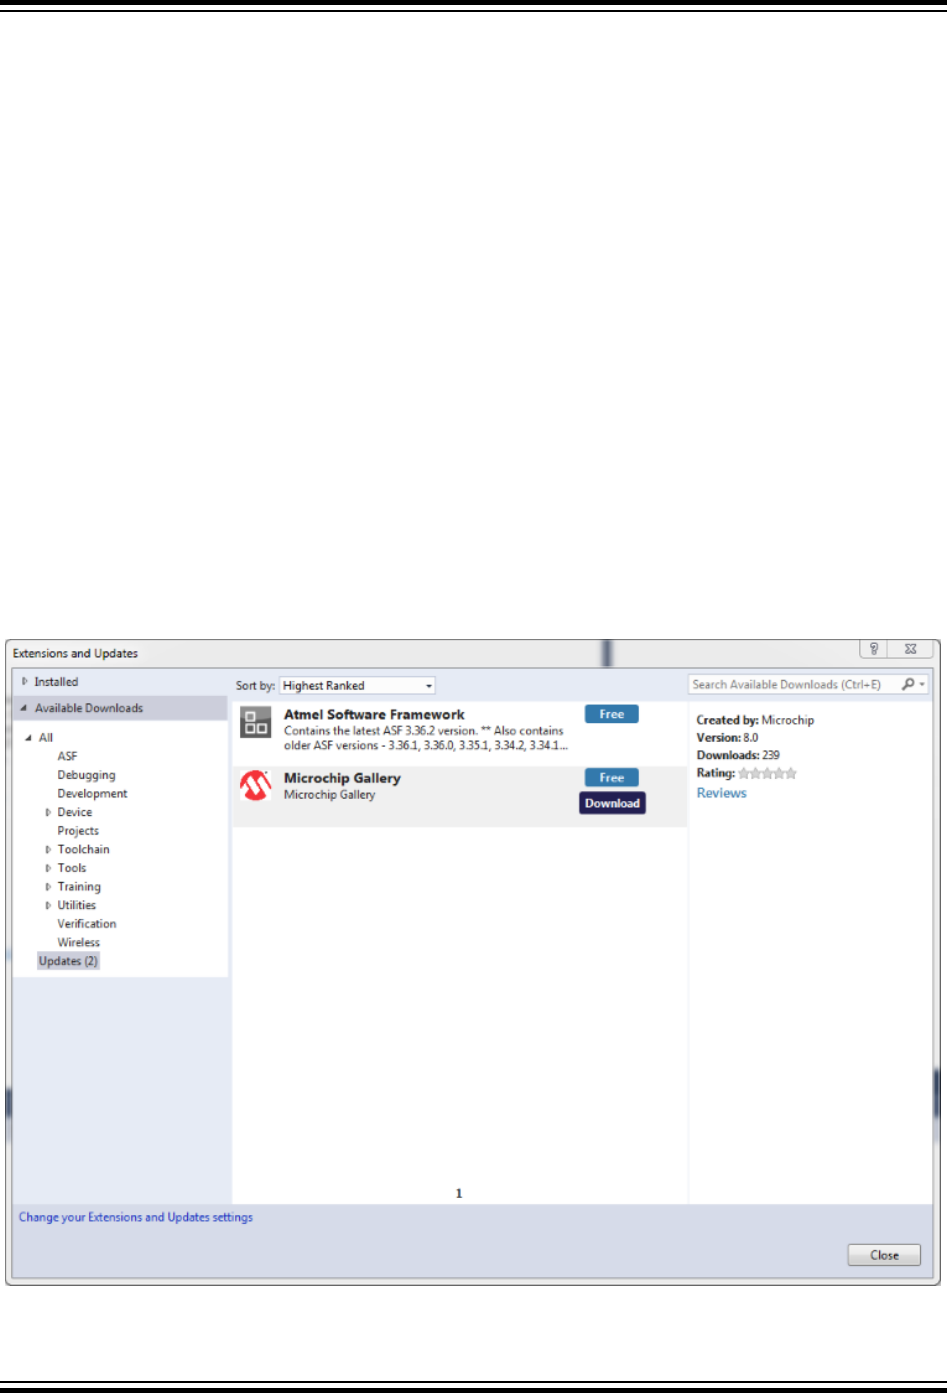
To get started with the extension manager, check the Installing New Extensions in Atmel Studio.
Extension Types
Extension Manager supports extensions in the VSIX package format, which may include project
templates, item templates, toolbox items, Managed Extension Framework (MEF) components, and
VSPackages. Extension Manager can also download and install MSI-based extensions, but it cannot
enable or disable them. Atmel Studio Gallery contains both VSIX and MSI extensions.
Dependency Handling
If a user tries to install an extension that has dependencies, the installer verifies that those dependencies
are already installed. If they are not installed, Extension Manager shows the user a list of dependencies
that must be installed before the extension can be installed.
Installing Without Using Extension Manager
Extensions that have been packaged in .vsix files may be available in locations other than the Atmel
Studio Gallery. Extension Manager cannot detect these files. However, you can install a .vsix file by
double-clicking it and then following the setup instructions. When the extension is installed, you can use
Extension Manager to enable it, disable it, or remove it.
8.2 Registering at the Microchip Gallery
In order to download extensions, registering at the Microchip Gallery is required.
Figure 8-2. Microchip Gallery Download
Once you click download, you will be taken to the sign-in page of the Microchip Gallery.
Atmel Studio 7 User Guide
Extending Atmel Studio
© 2018 Microchip Technology Inc. User Guide DS50002718A-page 264
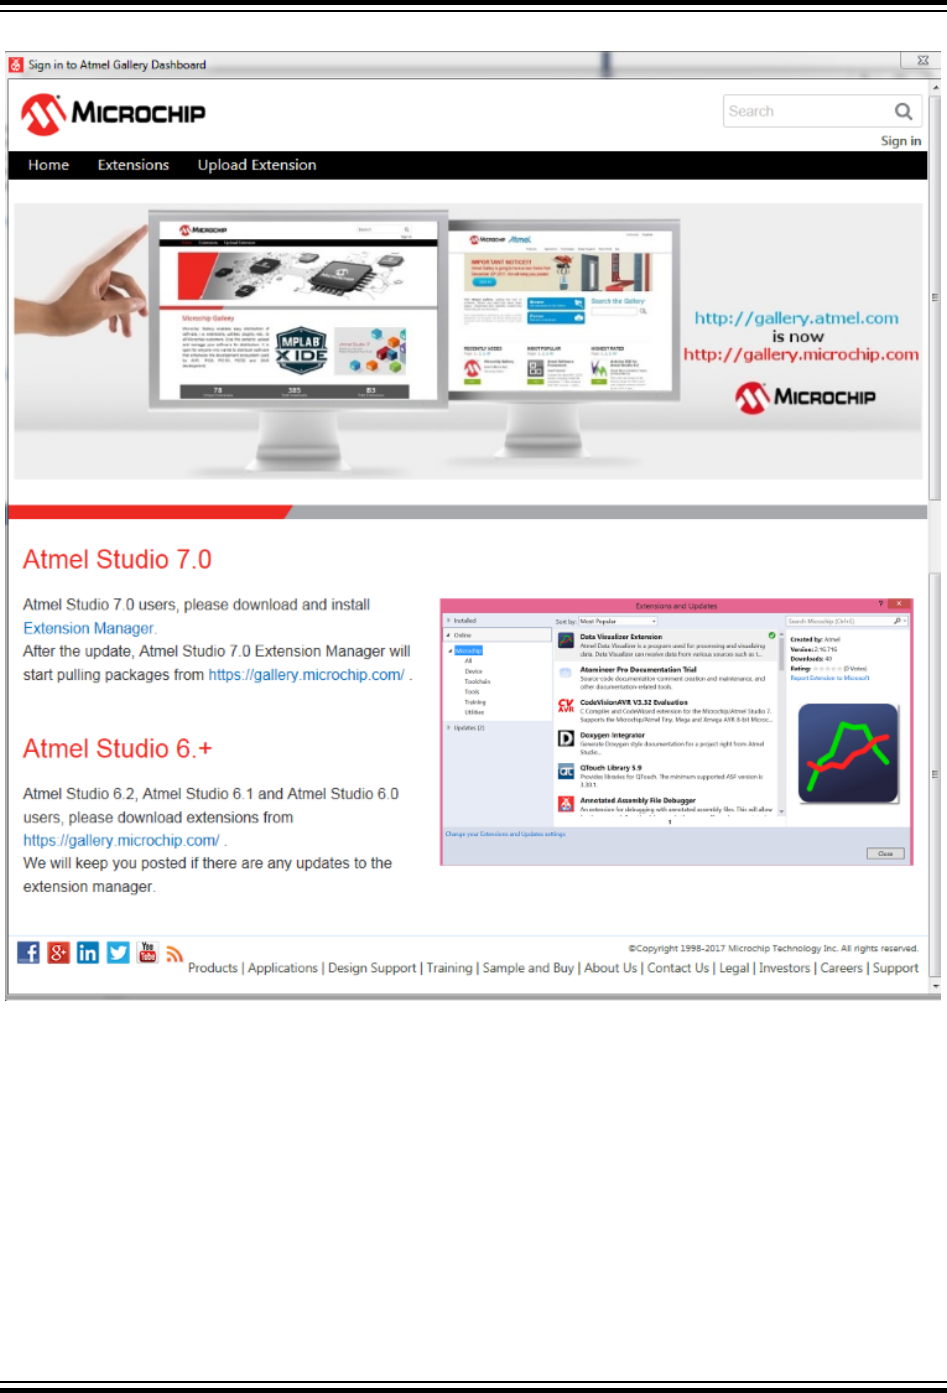
Figure 8-3. Sign-in page to Microchip Gallery
Clicking on Sign in, on the top right of the dialog, you will be asked to sign into your Microchip account.
Atmel Studio 7 User Guide
Extending Atmel Studio
© 2018 Microchip Technology Inc. User Guide DS50002718A-page 265

Figure 8-4. Sign in with a Microchip account
Clicking on Sign In takes you to the myMicrochip sign-in page.
Atmel Studio 7 User Guide
Extending Atmel Studio
© 2018 Microchip Technology Inc. User Guide DS50002718A-page 266
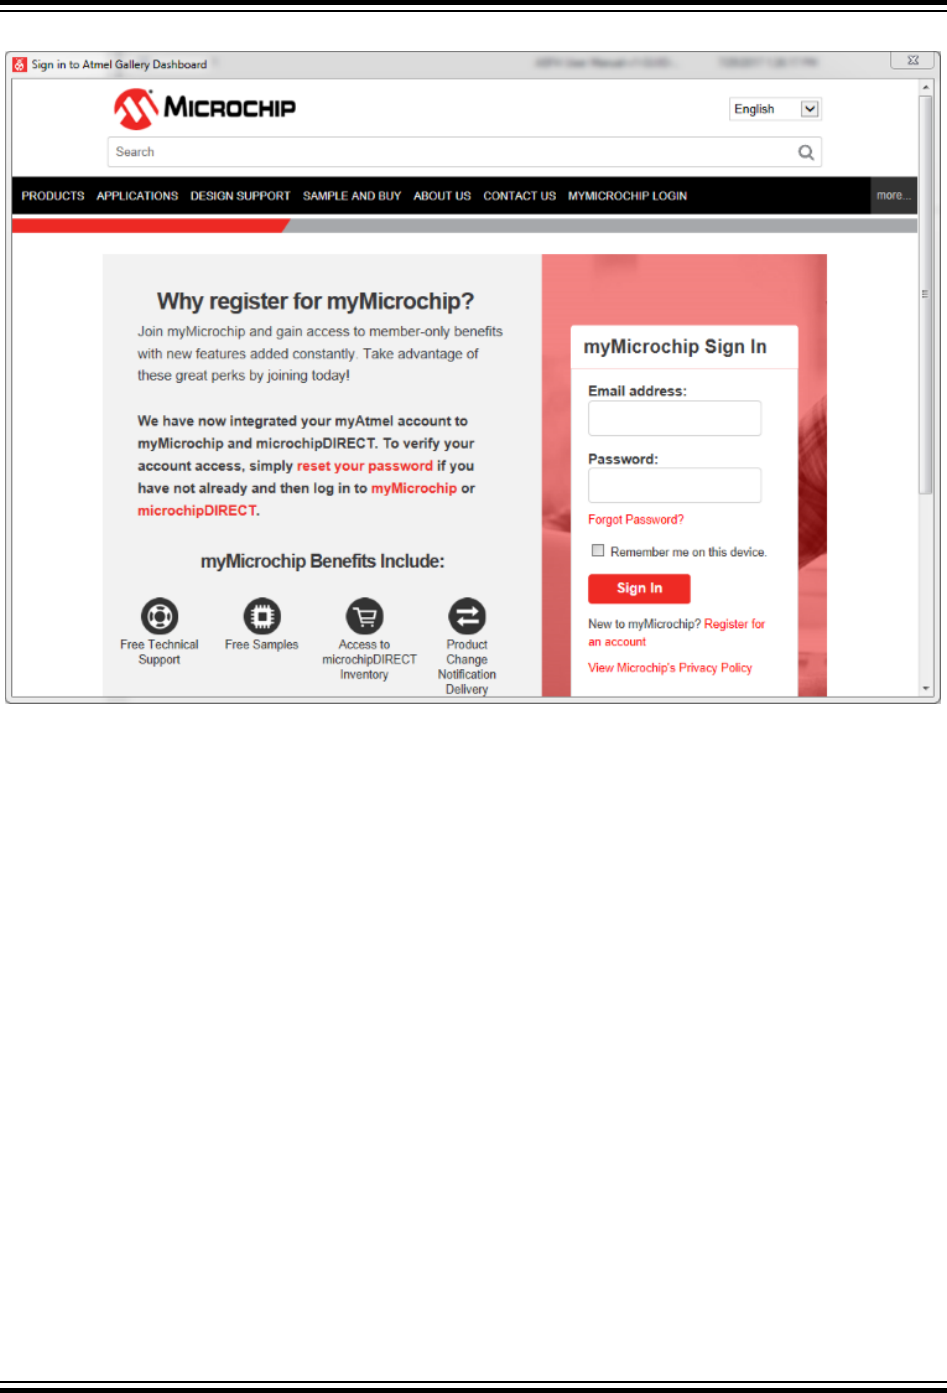
Figure 8-5. myMicrochip Sign In
8.3 Installing New Extensions in Atmel Studio
Step 1
Atmel Studio 7 User Guide
Extending Atmel Studio
© 2018 Microchip Technology Inc. User Guide DS50002718A-page 267
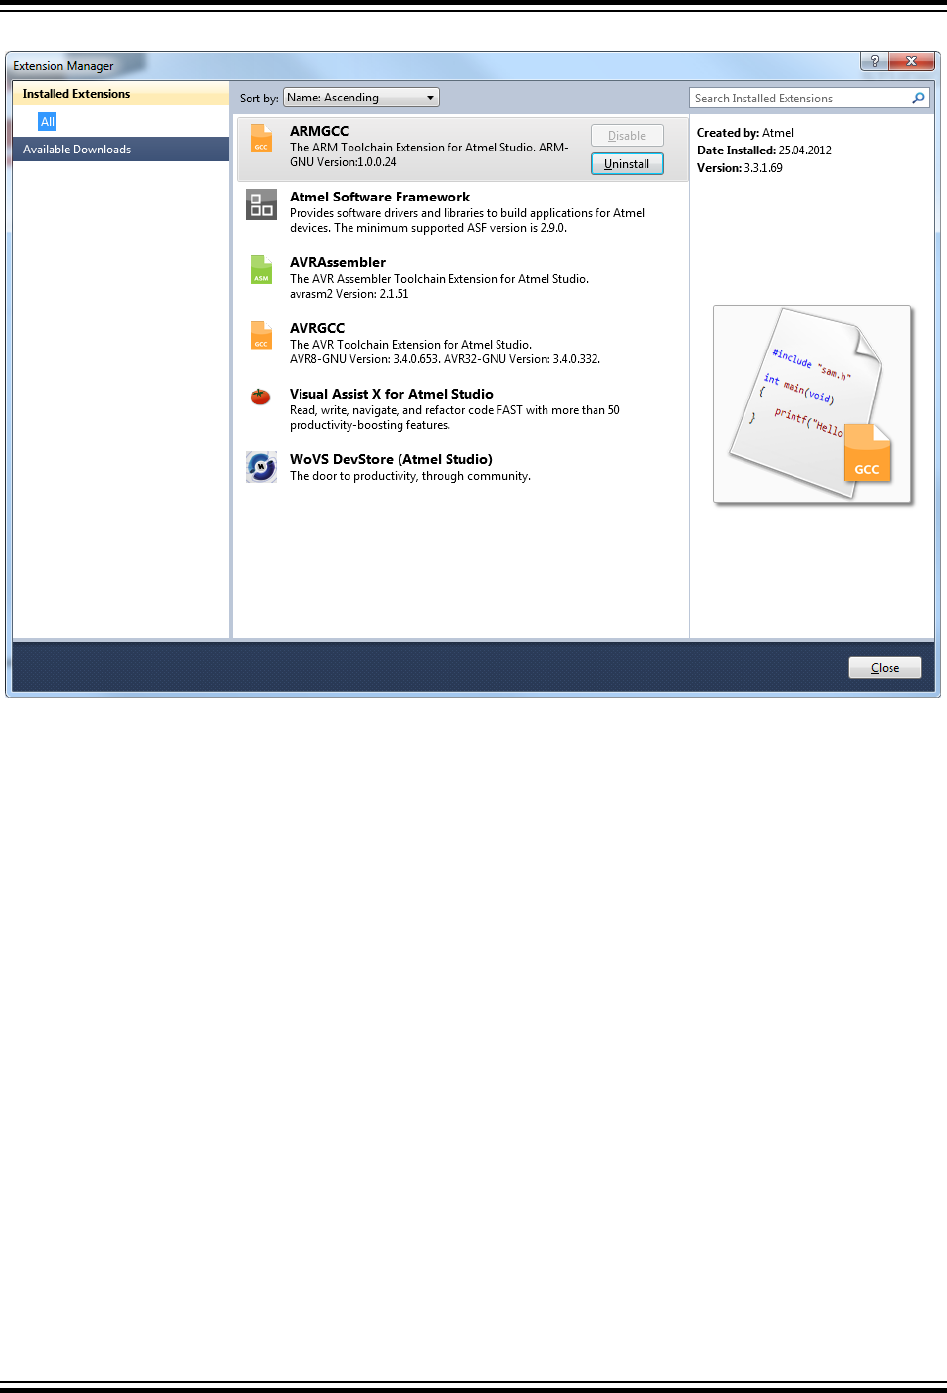
Figure 8-6. Extension Manager
Opening the extension manager window will show extensions installed.
In order to find and install a new extension, click the Available Downloads tab in the left pane.
Step 2
Atmel Studio 7 User Guide
Extending Atmel Studio
© 2018 Microchip Technology Inc. User Guide DS50002718A-page 268
Figure 8-7. Retrieving List of Extensions
Updating the available extension list will take some time.
Step 3
Atmel Studio 7 User Guide
Extending Atmel Studio
© 2018 Microchip Technology Inc. User Guide DS50002718A-page 269

Figure 8-8. List of Extensions
A green check mark identifies already installed extensions.
Select QTouch Composer and press Download. If you have not previously registered as a user in the
Extension Gallery you will be taken to the Registering at the Microchip Gallery at this point.
Atmel Studio 7 User Guide
Extending Atmel Studio
© 2018 Microchip Technology Inc. User Guide DS50002718A-page 270
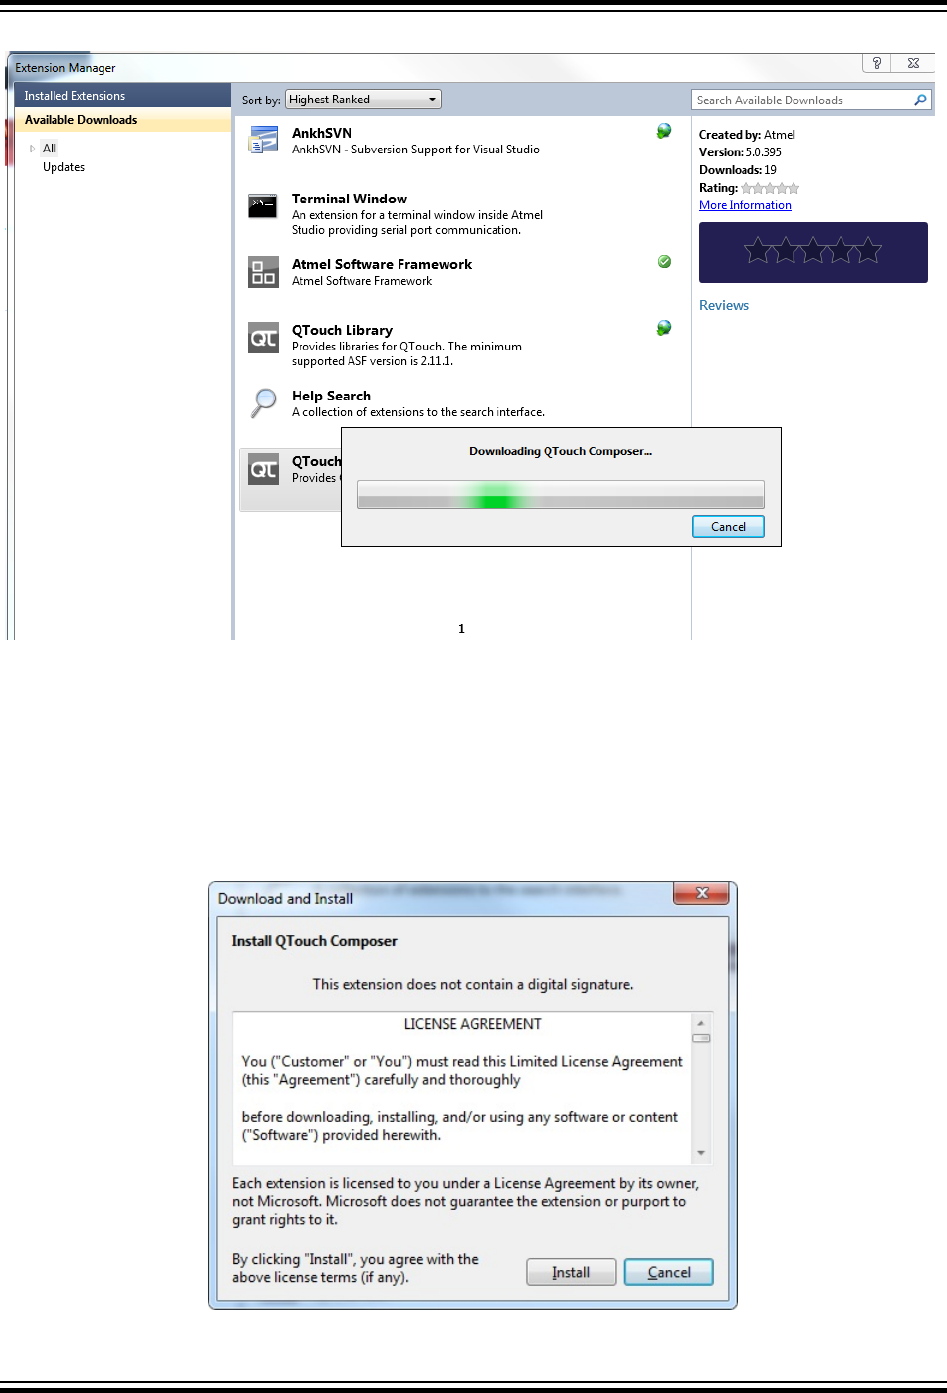
Figure 8-9. Extension Download Progression
The download will start as indicated in the status bar of Atmel Studio. If the extension is distributed as a
standalone installer you will be asked for a location to save the file. Downloading can take several
minutes for large files. A dialog with a running bar is displayed during download. Not that download can
take a long time for large extensions. Press Cancel to abort the download.
Step 4
Figure 8-10. Extension License
Atmel Studio 7 User Guide
Extending Atmel Studio
© 2018 Microchip Technology Inc. User Guide DS50002718A-page 271
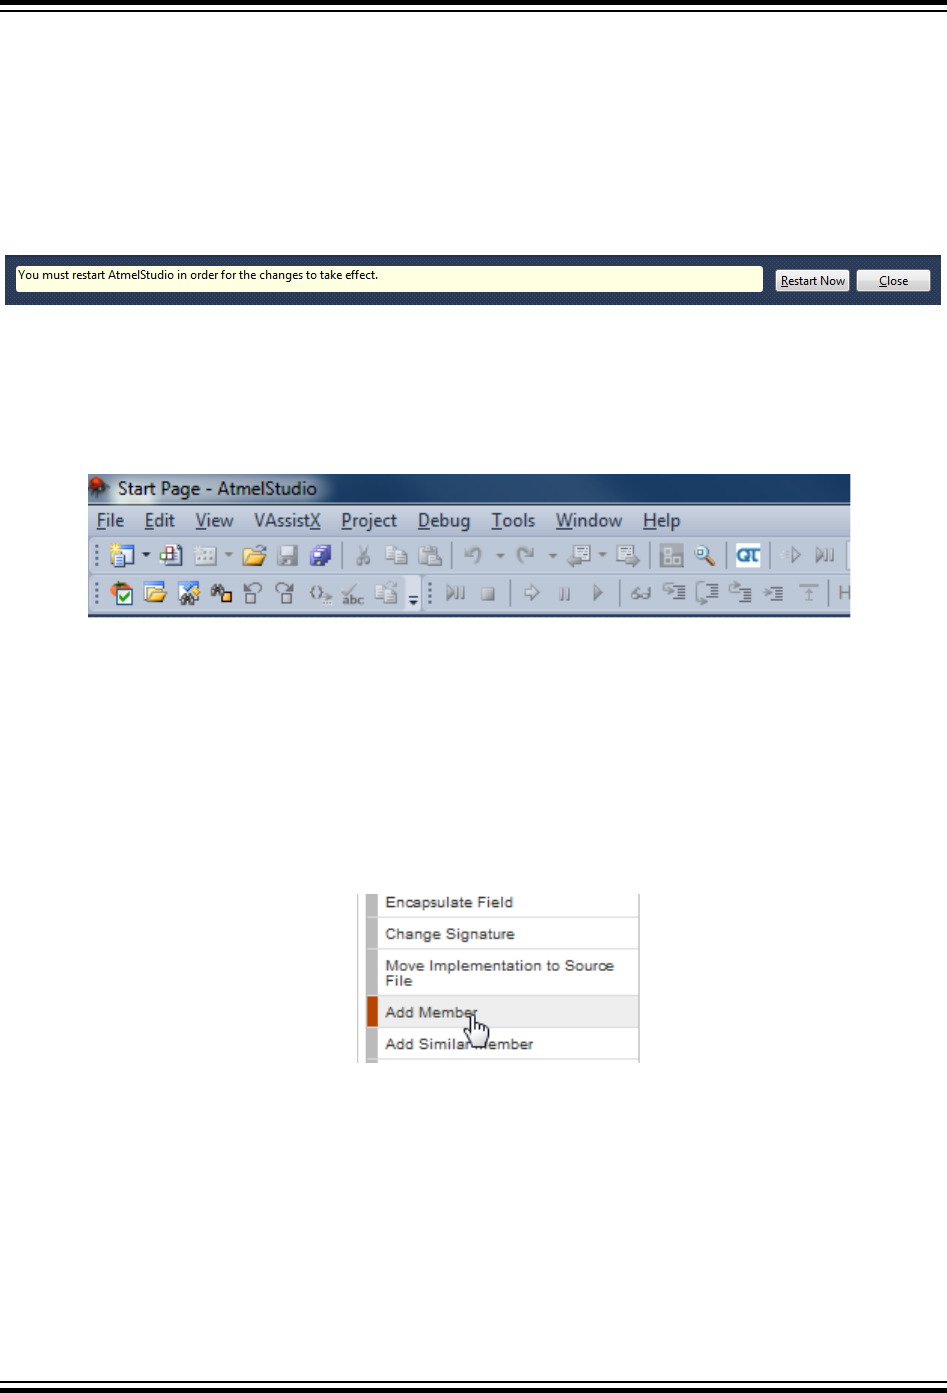
A license agreement will appear for you to read, most of the times when you install a new extension.
Read it carefully and install only the extensions you really need as most of the extensions' authors do not
take liability in a possible malfunction resulting from installation of mutually incompatible extensions and
collateral damages, for example, if extension security is breached.
Step 5
Once the extension is downloaded a message in the lower status bar will appear.
Figure 8-11. Extension Manager Restart Warning
Click the Restart Now button to restart the IDE immediately, otherwise, if you plan to restart it later - click
the Close button.
If you have an unsaved project you will be requested to save the changes you made, before restarting.
Step 6
Figure 8-12. QTouch Composer Button
After restarting Atmel Studio, a new button is added for starting QTouch Composer.
8.4 Visual Assist
The Atmel Studio comes with a preinstalled extension - the Visual Assist from WholeTomato Software.
The documentation on Visual Assist is available from several sources:
• Go to the www.wholetomato.com. Click on the left-hand menu to browse documentation by feature.
Figure 8-13. WholeTomato Software Documentation
• Jump directly to relevant documentation using hyperlinks in the Visual Assist options dialog
Atmel Studio 7 User Guide
Extending Atmel Studio
© 2018 Microchip Technology Inc. User Guide DS50002718A-page 272
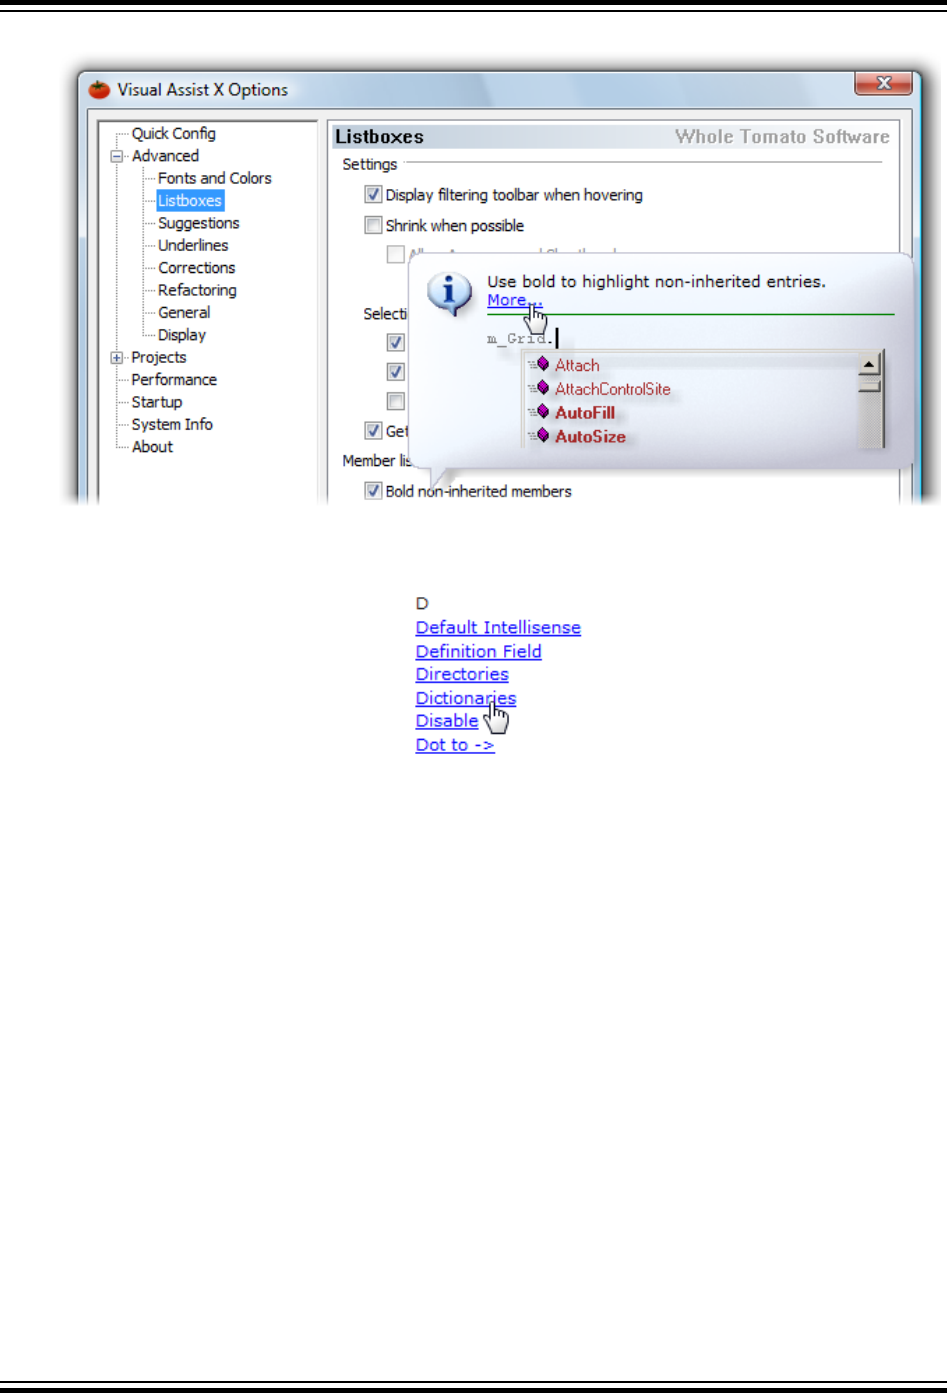
Figure 8-14. Visual Assist Options
• Click terms in the Glossary
8.5 Overview of QTouch Composer and Library
The QTouch Composer and library allows you to easily and seamlessly develop capacitive touch
functionality for your application. This simplifies the design process by tying together the tools required to
edit the code in Atmel Studio and tune the touch design. QTouch Composer, formerly called QTouch
Studio, is fully integrated in Atmel Studio 6 as an extension. QTouch Library is a software framework
extension to Atmel Studio, which allows you to add touch functionality on various Microchip devices.
8.5.1 Installation
1. Start Atmel Studio.
2. Go to Tools → Extension Manager → Online Gallery.
3. Select QTouch Library, click 'Download', and then install it.
4. Select QTouch Composer, click 'Download', and then install it.
5. Click the 'Restart Now' button in the Extension manager window.
6. After starting Atmel Studio, go to Tools → Extension Manager. Check that the QTouch library and
the QTouch composer are listed and the status is enabled.
Atmel Studio 7 User Guide
Extending Atmel Studio
© 2018 Microchip Technology Inc. User Guide DS50002718A-page 273
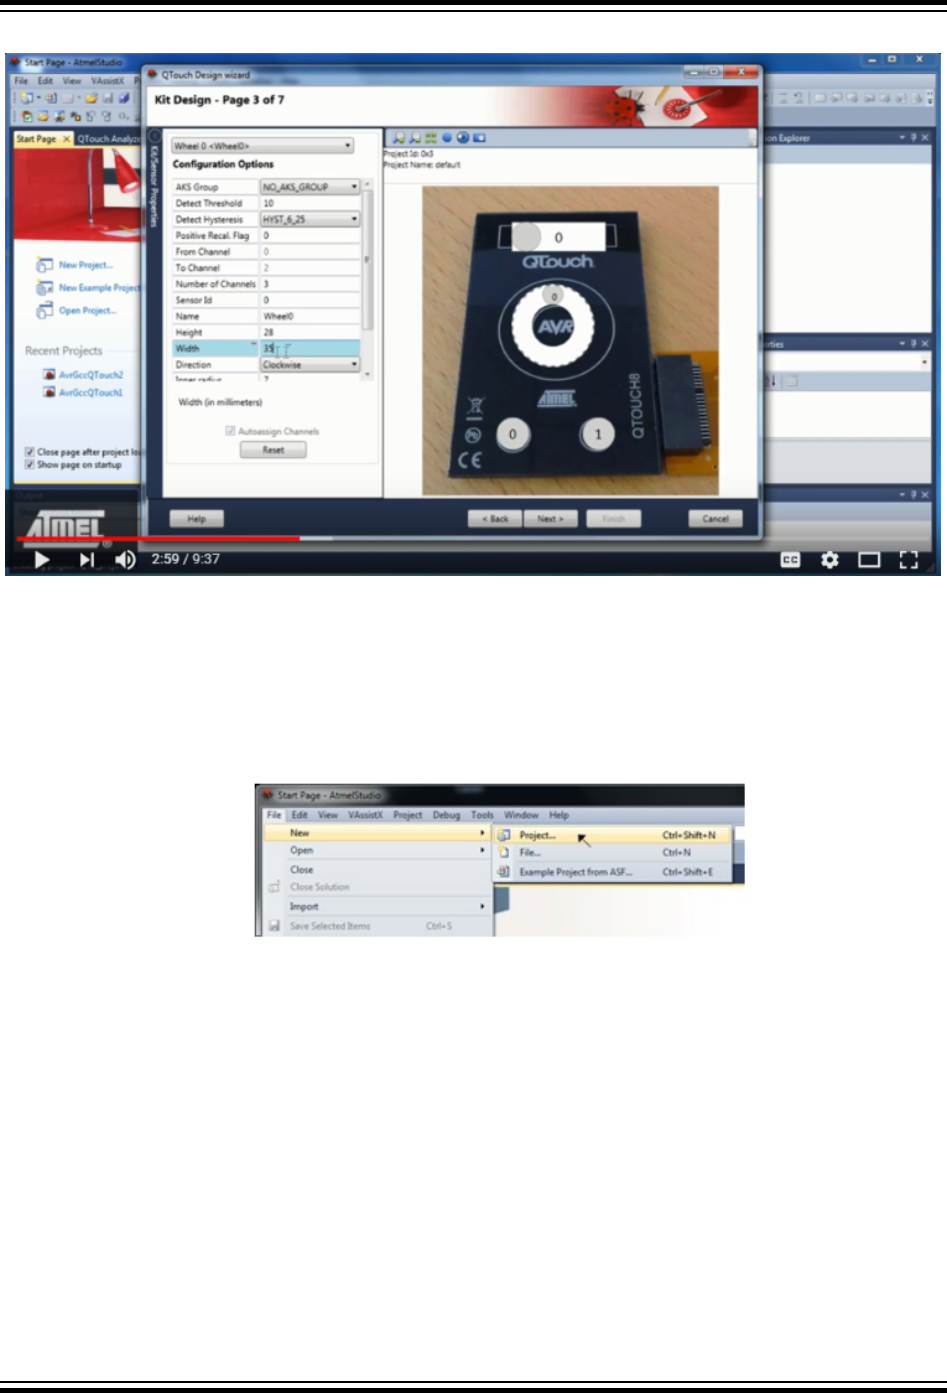
8.5.2 Overview of QTouch Project Builder
Getting Started With the QTouch Composer in Atmel Studio on YouTube.
QTouch Project builder will guide you through all steps from selecting device and touch sensors to
automatically generate a complete touch project.
1. Start Atmel Studio.
2. Open the File menu. Click on 'New → Project'.
3. The 'New Project' dialog is opened. Select 'GCC C QTouch Executable Project' in the New Project
dialog.
Atmel Studio 7 User Guide
Extending Atmel Studio
© 2018 Microchip Technology Inc. User Guide DS50002718A-page 274
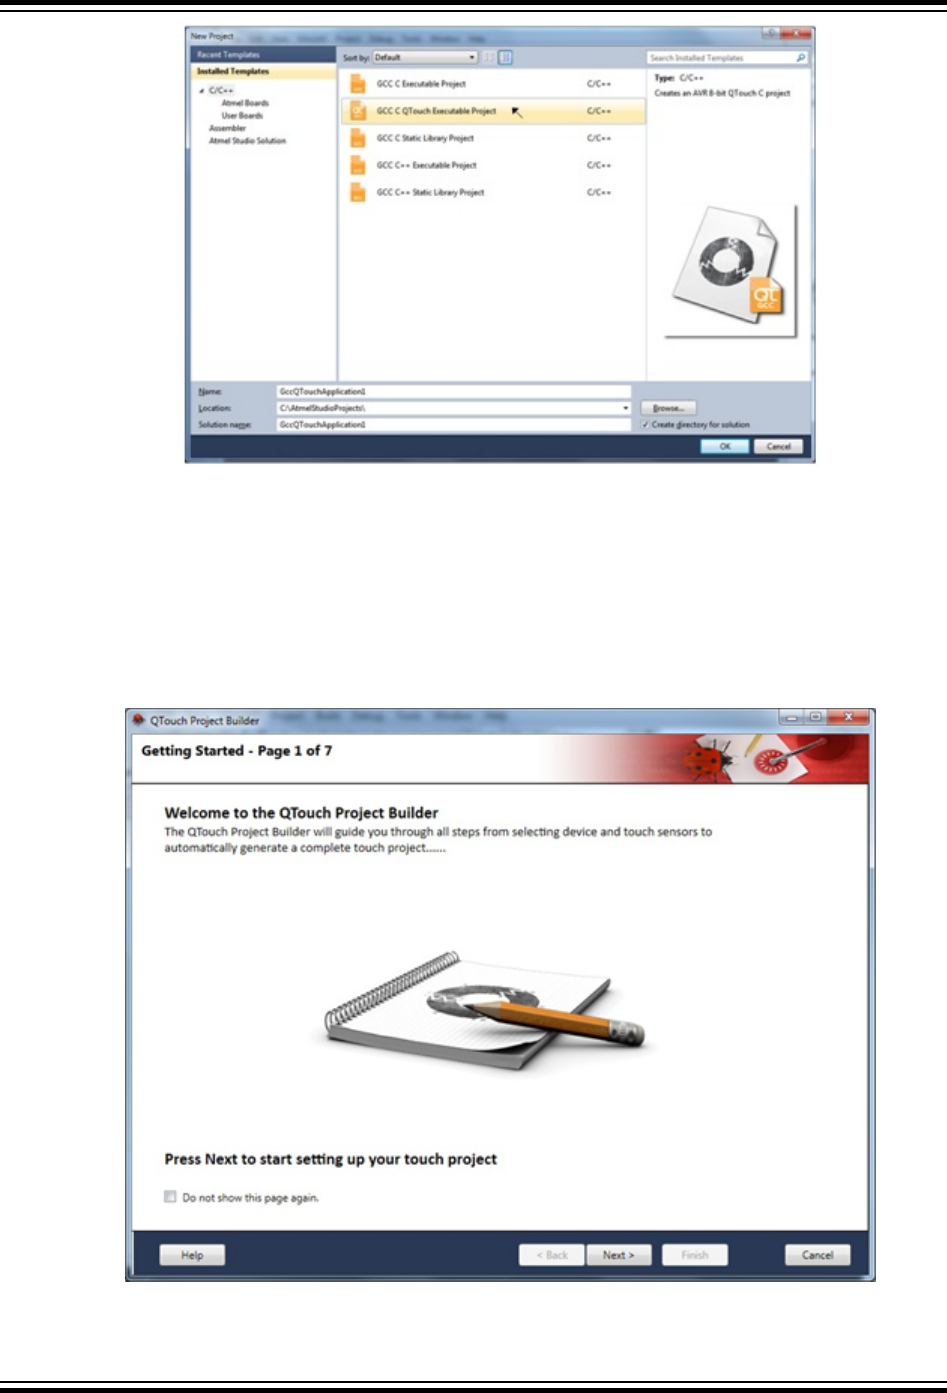
Enter the following details in the 'New Project' dialog and click the OK button.
– Name of the project
– Location of the project and solution
– Name of the solution
4. The 'QTouch Project Builder' wizard is opened, which will guide you through the steps involved in
creating a project.
Atmel Studio 7 User Guide
Extending Atmel Studio
© 2018 Microchip Technology Inc. User Guide DS50002718A-page 275
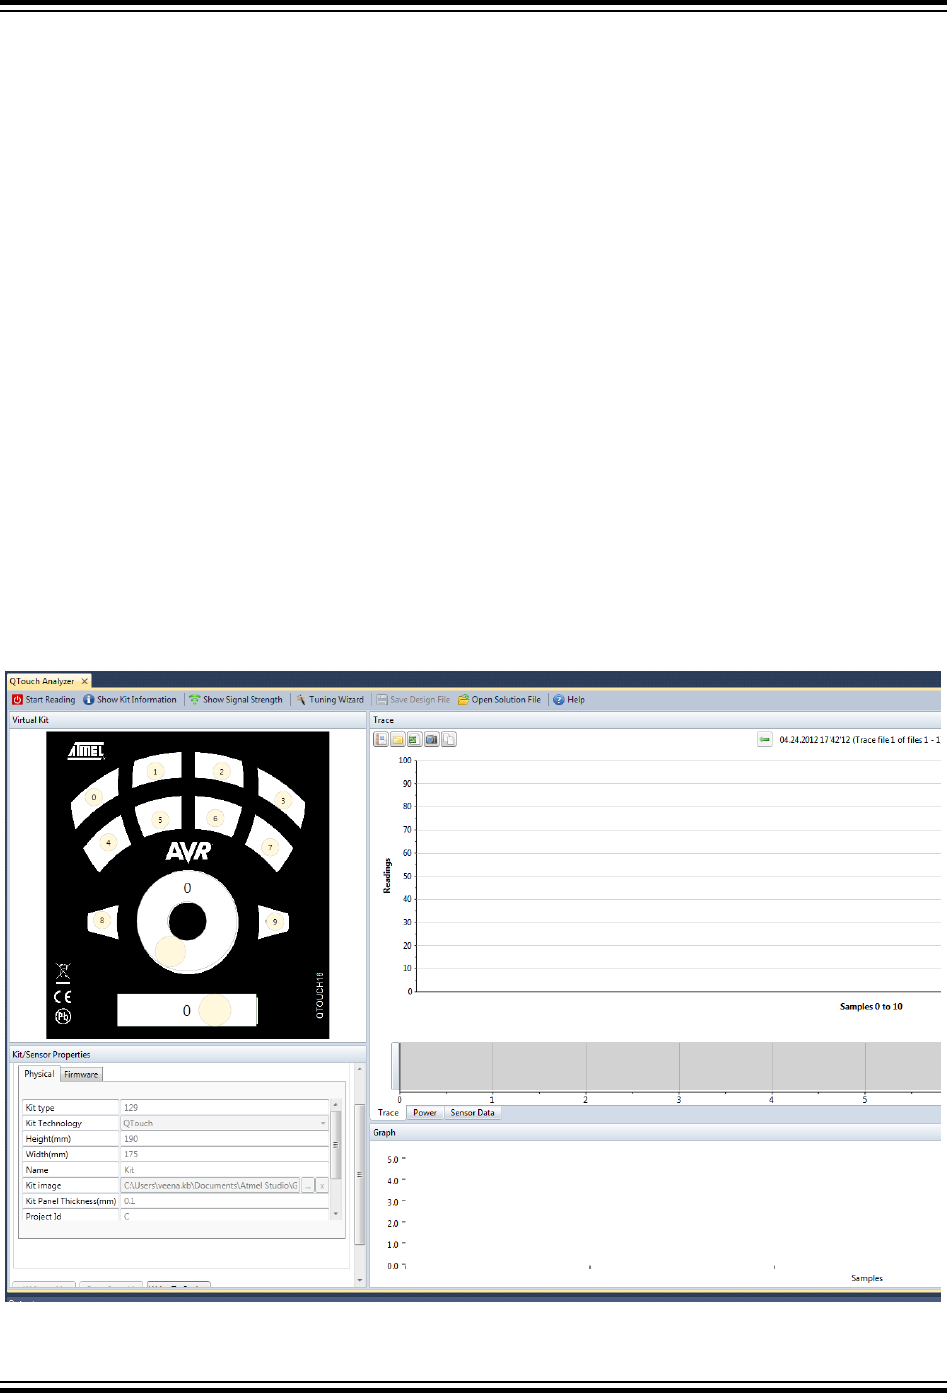
8.5.3 Overview of QTouch Analyzer
The QTouch Analyzer reads and interprets touch data sent from the QTouch kit into different views. The
Analyzer is separated into Kit View, Kit/Sensor Properties, Sensor Data, Trace View, Power View, and
Graph view. When the touch kit is connected and Atmel Studio is opened, the QTouch Analyzer window
opens up and the connection information is updated.
The Virtual Kit view shows touch events such as button press, wheel, and slider use. The image is
updated based on the touch data read from the connected Touch Kit.
The Kit/Sensor Properties view allows you to view and modify the kit/sensor configuration options.
The Sensor Data View provides touch data information of the currently connected kit.
The Graph View displays one or more selected touch data on a graph. The Graph shall display the most
recent touch data. The data set to show can be selected from the data set list at the right side of the view.
The data sets are displayed in tabbed pages representing the Signals, Deltas, References, and Wheel/
Slider positions. Each data set selection list follows normal selection convention; click on an item in the
list to selected that item. To select a continuous range of items, first, click on the first item then hold down
the SHIFT key and select the last item in the range. Multiple items can also be selected one at a time by
holding down the CTRL key prior to selecting the next item in the list. In the last case, the items need not
be in a continuous range. Using CTRL select method also allows deselection of individual items from a
selection of multiple items.
The Trace contains one or more data series with touch data in a chart. The trace keeps all historical data
of one single reading session (pressing start and stop reading), and the data can be saved in a separate
file and opened again later.
Atmel Studio 7 User Guide
Extending Atmel Studio
© 2018 Microchip Technology Inc. User Guide DS50002718A-page 276

8.6 Scripting Extensions
Atmel Studio provides some scripting hooks that can be executed automatically by the IDE. These
extensions are written mainly in Python and will execute, for instance, when a breakpoint is hit, when an
expression is evaluated, or when the program is being reset.
8.6.1 Debug Scripting
The debug scripting interface is function based and depends on certain, named functions to be defined in
a Python® file. The function will then be called when the corresponding event is occurring inside Atmel
Studio.
Attention:
Error checking is kept at a minimum for the functions exported into the Python environment so
that the time used on initialization during normal sessions are kept low. This means that there
are many ways to crash Atmel Studio through this interface.
To load a Python file, place a file named debughooks.py in the Debug folder of your project, next to the
ELF file, or one folder up where the project file is. It is also possible to place this file inside the Atmel
Studio installation directory to make the script load for all projects.
Note: The Python file is loaded and compiled when a project is launched, so changes to the Python file
during a debug session will not be active until the next debug session is started. The Python file is
running in an IronPython context, with full access to .NET and a Python 2.7 runtime. See http://
ironpython.net/documentation/dotnet/ for more information of the runtime.
The functions that Atmel Studio will try to load are shown below with their function signature.
def should_process_breakpoint(studio_interface,
breakpoint_address,
breakpoint_id,
obj):
"""
Called to determine if a breakpoint should cause Atmel Studio to enter debug mode.
If this function returns False, Atmel Studio will not break at the breakpoint.
"""
return True
def has_processed_breakpoint(studio_interface,
breakpoint_address,
breakpoint_id,
obj):
"""
This function is called if Atmel Studio is breaking at a breakpoint.
The GUI is now in halted mode.
"""
pass
def on_reset(studio_interface,
reset_address):
"""
This function is called when the target is reset. The address
where the reset went to is 'reset_address'.
"""
pass
Atmel Studio 7 User Guide
Extending Atmel Studio
© 2018 Microchip Technology Inc. User Guide DS50002718A-page 277

def on_eval_expr(studio_interface,
expression):
"""
This function is called for each expression that is evaluated in Atmel Studio.
This includes the watch window and other windows that show data from the target.
Pass the 'expression' string through to evaluate it, or return another expression
to be evaluated to override the expression. This override is not visible in the
Atmel Studio GUI.
"""
return expression
Note: Atmel Studio expects all these functions to be available if the script has been found and is loaded
correctly. If, for instance, the should_process_breakpoint is undefined, breakpoints might start to
misbehave as the return value of an undefined function is in itself undefined.
In the code shown above, the main interface back into the Atmel Studio is the studio_interface
object. This object contains some functions to show messages and do target interaction.
The Print function in the studio_interface object is used to show text in the output window inside
Atmel Studio. The function takes two arguments; the string to print and the name of the tab in the output
window. The example below prints all the evaluated expressions to the “Expressions” tab.
def on_eval_expr(studio_interface, expression):
studio_interface.Print("Evaluating {}".format(expression), "Expressions")
return expression
Note: The severity level of text sent through Print is set to INFO, which means that the output may be
masked by Atmel Studio. To lower the threshold, go to Tools > Tools, select Status Management, and
set the Display Threshold to INFO.
The ExecStmt function in the studio_interface object is used to execute statements in the
debugger. This can, for instance, be used to set variables. See MSDN Debugger.ExecuteStatement
Method for more information.
The WriteMemory and ReadMemory are symmetric functions for reading and writing memory on the
target. It is important to use a System.Array[System.Byte] object to pass the data between the
script and Atmel Studio.
import System
def should_process_breakpoint(studio_interface,
breakpoint_address,
breakpoint_id,
obj):
vals = System.Array[System.Byte]([1, 2, 3, 4, 5, 6, 7, 8, 9])
studio_interface.WriteMemory(data=vals, adr=0, type="eeprom")
ret = studio_interface.ReadMemory(adr=0, type="eeprom", count=9)
studio_interface.Print("ret == vals => {!r}".format(ret == vals), "Python")
return True
The CalcNumericValue is a shorthand for the CalcValue call. It will return the numeric value of the
symbol or the provided default value if the function fails to retrieve the value of the symbol.
def should_process_breakpoint(studio_interface,
breakpoint_address,
breakpoint_id,
obj):
a = studio_interface.CalcNumericValue("a", 0)
Atmel Studio 7 User Guide
Extending Atmel Studio
© 2018 Microchip Technology Inc. User Guide DS50002718A-page 278

if a == 0:
studio_interface.Print("a was 0 or default", "Value scripts")
else:
studio_interface.Print("a = {}".format(a), "Value scripts")
return True
The CalcValue function is used to retrieve information about a symbol in the scope where the target
code is running. The return value of this call is a list of information containing the address of the symbol,
symbol information, and value. The objects sent to this list contains all known information about a symbol,
but the most useful field is the last element which contains the value of the evaluated symbol.
def should_process_breakpoint(studio_interface,
breakpoint_address,
breakpoint_id,
obj):
a = studio_interface.CalcValue("a")
# a now contains all information about the variable a.
# It is a list with the following members:
# a = [
# <Atmel.VsIde.AvrStudio.Services.TargetService.TCF.Services.ValueInfo>,
# <Atmel.VsIde.AvrStudio.Services.TargetService.TCF.Services.SymbolInfo>,
# <Atmel.VsIde.AvrStudio.Services.TargetService.TCF.Services.ExpressionInfo>,
# '1' ] <-- This is the value of the symbol as a string, here it had the value 1
studio_interface.Print("Value of a = {}".format(a[3]), "Value Scripts")
return True
Note: The different objects returned by the CalcValue call contains objects that are either internal or
documented in the Atmel Studio SDK. Use the python dir() command to look at the fields that are
exported.
Atmel Studio 7 User Guide
Extending Atmel Studio
© 2018 Microchip Technology Inc. User Guide DS50002718A-page 279

9. Menus and Settings
9.1 Customizing Existing Menus and Toolbars
You can add or remove commands on any menu or toolbar, or change the order and grouping of those
commands. You can also add toolbars, and change the layout, position, and content of existing toolbars
in the integrated development environment (IDE).
To add a command to a menu or toolbar
1. On the Tools menu, click Customize.
2. In the Customize dialog box, on the Commands tab, under Choose a menu or toolbar to
rearrange, select the menu or toolbar you want to change and then click Add command.
3. In the Add Command dialog box, select a category name on the Categories list and then, on the
Commands list, select the command you want to add.
4. Click OK.
5. Click Close.
To remove a command from a menu or toolbar
1. On the Tools menu, click Customize.
2. In the Customize dialog box, on the Commands tab, under Choose a menu or toolbar to
rearrange, select the menu or toolbar you want to change.
3. Select the command you want to remove, and then click Delete.
4. Click Close.
To separate commands on a menu or toolbar
1. On the Tools menu, click Customize.
2. In the Customize dialog box, on the Commands tab, under Choose a menu or toolbar to
rearrange, select the menu or toolbar you want to change.
3. Select the command you want to separate from the commands above it.
4. In the Modify Selection list, select Begin a Group.
5. A separator bar appears on the list of commands, above the selected command.
6. Click OK.
7. Click Close.
The command appears on the menu or toolbar with a separator before it.
To add a new menu
1. On the Tools menu, click Customize.
2. In the Customize dialog box, on the Commands tab, click Add New Menu. The menu appears,
named New Menu.
3. In the Modify Selection list, enter the name for the new menu.
4. Click OK.
5. Click Close.
The command appears on the menu or toolbar before it.
To change the order of menus
Atmel Studio 7 User Guide
Menus and Settings
© 2018 Microchip Technology Inc. User Guide DS50002718A-page 280

1. On the Tools menu, click Customize.
2. In the Customize dialog box, on the Commands tab, under Choose a menu or toolbar to rearrange,
select the menu or toolbar you want to move.
3. Select Move Up or Move Down to move the command.
4. Click OK.
5. Click Close.
The command appears on the menu or toolbar with a separator before it.
To create a toolbar
1. On the Tools menu, click Customize.
2. In the Customize dialog box, on the Toolbars tab, click New.
3. In the New Toolbar dialog box, type a name for the toolbar.
4. Use the steps described earlier in this topic to add commands to the toolbar.
Changing Toolbar Layout
You can arrange toolbars by dragging them in the main docking area, or by using the Customize dialog
box to move them to other docking areas.
To arrange toolbars in the main docking area
1. Drag a toolbar by its left edge to move it where you want it.
2. Surrounding toolbars will be automatically rearranged.
3. To change the docking location of a toolbar.
4. On the Tools menu, click Customize.
5. In the Customize dialog box, on the Toolbars tab, on the Modify Selection list, select a dock
location.
6. Click Close.
Resetting the Main Menu and Shortcut Menus
If you change the locations of commands or change command icons, you can reset them to their original
configurations.
To reset a menu or toolbar
1. On the Tools menu, click Customize.
2. In the Customize dialog box, on the Commands tab, under Choose a menu or toolbar to
rearrange, select the menu or toolbar you want to reset.
3. Click Reset all.
The selected menu bar, toolbar, or context menu returns to its original configuration.
9.2 Reset Your Settings
You can reset the integrated development environment (IDE) to a previous state using the Import and
Export Settings wizard. All settings and categories are applied by default; if you want to specify which
settings to change, use the option Import selected environment settings.
To reset your settings
1. On the Tools menu, click Import and Export Settings.
Atmel Studio 7 User Guide
Menus and Settings
© 2018 Microchip Technology Inc. User Guide DS50002718A-page 281

2. On the Welcome to the Import and Export Settings Wizard page, click Reset all settings and
then click Next.
3. If you want to save your current settings combination, click Yes, save my current settings, specify
a file name, and then click Next.
—or—
If you want to delete your current settings combination, choose No, just reset settings, overwriting
my current settings, and then click Next. This option does not delete default settings, which will still
be available the next time you use the wizard.
4. In Which collection of settings do you want to reset to, select a settings collection from the list.
5. Click Finish.
The Reset Complete page alerts you to any problems encountered during the reset.
9.3 Options Dialog Box
The Options dialog box enables you to configure the integrated development environment (IDE) to your
needs. For example, you can establish a default save location for your projects, alter the default
appearance and behavior of windows, and create shortcuts for commonly used commands. There are
also options specific to your development language and platform. You can access Options from the
Tools menu.
Note: The options available in dialog boxes, and the names and locations of menu commands you see
might differ from what is described in Help depending on your active settings or edition. To change your
settings, choose Import and Export Settings on the Tools menu.
Layout of the Options dialog box
The Options dialog box is divided into two parts: a navigation pane on the left and a display area on the
right. The tree control in the navigation pane includes folder nodes, such as Environment, Text Editor,
Projects and Solutions, and Source Control. Expand any folder node to list the pages of options that it
contains. When you select the node for a particular page, its options appear in the display area.
Options for an IDE feature do not appear in the navigation pane until the feature is loaded into memory.
Therefore, the same options might not be displayed as you begin a new session that was displayed as
you ended the last. When you create a project or run a command that uses a particular application, nodes
for relevant options are added to the Options dialog box. These added options will then remain available
as long as the IDE feature remains in memory.
Note: Some settings collections scope the number of pages that appear in the navigation pane of the
Options dialog box. You can choose to view all possible pages by selecting Show all settings.
How options are applied
Clicking OK in the Options dialog box saves all settings on all pages. Clicking on Cancel any page
cancels all change requests, including any just made on other Options pages. Some changes to option
settings, such as those made on Fonts and Colors, Environment, Options Dialog Box, will only take
effect after you close and reopen Atmel Studio.
9.3.1 Environment Options
The pages in the Environment folder in the Options dialog box let you set how certain elements of the
integrated development environment (IDE) display and behave. You can access the Environment pages
by clicking Options on the Tools menu, and then click Environment.
Atmel Studio 7 User Guide
Menus and Settings
© 2018 Microchip Technology Inc. User Guide DS50002718A-page 282

9.3.1.1 General Environment Settings
Items shown in Window menu
Customizes the number of windows that appear in the Windows list of the Window menu. Type a number
between 1 and 24. By default, the number is 10.
Items shown in recently used lists
Customizes the number of most recently used projects and files that appear on the File menu. Type a
number between 1 and 24. By default, the number is 10. This is an easy way to retrieve recently used
projects and files.
Automatically adjust visual experience based on client performance
Specifies whether Atmel Studio sets the adjustment to the visual experience automatically or you set the
adjustment explicitly. This adjustment may change the display of colors from gradients to flat colors, or it
may restrict the use of animations in menus or pop-up windows.
Enable rich client experience
Enables the full visual experience of Atmel Studio, including gradients and animations. Clear this option
when using Remote Desktop connections or older graphics adapters, because these features may have
poor performance in those cases. This option is available only when you clear the Automatically adjust
visual experience based on client option.
Use hardware graphics acceleration if available
Uses hardware graphics acceleration if it is available, rather than software acceleration.
Show status bar
Displays the status bar. The status bar is located at the bottom of the IDE window and displays
information about the progress of ongoing operations.
Close button affects active tool window only
Specifies that when the Close button is clicked, only the tool window that has focus is closed and not all
of the tool windows in the docked set. By default, this option is selected.
Auto Hide button affects active tool window only
Specifies that when the Auto Hide button is clicked, only the tool window that has focus is hidden
automatically and not all of the tool windows in the docked set. By default, this option is not selected.
Restore File Associations
Registers file types that are typically associated with Atmel Studio. Registration causes Windows to
display the correct icons in Windows Explorer, and to recognize Atmel Studio as the correct application
for opening these file types.
This option can be useful if you have two different versions of Atmel Studio installed on the same
computer, and you later uninstall one of the versions. After uninstalling, the icons for Atmel Studio files no
longer appear in Windows Explorer. In addition, Windows no longer recognizes Atmel Studio as the
default application for editing these files. This option restores those associations.
9.3.1.2 Add-in/Macros Security
Add-in Security Settings
To enhance security by preventing malicious add-ins from automatically activating, Atmel Studio provides
settings in a Tools Options page named Add-in/Macros Security.
Atmel Studio 7 User Guide
Menus and Settings
© 2018 Microchip Technology Inc. User Guide DS50002718A-page 283
In addition, this options page allows you to specify the folders in which Atmel Studio searches for .Addin
registration files. This enhances security by allowing you to limit the locations where .Addin registration
files can be read, helping prevent malicious .Addin files from inadvertently being used.
The settings in the Add-in/Macros Security, Environment, and Options Dialog Box that relate to add-in
security are:
• Allow add-in components to load. Checked by default. When checked, add-ins are allowed to load
in Atmel Studio. When unchecked, add-ins are prohibited from loading in Atmel Studio.
• Allow add-in components to load from a URL. Unchecked by default. When checked, add-ins are
allowed to be loaded from external Web sites. When unchecked, remote add-ins are prohibited
from loading in Atmel Studio. If an add-in cannot load for some reason, then it cannot be loaded
from the web. This setting controls only the loading of the add-in DLL. The .Addin registration files
must always be located on the local system.
Default .Add-In File Search Locations
In addition to the security settings, the options page has a list containing folders in which to search
for .Addin registration files. By default, the following tokens are included:
• %ALLUSERSDOCUMENTS%
• %ALLUSERSPROFILE%
• %APPDATA%
• %VSAPPDATA%
• %VSCOMMONAPPDATA%
• %VSMYDOCUMENTS%
When Atmel Studio begins searching for .AddIn files, it replaces these tokens with the following path
strings:
Table 9-1. AddIn Files Search Path Tokens
Token Path
%ALLUSERSDOCUMENTS% %PUBLIC%\Documents
%ALLUSERSPROFILE% %ALLUSERSPROFILE% (defined by OS)
%APPDATA% %USERPROFILE%\AppData
%VSAPPDATA% %USERPROFILE%\AppData\Roaming\Microsoft\AVR Studio
5\<Version>
--OR--
%USERPROFILE%\AppData\Local\Microsoft\Atmel Studio 6\<Version>
%VSCOMMONAPPDATA% %ProgramData%\Microsoft\Atmel Studio 6\<Version>
%VSMYDOCUMENTS% <My Documents>\Atmel Studio 6
Note: Some of the default paths may resolve to targets that do not exist on your system.
You can remove these predefined tokens from the list by highlighting the token and clicking Remove. To
add other folders to the search list, click Add and specify a folder in the Browse for Folder dialog box.
Atmel Studio 7 User Guide
Menus and Settings
© 2018 Microchip Technology Inc. User Guide DS50002718A-page 284

9.3.1.3 AutoRecover
Use this page of the Options dialog box to specify whether or not files are automatically backed up. This
page also allows you to specify whether or not modified files are restored when the integrated
development environment (IDE) shuts down unexpectedly. You can access this dialog box by selecting
the Tools menu and choosing Options, and then select the Environment folder and choose the
AutoRecover page. If this page does not appear in the list, select Show all settings in the Options dialog
box.
Save AutoRecover information every <n> minutes
Use this option to customize how often a file is automatically saved in the editor. For previously saved
files, a copy of the file is saved in \...\My Documents\Atmel Studio 6.2\Backup Files
\<projectname>. If the file is new and has not been manually saved, the file is auto-saved using a
randomly generated file name.
Keep AutoRecover information for <n> days
Use this option to specify how long Atmel Studio keeps files created for auto-recovery.
9.3.1.4 Find and Replace
Use this page of the Options dialog box to control message boxes and other aspects of a find and replace
operation. You can access this dialog box from the Tools menu by clicking Options, expanding
Environment, and then click Find and Replace. If this page does not appear in the list, select Show all
settings in the Options dialog box.
Display informational messages
Select this option to display all Find and Replace informational messages that have the Always show
this message option. For example, if you chose not to display the message 'Find reached the starting
point of the search.', selecting this option would cause this informational message to appear again when
you use Find and Replace.
If you do not want to see any informational messages for Find and Replace, clear this option.
When you have cleared the Always show this message option on some, but not all, Find and Replace
informational messages, the Display informational messages checkbox appears to be filled but not
selected. To restore all optional Find and Replace messages, clear this option and then select it again.
Note: This option does not affect any Find and Replace informational messages that do not display the
Always show this message option.
Display warning messages
Select this option to display all cautionary Find and Replace messages that have the Always show this
message option. For example, if you chose not to display the Replace All warning message that appears
when you attempt to make replacements in files not currently opened for editing, selecting this option
would cause this warning message to appear again when you attempt to Replace All.
If you do not want to see any cautionary messages for Find and Replace, clear this option.
When you have cleared the Always show this message option on some, but not all, Find and Replace
warning messages, the Display warning messages checkbox appears to be filled but not selected. To
restore all optional Find and Replace messages, clear this option and then select it again.
Note: This option does not affect any Find and Replace warning messages that do not display the
Always show this message option.
Automatically populate Find What with text from the editor
Atmel Studio 7 User Guide
Menus and Settings
© 2018 Microchip Technology Inc. User Guide DS50002718A-page 285

Select this option to paste the text on either side of the current editor's insertion point into the Find what
field when you select any view of the Find and Replace Window window from the Edit menu. Clear this
option to use the last search pattern from the previous search as the Find what string.
Hide Find and Replace window after a match is located for Quick Find or Quick Replace
Select this option to automatically close the Find and Replace window when the first match is found for
Quick Find. To go to the next match, use the shortcut key for Edit.FindNext, usually F3, or display the
Find and Replace window again.
9.3.1.5 Fonts and Colors
The Fonts and Colors page of the Options dialog box lets you establish a custom font and color scheme
for various user interface elements in the integrated development environment (IDE). You can access this
dialog box by clicking Options on the Tools menu, and then select the Fonts and Colors page in the
Environment folder. If this page does not appear in the list, select Show all settings in the Options dialog
box.
Note: The dialog boxes and menu commands you see might differ from those described in Help
depending on your active settings or edition. To change your settings, choose Import and Export Settings
on the Tools menu.
Color scheme changes do not take effect during the session in which you make them. You can evaluate
color changes by opening another instance of Atmel Studio and producing the conditions under which
you expect your changes to apply.
Show settings for
Lists all of the user interface elements for which you can change font and color schemes. After selecting
an item from this list you can customize color settings for the item selected in Display items.
Text Editor
Changes to font style, size, and color display settings for Text Editor affect the appearance of text in your
default text editor. Documents opened in a text editor outside the IDE will not be affected by these
settings.
Printer
Changes to font style, size, and color display settings for Printer affect the appearance of text in printed
documents.
Note: As needed, you can select a different default font for printing than that used for display in the text
editor. This can be useful when printing code that contains both single-byte and double-byte characters.
Statement Completion
Changes the font style and size for the text that appears in statement completion pop-up in the editor.
Editor Tool tip
Changes the font style and size for the text that appears in ToolTips displayed in the editor.
Environment Font
Changes the font style and size for all IDE user interface elements that do not already have a separate
option in Show settings for. For example, this option applies to the Start Page but would not affect the
Output window.
[All Text Tool Windows]
Atmel Studio 7 User Guide
Menus and Settings
© 2018 Microchip Technology Inc. User Guide DS50002718A-page 286

Changes to font style, size, and color display settings for this item affect the appearance of text in tool
windows that have output panes in the IDE. For example, Output window, Command window, Immediate
window, etc.
Note: Changes to the text of [All Text Tool Windows] items do not take effect during the session in which
you make them. You can evaluate such changes by opening another instance of Atmel Studio.
Use Defaults/Use
Resets the font and color values of the list item selected in Show settings for. The Use button appears
when other display schemes are available for selection. For example, you can choose from two schemes
for the Printer.
Font (bold type indicates fixed-width fonts)
Lists all the fonts installed on your system. When the drop-down menu first appears, the current font for
the element selected in the Show settings for the field is highlighted. Fixed fonts — which are easier to
align in the editor — appear in bold.
Size
Lists available point sizes for the highlighted font. Changing the size of the font affects all Display items
for the Show settings for selection.
Display items
Lists the items for which you can modify the foreground and background color.
Note: PlainText is the default display item. As such, properties assigned to PlainText will be overridden
by properties assigned to other display items. For example, if you assign the color blue to PlainText and
the color green to Identifier, all identifiers will appear in green. In this example, Identifier properties
override PlainText properties.
Some of the display items include:
Display items
Description.
Plain Text
Text in the editor.
Selected Text
Text that is included in the current selection when the editor has focus.
Inactive Selected Text
Text that is included in the current selection when the editor has lost focus.
Indicator Margin
The margin at the left of the Code Editor where breakpoints and bookmark icons are displayed.
Line Numbers
Optional numbers that appear next to each line of code.
Visible White Space
Spaces, tabs, and word wrap indicators.
Atmel Studio 7 User Guide
Menus and Settings
© 2018 Microchip Technology Inc. User Guide DS50002718A-page 287

Bookmark
Lines that have bookmarks. A bookmark is visible only if the indicator margin is disabled.
Brace Matching (Highlight)
Highlighting that is typically bold formatting for matching braces.
Brace Matching (Rectangle)
Highlighting that is typically a grey rectangle in the background.
Breakpoint (Enabled)
Specifies the highlight color for statements or lines containing simple breakpoints. This option is
applicable only if statement-level breakpoints are active or the Highlight entire source line for breakpoints
or current statement option is selected on General, Debugging, and Options Dialog Box.
Breakpoint (Error)
Specifies the highlight color for statements or lines containing breakpoints that are in an error state.
Applicable only if statement-level breakpoints are active or the Highlight entire source line for breakpoints
or current statement option is selected on General, Debugging, and Options Dialog Box.
Breakpoint (Warning)
Specifies the highlight color for statements or lines containing breakpoints that are in a warning state.
Applicable only if statement-level breakpoints are active or the Highlight entire source line for breakpoints
or current statement option is selected on General, Debugging, and Options Dialog Box.
Breakpoint - Advanced (Disabled)
Specifies the highlight color for statements or lines containing disabled conditional or hit-counted
breakpoints. Applicable only if statement-level breakpoints are active or the Highlight entire source line for
breakpoints or current statement option is selected on General, Debugging, and Options Dialog Box.
Breakpoint - Advanced (Enabled)
Specifies the highlight color for statements or lines containing conditional or hit-counted breakpoints.
Applicable only if statement-level breakpoints are active or the Highlight entire source line for breakpoints
or current statement option is selected on General, Debugging, and Options Dialog Box.
Breakpoint - Advanced (Error)
Specifies the highlight color for statements or lines containing conditional or hit-counted breakpoints that
are in an error state. Applicable only if statement-level breakpoints are active or the Highlight entire
source line for breakpoints or current statement option is selected on General, Debugging, and Options
Dialog Box.
Breakpoint - Advanced (Warning)
Specifies the highlight color for statements or lines containing conditional or hit-counted breakpoints that
are in a warning state. Applicable only if statement-level breakpoints are active or the Highlight entire
source line for breakpoints or current statement option is selected on General, Debugging, and Options
Dialog Box.
Code Snippet Dependent Field
A field that will be updated when the current editable field is modified.
Code Snippet Field Editable
Atmel Studio 7 User Guide
Menus and Settings
© 2018 Microchip Technology Inc. User Guide DS50002718A-page 288

Field when a code snippet is active.
Collapsible Text
A block of text or code that can be toggled in and out of view within the Code Editor.
Comment
Code comments.
Compiler Error
Blue squiggles in the editor indicating a compiler error.
Coverage Not Touched Area
Code that has not been covered by a unit test.
Coverage Partially Touched Area
Code that has been partially covered by a unit test.
Coverage Touched Area
Code that has been completely covered by a unit test.
Current list location
Current line navigated to in a list tool window, such as the Output window or Find Results windows.
Current Statement
Specifies the highlight color for the source statement or line that indicates the current step position when
debugging.
Debugger Data Changed
The color of text used to display changed data inside the Registers and Memory windows.
Definition Window Background
The background color of the Code Definition window.
Definition Window Current Match
The current definition in the Code Definition window.
Disassembly File Name
The color of text used to display file name breaks inside the Disassembly window.
Disassembly Source
The color of text used to display source lines inside the Disassembly window.
Disassembly Symbol
The color of text used to display symbol names inside the Disassembly window.
Disassembly Text
The color of text used to display op-code and data inside the Disassembly window. Excluded Code that is
not to be compiled, per a conditional preprocessor directive such as #if.
Identifier
Identifiers in code such as the class names, methods names, and variable names.
Atmel Studio 7 User Guide
Menus and Settings
© 2018 Microchip Technology Inc. User Guide DS50002718A-page 289

Keyword
Keywords for the given language that are reserved. For example class and namespace.
Memory Address
The color of text used to display the address column inside the Memory window.
Memory Changed
The color of text used to display changed data inside the Memory window.
Memory Data
The color of text used to display data inside the Memory window.
Memory Unreadable
The color of text used to display unreadable memory areas within the Memory window.
Number
A number in code that represents an actual numeric value. Operators such as +, -, and !=.
Other Error
Other error types not covered by other error squiggles. Currently, this includes rude edits in
<guimenuitem>Edit and Continue</guimenuitem>.
Preprocessor Keyword
Keywords used by the preprocessor such as #include.
Read-Only Region
Code that cannot be edited. For example, code displayed in the Code Definition View window or code
that cannot be modified during Edit and Continue.
Register Data
The color of text used to display data inside the Registers window.
Register NAT
The color of text used to display unrecognized data and objects inside the Registers window.
Stale Code
Superseded code awaiting an update. In some cases, Edit and Continue cannot apply code changes
immediately but will apply them later as you continue debugging. This occurs if you edit a function that
must call the function currently executing, or if you add more than 64 bytes of new variables to a function
waiting on the call stack. When this happens, the debugger displays a 'Stale Code Warning' dialog box,
and the superseded code continues to execute until the function in question finishes and is called again.
Edit and Continue apply the code changes at that time.
String
String literals.
Syntax Error
Parse errors.
Task List Shortcut
Atmel Studio 7 User Guide
Menus and Settings
© 2018 Microchip Technology Inc. User Guide DS50002718A-page 290

If a Task List shortcut is added to a line, and the indicator margin is disabled, the line will be highlighted.
Tracepoint (Enabled)
Specifies the highlight color for statements or lines containing simple tracepoints. This option is applicable
only if statement-level tracepoints are active or the Highlight entire source line for breakpoints or current
statement option is selected on General, Debugging, and Options Dialog Box.
Tracepoint (Error)
Specifies the highlight color for statements or lines containing tracepoints that are in an error state. This
option is applicable only if statement-level tracepoints are active or the Highlight entire source line for
breakpoints or current statement option is selected on General, Debugging, and Options Dialog Box.
Tracepoint (Warning)
Specifies the highlight color for statements or lines containing tracepoints that are in a warning state. This
option is applicable only if statement-level tracepoints are active or the Highlight entire source line for
breakpoints or current statement option is selected on General, Debugging, and Options Dialog Box.
Tracepoint - Advanced (Disabled)
Specifies the highlight color for statements or lines containing disabled conditional or hit-counted
tracepoints. This option is applicable only if statement-level tracepoints are active or the Highlight entire
source line for breakpoints or current statement option is selected on General, Debugging, and Options
Dialog Box.
Tracepoint - Advanced (Enabled)
Specifies the highlight color for statements or lines containing conditional or hit-counted tracepoints. This
option is applicable only if statement-level tracepoints are active or the Highlight entire source line for
breakpoints or current statement option is selected on General, Debugging, and Options Dialog Box.
Tracepoint - Advanced (Error)
Specifies the highlight color for statements or lines containing conditional or hit-counted tracepoints that
are in an error state. This option is applicable only if statement-level tracepoints are active or the Highlight
entire source line for breakpoints or current statement option is selected on General, Debugging, and
Options Dialog Box.
Tracepoint - Advanced (Warning)
Specifies the highlight color for statements or lines containing conditional or hit-counted tracepoints that
are in a warning state. This option is applicable only if statement-level tracepoints are active or the
Highlight entire source line for breakpoints or current statement option is selected on General,
Debugging, and Options Dialog Box.
Track Changes after save
Lines of code that have been modified since the file was opened but are saved to disk.
Track Changes before save
Lines of code that have been modified since the file was opened but are not saved to disk.
User Types
Types defined by users.
User Types (Delegates)
Atmel Studio 7 User Guide
Menus and Settings
© 2018 Microchip Technology Inc. User Guide DS50002718A-page 291

Type color for delegates.
User Types (Enums)
Type color used for enums.
User Types (Interfaces)
Type color for interfaces.
User Types (Value types)
Type color for value types such as structs in C.
Warning
Compiler warnings.
Warning Lines
Path Used for Static Analysis warning lines.
XML Attribute
Attribute names.
XML Attribute Quotes
The quote characters for XML attributes.
XML Attribute Value
Contents of XML attributes.
XML Cdata Section
Contents of <![CDATA[…]]>.
XML Comment
The contents of <!-- -->.
XML Delimiter
XML Syntax delimiters, including <, <?, <!, <!--, -->, ?>, <![, ]]>, and [, ].
XML Doc Attribute
The value of an XML documentation attribute, such as <param name='I'> where the 'I' is colorized.
XML Doc Comment
The comments enclosed in the XML documentation comments.
XML Doc Tag
The tags in XML documentation comments, such as /// <summary>.
XML Keyword
DTD keywords such as CDATA, IDREF, and NDATA.
XML Name Element
Names and Processing Instructions target name.
XML Processing Instruction
Atmel Studio 7 User Guide
Menus and Settings
© 2018 Microchip Technology Inc. User Guide DS50002718A-page 292

Contents of Processing Instructions, not including target name.
XML Text Plain
Text element content.
XSLT Keyword
XSLT element names.
Item foreground
Lists the available colors you can choose for the foreground of the item selected in Display items.
Because some items are related, and should, therefore, maintain a consistent display scheme, change
the foreground color of the text and also change the defaults for elements such as Compiler Error,
Keyword, or Operator.
Automatic Items can inherit the foreground color from other display items such as Plain Text. Using this
option, when you change the color of an inherited display item, the color of the related display items also
change automatically. For example, if you selected the Automatic value for Compiler Error and later
changed the color of Plain Text to Red, the Compiler Error would also automatically inherit the color Red.
Default the color that appears for the item the first time you start AVR Studio 5. Clicking the Use Defaults
button resets to this color. Custom Displays the Color dialog box to allow you to set a custom color for the
item selected in the Display items list.
Note: Your ability to define custom colors may be limited by the color settings for your computer display.
For example, if your computer is set to display 256 colors and you select a custom color from the Color
dialog box, the IDE defaults to the closest available Basic color and displays the color black in the Color
preview box.
Item background
Provides a color palette from which you can choose a background color for the item selected in Display
items.
Because some items are related, and should, therefore, maintain a consistent display scheme, change
the background color of text, and also change the defaults for elements such as Compiler Error, Keyword,
or Operator.
Automatic Items can inherit the background color from other display items such as Plain Text.
Using this option, when you change the color of an inherited display item, the color of the related display
items also change automatically. For example, if you selected the Automatic value for Compiler Error and
later changed the color of Plain Text to Red, Compiler Error would also automatically inherit the color
Red.
Clicking the Use Defaults button resets to this color. Custom Displays the Color dialog box to allow you to
set a custom color for the item selected in the Display items list. Bold Select this option to display the text
of selected Display items in bold text. Bold text is easier to identify in the editor. Sample Displays a
sample of the font style, size, and color scheme for the Show settings for and Display items selected. You
can use this box to preview the results as you experiment with different formatting options.
9.3.1.6 Language and International Settings
The International Settings page allows you to change the default language when you have more than one
language version of the integrated development environment (IDE) installed on your machine.
Atmel Studio 7 User Guide
Menus and Settings
© 2018 Microchip Technology Inc. User Guide DS50002718A-page 293

You can access this dialog box by selecting Options from the Tools menu and then choosing
International Settings from the Environment folder. If this page does not appear in the list, select Show
all settings in the Options dialog box.
Any changes you make on this page apply only to the default IDE and do not take effect until the
environment is restarted.
Language
Lists the available languages for the installed product language versions. This option is unavailable
unless you have more than one language version installed on your machine. If multiple languages of
products or a mixed language installation of products share the environment, the language selection is
changed to Same as Microsoft Windows.
CAUTION
In a system with multiple languages installed, the build tools are not affected by this setting.
These tools use the version for the last language installed and the tools for the previously
installed language are overwritten because the build tools do not use the satellite DLL model.
9.3.1.7 Keyboard Settings
The shortcut key combinations in the scheme currently applied, (Default), depending on the settings you
have selected as well as any customizations you might have made. Visual Studio also includes seven
other keyboard mapping schemes, each of which differs from the others in the shortcut key combinations
assigned by default to various UI elements.
Commands with shortcut key combinations that are part of the Global scope can be superseded by
commands in other scopes depending on the current context of the integrated development environment
(IDE). For example, if you are editing a file, commands that are part of the Text Editor scope have
precedence over commands in the Global scope that start with the same key combination. For example,
if several Global commands have key combinations that start with CTRL + K and the Text Editor also has
several commands with key combinations that start with CTRL + K when you are editing code the Text
Editor key combinations will work and the Global key combinations will be ignored.
Note: The options available in dialog boxes, and the names and locations of menu commands you see
might differ from what is described in Help depending on your active settings or edition. This Help page
was written with General Development Settings in mind. To change your settings, from the Tools menu,
choose Import and Export Settings. For more information, see Working with Settings.
Determine the Shortcut Key Assigned to a Command
You can manually search for a command to determine whether or not it has an assigned shortcut key
combination.
To determine the shortcut key combination for a command
1. On the Tools menu, click Options.
2. Expand the Environment folder and select Keyboard.
Note: If you do not see the Keyboard page, check Show all settings located in the lower left of the
Options dialog box.
In the Show commands containing box, enter the name of the command without spaces. For
example, solutionexplorer.
3. In the list, select the correct command.
Atmel Studio 7 User Guide
Menus and Settings
© 2018 Microchip Technology Inc. User Guide DS50002718A-page 294

For example, View.SolutionExplorer.
4. If a shortcut key combination exists for the command, the combination appears in the Shortcut(s)
for selected command drop-down list.
Create Custom Shortcut Keys
You can create new shortcut key combinations for any command or change the shortcut key combination
for commands with existing combinations.
To create a new shortcut key combination
1. On the Tools menu, click Options.
2. Expand the Environment folder, and select Keyboard.
Note: If you do not see the Keyboard page, check Show all settings located in the lower left corner
of the Options dialog box. In the Show commands containing box, enter the name of the command
without spaces.
For example, solutionexplorer.
3. In the list, select the command you want to assign to a shortcut key combination.
4. On the Use new shortcut in drop-down list, select the feature area in which you want to use the
shortcut. For example, you can choose Global if you want the shortcut to work in all contexts.
Unless the same shortcut is mapped (as Global) in another editor, you can use it. Otherwise, the
editor overrides the shortcut.
Note: The following keys cannot be assigned to a command in Global: PRINT SCRN/SYS RQ,
SCROLL LOCK, PAUSE/BREAK, TAB, CAPS LOCK, INSERT, HOME, END, PAGE UP, PAGE
DOWN, Windows logo keys, Application key, any of the ARROW keys, or ENTER; NUM LOCK,
DEL, or CLEAR on the numeric keypad; or CTRL+ALT+DELETE.
5. Place the cursor in the Press shortcut key(s) box, and then use the keyboard to enter the key
combination you intend to use for the command.
Note: Shortcuts can contain the SHIFT, ALT, and/or CTRL keys in combination with letters. Be
sure to check the Shortcut currently used by box to see if the key combination is already assigned
to another command in the mapping scheme. Press BACKSPACE to delete the key combination, if
the combination is already in use, before trying another combination.
6. Click Assign.
Note: Changes made by using the Assign button are not canceled if you click the Cancel button.
Exporting and Importing Shortcut Keys
You can share the shortcut key combinations in the current keyboard mapping scheme by exporting the
information to a file so others can import the data.
To export shortcut keys only
1. On the Tools menu, choose Import and Export Settings Wizard.
2. Select Export select environment settings and then click Next.
3. Under What settings do you want to export?, clear all categories selected by default.
4. Expand Options and then expand Environment.
5. Select Keyboard and then click Next.
6. For What do you want to name your settings file?, enter a name and then click Finish.
To import only shortcut keys
1. On the Tools menu, click Import and Export Settings Wizard.
Atmel Studio 7 User Guide
Menus and Settings
© 2018 Microchip Technology Inc. User Guide DS50002718A-page 295

2. Select Import select environment settings and then click Next.
3. Click No, just import new settings, overwriting my current settings and then click Next.
4. Under My Settings, select the settings file that contains the shortcut keys you want to import or
click Browse to locate the correct settings file.
5. Click Next.
6. Under Which settings do you want to import?, clear all categories.
7. Expand Options and then expand Environment.
8. Select Keyboard and then click Finish.
9.3.1.8 Start-up Page — to Change the Default UI Displayed when You Start Atmel Studio
1. On the Tools menu, choose Options.
2. Expand Environment and then chose Startup.
3. From the At startup drop-down list, chose one of the options.
4. Click OK.
Your changes take effect the next time you start Atmel Studio.
Use this page to specify what content or user interface (UI), if any, is displayed when you start Atmel
Studio. To access this page, on the Tools menu, click Options, expand Environment, and then click
Startup. If this page does not appear in the list in the Options dialog box, select Show all settings.
Note: The options available in dialog boxes, and the names and locations of menu commands you see
might differ from what is described in Help depending on your active settings or edition. This Help page
was written with General Development settings in mind. To change your settings, on the Tools menu, click
Import and Export Settings.
At start-up
You can specify what you want to view every time you start Atmel Studio 7.
Open Home Page
Displays the default Web page specified by the Home page option in Web Browser, Environment, Options
Dialog Box.
Load last loaded solution
Loads the last saved solution in its previous state. Any files that were open in the solution when it was
last closed are opened and displayed when you start Atmel Studio. If no solution is loaded when you exit
the product, no solution is loaded when you return.
Show Open Project dialog box
Displays the Open Project dialog box when you start Atmel Studio. The dialog box uses the folder set in
the Atmel Studio Projects location field of the Projects and Solutions, Environment, Options Dialog Box.
Show New Project dialog box
Displays the New Project dialog box when you open Atmel Studio.
Show empty environment
Displays an empty integrated development environment (IDE) when you start Atmel Studio.
Show Start Page
Displays the Start Page associated with the settings that you have currently applied when you start Atmel
Studio.
Atmel Studio 7 User Guide
Menus and Settings
© 2018 Microchip Technology Inc. User Guide DS50002718A-page 296

Start Page news channel
Specifies the RSS feed used to display content in the Atmel Studio News section of the Start Page.
Download content every n minutes
Specifies how often the IDE checks for new RSS feed content and product headlines for the Start Page. If
this setting is not selected, RSS feed content and product headlines are not downloaded to the Start
Page.
Customize Start Page
If you have custom Start Pages installed, you can specify which Start Page to load. The Customize Start
Page drop-down list includes an (Default Start Page) entry to load the default Atmel Studio Start Page,
and an entry for each custom Start Page on your system.
Any .XAML file in your user start pages directory is considered a custom start page. For more information,
see Custom Start Pages.
9.3.1.9 Import and Export Settings
Use this page of the Options dialog box to set preferences for saving settings files as well as specifying
whether or not to use team settings files stored on a server. You can access this dialog box by selecting
Options from the Tools menu and choosing the Import and Export Settings page from the Environment
folder.
Tip:
If this page does not appear in the list, select Show all setting in the Options dialog box.
Note: The options available in dialog boxes, and the names and locations of menu commands you see
might differ from what is described in Help depending on your active settings or edition. This Help page
was written with General Development Settings in mind. To change your settings, choose Import and
Export Settings on the Tools menu.
Automatically load and save settings
Automatically save my settings to this file:
Displays the location and name of the .vssettings file you are currently using. When you close the IDE,
any changes you have made, such as moving windows or changing option selections, are saved to the
current file. The next time you start the IDE, your settings are loaded.
Team settings
Use team settings file:
When selected, allows you to navigate to a shared .vssettings file by using the Browse button. This
settings file is automatically re-applied each time Atmel Studio detects if a newer version is available.
Note: The location of the team settings file must be specified as a UNC path or local path. URLs and
other protocols are not supported paths.
9.3.1.10 Task List
This Options page allows you to add, delete, and change the comment tokens that generate Task List
reminders. To display these settings, select Options from the Tools menu, expand the Environment folder,
and choose Task List.
Confirm deletion of tasks
Atmel Studio 7 User Guide
Menus and Settings
© 2018 Microchip Technology Inc. User Guide DS50002718A-page 297

When selected, a message box is displayed whenever a User Task is deleted from the Task List, allowing
you to confirm the deletion. This option is selected by default.
Note: To delete a Task Comment, use the link to find the comment, and then remove it from your code.
Hide full file paths
When selected, the File column of the Task List displays only the names of files to be edited, not their full
paths.
Tokens
When you insert a comment into your code whose text begins with a token from the Token List, the Task
List displays your comment as new entry whenever the file is opened for editing. You can click this Task
List entry to jump directly to the comment line in your code.
Token List
Displays a list of tokens, and allows you to add or remove custom tokens. Comment tokens are case
sensitive.
Note: If you do not type the desired token exactly as it appears in the Token List, a comment task will
not be displayed in the Task List.
Priority
Sets the priority of tasks that use the selected token. Task comments that begin with this token are
automatically assigned the designated priority in the Task List.
Name
Enter the token string. This enables the Add button. On Add, this string is included in the Token List, and
comments that begin with this name will be displayed in the Task List.
Add
Enabled when you enter a new Name. Click to add a new token string using the values entered in the
Name and Priority fields.
Delete
Click to delete the selected token from the Token List. You cannot delete the default comment token.
Change
Click to make changes to an existing token using the values entered in the Name and Priority fields.
Note: You cannot rename or delete the default comment token, but you can change its priority level.
9.3.1.11 Web Browser Options
Sets options for both the internal Web browser and Internet Explorer. To access this dialog box, click
Options on the Tools menu, expand the Environment folder, and select Web Browser.
Note: The dialog boxes and menu commands you see might differ from those described in Help
depending on your active settings or edition. To change your settings, choose Import and Export Settings
on the Tools menu.
Attention:
Opening certain files or components from the Web can execute code on your computer.
Atmel Studio 7 User Guide
Menus and Settings
© 2018 Microchip Technology Inc. User Guide DS50002718A-page 298

Home page
Sets the page displayed when you open the Integrated Development Environment Web Browser.
Search page
Lets you designate a Search page for the internal Web browser. This location can differ from the search
page used by instances of Internet Explorer initiated outside of the integrated development environment
(IDE).
View Source in
Sets the editor used to open a Web page when you choose View Source on the page from the internal
Web browser.
Source editor
Select to view source in the Code and Text Editor.
HTML editor
Select to view source in the HTML Designer. Use this selection to edit the Web page in one of two views:
Design view or the standard text-based Source view.
External editor
Select to view source in another editor. Specify the path of any editor you choose, for example,
Notepad.exe.
Internet Explorer Options
Click to change options for Internet Explorer in the Internet Properties dialog box. Changes made in this
dialog box affect both the internal Web browser and instances of Internet Explorer initiated outside of the
Atmel Studio IDE (for example, from the Start menu).
9.3.1.12 Custom Start Pages
The Atmel Studio Start Page is a Windows Presentation Foundation (WPF) Extensible Application
Markup Language (XAML) page that runs in an Atmel Studio tool window. The Start Page tool window
can run Atmel Studio internal commands. When Atmel Studio starts, it opens the current default Start
Page. If you have installed a third-party Start Page, you can set that page as the default by using the
Options dialog box.
Installing and Applying a Custom Start Page
You can install custom Start Pages by using the Online Gallery section of Extension Manager. You can
also install directly from a Web site or local intranet page by locating and opening a .vsix file that contains
a custom Start Page, or by copying the Start Page files and pasting them into in the Documents\Atmel
Studio\StartPages\ folder on your computer.
You can apply a custom Start Page by selecting it in the Options dialog box. Start pages installed by
Extension Manager will appear in the Customize Start Page list as [InstalledExtension] Extension Name.
Start pages dropped into the \StartPages folder will include a partial file path in the list entry, as shown in
the following example.
Documents\Atmel Studio 6\StartPages\StartPage.xaml
To apply a custom Start Page
1. On the Tools menu, click Options.
2. On the left side of the Options dialog box, expand the Environment node, and then click Startup.
Atmel Studio 7 User Guide
Menus and Settings
© 2018 Microchip Technology Inc. User Guide DS50002718A-page 299

3. In the Customize Start Page list, select the Start Page you want.
4. This list includes every .xaml file in your user Start Pages folder and any installed extensions of
type StartPage.
5. Click OK.
Troubleshooting
It is possible for an error in a third-party Start Page to cause Atmel Studio to crash. If this happens, you
can start Atmel Studio in safe mode by adding the /SafeMode switch to the application, i.e.
avrstudio5.exe /SafeMode.
This prevents the bad Start Page from loading. You can then return to the Options dialog box and reset
Atmel Studio to use the default Start Page.
9.3.2 Project Options
9.3.2.1 General Settings
Sets the default path of Atmel Studio project folders, and determines the default behavior of the Output
window, Task List, and Solution Explorer as projects are developed and built. To access this dialog box,
on the Tools menu, click Options, expand Projects and Solutions, and click General.
Note: The options are available in the dialog boxes, and the names and locations of menu commands
you see, might differ from what is described in Help depending on your active settings or edition. This
Help page was written with the General Development settings in mind. To view or change your settings,
choose Import and Export Settings on the Tools menu.
Projects location
Sets the default location where new projects and solution folders and directories are created. Several
dialog boxes also use the location set in this option for folder starting points. For example, the Open
Project dialog box uses this location for the My Projects shortcut.
User project templates location
Sets the default location that is used by the New Project dialog box to create the list of My Templates.
User item templates location
Sets the default location that is used by the Add New Item dialog box to create the list of My Templates.
Always show Error List if build finishes with errors
Opens the Error List window on build completion, only if a project failed to build. Errors that occur during
the build process are displayed. When this option is cleared, the errors still occur but the window does not
open when the build is complete. This option is enabled by default.
Track Active Item in Solution Explorer
When selected, Solution Explorer automatically opens and the active item is selected. The selected item
changes as you work with different files in a project or solution, or different components in a designer.
When this option is cleared, the selection in Solution Explorer does not change automatically. This option
is enabled by default.
Show advanced build configurations
When selected, the build configuration options appear on the Project Property Pages dialog box and the
Solution Property Pages dialog box. When cleared, the build configuration options do not appear on the
Project Property Pages dialog box and the Solution Property Pages dialog box for projects that contain
Atmel Studio 7 User Guide
Menus and Settings
© 2018 Microchip Technology Inc. User Guide DS50002718A-page 300

one configuration or the two configurations debug and release. If a project has a user-defined
configuration, the build configuration options are shown.
When deselected, the commands on the Build menu, such as Build Solution, Rebuild Solution, and Clean
Solution, are performed on the Release configuration and the commands on the Debug menu, such as
Start Debugging and Start Without Debugging, are performed on the Debug configuration.
Always show solution
When selected, the solution and all commands that act on solutions are always shown in the IDE. When
cleared, all projects are created as standalone projects and you do not see the solution in Solution
Explorer or commands that act on solutions in the IDE if the solution contains only one project.
Save new projects when created
When selected, you can specify a location for your project in the New Project dialog box. When cleared,
all new projects are created as temporary projects. When you are working with temporary projects, you
can create and experiment with a project without having to specify a disk location.
Warn user when the project location is not trusted
If you attempt to create a new project or open an existing project in a location that is not fully trusted (for
example, on a UNC path or an HTTP path), a message is displayed. Use this option to specify whether
the message is displayed each time that you attempt to create or open a project in a location that is not
fully trusted.
Show Output window when build starts
Automatically displays the Output Window in the IDE at the outset of solution builds.
Prompt for symbolic renaming when renaming files
When selected, displays a message box asking whether or not Atmel Studio 7 should also rename all
references in the project to the code element.
9.3.2.2 Build and Run Options
Determines whether changed files are automatically saved when a project or its solution is built, the
maximum number of Visual C++ projects that can build at the same time, and certain default behavior on
Run. To access this dialog box, on the Tools menu, click Options, click Projects and Solutions, and then
click Build and Run.
Save all changes
Automatically saves changes to the solution file and all project files that were changed since the last build
when you press F5, or click Start on the Debug menu or Build on the Build menu. No prompt is given.
Items are saved with their current names. By default, this option is enabled.
Save changes to open documents only
Automatically saves changes to all open documents when you press F5, or click Start on the Debug
menu or Build on the Build menu. No prompt is given.
Prompt to save all changes
When selected, displays a dialog box that asks whether you want to save changes to the solution and
project items when you press F5 or click Start on the Debug menu or Build on the Build menu. The Save
As dialog box is displayed so that you can assign a name and location to your project. If this option is not
selected, the project runs by using the memory image that contains your changes, but the changes are
not saved.
Atmel Studio 7 User Guide
Menus and Settings
© 2018 Microchip Technology Inc. User Guide DS50002718A-page 301

Don't save any changes
When you run your project, the integrated development environment (IDE) runs the code version in the
open documents and does not save changes to open documents.
Maximum number of parallel project builds
Specifies the maximum number of projects that can build at the same time. To optimize the build process,
the maximum number of parallel project builds is automatically set to the number of CPUs of your
computer. The maximum is 32.
Only build start-up projects and dependencies on Run
When selected, pressing F5 or clicking Start on the Debug menu or Build on the Build menu only builds
the start-up project and its dependencies. When this option is cleared, pressing F5 builds all projects,
dependencies, and solution files. By default, this option is cleared.
Always build
The message box is not displayed and the out of date project configuration is built. This option is set
when you select Do not show this dialog again in the message, and then click Yes.
Never build
The message box is not displayed and the out of date project configuration is not built. This option is set
when you select Do not show this dialog again in the message, and then click No.
Prompt to build
Displays the message box every time that a project configuration is out of date.
Prompt to launch
Displays the message box every time that build errors occur.
Do not launch
The message box is not displayed and the application is not started. This option is set when you select
Do not show this dialog again in the message box, and then click No.
Launch old version
The message box is not displayed and the newly built version of the application is not started. This option
is set when you select Do not show this dialog again in the message box, and then click Yes.
For new solutions use the currently selected project as the start-up project
If selected, new solutions use the currently selected project as the start-up project.
MSBuild project build output verbosity
Sets the verbosity level for the build output. For more information, see the /verbosity switch in MSBuild
Command Line Reference.
MSBuild project build log file verbosity
Sets the verbosity level for the build log file. For more information, see the /verbosity switch in MSBuild
Command Line Reference.
9.3.3 Source Control
If you have plugins for source control (SVN, ClearCase, Vault, Git, etc.) installed, you should select it from
the drop-down list in this section, to activate and use your plugin with the source repository.
Atmel Studio 7 User Guide
Menus and Settings
© 2018 Microchip Technology Inc. User Guide DS50002718A-page 302

9.3.4 Text Editor Options
9.3.4.1 General Settings
This dialog box lets you change global settings for the Visual Studio Code and Text Editor. To display this
dialog box, click Options on the Tools menu, expand the Text Editor folder, and then click General.
Note: The dialog boxes and menu commands you see might differ from those described in Help
depending on your active settings or edition. To change your settings, choose Import and Export Settings
on the Tools menu.
Settings
Drag and drop text editing
When selected, this enables you to move text by selecting and dragging the text with the mouse to
another location within the current document or any other open document.
Automatic delimiter highlighting
When selected, delimiter characters that separate parameters or item-value pairs, as well as matching
braces, are highlighted.
Track changes
When selected, the code editor's selection margin displays a vertical yellow line to mark code recently
changed and vertical green lines next to unchanged code.
Auto-detect UTF-8 encoding without signature
By default, the editor detects encoding by searching for byte order marks or charset tags. If neither is
found in the current document, the code editor attempts to auto-detect UTF-8 encoding by scanning byte
sequences. To disable the auto-detection of encoding, clear this option.
Display
Selection margin
When selected, a vertical margin along the left edge of the editor's text area is displayed. You can click
this margin to select an entire line of text, or click and drag to select consecutive lines of text. Selection
Margin on/Selection Margin off
Indicator margin
When selected, a vertical margin outside the left edge of the editor's text area is displayed. When you
click in this margin, an icon and ToolTip that are related to the text appear. For example, breakpoint or
task list shortcuts appear in the indicator margin. Indicator Margin information does not print.
Vertical scroll bar
When selected, a vertical scrollbar which allows you to scroll up and down to view elements that fall
outside the viewing area of the Editor is displayed. If vertical scrollbars are not available, you can use the
Page Up, Page Down, and cursor keys to scroll.
Horizontal scroll bar
When selected, a horizontal scrollbar which allows you to scroll from side-to-side to view elements that
fall outside the viewing area of the Editor is displayed. If horizontal scrollbars are unavailable, you can
use the cursor keys to scroll.
9.3.4.2 File Extensions and Associations
There you can specify tool association of the source file extensions.
Atmel Studio 7 User Guide
Menus and Settings
© 2018 Microchip Technology Inc. User Guide DS50002718A-page 303

9.3.4.3 General Language Options
This dialog box allows you to change the default behavior of the Code Editor. These settings also apply to
other editors based upon the Code Editor, such as the HTML Designer's Source view. To open this dialog
box, select Options from the Tools menu. Within the Text Editor folder, expand the All Languages
subfolder and then select General.
CAUTION
This page sets default options for all development languages. Remember that resetting an
option in this dialog will reset the General options in all languages to whatever choices are
selected here. To change Text Editor options for just one language, expand the subfolder for
that language and select its option pages.
A grayed checkmark is displayed when an option has been selected on the General options pages for
some programming languages, but not for others.
Note: The dialog boxes and menu commands you see might differ from those described in Help
depending on your active settings or edition. To change your settings, choose Import and Export Settings
on the Tools menu.
Statement Completion
Auto list members
When selected, pop-up lists of available members, properties, values, or methods are displayed by
IntelliSense as you type in the editor. Choose any item from the pop-up list to insert the item into your
code. Selecting this option enables the Hide advanced members option.
Hide advanced members
When selected, shortens pop-up statement completion lists by displaying only those items most
commonly used. Other items are filtered from the list.
Parameter information
When selected, the complete syntax for the current declaration or procedure is displayed under the
insertion point in the editor, with all of its available parameters. The next parameter you can assign is
displayed in bold.
Settings
Enable virtual space
When this option is selected and Word wrap is cleared, you can click anywhere beyond the end of a line
in the Code Editor, and type. This feature can be used to position comments at a consistent point next to
your code.
Word wrap
When selected, any portion of a line that extends horizontally beyond the viewable editor area is
automatically displayed on the next line. Selecting this option enables the Show visual glyphs for word
wrap option.
Note: The Virtual Space feature is turned off while Word Wrap is on.
Show visual glyphs for word wrap
When selected, a return-arrow indicator is displayed where a long line wraps onto a second line.
Atmel Studio 7 User Guide
Menus and Settings
© 2018 Microchip Technology Inc. User Guide DS50002718A-page 304

Clear this option if you prefer not to display these indicators.
Note: These reminder arrows are not added to your code, and do not print. They are for reference only.
Apply Cut or Copy commands to blank lines when there is no selection
This option sets the behavior of the editor when you place the insertion point on a blank line, select
nothing, and then Copy or Cut.
When this option is selected, the blank line is copied or cut. If you then Paste, a new and blank line is
inserted.
When this option is cleared, the Cut command removes blank lines. However, the data on the Clipboard
is preserved. Therefore, if you then use the Paste command, the content most recently copied onto the
Clipboard is pasted. If nothing has been copied previously, nothing is pasted.
This setting has no effect on Copy or Cut when a line is not blank. If nothing is selected, the entire line is
copied or cut. If you then Paste, the text of the entire line and its endline character are pasted.
Tip:
To display indicators for spaces, tabs, and line ends, and thus distinguish indented lines from
lines that are entirely blank, select Advanced from the Edit menu and choose View White
Space.
Display
Line numbers
When selected, a line number appears next to each line of code.
Note: These line numbers are not added to your code, and do not print. They are for reference only.
Enable single-click URL navigation
When selected, the mouse cursor changes to a pointing hand as it passes over a URL in the editor. You
can click the URL to display the indicated page in your Web browser.
Navigation bar
When selected, the Navigation bar at the top of the code editor is displayed. Its drop-down Objects and
Members lists allow you to choose a particular object in your code, select from its members, and
navigates to the declaration of the selected member in the Code Editor.
9.3.4.4 Tabs Dialog
This dialog box allows you to change the default behavior of the Code Editor. These settings also apply to
other editors based upon the Code Editor, such as the HTML Designer's Source view. To display these
options, select Options from the Tools menu. Within the Text Editor folder expand the All Languages
subfolder and then choose Tabs.
Atmel Studio 7 User Guide
Menus and Settings
© 2018 Microchip Technology Inc. User Guide DS50002718A-page 305

CAUTION
This page sets default options for all development languages. Remember that resetting an
option in this dialog will reset the Tabs options in all languages to whatever choices are selected
here. To change Text Editor options for just one language, expand the subfolder for that
language and select its option pages.
If different settings are selected on the Tabs options pages for particular programming
languages, then the message 'The indentation settings for individual text formats conflict with
each other,' is displayed for differing Indenting options; and the message 'The tab settings for
individual text formats conflict with each other,' is displayed for differing Tab options.
Note: The dialog boxes and menu commands you see might differ from those described in Help
depending on your active settings or edition. To change your settings, choose Import and Export Settings
on the Tools menu.
Indenting
None
When selected, new lines are not indented. The insertion point is placed in the first column of a new line.
Block
When selected, new lines are automatically indented. The insertion point is placed at the same starting
point as the preceding line.
Smart
When selected, new lines are positioned to fit the code context, per other code formatting settings and
IntelliSense conventions for your development language. This option is not available for all development
languages.
For example, lines enclosed between an opening brace ( { ) and a closing brace ( } ) might automatically
be indented an extra tab stop from the position of the aligned braces.
Tab and indent size
Sets the distance in spaces between tab stops and for automatic indentation. The default is four spaces.
Tab characters, space characters, or both will be inserted to fill the specified size.
Insert spaces
When selected, indent operations insert only space characters, not TAB characters. If the Tab and Indent
size are set to 5, for example, then five space characters are inserted whenever you press the TAB key or
the Increase Indent button on the Formatting toolbar.
Keep tabs
When selected, each indent operation inserts one TAB character.
9.3.4.5 AVR Assembler Language-Specific Settings
General Language Options
This dialog box allows you to change the default behavior of the Code Editor. These settings also apply to
other editors based upon the Code Editor, such as the HTML Designer's Source view. To open this dialog
box, select Options from the Tools menu. Within the Text Editor folder, expand the All Languages
subfolder and then choose General.
Atmel Studio 7 User Guide
Menus and Settings
© 2018 Microchip Technology Inc. User Guide DS50002718A-page 306

CAUTION
This page sets default options for all development languages. Remember that resetting an
option in this dialog will reset the General options in all languages to whatever choices are
selected here. To change Text Editor options for just one language, expand the subfolder for
that language and select its option pages.
A grayed checkmark is displayed when an option has been selected on the General options pages for
some programming languages, but not for others.
Note: The dialog boxes and menu commands you see might differ from those described in Help
depending on your active settings or edition. To change your settings, choose Import and Export Settings
on the Tools menu.
Statement Completion
Auto list members
When selected, pop-up lists of available members, properties, values, or methods are displayed by
IntelliSense as you type in the editor. Choose any item from the pop-up list to insert the item into your
code. Selecting this option enables the Hide advanced members option.
Hide advanced members
When selected it shortens the pop-up statement completion lists by displaying only those items most
commonly used. Other items are filtered from the list.
Parameter information
When selected, the complete syntax for the current declaration or procedure is displayed under the
insertion point in the editor, with all of its available parameters. The next parameter you can assign is
displayed in bold.
Settings
Enable virtual space
When this option is selected and Word wrap is cleared, you can click anywhere beyond the end of a line
in the Code Editor and type. This feature can be used to position comments at a consistent point next to
your code.
Word wrap
When selected, any portion of a line that extends horizontally beyond the viewable editor area is
automatically displayed on the next line. Selecting this option enables the Show visual glyphs for word
wrap option.
Note: The Virtual Space feature is turned off while Word Wrap is on.
Show visual glyphs for word wrap
When selected, a return-arrow indicator is displayed where a long line wraps onto a second line.
Clear this option if you prefer not to display these indicators.
Note: These reminder arrows are not added to your code, and do not print. They are for reference only.
Apply Cut or Copy commands to blank lines when there is no selection
Atmel Studio 7 User Guide
Menus and Settings
© 2018 Microchip Technology Inc. User Guide DS50002718A-page 307

This option sets the behavior of the editor when you place the insertion point on a blank line, select
nothing, and then Copy or Cut.
When this option is selected, the blank line is copied or cut. If you then Paste, a new, blank line is
inserted.
When this option is cleared, the Cut command removes blank lines. However, the data on the Clipboard
is preserved. Therefore, if you then use the Paste command, the content most recently copied onto the
Clipboard is pasted. If nothing has been copied previously, nothing is pasted.
This setting has no effect on Copy or Cut when a line is not blank. If nothing is selected, the entire line is
copied or cut. If you then Paste, the text of the entire line and its endline character are pasted.
Tip:
To display indicators for spaces, tabs, and line ends, and thus distinguish indented lines from
lines that are entirely blank, select Advanced from the Edit menu and choose View White
Space.
Display
Line numbers
When selected, a line number appears next to each line of code.
Note: These line numbers are not added to your code, and do not print. They are for reference only.
Enable single-click URL navigation
When selected, the mouse cursor changes to a pointing hand as it passes over a URL in the editor. You
can click the URL to display the indicated page in your Web browser.
Navigation bar
When selected, displays the Navigation bar at the top of the code editor. Its drop-down Objects and
Members lists allow you to choose a particular object in your code, select from its members, and
navigates to the declaration of the selected member in the Code Editor.
Tabs Dialog
This dialog box allows you to change the default behavior of the Code Editor. These settings also apply to
other editors based upon the Code Editor, such as the HTML Designer's Source view. To display these
options, select Options from the Tools menu. Within the Text Editor folder expand the All Languages
subfolder and then choose Tabs.
CAUTION
This page sets default options for all development languages. Remember that resetting an
option in this dialog will reset the Tabs options in all languages to whatever choices are selected
here. To change Text Editor options for just one language, expand the subfolder for that
language and select its option pages.
If different settings are selected on the Tabs options pages for particular programming
languages, then the message 'The indentation settings for individual text formats conflict with
each other,' is displayed for differing Indenting options; and the message 'The tab settings for
individual text formats conflict with each other,' is displayed for differing Tab options.
Atmel Studio 7 User Guide
Menus and Settings
© 2018 Microchip Technology Inc. User Guide DS50002718A-page 308

Note: The dialog boxes and menu commands you see might differ from those described in Help
depending on your active settings or edition. To change your settings, choose Import and Export Settings
on the Tools menu.
Indenting
None
When selected, new lines are not indented. The insertion point is placed in the first column of a new line.
Block
When selected, new lines are automatically indented. The insertion point is placed at the same starting
point as the preceding line.
Smart
When selected, new lines are positioned to fit the code context, per other code formatting settings and
IntelliSense conventions for your development language. This option is not available for all development
languages.
For example, lines enclosed between an opening brace ( { ) and a closing brace ( } ) might automatically
be indented an extra tab stop from the position of the aligned braces.
Tab and indent size
Sets the distance in spaces between tab stops and for automatic indentation. The default is four spaces.
Tab characters, space characters, or both will be inserted to fill the specified size.
Insert spaces
When selected, indent operations insert only space characters, not TAB characters. If the Tab and Indent
size are set to 5, for example, then five space characters are inserted whenever you press the TAB key or
the Increase Indent button on the Formatting toolbar.
Keep tabs
When selected, each indent operation inserts one TAB character.
9.3.4.6 AVR GCC Language-Specific Settings
General Language Options
This dialog box allows you to change the default behavior of the Code Editor. These settings also apply to
other editors based upon the Code Editor, such as the HTML Designer's Source view. To open this dialog
box, select Options from the Tools menu. Within the Text Editor folder, expand the All Languages
subfolder and then choose General.
CAUTION
This page sets default options for all development languages. Remember that resetting an
option in this dialog will reset the General options in all languages to whatever choices are
selected here. To change Text Editor options for just one language, expand the subfolder for
that language and select its option pages.
A grayed checkmark is displayed when an option has been selected on the General options pages for
some programming languages, but not for others.
Atmel Studio 7 User Guide
Menus and Settings
© 2018 Microchip Technology Inc. User Guide DS50002718A-page 309

Note: The dialog boxes and menu commands you see might differ from those described in Help
depending on your active settings or edition. To change your settings, choose Import and Export Settings
on the Tools menu.
Statement Completion
Auto list members
When selected, pop-up lists of available members, properties, values, or methods are displayed by
IntelliSense as you type in the editor. Choose any item from the pop-up list to insert the item into your
code. Selecting this option enables the Hide advanced members option.
Hide advanced members
When selected it shortens the pop-up statement completion lists by displaying only those items most
commonly used. Other items are filtered from the list.
Parameter information
When selected, the complete syntax for the current declaration or procedure is displayed under the
insertion point in the editor, with all of its available parameters. The next parameter you can assign is
displayed in bold.
Settings
Enable virtual space
When this option is selected and Word wrap is cleared, you can click anywhere beyond the end of a line
in the Code Editor and type. This feature can be used to position comments at a consistent point next to
your code.
Word wrap
When selected, any portion of a line that extends horizontally beyond the viewable editor area is
automatically displayed on the next line. Selecting this option enables the Show visual glyphs for word
wrap option.
Note: The Virtual Space feature is turned off while Word Wrap is on.
Show visual glyphs for word wrap
When selected, a return-arrow indicator is displayed where a long line wraps onto a second line.
Clear this option if you prefer not to display these indicators.
Note: These reminder arrows are not added to your code, and do not print. They are for reference only.
Apply Cut or Copy commands to blank lines when there is no selection
This option sets the behavior of the editor when you place the insertion point on a blank line, select
nothing, and then Copy or Cut.
When this option is selected, the blank line is copied or cut. If you then Paste, a new, blank line is
inserted.
When this option is cleared, the Cut command removes blank lines. However, the data on the Clipboard
is preserved. Therefore, if you then use the Paste command, the content most recently copied onto the
Clipboard is pasted. If nothing has been copied previously, nothing is pasted.
This setting has no effect on Copy or Cut when a line is not blank. If nothing is selected, the entire line is
copied or cut. If you then Paste, the text of the entire line and its endline character are pasted.
Atmel Studio 7 User Guide
Menus and Settings
© 2018 Microchip Technology Inc. User Guide DS50002718A-page 310

Tip:
To display indicators for spaces, tabs, and line ends, and thus distinguish indented lines from
lines that are entirely blank, select Advanced from the Edit menu and choose View White
Space.
Display
Line numbers
When selected, a line number appears next to each line of code.
Note: These line numbers are not added to your code, and do not print. They are for reference only.
Enable single-click URL navigation
When selected, the mouse cursor changes to a pointing hand as it passes over a URL in the editor. You
can click the URL to display the indicated page in your Web browser.
Navigation bar
When selected, displays the Navigation bar at the top of the code editor. Its drop-down Objects and
Members lists allow you to choose a particular object in your code, select from its members, and
navigates to the declaration of the selected member in the Code Editor.
Tabs Dialog
This dialog box allows you to change the default behavior of the Code Editor. These settings also apply to
other editors based upon the Code Editor, such as the HTML Designer's Source view. To display these
options, select Options from the Tools menu. Within the Text Editor folder expand the All Languages
subfolder and then choose Tabs.
CAUTION
This page sets default options for all development languages. Remember that resetting an
option in this dialog will reset the Tabs options in all languages to whatever choices are selected
here. To change Text Editor options for just one language, expand the subfolder for that
language and select its option pages.
If different settings are selected on the Tabs options pages for particular programming
languages, then the message 'The indentation settings for individual text formats conflict with
each other,' is displayed for differing Indenting options; and the message 'The tab settings for
individual text formats conflict with each other,' is displayed for differing Tab options.
Note: The dialog boxes and menu commands you see might differ from those described in Help
depending on your active settings or edition. To change your settings, choose Import and Export Settings
on the Tools menu.
Indenting
None
When selected, new lines are not indented. The insertion point is placed in the first column of a new line.
Block
When selected, new lines are automatically indented. The insertion point is placed at the same starting
point as the preceding line.
Atmel Studio 7 User Guide
Menus and Settings
© 2018 Microchip Technology Inc. User Guide DS50002718A-page 311

Smart
When selected, new lines are positioned to fit the code context, per other code formatting settings and
IntelliSense conventions for your development language. This option is not available for all development
languages.
For example, lines enclosed between an opening brace ( { ) and a closing brace ( } ) might automatically
be indented an extra tab stop from the position of the aligned braces.
Tab and indent size
Sets the distance in spaces between tab stops and for automatic indentation. The default is four spaces.
Tab characters, space characters, or both will be inserted to fill the specified size.
Insert spaces
When selected, indent operations insert only space characters, not TAB characters. If the Tab and Indent
size are set to 5, for example, then five space characters are inserted whenever you press the TAB key or
the Increase Indent button on the Formatting toolbar.
Keep tabs
When selected, each indent operation inserts one TAB character.
9.3.4.7 Plain Text Settings
General Language Options
This dialog box allows you to change the default behavior of the Code Editor. These settings also apply to
other editors based upon the Code Editor, such as the HTML Designer's Source view. To open this dialog
box, select Options from the Tools menu. Within the Text Editor folder, expand the All Languages
subfolder and then choose General.
CAUTION
This page sets default options for all development languages. Remember that resetting an
option in this dialog will reset the General options in all languages to whatever choices are
selected here. To change Text Editor options for just one language, expand the subfolder for
that language and select its option pages.
A grayed checkmark is displayed when an option has been selected on the General options pages for
some programming languages, but not for others.
Note: The dialog boxes and menu commands you see might differ from those described in Help
depending on your active settings or edition. To change your settings, choose Import and Export Settings
on the Tools menu.
Statement Completion
Auto list members
When selected, pop-up lists of available members, properties, values, or methods are displayed by
IntelliSense as you type in the editor. Choose any item from the pop-up list to insert the item into your
code. Selecting this option enables the Hide advanced members option.
Hide advanced members
When selected, it shortens the pop-up statement completion lists by displaying only those items most
commonly used. Other items are filtered from the list.
Atmel Studio 7 User Guide
Menus and Settings
© 2018 Microchip Technology Inc. User Guide DS50002718A-page 312

Parameter information
When selected, the complete syntax for the current declaration or procedure is displayed under the
insertion point in the editor, with all of its available parameters. The next parameter you can assign is
displayed in bold.
Settings
Enable virtual space
When this option is selected and Word wrap is cleared, you can click anywhere beyond the end of a line
in the Code Editor and type. This feature can be used to position comments at a consistent point next to
your code.
Word wrap
When selected, any portion of a line that extends horizontally beyond the viewable editor area is
automatically displayed on the next line. Selecting this option enables the Show visual glyphs for word
wrap option.
Note: The Virtual Space feature is turned OFF while Word Wrap is ON.
Show visual glyphs for word wrap
When selected, a return-arrow indicator is displayed where a long line wraps onto a second line.
Clear this option if you prefer not to display these indicators.
Note: These reminder arrows are not added to your code, and do not print. They are for reference only.
Apply Cut or Copy commands to blank lines when there is no selection
This option sets the behavior of the editor when you place the insertion point on a blank line, select
nothing, and then Copy or Cut.
When this option is selected, the blank line is copied or cut. If you then Paste, a new, blank line is
inserted.
When this option is cleared, the Cut command removes blank lines. However, the data on the Clipboard
is preserved. Therefore, if you then use the Paste command, the content most recently copied onto the
Clipboard is pasted. If nothing has been copied previously, nothing is pasted.
This setting has no effect on Copy or Cut when a line is not blank. If nothing is selected, the entire line is
copied or cut. If you then Paste, the text of the entire line and its endline character are pasted.
Tip:
To display indicators for spaces, tabs, and line ends, and thus distinguish indented lines from
lines that are entirely blank, select Advanced from the Edit menu and choose View White
Space.
Display
Line numbers
When selected, a line number appears next to each line of code.
Note: These line numbers are not added to your code, and do not print. They are for reference only.
Enable single-click URL navigation
Atmel Studio 7 User Guide
Menus and Settings
© 2018 Microchip Technology Inc. User Guide DS50002718A-page 313

When selected, the mouse cursor changes to a pointing hand as it passes over a URL in the editor. You
can click the URL to display the indicated page in your Web browser.
Navigation bar
When selected, displays the Navigation bar at the top of the code editor. Its drop-down Objects and
Members lists allow you to choose a particular object in your code, select from its members, and
navigates to the declaration of the selected member in the Code Editor.
Tabs Dialog
This dialog box allows you to change the default behavior of the Code Editor. These settings also apply to
other editors based upon the Code Editor, such as the HTML Designer's Source view. To display these
options, select Options from the Tools menu. Within the Text Editor folder expand the All Languages
subfolder and then choose Tabs.
CAUTION
This page sets default options for all development languages. Remember that resetting an
option in this dialog will reset the Tabs options in all languages to whatever choices are selected
here. To change Text Editor options for just one language, expand the subfolder for that
language and select its option pages.
If different settings are selected on the Tabs options pages for particular programming
languages, then the message 'The indentation settings for individual text formats conflict with
each other,' is displayed for differing Indenting options; and the message 'The tab settings for
individual text formats conflict with each other,' is displayed for differing Tab options.
Note: The dialog boxes and menu commands you see might differ from those described in Help
depending on your active settings or edition. To change your settings, choose Import and Export Settings
on the Tools menu.
Indenting
None
When selected, new lines are not indented. The insertion point is placed in the first column of a new line.
Block
When selected, new lines are automatically indented. The insertion point is placed at the same starting
point as the preceding line.
Smart
When selected, new lines are positioned to fit the code context, per other code formatting settings and
IntelliSense conventions for your development language. This option is not available for all development
languages.
For example, lines enclosed between an opening brace ( { ) and a closing brace ( } ) might automatically
be indented an extra tab stop from the position of the aligned braces.
Tab and indent size
Sets the distance in spaces between tab stops and for automatic indentation. The default is four spaces.
Tab characters, space characters, or both will be inserted to fill the specified size.
Insert spaces
Atmel Studio 7 User Guide
Menus and Settings
© 2018 Microchip Technology Inc. User Guide DS50002718A-page 314

When selected, indent operations insert only space characters, not TAB characters. If the Tab and Indent
size are set to 5, for example, then five space characters are inserted whenever you press the TAB key or
the Increase Indent button on the Formatting toolbar.
Keep tabs
When selected, each indent operation inserts one TAB character.
9.3.4.8 XML Settings
General Language Options
This dialog box allows you to change the default behavior of the Code Editor. These settings also apply to
other editors based upon the Code Editor, such as the HTML Designer's Source view. To open this dialog
box, select Options from the Tools menu. Within the Text Editor folder, expand the All Languages
subfolder and then choose General.
CAUTION
This page sets default options for all development languages. Remember that resetting an
option in this dialog will reset the General options in all languages to whatever choices are
selected here. To change Text Editor options for just one language, expand the subfolder for
that language and select its option pages.
A grayed checkmark is displayed when an option has been selected on the General options pages for
some programming languages, but not for others.
Note: The dialog boxes and menu commands you see might differ from those described in Help
depending on your active settings or edition. To change your settings, choose Import and Export Settings
on the Tools menu.
Statement Completion
Auto list members
When selected, pop-up lists of available members, properties, values, or methods are displayed by
IntelliSense as you type in the editor. Choose any item from the pop-up list to insert the item into your
code. Selecting this option enables the Hide advanced members option.
Hide advanced members
When selected, shortens pop-up statement completion lists by displaying only those items most
commonly used. Other items are filtered from the list.
Parameter information
When selected, the complete syntax for the current declaration or procedure is displayed under the
insertion point in the editor, with all of its available parameters. The next parameter you can assign is
displayed in bold.
Settings
Enable virtual space
When this option is selected and Word wrap is cleared, you can click anywhere beyond the end of a line
in the Code Editor and type. This feature can be used to position comments at a consistent point next to
your code.
Word wrap
Atmel Studio 7 User Guide
Menus and Settings
© 2018 Microchip Technology Inc. User Guide DS50002718A-page 315

When selected, any portion of a line that extends horizontally beyond the viewable editor area is
automatically displayed on the next line. Selecting this option enables the Show visual glyphs for word
wrap option.
Note: The Virtual Space feature is turned off while Word Wrap is on.
Show visual glyphs for word wrap
When selected, a return-arrow indicator is displayed where a long line wraps onto a second line.
Clear this option if you prefer not to display these indicators.
Note: These reminder arrows are not added to your code, and do not print. They are for reference only.
Apply Cut or Copy commands to blank lines when there is no selection
This option sets the behavior of the editor when you place the insertion point on a blank line, select
nothing, and then Copy or Cut.
When this option is selected, the blank line is copied or cut. If you then Paste, a new, blank line is
inserted.
When this option is cleared, the Cut command removes blank lines. However, the data on the Clipboard
is preserved. Therefore, if you then use the Paste command, the content most recently copied onto the
Clipboard is pasted. If nothing has been copied previously, nothing is pasted.
This setting has no effect on Copy or Cut when a line is not blank. If nothing is selected, the entire line is
copied or cut. If you then Paste, the text of the entire line and its endline character are pasted.
Tip:
To display indicators for spaces, tabs, and line ends, and thus distinguish indented lines from
lines that are entirely blank, select Advanced from the Edit menu and choose View White
Space.
Display
Line numbers
When selected, a line number appears next to each line of code.
Note: These line numbers are not added to your code, and do not print. They are for reference only.
Enable single-click URL navigation
When selected, the mouse cursor changes to a pointing hand as it passes over a URL in the editor. You
can click the URL to display the indicated page in your Web browser.
Navigation bar
When selected, displays the Navigation bar at the top of the code editor. Its drop-down Objects and
Members lists allow you to choose a particular object in your code, select from its members, and
navigates to the declaration of the selected member in the Code Editor.
Tabs Dialog
This dialog box allows you to change the default behavior of the Code Editor. These settings also apply to
other editors based upon the Code Editor, such as the HTML Designer's Source view. To display these
options, select Options from the Tools menu. Within the Text Editor folder expand the All Languages
subfolder and then choose Tabs.
Atmel Studio 7 User Guide
Menus and Settings
© 2018 Microchip Technology Inc. User Guide DS50002718A-page 316

CAUTION
This page sets default options for all development languages. Remember that resetting an
option in this dialog will reset the Tabs options in all languages to whatever choices are selected
here. To change Text Editor options for just one language, expand the subfolder for that
language and select its option pages.
If different settings are selected on the Tabs options pages for particular programming
languages, then the message 'The indentation settings for individual text formats conflict with
each other,' is displayed for differing Indenting options; and the message 'The tab settings for
individual text formats conflict with each other,' is displayed for differing Tab options.
Note: The dialog boxes and menu commands you see might differ from those described in Help
depending on your active settings or edition. To change your settings, choose Import and Export Settings
on the Tools menu.
Indenting
None
When selected, new lines are not indented. The insertion point is placed in the first column of a new line.
Block
When selected, new lines are automatically indented. The insertion point is placed at the same starting
point as the preceding line.
Smart
When selected, new lines are positioned to fit the code context, per other code formatting settings and
IntelliSense conventions for your development language. This option is not available for all development
languages.
For example, lines enclosed between an opening brace ( { ) and a closing brace ( } ) might automatically
be indented an extra tab stop from the position of the aligned braces.
Tab and indent size
Sets the distance in spaces between tab stops and for automatic indentation. The default is four spaces.
Tab characters, space characters, or both will be inserted to fill the specified size.
Insert spaces
When selected, indent operations insert only space characters, not TAB characters. If the Tab and Indent
size are set to 5, for example, then five space characters are inserted whenever you press the TAB key or
the Increase Indent button on the Formatting toolbar.
Keep tabs
When selected, each indent operation inserts one TAB character.
XML Formatting Options
This dialog box allows you to specify the formatting settings for the XML Editor. You can access the
Options dialog box from the Tools menu.
Note: These settings are available when you select the Text Editor folder, the XML folder, and then the
Formatting option from the Options dialog box.
Attributes
Atmel Studio 7 User Guide
Menus and Settings
© 2018 Microchip Technology Inc. User Guide DS50002718A-page 317

Preserve manual attribute formatting Attributes are not reformatted. This is the default.
Note: If the attributes are on multiple lines, the editor indents each line of attributes to match the
indentation of the parent element.
Align attributes each on their own line
Aligns the second and subsequent attributes vertically to match the indentation of the first attribute. The
following XML text is an example of how the attributes would be aligned.
<item id = "123-A"
name = "hammer"
price = "9.95">
</item>
Auto Reformat
On paste from the Clipboard
Reformats XML text pasted from the Clipboard.
On completion of end tag
Reformats the element when the end tag is completed.
Mixed Content
Preserve mixed content by default
Determines whether the editor reformats mixed content. By default, the editor attempts to reformat mixed
content, except when the content is found in an xml:space="preserve" scope.
If an element contains a mix of text and markup, the contents are considered to be mixed content. The
following is an example of an element with mixed content.
<dir>c:\data\AlphaProject\
<file readOnly="false">test1.txt</file>
<file readOnly="false">test2.txt</file>
</dir>
XML Miscellaneous Options
This dialog box allows you to change the autocompletion and schema settings for the XML Editor. You
can access the Options dialog box from the Tools menu.
Note: These settings are available when you select the Text Editor folder, the XML folder, and then the
Miscellaneous option from the Options dialog box.
Auto Insert
Close tags
If the autocompletion setting is checked, the editor automatically adds an end tag when you type a right
angle bracket (>) to close a start tag, if the tag is not already closed. This is the default behavior.
The completion of an empty element does not depend on the autocompletion setting. You can always
autocomplete an empty element by typing a backslash (/).
Attribute quotes
When authoring XML attributes, the editor inserts the =" " characters and positions the caret (^) inside the
double quotes.
Selected by default.
Atmel Studio 7 User Guide
Menus and Settings
© 2018 Microchip Technology Inc. User Guide DS50002718A-page 318

Namespace declarations
The editor automatically inserts namespace declarations wherever they are needed.
Selected by default.
Other markup (Comments, CDATA)
Comments, CDATA, DOCTYPE, processing instructions, and other markup are auto-completed.
Selected by default.
Network
Automatically download DTDs and schemas
Schemas and document type definitions (DTDs) are automatically downloaded from HTTP locations. This
feature uses System.Net with auto-proxy server detection enabled.
Selected by default.
Outlining
Enter outlining mode when files open
Turns on the outlining feature when a file is opened.
Selected by default.
Caching
Schemas
Specifies the location of the schema cache. The browse button ( ...) opens the Directory Browse dialog
box at the current schema cache location. You can select a different directory, or you can select a folder
in the dialog, right-click, and choose Open to see what is in the directory.
9.3.5 Debugger
9.3.5.1 Usage
In Atmel Studio, you can specify various settings for debugger behavior, including how variables are
displayed, whether certain warnings are presented, how breakpoints are set, and how breaking affects
running programs. You specify debugger settings in the Options dialog box.
To set debugger options
On the Tools menu, click Options.
In the Options dialog box, open the Debugging folder.
In the Debugging folder, choose the category of options you want.
9.3.5.2 AVR Debugger Settings
AVR Communication Timeout
Shows the timeout delay used for communication with the back-end. If the watchdog detects that timeout
is exceeded the back-end is restarted. 20000 ms by default.
AVR Debugger Path
Shows the path to the AVR Debugger.
AVR Debugger Port
Atmel Studio 7 User Guide
Menus and Settings
© 2018 Microchip Technology Inc. User Guide DS50002718A-page 319

Indicates the Windows Comm API Port number, used by the AVR debugger. 0 by default.
RPC transaction times
Filename to put statistic logging in. This is log data from the communication with the back-end. Empty
means no logging. Note that the file must be written to a directory where the user has write permission.
E.g. C:/tmp/transactionlog.csv
User Tool polling
Use internal port polling method for hardware tool discovery, instead of relying on Windows Comm
Framework. Must restart Atmel Studio if activated, it may slow down your PC considerably, so use it only
if you have errors related to Windows Comm Framework. Disabled by default.
9.3.6 Advanced Software Framework Settings
Path of the application used to compare files
An application is normally used to compare files in the Advanced Software Framework, as such you must
specify a path here.
Command line arguments used for file comparison
Command line argument macros:
• %original - Path of the original Software Framework file.
• %mine - Path of the modified file in the local project
If the command line for the configured file compare application is FileCompare.exe filepath1
filepath2, specify %original for filepath1 and %mine for filepath2. For example, if configuring
WinMerge as the compare application, specify the following command line arguments: %original
%mine /s /u.
Atmel Studio 7 User Guide
Menus and Settings
© 2018 Microchip Technology Inc. User Guide DS50002718A-page 320
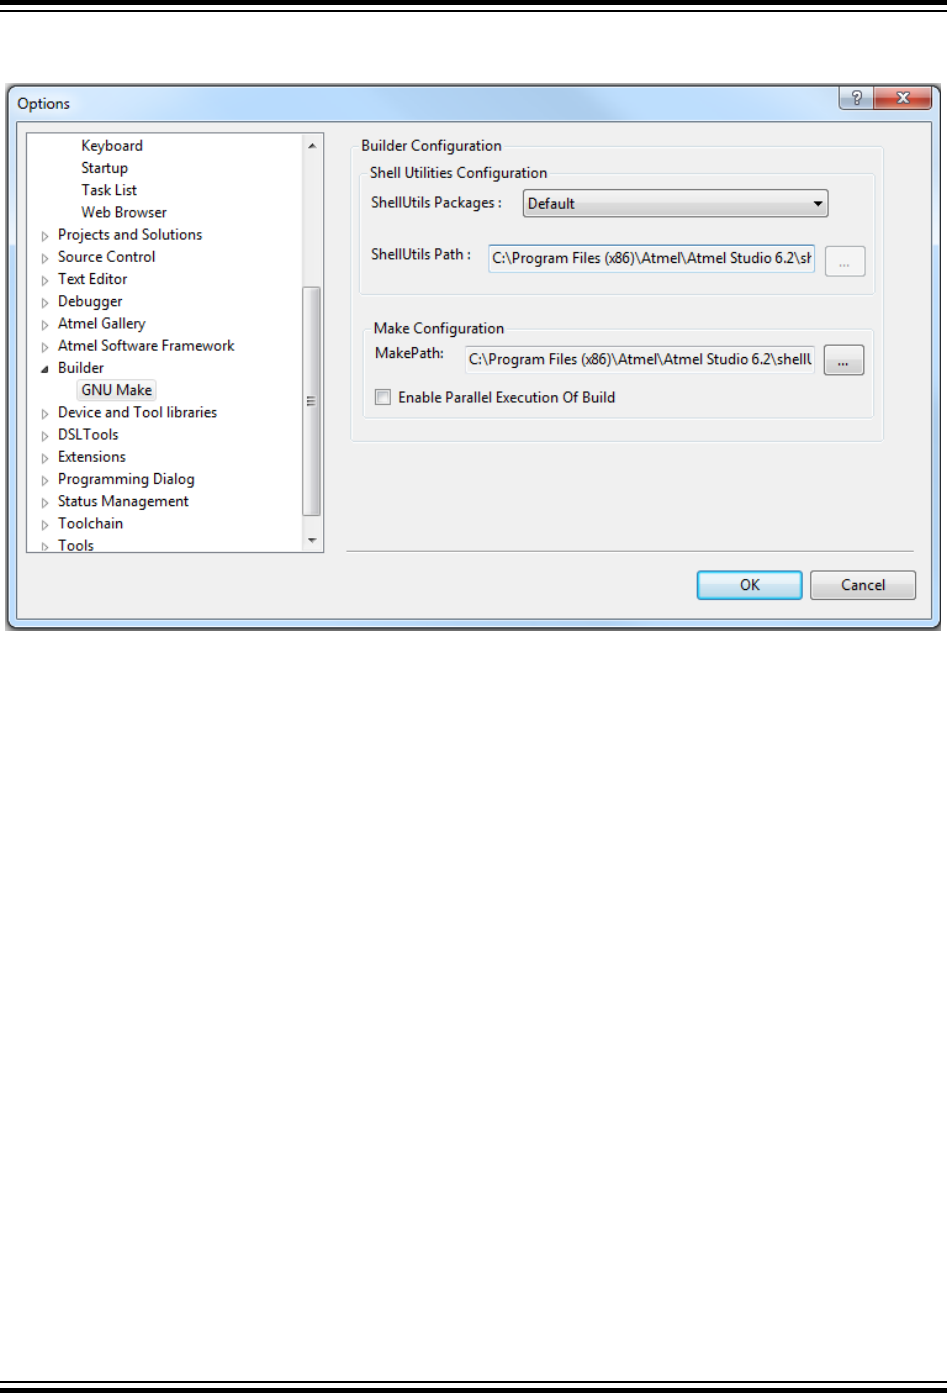
9.3.7 Builder
Figure 9-1. Builder
ShellUtils Packages
It will list Default, Custom, and installed Shell Utility extensions.
ShellUtils Path
Based on the package selected the ShellUtils Path will point to the corresponding utilities folder. If you
select a custom ShellUtil package then you can configure a custom Shell utilities folder by clicking on the
select file( ...) button. If you select default or installed shell extension package then the path will be read-
only and point to the package path.
Make Configuration
You can configure the path to the Make executable by clicking on the select file( ...) button by default it
points to INSTALLDIR\shellUtils\make.exe and you can enable parallel build of projects by checking the
box.
9.3.8 Device and Tool Libraries
In the Devices sub-menu you can specify the path to custom libraries for your device. In the Tools
submenu, you can specify the path to custom tools for your device.
9.3.9 Status Management
Contains path to the log files and logging settings.
Location
Path to the log file. You can change it by clicking and browsing to the desired location.
Severity threshold
Atmel Studio 7 User Guide
Menus and Settings
© 2018 Microchip Technology Inc. User Guide DS50002718A-page 321
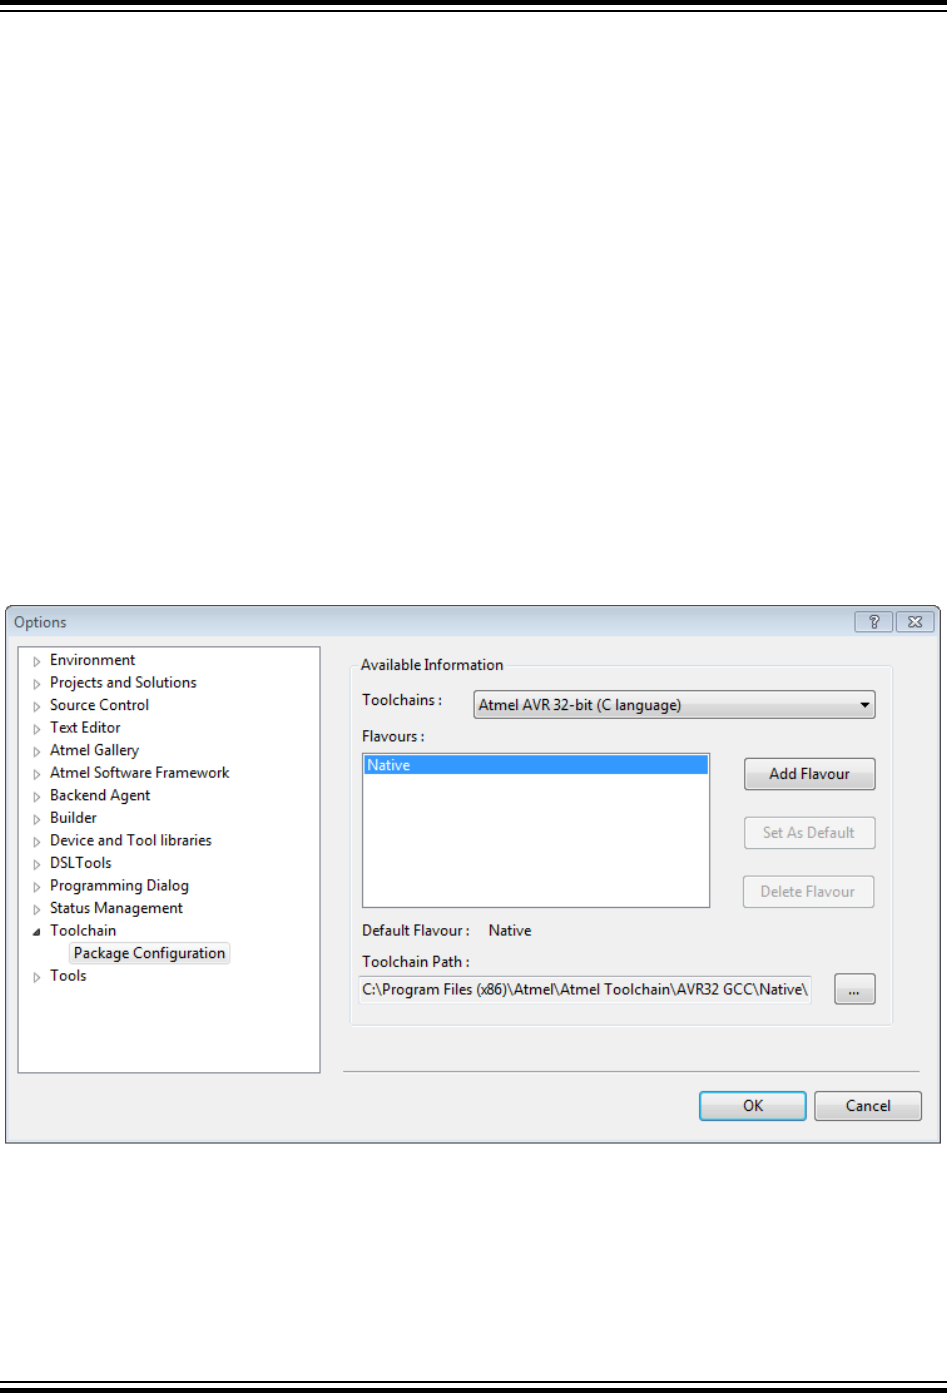
How severe the incident must be in order to generate a log entry. You can choose whether you want to
have an output when all operations are successful - OK level, when some unorthodox code is present -
Info level, when some operations have been canceled - Cancel setting. If you want to generate output
only in the case when the code is potentially unstable or erroneous, choose either Warning or Error
setting.
Component filter
Filter messages coming from the source code for standard or custom components in your design.
Severity threshold
Meaning identical to the Severity threshold for your source code log generation.
Use filter
Whether the logging process should use a filter to separate components output from your code output.
9.3.10 Text Templating
Show security message
Display a dialog prompting the user to ensure that the text templates are from a trusted source when a
text transformation operation is initiated.
9.3.11 Toolchain
Figure 9-2. Toolchain Flavor Configuration
Toolchain
Toolchain is used to compile, link, and transform the source code to an executable form targeting the AVR
devices. By default, AVR Studio has the following Toolchain Type extensions.
Atmel Studio 7 User Guide
Menus and Settings
© 2018 Microchip Technology Inc. User Guide DS50002718A-page 322
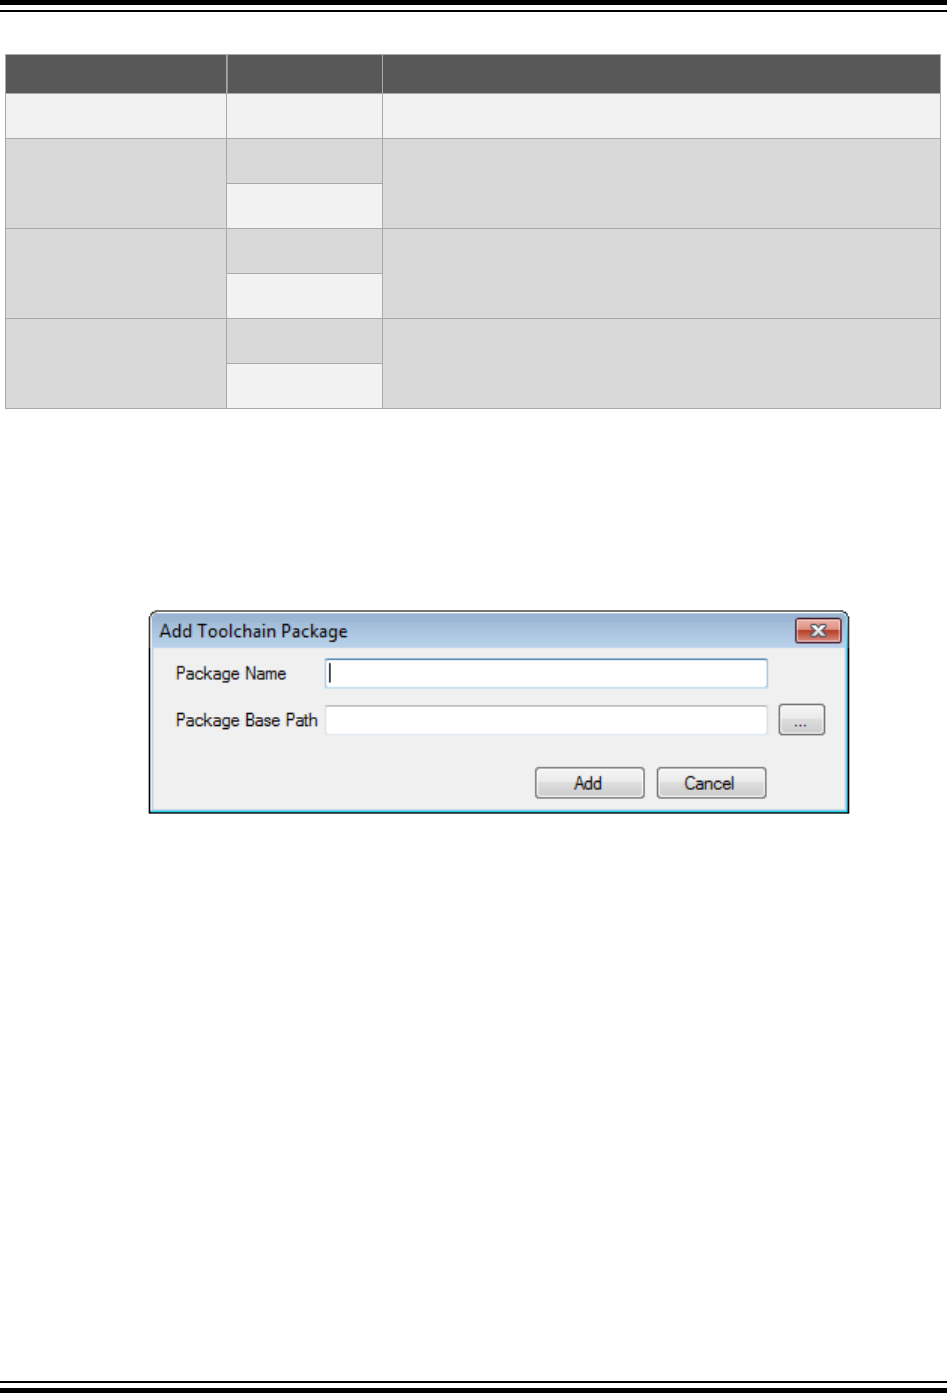
Table 9-2. Toolchain Options
Toolchain type Language Description
AVR Assembler Assembly Used for building 8-Bit Assembler projects
AVR 8-bit C Used for building 8-Bit C/C++ projects
C++
AVR 32-bit C Used for building 32-Bit C/C++ projects
C++
ARM 32-bit C Used for building ARM C/C++ projects
C++
9.3.11.1 Flavor
Flavor identifies a particular version of Toolchain extension of a desired Toolchain type. You could have
different flavors of same Toolchain type extensions installed for Atmel Studio.
Add Flavor
1. Select a Toolchain type for which the new Flavor is to be added.
Figure 9-3. Add Toolchain Flavor
2. Enter a new Flavor Name.
3. Configure the Toolchain path for the Flavor. The path should contain desired Toolchain executable,
e.g. avr-gcc.exe for AVR 8-bit.
4. Click the Add button.
Set Default Flavor
1. Select a Flavor to set as default. The flavor would be the default for the selected toolchain type.
Hence, a new project using the toolchain type would use the configured Flavor settings.
2. You can view and switch between various Flavors after creating the project through the project
properties page shown in Advanced Options.
Delete Flavor
Pressing the Delete Flavor button deletes the Flavor configuration.
Note: If the customized default flavor is deleted, then the Native flavor will be set as default. Also, the
projects that were configured with the deleted flavor will be changed to the default flavor of the respective
toolchain type when the project is opened the next time.
Atmel Studio 7 User Guide
Menus and Settings
© 2018 Microchip Technology Inc. User Guide DS50002718A-page 323
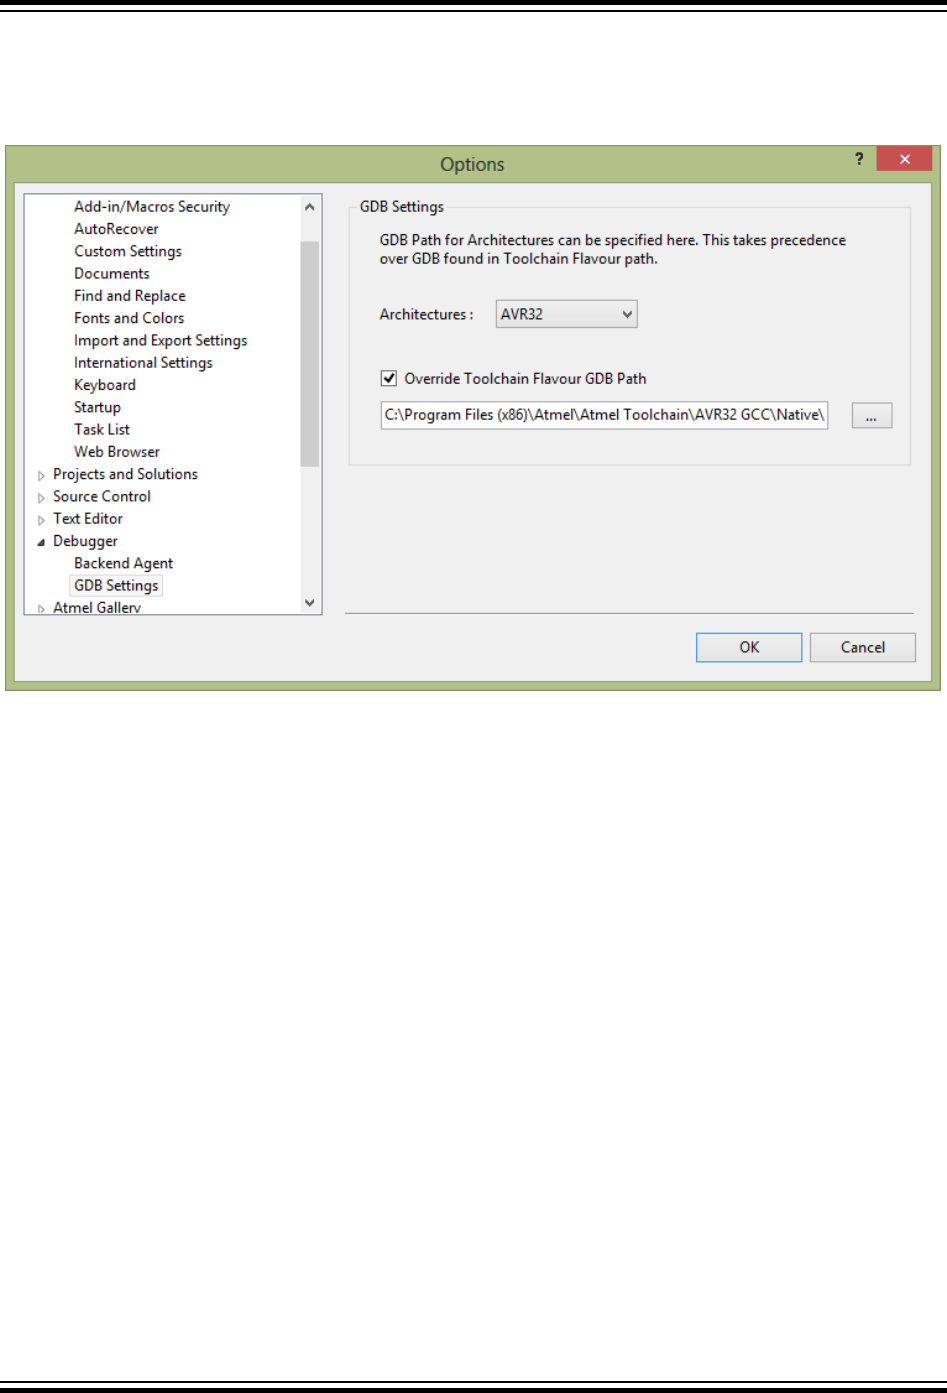
9.3.12 GDB Settings
We can configure architecture specific GDB path in this page. This will override the default toolchain
flavor GDB path.
9.4 Code Snippet Manager
Code snippets are particularly useful when writing AVR GCC applications. You can use the Code
Snippets Manager to add folders to the folder list that the Code Snippet Picker scans for XML .snippet
files. Having these building blocks of code at your disposal can facilitate project development.
The Code Snippets Manager can be accessed from the Tools menu.
9.4.1 Managing Code Snippets
To access the Code Snippets Manager
On the Tools menu, click Code Snippets Manager.
To add a directory to the Code Snippet Manager
1. In the Language: drop-down list, select the language that you want to add a directory to.
2. Click Add. This opens the Code Snippets Directory window.
3. Select the directory that you want to add to the Code Snippets Manager and click OK. The directory
will now be used to search for available code snippets.
To remove a directory from the Code Snippet Manager
1. Select the directory that you want to remove.
2. Click Remove.
Atmel Studio 7 User Guide
Menus and Settings
© 2018 Microchip Technology Inc. User Guide DS50002718A-page 324

To import a code snippet into the Code Snippet Manager
1. In the Language: drop-down list, select the language that you want to add the code snippet to.
2. Select the existing folder that you want to place the imported code snippet into.
3. Click Import. This opens the Code Snippets Directory window.
4. Select the code snippet file that you want to add to the Code Snippets Manager and click OK. The
code snippet is now available for insertion into the code editor.
9.4.2 Code Snippet Manager Layout
Language
Selects the development language whose code snippet folders are displayed in the folder list.
Location
Displays the path to the folders in the folder list, or to the code snippet file selected there.
Folder list
Shows the set of sub-folders, if any, and the code snippet files available for the Language selected. Click
any folder to expand it and list its files.
Description
Displays information on the folder or code snippet file selected in the folder list. When a code snippet file
is selected, displays the text from its Author, Description, Shortcut, and Type fields.
Add
Opens the Code Snippet Directory dialog box. Allows you to navigate to the desired snippets folder on
your local drive or server, and include it in the folder list.
Remove
Removes a selected top-level folder and its contents from the folder list. Does not physically delete the
folder.
Import
Opens the Code Snippet Directory dialog box. Allows you to navigate to the desired snippet on your local
drive or server, and add it to an existing code snippet folder.
Security
Whenever you store a new snippet in a folder accessed by the Code Snippets Manager, you are
responsible for ensuring that its code is constructed as securely as the rest of your application. Because
using code snippets saves development time, snippets can be reused frequently as you construct
applications. You should, therefore, make sure that model code saved in snippets is designed to address
security issues. Development teams should establish procedures to review code snippets for compliance
with general security standards.
9.4.3 Modifying Existing Code Snippets
IntelliSense Code Snippets are XML files with a .snippet file name extension that can be easily modified
using any XML editor, including Atmel Studio.
To modify an existing IntelliSense Code Snippet
1. Use the Code Snippets Manager to locate the snippet that you want to modify.
Atmel Studio 7 User Guide
Menus and Settings
© 2018 Microchip Technology Inc. User Guide DS50002718A-page 325
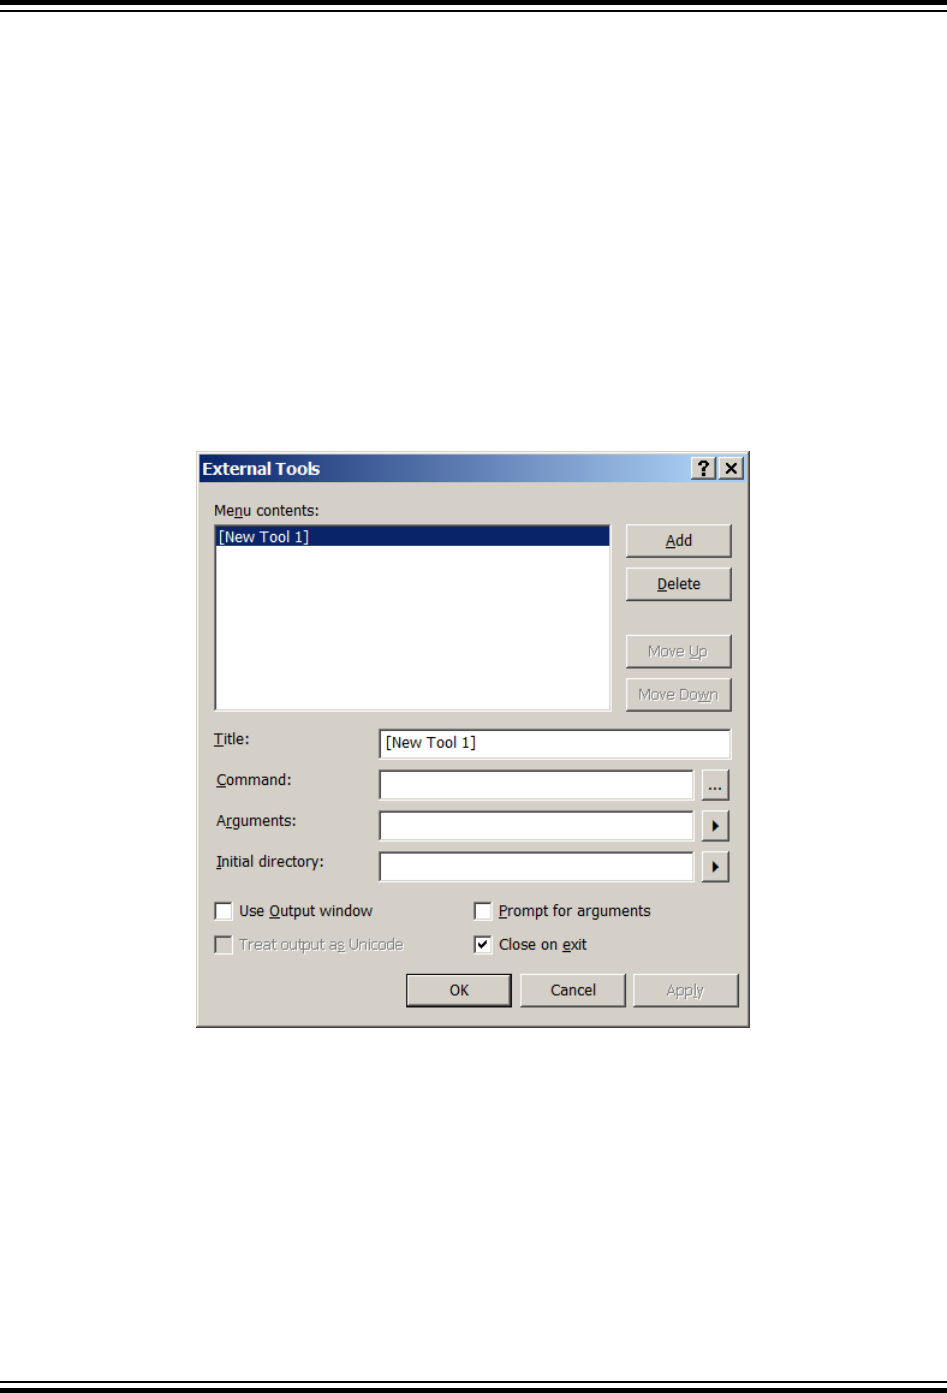
2. Copy the path of the code snippet to the clipboard and click OK.
3. On the File menu, click Open, and click File.
4. Paste the snippet path into the File location box and click OK.
5. Modify the snippet.
6. On the File menu, click Save. You must have write access to the file to save it.
9.5 External Tools
You can add items to the Tools menu that allow you to launch external tools from within Visual Studio. For
example, you can add an item to the Tools menu to launch utilities such as avrdude or a diffing tool.
9.5.1 Add an External Tool to the Tools Menu
You can add a command to the Tools menu to start another application, such as Notepad, from within the
integrated development environment (IDE).
Figure 9-4. External Tool Dialog
The dialog contains a list box where all previously defined external tools are listed. If you have not
defined any tool, the list box will be empty.
• On the Tools menu, choose External Tools
• In the External Tools dialog box, choose Add, and enter a name for the menu option in the Title box
Atmel Studio 7 User Guide
Menus and Settings
© 2018 Microchip Technology Inc. User Guide DS50002718A-page 326
Tip:
Type an ampersand before one of the letters in the tool name to create an accelerator key
for the command when it appears on the Tools menu. For example, if you use M&y
External Tool, the letter 'y' will be the accelerator key. See Assign a Keyboard Shortcut for
more information.
• In the Command box, enter the path to the file you intend to launch or choose Browse (...) to
navigate to the file. File types that you can launch include .exe, .bat, .com, .cmd, and .pif.
Note: If the file resides on the system path, you can enter just the file name. If not, enter the full
path to the file.
• Select Use output window and Close on exit, as appropriate, and then choose OK
9.5.2 Pass Variables to External Tools
You can specify that certain information is passed to a command when it is launched, such as command
line switches for console applications.
Fill in the Arguments box with the necessary launch arguments, either manually or using the auto-fill
button.
The auto-fill argument button can provide you with the macros described in the table below.
Table 9-3. External Tools Macros
Name Argument Description
Item Path $(ItemPath) The complete filename of the current source (defined as
drive + path + filename); blank if a non-source window is
active.
Item Directory $(ItemDir) The directory of the current source (defined as drive +
path); blank if a non-source window is active.
Item File Name $(ItemFilename) The filename of the current source (defined as filename);
blank if a non-source window is active.
Item Extension $(ItemExt) The filename extension of the current source.
Current Line $(CurLine) The current line position of the cursor in the editor.
Current Column $(CurCol) The current column position of the cursor in the editor.
Current Text $(CurText) The selected text.
Target Path $(TargetPath) The complete filename of the item to be built, (defined as
drive + path + filename).
Target Directory $(TargetDir) The directory of the item to be built.
Target Name $(TargetName) The filename of the item to be built.
Target Extension $(TargetExt) The filename extension of the item to be built.
Atmel Studio 7 User Guide
Menus and Settings
© 2018 Microchip Technology Inc. User Guide DS50002718A-page 327

Name Argument Description
Binary Directory $(BinDir) The final location of the binary that is being built (defined
as drive + path).
Project Directory $(ProjectDir) The directory of the current project (defined as drive +
path).
Project filename $(ProjectFileName) The filename of the current project (defined as drive +
path + filename).
Solution Directory $(SolutionDir) The directory of the current solution (defined as drive +
path).
Solution filename $(SolutionFileName) The filename of the current solution (defined as drive +
path + filename).
9.5.3 Initial Directory
You can also specify the working directory for the tool or command. For example, if the tool reads file
system data from the current directory, the tool requires that certain program components are present in
the current directory at start-up.
9.5.4 Run Behavior
Underneath the argument boxes, you can modify the tool behavior.
Use output window - if this box is checked, the tool will output processing information to the Atmel
Studio output window, otherwise, the output will be suppressed.
Close on exit - if the box is checked the tool window, if any, will be automatically closed after completing
all operations.
Prompt for arguments - used for toolchain automation. If the box is checked, the external tool will
require user intervention to input additional processing parameters, otherwise, the tool will be silent.
Treat output as Unicode - internationalization option. Some tools have a capacity to output Unicode
results for better interpretation. This option allows for correct output rendering if you are using such a tool.
9.5.5 Assign a Keyboard Shortcut
To assign a shortcut (accelerator) to a command, add an ampersand (&) in the title of the tool, just before
the letter that you want to use as the access key.
After the ampersand has been added the accelerator needs to be included as a keyboard shortcut.
• On the Tools menu, click Options
• Select Keyboard on the Environment page
• In the Show commands containing list, type Tools
• In the Command names list, locate the appropriate External Command n entry
Note: You can define keyboard shortcuts for up to twenty external tools. External tools are listed
as External Command 1-20 in the Command names list. The numbers correspond to the number
to the left of the custom external command name on the Tools menu. If the menu command
already has a shortcut assigned to it, that information appears in the Shortcuts for selected
command list.
Atmel Studio 7 User Guide
Menus and Settings
© 2018 Microchip Technology Inc. User Guide DS50002718A-page 328
• Put the cursor in the Press shortcut keys box, and then press the keys you want to assign to the
external tool
Note: If the keyboard shortcut is already assigned to another command, the Shortcut currently
assigned to list will display that information.
• Click Assign
9.6 Predefined Keyboard Shortcuts
The Atmel Studio uses the Visual Studio Shell framework from Microsoft Visual Studio 2010 and,
therefore, the integrated development environment (IDE) includes several predefined keyboard shortcut
schemes, identical to those in the Visual Studio. When you start Atmel Studio for the first time and select
your settings, the associated schemes are automatically set. Thereafter, by using the keyboard options
page in the Options dialog box, you can choose from additional schemes and you can also create your
own keyboard shortcuts.
Designers and Editors, Shared Shortcuts
These shortcuts work for both designers and editors.
Command Description General Development,
Web
Edit.Copy Copies the selected item to the Clipboard. CTRL+C or CTRL
+INSERT
Edit.Cut Deletes the selected item from the file and
copies it to the Clipboard.
CTRL+X or SHIFT
+DELETE
Edit.CycleClipboardRing Pastes an item from the Clipboard ring to the
cursor location in the file. To paste the next item
in the Clipboard ring instead, press the shortcut
again.
CTRL+SHIFT+V
Edit.Delete Deletes one character to the right of the cursor. DELETE
Edit.Find Displays the Quick tab of the Find and Replace
dialog box.
CTRL+F
Edit.FindAllReferences Displays the list of references for the selected
symbol.
SHIFT+ALT+F
Edit.FindinFiles Displays the In Files tab of the Find and Replace
dialog box.
CTRL+SHIFT+F
Edit.FindNext Finds the next occurrence of the search text. F3
Edit.FindNextSelected Finds the next occurrence of the currently
selected text, or the word at the cursor.
CTRL+F3
Edit.FindPrevious Finds the previous occurrence of the search text. SHIFT+F3
Atmel Studio 7 User Guide
Menus and Settings
© 2018 Microchip Technology Inc. User Guide DS50002718A-page 329
Command Description General Development,
Web
Edit.FindPreviousSelected Finds the previous occurrence of the currently
selected text, or the word at the cursor.
CTRL+SHIFT+F3
Edit.FindSymbol Displays the Find Symbol pane of the Find and
Replace dialog box.
ALT+F12
Edit.GoToFindCombo Puts the cursor in the Find/Command box on the
Standard toolbar.
CTRL+D
Edit.IncrementalSearch Activates incremental search. If incremental
search is on, but no input is passed, the previous
search query is used. If search input has been
found, the next invocation searches for the next
occurrence of the input text.
CTRL+I
Edit.Paste Inserts the Clipboard contents at the cursor. CTRL+V or SHIFT
+INSERT
Edit.QuickFindSymbol Searches for the selected object or member and
displays the matches in the Find Symbol Results
window.
SHIFT+ALT+F12
Edit.NavigateTo Displays the Navigate To dialog box. CTRL+,
Edit.Redo Repeats the most recent action. CTRL+Y or SHIFT+ALT
+BACKSPACE or CTRL
+SHIFT+Z
Edit.Replace Displays the replace options on the Quick tab of
the Find and Replace dialog box.
CTRL+H
Edit.ReplaceinFiles Displays the replace options on the In Files tab
of the Find and Replace dialog box.
CTRL+SHIFT+H
Edit.SelectAll Selects everything in the current document. CTRL+A
Edit.StopSearch Stops the current Find in Files operation. ALT+F3, S
Edit.Undo Reverses the last editing action. CTRL+Z or ALT
+BACKSPACE
View.ViewCode For the selected item, opens the corresponding
file and puts the cursor in the correct location.
CTRL+ALT+0
Text Navigation
These shortcuts are for moving around in an open document.
Atmel Studio 7 User Guide
Menus and Settings
© 2018 Microchip Technology Inc. User Guide DS50002718A-page 330
Command Description Shortcut
Edit.CharLeft Moves the cursor one character to the left. LEFT ARROW
Edit.CharRight Moves the cursor one character to the right. RIGHT ARROW
Edit.DocumentEnd Moves the cursor to the last line of the document. CTRL+END
Edit.DocumentStart Moves the cursor to the first line of the document. CTRL+HOME
Edit.GoTo Displays the Go To Line dialog box. CTRL+G
Edit.GoToDefinition Navigates to the declaration for the selected
symbol in code.
ALT+G
Edit.GoToNextLocation Moves the cursor to the next item, such as a task in
the Task List window or a search match in the Find
Results window. Subsequent invocations move to
the next item in the list.
F8
Edit.GoToPrevLocation Moves the cursor back to the previous item. SHIFT+F8
Edit.IncrementalSearch Starts incremental search. If incremental search is
started but you have not typed any characters,
recalls the previous pattern. If the text has been
found, searches for the next occurrence.
CTRL+I
Edit.LineDown Moves the cursor down one line. DOWN ARROW
Edit.LineEnd Moves the cursor to the end of the current line. END
Edit.LineStart Moves the cursor to the start of the line. HOME
Edit.LineUp Moves the cursor up one line. UP ARROW
Edit.NextBookmark Moves to the next bookmark in the document. CTRL+K, CTRL
+N
Edit.NextBookmarkInFolder If the current bookmark is in a folder, moves to the
next bookmark in that folder. Bookmarks outside
the folder are skipped.
If the current bookmark is not in a folder, moves to
the next bookmark at the same level.
If the Bookmark window contains folders,
bookmarks in folders are skipped.
CTRL+SHIFT+K,
CTRL+SHIFT+N
Edit.PageDown Scrolls down one screen in the editor window. PAGE DOWN
Edit.PageUp Scrolls up one screen in the editor window. PAGE UP
Edit.PreviousBookmark Moves the cursor to the location of the previous
bookmark.
CTRL+K, CTRL
+P
Atmel Studio 7 User Guide
Menus and Settings
© 2018 Microchip Technology Inc. User Guide DS50002718A-page 331
Command Description Shortcut
Edit.PreviousBookmarkInFolder If the current bookmark is in a folder, moves to the
previous bookmark in that folder. Bookmarks
outside the folder are skipped.
If the current bookmark is not in a folder, moves to
the previous bookmark at the same level.
If the Bookmark window contains folders,
bookmarks in folders are skipped.
CTRL+SHIFT+K,
CTRL+SHIFT+P
Edit.ReverseIncrementalSearch Changes the direction of incremental search to
start at the bottom of the file and progress toward
the top.
CTRL+SHIFT+I
Edit.ScrollLineDown Scrolls text down one line. Available in text editors
only.
CTRL+DOWN
ARROW
Edit.ScrollLineUp Scrolls text up one line. Available in text editors
only.
CTRL+UP
ARROW
Edit.ViewBottom Moves to the last visible line of the active window. CTRL+PAGE
DOWN
Edit.ViewTop Moves to the first visible line of the active window. CTRL+PAGE UP
Edit.WordNext Moves the cursor to the right one word. CTRL+RIGHT
ARROW
Edit.WordPrevious Moves the cursor to the left one word. CTRL+LEFT
ARROW
View.NavigateBackward Moves to the previously browsed line of code. CTRL+-
View.NavigateForward Moves to the next browsed line of code. CTRL+SHIFT+-
View.NextError Moves to the next error entry in the Error List
window, which automatically scrolls to the affected
section of text in the editor.
CTRL+SHIFT
+F12
View.NextTask Moves to the next task or comment in the Task List
window.
Visual Assist shortcuts
These shortcuts are for Visual Assist.
Command Description Shortcut
VAssistX.FindReference Find all references to the marked text. SHIFT+ALT+F
VAssistX.FindSymbolDialog Opens the symbols dialog listing all symbols in
the project.
SHIFT+ALT+S
Atmel Studio 7 User Guide
Menus and Settings
© 2018 Microchip Technology Inc. User Guide DS50002718A-page 332
Command Description Shortcut
VAssistX.GotoImplementation Go to implementation. ALT+G
VAssistX.ListMethodsInCurrentFile Opens the list of all methods in the current file. ALT+M
VAssistX.OpenCorrespondingFile Opens the corresponding file (i.e. .h/.c). ALT+O
VAssistX.OpenFileInSolutionDialog Displays a list of all files in the solution. SHIFT+ALT+O
VAssistX.Paste Shows the paste history menu. CTRL+SHIFT+V
VAssistX.RefactorContextMenu Shows the refactor context menu. SHIFT+ALT+Q
VAssistX.RefactorRename Shows the rename dialog. SHIFT+ALT+R
VAssistX.ScopeNext Jump to next scope. ALT+Down Arrow
VAssitX.ScopePrevious Jump to previous scope. ALT+Up Arrow
Text Selection
These shortcuts are for selecting text in an open document.
Command Description Shortcut
Edit.CharLeftExtend Moves the cursor one character to the left and
extends the current selection.
SHIFT+LEFT
ARROW
Edit.CharLeftExtendColumn Moves the cursor to the left one character,
extending the column selection.
SHIFT+ALT+LEFT
ARROW
Edit.CharRightExtend Moves the cursor one character to the right
and extends the current selection.
SHIFT+RIGHT
ARROW
Edit.CharRightExtendColumn Moves the cursor to the right one character,
extending the column selection.
SHIFT+ALT+RIGHT
ARROW
Edit.DocumentEndExtend Selects the text from the cursor to the last line
of the document.
CTRL+SHIFT+END
Edit.DocumentStartExtend Selects the text from the cursor to the first line
of the document.
CTRL+SHIFT
+HOME
Edit.LineDownExtend Extends text selection down one line, starting
at the location of the cursor.
SHIFT+DOWN
ARROW
Edit.LineDownExtendColumn Moves the pointer down one line, extending
the column selection.
SHIFT+ALT+DOWN
ARROW
Edit.LineEndExtend Selects text from the cursor to the end of the
current line.
SHIFT+END
Edit.LineEndExtendColumn Moves the cursor to the end of the line,
extending the column selection.
SHIFT+ALT+END
Atmel Studio 7 User Guide
Menus and Settings
© 2018 Microchip Technology Inc. User Guide DS50002718A-page 333
Command Description Shortcut
Edit.LineStartExtend Selects text from the cursor to the start of the
line.
SHIFT+HOME
Edit.LineStartExtendColumn Moves the cursor to the start of the line,
extending the column selection.
SHIFT+ALT+HOME
Edit.LineUpExtend Selects text up, line by line, starting from the
location of the cursor.
SHIFT+UP ARROW
Edit.LineUpExtendColumn Moves the cursor up one line, extending the
column selection.
SHIFT+ALT+UP
ARROW
Edit.PageDownExtend Extends selection down one page. SHIFT+PAGE
DOWN
Edit.PageUpExtend Extends selection up one page. SHIFT+PAGE UP
Edit.SelectCurrentWord Selects the word that contains the cursor or
the word to the right of the cursor.
CTRL+W
Edit.SelectionCancel Cancels the current selection. ESC
Edit.ViewBottomExtend Moves the cursor and extends the selection to
the last line in view.
CTRL+SHIFT
+PAGE DOWN
Edit.ViewTopExtend Extends the selection to the top of the active
window.
CTRL+SHIFT
+PAGE UP
Edit.WordNextExtend Extends the selection one word to the right. CTRL+SHIFT
+RIGHT ARROW
Edit.WordNextExtendColumn Moves the cursor to the right one word,
extending the column selection.
CTRL+SHIFT+ALT
+RIGHT ARROW
Edit.WordPreviousExtend Extends the selection one word to the left. CTRL+SHIFT+LEFT
ARROW
Edit.WordPreviousExtendColumn Moves the cursor to the left one word,
extending the column selection.
CTRL+SHIFT+ALT
+LEFT ARROW
Text Viewing
These shortcuts are for changing how text is displayed without changing the text itself, for example, by
hiding a selected area or by outlining methods.
Command Description Shortcut
Edit.ClearBookmarks Removes all bookmarks in all open documents. CTRL+K, CTRL+L
Edit.CollapseAllOutlining Collapses all regions on the page to show just the
outermost groups in the hierarchy; typically the
CTRL+M, CTRL+A
Atmel Studio 7 User Guide
Menus and Settings
© 2018 Microchip Technology Inc. User Guide DS50002718A-page 334
Command Description Shortcut
using/imports section and the namespace
definition.
Edit.CollapseCurrentRegion Collapses the region that contains the cursor to
show just the top line of the region, followed by an
ellipsis. Regions are indicated by triangles on the
left edge of the document window.
CTRL+M, CTRL+S
Edit.CollapseTag Hides the selected HTML tag and displays an
ellipsis (. . .) instead. You can view the complete
tag as a tooltip by putting the mouse pointer over
the ellipsis.
CTRL+M, CTRL+T
Edit.CollapsetoDefinitions Collapses existing regions to provide a high-level
view of the types and members in the source file.
CTRL+M, CTRL+O
Edit.EnableBookmark Enables bookmark usage in the current document.
Edit.ExpandAllOutlining Expands all collapsed regions on the page. CTRL+M, CTRL+X
Edit.ExpandCurrentRegion Expands the current region. Put the cursor on a
collapsed region to use this command.
CTRL+M, CTRL+E
Edit.HideSelection Hides the selected text. A signal icon marks the
location of the hidden text in the file.
CTRL+M, CTRL+H
Edit.StopHidingCurrent Removes the outlining information for the currently
selected region.
CTRL+M, CTRL+U
Edit.StopOutlining Removes all outlining information from the whole
document.
CTRL+M, CTRL+P
Edit.ToggleAllOutlining Toggles all previously collapsed outlining regions
between collapsed and expanded states.
CTRL+M, CTRL+L
Edit.ToggleBookmark Sets or removes a bookmark at the current line. CTRL+K, CTRL+K
Edit.ToggleOutliningExpansion Toggles the currently selected collapsed region
between the collapsed and expanded state.
CTRL+M, CTRL+M
Edit.ToggleTaskListShortcut Sets or removes a shortcut at the current line. CTRL+K, CTRL+H
Edit.ToggleWordWrap Enables or disables word-wrap in an editor. CTRL+E, CTRL+W
Edit.ViewWhiteSpace Shows or hides spaces and tab marks. CTRL+R, CTRL+W
Text Manipulation
These shortcuts are for deleting, moving, or formatting text in an open document.
Atmel Studio 7 User Guide
Menus and Settings
© 2018 Microchip Technology Inc. User Guide DS50002718A-page 335
Command Description Shortcut
Edit.BreakLine Inserts a new line. ENTER
Edit.CharTranspose Swaps the characters on either side of the
cursor. For example, AC|BD becomes AB|CD.
CTRL+T
Edit.CommentSelection Applies comment characters for the current
language to the current selection.
CTRL+K, CTRL+C
Edit.CompleteWord Completes the current word in the completion
list.
ALT+RIGHT ARROW or
CTRL+SPACEBAR
Edit.DeleteBackwards Deletes one character to the left of the cursor. BACKSPACE
Edit.FormatDocument Formats the current document according to the
indentation and code formatting settings
specified on the Formatting pane in the Options
dialog box, for the current language.
CTRL+K, CTRL+D
Edit.FormatSelection Formats the current selection according to the
indentation and code formatting settings
specified on the Formatting pane in the Options
dialog box, for the current language.
CTRL+K, CTRL+F
Edit.InsertSnippet Displays the Code Snippet Picker. The selected
code snippet will be inserted at the cursor
position.
CTRL+K, CTRL+X
Edit.InsertTab Indents the line of text a specified number of
spaces.
TAB
Edit.LineCut Cuts all selected lines, or the current line if
nothing has been selected, to the Clipboard.
CTRL+L
Edit.LineDelete Deletes all selected lines, or the current line if no
selection has been made.
CTRL+SHIFT+L
Edit.LineOpenAbove Inserts a blank line above the cursor. CTRL+SHIFT+ENTER
Edit.LineOpenBelow Inserts a blank line below the cursor. CTRL+ENTER
Edit.LineTranspose Moves the line that contains the cursor below the
next line.
SHIFT+ALT+T
Edit.ListMembers Invokes the IntelliSense completion list. CTRL+J
Edit.MakeLowercase Changes the selected text to lowercase
characters.
CTRL+U
Edit.MakeUppercase Changes the selected text to uppercase
characters.
CTRL+SHIFT+U
Atmel Studio 7 User Guide
Menus and Settings
© 2018 Microchip Technology Inc. User Guide DS50002718A-page 336
Command Description Shortcut
Edit.OvertypeMode Toggles between the insert and over-type
insertion modes.
INSERT
Edit.ParameterInfo Displays the name, number, and type of
parameters required for the specified method.
CTRL+SHIFT
+SPACEBAR
Edit.SurroundWith Displays the Code Snippet Picker. The selected
code snippet will be wrapped around the
selected text.
CTRL+K, CTRL+S
Edit.TabifySelectedLines Replaces spaces with tabs in the selected text.
Edit.TabLeft Moves selected lines to the left one tab stop. SHIFT+TAB
Edit.UncommentSelection Removes the comment syntax from the current
line of code.
CTRL+K, CTRL+U
Edit.UntabifySelectedLines Replaces tabs with spaces in the selected text.
Edit.WordDeleteToEnd Deletes the word to the right of the cursor. CTRL+DELETE
Edit.WordDeleteToStart Deletes the word to the left of the cursor. CTRL+BACKSPACE
Edit.WordTranspose Transposes the words on either side of the
cursor. For example, |End Sub would be changed
to read Sub End|.
CTRL+SHIFT+T
File and Project Operations
These shortcuts are for file and project operations and can be used anywhere in the IDE.
Command Description Shortcut
Build.BuildSelection Builds the selected project and its dependencies.
Build.BuildSolution Builds all the projects in the solution. F7
Build.Cancel Stops the current build. CTRL+BREAK
Build.Compile Creates an object file that contains machine code, linker
directives, sections, external references, and function/
data names for the selected file.
CTRL+F7
Build.RebuildSolution Rebuilds the solution. CTRL+ALT+F7
File.NewFile Displays the New File dialog box so that you can add a
new file to the current project.
CTRL+N
File.NewProject Displays the New Project dialog box. CTRL+SHIFT+N
File.OpenFile Displays the Open File dialog box. CTRL+O
Atmel Studio 7 User Guide
Menus and Settings
© 2018 Microchip Technology Inc. User Guide DS50002718A-page 337
Command Description Shortcut
File.OpenProject Displays the Open Project dialog box so that you can add
existing projects to your solution.
CTRL+SHIFT+O
File.Print Displays the Print dialog box so that you can select
printer settings.
CTRL+P
File.Rename Lets you modify the name of the item selected in Solution
Explorer.
F2
File.SaveAll Saves all documents in the current solution and all files in
the external files project.
CTRL+SHIFT+S
File.SaveSelectedItems Saves the selected items in the current project. CTRL+S
File.SaveSelectedItemsAs Displays the Save File As dialog box when items are
selected in the editor.
Project.AddExistingItem Displays the Add Existing Item dialog box, which lets you
add an existing file to the current project.
Project.AddNewItem Displays the Add New Item dialog box, which lets you add
a new file to the current project.
Project.Properties Displays the Project Properties dialog box for the current
project in the editing frame.
Window Management
These shortcuts are for moving, closing, or navigating in tool windows and document windows.
Command Description Shortcut
View.FullScreen Toggles Full-Screen mode ON and OFF. SHIFT+ALT
+ENTER
Window.ActivateDocumentWindow Closes a menu or dialog box, cancels an
operation in progress or puts focus in the
current document window.
ESC
Window.CloseDocumentWindow Closes the current tab. CTRL+F4
Window.CloseToolWindow Closes the current tool window. SHIFT+ESC
Window.Dock Returns a floating tool or document
window to its most recent docked location
in the IDE.
Window.NextDocumentWindow Cycles through the open documents. CTRL+F6
Window.NextDocumentWindowNav Displays the IDE Navigator, with the first
document window selected.
CTRL+TAB
Atmel Studio 7 User Guide
Menus and Settings
© 2018 Microchip Technology Inc. User Guide DS50002718A-page 338

Command Description Shortcut
Window.NextPane Moves to the next pane of the current tool
or document window.
ALT+F6
Window.NextToolWindow Moves to the next tool window.
Window.NextToolWindowNav Displays the IDE Navigator, with the first
tool window selected.
ALT+F7
Window.PreviousDocumentWindow Moves to the previous document in the
editor.
CTRL+SHIFT+F6
Window.PreviousDocumentWindowNav Displays the IDE Navigator, with the
previous document window selected.
CTRL+SHIFT
+TAB
Window.PreviousPane Moves to the previously selected window. SHIFT+ALT+F6
Window.ShowEzMDIFileList Displays a pop-up listing all open
documents only.
CTRL+ALT
+DOWN ARROW
Tool Windows
These shortcuts are for opening tool windows anywhere in the IDE.
Command Description Shortcut
Tools.CodeSnippetsManager Displays the Code Snippets Manager, which
lets you search for and insert code snippets in
files.
CTRL+K, CTRL+B
Tools.GoToCommandLine Puts the pointer in the Find/Command box on
the Standard toolbar.
CTRL+/
View.BookmarkWindow Displays the Bookmark window. CTRL+K, CTRL+W
View.CallHierarchy Displays the Call Hierarchy window. CTRL+ALT+K
View.CommandWindow Displays the Command window, where
commands can be invoked to make changes to
the IDE.
CTRL+ALT+A
View.EditLabel Lets you change the name of the selected item
in Solution Explorer.
F2
View.ErrorList Displays the Error List window. CTRL+\, E
View.FindSymbolResults Displays the Find Symbol Results window. CTRL+ALT+F12
View.Output Displays the Output window to view status
messages at runtime.
CTRL+ALT+O
View.SolutionExplorer Displays Solution Explorer, which lists the
projects and files in the current solution.
CTRL+ALT+L
Atmel Studio 7 User Guide
Menus and Settings
© 2018 Microchip Technology Inc. User Guide DS50002718A-page 339
Command Description Shortcut
View.TaskList Displays the Task List window, which displays
custom tasks, comments, shortcuts, warnings,
and error messages.
CTRL+\, T
View.WebBrowser Displays the Web Browser window, which lets
you view pages on the Internet.
CTRL+ALT+R
Window.PreviousToolWindow Brings focus to the previous tool-window.
Window.PreviousToolWindowNav Displays the IDE Navigator, with the previous
tool window selected.
SHIFT+ALT+F7
Bookmark Window
These shortcuts are for working with bookmarks, either in the Bookmarks window or in the editor.
Command Description Shortcut
Edit.ClearBookmarks Removes all bookmarks in all open documents. CTRL+K, CTRL+L
Edit.EnableBookmark Enables bookmark usage in the current document.
Edit.NextBookmark Moves to the next bookmark in the document. CTRL+K, CTRL
+N
Edit.NextBookmarkInFolder If the current bookmark is in a folder, moves to the
next bookmark in that folder. Bookmarks outside
the folder are skipped.
If the current bookmark is not in a folder, moves to
the next bookmark at the same level.
If the Bookmark window contains folders,
bookmarks in folders are skipped.
CTRL+SHIFT+K,
CTRL+SHIFT+N
Edit.ToggleBoomark Toggles a bookmark on the current line in the
document.
CTRL+K, CTRL+K
View.BookmarkWindow Displays the Bookmark window. CTRL+K, CTRL
+W
Edit.PreviousBookmark Moves the cursor to the location of the previous
bookmark.
CTRL+K, CTRL+P
Edit.PreviousBookmarkInFolder If the current bookmark is in a folder, moves to the
previous bookmark in that folder. Bookmarks
outside the folder are skipped.
If the current bookmark is not in a folder, moves to
the previous bookmark at the same level.
If the Bookmark window contains folders,
bookmarks in folders are skipped.
CTRL+SHIFT+K,
CTRL+SHIFT+P
Atmel Studio 7 User Guide
Menus and Settings
© 2018 Microchip Technology Inc. User Guide DS50002718A-page 340
Debugging
These shortcuts are for debugging code.
Command Description Shortcut
Debug.Autos Displays the Auto window, which displays
variables used in the current line of code and the
previous line of code.
CTRL+ALT+V, A
Debug.BreakAll Temporarily stops the execution of all processes in
a debugging session. Available only in Run mode.
CTRL+F5
Debug.BreakatFunction Displays the New Breakpoint dialog box. CTRL+B
Debug.Breakpoints Displays the Breakpoints dialog box, where you
can add, remove, and modify breakpoints.
ALT+F9 or CTRL
+ALT+B
Debug.CallStack Displays the Call Stack window, which displays a
list of all active methods or stack frames for the
current thread of execution.
ALT+7 or CTRL
+ALT+C
Debug.DeleteAllBreakpoints Clears all the breakpoints in the project. CTRL+SHIFT+F9
Debug.Disassembly Displays the Disassembly window. CTRL+ALT+D or
ALT+8
Debug.EnableBreakpoint Toggles the breakpoint between disabled and
enabled.
CTRL+F9
Debug.Exceptions Displays the Exceptions dialog box. CTRL+ALT+E
Debug.Immediate Displays the Immediate window, where
expressions can be evaluated.
CTRL+ALT+I
Debug.Locals Displays the Locals window, which displays the
local variables and their values for each method in
the current stack frame.
ALT+4 or CTRL
+ALT+V, L
Debug.Memory1 Displays the Memory 1 window to view large
buffers, strings, and other data that do not display
clearly in the Watch or Variables windows.
CTRL+ALT+M, 1
Debug.Memory2 Displays the Memory 2 window to view large
buffers, strings, and other data that do not display
clearly in the Watch or Variables windows.
CTRL+ALT+M, 2
Debug.Memory3 Displays the Memory 3 window to view large
buffers, strings, and other data that do not display
clearly in the Watch or Variables windows.
CTRL+ALT+M, 3
Debug.Memory4 Displays the Memory 4 window to view large
buffers, strings, and other data that do not display
clearly in the Watch or Variables windows.
CTRL+ALT+M, 4
Atmel Studio 7 User Guide
Menus and Settings
© 2018 Microchip Technology Inc. User Guide DS50002718A-page 341

Command Description Shortcut
Debug.Modules Displays the Modules window, which lets you view
the .dll or .exe files that are used by the program.
In multiprocess debugging, you can right click and
then click Show Modules for all Programs.
CTRL+ALT+U
Debug.ParallelStacks Opens the Parallel Stacks window. CTRL+SHIFT+D,
S
Debug.ParallelTasks Opens the Parallel Tasks window. CTRL+SHIFT+D,
K
Debug.Processes Displays the Processes window. Available in Run
mode.
CTRL+ALT+Z
Debug.QuickWatch Displays the QuickWatch dialog box that has the
current value of the selected expression. Available
only in Break mode. Use this command to
examine the current value of a variable, property,
or another expression for which you have not
defined a watch expression.
CTRL+ALT+Q or
SHIFT+F9
Debug.Registers Displays the Registers window, which displays
registers content for debugging native code
applications.
ALT+5 or CTRL
+ALT+G
Debug.RunToCursor In Break mode, resumes execution of your code
from the current statement to the selected
statement. The Current Line of Execution margin
indicator appears in the Margin Indicator bar. In
Design mode, starts the debugger and executes
your code to the pointer location.
CTRL+F10
Debug.Start Launches the application under the debugger
based off of the settings from the start-up project.
When in Break mode, invoking this command will
run the application until the next breakpoint.
F5
Debug.StepInto Executes code one statement at a time, following
execution into method calls.
F11
Debug.StepIntoCurrentProcess Available from the Processes window. CTRL+ALT+F11
Debug.StepOver Sets the execution point to the line of code you
select.
F10
Debug.StopDebugging Stops running the current application under the
debugger.
CTRL+SHIFT+F5
Debug.Threads Displays the Threads window to view the running
threads.
CTRL+ALT+H
Atmel Studio 7 User Guide
Menus and Settings
© 2018 Microchip Technology Inc. User Guide DS50002718A-page 342
Command Description Shortcut
Debug.ToggleBreakpoint Sets or removes a breakpoint at the current line. F9
Debug.Watch1 Displays the Watch window, which displays the
values of selected variables or watch expressions.
CTRL+ALT+W, 1
Debug.Watch2 Displays the Watch2 window to view the values of
selected variables or watch expressions.
CTRL+ALT+W, 2
Debug.Watch3 Displays the Watch3 window to view the values of
selected variables or watch expressions.
CTRL+ALT+W, 3
Debug.Watch4 Displays the Watch4 window to view the values of
selected variables or watch expressions.
CTRL+ALT+W, 4
Help
These shortcuts are for viewing topics in Help and moving among them.
Command Description Shortcut
Help.F1Help Displays a topic from Help that corresponds to the user
interface that has focus.
F1
Help.ManageHelpSettings Displays the Help Library Manager. CTRL+ALT+F1
Help.WindowHelp Displays a topic from Help that corresponds to the user
interface that has focus.
SHIFT+F1
Atmel Studio 7 User Guide
Menus and Settings
© 2018 Microchip Technology Inc. User Guide DS50002718A-page 343
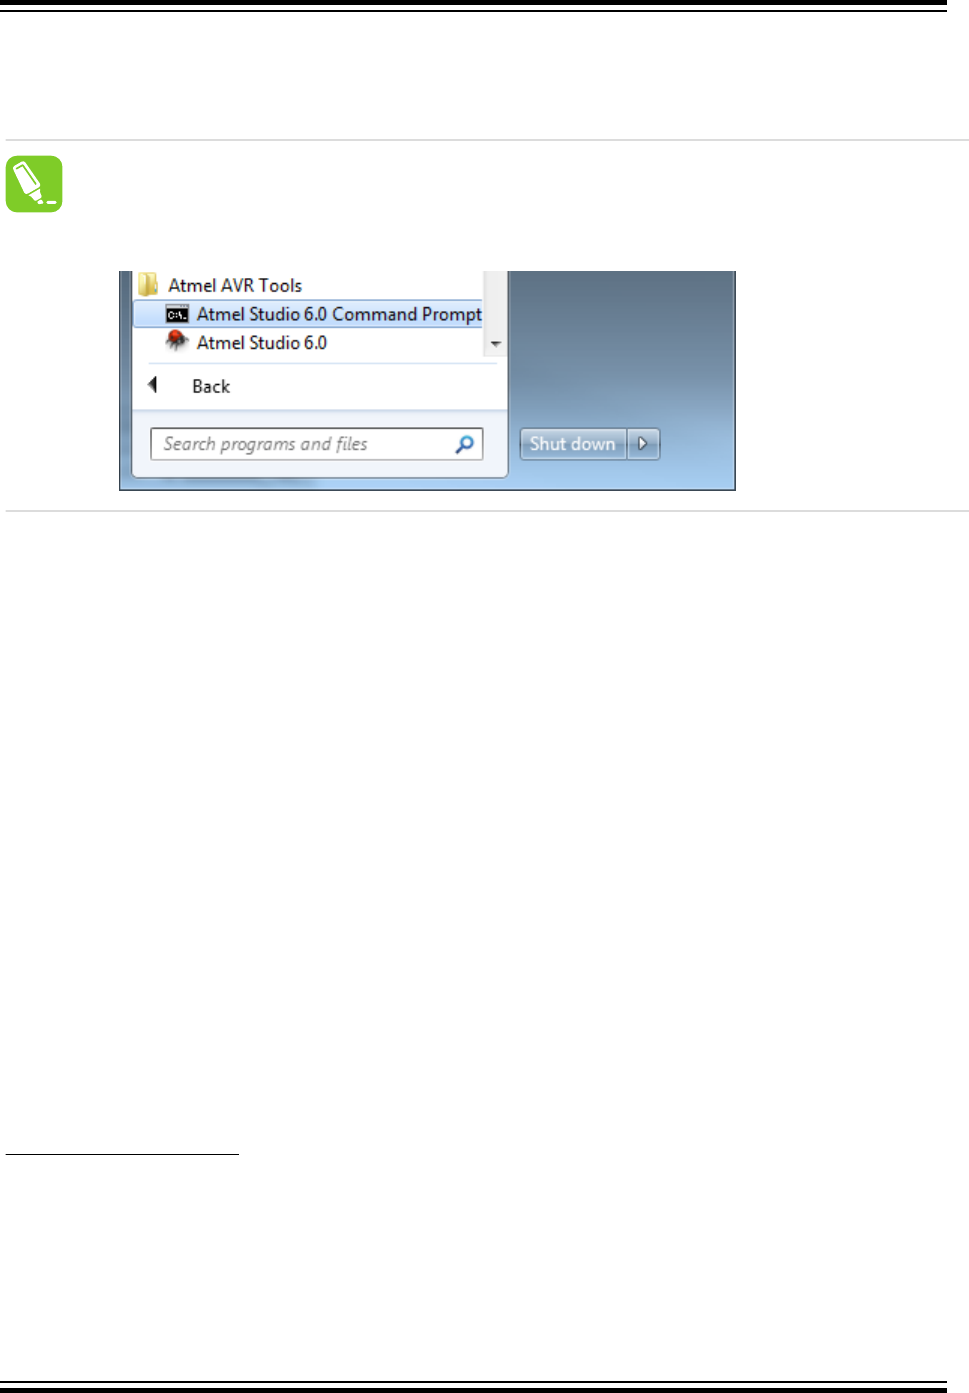
10. Command Line Utility (CLI)
Atmel Studio comes with a command line software utility called atprogram.exe.
Tip:
You can start a command shell with the PATH set up to run atprogram by clicking on Start > All
Programs > Atmel AVR Tools > Atmel Studio 6.2 Command Prompt as shown in the figure
below.
atprogram.exe can be used to:
• Program a .bin, .hex, or .elf file to a device
• Verify that the programming was correct
• Read, write, and erase the device memories
• Program fuses, lock bits, security bits, user page, and user signature
• Program a production file to a device 6
• List out all connected tools
• Set interface and interface clock speeds
To get help on how to use the utility, execute: atprogram.exe.
This will print out the atprogram CLI help text on stdout.
6The ELF production file format can hold the contents of both Flash, EEPROM, and User Signatures
(XMEGA devices only) as well as the Fuse- LockBit configuration in one single file. The format is
based on the Executable and Linkable Format (ELF).
The production file format is currently supported for tinyAVR, megaAVR, and XMEGA. See Creating
ELF Files with Other Memory Types for a description on how to configure the project in order to
generate such files.
Atmel Studio 7 User Guide
Command Line Utility (CLI)
© 2018 Microchip Technology Inc. User Guide DS50002718A-page 344

11. Frequently Asked Questions
Frequently asked questions about Atmel Studio.
What is the Atmel USB
Driver?
The Atmel USB Driver is a cumulative installer that bundles the required
USB drivers for all tools.
I get an error during
installation of the Atmel
USB Driver Package.
During installation of the Atmel USB Driver Package, you might get the
error 0x800b010a - A certificate chain could not be built to a trusted root
authority. This means that the certificate that signs the installer could not
be validated using the certificate authority built into Windows.
The reason for not being able to validate the certificate is because the
certificate chain needs to be updated through Windows Update. Make
sure that you have received all updates so that Windows is able to
validate the certificate.
If you are not able to update your computer due to the computer being
offline or restricted in some way, then the root certificate update can be
downloaded from http://support2.microsoft.com/kb/931125.
Will Atmel Studio work in
parallel with older versions
of Atmel Studio, AVR
Studio, and AVR32 Studio?
Yes, it will work side-by-side between major and minor versions. Side-
by-side installation with different build numbers is not possible. If you are
uninstalling AVR Studio 4.0 or AVR32 Studio be careful when you
manually delete folders or registry entries after uninstall, as there might
be other keys and folders deployed by Atmel Studio inside the Atmel
folder and registry paths. Note that drivers may be incompatible between
versions.
Atmel Studio cannot find
any debuggers or
programmers when Norton
AntiVirus is running.
Atmel Studio might not show any connected tools if Norton AntiVirus is
running. To make it work make sure Norton AntiVirus allows
atprogram.exe to communicate with Atmel Studio by adding
atbackend.exe as an exception in the Norton AntiVirus allowed
programs. This is the same with any anti-virus program that by default
blocks ports.
Windows shows a message
box with the following
message when attempting
to run Atmel Studio
installer: 'Windows cannot
access the specified
device, path or file. You
may not have the
appropriate permissions to
access the item.
This might be caused by an anti-virus program blocking the installation
of the Atmel Studio. We have seen this with the Sophos antivirus
package. Temporarily disable the Sophos service running on the
machine (or any corresponding anti-virus service), and attempt
installation.
Atmel Studio takes a very
long time to start but runs
well in a VM environment.
The Visual Studio shell (and thus Atmel Studio) does a considerable
amount of processing during start-up. Parts of the operations are WPF
operations which benefit greatly from updated graphics libraries and
drivers. Installing the latest graphics driver may give a performance
boost both during normal operation and during start-up.
Atmel Studio 7 User Guide
Frequently Asked Questions
© 2018 Microchip Technology Inc. User Guide DS50002718A-page 345

Verification and
programming often fail with
a serial port buffer overrun
error message when using
STK500.
This is a known issue. Due to DPC latency, serial communication can
have buffer overruns on the UART chipset. A workaround which works
for most systems is to use a USB to serial adapter.
When launching from a
guest account, the
following error is displayed
when starting Atmel Studio:
'Exception has been thrown
by the target of an
invocation'.
Atmel Studio neither installs under a guest account nor runs under it.
Can install and run Atmel
Studio from within a Virtual
Machine?
Yes, with simulator there should be no issues. However, with physical
devices like debuggers and programmers, the VM must offer support for
physical USB and Serial port connections.
How can I reduce the start-
up time of Atmel Studio?
• Make sure you have uninstalled unwanted extensions
• Disable Allow Add-in components to load:
2.1. Go to Tools, Options, Add-in/Macro Security.
2.2. Then, uncheck the Allow Add-in components to load
option.
• Disable the start-up page:
3.1. Go to Tools, Options, Environment, Startup, At Startup.
3.2. Select the Show empty environment option.
How to improve studio
performance for any
supported version of
Windows?
• Make sure your system has the latest version of the Windows
Automation API
• Exclude the following directories and files from your antivirus
scanner:
– The Atmel Studio installation directory, and all files and
folders inside it
–%AppData%\Roaming\Atmel directory, and all files and
folders inside it
–%AppData%\Local\Atmel directory, and all files and folders
inside it
– Your project directories
• Visual Studio Shell requires a lot of swap space. Increase the
paging file. Also, put the system to maximize performance. Both
options are found in the System, Properties, Performance,
Settings menu.
Should I install the latest
Windows Automation API
3.0?
Yes, if your OS is any of the following:
• Windows Server 2008
How can I make sure my
system has the latest
Your system has the latest Windows Automation API if you have
Windows 7 or Windows 8. Only Windows XP, Windows Vista,
Windows Server 2003, and Windows Server 2008 have the old version
Atmel Studio 7 User Guide
Frequently Asked Questions
© 2018 Microchip Technology Inc. User Guide DS50002718A-page 346

Windows Automation API
3.0?
of the API. Find the UIAutomationCore.dll file in your system (normally
found in the windows folder) and compare the version number of that
file. The version should be 7.X.X.X. for the new API. The latest API can
be found at http://support.microsoft.com/kb/971513.
My Project is large and it
takes a long time to open.
Is there any option to avoid
this delay?
Visual Assist X parses all the files when we open the existing project.
You could disable this option:
1. Go to VAssistX, Visual Assist X Options, Performance.
2. Uncheck the Parse all files when opening the project.
I have a limited RAM size in
my system and I work long
hours in the same instance
of Atmel Studio. After some
time, Atmel Studio
becomes slow on my
system.
Press Ctrl+Shift+Alt+F12 twice to force Atmel Studio to garbage collect.
How can I make my
projects build faster?
You can enable parallel build Option from Tools, Options, Builder, GNU
Make, Make Parallel Execution Of Build. This option will enable the
parallel execution feature in the GNU make utility. This option may cause
the build log to be displayed unordered.
11.1 Compatibility with Legacy AVR Software and Third-party Products
11.1.1 How do I Import External ELF Files for Debugging?
Use the File → Open object file for debugging.
11.1.2 How do I Reuse My AVR Studio 4 Projects with the New Atmel Studio?
1. Click the menu File→Import AVR Studio 4 project.
2. An 'Import AVR Studio 4 Project' dialog will appear.
3. Type in the name of your project or browse to the project location by clicking the Browse button of
the APFS File location Tab.
4. Name the new solution resulting from the conversion of your project in the Solution Folder Tab.
5. Click Next.
6. Atmel Studio will proceed with conversion. Depending on the complexity and specificity of your
project there might be some warnings and errors. They will be shown in the Summary window.
7. Click Finish to access your newly converted project.
11.2 Atmel Studio Interface
11.2.1 How can I Start Debugging My Code? What is the Keyboard Shortcut for Debugging?
Unlike the AVR Studio 4 to build your project, without starting debugging, you should press F7.
If you need to rebuild your project after a change to the source files, press Ctrl+Alt+F7.
To Start debugging - press F5.
Atmel Studio 7 User Guide
Frequently Asked Questions
© 2018 Microchip Technology Inc. User Guide DS50002718A-page 347

To open the Debugging Interface without running directly, press the Debug→Start Debugging and
Break menu button, or press F11.
To start a line-by-line debugging press F10, to start an instruction by instruction debugging session -
press F11.
To run your project without debugging, press the Debug→Start Without Debugging menu button.
11.2.2 What is a Solution?
A solution is a structure for organizing projects in Atmel Studio. The solution maintains the state
information for projects in .sln (text-based, shared) and .suo (binary, user-specific solution options) files.
11.2.3 What is a Project
A project is a logic folder that contains references to all the source files contained in your project, all the
included libraries and all the built executables. Projects allow seamless reuse of code and easy
automation of the build process for complex applications.
11.2.4 How can I use an External Makefile for my Project?
The usage of external makefiles and other project options can be configured in the project properties.
Remember that an external makefile has to contain the rules needed by Atmel Studio to work.
11.2.5 When Watching a Variable, the Debugger says Optimized away
Most compilers today are what is known as an optimizing compiler. This means that the compiler will
employ a number of tricks to reduce the size of your program or speed it up.
Note: This behavior is usually controlled by the -On switches.
The cause of this error is usually trying to debug parts of the code that does nothing. Trying to watch the
variable a in the following example may cause this behavior.
int main() {
int a = 0;
while (a < 42) {
a += 2;
}
}
The reason for a to be optimized away is obvious as the incrementation of a does not affect any other
part of our code. This example of a busy wait loop is a prime example of unexpected behavior if you are
unaware of this fact.
To fix this, either lower the optimization level used during compilation or preferably declare a as
volatile. Other situations where a variable should be declared volatile is if some variable is shared
between the code and an ISR7.
For a thorough walkthrough of this issue, have a look at Cliff Lawsons excellent tutorial on this issue.
11.2.6 When Starting a Debug Session, I get an Error Stating that Debug Tool is not Set
The reason for this message is that there is no tool capable to debug that is selected for your project. Go
to the Tool project pane and change the to a supported tool (Project Properties > Tool > Select debugger/
programmer).
If the tool you have selected does support debug, then check that the correct interface is chosen and that
the frequency is according to the specification. If the issue persists, try to lower the frequency to a
7Interrupt Service Routine
Atmel Studio 7 User Guide
Frequently Asked Questions
© 2018 Microchip Technology Inc. User Guide DS50002718A-page 348

frequency where programming is stable, and then slowly increase the frequency as long as it keeps
stable.
11.3 Performance Issues
11.3.1 Atmel Studio Takes a Very Long Time to Start on My PC but Runs Well in a VM Environment. Is
there Something I Can Do With This?
Visual Studio shell (and thus Atmel Studio) uses WPF as a graphics library and does a lot of processing
in the GUI thread. WPF has support for hardware acceleration. Some graphics card drivers does not
utilize this well and spend time in kernel space even when no graphics update is required. Installing the
latest graphics driver may give a performance boost.
11.3.2 Verification and Programming often Fails with a Serial Port Buffer Overrun Error Message when
using STK500
This is a known issue. Interrupt DPC latency for serial communication may be disrupted by other drivers,
thus causing buffer overruns on the UART chipset. A workaround which works for most systems is to use
a USB to serial adapter.
11.3.3 I've connected my Tool through a USB Hub, and now I get Error Messages and Inconsistent
Results while Programming and Debugging
Tools and devices should be connected directly to a USB port on your debugging PC. If this is not an
option, you may reduce/eliminate problems by:
• Disconnect any other USB devices connected to the hub
• Switch ports on the USB hub
• Set the tool clock frequency low. E.g. Set JTAG Clock < 600 kHz.
• If Use external reset is an option for your tool/device combination, enable this
Note: The AVR Dragon should be connected through a powered USB hub. This because the power
supply on the Dragon can be too weak if the motherboard does not provide enough power. If the Dragon
times out or freezes, then the hub might be of too low quality.
11.4 Driver and USB Issues
11.4.1 How do I get my Tool to be recognized by Atmel Studio?
This should happen automatically, but sometimes the Windows driver does not recognize the tool
correctly. To correct this, you have to check that the tool is listed under the Atmel node in the device
manager in Windows. If your tool is not listed, try to find it under Unknown devices. If it is located there,
try to reinstall the driver by double-clicking the tool, click the Driver tab and choose Update Driver. Let
Windows search for the driver. The driver should be reinstalled and the tool should be displayed under
Atmel. Now, the tool should be usable from Atmel Studio.
11.4.2 The Firmware upgrade Process fails or is Unstable on a Virtualized Machine
Most tools will perform a reset when asked to switch from normal operation mode to firmware upgrade
mode. This forces the tool to re-enumerate on the USB bus, and the virtualization software may not
reattach to it making your virtualized system with a disconnected tool.
Atmel Studio 7 User Guide
Frequently Asked Questions
© 2018 Microchip Technology Inc. User Guide DS50002718A-page 349

Normal virtualization software supports the idea of USB filters where you set a collection of USB devices
you want to automatically attach to a given guest operating system. Check the manual for your
virtualization solution to see how this is done, or see the Firmware Upgrade Fails on VirtualBox.
11.4.3 Debugging never Breaks under a Virtualized Machine
Some virtualization solutions have a limit on how many USB endpoints it supports. This may become an
issue if the number of endpoints is lower than the required number for the tool. Usually, this causes
programming to work as expected but debug not to work as debug events are transmitted on a higher
endpoint number.
Check with your virtualization software how many endpoints are available and on other endpoint-specific
issues with your virtualization software regarding this.
11.4.4 Firmware Upgrade Fails on VirtualBox
When doing a firmware upgrade on any tool, the tool needs to be reconnected in another mode than the
one used during regular operation. This causes the tool to be re-enumerated and can cause the tool to be
disconnected from the VirtualBox instance and returned to the host operating system.
To make the tool connect automatically to the VirtualBox instance, you need to set up a couple of USB
filters. More information on USB filters can be found in the VirtualBox documentation.
Make two filters that are similar to the two shown in the figure below.
Atmel Studio 7 User Guide
Frequently Asked Questions
© 2018 Microchip Technology Inc. User Guide DS50002718A-page 350
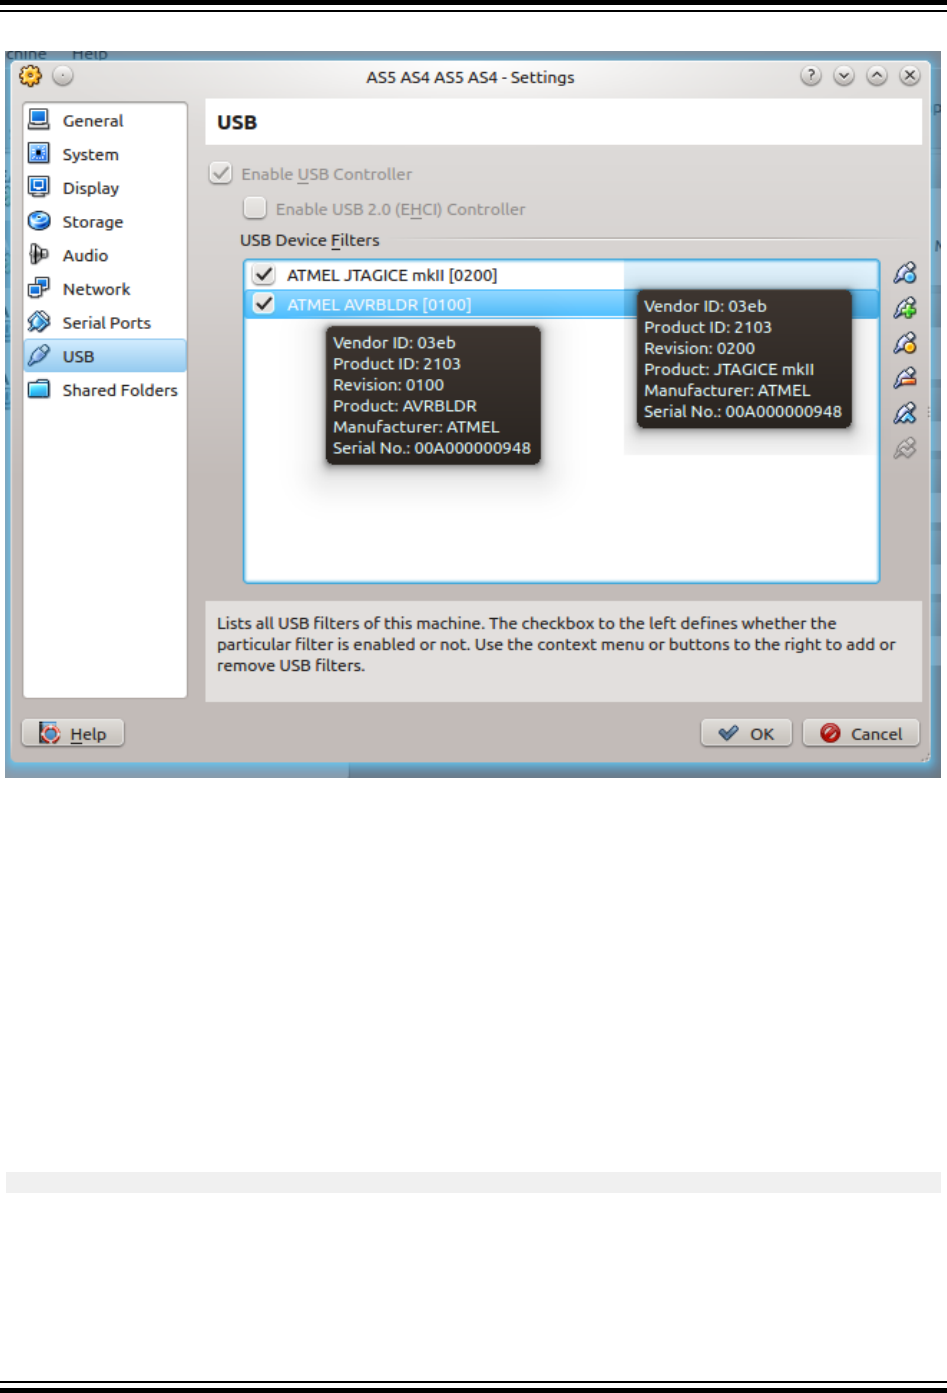
Figure 11-1. VirtualBox USB Filter
Note that the example in the figure above is specific for the JTAGICE mkII. There is one entry for the tool,
here the JTAGICE mkII, and one for AVRBLDR, which is the firmware upgrade mode for the tool. The
name, serial, Vendor ID, and Product ID may be different for your tool, so change those values
accordingly.
Note: This section contains specifics to VirtualBox. The same logic applies to other virtualization
software, but the steps may differ.
11.4.5 Issues with ARM Compatible Tools
In some rare instances, all ARM compatible tools disappear from Atmel Studio. This has been tracked
down to different dll load strategies used in different versions of Windows.
To check that it is a dll load error, try to read out the chip information using atprogram. This can be done
by opening the Atmel Studio command prompt from the Tools menu inside Atmel Studio or from the start
menu. In the command prompt, enter the following command and check that it does not fail.
atprogram -t <tool> -i <interface> -d <device> info
In the snippet above, replace <tool> with the tool name, e.g. atmelice, samice, or edbg. Likewise,
replace interface with the used interface and the device with the full device name, e.g. atsam3s4c.
Atmel Studio 7 User Guide
Frequently Asked Questions
© 2018 Microchip Technology Inc. User Guide DS50002718A-page 351
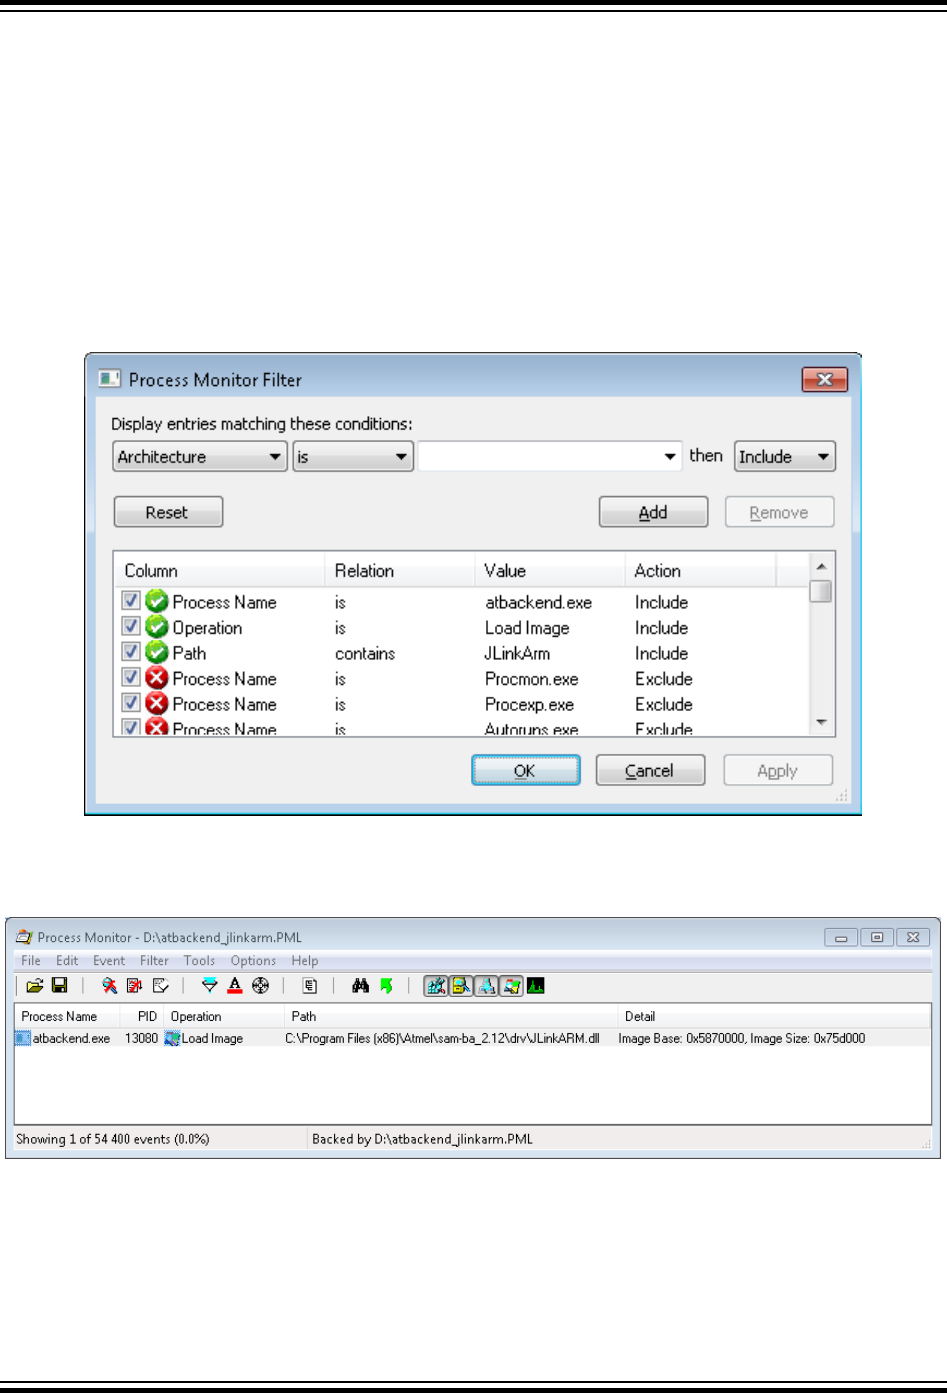
Invoking the above command should output information about the memory layout, the supply voltage for
the chip, and the fuse settings. If it fails it is likely a driver issue, which is covered by Driver and USB
Issues.
If atprogram is able to communicate with the device it means that the issue is most likely a wrong
version of JLinkArm.dll being loaded due to loader precedence. To check this, use the Procmon tool
to check what dll is being loaded.
Download the Procmon tool, open it, and configure the filter shown in the figure below. Then start Atmel
Studio. A couple of seconds after Atmel Studio has started, one line should become visible showing the
path to where the dll is being loaded from. It should be loaded from the atbackend folder inside the
Atmel Studio installation directory.
Figure 11-2. Procmon Filter Configuration
If the path of the dll is different it means that Atmel Studio has picked up the wrong dll, and this dll is
incompatible with the dll shipped with Atmel Studio. An example of this is shown in the figure below.
Figure 11-3. Procmon Filter Configuration
To solve the above issue, we recommend backing up the dll that is being loaded and then replacing it with
the JLinkARM.dll found in the atbackend directory inside the Atmel Studio installation directory. This
can be done given the assumption that the dll bundled with Atmel Studio is newer than the one that is
being loaded, and the dll is backward compatible.
Atmel Studio 7 User Guide
Frequently Asked Questions
© 2018 Microchip Technology Inc. User Guide DS50002718A-page 352

Note: Remember to back up the offending JLinkARM.dll before replacing it, as it is not given that it
will be compatible with the program that deployed it.
Atmel Studio 7 User Guide
Frequently Asked Questions
© 2018 Microchip Technology Inc. User Guide DS50002718A-page 353

12. Document Revision History
Doc Rev. Date Comments
A 02/2018 Converted to Microchip format and replaced the Atmel document number 42167.
A lot of corrections have been made throughout the whole document.
42167B 09/2016 Section 'Power Debugger' is added
42167A 07/2016 Initial document release.
Atmel Studio 7 User Guide
Document Revision History
© 2018 Microchip Technology Inc. User Guide DS50002718A-page 354

The Microchip Web Site
Microchip provides online support via our web site at http://www.microchip.com/. This web site is used as
a means to make files and information easily available to customers. Accessible by using your favorite
Internet browser, the web site contains the following information:
•Product Support – Data sheets and errata, application notes and sample programs, design
resources, user’s guides and hardware support documents, latest software releases and archived
software
•General Technical Support – Frequently Asked Questions (FAQ), technical support requests,
online discussion groups, Microchip consultant program member listing
•Business of Microchip – Product selector and ordering guides, latest Microchip press releases,
listing of seminars and events, listings of Microchip sales offices, distributors and factory
representatives
Customer Change Notification Service
Microchip’s customer notification service helps keep customers current on Microchip products.
Subscribers will receive e-mail notification whenever there are changes, updates, revisions or errata
related to a specified product family or development tool of interest.
To register, access the Microchip web site at http://www.microchip.com/. Under “Support”, click on
“Customer Change Notification” and follow the registration instructions.
Customer Support
Users of Microchip products can receive assistance through several channels:
• Distributor or Representative
• Local Sales Office
• Field Application Engineer (FAE)
• Technical Support
Customers should contact their distributor, representative or Field Application Engineer (FAE) for support.
Local sales offices are also available to help customers. A listing of sales offices and locations is included
in the back of this document.
Technical support is available through the web site at: http://www.microchip.com/support
Microchip Devices Code Protection Feature
Note the following details of the code protection feature on Microchip devices:
• Microchip products meet the specification contained in their particular Microchip Data Sheet.
• Microchip believes that its family of products is one of the most secure families of its kind on the
market today, when used in the intended manner and under normal conditions.
• There are dishonest and possibly illegal methods used to breach the code protection feature. All of
these methods, to our knowledge, require using the Microchip products in a manner outside the
operating specifications contained in Microchip’s Data Sheets. Most likely, the person doing so is
engaged in theft of intellectual property.
• Microchip is willing to work with the customer who is concerned about the integrity of their code.
Atmel Studio 7 User Guide
© 2018 Microchip Technology Inc. User Guide DS50002718A-page 356

• Neither Microchip nor any other semiconductor manufacturer can guarantee the security of their
code. Code protection does not mean that we are guaranteeing the product as “unbreakable.”
Code protection is constantly evolving. We at Microchip are committed to continuously improving the
code protection features of our products. Attempts to break Microchip’s code protection feature may be a
violation of the Digital Millennium Copyright Act. If such acts allow unauthorized access to your software
or other copyrighted work, you may have a right to sue for relief under that Act.
Legal Notice
Information contained in this publication regarding device applications and the like is provided only for
your convenience and may be superseded by updates. It is your responsibility to ensure that your
application meets with your specifications. MICROCHIP MAKES NO REPRESENTATIONS OR
WARRANTIES OF ANY KIND WHETHER EXPRESS OR IMPLIED, WRITTEN OR ORAL, STATUTORY
OR OTHERWISE, RELATED TO THE INFORMATION, INCLUDING BUT NOT LIMITED TO ITS
CONDITION, QUALITY, PERFORMANCE, MERCHANTABILITY OR FITNESS FOR PURPOSE.
Microchip disclaims all liability arising from this information and its use. Use of Microchip devices in life
support and/or safety applications is entirely at the buyer’s risk, and the buyer agrees to defend,
indemnify and hold harmless Microchip from any and all damages, claims, suits, or expenses resulting
from such use. No licenses are conveyed, implicitly or otherwise, under any Microchip intellectual
property rights unless otherwise stated.
Trademarks
The Microchip name and logo, the Microchip logo, AnyRate, AVR, AVR logo, AVR Freaks, BeaconThings,
BitCloud, CryptoMemory, CryptoRF, dsPIC, FlashFlex, flexPWR, Heldo, JukeBlox, KeeLoq, KeeLoq logo,
Kleer, LANCheck, LINK MD, maXStylus, maXTouch, MediaLB, megaAVR, MOST, MOST logo, MPLAB,
OptoLyzer, PIC, picoPower, PICSTART, PIC32 logo, Prochip Designer, QTouch, RightTouch, SAM-BA,
SpyNIC, SST, SST Logo, SuperFlash, tinyAVR, UNI/O, and XMEGA are registered trademarks of
Microchip Technology Incorporated in the U.S.A. and other countries.
ClockWorks, The Embedded Control Solutions Company, EtherSynch, Hyper Speed Control, HyperLight
Load, IntelliMOS, mTouch, Precision Edge, and Quiet-Wire are registered trademarks of Microchip
Technology Incorporated in the U.S.A.
Adjacent Key Suppression, AKS, Analog-for-the-Digital Age, Any Capacitor, AnyIn, AnyOut, BodyCom,
chipKIT, chipKIT logo, CodeGuard, CryptoAuthentication, CryptoCompanion, CryptoController,
dsPICDEM, dsPICDEM.net, Dynamic Average Matching, DAM, ECAN, EtherGREEN, In-Circuit Serial
Programming, ICSP, Inter-Chip Connectivity, JitterBlocker, KleerNet, KleerNet logo, Mindi, MiWi,
motorBench, MPASM, MPF, MPLAB Certified logo, MPLIB, MPLINK, MultiTRAK, NetDetach, Omniscient
Code Generation, PICDEM, PICDEM.net, PICkit, PICtail, PureSilicon, QMatrix, RightTouch logo, REAL
ICE, Ripple Blocker, SAM-ICE, Serial Quad I/O, SMART-I.S., SQI, SuperSwitcher, SuperSwitcher II, Total
Endurance, TSHARC, USBCheck, VariSense, ViewSpan, WiperLock, Wireless DNA, and ZENA are
trademarks of Microchip Technology Incorporated in the U.S.A. and other countries.
SQTP is a service mark of Microchip Technology Incorporated in the U.S.A.
Silicon Storage Technology is a registered trademark of Microchip Technology Inc. in other countries.
GestIC is a registered trademark of Microchip Technology Germany II GmbH & Co. KG, a subsidiary of
Microchip Technology Inc., in other countries.
All other trademarks mentioned herein are property of their respective companies.
Atmel Studio 7 User Guide
© 2018 Microchip Technology Inc. User Guide DS50002718A-page 357

© 2018, Microchip Technology Incorporated, Printed in the U.S.A., All Rights Reserved.
ISBN: 978-1-5224-2614-1
Quality Management System Certified by DNV
ISO/TS 16949
Microchip received ISO/TS-16949:2009 certification for its worldwide headquarters, design and wafer
fabrication facilities in Chandler and Tempe, Arizona; Gresham, Oregon and design centers in California
and India. The Company’s quality system processes and procedures are for its PIC® MCUs and dsPIC®
DSCs, KEELOQ® code hopping devices, Serial EEPROMs, microperipherals, nonvolatile memory and
analog products. In addition, Microchip’s quality system for the design and manufacture of development
systems is ISO 9001:2000 certified.
Atmel Studio 7 User Guide
© 2018 Microchip Technology Inc. User Guide DS50002718A-page 358
AMERICAS ASIA/PACIFIC ASIA/PACIFIC EUROPE
Corporate Office
2355 West Chandler Blvd.
Chandler, AZ 85224-6199
Tel: 480-792-7200
Fax: 480-792-7277
Technical Support:
http://www.microchip.com/
support
Web Address:
www.microchip.com
Atlanta
Duluth, GA
Tel: 678-957-9614
Fax: 678-957-1455
Austin, TX
Tel: 512-257-3370
Boston
Westborough, MA
Tel: 774-760-0087
Fax: 774-760-0088
Chicago
Itasca, IL
Tel: 630-285-0071
Fax: 630-285-0075
Dallas
Addison, TX
Tel: 972-818-7423
Fax: 972-818-2924
Detroit
Novi, MI
Tel: 248-848-4000
Houston, TX
Tel: 281-894-5983
Indianapolis
Noblesville, IN
Tel: 317-773-8323
Fax: 317-773-5453
Tel: 317-536-2380
Los Angeles
Mission Viejo, CA
Tel: 949-462-9523
Fax: 949-462-9608
Tel: 951-273-7800
Raleigh, NC
Tel: 919-844-7510
New York, NY
Tel: 631-435-6000
San Jose, CA
Tel: 408-735-9110
Tel: 408-436-4270
Canada - Toronto
Tel: 905-695-1980
Fax: 905-695-2078
Australia - Sydney
Tel: 61-2-9868-6733
China - Beijing
Tel: 86-10-8569-7000
China - Chengdu
Tel: 86-28-8665-5511
China - Chongqing
Tel: 86-23-8980-9588
China - Dongguan
Tel: 86-769-8702-9880
China - Guangzhou
Tel: 86-20-8755-8029
China - Hangzhou
Tel: 86-571-8792-8115
China - Hong Kong SAR
Tel: 852-2943-5100
China - Nanjing
Tel: 86-25-8473-2460
China - Qingdao
Tel: 86-532-8502-7355
China - Shanghai
Tel: 86-21-3326-8000
China - Shenyang
Tel: 86-24-2334-2829
China - Shenzhen
Tel: 86-755-8864-2200
China - Suzhou
Tel: 86-186-6233-1526
China - Wuhan
Tel: 86-27-5980-5300
China - Xian
Tel: 86-29-8833-7252
China - Xiamen
Tel: 86-592-2388138
China - Zhuhai
Tel: 86-756-3210040
India - Bangalore
Tel: 91-80-3090-4444
India - New Delhi
Tel: 91-11-4160-8631
India - Pune
Tel: 91-20-4121-0141
Japan - Osaka
Tel: 81-6-6152-7160
Japan - Tokyo
Tel: 81-3-6880- 3770
Korea - Daegu
Tel: 82-53-744-4301
Korea - Seoul
Tel: 82-2-554-7200
Malaysia - Kuala Lumpur
Tel: 60-3-7651-7906
Malaysia - Penang
Tel: 60-4-227-8870
Philippines - Manila
Tel: 63-2-634-9065
Singapore
Tel: 65-6334-8870
Taiwan - Hsin Chu
Tel: 886-3-577-8366
Taiwan - Kaohsiung
Tel: 886-7-213-7830
Taiwan - Taipei
Tel: 886-2-2508-8600
Thailand - Bangkok
Tel: 66-2-694-1351
Vietnam - Ho Chi Minh
Tel: 84-28-5448-2100
Austria - Wels
Tel: 43-7242-2244-39
Fax: 43-7242-2244-393
Denmark - Copenhagen
Tel: 45-4450-2828
Fax: 45-4485-2829
Finland - Espoo
Tel: 358-9-4520-820
France - Paris
Tel: 33-1-69-53-63-20
Fax: 33-1-69-30-90-79
Germany - Garching
Tel: 49-8931-9700
Germany - Haan
Tel: 49-2129-3766400
Germany - Heilbronn
Tel: 49-7131-67-3636
Germany - Karlsruhe
Tel: 49-721-625370
Germany - Munich
Tel: 49-89-627-144-0
Fax: 49-89-627-144-44
Germany - Rosenheim
Tel: 49-8031-354-560
Israel - Ra’anana
Tel: 972-9-744-7705
Italy - Milan
Tel: 39-0331-742611
Fax: 39-0331-466781
Italy - Padova
Tel: 39-049-7625286
Netherlands - Drunen
Tel: 31-416-690399
Fax: 31-416-690340
Norway - Trondheim
Tel: 47-7289-7561
Poland - Warsaw
Tel: 48-22-3325737
Romania - Bucharest
Tel: 40-21-407-87-50
Spain - Madrid
Tel: 34-91-708-08-90
Fax: 34-91-708-08-91
Sweden - Gothenberg
Tel: 46-31-704-60-40
Sweden - Stockholm
Tel: 46-8-5090-4654
UK - Wokingham
Tel: 44-118-921-5800
Fax: 44-118-921-5820
Worldwide Sales and Service
© 2018 Microchip Technology Inc. User Guide DS50002718A-page 359