CCES Guide 2016
CCES%2BGuide%2B2016
CCES%20Guide%202016
CCES%20Guide%202016
User Manual: Pdf
Open the PDF directly: View PDF ![]() .
.
Page Count: 182 [warning: Documents this large are best viewed by clicking the View PDF Link!]

Guide to the 2016 Cooperative Congressional
Election Survey
Data Release No. 21
Stephen Ansolabehere, PI
Harvard University
Brian Schaffner, co-PI
University of Massachusetts Amherst
Sam Luks, co-PI
YouGov
August 2017
The 2016 Cooperative Congressional Election Study was supported by the
National Science Foundation Award # 1559125.
1Data Release 1 occurred on March 2017, and corresponds to the 2016 CCES Common Content. Data
Release 2 occurred on August 4, 2017 and corresponds to the 2016 CCES Common Content with vote
validation appended.
1
Contents
Acknowledgments 4
Referencing the Study 6
Part I 7
Introduction 7
State Sample Sizes 9
Table of AAPOR Response Rates 11
Part II 12
Sampling Methodology 12
Sampling and Sample Matching . . . . . . . . . . . . . . . . . . . . . . . . . . . . 12
Theoretical Background for Sample Matching . . . . . . . . . . . . . . . . . . . . 13
Sampling Frame and Target Sample . . . . . . . . . . . . . . . . . . . . . . . . . . 14
Stratification and Matching . . . . . . . . . . . . . . . . . . . . . . . . . . . 15
Weighting ........................................ 16
UsingWeights...................................... 16
Accuracy of the CCES Sample . . . . . . . . . . . . . . . . . . . . . . . . . . . . . 16
Part III 23
Common Content 23
SampleIdentifiers.................................... 23
Profile.......................................... 26
Pre-election ....................................... 56
Post-election ...................................... 98
VoteValidation..................................... 126
Part IV 129
Contextual Variables 129
Pre-Election Survey Contextual Variables . . . . . . . . . . . . . . . . . . . . . . 129
Post-Election Survey Contextual Variables . . . . . . . . . . . . . . . . . . . . . . 134
Senate.......................................... 138
Governors........................................ 141
2

Acknowledgments
This project is the collaborative effort of 60 research teams and organizations. Individual
teams had their own principal investigators and research groups and designed their own team
surveys. The teams and their Principal Investigators are:
Table 1: Teams and Principal Investigators
Team Principal Investigator
American University Liz Suhay
Arizona State University Valerie Hoekstra
Brigham Young University Chris Karpowitz, Jeremy Pope
Campaign Finance Task Force Jeff Milyo
Columbia University Alex Hertel-Fernandez
Duke University 1 Alexandra Cooper
Duke University 2 Alexandra Cooper
Fordham University Costas Panagopoulos
Florida State University Brad Gomez
George Washington University 1 John Sides
George Washington University 2 Kim Gross
Harvard University 1 Steve Ansolabehere
Harvard University 2 Steve Ansolabehere
Harvard University 3/Stanford University Dustin Tingley, Mike Tomz
Indiana University 1 Chris DeSante
Indiana University 2 Ted Carmines, Chris DeSante
Louisiana State University/Skidmore College Kathleen Searles, Chris Mann
MIT 1 Charles Stewart
MIT 2 Andrea Campbell
Nazarbayev University Jee-Kwang Park
New York University Pat Egan
Notre Dame University Geoff Layman
Notre Dame University Gary Hollibaugh
Reed College Paul Gronke
Rutgers University David Redlawsk
Texas A&M Kirby Goidel
Texas Tech/Appalachian State Seth McKee, Dan Smith, Will Hicks
Tulane University Mirya Holman
UC Davis Chris Hare
UC Merced Alex Theodoridis
UC Riverside Jennifer Merolla
UNC Charlotte Cherie Maestas
University of Colorado Jennifer Wolak
University of Delaware 1 Paul Brewer
Continued on next page
4

Table 1 – continued from previous page
Team Principal Investigator
University of Delaware 2 Paul Brewer
University of Delaware 3 David Wilson
University of Georgia Keith Poole
University of Houston Scott Clifford, Justin Kirkland
University of Illinois Cara Wong
University of Iowa 2 Brian Lai
University of Maryland Antoine Banks
University of Massachusetts Amherst 1 Rebecca Lisi
University of Massachusetts Amherst 2 Brian Schaffner
University of Massachusetts Boston 3 Travis Johnston
University of Miami Joseph Uscinski
University of Michigan Nancy Burns, Don Kinder
University of Michigan/Duke University Nancy Burns, Ashley Jardina
University of Minnesota Joanne Miller
University of Mississippi Conor Dowling
University of Missouri Jeff Milyo
University of Montreal Marc Hooghe
University of Virginia Adam Hughes
UT Austin 1 Daron Shaw
UT Austin 2 Brian Roberts
UT Dallas Harold Clarke
Vanderbilt University Cindy Kam
William and Mary Ron Rapoport
Yale University 1 Greg Huber, Andrew Gooch
Yale University 2/Wesleyan U/U Minnesota Duluth John Henderson
Stephen Ansolabehere served as the Principal Investigator for the overall project, Brian
Schaffner and Sam Luks served as co-Principal Investigators, and Elizabeth Salazar at Har-
vard served as the Project Administrators. All teams contributed to the Common Content;
Stephen Ansolabehere and Brian Schaffner coordinated the development of the Common
Content questionnaire. Doug Rivers at YouGov provided general guidance for the sample
design. Special thanks to Marissa Shih of YouGov, who served as project manager for the
CCES. Thanks also to Steffen Weiss, Jason Cowden, Ruohnan Hu, Julissa Martinez, Jen-
nifer Dechnicz, Diana Rujoiu, Mircea Dumitru, Alin Orman, Crina Voda, Alexandru Ionescu,
Madalina Batu, and Mihail Mandroc for their work organizing, preparing, and processing
the team surveys. Finally, thanks to Ivelisse Cuevas Molina, Shiro Kuriwaki, and Kattalina
Berriochoa for their work in preparing this guide.
The Institute for Quantitative Study of the Social Sciences and the Dean of the Faculty of
Arts and Sciences at Harvard provided essential research support for this project, as did each
of the universities and research organizations sponsoring a team.
5
Referencing the Study
For research that uses the Common Content, the reference follows the ICPSR protocol:
Ansolabehere, Stephen and Brian F. Schaffner, COOPERATIVE CONGRES-
SIONAL ELECTION STUDY, 2016: COMMON CONTENT. [Computer File]
Release 2: August 4, 2017. Cambridge, MA: Harvard University [producer]
http://cces.gov.harvard.edu
As individual teams use their datasets for publication and make their datasets available,
referencing the team content will follow the same protocol:
[Name of Team Principal Investigator], COOPERATIVE CONGRESSIONAL
ELECTION STUDY, 2016: [TEAM NAME] CONTENT. [Computer File] Re-
lease: [Date]. [Location of Team]. [producer] http://cces.gov.harvard.edu
6
Part I
Introduction
The Cooperative Congressional Election Study, or CCES, seeks to study how Americans view
Congress and hold their representatives accountable during elections, how they voted and
their electoral experiences, and how their behavior and experiences vary with political geog-
raphy and social context. This study constructed a very large sample capable of capturing
variation across a wide variety of legislative constituencies. In fact, the state-level samples
are sufficiently large as to measure with a reasonable degree of precision the distribution of
voters’ preferences within most states.
The 2016 CCES involved 60 teams, yielding a Common Content sample of 64,600 cases. The
subjects for this study were recruited during the fall of 2016. Each research team purchased a
1,000 person national sample survey, conducted by YouGov of Redwood City, CA. Interviews
for the 2016 survey were conducted in two waves. The pre-election wave of the questionnaire
was in the field from September 28 to November 7; the post-election wave was in the field
from November 9 to December 14. Each survey has approximately 120 questions. For each
survey of 1,000 persons, half of the questionnaire was developed and controlled entirely by
each individual research team, and half of the questionnaire is devoted to Common Content.
The Common Content consists of the questions common to all team modules and has a
sample size equal to the total sample size of all team modules combined. Most of the 60
teams purchased 1,000 person surveys, though a few teams purchased additional cases to
increase their sample size and size of the Common Content. All cases were selected through
the Internet and YouGov constructed matched random samples for this study.
Data Release 1 occurred on March 3, 2017. Data for this study is archived and available at
the Harvard University Dataverse. A subsequent release will include vote validation for all
respondents.
The 2016 CCES is part of an on-going study. The Cooperative Congressional Election Study
formed in 2006 to study congressional elections and representation using very large scale
national surveys, building off of the 2005 MIT Public Opinion Research and Training Lab
(PORTL) study. The CCES has been conducted in every year since 2006 and has received
support from the National Science Foundation for all even-year surveys from 2010 onward.
This guide describes the methodology behind the overall study and the measures and vari-
ables developed for the Common Content of the 2016 study. There are five parts to the 2016
CCES Common Content – sample identifiers (including state and congressional district),
profile questions (largely demographic), pre-election questions, post-election questions, and
contextual data (including candidate names and parties, election results, and roll call votes).
This codebook provides question wordings, values, and frequencies presented of the vari-
ables for the 2016 Common Content dataset. Each Team Module has its own dataset and
codebook, which will be posted to the Dataverse by July, 2018.
7
The criteria for inclusion of a question in the Common Content were three-fold. First, what
questions would naturally be of interest to scholars researching Congress, representation, and
elections? Items such as approval of Congress, approval of the individual Senator or House
Member, Partisanship, Ideology, views on the economy and war, and voting behavior, as well
as demographic characteristics of voters fall into this category. Second, what questions did a
large number of teams want to include in the study? For example, a number of research teams
expressed interests in studying roll call voting behavior of members of Congress. Another
cluster of teams wanted a more extensive battery of questions on religion, which led the CCES
to expand beyond the usual questions asked by the ANES. Third, what phenomena can only
be measured with a large survey? The very large sample for the Common Content provides
the opportunity to study legislative constituencies – states and congressional districts – as
well as voters within those constituencies, to study very rare or low frequency events or
very small populations, and to measure with fairly high accuracy interactions. An example
of content included in the common for this reason is the battery of questions on problems
encountered when voting. Such problems occur at the frequency of about 2 or 3 percent, are
enough to present voting rights issues, but too small to be measured in standard surveys.
8

State Sample Sizes
Table 2: State Sample Sizes
State FIPS Cases
Alabama 1 792
Alaska 2 115
Arizona 4 1507
Arkansas 5 538
California 6 6021
Colorado 8 1,022
Connecticut 9 732
Delaware 10 267
District of Columbia 11 192
Florida 12 4988
Georgia 13 2062
Hawaii 15 200
Idaho 16 326
Illinois 17 2634
Indiana 18 1397
Iowa 19 688
Kansas 20 541
Kentucky 21 933
Louisiana 22 689
Maine 23 329
Maryland 24 1200
Massachusetts 25 1442
Michigan 26 2110
Minnesota 27 1083
Mississippi 28 409
Missouri 29 1309
Montana 30 191
Nebraska 31 370
Nevada 32 695
New Hampshire 33 376
New Jersey 34 1831
New Mexico 35 383
New York 36 4320
North Carolina 37 2004
North Dakota 38 126
Ohio 39 2698
Oklahoma 40 624
Oregon 41 1022
Continued on next page
9

Table 2 – continued from previous page
State FIPS Cases
Pennsylvania 42 3524
Rhode Island 44 212
South Carolina 45 857
South Dakota 46 167
Tennessee 47 1215
Texas 48 4462
Utah 49 531
Vermont 50 132
Virginia 51 2008
Washington 53 1444
West Virginia 54 429
Wisconsin 55 1354
Wyoming 56 99
10

Table of AAPOR Outcome Rates
Common
(YouGov
Sample)
Common
(External
Sample)
Common
(Total)
53939 52443 106382
7177 22692 29869
2519 5210 7729
64997
557367 622364
982 43822 44804
53939
52443 106382
7177
22692 29869
2519
5210 7729
0
0 0
0
0 0
0.985
0.647 0.763
64997
557367 622364
0
0 0
0.419
0.082 0.139
0.475
0.118 0.178
0.423
0.119 0.172
0.479
0.170 0.220
0.848
0.653 0.739
0.960
0.935 0.946
0.848
0.653 0.739
0.960
0.935 0.946
0.020
0.008 0.010
0.020
0.012 0.012
0.040
0.065 0.054
0.495
0.126 0.188
0.499
0.182 0.233
1.000
1.000 1.000
681534
811148
Refusal Rate 3
R/((I+P)+(R+NC+O))
(I+P)/((I+P)+R+O))
Cooperation Rate 3
I/((I+P)+R))
Cooperation Rate 4
I/((I+P) + (R+NC+O) + e(UH+UO))
R/((I+P)+(R+NC+O) + e(UH + UO))
Refusal Rate 1
R/((I+P)+(R+NC+O) + UH + UO))
Refusal Rate 2
(I+P)/((I+P)+R))
Response Rate 4
(I+P)/((I+P) + (R+NC+O) + e(UH+UO))
Cooperation Rate 1
I/(I+P)+R+O)
Cooperation Rate 2
(I+P)+R+O / (I+P)+R+O+NC
Contact Rate 1
(I+P)+R+O / (I+P)+R+O+NC+ (UH + UO)
Contact Rate 2
(I+P)+R+O / (I+P)+R+O+NC + e(UH+UO)
Contact Rate 3
(I+P)/(I+P) + (R+NC+O) + (UH+UO)
Response Rate 3
Total email addresses used
I=Complete Interviews (1.1)
P=Partial Interviews (1.2)
UH=Unknown household (3.1)
UO=Unknown other (3.2, 3.9)
Response Rate 1
I/(I+P) + (R+NC+O) + (UH+UO)
Response Rate 2
129614
NC=Non Contact (2.2)
O=Other (2.0, 2.3)
Estimate of e is based on proportion of eligible households among all numbers for
which a definitive determination of status was obtained (a very conservative
estimate). This will be used if you do not enter a different estimate in line 62.
Interview (Category 1)
Complete
Partial
Eligible, non-interview (Category 2)
Refusal
Unknown eligibility, non-interview (Category 3)
R=Refusal and breakoff (2.1)
No answer
Not eligible (Category 4)
Out of sample – other strata than originally coded
Part II
Sampling Methodology
The 2016 CCES survey was conducted over the Internet by YouGov. The Common Con-
tent was asked of 64,600 adults interviewed in October 2016 (for pre-election data), and
in November 2016 (for post-election data). The sampling method uses YouGov?s matched
random sample methodology.
Sampling and Sample Matching
Sample matching is a methodology for selection of “representative” samples from non-
randomly selected pools of respondents. It is ideally suited for Web access panels, but
could also be used for other types of surveys, such as phone surveys. Sample matching starts
with an enumeration of the target population. For general population studies, the target
population is all adults, and can be enumerated through the use of the decennial Census or
a high quality survey, such as the American Community Survey. In other contexts, this is
known as the sampling frame, though, unlike conventional sampling, the sample is not drawn
from the frame. Traditional sampling, then, selects individuals from the sampling frame at
random for participation in the study. This may not be feasible or economical as the contact
information, especially email addresses, is not available for all individuals in the frame and
refusals to participate increase the costs of sampling in this way.
Sample selection using the matching methodology is a two-stage process. First, a random
sample is drawn from the target population. We call this sample the target sample.
Details on how the target sample is drawn are provided below, but the essential idea is
that this sample is a true probability sample and thus representative of the frame from
which it was drawn. However, YouGov is not able to contact these individuals directly.
Therefore, the second step is that for each member of the target sample, we select one or more
matching members from our pool of opt-in respondents. This is called the matched sample.
Matching is accomplished using a large set of variables that are available in consumer and
voter databases for both the target population and the opt-in panel.
The purpose of matching is to find an available respondent who is as similar as possible to
the selected member of the target sample. The result is a sample of respondents who have
the same measured characteristics as the target sample. Under certain conditions, described
below, the matched sample will have similar properties to a true random sample. That is,
the matched sample mimics the characteristics of the target sample. It is, as far as we can
tell, representative of the target population (because it is similar to the target sample).
When choosing the matched sample, it is necessary to find the closest matching respondent
in the panel of opt-ins to each member of the target sample. Various types of matching
could be employed: exact matching, propensity score matching, and proximity matching.
12
Exact matching is impossible if the set of characteristics used for matching is large and,
even for a small set of characteristics, requires a very large panel (to find an exact match).
Propensity score matching has the disadvantage of requiring estimation of the propensity
score. Either a propensity score needs to be estimated for each individual study, so the
procedure is automatic, or a single propensity score must be estimated for all studies. If
large numbers of variables are used the estimated propensity scores can become unstable
and lead to poor samples.
YouGov employs the proximity matching method. For each variable used for matching,
we define a distance function, d(x,y), which describes how “close” the values x and y are
on a particular attribute. The overall distance between a member of the target sample
and a member of the panel is a weighted sum of the individual distance functions on each
attribute. The weights can be adjusted for each study based upon which variables are
thought to be important for that study, though, for the most part, we have not found the
matching procedure to be sensitive to small adjustments of the weights. A large weight, on
the other hand, forces the algorithm toward an exact match on that dimension.
Theoretical Background for Sample Matching
To understand better the sample matching methodology, it may be helpful to think of the
target sample as a simple random sample (SRS) from the target population. The SRS yields
unbiased estimates because the selection mechanism is unrelated to particular characteristics
of the population. The efficiency of the SRS can be improved by using stratified sampling
in place of simple random sampling. SRS is generally less efficient than stratified sampling
because the size of population subgroups varies in the target sample.
Stratified random sampling partitions the population into a set of categories that are be-
lieved to be more homogeneous than the overall population, called strata. For example, we
might divide the population into race, age, and gender categories. The cross-classification
of these three attributes divides the overall population into a set of mutually exclusive and
exhaustive groups or strata. Then an SRS is drawn from each category and the combined
set of respondents constitutes a stratified sample. If the number of respondents selected in
each strata is proportional to their frequency in the target population, then the sample is
self-representing and requires no additional weighting.
The intuition behind sample matching is analogous to stratified sampling: if respondents
who are similar on a large number of characteristics tend to be similar on other items for
which we lack data, then substituting one for the other should have little impact upon the
sample. This intuition can be made rigorous under certain assumptions.
Assumption 1: Ignorability. Panel participation is assumed to be ignorable with respect
to the variables measured by survey conditional upon the variables used for matching. What
this means is that if we examined panel participants and non-participants who have exactly
the same values of the matching variables, then on average there would be no difference
between how these sets of respondents answered the survey. This does not imply that panel
participants and non-participants are identical, but only that the differences are captured by
13
the variables used for matching. Since the set of data used for matching is quite extensive,
this is, in most cases, a plausible assumption.
Assumption 2: Smoothness. The expected value of the survey items given the variables
used for matching is a smooth function. Smoothness is a technical term meaning that the
function is continuously differentiable with bounded first derivative. In practice, this means
that that the expected value function does not have any kinks or jumps.
Assumption 3: Common Support. The variables used for matching need to have a
distribution that covers the same range of values for panelists and non-panelists. More
precisely, the probability distribution of the matching variables must be bounded away from
zero for panelists on the range of values (known as the support) taken by the non-panelists.
In practice, this excludes attempts to match on variables for which there are no possible
matches within the panel. For instance, it would be impossible to match on computer usage
because there are no panelists without some experience using computers.
Under Assumptions 1-3, it can be shown that if the panel is sufficiently large, then the
matched sample provides consistent estimates for survey measurements. The sampling vari-
ances will depend upon how close the matches are if the number of variables used for matching
is large. In this study, over 150,000 respondents to YouGov’s Internet surveys were used for
the pool from which to construct the matches for the final sample.
Sampling Frame and Target Sample
YouGov employed a combination of two frames. The first stage used a sampling frame of
U.S. Citizens from the the 2012 American Community survey, including data on age, race,
gender, education, marital status, number of children under 18, family income, employment
status, citizenship, state, and metropolitan area. The frame was constructed by stratified
sampling from the full 2012 ACS sample with selection within strata by weighted sampling
with replacement (using the person weights on the public use file). Data on congressional
districts was matched to this frame from Census tables. Data on voter registration status,
turnout, and vote choice was matched from the 2012 Current Population survey and 2012
national and state exit polls.
The second stage used a sampling frame of U.S. Citizens from the 2010 American Community
Survey with a similar set of variables. Data on reported 2010 voter registration and turnout
from the November 2010 Current Population Survey and on reported 2008 voter registration
and turnout from the November 2008 Current Population Survey was matched to this frame
using a weighted Euclidean distance metric. Data on religion, church attendance, born again
or evangelical status, news interest, party identification and ideology was matched from the
2007 Pew U.S. Religious Landscape Survey. The target sample was selected by stratification
by age, race, gender, education, and voter registration, and by simple random sampling
within strata.
14
Stratification and Matching
The sample drawn for the CCES were chosen from the YouGov Panel, along with the My-
Points, Research Now, SSI, and GMI panels using a five-way cross-classification (age x gender
x race x education x state). All respondents who completed the pre-election survey were
re-invited to the post-election survey. The final set of completed pre-election interviews
(numbering approximately 87,389, after quality controls were applied) were then matched
to the target frame, using a weighted Euclidean distances metric.
The following distance function was used for the match:
fmatch <- function(target, pool) {
25 * (abs(target$age - pool$age)/20) + #4
5 * (target$race3 != pool$race3) + #3
8 * (abs(target$educyrs - pool$educyrs)/4) + #2.5
10 * (I(target$educyrs == 10) != I(pool$educyrs == 10)) + #2.5
10 * (I(target$educyrs == 12) != I(pool$educyrs == 12)) + #2.5
2 * (I(target$educyrs < 14) * I(target$race3 != 1) != I(pool$educyrs < 14) * I(pool$race3 != 1)) +
4 * (target$gender != pool$gender) +
(mat.employ[target$employ, pool$employ]/3) +
(2 * mat.ideo5[target$ideo5, pool$ideo5]) +
(3 * mat.pid5b[target$pid5b, pool$pid5b]) +
1 * (mat.bornagain[target$bornagain, pool$bornagain]) +
2 * (I(target$ideo5 \%in\% c(1,5)) != I(pool$ideo5 \%in\% c(1,5))) +
15 * (target$votereg != pool$votereg) +
25 * (target$tookpost != pool$tookpost)
}
•Gender: respondent’s gender
•Age: respondent’s age in years
•Race3: categorical race variable with categories white/other, black, and Hispanic/Latino
•Educyrs: years of education
•Newsint: interest in politics
•Employ: employment status
•Bornagain: evangelical or born again status
•Pid5b: baseline party identification (from July 2012) with categories, Democrat, Inde-
pendent leaning Democrat, Independent, Independent leaning Republican, Republican,
and other
•Ideo5: 5-point ideology
•Tookpost: respondent took both waves of the survey
For unordered variables, matrices of distances were used, as indicated above.
15

Weighting
For each team and the common content, the matched cases were then weighted to the
sampling frame using entropy balancing. The sample is weighted to adjust for any remaining
imbalance that exists among the matched sample. Such imbalance results from the fact
that the closest match for a particular individual from the target sample is not necessarily a
perfect match across all demographics. The matched cases and the frame were combined and
the combined cases were balanced on multiple moment conditions. The moment conditions
included age, gender, education, race, voter registration, ideology, baseline party ID, born
again status, political interest, plus their interactions. The resultant weights were then
post-stratified by age, gender, education, race, and voter registration status, as needed.
Additionally, for the common content, the weights were post-stratified across states and
statewide political races. Weights larger than 15 in the common content were trimmed and
the final weights normalized to equal sample size. The team data weights were trimmed at
7.
Using Weights
Note that the 2016 CCES Common Content includes weights for both the Pre Election
and Post Election waves of the study. We recommend the use of “commonweight vv post”
any time researchers use variables from the Post Election wave of the study. Otherwise,
researchers should use the “commonweight vv” variable to weight the data.
Note that the dataset also includes the weights “commonweight” and “commonweight post”.
These weights were calculated before the vote validation, and are therefore somewhat less
desirable than “commonweight vv post” and “commonweight vv”. Nevertheless, we include
them in the dataset for scholars who wish to replicate analyses they conducted with the data
posted prior to the vote validation.
Finally, “commonweight vv lgbt” should be used for any analyses that make use of variables
“sexuality” or “trans”.
Accuracy of the CCES Sample
The large sample of the CCES provides allows us to validate the sampling by comparing the
state level samples within the survey with the actual election results.
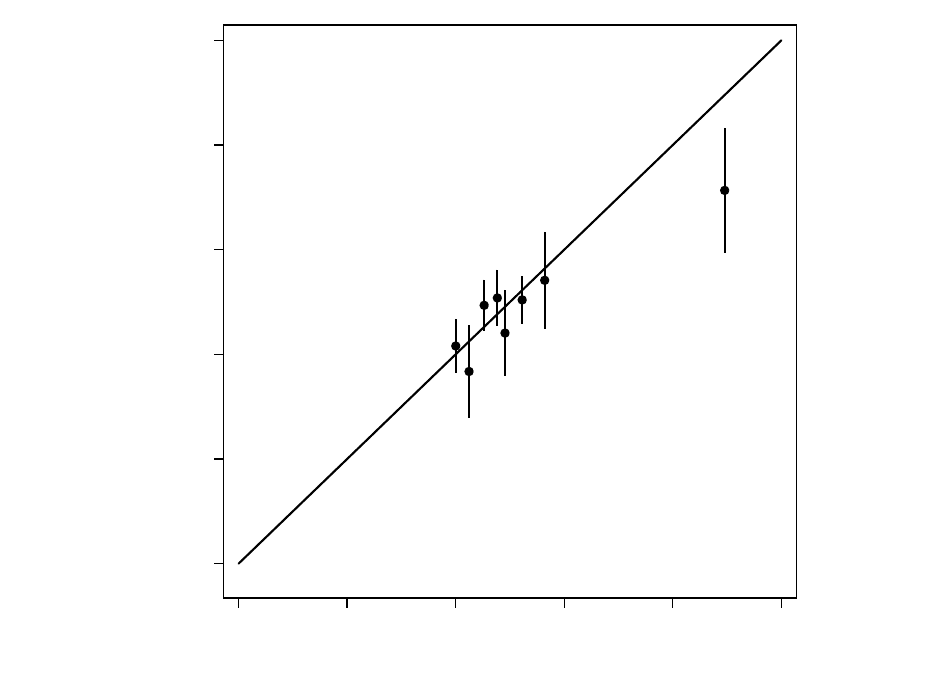
Comparison of the CCES with actual election results provides internal checks on the qual-
ity of the sample and responses. Specifically, we can aggregate (using the weights com-
monweights in the 2016 study) to the state level questions on vote for President (2016
CC16 410a), Governor (2016 CC16 411), U.S. Senator (2016 CC16 413c), and other statewide
offices (2016 CC16 413a and CC16 413b). The overall relationship between Democratic share
of the actual vote and Democratic share of the survey reported vote is shown in the Figures
1 - 5. For example, in Figure 1 we see the CCES estimate of the two-party vote for president
16
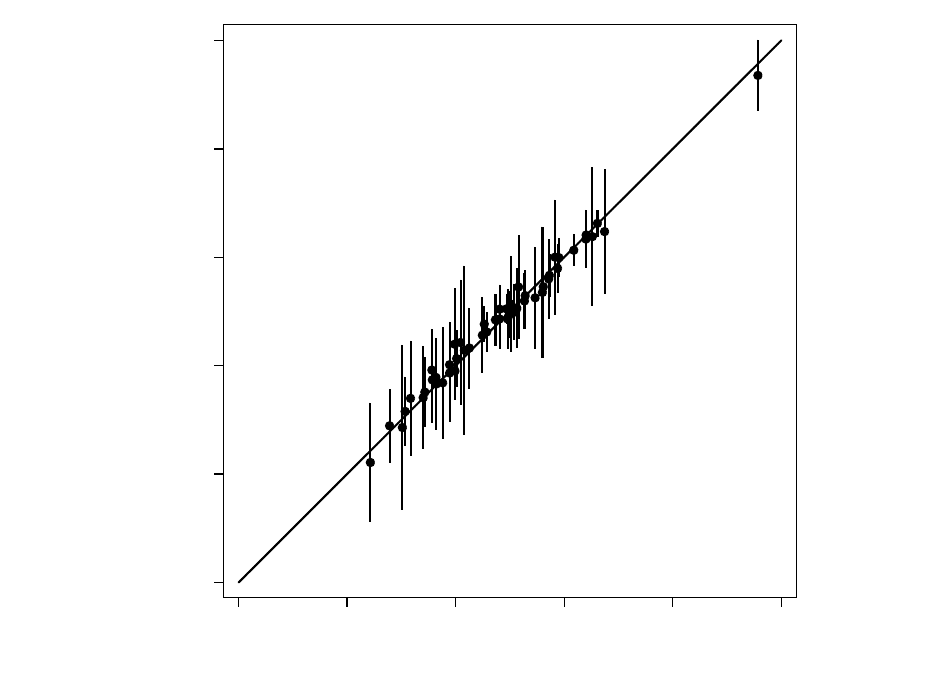
along with 95% confidence intervals constructed robust standard errors to account for the
sampling weights. For each state, the presidential vote estimate falls along the 45-degree line,
indicating that the CCES estimate of the presidential vote share is very close to the actual
vote share for that state. The subsequent plots show the same relationships for other offices.
In most cases, the actual two-party vote share falls within the 95% confidence intervals for
the CCES estimates.
0.2 .4 .6 .8 1
CCES Estimate
0.2 .4 .6 .8 1
Presidential Vote
Figure 1: Presidential Vote Accuracy Plot, 2016
The difference between the Democratic percent of the two party vote for each office in the
sample and the actual results measures the error. That error is due to sampling and to bias.
The simple difference is the Democratic party bias, the squared error is the mean squared
error, and the square root of the MSE is a measure of the standard error. The average (across
states) MSE, Root MSE, and Democratic Bias for each office are shown in Table 3. The
partisan bias in the sample is less than one percentage point for all offices except Secretary
of State. The Mean Squared Error is approximately the same size as the theoretically
derived Sampling Standard Error, indicating that there is no evidence of systematic bias or
of inflation of the precision of the estimates. The overall relationship between Democratic
share of the actual vote and Democratic share of the survey reported vote is shown in the
Figures 1-5. .
17
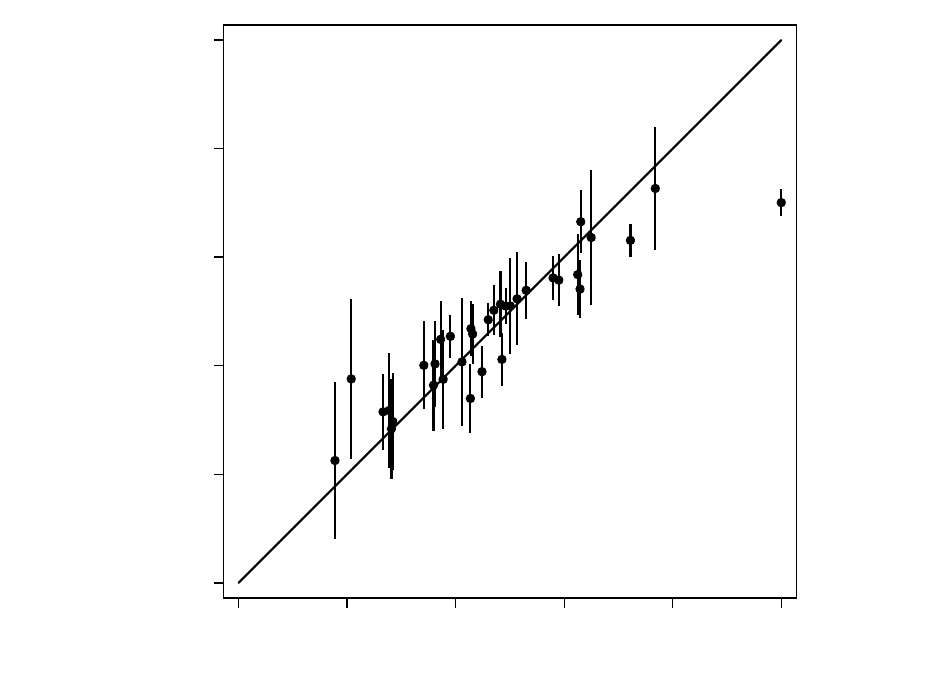
0.2 .4 .6 .8 1
CCES Estimate
0.2 .4 .6 .8 1
Senate Vote
Figure 2: Senate Vote Accuracy Plot, 2016
18
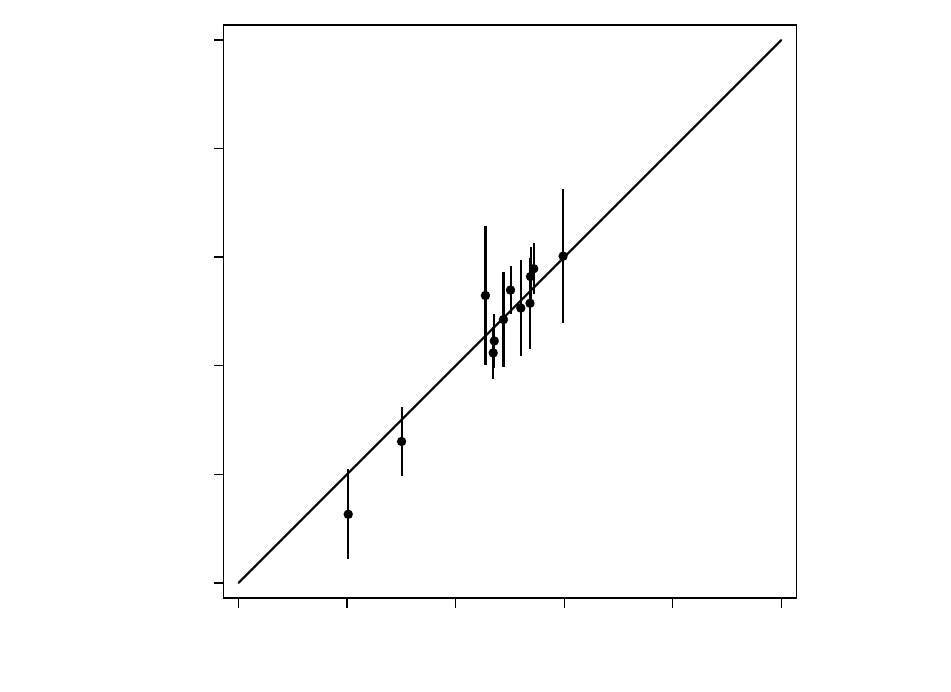
0.2 .4 .6 .8 1
CCES Estimate
0.2 .4 .6 .8 1
Gubernatorial Vote
Figure 3: Gubernatorial Vote Accuracy Plot, 2016
19
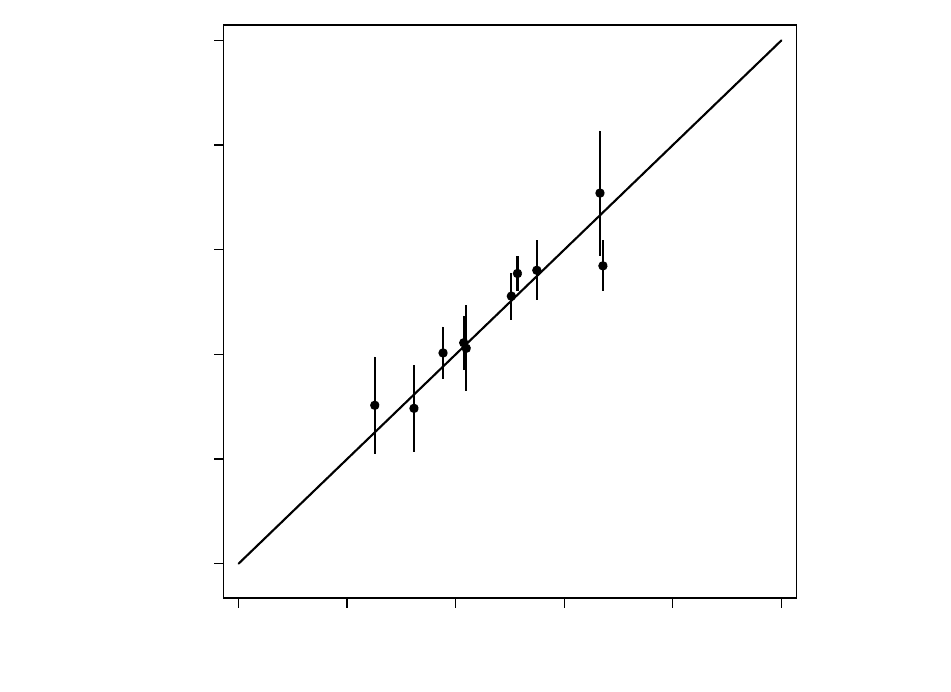
0.2 .4 .6 .8 1
CCES Estimate
0.2 .4 .6 .8 1
Attorney General Vote
Figure 4: Attorney General Vote Accuracy Plot, 2016
20
0.2 .4 .6 .8 1
CCES Estimate
0.2 .4 .6 .8 1
Secretary of State Vote
Figure 5: Secretary of State Vote Accuracy Plot, 2016
21

The square root of the Mean Squared Error is an alternative estimate of the standard error.
The usual estimate assumes that the only source of error comes from random sampling.
The variance of the error across surveys (in this case states) includes possible measurement
error, such as that caused by question wording, and sample biases, caused by non-response
or misreporting.
Table 3: Survey Accuracy in 2016 CCES Sample for Statewide Offices
Avg. Root Avg. Expected
Error MSE Freq St. Error
Office (DEM Bias) (St. Error) (Responses) (Avg. Sample)
President 0.25% 1.59% 786 1.78
Governor -0.40% 4.05% 527 2.17
US Senator -0.20% 7.38% 822 1.74
Attorney General 0.51% 4.27% 798 1.76
Secretary of State -3.05% 7.32% 798 1.76
22

Part III
Common Content
A tabulation of responses for each of the variables in the dataset are provided here. Contex-
tual variables, i.e. variables that are not survey questions and were either added as text to fill
in questions or added later, are tabulated in Part IV. The only exception to this separation
is the vote validation variables, which we include in this section.
All counts are unweighted, raw counts. The tables distinguish between subtypes of missing
data: missing due to respondent skipping and missing due to the question not being asked to
the respondent (e.g. due to branching), although some inaccurate labeling within the missing
data category may exist. Please consult the questionnaire to see the branching structure of
the questions asked.
Variables with a warning mark ( ) are questions that were only asked of a non-random
subset of the sample. Please make a note of this when analyzing these variable.
Sample Identifiers
commonweight Common Weight
Min. 0.00
1st Qu. 0.37
Median 0.70
Mean 1.00
3rd Qu. 1.16
Max. 15.00
common-
weight post Common Weight (Post)
Min. 0.00
1st Qu. 0.38
Median 0.64
Mean 1.00
3rd Qu. 1.07
Max. 15.00
NA’s 11701.00
23

inputstate Pre Election State Name
cdid113 Pre Election 113th/114th Congressional District Number
cdid115 Pre Election 115th Congressional District Number
countyfips Pre Election County FIPS Code
countyname Pre Election County Name
inputstate post Post Election State Name
cdid113 post Post Election 113th/114th Congressional District Number
cdid115 post Post Election 115th Congressional District Number
24

countyfips post Post Election County FIPS Code
countyname post Post Election County Name
25

Profile
birthyr Birth Year
In what year were you born?
Min. 1917.00
1st Qu. 1955.00
Median 1967.00
Mean 1968.12
3rd Qu. 1983.00
Max. 1998.00
gender Gender
Are you male or female?
29531 1 Male
35069 2 Female
08 skipped
09 not asked
sexuality Sexual Orientation
With which group do you most closely identify?
32152 1 Heterosexual / straight
453 2 Lesbian / gay woman
1228 3 Gay man
1185 4 Bisexual
399 5 Other
803 6 Prefer not to say
27380 8 skipped
09 not asked
1000 -1 No Data
26

trans Transgender
Have you ever undergone any part of a process (including any thought or action) to change
your gender / perceived gender from the one you were assigned at birth? This may include
steps such as changing the type of clothes you wear, name you are known by or undergoing
surgery.
458 1 Yes
30142 2 No
388 3 Prefer not to say
32612 8 skipped
09 not asked
1000 -1 No Data
educ Education
What is the highest level of education you have completed?
1971 1 No HS
16381 2 High school graduate
15685 3 Some college
7169 4 2-year
14884 5 4-year
8510 6 Post-grad
08 skipped
09 not asked
edloan Student debtor
Are you currently responsible for paying off a student loan? (Please indicate yes even if your
student loan is currently in deferment.)
10752 1 Yes
42037 2 No
097 Other
098 Don’t know
099 None of these
110 998 skipped
0999 not asked
0-1 No Data
27

votereg Voter Registration Status
Are you registered to vote?
57066 1 Yes
6677 2 No
857 3 Don’t know
08 skipped
09 not asked
race Race
What racial or ethnic group best describes you?
46289 1 White
7926 2 Black
5238 3 Hispanic
2278 4 Asian
522 5 Native American
135 8 Middle Eastern
1452 6 Mixed
760 7 Other
098 skipped
099 not asked
multrace 1 White
Please indicate the racial or ethnic groups that best describe you? (select all that apply)
21058 1 selected
241 2 not selected
08 skipped
43301 9 not asked
multrace 2 Black
Please indicate the racial or ethnic groups that best describe you? (select all that apply)
2264 1 selected
546 2 not selected
08 skipped
61790 9 not asked
28

multrace 3 Hispanic
Please indicate the racial or ethnic groups that best describe you? (select all that apply)
1363 1 selected
570 2 not selected
08 skipped
62667 9 not asked
multrace 4 Asian
Please indicate the racial or ethnic groups that best describe you? (select all that apply)
661 1 selected
660 2 not selected
08 skipped
63279 9 not asked
multrace 5 Native American
Please indicate the racial or ethnic groups that best describe you? (select all that apply)
779 1 selected
648 2 not selected
08 skipped
63173 9 not asked
multrace 8 Middle Eastern
Please indicate the racial or ethnic groups that best describe you? (select all that apply)
119 1 selected
788 2 not selected
08 skipped
63693 9 not asked
29

multrace 97 Other
Please indicate the racial or ethnic groups that best describe you? (select all that apply)
10 1 selected
02 not selected
08 skipped
64590 9 not asked
multrace 98 Don’t know
Please indicate the racial or ethnic groups that best describe you? (select all that apply)
423 1 selected
769 2 not selected
08 skipped
63408 9 not asked
multrace 99 None of these
Please indicate the racial or ethnic groups that best describe you? (select all that apply)
01 selected
02 not selected
08 skipped
64600 9 not asked
hispanic Hispanic
Are you of Spanish, Latino, or Hispanic origin or descent?
2257 1 Yes
56893 2 No
212 8 skipped
5238 9 not asked
30

Hispanic origin 1 No Country in Particular
From which country or region do you trace your heritage or ancestry? (Check all that apply)
93 1 selected
7456 2 not selected
08 skipped
57051 9 not asked
Hispanic origin 2 United States
From which country or region do you trace your heritage or ancestry? (Check all that apply)
2780 1 selected
4769 2 not selected
08 skipped
57051 9 not asked
Hispanic origin 3 Mexico
From which country or region do you trace your heritage or ancestry? (Check all that apply)
2804 1 selected
4745 2 not selected
08 skipped
57051 9 not asked
Hispanic origin 4 Puerto Rico
From which country or region do you trace your heritage or ancestry? (Check all that apply)
1186 1 selected
6363 2 not selected
08 skipped
57051 9 not asked
31

Hispanic origin 5 Cuba
From which country or region do you trace your heritage or ancestry? (Check all that apply)
471 1 selected
7078 2 not selected
08 skipped
57051 9 not asked
Hispanic origin 6 Dominican Republic
From which country or region do you trace your heritage or ancestry? (Check all that apply)
217 1 selected
7332 2 not selected
08 skipped
57051 9 not asked
Hispanic origin 7 South America
From which country or region do you trace your heritage or ancestry? (Check all that apply)
619 1 selected
6930 2 not selected
08 skipped
57051 9 not asked
Hispanic origin 8 Central America
From which country or region do you trace your heritage or ancestry? (Check all that apply)
344 1 selected
7205 2 not selected
08 skipped
57051 9 not asked
32

Hispanic origin 9 Caribbean
From which country or region do you trace your heritage or ancestry? (Check all that apply)
77 1 selected
7472 2 not selected
08 skipped
57051 9 not asked
His-
panic origin 10 Spain
From which country or region do you trace your heritage or ancestry? (Check all that apply)
1080 1 selected
6469 2 not selected
08 skipped
57051 9 not asked
His-
panic origin 11 Other
From which country or region do you trace your heritage or ancestry? (Check all that apply)
515 1 selected
7034 2 not selected
08 skipped
57051 9 not asked
His-
panic origin 12 I am not of Latino, Hispanic or Spanish Heritage
From which country or region do you trace your heritage or ancestry? (Check all that apply)
42 1 selected
7507 2 not selected
08 skipped
57051 9 not asked
33

Asian origin 1 No Country in Particular
From which country or region do you trace your heritage or ancestry? (Check all that apply)
27 1 selected
2566 2 not selected
08 skipped
62007 9 not asked
Asian origin 2 United States
From which country or region do you trace your heritage or ancestry? (Check all that apply)
631 1 selected
1962 2 not selected
08 skipped
62007 9 not asked
Asian origin 3 China
From which country or region do you trace your heritage or ancestry? (Check all that apply)
711 1 selected
1882 2 not selected
08 skipped
62007 9 not asked
Asian origin 4 Japan
From which country or region do you trace your heritage or ancestry? (Check all that apply)
288 1 selected
2305 2 not selected
08 skipped
62007 9 not asked
34

Asian origin 5 India
From which country or region do you trace your heritage or ancestry? (Check all that apply)
384 1 selected
2209 2 not selected
08 skipped
62007 9 not asked
Asian origin 6 Philippines
From which country or region do you trace your heritage or ancestry? (Check all that apply)
330 1 selected
2263 2 not selected
08 skipped
62007 9 not asked
Asian origin 7 Taiwan
From which country or region do you trace your heritage or ancestry? (Check all that apply)
150 1 selected
2443 2 not selected
08 skipped
62007 9 not asked
Asian origin 8 Korea
From which country or region do you trace your heritage or ancestry? (Check all that apply)
197 1 selected
2396 2 not selected
08 skipped
62007 9 not asked
35

Asian origin 9 Vietnam
From which country or region do you trace your heritage or ancestry? (Check all that apply)
147 1 selected
2446 2 not selected
08 skipped
62007 9 not asked
Asian origin 10 Pakistan
From which country or region do you trace your heritage or ancestry? (Check all that apply)
41 1 selected
2552 2 not selected
08 skipped
62007 9 not asked
Asian origin 11 Hmong
From which country or region do you trace your heritage or ancestry? (Check all that apply)
14 1 selected
2579 2 not selected
08 skipped
62007 9 not asked
Asian origin 12 Cambodia
From which country or region do you trace your heritage or ancestry? (Check all that apply)
18 1 selected
2575 2 not selected
08 skipped
62007 9 not asked
36

Asian origin 13 Thailand
From which country or region do you trace your heritage or ancestry? (Check all that apply)
52 1 selected
2541 2 not selected
08 skipped
62007 9 not asked
Asian origin 14 Other
From which country or region do you trace your heritage or ancestry? (Check all that apply)
227 1 selected
2366 2 not selected
08 skipped
62007 9 not asked
Asian origin 15 I am not of Asian Heritage
From which country or region do you trace your heritage or ancestry? (Check all that apply)
12 1 selected
2581 2 not selected
08 skipped
62007 9 not asked
employ Employment Status
Which of the following best describes your current employment status?
27908 1 Full-time
6956 2 Part-time
435 3 Temporarily laid off
3583 4 Unemployed
12860 5 Retired
3854 6 Permanently disabled
4852 7 Homemaker
2961 8 Student
1191 9 Other
098 skipped
099 not asked
37

hadjob hadjob
At any time over the past five years, have you had a job?
13502 1 Yes
16189 2 No
51 8 skipped
34858 9 not asked
phone Phone service
Thinking about your phone service, do you have ...?
17413 1 Both
12503 2 Cell only
1314 3 Landline
240 4 No phone
33130 8 skipped
09 not asked
internethome Internet Access at Home
What best describes the access you have to the internet at home?
60782 1 Broadband
968 2 Dial-up
2653 3 None
197 8 skipped
09 not asked
internetwork Internet access at work
What best describes the access you have to the internet at work (or at school)?
39317 1 Broadband
800 2 Dial-up
23236 3 None
1247 8 skipped
09 not asked
38

marstat Marital Status
What is your marital status?
34495 1 Married
1021 2 Separated
6715 3 Divorced
2928 4 Widowed
16550 5 Single
2835 6 Domestic partnership
56 8 skipped
09 not asked
pid7 7 point Party ID
pid7text
16251 1 Strong Democrat
8618 2 Not very strong Democrat
8479 7 Strong Republican
6814 6 Not very strong Republican
6270 3 Lean Democrat
5554 5 Lean Republican
10493 4 Independent
2067 8 Not sure
34 98 skipped
20 99 not asked
pid3 3 point party ID
Generally speaking, do you think of yourself as a ...?
24881 1 Democrat
15300 2 Republican
18238 3 Independent
2379 4 Other
3782 5 Not sure
20 8 skipped
09 not asked
39

ideo5 Ideology
In general, how would you describe your own political viewpoint?
5827 1 Very liberal
12555 2 Liberal
22040 3 Moderate
14351 4 Conservative
5042 5 Very conservative
4748 6 Not sure
37 8 skipped
09 not asked
pew bornagain Born Again (Pew version)
Would you describe yourself as a born-again or evangelical Christian, or not?
18186 1 Yes
46371 2 No
43 8 skipped
09 not asked
pew religimp Importance of religion (Pew version)
How important is religion in your life?
23864 1 Very important
17275 2 Somewhat important
9998 3 Not too important
13429 4 Not at all important
34 8 skipped
09 not asked
40

pew churatd Church attendance (Pew version)
Aside from weddings and funerals, how often do you attend religious services?
5101 1 More than once a week
11521 2 Once a week
5332 3 Once or twice a month
9338 4 A few times a year
14708 5 Seldom
17860 6 Never
707 7 Don’t know
33 8 skipped
09 not asked
pew prayer Frequency of Prayer (Pew version)
People practice their religion in different ways. Outside of attending religious services, how
often do you pray?
17283 1 Several times a day
9929 2 Once a day
8095 3 A few times a week
1859 4 Once a week
4521 5 A few times a month
9686 6 Seldom
11714 7 Never
1447 8 Don’t know
66 98 skipped
099 not asked
41

religpew Religion
What is your present religion, if any?
22888 1 Protestant
13880 2 Roman Catholic
870 3 Mormon
362 4 Eastern or Greek Orthodox
1546 5 Jewish
436 6 Muslim
621 7 Buddhist
299 8 Hindu
4025 9 Atheist
3993 10 Agnostic
11986 11 Nothing in particular
3621 12 Something else
73 98 skipped
099 not asked
relig-
pew protestant Protestant Church
To which Protestant church or group do you belong?
7178 1 Baptist
3221 2 Methodist
4906 3 Nondenominational or Independent Church
2412 4 Lutheran
1517 5 Presbyterian
1543 6 Pentecostal
1003 7 Episcopalian
832 8 Church of Christ or Disciples of Christ
536 9 Congregational or United Church of Christ
216 10 Holiness
194 11 Reformed
230 12 Adventist
300 13 Jehovah’s Witness
1314 90 Something else
39198 98 skipped
099 not asked
42

religpew baptist Baptist Church
To which Baptist church do you belong, if any?
2858 1 Southern Baptist Convention
608 2 American Baptist Churches in USA
275 3 National Baptist Convention
52 4 Progressive Baptist Convention
1100 5 Independent Baptist
124 6 Baptist General Conference
386 7 Baptist Missionary Association
76 8 Conservative Baptist Assoc. of America
440 9 Free Will Baptist
453 10 General Association of Regular Baptists
1241 90 Other Baptist
56987 98 skipped
099 not asked
relig-
pew methodist Methodist Church
To which Methodist church do you belong, if any?
2969 1 United Methodist Church
124 2 Free Methodist Church
142 3 African Methodist Episcopal
48 4 African Methodist Episcopal Zion
62 5 Christian Methodist Episcopal Church
250 90 Other Methodist Church
61005 98 skipped
099 not asked
43

relig-
pew nondenom Nondenominational or Independent Church
To which kind of nondenominational or independent church do you belong, if any?
2058 1 Nondenominational evangelical
321 2 Nondenominational fundamentalist
395 3 Nondenominational charismatic
475 4 Interdenominational
1679 5 Community church
1078 90 Other
58594 98 skipped
099 not asked
religpew lutheran Lutheran Church
To which Lutheran church do you belong?
1052 1 Evangelical Lutheran Church in America (ELCA)
863 2 Lutheran Church, Missouri Synod
203 3 Lutheran Church, Wisconsin Synod
480 4 Other Lutheran Church
62002 8 skipped
09 not asked
religpew presby Presbyterian Church
To which Presbyterian church do you belong?
840 1 Presbyterian Church USA
343 2 Presbyterian Church in America
36 3 Associate Reformed Presbyterian
27 4 Cumberland Presbyterian Church
51 5 Orthodox Presbyterian
152 6 Evangelical Presbyterian Church
359 90 Other Presbyterian Church
62792 98 skipped
099 not asked
44

relig-
pew pentecost Pentecostal Church
To which Pentecostal church do you belong?
583 1 Assemblies of God
96 2 Church of God Cleveland TN
61 3 Four Square Gospel
194 4 Pentecostal Church of God
111 5 Pentecostal Holiness Church
180 6 Church of God in Christ
26 7 Church of God of the Apostolic Faith
40 8 Assembly of Christian Churches
108 9 Apostolic Christian
430 90 Other Pentecostal Church
62771 98 skipped
099 not asked
religpew episcop Episcopal Church
To which Episcopalian church do you belong?
839 1 Episcopal Church in the USA
138 2 Anglican Church (Church of England)
15 3 Anglican Orthodox Church
18 4 Reformed Episcopal Church
103 90 Other Episcopalian or Anglican Church
63487 98 skipped
099 not asked
religpew congreg Congregational Church
To which congregational church do you belong?
513 1 United Church of Christ
55 2 Conservative Congregational Christian
33 3 National Association of Congregational Christians
106 90 Other Congregational
63893 98 skipped
099 not asked
45

religpew holiness Holiness Church
To which Holiness church do you belong?
42 1 Church of the Nazarene
12 2 Wesleyan Church
83 Free Methodist Church
64 Christian and Missionary Alliance
26 5 Church of God (Anderson, Indiana)
46 Salvation Army, American Rescue workers
207 90 Other Holiness
64295 98 skipped
099 not asked
religpew reformed Reformed Church
To which Reformed church do you belong?
84 1 Reformed Church in America
88 2 Christian Reformed Church
95 90 Other Reformed
64333 98 skipped
099 not asked
religpew catholic Catholic Church
To which Catholic church do you belong?
13725 1 Roman Catholic Church
138 2 National Polish Catholic Church
47 3 Greek-rite Catholic
177 4 Armenian Catholic
425 5 Old Catholic
365 90 Other Catholic
49723 98 skipped
099 not asked
46

religpew mormon Mormon Church
To which Mormon church do you belong?
906 1 The Church of Jesus Christ of Latter-day Saints
36 2 Community of Christ
890 Other Mormon
63650 98 skipped
099 not asked
religpew orthodox Orthodox Church
To which Orthodox church do you belong?
152 1 Greek Orthodox
85 2 Russian Orthodox
64 3 Orthodox Church in America
21 4 Armenian Orthodox
52 5 Eastern Orthodox
16 6 Serbian Orthodox
35 90 Other Orthodox
64175 98 skipped
099 not asked
religpew jewish Jewish Group
To which Jewish group do you belong?
801 1 Reform
498 2 Conservative
146 3 Orthodox
47 4 Reconstructionist
218 90 Other
62890 98 skipped
099 not asked
47

religpew muslim Muslim Group
To which Muslim group do you belong?
289 1 Sunni
45 2 Shia
78 3 Nation of Islam (Black Muslim)
59 90 Other Muslim
64129 98 skipped
099 not asked
religpew buddhist Buddhist group
To which Buddhist group do you belong?
143 1 Theravada (Vipassana) Buddhism
360 2 Mahayana (Zen) Buddhism
116 3 Vajrayana (Tibetan) Buddhism
184 90 Other Buddhist
63797 98 skipped
099 not asked
religpew hindu Hindu Group
With which of the following Hindu groups, if any, do you identify with most closely?
152 1 Vaishnava Hinduism
58 2 Shaivite Hinduism
35 3 Shaktism Hinduism
75 90 Other Hindu
64280 98 skipped
099 not asked
child18 Parent of Young Children
Are you the parent or guardian of any children under the age of 18?
17760 1 Yes
46722 2 No
118 8 skipped
09 not asked
48

child18num Number of Young Children
Min. 1.00
1st Qu. 1.00
Median 2.00
Mean 1.91
3rd Qu. 2.00
Max. 20.00
NA’s 47244.00
newsint Political Interest
Some people seem to follow what’s going on in government and public affairs most of the
time, whether there’s an election going on or not. Others aren’t that interested. Would you
say you follow what’s going on in government and public affairs ...
30328 1 Most of the time
18858 2 Some of the time
9158 3 Only now and then
4412 4 Hardly at all
1791 7 Don’t know
53 8 skipped
09 not asked
49

faminc Family income
Thinking back over the last year, what was your family’s annual income?
2835 1 Less than $10,000
4542 2 $10,000 - $19,999
6459 3 $20,000 - $29,999
6609 4 $30,000 - $39,999
5760 5 $40,000 - $49,999
5764 6 $50,000 - $59,999
4490 7 $60,000 - $69,999
4688 8 $70,000 - $79,999
5661 9 $80,000 - $99,999
4056 10 $100,000 - $119,999
3572 11 $120,000 - $149,999
162 31 $150,000 or more
6500 97 Prefer not to say
1859 12 $150,000 - $199,999
825 13 $200,000 - $249,999
439 14 $250,000 - $349,999
181 15 $350,000 - $499,999
177 16 $500,000 or more
21 98 skipped
099 not asked
032 $250,000 or more
ownhome Home ownership
Do you own your home or pay rent?
40682 1 Own
20859 2 Rent
2981 3 Other
78 8 skipped
09 not asked
50

citylength 1 Tenure Current City (years)
How long have you lived in your current city of residence? (Years)
Min. 0.00
1st Qu. 4.00
Median 12.00
Mean 16.51
3rd Qu. 25.00
Max. 100.00
NA’s 1843.00
citylength 2 Tenure Current City (months)
How long have you lived in your current city of residence? (Months)
Min. 0.00
1st Qu. 2.00
Median 4.00
Mean 4.55
3rd Qu. 7.00
Max. 100.00
NA’s 12312.00
milstat 1 Military Household - I am
We’d like to know whether you or someone in your immediate family is currently serving or
has ever served in the U.S. military. Immediate family is defined as your parents, siblings,
spouse, and children. Please check all boxes that apply.
703 1 selected
63897 2 not selected
08 skipped
09 not asked
51

milstat 2 Military Household - Family
We’d like to know whether you or someone in your immediate family is currently serving or
has ever served in the U.S. military. Immediate family is defined as your parents, siblings,
spouse, and children. Please check all boxes that apply.
4570 1 selected
60030 2 not selected
08 skipped
09 not asked
milstat 3 Military Household - I served previously
We’d like to know whether you or someone in your immediate family is currently serving or
has ever served in the U.S. military. Immediate family is defined as your parents, siblings,
spouse, and children. Please check all boxes that apply.
7569 1 selected
57031 2 not selected
08 skipped
09 not asked
milstat 4 Military Household - Family served previously
We’d like to know whether you or someone in your immediate family is currently serving or
has ever served in the U.S. military. Immediate family is defined as your parents, siblings,
spouse, and children. Please check all boxes that apply.
26382 1 selected
38218 2 not selected
08 skipped
09 not asked
milstat 5 Military Household - None
We’d like to know whether you or someone in your immediate family is currently serving or
has ever served in the U.S. military. Immediate family is defined as your parents, siblings,
spouse, and children. Please check all boxes that apply.
29890 1 selected
34710 2 not selected
08 skipped
09 not asked
52

immstat Citizen
Which of these statements best describes you?
4233 1 Immigrant Citizen
1368 2 Immigrant non-citizen
6136 3 First generation
12582 4 Second generation
40123 5 Third generation
158 8 skipped
09 not asked
union union
Are you a member of a labor union?
4804 1 Yes, I am currently a member of a labor union
11496 2 I formerly was a member of a labor union
48162 3 I am not now, nor have I been, a member of a labor union
138 8 skipped
09 not asked
unionhh unionhh
Other than yourself, is any member of your household a union member?
5948 1 Yes, a member of my household is currently a union member
8456 2 A member of my household was formerly a member of a labor
union, but is not now
49791 3 No, no one in my household has ever been a member of a labor
union
405 8 skipped
09 not asked
investor Stock ownership
Do you personally (or jointly with a spouse), have any money invested in the stock market
right now, either in an individual stock or in a mutual fund?
15508 1 Yes
19689 2 No
29403 8 skipped
09 not asked
53

healthins 1 Yes, through my job or a family member’s employer
Do you currently have health insurance? (Please check all that apply)
32765 1 selected
31835 2 not selected
08 skipped
09 not asked
healthins 2 Yes, through a government program, such as Medicare or
Medicaid
Do you currently have health insurance? (Please check all that apply)
21815 1 selected
42785 2 not selected
08 skipped
09 not asked
healthins 3 Yes, through my school
Do you currently have health insurance? (Please check all that apply)
594 1 selected
64006 2 not selected
08 skipped
09 not asked
healthins 4 Yes, I purchased my own
Do you currently have health insurance? (Please check all that apply)
7629 1 selected
56971 2 not selected
08 skipped
09 not asked
54

healthins 5 Not sure
Do you currently have health insurance? (Please check all that apply)
921 1 selected
63679 2 not selected
08 skipped
09 not asked
healthins 6 No
Do you currently have health insurance? (Please check all that apply)
5181 1 selected
59419 2 not selected
08 skipped
09 not asked
55

Pre-election
CC16 300 1 Blog
In the past 24 hours have you ...(check all that apply)
13588 1 selected
51012 2 not selected
08 skipped
09 not asked
CC16 300 2 TV
In the past 24 hours have you ...(check all that apply)
45790 1 selected
18810 2 not selected
08 skipped
09 not asked
CC16 300 3 Newspaper
In the past 24 hours have you ...(check all that apply)
29682 1 selected
34918 2 not selected
08 skipped
09 not asked
CC16 300 4 Radio
In the past 24 hours have you ...(check all that apply)
23341 1 selected
41259 2 not selected
08 skipped
09 not asked
56

CC16 300 5 Social Media
In the past 24 hours have you ...(check all that apply)
45314 1 selected
19286 2 not selected
08 skipped
09 not asked
CC16 300 6 None
In the past 24 hours have you ...(check all that apply)
2406 1 selected
62194 2 not selected
08 skipped
09 not asked
CC16 300b Watch News
Did you watch local news, national news, or both?
13958 1 Local Newscast
9120 2 National Newscast
22007 3 Both
710 8 skipped
18805 9 not asked
CC16 300c Read Newspaper
Did you read a print newspaper, an online newspaper, or both?
9715 1 Print
13707 2 Online
5888 3 Both
379 8 skipped
34911 9 not asked
57

CC16 300d 1 Posted a story, photo, video or link about politics
Did you do any of the following on social media (such as Facebook, YouTube or Twitter)?
13805 1 selected
31510 2 not selected
08 skipped
19285 9 not asked
CC16 300d 2 Posted a comment about politics
Did you do any of the following on social media (such as Facebook, YouTube or Twitter)?
15515 1 selected
29800 2 not selected
08 skipped
19285 9 not asked
CC16 300d 3 Read a story or watched a video about politics
Did you do any of the following on social media (such as Facebook, YouTube or Twitter)?
30758 1 selected
14557 2 not selected
08 skipped
19285 9 not asked
CC16 300d 4 Followed a political event
Did you do any of the following on social media (such as Facebook, YouTube or Twitter)?
14006 1 selected
31309 2 not selected
08 skipped
19285 9 not asked
58

CC16 300d 5 Forwarded a story, photo, video or link about politics to friends
Did you do any of the following on social media (such as Facebook, YouTube or Twitter)?
13390 1 selected
31925 2 not selected
08 skipped
19285 9 not asked
CC16 301a Gun control
How important are each of these issues to you?
6267 1 Very High Importance
3114 2 Somewhat High Importance
1684 3 Somewhat Low Importance
1102 4 Very Low Importance
1077 5 No Importance at All
25 8 skipped
51331 9 not asked
CC16 301b Abortion
How important are each of these issues to you?
4108 1 Very High Importance
3355 2 Somewhat High Importance
2814 3 Somewhat Low Importance
1647 4 Very Low Importance
1329 5 No Importance at All
16 8 skipped
51331 9 not asked
59

CC16 301c Taxes
How important are each of these issues to you?
6283 1 Very High Importance
4754 2 Somewhat High Importance
1780 3 Somewhat Low Importance
331 4 Very Low Importance
102 5 No Importance at All
19 8 skipped
51331 9 not asked
CC16 301d Immigration
How important are each of these issues to you?
5893 1 Very High Importance
3996 2 Somewhat High Importance
2275 3 Somewhat Low Importance
772 4 Very Low Importance
310 5 No Importance at All
23 8 skipped
51331 9 not asked
CC16 301e Budget deficit
How important are each of these issues to you?
5606 1 Very High Importance
4239 2 Somewhat High Importance
2295 3 Somewhat Low Importance
792 4 Very Low Importance
325 5 No Importance at All
12 8 skipped
51331 9 not asked
60

CC16 301f Defense spending
How important are each of these issues to you?
4661 1 Very High Importance
5222 2 Somewhat High Importance
2435 3 Somewhat Low Importance
679 4 Very Low Importance
251 5 No Importance at All
21 8 skipped
51331 9 not asked
CC16 301g Social security
How important are each of these issues to you?
7880 1 Very High Importance
3777 2 Somewhat High Importance
1225 3 Somewhat Low Importance
275 4 Very Low Importance
92 5 No Importance at All
20 8 skipped
51331 9 not asked
CC16 301h Environment
How important are each of these issues to you?
4888 1 Very High Importance
3828 2 Somewhat High Importance
2486 3 Somewhat Low Importance
1298 4 Very Low Importance
755 5 No Importance at All
14 8 skipped
51331 9 not asked
61

CC16 301i Jobs
How important are each of these issues to you?
6987 1 Very High Importance
4692 2 Somewhat High Importance
1254 3 Somewhat Low Importance
211 4 Very Low Importance
103 5 No Importance at All
22 8 skipped
51331 9 not asked
CC16 301j Crime
How important are each of these issues to you?
5904 1 Very High Importance
4845 2 Somewhat High Importance
2003 3 Somewhat Low Importance
396 4 Very Low Importance
104 5 No Importance at All
17 8 skipped
51331 9 not asked
CC16 301k National security
How important are each of these issues to you?
7957 1 Very High Importance
3685 2 Somewhat High Importance
1257 3 Somewhat Low Importance
253 4 Very Low Importance
97 5 No Importance at All
20 8 skipped
51331 9 not asked
62

CC16 301l Race relations
How important are each of these issues to you?
4879 1 Very High Importance
4439 2 Somewhat High Importance
2451 3 Somewhat Low Importance
869 4 Very Low Importance
609 5 No Importance at All
22 8 skipped
51331 9 not asked
CC16 301m Health care
How important are each of these issues to you?
8351 1 Very High Importance
3735 2 Somewhat High Importance
856 3 Somewhat Low Importance
196 4 Very Low Importance
105 5 No Importance at All
26 8 skipped
51331 9 not asked
CC16 301n Gay marriage
How important are each of these issues to you?
2251 1 Very High Importance
2576 2 Somewhat High Importance
2885 3 Somewhat Low Importance
2220 4 Very Low Importance
3324 5 No Importance at All
13 8 skipped
51331 9 not asked
63

CC16 301o Government corruption
How important are each of these issues to you?
8095 1 Very High Importance
3312 2 Somewhat High Importance
1340 3 Somewhat Low Importance
386 4 Very Low Importance
118 5 No Importance at All
18 8 skipped
51331 9 not asked
CC16 302 National Economy
OVER THE PAST YEAR the nation’s economy has ...?
3286 1 Gotten much better
16472 2 Gotten better
21840 3 Stayed about the same
14889 4 Gotten worse
5978 5 Gotten much worse
2018 6 Not sure
117 8 skipped
09 not asked
CC16 303 Past year - household income
Over the past FOUR YEARS, has your household’s annual income ...?
4470 1 Increased a lot
19622 2 Increased somewhat
24424 3 Stayed about the same
10655 4 Decreased somewhat
5357 5 Decreased a lot
72 8 skipped
09 not asked
64

CC16 304 Next year - household income
OVER THE NEXT YEAR, do you think the nation’s economy will ...?
3138 1 Get much better
15037 2 Get somewhat better
19221 3 Stay about the same
11751 4 Get somewhat worse
5216 5 Get much worse
10104 6 Not sure
133 8 skipped
09 not asked
CC16 305 1 Married
Over the past FOUR YEARS, have you... (Check all that apply)
6051 1 selected
58549 2 not selected
08 skipped
09 not asked
CC16 305 2 Lost a job
Over the past FOUR YEARS, have you... (Check all that apply)
8927 1 selected
55673 2 not selected
08 skipped
09 not asked
CC16 305 3 Finished school
Over the past FOUR YEARS, have you... (Check all that apply)
5784 1 selected
58816 2 not selected
08 skipped
09 not asked
65

CC16 305 4 Retired
Over the past FOUR YEARS, have you... (Check all that apply)
5404 1 selected
59196 2 not selected
08 skipped
09 not asked
CC16 305 5 Divorced
Over the past FOUR YEARS, have you... (Check all that apply)
1752 1 selected
62848 2 not selected
08 skipped
09 not asked
CC16 305 6 Had a child
Over the past FOUR YEARS, have you... (Check all that apply)
5428 1 selected
59172 2 not selected
08 skipped
09 not asked
CC16 305 7 Taken a new job
Over the past FOUR YEARS, have you... (Check all that apply)
16955 1 selected
47645 2 not selected
08 skipped
09 not asked
66

CC16 305 8 Been issued a traffic ticket
Over the past FOUR YEARS, have you... (Check all that apply)
8182 1 selected
56418 2 not selected
08 skipped
09 not asked
CC16 305 9 Been a victim of a crime
Over the past FOUR YEARS, have you... (Check all that apply)
3563 1 selected
61037 2 not selected
08 skipped
09 not asked
CC16 305 10 Visited an emergency room
Over the past FOUR YEARS, have you... (Check all that apply)
23518 1 selected
41082 2 not selected
08 skipped
09 not asked
CC16 305 11 Received a raise at work
Over the past FOUR YEARS, have you... (Check all that apply)
18013 1 selected
46587 2 not selected
08 skipped
09 not asked
67

CC16 307 Police make R feel safe
Do the police make you feel?
30349 1 Mostly safe
24549 2 Somewhat safe
6917 3 Somewhat unsafe
2687 4 Mostly unsafe
98 8 skipped
09 not asked
CC16 312 1 Do not get involved
As you may know, there are on-going conflicts in Syria and Iraq led by the organization
Islamic State of Iraq and Syria (or ISIS). What do you think the United States should do in
response to ISIS? (Check all that apply)
1471 1 selected
11798 2 not selected
08 skipped
51331 9 not asked
CC16 312 2 Send food, medicine and other aid to countries affected
As you may know, there are on-going conflicts in Syria and Iraq led by the organization
Islamic State of Iraq and Syria (or ISIS). What do you think the United States should do in
response to ISIS? (Check all that apply)
6134 1 selected
7135 2 not selected
08 skipped
51331 9 not asked
CC16 312 3 Provide arms to those opposing ISIS
As you may know, there are on-going conflicts in Syria and Iraq led by the organization
Islamic State of Iraq and Syria (or ISIS). What do you think the United States should do in
response to ISIS? (Check all that apply)
4448 1 selected
8821 2 not selected
08 skipped
51331 9 not asked
68

CC16 312 4 Enforce a no-fly zone
As you may know, there are on-going conflicts in Syria and Iraq led by the organization
Islamic State of Iraq and Syria (or ISIS). What do you think the United States should do in
response to ISIS? (Check all that apply)
4618 1 selected
8651 2 not selected
08 skipped
51331 9 not asked
CC16 312 5 Use drones and aircraft to bomb ISIS troops
As you may know, there are on-going conflicts in Syria and Iraq led by the organization
Islamic State of Iraq and Syria (or ISIS). What do you think the United States should do in
response to ISIS? (Check all that apply)
7661 1 selected
5608 2 not selected
08 skipped
51331 9 not asked
CC16 312 6 Send military support staff (non-combat)
As you may know, there are on-going conflicts in Syria and Iraq led by the organization
Islamic State of Iraq and Syria (or ISIS). What do you think the United States should do in
response to ISIS? (Check all that apply)
4279 1 selected
8990 2 not selected
08 skipped
51331 9 not asked
CC16 312 7 Send significant force to fight ISIS
As you may know, there are on-going conflicts in Syria and Iraq led by the organization
Islamic State of Iraq and Syria (or ISIS). What do you think the United States should do in
response to ISIS? (Check all that apply)
4045 1 selected
9224 2 not selected
08 skipped
51331 9 not asked
69

CC16 320a Obama
Do you approve of the way each is doing their job...
19001 1 Strongly approve
14800 2 Somewhat approve
6579 3 Somewhat disapprove
21258 4 Strongly disapprove
2940 5 Not sure
22 8 skipped
09 not asked
CC16 320b Congress
Do you approve of the way each is doing their job...
2354 1 Strongly approve
11353 2 Somewhat approve
17507 3 Somewhat disapprove
24521 4 Strongly disapprove
8832 5 Not sure
33 8 skipped
09 not asked
CC16 320c Supreme Court
Do you approve of the way each is doing their job...
4880 1 Strongly approve
22889 2 Somewhat approve
16623 3 Somewhat disapprove
10133 4 Strongly disapprove
10044 5 Not sure
31 8 skipped
09 not asked
70

CC16 320d Governor
Do you approve of the way each is doing their job...
9836 1 Strongly approve
20190 2 Somewhat approve
10700 3 Somewhat disapprove
15615 4 Strongly disapprove
8040 5 Not sure
215 8 skipped
49 not asked
CC16 320e Legislature
Do you approve of the way each is doing their job...
3713 1 Strongly approve
19207 2 Somewhat approve
14282 3 Somewhat disapprove
11776 4 Strongly disapprove
15394 5 Not sure
224 8 skipped
49 not asked
CC16 321a Reps
Which party has a majority of seats in ...
40028 1 Republicans
7282 2 Democrats
1112 3 Neither
16140 4 Not sure
38 8 skipped
09 not asked
71

CC16 321b Senate
Which party has a majority of seats in ...
36801 1 Republicans
9931 2 Democrats
1407 3 Neither
16403 4 Not sure
58 8 skipped
09 not asked
CC16 321c State Senate
Which party has a majority of seats in ...
23282 1 Republicans
16909 2 Democrats
1579 3 Neither
22217 4 Not sure
605 8 skipped
89 not asked
CC16 321d Lower Chamber
Which party has a majority of seats in ...
22499 1 Republicans
16388 2 Democrats
1419 3 Neither
24046 4 Not sure
244 8 skipped
49 not asked
72

CC16 322a Party Recall + Name Recognition - Governor
Please indicate whether you’ve heard of this person and if so which party he or she is affiliated
with...
2551 1 Never Heard of Person
31243 2 Republican
20232 3 Democrat
415 4 Other Party / Independent
9665 5 Not sure
490 8 skipped
49 not asked
CC16 322b Party Recall + Name Recognition - Senator 1
Please indicate whether you’ve heard of this person and if so which party he or she is affiliated
with...
3664 1 Never Heard of Person
17219 2 Republican
30374 3 Democrat
432 4 Other Party / Independent
12341 5 Not sure
566 8 skipped
49 not asked
CC16 322c Party Recall + Name Recognition - Senator 2
Please indicate whether you’ve heard of this person and if so which party he or she is affiliated
with...
3309 1 Never Heard of Person
27361 2 Republican
20249 3 Democrat
854 4 Other Party / Independent
12247 5 Not sure
576 8 skipped
49 not asked
73

CC16 322d Party Recall + Name Recognition - Rep
Please indicate whether you’ve heard of this person and if so which party he or she is affiliated
with...
5124 1 Never Heard of Person
22632 2 Republican
19391 3 Democrat
659 4 Other Party / Independent
15905 5 Not sure
881 8 skipped
89 not asked
CC16 320f Rep
Do you approve of the way each is doing their job...
8575 1 Strongly approve
15573 2 Somewhat approve
8503 3 Somewhat disapprove
9359 4 Strongly disapprove
22109 5 Not sure
473 8 skipped
89 not asked
CC16 320g Senator 1
Do you approve of the way each is doing their job...
8819 1 Strongly approve
16496 2 Somewhat approve
9567 3 Somewhat disapprove
12336 4 Strongly disapprove
17159 5 Not sure
219 8 skipped
49 not asked
74

CC16 320h Senator 2
Do you approve of the way each is doing their job...
8217 1 Strongly approve
15801 2 Somewhat approve
9867 3 Somewhat disapprove
13287 4 Strongly disapprove
17213 5 Not sure
211 8 skipped
49 not asked
CC16 326 President 2012
In 2012, who did you vote for in the election for President?
28031 1 Barack Obama
18157 2 Mitt Romney
1539 3 Someone else
78 4 Did not vote
734 5 Don’t recall
83 8 skipped
15978 9 not asked
CC16 327 Vote primary 2016
Did you vote in a Presidential primary election or caucus this year?
38606 1 Yes, voted in a primary or caucus
25849 2 No, didnt vote in a primary or caucus
145 8 skipped
09 not asked
75

CC16 328 Vote primary 2016 candidate
In the Presidential primary or caucus, who did you vote for?
12661 1 Hillary Clinton
9012 2 Bernie Sanders
240 3 Another Democrat
8026 4 Donald Trump
3759 5 Ted Cruz
1739 6 John Kasich
1539 7 Marco Rubio
961 8 Another Republican
604 9 Someone else who is not a Democrat or Republican
71 98 skipped
25988 99 not asked
CC16 330a Background checks for all sales, including at gun shows and
over the Internet
On the issue of gun regulation, do you support or oppose each of the following proposals?
58138 1 Support
6247 2 Oppose
215 8 skipped
09 not asked
CC16 330b Prohibit state and local governments from publishing the
names and addresses of all gun owners
On the issue of gun regulation, do you support or oppose each of the following proposals?
37944 1 Support
26273 2 Oppose
383 8 skipped
09 not asked
76

CC16 330d Ban assault rifles
On the issue of gun regulation, do you support or oppose each of the following proposals?
42603 1 Support
21548 2 Oppose
449 8 skipped
09 not asked
CC16 330e Make it easier for people to obtain concealed-carry permit
On the issue of gun regulation, do you support or oppose each of the following proposals?
24241 1 Support
39982 2 Oppose
377 8 skipped
09 not asked
CC16 331 1 Immigration — Grant legal status to all illegal immigrants who
have held jobs and paid taxes for at least 3 years, and not been
convicted of any felony crimes
What do you think the U.S. government should do about immigration? Select all that apply.
36182 1 selected
28418 2 not selected
08 skipped
09 not asked
CC16 331 2 Immigration — Increase the number of border patrols on the
U.S.-Mexican border
What do you think the U.S. government should do about immigration? Select all that apply.
31858 1 selected
32742 2 not selected
08 skipped
09 not asked
77

CC16 331 3 Immigration — Grant legal status to people who were
brought to the US illegally as children, but who have graduated
from a U.S. high school
What do you think the U.S. government should do about immigration? Select all that apply.
30286 1 selected
34314 2 not selected
08 skipped
09 not asked
CC16 331 4 Immigration — Fine U.S. businesses that hire illegal immigrants
What do you think the U.S. government should do about immigration? Select all that apply.
8578 1 selected
4691 2 not selected
08 skipped
51331 9 not asked
CC16 331 5 Immigration — Admit no refugees from Syria
What do you think the U.S. government should do about immigration? Select all that apply.
4767 1 selected
8502 2 not selected
08 skipped
51331 9 not asked
CC16 331 6 Immigration — Increase the number of visas for overseas
workers to work in the U.S.
What do you think the U.S. government should do about immigration? Select all that apply.
2590 1 selected
10679 2 not selected
08 skipped
51331 9 not asked
78

CC16 331 7 Immigration — Identify and deport illegal immigrants
What do you think the U.S. government should do about immigration? Select all that apply.
26249 1 selected
38351 2 not selected
08 skipped
09 not asked
CC16 331 8 Immigration — Ban Muslims from immigrating to the U.S.
What do you think the U.S. government should do about immigration? Select all that apply.
3097 1 selected
10172 2 not selected
08 skipped
51331 9 not asked
CC16 331 9 Immigration — None of these
What do you think the U.S. government should do about immigration? Select all that apply.
3049 1 selected
61551 2 not selected
08 skipped
09 not asked
CC16 332a Always allow a woman to obtain an abortion as a matter of
choice
Do you support or oppose each of the following proposals?
39808 1 Support
24730 2 Oppose
62 8 skipped
09 not asked
79

CC16 332b Permit abortion only in case of rape, incest or when the
woman’s life is in danger
Do you support or oppose each of the following proposals?
29616 1 Support
34892 2 Oppose
92 8 skipped
09 not asked
CC16 332c Prohibit all abortions after the 20th week of pregnancy
Do you support or oppose each of the following proposals?
39057 1 Support
25461 2 Oppose
82 8 skipped
09 not asked
CC16 332d Allow employers to decline coverage of abortions in insurance
plans
Do you support or oppose each of the following proposals?
28138 1 Support
36400 2 Oppose
62 8 skipped
09 not asked
CC16 332e Prohibit the expenditure of funds authorized or appropriated
by federal law for any abortion
Do you support or oppose each of the following proposals?
29217 1 Support
35321 2 Oppose
62 8 skipped
09 not asked
80

CC16 332f Make abortions illegal in all circumstances
Do you support or oppose each of the following proposals?
10144 1 Support
54369 2 Oppose
87 8 skipped
09 not asked
CC16 333a Give Environmental Protection Agency power to regulate
Carbon Dioxide emissions
Do you support or oppose each of the following proposals?
43932 1 Support
20608 2 Oppose
60 8 skipped
09 not asked
CC16 333b Raise required fuel efficiency for the average automobile from
25 mpg to 35 mpg
Do you support or oppose each of the following proposals?
45022 1 Support
19522 2 Oppose
56 8 skipped
09 not asked
CC16 333c Require a minimum amount of renewable fuels (wind,
solar, and hydroelectric) in the generation of electricity even if
electricity prices increase somewhat
Do you support or oppose each of the following proposals?
41447 1 Support
23087 2 Oppose
66 8 skipped
09 not asked
81

CC16 333d Strengthen enforcement of the Clean Air Act and Clean Water
Act even if it costs US jobs
Do you support or oppose each of the following proposals?
37672 1 Support
26875 2 Oppose
53 8 skipped
09 not asked
CC16 334a Eliminate mandatory minimum sentences for non-violent drug
offenders
Do you support or oppose each of the following proposals?
43030 1 Support
21538 2 Oppose
32 8 skipped
09 not asked
CC16 334b Require police officers to wear body cameras that record all of
their activities while on duty
Do you support or oppose each of the following proposals?
56468 1 Support
8099 2 Oppose
33 8 skipped
09 not asked
CC16 334c Increase the number of police on the street by 10 percent, even
if it means fewer funds for other public services
Do you support or oppose each of the following proposals?
35317 1 Support
29232 2 Oppose
51 8 skipped
09 not asked
82

CC16 334d Increase prison sentences for felons who have already
committed two or more serious or violent crimes
Do you support or oppose each of the following proposals?
54198 1 Support
10360 2 Oppose
42 8 skipped
09 not asked
CC16 335 Gay Marriage
Do you favor or oppose allowing gays and lesbians to marry legally?
41718 1 Favor
22407 2 Oppose
474 8 skipped
19 not asked
CC16 337 1 Cut Defense Spending
The federal budget deficit is approximately 1 trillion this year. If the Congress were to
balance the budget it would have to consider cutting defense spending, cutting domestic
spending (such as Medicare and Social Security), or raising taxes to cover the deficit. Please
rank the options below from what would you most prefer that Congress do to what you
would least prefer they do.
25054 1 1
24355 2 2
13760 3 3
0997 don’t know
1431 998 skipped
0999 not asked
83

CC16 337 2 Cut Domestic Spending
The federal budget deficit is approximately 1 trillion this year. If the Congress were to
balance the budget it would have to consider cutting defense spending, cutting domestic
spending (such as Medicare and Social Security), or raising taxes to cover the deficit. Please
rank the options below from what would you most prefer that Congress do to what you
would least prefer they do.
23740 1 1
16912 2 2
22715 3 3
0997 don’t know
1233 998 skipped
0999 not asked
CC16 337 3 Raise Taxes
The federal budget deficit is approximately 1 trillion this year. If the Congress were to
balance the budget it would have to consider cutting defense spending, cutting domestic
spending (such as Medicare and Social Security), or raising taxes to cover the deficit. Please
rank the options below from what would you most prefer that Congress do to what you
would least prefer they do.
14818 1 1
21920 2 2
26385 3 3
0997 don’t know
1477 998 skipped
0999 not asked
CC16 340a Yourself
How would you rate each of the following individuals and groups?
6107 1 Very Liberal
8562 2 Liberal
6358 3 Somewhat Liberal
16762 4 Middle of the Road
7045 5 Somewhat Conservative
10069 6 Conservative
5962 7 Very Conservative
3486 8 Not sure
249 98 skipped
099 not asked
84

CC16 340b Governor
How would you rate each of the following individuals and groups?
4590 1 Very Liberal
6192 2 Liberal
5940 3 Somewhat Liberal
6609 4 Middle of the Road
7360 5 Somewhat Conservative
11310 6 Conservative
8481 7 Very Conservative
13477 8 Not sure
637 98 skipped
499 not asked
CC16 340c Obama
How would you rate each of the following individuals and groups?
20464 1 Very Liberal
13792 2 Liberal
10097 3 Somewhat Liberal
7055 4 Middle of the Road
2493 5 Somewhat Conservative
2016 6 Conservative
1608 7 Very Conservative
6861 8 Not sure
214 98 skipped
099 not asked
85

CC16 340d Hillary Clinton
How would you rate each of the following individuals and groups?
19863 1 Very Liberal
12135 2 Liberal
9988 3 Somewhat Liberal
7657 4 Middle of the Road
3264 5 Somewhat Conservative
2483 6 Conservative
1713 7 Very Conservative
7171 8 Not sure
326 98 skipped
099 not asked
CC16 340e Donald Trump
How would you rate each of the following individuals and groups?
3695 1 Very Liberal
1944 2 Liberal
2858 3 Somewhat Liberal
7570 4 Middle of the Road
10896 5 Somewhat Conservative
10602 6 Conservative
12066 7 Very Conservative
14703 8 Not sure
266 98 skipped
099 not asked
86

CC16 340f Merrick Garland
How would you rate each of the following individuals and groups?
490 1 Very Liberal
755 2 Liberal
995 3 Somewhat Liberal
2526 4 Middle of the Road
441 5 Somewhat Conservative
199 6 Conservative
96 7 Very Conservative
7501 8 Not sure
51597 98 skipped
099 not asked
CC16 340g The Democratic Party
How would you rate each of the following individuals and groups?
18423 1 Very Liberal
15093 2 Liberal
10209 3 Somewhat Liberal
6525 4 Middle of the Road
2450 5 Somewhat Conservative
2162 6 Conservative
1507 7 Very Conservative
7421 8 Not sure
810 98 skipped
099 not asked
87

CC16 340h The Republican Party
How would you rate each of the following individuals and groups?
1439 1 Very Liberal
2031 2 Liberal
3047 3 Somewhat Liberal
5191 4 Middle of the Road
8754 5 Somewhat Conservative
16998 6 Conservative
18151 7 Very Conservative
8156 8 Not sure
833 98 skipped
099 not asked
CC16 340i The United States Supreme Court
How would you rate each of the following individuals and groups?
2460 1 Very Liberal
4398 2 Liberal
8613 3 Somewhat Liberal
20395 4 Middle of the Road
9153 5 Somewhat Conservative
5196 6 Conservative
2208 7 Very Conservative
11428 8 Not sure
749 98 skipped
099 not asked
88

CC16 340j CurrentSen1Name
How would you rate each of the following individuals and groups?
6327 1 Very Liberal
8186 2 Liberal
7341 3 Somewhat Liberal
6685 4 Middle of the Road
3881 5 Somewhat Conservative
3949 6 Conservative
2435 7 Very Conservative
15251 8 Not sure
10347 98 skipped
198 99 not asked
CC16 340k CurrentSen2Name
How would you rate each of the following individuals and groups?
4872 1 Very Liberal
5963 2 Liberal
4807 3 Somewhat Liberal
4556 4 Middle of the Road
3322 5 Somewhat Conservative
4515 6 Conservative
4169 7 Very Conservative
12598 8 Not sure
19498 98 skipped
300 99 not asked
89

CC16 340l SenCand1Name
How would you rate each of the following individuals and groups?
6011 1 Very Liberal
7886 2 Liberal
6456 3 Somewhat Liberal
5341 4 Middle of the Road
1900 5 Somewhat Conservative
1455 6 Conservative
698 7 Very Conservative
17192 8 Not sure
17406 98 skipped
255 99 not asked
CC16 340m SenCand2Name
How would you rate each of the following individuals and groups?
1403 1 Very Liberal
2075 2 Liberal
2277 3 Somewhat Liberal
4296 4 Middle of the Road
5223 5 Somewhat Conservative
9100 6 Conservative
5905 7 Very Conservative
16788 8 Not sure
17278 98 skipped
255 99 not asked
90

CC16 340n HouseCand1Name
How would you rate each of the following individuals and groups?
4504 1 Very Liberal
7401 2 Liberal
6009 3 Somewhat Liberal
6271 4 Middle of the Road
2283 5 Somewhat Conservative
1973 6 Conservative
976 7 Very Conservative
32750 8 Not sure
2403 98 skipped
30 99 not asked
CC16 340o HouseCand2Name
How would you rate each of the following individuals and groups?
815 1 Very Liberal
1430 2 Liberal
1951 3 Somewhat Liberal
5130 4 Middle of the Road
5545 5 Somewhat Conservative
9493 6 Conservative
5782 7 Very Conservative
31595 8 Not sure
2811 98 skipped
48 99 not asked
91

CC16 340p House member
How would you rate each of the following individuals and groups?
354 1 Very Liberal
534 2 Liberal
482 3 Somewhat Liberal
726 4 Middle of the Road
729 5 Somewhat Conservative
1195 6 Conservative
702 7 Very Conservative
2893 8 Not sure
56108 98 skipped
877 99 not asked
CC16 350 SCOTUS Appointments
Do you happen to know whether most of the current U.S. Supreme Court Justices were
appointed by Democratic or Republican presidents?
1439 1 Most were appointed by Democratic presidents
2625 2 Most were appointed by Republican presidents
3966 3 An equal number were appointed by Democratic and Republican
presidents
5221 4 Not sure
18 8 skipped
51331 9 not asked
CC16 351A Supreme Court Nomination. Approve the nomination of
Merrick Garland to the Supreme Court of the United States.
Congress considers many issues. If you were in Congress would you vote FOR or AGAINST
each of the following?
7323 1 For
5883 2 Against
51394 8 skipped
09 not asked
92

CC16 351B Trans-Pacific Partnership Act Free trade
agreement among 12 Pacific nations (Australia, Brunei, Canada,
Chile, Japan, Malaysia, Mexico, New Zealand, Peru, Singapore,
and the US).
Congress considers many issues. If you were in Congress would you vote FOR or AGAINST
each of the following?
35561 1 For
28913 2 Against
126 8 skipped
09 not asked
CC16 351C USA Freedom Act Ends the US government’s
phone surveillance database program. Allows individual phone
companies to keep such databases, and allows the government to
access those records if there is reasonable suspicion an individual
is connected to a terrorist organization.
Congress considers many issues. If you were in Congress would you vote FOR or AGAINST
each of the following?
9598 1 For
3557 2 Against
51445 8 skipped
09 not asked
CC16 351D Trade Adjustment Assistance Act. Provides education
assistance and retraining to workers who have lost their jobs as
a result of foreign trade.
Congress considers many issues. If you were in Congress would you vote FOR or AGAINST
each of the following?
11067 1 For
2162 2 Against
51371 8 skipped
09 not asked
93

CC16 351E Education Reform. Repeals the
No Child Left Behind Act, which required testing of all students
and penalized schools that fell below federal standards. Allows
states to identify and improve poor performing schools.
Congress considers many issues. If you were in Congress would you vote FOR or AGAINST
each of the following?
50367 1 For
14100 2 Against
133 8 skipped
09 not asked
CC16 351F Highway and Transportation Funding Act. Authorizes $305
Billion to repair and expand highways, bridges, and transit over
the next 5 years.
Congress considers many issues. If you were in Congress would you vote FOR or AGAINST
each of the following?
53279 1 For
11116 2 Against
205 8 skipped
09 not asked
CC16 351G Iran Sanctions Act Imposes new sanctions on Iran, if Iran does
not agree to reduce its nuclear program by June 30.
Congress considers many issues. If you were in Congress would you vote FOR or AGAINST
each of the following?
51177 1 For
13219 2 Against
204 8 skipped
09 not asked
94

CC16 351H Medicare
Accountability and Cost Reform Act. Shifts Medicare from fee-
for-service to pay-for-performance. Ties Medicare payments to
doctors to quality of care measures. Requires higher premiums
for seniors who make more than $134,000. Renews the Children
Health Insurance Program (CHIP).
Congress considers many issues. If you were in Congress would you vote FOR or AGAINST
each of the following?
43780 1 For
20545 2 Against
275 8 skipped
09 not asked
CC16 351I Repeal Affordable Care Act. Would repeal the Affordable Care
Act of 2009 (also known as Obamacare).
Congress considers many issues. If you were in Congress would you vote FOR or AGAINST
each of the following?
34693 1 For
29816 2 Against
91 8 skipped
09 not asked
CC16 351K Minimum wage. Raises the federal minimum wage to $12 an
hour by 2020.
Congress considers many issues. If you were in Congress would you vote FOR or AGAINST
each of the following?
45106 1 For
19475 2 Against
19 8 skipped
09 not asked
95

CC16 360 Party Registration
With which party, if any, are you registered?
15980 1 No Party, Independent, Decline to state
24084 2 Democratic Party
15908 3 Republican Party
1021 4 Other
73 8 skipped
7534 9 not asked
CC16 361 Residence
How long have you lived at your present address?
668 1 Less than 1 month
4557 2 2 to 6 months
2805 3 7 to 11 months
8687 4 1 to 2 years
8399 5 3 to 4 years
39386 6 5 or more years
98 8 skipped
09 not asked
CC16 364 Does R Intend to Vote in 2016
Do you intend to vote in the 2016 general election?
49805 1 Yes, definitely
4828 2 Probably
1521 3 I already voted (early or absentee)
5211 4 No
3123 5 Undecided
06 Undecided (1)
112 8 skipped
09 not asked
96

CC16 364b 2016 President early vote
For which candidate for President of the United States did you vote?
478 1 Donald Trump (Republican)
831 2 Hillary Clinton (Democrat)
85 3 Gary Johnson (Libertarian)
40 4 Jill Stein (Green)
45 5 Other
11 6 I didn’t vote in this election
25 7 I’m not sure
68 skipped
63079 9 not asked
CC16 364c 2016 President preference
Which candidate for President of the United States do you prefer?
19227 1 Donald Trump (Republican)
27502 2 Hillary Clinton (Democrat)
3145 3 Gary Johnson (Libertarian)
1400 4 Jill Stein (Green)
1880 5 Other
3312 6 I won’t vote in this election
6536 7 I’m not sure
77 8 skipped
1521 9 not asked
97

Post-election
CC16 401 Vote 2016 (Post)
Which of the following statements best describes you?
1802 1 I did not vote in the election this November.
750 2 I thought about voting this time but didn’t.
754 3 I usually vote, but didn’t this time.
487 4 I attempted to vote but did not or could not.
45292 5 I definitely voted in the General Election.
89 8 skipped
3725 9 not asked
0-1 No Data
CC16 402a Main reason - no vote
What was the main reason you did not vote?
69 1 I forgot
762 2 I’m not interested
317 3 Too busy
1950 4 Did not like the candidates
1653 5 I am not registered
122 6 I did not have the correct form of identification
267 7 Out of town
475 8 Sick or disabled
152 9 Transportation
20 10 Bad weather
128 11 The line at the polls was too long
65 12 I was not allowed to vote at the polls, even though I tried
112 13 I requested but did not receive an absentee ballot
73 14 I did not know where to vote
309 15 I did not feel that I knew enough about the choices
891 16 Other
249 55 Don’t know
13 98 skipped
45272 99 not asked
0-1 No Data
98

CC16 402b Other reason - no vote
Was there any other reason you did not vote?
79 1 I forgot
845 2 I’m not interested
327 3 Too busy
923 4 Did not like the candidates
715 5 I am not registered
81 6 I did not have the correct form of identification
166 7 Out of town
208 8 Sick or disabled
194 9 Transportation
38 10 Bad weather
113 11 The line at the polls was too long
66 12 I was not allowed to vote at the polls, even though I tried
83 13 I requested but did not receive an absentee ballot
113 14 I did not know where to vote
487 15 I did not feel that I knew enough about the choices
1073 16 Other
1305 55 Don’t know
535 98 skipped
45548 99 not asked
0-1 No Data
CC16 403 Vote Method
Did you vote in person on Election Day, in person before Election Day, or by mail (that is,
absentee or vote by mail)?
24462 1 In person on election day
9929 2 In person before election day (early)
11020 3 Voted by mail (or absentee)
290 4 Don’t know
78 8 skipped
7120 9 not asked
0-1 No Data
99

CC16 403b Vote Location
Did you vote at a precinct polling place or at a vote center?
19795 1 At a precinct polling place
4045 2 At a vote center
626 8 skipped
28433 9 not asked
0-1 No Data
CC16 404 Wait to Vote
Approximately, how long did you have to wait in line to vote?
13160 1 Not at all
11367 2 Less than 10 minutes
6544 3 10 - 30 minutes
2503 4 31 minutes - 1 hour
719 5 More than 1 hour
60 6 Don’t know
41 8 skipped
18505 9 not asked
0-1 No Data
CC16 405 Election Day Registration
Did you register to vote at the polls or city office on Election Day this year?
572 1 Yes
4292 2 No
38 skipped
48032 9 not asked
0-1 No Data
100

CC16 406a Voting Problem
Was there a problem with your voter registration or voter identification when you tried to
vote?
44647 1 No
1067 2 Yes
65 8 skipped
7120 9 not asked
0-1 No Data
CC16 406b 1 ID
What was the problem? Check all that apply.
199 1 selected
882 2 not selected
08 skipped
51818 9 not asked
0-1 No Data
CC16 406b 2 Registration
What was the problem? Check all that apply.
290 1 selected
791 2 not selected
08 skipped
51818 9 not asked
0-1 No Data
CC16 406b 3 Wrong Place
What was the problem? Check all that apply.
161 1 selected
920 2 not selected
08 skipped
51818 9 not asked
0-1 No Data
101

CC16 406b 4 Other
What was the problem? Check all that apply.
418 1 selected
663 2 not selected
08 skipped
51818 9 not asked
0-1 No Data
CC16 406c Allowed to Vote
Were you allowed to vote?
122 1 No, I was not allowed to vote
176 2 I was allowed to vote using a provisional ballot
766 3 I voted
48 skipped
51831 9 not asked
0-1 No Data
CC16 407a Feel Intimidated
Did you personally feel intimidated at the place where you voted?
847 1 Yes
33393 2 No
112 3 Don’t remember
39 8 skipped
18508 9 not asked
0-1 No Data
102

CC16 410a 2016 President vote (Post)
For whom did you vote for President of the United States?
18755 1 Donald Trump (Republican)
22136 2 Hillary Clinton (Democrat)
1829 3 Gary Johnson (Libertarian)
913 4 Jill Stein (Green)
163 8 Evan McMullin (Independent)
1136 5 Other
81 6 I didn’t vote in this election
229 7 I’m not sure
27 98 skipped
7630 99 not asked
0-1 No Data
CC16 410a nv 2016 President preference (Post)
Which candidate did you prefer for President of the United States?
2163 1 Donald Trump (Republican)
2454 2 Hillary Clinton (Democrat)
430 3 Gary Johnson (Libertarian)
213 4 Jill Stein (Green)
21 8 Evan McMullin (Independent)
598 5 Other
1732 7 I’m not sure
21 98 skipped
45267 99 not asked
0-1 No Data
CC16 413a Attorney General
For whom did you vote for in the following state elections ...
16349 1 Democratic candidate
13331 2 Republican candidate
939 3 Other candidate
3691 4 Did not vote in this race
10698 5 There was no race for this office
261 8 skipped
7630 9 not asked
0-1 No Data
103

CC16 413b Secretary of State
For whom did you vote for in the following state elections ...
15607 1 Democratic candidate
13236 2 Republican candidate
928 3 Other candidate
3749 4 Did not vote in this race
11397 5 There was no race for this office
352 8 skipped
7630 9 not asked
0-1 No Data
CC16 413c State Senate
For whom did you vote for in the following state elections ...
19485 1 Democratic candidate
16329 2 Republican candidate
1177 3 Other candidate
3236 4 Did not vote in this race
4384 5 There was no race for this office
650 8 skipped
7638 9 not asked
0-1 No Data
CC16 413d State Legislature’s Lower Chamber
For whom did you vote for in the following state elections ...
19783 1 Democratic candidate
16979 2 Republican candidate
1206 3 Other candidate
3377 4 Did not vote in this race
3532 5 There was no race for this office
388 8 skipped
7634 9 not asked
0-1 No Data
104

CC16 414 1 Ensure the supply of oil
Would you approve of the use of U.S. military troops in order to ... ? (Please check all that
apply)
9521 1 selected
43378 2 not selected
08 skipped
09 not asked
0-1 No Data
CC16 414 2 Destroy a terrorist camp
Would you approve of the use of U.S. military troops in order to ... ? (Please check all that
apply)
34290 1 selected
18609 2 not selected
08 skipped
09 not asked
0-1 No Data
CC16 414 3 Intervene in a region where there is genocide or a civil war
Would you approve of the use of U.S. military troops in order to ... ? (Please check all that
apply)
20546 1 selected
32353 2 not selected
08 skipped
09 not asked
0-1 No Data
CC16 414 4 Assist the spread of democracy
Would you approve of the use of U.S. military troops in order to ... ? (Please check all that
apply)
7896 1 selected
45003 2 not selected
08 skipped
09 not asked
0-1 No Data
105

CC16 414 5 Protect American allies under attack by foreign nations
Would you approve of the use of U.S. military troops in order to ... ? (Please check all that
apply)
37979 1 selected
14920 2 not selected
08 skipped
09 not asked
0-1 No Data
CC16 414 6 Help the United Nations uphold international law
Would you approve of the use of U.S. military troops in order to ... ? (Please check all that
apply)
24159 1 selected
28740 2 not selected
08 skipped
09 not asked
0-1 No Data
CC16 414 7 None of the above
Would you approve of the use of U.S. military troops in order to ... ? (Please check all that
apply)
5407 1 selected
47492 2 not selected
08 skipped
09 not asked
0-1 No Data
106

CC16 415r Taxes vs Spending
If your state were to have a budget deficit this year it would have to raise taxes on income
and sales or cut spending, such as on education, health care, welfare, and road construction.
What would you prefer more, raising taxes or cutting spending? Choose a point along the
scale from 100
Min. 0.00
1st Qu. 42.00
Median 52.00
Mean 57.50
3rd Qu. 76.00
Max. 100.00
NA’s 18240.00
CC16 416r Income vs Sales Taxes
If the state had to raise taxes, what share of the tax increase should come from increased
income taxes and what share from increased sales taxes? Choose a point along the scale
from 100
Min. 0.00
1st Qu. 26.00
Median 50.00
Mean 46.79
3rd Qu. 62.00
Max. 100.00
NA’s 20756.00
CC16 417a 1 Attend local political meetings (such as school board or city
council)
During the past year did you ... (Check all that apply)
6238 1 selected
46661 2 not selected
08 skipped
09 not asked
0-1 No Data
107

CC16 417a 2 Put up a political sign (such as a lawn sign or bumper sticker)
During the past year did you ... (Check all that apply)
8540 1 selected
44359 2 not selected
08 skipped
09 not asked
0-1 No Data
CC16 417a 3 Work for a candidate or campaign
During the past year did you ... (Check all that apply)
3215 1 selected
49684 2 not selected
08 skipped
09 not asked
0-1 No Data
CC16 417a 4 Donate money to a candidate, campaign, or political
organization
During the past year did you ... (Check all that apply)
12390 1 selected
40509 2 not selected
08 skipped
09 not asked
0-1 No Data
CC16 417a 5 Donate blood
During the past year did you ... (Check all that apply)
6933 1 selected
45966 2 not selected
08 skipped
09 not asked
0-1 No Data
108

CC16 417a 6 None of these
During the past year did you ... (Check all that apply)
30468 1 selected
22431 2 not selected
08 skipped
09 not asked
0-1 No Data
CC16 417bx 1 Candidate for President
Please indicate to which of the following groups or people you donated money. Select all
that apply.
9964 1 selected
2447 2 not selected
08 skipped
40488 9 not asked
0-1 No Data
CC16 417bx 2 Candidate for U.S. Senate in my state
Please indicate to which of the following groups or people you donated money. Select all
that apply.
1951 1 selected
10460 2 not selected
08 skipped
40488 9 not asked
0-1 No Data
CC16 417bx 3 Candidate for U.S. Senate in another state
Please indicate to which of the following groups or people you donated money. Select all
that apply.
1334 1 selected
11077 2 not selected
08 skipped
40488 9 not asked
0-1 No Data
109

CC16 417bx 4 Candidate for U.S. House in my state
Please indicate to which of the following groups or people you donated money. Select all
that apply.
1540 1 selected
10871 2 not selected
08 skipped
40488 9 not asked
0-1 No Data
CC16 417bx 5 Candidate for U.S. House in another state
Please indicate to which of the following groups or people you donated money. Select all
that apply.
837 1 selected
11574 2 not selected
08 skipped
40488 9 not asked
0-1 No Data
CC16 417bx 6 Candidate for state office
Please indicate to which of the following groups or people you donated money. Select all
that apply.
1388 1 selected
11023 2 not selected
08 skipped
40488 9 not asked
0-1 No Data
CC16 417bx 7 Political party committee (such as the DNC or RNC)
Please indicate to which of the following groups or people you donated money. Select all
that apply.
3085 1 selected
9326 2 not selected
08 skipped
40488 9 not asked
0-1 No Data
110

CC16 417bx 8 Political action committee at work (such as corporate or union
PAC)
Please indicate to which of the following groups or people you donated money. Select all
that apply.
1051 1 selected
11360 2 not selected
08 skipped
40488 9 not asked
0-1 No Data
CC16 417bx 9 Political group (not at your work)
Please indicate to which of the following groups or people you donated money. Select all
that apply.
889 1 selected
11522 2 not selected
08 skipped
40488 9 not asked
0-1 No Data
CC16 417bx 10 Other
Please indicate to which of the following groups or people you donated money. Select all
that apply.
666 1 selected
11745 2 not selected
08 skipped
40488 9 not asked
0-1 No Data
111

CC16 417c Political Donation Amount
Approximately how much did you contribute to all candidates and committees over the last
year?
Min. 1.00
1st Qu. 40.00
Median 100.00
Mean 1158.70
3rd Qu. 250.00
Max. 1000000.00
NA’s 52472.00
CC16 417e 1 Campaign contributions are an effective way to influence public
policy
Thinking about campaign contributions in general, to what extent do you agree or disagree
with the following statements?
348 1 Strongly disagree
590 2 Somewhat disagree
1426 3 Neither agree nor disagree
2308 4 Somewhat agree
827 5 Strongly agree
24 8 skipped
47376 9 not asked
0-1 No Data
CC16 417e 2 Campaign contributions are an effective way to help my
business/industry
Thinking about campaign contributions in general, to what extent do you agree or disagree
with the following statements?
831 1 Strongly disagree
789 2 Somewhat disagree
2395 3 Neither agree nor disagree
1042 4 Somewhat agree
432 5 Strongly agree
34 8 skipped
47376 9 not asked
0-1 No Data
112

CC16 417e 3 Campaign contributions allow me to be part of a network with
other contributors
Thinking about campaign contributions in general, to what extent do you agree or disagree
with the following statements?
465 1 Strongly disagree
494 2 Somewhat disagree
1731 3 Neither agree nor disagree
2112 4 Somewhat agree
680 5 Strongly agree
41 8 skipped
47376 9 not asked
0-1 No Data
CC16 417e 4 I prefer to give directly to candidates rather than contribute
money to a political party organization
Thinking about campaign contributions in general, to what extent do you agree or disagree
with the following statements?
178 1 Strongly disagree
253 2 Somewhat disagree
879 3 Neither agree nor disagree
1745 4 Somewhat agree
2446 5 Strongly agree
22 8 skipped
47376 9 not asked
0-1 No Data
CC16 417e 5 For anyone who can afford to contribute, it is a civic duty to
contribute financially to campaigns.
Thinking about campaign contributions in general, to what extent do you agree or disagree
with the following statements?
1563 1 Strongly disagree
881 2 Somewhat disagree
1699 3 Neither agree nor disagree
971 4 Somewhat agree
385 5 Strongly agree
24 8 skipped
47376 9 not asked
0-1 No Data
113

CC16 425a Contacted by candidate/political org
Did a candidate or political campaign organization contact you during the 2016 election?
28570 1 Yes
24266 2 No
63 8 skipped
09 not asked
0-1 No Data
CC416 25b 1 In person
How did these candidates or campaigns contact you? Check all that apply.
5848 1 selected
22723 2 not selected
08 skipped
24328 9 not asked
0-1 No Data
CC416 25b 2 Phone call
How did these candidates or campaigns contact you? Check all that apply.
20943 1 selected
7628 2 not selected
08 skipped
24328 9 not asked
0-1 No Data
CC416 25b 3 Email or text message
How did these candidates or campaigns contact you? Check all that apply.
15428 1 selected
13143 2 not selected
08 skipped
24328 9 not asked
0-1 No Data
114

CC416 25b 4 Letter or post card
How did these candidates or campaigns contact you? Check all that apply.
14961 1 selected
13610 2 not selected
08 skipped
24328 9 not asked
0-1 No Data
CC16 418a Run for Office
Have you ever run for elective office at any level of government (local, state or federal)?
1998 1 Yes
50725 2 No
176 8 skipped
09 not asked
0-1 No Data
CC16 418bx 1 School Board
Which of the following offices have you run for? Select all that apply.
530 1 selected
1469 2 not selected
08 skipped
50900 9 not asked
0-1 No Data
CC16 418bx 2 Other local board or commission (e.g. zoning commission)
Which of the following offices have you run for? Select all that apply.
401 1 selected
1598 2 not selected
08 skipped
50900 9 not asked
0-1 No Data
115

CC16 418bx 3 City Council
Which of the following offices have you run for? Select all that apply.
656 1 selected
1343 2 not selected
08 skipped
50900 9 not asked
0-1 No Data
CC16 418bx 4 Mayor
Which of the following offices have you run for? Select all that apply.
257 1 selected
1742 2 not selected
08 skipped
50900 9 not asked
0-1 No Data
CC16 418bx 5 City or District Attorney
Which of the following offices have you run for? Select all that apply.
173 1 selected
1826 2 not selected
08 skipped
50900 9 not asked
0-1 No Data
CC16 418bx 6 Countywide office (e.g. supervisor)
Which of the following offices have you run for? Select all that apply.
214 1 selected
1785 2 not selected
08 skipped
50900 9 not asked
0-1 No Data
116

CC16 418bx 7 State legislature
Which of the following offices have you run for? Select all that apply.
283 1 selected
1716 2 not selected
08 skipped
50900 9 not asked
0-1 No Data
CC16 418bx 8 Statewide office
Which of the following offices have you run for? Select all that apply.
114 1 selected
1885 2 not selected
08 skipped
50900 9 not asked
0-1 No Data
CC16 418bx 9 Federal legislature (U.S. House or Senate)
Which of the following offices have you run for? Select all that apply.
92 1 selected
1907 2 not selected
08 skipped
50900 9 not asked
0-1 No Data
CC16 418bx 10 Judge
Which of the following offices have you run for? Select all that apply.
61 1 selected
1938 2 not selected
08 skipped
50900 9 not asked
0-1 No Data
117

CC16 418bx 11 Other
Which of the following offices have you run for? Select all that apply.
353 1 selected
1646 2 not selected
08 skipped
50900 9 not asked
0-1 No Data
CC16 421a Party Identification
Generally speaking, do you think of yourself as a ... ?
20270 1 Democrat
14245 2 Republican
15787 3 Independent
2595 4 Other
28 skipped
09 not asked
0-1 No Data
CC16 421 dem Strong Democrat
Would you call yourself a strong Democrat or not so strong Democrat?
13036 1 Strong Democrat
7207 2 Not so strong Democrat
30 8 skipped
32626 9 not asked
0-1 No Data
CC16 421 rep Strong Republican
Would you call yourself a strong Republican or not so strong Republican?
7846 1 Strong Republican
6384 2 Not so strong Republican
15 8 skipped
38654 9 not asked
0-1 No Data
118

CC16 421b Party Leaners
Do you think of yourself as closer to the Democratic or the Republican party?
4654 1 The Democratic Party
4729 2 The Republican Party
8118 3 Neither
836 8 Not sure
46 98 skipped
34516 99 not asked
0-1 No Data
CC16 422c Angry Racism Exists
I am angry that racism exists.
30700 1 Strongly agree
11780 2 Somewhat agree
7913 3 Neither agree nor disagree
1384 4 Somewhat disagree
1057 5 Strongly disagree
65 8 skipped
09 not asked
0-1 No Data
CC16 422d Racial Advantages
White people in the U.S. have certain advantages because of the color of their skin.
14815 1 Strongly agree
13162 2 Somewhat agree
8926 3 Neither agree nor disagree
6627 4 Somewhat disagree
9307 5 Strongly disagree
62 8 skipped
09 not asked
0-1 No Data
119

CC16 422e Racial Fear
I often find myself fearful of people of other races.
1364 1 Strongly agree
6383 2 Somewhat agree
11967 3 Neither agree nor disagree
12828 4 Somewhat disagree
20233 5 Strongly disagree
124 8 skipped
09 not asked
0-1 No Data
CC16 422f Racial Problems Isolated
Racial problems in the U.S. are rare, isolated situations.
2837 1 Strongly agree
7712 2 Somewhat agree
8765 3 Neither agree nor disagree
15810 4 Somewhat disagree
17654 5 Strongly disagree
121 8 skipped
09 not asked
0-1 No Data
CC16 423a House Candidate 1
What is the race or ethnicity of the following candidates or politicians?
25538 1 White
4780 2 Black
2832 3 Hispanic
964 4 Asian
749 5 Other
16414 6 Not sure
1597 8 skipped
25 9 not asked
0-1 No Data
120

CC16 423b House Candidate 2
What is the race or ethnicity of the following candidates or politicians?
32500 1 White
1119 2 Black
2151 3 Hispanic
333 4 Asian
397 5 Other
14509 6 Not sure
1852 8 skipped
38 9 not asked
0-1 No Data
CC16 423c Current U.S. Representative
What is the race or ethnicity of the following candidates or politicians?
4450 1 White
320 2 Black
174 3 Hispanic
65 4 Asian
30 5 Other
1115 6 Not sure
45962 8 skipped
783 9 not asked
0-1 No Data
CC16 426 1 Welfare
State legislatures must make choices when making spending decisions on important state
programs. Would you like your legislature to increase or decrease spending on the five areas
below?
4995 1 Greatly increase
7657 2 Slightly increase
19534 3 Maintain
10176 4 Slightly decrease
10398 5 Greatly decrease
139 8 skipped
09 not asked
0-1 No Data
121

CC16 426 2 Health Care
State legislatures must make choices when making spending decisions on important state
programs. Would you like your legislature to increase or decrease spending on the five areas
below?
13550 1 Greatly increase
14765 2 Slightly increase
16781 3 Maintain
4562 4 Slightly decrease
3096 5 Greatly decrease
145 8 skipped
09 not asked
0-1 No Data
CC16 426 3 Education
State legislatures must make choices when making spending decisions on important state
programs. Would you like your legislature to increase or decrease spending on the five areas
below?
18166 1 Greatly increase
15144 2 Slightly increase
14460 3 Maintain
2993 4 Slightly decrease
1969 5 Greatly decrease
167 8 skipped
09 not asked
0-1 No Data
CC16 426 4 Law Enforcement
State legislatures must make choices when making spending decisions on important state
programs. Would you like your legislature to increase or decrease spending on the five areas
below?
11346 1 Greatly increase
17417 2 Slightly increase
19428 3 Maintain
3052 4 Slightly decrease
1449 5 Greatly decrease
207 8 skipped
09 not asked
0-1 No Data
122

CC16 426 5 Transportation/Infrastructure
State legislatures must make choices when making spending decisions on important state
programs. Would you like your legislature to increase or decrease spending on the five areas
below?
13764 1 Greatly increase
17798 2 Slightly increase
17793 3 Maintain
2451 4 Slightly decrease
921 5 Greatly decrease
172 8 skipped
09 not asked
0-1 No Data
CC16 427 a The schools
Thinking now about your local community, how would you grade the following:
7241 1 A - Excellent
16651 2 B Above Average
20745 3 C - Average
5969 4 D Below Average
2185 5 F Poor
108 8 skipped
09 not asked
0-1 No Data
CC16 427 b The police
Thinking now about your local community, how would you grade the following:
7772 1 A - Excellent
18170 2 B Above Average
21320 3 C - Average
3881 4 D Below Average
1627 5 F Poor
129 8 skipped
09 not asked
0-1 No Data
123

CC16 427 c The roads
Thinking now about your local community, how would you grade the following:
2451 1 A - Excellent
10461 2 B Above Average
23556 3 C - Average
12038 4 D Below Average
4268 5 F Poor
125 8 skipped
09 not asked
0-1 No Data
CC16 427 d Zoning and development
Thinking now about your local community, how would you grade the following:
2246 1 A - Excellent
10045 2 B Above Average
28228 3 C - Average
8751 4 D Below Average
3423 5 F Poor
206 8 skipped
09 not asked
0-1 No Data
CC16 427 e The Mayor or Town/City Manager
Thinking now about your local community, how would you grade the following:
4241 1 A - Excellent
11024 2 B Above Average
24447 3 C - Average
4831 4 D Below Average
3834 5 F Poor
4350 6 Not applicable
172 8 skipped
09 not asked
0-1 No Data
124

CC16 427 f The Town/City Council
Thinking now about your local community, how would you grade the following:
2566 1 A - Excellent
9701 2 B Above Average
26370 3 C - Average
6465 4 D Below Average
3711 5 F Poor
3752 6 Not applicable
334 8 skipped
09 not asked
0-1 No Data
125

Vote Validation
Individual records were matched to the Catalist database of registered voters in the United
States. Matching was performed in June, 2017. States have updated their vote history data
by May of the year following the election year. It should be noted that a record may not
be matched either because the individual is not registered to vote or because of incomplete
or inaccurate information that prevented a match. Matches are made only with records for
which there is a high level of confidence that the respondent is being assigned to the correct
record. However, even by setting a high threshold of confidence, there will still be some
false-positives which should be considered when using the validation records.
Among the CCES 2016 records that were matched to the voter files (i.e., were registered),
approximately 80 percent were determined to have voted in the 2016 General Election and
47 percent were determined to have voted in the 2016 Primary Elections.
There are three possible ways to measure turnout in the 2016 CCES using the validation
variables. Two use only the “E2016GVM” vote validation variable while the third uses
this variable in conjunction with self-reported registration (votereg post) and self-reported
turnout (CC16 401).
1. Un-matched as non-voters. The first specification defines voters as respondents
with a validated voting record no matter their mode of participation, and defines non-
voters as both matched non-voters and non-matched respondents. This specification
retains the integrity of the full CCES sample, no missing values are created. The jus-
tification for this approach is the fact that the most common reason that Catalist will
not have a record for an individual is because that individual is not registered to vote.
Indeed, rates of self-reported non-registration and non-voting are much higher among
un-matched respondents than among those for whom there is a match.
2. Only matched non-voters as non-voters. The second specification defines non-
voters as only matched non-voters. This specification reduces the CCES sample and
results in validated turnout estimates that are larger than those in the first specifica-
tion. However, this specification increases the level of certainty in the identification
of non-voters in the CCES, because there could possibly be actual voters among non-
matched respondents.
3. Matched non-voters and self-reported non-voters as non-voters. The third
specification defines non-voters as (1) matched non-voters, (2) non-matched respon-
dents who reported not being registered to vote in the “votereg post” question, and (3)
non-matched respondents who are self-reported non-voters in the “CC16 401” question.
This definition excludes non-matched respondents who are self-reported voters (these
individuals would be coded as missing). This definition assumes that self-reported
non-voters are honest about their non-participation because there is no incentive to go
against the democratic norm of participation.
126

CL matched Catalist - Panelist matched to voter file
43403 Matched to Voter File
21197 Not Matched to Voter File
CL voterstatus Catalist - Voter Status
38739 Active
1236 Dropped
496 Inactive
363 Multiple Appearances
2569 Unregistered
CL state Catalist - Voter file matched state
Alphabetical list of states
CL partyaffiliation Catalist - Party affiliation
8CST (Constitution Party)
10592 DEM (Democratic Party)
774 DTS (Decline to State)
88 GRE (Green Party)
428 IND (Independent)
155 LIB (Libertarian)
3556 NPA (No Party Affiliation)
266 OTH (Other)
1REF (Reform Party)
7555 REP (Republican Party)
19081 UNK (Unknown/No Party Registration)
CL E2016GVM Catalist - 2016 General election voting method
4547 absentee
5270 early
4356 mail
10870 polling
9086 unknown
127

CL E2016PVM Catalist - 2016 Primary election voting method
1411 absentee
986 earlyVote
1397 mail
2490 polling
1056 unknown
CL E2016PPEP Catalist - 2016 Presidential Primary election party
6055 DEM
5310 REP
CL E2016PPVM Catalist - 2016 Presidential Primary election voting method
1722 absentee
2260 earlyVote
2115 mail
8437 polling
5513 unknown
CL E2016PEP Catalist - 2016 Primary election party
1037 DEM
1135 REP
128

Part IV
Contextual Variables
Contextual variables consist of the names and parties of the candidates for U. S. House, U.
S. Senate, and Governor. For all offices, Candidate 1 is the Democrat and Candidate 2 is
the Republican, except when no Democrat is running. When no Democrat is running, the
Republican is listed as Candidate 1. When only one candidate is running, Candidate 2 is
listed as “NA”.
Pre-Election Survey Contextual Variables
CurrentGovParty Current Governor Party
192
24981 Democratic
115 Independent
39312 Republican
CurrentHouse-
Gender Current House Gender
448
12840 F
51312 M
CurrentHousePa-
rty Current House Party
448
27786 Democratic
36366 Republican
129

Cur-
rentSen1Gender Current Senate 1 Gender
192
15799 F
48609 M
CurrentSen1Party Current Senate 1 Party
192
41190 Democratic
1083 Democratic-Farmer-Labor
22135 Republican
Cur-
rentSen2Gender Current Senate 2 Gender
192
15057 F
49351 M
CurrentSen2Party Current Senate 2 Party
192
26069 Democratic
1083 Democratic-Farmer-Labor
461 Independent
36795 Republican
Gov-
Cand1Incumbent Governor Candidate 1 Incumbent
61943 0
2657 1
130

GovCand1Party Governor Candidate 1 Party
55372
9228 Democratic
GovCand2Party Governor Candidate 2 Party
55372
9228 Republican
GovCand3Party Governor Candidate 3 Party
61864
1022 Independent Party of Oregon
1714 Libertarian
House-
Cand1Incumbent House Candidate 1 Incumbent
39796 0
24804 1
HouseCand1Party House Candidate 1 Party
1715
60956 Democratic
94 Green
141 Independent
1512 Libertarian
182 Republican
131

House-
Cand2Incumbent House Candidate 2 Incumbent
32768 0
31832 1
HouseCand2Party House Candidate 2 Party
2147
315 Conservative Party
1007 Democratic
484 Independent
809 Libertarian
132 Liberty Union
59706 Republican
HouseCand3Party House Candidate 3 Party
62566
109 Conservative Party
500 Democratic
991 Green
342 Libertarian
92 Republican
Sen-
Cand1Incumbent Senate Candidate 1 Incumbent
55728 0
8872 1
SenCand1Party Senate Candidate 1 Party
17032
47568 Democratic
132

Sen-
Cand2Incumbent Senate Candidate 2 Incumbent
35906 0
28694 1
SenCand2Party Senate Candidate 2 Party
17032
6021 Democratic
41547 Republican
SenCand3Party Senate Candidate 3 Party
60928
326 Constitution
689 Democratic
2657 Libertarian
133

Post-Election Survey Contextual Variables
CurrentGov-
Party post Current Governor Party - post
11855
20484 Democratic
96 Independent
32165 Republican
CurrentHouse-
Gender post Current House Gender - post
12052
10226 F
42322 M
CurrentHousePa-
rty post Current House Party - post
12052
22044 Democratic
30504 Republican
Cur-
rentSen1Gender post Current Senate 1 Gender - post
11855
13063 F
39682 M
Cur-
rentSen1Party post Current Senate 1 Party - post
11855
33818 Democratic
937 Democratic-Farmer-Labor
17990 Republican
134

Cur-
rentSen2Gender post Current Senate 2 Gender - post
11855
12205 F
40540 M
Cur-
rentSen2Party post Current Senate 2 Party - post
11855
21265 Democratic
937 Democratic-Farmer-Labor
414 Independent
30129 Republican
Gov-
Cand1Incumbent post Governor Candidate 1 Incumbent - post
11701
50646 0
2253 1
Gov-
Cand1Party post Governor Candidate 1 Party - post
56872
7728 Democratic
Gov-
Cand2Incumbent post Governor Candidate 2 Incumbent - post
11701
50833 0
2066 1
135

Gov-
Cand2Party post Governor Candidate 2 Party - post
56872
7728 Republican
House-
Cand1Incumbent post House Candidate 1 Incumbent - post
11701
33184 0
19715 1
House-
Cand1Party post House Candidate 1 Party - post
13121
49925 Democratic
74 Green
117 Independent
1209 Libertarian
154 Republican
House-
Cand2Incumbent post House Candidate 2 Incumbent - post
11701
26241 0
26658 1
136

House-
Cand2Party post House Candidate 2 Party - post
13382
214 Conservative Party
749 Democratic
382 Independent
650 Libertarian
118 Liberty Union
49105 Republican
House-
Cand3Party post House Candidate 3 Party - post
62998
69 Conservative Party
396 Democratic
770 Green
296 Libertarian
71 Republican
Sen-
Cand1Incumbent post Senate Candidate 1 Incumbent - post
11701
45689 0
7210 1
Sen-
Cand1Party post Senate Candidate 1 Party - post
25610
38990 Democratic
137

Sen-
Cand2Incumbent post Senate Candidate 2 Incumbent - post
11701
29255 0
23644 1
Sen-
Cand2Party post Senate Candidate 2 Party - post
25610
4821 Democratic
34169 Republican
Sen-
Cand3Party post Senate Candidate 3 Party - post
61600
281 Constitution
544 Democratic
2175 Libertarian
Senate
Table 4: U.S. Senate, 115th Congress
State N CurrentSen1 CurrentSen2
Alabama 792 Richard Shelby(R) Jeff Sessions(R)
Alaska 115 Lisa Murkowski(R) Dan Sullivan(R)
Arizona 1,507 John McCain(R) Jeff Flake(R)
Arkansas 538 John Boozman(R) Tom Cotton(R)
California 6,021 Dianne Feinstein(D) Barbara Boxer(D)
Colorado 1,022 Michael Bennet(D) Cory Gardner(R)
Connecticut 732 Richard Blumenthal(D) Chris Murphy(D)
Delaware 267 Tom Carper(D) Chris Coons(D)
Continued on next page
138

Table 4 – continued from previous page
State N CurrentSen1 CurrentSen2
Florida 4,988 Bill Nelson(D) Marco Rubio(R)
Georgia 2,062 Johnny Isakson(R) David Perdue(R)
Hawaii 200 Brian Schatz(D) Mazie Hirono(D)
Idaho 326 Mike Crapo(R) Jim Risch(R)
Illinois 2,634 Dick Durbin(D) Mark Kirk(R)
Indiana 1,397 Dan Coats(R) Joe Donnelly(D)
Iowa 688 Chuck Grassley(R) Joni Ernst(R)
Kansas 541 Pat Roberts(R) Jerry Moran(R)
Kentucky 933 Mitch McConnell(R) Rand Paul(R)
Louisiana 689 David Vitter(R) Bill Cassidy(R)
Maine 329 Susan Collins(R) Angus King(D)
Maryland 1,200 Barbara Mikulski(D) Ben Cardin(D)
Massachusetts 1,442 Elizabeth Warren(D) Ed Markey(D)
Michigan 2,110 Debbie Stabenow(D) Gary Peters(D)
Minnesota 1,083 Amy Klobuchar(D) Al Franken(D)
Mississippi 409 Thad Cochran(R) Roger Wicker(R)
Missouri 1,309 Claire McCaskill(D) Roy Blunt(R)
Montana 191 Jon Tester(D) Steve Daines(R)
Nebraska 370 Deb Fischer(R) Ben Sasse(R)
Nevada 695 Harry Reid(D) Dean Heller(R)
New Hampshire 376 Jeanne Shaheen(D) Kelly Ayotte(R)
New Jersey 1,831 Bob Menendez(D) Cory Booker(D)
New Mexico 383 Tom Udall(D) Martin Heinrich(D)
New York 4,320 Chuck Schumer(D) Kirsten Gillibrand(D)
North Carolina 2,004 Richard Burr(R) Thom Tillis(R)
North Dakota 126 John Hoeven(R) Heidi Heitkamp(D)
Ohio 2,698 Sherrod Brown(D) Rob Portman(R)
Oklahoma 624 Jim Inhofe(R) James Lankford(R)
Oregon 1,022 Ron Wyden(D) Jeff Merkley(D)
Pennsylvania 3,524 Bob Casey Jr.(D) Pat Toomey(R)
Rhode Island 212 Jack Reed(D) Sheldon Whitehouse(D)
South Carolina 857 Lindsey Graham(R) Tim Scott(R)
South Dakota 167 John Thune(R) Mike Rounds(R)
Tennessee 1,215 Lamar Alexander(R) Bob Corker(R)
Texas 4,462 John Cornyn(R) Ted Cruz(R)
Utah 531 Orrin Hatch(R) Mike Lee(R)
Vermont 132 Patrick Leahy(D) Bernie Sanders(D)
Virginia 2,008 Mark Warner(D) Tim Kaine(D)
Washington 1,444 Patty Murray(D) Maria Cantwell(D)
West Virginia 429 Joe Manchin(D) Shelley Moore Capito(R)
Wisconsin 1,354 Ron Johnson(R) Tammy Baldwin(D)
Wyoming 99 Mike Enzi(R) John Barrasso(R)
139

Table 5: United States Senate, 116th Congress
State N Incumbent SenCand1 - Name, Party, and Vote SenCand2 - Name, Party, and Vote SenCand3 - Name, Party, and Vote
Alabama 792 Richard C. Shelby(R) Ron Crumpton(D) 35.8 Richard C. Shelby(R) 64.2 (-)
Alaska 115 Lisa Murkowski(R) Ray Metcalfe(D) 11.6 Lisa Murkowski(R) 44.4 Joe Miller(L) 29.2
Arizona 1,507 John McCain(R) Ann Kirkpatrick(D) 41.1 John McCain(R) 53.4 (-)
Arkansas 538 John Boozman(R) Conner Eldridge(D) 36.2 John Boozman(R) 59.8 Frank Gilbert(L) 4
California 6,021 open Kamala D. Harris(D) 62.4 Loretta L. Sanchez(D) 37.6 (-)
Colorado 1,022 Michael Bennet(D) Michael Bennet(D) 49.1 Darryl Glenn(R) 45.4 (-)
Connecticut 732 Richard Blumenthal(D) Richard Blumenthal(D) 62.9 Dan Carter(R) 34.9 (-)
Delaware 267 (-) (-) (-)
District of Columbia 192 (-) (-) (-)
Florida 4,988 Marco Rubio(R) Patrick E. Murphy(D) 44.3 Marco Rubio(R) 52 (-)
Georgia 2,062 Johnny Isakson(R) Jim Barksdale(D) 40.8 Johnny Isakson(R) 55 (-)
Hawaii 200 Brian Schatz(D) Brian Schatz(D) 73.6 John Carroll(R) 22.2 (-)
Idaho 326 Mike Crapo(R) Jerry Sturgill(D) 27.8 Mike Crapo(R) 66.1 Ray J. Writz(C) 6.1
Illinois 2,634 Mark Steven Kirk(R) Tammy Duckworth(D) 54.4 Mark Steven Kirk(R) 40.2 (-)
Indiana 1,397 Todd Young(R) Evan Bayh(D) 42.4 Todd Young(R) 52.1 (-)
Iowa 688 Charles E. Grassley(R) Patty Judge(D) 35.7 Charles E. Grassley(R) 60.2 (-)
Kansas 541 Jerry Moran(R) Patrick Wiesner(D) 32.1 Jerry Moran(R) 62.4 (-)
Kentucky 933 Rand Paul(R) Jim Gray(D) 42.7 Rand Paul(R) 57.3 (-)
Louisiana 689 John Neely Kennedy(R) Caroline Fayard(D) 12.5 John Fleming(R) 4.7 Foster Campbell(D) 17.5
Maine 329 (-) (-) (-)
Maryland 1,200 Chris Van Hollen(D) Chris Van Hollen(D) 60.4 Kathy Szeliga(R) 36.4 (-)
Massachusetts 1,442 (-) (-) (-)
Michigan 2,110 (-) (-) (-)
Minnesota 1,083 (-) (-) (-)
Mississippi 409 (-) (-) (-)
Missouri 1,309 Roy Blunt(R) Jason Kander(D) 46.2 Roy Blunt(R) 49.4 (-)
Montana 191 (-) (-) (-)
Nebraska 370 (-) (-) (-)
Nevada 695 Catherine Cortez Masto(D) Catherine Cortez Masto(D) 47.1 Joe Heck(R) 44.7 (-)
New Hampshire 376 Maggie Hassan(D) Maggie Hassan(D) 48 Kelly Ayotte(R) 47.9 (-)
New Jersey 1,831 (-) (-) (-)
New Mexico 383 (-) (-) (-)
New York 4,320 Charles E. Schumer(D) Charles E. Schumer(D) 70.4 Wendy Long(R) 27.4 (-)
North Carolina 2,004 Richard Burr(R) Deborah K. Ross(D) 45.3 Richard Burr(R) 51.1 Sean Haugh(L) 3.6
North Dakota 126 John Hoeven(R) Eliot Glassheim(D) 17 John Hoeven(R) 78.6 (-)
Ohio 2,698 Rob Portman(R) Ted Strickland(D) 36.9 Rob Portman(R) 58.3 (-)
Oklahoma 624 James Lankford(R) Mike Workman(D) 24.6 James Lankford(R) 67.7 (-)
Oregon 1,022 Ron Wyden(D) Ron Wyden(D) 56.7 Mark Callahan(R) 33.6 (-)
Pennsylvania 3,524 Pat Toomey(R) Katie McGinty(D) 47.2 Pat Toomey(R) 48.9 (-)
Rhode Island 212 (-) (-) (-)
South Carolina 857 Tim Scott(R) Thomas Dixon(D) 37 Tim Scott(R) 60.5 (-)
South Dakota 167 John R. Thune(R) Jay Williams(D) 28.2 John R. Thune(R) 71.8 (-)
Tennessee 1,215 (-) (-) (-)
Texas 4,462 (-) (-) (-)
Utah 531 Mike Lee(R) Misty K. Snow(D) 27.4 Mike Lee(R) 68 (-)
Vermont 132 Patrick Leahy(D) Patrick Leahy(D) 61.3 Scott Milne(R) 33 (-)
Virginia 2,008 (-) (-) (-)
Washington 1,444 Patty Murray(D) Patty Murray(D) 59.1 Chris Vance(R) 40.9 (-)
West Virginia 429 (-) (-) (-)
Wisconsin 1,354 Ron Johnson(R) Russ Feingold(D) 46.8 Ron Johnson(R) 50.2 (-)
Wyoming 99 (-) (-) (-)
140

Governors
Table 6: State Governors, Pre-Election
State N CurrentGovName CurrentGovParty
Alabama 792 Robert J. Bentley Republican
Alaska 115 Bill Walker Independent
Arizona 1,507 Doug Ducey Republican
Arkansas 538 Asa Hutchinson Republican
California 6,021 Jerry Brown Democratic
Colorado 1,022 John Hickenlooper Democratic
Connecticut 732 Dannel Malloy Democratic
Delaware 267 Jack Markell Democratic
Florida 4,988 Rick Scott Republican
Georgia 2,062 Nathan Deal Republican
Hawaii 200 David Ige Democratic
Idaho 326 Butch Otter Republican
Illinois 2,634 Bruce Rauner Republican
Indiana 1,397 Mike Pence Republican
Iowa 688 Terry Branstad Republican
Kansas 541 Sam Brownback Republican
Kentucky 933 Matt Bevin Republican
Louisiana 689 John Edwards Democratic
Maine 329 Paul LePage Republican
Maryland 1,200 Larry Hogan Republican
Massachusetts 1,442 Charlie Baker Republican
Michigan 2,110 Rick Snyder Republican
Minnesota 1,083 Mark Dayton Democratic
Mississippi 409 Phil Bryant Republican
Missouri 1,309 Jay Nixon Democratic
Montana 191 Steve Bullock Democratic
Nebraska 370 Pete Ricketts Republican
Nevada 695 Brian Sandoval Republican
New Hampshire 376 Maggie Hassan Democratic
New Jersey 1,831 Chris Christie Republican
New Mexico 383 Susana Martinez Republican
New York 4,320 Andrew Cuomo Democratic
North Carolina 2,004 Pat McCrory Republican
North Dakota 126 Jack Dalrymple Republican
Ohio 2,698 John Kasich Republican
Oklahoma 624 Mary Fallin Republican
Oregon 1,022 Kate Brown Democratic
Pennsylvania 3,524 Tom Wolf Democratic
Rhode Island 212 Gina Raimondo Democratic
Continued on next page
141

Table 6 – continued from previous page
State N CurrentGovName CurrentGovParty
South Carolina 857 Nikki Haley Republican
South Dakota 167 Dennis Daugaard Republican
Tennessee 1,215 Bill Haslam Republican
Texas 4,462 Greg Abbott Republican
Utah 531 Gary Herbert Republican
Vermont 132 Peter Shumlin Democratic
Virginia 2,008 Terry McAuliffe Democratic
Washington 1,444 Jay Inslee Democratic
West Virginia 429 Earl Ray Tomblin Democratic
Wisconsin 1,354 Scott Walker Republican
Wyoming 99 Matt Mead Republican
142

Table 7: Governors, Post-Election
State N Incumbent GovCand1 - Name, Party, and Vote GovCand2 - Name, Party, and Vote GovCand3 - Name, Party, and Vote
Alabama 792 0 (-) (-) (-)
Alaska 115 0 (-) (-) (-)
Arizona 1,507 0 (-) (-) (-)
Arkansas 538 0 (-) (-) (-)
California 6,021 0 (-) (-) (-)
Colorado 1,022 0 (-) (-) (-)
Connecticut 732 0 (-) (-) (-)
Delaware 267 open John C. Carney Jr.(D) 58.3 Colin Bonini(R) 39.2 (-)
Florida 4,988 0 (-) (-) (-)
Georgia 2,062 0 (-) (-) (-)
Hawaii 200 0 (-) (-) (-)
Idaho 326 0 (-) (-) (-)
Illinois 2,634 0 (-) (-) (-)
Indiana 1,397 open John R. Gregg(D) 45.4 Eric Holcomb(R) 51.4 Rex Bell(L) 3.2
Iowa 688 0 (-) (-) (-)
Kansas 541 0 (-) (-) (-)
Kentucky 933 0 (-) (-) (-)
Louisiana 689 0 (-) (-) (-)
Maine 329 0 (-) (-) (-)
Maryland 1,200 0 (-) (-) (-)
Massachusetts 1,442 0 (-) (-) (-)
Michigan 2,110 0 (-) (-) (-)
Minnesota 1,083 0 (-) (-) (-)
Mississippi 409 0 (-) (-) (-)
Missouri 1,309 open Chris Koster(D) 45.4 Eric Greitens(R) 51.3 (-)
Montana 191 Steve Bullock(D) Steve Bullock(D) 50.2 Greg Gianforte(R) 46.4 Ted Dunlap(L) 3.4
Nebraska 370 0 (-) (-) (-)
Nevada 695 0 (-) (-) (-)
New Hampshire 376 open Colin Van Ostern(D) 46.7 Chris Sununu(R) 49 (-)
New Jersey 1,831 0 (-) (-) (-)
New Mexico 383 0 (-) (-) (-)
New York 4,320 0 (-) (-) (-)
North Carolina 2,004 Pat McCrory(R) Roy Cooper(D) 49 Pat McCrory(R) 48.9 (-)
North Dakota 126 0 Marvin E. Nelson(D) 19.4 Doug Burgum(R) 76.7 Marty Riske(L) 3.9
Ohio 2,698 0 (-) (-) (-)
Oklahoma 624 0 (-) (-) (-)
Oregon 1,022 Kate Brown(D) Kate Brown(D) 50.5 Bud Pierce(R) 43.8 Cliff Thomason(I O) 2.4
Pennsylvania 3,524 0 (-) (-) (-)
Rhode Island 212 0 (-) (-) (-)
South Carolina 857 0 (-) (-) (-)
South Dakota 167 0 (-) (-) (-)
Tennessee 1,215 0 (-) (-) (-)
Texas 4,462 0 (-) (-) (-)
Utah 531 Gary R. Herbert(R) Mike Weinholtz(D) 28.9 Gary R. Herbert(R) 66.6 (-)
Vermont 132 open Sue Minter(D) 44.2 Phil Scott(R) 52.9 (-)
Continued on next page
143

Table 7 – continued from previous page
State N Incumbent GovCand1 - Name, Party, and Vote GovCand2 - Name, Party, and Vote GovCand2 - Name, Party, and Vote
Virginia 2,008 0 (-) (-) (-)
Washington 1,444 Jay Inslee(D) Jay Inslee(D) 54.5 Bill Bryant(R) 45.5 (-)
West Virginia 429 open Jim Justice(D) 49.1 Bill Cole(R) 42.3 (-)
Wisconsin 1,354 0 (-) (-) (-)
Wyoming 99 0 (-) (-) (-)
144

House
Table 8: U.S. House of Representatives, 115th Congress
State District N Member Party
Alabama 1 105 Bradley Byrne Republican
Alabama 2 125 Martha Roby Republican
Alabama 3 107 Mike Rogers Republican
Alabama 4 94 Robert Aderholt Republican
Alabama 5 123 Mo Brooks Republican
Alabama 6 104 Gary Palmer Republican
Alabama 7 134 Terri Sewell Democratic
Alaska 1 115 Don Young Republican
Arizona 1 111 Ann Kirkpatrick Democratic
Arizona 2 208 Martha McSally Republican
Arizona 3 136 Raul Grijalva Democratic
Arizona 4 187 Paul Gosar Republican
Arizona 5 143 Matt Salmon Republican
Arizona 6 198 David Schweikert Republican
Arizona 7 131 Ruben Gallego Democratic
Arizona 8 194 Trent Franks Republican
Arizona 9 199 Kyrsten Sinema Democratic
Arkansas 1 129 Rick Crawford Republican
Arkansas 2 139 French Hill Republican
Arkansas 3 144 Steve Womack Republican
Arkansas 4 126 Bruce Westerman Republican
California 1 118 Doug LaMalfa Republican
California 2 100 Jared Huffman Democratic
California 3 126 John Garamendi Democratic
California 4 120 Tom McClintock Republican
California 5 124 Mike Thompson Democratic
California 6 135 Doris Matsui Democratic
California 7 144 Ami Bera Democratic
California 8 135 Paul Cook Republican
California 9 93 Jerry McNerney Democratic
California 10 102 Jeff Denham Republican
California 11 131 Mark DeSaulnier Democratic
California 12 163 Nancy Pelosi Democratic
California 13 108 Barbara Lee Democratic
California 14 168 Jackie Speier Democratic
California 15 118 Eric Swalwell Democratic
California 16 86 Jim Costa Democratic
California 17 133 Mike Honda Democratic
California 18 115 Anna Eshoo Democratic
Continued on next page
145

Table 8 – continued from previous page
State District N Member Party
California 19 130 Zoe Lofgren Democratic
California 20 75 Sam Farr Democratic
California 21 65 David Valadao Republican
California 22 77 Devin Nunes Republican
California 23 121 Kevin McCarthy Republican
California 24 117 Lois Capps Democratic
California 25 125 Steve Knight Republican
California 26 88 Julia Brownley Democratic
California 27 129 Judy Chu Democratic
California 28 144 Adam Schiff Democratic
California 29 71 Tony Cardenas Democratic
California 30 132 Brad Sherman Democratic
California 31 104 Pete Aguilar Democratic
California 32 96 Grace Napolitano Democratic
California 33 166 Ted Lieu Democratic
California 34 129 Xavier Becerra Democratic
California 35 89 Norma Torres Democratic
California 36 129 Raul Ruiz Democratic
California 37 137 Karen Bass Democratic
California 38 101 Linda Sanchez Democratic
California 39 104 Ed Royce Republican
California 40 76 Lucille Roybal-Allard Democratic
California 41 101 Mark Takano Democratic
California 42 111 Ken Calvert Republican
California 43 128 Maxine Waters Democratic
California 44 75 Janice Hahn Democratic
California 45 122 Mimi Walters Republican
California 46 67 Loretta Sanchez Democratic
California 47 127 Alan Lowenthal Democratic
California 48 95 Dana Rohrabacher Republican
California 49 90 Darrell Issa Republican
California 50 115 Duncan D. Hunter Republican
California 51 104 Juan Vargas Democratic
California 52 142 Scott Peters Democratic
California 53 120 Susan Davis Democratic
Colorado 1 146 Diana DeGette Democratic
Colorado 2 137 Jared Polis Democratic
Colorado 3 129 Scott Tipton Republican
Colorado 4 121 Ken Buck Republican
Colorado 5 185 Doug Lamborn Republican
Colorado 6 136 Mike Coffman Republican
Colorado 7 168 Ed Perlmutter Democratic
Continued on next page
146

Table 8 – continued from previous page
State District N Member Party
Connecticut 1 123 John B. Larson Democratic
Connecticut 2 159 Joe Courtney Democratic
Connecticut 3 160 Rosa DeLauro Democratic
Connecticut 4 123 Jim Himes Democratic
Connecticut 5 167 Elizabeth Esty Democratic
Delaware 1 267 John Carney Democratic
District of Columbia 1 192 Eleanor Holmes Norton Democratic
Florida 1 175 Jeff Miller Republican
Florida 2 193 Gwen Graham Democratic
Florida 3 180 Ted Yoho Republican
Florida 4 184 Ander Crenshaw Republican
Florida 5 150 Corrine Brown Democratic
Florida 6 187 Ron DeSantis Republican
Florida 7 226 John Mica Republican
Florida 8 189 Bill Posey Republican
Florida 9 204 Alan Grayson Democratic
Florida 10 216 Daniel Webster Republican
Florida 11 283 Rich Nugent Republican
Florida 12 252 Gus Bilirakis Republican
Florida 13 219 David Jolly Republican
Florida 14 178 Kathy Castor Democratic
Florida 15 189 Dennis Ross Republican
Florida 16 203 Vern Buchanan Republican
Florida 17 142 Tom Rooney Republican
Florida 18 169 Patrick Murphy Democratic
Florida 19 154 Curt Clawson Republican
Florida 20 131 Alcee Hastings Democratic
Florida 21 158 Ted Deutch Democratic
Florida 22 184 Lois Frankel Democratic
Florida 23 147 Debbie Wasserman Schultz Democratic
Florida 24 200 Frederica Wilson Democratic
Florida 25 131 Mario Diaz-Balart Republican
Florida 26 181 Carlos Curbelo Republican
Florida 27 163 Ileana Ros-Lehtinen Republican
Georgia 1 128 Buddy Carter Republican
Georgia 2 116 Sanford Bishop Democratic
Georgia 3 138 Lynn Westmoreland Republican
Georgia 4 207 Hank Johnson Democratic
Georgia 5 187 John Lewis Democratic
Georgia 6 141 Tom Price Republican
Georgia 7 146 Rob Woodall Republican
Georgia 8 113 Austin Scott Republican
Continued on next page
147

Table 8 – continued from previous page
State District N Member Party
Georgia 9 134 Doug Collins Republican
Georgia 10 142 Jody Hice Republican
Georgia 11 178 Barry Loudermilk Republican
Georgia 12 135 Rick W. Allen Republican
Georgia 13 177 David Scott Democratic
Georgia 14 120 Tom Graves Republican
Hawaii 1 123
Hawaii 2 77 Tulsi Gabbard Democratic
Idaho 1 196 Raul Labrador Republican
Idaho 2 130 Mike Simpson Republican
Illinois 1 177 Bobby Rush Democratic
Illinois 2 204 Robin Kelly Democratic
Illinois 3 128 Dan Lipinski Democratic
Illinois 4 115 Luis Gutierrez Democratic
Illinois 5 149 Mike Quigley Democratic
Illinois 6 157 Peter Roskam Republican
Illinois 7 158 Danny K. Davis Democratic
Illinois 8 151 Tammy Duckworth Democratic
Illinois 9 197 Jan Schakowsky Democratic
Illinois 10 137 Robert Dold Republican
Illinois 11 143 Bill Foster Democratic
Illinois 12 107 Mike Bost Republican
Illinois 13 152 Rodney Davis Republican
Illinois 14 153 Randy Hultgren Republican
Illinois 15 96 John Shimkus Republican
Illinois 16 132 Adam Kinzinger Republican
Illinois 17 153 Cheri Bustos Democratic
Illinois 18 125 Darin LaHood Republican
Indiana 1 179 Pete Visclosky Democratic
Indiana 2 157 Jackie Walorski Republican
Indiana 3 143 Marlin Stutzman Republican
Indiana 4 140 Todd Rokita Republican
Indiana 5 162 Susan Brooks Republican
Indiana 6 147 Luke Messer Republican
Indiana 7 174 Andre Carson Democratic
Indiana 8 133 Larry Bucshon Republican
Indiana 9 162 Todd Young Republican
Iowa 1 195 Rod Blum Republican
Iowa 2 162 Dave Loebsack Democratic
Iowa 3 157 David Young Republican
Iowa 4 174 Steve King Republican
Kansas 1 121 Tim Huelskamp Republican
Continued on next page
148

Table 8 – continued from previous page
State District N Member Party
Kansas 2 161 Lynn Jenkins Republican
Kansas 3 134 Kevin Yoder Republican
Kansas 4 125 Mike Pompeo Republican
Kentucky 1 134
Kentucky 2 152 Brett Guthrie Republican
Kentucky 3 148 John Yarmuth Democratic
Kentucky 4 162 Thomas Massie Republican
Kentucky 5 156 Hal Rogers Republican
Kentucky 6 181 Andy Barr Republican
Louisiana 1 137 Steve Scalise Republican
Louisiana 2 112 Cedric Richmond Democratic
Louisiana 3 123 Charles Boustany Republican
Louisiana 4 92 John Fleming Republican
Louisiana 5 97 Ralph Abraham Republican
Louisiana 6 128 Garret Graves Republican
Maine 1 164 Chellie Pingree Democratic
Maine 2 165 Bruce Poliquin Republican
Maryland 1 118 Andy Harris Republican
Maryland 2 169 Dutch Ruppersberger Democratic
Maryland 3 167 John Sarbanes Democratic
Maryland 4 130 Donna Edwards Democratic
Maryland 5 159 Steny Hoyer Democratic
Maryland 6 156 John Delaney Democratic
Maryland 7 141 Elijah Cummings Democratic
Maryland 8 160 Chris Van Hollen Democratic
Massachusetts 1 160 Richard Neal Democratic
Massachusetts 2 171 Jim McGovern Democratic
Massachusetts 3 153 Niki Tsongas Democratic
Massachusetts 4 143 Joe Kennedy Democratic
Massachusetts 5 183 Katherine Clark Democratic
Massachusetts 6 163 Seth Moulton Democratic
Massachusetts 7 184 Mike Capuano Democratic
Massachusetts 8 144 Stephen F. Lynch Democratic
Massachusetts 9 141 Bill Keating Democratic
Michigan 1 167 Dan Benishek Republican
Michigan 2 147 Bill Huizenga Republican
Michigan 3 155 Justin Amash Republican
Michigan 4 167 John Moolenaar Republican
Michigan 5 132 Dan Kildee Democratic
Michigan 6 142 Fred Upton Republican
Michigan 7 136 Tim Walberg Republican
Michigan 8 151 Mike Bishop Republican
Continued on next page
149

Table 8 – continued from previous page
State District N Member Party
Michigan 9 174 Sander Levin Democratic
Michigan 10 141 Candice Miller Republican
Michigan 11 134 David Trott Republican
Michigan 12 168 Debbie Dingell Democratic
Michigan 13 153 John Conyers Democratic
Michigan 14 143 Brenda Lawrence Democratic
Minnesota 1 118 Tim Walz Democratic
Minnesota 2 130 John Kline Republican
Minnesota 3 151 Erik Paulsen Republican
Minnesota 4 140 Betty McCollum Democratic
Minnesota 5 172 Keith Ellison Democratic
Minnesota 6 126 Tom Emmer Republican
Minnesota 7 118 Collin Peterson Democratic
Minnesota 8 128 Rick Nolan Democratic
Mississippi 1 89 Trent Kelly Republican
Mississippi 2 115 Bennie Thompson Democratic
Mississippi 3 98 Gregg Harper Republican
Mississippi 4 107 Steven Palazzo Republican
Missouri 1 174 William Clay Democratic
Missouri 2 183 Ann Wagner Republican
Missouri 3 143 Blaine Luetkemeyer Republican
Missouri 4 151 Vicky Hartzler Republican
Missouri 5 193 Emanuel Cleaver Democratic
Missouri 6 154 Sam Graves Republican
Missouri 7 170 Billy Long Republican
Missouri 8 141 Jason T. Smith Republican
Montana 1 191 Ryan Zinke Republican
Nebraska 1 136 Jeff Fortenberry Republican
Nebraska 2 147 Brad Ashford Democratic
Nebraska 3 87 Adrian Smith Republican
Nevada 1 152 Dina Titus Democratic
Nevada 2 149 Mark Amodei Republican
Nevada 3 210 Joe Heck Republican
Nevada 4 184 Cresent Hardy Republican
New Hampshire 1 195 Frank Guinta Republican
New Hampshire 2 181 Ann McLane Kuster Democratic
New Jersey 1 161 Donald Norcross Democratic
New Jersey 2 133 Frank LoBiondo Republican
New Jersey 3 172 Tom MacArthur Republican
New Jersey 4 133 Chris Smith Republican
New Jersey 5 163 Scott Garrett Republican
New Jersey 6 201 Frank Pallone Democratic
Continued on next page
150

Table 8 – continued from previous page
State District N Member Party
New Jersey 7 155 Leonard Lance Republican
New Jersey 8 100 Albio Sires Democratic
New Jersey 9 134 Bill Pascrell Democratic
New Jersey 10 131 Donald Payne Jr. Democratic
New Jersey 11 172 Rodney Frelinghuysen Republican
New Jersey 12 176 Bonnie Watson Coleman Democratic
New Mexico 1 172 Michelle Lujan Grisham Democratic
New Mexico 2 106 Steve Pearce Republican
New Mexico 3 105 Ben Lujan Democratic
New York 1 128 Lee Zeldin Republican
New York 2 138 Peter King Republican
New York 3 120 Steve Israel Democratic
New York 4 145 Kathleen Rice Democratic
New York 5 124 Gregory Meeks Democratic
New York 6 121 Grace Meng Democratic
New York 7 135 Nydia Velazquez Democratic
New York 8 157 Hakeem Jeffries Democratic
New York 9 158 Yvette Clarke Democratic
New York 10 281 Jerrold Nadler Democratic
New York 11 168 Daniel Donovan Republican
New York 12 293 Carolyn Maloney Democratic
New York 13 182 Charles Rangel Democratic
New York 14 100 Joseph Crowley Democratic
New York 15 109 Jose Serrano Democratic
New York 16 132 Eliot Engel Democratic
New York 17 122 Nita Lowey Democratic
New York 18 148 Sean Patrick Maloney Democratic
New York 19 145 Chris Gibson Republican
New York 20 170 Paul Tonko Democratic
New York 21 149 Elise Stefanik Republican
New York 22 158 Richard Hanna Republican
New York 23 169 Tom Reed Republican
New York 24 196 John Katko Republican
New York 25 181 Louise Slaughter Democratic
New York 26 225 Brian Higgins Democratic
New York 27 166 Chris Collins Republican
North Carolina 1 155 G. K. Butterfield Democratic
North Carolina 2 141 Renee Ellmers Republican
North Carolina 3 141 Walter Jones Republican
North Carolina 4 173 David Price Democratic
North Carolina 5 179 Virginia Foxx Republican
North Carolina 6 182 Mark Walker Republican
Continued on next page
151

Table 8 – continued from previous page
State District N Member Party
North Carolina 7 135 David Rouzer Republican
North Carolina 8 124 Richard Hudson Republican
North Carolina 9 151 Robert Pittenger Republican
North Carolina 10 160 Patrick McHenry Republican
North Carolina 11 133 Mark Meadows Republican
North Carolina 12 152 Alma Adams Democratic
North Carolina 13 178 George Holding Republican
North Dakota 1 126 Kevin Cramer Republican
Ohio 1 171 Steve Chabot Republican
Ohio 2 164 Brad Wenstrup Republican
Ohio 3 201 Joyce Beatty Democratic
Ohio 4 159 Jim Jordan Republican
Ohio 5 185 Bob Latta Republican
Ohio 6 158 Bill Johnson Republican
Ohio 7 125 Bob Gibbs Republican
Ohio 8 125 Warren Davidson Republican
Ohio 9 209 Marcy Kaptur Democratic
Ohio 10 164 Mike Turner Republican
Ohio 11 197 Marcia Fudge Democratic
Ohio 12 184 Pat Tiberi Republican
Ohio 13 206 Tim Ryan Democratic
Ohio 14 141 David Joyce Republican
Ohio 15 137 Steve Stivers Republican
Ohio 16 172 Jim Renacci Republican
Oklahoma 1 141 Jim Bridenstine Republican
Oklahoma 2 106 Markwayne Mullin Republican
Oklahoma 3 95 Frank Lucas Republican
Oklahoma 4 137 Tom Cole Republican
Oklahoma 5 145 Steve Russell Republican
Oregon 1 181 Suzanne Bonamici Democratic
Oregon 2 173 Greg Walden Republican
Oregon 3 245 Earl Blumenauer Democratic
Oregon 4 226 Peter DeFazio Democratic
Oregon 5 197 Kurt Schrader Democratic
Pennsylvania 1 162 Bob Brady Democratic
Pennsylvania 2 191
Pennsylvania 3 189 Mike Kelly Republican
Pennsylvania 4 175 Scott Perry Republican
Pennsylvania 5 354 Glenn Thompson Republican
Pennsylvania 6 187 Ryan Costello Republican
Pennsylvania 7 143 Pat Meehan Republican
Pennsylvania 8 174 Mike Fitzpatrick Republican
Continued on next page
152

Table 8 – continued from previous page
State District N Member Party
Pennsylvania 9 170 Bill Shuster Republican
Pennsylvania 10 244 Tom Marino Republican
Pennsylvania 11 196 Lou Barletta Republican
Pennsylvania 12 183 Keith Rothfus Republican
Pennsylvania 13 190 Brendan F. Boyle Democratic
Pennsylvania 14 221 Michael Doyle Democratic
Pennsylvania 15 180 Charlie Dent Republican
Pennsylvania 16 171 Joe Pitts Republican
Pennsylvania 17 219 Matt Cartwright Democratic
Pennsylvania 18 175 Timothy F. Murphy Republican
Rhode Island 1 104 David Cicilline Democratic
Rhode Island 2 108 Jim Langevin Democratic
South Carolina 1 129 Mark Sanford Republican
South Carolina 2 124 Joe Wilson Republican
South Carolina 3 113 Jeff Duncan Republican
South Carolina 4 117 Trey Gowdy Republican
South Carolina 5 128 Mick Mulvaney Republican
South Carolina 6 128 Jim Clyburn Democratic
South Carolina 7 118 Tom Rice Republican
South Dakota 1 167 Kristi Noem Republican
Tennessee 1 137 Phil Roe Republican
Tennessee 2 162 Jimmy Duncan Republican
Tennessee 3 135 Chuck Fleischmann Republican
Tennessee 4 129 Scott DesJarlais Republican
Tennessee 5 156 Jim Cooper Democratic
Tennessee 6 140 Diane Black Republican
Tennessee 7 128 Marsha Blackburn Republican
Tennessee 8 106 Stephen Fincher Republican
Tennessee 9 122 Steve Cohen Democratic
Texas 1 101 Louie Gohmert Republican
Texas 2 136 Ted Poe Republican
Texas 3 124 Sam Johnson Republican
Texas 4 130 John Ratcliffe Republican
Texas 5 118 Jeb Hensarling Republican
Texas 6 128 Joe Barton Republican
Texas 7 170 John Culberson Republican
Texas 8 137 Kevin Brady Republican
Texas 9 131 Al Green Democratic
Texas 10 156 Michael McCaul Republican
Texas 11 87 Mike Conaway Republican
Texas 12 134 Kay Granger Republican
Texas 13 79 Mac Thornberry Republican
Continued on next page
153

Table 8 – continued from previous page
State District N Member Party
Texas 14 124 Randy Weber Republican
Texas 15 84 Ruben Hinojosa Democratic
Texas 16 134 Beto O’Rourke Democratic
Texas 17 118 Bill Flores Republican
Texas 18 118 Sheila Jackson Lee Democratic
Texas 19 113 Randy Neugebauer Republican
Texas 20 160 Joaquin Castro Democratic
Texas 21 175 Lamar S. Smith Republican
Texas 22 126 Pete Olson Republican
Texas 23 88 Will Hurd Republican
Texas 24 153 Kenny Marchant Republican
Texas 25 131 Roger Williams Republican
Texas 26 156 Michael Burgess Republican
Texas 27 115 Blake Farenthold Republican
Texas 28 82 Henry Cuellar Democratic
Texas 29 82 Gene Green Democratic
Texas 30 108 Eddie Johnson Democratic
Texas 31 198 John Carter Republican
Texas 32 166 Pete Sessions Republican
Texas 33 71 Marc Veasey Democratic
Texas 34 92 Filemon Vela Jr. Democratic
Texas 35 143 Lloyd Doggett Democratic
Texas 36 94 Brian Babin Republican
Utah 1 125 Rob Bishop Republican
Utah 2 153 Chris Stewart Republican
Utah 3 121 Jason Chaffetz Republican
Utah 4 132 Mia Love Republican
Vermont 1 132 Peter Welch Democratic
Virginia 1 199 Rob Wittman Republican
Virginia 2 137 Scott Rigell Republican
Virginia 3 229 Robert Scott Democratic
Virginia 4 143 Randy Forbes Republican
Virginia 5 142 Robert Hurt Republican
Virginia 6 197 Bob Goodlatte Republican
Virginia 7 201 Dave Brat Republican
Virginia 8 191 Don Beyer Democratic
Virginia 9 155 Morgan Griffith Republican
Virginia 10 259 Barbara Comstock Republican
Virginia 11 155 Gerry Connolly Democratic
Washington 1 128 Suzan DelBene Democratic
Washington 2 114 Rick Larsen Democratic
Washington 3 172 Jaime Herrera Beutler Republican
Continued on next page
154

Table 8 – continued from previous page
State District N Member Party
Washington 4 85 Dan Newhouse Republican
Washington 5 172 Cathy McMorris Rodgers Republican
Washington 6 173 Derek Kilmer Democratic
Washington 7 187 Jim McDermott Democratic
Washington 8 98 Dave Reichert Republican
Washington 9 156 Adam Smith Democratic
Washington 10 159 Dennis Heck Democratic
West Virginia 1 135 David McKinley Republican
West Virginia 2 146 Alex Mooney Republican
West Virginia 3 148 Evan Jenkins Republican
Wisconsin 1 162 Paul Ryan Republican
Wisconsin 2 203 Mark Pocan Democratic
Wisconsin 3 158 Ron Kind Democratic
Wisconsin 4 163 Gwen Moore Democratic
Wisconsin 5 161 Jim Sensenbrenner Republican
Wisconsin 6 186 Glenn Grothman Republican
Wisconsin 7 147 Sean Duffy Republican
Wisconsin 8 174 Reid Ribble Republican
Wyoming 1 99 Cynthia Lummis Republican
155

Table 9: United States House of Representatives, 116th Congress
State CD N Incumbent Cand1 - Name, Party, and Vote Cand2 - Name, Party, and Vote Cand3 - Name, Party, and Vote
Alabama 1 105 Bradley Byrne(R) (-) Bradley Byrne(R) (-)
Alabama 2 125 Martha Roby(R) Nathan Mathis(D) 45.4 Martha Roby(R) 54.6 (-)
Alabama 3 107 Mike Rogers(R) Jesse Smith(D) 32.9 Mike Rogers(R) 67.1 (-)
Alabama 4 94 Robert Anderholt(R) (-) Robert Anderholt(R) (-)
Alabama 5 123 Mo Brooks(R) Will Boyd, Jr.(D) 33.2 Mo Brooks(R) 66.8 (-)
Alabama 6 104 Gary Palmer(R) David J. Putman(D) 25.2 Gary Palmer(R) 74.8 (-)
Alabama 7 134 Terri Sewell(D) Terri Sewell(D) (-) (-)
Alaska 1 115 Don Young(R) Steve Lindbeck(D) 36.5 Don Young(R) 50.5 (-)
Arizona 1 111 open Tom O’Halleran(D) 50.8 Paul Babeu(R) 43.5 (-)
Arizona 2 208 Martha McSally(R) Matt Heinz(D) 43.3 Martha McSally(R) 56.7 (-)
Arizona 3 136 Raul Grijalva(D) Raul Grijalva(D) (-) (-)
Arizona 4 187 Paul Gosar(R) Mikel Weisser(D) 28.5 Paul Gosar(R) 71.5 (-)
Arizona 5 143 Andy Biggs(R) Talia Fuentes(D) 36.9 Andy Biggs(R) 63.1 (-)
Arizona 6 198 David Schweikert(R) John W. Williamson(D) 38.4 David Schweikert(R) 61.6 (-)
Arizona 7 131 Ruben Gallego(D) Ruben Gallego(D) 74.6 Eve Nunez(R) 25.4 (-)
Arizona 8 194 Trent Franks(R) Joe DeVivo(D) Trent Franks(R) 68.6 (-)
Arizona 9 199 Kyrsten Sinema(D) Kyrsten Sinema(D) 61.1 Dave Giles(R) 38.9 (-)
Arkansas 1 129 Rick Crawford(R) Mark West(L) 23.5 Rick Crawford(R) 76.5 (-)
Arkansas 2 139 French Hill(R) Dianne Curry(D) 36.8 French Hill(R) 58.4 (-)
Arkansas 3 144 Steve Womack(R) Steve Isaacson(L) 22.7 Steve Womack(R) 77.3 (-)
Arkansas 4 126 Bruce Westerman(R) Kerry Hicks(L) 25.1 Bruce Westerman(R) 74.9 (-)
California 1 118 Doug LaMalfa(R) Jim Reed(D) 40.5 Doug LaMalfa(R) 59.5 (-)
California 2 100 Jared Huffman(D) Jared Huffman(D) 77.1 Dale K. Mensing(R) 22.9 (-)
California 3 126 John Garamendi(D) John Garamendi(D) 58.2 Eugene Cleek(R) 41.8 (-)
California 4 120 Tom McClintock(R) Robert W. Derlet(D) 37.2 Tom McClintock(R) 62.8 (-)
California 5 124 Mike Thompson(D) Mike Thompson(D) 77.2 Carlos Santamaria(R) 22.8 (-)
California 6 135 Doris Matsui(D) Doris Matsui(D) 75.2 Robert (Bob) Evans(R) 24.8 (-)
California 7 144 Ami Bera(D) Ami Bera(D) 51.2 Scott R. Jones(R) 48.8 (-)
California 8 135 Paul Cook(R) Rita Ramirez(D) 37.3 Paul Cook(R) 62.7 (-)
California 9 93 Jerry McNerney(D) Jerry McNerney(D) 57.6 Antonio C. ”Tony” Amador(R) 42.4 (-)
California 10 102 Jeff Denham(R) Michael Eggman(D) 47.6 Jeff Denham(R) 52.4 (-)
California 11 131 Mark DeSaulnier(D) Mark DeSaulnier(D) 71.8 Roger Allen Petersen(R) 28.2 (-)
California 12 163 Nancy Pelosi(D) Nancy Pelosi(D) 81 Preston Picus(I) 19 (-)
California 13 108 Barbara Lee(D) Barbara Lee(D) 90.7 Sue Caro(R) 9.3 (-)
California 14 168 Jackie Speier(D) Jackie Speier(D) 80.9 Angel Cardenas(R) 19.1 (-)
California 15 118 Eric Swalwell(D) Eric Swalwell(D) 73.8 Danny R. Turner(R) 26.2 (-)
California 16 86 Jim Costa(D) Jim Costa(D) 57.8 Johnny M. Tacherra(R) 42.2 (-)
California 17 133 Mike Honda(D) Mike Honda(D) 38.9 Ro Khanna(D) 61.1 (-)
California 18 115 Anna Eshoo(D) Anna Eshoo(D) 71.2 Richard B. Fox(R) 28.8 (-)
California 19 130 Zoe Lofgren(D) Zoe Lofgren(D) 74 G. Burt Lancaster(R) 26 (-)
California 20 75 open Jimmy Panetta(D) 70.6 Casey Lucius(R) 29.4 (-)
California 21 65 David Valadao(R) Emilio Jesus Huerta(D) 42 David Valadao(R) 58 (-)
California 22 77 Devin Nunes(R) Louie J. Campos(D) 31.8 Devin Nunes(R) 68.2 (-)
California 23 121 Kevin McCarthy(R) Wendy Reed(D) 30 Kevin McCarthy(R) 70 (-)
California 24 117 open Salud Carbajal(D) 53.2 Justin Donald Fareed(R) 46.8 (-)
California 25 125 Steve Knight(R) Bryan Caforio(D) 45.8 Steve Knight(R) 54.2 (-)
California 26 88 Julia Brownley(D) Julia Brownley(D) 59.9 Rafael A. Dagnesses(R) 40.1 (-)
California 27 129 Judy Chu(D) Judy Chu(D) 66.5 Jack Orswell(R) 33.5 (-)
California 28 144 Adam Schiff(D) Adam Schiff(D) 77.9 Lenore Solis(R) 22.1 (-)
California 29 71 Tony Cardenas(D) Tony Cardenas(D) 75.2 Richard Alarcon(D) 24.8 (-)
California 30 132 Brad Sherman(D) Brad Sherman(D) 72.4 Mark Reed(R) 27.6 (-)
California 31 104 Pete Aguilar(D) Pete Aguilar(D) 55.7 Paul Chabot(R) 44.3 (-)
California 32 96 Grace Napolitano(D) Grace Napolitano(D) 62.4 Roger Hernandez(D) 37.6 (-)
California 33 166 Ted Lieu(D) Ted Lieu(D) 66.3 Kenneth W. Wright(R) 33.7 (-)
California 34 129 Xavier Becerra(D) Xavier Becerra(D) 78.2 Adrienne Nicole Edwards(D) 21.8 (-)
California 35 89 Norma Torres(D) Norma Torres(D) 71.8 Tyler Fischella(R) 28.2 (-)
California 36 129 Raul Ruiz(D) Raul Ruiz(D) 61.4 Jeff Stone(R) 38.6 (-)
California 37 137 Karen Bass(D) Karen Bass(D) 82 Chris Blake Wiggins(D) 18 (-)
California 38 101 Linda Sanchez(D) Linda Sanchez(D) 69.7 Ryan Downing(R) 30.3 (-)
California 39 104 Edward Royce(R) Brett Murdock(D) 42.3 Edward Royce(R) 57.7 (-)
California 40 76 Lucille Roybal-Allard(D) Lucille Roybal-Allard(D) 71.9 Roman Gabriel Gonzalez(I) 28.1 (-)
California 41 101 Mark Takano(D) Mark Takano(D) 64.4 Doug Shepherd(R) 35.6 (-)
Continued on next page
156

Table 9 – continued from previous page
State CD N Incumbent Cand1 - Name, Party, and Vote Cand2 - Name, Party, and Vote Cand3 - Name, Party, and Vote
California 42 111 Ken Calvert(R) Tim Sheridan(D) 41 Ken Calvert(R) 59 (-)
California 43 128 Maxine Waters(D) Maxine Waters(D) 75.6 Omar Navarro(R) 24.4 (-)
California 44 75 open Nanette Diaz Barragan(D) 51.1 Isadore Hall, III(D) 48.9 (-)
California 45 122 Mimi Walters(R) Ron Varasteh(D) 41 Mimi Walters(R) 59 (-)
California 46 67 open Lou Correa(D) 69.9 Bao Nguyen(D) 30.1 (-)
California 47 127 Alan Lowenthal(D) Alan Lowenthal(D) 62.5 Andy Whallon(R) 37.5 (-)
California 48 95 Dana Rohrabacher(R) Suzanne Savary(D) 41.5 Dana Rohrabacher(R) 58.5 (-)
California 49 90 Darrell Issa(R) Doug Applegate(D) 49 Darrell Issa(R) 51 (-)
California 50 115 Duncan Hunter(R) Patrick Malloy(D) 36.1 Duncan Hunter(R) 63.9 (-)
California 51 104 Juan Vargas(D) Juan Vargas(D) 71.9 Juan M. Hidalgo, Jr.(R) 28.1 (-)
California 52 142 Scott Peters(D) Scott Peters(D) 56.4 Denise Gitsham(R) 43.6 (-)
California 53 120 Susan Davis(D) Susan Davis(D) 66.1 James Veltmeyer(R) 33.9 (-)
Colorado 1 146 Diana DeGette(D) Diana DeGette(D) 67.8 Charles ”Casper” Stockham(R) 28.4 (-)
Colorado 2 137 Jared Polis(D) Jared Polis(D) 56.8 Nicholas Morse(R) 37.4 (-)
Colorado 3 129 Scott Tipton(R) Gail Schwartz(D) 40.6 Scott Tipton(R) 54.6 (-)
Colorado 4 121 Ken Buck(R) Bob Seay(D) 31.5 Ken Buck(R) 63.8 (-)
Colorado 5 185 Doug Lamborn(R) Misty Plowright(D) 30.8 Doug Lamborn(R) 62.4 (-)
Colorado 6 136 Mike Coffman(R) Morgan Carroll(D) 42.4 Mike Coffman(R) 51.3 (-)
Colorado 7 168 Ed Perlmutter(D) Ed Perlmutter(D) 55.2 George Athanasopoulos(R) 40 (-)
Connecticut 1 123 John Larson(D) John Larson(D) 63.6 Matthew Corey(R) 34.3 (-)
Connecticut 2 159 Joe Courtney(D) Joe Courtney(D) 63 Daria Novak(R) 33.9 (-)
Connecticut 3 160 Rosa DeLauro(D) Rosa DeLauro(D) 68.7 Angel Cadena(R) 31.3 (-)
Connecticut 4 123 Jim Himes(D) Jim Himes(D) 60.1 John Shaban(R) 39.9 (-)
Connecticut 5 167 Elizabeth Esty(D) Elizabeth Esty(D) 57.9 Clay Cope(R) 42.1 (-)
Delaware 1 267 Hans Reigle(R) Lisa Blunt Rochester(D) 55.5 Hans Reigle(R) 41 (-)
District of Columbia 1 192 Martin Moulton(L) Eleanor Holmes Norton(D) 84.8 Martin Moulton(L) 5.9 (-)
Florida 1 177 open Steven Specht(D) 30.9 Matt Gaetz(R) 69.1 (-)
Florida 2 180 open Walter Dartland(D) 29.9 Neal Patrick Dunn(R) 67.3 Rob Lapham(L) 2.7
Florida 3 198 Ted Yoho(R) Kenneth ”Ken” McGurn(D) 39.7 Ted Yoho(R) 56.6 (-)
Florida 4 177 open David E. Bruderly(D) 27.6 John Rutherford(R) 70.2 (-)
Florida 5 175 open Alfred Lawson, Jr.(D) 64.2 Glo Smith(R) 35.8 (-)
Florida 6 203 Ron DeSantis(R) William (Bill) McCullough(D) 41.4 Ron DeSantis(R) 58.6 (-)
Florida 7 222 John Mica(R) Stephanie Murphy(D) 51.5 John Mica(R) 48.5 (-)
Florida 8 189 Bill Posey(R) Corry Westbrook(D) 32.5 Bill Posey(R) 63.1 (-)
Florida 9 188 open Darren Soto(D) 57.5 Wayne Liebnitzky(R) 42.5 (-)
Florida 10 195 open Val Demings(D) 64.9 Thuy Lowe(R) 35.1 (-)
Florida 11 272 Daniel Webster(R) Dave Koller(D) 31.6 Daniel Webster(R) 65.4 (-)
Florida 12 253 Gus Bilirakis(R) Robert Matthew Tager(D) 31.4 Gus Bilirakis(R) 68.6 (-)
Florida 13 220 David Jolly(R) Charlie Crist(D) 51.9 David Jolly(R) 48.1 (-)
Florida 14 199 Kathy Castor(D) Kathy Castor(D) 61.8 Christine Quinn(R) 38.2 (-)
Florida 15 184 Dennis A. Ross(R) Jim Lange(D) 42.5 Dennis A. Ross(R) 57.5 (-)
Florida 16 170 Vern Buchanan(R) Jan Schneider(D) 40.2 Vern Buchanan(R) 59.8 (-)
Florida 17 165 Tom Rooney(R) April Freeman(D) 34.2 Tom Rooney(R) 61.8 (-)
Florida 18 168 open Randy Perkins(D) 43 Brian Mast(R) 53.6 (-)
Florida 19 161 open Robert M. Neeld(D) 34.1 Francis Rooney(R) 65.9 (-)
Florida 20 147 Alcee L. Hastings(D) Alcee L. Hastings(D) 80.3 Gary Stein(R) 19.7 (-)
Florida 21 140 Lois Frankel(D) Lois Frankel(D) 62.7 Paul Spain(R) 35.2 (-)
Florida 22 190 Ted Deutch(D) Ted Deutch(D) 58.9 Andrea Leigh McGee(R) 41.1 (-)
Florida 23 145 Debbie Wasserman Schultz(D) Debbie Wasserman Schultz(D) 56.7 Joseph ”Joe” Kaufman(R) 40.5 (-)
Florida 24 181 Frederica S. Wilson(D) Frederica S. Wilson(D) (-) (-)
Florida 25 130 Mario Diaz-Balart(R) Alina Valdes(D) 37.6 Mario Diaz-Balart(R) 62.4 (-)
Florida 26 176 Carlos Curbelo(R) Joe Garcia(D) 41.2 Carlos Curbelo(R) 53 (-)
Florida 27 183 Ileana Ros-Lehtinen(R) Scott Fuhrman(D) 45.1 Ileana Ros-Lehtinen(R) 54.9 (-)
Georgia 1 128 Earl ”Buddy” Carter(R) (-) Earl ”Buddy” Carter(R) (-)
Georgia 2 116 Sanford Bishop(D) Sanford Bishop(D) 61 Greg Duke(R) 39 (-)
Georgia 3 138 Drew Ferguson(R) Angela Pendley(D) 31.6 Drew Ferguson(R) 68.4 (-)
Georgia 4 207 open Hank Johnson(D) 75.6 Victor Armendariz(R) 24.4 (-)
Georgia 5 187 John Lewis(D) John Lewis(D) 84.6 Douglas Bell(R) 15.4 (-)
Georgia 6 141 Tom Price(R) Rodney Stooksbury(D) 38.4 Tom Price(R) 61.6 (-)
Georgia 7 146 Rob Woodall(R) Rashid Malik(D) 39.5 Rob Woodall(R) 60.5 (-)
Georgia 8 113 Austin Scott(R) James Neal Harris(D) 32.3 Austin Scott(R) 67.7 (-)
Georgia 9 134 Doug Collins(R) (-) Doug Collins(R) (-)
Georgia 10 142 Jody Hice(R) (-) Jody Hice(R) (-)
Georgia 11 178 Barry Loudermilk(R) Don Wilson(D) 32.5 Barry Loudermilk(R) 67.5 (-)
Continued on next page
157

Table 9 – continued from previous page
State CD N Incumbent Cand1 - Name, Party, and Vote Cand2 - Name, Party, and Vote Cand3 - Name, Party, and Vote
Georgia 12 135 Rick Allen(R) Tricia Carpenter McCracken(D) 38.4 Rick Allen(R) 61.6 (-)
Georgia 13 177 David Scott(D) David Scott(D) (-) (-)
Georgia 14 120 Tom Graves(R) (-) Tom Graves(R) (-)
Hawaii 1 123 open Colleen Wakako Hanabusa(D) 71.9 Shirlene D. (Shiri) Ostrov(R) 22.7 (-)
Hawaii 2 77 Tulsi Gabbard(D) Tulsi Gabbard(D) 81.1 Angela Aulani Kaaihue(R) 18.9 (-)
Idaho 1 196 Raul Labrador(R) James Piotrowski(D) 32 Raul Labrador(R) 68 (-)
Idaho 2 130 Mike Simpson(R) Jennifer Martinez(D) 29.3 Mike Simpson(R) 63 (-)
Illinois 1 177 Bobby Rush(D) Bobby Rush(D) 73.4 August (O’Neill) Deuser(R) 26.6 (-)
Illinois 2 204 Robin Kelly(D) Robin Kelly(D) 79.6 John F. Morrow(R) 20.4 (-)
Illinois 3 128 Daniel Lipinski(D) Daniel Lipinski(D) (-) (-)
Illinois 4 115 Luis Gutierrez(D) Luis Gutierrez(D) (-) (-)
Illinois 5 149 Mike Quigley(D) Mike Quigley(D) 67.6 Vince Kolber(R) 27.8 Rob Sherman(G) 4.6
Illinois 6 157 Peter Roskam(R) Amanda Howland(D) 40.5 Peter Roskam(R) 59.5 (-)
Illinois 7 158 Danny K. Davis(D) Danny K. Davis(D) 84 Jeffrey A. Leef(R) 16 (-)
Illinois 8 151 open Raja Krishnamoorthi(D) 58.1 Peter ”Pete” DiCianni(R) 41.9 (-)
Illinois 9 197 Janice Schakowsky(D) Janice Schakowsky(D) 65.8 Joan McCarthy Lasonde(R) 34.2 (-)
Illinois 10 137 Robert Dold(R) Brad Schneider(D) 52.5 Robert Dold(R) 47.5 (-)
Illinois 11 143 Bill Foster(D) Bill Foster(D) 59.9 Tonia Khouri(R) 40.1 (-)
Illinois 12 107 Mike Bost(R) Charles ”C.J.” Baricevic(D) 39.7 Mike Bost(R) 54.3 (-)
Illinois 13 152 Rodney Davis(R) Mark D. Wicklund(D) 40.3 Rodney Davis(R) 59.7 (-)
Illinois 14 153 Randy Hultgren(R) Jim Walz(D) 40.4 Randy Hultgren(R) 59.6 (-)
Illinois 15 96 John Shimkus(R) (-) John Shimkus(R) (-)
Illinois 16 132 Adam Kinzinger(R) Joseph Schreiner(L) Adam Kinzinger(R) 99.9 (-)
Illinois 17 153 Cheri Bustos(D) Cheri Bustos(D) 60.1 Patrick Harlan(R) 39.9 (-)
Illinois 18 125 Darin LaHood(R) Junius Rodriguez(D) 27.8 Darin LaHood(R) 72.2 (-)
Indiana 1 179 Peter Visclosky(D) Peter Visclosky(D) 81.5 John Meyer(R) (-)
Indiana 2 157 Jackie Walorski(R) Lynn C. Coleman(D) 36.9 Jackie Walorski(R) 59.3 (-)
Indiana 3 143 open Tommy A. Schrader(D) 23 James Banks(R) 70.1 (-)
Indiana 4 140 Todd Rokita(R) John Dale(D) 30.5 Todd Rokita(R) 64.6 (-)
Indiana 5 162 Susan Brooks(R) Angela Demaree(D) 34.3 Susan Brooks(R) 61.5 (-)
Indiana 6 147 Luke Messer(R) Barry Welsh(D) 26.7 Luke Messer(R) 69.1 (-)
Indiana 7 174 Andre Carson(D) Andre Carson(D) 60 Catherine (Cat) Ping(R) 35.7 (-)
Indiana 8 133 Larry Bucshon(R) Ron Drake(D) 31.6 Larry Bucshon(R) 63.7 (-)
Indiana 9 162 open Shelli Yoder(D) 40.5 Trey Hollingsworth(R) 54.1 (-)
Iowa 1 195 Rod Blum(R) Monica Vernon(D) 46.1 Rod Blum(R) 53.9 (-)
Iowa 2 162 Dave Loebsack(D) Dave Loebsack(D) 53.7 Christopher Peters(R) 46.3 (-)
Iowa 3 157 David Young(R) Jim Mowrer(D) 39.8 David Young(R) 53.5 (-)
Iowa 4 174 Steve King(R) Kim Weaver(D) 38.6 Steve King(R) 61.4 (-)
Kansas 1 121 open Kerry Burt(L) 7.3 Roger Marshall(R) 66.2 (-)
Kansas 2 161 Lynn Jenkins(R) Britani Potter(D) 32.5 Lynn Jenkins(R) 61.1 (-)
Kansas 3 134 Kevin Yoder(R) Jay Sidie(D) 40.6 Kevin Yoder(R) 51.3 (-)
Kansas 4 125 Mike Pompeo(R) Daniel B. Giroux(D) 29.4 Mike Pompeo(R) 61 (-)
Kentucky 1 134 open Samuel L. Gaskins(D) 27.4 James R. Comer(R) 72.6 (-)
Kentucky 2 152 Brett Guthrie(R) (-) Brett Guthrie(R) (-)
Kentucky 3 148 John Yarmuth(D) John Yarmuth(D) 63.5 Harold Bratcher(R) 36.5 (-)
Kentucky 4 162 Thomas Massie(R) Calvin Sidle(D) 28.7 Thomas Massie(R) 71.3 (-)
Kentucky 5 156 Hal Rogers(R) (-) Hal Rogers(R) (-)
Kentucky 6 181 Andy Barr(R) Nancy Jo Kemper(D) 38.9 Andy Barr(R) 61.1 (-)
Louisiana 1 137 Steve Scalise(R) Lee Ann Dugas(D) 12.8 Steve Scalise(R) 74.6 Danil Ezekiel Faust(D) 3.9
Louisiana 2 112 Cedric Richmond(D) Cedric Richmond(D) 69.8 Kip Holden(D) 20.1 Kenneth Cutno(D) 10.1
Louisiana 3 123 open Dorian Phibian(D) 8.9 Greg Ellison(R) 7.8 Larry Rader(D) 8.7
Louisiana 4 92 open Marshall Jones(D) 28.2 Trey Baucum(R) 17.6 Elbert Guillory(R) 7.3
Louisiana 5 97 Ralph Abraham(R) Ralph Abraham(R) Bily Burkette(R) (-)
Louisiana 6 128 Garret Graves(R) Richard Lieberman(D) 14.9 Garret Graves(R) 62.7 Jermaine Sampson(D) 9
Maine 1 164 Chellie Pingree(D) Chellie Pingree(D) 57.9 Mark I. Holbrook(R) 42.1 (-)
Maine 2 165 Bruce Poliquin(R) Emily Ann Cain(D) 45.1 Bruce Poliquin(R) 54.9 (-)
Maryland 1 118 Andy Harris(R) Joe Werner(D) 28 Andy Harris(R) 67.8 (-)
Maryland 2 169 Dutch Ruppersberger(D) Dutch Ruppersberger(D) 62.2 Pat McDonough(R) 33.3 (-)
Maryland 3 167 John Sarbanes(D) John Sarbanes(D) 62.8 Mark Plaster(R) 34.5 (-)
Maryland 4 130 George E. McDermott(R) Anthony G. Brown(D) 74.1 George E. McDermott(R) 21.6 (-)
Maryland 5 159 Steny Hoyer(D) Steny Hoyer(D) 67.3 Mark Arness(R) 20.1 (-)
Maryland 6 156 John Delaney(D) John Delaney(D) 55.4 Amie Hoeber(R) 40.9 (-)
Maryland 7 141 Elijah Cummings(D) Elijah Cummings(D) 75.1 Corrogan R. Vaughn(R) 21.9 (-)
Maryland 8 160 open Jamie Raskin(D) 59.3 Dan Cox(R) 35.6 (-)
Continued on next page
158

Table 9 – continued from previous page
State CD N Incumbent Cand1 - Name, Party, and Vote Cand2 - Name, Party, and Vote Cand3 - Name, Party, and Vote
Massachusetts 1 160 Richard Neal(D) Richard Neal(D) 73.4 Thomas Simmons(L) 8.6 (-)
Massachusetts 2 171 Jim McGovern(D) Jim McGovern(D) (-) (-)
Massachusetts 3 153 Niki Tsongas(D) Niki Tsongas(D) 68.7 Ann Wofford(R) 31.3 (-)
Massachusetts 4 143 Joseph Kennedy III(D) Joseph Kennedy III(D) 70 David Rosa(R) 30 (-)
Massachusetts 5 183 Katherine Clark(D) Katherine Clark(D) (-) (-)
Massachusetts 6 163 Seth Moulton(D) Seth Moulton(D) (-) (-)
Massachusetts 7 184 Michael Capuano(D) Michael Capuano(D) (-) (-)
Massachusetts 8 144 Stephen F. Lynch(D) Stephen F. Lynch(D) 72.4 William Burke(R) 27.6 (-)
Massachusetts 9 141 William Keating(D) William Keating(D) 55.7 Mark Alliegro(R) 33.8 (-)
Michigan 1 167 open Lon Johnson(D) 39.7 Jack Bergman(R) 55.3 (-)
Michigan 2 147 Bill Huizenga(R) Dennis B. Murphy(D) 32.4 Bill Huizenga(R) 62.7 (-)
Michigan 3 155 Justin Amash(R) Douglas Smith(D) 37.5 Justin Amash(R) 59.4 (-)
Michigan 4 167 John Moolenaar(R) Leonard Schwartz(L) 2.7 John Moolenaar(R) 37.4 (-)
Michigan 5 132 Dan Kildee(D) Dan Kildee(D) 32.1 Allen Hardwick(R) 61.6 (-)
Michigan 6 142 Fred Upton(R) Paul Clements(D) 61.2 Fred Upton(R) 35.1 (-)
Michigan 7 136 Tim Walberg(R) Gretchen D. Driskell(D) 36.4 Tim Walberg(R) 58.6 (-)
Michigan 8 151 Mike Bishop(R) Suzanna Shkreli(D) 40.1 Mike Bishop(R) 55 (-)
Michigan 9 174 Sander Levin(D) Sander Levin(D) 39.2 Christopher R. Morse(R) 56 (-)
Michigan 10 141 Paul Mitchell(R) Frank Accavitti Jr.(D) 32.3 Paul Mitchell(R) 63 (-)
Michigan 11 134 David A. Trott(R) Anil Kumar(D) 40.2 David A. Trott(R) 52.9 (-)
Michigan 12 168 Debbie Dingell(D) Debbie Dingell(D) 64.4 Jeff Jones(R) 29.2 (-)
Michigan 13 153 John Conyers Jr.(D) John Conyers Jr.(D) 77 Jeff Gorman(R) 15.8 (-)
Michigan 14 143 Brenda Lawrence(D) Brenda Lawrence(D) 78.5 Howard Klausner(R) 18.7 (-)
Minnesota 1 118 Tim Walz(D) Tim Walz(D) 50.4 Jim Hagedorn(R) 49.6 (-)
Minnesota 2 130 open Angie Craig(D) 45.2 Jason Lewis(R) 47 (-)
Minnesota 3 151 Erik Paulsen(R) Terri E. Bonoff(D) 43.1 Erik Paulsen(R) 56.9 (-)
Minnesota 4 140 Betty McCollum(D) Betty McCollum(D) 57.8 Greg Ryan(R) 34.5 (-)
Minnesota 5 172 Keith Ellison(D) Keith Ellison(D) 69.2 Frank Neslon Drake(R) 22.3 (-)
Minnesota 6 126 Tom Emmer(R) David Snyder(D) 34.3 Tom Emmer(R) 65.7 (-)
Minnesota 7 118 Collin Peterson(D) Collin Peterson(D) 52.5 Dave Hughes(R) 47.5 (-)
Minnesota 8 128 Rick Nolan(D) Rick Nolan(D) 50.3 Stewart Mills(R) 49.7 (-)
Mississippi 1 89 Trent Kelly(R) Jacob Owens(D) 27.8 Trent Kelly(R) 68.8 (-)
Mississippi 2 115 Bennie Thompson(D) Bennie Thompson(D) 66.8 John Bouie II(R) 29.4 (-)
Mississippi 3 98 Gregg Harper(R) Dennis Quinn(D) 30.3 Gregg Harper(R) 66.3 (-)
Mississippi 4 107 Steven Palazzo(R) Mark Gladney(D) 27.7 Steven Palazzo(R) 65.2 (-)
Missouri 1 174 William Lacy Clay(D) William Lacy Clay(D) 75.5 Steven G. Bailey(R) 20 (-)
Missouri 2 183 Ann Wagner(R) Bill Otto(D) 37.6 Ann Wagner(R) 58.6 (-)
Missouri 3 143 Blaine Luetkemeyer(R) Kevin Miller(D) 27.9 Blaine Luetkemeyer(R) 67.8 (-)
Missouri 4 151 Vicky Hartzler(R) Gordon Christensen(D) 27.8 Vicky Hartzler(R) 67.8 (-)
Missouri 5 193 Emanuel Cleaver II(D) Emanuel Cleaver II(D) 58.4 Jacob Turk(R) 38.5 (-)
Missouri 6 154 Sam Graves(R) David M. Blackwell(D) 28.3 Sam Graves(R) 68.1 (-)
Missouri 7 170 Billy Long(R) Genevieve (Gen) Williams(D) 27.4 Billy Long(R) 67.6 (-)
Missouri 8 141 Jason Smith(R) Dave Cowell(D) 22.7 Jason Smith(R) 74.4 (-)
Montana 1 191 Ryan Zinke(R) Denise Juneau(D) 40.5 Ryan Zinke(R) 56.3 (-)
Nebraska 1 136 Jeff Fortenberry(R) Daniel M. Wik(D) 30.4 Jeff Fortenberry(R) 69.6 (-)
Nebraska 2 147 Brad Ashford(D) Brad Ashford(D) 47.3 Don Bacon(R) 49.4 (-)
Nebraska 3 87 Adrian Smith(R) (-) Adrian Smith(R) (-)
Nevada 1 152 Dina Titus(D) Dina Titus(D) 61.8 Mary Perry(R) 28.8 (-)
Nevada 2 149 Mark Amodei(R) H.D. ”Chip” Evans(D) 36.9 Mark Amodei(R) 58.3 (-)
Nevada 3 210 Danny Tarkanian(R) Jacky Rosen(D) 47.2 Danny Tarkanian(R) 46 (-)
Nevada 4 184 Cresent Hardy(R) Ruben Kihuen(D) 48.5 Cresent Hardy(R) 44.5 (-)
New Hampshire 1 195 Frank Guinta(R) Carol Shea-Porter(D) 44.2 Frank Guinta(R) 42.9 (-)
New Hampshire 2 176 Annie Kuster(D) Annie Kuster(D) 49.8 Jim Lawrence(R) 45.4 (-)
New Jersey 1 161 Donald Norcross(D) Donald Norcross(D) 59.8 Bob Patterson(R) 36.9 (-)
New Jersey 2 133 Frank LoBiondo(R) David H. Cole(D) 37.1 Frank LoBiondo(R) 59.4 (-)
New Jersey 3 172 Tom MacArthur(R) Fredrick John Lavergne(D) 38.6 Tom MacArthur(R) 59.5 (-)
New Jersey 4 133 Christopher H. Smith(R) Lorna Phillipson(D) 33.5 Christopher H. Smith(R) 63.7 (-)
New Jersey 5 163 Scott Garrett(R) Joshua S. Gottheimer(D) 50.5 Scott Garrett(R) 47.2 (-)
New Jersey 6 201 Frank Pallone(D) Frank Pallone(D) 63 Brent Sonnek-Schmelz(R) 35.7 (-)
New Jersey 7 155 Leonard Lance(R) Peter Jacob(D) 43 Leonard Lance(R) 54.2 (-)
New Jersey 8 100 Albio Sires(D) Albio Sires(D) 76.9 Agha Khan(R) 18.6 (-)
New Jersey 9 134 Bill Pascrell(D) Bill Pascrell(D) 69.6 Hector L. Castillo(R) 28.1 (-)
New Jersey 10 131 Donald Payne Jr.(D) Donald Payne Jr.(D) 85.6 David H. Pinckney(R) 12 (-)
New Jersey 11 172 Rodney Frelinghuysen(R) Joseph M. Wenzel(D) 38.7 Rodney Frelinghuysen(R) 58.2 (-)
Continued on next page
159

Table 9 – continued from previous page
State CD N Incumbent Cand1 - Name, Party, and Vote Cand2 - Name, Party, and Vote Cand3 - Name, Party, and Vote
New Jersey 12 176 Bonnie Watson Coleman(D) Bonnie Watson Coleman(D) 62.6 Steven J. Uccio(R) 32.3 (-)
New Mexico 1 172 Michelle Lujan Grisham(D) Michelle Lujan Grisham(D) 65.1 Richard Gregory Priem(R) 34.9 (-)
New Mexico 2 106 Steve Pearce(R) Merrie Lee Soules(D) 37.2 Steve Pearce(R) 62.8 (-)
New Mexico 3 105 Ben Ray Lujan(D) Ben Ray Lujan(D) 62.5 Michael H. Romero(R) 37.5 (-)
New York 1 128 Lee Zeldin(R) Anna E. Throne-Holst(D) 41 Lee Zeldin(R) 59 (-)
New York 2 138 Peter King(R) DuWayne Gregory(D) 37.6 Peter King(R) 62.4 (-)
New York 3 120 open Thomas R. Suozzi(D) 52.4 Jack M. Martins(R) 47.6 (-)
New York 4 145 Kathleen M. Rice(D) Kathleen M. Rice(D) 59.4 David H. Gurfein(R) 40.6 (-)
New York 5 124 Gregory Meeks(D) Gregory Meeks(D) 85.5 Michael A. O’Reilly(R) 13 (-)
New York 6 121 Grace Meng(D) Grace Meng(D) 71.9 Danniel S. Maio(R) 27 (-)
New York 7 135 Nydia Velazquez(D) Nydia Velazquez(D) 90.7 Allan E. Romaguera(R) 9.3 (-)
New York 8 157 Hakeem Jeffries(D) Hakeem Jeffries(D) 93.2 Daniel J. Cavanagh(C) 6.8 (-)
New York 9 158 Yvette Clarke(D) Yvette Clarke(D) 92.3 Alan Bellone(C) 7.7 (-)
New York 10 281 Jerrold Nadler(D) Jerrold Nadler(D) 77.5 Philip Rosenthal(R) 22.5 (-)
New York 11 168 Daniel Donovan(R) Richard A. Reichard(D) 36.1 Daniel Donovan(R) 62.2 Henry J. Bardel(G) 1.7
New York 12 293 Carolyn Maloney(D) Carolyn Maloney(D) 83 Robert Ardini(R) 17 (-)
New York 13 182 open Adriano Espaillat(D) 88.8 Tony Evans(R) 6.9 Daniel Vila Rivera(G) 1.4
New York 14 100 Joseph Crowley(D) Joseph Crowley(D) 82.6 Frank J. Spotorno(R) 17.4 (-)
New York 15 109 Jose Serrano(D) Jose Serrano(D) 95.2 Alejandro Vega(R) 3.6 Eduardo Ramirez(C) 1.2
New York 16 132 Eliot Engel(D) Eliot Engel(D) (-) (-)
New York 17 122 Nita Lowey(D) Nita Lowey(D) (-) (-)
New York 18 148 Sean Patrick Maloney(D) Sean Patrick Maloney(D) 55.2 Phil Oliva(R) 44.8 (-)
New York 19 145 open Zephyr Teachout(D) 45.3 John J. Faso(R) 54.7 (-)
New York 20 170 Paul Tonko(D) Paul Tonko(D) 67.6 Francis J. Vitollo(R) 32.4 (-)
New York 21 149 Elise Stefanik(R) Mike Derrick(D) 29.3 Elise Stefanik(R) 66.1 (-)
New York 22 158 open Kim A. Myers(D) 40.4 Claudia Tenney(R) 47 (-)
New York 23 169 Tom Reed(R) John F. Plumb(D) 41.9 Tom Reed(R) 58.1 (-)
New York 24 196 John Katko(R) Colleen Deacon(D) 39 John Katko(R) 61 (-)
New York 25 181 Louise Slaughter(D) Louise Slaughter(D) 55.8 Mark W. Assini(R) 44.2 (-)
New York 26 225 Brian Higgins(D) Brian Higgins(D) 74.4 Shelly Schratz(R) 25.6 (-)
New York 27 166 Chris Collins(R) Diana K. Kastenbaum(D) 32.3 Chris Collins(R) 67.7 (-)
North Carolina 1 145 G.K. Butterfield(D) G.K. Butterfield(D) 68.6 H. Powell Dew, Jr.(R) 29 (-)
North Carolina 2 183 George Holding(R) John P. McNeil(D) 43.3 George Holding(R) 56.7 (-)
North Carolina 3 145 Walter B. Jones(R) Ernest T. Reeves(D) 32.6 Walter B. Jones(R) 67.4 (-)
North Carolina 4 189 David Price(D) David Price(D) 68.2 Sue Googe(R) 31.8 (-)
North Carolina 5 171 Virginia Foxx(R) Josh Brannon(D) 41.5 Virginia Foxx(R) 58.5 (-)
North Carolina 6 158 Mark Walker(R) Pete Glidewell(D) 40.7 Mark Walker(R) 59.3 (-)
North Carolina 7 147 David Rouzer(R) J. Wesley Casteen(D) 39 David Rouzer(R) 61 (-)
North Carolina 8 123 Richard Hudson(R) Thomas Mills(D) 41.2 Richard Hudson(R) 58.8 (-)
North Carolina 9 119 Robert Pittenger(R) Christian Cano(D) 41.7 Robert Pittenger(R) 58.3 (-)
North Carolina 10 156 Patrick McHenry(R) Andy Millard(D) 36.8 Patrick McHenry(R) 63.2 (-)
North Carolina 11 136 Mark Meadows(R) Rick Bryson(D) 35.8 Mark Meadows(R) 64.2 (-)
North Carolina 12 155 Alma Adams(D) Alma Adams(D) 67 Leon Threatt(R) 33 (-)
North Carolina 13 177 Ted Budd(R) Bruce Davis(D) 43.9 Ted Budd(R) 56.1 (-)
North Dakota 1 126 Kevin Cramer(R) Chase Iron Eyes(D) 23.8 Kevin Cramer(R) 69.2 (-)
Ohio 1 171 Steve Chabot(R) Michele Young(D) 40.4 Steve Chabot(R) 59.6 (-)
Ohio 2 164 Brad Wenstrup(R) William R. Smith(D) 33.4 Brad Wenstrup(R) 66.6 (-)
Ohio 3 201 Joyce Beatty(D) Joyce Beatty(D) 68.3 John Adams(R) 31.7 (-)
Ohio 4 159 Jim Jordan(R) Janet Garrett(D) 31.9 Jim Jordan(R) 68.1 (-)
Ohio 5 185 Bob Latta(R) James Neu Jr.(D) 29 Bob Latta(R) 71 (-)
Ohio 6 158 Bill Johnson(R) Michael L Lorentz(D) 29.4 Bill Johnson(R) 70.6 (-)
Ohio 7 125 Bob Gibbs(R) Roy Rich(D) 28.9 Bob Gibbs(R) 64.1 (-)
Ohio 8 125 Warren Davidson(R) Steve Fought(D) 26.8 Warren Davidson(R) 69 (-)
Ohio 9 209 Marcy Kaptur(D) Marcy Kaptur(D) 68.5 Donald P. Larson(R) 31.5 (-)
Ohio 10 164 Michael Turner(R) Robert Klepinger(D) 32.4 Michael Turner(R) 64.4 (-)
Ohio 11 197 Marcia Fudge(D) Marcia Fudge(D) 80.1 Beverly A. Goldstein(R) 19.9 (-)
Ohio 12 184 Patrick Tiberi(R) Ed Albertson(D) 29.9 Patrick Tiberi(R) 66.6 (-)
Ohio 13 206 Tim Ryan(D) Tim Ryan(D) 67.6 Richard A. Morckel(R) 32.4 (-)
Ohio 14 141 David Joyce(R) Michael Wager(D) 37.3 David Joyce(R) 62.7 (-)
Ohio 15 137 Steve Stivers(R) Scott Wharton(D) 33.8 Steve Stivers(R) 66.2 (-)
Ohio 16 172 Jim Renacci(R) Keith Mundy(D) 34.6 Jim Renacci(R) 65.4 (-)
Oklahoma 1 141 Jim Bridenstine(R) (-) Jim Bridenstine(R) (-)
Oklahoma 2 106 Markwayne Mullin(R) Joshua Harris-Till(D) 23.2 Markwayne Mullin(R) 70.6 (-)
Oklahoma 3 95 Frank Lucas(R) Frankie Robbins(D) 21.7 Frank Lucas(R) 78.3 (-)
Continued on next page
160

Table 9 – continued from previous page
State CD N Incumbent Cand1 - Name, Party, and Vote Cand2 - Name, Party, and Vote Cand3 - Name, Party, and Vote
Oklahoma 4 137 Tom Cole(R) Christina Owen(D) 26.1 Tom Cole(R) 69.6 (-)
Oklahoma 5 145 Steve Russell(R) Al McAffrey(D) 36.8 Steve Russell(R) 57.1 (-)
Oregon 1 181 Suzanne Bonamici(D) Suzanne Bonamici(D) 59.6 Brian J Heinrich(R) 37.3 (-)
Oregon 2 173 Greg Walden(R) James (Jim) Crary(D) 27.9 Greg Walden(R) 72.1 (-)
Oregon 3 245 Earl Blumenauer(D) Earl Blumenauer(D) 72.6 David W.Walker(I) 20.3 (-)
Oregon 4 226 Peter DeFazio(D) Peter DeFazio(D) 55.5 Art Robinson(R) 39.8 (-)
Oregon 5 197 Kurt Schrader(D) Kurt Schrader(D) 53.6 Colm Willis(R) 43.2 (-)
Pennsylvania 1 162 Robert Brady(D) Robert Brady(D) 82.2 Deborah Williams(R) 17.8 (-)
Pennsylvania 2 191 open Dwight Evans(D) 90.2 James A Jones(R) 9.8 (-)
Pennsylvania 3 189 Mike Kelly(R) (-) Mike Kelly(R) (-)
Pennsylvania 4 175 Scott Perry(R) Joshua Burkholder(D) 33.9 Scott Perry(R) 70.6 (-)
Pennsylvania 5 354 Glenn Thompson(R) Kerith Strano Taylor(D) 32.7 Glenn Thompson(R) 78.3 (-)
Pennsylvania 6 187 Ryan Costello(R) Mike Parrish(D) 42.7 Ryan Costello(R) 69.6 (-)
Pennsylvania 7 143 Patrick Meehan(R) Mary Ellen Balchunis(D) 40.3 Patrick Meehan(R) 57.1 (-)
Pennsylvania 8 174 open Steve Santarsiero(D) 45.5 Brian Fitzpatrick(R) 37.3 (-)
Pennsylvania 9 170 Bill Shuster(R) Art Halvorson(D) 36.6 Bill Shuster(R) 72.1 (-)
Pennsylvania 10 244 Tom Marino(R) Michael Molesevich(D) 29.7 Tom Marino(R) 39.8 (-)
Pennsylvania 11 196 Lou Barletta(R) Mike Marsicano(D) 36.3 Lou Barletta(R) 43.2 (-)
Pennsylvania 12 183 Keith Rothfus(R) Erin R. McClelland(D) 38.1 Keith Rothfus(R) 17.8 (-)
Pennsylvania 13 190 Brendan F. Boyle(D) Brendan F. Boyle(D) Armond James(R) (-)
Pennsylvania 14 221 Michael F. Doyle(D) Michael F. Doyle(D) 74.3 Lenny McAllister(R) 9.8 (-)
Pennsylvania 15 180 Charlie Dent(R) Rick Daugherty(D) 38 Charlie Dent(R) 58.4 (-)
Pennsylvania 16 171 open Christina Hartman(D) 42.7 Lloyd K Smucker(R) 53.9 (-)
Pennsylvania 17 219 Matt Cartwright(D) Matt Cartwright(D) 53.8 Matt Connolly(R) 46.2 (-)
Pennsylvania 18 175 Tim Murphy(R) (-) Tim Murphy(R) (-)
Rhode Island 1 104 David Cicilline(D) David Cicilline(D) 64.7 Russell Taub(R) 35.3 (-)
Rhode Island 2 108 Jim Langevin(D) Jim Langevin(D) 58.2 Rhue Reis(R) 30.8 (-)
South Carolina 1 129 Mark Sanford(R) Dimitri Cherny(D) 36.9 Mark Sanford(R) 58.6 (-)
South Carolina 2 124 Joe Wilson(R) Arik Bjorn(D) 35.9 Joe Wilson(R) 60.3 (-)
South Carolina 3 113 Jeff Duncan(R) Hosea Cleveland(D) 27.1 Jeff Duncan(R) 72.9 (-)
South Carolina 4 117 Trey Gowdy(R) Chris Fedalei(D) 31.1 Trey Gowdy(R) 67.2 (-)
South Carolina 5 128 Mick Mulvaney(R) Fran Person(D) 38.8 Mick Mulvaney(R) 59.1 (-)
South Carolina 6 128 James Clyburn(D) James Clyburn(D) 70.2 Laura Sterling(R) 27.6 (-)
South Carolina 7 118 Tom Rice(R) Mal Hyman(D) 39.3 Tom Rice(R) 60.7 (-)
South Dakota 1 167 Kristi Noem(R) Paula Hawks(D) 35.9 Kristi Noem(R) 64.1 (-)
Tennessee 1 137 Phil Roe(R) Alan Bohms(D) 15.4 Phil Roe(R) 78.4 (-)
Tennessee 2 162 John J. Duncan Jr.(R) Stuart Starr(D) 24.4 John J. Duncan Jr.(R) 75.6 (-)
Tennessee 3 135 Chuck Fleischmann(R) Melody Shekari(D) 28.8 Chuck Fleischmann(R) 66.4 (-)
Tennessee 4 129 Scott DesJarlais(R) Steven Reynolds(D) 35 Scott DesJarlais(R) 65 (-)
Tennessee 5 156 Jim Cooper(D) Jim Cooper(D) 62.5 Stacy Ries Snyder(R) 37.5 (-)
Tennessee 6 140 Diane Black(R) David W. Kent(D) 21.8 Diane Black(R) 71.1 (-)
Tennessee 7 128 Marsha Blackburn(R) Tharon Chandler(D) 23.5 Marsha Blackburn(R) 72.2 (-)
Tennessee 8 106 David Kustoff(R) Rickey Hobson(D) 25.1 David Kustoff(R) 68.8 (-)
Tennessee 9 122 Steve Cohen(D) Steve Cohen(D) 78.8 Wayne Alberson(R) 18.8 (-)
Texas 1 101 Louie Gohmert(R) Shirley McKellar(D) 24.1 Louie Gohmert(R) 73.9 (-)
Texas 2 136 Ted Poe(R) Pat Bryan(D) 36 Ted Poe(R) 61.3 (-)
Texas 3 124 Sam Johnson(R) Adam P. Bell(D) 34.5 Sam Johnson(R) 80.6 (-)
Texas 4 130 John Ratcliffe(R) Cody Wommack(L) 12 John Ratcliffe(R) 88 (-)
Texas 5 118 Jeb Hensarling(R) Ken Ashby(L) 19.4 Jeb Hensarling(R) 80.6 (-)
Texas 6 128 Joe Barton(R) Ruby Fay Woolridge(D) 39 Joe Barton(R) 58.3 (-)
Texas 7 170 John Culberson(R) James Cargas(D) 43.8 John Culberson(R) 56.2 (-)
Texas 8 137 Kevin Brady(R) (-) Kevin Brady(R) (-)
Texas 9 131 Al Green(D) Al Green(D) 80.6 Jeff Martin(R) 19.4 (-)
Texas 10 156 Michael McCaul(R) Tawana W. Cadien(D) 38.4 Michael McCaul(R) 57.4 (-)
Texas 11 87 Mike Conaway(R) Nicholas Landholt(L) 10.5 Mike Conaway(R) 60.6 (-)
Texas 12 134 Kay Granger(R) Bill Bradshaw(D) 26.8 Kay Granger(R) 69.4 (-)
Texas 13 79 Mac Thornberry(R) Calvin DeWeese(L) 6.7 Mac Thornberry(R) 88 Rusty Tomlinson(G) 3.4
Texas 14 124 Randy Weber(R) Michael Cole(D) 38.1 Randy Weber(R) 61.9 (-)
Texas 15 84 open Vincente Gonzalez(D) 57.3 Tim Westley(R) 37.7 (-)
Texas 16 134 Beto O’Rourke(D) Beto O’Rourke(D) 85.8 Jamie Perez(L) 2.4 Mary Gourdoux(G) 4.3
Texas 17 118 Bill Flores(R) William Matta(D) 35.2 Bill Flores(R) 60.8 (-)
Texas 18 118 Sheila Jackson Lee(D) Sheila Jackson Lee(D) 73.5 Lori Bartley(R) 23.6 (-)
Texas 19 113 open Troy Bonar(L) 8.5 Jodey Arrington(R) 86.7 Mark Lawson(G) 4.8
Texas 20 160 Joaquin Castro(D) Joaquin Castro(D) 79.7 Jeffrey Blunt(L) 15.5 (-)
Continued on next page
161

Table 9 – continued from previous page
State CD N Incumbent Cand1 - Name, Party, and Vote Cand2 - Name, Party, and Vote Cand3 - Name, Party, and Vote
Texas 21 175 Lamar Smith(R) Thomas Wakely(D) 36.4 Lamar Smith(R) 57 (-)
Texas 22 126 Pete Olson(R) Mark Gibson(D) 40.5 Pete Olson(R) 59.5 (-)
Texas 23 88 Will Hurd(R) Pete P. Gallego(D) 46.8 Will Hurd(R) 48.5 (-)
Texas 24 153 Kenny Marchant(R) Jan McDowell(D) 39.3 Kenny Marchant(R) 56.2 (-)
Texas 25 131 Roger Williams(R) Kathi Thomas(D) 37.7 Roger Williams(R) 58.4 (-)
Texas 26 156 Michael Burgess(R) Eric Mauck(D) 29.6 Michael Burgess(R) 66.3 (-)
Texas 27 115 Blake Farenthold(R) Raul (Roy) Barrera(D) 38.3 Blake Farenthold(R) 61.7 (-)
Texas 28 82 Henry Cuellar(D) Henry Cuellar(D) 66.2 Zeffen Hardin(R) 31.3 (-)
Texas 29 82 Gene Green(D) Gene Green(D) 72.5 Julio Garza(R) 24 (-)
Texas 30 108 Eddie Bernice Johnson(D) Eddie Bernice Johnson(D) 77.9 Charles Lingerfelt(R) 19 (-)
Texas 31 198 John Carter(R) Mike Clark(D) 36.5 John Carter(R) 58.4 (-)
Texas 32 166 Pete Sessions(R) Ed Rankin(L) 19 Pete Sessions(R) 71.1 Gary Stuard(G) 9.9
Texas 33 71 Marc Veasey(D) Marc Veasey(D) 73.7 M. Mark Mitchell(R) 26.3 (-)
Texas 34 92 Filemon Vela(D) Filemon Vela(D) 62.7 Rey Gonzalez, Jr.(R) 37.3 (-)
Texas 35 143 Lloyd Doggett(D) Lloyd Doggett(D) 63.1 Susan Narvaiz(R) 31.6 (-)
Texas 36 94 Brian Babin(R) Hal Ridley Jr.(G) 11.3 Brian Babin(R) 88.7 (-)
Utah 1 125 Rob Bishop(R) Peter C. Clemens(D) 27.2 Rob Bishop(R) 65.4 (-)
Utah 2 153 Chris Stewart(R) Charlene Albarran(D) 34.1 Chris Stewart(R) 61.5 (-)
Utah 3 121 Jason Chaffetz(R) Stephen P. Tryon(D) 26.7 Jason Chaffetz(R) 73.3 (-)
Utah 4 132 Mia Love(R) Doug Owens(D) 41.7 Mia Love(R) 53.5 (-)
Vermont 1 132 Peter Welch(D) Peter Welch(D) 90 Erica Clawson(LU) 10 (-)
Virginia 1 184 Robert Wittman(R) Matt Rowe(D) 35.8 Robert Wittman(R) 60.9 (-)
Virginia 2 148 open Shaun D. Brown(D) 38.3 Scott W. Taylor(R) 61.7 (-)
Virginia 3 189 Robert Scott(D) Robert Scott(D) 66.9 Marty Williams(R) 33.1 (-)
Virginia 4 178 open A. Donald McEachin(D) 57.3 Michael L. ”Mike” Wade(R) 42.7 (-)
Virginia 5 143 open Jane Dittmar(D) 41.7 Tom Garrett(R) 58.3 (-)
Virginia 6 196 Bob Goodlatte(R) Kai Degner(D) 33.3 Bob Goodlatte(R) 66.7 (-)
Virginia 7 205 David Brat(R) Eileen Bedell(D) 42.1 David Brat(R) 57.9 (-)
Virginia 8 192 Don Beyer(D) Don Beyer(D) 68.6 Charles Hernick(R) 27.4 (-)
Virginia 9 155 Morgan Griffith(R) Derek Kitts(D) 28.4 Morgan Griffith(R) 68.7 (-)
Virginia 10 255 Barbara Comstock(R) LuAnn Bennett(D) 47.1 Barbara Comstock(R) 52.9 (-)
Virginia 11 163 Gerald Connolly(D) Gerald Connolly(D) (-) (-)
Washington 1 128 Suzan DelBene(D) Suzan DelBene(D) 55.5 Robert J. Sutherland(R) 44.5 (-)
Washington 2 114 Rick Larson(D) Rick Larson(D) 64 Marc Hennemann(R) 36 (-)
Washington 3 172 Jaime Herrera Beutler(R) Jim Moeller(D) 38.6 Jaime Herrera Beutler(R) 61.4 (-)
Washington 4 85 Dan Newhouse(R) Clint Didier(R) 42.6 Dan Newhouse(R) 57.4 (-)
Washington 5 172 Cathy McMorris Rodgers(R) Joe Pakootas(D) 40.5 Cathy McMorris Rodgers(R) 59.5 (-)
Washington 6 173 Derek Kilmer(D) Derek Kilmer(D) 61.7 Todd A. Bloom(R) 38.3 (-)
Washington 7 187 open Pramila Jayapal(D) 56.1 Brady Pinero Walkinshaw(D) 43.9 (-)
Washington 8 98 Dave Reichert(R) Tony Ventrella(D) 43.9 Dave Reichert(R) 60 (-)
Washington 9 156 Adam Smith(D) Adam Smith(D) 40 Doug Basler(R) 27 (-)
Washington 10 159 Denny Heck(D) Denny Heck(D) 73 Jim Postma(R) 41.3 (-)
West Virginia 1 135 David McKinley(R) Mike Manypenny(D) 58.7 David McKinley(R) 69 (-)
West Virginia 2 146 Alex Mooney(R) Mark Hunt(D) 31 Alex Mooney(R) 58.2 (-)
West Virginia 3 148 Evan Jenkins(R) Matt Detch(D) 41.8 Evan Jenkins(R) 67.9 (-)
Wisconsin 1 162 Paul Ryan(R) Ryan Solen(D) 24 Paul Ryan(R) 65 Jason Lebeck(L) 2.1
Wisconsin 2 203 Mark Pocan(D) Mark Pocan(D) 30.2 Peter Theron(R) 31.3 (-)
Wisconsin 3 158 Ron Kind(D) Ron Kind(D) 68.7 (-) (-)
Wisconsin 4 163 Gwen Moore(D) Gwen Moore(D) 77 Andy Craig(L) 11.3 (-)
Wisconsin 5 161 Jim Sensenbrenner(R) Khary Penebaker(D) 29.3 Jim Sensenbrenner(R) 66.8 (-)
Wisconsin 6 186 Glenn Grothman(R) Sarah Lloyd(D) 37.3 Glenn Grothman(R) 57.2 (-)
Wisconsin 7 147 Sean Duffy(R) Mary Hoeft(D) 38.2 Sean Duffy(R) 61.8 (-)
Wisconsin 8 174 open Tom Nelson(D) 37.3 Mike Gallagher(R) 62.7 (-)
Wyoming 1 99 open Ryan Greene(D) 30.1 Liz Cheney(R) 62.2 (-)
162

Part V
Cross-reference
Variable Listing, in order of appearance in dataset. Open response items included.
Table 10: List of Variables
Variable Label Name
V101 Case ID
commonweight Common content weights
commonweight post Common content weights (post survey)
lookupzip Pre Election Survey Respondent Zip Code
inputstate Pre Election State Name
cdid113 CD 113th/114th Congress- post
cdid115 CD 115th Congress - post
countyfips County FIPS code
countyname County Name
inputstate post Post Election State Name
cdid113 post CD 113th/114th Congress
cdid115 post CD 115th Congress
countyfips post County FIPS code- post
countyname post County Name- post
birthyr Birth Year
gender Gender
sexuality Sexual Orientation
trans Transgender
educ Education
edloan Student debtor
votereg Voter Registration Status
regzip Zip code where registered
votereg f Registered to vote
race Race
163

Table 10 – continued from previous page
Variable Label
race other Race, other
multrace 1 Multi-racial - White
multrace 2 Multi-racial - Black
multrace 3 Multi-racial - Hispanic
multrace 4 Multi-racial - Asian
multrace 5 Multi-racial - Native American
multrace 8 Multi-racial - Middle Eastern
multrace 97 Multi-racial - Other
multrace 98 Multi-racial - Don’t know
multrace 99 Multi-racial - None of these
hispanic Spanish, Latino or Hispanic origin or descent
Hispanic origin 1 Hispanic origin - No country in Particular
Hispanic origin 2 Hispanic origin - United States
Hispanic origin 3 Hispanic origin - Mexico
Hispanic origin 4 Hispanic origin - Puerto Rico
Hispanic origin 5 Hispanic origin - Cuba
Hispanic origin 6 Hispanic origin - Dominican Republic
Hispanic origin 7 Hispanic origin - South America
Hispanic origin 8 Hispanic origin - Central America
Hispanic origin 9 Hispanic origin - Caribbean
Hispanic origin 10 Hispanic origin - Spain
Hispanic origin 11 Hispanic origin - Other
Hispanic origin 12 Hispanic origin - I am not of Latino, Hispanic or Spanish
Heritage
Hispanic origin t Hispanic origin - None
Asian origin 1 Asian origin - No Country in Particular
Asian origin 2 Asian origin - United States
Asian origin 3 Asian origin - China
Asian origin 4 Asian origin - Japan
Asian origin 5 Asian origin - India
164

Table 10 – continued from previous page
Variable Label
Asian origin 6 Asian origin - Philippines
Asian origin 7 Asian origin - Taiwan
Asian origin 8 Asian origin - Korea
Asian origin 9 Asian origin - Vietnam
Asian origin 10 Asian origin - Pakistan
Asian origin 11 Asian origin - Hmong
Asian origin 12 Asian origin - Cambodia
Asian origin 13 Asian origin - Thailand
Asian origin 14 Asian origin - Other
Asian origin 15 Asian origin - I am not of Asian Heritage
Asian origin t Asian origin - None
employ Employment Status
employ t Employment Status - open
hadjob Had a Job
whatkindofwork $whatkindofworktext
jobactivities $jobactivitiestext
industryclass Industry classification
phone Phone Service
internethome Internet Access at Home
internetwork Internet Access at Work
marstat Marital Status
pid7 7 point party ID
pid3 3 point Party ID
pid3 t 3 point party ID - other
ideo5 Ideology
pew bornagain Born Again (Pew version)
pew religimp Importance of Religion (Pew Version)
pew churatd Church attendance (Pew Version)
pew prayer Frequency of Prayer (Pew Version)
religpew Pew religion
165

Table 10 – continued from previous page
Variable Label
religpew t Pew religion - open
religpew protestant Protestant Church
religpew protestant t Protestant Church - open
religpew baptist Baptist Church - open
religpew baptist t Baptist Church - open
religpew methodist Methodist Church
religpew methodist t Methodist Church - open
religpew nondenom Nondenominational or Independent Church
religpew nondenom t Nondenominational or Independent Church - open
religpew lutheran Lutheran Church
religpew lutheran t Lutheran Church - open
religpew presby Presyterian Church
religpew presby t Presyterian Church - open
religpew pentecost Pentecostal Church
religpew pentecost t Pentecostal Church - open
religpew episcop Episcopal Church
religpew episcop t Episcopal Church - open
relgipew christian Christian Church
relgipew christian t Christian Church - open
religpew congreg Congregational Church
religpew congreg t Congregational Church - open
religpew holiness Holiness Church
religpew holiness t Holiness Church - open
religpew reformed Reformed Church
religpew reformed t Reformed Church - open
relgipew advent Adventist Church
relgipew advent t Adventist Church - open
religpew catholic Catholic Church
religpew catholic t Catholic Church - open
religpew mormon Mormon Church
166

Table 10 – continued from previous page
Variable Label
religpew mormon t Mormon Church - open
religpew orthodox Orthodox Church
religpew orthodox t Orthodox Church - open
religpew jewish Jewish Group
religpew jewish t Jewish Group - open
religpew muslim Muslim Group
religpew muslim t Muslim Group - open
religpew buddhist Budhist Group
religpew buddhist t Budhist Group - open
religpew hindu Hindu Group
religpew hindu t Hindu Group - open
child18 Child under 18 years
child18num Number of children under 18
newsint Political Interest
faminc Family Income
ownhome Home ownership
ownhome t Home ownership - open
citylength 1 Current city residence length - Years
citylength 2 Current city residence length - Months
milstat 1 Military Household - I am
milstat 2 Military Household - Family
milstat 3 Military Household - I served previously
milstat 4 Military Household - Family served previously
milstat 5 Military Household - None
immstat Citizen
union Labor union member
unionhh Family labor union member
investor Stock Ownership
heathins2 Purchase health insurance thru exchange
healthins 1 Health Insurance - Yes, through my job or a family
167

Table 10 – continued from previous page
Variable Label
healthins 2 Health Insurance - Yes, through a government
healthins 3 Health Insurance - Yes, through my school
healthins 4 Health Insurance - Yes, I purchase my own
healthins 5 Health Insurance - Not Sure
healthins 6 Health Insurance - No
CC16 300 1 Media Use - Blog
CC16 300 2 Media Use - TV
CC16 300 3 Media Use - Newspaper
CC16 300 4 Media Use - Radio
CC16 300 5 Media Use - Social Media
CC16 300 6 Media Use - None
CC16 300b Watch local news, national news or both
CC16 300c Read print news, online news or both
CC16 300d 1 Social Media - Posted a story, photo, video or link about
politics
CC16 300d 2 Social Media - Posted a comment about politics
CC16 300d 3 Social Media - Read a story or watched a video about politics
CC16 300d 4 Social Media - Followed a political event
CC16 300d 5 Social Media - Forwarded a story, photo, video or link about
politics to friends
CC16 301a Most Important Problem - Gun control
CC16 301b Most Important Problem - Abortion
CC16 301c Most Important Problem - Taxes
CC16 301d Most Important Problem - Immigration
CC16 301e Most Important Problem - Budget deficit
CC16 301f Most Important Problem - Defense spending
CC16 301g Most Important Problem - Social security
CC16 301h Most Important Problem - Environment
CC16 301i Most Important Problem - Jobs
CC16 301j Most Important Problem - Crime
168

Table 10 – continued from previous page
Variable Label
CC16 301k Most Important Problem - National security
CC16 301l Most Important Problem - Race relations
CC16 301m Most Important Problem - Health care
CC16 301n Most Important Problem - Gay marriage
CC16 301o Most Important Problem - Government Corruption
CC16 302 National Economy
CC16 303 Past year - household income
CC16 304 Next year - household income
CC16 305 1 Past four years - Married
CC16 305 2 Past four years - Lost a job
CC16 305 3 Past four years - Finished school
CC16 305 4 Past four years - Retired
CC16 305 5 Past four years - Divorced
CC16 305 6 Past four years - Had a child
CC16 305 7 Past four years - Taken a new job
CC16 305 8 Past four years - Been issued a traffic ticket
CC16 305 9 Past four years - Been a victim of a crime
CC16 305 10 Past four years - Visited an emergency room
CC16 305 11 Past four years - Received a raise at work
CC16 307 Police make R feel safe
CC16 312 1 Do not get involved
CC16 312 2 Send food, medicine and other aid to countries affected
CC16 312 3 Provide arms to those opposing ISIS
CC16 312 4 Enforce a no-fly zone
CC16 312 5 Use drones and aircraft to bomb ISIS troops
CC16 312 6 Send military support staff (non-combat)
CC16 312 7 Send significant force to fight ISIS
CC16 320a Approve of Job - Obama
CC16 320b Approve of Job - Congress
CC16 320c Approve of Job - Supreme Court
169

Table 10 – continued from previous page
Variable Label
CC16 320d Approve of Job - Governor
CC16 320e Approve of Job - Legislature
CC16 321a Party of Government Knowledge - Reps
CC16 321b Party of Government Knowledge - Senate
CC16 321c Party of Government Knowledge - State Senate
CC16 321d Party of Government Knowledge - Lower Chamber
CC16 322a Party Recall + Name Recognition - Governor
CC16 322b Party Recall + Name Recognition - Senator 1
CC16 322c Party Recall + Name Recognition - Senator 2
CC16 322d Party Recall + Name Recognition - Rep
CC16 320f Approve of Job - Rep
CC16 320g Approve of Job - Senator 1
CC16 320h Approve of Job - Senator 2
CC16 316 Vote 2012
CC16 326 President 2012
CC16 326 t President 2012 - open
CC16 327 Vote primary 2016
CC16 328 Vote primary 2016 candidate
CC16 330a Gun Control - Background checks for all sales, including at
gun shows and over the Internet
CC16 330b Gun Control - Prohibit state and local governments from pub-
lishing the names and addresses of all gun owners
CC16 330d Gun Control - Ban assault rifles
CC16 330e Gun Control - Make it easier for people to obtain concealed-
carry permit
CC16 331 1
Immigration - Grant legal status to all illegal immigrants who
have held jobs and paid taxes for at least 3 years, and not been
convicted of any felony crimes
CC16 331 2 Immigration - Increase the number of border patrols on the
U.S.-Mexican border
170

Table 10 – continued from previous page
Variable Label
CC16 331 3
Immigration - Grant legal status to people who were brought
to the US illegally as children, but who have graduate from a
U.S. high school
CC16 331 4 Immigration - Fine U.S. businesses that hire illegal
immigrants
CC16 331 5 Immigration - Admit no refugees from Syria
CC16 331 6 Immigration - Increase the number of visas for overseas work-
ers to work in the U.S.
CC16 331 7 Immigration - Identify and deport illegal immigrants
CC16 331 8 Immigration - Ban Muslims from immigrating to the U.S.
CC16 331 9 Immigration - None of these
CC16 332a Abortion Policies - Always allow a woman to obtain an abor-
tion as a matter of choice
CC16 332b Abortion Policies - Permit abortion only in case of rape, incest
or when the woman’s life is in danger
CC16 332c Abortion Policies - Prohibit all abortions after the 20th week
of pregnancy
CC16 332d Abortion Policies - Allow employers to decline coverage of
abortions in insurance plans
CC16 332e Abortion Policies - Prohibit the expenditure of funds autho-
rized or appropriated by federal law for any abortion
CC16 332f Abortion Policies - Make abortions illegal in all circumstances
CC16 333a Environment Policies - Give Environmental Protection
Agency power to regulate Carbon Dioxide emissions
CC16 333b Environment Policies - Raise required fuel efficiency for the
average automobile from 25 mpg to 35 mpg
CC16 333c
Environment Policies - Require a minimum amount of renew-
able fuels (wind, solar, and hydroelectric) in the generation of
electricity even if electricity prices increase somewhat
CC16 333d Environment Policies - Strengthen enforcement of the Clean
Air Act and Clean Water even if it costs US jobs
CC16 334a Crime Policies - Eliminate mandatory minimum sentences for
non-violent drug offenders
CC16 334b Crime Policies - Require police officers to wear body cameras
that record all of their activities while on duty
171

Table 10 – continued from previous page
Variable Label
CC16 334c
Crime Policies - Increase the number of police on the street
by 10 percent, even if it means fewer funds for other public
services
CC16 334d Crime Policies - Increase prison sentences for felons who have
already committed two or more serious or violent crimes
CC16 335 Gay Marriage
CC16 337 1 Budget Priorities - Cut Defense Spending
CC16 337 2 Budget Priorities - Cut Domestic Spending
CC16 337 3 Budget Priorities - Raise Taxes
CC16 340a Ideology - Yourself
CC16 340b Ideology - Governor
CC16 340c Ideology - Obama
CC16 340d Ideology - Hillary Clinton
CC16 340e Ideology - Donald Trump
CC16 340f Ideology- Merrick Garland
CC16 340g Ideology - The Democratic Party
CC16 340h Ideology - The Republican Party
CC16 340i Ideology - The United States Supreme Court
CC16 340j Ideology - $CurrentSen1Name
CC16 340k Ideology - $CurrentSen2Name
CC16 340l Ideology - $SenCand1Name
CC16 340m Ideology - $SenCand2Name
CC16 340n Ideology - $HouseCand1Name
CC16 340o Ideoogy - $HouseCand2Namde
CC16 340p Ideology - House member
CC16 350 SC Appointments
CC16 351A For or Against - Congress - Approve Garland Nominations
CC16 351B For or Against - Congress - Trans-Pacific Partnership Act
CC16 351C For or Against - Congress - USA Freedom Act
CC16 351D For or Against - Congress - Trade Adjustment Assistence Act
CC16 351E For or Against - Congress- Education Reform
172

Table 10 – continued from previous page
Variable Label
CC16 351F For or Against - Congress - Highway and Transportation
Funding Act
CC16 351G For or Against - Congress - Iran Sanctions Act
CC16 351H For or Against - Congress - Medicare Accountability and Cost
Reform Act
CC16 351I For or Against - Congress - Repeal Affordable Care Act
CC16 351K For or Against - Congress - Minimum wage
CC16 360 Party Registration
CC16 361 Residence
CC16 364 Does R Intend to Vote in 2016
CC16 364b Pres vote
CC16 364b t Pres vote - open
CC16 364c Pres pref
CC16 364c t Pres pref - open
CC16 365 Senator pref
CC16 365 t Senator pref - open
CC16 365a Senator pref 2nd choice
CC16 365a t Senator pref 2nd choice- open
CC16 365x Senate vote
CC16 365x t Senate vote- open
CC16 366 Governor pref
CC16 366 t Governor pref - open
CC16 366x Governor vote
CC16 366x t Governor vote- open
CC16 366a Governor pref 2nd choice
CC16 366a t Governor pref 2nd choice - open
CC16 367 House pref
CC16 367 t House pref - open
CC16 367a House pref 2nd choice
CC16 367a t House pref 2nd choice - open
173

Table 10 – continued from previous page
Variable Label
CC16 367x House vote
CC16 367x t House vote - open
votereg post Voter Registration Status
CC16 401 Voted 2016
CC16 402a Main reason didn’t vote
CC16 402a t Main reason didn’t vote - open
CC16 402b Second reason didn’t vote
CC16 402b t Second reason didn’t vote - open
CC16 403 Vote in person or by mail
CC16 403b Vote at precinct polling place or vote center
CC16 404 Voting length wait time
CC16 404 t Voting length wait time - open
CC16 405 Registered to vote on Election Day
CC16 406a Problem with voter registration or ID when trying to vote
CC16 406b 1 Problem with voting - ID
CC16 406b 2 Problem with voting - Registration
CC16 406b 3 Problem with voting - Wrong Place
CC16 406b 4 Problem with voting - Other
CC16 406b t Problem with voting - open
CC16 406c Allowed to vote
CC16 407a Feel intimidated voting
CC16 407b Why intimidated voting
CC16 410a President vote
CC16 410a t President vote
CC16 410b Senator vote
CC16 410b t Senator vote - open
CC16 411 Governor vote
CC16 411 t governor vote - open
CC16 412 House vote
CC16 412 t House vote - open
174

Table 10 – continued from previous page
Variable Label
CC16 410a nv President prefer
CC16 410a nv t President prefer - open
CC16 410b nv Senator prefer
CC16 410b nv t Senator prefer - open
CC16 411 nv Governor prefer
CC16 411 nv t Governor prefer
CC16 412 nv House vote
CC16 412 nv t House vote - open
CC16 413a Vote in state elections - Attorney General
CC16 413b Vote in state elections - Secretary of State
CC16 413c Vote in state elections - $inputstate State Senator
CC16 413d Vote in state elections - $LowerChamberName
CC16 414 1 Approve use of US military - ensure the supply of oil
CC16 414 2 Approve use of US military - destroy a terrorist camp
CC16 414 3 Approve use of US military - Intervene in a region
CC16 414 4 Approve use of US military - assist the spread of democracy
CC16 414 5 Approve use of US military - Protect allies from foreign attack
CC16 414 6 Approve use of US military - Help the UN uphold interna-
tional law
CC16 414 7 Approve use of US military - None of the above
CC16 415r Budget deficit - spending cuts vs tax increases
CC16 416r Raise taxes - income tax vs sales tax
CC16 417a 1 Past Year - Attend local political meetings
CC16 417a 2 Past Year - Put up a politcal sign
CC16 417a 3 Past Year - Work for a candidate or campaign
CC16 417a 4 Past Year - Donate money to a candidate, campaign or polit-
ical organization
CC16 417a 5 Past Year - Donate blood
CC16 417a 6 Past Year - None of these
CC16 417bx 1 Donated Money to - Candidate for President
175

Table 10 – continued from previous page
Variable Label
CC16 417bx 2 Donated Money to - Candidate for U.S. Senate in my state
CC16 417bx 3 Donated Money to - Candidate for U.S. Senate in another
state
CC16 417bx 4 Donated Money to - Candidate for U.S. House in my state
CC16 417bx 5 Donated Money to - Candidate for U.S. House in another
state
CC16 417bx 6 Donated Money to - Candidate for state office
CC16 417bx 7 Donated Money to - Political party committee (such as the
DNC or RNC)
CC16 417bx 8 Donated Money to - Political action committee at work
CC16 417bx 9 Donated Money to - Political group (not at your work)
CC16 417bx 10 Donated Money to - Other [CC417bx t]
CC16 417bx t1 Donate money - Political group not at work - open
CC16 417bx t2 Donate money - other - open
CC16 417c Amount contribute to all candidates/committees
CC16 417d 1 How many of the above statements are true for you?
CC16 417d 2 How many of the above statements are true for you?
CC16 417e 1 Campaign contributions are an effective way to influence pub-
lic policy
CC16 417e 2 Campaign contributions are an effective way to help my
business/industry
CC16 417e 3 Campaign contributions allow me to be part of a network with
other contributors
CC16 417e 4 I prefer to give directly to candidates rather than contribute
money to a politi
CC16 417e 5 For anyone who can afford to contribute, it is a civic duty to
contribute financ
CC16 425a Contacted by candidate/political org
CC416 25b 1 Candidate/campaign contact - in person
CC416 25b 2 Candidate/campaign contact - Phone call
CC416 25b 3 Candidate/campaign contact - Email or text message
CC416 25b 4 Candidate/campaign contact - Letter or post card
176

Table 10 – continued from previous page
Variable Label
CC16 418a Ever run for elective office
CC16 418bx 1 Run for Office - School Board
CC16 418bx 2 Run for Office - Other local board or commission (e.g. zoning
commission)
CC16 418bx 3 Run for Office - City Council
CC16 418bx 4 Run for Office - Mayor
CC16 418bx 5 Run for Office - City or District Attorney
CC16 418bx 6 Run for Office - Countywide office (e.g. supervisor)
CC16 418bx 7 Run for Office - State legislature
CC16 418bx 8 Run for Office - Statewide office
CC16 418bx 9 Run for Office - Federal legislature (U.S. House or Senate)
CC16 418bx 10 Run for Office - Judge
CC16 418bx 11 Run for Office - Other
CC16 418b t Run for office - open
CC16 421a 3 pt party ID
CC16 421 t 3 pt party ID- open
CC16 421 dem Party ID Dem Strength
CC16 421 rep Party ID Rep Strength
CC16 421b Party ID lean
CC16 422c Racism - angry racist exists
CC16 422d Racism - white people have advantages
CC16 422e Racism - fearful of people of other races
CC16 422f Racism - racial problems are rare, isoluated situations
CC16 423a Race/ethnicity politicians - $HouseCand1Name
CC16 423b Race/ethnicity politicians - $HouseCand2Name
CC16 423c Race/ethnicity politicans - $CurrentHouseName
CC16 423a other Race/ethnicity politicians - $HouseCand1Name - open
CC16 423b other Race/ethnicity politicians - $HouseCand2Name - open
CC16 423c other Race/ethnicity politicans - $CurrentHouseName - open
CC16 426 1 State spending - Welfare
177

Table 10 – continued from previous page
Variable Label
CC16 426 2 State spending - health care
CC16 426 3 State spending - education
CC16 426 4 State spending - law enforcement
CC16 426 5 State spending - transportation/infrastructure
CC16 427 a Grade local community - the schools
CC16 427 b Grade local community - the police
CC16 427 c Grade local community - the roads
CC16 427 d Grade local community - zoning and development
CC16 427 e Grade local community - the mayor or town/city manager
CC16 427 f Grade local community - the town/city council
CurrentGovName Current Governor Name
CurrentGovParty Current Governor Party
CurrentHouseGender Current House Gender
CurrentHouseName Current House Name
CurrentHouseParty Current House Party
CurrentSen1Gender Current Senate 1 Gender
CurrentSen1Name Current Senate 1 Name
CurrentSen1Party Current Senate 1 Party
CurrentSen2Gender Current Senate 2 Gender
CurrentSen2Name Current Senate 2 Name
CurrentSen2Party Current Senate 2 Party
GovCand1Incumbent Governor Candidate 1 Incumbent
GovCand1Name Governor Candidate 1 Name
GovCand1Party Governor Candidate 1 Party
GovCand2Name Governor Candidate 2 Name
GovCand2Party Governor Candidate 2 Party
GovCand3Name Governor Candidate 3 Name
GovCand3Party Governor Candidate 3 Party
HouseCand1Incumbent House Candidate 1 Incumbent
HouseCand1Name House Candidate 1 Name
178

Table 10 – continued from previous page
Variable Label
HouseCand1Party House Candidate 1 Party
HouseCand2Incumbent House Candidate 2 Incumbent
HouseCand2Name House Candidate 2 Name
HouseCand2Party House Candidate 2 Party
HouseCand3Name House Candidate 3 Name
HouseCand3Party House Candidate 3 Party
HouseCand4Name House Candidate 4 Name
HouseCand4Party House Candidate 4 Party
HouseCand5Name House Candidate 5 Name
HouseCand5Party House Candidate 5 Party
HouseCand6Name House Candidate 6 Name
HouseCand6Party House Candidate 6 Party
HouseCand7Name House Candidate 7 Name
HouseCand7Party House Candidate 7 Party
HouseCand8Name House Candidate 8 Name
HouseCand8Party House Candidate 8 Party
HouseCand9Name House Candidate 9 Name
HouseCand9Party House Candidate 9 Party
HouseCand10Name House Candidate 10 Name
HouseCand10Party House Candidate 10 Party
HouseCand11Name House Candidate 11 Name
HouseCand11Party House Candidate 11 Party
LegName Legislature name
LowerChamberName Lower chamber name
SenCand1Incumbent Senate Candidate 1 Incumbent
SenCand1Name Senate Candidate 1 Name
SenCand1Party Senate Candidate 1 Party
SenCand2Incumbent Senate Candidate 2 Incumbent
SenCand2Name Senate Candidate 2 Name
SenCand2Party Senate Candidate 2 Party
179

Table 10 – continued from previous page
Variable Label
SenCand3Name Senate Candidate 3 Name
SenCand3Party Senate Candidate 3 Party
SenCand4Name Senate Candidate 4 Name
SenCand4Party Senate Candidate 4 Party
CurrentGovParty post Current Governor Party - post
CurrentHouseGender post Current House Gender - post
CurrentHouseName post Current House Name - post
CurrentHouseParty post Current House Party - post
CurrentSen1Gender post Current Senate 1 Gender - post
CurrentSen1Name post Current Senate 1 Name - post
CurrentSen1Party post Current Senate 1 Party - post
CurrentSen2Gender post Current Senate 2 Gender - post
CurrentSen2Name post Current Senate 2 Name - post
CurrentSen2Party post Current Senate 2 Party - post
GovCand1Incumbent post Governor Candidate 1 Incumbent - post
GovCand1Name post Governor Candidate 1 Name - post
GovCand1Party post Governor Candidate 1 Party - post
GovCand2Incumbent post Governor Candidate 2 Incumbent - post
GovCand2Name post Governor Candidate 2 Name - post
GovCand2Party post Governor Candidate 2 Party - post
GovCand3Name post Governor Candidate 3 Name - post
GovCand3Party post Governor Candidate 3 Party - post
HouseCand1Incumbent post House Candidate 1 Incumbent - post
HouseCand1Name post House Candidate 1 Name - post
HouseCand1Party post House Candidate 1 Party - post
HouseCand2Incumbent post House Candidate 2 Incumbent - post
HouseCand2Name post House Candidate 2 Name - post
HouseCand2Party post House Candidate 2 Party - post
HouseCand3Name post House Candidate 3 Name - post
HouseCand3Party post House Candidate 3 Party - post
180

Table 10 – continued from previous page
Variable Label
HouseCand4Name post House Candidate 4 Name - post
HouseCand4Party post House Candidate 4 Party - post
HouseCand5Name post House Candidate 5 Name - post
HouseCand5Party post House Candidate 5 Party - post
HouseCand6Name post House Candidate 6 Name - post
HouseCand6Party post House Candidate 6 Party - post
HouseCand7Name post House Candidate 7 Name - post
HouseCand7Party post House Candidate 7 Party - post
HouseCand8Name post House Candidate 8 Name - post
HouseCand8Party post House Candidate 8 Party - post
HouseCand8Name post House Candidate 9 Name - post
HouseCand9Party post House Candidate 9 Party - post
HouseCand9Name post House Candidate 10 Name - post
HouseCand10Party post House Candidate 10 Party - post
HouseCand10Name post House Candidate 11 Name - post
HouseCand11Party post House Candidate 11 Party - post
HouseCand11Name post House Candidate 4 Name - post
LegName post Legislature name - post
LowerChamberName post Lower chamber name - post
SenCand1Incumbent post Senate Candidate 1 Incumbent - post
SenCand1Name post Senate Candidate 1 Name - post
SenCand1Party post Senate Candidate 1 Party - post
SenCand2Incumbent post Senate Candidate 2 Incumbent - post
SenCand2Name post Senate Candidate 2 Name - post
SenCand2Party post Senate Candidate 2 Party - post
SenCand3Name post Senate Candidate 3 Name - post
SenCand3Party post Senate Candidate 3 Party - post
SenCand4Name post Senate Candidate 4 Name - post
SenCand4Party post Senate Candidate 4 Party - post
starttime post Interview Start Time- post
181

Table 10 – continued from previous page
Variable Label
endttime post Interview End Time- post
starttime pre Interview Start Time
182
