C Tick 550987
2016-04-12
: Pdf C-Tick 550987 C-Tick_550987 CertsReports 550987 ProductFiles
Open the PDF directly: View PDF ![]() .
.
Page Count: 28
Compliance Certification Services Inc. Report No.:91210303-C
Page 1 of 28
C-TICK AS/NZS CISPR 22
TEST REPORT
For
IP Cam
Model : D510E
Trade Name : ZAVIO
Issued for
ZAVIO Inc.
B3,1F,NO. 1,Lising 1st Rd., Science-Based Industrial Park,Hsinchu,Taiwan
Issued by
Compliance Certification Services Inc.
Hsinchu Lab.
NO. 989-1 Wen Shan Rd., Shang Shan Village,
Qionglin Shiang Hsinchu County 30741, Taiwan, R.O.C
TEL: +886-3-5921698
FAX: +886-3-5921108
Note: This report shall not be reproduced except in full, without the written approval of
Compliance Certification Services Inc. This document may be altered or revised by Compliance
Certification Services Inc. personnel only, and shall be noted in the revision section of the document.
The client should not use it to claim product endorsement by TAF or any
government agencies. The test results in the report only apply to the tested sample.
Compliance Certification Services Inc. Report No.:91210303-C
Page 2 of 28
Revision History
Rev. Issue Date Revisions Effect Page Revised By
00 12/25/2009 Initial Issue All Page 28 Alan Fan

Compliance Certification Services Inc. Report No.:91210303-C
Page 3 of 28
TABLE OF CONTENTS
TITLE PAGE NO.
1. TEST REPORT CERTIFICATION............................................................................................4
2. EUT DESCRIPTION...................................................................................................................5
2.1 DESCRIPTION OF EUT & POWER................................................................................................. 5
3. DESCRIPTION OF TEST MODES...........................................................................................5
4. TEST METHODOLOGY.............................................................................................................5
5. FACILITIES AND ACCREDITATION.....................................................................................6
5.1 FACILITIES ....................................................................................................................................... 6
5.2 EQUIPMENT ..................................................................................................................................... 6
5.3 LABORATORY ACCREDITATIONS LISTINGS................................................................................ 6
5.4 LABORATORY ACCREDITATIONS AND LISTINGS....................................................................... 7
6. CALIBRATION AND UNCERTAINTY.....................................................................................8
6.1 MEASURING INSTRUMENT CALIBRATION .................................................................................. 8
6.2 MEASUREMENT UNCERTAINTY.................................................................................................... 8
7. SETUP OF EQUIPMENT UNDER TEST ................................................................................9
8. EMISSION TEST........................................................................................................................10
8.1 RADIATED EMISSIONS.................................................................................................................... 10-14
8.2 POWERLINE CONDUCTED EMISSIONS........................................................................................ 15-24
APPENDIX SETUP PHOTOS........................................................................................................25-28
Compliance Certification Services Inc. Report No.:91210303-C
Page 4 of 28
1. TEST REPORT CERTIFICATION
Applicant :ZAVIO Inc.
Address :B3,1F,NO. 1,Lising 1st Rd., Science-Based Industrial
Park,Hsinchu,Taiwan
Equipment Under Test :IP Cam
Model :D510E
Trade Name :ZAVIO
Tested Date :December 07 ~ 10, 2009
APPLICABLE STANDARD
STANDARD TEST RESULT
AS/NZS CISPR 22, CLASS B:2006 PASS
WE HEREBY CERTIFY THAT: The measurements shown in the attachment were made in
accordance with the procedures indicated, and the energy emitted by the equipment was found
to be within the limits applicable. We assume full responsibility for the accuracy and
completeness of these measurements and vouch for the qualifications of all persons taking
them.
Compliance Certification Services Inc. Report No.:91210303-C
Page 5 of 28
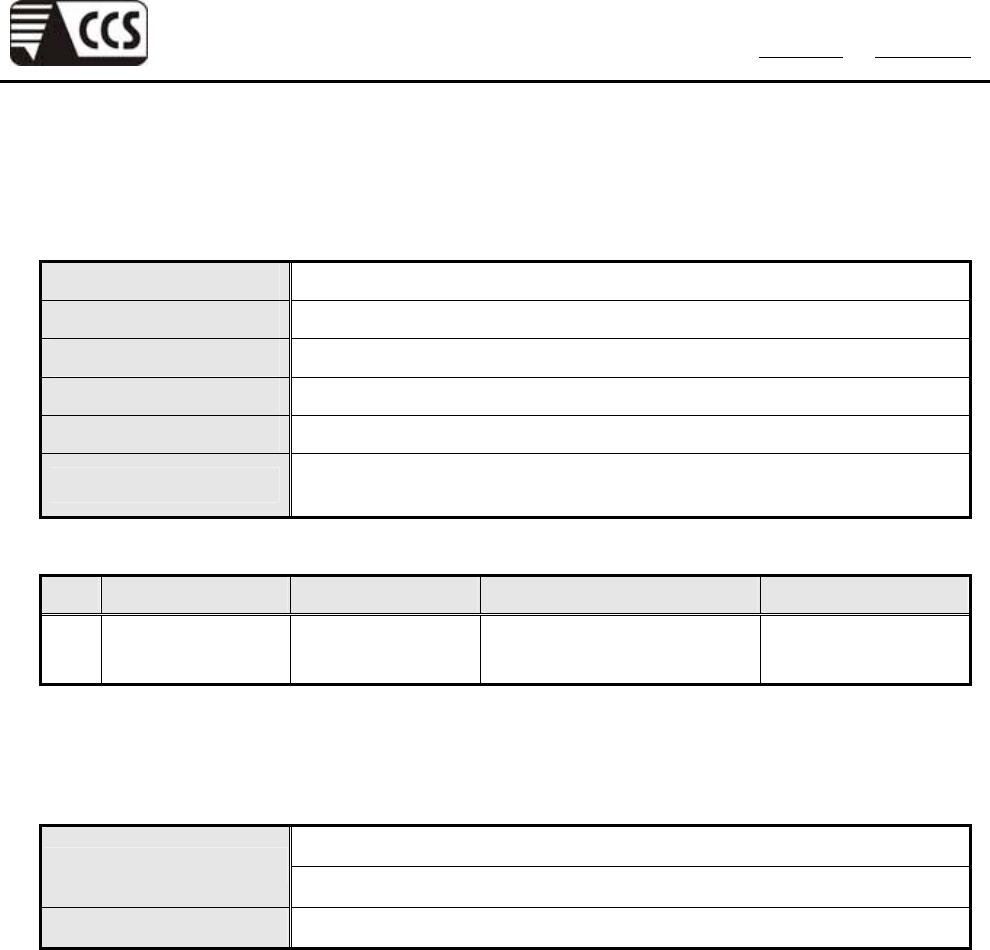
2. EUT DESCRIPTION
2.1 DESCRIPTION OF EUT & POWER
Product Name IP Cam
Model Number D510E
Trade Name ZAVIO
Power Source 12VDC(From Power Adapter)
DC Power Cord Type Unshielded cable, 1.8 m (no detachable)
I/O Port RJ-45 port × 1, Audio In port × 1, Audio Out port × 1, Power port × 1,
DI/DO port × 1
Power Adapter :
No. Manufacturer Model No. Power Input Power Output
1 FAIRWAY WRG15F-120B 100-240VAC , 1.0A max ,
50/60Hz 12V, 1.25A
Remark: For more details, please refer to the User’s manual of the EUT.
3. DESCRIPTION OF TEST MODES
AC mode (From Adapter power supply)
Radiation test mode POE mode(From POE switch Hub )
Conduction test mode AC mode (From Adapter power supply)
Remark: The EUT had been tested under normal operating condition
4. TEST METHODOLOGY
The tests documented in this report were performed in accordance with AS/NZS CISPR 22.

Compliance Certification Services Inc. Report No.:91210303-C
Page 6 of 28
5. FACILITIES AND ACCREDITATION
5.1 FACILITIES
All measurement facilities used to collect the measurement data are located at
NO. 989-1 Wen Shan Rd., Shang Shan Village, Qionglin Shiang Hsinchu County
30741, Taiwan, R.O.C
The sites are constructed in conformance with the requirements of ANSI C63.7, ANSI C63.4 :
2003 and CISPR Publication 22.
5.2 EQUIPMENT
Radiated emissions are measured with one or more of the following types of linearly polarized
antennas: tuned dipole, biconical, log periodic, bi-log, and/or ridged waveguide, horn.
Spectrum analyzers with preselectors and quasi-peak detectors are used to perform radiated
measurements.
Conducted emissions are measured with Line Impedance Stabilization Networks and EMI
Test Receivers.
Calibrated wideband preamplifiers, coaxial cables, and coaxial attenuators are also used for
making measurements.
All receiving equipment conforms to CISPR Publication 16-1, “Radio Interference Measuring
Apparatus and Measurement Methods.”
5.3 LABORATORY ACCREDITATIONS LISTINGS
The test facilities used to perform radiated and conducted emissions tests are accredited by
Taiwan Accreditation Foundation for the specific scope of accreditation under Lab Code:
0240 to perform Electromagnetic Interference tests according to FCC PART 15 AND CISPR
22 requirements. No part of this report may be used to claim or imply product endorsement by
TAF or any agency of the Government. In addition, the test facilities are listed with Federal
Communications Commission (registration no: 90585 and 90584).
Compliance Certification Services Inc. Report No.:91210303-C
Page 7 of 28
5.4 LABORATORY ACCREDITATIONS AND LISTINGS
Country Agency Scope of Accreditation Logo
USA FCC
3/10 meter Open Area Test Sites to perform FCC
Part 15/18 measurements
90585, 90584
Taiwan TAF
FCC Method-47 CFR Part 15 Subpart C,D,E
CISPR 11, FCC METHOD-47 CFR Part 18, EN
55011, CNS 13803, CISPR 13, CNS 13439, FCC
Method-47 CFR Part 15 Subpart B, CISPR 14-1,
EN 55014-1, CNS 13783-1, EN 55015, CNS
14115, CISPR 22, EN 55022, VCCI CNS 13438,
EN 61000-4-2/3/4/5/6/8/11
Taiwan BSMI
CNS 13803, CNS 13438, CNS 13439,
CNS 13783-1, CNS 14115
SL2-IS-E-0002
SL2-IN-E-0002
SL2-A1-E-0002
SL2-R1-E-0002
SL2-R2-E-0002
SL2-L1-E-0002
* No part of this report may be used to claim or imply product endorsement by TAF or any agency of the
US Government.
Compliance Certification Services Inc. Report No.:91210303-C
Page 8 of 28
6. CALIBRATION AND UNCERTAINTY
6.1 MEASURING INSTRUMENT CALIBRATION
The measuring equipment utilized to perform the tests documented in this report has been
calibrated in accordance with the manufacturer’s recommendations, and is traceable to
recognized national standards.
6.2 MEASUREMENT UNCERTAINTY
Where relevant, the following measurement uncertainty levels have been estimated for tests
performed on the apparatus:
PARAMETER UNCERTAINTY
Radiated Emission, 30 to 1000 MHz +/- 3.2 dB
Radiated Emission, 1 to 26.5 GHz +/- 3.2 dB
Power Line Conducted Emission +/- 2.1 dB
This uncertainty represents an expanded uncertainty expressed at approximately the 95%
confidence level using a coverage factor of k=2.
Compliance Certification Services Inc. Report No.:91210303-C
Page 9 of 28
7. SETUP OF EQUIPMENT UNDER TEST
SUPPORT EQUIPMENT
No. Product Manufacturer Model No. Serial No. FCC ID
1 Notebook PC DELL PP01L
CN-09C748-48155-1AP-
6630 DOC
2 Multi-media Stereo
Headset KINYO EM-3000 4712257589073 -----
3 8-poer fast Ethernet
PoE Switch Air Live POE-FSH804 POEF80411700328 DOC
No. Signal cable description
1 Unshielded RJ-45 cable , 10 m × 1
2 Unshielded RJ-45 cable , 1.8 m × 1
SETUP DIAGRAM FOR TESTS
EUT & peripherals setup diagram is shown in appendix setup photos.
EUT OPERATING CONDITION
All the equipment/cables were placed in the worst-case configuration to maximize the emission during
the test. Grounding was established in accordance with the manufacturer’s requirements and
conditions for the intended use.
1. Setup whole system for test as shown on diagram
2. Notebook PC ping 192.168.1.81 to EUT.
3. Audio In/Out link Headset/Microphone.
4. All of the function are under run.
5. Start test.
Compliance Certification Services Inc. Report No.:91210303-C
Page 10 of 28
8. EMISSION TEST
8.1 RADIATED EMISSIONS
LIMITS
All emanation from a class B computing device or system , including any network of
conductors and apparatus connected thereto, shall not exceed the level of field strengths specified
below:
For Frequency Below 1GHz
Field Strength Quasi-peak limits (dBµV/m) Frequency range
(MHz) Class A Class B Distance
(meters)
30 - 230 40 30 10
230 - 1000 47 37 10
Note:(1) The lower limit shall apply at the transition frequency.
(2) Additional provisions may be required for cases where interference occurs.
(3) The tighten limit shall apply at the edge between two frequency bands.
(4) Distance refers to the distance in meters between the measuring instrument antenna and the
closest point of any part of the device or system.
For Frequency Above 1GHz
Field Strength Limit (dBµV/m)
Class A Class B
Frequency range
(GHz) Peak Average Peak Average
Distance
(meters)
1 - 3 76 56 70 50 3
3 - 6 80 60 74 54 3
Note:(1) The lower limit applies at the transition frequency.
Compliance Certification Services Inc. Report No.:91210303-C
Page 11 of 28
TEST EQUIPMENT
Name of Equipment Manufacturer Model Serial Number Calibration Due
BILOG ANTENNA SCHAFFER CBL6112B 2696 09/09/2010
EMI TEST RECEIVER R & S ESCS30 835418/008 10/14/2010
N TYPE COAXIAL
CABLE MIYAZAKIN 8D-FB 03 07/26/2010
Pre-amplifier Agilent 8447D
2944A10052 07/26/2010
SPECTRUM
ANALYZER AGILENT E4446A MY43360132 06/09/2010
SPECTRUM
ANALYZER AGILENT E4446A MY46180323 05/26/2010
EMI TEST RECEIVER R & S ESCI 100221 05/17/2010
BILOG ANTENNA SCHWARZBECK VULB 9168_249 09/17/2010
Double-Ridged
Waveguide Horn ETS LINDGREN 3117 00078732 06/30/2010
Notch Filters
Band Reject Micro-Tronics BRM50702-01 009 N.C.R.
RF COAXIAL CABLE HUBERSUHNER SUCOFLEX
104PEA SN31350 07/21/2010
Remark: 1. Each piece of equipment is scheduled for calibration once a year.
2. N.C.R = No Calibration Request.
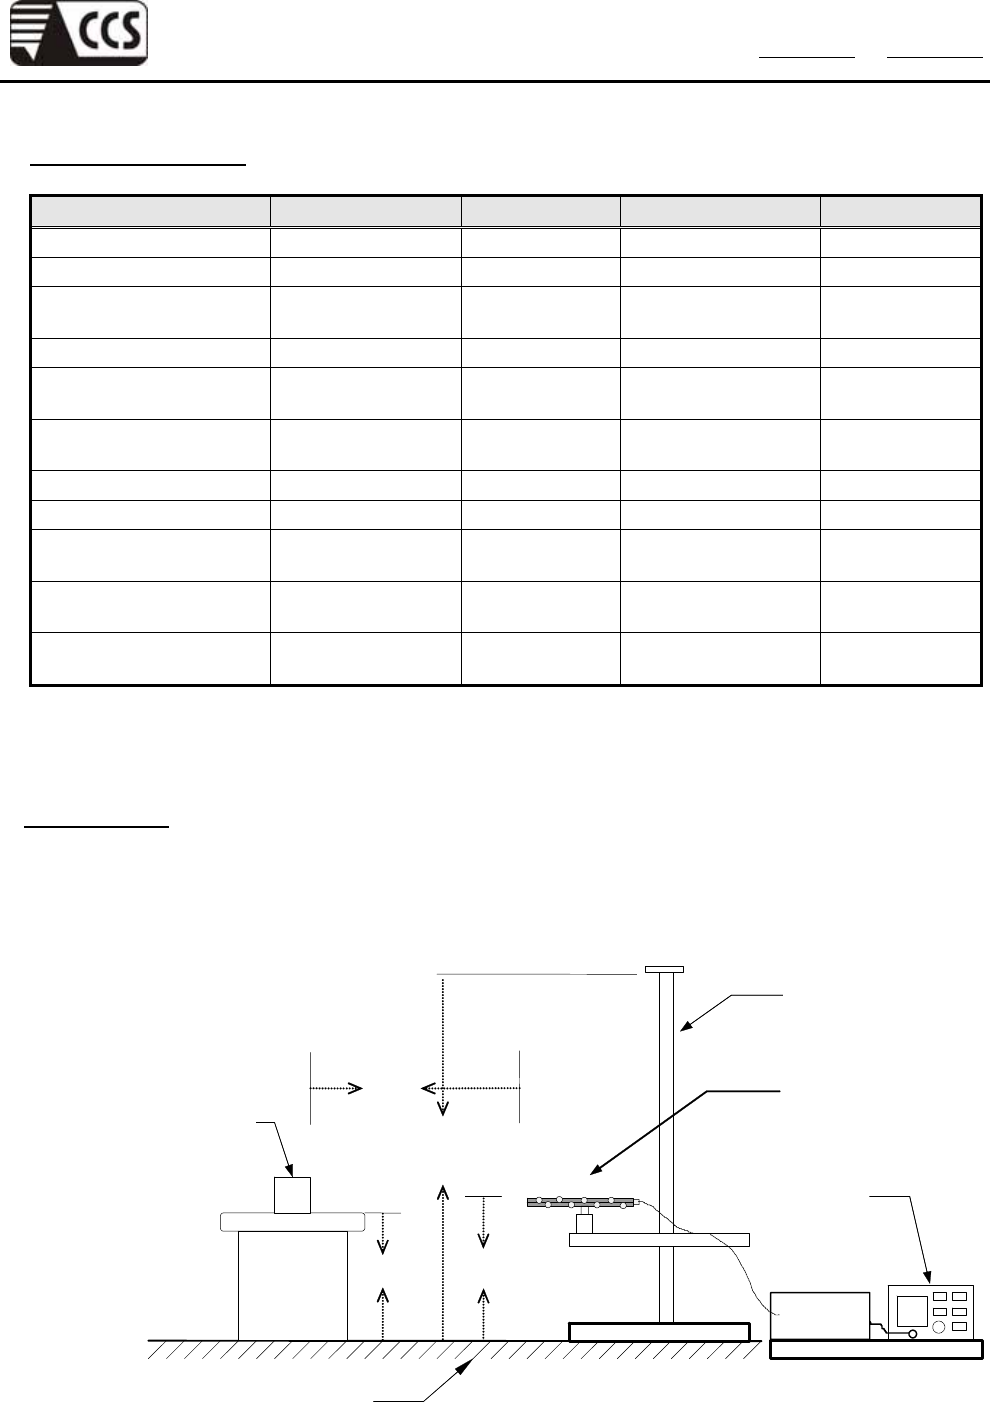
TEST SETUP
The diagram below shows the test setup which is utilized to make these measurements for
emission from so to 1GHz
EMI
Receiver
10m
1~4m
1m
Turntable
EUT
0.8m
Antenna
tower
Reference ground plane
Bi-log
antenna
Pre-amp
Coaxial Cable
The diagram below shows the test setup that is utilized to make the measurements for emission
above 1GHz.
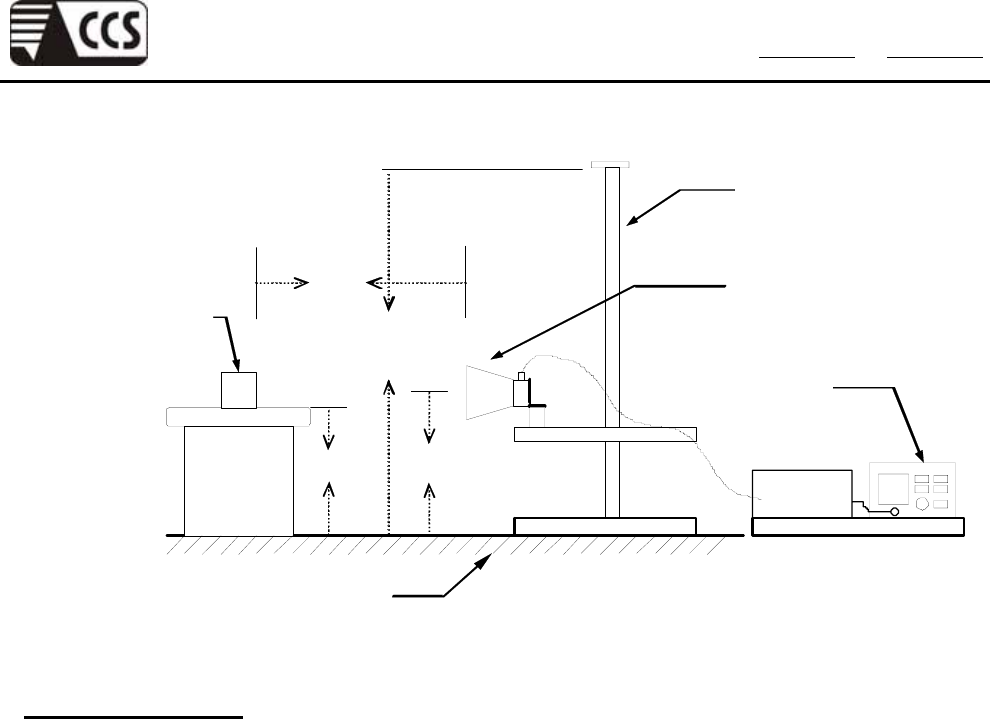
Compliance Certification Services Inc. Report No.:91210303-C
Page 12 of 28
Spectru
m
analyzer
Horn
antenna
3m
1~4
m
1m
Turntable
EUT
0.8m
Antenna
tower
Pre-amp
Reference ground plane
Coaxial Cable
TEST PROCEDURE
The devices under test were placed on a rotatable table top 0.8 meter above ground. The table
was rotated 360 degrees to determine the position of the highest radiation. EUT is set 3 or 10
meters from the interference receiving antenna which is mounted on the top of a variable height
mast. The antenna height is varied between one meter and four meters above ground to find the
maximum value of the field strength both horizontal polarization and vertical polarization of the
antenna are set to make the measurement.
Note:
1. The bandwidth setting on the E.M.I. meter (R/S TEST RECEIVER) is 120 KHz. The
levels are quasi peak value readings. The frequency spectrum from 30MHz to
1000MHz was investigated.
2. The resolution bandwidth and video bandwidth of test receiver/spectrum analyzer is 1
MHz for Peak detection and frequency above 1GHz.
3. The resolution bandwidth of test receiver/spectrum analyzer is 1 MHz and the video
bandwidth is 10 Hz for Average detection (AV) at frequency above 1GHz.
Compliance Certification Services Inc. Report No.:91210303-C
Page 13 of 28
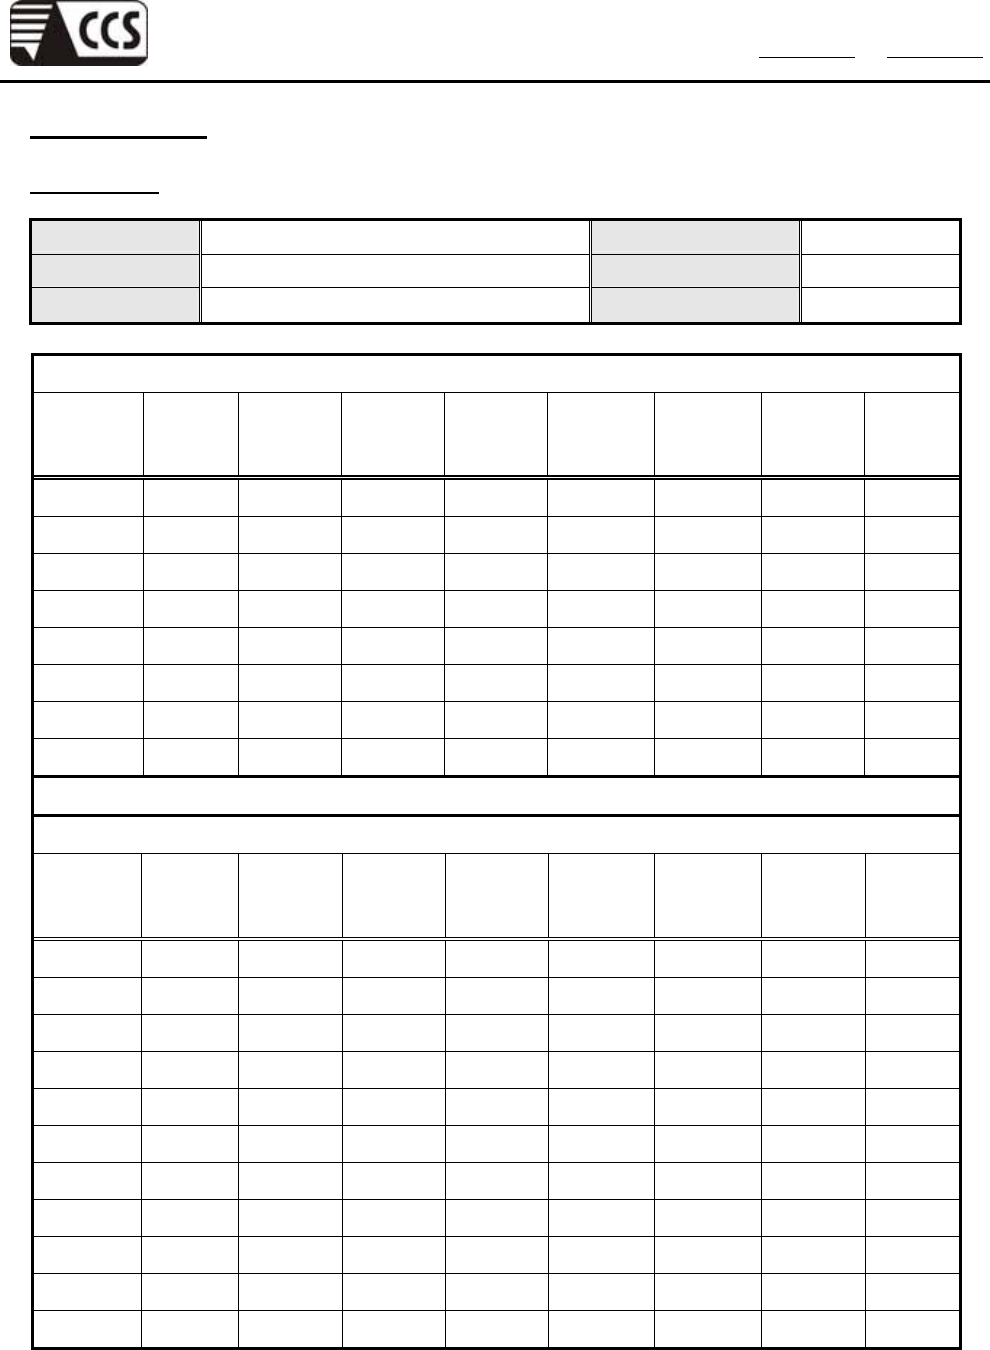
TEST RESULTS
Below 1GHz
Product Name IP Cam Test Date 2009/12/09
Model D510E Test By Eden Zhan
Test Mode Normal operating / AC Mode TEMP & Humidity 21°C, 74%
Open Site at 10Meter / Horizontal
Frequency
(MHz)
Antenna
Factor
(dB/m)
Pre Amp.
Gain
(dB)
Cable
Loss
(dB)
Meter
Reading
(dBµV)
Limits
(dBµV/m)
Emission
Level
(dBµV/m)
Margin
Limit
(dB) Remark
125.00 11.51 29.10 1.69 43.70 30.00 27.80 -2.20 QP
199.07 9.03 28.71 2.18 40.30 30.00 22.80 -7.20 QP
298.61 13.18 28.39 2.88 47.50 37.00 35.16 -1.84 QP
398.15 15.63 29.10 3.44 40.50 37.00 30.48 -6.52 QP
696.76 18.86 29.70 4.90 37.30 37.00 31.36 -5.64 QP
791.99 19.83 29.50 5.33 37.20 37.00 32.86 -4.14 QP
887.99 20.61 29.02 5.71 36.30 37.00 33.60 -3.40 QP
935.99 20.96 28.76 5.91 34.00 37.00 32.11 -4.89 QP
Open Site at 10Meter / Vertical
Frequency
(MHz)
Antenna
Factor
(dB/m)
Pre Amp.
Gain
(dB)
Cable
Loss
(dB)
Meter
Reading
(dBµV)
Limits
(dBµV/m)
Emission
Level
(dBµV/m)
Margin
Limit
(dB) Remark
86.99 8.51 29.41 1.41 47.14 30.00 27.66 -2.34 QP
96.69 9.88 29.26 1.48 45.60 30.00 27.70 -2.30 QP
108.00 10.85 29.15 1.57 43.98 30.00 27.25 -2.75 QP
125.00 11.51 29.10 1.69 45.50 30.00 29.60 -0.40 QP
199.07 9.03 28.71 2.18 43.50 30.00 26.00 -4.00 QP
298.61 13.18 28.39 2.88 46.50 37.00 34.16 -2.84 QP
398.15 15.63 29.10 3.44 38.80 37.00 28.78 -8.22 QP
695.99 18.85 29.70 4.90 32.10 37.00 26.16 -10.84 QP
791.99 19.83 29.50 5.33 37.00 37.00 32.66 -4.34 QP
887.99 20.61 29.02 5.71 37.80 37.00 35.10 -1.90 QP
935.99 20.96 28.76 5.91 34.90 37.00 33.01 -3.99 QP
Remark:
1. Quasi-peak test would be performed if the peak result were greater than the quasi-peak limit.
2. Data of measurement within this frequency range shown " --- " in the table above means the reading of
emissions are attenuated more than 20dB below the permissible limits or the field strength is too small
to be measured.
3 .Emission Level = Antenna Factor (dB/m) + Cable Loss (dB) + Meter Reading (dBµV) – PreAmp.Gain (dB)
4. Margin (dB) = Emission Level (dBuV/m) - Quasi-peak limit (dBuV/m)
Compliance Certification Services Inc. Report No.:91210303-C
Page 14 of 28
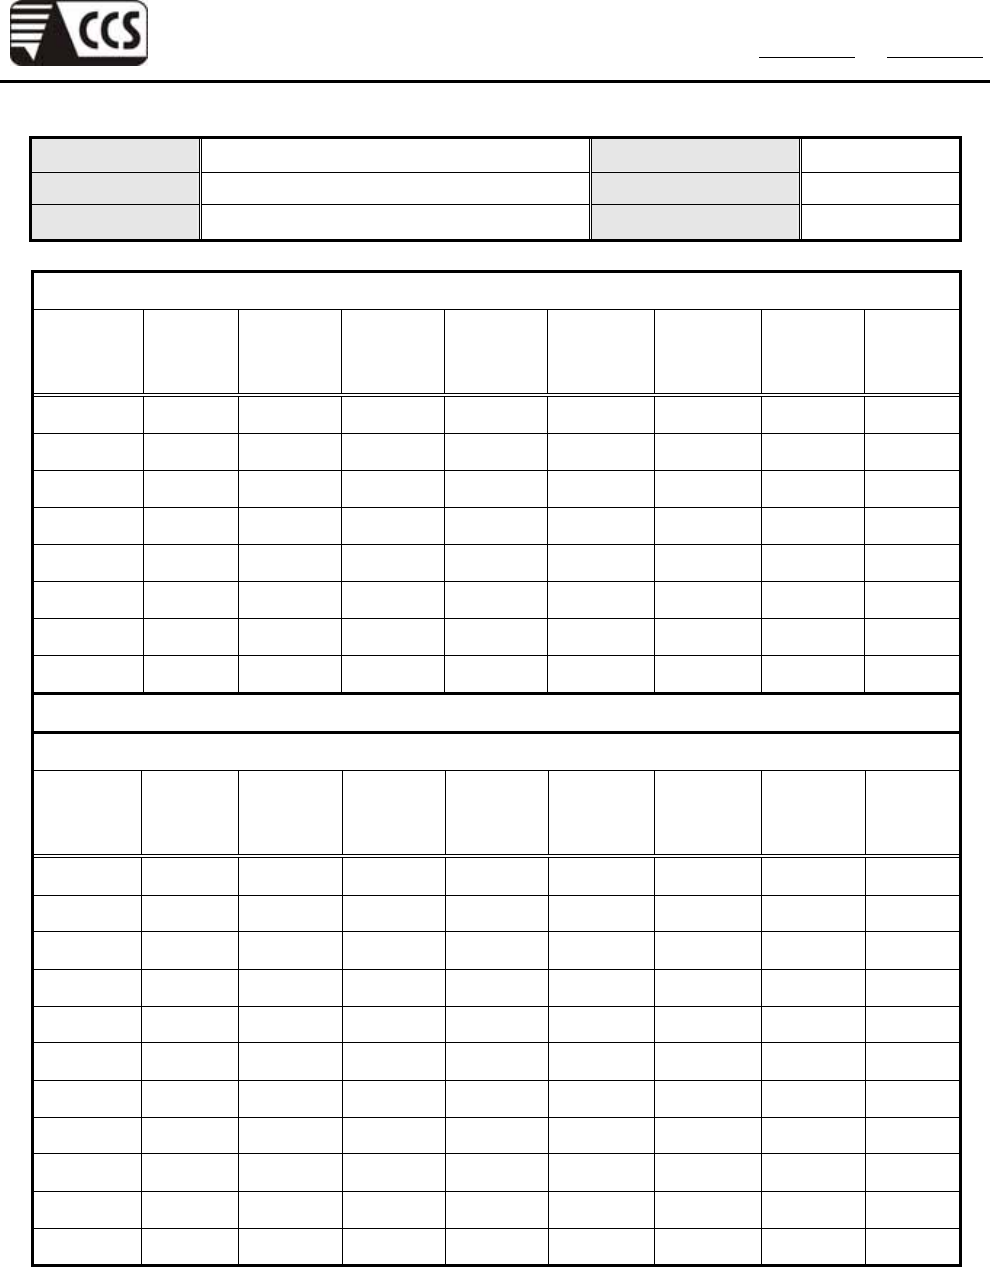
Product Name IP Cam Test Date 2009/12/09
Model D510E Test By Eden Zhan
Test Mode Normal operating / POE Mode TEMP & Humidity 21℃, 74%
Open Site at 10Meter / Horizontal
Frequency
(MHz)
Antenna
Factor
(dB/m)
Pre Amp.
Gain
(dB)
Cable
Loss
(dB)
Meter
Reading
(dBµV)
Limits
(dBµV/m)
Emission
Level
(dBµV/m)
Margin
Limit
(dB) Remark
125.00 11.51 29.10 1.69 30.50 30.00 14.60 -15.40 QP
199.07 9.03 28.71 2.18 33.50 30.00 16.00 -14.00 QP
298.61 13.18 28.39 2.88 47.50 37.00 35.16 -1.84 QP
398.15 15.63 29.10 3.44 40.50 37.00 30.48 -6.52 QP
696.76 18.86 29.70 4.90 36.20 37.00 30.26 -6.74 QP
791.99 19.83 29.50 5.33 37.90 37.00 33.56 -3.44 QP
887.99 20.61 29.02 5.71 36.40 37.00 33.70 -3.30 QP
935.99 20.96 28.76 5.91 33.70 37.00 31.81 -5.19 QP
Open Site at 10Meter / Vertical
Frequency
(MHz)
Antenna
Factor
(dB/m)
Pre Amp.
Gain
(dB)
Cable
Loss
(dB)
Meter
Reading
(dBµV)
Limits
(dBµV/m)
Emission
Level
(dBµV/m)
Margin
Limit
(dB) Remark
91.69 9.20 29.36 1.44 46.21 30.00 27.49 -2.51 QP
106.00 10.72 29.16 1.56 43.91 30.00 27.02 -2.98 QP
125.00 11.51 29.10 1.69 42.70 30.00 26.80 -3.20 QP
199.07 9.03 28.71 2.18 42.60 30.00 25.10 -4.90 QP
216.00 10.13 28.65 2.29 43.60 30.00 27.37 -2.63 QP
298.61 13.18 28.39 2.88 46.20 37.00 33.86 -3.14 QP
398.15 15.63 29.10 3.44 39.50 37.00 29.48 -7.52 QP
695.99 18.85 29.70 4.90 32.30 37.00 26.36 -10.64 QP
791.99 19.83 29.50 5.33 37.30 37.00 32.96 -4.04 QP
887.99 20.61 29.02 5.71 37.50 37.00 34.80 -2.20 QP
935.99 20.96 28.76 5.91 33.50 37.00 31.61 -5.39 QP
Remark:
1. Quasi-peak test would be performed if the peak result were greater than the quasi-peak limit.
2. Data of measurement within this frequency range shown " --- " in the table above means the reading of
emissions are attenuated more than 20dB below the permissible limits or the field strength is too small
to be measured.
3 .Emission Level = Antenna Factor (dB/m) + Cable Loss (dB) + Meter Reading (dBµV) – PreAmp.Gain (dB)
4. Margin (dB) = Emission Level (dBuV/m) - Quasi-peak limit (dBuV/m)
Compliance Certification Services Inc. Report No.:91210303-C
Page 15 of 28
8.2 POWERLINE CONDUCTED EMISSIONS
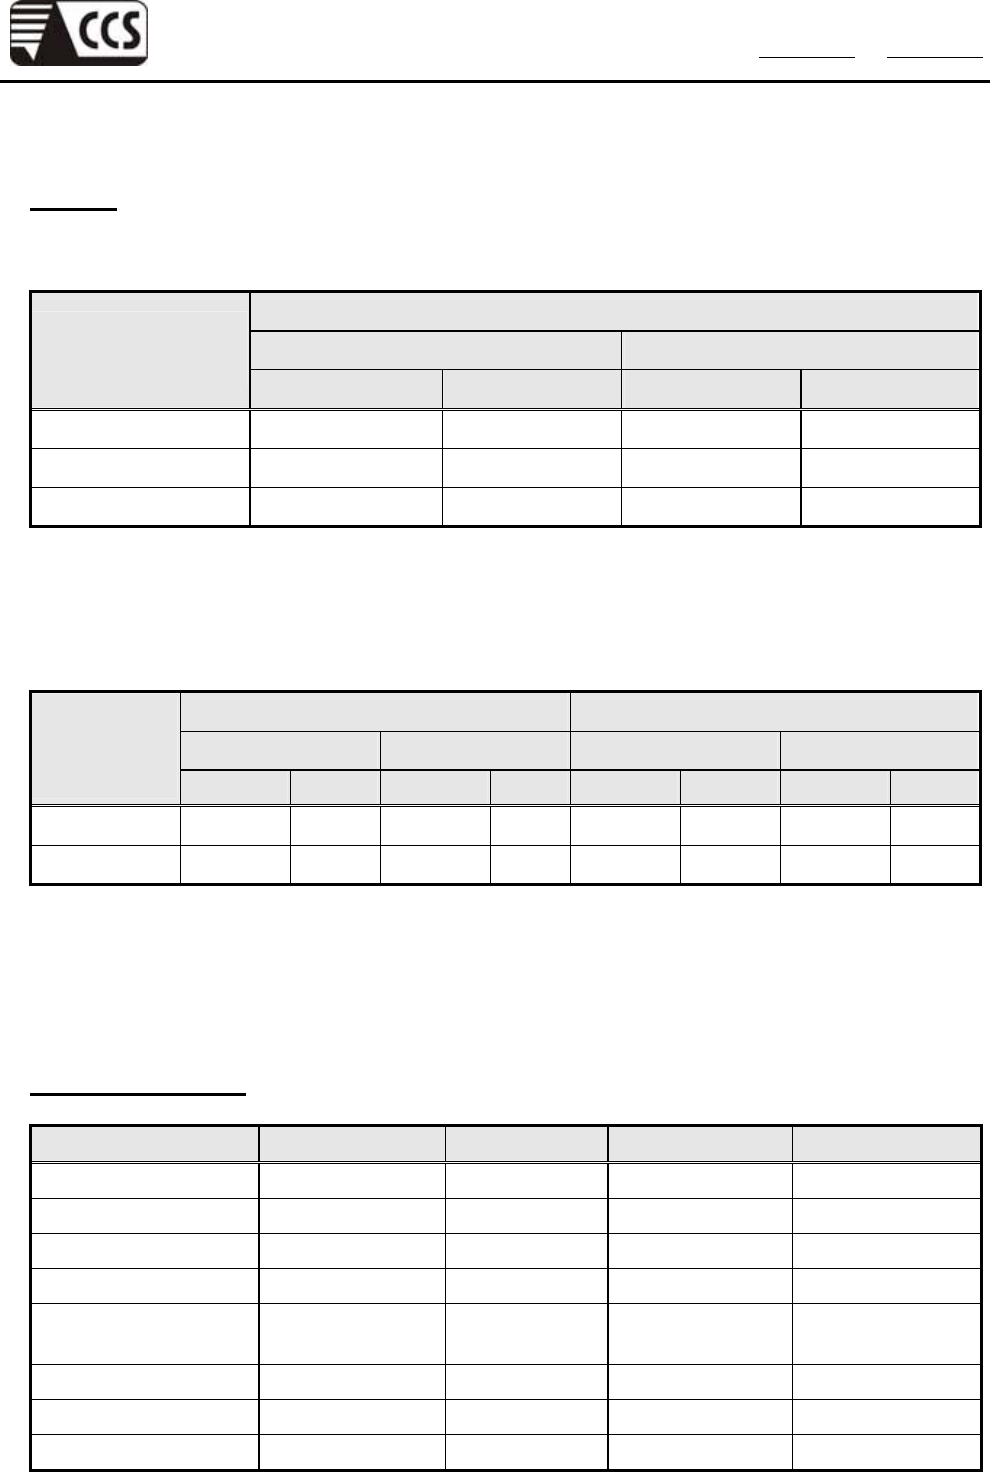
LIMITS
(1) Power Line Conducted Emission
Voltage Limits (dBµV)
Class A Class B
Frequency range
(MHz) Quasi-peak Average Quasi-peak Average
0.15 - 0.50 79 66 66 - 56* 56 - 46*
0.50 - 5.00 73 60 56 46
5.00 - 30.0 73 60 60 50
Note: (1) The limit decreases linearly with logarithm of the frequency in the range 0.15 MHz to 0.50 MHz.
(2) The lower limit shall apply at the transition frequency.
(3) * Decreasing linearly with the logarithm of the frequency.
(2) Common Mode Conducted Emission (Telecommunication Ports)
Voltage Limits (dBµV) Current Limits (dBµA)
Class A Class B Class A Class B
Frequency
range
(MHz) Quasi-peak Average Quasi-peak Average Quasi-peak Average Quasi-peak Average
0.15 - 0.50 97 - 87 84 - 74 84 - 74 74 - 64 53 - 43 40 - 30 40 - 30 30 - 20
0.50 - 30.0 87 74 74 64 43 30 30 20
Note: (1) The limit decreases linearly with logarithm of the frequency in the range 0.15 MHz to 0.50 MHz.
(2) The current and voltage disturbance limits are derived for use with an impedance stabilization
network (ISN) which presents a common mode (asymmetric mode) impedance of 150Ω to the
telecommunication port under test (conversion factor is 20 log10 150 / I = 44 dB).
TEST EQUIPMENT
Name of Equipment Manufacturer Model Serial Number Calibration Due
L.I.S.N SCHWARZBECK NSLK 8127 8127-465 08/13/2010
TEST RECEIVER R & S ESHS 30 838550/003 02/02/2010
TEST RECEIVER R & S ESCS 30 826547/004 08/05/2010
PULSE LIMIT R & S ESH3-Z2 100117 09/17/2010
N TYPE COAXIAL
CABLE BELDEN 8268 M17/164 003 07/09/2010
I.S.N. SCHAFFNER T800 24313 05/25/2010
CURRENT PROBE SCHAFFNER SMZ11 14802 11/30/2010
FERRITE CLAMP SCHAFFNER KEMA 801 15937 05/25/2010
Remark: Each piece of equipment is scheduled for calibration once a year.
Compliance Certification Services Inc. Report No.:91210303-C
Page 16 of 28
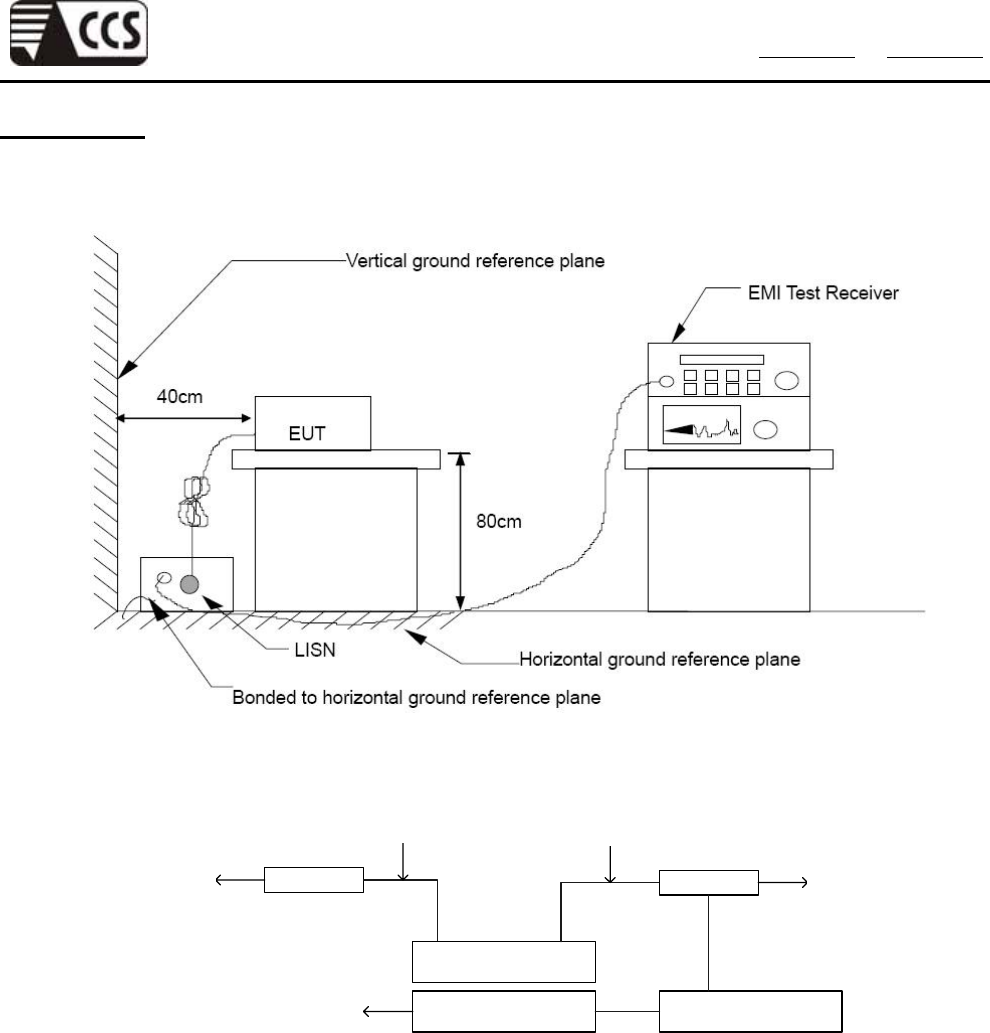
TEST SETUP
(1) Power Line
L.I.S.N.
230VAC
/ 50Hz
EUT & Peripherals
Powerline of
Peripherals
L.I.S.N.
Powerline of
EUT
230,240VAC
/ 50Hz
EMI Test ReceiverIsolate Transformer
230VAC
/ 50Hz
Compliance Certification Services Inc. Report No.:91210303-C
Page 17 of 28
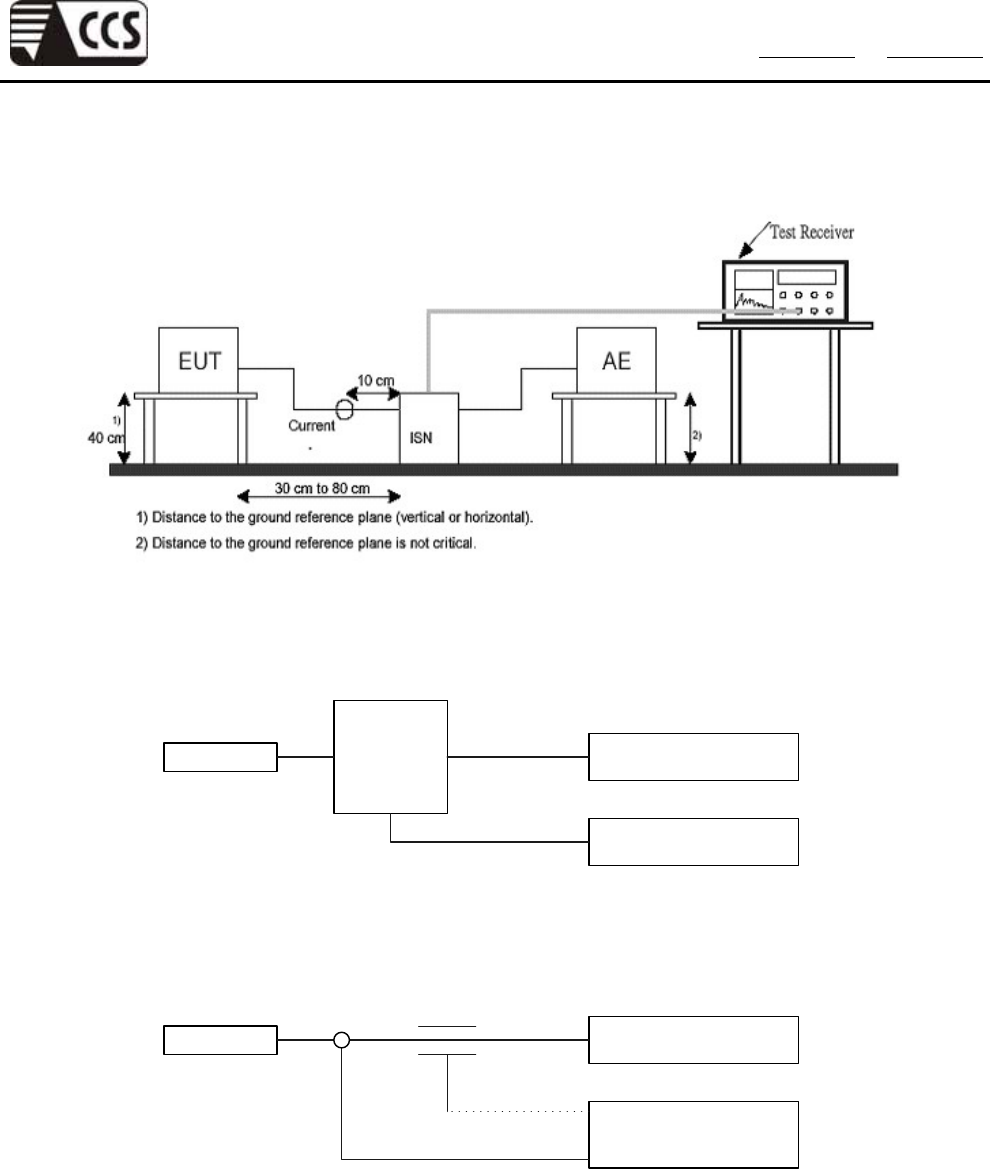
(2) Common Mode
I.S.N.
o.r.
C.D.N.
EUT Peripherals
EMI Test Receiver
EUT Peripherals
EMI Test Receiver
Current probe Capacitive voltage probe

Compliance Certification Services Inc. Report No.:91210303-C
Page 18 of 28
TEST PROCEDURE
(1) Power Line
The test procedure is performed in a 4m × 3m × 2.4m(L×W×H) shielded room.
The EUT along with its peripherals were placed on a 1.0m(W)× 1.5m(L) and 0.8m in height
wooden table and the EUT was adjusted to maintain a 0.4 meter space from a vertical reference
plane. The EUT was connected to power mains through a line impedance stabilization network
(LISN) which provides 50 ohm coupling impedance for measuring instrument and the chasis
ground was bounded to the horizontal ground plane of shielded room. All peripherals were
connected to the second LISN and the chasis ground also bounded to the horizontal ground plane
of shielded room. The excess power cable between the EUT and the LISN was bundled. The power
cables of peripherals were unbundled. All connecting cables of EUT and peripherals were moved
to find the maximum emission.
(2) Common Mode
For I.S.N. or C.D.N.
The test is performed in a 4m × 3m × 2.4m(L×W×H) shielded room. The EUT was placed on a
1.0m(W)× 1.5m(L) and 0.8m (H) wooden table and the EUT was adjusted to maintain a 0.8m
space from the used I.S.N. or C.D.N. The used I.S.N. or C.D.N. is bonded to the horizontal ground
plane of the shielded room. The Telecom port of EUT is connected to the I.S.N. or C.D.N through
the designated cable with specified longitudinal conversion loss (LCL). Also the telecom port of
relevant peripheral is connected to the I.S.N or C.D.N. through the designated cable. RF output
port of I.S.N. or C.D.N. is connected to test receiver through coaxial cable for measurement.
For Current probe / Capacitive voltage probe
The test is performed in a 4m × 3m × 2.4m(L×W×H) shielded room. The EUT was placed on a
1.0m(W) × 1.5m(L) and 0.8m (H) wooden table and the current probe / capacitive voltage probe is
adjusted to maintain a 0.3m to 0.8m space from the EUT. The telecom port of the EUT is
connected to the relevant peripheral through the designated cable with specified longitudinal
conversion loss (LCL). RF output port of the probes is connected to test receiver through coaxial
cable for measurement. When deriving final result, the transfer factor of probe should be taken into
consideration.
Compliance Certification Services Inc. Report No.:91210303-C
Page 19 of 28
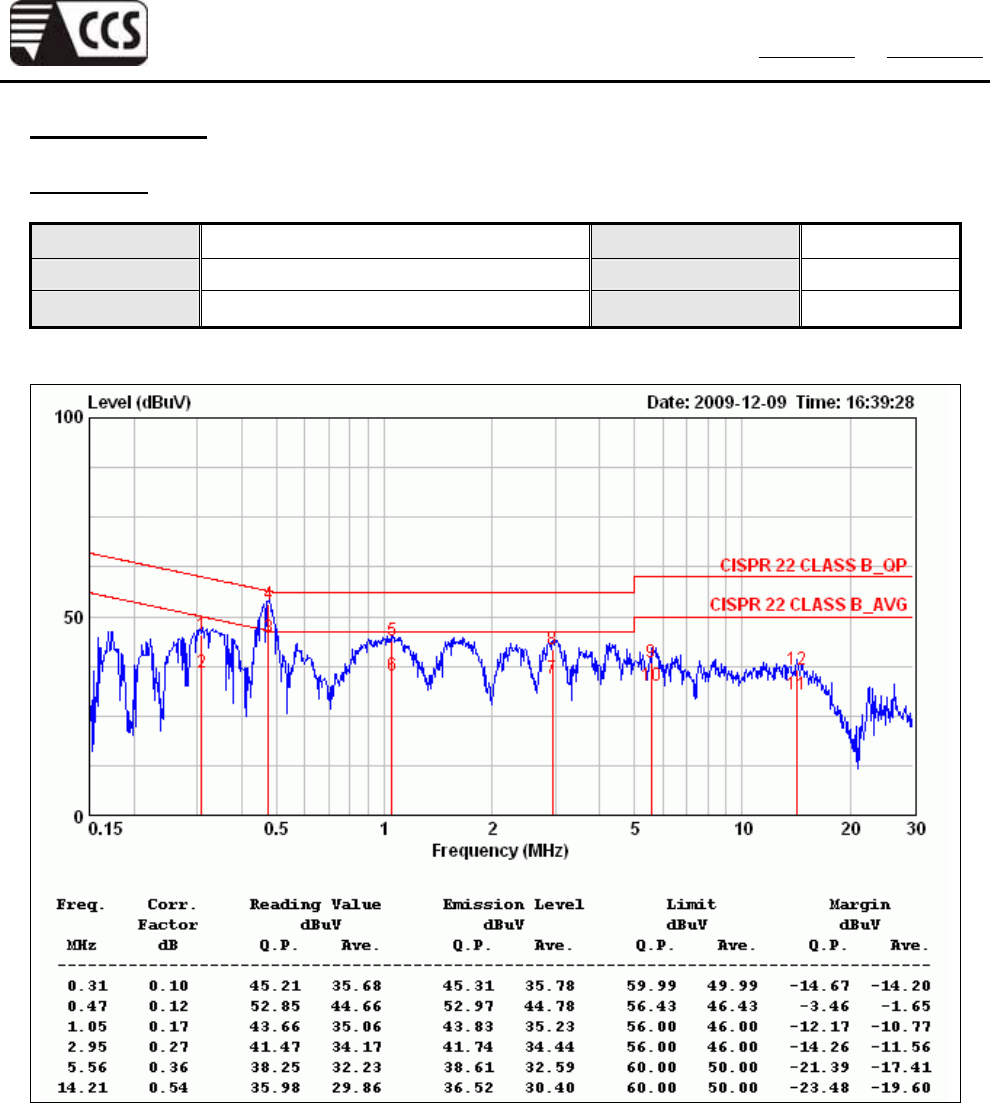
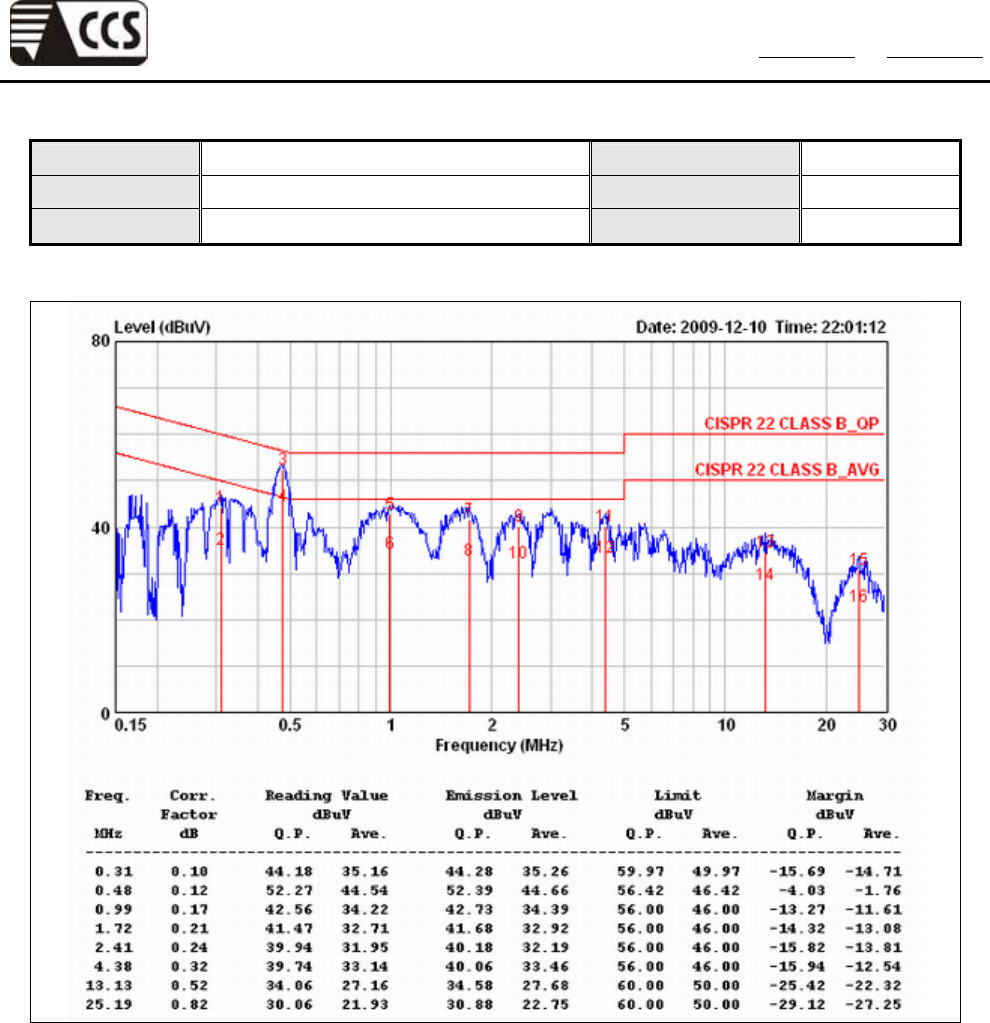
TEST RESULTS
Power Line
Product Name IP Cam Test Date 2009/12/09
Model D510E Test By Joe Peng
Test Mode Normal operating TEMP & Humidity 22.4°C, 47%
LINE
Remark:
1. Correction Factor = Insertion loss + cable loss
2. Margin value = Emission level – Limit value
3. For 230VAC

Compliance Certification Services Inc. Report No.:91210303-C
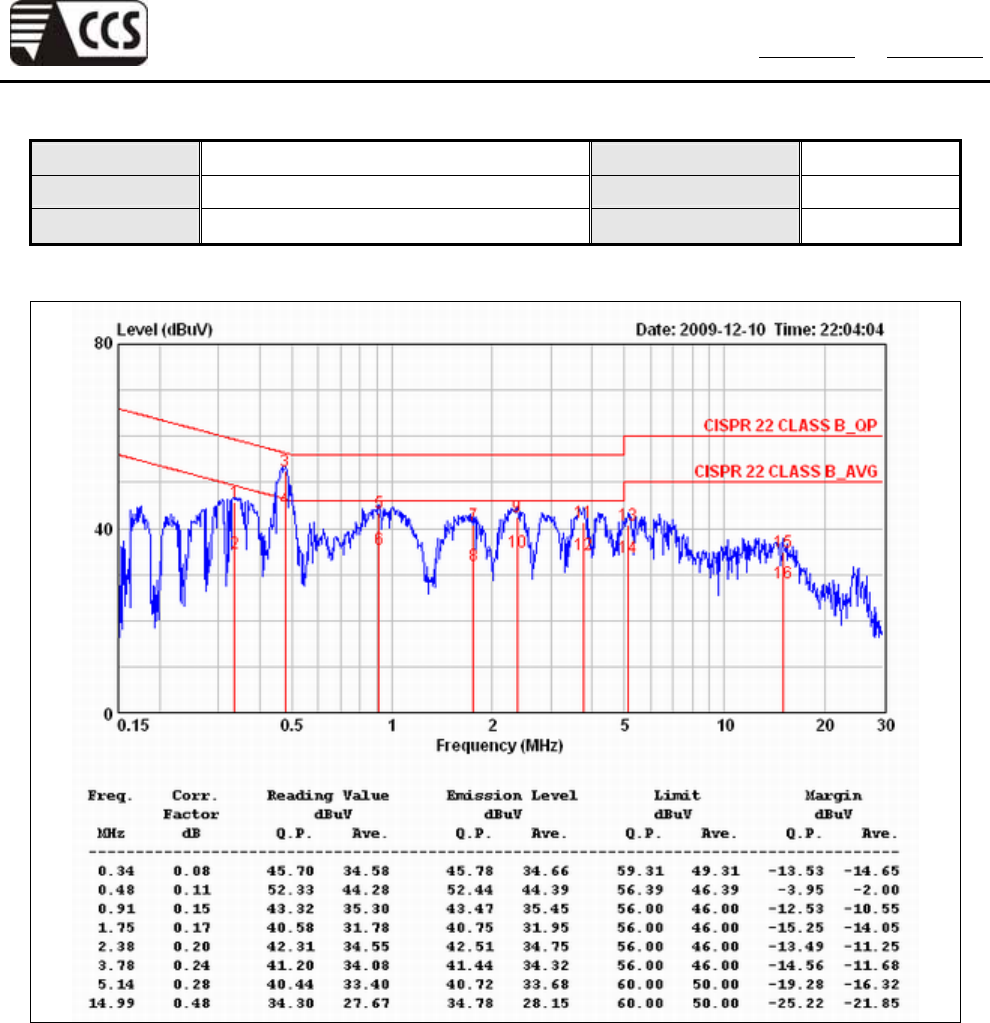
Page 20 of 28
Product Name IP Cam Test Date 2009/12/09
Model D510E Test By Joe Peng
Test Mode Normal operating TEMP & Humidity 22.4°C, 47%
NEUTRAL
Remark:
1. Correction Factor = Insertion loss + cable loss
2. Margin value = Emission level – Limit value
3. For 230VAC.
Compliance Certification Services Inc. Report No.:91210303-C
Page 21 of 28
Product Name IP Cam Test Date 2009/12/10
Model D510E Test By Eden Zhan
Test Mode Normal operating TEMP & Humidity 22.4°C, 47%
LINE
Remark:
1. Correction Factor = Insertion loss + cable loss
2. Margin value = Emission level – Limit value
3. For 240VAC.
Compliance Certification Services Inc. Report No.:91210303-C
Page 22 of 28
Product Name IP Cam Test Date 2009/12/10
Model D510E Test By Eden Zhan
Test Mode Normal operating TEMP & Humidity 22.4°C, 47%
NEUTRAL
Remark:
1. Correction Factor = Insertion loss + cable loss
2. Margin value = Emission level – Limit value
3. For 240VAC.
Compliance Certification Services Inc. Report No.:91210303-C
Page 23 of 28
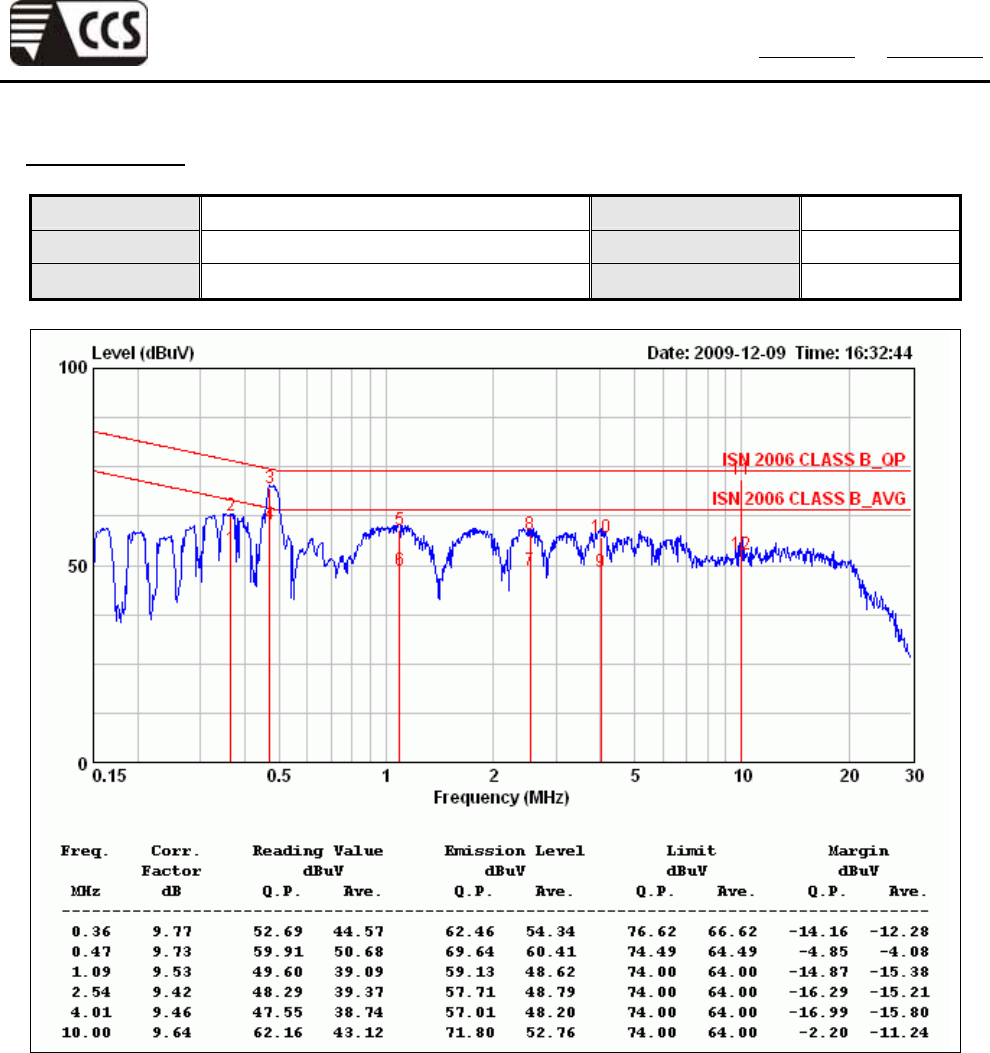
Common Mode
Product Name IP Cam Test Date 2009/12/09
Model D510E Test By Joe Peng
Test Mode LAN – 10Mbps TEMP & Humidity 22.4°C, 47%
Remark:
1. Correction Factor = Insertion loss + cable loss
2. Margin value = Emission level – Limit value
Compliance Certification Services Inc. Report No.:91210303-C
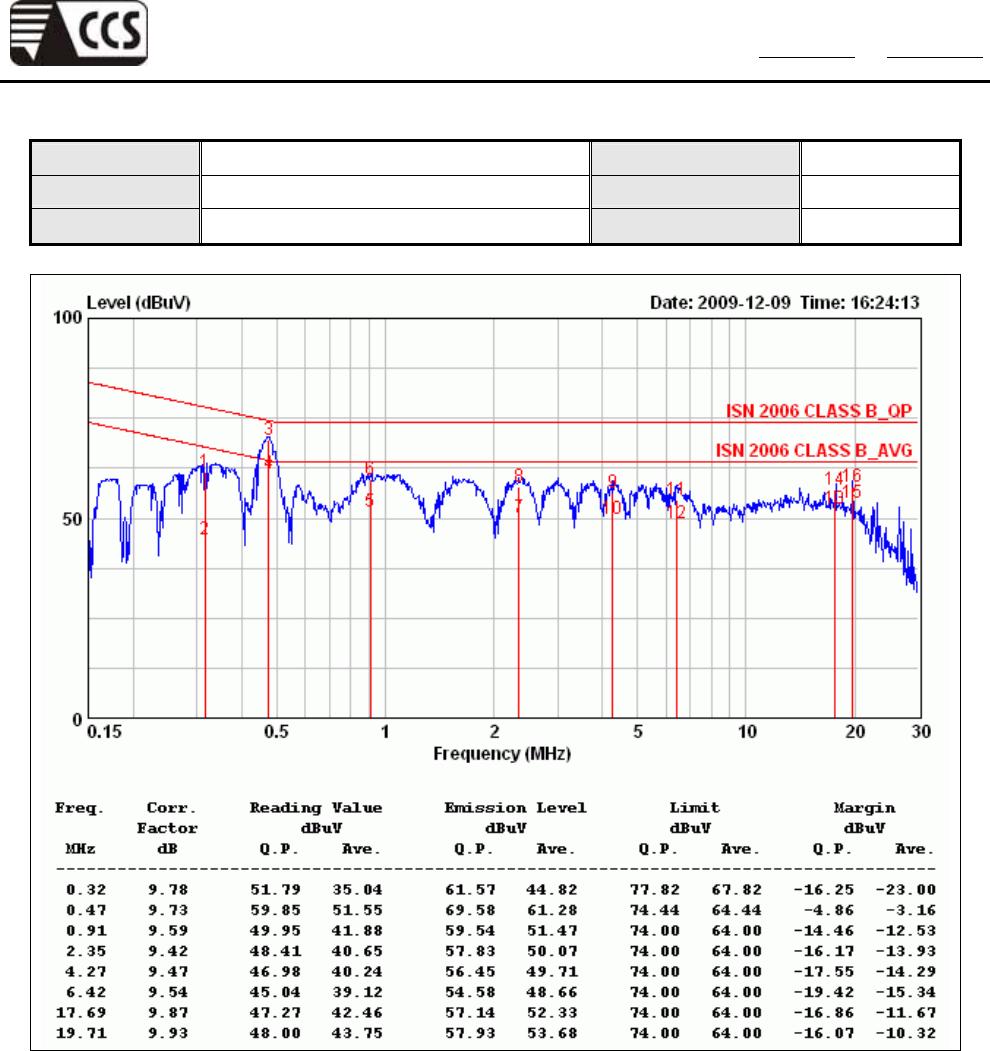
Page 24 of 28
Product Name IP Cam Test Date 2009/12/09
Model D510E Test By Joe Peng
Test Mode LAN – 100Mbps TEMP & Humidity 22.4°C, 47%
Remark:
1. Correction Factor = Insertion loss + cable loss
2. Margin value = Emission level – Limit value
Compliance Certification Services Inc. Report No.:91210303-C
Page 25 of 28
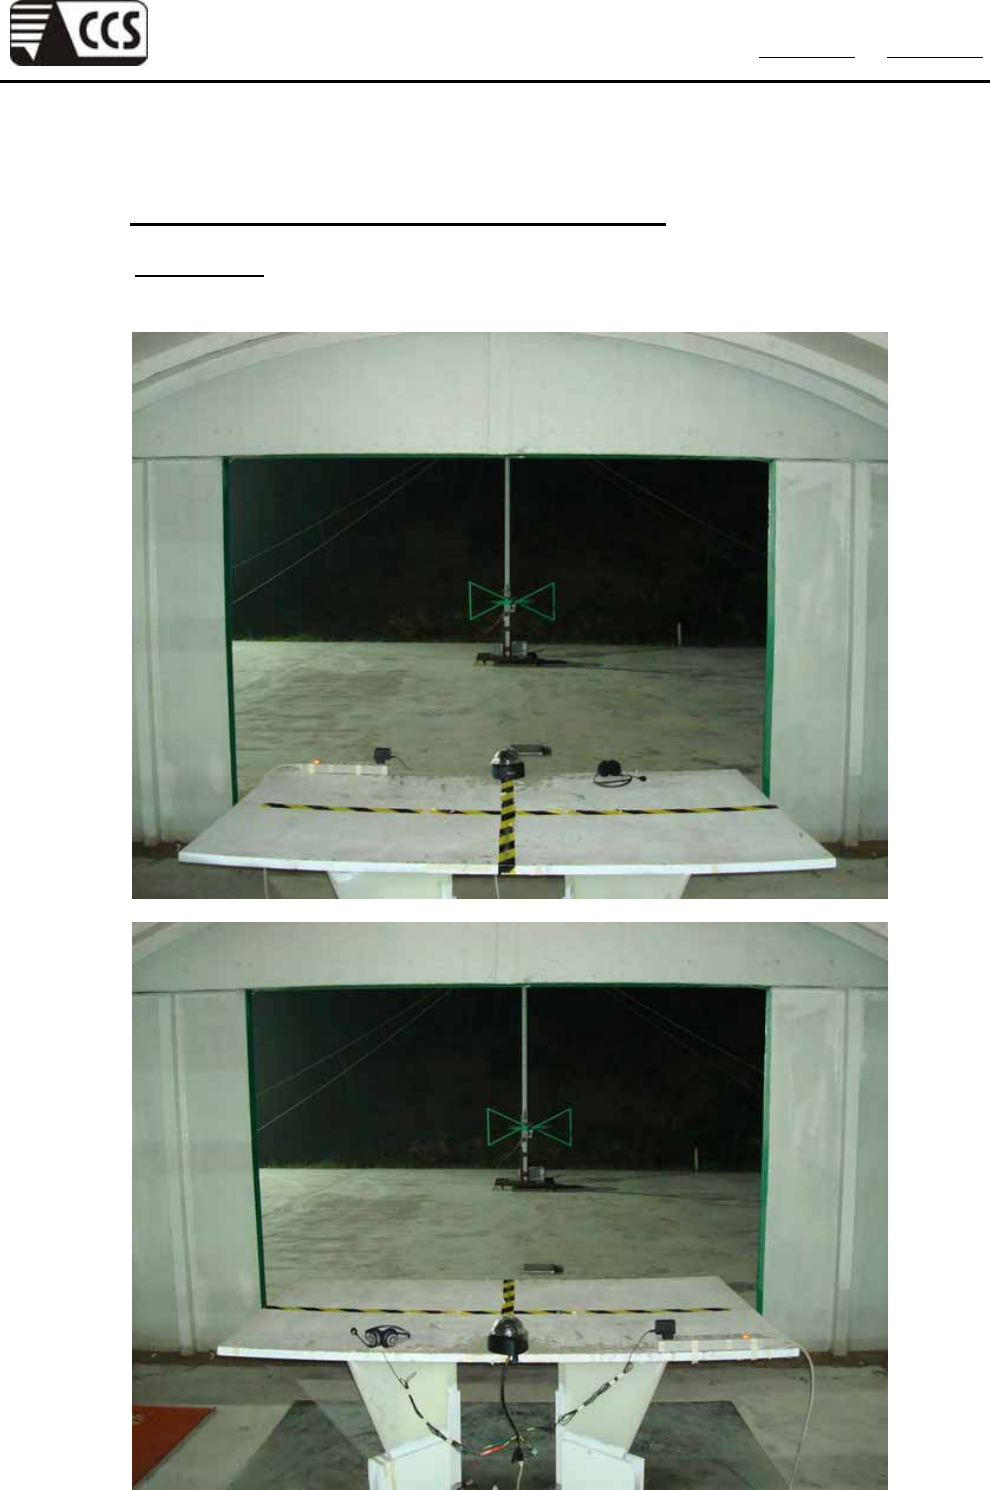
APPENDIX SETUP PHOTOS
RADIATED EMISSION MEASUREMENT SETUP
Below 1GHz
AC Mode
Compliance Certification Services Inc. Report No.:91210303-C
Page 26 of 28
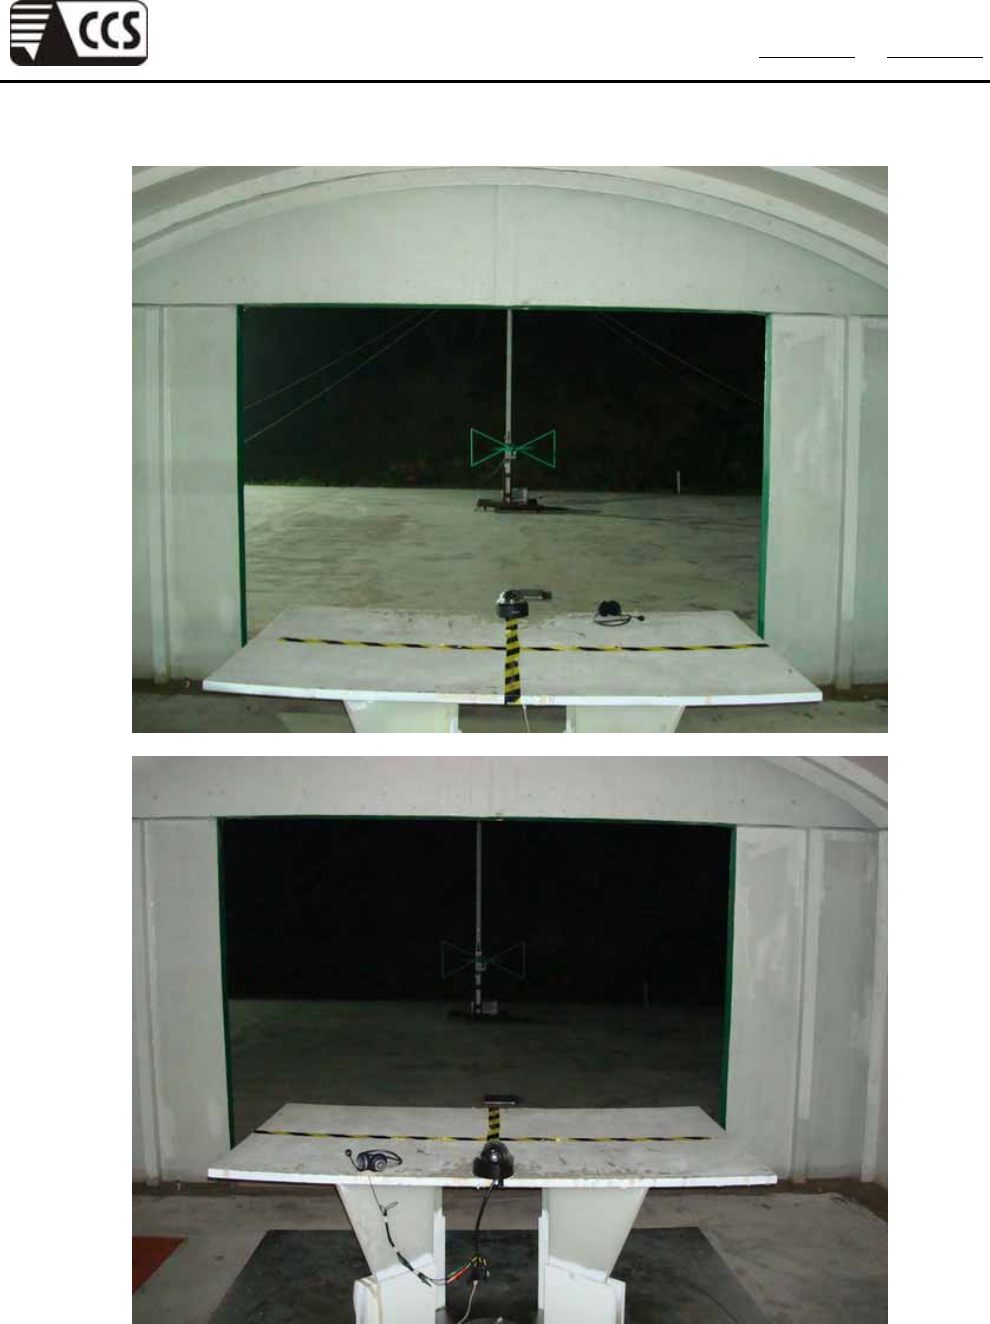
POE Mode
Compliance Certification Services Inc. Report No.:91210303-C
Page 27 of 28
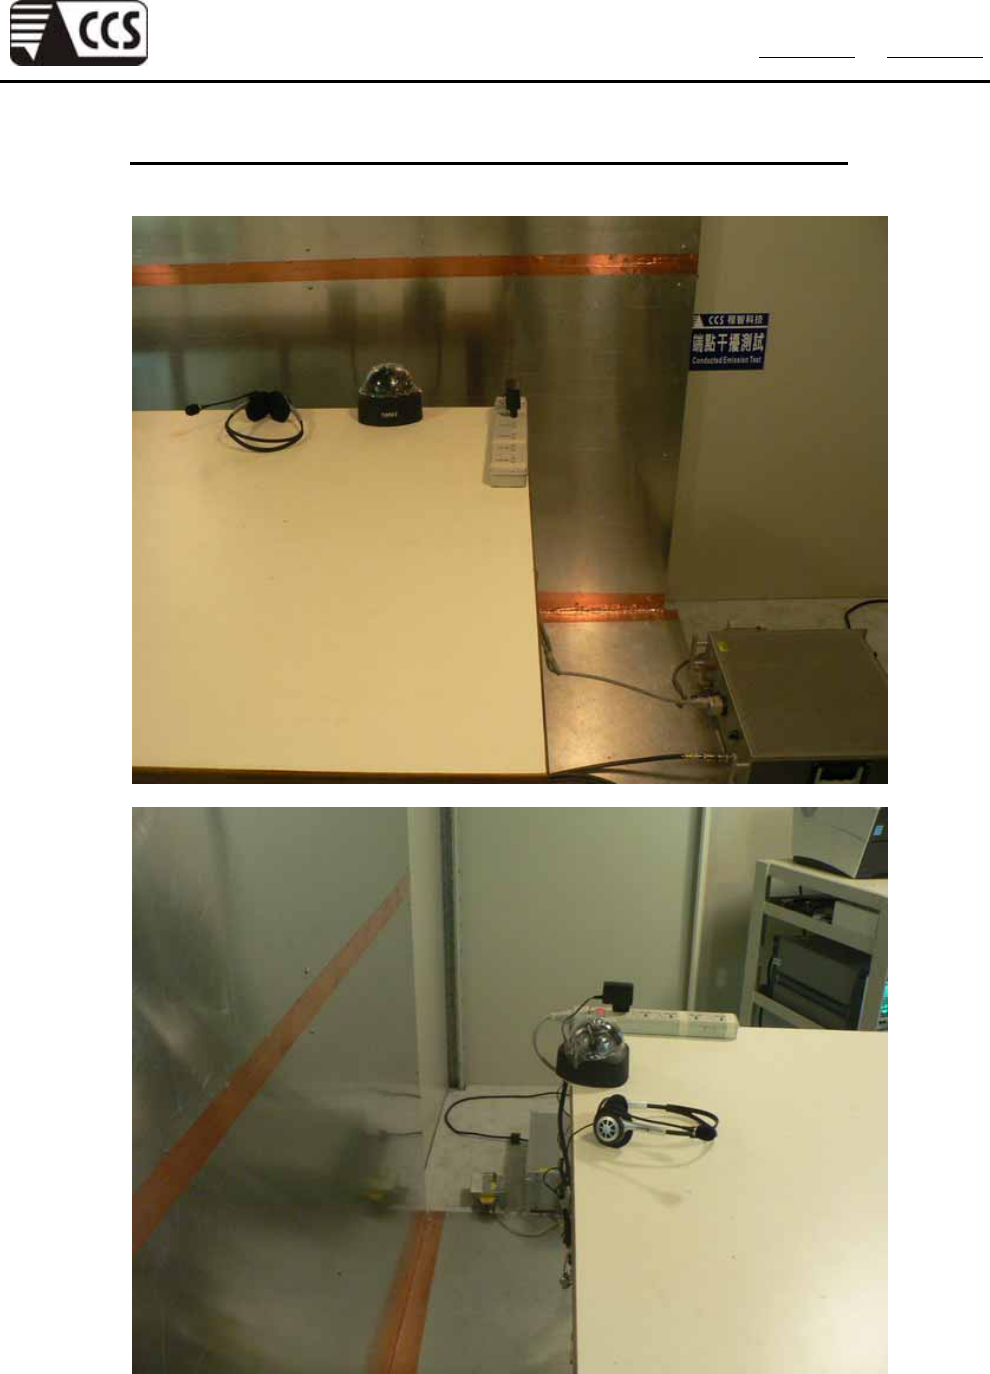
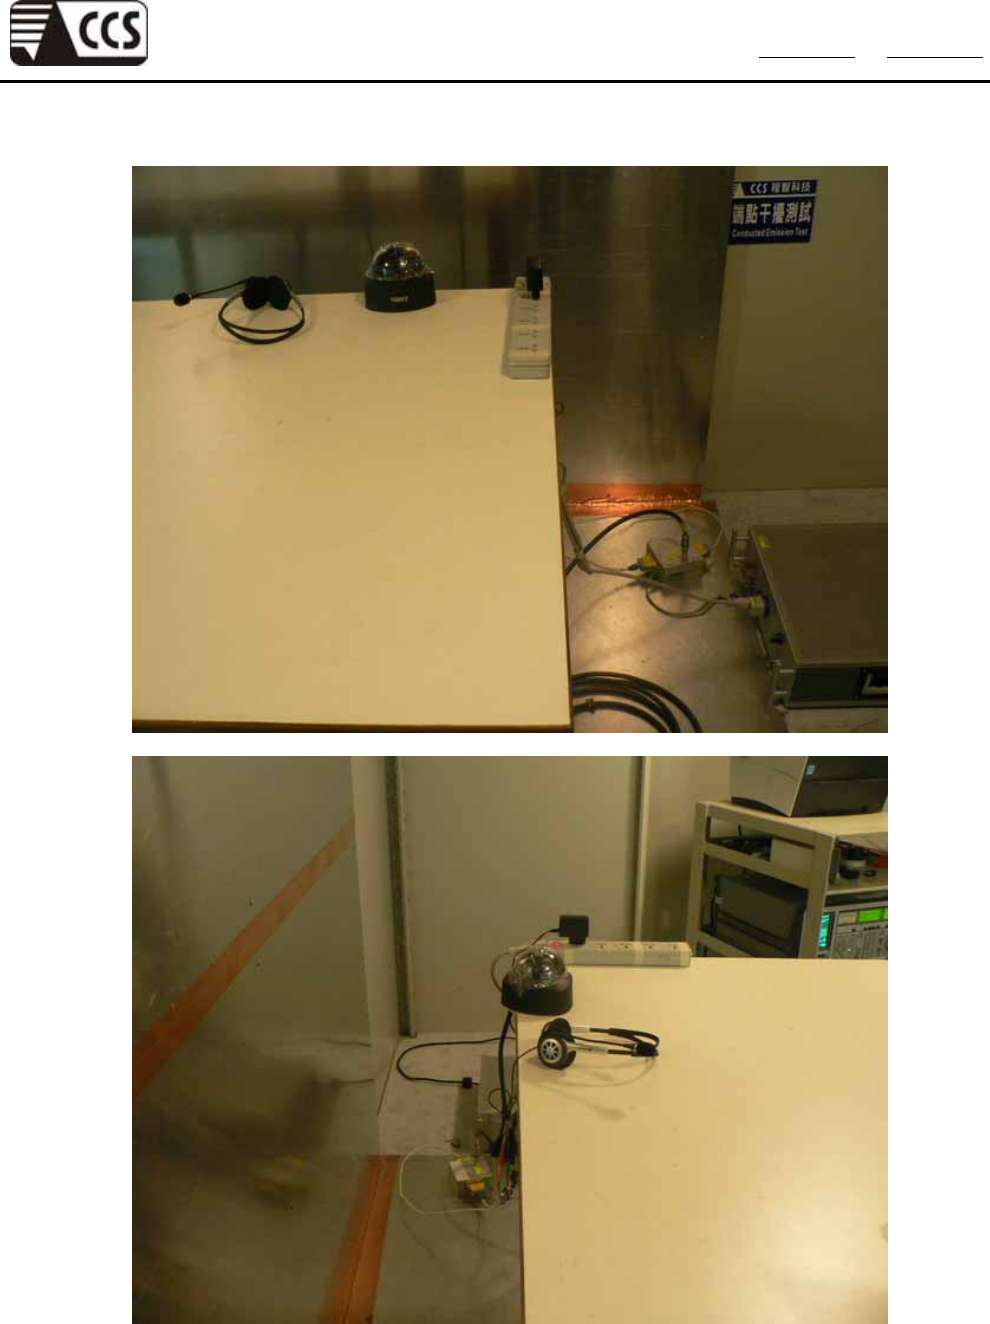
POWERLINE CONDUCTED EMISSION MEASUREMENT SETUP
Power Line
Compliance Certification Services Inc. Report No.:91210303-C
Page 28 of 28
Common Mode
