D Geo Stability User Manual DGeo
User Manual: Pdf DGeoStability-Manual
Open the PDF directly: View PDF ![]() .
.
Page Count: 308 [warning: Documents this large are best viewed by clicking the View PDF Link!]
- List of Figures
- List of Tables
- 1 General Information
- 2 Getting Started
- 3 General
- 4 Input
- 5 Calculations
- 6 View Results
- 7 Graphical Geometry Input
- 8 Tutorial 1: Dike reinforced with berm
- 9 Tutorial 2: Unsaturated soil
- 10 Tutorial 3: Geotextile
- 11 Tutorial 4: The Spencer Method
- 12 Tutorial 5: The Uplift-Van model
- 13 Tutorial 6: Reliability Analysis
- 14 Tutorial 7: Bishop Random Field Method
- 15 Tutorial 8: Zone Plot
- 16 Method of slices
- 16.1 Method of slices
- 16.2 Circular slip plane (Bishop and Fellenius)
- 16.3 Uplift Van
- 16.4 Spencer
- 16.5 Horizontal Balance
- 17 Loads
- 18 Pore pressures
- 19 Shear strength models
- 20 Reliability analysis
- 21 Bishop probabilistic random field
- 22 Zone Plot
- 23 Benchmarks
- Bibliography

User Manual
D-Geo Stability
Slope stability soware for so soil engineering
D-GEO STABILITY
Slope stability software for soft soil engineering
User Manual
Version: 16.2
Revision: 00
11 December 2016
D-GEO STABILITY
, User Manual
Published and printed by:
Deltares
Boussinesqweg 1
2629 HV Delft
P.O. 177
2600 MH Delft
The Netherlands
telephone: +31 88 335 82 73
fax: +31 88 335 85 82
e-mail: info@deltares.nl
www: https://www.deltares.nl
For sales contact:
telephone: +31 88 335 81 88
fax: +31 88 335 81 11
e-mail: sales@deltaressystems.nl
www: http://www.deltaressystems.nl
For support contact:
telephone: +31 88 335 81 00
fax: +31 88 335 81 11
e-mail: support@deltaressystems.nl
www: http://www.deltaressystems.nl
Copyright © 2016 Deltares
All rights reserved. No part of this document may be reproduced in any form by print, photo
print, photo copy, microfilm or any other means, without written permission from the publisher:
Deltares.
Contents
Contents
List of Figures x
List of Tables xvi
1 General Information 1
1.1 Foreword ................................... 1
1.2 Preface .................................... 1
1.3 Features in standard module ......................... 2
1.3.1 Soil modeling ............................. 2
1.3.2 Loads ................................ 2
1.3.3 Slip plane determination . . . . . . . . . . . . . . . . . . . . . . . 3
1.3.4 Results ................................ 3
1.4 Features in additional modules ........................ 3
1.4.1 Spencer model ............................ 3
1.4.2 Uplift Van model ........................... 3
1.4.3 Reliability based design methods . . . . . . . . . . . . . . . . . . . 4
1.4.4 Product integration .......................... 4
1.5 History .................................... 5
1.6 Limitations .................................. 6
1.7 Minimum System Requirements . . . . . . . . . . . . . . . . . . . . . . . 7
1.8 Definitions and Symbols ........................... 7
1.9 Getting Help ................................. 9
1.10 Getting Support ................................ 9
1.11 Deltares ................................... 11
1.12 Deltares Systems ............................... 12
1.13 Rijkswaterstaat/DWW ............................. 12
1.14 On-line software (Citrix) . . . . . . . . . . . . . . . . . . . . . . . . . . . . 12
2 Getting Started 13
2.1 Starting D-Geo Stability . . . . . . . . . . . . . . . . . . . . . . . . . . . . 13
2.2 Main Window ................................. 13
2.2.1 The menu bar . . . . . . . . . . . . . . . . . . . . . . . . . . . . 14
2.2.2 The icon bar ............................. 15
2.2.3 View Input .............................. 16
2.2.4 Info bar ................................ 18
2.2.5 Title panel .............................. 19
2.2.6 Status bar .............................. 19
2.3 Files ..................................... 19
2.4 Tips and Tricks ................................ 19
2.4.1 Keyboard shortcuts . . . . . . . . . . . . . . . . . . . . . . . . . . 19
2.4.2 Exporting figures and reports . . . . . . . . . . . . . . . . . . . . . 20
2.4.3 Copying part of a table . . . . . . . . . . . . . . . . . . . . . . . . 20
2.4.4 Command line . . . . . . . . . . . . . . . . . . . . . . . . . . . . 20
3 General 23
3.1 File menu ................................... 23
3.2 Tools menu .................................. 24
3.2.1 Program Options ........................... 24
3.3 Help menu .................................. 27
3.3.1 Error Messages ........................... 28
3.3.2 Manual ................................ 28
3.3.3 Deltares Systems Website . . . . . . . . . . . . . . . . . . . . . . 28
3.3.4 Support ................................ 28
Deltares iii

D-GEO STABILITY
, User Manual
3.3.5 About D-GEO STABILITY ....................... 28
4 Input 31
4.1 Project menu ................................. 31
4.1.1 Model ................................ 31
4.1.2 Probabilistic Defaults ......................... 34
4.1.3 Project Properties . . . . . . . . . . . . . . . . . . . . . . . . . . 36
4.1.4 View Input File . . . . . . . . . . . . . . . . . . . . . . . . . . . . 41
4.2 Soil menu ................................... 41
4.2.1 Sigma-Tau Curves . . . . . . . . . . . . . . . . . . . . . . . . . . 42
4.2.1.1 Sigma-Tau Curves for deterministic design . . . . . . . . . 42
4.2.1.2 Sigma-Tau Curves for Reliability analysis . . . . . . . . . . 43
4.2.1.3 Sigma-Tau Curves for Pseudo values Shear strength model 44
4.2.2 Bond Stress Diagrams . . . . . . . . . . . . . . . . . . . . . . . . 45
4.2.3 Measured Yield Stresses . . . . . . . . . . . . . . . . . . . . . . . 46
4.2.4 Materials ............................... 47
4.2.4.1 Materials – Input of fixed parameters . . . . . . . . . . . . 47
4.2.4.2 Materials – Import from Database . . . . . . . . . . . . . 50
4.2.4.3 Materials – Soil Groups . . . . . . . . . . . . . . . . . . . 51
4.2.4.4 Materials – Reliability Analysis . . . . . . . . . . . . . . . 52
4.2.4.5 Materials – Bishop probabilistic random field method . . . . 58
4.2.4.6 Materials – Nails . . . . . . . . . . . . . . . . . . . . . . 60
4.2.5 Model Factor ............................. 61
4.3 Geometry menu ............................... 62
4.3.1 New ................................. 62
4.3.2 New Wizard ............................. 62
4.3.3 Import ................................ 62
4.3.4 Import geometry from database . . . . . . . . . . . . . . . . . . . . 63
4.3.5 Export ................................ 63
4.3.6 Export as Plaxis/DOS ......................... 63
4.3.7 Limits ................................. 64
4.3.8 Points ................................ 64
4.3.9 Import PL-line . . . . . . . . . . . . . . . . . . . . . . . . . . . . 65
4.3.10 PL-lines ............................... 65
4.3.11 Phreatic Line ............................. 66
4.3.12 Layers ................................ 66
4.3.13 PL-lines per Layer . . . . . . . . . . . . . . . . . . . . . . . . . . 68
4.3.14 Check Geometry ........................... 70
4.4 Definitions menu ............................... 70
4.4.1 Slip Plane Definition ......................... 70
4.4.1.1 Slip Circle Definition (Bishop or Fellenius) . . . . . . . . . 71
4.4.1.2 Slip Plane Definition (Uplift Van, Uplift Spencer) . . . . . . 72
4.4.1.3 Slip Plane Definition (Spencer) . . . . . . . . . . . . . . . 73
4.4.2 Calculation Area Definition . . . . . . . . . . . . . . . . . . . . . . 74
4.4.3 Forbidden lines . . . . . . . . . . . . . . . . . . . . . . . . . . . . 74
4.4.4 Zone Areas for Safety ......................... 75
4.4.5 Reference Level for Ratio S . . . . . . . . . . . . . . . . . . . . . . 76
4.5 Reinforcements ................................ 78
4.5.1 Geotextiles .............................. 78
4.5.2 Nail Type Defaults . . . . . . . . . . . . . . . . . . . . . . . . . . 80
4.5.3 Nails ................................. 80
4.5.3.1 Nails – Geometry . . . . . . . . . . . . . . . . . . . . . . 81
4.5.3.2 Nails – Nail Type . . . . . . . . . . . . . . . . . . . . . . 81
4.5.3.3 Nails – Lateral Stress . . . . . . . . . . . . . . . . . . . . 82
iv Deltares

Contents
4.5.3.4 Nails – Shear Stress . . . . . . . . . . . . . . . . . . . . 82
4.6 Water menu .................................. 83
4.6.1 Unit Weight .............................. 83
4.6.2 External Water Levels . . . . . . . . . . . . . . . . . . . . . . . . 83
4.6.3 Degree of Consolidation . . . . . . . . . . . . . . . . . . . . . . . 85
4.6.4 Use MSeep net . . . . . . . . . . . . . . . . . . . . . . . . . . . . 85
4.7 Loads menu ................................. 86
4.7.1 Line Loads .............................. 86
4.7.2 Uniform Loads . . . . . . . . . . . . . . . . . . . . . . . . . . . . 87
4.7.3 Earthquake .............................. 88
4.7.4 Tree on Slope ............................. 89
5 Calculations 91
5.1 Calculation Options .............................. 91
5.2 Start Calculation ............................... 92
5.2.1 Grid based calculation . . . . . . . . . . . . . . . . . . . . . . . . 92
5.2.2 Genetic Algorithm based calculation . . . . . . . . . . . . . . . . . 93
5.3 Error messages ................................ 95
5.4 Progress of Calculation . . . . . . . . . . . . . . . . . . . . . . . . . . . . 95
6 View Results 97
6.1 Report .................................... 97
6.1.1 Report – Safety factor table (long report) . . . . . . . . . . . . . . . 97
6.1.2 Report – Information about critical slip plane . . . . . . . . . . . . . 98
6.1.3 Report – Extensive information about critical planes (long report) . . . 99
6.1.4 Report for Bishop Probabilistic Random Field model . . . . . . . . . 100
6.2 Stresses in Geometry . . . . . . . . . . . . . . . . . . . . . . . . . . . . . 101
6.3 Stresses . . . . . . . . . . . . . . . . . . . . . . . . . . . . . . . . . . . 102
6.3.1 Critical Circle (Fellenius and Bishop) . . . . . . . . . . . . . . . . . 102
6.3.2 Critical Plane (Uplift-Van and Spencer) . . . . . . . . . . . . . . . . 104
6.3.3 Critical Circle for Reliability Analysis . . . . . . . . . . . . . . . . . 104
6.4 FMin Grid . . . . . . . . . . . . . . . . . . . . . . . . . . . . . . . . . . . 105
6.5 Safety Factor per Zone . . . . . . . . . . . . . . . . . . . . . . . . . . . . 105
6.6 Stresses per Zone ..............................106
6.7 Influence Factors . . . . . . . . . . . . . . . . . . . . . . . . . . . . . . . 107
6.8 Safety Overview . . . . . . . . . . . . . . . . . . . . . . . . . . . . . . . 107
7 Graphical Geometry Input 109
7.1 Geometrical objects ..............................109
7.1.1 Geometry elements . . . . . . . . . . . . . . . . . . . . . . . . . . 109
7.1.2 Construction elements . . . . . . . . . . . . . . . . . . . . . . . . 110
7.2 Assumptions and restrictions . . . . . . . . . . . . . . . . . . . . . . . . . 110
7.3 View Input Window ..............................110
7.3.1 General ................................111
7.3.2 Buttons ................................112
7.3.3 Legend ................................114
7.4 Geometry modeling ..............................117
7.4.1 Create a new geometry . . . . . . . . . . . . . . . . . . . . . . . . 117
7.4.2 Set limits . . . . . . . . . . . . . . . . . . . . . . . . . . . . . . . 117
7.4.3 Draw layout ..............................118
7.4.4 Generate layers . . . . . . . . . . . . . . . . . . . . . . . . . . . 119
7.4.5 Add piezometric level lines . . . . . . . . . . . . . . . . . . . . . . 120
7.5 Graphical manipulation . . . . . . . . . . . . . . . . . . . . . . . . . . . . 120
7.5.1 Selection of elements . . . . . . . . . . . . . . . . . . . . . . . . . 120
Deltares v

D-GEO STABILITY
, User Manual
7.5.2 Deletion of elements . . . . . . . . . . . . . . . . . . . . . . . . . 121
7.5.3 Using the right-hand mouse button . . . . . . . . . . . . . . . . . . 122
7.5.4 Dragging elements Drag and drop . . . . . . . . . . . . . . . . . . 124
8 Tutorial 1: Dike reinforced with berm 125
8.1 Introduction to the case . . . . . . . . . . . . . . . . . . . . . . . . . . . . 125
8.2 Creating a new file using the Geometry Wizard . . . . . . . . . . . . . . . . 126
8.2.1 Wizard – Basic Layout . . . . . . . . . . . . . . . . . . . . . . . . 127
8.2.2 Wizard – Shape selection . . . . . . . . . . . . . . . . . . . . . . . 127
8.2.3 Wizard – Shape definition . . . . . . . . . . . . . . . . . . . . . . . 128
8.2.4 Wizard – Material types . . . . . . . . . . . . . . . . . . . . . . . . 129
8.2.5 Wizard – Checking . . . . . . . . . . . . . . . . . . . . . . . . . . 130
8.2.6 View Input ..............................131
8.3 Project ....................................131
8.3.1 Model ................................132
8.3.2 Project Properties . . . . . . . . . . . . . . . . . . . . . . . . . . 133
8.4 Geometry . . . . . . . . . . . . . . . . . . . . . . . . . . . . . . . . . . . 136
8.4.1 Points ................................136
8.4.2 PL-lines . . . . . . . . . . . . . . . . . . . . . . . . . . . . . . . 137
8.4.3 PL-lines per layer . . . . . . . . . . . . . . . . . . . . . . . . . . . 139
8.4.4 Check Geometry . . . . . . . . . . . . . . . . . . . . . . . . . . . 139
8.5 Soil ......................................140
8.6 Definitions ..................................140
8.7 Calculation ..................................141
8.8 Results ....................................142
8.8.1 Report ................................142
8.8.2 Stresses in Geometry . . . . . . . . . . . . . . . . . . . . . . . . . 143
8.8.3 Stresses . . . . . . . . . . . . . . . . . . . . . . . . . . . . . . . 144
8.8.4 FMin Grid . . . . . . . . . . . . . . . . . . . . . . . . . . . . . . . 146
8.8.5 Safety overview . . . . . . . . . . . . . . . . . . . . . . . . . . . . 147
8.9 Berm construction ..............................148
8.9.1 Berm inputted graphically . . . . . . . . . . . . . . . . . . . . . . . 149
8.9.2 Soil material assigned to the berm . . . . . . . . . . . . . . . . . . 150
8.9.3 Calculation and Results . . . . . . . . . . . . . . . . . . . . . . . . 150
8.10 Conclusion ..................................151
9 Tutorial 2: Unsaturated soil 153
9.1 Introduction to the case . . . . . . . . . . . . . . . . . . . . . . . . . . . . 153
9.2 Project Properties . . . . . . . . . . . . . . . . . . . . . . . . . . . . . . . 153
9.3 Changing the phreatic line . . . . . . . . . . . . . . . . . . . . . . . . . . 154
9.4 Soil properties ................................156
9.5 Definitions ..................................156
9.6 Calculation and Results . . . . . . . . . . . . . . . . . . . . . . . . . . . . 157
9.7 Conclusion ..................................158
10 Tutorial 3: Geotextile 159
10.1 Introduction to the case . . . . . . . . . . . . . . . . . . . . . . . . . . . . 159
10.2 Project Properties . . . . . . . . . . . . . . . . . . . . . . . . . . . . . . . 160
10.3 Geotextile . . . . . . . . . . . . . . . . . . . . . . . . . . . . . . . . . . . 160
10.4 Calculation and Results . . . . . . . . . . . . . . . . . . . . . . . . . . . . 161
10.5 Conclusion ..................................162
11 Tutorial 4: The Spencer Method 163
11.1 Introduction to the case . . . . . . . . . . . . . . . . . . . . . . . . . . . . 163
11.2 Project ....................................164
vi Deltares

Contents
11.2.1 Importing an existing geometry . . . . . . . . . . . . . . . . . . . . 164
11.2.2 Model ................................165
11.2.3 Importing material properties from an MGeobase database . . . . . . 166
11.2.4 Materials . . . . . . . . . . . . . . . . . . . . . . . . . . . . . . . 167
11.2.5 PL-lines per layer . . . . . . . . . . . . . . . . . . . . . . . . . . . 168
11.2.6 Degree of Consolidation . . . . . . . . . . . . . . . . . . . . . . . 169
11.2.7 Loads ................................170
11.3 Calculation using one defined slip plane (Tutorial-4a) . . . . . . . . . . . . . 171
11.3.1 Slipe Plane ..............................171
11.3.2 Calculation and Results . . . . . . . . . . . . . . . . . . . . . . . . 172
11.4 Search between slip planes (Tutorial-4b) . . . . . . . . . . . . . . . . . . . 174
11.4.1 Define slip planes . . . . . . . . . . . . . . . . . . . . . . . . . . . 174
11.4.2 Calculation and Results . . . . . . . . . . . . . . . . . . . . . . . . 176
11.5 Conclusion ..................................177
12 Tutorial 5: The Uplift-Van model 179
12.1 Introduction to the case . . . . . . . . . . . . . . . . . . . . . . . . . . . . 179
12.2 Geometry Wizard . . . . . . . . . . . . . . . . . . . . . . . . . . . . . . . 180
12.3 Model .....................................181
12.4 Soil materials . . . . . . . . . . . . . . . . . . . . . . . . . . . . . . . . . 181
12.5 Geometry . . . . . . . . . . . . . . . . . . . . . . . . . . . . . . . . . . . 182
12.5.1 Points ................................182
12.5.2 PL-lines . . . . . . . . . . . . . . . . . . . . . . . . . . . . . . . 183
12.5.3 PL-lines per Layers . . . . . . . . . . . . . . . . . . . . . . . . . . 184
12.6 Definitions ..................................184
12.7 Calculation and Results . . . . . . . . . . . . . . . . . . . . . . . . . . . . 185
12.7.1 Stresses . . . . . . . . . . . . . . . . . . . . . . . . . . . . . . . 185
12.7.2 FMin Grid . . . . . . . . . . . . . . . . . . . . . . . . . . . . . . . 186
12.8 Conclusion ..................................187
13 Tutorial 6: Reliability Analysis 189
13.1 Introduction to the case . . . . . . . . . . . . . . . . . . . . . . . . . . . . 189
13.2 Model .....................................190
13.3 Probabilistic Defaults . . . . . . . . . . . . . . . . . . . . . . . . . . . . . 191
13.4 Soil ......................................191
13.5 Geometry . . . . . . . . . . . . . . . . . . . . . . . . . . . . . . . . . . . 193
13.5.1 Points ................................193
13.5.2 PL-lines . . . . . . . . . . . . . . . . . . . . . . . . . . . . . . . 194
13.5.3 PL-lines per Layer . . . . . . . . . . . . . . . . . . . . . . . . . . 195
13.6 Water .....................................195
13.7 Calculation and Results . . . . . . . . . . . . . . . . . . . . . . . . . . . . 197
13.7.1 Stresses . . . . . . . . . . . . . . . . . . . . . . . . . . . . . . . 197
13.7.2 FMin Grid . . . . . . . . . . . . . . . . . . . . . . . . . . . . . . . 199
13.7.3 Influence Factors . . . . . . . . . . . . . . . . . . . . . . . . . . . 199
13.8 Conclusion ..................................200
14 Tutorial 7: Bishop Random Field Method 201
14.1 Introduction to the case . . . . . . . . . . . . . . . . . . . . . . . . . . . . 201
14.2 Project ....................................202
14.2.1 Model ................................202
14.2.2 Project Properties . . . . . . . . . . . . . . . . . . . . . . . . . . 202
14.3 Model Factor . . . . . . . . . . . . . . . . . . . . . . . . . . . . . . . . . 202
14.4 Calculation and Results . . . . . . . . . . . . . . . . . . . . . . . . . . . . 203
14.5 Conclusion ..................................204
Deltares vii

D-GEO STABILITY
, User Manual
15 Tutorial 8: Zone Plot 205
15.1 Introduction to the case . . . . . . . . . . . . . . . . . . . . . . . . . . . . 205
15.2 Project ....................................206
15.2.1 Model ................................206
15.2.2 Project Properties . . . . . . . . . . . . . . . . . . . . . . . . . . 206
15.3 Zone Areas for Safety . . . . . . . . . . . . . . . . . . . . . . . . . . . . . 206
15.4 Rest slope of the soil materials . . . . . . . . . . . . . . . . . . . . . . . . 207
15.5 Calculation and Results . . . . . . . . . . . . . . . . . . . . . . . . . . . . 208
15.5.1 Safety Factor per Zone . . . . . . . . . . . . . . . . . . . . . . . . 208
15.5.2 Stresses per Zone . . . . . . . . . . . . . . . . . . . . . . . . . . 209
15.6 Conclusion ..................................209
16 Method of slices 211
16.1 Method of slices . . . . . . . . . . . . . . . . . . . . . . . . . . . . . . . 211
16.2 Circular slip plane (Bishop and Fellenius) . . . . . . . . . . . . . . . . . . . 212
16.2.1 Driving moments . . . . . . . . . . . . . . . . . . . . . . . . . . . 213
16.2.1.1 Driving soil moment . . . . . . . . . . . . . . . . . . . . 213
16.2.1.2 Driving water moment . . . . . . . . . . . . . . . . . . . 213
16.2.1.3 Driving load moment . . . . . . . . . . . . . . . . . . . . 215
16.2.2 Resisting moments . . . . . . . . . . . . . . . . . . . . . . . . . . 216
16.2.2.1 Resisting moment from soil . . . . . . . . . . . . . . . . . 216
16.2.2.2 Resisting moment from geotextiles . . . . . . . . . . . . . 217
16.2.2.3 Resisting moment from nails . . . . . . . . . . . . . . . . 218
16.2.2.4 Resisting moment from end section . . . . . . . . . . . . 223
16.2.3 Safety factor . . . . . . . . . . . . . . . . . . . . . . . . . . . . . 223
16.2.4 Limited inclination of the slip plane . . . . . . . . . . . . . . . . . . 224
16.2.5 Search algorithm for critical circle . . . . . . . . . . . . . . . . . . . 225
16.3 Uplift Van . . . . . . . . . . . . . . . . . . . . . . . . . . . . . . . . . . . 226
16.3.1 Driving moments of the circular parts . . . . . . . . . . . . . . . . . 226
16.3.1.1 Driving soil moment . . . . . . . . . . . . . . . . . . . . 226
16.3.1.2 Driving water moments . . . . . . . . . . . . . . . . . . . 227
16.3.1.3 Driving load moments . . . . . . . . . . . . . . . . . . . 230
16.3.1.4 Horizontal quake moments . . . . . . . . . . . . . . . . . 231
16.3.1.5 Total driving moments . . . . . . . . . . . . . . . . . . . 231
16.3.1.6 Determination of active and passive sides . . . . . . . . . 231
16.3.2 Resisting moments of the circular parts . . . . . . . . . . . . . . . . 231
16.3.2.1 Resisting moment from soil . . . . . . . . . . . . . . . . . 232
16.3.2.2 Resisting moment from geotextiles . . . . . . . . . . . . . 232
16.3.2.3 Resisting moment from nails . . . . . . . . . . . . . . . . 232
16.3.3 Horizontal forces . . . . . . . . . . . . . . . . . . . . . . . . . . . 232
16.3.3.1 Soil resistance force along horizontal part Is. . . . . . . . 232
16.3.3.2 Resulting water force along horizontal part Fwater;horiz . . . . 233
16.3.3.3 Horizontal nail force . . . . . . . . . . . . . . . . . . . . 233
16.3.3.4 Resulting horizontal force at active side Ia. . . . . . . . . 234
16.3.3.5 Resulting horizontal force at passive side Ip. . . . . . . . 234
16.3.4 Safety factor . . . . . . . . . . . . . . . . . . . . . . . . . . . . . 235
16.4 Spencer . . . . . . . . . . . . . . . . . . . . . . . . . . . . . . . . . . . 237
16.5 Horizontal Balance ..............................239
17 Loads 241
17.1 Line loads ..................................241
17.2 Uniform loads . . . . . . . . . . . . . . . . . . . . . . . . . . . . . . . . . 242
17.3 Earthquake ..................................244
17.3.1 Additional moment due to horizontal acceleration . . . . . . . . . . . 244
viii Deltares

Contents
17.3.2 Additional moments due to vertical acceleration . . . . . . . . . . . . 244
17.4 Tree on Slope . . . . . . . . . . . . . . . . . . . . . . . . . . . . . . . . . 246
18 Pore pressures 247
18.1 Phreatic line . . . . . . . . . . . . . . . . . . . . . . . . . . . . . . . . . 247
18.2 Hydraulic pore pressure (from piezometric level line) . . . . . . . . . . . . . 247
18.3 Pore pressure due to degree of consolidation . . . . . . . . . . . . . . . . . 248
18.4 Pore pressure from temporary distributed loads . . . . . . . . . . . . . . . . 249
18.5 Total pore pressure and effective stress . . . . . . . . . . . . . . . . . . . . 249
19 Shear strength models 251
19.1 C-Phi model with dilatancy . . . . . . . . . . . . . . . . . . . . . . . . . . 251
19.2 Stress tables . . . . . . . . . . . . . . . . . . . . . . . . . . . . . . . . . 251
19.3 Measured undrained strength . . . . . . . . . . . . . . . . . . . . . . . . . 252
19.4 Calculated undrained shear strength . . . . . . . . . . . . . . . . . . . . . 253
19.5 Pseudo values ................................255
19.5.1 Local measurements . . . . . . . . . . . . . . . . . . . . . . . . . 255
19.5.2 Global measurements (regional set of tests) . . . . . . . . . . . . . 257
20 Reliability analysis 261
20.1 Supported methods ..............................261
20.2 Stochastic distributions . . . . . . . . . . . . . . . . . . . . . . . . . . . . 261
20.3 Stochastic shear strength . . . . . . . . . . . . . . . . . . . . . . . . . . . 262
20.3.1 Mean . . . . . . . . . . . . . . . . . . . . . . . . . . . . . . . . . 262
20.3.2 Standard deviation . . . . . . . . . . . . . . . . . . . . . . . . . . 262
20.3.3 Stress tables . . . . . . . . . . . . . . . . . . . . . . . . . . . . . 264
20.3.4 Characteristic value from a normal distribution . . . . . . . . . . . . 264
20.3.5 Characteristic value from a lognormal distribution . . . . . . . . . . . 264
20.3.6 Design value . . . . . . . . . . . . . . . . . . . . . . . . . . . . . 265
20.4 Probabilistic analysis . . . . . . . . . . . . . . . . . . . . . . . . . . . . . 265
20.4.1 FORM procedure . . . . . . . . . . . . . . . . . . . . . . . . . . . 265
20.4.2 Assumptions and limitations of the Reliability module . . . . . . . . . 266
20.4.3 Stochastic hydraulic pore pressure . . . . . . . . . . . . . . . . . . 267
20.4.4 Stochastic excess pore pressure . . . . . . . . . . . . . . . . . . . 267
20.4.5 Stochastic water level model . . . . . . . . . . . . . . . . . . . . . 268
20.4.6 Stochastic model factor . . . . . . . . . . . . . . . . . . . . . . . . 268
21 Bishop probabilistic random field 271
21.1 About the Bishop probabilistic random field . . . . . . . . . . . . . . . . . . 271
21.2 History ....................................271
21.3 Introduction ..................................271
21.3.1 Special Files . . . . . . . . . . . . . . . . . . . . . . . . . . . . . 272
21.3.2 Selecting the module and model . . . . . . . . . . . . . . . . . . . 272
21.4 Working with the model . . . . . . . . . . . . . . . . . . . . . . . . . . . . 273
21.5 Background ..................................273
21.5.1 Random field model for shear strength . . . . . . . . . . . . . . . . 274
21.5.2 Failure mechanism, probability of slope failure . . . . . . . . . . . . 276
21.5.3 Probabilistic analysis . . . . . . . . . . . . . . . . . . . . . . . . . 276
21.5.4 Stochastic water level model . . . . . . . . . . . . . . . . . . . . . 278
22 Zone Plot 279
22.1 Differentiation of safety factors . . . . . . . . . . . . . . . . . . . . . . . . 279
22.2 Determination of the modified slip surface . . . . . . . . . . . . . . . . . . . 279
23 Benchmarks 281
Deltares ix
List of Figures
List of Figures
1.1 Deltares Systems website (www.deltaressystems.com) . . . . . . . . . . . . 10
1.2 Support window, Problem Description tab ................... 11
1.3 Send Support E-Mail window ......................... 11
2.1 Modules window ............................... 13
2.2 D-Geo Stability main window ......................... 14
2.3 D-Geo Stability menu bar ........................... 14
2.4 D-Geo Stability icon bar . . . . . . . . . . . . . . . . . . . . . . . . . . . . 15
2.5 View Input window . . . . . . . . . . . . . . . . . . . . . . . . . . . . . . 16
2.6 Selection of different parts of a table using the arrow cursor . . . . . . . . . . 20
2.7 D-Geo Stability batch processing window . . . . . . . . . . . . . . . . . . . 21
3.1 New File window ............................... 23
3.2 Program Options window, View tab . . . . . . . . . . . . . . . . . . . . . . 24
3.3 Program Options window, General tab . . . . . . . . . . . . . . . . . . . . 25
3.4 Program Options window, Locations tab . . . . . . . . . . . . . . . . . . . . 26
3.5 Program Options window, Language tab ................... 26
3.6 Program Options window, Modules tab . . . . . . . . . . . . . . . . . . . . 27
3.7 Error Messages window ........................... 28
3.8 About D-GEO STABILITY window . . . . . . . . . . . . . . . . . . . . . . . 29
4.1 Model window ................................ 31
4.2 Soil Resistance window ............................ 33
4.3 Measurements window . . . . . . . . . . . . . . . . . . . . . . . . . . . . 33
4.4 Default Input Values window ......................... 34
4.5 Probabilistic Defaults window ......................... 35
4.6 Project Properties window, Identification tab . . . . . . . . . . . . . . . . . 36
4.7 Project Properties window, View Input tab . . . . . . . . . . . . . . . . . . 37
4.8 Project Properties window, Stresses Results tab . . . . . . . . . . . . . . . 38
4.9 Project Properties window, FMin Grid Results tab . . . . . . . . . . . . . . . 39
4.10 Project Properties window, Safety Results tab . . . . . . . . . . . . . . . . . 40
4.11 Project Properties window, General tab . . . . . . . . . . . . . . . . . . . . 41
4.12 Sigma-Tau Curves window for deterministic design . . . . . . . . . . . . . . 42
4.13 Import Stress Table window .......................... 43
4.14 Sigma-Tau Curves window with imported data . . . . . . . . . . . . . . . . 43
4.15 Sigma-Tau Curves window for Reliability Analysis . . . . . . . . . . . . . . . 44
4.16 Sigma-Tau Curves window for Pseudo values shear strength model . . . . . . 44
4.17 Bond Stress Diagrams window . . . . . . . . . . . . . . . . . . . . . . . . 45
4.18 Import Stress Table window .......................... 45
4.19 Bond Stress Diagrams window with imported data . . . . . . . . . . . . . . 46
4.20 Measured Yield Stresses window . . . . . . . . . . . . . . . . . . . . . . . 46
4.21 Materials window for fixed value input . . . . . . . . . . . . . . . . . . . . . 47
4.22 Materials window, C-phi shear strength model . . . . . . . . . . . . . . . . . 48
4.23 Materials window, Stress Tables shear strength model . . . . . . . . . . . . 48
4.24 Materials window, Su-calculated shear strength models . . . . . . . . . . . . 48
4.25 Materials window, Su-measured shear strength model . . . . . . . . . . . . 49
4.26 Materials window, Su-gradient shear strength model . . . . . . . . . . . . . 49
4.27 Program Options window, Locations tab, Database selection . . . . . . . . . 50
4.28 Materials window, Database tab, Import predefined soil types . . . . . . . . . 50
4.29 Information window .............................. 51
4.30 Materials window for Pseudo values shear strength model with Global mea-
surements .................................. 51
4.31 Soil Groups window . . . . . . . . . . . . . . . . . . . . . . . . . . . . . . 51
Deltares xi

D-GEO STABILITY
, User Manual
4.32 Materials window for Standard stochastic input . . . . . . . . . . . . . . . . 53
4.33 C-phi – Standard stochastic input . . . . . . . . . . . . . . . . . . . . . . . 54
4.34 C-phi – Advanced stochastic input . . . . . . . . . . . . . . . . . . . . . . 54
4.35 Stress table (sigma-tau) – Standard stochastic input . . . . . . . . . . . . . 55
4.36 Stress table (sigma-tau) – Advanced stochastic input . . . . . . . . . . . . . 55
4.37 Su-calculated with POP – Standard stochastic input . . . . . . . . . . . . . . 55
4.38 Su calculated with POP – Advanced stochastic input . . . . . . . . . . . . . 56
4.39 Su measured – Standard stochastic input . . . . . . . . . . . . . . . . . . . 57
4.40 Su measured – Advanced stochastic input . . . . . . . . . . . . . . . . . . 57
4.41 Su gradient – Standard stochastic input . . . . . . . . . . . . . . . . . . . . 58
4.42 Materials window for Bishop probabilistic random field method . . . . . . . . 59
4.43 Materials window for nails with option Use soil parameters c, phi / Su . . . . . 60
4.44 Model Factor window ............................. 61
4.45 Import Geometry From window . . . . . . . . . . . . . . . . . . . . . . . . 62
4.46 Geometry Limits window ........................... 64
4.47 Points window ................................ 64
4.48 Confirm window for deleting used points ................... 65
4.49 PL-lines window ............................... 65
4.50 Phreatic Line window ............................. 66
4.51 Layers window, Boundaries tab . . . . . . . . . . . . . . . . . . . . . . . . 67
4.52 Layers window, Materials tab ......................... 68
4.53 PL-lines per Layer window .......................... 69
4.54 PL-lines and vertical pressure distribution . . . . . . . . . . . . . . . . . . . 70
4.55 Information window on confirmation of a valid geometry . . . . . . . . . . . . 70
4.56 Warning window on confirmation of a valid geometry . . . . . . . . . . . . . 70
4.57 Slip Circle Definition window (Bishop and Fellenius methods) . . . . . . . . . 71
4.58 Slip Plane Definition window (Uplift Van and Uplift Spencer methods) . . . . . 72
4.59 Slip Plane Definition window (Spencer method) . . . . . . . . . . . . . . . . 73
4.60 Calculation Area Definition window (Horizontal Balance method) . . . . . . . 74
4.61 Forbidden Lines window ........................... 75
4.62 Zone Areas for Safety window ........................ 75
4.63 Schematization of the zone areas for the Zone Plot model . . . . . . . . . . . 76
4.64 Reference Level for Ratio S window . . . . . . . . . . . . . . . . . . . . . . 77
4.65 View Input window - Reference level (green line) in case of an embankment . 78
4.66 View Input window - Reference level (green line) in case of an excavation . . . 78
4.67 Geotextiles window . . . . . . . . . . . . . . . . . . . . . . . . . . . . . . 79
4.68 Nail Type Defaults window . . . . . . . . . . . . . . . . . . . . . . . . . . 80
4.69 Nails window, Geometry tab ......................... 81
4.70 Nails window, Nail Type tab .......................... 81
4.71 Nails window, Lateral Stress tab . . . . . . . . . . . . . . . . . . . . . . . 82
4.72 Nails window, Shear Stress tab . . . . . . . . . . . . . . . . . . . . . . . . 83
4.73 Unit Weight of Water window ......................... 83
4.74 External Water Levels window . . . . . . . . . . . . . . . . . . . . . . . . 84
4.75 Degree of Consolidation window (consolidation by soil weight) . . . . . . . . 85
4.76 Use MSeep Net window ........................... 86
4.77 Line Loads window . . . . . . . . . . . . . . . . . . . . . . . . . . . . . . 86
4.78 Schematization of the angles θand δfor the definition of a line load . . . . . . 87
4.79 Uniform Loads window . . . . . . . . . . . . . . . . . . . . . . . . . . . . 87
4.80 Earthquake window .............................. 88
4.81 Tree on Slope window ............................ 89
5.1 Calculation Options window . . . . . . . . . . . . . . . . . . . . . . . . . . 91
5.2 Start window, Grid method .......................... 93
5.3 Start window, Genetic algorithm method ................... 93
xii Deltares

List of Figures
5.4 Options Genetic Algorithm window . . . . . . . . . . . . . . . . . . . . . . 94
5.5 Progress of Calculation window ........................ 96
6.1 Report window for Bishop method . . . . . . . . . . . . . . . . . . . . . . 98
6.2 Report window, intermediate results . . . . . . . . . . . . . . . . . . . . . 100
6.3 Report window, final results . . . . . . . . . . . . . . . . . . . . . . . . . . 101
6.4 Stresses in Geometry window . . . . . . . . . . . . . . . . . . . . . . . . 102
6.5 Critical Circle window . . . . . . . . . . . . . . . . . . . . . . . . . . . . . 102
6.6 Slice Result window . . . . . . . . . . . . . . . . . . . . . . . . . . . . . 103
6.7 Critical Plane window for Uplift-Van method . . . . . . . . . . . . . . . . . . 104
6.8 Critical Circle window for probabilistic analysis . . . . . . . . . . . . . . . . 104
6.9 textitFMin Grid window . . . . . . . . . . . . . . . . . . . . . . . . . . . . 105
6.10 Safety Factor per Zone window . . . . . . . . . . . . . . . . . . . . . . . . 106
6.11 Critical circle window for the Zone plot model . . . . . . . . . . . . . . . . . 106
6.12 Influence Factors window . . . . . . . . . . . . . . . . . . . . . . . . . . . 107
6.13 Safety Overview window . . . . . . . . . . . . . . . . . . . . . . . . . . . 108
7.1 View Input window, Geometry tab . . . . . . . . . . . . . . . . . . . . . . 111
7.2 View Input window, Geometry tab (legend displayed as Layer Numbers). . . 114
7.3 Legend, Context menu . . . . . . . . . . . . . . . . . . . . . . . . . . . . 115
7.4 View Input window, Geometry tab (legend displayed as Material Numbers). . 115
7.5 View Input window, Geometry tab (legend displayed as Material Names). . . 116
7.6 Legend, Context menu (for legend displayed as Materials). . . . . . . . . . 116
7.7 Color window .................................116
7.8 View input window, Geometry tab . . . . . . . . . . . . . . . . . . . . . . . 117
7.9 Right Limit window . . . . . . . . . . . . . . . . . . . . . . . . . . . . . . 117
7.10 Representation of a polyline . . . . . . . . . . . . . . . . . . . . . . . . . . 118
7.11 Examples of configurations of (poly)lines . . . . . . . . . . . . . . . . . . . 118
7.12 Modification of the shape of a berm . . . . . . . . . . . . . . . . . . . . . . 119
7.13 Example of invalid point not connected to the left limit . . . . . . . . . . . . . 120
7.14 Selection accuracy as area around cursor . . . . . . . . . . . . . . . . . . . 120
7.15 Selection accuracy as area around cursor . . . . . . . . . . . . . . . . . . . 121
7.16 Selection accuracy as area around cursor . . . . . . . . . . . . . . . . . . . 121
7.17 Example of deletion of a point . . . . . . . . . . . . . . . . . . . . . . . . . 121
7.18 Example of deletion of a geometry point . . . . . . . . . . . . . . . . . . . 122
7.19 Example of deletion of a line . . . . . . . . . . . . . . . . . . . . . . . . . 122
7.20 Pop-up menu for right-hand mouse menu (Select mode) . . . . . . . . . . . 122
7.21 layer window (Property editor of a layer) . . . . . . . . . . . . . . . . . . . . 123
7.22 Point window (Property editor of a point) . . . . . . . . . . . . . . . . . . . 123
7.23 Boundary window (Property editor of a polyline) . . . . . . . . . . . . . . . 123
7.24 Boundary window (Property editor of a line) . . . . . . . . . . . . . . . . . . 124
7.25 PL-line window (Property editor of a PL-line) . . . . . . . . . . . . . . . . . 124
7.26 Example of dragging of a point . . . . . . . . . . . . . . . . . . . . . . . . 124
8.1 Water retaining dike (Tutorial 1) . . . . . . . . . . . . . . . . . . . . . . . . 125
8.2 New File window ...............................126
8.3 New Wizard window, Basic geometrical properties . . . . . . . . . . . . . . 127
8.4 New Wizard window, Basic geometric situation . . . . . . . . . . . . . . . . 128
8.5 New Wizard window, Top layer measurements . . . . . . . . . . . . . . . . 129
8.6 New Wizard window, Soil selection . . . . . . . . . . . . . . . . . . . . . . 130
8.7 New Wizard window, Geometry overview . . . . . . . . . . . . . . . . . . . 131
8.8 View Input window . . . . . . . . . . . . . . . . . . . . . . . . . . . . . . 131
8.9 Model window ................................132
8.10 Project Properties window, Identification tab . . . . . . . . . . . . . . . . . 133
Deltares xiii

D-GEO STABILITY
, User Manual
8.11 Project Properties window, View Input tab . . . . . . . . . . . . . . . . . . 134
8.12 Project Properties window, Stresses Results tab . . . . . . . . . . . . . . . 134
8.13 Project Properties window, FMin Grid Results tab . . . . . . . . . . . . . . . 135
8.14 Project Properties window, Safety Results tab . . . . . . . . . . . . . . . . . 135
8.15 Project Properties window, General tab . . . . . . . . . . . . . . . . . . . . 136
8.16 Points window ................................137
8.17 Pl-Lines window . . . . . . . . . . . . . . . . . . . . . . . . . . . . . . . 138
8.18 View Input window with new phreatic line . . . . . . . . . . . . . . . . . . . 138
8.19 PL-lines per Layer window ..........................139
8.20 Information window ..............................139
8.21 Materials window . . . . . . . . . . . . . . . . . . . . . . . . . . . . . . . 140
8.22 Slip Circle Definition window . . . . . . . . . . . . . . . . . . . . . . . . . 141
8.23 Start calculation window . . . . . . . . . . . . . . . . . . . . . . . . . . . 142
8.24 Progress of Calculation window . . . . . . . . . . . . . . . . . . . . . . . . 142
8.25 Report window ................................143
8.26 Stresses in Geometry window . . . . . . . . . . . . . . . . . . . . . . . . 144
8.27 Critical Circle window (Slip circle with lowest safety factor) . . . . . . . . . . 145
8.28 Stress mode toolbox . . . . . . . . . . . . . . . . . . . . . . . . . . . . . 145
8.29 Shear stresses window (along the slip circle) . . . . . . . . . . . . . . . . . 146
8.30 FMin Grid window ..............................147
8.31 Safety Overview window . . . . . . . . . . . . . . . . . . . . . . . . . . . 148
8.32 Construction of a berm (Tutorial 1b) . . . . . . . . . . . . . . . . . . . . . . 148
8.33 Lower left corner of View Input window . . . . . . . . . . . . . . . . . . . . 149
8.34 View Input window, Geometry tab – Berm construction points . . . . . . . . . 149
8.35 Point 13 properties window . . . . . . . . . . . . . . . . . . . . . . . . . . 150
8.36 Layer 5 properties window ..........................150
8.37 Safety Overview window . . . . . . . . . . . . . . . . . . . . . . . . . . . 151
9.1 Dike with lowered water level (Tutorial 2) . . . . . . . . . . . . . . . . . . . 153
9.2 View Input window, Geometry tab – Adding of three points on the phreatic line 154
9.3 Point 20 properties window ..........................155
9.4 View Input window, Geometry tab – New phreatic line . . . . . . . . . . . . 155
9.5 Materials window . . . . . . . . . . . . . . . . . . . . . . . . . . . . . . . 156
9.6 Slip Circle Definition window . . . . . . . . . . . . . . . . . . . . . . . . . 157
9.7 Critical Circle window . . . . . . . . . . . . . . . . . . . . . . . . . . . . . 157
10.1 Dike reinforced with geotextile (Tutorial 3) . . . . . . . . . . . . . . . . . . . 159
10.2 Model window ................................160
10.3 Geotextiles window . . . . . . . . . . . . . . . . . . . . . . . . . . . . . . 161
10.4 View Input window . . . . . . . . . . . . . . . . . . . . . . . . . . . . . . 161
10.5 Critical Circle window . . . . . . . . . . . . . . . . . . . . . . . . . . . . . 162
11.1 Dike with different water levels at either side (Tutorial 4) . . . . . . . . . . . . 163
11.2 New File window ...............................164
11.3 View Input window, Geometry tab after importing geometry . . . . . . . . . . 165
11.4 Model window ................................166
11.5 Program Options window, Locations tab . . . . . . . . . . . . . . . . . . . . 167
11.6 Materials window, Database tab . . . . . . . . . . . . . . . . . . . . . . . 167
11.7 Information window ..............................168
11.8 Materials window, Parameters tab . . . . . . . . . . . . . . . . . . . . . . . 168
11.9 PL-lines per Layer window ..........................169
11.10 Degree of Consolidation window . . . . . . . . . . . . . . . . . . . . . . . 170
11.11 Uniform Loads window . . . . . . . . . . . . . . . . . . . . . . . . . . . . 170
11.12 View Input window, Input tab (Tutorial-4a) . . . . . . . . . . . . . . . . . . . 171
xiv Deltares

List of Figures
11.13 Slip Plane Definition window (Tutorial-4a) . . . . . . . . . . . . . . . . . . . 172
11.14 Slip Plane window (Tutorial-4a) ........................172
11.15 Slice Result window for slice 57 (Tutorial-4a) . . . . . . . . . . . . . . . . . 173
11.16 Stresses in Geometry window (Tutorial-4a) . . . . . . . . . . . . . . . . . . 174
11.17 View Input window, Input tab – Suggested second slip plane (Tutorial-4b) . . . 175
11.18 Slip Plane Definition window (Tutorial-4b) . . . . . . . . . . . . . . . . . . . 175
11.19 Start window (Tutorial-4b) . . . . . . . . . . . . . . . . . . . . . . . . . . . 176
11.20 Options Genetic Algorithm window (Tutorial-4b) . . . . . . . . . . . . . . . . 176
11.21 Slip Plane window with lowest safety factor found by Spencer model using a
genetic algorithm (Tutorial-4b) . . . . . . . . . . . . . . . . . . . . . . . . . 177
12.1 Geometry overview (Tutorial 5) . . . . . . . . . . . . . . . . . . . . . . . . 179
12.2 New Wizard windows . . . . . . . . . . . . . . . . . . . . . . . . . . . . . 180
12.3 View Input window, Geometry tab . . . . . . . . . . . . . . . . . . . . . . 181
12.4 Materials window . . . . . . . . . . . . . . . . . . . . . . . . . . . . . . . 182
12.5 Points window ................................183
12.6 Pl-Lines window ...............................183
12.7 PL-Lines per Layer window ..........................184
12.8 Slip Plane Definition window . . . . . . . . . . . . . . . . . . . . . . . . . 184
12.9 View Input window, Input tab . . . . . . . . . . . . . . . . . . . . . . . . . 185
12.10 Slip Plane window ..............................186
12.11 FMin Grid window ..............................186
13.1 Geometry overview (Tutorial 6) . . . . . . . . . . . . . . . . . . . . . . . . 189
13.2 Model window ................................190
13.3 Default Input Values window . . . . . . . . . . . . . . . . . . . . . . . . . 190
13.4 Probabilistic Defaults window . . . . . . . . . . . . . . . . . . . . . . . . . 191
13.5 Materials window for Standard input . . . . . . . . . . . . . . . . . . . . . 192
13.6 Materials window, Shear Strength Advanced tab . . . . . . . . . . . . . . . 193
13.7 Points window ................................194
13.8 PL-Lines window . . . . . . . . . . . . . . . . . . . . . . . . . . . . . . . 194
13.9 View Input window, Geometry tab . . . . . . . . . . . . . . . . . . . . . . 195
13.10 External Water Levels window, MHW . . . . . . . . . . . . . . . . . . . . . 196
13.11 External Water Levels window, MLW . . . . . . . . . . . . . . . . . . . . . 197
13.12 Critical Circle window . . . . . . . . . . . . . . . . . . . . . . . . . . . . . 198
13.13 Critical Circle window for Mean High Water level . . . . . . . . . . . . . . . 198
13.14 FMin Grid window ..............................199
13.15 Influence Factors window . . . . . . . . . . . . . . . . . . . . . . . . . . . 200
14.1 Geometry overview (Tutorial 7) . . . . . . . . . . . . . . . . . . . . . . . . 201
14.2 Model window ................................202
14.3 Model Factor window . . . . . . . . . . . . . . . . . . . . . . . . . . . . . 203
14.4 Critical Circle window . . . . . . . . . . . . . . . . . . . . . . . . . . . . . 203
15.1 Geometry overview (Tutorial 8) . . . . . . . . . . . . . . . . . . . . . . . . 205
15.2 Model window ................................206
15.3 Zone Areas for Safety window ........................207
15.4 Materials window . . . . . . . . . . . . . . . . . . . . . . . . . . . . . . . 208
15.5 Safety Factor per Zone window . . . . . . . . . . . . . . . . . . . . . . . . 208
15.6 Critical Circle window for Zone 1a . . . . . . . . . . . . . . . . . . . . . . . 209
16.1 Slip plane including method of slices . . . . . . . . . . . . . . . . . . . . . 211
16.2 Force equilibrium for one slice in the method of slices . . . . . . . . . . . . . 212
16.3 Horizontal water pressures (due to free water) acting on the side of a slice in
case of vertical layer boundary . . . . . . . . . . . . . . . . . . . . . . . . 214
Deltares xv

D-GEO STABILITY
, User Manual
16.4 Resisting contribution by geotextiles . . . . . . . . . . . . . . . . . . . . . 217
16.5 Resisting contribution by nails . . . . . . . . . . . . . . . . . . . . . . . . . 218
16.6 Representation of the four criteria in the FN−FDdiagram to determine Fnail . 219
16.7 Representation of the Tresca’s criterion by Mohr’s circle . . . . . . . . . . . . 222
16.8 Relation angle α- Shear Stress for αmin = 35◦. . . . . . . . . . . . . . . . 225
16.9 Uplift failure mechanism . . . . . . . . . . . . . . . . . . . . . . . . . . . . 226
16.10 Van-Uplift Stability derivation . . . . . . . . . . . . . . . . . . . . . . . . . 226
16.11 Schematization of the pore pressure distribution on bars . . . . . . . . . . . 229
16.12 Interslice forces according to Spencer method . . . . . . . . . . . . . . . . 237
17.1 Line Load . . . . . . . . . . . . . . . . . . . . . . . . . . . . . . . . . . . 242
17.2 Uniform Load . . . . . . . . . . . . . . . . . . . . . . . . . . . . . . . . . 243
17.3 Representation of the effect of wind on trees . . . . . . . . . . . . . . . . . 246
18.1 PL-lines per layer . . . . . . . . . . . . . . . . . . . . . . . . . . . . . . . 248
19.1 Example of σ-τcurve . . . . . . . . . . . . . . . . . . . . . . . . . . . . . 252
19.2 Stress induced anisotropy . . . . . . . . . . . . . . . . . . . . . . . . . . . 253
19.3 Reference level and stress induced anisotropy . . . . . . . . . . . . . . . . 255
20.1 Limit Surface and Limit State Function . . . . . . . . . . . . . . . . . . . . 266
20.2 Linear interpolation between the conditional reliability index βand the external
water level h.................................268
21.1 Program Options window . . . . . . . . . . . . . . . . . . . . . . . . . . . 272
21.2 Model window ................................273
21.3 Typical pattern of spatial fluctuations of cone resistances in a soft cohesive layer275
22.1 Schematization of the zones 1A, 1B, 2A, 2B and 3 of the zone plot method . . 279
22.2 Schematization of the modified slip surface (deformed situation after rotation) . 280
xvi Deltares
List of Tables
List of Tables
2.1 Keyboard shortcuts for D-Geo Stability . . . . . . . . . . . . . . . . . . . . 19
4.1 Rheological coefficient and compression ratio for different soil types . . . . . . 61
8.1 Soil properties (Tutorial 1) . . . . . . . . . . . . . . . . . . . . . . . . . . . 126
8.2 X and Y coordinates of the berm construction points . . . . . . . . . . . . . 149
9.1 X and Y coordinates of the consecutive points of the phreatic line . . . . . . . 155
10.1 Characteristics of the geotextile . . . . . . . . . . . . . . . . . . . . . . . . 159
11.1 Soil properties (Tutorial 4) . . . . . . . . . . . . . . . . . . . . . . . . . . . 164
11.2 Degree of consolidation per layer . . . . . . . . . . . . . . . . . . . . . . . 169
12.1 Soil properties (Tutorial 5) . . . . . . . . . . . . . . . . . . . . . . . . . . . 180
13.1 Safety factor for different water levels . . . . . . . . . . . . . . . . . . . . . 199
15.1 Required safety factors for the zone areas of the Zone Plot model . . . . . . . 205
18.1 Different degrees of consolidation in different layers . . . . . . . . . . . . . . 249
Deltares xvii

D-GEO STABILITY
, User Manual
xviii Deltares

1 General Information
1.1 Foreword
More than a century ago notorious slope failures have marked the start of geo-engineering. A
major slope failure in Berlin in 1879, massive slope failures during construction of the Panama
Canal in 1909, a quay collapse in Gothenburg Sweden in 1916, and a dramatic railway em-
bankment collapse in The Netherlands in 1918. These events triggered authorities and en-
gineers to better understand what really happened. In a swift response scientific committees
established by the authorities stated that water pressure is likely a major culprit.
In 1925 Prof. Terzaghi astonished these committees with the first basic book on the principles
of soil mechanics, and since then the profession of geo-engineering got real impetus.
Though in Sweden Fellenius designed an elegant and practical circular method to evaluate
slope stability around 1916, already in 1846 Alexander Collin had shown the relation of water
and strength of clay and proved that a slip surface is actually a cycloid. Collin’s work was
forgotten. It was rediscovered a century later and applied in Lorimer’s method. Since then
Taylor, Bishop, Morgenstern-Price, Janbu and Spencer have developed practical methods,
and de Josselin de Jong improved the fundamentals by the double sliding mechanism. The
existence of various methods reveals that there is no absolutely correct method and special
care and experience are required when applying them. Recently, Teunissen showed us that
induced non-uniformity, which is inherent to localization and fundamental in slip line failure
modes, still represent space for further improvement. The challenge is to incorporate the
proper slip mechanism and its relation to local deformations, without loosing the elegance of
the Fellenius’ original method.
Was in earlier times the determination of slope safety a cumbersome handwork of tedious
calculations, since around the 1960s numerical analysis on the first generation computers
led the way to self-controlling, fast, flexible and relatively cheap computer codes, such as
D-GEO STABILITY
, now suited to run on modern hard- and software. An experienced supporting
team takes care of catching up with relevant scientific progress and new developments such
as risk engineering, geostatistics and random field approach, and the latest computer art of
processing and visualization. The philosophy after
D-GEO STABILITY
is to keep it user-friendly
and up-to-date such that a sufficiently large family of happy users will allow for continuity and
further progress.
Prof. dr. ir. F.B.J. Barends
Technical University Delft, Civil Engineering department.
1.2 Preface
D-GEO STABILITY
is developed specifically for geotechnical engineers. It is a tool used to ana-
lyze slope stability in two-dimensional geometry.
D-GEO STABILITY
has proved itself a powerful
tool for solving soil stability problems in everyday engineering practice.
D-GEO STABILITY
’s
graphical interface requires just a short training period, allowing users to focus their skill di-
rectly on the input of sound geotechnical data and the subsequent evaluation of the calculated
stability of a slope.
D-GEO STABILITY
comes as a standard module that can be extended with other modules to fit
more advanced applications:
Spencer model
Uplift Van model
Deltares 1 of 286

D-GEO STABILITY
, User Manual
Reliability model
Probabilistic random field model
1.3 Features in standard module
This section contains an overview of the features in
D-GEO STABILITY
for the calculation of
slope stability. For more information on this topic see the Reference and Background sections
of this manual.
1.3.1 Soil modeling
Multiple layers
The two-dimensional soil structure can be composed of several soil layers with an arbi-
trary shape and orientation. The deep soil layer is assumed to be infinitely thick. Each
layer is connected to a certain soil type. It is possible to combine layers with different
material models.
Geotextiles
It is possible to model geotextiles with arbitrary inclination. The stability of a slope will
increase if a slip plane intersects with a geotextile.
Nails
It is possible to model nails with arbitrary inclination. The resisting moment of the soil
will increase due to the nails.
Drained and undrained behavior
Soil parameters are defined per soil type. Besides input of a cohesion cand internal
friction angle, a direct relationship between shear stress and normal stress can be
applied by entering a so-called sigma-tau curve. Alternatively, it is possible to use an
undrained shear strength su, either by direct input of the measured value, or by input of
the ratio with the pre-consolidation stress. It is possible to combine layer with different
models.
1.3.2 Loads
D-GEO STABILITY
provides the following options for defining loads:
Pore Fluid load
Separate piezometric level lines can be specified to determine hydrostatic pore pres-
sures distributions and the phreatic level in each layer. The volumetric weight of water
can be adjusted. It is also possible to include the effect of suction above the phreatic
line in calculations. (Excess) pore water pressures can be defined with piezometric
level lines or with a degree of consolidation per soil layer. It is also possible to use an
external file containing a net of nodes in which the pore pressure is known, generated
with the water flow model MSeep.
Permanent and temporary surcharges
Permanent point loads can be positioned anywhere in the geometry. Distributed loads
can be positioned as permanent or temporary loads (very short loading time) on the
surface of the soil structure. For these loads, an angle of dispersion can be defined
while a degree of consolidation must be specified for the temporary loads.
Earthquake
In order to simulate the effects of an earthquake, certain coefficients can be entered
to introduce additional moment and excess pore pressure and to modify the free water
movement.
Tree on Slope
The effect of wind on trees rooted in the slope can be modeled.
2 of 286 Deltares

General Information
1.3.3 Slip plane determination
A limit equilibrium method like Bishop, Uplift-Van or Spencer determines the safety factor
along a given slip plane. In a geometry, an infinite amount of slip planes can occur. Therefore,
a search algorithm needs to find which slip plane is representative.
The default search algorithm is the “grid” method. By defining a square with center points
and a number of tangent lines, all combinations of possible slip planes are investigated. If the
representative plane is on the edge of the grid, it is an option to move the grid in that direction
to ensure a minimum.
This grid based procedure works for all implemented limit equilibrium methods. It becomes
very time consuming if the search space is very large (Bishop, Van) or if an unconstrained
slip plane is sought after using Spencer’s method. The Genetic Algorithm offers an alternative
that is faster in case of a large search space. The precision of the result depends on the input
parameters.
In short, two optimization techniques are available to find the representative slip plane:
the Grid method calculates all combinations of center points and tangent lines, if appli-
cable.
the Genetic algorithm finds the representative plane through an algorithm that is more
efficient in a large search space, with many degrees of freedom for the slip plane.
1.3.4 Results
After analysis,
D-GEO STABILITY
can present results in a tabular and graphical form. The tabu-
lar report contains an echo of the input data, concise information on all calculated slip surfaces
and (if required) detailed information on the critical slip surface.
It is possible to view graphical output of the distribution of various stress components along
the (critical) slip plane, as well as view graphs of the water pressure and vertical effective
stress along verticals.
A probabilistic analysis will yield a graph with influence factors. Influence factors are in fact
the result of an automated sensitivity analysis, and show how much uncertainties in specific
parameters contribute to the overall uncertainty in the factor safety.
1.4 Features in additional modules
1.4.1 Spencer model
This model is intended for special (non-circular) stability analysis. It determines a single safety
factor for a user-defined position of an arbitrary shaped slip surface.
1.4.2 Uplift Van model
This model is intended for usual uplift stability analysis. It determines automatically the lowest
safety factor, assuming a horizontal plane, bounded by two circles.
Deltares 3 of 286

D-GEO STABILITY
, User Manual
1.4.3 Reliability based design methods
With
D-GEO STABILITY
’s reliability module, it is easy to switch between the following design
methods:
Mean value analysis
Calculation of the safety factor, using fixed mean values of the parameters.
Design value analysis
Calculation of the safety factor, using fixed design values of the parameters.
D-GEO STABILITY
derives these unfavorable lower or upper limits from stochastic parameter distributions
and partial factors.
Probabilistic design
Calculation of the safety factor (mean value), a probability of failure and influence
factors. The probabilistic FORM (First Order Reliability Method) method uses varia-
tions of stochastic parameters for strength and pore pressure. A system of probabilis-
tic defaults enables an approximate reliability analysis without any additional input of
stochastic data. The defaults are largely based on the Dutch NEN design standard.
D-GEO STABILITY
uses the defaults also to calculate approximate design values from
mean values or approximate mean values from design values.
Probabilistic random field model
The Bishop probabilistic random field model performs a probabilistic slope stability anal-
ysis, in order to determine the probability that the safety factor is less than the required
value. Furthermore, this model calculates sensitivity factors, which are used by the
computer program PCRING for the analysis of dike systems. The computation model
is based on Bishop’s method of slices for equilibrium analysis, random field modeling
of spatial variability of soil strength and pore pressures, and first order second moment
probabilistic reliability analysis. The probability of the external water level can be taken
into account optionally.
1.4.4 Product integration
D-GEO STABILITY
is an integrated component of the Deltares Systems tools. This means
that it is possible to exchange relevant data with MGeobase (central project environment),
D-SETTLEMENT
formerly known as MSettle (transient settlements), MSeep (seepage) and
D-GEO PIPELINE
formerly known as MDrill (pipeline installation). Besides the exchange of
input data,
D-GEO STABILITY
can also import a settled geometry calculated by
D-SETTLEMENT
or a pore pressure load generated by MSeep. MGeobase is used to maintain a central project
database with measurements, soil properties and geometry. MGeobase offers power tools
to create geotechnical profiles and longitudinal cross-sections automatically from measure-
ments. MGeobase can also use
D-GEO STABILITY
to perform a batch stability analysis for
multiple cross-sections.
4 of 286 Deltares

General Information
1.5 History
D-GEO STABILITY
was first named MStab and developed at GeoDelft/Deltares in 1987/1988
with the support of both Oranjewoud BV and the Road and Hydraulic Engineering Division of
the Ministry of Transport and Public Works.
MStab version 1.0 was first released in 1988 and has since been upgraded a number of
times, each time adding new features and improving its user interface to suit the new demands
of its users.
MStab version 6.0 was released in 1995. This version included a major alteration to the
geometry file and a more flexible way of adding and deleting points and layer boundaries.
Furthermore, each soil layer now had to be assigned a soil type, while soil properties were
in turn assigned to a soil type. As a result, these properties were linked to the soil layers
through the soil type. Lastly, traffic loads became temporarily distributed loads with a degree
of consolidation for each layer.
MStab version 7.0 was released in 1998, the first Windows version of MStab.
MStab version 8.0 (1999) contains further improvements, including the option of non-circular
slip planes.
MStab version 9.0 (2001) includes an enhanced module for geometrical modeling, and im-
proved versions of the user manual and on-line Help have been released.
MStab version 9.7 (2002) includes separately licensed modules for the general Spencer
method, and for the new “Uplift Van” and “Uplift Spencer” methods. The new methods deter-
mine automatically a slip plane in cases with excessive interface water pressures.
MStab version 9.8 (2004) contains the following new features: Reliability Analysis module,
Bishop Probabilistic Random Field module, calculated undrained shear strength, combination
of material models.
MStab version 9.10 (August 2007) contains the following new features: Tree on slope, Zone
plot, Pseudo values shear strength model and Horizontal balance check.
D-GEO STABILITY
version 10.1 was released in 2011. The name of the program has changed:
D-GEO STABILITY
replaces MStab. A genetic algorithm might be used to find the minimum
center point in a calculation. It is possible to find a Spencer slip plane with a genetic algorithm.
The correlation coefficients of soil groups (probabilistic calculation) is adjusted. The error in
Horizontal Balance calculation above phreatic line is solved. It is possible to calculate with
soil nails.
D-GEO STABILITY
version 14.1 (2014). A Spencer plane has a zone number as well (Zone
Plot option). The shear stresses per slice for Fellenius model are now correct. The use of
nails with the Uplift-Van method is now possible.
D-GEO STABILITY
version 15.1 (April 2015). This version implements some improvements:
For Horizontal Balance model, a negative safety factor could be found. This is now
fixed.
A toggle button is implemented in the View Input (Figure 2.5), to switch between same
scale for X and Y-axis and not same scale for X and Y-axis.
In the Calculation Options window (Figure 5.1), a range for the horizontal position of the
Deltares 5 of 286

D-GEO STABILITY
, User Manual
entry point of the critical slip plane can be specified.
The Help file is no more available; clicking on the Help button will open the User Manual
in which a search by specific word can be performed.
The background section of the manual is improved for circular slip plane (section 16.2).
D-GEO STABILITY
version 16.1 (January 2016). With this version, license(s) can be borrowed
for a certain period allowing working without connection to the licence server (see Figure 3.6
for more information). In this version, the critical angle for nails works properly (section 4.5.3).
D-GEO STABILITY
version 16.2 (December 2016). This release contains several changes with
regard to previous versions that can cause different calculation results. Most relevant changes
are:
Method Uplift-Van incorporates the change of water pressures along the horizontal part
of the slip plane (section 16.3.4). The resulting force is added to the horizontal equi-
librium. The effect of the driving moment of this horizontal part is also added to the
equilibrium.
The Su-calculated model is also implemented conform the SHANSEP method. Over-
consolidation is represented through a “yield stress field” (section 4.2.3). Using a refer-
ence line (section 4.4.5), one can model the effect of an elevation as well as an exca-
vation. If no reference line is given, the current effective stress is used as the pre-load
stress.
The dilatancy angle (ψ) is added to the material properties (Figure 4.22). If ϕ=ψ, the
earlier implemented associative material behavior is represented. By entering a differ-
ent value for psi, one can perform a non-associative analysis (see also section 19.1).
1.6 Limitations
When working with
D-GEO STABILITY
, the following limitations apply:
D-GEO STABILITY
can automatically determine the position of a critical slip circle. This
search algorithm is accurate as long as:
the distribution of center points and tangent lines is reasonably fine;
the location of the initial trial grid will yield a slip circle at the right slope;
the shape of the true slip surface does not deviate significantly from the assumed
shape.
D-GEO STABILITY
discards the friction following from the horizontal stress component at
the vertical slice interfaces.
D-GEO STABILITY
therefore assumes that the orientation of
a slip surface is predominantly horizontally.
D-GEO STABILITY
assumes values for the total vertical stress that are estimated from
the composed weight of a vertical column of soil and from the additional load spread.
The influence of load spread by a non-horizontal soil surface is therefore not taken into
account.
Application of
D-GEO STABILITY
is allowed as long as the two-dimensional plane-strain
assumption applies.
See also section 20.4.2 “Assumptions and limitations of the Reliability module".
6 of 286 Deltares
General Information
1.7 Minimum System Requirements
The following minimum system requirements are needed in order to run and install the
D-GEO STABILITY
software, either from CD or by downloading from the Deltares Systems website via MS Inter-
net Explorer:
Operating systems:
Windows 2003,
Windows Vista,
Windows 7 – 32 bits
Windows 7 – 64 bits
Windows 8
Hardware specifications:
1 GHz Intel Pentium processor or equivalent
512 MB of RAM
400 MB free hard disk space
SVGA video card, 1024 ×768 pixels, High colors (16 bits)
CD-ROM drive
Microsoft Internet Explorer version 6.0 or newer (download from www.microsoft.com)
To display the
D-GEO STABILITY
Help texts properly, the Symbol TrueType font must be installed
on the system.
1.8 Definitions and Symbols
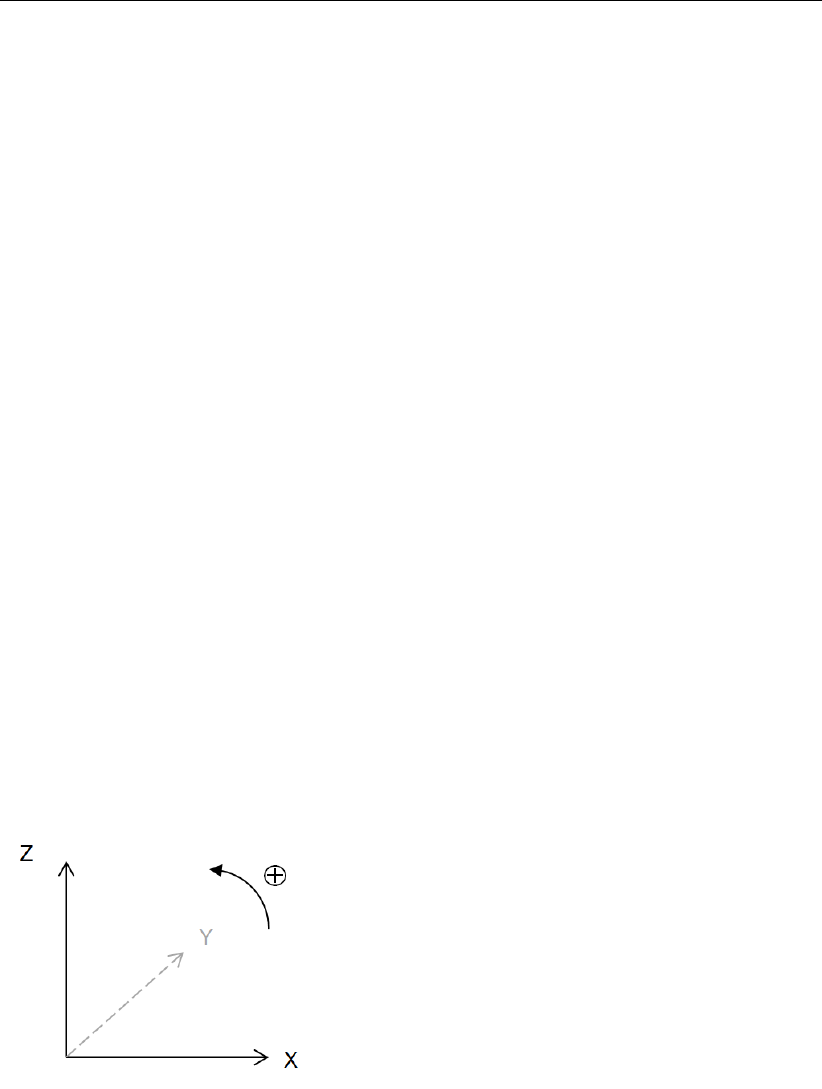
coordinate system
The horizontal axis is defined as the X-axis. The vertical axis is defined to be the Z-direction.
Upward is positive and downward negative. Perpendicular to the cross section is the Y-
direction.
Geometry
Zsurface Surface level
Zwater Phreatic level
Zpiezo Piezometric level (also called hydraulic head)
Soil material
cCohesion
suUndrained shear strength
su;bottom Undrained shear strength at the bottom of the layer
su;gradient Gradient in shear strength over the depth of the layer
su;top Undrained shear strength at the top of the layer
POP Pre-overburden pressure
Deltares 7 of 286

D-GEO STABILITY
, User Manual
Uij Degree of consolidation: ratio (in percent) between the excess pore pressure
and the vertical total stress increment, both in layer i, by addition of layer j
ϕFriction angle of shearing resistance
γsat Unit weight of saturated soil (below the phreatic line)
γunsat Unit weight of unsaturated soil (above the phreatic line)
σpPre-consolidation stress (also written Pc)
Slices
biWidth of slice i
hiHeight of slice i
kNumber of layers along slice i
liLength of the arc at bottom of slice i:li=bi/cos αi
nTotal number of slices in which the sliding part of the ground mass is divided
nleft Number of slices in which the left sliding part of the ground mass is divided
(Uplift Van)
nright Number of slices in which the right sliding part of the ground mass is divided
(Uplift Van)
XiHorizontal coordinate of the middle of slice i
Zi;top Vertical coordinate of the middle top of slice i
Zi;bottom Vertical coordinate of the middle bottom of slice i
αiSlide plane angle (at the bottom) of slice i
βiSlope angle (at the top) of slice i
Stresses acting on a slice
uHydraulic (piezometric) pore pressure
uhHydrostatic pore pressure (from the position of the phreatic line)
σTotal vertical soil stress (positive in compression)
σ0Effective vertical soil stress (positive in compression)
τShear stress
Slip plane / Slipe circle(s)
FsThe factor of safety
RThe radius of the slip circle (Bishop, Fellenius)
Rleft The radius of the left slip circle (Uplift Van)
Rright The radius of the right slip circle (Uplift Van)
XcThe X-coordinate of the slip circle (Bishop, Fellenius)
Xc;left The X-coordinate of the left slip circle (Uplift Van)
Xc;right The X-coordinate of the right slip circle (Uplift Van)
ZcThe Z-coordinate of the slip circle (Bishop, Fellenius)
Zc;left The Z-coordinate of the left slip circle (Uplift Van)
Zc;right The Z-coordinate of the right slip circle (Uplift Van)
Probabilistic
Frequired The required value for the safety factor
ZThe limit state function: Z=Fs−Frequired
µ[x]The mean value of parameter x
σ[x]The standard deviation of parameter x, quantifying the uncertainty
VThe coefficient of variation: V=σ[x]/µ [x]
P(x>xcharac)The probability of exceeding a characteristic value:
P(x>xcharac) = 1 −P(x<xcharac)
8 of 286 Deltares
General Information
ΦN(ucharac)The probability that parameter xdoes not exceed a characteristic
value:
ΦN(ucharac) = P(x<xcharac) =
ucharac
R
−∞
ϕN(u)×du
ϕN(u)Standard normal probability density:
ϕN(u) = exp (−u2/2)
√2πσ [x]
fpartial The partial factor, used to reduce characteristic strength values to
safe low values
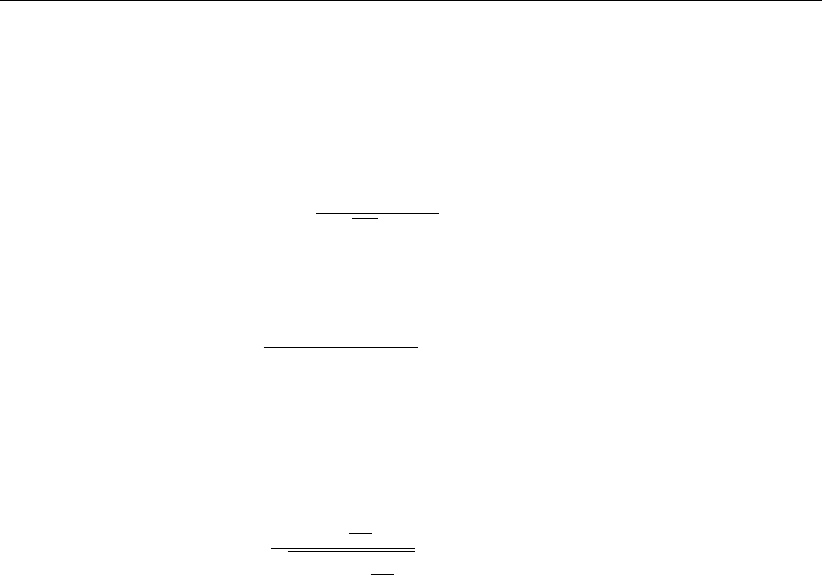
βThe reliability index:
β=µ[Fs]−Frequired
σ[Fs]
connected to the probability of failure:
ΦN(−β) = P(Fs< Frequired)
Design point The most likely set of parameter values with Fs=Frequired
αiThe influence factor for parameter xi, describing the sensitivity of
the limit state function for parameter variation, weighted by the stan-
dard deviation:
αi=σ[xi]∂Z
∂xi
sn
P
i=1
σ2[xi]∂Z
∂xi2
1.9 Getting Help
From the Help menu, choose the Manual option to open the User Manual of
D-GEO STABILITY
in PDF format. Here help on a specific topic can be found by entering a specific word in the
Find field of the PDF reader.
1.10 Getting Support
Deltares Systems tools are supported by Deltares. A group of 70 people in software develop-
ment ensures continuous research and development. Support is provided by the developers
and if necessary by the appropriate Deltares experts. These experts can provide consultancy
backup as well.
If problems are encountered, the first step should be to consult the online Help at
www.deltaressystems.com menu ‘Software’. Different information about the program can be
found on the left-hand side of the window (Figure 1.1):
In ‘Support - Frequently asked questions’ are listed the most frequently asked technical
questions and their answers.
In ’Support - Known issues’ are listed the bugs of the program.
In ‘Release notes’ are listed the differences between an old and a new version.
Deltares 9 of 286

D-GEO STABILITY
, User Manual
Figure 1.1: Deltares Systems website (www.deltaressystems.com)
If the solution cannot be found there, then the problem description can be e-mailed (preferred)
or faxed to the Deltares Systems Support team. When sending a problem description, please
add a full description of the working environment. To do this conveniently:
Open the program.
If possible, open a project that can illustrate the question.
Choose the Support option in the Help menu. The System Info tab contains all relevant
information about the system and the software. The Problem Description tab enables a
description of the problem encountered to be added.
10 of 286 Deltares
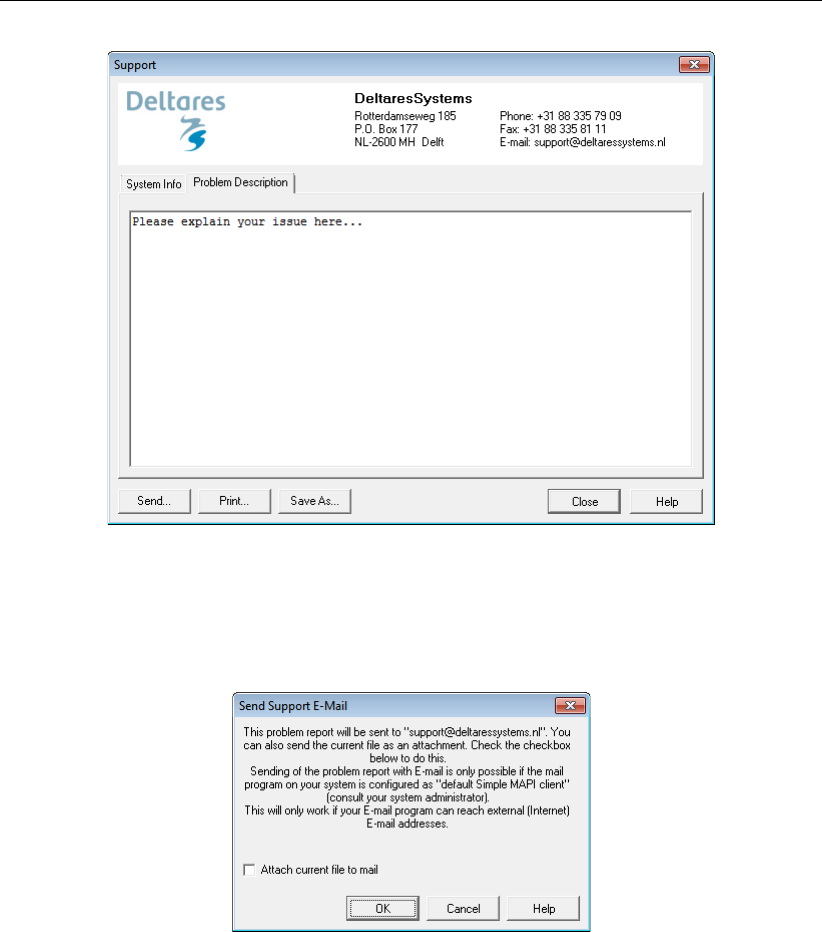
General Information
Figure 1.2: Support window, Problem Description tab
After clicking on the Send button, the Send Support E-Mail window opens, allowing
sending current file as an attachment. Marked or not the Attach current file to mail
check-box and click OK to send it.
Figure 1.3: Send Support E-Mail window
The problem report can either be saved to a file or sent to a printer or PC fax. The document
can be emailed to geo.support@deltares.nl or alternatively faxed to +31(0)88 335 8111.
1.11 Deltares
Since January 1st 2008, GeoDelft together with parts of Rijkswaterstaat /DWW, RIKZ and
RIZA, WL |Delft Hydraulics and a part of TNO Built Environment and Geosciences are form-
ing the Deltares Institute, a new and independent institute for applied research and special-
ist advice. Founded in 1934, GeoDelft was one of the world’s most renowned institutes for
geotechnical and environmental research. As a Dutch national Grand Technological Institute
(GTI), Deltares role is to obtain, generate and disseminate geotechnical know-how. The in-
stitute is an international leader in research and consultancy into the behavior of soft soils
(sand clay and peat) and management of the geo-ecological consequences which arise from
these activities. Again and again subsoil related uncertainties and risks appear to be the key
factors in civil engineering risk management. Having the processes to manage these uncer-
tainties makes Deltares the obvious Partner in risk management for all parties involved in the
Deltares 11 of 286

D-GEO STABILITY
, User Manual
civil and environmental construction sector. Deltares teams are continually working on new
mechanisms, applications and concepts to facilitate the risk management process, the most
recent of which is the launch of the concept "GeoQ" into the geotechnical sector.
For more information on Deltares, visit the Deltares website: www.deltares.nl.
1.12 Deltares Systems
Deltares objective is to convert Deltares knowledge into practical geo-engineering services
and software. Deltares Systems has developed a suite of software for geotechnical engineer-
ing. Besides software, Deltares Systems is involved in providing services such as hosting
on-line monitoring platforms, hosting on-line delivery of site investigation, laboratory test re-
sults, etc. As part of this process Deltares Systems is progressively connecting these services
to their software. This allows for more standardized use of information, and the interpreta-
tion and comparison of results. Most software is used as design software, following design
standards. This however, does not guarantee a design that can be executed successfully in
practice, so automated back-analysis using monitoring information are an important aspect in
improving geotechnical engineering results.
Deltares Systems makes use of Deltares’s intensive engagement in R&D for GeoBrain. Geo-
Brain’s objective is to combine experience, expertise and numerical results into one forecast,
using Artificial Intelligence, Neural Networks and Bayesian Belief Networks. For more in-
formation about Deltares Systems’ geotechnical software, including download options, visit
www.deltaressystems.com.
1.13 Rijkswaterstaat/DWW
The Road and Hydraulic Engineering Division (Rijkswaterstaat/DWW) of the Dutch Ministry of
Transport, Public Works and Water Management is the advisory division for road and hydraulic
engineering related to technology and the environment. It researches, advises and transfers
knowledge on nature and on the environmental engineering of the physical infrastructure, wa-
ter and water defense systems and the supply of construction raw materials, including the
environmental aspects. DWW has sponsored the development of
D-GEO STABILITY
in order to
support a uniform and reliable design of embankments, dikes and other geotechnical struc-
tures.
For more information on DWW, visit www.minvenw.nl/rws/dww/home.
1.14 On-line software (Citrix)
Besides purchased software, Deltares Systems tools are available as an on-line service. The
input can be created over the internet. Heavy duty calculation servers at Deltares guarantee
quick analysis, while results are presented on-line. Users can view and print results as well
as locally store project files. Once connected, clients are charged by the hour. For more
information, please contact the Deltares Systems sales team: sales@deltaressystems.nl.
12 of 286 Deltares
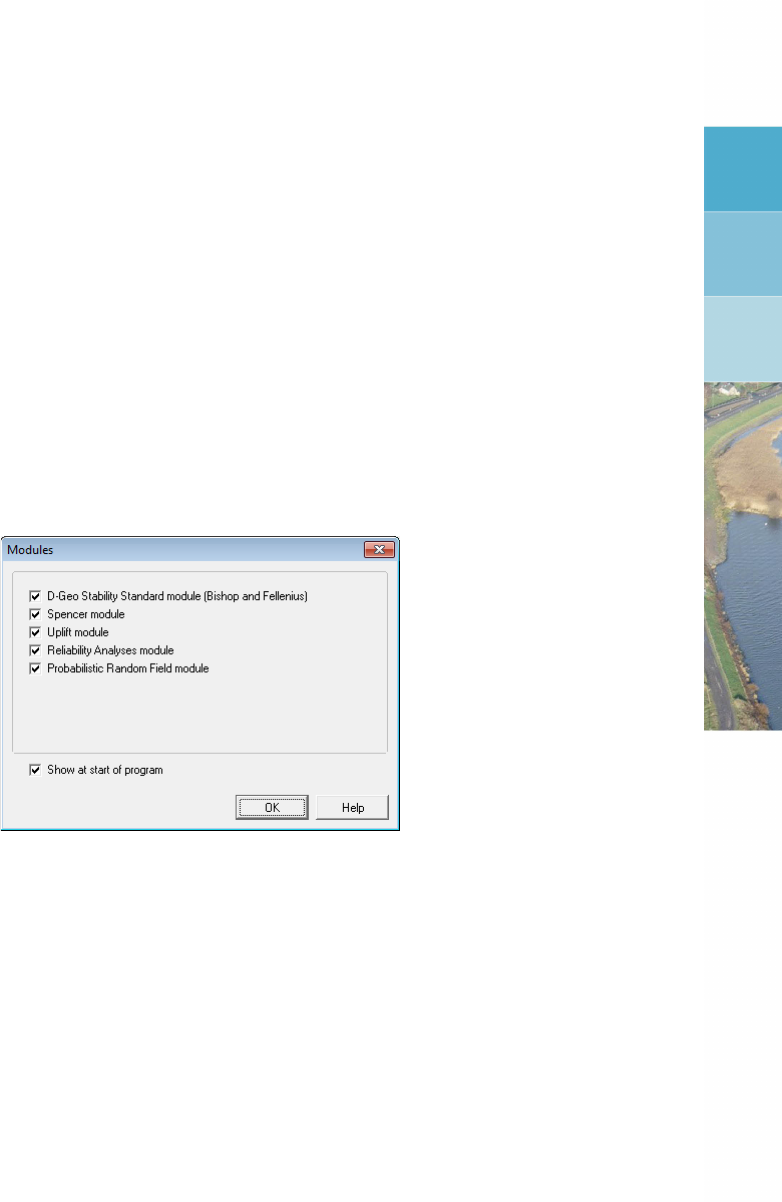
2 Getting Started
This Getting Started chapter aims to familiarize the user with the structure and user interface
of
D-GEO STABILITY
. The Tutorial section which follows uses a selection of case studies to
introduce the program’s functions. Getting Started
2.1 Starting D-Geo Stability
To start
D-GEO STABILITY
, click Start on the Windows menu bar and then find it under Pro-
grams, or double-click an
D-GEO STABILITY
input file that was generated during a previous
session.
For an
D-GEO STABILITY
installation based on floating licenses, the Modules window may ap-
pear at start up (Figure 2.1). Check that the correct modules are selected and click OK.
Figure 2.1: Modules window
When
D-GEO STABILITY
is started from the Windows menu bar, the last project that was worked
on will open automatically, unless the program has been configured otherwise under Tools:
Program Options.
2.2 Main Window
When
D-GEO STABILITY
is started, the main window is displayed (Figure 2.2). This window
contains a menu bar (section 2.2.1), an icon bar (section 2.2.2), a View Input window (sec-
tion 2.2.3) that displays the pre-selected or most recently accessed project, an info bar (sec-
tion 2.2.4), a title panel (section 2.2.5) and a status bar (section 2.2.6).
The caption of the main window of
D-GEO STABILITY
displays the program name, followed by
the model and the default shear strength names and the project name. When a new file is
created, the default model is Bishop, the default shear strength is C – Phi and the project
name is Project1.
Deltares 13 of 286
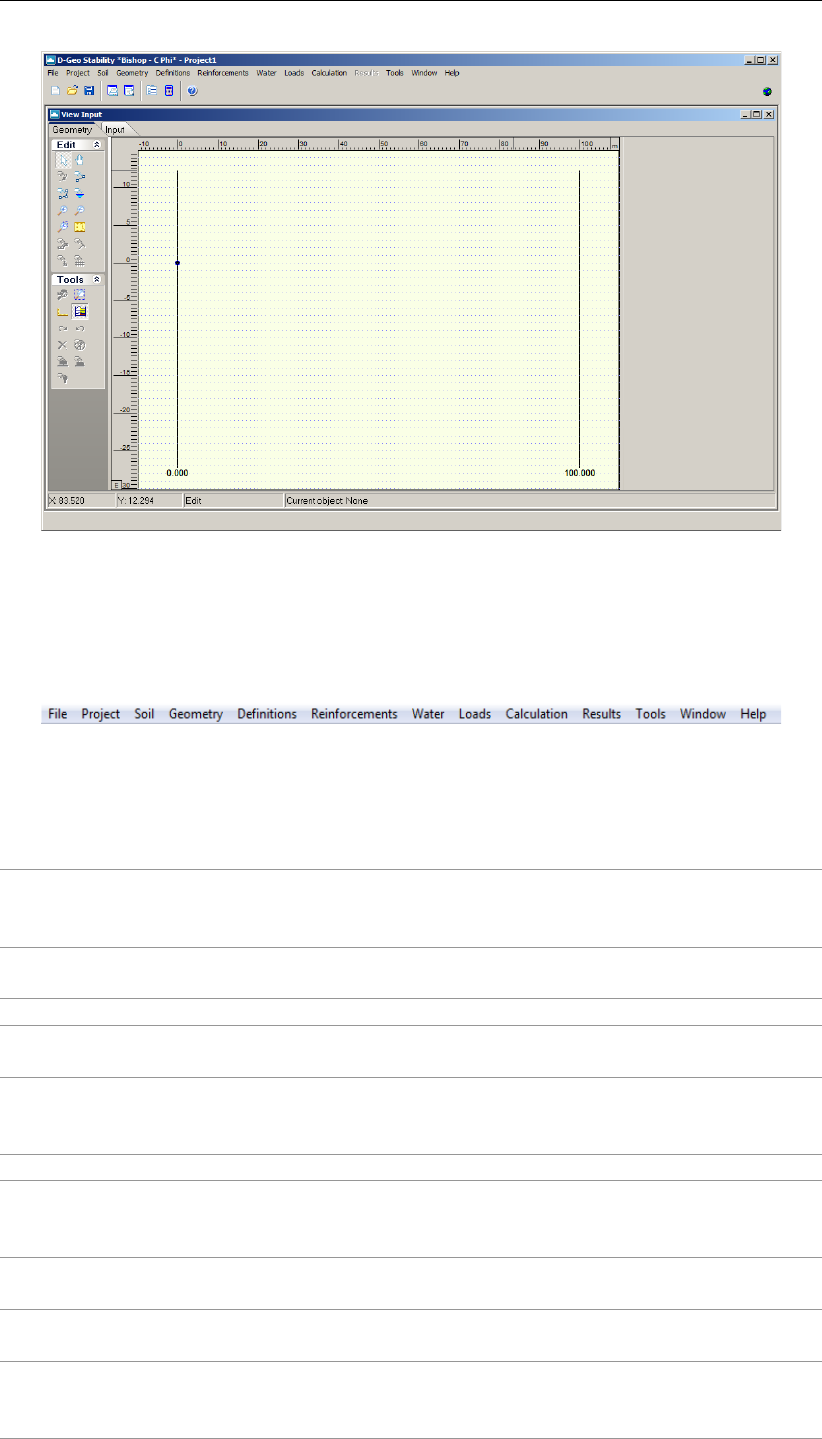
D-GEO STABILITY
, User Manual
Figure 2.2: D-Geo Stability main window
2.2.1 The menu bar
To access the
D-GEO STABILITY
menus, click the menu names on the menu bar.
Figure 2.3: D-Geo Stability menu bar
The menu contains the following functions:
File Standard Windows options for opening and saving as well as several
D-GEO STABILITY
options for exporting and printing the active window
(section 3.1).
Project Global model selection. Input of project identification and layout options
for specific windows. Modification of probabilistic defaults (section 4.1).
Soil Definition of soil type properties (section 4.2).
Geometry Definition of general geometrical data like layers, soil types and piezo-
metric lines (section 4.3).
Definitions Definition of specific geometrical data for
D-GEO STABILITY
models, like
the initial/possible slip plane position, geotextiles, “forbidden lines”, ref-
erence level et cetera (section 4.4).
Reinforcements Input of the geotextiles and nails (section 4.5).
Water Input of water weight, degree of consolidation or import of pore pres-
sures from MSeep. Input of external water levels for probabilistic design
(section 4.6).
Loads Options for input of distributed surcharge and earth quake coefficients
(section 4.7).
Calculation Determine the stresses along the critical slip circle or a user-defined slip
plane, for a selected design analysis type (chapter 5).
Results Graphical or tabular output of the safety level and stress components
along the slip plane. Graphical output of the influence factors (chap-
ter 6).
14 of 286 Deltares
Getting Started
Tools Options for editing
D-GEO STABILITY
program defaults (section 3.2).
Window Default Windows options for arranging the
D-GEO STABILITY
windows
and choosing the active window.
Help Online Help options (section 1.9).
Detailed descriptions of these menu options can be found in the Reference section.
2.2.2 The icon bar
Use the buttons on the icon bar to quickly access frequently used functions (see below).
Figure 2.4: D-Geo Stability icon bar
Click on the following buttons to activate the corresponding functions:
Start a new
D-GEO STABILITY
project.
Open the input file of an existing project.
Save the input file of the current project.
Print the contents of the active window.
Display a print preview of the active window.
Open the Project Properties window. Here the project title and other identification
data can be entered, and the View Layout and Graph Settings for the project can
be determined.
Start the calculation.
Display the contents of online Help.
Display the Dutch website of the Deltares Software Simulation Products and So-
lutions.
Deltares 15 of 286
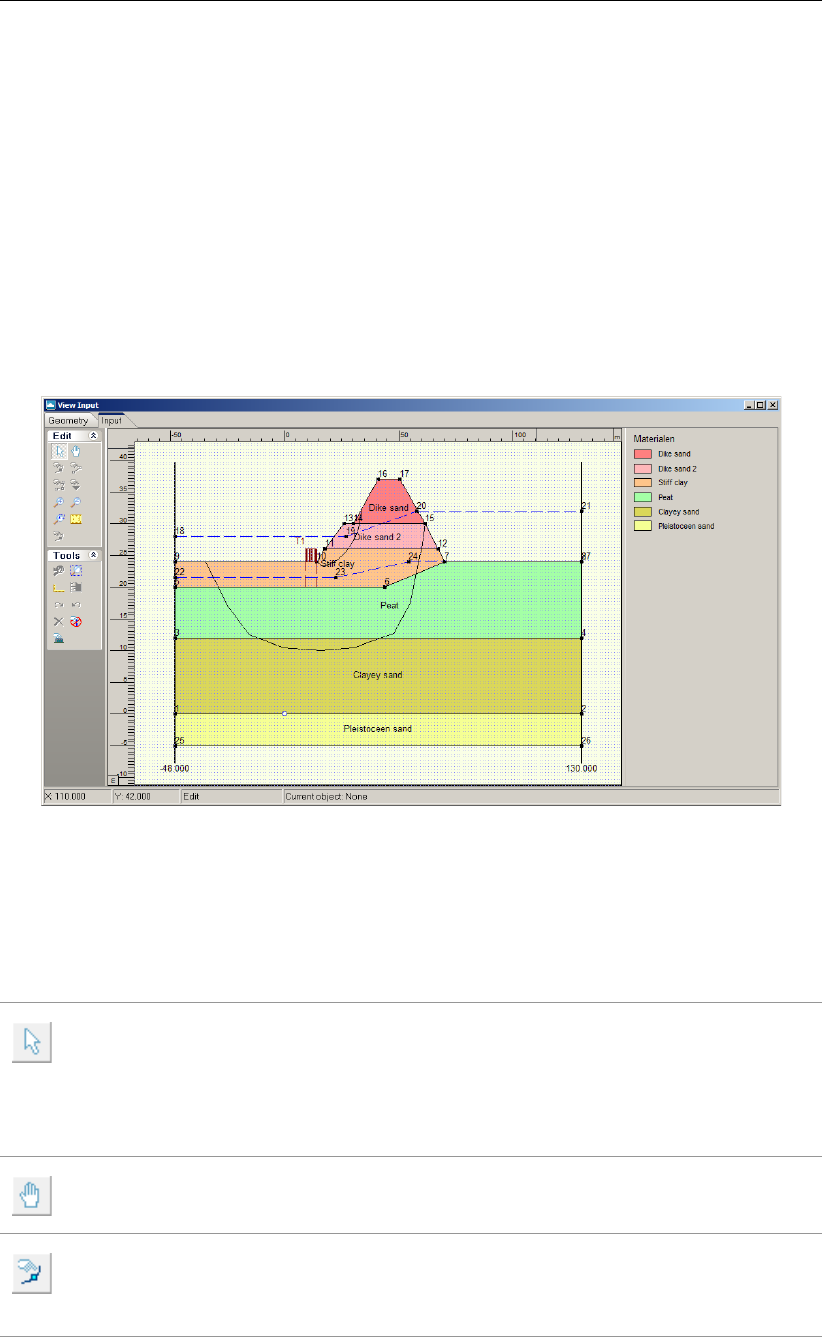
D-GEO STABILITY
, User Manual
2.2.3 View Input
The View Input window displays the geometry and additional
D-GEO STABILITY
input of the
current project. The window has the following two tabs:
Geometry
In this view it is possible to define, inspect and modify the positions and soil types of
different layers. For more information on these general
D-GEO STABILITY
options for
geometrical modeling, see the description of the Geometry menu (section 4.3).
Input
In this view it is possible to define, inspect and modify the additional,
D-GEO STABILITY
specific input. For more information on the available options, see below in this section.
See also the description of the Definitions menu (section 4.4).
Figure 2.5: View Input window
It is possible to use the buttons on the panels at the left to control the graphical view and
to add input data. Click on the following buttons in the Edit and Tools panel to activate the
corresponding functions:
Select and Edit mode
In this mode, the left-hand mouse button can be used to graphically select a previ-
ously defined grid, load, geotextile or forbidden line. Items can then be deleted or
modified by dragging or resizing, or by clicking the right-hand mouse button and
choosing an option from the menu displayed. Pressing the Escape key will return
the user to this Select and Edit mode.
Pan
Click this button to change the visible part of the drawing by clicking and dragging
the mouse.
Add point(s) to boundary / PL-line
Click this button to add points to all types of lines (lines, polylines, boundary lines,
PL-lines). By adding a point to a line, the existing line is split into two new lines.
This provides more freedom when modifying the geometry.
16 of 286 Deltares
Getting Started
Add single lines(s)
Click this button to add single lines. When this button is selected, the first left-hand
mouse click will add the info bar of the new line and a “rubber band” is displayed
when the mouse is moved. The second left-hand mouse click defines the end
point (and thus the final position) of the line. It is now possible to either go on
clicking start and end points to define lines, or stop adding lines by selecting one
of the other tool buttons, or by clicking the right-hand mouse button, or by pressing
the Escape key.
Add polyline(s)
Click this button to add poly-lines. When this button is selected, the first left-
hand mouse click adds the starting point of the new line and a “rubber band” is
displayed when the mouse is moved. A second left-hand mouse click defines the
end point (and thus the final position) of the first line in the poly-line and activates
the “rubber band” for the second line in the poly-line. Every subsequent left-hand
mouse click again defines a new end point of the next line in the poly-line. It is
possible to end a poly-line by selecting one of the other tool buttons, or by clicking
the right-hand mouse button, or by pressing the Escape key.
Add PL-line(s)
Click this button to add a piezometric level line (PL-line). Each PL-line must start
at the left limit and end at the right limit. Furthermore, each consecutive point must
have a strictly increasing X coordinate. Therefore, a PL-line must be defined from
left to right, starting at the left limit and ending at the right limit. To enforce this,
the program will always relocate the first point clicked (left-hand mouse button) to
the left limit by moving it horizontally to this limit. If trying to define a point to the
left of the previous point, the rubber band icon indicates that this is not possible.
Subsequently clicking on the left side of the previous point, the new point will be
added at the end of the rubber band icon instead of the position clicked.
Zoom in
Click this button to enlarge the drawing, then click the part of the drawing which is
to be at the center of the new image. Repeat if necessary.
Zoom out
Click this button, then click on the drawing to reduce the drawing size. Repeat if
necessary.
Zoom rectangle
Click this button then click and drag a rectangle over the area to be enlarged. The
selected area will be enlarged to fit the window. Repeat if necessary.
Measure the distance between two points
Click this button, then click the first point on the View Input window and place the
cross on the second point. The distance between the two points can be read at
the bottom of the View Input window. To turn this option off, click the escape key.
Add geotextile
In this mode, it is possible to use the left mouse button to graphically define the
starting and end point of a geotextile section. The stability of a slope will increase
if a slip plane crosses a geotextile.
Add nail
In this mode, it is possible to use the left mouse button to graphically define the
starting and end point of a nail. The resistance of the soil will increase.
Add fixed point
Click this button to graphically define the position of a point that will be part of the
critical slip circle.
Deltares 17 of 286
D-GEO STABILITY
, User Manual
Add calculation grid
Click this button to graphically define the initial position of the trial grid with slip-
circle center points and the corresponding positions of the trial horizontal tangent
lines of the slip circle.
Undo zoom
Click this button to undo the zoom. If necessary, click several times to retrace
each consecutive zoom-in step that was made.
Zoom limits
Click this button to display the complete drawing.
Same scale for X and Y axis
Click this button to use the same scale for the horizontal and vertical directions.
Undo
Click this button to undo the last change(s) made to the geometry
Redo
Click this button to redo the previous Undo action.
Automatic regeneration of geometry on/off
When selected, the program will automatically try to generate a new valid geom-
etry whenever geometry modifications require this. During generation, (poly)lines
(solid blue) are converted to boundaries (solid black), with interjacent layers. New
layers receive a default material type. Existing layers keep the materials that were
assigned to them. Invalid geometry parts are converted to construction elements.
Automatic regeneration may slow down progress during input of complex geome-
try, because validity will be checked continuously.
Delete
Click this button to delete a selected element. Note that this button is only available
when an element is selected.
Add forbidden lines
Click this button to display a window in which it is possible to add, modify or delete
lines. Slip circles are not allowed to cross forbidden lines.
Add line loads
Click this button to display a window in which it is possible to add, modify or delete
point loads per unit of length.
Add uniform loads
Click this button to display a window in which it is possible to add, modify or delete
uniform loads per unit of area.
Edit tree on slope
Click this button to display a window in which it is possible to input an area on the
slope where trees are present.
See section 7.3.2 for more information on how using those buttons.
2.2.4 Info bar
This bar situated at the bottom of the View Input window displays the coordinates of the
current position of the cursor and the distance between two points when the icon Measure the
distance between two points is selected from the Edit panel.
18 of 286 Deltares
Getting Started
Table 2.1: Keyboard shortcuts for D-Geo Stability
Keyboard shortcut Opened window
Ctrl + N New
Ctrl + O Open
Ctrl + S Save
F12 Save As
Shift + Ctrl + C Copy Active Window to Clipboard
Ctrl + M Model
Ctrl + T Materials
Ctrl + L Slip Circle Definition
F9 Start Calculation
Ctrl + R Report
2.2.5 Title panel
This panel situated at the bottom of the main window displays the project titles, as entered on
the Identification tab in the Project Properties window (section 4.1.3).
2.2.6 Status bar
This bar situated at the bottom of the main window displays a description of the selected icon
of the icon bar (section 2.2.2) or of the View Input window (section 2.2.3).
2.3 Files
*.sti Input file (ASCII):
Contains the
D-GEO STABILITY
specific input with the problem description. After
interactive generation, this file can be reused in subsequent
D-GEO STABILITY
analysis.
*.geo Input file (ASCII):
Contains geometry data, resulting for example for a settlement analysis with
D-SETTLEMENT
(formerly known as MSettle).
*.sto Output file (ASCII):
After a calculation has been performed, all output is written to this file. If there
are any errors in the input, they are described in this file.
*.sed Optional Input file (ASCII):
Contains pore pressures from MSeep.
*.set Working file (ASCII):
Contains settings data.
2.4 Tips and Tricks
2.4.1 Keyboard shortcuts
Use the keyboard shortcuts given in Table 2.1 to directly open a window without selecting the
option from the menu bar.
Deltares 19 of 286
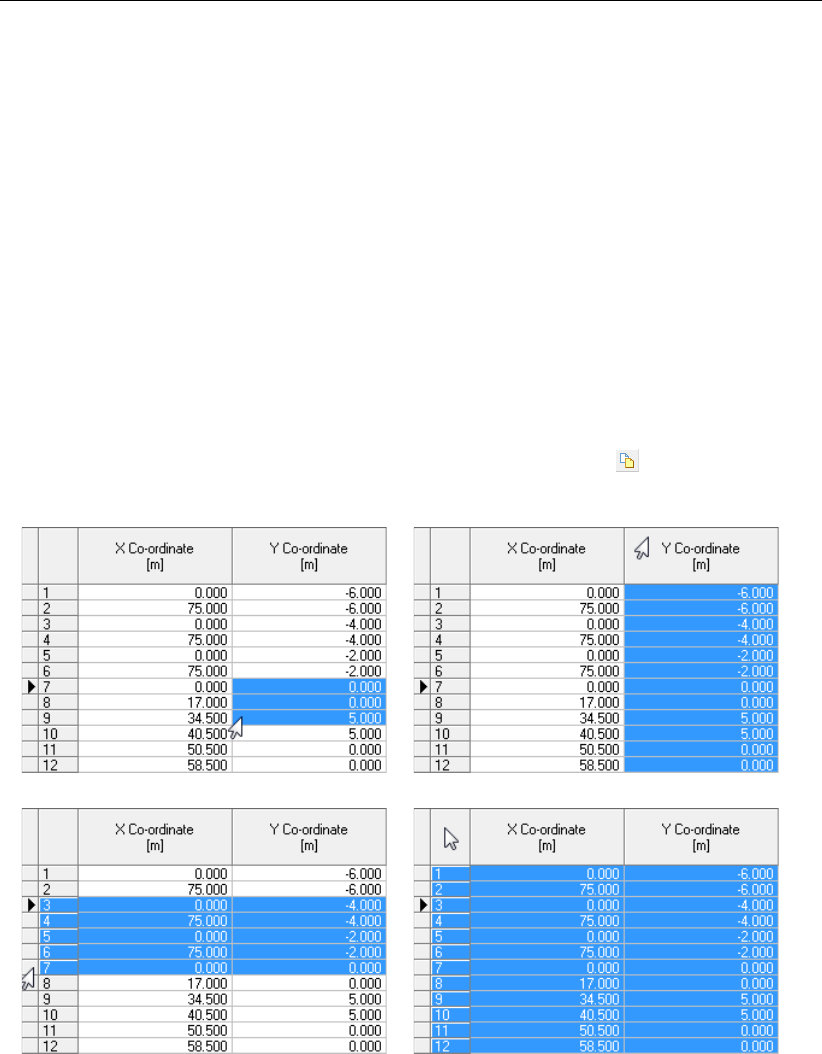
D-GEO STABILITY
, User Manual
2.4.2 Exporting figures and reports
All figures in
D-GEO STABILITY
such as geometry and graphical output can be exported in
WMF (Windows Meta Files) format. In the File menu, select the option Export Active Window
to save the figures in a file. This file can be later imported in a Word document for example
or added as annex in a report. The option Copy Active Window to Clipboard from the File
menu can also be used to copy directly the figure in a Word document. The report can be
entirely exported as PDF (Portable Document Format) or RTF (Rich Text Format) file. To look
at a PDF file Adobe Reader can be used. A RTF file can be opened and edited with word
processors like MS Word.
2.4.3 Copying part of a table
It is possible to copy part of a table into another document, an Excel sheet for example, or use
it within
D-GEO STABILITY
. If the cursor is placed on the left-hand side of a cell of the table, the
cursor changes in an arrow which points from bottom left to top right. Select a specific area
by using the mouse (see Figure 2.6a). Then, using the copy button (or ctrl+C) this area
can be copied.
(a) (b)
(c) (d)
Figure 2.6: Selection of different parts of a table using the arrow cursor
To select a row, click on the cell before the row number (see Figure 2.6b). To select a column,
click on the top cell of the column (see Figure 2.6c). To select the complete table, click on the
top left cell (see Figure 2.6d). In some tables the button Copy is also present at the left hand
pane.
2.4.4 Command line
There are two tools available for processing large amounts of
D-GEO STABILITY
calculations
and producing graphical output: Batch processing and Plot.
20 of 286 Deltares
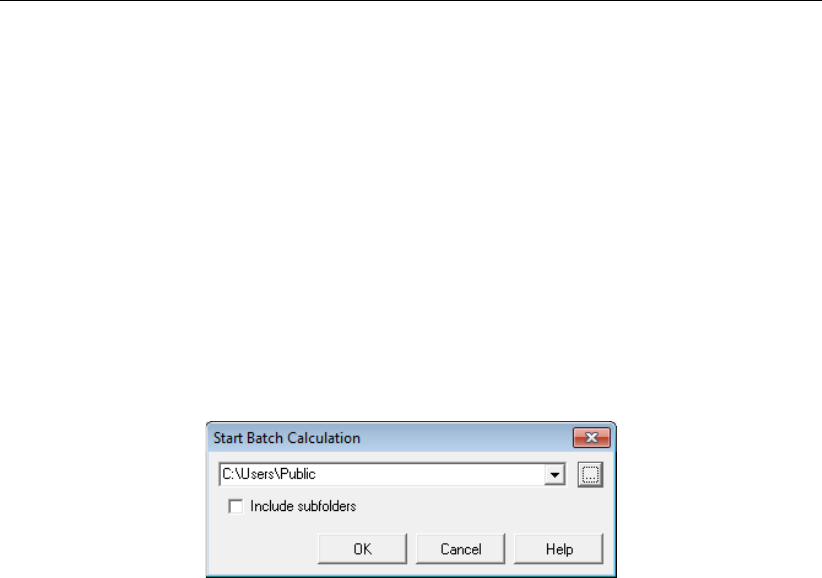
Getting Started
Batch Processing
Batch Processing of
D-GEO STABILITY
is possible by using /b as a command line parameter,
whether or not followed by a second parameter. The second parameter has multiple options:
the name of an inputfile
the name of a folder
In each of the accounts, the program is closed after the last calculation has been made. When
the second parameter is left out, e.g. C:\Program Files\Deltares\DGeoStability\DGeoStability.exe
/b, a dialog box is shown (see Figure 2.7) enabling the user to choose which folder has to be
used for processing. This folder can be typed in the Combobox, selected from the list of
the last nine folders used for processing or looked up using the Browse button. If the option
Include subfolders is on, all subfolders will be processed (recursive).
Figure 2.7: D-Geo Stability batch processing window
When the second parameter is given, e.g. C:\Program Files\Deltares\DGeoStability\DGeoStability.exe
/b D:\tmp\DGeoStabilityBatch\<Filename, only this file will be processed. When the second
parameter is a folder, this folder will be processed, including all (recursive) subfolders.
Plot
The command line parameter /plot is available in
D-GEO STABILITY
. When processing large
amounts of calculations, using this parameter enables you to create plots of every calculation
during processing. A wmf picture is exported of the critical circle, or the 2 zone circles in case
of zoneplot of every calculation. E.g.: C:\Program Files\Deltares\DGeoStability\DGeoStability.exe
/b /Plot <Filename> gives the critical circle of the chosen file. For this parameter the same
second parameter rules apply, as described in the previous paragraph.
Deltares 21 of 286

D-GEO STABILITY
, User Manual
22 of 286 Deltares
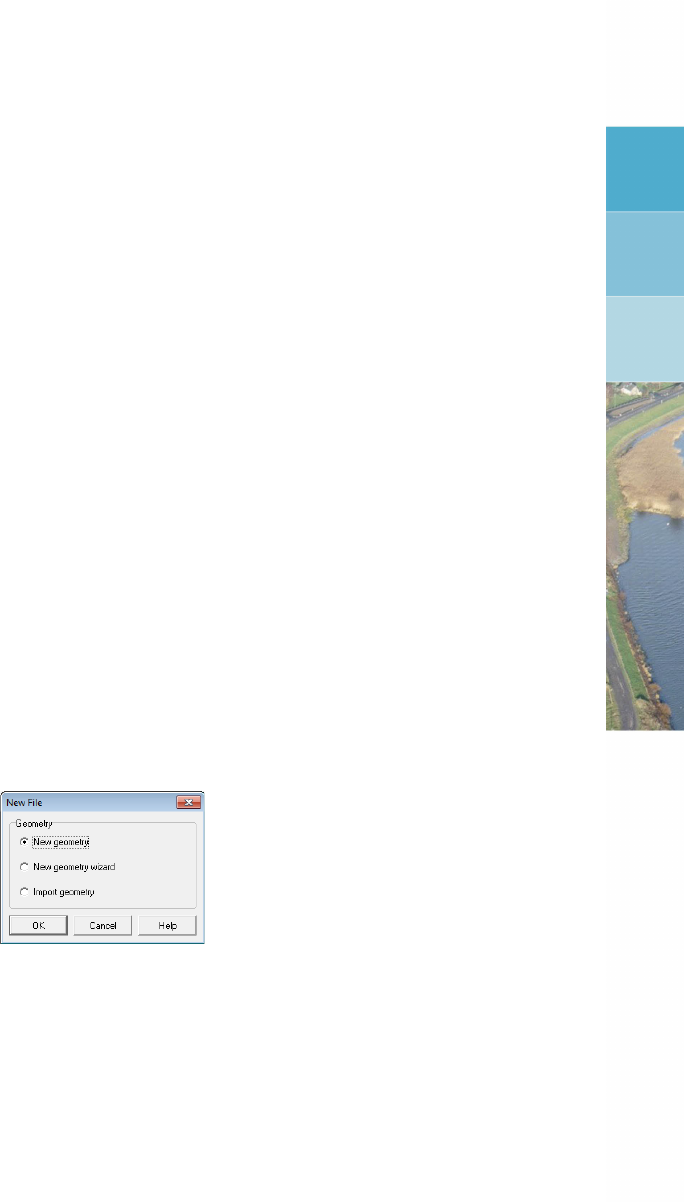
3 General
This part of the manual contains a detailed description of the available menu options for
inputting data for a soil structure, calculating slope stability and viewing results.
The examples in the tutorial section provide a convenient starting point for familiarization with
the program.
3.1 File menu
Besides the familiar Windows options for opening and saving files, the File menu contains a
number of options specific to
D-GEO STABILITY
.
New
Select this option to display the New File window (Figure 3.1). Three choices are avail-
able to create a new geometry:
Select New geometry
to display the View Input window, showing only the geometry limits (with their
defaults values) of the geometry;
Select New geometry wizard
to create a new geometry faster and easier using the wizard option (involving a
step-by-step process for creating a geometry, see section 4.3.2);
Select Import geometry
to use an existing geometry.
Figure 3.1: New File window
Copy Active Window to Clipboard
Use this option to copy the contents of the active window to the Windows clipboard so
that they can be pasted into another application. The contents will be pasted in either
text format or Windows Meta File format.
Export Active Window
Use this option to export the contents of the active window as a Windows Meta File
(*.wmf), a Drawing Exchange File (*.dxf) or a text file (*.txt).
Page Setup
This option allows definition of the way
D-GEO STABILITY
plots and reports are to be
printed. The printer, paper size, orientation and margins can be defined as well as
whether and where axes are required for plots. Click Autofit to get
D-GEO STABILITY
to
choose the best fit for the page.
Print Preview Active Window
This option will display a print preview of the current contents of theView Input or Results
window.
Print Active Window
This option prints the current contents of the View Input or Results window.
Deltares 23 of 286
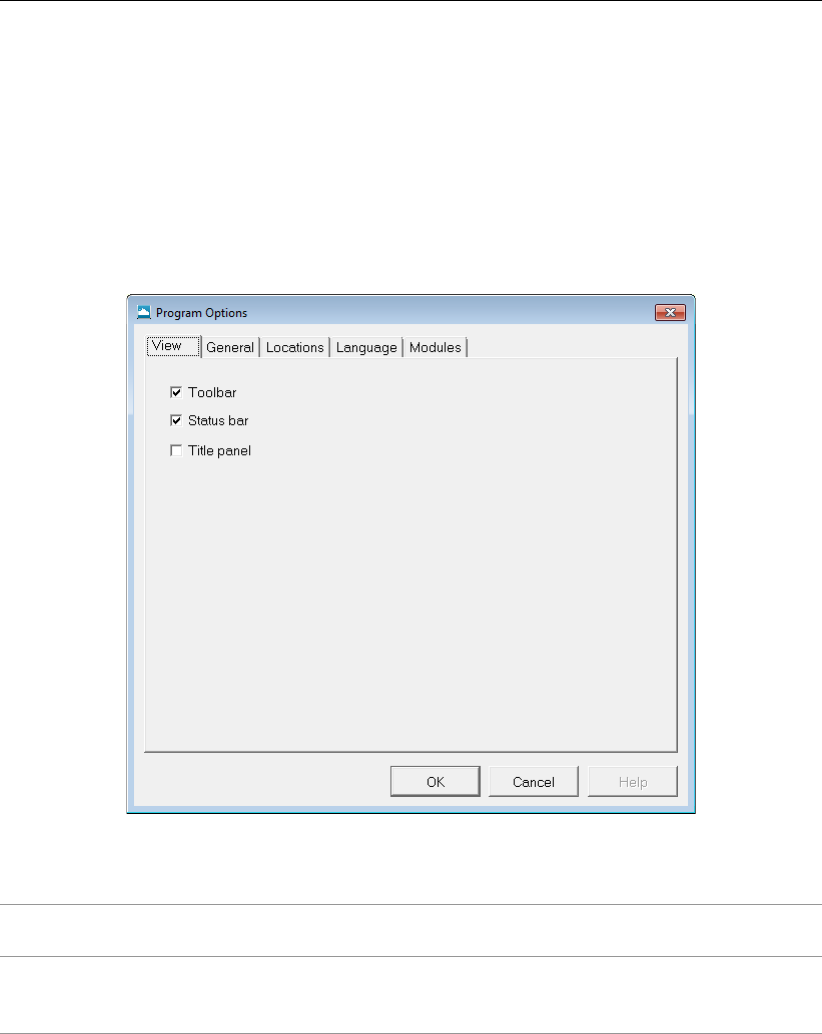
D-GEO STABILITY
, User Manual
3.2 Tools menu
On the menu bar, click Tools and then choose Program Options to open the corresponding
input window. In this window, the user can optionally define their own preferences for some of
the program’s default values.
3.2.1 Program Options
Program options – View
Figure 3.2: Program Options window, View tab
Toolbar or
Status bar
Mark the relevant check-box to display the toolbar and/or status bar each
time
D-GEO STABILITY
is started.
Title panel Mark the check-box to display the project titles, as entered on the Iden-
tification tab in the Project Properties window, in a panel at the bottom
of the View Input window.
Program options – General
24 of 286 Deltares
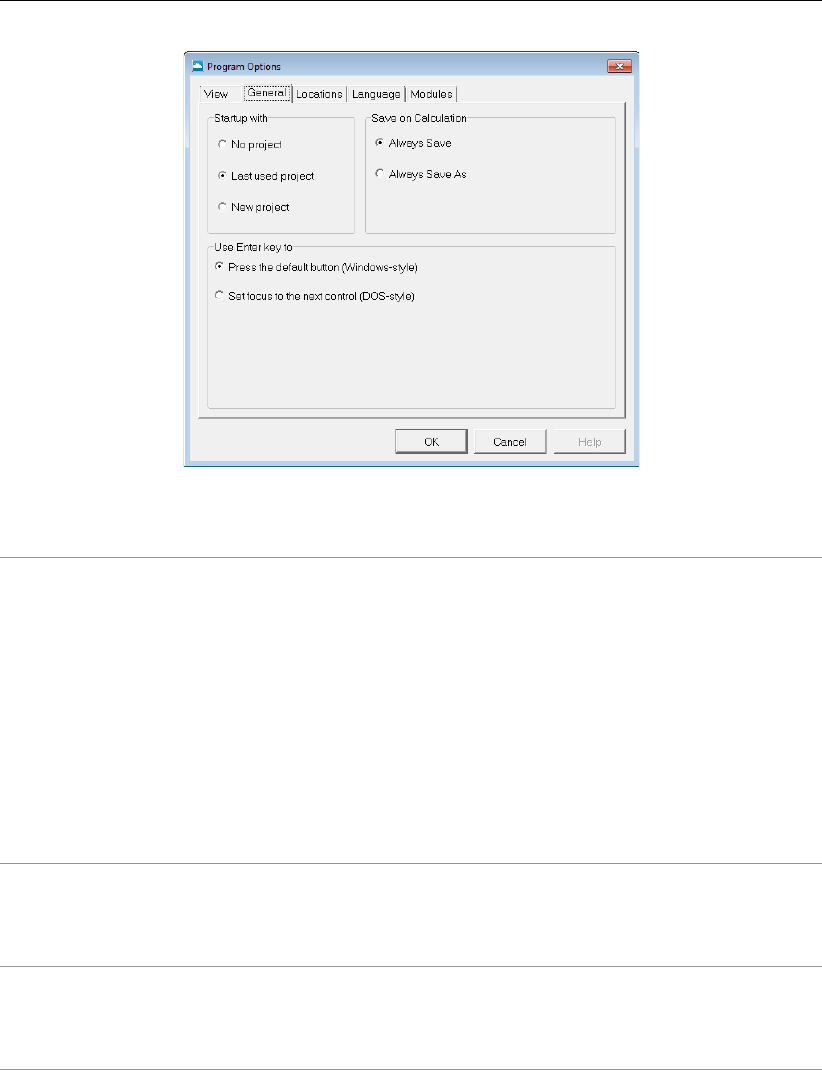
General
Figure 3.3: Program Options window, General tab
Start-up with Click one of these toggle buttons to determine whether a project should
be opened or initiated when the program is started.
No project: Each time
D-GEO STABILITY
is started, the buttons in the
toolbar or the options in the File menu must be used to open an existing
project or to start a new one.
Last used project: Each time
D-GEO STABILITY
is started, the last project
that has been worked on is opened automatically.
New project: A new project is created. The user is offered three options
at the start up of
D-GEO STABILITY
: New Geometry, new Geometry wiz-
ard and Import geometry.
Note that this option is ignored when the program is started by double-
clicking an input file.
Save on
Calculation
The toggle buttons determine how input data is saved prior to calcula-
tion. The input data can either be saved automatically, using the same
file name each time, or a file name can be specified each time the data
is saved.
Use Enter
key to
The toggle buttons allow the way the Enter key is used in the program:
either as an equivalent of pressing the default button (Windows-style) or
to shift the focus to the next item in a window (for users accustomed to
the DOS version(s) of the program).
Program options – Locations
Deltares 25 of 286
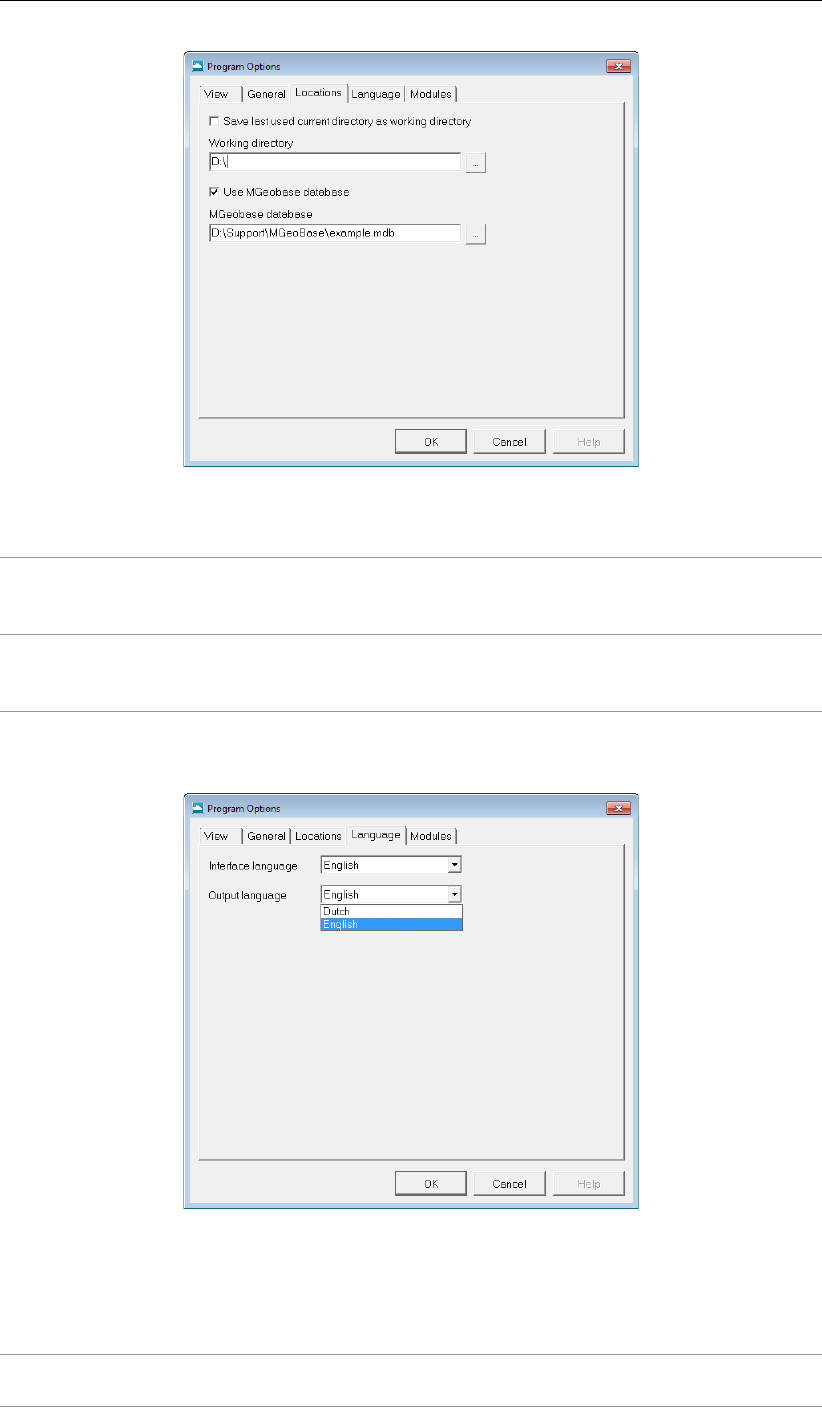
D-GEO STABILITY
, User Manual
Figure 3.4: Program Options window, Locations tab
Working
directory
D-GEO STABILITY
will start up with a working directory for selection and
saving of files. Either choose to use the last used directory, or specify a
fixed path.
MGeobase
database
Here it is possible to assign a database location. This database (*.gdb
or *.mdb) can be accessed with several options in
D-GEO STABILITY
to
retrieve
D-GEO STABILITY
specific data from this file location.
Program options – Language
Figure 3.5: Program Options window, Language tab
Select the language to be used in the
D-GEO STABILITY
windows and on printouts.
Interface
language
Currently, the only available interface language is English.
26 of 286 Deltares
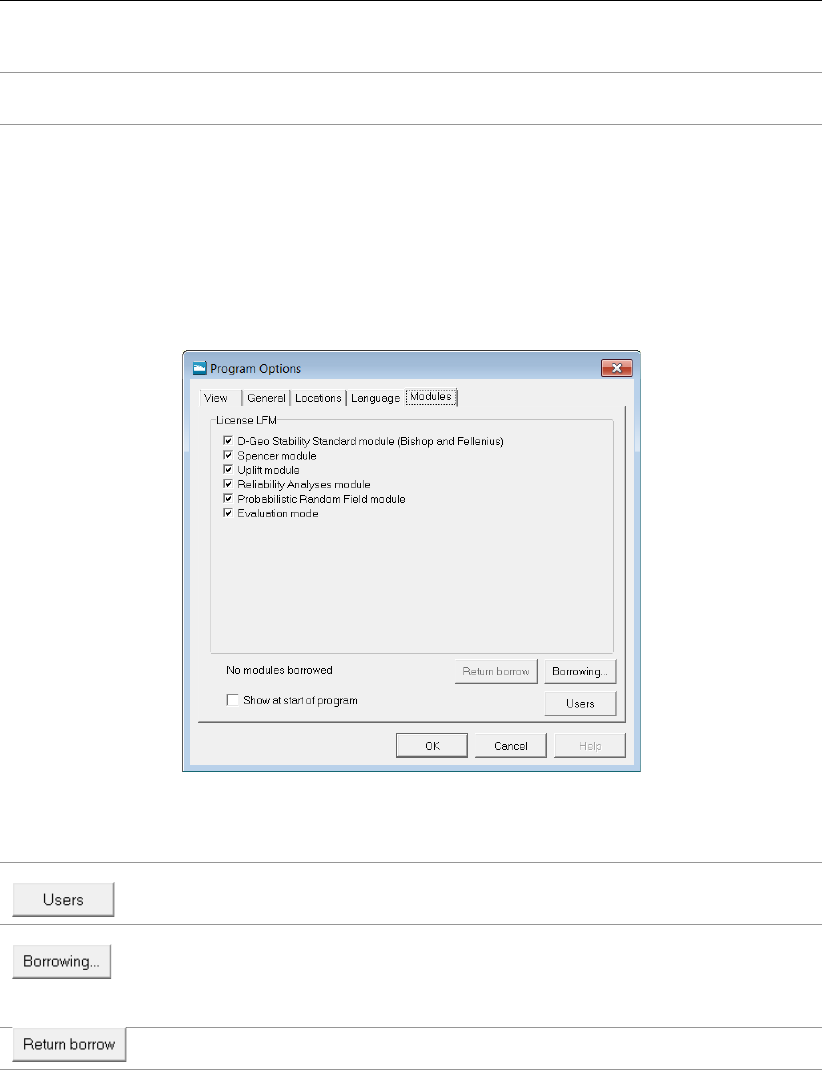
General
Output
language
Two output languages are supported, English and Dutch. The selected
output language will be used in all exported reports and graphs.
Program options – Modules
For a
D-GEO STABILITY
installation based on floating licenses, the Modules tab can be used to
claim a license for the particular modules that are to be used. If the Show at start of program
check-box is marked then this window will always be shown at start-up. For a
D-GEO STABILITY
installation based on a license dongle, the Modules tab will just show the modules that may
be used.
Figure 3.6: Program Options window, Modules tab
Click this button to see which modules are (at this moment) in used and
who (within the company) is using them.
Click this button to borrow the selected modules for a certain period. The
modules will be taken from the server pool and will be available on this
computer even if no connection to the license server is available. Set the
date and time for the expiration of the borrowing and press OK.
Click this button to end the borrow immediately.
3.3 Help menu
The Help menu allows access to different options.
Deltares 27 of 286
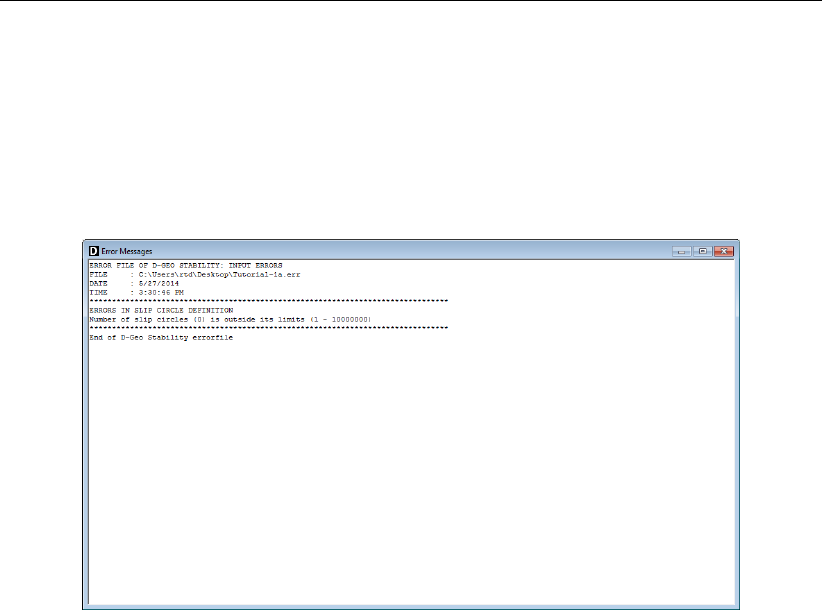
D-GEO STABILITY
, User Manual
3.3.1 Error Messages
If errors are found in the input, no calculation can be performed and
D-GEO STABILITY
opens
the Error Messages window displaying more details about the error(s). Those errors must
be corrected before performing a new calculation. To view those error messages, select the
Error Messages option from the Help menu. They are also written in the *.err file. They will
be overwritten the next time a calculation is started.
Figure 3.7: Error Messages window
3.3.2 Manual
Select the Manual option from the Help menu to open the User Manual of
D-GEO STABILITY
in
PDF format. Here help on a specific topic can be found by entering a specific word in the Find
field of the PDF reader.
3.3.3 Deltares Systems Website
Select Deltares Systems Website option from the Help menu to visit the Deltares Systems
website (www.deltaressystems.com) for the latest news.
3.3.4 Support
Use the Support option from the Help menu to open the Support window in which program
errors can be registered. Refer to section 1.9 for a detailed description of this window.
3.3.5 About D-GEO STABILITY
Use the About option from the Help menu to display the About
D-GEO STABILITY
window which
provides software information (for example the version of the software).
28 of 286 Deltares
General
Figure 3.8: About D-GEO STABILITY window
Deltares 29 of 286

D-GEO STABILITY
, User Manual
30 of 286 Deltares
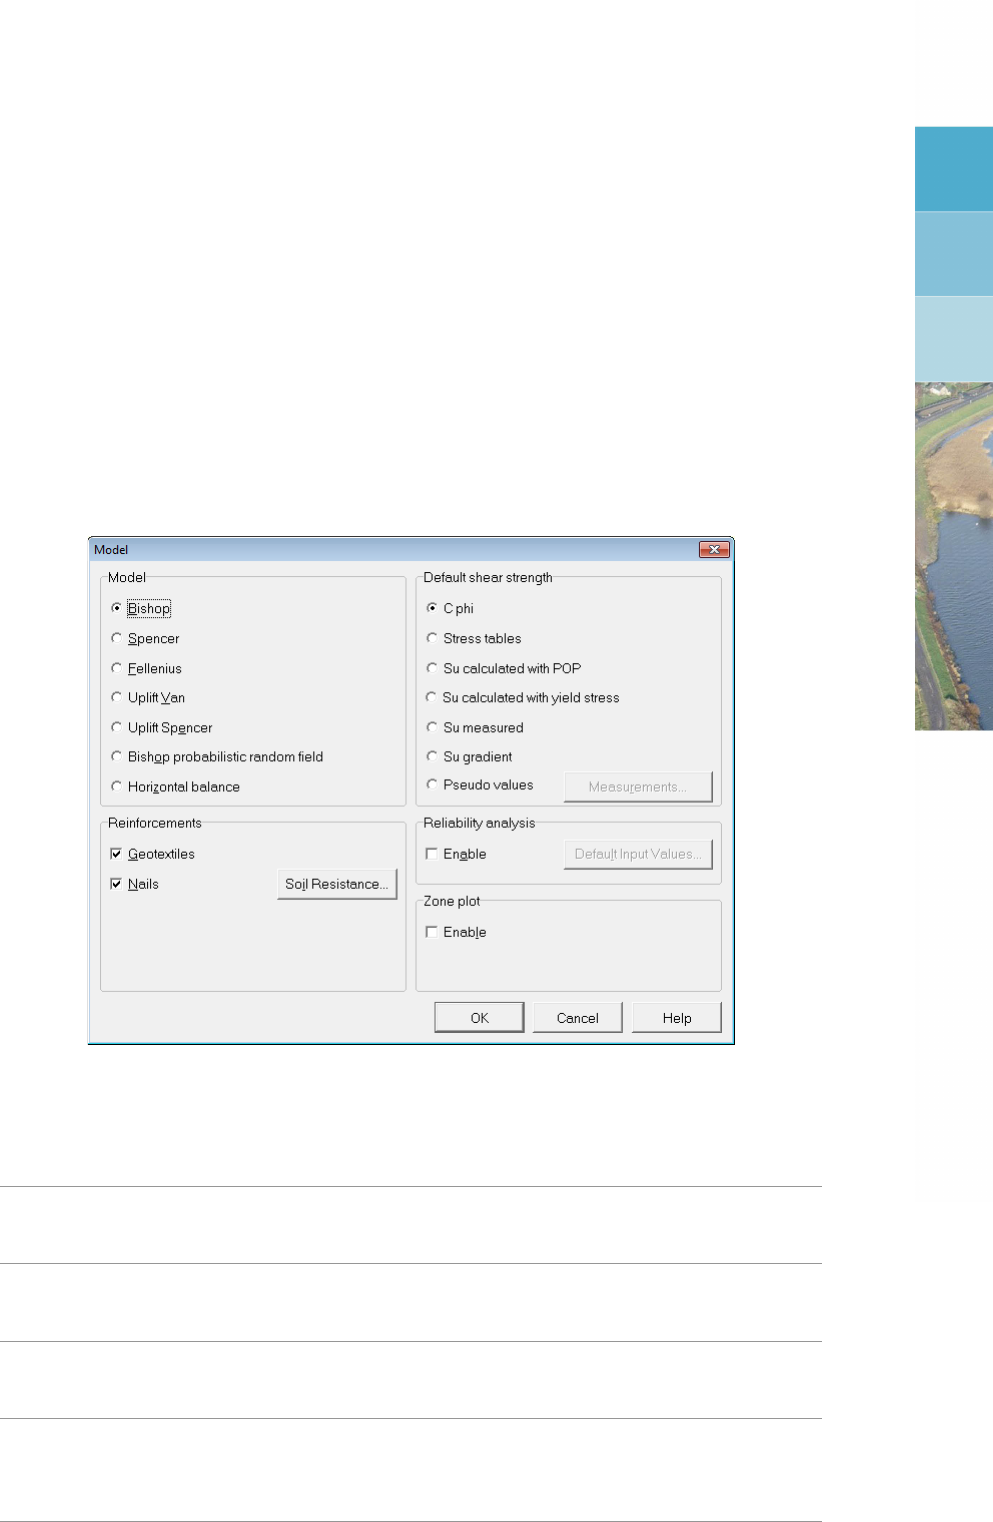
4 Input
Before the analysis can be started, data for the soil structure, soil types and loads need to be
input.
4.1 Project menu
The Project menu can be used to set the model settings. The project preferences can be set
and it is possible to view the input file.
4.1.1 Model
On the menu bar, click Project and then choose Model to display an input window with the
following data. Calculation methods
Figure 4.1: Model window
Model
Choose one of the following methods:
Bishop Usual choice for slope stability analysis. Automatically finds a circular
slip plane with minimum safety. Equilibrium of moments and vertical
forces is ensured. For background information, see section 16.2.
Spencer For special slip plane analysis. User-defined coordinates now fix the slip
plane. Equilibrium is ensured for moments, vertical forces and horizontal
forces. For background information, see section 16.4.
Fellenius Obsolete. Automatically finds a circular slip plane with minimum safety.
Only equilibrium of moments is ensured. For background information,
see section 16.2.
Uplift Van Usual choice for uplift stability analysis. Finds automatically a slip plane
with minimum safety. The plane consists of a horizontal part bounded
by two circles. Equilibrium is ensured for moments and vertical forces.
For background information, see section 16.3.
Deltares 31 of 286
D-GEO STABILITY
, User Manual
Uplift Spencer An alternative choice for uplift stability analysis. Automatically finds a
slip plane with minimum safety. The plane consists of a horizontal part
bounded by a circle (active side) and a straight plane (passive side).
Compared to Van’s method, equilibrium is now also ensured for hori-
zontal forces.
Bishop prob.
random field
A special module for advanced probabilistic design, incorporating spatial
variability. This module, formerly known as MProStab, is described in
chapter 21.
Horizontal Bal-
ance
To check the horizontal balance especially in case of seepage forces
due to different water levels at the left and the right of a dike retaining
water.
Reinforcements
Mark the reinforcements used in the project:
Geotextiles Mark this check-box to enable the usage of geotextiles in the project.
Nails Mark this check-box to enable the usage of nails in the project.
This button is available only if Nails is marked. When clicking this button,
the Soil Resistance window appears (Figure 4.2) in which the lateral and
shear stresses criterion at the interface soil/nails can be defined.
In Dowel action sub-window, the lateral stress along the nail can
be defined in two ways:
the lateral stress is defined as a stress curve (distance from
nail head vs. ultimate stress) for each nail if option Input of
ultimate lateral stress along nail is selected. Refer to sec-
tion 4.5.3.3 for the input of this curve.
the lateral stress is automatically determined by the program
using the soil parameters if option Use soil parameters c, phi
/ Su is selected. Refer to section 4.2.4.6 for the input of the
extra soil paramaters needed.
In Pull-out sub-window, the shear stress along the nail can either:
be defined as a stress curve (distance from nail head vs.
ultimate stress) for each nail if option Input of ultimate lateral
stress along nail is selected;
be defined as a bond stress diagram (normal ultimate stress
σ0
nvs. shear ultimate stress τ) for each soil type if option
Input of bond stress diagram (sigma, tau) is selected.
32 of 286 Deltares
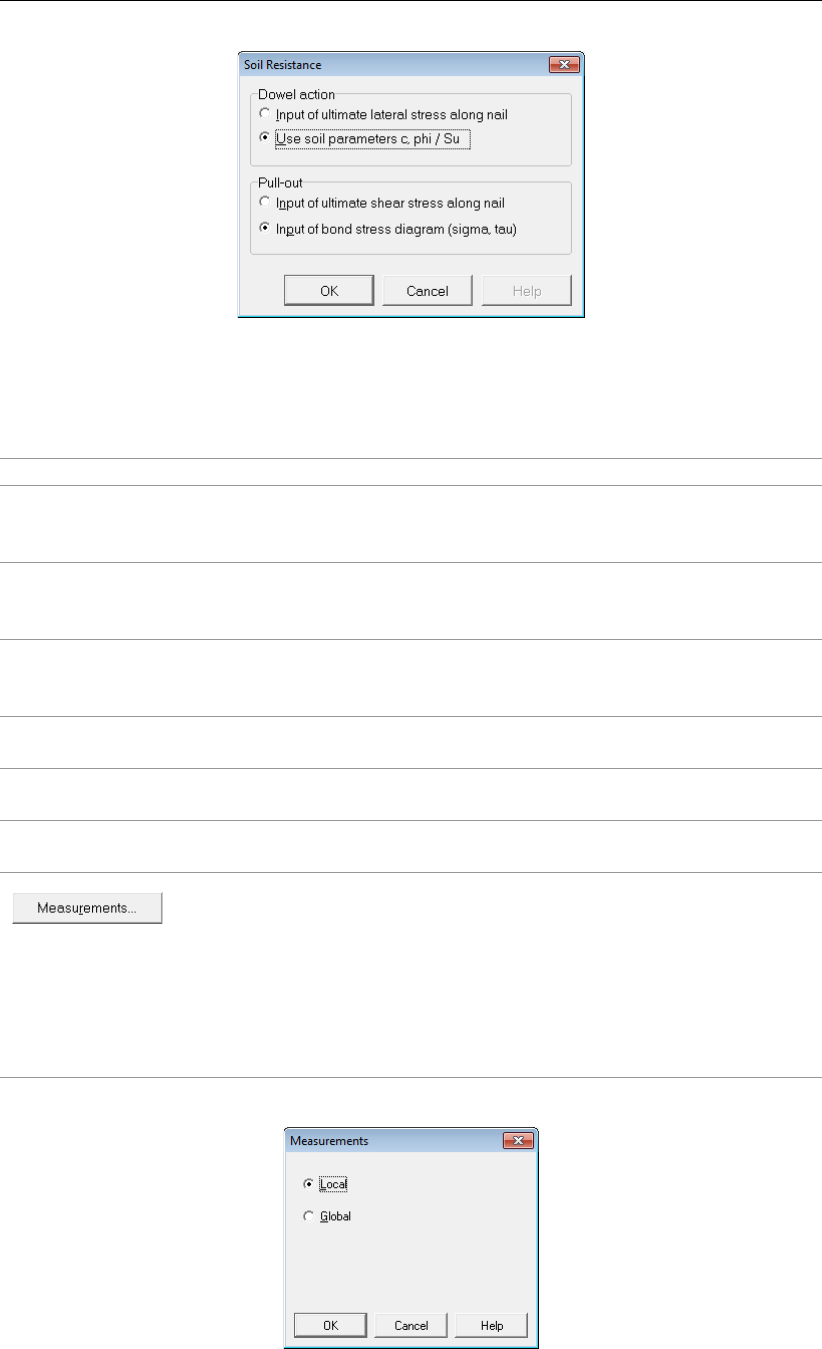
Input
Figure 4.2: Soil Resistance window
Default Shear Strength
Choose one of the following methods for entering the default shear strength model:
C phi Use by default the input of cohesion and internal friction angle.
Stress tables Use by default the input of user-defined Sigma-Tau curves. These
curves relate the effective normal stress along a slip plane directly to
the shear strength.
Su calculated
with POP
Use by default the input of the ratio Sbetween undrained shear strength
and yield stress, where the yield stress is calculated from the POP value
of the material.
Su calculated
with yield stress
Use by default the input of the ratio Sbetween undrained shear strength
and yield stress, where the yield stress is calculated from the user-
defined yield stress measurements.
Su measured Use by default the direct input of undrained shear strength at the top and
the bottom of a layer.
Su gradient Use by default the input of the undrained shear strength at the top of the
layer and the gradient over the depth of the layer.
Pseudo values Use by default the input of Sigma-Tau curves based on in situ measure-
ments.
This button is available only with the Pseudo values shear strength
model. When clicking this button, the Measurements window appears
(Figure 4.3) in which the type of inputted measurements used with the
Pseudo values model can be defined:
-Local for measurements resulting of laboratory tests performed on soil
samples from the surrounding area where the stability analysis is per-
formed,
-Global for measurements from a set of tests.
Figure 4.3: Measurements window
Deltares 33 of 286
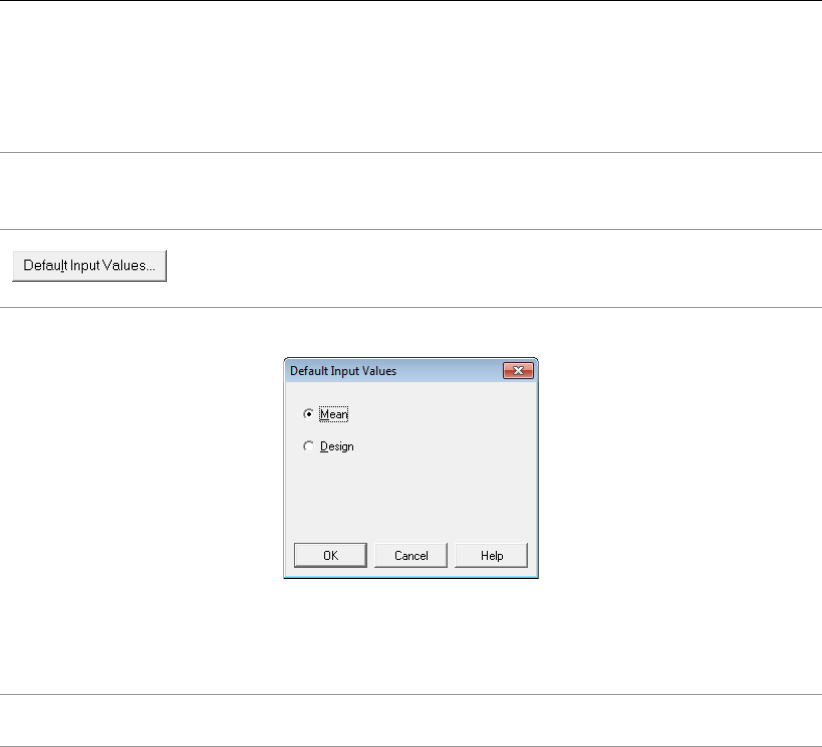
D-GEO STABILITY
, User Manual
It is possible to change the choice of shear strength description per soil type via the Soil menu
(section 4.2).
Reliability Analysis
Enable Mark this check-box to enable the usage of reliability based design
(chapter 20). This option can be used only in combination with Bishop
and Uplift Van models.
When clicking this button the Default Input Values window appears (Fig-
ure 4.4) in which the type of input parameters, either mean values or
design values can be chosen.
Figure 4.4: Default Input Values window
Zone plot
Enable Mark this check-box to enable the usage of zone plot which allows defin-
ing different safety factors in the dike body.
4.1.2 Probabilistic Defaults
On the menu bar, click Project and then choose Probabilistic Defaults to open the input win-
dow. This option is only available if Reliability Analysis has been selected in the Model window
(section 4.1.1). In this window the default settings for the uncertainty in soil parameters, pore
pressure parameters and in model factor.
34 of 286 Deltares

Input
Figure 4.5: Probabilistic Defaults window
Coef. of var.
(Std. dev/mean)
The coefficient of variation (equals to the standard deviation divided
by the mean value).
Partial The partial factor, used to reduce characteristic values to safe low
values.
Std. dev. The standard deviation of a parameter, quantifying the uncertainty.
Distribution The distribution type of a parameter:
Log normal = lognormal probability distribution,
Normal = standard normal probability distribution,
None = zero standard deviation.
Mean The mean value of a parameter.
Deltares 35 of 286
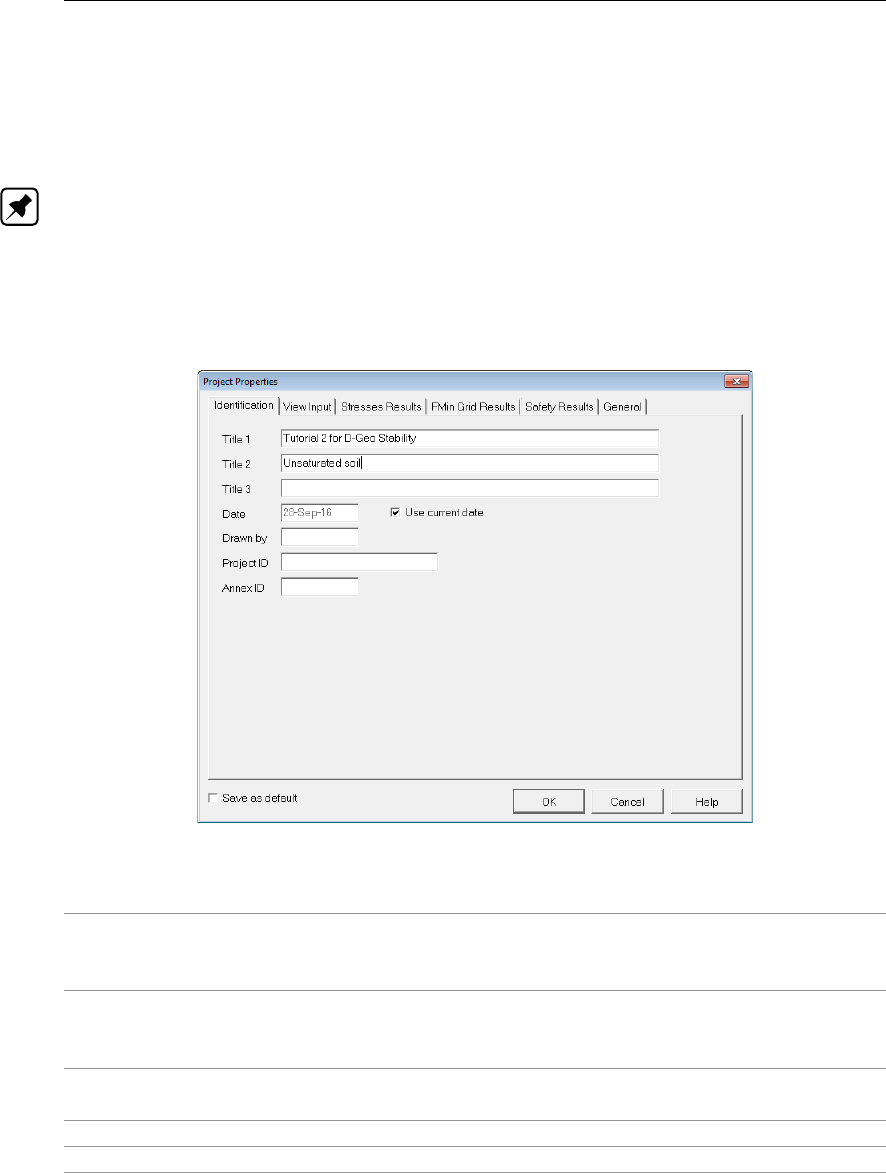
D-GEO STABILITY
, User Manual
4.1.3 Project Properties
On the menu bar, click Project and then choose Properties to open the input window. The
Project Properties window contains six tabs, on which allow then settings for the current
project to be changed.
Note: It is recommended to specify the settings in the Project Properties before inputting the
data into the file. The settings can be changed at any time. It is also possible to save the
setting as default, defining the settings the same each time
D-GEO STABILITY
is run.
Project Properties – Identification
Use the Identification tab to specify the project identification data.
Figure 4.6: Project Properties window, Identification tab
Titles Use Title 1 to give the project a unique, easily recognizable name. Title
2and Title 3 can be added to indicate specific characteristics of the
calculation. The three titles will be included on printed output.
Date The date entered here will be used on printouts and graphic plots for this
project. Either mark the Use current date check-box on each printout, or
enter a specific date.
Drawn by Enter the name of the user performing the calculation or generating the
printout.
Project ID Enter a project identification number.
Annex ID Specify the annex number of the printout.
Enable the check-box Save as default to use these settings every time
D-GEO STABILITY
is
started or a new project is created.
Project Properties – View Input
Use the View Input tab to specify the availability of components in two tabs of the View Input
window (section 2.2.3).
36 of 286 Deltares
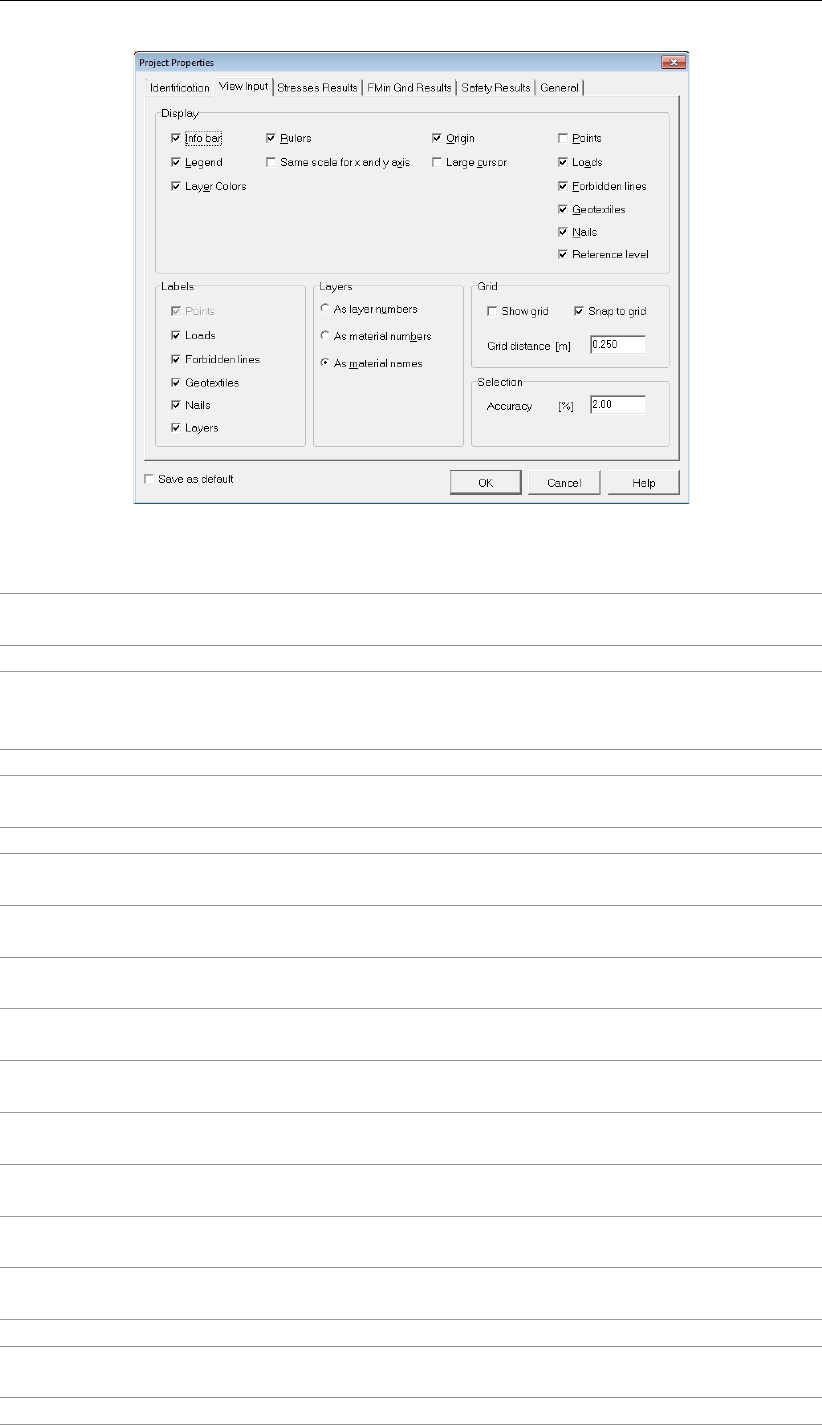
Input
Figure 4.7: Project Properties window, View Input tab
Info bar Mark this check-box to display the information bar at the bottom of the
View Input window.
Legend Mark this check-box to display the legend with soil types.
Layer Colors Mark this check-box to display each soil layer using a different color.
It is recommended that this option is deselected if printouts are to be
photo-copied or faxed.
Rulers Mark this check-box to display the horizontal and vertical rulers.
Same scale for
x and y axis
Mark this check-box to use the same scale for the horizontal and vertical
directions.
Origin Mark this check-box to display the origin.
Large cursor Mark this check-box to use the large cross-hair cursor instead of the
small one.
Points Mark this check-box to display geometry points in the View Input win-
dow, defined in section 4.3.8.
Loads Mark this check-box to display loads in the View Input window, defined
in section 4.7.1 and section 4.7.2.
Forbidden lines Mark this check-box to display forbidden lines in the View Input window,
defined in section 4.4.3.
Geotextiles Mark this check-box to display geotextiles in the View Input window,
defined in section 4.5.1.
Nails Mark this check-box to display nails in the View Input window, defined
in section 4.5.3.
Reference level Mark this check-box to display the reference line in the View Input win-
dow, defined in section 4.4.5.
Labels Mark the check-box of the elements (Points,Loads,Forbidden lines,
Geotextiles,Nails and Layers) to display the labels of this element.
Layers Soil layers may be identified by their material name, their index in the list
of materials, or their index in the list of layers in the soil profile.
Show Grid Mark this check-box to display and use a grid.
Snap to Grid Mark this check-box to ensure that objects align to the grid automatically
when they are moved or positioned.
Grid Distance Alter this value to modify the default grid distance.
Deltares 37 of 286
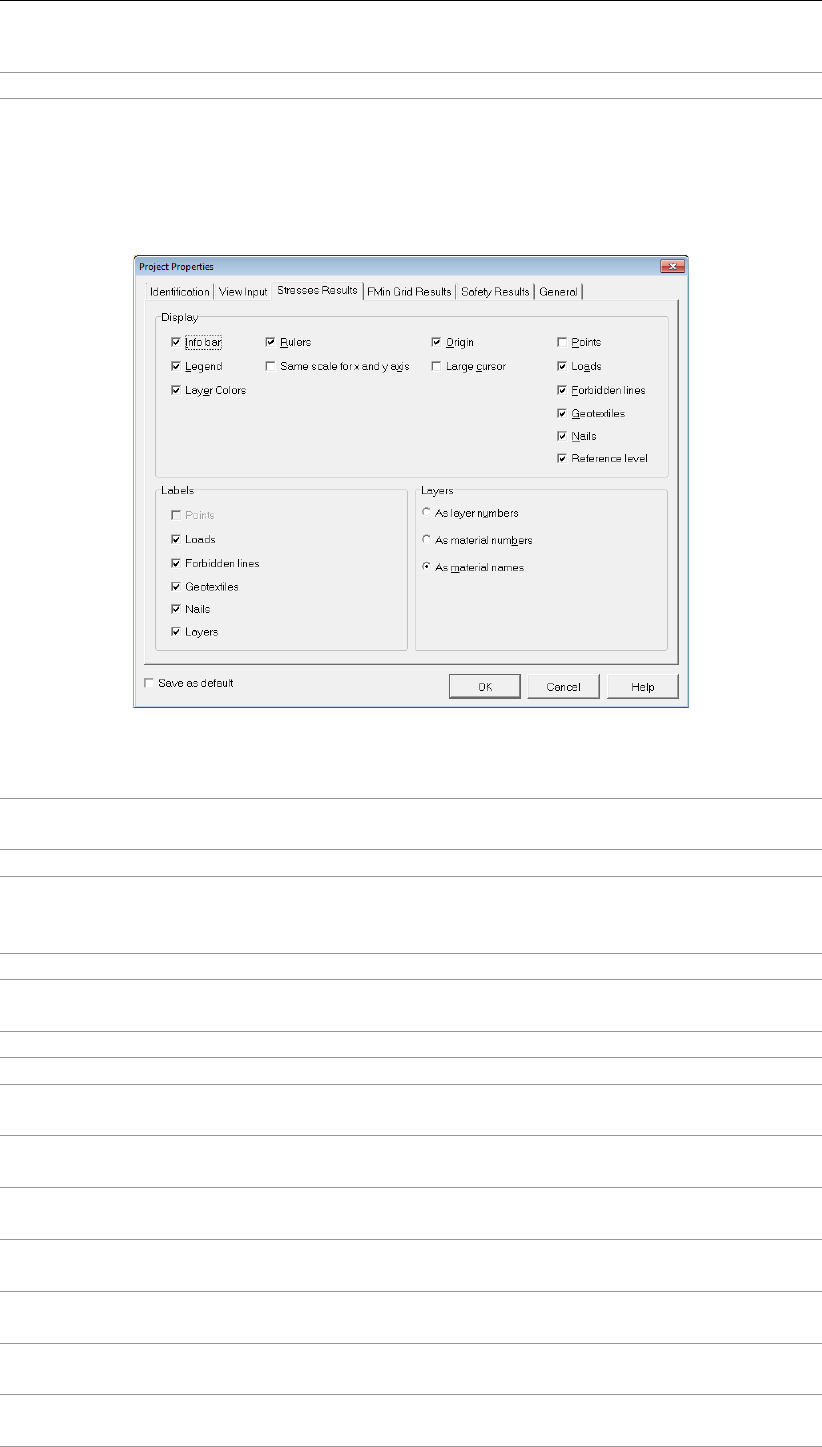
D-GEO STABILITY
, User Manual
Accuracy Mouse selection accuracy, define a large value for a large selection area.
Project Properties – Stresses Results
The Stresses Results tab allows selecting the way the Stresses and Stresses in Geometry
results are presented in the Results windows (see section 6.2 and section 6.3).
Figure 4.8: Project Properties window, Stresses Results tab
Info bar Mark this check-box to display the title panel with the information bar at
the bottom of the Stresses Result window
Legend Mark this check-box to display the legend with soil types.
Layer Colors Mark this check-box to display each soil layer using a different color.
It is recommended that this option is deselected if printouts are to be
photo-copied or faxed.
Rulers Mark this check-box to display the rulers.
Same scale for
x and y axis
Mark this check-box to enforce the same length scale for horizontal and
vertical axis.
Origin Mark this check-box to display the origin.
Large cursor Mark this check-box to use the large cursor instead of the small one.
Points Mark this check-box to display geometry points in the Stresses Results
window, defined in section 4.3.8.
Loads Mark this check-box to display loads in the Stresses Results window,
defined in section 4.7.1 and section 4.7.2.
Forbidden lines Mark this check-box to display forbidden lines in the Stresses Results
window, defined in section 4.4.3.
Geotextiles Mark this check-box to display geotextiles in the Stresses Results win-
dow, defined in section 4.5.1.
Nails Mark this check-box to display nails in the Stresses Results window,
defined in section 4.5.3.
Reference level Mark this check-box to display the reference line in the Stresses Results
window, defined in section 4.4.5.
Labels Mark the check-box of the elements (Points,Loads,Forbidden lines,
Geotextiles,Nails and Layers) to display the labels of this element.
38 of 286 Deltares

Input
Layers Soil layers may be identified by their material name, their index in the list
of materials, or their index in the list of layers in the soil profile.
Project Properties – FMin Grid Results
The FMin Grid Results tab allows selecting the way the minimum factors of safety are repre-
sented in the FMin Grid results window (section 6.4).
Figure 4.9: Project Properties window, FMin Grid Results tab
Info bar Mark this check-box to display the information bar at the bottom of the
FMin Grid results window.
Rulers Mark this check-box to display the rulers.
Same scale for
x and y axis
Mark this check-box to enforce the same length scale for horizontal and
vertical axis.
Large cursor Mark this check-box to use the large cursor instead of the small one.
Points Mark this check-box to display geometry points.
Iso-lines Mark this check-box to display iso-lines of the safety factor on the grid of
center points.
Number of lines Define the number of iso-lines between the lower and upper limits.
Minimum value Define the lower limit of the iso-lines to be displayed.
Maximum value Define the upper limit of the iso-lines to be displayed.
Use values
from results
Mark this check-box if iso-lines should be displayed with the specified
range and number.
Display line
numbers
Mark this check-box to display the line numbers.
Project Properties – Safety Results
The Safety Results tab allows selecting the way the data in the Safety Overview results win-
dow is presented. In this window the safety factor distribution is drawn in the geometry.
Deltares 39 of 286
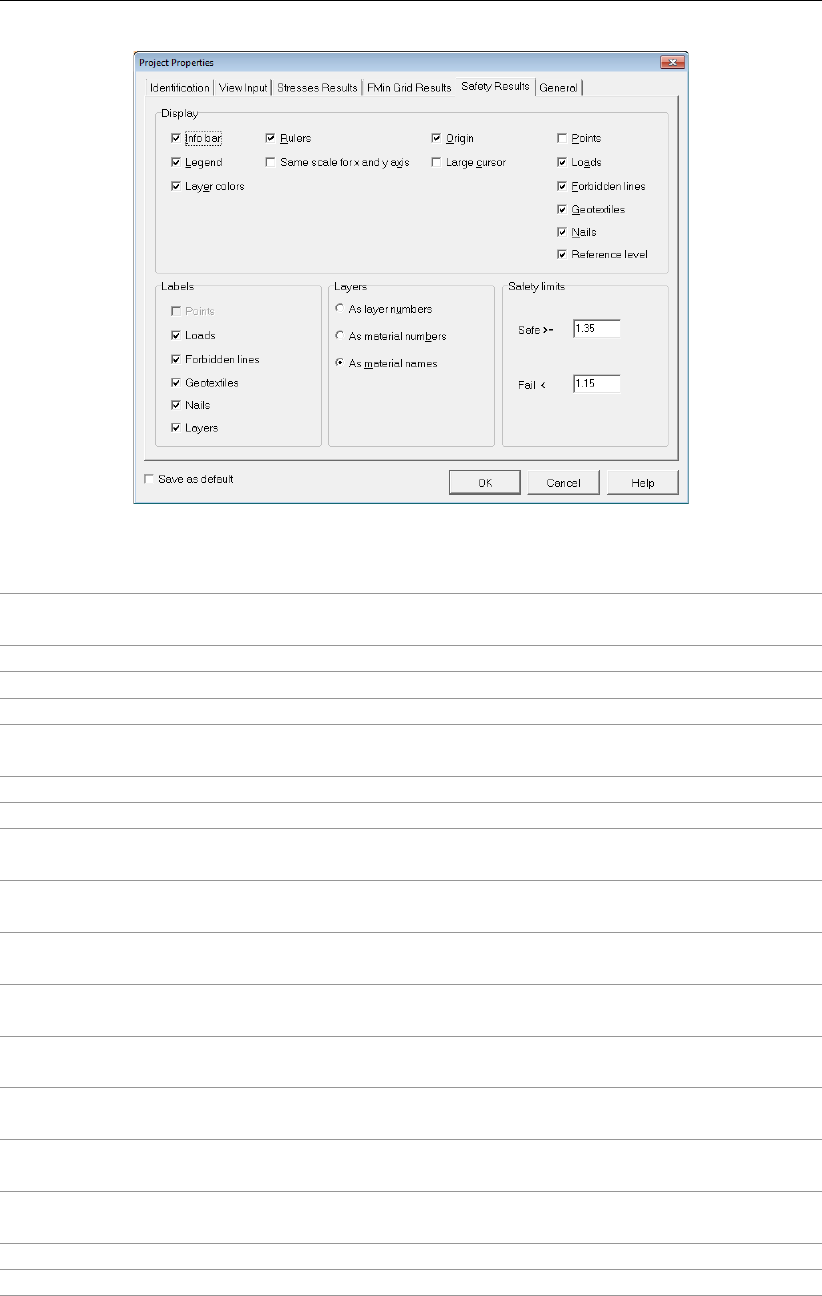
D-GEO STABILITY
, User Manual
Figure 4.10: Project Properties window, Safety Results tab
Info bar Mark this check-box to display the information bar at the bottom of the
Safety Results window.
Legend Mark this check-box to display the legend with soil types.
Layer Colors Mark this check-box to alter the default legend colors.
Rulers Mark this check-box to display the rulers.
Same scale for
x and y axis
Mark this check-box to enforce the same length scale for horizontal and
vertical axis.
Origin Mark this check-box to display the origin.
Large cursor Mark this check-box to use the large cursor instead of the small one.
Points Mark this check-box to display geometry points in the Safety Results
window, defined in section 4.3.8.
Loads Mark this check-box to display loads in the Safety Results window, de-
fined in section 4.7.1 and section 4.7.2.
Forbidden lines Mark this check-box to display forbidden lines in the Safety Results win-
dow, defined in section 4.4.3.
Geotextiles Mark this check-box to display geotextiles in the Safety Results window,
defined in section 4.5.1.
Nails Mark this check-box to display nails in the Safety Results window, de-
fined in section 4.5.3.
Reference level Mark this check-box to display the reference line in the Safety Results
window, defined in section 4.4.5.
Labels Mark the check-box of the elements (Points,Loads,Forbidden lines,
Geotextiles,Nails and Layers) to display the labels of this element.
Layers Soil layers may be identified by their material name, their index in the list
of materials, or their index in the list of layers in the soil profile.
Safe >=Enter the values that define the safe area in the Safety Overview plot.
Fail <Enter the values that define the failure area in the Safety Overview plot.
Project Properties – General
The General tab allows defining general output preferences:
40 of 286 Deltares
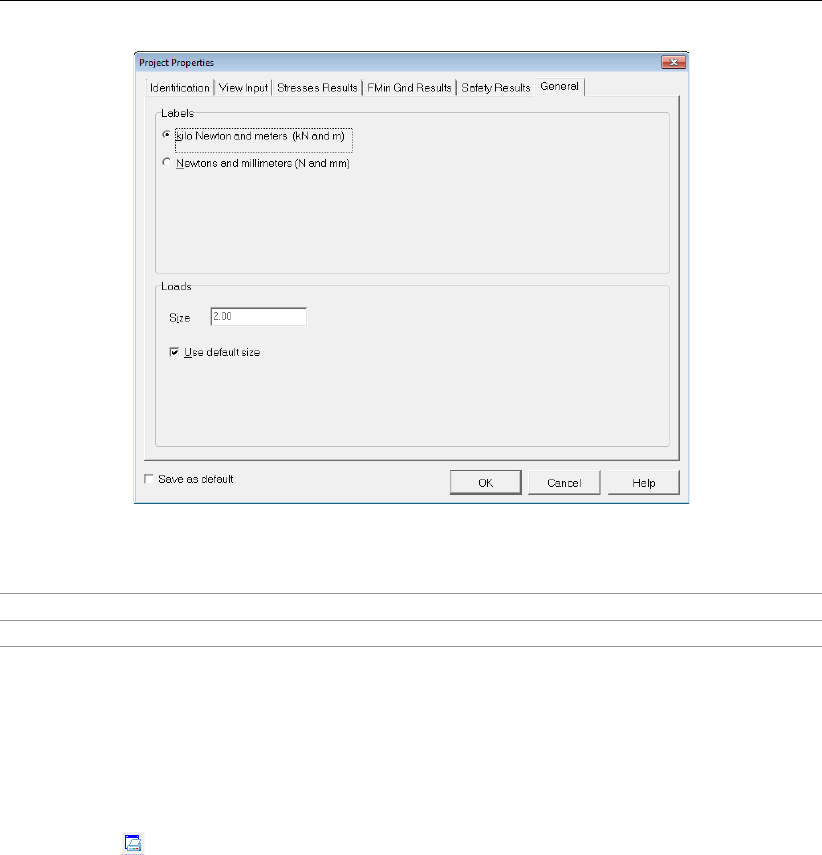
Input
Figure 4.11: Project Properties window, General tab
Labels Select the units for output of results.
Size Define the load size in the geometry plot.
4.1.4 View Input File
On the menu bar, click Project and than choose View Input File to display an overview of the
input data.
The data will be displayed in the
D-GEO STABILITY
main window. Click on the Print Active
Window icon to print this file.
4.2 Soil menu
The Soil menu can be used to enter the soil properties for the analysis. On the menu bar,
click Soil to display a menu with the following options for definition of soil type parameters:
section 4.2.1 –Sigma-Tau Curves to import or enter stress tables:
section 4.2.1.1 for traditional deterministic design.
section 4.2.1.2 for reliability based design and pseudo values.
section 4.2.1.3 for reliability based design and pseudo values.
section 4.2.2 –Bond Stress Diagrams to define friction curve at the interface between
the soil and the nail.
section 4.2.4 –Materials to define soil type properties by one of the following options:
section 4.2.4.1 Input of fixed parameters for traditional deterministic design.
section 4.2.4.2 Import from a material library.
section 4.2.4.3 Input of parameter distributions for reliability based design.
section 4.2.4.4 Input of parameters for pseudo values shear strength model.
section 4.2.4.5 Input of parameter for Bishop probabilistic random field method
section 4.2.4.6 Input of parameters for the soil/nails interface
section 4.2.5 –Model factor to define the parameters for Bishop probabilistic random
field method.
Deltares 41 of 286
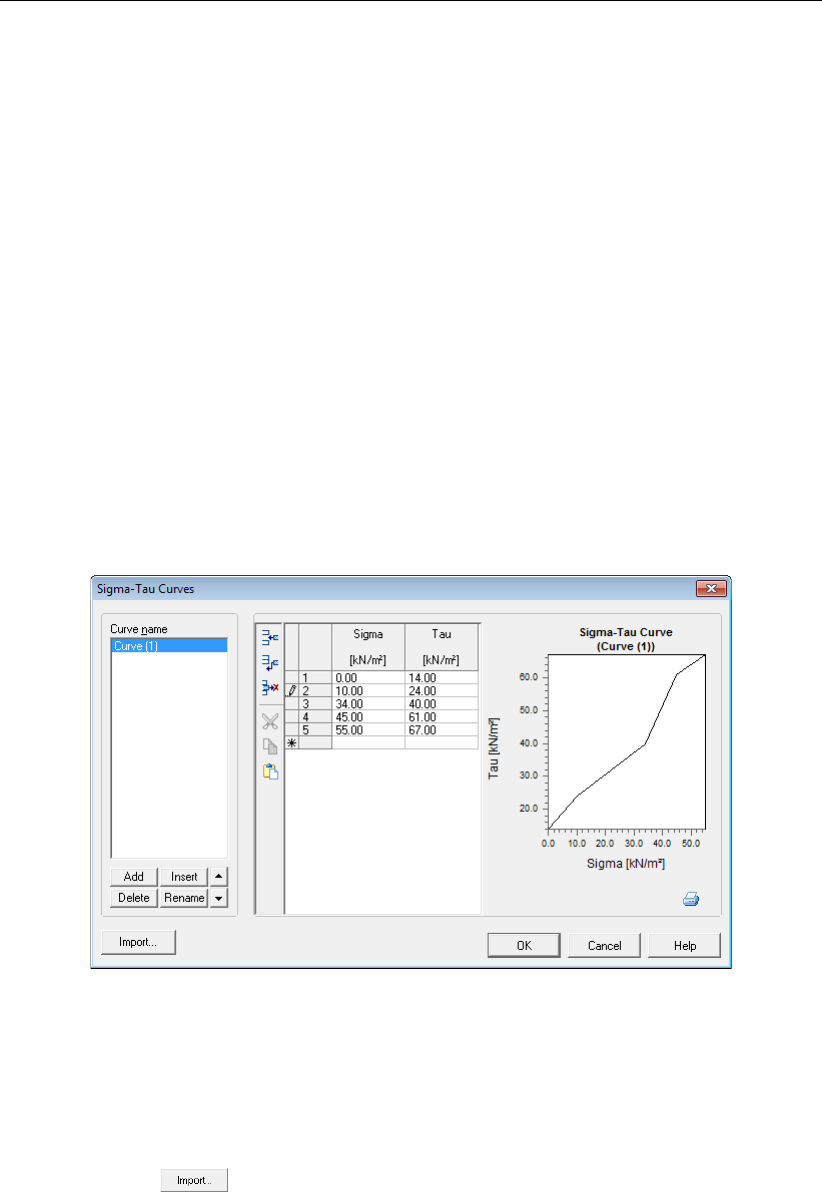
D-GEO STABILITY
, User Manual
4.2.1 Sigma-Tau Curves
On the menu bar, click Soil and then select Sigma-Tau Curves in order to open the Sigma-Tau
Curves window in which stress tables can be imported or entered. The content of this window
depends on the selected model:
Refer to section 4.2.1.1 for traditional deterministic design;
Refer to section 4.2.1.2 for reliability based design;
Refer to section 4.2.1.3 for reliability based pseudo values.
4.2.1.1 Sigma-Tau Curves for deterministic design
The curves relate the normal effective stress σ0
n(sigma) to the shear strength τ(tau). Each
curve is defined by entering successive coordinates. A deterministic analysis requires two
coordinate pairs (σ0
nand τ-design). Furthermore the input values of both σ0
nand τmust be
monotonically increasing.
D-GEO STABILITY
always extends the curve with a last horizontal
branch.
In the Sigma-Tau Curves window (see Figure 4.12) it is possible to specify different sigma-tau
curves. Figure 4.12 gives an example a user defined sigma-tau curve.
Figure 4.12: Sigma-Tau Curves window for deterministic design
Import predefined Curves
Alternatively, it is possible to use predefined Sigma-Tau curves. To do so, place a file with
Sigma–Tau data, called Tausigma.dat, in the
D-GEO STABILITY
Install directory.
When clicking the button, the Import Stress Table window appears (Figure 4.13). This
window contains predefined Sigma-Tau curves for different kind of soil.
42 of 286 Deltares
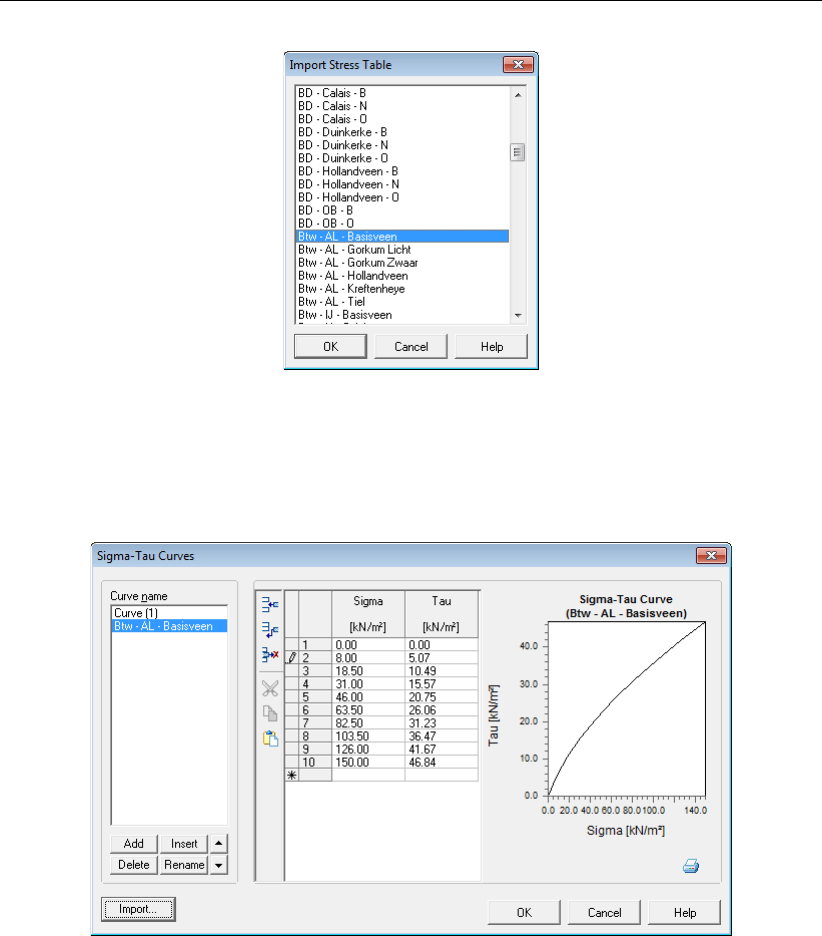
Input
Figure 4.13: Import Stress Table window
After selecting the desired curve and clicking OK, this curve is added to the others manually
inputted curves in the Sigma-Tau Curves window (Figure 4.14).
Figure 4.14: Sigma-Tau Curves window with imported data
4.2.1.2 Sigma-Tau Curves for Reliability analysis
If the Reliability analysis in the Model window is enabled (section 4.1.1),
D-GEO STABILITY
uses
stochastic values for its calculations.The values in the sigma-tau relation are user defined. It
is possible that the user provides basic values or data that includes stochastic values. If only
deterministic values are provided (while the Reliability analysis is enabled)
D-GEO STABILITY
automatically determines the stochastic values of the Sigma-Tau curves. It does so using
standard stochastic assumptions given in the Probabilistic Defaults window (section 4.1.2).
In this case the stress table will consist of two additional columns. Column 3 contains the
characteristic value. Column 4 contains the mean value. See Figure 4.15 for an example.
Deltares 43 of 286
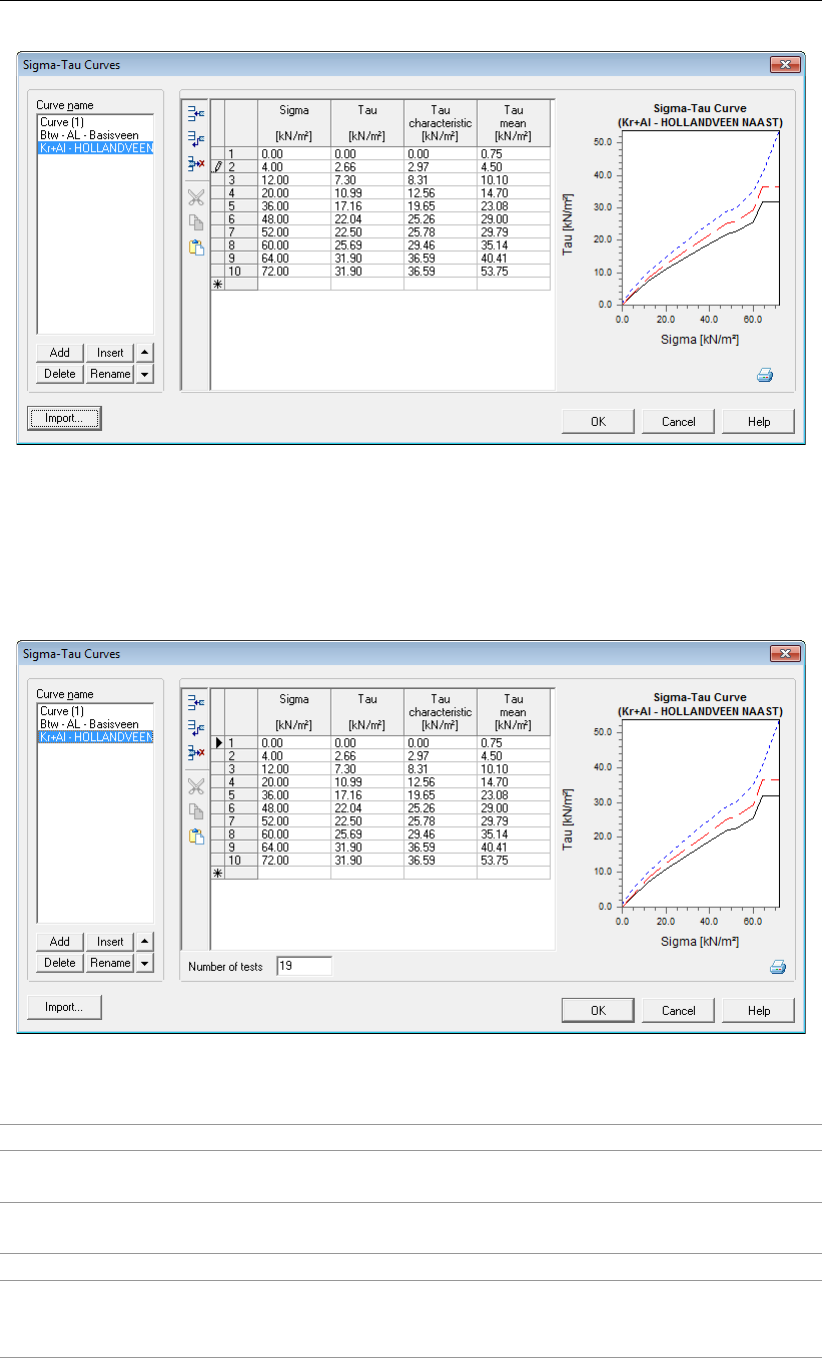
D-GEO STABILITY
, User Manual
Figure 4.15: Sigma-Tau Curves window for Reliability Analysis
4.2.1.3 Sigma-Tau Curves for Pseudo values Shear strength model
If the Pseudo values shear strength model in the Model window is enabled (section 4.1.1),
D-GEO STABILITY
uses stochastic values for its calculations.
Figure 4.16: Sigma-Tau Curves window for Pseudo values shear strength model
Sigma The normal stress values of the σ-τcurves.
Tau The measured shear stress values (drawn in black in the chart at the
right of the window).
Tau characteris-
tic
The characteristic shear stress values (drawn in red).
Tau mean The mean shear stress values (drawn in blue).
Number of tests Only available for Global measurements (section 4.1.1). The number of
tests performed to get the three inputted σ-τcurves (measured, char-
acteristic and mean).
44 of 286 Deltares
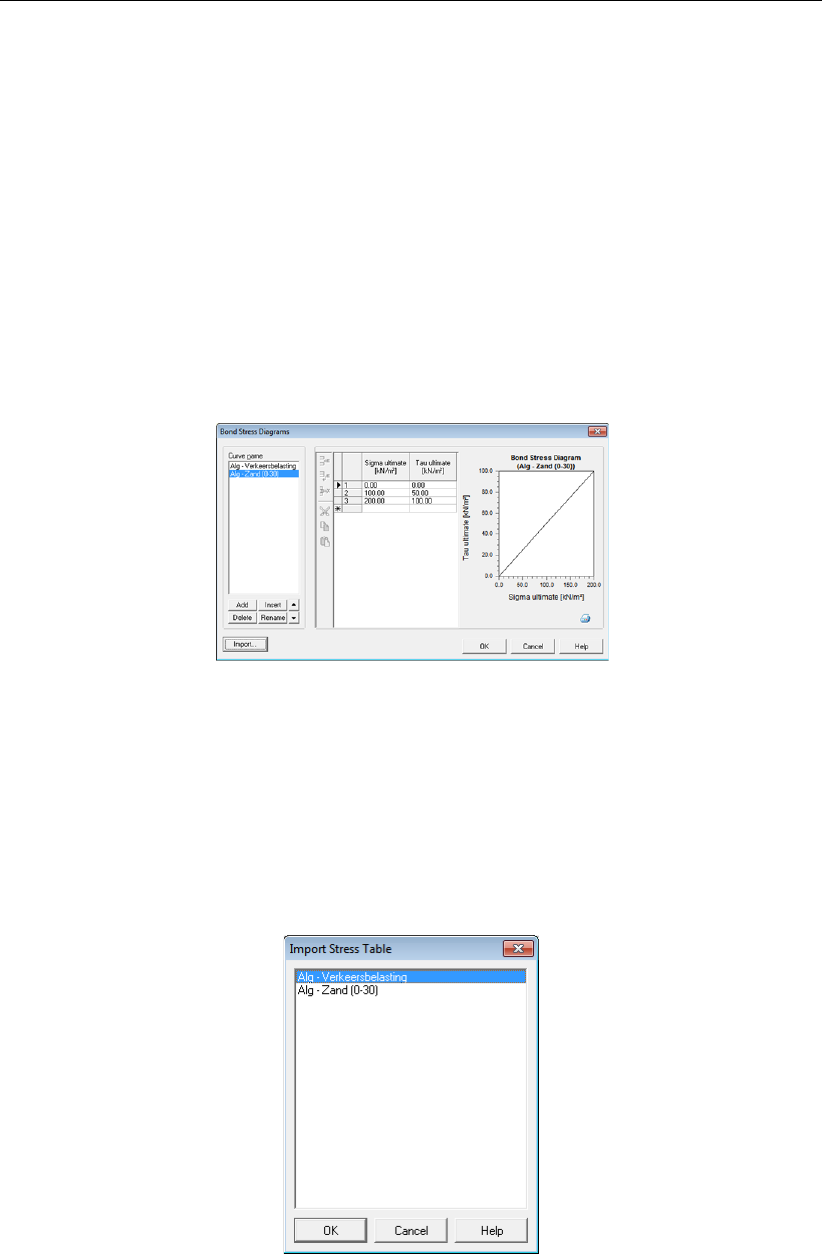
Input
4.2.2 Bond Stress Diagrams
This option is available only if the option Input of bond stress diagram (sigma, tau) has been
selected in the Soil Resistance window (section 4.1.1).
On the menu bar, click Soil and then select Bond Stress Diagrams in order to open the Bond
Stress Diagrams window. The curves relate the normal ultimate stress σ0
n(sigma) to the
shear ultimate stress τ(tau). Each curve is defined by entering successive coordinates. Two
coordinate pairs (σ0
nand τ) are required. Furthermore the input values of both σ0
nand τmust
be monotonically increasing.
D-GEO STABILITY
always extends the curve with a last horizontal
branch.
In the Bond Stress Diagrams window it is possible to specify different bond stress diagrams.
Figure 4.17 gives an example of a user defined bond stress diagram.
Figure 4.17: Bond Stress Diagrams window
Import predefined Diagrams
Alternatively, it is possible to use predefined bond stress diagrams. To do so, place a DAT file
with bond stress data, called BondStressDiagrams, in the
D-GEO STABILITY
Install directory.
When clicking the Import button, the Import Stress Table window appears (Figure 4.18). This
window contains predefined Sigma-Tau curves for different kind of soil.
Figure 4.18: Import Stress Table window
After selecting the desired curve and clicking OK, this curve is added to the others manually
inputted curves in the Bond Stress Diagrams window (Figure 4.19).
Deltares 45 of 286
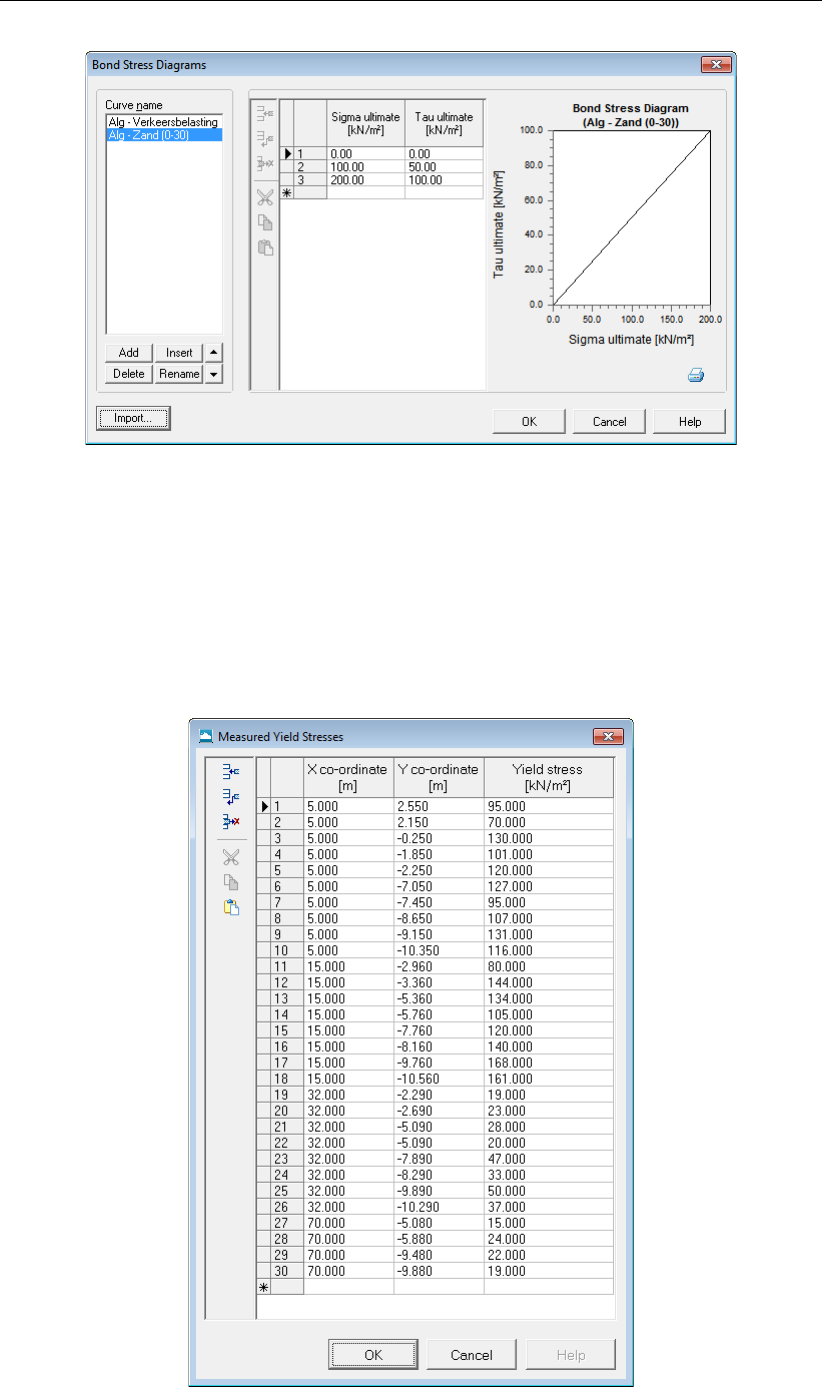
D-GEO STABILITY
, User Manual
Figure 4.19: Bond Stress Diagrams window with imported data
4.2.3 Measured Yield Stresses
The list of yield stress points with X- and Z-coordinates needed with the Su-calculated with
yield stress model, can be entered by selecting Measured Yield Stresses under the Soil menu.
Note that the copy and paste buttons are available to fill the list (copy and paste from an Excel
sheet or Matlab or Python output).
Figure 4.20: Measured Yield Stresses window
46 of 286 Deltares
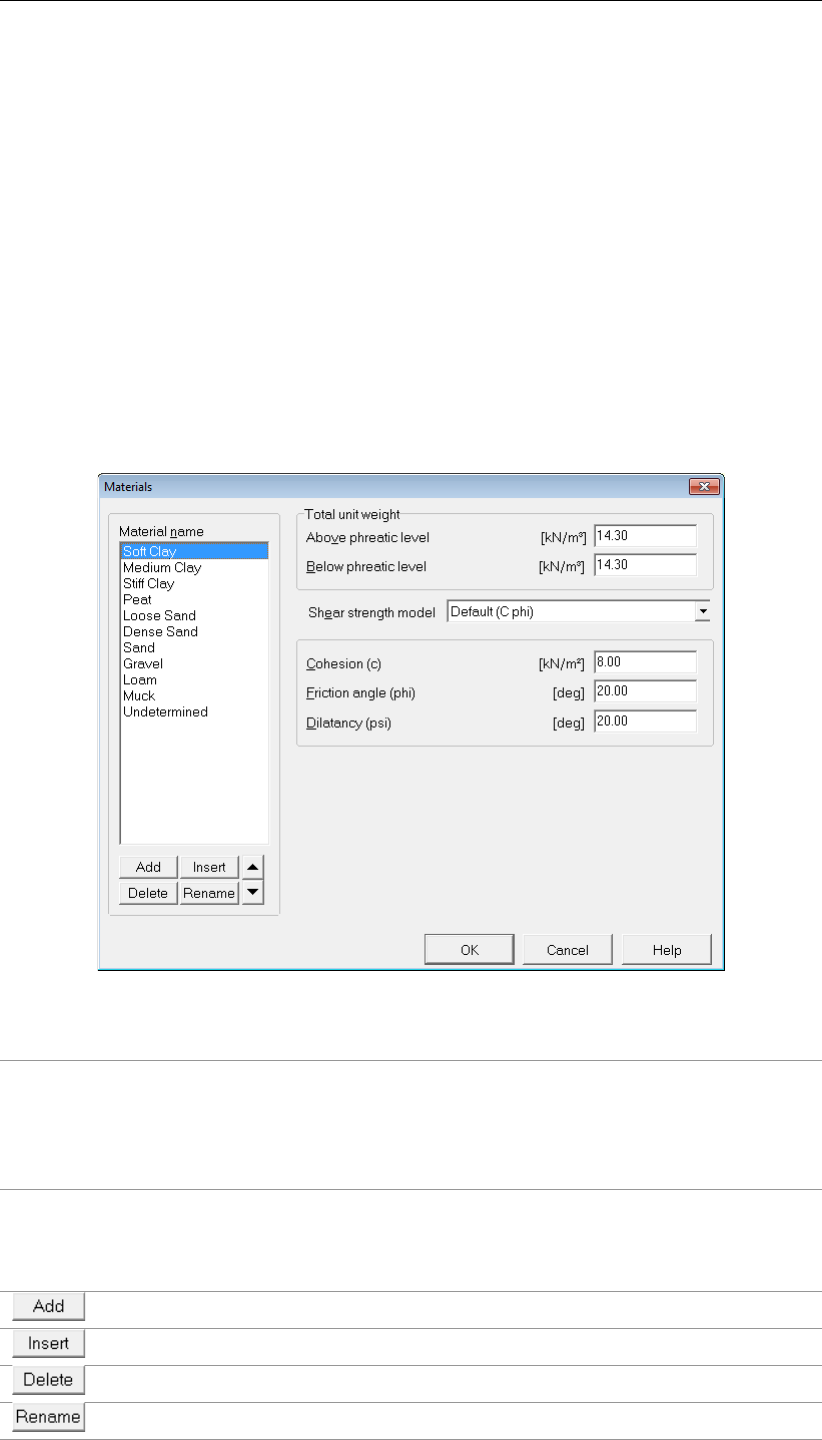
Input
4.2.4 Materials
On the menu bar, click Soil and then select Materials, in order to open the Materials window in
which material parameters can be imported or entered. The content of this window depends
on the selected model:
section 4.2.4.1 Input of fixed parameters for traditional deterministic design;
section 4.2.4.2 Import from a material library;
section 4.2.4.3 Input of parameter distributions for reliability based design;
section 4.2.4.4 Input of parameters for pseudo values shear strength model;
section 4.2.4.5 Input of parameters for Bishop probabilistic random field method;
section 4.2.4.6 Input of parameters for the soil/nails interface;
4.2.4.1 Materials – Input of fixed parameters
The input of fixed parameters for traditional deterministic design is described in this section.
Figure 4.21: Materials window for fixed value input
Total unit
weight
The unit weight of the soil:
–Above phreatic level is the unsaturated unit weight of the soil above
the phreatic line (γunsat)
–Below phreatic level is the saturated unit weight of the soil below the
phreatic line (γsat).
Shear strength
model
Use one of the following shear strength models, either by default (as
defined in section 4.1.1), or by specific selection (see below): C phi,
Stress tables,Su calculated with POP,Su calculated with yield stress,
Su measured or Su gradient.
Click this button to add a new material at the end of the existing list.
Click this button to insert a new material after the selected material.
Click this button to delete the selected material.
Click this button to rename the material.
Deltares 47 of 286
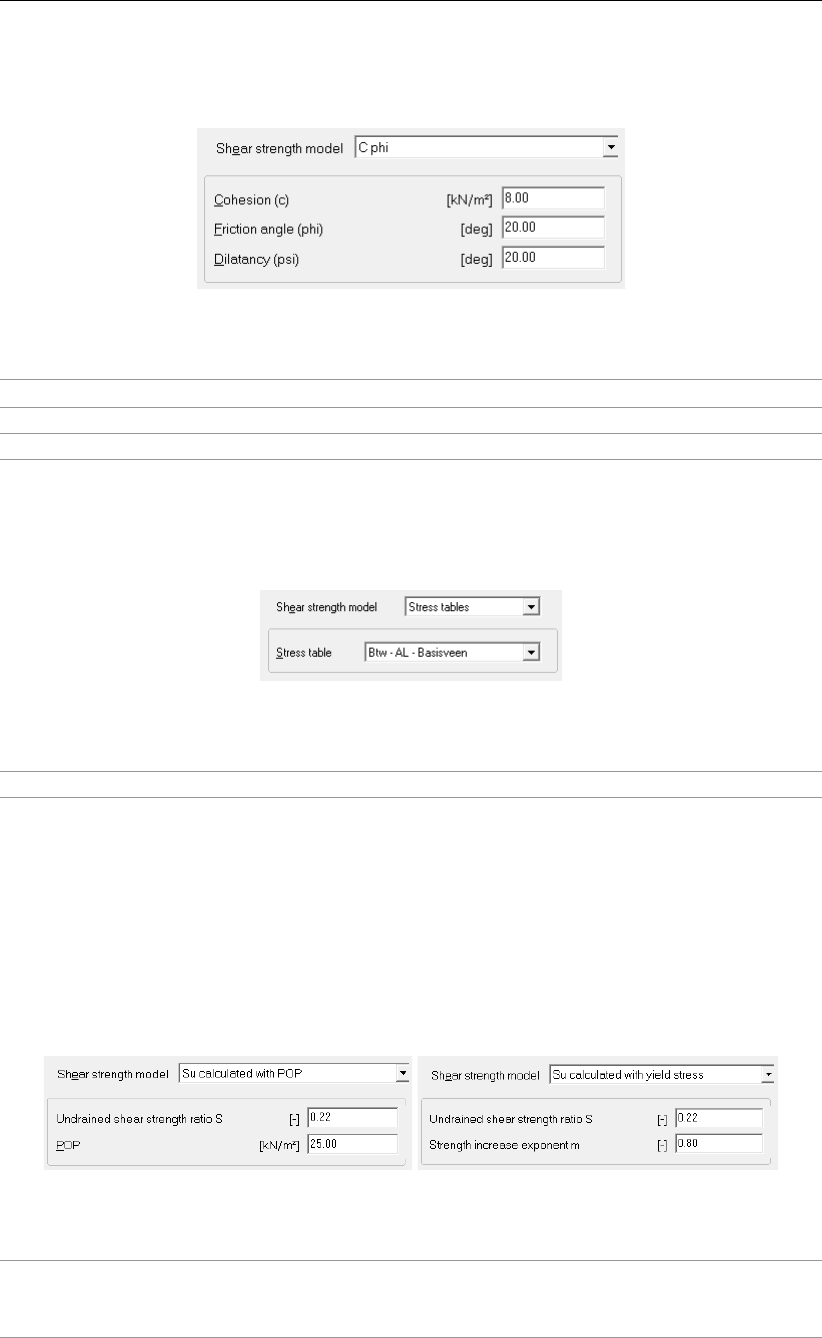
D-GEO STABILITY
, User Manual
Fixed – Cohesion and friction (C-phi)
Refer to section 19.2 and section 16.2.2.1.1 for background information.
Figure 4.22: Materials window, C-phi shear strength model
Cohesion The cohesion c, in kN/m2.
Friction angle The internal friction angle ϕ, in degrees.
Dilatancy The dilatancy angle ψ, in degrees.
Fixed – Stress table (Sigma-Tau)
Refer to section 19.2 “Stress tables" for background information.
Figure 4.23: Materials window, Stress Tables shear strength model
Stress table Select a previously defined Sigma-Tau curve (section 4.2.1) from the list.
Fixed – Calculated undrained shear strength (Su)
Two Su-calculated models are available:
Su calculated with POP
Su calculated with yield stress (section 4.2.3)
Refer to section 19.4 “Calculated undrained shear strength" for background information.
Figure 4.24: Materials window, Su-calculated shear strength models
Undrained
shear strength
ratio S
The uniform ratio between the undrained strength suand the vertical
yield stress σ0
y. Values range typically between 0.18 and 0.40.
48 of 286 Deltares
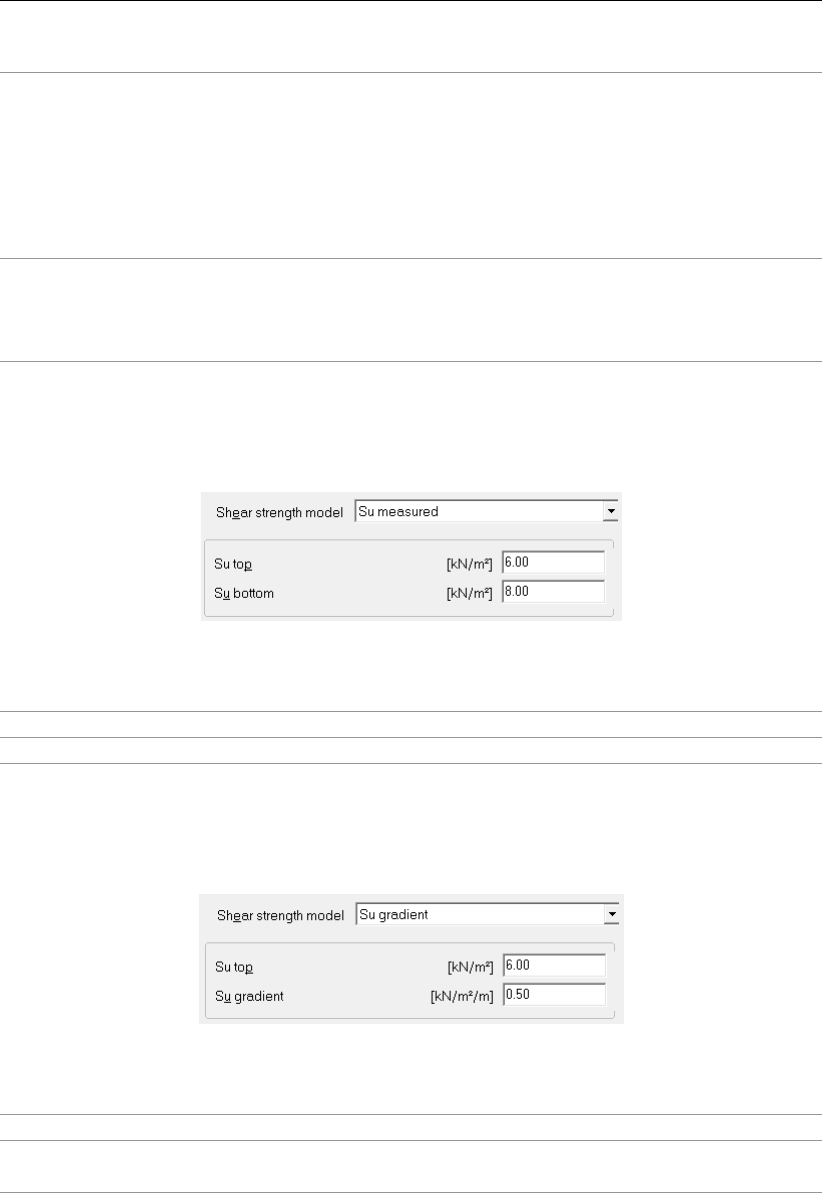
Input
POP (Only for Su calculated with POP model)
The pre-overburden pressure.
D-GEO STABILITY
uses this value to calcu-
late the vertical yield stress σ0
yfrom the effective vertical stress:
σ0
y= max(σ0
v.ref +POP, σ0
v)
The reference value of the vertical stress σ0
v.ref is determined from a ref-
erence level of the historic ground surface, see section 4.4.5 “Reference
Level for Ratio S".
Strength
increase
exponent m
(Only for Su calculated with yield stress model)
The strength increase exponent m.
D-GEO STABILITY
uses this parame-
ter to calculate the undrained shear strength as follows:
su=σ0
v×S×OCRm.
Fixed – Measured undrained shear strength (Su)
Refer to section 19.3 “Measured undrained strength" for background information.
Figure 4.25: Materials window, Su-measured shear strength model
Su top The apparent undrained strength suat the top of the layer.
Su bottom The apparent undrained strength suat the bottom of the layer.
Fixed – Gradient undrained shear strength (Su)
Refer to section 19.4 “Calculated undrained shear strength" for background information.
Figure 4.26: Materials window, Su-gradient shear strength model
Su top The apparent undrained strength suat the top of the layer.
Su gradient The apparent gradient in undrained strength suover the depth of the
layer (per meter).
Deltares 49 of 286
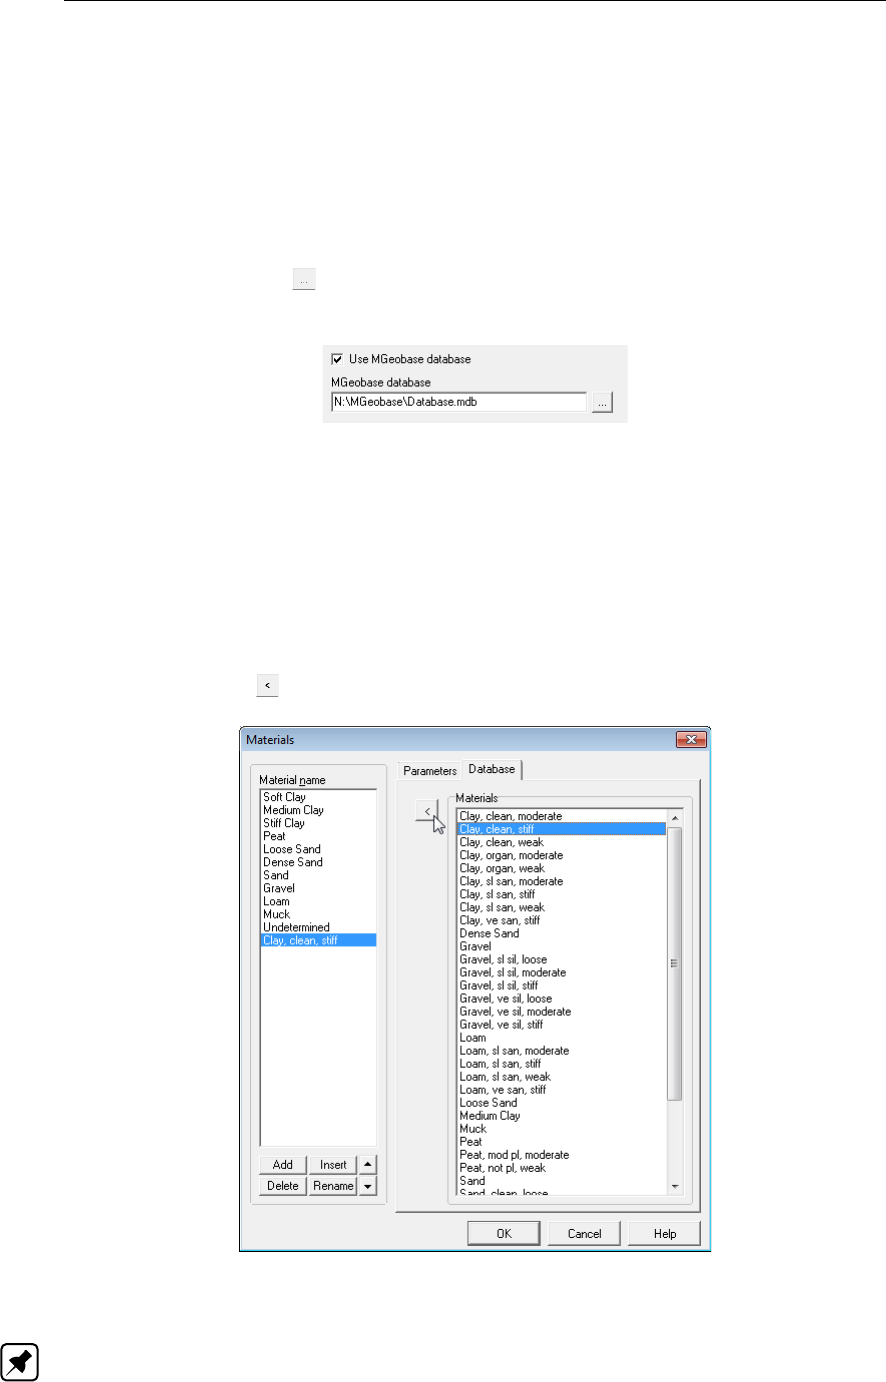
D-GEO STABILITY
, User Manual
4.2.4.2 Materials – Import from Database
It is possible to access the MGeobase material database for predefined material properties.
It is necessary that the database option for
D-GEO STABILITY
is available. To be able to access
the database, its directory first has to be indicated in the Program Options window from the
Tools menu:
Click on the Locations tab.
Make sure that the Use MGeobase database check-box is marked.
The Browse button allows the user to determine the database file to be used.
Select the relevant database. An example is given in Figure 4.27.
Figure 4.27: Program Options window, Locations tab, Database selection
To use the MGeobase database in the Materials option in the Soil menu, do the following:
On the menu bar, click Soil and then select Materials in order to open the Materials
window, see section 4.2.4.1.
Select the Database tab.
Select the material of which the properties are to be imported.
Click the arrow button to import.
Figure 4.28: Materials window, Database tab, Import predefined soil types
Note: If the soil type has already been defined locally, then
D-GEO STABILITY
will ask if the
existing local properties should be overwritten
50 of 286 Deltares
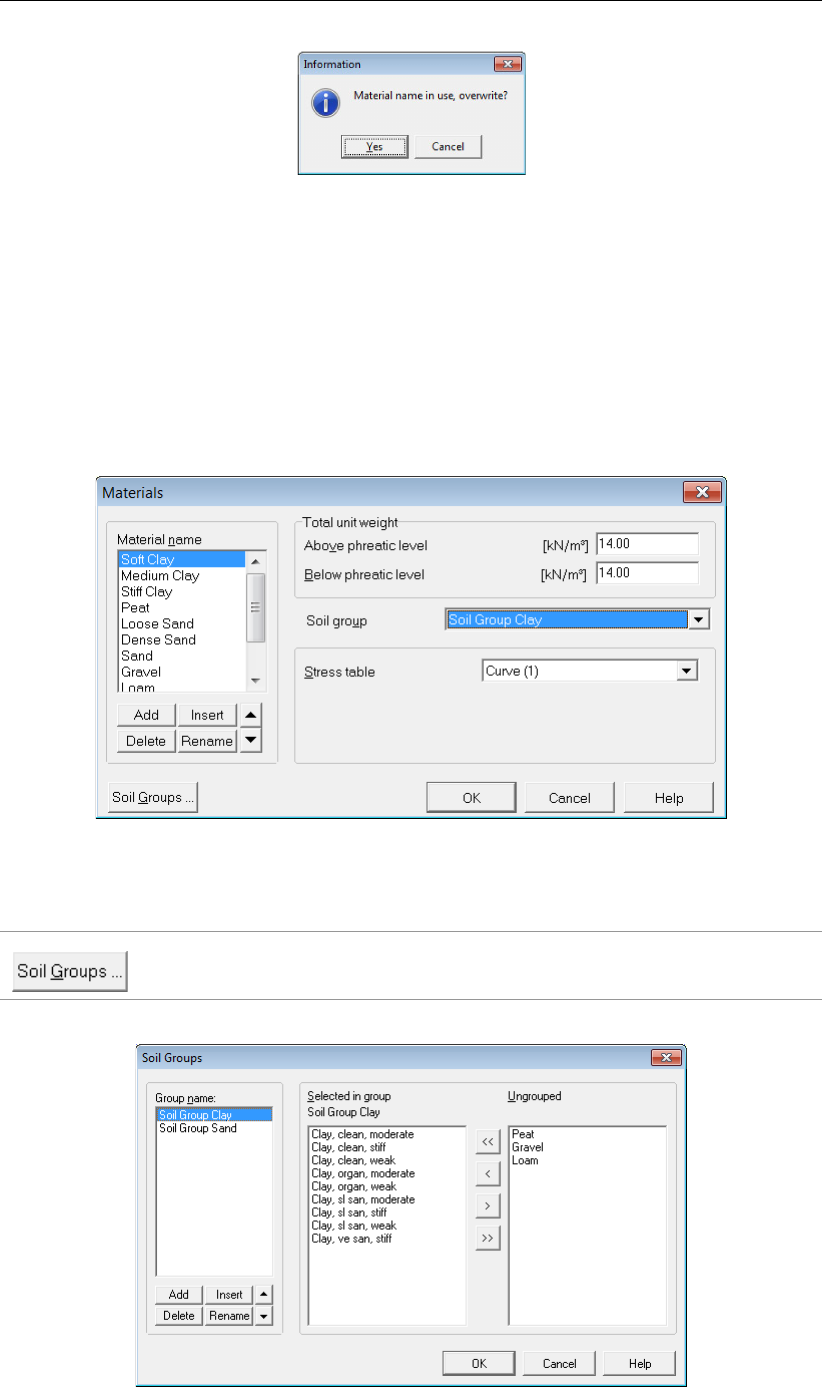
Input
Figure 4.29: Information window
4.2.4.3 Materials – Soil Groups
This option is available only if the Pseudo values shear strength model with Global measure-
ments in the Model window is enabled (section 4.1.1) or when the Reliability analysis option
is selected. On the menu bar, click Materials in the Soil menu (see Figure 4.30). This window
is the same as for fixed parameters (section 4.2.4.1) except that it is now possible to define
Soil Groups. Inside a soil group, correlation factors between the soil materials are used for
the calculation of the pseudo Tau value. For background information, refer to section 19.5.2.
Figure 4.30: Materials window for Pseudo values shear strength model with Global mea-
surements
Click the Soil Groups button at the bottom of the Materials window to open
the Soil Groups window (see Figure 4.31).
Figure 4.31: Soil Groups window
Deltares 51 of 286
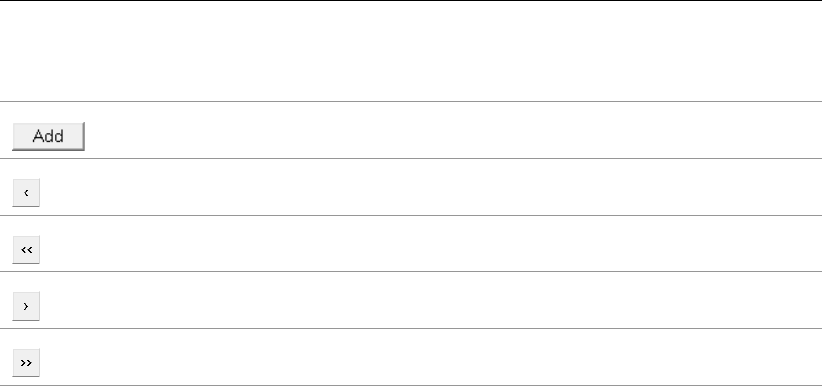
D-GEO STABILITY
, User Manual
In this window it is possible to define soil groups.
Click on the Add button to create a new Soil Group. Select a material in the
available list of soil materials called Ungrouped at the right side of the window.
Click on the Select highlighted material button to add the selected material to
the selected soil group.
Click on the Select all materials button to add all the available materials in the
selected soil group.
Click the Unselect highlighted material button to delete the selected material
from the selected soil group.
Click the Unselect all material button to delete the selected material from the
selected soil group.
A soil material can be part of only one soil group. Therefore, when selected in a group, the
soil material disappears from the Ungrouped list.
4.2.4.4 Materials – Reliability Analysis
If the Reliability analysis in the Model window is enabled (section 4.1.1),
D-GEO STABILITY
uses stochastic values for its calculations. On the menu bar, click Materials in the Soil menu
(see Figure 4.32). In this window it is possible to enter material parameters and their statistical
descriptions.
By default, the Standard option is selected and allows inputting standard stochastic parame-
ters.
52 of 286 Deltares
Input
Figure 4.32: Materials window for Standard stochastic input
Only the stochastic parameters are described in the paragraph. For the description of the
material parameters, refer to Materials – Input of fixed parameters (section 4.2.4.1).
Shear strength
model
Selected a shear strength model from the drop-down list.
Shear strength
input
Use one of the following type of input parameters, either by default (as
defined in section 4.1.1), or by specific selection: Mean values or Design
values.
Use probabilis-
tic defaults
Select this option when
D-GEO STABILITY
should allow user-defined val-
ues for stochastic data (section 4.1.1). Also unselect this option when
D-GEO STABILITY
should derive stochastic data from the last two columns
of a stress table. When the option is reselected, the defaults will over-
write all user-defined stochastic data for this soil type.
Standard /
Advanced
Select the advanced button to access both regular and special shear
strength parameters.
Mean The mean value of a parameter (section 20.3.1).
Design The design value of a parameter (section 20.3.6).
Std. dev. The standard deviation of a parameter (section 20.3.2).
Distribution The distribution type of a parameter: Normal,Log normal or None (sec-
tion 20.2). A distribution type None is equivalent to a zero standard
deviation.
Deltares 53 of 286
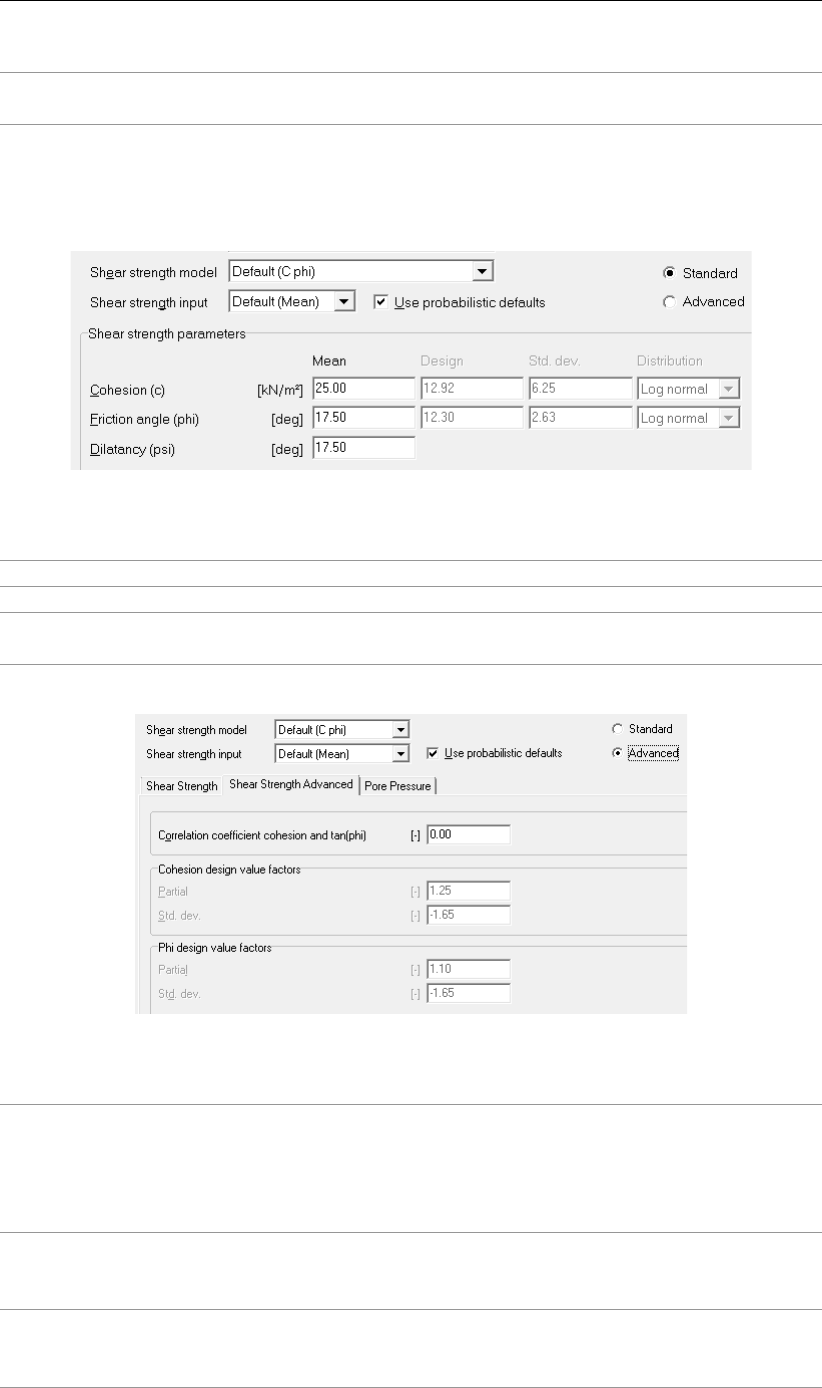
D-GEO STABILITY
, User Manual
Hydraulic
pressure
The hydraulic pressure, defined by PL-lines (section 20.4.3).
Stochastic – Cohesion and friction angle (c, phi)
Select the Advanced button to access both regular and special shear strength parameters.
Figure 4.33: C-phi – Standard stochastic input
Cohesion The cohesion c.
Friction Angle The internal friction angle ϕ.
Dilatancy The dilatancy angle ψ, in degrees. Note that this parameter is not a
stochast.
Figure 4.34: C-phi – Advanced stochastic input
Correlation
coefficient
cohesion and
tan(phi)
The correlation coefficient defines the dependency between variations
of cohesion and tan(phi). A value of 1 means that both parameters will
vary equally, with respect to the mean value. A zero value means that
the parameters can vary independently. A zero value is a safe assump-
tion.
Design value
factors - Partial
The partial factor fpartial used by
D-GEO STABILITY
to reduce the unfavor-
able characteristic value of cohesion and friction angle to a safe lower
limit (section 20.3.6).
Design value
factors - Std.
dev.
The value of the standard normal parameter ucharac used by
D-GEO STABILITY
to calculate the unfavorable characteristic value of co-
hesion and friction angle (section 20.3.4 and section 20.3.5).
54 of 286 Deltares
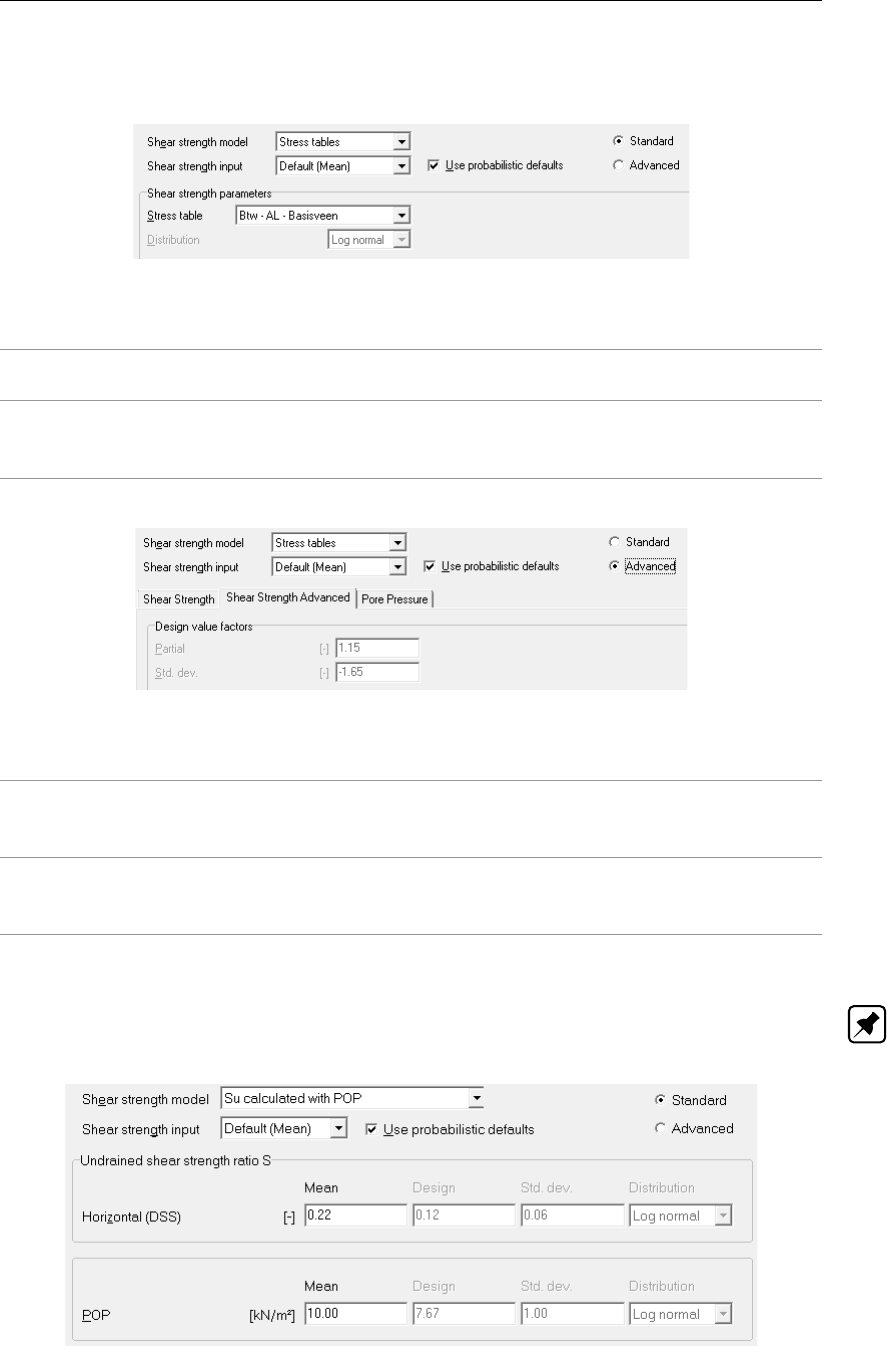
Input
Stochastic – Stress table (Sigma-Tau)
Figure 4.35: Stress table (sigma-tau) – Standard stochastic input
Stress table Select a previously defined or imported stress table (see also sec-
tion 4.2.1,section 19.2 and section 20.3.3).
Distribution The distribution type of the shear strength: Normal,Log normal or None
(section 20.2). The distribution type None is equivalent to a zero stan-
dard deviation.
Figure 4.36: Stress table (sigma-tau) – Advanced stochastic input
Design value
factors – Partial
The partial factor fpartial used by
D-GEO STABILITY
to reduce the unfa-
vorable characteristic value of the shear strength to a safe lower limit
(section 20.3.6).
Design value
factors – Std.
dev.
The value of the standard normal parameter ucharac , used by
D-GEO STABILITY
to calculate the unfavorable characteristic value of co-
hesion and friction angle (section 20.3.4 and section 20.3.5).
Stochastic – Calculated undrained shear strength (Su)
Note: A stochastic analysis is available only for the Su-calculated with POP model, not for
the Su-calculated with yield stress model.
Figure 4.37: Su-calculated with POP – Standard stochastic input
Deltares 55 of 286
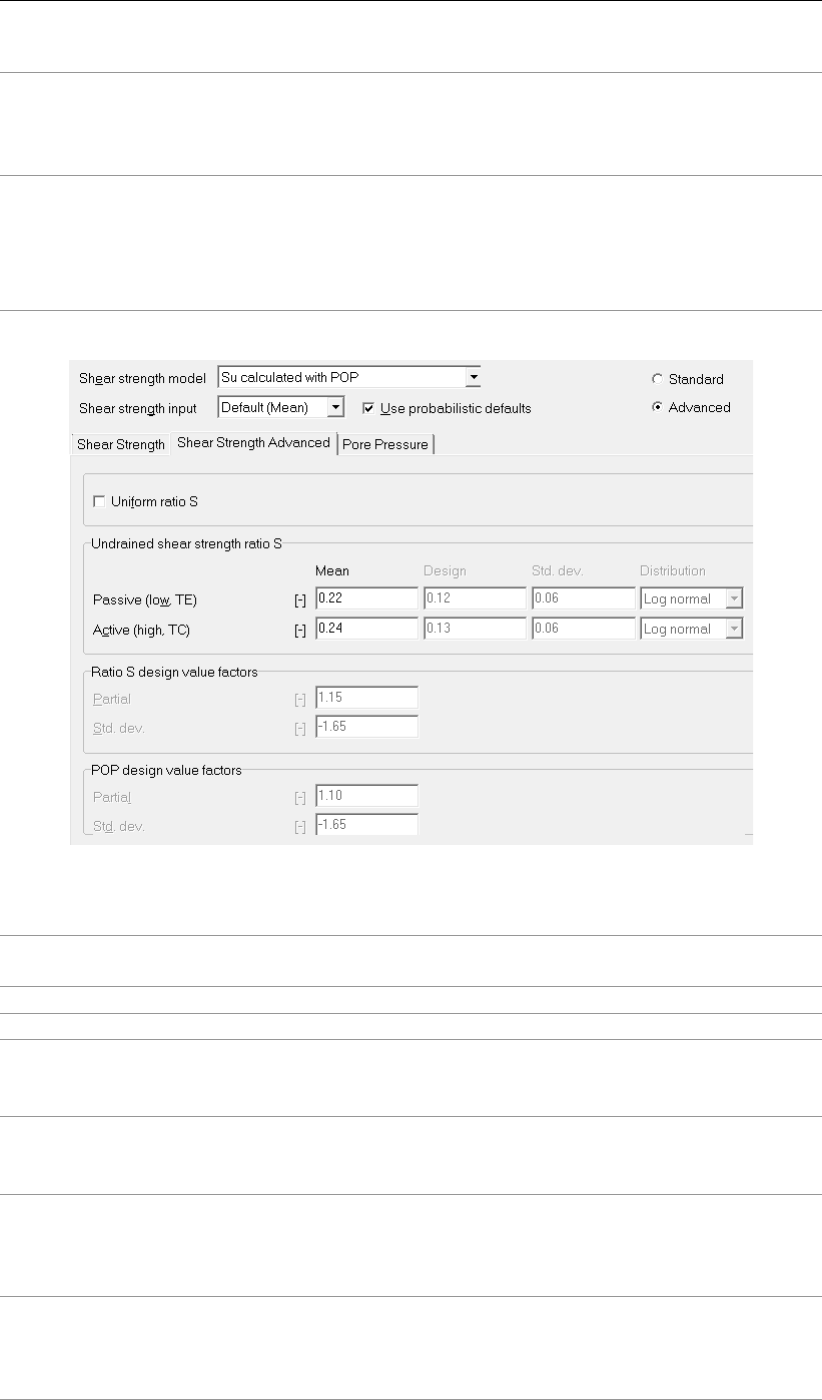
D-GEO STABILITY
, User Manual
Undrained
shear strength
ratio S
The ratio between the undrained shear strength suand the vertical yield
stress σ0
y(section 19.4). Values range typically between 0.18 and 0.40.
Average values for horizontal orientation of the slip plane are derived
from example from Direct Simple Shear (DSS) tests.
POP The pre-overburden pressure.
D-GEO STABILITY
uses this value to calcu-
late the yield stress σ0
yfrom the effective vertical stress:
σ0
y= max(σ0
v.ref +POP, σ0
v)
The reference value of the vertical stress σ0
v.ref is determined from a
reference level of the historic ground surface, see section 4.4.5.
Figure 4.38: Su calculated with POP – Advanced stochastic input
Uniform ratio S Unselect this option to define stress induced anisotropy for over-
consolidated soil (section 19.4).
Mean The mean value of the ratio (section 20.3.1).
Design The design value of the ratio (section 20.3.6).
Undrained shear
strength ratio S –
Passive (low, TE)
The low value of the undrained shear strength ratio, resulting from
Triaxial Extension tests.
Undrained shear
strength ratio S –
Active (high, TC)
The high value of the undrained shear strength ratio, resulting from
Triaxial Compression tests.
Design value
factors - Partial
The partial factor fpartial used by
D-GEO STABILITY
to reduce the un-
favorable characteristic value of the undrained shear strength ratio
(S) and pre-overburden pressure (POP) to a safe lower limit (sec-
tion 20.3.6).
Design value
factors – Std. dev.
The value of the standard normal parameter ucharac used by
D-GEO STABILITY
to calculate the unfavorable characteristic value of
the undrained shear strength ratio (S) and pre-overburden pressure
(POP) (section 20.3.4 and section 20.3.5).
56 of 286 Deltares
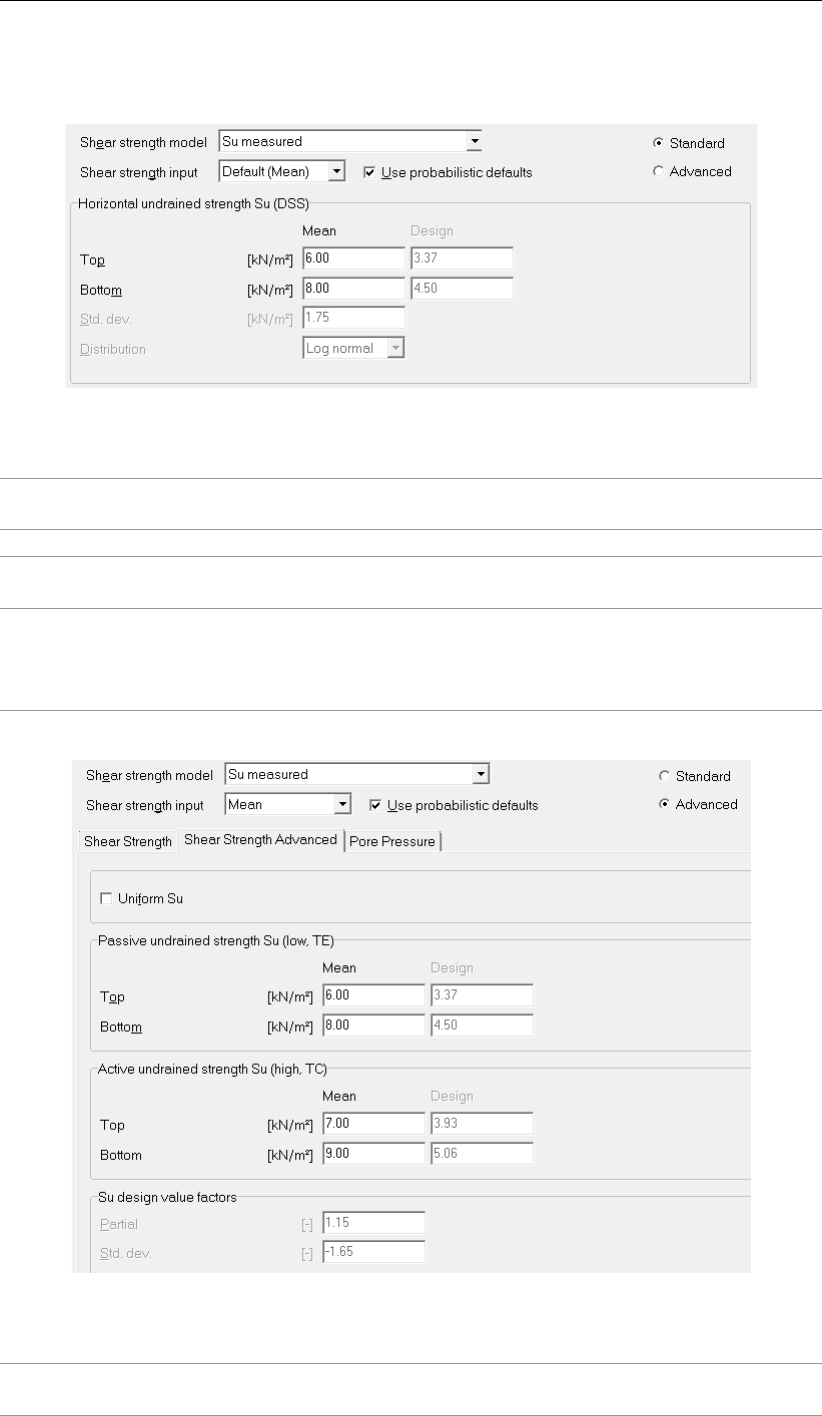
Input
Stochastic – Measured undrained shear strength (Su)
Figure 4.39: Su measured – Standard stochastic input
Horizontal undrained
strength Su (DSS)
Undrained shear strength for a horizontal slip plane, derived from
Direct Simple Shear (DSS) tests (section 19.3).
Top The apparent undrained shear strength suat the top of the layer.
Bottom The apparent undrained shear strength suat the bottom of the
layer.
Std. dev. The value of the standard normal parameter ucharac used
by
D-GEO STABILITY
to calculate the unfavorable characteristic
value of the undrained shear strength (section 20.3.4 and sec-
tion 20.3.5).
Figure 4.40: Su measured – Advanced stochastic input
Uniform Su Select this option to define stress induced anisotropy for over-
consolidated soil (section 19.3).
Deltares 57 of 286
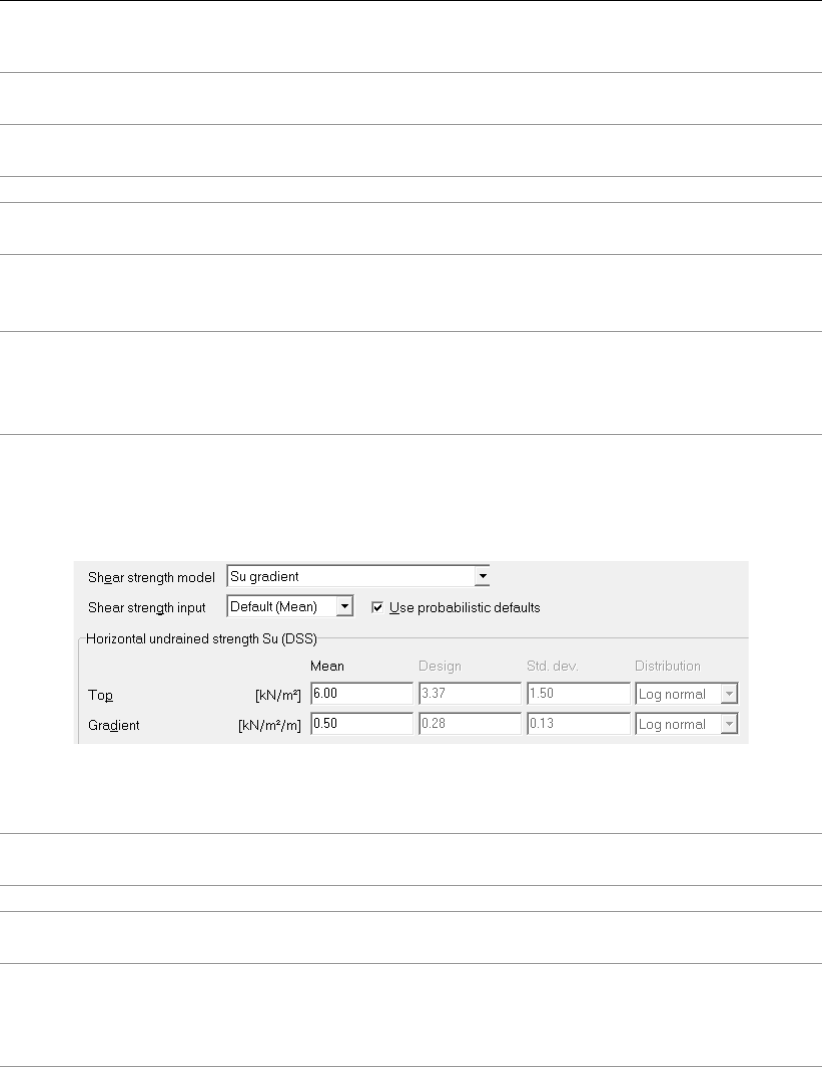
D-GEO STABILITY
, User Manual
Passive undrained
strength Su (low, TE)
The low value of the undrained shear strength at the passive side
of the slip plane, derived from Triaxial Extension (TE) tests.
Active undrained
strength Su (high, TC)
The high value of the undrained shear strength at the active side
of the slip plane, derived from Triaxial Compression (TC) tests.
Top The apparent undrained shear strength suat the top of the layer.
Bottom The apparent undrained shear strength suat the bottom of the
layer.
Design value factors -
Partial
The partial factor fpartial used by
D-GEO STABILITY
to reduce the
unfavorable characteristic value of the undrained shear strength
to a safe lower limit (section 20.3.6).
Design value factors –
Std dev.
The value of the standard normal parameter ucharac, used
by
D-GEO STABILITY
to calculate the unfavorable characteristic
value of the undrained shear strength (section 20.3.4 and sec-
tion 20.3.5).
Stochastic – Gradient undrained shear strength (Su)
Figure 4.41: Su gradient – Standard stochastic input
Horizontal undrained
strength Su (DSS)
Undrained shear strength for a horizontal slip plane, derived from
Direct Simple Shear (DSS) tests (section 19.3).
Top The apparent undrained shear strength suat the top of the layer.
Gradient The apparent gradient in undrained shear strength suover the
depth of the layer (per meter).
Std. dev. The value of the standard normal parameter ucharac used
by
D-GEO STABILITY
to calculate the unfavorable characteristic
value of the undrained shear strength (section 20.3.4 and sec-
tion 20.3.5).
4.2.4.5 Materials – Bishop probabilistic random field method
If the Bishop probabilistic random field method in the Model window is enabled (section 4.1.1),
D-GEO STABILITY
uses stochastic values for its calculations. On the menu bar, click Soil and
then select the Materials option to open the Materials window (see Figure 4.42). In this
window all data related to the soil type is entered. Note that in this method the dilatancy angle
is not used. See section 21.5.1 for background.
58 of 286 Deltares
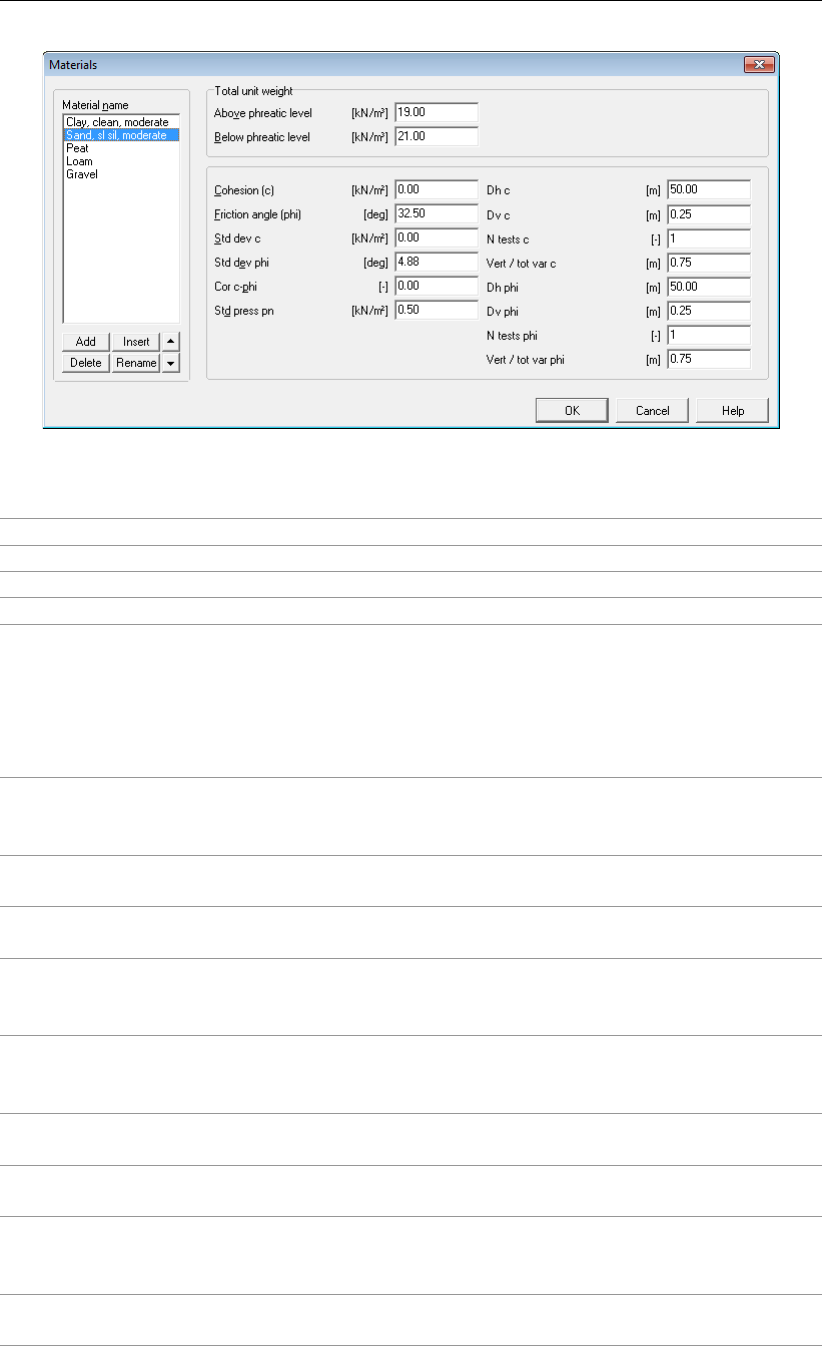
Input
Figure 4.42: Materials window for Bishop probabilistic random field method
Cohesion Bishop prob. random field Mean value of the cohesion.
Friction angle Mean value of the friction angle.
Std dev c Standard deviation of the cohesion.
Std dev phi Standard deviation of the tangent of the friction angle.
Cor c-phi Correlation coefficient between cohesion and friction angle, ranging be-
tween -1 and 1. A1. A zero value means that parameter values can vary
independently. A value of 1 means that the values of cohesion and fric-
tion vary identically on normalized scale. A value of -1 means that the
increase of one value causes an identical decrease in the other value,
again on normalized scale.
Std press pn Standard deviation of the hydraulic pore pressure per material. This hy-
draulic pressure is derived from the input of PL-lines per layer (Geometry
menu, Water menu). See section 20.4.3.
Dh c Bishop prob. random field correlation length of the cohesion. See sec-
tion 21.5.1 Equation 21.3.
Dv c The vertical correlation length of the cohesion. See section 21.5.1,
Equation 21.3.
N tests c Number of tests used to determine the cohesion. The model uses this
value to modify the auto-correlation function. See section 21.5.1,Equa-
tion 21.5.
Vert/tot var c The ratio αbetween vertical and total variance (variance is the square
of the standard deviation) of the cohesion. See section 21.5.1,Equa-
tion 21.3.
dh phi The horizontal correlation length of the friction angle. See section 21.5.1
Equation 21.2.
dv phi The vertical correlation length of the friction angle. See section 21.5.1,
Equation 21.2.
N tests phi Number of tests used to determine the friction angle. The model uses
this value to modify the auto-correlation function. See section 21.5.1,
Equation 21.4.
Vert/tot var phi The ratio αbetween vertical and total variance (variance is the square
of the standard deviation). See section 21.5.1,Equation 21.4.
Deltares 59 of 286
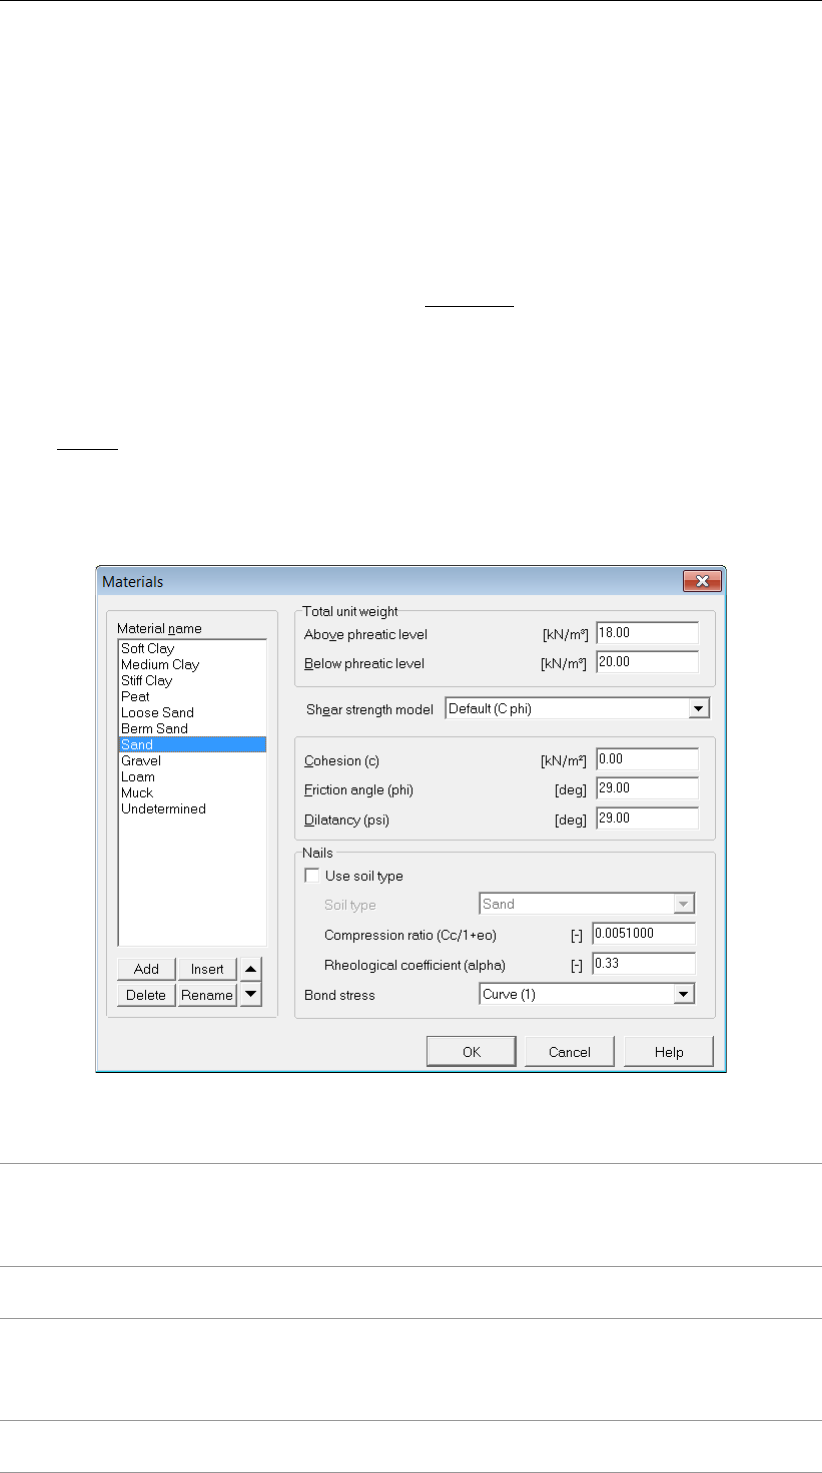
D-GEO STABILITY
, User Manual
4.2.4.6 Materials – Nails
If the Use soil parameters c, phi / Su option in the Soil Resistance window is selected (sec-
tion 4.1.1),
D-GEO STABILITY
uses the following soil parameters to determine:
the ultimate lateral stress at the interface soil/nail puusing either the friction angle ϕor
the undrained shear strength suof the soil, depending on the Shear Strength model of
the soil:
pu= 3 ×σ0
v×Kpwith Kp=1 + sin ϕ
1−sin ϕfor c-phi models
pu= 9 ×sufor Su models
the Young’s modulus of the soil Esusing the compression ratio of the soil (CR =
Cc
1 + e0
) and the rheological coefficient of the soil α.
See section 16.2.2.3 for background information.
Figure 4.43: Materials window for nails with option Use soil parameters c, phi / Su
Use soil type If this check-box is marked, the Soil type must be specified.
D-GEO STABILITY
will automatically determine the compression ratio and
the rheological coefficient using the values according to Ménard and
given in Table 4.1.
Compression
ratio (Cc/1+eo)
Enter the compression ratio of the soil CR =Cc/(1 + e0).
Rheological co-
efficient (alpha)
Enter the rheological coefficient of the soil (α), empirical parameter used
by Ménard to relate the modulus of deformation Esto the pressuremeter
modulus Epm:
Es=Epm/α
Bond stress Select a previously defined bond stress diagram (section 4.2.2) from the
list.
60 of 286 Deltares
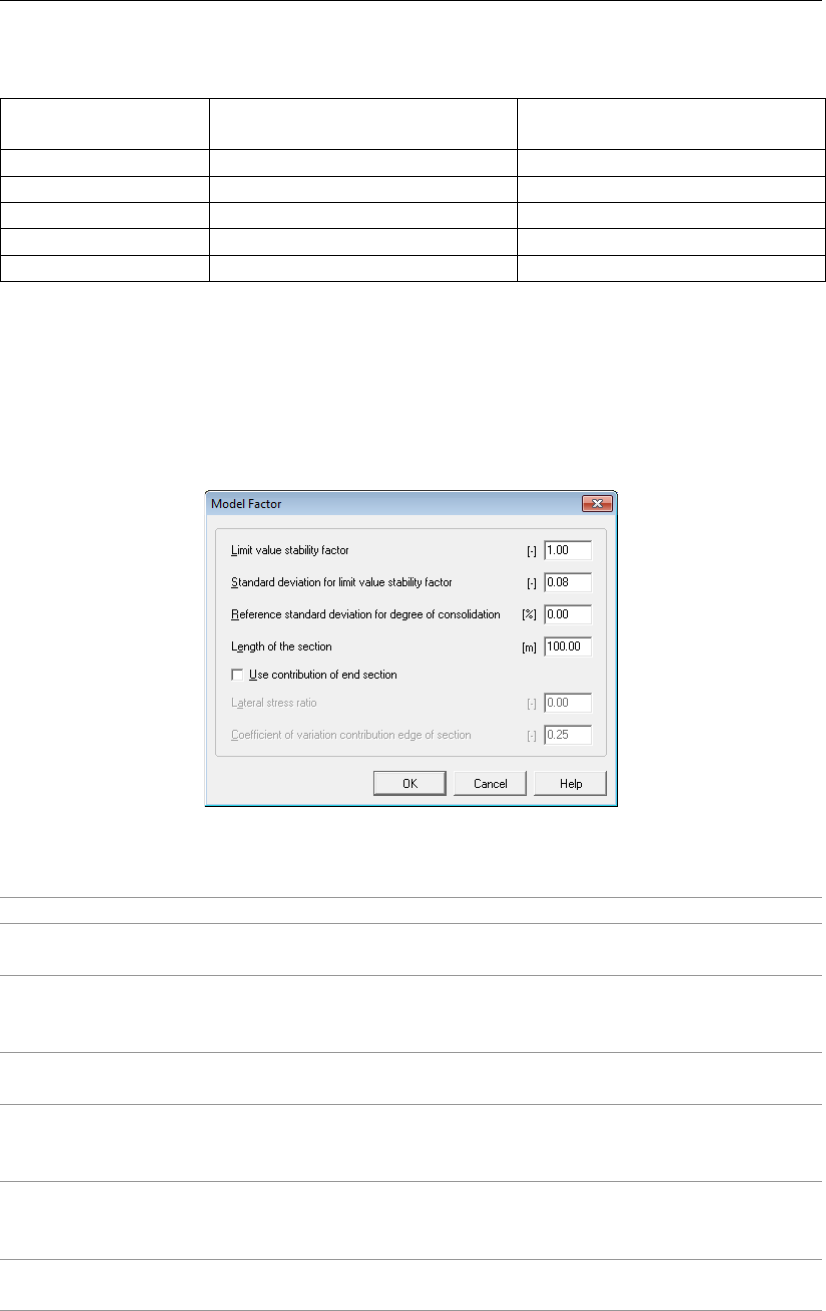
Input
Table 4.1: Rheological coefficient and compression ratio for different soil types
Soil type Rheological coefficient
α
Compression ratio
CR =Cc/(1 + e0)
Gravel 1/4 0.0023884
Sand 1/3 0.0039806
Loam 1/2 0.0495100
Clay 2/3 0.1287400
Peat 1 0.8991000
4.2.5 Model Factor
This option is available only if the Bishop probabilistic random field method in the Model
window is enabled (section 4.1.1). On the menu bar, click Soil and then select the Model
Factor option in order to open the Model Factor window (see Figure 4.44). In this window, all
general stochastic data can be entered. See section 21.5.3 for background.
Figure 4.44: Model Factor window
Limit value stability factor The required value for the safety factor Frequired.
Standard deviation for the
limit value stability factor
This value expresses the uncertainty caused by the Bishop
model assumptions.
Reference standard devi-
ation for degree of con-
solidation
The standard deviation of the reference excess pore pressure
at a degree of consolidation of 50%. See Equation 20.22 in
section 20.4.3.
Length of section The length of the considered section in the out-of-plane direc-
tion.
Use contribution of end
section
Select this button to include the stability increase caused by
the resistance at the edges of a sliding section in the out-of-
plane direction, see section 21.5.3.
Lateral stress ratio The model assumes a single value for the earth pressure co-
efficient K0of all layers during calculation of the resistance at
the edges. A common value is 0.5.Lateral stress ratio
Coefficient of variation
contribution edge
The ratio for the moment at the edges of a section. See Equa-
tion 21.9 in section 21.5.3.
Deltares 61 of 286
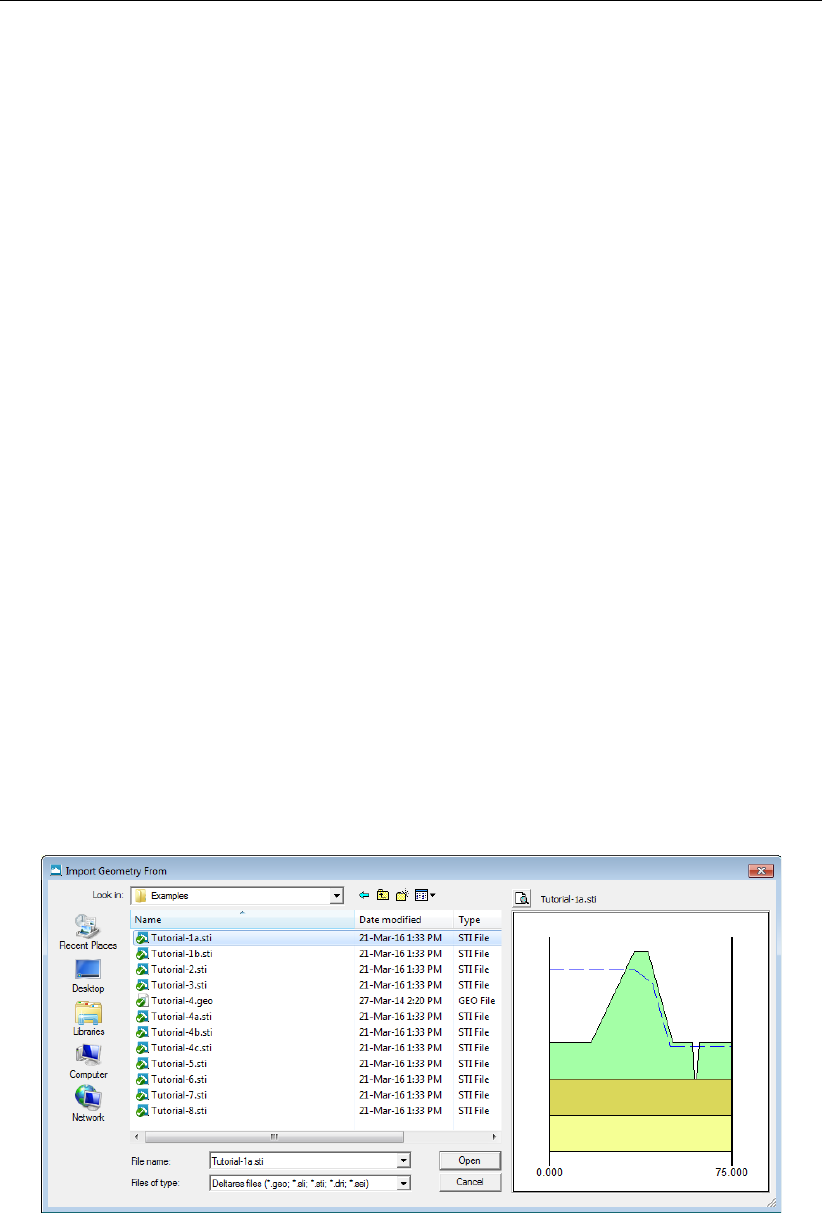
D-GEO STABILITY
, User Manual
4.3 Geometry menu
The Geometry menu can be used to enter geometry specifications for the analysis.
4.3.1 New
Select this option to display the View Input (Geometry) window, showing only the geometry
limits (with their default values) of the geometry. It is possible to now start modeling the geom-
etry. However, it is possible to create a new geometry faster and easier using the Geometry
Wizard. This wizard involves a step-by-step process for creating a geometry.
4.3.2 New Wizard
Use this option to start the wizard, which will guide the user step-by-step through the process
of creating a geometry. For a detailed description see Tutorial 1 (chapter 8). Using this wizard
significantly reduces time and effort required to enter data.
4.3.3 Import
This option displays a standard file dialog for selecting an existing geometry stored in a geom-
etry file. Existing input files for
D-SETTLEMENT
(formerly known as MSettle),
D-GEO STABILITY
,
D-GEO PIPELINE
(formerly known as MDrill) or MSeep are also supported. For a full description
of these programs and how to obtain them, visit www.deltaressystems.com.
When selecting the geometry, it is imported into the current project, replacing the current
geometry. The imported geometry is displayed in the View Input (Geometry) window. It is
also possible to use this option to analyze the settled geometry at different stages, as all other
input is retained.
Click Import in the Geometry menu. The Import Geometry From dialog will appear, see
Figure 4.45. Choose the desired geometry and click Open.
Figure 4.45: Import Geometry From window
62 of 286 Deltares

Input
4.3.4 Import geometry from database
To be able to import a geometry from a database, this option has to be provided with the
purchased version of
D-GEO STABILITY
.
To import a geometry from a database, click Import from Database in the Geometry menu.
The Select Geometry dialog will appear. Again, the imported geometry will replace the current
one and will be displayed in the View Input (Geometry) window.
Note: This option is only available when the correct database directory has been specified
using the Locations tab in the Program Options menu (see section 4.2.4). For more informa-
tion on MGeobase, visit www.deltaressystems.com.
4.3.5 Export
This option displays a standard Save As dialog that enables the user to choose a directory
and a file name and format in which to save the current geometry file. The file will be saved in
the standard geometry format for the Deltares Systems Geo-tools (*.geo). Files in this format
can be used in a multitude of Deltares Systems geo-programs, such as
D-GEO STABILITY
,
D-SETTLEMENT
(formerly known as MSettle), MSeep and
D-GEO PIPELINE
(formerly known as
MDrill). For a full description of these programs and how to obtain them, visit:
www.deltaressystems.com.
4.3.6 Export as Plaxis/DOS
This option displays the Save As Plaxis/DOS dialog that enables the user to choose a direc-
tory and a file name in which to save the current geometry. The file will be saved using the
old DOS-style geometry format for the Deltares systems geo-tools. Files in this format can be
used by the finite element program Plaxis and in old DOS-based versions of Deltares Systems
programs such as
D-GEO STABILITY
(DOS) and MZet.
Saving files of this type will only succeed, however, if the stringent demands imposed by the
old DOS style are satisfied:
number of layers = 20
number of PL-lines = 20
number of lines per boundary <50
total number of points = 500
To be able to differentiate between an old DOS-style file and a normal geometry file, the file
dialog that prompts for a new file name for the old DOS-style geometry file provides a default
file name, prefixing the current file name with a ‘D’.
Deltares 63 of 286
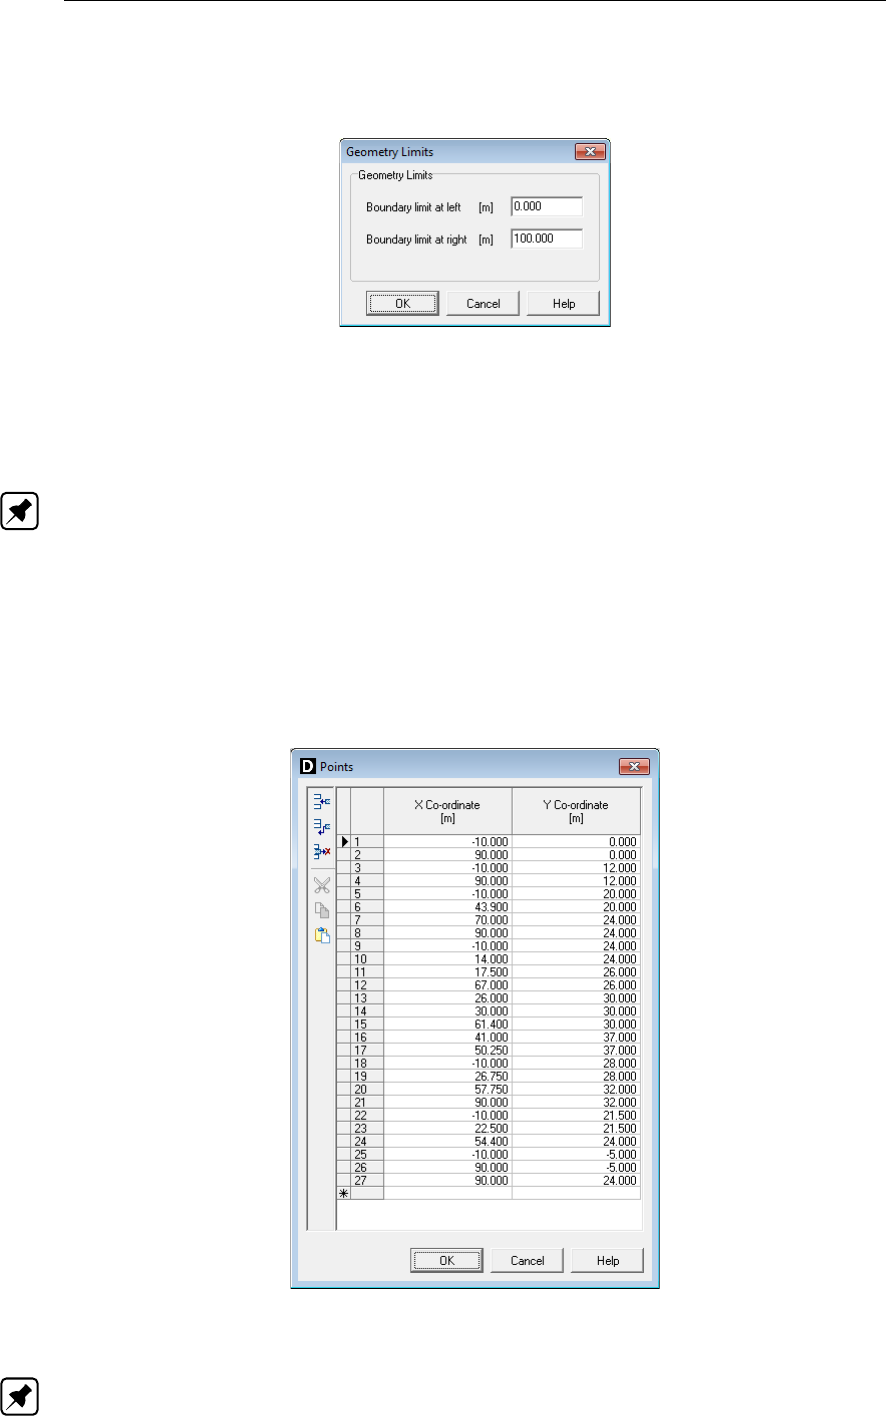
D-GEO STABILITY
, User Manual
4.3.7 Limits
Use this option to edit the geometry limits.
Figure 4.46: Geometry Limits window
A limit is a vertical boundary defining the ‘end’ at either the left or right side of the geometry.
It is defined by an X coordinate only.
Note: The values entered in the Geometry Limits window are ignored if they resulted in an
invalid geometry.
4.3.8 Points
Use this option to add or edit points that can be used as part of layer boundaries or PL-lines
(section 4.3.10). A point is a basic geometry element defined by its coordinates. Since the
geometry is restricted to two dimensions, it allows the user to define an X and Y coordinates,
respectively in horizontal and vertical directions.
Figure 4.47: Points window
Note: When a point is to be deleted,
D-GEO STABILITY
will check whether the point is used as
part of a PL-line or layer boundary. If so, a message will be displayed.
64 of 286 Deltares
Input
Figure 4.48: Confirm window for deleting used points
When Yes is clicked, all layer boundaries and/or PL-lines using the point will also be deleted.
Every change made using this window (Figure 4.47) will only be displayed in the underlying
View Input (Geometry) window after closing this window using the OK button. When this
button is clicked, a validity check is performed on the geometry. Any errors encountered
during this check are displayed in a separate window. Of course, it is always possible to close
the window using the Cancel button, but this will discard all changes.
4.3.9 Import PL-line
Use this option to display the Import PL-line dialog for importing a Piezometric Level (PL) line
from an existing MPL file. Such file is made using the WATEX program of Deltares: in tab
Head-Location Plot, click on the button “Export...” and fill in a file name in the “Export Water
Pressure Line” window.
4.3.10 PL-lines
Use this option to add or edit Piezometric Level lines (PL-lines) to be used in the geometry. A
PL-line represents the pore pressures in the soil. A file can contain more PL-lines as different
soil layers can have different piezometric level. In the next section it is described how different
PL-lines are assigned to different layers.
It is possible to add, insert edit and delete PL-lines (see Figure 4.49).
Figure 4.49: PL-lines window
In the lower left part of the window it is possible to use the buttons to add, insert and delete
PL-lines. The selection box on the left can be used to navigate between PL-lines that have
already been defined.
Deltares 65 of 286
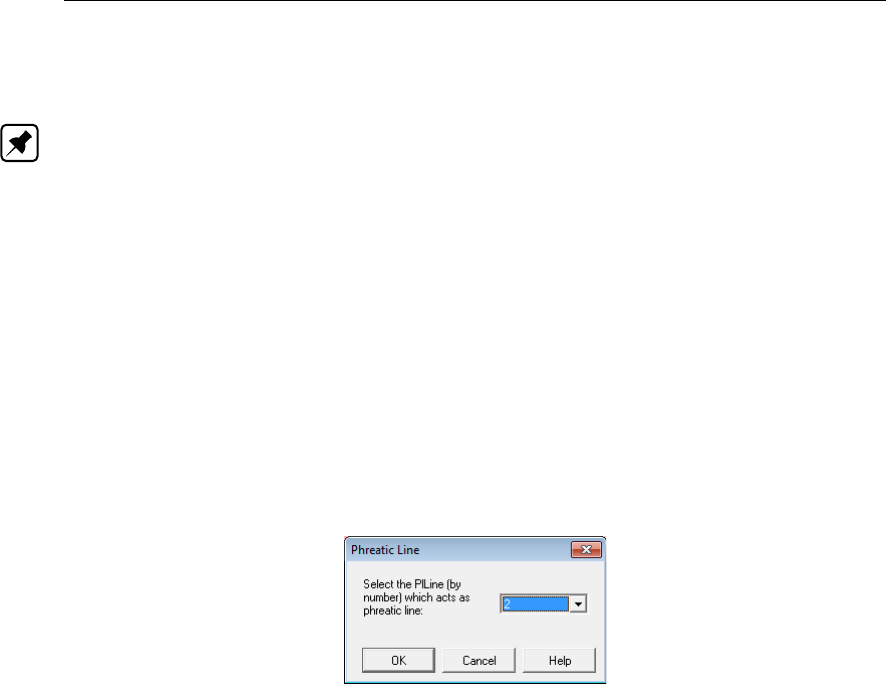
D-GEO STABILITY
, User Manual
Use the table to add/edit the points identifying the PL-lines. It is only possible to select points
that are not attached to layer boundaries (section 4.3.12).
Note: It is only possible to manipulate the Point number column – that is, the coordinate
columns are purely for informative purposes. To manipulate the coordinates of the points,
select the Points option from the Geometry menu (see section 4.3.8).
Every change made using this window will only be displayed in the underlying View Input
(Geometry) window after closing this window using the OK button. When clicking this button,
a validity check is performed on the geometry. Any errors encountered during this check are
displayed in a separate window. These errors must be corrected before closing this window
using the OK button. Of course, it is always possible to close the window using the Cancel
button, but this will discard all changes.
4.3.11 Phreatic Line
Use this option to select the PL-line that acts as a phreatic line (see Figure 4.50). The phreatic
line (or groundwater level) is used to mark the border between dry and wet soil.
Figure 4.50: Phreatic Line window
Select the appropriate line number from the drop-down list and click the OK button. At least
one PL-line has to be defined to be able to pick a Phreatic Line.
4.3.12 Layers
This option enables the user to add or edit layers to be used in the geometry. A layer is
defined by its boundaries and its material. Use the Boundaries tab (seen here in Figure 4.51)
to define the boundaries for all layers by choosing the points that identify each boundary.
66 of 286 Deltares
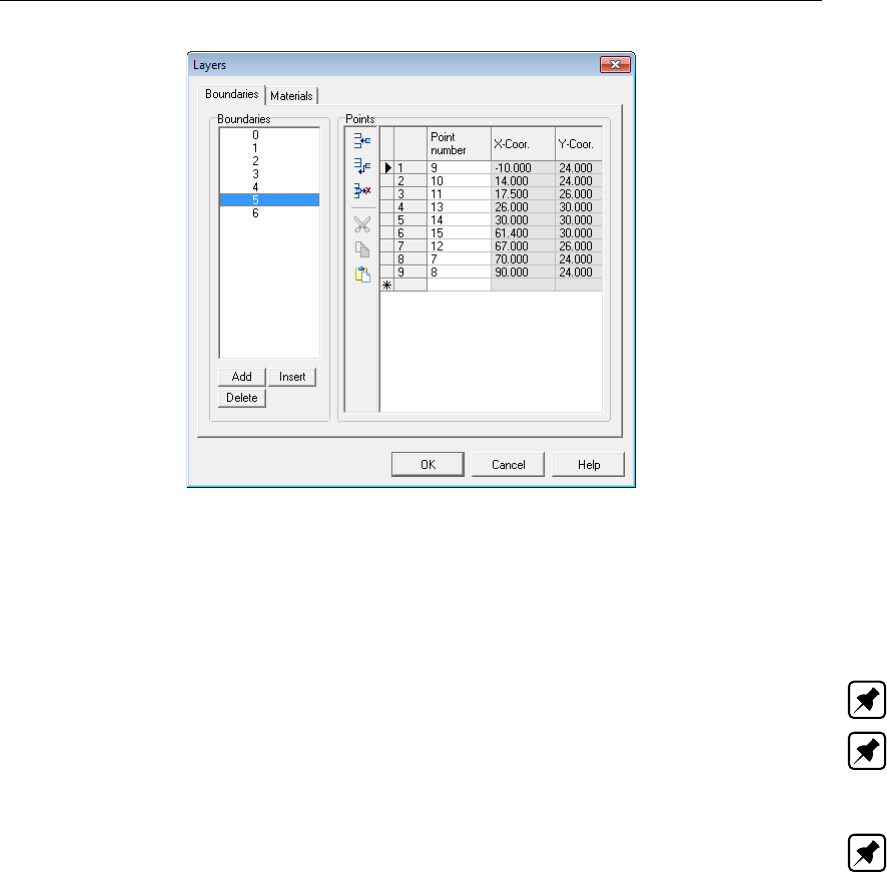
Input
Figure 4.51: Layers window, Boundaries tab
On the left-hand side of the window, it is possible to add, insert, delete or select a boundary.
In the table on the right, it is possible to modify or add the points that identify the selected
boundary.
Note: It is only possible to select points that are not attached to PL-lines (section 4.3.10).
Note: It is only possible to manipulate the Point number column, because the coordinate
columns are purely for informative purposes. To manipulate the coordinates of the points,
select the Points option in the Geometry menu (see section 4.3.8).
Note: When inserting or adding a boundary, all points of the previous boundary (if this exists)
are automatically copied. By default, the material of a new layer is set equal to the material of
the existing layer just beneath it.
The Materials tab (see Figure 4.52) enables the user to assign materials to the layers.
Deltares 67 of 286
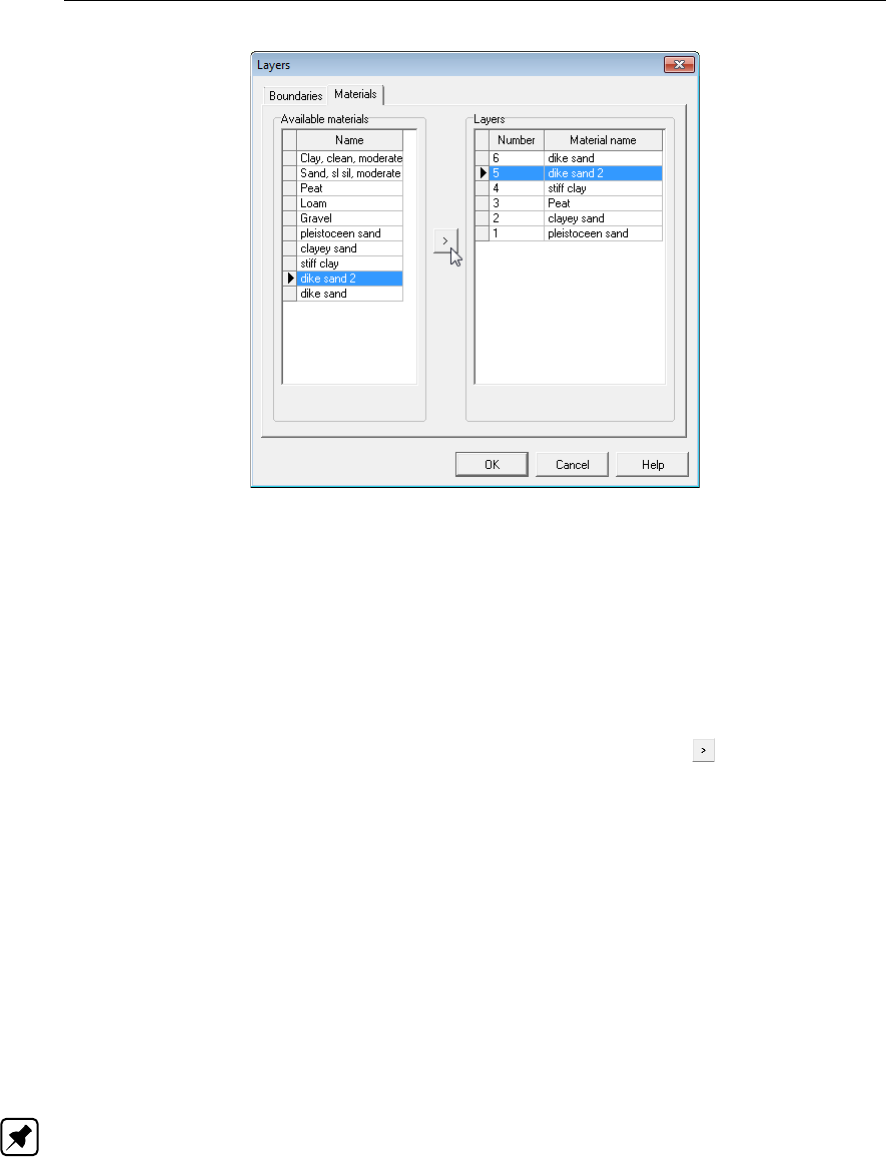
D-GEO STABILITY
, User Manual
Figure 4.52: Layers window, Materials tab
On the left of the screen, a list containing all defined materials (see the Materials option in the
Soil menu section 4.2.4.1) is displayed. On the right, a list of all defined layers together with
their assigned materials (if available) is displayed. Note that the layers are listed from top to
bottom as displayed in the View Input (Geometry) window.
To assign a material to a layer, first select that layer on the right of the window. Then select
the required material on the left of the window. Finally, click the Assign button.
4.3.13 PL-lines per Layer
Use this option to define the top and bottom PL-lines for the defined layers. The PL-lines
represent the pore pressure in a soil layer. For each soil layer (except the deepest layer), two
PL-line numbers can be entered – one that corresponds to the top of the soil layer, and one
that corresponds to the bottom.
Therefore, different PL-lines can be defined for the top and bottom of each soil layer (see
section 4.3.13).
To do this, select the appropriate PL-line at top / PL-line at bottom field and enter the appro-
priate number, see Figure 4.53.
Note:
D-GEO STABILITY
has reserved two numbers for special cases. Also use the special
values 0 and 99.
D-GEO STABILITY
’s Darcy model expects only input for layers with fixed head, as it will calculate
by itself the distribution inside clusters of compressible layers.
68 of 286 Deltares
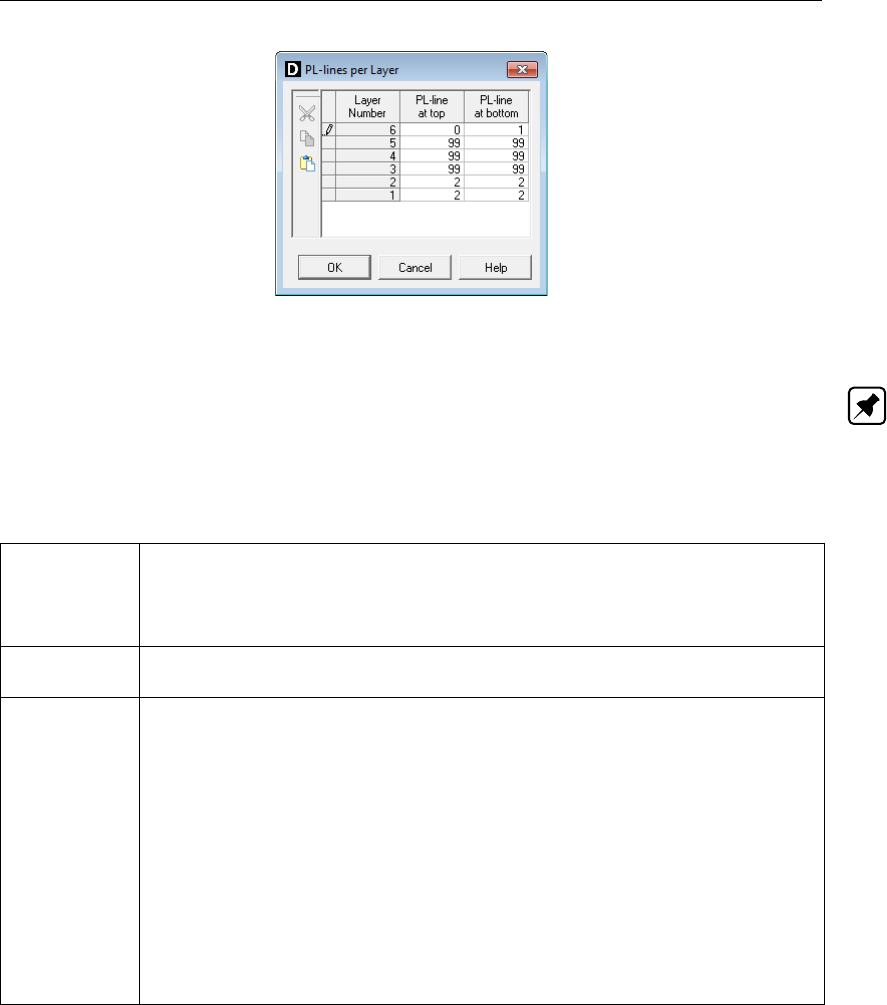
Input
Figure 4.53: PL-lines per Layer window
Note: For the deepest soil layer, no second PL-line number is required. For this layer a
hydrostatic increase of the pore pressure is automatically assumed from the pore pressure at
the top of the layer downwards.
The following values can be used as PL-line numbers (N):
0<N<99 The number corresponds to one of the PL-lines defined during the geom-
etry input. Capillary water pressures are not used – that is, if a negative
water pressure is calculated for a point above the phreatic line, the water
pressure in that point is defined as 0.
N=0 Each point within the layer has a water pressure equal to 0. (Define 0 for
PL-line at top of layer).
N=99 It is possible to have a number of overlying soil layers with a non-hydrostatic
pore pressure (for example, a number of layers consisting of cohesive soil).
In this case, a large number of PL-lines would have to be calculated, one
or two for each layer. To avoid this,
D-GEO STABILITY
is able to interpolate
across layer boundaries. For layers with a non-hydrostatic pore pressure,
99 can be entered as the PL-line number. For this layer, the interpolation
will take place between the PL-line belonging to the first soil layer above
with a real PL-line number, and the PL-line belonging to the first soil layer
below with a real PL-line number. The first and the last soil layer must
therefore always have a real PL-line number.
Note: A real PL-line number is not equal to 99. Water pressures above the
phreatic line are set to zero. An example can be seen in Figure 4.54.
D-GEO STABILITY
has a special input option, if a PL-line number 99 is given for the top and/or
bottom of any soil layer, the nearest soil layer with thickness >0.0 meter0.0 meter and with
a PL-line number unequal to 99 above and/or below the point is searched for. In this layer,
the pore pressure is calculated. Using this pressure, together with the corresponding vertical
co-ordinate, the pore pressure along the slip circle arc is calculated by interpolation. If the
interpolation point is located above the phreatic line, the pore pressure is assumed to be
zero or a negative capillary pressure, depending on the sign of the given PL-line number. An
example using two different PL-lines is given in Figure 4.54 showing how the pore pressure
varies in the vertical.
Deltares 69 of 286
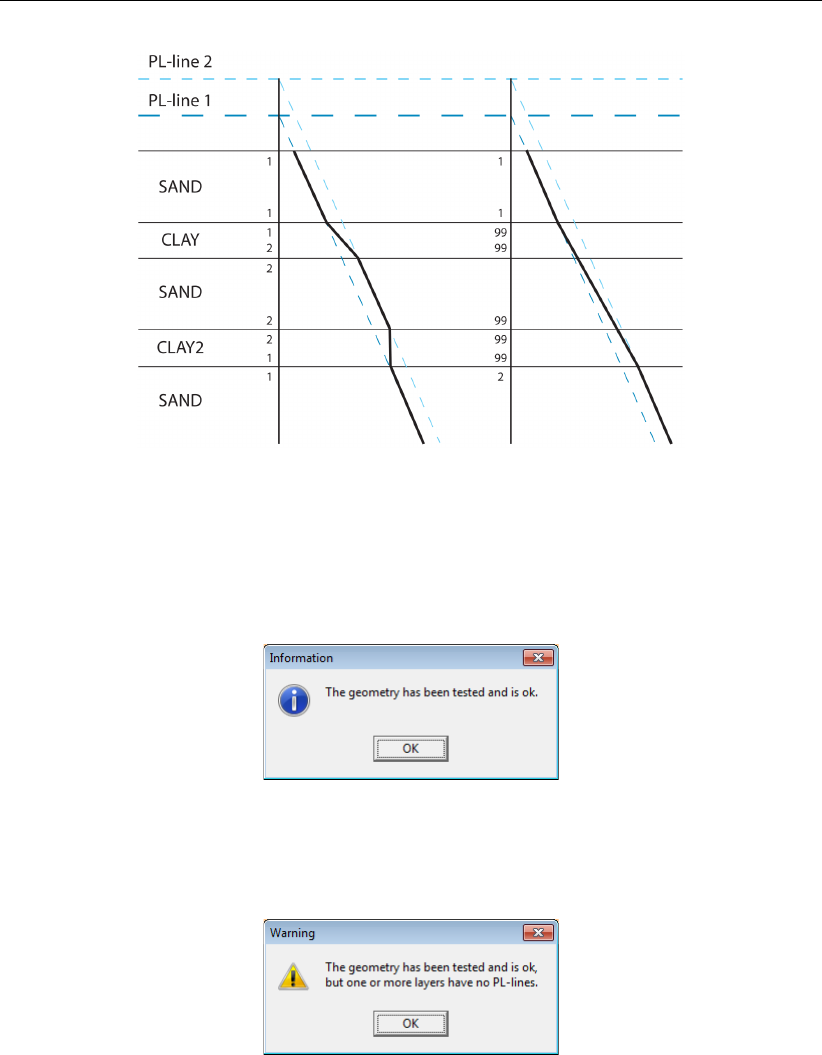
D-GEO STABILITY
, User Manual
Figure 4.54: PL-lines and vertical pressure distribution
4.3.14 Check Geometry
Select this option to verify the validity of the geometry. All requirements are checked. If the
geometry complies with all the requirements, a message will confirm this, see Figure 4.55.
Figure 4.55: Information window on confirmation of a valid geometry
If any errors are encountered during this check, they are displayed in a separate window.
Figure 4.56: Warning window on confirmation of a valid geometry
4.4 Definitions menu
The Definitions menu can be used to enter definitions slip plane geometry specifications.
4.4.1 Slip Plane Definition
To open the input window for slip plane definition, click the button at the left of the View Input
window (section 2.2.3) or use the menu bar (section 2.2.1) (open the Definitions menu and
choose Slip Plane).
Depending on the selected model in the Model window (section 4.1.1), the content of the
window will be different:
70 of 286 Deltares
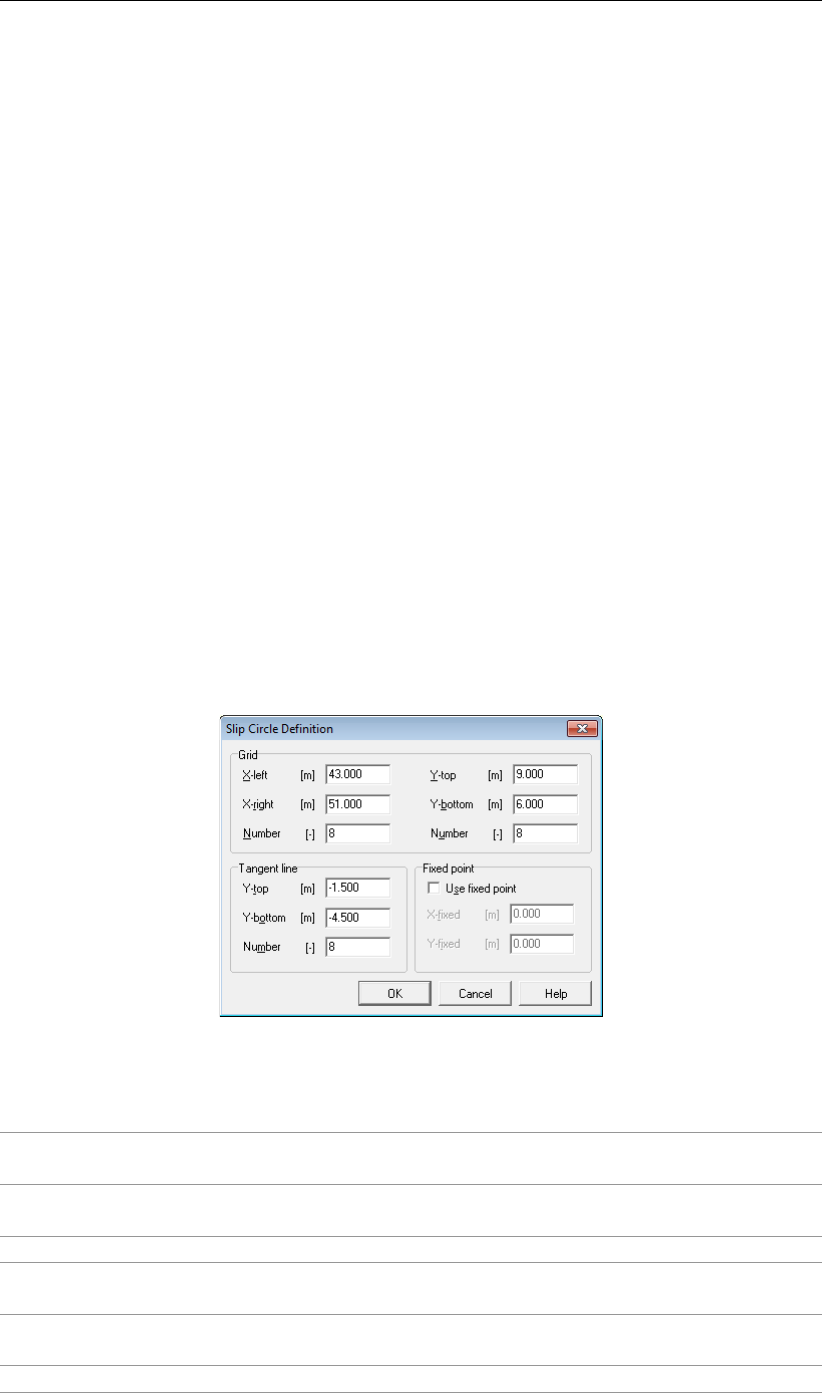
Input
Refer to section 4.4.1.1 for Bishop and Fellenius models;
Refer to section 4.4.1.2 for Uplift Van and Uplift Spencer models;
Refer to section 4.4.1.3 for Spencer model.
4.4.1.1 Slip Circle Definition (Bishop or Fellenius)
The following applies when the Bishop or Fellenius method is selected (section 4.1.1).
D-GEO STABILITY
determines the critical slip circle in an iterative way. The trials that
D-GEO STABILITY
performs are based on a grid of center points and a set of horizontal tangent lines. Both the
grid and the tangent lines can move towards the direction with the lowest safety factor during
the calculation process.
In the input window, the initial location of the grid and the initial location of the horizontal trial
tangent lines are supplied. In addition, it is also possible to define a fixed point that the circle
must pass.
To find the global position of the critical slip plane, it is possible to use a rather coarse grid
with a sufficiently large horizontal range, and also a rather coarse distribution of tangent lines
with a sufficiently large vertical range. To find a more accurate value for the safety factor, it
is possible to reduce the range and refine the distribution of the grid and tangent lines, while
locating them around the position of the global slip circle.
For more information on the theory on slip circles, see section 16.2. For an example of usage,
see the Tutorial 1 (section 8.6).
Figure 4.57: Slip Circle Definition window (Bishop and Fellenius methods)
Grid
X-left The initial horizontal coordinate of the leftmost center point in the (moving) trial
grid.
X-right The initial horizontal coordinate of the rightmost center point in the (moving)
trial grid.
Number The number of grid points in horizontal direction.
Y-top The initial vertical coordinate of the highest center point in the (moving) trial
grid.
Y-bottom The initial vertical coordinate of the lowest center point in the (moving) trial
grid.
Number The number of grid points in vertical direction.
Deltares 71 of 286
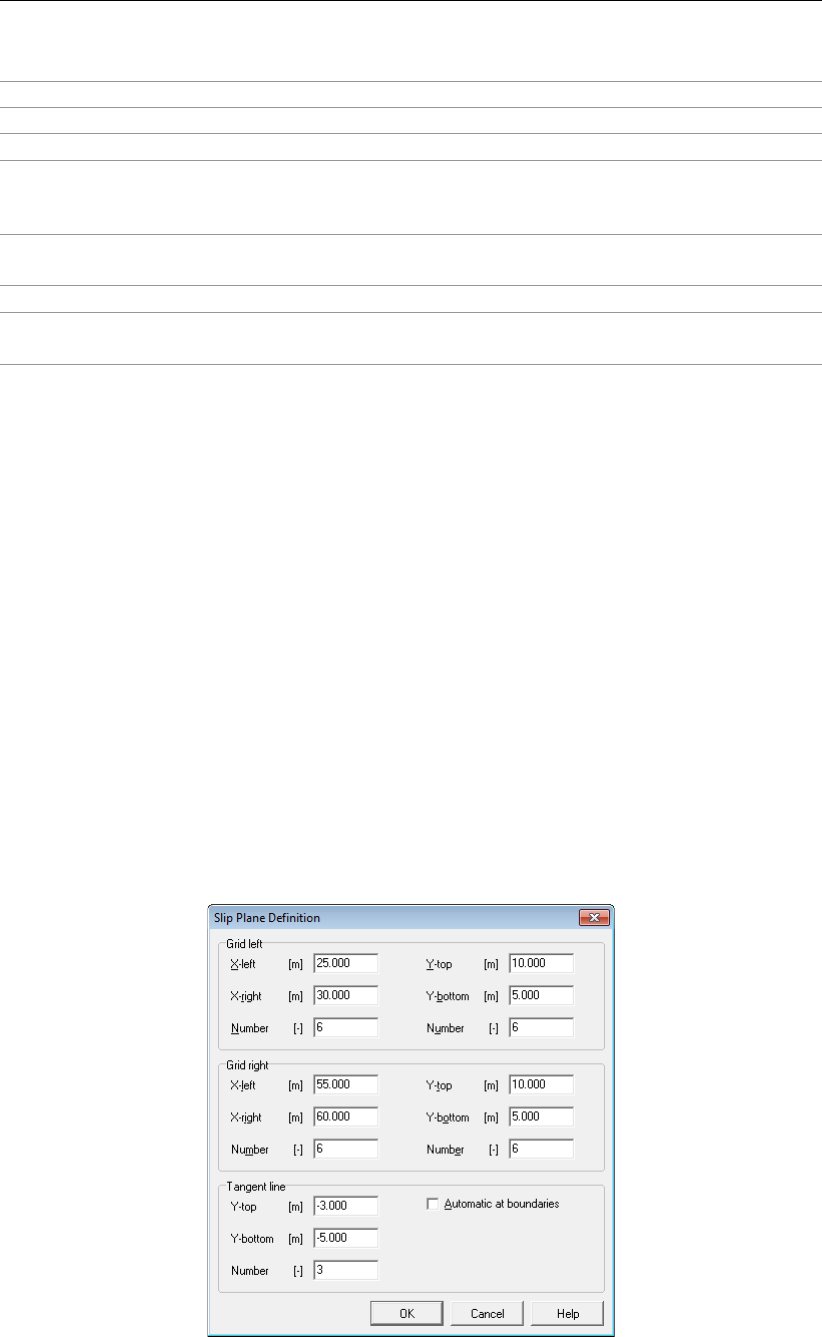
D-GEO STABILITY
, User Manual
Tangent Line
Y-top The initial vertical coordinate of the highest tangent line of a trial slip circle.
Y-bottom The initial vertical coordinate of the lowest tangent line of a trial slip circle.
Number The number of tangent lines in vertical direction.
Fixed Point
Use Fixed
Point
Enforce a slip circle through a particular point.
X-fixed The horizontal coordinate of the fixed point.
Y-fixed The horizontal coordinate of the fixed point. This coordinate must be above
the Y-bottom coordinate of the tangent lines.
4.4.1.2 Slip Plane Definition (Uplift Van, Uplift Spencer)
The following applies when the Uplift Van or Uplift Spencer method is selected (section 4.1.1).
The plane for uplift stability consists of a horizontal part, bounded by a circle at the ac-
tive side, and a circle (Uplift Van) or a straight plane (Uplift Spencer) at the passive side.
D-GEO STABILITY
determines the critical plane in iterative way. The trials that
D-GEO STABILITY
performs are based on two grids of center points and one horizontal tangent line. The grids
can move towards the direction with the lowest safety factor during the calculation process.
The position of the tangent line is fixed and should be located at the interface between imper-
meable weak layers and underlying sand layer.
In the input window, the initial location of the grids and the fixed location of the horizontal
tangent line are supplied. It is possible to use a rather coarse grid with a sufficiently large
horizontal range.
D-GEO STABILITY
will refine the grid automatically around the area with the
lowest safety factor.
For more information on Van’s theory, see section 16.3. For more information on Spencer’s
theory, see section 16.4. For an example of usage, see Tutorial 5 (section 12.6).
Figure 4.58: Slip Plane Definition window (Uplift Van and Uplift Spencer methods)
72 of 286 Deltares
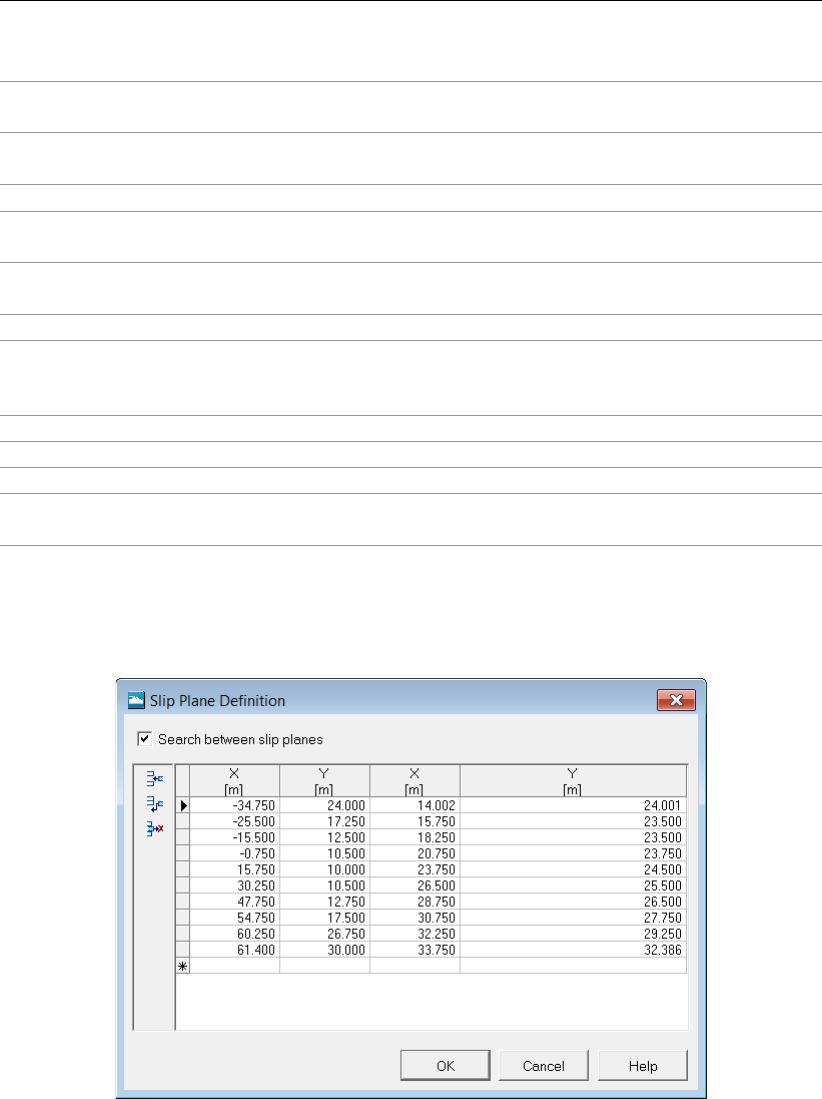
Input
Grid left/right
X-left The initial horizontal coordinate of the leftmost center point in the (moving)
trial grid
X-right The initial horizontal coordinate of the rightmost center point in the (moving)
trial grid
Number The number of grid points in horizontal direction
Y-top The initial vertical coordinate of the highest center point in the (moving) trial
grid
Y-bottom The initial vertical coordinate of the lowest center point in the (moving) trial
grid
Number The number of grid points in vertical direction
Tangent Line
Y-top The initial vertical coordinate of the highest tangent line of a trial slip circle.
Y-bottom The initial vertical coordinate of the lowest tangent line of a trial slip circle.
Number The number of tangent lines in vertical direction.
Automatic at
boundary
Mark this check-box to define tangent lines at the boundaries between the
different layers.
4.4.1.3 Slip Plane Definition (Spencer)
The following applies only when the Spencer method is selected (section 4.1.1).
Figure 4.59: Slip Plane Definition window (Spencer method)
It is possible to generate a single slip plane by entering X and Y coordinates into the table.
This is possible when the Search between slip planes option in this window is not selected.
The table will then only contain two columns.
It is also possible to input a range of slip planes by entering the X and Y coordinates of two
slip planes in the table. The slip planes used in the calculation will all lie between these two
planes. This is possible when the Search between slip planes option is selected. The table
contains four columns in this case. Both planes should contain the same number of points.
Therefore, empty input fields are not allowed.
Deltares 73 of 286
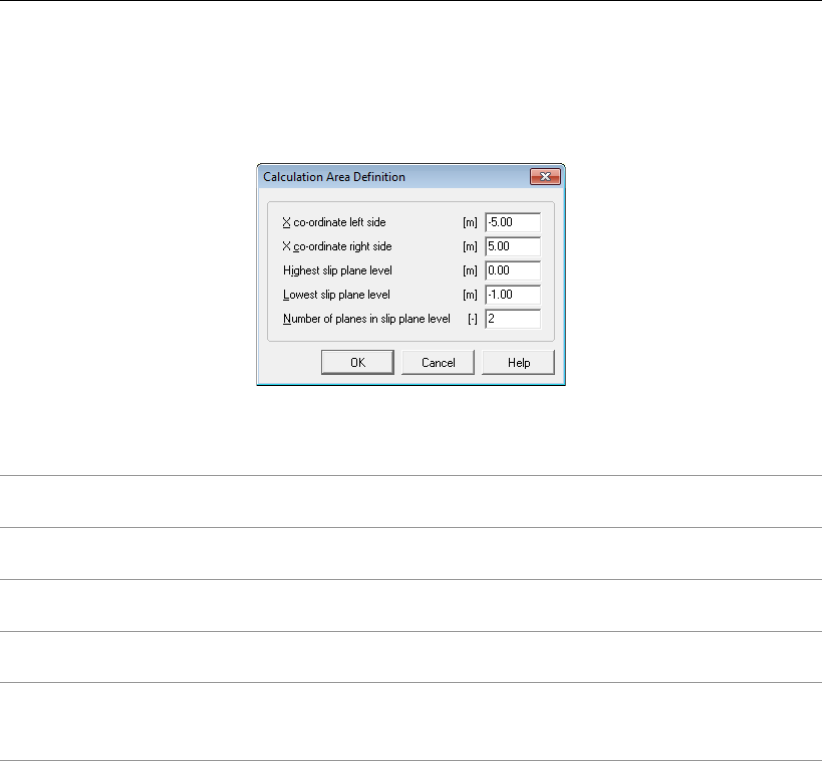
D-GEO STABILITY
, User Manual
4.4.2 Calculation Area Definition
The following applies only when the Horizontal Balance method is selected (section 4.1.1).
Click Definitions and then choose Calculation Area.
Figure 4.60: Calculation Area Definition window (Horizontal Balance method)
X coordinate
left side
The horizontal coordinate of the left side of the calculation area.
X coordinate
right side
The horizontal coordinate of the right side of the calculation area.
Highest slip
plane level
The vertical coordinate of the highest slip plane level.
Lowest slip
plane level
The vertical coordinate of the lowest slip plane level.
Number of
planes in slip
plane level
The number of planes in vertical direction between the highest and the
lowest slip plane levels.
4.4.3 Forbidden lines
It is possible to open the input window for forbidden lines either using the button at the left of
the View Input window (section 2.2.3) or from the Menu bar (section 2.2.1) (click Definitions
and then choose Forbidden Lines).
D-GEO STABILITY
uses forbidden lines as a constraint
during the automatic determination of the critical slip circle. The slip circle is not allowed to
intersect with the forbidden line. A forbidden line can be used, for example, to model a sheet
piling. By clicking Forbidden Lines in the Definitions menu, the Forbidden Lines window (see
Figure 4.61) will allow the addition of a forbidden line in the geometry. This is done by entering
the relevant coordinates in the right part of the window. It is also possible to modify existing
forbidden lines.
74 of 286 Deltares
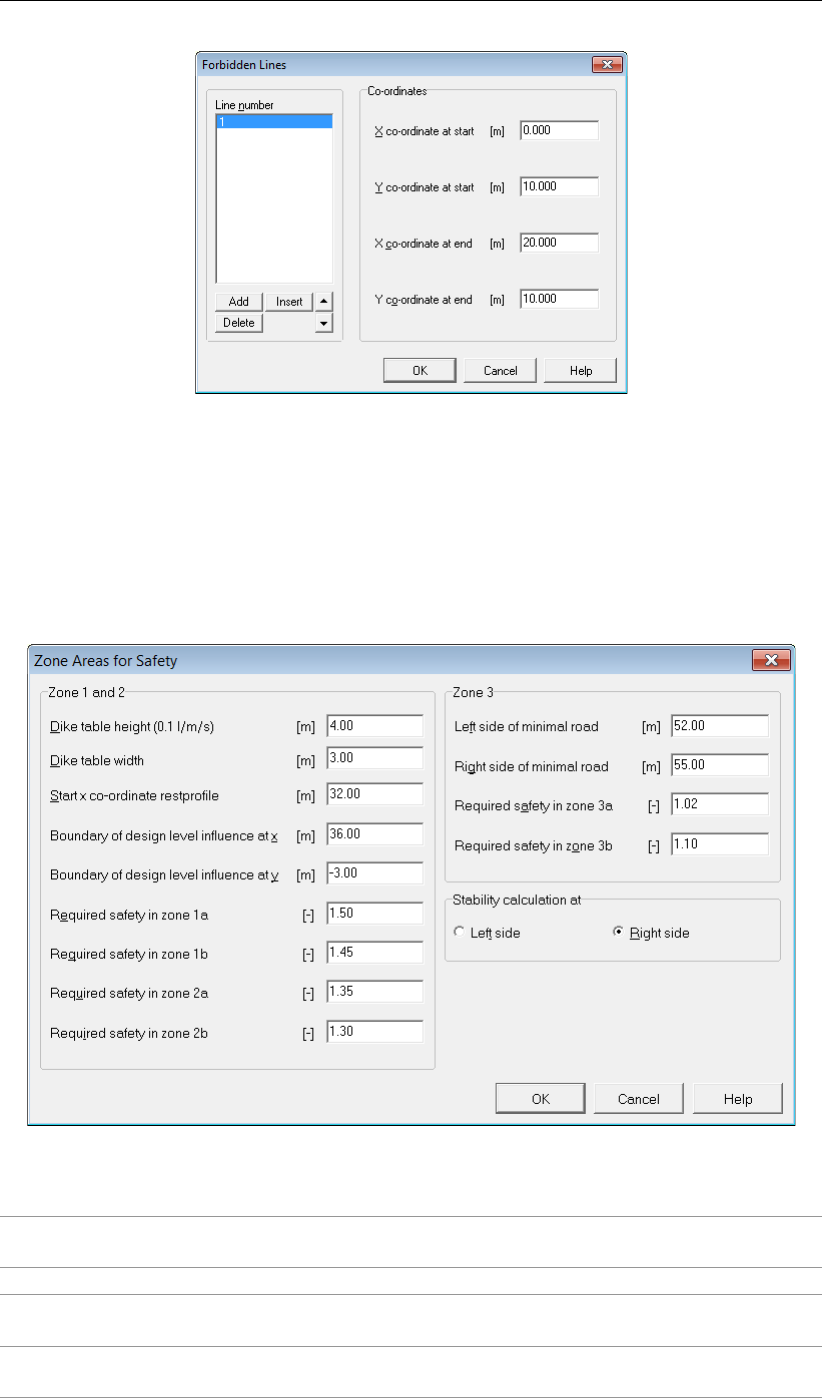
Input
Figure 4.61: Forbidden Lines window
4.4.4 Zone Areas for Safety
This option is available only if the Enable check-box in the Zone Plot sub-window of the Model
window is marked (section 4.1.1). The Zone Plot option allows defining different zones in
the dike body with a different safety factor. The limits of those different zones and there
corresponding safety factor can be inputted in the Zone Areas for Safety window.
Figure 4.62: Zone Areas for Safety window
Dike table height
(0.1 l/m/s)
Level (Z coordinate) of the dike table [m].
Dike table width Width of the dike table [m].
Start x coordinate
rest profile
X coordinate of the starting point of the rest profile [m].
Boundary of design
level influence at x
Vertical boundary of the design high water level [m].
Deltares 75 of 286
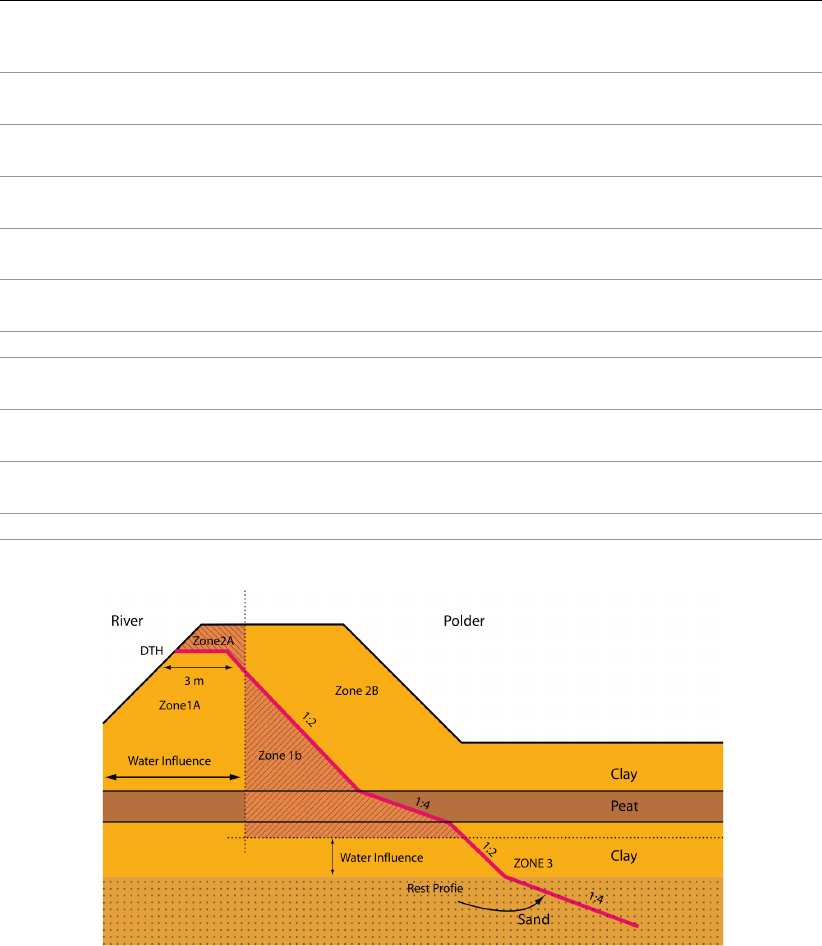
D-GEO STABILITY
, User Manual
Boundary of design
level influence at y
Horizontal boundary of the design high water level [m].
Required safety in
zone 1a
Required safety factor in zone 1a of the dike.
Required safety in
zone 1b
Required safety factor in zone 1b of the dike.
Required safety in
zone 2a
Required safety factor in zone 2a of the dike.
Required safety in
zone 2b
Required safety factor in zone 2b of the dike.
Left side minimal road Left side of the road construction at the polder side of the dike.
Right side minimal
road
Right side of the road construction at the polder side of the dike.
Required safety in
zone 3a
Required safety factor in zone 3a of the dike.
Required safety in
zone 3b
Required safety factor in zone 3b of the dike.
Stability calculation at Select Left side or Right side to design the polder side of the dike.
Figure 4.63: Schematization of the zone areas for the Zone Plot model
4.4.5 Reference Level for Ratio S
In this window, it is possible to define a reference surface level. This option applies only to the
calculated undrained strength model (section 4.2.4.1 and section 4.2.4.2). It is appropriate to
use the reference level, if an embankment or an excavation has been added to initially over-
consolidated soil. This reference level will be used to calculate σ0
v.ref, the reference value of
the vertical stress, used in Equation 19.5 (section 19.4) for the calculation of the yield stress.
76 of 286 Deltares
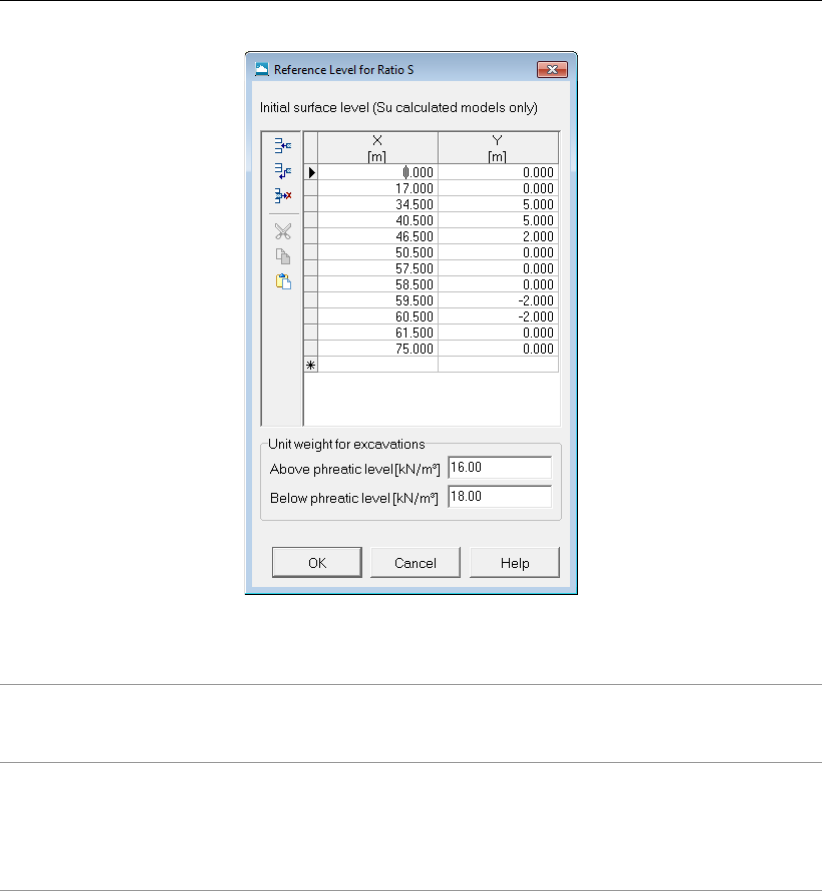
Input
Figure 4.64: Reference Level for Ratio S window
X, Y Enter the horizontal and vertical coordinates of the different points form-
ing the reference level. Tip: To easily define a reference level, coordi-
nates can be copied from the layers menu and copied into this window.
Unit weight for
excavations
Enter the unit weight of the excavated material. Only used in case
the Reference Line is situated above the actual surface level (see Fig-
ure 4.66).
Above phreatic level is the unsaturated unit weight.
Below phreatic level is the saturated unit weight.
The reference level is displayed as a green line in the Input tab of the View Input window.
In Figure 4.65, the embankment ’Berm Sand’ has been added to initially over-consolidated
soil; the reference level is therefore below the actual surface level.
In Figure 4.66, part of the ground has been excavated from the initially over-consolidated soil;
the reference level is therefore above the actual surface level. Note that in cases where an
excavation is defined in the same vertical or section as the yield stresses are defined, this
may result in erroneous stresses and strength results.
Deltares 77 of 286
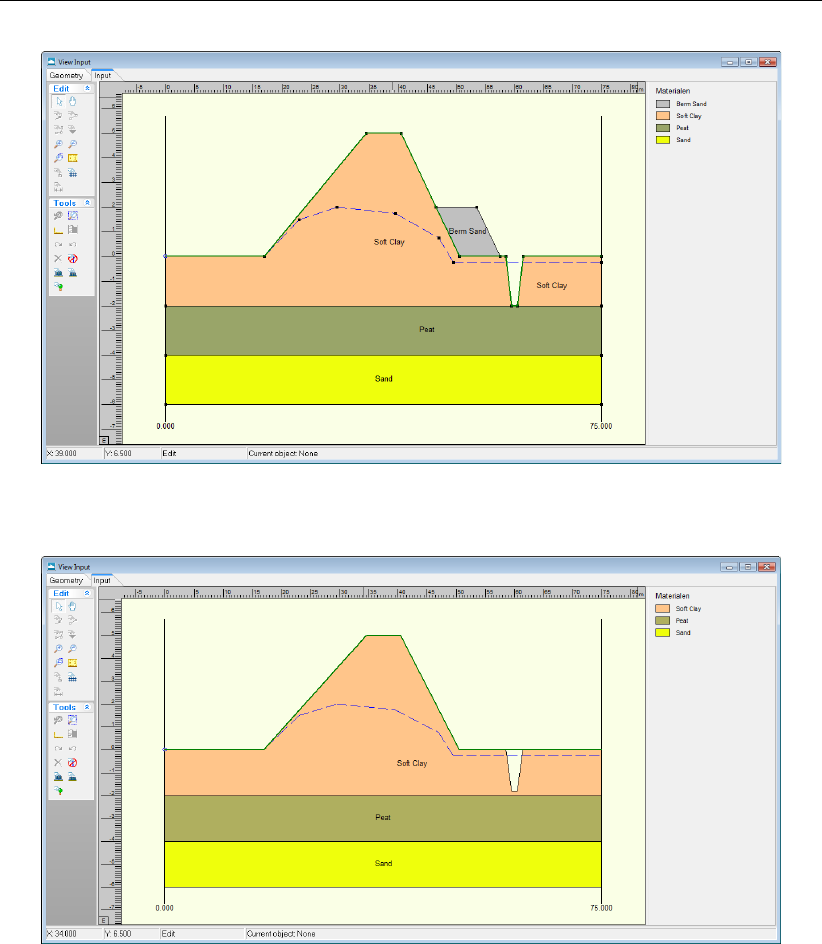
D-GEO STABILITY
, User Manual
Figure 4.65: View Input window - Reference level (green line) in case of an embankment
Figure 4.66: View Input window - Reference level (green line) in case of an excavation
4.5 Reinforcements
4.5.1 Geotextiles
In this window (see Figure 4.67), it is possible to add geotextiles to the cross section. For
background information, see section 16.2.2.2.
78 of 286 Deltares
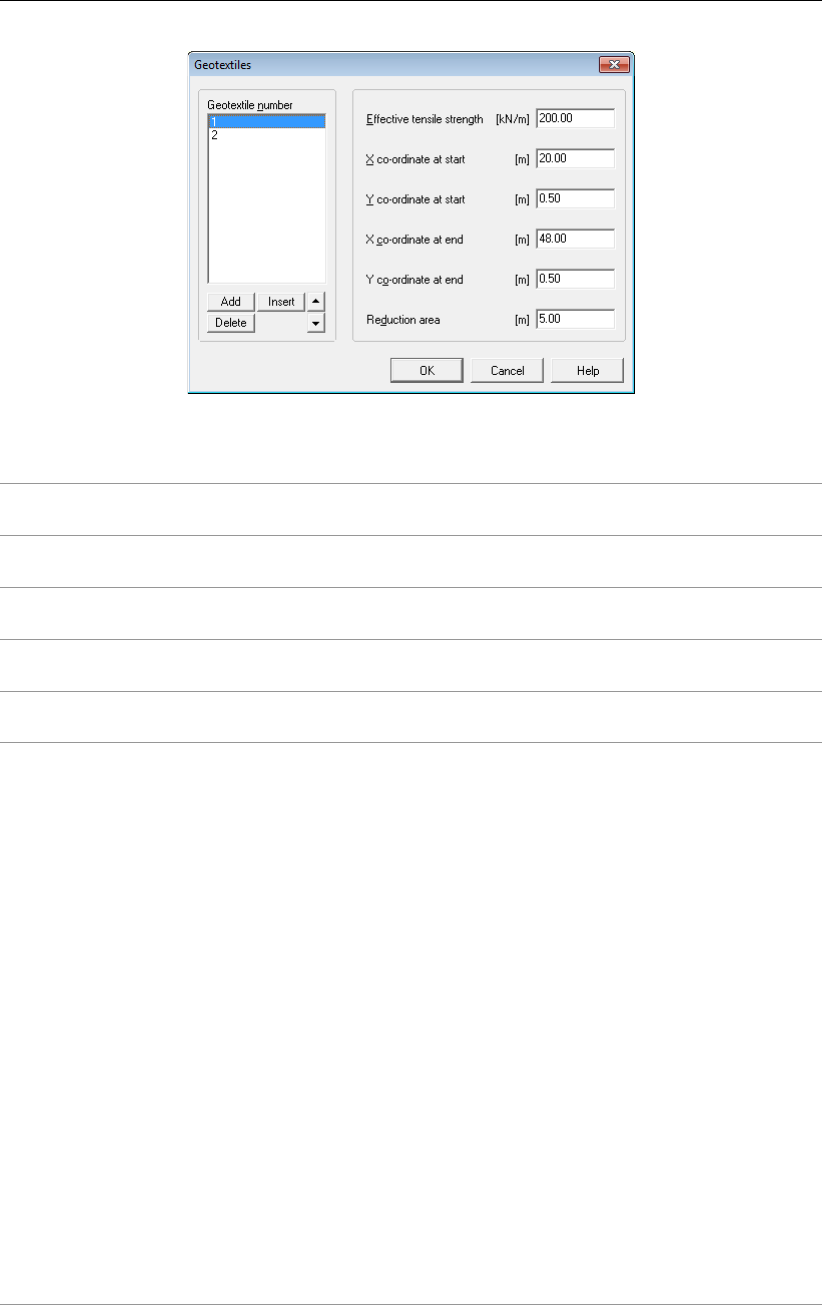
Input
Figure 4.67: Geotextiles window
Effective tensile
strength
The amount of tensile strength Tfper unit width of geotextile (kN/m) that
is activated at common deformation levels.
X coordinate at
start
The horizontal coordinate of the start of the section.
Y coordinate at
start
The vertical coordinate of the start of the section.
X coordinate at
end
The horizontal coordinate of the end of the section.
Y coordinate at
end
The vertical coordinate of the end of the section.
Reduction area The required transmission length of the geotextile to enable the ten-
sile stress to grow to the full tensile strength. If the length of a side
near the intersection with a slip circle is less than the required length,
D-GEO STABILITY
will assume a tensile stress lower than the effective ten-
sile strength. In that case,
D-GEO STABILITY
will use a linear dependency
between tensile stress and side length.
For example: a geotextile has a total length of 5 m, of which 3 m are
inside the slip plane. The minimum length is therefore 2 m. If this mini-
mum length is larger than (or equal to) the Reduction Area, then the full
tensile strength of the geotextile is taken into account. But if this mini-
mum length is only a quarter of the Reduction area, then only a quarter
of the tensile strength of the geotextile is taken into account.
NOTE: This input must be determined by the user and depend on dif-
ferent factors such as the soil weight, the ground structure... According
to a geotextile provider, the Reduction area Xcan be determined using
the following formula:
σy= 2 tan ϕ×H×γ×X
where σyis the effective tensile strength of the geotextile, ϕis the fric-
tion angle with the soil, His the soil cover above the geotextile and γis
the unit weight of the soil. In case of non-horizontal surface , the weight
of the soil above above the geotextile has to be defined as a function of
X.
Deltares 79 of 286
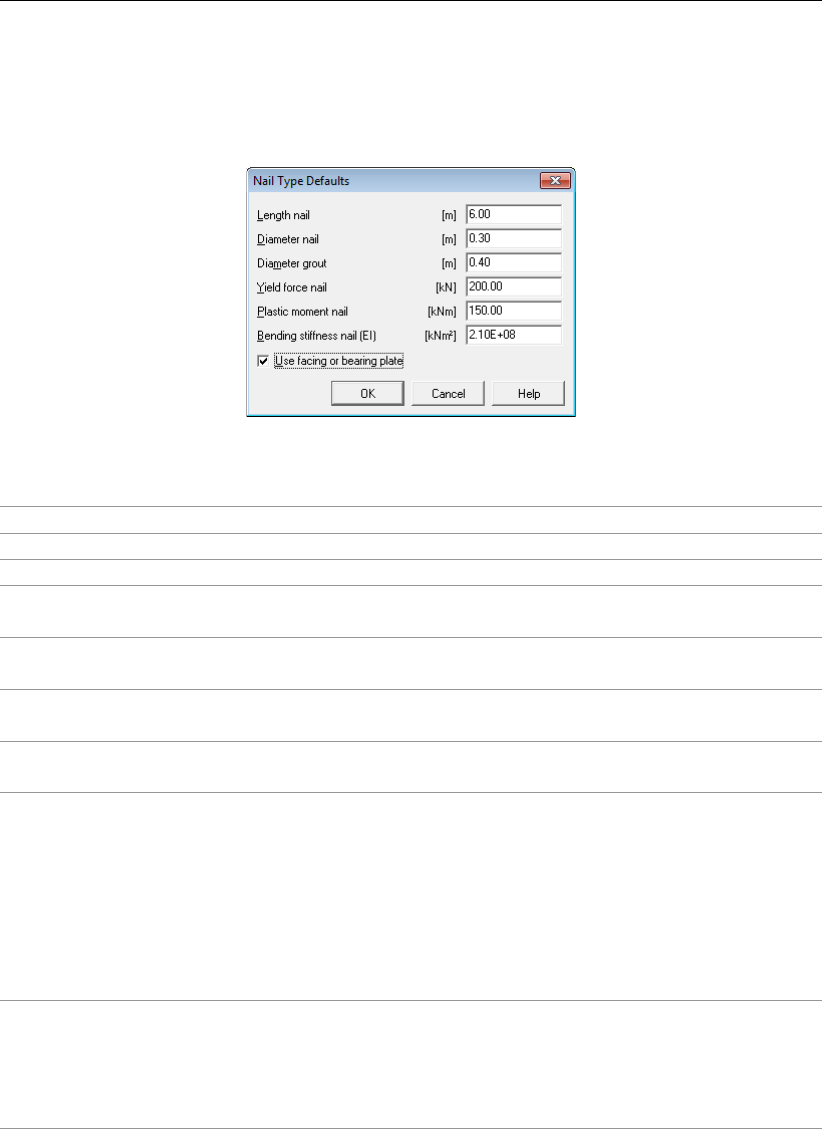
D-GEO STABILITY
, User Manual
4.5.2 Nail Type Defaults
In this window, it is possible to define a default type of nail that can be used later in the Nails
window (section 4.5.3). For background information, see section 16.2.2.3.
Figure 4.68: Nail Type Defaults window
Length nail Enter the length of the nail.
Diameter nail Enter the diameter of the nail.
Diameter grout Enter the diameter of the grout of the nail.
Yield force nail Enter the yield force in tension of the nail (Fy), obtained from a uni-axial
tensile test.
Plastic moment
nail
Enter the plastic moment of the nail.
Bending stiff-
ness nail (EI)
Enter the bending stiffness of the nail.
Use facing or
bearing plates
Mark this check-box if a facing or bearing plate is used.
4.5.3 Nails
In this window, the characteristic’s of the nail and the lateral and shear stresses curves at the
interface soil/nails can be defined. For background information, see section 16.2.2.3.
Options for all nails:
Critical angle The critical angle of the nail αcritical. Depending on the value of α, the
angle between the nail and the tangent line along the circle where the
nail intersects the slip circle, compared to αcritical, the lateral or shear
forces of the nail can be neglected. For more information, refer to Equa-
tion 16.18 and Equation 16.19.
80 of 286 Deltares
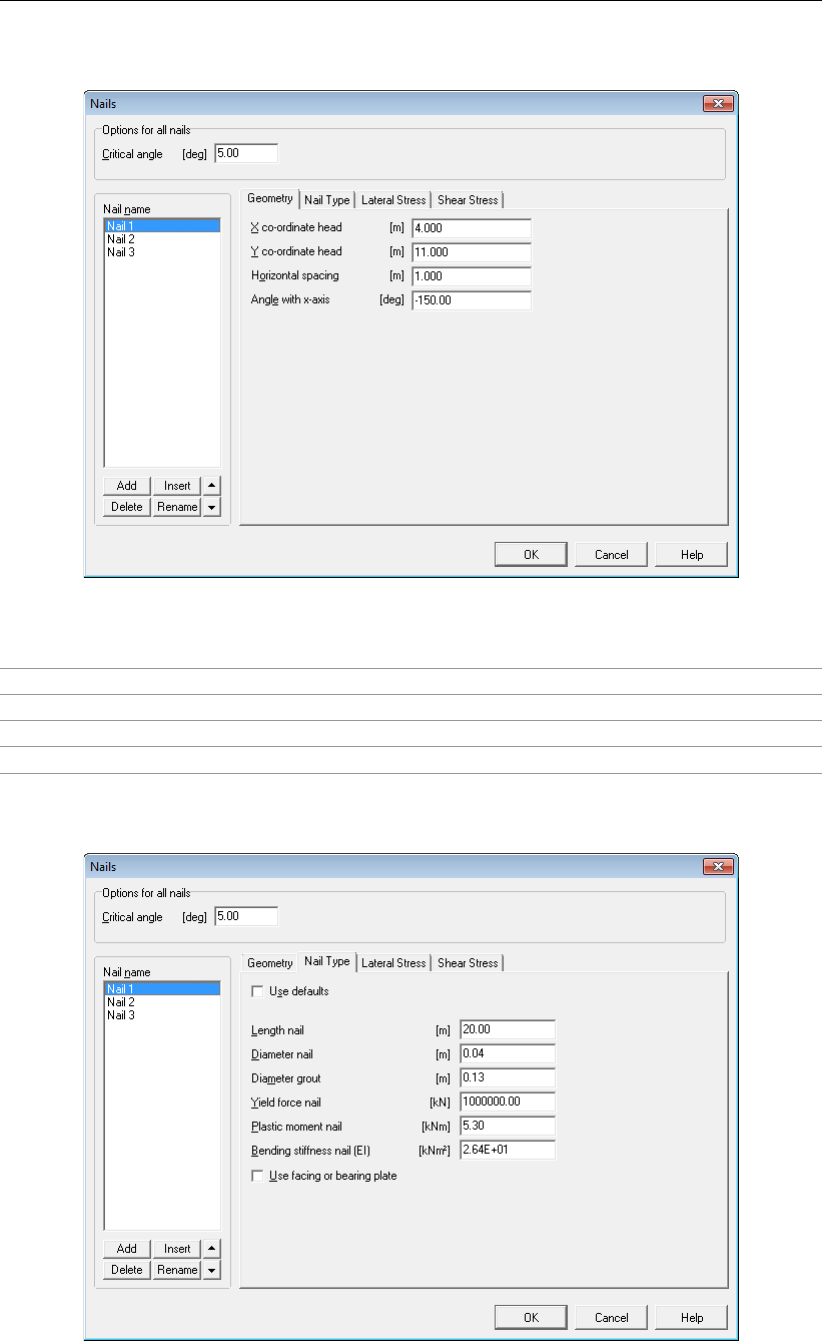
Input
4.5.3.1 Nails – Geometry
Figure 4.69: Nails window, Geometry tab
X coordinate head The horizontal coordinate of the head of the section.
Y coordinate head The vertical coordinate of the head of the section.
Horizontal spacing The horizontal spacing between two nails.
Angle with x-axis The angle with the vertical axis.
4.5.3.2 Nails – Nail Type
Figure 4.70: Nails window, Nail Type tab
Deltares 81 of 286
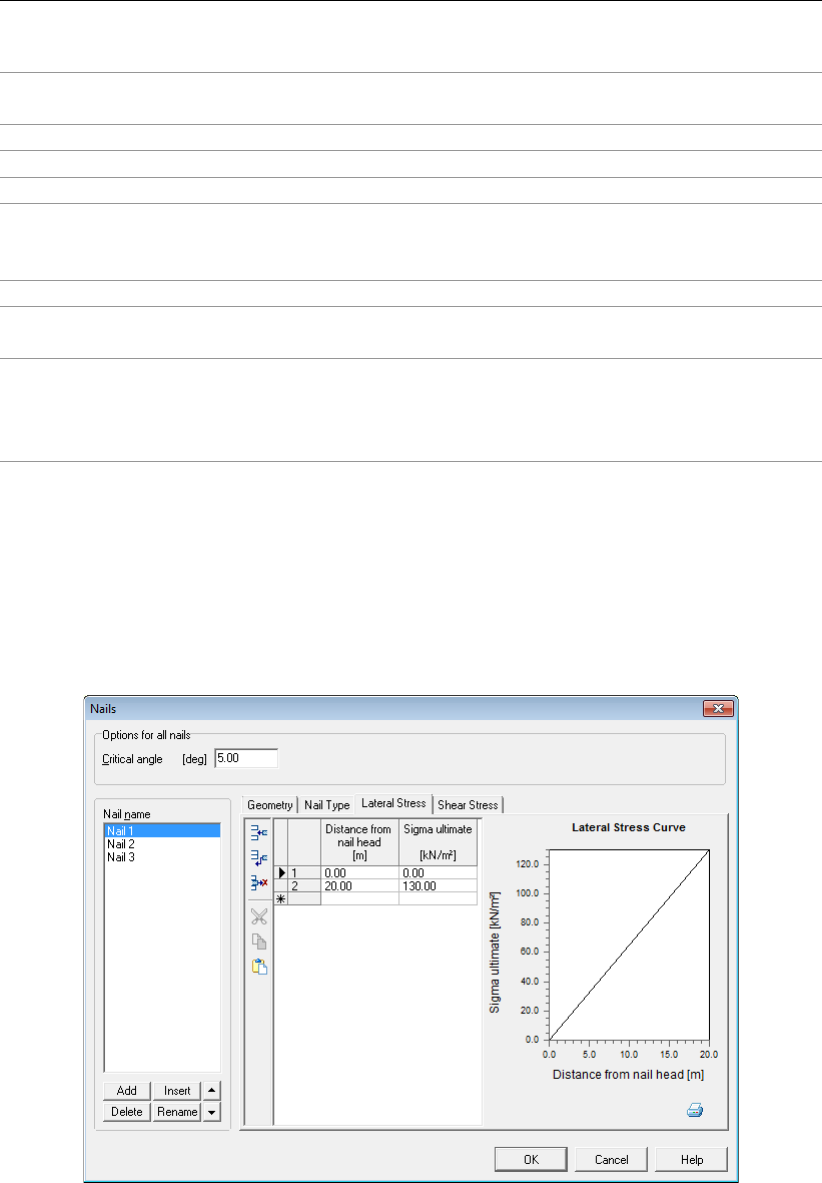
D-GEO STABILITY
, User Manual
Use defaults Mark this check-box to use the nail type defaults previously de-
fined in the Nail Type Defaults window (section 4.5.2).
Length nail Enter the length of the nail.
Diameter nail Enter the diameter of the nail.
Diameter grout Enter the diameter of the grout of the nail.
Yield force nail Enter the yield force in tension of the nail (Fy), obtained from
a uni-axial tensile test, and used in Equation 16.31 and Equa-
tion 16.32.
Plastic moment nail Enter the plastic moment of the nail.
Bending stiffness nail
(EI)
Enter the bending stiffness of the nail.
Use facing or bearing
plates
Mark this check-box if a facing or bearing plate is used. This input
is used for the calculation of the distance Lshear used to determine
τmax, the ultimate frictional resistance to pull-out between ground
and bonded length in Equation 16.22.
4.5.3.3 Nails – Lateral Stress
The Lateral Stress tab is available only if the option Input of ultimate lateral stress along nail
was selected in the Soil Resistance window (section 4.1.1).
In this tab, the lateral stress curve along the nail can be defined (ultimate lateral stress vs.
distance from nail head).
Figure 4.71: Nails window, Lateral Stress tab
4.5.3.4 Nails – Shear Stress
The Shear Stress tab is available only if the option Input of ultimate shear stress along nail
was selected in the Soil Resistance window (section 4.1.1).
In this tab, the shear stress curve along the nail can be defined (ultimate shear stress vs.
distance from nail head).
82 of 286 Deltares
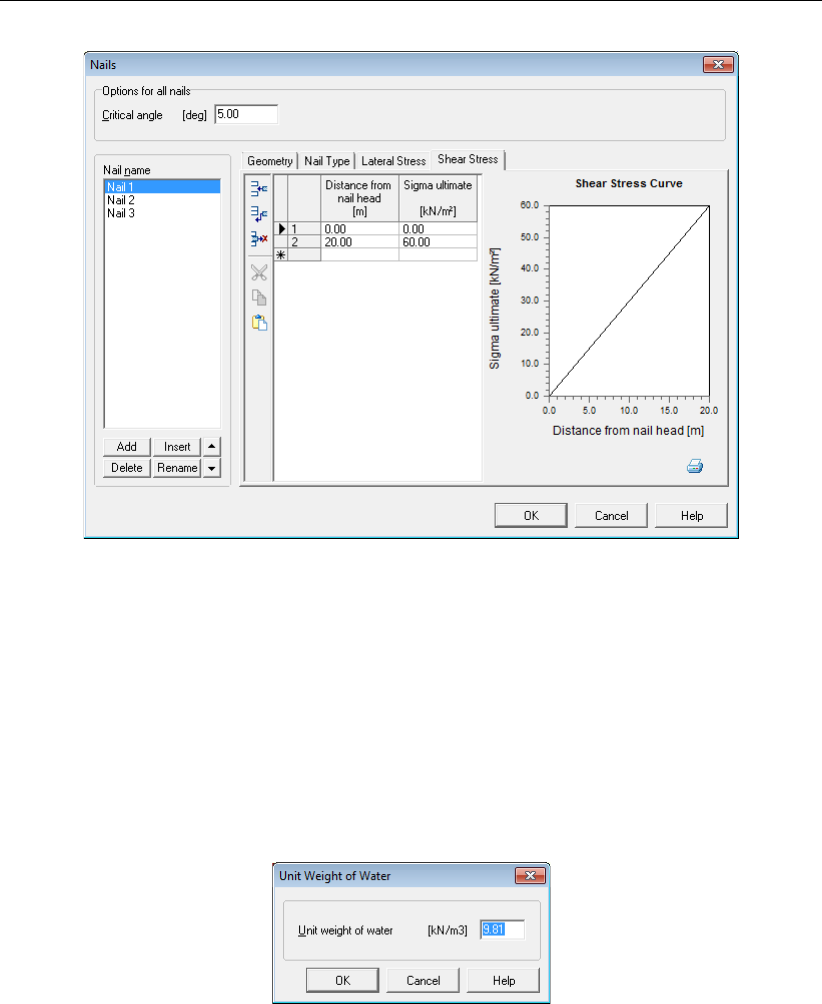
Input
Figure 4.72: Nails window, Shear Stress tab
4.6 Water menu
The Water menu can be used to make specifications concerning water related properties in
the project.
4.6.1 Unit Weight
Choose the Unit Weight option from the Water menu to modify the default unit weight of water
(see Figure 4.73).
Figure 4.73: Unit Weight of Water window
4.6.2 External Water Levels
Input of external water levels is only required for stochastic modeling of external water level
and the associated hydraulic pore pressure field, in combination with either the Reliability
Module, or the Bishop probabilistic random field module.
On the menu bar, click Water and then select the External Water Levels option to open the
External Water Levels window, see Figure 4.74. In the window that appears, mark the Use
water data check-box in order to activate the option for stochastic modeling. After that, it is
possible to enter all the required data.
D-GEO STABILITY
can determine the conditional probability of failure for a maximum of five
different external water levels, and then apply a Gumbel distribution assumption for the water
level in order to determine the integrated probability. This probability is determined at a certain
Deltares 83 of 286
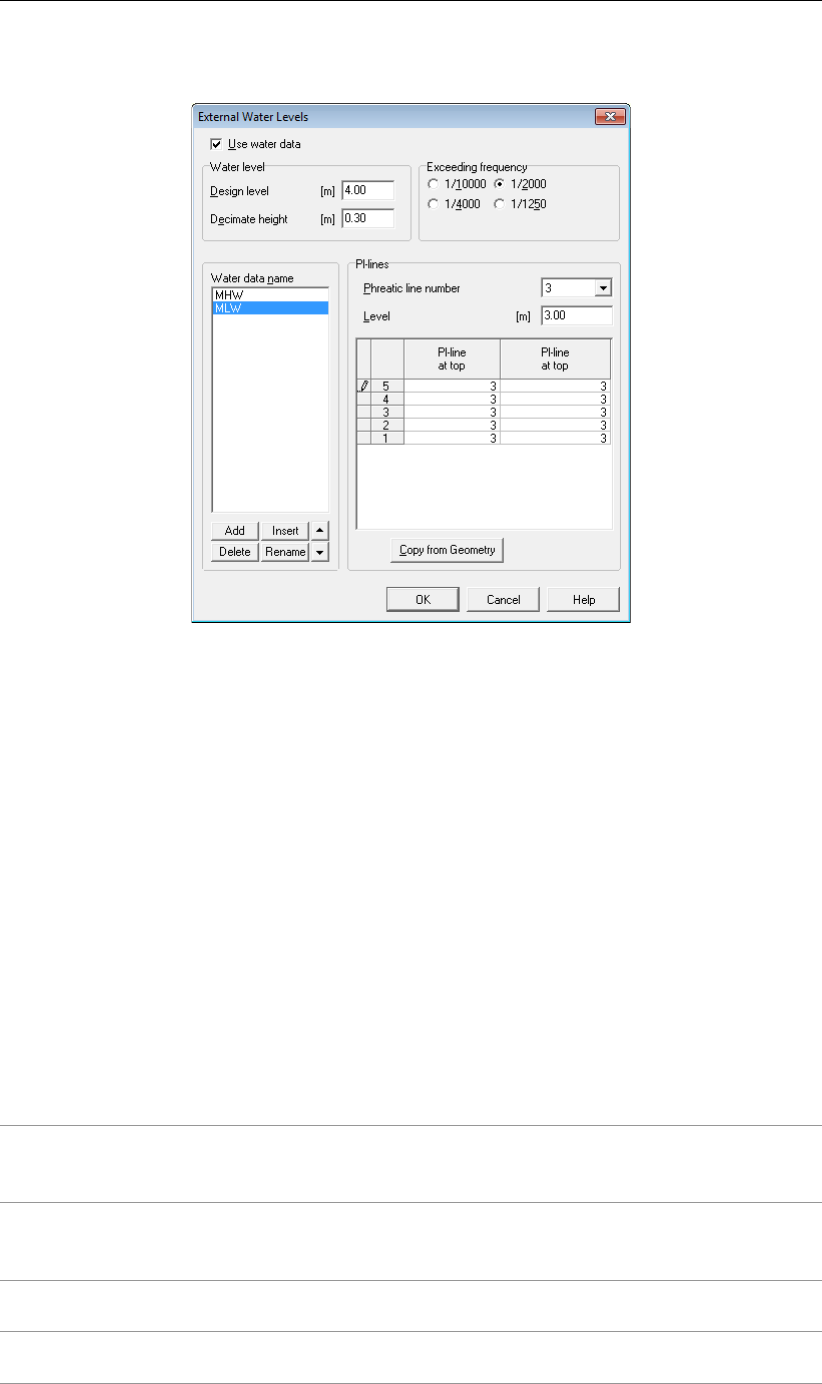
D-GEO STABILITY
, User Manual
external level, called the design point. See section 20.4.5 for background information.
Figure 4.74: External Water Levels window
In the top part of the External Water Levels window, the design level itself is entered, together
with the exceeding frequency for that same level.
D-GEO STABILITY
expects that the associated
hydraulic field for this level via the PL-lines per layer option from the Geometry menu is
already defined.
The lower part of the External Water Levels window enables the user to define a maximum of
four additional levels and associated fields. It is possible to add, modify or delete the names
of fields at the left hand side. At the right hand side the external level can be entered, together
with the associated PL-lines at the edges of all soil layers. A value of 99 yields a linear
interpolation between the PL-lines at the outside of the cluster.
The Copy from Geometry button allows the user to define a new field by modification of a
copy of the design level field.
A further description of nontrivial input fields is given below.
Design level The design level hdesign, corresponding to the hydraulic field that has
been specified via the PL-lines per layer option from the Geometry
menu. See section 20.4.5,Equation 20.23.
Decimate height The increase in the external water level Bthat reduces the exceed-
ing frequency with a factor 10. This value varies in the Netherlands
roughly from 0.3 m to 1 m. See section 20.4.5,Equation 20.23.
Exceeding
frequency
The exceeding frequency for the design level P(h > hdesign). See
section 20.4.5,Equation 20.23.
Level The external level connected to the hydraulic field that is defined by
the PL-lines at the top and bottom of each layer.
84 of 286 Deltares
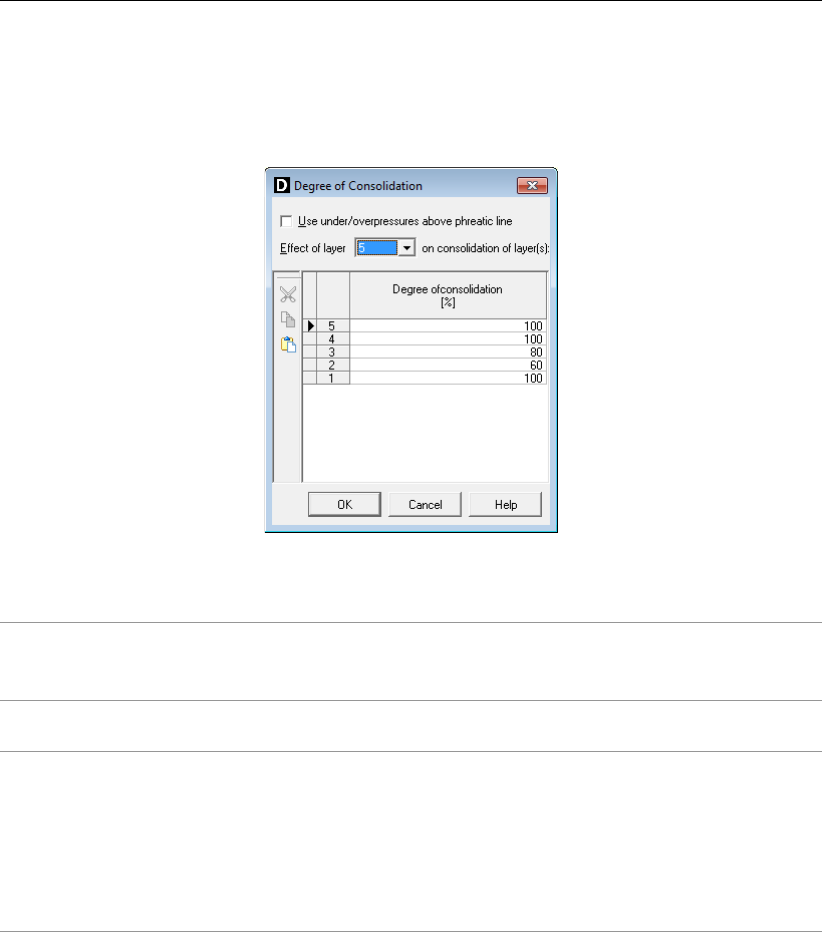
Input
4.6.3 Degree of Consolidation
Choose the Degree of Consolidation option from the Water menu to model excess pore pres-
sures by soil weight, see Figure 4.75.
Figure 4.75: Degree of Consolidation window (consolidation by soil weight)
Use under/ over-
pressures above
the phreatic line
Activate this check-box to use positive or negative excess pore pres-
sures above the phreatic line.
Effect of layer Select the layer that causes excess pore pressures in the layers be-
low.
Degree of
consolidation
Specify the relative degree of consolidation ∆Uiper layer i. This is
the relative amount of the total vertical stress by the weight of the se-
lected layer that is assumed to be carried as effective vertical stress
by the soil skeleton. A degree of consolidation of 0% means no addi-
tional effective stress. A degree of consolidation of 100% means no
additional excess pore pressures. See section 18.3 for background
information.
4.6.4 Use MSeep net
Choose the Use MSeep Net option from the Water menu to import hydraulic pore pres-
sures from a previous MSeep analysis. MSeep software (stationary groundwater flow cal-
culations) calculates water pressures and phreatic lines. When using this option, MSeep
and
D-GEO STABILITY
should share the same geometry, so that
D-GEO STABILITY
can use the
MSeep dump file (*.SED) to obtain the water pressures. The MSeep dump file contains a list
of nodes with their X and Y coordinates and the calculated water pressure at each node. The
file also contains information on the position of the phreatic line, which in
D-GEO STABILITY
forms the boundary between dry and wet soil. All nodes in the MSeep dump file are drawn
as dots, and should cover the
D-GEO STABILITY
geometry at all places below the phreatic
line. In some cases, MSeep calculates negative water pressures when a phreatic block be-
comes too thin (see MSeep for more information). If negative water pressures are present,
the
D-GEO STABILITY
user can select whether these should be equal to zero.
Deltares 85 of 286
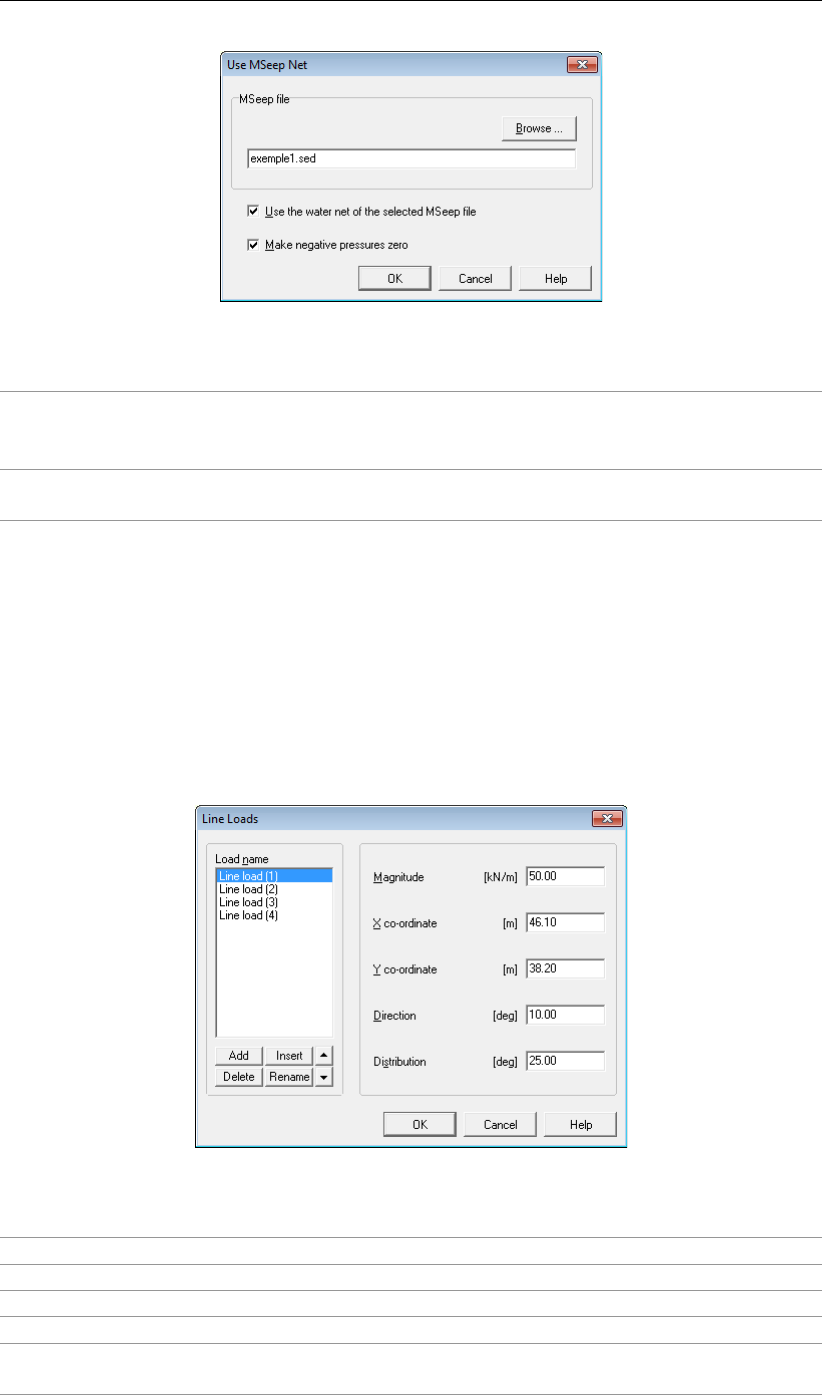
D-GEO STABILITY
, User Manual
Figure 4.76: Use MSeep Net window
Use the water net
of the selected
MSeep file
Mark this check-box to confirm the use of the pressures in the se-
lected file.
Make negative
pressures zero
Mark this check-box to avoid contribution of pore pressures in unsat-
urated areas.
4.7 Loads menu
The Loads menu can be used to define loads in the geometry.
4.7.1 Line Loads
The Line Loads option in the Loads menu displays an input window in which the line load per
unit length in the direction perpendicular to the cross section are defined. For background
information, see section 17.1.
Figure 4.77: Line Loads window
Magnitude The load size per unit of length
X coordinate The horizontal coordinate
Y coordinate The vertical coordinate
Direction The angle θbetween the load and the vertical axis
Distribution The angle δthat defines the assumed load distribution relative to the
direction of the load (0 < δ < 90◦).
86 of 286 Deltares
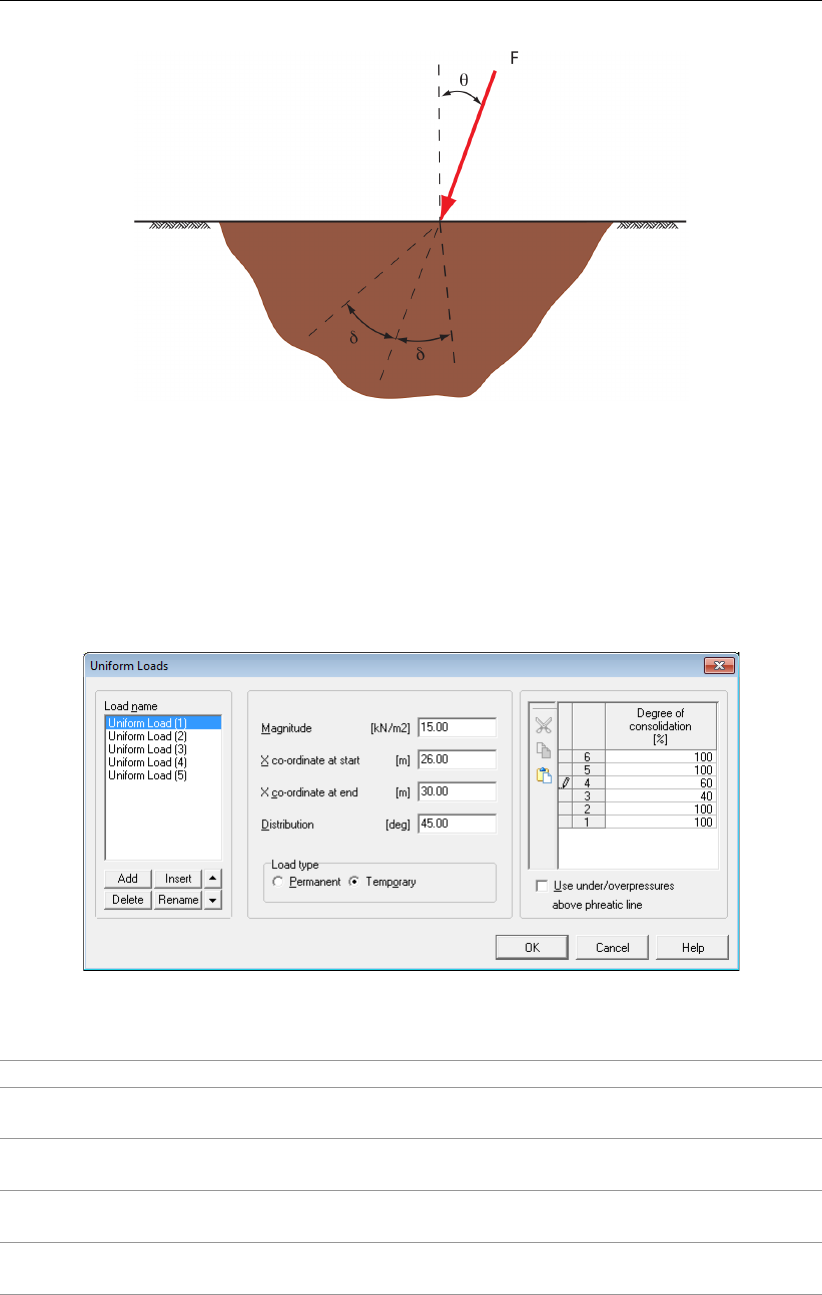
Input
Figure 4.78: Schematization of the angles θand δfor the definition of a line load
4.7.2 Uniform Loads
The Uniform Loads option in the Loads menu displays an input window in which a uniformly
distributed vertical surface load per unit of area are defined. The part of the load acting
between entry and exit point of the slip circle is taken into account in the load moment. For
background information, see section 17.2.
Figure 4.79: Uniform Loads window
Magnitude The load size for each unit of area.
X coordinate at
start
The X coordinate of the starting point of the distributed vertical load.
X coordinate at
end
The upper X coordinate of the ending point of the distributed vertical
load.
Distribution The angle δthat defines the assumed load distribution relative to the
vertical direction of the load (0 < δ < 90◦)
Load Type Select Permanent if this load should not cause any excess pore pres-
sures. Select Temporary if it does do.
Deltares 87 of 286
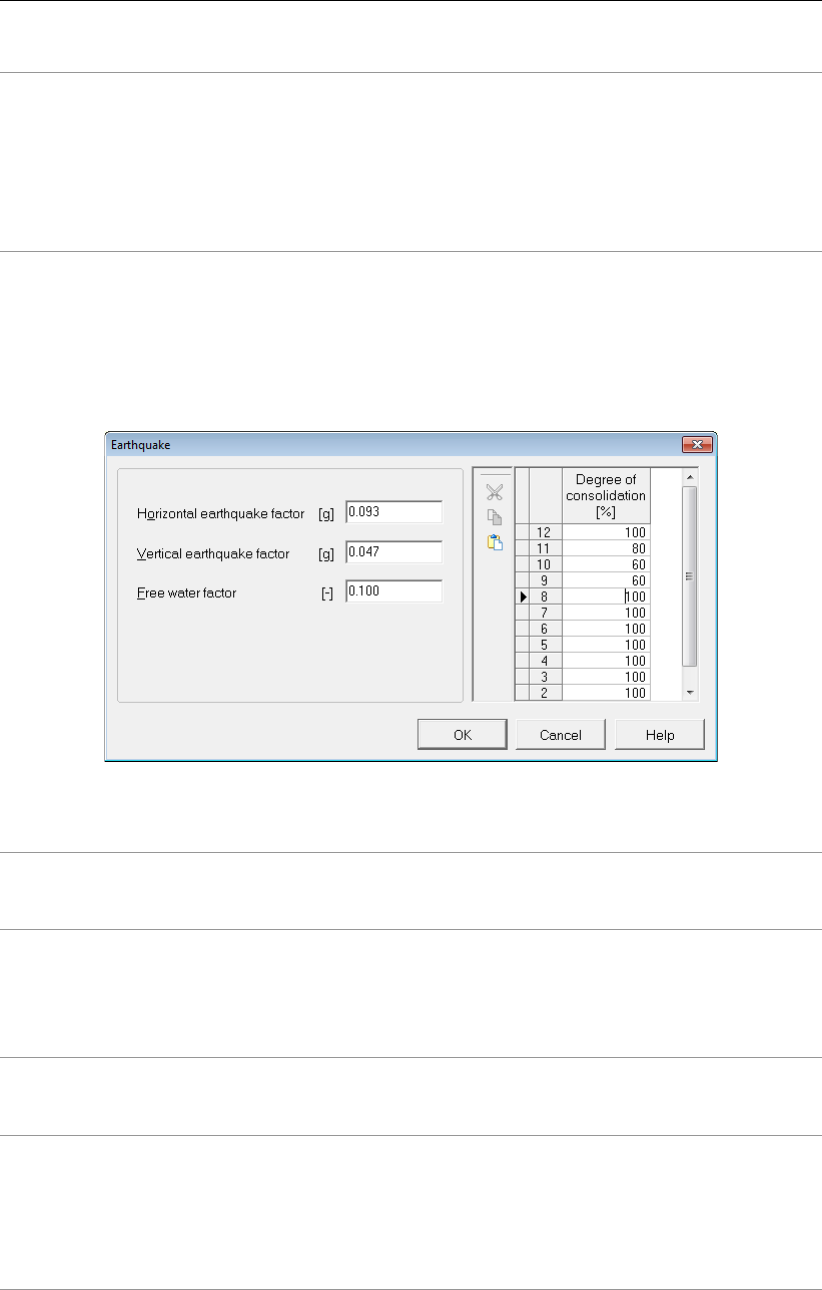
D-GEO STABILITY
, User Manual
Degree of
consolidation
In case of Temporary load: specify the relative degree of consolida-
tion per layer. This is the relative amount of the total vertical stress
by loading that is assumed to be carried as effective vertical stress
by the soil skeleton. A degree of consolidation of 0% means no addi-
tional effective stress. A degree of consolidation of 100% means no
additional excess pore pressures. See section 18.3 for background
information.
4.7.3 Earthquake
The Earthquake Loads option in the Loads menu displays an input window in which a hor-
izontal and an additional vertical acceleration are defined. For background information, see
section 17.3.
Figure 4.80: Earthquake window
Horizontal earth
quake factor
Horizontal acceleration relative to gravity, causing additional mo-
ment. The direction of acceleration with positive sign is equal to the
X-direction.
Vertical earth
quake factor
Additional vertical acceleration relative to gravity, causing temporary
additional weight and moment. The direction of acceleration with
positive sign is equal to the direction of gravity. The additional weight
will also yield additional total vertical stress and additional hydraulic
pore pressure.
Free Water Factor A reduction factor fon the moment caused by free water (0 < f < 1,
default f= 0). This factor can be used to simulate the drag down of
free water by earthquake loading.
Degree of
consolidation
The relative degree of consolidation rper layer (0 < r < 100, default
r= 100). This is the relative amount of the total vertical stress by
vertical earthquake loading that is assumed to be carried as effective
vertical stress by the soil skeleton. A degree of consolidation of 100%
means no excess pore pressures. For background information, see
section 18.3.
88 of 286 Deltares
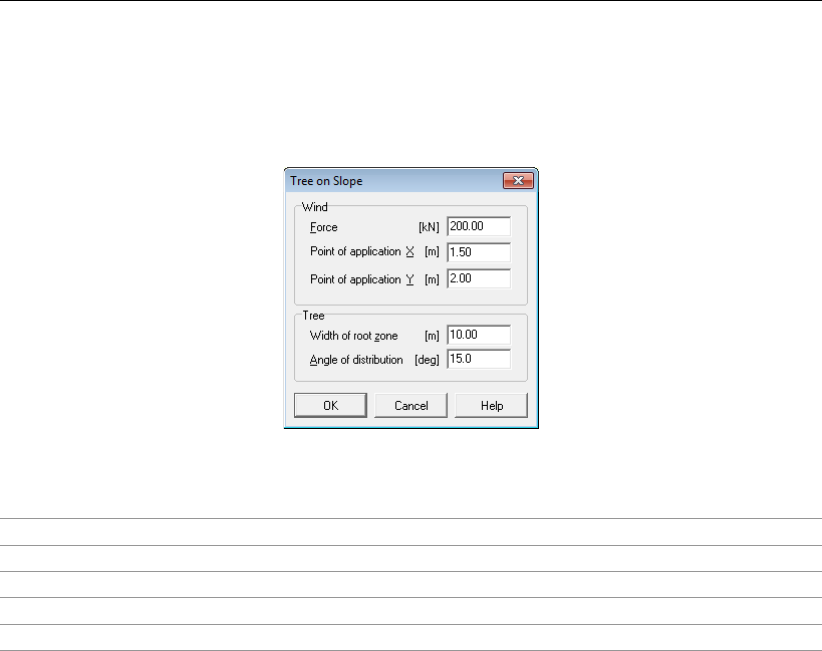
Input
4.7.4 Tree on Slope
The Tree on Slope option in the Loads menu displays an input window in which the effect of
the wind in the trees can be inputted. For background information, see section 17.4.
Figure 4.81: Tree on Slope window
Force Enter the magnitude of the wind force.
Point of application X Enter the horizontal coordinate of the application point.
Point of application Y Enter the vertical coordinate of the application point.
Width of root zone Enter the horizontal width of the root zone.
Angle of distribution Enter the angle of distribution of the effect of the root zone.
Deltares 89 of 286

D-GEO STABILITY
, User Manual
90 of 286 Deltares
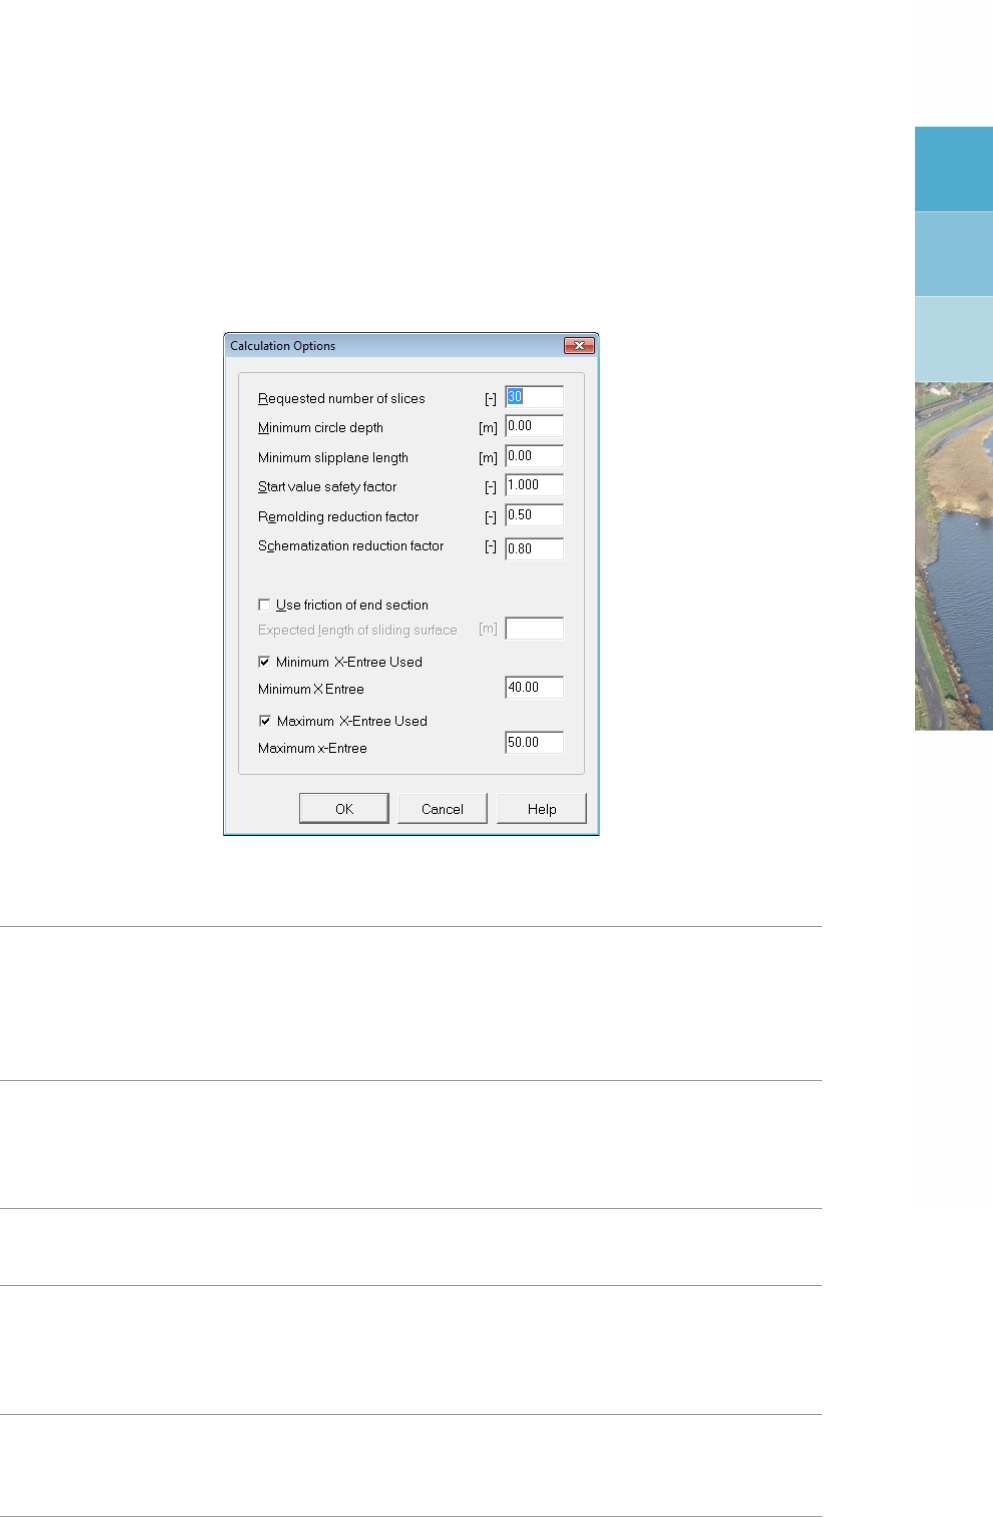
5 Calculations
5.1 Calculation Options
On the Menu bar, click Calculation and then chooseOptions to modify a number of settings for
the analysis: the number of slices, the minimum slice depth and the start value safety factor.
Figure 5.1: Calculation Options window
Requested number
of slices
D-GEO STABILITY
uses the requested number of slices to determine
the maximum width of a slice. At first, slice boundaries are put on
points such as geometry points or intersections between circle and
layers. Slices exceeding the maximum width will then be divided into
smaller ones. The default number of slices is 30. This is a reasonable
number for a calculation.
Minimum circle
depth
Only available for Bishop,Uplift Van and Bishop Probabilistic Ran-
dom Fields models (section 4.1.1). In order to avoid slip circles with
near-zero soil volumes, it is possible to enter a significant value for
the minimum vertical depth.
D-GEO STABILITY
will only consider the
slip circles with a depth exceeding this minimum.
Start value safety
factor
Only available for Bishop and Uplift Van models (section 4.1.1).
D-GEO STABILITY
uses this value as the start value for the iterative
determination of the final safety factor.
Remolding
reduction factor
Only available for Zone Plot model (section 4.1.1). Reduction fac-
tor applied on the sliding force of the ground to take into account
the ground deformation due to the deformed slip surface. For back-
ground information, refer to section 22.2. Based on tests and litera-
ture, the default value is set to 0.5.
Schematization
reduction factor
Only available for Zone Plot model (section 4.1.1). Extra model factor
used for the calculation of the stability of the deformed slip surface.
For background information, refer to section 22.2. Its default value is
set to 0.8.
Deltares 91 of 286
D-GEO STABILITY
, User Manual
Use friction of end
section
Only available for Bishop model (section 4.1.1). Select this button to
include the stability increase caused by the resistance at the edges
of a sliding section in the out-of-plane direction. For background in-
formation, refer to section 16.2.2.4.
Expected length of
sliding surface
Only available for Bishop model (section 4.1.1). If the option Use
friction of end section is enabled, enter the length of the considered
section in the out-of-plane direction.
Minimum X-entree
used
Select this button to used a minimum X-coordinate for the entry point
of the slip plane. Slip planes with an entry point situated at the left
of this point will not be retained during the search procedure of the
critical slip plane.
Minimum X-entree If the option Minimum X-entree used is enabled, enter a minimum
X-coordinate for the entry point of the slip plane.
Maximum X-entree
used
Select this button to used a maximum X-coordinate for the entry point
of the slip plane. Slip planes with an entry point situated at the right
of this point will not be retained during the search procedure of the
critical slip plane.
Maximum X-entree If the option Maximum X-entree used is enabled, enter a maximum
X-coordinate for the entry point of the slip plane.
5.2 Start Calculation
On the Menu bar, click Calculation and then chooseStart to open the Start window (Fig-
ure 5.2) in which some settings can be adjusted before the start of the calculation. Two
optimization techniques are available to find the representative slip surface:
section 5.2.1 – The grid method calculates all combinations of center points and tangent
lines.
section 5.2.2 – The genetic algorithm is an advanced optimization procedure that can
find either the representative slip circle with Bishops or Vans method or an uncon-
strained slip plane using Spencer’s method. The genetic algorithm is a generally ac-
cepted optimization method. Default values are sufficient for most problems to con-
verge. In specific cases, advanced options need to be adjusted. Sufficient literature on
this algorithm is available to understand the parameters used.
5.2.1 Grid based calculation
By clicking OK the calculation is started. If the input contains no errors, the calculation is
started. If the input data contains any errors, a message is displayed.
92 of 286 Deltares
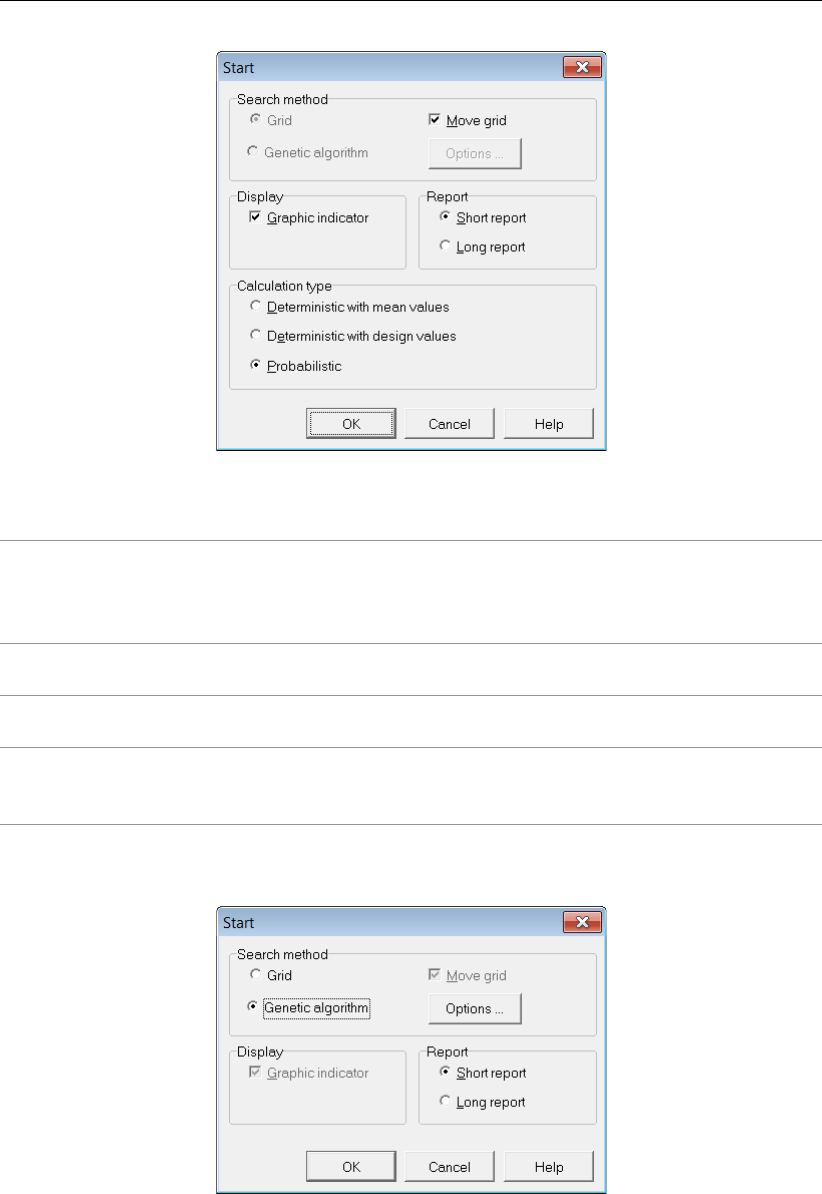
Calculations
Figure 5.2: Start window, Grid method
Move grid Activate this check-box if
D-GEO STABILITY
should move the grid in
the direction of the minimum safety factor.
Deactivate if
D-GEO STABILITY
should only calculate the minimum
safety factor with the initial grid.
Graphic indicator Activate if
D-GEO STABILITY
should graphically display the progress of
the automatic slip circle search.
Report type Select the report type. The long report will contain all available re-
sults. The short report will contain only key data.
Calculation type Only in combination with reliability analysis (section 4.1.1). Select
the calculation type: a mean value analysis, a design value analysis
or a probabilistic design with random parameter values.
5.2.2 Genetic Algorithm based calculation
Figure 5.3: Start window, Genetic algorithm method
A genetic algorithm is an advanced optimization method that is particularly good in finding a
solution in a large and complex search space. It searches the same space as the calcula-
tion grid, without analyzing every possible grid point. With the right options is it much more
efficient. The Genetic Algorithm is only implemented in combination with the following limit
equilibrium methods:
Deltares 93 of 286
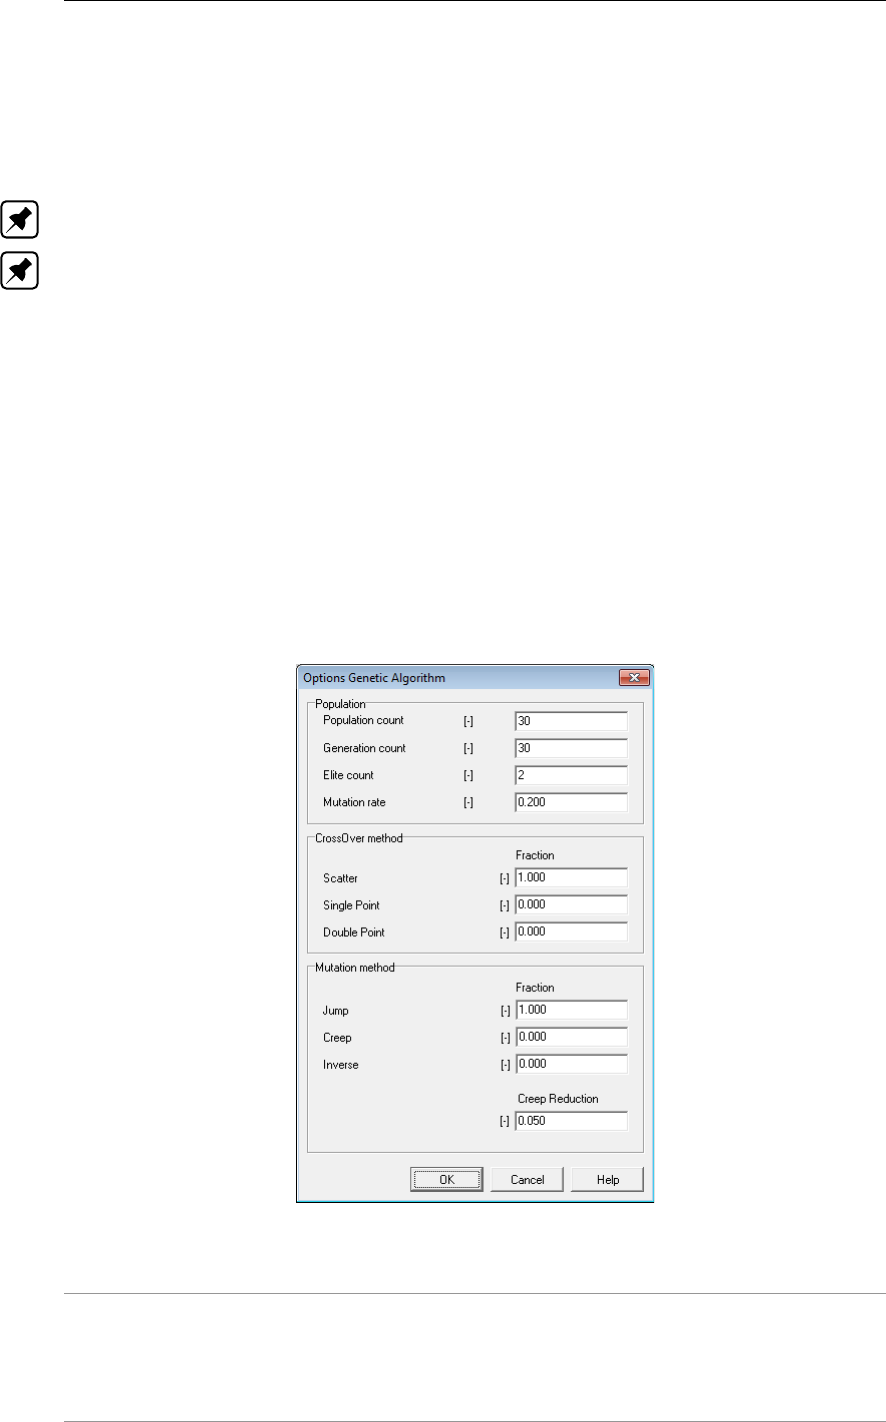
D-GEO STABILITY
, User Manual
Bishop
Spencer
Fellenius
Uplift Van
Uplift Spencer
Note: Some features like Fmin in grid don’t work after a genetic algorithm based calculation.
Note: It is possible to find only so called “zone 1” circles using the genetic algorithm, but one
needs to take care when using this method. One can do so by checking “enable” under “zone
plot” in the model window. This option gives a penalty of 3 to each zone 2 or zone 3 circle. If
a safety factor higher than 3 is returned, chances exist no zone 1 circle is found.
The search space must be defined in the same way as by the grid-based method. The shown
grid is not used, instead, the slip plane with the lowest resistance is found with the genetic
algorithm. A very large search area may be used with Bishop’s method, as the optimization
technique is very efficient.
Click the Options button to open the Options Genetic Algorithm window and view the default
options (Figure 5.4). Those advances options are chosen automatically, based on the chosen
limit equilibrium method and the size of the search space. If these defaults do not lead to the
desired optimum, the advanced options must be set differently. Some knowledge of genetic
algorithms is required in order to do this.
Figure 5.4: Options Genetic Algorithm window
Population The product of the population- and the generation count determines
the precision of the calculation result. A larger elite can increase the
convergence speed, but increases the risk of finding a local mini-
mum. A different mutation rate can change the convergence speed
and the smoothness of the solution.
94 of 286 Deltares

Calculations
CrossOver method Scatter implies a random combination of genes from both parents.
This fraction can be 100% in case of a relatively simple solution
space like Bishop or Uplift-Van. With Spencer’s method, the slip
planes become too chaotic and single- or double point crossover will
result in much better convergence.
Mutation method A jump mutation causes a gene to get another, uniformly drawn
value, between the boundary conditions of the value. A creep mu-
tation draws another value in a smaller range: the change will be no
more than the creep reduction factor. An inversion inverts all values
in a chromosome. Jump mutations are efficient in a simple search
space like Bishops method and Uplift-Van. With Spencer’s method,
creep- and inverse mutations are more likely to produce good off-
spring.
Note: Spencer’s limit equilibrium method cannot always produce a valid result. Searching
in a space with a relative large number of invalid results requires a large population- and
generation count in order to find a good solution and will require much more calculation time.
Only solutions with the thrust line inside the soil body are accepted.
5.3 Error messages
If the input contains any errors, a message is displayed. A description of the errors that must
be corrected is located in the output file or in the error file. The output file contains an echo
of the input, and messages concerning all errors that were found. This file can be viewed
with the Report option in the Results menu. The Error messages option in the Help menu
allows the user to display the error messages for the last calculation performed for the current
project.
Note: To keep the messages, it is only possible to print them, as they will be overwritten the
next time a calculation is started.
5.4 Progress of Calculation
Critical circle search
If the input contains no errors, the program will start calculating all circles in the initial grid.
The screen displays a progress overview and the minimum safety factor found so far in the
Progress of Calculation window (Figure 5.5).
Deltares 95 of 286
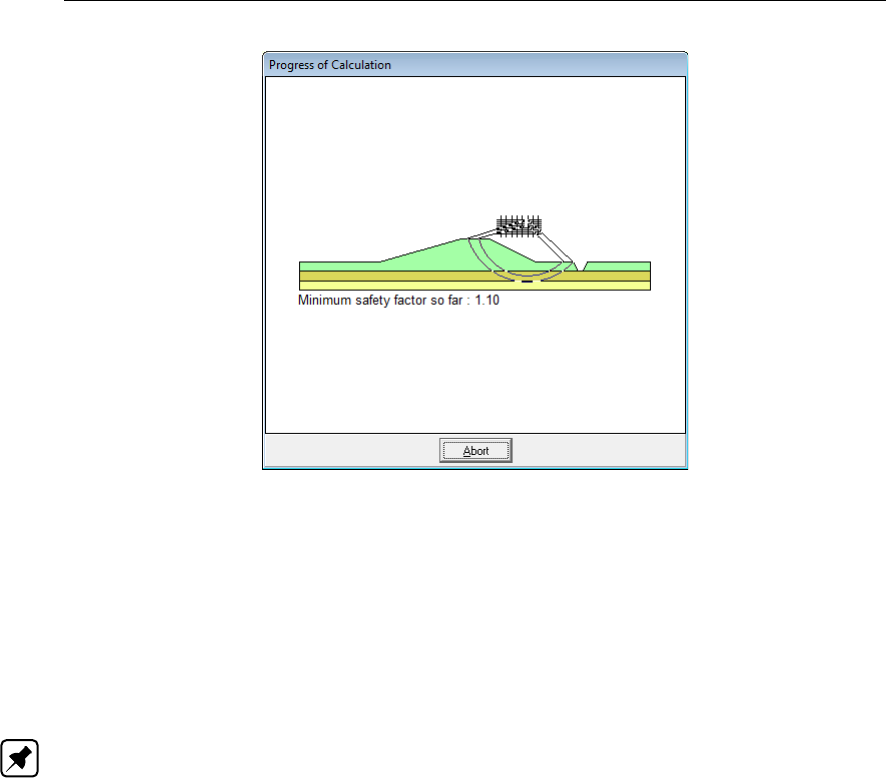
D-GEO STABILITY
, User Manual
Figure 5.5: Progress of Calculation window
Once the entire initial grid has been calculated for all tangent lines, the program checks
whether the center point grid needs to be moved (only if larger than 2x2) if the option Move
Grid in the Start window was enabled. If the critical circle is located along either the top or
bottom tangent line, then
D-GEO STABILITY
will also shift the tangent lines, in order to find the
real minimum safety factor. It is possible to do this using the View Input window (section 2.2.3)
or the Slip Circle Definition option in the Definitions menu (section 4.4.1.1).
Note: It is possible to abort the calculation by clicking the Abort button in the Progress of
Calculation window. This stops the calculation and an empty graphic dump file (*.STD) is cre-
ated, indicating that no graphical results are available. A message is appended to the output
file (*.STO) and only the data is saved for the slip circles calculated before the calculation was
aborted.
96 of 286 Deltares

6 View Results
The options in the Results menu can be used to view the results of the performed calculations.
6.1 Report
On the menu bar, click Results and then choose Report to view a window displaying a table
of the most recent calculation results.
Click the Print active window to print the report.
Note: It is possible to export the report to a text file. To do so, click Export Active Window in
the File menu.
The output file consists of the following elements:
general section
program name and version, update, company name, license and copy number
title of the problem
names of the used files
echo of the input
the safety factor table for each center point and for each tangent line and/or fixed point
(section 6.1.1)
information about the critical slip circle (section 6.1.2)
extensive information about the critical slip circle (optional) (section 6.1.3)
The following sections describe the output in more detail. The calculation process can be
aborted, after which a message is appended to the output file and the file is closed. All results
until the moment the calculation was aborted remain stored in the file.
6.1.1 Report – Safety factor table (long report)
If the Long report option is selected when starting a calculation (section 5.2), a table with
the X and Y coordinates of the center point, the radius and the safety factor is presented for
each calculated circle. If the grid has moved during the calculation, the new grid position is
displayed, followed by a new table with information on the circles and factors of safety for the
new grid. Messages may be displayed behind the safety factor column, either indicating that
the circle was rejected for some reason or noting anything exceptional about the circle.
The following can be reasons for rejecting a circle:
circle cuts the surface less than two times
circle cuts the surface an uneven number of times
circle cuts a forbidden line
circle center point is too low
circle center is located within the geometry
too many slices
driving moment too small (limit = 0.001)
resisting moment too small (limit = 0.001)
more than maximum number of iterations required
The following are possible output notes about a slip circle:
“circle cuts surface >2 times =>piece X = ... till ... taken” to indicate which part of the
Deltares 97 of 286
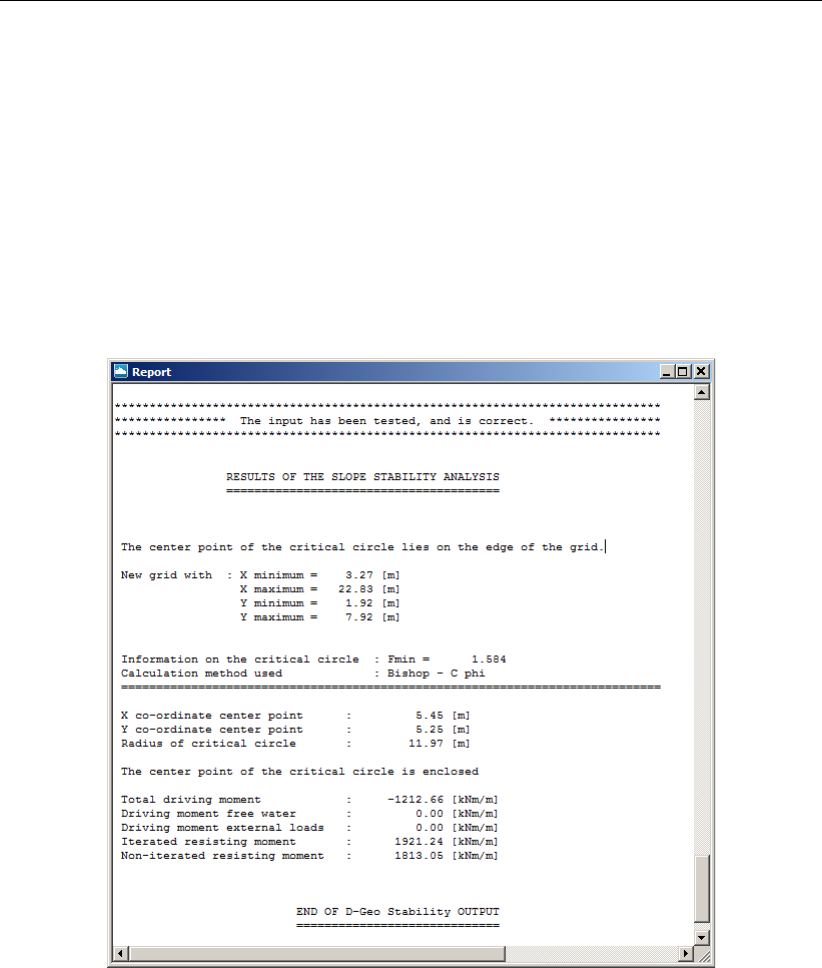
D-GEO STABILITY
, User Manual
slip circle is used if the circle intersects the surface more than two times
“occurrence of negative effective stress”
“evaluated earlier” (in former grid position)
This table can become very long, depending on the number of circles for each grid and the
number of times the grid is moved in search of a minimum safety factor.
6.1.2 Report – Information about critical slip plane
If a slip plane was found with a minimum safety factor, the following information is displayed
about that slip plane:
Figure 6.1: Report window for Bishop method
The calculated minimum safety factor and the position of the circle are displayed. If the center
point is enclosed, this is noted. If not, the side of the grid where the minimum safety factor
was found is displayed.
An iterative process determines the resisting moment in the Bishop method. The non-iterated
resisting moment is the resisting moment in the first iteration with F= 1.0. With the changing
of Fin each iteration, the resisting moment also changes and the moment in the last iteration
is given by the Iterated resisting moment. This moment should be approximately equal to the
absolute value of the total driving moment.
There is no iterative process for the suand Fellenius methods. In such cases, therefore, only
the total available resisting moment is displayed. Division of this moment by the total driving
moment immediately produces the safety factor.
98 of 286 Deltares

View Results
If geotextiles were used and were active for the critical slip circle, extra information is displayed
about the contribution of the geotextile(s) to the resisting moment.
In case of a probabilistic design, the probability of failure and the corresponding reliability
index are written, additionally to the mean value of the safety factor.
In case of a probabilistic design with different water levels, the results for all separate levels
are first presented, followed by the integrated probability of failure at the design point level.
6.1.3 Report – Extensive information about critical planes (long report)
If the Long report option is selected when starting a calculation (section 5.2), a large number
of calculated values for the slices of the critical slide plane are displayed in three tables. The
values presented in these tables depend on the calculation method used.
The following column headings are possible:
Slice [-] Slice number
X-coor [m] Horizontal coordinate at center of slice
Y-bot [m] Vertical coordinate at the center of the bottom of slice
Y-top [m] Vertical coordinate at the center of the top of slice (= geom-
etry surface)
Width [m] Width of slice
Angle bottom [deg] Average angle slice bottom
Angle top [deg] Angle slice top (= at geometry surface)
Arc.len. [m] Length of slip circle for the slice (approximated by a straight
line)
Cohesion [kN/m2] Cohesion at slice bottom
Phi [deg] Internal friction angle at slice bottom
Sw surf [kN/m2] Water pressure at geometry surface at slice top
Fw hor. [kN] Horizontal water force on geometry surface at slice top
Fw ver. [kN] Vertical water force on geometry surface at slice top
Weight [kN] Total weight of the slice
S-tot [kN/m2] Total stress at slice bottom
S-eff. [kN/m2] Effective stress at slice bottom
Sw-hydro [kN/m2] Hydrostatic pore water pressure at slice bottom
Sw-extr [kN/m2] Pore water pressure (positive or negative) at slice bottom
due to degree of consolidation and PL-lines at slice bottom
Sw tot [kN/m2] Total water pressure at slice bottom
S shear [kN/m2] Shear stress at slice bottom
Su [kN/m2] Shear strength suat slice bottom
Ko [-] Horizontal stress ratio at slice bottom
Sig-Vo’ [kN/m2] Effective vertical stress before loading at slice bottom
Alf*SigB [kN/m2] Alf is the degree of consolidation to the stress (SigB) result-
ing from the applied load (Su-calculated)
Sig-Alfa [kN/m2] Normal stress at slice bottom (Bishop stress dependent)
In the case of a Spencer calculation, the value, position and angle of the inter-slice forces are
added to the output.
In the case of a probabilistic design, a long report also shows the values of the influence
factors and the values of all stochastic parameters at the design point.
Deltares 99 of 286
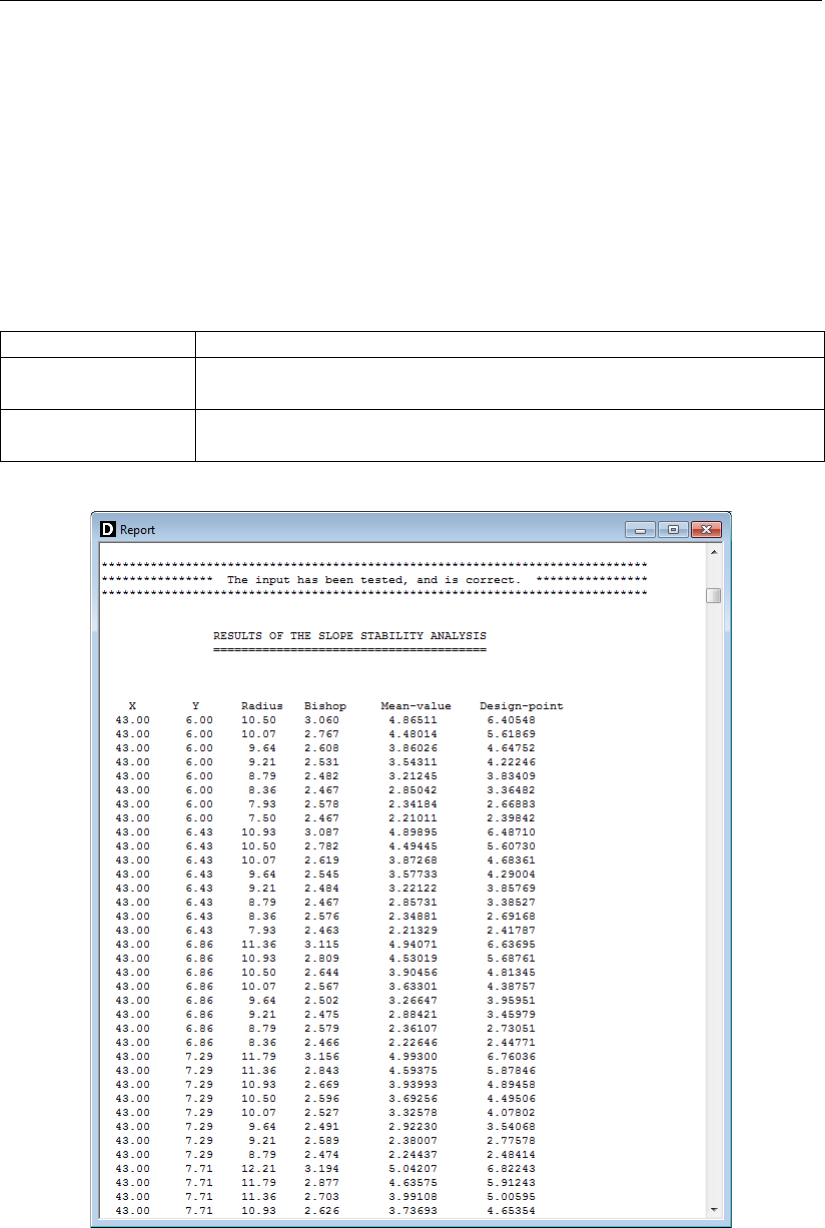
D-GEO STABILITY
, User Manual
If a column does not apply to a particular calculation method, zeros are printed instead.
6.1.4 Report for Bishop Probabilistic Random Field model
On the menu bar, click Results and then select the Report option to open the Report window.
Hereafter is only the output in the Short Report is described. Theoutput type can be selected
in the Start window (see Figure 6.2).
The short report gives the following intermediate data for each of the water levels and each of
the circles that were analyzed:
X, Y, Radius The dimension of the slip circle.
Mean Value The reliability index βresulting from a linearization at the mean value
of all parameters.
Design point The reliability index βresulting from a linearization at the so-called
design point in a FORM analysis.
Figure 6.2: Report window, intermediate results
100 of 286 Deltares
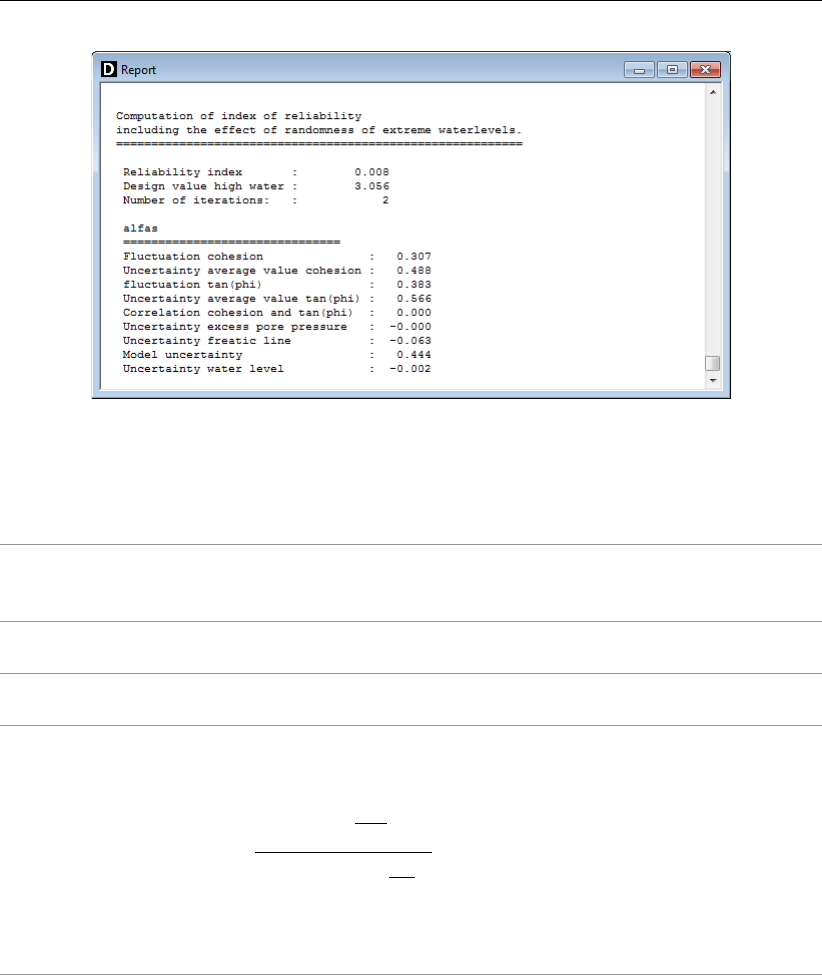
View Results
Figure 6.3: Report window, final results
The short report gives the following output of the final analysis results (see Figure 6.3):
Reliability index The final value of the reliability index β. In case of a stochastic ex-
ternal water level, this value is the result of the integration of the
conditional values for the different water levels.
Design value high
water
Only for a stochastic external water level: the value of the water level
corresponding to the integrated value of β.
Number of
iterations
Only for a stochastic external water level: the number of iterations
used for the determination of the integrated βvalue.
Alfas The sensitivity coefficient αof parameter xiindicates the effect of
parameter change and parameter uncertainty on the probability of
failure for the cross-section:
α=
σ[xi]dF
dxi
Pn
j=1 σ[xj]dF
dxj
The sensitivity coefficients for soil parameters result from integration
along all soil types. The sum of the sensitivity coefficients equals 1.
The values are based on a cross-section analysis only.
6.2 Stresses in Geometry
The Stresses in Geometry option in the Results menu presents a view of the distribution of
pore pressure and effective vertical stress along verticals that can be selected with the mouse
pointer.
Clicking the cursor anywhere in the horizontal domain will produce a representation of the
stresses in the vertical at that point. It is also possible to manually provide the X coordinate
(in the domain) of which to see the stresses in the vertical at that point. This X coordinate can
be given in the upper left corner of the screen.
Deltares 101 of 286
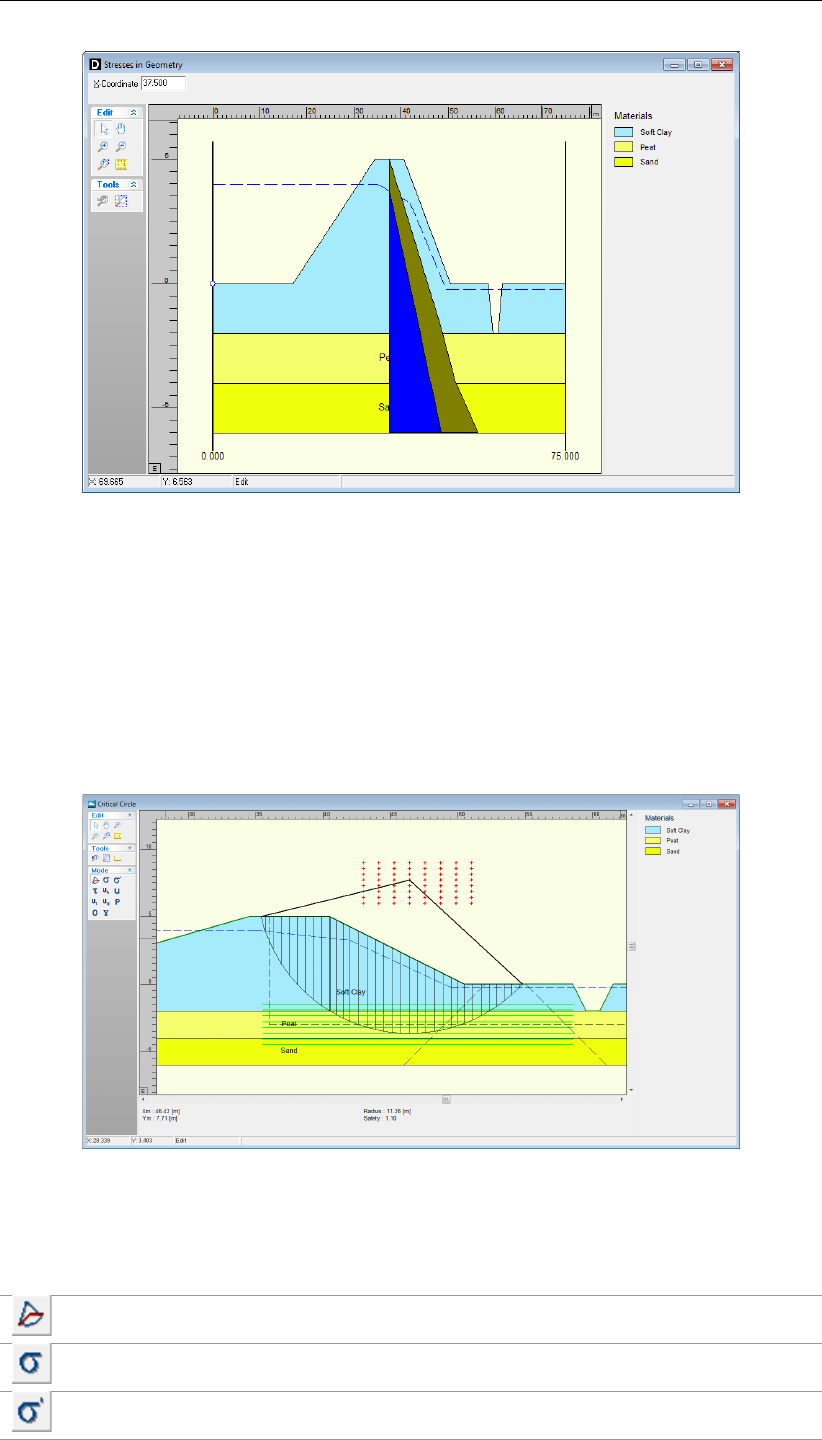
D-GEO STABILITY
, User Manual
Figure 6.4: Stresses in Geometry window
6.3 Stresses
6.3.1 Critical Circle (Fellenius and Bishop)
On the menu bar, click Results and then select the Stresses option to open the Critical Circle
window which gives access to various graphical representations of the calculated results for
Fellenius or Bishop method. Key information like the safety factor and the probability of failure
are printed in the status panel at the bottom.
Figure 6.5: Critical Circle window
Click on the following buttons to view:
The critical slip circle, with the initial and final position of the grid.
The distribution of the vertical total stress.
The distribution of the vertical effective stress.
102 of 286 Deltares
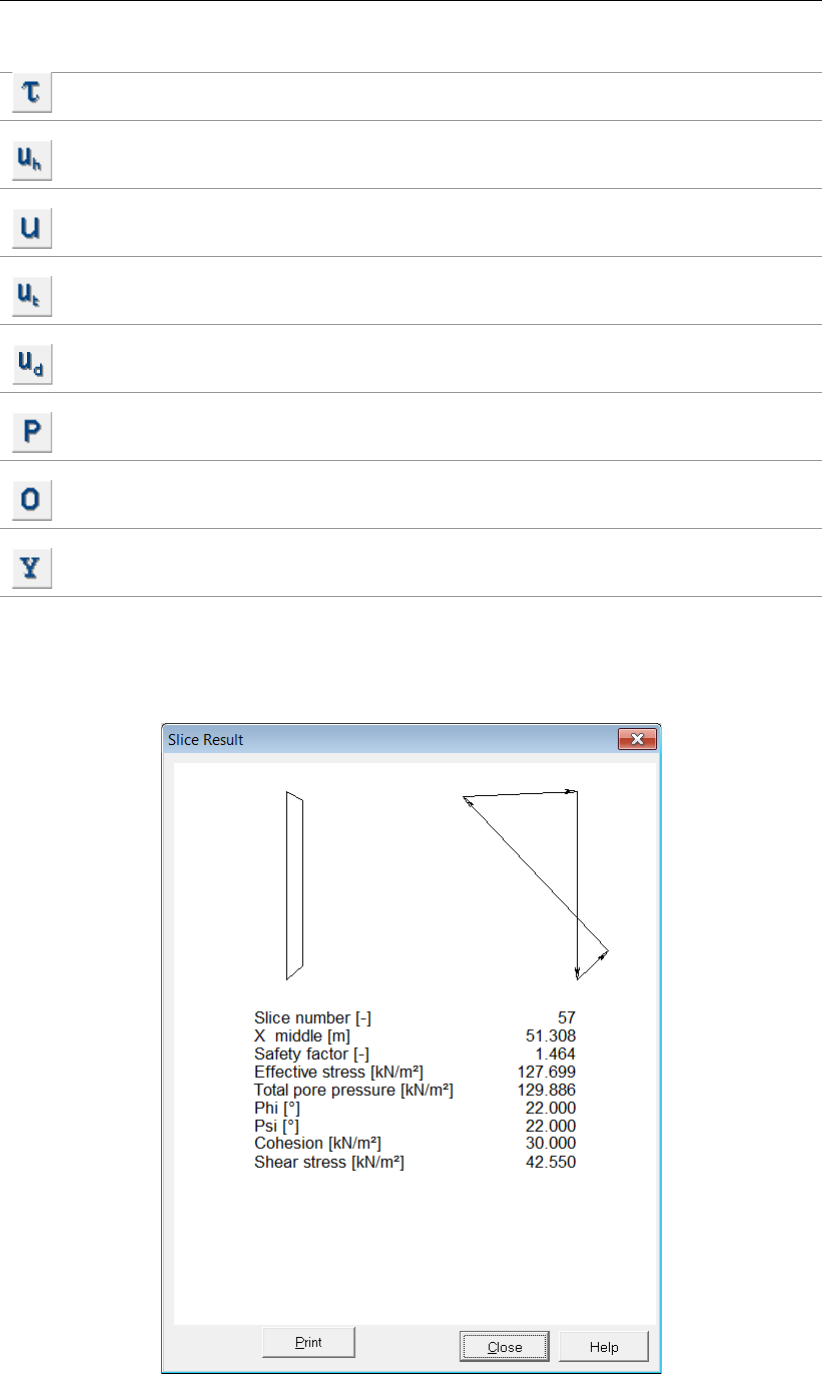
View Results
The distribution of the shear stress along the slip plane.
The hydrostatic pore pressure component along the slip plane (from the phreatic
line definition).
The hydraulic (piezometric) pore pressure component along the slip plane (from
the piezometric lines definition or the MSeep pore pressures).
The excess pore pressure component along the slip plane, caused by the speci-
fied degrees of consolidation by addition of different layers and loads.
The total pore pressure along the slip plane. Summation of the hydraulic pressure
and the excess pore pressure.
The pre-overburden pressure (POP) along the slip plane, only relevant for Su-
calculated models.
The over-consolidation ratio (OCR) along the slip plane, only relevant for Su-
calculated models.
The yield stress along the slip plane, only relevant for Su-calculated models.
By double-clicking on a certain slice, a special window is displayed, containing detailed infor-
mation on that slice, as shown in Figure 6.6.
Figure 6.6: Slice Result window
Deltares 103 of 286
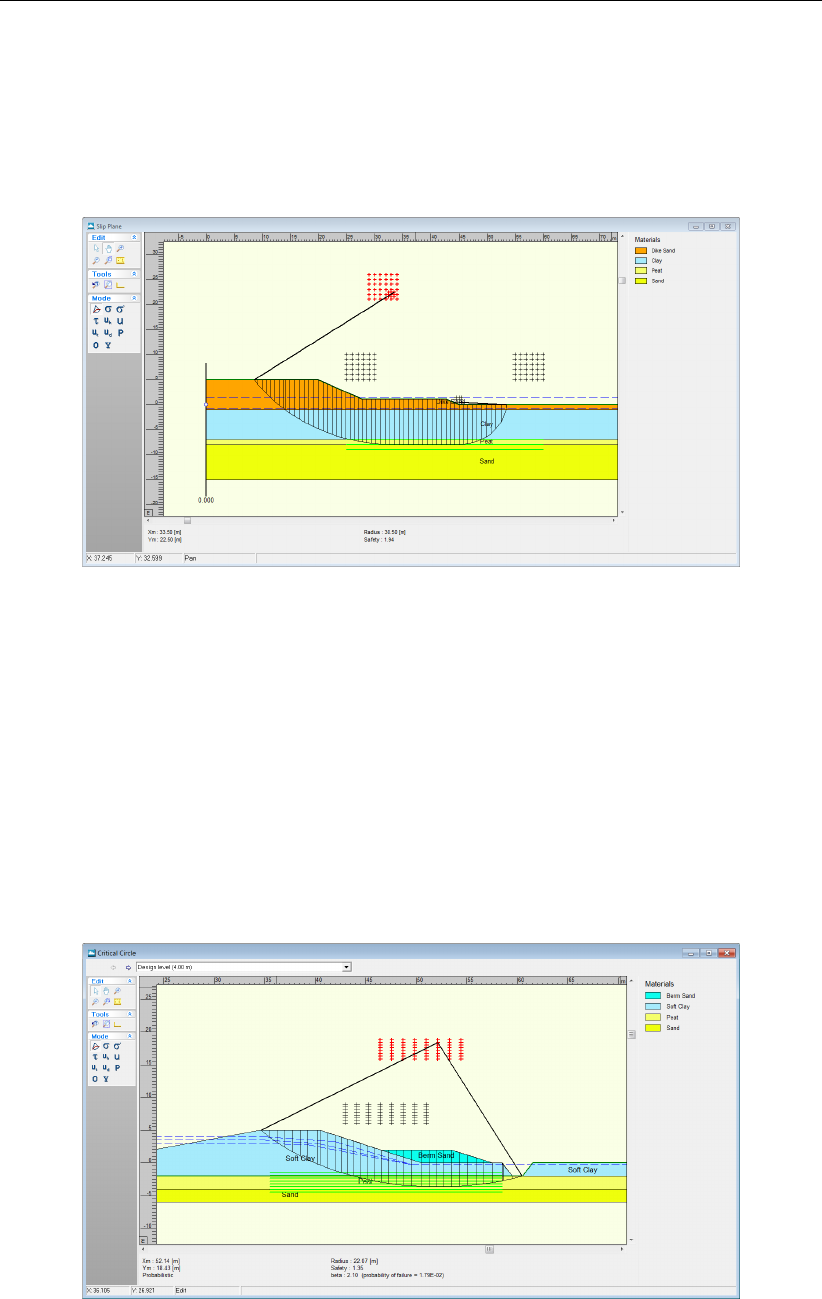
D-GEO STABILITY
, User Manual
6.3.2 Critical Plane (Uplift-Van and Spencer)
On the menu bar, click Results and then select the Stresses option to open the Critical Plane
window which gives access to various graphical representations of the calculated results for
Uplift-Van or Spencer method. Key information like the safety factor are printed in the status
panel at the bottom.
Figure 6.7: Critical Plane window for Uplift-Van method
Refer to section 6.3.1 for a detailed description of this window
6.3.3 Critical Circle for Reliability Analysis
In case of a probabilistic calculation (using the Reliability analysis option or the Bishop prob-
abilistic random field model in the Model window, see section 4.1.1), complementary infor-
mation compared to a standard calculation (section 6.3.1) is given: the value of the reliability
index βand the probability of failure (see Figure 6.8). When using external water levels (sec-
tion 4.6.2) for probabilistic design, it is possible to view the results for each level separately,
by using the selection list on top.
Figure 6.8: Critical Circle window for probabilistic analysis
104 of 286 Deltares
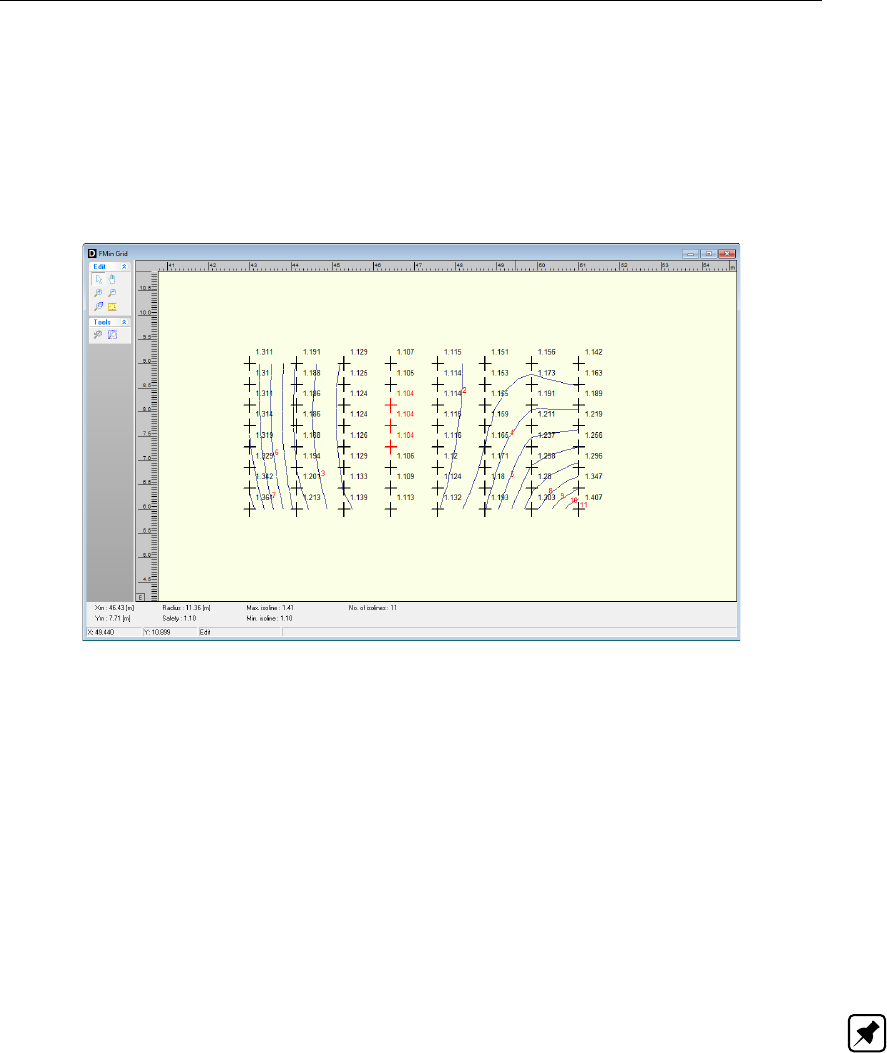
View Results
6.4 FMin Grid
The FMin Grid option in the Results menu enables the user to view iso-lines of the safety
factor distribution on the final grid, provided that the Point and/or Iso-lines option is activated.
This option can be found in the FMin Grid Results tab of the Project Properties window (sec-
tion 4.1.3). This plot is only drawn if the number of grid points is less than 11 for both the X
and Zdirections. For larger grids, only the minimum value is drawn in the grid.
Figure 6.9: textitFMin Grid window
6.5 Safety Factor per Zone
In case of a Zone plot calculation (section 4.1.1), click the Safety Factor per Zone option in
the Results menu to open the Safety Factor per Zone window. This window shows a diagram
of the Safety factor / Model factor vs. the Entry point active circle (i.e. X coordinate) for the
calculated slip circles of each zone.
Mark and unmark the six check-boxes at the right side of the window to show the desired
zones (1a, 1b, 2a, 2b, 3a or 3b). The horizontal black lines in the diagram correspond to
the required safety factors of each zone as defined in the Zone Areas for Safety window
(section 4.4.4).
Note: A slip surface passing through zone 1, but with an entrance point in zone 2, is ac-
cording to the zone plot method defined as a slip surface in zone 2 only if the modified slip
surface (deformed situation after rotation) satisfies the required safety factor for zone 1. For
background information on the determination of the modified slip surface, refer to section 22.2.
Deltares 105 of 286
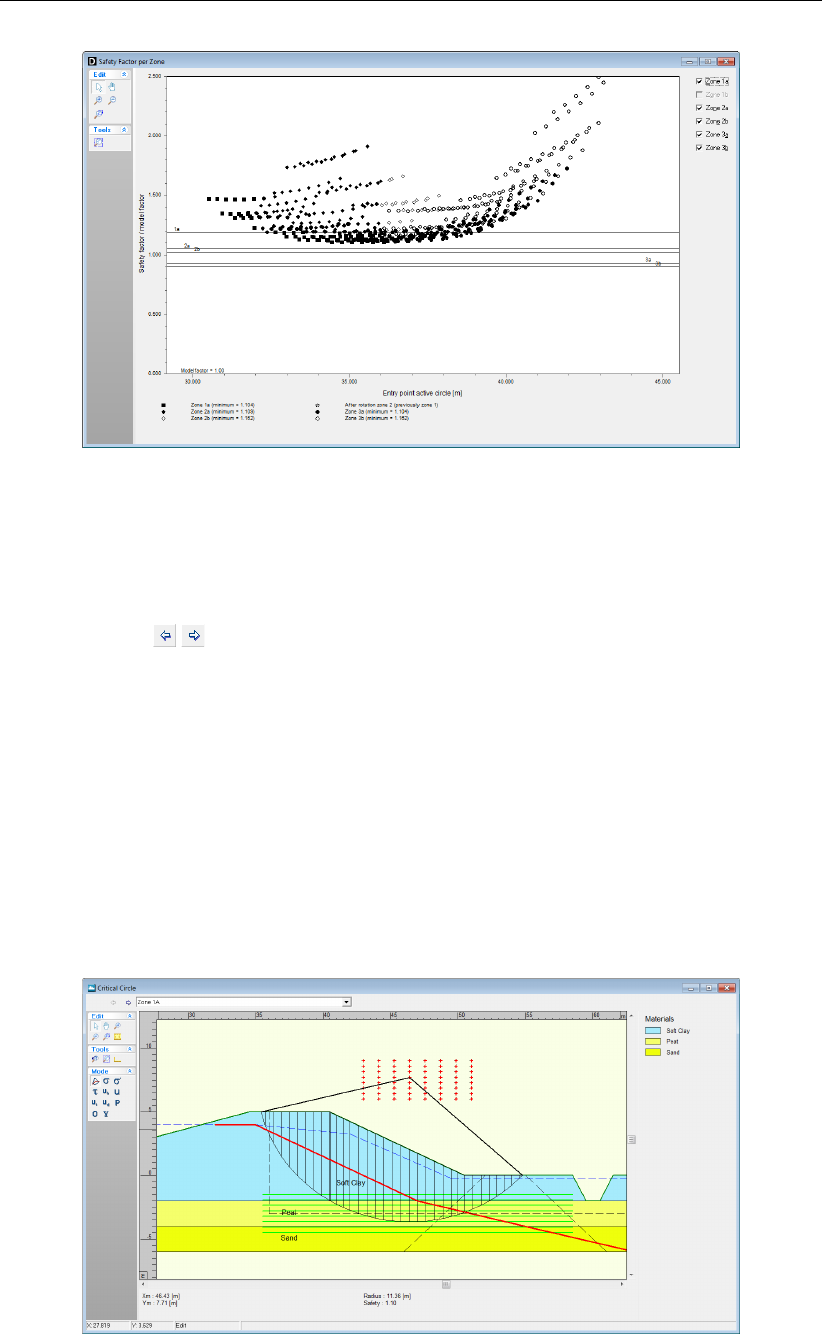
D-GEO STABILITY
, User Manual
Figure 6.10: Safety Factor per Zone window
6.6 Stresses per Zone
In case of a Zone plot calculation (section 4.1.1), click the Stresses per Zone option in the
Results menu to open the Critical Circle window (Figure 6.11). Click the Previous zone and
Next zone icons, , to view various calculated results for each zone:
Graphical representations of the critical circle divided into a certain number of slices.
By double-clicking on a certain slice, a special window is displayed, containing detailed
information on that slice.
Key information like the radius and center coordinates of the critical circle and the safety
factor are printed in the status panel at the bottom.
Graphical representation of the zone areas of the Zone plot model:
the bold red line represents the rest profile;
the vertical and horizontal dotted black lines represent the boundaries of the de-
sign level influence respectively at X and Y;
the two inclined dotted black lines at the right side of the window represent the
limits of the minimal road influence.
Figure 6.11: Critical circle window for the Zone plot model
106 of 286 Deltares
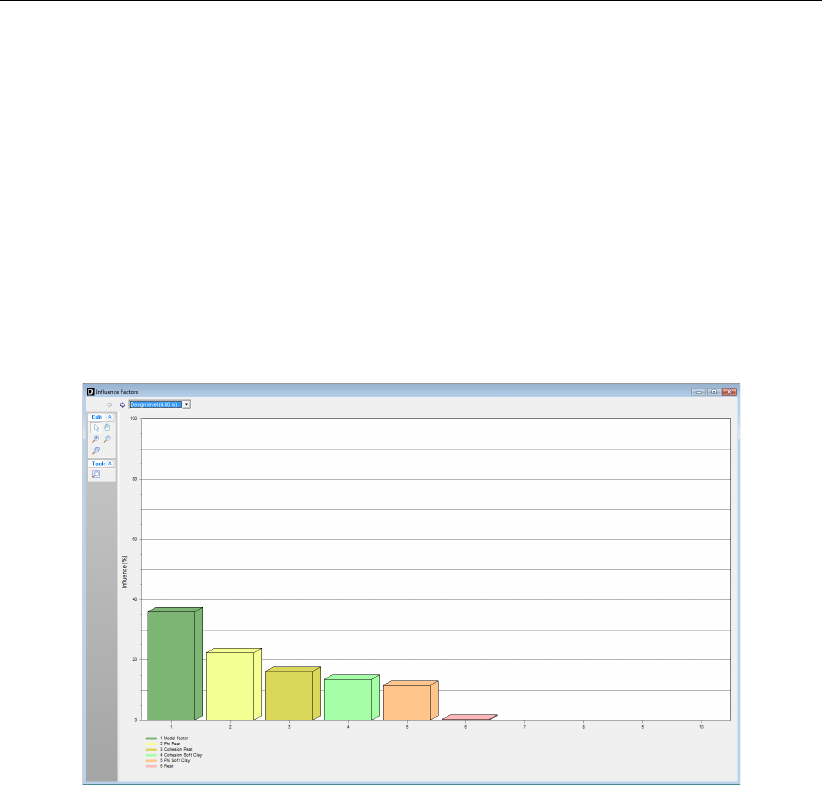
View Results
For the description of the Mode panel, refer to section 6.3.
6.7 Influence Factors
In case of a probabilistic analysis, the Influence factor option in the Results menu gives access
to the Influence Factors window. This window shows the influence of variations of uncertain
parameters on the probability of failure, see Equation 20.21, page 293.
When using external water levels (section 4.6.2) for probabilistic design, it is possible to
view the results for each level separately, by using the selection list on top. Besides the
results for each level, it is also possible to view the integrated influence factors, calculated by
D-GEO STABILITY
in the design point.
Figure 6.12: Influence Factors window
6.8 Safety Overview
The Safety Overview option in the Results menu displays the soil region with a safety fac-
tor within a certain range, according to the results of the various trials that
D-GEO STABILITY
performs when determining the critical slip surface. It also displays the regions with a safety
value greater and less than the range bounds. The default range bounds (1.15 and 1.35) are
defined in the Safety Results tab of the Project Properties window (section 4.1.3).
Deltares 107 of 286
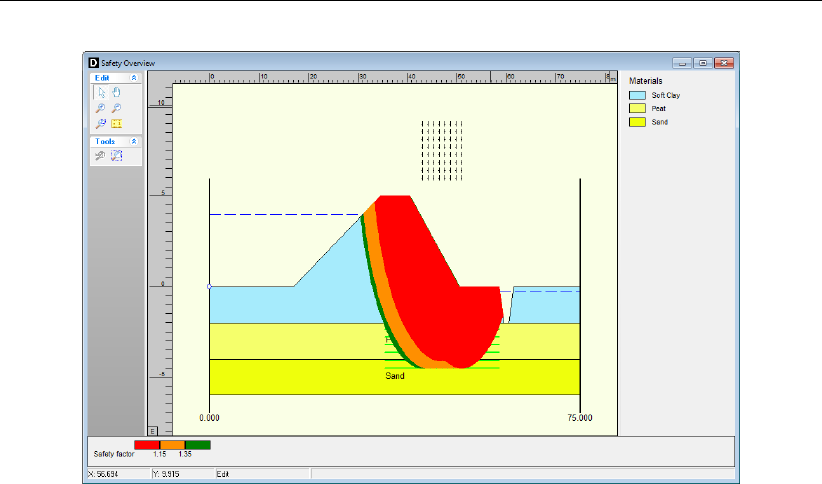
D-GEO STABILITY
, User Manual
Figure 6.13: Safety Overview window
108 of 286 Deltares
7 Graphical Geometry Input
This chapter explains how to define the soil layers in a two-dimensional cross section by
drawing, using the shared Deltares Systems Geo-tools options for geometry modeling.
section 7.1 introduces the basic geometrical elements that can be used.
section 7.2 lists the restrictions and assumptions that the program imposes during ge-
ometry creation.
section 7.3 gives an overview of the functionality of the View Input window.
section 7.4 describes the creation and section 7.5 describes the manipulation of general
graphical geometry using the View Input window.
Besides graphical input, the geometry can also be imported or tabular forms can be used
(see section 4.3). See the MGeobase manual for a description of special features to create
cross-section geometry semi-automatically from CPT and/or boring records.
7.1 Geometrical objects
A geometry can be built step-by-step through the repetitive use of sketching, geometry cre-
ation and geometry manipulation. Each step can be started by using line-shaped construction
elements (autorefsec:7.1.2) to add line drawings. After converting these drawings to valid ge-
ometry parts, the specific geometry elements created can be manipulated (section 7.1.1).
7.1.1 Geometry elements
A geometry can be composed from the following geometry elements:
Points A point is a basic geometry element defined by its coordinates. As
stated earlier, the geometry is restricted to two dimensions, allowing
to define X and Y coordinates only.
Boundary lines A boundary line is a straight line piece between two points and is part
of a boundary.
Boundaries A boundary is a collection of connected boundary lines that forms
the continuous boundary between layers.
PL-lines A piezometric level line is a collection of connected straight line
pieces defining a continuous piezometric level.
Phreatic line This is a PL-line that acts as phreatic line. The phreatic line (or
groundwater level) is used to mark the border between saturated and
unsaturated soil.
Layers A layer is the actual soil layer. Its geometrical shape is defined by its
boundaries, and its soil type is defined by its material.
Materials A material defines the actual soil material (or soil type). It contains
the parameters belonging to the soil type, such as its unsaturated
weight and its saturated weight. A material can be connected to a
layer in order to define the soil type of the layer.
Limits A limit is a vertical boundary defining the ‘end’ at either the left or
right side of the geometry. It is defined by an X coordinate only. Note
that this is the only type of element that cannot be deleted.
Adding, moving and deleting the above-mentioned elements are subject to the conditions for
a valid geometry (see section 7.2). For example, while dragging selected geometry elements,
the program can perform constant checks on the geometry validity (section 7.4.4). Invalid
parts will be shown as construction elements (thick blue lines).
Deltares 109 of 286
D-GEO STABILITY
, User Manual
7.1.2 Construction elements
Besides the
D-GEO STABILITY
geometry elements (section 7.1.1), special construction ele-
ments can also be used for sketching the geometry graphically. These elements are not a
direct part of the geometry and the restrictions on editing (adding, moving, and deleting);
these elements are therefore far less rigid. The only restriction that remains is that these
elements cannot be moved and/or defined beyond the limits of the geometry.
Lines A line consists of a starting point and end point, both defined by a
left-hand mouse click in the graphic input screen.
Poly-lines A poly-line consists of a series of connected lines, all defined by a
left-hand mouse click in the graphic input screen.
Construction elements will be displayed as solid blue lines. Valid constructions elements
are converted to geometry elements as soon as the geometry is (re-) generated. For more
information on adding lines and poly-lines, see section 7.4.
7.2 Assumptions and restrictions
During geometrical modeling, the program uses the following assumptions.
Boundary number 0 is reserved for the base.
A soil layer number is equal to the boundary number at the top of the layer.
The boundary with the highest number defines the soil top surface.
A material (soil type) must be defined for each layer – except for layer 0 (base). Different
layers can use the same material.
All the boundaries must start and end at the same horizontal coordinates.
Boundaries should not intersect, but they may coincide over a certain length.
All horizontal coordinates on a boundary must be ascending – that is, the equation
X[i+1] = X[i] must be valid for each following pair of Xcoordinates (vertical parts are
allowed).
PL-lines may intersect and may coincide with each other over a certain length.
PL lines and layer boundaries may intersect.
All PL-lines must start and end at the same horizontal coordinate.
All Xcoordinates on a PL-line must be strictly ascending – that is, the equation X[i+1] > X[i]
must be valid for each following pair of Xcoordinates (no vertical parts allowed).
One way for inputting geometry data is through the Geometry menu, as explained in the
Reference section (section 4.3). This section describes an other way to create and manipulate
geometry graphically using the tool buttons of the View Input window.
7.3 View Input Window
110 of 286 Deltares
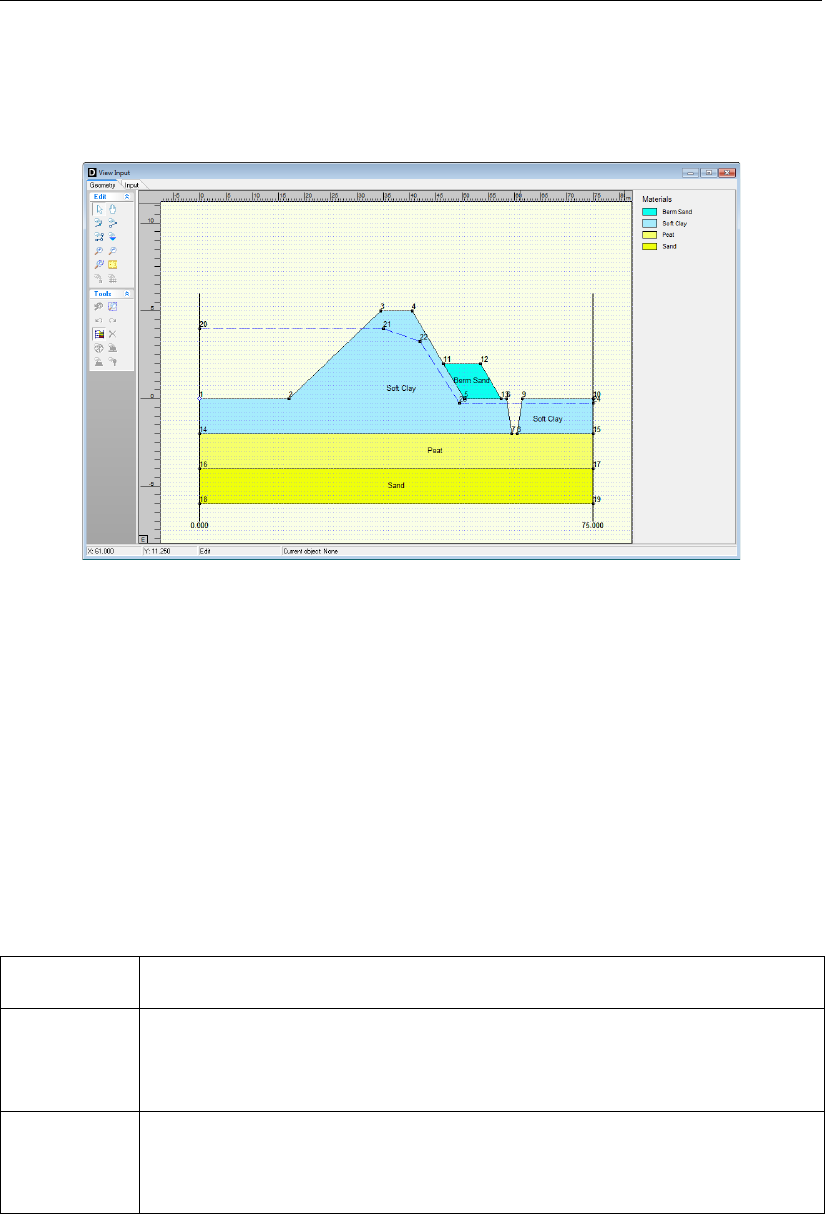
Graphical Geometry Input
7.3.1 General
To use the View Input option, click the Geometry tab to activate it in the regular View Input
window or use the menu to select it.
Figure 7.1: View Input window, Geometry tab
When the Geometry tab in the View Input window is selected, it displays a graphical repre-
sentation of only the geometrical data. On the left of the window, the Edit and Tools buttons
are displayed (section 7.3.2). On the right, the legend belonging to the geometry is displayed
(section 7.3.3). At the bottom of the window, the title panel and the info bar are displayed. The
title panel displays the project titles defined using the Properties option in the Project menu.
The info bar provides information (from left to right) about the current cursor position, the cur-
rent mode and the object currently selected. The legend, title panel and info bar are optional
and can be controlled using the Properties option in the Project menu (section 4.1.3).
It is possible to use three different modes when working in the Geometry tab of the View Input
window:
Select The Select mode is the default mode and enables the user to select existing
elements in the window.
Add The Add mode allows the addition of elements using one of the Add but-
tons. By selecting one of these buttons, one switches to the Add mode. As
long as this mode is active, the user can add the type of element which is
selected.
Zoom The Zoom mode allows the user to view the input geometry in different
sizes. By selecting one of the Zoom buttons or the Pan button, one activates
the Zoom mode. While in this mode, the user can repeat the zoom or pan
actions without re-selecting the buttons.
It is possible to change modes in the following ways. When in Add or Zoom mode, it is
possible to return to the Select mode by clicking the right-hand mouse button, or by pressing
the Escape key, or by clicking the Select mode button. To activate the Add mode, select one
of the Add buttons. To activate the Zoom mode, select one of the Zoom buttons or the Pan
button.
Deltares 111 of 286
D-GEO STABILITY
, User Manual
Note: The current mode is displayed on the info bar at the bottom of the View Input window.
7.3.2 Buttons
Select and Edit mode
In this mode, the left-hand mouse button can be used to graphically select a previ-
ously defined grid, load, geotextile or forbidden line. Items can then be deleted or
modified by dragging or resizing, or by clicking the right-hand mouse button and
choosing an option from the menu displayed. Pressing the Escape key will return
the user to this Select and Edit mode.
Pan
Click this button to change the visible part of the drawing by clicking and dragging
the mouse.
Add point(s) to boundary / PL-line
Click this button to add points to all types of lines (e.g. poly-lines, boundary lines,
PL-lines). By adding a point to a line, the existing line is split into two new lines.
This provides more freedom when modifying the geometry.
Add single lines(s)
Click this button to add single lines. When this button is selected, the first left-hand
mouse click will add the info bar of the new line and a “rubber band” is displayed
when the mouse is moved. The second left-hand mouse click defines the end
point (and thus the final position) of the line. It is now possible to either go on
clicking start and end points to define lines, or stop adding lines by selecting one
of the other tool buttons, or by clicking the right-hand mouse button, or by pressing
the Escape key.
Add polyline(s)
Click this button to add poly-lines. When this button is selected, the first left-hand
mouse click adds the starting point of the new line and a “rubber band” is displayed
when the mouse is moved. A second left-hand mouse click defines the end point
(and thus the final position) of the first line in the poly-line and activates the “rubber
band” for the second line in the poly-line. Every subsequent left-hand mouse click
again defines a new end point of the next line in the poly-line. It is possible to end
a poly-line by selecting one of the other tool buttons, or by clicking the right-hand
mouse button, or by pressing the Escape key. This also stops adding poly-lines
altogether.
A different way to end a poly-line is to double-click the left-hand mouse button.
Then the poly-line is extended automatically with an ‘end line’. This end line runs
horizontally from the position of the double-click to the limit of the geometry in the
direction the last line of the poly-line was added. Therefore, if the last line added
was defined left to right, the ‘end line’ will stop at the right limit. Note that by
finishing adding a poly-line this way, it is possible to start adding the next poly-line
straight away.
112 of 286 Deltares
Graphical Geometry Input
Add PL-line(s)
Click this button to add a piezometric level line (PL-line). Each PL-line must start
at the left limit and end at the right limit. Furthermore, each consecutive point must
have a strictly increasing X coordinate. Therefore, a PL-line must be defined from
left to right, starting at the left limit and ending at the right limit. To enforce this,
the program will always relocate the first point clicked (left-hand mouse button) to
the left limit by moving it horizontally to this limit. If trying to define a point to the
left of the previous point, the rubber band icon indicates that this is not possible.
Subsequently clicking on the left side of the previous point, the new point will be
added at the end of the rubber band icon instead of the position clicked.
As with poly-lines, it is also possible to end a PL-line by double-clicking the left-
hand mouse button. In this case, the automatically added ‘end line’ will always
end at the right limit.
To stop adding PL-lines, select one of the other tool buttons, or click the right-hand
mouse button, or press the Escape key.
Measure the distance between two points
Click this button, then click the first point on the View Input window and place the
cross on the second point. The distance between the two points can be read at
the bottom of the View Input window. To turn this option off, click the escape key.
Zoom in
Click this button to enlarge the drawing, then click the part of the drawing which is
to be at the center of the new image. Repeat if necessary.
Zoom out
Click this button, then click on the drawing to reduce the drawing size. Repeat if
necessary.
Zoom rectangle
Click this button then click and drag a rectangle over the area to be enlarged. The
selected area will be enlarged to fit the window. Repeat if necessary.
Add geotextile
In this mode, it is possible to use the left mouse button to graphically define the
starting and end point of a geotextile section. The stability of a slope will increase
if a slip plane crosses a geotextile.
Add nail
In this mode, it is possible to use the left mouse button to graphically define the
starting and end point of a nail. The resistance of the soil will increase.
Add fixed point
Click this button to graphically define the position of a point that will be part of the
critical slip circle.
Add calculation grid
Click this button to graphically define the initial position of the trial grid with slip-
circle center points and the corresponding positions of the trial horizontal tangent
lines of the slip circle.
Undo zoom
Click this button to undo the zoom. If necessary, click several times to retrace
each consecutive zoom-in step that was made.
Zoom limits
Click this button to display the complete drawing.
Undo
Click this button to undo the last change(s) made to the geometry
Deltares 113 of 286
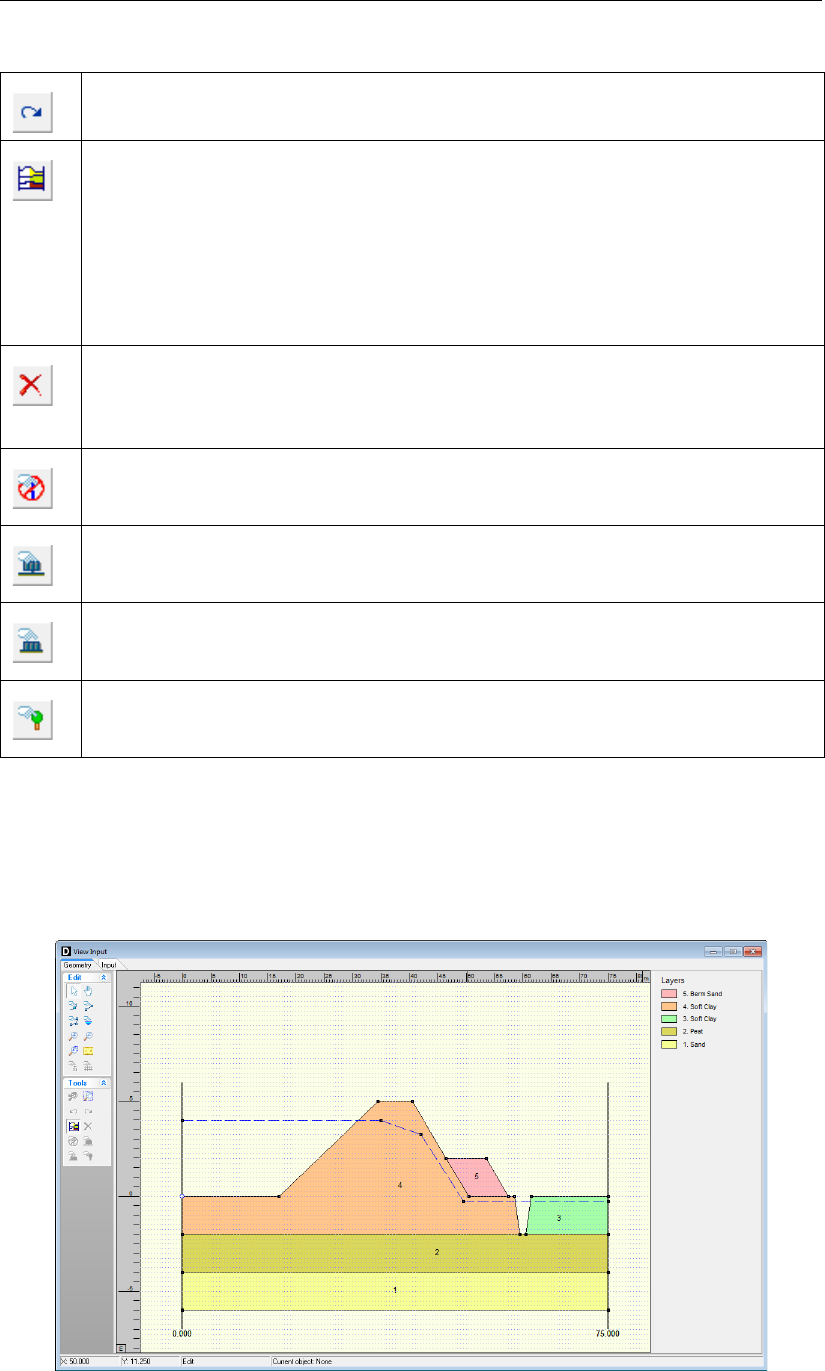
D-GEO STABILITY
, User Manual
Redo
Click this button to redo the previous Undo action
Automatic regeneration of geometry on/off
When selected, the program will automatically try to generate a new valid geom-
etry whenever geometry modifications require this. During generation, (poly)lines
(solid blue) are converted to boundaries (solid black), with interjacent layers. New
layers receive a default material type. Existing layers keep the materials that were
assigned to them. Invalid geometry parts are converted to construction elements.
Automatic regeneration may slow down progress during input of complex geome-
try, because validity will be checked continuously.
Delete
Click this button to delete a selected element. Note that this button is only available
when an element is selected. See section 7.5.2 for more information on how using
this button.
Add forbidden lines
Click this button to display a window in which it is possible to add, modify or delete
lines. Slip circles are not allowed to cross forbidden lines.
Add line loads
Click this button to display a window in which it is possible to add, modify or delete
point loads per unit of length.
Add uniform loads
Click this button to display a window in which it is possible to add, modify or delete
uniform loads per unit of area.
Edit tree on slope
Click this button to display a window in which it is possible to define the position
of trees on the slope and the magnitude of wind.
7.3.3 Legend
At the right side of the View Input window (Figure 7.2) the legend belonging to the geometry
is shown. This legend is present only if the Legend check-box in the View Input tab of the
Project Properties window is activated (see section 4.1.3).
Figure 7.2: View Input window, Geometry tab (legend displayed as Layer Numbers)
114 of 286 Deltares
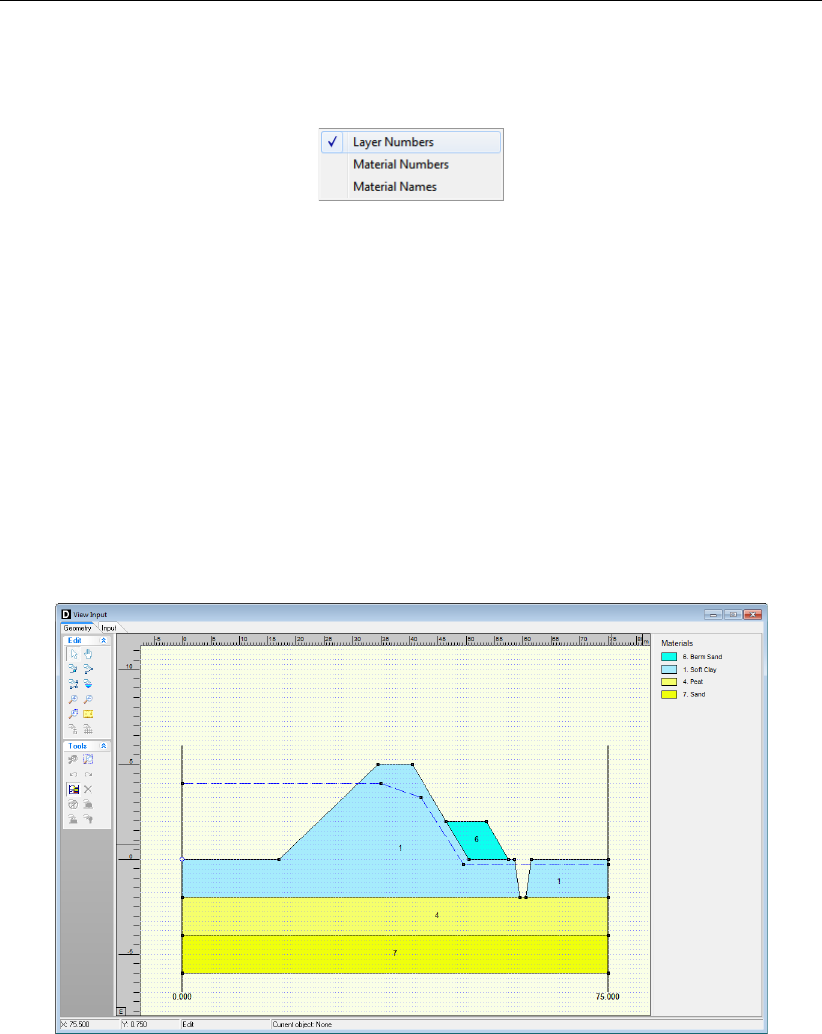
Graphical Geometry Input
In the Geometry tab of the View Input window, it is possible to change the type of legend.
When a soil type box in the legend is right clicked, the menu from Figure 7.3 is displayed.
Figure 7.3: Legend, Context menu
With this menu, there are three ways to display the legend of the layers:
As Layer Numbers: the legend displays one box for each layer. Each layer (and there-
fore each box) is displayed in a different standard color. Next to each box, the layer
number and the material name are displayed, corresponding to the color and number
of the layer in the adjacent Geometry window (see Figure 7.2).
As Material Numbers: the legend displays one box for each material. Each material
(and therefore each box) is displayed in a different color which can be changed by
the user (see below). Next to each box, the material number and name are displayed,
corresponding to the color and number of the material in the adjacent Geometry window
(see Figure 7.4).
Figure 7.4: View Input window, Geometry tab (legend displayed as Material Numbers)
As Material Names: the legend displays one box for each material. Each material (and
therefore each box) is displayed in a different color which can be changed by the user
(see below). Next to each box, only the material name is displayed, corresponding to
the color and name of the material in the adjacent Geometry window (see Figure 7.5).
Deltares 115 of 286
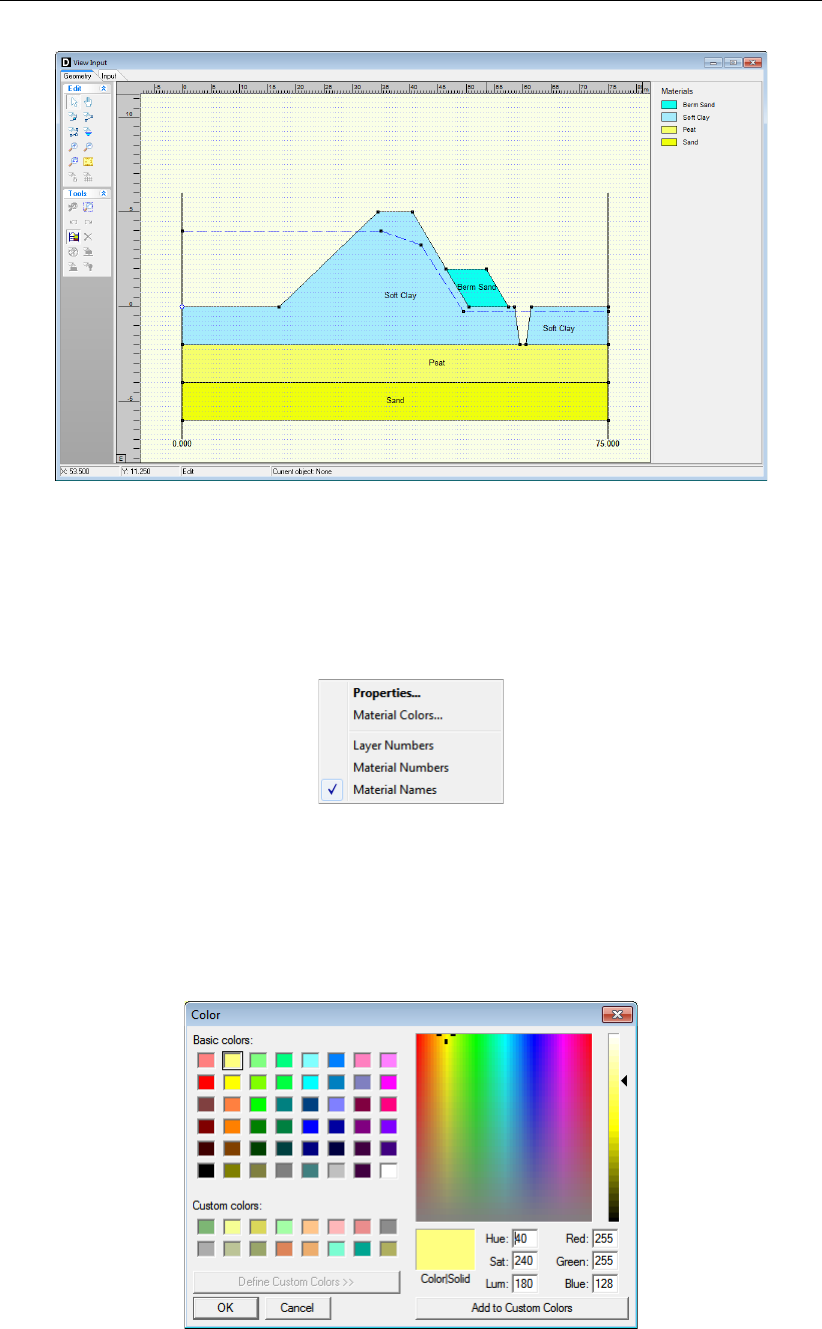
D-GEO STABILITY
, User Manual
Figure 7.5: View Input window, Geometry tab (legend displayed as Material Names)
Unlike the standard colors used to display layers with their layer colors, it is possible to define
different colors used when displaying materials. To change the color assigned to a material,
right click the material box. The menu from Figure 7.6 is displayed.
Figure 7.6: Legend, Context menu (for legend displayed as Materials)
When selecting Material Colors the Color window appears (Figure 7.7), in which the user can
pick a color or even define customized colors himself (by clicking the Define Custom Colors
button).
Figure 7.7: Color window
116 of 286 Deltares
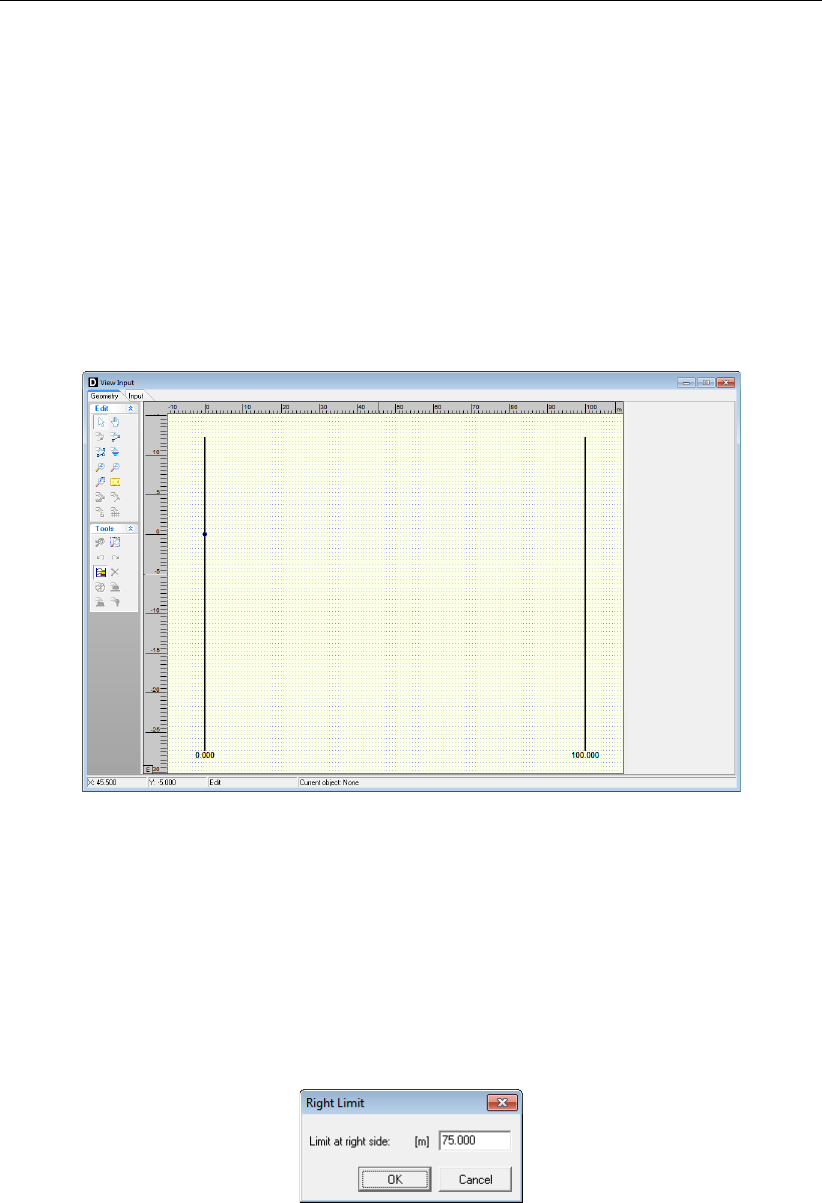
Graphical Geometry Input
7.4 Geometry modeling
7.4.1 Create a new geometry
There are two ways to create a new geometry without the wizard:
Open the Geometry menu and choose New.
Open the File menu and choose New. In the New File window displayed, select New
geometry and click OK (see section 3.1).
In both cases, the Geometry tab of the View Input window is displayed (Figure 7.8) with the
default limits of the geometry (from 0 to 100 m).
Figure 7.8: View input window, Geometry tab
7.4.2 Set limits
The first thing to do when creating new geometry is to set the model limits. This is possible by
selecting and then dragging the limits to their proper place one by one. It is also possible to
select a limit and edit its value by clicking the right-hand mouse button after selecting the limit
and then choosing the Properties option in the pop-up menu. The property window belonging
to the selected limit is displayed (Figure 7.9), enabling to define the new X coordinate for this
limit.
Figure 7.9: Right Limit window
Deltares 117 of 286
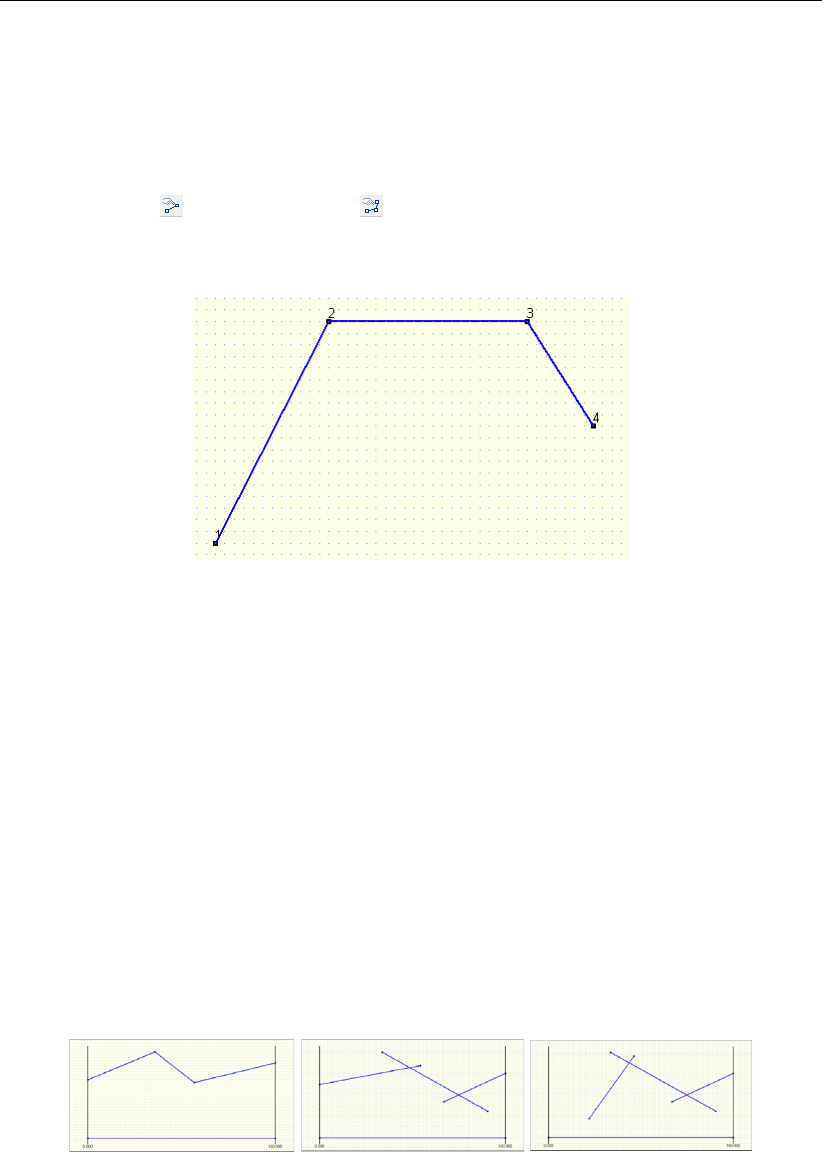
D-GEO STABILITY
, User Manual
7.4.3 Draw layout
It is possible to use the Add single line(s),Add polyline(s) and Add point(s) to boundary / PL-
line buttons to draw the layout of the geometry. See section 2.2.3 for more information’s on
how using those buttons.
Add single line(s) and Add polyline(s)
Each (poly)line is displayed as a solid blue line, and each point as a small black rectangle
(Figure 7.10).
Figure 7.10: Representation of a polyline
The position of the different points of a (poly)line can be modified by dragging the points as
explained in section 7.5.4 or by editing the (poly)line. This is done by clicking the right-hand
mouse button after selecting the (poly)line and then choosing the Properties option in the
pop-up menu (section 7.5.3).
The underlying grid helps the user to add and edit (poly)lines. Use the Properties option in
the Project menu to adjust the grid distance and force the use of the grid by activating Snap
to grid (section 4.1.3). When this option is activated, each point is automatically positioned at
the nearest grid point.
The specified line pieces must form a continuous line along the full horizontal width of the
model. This does not mean that each line piece has to be connected exactly to its predecessor
and/or its successor. Intersecting line pieces are also allowed, as shown in the examples of
Figure 7.11.
(1) (2) (3)
Figure 7.11: Examples of configurations of (poly)lines
Configuration (1) is allowed. The different lines are connected and run from boundary
to boundary
Configuration (2) is also allowed. The different are connected. They are defined as
being connected because they intersect. The line construction runs from boundary to
boundary.
Configuration (3) is illegal, as there is no connection with the left boundary.
118 of 286 Deltares
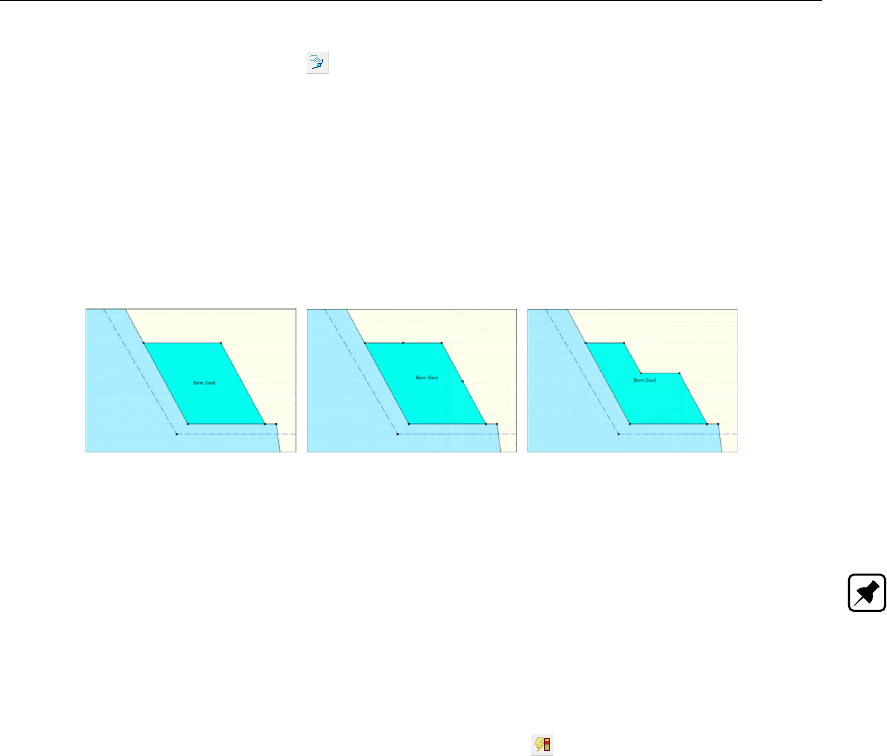
Graphical Geometry Input
Add point(s) to boundary / PL-line
Use this button to add extra points to lines (lines, polylines, boundary lines, PL-lines). By
adding a point to a line, the existing line is split into two new lines. This provides more freedom
when modifying the geometry.
For example, the shape of the berm of Figure 7.12 (1) needs to be modified. Two points
are added to the outer lines of the berm as shown in Figure 7.12 (2). Then, the middle
point is selected and dragged to the position that completes the new geometry as shown in
Figure 7.12 (3).
(1) (2) (3)
Figure 7.12: Modification of the shape of a berm
Note: When the Add point(s) to boundary / PL-line button is clicked, each left-hand mouse
click adds a new point to the nearest line until one of the other tool buttons is selected, or click
the right-hand mouse button, or press the Escape key.
7.4.4 Generate layers
Use the Automatic regeneration of geometry on/off button to start or stop the automatic
conversion of construction elements to actual boundaries and layers. Valid (poly)lines are
converted to boundaries, which are displayed as black lines. Invalid lines remain blue.
Layers are generated between valid boundaries, and default soil types are assigned.
It is possible to modify the soil type assigned to a layer by first selecting the layer and then
clicking the right-hand mouse button and choosing the Layer Properties option in the pop-
up menu to display the layer window (see Figure 7.21 in section 7.5.3). Once a material
has been assigned to a layer, this material will continue to be associated to that layer in
subsequent conversions of construction elements as long as the layer is not affected by those
conversions.
The most common cause of invalid (poly)lines is that they are not part of a continuous poly-
line running from limit to limit. Sometimes, lines appear to start/end at a limit without actually
being on a limit. Figure 7.13 gives an example: on the left geometry (1), the end of the line
seems to coincide with the boundary. However, zooming in on the point (geometry (2) on the
right) reveals that it is not connected to the boundary. Therefore the geometry is considered
invalid.
It is possible to correct this by dragging the point to the limit while the specific area is zoomed
in or by selecting the point, clicking the right-hand mouse button, choosing the Properties
option in the pop-up menu (section 7.5.3) and making the X coordinate of the point equal to
the X coordinate of the limit.
Deltares 119 of 286
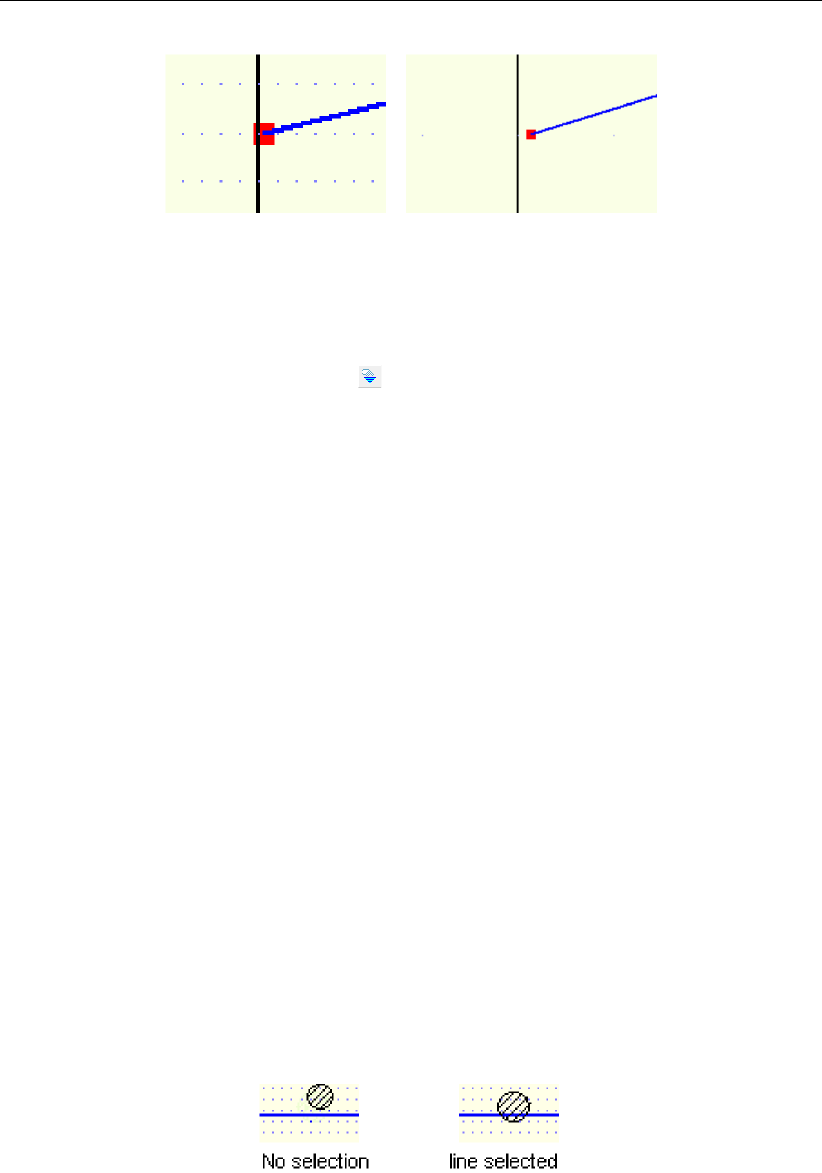
D-GEO STABILITY
, User Manual
(1) (2)
Figure 7.13: Example of invalid point not connected to the left limit
7.4.5 Add piezometric level lines
It is possible to use the Add PL-line(s) button to add PL-lines. When adding a PL-line,
D-GEO STABILITY
imposes the limitation that the subsequent points of the PL-line have an in-
creasing X coordinate. Furthermore the first point of a PL-line is to be set on the left boundary
and the last point on the right boundary.
It is possible to change the position of the different points of a PL-line by dragging the points
as explained in section 7.5.4 or by editing the PL-line. This is done by selecting the PL-line,
clicking the right-hand mouse button and choosing the Properties option in the pop-up menu
(section 7.5.3).
7.5 Graphical manipulation
7.5.1 Selection of elements
After selecting a geometry element it is possible to manipulate it. In order to be able select a
geometry element, the select mode should be active. Then it is possible to select an element
by clicking the left-hand mouse button. To select a layer, click on the layer number, material
number or material name, depending on the option chosen in the Properties dialog in the
Project menu. When successfully selected, the element will be displayed highlighted (for
example, a point will be displayed as a large red box instead of a small black box).
The following remarks are relevant to selection accuracy and ambiguity.
Accuracy
The program draws a circular selection area around the mouse pointer. If the element falls
within this circle, it will be selected when click the left-hand mouse button is clicked (Fig-
ure 7.14).
Figure 7.14: Selection accuracy as area around cursor
The Selection accuracy determines the required distance between the mouse pointer and the
geometrical element for selection. It is possible to use the Properties option in the Project
menu to modify the accuracy (section 4.1.3). This is defined in percentages of the screen
size and its default value is 2%. If a larger percentage is defined, this increases the selection
area. However, if the percentage is set to a relatively high value, the accuracy required for
the selection of certain geometry items may be inaccurate. In other words, it will most likely
120 of 286 Deltares
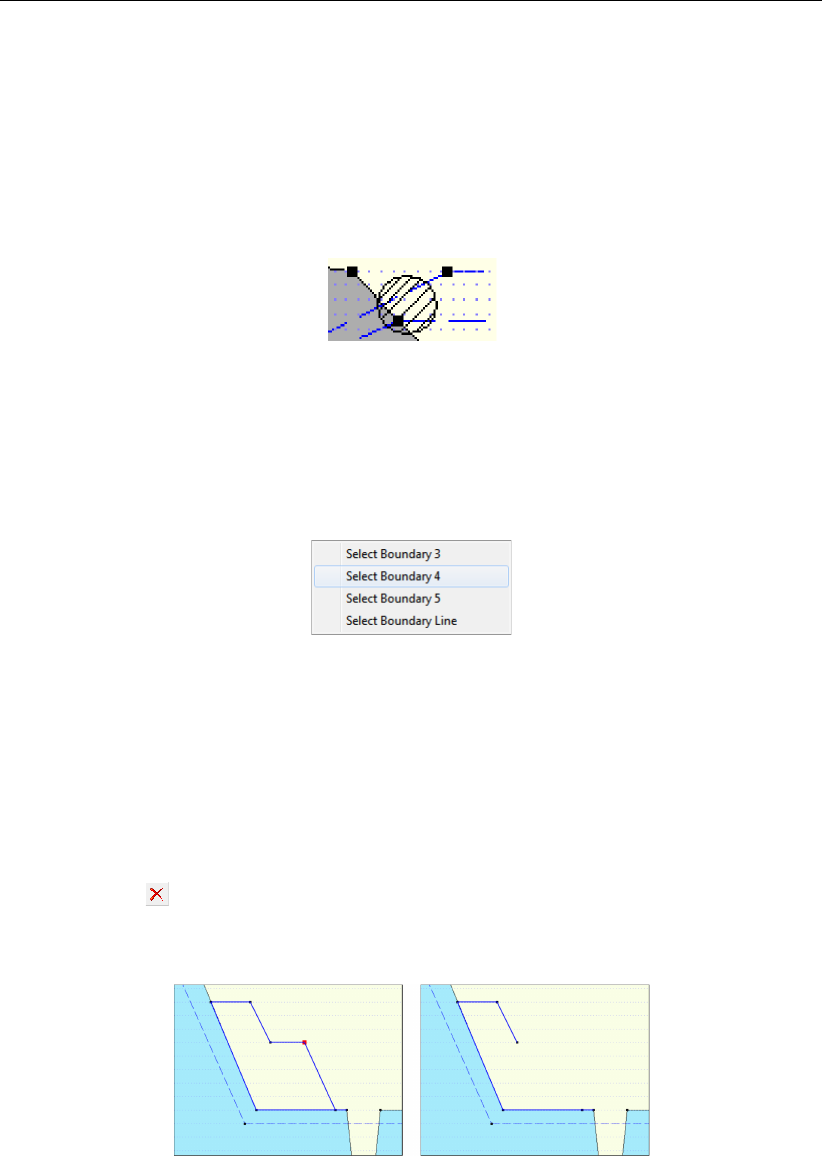
Graphical Geometry Input
result in too many ‘ambiguous’ selections (see the following section), or will make it difficult to
perform an intentionally empty selection.
Ambiguous selection
A selection of geometrical elements can be ambiguous. Figure 7.15 gives an example: a user
may want to select a point, a boundary line, a boundary or a PL-line. As several elements are
in close proximity to each other,
D-GEO STABILITY
does not automatically select an element.
Figure 7.15: Selection accuracy as area around cursor
In this case
D-GEO STABILITY
requires the user to assign the element that is to be selected by
displaying a pop-up menu (Figure 7.16) with the available types of elements within the range
of the selection click. It is possible to select the element from this menu.
Figure 7.16: Selection accuracy as area around cursor
Clear selection
It is possible to clear a selection by clicking in an area without geometry elements in the direct
area.
7.5.2 Deletion of elements
Click the Delete button to delete a selected element. This button is only available when an
element is selected. When a point is selected and deleted, it and all lines connected to it are
deleted as shown in Figure 7.17.
Before After
Figure 7.17: Example of deletion of a point
When a geometry point (a point used in a boundary or PL-line) is selected and deleted, the
program deletes the point and its connected boundary lines as shown in Figure 7.18. It then
inserts a new boundary that reconnects the remaining boundary lines to a new boundary.
Deletion of a geometry element (boundary, boundary line, geometry point, PL-line) can result
in automatic regeneration of a new valid geometry, if the Automatic regeneration option is
switched on.
Deltares 121 of 286
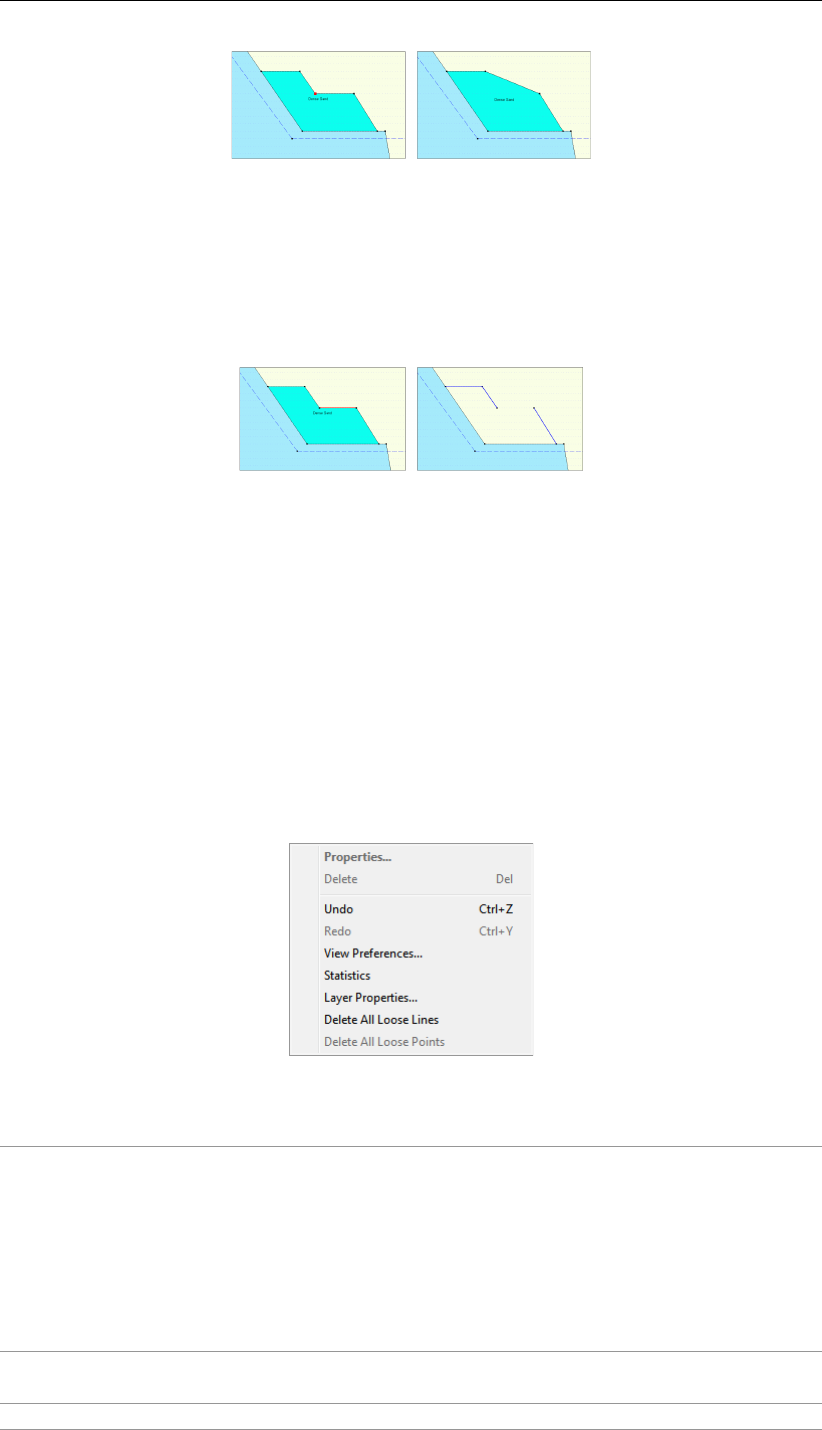
D-GEO STABILITY
, User Manual
Before After
Figure 7.18: Example of deletion of a geometry point
When a line is selected and then deleted, the line and its connecting points are deleted as
shown in Figure 7.19. In addition the layer just beneath that boundary is deleted. All other line
parts that are not part of other boundaries will be converted to construction lines.
Before After
Figure 7.19: Example of deletion of a line
7.5.3 Using the right-hand mouse button
When using the mouse to make geometrical manipulations, the right mouse button enables
full functionality in a pop-up menu, while the left button implies the default choice. The options
available in the pop-up menu depend on the selected geometrical element and the active
mode.
When the Select mode is active and the right-hand mouse button is clicked, the pop-up menu
of Figure 7.20 is displayed.
Figure 7.20: Pop-up menu for right-hand mouse menu (Select mode)
Properties... When this option is clicked, the property editor for the selected object
is displayed. This procedure is performed by first selecting an object
by clicking on it with the left-hand mouse button. Then clicking the right-
hand mouse button anywhere in the graphic window will display the pop-
up menu. It is possible to use the property editor to quickly adapt the
values (properties) of the selected object. Each type of element requires
its own properties and therefore its own property editor as shown from
Figure 7.22 to Figure 7.25 below.
Delete This option deletes the element that has been selected (see the com-
ments for the Delete button in section 7.5.2).
Undo This option will undo the last change(s) made to the geometry.
122 of 286 Deltares
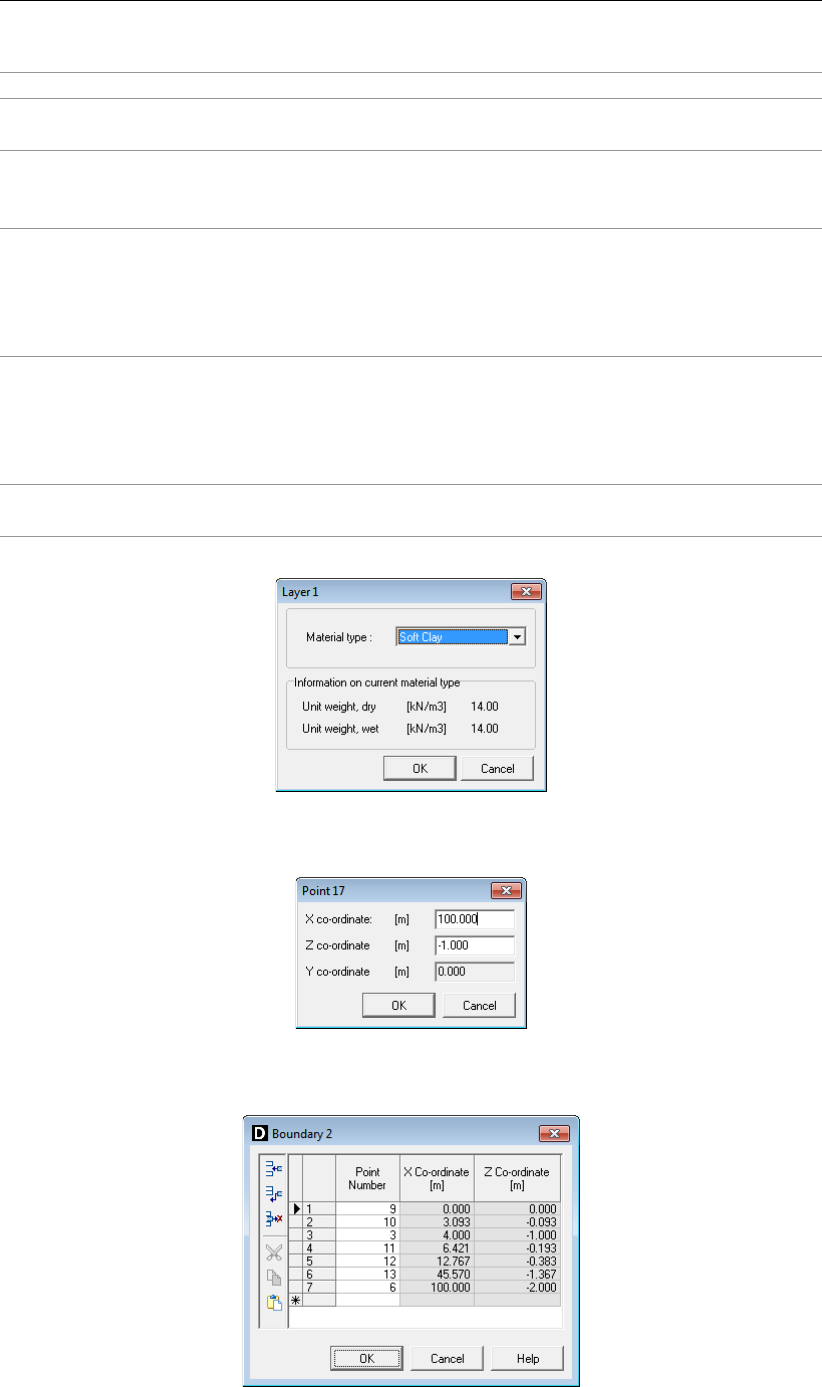
Graphical Geometry Input
Redo This option will redo the previous Undo action.
View Prefer-
ences
This option opens the Properties dialog in the Project menu as displayed
in.
Statistics It is possible to use this option to view a window displaying all the vital
statistics of the input data. Note that in the window construction lines
are called free lines.
Layer
Properties...
This option is a special feature that edits the material properties of lay-
ers. It is possible to click anywhere in a layer and directly choose this
option to edit its properties (Figure 7.21). Clicking outside the geometry
layers will display the menu with the Layer Properties option disabled,
as there is no layer for which properties can be displayed.
Delete All
Loose Lines
This option will delete all loose lines. Loose lines are actually construc-
tion lines that are not part of the boundaries or PL-lines (therefore, all
lines displayed as solid blue lines). With this option, it is possible to
quickly erase all the “leftover bits” of loose lines that may remain after
converting lines to a geometry.
Delete All
Loose Points
This option will delete all loose points.
Figure 7.21: layer window (Property editor of a layer)
Figure 7.22: Point window (Property editor of a point)
Figure 7.23: Boundary window (Property editor of a polyline)
Deltares 123 of 286
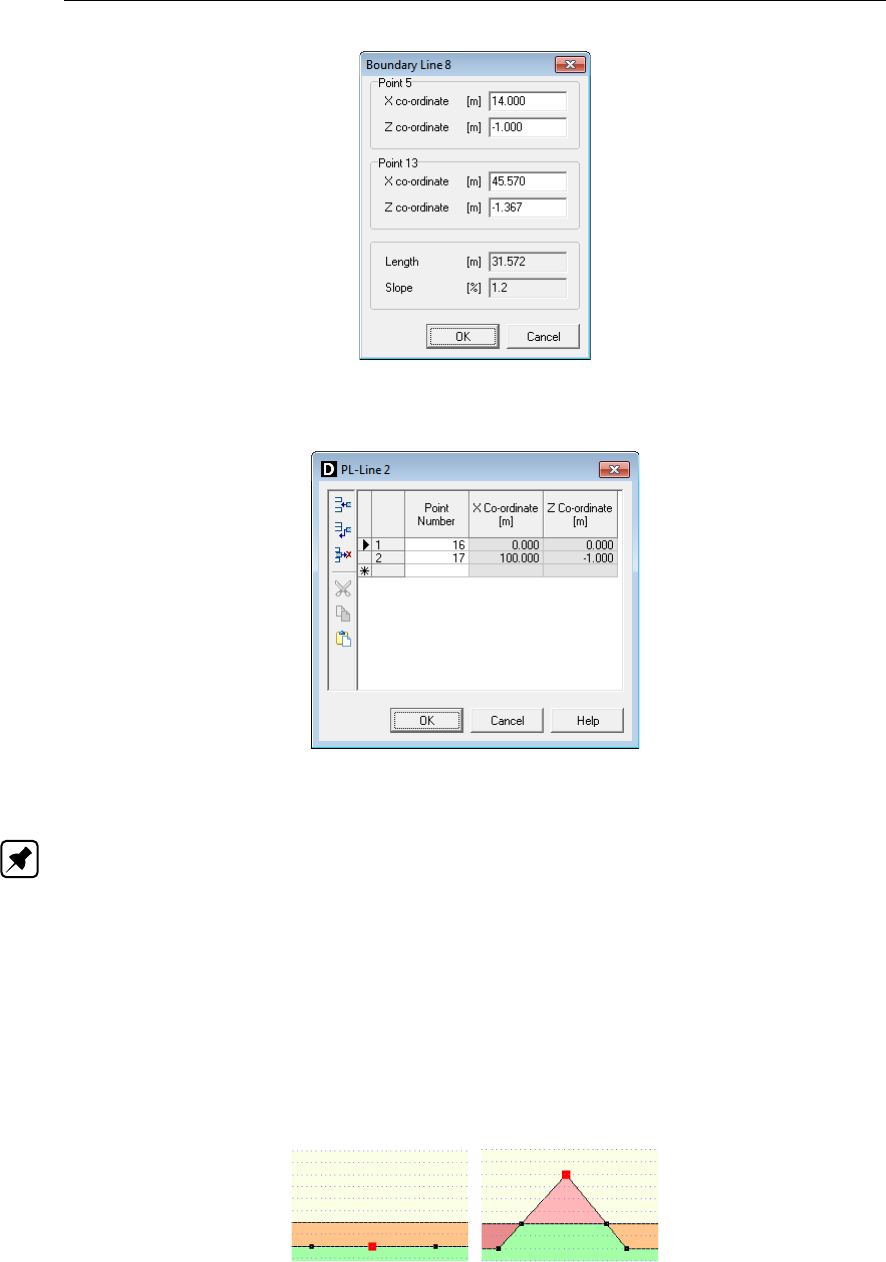
D-GEO STABILITY
, User Manual
Figure 7.24: Boundary window (Property editor of a line)
Figure 7.25: PL-line window (Property editor of a PL-line)
Note: In the Boundary and PL-line properties windows, only the point’s number can be
modified, not the X and Y coordinates.
7.5.4 Dragging elements Drag and drop
One way to modify elements is to drag them to other locations. To drag an element, first select
it. Once the element has been selected, it is possible to drag it by pressing and holding down
the left-hand mouse button while relocating the mouse cursor. Dragging of geometry elements
can result in automatic regeneration of geometry, if this option is switched on section 7.4.4
as shown in the example of Figure 7.26: when the selected point is moved upwards, a new
geometry will be created.
D-GEO STABILITY
creates new layers according to this new geometry.
Before After
Figure 7.26: Example of dragging of a point
124 of 286 Deltares
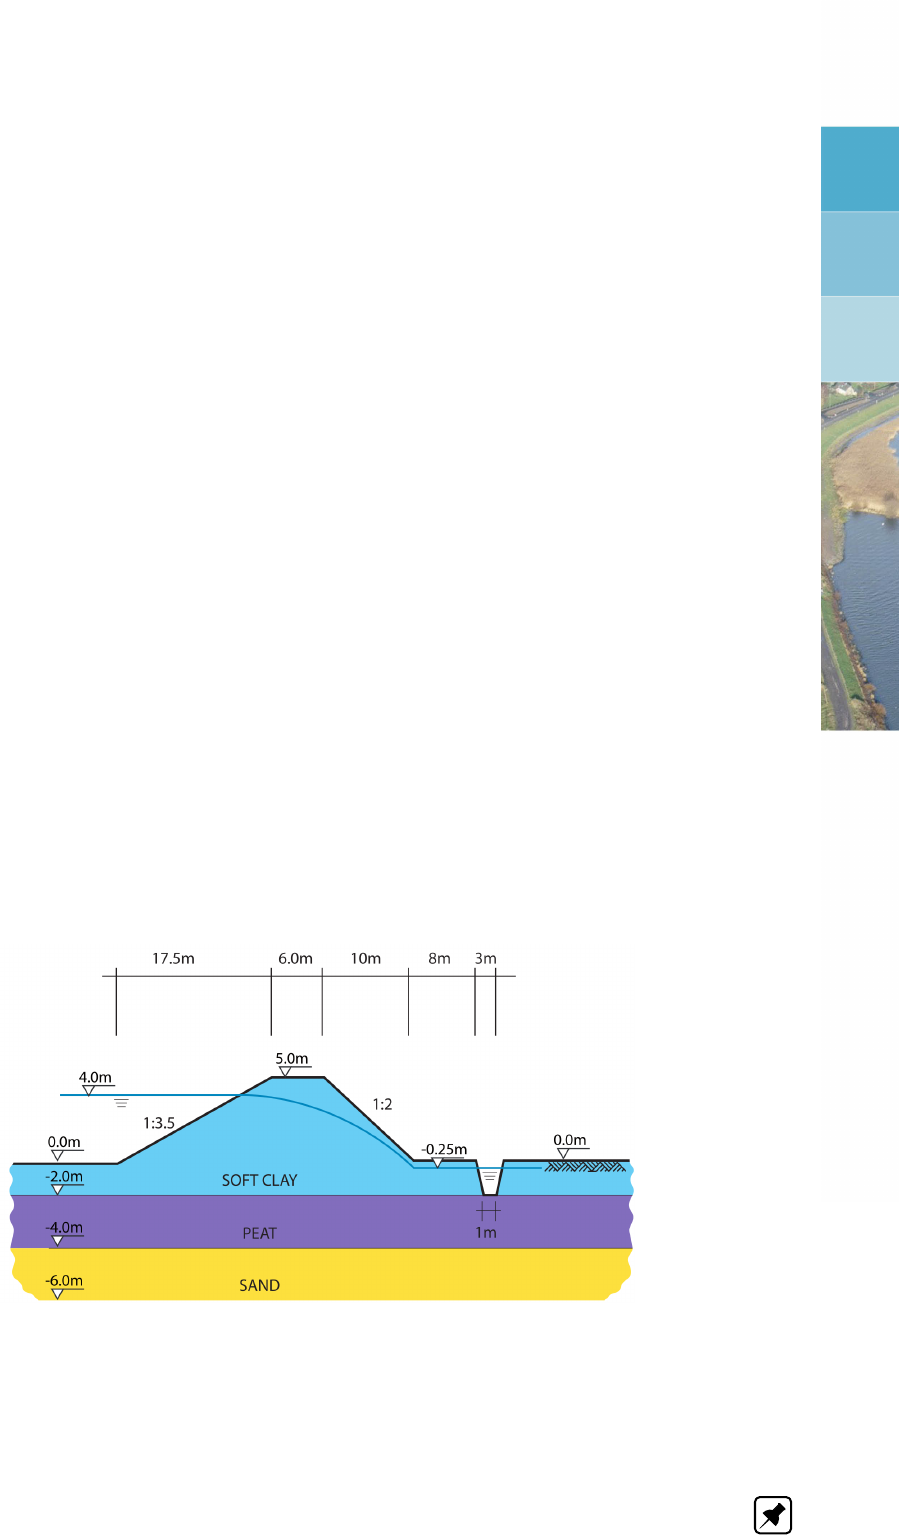
8 Tutorial 1: Dike reinforced with berm
In this first tutorial the safety factor of a dike body which is part of a water retaining reservoir
is determined and shows that the dike body doesn’t meet the safety requirement. Therefore,
a berm have to be added to stabilize it.
The objectives of this exercise are:
To learn the steps needed to set up a model geometry and calculation.
To learn to create soil layers and attach properties (like shear strength and friction
angle).
To perform a simple slip plane calculations using the Bishop method and to determine
the minimum safety factor.
To learn to change the existing geometry in the project.
For this example, the following
D-GEO STABILITY
module is needed:
D-GEO STABILITY
Standard module (Bishop and Fellenius).
This tutorial is presented in the files Tutorial-1a.sti and Tutorial-1b.sti.
8.1 Introduction to the case
The dike (Figure 8.1) has a high water level on the left and a low water level on the right.
The slope on the right side of the dike is relatively steep. There are three different soil layers.
These circumstances result in the fact that the dike, in its current geometry, does not meet the
required safety criterion. A situation like this might occur when river water levels rise. It will be
seen that placing a berm on the right side of the dike shall result in a more satisfactory safety
factor.
D-GEO STABILITY
is able to use the geometry, water levels, and soil layer properties to
calculate the minimum safety factor for the dike.
Figure 8.1: Water retaining dike (Tutorial 1)
The relevant values of the soil types used in this tutorial are given in Table 8.1. The properties
of ‘Berm sand’ are also given as this soil type will be used to construct the berm later on. This
berm will help to increase the safety factor.
Note: In general safety factors are described in Design Codes (which may vary from country
Deltares 125 of 286
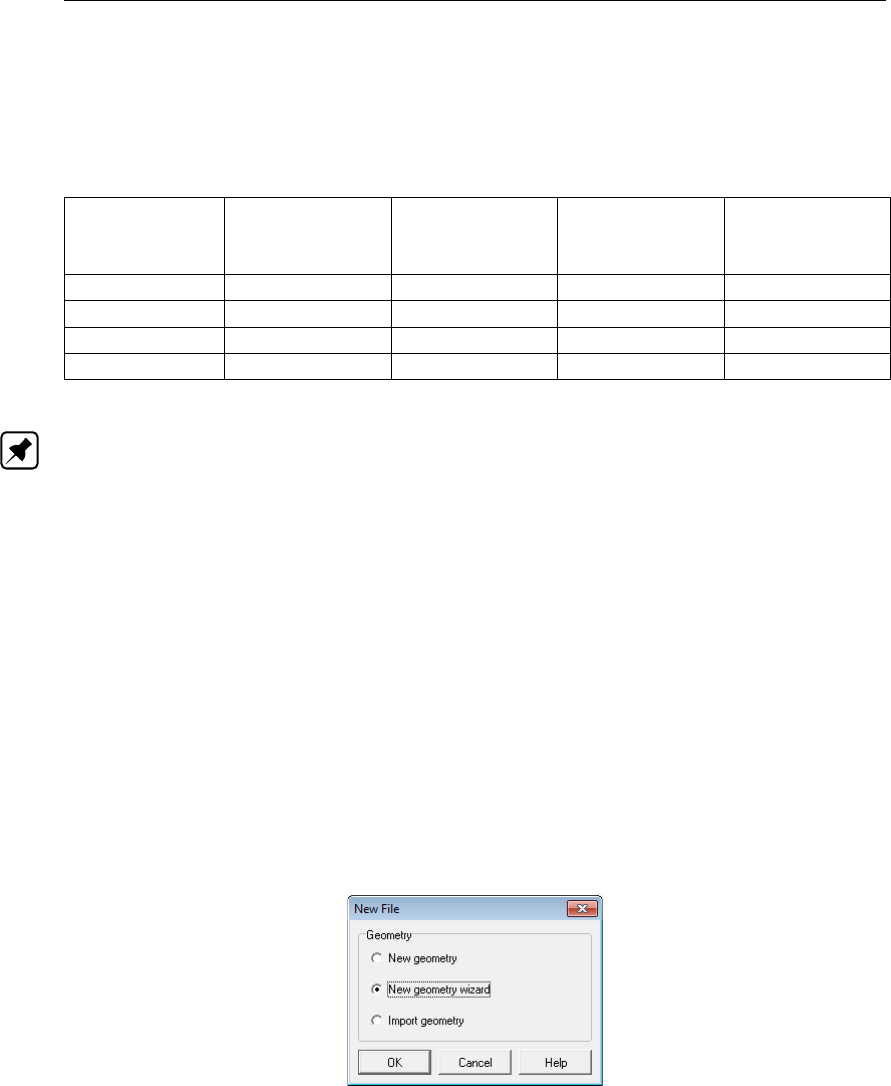
D-GEO STABILITY
, User Manual
to country). Safety factors usually depend on the type of soil structure and its location. In
the tutorials in this manual soil structures with a safety factor lower than 1.15 are considered
unsafe. Soil structures with a safety factor higher than 1.35 are considered safe.
Table 8.1: Soil properties (Tutorial 1)
Cohesion
[kN/m2]
Friction angle
[deg]
Unsaturated
unit weight
[kN/m3]
Saturated unit
weight
[kN/m3]
Soft Clay 8 20 14 14
Peat 5 15 12 12
Berm Sand 2 32 19.5 21
Sand 0 29 18 20
Note: The dilatancy ψis set equal to the friction angle ϕ.
8.2 Creating a new file using the Geometry Wizard
Firstly, the geometry of Figure 8.1 needs to be inputted in
D-GEO STABILITY
. This basis of ge-
ometry can easily be created in
D-GEO STABILITY
using the Geometry Wizard. In the Wizard,
also, basic soil layer properties can be assigned. When the Wizard is completed, modifica-
tions to complete the geometry can be made using the Edit toolbox which will be available in
the View Input window. This will make the geometry complete.
To create a new file, follow the steps described below:
1. Start
D-GEO STABILITY
from the Windows taskbar (Start/Programs/Deltares Systems/
D-GEO STABILITY
/
D-GEO STABILITY
).
2. Click File and choose New on the
D-GEO STABILITY
menu bar.
3. Select New geometry wizard (Figure 8.2) to use the geometry wizard to create the dike
geometry and click OK.
Figure 8.2: New File window
The Wizard will now go through the steps needed to set up the basic geometry of the project.
Later in this tutorial, the user shall also make slight alterations to the geometry manually.
126 of 286 Deltares
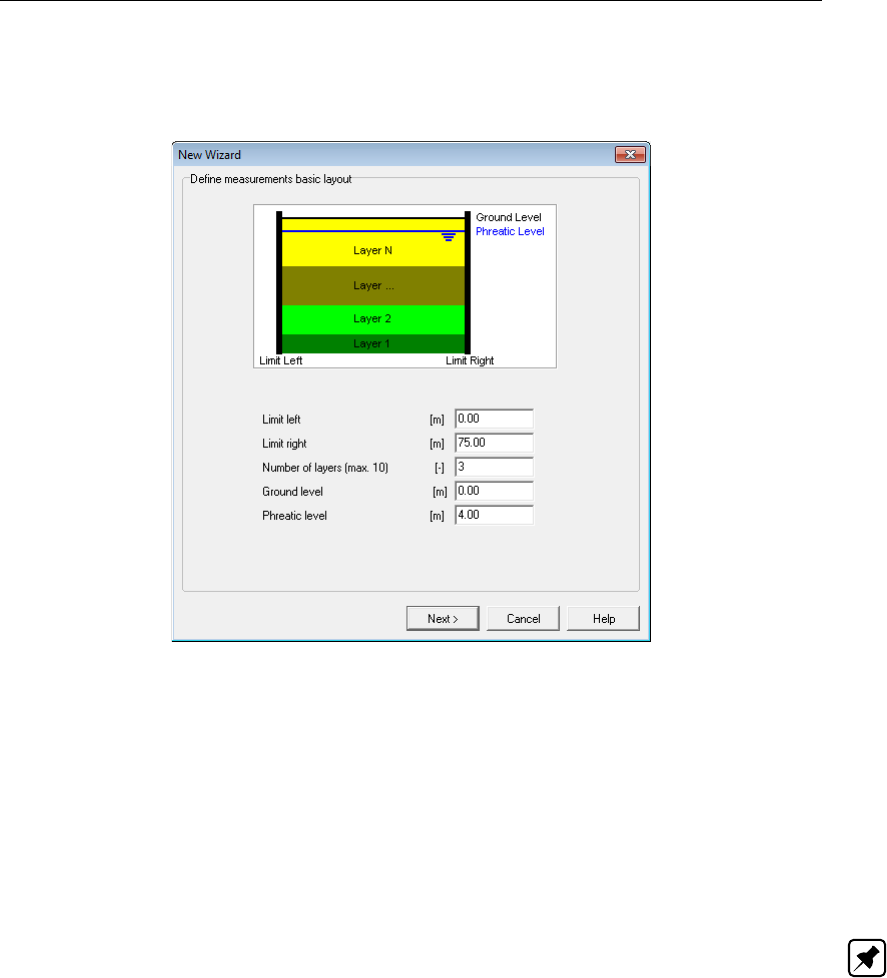
Tutorial 1: Dike reinforced with berm
8.2.1 Wizard – Basic Layout
The first Wizard window sets the basic geometrical properties of the project (Figure 8.3).
Figure 8.3: New Wizard window, Basic geometrical properties
4. Determine the boundaries of the calculation domain by checking if the left and right limits
are <0 m>and <75 m>respectively.
5. Set the number of layers to <3>.
6. Leave the ground level at 0 m.
7. In this tutorial there is a higher water level left of the dike. Set the phreatic level to <4 m>.
This will set the phreatic level to 4 m across the whole domain. Later it will be modified
manually according to Figure 8.1.
8. Click Next.
Note: Usually the left limit is 0 m and the right limit is in the order of two times the width of
the soil structure to be modeled.
8.2.2 Wizard – Shape selection
In the next window (Figure 8.4), several basic geometric situations can be selected. In this
tutorial, a dike structure without berm, but with a dewatering channel on the right must be
selected to be in accordance with Figure 8.1.
Deltares 127 of 286
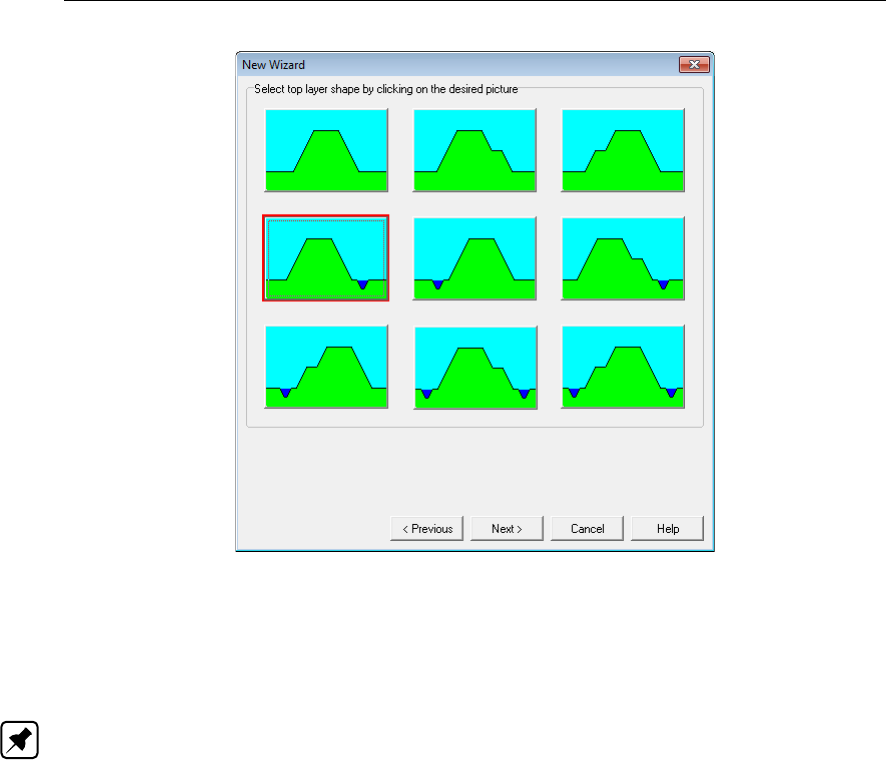
D-GEO STABILITY
, User Manual
Figure 8.4: New Wizard window, Basic geometric situation
9. Select the option with a dike with a dewatering channel on the right (also indicated in
Figure 8.4).
10. Click Next.
Note: Within the Wizard it is always possible to navigate between the wizard windows using
the Previous and Next buttons.
8.2.3 Wizard – Shape definition
In the next window (Figure 8.5), the geometric values of the dike body and the dewatering
channel can be set.
128 of 286 Deltares
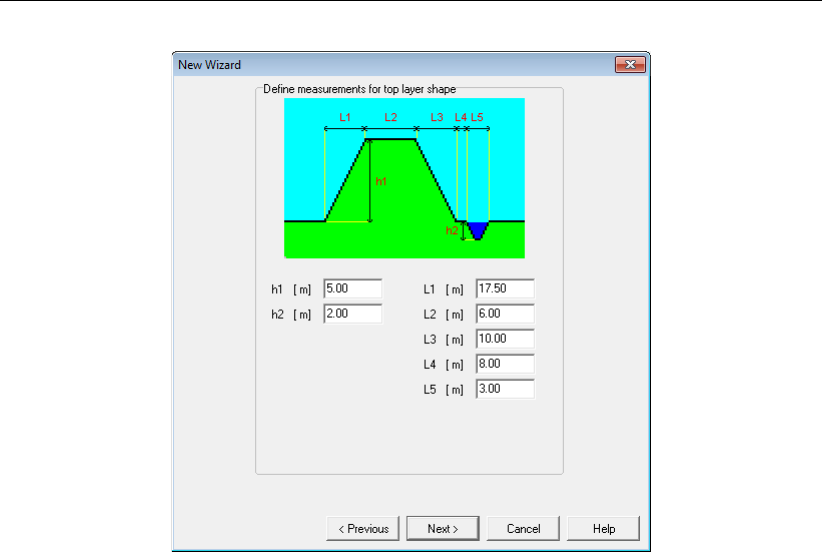
Tutorial 1: Dike reinforced with berm
Figure 8.5: New Wizard window, Top layer measurements
In Figure 8.1, the measurements of the dike and the dewatering channel have been depicted.
11. Fill in the values in Figure 8.5 to provide the measurements for the top layers.
12. Click Next.
8.2.4 Wizard – Material types
The next window (Figure 8.6) allows choosing a soil type for each layer from the drop-down
menus beside the layer numbers. Later it is possible to modify properties, including strength
properties, of the soil types.
Deltares 129 of 286
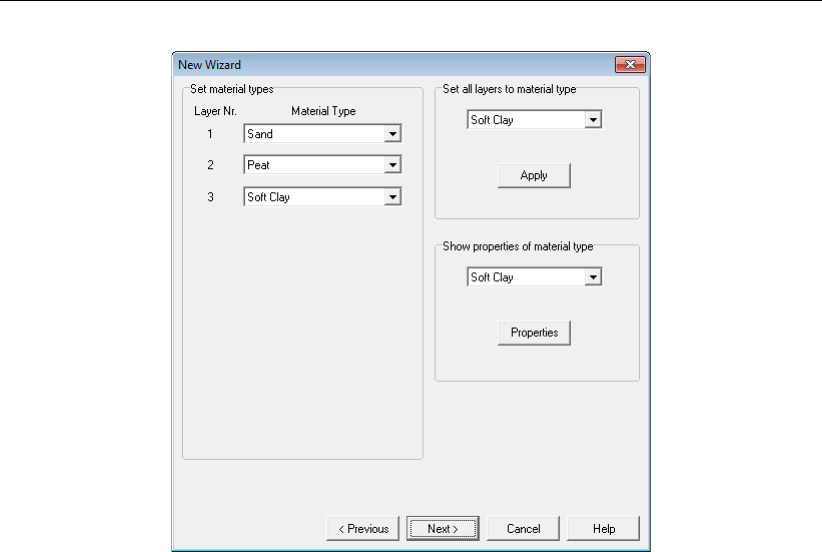
D-GEO STABILITY
, User Manual
Figure 8.6: New Wizard window, Soil selection
13. Set Layer Nr. 1 to Sand.
14. Set Layer Nr. 2 to Peat.
15. Set Layer Nr. 3 to Soft Clay.
16. Click Next.
8.2.5 Wizard – Checking
The last window of the Geometry Wizard (Figure 8.7) presents an overview of the entered
geometry. The user can check whether it is as desired. If not, the Previous button can be
used to modify the values in the previous Wizard windows.
130 of 286 Deltares
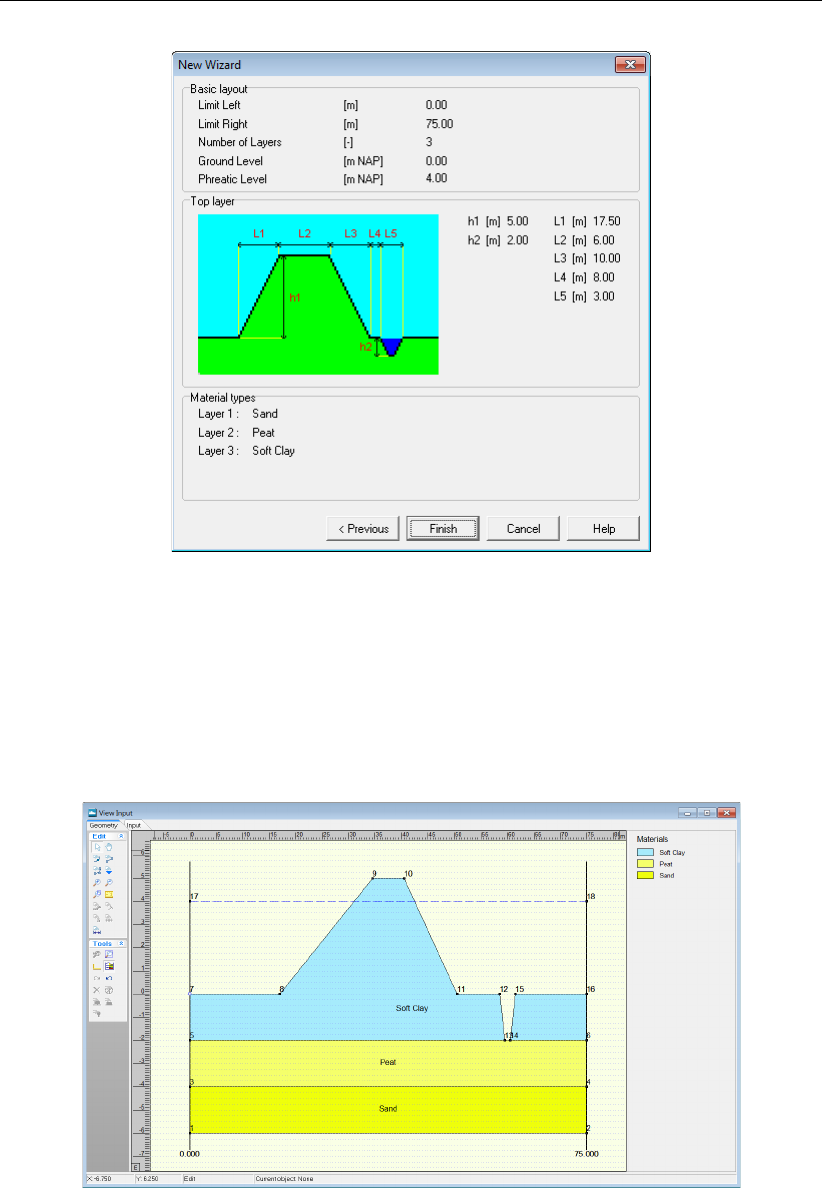
Tutorial 1: Dike reinforced with berm
Figure 8.7: New Wizard window, Geometry overview
17. Click Finish.
8.2.6 View Input
AView Input window appears (Figure 8.8) with the
D-GEO STABILITY
geometry that has been
created so far. At this point the geometry needs to be saved.
Figure 8.8: View Input window
18. Click Save as in the File menu.
19. Enter <Tutorial-1a>as file name.
20. Click Save.
8.3 Project
Deltares 131 of 286
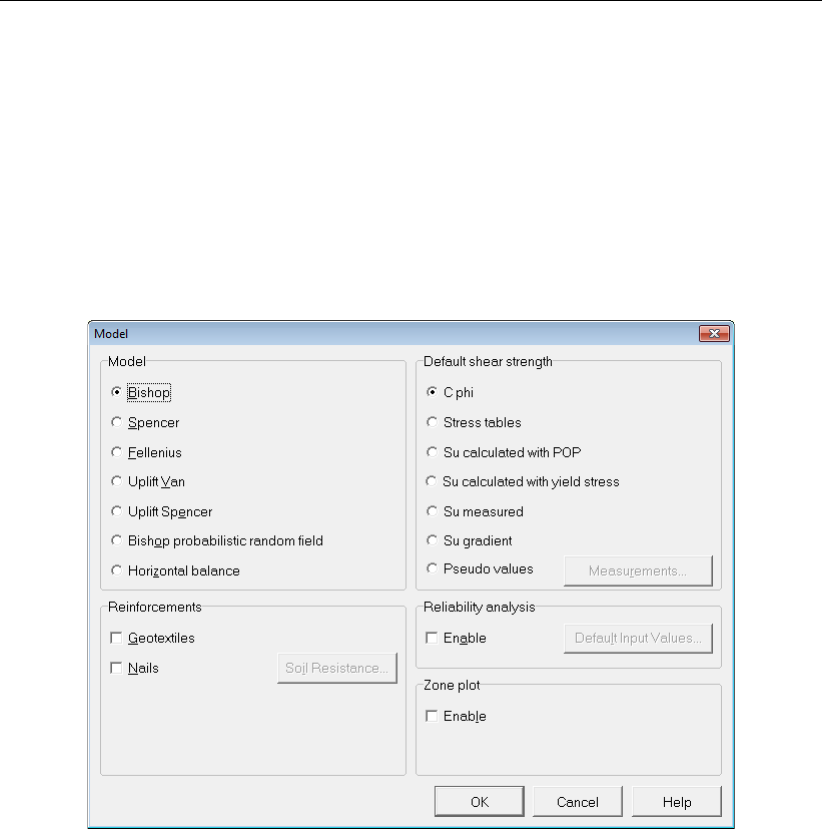
D-GEO STABILITY
, User Manual
8.3.1 Model
At this point the calculation model is to be set. In this tutorial, the minimum safety factor for
the dike structure must be determined. This can be done by assessing the stability of the dike
via one of its possible failure mechanisms, namely a slip circle. The Bishop method performs
calculations on such a slip circle therefore the Bishop model is used in this tutorial. Later, in
Definitions (section 8.6), it will be described how
D-GEO STABILITY
uses the Bishop method to
determine the minimum safety factor for the soil structure.
21. Choose Model from the Project menu to open the Model window (Figure 8.9).
Figure 8.9: Model window
22. Select the Bishop model (using a circular slip plane).
23. From the Soil menu, select Materials and set the Default shear strength to C phi.
24. Set the cohesion and friction angle for each layer (see Table 8.1).
25. Unmark the Geotextiles and Nails check-boxes as no geotextile or nail is used in this
tutorial.
26. Click OK to confirm.
See section 4.1.1 “Model" for a detailed description of this window.
132 of 286 Deltares
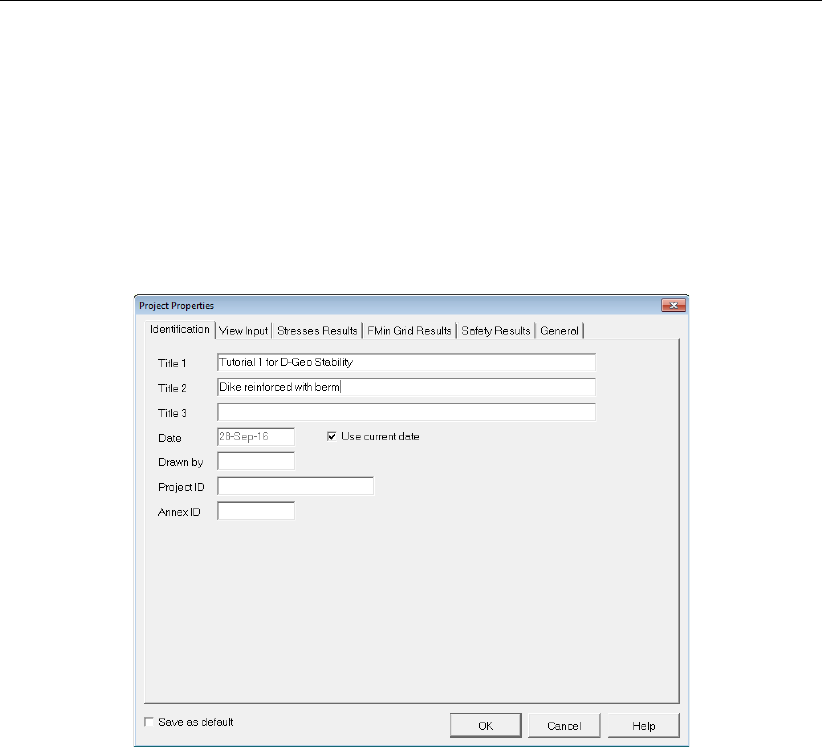
Tutorial 1: Dike reinforced with berm
8.3.2 Project Properties
To give the project a meaningful description, follow the steps described below:
27. On the menu bar, click Project and then choose Properties to open the Project Properties
window (Figure 8.10).
28. Fill in <Tutorial 1 for
D-GEO STABILITY
>and <Dike reinforced with berm>for Title 1 and
Title 2 respectively in the Identification tab. The settings of the others tabs of the Project
Properties window are set to their default values.
Figure 8.10: Project Properties window, Identification tab
In the other tabs of the Project Properties window, some defaults values are modified in order
to make the graphical geometry input (section 8.9.1) and the view results (section 8.8) more
understandable.
29. Select the View Input tab (Figure 8.11) to change the settings of the View Input window.
30. Mark the Points check-box of the Labels sub-window in order to display the point’s number.
31. In the Layers sub-window, select As material names to display the material name of the
different layers.
32. In the Grid sub-window, enter a Grid distance of 0.25 m and mark the Snap to grid check-
box in order to ensure that objects align to the grid automatically when they are moved or
positioned.
Deltares 133 of 286
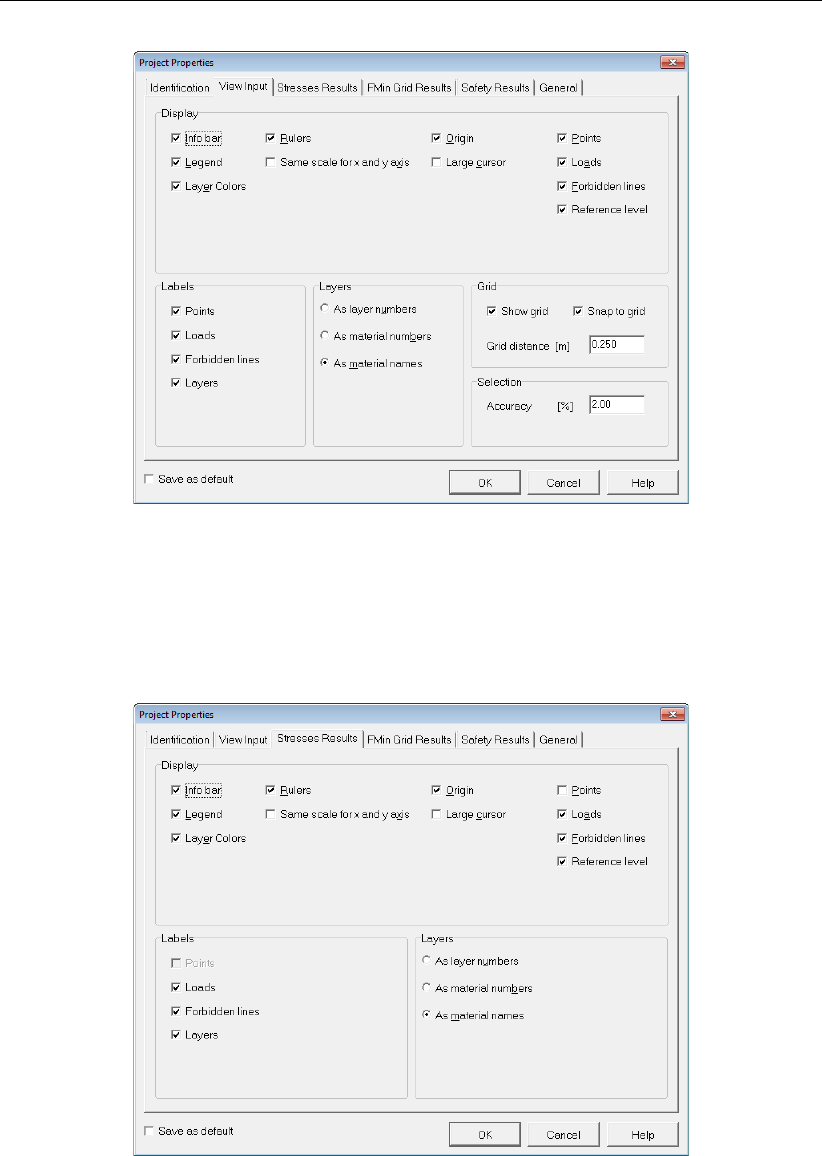
D-GEO STABILITY
, User Manual
Figure 8.11: Project Properties window, View Input tab
33. Select the Stresses Results tab (Figure 8.12) to change the settings of the Stresses (sec-
tion 8.8.3) and Stresses in Geometry (section 8.8.2) windows.
34. Select the As material names in the Layers sub-window to display the material name of
the different layers in the Stresses window.
Figure 8.12: Project Properties window, Stresses Results tab
35. Select the FMin Grid Results tab (Figure 8.13) to change the settings of the FMin Grid
window (section 8.8.4).
36. Mark the Use values from results check-box to display the iso-lines with a range automati-
cally calculated by
D-GEO STABILITY
.
37. Mark the Points labels check-box to display the safety factor of each point of the FMin grid.
134 of 286 Deltares
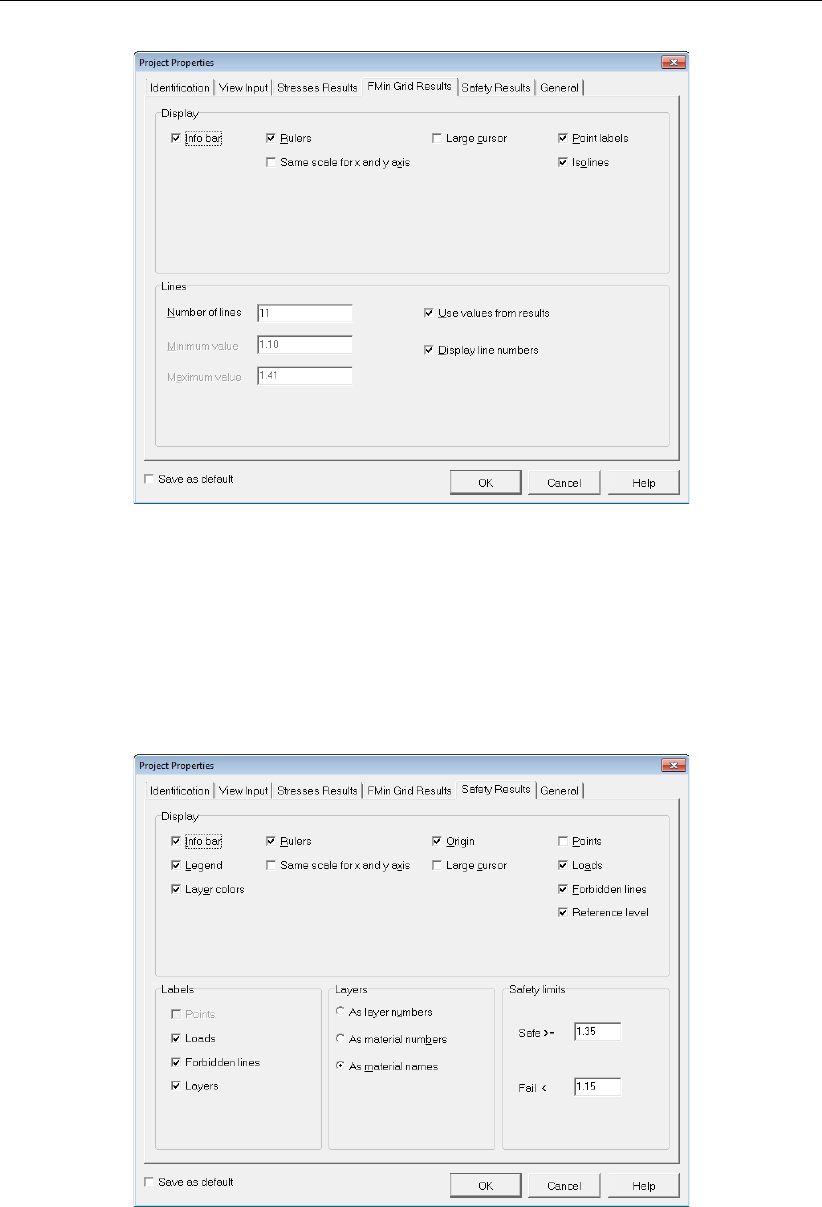
Tutorial 1: Dike reinforced with berm
Figure 8.13: Project Properties window, FMin Grid Results tab
38. Select the Safety Results tab (Figure 8.14) to change the settings of the Safety Overview
window (section 8.8.5).
39. Select the As material names in the Layers sub-window to display the material name of
the different layers.
40. Enter values of <1.35>in the Safe>=box and <1.15>in the Fail<box to define respec-
tively the safe and failure areas as given in the tutorial introduction (section 8.1).
Figure 8.14: Project Properties window, Safety Results tab
41. Select the General tab (Figure 8.15) to check that the results will be displayed in kilo
Newton and meters.
Deltares 135 of 286
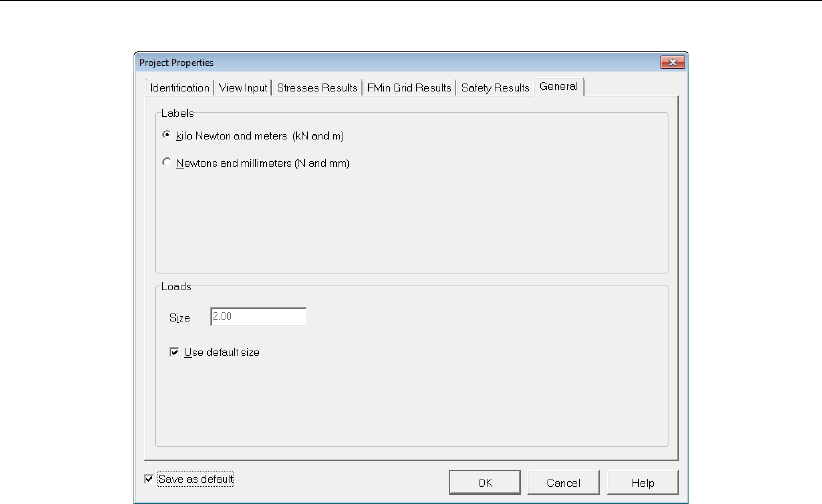
D-GEO STABILITY
, User Manual
Figure 8.15: Project Properties window, General tab
42. Before closing the Project Properties window, mark the Save as default check-box to use
the settings previously inputted every time
D-GEO STABILITY
is started, which mean for the
other tutorials.
43. Click OK to confirm.
See section 4.1.3 “Project Properties" for a detailed description of this window.
8.4 Geometry
In the Geometry menu the geometry aspects of the project can be specified. Most of the
relevant geometry aspects of this tutorial have already been addressed in the Wizard (sec-
tion 8.2). With the Geometry menu it is possible to complete the geometry as given in Fig-
ure 8.1. In this tutorial the shape of the phreatic line needs to be modified and the piezometric
level lines (PL-lines) per layer need to be set. After this has been done,
D-GEO STABILITY
can
perform a check if all the entered geometry is correct.
8.4.1 Points
At this point the phreatic level is still +4.0 m across the whole domain, as set in the Wizard
(section 8.2.1). However, according to Figure 8.1, the phreatic line has a curved shape with
different water levels at both sides of the dike and a groundwater flow within the dike. There-
fore, the phreatic line must be adjusted so that it represents the phreatic line of Figure 8.1.
All lines in
D-GEO STABILITY
are connections between points. The phreatic line can be adjusted
by creating new points (or modifying existing points) and connecting them to represent the
phreatic line.
First the point on the right side of the boundary is lowered:
44. Choose Points from the Geometry menu. The Points window appears (Figure 8.16). It
is possible to modify the coordinates of the current points in the entries to the right of the
point number.
45. Click the Y coordinate of point 18 and change it from value 4.0 to <-0.25>.
136 of 286 Deltares
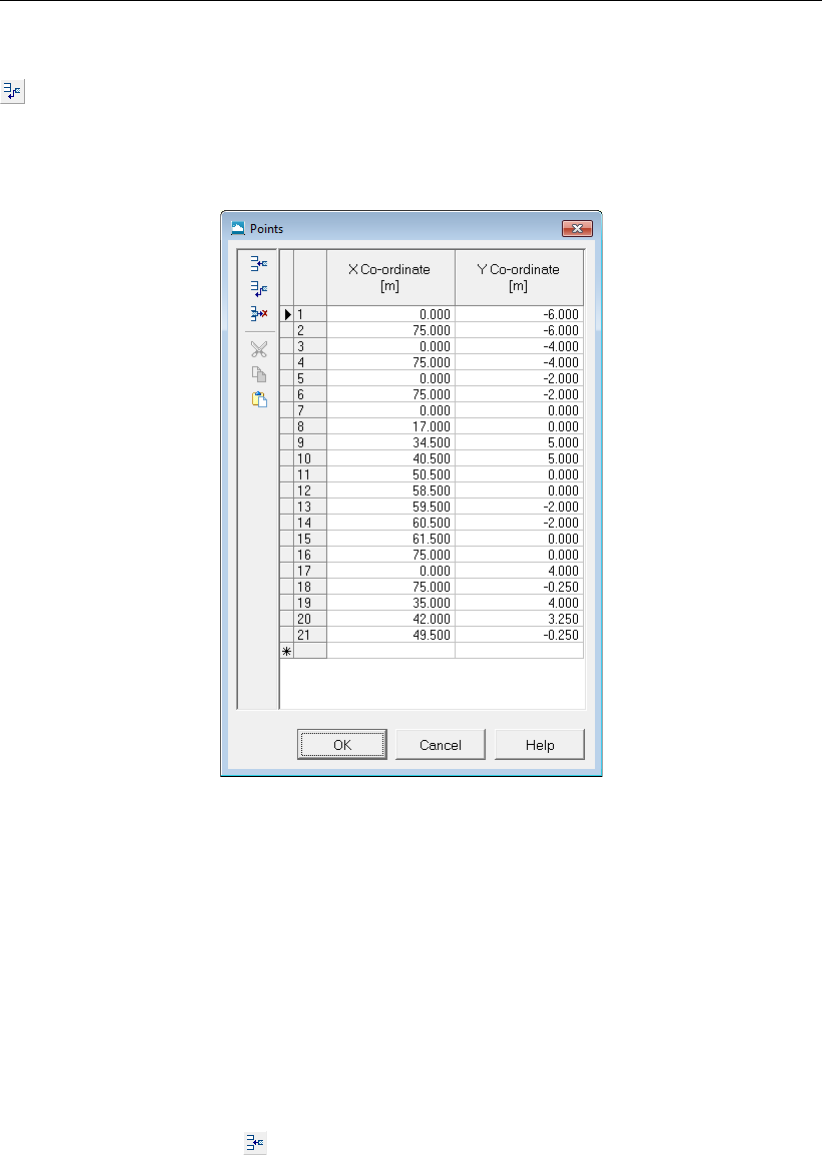
Tutorial 1: Dike reinforced with berm
Then, to get a new shape of the phreatic line three new points are added using theAdd row
button:
46. Click the Add row button three times to add three new points.
47. Modify the coordinates of the points 19, 20 and 21 as given in Figure 8.16 below.
Figure 8.16: Points window
48. Click OK.
See section 4.3.8 “Points" for a detailed description of this window.
8.4.2 PL-lines
The horizontal shape of PL-line 1 which represents the phreatic line is now modified by adding
the three points defined before (section 8.4.1):
49. Click PL-Lines in the Geometry menu to open the PL-Lines window (Figure 8.17).
By clicking the Insert Row button, it is possible to enter new points in the sequence that
connects the different points of PL-line 1.
50. Click on row number 2.
51. Click the Insert Row button three times. The PL-line will now consist of five points. Points
2, 3 and 4 have to be provided.
52. At the entry right of 2, enter <19>.
53. Click on the row that represents point 3.
54. At the entry right of point 3, enter <20>.
55. Click on the row that represents point 4.
56. At the entry right of point 4, enter <21>.
Deltares 137 of 286

D-GEO STABILITY
, User Manual
The PL-lines window should now look as in Figure 8.17.
Figure 8.17: Pl-Lines window
57. Click OK to confirm.
Note: The phreatic line drawn in this example is a very crude approximation on the actual
shape of the phreatic line. It is possible to import a detailed and realistic shape of a phreatic
line from calculations in MSeep or WATEX.
The PL-line and thus the phreatic line have been changed and can now be seen in the View
Input window (Figure 8.18).
Figure 8.18: View Input window with new phreatic line
See section 4.3.10 “PL-lines" for a detailed description of this window.
138 of 286 Deltares
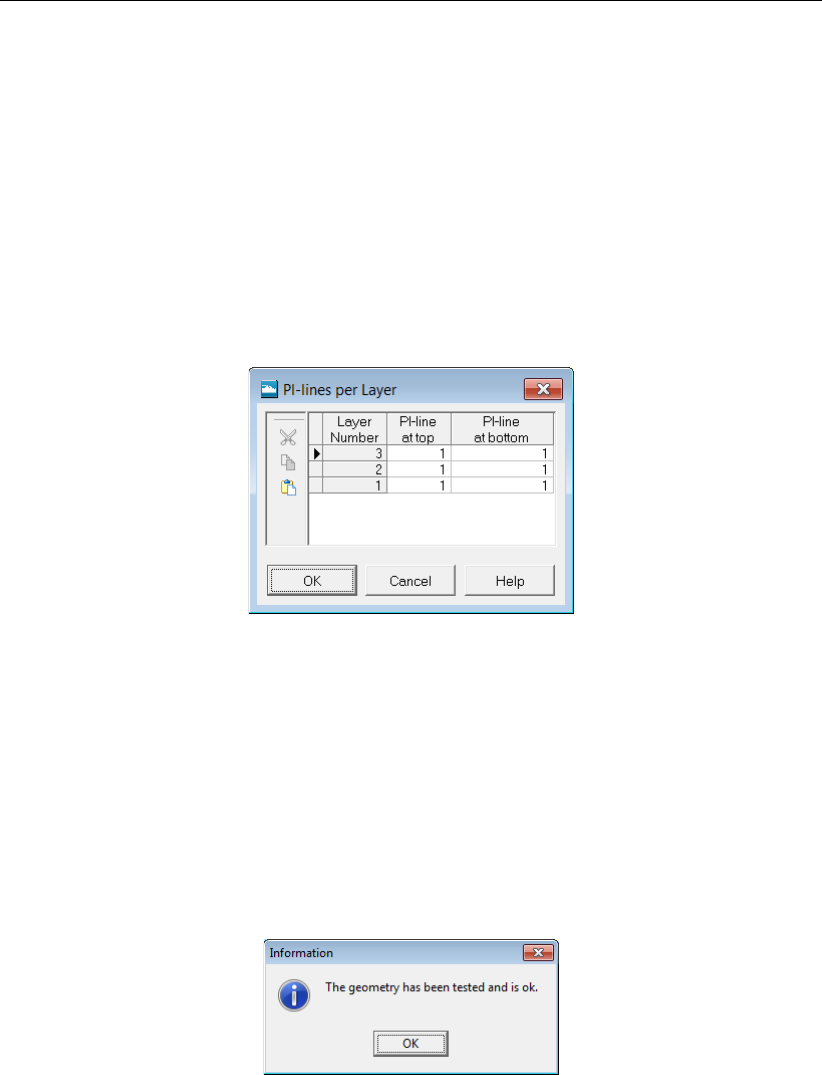
Tutorial 1: Dike reinforced with berm
8.4.3 PL-lines per layer
Each soil layer has to be assigned its own piezometric level. In the situation in this tutorial the
water level in the reservoir is at its maximum design level. If this water level is constant for a
longer period of time, it can be assumed that all the hydrostatic pressures in all the soil layers
will be defined by the phreatic line. Such a situation is assumed in this tutorial and thus all the
layers have their piezometric level in the phreatic line. In this case that is PL-line number 1.
To assign the phreatic line (line 1) to be the PL-line of each of the layers, do the following:
58. In the Geometry menu, choose PL-lines per layer to open the PL-lines per Layer window.
59. Enter PL-line <1>as piezometric level for all the layers (Figure 8.19).
60. Click OK.
Figure 8.19: PL-lines per Layer window
See section PL-lines per Layer (section 4.3.13) for a detailed description of this window.
8.4.4 Check Geometry
It is possible to check whether the defined geometry has any errors:
61. Click Check geometry in the Geometry menu. At this point, an information window indi-
cating that the entered geometry is correct should appear (Figure 8.20).
Figure 8.20: Information window
62. Click OK.
See section 4.3.14 “Check Geometry" for a detailed description of this window.
Deltares 139 of 286
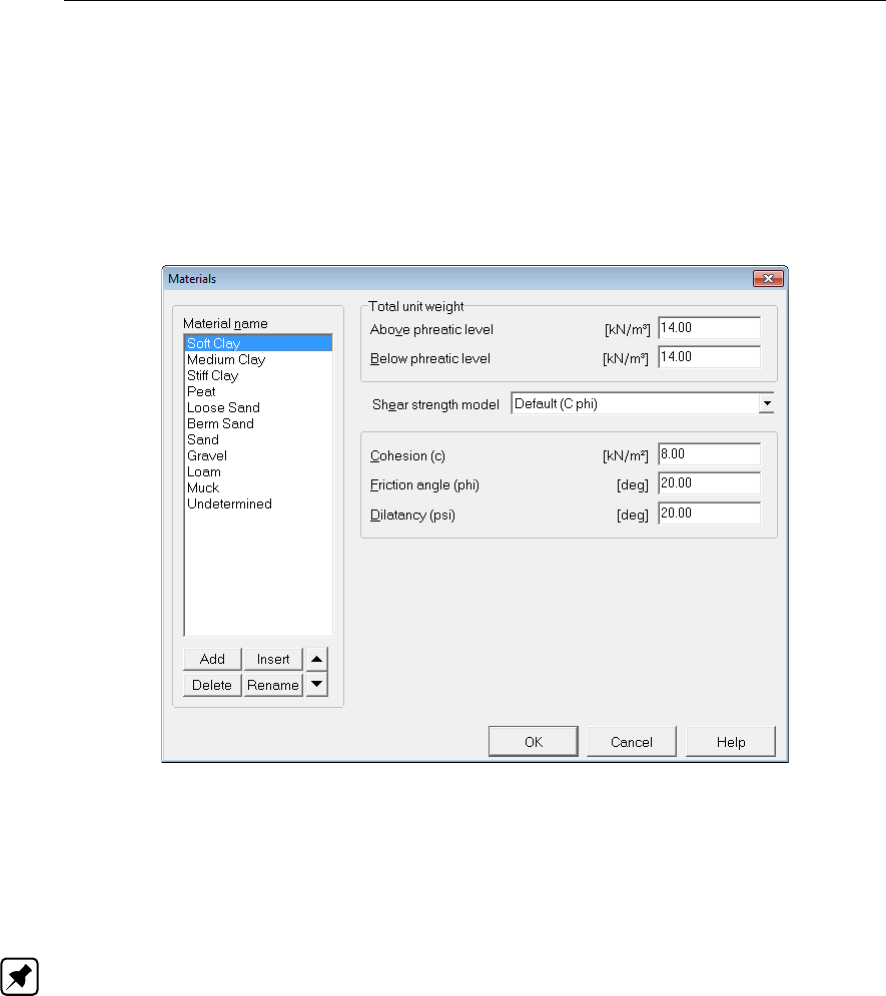
D-GEO STABILITY
, User Manual
8.5 Soil
In the Soil menu it is possible to modify properties of the soil layers that were created earlier
(section 8.2.4) to be in accordance with Table 8.1.
63. Choose Materials from the Soil menu to open the Materials window.
64. Select Dense Sand in the material list. Click Rename and change Dense Sand into <Berm
Sand>.
Figure 8.21: Materials window
65. Enter the soil properties values of the four layers used in this tutorial (Soft Clay,Peat,
Sand and Berm Sand) as indicated in Table 8.1. For dilatancy, enter the same values as
for friction angle.
66. Click OK when finished.
Note: It is possible to import soil properties from the MGeobase database, see section 4.3.4.
See section 4.2.4.1 “Materials – Input of fixed parameters" for a detailed description of this
window.
8.6 Definitions
In this tutorial
D-GEO STABILITY
uses the Bishop method to determine the minimum safety fac-
tor for a soil structure by performing a slip plane calculation based on equilibrium of horizontal
forces and moments.
D-GEO STABILITY
performs this Bishop calculation on several slip planes.
From those calculations,
D-GEO STABILITY
determines the slip plane with the lowest safety fac-
tor. In
D-GEO STABILITY
a slip plane is geometrically defined by its midpoint and by a tangent
line. In the Definitions menu specifications concerning such a calculation grid can be made by
the user. In addition, possible tangent lines for each slip circle need to be defined. This can be
done manually or via the Slip Circle Definition window in the Definitions menu (Figure 8.22).
For the first method do the following:
67. In the View Input window, select the Input tab.
140 of 286 Deltares
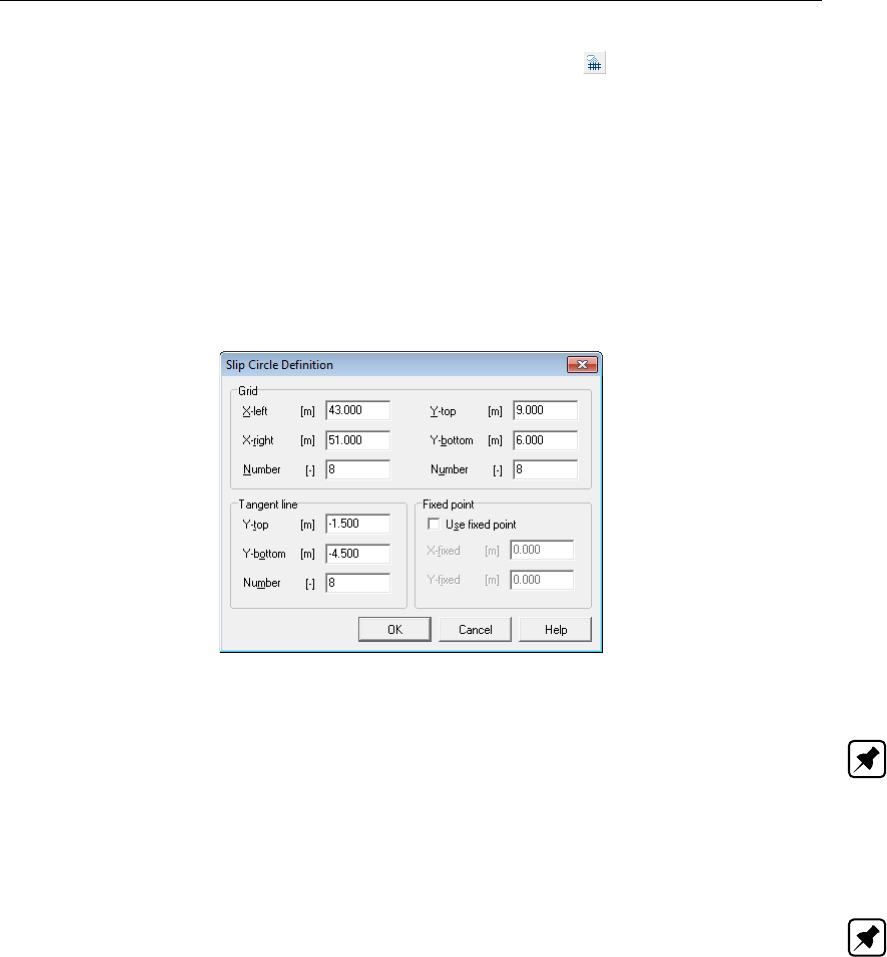
Tutorial 1: Dike reinforced with berm
68. In the Edit toolbox on the left, click the Add calculation grid button. The cursor will
change to a hand. It is now possible to graphically “drop” the grid in the calculation domain.
69. By left clicking, place the grid to the right side of the dike, just above its crest.
70. The horizontal position can be manually adjusted by left clicking it and dragging it left or
right. Under the point grid also a set of tangent lines appears. Its vertical position can be
manually adjusted by left clicking it and dragging it up or down.
71. Left click on the grid to select the grid.
72. Modify precisely its properties by clicking the right-hand mouse and selecting Properties.
The Slip Circle Definition window appears.
73. Fill in the values shown in Figure 8.22.
74. Click OK
Figure 8.22: Slip Circle Definition window
Note: The position and coarseness of the calculation grid have an affect on the minimum
safety factor (in the program also called FMin). Firstly, when the program finds a minimum
value at one of the outer points of the grid, it will move the grid. This position of the grid will be
shifted one grid point distance into the direction of the grid boundary with the minimum safety
factor. The program will repeat this procedure until it finds a minimum safety factor that does
not lie on one of the outer grid points.
Note: A coarse grid produces less accurate information on the position of the slip circle with
the lowest safety factor. A possibility is to define a coarse grid to find the position of the slip
circle with the minimum safety factor. Then repeat the calculation with a finer grid, that cover
the coordinates associated with the minimum safety factor in the foregone calculation.
See section 4.4.1.1 “Slip Circle Definition (Bishop or Fellenius)" for a detailed description of
this window.
8.7 Calculation
At this point all the necessary project input has been given to start a calculation. Before start-
ing the calculation, there are some options which can be selected concerning the calculation
and the kind of user preferred results report for the program to generate. This can be done in
the Start window (Figure 8.23).
The Move grid option allows the program to move the grid, when it finds a minimum safety
factor at one of the outer grid points. The grid will then shift one grid spacing. As these grid
spacings are user defined, this can possibly result in a slightly differing safety factor. Not
selecting this option means that the calculation will only produce a minimum safety factor
within the given grid.
Deltares 141 of 286
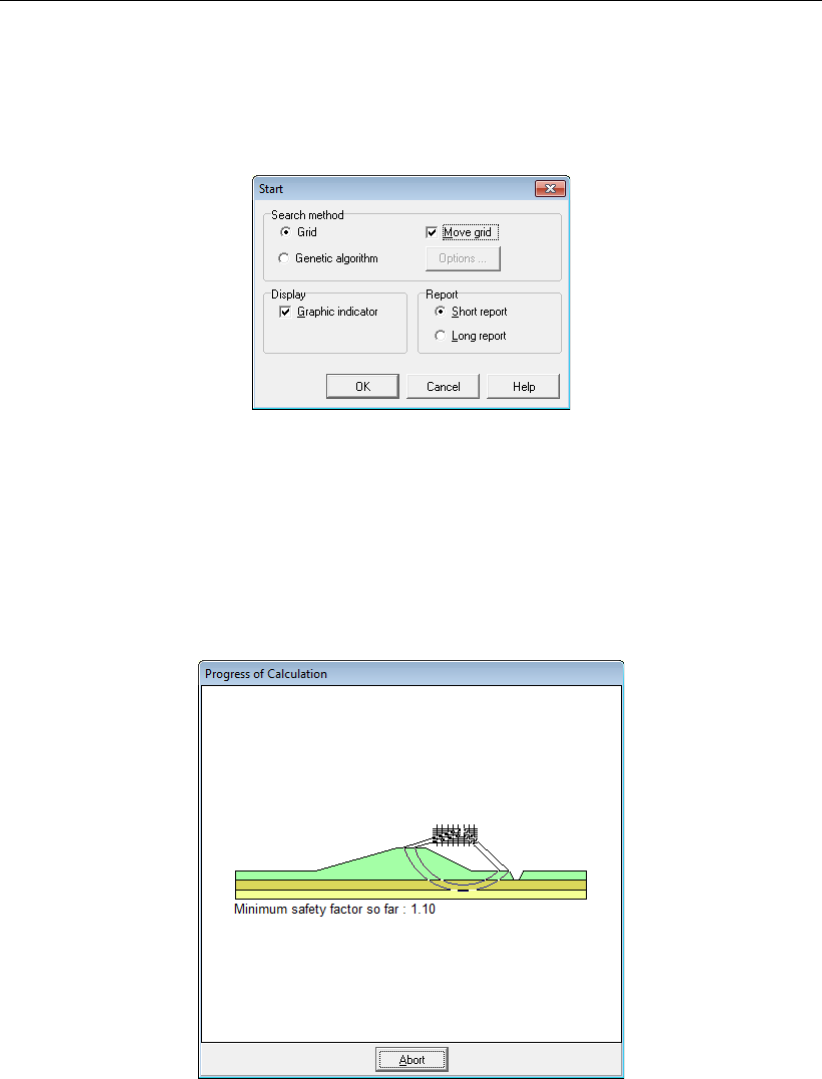
D-GEO STABILITY
, User Manual
The Graphic indicator shows the different slip circles as the program calculates. Also the
minimum safety factor found during the calculation thus far is displayed.
75. Choose Start in the Calculation menu.
Figure 8.23: Start calculation window
76. Leave the Move grid,Graphic indicator and Short report marked by default.
77. Click OK.
At this point the calculation starts. It is possible to view the progress of the calculation, includ-
ing the minimum safety factor, in a separate window (Figure 8.24) as the Graphic indicator
option was selected in the Start window.
Figure 8.24: Progress of Calculation window
See section 5.2 “Start Calculation" for a detailed description of this window.
8.8 Results
In the Results menu there are several possibilities to view the results of the calculation.
8.8.1 Report
To view a report (text format) that includes the input geometry and information about the
critical slip circle:
142 of 286 Deltares

Tutorial 1: Dike reinforced with berm
78. Choose Report from the Results menu.
79. Go at the end of the short report to view information on the critical circle (Figure 8.25).
Figure 8.25: Report window
Note: It is possible to export the report shown in the Report window to a text file. When the
Report window is active, choose Export Active Window in the File menu. In fact, it is possible
to export any active window within
D-GEO STABILITY
. Windows that contain geometrical infor-
mation can usually be exported to a ‘Windows Meta File’ (.wmf) or a ‘Drawing exchange file’
for AutoCAD 14 (.dxf).
See section 6.1 “Report" for a detailed description of this window.
8.8.2 Stresses in Geometry
To view the stresses in any vertical across the calculation domain:
80. Click Results and then choose Stresses in Geometry.
This will produce the graphical output (Figure 8.26). The blue (left) area represents water
pressure. The green (right) area represents the total soil pressure. As expected the pore
pressure is linear throughout all the layers. The effective vertical stress increases linearly
within each layer.
Deltares 143 of 286

D-GEO STABILITY
, User Manual
Figure 8.26: Stresses in Geometry window
81. Clicking the cursor anywhere in the horizontal domain will produce a representation of the
stresses in the vertical at that point.
It is also possible to manually provide the X coordinate (in the domain) of which to see the
stresses in the vertical at that point. This X coordinate can be given in the upper left corner of
the window.
See section 6.2 “Stresses in Geometry" for a detailed description of this window.
8.8.3 Stresses
To view the slip circle that coincides with the lowest safety factor found by the calculation:
82. Choose Stresses from the Results menu to open the Critical Circle window (Figure 8.27).
This window shows the slip circle drawn in the geometry and includes its measurements.
Here, it can be seen that
D-GEO STABILITY
did not moved the grid to find the minimum
safety factor; the center point of the slip circle lies within the chosen grid. The slip circle
measurements meet expectations. With a minimum safety factor of 1.10, the dike is unsafe.
144 of 286 Deltares

Tutorial 1: Dike reinforced with berm
Figure 8.27: Critical Circle window (Slip circle with lowest safety factor)
In this window it is also possible to see the different stress types displayed in the geometry. In
the Mode toolbox in the left of the screen, the type of stress to be displayed can be selected,
see Figure 8.28.
Note: When the cursor is placed over one of the symbols in the stress mode toolbox, a textbox
will appear to remind the user on which sort of stress the symbol indicates (section 6.2) .
Figure 8.28: Stress mode toolbox
83. Click the Shear stress button in the Mode toolbox. The results window will show the
shear stresses along the slip circle (Figure 8.29).
Deltares 145 of 286
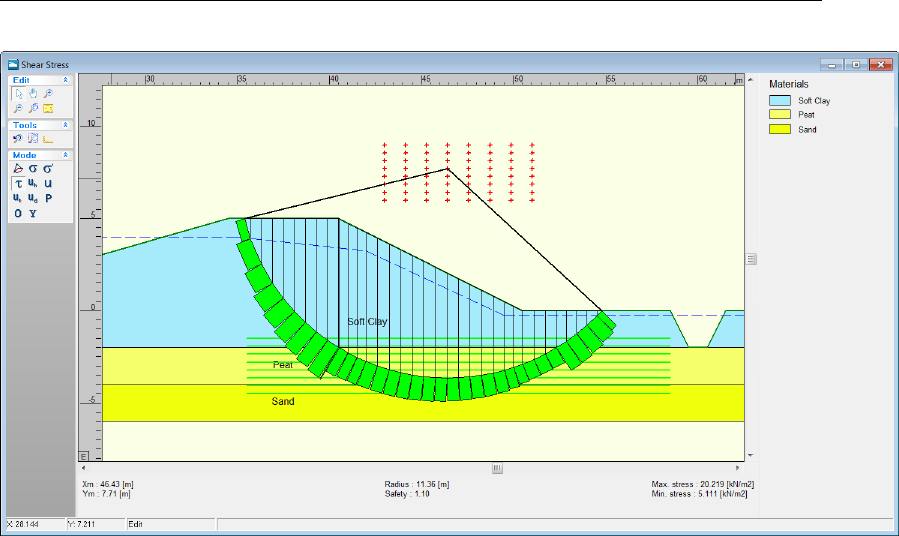
D-GEO STABILITY
, User Manual
Figure 8.29: Shear stresses window (along the slip circle)
See section 6.3 “Stresses" for a detailed description of this window.
8.8.4 FMin Grid
To see an overview of the safety factors within the grid:
84. Choose FMin Grid in the Results menu.
In the FMin Grid window displayed (Figure 8.30), the isolines connect point with equal values
for the safety factor. The variations of the safety factors within the grid are within an accept-
able margin of each other. When the differences are larger, it is advisable to perform a new
calculation with a finer grid.
146 of 286 Deltares

Tutorial 1: Dike reinforced with berm
Figure 8.30: FMin Grid window
Note: Values of -1 indicate the impossibility of calculation.
See section 6.4 “FMin Grid" for a detailed description of this window.
8.8.5 Safety overview
To view the areas with particular ranges of safety factor:
85. Click Safety Overview option in the Results menu.
In the Safety Overview window displayed (Figure 8.31), the green color indicates the area
with a safety factor greater than 1.35, the red color indicates an area with a safety factor
below 1.15, and the orange color indicates an area with a safety factor in the range between
1.15 and 1.35. In this way, it is possible to get an idea of areas that are more sensitive and
less sensitive to instability.
A large part of the study area of the dike has a safety factor lower than 1.15, which through
the definitions in the preferences window, is regarded as unsafe.
Deltares 147 of 286
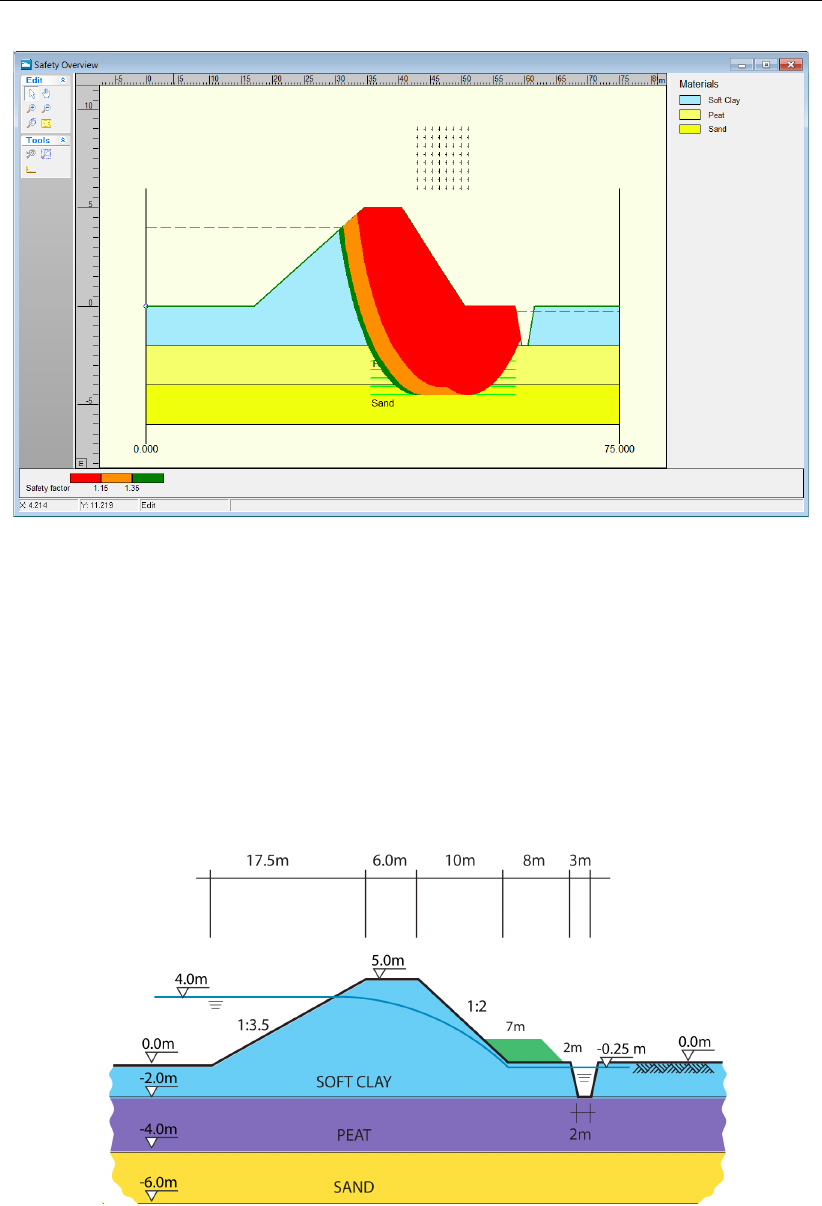
D-GEO STABILITY
, User Manual
Figure 8.31: Safety Overview window
See section 6.8 “Safety Overview" for a detailed description of this window.
8.9 Berm construction
The result of the calculation is a minimum safety factor lower than 1.15; this usually means
that the dike is considered unsafe. In order to improve the dike’s stability, it is proposed to
construct a berm structure at the right side of the dike. The general measurements of the
proposed berm are depicted in Figure 8.32.
Figure 8.32: Construction of a berm (Tutorial 1b)
Before adding a berm to the current project, a new file is created:
86. Save the current file as <Tutorial-1b>using the Save As window of the File menu.
87. Click Save.
148 of 286 Deltares
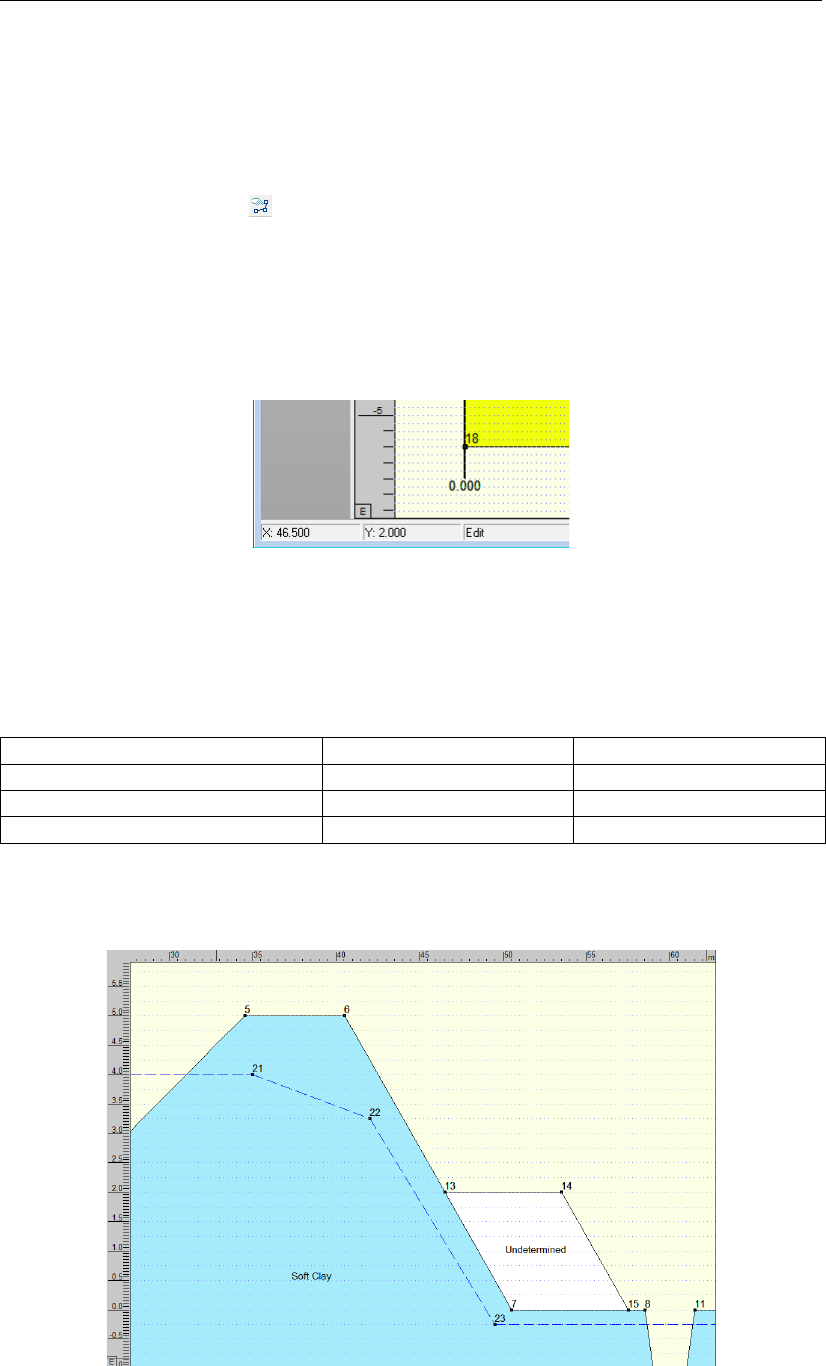
Tutorial 1: Dike reinforced with berm
8.9.1 Berm inputted graphically
The berm will be made using the soil Berm Sand previously defined in section 8.5. Using the
Edit toolbox it is possible to represent the berm. In order to do so, follow these steps:
88. In the View Input window select the Geometry tab to begin to add the berm geometry.
89. Click the Add polyline(s) button in the Edit toolbox, located on the left of the window.
90. Draw the polyline by clicking on the places consecutively indicated in Figure 8.34. The
points of the polyline can be placed at exact coordinates (due to the ‘snap to grid’ settings,
in the Project Properties window, see section 4.1.3). This can be achieved by checking to
which coordinates the cursor will snap to (this can be seen in the lower left corner of the
View Input window, see Figure 8.33).
91. To finish drawing the polyline, right click anywhere in the geometry.
Figure 8.33: Lower left corner of View Input window
The coordinates of the consecutive points are given in Table 8.2.
Table 8.2: X and Y coordinates of the berm construction points
Points nr. X coordinate Y coordinate
13 46.5 m 2.0 m
14 53.5 m 2.0 m
15 57.5 m 0.0 m
In the enclosed area the Undetermined shall appears (Figure 8.34).
Figure 8.34: View Input window, Geometry tab – Berm construction points
Deltares 149 of 286
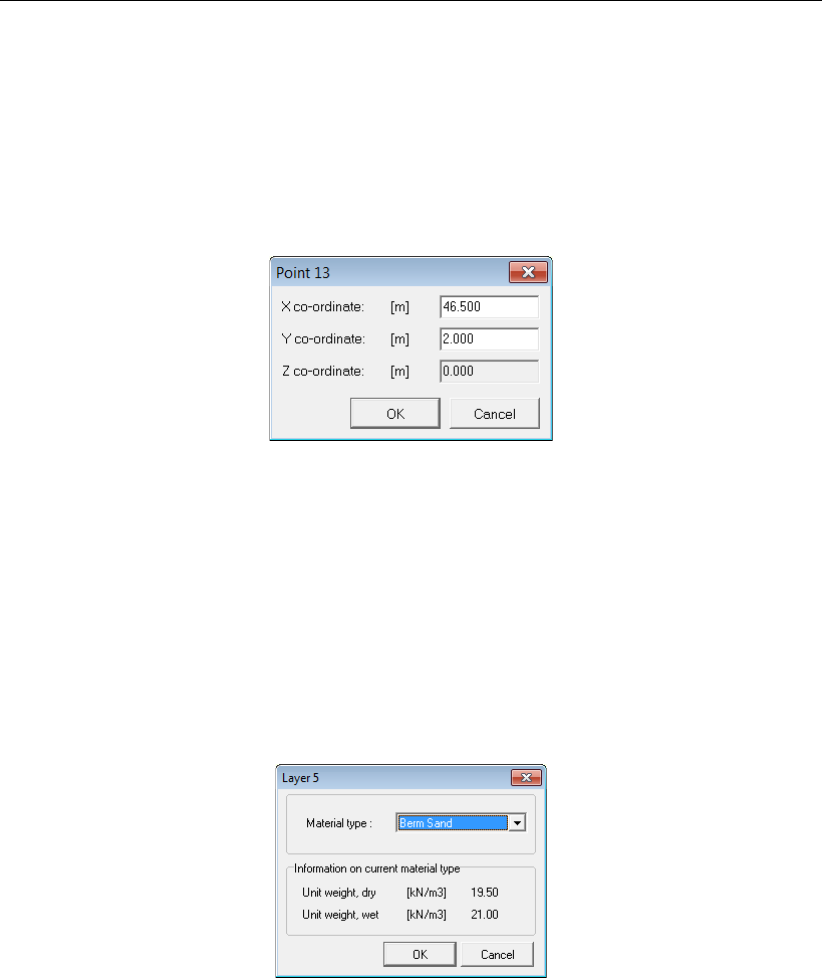
D-GEO STABILITY
, User Manual
To check whether the point of the new polyline has the correct coordinates, do the following:
92. Click on point number 13. A red square will be placed over the selected point.
93. Click the right-hand mouse button and select Properties. In the window displayed (Fig-
ure 8.35), the coordinates can be checked and modified if needed.
94. Click OK.
95. Repeat this verification for points 14 and 15 using Table 8.2.
Figure 8.35: Point 13 properties window
8.9.2 Soil material assigned to the berm
The soil material <Berm Sand>previously defined (section 8.5) is assigned to this berm:
96. In the Geometry tab of the View input window, click the name Undetermined in the berm
geometry. When selected, the name becomes red.
97. Then right click and choose Properties. TheLayer 5 propertieswindow will appear.
98. From the drop-down menu choose the material Berm Sand as shown in Figure 8.36.
99. Click OK.
Figure 8.36: Layer 5 properties window
8.9.3 Calculation and Results
In order to start a calculation with this new geometry:
100. Click Start from the Calculation menu to open the Start calculation window.
101. Click OK.
102. Choose Stresses from the Results menu to open the Critical Circle window. This window
shows that the minimum safety factor is now 1.35 (instead of 1.10 without the berm).
The increase of the minimum safety factor, as expected when adding a berm, can also be
seen in the Safety Overview window:
103. Select Safety Overview from the Results menu.
150 of 286 Deltares
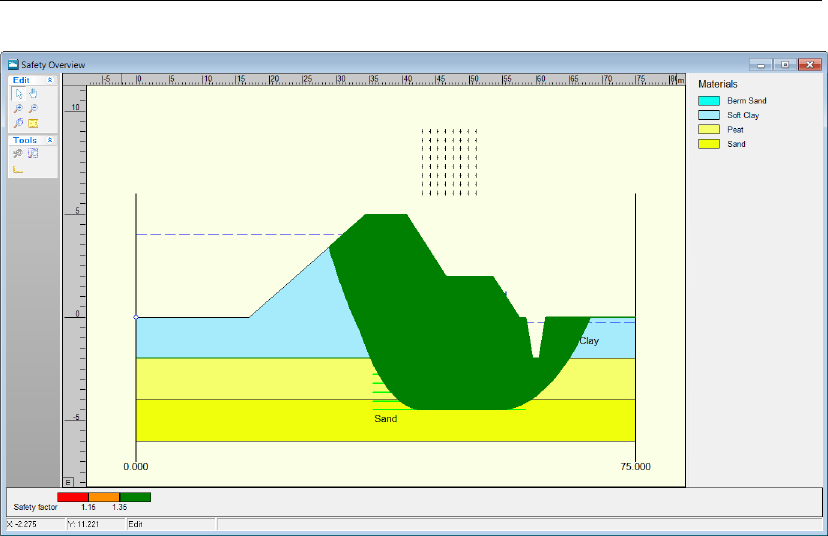
Tutorial 1: Dike reinforced with berm
Figure 8.37: Safety Overview window
The window displayed (Figure 8.37) shows that the full dike has a safety factor higher than
1.35. Therefore, the construction of the berm has made the dike structure safer.
8.10 Conclusion
The Geometry Wizard is one of the ways to construct a simple project geometry. There are
tools in the program to completely customize the geometry to specific needs. Once these
details have been input, they can be used to calculate a range of results. These include the
minimum safety factor, measurements of the critical slip circle and stresses along the slip
circle and in any vertical in the geometry. One way to view these results is to display them
graphically on the screen.
A design conclusion is that, in this case, the construction of a berm has helped to increase
the minimum safety factor of the dike structure.
Deltares 151 of 286

D-GEO STABILITY
, User Manual
152 of 286 Deltares
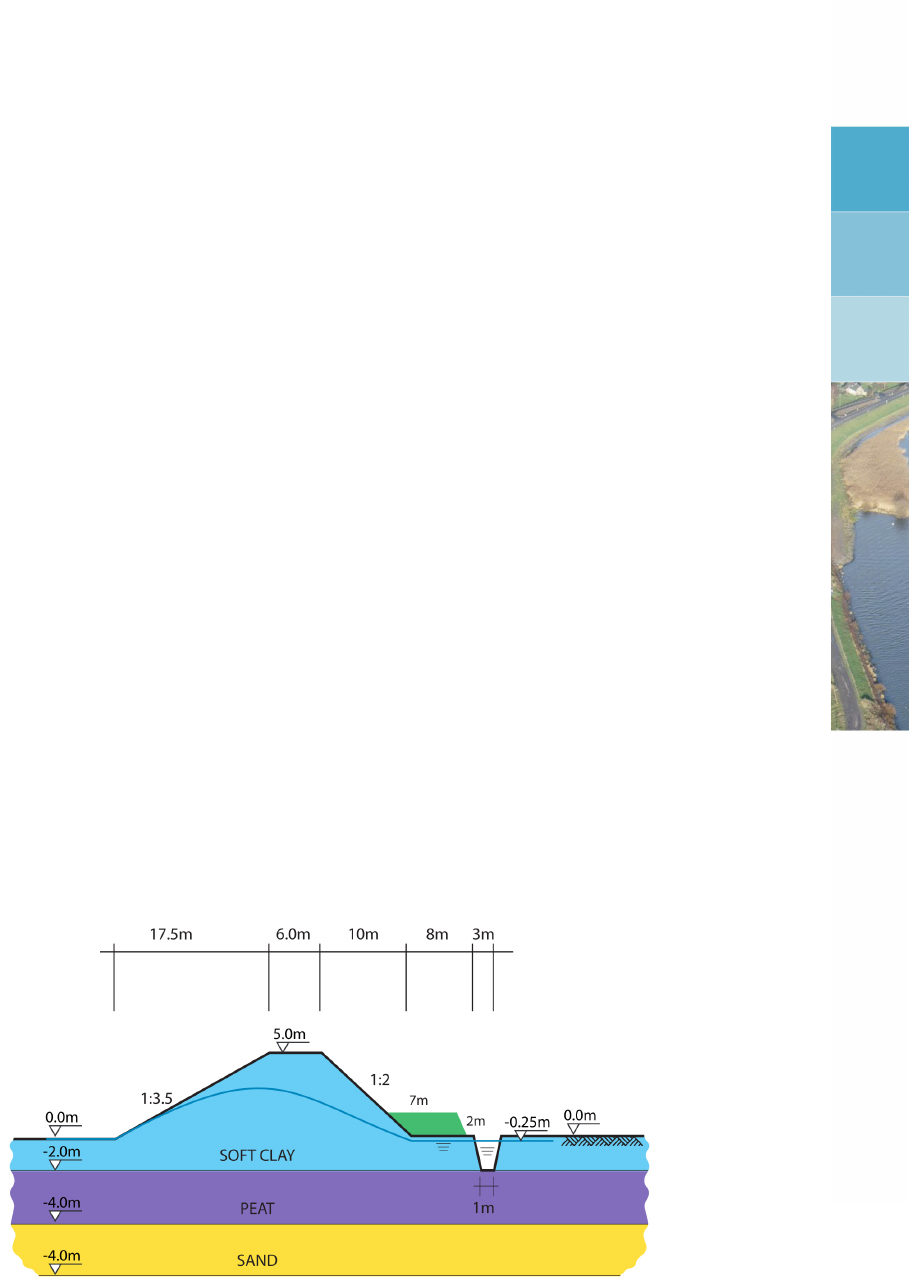
9 Tutorial 2: Unsaturated soil
This tutorial continues the case in Tutorial 1 (chapter 8). Here, a measure is taken to lower
the water level in the reservoir (left of the dike). In the dike itself excess pore pressures shall
arise (clay). Pore pressures will remain high for a period of time after lowering the water level.
To see what this means for slope stability on both sides of the dike, the strength of the dike
layer shall be described by the unsaturated cohesion, su. The underlying layers will adjust
pore pressures more rapidly as they consist of more permeable soils.
The objective of this exercise is:
To learn how to assign different shear strength properties to a particular soil (layer).
For this example, the following
D-GEO STABILITY
module is needed:
D-GEO STABILITY
Standard module (Bishop and Fellenius).
This tutorial is presented in the file Tutorial-2.sti.
9.1 Introduction to the case
The same dike geometry as Tutorial 1b is used. In this example the water level on the left
side of the dike is lowered, see Figure 9.1. This might occur when, for instance, maintenance
is needed on the dike. The water level is lowered at a considerable place. A calculation of
the safety factor of the dike is performed when the water level at the left of the dike is at its
required level. As can be seen in Figure 9.1, the groundwater level in the dike is still quite
high. Therefore it is now possible to describe the shear strength model for the top layer by its
undrained shear strength value suwhich is equal to 6.0 kN/m2at the top and 8.0 kN/m2at the
bottom of the clay layer.
Figure 9.1: Dike with lowered water level (Tutorial 2)
9.2 Project Properties
In this tutorial, the same file which has been created in the Tutorial 1 is used.
1. Click Open in the File menu.
2. Select Tutorial-1b.
3. Click Open.
Deltares 153 of 286

D-GEO STABILITY
, User Manual
4. Click Save As in the File menu.
5. Enter <Tutorial-2>as a file name.
6. Click Save.
7. On the menu bar, click Project and then choose Properties to open the Project Properties
window.
8. Fill in <Tutorial 2 for
D-GEO STABILITY
>and <Unsaturated soil>for Title 1 and Title 2
respectively in the Identification tab.
9. Click OK.
9.3 Changing the phreatic line
To lower the water level, the phreatic line needs to be altered. This can be done in the
Geometry tab of the View Input window.
10. Click the Add point(s) to boundary / PL-line button to create extra points on the current
phreatic line.
11. Place three points on the left part of the phreatic line by clicking three times between points
20 and 21 (from left to right). Points 25, 26 and 27 should appear consecutively as shown
in Figure 9.2.
Figure 9.2: View Input window, Geometry tab – Adding of three points on the phreatic line
12. Click the Edit button to exit the Add point mode.
The coordinates of the first six points of the phreatic line have to be adjusted so that it repre-
sents the shape of Figure 9.1. The new points’ positions of Table 9.1 give an approximation
of the desired shape. To alter the phreatic line, follow these steps:
13. Select the first left point (point 20). After selection, it should be covered by a red square.
14. To change its position, click the right-hand mouse button and select Properties.
15. In the window displayed (Figure 9.3), modify the coordinates of point 20 according to Ta-
ble 9.1.
154 of 286 Deltares
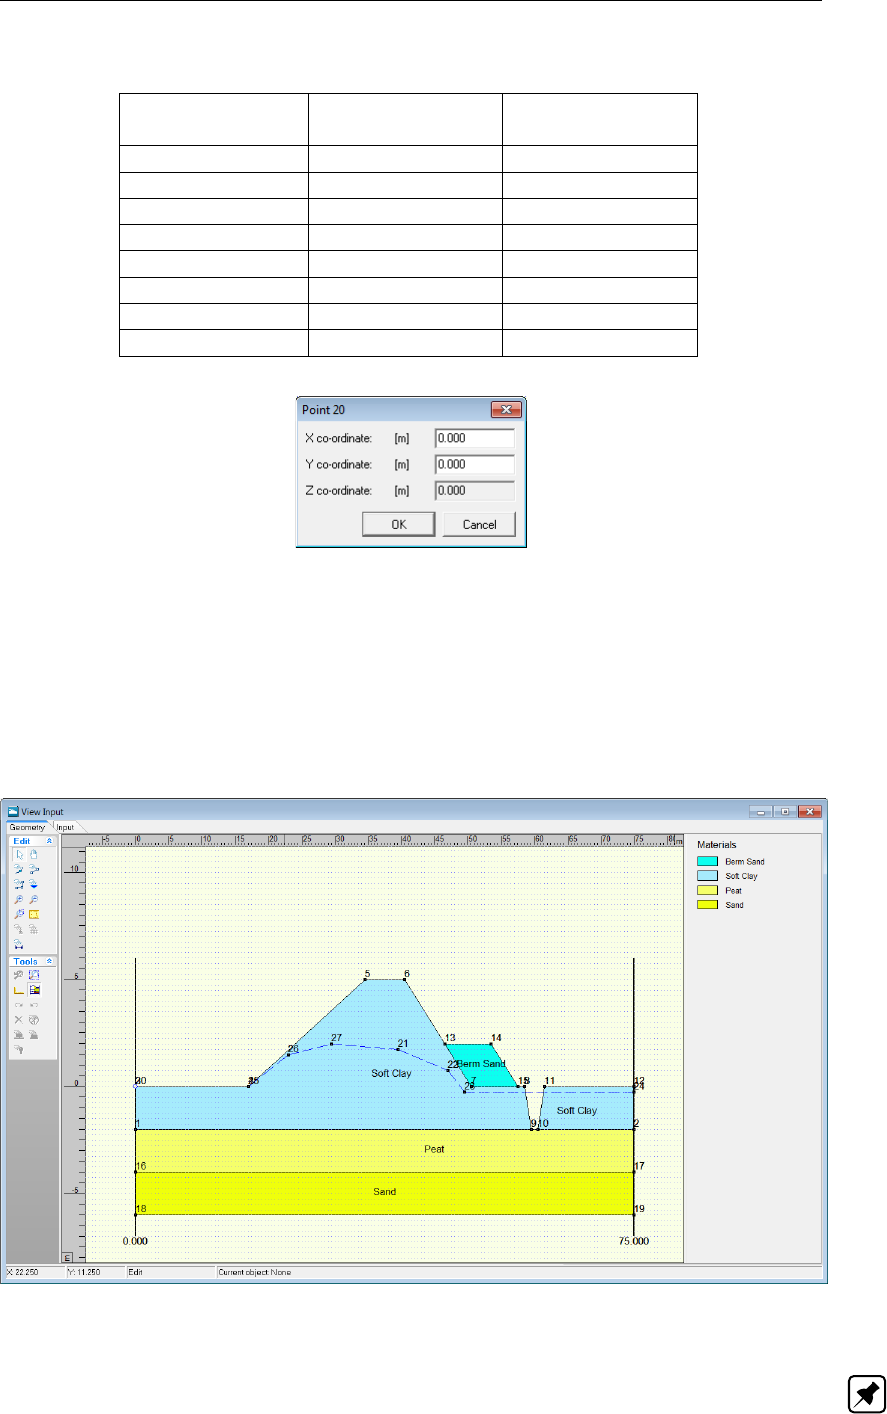
Tutorial 2: Unsaturated soil
Table 9.1: X and Y coordinates of the consecutive points of the phreatic line
Points nr. X coordinate
[m]
Y coordinate
[m]
20 (left) 0.0 0.0
25 17.0 0.0
26 23.0 1.5
27 29.5 2.0
21 39.5 1.75
22 47.0 0.75
23 49.5 -0.25
24 (right) 75.0 -0.25
Figure 9.3: Point 20 properties window
16. Repeat this for points 22, 21, 27, 26 and 25 consecutively. It is not possible to move a point
horizontally beyond the adjacent points, otherwise an error message appears. That’s why
the coordinates of the points must be changed from the right (point 22) to the left (point
25).
The new shape of the phreatic line is shown in Figure 9.4.
Figure 9.4: View Input window, Geometry tab – New phreatic line
Note: The coordinates can also be changed by dragging the points. It is advised to individu-
ally check the points coordinates.
Deltares 155 of 286
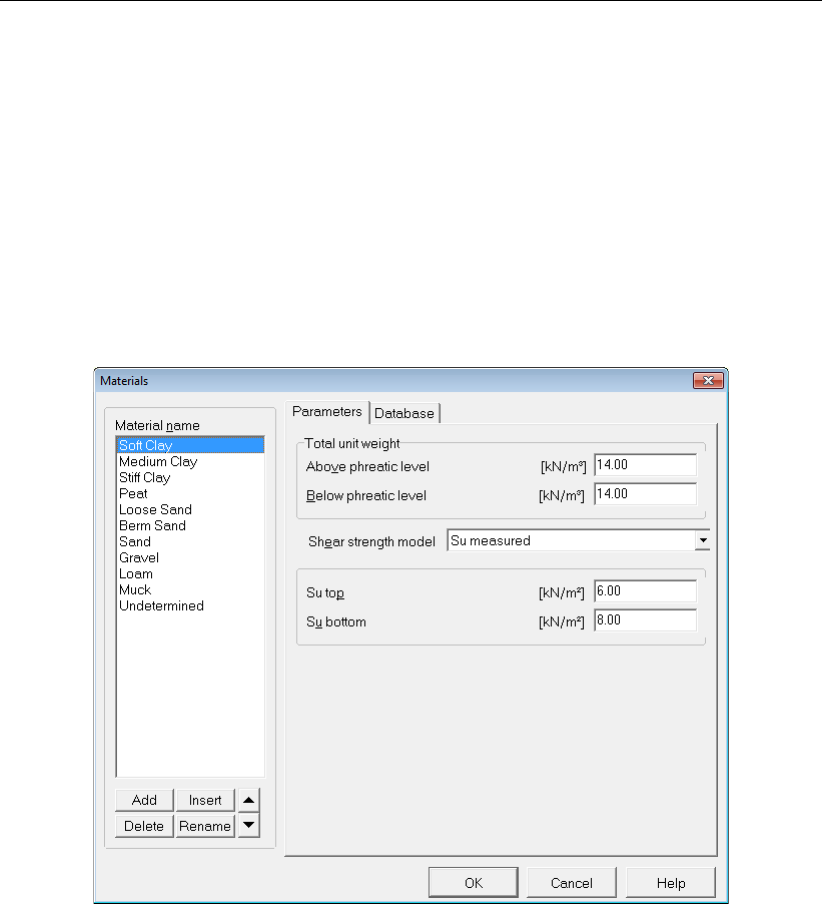
D-GEO STABILITY
, User Manual
9.4 Soil properties
As explained in introduction, the shear strength model for the top layer (Soft clay) shall be
described by the undrained shear strength su.
17. Click Materials in the Soil menu.
18. Select Soft Clay.
19. From the drop down menu at Shear strength model, choose Su measured as the undrained
shear strength at the top and the bottom is known (section 9.1).
20. Enter the suggested values for su. At the top of the clay layer Su top is <6.0 kN/m2>. At
the bottom of the clay layer Su bottom is <8.0 kN/m2>.
21. Click OK.
Figure 9.5: Materials window
9.5 Definitions
The safety factor of the dike has to be determined considering the left side of the dike. To this
end the calculation grid is placed on the left side of the dike.
22. Make sure the Input tab in the View Input window is active. Select the calculation grid. It
will turn red.
23. Right click and then select Properties.
24. Enter the coordinates as shown in Figure 9.6.
25. Click OK.
156 of 286 Deltares
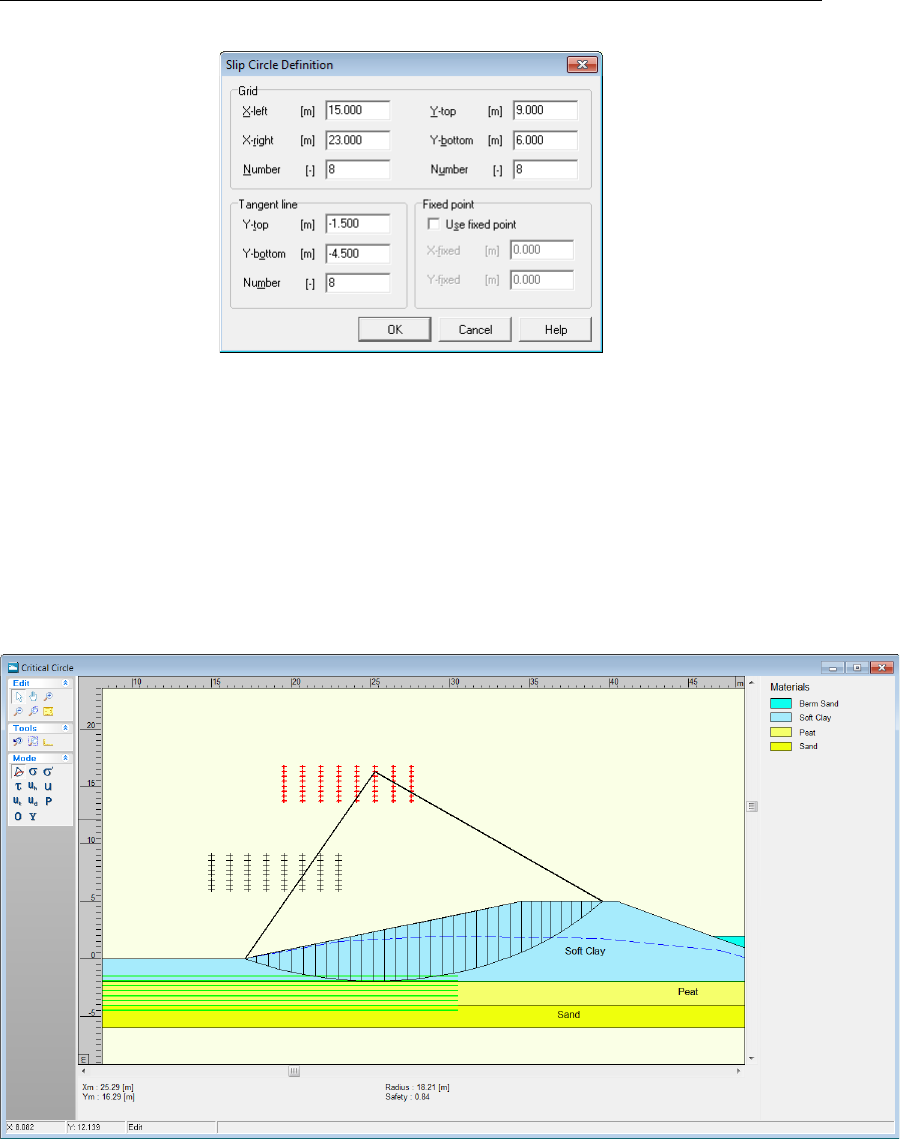
Tutorial 2: Unsaturated soil
Figure 9.6: Slip Circle Definition window
9.6 Calculation and Results
26. To perform the calculation, select the Start option from the Calculation menu and click OK.
27. Select the Stresses option from the Results menu to open the Critical Circle window (Fig-
ure 9.7).
In this window, the slip circle with the lowest safety factor is shown. The safety factor is
relatively low: 0.84.
Figure 9.7: Critical Circle window
It is common for a calculation, which incorporates the undrained shear strength properties of
a soil type, to result in a lower safety factor than for soil with a c-phi shear strength model.
To compare the results for calculations using an undrained sheer strength and c-phi relation,
change the sheer strength model in the Materials option in the Soil menu. Run the calculation
again and compare the results. When a c-phi shear strength model is used for Soft Clay the
safety factor will be 1.38.
Deltares 157 of 286

D-GEO STABILITY
, User Manual
9.7 Conclusion
It is possible to describe the shear strength properties of a soil with different models. One of
those models is the undrained shear strength. In this tutorial a case in which it is relevant to
use this model has been presented.
158 of 286 Deltares
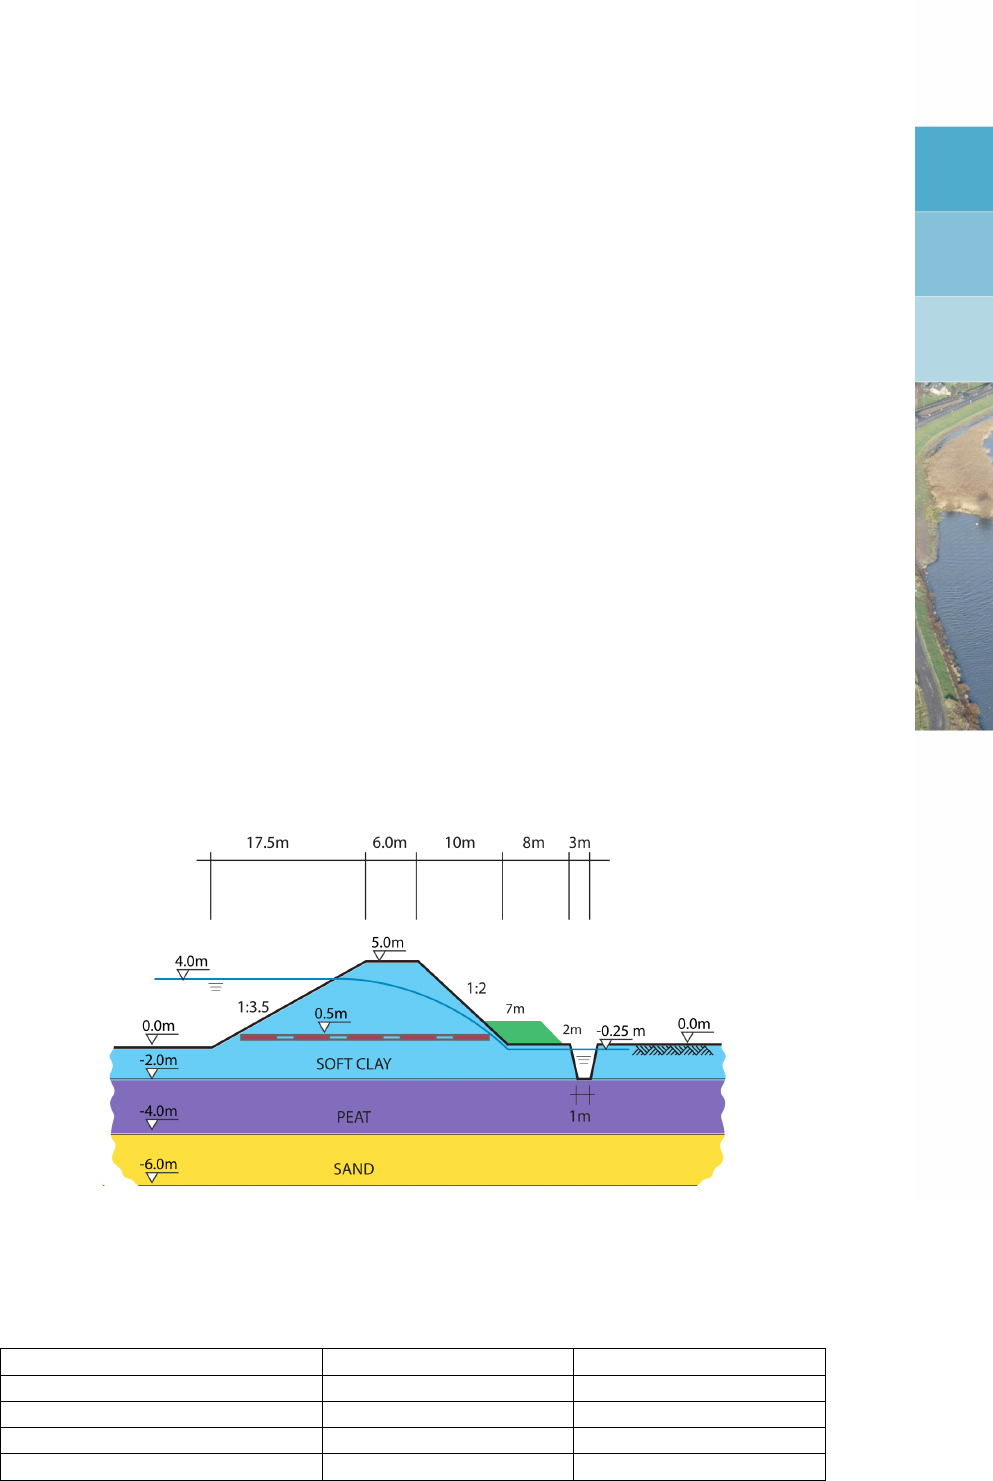
10 Tutorial 3: Geotextile
This example continues the case in Tutorial 1 (chapter 8). The same soil structure is in place
and the same layer build up is present. Now the effect of the presence of a geotextile placed
in the geometry is considered.
The objective of this exercise is:
To learn how to place a geotextile into the geometry.
For this example, the following
D-GEO STABILITY
module is needed:
D-GEO STABILITY
Standard module (Bishop and Fellenius).
This tutorial is presented in the file Tutorial-2.sti.
10.1 Introduction to the case
In the geometry presented in Tutorial 1, the influence the placement of a geotextile has on the
safety factor is assessed (see Figure 10.1). Using a geotextile placed between two soil layers
can help improve the stability of a slope. When a geotextile intersects the critical slip circle, it
helps to enlarge the resisting moment and increase the safety factor. The contribution to the
resisting moment increases when the tensile strength of the geotextile is of a greater value.
The characteristics of the geotextile are given in Table 10.1. The reduction area is set at a low
value in order to make sure that the full tensile strength of the geotextile is used.
Figure 10.1: Dike reinforced with geotextile (Tutorial 3)
Table 10.1: Characteristics of the geotextile
Effective tensile strength [kN/m] 200
X coordinates at start [m] 20
Y coordinates at start [m] 0.5
Length [m] 28
Reduction area [m] 5
Deltares 159 of 286
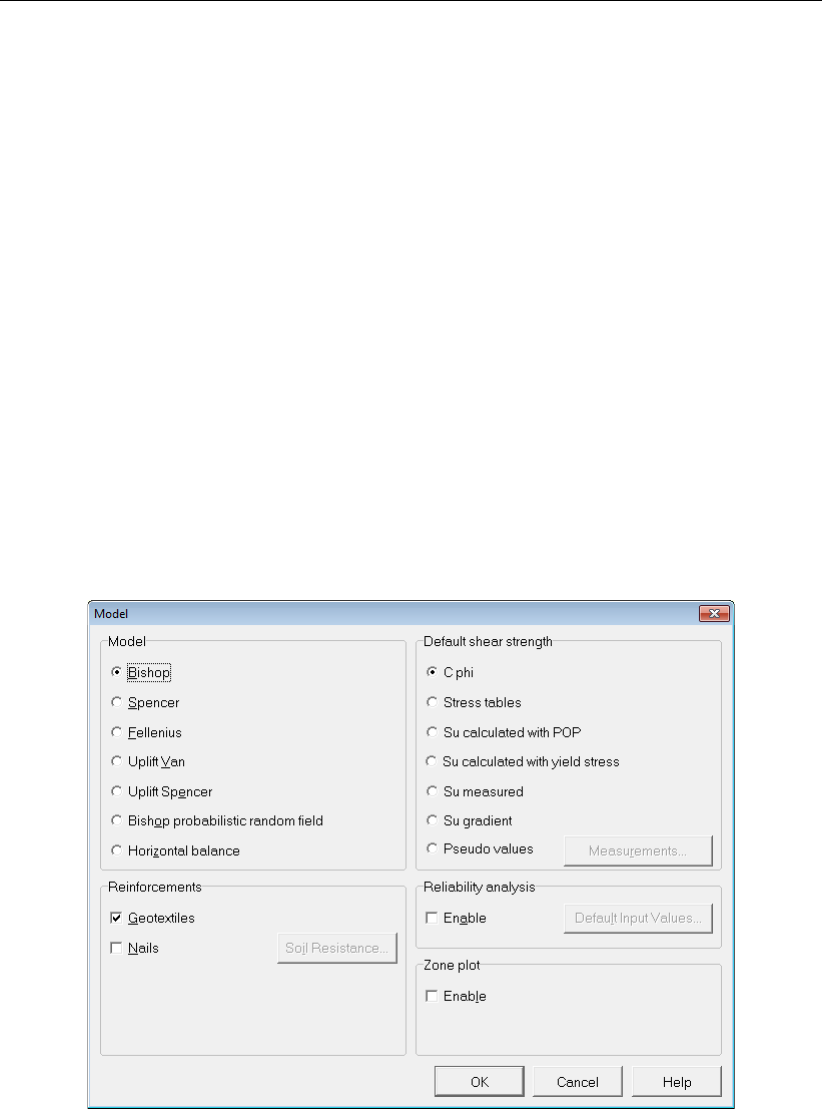
D-GEO STABILITY
, User Manual
10.2 Project Properties
In this tutorial, the same file which has been created in the Tutorial 1 is used.
1. Open the first tutorial by clicking Open in the File menu and selecting the tutorial named
Tutorial-1a.
2. Click Open.
3. Save the project as a new file by clicking Save as in the File menu and by entering
<Tutorial-3>as the file name.
4. Click Save.
5. On the menu bar, click Project and then choose Properties to open the Project Properties
window.
6. Fill in <Tutorial 3 for
D-GEO STABILITY
>and <Dike reinforced with geotextile>for Title 1
and Title 2 respectively in the Identification tab.
7. Click OK.
10.3 Geotextile
To add a geotextile to the geometry do the following:
8. Mark the Geotextiles check-box in the Model window of the Project menu.
Figure 10.2: Model window
9. Select Geotextiles in the Reinforcements menu.
10. Click on the Add button. The geotextile will automatically be given number <1>.
11. Enter the characteristic values given in Table 10.1 which describe the geotextile (Fig-
ure 10.3).
12. Click OK.
160 of 286 Deltares
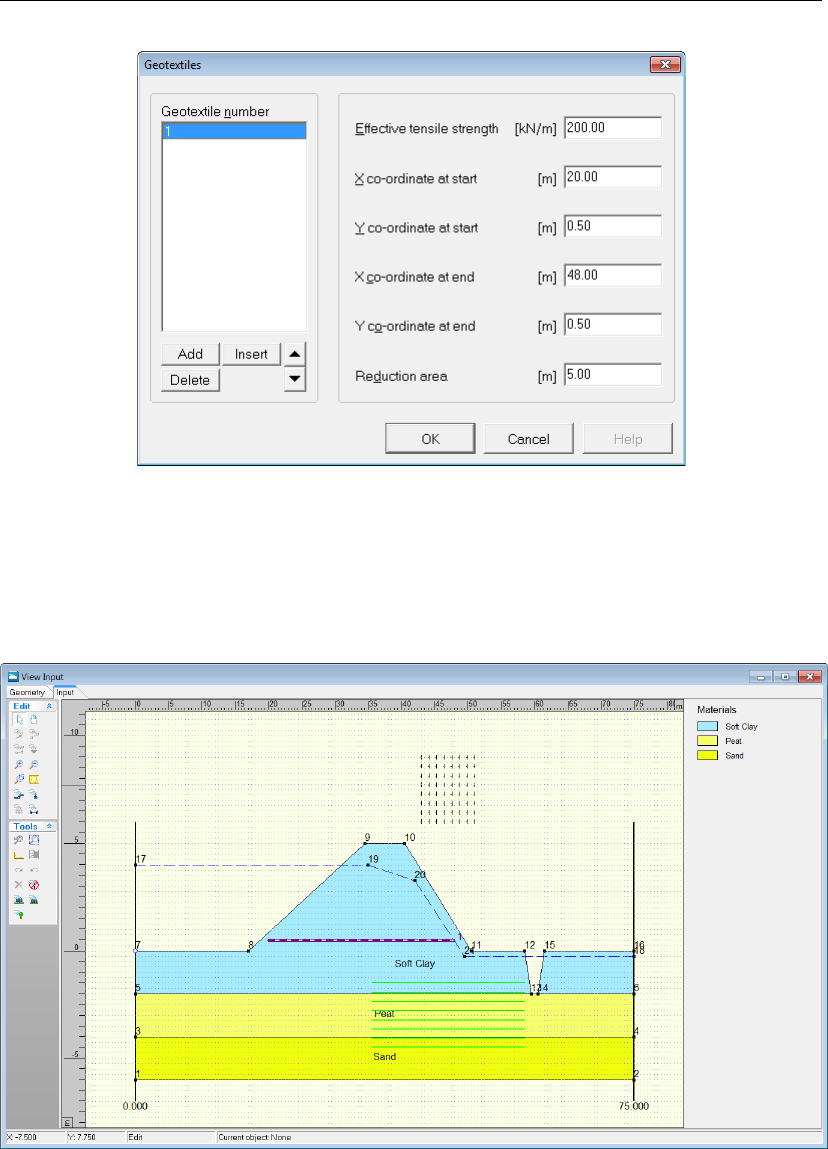
Tutorial 3: Geotextile
Figure 10.3: Geotextiles window
See section 4.5.1 “Geotextiles" for a detailed description of this window.
In the View Input window, the inputted geotextile is represented in purple (see Figure 10.4).
Figure 10.4: View Input window
10.4 Calculation and Results
13. Click Start in the Calculation menu to perform the calculation.
14. Click Stresses in the Results menu to open the Critical Circle window (Figure 10.5).
15. Check that the safety factor is 1.56.
Adding the geotextile results in an increase of the safety factor from 1.10 (Tutorial 1a) to 1.56.
The dike can be considered safe with the geotextile.
Deltares 161 of 286
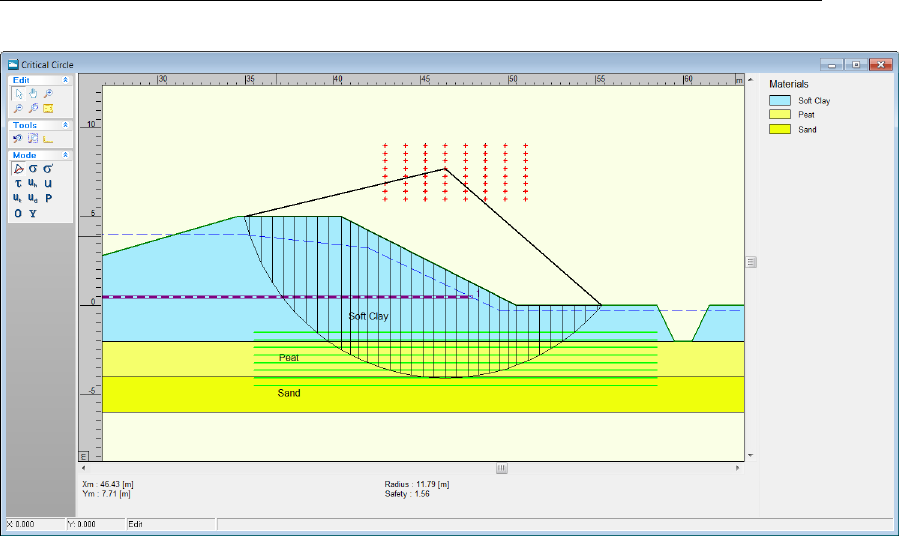
D-GEO STABILITY
, User Manual
Figure 10.5: Critical Circle window
10.5 Conclusion
D-GEO STABILITY
is able to make calculations incorporating a geotextile in the geometry. For
this, the strength properties of the geotextile should be known. The safety factor will increase
when a geotextile with greater tensile strength is placed in the geometry.
162 of 286 Deltares
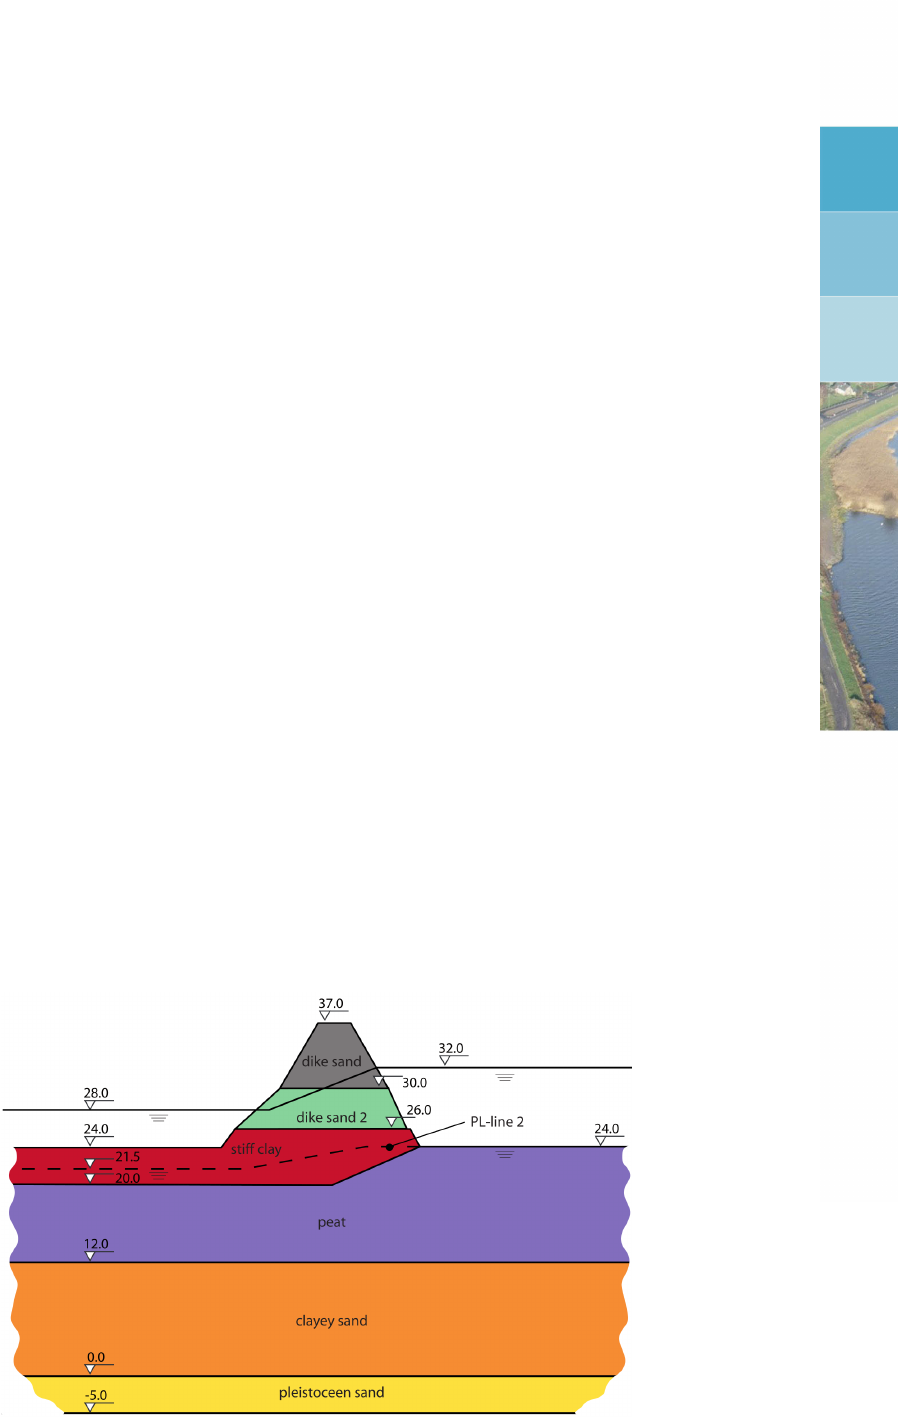
11 Tutorial 4: The Spencer Method
In this tutorial, the safety factor of a dike with different water levels at either side is established.
The calculation is carried out with the Spencer method. This method uses a user defined slip
plane, and thus requires the user to manually describe this slip plane. The slip plane is of an
arbitrary shape, consisting of a line defined by a series of user defined points.
The objectives of this exercise are:
To learn how to import the soil type properties from an MGeobase database;
To learn how to assign different piezometric levels to layers;
To learn how to apply loads;
To learn how to carry out a calculation using the Spencer method;
To learn how to perform a calculation using a generic algorithm.
For this example, the following
D-GEO STABILITY
modules are needed:
D-GEO STABILITY
Standard module (Bishop and Fellenius)
Spencer module.
This tutorial is presented in the files Tutorial-4a.sti and Tutorial-4b.sti.
11.1 Introduction to the case
In the soil structure geometry of this tutorial (Figure 11.1), two different piezometric levels are
assigned to the different layers. Moreover, some of the layers have not completely consoli-
dated; to model this, it is possible to input a degree of consolidation for each layer. In addition
loads are applied on the dike.
To see what effect this will have on the stability of the dike, a calculation using the Spencer
method will be carried out. One might use this method, when there is reason to believe that
the slip plane might have a preferred shape.
Figure 11.1: Dike with different water levels at either side (Tutorial 4)
The relevant values of the soil types used in this tutorial are given in Table 11.1.
Deltares 163 of 286
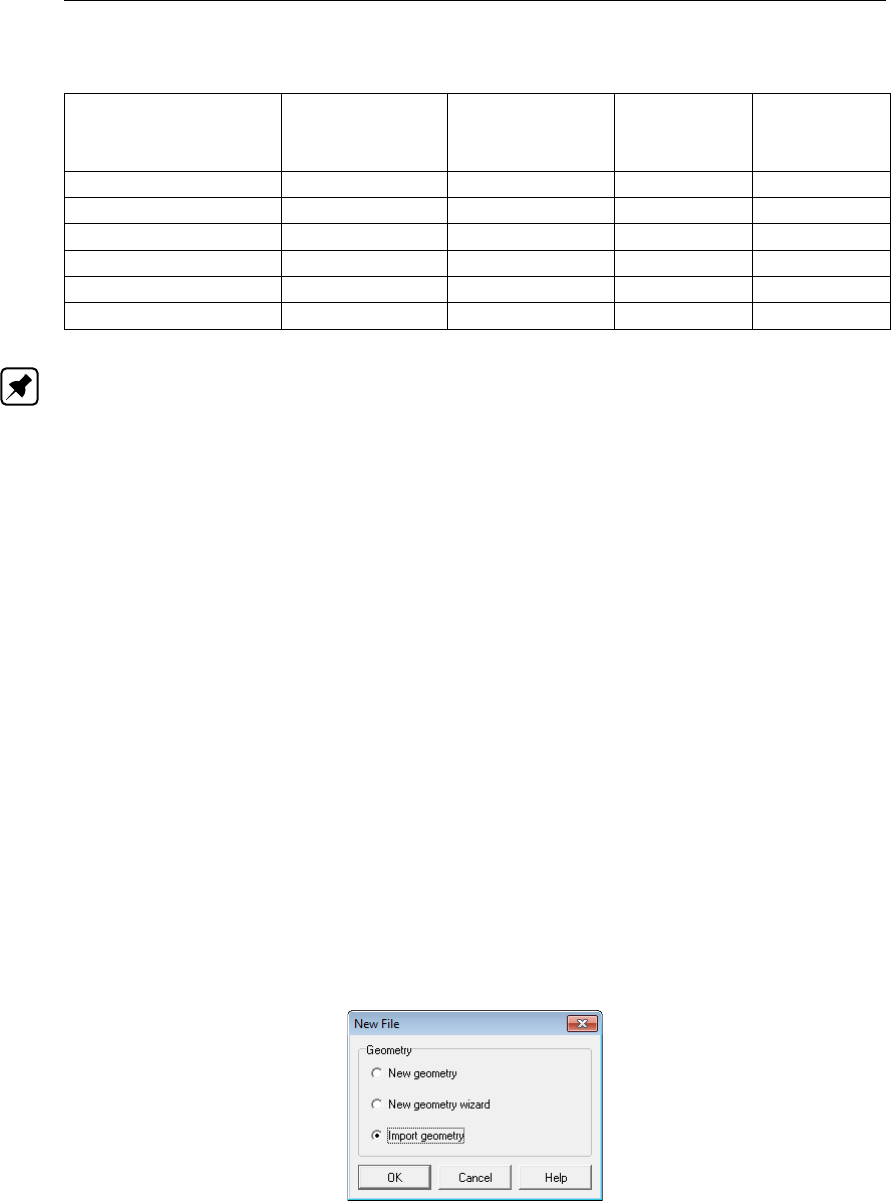
D-GEO STABILITY
, User Manual
Table 11.1: Soil properties (Tutorial 4)
Cohesion
[kN/m2]
Friction angle
[◦]
Unsaturated
unit weight
[kN/m3]
Saturated
unit weight
[kN/m3]
Dike sand 0 25 18 20
Dike sand 2 0 25 19 21
Stiff clay 30 22 20 21
Peat 5 10 11 16
Clayey sand 10 23.5 18 21
Pleistocene sand 0 27 18 20
Note: The dilatancy ψis set equal to the friction angle ϕ.
For this project, two different calculation are performed:
Tutorial-4a uses one defined slip plane;
Tutorial-4b uses two defined slip planes to search for the slip plane with the least resis-
tance, without presupposing the shape of the slip plane (i.e. genetic algorithm).
11.2 Project
How to define the layers geometry and soil properties has been explained already in the
previous tutorials. Use the different figures and data’s given in section 11.1 to create the
geometry and then proceed with section 11.3 for the description of the additional steps.
However, an alternative to the manual input is to import the geometry from a so-called GEO
file (section 11.2.1) and to import the soil properties from an MGeobase database (sec-
tion 11.2.3).
11.2.1 Importing an existing geometry
To import the geometry from a GEO file, follow the steps below.
1. In the File menu, select New to open the New File window (Figure 11.2).
2. Select the Import geometry option and click OK.
Figure 11.2: New File window
3. In the Import Geometry From window displayed, select the GEO file named <Tutorial-
4.geo>located in the Examples folder where the program was installed.
4. Click OK.
The predefined geometry is displayed in the Geometry tab of the View Input window (Fig-
ure 11.3). This imported geometry contains only the points, the layers boundary and the
164 of 286 Deltares
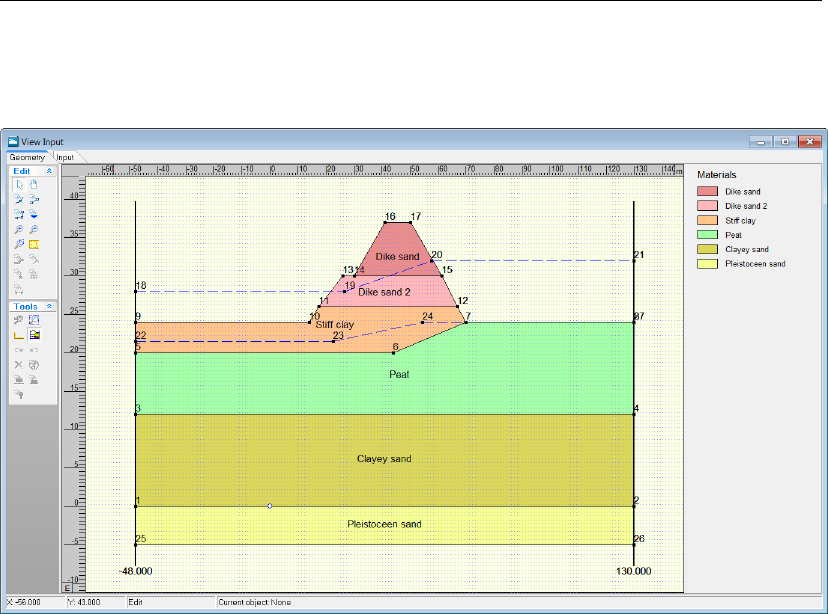
Tutorial 4: The Spencer Method
PL-lines, not the material types and properties. They will be imported from an MGeobase
database (section 11.2.3).
Figure 11.3: View Input window, Geometry tab after importing geometry
5. Click Save as in the File menu, enter <Tutorial-4>as file name and click Save.
11.2.2 Model
The calculation is carried out with the Spencer method as a user defined slip plane will be
used.
6. Open the Model window from the Project menu.
Deltares 165 of 286

D-GEO STABILITY
, User Manual
Figure 11.4: Model window
7. Select the Spencer model.
8. Click OK to confirm.
11.2.3 Importing material properties from an MGeobase database
The layers geometry is already modeled however the material properties still need to be de-
fined.
The parameters from Table 11.1 were saved in an MGeobase database. To import them, the
location of this MGeobase database must be first specified:
9. In the Program Options window from the Tools menu, select the Locations tab.
10. Mark the Use MGeobase database check-box and click the Browse button to specify the
location of the MGeobase database with material data.
11. In the Open project database window displayed, select the MDB file named <Tutorial-
4.mdb>located in the Examples folder where the program was installed.
12. Click Open and then OK.
166 of 286 Deltares
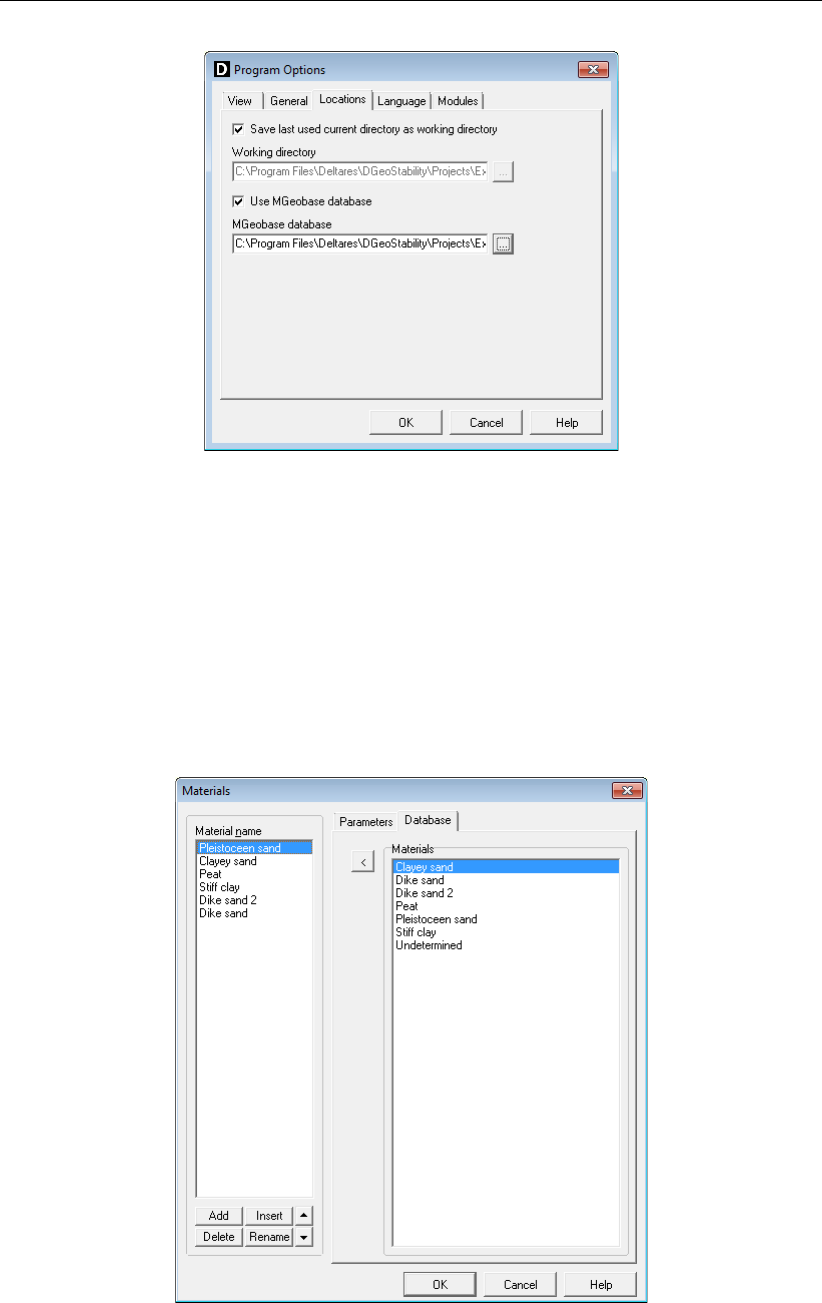
Tutorial 4: The Spencer Method
Figure 11.5: Program Options window, Locations tab
11.2.4 Materials
The soil properties of each material given in Table 11.1 can now be imported from this
MGeobase file:
13. Open the Materials window from the Soil menu and select the Database tab.
14. Select Clayey sand in the Materials list at the right of the Database tab and click the button
to import this soil type (with associated properties) in the material list of the Materials
window (Figure 11.6).
Figure 11.6: Materials window, Database tab
15. As the soil type already exists, an Information window opens asking if the existing local
properties should be overwritten (Figure 11.7). Confirm by clicking Yes.
Deltares 167 of 286
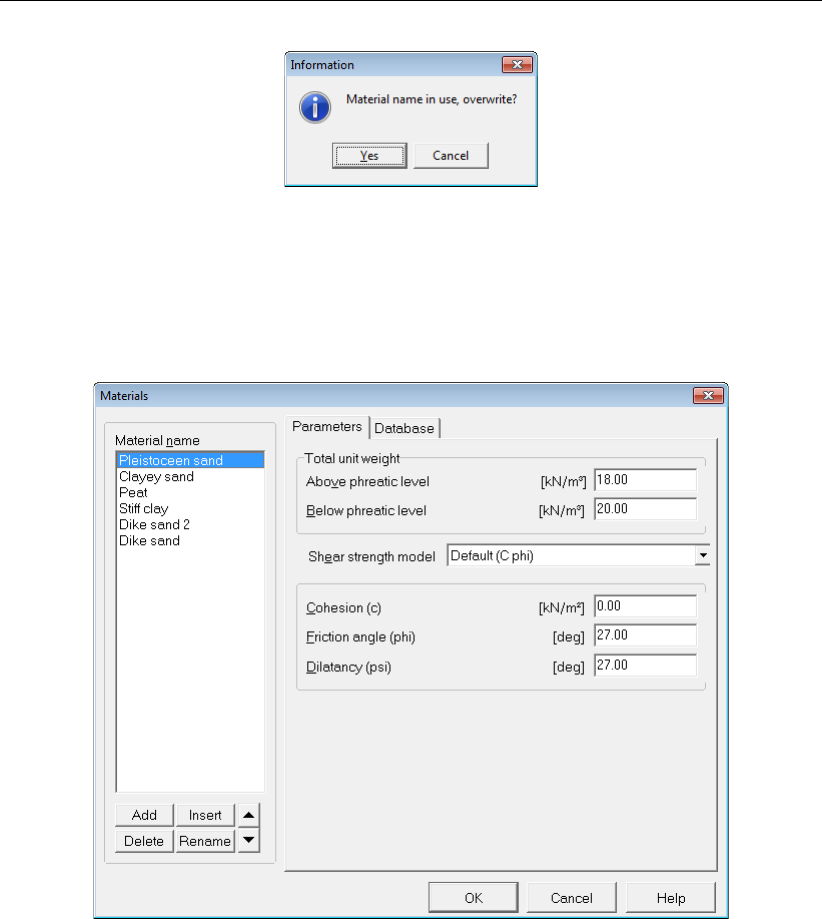
D-GEO STABILITY
, User Manual
Figure 11.7: Information window
16. Repeat it for the five other materials.
17. In the Parameters tab (Figure 11.8), check that the imported properties are the same as in
Table 11.1. Manually add for dilatancy the same values as for friction angle, since dilatancy
was not included in the database.
Figure 11.8: Materials window, Parameters tab
18. Click OK.
11.2.5 PL-lines per layer
In the current file two piezometric level lines are drawn. PL-line 1 is the phreatic level. Some
of the layers have a different PL-line. The bottoms of layers 2 and 3 have PL-line 2 as their
piezometric level.
19. Click PL-lines per Layer in the Geometry menu.
20. Enter the PL-line numbers as given in Figure 11.9.
21. Click OK.
168 of 286 Deltares

Tutorial 4: The Spencer Method
Table 11.2: Degree of consolidation per layer
Layer number Effect of layer 6 Effect of layer 5
6 100 -
5 100 100
4 50 100
3 40 80
2 30 60
1 100 100
Figure 11.9: PL-lines per Layer window
11.2.6 Degree of Consolidation
The weight of the top layers of the dike will cause excess pore pressure in some layers. Part
of the excess pore pressure is still present in the less permeable layers. The dissipation of
pore pressure is expressed in the degree of consolidation. E.g. when 60% of the excess pore
pressure has dissipated, the degree of consolidation is 60%. Let assume that layer 4 (stiff clay)
is affected by layer 6. 50% of the excess pore pressures in layer 4 have dissipated. Similarly,
some of the lower layers are affected by layer 5. In Table 11.2 the degree of consolidation due
to the influencing layers is given.
To input this, perform the following steps:
22. From the Water menu, choose the Degree of Consolidation option.
23. In the window displayed, select for Effect of layer number 6, change the degree of consol-
idation in layer 4 to 50%, in layer 3 to 40% and in layer 2 to 30% according to Table 11.2.
The Degree of Consolidation window should be as Figure 11.10.
Deltares 169 of 286
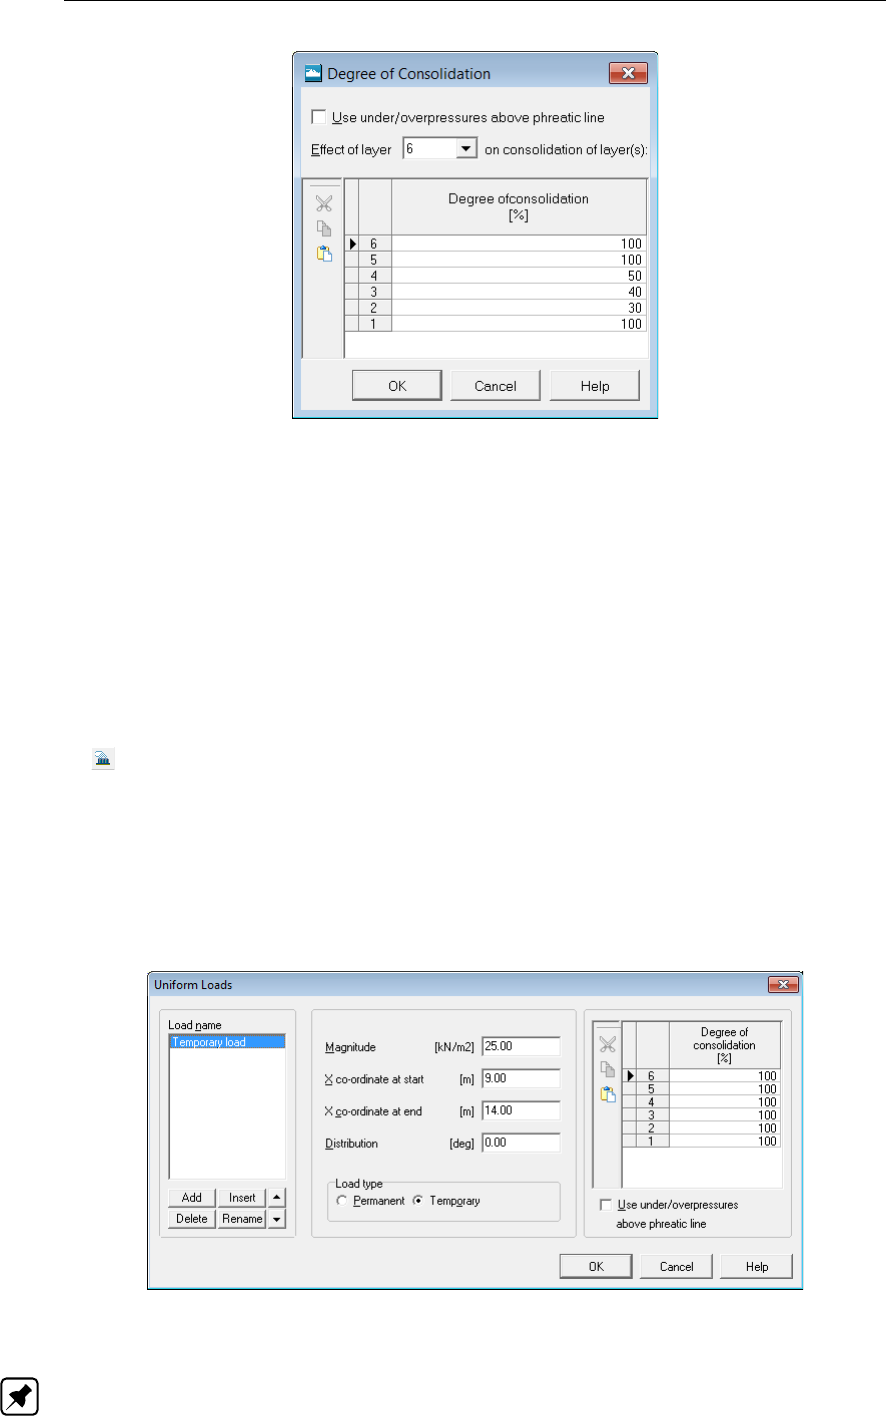
D-GEO STABILITY
, User Manual
Figure 11.10: Degree of Consolidation window
24. Select Effect of layer number 5, and change the degree of consolidation in layer 3 to 80%,
and in layer 2 to 60% according to Table 11.2.
25. Click OK to confirm and close the window.
11.2.7 Loads
A temporary uniform load at the foot of the dike shall be applied to the dike structure. In order
to input these loads, perform the following steps:
26. Make sure the Input tab in the View input window is selected. Click the Add uniform loads
button.
27. In the Load name sub-window click Add.
D-GEO STABILITY
gives a default name Uniform
Load (1) to the load.
28. Rename it with <Temporary load>.
29. Fill in <25 kN/m2>for the magnitude of the load.
30. Fill in <9.0 m>for the X coordinate at start, and <14.0 m>for the X coordinate at end.
31. In the load type section, select Temporary.
32. Click OK to confirm.
Figure 11.11: Uniform Loads window
Note: In the right section of the Uniform Loads window (Figure 11.11), it is possible to assign
a degree of consolidation to the soil layers as a result of the uniform load. The default is set
170 of 286 Deltares
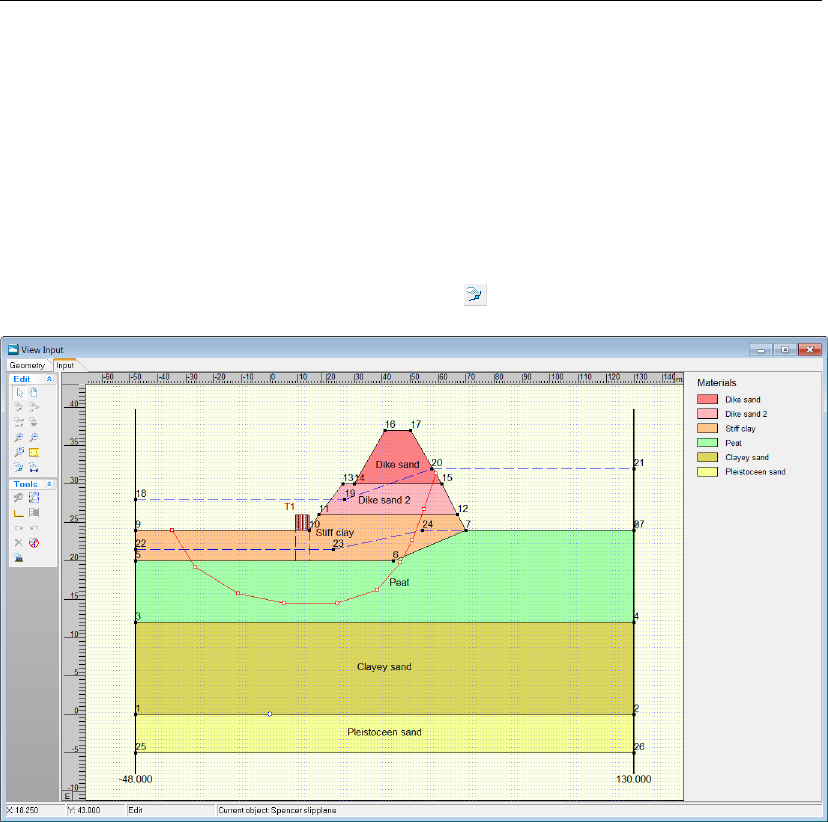
Tutorial 4: The Spencer Method
to 100%. The distribution is set to 0 degrees.
11.3 Calculation using one defined slip plane (Tutorial-4a)
11.3.1 Slipe Plane
To perform a calculation with the Spencer model, a slip plane has to be created.
33. Select the Input tab in the View Input window.
34. Create a slip plane by clicking the Add slip plane button.
Figure 11.12: View Input window, Input tab (Tutorial-4a)
35. Draw the slip plane by placing ten points from left to right in the dike body. Figure 11.12
suggests a shape for the slip plane.
36. Click Slip Plane in the Definitions menu to view the properties of the slip plane just created
manually.
37. Modify the X and Y coordinates of the slip plane to be in accordance with the values of
Figure 11.13.
38. Click OK.
Deltares 171 of 286
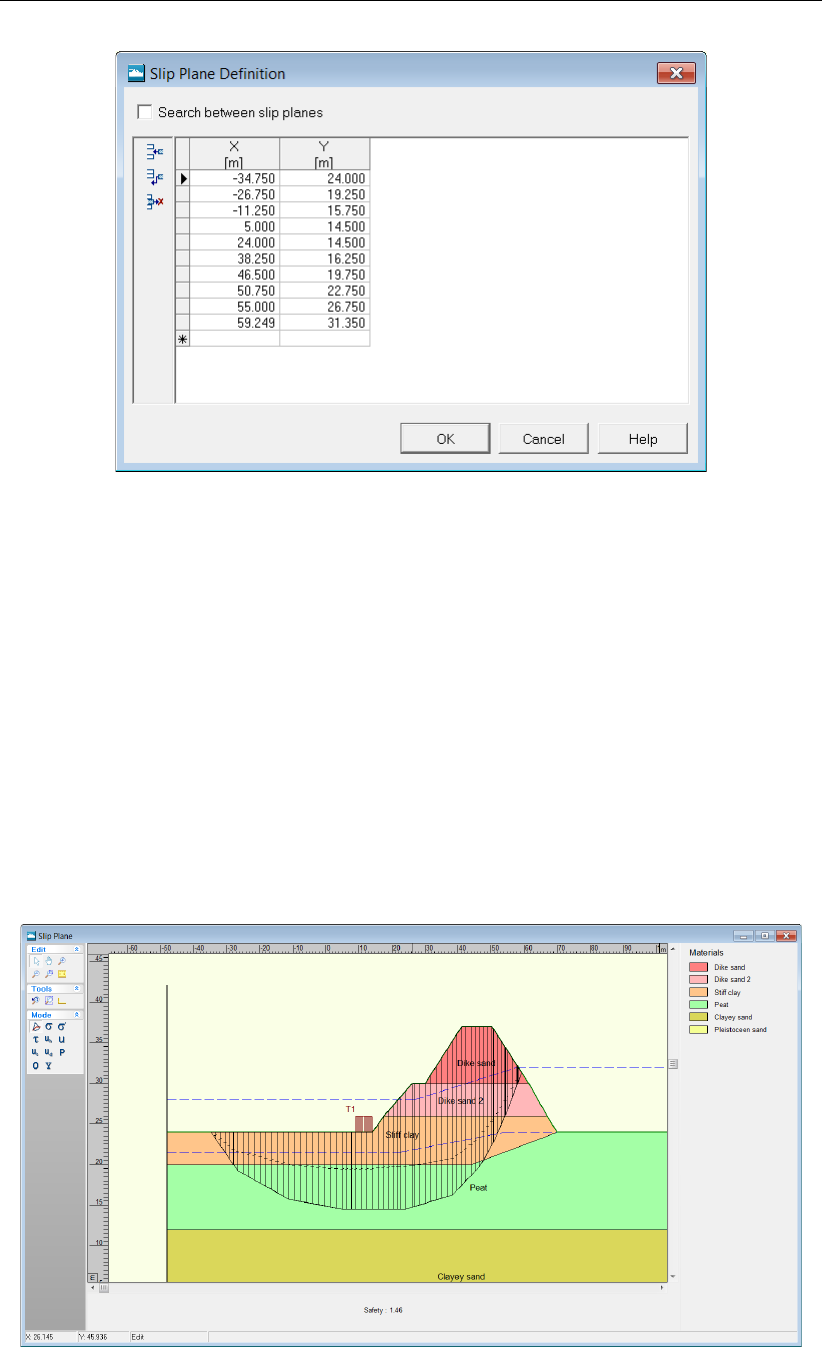
D-GEO STABILITY
, User Manual
Figure 11.13: Slip Plane Definition window (Tutorial-4a)
As only one slip plane is inputted,
D-GEO STABILITY
will calculate only one safety factor (for
this slip plane).
D-GEO STABILITY
allows the calculation of either one or a multitude of slip
planes with the Spencer method. These slip planes shall be defined later on in this tutorial
(section 11.4.1). The Spencer method ensures moment, vertical and horizontal equilibrium.
11.3.2 Calculation and Results
To calculate the safety factor for the slip plane that has been inputted, do the following:
39. Click Start in the Calculation menu.
40. Click OK to perform the calculation.
41. Click Stresses in the Results menu to open the Slip Plane window. The Slip Plane window
displayed (Figure 11.14) gives a safety factor of 1.46.
Figure 11.14: Slip Plane window (Tutorial-4a)
172 of 286 Deltares
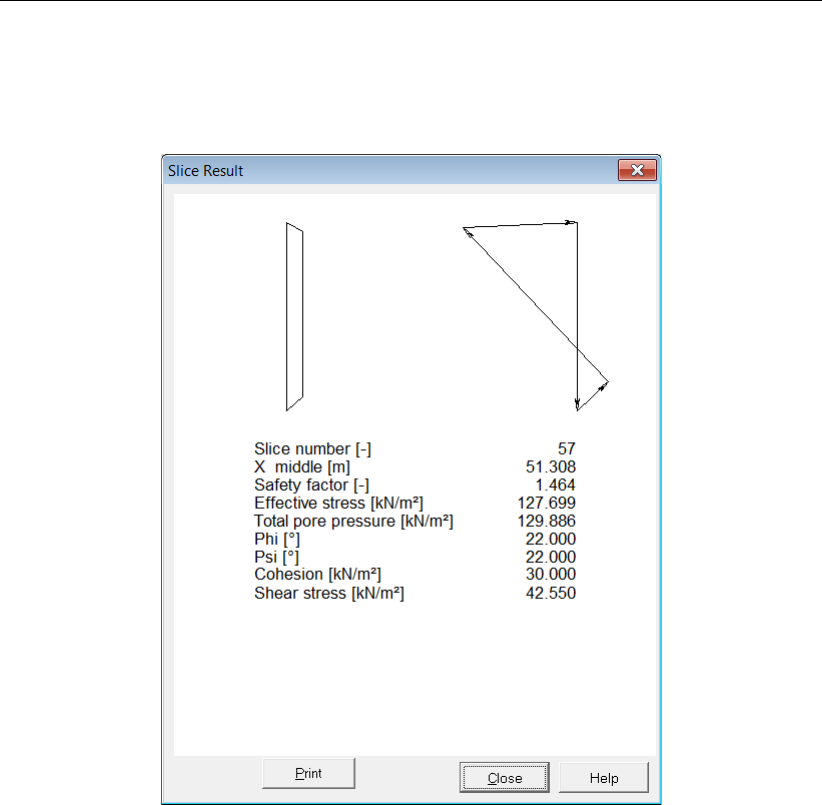
Tutorial 4: The Spencer Method
42. Double click on a slice to see the results for this individual slice. In Figure 11.15 the results
for slice 57 are shown. They include the visualization of the force balance and several
values that describe the slice’s geometry, forces or stresses.
Figure 11.15: Slice Result window for slice 57 (Tutorial-4a)
43. Click Stresses in Geometry in the Results menu to open the Stresses in Geometry window
(Figure 11.16).
Deltares 173 of 286
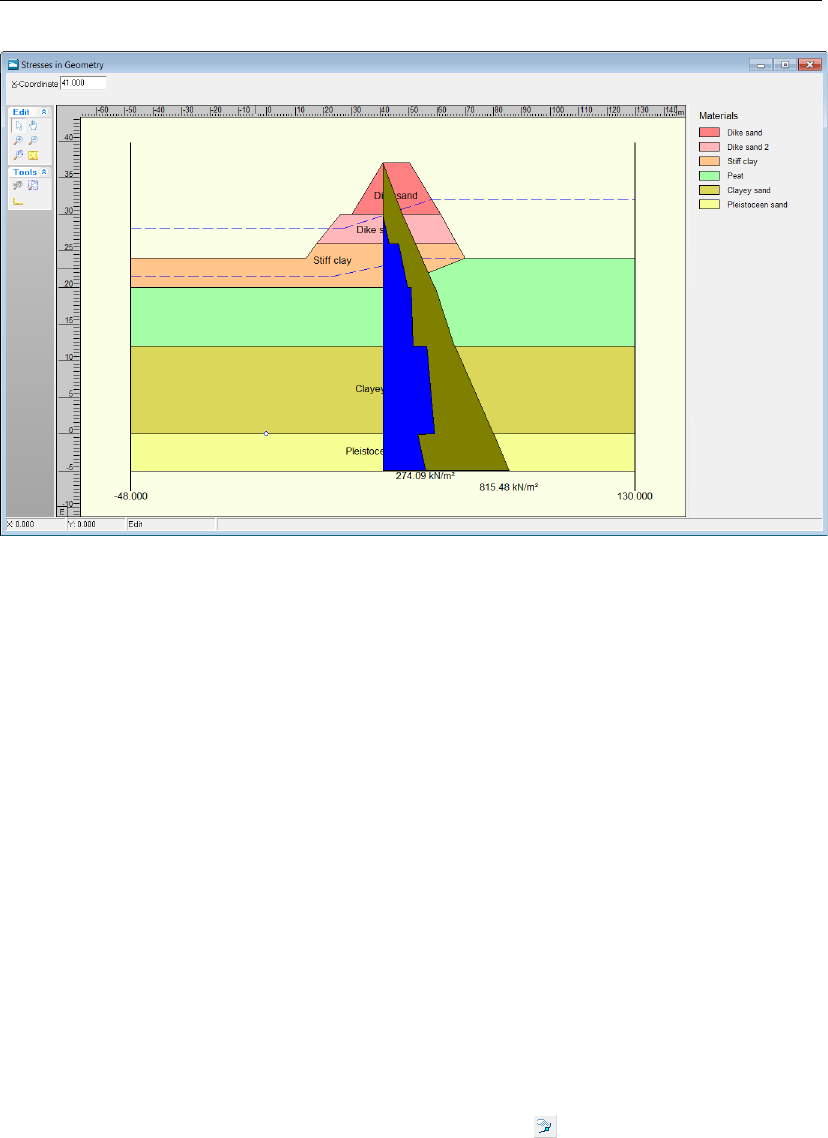
D-GEO STABILITY
, User Manual
Figure 11.16: Stresses in Geometry window (Tutorial-4a)
It can be seen that the pore pressures in the vertical have strongly alternating values from
layer to layer This is due to the different degrees of consolidation that have been assigned to
the layers.
11.4 Search between slip planes (Tutorial-4b)
D-GEO STABILITY
offers the unique possibility to search for the slip plane with the least resis-
tance, without presupposing the shape of the slip plane.
11.4.1 Define slip planes
D-GEO STABILITY
has now calculated the safety factor for the dike, using one defined slip plane.
However it is possible for
D-GEO STABILITY
to determine the safety factors of the dike using a
multitude of slip planes. To create those slip planes, the existing slip plane (section 11.3.1)
has to be enlarged and a second slip plane has to be first created.
D-GEO STABILITY
will create
a number of slip planes based on these two slip planes.
44. Click Save as in the File menu and save this tutorial as <Tutorial-4b>.
45. Click Save.
46. Create a second slip plane by clicking the Add slip plane button. Be sure that the Input
tab of the View Input window is selected.
47. Draw the second slip plane by placing points from left to right in the dike body. It is im-
portant that the number of points is equal to that of the initial slip plane (which is 10).
Figure 11.17 suggests a shape for the second slip plane (red line).
174 of 286 Deltares
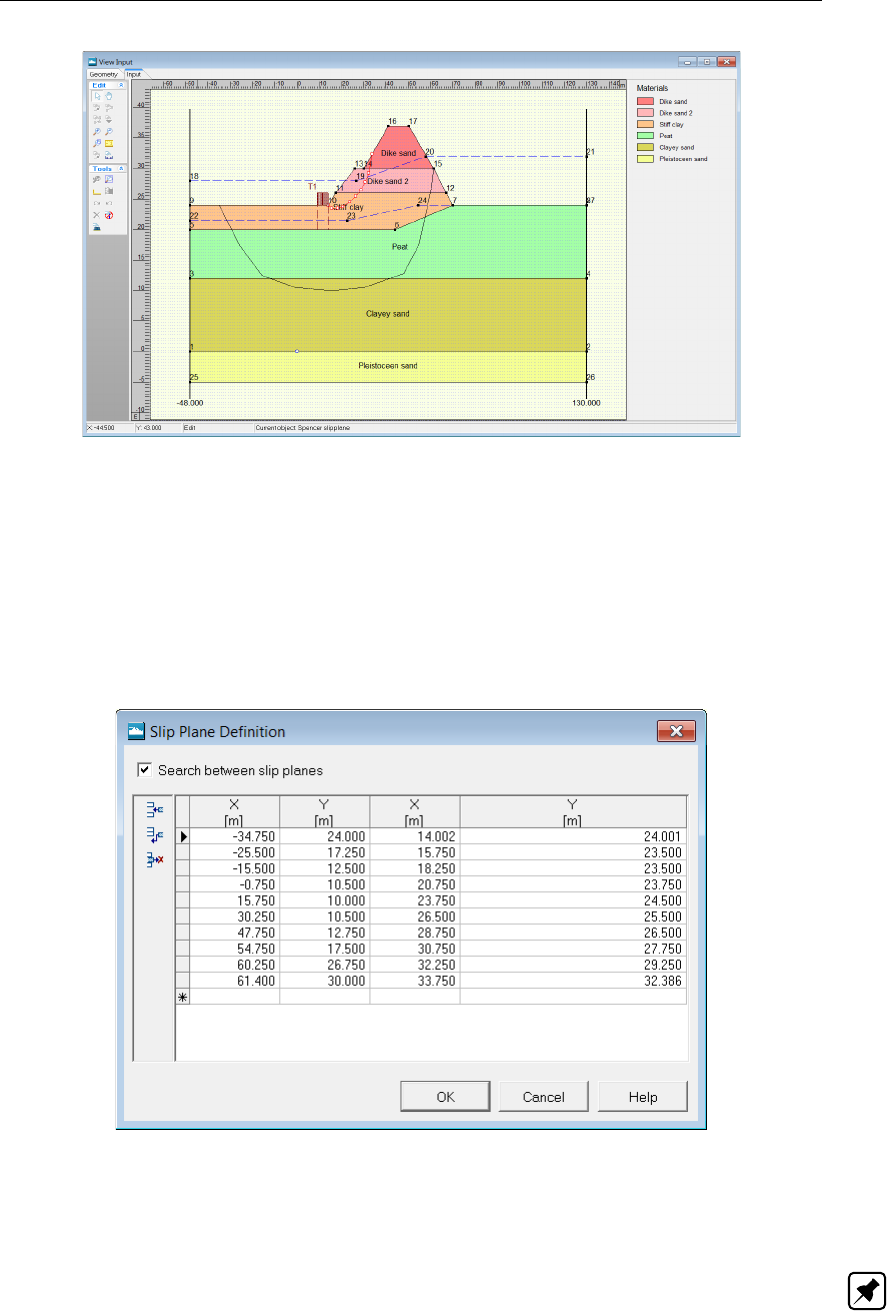
Tutorial 4: The Spencer Method
Figure 11.17: View Input window, Input tab – Suggested second slip plane (Tutorial-4b)
48. Click Slip Plane in the Definitions menu to view the properties of the slip planes to be
created using the two that are now provided (Figure 11.18).
49. Modify the coordinates (first and second columns) of the first slip plane to be in accordance
with the values of Figure 11.18.
50. Modify the coordinates (third and fourth columns) of the second slip plane just inputted
manually to be in accordance with the values of Figure 11.18.
51. Click OK.
Figure 11.18: Slip Plane Definition window (Tutorial-4b)
See section 4.4.1.3 “Slip Plane Definition (Spencer)" for a detailed description of this window.
Note: Too many points on a slip plane can decrease the smoothness of a slip plane, and
therefore increase the resulting safety factor (Van der Meij,2014). In general 10-12 points
along the plane are sufficient to find an unconstrained slip plane.
Deltares 175 of 286
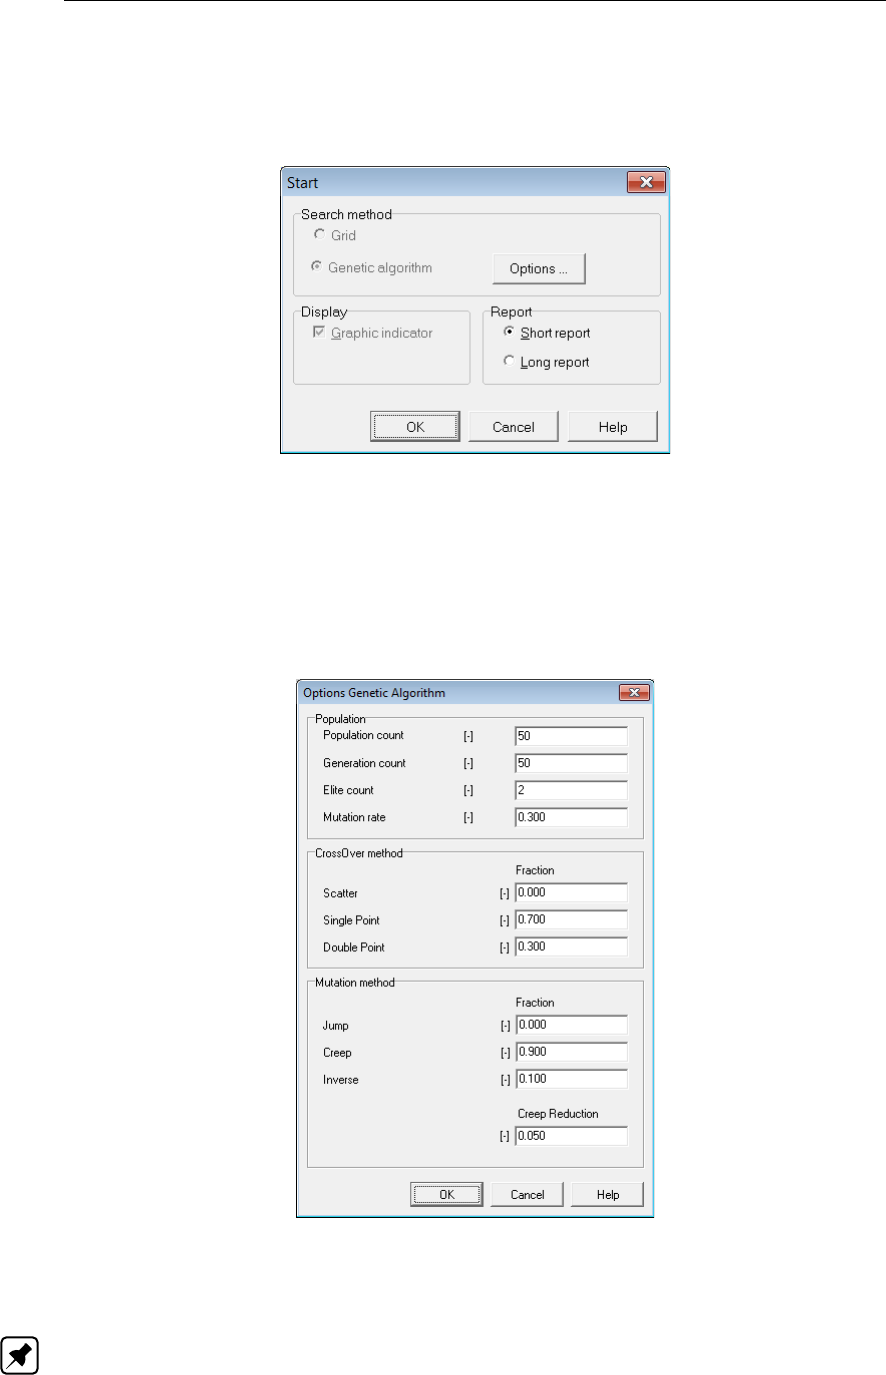
D-GEO STABILITY
, User Manual
11.4.2 Calculation and Results
52. Click Start in the Calculation menu. Genetic algorithm is automatically selected because
the option Search between slip planes in the Slip Plane Definition window was selected.
Figure 11.19: Start window (Tutorial-4b)
53. Click the Options button to open the Options Genetic Algorithm window and view the de-
fault options (Figure 11.20). Those advanced options are chosen automatically, based on
the chosen limit equilibrium method and the size of the search space. If these defaults
do not lead to the desired optimum, the advanced options must be set differently. Some
knowledge of genetic algorithms is required in order to do this.
Figure 11.20: Options Genetic Algorithm window (Tutorial-4b)
54. Leave the values to their defaults and click OK to close the window.
Note: Having a unnecessarily large search space decreases the precision of the answer. This
can be compensated by increasing the size of the population and the number of generations
but it increases the computational time.
176 of 286 Deltares
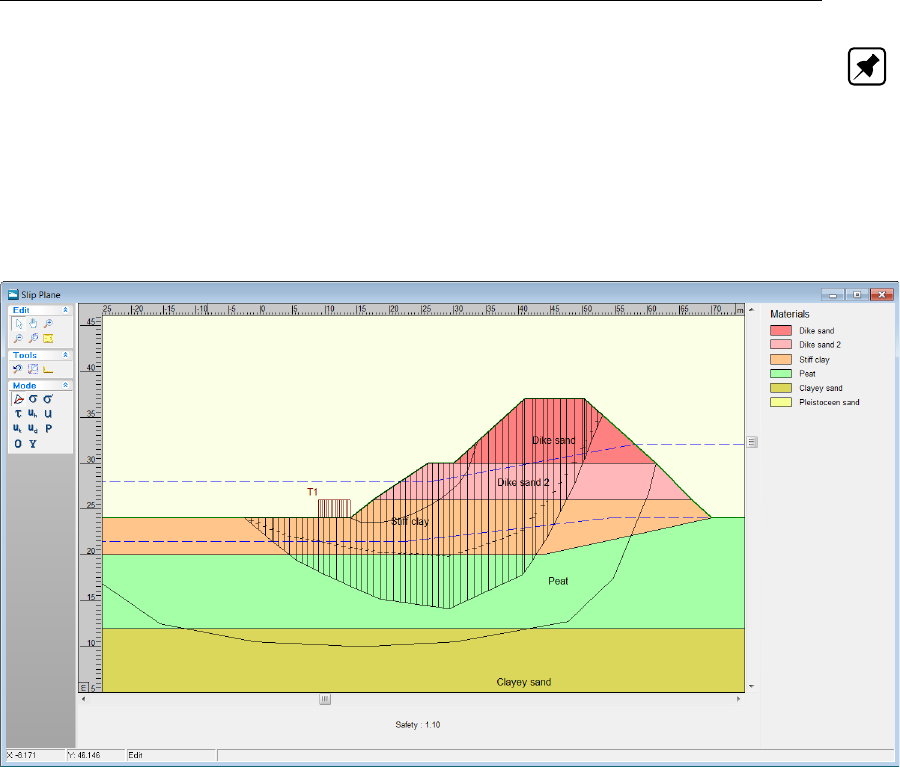
Tutorial 4: The Spencer Method
Note: The optimization parameters are calculated based on the limit equilibrium method and
the size of the search space. These defaults do not always guarantee al global minimum with
sufficient accuracy. With a little knowledge of genetic algorithms, the user can change the
calculation options, but a comparison with another analysis (e.g. Bishop with grid) is always
advised.
55. Click OK to perform the calculation.
56. Click Stresses in the Results menu to open the Slip Plane window.
Figure 11.21: Slip Plane window with lowest safety factor found by Spencer model using
a genetic algorithm (Tutorial-4b)
This slip plane is unconstrained and the limit equilibrium method guarantees the equilibrium
of all forces. The calculated safety factor is 1.10.
11.5 Conclusion
D-GEO STABILITY
uses the Spencer method to calculate minimum safety factors with uncon-
strained or user defined slip planes. It is also possible to add uniform loads and attribute
degrees of consolidation to soil layers due to the influence of either loads or other soil layers.
Deltares 177 of 286

D-GEO STABILITY
, User Manual
178 of 286 Deltares
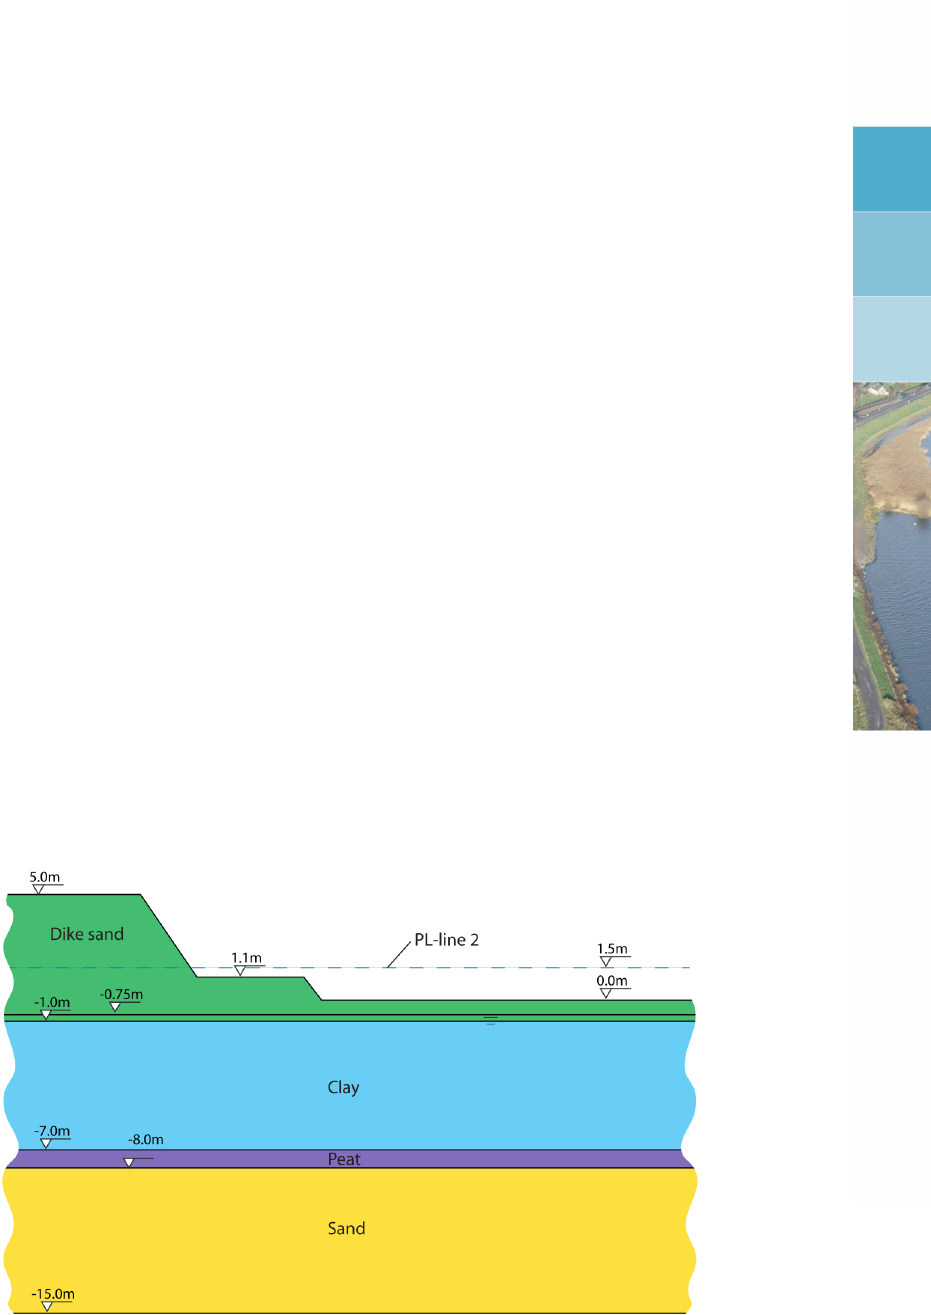
12 Tutorial 5: The Uplift-Van model
In this tutorial, a soil structure beneath which some of the layers have low weight and low
cohesion is considered. This situation might cause a non circular slide plane to come into
effect. In addition, some of the layers have a different piezometric level than the phreatic line.
This might cause a portion of the layers to be lifted. Therefore, for this case it is strongly
advised to use the Uplift-Van method.
The objective of this exercise is:
To learn how to make calculations using the Uplift-Van method.
For this example, the following
D-GEO STABILITY
modules are needed:
D-GEO STABILITY
Standard module (Bishop and Fellenius).
Uplift Van model.
This tutorial is presented in the file Tutorial-5.sti.
12.1 Introduction to the case
In the soil geometry (Figure 12.1) the thin peat layer beneath the clay layer might have an
effect on a slip failure mechanism. It is possible that the soil might slip along a certain length
of this peat layer. When this happens, describing the slip surface by a single circle would be
incorrect. Using the Uplift Van method the slip surface can be described by two circular slip
surfaces connected by a straight slip surface. This straight slip surface usually lies along the
bottom of a weak soil layer. The slip surface is thus described by more parameters.
Figure 12.1: Geometry overview (Tutorial 5)
The relevant values of the soil types used in this tutorial are given in Table 12.1.
Deltares 179 of 286
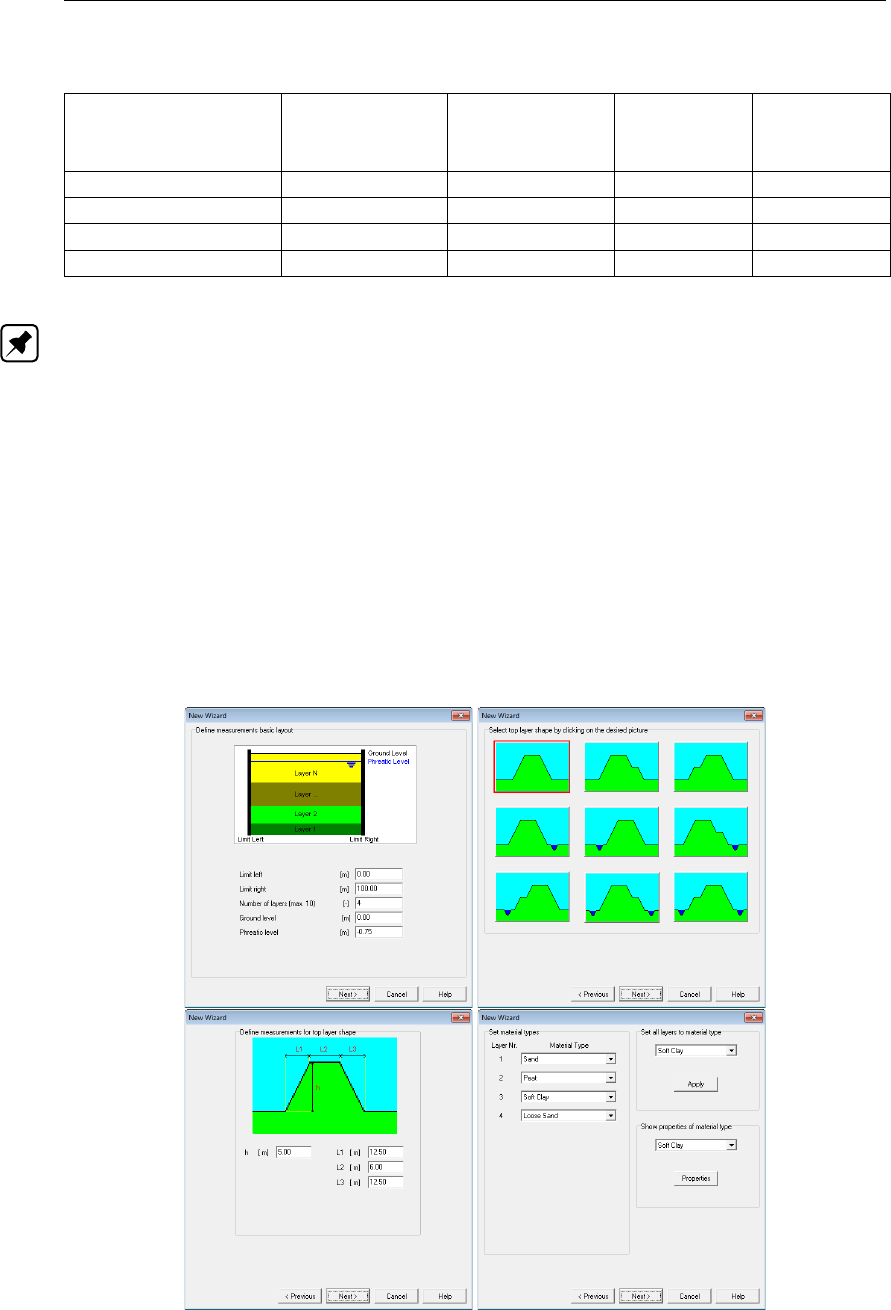
D-GEO STABILITY
, User Manual
Table 12.1: Soil properties (Tutorial 5)
Cohesion
[kN/m2]
Friction angle
[◦]
Unsaturated
unit weight
[kN/m3]
Saturated
unit weight
[kN/m3]
Dike sand 5 20 17 17
Clay 3 20 14 14
Peat 2 20 11 11
Sand 0.1 30 17 20
Note: The dilatancy ψis set equal to the friction angle ϕ.
12.2 Geometry Wizard
Firstly, the geometry of Figure 12.1 needs to be inputted in
D-GEO STABILITY
. This is done
using the Geometry Wizard as for Tutorial 1 (section 8.2). When the Wizard is completed,
modifications to change and complete the geometry will be made using the Geometry menu.
To create a new geometry using the Wizard, follow the steps described below:
1. Click File and choose New on the
D-GEO STABILITY
menu bar.
2. Select New geometry wizard and click OK.
3. Enter the basic geometrical properties, the basic geometric situation with the geometric
values and the soil type for each layer as given in Figure 12.2.
Figure 12.2: New Wizard windows
4. Click Finish in the last New Wizard window which gives an overview of the inputted geom-
etry. A View Input window appears (Figure 12.3) with the
D-GEO STABILITY
geometry that
180 of 286 Deltares
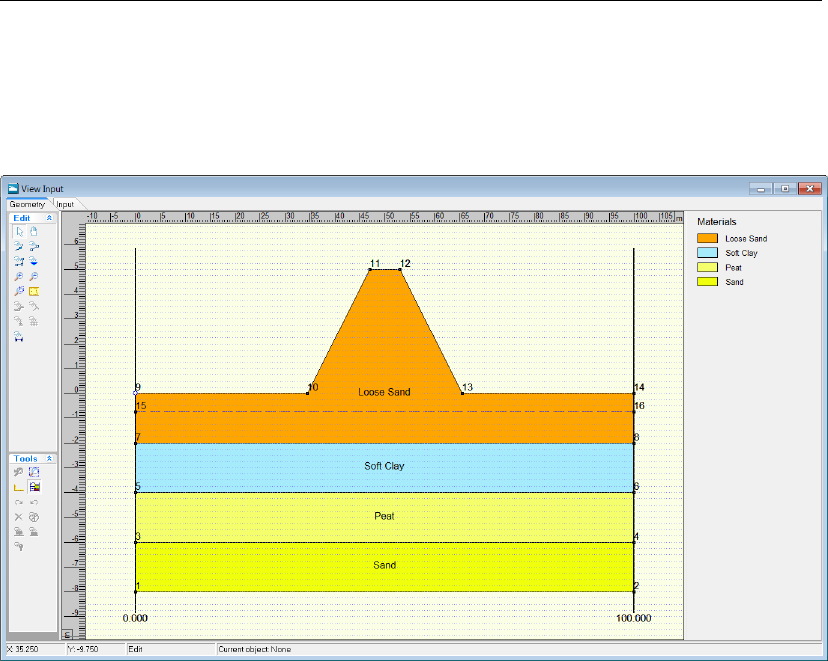
Tutorial 5: The Uplift-Van model
has been created so far. At this point the geometry needs to be saved.
5. Click Save as in the File menu.
6. Enter <Tutorial-5>as file name.
7. Click Save.
Figure 12.3: View Input window, Geometry tab
12.3 Model
As the Bishop method, the Uplift Van method can also be used to calculate the safety factor
of many different slip surfaces and ensures vertical force equilibrium and moment equilibrium.
8. Click Model in the Project menu.
9. Select the Uplift Van model.
10. Unmark the Geotextiles and Nails check-boxes as no geotextile or nail is used in this
tutorial.
11. Click OK.
12.4 Soil materials
In the Soil menu it is possible to modify the properties of the soil layers to be in accordance
with Table 12.1.
12. Choose Materials from the Soil menu to open the Materials window.
Deltares 181 of 286
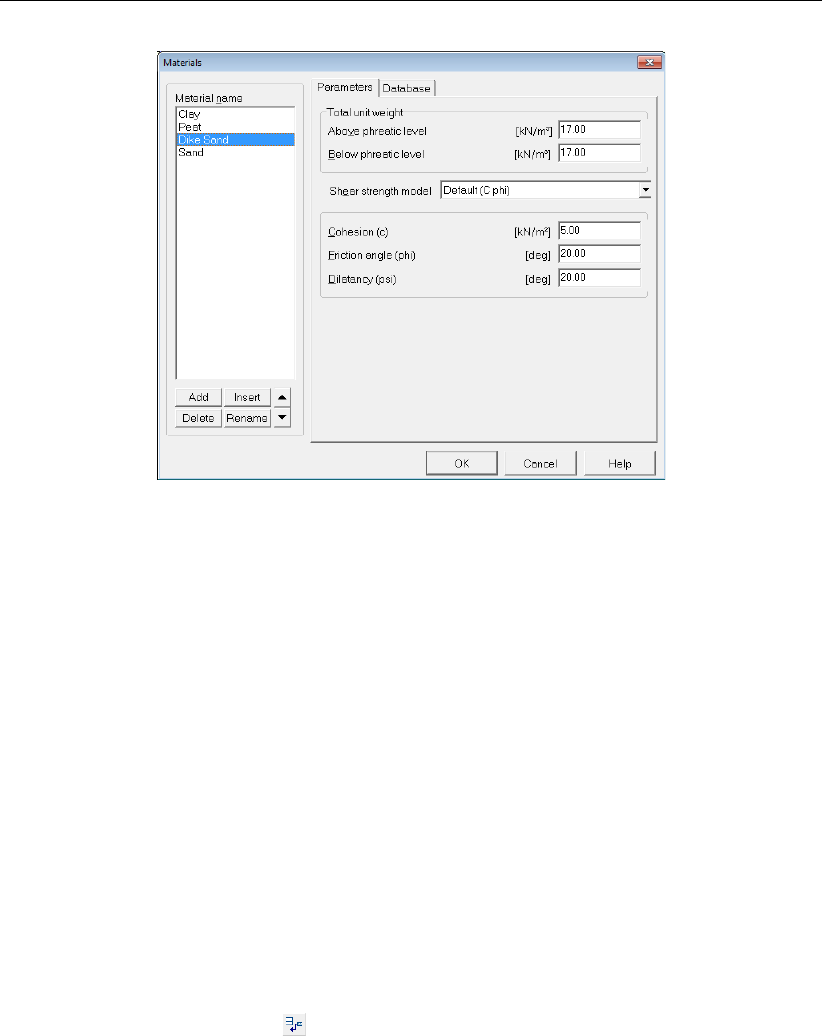
D-GEO STABILITY
, User Manual
Figure 12.4: Materials window
13. Select Loose Sand in the material list. Click Rename and change Loose Sand into <Dike
sand>.
14. Select Soft Clay in the material list and rename it into <Clay>.
15. Delete the unused materials by selecting them and clicking the Delete button.
16. Enter the soil properties values of the four layers used in this tutorial (Clay,Peat,Sand and
Dike Sand) as indicated in Table 12.1.
17. Click OK when finished.
12.5 Geometry
With the Geometry menu it is possible to modify the current geometry as given in Figure 12.1.
12.5.1 Points
The geometric values of the different layers need to be adjusted and two points need to be
added to create a second PL-line (called PL-line 2 in Figure 12.1) at level 1.5 m.
18. Click Points in the Geometry menu to open the Points window.
19. Click two times the Add row button to add points number <17>and <18>which will
be used to create PL-line 2 (see section 12.5.2).
20. Modify the coordinates of points number <1>till <18>as given in Figure 12.5.
21. Click OK.
182 of 286 Deltares
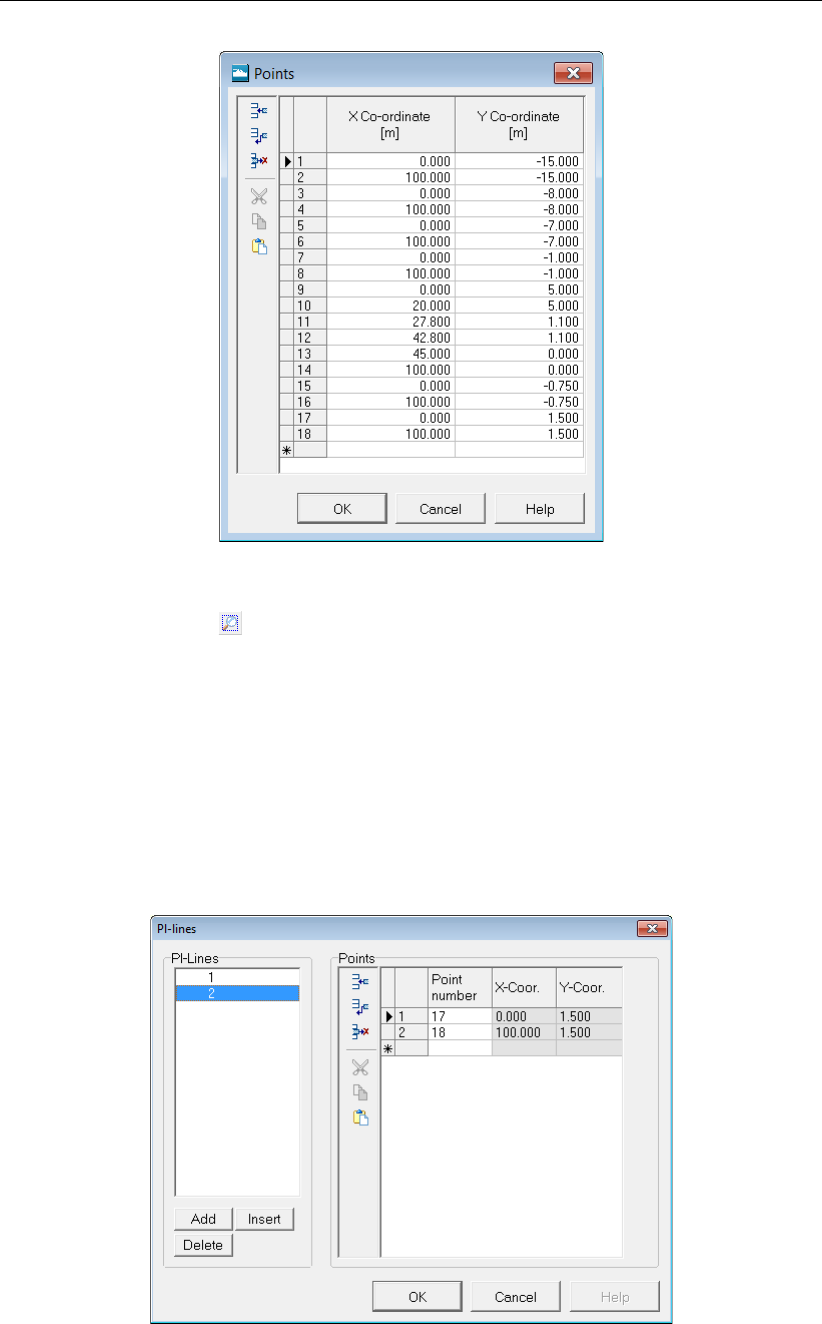
Tutorial 5: The Uplift-Van model
Figure 12.5: Points window
22. Click the Zoom limits button to display the complete new geometry.
12.5.2 PL-lines
To create PL-line 2, follow these steps:
23. Click PL-lines in the Geometry menu to open the PL-Lines window.
24. Click the Add button to add PL-line number <2>.
25. Enter points number <17>and <18>in the Point number column at the right of the
Pl-Lines window (Figure 12.6).
26. Click OK.
Figure 12.6: Pl-Lines window
Deltares 183 of 286
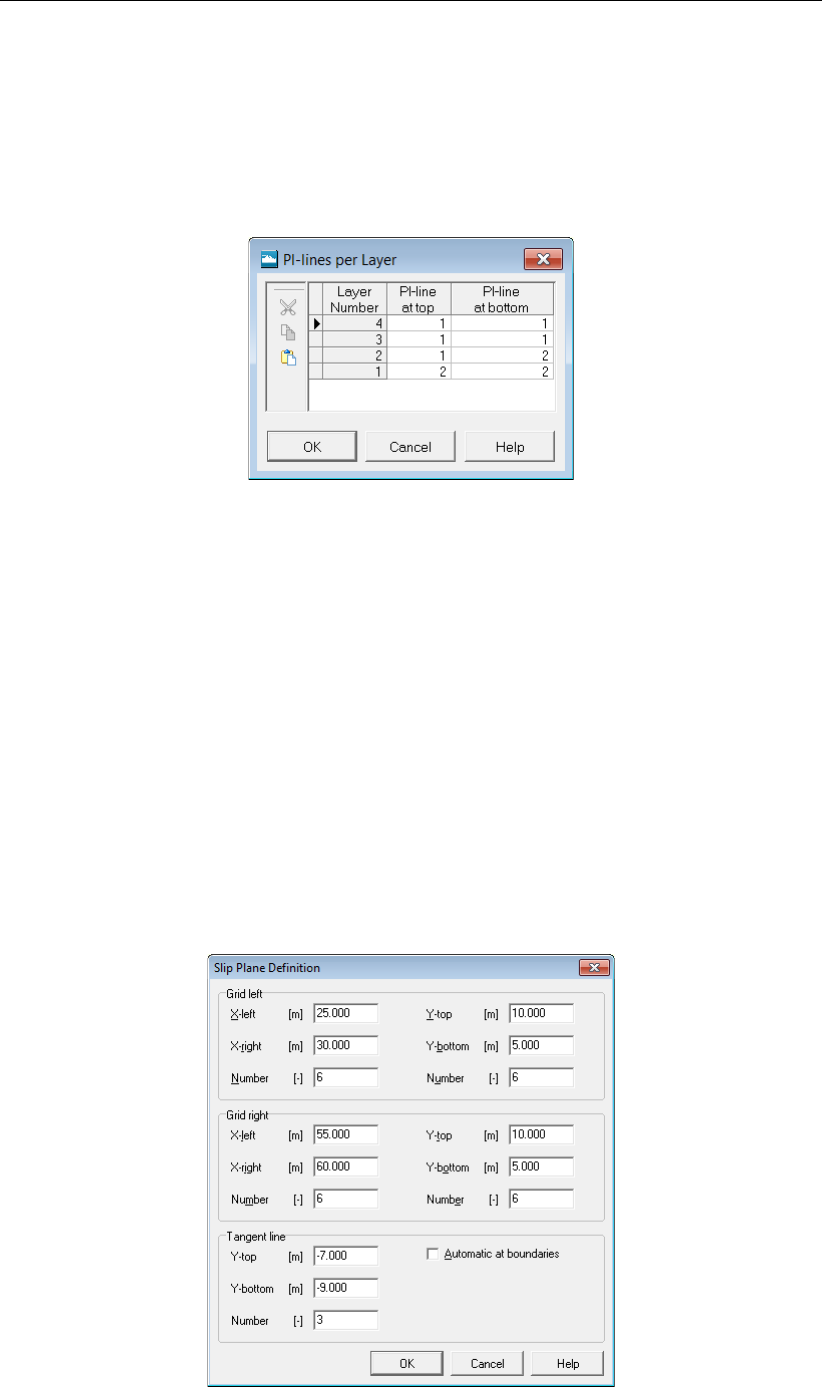
D-GEO STABILITY
, User Manual
12.5.3 PL-lines per Layers
To assign a PL-line to each layer, do the following:
27. In the Geometry menu, choose PL-lines per layer to open the PL-lines per Layer window.
28. Enter the PL-line numbers given in Figure 12.7 for each layer.
29. Click OK.
Figure 12.7: PL-Lines per Layer window
Due to the different piezometric levels in the soil layers, the soil is prone to lifting forces. This
can be verified with a simple evaluation or hand calculation.
12.6 Definitions
To make a calculation with the Uplift Van model, the specifications of the slip surface need to
be defined. To this end two grids are needed to define the slip circles on either side of the slip
surface. The slip surface on the left will cut the soil structure. The right slip surface will cut
the surface somewhere right of the soil structure. Also, tangent lines that connect the two slip
circles need to be placed in the geometry. Those lines will lie at the bottom of the weak peat
layer. Those connecting lines complete the total slip surface.
30. Click Slip Plane in the Definitions menu.
31. In the Slip Plane Definition window, enter the specifications shown in Figure 12.8.
Figure 12.8: Slip Plane Definition window
184 of 286 Deltares
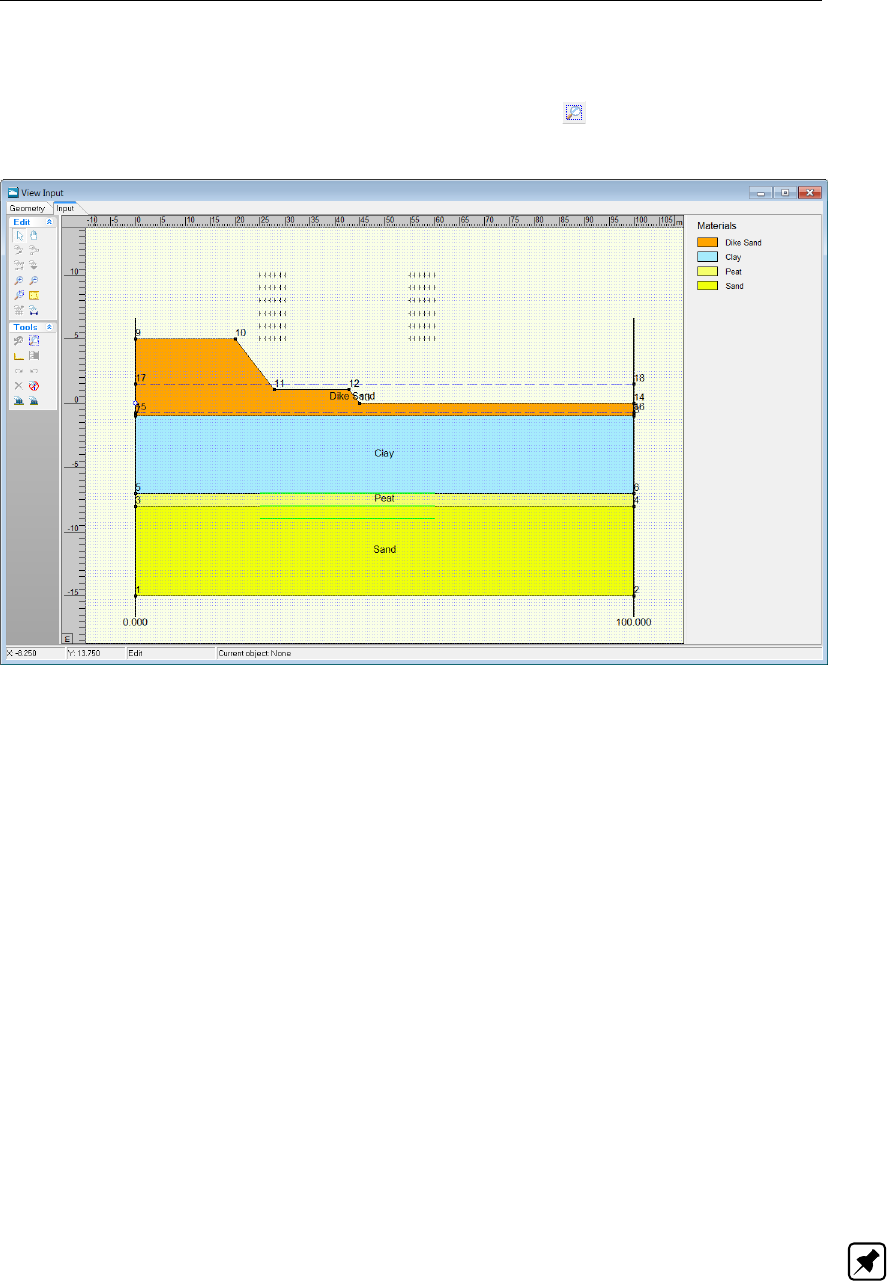
Tutorial 5: The Uplift-Van model
32. Click OK. The entered specifications will result in the calculation set up as seen in Fig-
ure 12.9.
33. Select the Input tab in View Input and click the Zoom limits button to display the com-
plete geometry.
Figure 12.9: View Input window, Input tab
12.7 Calculation and Results
34. Click Start in the Calculation menu.
35. Click OK to perform the calculation.
12.7.1 Stresses
To view the shape of the slip surface:
36. Click Stresses in the Results menu to open the Slip Plane window.
In the window displayed (Figure 12.10) the measurements of the slip surface can be seen. It
consists of two partial circular slip surfaces connected by a line. As with the Bishop method
each slip circle has a grid that has moved from its original position. The safety factor is equal
to 1.94.
The measurements of the left slip circle are given as this is the more deciding factor in the
determination of the safety factor. The measurements of the right slip circle are found in the
report.
Note: It is possible to compare results obtained by the Uplift Van method to those of other
methods. E.g. the Bishop method in this case gives a result with a slip circle with a large
radius and a higher safety factor.
Deltares 185 of 286

D-GEO STABILITY
, User Manual
Figure 12.10: Slip Plane window
12.7.2 FMin Grid
The FMin Grid window also shows the grid of the left slip circle:
37. Click FMin Grid in the Results menu to open the FMin Grid window (Figure 12.11). The
minimum safety factor of 1.939 is indicated in red.
Figure 12.11: FMin Grid window
186 of 286 Deltares

Tutorial 5: The Uplift-Van model
12.8 Conclusion
In this tutorial the soil conditions and piezometric levels are such that it is probable to expect
a non-circular slip plane. That’s why the Uplift Van model is used as it evaluates the safety
factor of a soil structure finding a non-circular slip plane.
Deltares 187 of 286

D-GEO STABILITY
, User Manual
188 of 286 Deltares
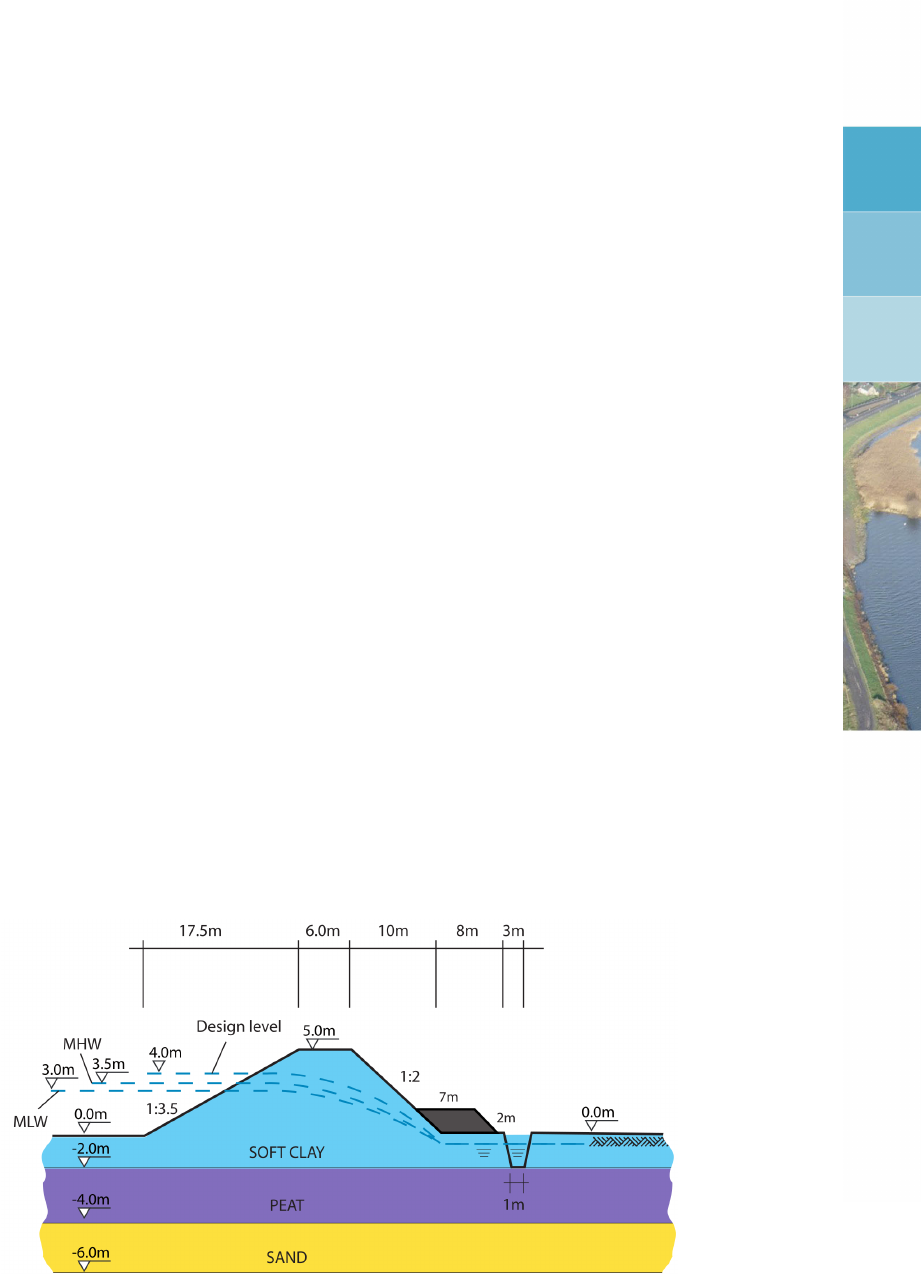
13 Tutorial 6: Reliability Analysis
In this tutorial an example is given of a probabilistic calculation.
D-GEO STABILITY
has the
possibility of describing soil parameters stochastically. In addition, it is possible to describe
different water levels and provide their frequency of exceeding. After
D-GEO STABILITY
per-
forms a probabilistic calculation, the output will consist of a safety factor and the probability of
failure at each given water level. Also, the parameters which influence the outcome most are
named and their influence represented by a percentage.
The objective of this tutorial is:
To learn how to describe input into
D-GEO STABILITY
stochastically
For this example, the following
D-GEO STABILITY
modules are needed:
D-GEO STABILITY
Standard module (Bishop and Fellenius).
Uplift Van model
Reliability model
This tutorial is presented in the file Tutorial-6.sti.
13.1 Introduction to the case
In order to gain insight into the probability of failure of a soil structure and assess the influence
of model input,
D-GEO STABILITY
performs a probabilistic calculation. To this end, input has to
be described stochastically. This input includes material and model properties as well as an
option to describe different occurring water levels.
The basic geometry of this tutorial (Figure 13.1) is based on Tutorial 1b (section 8.9).
Figure 13.1: Geometry overview (Tutorial 6)
1. Click Open in the File menu.
2. Select Tutorial-1b.
3. Click Open.
4. Click Save as in the File menu and save this tutorial as <Tutorial-6>.
5. Click Save.
Deltares 189 of 286
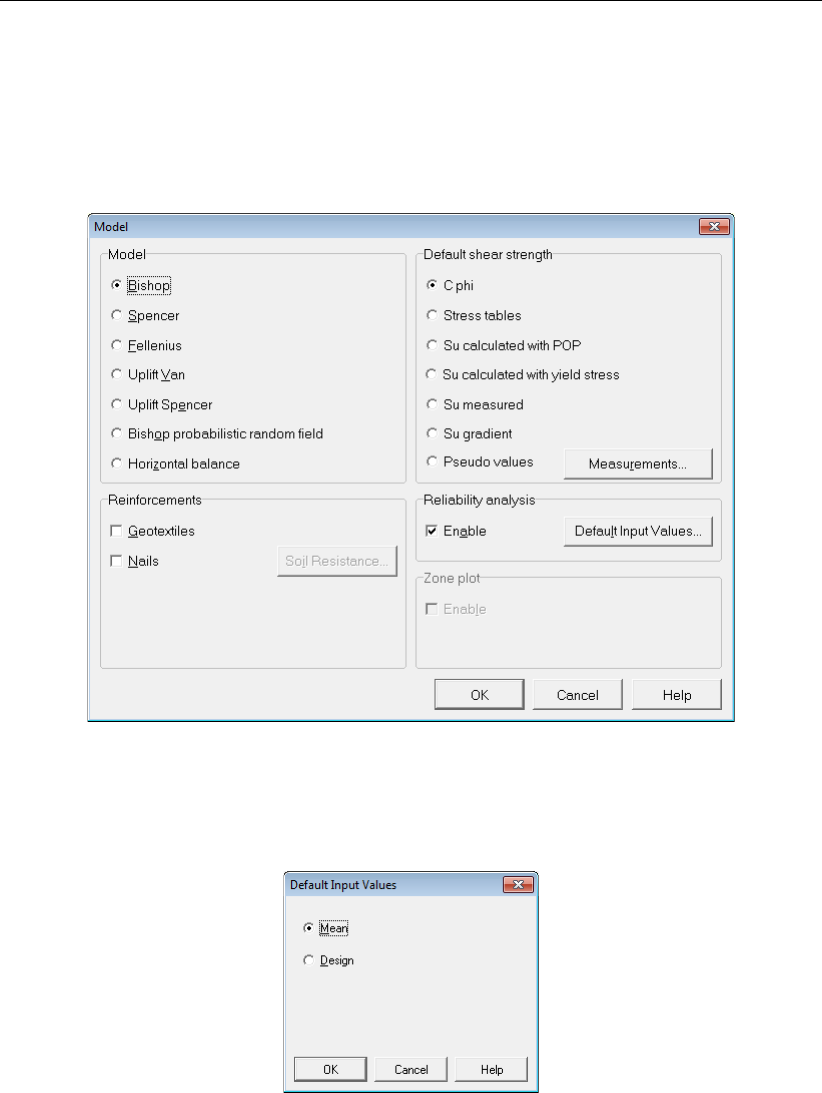
D-GEO STABILITY
, User Manual
13.2 Model
6. Click the Model option in the Project menu.
7. Make sure the Bishop method is selected.
8. Mark the Enable Reliability analysis check-box as a probabilistic calculation will be per-
formed.
Figure 13.2: Model window
9. Click on the Default Input Values button to open the Default Input Values window and
choose mean as input values (Figure 13.3).
Figure 13.3: Default Input Values window
10. Click OK to close the Default Input Values window.
11. Click OK to close the Model window.
190 of 286 Deltares
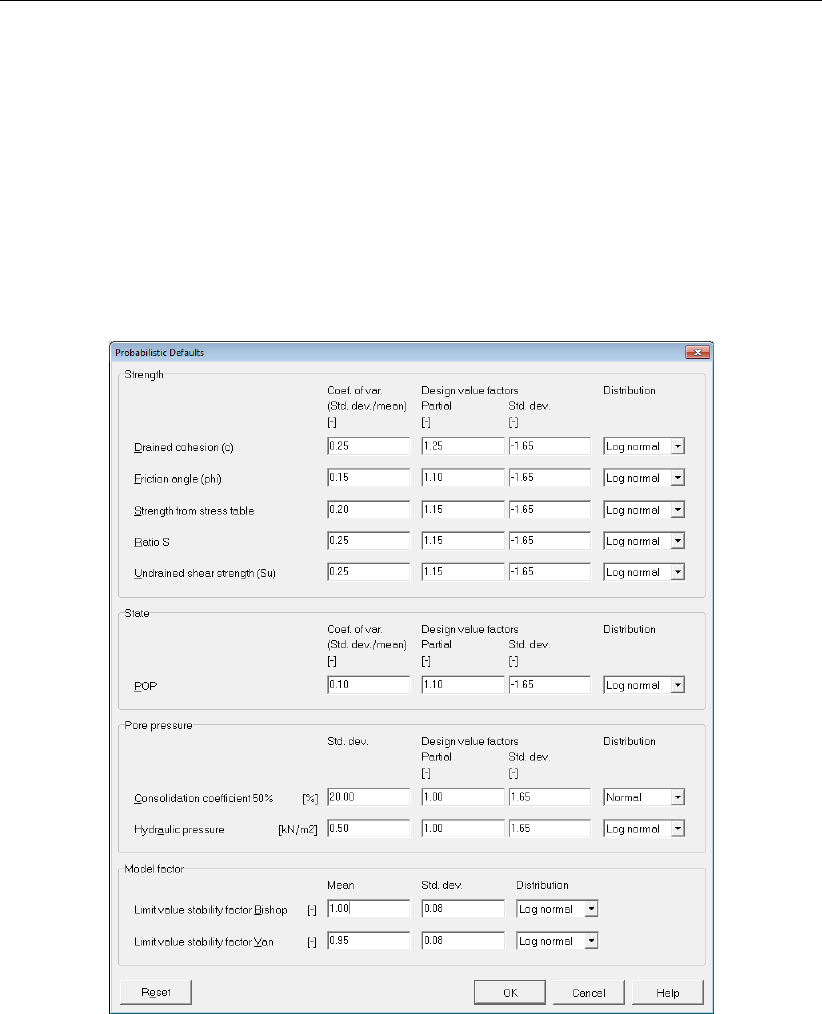
Tutorial 6: Reliability Analysis
13.3 Probabilistic Defaults
To perform a probabilistic calculation,
D-GEO STABILITY
makes use of predefined probabilistic
parameters. These are applied to soil strength parameters, pore pressure properties and a
model factor. In order to modify these parameters:
12. Click Probabilistic Defaults option in the Project menu. The default values of the proba-
bilistic parameters are displayed in the window that opens (Figure 13.4). In this tutorial the
default values as provided should be used. The defaults under Strength and Pore pressure
are applied to all materials.
13. Click OK.
Figure 13.4: Probabilistic Defaults window
13.4 Soil
It is possible to modify the probabilistic properties of each material individually by changing the
numerical values. In this tutorial the properties for ‘Soft Clay’ shall be modified by changing
the standard deviation of the friction angle from 3 to 5◦.
14. Click Materials in the Soil menu.
15. Select Soft Clay in the materials list.
16. Deselect Use Probabilistic defaults.
17. Enter <5.0>for the standard deviation of the friction angle.
Deltares 191 of 286
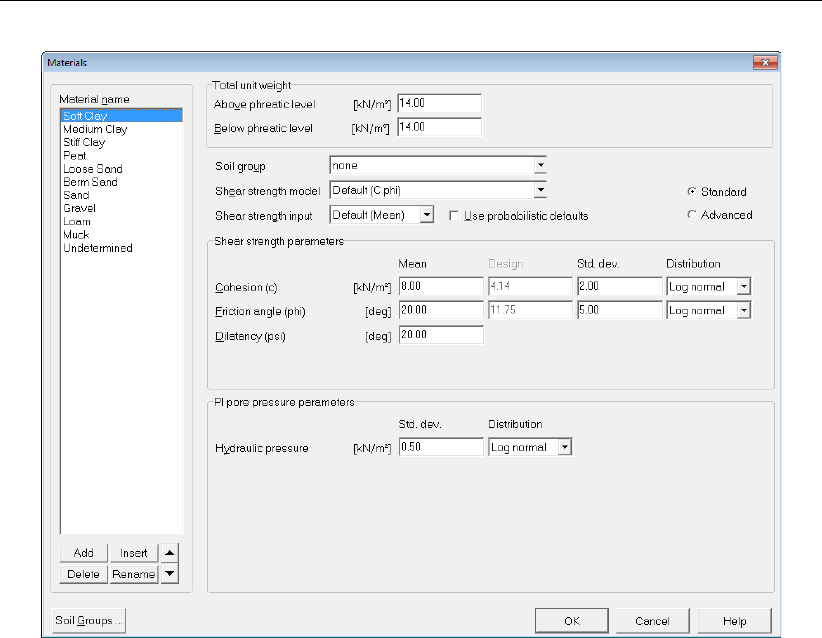
D-GEO STABILITY
, User Manual
Figure 13.5: Materials window for Standard input
It is also possible to describe the materials’ properties in more detail, i.e. provide probabilistic
information on the use of cohesion and friction angle. This can be done with or without using
the probabilistic defaults.
In this tutorial the design value factor for the friction angle of Berm Sand must be changed.
18. Select Berm Sand in the materials list.
19. Deselect Use probabilistic defaults.
20. In the right part of the window, select Advanced.
21. Now select the Shear Strength Advanced tab.
22. Change the value of partial to <1.20>in the Phi design value factors sub-window.
23. Click OK.
192 of 286 Deltares
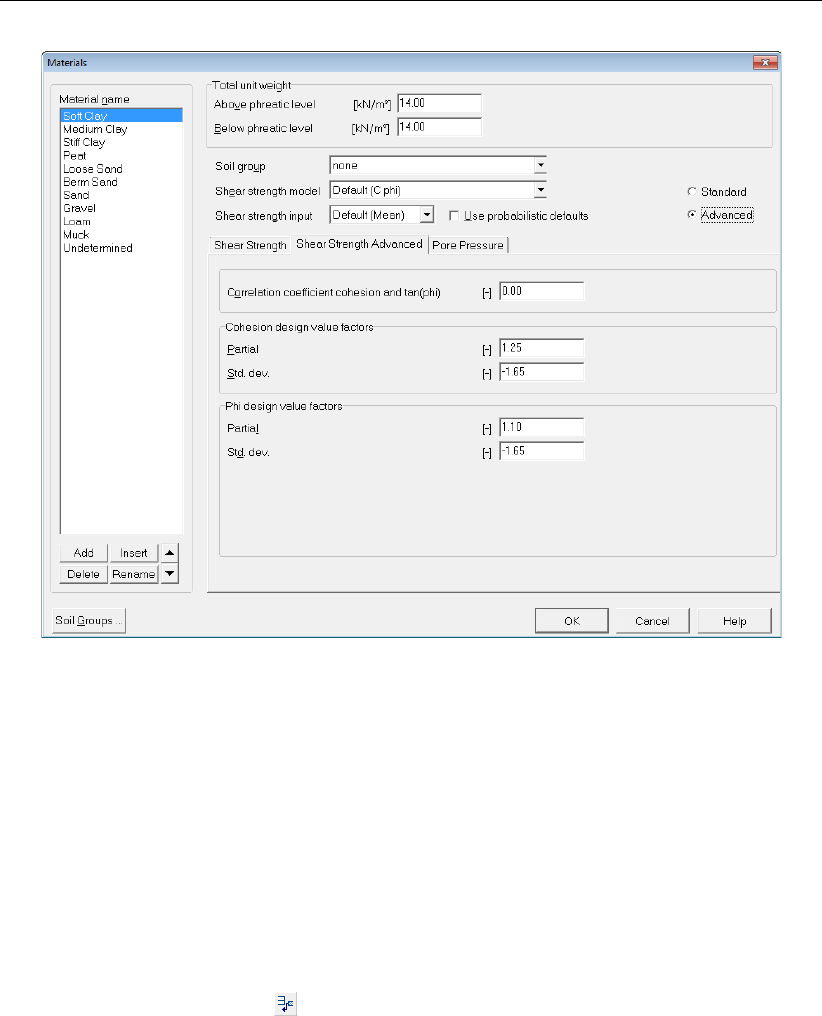
Tutorial 6: Reliability Analysis
Figure 13.6: Materials window, Shear Strength Advanced tab
13.5 Geometry
For this probabilistic calculation three possible water levels on the left side of the dike are
taking into account. To this end, two new PL-lines (called MHW and MLW in Figure 13.1)
have to be first inputted into the geometry.
13.5.1 Points
To create two new PL-lines six new points are first added to the existing points.
24. Click Points in the Geometry menu to open the Points window.
25. Click six times the Add row button to add points number <25>till <30>which will be
used to create PL-lines 2 and 3 (see section 13.5.2).
26. Modify the coordinates of those points number as given in Figure 13.7.
27. Click OK.
Deltares 193 of 286
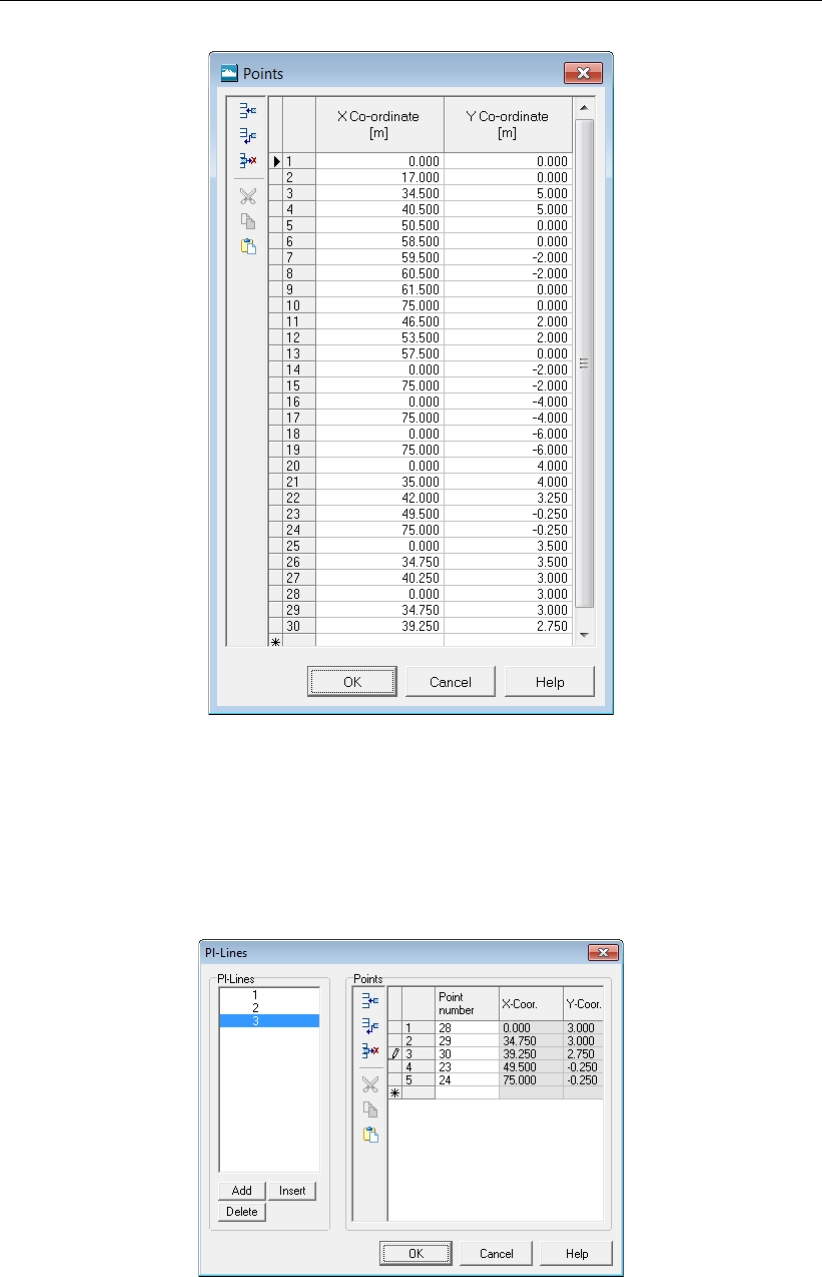
D-GEO STABILITY
, User Manual
Figure 13.7: Points window
13.5.2 PL-lines
To create two new PL-lines follow these steps:
28. Click PL-lines in the Geometry menu to open the PL-Lines window.
Figure 13.8: PL-Lines window
29. Click the Add button to add PL-line number <2>.
30. Enter points number <25>,<26>,<27>,<23>and <24>in the Point number column
at the right of the PL-lines window.
194 of 286 Deltares
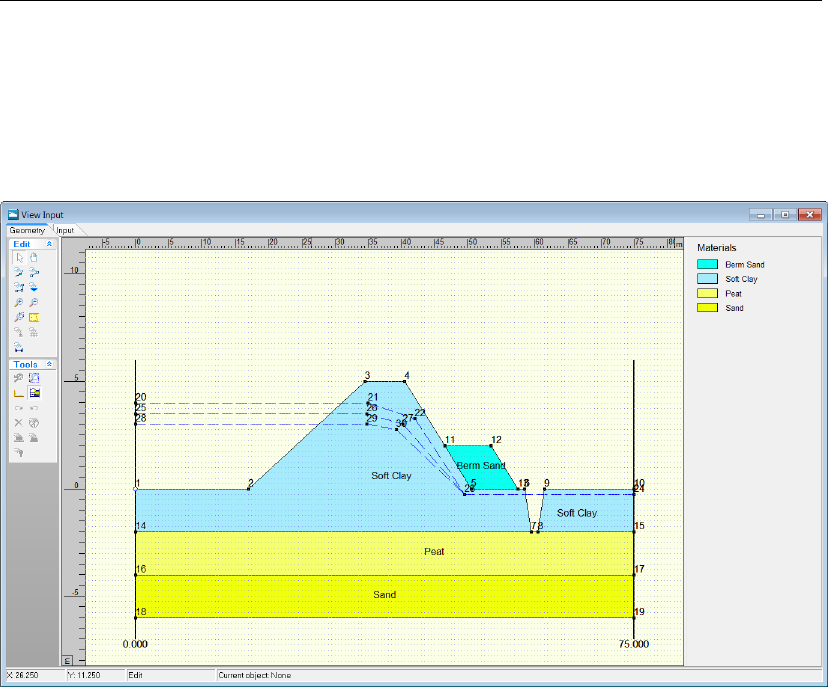
Tutorial 6: Reliability Analysis
31. Click again the Add button to add PL-line number <3>.
32. Enter points number <28>,<29>,<30>,<23>and <24>in the Point number column
at the right of the PL-lines window (Figure 13.8).
33. Click OK. This will result in a new geometry in the View Input window, as shown in Fig-
ure 13.9.
Figure 13.9: View Input window, Geometry tab
13.5.3 PL-lines per Layer
In this tutorial the piezometric level of all the layers coincides with the phreatic line (which is
the upper line in Figure 13.1).
13.6 Water
In the geometry three different piezometric level lines are drawn. In the design case, the upper
line functions as the phreatic line. The second line has been added to be incorporated as a
mean high water level in this probabilistic calculation. The lower line will be incorporated as a
mean low water level.
To define how the water levels are to be incorporated, do the following:
34. Click External water levels in the Water menu.
35. Mark the Use water data check box.
First, a design level must be set for the calculation.
36. In the Water level sub-window, enter <4.0 m>as Design level and <0.3 m>as Decimate
height.
37. Set the level of exceeding to <1/2000>. This means that this water level is exceeded once
every 2000 years.
In order to describe the first water level, do the following:
Deltares 195 of 286
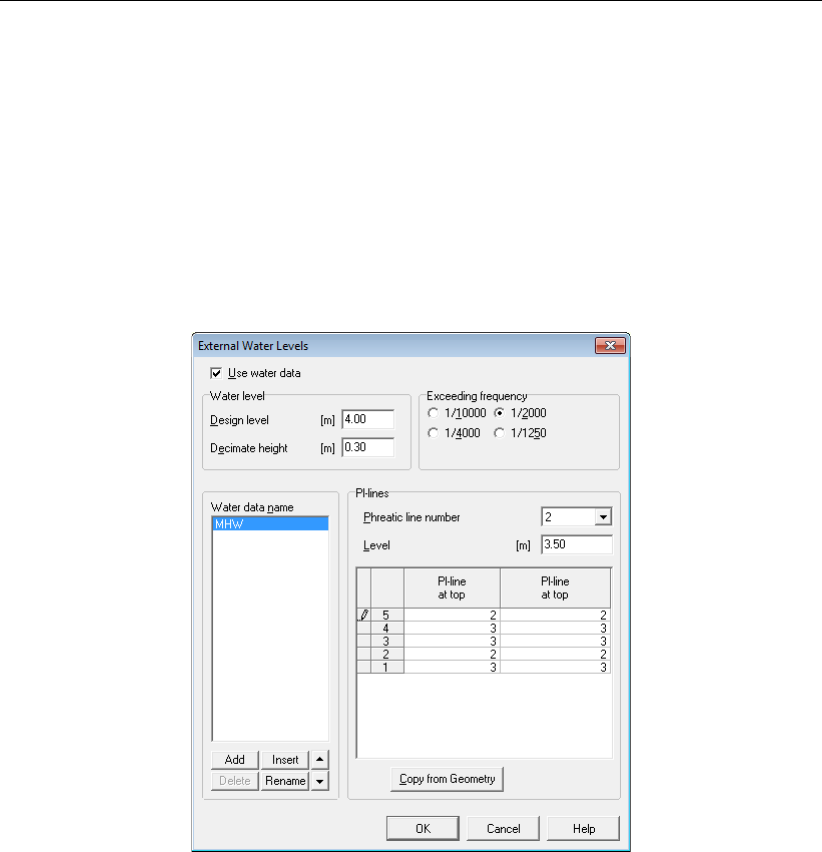
D-GEO STABILITY
, User Manual
38. Click Rename and change the name of the current water level to <MHW>(Mean High
Water).
39. In the PL-lines sub-window, the Phreatic line number for this water level is defined by line
number <2>. In other words, all the weight of the soil beneath this level will be calculated
by its weight under the phreatic line. To include this in the calculation select phreatic line
number 2 from the drop down menu.
40. Enter <3.5 m>for Level. In combination with the design level and its frequency of ex-
ceeding, an exceeding frequency is established for this particular water level.
41. At this particular water level some of the layers’ piezometric levels differ. Enter PL-line at
top and PL-line at bottom according to the values shown in Figure 13.10.
Figure 13.10: External Water Levels window, MHW
42. To add the second water level to the calculation input, click Add in the Water data name
sub-window.
43. Change the name of this water level to <MLW>(Mean Low Water).
44. In the PL-lines sub-window, the Phreatic line number for this water level is defined by line
number <3>.
45. Set Level to <3.0 m>.
46. For all the layers enter <3>as PL-line at top and PL-line at bottom.
47. Click OK.
196 of 286 Deltares
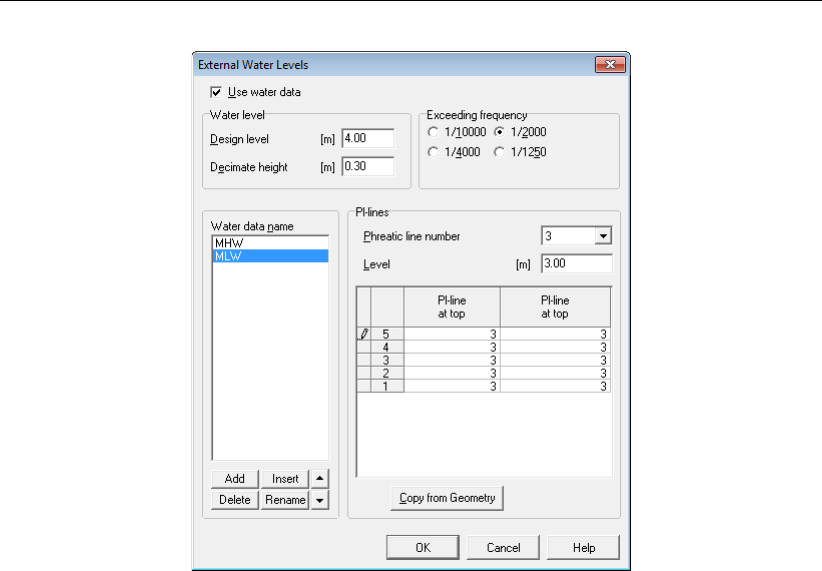
Tutorial 6: Reliability Analysis
Figure 13.11: External Water Levels window, MLW
13.7 Calculation and Results
The input now includes stochastic values for soil properties and three different water levels
have been defined. These inputs are going to be included in a calculation that will result in a
safety factor and a probability of failure for each water level.
48. Click Start in the Calculation menu.
49. Check that the Probabilistic calculation type is selected.
50. Click OK.
While
D-GEO STABILITY
performs the calculation, the Calculation Progress window shows the
current lowest safety factor for the water level that is being calculated.
13.7.1 Stresses
51. Click Stresses in the Results menu to display the Critical Circle window (Figure 13.12).
The screen shows the failure mechanism for the design case. The safety factor is the
same as in Tutorial-1b (section 8.9.3) with a value of 1.35. At the bottom of the screen
the measurements of the slip circle are displayed. Important to this tutorial are the safety
factor and the probability of failure.
Deltares 197 of 286
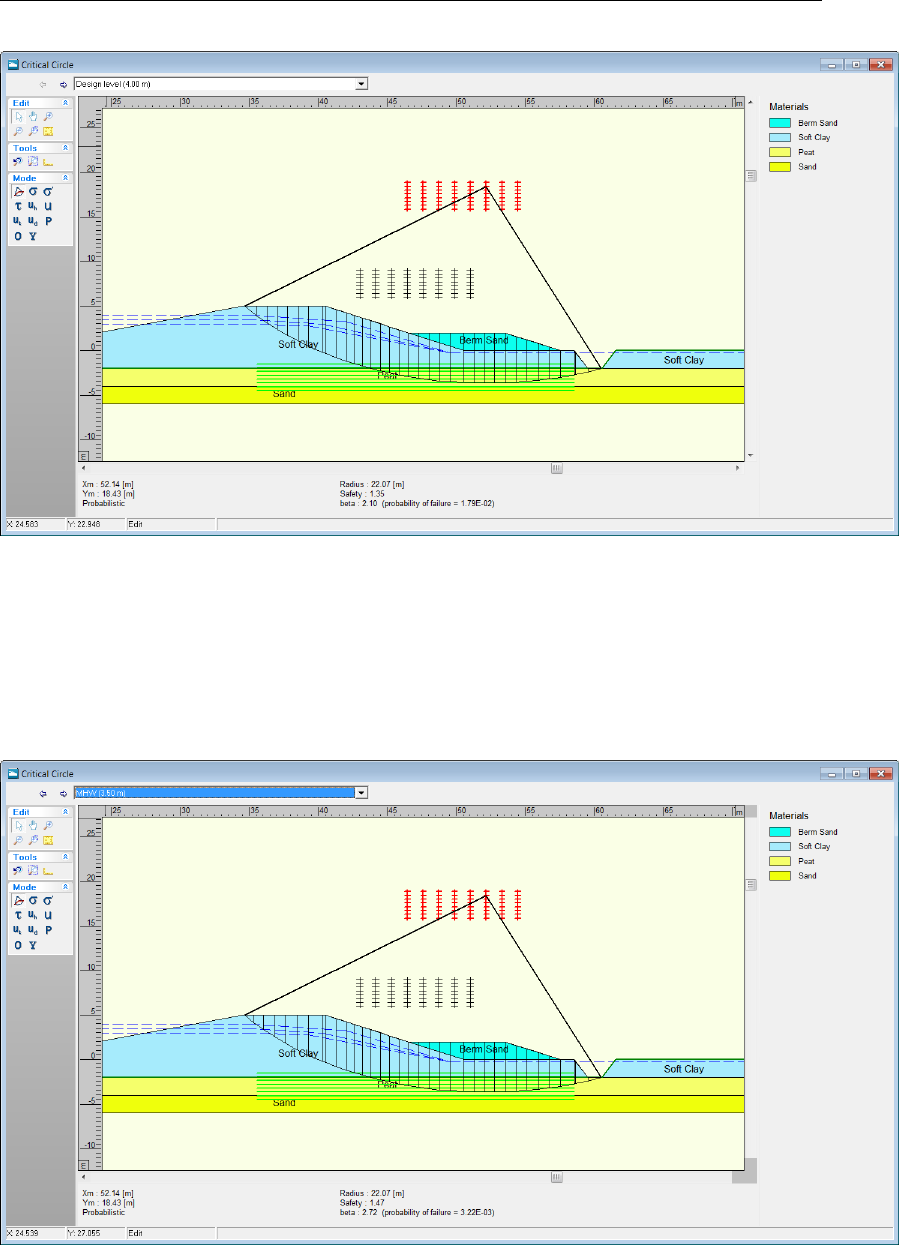
D-GEO STABILITY
, User Manual
Figure 13.12: Critical Circle window
The drop down menu at the top of the window can navigate between the results for the different
water levels.
52. Select MHW (+3.50 m) to display the results for Mean High Water (Figure 13.13).
Figure 13.13: Critical Circle window for Mean High Water level
As expected the safety factor (1.47) is higher than in the design case. An overview of the
results is given in Table 13.1.
198 of 286 Deltares
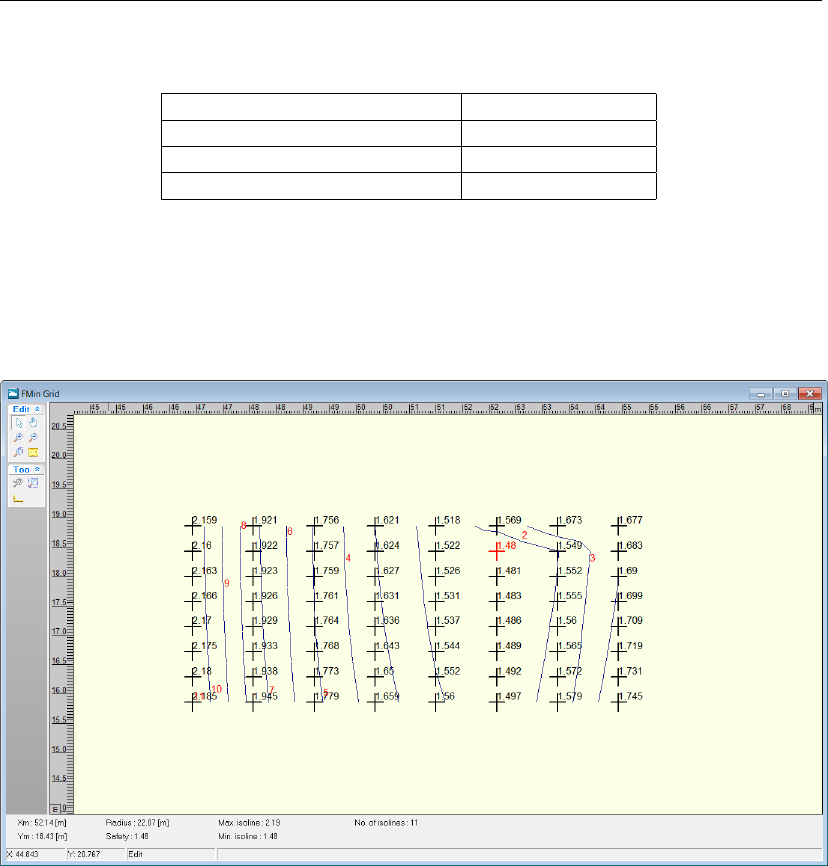
Tutorial 6: Reliability Analysis
Table 13.1: Safety factor for different water levels
Water levels Safety factor
Design level (+4.0 m) 1.35
MHW (+3.5 m) 1.47
MLW (+3.0 m) 1.48
13.7.2 FMin Grid
To view the FMin Grid window for the case that results in the largest safety factor:
53. Click FMin grid in the Results menu (Figure 13.14).
Figure 13.14: FMin Grid window
13.7.3 Influence Factors
To get an idea of what parameters in the input contribute most the final outcome of the calcu-
lation:
54. Click Influence Factors in the Results menu.In the Influence Factors window displayed the
results for the different external water levels can be seen using the drop down menu at
the top. In addition, this menu also includes the Design point water level which is equal to
3.06 m in this tutorial.
55. Select Design point water level (3.06 m) from the drop down menu.
The window displayed (Figure 13.15) shows that the Model Factor has a large influence on
the outcome of the safety factor and the slope’s probability of failure.
Deltares 199 of 286
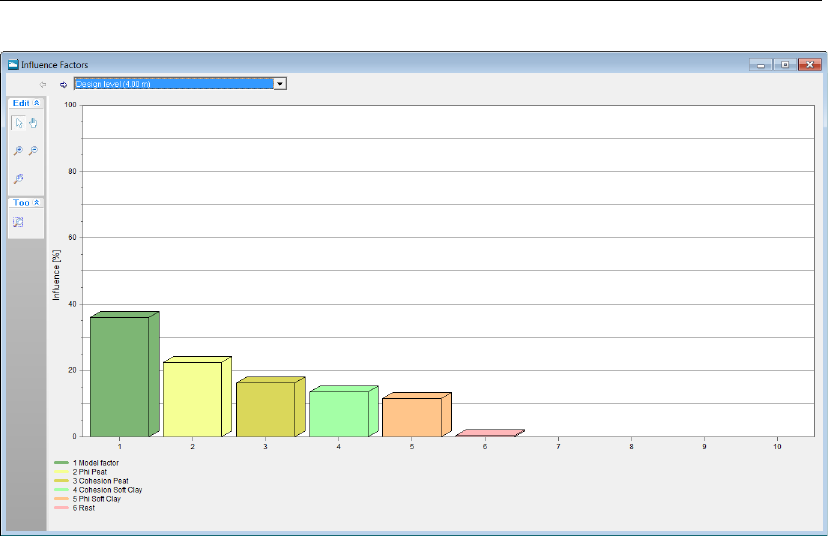
D-GEO STABILITY
, User Manual
Figure 13.15: Influence Factors window
13.8 Conclusion
The Reliability Analysis in
D-GEO STABILITY
is able to perform a probabilistic calculation in-
corporating stochastic description of soil properties as well as probabilistic descriptions of
external water levels. A design conclusion is that for cases with higher water levels the safety
factor is lower.
200 of 286 Deltares
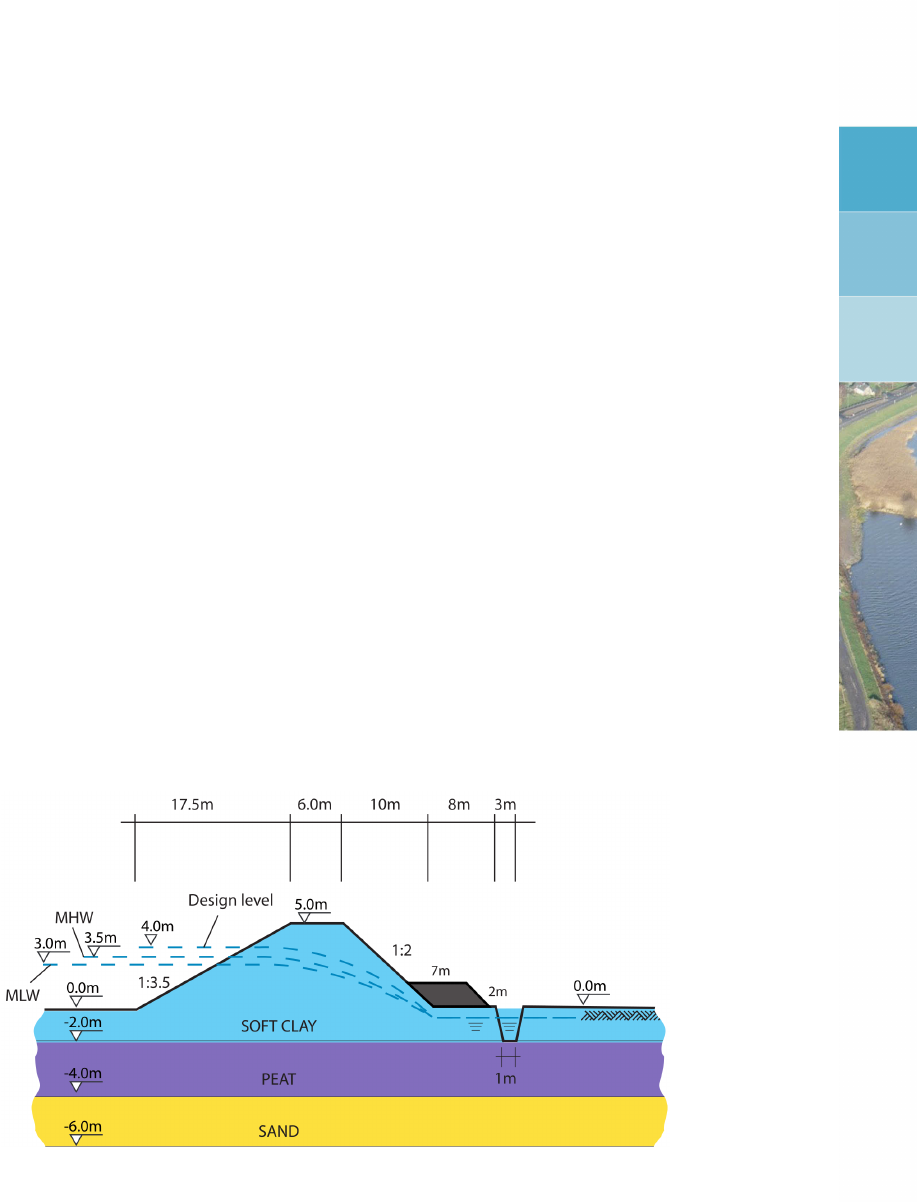
14 Tutorial 7: Bishop Random Field Method
The case from Tutorial 6 (chapter 13) is used in this tutorial to determine the probability that the
stability of the slope is less than the required value.
D-GEO STABILITY
performs a probabilistic
calculation to determine this probability. Next to this it will calculate sensitivity factors that can
be used in the PCRING program.
The objective of this tutorial is:
To learn how to perform a calculation using the Bishop Random Field method.
For this example, the following
D-GEO STABILITY
modules are needed:
D-GEO STABILITY
Standard module (Bishop and Fellenius).
Probabilistic random field model.
This tutorial is presented in the file Tutorial-7.sti.
14.1 Introduction to the case
The Bishop Random Field Method will calculate the probability of failure for each different
water level. To this end
D-GEO STABILITY
requires the input of the values of model factors.
The most important one is the required safety factor. Next to this the soil properties can be
described stochastically.
Figure 14.1: Geometry overview (Tutorial 7)
The geometry, soil properties and external water levels show in Figure 14.1 are the same as
Tutorial 6:
1. Click Open in the File menu.
2. Select Tutorial-6.
3. Click Open.
4. Click Save as in the File menu.
5. Enter <Tutorial-7>as file name.
6. Click Save.
Deltares 201 of 286
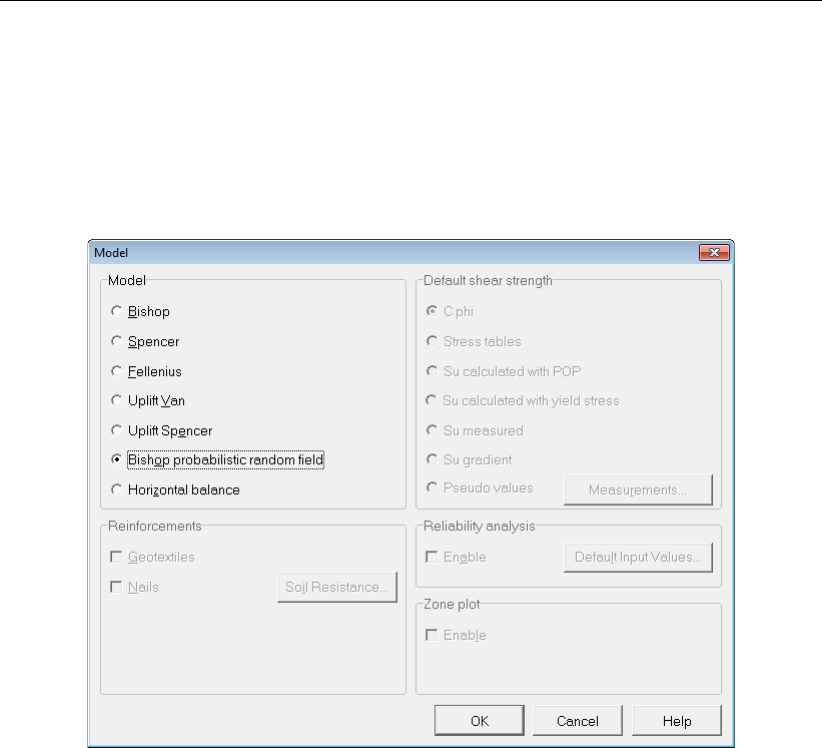
D-GEO STABILITY
, User Manual
14.2 Project
14.2.1 Model
7. Click Model in the Project menu.
8. Select the Bishop prob. random field method.
9. Click OK.
Figure 14.2: Model window
14.2.2 Project Properties
10. On the menu bar, click Project and then choose Properties to open the Project Properties
window.
11. Fill in <Tutorial 7 for
D-GEO STABILITY
>and <Bishop Prob. Random Field model for dike
body>for Title 1 and Title 2 respectively in the Identification tab.
12. Click OK.
14.3 Model Factor
The required safety factor for which probability is to be established can be entered.
13. Click Model Factor in the Soil menu to open the Model Factor window.
14. Enter <1.35>for the Limit value stability factor. This is a realistic value to consider a slope
as safe.
15. Leave the other values unchanged (Figure 14.3).
16. Click OK.
202 of 286 Deltares
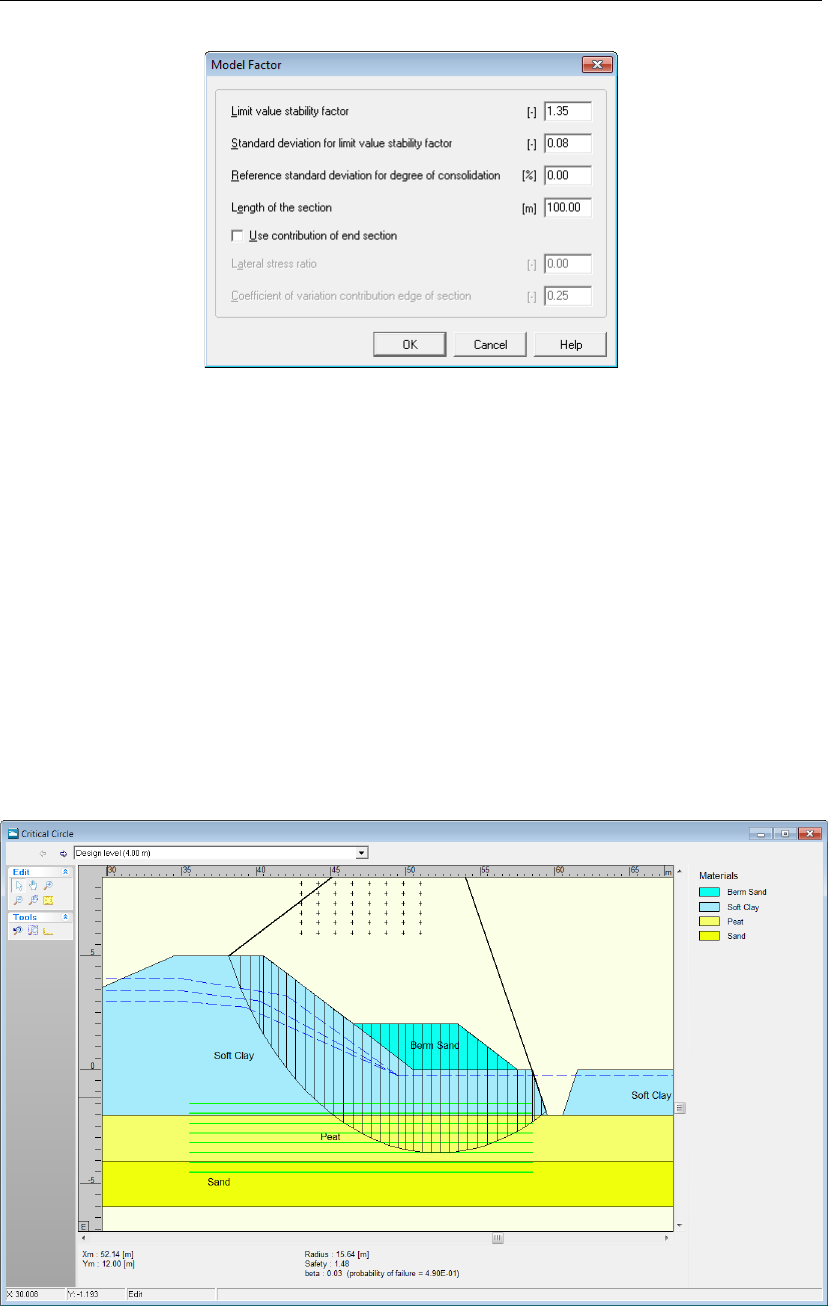
Tutorial 7: Bishop Random Field Method
Figure 14.3: Model Factor window
See section 4.2.5 “Model Factor" for a detailed description of this window.
14.4 Calculation and Results
To start the calculation:
17. Choose Start in the Calculation menu to open the Calculation window.
18. Click OK.
To view the results:
19. Choose Stresses from the Results menu. The Critical Circle window will appear (Fig-
ure 14.4).
Figure 14.4: Critical Circle window
The results of the Bishop Random Field method (measurements for the critical slip plane and
Deltares 203 of 286

D-GEO STABILITY
, User Manual
probability of failure) are given for each of the three described water levels (MLW, MHW and
design level) using the drop down menu at the top of the Critical Circle window.
14.5 Conclusion
The Bishop Random Field method is capable of performing a probabilistic slope analysis.
It can incorporate stochastic descriptions of soil parameters and external water levels. It
calculates the probability of failure according to a required safety factor.
204 of 286 Deltares
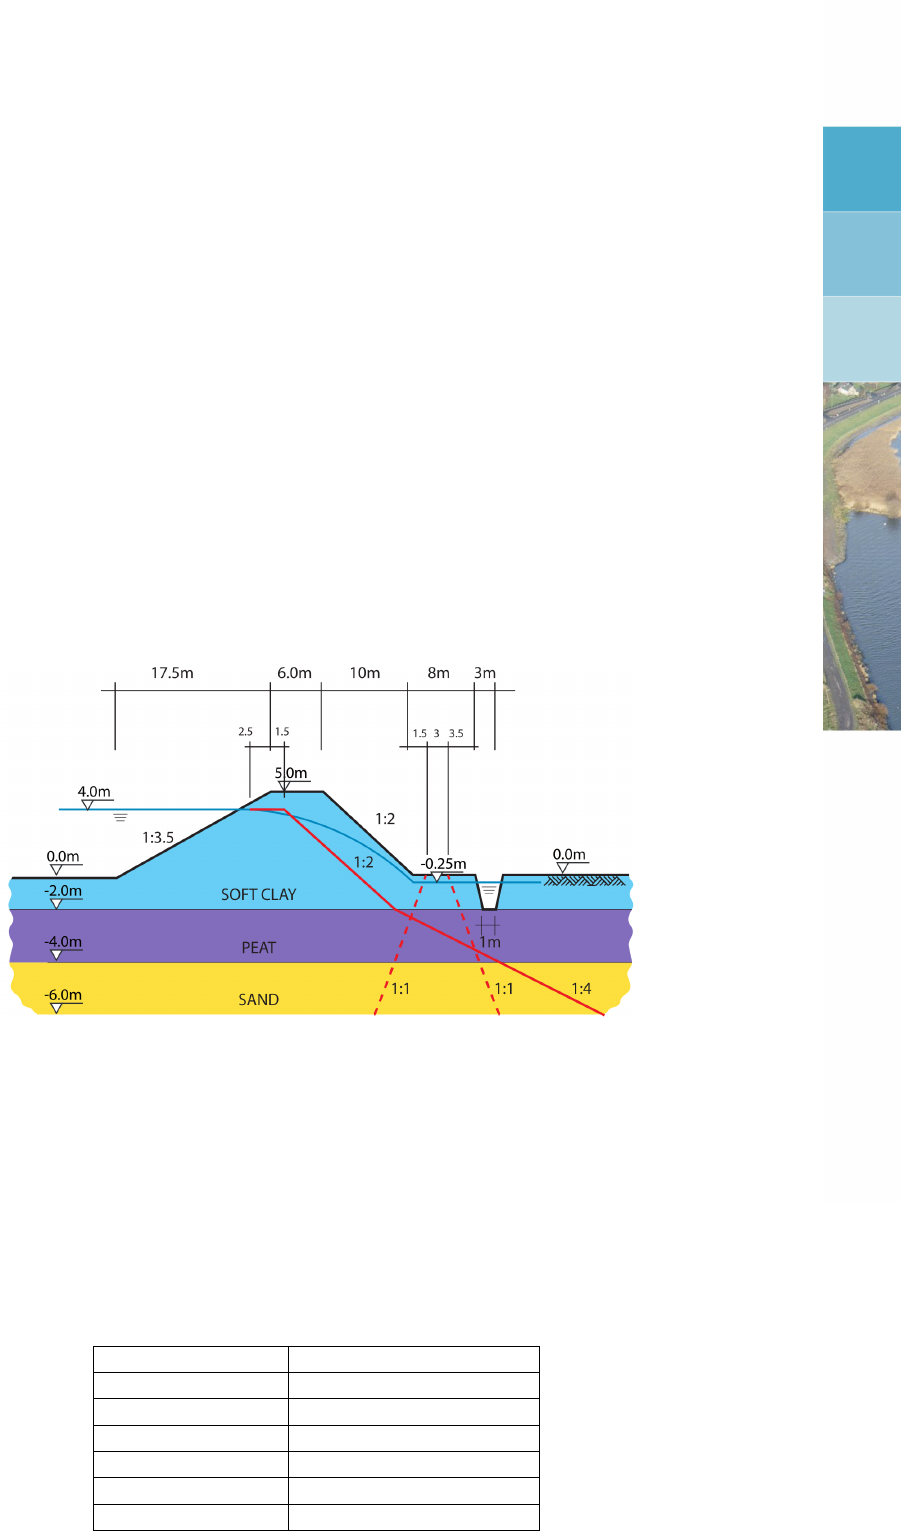
15 Tutorial 8: Zone Plot
The case from Tutorial 1 (chapter 8) is used in this tutorial to determine the safety factor of the
dike using the Zone Plot model. The dike body is divided into six parts (called 1a, 1b, 2a, 2b,
3a and 3b) with a different required safety factor.
The objective of this tutorial is:
To learn how to perform a calculation using the Zone Plot model.
For this example, the following
D-GEO STABILITY
module is needed:
D-GEO STABILITY
Standard module (Bishop and Fellenius).
This tutorial is presented in the file Tutorial-8.sti.
15.1 Introduction to the case
The Zone Plot model divides the body into six parts as shown in Figure 15.1.
Figure 15.1: Geometry overview (Tutorial 8)
The required safety factors for the different zone areas are given in Table 15.1.
The geometry, soil properties and external water levels shown in Figure 15.1 are the same as
Tutorial 1a:
1. Click Open in the File menu.
Table 15.1: Required safety factors for the zone areas of the Zone Plot model
Zone area Required safety factor
1a 1.19
1b 1.11
2a 1.05
2b 1.02
3a 0.93
3b 0.90
Deltares 205 of 286
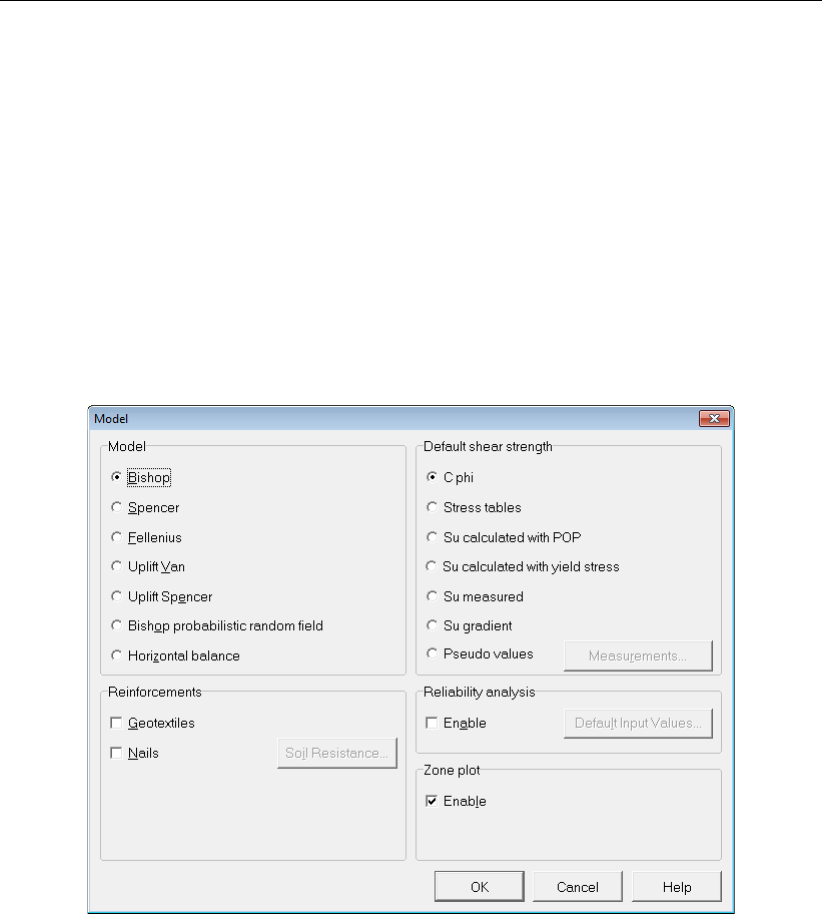
D-GEO STABILITY
, User Manual
2. Select Tutorial-1a.
3. Click Open.
4. Click Save as in the File menu.
5. Enter <Tutorial-8>as file name.
6. Click Save.
15.2 Project
15.2.1 Model
7. Click Model in the Project menu.
8. Mark the Zone plot check-box.
9. Click OK.
Figure 15.2: Model window
15.2.2 Project Properties
10. On the menu bar, click Project and then choose Properties to open the Project Properties
window.
11. Fill in <Tutorial 8 for
D-GEO STABILITY
>and <Zone Plot model>for Title 1 and Title 2
respectively in the Identification tab.
12. Click OK.
15.3 Zone Areas for Safety
The six zone areas with a different required safety factor should be defined.
13. Click Zone Areas for Safety in the Definitions menu to open the Zone Areas for Safety
window.
14. Enter the values given in Figure 15.3 in order to define the zone areas given in Figure 15.1
and the required safety factors given in Table 15.1. The Stability calculation is performed
at the <Right side>as the river is situated at the left side of the dike.
206 of 286 Deltares
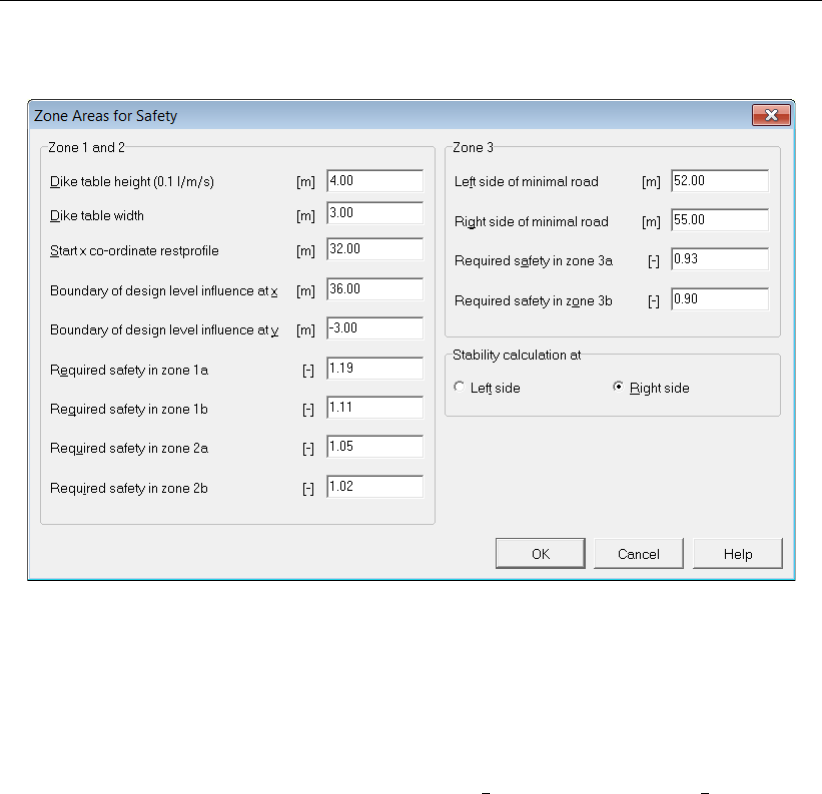
Tutorial 8: Zone Plot
15. Click OK.
Figure 15.3: Zone Areas for Safety window
See section 4.4.4 “Zone Areas for Safety" for a detailed description of this window.
15.4 Rest slope of the soil materials
The slope of the rest profile depends on the soil type: 1
4for peat and sand and 1
2for clay.
16. Open the Materials window from the Soil menu.
17. Leave the Rest slope of the Soft Clay to its default value <1:2>.
18. Select the Peat material and define a Rest slope of <1:4>as shown in Figure 15.4.
19. Do the same for the Sand material.
20. Click OK.
Deltares 207 of 286
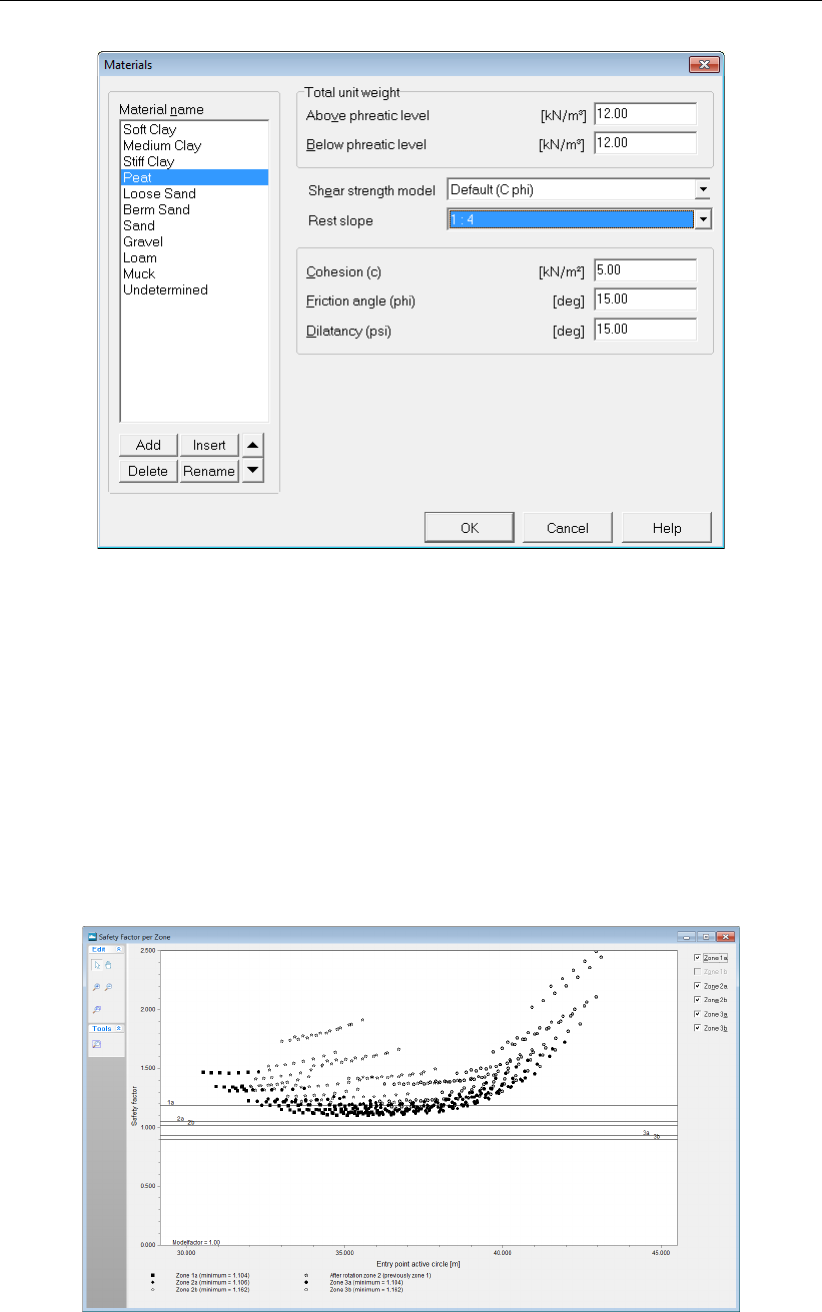
D-GEO STABILITY
, User Manual
Figure 15.4: Materials window
15.5 Calculation and Results
To start the calculation:
21. Choose Start in the Calculation menu to open the Calculation window.
22. Click OK.
15.5.1 Safety Factor per Zone
23. Choose Safety Factor per Zone from the Results menu to open the Safety Factor per Zone
window (Figure 15.5).
Figure 15.5: Safety Factor per Zone window
This window shows a diagram of the Safety factor / Model factor vs. the Entry point active
208 of 286 Deltares
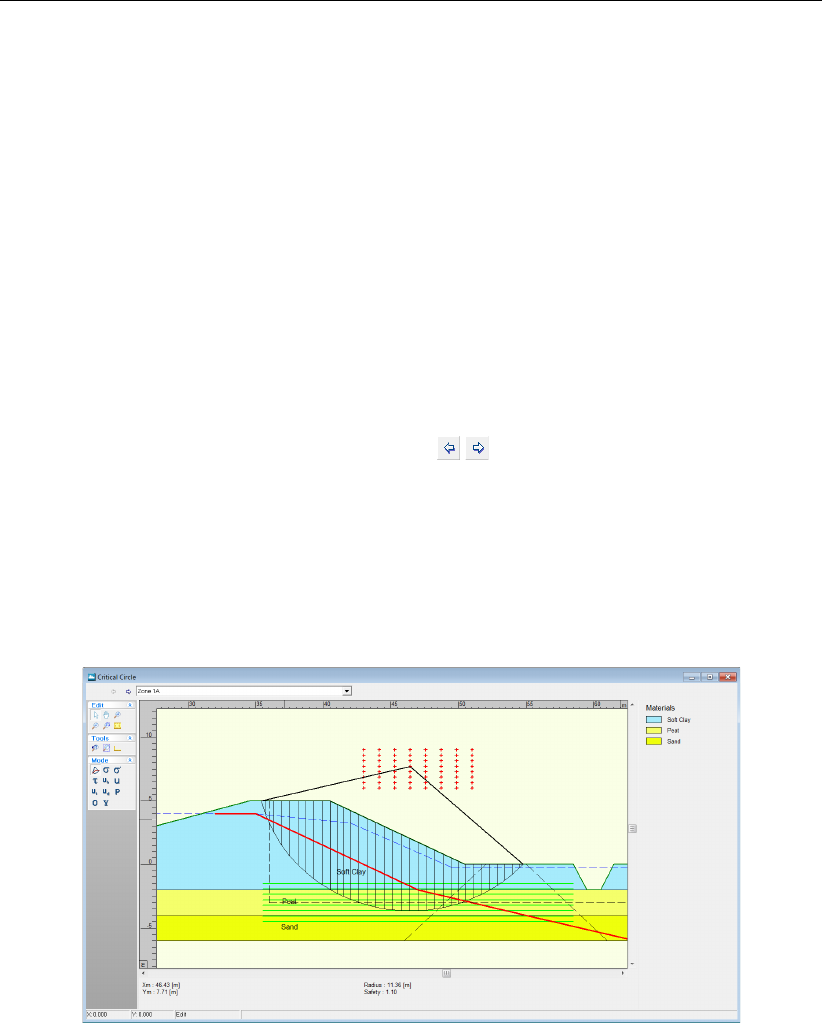
Tutorial 8: Zone Plot
circle (i.e. X coordinate) for the calculated slip circles of each zone. Mark and unmark the
available check-boxes at the right side of the window to show the corresponding zone. The
horizontal black lines in the diagram correspond to the required safety factors of each zone as
defined in the Zone Areas for Safety window (section 15.3). Any result is available for Zone
1b which means that any circle pass through this zone. For zone 1a, many points are situated
below the required safety factor line which means they are not acceptable.
See section 6.5 “Safety Factor per Zone" for a detailed description of this window.
15.5.2 Stresses per Zone
To view the graphical representation of the zone areas do the following:
24. Click the Stresses per Zone option in the Results menu to open the Critical Circle window
(Figure 15.6).
25. Click the Previous zone and Next zone icons, , to view various calculated results for
each zone.
The bold red line represents the rest profile. The vertical and horizontal dotted black lines
represent the boundaries of the design level influence respectively at X and Y. The two inclined
dotted black lines at the right side of the window represent the limits of the minimal road
influence. Information like the radius and center coordinates of the critical circle and the
safety factor are printed in the status panel at the bottom of the window.
Figure 15.6: Critical Circle window for Zone 1a
See section 6.6 “Stresses per Zone" for a detailed description of this window.
15.6 Conclusion
A calculation using the Zone Plot model has been performed. The body dike is divided into
six parts showing the rest profile. The required safety factor for many circles situated in Zone
1a is not reached.
Deltares 209 of 286

D-GEO STABILITY
, User Manual
210 of 286 Deltares
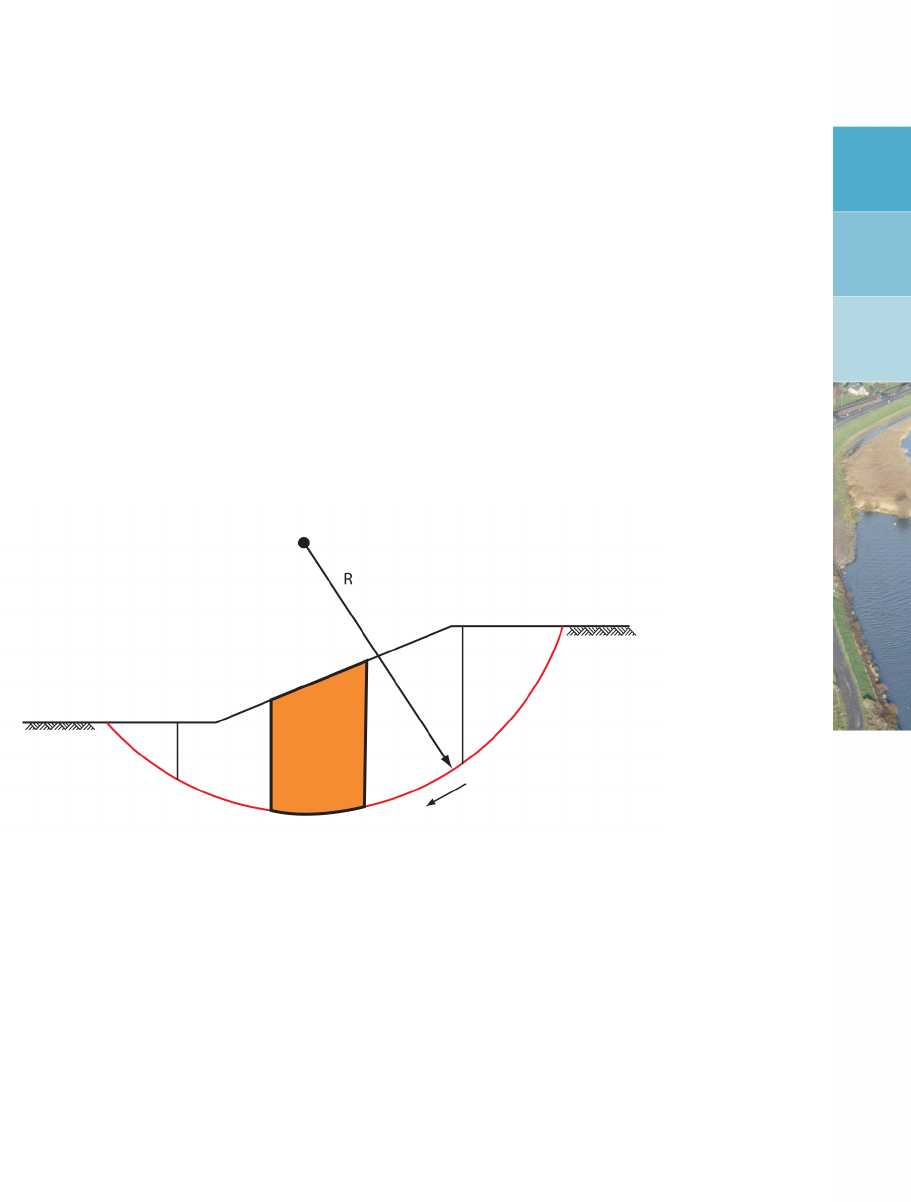
16 Method of slices
This c gives background information on the methods used in the current release of
D-GEO STABILITY
.
Next to this the theories of shear strength model, pore pressures and loads are given. Exten-
sive attention is given to reliability based design.
16.1 Method of slices
For calculating slope stability
D-GEO STABILITY
uses the method of slices. This method divides
the earth mass above the slide plane into a number of vertical slices (see Figure 16.1)Slices.
For each slice, the different soil parameters, effective stresses and pore water pressures are
calculated. These values are assumed to be representative for the entire slice. The method
assumes a circular shaped slip plane (failure mechanism) with radius r.
Figure 16.1: Slip plane including method of slices
D-GEO STABILITY
automatically divides the slip plane into slices in accordance with the follow-
ing criteria:
Within one slice, there are no intersection points of layer boundaries and/or PL-lines.
Within one slice, there are no intersection points of layer boundaries and the phreatic
line.
The entire base of any slice, which is part of the slip circle, is located totally within one
soil layer and completely above or below the phreatic line.
In addition,
D-GEO STABILITY
follows the following procedures in case a slide plane intersects
the soil surface at more than two points. This is possible with a ditch as well as with a dike.
In this case the largest area between two intersection points is taken to be the slide plane. If
the plane cuts the surface of the geometry at only one point, the plane is rejected and is not
processed any further. This latter case may occur when the geometry has not been defined
wide enough so that slide planes reach the outer boundaries of the geometry, or when the
slide planes just touches the surface at one point.
Deltares 211 of 286
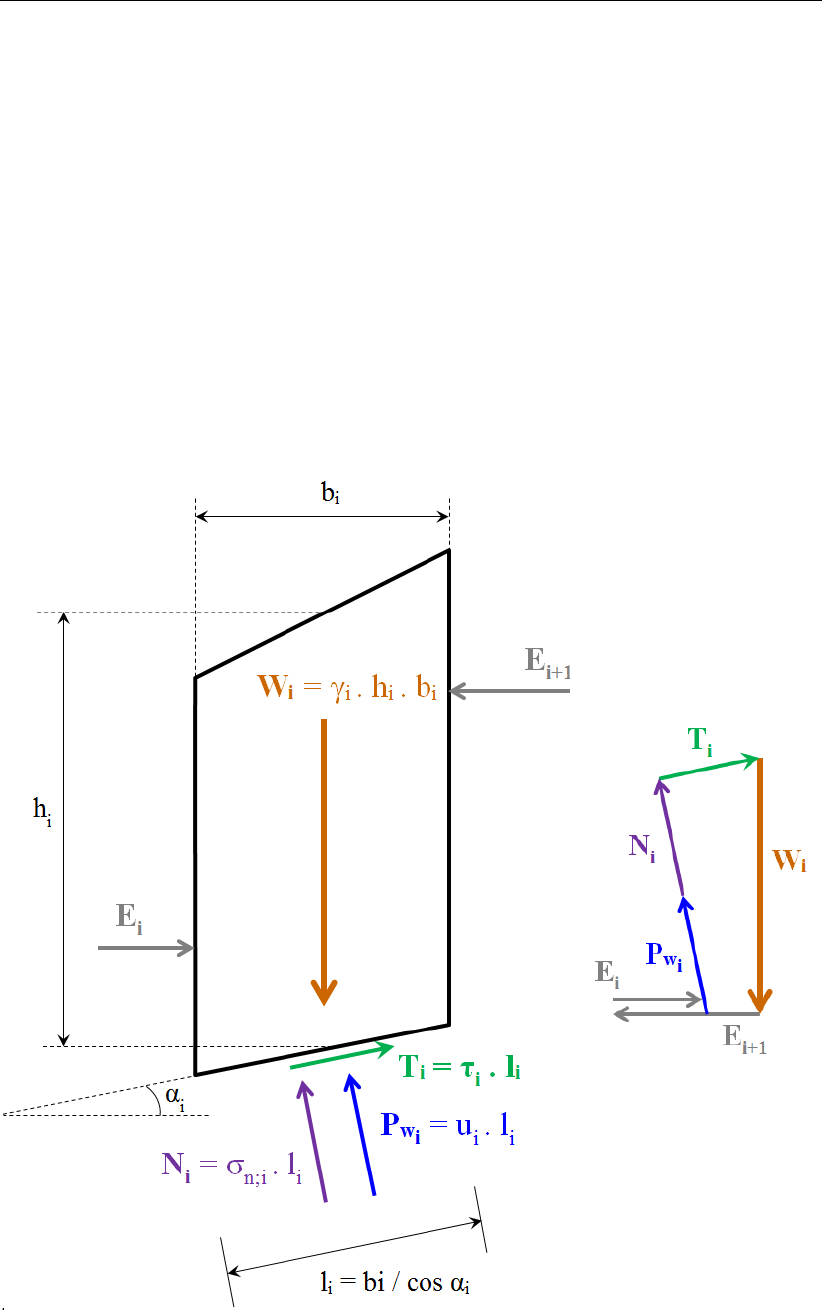
D-GEO STABILITY
, User Manual
16.2 Circular slip plane (Bishop and Fellenius)
The Bishop and Fellenius method both consider the driving moments by soil weight, water
pressures and loads around the center of a slip circle.
Stability requires that the sum of these driving moments is equal to a certain resisting moment.
The resistance moment is generally determined by the shear strength of the soil along the slip
circle and by an additional contribution from geotextiles.
Fellenius defines the safety factor by simply using the ratio between the driving moments and
the ultimate resistance moment. Bishop defines the safety by the reduction factor that can
be applied to cohesion and (the tangent of) the friction. This means that only with Bishop’s
method the equilibrium of vertical forces is preserved. Therefore Bishop’s method is preferred.
The equilibrium evaluation is based on the summation of the influence of the all slices. The
equilibrium evaluation of a slice includes the forces and pressures in Figure 16.2.
Figure 16.2: Force equilibrium for one slice in the method of slices
The following table gives the definitions of the forces given in Figure 16.2:
212 of 286 Deltares

Method of slices
Wiis the weight of slice i, in kN/m;
Tiis the shear force along of slice i, in kN/m;
Eiis the interaction force of slice iwith the slice at the left side, in kN/m;
Ei+1 is the interaction force of slice iwith the slice at the right side, in kN/m;
P wiis the water force acting on the base of slice i, in kN/m;
Niis the (total) normal reaction of the soil acting on the base of slice i, in kN/m;
Refer to section 1.8 for the definition of the other symbols used in Figure 16.2.
The next section describes how the different moments are calculated for a slice.
16.2.1 Driving moments
16.2.1.1 Driving soil moment
The driving soil moment MD;soil is the moment caused by the mass of the soil within the slip
circle around its center:
MD;soil =
n
X
i=1
Gi×(Xi−Xc)(16.1)
with:
Gi=
ki
X
j=1
γj×hj×bi(16.2)
where:
Giis the weight of the soil in slice i(see Figure 16.2), in kN/m;
hjis the thickness of layer jin slice i;
kiis the number of layers along slice i;
nis the number of slices;
γjis the unit weight of soil layer jin slice i, in kN/m3;
Refer to section 1.8 for the definition of the other symbols.
16.2.1.2 Driving water moment
The water moment is the contribution of two water moments:
MD;water =MWater;Top +MWater;Side (16.3)
where:
MWater;Top is caused by the water forces (due to free water on surface) acting on the top
of the slice, see Equation 16.4;
MWater;Side is caused by the water forces (due to free water on surface) acting on the side
of the slice, see Equation 16.5 and Equation 16.6.
Deltares 213 of 286
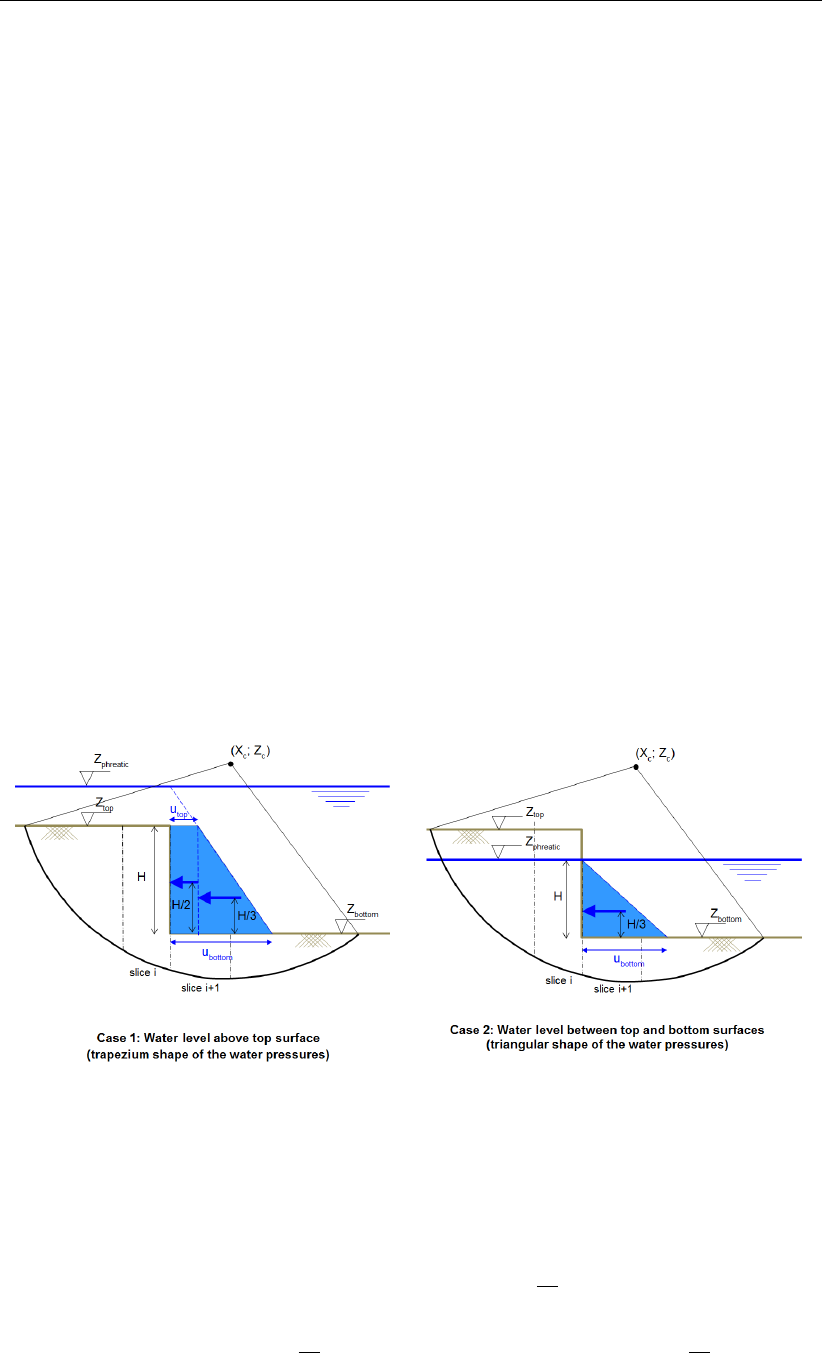
D-GEO STABILITY
, User Manual
Water forces (due to free water on surface) acting on the top of the slice
The water forces acting on and within the soil slice. When there is free water on the surface
of the geometry and within the boundaries of the slip circle, it can have a positive or negative
effect on the safety factor. The driving water moment Mwater for a slice is calculated as follows:
MWater;Top =
n
X
i=1
(Xi−Xc)×Wv;i×+ (Zc−Zi;top)×Wh;i(16.4)
where:
Wv;iis the vertical component of the water force on top of slice i, in kN:
Wv;i=−max [0; (Zphreatic −Ztop;i)] ×γw×bi
Wh;iis the horizontal component of the water force on top of slice i, in kN:
Wh;i= max [0; (Zphreatic −Ztop;i)] ×γw×bi×tan βi
Refer to section 1.8 for the definition of the other symbols.
Water forces (due to free water on surface) acting on the side of the slice
With the introduction of vertical layer boundaries, it became possible to have a surface with
a vertical component. If this vertical component is part of the slip circle,
D-GEO STABILITY
will
place a slice to the left and right of this vertical. The moment caused by the free water on
the top of both slices is calculated using the above formula (Equation 16.4). The force and
moment of the free water against the vertical component of the surface (now also the side of
a slice) is not taken into account by the above formula. Instead,
D-GEO STABILITY
separately
calculates the horizontal free water force and the moment caused by it.
Figure 16.3: Horizontal water pressures (due to free water) acting on the side of a slice
in case of vertical layer boundary
If the phreatic line is above the top surface, the shape of the horizontal water pressures
against the side of the slice is trapezium (case 1 in Figure 16.3):
MWater;Side =uh;top HZc−Zbottom +H
2 (16.5)
+H
2(uh;bottom −uh;top)Zc−Zbottom +H
3
214 of 286 Deltares

Method of slices
If the phreatic line is between the top and the bottom surfaces, the shape of the hori-
zontal water pressures against the side of the slice is triangular (case 2 in Figure 16.3):
MWater;Side =H
2uh;bottom Zc−Zbottom +H
3 (16.6)
where:
His the height of the saturated soil along the vertical layer boundary:
H= min (Zphreatic;Ztop)−min (Zphreatic;Zbottom)
If the soil within the slip plane height is dry, then H= 0.
uh;top is the hydrostatic pressure at level Ztop
uh;top = (Zphreatic −min (Zphreatic;Ztop)) ×γw
uh;bottom is the hydrostatic pressure at level Zbottom:
uh;bottom = (Zphreatic −Zbottom)×γw
Ztop is the top level of the vertical part;
Zbottom is the bottom level of the vertical part.
Refer to section 1.8 for the definitions of the other symbols.
16.2.1.3 Driving load moment
The (part of the) uniform loads and the line loads located within the confines of a slip circle
creates a moment MD;load around the slip-circle center point.
MD;load =
nloads
X
j=1
Fj×∆wj×(Xc−Xj) +
nlines
X
l=1
Fl×∆ (Xc−Xl)(16.7)
with:
Xj=max (X1;left;Xbegin;j) + min (Xn;right;Xend;j)
2
Xl=max (X1;left;Xl) + min (Xn;right;Xl)
2
∆wj= min (Xn;right;Xend;j)−max (X1;left;Xbegin;j)
where:
Fjis the magnitude of uniform-load number j, in kN/m2;
Flis the magnitude of line-load number l, in kN/m;
nlines is the total number of lines-loads;
nloads is the total number of uniform-loads;
Xbegin;jis the X-coordinate o f the starting point of load j;
Xend;jis the X-coordinate of the ending point of load j;
Xlis the X coordinate of line-load l;
X1;left is the X-coordinate of the left side of slice 1 (i.e. entry point of the slip circle);
Xn;right is the X-coordinate of the right side of slice n(i.e. exit point of the slip circle);
∆wjis the width of the part of the uniform-load jlocated within the confines of a slip
circle;
Xjis the X-coordinate at the middle of the part of the uniform-load jlocated within
the confines of a slip circle;
Xlis the X-coordinate of the line-load llocated within the confines of a slip circle;
Refer to section 1.8 for the definitions of the other symbols.
Deltares 215 of 286

D-GEO STABILITY
, User Manual
16.2.2 Resisting moments
16.2.2.1 Resisting moment from soil
Shear stresses and normal effective stresses act along the slip circle. The shear stresses
prevent the circular soil mass from slipping. The resisting moment MR;soil is defined as the
moment caused by the shear stresses along the circular arc around the center of the slip
circle.
MR;soil =R×
n
X
i=1
τi.li(16.8)
where:
τiis the shear stress along bottom of slice, in kN/m2, see Equation 16.11 for Bishop
method and Equation 16.16 for Fellenius method;
Refer to section 1.8 for the definitions of the other symbols.
16.2.2.1.1 Shear stress - Bishop
The vertical equilibrium of the force acting on the slice (Figure 16.2) writes:
XFv= 0 = −Wi+Ui.cos αi+N0
i.cos αi+Ti.sin αi
=−γi.hi.b +ui.li.cos αi+σ0
n;i.li.cos αi+τi
Fs
.li.sin αi
which leads to:
σ0
n;i=σ0
v;i−τi
Fs
.tan αi(16.9)
where σ0
v;iis the effective stress at the base of slice i:σ0
v;i=γi.hi−ui
According to Morh-Coulomb, the relation between the shear stress τmax;iand the normal
effective stress σ0
n;iis:
τi=ci+σ0
n;i.tan ϕi(16.10)
Substitution of Equation 16.9 into Equation 16.10 leads to:
τi=ci+σ0
v;i×tan ϕi
1 + tan αi×tan ϕi
Fs
(16.11)
where:
ciis the cohesion at the bottom of slice i, in kN/m2;
σ0
v;iis the vertical effective stress at the bottom of slice i, in kN/m2, see Equation 18.6;
ϕiis the internal friction angle of the soil at the bottom of slice i, in degree;
αiis the angle at bottom of slice, in degree;
Fsis the safety factor, see Equation 16.34 in section 16.2.3.
216 of 286 Deltares
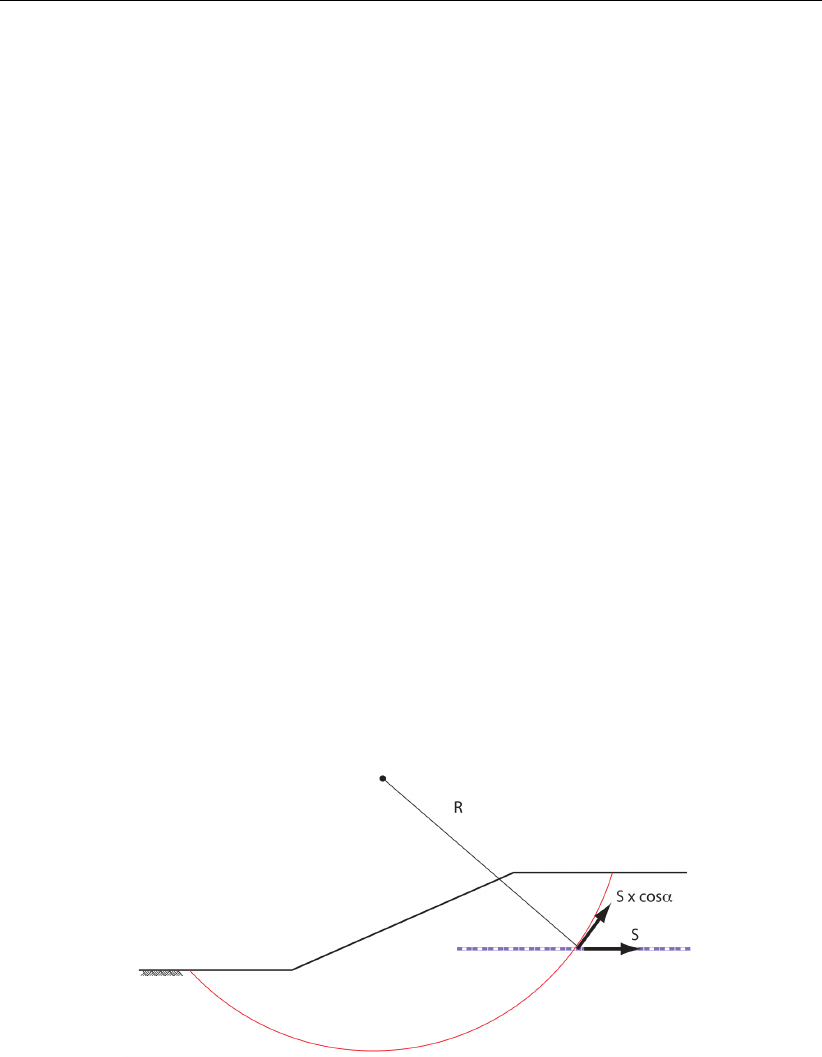
Method of slices
16.2.2.1.2 Shear stress - Fellenius
For the ordinary method of slices of Fellenius, the resultant vertical and horizontal forces of a
slice (Figure 16.2) are:
XFv=0=−Wi+Ui.cos αi+N0
i.cos αi+Ti.sin αi(16.12)
XFh= 0 = Ti.cos αi−Ui.sin αi−N0
i.sin αi(16.13)
Substitution of Equation 16.12 into Equation 16.13 leads to:
N0
i=Wi.cos αi−Ui(16.14)
The effective normal stress σ0
n;iis therefore:
σ0
n;i=σv;i.cos2αi−ui(16.15)
where σv;i=γi.hiis the total soil stress at the base of slice iand uithe total pore pressure.
Substitution of Equation 16.15 into Equation 16.10 gives the shear stress τi:
τi=ci+σv;i.cos2αi−ui.tan ϕi(16.16)
16.2.2.2 Resisting moment from geotextiles
Geotextiles can be used to reinforce and improve the stability of slopes. The geotextile intro-
duces a force that can act at the boundary of a slip circle (see Figure 16.4).
Figure 16.4: Resisting contribution by geotextiles
When calculating the safety factor for the Bishop method, an extra resisting moment due to
the geotextile MR;geotextile is introduced:
MR;geotextile =R×Tf×cos α(16.17)
where:
Tfis the tensile strength in kN/m, as defined in the Geotextiles window (section 4.5.1);
Ris the radius of the slip circle;
αis the angle between the geotextile and the tangent line along the circle where the
geotextile intersects the slip circle, in degree.
Deltares 217 of 286
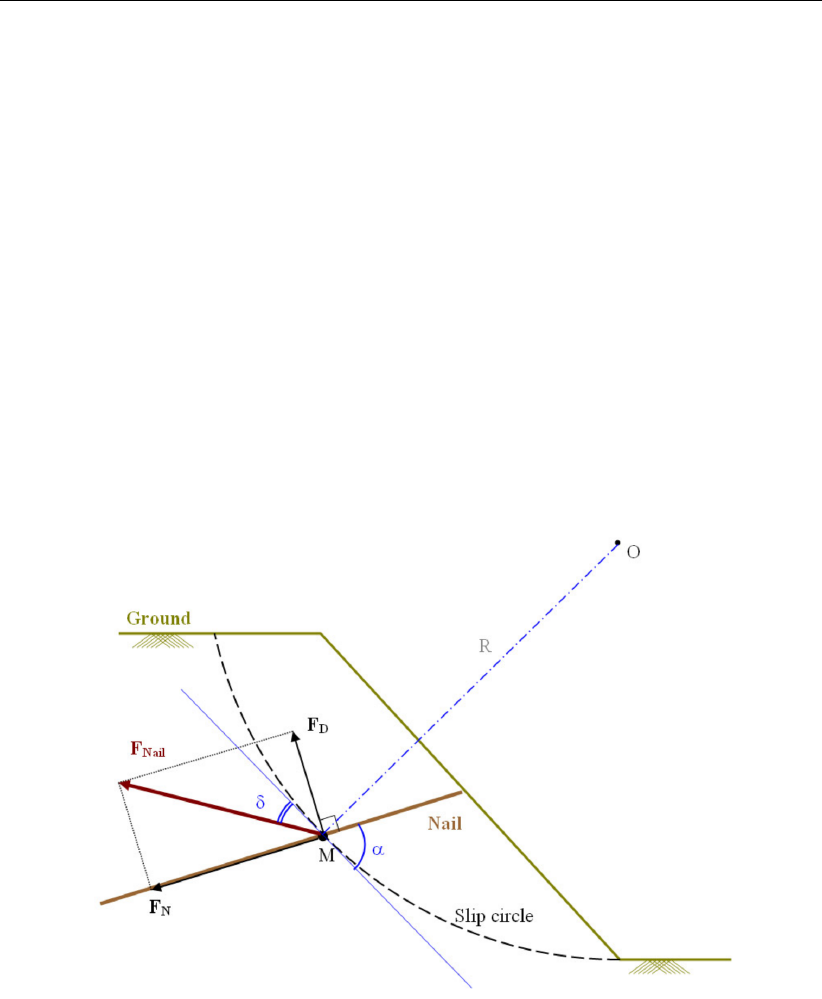
D-GEO STABILITY
, User Manual
The contribution of the geotextile depends on the vertical distance between the slip circle
center and the geotextile. Therefore, for acquiring a larger safety factor, it is required that
this distance is relatively large. Only geotextiles that intersect a slip circle contribute to the
resisting moment.
16.2.2.3 Resisting moment from nails
Soil nailing is a technique to reinforce and strengthen the existing ground by installing closely
spaced steel bars, called nails. The bars are usually installed into a pre-drilled hole and then
grouted into place or drilled and grouted simultaneously. They are usually installed at a slight
downward inclination. A rigid or flexible facing (often pneumatically applied concrete otherwise
known as shotcrete) or isolated soil nail heads may be used at the surface.
Nails are taken into account in the calculation by considering the forces generated at the
intersection with the slip circle (Figure 16.5):
the lateral force FN, parallel to the nail;
the shear force FD, perpendicular to the nail.
Figure 16.5: Resisting contribution by nails
The design method used for the calculation of both forces FNand FDis based on the Clouterre
recommendations (Clo,July 1993) considering four failure criteria:
section 16.2.2.3.1 the tensile resistance at the soil-nail interface is reached;
section 16.2.2.3.2 the soil fails in bearing below the nail;
section 16.2.2.3.3 the tensile and shear resistance of the nail is reached;
section 16.2.2.3.4 the (stiff) nail breaks in bending.
The vector Fnail (FN,FD) must be located within the stability domain satisfying the four cri-
teria mentioned above. The program determines the vector giving the maximum FNand the
minimum FD. This is illustrated in Figure 16.6 where criteria 1 and 3 are relevant.
218 of 286 Deltares
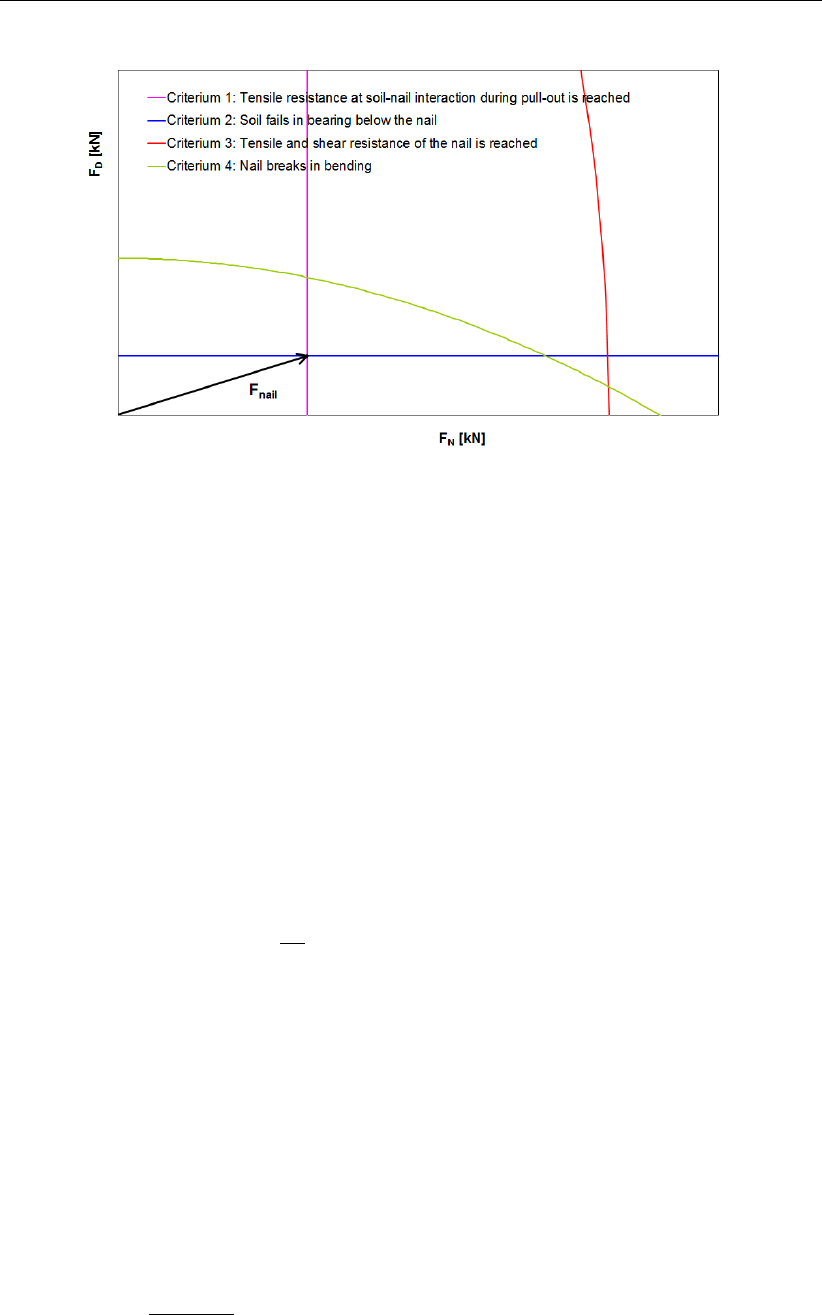
Method of slices
Figure 16.6: Representation of the four criteria in the FN−FDdiagram to determine Fnail
Influence of the critical angle
Depending on the value of α(angle between the nail and the tangent line along the circle
where the nail intersects the slip circle) compared to the value of the critical angle αcritical
(inputted in the Nails window, see Figure 4.72), FNor FDcan be neglected:
If α < αcritical, the shear force is neglected:
FN= min (FN;1;Fy)(16.18)
FD= 0
If α≥90◦−αcritical, the lateral force is neglected:
FN= 0 (16.19)
FD= min FD;2;Fy
2;FD;4
where:
FN;1 is the limit resistance to pull-out between ground and bond, given by Equa-
tion 16.22;
FD;2 is the limit shear force when soil fails in bearing below the nail, given by Equa-
tion 16.25;
FD;4 is the limit shear force when nail breaks in bending, given by Equation 16.30;
Fyis the yield force in tension, as inputted in the Nail Type tab of the Nails window
(Figure 4.70);
The total force in the nail is:
Fnail =qF2
D+F2
N(16.20)
The extra resisting moment MR;nail due to the nail is:
MR;nail =MD+MN(16.21)
Deltares 219 of 286

D-GEO STABILITY
, User Manual
with:
MD=Fnail ×cos δ×R
MN=Fnail ×sin δ×tan ϕ×R
where:
MDis the moment due to the projection of Fnail on the tangent line along the circle, in
kNm;
MNis the moment due to soil friction, in kNm;
ris the radius of the slip circle, in m;
δis the angle between the nail force Fnail and the tangent line along the circle where
the nail intersects the slip circle, in degree:
δ=α−arctan FD
FN
αis the angle between the nail and the tangent line along the circle where the nail
intersects the slip circle, in degree.
16.2.2.3.1 Tensile resistance at soil-nail interaction during pull-out
Reaching the pull-out capacity of soil nails can be assessed by the following criteria:
FN≤FN;1 =τmax ×π×D×La(16.22)
where:
τmax is the ultimate frictional resistance to pull-out between ground and bonded length,
in kN/m2.
If Input of ultimate shear stress along nail is selected in the Soil Resistance window
(Figure 4.2), then τmax is determined using the table inputted in the Shear Stress
tab of the Nails window (Figure 4.72) using distance Lshear.
If Input of bond stress diagram (sigma, tau) is selected in the Soil Resistance
window (Figure 4.2), then τmax is determined using the table inputted in the Bond
Stress Diagrams window (Figure 4.17).
Dis the borehole diameter, in m;
Lais the adherence length beyond the failure surface, in m.
Lshear is the distance from nail head used in the shear stress curve (L–τmax curve), in
m:
Lshear =(L2+ 0.5L1if facing or bearing plate is used
L2+ 0.5L1if no facing or bearing plate is used and if L1< L2
0.5L2if no facing or bearing plate is used and if L1≥L2
L1is the length from failure surface to end nail, in m;
L2is the length from failure surface to head nail, in m: L2=L−L1.
16.2.2.3.2 Soil/nail normal reaction: soil fails in bearing below the nail
The nail is consider as a beam on elastic supports (i.e. soil):
EI d4y
dz4+Es×y= 0 (16.23)
where:
EI is the stiffness of the nail, in kNm2;
220 of 286 Deltares

Method of slices
Esis the Young’s modulus of the soil determined from the following empirical formula,
in kN/m2:
Es=α×σ0
v
CR ×2
92.65α+1
6α
αis the rheological coefficient of the soil, in m;
CR is the compression ratio of the soil:
CR =Cc
1 + e0
σ0
vis the effective stress of the soil at the intersection point between the nail and the
slip circle, in kN/m2.
The soil plastification occurs at:
y=pu×D
Es
(16.24)
The limit shear force is therefore:
FD;2 =1
2×pu×D×L0(16.25)
where:
puis the ultimate lateral stress. In
D-GEO STABILITY
, it can either be:
– user-defined if Input of ultimate lateral stress along nail is selected in the Soil Re-
sistance window (Figure 4.2). In this case,puis determined using the table inputted
in the Lateral Stress tab of the Nails window (Figure 4.71) using distance L2.
– automatically calculated by the program if Use soil parameters c, phi / su is se-
lected in the Soil Resistance window (Figure 4.2). In this case, the program uses
the following empirical formulas, depending on the shear strength model, in kN/m2:
pu=(3σ0
v×Kpwith Kp=1 + sin ϕ
1−sin ϕfor c,ϕmodels
9sufor sumodels
Dis the borehole diameter, in m;
L0is the reference length, in m, defined as:
L0=4EI
Es1/4
L2is the length from failure surface to head nail, in m.
16.2.2.3.3 Tensile and shear resistance of the nail
The maximum shear stress criterion, also known as Tresca’s criterion, predicts that failure of
a ductile material (e.g. nail in this case) occurs when the maximum shear stress (τmax) at a
given point in the nail reaches the yield shear stress (τy) obtained from a uni-axial tensile test:
τmax =τy(16.26)
With respect to 2D stress, the maximum shear stress (τmax) is related to the difference in the
two principal stresses σ1and σ3by the following equation:
τmax =1
2(σ1−σ3)(16.27)
For a tensile test, σ1=σand σ3= 0, so that:
τmax =1
2σ(16.28)
Deltares 221 of 286
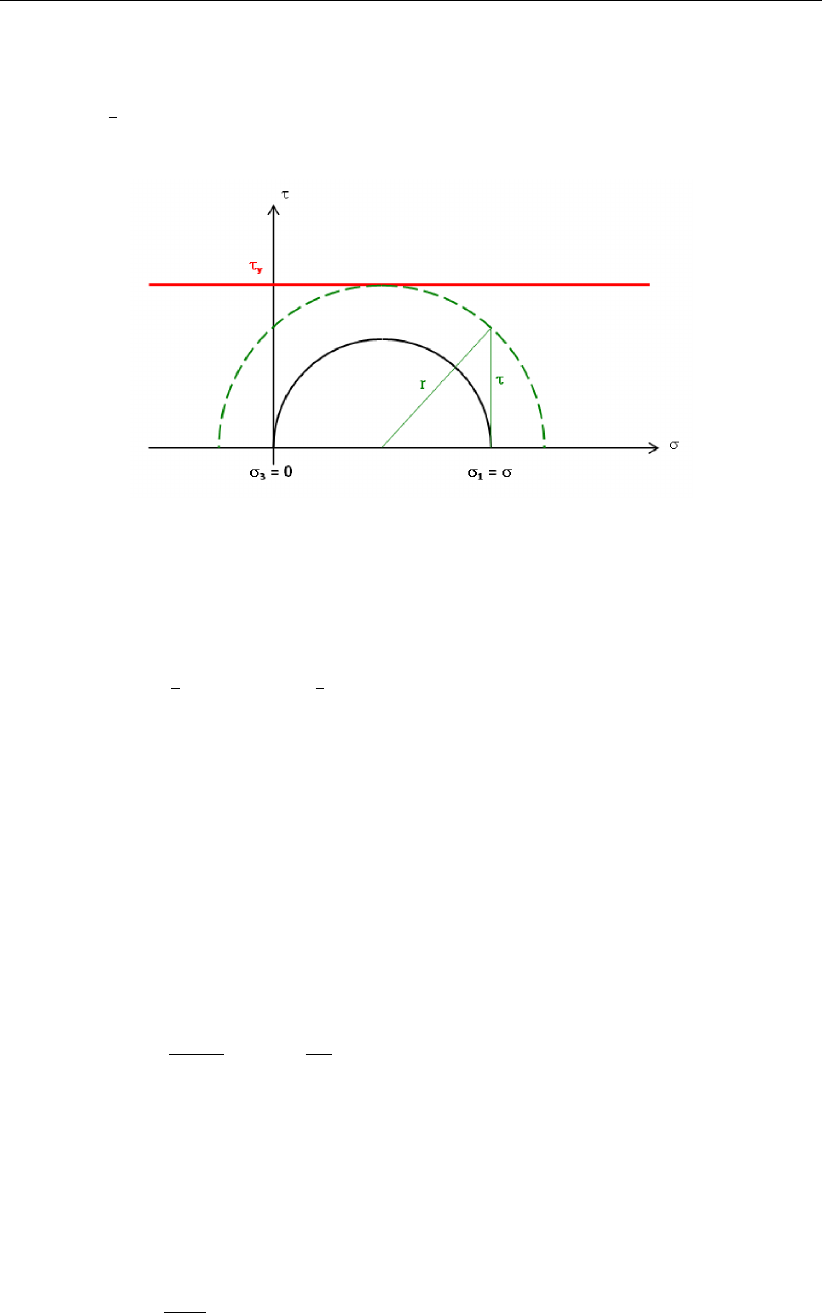
D-GEO STABILITY
, User Manual
Similarly, the yield strength in shear (τy) is related to the yield strength in tension (σy) by:
τy=1
2σy(16.29)
Figure 16.7: Representation of the Tresca’s criterion by Mohr’s circle
To represent this yield criterion graphically, Mohr’s circles are used (Figure 16.7). It indicates
that the yielding occurs if the radius of the Mohr’s circle reaches τy, which writes:
r2=τ2+1
2σ2≤τ2
y=1
2σy2(16.30)
After integration of this equation over the cross-section Sof the nail, the maximum shear
stress criterion finally becomes:
4F2
D+F2
N≤F2
y(16.31)
where Fy=S×σyis the yield force in tension, as inputted in the Nail Type tab of the Nails
window (Figure 4.70).
16.2.2.3.4 Soil/nail normal reaction: nail breaks in bending
The plastification of the nail occurs for a limit shear force of:
FD;4 = 1.62Mmax
L0 1−FN
Fy2!+ 0.24 ×pu×D×L0(16.32)
where:
Dis the borehole diameter, in m;
Fyis the yield force in tension, as inputted in the Nail Type tab of the Nails window
(Figure 4.70);
puis the ultimate lateral stress, see Equation 16.25;
L0is the reference length, in m, defined as:
L0=4EI
Es1/4
222 of 286 Deltares

Method of slices
16.2.2.4 Resisting moment from end section
The resisting moment is increased by MR;end section, the resistance at the edges of a sliding
section in the out-of-plane direction, due to the undrained shear strength:
MR;end section =1
Fs
1
L/2
n
X
i=1 bi×
ki
X
j=1
Mj;su!(16.33)
with:
Mj;su =hjsu;j;min (Zc−Zj;avg) + hj
2|su;j;bot −su;j;top|(Zc−Zj;cg)
su;j;min = min (su;j;bot;su;j;top)
Zj;avg =Zj;bot +Zj;top
2
Zj;cg =Zj;bot −hj/3if su;j;top < su;j;bot
2hj/3if su;j;top > su;j;bot
where:
Fsis the safety factor, see Equation 16.34 in section 16.2.3;
hjis the thickness of layer jin slice i;
kiis the number of layers along slice i;
Lis the expected length of the sliding surface in the out-of-plane direction (i.e. cross
section perpendicular to the cross section plane), as defined in the Calculation
Options window in section 5.1;
nis the number of slices;
su;j;bot is the undrained shear strength at the bottom of layer jin slice i;
su;j;top is the undrained shear strength at the top of layer jin slice i;
Zj;bot is the level at the bottom of layer jin slice i;
Zj;top is the level at the top of layer jin slice i.
Refer to section 1.8 for the definition of the other symbols.
Note: This extra resisting moment is calculated only if the option Use friction of end section
in the Calculation Options window (section 5.1) is enabled and only for the Bishop model in
combination with an undrained shear strength model.
16.2.3 Safety factor
The safety factor Fsfor stability of slip circles is expressed by:
Fs=MR;soil +MR;geotextile +MR;nail +i|MR;end section|
MD;soil +MD;water +MD;water;quake +MD;load +MD;soil;quake
(16.34)
with:
MD;soil;quake =MD;soil;quake;V +j|MD;soil;quake;H|
where:
MR;soil is the resisting soil moment, in kNm/m, see Equation 16.8;
MR;geotextile is the resisting moment from geotextiles, in kNm/m, see Equation 16.17;
MR;nail is the resisting moment from nails, in kNm/m, see Equation 16.21;
Deltares 223 of 286
D-GEO STABILITY
, User Manual
MR;end section is the resisting moment due to the additional friction caused by a limited
end section of the slip plane, in kNm/m, see Equation 16.33 (only for Bishop
model in combination with sushear strength models);
MD;soil is the driving soil moment, in kNm/m, see Equation 16.1;
MD;water is the driving water moment, in kNm/m, see Equation 16.3;
MD;water;quake is the additional driving water moment due to the temporary draw down of
the water during the earthquake, in kNm/m, see Equation 17.7;
MD;load is the driving load moment, in kNm/m, see Equation 16.7.
MD;soil;quake;V is the additional driving soil moment due to vertical acceleration of the
earthquake, in kNm/m, see Equation 17.4;
MD;soil;quake;H is the additional driving soil moment due to horizontal acceleration of the
earthquake, in kNm/m, see Equation 17.3;
iis the sign of MR;end section:
– If MR<0,i=−1;
– If MR>0,i= 1
jis the sign of MD;soil;quake;H:
– If MD<0,j=−1;
– If MD>0,j= 1
MDis the total driving moment without the contribution of MD;soil;quake;H:
MD=MD;soil +MD;water +MD;water;quake +MD;load +MD;soil;quake;V
MRis the total resisting moment without the contribution of MR;end section:
MR=MR;soil +MR;geotextile +MR;nail
Note: The unit kNm/m indicates the moment per 1 meter of the cross section perpendicular
to the cross section plane.
For Bishop, substitution of Equation 16.11 in the expression for the safety factor Equation 16.34
yields to Equation 16.35, an expression in which the safety factor occurs at both sides.
D-GEO STABILITY
therefore determines the safety value for Bishop in iterative fashion, start-
ing with a first estimate of the safety factor of 1.0. The result of the calculation (on the left) is
used as a next estimate and this process continues until |FN−FN-1|= 0.001 or a maximum
number of iterations has been made in which case no result is obtained.
Fs=
R
n
X
i=1
bi
cos αi
ci+σ0
v;itan ϕi
1 + tan αi
tan ϕi
Fs
+MR;geotextile +MR;nail +i|MR;end section|
MD;soil +MD;water +MD;water;quake +MD;load +MD;soil;quake
(16.35)
16.2.4 Limited inclination of the slip plane
In the formula for the calculation of the shear stresses (τ), a problem arises for large negative
values of the angle α. For these negative values, a large value for τwill be calculated, but this
is unrealistic. To prevent this from happening, the value for αis restricted to ϕ/2 - 45◦. This
means that αnever obtains a value less than ϕ/2 - 45◦. To illustrate this, see the following
table where the τand restricted τ0are given for various values of αand restricted α’.
In Figure 16.8, the value of the other parameters in the formula for τis as follows:
c= 0 kN/m2
ϕ= 20◦
224 of 286 Deltares
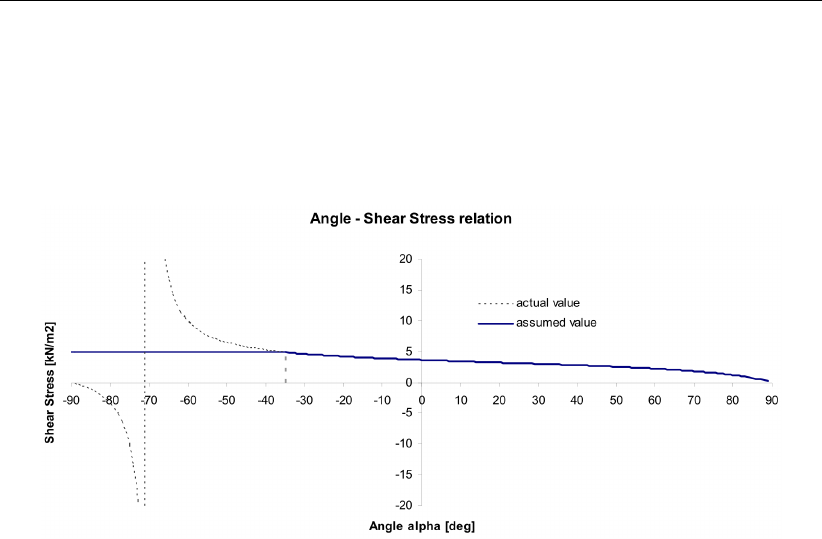
Method of slices
σ0
v= 10 kN/m2
Fs= 1
The minimum value for αbecomes: ϕ/2 – 45◦= –35◦. The relation plus the assumption is
displayed in Figure 16.8.
Figure 16.8: Relation angle α- Shear Stress for αmin = 35◦
16.2.5 Search algorithm for critical circle
D-GEO STABILITY
applies a search algorithm that automatically moves the grid and tangent
lines towards the direction of the minimal safety factor. During this procedure, the size of the
grid is not changed. This procedure can only be used when there are three or more center
points in both the Xand Zdirections.
If a minimum safety factor is found that is enclosed within the grid, this is not a definite guar-
antee that it is the absolute minimum safety factor for the problem at hand. In a large grid of
center points, it is possible to have several local minimums in the grid. Therefore, when using
a smaller grid it is possible to find one of the minimums. With some experience however it
is possible to make a good first estimate of the position of the center point of the critical slip
circle and choose a reasonable grid around that estimate.
Care needs to be taken when the grid is moved several times automatically. In that case,
the grid may ‘move’ in such a way that, ultimately, micro-stability is being calculated. Micro-
stability is the safety factor of a very small slice out of the soil structure, typically only a few
centimeters deep. If this is not desired, automatic movement of the grid should be stopped.
Deltares 225 of 286
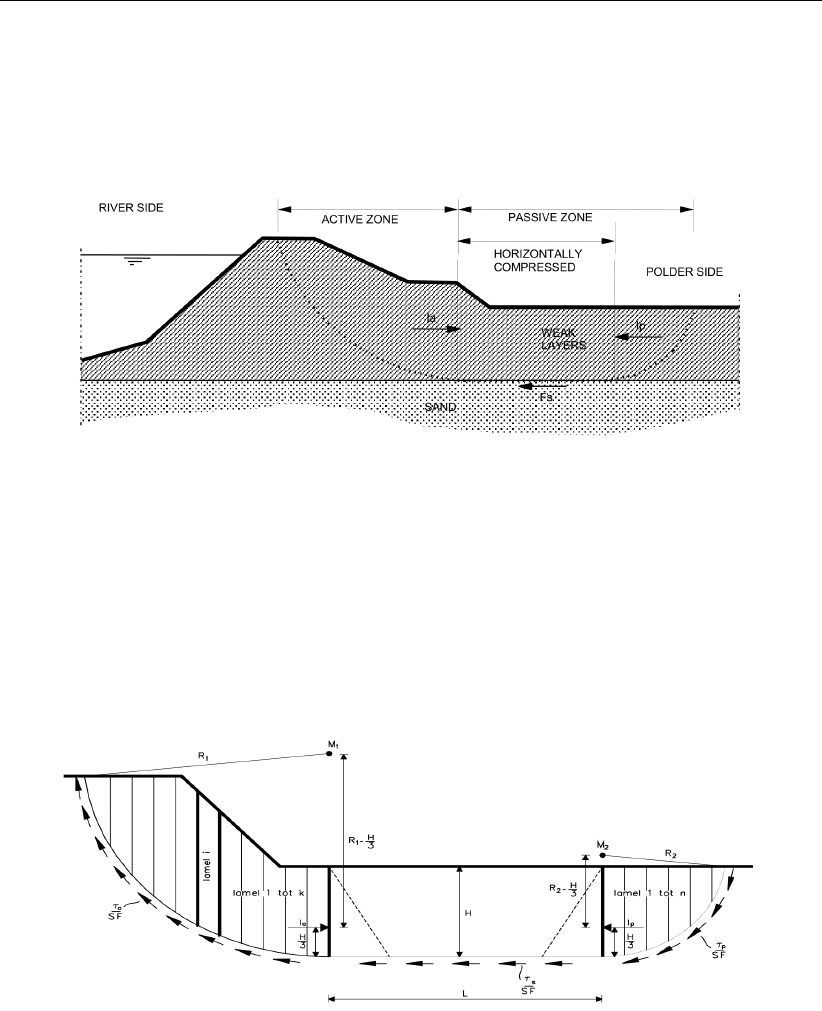
D-GEO STABILITY
, User Manual
16.3 Uplift Van
High pore pressures at the horizontal interface of weak layers with an underlying sand layer
will cause reduction or even complete loss of shear resistance at this plane. This can yield an
uplift failure mechanism, which is schematically drawn in Figure 16.9.
Figure 16.9: Uplift failure mechanism
The passive side of the slip plane is elongated in order to find equilibrium of horizontal forces.
Van’s method therefore assumes that the total slip plane is composed of a horizontal part
bounded by two circular parts. The safety factor is determined using equilibrium of the hori-
zontal forces acting on the compressed area between the active and passive slip circles. The
method becomes equal to Bishop’s method if the length of the horizontal part reduces to zero.
Figure 16.10: Van-Uplift Stability derivation
16.3.1 Driving moments of the circular parts
16.3.1.1 Driving soil moment
The driving soil moment is the moment caused by the mass of the soil within the slip circle
around its centre:
MD;soil;left =
nleft
X
i=1
Gi×(1 + av)×(Xc;left −Xi;top)(16.36)
MD;soil;right =
n
X
i=nright
Gi×(1 + av)×(Xc;right −Xi;top)(16.37)
226 of 286 Deltares

Method of slices
with:
Gi=
ki
X
j=1
γj×hj×bi
where:
avis the vertical earthquake factor (i.e. acceleration coefficient) as defined in the
Earthquake window in section 4.7.3.
Giis the weight of the soil in slice i, in kN/m;
hjis the thickness of layer jin slice i;
kiis the number of layers along slice i;
γjis the unit weight of soil layer jin slice i, in kN/m3;
Refer to section 1.8 for the definition of the other symbols.
The unit kNm/m indicates the moment per 1 meter of the cross section perpendicular to the
cross section plane.
16.3.1.2 Driving water moments
The water moment is the contribution of three water moments:
MD;water;left =MWaterTop;left +MWaterSide;left +MWaterBar;left (16.38)
MD;water;right =MWaterTop;right +MWaterSide;right +MWaterBar;right (16.39)
where:
MWaterTop;left is caused by the water forces (due to free water on surface) acting on the
top of the slice at left side, see Equation 16.40;
MWaterTop;right is caused by the water forces (due to free water on surface) acting on the
top of the slice at right side, see Equation 16.41;
MWaterSide;left is caused by the water forces (due to free water on surface) acting on the
side of the slice at left side, see Equation 16.42 and Equation 16.44;
MWaterSide;right is caused by the water forces (due to free water on surface) acting on the
side of the slice at right side, see Equation 16.43 and Equation 16.45;
MWaterBar;left is caused by the pore pressures acting on the left bar, see Equation 16.46;
MWaterBar;right is caused by the pore pressures acting on the right bar, see Equation 16.47.
Water forces (due to free water forces on surface) acting on the top of the slice
The water moment is the moment caused by the water forces acting on and within the soil
slice. When there is free water on the surface of the geometry and within the boundaries of
the slip circle, it can have a positive or negative effect on the safety factor. The driving water
moment due to free water forces acting on slices is calculated as follows:
MWaterTop;left =
nleft
X
i=1
(Xi−Xc;left)×Wv;i+ (Zc;left −Zi;top)×Wh;i(16.40)
MWaterTop;right =
n
X
i=nright
(Xi−Xc;right)×Wv;i+ (Zc;right −Zi;top)×Wh;i(16.41)
where:
Deltares 227 of 286

D-GEO STABILITY
, User Manual
Wv;iis the vertical component of the water force on top of slice i, in kN/m:
Wv;i=−max [0; (Zphreatic −Ztop;i)] ×γw×bi
Wh;iis the horizontal component of the water force on top of slice i, in kN/m:
Wh;i= max [0; (Zphreatic −Ztop;i)] ×γw×bi×tan βi
Refer to section 1.8 for the definitions of the other symbols.
Horizontal water forces (due to free water forces) acting on the side of the slice
With the introduction of vertical layer boundaries, it became possible to have a surface with
a vertical component. If this vertical component is part of the slip circle,
D-GEO STABILITY
will
place a slice to the left and right of this vertical. The force and moment of the free water
against the vertical component of the surface (now also the side of a slice) must be taken into
account (see Figure 16.3).
If the phreatic line is above the top surface, the shape of the horizontal water pressures
against the side of the slice is trapezium (case 1 in Figure 16.3):
MWaterSide;left =uh;top ×H×Zc;left −Zbottom +H
2 (16.42)
+H
2(uh;bottom −uh;top)×Zc;left −Zbottom +H
3
MWaterSide;right =uh;top ×H×Zc;right −Zbottom +H
2 (16.43)
+H
2(uh;bottom −uh;top)×Zc;right −Zbottom +H
3
If the phreatic line is between the top and the bottom surfaces, the shape of the hori-
zontal water pressures against the side of the slice is triangular (case 2 in Figure 16.3):
MWaterSide;left =1
2H×uh;bottom ×Zc;left −Zbottom +H
3 (16.44)
MWaterSide;right =1
2H×uh;bottom ×Zc;right −Zbottom +H
3 (16.45)
where:
His the height of the saturated soil along the vertical part:
H= min (Zwater;Ztop)−min (Zwater;Ztangent)
If the soil within the slip plane height is dry, then H= 0.
uh;top is the hydrostatic pressure at level Ztop:
uh;top = (Zwater −min (Zwater;Ztop)) ×γw
uh;bottom is the hydrostatic pressure at level Zbottom:
uh;bot = (Zwater −Zbottom)×γw
Ztop is the top level of the vertical part.
Zbottom is the bottom level of the vertical part.
228 of 286 Deltares
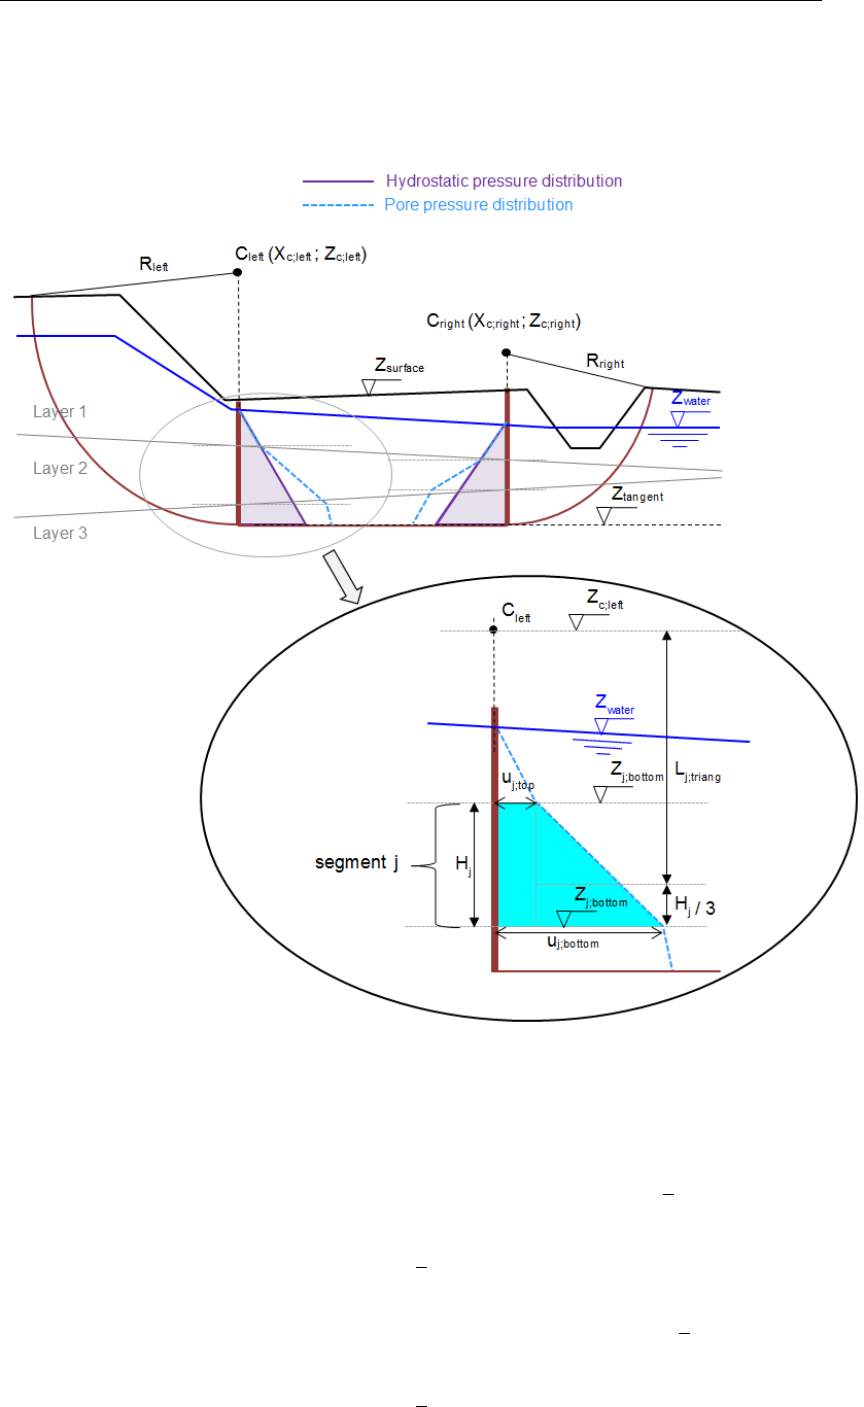
Method of slices
Horizontal pore pressures acting on both bars of the horizontal part (i.e. circle’s end)
An Uplift-Van calculation consists of two circle parts and an horizontal part. Equilibrium for
the circle parts must include pore pressure against such a part, as illustrated in Figure 16.11.
Figure 16.11: Schematization of the pore pressure distribution on bars
MPoreBar;left =
nsegments;left
X
j=1
min (uj;top;uj;bottom)×Hj×
Zc;left −1
2Hj
(16.46)
+|uj;top;uj;bottom| × 1
2Hj×Lj;triang
MPoreBar;right =
nsegments;right
X
j=1
min (uj;top;uj;bottom)×Hj×
Zc;right −1
2Hj
(16.47)
+|uj;top;uj;bottom| × 1
2Hj×Lj;triang
Deltares 229 of 286

D-GEO STABILITY
, User Manual
where:
nsegments;left is the number of segments having a linear pore pressure distribution along
the left bar;
nsegments;right is the number of segments having a linear pore pressure distribution along
the right bar;
Hjis the height of segment jalong the considered bar;
uj;top is the pore pressure at level Zj;top;
uj;bottom is the pore pressure at level Zj;bottom;
Zj;top is the top level of segment jalong the considered bar;
Zj;bottom is the bottom level of segment jalong the considered bar;
Lj;triang is the arm of the resulting force of the triangular part of the pore pressure
distribution for segment jalong the considered bar:
Lj;triang =
Zc;left −Zj;bottom +1
3Hjif uj;top < uj;bottom for left bar
Zc;left −Zj;top −1
3Hjif uj;top ≥uj;bottom for left bar
Zc;right −Zj;bottom +1
3Hjif uj;top < uj;bottom for right bar
Zc;right −Zj;top −1
3Hjif uj;top ≥uj;bottom for right bar
16.3.1.3 Driving load moments
The (part of the) uniform loads and the line loads located within the confines of a slip circle
creates a moment around the slip-circle center point:
MD;load;left =
nloads
X
j=1
Fj;left ×∆wj;left ×(Xc;left −Xj;left) +
nlines
X
l=1
Fl×(Xc;left −Xl;left)
(16.48)
MD;load;right =
nloads
X
j=1
Fj;right ×∆wj;right ×(Xc;right −Xj;right) +
nlines
X
l=1
Fl×(Xc;right −Xl;right)
(16.49)
with:
Xj;left =−max (X1;left;Xbegin;j) + min (Xnleft;right;Xend;j)
2
Xj;right =−max (X1;left;Xbegin;j) + min (Xnleft;right;Xend;j)
2
Xl;left =Xc;left −max Xnright;left;Xl+ min (Xn;right;Xl)
2
Xl;right =Xc;right −max Xnright;left;Xl+ min (Xn;right;Xl)
2
∆wj;left = min (Xc;left;Xj;end)−max (X1;left;Xj;begin)
∆wj;right = min (Xn;right;Xj;end)−max (Xc;right;Xj;begin)
where:
Fjis the magnitude of uniform-load number j, in kN/m2;
Flis the magnitude of line-load number l, in kN/m;
nlines is the total number of lines-loads;
nloads is the total number of uniform-loads;
Xj;begin is the X-coordinate of the starting point of load j;
Xj;end is the X-coordinate of the ending point of load j;
230 of 286 Deltares

Method of slices
Xlis the X-coordinate of line-load l;
X1;left is the X-coordinate of the left side of slice 1 (i.e. entry point of the left slip circle);
Xn;right is the X-coordinate of the right side of slice n(i.e. exit point of the right slip
circle);
∆wj;left is the width of the part of the uniform-load jlocated within the confines of a left
slip circle;
∆wj;right is the width of the part of the uniform-load jlocated within the confines of a right
slip circle;
Xj;left is the X-coordinate at the middle of the part of the uniform-load jlocated within
the confines of a left slip circle;
Xl;left is the X-coordinate of the line-load llocated within the confines of a left slip
circle;
Xj;right is the X-coordinate at the middle of the part of the uniform-load jlocated within
the confines of a right slip circle;
Xl;right is the X-coordinate of the line-load llocated within the confines of a right slip
circle.
Refer to section 1.8 for the definitions of the other symbols.
16.3.1.4 Horizontal quake moments
Refer to section 17.3.
16.3.1.5 Total driving moments
The total driving moment is the contribution of different components:
MD;total;left =MD;soil;left +MD;water;left +MD;load;left (16.50)
MD;total;right =MD;soil;right +MD;water;right +MD;load;right (16.51)
where:
MD;soil;left is the driving soil moment at left side, in kNm/m, see Equation 16.36;
MD;soil;right is the driving soil moment at right side, in kNm/m, see Equation 16.37;
MD;water;left is the driving water moment at left side, in kNm/m, see Equation 16.38;
MD;water;right is the driving water moment at right side, in kNm/m, see Equation 16.39;
MD;load;left is the driving load moment at left side, in kNm/m, see Equation 16.48;
MD;load;right is the driving load moment at right side, in kNm/m, see Equation 16.49;
16.3.1.6 Determination of active and passive sides
The left side is considered as active if:
MD;total;left > MD;total;right
where MD;total;left is the total driving moment at left side (Equation 16.50) and MD;total;right is
the total driving moment at right side (Equation 16.51).
This leads therefore to:
MD;total;act = max (MD;total;left;MD;total;right)(16.52)
MD;total;pas = min (MD;total;left;MD;total;right)(16.53)
16.3.2 Resisting moments of the circular parts
Deltares 231 of 286

D-GEO STABILITY
, User Manual
16.3.2.1 Resisting moment from soil
Shear stresses and normal effective stresses act along the slip circle. The shear stresses
prevent the circular soil mass from slipping. The resisting moment is defined as the moment
caused by the shear stresses along the circular arc around the center of the slip circle:
MR;soil;left =Rleft ×
nleft
X
i=1
τi×li(16.54)
MR;soil;right =Rright ×
n
X
i=nright
τi×li(16.55)
with:
τi=ci+σ0
v;i×tan ϕi
1 + tan αi×tan ϕi
Fs
(16.56)
where:
τiis the shear stress along bottom of slice i, in kN/m2;
σ0
v;iis the vertical effective stress at the bottom of slice i, in kN/m2, see Equation 18.6;
Fsis the safety factor, see Equation 16.79.
Refer to section 1.8 for the definitions of the other symbols.
16.3.2.2 Resisting moment from geotextiles
Geotextiles can be used to reinforce and improve the stability of slopes. The geotextile intro-
duces a force that can act at the boundary of a slip circle. Refer to section 16.2.2.2 for the
calculation of the resisting moments MR;geotextile;left or MR;geotextile;right if the geotextile inter-
sects respectively the left or right circle.
16.3.2.3 Resisting moment from nails
The extra resisting moments MR;nail;left and MR;nail;right respectively for the left and right circle
are calculated in the same way as explained in section 16.2.2.3, see Equation 16.21.
16.3.3 Horizontal forces
16.3.3.1 Soil resistance force along horizontal part Is
The horizontal resisting force acting along the horizontal part is:
Is=j×
nright−1
X
i=nleft+1 ci+σ0
v;i×tan ϕi×li
Fs
(16.57)
with:
j=−1if the left side is active
1if the left side is passive
where:
jis the sign of the force;
σ0
v;iis the vertical effective stress at the bottom of slice i, in kN/m2, see Equation 18.6;
Refer to section 1.8 for the definitions of the other symbols.
232 of 286 Deltares
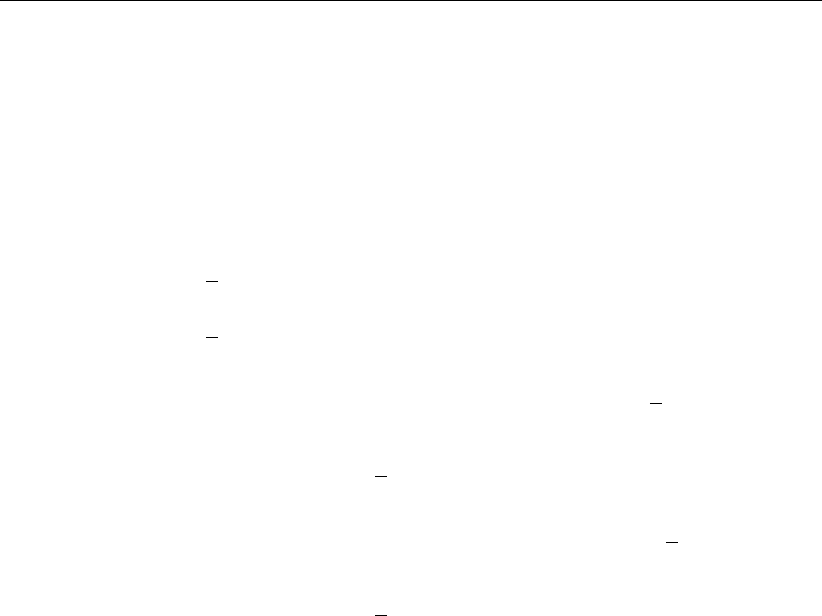
Method of slices
16.3.3.2 Resulting water force along horizontal part Fwater;horiz
The resulting water force along the horizontal part is the contribution of the water force due to
(free) water on surface and of the pore pressures applying on the bars:
Fwater;horiz =Fw;surf;left −Fw;surf;right +Fu;left −Fu;right (16.58)
with:
Fw;surf;left =1
2[max (Zphreatic;left;Zsurf;left)−Zsurf;left]2×γw(16.59)
Fw;surf;right =1
2[max (Zphreatic;right;Zsurf;right)−Zsurf;right]2×γw(16.60)
Fu;left =
nsegments;left
X
j=1
min (uj;top;uj;bottom)×Hj×
Zc;left −1
2Hj
(16.61)
+|uj;top;uj;bottom| × 1
2Hj(16.62)
Fu;right =
nsegments;right
X
j=1
min (uj;top;uj;bottom)×Hj×
Zc;right −1
2Hj
(16.63)
+|uj;top;uj;bottom| × 1
2Hj(16.64)
where:
Zsurf;left is the surface level at vertical X=Xc;left
Zsurf;right is the surface level at vertical X=Xc;right
Zphreatic;left is the phreatic level at vertical X=Xc;left
Zphreatic;right is the phreatic level at vertical X=Xc;right
nsegments;left is the number of segments having a linear pore pressure distribution along
the left bar;
nsegments;right is the number of segments having a linear pore pressure distribution along
the right bar;
Hjis the height of segment jalong the considered bar;
uj;top is the pore pressure at level Zj;top;
uj;bottom is the pore pressure at level Zj;bottom;
Zj;top is the top level of segment jalong the considered bar;
Zj;bottom is the bottom level of segment jalong the considered bar.
See also Figure 16.11 for the definition of the symbols.
16.3.3.3 Horizontal nail force
The extra resisting force FR;nail;horiz in the horizontal part due to a nail is calculated in the same
way as explained in section 16.2.2.3, see Equation 16.20.
Deltares 233 of 286

D-GEO STABILITY
, User Manual
16.3.3.4 Resulting horizontal force at active side Ia
Moment equilibrium around active circle center yields Equation 16.65 for the resulting force
Iaat active side.
Ia=|MD;act| − |MR;soil;act|
Fs− |MR;nail;act|−|MR;geotextile;act|
Ract −∆Hact
(16.65)
with:
MR;soil;act =MR;soil;left if the left side is active
MR;soil;right if the right side is active (16.66)
MR;nail;act =MR;nail;left if the left side is active
MR;nail;right if the right side is active (16.67)
MR;geotextile;act =MR;geotextile;left if the left side is active
MR;geotextile;right if the right side is active (16.68)
(16.69)
where:
MD;act is the total active driving moment, see Equation 16.52;
MR;soil;left is the soil resisting moment at left side, see Equation 16.54;
MR;soil;right is the soil resisting moment at right side, see Equation 16.55;
∆Hact is the arm of the active force Iacompare to the tangent level;
Ract is the radius of the active circle;
Fsis the safety factor that has to be determined;
16.3.3.5 Resulting horizontal force at passive side Ip
Moment equilibrium around passive circle center yields Equation 16.70 for the resulting force
Ipat passive side.
Ip=|MD;pas| − |MR;soil;pas|
Fs− |MR;nail;act|−|MR;geotextile;act|
Rpas −∆Hpas
(16.70)
with:
MR;soil;pas =MR;soil;left if the left side is passive
MR;soil;right if the right side is passive (16.71)
MR;nail;pas =MR;nail;left if the left side is passive
MR;nail;right if the right side is passive (16.72)
MR;geotextile;pas =MR;geotextile;left if the left side is passive
MR;geotextile;right if the right side is passive (16.73)
(16.74)
where:
MD;pas is the total passive driving moment, see Equation 16.53;
MR;soil;left is the soil resisting moment at left side, see Equation 16.54;
MR;soil;right is the soil resisting moment at right side, see Equation 16.55;
∆Hact is the arm of the active force Iacompare to the tangent level;
234 of 286 Deltares

Method of slices
∆Hpas is the arm of the passive force Ipcompare to the tangent level;
Rpas is the radius of the passive circle;
Ract is the radius of the active circle;
Fsis the safety factor that has to be determined;
16.3.4 Safety factor
Determination of arm of active force Ia
The resulting horizontal force at passive side of the compressed soil Ipis assumed to act
above the interface with the sand, at 1/3 of the height of the weak soil layers. This assumption
is relatively correct as no free water on surface is present at the polder side (i.e. Fw;surf;left =
0).
∆Hpas =1
3Hpas (16.75)
where Hpas is the height of the bar at passive side.
The resulting horizontal force at active side of the compressed soil Iais assumed to act above
the interface with the sand, at a distance ∆Hact of the weak soil layers. To determine the arm
∆Hact of force Ia, an intern iterative process is used by means of the moments equilibrium:
∆Hact = ∆Hpas ×(Ip+Mwater;pas −Mwater;act)
Ia
(16.76)
with:
Mwater;act =Mwater;left if the active side is the left side
Mwater;right if the active side is the right side
Mwater;pas =Mwater;left if the passive side is the left side
Mwater;right if the passive side is the right side
Mwater;left =Fw;surf;left ×∆Hw;surf;left +MPoreBar;left |tangent
Mwater;right =Fw;surf;right ×∆Hw;surf;right +MPoreBar;right |tangent
∆Hw;surf;left =Zsurf;left +1
3(Zphreatic;left −Zsurf;left)−Ztangent
∆Hw;surf;right =Zsurf;right +1
3(Zphreatic;right −Zsurf;right)−Ztangent
where:
Fw;surf;left is the horizontal water force on left bar due to (free) water on surface,
see Equation 16.59;
Fw;surf;right is the horizontal water force on left bar due to (free) water on surface,
see Equation 16.60;
Zsurf;left is the surface level at vertical X=Xc;left;
Zsurf;right is the surface level at vertical X=Xc;right;
Zphreatic;left is the phreatic level at vertical X=Xc;left;
Zphreatic;right is the phreatic level at vertical X=Xc;right;
Ztangent is the bottom level of the horizontal part;
MPoreBar;left |tangent is the moment around the tangent line due to pore pressures along the
left bar. It is similar to MPoreBar;left in Equation 16.46 except that the
rotational point Zc;left is replaced with Ztangent;
MPoreBar;right |tangent is the moment around the tangent line due to pore pressures along the
right bar. It is similar to MPoreBar;right in Equation 16.47 except that the
rotational point Zc;left is replaced with Ztangent.
Deltares 235 of 286

D-GEO STABILITY
, User Manual
The substitution of Equation 16.65 and Equation 16.75 in Equation 16.76 yields to Equa-
tion 16.77, an expression in which distance ∆Hact occurs at both sides.
D-GEO STABILITY
therefore determines this distance in iterative fashion, starting with a first estimate of the dis-
tance of ∆Hact = ∆Hpas =1
3Hpas. The result of the calculation (on the left) is used as a
next estimate and this process continues until |∆Hact;N−∆Hact;N−1|<0.001 or a maxi-
mum number of iterations has been made in which case no result is obtained.
∆Hact =1
3Hpas ×Ip+Mwater;pas −Mwater;act
|MD;act| − |MR;soil;act|
Fs− |MR;nail;act|−|MR;geotextile;act|
Ract −∆Hact
(16.77)
Equilibrium of horizontal forces
The equation for equilibrium of horizontal forces yields:
Ia+Ip+Is+Fwater;horiz +Fnail;horiz = 0 (16.78)
Substitution of Equation 16.65 and Equation 16.70 into the equation for equilibrium of horizon-
tal forces Equation 16.78 finally yields Equation 16.79 for the safety factor.
D-GEO STABILITY
solves this equation in iterative fashion:
Fs=FR
FD
=
|MR;soil;pas|
Rpas −∆Hpas
+|MR;soil;act|
Ract −∆Hact −Is×Fs+nail +geotextile
|MD;pas|
Rpas −∆Hpas
+|MD;act|
Ract −∆Hact
+Fwater;horiz
(16.79)
where FRand FDare respectively the resisting and driving forces.
The substitution of Equation 16.66 and Equation 16.66 in Equation 16.79 yields to an ex-
pression in which distance Fsoccurs at both sides.
D-GEO STABILITY
therefore determines
the safety factor in iterative fashion, starting with a first estimate of F0= 1. The result
of the calculation (on the left) is used as a next estimate and this process continues until
|Fs;N−Fs;N−1|<0.001 or a maximum number of iterations has been made in which case
no result is obtained.
236 of 286 Deltares
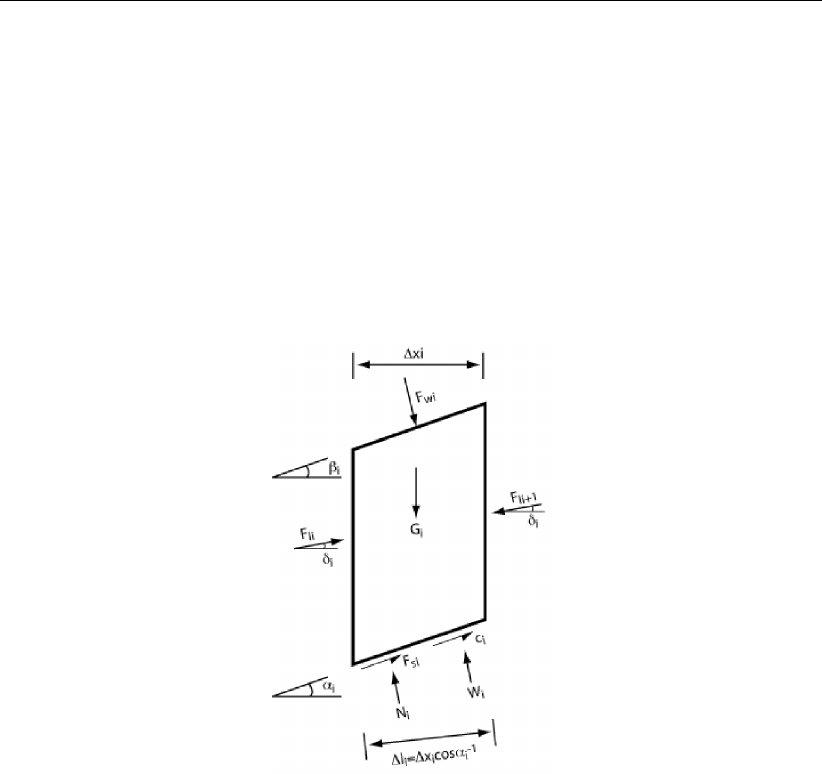
Method of slices
16.4 Spencer
The Spencer method (Spencer,1993) uses the cohesion and constant friction angle as pa-
rameters. These values are obtained in the same way as in the Bishop method, with the
difference that only the initial c and ϕare used from a stress table. This calculation method is
applied in
D-GEO STABILITY
as described below.
By definition, the safety factor is found when the slide plane is in limit state of equilibrium. To
fulfill this requirement, each slice must have equilibrium of moments, horizontal and vertical
forces. The Spencer method satisfies this condition of equilibrium with respect to moments
and forces.
Figure 16.12: Interslice forces according to Spencer method
where:
αiSlide plane angle [◦]
βiSlope angle [◦]
δiInterslice force angle [◦]
ϕiInternal friction angle along slip surface [◦]
hiSlice height [m]
xiSlice width [m]
ciCohesion along slip surface [kN/m2]
FsSafety factor [-]
GiWeight [kN]
Fli Interslice force [kN]
NiEffective normal force at bottom [kN]
Fsi Shear force along the bottom [kN]
Fwi Water force on slope [kN]
LiLength of sliding plane [m]
WiWater pressure against bottom [kN]
xiDistance interslice force – sliding plane [m]
Deltares 237 of 286

D-GEO STABILITY
, User Manual
Calculation of the interslice force Fli at intersection i:
Fl,i+1 cos(αi−δi+1) + tan ϕi
Fs
sin(αi−δi+1)−Fl,i cos(αi−δi) + tan ϕi
Fs
sin(αi−δi)
−Fw,i sin(αi−βi) + Gisin(αi)−ciLi
Fs−Fw,i sin(αi−βi) + Gisin(αi)−WiLi
Fs
= 0
(16.80)
The interslice force is considered as a resultant of three forces acting on a slice side:
shear force along this side
effective normal force
water force
The angle of interslice forces of the first and last (fictitious) interslice force is set to zero
implying horizontal forces. The angles of the other forces are set to δ. The fictitious interslice
force acting on the first slice is zero. Now the (fictitious) force needed to ensure equilibrium at
the end of the slide plane can be calculated.
By considering the equilibrium of moments round the center bottom point of the slice, the
position of the resultant of interslice force is found in the following way:
Fl,i−1cos δi−1(Xi−1+ 0.5∆xitan αi)−0.5Fl,i−1sin δi−1∆xi
Fl,i cos δi
−0.5∆xiFl,i sin δi−Fw,i sin βi
Fl,i cos δi
+ 0.5∆xitan αi
(16.81)
The distance between the first fictitious interslice force and the sliding plane is zero. Now,
calculating from the first to the last but one slice, the distance can be calculated between
the last but one interslice force and the sliding plane. To keep the equilibrium of moments
a fictitious rest moment (Mrest) is required for the last slice. Mrest can be calculated in the
following way:
Mrest =Fl,n cos δn(Xn+ 0.5∆xn+1 tan αn+1)−0.5Fl,n sin δn∆xi+1
−Fw,n+1αn+1 sin βn+1 (16.82)
For calculation of the rest moment, a working line for the rest force (Frest) is defined by the
horizontal line through point M. The solution procedure of the Spencer method consists of the
search for Fand δin such a way that both Frest = 0 and Mrest = 0. The search for the correct
values for Fand δis carried out by means of an iterative model, using the following steps:
Choose starting values for Fand δ.
Iterate formula 1 until Frest = 0. Fis adapted while δis kept constant.
Iterate formula 2 and 3 with the final values of the interslice forces from step 2 until
Mrest = 0. Fis kept constant while δis adapted.
With the values of Fand δthat were gained by step 2 and 3, repeat the process from
step 2 until Frest = 0 and Mrest = 0.
Iteration of Equation 16.80 (step 2) is ended when the absolute value of rest force is less than
. Iteration of Equation 16.81 and Equation 16.82 (step 3) is ended when the absolute value
of the rest moment is less than . The complete iteration process is ended when the absolute
values of both the rest force and the rest moment are less than 10◦. As a starting value, a
238 of 286 Deltares

Method of slices
safety factor of 1.1 is assumed. The program calculates a starting value for δin the following
way:
δstart =δmin +δmax
2(16.83)
In the calculation of the interslice forces from Equation 16.80, a division is made by factor:
cos (αi−δi) + tan ϕ+ sin (αi−δi)
Fs
(16.84)
At a certain combination of δand F, this can lead to a division by zero. This critical combina-
tion can be found by:
cos (αi−δi) + tan ϕ+ sin (αi−δi)
Fs
= 0 (16.85)
This leads to:
δi,min =αi−π+ arctan −Fs
tan ϕ (16.86)
or:
δi,max =αi−arctan −Fs
tan ϕ(16.87)
With this, the critical values of δi;max and δi;min can be calculated as a function of the starting
value of F. The maximum of all δi;max is δmax. The denominator of formula 2 includes cos(δi).
The denominator becomes zero when δ= -1
2πor δ= +1
2π.
When δmin is less than -1
2π, then δmin = -1
2π
When δmax is larger than +1
2π, then δmax = +1
2π
16.5 Horizontal Balance
This paragraph describes the background of the Horizontal Balance calculation method. Dif-
ferent water levels at the left and the right of a dike body causes seepage forces that change
the earth pressures.The horizontal force Fwdue to water is:
Fw=(Zphreatic −Zslip)×γw
2(16.88)
where:
Zphreatic is the vertical level of the phreatic line, in m;
Zslip is the vertical level of the slip plane, in m;
γwis the unit weight of water, in kN/m2.
Deltares 239 of 286

D-GEO STABILITY
, User Manual
The safety factor is:
Fs=R
Fw
(16.89)
where Ris the total resisting force.
240 of 286 Deltares
17 Loads
Different kinds of loads can be applied in
D-GEO STABILITY
:
section 17.1 Line load
section 17.2 Uniform load
section 17.3 Earthquake
section 17.4 Tree on slope
17.1 Line loads
A line load can be placed in, on or above the soil structure, and is assumed to continue
infinitely in the direction perpendicular to the geometry plane. The angle of the load can be
chosen freely, as long as there is a vertical downward component. The distribution angle
determines the way the load spreads in the soil structure. If the bottom of a slice is located
within the dispersion area of the load, the total stress is increased using the following formula:
∆σg=F×sin π
2−θ
2×q(x0−x1)2+ (y0−y1)2×tan δ
(17.1)
where:
∆σgis the increase of the total stress at bottom of slice, in kN/m2;
Fis the magnitude of the line load, in kN;
θis the angle of load with the vertical axis, in degree;
x0is the X co-ordinate center of bottom of slice, in m;
y0is the Z co-ordinate center of bottom of slice, in m;
x1is the X co-ordinate of line load, in m;
y1is the Z co-ordinate of line load, in m;
δis the load distribution angle, in degree.
Refer to section 4.7.1 “Line Loads" for the input.
Deltares 241 of 286
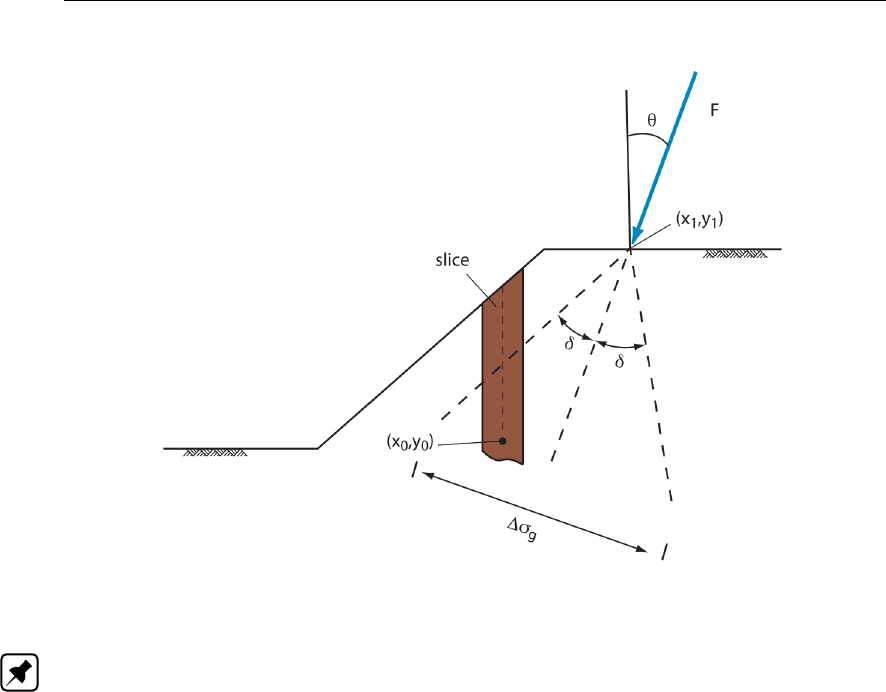
D-GEO STABILITY
, User Manual
Figure 17.1: Line Load
Note: The line load can be situated in or above the soil structure.
Besides an increase of the total stress, line loads located in the confines of the slip circle also
contributes to the driving moment of the slip circle. This moment is added to the driving load
moment.
17.2 Uniform loads
A permanent or temporary vertical uniform load can be applied on a surface area. In the direc-
tion perpendicular to the geometry plane, the load is assumed to be infinite. The magnitude,
the start and end X coordinate and a distribution angle for the load must be specified. For
temporary loads, a table of the degree of consolidation must be specified.
242 of 286 Deltares
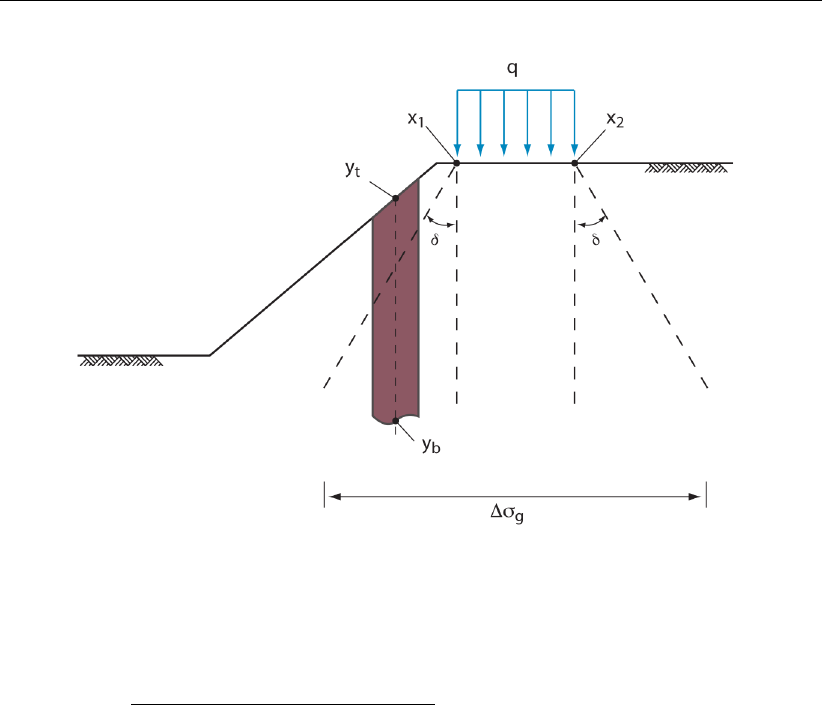
Loads
Figure 17.2: Uniform Load
The increase is calculated using the following formula:
∆σg=α×Q×(x2−x1)
(x2−x1) + 2 (y1−yb)×tan δ(17.2)
where:
∆σgis the increase of the total stress, in kN/m2;
Qis the magnitude of the distributed load, in kN/m2;
X1is the horizontal co-ordinate where load starts, in m;
y1is the vertical co-ordinate where load starts, in m;
X2is the horizontal co-ordinate where load ends, in m;
ybis the vertical co-ordinate at the bottom of a slice, in m;
ytis the vertical co-ordinate at the top of a slice, in m;
δis the distribution angle of the load, in degree;
αis the degree of consolidation for the load (1 in case of permanent loads).
Refer to section 4.7.2 “Uniform Loads" for the input.
Besides an increase of the total stress, the load also contributes to the driving moment of the
slip circle. The part of the load located within the confines of a slip circle creates a moment
around the slip-circle center point. This moment is added to the driving load moment (see
Equation 16.7 in section 16.2.1.3.
Deltares 243 of 286

D-GEO STABILITY
, User Manual
17.3 Earthquake
In
D-GEO STABILITY
it is possible to simulate the influences of earthquake forces. The earth-
quake forces induce several forces, stresses and moments. The influences of these earth-
quake forces are incorporated in
D-GEO STABILITY
by so-called earthquake coefficients.
These coefficients give the mass (of soil and water) an additional horizontal and vertical ac-
celeration.
To simplify the calculation, it is assumed that the groundwater in the soil mass has the same
extra acceleration as the soil in this mass.
Note: For the free water on the slope, a different coefficient must be specified.
17.3.1 Additional moment due to horizontal acceleration
The driving moment of slip circles increases due to the earthquake coefficients. This extra
moment MD;soil;quake;H called additional horizontal driving soil moment due to earthquake is:
MD;soil;quake;H =ah×
n
X
i=1
Gi×(Zi;cg −Zc)(17.3)
where:
ahis the horizontal earthquake factor (i.e. acceleration coefficient) as defined in the
Earthquake window in section 4.7.3;
Giis the weight of the soil in slice i(see Equation 16.2), in kN/m;
Zi;cg is the vertical co-ordinate of the centre of gravity of slice i, in m:
Zi;cg =MD;soil;i
(Gi×bi)
where MD;soil;i is the moment of soil loads at the bottom of slice ifrom the top to
the bottom of slice i, in kNm/m.
Refer to section 1.8 for the definition of the other symbols.
17.3.2 Additional moments due to vertical acceleration
The coefficient to increase the vertical gravitation has the following influence on soil stress,
slice weight, driving moment and water pressure:
Additional driving soil moment due to vertical acceleration:
MD;soil;quake;V =av×
n
X
i=1
Gi×(Xi;top −Xc)(17.4)
where:
avis the vertical earthquake factor (i.e. acceleration coefficient) as defined in the
Earthquake window in section 4.7.3;
Giis the weight of the soil in slice i(see Equation 16.2), in kN/m;
Refer to section 1.8 for the definition of the other symbols.
244 of 286 Deltares

Loads
Excess pore pressure due to earthquake:
Earthquake forces will generate excess pore pressures in layers that are not fully drained.
The excess pore pressures are determined by taking into account the degree of consolidation
per layer. This degree of consolidation ensures that part of the vertical acceleration results in
an increase in effective stress. The other part results in excess pore pressure. The excess
pore pressure uquake;excess generated by the earthquake is:
uquake;excess =av
ki
X
j=1
γj×hj×(1 −βj)(17.5)
where:
avis the vertical earthquake factor (i.e. acceleration coefficient) as defined in the
Earthquake window in section 4.7.3;
hjis the thickness of layer jin slice i;
kiis the number of layers along slice i;
βjis the degree of consolidation of layer j(0≤β≤1), as defined in the Earth-
quake window in section 4.7.3;
γjis the unit weight of soil layer jin slice i, in kN/m3;
Refer to section 1.8 for the definition of the other symbols.
Additional pore pressure at the bottom of the slice:
The additional pore pressure includes the change in hydrostatic pressure as well as the ex-
cess pore pressure due to vertical quake component:
uquake =uhydro ×av+uquake;excess (17.6)
where:
uhydro is the hydrostatic pore pressure, in kN/m2:
uhydro = max [(Zphreatic −Z)×γw; 0]
avis the vertical acceleration coefficient;
uquake;excess is the excess pore pressure due to the earthquake in kN/m2, see Equa-
tion 17.5.
Water moment:
The free water coefficient simulates the temporary draw down of the water. The free water
moment is modified according to equation:
MD;water;quake =−MD;water ×cfw (17.7)
where:
MD;water is the driving water moment in kNm, see Equation 16.3;
cfw is the free water factor as defined in the Earthquake window in section 4.7.3.
Deltares 245 of 286
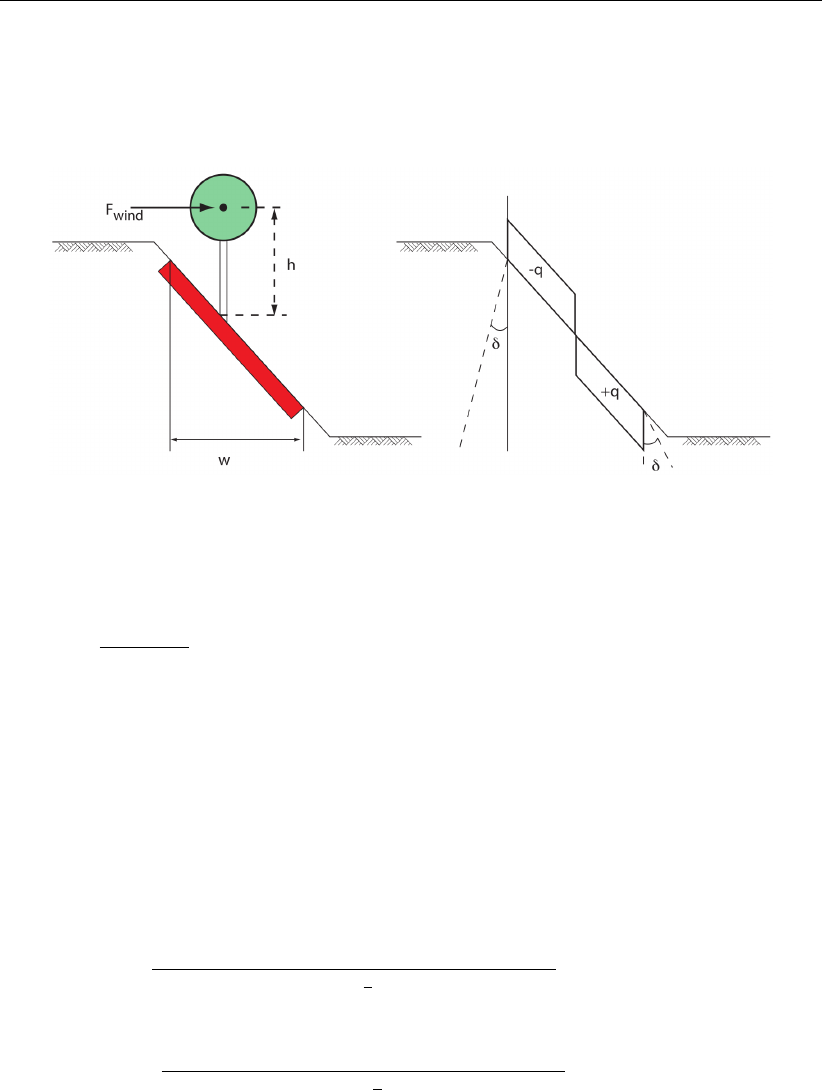
D-GEO STABILITY
, User Manual
17.4 Tree on Slope
The effect of the wind in the trees is equivalent to the effect of two uniform loads at both sides
of the application point, one positive, the other one negative (Figure 17.3).
Figure 17.3: Representation of the effect of wind on trees
The magnitude of the equivalent uniform load qis:
q=Fwind ×h
(w/2)2(17.8)
where:
Fwind is the magnitude of the wind, in kN/m;
his the vertical distance slope/wind, in m;
wis the horizontal width of the root zone, in m.
The increase of stress is the sum of the stress due to the equivalent load respectively at the
left and at the right:
∆σleft,i =−q×w
w+2 (Zwind −h) + 1
2w−2Zb;i×tan δ(17.9)
∆σright,i =q×w
w+2 (Zwind −h)−1
2w−2Zb;i×tan δ(17.10)
where:
Zwind is the vertical co-ordinate of the application point of the wind, in m;
Zb;iis the vertical co-ordinate at the bottom of slice i, in m.
The driving moment due to tree on slope is therefore:
Mload =−Fwind ×(Zwind −Zcircle)(17.11)
246 of 286 Deltares
18 Pore pressures
18.1 Phreatic line
The phreatic line (or groundwater level) is used to mark the border between dry and wet soil.
The phreatic line is treated as if it was a PL-line, and can also be used as such. The PL-line
acting as the phreatic line is determined while the geometry is being defined. If no phreatic
line is entered, then all the soil is assumed to be dry.
The phreatic line is also used to determine the water moment in the method of slices. For
all slices where the phreatic line is above the soil surface, the load of the ‘free’ water on
the surface is taken into account as a moment around the slip circle centre (MD;water), see
Equation 16.3.
18.2 Hydraulic pore pressure (from piezometric level line)
A piezometric level line (PL-line) represents the initial and transient hydraulic water head (ex-
cluded the excess component). A PL-line can be defined for the top and the bottom of each
soil layer (section 4.3.10,section 4.3.13). One of these PL-lines can be defined as the phreatic
line. If no phreatic line or PL-lines are defined, then all the soil is assumed to be dry.
D-GEO STABILITY
, calculates the hydraulic pore pressure along a vertical in the following way:
The pore pressure inside a layer is calculated by linear interpolation between the pore
pressures at top and bottom.
The pore pressure at the top or bottom is equal to the vertical distance between this
point and the position of the PL-line that belongs to this layer, multiplied by the unit
weight of water (see Equation 18.1).
If PL-line number 99 is specified for the top and/or bottom of any soil layer,
D-SETTLEMENT
will use at that boundary the PL-line of the nearest soil layer above or below, which has
a thickness larger than zero and a PL-line number not equal to 99. If the interpolation
point is located above the phreatic line, the pore pressure is assumed to be zero or a
capillary pressure, depending on the sign of the PL-line number.
uPL (z) = (ϕ(z)−z)×γw≥0if z < zphreatic
0if z≥zphreatic
(18.1)
where:
zphreatic is the level of the phreatic line, see section 18.1;
ϕ(z)is the hydraulic head at position (x,z) derives from the user-defined PL-lines per
layer (section 4.3.13) in m;
γwis the unit weight of water in kN/m3.
The following options are available, therefore, for giving PL-line numbers:
Positive integer: Capillary pore pressures are not used – that is, if negative pore pres-
sures are calculated for points above the phreatic line they become
zero
Zero: All points within the layer obtain a pore pressure 0 kN/m2
99: The pore pressure depends on the first layer above and/or below the
point with a PL-line number unequal to 99.
Deltares 247 of 286
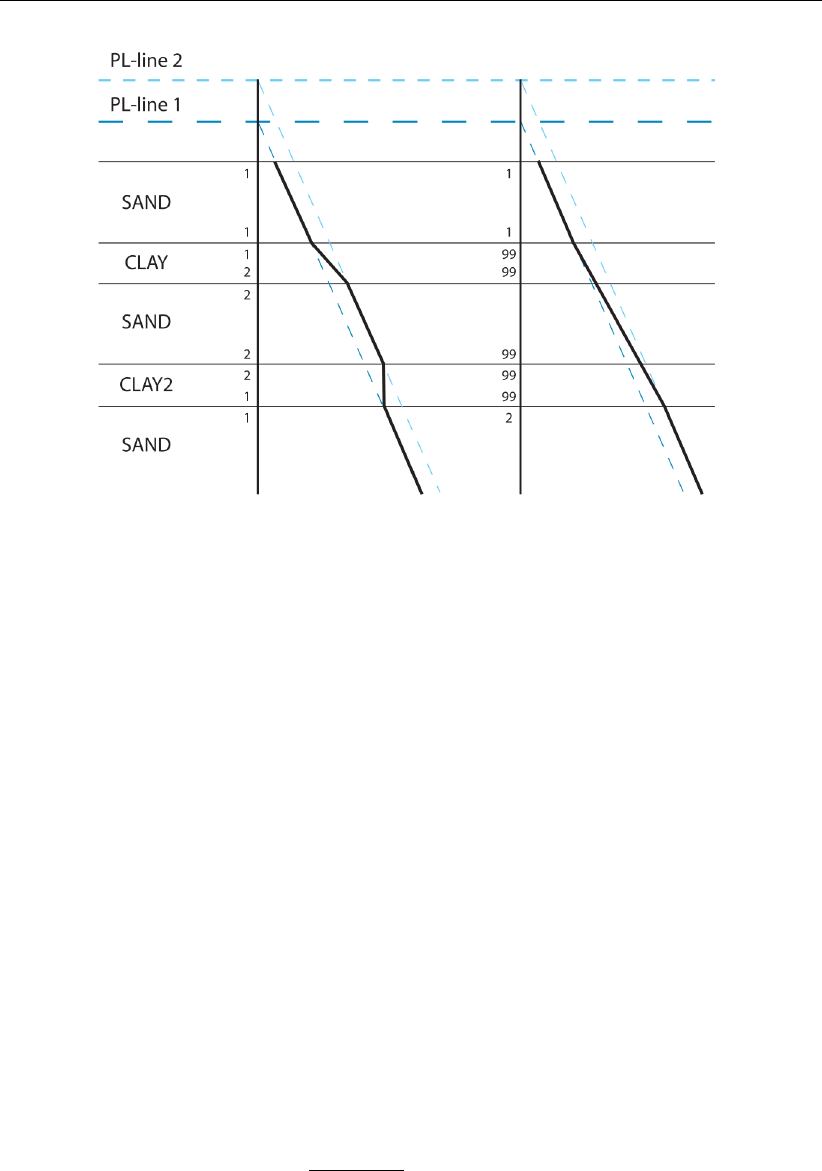
D-GEO STABILITY
, User Manual
Figure 18.1: PL-lines per layer
18.3 Pore pressure due to degree of consolidation
The degree of consolidation determines which part of the effective weight of an overlying soil
layer is carried by effective stress, and which part by (excess) pore pressure. This degree
ranges between 0% and 100%.
The effective weight σ0
v;iof layer iis equal to:
σ0
v;i=γunsat ×hfor a layer (part) above the groundwater level
(γsat −γw)×hfor a layer (part) below the groundwater level (18.2)
where:
his the thickness of the layer (part) in m;
γunsat is the unsaturated (i.e. dry) unit weight of the soil, in kN/m3;
γsat is the saturated (i.e. wet) unit weight of the soil, in kN/m3;
γwis the volumetric weight of the water, in kN/m3.
The pore pressure induced by the degree of consolidation Uij in layer iby addition of layer j
is:
uDOC (z) =
k
X
i=1
i
X
j=1
σ0
v;i×100 −Uij
100 (18.3)
where:
kis the number of layers;
σ0
v;iis the effective vertical stress in layer i, see Equation 18.2;
Uij is the relative degree of consolidation in layer idue to layer j, in %, as defined in
the Degree of Consolidation window (section 4.6.3).
248 of 286 Deltares
Pore pressures
Examples of excess pore pressures by soil self-weight
Table 18.1 shows an example of a three layered soil structure, where there are different de-
grees of consolidation.
Table 18.1: Different degrees of consolidation in different layers
Layer i
(top to bottom)
Degree of
consolidation
in layer i...
... by addition
of layer j
Effective
stress
[%]
Pore
pressures
[%]
1 100 1 100 0
2 70 1 70 30
100 2 100 0
3 60 1 60 40
90 2 90 10
100 3 100 0
The effective stress at the bottom of a slice in layer 3 is equal to 60% of the effective weight
of layer 1, plus 90% of the effective weight of layer 2, plus 100% of the effective weight of the
part of layer 3 above the bottom of the slice.
The excess pore pressure at the same spot is equal to (100% - 60%) = 40% of the effective
weight of layer 1 plus (100% - 90%) = 10% of the effective weight of layer 2 plus (100% -
100%) = 0% of the effective weight of the part of layer 3 above the bottom of the slice. This
example assumes that the phreatic line is located above layer boundary 2.
By defining the degree of consolidation for the load of each layer above the actual layer,
and for the weight of the actual layer itself, it is possible to simulate different stages of a
construction process. If, for example, one extra layer is placed on the surface as a new load,
the early stages of construction can be calculated by assigning a low degree of consolidation
in underlying layers with low permeability due to the weight of the new layer.
For points above the phreatic line, it is possible to choose whether pore (excess/under) pres-
sures are to be used to affect the effective stress.
18.4 Pore pressure from temporary distributed loads
The extra pore pressure due to temporary distributed loads is:
utemp load (z) = 1−Uload
100 ×∆σg(z)(18.4)
where:
Uload is the degree of consolation due to the temporary load, as defined in the Uniform
Loads window in section 4.7.2;
∆σg(z)is the increase of the total stress at depth zdue to the temporary uniform load,
see Equation 17.2 in section 17.2.
18.5 Total pore pressure and effective stress
The total pore pressure uis obtained by adding the following contributions:
u=uPL +uDOC +utemp load +uquake (18.5)
Deltares 249 of 286

D-GEO STABILITY
, User Manual
where:
uPL is the pore pressure derived from the PL-lines, see Equation 18.1 in sec-
tion 18.2;
uDOC is the pore (excess/under) pressure derived from the degree of consolidation,
see Equation 18.3 in section 18.3;
utemp load is the extra pore pressure from temporary distributed loads, see Equation 18.4;
uquake is the extra pore pressure due to vertical quake, see Equation 17.6 in sec-
tion 17.3.2.
The pore pressure derived from the PL-lines represents (uPL) the situation without any loads
being applied, while the extra pore pressures due to the consolidation process (uDOC) and
temporary loads (utemp load) are the result of the extra loading of soils with a low permeability.
D-GEO STABILITY
determines the effective stress at depth z, using:
σ0(z) = σ(z)−u(z)(18.6)
where uis the total pore pressure (Equation 18.5) and σ(z)is the total stress at depth z:
σ(z) = σsoil (z)+∆σg(z) + σfree water (z)(18.7)
with:
σsoil (z) =
k
X
i=1
γi×hi
σfree water (z) = (zphreatic −z)×γw≥0
where:
hiis the thickness of layer i;
kis the number of layers until depth z, along the considered vertical;
zphreatic is the level of the phreatic line, see section 18.1;
γiis the unit weight of soil layer i, in kN/m3;
σsoil (z)is the stress due to soil weight;
σwater (z)is the stress due free water above the soil surface;
∆σg(z)is the increase of the total stress at depth zdue a load, see Equation 17.1 for
line loads and Equation 17.2 for uniform loads.
250 of 286 Deltares
19 Shear strength models
This section gives background on the following shear strength models:
section 19.1 C-Phi model with dilatancy
section 19.2 Stress tables
section 19.3 Measured undrained strength
section 19.4 Calculated undrained shear strength
section 19.5 Pseudo values
For a description of stochastic shear strength modelling, see section 20.3.
19.1 C-Phi model with dilatancy
When using the C-Phi shear strength option (section 4.2.4.1) with dilatancy ψ,
D-GEO STABILITY
will determine the shear stress along the slip plane using the following equation:
τi=ci×cos ψi.cos ϕi
1−sin ψi.sin ϕi
+σ0
n;i×cos ψi.sin ϕi
1−sin ψi.sin ϕi
(19.1)
where:
ciis the cohesion at the bottom of slice i, in kN/m2;
ϕiis the friction angle at the bottom of slice i, in degree;
ψiis the dilatancy at the bottom of slice i, in degree;
αiis the angle at the bottom of slice i, in degree;
σ0
n;iis the normal effective stress along the bottom of slice i, in kN/m2.
Assuming ϕ=ψis the so called associative behaviour. When using ϕ=ψ, the shear
strength is τ=c+σ0
n×tan ϕ. This is the well-known Mohr-Coulomb definition of the failure
line.
Assuming ϕ6=ψis the so called non-associative behaviour.
When using ψ= 0, the shear strength is τ=c×cos ϕ+σ0
n×sin ϕ.
19.2 Stress tables
When using the Stress Table shear strength option (section 4.2.4.1),
D-GEO STABILITY
will
determine the shear strength from user-supplied stress tables, also called (sigma-tau) σ-τ
curves (section 4.2.1). Depending on the stress situation at the bottom of a slice, one of
the line segments of this curve is used to find values for c(cohesion) and ϕ(internal friction
angle).
In order to determine which line segment to use,
D-GEO STABILITY
uses Equation 16.11 and
Equation 16.16 for the shear stress of resp. Bishop and Fellenius models and Equation 19.2
for the effective normal stress.
σ0
n=Fs×σ0
v−c×tan α
Fs+ tan α×tan ϕ(19.2)
where:
Deltares 251 of 286
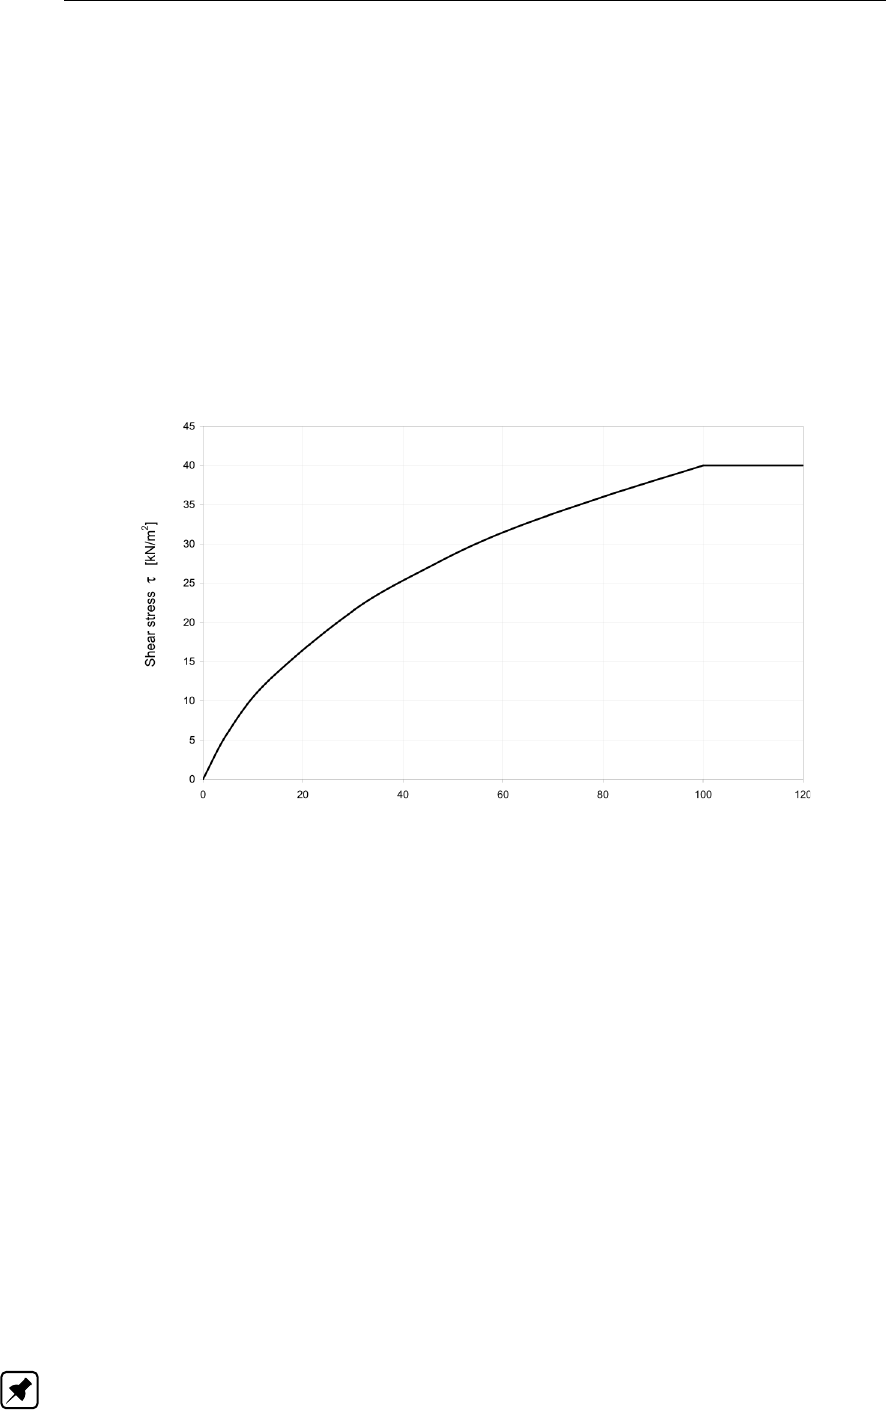
D-GEO STABILITY
, User Manual
σ0
nis the normal effective stress along the slip plane, in kN/m2;
Fsis the safety factor;
σ0
vis the vertical effective stress in kN/m2;
cis the cohesion in kN/m2;
αis the angle of slice bottom, in degree.
With this σ0
nvalue the line segment of the σ-τcurve containing this value is determined, and
from the line segment equation the values for cand ϕare determined. ϕis determined by the
angle of the line segment, while cis determined by the point where the line segment would
intersect the vertical σ= 0 kN/m2axis. In the first iteration σ0
ncannot be determined with the
above formula because ϕis unknown (also stress-dependent); therefore in the first iteration
σ0
vis used to determine the first estimate of cand ϕ.
Figure 19.1: Example of σ-τcurve
Figure 19.1 shows an example of a σ-τcurve. Such a curve is usually obtained from test
results on the soil. The curve obtained from the test results will normally have to be adjusted
in order to include a certain degree of safety.
For the angle at the bottom of the slice, the same restrictions apply as with the standard cal-
culation method explained in the section above. With the cand ϕdetermined as explained
above, the safety factor Fscan be determined in an iterative process as explained in sec-
tion 16.2.2.1.1.
19.3 Measured undrained strength
When using the shear strength option Su-measured (section 4.2.4.1),
D-GEO STABILITY
will
define the shear stress acting at the bottom of each slice as equal to the specified value for
the undrained strength.
τα=su(19.3)
Stress induced anisotropy
Note: The stress induced anisotropy is only applicable in the Reliability Analysis module of
D-GEO STABILITY
, but it can be applied without definition of uncertainties.
252 of 286 Deltares
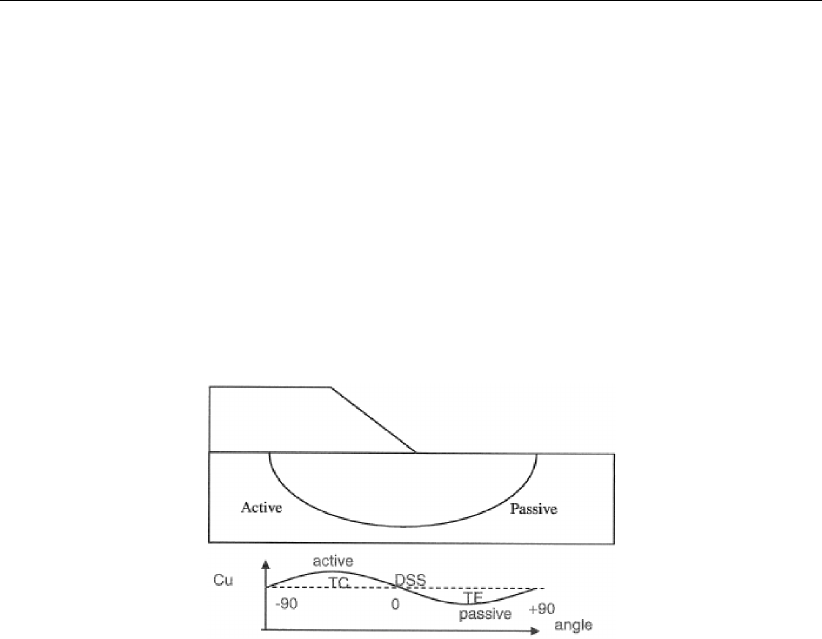
Shear strength models
The shear strength in an over consolidated soil is larger at the active side of the slip plane,
and smaller at the passive side.
An average value at the horizontal part of the slip plane follows from a direct simple shear test
(DSS). A small passive value follows from a triaxial test in extension (TE). A high active value
follows from a triaxial test in compression (TC).
D-GEO STABILITY
can model this stress induced anisotropy by assuming a shear strength that
can vary not only top down. Also
D-GEO STABILITY
can define a sinus function along the orien-
tation of the slip plane. The shear strength then varies horizontally according to this function.
The function along the plane is defined by the input of the average value, the minimum value
at the passive side and the maximum value at the active side (Figure 19.2).
Figure 19.2: Stress induced anisotropy
19.4 Calculated undrained shear strength
Su-calculated with POP
When using the shear strength option Su-calculated with POP (section 4.2.4.1),
D-GEO STABILITY
will calculate the shear stress along the slip plane from the ratio Sbetween the undrained co-
hesion and the yield stress, according to the following equation:
τα=S×σ0
y(19.4)
with:
σ0
y= max (σ0
v.ref +POP, σ0
v)(19.5)
where:
Sis the ratio between the undrained shear strength suand the yield stress σ0
y. The
average value of Sranges between 0.18 and 0.40;
σ0
yis the vertical yield stress in kN/m2;
σ0
v.ref is the reference vertical effective stress, calculated from the reference level of the
soil surface (Figure 19.3), in kN/m2. This reference level defines the initial surface,
before embankment addition or excavation;
σ0
vis the actual effective vertical stress, after embankment addition, in kN/m2;
POP is the pre-overburden pressure, in kN/m2, defined per material (see Figure 4.24).
Deltares 253 of 286

D-GEO STABILITY
, User Manual
Su-calculated with yield stress
When using the shear strength option Su-calculated with yield stress (section 4.2.4.1),
D-GEO STABILITY
will calculate the shear stress along the slip plane as follows:
τα=σ0
v×S×OCRm(19.6)
with:
OCR =σ0
y
σ0
v
=σ0
v+POP
σ0
v
(19.7)
where:
OCR is the over-consolidation ratio;
mis the strength increase exponent;
POP is the pre-overburden pressure, in kN/m2, deduced from the yield stress measure-
ments (see Figure 4.20) using the procedure described below.
Procedure for the determination of the POP from a list of σ0
y-measurements
When one or more yield stress values are measured at certain levels, these data must be
assigned to the soils. The following procedure is used in
D-GEO STABILITY
:
First, the geometry is divided in columns, and these columns are divided in areas, see
note below for the definition of columns and area’s.
Next, all the POP-values are calculated (POP =σ0
y−σ0v) by
D-GEO STABILITY
at the
specified yield stress positions.
Next, per row:
If one or more calculated POP are present in the same soil in one column, the soil
in the column gets the average value of these POP.
If no POP is available in an area, the POP given to that area is the POP with the
X-coordinate closest to the X-coordinate of the middle of the area.
When more than one POP values in a soil layer are available with the same hori-
zontal distance the soil in the column gets the average value of these POP values.
Finally, along a column, the following is done for the areas without a POP:
The areas situated above the highest area with a POP get that POP.
The areas situated below the lowest area with a POP get that POP.
The areas with a POP above and below get an interpolated value over the Z-
coordinate at the middle of these areas.
In case there are still areas without POP (meaning a column without POP), all the areas
in the column get the value of the closest calculated POP.
When determining the POP of a layer, it is not taken into account that the layer changes in
thickness or that the surface line above changes.
Note: Columns are defined by drawing vertical lines through all vertex points and intersec-
tions of the water lines with the geometry. A vertex is a point in the geometry that does not
254 of 286 Deltares
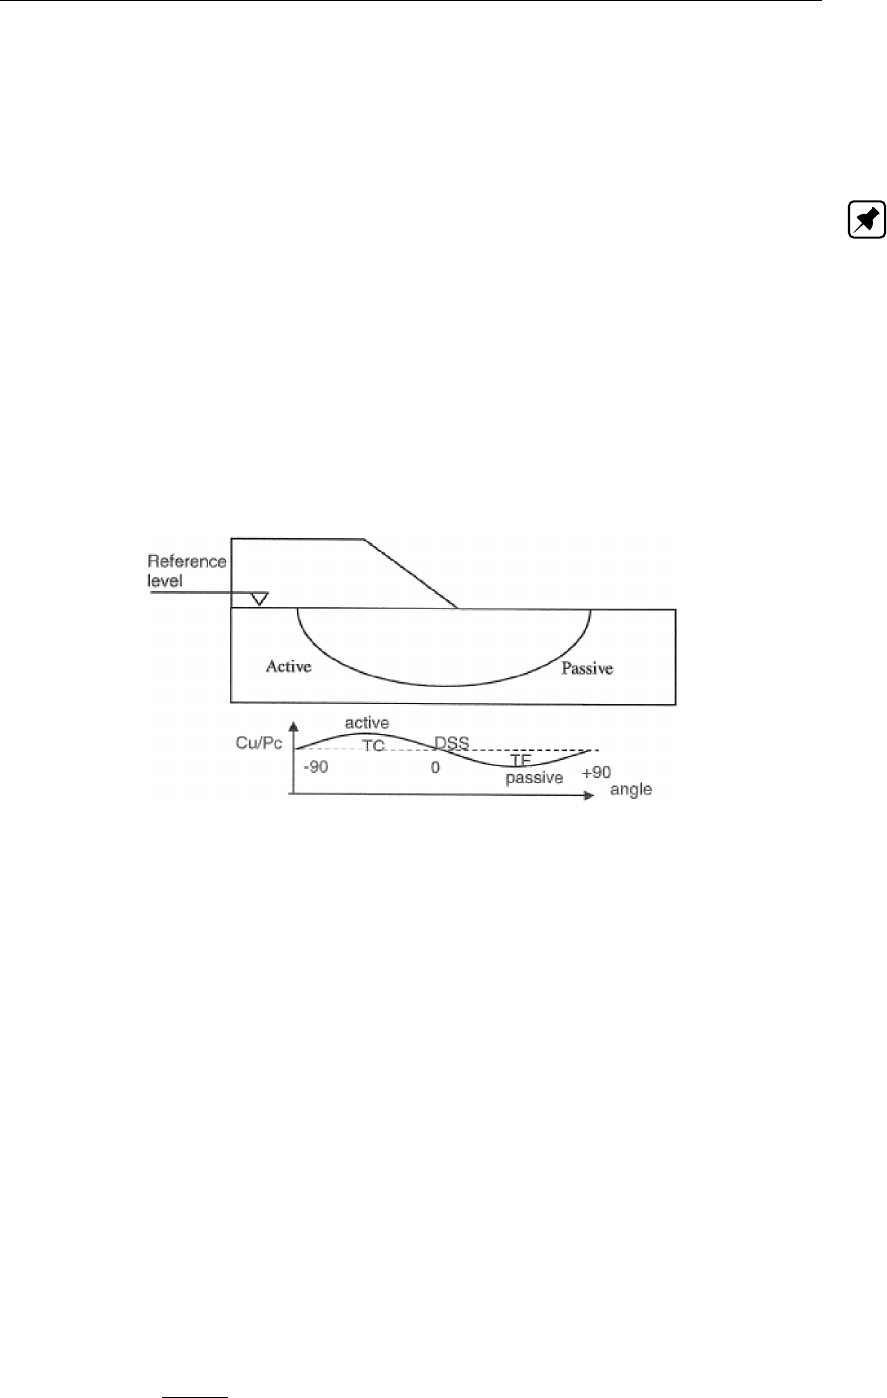
Shear strength models
lie exactly in between two other points on a line. A column exists of different areas on top of
each other. Areas are created because columns are intersected by layer boundaries and a
phreatic line. Inside an area, stresses can be interpolated linearly.
Stress induced anisotropy
Note: The stress induced anisotropy is only applicable in the Reliability Analysis module of
D-GEO STABILITY
, but it can be applied without definition of uncertainties.
The shear strength ratio in over-consolidated soil is larger at the active side of the slip plane,
and smaller at the passive side. An average value at the horizontal part of the slip plane
follows from a direct simple shear test (DSS). A small passive value follows from a triaxial test
in extension (TE). A high active value follows from a triaxial test in compression (TC).
D-GEO STABILITY
can model this stress induced anisotropy by assuming a shear strength ratio
that varies with a sinus function along the orientation of the slip plane (Figure 19.3). The
function is defined by the input of the average value, the minimum value at the passive side
and the maximum value at the active side.
Figure 19.3: Reference level and stress induced anisotropy
19.5 Pseudo values
When using the shear strength option Pseudo values (section 4.2.4.1),
D-GEO STABILITY
will
calculate the shear stress along the slip plane assuming a stochastic (normal) shear strength
modeling and using three inputted σ-τcurves:
the measured values (τmeas),
the characteristic values(τchar),
the mean values (τmean).
19.5.1 Local measurements
The pseudo characteristic value for the shear stress τij;pchar at the bottom of slice iin layer j
is:
τij;pchar =µ[τij]−1.65 ×ξj×σ[τij ](19.8)
and the pseudo measured value for the shear stress τij;pmeas at the bottom of slice iin layer
jis:
τij;pmeas =τij;meas
τij;char ×τij;pchar (19.9)
Deltares 255 of 286

D-GEO STABILITY
, User Manual
where:
256 of 286 Deltares
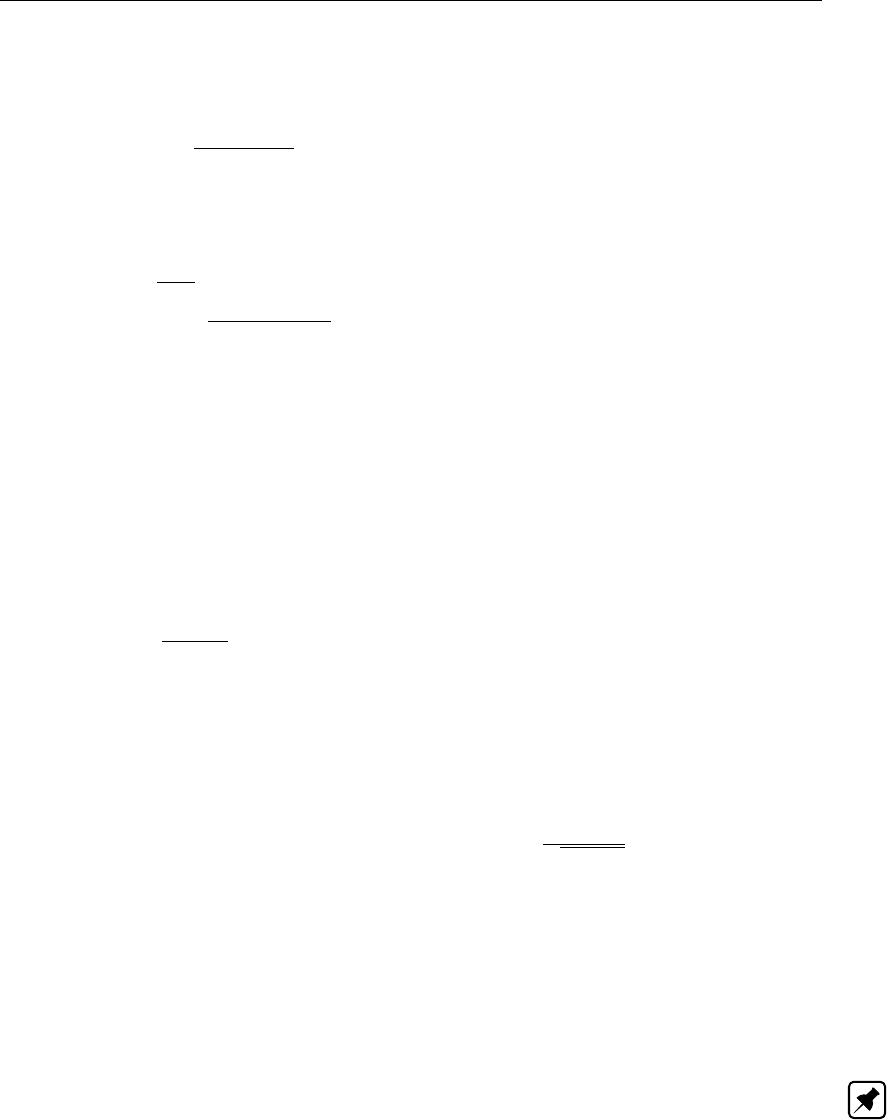
Shear strength models
µ[τij]is the average shear stress determined from a test boring and inputted in the
fourth column of the Sigma-Tau Curves window, see section 4.2.1.2;
σ[τij]is the standard deviation of the tangential stress:
σ[τij] = µ[τij ]−τij;char
1.65
τij;char is the characteristic value of the shear stress determined from a test boring
and inputted in the third column of the Sigma-Tau Curves window, see sec-
tion 4.2.1.2. It corresponds with the 5%-lower limit.
ξjis the pseudo characteristic factor for layer j:
ξj=σ[Tj]
σ[T]
σ[T]is the standard deviation of the total shear stress T:
σ[T] = qPnl
j=1 σ2[Tj]
σ[Tj]The standard deviation of the shear stress in layerj:
σ[Tj] = Pnj
i=1 lijσ[τij ]
nlis the number of layers that are cut by the slip circle;
njis the number of slices in layer j.
τij;meas is the measured shear stress inputted in the second column of the Sigma-Tau
Curves window, see section 4.2.1.2;
In
D-GEO STABILITY
,Equation 19.9 is implemented using the following formula:
τij;pmeas =τij;meas
τij;char
(µ[τi]−Pjδτi)(19.10)
with:
δτi=µ[τij]−τij;char
where:
Pjis the pseudo characteristic factor for layer j:Pj=Tj
qPnl
j=1 Tj
;
Tjis the total shear stress in layerj:Tj=Pnj
i=1 lij ×δτi.
19.5.2 Global measurements (regional set of tests)
In case of global measurements (from a regional set of in situ tests), the variances of the
contributions to the total shear stress which come from separate ground layers which are not
associated with another ground layer can be calculated using equations of section 19.5.1.
Note: In
D-GEO STABILITY
, two associated layers are part of the same soil group. For more
information about the Soil Groups option, refer to section 4.2.4.3.
For the variances of the contributions of associated ground layers, the combined contribution
of two associated ground layers must be considered. Assuming that layers jand kare asso-
ciated (for example: jis the layer under the dike and kis the corresponding layer beside the
dike), the combined contribution to the total shear stress along the slip circle is:
Tjk =
nj
X
i=1
lij ×τij +
nk
X
h=1
lhk ×τhk (19.11)
Deltares 257 of 286

D-GEO STABILITY
, User Manual
The variance of this contribution is:
σ2[Tjk] = E
nj
X
i=1
lij δij +
nk
X
h=1
lhk δhk!2
(19.12)
This equation leads to:
σ2[Tjk] = σ2[Tj] + σ2[Tk]+2Rjk ×σ[Tj]×σ[Tk](19.13)
where:
σ[Tj]is the standard deviation of the shear stress in layer j:σ[Tj] = Pnj
i=1 lij ×σ[τij];
σ[Tk]is the standard deviation of the shear stress in layer k:σ[Tk] = Pnk
h=1 lhk ×
σ[τhk];
nlis the number of layers that are cut by the slip circle;
njis the number of slices in layer j.
The separate characteristic factors ξjand ξkfor layers jand kare determined using the
same procedure as for unassociated layers (section 19.5.1). Difference is that a correlation
factor Rjk between the two layers is now introduced:
ξj=ξjk ×(σ[Tj] + Rjk ×σ[Tk])
σ[Tjk](19.14)
ξk=ξjk ×(Rjk ×σ[Tj] + σ[Tk])
σ[Tjk](19.15)
where:
ξjk is the pseudo characteristic factor of the soil group containing layers jand k;
Rjk is the correlation factor between the associated layers jand k:
Rjk =1
s1 + 1
Γ2Nj1 + 1
Γ2Nk
Γ2factor set equal to Γ2= 0.25, according to the Dutch guideline for river dyke
(TAW);
Nj,Nkare the number of tests performed in the regional set of tests of layers jand k.
The pseudo measured value for the shear stress at the bottom of slice iin layer jis deter-
mined using the same equation as for unassociated layers (section 19.5.1):
τij;pmeas =τij;meas
τij;char
(µ[τij]−1.65ξj×σ[τij ]) (19.16)
In
D-GEO STABILITY
,Equation 19.16 is implemented using the following formula:
τij;pmeas =τij;meas
τij;char
(µ[τi]−Pj;global ×δτi)(19.17)
258 of 286 Deltares

Shear strength models
with
δτi=µ[τij]−τij;char
Pj;global =Pjk ×(Pj+Rjk ×Pk)
qP2
j+P2
k+ 2Rjk ×Pj×Pk
Pjk =qP2
j+P2
k+ 2Rjk ×Pj×Pk
pPnj
i=1 P2
i+ 2Rjk ×Pj×Pk
where:
Pj;global is the global pseudo characteristic factor for layer j;
Pjk is the pseudo characteristic factor of the soil group containing layers jand k;
Pj;Pkis the local pseudo characteristic factors of layersjand k, see Equation 19.10.
Deltares 259 of 286

D-GEO STABILITY
, User Manual
260 of 286 Deltares

20 Reliability analysis
20.1 Supported methods
Commonly used design standards like the Eurocode and the Dutch NEN standard prescribe
to apply reliability based approach for both structural and geotechnical design.
For this purpose the standards supply two options:
Design value approach (semi-probabilistic, level III). In this approach calculations are
made with combinations of unfavorable values of input parameters for resistance and
loads. The unfavorable values are called design values. They are determined by ap-
plying a partial factor on the unfavorable characteristic value, commonly defined by a
confidence limit of 95%. The characteristic value of parameter follows from a stochastic
distribution, usually defined by mean and standard deviation, where the standard de-
viation quantifies the uncertainty. In
D-GEO STABILITY
calculations the calculated safety
factor must be larger than the required value: Fs> Frequired.
Probabilistic approach. This is an analysis with free variations of stochastically dis-
tributed input parameters, defined by mean and standard deviation. A level II analysis
with FORM (First Order Reliability Method) supplies a reasonable balance between the
accuracy required and the efficiency desired. Result of a probabilistic analysis is the
reliability index β.
D-GEO STABILITY
support both these approaches, beside the traditional mean value analysis.
20.2 Stochastic distributions
In order to support a First Order Reliability Method calculation,
D-GEO STABILITY
can apply
a standard normal or lognormal probability distribution for all stochastic parameters. Both
distribution types are characterized by a mean µand a standard deviation σfor a standard
normal distribution.
Normal distribution
The probability that a value xis smaller than the value xcharac is for a normal distribution
expressed by:
P(x<xcharac)=ΦN(ucharac) = Zucharac
−∞
ϕN(u)×du (20.1)
where:
uis the parameter of a standard normal distribution: u=x−µ[x]
σ[x];
ΦN(ucharac)is the integral of the standard normal probability density;
ϕN(u)is the standard normal probability density: ϕN(u) = exp(−u2/2)
√2π×σ[x].
Deltares 261 of 286

D-GEO STABILITY
, User Manual
Lognormal distribution
If parameter y= ln(x)has a normal distribution, then parameter xhas a lognormal dis-
tribution. A lognormal distribution always yields positive values. The normal and lognor-
mal distributions are similar for small ratios between the standard deviation and the mean.
D-GEO STABILITY
uses Equation 20.2 and Equation 20.3 respectively to calculate µ[y]and
σ[y]from the user input of µ[x]and σ[x].
σ[y] = v
u
u
tln 1 + σ[x]
µ[x]2!(20.2)
µ[y] = ln µ[x]−1
2σ2[x](20.3)
20.3 Stochastic shear strength
The following subjects are related to stochastic shear strength modeling. The definitions
presented hereafter are applicable to both a design value analysis and a probabilistic analysis.
section 20.3.1 Mean value
section 20.3.2 Determination of the standard deviation
section 20.3.3 Stress tables
section 20.3.4 Characteristic value from a normal distribution
section 20.3.5 Characteristic value from a lognormal distribution
section 20.3.6 Design value
Note that dilatancy angle is not a stochast when using the C phi model with dilatancy.
20.3.1 Mean
To calculate the mean value of parameter x, one can straightforwardly evaluate the following
equation:
µ[x] = 1
n
n
X
i=1
xi(20.4)
where nis the number of samples.
D-GEO STABILITY
is able determine the mean value from the input of a design value (sec-
tion 20.3.6). For this purpose
D-GEO STABILITY
uses a calculated characteristic value (sec-
tion 20.3.4,section 20.3.5), a partial factor and standard deviation (section 20.3.2) associated
with the design value. The values
D-GEO STABILITY
derives for default standard deviation and
partial factors are largely based on Dutch design standards (NEN).
20.3.2 Standard deviation
The standard deviation quantifies the uncertainty in a parameter.
D-GEO STABILITY
supplies
defaults via the variation coefficient V:
V=σ[x]
µ[x](20.5)
The default values for the coefficient of variation are mainly based on the Dutch NEN standard
NEN (1997). In practice the following guidelines are used to determine a value for the standard
deviation when processing soil test results.
262 of 286 Deltares

Reliability analysis
The input value of the standard deviation is composed of a statistical contribution of several
factors:
inherent soil variability
systematic uncertainty contribution by soil testing
the transformation from measurements to parameters
D-GEO STABILITY
assumes a homogeneous soil distribution. For a complete description of
the uncertainty in the soil the effect of spatial fluctuations in the standard deviation must be
included. A suitable expression for the standard deviation can be derived, by applying Van
Marcke’s random field theory (Van Marcke,1983). Combination of this expression with a
systematic contribution yields:
σtotal =s(µ Vsys)2+1
n+ Γ2+γv(1 −Γ2)t
uσstatistical2
(20.6)
with:
σ2
statistical =1
n−1
n
X
i=1
(xi−µ)2(20.7)
Γ2= 1 −
1
nverticals Pnverticals
i=1 σ2
statistical.i
σ2
statistical
(20.8)
γv= max ΠDv
dlayer
; 1(20.9)
where:
tis the parameter from a Student distribution, which depends on the number of sam-
ples n. The parameter becomes equal to u for large values of n;
Vsys is the coefficient of variation that quantifies the systematic uncertainty by soil testing
and by the transformation from measurements to parameters. A usual value is 0.1
for cohesion, and 0.04 for the angle of friction (Phoon and Kulhawy,1999b,a);
Γdefines the ratio between the average standard deviation along separate verticals
and the global standard deviation. The value is 0 if the standard deviation ex-
presses the uncertainty in horizontal direction on the mean value. The value is 1
if the standard deviation expresses the uncertainty in horizontal direction on a lo-
cal value. A value of 0.5 is often applicable, assuming regular dimensions for (a)
the width of the shearing volume, (b) the horizontal correlation length and (c) the
regions of test sampling;
γVdefines the ratio between the vertical scale of fluctuation (correlation length) Dv
and the thickness of the layer dlayer that is intersected by the slip plane. A usual
value for Dv= 0.25 m.
Deltares 263 of 286

D-GEO STABILITY
, User Manual
20.3.3 Stress tables
D-GEO STABILITY
determines a standard deviation of the shear strength from stress tables
(section 4.2.1) by application of the following procedure:
D-GEO STABILITY
calculates per layer the average normal stress along the slip plane
σnormal.ref;
D-GEO STABILITY
determines the value of the standard deviation at this reference normal
stress from the characteristic and mean value of the shear strength:
σ[τ] = τref.characteristic −µ[τref]
ucharac
(20.10)
During probabilistic analysis,
D-GEO STABILITY
will use the shear strength at the reference
normal stress τref as the random stochastic parameter per layer, and scale the shear strength
values at other normal stress levels:
τ=σnormal
σnormal.ref ×τref (20.11)
Note: Stress tables are characterized by this one stochastic parameter, whereas the c-phi
model is characterized by two.
20.3.4 Characteristic value from a normal distribution
D-GEO STABILITY
determines a characteristic value of a normally distributed shear strength
parameter xfrom the following equations:
xcharac =µ[x] + ucharac ×σtotal (20.12)
P(x<xcharac) = ΦN(ucharac)(20.13)
where uis the parameter of a standard normal distribution and σtotal the value of the standard
deviation.
D-GEO STABILITY
supplies defaults for the value of ucharac per parameter type. A probability
P(x<xcharac) = 0.05 corresponds for example to ucharac =−1.65.
20.3.5 Characteristic value from a lognormal distribution
D-GEO STABILITY
determines a characteristic value of a lognormal distributed shear strength
parameter xby using the following equation:
xcharac = exp (µ[y] + ucharac ·σ[y]) (20.14)
where:
µ[y] = 1
2ln µ2[x]
V2+ 1(20.15)
σ[y] = pln (1 + V2)(20.16)
V=σtotal [x]
µ[x](20.17)
264 of 286 Deltares

Reliability analysis
20.3.6 Design value
D-GEO STABILITY
determines the design value xdesign of a shear strength parameter xby using
the following formula:
xdesign =xcharac
fpartial
(20.18)
where fpartial is the partial factor, used by
D-GEO STABILITY
to reduce the characteristic strength
to lower values.
D-GEO STABILITY
supplies defaults for the value of Fpartial that are based on
the Dutch NEN code.
20.4 Probabilistic analysis
The following subjects are specifically related to probabilistic analysis with
D-GEO STABILITY
’s
Reliability module.
(section 20.4.1) The probabilistic procedure (FORM)
(section 20.4.2) The assumptions and limitation when using this procedure
(section 20.4.3) The stochastic hydraulic pore pressure
(section 20.4.4) The stochastic excess pore pressure
(section 20.4.5) The stochastic external water level
(section 20.4.6) The stochastic model factor
See section 21.5 for specific background on probabilistic analysis with the Bishop probabilistic
random field model.
20.4.1 FORM procedure
All combinations of parameter values where the safety factor equals the required value are
together called the Limit State Surface.
The FORM procedure determines the most likely parameter combination on this surface (the
design point), by iteratively calculating the probability of failure, using a linearization of the
limit state function Z.
Z=F−Frequired (20.19)
D-GEO STABILITY
calculates the derivatives for the linearization numerically, via small param-
eter variations (perturbation method).An example of the Limit State Surface is given in Fig-
ure 20.1.
Deltares 265 of 286
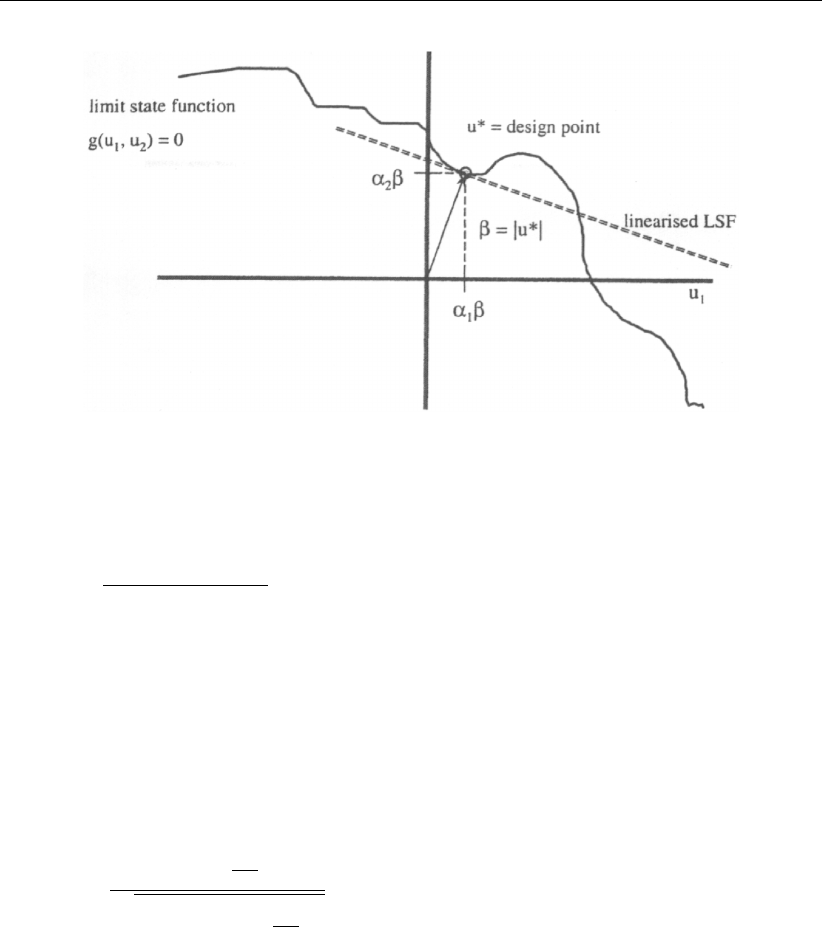
D-GEO STABILITY
, User Manual
Figure 20.1: Limit Surface and Limit State Function
A FORM analysis results in the reliability indexwhich iscalculated with the following equation.
β=µ[Fs]−Frequired
σ[Fs](20.20)
where:
µ[Fs]is the expected mean value of the safety factor
σ[Fs]is the standard deviation of the safety factor
In
D-GEO STABILITY
the FORM analysis results are also used to determine so-called influence
factors per parameter. The influence factor for parameter xiis defined by:
αi=σ[xi]∂Z
∂xi
rPn
i=1 σ2[xi]∂Z
∂xi2(20.21)
The influence factor therefore reflects the sensitivity of the safety factor for the variation of pa-
rameters with significant uncertainty (standard deviation). Reduction of the standard deviation
will reduce the value of the influence factor.
20.4.2 Assumptions and limitations of the Reliability module
D-GEO STABILITY
can model the shear strength parameters and the pore pressures as
stochastic data. The uncertainty in geometry, unit weight and loads is not directly taken
into account.
Spatial variability can only be modeled explicitly by using the Bishop probabilistic ran-
dom field module, formerly known as the MProStab module. The Reliability analysis
module of
D-GEO STABILITY
assumes homogeneous soil parameters.
Out-of-plane effects can only be modeled with the Bishop probabilistic random field
module. The Reliability analysis module does not model the out-of-plane effects.
The probabilistic FORM procedure is available in combination with the Bishop model
and the Uplift Van model.
The Reliability analysis module applies the probabilistic FORM procedure only on the
slip surface position that has been determined from a preceding mean value analysis.
266 of 286 Deltares

Reliability analysis
It is possible to manually check if this position results in the lowest value of the reliability
index, by performing separate calculations for fixed adjacent positions.
The FORM procedure can not be used to determine the probability of failure that is
caused by significant contributions from multiple failure modes.
The FORM procedure is not guaranteed to give a minimum value for the probability of
failure.
20.4.3 Stochastic hydraulic pore pressure
Hydraulic pressure is caused by gravity (hydrostatic part) and by hydraulic boundary condi-
tions.
D-GEO STABILITY
derives the hydraulic pressure from the user-defined PL-lines at the
top and bottom of each layer, using a linear interpolation.
D-GEO STABILITY
assumes that the standard deviation of the phreatic line equals the user-
defined standard deviation of the hydraulic pressure of the soil type to which the phreatic line
is attached. The standard deviation of the hydrostatic pressure component in all layers is
equal to the standard deviation of the phreatic surface.
User-defined standard deviations of hydrostatic pore pressures in layers below the phreatic
surface should not be less than the standard deviation of the hydrostatic pressure. In case
this condition is not fulfilled,
D-GEO STABILITY
assumes negative correlations among the hy-
drostatic and the remaining pressure component, in order to obtain a consistent stochastic
model.
20.4.4 Stochastic excess pore pressure
Excess pore pressure is caused by loading.
D-GEO STABILITY
can attribute a degree of con-
solidation to a soil layer.
D-GEO STABILITY
also takes into account which layer’s load causes
the excess pore pressure. The degree of consolidation expresses the adjustment of effec-
tive stresses in this layer and is denoted in percentages. For example, 100 percent in a layer
means that the weight of an (predefined) overlying layer is fully consolidated. 0 percent means
an undrained condition.
The estimation of excess pore pressures is often based on very rough guesses of permeability
and poor calculation methods. Consequently, substantial uncertainties may be involved. It is
assumed that these uncertainties greatly overrule local fluctuations of pore pressures, for
example due to small scale heterogeneity of permeability.
In case excess pore pressures are specified in terms of degrees of consolidation, a reference
value for the standard deviation must be provided: σref (percents).
The standard deviation of uncertainty of a specified degree of consolidation is calculated as:
σlayer = 4σref 1−Player
100 ×Player
100 (20.22)
Thus, standard deviations of excess pore pressures equal zero in the case of fully undrained
and completely consolidated conditions. Excess pore pressures, specified by this option are
assumed to be perfectly spatially correlated within a soil layer and not correlated among dif-
ferent soil layers.
Deltares 267 of 286
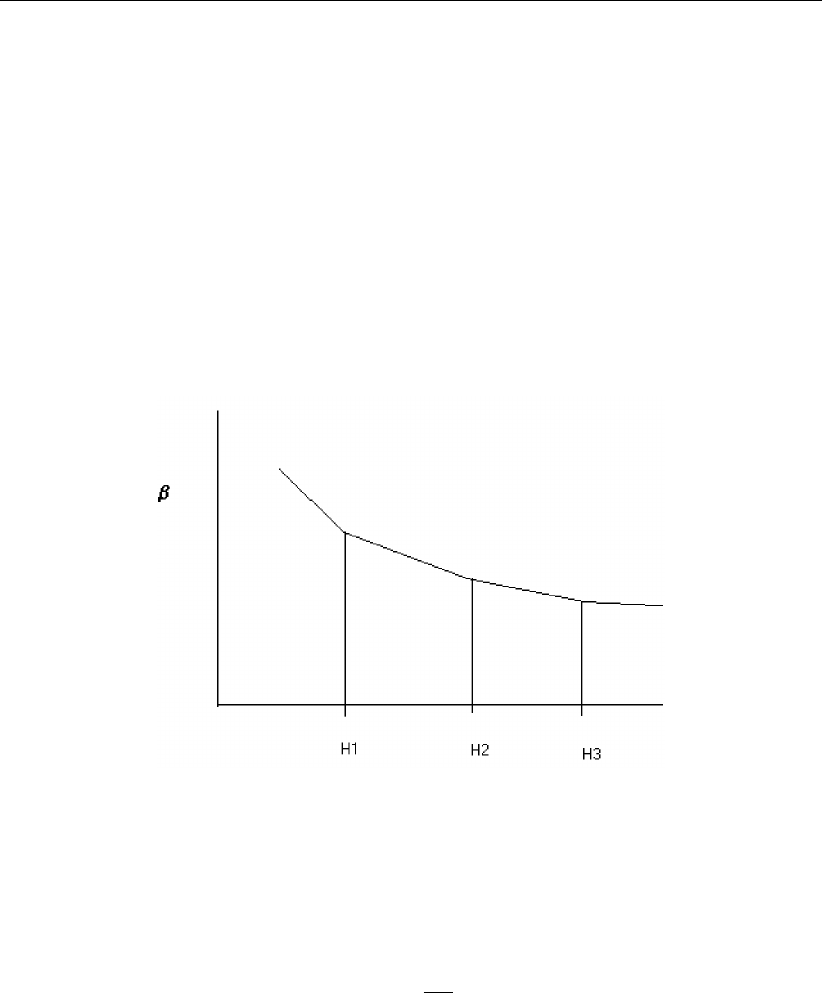
D-GEO STABILITY
, User Manual
20.4.5 Stochastic water level model
The Bishop probabilistic random field model determines the probability of failure given a safety
factor. It can do so for differing external water levels. The external water levels provide a basis
for a stochastic description of the water level. The model incorporates the uncertainty in the
external water level by the execution of the following steps.
D-GEO STABILITY
determines the conditional probability of failure for different user-specified
external water levels and their associated hydraulic fields.
D-GEO STABILITY
combines the resulting relationship between the reliability index and
the external water level, using linear interpolation, with a Gumbel assumption for the
water level distribution. This is in order to find the integrated probability of failure that is
shown in the report.
D-GEO STABILITY
applies a FOSM procedure for this purpose.
Figure 20.2: Linear interpolation between the conditional reliability index βand the exter-
nal water level h
Equation 20.23 shows the exceeding probability for the design level, according to the Gumbel
distribution. This distribution is determined by the Gumbel parameters Band ugumbel.
P(h > hdesign) = 1 −exp −exp −2.3
B(hdesign −ugumbel) (20.23)
Parameter Bis the decimate height; the increase of the external water level that reduces the
exceeding probability with a factor 10.
D-GEO STABILITY
determines the parameter ugumbel from the input values of B, the design
level hdesign and the allowed exceeding frequency at the design level.
20.4.6 Stochastic model factor
It is possible to model all remaining uncertainty on the 2D calculation model, the loads and the
geometry via the global model factor. This factor represents the required safety factor Frequired
by a mean value and a standard deviation.
The default
D-GEO STABILITY
values are safe values, obtained from Dutch research on water
retaining structures.
268 of 286 Deltares

Reliability analysis
Experience with these safe values indicates that the model factor will generally dominate the
probability of failure. To eliminate this influence, for example for the purpose of an automated
sensitivity analysis, then it is also possible to set the assumed distribution for the model factor
to none and set the mean value of Frequired equal to the value, normally used for a design
value analysis.
Deltares 269 of 286

D-GEO STABILITY
, User Manual
270 of 286 Deltares

21 Bishop probabilistic random field
This chapter describes the specific usage and background of the Bishop probabilistic random
field module, formerly known as MProStab. This module has been developed by Deltares.
21.1 About the Bishop probabilistic random field
The Bishop probabilistic random field model performs a probabilistic slope stability analysis,
in order to determine the probability that the safety factor is less than the required value.
Furthermore, this model calculates sensitivity factors, which are used by the computer pro-
gram PCRING for the analysis of dike systems. The computation model is based on Bishop’s
method of slices for equilibrium analysis, random field modeling of spatial variability of soil
strength and pore pressures, and first order second moment probabilistic reliability analysis.
The probability of the external water level can be taken into account optionally. Contribu-
tions to the failure resisting moment from the edges of a finite width cylindrical failure model
(Van Marcke,1983) can also be taken into account optionally.
21.2 History
The original MProStab program has been developed since 1980 by GeoDelft, with major
sponsorship of the Dutch Ministry of Transport, Public Works and Water Management (Rijk-
swaterstaat).
The first DOS based release from April 1990 contained already almost all of the current func-
tionality. The option for probabilistic external water levels was added in the extended version
from November 2000. MProStab has been incorporated in the windows-based
D-GEO STABILITY
program version 9.8 in the course of 2003 and is now called the Bishop probabilistic random
field model. In this version, the original MProStab features for apostiori analysis are no longer
supported.
21.3 Introduction
The Bishop probabilistic random field model is applicable when the stability requirements are
stated in terms of acceptable probability of failure instead of the conventional safety factors.
Such situations occur when a risk analysis based approach is used for the design of a struc-
ture, involving earth slopes. For example, the probabilistic design of water retaining systems
in the Netherlands is executed by application of the PCRing program, in connection with this
model for the stability of cross-sections. Functional performance of these systems is stated in
term of accepted probabilities of flooding due to extreme high tides or river discharge or struc-
tural failure due to other causes, among which breach triggered by embankment slope failure.
The Bishop probabilistic model was developed for this purpose, but it has been successfully
applied in various other projects.
Since 2003, the original MProStab is a special module of the computer program
D-GEO STABILITY
.
This chapter describes only the specific extensions and differences for this module, assuming
familiarity with the regular
D-GEO STABILITY
program and the concepts of probabilistic analy-
sis. The other chapters of the
D-GEO STABILITY
manual contain a comprehensive description
of the regular
D-GEO STABILITY
usage and backgrounds, including a tutorial introduction.
This section deals with the following topics:
section 21.3.1 Special files used by Bishop probabilistic model
section 21.3.2 How to select the Bishop probabilistic module and model
Deltares 271 of 286
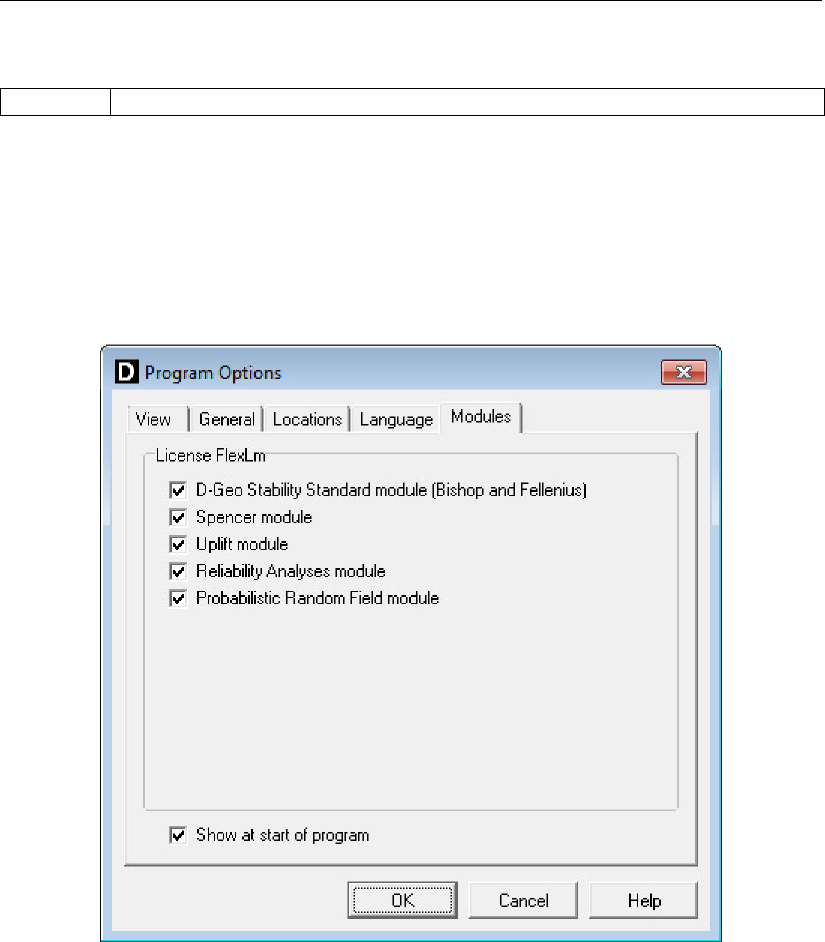
D-GEO STABILITY
, User Manual
21.3.1 Special Files
*.pcr Output file (ASCII) with sensitivity factors for PCRING.
21.3.2 Selecting the module and model
On the menu bar, click Tools and then select Options to open the Program Options window.
If the
D-GEO STABILITY
installation is based on floating licenses, then it is possible to use the
Modules tab to claim a license for the particular modules that are to be used. This window
(Figure 21.1) will also be shown directly at start-up, as long as the Show at start program box
marked.
Figure 21.1: Program Options window
On the menu bar, click Project and then select Model to open the Model window (see Fig-
ure 21.2). Select the Bishop prob. random field option.
272 of 286 Deltares
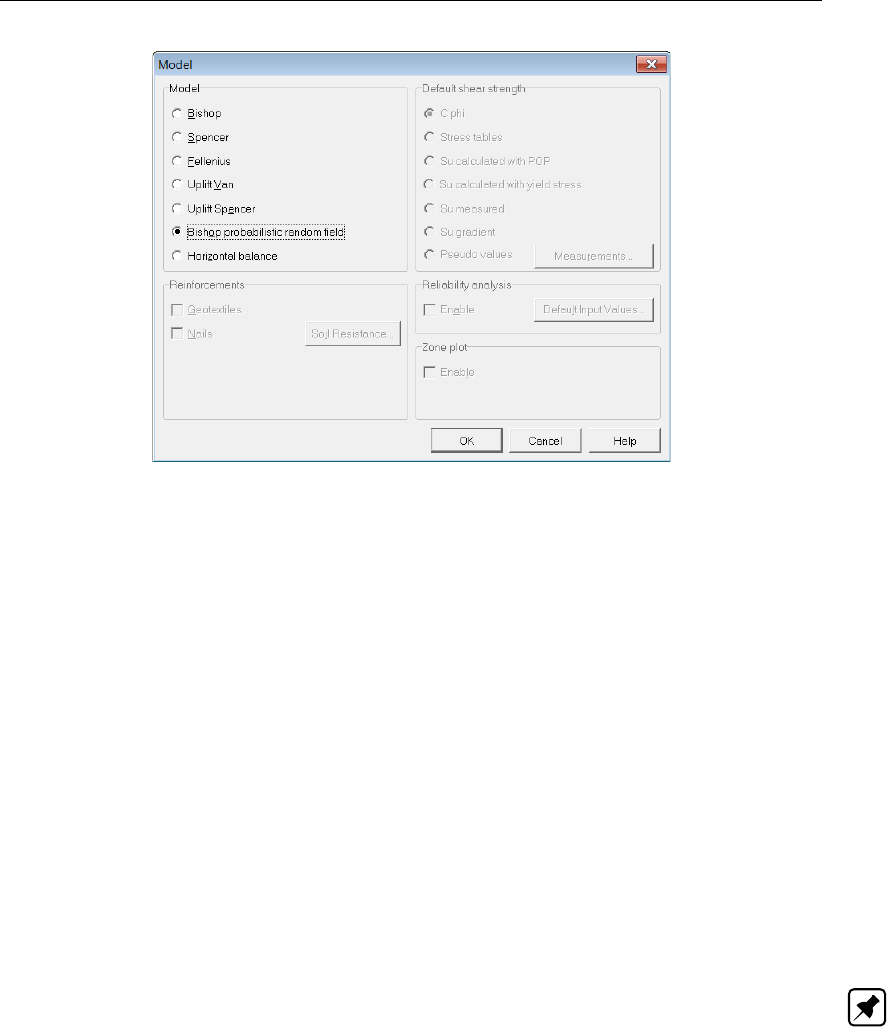
Bishop probabilistic random field
Figure 21.2: Model window
21.4 Working with the model
The following menu options are associated with the Bishop Random Field Method. They deal
with inputting stochastic data to obtain factors for the PCRing program:
Model Factor window
All general stochastic data is entered. See section 4.2.5 for the input description;
Materials window
All data related to the soil type is entered. Note that dilatancy angle is not used in the
C phi model in this probabilistic random field model. See section 4.2.4.5 for the input
description;
External Water Levels window
The Bishop probabilistic model determines the conditional probability of failure for a
possible maximum of five different external water levels, and then apply a Gumbel dis-
tribution assumption for the water level in order to determine the integrated probability.
See section 4.6.2 for the input description. See section 20.4.5 for background informa-
tion.
Note: Special for the Bishop probabilistic random field model is that the output from the
separate water levels (in the .pcr file) serves as direct input for PCRING.
21.5 Background
The Bishop probabilistic model is a strongly modified version of Van Marcke’s model (Van Mar-
cke,1983). Some basic features of the model are discussed in this section. For more detailed
descriptions, refer to Calle (1985) and Calle (1990).
Deltares 273 of 286

D-GEO STABILITY
, User Manual
21.5.1 Random field model for shear strength
Properties of soils in natural deposits may exhibit considerable spatial variability as a result of
large and small scale differences (in space and in time) of the deposition regime and loading
conditions during its geological history. The purpose of soil investigation is to model the
relevant patterns of spatial variability as accurately as possible.
Common soil investigation acquires data at single spatial points of the deposit, or -semi-
continuous data at distinct lines. In general, soil investigation programs allow fairly accurate
modeling of the global patterns of variability, such as soil stratification and average trends of
variation of soil properties. Patterns of small scale variability within each soil layer, however,
remain unrevealed, and evaluation of its effects on stability of slopes can only be dealt with by
statistical analysis.
In the Bishop probabilistic random field model, the following assumptions regarding the geo-
metrical soil model and soil properties have been adopted.
The geometry of soil layers is considered to be deterministic data, no uncertainty about
geometrical data is taken into account.
From earlier reported studies on probabilistic stability analysis (Alonso,1976), it may
be concluded that spatial variability of unit weights is of minor importance. Therefore,
this parameter is also left out of consideration in the stochastic model, both for the soil
and the water.
The background on the stochastic model for the pore pressures is equal to
D-GEO STABILITY
’s
reliability module. The background on the random field model for the (drained) shearing
strength parameters will be discussed in detail hereafter.
The Bishop probabilistic random field model applies a lognormal probability distribution in
combination with a certain auto correlation function to define the stochastic model for both the
drained cohesion c’, and the tangent of the internal friction angle tan ϕ.
Lognormal distribution
If parameter y= ln(x)has a normal distribution ΦN(y), then parameter xhas a lognormal
distribution. A lognormal distribution yields always positive values. The normal and lognor-
mal distributions are similar for small ratios between the standard deviation and the mean
σ[x]/µ[x]. The model derives µ[y]and σ[y]from the user input of µ[x]and σ[x], using
equations Equation 20.2 and Equation 20.3.
σ[y] = v
u
u
tln 1 + σ[x]
µ[x]2!(21.1)
µ[y] = ln µ[x]−1
2σ2[x](21.2)
Auto Correlation Function
The Bishop probabilistic model describes the pattern of fluctuation within a soil layer as a
weak stationary random function in space. This means that in each spatial point of the layer
the actual shear strength parameter value is considered to be a sample realization of a random
variable. Weak stationary means that for any two spatial points (X1,Y1,z1) and (x2,y2,z2), x
and zbeing the horizontal and y the vertical spatial coordinates, the (marginal) probability
274 of 286 Deltares
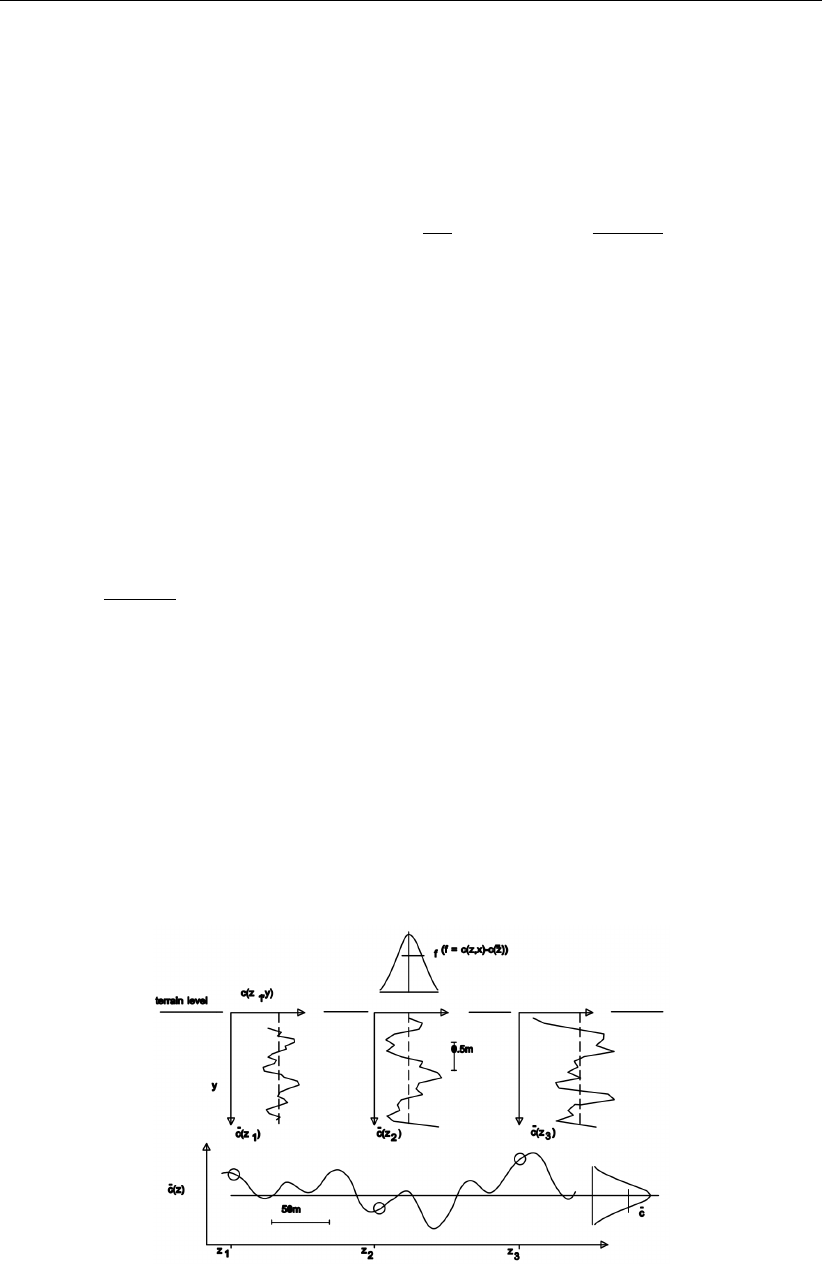
Bishop probabilistic random field
distributions are identical and that the correlation among the random variables is a function of
the distance between these points.
The selected auto-correlation function, which expresses the correlation among any two points
as a function of the distance lags, is of a modified Gaussian type:
ρ(δx, δy, δz) = 1−α+α×exp −δ2
y
D2
v×exp −δ2
x+δ2
z
D2
v(21.3)
with:
δx=|x1−x2|,δy=|y1−y2|and δz=|z1−z2|
where Dhand Dvare the so-called correlation lengths, which are related to the scales of
fluctuation as introduced by Van Marcke (Van Marcke,1983). Typical values of Dhrange
between 25 m and 100 m and values of Dvmay range between 0.1 m and 3 m.
The parameter αis a variance parameter, which equals the ratio of local variance, i.e. the
variance of fluctuations relative to the mean value along a vertical line, and the total variance,
which is the variance relative to the mean value taken over the whole deposit space.
α=σ2
vertical
σ2
total
(21.4)
For α= 1, the auto-correlation function takes on the classical Gaussian form, which is often
suggested in literature. It was found, however, that such type may be inconsistent with actual
measurements.
Figure 21.3 shows typical fluctuation behavior of cone resistances in a soft clay layer. It
appears that averages over depth of the CPT-record show considerable differences from one
test location to another, which cannot be explained when a classical Gaussian function type is
assumed. The α-parameter enables consistent modeling of the presence of overall weak and
strong locations within a layer. For fluctuations of cone resistance in clayey layers, αvalues
ranging between 0.5 and 1.0 have been found.
Figure 21.3: Typical pattern of spatial fluctuations of cone resistances in a soft cohesive
layer
Parameters of the probability distributions, i.e. expected mean values and standard devia-
tions, must be estimated on the basis of series of laboratory or in situ test results. Usually the
Deltares 275 of 286

D-GEO STABILITY
, User Manual
number of available test results will be limited, which implies that estimates are statistically
biased. Bias of the estimation of the expected mean value is a source of uncertainty which
is correlated throughout the soil layer and it must be taken into account in the probabilistic
analysis. This has been done in the computation model by adjusting the field variance with a
factor (n+1)/n and modifying the auto-correlation function into:
r(δx, δy, δz) = n
n+ 1ρ(δx, δy, δz) + 1
n+ 1 (21.5)
where nis the number of test samples.
If both cand tan(ϕ) are estimated from test results of the same experiment, e.g. triaxial test,
the estimates are (negatively) correlated. In the stochastic field model it is assumed that the
fluctuation fields of the two parameters are not correlated. Correlation among estimates c
and tan(ϕ) from the test result of a sample, results in correlated estimates of the expected
mean values of these parameters. The larger the number of tests, the smaller the coefficient
of correlation among estimates of expected mean values of the parameters (Calle,1990).
Correlation can be taken into account in the Bishop probabilistic model. The assumption of
zero correlation, however, is slightly conservative.
21.5.2 Failure mechanism, probability of slope failure
The Bishop probabilistic random field model assumes a failure mode and equilibrium analysis
of the Bishop type, i.e. circular failure modes and the method of slices, is used for equilibrium
analysis.
In the conventional deterministic analysis it is assumed that soil data are constant in the along
slope direction and that failure modes are of infinite width. As a consequence, no shearing
forces in the cross sectional plane of slope must be considered in the equilibrium analysis.
In the probabilistic model it is assumed that shearing strength of the soil may fluctuate stochas-
tically from one cross section to another in the along slope direction. Consequently, the re-
sulting safety factor will be a stochastic function in the along slope direction. Strictly speaking,
the assumption of absence of shearing forces in the cross sectional plane is no longer valid,
unless it is assumed that failure modes behave as perfectly rigid 3-D bodies. Such assump-
tion is only justifiable if the width of a failure mode (initially) equals the width of a stretch where
the safety factor is less than 1.0 (Calle,1985). The occurrence of such stretch is therefore a
necessary, though not sufficient, condition for failure. Whether or not real failure occurs de-
pends on the contribution to the resisting moment, which comes from shearing forces at the
edges of the finite width failure mode (Calle,1985).
The probability of occurrence of a stretch where the Bishop safety factor is less than 1.0 will
be referred to as the probability of a potential failure zone. The probability of failure, taking
the edge contributions to the failure resisting moment into account, will be referred to as the
probability of slope failure.
21.5.3 Probabilistic analysis
The Bishop probabilistic random field module determines the probability of failure for one
water level in two steps, i.e.:
Cross-Section analysis
First order second moment probabilistic (FOSM) analysis of the slip circle equilibrium ac-
cording to Bishop’s method. The Bishop probabilistic model determines probabilities by lin-
earization of the limit state function at the mean value and at the so-called design point value.
276 of 286 Deltares

Bishop probabilistic random field
The latter approach is also known as the FORM method. Based on input data regarding ge-
ometry and soil parameters and statistical data regarding soil strength parameters and pore
pressures, as previously discussed, the computer program calculates statistical parameters
of the Bishop stability factor. The calculated parameters are the mean expected value µF, the
standard deviation σF, and the auto-correlation function rFin the out-of-plane direction.
Out-of-plane analysis
The Bishop probabilistic model calculates for each of the failure circles the probability of oc-
currence of a potential failure zone, based on the results of the first step. Calculation is based
on the concept of first exceeding events in the theory of stationary stochastic processes, as-
suming the occurrence of an event F(Z)<1 somewhere in a stretch of length Las a rare
Poisson event.
The last step is explained below.
The probability of occurrence of a potential failure zone may, by approximation, be calculated
as:
P(F(Z)< Frequired, Z ∈[0, L]) = Φ (−βF) + Φ (βF) [1 −exp (−NFL)]
(21.6)
with:
NF=1
2πexp −1
2β2
Fq−r00
F(0)
where r00
F(0) denotes the second derivative at zero lag of the modified auto-correlation func-
tion of the safety factor (see Equation 21.5).
The width of a potential failure zone, l, is exponentially distributed. Its expected mean value
equals:
µl=Φ (−βF)
NF
(21.7)
The above approximation is valid for small probabilities, i.e. for βFvalues greater than, say,
1.5.
Finally, the Bishop probabilistic model calculates the probability of real occurrence of a 3D
failure mode with finite width equal to µlas:
P(Fl< l)≈Φ (−βl)
Φ (−βF)P(F(z)<1, z ∈[0, L]) (21.8)
with:
βl≈µF+µMe
µlMo−1
qσ2
F+σ2
Me
µ2
lM2
o
(21.9)
where Fldenotes the stability factor of the failure mode, including the edge contributions to
the failure resisting moment.
In this equation, M0denotes the overturning moment of the corresponding slip circle, and
µMe and σMe are the expected mean value and standard deviation of the edge contribution
to the failure resisting moment.
Deltares 277 of 286

22 Zone Plot
This chapter describes the background of the Zone Plot module.
22.1 Differentiation of safety factors
The zone plot method is based on the requirement that the rest profile of a dike remains always
intact in case of high water turning back. This rest profile is defined by (see Figure 22.1):
a crest of 3 meters width, with a level corresponding to the dike table height (DTH), and
an overtopping flow of 0.1 l/s/m;
an inside talus, with a slope depending on the material of the dike and the underground:
1:2 for clay and 1:4 for sand and peat.
Figure 22.1: Schematization of the zones 1A, 1B, 2A, 2B and 3 of the zone plot method
A high safety factor applies below this rest profile (zone 1). Slip surfaces which damage this
rest profile must have a safety factor which is higher than (or at least equal to) the safety factor
for macro stability recommended by the Dutch TAW guidelines (TAW,1985,1989,1994). If a
slip surface leaves intact this rest profile, a lower required safety factor can be used (zone 2).
A third zone, called zone 3, is also defined. This zone contains all the slip surfaces which are
important for the traffic function of the dike.
It is also determined if the action of the high water has an influence on the slip surface. If it
is the case, then the slip surface is situated in zone A and a high required safety factor must
be used. If the action of the high water has no influence on the slip surface, then a less strict
required safety factor can be used in the zone B.
22.2 Determination of the modified slip surface
A slip surface passing through zone 1, but with an entrance point in zone 2, is according to the
zone plot method defined as a slip surface in zone 2 only if the modified slip surface (deformed
situation) leaves the rest profile intact. For this deformed situation, an additional calculation
is carried out. The (original) entrance point of the slip surface is dropped down to come just
in the rest profile. The entrance point of this modified slip surface lies then in zone 1 and
therefore must satisfied the required safety of zone 1. If the modified slip surface satisfies the
required safety of zone 1, then the original slip surface (non-deformed situation) is in zone 2.
If the modified slip surface does not satisfy the required safety of zone 1, then the slip surface
Deltares 279 of 286
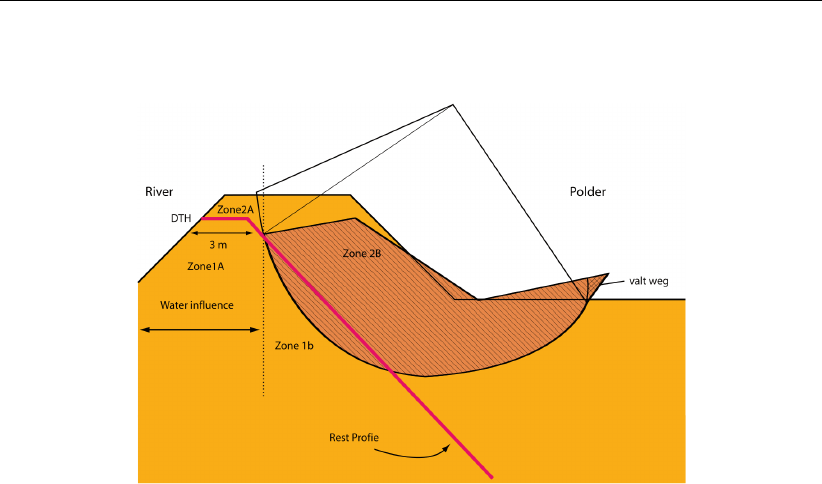
D-GEO STABILITY
, User Manual
is in zone 1 (see Figure 22.2).
Figure 22.2: Schematization of the modified slip surface (deformed situation after rota-
tion)
The additional calculation makes the assumption that if the slip surface slides the stability
factor changes. The driving moment decreases, whereas the resisting moment increases.
Because the ground will deform, the sliding force of the ground decreases. This decrease of
the force is taken into account in the using a factor called remolding reduction factor. Based
on tests and literature, the default value of this factor is set to 0.5 in
D-GEO STABILITY
, however
it can be changed in the Calculation Options window (section 5.1). Additional calculation is
carried out as a supplement to the standard calculation. It is assumed that the ground which
is beyond the exit point after rotation (and therefore above the surface level) is no more part
of the slip surface. During the calculation of the stability of the sliding slip surface, an extra
model factor called schematization reduction factor is used. Its default value is set to 0.8 but
it can be changed in the Calculation Options window (section 5.1).
280 of 286 Deltares

23 Benchmarks
Deltares Systems commitment to quality control and quality assurance has leaded them to
develop a formal and extensive procedure to verify the correct working of all of their geotech-
nical engineering tools. An extensive range of benchmark checks have been developed to
check the correct functioning of each tool. During product development these checks are run
on a regular basis to verify the improved product. These benchmark checks are provided in
the following sections, to allow the users to overview the checking procedure and verify for
themselves the correct functioning of
D-GEO STABILITY
.
The benchmarks for Deltares Systems are subdivided into five separate groups as described
below.
Group 1 – Benchmarks from literature (exact solution)
Simple benchmarks for which an exact analytical result is available.
Group 2 – Benchmarks from literature (approximate solution)
More complex benchmarks described in literature, for which an approximate solution is
known.
Group 3 – Benchmarks for additional options
Benchmarks which test program features specific to the program being verified.
Group 4 – Benchmarks generated with
D-GEO STABILITY
The benchmarks in this chapter have no exact solution, but are compared with other
programs (using the same method).
Group 5 – Benchmarks compared with other programs
The benchmarks in this chapter have no exact solution, but are compared with other
programs (using the same method).
The number of benchmarks in group 1 will probably remain the same in the future. The reason
for this is that they are very simple, using only the most basic features of the program.
The number of benchmarks in group 2 may grow in the future. The benchmarks in this chapter
are well documented in literature. There are no exact solutions for these problems available,
however in the literature estimated results are available. When verifying the program, the
results should be close to the results found in the literature.
Groups 3, 4 and 5 of benchmarks will grow as new versions of the program are released.
These benchmarks are designed in such a way that (new) features specific to the program
can be verified. The benchmarks are kept as simple as possible so that, per benchmark, only
one specific feature is verified.
As much as software developers would wish they could, it is impossible to prove the correct-
ness of any non-trivial program. Re-calculating all the benchmarks in this report, and making
sure the results are as they should be, will prove to some degree that the program works as it
should.
Nevertheless there will always be combinations of input values that will cause the program to
crash or produce wrong results. Hopefully by using the verification procedure the number of
times this occurs will be limited.
The benchmarks will all be described to such detail that reproduction is possible at any time.
In some cases, when the geometry is too complex to describe, the input file of the benchmark
is needed. The results are presented in text format with each benchmark description.
The input files belonging to the benchmarks can be found on CD-ROM or can be downloaded
Deltares 281 of 286
Bibliography
“Program UTEXAS3.” URL
.
July 1993. Soil Nailing Recommendations-1991 for Designing, Calculating, Constructing and
Inspecting Earth Support Systems Using Soil Nailing (English Translation). Tech. rep.,
Recommendations CLOUTERRE 1991.
Alonso, E., 1976. “Risk Analysis of Slopes and its Application to Canadian Sensitive Clays.”
Geotechnique vol. 26, no 3.
American Petroleum Institute Washington, D., 1984. “Recommended practice for planning,
designing, and constructing fixed offshore platforms.” .
Calle, E. O. F., 1985. “Probabilistic Approach of Stability of Earth Slopes.” Proc. XI-th ICSMFE,
San Francisco .
Calle, E. O. F., 1990. “PROSTAB: A Computer Model for Probabilistic Analysis of Stability of
Slopes.” GeoDelft report CO-266484/32 (in Dutch) .
Calle, E. O. F., 2000. “Aaanpassing MPROSTAB.” GeoDelft report CO-395380/04 (in Dutch) .
CUR, 1992. “Publicatie 162: Construeren met grond Grondconstructies op en in weinig
draagkrachtige en sterk samendrukbare ondergrond.” Civieltechnischcentrum Uitvoering
en Regelgeving.
Dutch) report SE-52029/2 (in, February 2000. Development of Uplift Stability Theory. Tech.
rep., GeoDelft. Geodelft.
Dutch) report SE-703234/02 (in, January 1992. Spanningsafhankelijk rekenen in MStab.
Tech. rep., GeoDelft.
Meij, R. van der, 2014. Handleiding bij methode Spencer-Van der Meij - Macrostabiliteit in
DGeoStability. Tech. Rep. 1209607-000-GEO-0004, Deltares.
NEN, 1997. NEN 6740, Dutch Design Code TGB; Geotechnical Structures.
Phoon, K. K. and F. H. Kulhawy, 1999a. “Characterization of geotechnical variability.” Can.
Geotech. Journal no 36: 625-639.
Phoon, K. K. and F. H. Kulhawy, 1999b. “Evaluation of geotechnical property variability.” Can.
Geotech. Journal no 36: 625-639.
Spencer, E., 1993. “A method of analysis of the stability of embankments assuming parallel
interslice forces.” Geotechnique (17) no 1: 11-26.
TAW, 1985. Leidraad voor het ontwerpen van rivierdijken, Deel 1 – Bovenrivierengebied. Tech.
rep., Technische Adviescommissie voor de Waterkeringen.
TAW, 1989. Leidraad voor het ontwerpen van rivierdijken, Deel 2 – Benedenrivierengebied.
Tech. rep., Technische Adviescommissie voor de Waterkeringen. Uitgeverij Waltman. Delft.
TAW, 1994. Handreiking Constructief ontwerpen. Tech. rep., Technische Adviescommissie
voor de Waterkeringen.
Van Marcke, E., 1983. “Random Fields, Analysis and Synthesis.” .
Verruijt, 1982. “Collegedictaat b22: Grondmechanica CUR – Civiele.” Technische Hogeschool
Delft, afdeling Civiele Techniek, vakgroep Geotechniek.
Deltares 283 of 286

D-GEO STABILITY
, User Manual
284 of 286 Deltares
PO Box 177
2600 MH Del
Rotterdamseweg 185
2629 HD Del
The Netherlands
+31 (0)88 335 81 88
sales@deltaressystems.nl
www.deltaressystems.nl


