E Discovery Reviewer Guide
2016-05-23
: Pdf Ediscovery Reviewer Guide eDiscovery_Reviewer_Guide 5.6 eDiscovery ProductUserGuidesForensics-eDisco
Open the PDF directly: View PDF ![]() .
.
Page Count: 334 [warning: Documents this large are best viewed by clicking the View PDF Link!]
- AccessData Legal and Contact Information
- Contents
- Introducing Resolution1 eDiscovery
- Introducing Resolution1 eDiscovery
- Getting Started
- Reviewing Project Data
- Introduction to Project Review
- Project Review Page
- Customizing the Project Review Layout
- Viewing Data
- Viewing Data in Panels
- Using the Item List Panel
- Using the Project Explorer Panel
- Using Document Viewing Panels
- Using Document Data Panels
- Viewing Timeline Data
- Viewing Graphics and Videos
- Deleting Documents
- Searching Data
- Introduction to Searching Data
- Running Searches
- Running Advanced Searches
- Re-running Searches
- Using Filters to Cull Data
- Using Visualization
- Using Visualization
- Using Visualization Social Analyzer
- Using Visualization Heatmap
- Using Visualization Geolocation
- About Geolocation Visualization
- Viewing Geolocation EXIF Data
- Using Geolocation Tools
- Using the Geolocation Grid
- Using Geolocation Columns in the Item List
- Using Geolocation Facets
- Using Geolocation Visualization to View Security Data
- Using Litigation and eDiscovery Tools
- Working with Transcripts and Exhibits
- Working with Transcripts
- Culling Transcripts and Exhibits
- The Exhibits Panel
- Imaging Documents
- Applying Tags
- Coding Documents
- Annotating Evidence
- Bulk Printing
- Managing Review Sets
- Working with Transcripts and Exhibits
- Exporting Data
- Introduction to Exporting Data
- Creating Production Sets
- Exporting Production Sets
- Creating Export Sets
- Creating Export Sets
- AD1 Export General Options
- Creating a Native Export
- Native Export General Options
- Native Export Files to Include
- Export Volume Document Options
- Export Excel Rendering Options
- Export Word Rendering Options
- Creating a Load File Export
- Load File General Options
- Load File Options
- Load File Files to Include Options
- Reference
- Getting Started with KFF (Known File Filter)
- About KFF
- About the KFF Server and Geolocation
- Installing the KFF Server
- Configuring the Location of the KFF Server
- Migrating Legacy KFF Data
- Importing KFF Data
- About CSV and Binary Formats
- Uninstalling KFF
- Installing KFF Updates
- KFF Library Reference Information
- What has Changed in Version 5.6
- Using KFF (Known File Filter)
- Integrating with AccessData Forensics Products
- Getting Started with KFF (Known File Filter)

| 1

AccessData Legal and Contact Information | 2
AccessData Legal and Contact Information
Document date: December 30, 2014
Legal Information
©2014 AccessData Group, Inc. All rights reserved. No part of this publication may be reproduced, photocopied,
stored on a retrieval system, or transmitted without the express written consent of the publisher.
AccessData Group, Inc. makes no representations or warranties with respect to the contents or use of this
documentation, and specifically disclaims any express or implied warranties of merchantability or fitness for any
particular purpose. Further, AccessData Group, Inc. reserves the right to revise this publication and to make
changes to its content, at any time, without obligation to notify any person or entity of such revisions or changes.
Further, AccessData Group, Inc. makes no representations or warranties with respect to any software, and
specifically disclaims any express or implied warranties of merchantability or fitness for any particular purpose.
Further, AccessData Group, Inc. reserves the right to make changes to any and all parts of AccessData
software, at any time, without any obligation to notify any person or entity of such changes.
You may not export or re-export this product in violation of any applicable laws or regulations including, without
limitation, U.S. export regulations or the laws of the country in which you reside.
AccessData Group, Inc.
1100 Alma Street
Menlo Park, California 94025
USA
www.accessdata.com
AccessData Trademarks and Copyright Information
AccessData® MPE+ Velocitor™
AccessData Certified Examiner® (ACE®) Password Recovery Toolkit®
AD Summation® PRTK®
Discovery Cracker® Registry Viewer®
Distributed Network Attack® ResolutionOne™
DNA® SilentRunner®
Forensic Toolkit® (FTK®) Summation®
Mobile Phone Examiner Plus® ThreatBridge™

AccessData Legal and Contact Information | 3
A trademark symbol (®, ™, etc.) denotes an AccessData Group, Inc. trademark. With few exceptions, and
unless otherwise notated, all third-party product names are spelled and capitalized the same way the owner
spells and and capitalizes its product name. Third-party trademarks and copyrights are the property of the
trademark and copyright holders. AccessData claims no responsibility for the function or performance of third-
party products.
Third party acknowledgements:
-FreeBSD ® Copyright 1992-2011. The FreeBSD Project .
-AFF® and AFFLIB® Copyright® 2005, 2006, 2007, 2008 Simson L. Garfinkel and Basis Technology
Corp. All rights reserved.
-Copyright © 2005 - 2009 Ayende Rahien
BSD License: Copyright (c) 2009-2011, Andriy Syrov. All rights reserved. Redistribution and use in source and
binary forms, with or without modification, are permitted provided that the following conditions are met:
Redistributions of source code must retain the above copyright notice, this list of conditions and the following
disclaimer; Redistributions in binary form must reproduce the above copyright notice, this list of conditions and
the following disclaimer in the documentation and/or other materials provided with the distribution; Neither the
name of Andriy Syrov nor the names of its contributors may be used to endorse or promote products derived
from this software without specific prior written permission. THIS SOFTWARE IS PROVIDED BY THE
COPYRIGHT HOLDERS AND CONTRIBUTORS "AS IS" AND ANY EXPRESS OR IMPLIED WARRANTIES,
INCLUDING, BUT NOT LIMITED TO, THE IMPLIED WARRANTIES OF MERCHANTABILITY AND FITNESS
FOR A PARTICULAR PURPOSE ARE DISCLAIMED. IN NO EVENT SHALL THE COPYRIGHT OWNER OR
CONTRIBUTORS BE LIABLE FOR ANY DIRECT, INDIRECT, INCIDENTAL, SPECIAL, EXEMPLARY, OR
CONSEQUENTIAL DAMAGES (INCLUDING, BUT NOT LIMITED TO, PROCUREMENT OF SUBSTITUTE
GOODS OR SERVICES; LOSS OF USE, DATA, OR PROFITS; OR BUSINESS INTERRUPTION) HOWEVER
CAUSED AND ON ANY THEORY OF LIABILITY, WHETHER IN CONTRACT, STRICT LIABILITY, OR TORT
(INCLUDING NEGLIGENCE OR OTHERWISE) ARISING IN ANY WAY OUT OF THE USE OF THIS
SOFTWARE, EVEN IF ADVISED OF THE POSSIBILITY OF SUCH DAMAGE.
WordNet License
This license is available as the file LICENSE in any downloaded version of WordNet.
WordNet 3.0 license: (Download)
WordNet Release 3.0 This software and database is being provided to you, the LICENSEE, by Princeton
University under the following license. By obtaining, using and/or copying this software and database, you agree
that you have read, understood, and will comply with these terms and conditions.: Permission to use, copy,
modify and distribute this software and database and its documentation for any purpose and without fee or
royalty is hereby granted, provided that you agree to comply with the following copyright notice and statements,
including the disclaimer, and that the same appear on ALL copies of the software, database and documentation,
including modifications that you make for internal use or for distribution. WordNet 3.0 Copyright 2006 by
Princeton University. All rights reserved. THIS SOFTWARE AND DATABASE IS PROVIDED "AS IS" AND
PRINCETON UNIVERSITY MAKES NO REPRESENTATIONS OR WARRANTIES, EXPRESS OR IMPLIED. BY
WAY OF EXAMPLE, BUT NOT LIMITATION, PRINCETON UNIVERSITY MAKES NO REPRESENTATIONS OR
WARRANTIES OF MERCHANT- ABILITY OR FITNESS FOR ANY PARTICULAR PURPOSE OR THAT THE
USE OF THE LICENSED SOFTWARE, DATABASE OR DOCUMENTATION WILL NOT INFRINGE ANY THIRD
PARTY PATENTS, COPYRIGHTS, TRADEMARKS OR OTHER RIGHTS. The name of Princeton University or

AccessData Legal and Contact Information | 4
Princeton may not be used in advertising or publicity pertaining to distribution of the software and/or database.
Title to copyright in this software, database and any associated documentation shall at all times remain with
Princeton University and LICENSEE agrees to preserve same.
Documentation Conventions
In AccessData documentation, a number of text variations are used to indicate meanings or actions. For
example, a greater-than symbol (>) is used to separate actions within a step. Where an entry must be typed in
using the keyboard, the variable data is set apart using [variable_data] format. Steps that require the user to
click on a button or icon are indicated by Bolded text. This Italic font indicates a label or non-interactive item in
the user interface.
A trademark symbol (®, ™, etc.) denotes an AccessData Group, Inc. trademark. Unless otherwise notated, all
third-party product names are spelled and capitalized the same way the owner spells and capitalizes its product
name. Third-party trademarks and copyrights are the property of the trademark and copyright holders.
AccessData claims no responsibility for the function or performance of third-party products.
Registration
The AccessData product registration is done at AccessData after a purchase is made, and before the product is
shipped. The licenses are bound to either a USB security device, or a Virtual CmStick, according to your
purchase.
Subscriptions
AccessData provides a one-year licensing subscription with all new product purchases. The subscription allows
you to access technical support, and to download and install the latest releases for your licensed products during
the active license period.
Following the initial licensing period, a subscription renewal is required annually for continued support and for
updating your products. You can renew your subscriptions through your AccessData Sales Representative.
Use License Manager to view your current registration information, to check for product updates and to
download the latest product versions, where they are available for download. You can also visit our web site,
www.accessdata.com anytime to find the latest releases of our products.
For more information, see Managing Licenses in your product manual or on the AccessData website.
AccessData Contact Information
Your AccessData Sales Representative is your main contact with AccessData. Also, listed below are the general
AccessData telephone number and mailing address, and telephone numbers for contacting individual
departments
AccessData Legal and Contact Information | 5
Mailing Address and General Phone Numbers
You can contact AccessData in the following ways:
Technical Support
Free technical support is available on all currently licensed AccessData solutions.
You can contact AccessData Customer and Technical Support in the following ways:
AccessData Mailing Address, Hours, and Department Phone Numbers
Corporate Headquarters: AccessData Group, Inc.
1100 Alma Street
Menlo Park, California 94025 USAU.S.A.
Voice: 801.377.5410; Fax: 801.377.5426
General Corporate Hours: Monday through Friday, 8:00 AM – 5:00 PM (MST)
AccessData is closed on US Federal Holidays
State and Local
Law Enforcement Sales: Voice: 800.574.5199, option 1; Fax: 801.765.4370
Email: Sales@AccessData.com
Federal Sales: Voice: 800.574.5199, option 2; Fax: 801.765.4370
Email: Sales@AccessData.com
Corporate Sales: Voice: 801.377.5410, option 3; Fax: 801.765.4370
Email: Sales@AccessData.com
Training: Voice: 801.377.5410, option 6; Fax: 801.765.4370
Email: Training@AccessData.com
Accounting: Voice: 801.377.5410, option 4
AD
Customer & Technical Support Contact Information
AD
SUMMATIONand
AD EDISCOVERY
Americas/Asia-Pacific:
800.786.8369 (North America)
801.377.5410, option 5
Email: legalsupport@accessdata.com
AD IBLAZE and
ENTERPRISE:Americas/Asia-Pacific:
800.786.2778 (North America)
801.377.5410, option 5
Email: support@summation.com
All other AD
SOLUTIONS Americas/Asia-Pacific:
800.658.5199 (North America)
801.377.5410, option 5
Email: support@accessdata.com
AD
INTERNATIONAL
SUPPORT
Europe/Middle East/Africa:
+44 (0) 207 010 7817 (United Kingdom)
Email: emeasupport@accessdata.com
AccessData Legal and Contact Information | 6
Documentation
Please email AccessData regarding any typos, inaccuracies, or other problems you find with the documentation:
documentation@accessdata.com
Professional Services
The AccessData Professional Services staff comes with a varied and extensive background in digital
investigations including law enforcement, counter-intelligence, and corporate security. Their collective
experience in working with both government and commercial entities, as well as in providing expert testimony,
enables them to provide a full range of computer forensic and eDiscovery services.
At this time, Professional Services provides support for sales, installation, training, and utilization of FTK, FTK
Pro, Enterprise, eDiscovery, Lab and the entire Resolution One platform. They can help you resolve any
questions or problems you may have regarding these solutions.
Contact Information for Professional Services
Contact AccessData Professional Services in the following ways:
Hours of Support: Americas/Asia-Pacific:
Monday through Friday, 6:00 AM– 6:00 PM (PST), except corporate holidays.
Europe/Middle East/Africa:
Monday through Friday, 8:00 AM– 5:00 PM (UK-London) except corporate holidays.
Web Site: http://www.accessdata.com/support/technical-customer-support
The Support website allows access to Discussion Forums, Downloads, Previous
Releases, our Knowledge base, a way to submit and track your “trouble tickets”, and
in-depth contact information.
AccessData Professional Services Contact Information
Contact Method Number or Address
Phone North America Toll Free: 800-489-5199, option 7
International: +1.801.377.5410, option 7
Email services@accessdata.com
AD
Customer & Technical Support Contact Information (Continued)

Contents | 7
Contents
AccessData Legal and Contact Information
. . . . . . . . . . . . . . . . . . . . . . . . . . . 2
Contents
. . . . . . . . . . . . . . . . . . . . . . . . . . . . . . . . . . . . . . . . . . . . . . . . . 7
Part 1: Introducing Resolution1 eDiscovery
. . . . . . . . . . . . . . . . . . . . . . . .17
Chapter 1: Introducing Resolution1 eDiscovery
. . . . . . . . . . . . . . . . . . . . . . . . . . . . . . . . . . . . 18
About Resolution1 eDiscovery . . . . . . . . . . . . . . . . . . . . . . . . . . . . . . .18
About This Reviewer Guide . . . . . . . . . . . . . . . . . . . . . . . . . . . . . . . . .18
Chapter 2: Getting Started
. . . . . . . . . . . . . . . . . . . . . . . . . . . . . . . . . . . . . . . . . . . . . . . . . . . . . . . . 19
Terminology . . . . . . . . . . . . . . . . . . . . . . . . . . . . . . . . . . . . . . . . . .19
About the AccessData Web Console . . . . . . . . . . . . . . . . . . . . . . . . . . .19
Web Console Requirements . . . . . . . . . . . . . . . . . . . . . . . . . . . . . .20
About User Accounts . . . . . . . . . . . . . . . . . . . . . . . . . . . . . . . . . . . . .20
User Account Types . . . . . . . . . . . . . . . . . . . . . . . . . . . . . . . . . .21
Opening the AccessData Web Console . . . . . . . . . . . . . . . . . . . . . . . . .21
Installing the Browser Components . . . . . . . . . . . . . . . . . . . . . . . . . . . .23
Installing Components through the Browser . . . . . . . . . . . . . . . . . . . . .23
Installing Browser Components Manually . . . . . . . . . . . . . . . . . . . . . .25
Introducing the Web Console . . . . . . . . . . . . . . . . . . . . . . . . . . . . . . . .26
The Project List Panel . . . . . . . . . . . . . . . . . . . . . . . . . . . . . . . . . . . .28
User Actions . . . . . . . . . . . . . . . . . . . . . . . . . . . . . . . . . . . . . . . . . .31
Changing Your Password . . . . . . . . . . . . . . . . . . . . . . . . . . . . . . .32
Using Elements of the Web Console . . . . . . . . . . . . . . . . . . . . . . . . . . .33
Maximizing the Web Console Viewing Area . . . . . . . . . . . . . . . . . . . . .33
About Content in Lists and Grids . . . . . . . . . . . . . . . . . . . . . . . . . . .33
Part 2: Reviewing Project Data
. . . . . . . . . . . . . . . . . . . . . . . . . . . . . . . . . . .39
Chapter 3: Introduction to Project Review
. . . . . . . . . . . . . . . . . . . . . . . . . . . . . . . . . . . . . . . . . 40
About Project Review . . . . . . . . . . . . . . . . . . . . . . . . . . . . . . . . . . . .40
Workflow for Reviewing Projects . . . . . . . . . . . . . . . . . . . . . . . . . . . . .40
About Date and Time Information . . . . . . . . . . . . . . . . . . . . . . . . . . . . .41
About How Time Zones Are Set . . . . . . . . . . . . . . . . . . . . . . . . . . . .41
Configuring the Date Format Used in Review . . . . . . . . . . . . . . . . . . . .41
Configuring the Date Format Used in Production Sets and Export Sets . . . . .45

Contents | 8
Chapter 4: Project Review Page
. . . . . . . . . . . . . . . . . . . . . . . . . . . . . . . . . . . . . . . . . . . . . . . . . . . 46
Introducing the Project Review Page . . . . . . . . . . . . . . . . . . . . . . . . . . .46
Project Review Page . . . . . . . . . . . . . . . . . . . . . . . . . . . . . . . . . .47
Project Bar. . . . . . . . . . . . . . . . . . . . . . . . . . . . . . . . . . . . . . . .48
Review Page Panels . . . . . . . . . . . . . . . . . . . . . . . . . . . . . . . . . .49
Chapter 5: Customizing the Project Review Layout
. . . . . . . . . . . . . . . . . . . . . . . . . . . . . . . . 51
Working with Panels . . . . . . . . . . . . . . . . . . . . . . . . . . . . . . . . . . . . .51
Hiding and Showing Panels . . . . . . . . . . . . . . . . . . . . . . . . . . . . . .51
Collapsing and Showing Panels. . . . . . . . . . . . . . . . . . . . . . . . . . . .52
Moving Panels. . . . . . . . . . . . . . . . . . . . . . . . . . . . . . . . . . . . . .52
Moving Panels to a New Window . . . . . . . . . . . . . . . . . . . . . . . . . . .53
Working with Layouts . . . . . . . . . . . . . . . . . . . . . . . . . . . . . . . . . . . . .54
Selecting a Layout . . . . . . . . . . . . . . . . . . . . . . . . . . . . . . . . . . .54
Resetting Layouts. . . . . . . . . . . . . . . . . . . . . . . . . . . . . . . . . . . .54
Saving Layouts . . . . . . . . . . . . . . . . . . . . . . . . . . . . . . . . . . . . .54
Managing Saved Custom Layouts . . . . . . . . . . . . . . . . . . . . . . . . . .55
Chapter 6: Viewing Data
. . . . . . . . . . . . . . . . . . . . . . . . . . . . . . . . . . . . . . . . . . . . . . . . . . . . . . . . . . 56
Viewing Data in Panels . . . . . . . . . . . . . . . . . . . . . . . . . . . . . . . . . . .56
Using the Item List Panel. . . . . . . . . . . . . . . . . . . . . . . . . . . . . . . . . . .58
Viewing Documents in the Item List Panel . . . . . . . . . . . . . . . . . . . . . .59
Using Columns in the Item List Panel. . . . . . . . . . . . . . . . . . . . . . . . .60
Using Quick Columns. . . . . . . . . . . . . . . . . . . . . . . . . . . . . . . . . .62
Using Quick Filters . . . . . . . . . . . . . . . . . . . . . . . . . . . . . . . . . . .63
Using Views . . . . . . . . . . . . . . . . . . . . . . . . . . . . . . . . . . . . . . .63
Performing Actions from the Item List. . . . . . . . . . . . . . . . . . . . . . . . .69
Using the Project Explorer Panel . . . . . . . . . . . . . . . . . . . . . . . . . . . . . .72
The Explore Tab. . . . . . . . . . . . . . . . . . . . . . . . . . . . . . . . . . . . .73
The Navigation Tab . . . . . . . . . . . . . . . . . . . . . . . . . . . . . . . . . . .74
Using Document Viewing Panels. . . . . . . . . . . . . . . . . . . . . . . . . . . . . .76
Using the Natural Panel . . . . . . . . . . . . . . . . . . . . . . . . . . . . . . . .76
Using the Image Panel . . . . . . . . . . . . . . . . . . . . . . . . . . . . . . . . .79
Using the Text Panel . . . . . . . . . . . . . . . . . . . . . . . . . . . . . . . . . .80
Using the KFF Details and Detail Information Panels . . . . . . . . . . . . . . . .81
Using Document Data Panels. . . . . . . . . . . . . . . . . . . . . . . . . . . . . . . .82
The Activity Panel. . . . . . . . . . . . . . . . . . . . . . . . . . . . . . . . . . . .82
The Similar Panel . . . . . . . . . . . . . . . . . . . . . . . . . . . . . . . . . . . .83
The Production Panel. . . . . . . . . . . . . . . . . . . . . . . . . . . . . . . . . .83
The Notes Panel . . . . . . . . . . . . . . . . . . . . . . . . . . . . . . . . . . . .84
The Conversation Panel . . . . . . . . . . . . . . . . . . . . . . . . . . . . . . . .85
The Family Panel . . . . . . . . . . . . . . . . . . . . . . . . . . . . . . . . . . . .86
The Linked Panel . . . . . . . . . . . . . . . . . . . . . . . . . . . . . . . . . . . .88

Contents | 9
Viewing Timeline Data . . . . . . . . . . . . . . . . . . . . . . . . . . . . . . . . . . . .89
Viewing Graphics and Videos . . . . . . . . . . . . . . . . . . . . . . . . . . . . . . . .91
Chapter 7: Deleting Documents
. . . . . . . . . . . . . . . . . . . . . . . . . . . . . . . . . . . . . . . . . . . . . . . . . . . 92
Deleting a Document . . . . . . . . . . . . . . . . . . . . . . . . . . . . . . . . . . . . .92
Part 3: Searching Data
. . . . . . . . . . . . . . . . . . . . . . . . . . . . . . . . . . . . . . . . . .94
Chapter 8: Introduction to Searching Data
. . . . . . . . . . . . . . . . . . . . . . . . . . . . . . . . . . . . . . . . . 95
About Searching Data . . . . . . . . . . . . . . . . . . . . . . . . . . . . . . . . . . . .95
Search Limitations . . . . . . . . . . . . . . . . . . . . . . . . . . . . . . . . . . .96
Chapter 9: Running Searches
. . . . . . . . . . . . . . . . . . . . . . . . . . . . . . . . . . . . . . . . . . . . . . . . . . . . . 97
Running a Quick Search . . . . . . . . . . . . . . . . . . . . . . . . . . . . . . . . . .97
Building Search Phrases . . . . . . . . . . . . . . . . . . . . . . . . . . . . . . . . . . .99
Using Search Operators . . . . . . . . . . . . . . . . . . . . . . . . . . . . . . . .99
Using Boolean Logic Options . . . . . . . . . . . . . . . . . . . . . . . . . . . . 101
Using ? and * Wildcards . . . . . . . . . . . . . . . . . . . . . . . . . . . . . . . 102
Searching Numbers. . . . . . . . . . . . . . . . . . . . . . . . . . . . . . . . . . 103
Searching for Virtual Columns . . . . . . . . . . . . . . . . . . . . . . . . . . . . . . 103
Running a Subset Search . . . . . . . . . . . . . . . . . . . . . . . . . . . . . . . . . 104
Returning to a Previous Search . . . . . . . . . . . . . . . . . . . . . . . . . . . 104
Searching in the Natural Panel . . . . . . . . . . . . . . . . . . . . . . . . . . . . . . 105
Using Global Replace. . . . . . . . . . . . . . . . . . . . . . . . . . . . . . . . . . . . 105
Committing a Global Replace Job. . . . . . . . . . . . . . . . . . . . . . . . . . 106
Using Dates and Times in Search . . . . . . . . . . . . . . . . . . . . . . . . . . . . 107
Using Dates and Times in Searches . . . . . . . . . . . . . . . . . . . . . . . . 107
How Time Zone Settings Affect Searches . . . . . . . . . . . . . . . . . . . . . 107
Viewing the Display Time Zone . . . . . . . . . . . . . . . . . . . . . . . . . . . 107
Using the Search Excerpt View. . . . . . . . . . . . . . . . . . . . . . . . . . . . . . 108
Using Search Reports . . . . . . . . . . . . . . . . . . . . . . . . . . . . . . . . . . . 110
About Search Reports . . . . . . . . . . . . . . . . . . . . . . . . . . . . . . . . 110
Generating and Downloading a Search Report . . . . . . . . . . . . . . . . . . 110
About the Search Report Details . . . . . . . . . . . . . . . . . . . . . . . . . . 111
Chapter 10: Running Advanced Searches
. . . . . . . . . . . . . . . . . . . . . . . . . . . . . . . . . . . . . . . . 112
Running an Advanced Search . . . . . . . . . . . . . . . . . . . . . . . . . . . . . . 112
Advanced Search Operators. . . . . . . . . . . . . . . . . . . . . . . . . . . . . 115
Advanced Search Operators Exceptions . . . . . . . . . . . . . . . . . . . . . . 115

Contents | 10
Understanding Advanced Variations . . . . . . . . . . . . . . . . . . . . . . . . . . . 117
Using the Term Browser to Create Search Strings . . . . . . . . . . . . . . . . . . 118
Importing Index Search Terms . . . . . . . . . . . . . . . . . . . . . . . . . . . . . . 119
Chapter 11: Re-running Searches
. . . . . . . . . . . . . . . . . . . . . . . . . . . . . . . . . . . . . . . . . . . . . . . . 120
The Search Tab . . . . . . . . . . . . . . . . . . . . . . . . . . . . . . . . . . . . . . . 120
Running Recent Searches . . . . . . . . . . . . . . . . . . . . . . . . . . . . . . . . . 121
Clearing Search Results . . . . . . . . . . . . . . . . . . . . . . . . . . . . . . . 121
Saving a Search . . . . . . . . . . . . . . . . . . . . . . . . . . . . . . . . . . . . . . . 122
Sharing a Search . . . . . . . . . . . . . . . . . . . . . . . . . . . . . . . . . . . . . . 123
Chapter 12: Using Filters to Cull Data
. . . . . . . . . . . . . . . . . . . . . . . . . . . . . . . . . . . . . . . . . . . . 124
Filtering Data in Case Review . . . . . . . . . . . . . . . . . . . . . . . . . . . . . . 124
About Filtering Data with Facets. . . . . . . . . . . . . . . . . . . . . . . . . . . 124
The Facets Tab . . . . . . . . . . . . . . . . . . . . . . . . . . . . . . . . . . . . 127
Available Facet Categories . . . . . . . . . . . . . . . . . . . . . . . . . . . . . 129
Examples of How Facets Work . . . . . . . . . . . . . . . . . . . . . . . . . . . 132
Using Facets . . . . . . . . . . . . . . . . . . . . . . . . . . . . . . . . . . . . . . . . . 137
Caching Filter Data . . . . . . . . . . . . . . . . . . . . . . . . . . . . . . . . . . . . . 138
Filtering by Column in the Item List Panel . . . . . . . . . . . . . . . . . . . . . . . 139
Clearing Column Filters . . . . . . . . . . . . . . . . . . . . . . . . . . . . . . . 139
Object Types . . . . . . . . . . . . . . . . . . . . . . . . . . . . . . . . . . . . . . . . . 140
Part 4: Using Visualization
. . . . . . . . . . . . . . . . . . . . . . . . . . . . . . . . . . . . .142
Chapter 13: Using Visualization
. . . . . . . . . . . . . . . . . . . . . . . . . . . . . . . . . . . . . . . . . . . . . . . . . . 143
Culling Data with Visualization . . . . . . . . . . . . . . . . . . . . . . . . . . . . . . 143
Files Visualization . . . . . . . . . . . . . . . . . . . . . . . . . . . . . . . . . . . . . . 144
Emails Visualization . . . . . . . . . . . . . . . . . . . . . . . . . . . . . . . . . . . . . 147
Chapter 14: Using Visualization Social Analyzer
. . . . . . . . . . . . . . . . . . . . . . . . . . . . . . . . . . 150
About Social Analyzer . . . . . . . . . . . . . . . . . . . . . . . . . . . . . . . . . . . 150
Accessing Social Analyzer . . . . . . . . . . . . . . . . . . . . . . . . . . . . . . 152
Social Analyzer Options . . . . . . . . . . . . . . . . . . . . . . . . . . . . . . . 153
Analyzing Email Domains in Visualization . . . . . . . . . . . . . . . . . . . . . 154
Analyzing Individual Emails in Visualization . . . . . . . . . . . . . . . . . . . . 154
Chapter 15: Using Visualization Heatmap
. . . . . . . . . . . . . . . . . . . . . . . . . . . . . . . . . . . . . . . . . 155
Chapter 16: Using Visualization Geolocation
. . . . . . . . . . . . . . . . . . . . . . . . . . . . . . . . . . . . . . 157
About Geolocation Visualization . . . . . . . . . . . . . . . . . . . . . . . . . . . . . 157
Geolocation Components . . . . . . . . . . . . . . . . . . . . . . . . . . . . . . 157

Contents | 11
Geolocation Workflow . . . . . . . . . . . . . . . . . . . . . . . . . . . . . . . . 158
General Geolocation Requirements. . . . . . . . . . . . . . . . . . . . . . . . . 158
Viewing Geolocation EXIF Data . . . . . . . . . . . . . . . . . . . . . . . . . . . . . 158
Using Geolocation Tools . . . . . . . . . . . . . . . . . . . . . . . . . . . . . . . . . . 160
The Geolocation Map Panel . . . . . . . . . . . . . . . . . . . . . . . . . . . . . 160
Using the Geolocation Grid . . . . . . . . . . . . . . . . . . . . . . . . . . . . . . . . 163
Filtering Items in the Geolocation Grid . . . . . . . . . . . . . . . . . . . . . . . 163
Using Geolocation Columns in the Item List . . . . . . . . . . . . . . . . . . . . . . 164
Using Geolocation Column Templates . . . . . . . . . . . . . . . . . . . . . . . 165
Using Geolocation Facets . . . . . . . . . . . . . . . . . . . . . . . . . . . . . . . . . 165
Using Geolocation Visualization to View Security Data . . . . . . . . . . . . . . . 166
Prerequisites for Using Geolocation Visualization to View Security Data . . . . 166
Viewing Geolocation IP Locations Data . . . . . . . . . . . . . . . . . . . . . . 168
Using the Geolocation Network Information Grid . . . . . . . . . . . . . . . . . 168
Geolocation Filter . . . . . . . . . . . . . . . . . . . . . . . . . . . . . . . . . . . 169
Part 5: Using Litigation and eDiscovery Tools
. . . . . . . . . . . . . . . . . . . . . .172
Chapter 17: Working with Transcripts and Exhibits
. . . . . . . . . . . . . . . . . . . . . . . . . . . . . . . . 173
Working with Transcripts . . . . . . . . . . . . . . . . . . . . . . . . . . . . . . . . . 173
Formatting Transcripts . . . . . . . . . . . . . . . . . . . . . . . . . . . . . . . . 173
The Transcript Panel. . . . . . . . . . . . . . . . . . . . . . . . . . . . . . . . . 176
Viewing Transcripts . . . . . . . . . . . . . . . . . . . . . . . . . . . . . . . . . . 177
Annotating Transcripts . . . . . . . . . . . . . . . . . . . . . . . . . . . . . . . . 177
Searching in Transcripts . . . . . . . . . . . . . . . . . . . . . . . . . . . . . . . 180
Displaying Selected Notes . . . . . . . . . . . . . . . . . . . . . . . . . . . . . . 180
Displaying Selected Highlights. . . . . . . . . . . . . . . . . . . . . . . . . . . . 180
Opening Multiple Transcripts. . . . . . . . . . . . . . . . . . . . . . . . . . . . . 181
Generating Reports on Multiple Transcripts . . . . . . . . . . . . . . . . . . . . 181
Culling Transcripts and Exhibits . . . . . . . . . . . . . . . . . . . . . . . . . . . . . 182
Using the Explorer Panel to Cull Transcripts and Exhibits . . . . . . . . . . . . 182
Using Object Type Facets to Cull Transcripts and Exhibits. . . . . . . . . . . . 182
The Exhibits Panel. . . . . . . . . . . . . . . . . . . . . . . . . . . . . . . . . . . . . . 183
Viewing Exhibits. . . . . . . . . . . . . . . . . . . . . . . . . . . . . . . . . . . . 183
Chapter 18: Imaging Documents
. . . . . . . . . . . . . . . . . . . . . . . . . . . . . . . . . . . . . . . . . . . . . . . . . 184
Converting a Document to an Image . . . . . . . . . . . . . . . . . . . . . . . . . . 184
TIFF on the Fly . . . . . . . . . . . . . . . . . . . . . . . . . . . . . . . . . . . . . . . 189
Chapter 19: Applying Tags
. . . . . . . . . . . . . . . . . . . . . . . . . . . . . . . . . . . . . . . . . . . . . . . . . . . . . . . 190
The Tags Tab . . . . . . . . . . . . . . . . . . . . . . . . . . . . . . . . . . . . . . . . 190

Contents | 12
The Labeling Panel . . . . . . . . . . . . . . . . . . . . . . . . . . . . . . . . . . . . . 192
Applying Labels to Single Documents. . . . . . . . . . . . . . . . . . . . . . . . . . 193
Removing Labels from a Single Document. . . . . . . . . . . . . . . . . . . . . 193
Applying Labels to Multiple Documents . . . . . . . . . . . . . . . . . . . . . . . . . 194
Removing Labels from Multiple Documents . . . . . . . . . . . . . . . . . . . . 195
Viewing Documents with Tags . . . . . . . . . . . . . . . . . . . . . . . . . . . . . . 196
Viewing Documents with a Label Applied . . . . . . . . . . . . . . . . . . . . . 196
Viewing Documents with an Issue Coded . . . . . . . . . . . . . . . . . . . . . 196
Viewing Documents with a Category Coded . . . . . . . . . . . . . . . . . . . . 196
Using the Case Organizer . . . . . . . . . . . . . . . . . . . . . . . . . . . . . . . . . 197
About Case Organizer Categories and Organization . . . . . . . . . . . . . . . 197
Chapter 20: Coding Documents
. . . . . . . . . . . . . . . . . . . . . . . . . . . . . . . . . . . . . . . . . . . . . . . . . . 199
The Review Sets Tab . . . . . . . . . . . . . . . . . . . . . . . . . . . . . . . . . . . 199
The Review Batches Panel . . . . . . . . . . . . . . . . . . . . . . . . . . . . . 200
Checking In/Out a Review Set. . . . . . . . . . . . . . . . . . . . . . . . . . . . 201
Coding in the Grid . . . . . . . . . . . . . . . . . . . . . . . . . . . . . . . . . . . . . . 202
Editable Fields. . . . . . . . . . . . . . . . . . . . . . . . . . . . . . . . . . . . . 202
Using the Coding Panel . . . . . . . . . . . . . . . . . . . . . . . . . . . . . . . . . . 205
The Coding Panel. . . . . . . . . . . . . . . . . . . . . . . . . . . . . . . . . . . 205
Coding Single Documents . . . . . . . . . . . . . . . . . . . . . . . . . . . . . . 206
Coding Multiple Documents . . . . . . . . . . . . . . . . . . . . . . . . . . . . . 207
Predictive Coding . . . . . . . . . . . . . . . . . . . . . . . . . . . . . . . . . . . . . . 209
Understanding Predictive Coding . . . . . . . . . . . . . . . . . . . . . . . . . . 209
Instructing Predictive Coding . . . . . . . . . . . . . . . . . . . . . . . . . . . . 210
Obtaining a Confidence Score. . . . . . . . . . . . . . . . . . . . . . . . . . . . 211
Applying Predictive Coding . . . . . . . . . . . . . . . . . . . . . . . . . . . . . 212
Performing Quality Control . . . . . . . . . . . . . . . . . . . . . . . . . . . . . . 213
Chapter 21: Annotating Evidence
. . . . . . . . . . . . . . . . . . . . . . . . . . . . . . . . . . . . . . . . . . . . . . . . 214
About Annotating Evidence . . . . . . . . . . . . . . . . . . . . . . . . . . . . . . . . 214
Prerequisites for Annotating . . . . . . . . . . . . . . . . . . . . . . . . . . . . . . . 214
About Generating SWF Files for Annotating . . . . . . . . . . . . . . . . . . . . . . 215
Accessing SWF Files for Annotating. . . . . . . . . . . . . . . . . . . . . . . . . . . 216
About Annotating Tools . . . . . . . . . . . . . . . . . . . . . . . . . . . . . . . . . . . 217
Profiles and Markup Sets . . . . . . . . . . . . . . . . . . . . . . . . . . . . . . . . . 219
Selecting a Highlight Profile . . . . . . . . . . . . . . . . . . . . . . . . . . . . . 219
Selecting a Markup Set. . . . . . . . . . . . . . . . . . . . . . . . . . . . . . . . 219
Adding a Note . . . . . . . . . . . . . . . . . . . . . . . . . . . . . . . . . . . . . . . . 220
Editing a Note. . . . . . . . . . . . . . . . . . . . . . . . . . . . . . . . . . . . . . . . . 221
Adding a Highlight . . . . . . . . . . . . . . . . . . . . . . . . . . . . . . . . . . . . . . 222
Adding a Text-Based Highlight. . . . . . . . . . . . . . . . . . . . . . . . . . . . 222

Contents | 13
Adding a Drawn Highlight . . . . . . . . . . . . . . . . . . . . . . . . . . . . . . 222
Adding a Link . . . . . . . . . . . . . . . . . . . . . . . . . . . . . . . . . . . . . . . . . 223
Adding a Redaction . . . . . . . . . . . . . . . . . . . . . . . . . . . . . . . . . . . . . 224
Adding a Text-Based Redaction . . . . . . . . . . . . . . . . . . . . . . . . . . . 224
Adding a Drawn Redaction. . . . . . . . . . . . . . . . . . . . . . . . . . . . . . 224
Toggling Redactions On and Off. . . . . . . . . . . . . . . . . . . . . . . . . . . 225
Chapter 22: Bulk Printing
. . . . . . . . . . . . . . . . . . . . . . . . . . . . . . . . . . . . . . . . . . . . . . . . . . . . . . . . 226
Bulk Printing Multiple Documents . . . . . . . . . . . . . . . . . . . . . . . . . . . . 226
Network Bulk Printing. . . . . . . . . . . . . . . . . . . . . . . . . . . . . . . . . 227
Local Bulk Printing . . . . . . . . . . . . . . . . . . . . . . . . . . . . . . . . . . 227
General Print Options. . . . . . . . . . . . . . . . . . . . . . . . . . . . . . . . . 227
Bulk Print Dialog Options. . . . . . . . . . . . . . . . . . . . . . . . . . . . . . . 228
Viewing Print Statuses . . . . . . . . . . . . . . . . . . . . . . . . . . . . . . . . . . . 228
Viewing Print Logs . . . . . . . . . . . . . . . . . . . . . . . . . . . . . . . . . . 229
Chapter 23: Managing Review Sets
. . . . . . . . . . . . . . . . . . . . . . . . . . . . . . . . . . . . . . . . . . . . . . . 230
Creating a Review Set . . . . . . . . . . . . . . . . . . . . . . . . . . . . . . . . . . . 230
Deleting Review Sets . . . . . . . . . . . . . . . . . . . . . . . . . . . . . . . . . . . . 232
Renaming a Review Set . . . . . . . . . . . . . . . . . . . . . . . . . . . . . . . . . . 233
Manage Permissions for Review Sets. . . . . . . . . . . . . . . . . . . . . . . . . . 234
Part 6: Exporting Data
. . . . . . . . . . . . . . . . . . . . . . . . . . . . . . . . . . . . . . . . .235
Chapter 24: Introduction to Exporting Data
. . . . . . . . . . . . . . . . . . . . . . . . . . . . . . . . . . . . . . . 236
About Exporting Data . . . . . . . . . . . . . . . . . . . . . . . . . . . . . . . . . . . 236
Export Tab . . . . . . . . . . . . . . . . . . . . . . . . . . . . . . . . . . . . . . . 237
Production Set History Tab. . . . . . . . . . . . . . . . . . . . . . . . . . . . . . 237
Export Set History Tab . . . . . . . . . . . . . . . . . . . . . . . . . . . . . . . . 239
Exporting Export Sets . . . . . . . . . . . . . . . . . . . . . . . . . . . . . . . . 240
Chapter 25: Creating Production Sets
. . . . . . . . . . . . . . . . . . . . . . . . . . . . . . . . . . . . . . . . . . . . 241
Points to Consider . . . . . . . . . . . . . . . . . . . . . . . . . . . . . . . . . . 241
Production Set General Options . . . . . . . . . . . . . . . . . . . . . . . . . . . . . 243
Production Set Files to Include Options. . . . . . . . . . . . . . . . . . . . . . . . . 244
Volume Document Options. . . . . . . . . . . . . . . . . . . . . . . . . . . . . . 246
Production Set Image Branding Options . . . . . . . . . . . . . . . . . . . . . . . . 253
Additional Production Set Options . . . . . . . . . . . . . . . . . . . . . . . . . . . . 256
Saving Production Set Options as a Template . . . . . . . . . . . . . . . . . . . 256
Deleting a Production Set . . . . . . . . . . . . . . . . . . . . . . . . . . . . . . 256
Sharing a Production Set. . . . . . . . . . . . . . . . . . . . . . . . . . . . . . . 256

Contents | 14
Chapter 26: Exporting Production Sets
. . . . . . . . . . . . . . . . . . . . . . . . . . . . . . . . . . . . . . . . . . . 257
Exporting a Production Set . . . . . . . . . . . . . . . . . . . . . . . . . . . . . . . . 257
Export Tab . . . . . . . . . . . . . . . . . . . . . . . . . . . . . . . . . . . . . . . . . . 259
Chapter 27: Creating Export Sets
. . . . . . . . . . . . . . . . . . . . . . . . . . . . . . . . . . . . . . . . . . . . . . . . . 260
Creating Export Sets . . . . . . . . . . . . . . . . . . . . . . . . . . . . . . . . . . . . 260
Creating an AD1 Export . . . . . . . . . . . . . . . . . . . . . . . . . . . . . . . 260
AD1 Export General Options . . . . . . . . . . . . . . . . . . . . . . . . . . . . . . . 262
Creating a Native Export . . . . . . . . . . . . . . . . . . . . . . . . . . . . . . . . . . 264
Native Export General Options . . . . . . . . . . . . . . . . . . . . . . . . . . . . . . 265
Native Export Files to Include . . . . . . . . . . . . . . . . . . . . . . . . . . . . . . . 267
Export Volume Document Options . . . . . . . . . . . . . . . . . . . . . . . . . . . . 269
Export Excel Rendering Options . . . . . . . . . . . . . . . . . . . . . . . . . . . . . 271
Export Word Rendering Options . . . . . . . . . . . . . . . . . . . . . . . . . . . . . 273
Creating a Load File Export . . . . . . . . . . . . . . . . . . . . . . . . . . . . . . . . 274
Load File General Options . . . . . . . . . . . . . . . . . . . . . . . . . . . . . . . . . 275
Load File Options . . . . . . . . . . . . . . . . . . . . . . . . . . . . . . . . . . . . . . 276
Load File Files to Include Options . . . . . . . . . . . . . . . . . . . . . . . . . . . . 278
Part 7: Reference
. . . . . . . . . . . . . . . . . . . . . . . . . . . . . . . . . . . . . . . . . . . . .280
Chapter 28: Getting Started with KFF (Known File Filter)
. . . . . . . . . . . . . . . . . . . . . . . . . . 281
About KFF . . . . . . . . . . . . . . . . . . . . . . . . . . . . . . . . . . . . . . . . . . 281
Introduction to the KFF Architecture . . . . . . . . . . . . . . . . . . . . . . . . 282
Components of KFF Data . . . . . . . . . . . . . . . . . . . . . . . . . . . . . . 282
How KFF Works. . . . . . . . . . . . . . . . . . . . . . . . . . . . . . . . . . . . 284
About the KFF Server and Geolocation . . . . . . . . . . . . . . . . . . . . . . . . . 286
Installing the KFF Server . . . . . . . . . . . . . . . . . . . . . . . . . . . . . . . . . . 287
About Installing the KFF Server . . . . . . . . . . . . . . . . . . . . . . . . . . . 287
About KFF Server Versions . . . . . . . . . . . . . . . . . . . . . . . . . . . . . 287
Installing the KFF Server Service . . . . . . . . . . . . . . . . . . . . . . . . . . 287
Configuring the Location of the KFF Server . . . . . . . . . . . . . . . . . . . . . . 288
Configuring the KFF Server Location on FTK-based Computers . . . . . . . . 288
Configuring the KFF Server Location on Resolution1 and Summation Applications
288
Migrating Legacy KFF Data . . . . . . . . . . . . . . . . . . . . . . . . . . . . . . . . 289
Importing KFF Data . . . . . . . . . . . . . . . . . . . . . . . . . . . . . . . . . . . . . 291
About Importing KFF Data . . . . . . . . . . . . . . . . . . . . . . . . . . . . . . 291
Using the KFF Import Utility . . . . . . . . . . . . . . . . . . . . . . . . . . . . . 292
Importing Pre-defined KFF Data Libraries . . . . . . . . . . . . . . . . . . . . . 294
Installing the Geolocation (GeoIP) Data . . . . . . . . . . . . . . . . . . . . . . 297

Contents | 15
About CSV and Binary Formats . . . . . . . . . . . . . . . . . . . . . . . . . . . . . 298
Uninstalling KFF . . . . . . . . . . . . . . . . . . . . . . . . . . . . . . . . . . . . . . . 301
Installing KFF Updates . . . . . . . . . . . . . . . . . . . . . . . . . . . . . . . . . . . 302
KFF Library Reference Information . . . . . . . . . . . . . . . . . . . . . . . . . . . 303
About KFF Pre-Defined Hash Libraries. . . . . . . . . . . . . . . . . . . . . . . 303
What has Changed in Version 5.6 . . . . . . . . . . . . . . . . . . . . . . . . . . . . 308
Chapter 29: Using KFF (Known File Filter)
. . . . . . . . . . . . . . . . . . . . . . . . . . . . . . . . . . . . . . . . 309
About KFF and De-NIST Terminology . . . . . . . . . . . . . . . . . . . . . . . . . 309
Process for Using KFF . . . . . . . . . . . . . . . . . . . . . . . . . . . . . . . . . . . 310
Configuring KFF Permissions . . . . . . . . . . . . . . . . . . . . . . . . . . . . . . 310
Adding Hashes to the KFF Server . . . . . . . . . . . . . . . . . . . . . . . . . . . . 311
About the Manage KFF Hash Sets Page . . . . . . . . . . . . . . . . . . . . . . 311
Importing KFF Data . . . . . . . . . . . . . . . . . . . . . . . . . . . . . . . . . . 312
Manually Creating and Managing KFF Hash Sets. . . . . . . . . . . . . . . . . 314
Adding Hashes to Hash Sets Using Project Review. . . . . . . . . . . . . . . . 315
Using KFF Groups to Organize Hash Sets . . . . . . . . . . . . . . . . . . . . . . . 317
About KFF Groups . . . . . . . . . . . . . . . . . . . . . . . . . . . . . . . . . . 317
Creating a KFF Group . . . . . . . . . . . . . . . . . . . . . . . . . . . . . . . . 318
Viewing the Contents of a KFF Group . . . . . . . . . . . . . . . . . . . . . . . 318
Managing KFF Groups . . . . . . . . . . . . . . . . . . . . . . . . . . . . . . . . 318
About the Manage KFF Groups Page . . . . . . . . . . . . . . . . . . . . . . . 319
Enabling a Project to Use KFF . . . . . . . . . . . . . . . . . . . . . . . . . . . . . . 321
About Enabling and Configuring KFF . . . . . . . . . . . . . . . . . . . . . . . . 321
Enabling and Configuring KFF. . . . . . . . . . . . . . . . . . . . . . . . . . . . 321
Reviewing KFF Results. . . . . . . . . . . . . . . . . . . . . . . . . . . . . . . . . . . 323
Viewing KFF Data Shown on the Project Details Page . . . . . . . . . . . . . . 323
About KFF Data Shown in the Review Item List . . . . . . . . . . . . . . . . . . 323
Using the KFF Information Quick Columns. . . . . . . . . . . . . . . . . . . . . 323
Using Quick Filters . . . . . . . . . . . . . . . . . . . . . . . . . . . . . . . . . . 324
Using the KFF Facets . . . . . . . . . . . . . . . . . . . . . . . . . . . . . . . . 325
Viewing Detailed KFF Data . . . . . . . . . . . . . . . . . . . . . . . . . . . . . 326
Re-Processing KFF . . . . . . . . . . . . . . . . . . . . . . . . . . . . . . . . . . . . . 327
Exporting KFF Data . . . . . . . . . . . . . . . . . . . . . . . . . . . . . . . . . . . . . 328
About Exporting KFF Data . . . . . . . . . . . . . . . . . . . . . . . . . . . . . . 328
Exporting KFF Groups and Hash Sets . . . . . . . . . . . . . . . . . . . . . . . 328
Chapter 30: Integrating with AccessData Forensics Products
. . . . . . . . . . . . . . . . . . . . . . 330
Installation . . . . . . . . . . . . . . . . . . . . . . . . . . . . . . . . . . . . . . . . . . 331
Managing User Accounts and Permissions Between
FTK and Summation/Resolution1 eDiscovery . . . . . . . . . . . . . . . . . . 331
Creating and Viewing Projects . . . . . . . . . . . . . . . . . . . . . . . . . . . . . . 331
Managing Evidence in FTK . . . . . . . . . . . . . . . . . . . . . . . . . . . . . 331


| 18
Chapter 1
Introducing Resolution1 eDiscovery
About Resolution1 eDiscovery
Resolution1 eDiscovery helps you to identify and collect relevant data in-house to address electronic discovery
from beginning to end. You can run collections across the entire enterprise Network of a company. The collected
evidence can then be processed, reviewed, and exported.
The reports are enhanced by the use of keyword searches and filters to gather only relevant data that pertains to
a case. The resulting production set can then be exported into an AD1 format, or into a variety of load file
formats such as Concordance, Summation, EDRM, Introspect, and iConect.
About This Reviewer Guide
This Resolution1 Reviewer Guide explains how to use Project Review to analyze the data in your projects.
This guide includes the following parts:
-Getting Started (page 19)
-Reviewing Project Data (page 39)
-Searching Data (page 94)
-Using Visualization (page 142)
-Using Litigation and eDiscovery Tools (page 172)
-Exporting Data (page 235)
-Reference (page 280)
For information about administrating the AccessData Resolution1 eDiscovery product and projects, see the
Resolution1 eDiscovery Admin Guide.
For information about new features, fixed issues, and known issues, see the Resolution1 eDiscovery Release
Notes.
You can download the Admin Guide and Release Notes from the Help/Documentation link.
See User Actions on page 31.
Getting Started Terminology | 19
Chapter 2
Getting Started
Terminology
The Resolution1 platform is a platform of litigation support and cyber security suite of products. To better reflect
how each of AccessData’s applications work within the Resolution1 platform, AccessData has renamed the
individual products of the Resolution1 platform. The following table lists the name changes:
To provide greater compatibility between products, some terminology in the user interface and documentation
has been consolidated. The following table lists the common terminology:
About the AccessData Web Console
The application displays the AccessData web-based console that you can open from any computer connected to
the network.
All users are required to enter a username and password to open the console.
Application Name Changes
Previous Name New Name
CIRT Resolution1 CyberSecurity
eDiscovery Resolution1 eDiscovery
Terminology Changes
Previous Term New Term
Case Project
Custodian Person
Custodians People
System Console Work Manager Console
Security Log Activity Log
Audit Log User Review Activity

Getting Started About User Accounts | 20
What you can see and do in the application depends on your product license and the rights and permissions
granted to you by the administrator. You may have limited privileges based on the work you do.
See About User Accounts on page 20.
Web Console Requirements
Software Requirements
The following are required for using the features in the web console:
-Windows-based PC running the Internet Explorer web browser:
Internet Explorer 9 or higher is required for full functionality of most features.
Internet Explorer 10 or higher is required for full functionality of all features. (Some new features use
HTML5 which requires version 10 or higher.
Note: If you have issues with the interface displaying correctly, view the application in compatibility
view for Internet Explorer.
The console may be opened using other browsers but will not be fully functional.
-Internet Explorer Browser Add-on Components
Microsoft Silverlight--Required for the console.
Adobe Flash Player--Required for imaging documents in Project Review.
-AccessData console components
AD NativeViewer--Required for viewing documents in the Alternate File Viewer in Project Review.
Includes Oracle OutsideX32.
AD Bulk Print Local--Required for printing multiple records using Bulk Printing in Project Review.
To use these features, install the associated applications on each users’ computer.
See Installing the Browser Components on page 23.
Hardware Recommendations
-Use a display resolution of 1280 x 1024 or higher.
Press F11 to display the console in full-screen mode and maximize the viewing area.
About User Accounts
Each user that uses the web console must log in with a user account. Each account has a username and
password. Administrators configure the user accounts.
User accounts are granted permissions based on the tasks those users perform. For example, one account may
have permissions to create and manage projects while another account has permissions only to review files in a
project.
Your permissions determine which items you see and the actions you can perform in the web console.
There is a default Administrator account.
Getting Started Opening the AccessData Web Console | 21
User Account Types
Depending on how the application is configured, your account may be either an Integrated Windows
Authentication account or a local application account.
The type of account that you have will affect a few elements in the web interface. For example, if you use an
Integrated Windows Authentication account, you cannot change your password within the console. However,
you can change your password within the console if you are using an application user account.
Opening the AccessData Web Console
You use the AccessData web console to perform application tasks.
See About the AccessData Web Console on page 19.
You can launch the console from an approved Web browser on any computer that is connected to the
application server on the network.
See Web Console Requirements on page 20.
To start the console, you need to know the IP address or the host name of the computer on which the application
server is installed.
When you first access the console, you are prompted to log in. Your administrator will provide you with your
username and password.
To open the web console
1. Open Internet Explorer.
Note: Internet Explorer 7 or higher is required to use the web console for full functionality. Internet
Explorer 10 or 11 is recommended.
2. Enter the following URL in the browser’s address field:
https://<host_name>/ADG.map.Web/
where <host_name> is the host name or the IP address of the application server.
This opens the login page.
You can save this web page as a favorite.
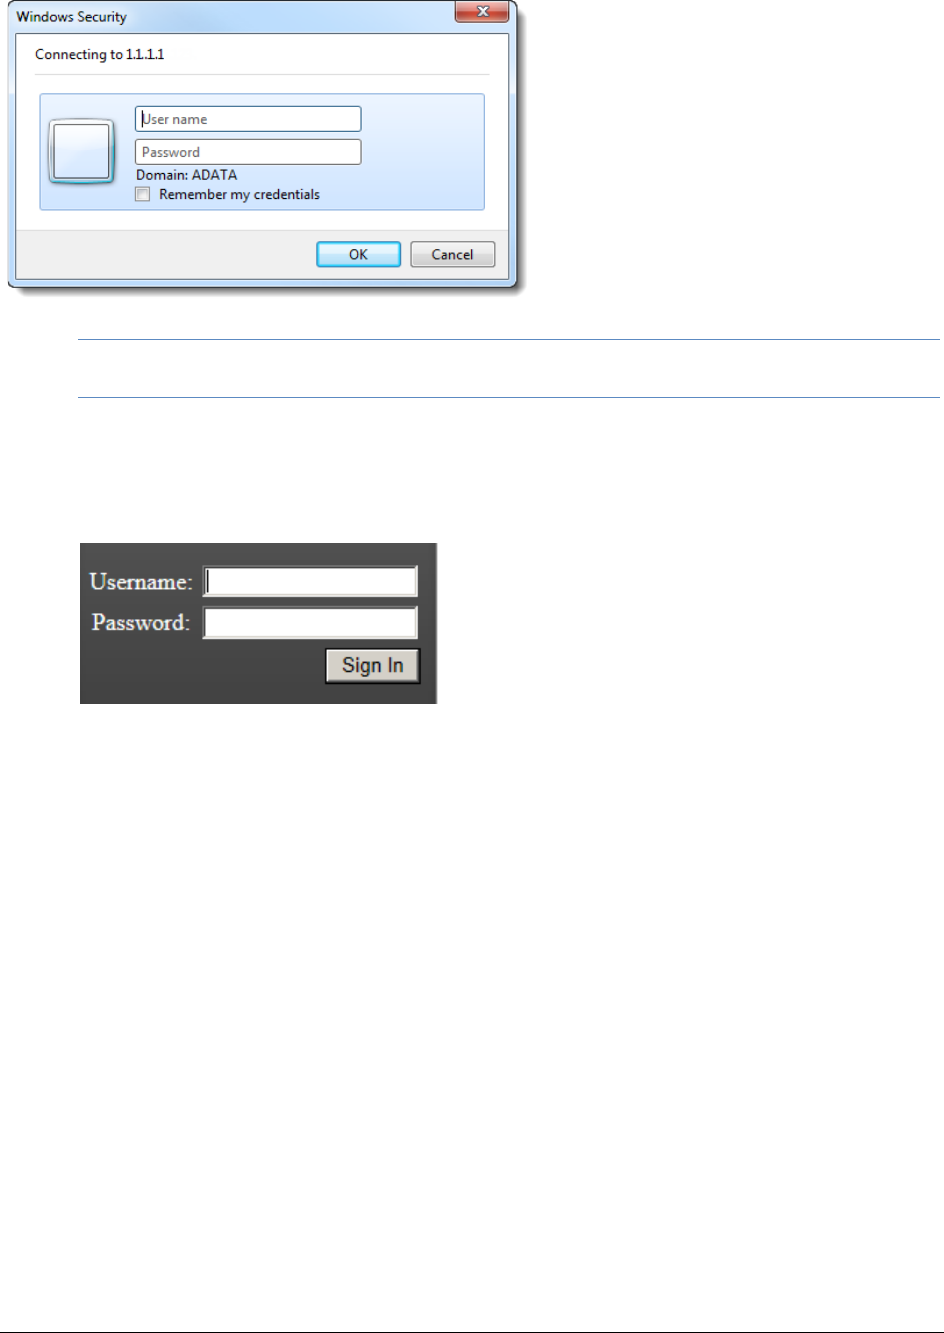
3. One of two login pages displays:
If you are using Integrated Windows Authentication, the following login page displays.
Integrated Windows Authentication Page
Getting Started Opening the AccessData Web Console | 22
Note: If you are using Integrated Windows Authentication and are not on the domain, you will see a
Windows login prompt.
If you are not using Integrated Windows Authentication, the login page displays the product name and
version for the product license that your organization is using and provides fields for your username and
password.
Non-Integrated Windows Authentication Login
4. On the login page, enter the username and password for your account.
If you are logging in as the administrator for the very first time and have not enabled Integrated Window
Authentication, enter the pre-set default user name and password. Contact your technical support or
sales representative for login information.
5. Click Sign In.
If you are authenticated, the application console displays.
If you cannot log in, contact your administrator.
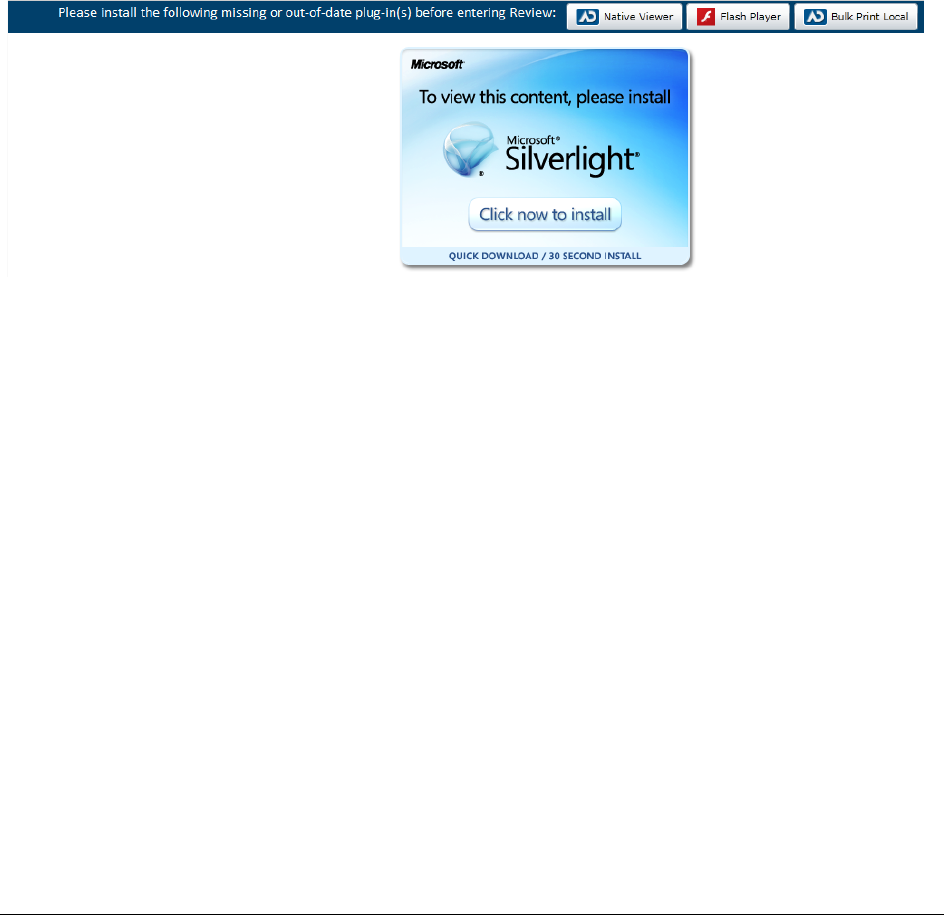
6. The first time the web console is opened on a computer, you may be prompted to install the following
plug-ins:
-Microsoft Silverlight
-Adobe Flash Player
-AD Alternate File Viewer (Native Viewer)
-AD Bulk Print Local
Download the plug-ins. When a pop-up from Internet Explorer displays asking to run or download the
executable, click Run. Complete the install wizard to finish installing the plug-in.
See Web Console Requirements on page 20.
See Installing Browser Components Manually on page 25.
Getting Started Installing the Browser Components | 23
Installing the Browser Components
To use all of the features of the web console, each computer that runs the web console must have Internet
Explorer and the following add-ons:
-Microsoft Silverlight--Required for the console.
-Adobe Flash Player--Required for imaging documents in Project Review.
-AccessData NativeViewer--Required for imaging documents in Project Review.
This includes the Oracle OutsideX32 plug-in.
-AccessData Local Bulk Print--Required for printing multiple records using Bulk Printing in Project Review
Important:
Each computer that runs the console must install the required browser components. The installations
require Windows administrator rights on the computer.
Upon first login, the web console will detect if the workstation's browser does not have the required versions of
the add-ons and will prompt you to download and install the add-ons.
See Installing Components through the Browser on page 23.
See Installing Browser Components Manually on page 25.
Installing Components through the Browser
Microsoft Silverlight
To install Silverlight
1. If you need to install Silverlight, click Click now to install in the Silverlight plug-in window.
2. Click Run in the accompanying security prompts.
3. On the Install Silverlight dialog, Install Now.
When the Silverlight installer completes, on the Installation successful dialog, click Close.

Getting Started Installing the Browser Components | 24
If the web browser does not display the AD logo and then the console, refresh the browser window.
The application Main Window displays and you can install Flash Player from the plug-in installation bar.
Adobe Flash Player
To install Flash Player
1. If you need to install Flash Player, click the Flash Player icon.
2. Click Download now.
3. Click Run in the accompanying security prompts.
4. Complete the installation.
5. Refresh the browser.
Once the application is installed, you need to install the Alternate File Viewer and Local Bulk Print software. You
can find the links to download the add-ons in the dropdown in the upper right corner of the application.
AccessData NativeViewer
To install the AD NativeViewer
1. From the User Actions dropdown, select AD Alternate File Viewer.
2. Click RUN on the NearNativeSetup.exe prompt.
3. Click Next on the InstallShield Wizard dialog.
4. Click Next on the Custom Setup dialog.
5. Click Install on the Ready to Install the Program dialog.
6. Allow the installation to proceed and then click Finish.
7. Close the browser and re-log in.
8. Click Allow on the ADG.UI.Common.Document.Views.NearNativeControl prompt.
9. Refresh the browser.

Getting Started Installing the Browser Components | 25
AccessData Local Bulk Print
To install the Local Bulk Print add-on
1. From the User Actions dropdown, select AD Local Bulk Print.
2. Click Run at the AccessData Local Bulk Print .exe prompt in Internet Explorer.
3. In the InstallShield Wizard dialog, click Next.
4. Accept the license terms and click Next.
5. Accept the default location in the Choose Destination Location dialog and click Next.
6. Click Install on the Ready to Install the Program dialog.
7. Click Finish.
Installing Browser Components Manually
You can use EXE files to install the components outside of the browser. You can run these locally or use
software management tools to install them remotely.
Installing AD Alternate File Viewer
To install the Alternate File Viewer add-on, navigate to the following path on the server:
C:\Program Files (x86)\AccessData\MAP\NearNativeSetup.exe
To install the AD Alternate File Viewer add-on
1. Run the NearNativeSetup.MSI file.
2. Click Next on the InstallShield Wizard dialog.
3. Click Next on the Custom Setup dialog.
4. Click Install on the Ready to Install the Program dialog.
5. Allow the installation to proceed and then click Finish.
Installing the Local Bulk Print Tool
To install the Local Bulk Print tool, navigate to the following path on the server:
C:\Program Files (x86) \AccessData\MAP\AccessDataBulkPrintLocal.exe
To install the Local Bulk Print add-on
1. Run the AccessDataBulkPrintLocal.exe . The wizard should appear.
2. Click Next to begin.
3. Click Next on the Select Installation Folder dialog.
4. Click Next. After the installation is complete, click Close.
Installing Adobe Flash Player
Visit http://get.adobe.com/flashplayer/ and follow the prompts to install the flash player.
Getting Started Introducing the Web Console | 26
Introducing the Web Console
The user interface for the application is the AccessData Web console. The console includes different tabs and
elements.
The items that display in the console are determined by the following:
-Your application’s license
-Your user permissions
The main elements of the application are listed in the following table. Depending on the license that you own and
the permissions that you have, you will see some or all of the following:
Component Description
Navigation bar This lets you open multiple pages in the console.
Home page The Home page lets you create, view, manage, and review projects based on the
permissions that you have. This is the default page when you open the console.
See Using the Project Management Home Page on page 194.
Getting Started Introducing the Web Console | 27
Dashboard (Available in Resolution1 CyberSecurity, Resolution1, and Resolution1 eDiscovery)
The Dashboard allows you to view important event information in an easy-to-read
visual interface.
See Using the Dashboard on page 605.
Data Sources The Data Sources tab lets you manage people, computers, network shares, evidence,
as well as several different connectors. This tab allows you to manage these data
sources throughout the system, not just by project.
See About Data Sources on page 115.
Lit Hold (Available in Resolution1 CyberSecurity and Resolution1 eDiscovery)
The Lit Hold tab lets you create and manage litigation holds.
See Managing Litigation Holds on page 376.
Alerts (Available in Resolution1 CyberSecurity, Resolution1, and Resolution1 eDiscovery)
The Alerts tab allows you to view alerts as they enter the user interface. Viewing Alerts
on page 540
Management
(gear icon) The Management page lets administrators perform global management tasks.
See Opening the Management Page on page 44.
User Actions Actions specific to the logged-in user that affects the user’s account.
See User Actions on page 31.
Project
Review
The Project Review page lets you analyze, filter, code and label documents for a
selected project.
You access Project Review from the Home page.
See the Reviewer Guide for more information on Project Review. You can download the
Reviewer Guide from the Help/Documentation link. See User Actions on page 31.
Component Description
Getting Started The Project List Panel | 28
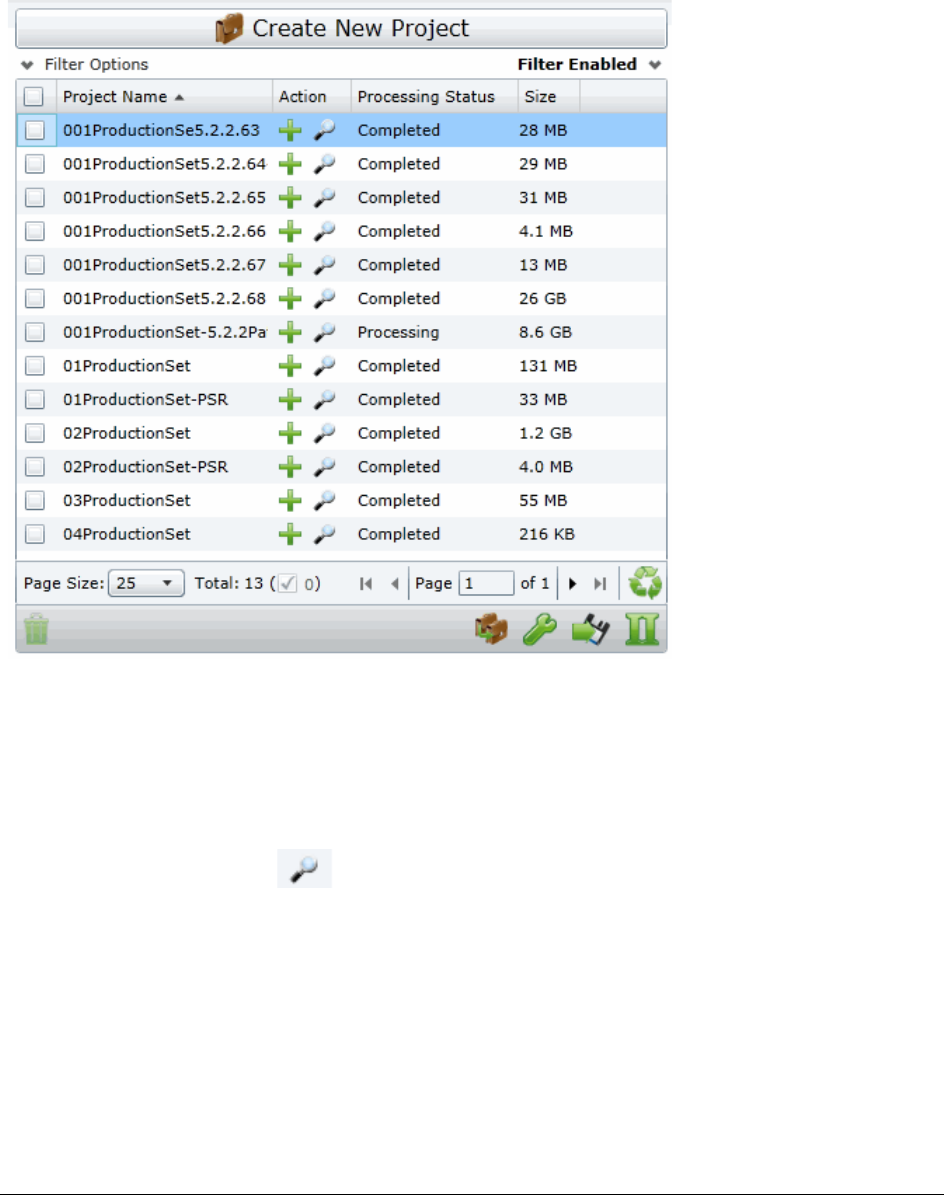
The Project List Panel
The Home page includes the Project List panel. The Project List panel is the default view after logging in. Users
can only view the projects for which they have created or been given permissions.
Administrators and users, given the correct permissions, can use the project list to do the following:
-Create projects.
-View a list of existing projects.
-Add evidence to a project.
See Importing Data on page 354.
-Launch Project Review.
If you are not an administrator, you will only see either the projects that you created or projects to which you
were granted permissions.
The following table lists the elements of the project list. Some items may not be visible depending on your
permissions.
Getting Started The Project List Panel | 29
Elements of the Project List
Element Description
Create New Project Click to create a new project.
See Creating a Project on page 206.
Filter Options Allows you to search and filter all of the projects in the project list. You can
filter the list based on any number of fields associated with the project,
including, but not limited to the project name.
See Filtering Content in Lists and Grids on page 36.
Filter Enabled Displayed if you have enabled a filter.
Project Name Column Lists the names of all the projects to which the logged-in user has permissions.
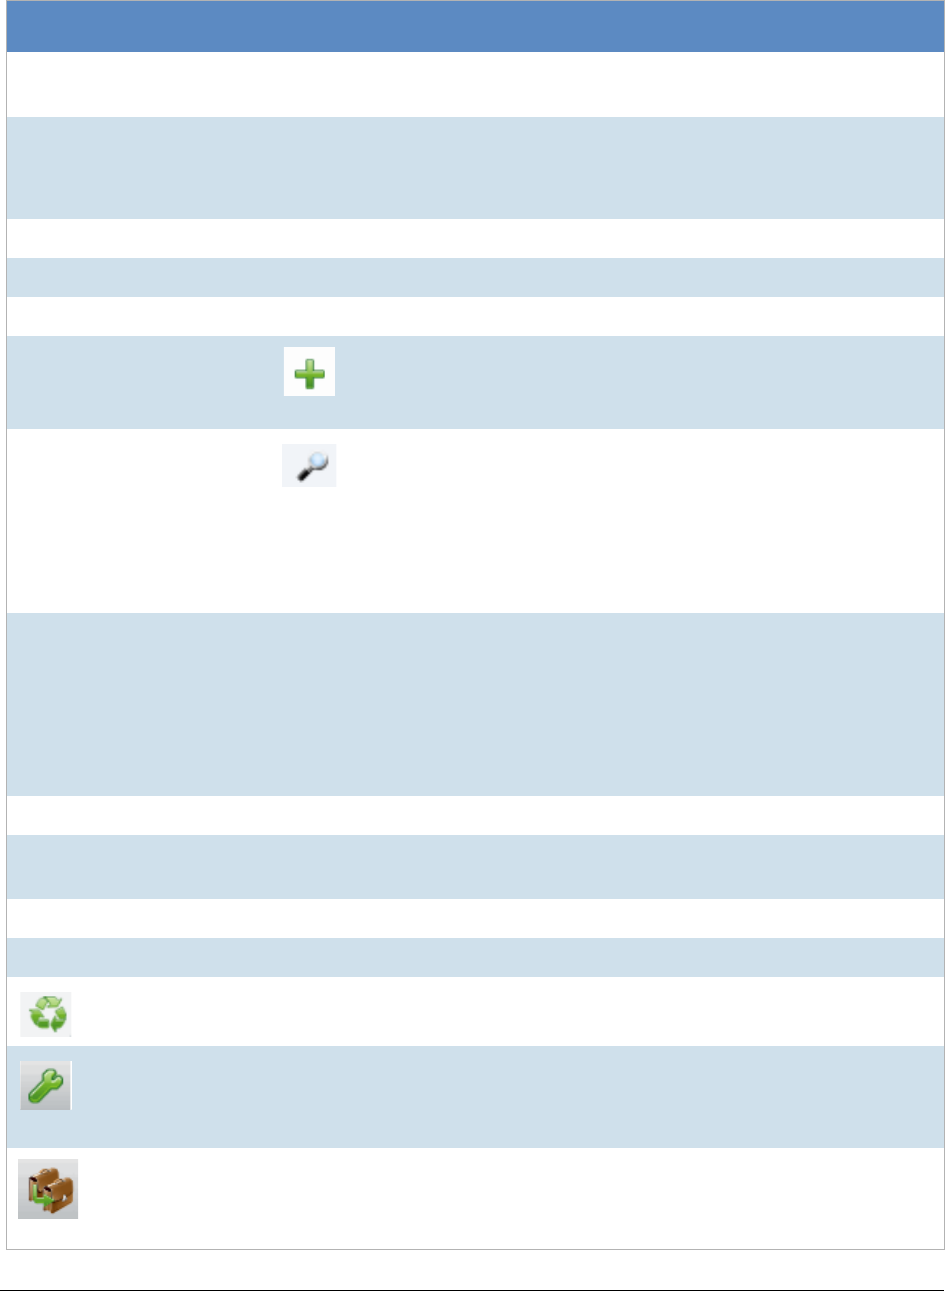
Action Column Allows you to add evidence to a project or enter Project Review.
Add Data
Allows you to add data to the selected project.
Project Review
Allows you to review the project using Project Review.
See the Reviewer Guide for more information on using Product Review. You
can download the Reviewer Guide from the Help/Documentation link. See
Changing Your Password on page 32.
Processing Status Column Lists the status of the projects:
Not Started - The project has been created but no evidence has been added.
Processing - Evidence has been added and is still being processed.
Completed - Evidence has been added and processed.
Note: When processing a small set of evidence, the Processing Status may
show a delay of two minutes behind the actual processing of the evidence.
You may need to refresh the list to see the current status. See Refresh below.
Size Column Lists the size of the data within the project.
Page Size drop-down Allows you to select how many projects to display in the list.
The total number of projects that you have permissions to see is displayed.
Total Lists the total number of projects displayed in the Project List.
Page Allows you to view another page of projects.
Refresh If you create a new project, or make changes to the list, you may need to
refresh the project list
Custom Properties
Add, edit, and delete custom columns with the default value that will be listed
in the Project list panel. When you create a project, this additional column will
be listed in the project creation dialog.
See Adding Custom Properties on page 199.
Project Property
Cloning
Clone the properties of an existing project to another project. You can apply a
single project’s properties to another project, or you can pick and choose
properties from multiple individual projects to apply to a single project.
See Using Project Properties Cloning on page 220.
Getting Started The Project List Panel | 30
Export to CSV Export the Project list to a .csv file. You can save the file and open it in a
spreadsheet program.
Columns Add or remove viewable columns in the Project List.
Delete Highlight project and click Delete Project to delete it from the Project List.
Element Description
Getting Started User Actions | 31
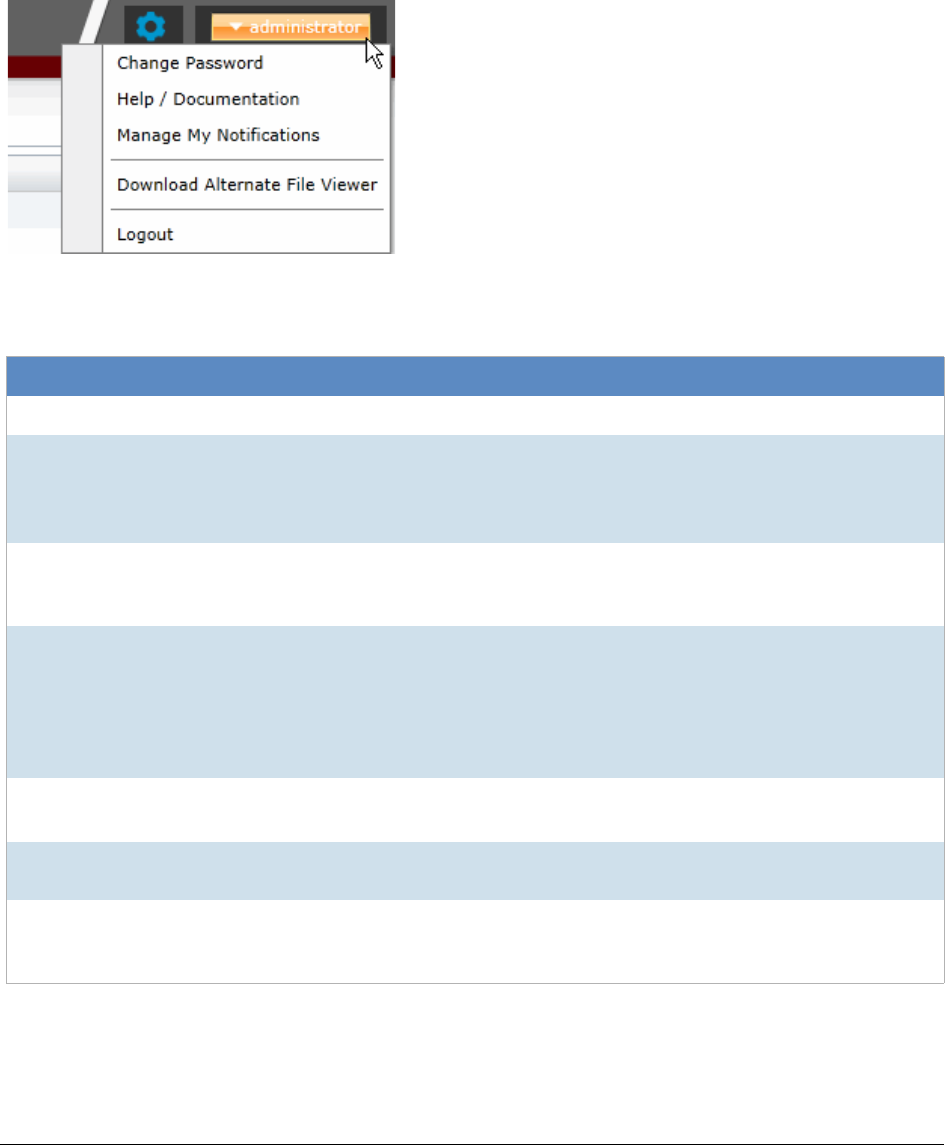
User Actions
Once in the web console, you can preform user actions that are specific to you as the logged-in user. You access
the options by clicking on the logged-in user name in the top right corner of the console.
User Actions
User Actions
Link Description
Logged-on user The username of the logged-on user is displayed; for example, administrator.
Change password Lets the logged-on user change their password.
See Changing Your Password on page 32.
Note: This function is hidden if you are using Integrated Windows
Authentication.
Help/ Documentation Lets you to access the latest version of the Release Notes and User Guide.
The files are in PDF format and are contained in a ZIP file that you can
download.
Manage My Notifications Lets you to manage the notifications that you have created and that you belong
to.
See About Managing Notifications for a Job on page 411.
You can delete notifications, export the notifications list to a CSV file, and filter
the notifications with the Filter Options.
See Filtering Content in Lists and Grids on page 36.
Download Alternate File
Viewer Lets you to download the Alternate FIle Viewer application.
See AccessData NativeViewer on page 24.
Download Local Bulk
Print software Lets you to access the latest version of the Local Bulk Print software. See
AccessData Local Bulk Print on page 25.
Logout Logs you off and returns you to the login page.
Note: This function is hidden if you are using Integrated Windows
Authentication.
Getting Started User Actions | 32
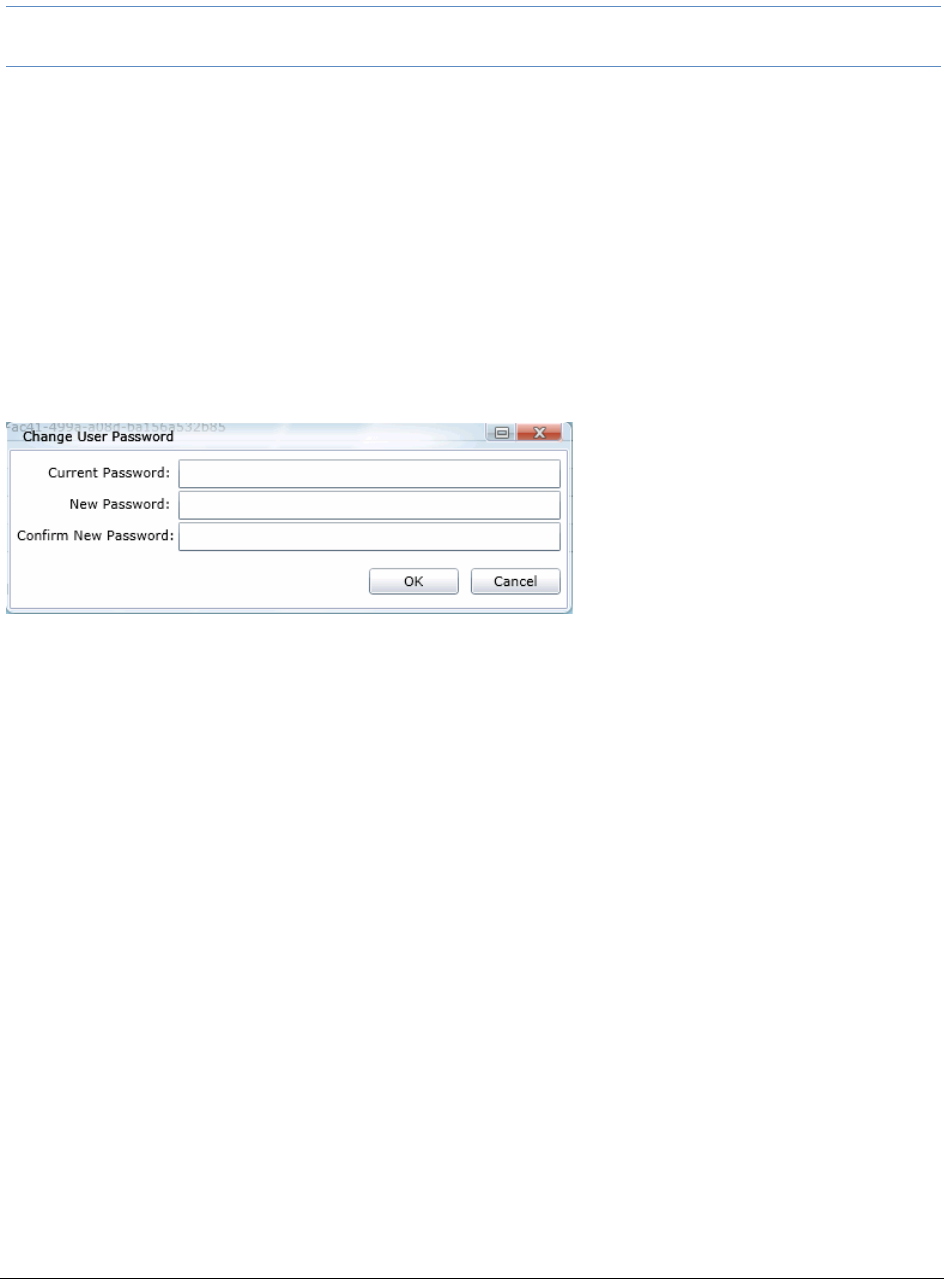
Changing Your Password
Note: This function is hidden if you are using Integrated Windows Authentication. You must change your
password using Windows.
Any logged-in user can change their password. You may want to change your password for one of the following
reasons:
-You are changing a default password after you log in for the first time.
-You are changing your password on a schedule, such as quarterly.
-You are changing your password after having a password reset.
To change your own password
1. Log in using your username and current password.
See To open the web console on page 21.
2. In the upper right corner of the console, click Change Password.
Change User Password
3. In the Change User Password dialog, enter the current password and then enter and confirm the new
password in the respective fields. The following are password requirements:
-The password must be between 7 - 50 characters.
-At least one Alpha character.
-At least one non-alphanumeric character.
4. Click OK.

Getting Started Using Elements of the Web Console | 33
Using Elements of the Web Console
Maximizing the Web Console Viewing Area
You can press F11 to display the console in full-screen mode.
About Content in Lists and Grids
Many objects within the console are made up of lists and grids. Many elements in the lists and grids recur in the
panels, tabs, and panes within the interface. The following sections describe these recurring elements.
You can manage how the content is displayed in the grids.
-See Refreshing the Contents in List and Grids on page 33.
-See Managing Columns in Lists and Grids on page 34.
-See Sorting by Columns on page 33.
-See Filtering Content in Lists and Grids on page 36.
-See Changing Your Password on page 32.
Refreshing the Contents in List and Grids
There may be times when the list you are looking at is not dynamically updated. You can refresh the contents by
clicking .
Sorting by Columns
You can sort grids by most columns.
To sort a grid by columns
1. Click the column head to sort by that column in an ascending order.
A sort indicator (an up or down arrow) is displayed.
2. Click it a second time to sort by descending order.
Sorting By Multiple Columns
In the Item List in Project Review, you can also sort by multiple columns. For example, you can do a primary sort
by file type, and then do a second sort by file size, then a third sort by accessed date.
To sort a grid by columns
1. Click the column head to sort by that column in an ascending order.
A sort indicator (an up or down arrow) is displayed.
2. Click it a second time to sort by descending order.
Getting Started Using Elements of the Web Console | 34
3. In the Item List in Project Review, to perform a secondary search on another column, hold Shift+Alt keys
and click another column.
A sort indicator is displayed for that column as well.
4. You can repeat this for multiple columns.
Moving Columns in a Grid View
You can rearrange columns in a Grid view in any order you want. Some columns have pre-set default positions.
Column widths are also sizable.
To move columns
In the Grid view, click and drag columns to the position you want them.
Managing Columns in Lists and Grids
You can select the columns that you want visible in the Grid view. Project managers can create custom columns
in the Custom Fields tab on the Home page.
See Configuring Custom Fields on page 263.
For additional information on using columns, see Using Columns in the Item List Panel in the Reviewer Guide.
To manage columns
1. In the grid, click Columns.
2. In the Manage Columns dialog, there are two lists:
-Available Columns
Lists all of the Columns that are available to display. They are listed in alphabetical order.
If the column is configured to be in the Visible Columns, it has a .
If the column is not configured to be in the Visible Columns, it has a .
If the column is a non-changeable column (for example, the Action column in the Project List), it has
a .
-Visible Columns
Lists all of the Columns that are displayed. They are listed in the order in which they appear.
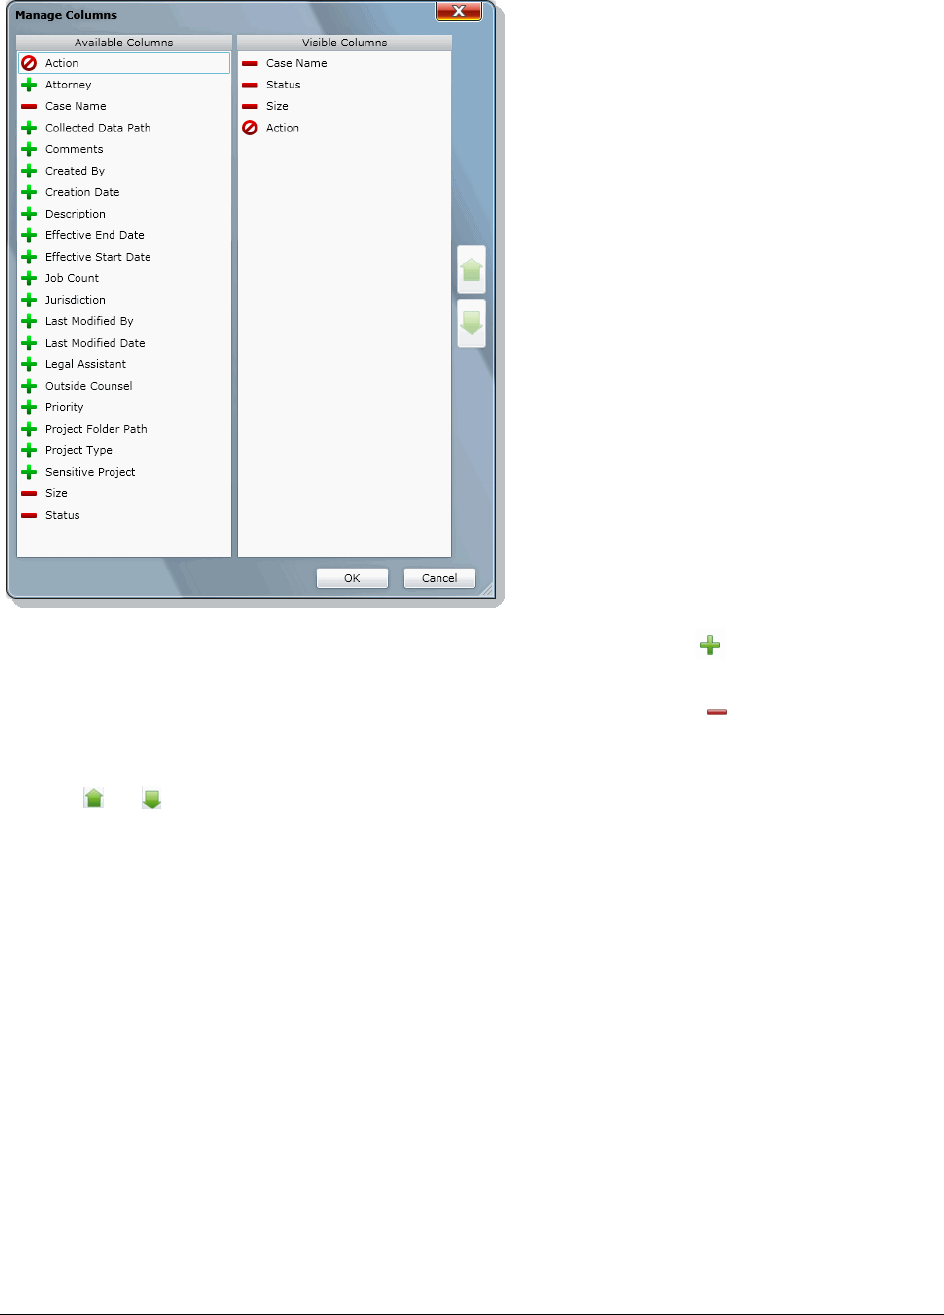
Getting Started Using Elements of the Web Console | 35
Manage Columns Dialog
3. To configure columns to be visible, in the Available Columns list, click the for the column you want
visible.
4. To configure columns to not be visible, in the Visible Columns list, click the for the column you want
not visible.
5. To change the display order of the columns, in the Visible Columns list, select a column name and click
or to change the position.
6. Click OK.
Managing the Grid’s Pages
When a list or grid has many items, you can configure how many items are displayed at one time on a page. This
is helpful for customizing your view based on your display size and resolution and whether or not you want to
scroll in a list.
To configure page size
1. Below a list, click the Page Size drop-down menu.
2. Select the number of items to display in one page.
3. Use the arrows by Page n of n to view the different pages.
Getting Started Using Elements of the Web Console | 36
Filtering Content in Lists and Grids
When a list or grid has many items, you can use a filter to display a portion of the list. Depending on the data you
are viewing, you have different properties that you can filter for.
For example, when looking at the Activity Log, there could be hundreds of items. You may want to view only the
items that pertain to a certain user. You can create a filter that will only display items that include references to
the user.
For example, you could create the following filter:
Activity contains BSmith
This would include activities that pertain to the BSmith user account, such as when the account was created and
permissions for that user were configured.
You could add a second filter:
Activity contains BSmith
OR Username = BSmith
This would include the activities performed by BSmith, such as each time she logged in or created a project.
In this example, because an OR was used instead of an AND, both sets of results are displayed.
You can add as many filters as needed to see the results that you need.
To use filters
1. Above the list, click Filter Options.
This opens the filter tool.
Filter Options
2. Use the Property drop-down to select a property on which to filter.
This list will depend on the page that you are on and the data that you are viewing.
3. Use the Operator drop-down to select an operator to use.
See Filter Operators on page 37.
4. Use the Value field to enter the value on which you want to filter.
See Filter Value Options on page 38.
5. Click Apply.
The results of the filter are displayed.
Once a filter had been applied, the text Filter Enabled is displayed in the upper-right corner of the panel.
This is to remind you that a filter is applied and is affecting the list of items.
6. To further refine the results, you can add additional filters by clicking Add.
7. When adding additional filters, be careful to properly select And/Or.
If you select And, all filters must be true to display a result. If you select OR, all of the results for each
filter will be displayed.
Getting Started Using Elements of the Web Console | 37
8. After configuring your filters, click Apply.
9. To remove a single filter, click Delete.
10. To remove all filters, click Disable or Clear All.
11. To hide the filter tool, click Filter Options.
Filter Operators
The following table lists the possible operators that can be found in the filter options. The operators available
depend upon what property is selected.
Filter Operators
Operator Description
= Searches for a value that equals the property selected. This operator is available
for almost all value filtering and is the default value.
!= Searches for a value that does not equal the property selected. his operator is
available for almost all value filtering.
> Searches for a value that is greater than the property selected. This operator is
available for numerical value filtering.
<Searches for a value that is less than the property selected. This operator is
available for numerical value filtering.
>= Searches for a value that is greater than and/or equal to the property selected.
This operator is available for numerical value filtering.
<= Searches for a value that is less than and/or equal to the property selected. This
operator is available for numerical value filtering.
Contains Searches for a text string that contains the value that you have entered in the
value field. This operator is available for text string filtering.
StartsWith Searches for a text string that starts with the value that you have entered in the
value field. This operator is available for text string filtering.
EndsWith Searches for a text string that ends with a value that you have entered in the
value field. This operator is available for text string filtering.
Getting Started Using Elements of the Web Console | 38
Filter Value Options
The following table lists the possible value options that can be found in the filter options. The value options
available depend upon what property is selected.
Filter Value Options
Value Option Description
Blank field This value allows you to enter a specific item that you can search for. The
Description property is an example of a property where the value is a blank field.
Date value This value allows you to enter a specific date that you can search for. You can
enter the date in a m/d/yy format or you can pick a date from a calendar. The
Creation Date property is an example of a property where the value is entered as
a date value.
Pulldown This value allows you to select from a pulldown list of specific values. The
pulldown choices are dependent upon the property selected. The Priority
property with the choices High, Low, Normal, Urgent is an example of a property
where the value is chosen from a pulldown.

Reviewing Project Data | 39
Part 2
Reviewing Project Data
This part describes how to review project data and includes the following sections:
-Introduction to Project Review (page 40)
-Project Review Page (page 46)
-Customizing the Project Review Layout (page 51)
-Viewing Data (page 56)
-Deleting Documents (page 92)
Introduction to Project Review About Project Review | 40
Chapter 3
Introduction to Project Review
This guide is designed to aid reviewers in performing tasks in Project Review.
About Project Review
In Project Review, you can review documents, electronic data, and transcripts in a web-based console. You can
cull and filter the data in a particular project and search for specific terms. The collected evidence can then be
processed, reviewed, and exported.
The resulting production set can then be exported into an AD1 format, or into a variety of load file formats such
as Concordance, Summation, EDRM, Introspect, and iConect. You can also export native files.
Workflow for Reviewing Projects
Although there is no formal order in which you process evidence, you can use the following basic workflow as a
guide.
Basic Workflow
Step Task Link to the tasks
1 After you process a collection, you
open the resulting project in Project
Review
See Introducing the Project Review Page on page 46.
2View Data See Viewing Data in Panels on page 56.
3 Search Documents See Searching Data on page 94.
4Culling Documents See Using Filters to Cull Data on page 124.
5 Imaging Documents See Imaging Documents on page 184.
6Coding Documents See Coding Documents on page 199.
7 Annotating Documents See Annotating Evidence on page 214.

Introduction to Project Review About Date and Time Information | 41
About Date and Time Information
When viewing data in Review, most items have dates and times associated with them. For example, you can
see the following:
-File created, accessed, and modified dates and times.
-Email sent and received dates and times.
How dates and times are displayed can be configured.
About How Time Zones Are Set
The dates and times associated with data files in a project are stored, by default, in Coordinated Universal Time
(UTC), also known as Greenwich Mean Time (GMT). The Project Manager can configure a Display Time Zone
for the project. This will offset the times as needed and display them in the desired time zone. For example, a
project can be configured so that all times are displayed in Pacific Time Zone.
For more information, see the Normalized Time Zones topic in the Creating a Project chapter in the Admin
Guide.
Configuring the Date Format Used in Review
Each user of the Web console can configure which date format is used for displaying date fields in Review. For
example, some of the date formats that you can use include the following:
-M/d/yyyy (1/31/2014)
-dd.MM.yy (31.01.14)
-yyyy-MM-dd (2014-01-31)
This only applies to how the dates are displayed in the Web console; it does not affect how the dates are stored
in the database.
The date format that is displayed is controlled by the Windows region date format that is configured on one or
both of the following:
-The Windows computer (server) that is running the Resolution1 or Summation application.
-The Windows client computer (the computer that is accessing the Web Console through a browser)
However, some date fields behave differently and must be configured differently.
8Work with Transcripts See Viewing Transcripts on page 177.
See Annotating Transcripts on page 177.
See Viewing Exhibits on page 183.
See Searching in Transcripts on page 180.
9 Deleting Documents See Deleting Documents on page 92.
Basic Workflow
Step Task Link to the tasks
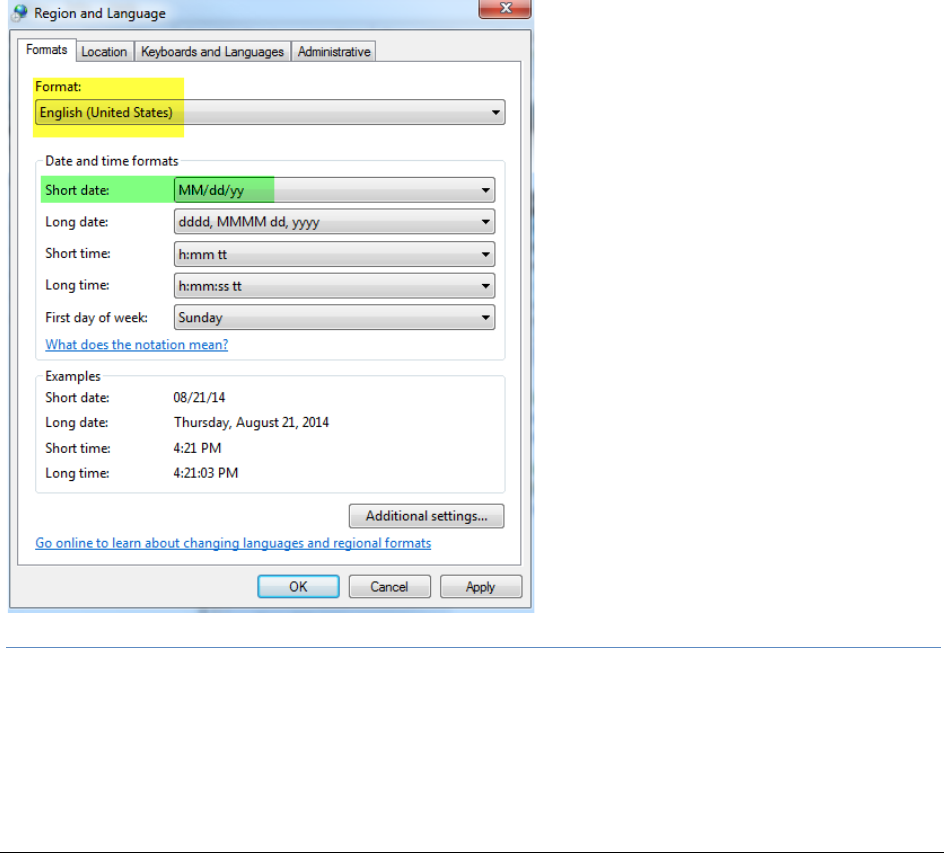
Introduction to Project Review About Date and Time Information | 42
Configuring the Date Format for File and Email Date Fields
The following dates are stored in the database and are displayed as standard dates:
-Review
File: CreatedDate, AccessedDate, LastModifiedDate, and LastUpdated
Email: SentDate and RecieivedDate
Event: EventDate
-Home page:
Project creation
Evidence processing
Job events
Each user can configure their computer's Windows date format to what they want to use. For example, one
person can use M/d/yyyy while another person uses yyyy-MM-dd.
To configure a date format, a user selects the Short date format using the Windows Control Panel > Region and
Language setting.
Note: A console user can select any available Short date format, however, the Language (Country) format on
the client computer must match the Language (Country) format selected on the Windows computer
(server) that is running Summation. Otherwise, you will get a default date format based on the server’s
settings.
For example, if the server is set to English (New Zealand) and the client is also set to English (New

Introduction to Project Review About Date and Time Information | 43
Zealand), the client can display any of the New Zealand Short date formats. However, if the server is set
to English (New Zealand) and the client is set to English (United States), the client will display the default
New Zealand format.
To configure the Windows date format
1. On the client computer that is accessing the Web console, open the Control Panel > Region and
Language.
2. Select the language/country Format and Short date format that you want to use.
3. Click OK.
Configuring the Date Format for DocDate and NoteDate fields
When you enter a DocDate or a NoteDate, it is not entered into the database as a standard date value, but
rather as a text string that is masked as a date. Because of this, these two fields will not be affected by the date
format setting on the client computer. Instead, it is controlled by the date format setting on the Windows server
that is running the Resolution1 or Summation application.
Note: If you are using multiple Windows servers, the server running the AccessData Business Services
Common service determines the date format.
When entering a DocDate or a NoteDate, it will only accept a date format that is set on the application server.
DocDate and NoteDate Format Limitations
-The DocDate and NoteDate fields do not support a year-first date format, such as yyyy/MM/dd. If this
format is selected, these two date fields will display the year at the end, for example, MM/dd/yyyy.
-Slashes are always used as separators instead of dashes or dots (MM/dd/yyyy).
Changing the Date Format on the Application Server
If you want to change the date format on the application server (the computer running the Resolution1 or
Summation application), there are a few steps that you must follow in order to have the new date recognized
properly.
To configure the Windows date format
1. On the Windows computer running the application, you must log in using the Windows Administrator
account that is the “service user”.
2. Open the Control Panel > Region and Language.
3. Select the language format and date format that you want to use.
4. Click OK.
After changing the date format in Windows, you must perform a few manual steps to reset the date format in the
application.
Important:
The following process will temporarily disable the Web server making the Web console unavailable to
users. Make sure no one is working in the console before proceeding.
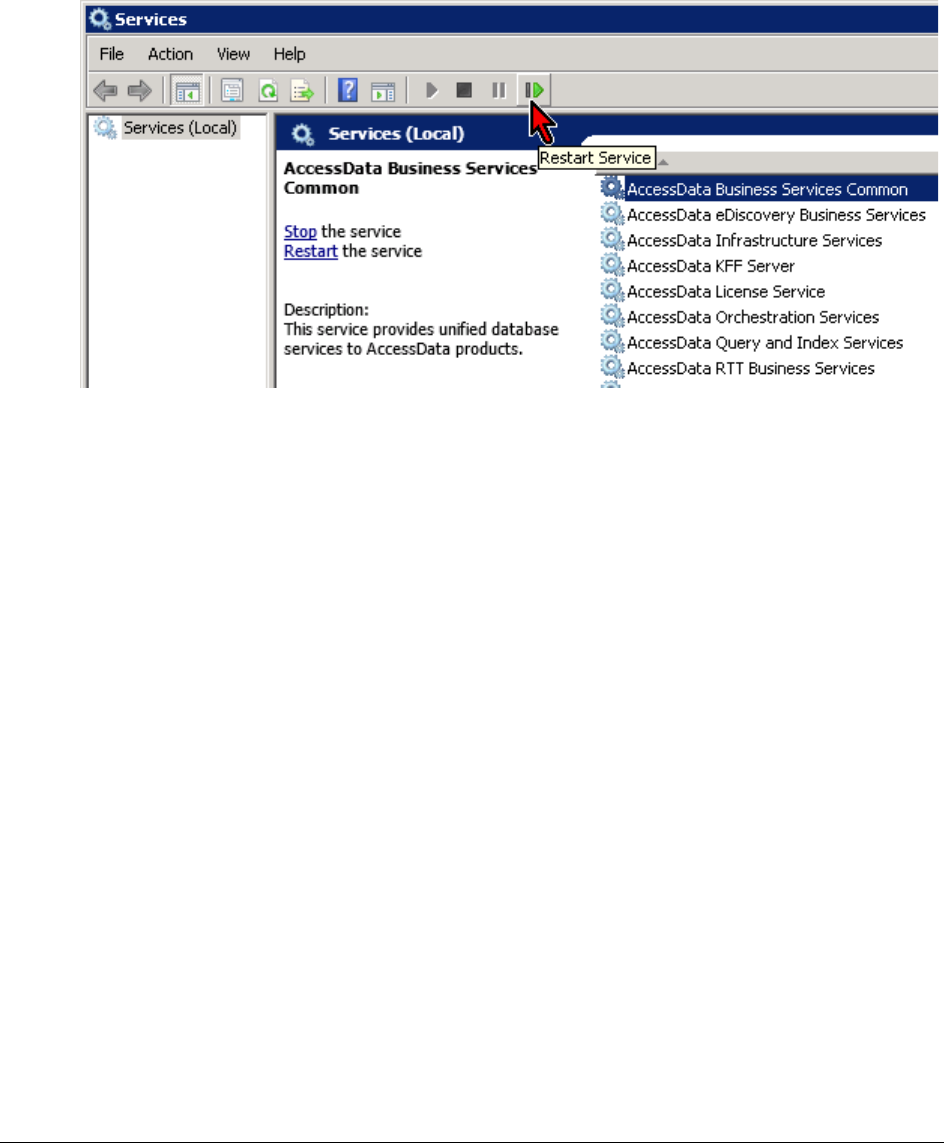
Introduction to Project Review About Date and Time Information | 44
To reset the date format in the application
1. Restart an application service by doing the following:
1a. On the Windows computer running the application, click Start > Run.
1b. Enter services.msc.
1c. Click OK.
1d. From the list of services, select AccessData Business Services Common.
1e. Click Restart Service.
1f. After the service has been restarted, close the Services management console.
2. Stop the IIS Web server so that you can delete cached settings by doing the following:
2a. On the Windows computer running the application, click Start > Run.
2b. Enter cmd.
2c. Click OK.
2d. In the command prompt window, type iisreset /stop and press ENTER; type Y and then press
ENTER.
The Web server is stopped.
2e. Leave this CMD prompt window open so you can re-start IIS later.
3. Delete cached application settings by doing the following:
3a. On the Windows computer running the application, browse to the following folder:
\Windows\Microsoft.NET\Framework64\v4.0.30319\Temporary ASP.NET Files.
3b. While the IIS Web server is stopped, delete the adg.map.web folder.
4. Re-start the IIS Web server by doing the following:
4a. In the command prompt window, type iisreset /start and press ENTER.
4b. After IIS has successfully started, close the CMD prompt window.
5. Close and re-launch the browser running the Web console.

Introduction to Project Review About Date and Time Information | 45
Configuring the Date Format Used in Production Sets and Export Sets
In this version, dates that are in Production Sets and Export Sets do not follow the Windows Regional settings.
Instead, they default to the United States default format.
In order to change the date format in Production Sets and Export Sets, you must change a setting in a
configuration file by doing the following:
1. On the computer running the Summation application, open the folder where the WorkManager service
is installed.
The default location is C:\Program Files\AccessData\eDiscovery\Work Manager.
2. Edit the Infrastructure.WorkExecutionServices.Host.exe.config file.
3. Replace the following keys in the Config section:
-DefaultLoadFileDateFormat
-DefaultLoadFileTimeFormat
-DefaultLoadFileDateTimeFormat
For example, to have dates in the dd-MM-yyyy format, replace the values as follows:
<add key="DefaultLoadFileDateFormat" value="dd-MM-yyyy" />
<add key="DefaultLoadFileTimeFormat" value="" />
<add key="DefaultLoadFileDateTimeFormat" value="dd-MM-yyyy h:mm:ss" />
4. Save the config file.
5. Restart the WorkManager service.

Project Review Page Introducing the Project Review Page | 46
Chapter 4
Project Review Page
Introducing the Project Review Page
You can use the Project Review page to search, analyze, filter, code, annotate, and label evidence for a selected
project. You have access to Project Review for the projects that you have created or that you are associated
with. You can access Project Review by clicking the magnifying glass button next to the project in the Project List
panel.
To access the Project Review page
From the project list on the Home page, click next to the desired project.
See The Project List Panel on page 28.
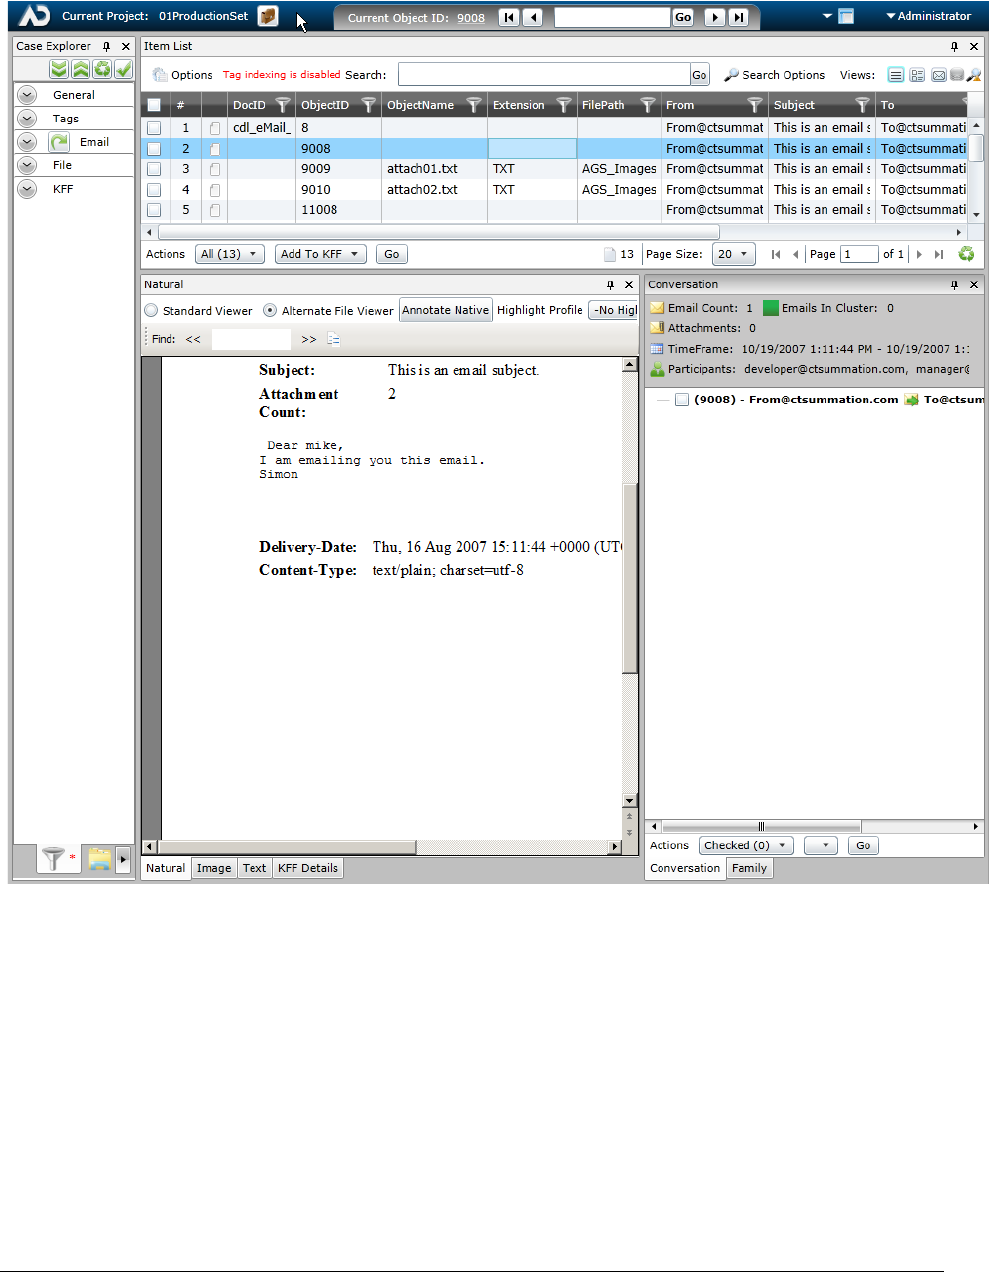
Project Review Page Introducing the Project Review Page | 47
Project Review Page
At the top of the Project Review page is a project bar and below that are multiple panels that are customizable.
Project Review Page Introducing the Project Review Page | 48
Project Bar
The project bar is at the top of the Project Review page.
Elements of the Project Bar
Element Description
Current Project The name of the current project.
Return to Project Management Click this button to return to the Home page.
Current Item ID Displays the DocID, ObjectID, or Transcript name for the item selected
in the Item List grid. You can download the current document if the Item
ID is underlined. Click the number. When the Do you want to open or
save <document> bar appears at the bottom of the menu, either click
Open or Save and save the file.
Go to Doc ID Enter a DocID and click Go to go to that document in the Item List
panel.
You can also enter the DocID to open the native file.
Note: If you processed data using evidence processing, you will need
to put the documents into a Document group in order to use this
feature.
Next and Previous Buttons Click previous page or previous document button to move around in the
Item List panel.
Click next page or next document to move around in the Item List panel.
Layout Button
Expand to manipulate panels in the Project Review. Panels can be
hidden, shown, dragged, and/or docked to customize the Project
Review page for your workflow.
See Customizing the Project Review Layout on page 51.
User Name Displays the name of the currently logged in user and allows you to log
out if desired.
Project Review Page Introducing the Project Review Page | 49
Review Page Panels
The Project Review page is made up of many panels. You select which panels are visible or hidden. The panels
that you can use may depend on the license that you own and the permissions that you have.
You can select which panels to display by doing either of the following:
-Manually selecting panels.
- Using the Layout tool. You can choose pre-defined layouts that display certain panels or you can
customize a layout.
See Customizing the Project Review Layout on page 51.
To manually select panels
1. Open a project in Review.
2. Click the Layouts drop-down.
3. Click Panels.
4. Select the panels that you want to display.
The following table briefly describes each panel that is available.
Panels in the Project Review
Panel Description
Activity Lists the history of actions performed on the selected document.
See The Activity Panel on page 82.
Case Organizer
Details Lets you view and edit the details of Case Organizer objects.
See Using the Case Organizer Details Panel on page 202.
Coding Use to select and edit coding layouts.
See The Coding Panel on page 205.
Confidence Displays Predictive Coding confidence scores.
See Predictive Coding on page 209.
Conversation Displays email conversation threads.
See The Conversation Panel on page 85.
Detail Information The Detail Information contains tabs that allow you to view information about the
selected record.
See Using the KFF Details and Detail Information Panels on page 81.
Exhibits Displays exhibits for the selected transcript.
See The Exhibits Panel on page 183.
Family Lists the family relationships for email documents.
See The Family Panel on page 86.
Image Displays the selected document as an image. You can perform annotations, redactions,
and make notes in this view.
See Using the Image Panel on page 79.
Project Review Page Introducing the Project Review Page | 50
Item List Lists the filtered evidence for the selected project. This panel also includes the search
bar.
See Using the Item List Panel on page 58.
KFF Details Lets you view KFF Details.
See Using the KFF Details and Detail Information Panels on page 81.
Labels Lists available labels in the project to apply to evidence. Also displays the selected label
for the document currently being viewed.
See The Labeling Panel on page 192.
Linked Two types of documents are displayed in this view:
-Documents manually linked to other documents of the same project
-Documents linked to other documents during import
See The Linked Panel on page 88.
Natural This viewer displays a file’s contents as it would appear normally without having to use
the native application.
The first time you use this view, you will need to follow the prompts to install the viewer
application.
See Using the Natural Panel on page 76.
Notes Use to display the notes for the currently selected document.
See The Notes Panel on page 84.
Production Displays the history of production.
See The Production Panel on page 83.
Project Explorer Lets you cull and configure project data.
Contains the following tabs: Facets, Explorer, Tags, Searches, and Review Sets.
See Using the Project Explorer Panel on page 72.
Review Batches Displays review batches. You can check in and check out batches from this panel.
See The Review Batches Panel on page 200.
Search Excerpt Lets you generate and view a list of search excerpts.
See Using the Search Excerpt View on page 108.
Similar Use to set relationships between documents.
See The Similar Panel on page 83.
Text The Text view displays the file’s content as text.
You can configure the text view so that sentences wrap if they are longer than the
panel’s width.
You can also limit how much text is displayed by setting the Page Depth in characters.
See Using the Text Panel on page 80.
Transcript Displays transcripts for the project.
See The Transcript Panel on page 176.
Panels in the Project Review (Continued)
Panel Description

Customizing the Project Review Layout Working with Panels | 51
Chapter 5
Customizing the Project Review Layout
You can customize the Project Review panels for your workflow. Layouts are specific to the logged-in user.
You can save custom layouts for future use.
See Managing Saved Custom Layouts on page 55.
You can customize the layout by doing the following:
-Hiding and Showing Panels (page 51)
-Collapsing and Showing Panels (page 52)
-Moving Panels (page 52)
-Resetting Layouts (page 54)
-Saving Layouts (page 54)
-Managing Saved Custom Layouts (page 55)
Working with Panels
All data in Review is shown in various panels.
See Review Page Panels on page 49.
You can show or hide panels.
Hiding and Showing Panels
You can hide and show panels to fit your needs.
To hide a panel
To hide a panel, do one of the following:
-Click the close button (x) on the panel.
-Click Layout > Panes and uncheck the panel you want to hide.
To show a panel
Click Layout > Panes and check the panel from the list.
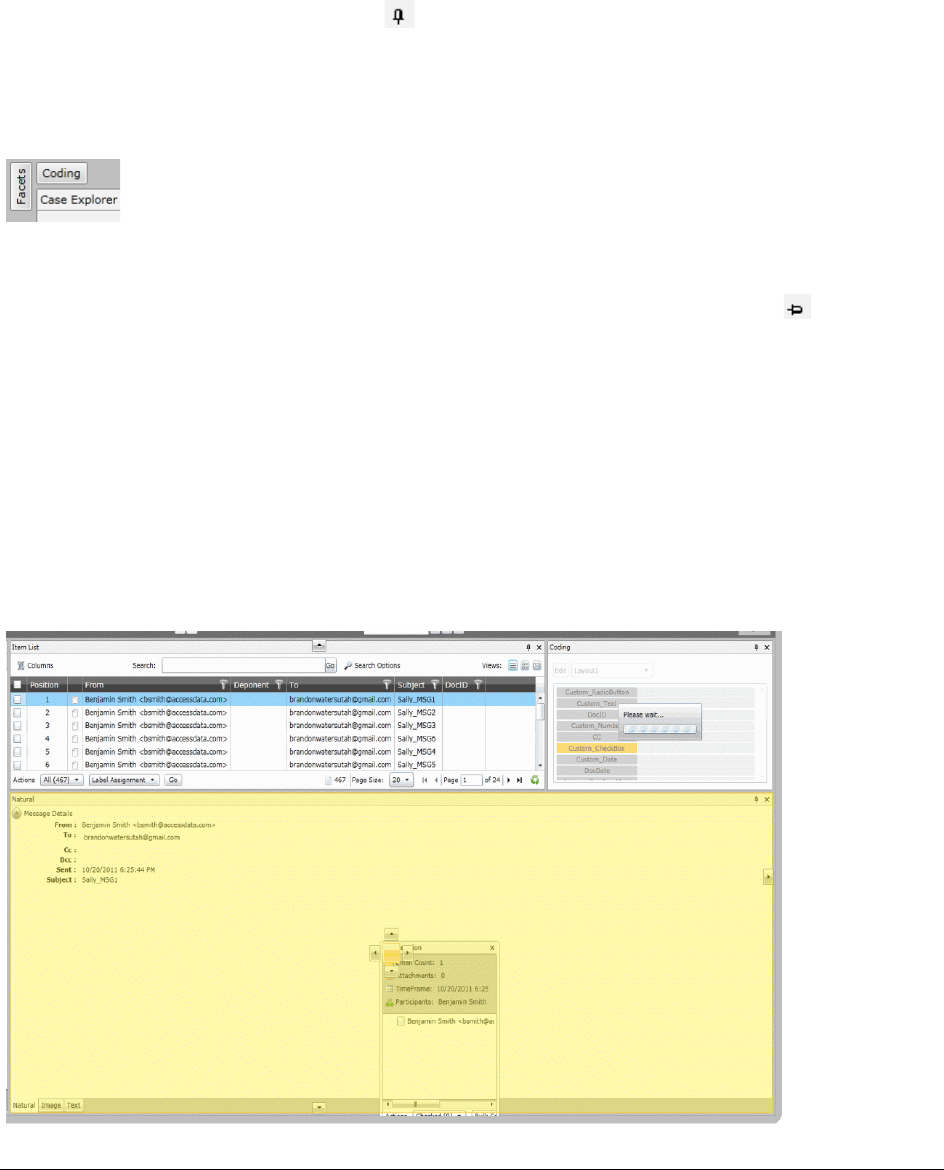
Customizing the Project Review Layout Working with Panels | 52
Collapsing and Showing Panels
You can collapse a panel so that it is still open, but not shown unless you hover your mouse over it. This is useful
for panels that you want to view less frequently.
To collapse a panel
1. In top-right corner of the panel, click .
The panel is collapsed and the name of the panel is displayed in a box on the left side.
If the panel was in the top half of the page, the collapsed panel name is displayed in the top-left corner.
If the panel was in the bottom half of the page, it will be displayed in the bottom-left corner.
Collapsed Panels
2. To view a collapsed panel, mouse over the panel name and the panel will be shown until you move the
mouse away from the panel.
3. To un-collapse a panel, view the panel, and in the top-right corner of the panel, click .
Moving Panels
You can move panels to different locations on the Project Review page. When you move a panel, you can
position it in one of the following ways:
To move Project Review panels
1. Click and drag the panel that you want to move.
Docking guides appear on the page.
Project Review Page with Docking Guides

Customizing the Project Review Layout Working with Panels | 53
2. Place the panel by doing one of the following:
-Floating: Leave the panel floating on top of the page.
-Docking to a location on the page: Dock the panel by dragging the panel to one of the docking
guide arrows and releasing the mouse button.
There are four page docking guides on the outside of the page.
-Docking as a tab on another panel: Drag the panel on top of another panel and onto the center of
the docking cluster and release the mouse button.
There is a cluster of four page docking guides on the panel.
Moving Panels to a New Window
You can move the Natural, Image, Text, and Transcript panels to a new window from the Project Review page.
To move panels to a new window
In the Project Review, expand the Layouts drop-down and select Move Viewers to New Window.
The Natural, Image, and Text panels open in one window with tabs at the bottom so that you can toggle
between views. The transcript panel opens in its own window.
Customizing the Project Review Layout Working with Layouts | 54
Working with Layouts
Selecting a Layout
You can use default layouts and custom layouts that you have saved in Project Review. The following are the
available default layouts:
-Culling Layout: Designed to aid reviewers in culling documents
-Review Layout: Designed to aid reviewers in viewing documents
-Search Layout: Designed to aid reviewers in searching documents
-Transcript Layout: Designed to aid reviewers in working with transcripts
-CIRT Layout: Designed to aid reviewers in working with KFF and Security jobs including Cerberus,
threat analysis. Displays the Detail Information panel.
To select a layout
1. Open a project in Review.
2. Click the Layouts drop-down.
3. Click Layouts.
4. Select the layout that you want to use.
Default layouts appear above the line and custom layouts appear below the line.
Resetting Layouts
If you have hidden, collapsed, or moved panels, you can return to the original layout.
To reset a layout
Select Layout > Reset Layout.
If you have modified a custom layout, it will reset to the last saved state.
Saving Layouts
If you have customized the default layout, you can save it as a custom layout. You can save multiple layouts.
To create a second custom layout, you must first return to a default layout, modify it, and then save it. If you
make changes to a custom layout, and save it, it will save it as an update.
To save a layout
1. Customize the layout.
2. Click Layout > Save Layout.
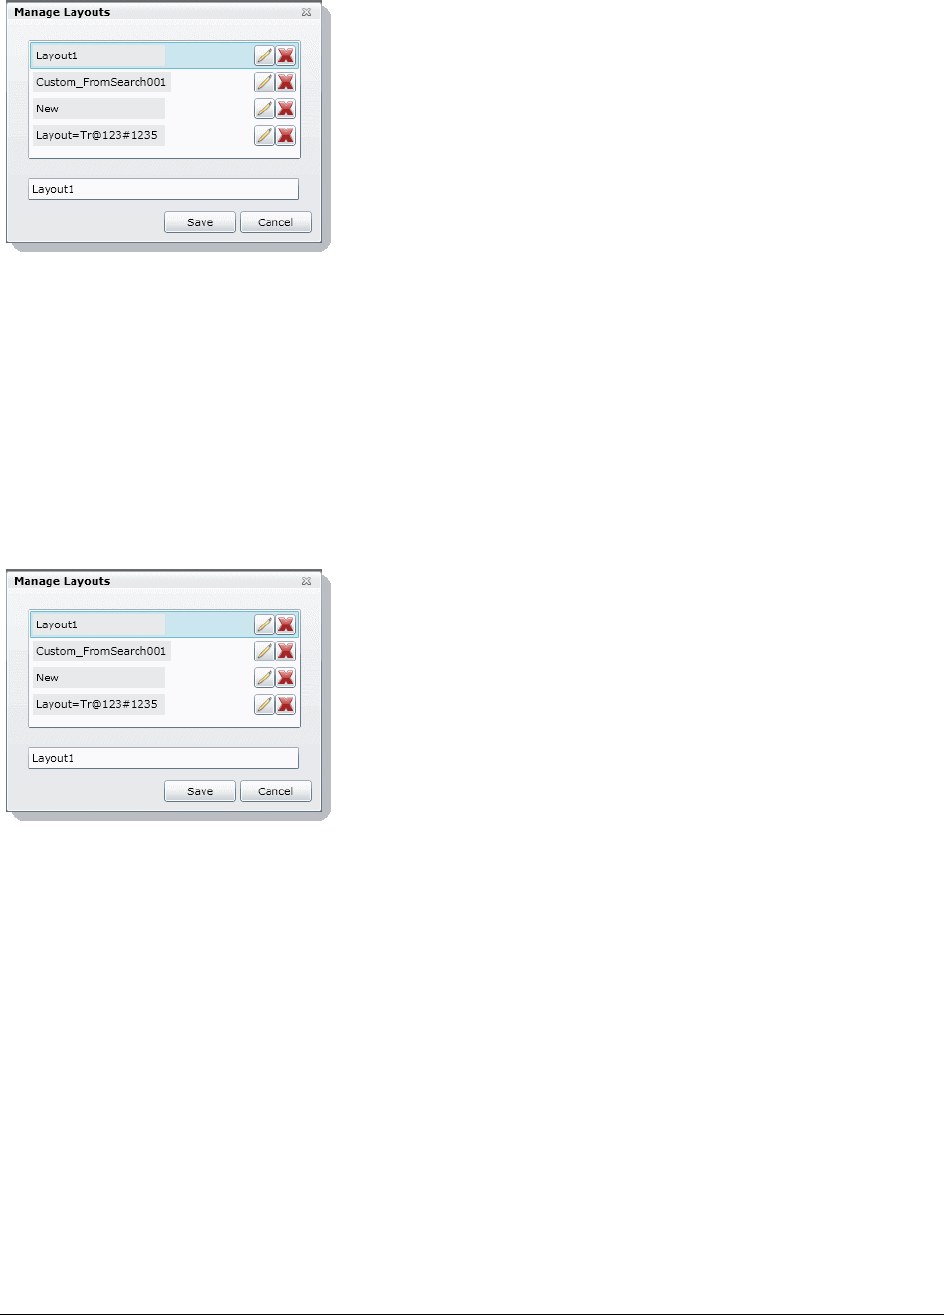
Customizing the Project Review Layout Working with Layouts | 55
Manage Layouts Dialog
3. Enter the name of the layout and click Save.
Managing Saved Custom Layouts
You can rename and delete custom layouts that you have saved. You cannot delete the currently selected layout
using the Manage Layouts dialog.
To manage a saved custom layout
1. Select Layout > Manage Layouts.
Manage Layouts Dialog
2. To rename a layout, select the layout, and enter a new name.
3. To delete a layout, click the X next to the layout, and click OK.
4. Click Save.
Viewing Data Viewing Data in Panels | 56
Chapter 6
Viewing Data
Viewing Data in Panels
Using Project Review, you can select and examine your data in multiple ways. You can use various panels to
examine the data.
You use the Panels List to select which panels to display. The panels that you can use may depend on the
license that you own and the permissions that you have.
See Review Page Panels on page 49.
Note: Actions completed in a specific panel may affect search results in that panel. Always execute a previous
search in a panel if you have changed the scope of what you are examining in the panel. For example, if
you change the page depth of a document in the Text panel, you should execute any previous searches in
that panel after changing the page depth.
This chapter describes how to use the following panels to view data in Project Review:
Data Viewing Panels
Panel Category Panel Descriptions
Project Data Panels Lets you view and manage the data in your project.
Item List Provides a list of evidence items in your project. This list may
be filtered.
See Viewing Documents in the Item List Panel on page 59.
Project Explorer Lets you cull and configure project data.
Contains six tabs: Facets, Explorer, Tags, Searches, and
Review Sets.
See Using the Project Explorer Panel on page 72.
File Data Panels Lets you view the data about the selected document.
Document Viewing
Panels Lets you view document data.
See Using Document Viewing Panels on page 76.
-See Using the Natural Panel on page 76.
-See Using the Image Panel on page 79.
-See Using the Text Panel on page 80.
-See Using the KFF Details and Detail Information Panels
on page 81.
Viewing Data Viewing Data in Panels | 57
Note: The language identification feature only works in the following categories: documents, spreadsheets, and
email.
Activity Lists the history of actions performed on the selected
document.
See The Activity Panel on page 82.
Conversation Displays email conversation threads.
See The Conversation Panel on page 85.
Family Lists the family relationships for email documents.
See The Family Panel on page 86.
Linked Two types of documents are displayed in this view:
-Documents manually linked to other documents of the
same project
-Documents linked to other documents during import
See The Linked Panel on page 88.
Notes Use to display the notes for the currently selected document.
See The Notes Panel on page 84.
Production Displays the history of production for the project.
See The Production Panel on page 83.
Similar Use to set relationships between documents.
See The Similar Panel on page 83.
Data Viewing Panels
Panel Category Panel Descriptions
Viewing Data Using the Item List Panel | 58
Using the Item List Panel
The Item List panel lists the filtered evidence for the selected project. This panel also includes the search bar
and the ability to perform mass actions.
Item List Panel
Elements of the Item List Panel
Element Description
Options Click to use the following options in the Item Grid:
-Cache: See Caching Filter Data on page 138.
-Columns: See Selecting Visible Columns on page 61.
-Quick Columns: See Using Quick Columns on page 62.
-Quick Filters: See Using Quick Filters on page 63.
-Visualization: See Using Visualization on page 142.
Search field Enter search terms to perform a quick search of documents checked in the Document
Tree. Results appear in the Item Grid.
Go button Click to execute your quick search.
Viewing Data Using the Item List Panel | 59
Viewing Documents in the Item List Panel
The Item List panel displays documents in the project.
By default, items are displayed using the Grid view. You can use different Views.
See Using Views on page 63.
To view documents in the Item List panel
1. From the project list on the Home page, click next to the desired project to enter Project Review.
2. By default, the Item List and Project Explorer panels are displayed.
3. Do the following to determine the items displayed in the Item List:
-In the Item List panel, use the Options to use columns, Quick Filters, and Visualization.
See Elements of the Item List Panel on page 58.
-In the Project Explorer panel, use the Facets, Explore, Tags, or Review Sets tabs.
See Using the Project Explorer Panel on page 72.
Search Options Select to perform the following actions:
-Clear Searches
-Advanced Search
-Expansion
-Settings
-Search Report Options
Views The following views are available: See Using Views on page 63.
-Grid View: See Using the Grid View on page 64.
-Summary View: See Using the Summary View on page 65.
-Timeline View: See Using the Timeline View on page 66.
-Conversation View: See Using Conversation View on page 67.
-Thumbnail View: See Using the Timeline View on page 66.
-Not Cached: See Caching Filter Data on page 138.
Actions Select the mass action that you want to perform on the documents in the Item List.
See Performing Actions from the Item List on page 69.
Actions Go Button
(bottom of panel) Click to execute the selected mass action.
Page Size Select the number of documents you want visible in the Item List.
Page Lists the page you are on and the number of pages. Click the next arrow to see the next
page.
(Refresh) Click the refresh button to update the Item List.
Elements of the Item List Panel (Continued)
Element Description

Viewing Data Using the Item List Panel | 60
Using Columns in the Item List Panel
About Columns
You use columns to display specific data properties about evidence items.
You can sort, filter, customize, and reposition the columns of information in the Item List panel in Grid.
See About Content in Lists and Grids on page 33.
There are many pre-configured columns that you can use.
Project managers can also create custom columns in the Custom Fields tab on the Home page.
See Configuring Custom Fields in the Admin Guide.
About Pre-existing Columns
There are many pre-existing columns. Some provide basic information. For example, the following general
columns are displayed by default:
-DocID - Documents are given a DocID when data is added to a document group. Documents are added
to a document group either when data is imported to a project or when document groups are created
manually by a project manager. A document may not be assigned more than one DocID number.
-ObjectID - Add documents are given a DocID when data is added to the project.
-ObjectName
-ObjectType and ObjectSubType (see Object Types page 140)
-[File] Extension
-FilePath
-[Email] From
-[Email] Subject
-[Email] To
-[Email] ReceivedDate
-LogicalSize
-AccessedDate
Some columns provide information about the file. For example:
-ActualFile
-Archive
-ArchiveType
-Attachment
-BadExtension
-Decrypted
-EmailDirectAttachCount - Shows the direct email attachments to an email. It does not display children
attachments of the direct attachments.
-EMailMessage
-Encrypted

Viewing Data Using the Item List Panel | 61
-FromEmail
-FromMSOffice
-GraphicFile
-HasTrackChanges (for Office files)
-Person
-System
Some columns provide specific data about certain file types. For example:
-HasTrackChanges lets you to sort and filter the following documents that have Track Changes enabled:
Word documents (This currently only applies to DOCX document formats)
Excel documents (.XSLX and .XLS documents)
-EXIF geolocation data (See Using Geolocation Columns in the Item List on page 164.)
- OLESubItem
-PSTFilePath and PSTStoreID
Some columns display date related to certain product functions. For example:
-BatesNumber
-Hash values
-ProductionDocID
-KFF
Selecting Visible Columns
You can select the columns that you want visible in the Grid view.
You can also select Quick Columns to use pre-define column templates.
Only the columns and fields related to the features of your licensed product are displayed. For example, columns
related to Resolution1 product features, such as EVTX data, are not shown in Summation.
See Using Quick Columns on page 62.
To select visible columns
1. In the Item List panel in Grid view, click the Columns button and select Select
Columns.
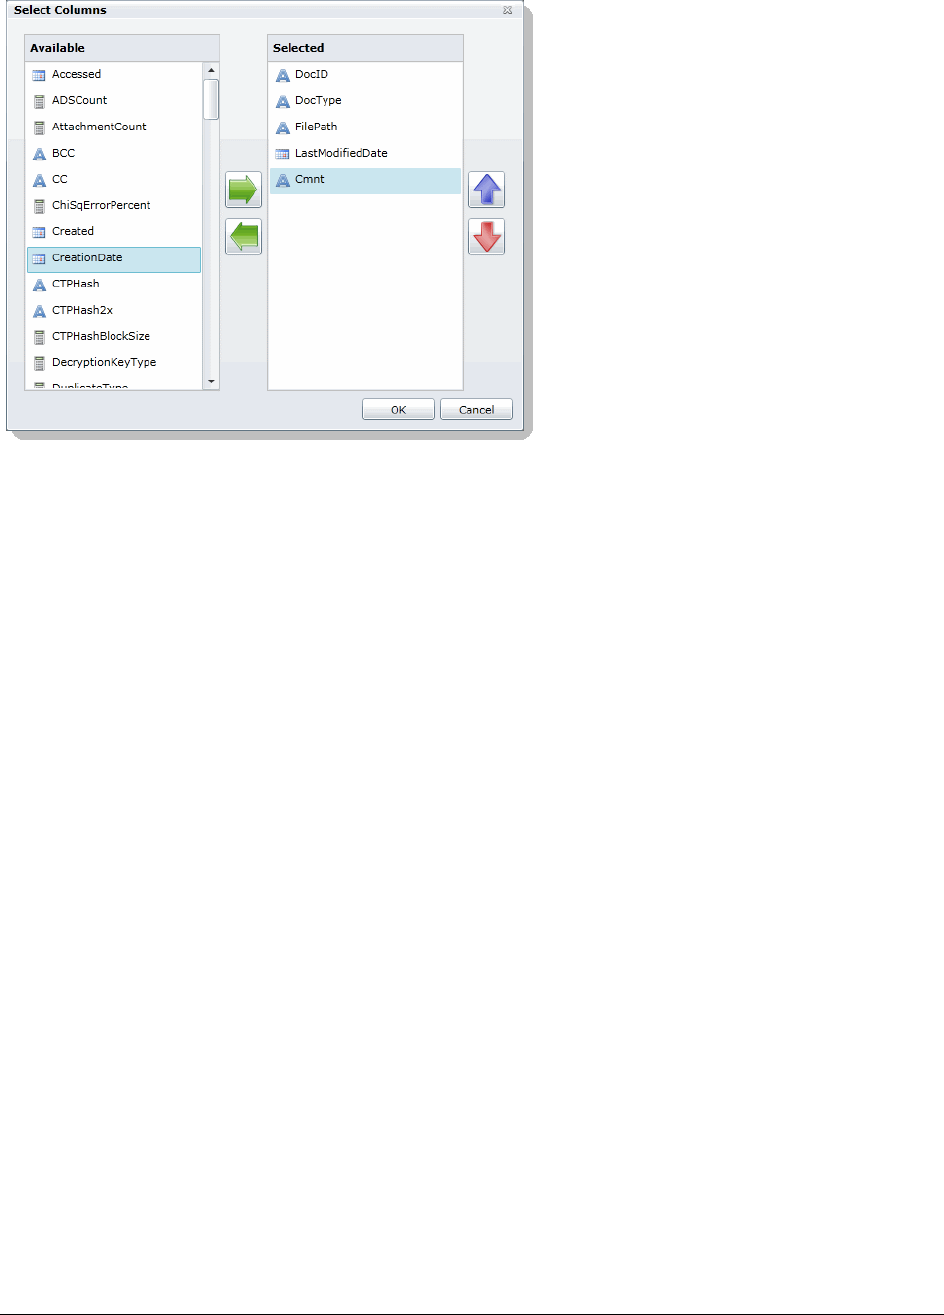
Viewing Data Using the Item List Panel | 62
Select Columns Dialog
2. Click the right arrow to add columns to the Grid and the left arrow to remove them from the Grid.
3. Organize the order of the columns by clicking the up and down arrows.
Columns Tips
-The FilePath column has been changed to display the heading Path in the Item List. This allows the
column to display any path information, not just file paths. Searches for this value should be created by
specifying Path instead of FilePath.
Using Quick Columns
You can use Quick Columns to quickly display columns related to certain types of data. This allows you to make
relevant columns visible without having to manually select them.
The following standard pre-configured Quick Columns are available to choose from.
-Case Organizer
-Document
-eDocs
-eMail
-KFF
-Notes
-Scanned Paper
-Transcripts
Depending on the license that you own, you may have more. For security related products, see the Viewing
Security Data chapter of the Admin Guide.
Viewing Data Using the Item List Panel | 63
To apply Quick Columns
1. For a project, enter Review.
2. Click Options > Quick Columns.
3. Select the Quick Columns that you want to use.
The selected Quick Column will be designated with a check.
4. To remove a Quick Column, select it again and the check will be cleared.
Using Quick Filters
The Item List panel includes Quick Filters that you can use to quickly refine the list of evidence.
You can quickly hide or show the following types of data.
Depending on the license that you own, you may have more. For security related products, see the Viewing
Security Data chapter of the Admin Guide.
Using Views
You can use different pre-configured views to help you review data.
-Grid View: See Using the Grid View on page 64.
-Summary View: See Using the Summary View on page 65.
-Timeline View: See Using the Timeline View on page 66.
-Conversation View: See Using Conversation View on page 67.
-Thumbnail View: See Using the Thumbnail View on page 68.
-Not Cached
Whenever you change views, the File List is refreshed.
You can perform actions on the documents in the Item Grid.
See Performing Actions from the Item List on page 69.
Quick Filters
Filter Description
Hide/Show Duplicates By default, the Hide Duplicates Quick Filter is set and duplicate files are hidden.
To view duplicate files, change to Show Duplicates.
Hide/Show eDiscovery
Refinement By default, the Hide eDiscovery Refinement Quick Filter is set.
Enabling this shows extra files that may not be important. For example, this
includes embedded files, such as XML, RELS, and graphics that are embedded
in office documents.
Hide/Show Folders By default, the Hide Folders Quick Filter is set and folder items are hidden. To
view folder items, change to Show Folders..
Hide/Show Ignorables By default, the Hide Ignorable Quick Filter is set and KFF Ignorable files are
hidden. To view Ignorable files, change to Show Ignorables.
See About KFF on page 281.
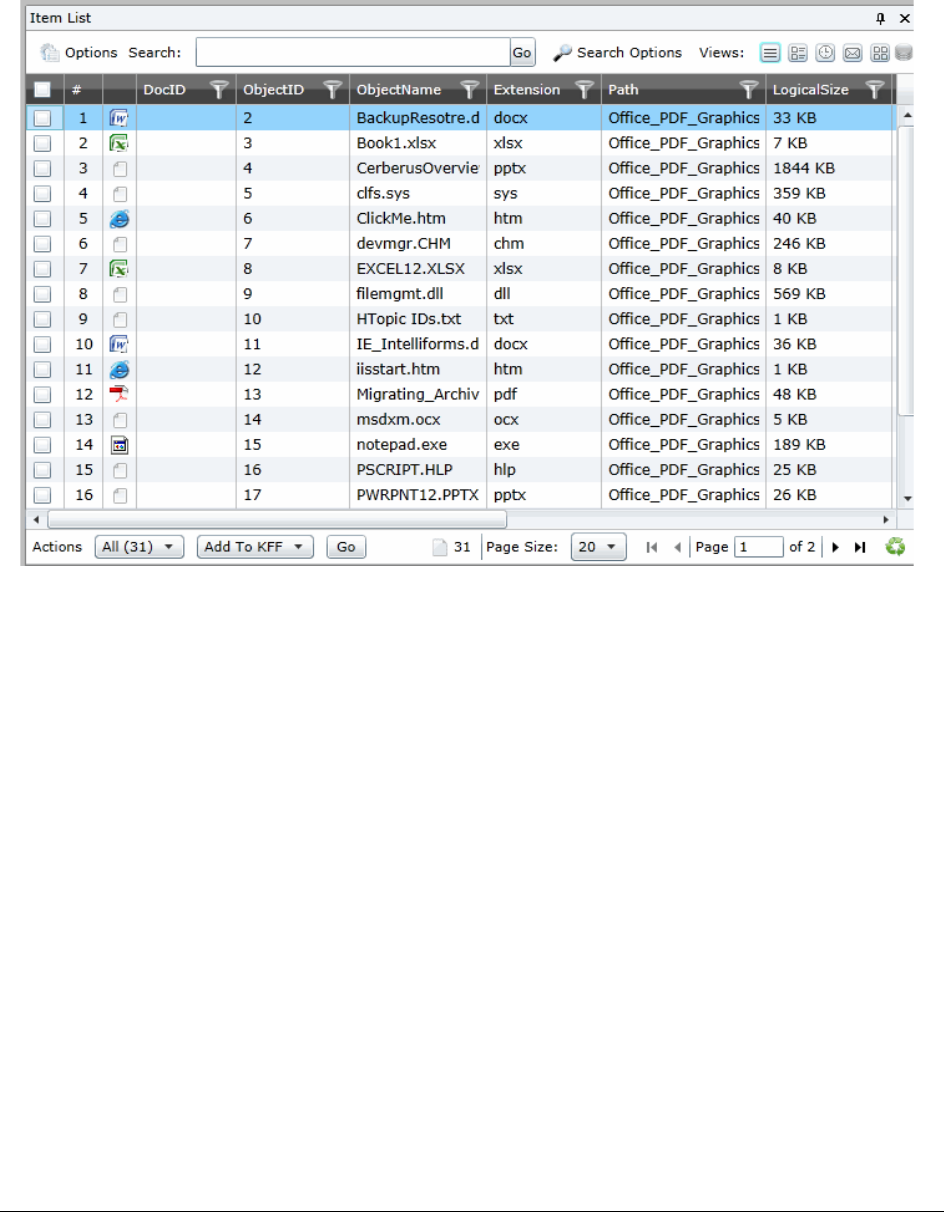
Viewing Data Using the Item List Panel | 64
Using the Grid View
The default view in the Item List panel is the grid view. Grid view is a grid that displays each document.
Grid View
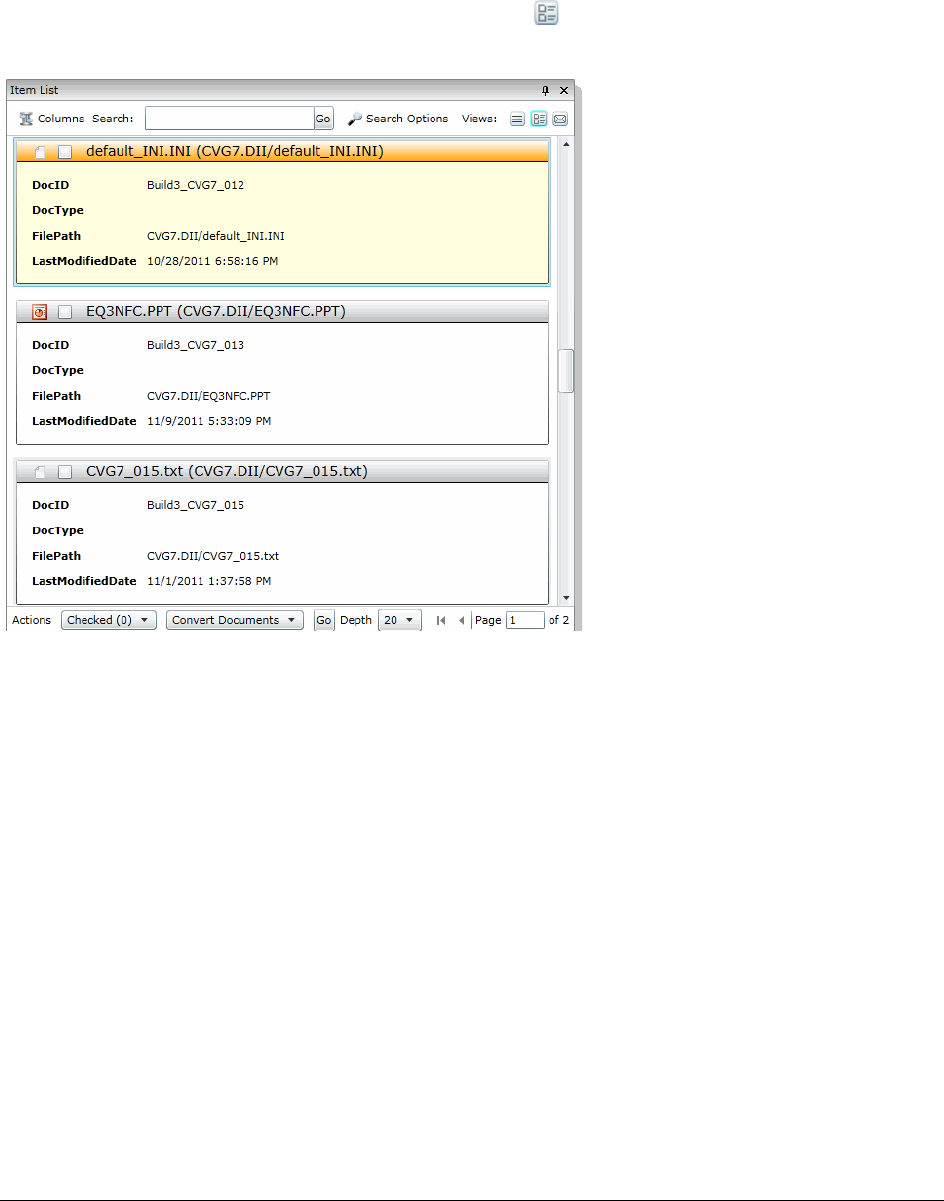
Viewing Data Using the Item List Panel | 65
Using the Summary View
The Summary view displays a detail of the documents.
To access Summary view
In the Item List panel, click the Summary View button .
Summary View
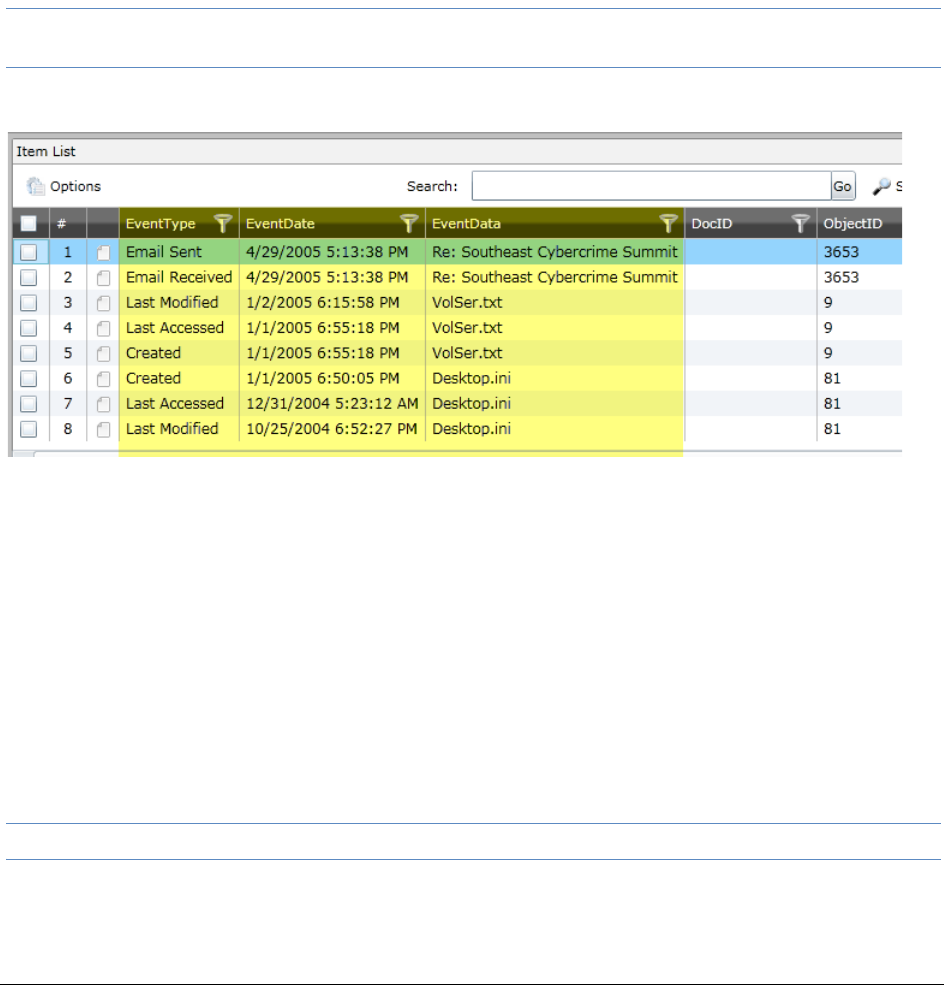
Viewing Data Using the Item List Panel | 66
Using the Timeline View
This view lets you view file actions and the date and time that those actions took place. You can view the
following file action information:
-File (Created, Last Modified, Last Accessed)
-Registry (Modified)
-Event Log (Event Created)
-Email (Sent and Received)
-Process (Start time)
-Queried events (see the Admin Guide)
Each action is listed on it own row in the list.
Note: You can configure the format that dates are displayed in. SeeConfiguring the Date Format Used in
Review page 41
The Timeline View is an extension of the default Grid View with special event columns data added.
The following columns are added:
-EventType - Displays the type of action (created, last accessed, and last modified)
-EventDate - Displays the date and time of the file action.
-EventData - Displays data about the item that evoked the timeline event. For example:
If the event was file-related, the name of the file is displayed.
If the event was process-related, the name of the process is displayed.
If the event was web-related, the name of the URL is displayed.
If the event was email-related, the email subject is displayed.
If the event is from an EVTX file, the event data xml is displayed.
When you open the Timeline View, any other columns that you had configured for the Grid View are maintained.
Note: The ActionDate and ActionType columns are only available in the Timeline View.
If you perform a search or filter in the Grid View, and then change to the Timeline View, only the results of the
search or filter are in the list.
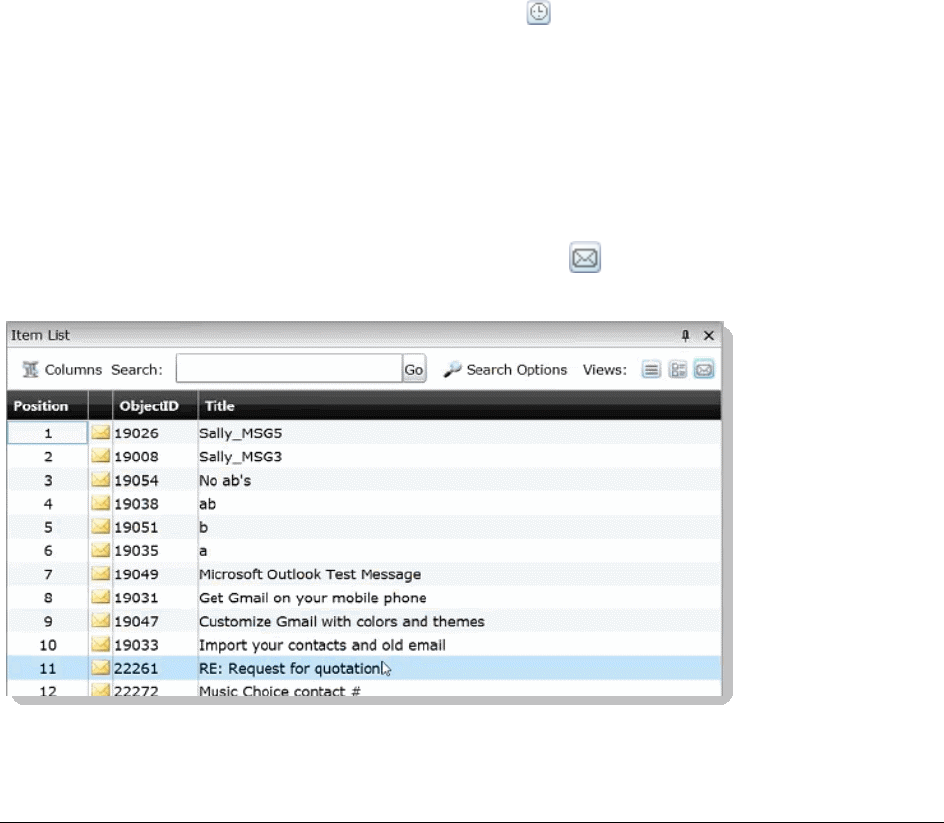
Viewing Data Using the Item List Panel | 67
A difference between the normal Grid View and the Timeline View is that the Timeline View displays multiple
rows for the same item (ObjectID). Each row will have a different action type but have the same Object ID.
Depending on your data and how your list is sorted, rows for the same file may be on different pages. When you
check an item to perform an action on it, all rows related to ObjectID file are also checked.
From the Timeline View, you can do the following:
-Sort on one or more columns including the ActionDate and ActionType columns.
-Use filters on any column.
-Add columns to the view. (Any added columns persist when returning to the Grid View.)
-Perform mass actions on items in the list.
See Performing Actions from the Item List on page 69.
-Export the list to CSV.
You will get a separate row in the CSV for every Action Type.
See Exporting a List to CSV on page 69.
-You can view, filter, and sort events related to modifying registry keys
-You can view, filter, and sort log2timeline events that come from Add Evidence and Collection jobs.
To access the Timeline view
In the Item List panel, click the Timeline View button .
Using Conversation View
Conversation view displays all the conversation threads for emails.
To access the conversation view
In the Item List panel, click the Conversation View button .
Conversation View

Viewing Data Using the Item List Panel | 68
Using the Thumbnail View
You use the Thumbnails View to see rows of thumbnail images of the graphic files or video files in your project.
See Viewing Graphics and Videos on page 91.
If your project has graphics, such as JPEG, GIF, or PNG, thumbnails of those files are automatically created
during processing.
Note: Image thumbnails are generated only when using the Standard and Forensic processing mode.
To view thumbnails for video files, you must first enable the Generate (Video) Thumbnails processing option
when you create a project. You can use the Thumbnail View to rapidly scan through the visual contents in a
video file, without having to launch and watch the entire video.
See Evidence Processing and Deduplication Options on page 210.
To access the Thumbnail view
In the Item List panel, click the Thumbnail View button .
When you click a thumbnail, the item is displayed in the Natural panel.
You can use the slider to change the size of the displayed thumbnail.
Viewing Data Using the Item List Panel | 69
Performing Actions from the Item List
You can perform mass actions on items in the list.
There are two drop-downs for performing actions.
-In the first Actions drop-down, you specify whether you want to perform an action on all of the objects in
the grid or only the checked objects.
-In the Action-type drop-down, you select the action that you want to perform.
Exporting a List to CSV
You can export the Item List to a CSV file. Any field that is available in the list can be exported to a CSV file.
Once exported, you download the exported CSV file from the Work List on the Home page.
To perform an Export to CSV action
1. Identify the files that you want to perform the action on by doing one of the following:
-In the first Action drop-down, click All.
-Check individual files, and then in the first Action drop-down, click Selected Objects.
2. In the second Action drop-down, click Export List to CSV.
3. Click Go.
Actions You Can Perform in the File List
Task Link
Add to KFF See Adding Hashes to Hash Sets Using Project Review on page 315.
Add to Summaries See Using the Case Organizer on page 197.
Bulk Coding See Coding Multiple Documents on page 207.
Delete Evidence See Deleting Documents on page 92.
Export List to CSV See Exporting a List to CSV on page 69.
Global Replace See Using Global Replace in the Searching documentation.
Imaging See Imaging Documents on page 184.
Label Assignment See Applying Labels to Multiple Documents on page 194.
Local Bulk Print See Local Bulk Printing on page 227.
Network Bulk Print Reviewers with the Imaging permission can print multiple records.
See Bulk Printing on page 226.
OCR Documents See Using OCR on page 70.
View Transcripts Click to view selected transcripts. Only transcripts will be opened in a separate
window. See Viewing Transcripts on page 177.
ThreatLookup (Resolution1 Platform and Resolution1 CyberSecurity only) Allows you to execute
a ThreatLookup scan against the data to scan for threats. See the ThreatLookup
chapter in the Admin Guide.

Viewing Data Using the Item List Panel | 70
To view the status of an Export to CSV job
1. Click Return to Project Management.
2. For the project, click Work Lists.
3. Under Job Type, view the ExportToCSV job.
To download the CSV file
1. On the Work List page, select the ExportToCSV job that you want to download the file for.
2. In the Filter Options pane, click Download.
3. Select to Open or Save the file.
4. If you save the file, go to your Downloads folder to access the file.
Using OCR
You can create a job to OCR documents if you did not select to have this done during processing.
About Optical Character Recognition (OCR)
Optical Character Recognition (OCR) is a feature that generates text from graphic files and then indexes the
content so the text can be searched, labeled, and so forth.
OCR currently supports English only.
Some limitations and variables of the OCR process include:
-OCR can have inconsistent results. OCR engines have error rates which means that it is possible to have
results that differ between processing jobs on the same machine with the same piece of evidence.
-OCR may incur longer processing times with some large images and, under some circumstances, not
generate any output for a given file.
-Graphical images that have no text or pictures with unaligned text can generate illegible output.
-OCR functions best on typewritten text that is cleanly scanned or similarly generated. All other picture
files can generate unreliable output.
-OCR is only a helpful tool for you to locate images with index searches, and you should not consider
OCR results as evidence without further review.
-You can only perform OCR from the Item List on .TIFF and .PDF files. If you attempt to OCR a document
that is not a .TIFF or a .PDF, the application skips the document. The action does not error, and only
those documents that had OCR processing appear in the processed count when you view the OCR job in
the Work List.
-Documents that have already been processed for OCR do not process again.
-Documents imported with the @O token cannot be processed for OCR. The OCR tab displays filtered
text.
Viewing Data Using the Item List Panel | 71
Performing an Optical Character Recognition (OCR) Action
To perform an OCR action
1. Identify the files that you want to perform the action on by doing one of the following:
-In the first Action drop-down, click All.
-Check individual files, and then in the first Action drop-down, click Selected Objects.
2. In the second Action drop-down, click OCR Documents.
3. Click Go.
About Viewing Optical Character Recognition (OCR) Jobs
After performing an OCR action you can view the the status of the OCR job.
To view the status of an OCR job
1. Click Return to Project Management.
2. For the project, click Work Lists.
3. Under Job Type, view the OCR Documents job.
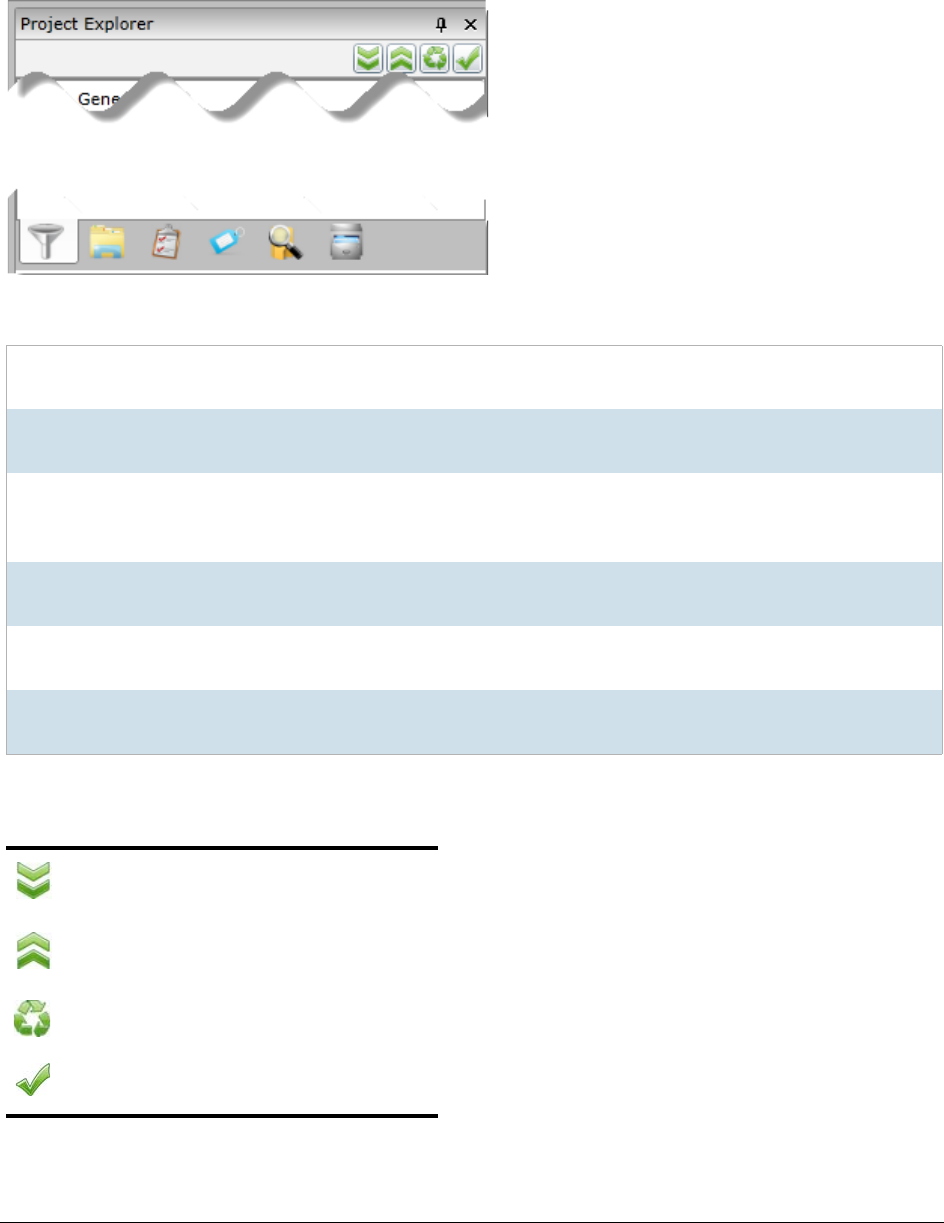
Viewing Data Using the Project Explorer Panel | 72
Using the Project Explorer Panel
The Project Explorer provides tools to help you organize and cull your data.
The Project Explorer panel has the following tabs:
In the project Exporer, you use the following icons:
Facets This is the default tab and lets you use facets to cull your data.
See Filtering Data in Case Review on page 124.
Explore This can be used to organize cull documents.
See The Explore Tab on page 73.
Navigation This lets you specify the scope of evidence that you want to view in the Item List panel.
(Not available in all products)
See The Navigation Tab on page 74.
Tags This lets you manage and view the different types of tags.
See Applying Tags on page 190.
Searches This let you view searches that you have run.
See Introduction to Searching Data on page 95.
Review Sets This lets you manage and view Review Sets.
See Managing Review Sets on page 230.
Expand the items in the list.
Collapse the items in the list.
Reset the selections.
Apply the selections to the Item List.
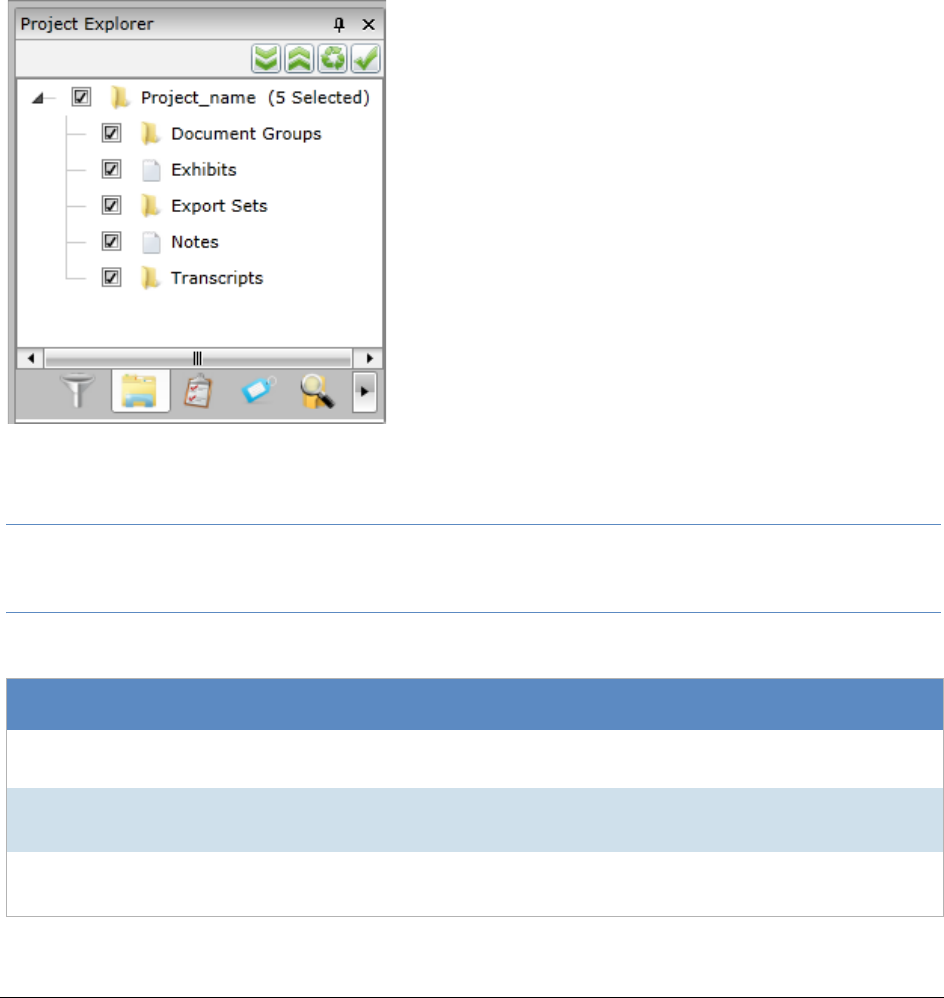
Viewing Data Using the Project Explorer Panel | 73
The Explore Tab
The Explore tab in the Project Explorer panel can be used to cull documents by the following items:
-Document Groups
-Exhibits
-Export Sets
-Notes
-Production Sets
-Transcripts
Explore Tab
When you check an item in the document tree, then click the Apply icon, all documents in that category will be
included in your search query.
Note: If you check only the parent node, you will not get any documents included in the search. You must select
one or more of the child nodes (Document Groups, Production Sets, Transcripts, Notes, or Exhibits) in
order to return results.
Elements of the Document Tree
Element Description
Document Groups Check to include document groups in your search. Right-click to create document
groups.
Exhibits Check to include exhibits in your search.
See Working with Transcripts and Exhibits on page 173.
Exports Sets Check to include export sets in your search.
See Creating Export Sets on page 260.

Viewing Data Using the Project Explorer Panel | 74
The Navigation Tab
Use the navigation panel to specify the scope of evidence that you want to view in the Item List panel of the
Project Review.
Navigation Panel
Notes Check to include notes in your search.
See The Notes Panel on page 84.
Production Sets Check to include Production Sets in your search. Right-click to create Production Sets.
See Creating Production Sets on page 241.
Transcripts Check to include transcripts in your search. Right-click to create transcript groups,
upload transcripts, update transcript, and upload exhibits.
See Working with Transcripts on page 173.
Elements of the Navigation Panel
Element Description
Navigation Tree
Button
Select this button to select the scope of evidence from among the following:
-Jobs
-Groups
-People
-Computers
-Shares
-Mobile
Elements of the Document Tree
Element Description

Viewing Data Using the Project Explorer Panel | 75
Jobs Button Click to select a scope of evidence from the jobs in the project.
Groups Button Click to select a scope of evidence from the groups in the project.
People Button Click to select a scope of evidence from the people in the project.
Computers Button Click to select a scope of evidence from the computers in the project.
Shares Button Click to select a scope of evidence from the network shares in the project.
Mobile Button Click to select a scope of evidence from the mobile devices in the project.
Apply Button Click to apply the scope that you selected. Results appear in the Item List panel.
Elements of the Navigation Panel
Element Description
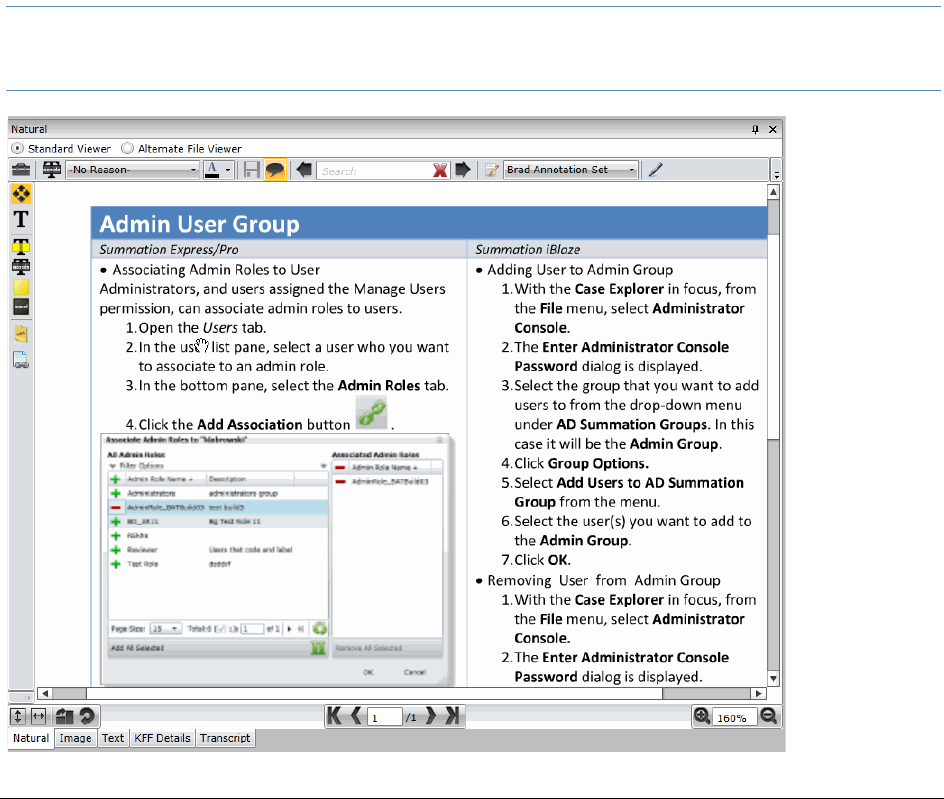
Viewing Data Using Document Viewing Panels | 76
Using Document Viewing Panels
You can use various panels to view document data.
See Viewing Data in Panels on page 56.
You can use the following panels:
-See Using the Natural Panel on page 76.
-See Using the Image Panel on page 79.
-See Using the Text Panel on page 80.
-See Using the KFF Details and Detail Information Panels on page 81.
Using the Natural Panel
You can use the Natural Panel to view, annotate, and redact documents in your project.
The first time you use this, you will need to follow the prompts to install the viewer application. When Internet
Explorer displays a message that it has blocked a pop-up, select Always allow from the Options for this site
pull-down.
Note: The viewer application in this version of the software has been updated. Even if you have already
installed Native Viewer to use in earlier versions of the software, you will need to uninstall the Native
Viewer, and then reinstall at the prompts.
Viewing Data Using Document Viewing Panels | 77
To view documents in the Natural panel
1. In Project Review, select a file in the Item List panel.
2. Click the Natural tab.
If the Natural panel isn’t showing, select the panel from the Layouts drop-down.
Using the Standard Viewer and the Alternate File Viewer
The Natural panel has two viewers that have different functionality:
-Standard Viewer
-Alternate File Viewer
Both of these viewers are designed to show documents as they would appear natively.
Elements of the Natural Panel
Element Description
Standard Viewer Lets you view a AccessData-generated SWF version of the document that lets you
do the following:
-View the document as it appears in its native format
-Edit the document with annotation tools
See Using the Standard Viewer and the Alternate File Viewer on page 77.
See About Annotating Tools on page 217.
Alternate File Viewer Uses INSO viewer technology that lets you view the document as it appears in its
native format.
This format has some limitations on the data that can be displayed. In some cases
the Standard Viewer has greater functionality.
See Using the Standard Viewer and the Alternate File Viewer on page 77.
Annotate Native Click to annotate the native document. A new version of the document will be
created in SWF format. Check the progress of the image being created in the Work
List of the Home Page.
See Using the Standard Viewer and the Alternate File Viewer on page 77.
Create Image Click to create an image of the native document. An image of the document will be
created. Check the progress of the image being created in the Work List of the
Home Page.
Highlight Profile Select a predefined highlight profile to apply to the document.
Find Enter a word or phrase to find in the document. The term highlights in the panel. You
do not need to enter the whole word or phrase. You can begin to type the first few
letters of the word and the pane highlights the first word that matches the typed
letters. For example, typing “Glo” highlights the word “Global.”
To navigate from one highlight to the next, use the arrow keys.
Note: You cannot navigate highlighted terms displayed by a highlight profile.
Copy Selected
Text
Enter a word or phrase to find in the document.

Viewing Data Using Document Viewing Panels | 78
The most basic viewer is the Alternate File Viewer, which used to be called the Natural View or the INSO viewer.
This viewer uses INSO viewer technology to display the content of a document as it would in its native
application.
Note: The following file types do not display in the Alternate File Viewer: 3G2, 3GP, 7ZIP, AD1, AIF, ASF, AVI,
ASX, DBX, DD, DMG, E01, EX01, FLAC, FLV, GZIP, JAR, L01, M3U, M4A, M4V, MID, MKV, MOV, MP3,
MP4, MPA, MPG, NSF, OGG, OST, PST, RA, RAR, RM, SRT, SWF, TAR, VOB, WAV, WMA, WMV, WTV,
ZIP, and ZIPX. Also, files over 50 MB will not display. However, depending upon the options that you
select, these files will be processed.
The more advanced viewer is the Standard Viewer, which used to be called the Edit or ADViewer. This viewer
lets you view an AccessData-generated SWF version of the document that lets you do the following:
-View the document as it appears in its native format
-Edit the document with annotation tools (See About Annotating Tools on page 217.)
However, in order to view content in the Standard Viewer, a document must first be converted to a format that
can be annotated or redacted.
See About Generating SWF Files for Annotating on page 215.
In some cases the Standard Viewer has advanced viewing capabilities. For example, if a Word document has
Track Changes enabled, this viewer can show the formatted changes, where as the Alternate File Viewer
cannot.
AccessData converts documents into an Adobe’s SWF file format for viewing and editing. As a result, the
Standard Viewer will only display files that have been converted to SWF.
If a SWF file is not available, the contents of the file will be displayed using the Alternate File Viewer.
Workflow for the Standard Viewer and the Alternate File Viewer
-If the Enable Standard Viewer processing option is enabled, the Standard Viewer is the default viewer.
When you click a file in the item list, if a SWF has been generated, or if the file can have a SWF
generated, it will display in the Standard Viewer.
If the SWF file has not yet been generated, it will do do automatically.
If you click a file that does not support SWF, it will be displayed in the Alternate File Viewer instead.
-If the Enable Standard Viewer processing option is not enabled, by default, the Alternate File Viewer is
used. If you then change to the Standard Viewer, and if a SWF can be generated, it will be converted “on-
the-fly”.
Attachment Counts
You can see attachment counts on imported Emails in the Natural panel.
Emails imported using a load file, are constructed in the Natural panel using the metadata from the load file for a
consistent Outlook type look and feel. In previous versions emails with attachments did not display that
attachments existed unless the user imported these files as EDOCS. Now, when importing these files as EMAIL
document types, the count of the attachments is now displayed in the Natural Viewer. Emails processed using
evidence processing will display the attachment name rather than the attachment count.
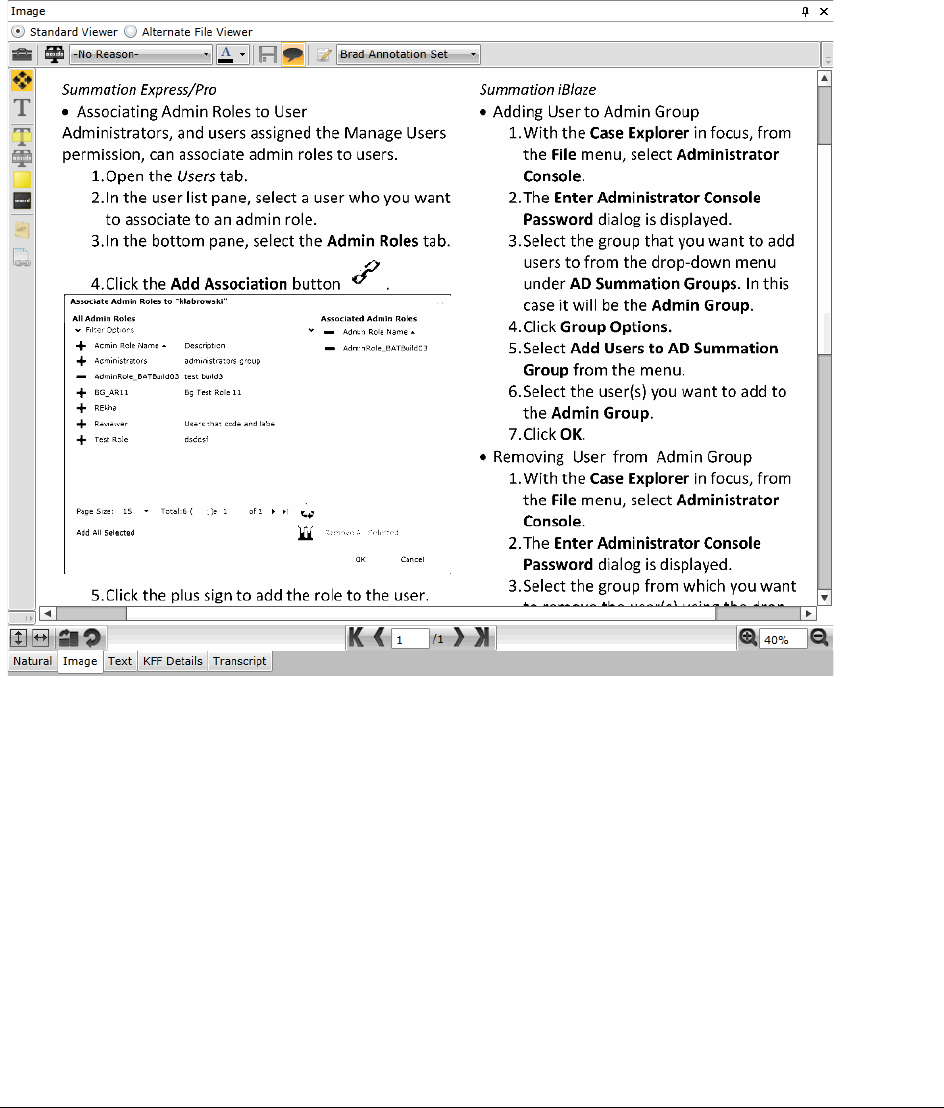
Viewing Data Using Document Viewing Panels | 79
Using the Image Panel
The Image panel displays image documents and electronic documents that have been converted into images in
the Natural panel.
The Image panel displays the selected document as an image. You can perform annotations and make notes in
this view.
Image Panel
See About Annotating Tools on page 217.
To view documents in Image view
1. In Project Review, select a file in the Item List panel.
2. Click on the Image view tab.
If the Image panel isn’t showing, select the panel from the Layouts drop-down.
Viewing Data Using Document Viewing Panels | 80
Using the Text Panel
The Text panel in Project Review displays the file’s content as text. You can configure the text view so that
sentences wrap if they are longer than the panel’s width. You can also limit how much text is displayed by setting
the Page Depth in characters.
Text Panel
To view documents in Text view
1. In Project Review, select a file in the Item List panel.
2. Click on the Text view tab.
If the Text panel isn’t showing, select the panel from the Layouts drop-down.
Elements of the Text Panel
Element Description
Page Depth Select the number of characters you want visible in the Text Panel.
Wrap Check Box Check to wrap the text in the panel.
Viewing Data Using Document Viewing Panels | 81
Using the KFF Details and Detail Information Panels
You can show the KFF Details panel or the Detail Information panel. The Detail Information contains tabs that
allow you to view information about the selected record.
You can enable these panels by customizing the Project Review panels and layouts.
See Customizing the Project Review Layout on page 51.
To view KFF Detail / Detail Information
1. In Project Review, select a file in the Item List panel.
2. Click on the KFF Detail / Detail Information view tab.
Elements of the Detail Information Panel
Element Description
Archived Details Displays the details of the file path, size, and dates associated with the record.
Cerberus Displays the Cerberus threat score for the record.
You will see data for applicable files if you selected the Enable Cerberus processing
option.
See the About Cerberus Malware Analysis chapter.
You can download the information as an HTM file by clicking Download in the bottom-
right corner.
KFF Details Displays the details of the Known File Filter for the selected record.
See Using KFF (Known File Filter) on page 309.
Evidence Source Displays the source of the evidence.
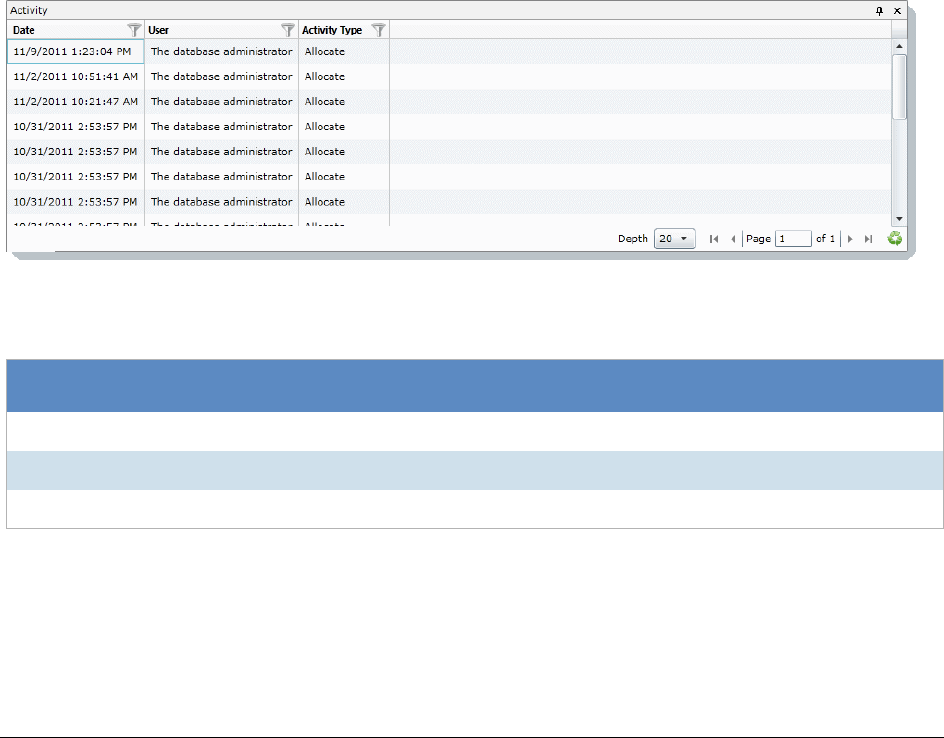
Viewing Data Using Document Data Panels | 82
Using Document Data Panels
You can use the following document data panels in Review:
-The Activity Panel page 82
-The Similar Panel page 83
-The Production Panel page 83
-The Notes Panel page 84
-The Conversation Panel page 85
-The Family Panel page 86
-The Linked Panel page 88
-Exporting a List to CSV page 69
-Using OCR page 70
See Viewing Data in Panels on page 56.
The Activity Panel
The Activity panel on the Project Review page lists the history of actions performed on the selected document.
Activity Panel
Elements of the Activities Panel
Element Description
Date Column Displays the date of the action performed.
User Displays the user that performed the action.
Activity Type Displays the type of activity that was performed.
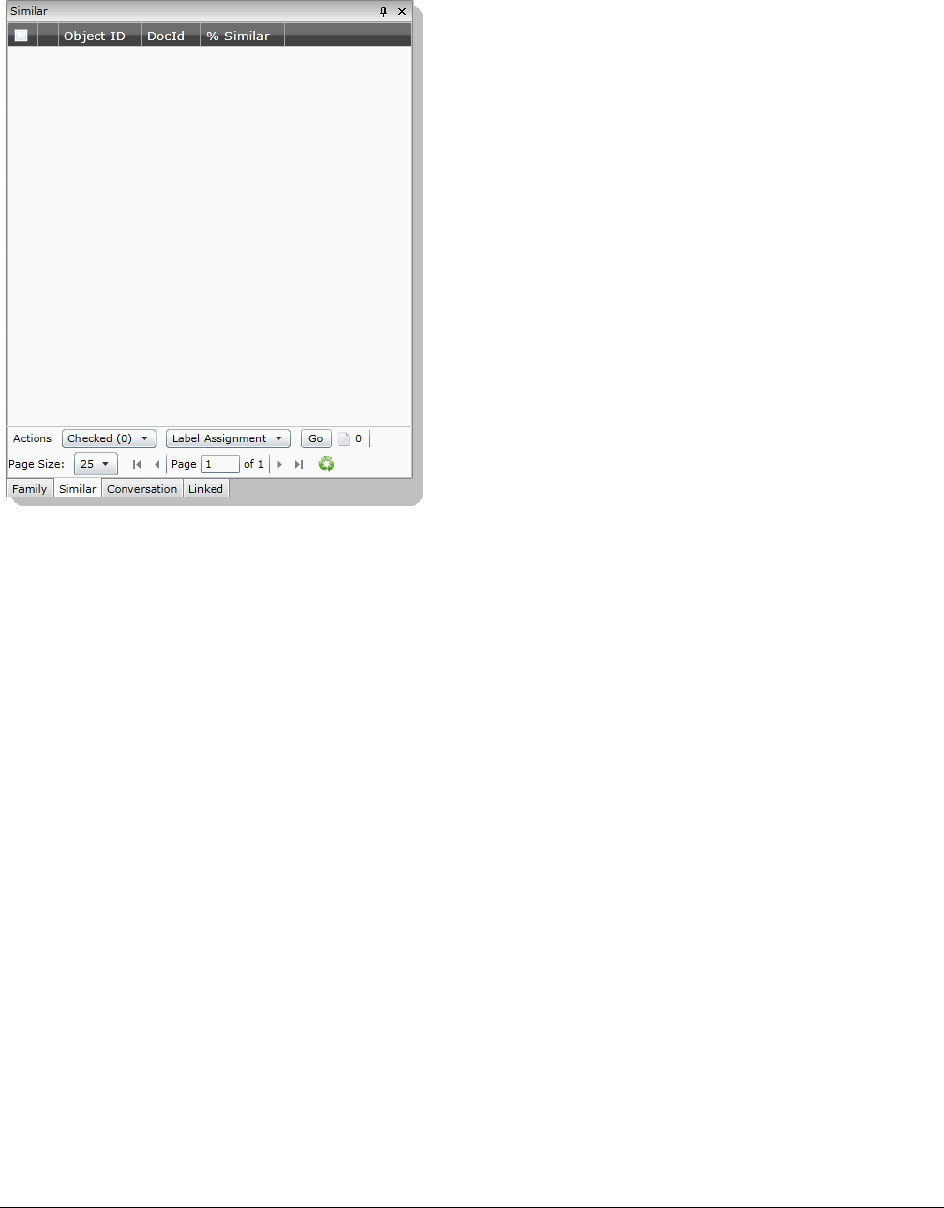
Viewing Data Using Document Data Panels | 83
The Similar Panel
The Similar panel in Project Review can be used to set relationships between documents.
Similar Panel
The Production Panel
The Production panel in Project Review displays the history of production for the project. You can navigate to
produced documents via hyperlinks in the Production panel. The ProductionDocID appears as a hyperlink in the
Production panel. While viewing a source document highlighted in the Item List, you can click on the
ProductionDocID in the Production panel, and the produced document opens in a new window.
When a document is produced, it is automatically linked to the original from which it was produced. When
looking at the original document, you can see that it has been produced.
You can navigate to the produced documents via hyperlinks in the Production panel.
-The ProductionDocID appears as a hyperlink in the Production panel. While viewing a source document
highlighted in the Item List, you can click on the ProductionDocID in the Production panel, and the
produced document opens in a new window.
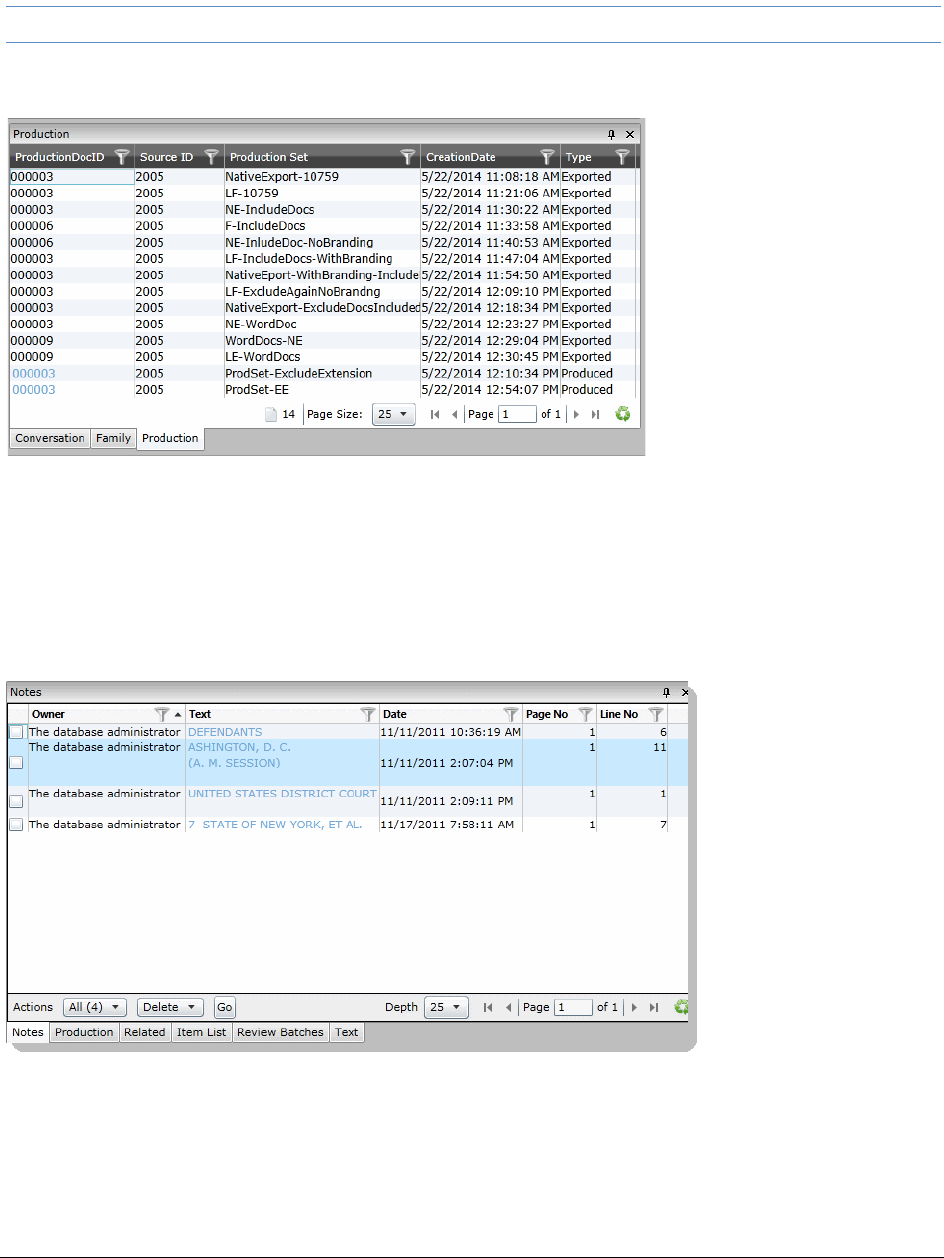
Viewing Data Using Document Data Panels | 84
-Also, if you display produced documents in the Item List by filtering, the Source ID of a produced
document appears as a hyperlink in the Production panel. Clicking on the Source ID opens the source
document in a new window.
Note: Export sets do not have hyperlinks in the Production panel.
Production Panel
The Notes Panel
The Notes panel in Project Review can be used to view, navigate, and delete notes.
Notes Panel
Viewing Data Using Document Data Panels | 85
The Conversation Panel
The Conversation panel in Project Review displays email conversation threads and emails from a cluster. The
Conversation panel shows any compilation of related messages that makes up a conversation. The displayed
threads are those emails that are sent and answered or answered emails with the originals and any string of
threads that went back and forth for each message.
Emails are organized by cluster in the Conversation panel.
-The email clusters are displayed in a hierarchical order with the original message displayed first, followed
by subsequent messages for any email that have a conversational ID.
-There may be an email in the cluster that is from the thread which is not necessarily a part of the cluster
since they are a part of the thread.
-Emails may be identified because they are in the cluster, but not a part of the thread.
-Clusters are green.
-Threaded items are black.
-Significant items in a cluster are marked with a star.
You can use the Filters panel to refine the list by: who the email was sent to, who the email is from, and a date
range.
Elements of the Notes Panel
Element Description
Owner Column Lists the author of the note.
Texts Column Displays the text of the note.
Date Column Displays the date that the note was created.
Page No Column Displays the page on which the note was made.
Line No Column Displays the line number on which the note was made.
Actions Expand the first actions drop-down and select one of the following options:
-All: To include all notes visible in the panel in the action
-Checked: To include checked notes in the action
-Unchecked: To include all the unchecked notes in the action
-This Page: To include all the notes on the current page in the action
Actions Cont... Select an action to perform from the drop-down.
Go Button Click to execute the selected action.
Depth Select the number of documents you want visible in the Linked panel.
Page Lists the page you are on and the number of pages. Click the next arrow to see the next
page.
Refresh Click the refresh button to update the Linked panel.
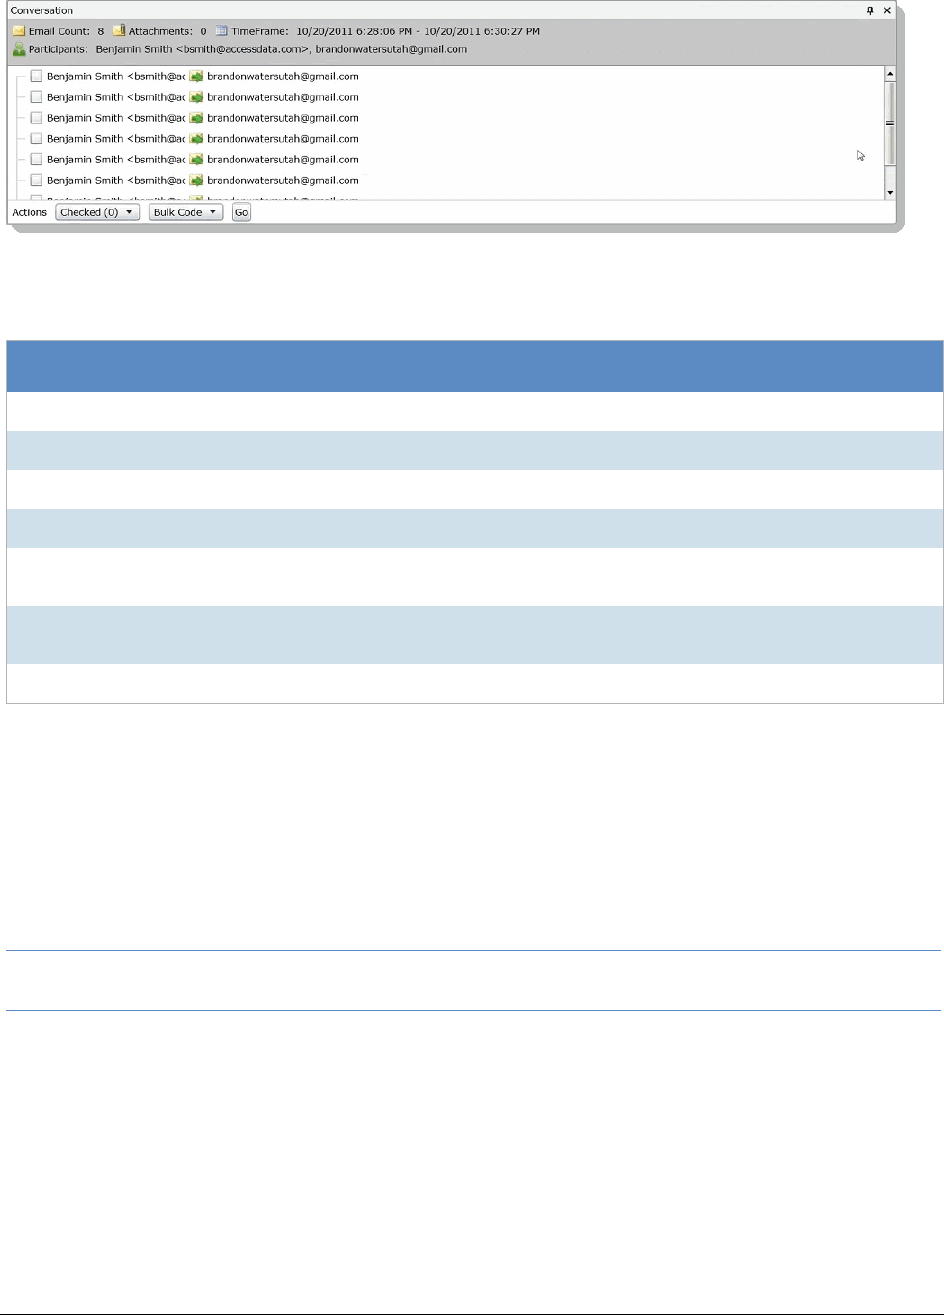
Viewing Data Using Document Data Panels | 86
Conversation Tab
The Family Panel
The Family panel in Project Review lists the family relationships for email documents. The Family panel shows
the email message and any attachments to the message.
The Family panel will only display related documents if you select the parent document. If you select a child
document you will not see the related documents.
Note: If you have a zip file containing a folder, the family relationship does not contain the folder because the
folder is omitted from view.
For both the message file and the attachments, you can do the following:
-Click the item to view the item in the Natural panel.
-Apply labels.
See Applying Labels to Single Documents on page 193.
When you click the child attachment in the Family panel, that child document will be displayed in the document
view panel. Also, the Current Item ID will also change to reflect the child's record number so that you can select
the hyperlink and open the child record in its native format.
Elements of the Conversation Tab
Element Description
Email Count Displays the number of emails in the thread.
Attachments Displays the number of attachments.
Time Frame Displays the time frame when the emails were sent.
Participants Displays the email address of the email participants.
Actions Drop-
down Checked Select Checked or All to perform mass actions.
Actions Drop-
down Bulk Code Select the type of mass action that you want to perform.
Go Click to start the mass actions.
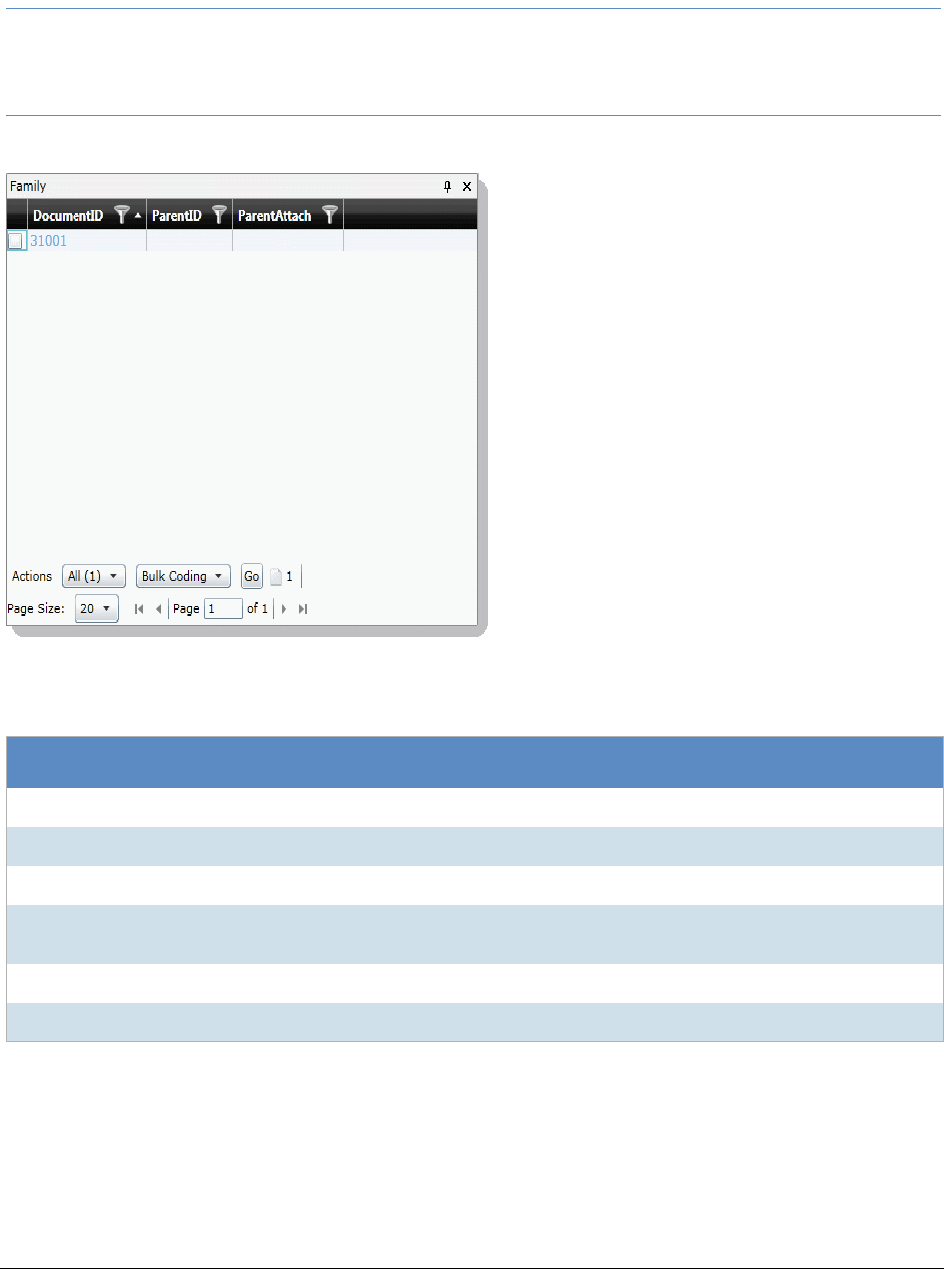
Viewing Data Using Document Data Panels | 87
However, the Item List panel will not change to highlight the child's record; it will still remain on the parent's
record.
Note: In order to avoid memory issues, the family panel will limit the amount of documents retrieved to 1000.
Families will be displayed for the following types of documents: TAR, JAR, GZIP, RAR, 7ZIP, ZIP, and
ZIPX. Families will not be displayed for the following type of documents: AD1, PST, NSF, OST, E01, CSV,
and DII.
Family Panel
Elements of the Family Panel
Element Description
DocumentID Displays the DocID for the documents in the same family as the selected document.
ParentID Displays the DocID for the parent document.
ParentAttach Displays whether the parent document has attachments.
Actions Drop-
down All Select to perform a mass action.
Action Drop-down Select the action that you want to perform.
Go Click to start the mass action.
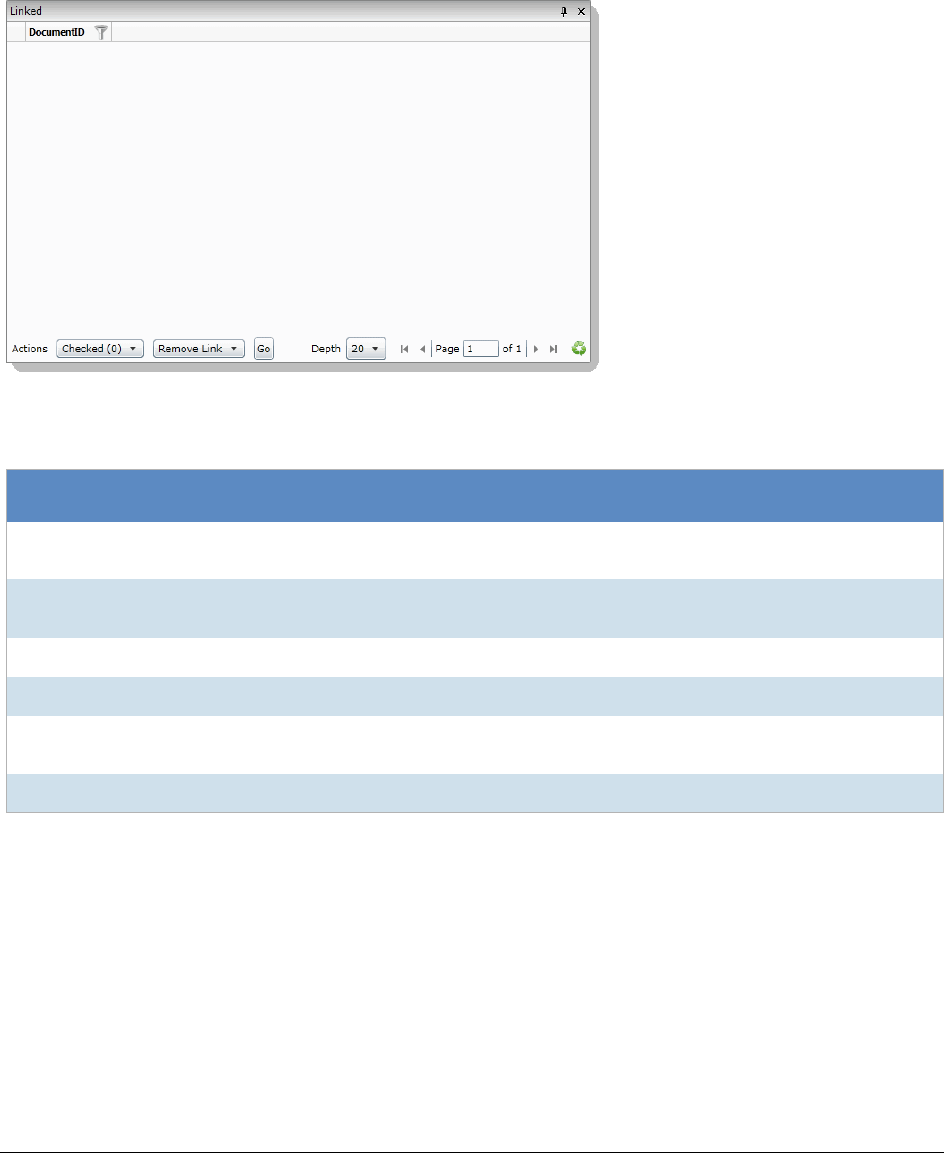
Viewing Data Using Document Data Panels | 88
The Linked Panel
The Linked panel in Project Review displays two types of documents:
-Documents manually linked to other documents of the same project
-Documents linked to other documents during import
Linked Panel
Elements of the Linked Panel
Element Description
Actions (Checked) Select Checked to perform actions on documents checked in the Linked panel. Select
All to perform actions on all documents in the Linked panel.
Actions (Convert) Select the action that you want to perform on the documents in the Linked panel. The
following actions are available: Link Documents and Remove Links.
Go Button Click to execute the selected action.
Depth Select the number of documents you want visible in the Linked panel.
Page Lists the page you are on and the number of pages. Click the next arrow to see the next
page.
Refresh Click the refresh button to update the Linked panel.

Viewing Data Viewing Timeline Data | 89
Viewing Timeline Data
Depending on your license, you can parse and view the following types of timeline data.
-Data that is contained in CSV files that are in the Log2timeline format
-EVTX event logs
You can view the data in the INSO view of the Item List.
The individual records from the original files will be interspersed with other data, giving you the ability to perform
more advanced timeline analysis across a very broad set of data. In addition you can leverage the visualization
engine to perform more advanced timeline based visual analysis.
To process timeline files, there is a Timeline Options processing option. This option is not enabled by default.
You can view timeline data in one of two ways:
To expand timeline files and view individual records
1. Create a new project.
2. In the Processing Options, select Expand Additional Timeline Events.
3. Include a timeline file, such as a Log2timeline CSV or EVTX file in your evidence and process it.
4. In Review, in the Item List, you can click and view the contents of original file.
5. You can also view the expanded individual records in individual rows.
Log2Timeline items have row #... in the ObjectName.
EVTX items have a event # ... in the ObjectName.
6. You can use the Timeline view to sort items by data and time.
See Using the Timeline View on page 66.
To filter timeline data
1. You can filter your data to find timeline data.
For example, you can find Log2Timeline data by using the File Category > Other Known Types facets:
-The original zip files: Log2t CSV logs
-The expanded entries: Log2t CSV log entries
You can find EVTX data by using the File Category > OS/File System Files facets:
-The original EVTX files: Windows EVTX Events
-The expanded entries: Windows EVTX Event
View the original
files, such as the
CSV or EVTX
In the File List, you can see the original files. When you select a file, you can view the
information that is contained in each file in the File Content pane .
Expand file data out
as individual
records
When you expand timeline files, each record is extracted. As a result, in the Item List,
each record is shown as its own item.
If you expand Log2Timeline files into separate records, you can also use columns
to view each field.
See the table Log2timeline CSV fields (page 90)
Viewing Data Viewing Timeline Data | 90
To add Log2Timeline-related columns in the Item List
1. In Review, click Options > Columns.
2. Add one or more Log2T columns.
3. Click OK.
Log2timeline CSV fields
Log2t Desc A description field, this is where most of the information is stored. This field is the full
description of the field, the interpreted results or the content of the actual log line..
Log2t Extra Additional information parsed is joined together and put here. This 'extra' field may
contain various information that further describe the event. Some input modules contain
additional information about events, such as further divide the event into source IP's,
etc. These fields may not fit directly into any other field in the CSV file and are thus
combined into this 'extra' field.
Log2t Filename The full path of the filename that contained the entry. In most input modules this is the
name of the logfile or file being parsed, but in some cases it is a value extracted from it,
in the instance of $MFT this field is populated as the name of the file in question, not the
$MFT itself.
Log2t Format The name of the input module that was used to parse the file. If this is a log2timeline
input module that produced the output it should be of the format Log2t::input::NAME
where name is the name of the module. However other tools that produce l2t_csv
output may put their name here.
Log2t Host The hostname associated with the entry, if one is available.
Log2t Inode The inode number of the file being parsed, or in the case of $MFT parsing and possibly
some other input modules the inode number of each file inside the $MFT file.
Log2t MACB The MACB or legacy meaning of the fields, mostly for compatibility with the mactime
format.
Log2t Notes Some input modules insert additional information in the form of a note, which comes
here. This might be some hints on analysis, indications that might be useful, etc. This
field might also contain URL's that point to additional information, such as information
about the meaning of events inside the EventLog, etc.
Log2t Short The short description of the entry, usually contains less text than the full description
field. This is created to assist with tools that try to visualize the event. In those output
the short description is used as the default text, and further information or the full
description can be seen by either hovering over the text or clicking on further details
about the event.
Log2t Source The short name for the source. This may be something like LOG, WEBHIST, REG, etc.
This field name should correspond to the type field in the TLN output format and
describes the nature of the log format on a high level (all log files are marked as LOG,
all registry as REG, etc.)
Log2t SourceType A more comprehensive description of the source. This field further describes the format,
such as "Syslog" instead of simply "LOG", "NTUSER.DAT Registry" instead of "REG",
etc.
Log2t User The username associated with the entry, if one is available.
Log2t Version The version number of the timestamp object.

Viewing Data Viewing Graphics and Videos | 91
Viewing Graphics and Videos
You can view graphics (such as JPEG, GIF, PNG) and play video files that are in your project. The files are
displayed in the Natural Panel.
How videos are viewed is in part determined by the video processing options that were used when the project
was created. For example, you can view video thumbnails that were created a certain intervals.
See Evidence Processing and Deduplication Options on page 210.
See Using the Thumbnail View on page 68.
The following video files are supported:
To find graphics and media files
Do the following:
-Use filters, such as File Category or File Extensions.
-Use the Thumbnails View.
See Using the Thumbnail View on page 68.
To play a video file
1. Select a video file in the Item List or Thumbnail View.
2. Click the play button in the Natural Panel.
You can change the volume and expand the video viewer.
3G2 AVI MP4 SWF FLAC
3GP FLV MPG VOB MKV
ASF M4V RM WMV WTV
ASX MOV SRT OGG WEBM

Deleting Documents Deleting a Document | 92
Chapter 7
Deleting Documents
Users with the Delete Summaries permission can delete documents in the Item List panel of Project Review.
Users must be careful and back up the project before deleting documents.
You can delete individual records and documents from a project that has been added by either Evidence
Processing or Import. You can select any record or multiple records in Review and delete them. This will delete
the record and system generated data associated with the record, such as filtered text, .DAT files, and data from
the database.
Note the following:
-If a record is in use by another process, some part of the record might be locked, triggering an error when
you attempt to delete the record.
-If an original document has been included in a production set, you will not be able to delete that
document. This avoids issues with production sets.
-Both the Audit Log and the Work List displays what records have been deleted and which user has
deleted the record.
Note: You cannot delete an individual record that is part of a production set. However, you can delete a
complete production set.
You can also use the Delete action in the Item List to delete all filtered files without having to select the files
individually.
Deleting a Document
To delete a document
1. Log in as a user with Delete Summaries permissions.
2. Click the Project Review button in the Project List panel next to the project.
3. In the Project Review, ensure that the Item List panel is showing.
4. Use filters or others tools to cull the files in the Item List.
5. Check the documents that you want to delete. Skip this step if want to delete all the documents.
6. In the first Actions drop-down, select one of the following:
-Checked: Select this to delete just the checked documents.
-All: Select this to delete all of the documents on all pages of the Grid list.
7. In the second Actions drop-down, select Delete.

Deleting Documents Deleting a Document | 93
8. Click Go.
9. In the Confirm Delete Dialog, check Include Family to delete family documents as well.
10. Click Delete.
The job is sent to the Work List for the project/case manager to complete.
Note: When you apply the Delete action to filtered items in the Item List, the filtered data will not reset after the
data is deleted. You will need to click on the clear button to show all of the data back into the grid.


Introduction to Searching Data About Searching Data | 95
Chapter 8
Introduction to Searching Data
This document will help you filter and search through data in the Project Review.
About Searching Data
You can use searching to help you find files of interest that are relevant to your project. After you perform a
search, you can save your search or share your search with groups. Then, you can filter your result set to further
cull down evidence. As you find relevant files, you can tag the files with Labels, Issues, or Categories for further
review or for export.
When you search data, you use search phrases to find relevant evidence. A search phrase is any item that you
would receive a search hit on, such as a word, a number, or a grouping of words or numbers.
See Building Search Phrases on page 99.
You can search for text that is either in the file name or in the body of a file. You can narrow the scope of the
search to only checked items in the list, or search through the entire list. And you can select a column in the Item
List panel and filter on that specific column.
When you start a search, be mindful of the items in the list that you are starting with. For example, if you have
applied a facet filter to show only DOC files, and you search for a text string that you think is in a PDF file, it will
not find it. However, the same is not true for column filters. If you have applied a column filter to show only DOC
files and you search for a text string that you think is in a PDF file, it will locate the file, regardless of the previous
column filter application.
Searching Results
When you run a search, any items in your data that contain the search phrase are displayed in the Item List.
When you view an item in the INSO view, the terms in the search phrase are highlighted.
You need to be aware of the following when viewing highlighted terms:
-After the first page of search results are available, the application retrieves the excerpts for the word/
phrase hits on the document through a separate workflow. Depending upon the load on the system,
highlights might take longer to appear.
-Search results are not highlighted in the view if the word phrases is split on separate lines, especially in
documents created in ASCII, such as text files.

Introduction to Searching Data About Searching Data | 96
-If you have a document where the text is arranged in columns, search results that appear in the same
column or span across multiple columns do not highlight in the INSO view. The Text view should highlight
the results accurately.
To search data, see information about the following:
-Running Searches (page 97)
-Running an Advanced Search (page 112)
-Running Recent Searches (page 121)
-Saving a Search (page 122)
Search Limitations
When performing a Quick Search or Advanced Search, if you have over 10,000 total characters of search text,
the search may fail and the application may become non-responsive.

Running Searches Running a Quick Search | 97
Chapter 9
Running Searches
You can perform the following search tasks:
-Running a Quick Search (page 97)
-Searching for Virtual Columns (page 103)
-Running a Subset Search (page 104)
-Searching in the Natural Panel (page 105)
-Using Global Replace (page 105)
-Using Dates and Times in Search (page 107)
-Using the Search Excerpt View (page 108)
-Using Search Reports (page 110)
-Running an Advanced Search (page 112)
When running a search, you build and use search phrases.
See Building Search Phrases on page 99.
Running a Quick Search
In most projects, relevant data and privileged information in a data set is found using quick searches. You can
use the basic search field in the Item List panel to help you perform fast filtering on selected evidence.
When you start a search, be mindful of the items in the list that you are starting with.
See About Searching Data on page 95.
Important:
A processing option, Disable Tab Indexing, disables the reindexing of labels, categories, and issues.
With this option, the application prevents reindexing from occurring as frequently while you are
reviewing data, and search counts appear correctly. This option is enabled by default. If this option is
enabled, in Review, the following text is displayed: Tag indexing is disabled. However, you can still
search for specific tags using a field search, such as “Label contains xxx”.
To run a quick search
1. Log in as a user with Run Search privileges.
2. Click the Project Review button in the Project List panel next to the project.
3. In Project Review, ensure that the Project Explorer, the Item List, and Natural panel are showing.
4. Select the data that you want to search in by doing the following:
Running Searches Running a Quick Search | 98
4a. In the Project Explorer, the default scope selection includes all evidence items in the project. Using
the check boxes, uncheck items to exclude items from the scope of the search. These scope items
include:
Document Groups
Production Sets
Transcripts
Notes
Exhibits
Labels
Issues
Categories
4b. In the Facets tab of the Project Explorer, you may select any combination of facets to apply to the
current search scope.
4c. Click the Apply check mark button in the top of the Project Explorer. This will apply the currently
selected scope and any selected facets to the Item List, allowing you to search and review on the
resulting subset. The facets will persist through searches until you clear them. Scopes may be
changed and searches re-run by use of the Apply button as well. After updating a facet or scope
item, you may click the Apply button, which will update the scope and re-run any search that has
not been cleared out by use of the Clear Search button in the Search Options menu of the Item
List panel.
5. In the search bar of the Item List panel, enter a search phrase.
A search phrase can be either one word or or number or multiple words. You may also use operators or
boolean search phrases.
See Building Search Phrases on page 99.
6. Click Go to execute the search.
The search is performed within the specified scope and searches the body content of the documents within the
scope. Also depending upon the type of search query, the query will also search the documents’ metadata.
Search results appear in the Item List panel.
If you are searching by keyword, you can select a document from your search results, and see highlighted
instances of the word in the INSO view. The instances will also be highlighted in the text view and in the Item List
if there are results in the metadata.
Quick searches will also appear in the Recent Searches on the Searches tab of the Project Explorer.
Note: You are unable to perform a quick search for values in the ProductionDocID column. To search for values
in the ProductionDocID column, use Advanced Search. See Running an Advanced Search on page 112.
Running Searches Building Search Phrases | 99
Building Search Phrases
When you search data, you use search phrases to find relevant evidence. A search phrase is any item that you
would receive a search hit on, such as a word, a number, or a grouping of words or numbers.
A search phrase can be any of the following:
-A single term, such as a word or number
For example, patent. Any document with the term “patent” will be found.
-A string of terms (within parentheses)
For example, 2010 patent application. Any document with the string “2010 patent application” will be
found.
-Multiple terms with boolean operators, such as AND or OR
For example, patent AND 2010. Any document with both “patent” and “2010” will be found.
See the following about building search phrases:
-See Using Search Operators on page 99.
-See Using Boolean Logic Options on page 101.
-See Using ? and * Wildcards on page 102.
-See Searching Numbers on page 103.
-See Search Limitations on page 96.
Using Search Operators
You can use a Boolean search to find the logical relationships among the search terms and phrases that you
enter. A Boolean search consists of the following three full logical operators:
-OR
-AND
-NOT
Note: The NOT operator by itself is not an option in Advanced Search. The Not Contains and Not Equals
operators are available in Advanced Search. However, you can use the NOT operator in Quick Search.
If you use more than one logical operator, you should use parentheses to indicate precisely what you want to
search for. For example, the phrase apple and pear or orange could mean either (apple and pear) or orange,
or it could mean apple and (pear or orange). Use parentheses to clarify which of the two searches that you
want.
However, if you want to execute searches that contain parentheses as part of the search term, you should
enclose the search term with double quotes. For example, if you want to search the To field of emails for the
phrase, Carton, Sydney (TTC-San Antonio), you need to write the search query as To Contains “Carton,
Sydney (TTC-San Antonio).” This will allow you to get the expected search results and those search results will
be highlighted in the Text view. However, the search results will not be highlighted in the the INSO views.
Only alphanumeric characters are recognized in search terms. Also, certain non-alphanumeric characters are
recognized by the search, such as @ and $. To search for text with non-alphanumeric characters, include the
whole string in quotes. For example, if you searched for mckay@accessdata, you would find
mckay@accessdata. But if you searched for mckay#accessdata, it would not return results.

Running Searches Building Search Phrases | 100
Noise Words
Noise words, such as if, or the are ignored in searches. For example, if you were to search on the term MD&A,
the search would treat the & as an AND operator and return documents with both the terms “MD” and “A” in
them. However, because A is a noise word, the search only highlights “MD” in the document.
When a term contains a noise word with another term, the search results will return results with the noise word,
as well as other words that are in the same place as the noise word. For example, by searching for the term MD
and A, not only are results returned that locate the terms “MD” and “A,” but also “MD” and “<any word that is
adjacent to ‘MD’>.” For example, by searching for the term MD and A, you might also get the result of “MD” and
“Surgeon.”
However, if you were to search on MD&Surgeon, you will not get “MD” and “A” or any other variation. The
results are only “MD” and “Surgeon.
Words that are used as logical operators, such as and or or will be treated as operators and not as part of the
search term. If you want to include words such as and or or as part of the search term, you need to enclose the
entire search term in double quotes. For example, enclosing in double quotes the search term “this or that” will
return only those occurrences where all three search words appear together, and not all of the terms where this
appears separately from that.
The following words are ignored in searches:
a, about, after, all, also, an, and, any, are, as, at, be, been, but, by, can, come, could, did, do, even, for,
from, get, got, he, her, him, his, how, i, if, in, into, it, its, just, like, me, my, not, now, of, on, only, or, other,
our, out, over, see, she, some, take, than, that, the, their, them, then, there, these, they, this, those, to,
too, under, up, very, was, way, we, well, were, what, when, where, which, while, who, will, with, would,
you, your
Also, there are exceptions for certain characters:
-The characters 0-9, a-z, A-Z, @, and the _ (underscore) are searchable.
-Other characters, such as - , +, and ; are not searchable. With a few exceptions, they are treated as
spaces.
-The characters ? and * are wildcards. See Using ? and * Wildcards on page 102.
-The %, ~, #, & , :, = characters are used in advanced variations of the search, such as synonym or fuzzy
searches. See Understanding Advanced Variations on page 117.
Running Searches Building Search Phrases | 101
Note: The & symbol is interpreted as an AND operator. If you searched for Steinway & Sons, it would search for
Steinway AND Sons. To use the & symbol in a search, include it in quotes. For example, “Steinway &
Sons”.
Using Boolean Logic Options
The following table describes the boolean options that you can use in searches. Some boolean options are
combined in the table to serve as examples of what is possible.
Boolean Logic Options
Option Description
AND Returns as search results those evidence files that contain all of the search words that you
specified. For example:
marijuana AND cocaine
Matches all evidence files that contain both the words “marijuana” and “cocaine.” However, if you
search for the example:
marijuana + cocaine
You will only get search results highlighted if “marijuana” and “cocaine” are adjacent.
OR Returns as search results those evidence files that contain any of the search words that you
specified or at least one of the search words that you specified. For example:
marijuana OR cocaine
Matches all evidence files that contain either the word “marijuana” or “cocaine.”
NOT Returns as search results those evidence files that do not contain the search words that you
specified.
This expression is an efficient way to eliminate potential privileged data from production sets.
Used the expression at the beginning of your search word or phrase. For example:
NOT licensed
Matches all evidence files except those with the word “licensed” in them.
Note: Do not use implied boolean search with this operator (Example: -license). It will
return incorrect results.
W/N Returns as search results those evidence files that include the specified word or phrase that is
found within so many number of words (for example, W/2) of another.
For example:
(rock AND stump) W/2 (fence AND gate)
Matches all evidence files that contain both the words “rock” and “stump” that occur within two
words of both the words “fence” and “gate.”
or
(pear w/10 peach) W/7 (apple OR plum)
Matches all evidence files that contain the word “pear” that occurs within ten words of the word
“peach” and that also occurs within seven words of either “apple” or “plum.”
You can also use this option to search for evidence files with known words in certain locations or
instant messaging chats.
Note: For eDocs, all occurrences of the words on either side of the W/N operator are
highlighted. For Cool HTML email files, there is no highlighting on the Natural and Text
views.
Running Searches Building Search Phrases | 102
Using ? and * Wildcards
A search word can contain the wildcard characters * and ?. A ? in a word matches any single alphanumeric
character, and a * matches any number of alphanumeric characters. The wildcard characters can be in any
position in a word.
You can use wildcards with search phrases that use operators.
For example, 20* OR pat* OR appl* would match any document that had 2010, 2011, patent, patents,
application, or applications.
You can use wildcards within terms that are within text strings.
For example, “20* p*t a*n” would match 2010 patent application.
? and * Wildcard Limitations and Tips
-The ? and * wildcards can be used for alphanumeric characters only.
For example, a search of PSE?G or PSE*G will not find PSE&G.
AND
NOT Returns as search results those evidence files that contain the expression on the left when the
expression on the right is not found. For example:
peach AND NOT pineapple
Matches all evidence files that contain the word “peach,” but do not also contain the word
“pineapple.”
OR NOT Returns as search results those evidence files that contain either the left expression or
specifically not containing the right expression. For example:
peach OR NOT pineapple
Matches all evidence files that contain the word “peach,” and any other file that does not contain
the word “pineapple.”
Note: The search phrase before the OR operator is highlighted.
Wildcard Description
? Matches any single alphanumeric character.
The following are examples:
-appl? matches apply or apple, but not apples
-a?l matches all or aol
*Matches any number of characters within a single word.
The following are examples:
-appl* matches apply, apple, apples, application
-ap*ed matches applied, approved
-appl*ion matches application
-a*l matches all, aol, april, actual, additional
-*cipl* matches principle, participle
Note: Use of the * wildcard character near the beginning of a word will slow searches
somewhat.
Boolean Logic Options (Continued)
Option Description

Running Searches Searching for Virtual Columns | 103
-The ? and * wildcards only work within single words not separated by spaces, periods, commas, and so
on.
For example, a search of “n*w” will find “New” but a search of “n*k” will not find “New York” or New.York”.
Searching Numbers
When searching for numbers, be aware the commas, dashes, and spaces are word separators. A word
separator will find docs where terms are separated by that separator or space.
For example:
-A search of 123,?56 will find
123,456, 123,556, 123,656, etc.
123-456
123 456
-A search of 123-456 will also find 123,456
-A search of *123, 456* will find
xxx123
456xxx
To find numbers containing a comma, dash, or space, use a string in parentheses.
Searching for Virtual Columns
You can search for virtual columns in the quick search field. Virtual columns are fields of data that are included in
the records, but there is not a physical column in the database that correlates with that data. Searching for virtual
columns will result in records that contain the virtual data, but the column will not actually appear in the Item List
panel.

Running Searches Running a Subset Search | 104
Running a Subset Search
After running a quick search, you can run another search that is a subset of your search. Subset searches
appear in your recent searches. Subset searches connect your first search with your second search using an
AND connector. Subset searches will appear in the recent searches of the Searches tab of the Project Explorer.
To run a subset search
1. Run a quick search.
See Running a Quick Search on page 97.
2. Enter new search criteria in the quick search field in the Item List panel.
Subset Search Button
3. Click the Subset Search button.
Your search results appear in the Item List panel.
Returning to a Previous Search
After you run a subset search, you can return to a previous search using the subset drop-down.
To return to a previous search
After you run a quick search and a subset search, expand the Subset Search drop-down and select
Previous Search.
Running Searches Searching in the Natural Panel | 105
Searching in the Natural Panel
In the Natural panel, you can search by keyword in the Search tab for the selected document.
To search in the Natural panel
1. In Project Review, ensure the Natural and Item List panel are showing.
2. Select a document in the Item List that has a native application.
3. In the Natural panel, click the Search tab.
4. In the Search field, enter a keyword for which you want to search.
5. The first instance of the word is highlighted in the INSO view.
6. Click the next and previous buttons to see the other instances of the keyword.
Note: You will not be able to search for numerals in spreadsheets.
Using Global Replace
In the Item List, you can use Global Replace to globally search the documents and replace a keyword or phrase.
Only one Global Replace job can be submitted at a time per project. Once the job is submitted, you will have
thirty minutes to either manually commit the job or allow it to commit automatically. After a Global Replace job
has been committed, you can choose to create a new Global Replace job for that project.
Note: If Global Replace jobs are submitted by two different users on the same project at the same time, both
Global Replace jobs will fail. However, if two different users submit Global Replace jobs on two separate
projects at the same time, both Global Replace jobs should complete successfully.
See Committing a Global Replace Job on page 106.
To use Global Replace
1. In Project Review, either select a document in the Item List or select All from the actions.
2. Select Global Replace from the pull-down menu. The Global Replace dialog appears.
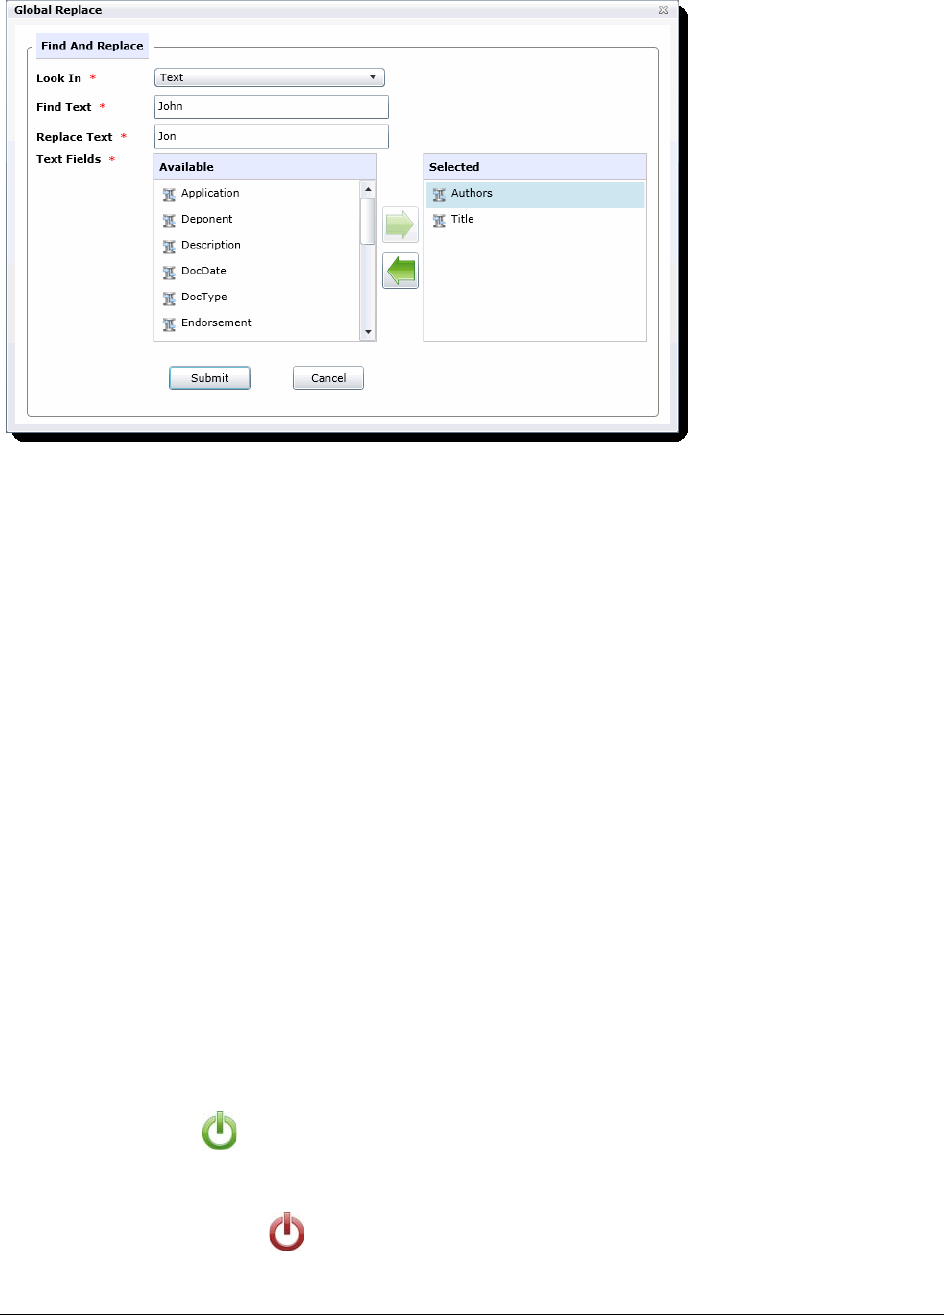
Running Searches Using Global Replace | 106
Global Replace Dialog
3. Choose which field that Global Replace will search and replace:
-Text
-Number
-Date Time - You cannot search for a specific data and replace it with a fuzzy date.
4. Add text fields that you want to change to the selected box. The options available will change
depending on what is chosen in the Look In field.
5. Click Submit.
Once you have completed the Global Replace action, return to the Work List on the Home page. If there were
any Document IDs that failed to code, they will be listed by their number under the Work List. You can then
resubmit Global Replace for those failed IDs.
Committing a Global Replace Job
You must manually commit a Global Replace job if you want to run another Global Replace job on the same
project before thirty minutes has elapsed. You can also undo a Global Replace job within that thirty minute
window.
To manually commit a Global Replace job
1. In the Work List on the Home page, select the Global Replace job.
2. Click Commit .
3. A Commit job will appear in the Work List.
4. (optional) Click Undo to cancel a Global Replace job. You cannot cancel a Global Replace job
once thirty minutes has elapsed from the job’s creation.

Running Searches Using Dates and Times in Search | 107
Using Dates and Times in Search
Using Dates and Times in Searches
You can perform searches based on dates and times. For example, you can perform searches based on the
date a files was created or when an email was sent or received. The following are examples of date or time
searches:
-2/2/2008 - this will find any item with text or a database date of 2/2/2008
-anydate = 2/5/2011 - this will find any item with an event occurring on 2/5/2011
-anytext = 2/5/2011 - this will find any item with a date of 2/5/2011 in the text
-receiveddate = 12/18/2011 - this will find emails that were received on 12/18/2011
-receiveddate between 12/17/2011 and 12/19/2011 - this will find emails that were received between those
dates
-receiveddate > 12/17/2011 - this will find emails that were received after 12/17/2011
-receiveddate < = 12/17/2011 - this will find emails that were received on or before 12/17/2011
How Time Zone Settings Affect Searches
By default, date and times from meta data that you see in Review are in UTC format. These dates and times are
converted to UTC when data is entered in a project. As a result, by default, email dates and times, and file stamp
date and times are displayed in the UTC time zone.
However, an administrator can configure a Display Time Zone for a project. If this was done, then all dates and
times are offset to be shown in the specified time zone. For example, suppose an email was sent on 1/1/ 2010 at
1:15 am based on UTC time. If the project was set to the display the Pacific Time Zone, the email sent data
would have an -8:00 offset. As a result, it would have a sent date and time of 5:15 pm on December 31, 2009.
The offset does apply to dates or times that are in the text body of a document, only dates in the meta data. For
example, file creation dates, email sent dates. As another example, if an email is a reply, the date and time of the
original email is in the email but simply as text, not meta data.
If you perform a search based on a meta data date or time, be aware the Display Time Zone will be used, not the
UTC date and time.
Viewing the Display Time Zone
To the Display Time Zone settings for a project
1. On the Home page in Review, select the case.
2. On the (Info) page, view the Display Time Zone value.
The time zone and the offset from UTC is displayed.
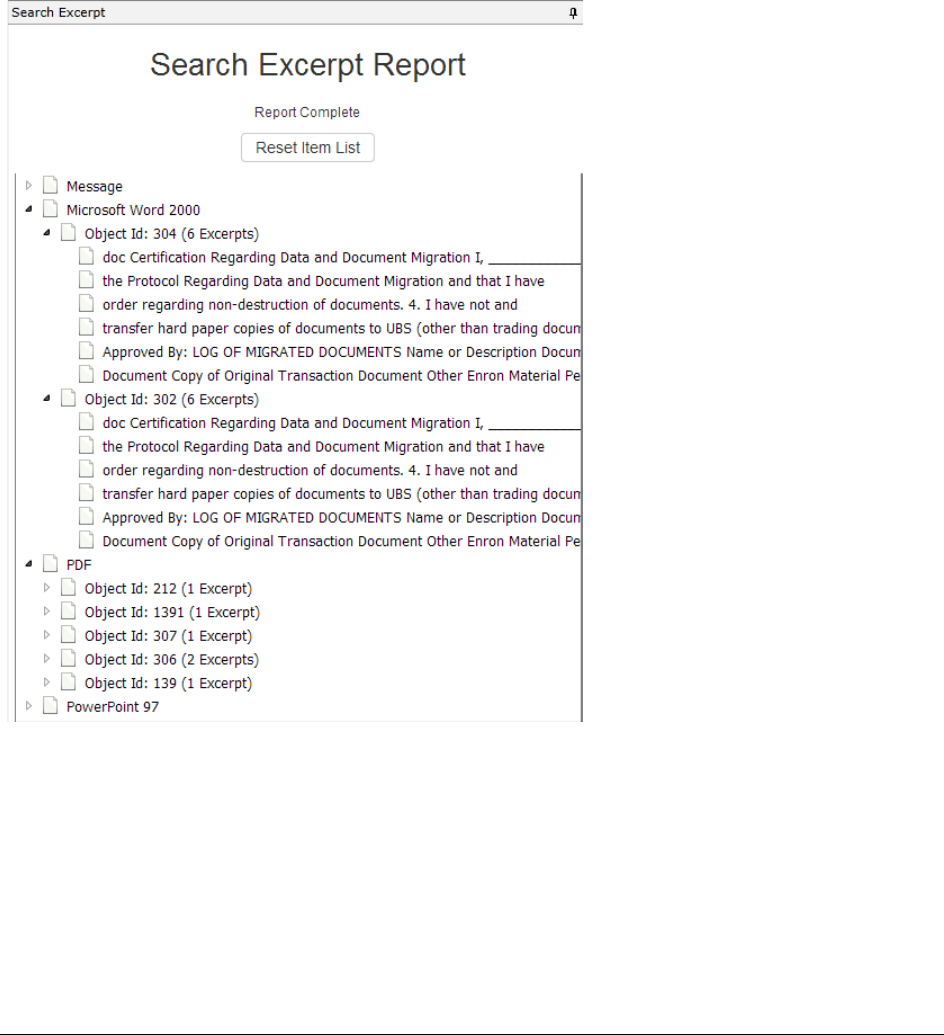
Running Searches Using the Search Excerpt View | 108
Using the Search Excerpt View
After performing a search, you can generate a Search Excerpt view. You generate and see this view in the
Search Excerpt panel. This panel is now included by default in the Search layout.
You can generate the Search Excerpt view after you have completed a search. When you generate the Search
Excerpt view, a DTSearch job is run in the background on the text of the documents.
The Search Excerpt view contains a list of all of the items, by Object ID, that have search hits. The items are
clustered by document type, such as email Message, Microsoft Word, PowerPoint, PDF, and so on. Under each
ObjectID item, there is a list of excerpts of the text that contains the search hits.
You can click either the item or the excerpt and the document is shown in the Natural Viewer and the search
results and the excerpts are highlighted.
The Search Excerpt uses dtSearch to search for text strings. dtSearch will find exact terms unless you use
wildcards. For example, if your initial search is for the word document, other forms of the word, like documents or
documented will be highlighted as a partial hit, but will not ne shown as excerpts --it will not show excerpts of text
containing documents or documented. However, if your search includes a wildcard, like document*, then it will
display excerpts for all forms of the word.

Running Searches Using the Search Excerpt View | 109
Also, the dtSearch will not return excerpts for search results that do not contain text strings. For example, you
can search on a database property such as ObjectID > 50. Because there are no text hits, no excerpt scan be
generated.
You can also save and download a Search Excerpt report.
To access the Search Excerpt panel
1. Open a project in Review.
2. Click the Layouts drop-down.
3. Click Panels.
4. Make sure that the Search Excerpt panel is checked.
5. If it is already checked, click the Search Excerpt panel in Review.
To generate the Search Excerpt view
1. Run a report and let it complete.
2. In the Search Excerpt panel, click Create Search Excerpt Report.
A DTSearch job is run in the background to generate the list.
The resulting view lists all items that contain the search results.
The items are clustered by document type, such as email Message, Microsoft Word, PowerPoint, PDF,
and so on.
3. Expand a document category.
All of the items are listed by their ObjectID.
It also shows how many excerpts within that item have the search results.
4. Expand an item.
One or more excerpts are displayed.
5. You can do one of the following.
In either case, the Item List only displays that one item and the document is shown in the Viewer.
-Click an ObjectID item.
If you click an item, the document is opened in the Viewer and the search results are highlighted in
the document.
-Click an excerpt.
If you click an excerpt, and if the document has been converted to SWF, the document is displayed
in the Stand Viewer, and the whole excerpt is highlighted along with the search results. If the
document has not been converted to SWF, the document is displayed in the Alternate File Viewer
and only the search results are highlighted.
See Using the Standard Viewer and the Alternate File Viewer on page 77.
6. To restore the Item List to include all of the documents from the search, click Return Item List to
Search Results.
7. To save and download a report, click Save.
Running Searches Using Search Reports | 110
Using Search Reports
About Search Reports
You can generate, download, and view search reports. The search reports provide a history of a search and
information about the results.
The reports are saved in XLSX format. The report has the following XLSX sheets:
Generating and Downloading a Search Report
After you have generated a search report you can download it in one of two ways:
-In Review, from the Search Options.
-On the Home page, on the Reports tab, under Search Reports.
To generate and download a search report
1. In Review, after performing a search, click Search Options.
2. Click Search Report Options > Generate Search Report.
After several seconds, the report is generated.
To download the report, click Download Search Report.
3. Select to Open or Save the report.
By default, the report is saved in the browser’s Downloads folder as Search History Report - n.
You can use Save As to specify a filename and path.
Search Report Sheets
Sheet Description
Details Includes the following:
-The date and time of the search
-Who performed the search
-Which phrase was searched for
-Which search options were used
-Information about the files that were in the search results
Filters Which facets were included and excluded and which Quick Filters were applied.
Documents Group Any related Document Groups
Hits by Type Details which file types hits were found in
Keywords Details hit counts for each keyword used
Files Details of the files for the search hits
Running Searches Using Search Reports | 111
About the Search Report Details
The following table describes some of the information provided in the report details.
Search Report Details
Field Description
Total Files Includes all emails and eDocs that match the search criteria.
Unique Family Items This count is the number of files where any single family member had a keyword
hit. If any one file within a document family had a keyword hit, the individual files
that make up this family are counted and added to this total. For example, one
email had 3 attachments and the email hit on a keyword, a count of 4 files would
be added to this count as a result.
Unique Family Emails This count is the number of emails that have attachments where either the email
itself or any of the attachments had a search hit. This count is for top level
emails only. Emails as attachments are counted as attachments.
Unique Emails with no
Attachments This count is the number of the emails that have no attachments where a search
hit was found.
Unique Loose eDocs This count is the number of loose edocuments where a search hit was found.
This does not include attachments to emails, but does count the individual
documents where a hit was found from within a zip file.
Total Hit Count This count is the total number of hits that were found within all of the documents.
Max Relevancy This is the maximum relevancy score achieved with the search criteria. *
Min Relevancy This is the minimum relevancy score achieved with the search criteria. *
Note: * Max and Min relevancy scores are calculated based on the total number
of hits in the document as a percentage of the maximum number of hits found
in a during the search when performing an index search. For example, if one
document contains 50 hits but another document in the results has 100 hits
(and that’s the max) then the first document will be scored as 50% relevant
and the second document will be scored as 100% relevant. These relevancy
scores are only relative within a single search set. They may vary when the
search set is increased or decreased. Additionally, some searches are run
against the database instead of the index and these searches will always get a
100% relevancy score. A database search would be one that requests
information within a specific field or non-indexed field such as “ObjectID =
xxx”.
Running Advanced Searches Running an Advanced Search | 112
Chapter 10
Running Advanced Searches
Running an Advanced Search
If using a simple search does not return the results you expected, you can use advanced searching techniques
to pinpoint relevant data and privileged information.
AccessData software uses the utility dtSearch to index project data. In Advanced Searching, you can query the
index using a specialized query language. In addition to extended searching capabilities, the index allows
searches to be returned in seconds instead of the minutes or hours that are required for a standard linear
search.
Note: In order for a document to be indexed for search, it must contain at least six characters in the file.
Documents with less than six characters will not be indexed. However the metadata in those documents
will be indexed normally.
Note: When searching using the DocDate or NoteDate fields, you must search using a YYYYMMDD format
regardless of how your date fields are formatted for display.
For more information on using dtSearch syntax, you can view technical papers on the AccessData web site:
http://www.accessdata.com/technical
To run an advanced search
1. Log in as a user with Run Search privileges.
2. Click the Project Review button in the Project List panel next to the project.
3. In Project Review, ensure that the Project Explorer, the Item List, and Natural panel are showing.
4. In the Project Explorer, default scope selection includes all evidence items in the project. Using the
check boxes, uncheck items to exclude them from the scope of the search. These scope items include:
-Document Groups
-Production Sets
-Transcripts
-Notes
-Exhibits
-Labels
-Issues
-Categories
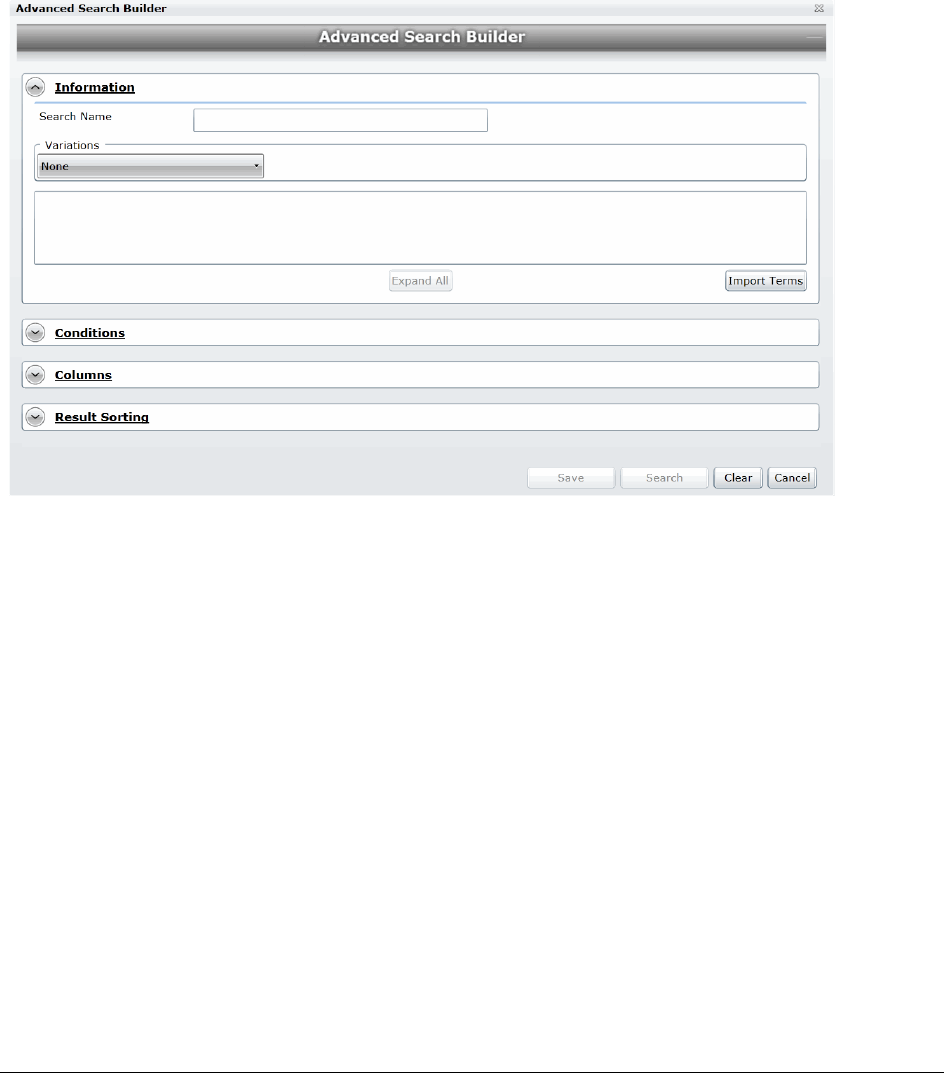
Running Advanced Searches Running an Advanced Search | 113
5. In the Facets tab of the Project Explorer, you can select any combination of Facets to apply to the
current search scope.
6. Click the Apply check mark button in the top of the Project Explorer. This applies the currently selected
scope and any selected Facets to the Item List, allowing search and review on the resulting subset. The
scope of a search is saved along with the query. This Facet will persist through searches until you clear
it. Scopes may be changed and searches re-run by use of the Apply button. After updating a Facet or
scope item, you may click the Apply button to update the scope and re-run any search that has not
been cleared out by use of the Clear Search button in the Search Options menu.
7. Click the Search Options button in the Item List panel and select Advanced Search.
Advanced Search Dialog
8. In the Information section, do the following:
8a. Enter a Name for the search if you want to save the search. Otherwise, the search will appear in
the Recent Searches list and will not be able to be saved.
8b. (Optional) Select the type of Variation you want to include in your search.
See Understanding Advanced Variations on page 117.
8c. In the text field, enter the free form text you want to include in the search. Freeform searching lets
you combine keyword, boolean, and regular expression criteria to perform a search on evidence
files.
See Using the Term Browser to Create Search Strings on page 118.
8d. To add related terms for the words you entered, click Expand All.
See Using the Term Browser to Create Search Strings on page 118.
8e. To import a list of terms from a TXT file, click Import Terms.
See Importing Index Search Terms on page 119.
9. Expand the Conditions section to search within the fields/columns of the documents.
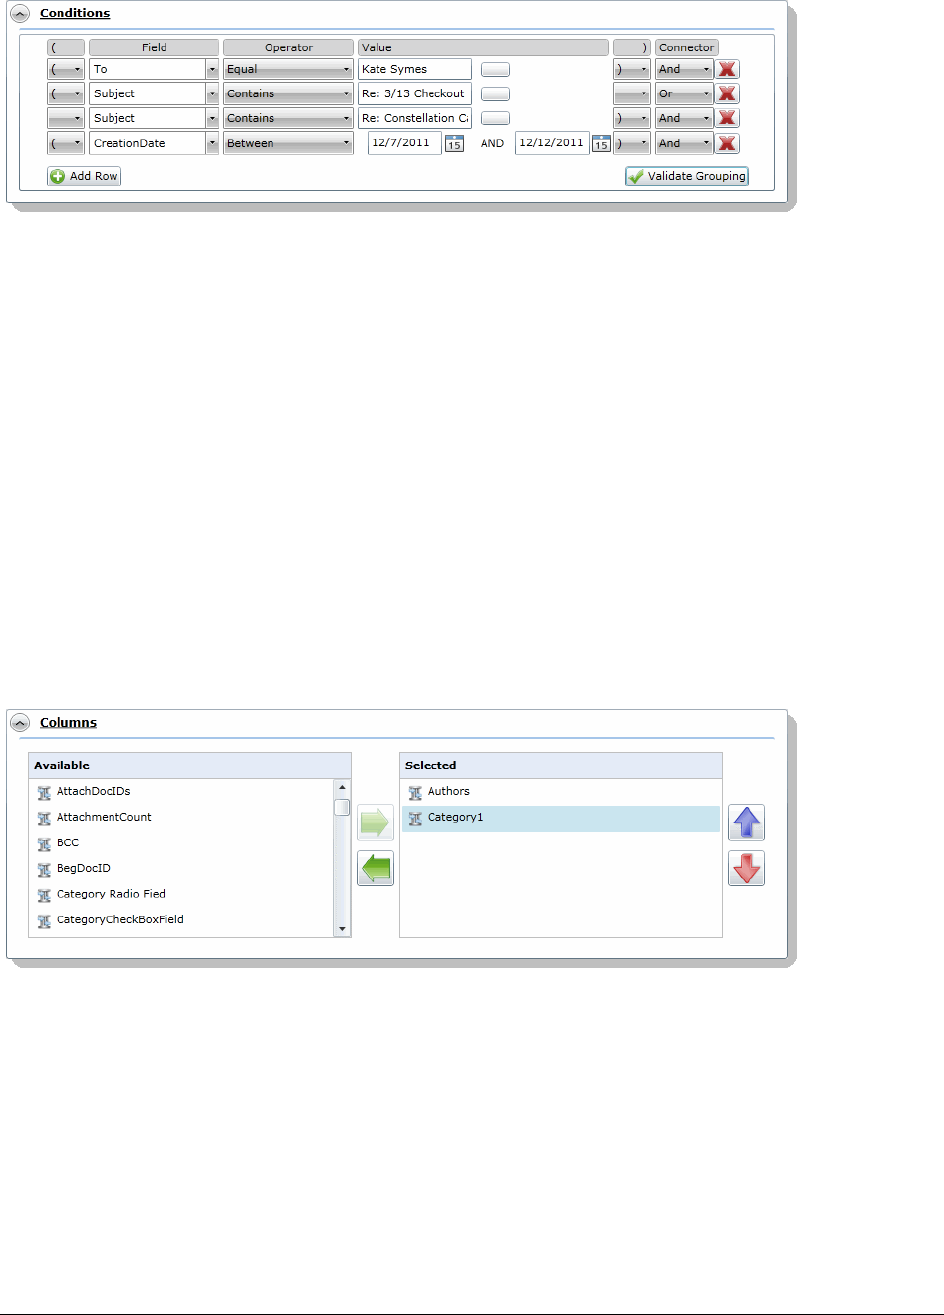
Running Advanced Searches Running an Advanced Search | 114
Conditions
10. In the Conditions section, do the following:
10a. Select a field that you want to search within.
See the Project Manager Guide for more information on creating custom fields.
10b. Select an Operator from the drop-down.
See Using Search Operators on page 99.
See Using Boolean Logic Options on page 101.
10c. Select or enter a value using the following:
Field: Enter text or symbols.
Date: Enter a date or click the calendar to select a date.
Look up button: Click the blank button to look up available search criteria for the selected field.
10d. Select either “And” or “Or” as the connector.
See Using Boolean Logic Options on page 101.
10e. Click Add Row to add additional conditions.
10f. Set parenthetical criteria. Then, click Validate Grouping to validate your parenthesis.
11. Expand the Columns section to add visible columns to your search results.
Columns
11a. Click the right arrow to add columns and the left arrow to remove columns.
11b. Click the up and down arrows to adjust the order of the columns.
12. Expand Result Sorting to select the column by which you want the search results to be sorted. The
column does not need to be visible to sort by it.
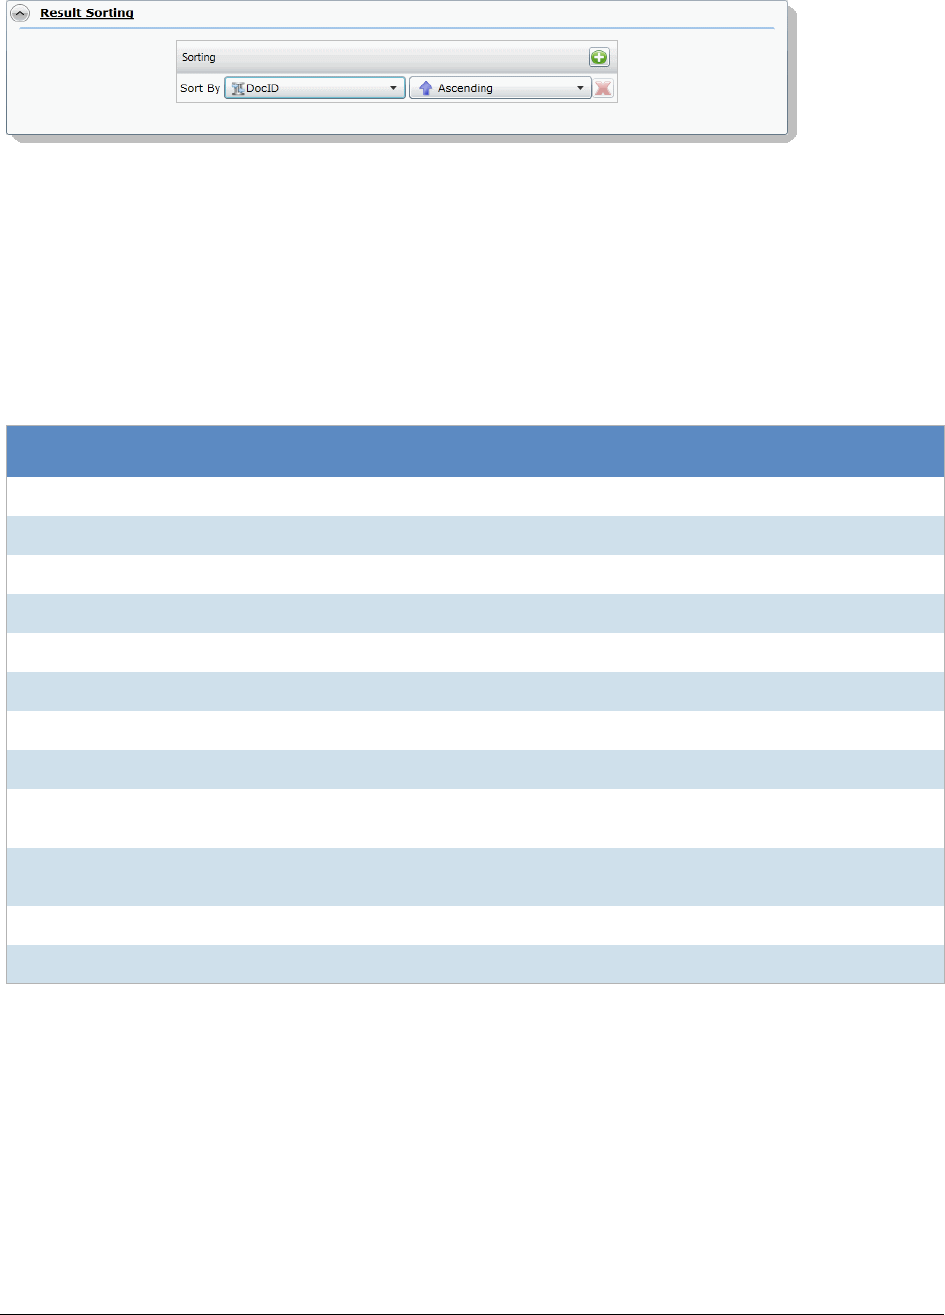
Running Advanced Searches Running an Advanced Search | 115
Result Sorting
12a. In the Sort By drop-down, select the field you want to sort by.
12b. In the second drop-down, select whether you want to sort by Ascending or Descending.
13. Click Search.
Advanced Search Operators
The following search operators are available in the advanced search:
The search operators available depend upon the field selected to search. Not all search operators are available
for all fields.
Advanced Search Operators Exceptions
The ProductionSetID column contains values for exported files from both Export Sets and Production Sets and is
used for associating exported files with the original file. This column is populated with queries from multiple
Advanced Search Operators
Operator Description
Equal Searches for the exact value entered.
Not Equal Searches for everything in the selected field except the exact value entered.
Exists Searches for the existence of data within the selected field.
Fails Searches for all documents that do not contain data within the selected field.
GreaterThan Searches for a number greater than the value entered.
GreaterThanEqualTo Searches for a number greater than or equal to the value entered.
LessThan Searches for a number less than the value entered.
LessThanEqualTo Searches for a number less than or equal to the value entered.
Contains Searches for the value entered within a string. The value should be a full word. If
you want to search for a partial word, you need to include the * operator.
NotContains Searches for everything except the value entered. The value should be a full word.
If you want to exclude a partial word, you need to include the * operator.
Between Searches between a range of dates or numbers.
NotBetween Searches for all dates or numbers except the range selected.

Running Advanced Searches Running an Advanced Search | 116
tables and does not operate like other standard metadata columns. Search operators will return different results
than expected with other columns. You can expect the following results when searching the ProductionSetID
column:
Search Operators Exceptions for ProductionSetIDs
Operator Results
Exists Search results return only the produced document.
Fails Search results return source documents and not the produced copy.
Contains Search results return only the produced document.
Not Contains Search results return source documents and not the produced copy.
Running Advanced Searches Understanding Advanced Variations | 117
Understanding Advanced Variations
The following table describes the Variation options in the Information section of the Advanced Search dialog.
Variation Options in the Advanced Search Dialog
Search Variations Description
None No search variations are applied.
Stemming Finds grammatical variations on word endings. For example, stemming reduces
the words “fishing,” “fished,” “fishy,” and “fisher” to the root word “fish.”
Phonic Finds words that sound like the word that you are searching and begins with the
same first letter. For example, searching for “whale” using phonic, would also find
wale and wail.
Synonyms Finds word synonyms. For example, searching on “fast” would also find “quick”
and “rapid.” You can enable this option for all words in a request. You can also
add the “&” character after certain words in your request.
Related Finds all words in the search criteria and any related words from the known
related categories.
Fuzzy Finds words that have similar spellings, such as “raise” and “raize.” You can
enable this option for all words in a request.
The level of fuzziness that you can set is 1-10. The higher the level of fuzziness,
the more differences are allowed when matching words, and the closer these
differences can be to the start of the word. Setting too many letter differences
may make the search less useful.
Dragging the slider bar to the right increases the number of letters in a word that
can be different from the original search term.
Dragging the slider bar to the left decreases the number of letters in a word that
can be different from the original search term.
You can also add fuzziness directly in the search term you enter using the “%”
character. The number of % characters that you add determines the number of
differences that are ignored when you search for a word. The position of the %
characters determines how many letters at the start of the word have to match
exactly.
For example, “ca%nada” must begin with “ca” and have just one letter difference
between it and “canada.” Whereas, “c%%anada” must begin with “c” and have
only two letter differences between it and “canada.” In another example,
marijuana can be spelled “marihuana” or “maryjuana.” In this project, your
search expression could be “mar%%uana.”
As with the fuzzy slider bar setting, you should exercise care when you use
multiple % symbols because the number of junk hits rises quickly with each
added error.
Running Advanced Searches Using the Term Browser to Create Search Strings | 118
Using the Term Browser to Create Search Strings
You can create a search using terms that are related to any keyword. You can use the Term Browser to generate
a list of similar words. You then select which words you want to include in the search.
For example, you may start with a keyword of “delete.” By using the Term Browser, it will suggest synonyms,
such as “erase” and “cut.” It will also suggest related terms, such as “cut,” “deletions,” “excise,” and “expunge.” It
will also suggest general related terms, such as “censor,” “remove,” “take,” and “withdraw.” You can select which
of those words to include in your search.
To search for terms using related words
1. In Project Review, in the Item List panel, click Search Options > Advanced Search.
2. Enter a keyword.
3. Click Expand All.
Term Browser
4. In the Term Browser, highlight the keyword.
A list of synonyms is generated.
5. To add other related words, select the Include Related, Include Specific, and Include General check
boxes.
6. Select the words that you want to include in the search or click Variations to select all words.
7. To build a search including the words that you selected, click Apply.
8. You can edit the search or run it by clicking Search.

Running Advanced Searches Importing Index Search Terms | 119
Importing Index Search Terms
You can import a list of search terms. This lets you reuse a list of search terms that you saved from previous
searches, or that you saved for documentation purposes.
To import a saved search terms file
1. In Project Review, in the Item List panel, click Search Options > Advanced Search.
2. Click Import to import a set of search terms.
3. Select the text file that you previously saved.
4. Click Open.
Re-running Searches The Search Tab | 120
Chapter 11
Re-running Searches
You
can re-run searches by using the Search tab in the Project Explorer panel in the Project Review.
The Search Tab
The Search tab in the Project Explorer can be used to view recent searches, your searches, and shared
searches.
Search tab in Project Explorer
Elements of the Search Tab
Element Description
Saved Searches Contains the Recent Searches, My Searches, and Shared Searches.

Re-running Searches Running Recent Searches | 121
Running Recent Searches
When you execute a search, the search conditions are saved. You can view and reuse recent searches. The last
ten searches are saved in the Recent Searches. To run recent searches, you must have the Run Searches
permission.
To run a recent search
1. Log in as a user with Run Searches permissions.
2. Click the Project Review button in the Project List panel next to the project.
3. In Project Review, ensure the Project Explorer is showing.
4. Click on the Searches tab.
5. Expand the Recent Searches.
6. Right-click the search and select Run Search.
The search is run using the original search scope and the original search criteria. The search results
appear in the Item List panel.
Clearing Search Results
After you have performed a search, the items in the Item List are the result of the list. You can clear the search
result to view the documents in the Grid before you performed the search.
To clear search results
1. In Project Review, ensure the Item List panel is showing.
2. Click Search Options > Clear Search.
Recent Searches Every time a search is performed, it is saved in the recent searches. The last 10
searches are saved here in chronological order. Users can execute and edit searches
from Recent Searches.
My Searches Displays all the searches that the user has saved. Users can execute, delete and edit
searches from My Searches. Users can also share their searches.
Shared Searches Displays all the shared searches that the user has permissions to access. Users can
execute searches from Shared Searches.
Elements of the Search Tab (Continued)
Element Description

Re-running Searches Saving a Search | 122
Saving a Search
You can save any advanced search that you design in the Advanced Search Builder. All saved searches are
stored in the Searches tab of the Project Explorer. You can use saved searches to run past searches again or to
share your search with a group of users.
To save a search
1. Log in as a user with Run Search privileges.
2. Click the Project Review button in the Project List panel next to the project.
3. In Project Review, ensure that the Project Explorer, and the Item List panel are showing.
4. In the Project Explorer, the default scope selection includes all evidence items in the project. Using the
check boxes, uncheck items to exclude them from the scope of the search. These scope items include:
-Document Groups
-Production Sets
-Transcripts
-Notes
-Exhibits
-Labels
-Issues
-Categories
5. In the Facets tab of the Project Explorer, you can select any combination of Facets to apply to the
current search scope.
6. Click the Apply check mark button in the top of the Project Explorer. This applies the currently selected
scope and any selected Facets to the Item List, allowing search and review on the resulting subset. The
scope of a search is saved along with the query. This Facet will persist through searches until you clear
it. Scopes may be changed and searches re-run by use of the Apply button. After updating a Facet or
scope item, you may click the Apply button to update the scope and re-run any search that has not
been cleared out by use of the Clear Search button in the Search Options menu.
7. Click the Search Options button in the Item List panel and select Advanced Search.
8. Enter a Name for the search.
9. Enter criteria for the search.
See Running Recent Searches on page 121.
10. Click Save.
Re-running Searches Sharing a Search | 123
Sharing a Search
You can share your saved searches with other groups of users. To share a search, you need to have the
Manage Searches permission.
To share a search
1. Log in as a user with Manage Searches permissions.
2. Click the Project Review button in the Project List panel next to the project.
3. In Project Review, ensure the Project Explorer is showing.
4. Click on the Searches tab.
5. Expand My Searches.
6. Right-click the search and select Manage Permissions.
Assign Security Permissions
7. Check the groups with which you want to share the search.
8. Click Save.

Using Filters to Cull Data Filtering Data in Case Review | 124
Chapter 12
Using Filters to Cull Data
Filtering Data in Case Review
In Project Review, you can filter evidence to help view only relevant evidence for the project. After filtering data,
the results are then displayed in the Item List. You can also use searches and column sorting to help you further
review and cull down evidence.
About Filtering Data with Facets
You can filter data using facets. Facets are properties of a document that you can include or exclude. The
following are a few example of facets:
-Object type and object sub-type (File > Email, File > Spreadsheet, Disk Image, Partition)
-File extension type (EXE, DLL, TXT, GIF, DOC, XLS)
-File category (Documents, Email, Graphics, Audio Multimedia, Video Multimedia)
-File Size (Small, Medium, Large)
-Email Senders Address
-Email Recipients Address
-Email by Date
See Available Facet Categories on page 129.
That facets that are available to use are based on your evidence. For example, if there are no XLSX documents
in your evidence, the XLSX facet is not displayed.
By default, when you first open a project in Project Review, all facets are applied, and as a result, all evidence is
listed in the Item List. You can use the facets to include or exclude evidence from the Item List. You can choose
one or more facets within a single category or you can choose facets across multiple categories.
For example, you can filter evidence to only display emails sent by one person to another person with a certain
date range. As another example, you can filter evidence to display only DOC or DOCX files that have a specific
label applied.
Applied facets are persistent across searches and have to be cleared by you manually.
Note: When you cull data with facets, this filtering will override and clear other filters applied to the Item List,
including Search and Column Filters.
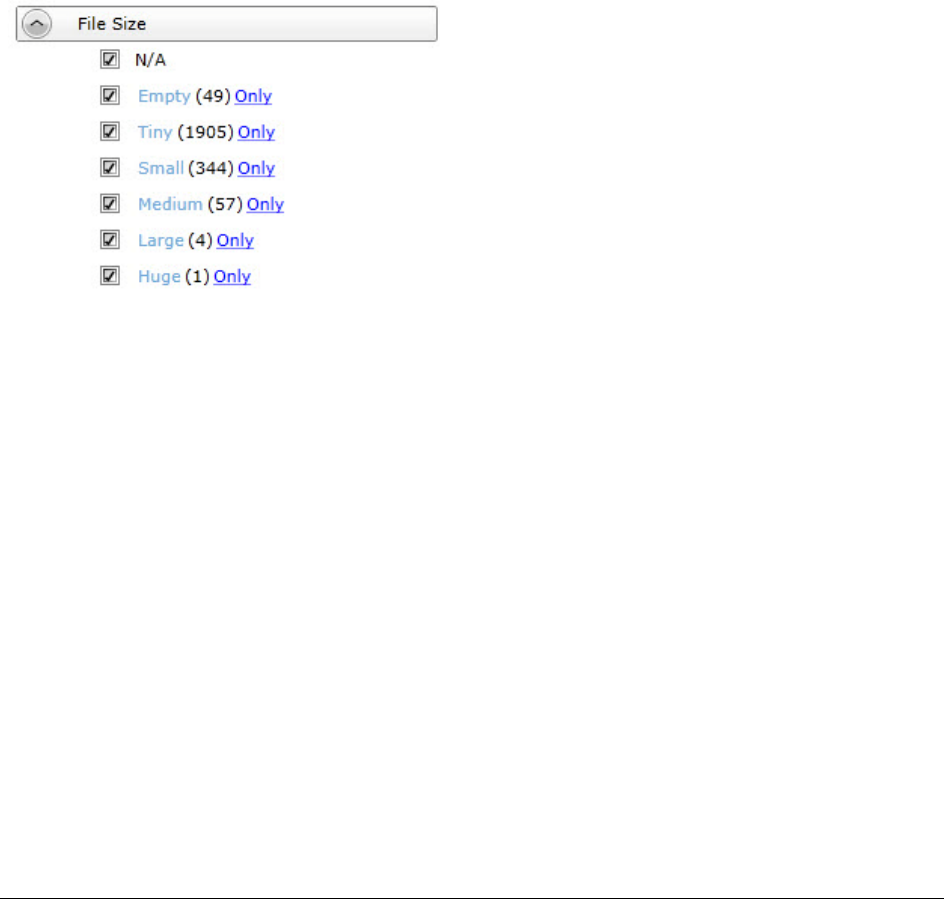
Using Filters to Cull Data Filtering Data in Case Review | 125
About Dynamic Facets
Most facets are now dynamic. When you select and apply a facet, all other facet categories will reflect the results
of the previously selected facet. Other categories will only show facets that have data based on the applied
facet.
For example, suppose that before applying any facets, that under File Extensions, there are 25 DOCX files of
various file sizes. And then suppose you apply a facet to include only Large files. When you look at the File
Extensions filter again, you will only see the number of DOCX files that have a Large file size.
However, applying column filters, column filters, or searches does not affect facet counts.
About Sortable and Searchable Facets
Some facet categories include a pre-configured set of facets. For example, under the File > File Size facet
category, there will be a maximum of five facets: Tiny, Small, Medium, Large, and Huge.
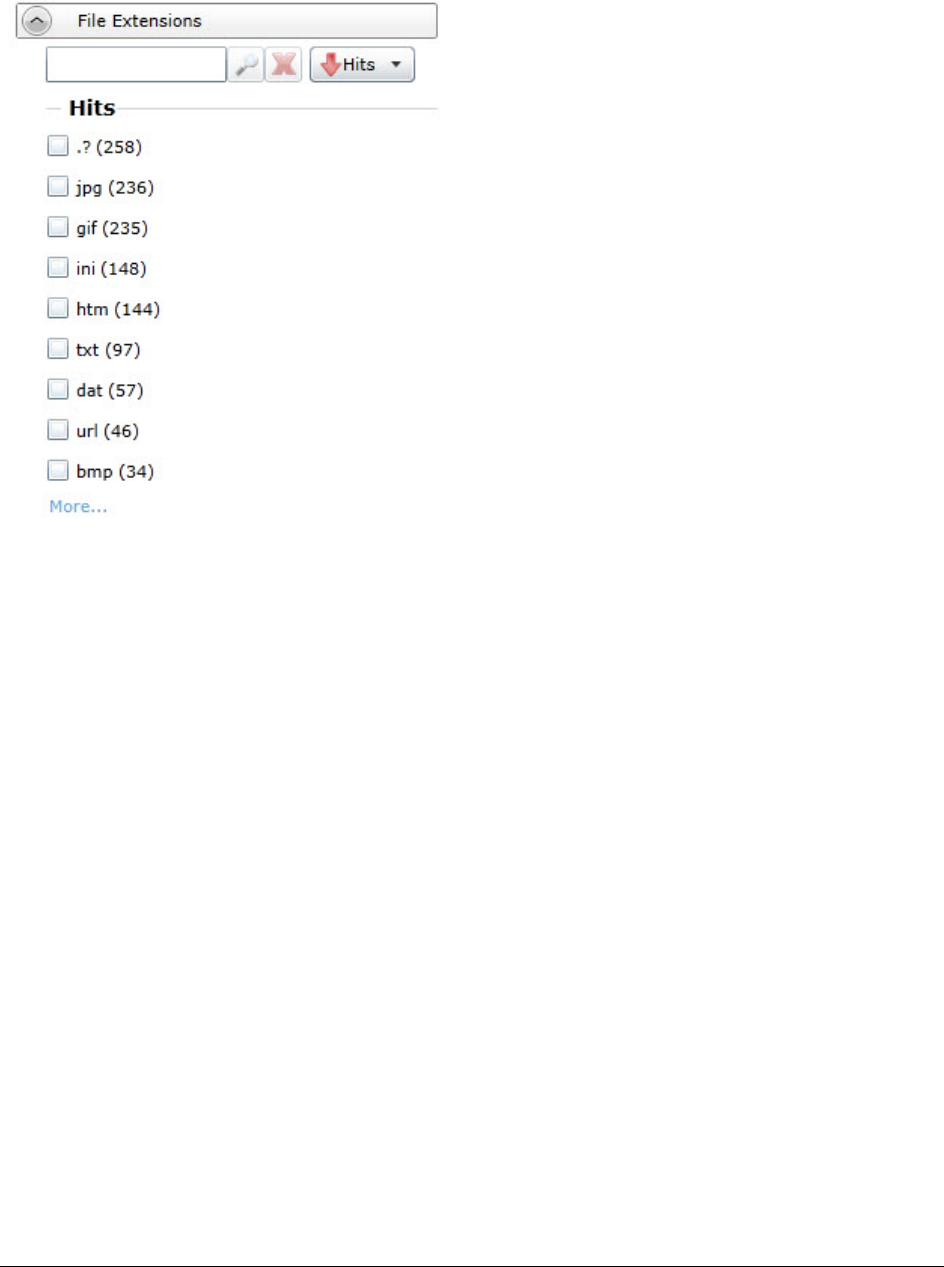
Using Filters to Cull Data Filtering Data in Case Review | 126
Some facet categories include a dynamic set of facets based on the files in the evidence. For example under the
File > File Extensions facet category, facets are shown for all of the file extensions that exist in the evidence.
These facet categories can potentially have a very large number of facets. A project could easily include dozens
of different file extensions.
Facet categories that have a large number of facets have additional features that help you use them:
-By default only nine facets are shown but you can select to see more.
-Facets are sortable.
By default, the facets are sorted by the facets with the most hits. When you open a category, by default
the nine facets with the most hits are shown. You can use the following sort orders:
Ascending by name
Descending by name
Ascending by the number of hits
Descending by the number of hits
-You can search for specific values within the facets.
For example, if there are 100 email senders names, you can search for a certain name. You can clear the
search by clicking the red X.

Using Filters to Cull Data Filtering Data in Case Review | 127
About Excluding Tags Filters From a Facet Search
You can exclude Tags filters (categories, issues, labels, and summaries) from a facet search. The default for the
Tags facets are checked, or included. Clicking the check box once actively excludes the facet in filters group.
Clicking the check box a second time clears the check box and the facet is not included in the facet search.
When excluded, a red x appears in the facet check box, indicating that the facet is excluded. The hyperlink to
apply the excluded facet is disabled. You need to be aware of the following considerations when excluding Tags
facets:
-For labels, the exclude feature applies to all labels in a group. However, if there are children under the
labels, and one child label is selected for exclusion while another is not, the label group appears blank.
This is because you cannot include a whole label group when one of the child labels is excluded.
-For issues, you can exclude or include an individual issue. Additionally, you can exclude a child issue
while including a parent issue or vice versa.
-If you have a document that has been assigned a tagged item that is included in a facet in the Tags filter
and has also been assigned a tagged item that is excluded in a facet in the Tags filter, the facet does not
display the document. For example, a document may be tagged with both Tag 1 and Tag 2. If all
documents with Tag 1 are included in the facet and all documents with Tag 2 are excluded in the facet,
the document with both Tag 1 and Tag 2 is not posted to the Item List. The exclusion takes precedence.
This is because exclusions and inclusions in facets act as an AND property, not as an OR property.
The Facets Tab
The Facets tab in the Project Explorer in Project Review lists the available facets to apply to documents. You can
filter evidence to help view only relevant evidence for the Project. After you have applied facets, the results are
then displayed in the Item List. You can also use searches along with column sorting and filtering to help you
further review and cull down evidence.
The Facets tab in the Project Explorer allows you to filter before (and maintain after) conducting any searches.
This allows targeting specific areas of data for search and review with persistent facets. You may maintain the
applied facets as long as desired.
You can use one or more facets within a single filter or one or more facets across several categories to cull down
the evidence. By default, when you first open a project in Project Review, all filter facets are applied, and as a
result, all evidence is listed in the Item List. You use the facets to exclude evidence from the Item List.
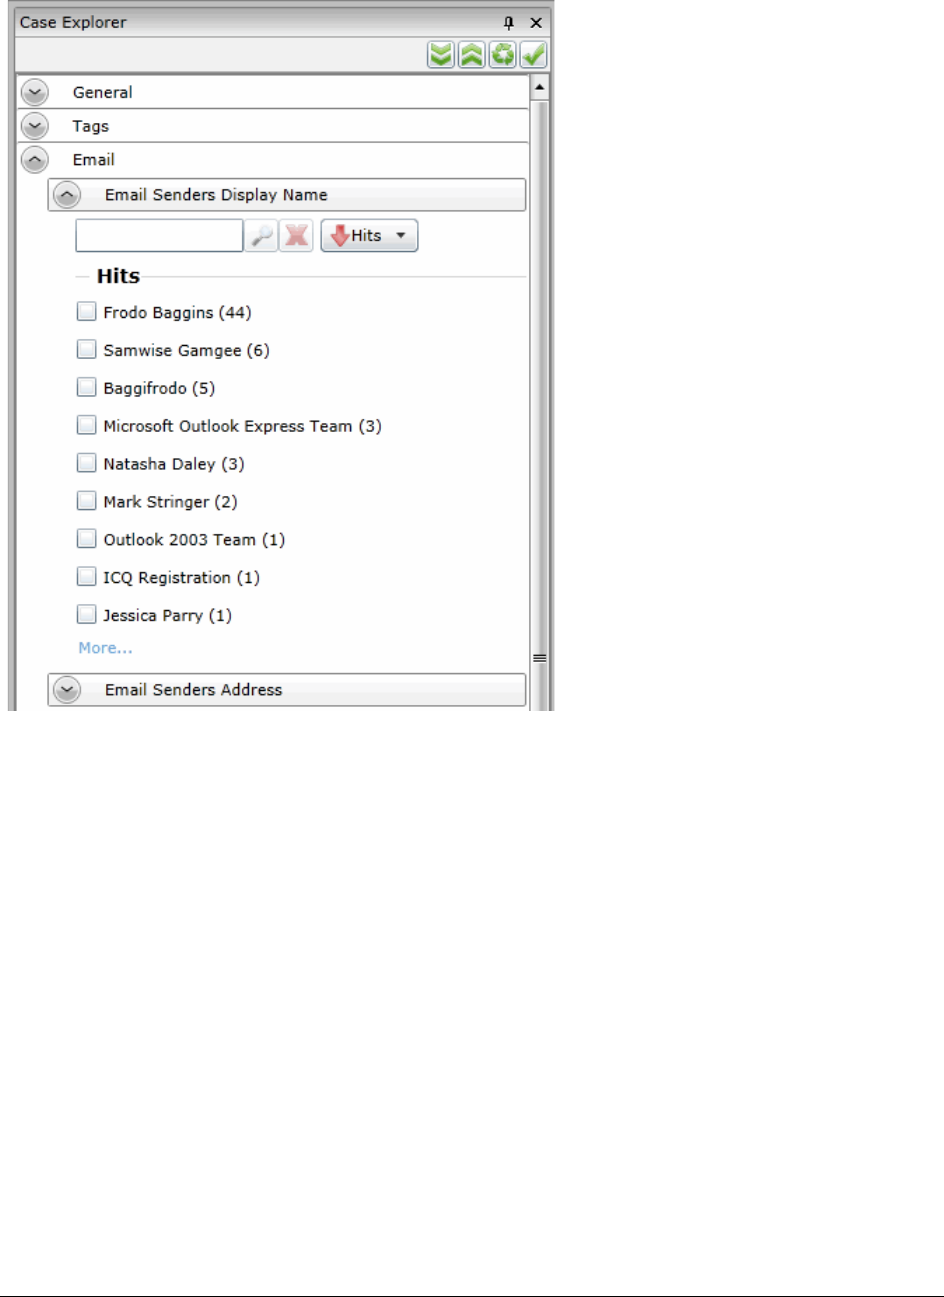
Using Filters to Cull Data Filtering Data in Case Review | 128
Facets Panel
Only the top nine facets of a filter display when you expand a category. To see all the facets in a category, click
More... to display a facet dialog. Many categories also contains a search field that searches for facet hits within
that particular category.
The facets that appear in the Facets tab depends upon the product license that you have.
Using Filters to Cull Data Filtering Data in Case Review | 129
Available Facet Categories
The following table lists facets that may be available in the Facets tab of the Project Explorer.
Note: The Evidence Explorer and Custodian Facet counts are reduced when Family data uploaded by
Evidence Processing is updated by a CSV import. Existing documents that are updated by the CSV
import are removed from the Evidence Explorer and Custodian Facets.
Depending on your license, some filters may not be available.
General
Facet Category
General Filters Description
Evidence Explorer Filters evidence based on the source of the evidence.
Note: If you add new evidence to either an existing or an upgraded project,
only the new evidence that has been added will populate this filter.
Custodians Filters evidence based on people or custodians associated to the items is a
project.
Authors Filters evidence by author of Microsoft Office documents.
Object Types
Object Sub-Type
Filters evidence based on the Object Type. You can expand an ObjectType facet
for a list of object sub-type facets.
See Object Types (page 140)
Tags Facet Category
Tags Filters Description
Issues Filters evidence based on issues tags. You can still filter for issues under the
Tags tab.
Labels Filters evidence based on labels tags. You can still filter for labels under the Tags
tab.
Categories Filters evidence based on category tags. You can still filter for categories under
the Tags tab.
Case Organizer Filters evidence based on summaries. You can still filter for summaries under the
Tags tab.
Production Sets Filters evidence based on production sets. You can filter out the produced
records from the normal view.
When a production set is created, a new facet is added to the Production Set
Facet and by default this facet is set to exclude those records from the Item List
grid. These records can be displayed by simply clicking the facet until you have a
check mark and then applying the setting.
Using Filters to Cull Data Filtering Data in Case Review | 130
Email Facet Category
Email Filters Description
Email Senders Display
Name Filters evidence based on the email senders display name.
Email Senders Address Filters evidence based on the email senders address.
Email Senders Domain Filters evidence based on the email senders domain.
Email Recipients Display
Name Filters evidence based on the email recipients display name.
Email Recipients Address Filters evidence based on the email recipients address.
Email Recipients
Domains Filters evidence based on the email recipients domain.
Email Recipients BCC Filters evidence based on BCC recipient address, display name, and domain.
Email Recipients CC Filters evidence based on CC recipient address, display name, and domain.
Email Recipients To Filters evidence by To recipient address, display name, and domain.
Email by Date Filters evidence by email date. You can select to filter by the Delivered date or
the Submitted date.
Email by Date Range Filters evidence by either the delivered (received) date or by submitted (sent)
date. You can enter a start range or/and an end range. Both fields are not
required for the search.
Email Status Filters evidence by email status, including: attachments, related items, replies,
and forwarded.
File Filters Facet Category
File Filters Description
File by Date Range Filters evidence by the Date Range: by modified date, by creation date, and by
accessed date. You can enter a start range or/and an end range. Both fields are
not required for the search.
File Extensions Filters evidence by file extension, including: .doc, .docx, .log, .msg, .rtf, .txt, .wpd,
.wps. This filter is both sortable and searchable.
File Size Filters evidence by file size.
-Empty = 0KB
-0KB < Tiny <= 10KB
-10KB < Small <= 100KB
-100KB < Medium <= 1MB
-1MB < Large <= 16MB
-16MB < Huge <= 128MB
-128MB < Gigantic
Using Filters to Cull Data Filtering Data in Case Review | 131
For information about KFF, see Reviewing KFF Results (page 323)
For information about Geolocation, see Using Visualization Geolocation (page 157).
File Category Filters evidence by file category, including: archives, databases, documents,
email, executables, folders, graphics, internet/chat files, mobile phone data,
multimedia, OS/file system files, other encryption files, other known types,
presentations, slack/free space, spreadsheets, unknown types, and user types.
File Status Filters evidence by file status, including: bad extension, email attachments, email
related items, encrypted files, and OLE sub-items.
KFF Facet Category
KFF Filters Description
KFF Vendors Filters evidence by vendor as listed in the KFF Vendor field.
KFF Groups Filters evidence by group as listed in the KFF Groups field.
KFF Statuses Filters evidence by status according to the KFF Statuses field. There are two
possible KFF Statuses, Unknown (0), Ignore (1), and Alert (2). The KFF Status,
Ignore (1) is not included in an evidence search because it was already ignored
by KFF during the initial evidence search.
KFF Sets Filters evidence by sets at listed in the KFF Sets field. KFF Sets contain multiple
document hashes.
Geolocation Facet Category
Geolocation Filters Description
From Country Name Filters evidence by the country that the communication originated from.
To Country Name Filters evidence by the country that the communication was sent to.
From City Name Filters evidence by the city that the communication originated from. Example:
San Francisco, San Jose, Los Angeles.
To City Name Filters evidence by the city that the communication was sent to. Example: San
Francisco, San Jose, Los Angeles.
From Continent Filters evidence by the continent that the communication originated from.
To Continent Filters evidence by the continent that the communication was sent to.
File Filters Facet Category (Continued) (Continued)
File Filters Description
Using Filters to Cull Data Filtering Data in Case Review | 132
Examples of How Facets Work
Including and Excluding Items
Next to each facet within a filter is a check box. By default, all facets within each filter are selected. Next to each
facet is also a count of the number of files that match that facet’s criteria.
Document Content Facet Category
Document Content
Filters
Description
Cluster Topic Filters evidence by clusters of similar documents. These clusters are determined
by cluster analysis of the documents.
See Using Cluster Analysis in the Admin Guide.
Credit Card Numbers Filters evidence based on extracted credit card numbers.
See Using Entity Extraction in the Admin Guide.
Email Addresses Filters evidence based on extracted email addresses found within the body of
documents, not in the email meta data.
For Email addresses found in To: or From: fields in Email meta data, use the
Email facet category.
See Using Entity Extraction in the Admin Guide.
People Filters evidence based on extracted people's names.
See Using Entity Extraction in the Admin Guide.
Phone Numbers Filters evidence based on extracted phone numbers.
See Using Entity Extraction in the Admin Guide.
Social Security Numbers Filters evidence based on extracted social security numbers.
See Using Entity Extraction in the Admin Guide.
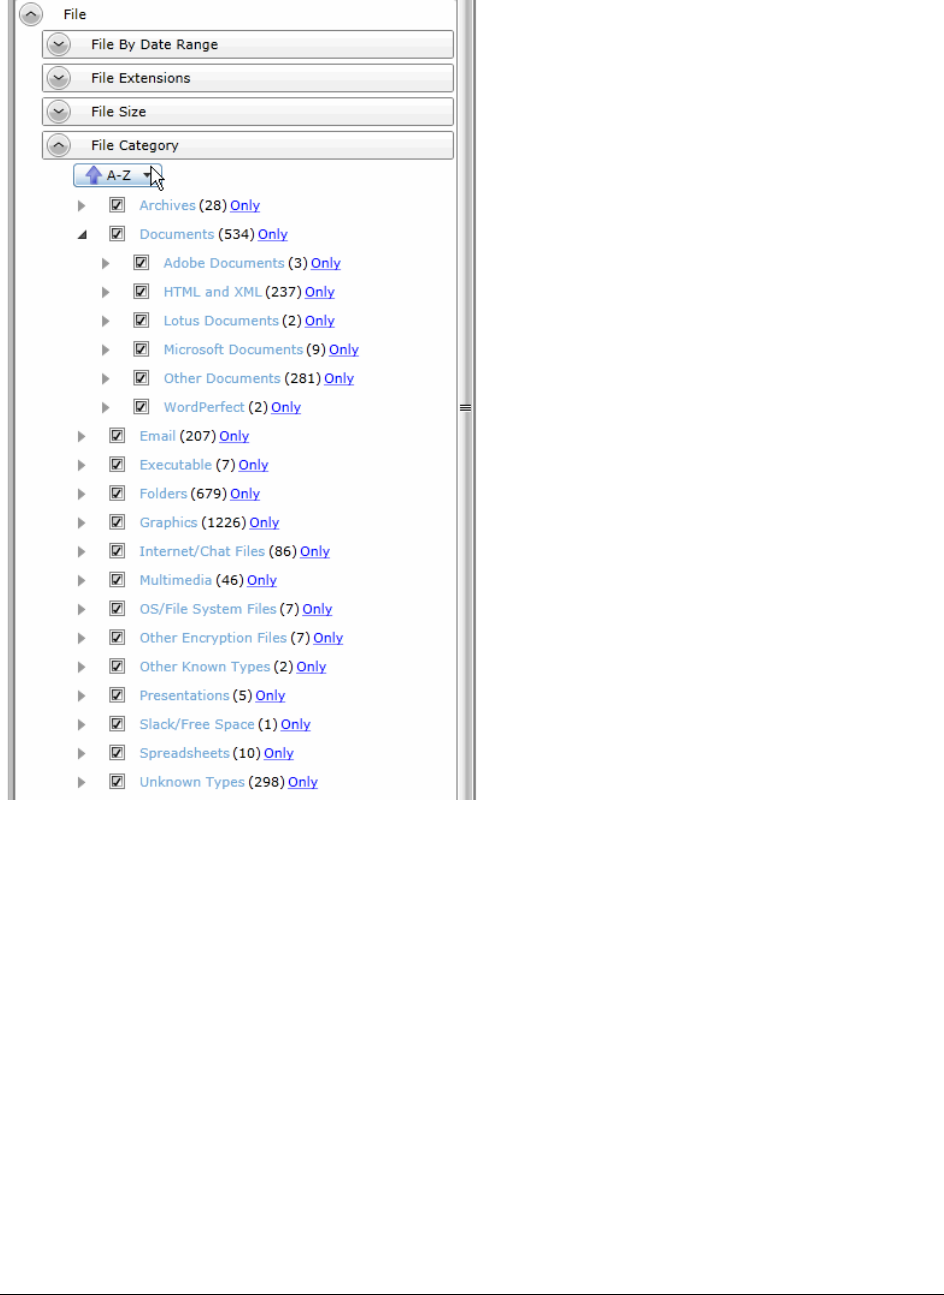
Using Filters to Cull Data Filtering Data in Case Review | 133
The following figure shows an example of the File Category filter with all of the individual facets in that category.
As an example of how you can use this category, to help reduce irrelevant files, you can exclude executable and
system files.
For each facet, there is also a link labeled Only. You can click Only for a facet and that one facet will be checked
and all other facets within that filter will be cleared. This action only affects that particular filter that you are
working with. All other filters in the Facet Panel will remain as you have previously set them.
You can also click on the facet name which will exclude all other facets and all other filters.
See Using Facets on page 137.

Using Filters to Cull Data Filtering Data in Case Review | 134
Excluding Tags Facets
In addition to using the Only link, you can exclude Tags filters (categories, issues, and labels) from a facet
search. This allows you to further narrow and refine your facet scope.
The default for the Tags facet displays as checked or included. Selecting the check box once actively excludes
the facet in the Tags filters. Selecting the check box a second time clears the check box and the facet is not
included in the facet search.
When excluded, a red x appears in the facet check box, indicating that the facet is excluded. The hyperlink to
apply the excluded facet is disabled.
You need to be aware of the following considerations when actively excluding Tags facets:
-For labels, the exclude feature applies to all labels in a group. However, if there are children under the
labels, and one child label is selected for exclusion while another is not, the label group appears blank.
This is because you cannot include a whole label group when one of the child labels is excluded.
-For issues, you can exclude or include an individual issue. Additionally, you can exclude a child issue
while including a parent issue or vice versa.
-If you have a document that has been assigned a tagged item that is included in a facet in the Tags filter
and has also been assigned a tagged item that is excluded in a facet in the Tags filter, the facet does not
display the document. For example, a document may be tagged with both Tag 1 and Tag 2. If all
documents with Tag 1 are included in the facet and all documents with Tag 2 are excluded in the facet,
the document with both Tag 1 and Tag 2 is not posted to the Item List. The exclusion takes precedence.
This is because exclusions and inclusions in facets act as an AND property, not as an OR property.
Using a Single Facet
You can filter your evidence based on one or more facets within a given filter or based on one or more facets
across multiple filters. There may be times when you want to use a single facet.
For example, there is a filter category called Tags. Inside that category is a filter called Labels. Nested inside the
Label filter are facets for each of the labels that have been used in the project. You can clear all but one label
facet and only the files with that label are displayed; all other files are excluded.
However, the action of clearing all but one label facet will not exclude documents with multiple labels, if one of
those labels is within the scope of the selected label facet. Even if the non-selected label facet is left unchecked,
documents with multiple labels will be included.
Using Multiple Facets in a Single Category
You can filter evidence using multiple facets within a single filter category. For example, there is a filter category
called File Category. Inside that category are individual filter facets for each type of files that are in the project
(archives, documents, emails, graphics, spreadsheets, and so on.) You can exclude the types of files that you do
not need to review while leaving the file types that you do want to review.

Using Filters to Cull Data Filtering Data in Case Review | 135
Using the N/A Facet
In most of the filter categories, there is a special facet that is labeled N/A, which stands for “not applicable.” If you
check this, the filter will display items to the results that are not applicable to that category.
For example, if you apply a single facet for one or more email addresses, and N/A is unchecked for that
category, then the only results will be records that contain an email address. If you also check N/A, then other file
types will also be displayed, such as documents, spreadsheets, and PDFs, because they don’t have an email
address property.
As another example, you can see a list of all files that do not have a person applied to them. In the People
category, you can select only the N/A facet, and that excludes all files that have a person applied.
If your project has no files that pertain to a filter, it will show N/A as the only item in the facet.
Refining Evidence Using Facets in Multiple Categories
You can use multiple facets together in order to further refine your evidence. For example, you may have applied
a facet for a single person and want to refine it further to only include spreadsheets and documents that are
related to that person. You can apply another set of facets for file extensions choosing to exclude all files but
Documents and Spreadsheet files. By combining the two facet categories, you can display only spreadsheets
and documents that have a certain person.
Assume you want to find all the PDFs associated with a person named Sarah. In the Person filter, you would
deselect all facets except for Sarah, who has 20 files of multiple file types associated with her. In the File
Extensions filter, you would deselect all facets except for PDF, which has 40 different people associated with it.
Since five of those PDFs are associated with Sarah, only those five PDF would display in the results.
Almost every filter can be used together to find information. Most filters treat the combination as a Boolean AND
operator in conjunction with other filters. (In the example of Sarah and the PDFs, the search syntax was: Where
Person = Sarah AND File Extension = PDF.) The only filters that cannot act as an AND operator against other
filters are Email Sender’s Display, Address, and Domain, as well as the Email Recipient’s Display, Address, and
Domain filters. These filters act as OR operators.
You would use the filters with the OR operator functionality when you wanted results that produced returns of
two different sets of data. For example, if you were to select the Sarah facet under the Email Senders Display
filter and the accessdata.com facet under the Email Senders Domain, you would get results of all emails where
the email was sent by Sarah. You would also get results of all the emails that were sent within the
accessdata.com domain. The search syntax would be: Where Email Senders Display = Sarah OR Email
Senders = accessdata.com.
If you want to narrow the scope of your search using OR filters, you must use a filter that operates as an AND
operator with one of the filters that operate as an OR. For example, if you were to select the Sarah facet under
the Email Senders Display and the Larry facet under the Email Recipients To, this would return results of emails
that contained both Sarah in the Email Senders Display field, and Larry in the Email Recipients To field.

Using Filters to Cull Data Filtering Data in Case Review | 136
Examples of Using Facets in Multiple Categories
Assume you need to create an export set of a specific person’s data, but at the same time, remove anything that
is obviously unimportant to reviewers. You can do the following:
-Using the People category, select only the one person.
-Using the File Extensions category, exclude unimportant file types, such as EXE and DLL files.
-Using the Email Senders Domain category, exclude all emails that came from ESPN.com and
Comcast.com.
As another example, a development in a project may reveal that some very important evidence may exist as an
email attachment sent either to or by a person within a specific date range. You can do the following:
-Using the People category, select only the one person.
-Using the File Status category, select only Email Attachments.
-Using the Email by Date category, select only emails delivered in March and April of 2009.
Email Recipient and Senders Facet Counts
When viewing facets, a count of the items related to each facet is displayed. For any given facet that is selected,
the filter count will be part of the total number of items displayed in the Item List. For example, suppose you
configure facets to show only PDF and XLS files and the facet counts show 6 PDF files and 4 XLS files. In the
Item list, only the 10 PDF and XLS files will be displayed. The total of the two facet counts will match the number
of files in the Item List.
There is a situation where the facet count may be higher than the count of items in the Item list. There are six
different filters that are related to email recipients and senders. To help reduce the length of the list of recipients,
there is a first-level division that contains alphabetical ranges of the names that are used. For example, ABurr --
> AHamilton, ALincoln --> ASteveson, and so on. From that first level, you can drill down to individual names.
The facet counts displayed for the first levels (a range of names) may by higher than the number of emails in the
Item List. The reason is that a single email may have been sent to multiple recipients. In the Item List, that email
is reflected as one single item, yet in the first-level list of the facet, the counts may reflect 5 recipients of that one
email. Because there can be more recipients than emails, this can cause the first-level facet count to be higher
than the Item List count.
Using Filters to Cull Data Using Facets | 137
Using Facets
To use facets, you specify the items that you want to include. As you specify facets, the results are displayed to
the Item List. As you clear facets, files are removed from the Item List.
The Filters list denotes with an icon which facets you have configured.
Note: You must be careful when filtering evidence. Once evidence has been culled using a facet in the Facets
panel, the only way to display that evidence again is to recheck the specific facet or reset all of the facets.
No other facet will return the evidence to the item list.
To apply a single facet to evidence
1. In the Facets panel on the Project Review page, expand the filter category that you want to use.
For a list of filter categories, see Available Facet Categories (page 129).
To expand all categories, click Expand.
2. In the expanded filter, click the Facet name link.
Click this link to filter out all other facets and filters.
For example, in the filter, if you click the facet named Email, you will only get email messages.
3. To reset a single facet, click .
To apply one or more facets to evidence
1. In the Facets panel on the Project Review page, expand the filter that you want to use.
For a list of filters, see Available Facet Categories (page 129).
To expand all filters, click Expand.
2. In the expanded filter, perform one of the following tasks:
-Check: Manually check the items that you want to include.
-Uncheck: Manually uncheck the items that you want to exclude.
-Only: Click Only to uncheck all other facets in the filter.
-Expand: Many facets can be expanded to show dynamic facets. For example, in the Email By Date
filter, there is a Delivered facet. You can expand it to show detailed facets for years, months, or days.
3. Click Apply.
The Item List will change to display only the items that you filtered for.
When you change the configuration of a category, a appears next to the category name. This
shows you which categories have been configured.
4. (Optional) Repeat steps 2 and 3 as often as needed. After making any changes, you must click
Apply.
5. (Optional) To reset facets, do any or all of the following:
-To undo an individual facet, check the box for an item that you previously unchecked.
-To reset all facets in a single filter category, click the next to the filter name.
-To undo all filters, click Reset.
6. Click Apply.

Using Filters to Cull Data Caching Filter Data | 138
Caching Filter Data
If you use the same filters a lot, you can cache your results in the database so that the next time you use the
filter, your results will appear faster.
To cache a filter result set
1. Set filters that you commonly use in the Project Review.
2. In the Item List panel, select Options > Cache > Add current filter to cache.
Your data is cached in the database and the cached icon turns orange.
Cached Icon in the Item List Panel
Using Filters to Cull Data Filtering by Column in the Item List Panel | 139
Filtering by Column in the Item List Panel
You can filter the evidence in the Item List panel by the data in the columns. You cannot filter the content of the
first three columns. You can apply multiple column filters.
For ore information, see Filtering Content in Lists and Grids (page 36).
Note: Column Filters are applied after facet scope filters and visualization filters. Changing your facets scope or
visualization filters will clear the column level filters. Also, Column Filters do not persist and will be cleared
out when you either execute a new search or use the Clear Search button.
To filter evidence by data in columns
1. In Project Review, ensure the Item List panel is showing.
2. Select the document groups, labels, or issues that you want to view from the Project Explorer and click
Apply.
3. In the Item List panel, click on the column filters button .
4. Uncheck the items that you want to filter out of your view.
5. (Optional) You can use the Search field to search by keyword among the items in the column.
6. (Optional) Expand the Sort drop-down to sort the items in the column by ascending or descending hits
or values.
7. Click Apply.
All documents with the item that you unchecked are removed from the Item List panel.
Note: When you filter the ProductionDocID column, only the produced record value is displayed, not the source
document.
Clearing Column Filters
You can clear column filters that you have applied to the Item List panel.
To clear column filters
1. In Project Review, ensure the Item List panel is showing.
2. Select the document groups, labels, or issues that you want to view from the Project Explorer.
3. In the Item List panel, click on the column filters button .
4. Click Clear Filter.
Using Filters to Cull Data Object Types | 140
Object Types
You can use columns and facets to view an item’s Object Type and cull data based on the Item Types in your
evidence.
Some Object Types have Object Sub-Type data. For example, for the Endpoint Event object type, you can have
the following object sub-types: File Event, Network Event, Registry Event, and Endpoint OS Event.
With the ObjectType and ObjectSubType columns, you can search, filter, and sort on these columns in order to
quickly cull down the files that you are viewing.
The Object Type facets, which are under the General facet category, dynamically list facets for all of the object
types in your evidence. You can expand an ObjectType facet for a list of object sub-type facets.
The following table lists the object types and object sub-types that may exist in your data.
Object Types and Object Sub-Types
Object Types Object Sub-Types
Unknown
Partition
File System
Live Folder
Live File
Directory
File or Loose Files
(Listed in the Facets
as Files & Email)
Files that are added
through Import have
the object type of
Loose Files, whereas
files added as
evidence have the
object type of Files.
-Documents
-Spreadsheet
-Database
-Presentations
-Graphics
-Multimedia
-Email
-Executable
-Archives
-Folders
-Slack Free Space
-Other Known
-Mobile Device Items
-Encryptions Files
-Internet Chat
-OS Files
-Transcripts
-Exhibits
-Notes
Mailbox
Archive
Unpartitioned Space
Using Filters to Cull Data Object Types | 141
Carved File
Drive Remote
File Slack
File System Remote
Custodian Group
Removable Media File -Devices Inserted
-Devices Removed
-Files Copied From Device
-Files Copied To Device
Network Traffic -There are many types, for example, WebMail, SMTP email, Chat, and FTP.
Threat Scan
Endpoint Event -File Event
-Registry Event
-Network Event
-OSEvent
-ProcessEvent
Mobile
Case Organizer -Event
-Fact
-Person
-Question
-Research
-Pleading
-Summary
Volatile -There are many types, for example, Process, DLL, Socket, Driver, Service,
Registry Key, Registry Value
Object Types and Object Sub-Types (Continued)
Object Types Object Sub-Types


Using Visualization Culling Data with Visualization | 143
Chapter 13
Using Visualization
Culling Data with Visualization
Visualization allows you to see visual representations of data in the selected project and to filter the data, based
on the visualization graphs. The Visualization feature allows you to choose the type of graph in which to display
the data. The graphs are interactive, allowing you to isolate and search on sections of the graph. Once you
select how you want the data represented, you can apply the visualization filter to the data. The filtered data will
appear in the Item List, and you can apply additional scope filters and column filters to further cull the data.
You can also clear previous visualization filtering sessions in the Options > Visualization dialog. If no previous
visualization filter has been applied to the data, the Clear Visualization options are inactive.
You can apply visualization filters to the data in the following ways:
Files Visualization (page 144)
Emails Visualization (page 147)
About Geolocation Visualization (page 157)
Using Visualization Social Analyzer (page 150)
Using Visualization Geolocation (page 157)
Using Visualization Files Visualization | 144
Files Visualization
Files Visualization allows you to view and filter data in a project by using the same data that is posted in the Item
List grid. This allows you to cull the data in the Item List grid with filters before applying Files Visualization to the
data.
To access Files Visualization
1. Click Project Review.
2. In the Item List panel, click Options > Visualization > Files.
Important:
When you first open File Visualization, the Files grid will show only a portion of the total files. The
Files grid only shows the files that are currently filtered using the Visualization tool. Initially, the top
Timeline filter only covers a small part of the total timeline, as a result, you may not see many files
listed in the Files grid. You can expand or move the Timeline filter to show other files.
Files Visualization Panel
Using Visualization Files Visualization | 145
Files Visualization Options Panel
The following table identifies the tasks that you can perform from the File Visualization panel
.
File Visualization Panel Options
Element Description
Apply Visualization Applies the files that have been filtered in the visualization graph filters to the
Item List grid. Once applied, only those items filtered with visualization appear in
the Item List grid.
To remove the filters, re-enter files visualization and click Cancel.
Note: If you use the “check all” button in the visualization Files grid, be aware
that only the items on the current page will be selected.
Cancel Visualization Cancel the visualization graph filters and exit out of Visualization.
Options
Refresh Timeline Refreshes the Timeline pane.
Refresh Extensions Refreshes the Extensions pane.
Refresh Categories Refreshes the Categories pane.
Refresh Files Refreshes the Files pane.
Data -Scale - Choose to display the data scale either by logarithmic or by linear. If
this field is changed, data in the panes will refresh automatically.
-Metrics - Choose to display the data metrics either by size or by count. If this
field is changed, data in the panes will refresh automatically.
View -Timeline Data Type - Choose to display the data in the timeline, extensions,
categories, and files panes by date created, modified, or accessed.
-Timeline Graph Type - Choose to display timeline data by bar, line, area, or
scatter graph.
-Extension Graph Type - Choose to display extension data by bar or pie
graph.
-Categories Graph Type - Choose to display category data by bar or pie
graph.
Using Visualization Files Visualization | 146
Timeline Examine the data based on when the data was created, accessed, or modified.
You can highlight a specific period of time in the timeline and filter data based on
that specific time.
Extensions Displays the data by document’s extension, such as .doc or .dll. Only extensions
found in the data set will display in the graph. You can click a specific extension
in the graph’s list or graphic, and all files with that extension will appear in the
Files panel.
Categories Displays the data by category. The categories available by which to sort are
documents, spreadsheets, database, presentations, graphics, multimedia, email,
executables, archives, folders, slack free space, encryption files, internet chat,
operating system file, other known, unknown, user types, stego apps, and mobile
device items. You can click a specific category in the graph’s list or graphic, and
all files within that category will appear in the Files panel.
Files Displays the files represented by the visualization graphs. This list can be all of
the data set, or only files filtered by either timeline, extensions, or categories. You
can sort information in each column by clicking the column header.
History The History tab captures the movement of the box that isolates a time period
within the time line. Each time that you move the box along the timeline, a new
tab is created for that section of the timeline. Each section can be identified by
start date and end date. By clicking one of the History tabs, you can examine the
data from that particular time period, allowing you to quickly return to a period
that you have already examined.
Selected Lists the files selected in the Files pane.
File Visualization Panel Options
Element Description
Using Visualization Emails Visualization | 147
Emails Visualization
Emails Visualization allows you to view and filter data in a project by using the same data that is posted in the
Item List grid. This allows you to cull the data in the Item List grid with filters before applying Emails Visualization
to the data.
To access Email Visualization
1. Click Project Review.
2. In the Item List panel, select Options > Visualization > Emails.
Emails Visualization Panel
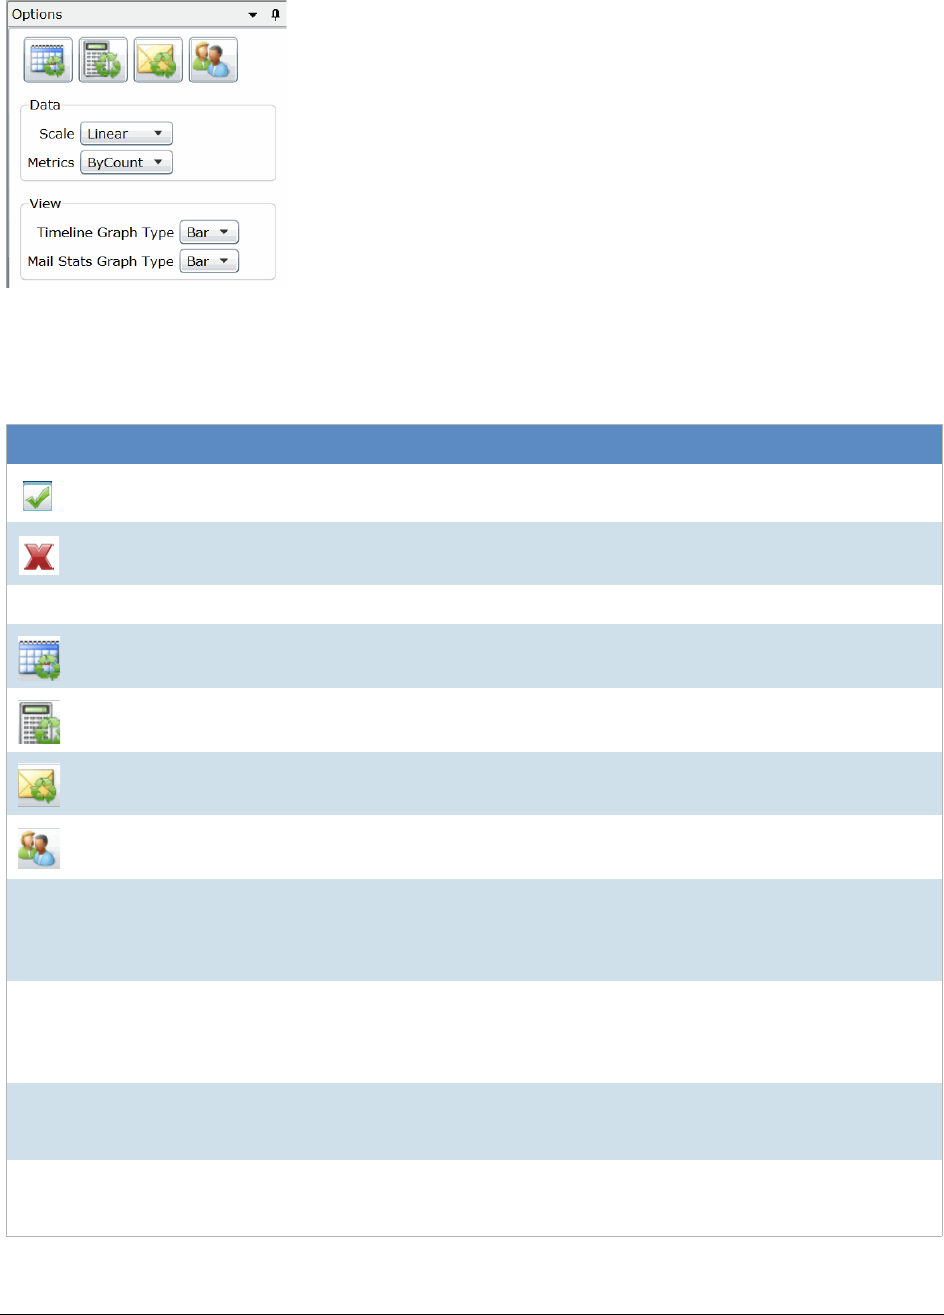
Using Visualization Emails Visualization | 148
Email Visualization Options Pane
l
The following table identifies the tasks that you can perform from the Emails Visualization panel.
Emails Visualization Panel
Element Description
Apply Visualization Apply the visualization graph filters to the Item List grid. Once applied, only
those items filtered with visualization will appear in the Item List grid.
Cancel Visualization Cancel the visualization graph filters and exit out of Visualization.
Options
Refresh Timeline Refreshes the Timeline pane.
Refresh Mail Statistics Refreshes the Mail Statistics pane.
Refresh Email Addresses Refreshes the Email Addresses pane.
Launch Social Analyzer Click to launch the Social Analyzer pane. See Using Visualization Social
Analyzer on page 150.
Data -Scale - Choose to display the data scale either by logarithmic or by lin-
ear. If this field is changed, data in the panels will refresh automatically.
-Metrics - Choose to display the data metrics either by size or by count.
If this field is changed, data in the panels will refresh automatically.
View -Timeline Graph Type - Choose to display timeline data by bar, line,
area, or scatter graph.
-Mail Stats Graph Type - Choose to display mail stats graph by bar, line,
spline, or scatter graph.
Timeline Examine the email data set based on when the emails were created,
accessed, or modified. You can highlight a specific period of time in the
timeline and filter the emails based on that specific time.
Mail Statistics Displays the Mail Statistics of the emails - the sent and receive dates. You
can click a specific item in the graph and filter the email addresses in the
email addresses list.

Using Visualization Emails Visualization | 149
Email Addresses Lists the email addresses in the email data set. You can view display
name, email address, traffic count, and the sent and received data.
Expand either the sent or received field for a particular email address to
obtain additional information.
Selected Lists the history of the data set. By highlighting a tabbed date in History,
you can examine the data from that particular time period.
History Lists the files selected in the Files pane.
Emails Visualization Panel
Element Description
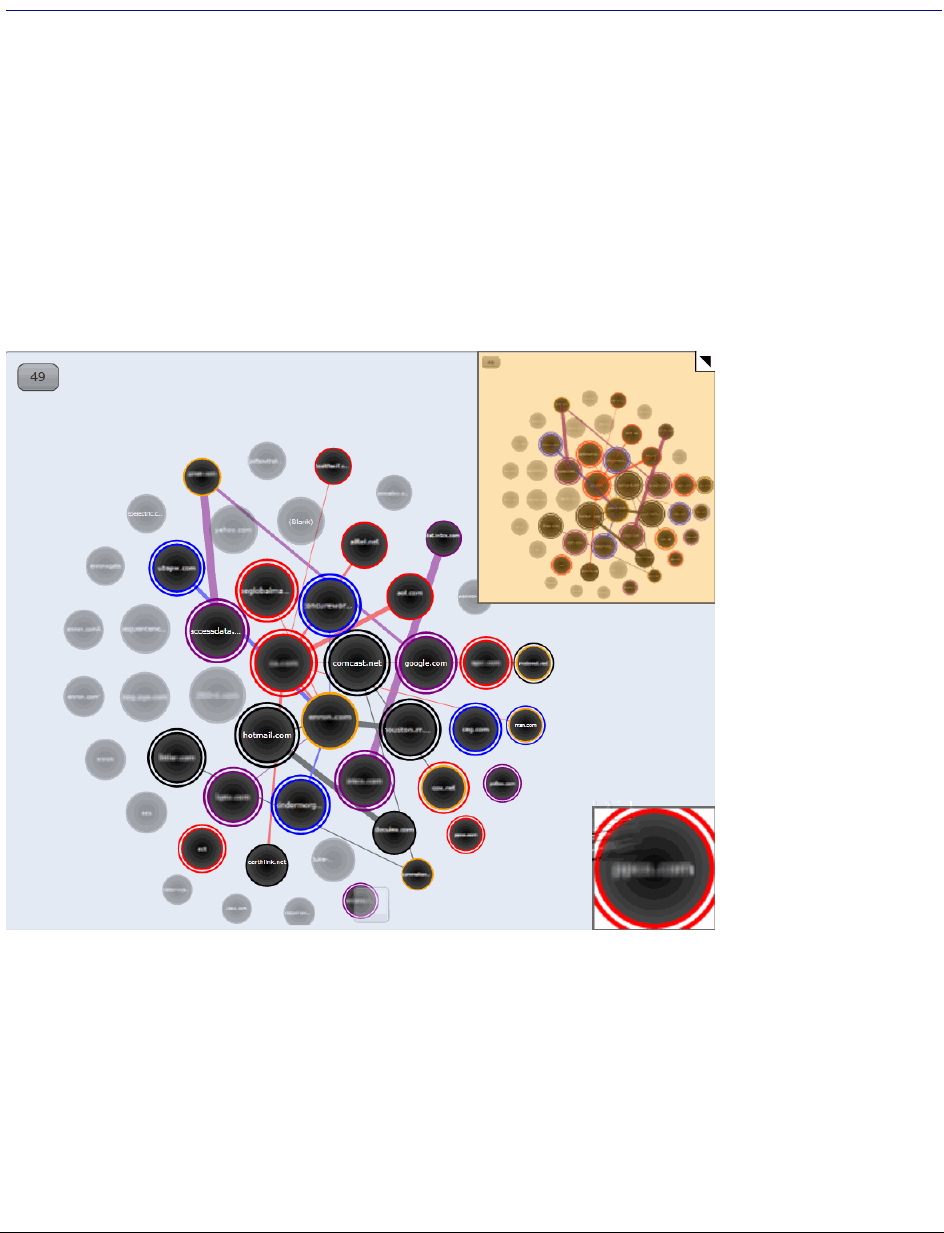
Using Visualization Social Analyzer About Social Analyzer | 150
Chapter 14
Using Visualization Social Analyzer
About Social Analyzer
The Social Analyzer shows a visual representation of email volume contained in the data set. Social Analyzer
will display all of the email domains in a project, as well as individual email addresses within the email domains.
Social Analyzer Map
The Social Analyzer map displays emails in the data set group by domain name. These domain names appear
on the map in circles called “bubbles.” The larger the bubble, the more emails are contained within that domain.
The bubbles in the map are arranged in a larger sphere according to how many emails were sent to that domain.
The center bubble in the sphere will have the most emails sent from this domain, while domains radiating
clockwise from the center will have fewer and fewer emails in their domain bubble. If you want to examine email
domains with the most sent emails, concentrate on examining the bubbles in the center of the map.
Email data in the Social Analyzer map can be examined on two different levels. On the first level, you can get an
overall view of communications between domains. You can then select domains that you want to examine in a
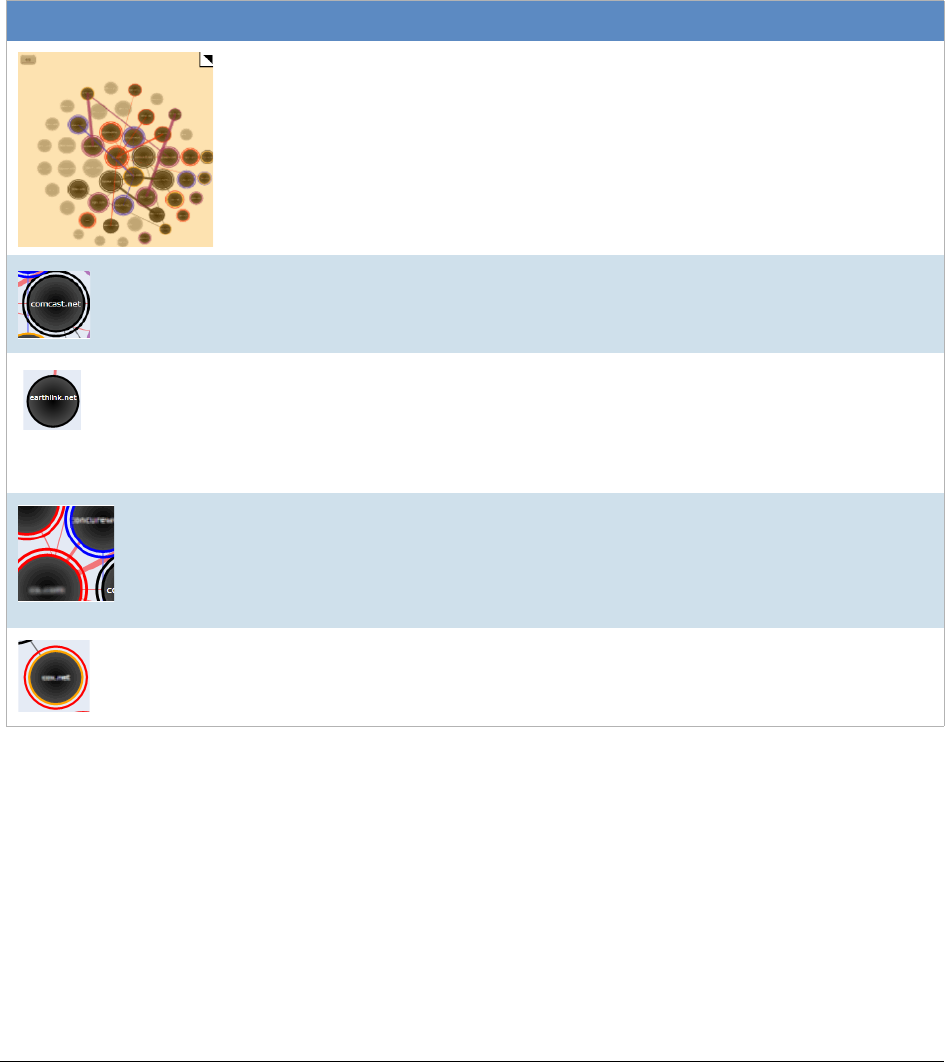
Using Visualization Social Analyzer About Social Analyzer | 151
more detailed view and expand those domains to view communications between specific email addresses from
the domain. For example, if you search for high email traffic between two domains, you can see which two
domains have the highest amount of traffic between them. Select the two domains, and expand them to view the
email traffic between individual users from those two selected domains.
See Analyzing Email Domains in Visualization on page 154.
See Analyzing Individual Emails in Visualization on page 154.
Elements of the Social Analyzer Map
Element Description
This map presents the overall view of the social analyzer data. The orange
rectangle indicates the area displayed in the main social analyzer map. Black
dots in the overall view show domains that are either selected or communicating.
You can either expand or collapse the overall view by clicking on the triangle in
the upper right corner.
When you select a domain bubble, it is surrounded by a colored double ring. The
ring may be colored blue, black, purple, or red. The different colors allow you to
distinguish between different selected domains, but they do not have any
significant meaning.
Domain bubbles that are not selected, but have sent emails to the selected
domain bubble, are surrounded by a single colored ring that is the same color as
the selected domain bubble. This allows you to easily tell which domains have
been communicating with the selected domain bubble. Domain bubbles that do
not connect to any selected domains are greyed out.
Lines connect other domain bubbles to the selected domain bubble. These lines
represent emails sent to the selected domain from other domains. The more
emails that have been sent to the domain, the thicker the line between domain
bubbles are. You can also see emails sent from the selected domain. Select
Show Reversed Connections in the Social Analyzer panel to show visual
representations of emails sent from the selected domain.
A domain bubble with an orange ring indicates that a domain has been
connected to from another domain multiple times. This allows you to pinpoint
domains that have heavy communication between them.
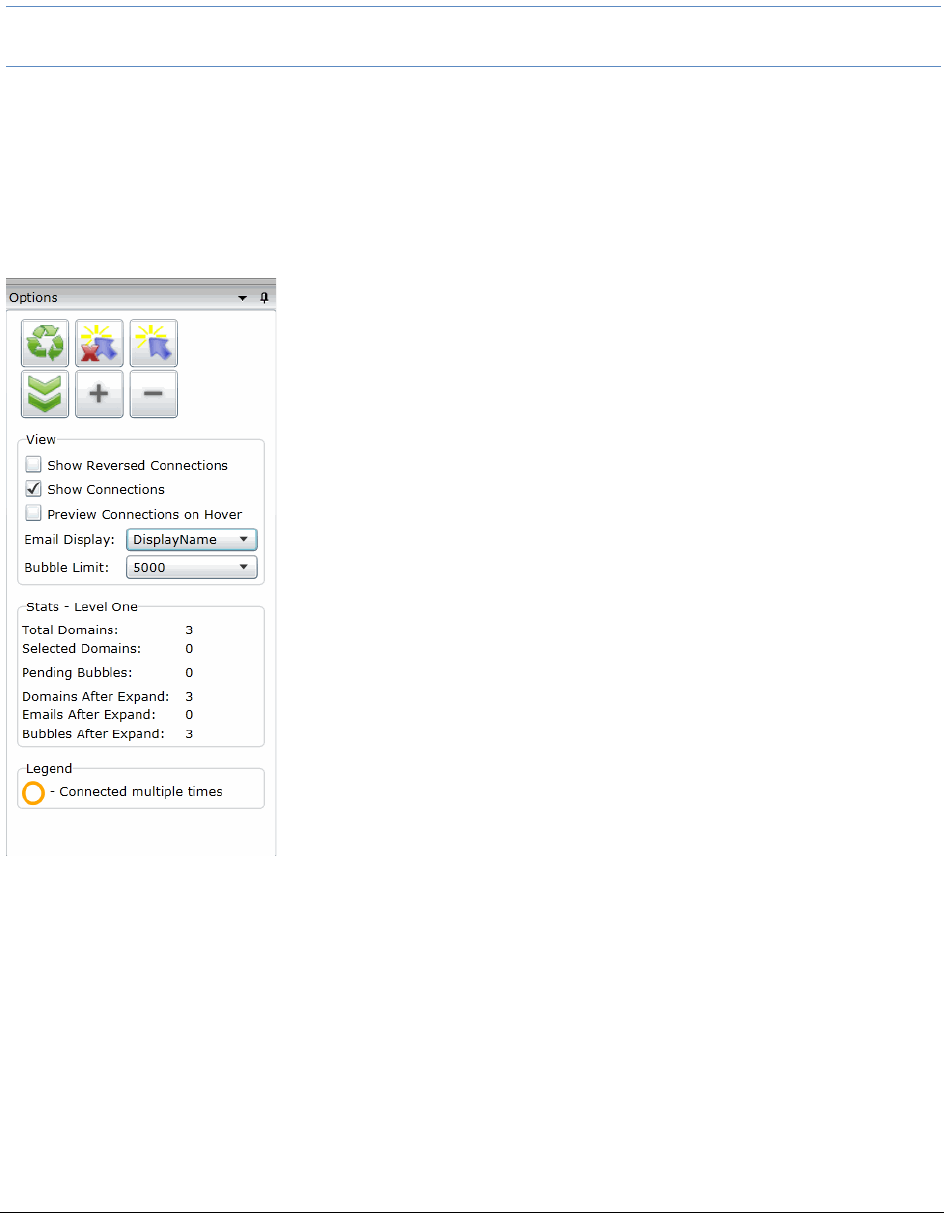
Using Visualization Social Analyzer About Social Analyzer | 152
Accessing Social Analyzer
To navigate throughout the Social Analyzer pane, click and drag inside the pane. Hover over an email domain
bubble to view the total number of emails that were sent from the domain.
Note: Expansion of large datasets may result in slow server speeds and slow rendering the Social Analyzer
visualization data.
To access Social Analyzer
1. Click Project Review.
2. In the Item List panel, click Options > Visualization > Social Analyzer.
Social Analyzer Options Panel
Using Visualization Social Analyzer About Social Analyzer | 153
Social Analyzer Options
The following table identifies the tasks that you can perform from the Social Analyzer panel
.
Social Analyzer Options
Element Description
Apply Visualization Applies the visualization graph filters to the Item List grid. Once
applied, only those items filtered with visualization will appear in
the Item List grid.
Cancel Visualization Cancels the visualization graph filters and exits out of
Visualization.
Refresh Refreshes the Social Analyzer pane.
Clear Selections Clears the selected bubbles in the Social Analyzer pane.
Select Most Connected Items Selects the ten bubbles that have been most connected to in the
Social Analyzer pane. Each time you click this icon, the next top
ten bubbles will be selected, and so forth.
Expand Selected Domains Expands selected domains in the Social Analyzer pane. You can
drill down to a second level to examine the email data. See
Analyzing Individual Emails in Visualization on page 154.
Zoom In Zooms into the Social Analyzer pane. If you are unable to view
the social analyzer data, click Zoom In to locate the data. You can
also zoom in by expanding the slider bar located at the bottom of
the Social Analyzer pane, by using the + key on the keyboard, or
by scrolling the mouse wheel up.
Zoom Out Zooms out of the Social Analyzer pane. You can also zoom out
by expanding the slider bar located at the bottom of the Social
Analyzer pane, by using the - key on the keyboard, or by scrolling
the mouse wheel down.
Expands and collapses the overall map of the data set. Dots that
appear in black in the overall map are domains/emails that are
connected to the selected domain/email. The orange rectangle on
the map shows where the expanded location is on the map.
View -Show Reversed Connections - Select to show all reversed
connections in the pane. Reversed connections are emails
sent from a particular email or email domain.
-Show Connections - Select to show the connections between
domains in the pane. Connections are emails sent to a particu-
lar email or email domain.
-Preview Connections on Hover - Select to view connections
between domains when you hover over them. This option is
not selected by default to speed rendering of the map.
-Email Display - Display email domains either by the display
name or address.
-Bubble Limit - You can choose a display limit of either 2,500,
5,000, or 10,000 domains. Server issues may occur with larger
display limits.
Using Visualization Social Analyzer About Social Analyzer | 154
Analyzing Email Domains in Visualization
Once you have you opened the Social Analyzer pane, you can isolate and examine individual email domains.
Note: Social Analyzer is very graphics-intensive. In order to avoid server issues, you should cull the data with
facets and other filters to isolate the information that you want to examine before viewing it in Social
Analyzer.
To analyze email domains in Visualization mode
1. Click Project Review.
2. In the Item List panel, click Options > Visualization > Social Analyzer.
3. Click the domain bubbles to select the domain(s) that you want to view.
4. (optional) If you want to view the top ten domains in terms of received emails. click . Each time you
click this icon, the next top ten bubbles will be selected, and so forth.
5. (optional) You can zoom in and zoom out of the Social Analyzer panel. If you hover over a domain
bubble, the full display name and address, as well as the count, is displayed in the tool tip.
6. You can expand selected email domains and examine individual emails in a domain. See Analyzing
Individual Emails in Visualization on page 154.
Analyzing Individual Emails in Visualization
You can expand email domains to display individual emails and the traffic between those emails.
To analyze individual emails within selected email domains
1. Click Project Review.
2. In the Item List panel, select Options > Visualization > Social Analyzer.
3. Click the domain bubbles to select the domain(s) that you want to view.
4. (optional) If you want to view the top ten domains in terms of received emails. click . Each time you
click this icon, the next top ten bubbles will be selected, and so forth.
5. (optional) You can zoom in and zoom out of the Social Analyzer panel. If you hover over a domain
bubble, the full DisplayName and address, as well as the count, will be displayed in the tool tip.
6. Click to expand the domain names to display the individual emails.
Stats Displays the statistics of either the first or second level of the
email domain data. You can view:
-The total number of domains, emails, and bubbles in the pane.
-The total number of selected domains, emails, and bubbles in
the pane.
-The total number of domains, emails, and bubbles that have
been expanded.
You can access the second level of data by clicking Expand
Selected Data.
Social Analyzer Options
Element Description
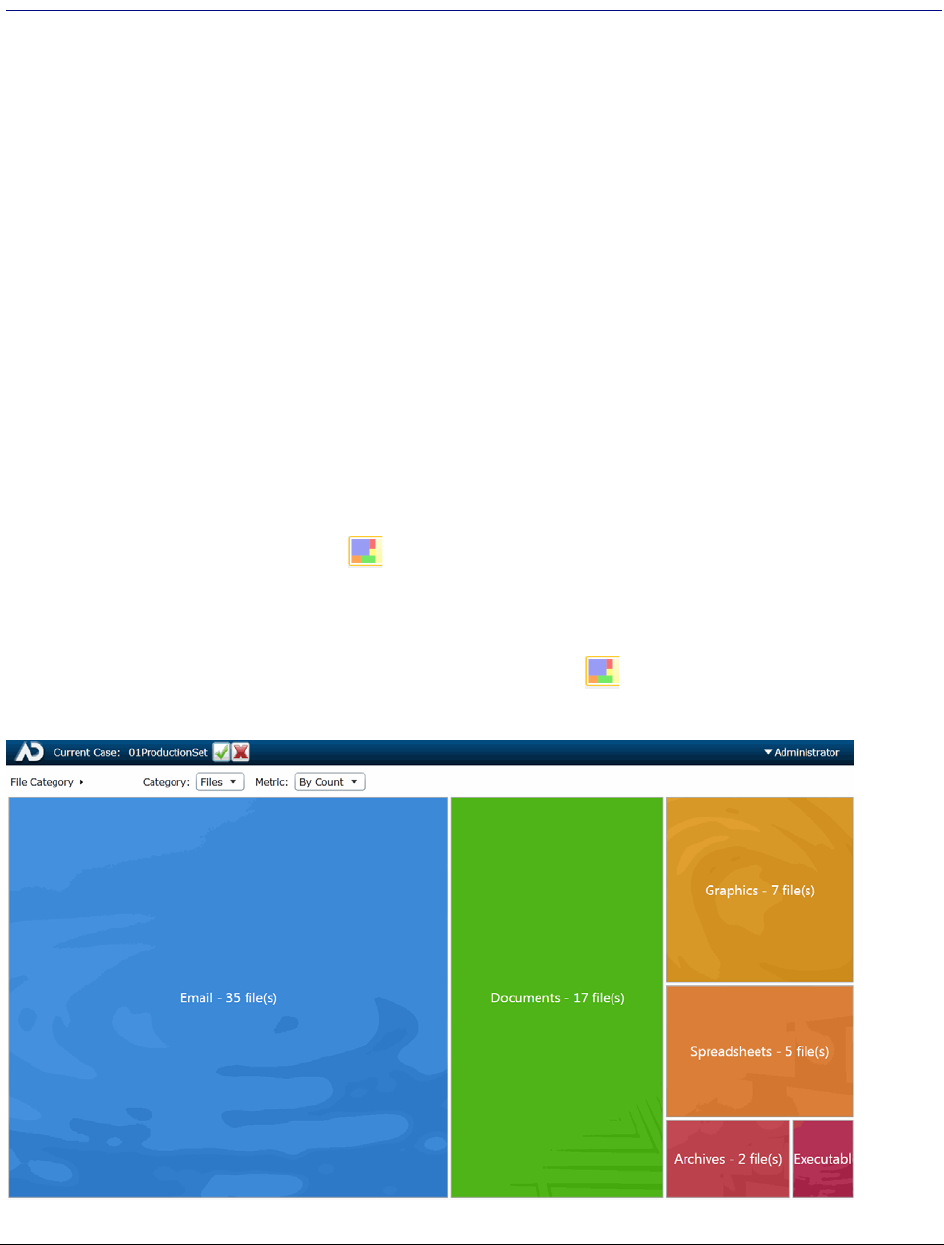
Using Visualization Heatmap | 155
Chapter 15
Using Visualization Heatmap
Heatmap allows you to view a visual representation of file categories and file volume within a project. Information
displays in a grid comprised of squares of different colors and sizes. Each color represents a different file
category, and the relative size of the square represents the file volume within the category. You can view each
file category for more details about the files within that category (similar to a file tree) and navigate between file
categories.
You can also switch between viewing the file volume by the physical size of each file and the file count. This
allows you to see any discrepancies in the size of the files. For example, if someone were trying to hide a file by
renaming the file extension, you could easily see the size discrepancy in the heatmap, and then investigate that
particular file further.
To access Heatmap
1. In FTK, do the following:
1a. Open the Examiner.
1b. In the File List panel, click (Heatmap).
2. In Summation, Resolution1 eDiscovery, Resolution1 CyberSecurity, or Resolution1, do the following:
2a. Click Project Review.
2b. In the Item List panel, click Options > Visualization > Heatmap.
Heatmap Panel
Using Visualization Heatmap | 156
Heatmap Options Panel
The following table defines the tasks from the Heatmap panel
.
Heatmap Panel Options
Element Description
Cancels the heatmap filters and exits out of Visualization.
Apply the visualization graph filters to the Item List grid. Once applied, only those
items filtered with visualization appear in the Item List grid.
Options
Category -Files - Allows you to view files by the file category. You can view the files in
each category:
By double-clicking that particular file category’s square, or
By clicking the menu from the upper left side and choosing the file cate-
gory that you want to view in the heatmap.
-Folders - Allows you to view files by the folders contained within the project.
You can view the files in each folder:
By double-clicking that particular folder’s square.
By clicking the menu from the upper left side and choosing the folder that
you want to view in the heatmap.
-Extensions - Allows you to view files by the file extension.
Metric -By Size - Allows you to view file types by size of the files. The larger the files,
the larger the represented square in the heatmap.
-By Count - Allows you to view file types by quantity. The more files of a partic-
ular type that are in the project, the larger the represented square in the heat
map.

Using Visualization Geolocation About Geolocation Visualization | 157
Chapter 16
Using Visualization Geolocation
About Geolocation Visualization
Geolocation allows you to view a map with real-world geographic location of evidence items that have
geolocation information associated with them. This lets you understand where certain activities/actions took
place .
See Using Visualization on page 143.
For example, if you have photos in the evidence that have GPS data in the EXIF data, you can see where those
photos were taken. For volatile/RAM data, you can see the lines of communication (both sent and received)
between addresses, showing the location of all parties involved.
Geolocation supports the following data types:
-Photos with GPS information in the EXIF data.
-Live email sender and receiver IP data gathered using a Volatile Job in AD Resolution1 CyberSecurity
and AD Resolution1.
-Email sender and receiver IP data gathered using a Network Acquisition Job in AD Resolution1
CyberSecurity and AD Resolution1. Because the data is gathered from Sentinel, the data displayed
shows a snapshot of the traffic at the time that Sentinel captured the data.
Note: Geolocation IP address data may take up to eight minutes to generate, depending upon other jobs
currently running in the application.
Geolocation Components
Geolocation includes the following components:
-Maps
When viewing geolocation data, you can use any of the three following maps:
MapQuest Streets
MapQuest Satellite
OpenStreetMaps
You have the option to switch between the three map views while in the Geolocation filter.
-Geolocation Grid
Below the map, you can view a grid that shows details about the items in the map.
See Using the Geolocation Grid on page 163.
Using Visualization Geolocation Viewing Geolocation EXIF Data | 158
-Geolocation Data in columns in the Item List
You can view geolocation data for files in the Item List.
See Using Geolocation Columns in the Item List on page 164.
-Geolocation Facets
There are specific facets for filtering on Geolocation data.
See Using Geolocation Facets on page 165.
Geolocation Workflow
When you launch Geolocation, it will display all relevant files currently in the item list. You can cull the data using
filters and other tools in the item list to limit the data that is displayed in geolocation.
General Geolocation Requirements
As a prerequisite, you must have the following:
-Access to a KFF Service Server.
The KFF Server can be installed on the same computer as the AccessData software or on a separate
computer.
KFF Geolocation Data. This must be installed on the KFF Server.
See Getting Started with KFF in the Admin Guide.
-Internet access to view Web-based maps.
You can download the offline maps for Geolocation. Use the link Geolocation Map for Offline Use
and Geolocation Map for Offline ReadMe on the FTK Product download page:
http://www.accessdata.com/support/product-downloads/ftk-download-page
-For AD Resolution1 Platform and AD Resolution1 CyberSecurity:
The Geolocation option selected when processing the evidence. This option allows the data to display
properly in the Geolocation filter. Geolocation is selected by default when evidence is processed.
Default Evidence Processing Options (page 85)
-For FTK, FTK Pro, Lab, and Enterprise:
The File Signature Analysis option selected when processing the evidence.
Viewing Geolocation EXIF Data
When your evidence has photos with GPS information in the EXIF data, you can view photo locations.
To view EXIF data in FTK
1. In FTK, open the Examiner.
2. In the File List panel, click (Geolocation).
3. You can filter the items displayed and see item details..
See Using the Geolocation Grid on page 163.
To view EXIF data in Summation or Resolution1 products
1. Click Project Review.

Using Visualization Geolocation Using Geolocation Tools | 160
Using Geolocation Tools
The Geolocation Map Panel
Points of data in a particular area on the map are represented by large dots called clusters. The number on each
cluster show how many points of data (known as pins) are represented by the cluster. Clicking a particular
cluster on the map zooms in on a group of pins.
The general location of the clusters are determined by a central point on the map. The clusters radiate from this
central point. When you zoom in and out of the map, your central point on the map moves as well, and clusters
will shift position on the map. However, as you zoom into a cluster, the cluster rendered will more closely align
itself with the location of the individual pins.
When viewing IP data, the connections between two pins display on the map as lines between clusters/pins. The
width of the lines represent the amount of traffic between two IP address. The thicker the lines, the more traffic
has occurred. Green lines represent traffic originating from the pin and red lines represent traffic entering the pin.
When you select a cluster and zoom in on a particular pin, you can select one or more pins. When a pin is
selected, the outline and shadow of the selected pin turns orange. If you zoom out of the map, the cluster with
one or more selected pins has an orange ring.
Hovering over the cluster displays the following icons:
- Selects all of the pins in a cluster.
- Clears all of the selected pins in a cluster.
The following table describes the Geolocation panel options.
Geolocation Panel
Element Description
After filtering data by selecting one or more pins, this applies the selected
geolocations to the Item List grid. Once applied, only those geolocations filtered
with visualization appear in the Item List grid.
For network data, you will see any communication from those pins to any other
location. This may include one or more items.
If you enter the Geolocation view again, only those geolocation will be displayed
in the map.
To reset the items in the Item List, click the Project Explorer’s Reset and Apply
icons.
(Network Acquisition Job data from Resolution1 CyberSecurity or Resolution1
only)
After filtering data by selecting one or more pins, this applies the selected
geolocations to the Item List grid. Once applied, only those geolocations filtered
with visualization appear in the Item List grid.
This applies only the connections between the selected pins. As a result, it
shows the communication between only the selected pins and not to other
locations. This may include one or more items.
If you enter the Geolocation view again, only those geolocations will be displayed
in the map.
To reset the items in the Item List, click the Project Explorer’s Reset and Apply
icons.
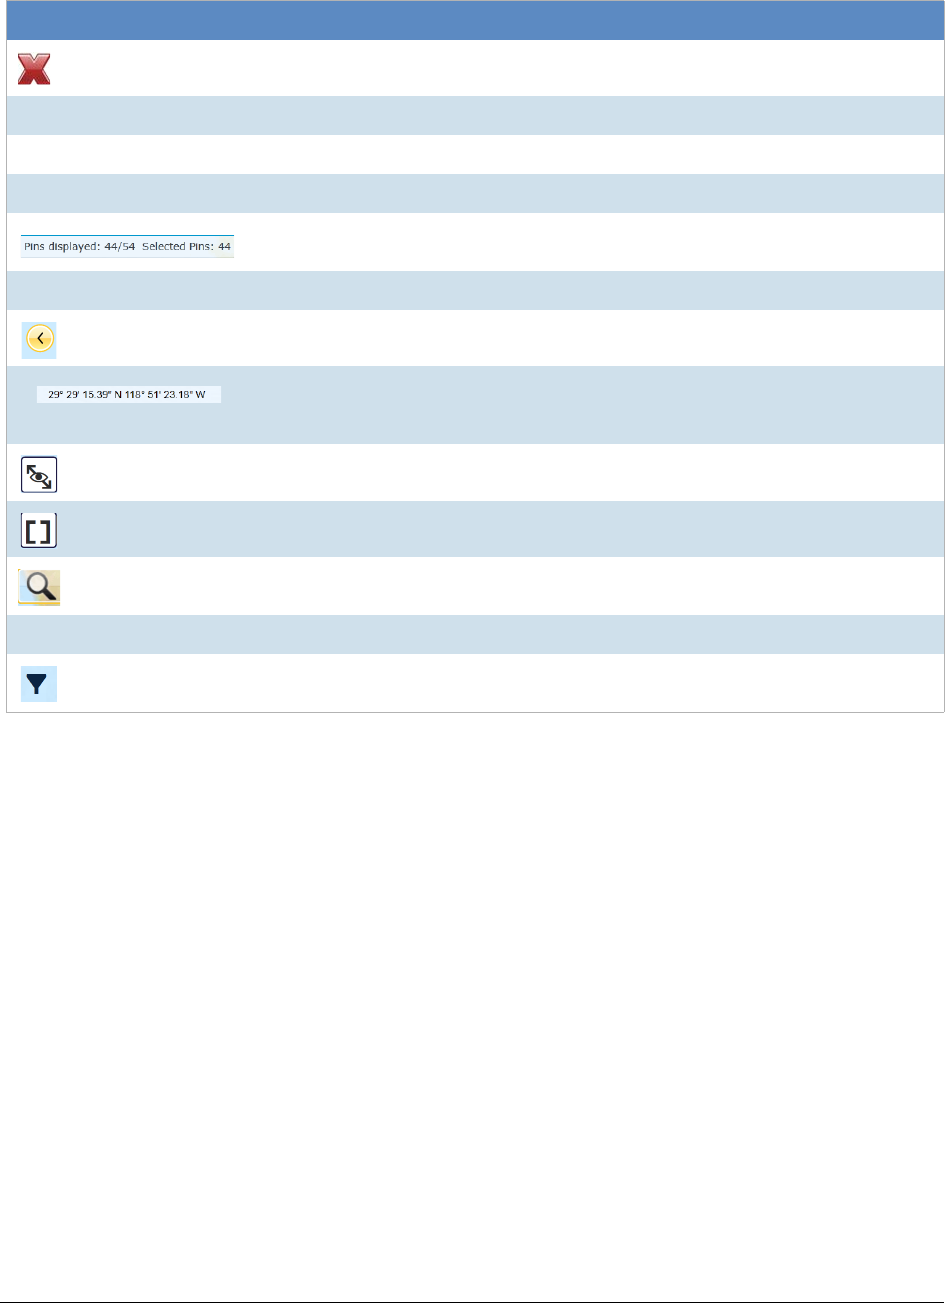
Using Visualization Geolocation Using Geolocation Tools | 161
Right-clicking a pin displays more information about the pin.
Cancels the geolocation filters and exits out of Visualization.
Pins displayed Shows the number of spins that are displayed and the number selected.
Clear Clears and selected pins.
Options
Displays the number of pins selected in the map versus the number of pins
available in the data.
Map Tab Choose which map to display in the Geolocation filter.
Expands or collapses the overall view map.
Displays the latitude and longitude where the mouse pointer resides. To view the
position of a particular pin, hover the mouse over the pin. To view the exact
coordinates of the pin, select the pin and right-click.
Turns the connections between the pins/clusters either on or off.
Displays all of the pins on the map.
Zooms in or out on the map. A slide bar displays, allowing you to control the
zoom feature.
View All/View Selected
Filter Displays either EXIF data or network connection data. You can also view both
types of data at the same time.
Geolocation Panel
Element Description
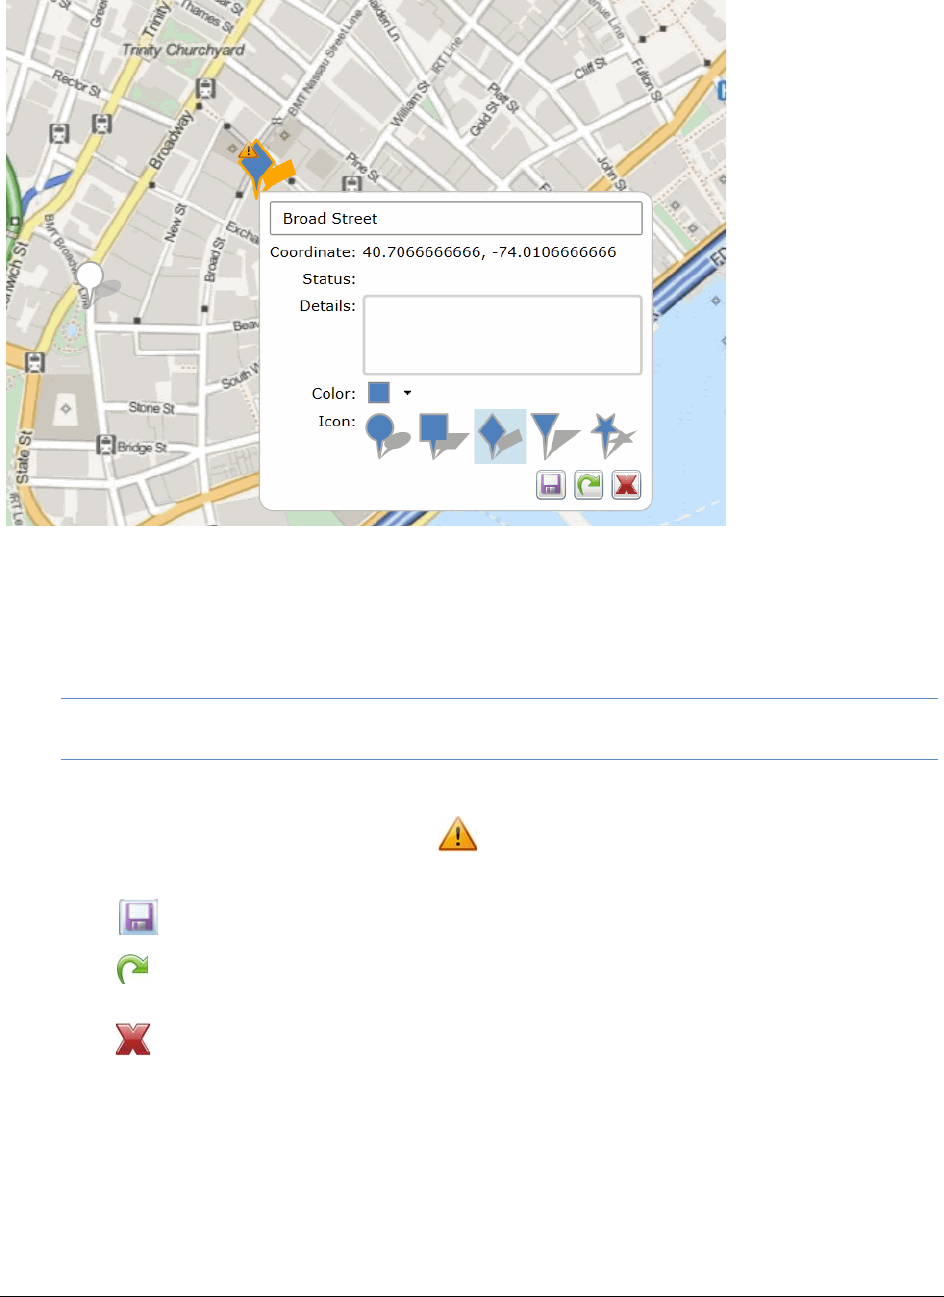
Using Visualization Geolocation Using Geolocation Tools | 162
Detail of Pin
In the pin dialog, you can:
-Add any notes
-View the exact coordinates and status of the pin
-View the IP Address of the pin
Note: To save processing time and to ensure data accuracy, the host name does not populate in the
Geolocation pin. However, the host name does populate in the Item List.
-Change the color and shape of the pin
If you make any changes to the pin, a warning icon displays that notifies you that changes were made to
the pin and need to be saved. You can do the following in the pin dialog:
-Click to save the changes that you have made to the pin
-Click to reset the pin. If changes have been saved previously to the pin, this action resets the pin to
the saved version
-Click to close the dialog

Using Visualization Geolocation Using the Geolocation Grid | 163
Using the Geolocation Grid
When you open Geolocation, you can view a grid that shows details of the items on the map.
The Geolocation Grid has two tabs:
-Network Communication:
In Resolution1 CyberSecurity and Resolution1, this shows network acquisition and volatile data from
security jobs.
In FTK, this show data from the Volatile tab.
You can see the following
Process Start Time column
Machine column
Process Name column
Path column
Host Name column
Bar chart (Resolution1 CyberSecurity and Resolution1 only)
Within the Network Communication tab, you can also view a bar chart that shows the count of
items sorted by either Process Name or by Machine (computer IP address).
-Exif: This shows the following Exif data from photos
Capture Data column
File Name column
File Size Coordinate column
When you click an item in the grid, the map will be centered to reflect the location of the selected item.
You can minimize the grid so that the whole map is visible.
Filtering Items in the Geolocation Grid
When you first launch Geolocation, all of the items on the map are shown in the grid.
You can filter the contents of the grid in the following ways.
-In the map, if you select a pin, only that item is displayed. You can click (and select) multiple pins.
-In the map, if you right-click a cluster and click , that selects all of the pins in a cluster. This will filter
the grid to those clustered pins. You can add multiple clusters to the grid.
-In the grid, the columns in the Geolocation Grid can be filtered to cull the items in the grid. For Network
Communication data, the data in the bar chart is filtered as well when columns are filtered.
Using Visualization Geolocation Using Geolocation Columns in the Item List | 164
Using Geolocation Columns in the Item List
The data that the Geolocation filter uses to render the information is also available in columns in the Item List.
You can find the following columns in the Item List, depending upon the data that has been collected. These
columns can be sorted and filtered.
Data for geolocation columns require that the KFF Geolocation Data be installed.
See General Geolocation Requirements on page 158.
Geolocation EXIF Data Columns
When your evidence has photos with GPS information in the EXIF data, you can view data using the following
columns.
Geolocation Columns: EXIF data
Column Display name Description
Geotagged Area Code: Area Code Area code location of geotagged photo or object.
Geotagged City: City City location of geotagged photo or object.
Geotagged Country Code: Country Code: ISO country code location of geotagged photo or object,
such as USA, FRA, MEX, HKG, and EST.
Geotagged Direction: Direction Direction geotagged photo or object.
Geotagged Latitude: Latitude Latitude of geotagged photo or object.
Geotagged Longitude: Longitude Longitude of geotagged photo or object.
Geotagged Postal Code: Postal Code Postal code of geotagged photo or object.
Geotagged Region: Region Regional or State location of geotagged photo or object,
such as NY, DC, IL, FL, and UT.
Geotagged Source: Source Source used to resolve geotagged GPS location to locality
information.

Using Visualization Geolocation Using Geolocation Facets | 165
Using Geolocation Column Templates
When using AD Forensics products, you can use the following Column Templates to help you quickly display
Geolocation-based columns in the File List:
Geolocation - Displays all available Geolocation columns.
GeoEXIF - Displays all columns that contain EXIF-related Geolocation data.
GeoIP - Displays all columns that contain IP-related Geolocation data.
Using Geolocation Facets
When using Summation, or Resolution1 products, you can also use facets to cull data based on Geolocation
data.
See Geolocation Facet Category on page 131.
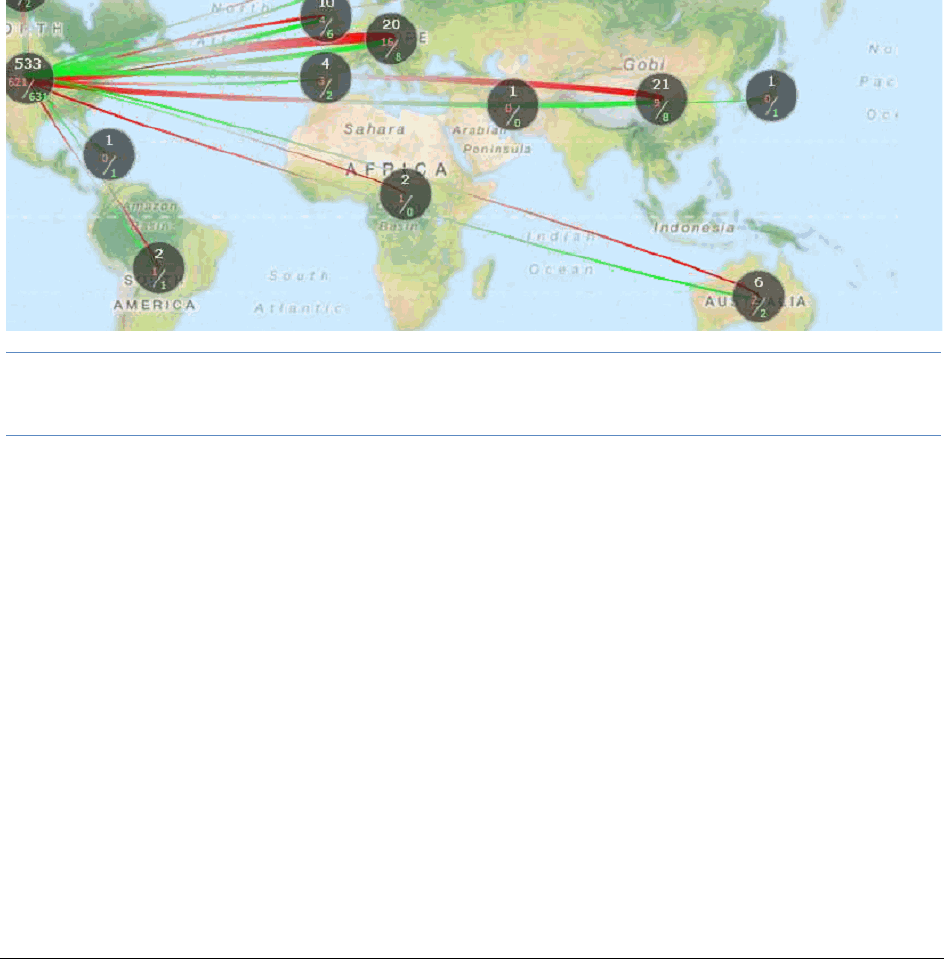
Using Visualization Geolocation Using Geolocation Visualization to View Security Data | 166
Using Geolocation Visualization to View Security Data
You can use geolocation to view IP location data to discover where in the world a computer is communicating.
You can view IP locations data when using one of the following products:
-AD Resolution1 CyberSecurity and AD Resolution1 Platform, after running either a Volatile Job or a
Network Acquisition Job
-AD Forensics products, after gathering Volatile data
The Geolocation view will display lines that trace internet traffic sent and received between IP addresses,
indicating the physical location of all parties involved. You can drill into geographic regions to see multiple
evidence items. You can then select specific data to post back to the case, where they can view information in
the examiner or include it in reports.
Geolocation Panel - IP Locations
To view IP data in Geolocation viewer
Note: For data collected by Geolocation Visualization, the To Domain Name, To ISP, To Netspeed, and To
Organization columns do not populate in the Item Grid. If you require this data, you need to purchase a
MaxMind Premier database license.
Prerequisites for Using Geolocation Visualization to View Security Data
-For FTK, Enterprise, AD Resolution1 Platform, and AD Resolution1 CyberSecurity:
For examining network acquisition and volatile data, enable the Geolocation option in the Web Config
file. To enable this option, contact AccessData’s support.
Also for examining network acquisition and volatile data, you need to generate a text file of your IP
locations and place the text file in the GeoData directory. Configuring the Geolocation Location
Configuration File (page 166)
Configuring the Geolocation Location Configuration File
When working with network acquisition and volatile data, some data may come from a private network where the
physical location of the IP address is not known. For example, you may need to provide the location of your own
network and any satellite offices that you interact with.
Normally you would start with block of IPs in your local network.

Using Visualization Geolocation Using Geolocation Visualization to View Security Data | 167
To set this information, you need to populate a configuration file for the KFF server.
The filename is iplocations.txt.
You can configure this file in one of two ways:
-Using the Management page > System Configuration > Geolocation page.
-Configuring the file manually
If you have already manually created this file, you will see the information in the configuration page interface.
Using the Geolocation Configuration Page
1. In the console, click Management > System Configuration > Geolocation
2. Click to add an item.
3. Fill in the location data.
See sample data below. You can get latitude longitude data for an area from Google maps.
Any data you save here is saved in the configuration file.
Important:
Any time you save new data, the KFF Service is automatically restarted. This can affect running KFF
jobs.
Configuring the Location Configuration File Manually
You can manually create and edit the iplocations.txt text file for the KFF server. It has the the following
requirements:
-The text file needs to be saved with the filename iplocations.txt.
-The IP addresses must be written in CIDR format and need to be IPv4 addresses.
-Each comment line in the file must start with the character #. List only one address/network per line.
-The network line must contain the following information in the following order: address (in CIDR format),
Id, CountryCode, CountryCode3, CountryName, Region, City, PostalCode, Latitude, Longitude,
MetroCode, AreaCode, ContinentCode, Source.
-The iplocations.txt file must be placed in the Geodata folder of the kffdata folder on the server.
The following is an example of an iplocations.txt file:
#this file goes in the <kffdata>\GeoData directory
#address (in cidr
form),Id,CountryCode,CountryCode3,CountryName,Region,City,PostalCode,Latitude,Longitud
e,MetroCode,AreaCode,ContinentCode,Source
#192.168.0.0/24,1,,USA,United States,Utah,Taylorsville,84129,40.6677,-111.9388,,801,,
#10.10.200.252/30,1,,USA,United States,Utah,Orem,84042,40.2969,-111.6946,,801,NA,
#10.10.200.48/32,1,,USA,United States,Utah,Orem,84042,40.2969,-111.6946,,801,NA,
10.10.200.0/24,1,,USA,United States,Utah,Orem,84042,40.2969,-111.6946,,801,NA,

Using Visualization Geolocation Using Geolocation Visualization to View Security Data | 168
Viewing Geolocation IP Locations Data
To view IP location data in FTK
1. Open the Examiner.
2. Click the Volatile tab.
3. In the Volatile tab, click (Geolocation).
4. You can filter the items displayed and see item details..
See Using the Geolocation Grid on page 163.
To view IP location data in Resolution1 CyberSecurity or Resolution1
1. Open Project Review.
2. In the Item List panel, click Options > Visualization > Geolocation.
3. You can filter the items displayed and see item details..
See Using the Geolocation Grid on page 163.
For example, you can do the following:
-You can click one or more pins and then click . This applies only the items you selected and
displays them in the Item List. This displays any communication to or from those pins with any other
location.
-You can click one or more pins and then click . This applies only the items you selected and
displays them in the Item List. This displays only the communication between the selected pins.
4. If you have both Network Communication and Exif pins in your data, you can select to turn on or off
those pins in the map as well as items in the grid.
Click the “eye” icon for Network Communication or Exif.
If the icon is yellow, the data is displayed. If the icon is black, the data is not displayed.
Using the Geolocation Network Information Grid
-When viewing network acquisition and volatile data connection information, you can now view a grid that
displays the following information:
Process Start Time
Machine
User Name
Process Name
Path
Host Name
IP Address
Coordinates
Ports
You can show the communication between multiple pins.
Using Visualization Geolocation Using Geolocation Visualization to View Security Data | 169
Geolocation Filter
You can filter your Geolocation data with filters in the Facets Panel. The following filters are available under the
Geolocation filter categories for security jobs that contain geolocation data.
Geolocation Filters in the Facets Panel
Geolocation Filters Description
From Country Name Filters evidence by the country from which the communication originated.
To Country Name Filters evidence by the country to which the communication was sent.
From City Name Filters evidence by the city from which the communication originated. Example:
San Francisco, San Jose, Los Angeles.
To City Name Filters evidence by the city that the communication to which was sent. Example:
San Francisco, San Jose, Los Angeles
From Continent Filters evidence by the continent from which the communication originated.
To Continent Filters evidence by the continent to which the communication was sent.
Using Visualization Geolocation Using Geolocation Visualization to View Security Data | 170
Geolocation IP Locations Columns
When using AD Resolution1 CyberSecurity and AD Resolution1, after running either a Volatile Job or a Network
Acquisition Job, you can view IP location data using the following columns.
Geolocation Columns: IP Data
Column Description
GeolocationFromAreaCode The area code that the communication originated from. This is usually
related to phone communication. Example: 415 is the area code for San
Francisco.
GeolocationFromCity The city that the communication originated from. Example: San Francisco,
San Jose, Los Angeles.
GeolocationFromCountryCode The numerical code of the country that the communication originated from.
This is usually related to phone communication. Example: The United
States’s country code is 1, China’s code is 86, and Australia's code is 61.
GeolocationFromDomainName The identification string of a origin point of communication on the Internet.
This can be to a website or the domain of a company. Example:
Accessdata.com.
GeolocationFromISP The Internet Service Provider that the communication originated from.
Example: Comcast, AT&T, Time Warner Cable.
GeolocationFromLatitude The exact numerical value of the North-South location on the globe that
the communication originated from. Example: 37.783333 is the latitudinal
value for San Francisco.
GeolocationFromLongitude The exact numerical value of the East-West location on the globe that the
communication originated from. Example: -122.416667 is the longitudinal
value for San Francisco.
GeolocationFromMetroCode The code assigned to a particular region. This code indicated the location
in or near a large city where the communication originated from.
GeolocationFromNetspeed The size of the connection, in bytes, that the communication originated
from. Example: 5000 is 5000 bytes of data a second.
GeolocationFromOrganization The place or group that the communication originated from. Example:
AccessData.
GeolocationFromPostalCode The code used for mailing identification of where the communication
originated from. Example: 94127 is the postal code for San Francisco.
GeolocationFromRegion The area from which the communication originated from. Example:
Maidenhead’s region is England, Tokyo’s region is Tokyo.
GeolocationFromSource The feed, or source from where the software obtained the information
about the communication and the origin. Example: Sentinel or from a third-
party source.
GeolocationToAreaCode The area code that the communication is being sent to. This is usually
related to phone communication. Example: 617 is the area code for
Boston.
GeolocationToCity The city that the communication was sent to. Example: Boston,
Philadelphia, New York City.
Using Visualization Geolocation Using Geolocation Visualization to View Security Data | 171
GeolocationToCountryCode The numerical code of the country the communication is being sent to,
usually related to phone communication. Example: The United States’s
country code is 1, China’s code is 86, and Australia's code is 61.
GeolocationToLatitude The exact numerical value of the North-South location on the globe of the
communication’s destination. Example: 42.358056 is the latitudinal value
for Boston.
GeolocationToLongitude The exact numerical value of the East-West location on the globe of the
communication’s destination. Example: -71.063611 is the longitudinal
value for Boston.
GeolocationToMetroCode The code assigned to a particular region. This code indicated the location
in or near a large city where the communication was destined for.
GeolocationToPostalCode The code used for mailing identification of where the communication was
destined for. Example: 94127 is the postal code for San Francisco.
GeolocationToRegion The area from which the communication was destined for. Example:
Maidenhead’s region is England, Tokyo’s region is Tokyo.
GeolocationToSource The feed, or source from where the software obtained the information
about the communication and the destination. Example: Sentinel or from a
third-party source.
Geolocation Columns: IP Data (Continued)
Column Description

Using Litigation and eDiscovery Tools | 172
Part 5
Using Litigation and
eDiscovery Tools
This part describes how to review files for litigation and eDiscovery and includes the following sections:
-Working with Transcripts and Exhibits (page 173)
-Imaging Documents (page 184)
-Applying Tags (page 190)
-Coding Documents (page 199)
-Annotating Evidence (page 214)
-Bulk Printing (page 226)
-Managing Review Sets (page 230)

Working with Transcripts and Exhibits Working with Transcripts | 173
Chapter 17
Working with Transcripts and Exhibits
Working with Transcripts
Reviewers can view and annotate transcripts using the Transcripts panel in Project Review. Project managers
with the Upload Exhibits, Upload Transcripts, and Manage Transcripts permissions can upload transcripts,
create transcript groups, grant transcript permissions to users, and upload exhibits.
Formatting Transcripts
All AD Summation products support transcripts in ASCII text format. A court reporter’s computer-aided
transcription (“CAT”) system should include the option to save or export a transcript in Summation or Amicus
format, both of which are compatible with Summation.
If, however, a court reporter’s CAT system does not allow export to Summation or Amicus format — or if a court
reporter uses word-processing software to produce a transcript and does not have the option to export a
transcript in Summation or Amicus format — the specifications and accompanying illustration below will guide
you in creating a Summation-compatible transcript file. Conforming to this specification will save Summation
users transcript-loading time, avoid formatting errors, enhance searching capability, and and enhance note-
location accuracy.
Summation Preferred Transcript Style Specification
-Transcript size is less than one megabyte
-Page number specification:
All transcript pages are numbered
Page numbers appear next to the left margin, with the first digit of the page number appearing in
Column 1. (See illustration of column numbers and transcript elements below.)
Page numbers appear at the top of each page
Page numbers contain at least four digits, including zeros, if necessary. For example, Page 34 would
be shown as “0034” or “00034”
The very first line of the transcript (Line 1 of the title page) contains the starting page number of that
volume. For example, “0001” or “00001” if the volume starts on Page 1; “0123” or “00123” if the
volume starts on Page 123.
-All lines in the transcript are numbered
-Line numbers appear in the Columns 2 and 3
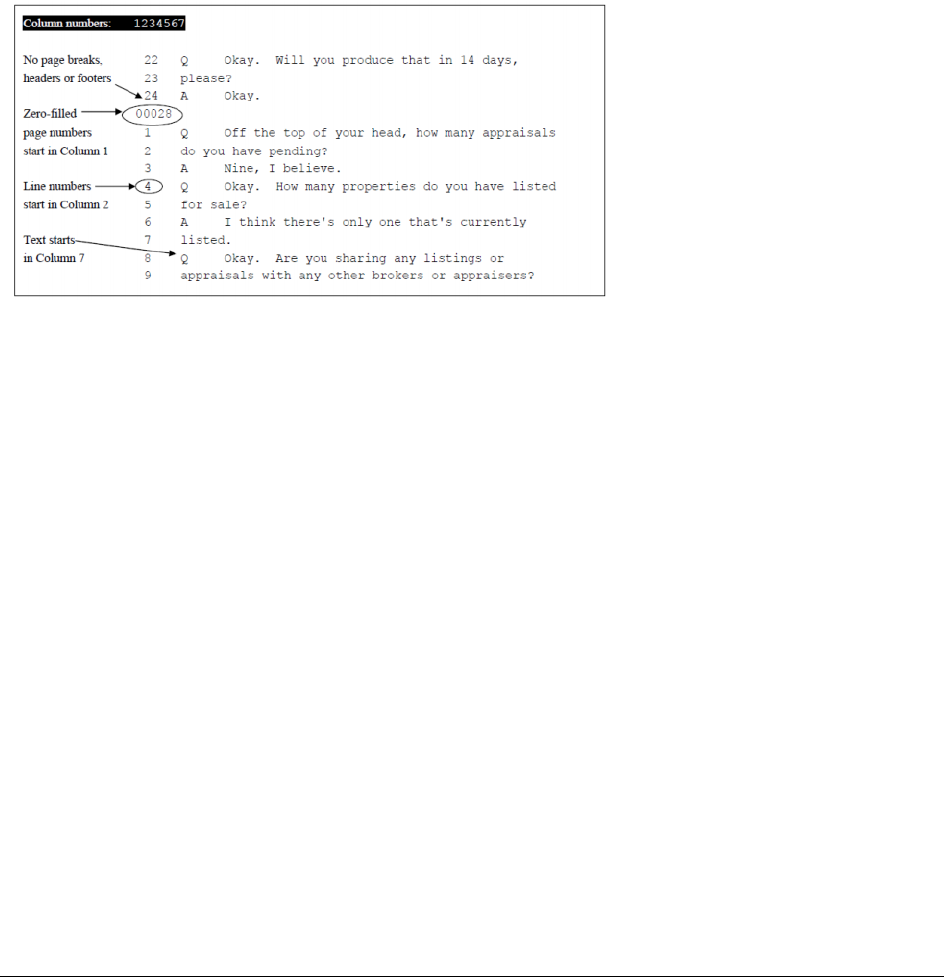
Working with Transcripts and Exhibits Working with Transcripts | 174
-Text starts at least one space after the line number. (We recommend starting text in Column 7)
-No lines are longer than 78 characters (letters and spaces)
-If possible, there are no page breaks. If you must include them, they should be on the line preceding the
page number
-There is a consistent number of lines per page if neither page breaks nor Summation’s page number
format are used
-No headers or footers appear, except for headers bearing page numbers only
-In the example below, the column numbers at the top designate how many spaces from the left margin a
given transcript element should occur
In the example below, the column numbers at the top designate how many spaces from the left margin a given
transcript elements should occur.
Summation Preferred Transcript Style
Tips for Working WIth Word-Processed Transcripts
Sometimes word-processed transcripts (e.g., those produced using Microsoft Word) may not display correctly in
Summation. This is because, even if the word-processed transcript is exported to ASCII or TXT format, word-
processing programs leave behind embedded formatting characters that interfere with proper display in
Summation. If you open a word-processed transcript in Microsoft WordPad and see unusual characters, the
transcript may need to be edited before loading into Summation. The closer the transcript files are to pure ASCII
or TXT format, the better.
The following are some suggested methods to remedy these issues. Success depends on how heavily a
transcript has been formatted; e.g., graphics contained in the footers.
Using Generic/Text Only Printer
Reporters can try using word-processing software to create a PRN file, rather than create an ASCII file.
Make a copy of your transcript within the word-processing program to use as a test file and format it in this way:
To format a transcript for a generic/text only printer
1. All pages must have a page number, including the title page, appearance page, etc.
2. The page number should appear at the top of each page.
3. Delete all headers, except for page numbers.

Working with Transcripts and Exhibits Working with Transcripts | 175
4. Delete all footers.
5. Make sure all lines are numbered.
6. For Microsoft Word transcripts, it may help to select Use printer metrics to lay out document. You
can find this option in Microsoft Word by selecting File > Options > Advanced. Scroll to the bottom of
the pane, expand Layout Options and select Use printer metrics to lay out document.
7. Print the file, selecting Generic/Text Only as the printer. See Adding Generic/Text Only as a Printer on
page 175.
8. When prompted, save the file to .PRN format (or as Printer Files in Windows 7).
9. Save the file to a location that you will remember later, such as your Desktop.
10. Open the . PRN file with Notepad to view the result. You can then also save it as a .TXT file.
Adding Generic/Text Only as a Printer
Follow the instructions below to add Generic / Text Only as a printer.
These steps may vary somewhat, depending on which version of Windows you are running. The screens may
also look slightly different, depending on your view options.
To add Generic/Text Only as a printer
1. In Control Panel, double-click Devices and Printers to open the Devices and Printers screen. Select
Add a printer.
2. Select the Add a local printer option. Click Next.
3. In the Choose a printer port screen, choose Use an existing port and select FILE: (Print to File)
from the drop-down menu. Click Next.
4. In the Install the printer driver screen, scroll down the list of Manufacturers and choose Generic. In the
Printers list, Select Generic/Text Only. Click Next.
5. The printer is named Generic/Text Only by default. This is the name which appears on the list of
printers that you select from when printing. Click Next.
6. In the Printer Sharing screen, select Do not share this printer. Click Next.
7. In the You’ve successfully added Generic/Text Only screen, uncheck Set as the default printer. Click
Finish.
8. The Generic/Text Only printer icon now displays in the Devices and Printers folder.
Additional Suggestions
You can use also takes the following actions:
-Fix “curly” quotes
If unusual characters ( such as “smart” or “curly” quotes - “”) occur within the word-processed transcript
and are causing display issues in Summation, convert them to regular characters before creating a text
file. For specific instruction, consult your world-processing program’s Help file.
-Convert file via a CAT system
Alternatively, try importing a word-processing ASCII file into a CAT system. Apply the CAT system’s
standard transcript formatting, then export the file in a Summation-friendly format: Amicus, CAT-
generated ASCII or Summation. Sometimes condensed-printing programs can also successfully perform
this conversion.
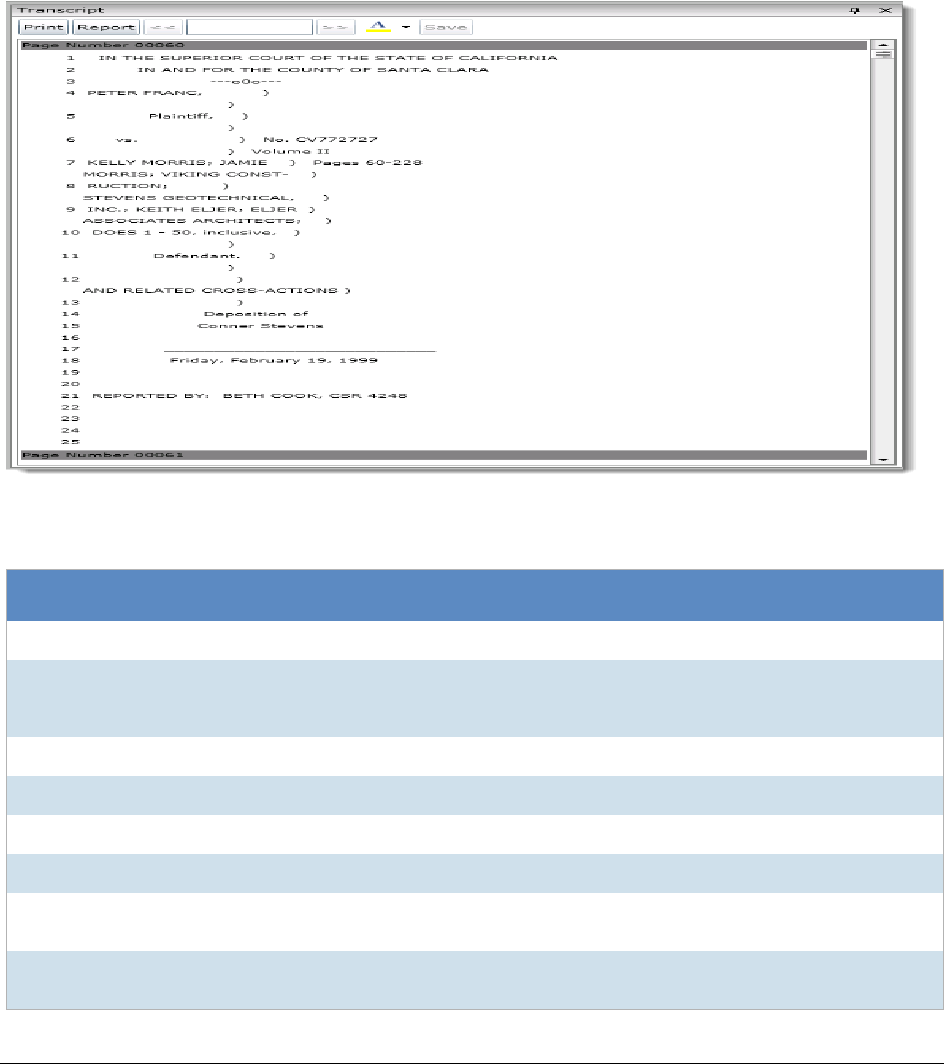
Working with Transcripts and Exhibits Working with Transcripts | 176
-Double-check transcript page-and-line integrity
Whatever method you choose, check the page-and-line integrity of the transcript in Summation with that
of the original transcript to ensure that the text appears in the correct position.
The Transcript Panel
The Transcripts panel in Project Review displays transcripts for the project. You can add and edit notes in the
transcript view.
Transcript Panel
Elements of the Transcript Panel
Element Description
Print Button Click to print the transcript.
Report Click to print a report of the transcript with notes and highlights optionally included. To
generate a report listing issues, highlights and notes that occur across multiple
transcripts, see Generating Reports on Multiple Transcripts (page 181)
Search Field Enter text that you want to search for in the selected transcript.
Previous Button Click to go to the previous hit of the search term.
Next Button Click to go to the next hit of the search term.
Transcript Name The name of the transcript appears in the title bar.
Previous Page
Button Click to go to the previous page in the transcript.
Page Field Displays the current page that you are on in the transcript. You can enter a page
number to quickly jump to a desired page in the transcript.
Working with Transcripts and Exhibits Working with Transcripts | 177
Viewing Transcripts
To view transcripts
1. In the Project Review, ensure the Project Explorer, Item List and Transcript panels are showing.
2. In the Project Explorer, in the Document Tree, expand the Transcript folder.
3. Select the Transcript Groups that you want to view and click (Apply) on the Project Explorer panel.
4. In the Item List panel, select the transcript you want to view.
The transcript appears in the Transcript panel.
Annotating Transcripts
Reviewers with the Add Annotations permission can annotate transcripts in the Transcripts panel.
You can add the following annotations to a transcript:
-See Adding a Note to a Transcript on page 177.
-See Adding Highlights to a Transcript on page 178.
-See Adding Links to a Transcript on page 178.
Adding a Note to a Transcript
Reviewers with the Add Notes permission can add notes to transcripts in the Transcripts panel of the Project
Review. Notes can be viewed and deleted from the Notes panel for users with the View Notes and Delete Notes
permission.
See The Notes Panel on page 84.
To add a note to a transcript
1. View a transcript in the Transcripts panel.
See Viewing Transcripts on page 177.
2. In the Transcripts panel, highlight the text to which you want to add a note.
3. Right-click and select Add Note.
4. In the Create Note View dialog, enter a note in the Note field.
5. Select a Date for the note.
6. (Optional) Check issues related to the note.
Note: If you check an issue that has a color associated with it, the selected text will be highlighted that
color.
7. Check the groups with which you want to share the note.
Next Page Button Click to go to the next page in the transcript.
Elements of the Transcript Panel (Continued)
Element Description
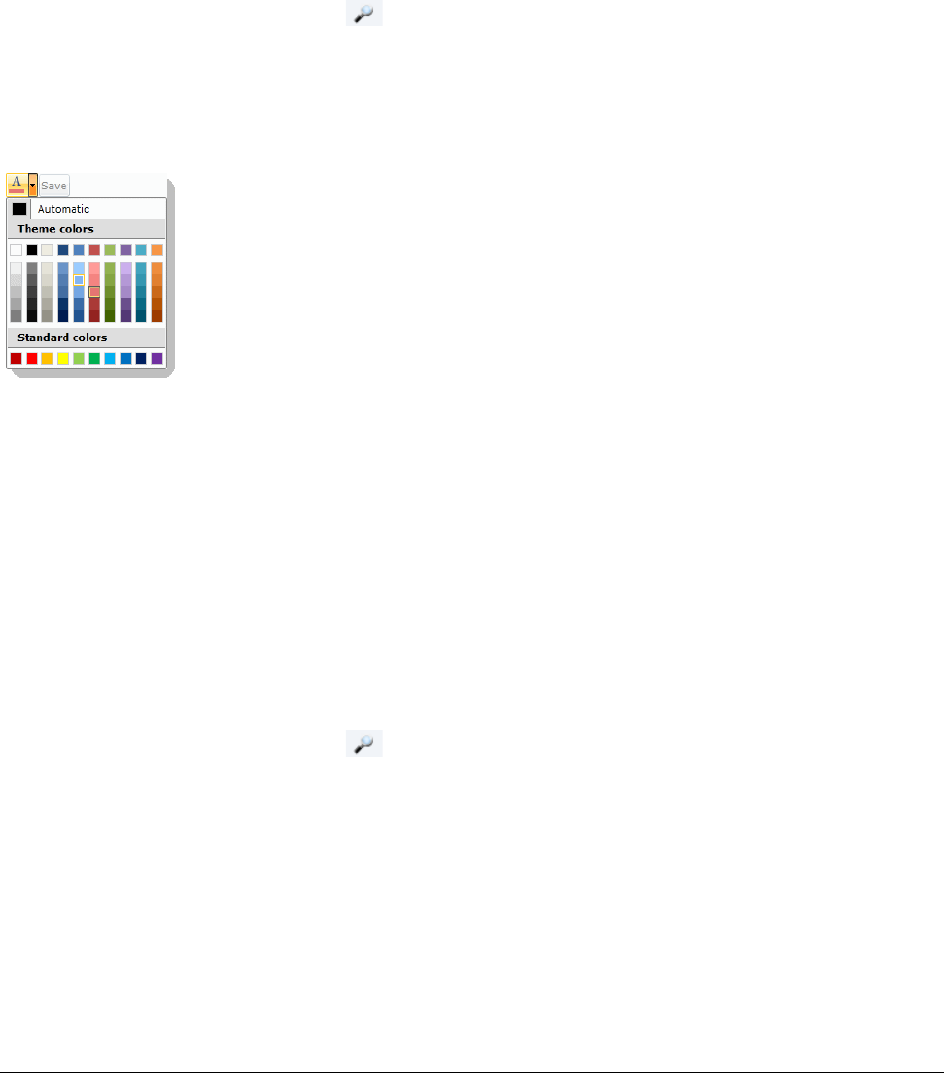
Working with Transcripts and Exhibits Working with Transcripts | 178
8. Click Save.
Adding Highlights to a Transcript
Reviewers with the Add Annotations permission can add highlights to a transcript in the Transcripts panel of
Project Review.
To add a highlight
1. Log in as a user with Add Annotations permission.
2. Click the Project Review button in the Project List panel next to the project.
3. View a transcript in the Transcripts panel.
See Viewing Transcripts on page 177.
4. In the Transcripts panel, expand the color drop-down and select a color for your highlight.
Color Drop-down
5. Highlight the text and a highlight is added.
Adding Links to a Transcript
Reviewers with the Add Annotations permission can add links to transcripts in the Transcripts panel of Project
Review. Transcripts can be linked to other transcripts or to other documents.
Linking to Another Transcript
To link to another transcript
1. Log in as a user with Add Annotations permission.
2. Click the Project Review button in the Project List panel next to the project.
3. View a transcript in the Transcripts panel.
See Viewing Transcripts on page 177.
4. In the Transcripts panel, highlight the text to which you want to add a link.
5. Right-click and select Add Transcript Link.
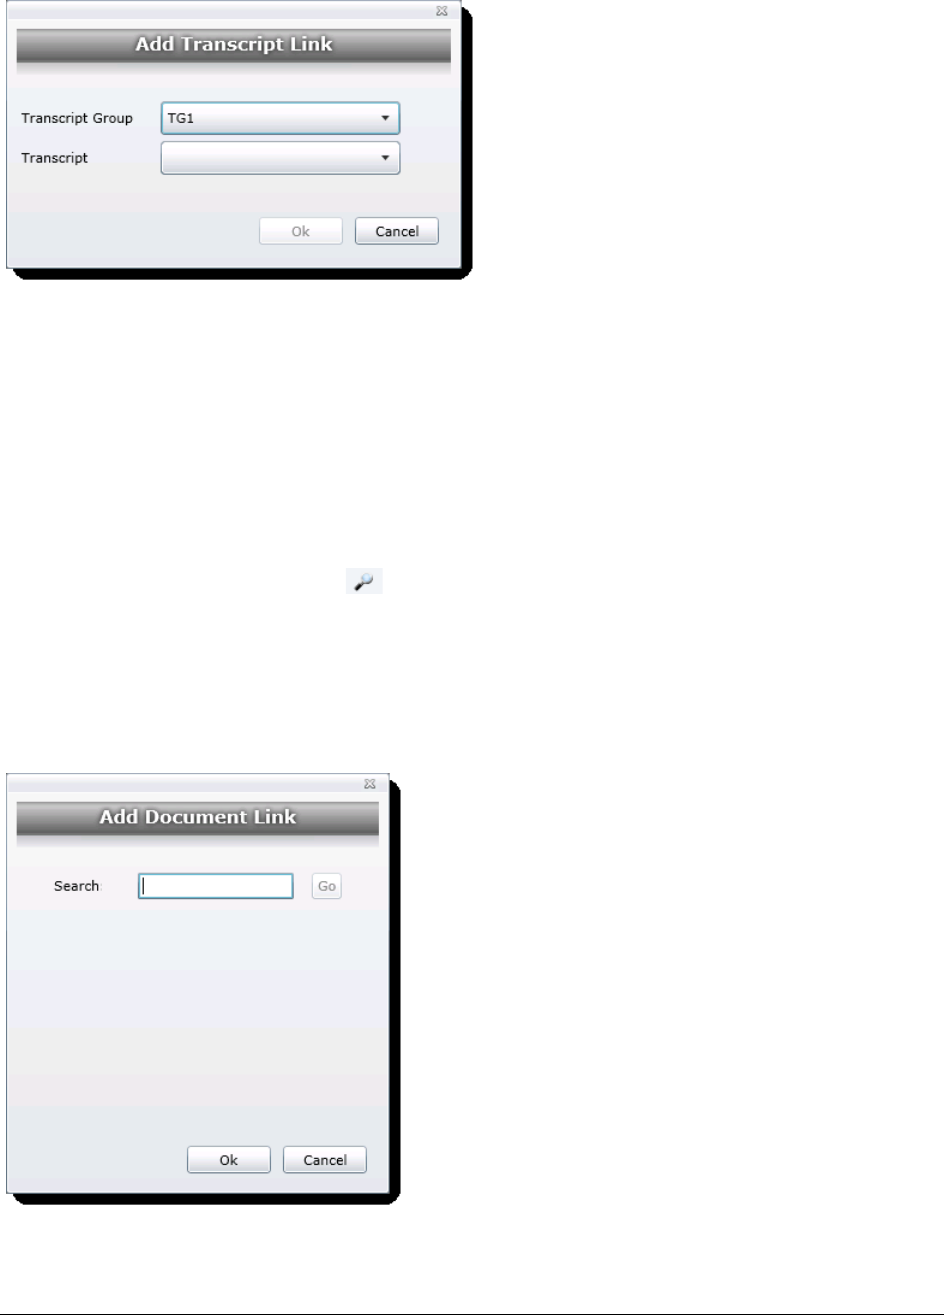
Working with Transcripts and Exhibits Working with Transcripts | 179
Add Transcript Link
6. In the Add Transcript Link dialog, select the Transcript Group that contains the transcript to which you
want to link.
7. In the Transcript drop-down, select the transcript to which you want to link.
8. Click Ok.
Linking to a Document
To link to another transcript
1. Log in as a user with Add Annotations permission.
2. Click the Project Review button in the Project List panel next to the project.
3. View a transcript in the Transcripts panel.
See Viewing Transcripts on page 177.
4. In the Transcripts panel, highlight the text to which you want to add a link.
5. Right-click and select Add Document Link.
Add Document Link
6. In the Search field, enter the DocID of the document you want to link to.

Working with Transcripts and Exhibits Working with Transcripts | 180
Note: If you want to see a list of DocIDs, enter a wildcard (*) and click Go.
7. Click Go.
8. Select the document you want link to from the search results.
9. Click OK.
Searching in Transcripts
You can search within a transcript by keyword using the Transcripts panel.
To search within a transcript
1. View a transcript in the Transcripts panel.
See Viewing Transcripts on page 177.
2. Enter a keyword in the search field.
3. Click the Next button to see the first instance of the keyword. The keyword is highlighted in the
transcript.
4. Click the Next or Previous buttons to see more instances of the keyword.
Displaying Selected Notes
You can display selected notes in the transcripts. This allows you to control which notes to display or hide from
view. Filter the notes either by owner or by issues.
To display selected notes within a transcript
1. View a transcript in the Transcripts panel.
See Viewing Transcripts on page 177.
2. Click Notes. Click Apply Filter.
3. Click either the By Owner or By Issues radio button.
4. (optional) You can select owners or issues individually. Click Select All to select all the owners/issues
or Select None to clear the check boxes.
5. Click Apply.
6. Once the Notes filter has been applied, the filter icon appears orange.
7. (optional) To clear the filter, click the filter icon again.
Displaying Selected Highlights
You can display selected highlights in the transcripts. This allows you to control which highlights to display or
hide from view. Filter the highlights either by owner or by color.
To display selected notes within a transcript
1. View a transcript in the Transcripts panel.
See Viewing Transcripts on page 177.
2. Click Highlights. Click Apply Filter.
3. Click either the By Owner or By Color radio button.

Working with Transcripts and Exhibits Working with Transcripts | 181
4. (optional) You can select owners or colors individually. Click Select All to select all the owners/colors or
Select None to clear the check boxes.
5. Click Apply.
6. Once the Highlights filter has been applied, the filter icon appears orange.
7. (optional) To clear the filter, click the filter icon again.
Opening Multiple Transcripts
You can open multiple transcripts in by using the mass actions. This will allow you to view multiple transcripts at
once. Each transcript opens in a new window.
To open multiple transcripts
1. In the Item List Grid, check the transcripts that you want to open.
2. In the first Actions drop-down, select Checked.
3. In the second Actions drop-down, select View Transcripts.
4. Click Go.
5. Click OK.
The transcripts open in their own windows.
Generating Reports on Multiple Transcripts
You can generate a report listing issues, highlights and notes that occur across multiple transcripts.
To generate the report
1. In Project Explorer, click on the Explore tab.
2. Right-click Transcripts.
3. Select Transcript Report.
4. In the Transcript Report dialog, select the notes, issues, and highlights on which you want to generate a
report. You can select either just your notes and/or highlights or you can select all users’ notes and/or
highlights.
5. Click Generate Report.
The report will display all the transcripts that have those selected notes, issues, and highlights in
common. You can export this report to PDF.

Working with Transcripts and Exhibits Culling Transcripts and Exhibits | 182
Culling Transcripts and Exhibits
Using the Explorer Panel to Cull Transcripts and Exhibits
You can use the Explorer Panel to cull the transcripts and exhibits in a project.
To use the Explorer panel to view transcripts and exhibits
1. In Project Review, in the Project Explorer panel, open the Explorer tab.
2. Clear the top (project) item.
3. Select the Transcripts or Exhibits nodes that you want to view and click .
See The Explore Tab on page 73.
Using Object Type Facets to Cull Transcripts and Exhibits
You can use facets to cull the transcripts and exhibits in a project.
To use facets to view transcripts and exhibits
1. In Project Review, in the Project Explorer panel, open the Facets tab.
2. Expand the General > Object Types category.
3. Expand the Files & Email category.
4. Select the Transcripts or Exhibits facets that you want to view and click .
See Filtering Data in Case Review on page 124.
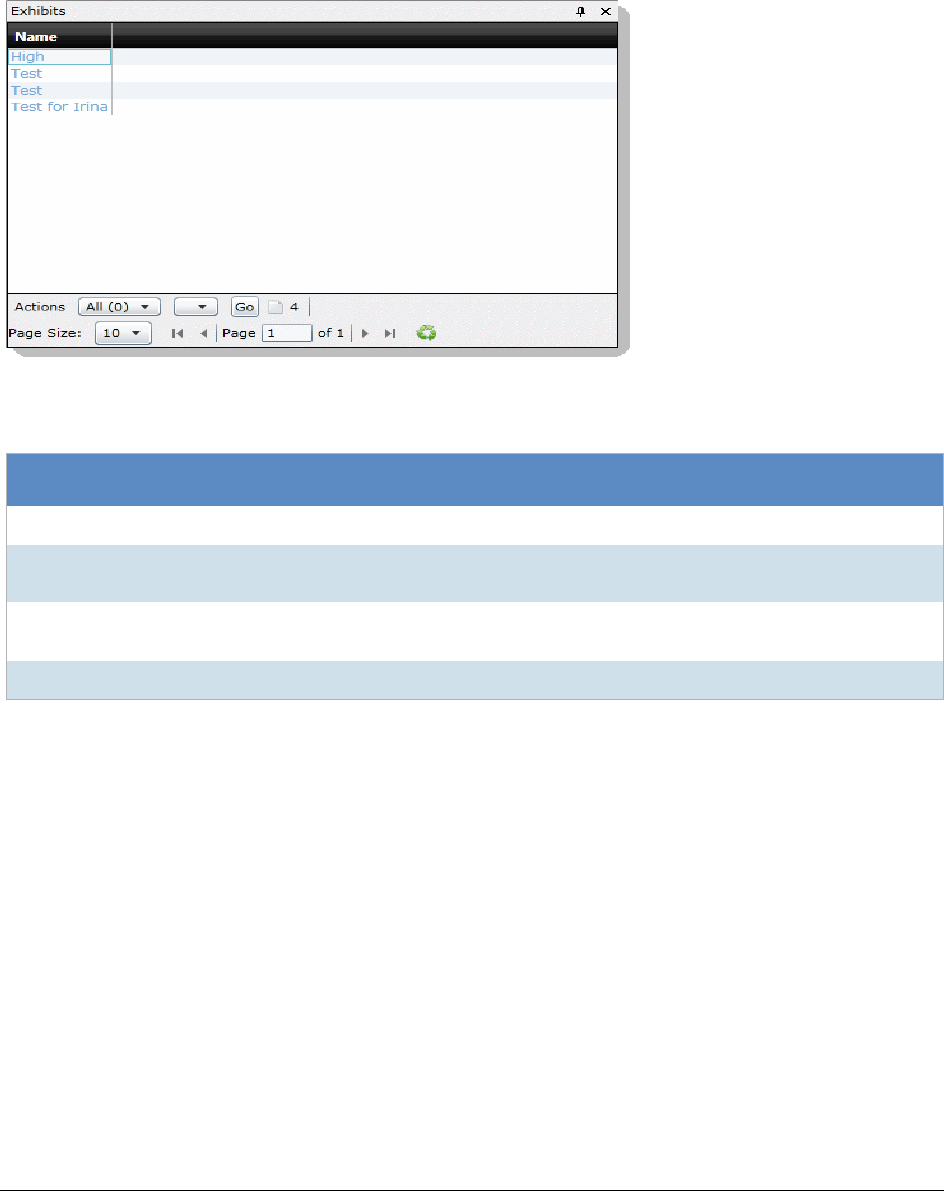
Working with Transcripts and Exhibits The Exhibits Panel | 183
The Exhibits Panel
The Exhibits tab in the Project Review displays the exhibits for the selected transcript.
Exhibits Tab
Viewing Exhibits
You can use the Exhibits panel to view the list of exhibits for the selected transcript. Exhibits are imported by the
project manager.
To view exhibits
1. In the Project Review, ensure the Project Explorer, Exhibits, Item List, and Natural panel are showing.
2. Select a transcript group in the Project Explorer.
3. In the Item List, select a transcript.
4. In the Exhibits panel, select an exhibit.
The exhibit is displayed in the Natural panel.
Elements of the Exhibits Tab
Element Description
Name Lists the name of the exhibit for the selected transcript.
Actions Drop-
down All Select to perform a mass action.
Action 2nd Drop-
down Select the action that you want to perform.
Go Click to start the mass action.
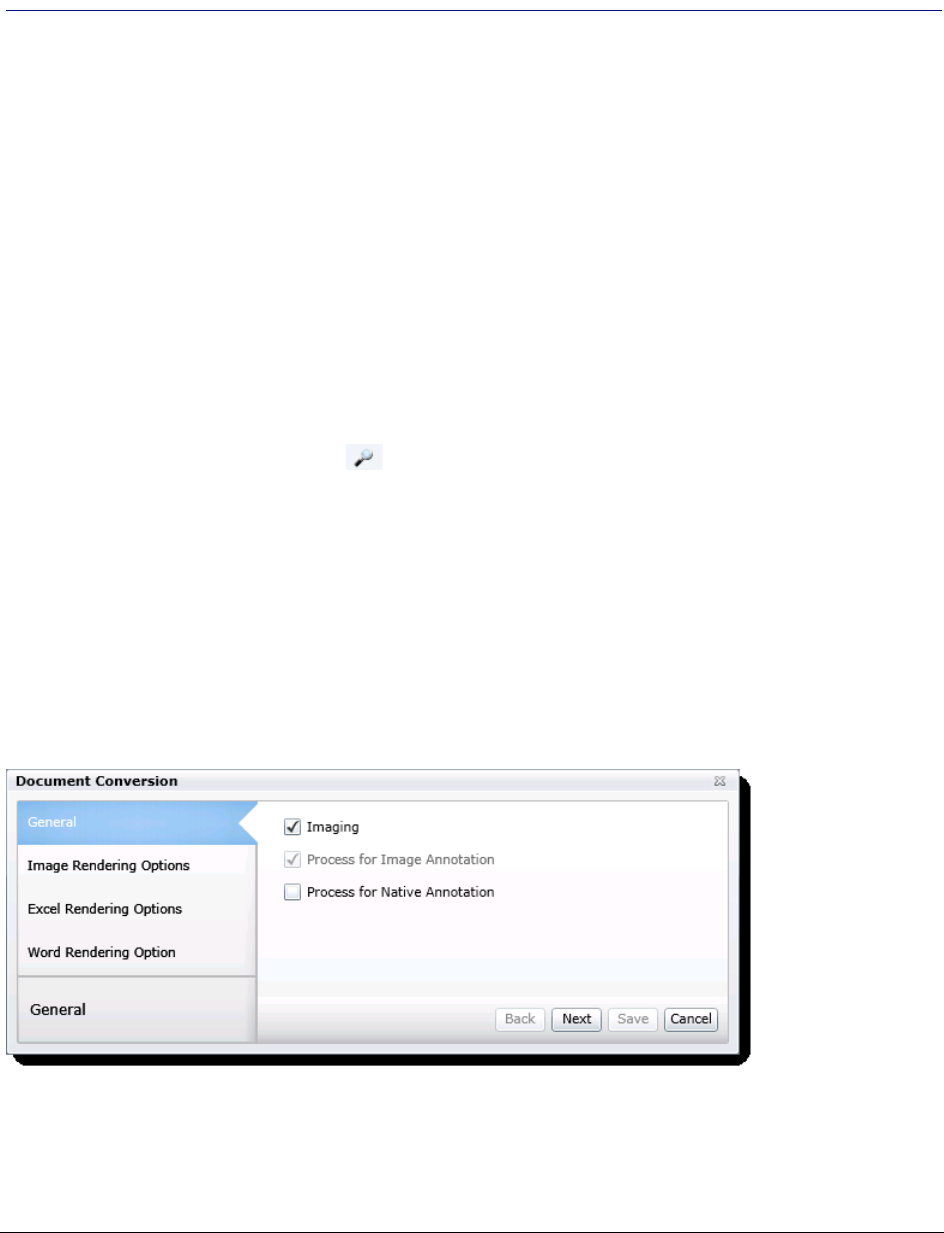
Imaging Documents Converting a Document to an Image | 184
Chapter 18
Imaging Documents
Reviewers with the Imaging permission can convert multiple documents to an image using the Imaging mass
action in the Item List panel.
Converting a Document to an Image
To convert documents to an image
1. Log in as a user with Imaging permission.
2. Click the Project Review button in the Project List panel next to the project.
3. In the Project Review, ensure the Item List panel is showing.
4. In the Item List panel, check the documents that you want to convert to images. Skip this step if you are
converting all the documents to images.
5. In the first Actions drop-down at the bottom of the panel, do one of the following:
-Select Checked to convert all the checked documents.
-Select All to convert all documents, including documents on pages not visible.
6. In the second Actions drop-down, select Imaging.
7. Click Go.
Document Conversion Dialog General Options
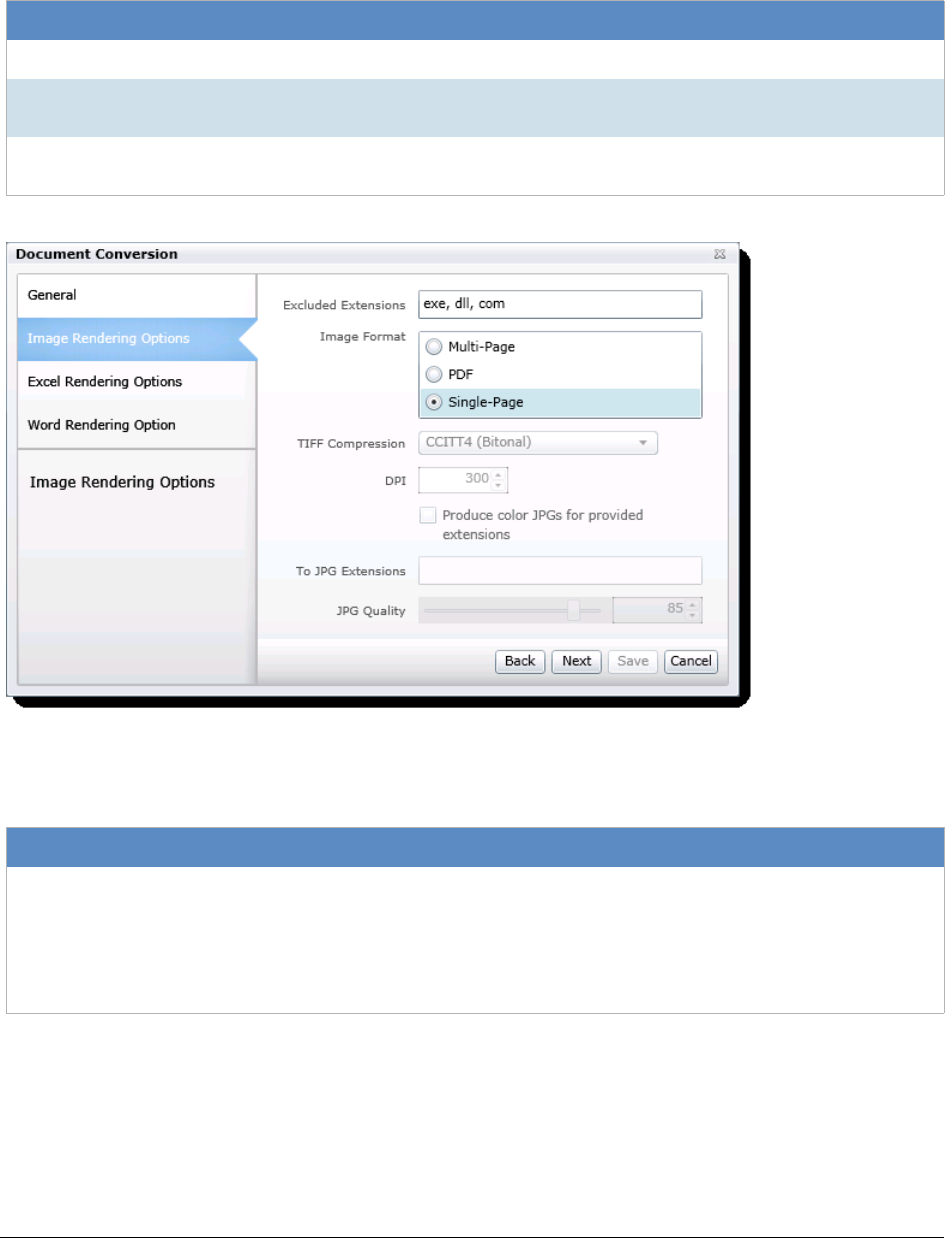
Imaging Documents Converting a Document to an Image | 185
8. In the General tab of the Document Conversion dialog, make your selections and click Next. The
following options are available.:
Image Rendering Options
9. In the Image Rendering Options, make your selections and click Next. The following options are
available:
General Options
Option Description
Imaging Check to create an image of the documents.
Process for Image
Annotation Check to create an image that will appear in the Image panel for annotation.
Process for Native
Annotation Check to create an image that will appear in the Natural panel for annotation.
Image Rendering Options
Option Description
Excluded Extensions Enter the file extensions of documents that you do not want to be converted. File
extensions must be typed in exactly as they appear and separated by commas
between multiple entries. This field does not allow the use of wild card
characters.
The default values are:
EXE, DLL, and COM
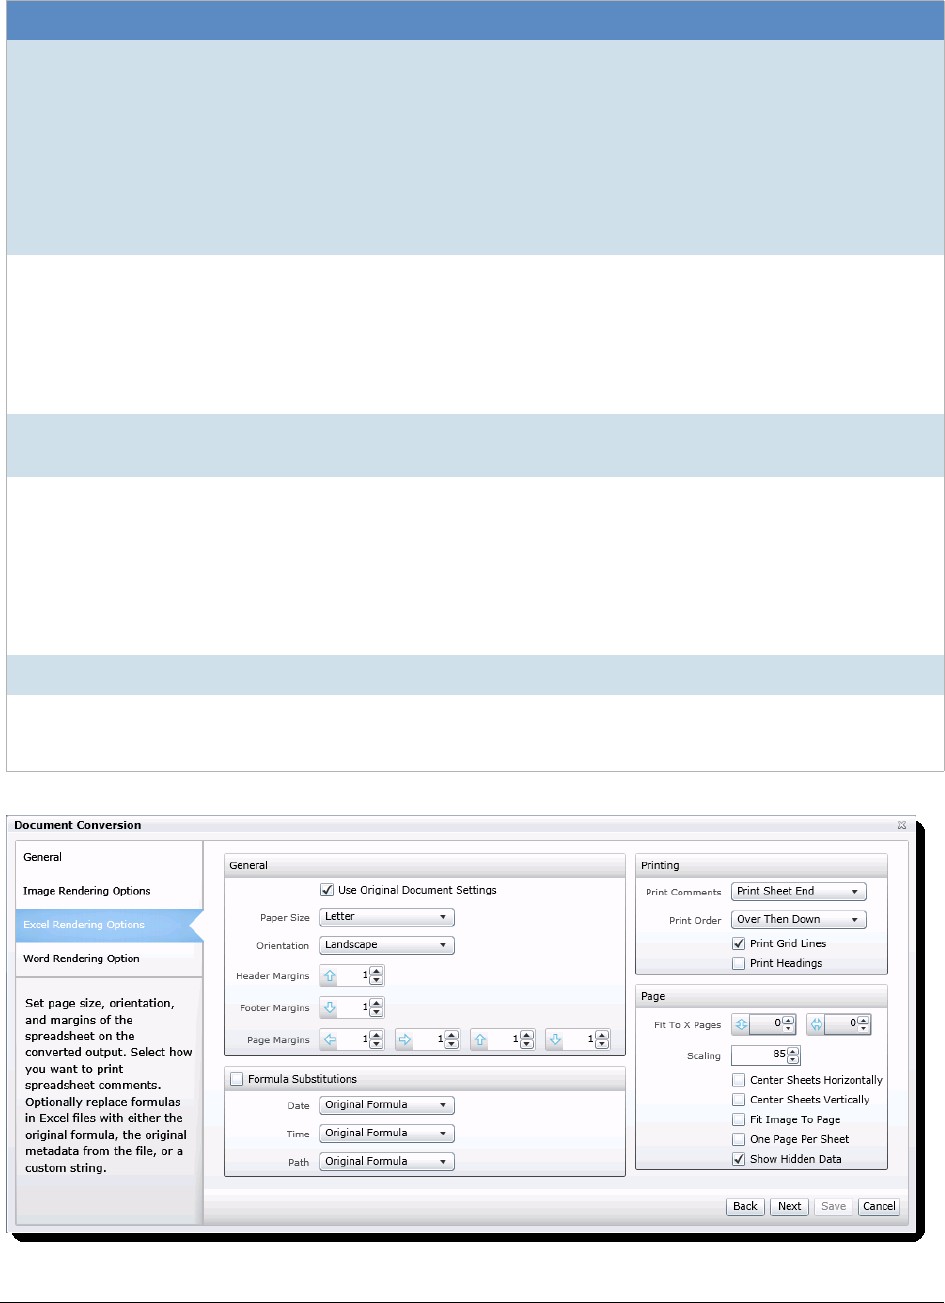
Imaging Documents Converting a Document to an Image | 186
Excel Rendering Options
Image Format Select which format you want the native file converted to:
-Multi-page - one TIFF image with multiple pages for each document.
-PDF - one PDF file with multiple pages for each document.
-Single Page - a single TIFF image for each page of each document. For
example, a 25 page document would output 25 single-page TIFF images.
Note: Rendering a document into a TIFF image causes the image to appear
black and white, without any grayscale. If you want the tonality of
grayscale in the image, select Produce Color JPGs for Provided
Extensions.
TIFF Compression -CCITT3 (Bitonal) - Produces a lower quality black and white image.
-CCITT4 (Bitonal) - Produces a higher quality black and white image.
-LZW (Color) - Produces a color image with LZW compression.
-None (Color) - Produces a color image with no compression (This is a very
large image).
-RLE (Color) - Produces a color image with RLE compression.
DPI Set the resolution of the image.
The range is from 96 - 1200 dots per inch (DPI).
Produce Color JPGs for
Provided Extensions This and the following two options are available if you are rendering to CCITT3 or
CCITT4 format and allows you to specify certain file extensions to render in color
JPGs.
For example, if you wanted everything in black and white format, but wanted all
PowerPoint documents in color, you would choose this option and then type PPT
or PPTX in the To JPG Extensions text box. Additionally, you can choose the
quality of the resulting JPG from 1 - 100 percent (100 percent being the most
clear, but the largest resulting image).
To JPG Extensions Lets you specify file extensions that you want exported to JPG images.
JPG Quality Sets the value of JPG quality (1-100). A high value (100) creates high quality
images. However, it also reduces the compression ratio, resulting in large file
sizes. A value of 50 is average quality.
Image Rendering Options (Continued)
Option Description
Imaging Documents Converting a Document to an Image | 187
10. In the Excel Rendering Options, make your selections and click Next. The following options are
available:
Excel Rendering Options
Option Description
Use Original Document
Settings Check to use the settings from the original document.
Paper Size Select the size of the paper that you would like to use for the image.
Orientation Select the orientation of the paper that you would like to use for the image.
Header Margins Set the size of the Header margin of the image (in inches).
Footer Margins Set the size of the Footer margin of the image (in inches).
Page Margins Set the size of the page margins of the image (in inches).
Formula Substitutions Check if you want to set the options of the formula substitutions in the image of
the excel document.
Date, Time, and Path Set how you would like the image to deal with formulas found in the excel file.
The following options are available:
-Original Formula: Select to keep the original formulas in the excel file.
-Custom Text: Select to replace the formulas with the text you provide.
-Original Metadata: Select to keep the original metadata of the excel file.
Print Comments Select how you would like to treat comments in the image:
-Print in Place: Select to have the comments appear where they are in the
document.
-Print No Comments: Select to not include comments in the image.
-Print Sheet End: Select to have the comments appear at the end of each
sheet in the image.
Print Order Set the print order:
-Over then Down: For use with Excel spreadsheets that may not fit on the
rendered page. For example, if the spreadsheet is too wide to fit on the ren-
dered page, you can choose to print left to right first and then print top to bot-
tom.
-Down then Over: For use with Excel spreadsheets that may not fit on the
rendered page. For example, if the spreadsheet is too wide to fit on the ren-
dered page, you can choose to print top to bottom first and then print left to
right.
Print Gridlines Check to include the gridlines of the spreadsheet in the image.
Print Headings Check to include the headings of the spreadsheet in the image.
Fit to X Pages Set the number of pages that you want the information to shrink to fit on.
Scaling Set the scale that you want to shrink or expand the content to on the image page.
Center Sheets
Horizontally Check to center the sheet horizontally on the page.
Center Sheets Vertically Check to center the sheet vertically on the page.
Fit Image to Page Check to fit the image to the page.
One Page Per Sheet Check to put each sheet on its own page.
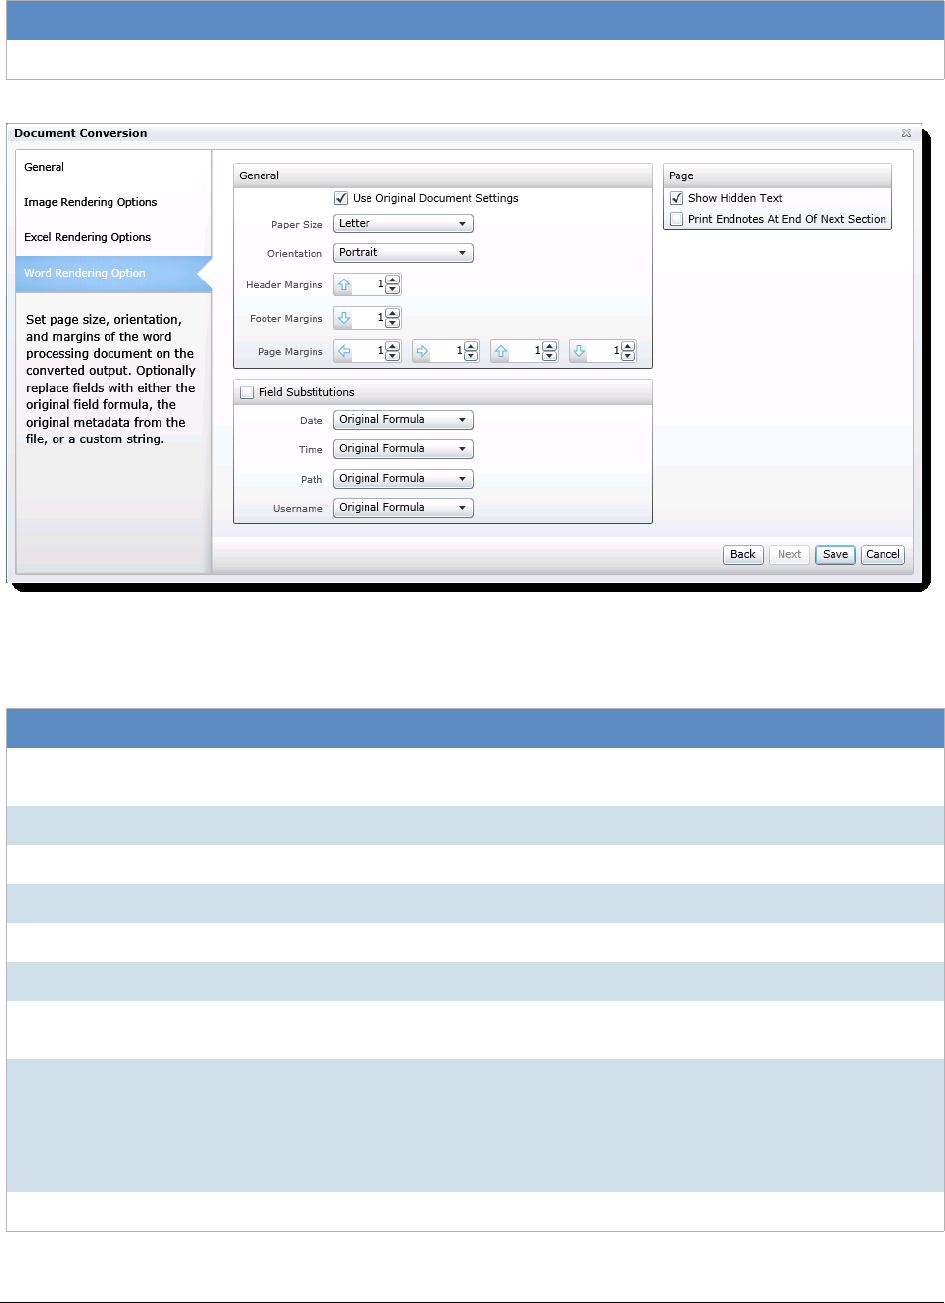
Imaging Documents Converting a Document to an Image | 188
Word Rendering Options
11. In the Word Rendering Options, make your selections and click Next. The following options are
available:
Show Hidden Data Check to include hidden rows or columns in the image.
Word Rendering Options
Option Description
Use Original Document
Settings Check to use the settings from the original document.
Paper Size Select the size of the paper that you would like to use for the image.
Orientation Select the orientation of the paper that you would like to use for the image.
Header Margins Set the size of the Header margin of the image (in inches).
Footer Margins Set the size of the Footer margin of the image (in inches).
Page Margins Set the size of the page margins of the image (in inches).
Field Substitutions Check if you want to set the options of the field substitutions in the image of the
word document.
Date, Time, Path, and
Username Set how you would like the image to deal with fields found in the Word file. The
following options are available:
-Original Formula: Select to keep the original formulas in the file.
-Custom Text: Select to replace the fields with the text you provide.
-Original Metadata: Select to keep the original metadata of the file.
Show Hidden Text Check to include hidden text in the image.
Excel Rendering Options (Continued)
Option Description

Imaging Documents TIFF on the Fly | 189
12. Click Save.
TIFF on the Fly
When viewing a document in its native format in the Natural panel, you can create an image of the document so
that you may annotate it.
Once an image has been annotated, you can not create another image of the record using TIFF on the fly.
However, you can still use the mass operations imaging to create an image.
See Converting a Document to an Image on page 184.
To create a TIFF on the fly
1. Log in as a user with Imaging permission.
2. Click the Project Review button in the Project List panel next to the project.
3. In the Project Review, ensure the Item List, Natural, and Image panels are showing.
4. In the Item List panel, select the document for which you want to create an image.
5. In the Natural panel, click the Create Image button.
6. An image is created and opened in the Image panel. Make your annotations as usual.
Print Endnotes at End of
Next Section Check to include the endnotes at the end of the next section in the image.
Word Rendering Options
Option Description
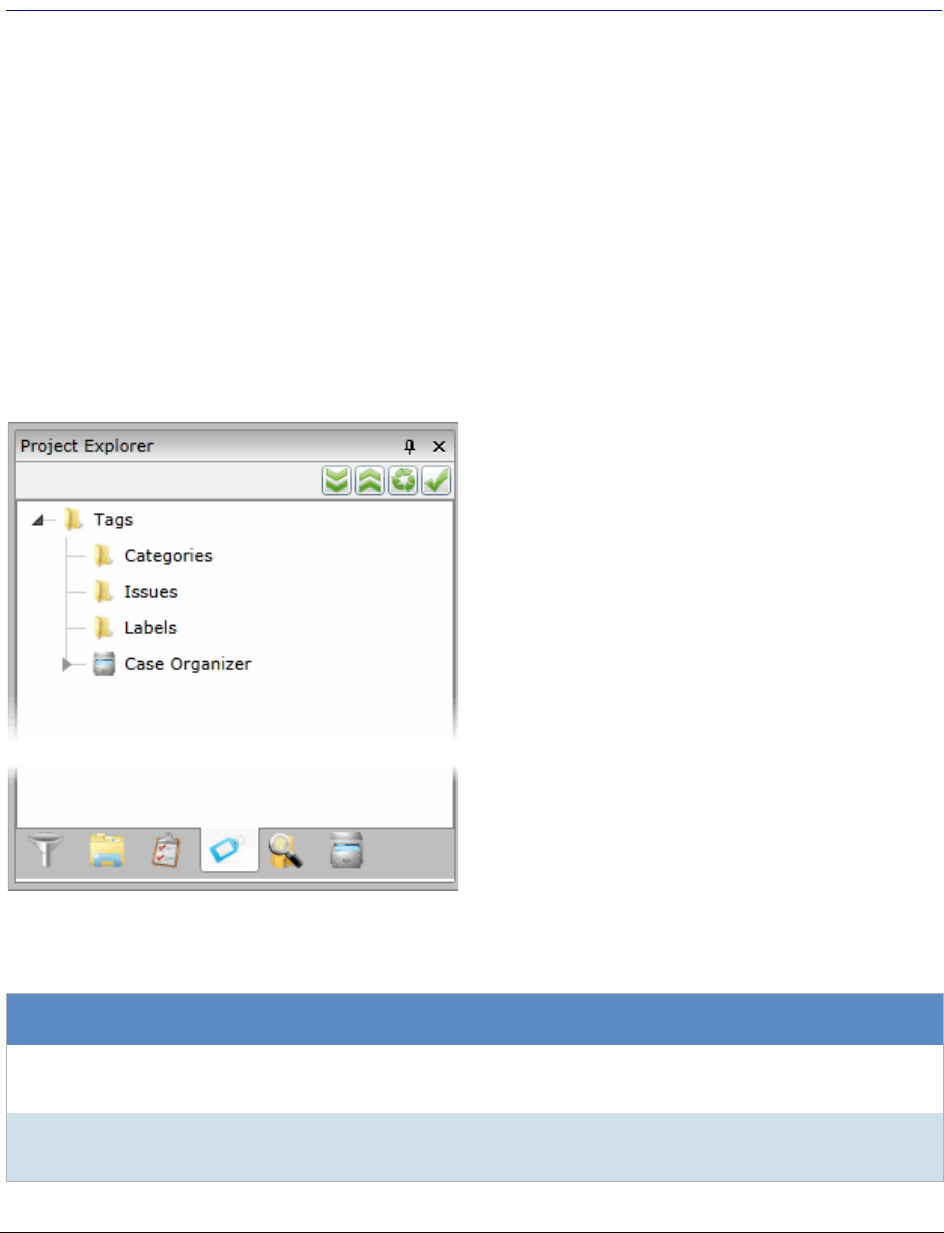
Applying Tags The Tags Tab | 190
Chapter 19
Applying Tags
The Tags Tab
The Tags tab in the Project Explorer can be used to create labels, create issues, view categories, and create
Case Organizer objects. You can view documents assigned to tags using the Tags tab in the Project Explorer.
Project managers can create labels and issues for the reviewer to use.
Tags Tab in Project Explorer
Elements of the Tags Tab
Elements Description
Categories Displays all the existing categories for the project. Right-click to create category values.
See Viewing Documents with a Category Coded on page 196.
Issues Displays all the existing issues. Right-click to create a new issue for the project.
See Viewing Documents with an Issue Coded on page 196.

Applying Tags The Tags Tab | 191
Labels Contains all the existing labels. Right-click to create a new label for the project.
See Viewing Documents with a Label Applied on page 196.
Case Organizer Displays all the existing case organizer objects for the project. Right-click to create new
objects.
See Using the Case Organizer on page 197.
Production Sets
Elements of the Tags Tab
Elements Description
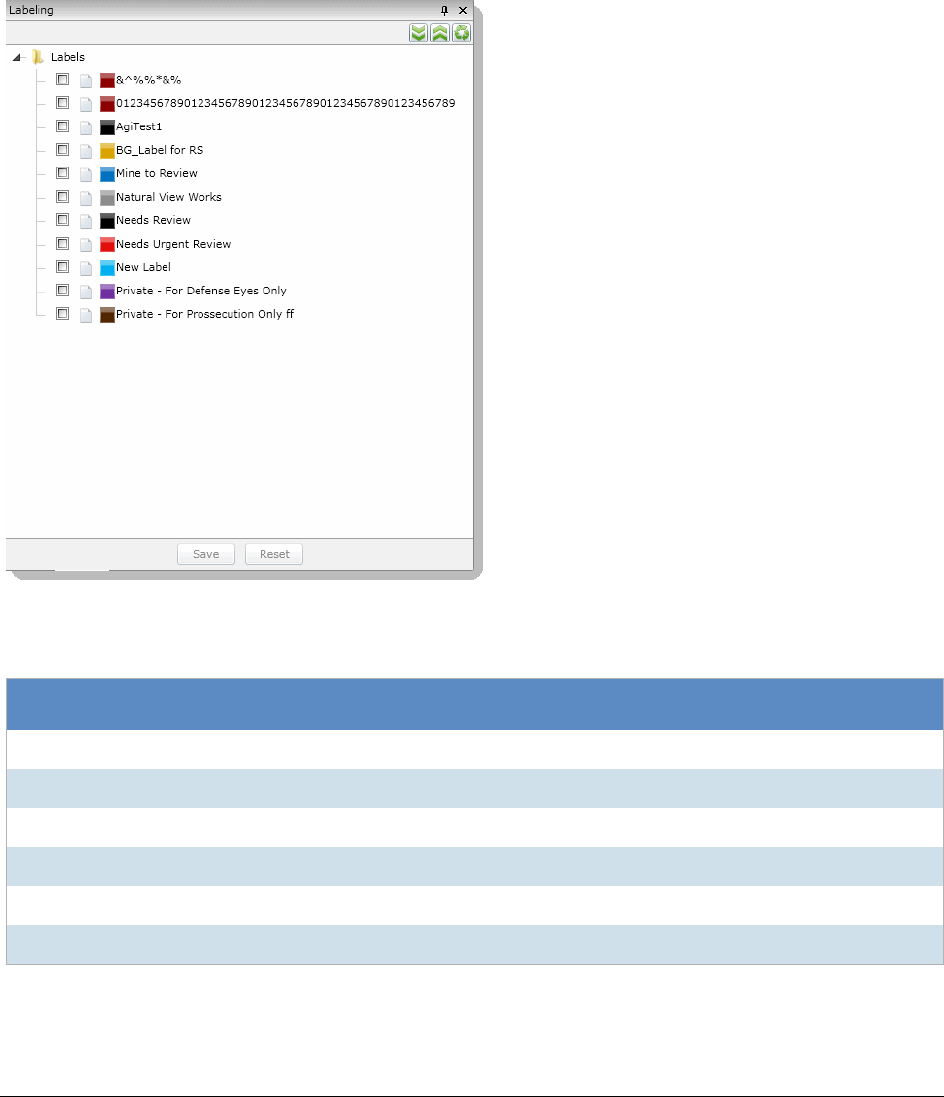
Applying Tags The Labeling Panel | 192
The Labeling Panel
The Labeling panel in Project Review can be used to apply labels to documents. You can organize your
documents by applying labels using the Labeling panel. The Labeling panel allows you to apply labels to
documents one at a time.
See Applying Labels to Multiple Documents on page 194.
Labeling Panel
Elements of the Labeling Tab
Element Description
Labels Folder Expand to see the labels created by the project manager.
Collapse All Button Click to collapse all the folders.
Expand All Button Click to expand all the folders.
Refresh Click to refresh the label list.
Save Click to apply the selected labels to the selected document.
Reset Click to reset the labels to their original condition.
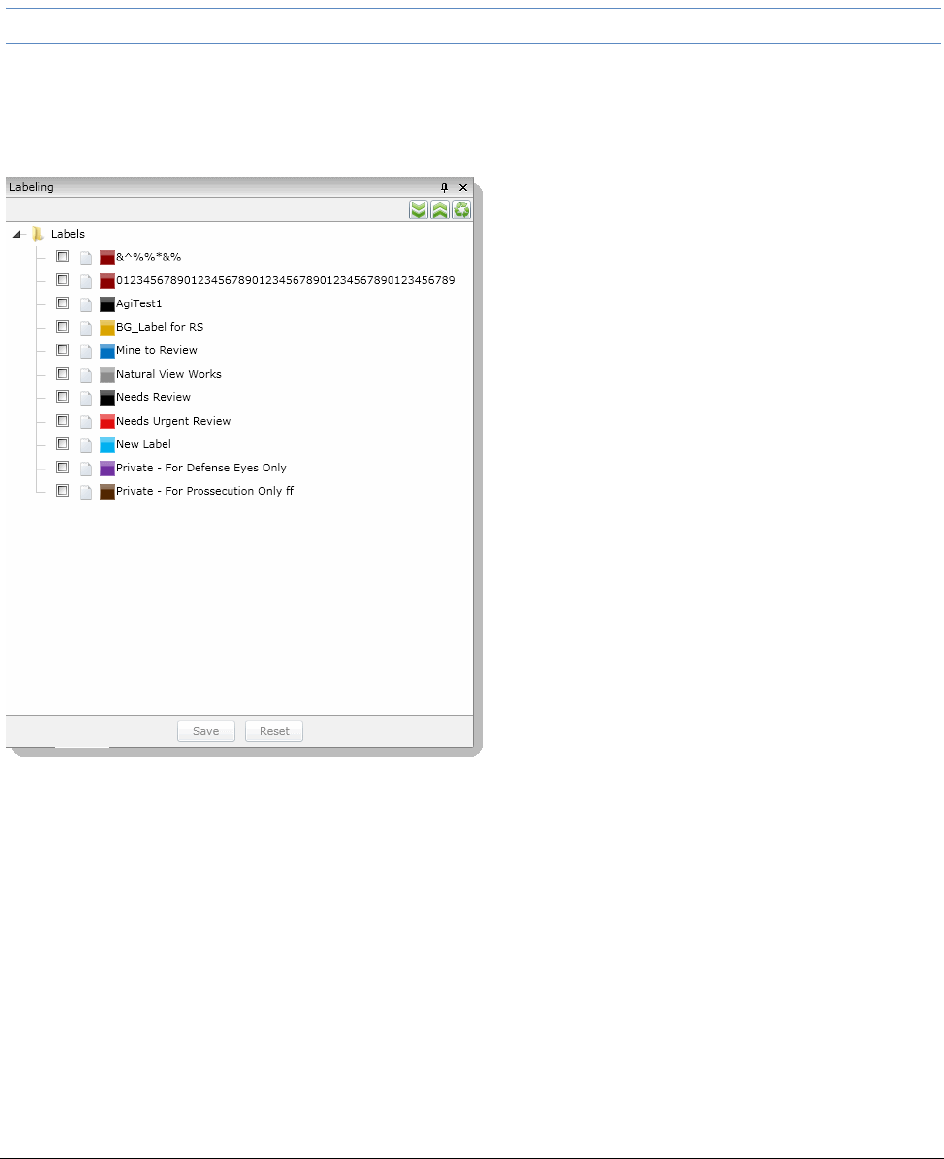
Applying Tags Applying Labels to Single Documents | 193
Applying Labels to Single Documents
You can apply labels to documents one at a time by using the Labeling panel. Labels can be created by the
project manager.
See the Project Manager documentation for more information on creating labels.
Note: Production set records cannot be labeled.
To apply labels to single documents
1. In the Project Review, ensure the Labeling and Item List panels are showing.
Labeling Panel
2. In the Item List panel, highlight the document to which you want to apply a label.
3. In the Labeling panel, check the label(s) that you want to apply and click Save.
Removing Labels from a Single Document
You can remove labels from a single document using the Labeling panel.
To remove labels from a single document
1. In the Project Review, ensure the Labelling and Item List panels are showing.
2. In the Item List panel, highlight the document from which you want to remove a label.
3. In the Labeling panel, uncheck the label(s) that you want to remove and click Save.
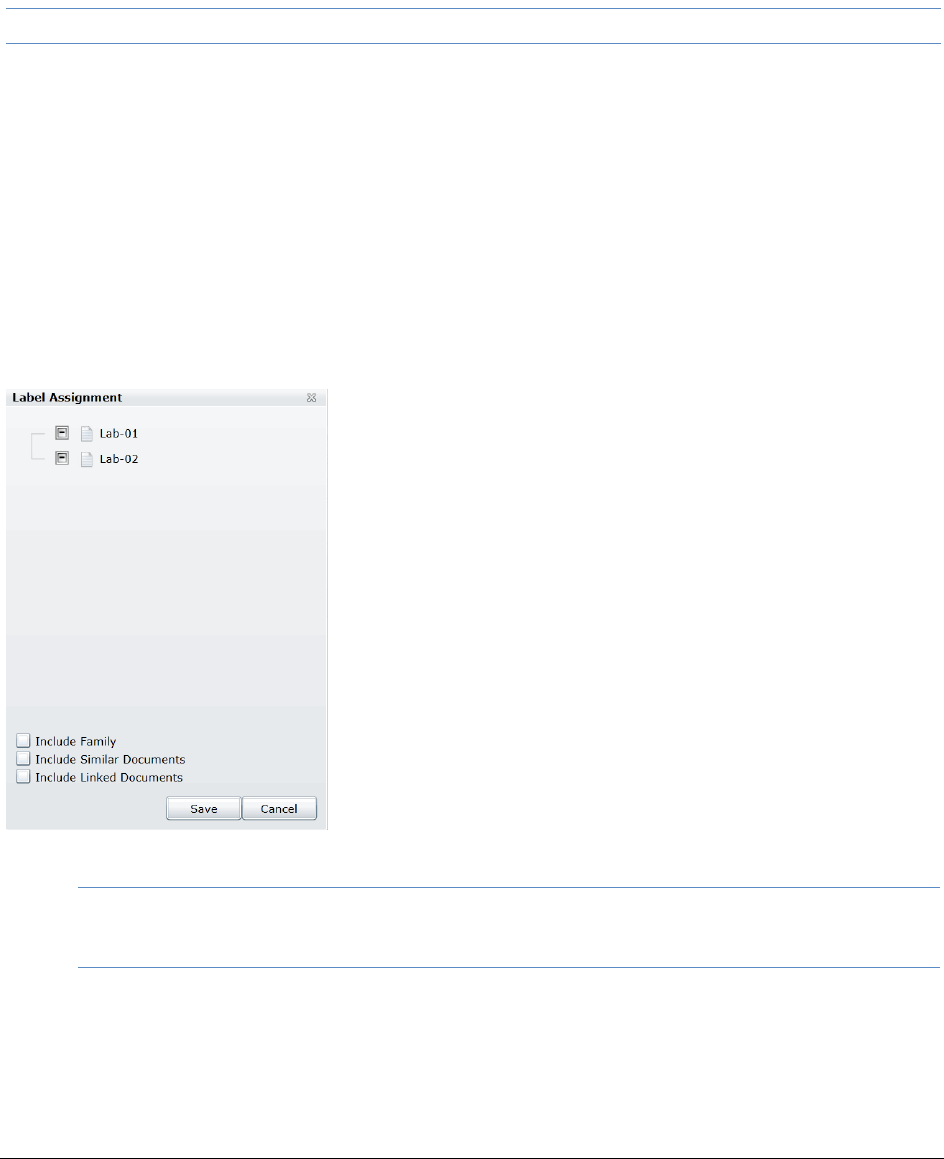
Applying Tags Applying Labels to Multiple Documents | 194
Applying Labels to Multiple Documents
You can apply labels to multiple documents at once using the mass actions in the Item List panel. Labels can be
created by the project manager.
See the Project Manager documentation for more information on creating labels.
Note: Production set records cannot be labeled.
To apply labels to multiple documents
1. In the Project Review, ensure the Item List panel is showing.
2. Check the documents to which you want to apply labels. If applying labels to all documents, skip this
step.
3. In the first Actions drop-down at the bottom of the panel, do one of the following:
-Select Checked to apply labels to all the checked documents.
-Select All to apply labels to all documents, including documents on pages not visible.
4. In the second Actions drop-down, select Label Assignment.
5. Click Go.
Label Assignment Dialog
6. Check the labels that you want to assign to the documents.
Note: Boxes with a dash (-) indicate that one or more (but not all) of the documents are already
assigned that label. Click the box until it becomes a check mark to apply the label to all the
selected documents.

Applying Tags Applying Labels to Multiple Documents | 195
7. (Optional) Check the following Keep Together check boxes if desired:
-Keep Families Together: Check to apply the selected label to documents within the same family as
the selected documents.
-Keep Related Documents Together: Check to apply the selected label to all documents related to
the selected documents.
-Keep Linked Documents Together: Check to apply the selected label to all documents linked to the
selected documents.
8. Click Save.
Removing Labels from Multiple Documents
You can remove labels from multiple documents by using the mass actions in the Item List panel.
To remove labels from multiple documents
1. In the Project Review, ensure the Item List panel is showing.
2. Check the documents from which you want to remove labels. If removing labels from all documents,
skip this step.
3. In the first Actions drop-down at the bottom of the panel, do one of the following:
-Select Checked to remove labels from all the checked documents.
-Select All to remove labels from all documents, including documents on pages not visible.
4. In the second Actions drop-down, select Label Assignment.
5. Click Go.
6. In the Label Assignment dialog, click the check boxes until they are blank on the labels that you want to
remove.
7. Click Save.

Applying Tags Viewing Documents with Tags | 196
Viewing Documents with Tags
Viewing Documents with a Label Applied
You can view all the documents assigned to a specific label using the Tags tab in the Project Explorer.
To view documents assigned a label
1. In the Project Review, ensure the Project Explorer and Item List panel are showing.
2. In the Project Explorer, click on the Explore tab. Ensure all the folders are checked.
3. In the Project Explorer, click on the Tags tab.
See The Tags Tab on page 190.
4. Uncheck everything on the Tags tab, then expand the Labels and check the label(s) that you want to
see.
5. Click the Apply check mark button in the Project Explorer panel.
All documents with the selected label appear in the Item List panel.
Viewing Documents with an Issue Coded
You can view all the documents assigned to a specific issue using the Tags tab in the Project Explorer.
To view documents assigned an issue
1. In the Project Review, ensure the Project Explorer and Item List panel are showing.
2. In the Project Explorer, click on the Explore tab. Ensure all the folders are checked.
3. In the Project Explorer, click on the Tags tab.
See The Tags Tab on page 190.
4. Uncheck everything on the Tags tab, then expand the Issues and check the issue(s) that you want to
see.
5. Click the Apply check mark button in the Project Explorer panel.
All documents with the selected issue appear in the Item List panel.
Viewing Documents with a Category Coded
You can view all the documents assigned to a specific category using the Tags tab in the Project Explorer.
To view documents assigned an issue
1. In the Project Review, ensure the Project Explorer and Item List panel are showing.
2. In the Project Explorer, click on the Explore tab. Ensure all the folders are checked.
3. In the Project Explorer, click on the Tags tab.
See The Tags Tab on page 190.
4. Uncheck everything on the Tags tab, then expand the Categories and check the category that you want
to see.
5. Click the Apply check mark button in the Project Explorer panel.
All documents with the selected category appear in the Item List panel.
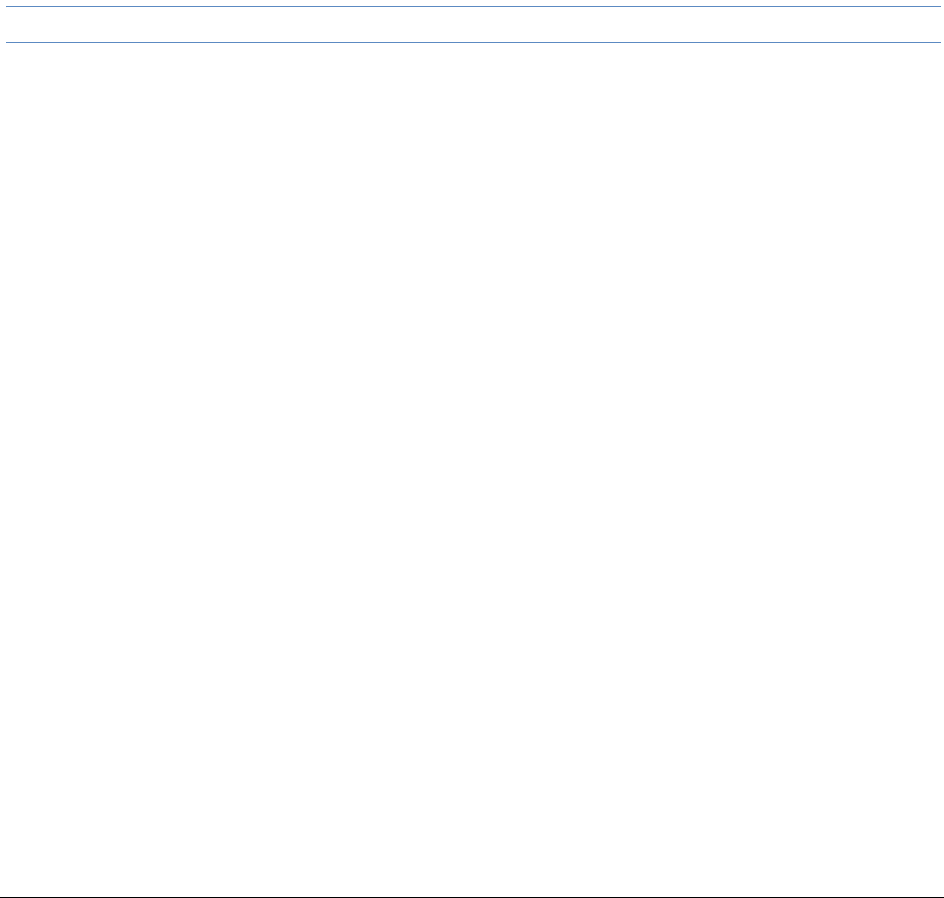
Applying Tags Using the Case Organizer | 197
Using the Case Organizer
You can use the Case Organizer to add reference information to evidence files in your project. To use the case
organizer, you create a Case Organizer object and associate one or more evidence files to it . Within Case
Organizer objects, you can include the following:
-Comments, including formatted rich text, numbered and bulleted lists, images, and hyperlinks
-Reference details, including Status, Impact, Material, and Date range
-Attached supplemental files
-Text snippets from the evidence files
You can generate reports that provide all information related to Case Organizer objects.
You can create as many case organizer objects as needed in a project. Case Organizer objects only apply to the
project that they are created in.
Case Organizer objects are compatible with FTK Bookmarks.
Note: The Case Organizer requires Internet Explorer 9 or higher.
About Case Organizer Categories and Organization
Within the Case Organizer, you use the following categories of Case Organizer objects:
-Event
-Fact
-Pleadings
-Research
-Summary
-People
These Case Organizer categories share the same functionality. The different categories are available to help
you organize your data. You can generate a report for each object category as well as each object.
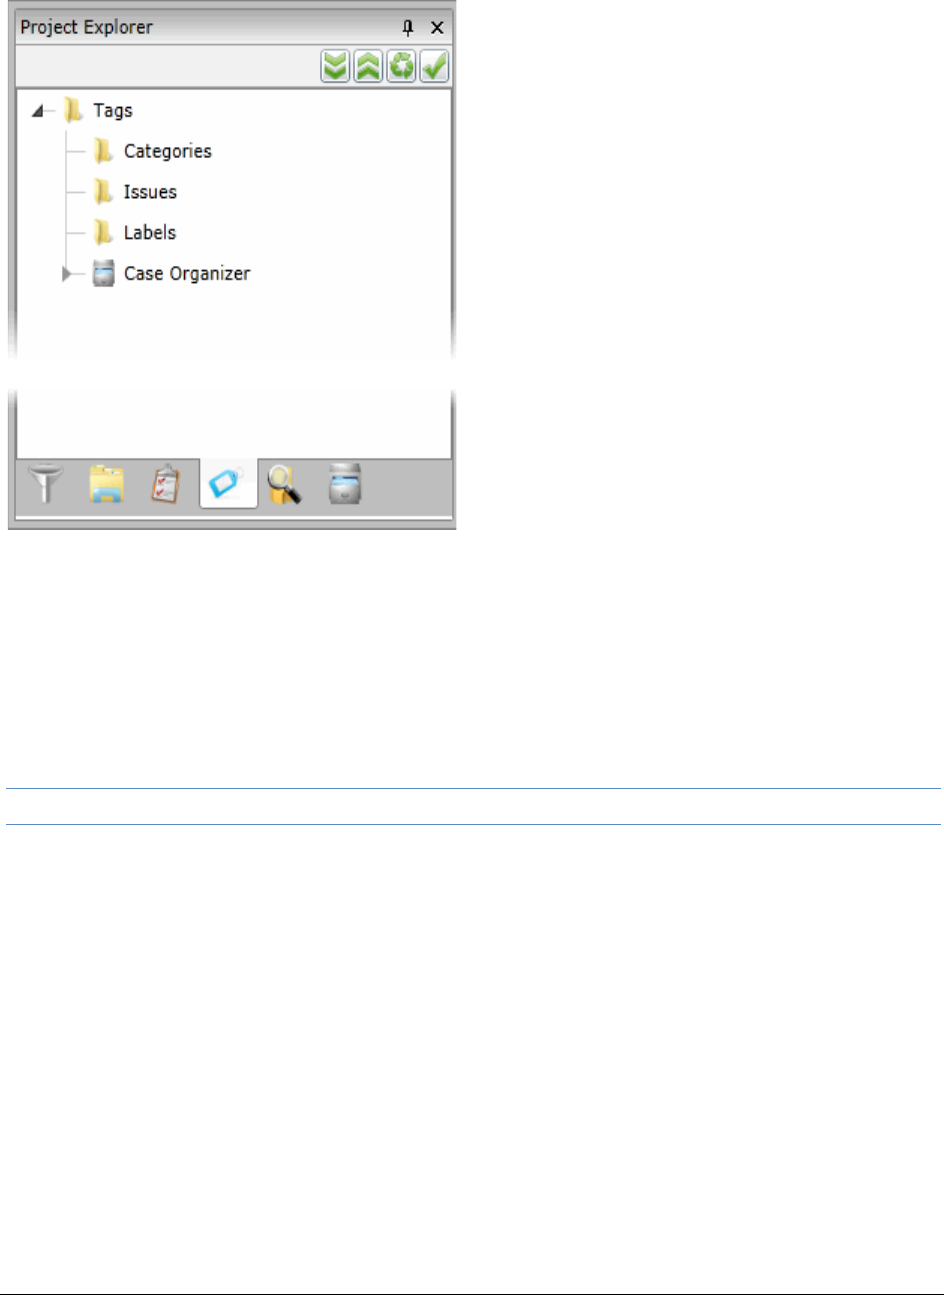
Applying Tags Using the Case Organizer | 198
You organize the Case Organizer objects in the Tags tab in the Project Explorer panel of Project Review.
Case Organizer objects are organized under each category parent. When you create an object, you select the
parent under which you save the Case Organizer object. You can also nest objects, meaning you can create
objects under other objects.
Except for the Summary category, all Case Organizer objects are shared with and can be viewed by all project
reviewers. However, under the Summary category, you have two options:
-A Shared tree that is available to all reviewers
-A tree specific to the logged-in-user that is not shared
Note: Administrators and Case Administrators can see and use all Case Organizer objects in a project.
Additional Informaiton will be available in an updated document.
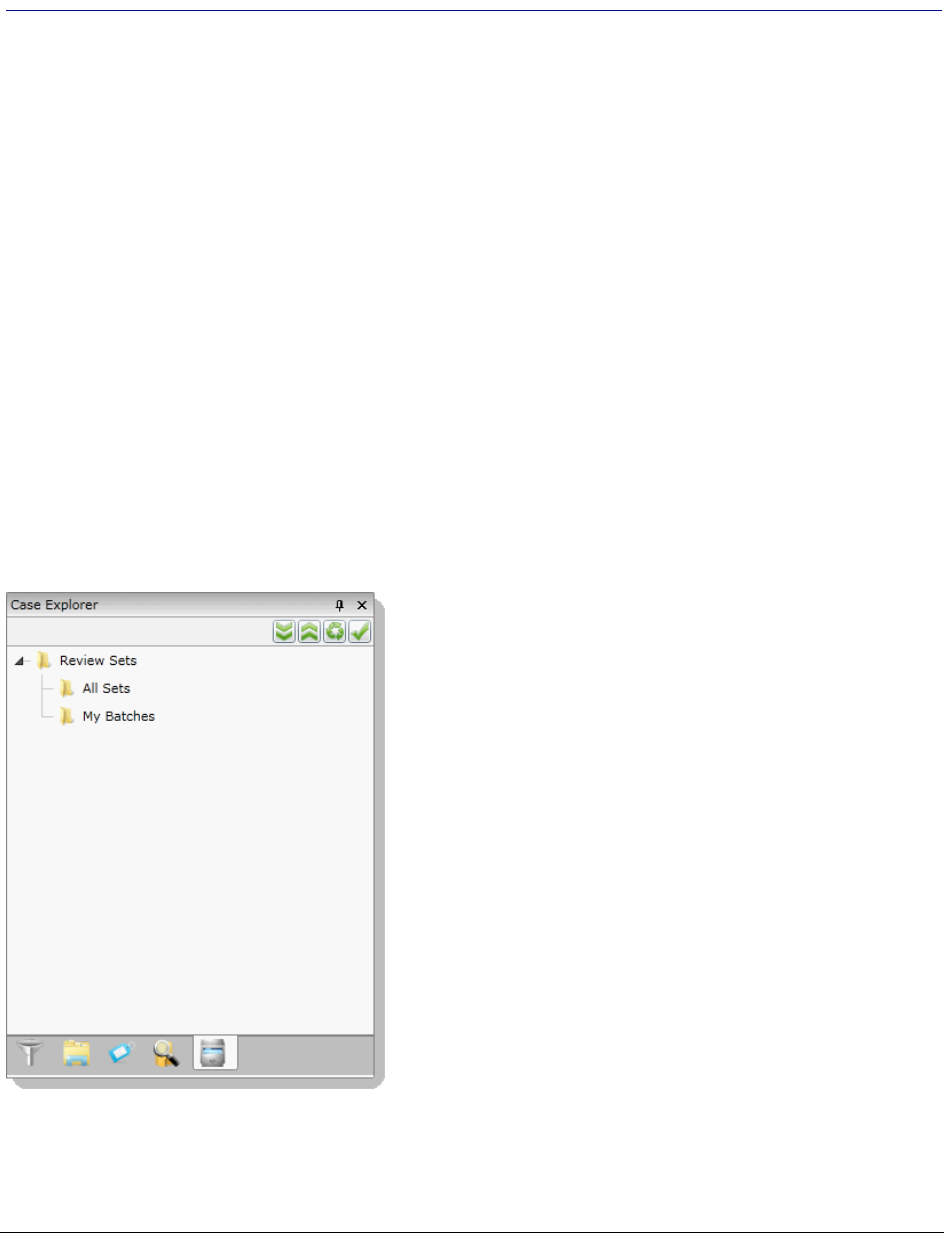
Coding Documents The Review Sets Tab | 199
Chapter 20
Coding Documents
The Review Sets Tab
The Review Sets tab in the Project Explorer panel can be used to create review sets and view review sets in the
Review Batches panel. Review sets are batches of documents that users can check out for coding and then
check back in.
Before you code a set of documents, you can check out a review set so that you can track the documents you
code and to structure your workflow. Project managers can create and associate review sets. When you are
done coding a set of documents, you can check them back in if you have the Check In/Check Out Review
Batches permission.
See Managing Review Sets in the Project Manager documentation for more information.
See Checking In/Out a Review Set on page 201.
Review Sets Tab in Project Explorer
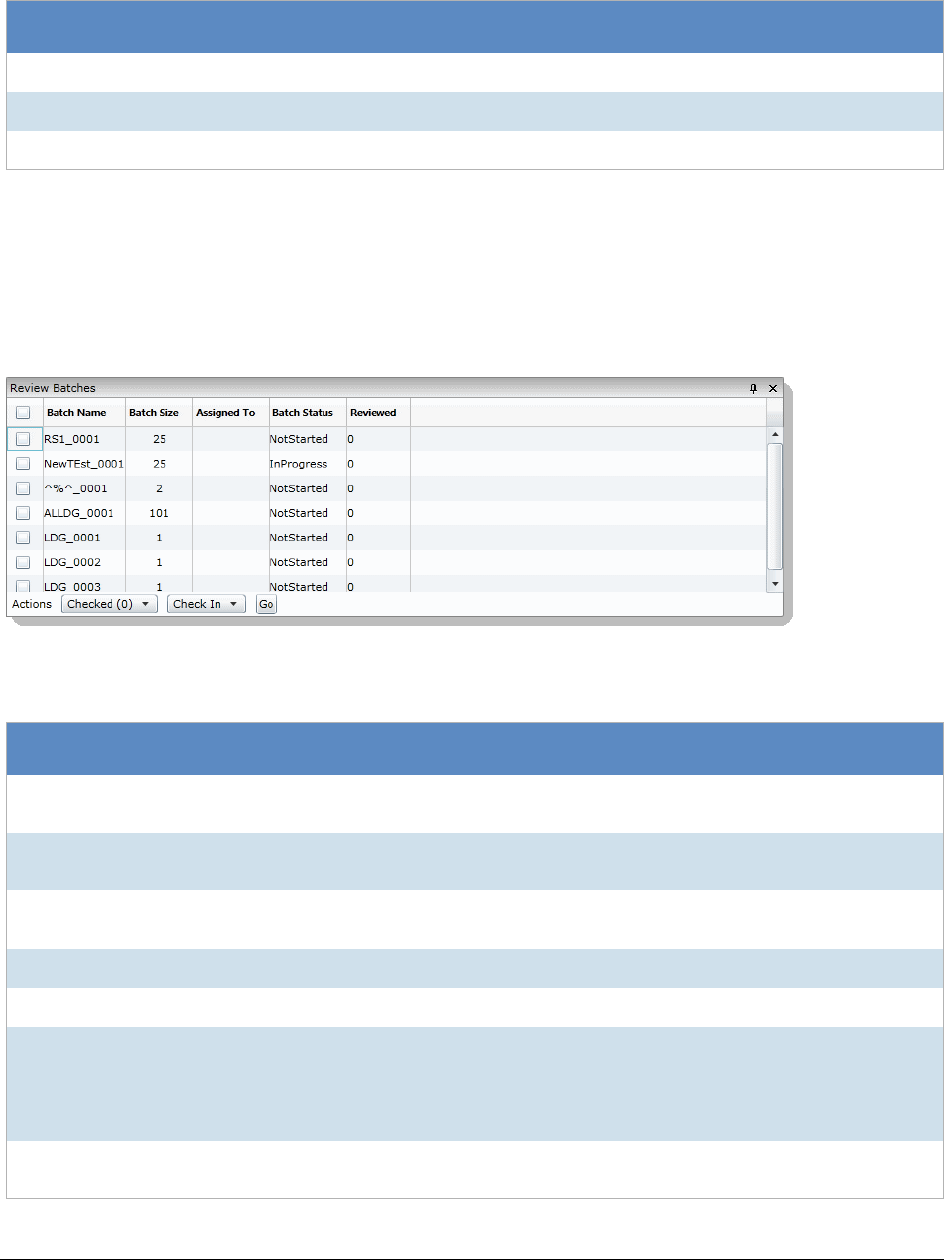
Coding Documents The Review Sets Tab | 200
The Review Batches Panel
The Review Batches panel in Project Review displays review batches. You can check in and check out batches
from this panel.
Review Batch Panel
Elements of the Review Sets Tab
Elements Description
Review Sets Contains the All Sets and My Batches folders.
All Sets Displays all the review sets available.
My Batches Displays review sets that you have checked out.
Elements of the Review Batches Panel
Element Description
Batch Name
Column Displays the name of the review set.
Batch Size
Column Displays the number of documents in review set.
Assigned To
Column Displays the user that the review set is assigned to.
Batch Status Displays the status of the review set.
Reviewed Displays the number of documents reviewed in set.
Actions Expand the first actions drop-down and select one of the following options:
-All: To include all review sets in the panel in the action
-Checked: To include checked review sets in the action
-Unchecked: To include all the unchecked review sets in the action
Actions Check In/
Out The second Actions drop-down allows you to select to either Check In or Check Out the
review set.

Coding Documents The Review Sets Tab | 201
Checking In/Out a Review Set
Reviewers with the Check In/Check Out Review Batches permission can check out sets of documents for
coding. Project managers can create and associate review sets for reviewers. When you are done coding a set
of documents, you can check them back in if you have the Check In/Check Out Review Batches permission.
To check out a review set
1. Log in as a user with Check In/Check Out Review Batches permission.
2. Click the Project Review button in the Project List panel next to the project.
3. In the Project Review, ensure that the Review Batches panel is showing.
See The Review Batches Panel on page 200.
4. In the Review Batches panel, check the batch(es) that you want to check out. Skip this step if you are
checking out all the review batches.
5. In the first Actions drop-down in the bottom of the panel, select one of the following:
-Checked: Select this to check out the checked review batches.
-All: Select this to check out all of the review batches, including those not visible on the current page.
6. In the second Actions drop-down, select one of the following:
-Check Out: Select this to check out the review set. Only one person can have a review set checked
out at a time.
-Check In: Select this to check in a checked out review set.
7. Click Go.
8. Click OK.
Go Button Click to execute the selected actions.
Elements of the Review Batches Panel
Element Description

Coding Documents Coding in the Grid | 202
Coding in the Grid
You change the data of editable columns by using Edit Mode in the Item List panel in Grid View. Only columns
that are editable can be altered in the Item List Grid, just as if you were coding using the coding panel. Data in
the Read-Only and evidence columns cannot be edited. You can edit dates, text, issues, categories, transcripts,
and notes in the Item List Grid. Data cannot be changed for records brought into the application using Evidence
Processing.
To code data in the Item List Grid
1. In Project Review, select the Item List panel and ensure it is in Grid View.
2. Do one of the following:
-Double click the field that you want to code.
-Select the field that you want to code and press F2.
Note: Not all fields are editable. You can only edit non-read-only fields, and columns that are not
populated by Evidence Processor.
3. Enter or select the text, date, or numbers that you want for the field.
See Editable Fields on page 202.
4. Move the focus away from the field by doing one of the following to save the changes that you have
made:
-Click anywhere else on the screen outside of the field.
-Press Tab to move to the next editable field.
Editable Fields
There are multiple different fields that you can edit, including custom fields created by the project manager. You
can always edit any custom fields that you have added. The following are examples of the kinds of editable fields
that you will see by default in the Item List panel grid:
-Authors
-Deponents (transcript records only)
-DepositionDate (transcript records only)
-DocDate (allows fuzzy dates)
-DocType
-Endorsement
-Issues
-Mentioned
-Note (Note records only)
-NoteDate
-OriginalFileName
-Recipients
-Source
-Title
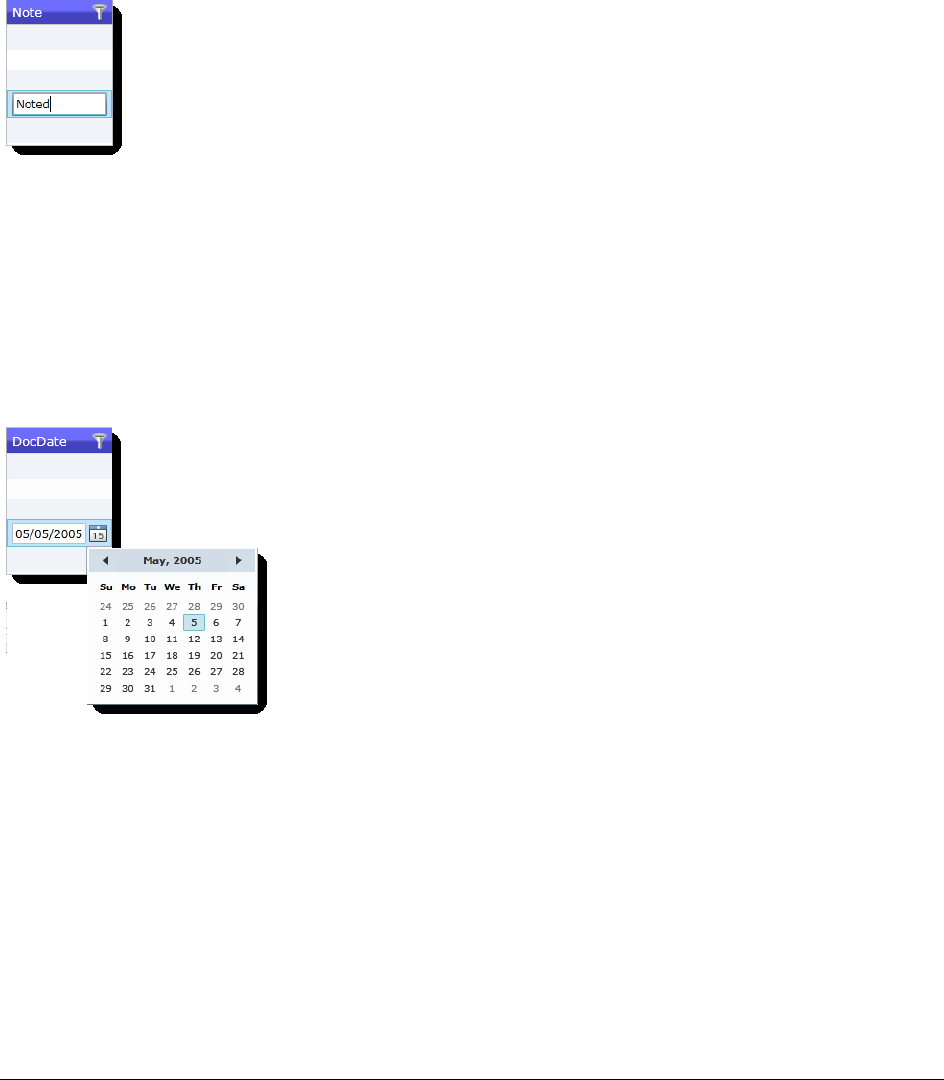
Coding Documents Coding in the Grid | 203
-UUID
-Volume
Text Fields
Text fields can contain numbers, letters, and symbols. Text fields are limited to 250 characters. If you attempt to
exceed 250 characters, your text will be truncated at 250 without warning that you have exceeded the limit.
Text Fields in the Item List Grid
Date Fields
Date fields can only contain numbers and must be a valid date. You can expand the calendar to select a date or
enter a date using your keyboard. If the column allows fuzzy dates, your date does not have to be complete, but
it still must be valid.
Date Fields in the Item List Grid
Number Fields
Number fields can only contain numbers. Numbers may be positive or negative. You can use the spin box in the
field to increase or decrease the number.
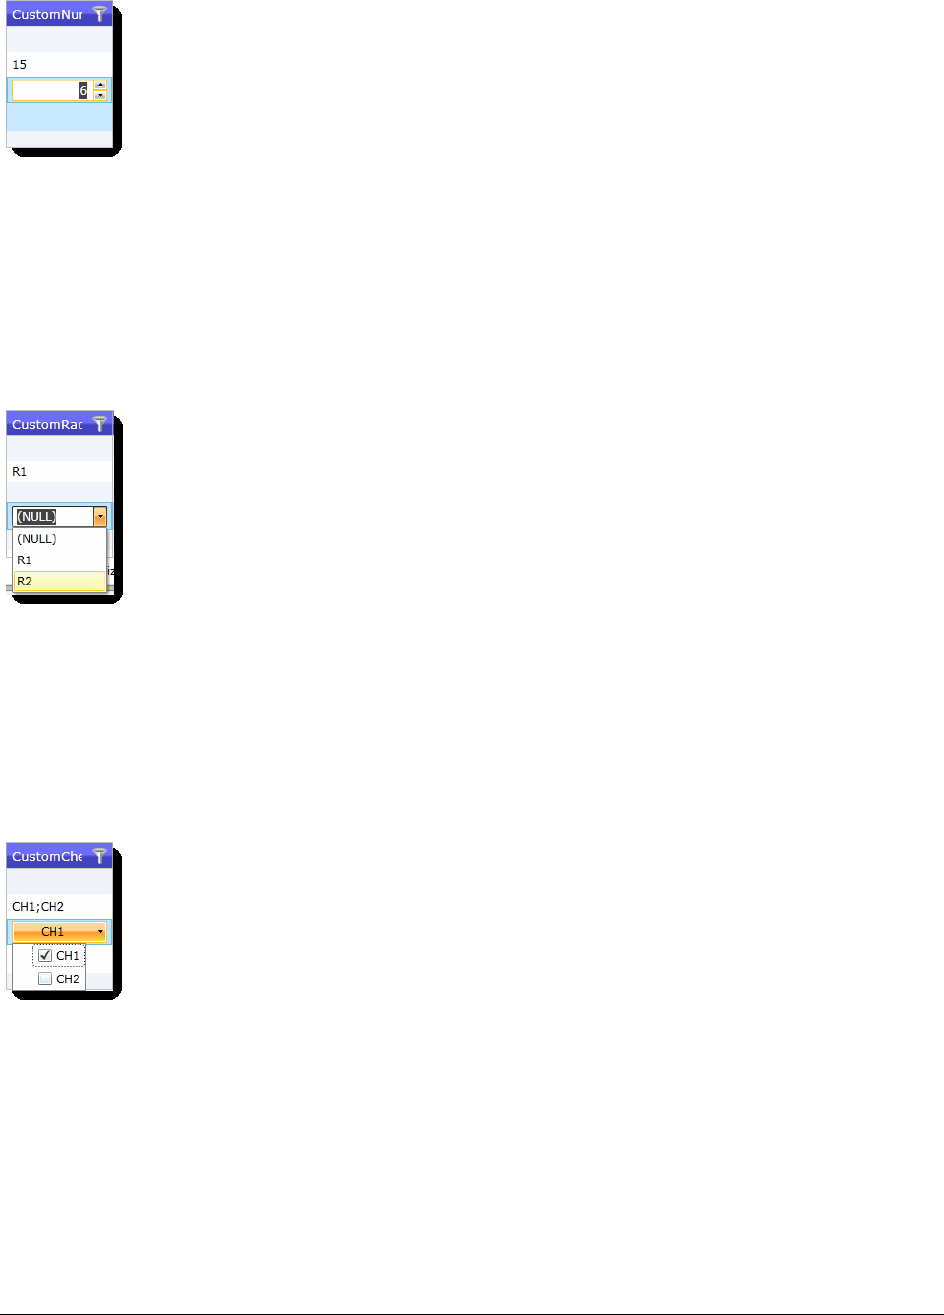
Coding Documents Coding in the Grid | 204
Number Fields in the Item List Grid
Radio Button Fields
Custom fields that include radio button options were created by the project manager and appear as options in a
drop-down. You may select one of the available options, but you cannot enter your own custom text in the grid
view in a radio button field.
Radio Button Field in the Item List Grid
Check Box Fields
Custom fields that include check boxes were created by the project manager and appear in a drop-down as a
check box. You can check one or multiple boxes if the field contains check box options.
Check Box Field in the Item List Grid
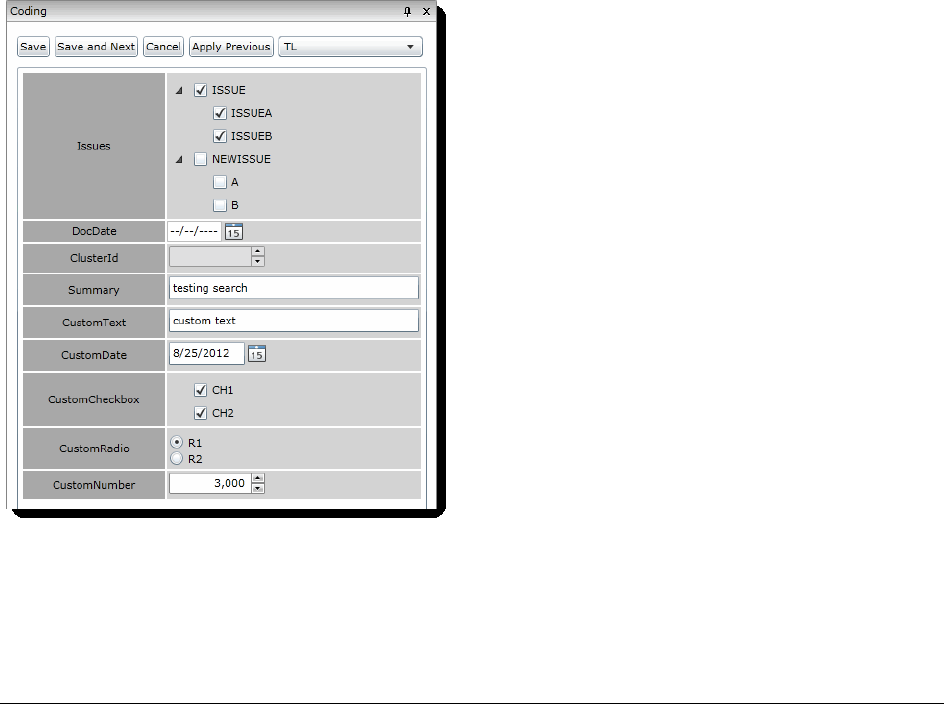
Coding Documents Using the Coding Panel | 205
Using the Coding Panel
The Coding Panel
Coding is putting values into the fields (columns) of documents. The Coding panel in Project Review allows you
to use coding layouts to change the data of the selected document. Coding layouts can be created on the
Tagging Layout tab of the Home page. Fields with greyed-out text on the Coding tab are read only. Fields in blue
on the Coding tab are required.
Reviewers with View Coding Layout permissions can code the data of a document using the Coding panel and
the mass actions in the Item List panel. Coding allows you to identify descriptive pieces of information that never
had metadata, like images that were loaded and need to have dates manually added into the field. The Coding
panel in Project Review allows you to use coding layouts to code the selected document.
You can code documents and transcripts. Transcripts can be coded for Deponent and Deposition Date as long
as the fields are in the tagging layout.
See Coding Single Documents on page 206.
See Coding Multiple Documents on page 207.
Coding layouts can be created by the project manager in the Tagging Layout tab of the Home page.
See the Project Manager documentation for information on creating coding layouts.
Coding Panel

Coding Documents Using the Coding Panel | 206
Coding Single Documents
Reviewers with the View Coding Layout permission can code the data of documents outlined in a coding layout.
Layouts are defined by the project manager. Layouts include custom fields, categories, and issues. You can
code the data for all of these things as long as they are included in the Layout defined by the project manager.
You can code single documents using the Coding panel. Fields with greyed-out text on the Coding tab are read
only. Fields in blue in the coding layout are required.
To code single documents
1. Log in as a user with View Coding Layout permission.
2. Click the Project Review button in the Project List panel next to the project.
3. In the Project Review, ensure that the Item List, Project Explorer and Coding panel are showing.
4. If you are coding a checked out review batch, in the Project Explorer, click the Review Batches tab,
expand the My Batches folder, and select the batch that you want to code. The documents for the
selected batch appear in the Item List panel.
See The Review Batches Panel on page 200.
5. In the Item List panel, select the document that you want to code.
See Using the Item List Panel on page 58.
6. In the Coding panel, expand the layout drop-down and select the layout that you want to use. You must
be associated with the layout in order to use it. Project managers can associate layouts to users and
groups.
See The Coding Panel on page 205.
7. In the Coding panel, click Edit.
8. Edit the data to reflect accurate data. The options available will differ depending on the layout that the
project manager created.
9. Click one of the following:
-Save: Click this to save your changes and stay on the same document.
-Save and Next: Click this to save your changes and go to the next document in the Item List panel.
Elements of the Coding Panel
Element Description
Save Button Click to save your changes.
Save and Next Click to save your changes and move to the next codable record.
Cancel Click to cancel the coding and leave edit mode.
Apply Previous Click to apply the changes that you made to the previous record to the current record
you are viewing.
Layout Drop-down All available layouts for the user are in this drop-down.

Coding Documents Using the Coding Panel | 207
Note: You will only be able to save your changes if all the required fields (blue fields) are populated. If
all required fields are not populated, you will get an error message when you attempt to save the
record.
Coding Multiple Documents
Reviewers with the View Coding Layout permission can code the data of documents outlined in a coding layout.
Layouts are defined by the project manager. Layouts include custom fields, categories, and issues. You can
code the data for all of these things as long as they are included in the Layout defined by the project manager.
You can code multiple documents using the mass actions in the Item List panel. Fields with greyed out text in the
coding layout are read only. Fields in blue in the coding layout are required.
To code multiple documents
1. Log in as a user with View Coding Layout permission.
2. Click the Project Review button in the Project List panel next to the project.
3. In the Project Review, ensure that the Item List and Project Explorer panel are showing.
4. If you are coding a checked out review batch, in the Project Explorer, click the Review Batches tab,
expand the My Batches folder, and select the batch that you want to code. The documents for the
selected batch appear in the Item List panel.
See The Review Batches Panel on page 200.
5. In the Item List panel, check the documents that you want to code. Skip this step if you are coding for all
the documents.
See Using the Item List Panel on page 58.
6. In the first Actions drop-down at the bottom of the panel, select one of the following:
-Checked: Select this to code only the documents that you checked.
-All: Select this to code all the documents in the Item List panel, including those on pages not
currently visible.
7. In the second Actions drop-down, select Bulk Coding.
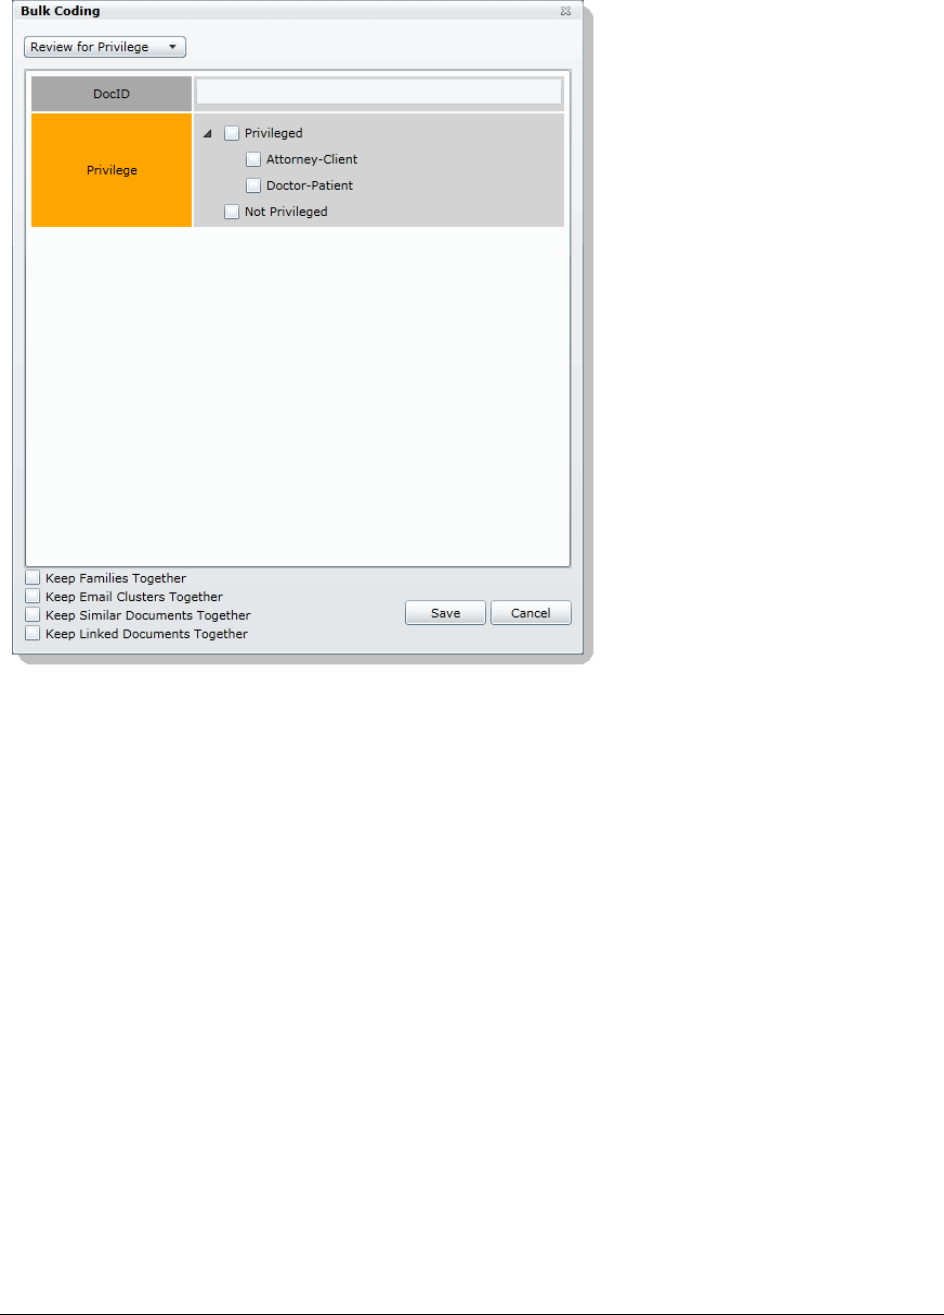
Coding Documents Using the Coding Panel | 208
Bulk Coding Dialog
8. In the Bulk Coding dialog, select the layout in the layout drop-down.
9. Edit the data to reflect accurate data. The options available will differ depending on the layout that the
project manager created. Check boxes with a dash (-) indicates that some of the documents have the
box checked. Click the check box until it becomes a check mark to apply it to all the selected
documents.
10. (Optional) Check the following Keep Together check boxes if desired:
-Include Family: Check to apply the same coding to documents within the same family as the
selected documents.
-Include SImilar Documents: Check to apply the same coding to all documents related to the
selected documents.
-Include Linked Documents: Check to apply the same coding to all documents linked to the selected
documents.
11. Click Save.
Once you have completed the Bulk Coding action, return to the Work List on the Home page. If there were any
Document IDs that failed to code, they will be listed by their number under the Work List. You can then resubmit
Bulk Coding for those failed IDs.

Coding Documents Predictive Coding | 209
Predictive Coding
You can automatically code documents by applying Predictive Coding to the document set. With Predictive
Coding, the system “learns” how you want certain documents coded and apply that coding to future documents.
This allows you to automatically code documents throughout the project.
In order to use Predictive Coding, you need to create a learning session from a subset of documents in the
project and code these documents with the appropriate responsive coding within that learning session. As the
system learns coding methodology, the system’s overall confidence level increases. This tells you how confident
the system is in learning how future documents should be coded. Once you have reached an acceptable
confidence score with the predictive coding, you can apply the predictive coding to the rest of the documents
within the project.
Note: Due to the conjecturable nature of predictive coding, any results from the predictive coding should be
considered an estimate and is not guaranteed to produce 100% accurate results. All results from
predictive coding should be verified against the data set.
The decision tree used by the system to perform Predictive Coding is generated by the Iterative Dichotomiser3
(ID3) algorithm. For more information on the ID3 algorithm, see http://www.cse.unsw.edu.au/~cs9417ml/DT1/
decisiontreealgorithm.html#A0.0 or http://en.wikipedia.org/wiki/ID3_algorithm .
A document that has Predictive Coding applied to it will be marked as responsive or non-responsive to the
subject matter that the reviewer has determined in the learning set. The reviewer has the ability to review the
Predictively Coded documents to ensure that the Predictive Coding was applied correctly. Any document that
has Predictive Coding applied to it can have the coding decision overridden. Also, any document that has had
manual coding applied to it will retain that manual coding.
There are four types of documents that are coded with predictive coding:
-Email
-Presentations
-Excel spreadsheets
-Word documents
All other document types will not be automatically coded.
The workflow of predictive coding occurs in three phases:
Instructing Predictive Coding (page 210)
Applying Predictive Coding (page 212)
Performing Quality Control (page 213)
Understanding Predictive Coding
In order for the system to learn the parameters of the predictive coding, a set of documents must be defined by
the reviewer. These documents would be selected by either applying filters, facets, or search results to the
documents. You can also select documents from the Item List.
Coding Documents Predictive Coding | 210
When a new project is created, by default that project has a standard coding/tagging layout associated with it
named Predictive Coding. You can find this tagging layout under Tagging Layouts in the Home tab.
See The Project Manager Guide for more information on tagging layouts.
Instructing Predictive Coding
Because predictive coding is based on statistical analysis of the data, the subset of the data used for coding
should be selected using the following parameters. Data selected with these parameters will assist in achieving
greater success with predictive coding:
-You should code a minimum of 10% of the documents in a project. The more documents that are coded
within a project, the more likely predictive coding will be successful in determining how to code the rest of
the documents in a project.
-You should apply the Predictive Coding layout to documents scattered randomly throughout the project,
not to just the first 10% of the documents that are listed in a project.
-The subset of documents used for predictive coding should contain a combination of documents marked
as either Responsive and Non Responsive.
-At least ten documents must be coded Responsive and at least ten additional documents must be coded
Non Responsive. These documents must be native documents that contain text.
Note: If you do not code at least ten documents Responsive and ten documents Non Responsive, the
Confidence Score and Predictive Coding Job will fail.
You can code the documents with the Predictive Coding layout in order to teach the system.
To code a learning set of documents with Predictive Coding
1. Log in as a user with View Coding Layout permission.
2. Click the Project Review button in the Project List panel next to the project.
3. In the Project Review, ensure that the Item List, Project Explorer and Coding panel are showing.
4. If you are coding a checked out review batch, in the Project Explorer, click the Review Batches tab,
expand the My Batches folder, and select the batch that you want to code. The documents for the
selected batch appear in the Item List panel.
See The Review Batches Panel on page 200.
5. In the Item List panel, select the document that you want to code.
See Using the Item List Panel on page 58.
6. In the Coding panel, expand the layout drop-down and select the Predictive Coding layout. You must be
associated with the layout in order to use it. Project managers can associate layouts to users and
groups.
7. Click Edit.
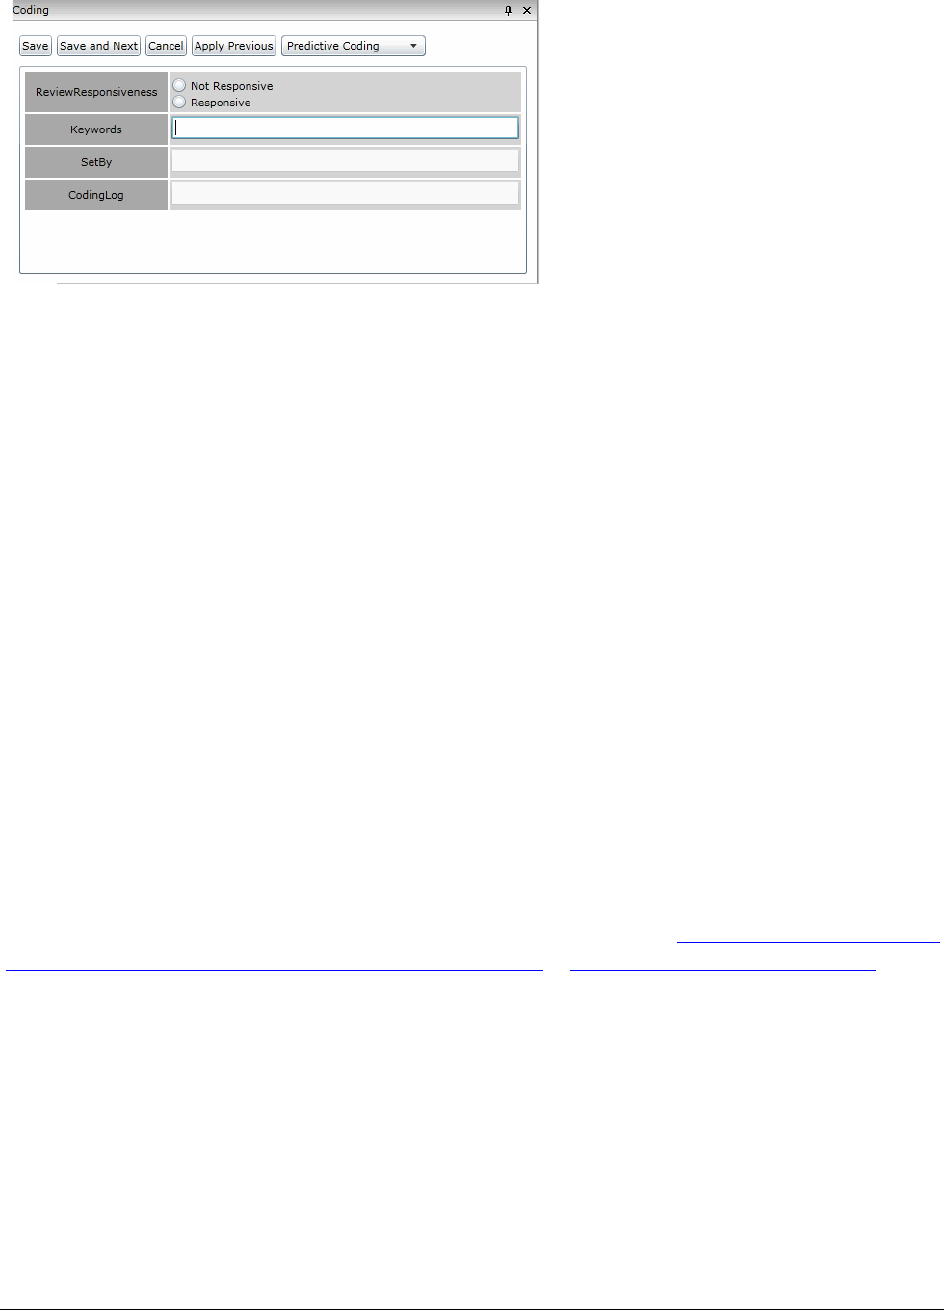
Coding Documents Predictive Coding | 211
Predictive Coding Panel
8. Mark whether a document is responsive or not responsive for the subset that you are creating.
-Add any additional keywords, separated by commas.
-The SetBy and CodingLog fields are not editable. SetBy displays whether a document has been
manually coded or predictively coded, and the CodingLog field displays data for predictively coded
documents.
9. Click one of the following:
-Save: Click this to save your changes and stay on the same document.
-Save and Next: Click this to save your changes and go to the next document in the Item List panel.
10. Code as many documents as you feel is necessary for the Predictive Coding subset.
See Instructing Predictive Coding on page 210.
Once you have completed manually coding the documents to be used in Predictive Coding, you should test the
system and obtain a confidence score of how well the system has learned.
Obtaining a Confidence Score
In order to determine if the system has received enough information in order to perform a successful coding, a
reviewer must run a confidence scoring job and generate a confidence score. The confidence score is a
percentage-based score. The higher the score, the greater the confidence that the system has in coding the rest
of the documents in the project correctly.
The confidence score is determined by using the F1 score statistical calculation. This score is calculated using
the precision rate (true positive count over total positive labeled) and recall rate (true positive count over total
positive count). For more information on the F1 score statistical calculation, see http://www.cs.odu.edu/~mukka/
cs795sum10dm/Lecturenotes/Day3/F-measure-YS-26Oct07.pdf or http://en.wikipedia.org/wiki/F1_score .
Cross-validation is the process used to determine the confidence level of the system. In this process, the original
learning set of manually coded documents is randomly partitioned into subsamples. These subsamples are
called validations folds, and the quantity of the subsamples in a given learning set is represented by the variable
k. From the k subsamples, a certain quantity of subsamples, represented by the variable n, is retained as the
validation data for testing the model. The remaining k - n subsamples are used as training data. The validation
process is then repeated k times (the folds), with different sets of n subsamples used as the validation data. The
results from the validation folds are then averaged to produce a single estimation.
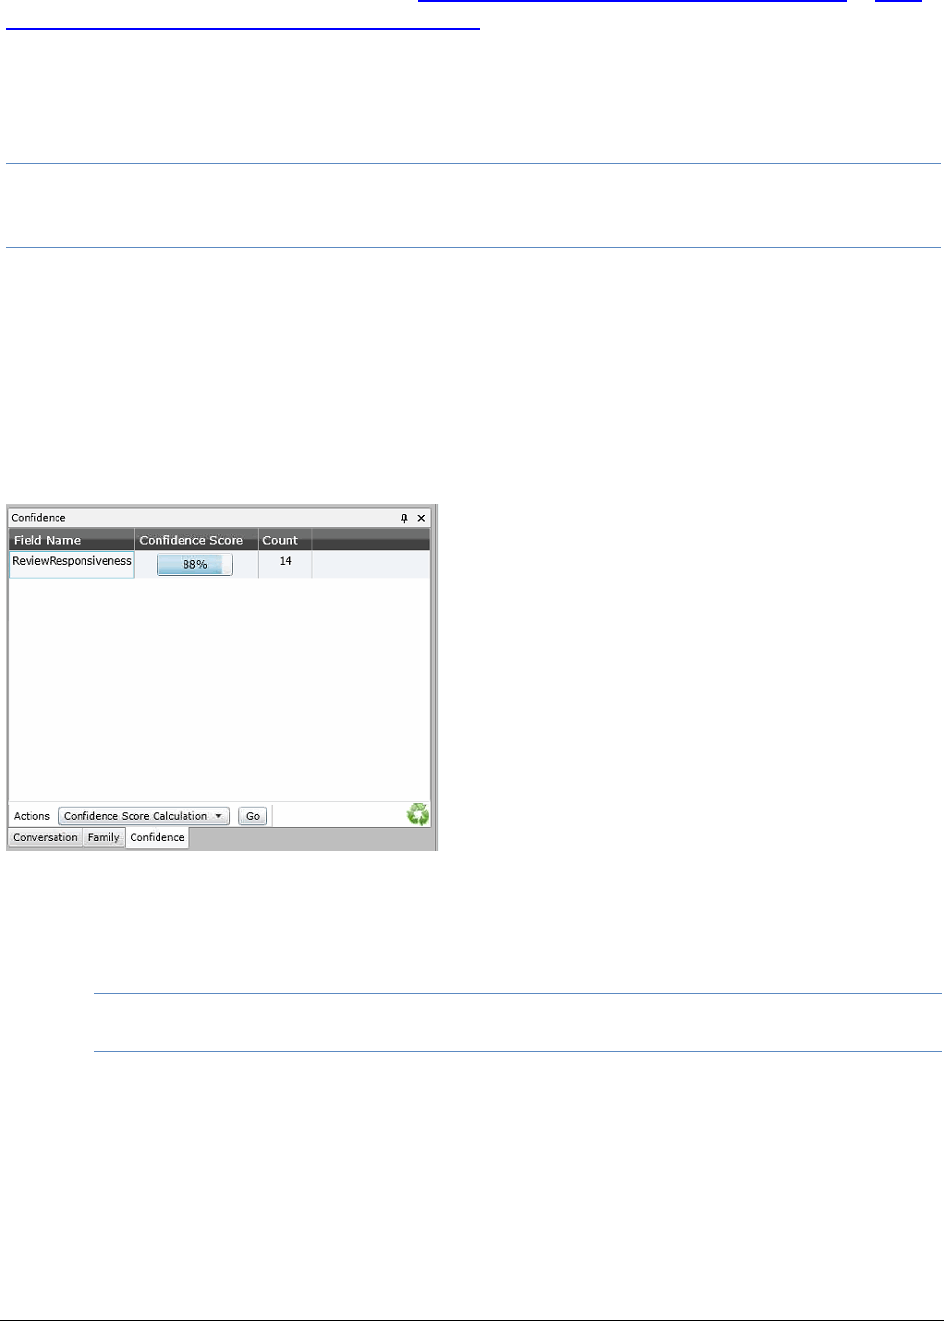
Coding Documents Predictive Coding | 212
For more information about cross-validation, see http://www.cs.cmu.edu/~schneide/tut5/node42.html or http://
en.wikipedia.org/wiki/Cross-validation_%28statistics%29 .
In order to obtain the confidence score, you need to perform a confidence score job after the learning set has
been coded with Predictive Coding.
Note: You must code at least ten documents as responsive and ten other documents as non-responsive before
running a confidence score job. If not, the confidence score job will fail. You will be notified of the failed
job in the Job List.
To perform a confidence score job
1. From Project Review, open the Confidence panel by going to Layouts > Panels > Confidence.
2. From the Actions pull-down, select Confidence Score Calculation and click Go.
3. Go to the Work List under the Home tab to view the status of the Confidence Scoring job. Once the job
has completed, return to Project Review.
4. The confidence score will appear in the Confidence panel.
Confidence Panel
-Field Name - indicates the field that was tested against in the cross-validation.
-Confidence Score - the higher the score, the more confidence that the system has in applying the
Predictive Coding.
-Count - the count of the documents in the learning set.
Note:The Confidence Panel will display only the last confidence score that was calculated for the
learning set.
Applying Predictive Coding
After achieving a confidence score that sufficiently shows that the system can code the rest of the documents in
the project, you can apply the Predictive Coding to the rest of the documents in the project.

Coding Documents Predictive Coding | 213
Note: Only one Predictive Coding job may be executed at any one time per project.
To apply Predictive Coding to the project
1. From Project Review, open the Confidence panel by going to Layouts > Panels > Confidence.
2. From the Actions pull-down, select Predictive Coding and click Go.
3. Go to the Work List under the Home tab to view the status of the Predictive Coding job. Once the job
has completed, return to Project Review.
Performing Quality Control
Once the Predictive Coding job has completed, the reviewer can evaluate whether or not Predictive Coding was
applied successfully to the documents in the project. The reviewer can filter the documents to display only those
documents which have been predictively coded, and evaluate individual documents. If the coding for a
document is incorrect, the reviewer can override the Predictive Coding, and code the document manually. If the
reviewer has determined that the predictive coding was not accurate in coding the documents properly, the
reviewer can create a new Predictive Coding learning set, and reapply the Predictive Coding to the documents.
To check the Predictive Coding
1. In the Item List under Project Review, select Columns.
2. Add the SetBy column to the selected columns. The SetBy column displays whether a document has
been manually coded or predictively coded. Click Ok.
3. Filter the SetBy column to display only predictively coded documents.
4. In the Coding panel, expand the layout drop-down and select the Predictive Coding layout.
5. Click Edit.
6. Examine whether a document has been coded correctly. If not, mark the correct coding and click one of
the following:
-Save: Click this to save your changes and stay on the same document.
-Save and Next: Click this to save your changes and go to the next document in the Item List panel.
7. The manual override will appear in the SetBy column in the Item List.

Annotating Evidence About Annotating Evidence | 214
Chapter 21
Annotating Evidence
About Annotating Evidence
Reviewers with the Add Annotations permission can annotate documents and emails.
The following annotation options are available:
-Adding a Note (page 220)
-Adding a Highlight (page 222)
-Adding a Drawn Highlight (page 222)
-Adding a Redaction (page 224)
-Adding a Drawn Redaction (page 224)
-Adding a Link (page 223)
-Selecting a Highlight Profile (page 219)
-Selecting a Markup Set (page 219)
You can use the Natural Panel to perform all annotation options.
See Using the Natural Panel on page 76.
You can use the Image Panel to create redactions, highlights, and markup sets is also available on the.
See Using the Image Panel on page 79.
Prerequisites for Annotating
In order to Select Text, Draw Highlight Text, Draw Redaction Text, Draw Highlight, Draw Redaction, Create Note,
or Create Link, you must select an existing Markup Set.
See Selecting a Markup Set on page 219.
Markup Sets are created for the project on the Home page.
Annotating Evidence About Generating SWF Files for Annotating | 215
About Generating SWF Files for Annotating
Before annotating a file, the file must first be converted to a format that can be annotated or redacted.
AccessData generates an Adobe’s SWF file for files that you can annotate.
You can generate SWF for the following file types: TXT, DOC, PPT, PDF, MSG, HTM, GIF, and so forth.
You can generate a SWF in the following ways:
Method Description
Generate SWF files when
processing the project There is a Enable Standard Viewer processing option that will automatically
convert many files to SWF and make the Standard Viewer the default viewer.
This option is checked as the default for the Summation license, but can be
enabled in other products.
When this option is enabled, during processing, a SWF file will be generated for
any document that can be generated as a SWF and that is also 1 MB or larger.
Some documents are not converted to SWF, such as PST, ZIP, DLL, and EXE
files.
For files that are smaller than 1 MB, the SWF file is generated “on-the-fly” when
the document is loaded into the Standard Viewer.
Microsoft Excel files are not automatically converted into SWF, neither during
processing nor “on-the-fly”, but can be done manually later.
Have SWF files
automatically generated
in Review
If you view a file that has not had a SWF file generated for it in the Alternate File
Viewer, then change to the Standard Viewer, and a SWF can be generated, it will
be converted “on-the-fly”.
Generate SWF files
manually You can generate SWF files with the Annotate Native or Create Image features.
See Using the Image Panel on page 79.

Annotating Evidence Accessing SWF Files for Annotating | 216
Accessing SWF Files for Annotating
You can annotate files using one of the following:
-The Standard Viewer in the Natural Panel
-The Image Panel
You cannot annotate files using the Alternate File Viewer in the Natural Panel.
How you access SWF files in the Standard Viewer depends on whether you enabled the Enable Standard
Viewer processing option for the project.
-If the Enable Standard Viewer processing option is enabled, the Standard Viewer is the default viewer.
When you click a file in the item list, if a SWF has been generated, or if the file can have a SWF
generated, it will display in the Standard Viewer.
If the SWF file has not yet been generated, it will do do automatically.
If you click a file that does not support SWF, it will be displayed in the Alternate File Viewer instead.
-If the Enable Standard Viewer processing option is not enabled, by default, the Alternate File Viewer is
used. If you then change to the Standard Viewer, and if a SWF can be generated, it will be converted “on-
the-fly”.
To access a file to annotate it
1. Log in as a user with appropriate permissions.
2. Click the Project Review button in the Project List panel next to the project.
3. In the Project Review, ensure that the Item List and Natural panel are showing.
4. Select a document in the Item List panel that has a native application.
5. Do one of the following:
-Verify that the file is displayed in the Standard Viewer.
-If the file is displayed in the Alternate Viewer, either click the Standard Viewer, or click the Annotate
Native or Create Image button.
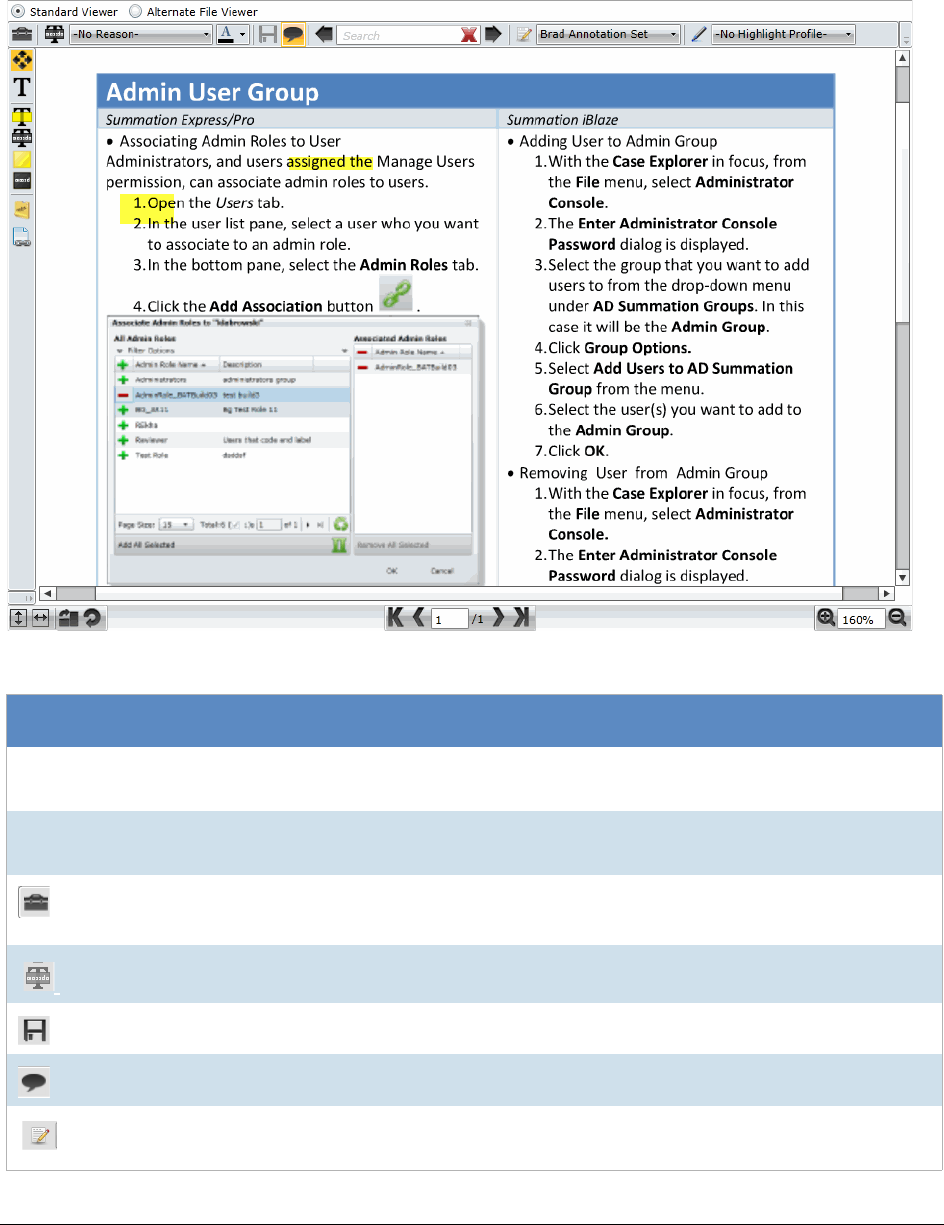
Annotating Evidence About Annotating Tools | 217
About Annotating Tools
Standard Viewer
Elements of the Standard Viewer
Element Description
Standard Viewer Format that allows you to create annotations on the file.
See Using the Natural Panel on page 76.
Alternate File Viewer Format that allows you to view a native representation of the file.
See Using the Natural Panel on page 76.
Toggle Annotation
Tools
Toggles the annotation tools on and off.
Redaction Reasons Click to select a redaction reason to apply to the document.
Save Annotations Save the annotations to file.
Show/Hide Redactions Click to show and hide the redactions in the document.
Markup Sets Click to show the Markup Sets that are available to apply to the document.
Note: An existing Markup Set is required for using Annotation Tools.
Annotating Evidence About Annotating Tools | 218
Annotation Tools Note: An existing Markup Set is required for using Annotation Tools.
Pan Mode Click to move within a document page. Navigate by clicking and dragging with
the hand icon.
Text Selection Mode Click to select text within the document to highlight or redact.
Text Highlight Click to highlight selected text. See Adding a Highlight on page 222.
Text Redaction Click to redact selected text. See Adding a Redaction on page 224.
Drawn Highlight Click to create a drawn or coordinate-based rectangle highlight. You can use
this tool for creating highlights on documents that are graphics based, rather
than text based. See Adding a Drawn Highlight on page 222.
Drawn Redaction Click to create a drawn or coordinate-based rectangle redaction. You can use
this tool for creating redactions on documents that are graphics based, rather
than text based. See Adding a Drawn Redaction on page 224.
Create Note Click to add a note to the document. See Adding a Note on page 220.
Create Link Click to add a link to another document in the project. See Adding a Link on
page 223.
Navigation Icons
Thumbnails Click to view thumbnails of the pages in the document.
Fit to Page Click to fit the document to the Natural pane.
Fit to Width Click to fit the document to the width of the Natural pane.
Rotate All Click to rotate the document clockwise in 90 degree increments.
Rotate Page Click to rotate a page of the document clockwise in 90 degree increments.
Page Navigation
Navigate through the document with either the arrows or by entering a page
number in the field. When documents are generated as PDFs, the page
navigation bar will not be available. You can still navigate through the PDF by
using the vertical scroll bar.
Zoom
Zoom in and out of the document. Use either the magnifying glass or enter a
percentage in the field.
Elements of the Standard Viewer (Continued)
Element Description
Annotating Evidence Profiles and Markup Sets | 219
Profiles and Markup Sets
Selecting a Highlight Profile
Persistent highlighting profiles are defined by the project/case manager and can be toggled on and off using the
Highlight Profile drop-down in Natural panel in the Project Review.
To select a highlight profile
1. In the Project Review, ensure that the Item List and Natural panel are showing.
2. Expand the Highlight Profile drop-down and select a profile.
Selecting a Markup Set
Markup sets are a set of annotations performed by a specified group of users. For example, you can create a
markup set for paralegals, then when paralegal reviewers perform annotations on documents in the Project
Review, all of their markups will only appear when Paralegal is selected as the markup for the document in the
Natural or Image panel.
Having an existing Markup Set is required for using Annotation tools.
See Prerequisites for Annotating on page 214.
Note: Only redactions and highlights are included in markup sets.
Markup sets are created by the project/case manager on the home page. Markup Sets are only accessible in the
Standard Viewer of the Natural or Image Panel.
To select a markup set
1. In the Project Review, ensure that the Item List and Natural or Image panel are showing.
2. Access the file in the Standard Viewer.
3. Expand the Markup Set drop-down and select a markup set.

Annotating Evidence Adding a Note | 220
Adding a Note
Reviewers with the Add Notes permission can add notes to documents in the Natural panel of Project Review.
Notes can be viewed and deleted from the Notes panel for users with the View Notes and Delete Notes
permission.
See The Notes Panel on page 84.
To add a note
1. Log in as a user with Add Notes permission.
2. Click the Project Review button in the Project List panel next to the project.
3. Access the file in the Standard Viewer.
4. Select an existing Markup Set.
See Prerequisites for Annotating on page 214.
5. Click on the Create Note tool button .
6. Highlight the text in the body of the document to which you want to add a note. The Create Note dialog
appears.
Create Note View Dialog
7. Enter a note in the Note field.
8. Set a Date for the note. The date does not have to be exact, but can be just a month or year.
9. (Optional) Check issues related to the note.
Note: If you check an issue that has a color associated with it, the selected text will be highlighted that
color.
10. Check the groups with which you want to share the note.
11. Click Save.

Annotating Evidence Editing a Note | 221
Editing a Note
Reviewers with the Edit Notes permission can edit notes to documents in the Natural panel of the Project
Review.
To edit a note
1. Log in as a user with Add Notes permission.
2. Click the Project Review button in the Project List panel next to the project.
3. Access the file in the Standard Viewer.
4. In the document, locate the red marker in the text that indicates a note in the document. Double-click
the marker. The Edit Note dialog appears.
5. Edit the fields that you want to change.
6. Click Save.

Annotating Evidence Adding a Highlight | 222
Adding a Highlight
Adding a Text-Based Highlight
Reviewers with the Add Annotations permission can add highlights to documents in the Natural panel of Project
Review.
To add a text-based highlight
1. Log in as a user with Add Annotations permission.
2. Click the Project Review button in the Project List panel next to the project.
3. In the Project Review, ensure that the Item List and Natural panel are showing.
4. Access the file in the Standard Viewer.
5. Select an existing Markup Set.
See Prerequisites for Annotating on page 214.
6. Click the Text Highlight tool button.
7. (Optional) To delete a text highlight, click on the highlight and press Delete.
Adding a Drawn Highlight
Reviewers with the Add Annotations permission can add a drawn or coordinate-based highlights to documents
in the Natural or Image panel of Project Review. The following steps describe how to add a drawn highlight in the
Natural panel. These steps will also work in the Image panel.
To add a drawn highlight
1. Log in as a user with Add Annotations permission.
2. Click the Project Review button in the Project List panel next to the project.
3. In the Project Review, ensure that the Item List and Natural panel are showing.
4. Access the file in the Standard Viewer.
5. Select an existing Markup Set.
See Prerequisites for Annotating on page 214.
6. Click the Drawn Highlight tool button .
7. Click and drag the rectangle onto the body of the document.
8. (Optional) To delete a drawn highlight, click on the highlight and press delete.
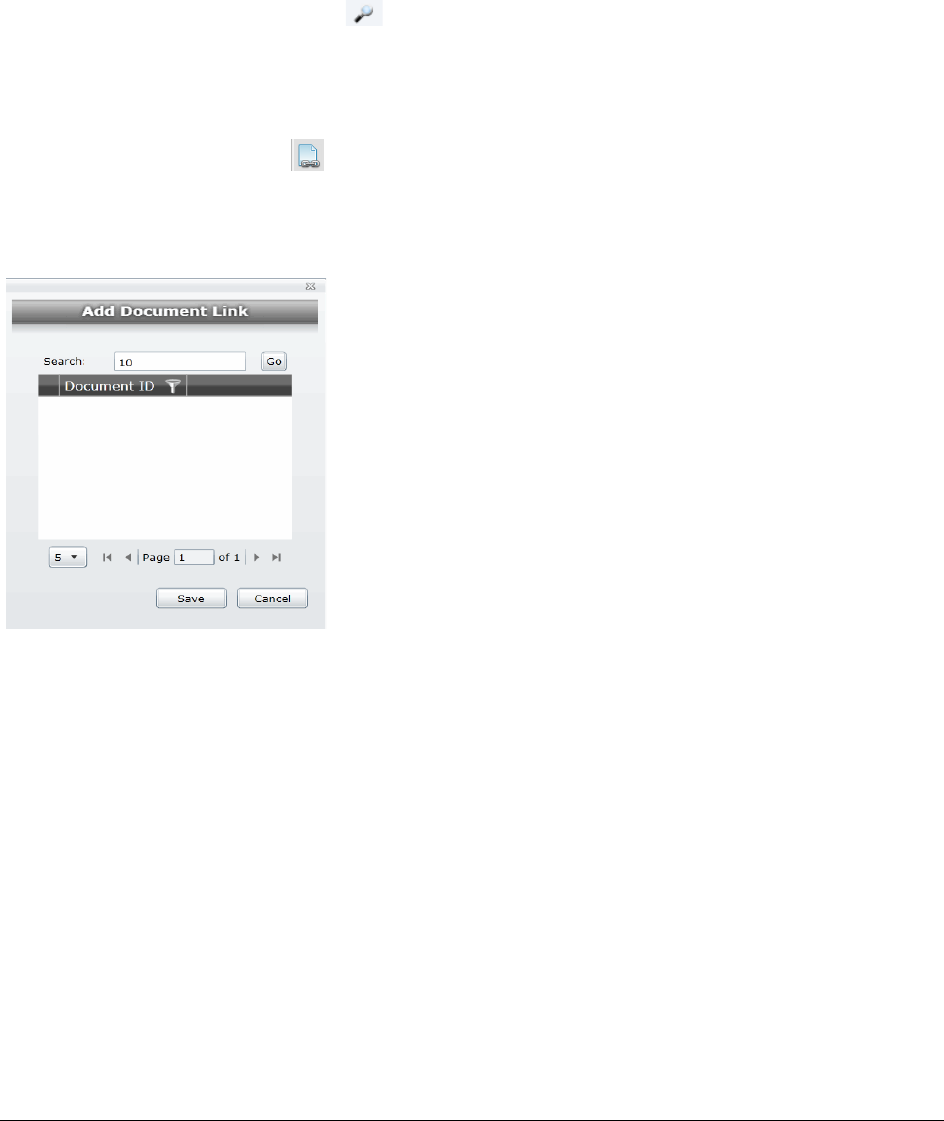
Annotating Evidence Adding a Link | 223
Adding a Link
Reviewers with the Add Annotations permission can add links to documents in the Natural panel of Project
Review.
To add a link
1. Log in as a user with Add Annotations permission.
2. Click the Project Review button in the Project List panel next to the project.
3. Access the file in the Standard Viewer.
4. Select an existing Markup Set.
See Prerequisites for Annotating on page 214.
5. Click on the Create Link tool button.
6. Highlight the area in the body of the document to which you want to add a link. The Add Document
Link dialog appears.
Add Document Link Dialog
7. In the Search field, enter the DocID of the document you want to link to.
8. Press the tab button to activate the Go button and click Go.
9. Select the document you want to link to from the search results.
10. Click OK.
Annotating Evidence Adding a Redaction | 224
Adding a Redaction
Adding a Text-Based Redaction
Reviewers with the Add Annotations permission can add redactions to documents in the Natural panel of Project
Review.
Note: If you hover over a redaction while in ADViewer mode, the redaction will become transparent, and you
can view the text underneath the redaction.
Redaction color tips:
-You can change the color block for redacting documents to any color.
-If the redaction block color is a darker shade such as black or navy blue, the redaction reason will be set
to white. If the redaction color block is a lighter color such as yellow or white, the redaction reason will be
set to black.
To add a text-based redaction
1. Log in as a user with Add Annotations permission.
2. Click the Project Review button in the Project List panel next to the project.
3. Access the file in the Standard Viewer.
4. Select an existing Markup Set.
See Prerequisites for Annotating on page 214.
5. Click the Text Redaction tool button.
6. Drag over the text that you want to redact.
7. (Optional) To delete a text redaction, click on the redaction and press Delete.
Adding a Drawn Redaction
Reviewers with the Add Annotations permission can add a drawn or coordinate-based redactions to documents
in the Natural or Image panel of Project Review. The following steps describe how to add drawn redactions in the
Natural panel. These steps will also work in the Image panel.
Note: When using Draw Redaction, text that is very close to the Draw Redaction box may be included in the
redaction.
To add a coordinate-based redaction
1. Log in as a user with Add Annotations permission.
2. Click the Project Review button in the Project List panel next to the project.
3. Access the file in the Standard Viewer.
4. Click the Drawn Redaction tool button .
5. Click and drag the rectangle onto the body of the document.
6. (Optional) To delete a drawn redaction, click on the redaction and press Delete.

Annotating Evidence Adding a Redaction | 225
Coordinate-Based Redactions Boundaries
After drawing a coordinate-based redaction, red square boxes may appear on the redacted text, above the
redacted text, and/or below the redacted text. These red square boxes are the application’s attempt to insure
that all of a character is redacted. The application accomplishes this by indicating all characters that will be
redacted, including font boundaries defined in the file that the user cannot view. Any characters that are bound
by these red boxes will be redacted. If the application is indicating text that you do not want redacted, you can
adjust your redaction so that application will only redact the characters that you want.
Toggling Redactions On and Off
You can toggle redactions on and off in the Natural and Image panels so that you can view or hide them without
deleting redactions.
To toggle redactions on and off
1. In the Project Review, ensure that the Item List and Natural panel are showing.
2. Access the file in the Standard Viewer.
3. Click the Show/Hide Redactions button .
4. Click the button again to turn them back on.

Bulk Printing Bulk Printing Multiple Documents | 226
Chapter 22
Bulk Printing
Reviewers with the Imaging permission can print multiple records using the Bulk Printing mass action in the Item
List panel. You can print to printers that are on the server or to a local machine. You can also brand printed
documents. Bulk printing will print the source documents and include annotations or redactions on the
documents.
You can perform other actions (except for starting another print job) while the system is running a bulk print job.
Note: Before you can print to a printer, you need to download and install the Bulk Print Local plug-in. Upon initial
installation of the application, a prompt appears after logging in asking if you want to install the plug-in. If
this plug-in was not installed at login, the system will prompt you to install when running Local Bulk
Printing for the first time. See the Admin guide for more information.
You can print highlights and redactions on printed documents without needing to create a production set. In the
Bulk Printing dialog, you can select which type of markup sets to print.
In the
Note: For documents that contain both Native and Image redactions, only Image redactions print. Image
redactions take precedence over Native redactions.
Bulk Printing Multiple Documents
To print multiple documents at one time
1. Click Project Review in the Project List panel next to the project.
2. In the Project Review window, verify that the Item List panel is showing.
3. In the Item List panel, select the documents that you want to print. Skip this step if you are printing all
the documents in the panel.
4. In the first Actions drop-down menu at the bottom of the panel, do one of the following:
-Select Checked to print all the checked documents.
-Select All to print all documents, including documents on pages not visible.
Bulk Printing Bulk Printing Multiple Documents | 227
5. In the second Actions drop-down menu, select either Network Bulk Printing to print to a network
printer that has been set up by your IT or Administrator or Local Bulk Print to print to a local printer that
has been set up on you local workstation that has been set up by your IT staff or Administrator.
See Network Bulk Printing on page 227.
See Local Bulk Printing on page 227.
Network Bulk Printing
To print to a network printer
1. Click Go.
2. Enter options in the General Print Options tab. See General Print Options on page 227.
3. Click Print.
Local Bulk Printing
To print to a local printer
1. Click Go.
2. Enter options in the General Print Options tab. See General Print Options on page 227.
3. A dialog box appears, asking if the file BulkPrintLocal.WPF may be opened on your system.
Click Allow.
Note: If you start another print job when the dialog window from a previous Local Bulk Printing job is
already open, a new Bulk Printing window will appear. Close the initial Local Bulk Print window
before starting a new local print job.
4. The Bulk Print Application dialog window appears. See Bulk Print Dialog Options on page 228.
5. Choose your printer from the drop down box in the Printer Selection area and click Print.
Note: This process may take longer than typical network print operations due in part to document image
conversion processes.
6. (optional) To cancel a printing job, click Cancel Print Job or close the Bulk Printing dialog box.
General Print Options
The following table shows the options available in the General Print Options screen.
General Print Screen Options
Option Description
Include Markups Allows you to print redactions on the printed documents. In the Markup Sets tab,
select which markup set(s) that you want to print.
Note: For a document with both native and image redactions, image redactions
will print, but not native redactions. Image redactions take precedence over
native redactions.
Bulk Printing Viewing Print Statuses | 228
Bulk Print Dialog Options
The following table shows the options available in the Local Bulk Print dialog.
Viewing Print Statuses
You can view the status of bulk printing jobs on the Printing/Export tab of the Home page. You can view the
status of your local bulk print job in the Bulk Print dialog window.
To view the status of your bulk print job
1. Select the project in the Project List panel.
2. Click the Printing/Export tab on the Home page.
3. Click the Printer Status tab.
Image Branding Allows you to brand the printed documents. In the Image Branding Options tab,
select the options that you want for the branding. For more information, see the
Exporting Guide.
Note: Branding the document with the DocID in Local Bulk Printing will brand the
document with the existing DocID. Branding the document in the Export Wizard
will brand the document with the original DocID.
Bulk Printing Dialog Options
Option Description
Job Details Displays the job details of the print job, including the Project ID, Project Name,
User Name, Job ID, and number of documents in the print job.
Printer Selection Select a printer to print the documents to.
Note: You can also select a virtual printer, such as a PDF creation tool, to
print the documents to.
Cancel Print Job Click to cancel a print job. You can also cancel a print job by closing the Bulk
Printing Dialog window.
Progress Report -Docs Printed: Shows the number of documents that have already printed,
and the documents remaining to be printed.
-Pages Printed: Shows the number of pages that have been printed in a docu-
ment sent to the printer. It does not show the total amount of pages printed in
a job.
Status Report Displays the status of the print job.
Note: You can also monitor the status of the print job from the Printing/
Export tab of the Home page.
General Print Screen Options
Option Description

Bulk Printing Viewing Print Statuses | 229
Viewing Print Logs
You can access and view the logs from local bulk printing jobs. The logs are stored in a folder on the server.
To view the log of your bulk print job
1. In the Windows Start menu, enter Run.
2. In the Open field, enter %public%.
3. Open the folder and select the log that you want to view.
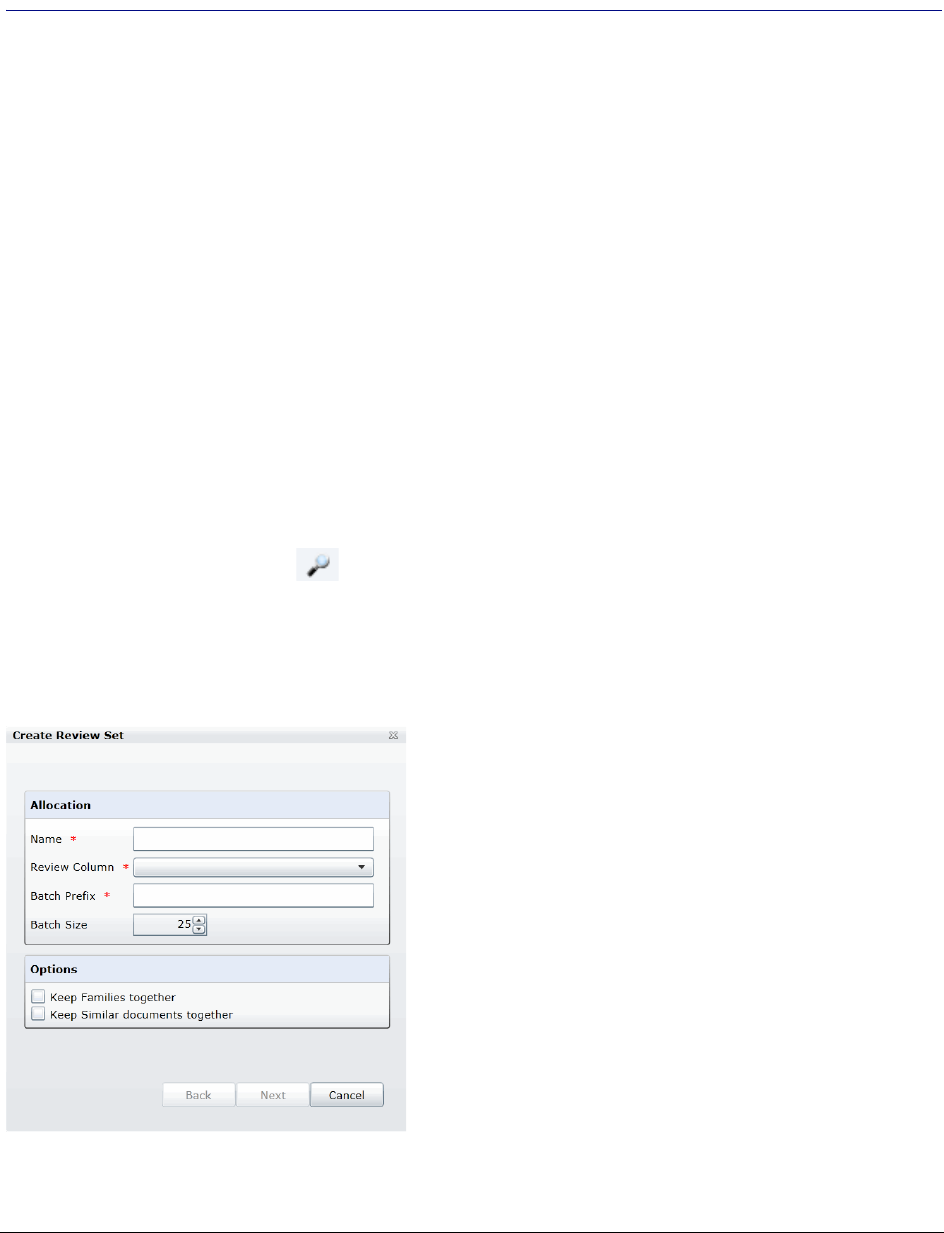
Managing Review Sets Creating a Review Set | 230
Chapter 23
Managing Review Sets
Review sets are batches of documents that you can check out for coding and then check back in. Review sets
aid in the work flow of the reviewer. It allows the reviewer to track the documents that have been coded and still
need to be coded. Project/case managers with Create/Delete Review Set permissions can create and delete
review sets.
Creating a Review Set
Project/case managers with Create/Delete Review Set permissions can create and delete review sets.
To create a review set
1. Log in as a user with Project Administrator rights.
2. Click the Project Review button next to the project in the Project List.
3. Click the Review Sets button in the Project Explorer.
See the Reviewer Guide for more information on the Review Sets tab.
4. Right-click the Review Sets folder and click Create Review Set.
Create Review Set Dialog
5. Enter a Name for the review set.
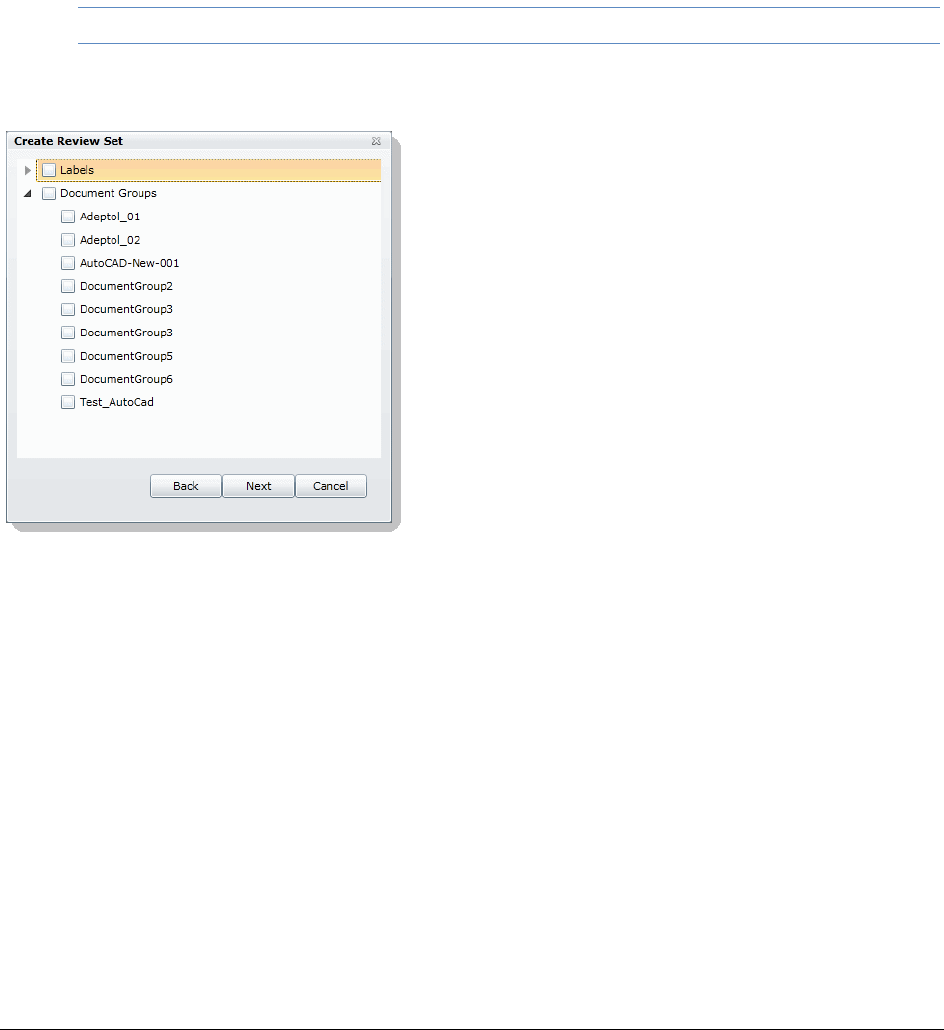
Managing Review Sets Creating a Review Set | 231
6. Select a Review Column that indicates the status of the review. New columns can be created in the
Custom Fields tab of the Home page.
See Custom Fields Tab on page 263.
7. Enter a prefix for the batch that will appear before the page numbers of the docs.
8. Increase or decrease the Batch Size to match the number of documents that you want to appear in the
review set.
9. Check the following options if desired:
-Keep Families together: Check this to include documents within the same family as the selected
documents in the batch.
-Keep Similar document sets together: Check this to include documents related to the selected
documents in the batch.
Note: Any “Keep” check box selected will override the restricted Batch Size.
10. Click Next.
Create Review Sets Dialog Second Screen
11. Expand Labels and check the labels that you want to include in the review set. All documents with that
label applied will be included in the review set. This is only relevant if the documents have already been
labeled by reviewers.
12. Expand the Document Groups and check the document groups that you want to include in the review
set.
13. Click Next.
14. Review the summary of the review set to ensure everything is accurate and click Create.
15. Click Close.

Managing Review Sets Deleting Review Sets | 232
Deleting Review Sets
Project/case managers with Create/Delete Review Set permissions can create and delete review sets.
To create a review set
1. Log in as a user with Project Administrator rights.
2. Click the Project Review button next to the project in the Project List.
3. Click the Review Sets button in the Project Explorer.
See the Reviewer Guide for more information on the Review Sets tab.
4. Expand the All Sets folder.
5. Right-click the review set that you want to delete and click Delete.
6. Click OK.

Managing Review Sets Renaming a Review Set | 233
Renaming a Review Set
Project/case managers with Manage Review Set permissions can rename review sets.
To rename a review set
1. Log in as a user with Project Administrator rights.
2. Click the Project Review button next to the project in the Project List.
3. Click the Review Sets button in the Project Explorer.
See the Reviewer Guide for more information on the Review Sets tab.
4. Expand the All Sets folder.
5. Right-click the review set that you want to rename and click Rename.
6. Enter a name for the review set.
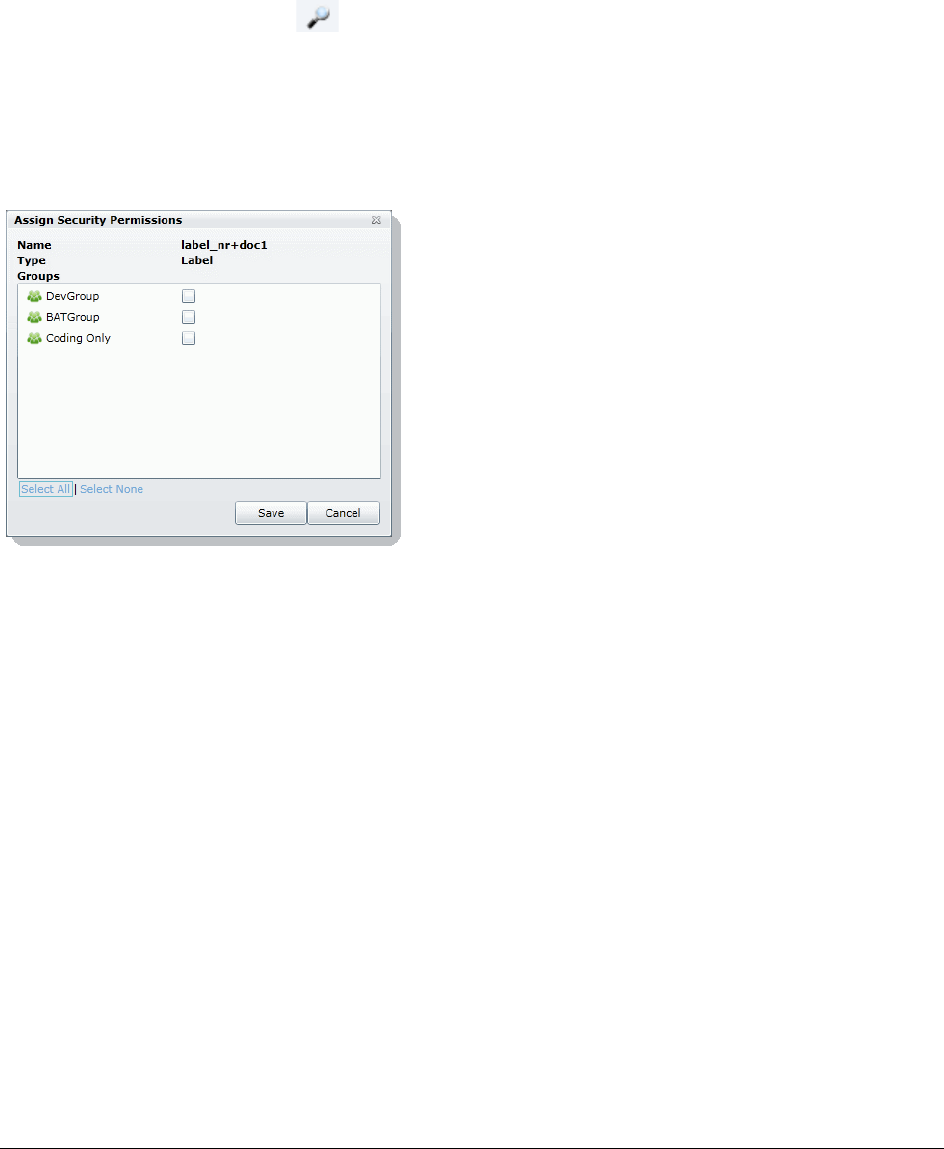
Managing Review Sets Manage Permissions for Review Sets | 234
Manage Permissions for Review Sets
Project/case managers with Manage Review Set permissions can manage the permissions for review sets.
To rename a review set
1. Log in as a user with Project Administrator rights.
2. Click the Project Review button next to the project in the Project List.
3. Click the Review Sets button in the Project Explorer.
See the Reviewer Guide for more information on the Review Sets tab.
4. Expand the All Sets folder.
5. Right-click the review set that you want to manage permissions for and click Manage Permissions.
Assign Security Permissions Dialog
6. Check the groups that you want to grant permissions to the review set. Groups granted the Check In/
Check Out Review Batches permission will be able to check out the review sets to which they are
granted permission.
7. Click Save.


Introduction to Exporting Data About Exporting Data | 236
Chapter 24
Introduction to Exporting Data
This document contains information about creating and exporting production sets for a project. Exporting data, in
most projects, is performed by the project/case manager. You need the correct permissions to create and export
production sets.
About Exporting Data
When you sort through data, organization remains the key to preparing a streamlined set of data to include in a
report that is delivered to the attorney for the criminal project, civil project, or corporate authorities for a corporate
security project . To prepare data for the final report, you can create sets of filtered data that you can export in
various formats.
After applying labels to the evidence set, you can create either a production set or an export set of data.
When you create production or export sets of data, you can only use one label per set.
Note: Production set records cannot be labeled. Creating a production set results in new items being created.
These resulting items cannot be labeled.
Note: There are certain native formats that do not work for imaging and TIFF operations. These are: PST, NSF,
FC, DAT, DB, EXE, DLL, ZIP, and 7zip
See Export Tab on page 259.
See Exporting Production Sets on page 257.
See Creating Export Sets on page 260.
The following table describes the export formats that you can use for your production and export sets.

Introduction to Exporting Data About Exporting Data | 237
Export Formats
Export Tab
The Export tab on the Home page can be used to manage production sets and export sets.
Production Set History Tab
The Production Set History can be used to export or delete production sets and view the history of the
production set.
Format Description
AD1 Creates an AD1 forensic image of the documents included in the Export Set.
AD1 is a forensic file format that integrates with FTK.
An AD1 contains the logical structure of the original files and the original files
themselves. The AD1 file is hashed and verifiable to ensure that no changes
have occurred to it.
Image Load File Export Converts the native documents to a graphic format such as TIFF, JPG, or PDF.
It creates a load file in the IPRO LFP or the Opticon OPT formats.
This is similar to Load File Export except that it does not contain any metadata.
Native Export Exports the native documents in their original format and optionally rendered
images into a directory of your choosing. This export does not provide a load file.
Load File Export Exports your choice of Native, Filtered text (includes the OCR text that was
created during processing), rendered images of the native document, and
optionally OCR text of the rendered images.
If the recipient intends to use third-party software to review the export set, select
Load File Export.
You have the option of exporting rendered documents in the following formats:
-Concordance
-EDRM (Electronic Discovery Reference Model) XML
-Generic
-iCONECT
-Introspect
-Relativity
-Ringtail (MDB)
-Summation eDII
-CaseVantage
Some programs have load file size limits. If needed, you can split load files into
multiple files.
If you use the Concordance, Generic or Relativity exports, and include rendered
images, you will also get an LFP and OPT file.

Introduction to Exporting Data About Exporting Data | 238
Production Set History Tab Elements
Element Description
Production Set
History Search
Field
Enter text to search by production set name.
Click to Show/Hide Filtering options. You can add and delete filters, and specify
whether the filter is ascending or not. Field options that you can filter on include:
-Created By
-Description
-Email Count
-Export Path
-Item Count
-Total Size
Production Set List Lists the production set details and the status of the production sets.
Shows the status of the production set creation. During the creation process, the tab
displays blue, and displays the percentage of the process as it is being created. When
the tab turns green, the production set creation is complete.
Note: Even if the percentage counter shows 100%, the production set is not
complete until the status tab turns green.
Expand the tab to view the Status of the Production Set.
Cancel Button Click to cancel the creation of a production set.
Export Button Click to export the production set to a load file. This option is not available until the
production set has been created.
Delete Button Click to delete the production set. This option is not available until the production set
has been created.
Click to expand all expanders. Once the production set has been created, you can
expand the pane to access the reports for the production set, as well as Load File
Generations if the job is a load file.
Click to collapse all expanders.
Click to refresh the production set history list.
Show/Hide
Reports Expand to access reports.
Show/Hide Load
File Generations Expand to access the load file generations.
Introduction to Exporting Data About Exporting Data | 239
Export Set History Tab
The Export Set History Tab can be used to export or delete export sets and view the history of the export set.
Export Set History Set Elements
Element Description
Export Set History
Search Field Enter text to search by export set name.
Click to Show/Hide Filtering options. You can add and delete filters, and specify
whether the filter is ascending or not. Field options that you can filter on include:
-Created By
-Email Count
-Export Path
-Item Count
-Total Size
Export Set List Lists the export set details and the status of the export sets.
Shows the status of the export set creation. During the creation process, the tab
displays blue, and displays the percentage of the process as it is being created. When
the tab turns green, the production set creation is complete.
Note: Even if the percentage counter shows 100%, the production set is not
complete until the status tab turns green.
Expand the tab to view the Status of the Export Set.
Cancel Button Click to cancel the creation of a export set.
Export Button Click to export the export set to either an AD1 file, Native file, or Load File. This option
is not available until the export set has been created. See Exporting Export Sets on
page 240.
Delete Button Click to delete the export set. This option is not available until the export set has been
created.
Click to expand all expanders. Once the export set has been created, you can expand
the pane to access the reports for the export set, as well as Load File Generations if the
job is a load file.
Click to collapse all expanders.
Click to refresh the export set history list. You can delete the load file generation.
Expand the status tab to view the status of the load file generation.
Show/Hide
Reports Expand to access reports. You can download the following reports:
Renaming: Export Renaming Report
Image Conversion Exception: Image Conversion Exception Report
Summary: This report must be generated before it can be downloaded. Allow a few
minutes to generate the report.
Show/Hide Load
File Generations Expand to access the load file generations.

Introduction to Exporting Data About Exporting Data | 240
Exporting Export Sets
Export Sets can be exported from the Export History Set as an AD1 file, Native file, or a Load file. Export Sets
can be exported more than one time.
The status of a successful export that contains any errors or warnings logged to the CSV log file now displays as
Export Completed With Warnings. The status display in the Export History tab displays the status as yellow-
green to differentiate the status from a successful export without errors or warnings logged. (13329)
Note: If slipsheets have been generated upon the initial export of the export set, the slipsheet will be counted as
the main image for the object. On any subsequent export set export, the slipsheet generated is counted
as an image for the object. No new images are generated for that object, and a currently-selected
slipsheet is not placed.

Creating Production Sets | 241
Chapter 25
Creating Production Sets
When you create a production set, you include all of the evidence to which you have applied a given label. After
you create the production set, you export the set to a load file.
Case/project managers with the Create Production Sets permission can create production sets.
Points to Consider
-Once you've created a production set you cannot add documents to that set even if you use the same
labels. You will need to label the additional documents and then create a new set using the same label.
-When you create production sets with the PDF option selected, large files will take a long time to create
and may appear to stall.
-The ThreatLookup column is not copied when objects are copied as part of production set creation. Even
if a ThreatLookup was computed for an object that is labeled and included in a production set, then the
object copied from the labeled object will initially have no ThreatLookup score. If desired, you can initiate
ThreatLookup on any selected items by executing a ThreatLookup as a mass action in Review. See
Using the Item List Panel on page 58.
To create a production set
1. Before you create a production set, be sure you have applied at least one label to evidence files that
you want to filter into the export set.
See Applying Tags on page 190.
2. Log in as a user with Create Production Set rights.
3. Click the Project Review button next to the project in the Project List.
4. In the Project Explorer, select the Tags tab, right-click the Production Sets folder, and select Create
Production Set.
5. Configure the General Options.
See Production Set General Options (page 243) for information on how to fill out the options in the
General Options screen.
6. Click Next.
7. Configure the Files To Include.
See Production Set Files to Include Options (page 244) for information on the option in the Files to
Include screen.
8. Click Next.
9. Configure the Columns to Include.

Creating Production Sets | 242
10. In the Columns to Include, click the right arrow to add a column to the production set and the left arrow
to remove a column from the production set. You can rearrange the order of the columns by clicking the
up and down arrows.
Note: Only columns added at this time will be available for exporting. Any columns not added will not be
available in the production set. Also, for a field to be available for branding, it must be included in
the Columns to Include. Field Branding for a production set fails if the field is not included in the
production columns.
11. Click Next.
12. Configure Volume Document Options.
See Volume Document Options (page 246) for information on the options in the Volume Document
Options screen.
13. Configure Image Branding Options.
See Production Set Image Branding Options (page 253) for information on the options in the Image
Branding Options screen.
14. In the Summary screen, review the options that you have selected for the production set and click the
Edit (pencil) button if you want to make any changes.
15. Click Save.
After your production set is created, it will appear in the Export tab of the Home page and under the
Production Sets folder in the Project Explorer of the Project Review.
See Export Tab on page 259.
Creating Production Sets Production Set General Options | 243
Production Set General Options
The following table describes the options that are available on the General Options screen of the production set
wizard.
See Export Tab on page 259.
General Export Options
Option Description
Name Enter the name of the production set job you are creating.
This does not need to be a unique name, but it is recommended that you make all names
unique to avoid confusion.
Label Select the label that has the documents you want to include in the production set.
Description Enter a description for the production set if desired.
Templates Select a previously created template to populate all the fields of the production set wizard
using the options selected in a previous production set.
Creating Production Sets Production Set Files to Include Options | 244
Production Set Files to Include Options
The following table describes the options that are available on the Files to Include screen of the production set
wizard.
See Export Tab on page 259.
Files to Include Options
Option Description
Include Text Files Select this to include all filtered text files in the production set. This does not
include redacted text. This will not re-extract text from native files.
Export Native Files Select this option if you want to include the native documents with the production
set. This will only include native files that have not been redacted. If the native file
has been redacted, a PDF of the file will be included.
Output Email in
Archives Select this option if there are emails that were originally in a PST or an NSF
format and you want to put them into a PST or NSF container.
Output Email as HTML Select this option if there are emails that were originally in a PST or NSF and you
want to make them HTML files.
This option will not take loose MSG files and put them into a PST.
Output email as MSG Select this option if there are emails that were originally in a PST or an NSF that
you want to make into MSG files.
Include Rendered and
Redacted Images Select this option to include images that have been created in the Project Review.
Additionally, if an image has not yet been created, this option will convert the
native document to an image format.
Excluded Extensions Enter the file extensions of documents that you do not want to be converted. File
extensions must be typed in exactly as they appear and separated by commas
between multiple entries. This field does not allow the use of wild card characters.
The default values are:
EXE, DLL, and COM
File Format Select which format you want the native file converted to:
-Multi-page - one TIFF image with multiple pages for each document.
-PDF - one PDF file with multiple pages for each document.
-Single Page - a single TIFF image for each page of each document. For exam-
ple, a 25 page document would output 25 single-page TIFF images.
Compression -CCITT3 (Bitonal) - Produces a lower quality black and white image.
-CCITT4 (Bitonal) - Produces a higher quality black and white image.
-LZW (Color) - Produces a color image with LZW compression.
-None (Color) - Produces a color image with no compression (This is a very
large image).
-RLE (Color) - Produces a color image with RLE compression.
DPI Set the resolution of the image.
The range is from 96 - 1200 dots per inch (DPI).
Page Format Select the page size for the image. The available page sizes are:
-Letter – 8 ½” x 11”
-A3 – 29.7 cm x 42 cm
-A4 – 29.7 cm x 21 cm
Creating Production Sets Production Set Files to Include Options | 245
Normalize images Select this option to obtain consistent branding sizes throughout the entire
production.
Any image that is less than the chosen size will not be resized or rescaled to fit the
chosen page size but will be placed inside of the chosen size frame and will be
oriented to the upper left corner of the page.
Any document determined to be landscape in orientation will produce a proper
landscape image.
Produce color JPGs for
provided extensions This and the following two options are available if you are rendering to CCITT3 or
CCITT4 format and allows you to specify certain file extensions to render in color
JPGs.
For example, if you wanted everything in black and white format, but wanted all
PowerPoint documents in color, you would choose this option and then type PPT
or PPTX in the To JPG Extensions text box. Additionally, you can choose the
quality of the resulting JPG from 1 - 100 percent (100 percent being the most
clear, but the largest resulting image).
To JPG Extensions Lets you specify file extensions that you want exported to JPG images.
JPG Quality Sets the value of JPG quality (1-100). A high value (100) creates high quality
images. However, it also reduces the compression ratio, resulting in large file
sizes. A value of 50 is average quality.
OCR TIFF Images Creates a page by page OCR text file from the rendered images.
By default, the text file uses a TXT extension.
As a best practice, you would not create both Filtered Text files and OCR text files.
However, if you do both, the Filtered Text files use a TXT extension and the OCR
text files use an OCR.TXT extension.
If you create only OCR text files and not Filtered Text files, the OCR text files use
a TXT extension.
OCR Text Encoding -ANSI - Encodes text files using ANSI.
ANSI encoding has the advantage of producing a smaller text file than a Uni-
code file (UTF). ANSI-encoded text files process faster and save space. The
ANSI encoding includes characters for languages other than English, but it is
still limited to the Latin script.
If you are exporting documents that contain languages written in scripts other
than Latin, you need to choose a Unicode encoding form. Unicode encoding
forms contain the character sets for all known languages.
-UTF- 16 Encodes load files using UTF-16.
-UTF - 8 (Default) Encodes load files using UTF-8.
For more information on the Unicode standard, see the following web site
http://www.unicode.org/standard/principles.html\
Redactions Markups Check the Markup Sets that you want included in the production set. Markups will
be burned into the images that are created.
Files to Include Options (Continued)
Option Description
Creating Production Sets Production Set Files to Include Options | 246
Volume Document Options
This section describes the options available in the Volume Document Options screen of the production set
wizard if you have US numbering enabled. US numbering is default. The following table describes the options
available in the following screen.
Volume Document Options Screen
Option Type Option Description
Naming Options Choose a naming option:
New
Production
DocID
(Default) This file naming allows you to determine what the name of
the files will be, based on the document ID numbering scheme. This
option is used with the Document Numbering Options below.
In Project Review, you can view the ProductionDocID that is created
for exported files. This is useful in associating an exported file with the
original file.
Original DocID This naming is based on the original DocID.
Documents that were imported were put into a document group and
will have a DocID. Documents that were added through the evidence
wizard, will not.
This option lets you re-use that original DocID for the produced record.
If the documents do not have an existing DocID, you can assign one
by placing the documents in a document group or by providing a
DocID naming schema using the Document Numbering Options
below.
Original File
Name This file naming uses the original file name as the name of the
document rather than a numbered naming convention.
If the files were brought into the project by way of importing a DII or
CSV file, the file name may not be present and therefore the file will be
put into the Production Set using the original DocID that it was
imported with. With this option, the files when exported will be put into
a standard volume directory structure.
Original File
Path This option uses both the original file name and the original file path
when the production set is exported. The file path will be recreated
within the export folder.
Volume Partition Sorting You can sort the documents before they are converted and named.
This allows you to choose one or more meta data field values to sort
the documents in ascending or descending order.
You can choose any combination of fields by which to sort, however, it
is not recommended to choose more than 3 fields to sort by.
(Volume
Partition
Sorting)
Add volume partition sorting filters based on specified ascending or
descending fields.
(Volume
Partition
Sorting)
Delete the selected sorting option.
Creating Production Sets Production Set Files to Include Options | 247
Sorting Specify the order that the files are listed in each volume. Sorting
occurs on the parent document.
For example, you might sort by Ascending on the field FILESIZE. In
such project, the first volume contains the largest file sizes, and the
last volume contains the smallest file sizes.
Field Set the column heading by which you want to sort.
Add Add the sorting options that you have selected. You can add one or
more sorting filters.
Volume Sample Provides a sample of the volume directory structure that will be
created when the production set is exported.
Volume Options Select a volume folder structure for the output files. The selections will
determine how much data is put into each folder before a new folder is
created and the folder structure in which the output is placed.
See About the U.S. Volume Structure Options on page 249.
Partition Type Select the type of partition you would like to create.
Partition Limit Set the size of the partition based on the partition type that you have
selected.
Prefix Specify the prefix-naming convention you want to use for the root
volume of the production set.
Starting
Number Set the starting number of the first partition in the production set.
Padding Specify the number of document counter digits that you want. The
range is 1 to 21. 0 padding is not available.
Folder Limit Create a new numbered volume when the specified folder limit is
reached inside the volume.
Folder Lets you name and limit the size or the number of items that are
contained in a folder. An export can have one or more folders.
Prefix Specifies the prefix-naming convention that you want to use for the
folders within the volume of the export.
Suffix Specifies the suffix-naming convention that you want to use for the
folders within the volume of the export.
Starting
Number Sets the starting number of the first folder within the volume of the
export.
Padding Specify the number of document counter digits that you want. The limit
is 21.
File Limit Creates a new numbered folder when the specified file limit is reached
inside the folder.
Native Folder Lets you set the name of the Natives folder.
See Files to Include Options on page 244.
Image Folder Lets you set the name of the Image folder.
See Files to Include Options on page 244.
Volume Document Options Screen (Continued)
Option Type Option Description
Creating Production Sets Production Set Files to Include Options | 248
Text Folder Lets you set the name of the Text folder where text files go that are
generated by the OCR engine.
See Files to Include Options on page 244.
Document This pane is only available if the New Production Doc ID or Original
Doc ID option is selected in the Naming Options.
Use these setting to determine how to generate new names of
produced records. (Some files may retain an original DocID.
See Naming Options above.)
Numbering
Options See About U.S. Document Numbering Options on page 250.
Prefix Specifies the prefix-naming convention that you want to use for the
document and page numbering within the folders of the export.
Suffix Specifies the suffix-naming convention that you want to use for the
document and page numbering within the folders of the export.
Starting
Number Sets the starting number of the first document or image within the
volume of the export.
Padding Specify the number of document counter digits that you want. The limit
is 21.
Volume Document Options Screen (Continued)
Option Type Option Description
Creating Production Sets Production Set Files to Include Options | 249
About the U.S. Volume Structure Options
You can specify the volume folder structure for the output files. The selections will determine how much data is
put into each folder before a new folder is created and the folder structure in which the output is placed.
See Volume Document Options on page 246.
The output files will be contained within the following hierarchy:
-Volume folder - Contains two levels of subfolders for organizing the files. A new volume will be created
when a specified limit is reached.
You can choose from the following limits.
You can also specify a volume folder limit. In order to prevent issues with Microsoft Windows Explorer,
you can specify an additional limit of the number of folders in a volume. This works in addition to the
selected limit type. If the specified volume limit is not reached, but the folder limit is, a new volume will be
created.
-File type folder - The first level subfolders within each volume are separated by the file types of the
exported files. By default, the folders are named by file type, for example, native documents, images, or
text files. You can name these file type folders anything you want. This allows you to put your image and
text files into the same folder. While you can name all of the file type folders the same; thereby placing
the natives, images, and text files into a single folder; it is not recommended because there could be
naming conflicts if your native file and image or text file have the same name.
-Level 2 folder - The second level folders contain the actual files being exported. You can specify a limit of
the total number of files per folder. This limit, once reached, will create a new folder within the same file
type folder until the volume maximum or number of folders has been reached.
Using the Partition Type, Partition Limit, and Folder limit values together, you can create the volume structure
that meets your needs. The following graphic is an example of a volume structure.
Limits
Limit Description
Documents Output will be placed into a volume until the specified number of documents has
been reached, then a new volume will be created.
For example, if you export 2000 files and you set the partition limit to 1000, you
will have two document volumes.
Images Output will be placed into a volume until the specified number of images has
been reached, then a new volume will be created.
This option is useful because a single, large document may create hundreds or
thousands of single page images.
Megabyte Output will be placed into a volume until the specified megabyte size of all of the
files has been reached, then a new volume will be created.
For example, you can set a partition limit of 4000 MB if you intend to burn the
files to DVD media.
Single All output will be placed into one volume.
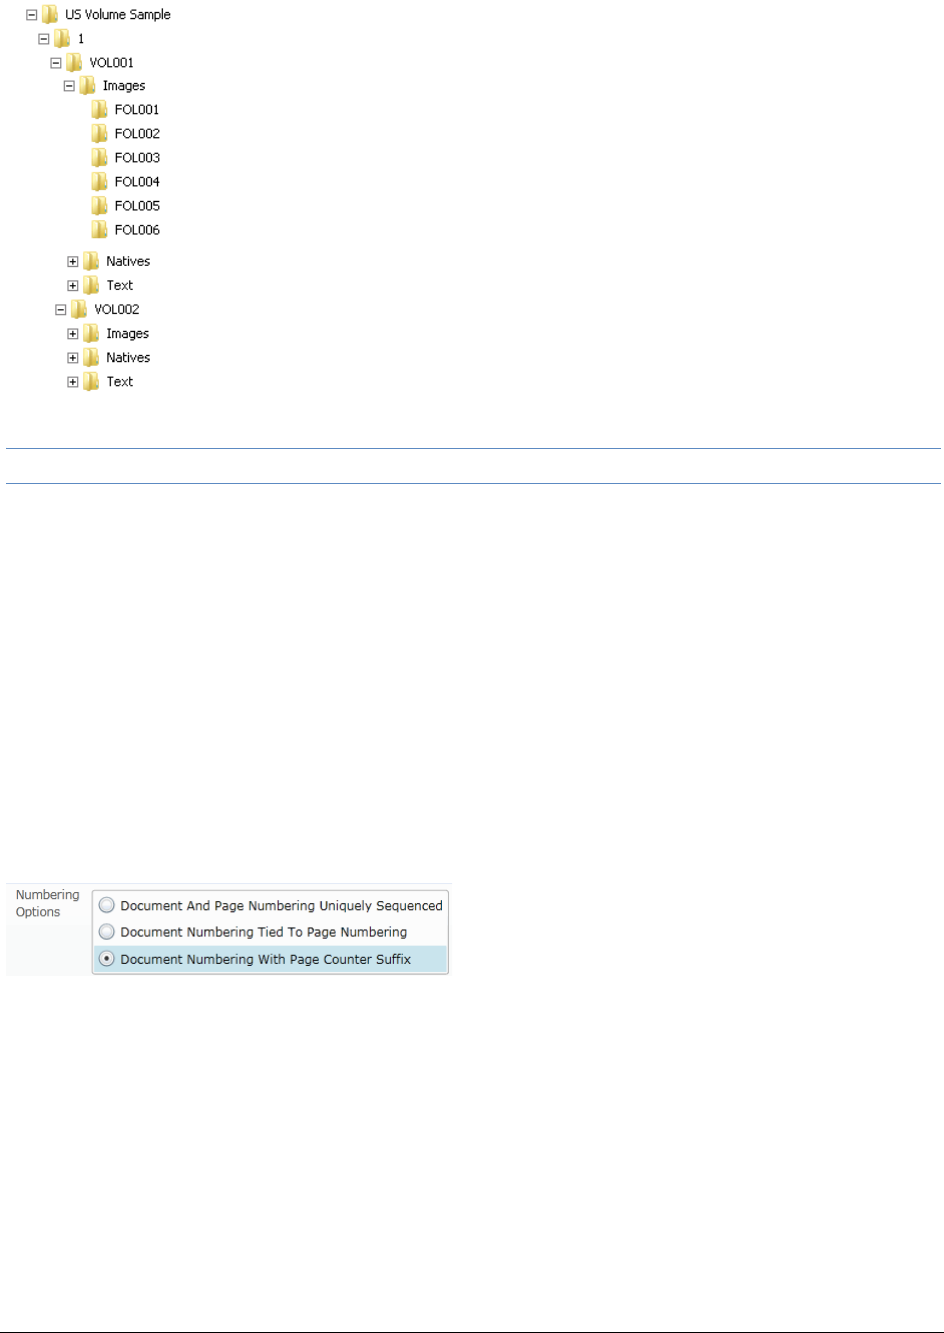
Creating Production Sets Production Set Files to Include Options | 250
Note: No document that has been rendered will have its rendered pages divided into more than one folder.
If a folder limit is about to be reached, but the next document that should go into that folder will exceed the
maximum, a new folder will be started automatically for the new document. The same applies to document
families, if the volume maximum is about to be reached and the next document family will exceed the limit, a new
volume will be started and the next document family will be placed into that new volume.
About U.S. Document Numbering Options
If you have chosen to use a DocID naming scheme for the output files, you can specify the method for creating
Doc IDs. This section describes the Numbering options found in the Volume Document Options screen of the
Production Set wizard.
See Volume Document Options on page 246.
Production Set Numbering Options
You will choose from the document numbering options:
Document And Page Numbering Uniquely Sequenced (page 251)
Document Numbering Tied To Page Numbering (page 251)
Document Numbering With Page Counter Suffix (page 252)
Creating Production Sets Production Set Files to Include Options | 251
Document And Page Numbering Uniquely Sequenced
This option generates a sequential number that is applied to the document without regard to the rendered pages
that may or may not be produced. The images will also be numbered sequentially without regard to the
document number.
For example, if you have two documents each that produce two images during conversion, the output would be:
You can optionally specify a prefix- and a suffix-naming convention.
Document Numbering Tied To Page Numbering
This option generates a sequential number for every document and the pages produced for that document will
carry the document's name with a counter as a suffix that represents which page is represented by the image.
For example, if you have two documents each that produce two images during conversion, the output would be:
Considerations for Document Numbering Tied to Page Numbering
If creating production sets with a dot (.) in the DocID and page branding, you must choose the option Document
Numbering with Page Counter Suffix, not Document Numbering Tied to Page Numbering in order to
ensure that each page has a unique page ID.
For example, if the original DocIDs are:
JXT.001.0001
JXT.001.0002
JXT.001.0003 and so on.
If you chooses Document Numbering Tied to Page Numbering as the numbering option, then the last numeric
part of the DocID is used as the page ID, and it is incremented for each page. Suppose that each document has
Example Output
Native Documents Image Output
ABC00001.doc IMG00001.tif
IMG00002.tif
ABC00002.doc IMG00003.tif
IMG00004.tif
Example Output
Native Document Image Output
ABC00001.doc ABC00001.001.tif
ABC00001.002.tif
ABC00002.doc ABC00002.001.tif
ABC00002.002.tif

Creating Production Sets Production Set Files to Include Options | 252
five pages, and that the Page ID is branded on each page. In this example, the DocID of the first document will
be JXT.001.0001. The first page is branded as JXT.001.0001, the second page as JXT.001.0002, and so forth.
The second document's doc ID will be JXT.001.0002. The first page will be branded as JXT.001.0002, the
second page as JXT.001.0003, and so on.
In this example, you can see that the page IDs are not unique, since JXT.001.0003 will be branded on:
-The third page of the first document
-The second page of the second document
-The first page of the third document
In order for the page IDs to be unique, the Document Numbering with Page Counter Suffix must be chosen.
Continuing with the same DocIDs as in the first example and with this numbering option, the DocID of the first
document will still be JXT.001.0001, but the first page will be branded as JXT.001.0001.0001, the second page
as JXT.001.0001.0002, and so on. This will ensure that each page has a unique page ID.
Document Numbering With Page Counter Suffix
This option generates a sequential number for every page created. The corresponding document name will be
the same as its first page generated for each document.
For example, if you have two documents each that produce two images during conversion, the output would be:
You can optionally specify a prefix- and a suffix-naming convention.
Example Output
Native Documents Image Output
ABC00001.doc ABC00001.tif
ABC00002.tif
ABC00003.doc ABC00003.tif
ABC00004.tif
Creating Production Sets Production Set Image Branding Options | 253
Production Set Image Branding Options
You can brand the PDF or TIFF image pages with several different brands and in several different locations on
the page using the Production Set wizard.
See Export Tab on page 259.
Image Branding Options
Option Group Options Options Options Description
Sample Displays a sample of the image branding
options selected.
Watermark Set options to brand a watermark to the middle
of the document.
Watermark
Opacity Sets the visibility of the watermark text.
Watermark
Type There are multiple types of image branding
available. The options in the Watermark group
box will differ depending on the Type that you
select.
None No branding on the image.
Font Sets the font style for the text.
Font Size Sets the font size for the text.
Bates Bates numbering is a term used for placing an
identifying number on every page of evidence
files that are presented in court.
Bates numbering in this project is not driven by
the document or page numbering that was
assigned in the Volume/Document Options
panel.
Prefix Specify up to any 25 alphanumeric characters
except the forward slash or backward slash.
You can use a separator to create a visual
break between the different sections of the
Bates number.
Starting
Number Sets the starting number to a value from 1-100.
Padding Specify the number of document counter digits
that you want. The limit is 42.
Font Sets the font style for the text.
Font Size Sets the font size for the text.
Creating Production Sets Production Set Image Branding Options | 254
Doc ID Brands each page with the Doc ID in the
designated location. For example, if you have a
single document that was assigned a DocID of
ABC00005.doc, each image representing that
document will have ABC00005 branded in the
specified location.
Note: This brands the document with the
original DocID.
Font Sets the font style for the text.
Font Size Sets the font size for the text.
Global
Endorsem
ent
Brands each page with the entered text in the
designated location.
Text Enter the text that you want to appear in the
designated location.
Font Sets the font style for the text.
Font Size Sets the font size for the text.
Page ID Brands each page with the name that was
provided during the Production Set creation in
the designated location.
For example if you have a document that
produced three image pages named
ABC00001.tif, ABC00002.tif, and
ABC00003.tif, the images will be branded with
ABC00001, ABC00002, and ABC0003
respectively.
Font Sets the font style for the text.
Font Size Sets the font size for the text.
Near Header Displays the branding options for a header on
the upper-left side of the page. These options
are based on the Header Type selected. See
the Watermark Type options above for more
information on the Header Type options as they
are the same options.
Center Header Displays the branding options for a header on
the upper-center side of the page. These
options are based on the Header Type
selected. See the Watermark Type options
above for more information on the Header Type
options as they are the same options.
Far Header Displays the branding options for a header on
the upper-right side of the page. These options
are based on the Header Type selected. See
the Watermark Type options above for more
information on the Header Type options as they
are the same options.
Image Branding Options (Continued)
Option Group Options Options Options Description
Creating Production Sets Production Set Image Branding Options | 255
Near Footer Displays the branding options for a header on
the lower-left side of the page. These options
are based on the Header Type selected. See
the Watermark Type options above for more
information on the Header Type options as they
are the same options.
Center Footer Displays the branding options for a header on
the lower-center side of the page. These
options are based on the Header Type
selected. See the Watermark Type options
above for more information on the Header Type
options as they are the same options.
Far Footer Displays the branding options for a header on
the lower-right side of the page. These options
are based on the Header Type selected. See
the Watermark Type options above for more
information on the Header Type options as they
are the same options.
Image Branding Options (Continued)
Option Group Options Options Options Description

Creating Production Sets Additional Production Set Options | 256
Additional Production Set Options
Saving Production Set Options as a Template
After configuring the production set options, you can save the settings as a template. The template can be
reused for future production sets with the current project or other projects.
To save options as a template
1. Access the production set wizard and set the options for the production set.
See Export Tab on page 259.
2. In the production set wizard, click Save As.
3. Enter a name for the template.
4. Click Save.
Deleting a Production Set
Users with production set rights can delete production sets from Project Review.
To delete a production set from Project Review
1. Log in as a user with Production Set rights.
2. Click the Project Review button next to the project in the Project List.
3. In the Project Explorer, select the Explore tab, expand the Production Sets folder, right-click the
production set that you want to delete and select Delete.
4. Click OK.
To delete a production set from the Home page
1. Log in as a user with Production Set rights.
2. Select the project in the Project List panel.
3. Click the Print/Export tab on the Home page.
4. Click the Delete button next to the production set.
Sharing a Production Set
Users with production set rights can share production sets that they have created with other groups of users.
To share a production set
1. Log in as a user with Production Set rights.
2. Click the Project Review button next to the project in the Project List.
3. In the Project Explorer, select the Explore tab, expand the Production Sets folder, right-click the
production set that you want to share and select Manage Permissions.
4. Check the groups that you want to have access to the production set that you created and click Save.
Exporting Production Sets Exporting a Production Set | 257
Chapter 26
Exporting Production Sets
Exporting a Production Set
After you create a production set, you can export it containing only the files needed for presentation to a law firm
or corporate security professional.
To export a production set
1. On the Home Page, select a project and click the Export tab.
2. Next to the production set that you want to export, click Export.
3. Enter or browse to the path where you want to save the export.
4. Enter a name for the Load File.
5. Select a format that you want to use for the export. The following formats are available:
-Browser Briefcase - Generates an HTML format that provides links to the native documents, images,
and text files.
You can have multiple links for image, native, and text documents.
-CaseVantage - Generates a DII file specifically formatted for use with the AD Summation
CaseVantage program.
-Concordance - Generates a DAT file that can be used in Concordance.
-EDRM - Generates an XML file that meets the EDRM v1.2 standard.
-Generic - Generates a standard delimited text file.
-iCONECT - Generates an XML file formatted for use with the iConect program.
-Introspect (IDX file) - Generates an IDX file specifically formatted for use with the Introspect
program.
-Relativity - Generates a DAT file that can be used in Relativity.
-Ringtail (MDB) - Generates a delimited text file that can be converted to be used in Ringtail.
-Summation eDII - Generates a DII file specifically formatted for use with the AD Summation iBlaze or
Enterprise programs.

Exporting Production Sets Exporting a Production Set | 258
Note: If you are outputting a Concordance, Relativity, or Generic load file, and include rendered
images, you will also get an OPT and LFP file in the export directory.
6. Depending on the load file format you choose, you may need to check whether or not to show the row
header for the columns of data. The Show Row Header option is only available for the following load file
formats:
-Concordance
-Generic
-Introspect
-Relativity
-Ringtail (MDB)
7. Select an option for Load File Encoding. The following options are available:
-ANSI - Encodes load files using ANSI (for text written in the Latin script).
ANSI encoding has the advantage of producing a smaller load file than a Unicode file (UTF). ANSI-
encoded load files process faster and save space. The ANSI encoding includes characters for
languages other than English, but it is still limited to the Latin script.
If you are exporting documents that contain languages written in scripts other than Latin, you need to
choose a Unicode encoding form. Unicode encoding forms contain the character sets for all known
languages.
-UTF-8 - (Default) Encodes load files using UTF-8.
For more information on the Unicode standard, see the following website:
http://www.unicode.org/standard/principles.html
Most commonly used for text written in Chinese, Japanese, and Korean.
-UTF-16 - Encodes load files using UTF-16.
Similar to UTF-8 this option is used for text written in Chinese, Japanese, and Korean.
8. Select a Field Mapping character. This delimiter is the character that is placed between the columns of
data. The default delimiters are recommended by the program to which the load file was intended.
However, you can change these defaults by selecting the drop-down and choosing an alternative.
Field Mapping is available for the following load file formats:
-Concordance
-Generic
-Introspect
-Relativity
-Ringtail (MDB)
9. Select a Text Identifier character. This delimiter is the character that is placed on either side of the
value within each of the columns. All of the text that follows the character and precedes the next
occurrence of the same character is imported as one value.
The default delimiters are recommended by the program to which the load file was intended. However,
you can change these defaults by selecting the drop-down and choosing an alternative. If you do not
wish to use a delimiter, you can choose the (none) option.
Text Identifier is available for the following load file formats:
-Concordance
-Generic
-Introspect
-Relativity
-Ringtail (MDB)

Exporting Production Sets Export Tab | 259
10. Select a Newline character. This is a replacement character for any newline (carriage return/line feed)
character. The default delimiters are recommended by the program to which the load file was intended.
However, you can change these defaults by selecting the drop-down and choosing an alternative. If you
do not wish to use a delimiter, you can choose the (none) option.
Newline is available for the following load file formats:
-Concordance
-Generic
-Introspect
-Relativity
-Ringtail (MDB)
11. Select the Available Fields of metadata to be included in the load file and click the right arrow to add
the field.
12. Some load file applications require that certain fields be in the load file. In such projects, you can click
the Custom plus button to add a custom field entry that is not already listed in the Available Fields list.
13. Click Export.
Export Tab
The Export tab on the Home page can be used to export or delete production sets and view the history.
Export Tab Elements
Element Description
Production Set
History Search
Field
Enter text to search by production set name.
Production Set List Lists the production sets and the status of the production sets.
Export Button Click to export the production set to a load file.
Delete Button Click to delete the production set.
Creating Export Sets Creating Export Sets | 260
Chapter 27
Creating Export Sets
Creating Export Sets
You can export documents without creating a production set. To do this, create an Export Sets of labelled
documents, and then export the created Export Sets. Unused Export Sets can also be deleted.
When you create a set, you include all of the evidence to which you have applied a given label. After you create
the export set, you export the set to an AD1 image file, an image load file, a native export, or a load file.
Note: Once you've created an export set you cannot add documents to that set even if you use the same labels
used previously. You can label additional documents and then create a new set using the same label.
See Creating an AD1 Export on page 260.
See Creating a Native Export on page 264.
See To create a load file export on page 274.
Creating an AD1 Export
Choose to create an AD1 forensic image of the document included in the Export Set if you want to load the AD1
files into AD Forensic Toolkit (FTK) for further investigation. An AD1 contains the logical structure of the original
files and the original files themselves.
To create an AD1 export
1. Before you create an AD1 export, be sure that you have applied at least one label to evidence files that
you want to filter into the export set.
2. Log in as a user with Create Export rights.
3. Click the Project Review button next to the project in the Project List.
4. In the Project Explorer, click Explore.
5. Right-click the Export Sets folder, and select Create AD1 Export.
6. See AD1 Export General Options on page 262. for information on how to fill out the options in the
General Option screen.
7. Click Export.

Creating Export Sets Creating Export Sets | 261
8. After your export is created, it appears in the Export tab of the Home page and under the Export Sets
folder in the Project Explorer of the Project Review. A Summary report generates and saves to the
export folder.
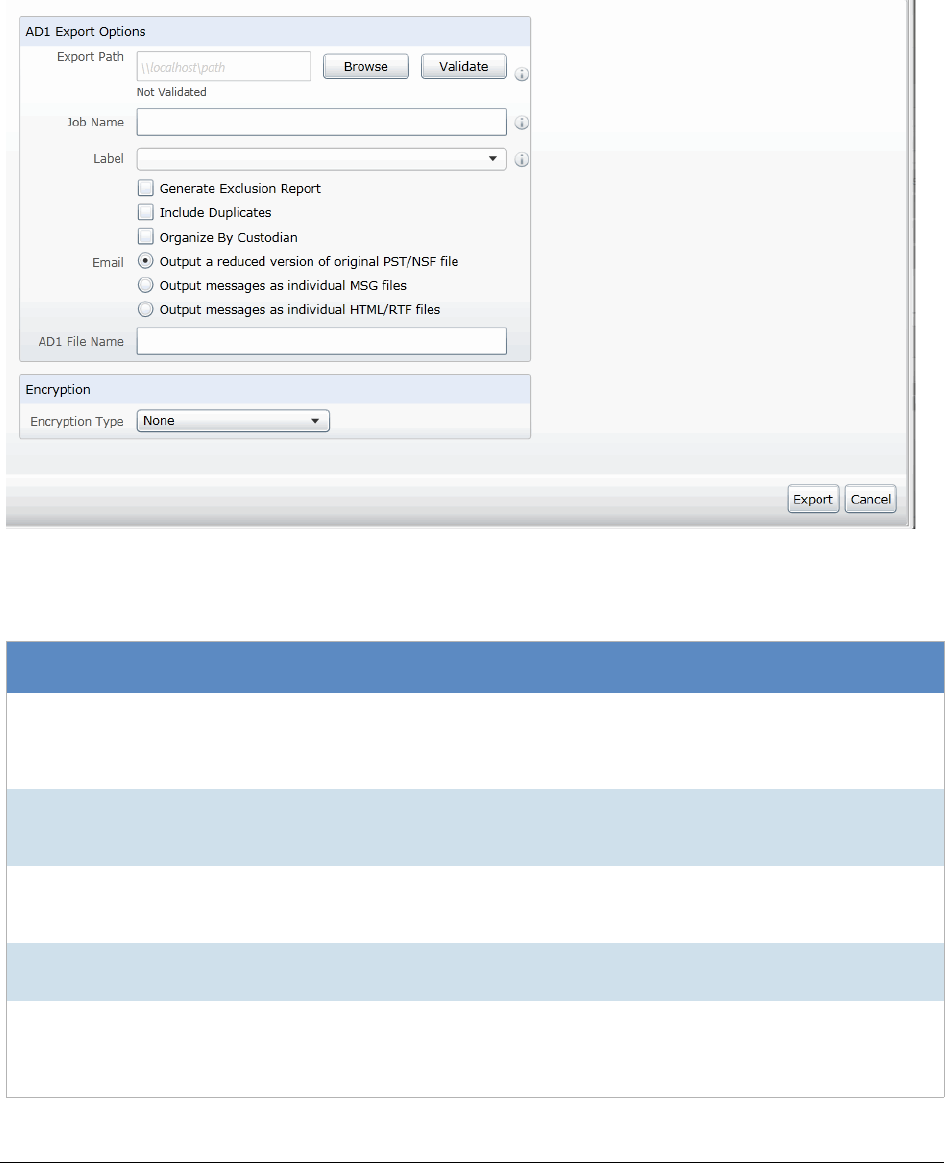
Creating Export Sets AD1 Export General Options | 262
AD1 Export General Options
The following table describes the options that are available on the General Options screen of the AD1 export set
wizard.
AD1 Export General Options Screen
AD1 Export General Option Screen
Option Description
Export Path Enter the UNC path to the export set. You can browse to the server and path,
and validate the path before exporting the load file. This path must be accessible
to the logged in user. A new folder will be created if the folder you specify does
not exist.
Job Name Specify the name for your export set. For example, you can organize export sets
by using the person’s name for ease of examination. This naming method is
particularly useful if there are multiple people.
Label This field is required. Before you create an AD1 export, be sure that you have
applied at least one label to evidence files that you want to filter into the export
set.
Generate Exclusion
Report Lets you create a report of all the documents within the selected collection that
were not included in the export.
Include Duplicates Mark to include duplicates. Includes unlabeled documents that are flagged as
secondary (duplicates) to the labeled primary documents. These duplicate files
will not be labeled as part of the export set, however, so the file count in the load
file will be different that what is listed in the export set.

Creating Export Sets AD1 Export General Options | 263
Organize by Person Creates a folder for each person to place the output into.
Email Contained in PST/
NSF Select to either output a reduced version of the original PST/NSF file, the emails
as individual MSG files, or as individual HTML/RTF files.
Note: In order to view the PST file after export, make sure to have Outlook
installed on the environment.
AD1 File Name Specifies the name of the exported AD1 file. If you are also selecting to organize
by person, each person’s folder will contain its own AD1 image file with this
name.
Encryption Select to encrypt the AD1 file, either with a certificate or password, or choose not
to encrypt it.
AD1 Export General Option Screen
Option Description

Creating Export Sets Creating a Native Export | 264
Creating a Native Export
Choose to create a Native Export if you want to export the native documents in their original format and
optionally rendered images into a directory of your choosing. This export does not provide a load file.
To create a native export
1. Before you create an export, be sure that you have applied at least one label to evidence files that you
want to filter into the export set.
2. Log in as a user with Create Export rights.
3. Click the Project Review button next to the project in the Project List.
4. In the Project Explorer, click Explore.
5. Right-click the Export Sets folder, and select Create Native Export.
6. See Native Export General Options on page 265. for information on how to fill out the options in the
General Option screen.
7. Click Next.
8. See Native Export Files to Include on page 267. for information on how to fill out the options in the Files
to Include screen.
9. Click Next.
10. See Export Volume Document Options on page 269. for information on how to fill out the options in the
Volume Document Options screen.
11. Click Next.
12. See Export Excel Rendering Options on page 271. on how to fill out the options in the Excel Rendering
Options screen.
13. Click Next.
14. See Export Word Rendering Options on page 273. for information on how to fill out the options in the
Word Rendering Options screen.
15. Click Next.
16. On the Summary page, review your options before saving to export.
After your export is created, it will appear in the Export tab of the Home page and under the Export Sets folder in
the Project Explorer of the Project Review.
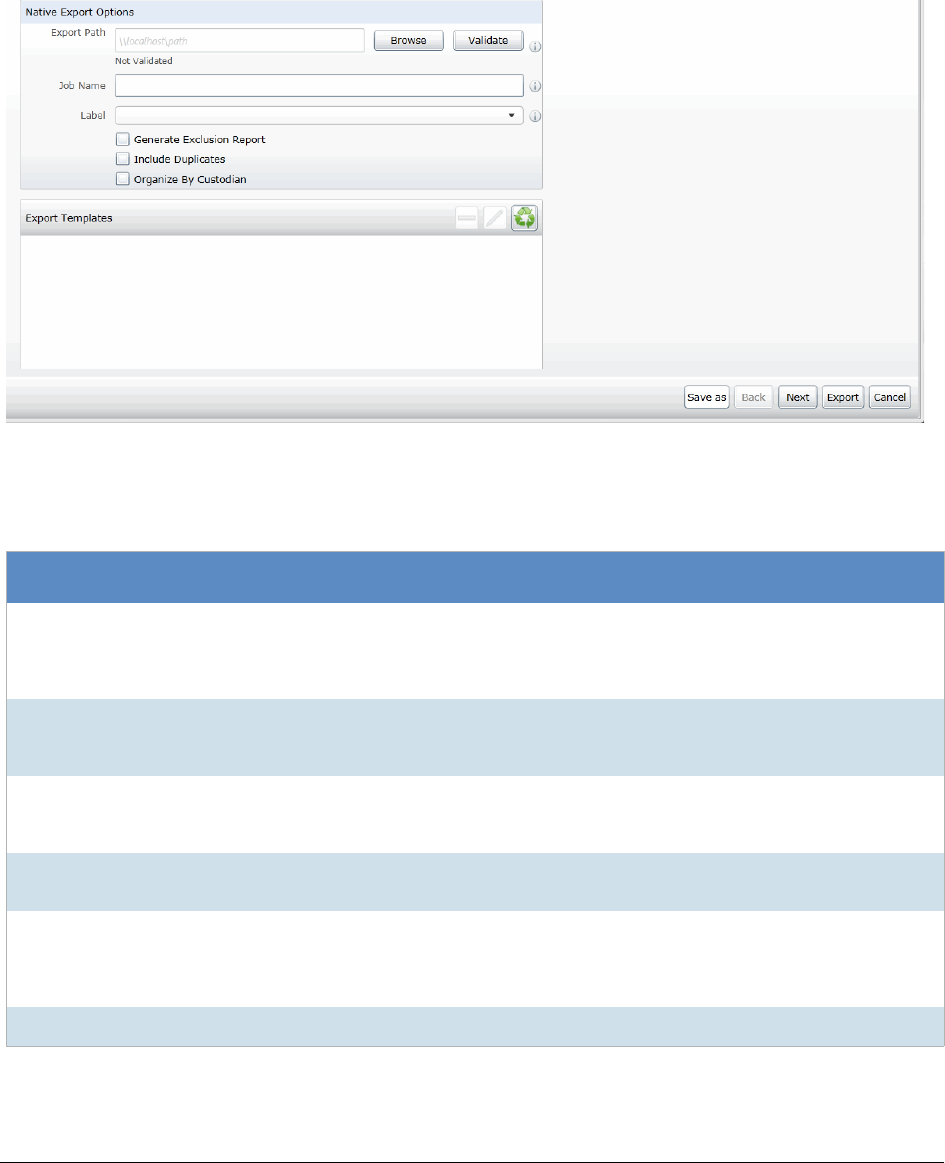
Creating Export Sets Native Export General Options | 265
Native Export General Options
The following table describes the options that are available on the General Options screen of the Native Export
set wizard.
Native Export General Options Screen
Native Export General Options Screen
Option Description
Export Path Enter the UNC path to the export set. You can browse to the server and path,
and validate the path before exporting the load file. This path must be accessible
to the logged in user. A new folder will be created if the folder you specify does
not exist.
Job Name Specify the name for your export set. For example, you can organize export sets
by using the person name for ease of examination. This naming method is
particularly useful if there are multiple people.
Label This field is required. Before you create an AD1 export, be sure that you have
applied at least one label to evidence files that you want to filter into the export
set.
Generate Exclusion
Report Lets you create a report of all the documents within the selected collection that
were not included in the export..
Include Duplicates Mark to include duplicates. Includes unlabeled documents that are flagged as
secondary (duplicates) to the labeled primary documents. These duplicate files
will not be labeled as part of the export set, however, so the file count in the load
file will be different that what is listed in the export set.
Organize By Person Creates a folder for each person to place the output into.

Creating Export Sets Native Export General Options | 266
Export Templates If you have saved an export template you can apply it to the current export set.
By applying a template, all current settings will be replaced.
You can also delete and rename a template.
By clicking Save As in the wizard, you can save the export options as a template.
Native Export General Options Screen
Option Description
Creating Export Sets Native Export Files to Include | 267
Native Export Files to Include
You can select how you want to export native files and rendered images. Select the graphics images that you
want to use for slipsheets in the load file. The following table describes the options that are available on the
Native Files screen of the Native Export set wizard.
Export Files to Include Options
Options Description
Include Native Files Select this option if you want to include the native documents with the export set.
This will only include native files that have not been redacted. If the native file
has been redacted, a pdf of the file will be included.
Output a Reduced
Version of the Original
PST/NSF file
Select this option if you want to output a reduced version of the PST/NSF file.
Output messages as
individual HTML/RTF Select this option if you are exporting emails that were originally in a PST or NSF
and you want to export them as HTML or RTF files.
Uses the FTK object ID instead of the file name of the email message.
Note: MSG files exported as HTML format are output in MSG format instead
of HTML/RTF format.
Output messages as
individual MSG Select this option if you want to save the email as individual MSG files.
Include Rendered
Images Select this option to include images that have been created in the Project
Review. Additionally, if an image has not yet been created, this option will convert
the native document to an image format. If selected, you will have the option to
set rendering options for Excel and Word documents.
See Export Excel Rendering Options on page 271.
See Export Word Rendering Options on page 273.
Excluded Extensions Enter the file extensions of documents that you do not want to be converted. File
extensions must be typed in exactly as they appear and separated by commas
between multiple entries. This field does not allow the use of wild card
characters. The default values are:
EXE, DLL, and COM
File Format Select which format you want the native file converted to:
-Multi-page - one TIFF image with multiple pages for each document.
-PDF - one PDF file with multiple pages for each document.
-Single Page - a single TIFF image for each page of each document. For
example, a 25 page document would output 25 single-page TIFF images.
Compression -CCITT3 (Bitonal) - Produces a lower quality black and white image.
-CCITT4 (Bitonal) - Produces a higher quality black and white image.
-LZW (Color) - Produces a color image with LZW compression.
-None (Color) - Produces a color image with no compression (This is a very
large image).
-RLE (Color) - Produces a color image with RLE compression.
DPI Set the resolution of the image.
The range is from 96 - 1200 dots per inch (DPI).
Creating Export Sets Native Export Files to Include | 268
Page Format Select the page size for the image. The available page sizes are:
-Letter – 8 ½” x 11”
-A3 – 29.7 cm x 42 cm
-A4 – 29.7 cm x 21 cm
Normalize images Select this option to obtain consistent branding sizes throughout the entire
production.
Any image that is less than the chosen size will not be resized or rescaled to fit
the chosen page size but will be placed inside of the chosen size frame and will
be oriented to the upper left corner of the page.
Any document determined to be landscape in orientation will produce a proper
landscape image.
Produce color JPGs for
provided extensions This and the following two options are available if you are rendering to CCITT3 or
CCITT4 format and allows you to specify certain file extensions to render in color
JPGs.
For example, if you wanted everything in black and white format, but wanted all
PowerPoint documents in color, you would choose this option and then type PPT
or PPTX in the To JPG Extensions text box. Additionally, you can choose the
quality of the resulting JPG from 1 - 100 percent (100 percent being the most
clear, but the largest resulting image).
To JPG Extensions Lets you specify file extensions that you want exported to JPG images.
JPG Quality Sets the value of JPG quality (1-100). A high value (100) creates high quality
images. However, it also reduces the compression ratio, resulting in large file
sizes. A value of 50 is average quality.
Slipsheet Select this option to upload a slipsheet image to the server for use in the exports.
Slipsheets are an image that you can use when certain files cannot be converted
to an image, such an .exe file, or a .dll file. The slipsheet image is substituted in
place of the unconverted file.
A copy of this file is placed in the export image folder for every document that
you have chosen to exclude from conversion and will be named in accordance
with your file naming selection.
You need to select a file that matches the export file type. For example, if you are
exporting TIFFs, you must select a TIFF file as a slipsheet.
Enter the path to the slipsheet. You can browse to the server and path, and
validate the slipsheet path.
Note: You can have only one custom slipsheet per project.
Export Files to Include Options
Options Description
Creating Export Sets Export Volume Document Options | 269
Export Volume Document Options
This section describes the options available in the Volume Document Options screen of the Export set wizard if
you have US numbering enabled. US numbering is the default. If you click Original in Naming Options, this panel
becomes disabled. The following table describes the options available.
Export Volume Document Options
Options Description
Naming Options Choose a naming option.
New Production DocID (Default) This file naming allows you to determine what the name of the files will
be, based on the document ID numbering scheme. This option is used with the
Document Numbering Options on this tab.
In Project Review, you can view the ProductionDocID that is created for exported
files. This is useful in associating an exported file with the original file.
Original DocID This naming is based on the original DocID.
Documents that were imported were put into a document group and will have a
DocID. Documents that were added through the evidence wizard, will not.
This option lets you re-use that original DocID for the produced record.
If the documents do not have an existing DocID, you can assign one by placing
the documents in a document group or by providing a DocID naming schema
using the Document Numbering Options on this tab.
Original File Name This file naming uses the original file names in the name of the documents rather
than a numbered naming convention.
Original File Path with
Original Path This uses the original file path folder structure rather than an auto-generated,
numbered folder structure. Clicking this option disables the Doc ID Numbering
pane
Append Object ID’s Allows you to use the name of your choice (Original or Original File Name with
Original Path), but also include the FTK Object ID as part of the native file
names. This option is not available for Doc ID
Volume Partition
Sorting You can sort the documents before they are converted and named. This allows
you to choose one or more metadata field values to sort the documents in
ascending or descending order.
You can choose any combination of fields by which to sort, however, it is not
recommended to choose more than 3 fields to sort by.
-Plus sign - Add volume partition sorting filters based on specified ascending
or descending fields.
-Minus sign - Delete the selected sorting option.
Sorting Specifies the order that the files are listed in each volume. Sorting occurs on the
parent document.
For example, you might sort by Ascending on the field FILESIZE. In such project,
the first volume contains the largest file sizes, and the last volume contains the
smallest file sizes.
Field Sets the FTK column heading by which you want to sort.
Volume Sample Provides a sample of the volumes.
Doc ID Numbering
Creating Export Sets Export Volume Document Options | 270
Volume Partition
Options Select a volume folder structure for the output files. The selections will determine
how much data is put into each folder before a new folder is created and the
folder structure in which the output is placed.
Folder Lets you name and limit the size or the number of items that are contained in a
folder. An export can have one or more folders.
Prefix Specifies the prefix-naming convention that you want to use for the folders within
the volume of the export.
Suffix Specifies the suffix-naming convention that you want to use for the folders within
the volume of the export.
Starting Number Sets the starting number of the first folder within the volume of the export
File Limit Creates a new numbered folder when the specified file limit is reached inside the
folder.
Native Folder Lets you set the name of the Natives folder.
Image Folder Lets you set the name of the Image folder.
See Native Export Files to Include on page 267.
Text Folder Lets you set the name of the Text folder where text files go that are generated by
the OCR engine. See Native Export Files to Include on page 267.
Document This pane is only available if the New Production Doc ID or Original Doc ID
option is selected in the Naming Options.
Use these setting to determine how to generate new names of produced records.
(Some files may retain an original DocID. See the Naming Options on this tab.)
Numbering Options See About U.S. Document Numbering Options on page 250.
Prefix Specifies the prefix-naming convention that you want to use for the document
and page numbering within the folders of the export.
Suffix Specifies the suffix-naming convention that you want to use for the document
and page numbering within the folders of the export.
Starting Number Sets the starting number of the first document or image within the volume of the
export.
Padding Specify the number of document counter digits that you want. The limit is 21.
Export Volume Document Options
Options Description
Creating Export Sets Export Excel Rendering Options | 271
Export Excel Rendering Options
You can set the options to format any Microsoft Excel spreadsheet prior to converting it to a graphic format. In
order for any of the options within this tab to be applied, you must first deselect the Use Original Document
Settings option check box. When this option is selected, the other formatting options will not be applied and the
document will be converted using the fromatting that it was last saved with. The following table describes the
options that are available on the Excel Rendering Options screen.
Export Excel Rendering Options
Options Description
General Set to determine how the spreadsheet is rendered.
Use Original Document
Settings Specifies that the original settings for Excel spreadsheets, such as paper size,
orientation, and margins, be maintained on the converted output.
Paper Size Choose to render the spreadsheet in the following paper sizes. The default paper
size is Letter:
-10 x 14
-11 x 17
-A3
-A4
-A5
-B4
-B5
-Custom
-Envelope DL
-Executive
-Folio
-Ledger
-Legal
-Letter
-Quarto
-Statement
-Tabloid
Orientation Select either Letter or Landscape for the paper size of the spreadsheet.
Header, Footer, and
Page Margins Set the margins of the spreadsheet. The default is 1 inch.
Formula Substitutions Substitute the formulas for the Date, Time, and Path fields. You can choose to
substitute the original formula, the original metadata, or custom text string.
Printing Specify how the spreadsheet comments are printed
Printing Comments Print comments on either Print Sheet End, Print in Place, or Print No Comments
Print Order For use with Excel spreadsheets that may not fit on the rendered page. If the
spreadsheet is too wide to fit on the rendered page, you can choose to print in
the following ways:
Down Then Over - Choose to print top to bottom first and then print left to right.
Over Then Down - Choose to print left to right first and then print top to bottom.

Creating Export Sets Export Excel Rendering Options | 272
Page Mark the following options:
-Center Sheets Horizontally
-Center Sheets Vertically
-Fit Image To Page
-One Page Per Sheet
-Show Hidden Data - This is checked by default
Fix To X Pages Converts an Excel document and attempts to fit the resulting output image into a
specified number of pages.
Scaling Scales the output image to a specified percentage of the original size. The
maximum scale is 100%.
Export Excel Rendering Options
Options Description
Creating Export Sets Export Word Rendering Options | 273
Export Word Rendering Options
You can set the page size, orientation, and margins of a word processing document on the converted output.
The following table describes the options that are available on the Word Rendering Options screen of the Native
Export set wizard.
Export Word Rendering Options
Options Description
General Set to determine how the word processing is rendered.
Use Original Document
Settings Specifies that the original settings for Word documents, such as paper size,
orientation, and margins, be maintained on the converted output.
Paper Size Choose to render the word processing document in the following paper sizes.
The default paper size is Letter:
-10 x 14
-11 x 17
-A3
-A4
-A5
-B4
-B5
-Custom
-Envelope DL
-Executive
-Folio
-Ledger
-Legal
-Letter
-Quarto
-Statement
-Tabloid
Orientation Select either Letter or Landscape.
Header, Footer, and
Page Margins Set the margins of the spreadsheet. The default is 1 inch.
Field Substitutions Substitute the fields for the Date, Time, and Path fields. You can choose to
substitute the original formula, the original metadata, or custom text fields.
Page -Show Hidden Text - this is checked as default
-Print Endnotes At End Of Next Section

Creating Export Sets Creating a Load File Export | 274
Creating a Load File Export
When creating a load file export, you can export your choice of Native, Filtered text (includes the OCR text that
was created during processing), rendered images of the native document, and optionally OCR text of the
rendered images.
If the recipient intends to use third-party software to review the export set, select Load File Export.
To create a load file export
1. Before you create an export, be sure that you have applied at least one label to evidence files that you
want to filter into the export set.
2. Log in as a user with Create Export rights.
3. Click the Project Review button next to the project in the Project List.
4. In the Project Explorer, click Explore.
5. Right-click the Export Sets folder, and select Create Load File Export.
6. See Load File General Options on page 275. for information on how to fill out the options in the General
Option screen.
7. Click Next.
8. See Load File Options on page 276. for information on how to fill out the options in the Load File
Options screen.
9. Click Next.
10. See Load File Files to Include Options on page 278. for information on how to fill out the options in the
Include screen.
11. Click Next
12. See Export Volume Document Options on page 269. for information on how to fill out the options in the
Volume Document Options screen.
13. Click Next.
14. See Export Excel Rendering Options on page 271. on how to fill out the options in the Excel Rendering
Options screen.
15. Click Next.
16. See Export Volume Document Options on page 269. for information on how to fill out the options in the
Word Rendering Options screen.
17. Click Next.
18. On the Summary page, review your options before saving to export.
After your export is created, it will appear in the Export tab of the Home page and under the Export Sets folder in
the Project Explorer of the Project Review.
Creating Export Sets Load File General Options | 275
Load File General Options
The following table describes the options that are available on the Load FIle General Options screen of the Load
FIle Export set wizard.
Load File General Options
Options Descriptions
Export Path Enter the UNC path to the export set. You can browse to the server and path,
and validate the path before exporting the load file. This path must be accessible
to the logged in user. A new folder will be created if the folder you specify does
not exist.
Job Name This field is required.
Label This field is required. Before you create a load file, be sure that you have applied
at least one label to evidence files that you want to filter into the export set.
Generate Exclusion
Report Lets you create a report of all the documents within the selected collection that
were not included in the export.
Include Duplicates Mark to include duplicates. Includes unlabeled documents that are flagged as
secondary (duplicates) to the labeled primary documents. These duplicate files
will not be labeled as part of the export set, however, so the file count in the load
file will be different that what is listed in the export set.
Generate Load File This is marked as default.
Export Templates If you have saved an export template you can apply it to the current export set.
By applying a template, all current settings will be replaced.
You can also delete and rename a template.
By clicking Save As in the wizard, you can save the export options as a template.
Creating Export Sets Load File Options | 276
Load File Options
The following table describes the options that are available on the Load File Options screen of the Load FIle
Export set wizard.
Load File Export Options
Options Descriptions
Load File Export
Load File Name Enter the name for the Load File.
Load File Encoding The following options are available for load file encoding:
-ANSI - Encodes load files using ANSI (for text written in the Latin script).
ANSI encoding has the advantage of producing a smaller load file than a Uni-
code file (UTF). ANSI-encoded load files process faster and save space. The
ANSI encoding includes characters for languages other than English, but it is
still limited to the Latin script.
If you are exporting documents that contain languages written in scripts other
than Latin, you need to choose a Unicode encoding form. Unicode encoding
forms contain the character sets for all known languages.
-UTF-8 - (Default) Encodes load files using UTF-8.
For more information on the Unicode standard, see the following website:
http://www.unicode.org/standard/principles.html
Most commonly used for text written in Chinese, Japanese, and Korean.
-UTF-16 - Encodes load files using UTF-16.
Similar to UTF-8 this option is used for text written in Chinese, Japanese, and
Korean.
Selected Format The following formats are available for export:
-Browser Briefcase - Generates an HTML format that provides links to the
native documents, images, and text files.
You can do the following:
Have multiple links for image, native, and text documents.
Work with production sets exported previously in iBlaze Browser Briefcase
format. This allows you to have greater control over the production set.
-caseVantage - Generates a DII file specifically formatted for use with the AD
Summation caseVantage program.
-Concordance - Generates a DAT file that can be used in Concordance.
-EDRM - Generates an XML file that meets the EDRM v1.2 standard.
-Generic - Generates a standard delimited text file.
-iCONECT - Generates an XML file formatted for use with the iConect pro-
gram.
-Introspect (IDX file) - Generates an IDX file specifically formatted for use with
the Introspect program.
-Relativity - Generates a DAT file that can be used in Relativity.
-Ringtail (MDB) - Generates a delimited text file that can be converted to be
used in Ringtail.
-Summation eDII - Generates a DII file specifically formatted for use with the
AD Summation iBlaze or Enterprise programs.
Note: If you are outputting a Concordance, Relativity, or Generic load file, and
include rendered images, you will also get an OPT and LFP file in the export
directory.
Multi-Entry Separator Choose which character to separate multi-entries. The default character is ;.

Creating Export Sets Load File Options | 277
Available Fields Select from the available fields.
There is an ORIGINALDOCID field available. This allows you to include a field to
reflect the original DocID when exporting with new DocIDs.
You can select FTK metadata to be included in the load file. Select columns of
metadata to be included in the load file and click the right arrow to add the
Selected Mapping field.
Selected Mapping In addition to the columns of metadata, you can also add Custom fields to be
included in the load file.
Field Mapping Templates Additionally, you may need a placeholder field. Use the plus button to add a field
mapping template. You can also edit and delete the templates.
Load File Export Options
Options Descriptions
Creating Export Sets Load File Files to Include Options | 278
Load File Files to Include Options
The following table describes the options that are available on the Load File Export Files to Include Options
screen.
Load File Export Files to Include Options
Options Description
Include Native Files Select this option if you want to include the native documents with the export set.
This will only include native files that have not been redacted. If the native file
has been redacted, a pdf of the file will be included.
Output a Reduced
Version of the Original
PST/NSF file
Select this option if you want to output a reduced version of the PST/NSF file.
Output messages as
individual HTML/RTF Select this option if you are exporting emails that were originally in a PST or NSF
and you want to export them as HTML or RTF files.
Uses the FTK object ID instead of the file name of the email message.
Output messages as
individual MSG Select this option if you are exporting emails that were originally in a PST or NSF
and you want to export them as HTML or RTF files.
Uses the FTK object ID instead of the file name of the email message.
Include Rendered
Images Select this option to include images that have been created in the Project
Review. Additionally, if an image has not yet been created, this option will convert
the native document to an image format.
Excluded Extensions Enter the file extensions of documents that you do not want to be converted. File
extensions must be typed in exactly as they appear and separated by commas
between multiple entries. This field does not allow the use of wild card
characters. The default values are:
EXE, DLL, and COM
File Format Select which format you want the native file converted to:
-Multi-page - one TIFF image with multiple pages for each document.
-PDF - one PDF file with multiple pages for each document.
-Single Page - a single TIFF image for each page of each document. For
example, a 25 page document would output 25 single-page TIFF images.
Compression -CCITT3 (Bitonal) - Produces a lower quality black and white image.
-CCITT4 (Bitonal) - Produces a higher quality black and white image.
-LZW (Color) - Produces a color image with LZW compression.
-None (Color) - Produces a color image with no compression (This is a very
large image).
-RLE (Color) - Produces a color image with RLE compression.
DPI Set the resolution of the image.
The range is from 96 - 1200 dots per inch (DPI).
Page Format Select the page size for the image: A3, A4, Letter.
Normalize images Select this option to normalize the image n to the same size so that
endorsements appear to be the same size on all pages.
Creating Export Sets Load File Files to Include Options | 279
Produce color JPGs for
provided extensions This and the following two options are available if you are rendering to CCITT3 or
CCITT4 format and allows you to specify certain file extensions to render in color
JPGs.
For example, if you wanted everything in black and white format, but wanted all
PowerPoint documents in color, you would choose this option and then type PPT
or PPTX in the To JPG Extensions text box. Additionally, you can choose the
quality of the resulting JPG from 1 - 100 percent (100 percent being the most
clear, but the largest resulting image).
To JPG Extensions Lets you specify file extensions that you want exported to JPG images.
JPG Quality Sets the value of JPG quality (1-100). A high value (100) creates high quality
images. However, it also reduces the compression ratio, resulting in large file
sizes. A value of 50 is average quality.
Slipsheet Select this option to upload a slipsheet image to the server for use in the exports.
Slipsheets are an image that you can use when certain files cannot be converted
to an image, such an .exe file, or a .dll file. The slipsheet image is substituted in
place of the unconverted file.
A copy of this file is placed in the export image folder for every document that
you have chosen to exclude from conversion and will be named in accordance
with your file naming selection.
You need to select a file that matches the export file type. For example, if you are
exporting TIFFs, you must select a TIFF file as a slipsheet.
Enter the path to the slipsheet. You can browse to the server and path, and
validate the slipsheet path.
Note: You can have only one custom slipsheet per project.
OCR TIFF Images Mark to OCR TIFF Images.
OCR Text Encoding Encode the text in the OCR with either ANSI, UTF-16, or UTF-8. See Load File
Options on page 276.
Load File Export Files to Include Options
Options Description


Getting Started with KFF (Known File Filter) About KFF | 281
Chapter 28
Getting Started with KFF (Known File Filter)
This document contains the following information about understanding and getting started using KFF (Known
File Filter).
-About KFF (page 281)
-About the KFF Server and Geolocation (page 286)
-Installing the KFF Server (page 287)
-Configuring the Location of the KFF Server (page 288)
-Migrating Legacy KFF Data (page 289)
-Importing KFF Data (page 291)
-About CSV and Binary Formats (page 298)
-Installing KFF Updates (page 302)
-Uninstalling KFF (page 301)
-KFF Library Reference Information (page 303)
-What has Changed in Version 5.6 (page 308)
Important:
AccessData applications versions 5.6 and later use a new KFF architecture. If you are using one of
the following applications version 5.6 or later, you must install and implement the new KFF
architecture:
Resolution1 (Resolution1 Platform, Resolution1 CyberSecurity, Resolution1 eDiscovery)
Summation
FTK-based products (FTK, FTK Pro, AD Lab, AD Enterprise)
See What has Changed in Version 5.6 on page 308.
About KFF
KFF (Known File Filter) is a utility that compares the file hash values of known files against the files in your
project. The known files that you compare against may be the following:
-Files that you want to ignore, such as operating system files
-Files that you want to be alerted about, such as malware or other contraband files
The hash values of files, such as MD5, SHA-1, etc., are based on the file’s content, not on the file name or
extension. The helps you identify files even if they are renamed.
Using KFF during your analysis can provide the following benefits:
Getting Started with KFF (Known File Filter) About KFF | 282
-Immediately identify and ignore 40-70% of files irrelevant to the project.
-Immediately identify known contraband files.
Introduction to the KFF Architecture
There are two distinct components of the KFF architecture:
-KFF Data - The KFF data are the hashes of the known files that are compared against the files in your
project. The KFF data is organized in KFF Hash Sets and KFF Groups. The KFF data can be comprised
of hashes obtained from pre-configured libraries (such as NSRL) or custom hashes that you configure
yourself.
See Components of KFF Data on page 282.
-KFF Server - The KFF Server is the component that is used to store and process the KFF data against
your evidence. The KFF Server uses the AccessData Elasticsearch Windows Service. After you install
the KFF Server, you import your KFF data into it.
Note: The KFF database is no longer stored in the shared evidence database or on the file system in EDB
format.
Components of KFF Data
Item Description
Hash The unique MD5 or SHA-1 hash value of a file. This is the value that is compared
between known files and the files in your project.
Hash Set A collection of hashes that are related somehow. The hash set has an ID, status,
name, vendor, package, and version. In most cases, a set corresponds to a
collection of hashes from a single source that have the same status.
Group KFF Groups are containers that are used for managing the Hash Sets that are
used in a project.
KFF Groups can contains Hash Sets as well as other groups.
Projects can only use a single KFF Group. However, when configuring your
project you can select a single KFF Group which can contains nested groups.
Status The specified status of a hash set of the known files which can be either Ignore
or Alert. When a file in a project matches a known file, this is the reported status
of the file in the project.
Library A pre-defined collection of hashes that you can import into the KFF Serve.
There are three pre-defined libraries:
-NSRL
-NDIC HashKeeper
-DHS
See About Pre-defined KFF Hash Libraries on page 284.

Getting Started with KFF (Known File Filter) About KFF | 283
About the Organization of Hashes, Hash Sets, and KFF Groups
Hashes, such as MD5, SHA-1, etc., are based on the file’s content, not on the file name or extension.
You can also import hashes into the KFF Server in .CSV format.
For FTK-based products, you can also import hashes into the KFF Server that are contained in .TSV, .HKE,
.HKE.TXT, .HDI, .HDB, .hash, .NSRL, or .KFF file formats.
You can also manually add hashes.
Hashes are organized into Hash Sets. Hash Sets usually include hashes that have a common status, such as
Alert or Ignore.
Hash Sets must be organized into to KFF Groups before they can be utilized in a project.
Index/Indices When data is stored internally in the KFF Library, it is stored in multiple indexes
or indices.
The following indices can exist:
-NSRL index
A dedicated index for the hashes imported from the NSRL library.
-NDIC index
A dedicated index for the hashes imported from the NDIC library.
-DHC index
A dedicated index for the hashes imported from the DHC library.
-KFF index
A dedicated index for the hashes that you manually create or import from
other sources, such as CSV.
These indices are internal and you do not see them in the main application. The
only place that you see some of them are in the KFF Import Tool.
See Using the KFF Import Utility on page 292.
The only time you need to be mindful of the indices is when you use the KFF
binary format when you either export or import data.
See About CSV and Binary Formats on page 298.
Item Description
Getting Started with KFF (Known File Filter) About KFF | 284
About Pre-defined KFF Hash Libraries
All of the pre-configured hash sets currently available for KFF come from three federal government agencies
and are available in KFF libraries.
See About KFF Pre-Defined Hash Libraries on page 303.
You can use the following KFF libraries:
-NIST NSRL
See About Importing the NIST NSRL Library on page 294.
-NDIC HashKeeper (Sept 2008)
See Importing the NDIC Hashkeeper Library on page 296.
-DHS (Jan 2008)
See Importing the DHS Library on page 296.
It is not required to use a pre-configured KFF library in order to use KFF. You can configure or import custom
hash sets. See your application’s Admin Guide for more information.
How KFF Works
The Known File Filter (KFF) is a body of MD5 and SHA1 hash values computed from electronic files. Some pre-
defined data is gathered and cataloged by several US federal government agencies or you can configure you
own. KFF is used to locate files residing within project evidence that have been previously encountered by other
investigators or archivists. Identifying previously cataloged (known) files within a project can expedite its
investigation.
When evidence is processed with the MD5 Hash (and/or SHA-1 Hash) and KFF options, a hash value for each
file item within the evidence is computed, and that newly computed hash value is searched for within the KFF
data. Every file item whose hash value is found in the KFF is considered to be a known file.
Note: If two hash sets in the same group have the same MD5 hash value, they must have the same metadata.
If you change the metadata of one hash set, all hash sets in the group with the same MD5 hash file will be
updated to the same metadata.
The KFF data is organized into Groups and stored in the KFF Server. The KFF Server service performs lookup
functions.
Status Values
In order to accelerate an investigation, each known file can labeled as either Alert or Ignore, meaning that the file
is likely to be forensically interesting (Alert) or uninteresting (Ignore). Other files have a status of Unknown.
The Alert/Ignore designation can assist the investigator to hone in on files that are relevant, and avoid spending
inordinate time on files that are not relevant. Known files are presented in the Overview Tab’s File Status
Container, under “KFF Alert files” and “KFF Ignorable.”

Getting Started with KFF (Known File Filter) About KFF | 285
Hash Sets
The hash values comprising the KFF are organized into hash sets. Each hash set has a name, a status, and a
listing of hash values. Consider two examples. The hash set “ZZ00001 Suspected child porn” has a status of
Alert and contains 12 hash values. The hash set “BitDefender Total Security 2008 9843” has a status of Ignore
and contains 69 hash values. If, during the course of evidence processing, a file item’s hash value were found to
belong to the “ZZ00001 Suspected child porn” set, then that file item would be presented in the KFF Alert files
list. Likewise, if another file item’s hash value were found to belong to the “BitDefender Total Security 2008 9843”
set, then that file would be presented in the KFF Ignorable list.
In order to determine whether any Alert file is truly relevant to a given project, and whether any Ignore file is truly
irrelevant to a project, the investigator must understand the origins of the KFF’s hash sets, and the methods
used to determine their Alert and Ignore status assignments.
You can install libraries of pre-defined hash sets or you can import custom hash sets. The pre-defined hash sets
contain a body of MD5 and SHA1 hash values computed from electronic files that are gathered and cataloged by
several US federal government agencies.
See About KFF Pre-Defined Hash Libraries on page 303.
Higher Level Structure and Usage
Because hash set groups have the properties just described, and because custom hash sets and groups can be
defined by the investigator, the KFF mechanism can be leveraged in creative ways. For example, the
investigator may define a group of hash sets created from encryption software and another group of hash sets
created from child pornography files and then apply only those groups while processing.

Getting Started with KFF (Known File Filter) About the KFF Server and Geolocation | 286
About the KFF Server and Geolocation
In order to use the Geolocation Visualization feature in various AccessData products, you must use the KFF
architecture and do the following:
-Install the KFF Server.
See Installing the KFF Server on page 287.
-Install the Geolocation (GeoIP) Data (this data provide location data for evidence)
See Installing the Geolocation (GeoIP) Data on page 297.
From time to time, there will be updates available for the GeoIP data.
See Installing KFF Updates on page 302.
If you are upgrading to 5.6 or later from an application 5.5 or earlier, you must install the new KFF Server and the
updated Geolocation data.

Getting Started with KFF (Known File Filter) Installing the KFF Server | 287
Installing the KFF Server
About Installing the KFF Server
In order to use KFF, you must first configure an KFF Server.
For product versions 5.6 and later, you install a KFF Server by installing the AccessData Elasticsearch Windows
Service.
Where you install the KFF Server depends on the product you are using with KFF:
-For FTK and FTK Pro applications, the KFF Server must be installed on the same computer that runs the
Examiner.
-For all other applications, such as AD Lab, Resolution1, or Summation, the KFF Server can be installed
on either the same computer as the application or on a remote computer. For large environments, it is
recommended that the KFF Server be installed on a dedicated computer.
After installing the KFF Server, you configure the application with the location of the KFF Server.
See Configuring the Location of the KFF Server on page 288.
About KFF Server Versions
The KFF Server (AccessData Elasticsearch Windows Service) may be updated from time to time. It is best to
use the latest version.
For applications 5.5 and earlier, the KFF Server component was version 1.2.7 and earlier.
About Upgrading from Earlier Versions
If you have used KFF with applications versions 5.5 and earlier, you can migrate your legacy KFF data to the
new architecture.
See Migrating Legacy KFF Data on page 289.
Installing the KFF Server Service
For instructions on installing the AccessData Elasticsearch Windows Service, see Installing the Elasticsearch
Service (page 611).
AccessData
Elasticsearch
Windows Service
Released Installation Instructions
Version 1.3.2 November 2014 with 5.6
versions of
-Resolution1
-Summation
-FTK-based
products
See Installing the KFF Server Service on page 287.
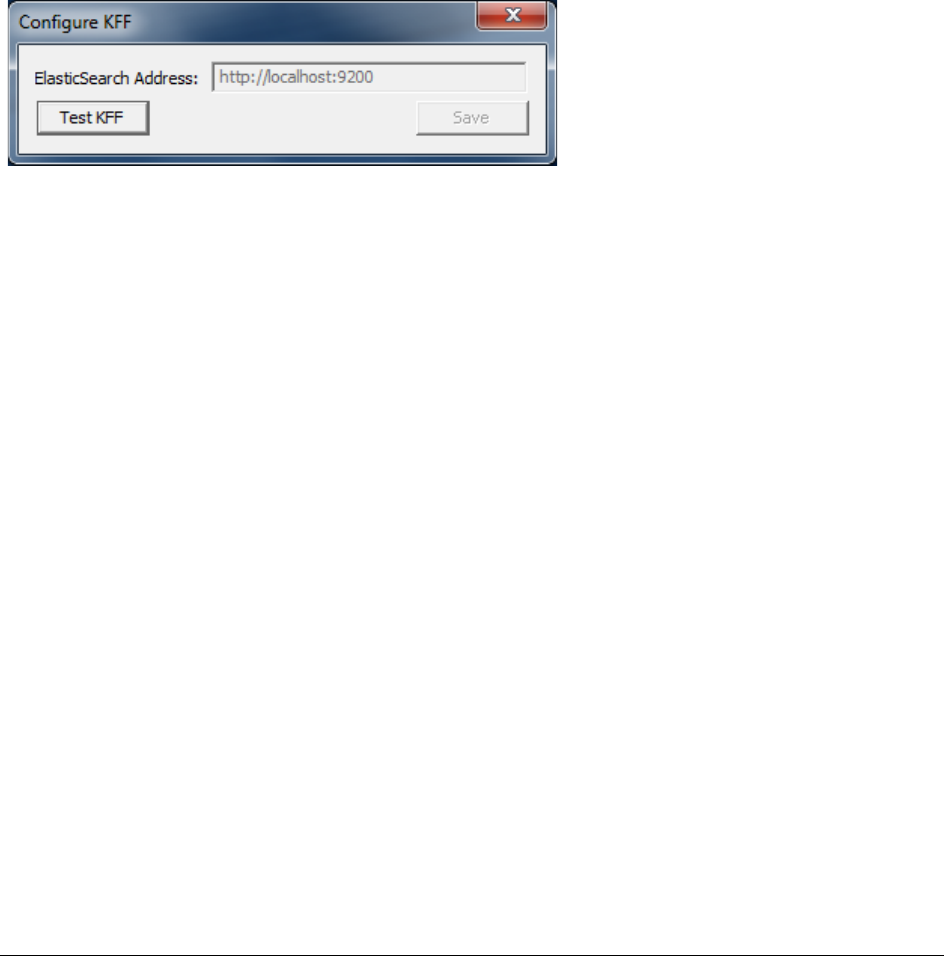
Getting Started with KFF (Known File Filter) Configuring the Location of the KFF Server | 288
Configuring the Location of the KFF Server
After installing the KFF Server, on the computer running the application, such as FTK, Lab, Summation, or
Resolution1, you configure the location of the KFF Server.
Do one of the following:
-Configuring the KFF Server Location on FTK-based Computers (page 288)
-Configuring the KFF Server Location on Resolution1 and Summation Applications (page 288)
Configuring the KFF Server Location on FTK-based Computers
Before using KFF with FTK, FTK Pro, Lab, or Enterprise, with KFF, you must configure the location of the KFF
Server.
Important:
To configure KFF, you must be logged in with Admin privileges.
To view or edit KFF configuration settings
1. In the Case Manager, click Tools > Preferences > Configure KFF.
2. You can set or view the address of the KFF Server.
-If you installed the KFF Server on the same computer as the application, this value will be localhost.
-If you installed the KFF Server on a different computer, identify the KFF server.
3. Click Test to validate communication with the KFF Server.
4. Click Save.
5. Click OK.
Configuring the KFF Server Location on Resolution1 and Summation
Applications
When using the KFF Server with Summation or Resolution1 applications, two configuration files must point to
the KFF Server location.
These setting are configured automatically during the KFF Server installation. If needed, you can verify the
settings.
However, if you change the location of the KFF Server, do the following to specify the location of the KFF Server.
1. Configure AdgWindowsServiceHost.exe.config:
1a. On the computer running the application (for example, the server running Summation), go to
C:\Program Files\AccessData\Common\FTK Business Services.
1b. Open AdgWindowsServiceHost.exe.config.

Getting Started with KFF (Known File Filter) Migrating Legacy KFF Data | 289
1c. Modify the line <add key="KffElasticSearchUrl" value="http://localhost:9200" />.
1d. Change localhost to be the location of your KFF server (you can use hostname or IP).
1e. Save and close file.
1f. Restart the business services common service.
2. Configure AsyncProcessingServices web.config:
2a. On the computer running the application (for example, the server running Summation), go to
C:\Program Files\AccessData\AsyncProcessingServices.
2b. Open web.config.
2c. Modify the line <add key="KffElasticSearchUrl" value="http://localhost:9200" />.
2d. Change localhost to be the location of your KFF server (you can use hostname or IP).
2e. Save and close file.
2f. Restart the AsyncProcessing service.
Migrating Legacy KFF Data
If you have used KFF with applications versions 5.5 and earlier, you can migrate that data from the legacy KFF
Server to the new KFF Server architecture.
Important:
Applications version 5.6 and later can only use the new KFF architecture that was introduced in 5.6.
If you want to use KFF data from previous versions, you must migrate the data.
Important:
If you have NSRL, NDIC, or DHS data in your legacy data, those sets will not be migrated. You must
re-import them using the 5.6 versions or later of those libraries. Only legacy custom KFF data will be
migrated.
Legacy KFF data is migrated to KFF Groups and Hash Sets on the new KFF Server.
Because KFF Templates are no longer used, they will be migrated as KFF Groups, and the groups that were
under the template will be added as sub-groups.
You migrate data using the KFF Migration Tool. To use the KFF Migration Tool, you identify the following:
-The Storage Directory folder where the legacy KFF data is located.
This was folder was configured using the KFF Server Configuration utility when you installed the legacy
KFF Server. If needed, you can use this utility to view the KFF Storage Directory. The default location of
the KFF_Config.exe file is Program Files\AccessData\KFF.
-The URL of the new KFF Server ( the computer running the AccessData Elastic Search Windows
Service)
This is populated automatically if the new KFF Server has been installed.
To install the KFF Migration Tool
1. On the computer where you have installed the KFF Server, access the KFF Installation disc, and run the
autorun.exe.
2. Click the 64 bit or 32 bit Install KFF Migration Utility.
3. Complete the installation wizard.
To migrate legacy KFF data
1. On the legacy KFF Server, you must stop the KFF Service.
You can stop the service manually or use the legacy KFF Config.exe utility.

Getting Started with KFF (Known File Filter) Migrating Legacy KFF Data | 290
2. On the new KFF Server, launch the KFF Migration Tool.
3. Enter the directory of the legacy KFF data.
4. The URL of Elasticsearch should be listed.
5. Click Start.
6. When completed, review the summary data.
Getting Started with KFF (Known File Filter) Importing KFF Data | 291
Importing KFF Data
About Importing KFF Data
You can import hashes and KFF Groups that have been previous configured.
You can import KFF data in one of the following formats:
KFF Data sources that you can import
Source Description
Pre-configured KFF libraries You can import KFF data from the following pre-configured libraries
-NIST NSRL
-NDIC HashKeeper
-DHS
To import KFF libraries, it is recommended that you use the KFF Import
Utility.
See Using the KFF Import Utility on page 292.
See Importing Pre-defined KFF Data Libraries on page 294.
See KFF Library Reference Information on page 303.
Custom Hash Sets and KFF
Groups You can import custom hashes from CSV files.
See About the CSV Format on page 298.
For FTK-based products, you can also import custom hashes from the
following file types:
-Delimited files (CSV or TSV)
-Hash Database files (HDB)
-Hashkeeper files (HKE)
-FTK Exported KFF files (KFF)
-FTK Supported XML files (XML)
-FTK Exported Hash files (HASH)
To import these kinds of files, use the KFF Import feature in your
application.
See Using the Known File Feature chapter.
KFF binary files You can import KFF data that was exported in a KFF binary format, such an
an archive of a KFF Server.
See About CSV and Binary Formats on page 298.
When you import a KFF binary snapshot, you must be running the same
version of the KFF Server as was used to create the binary export.
To import KFF binary files, it is recommend that you use the KFF Import
Utility.
See Using the KFF Import Utility on page 292.

Getting Started with KFF (Known File Filter) Importing KFF Data | 292
About KFF Data Import Tools
When you import KFF data, you can use one of two tools:
About Default Status Values
When you import KFF data, you configure a default status value of Alert or Ignore. When adding Hash Sets to
KFF Groups, you can configure the KFF Groups to use the default status values of the Hash Set or you can
configure the KFF Group with a status that will override the default Hash Set values.
See Components of KFF Data on page 282.
About Duplicate Hashes
If multiple Hash Set files containing the same Hash identifier are imported into a single KFF Group, the group
keeps the last Hash Set’s metadata information, overwriting the previous Hash Sets’ metadata. This only
happens within an individual group and not across multiple groups.
Using the KFF Import Utility
About the KFF Import Utility
Due to the large size of of some KFF data, a stand-alone KFF Import utility is available to use to import the data.
This KFF Import utility can import large amounts of data faster then using the import feature in the application.
It is recommend that you install and use the KFF Import utility to import the following:
-NSRL, DHC, and NIST libraries
-An archive of a KFF Server that was exported in the binary format
After importing NSRL, NDIC, or DHS libraries, these indexes are displayed in the Currently Installed Sets list.
See Components of KFF Data on page 282.
You can also use the KFF Import Utility to remove the NSRL, NDIC, or DHS indexes that you have imported.
An archive of a KFF Server, which is the exported KFF Index, is not shown in the list.
KFF Data Import Tools
The application’s Import
feature The KFF management feature in the application lets you import both .CSV and
KFF Binary formats. Use the application to import .CSV files.
See Using the Known File Feature chapter.
Even though you can import KFF binary files using the application, it is
recommend that you use the KFF Import Utility.
KFF Import Utility It is recommended that you use the KFF Import Utility to import KFF binary files.
See Using the KFF Import Utility on page 292.

Getting Started with KFF (Known File Filter) Importing KFF Data | 293
Installing the KFF Import Utility
You should use the KFF Import Utility to import some kinds of KFF data.
To install the KFF Import Utility
1. On the computer where you have installed the KFF Server, access the KFF Installation disc, and run the
autorun.exe.
2. Click the 64 bit or 32 bit Install KFF Import Utility.
3. Complete the installation wizard.
Importing a KFF Server Archive Using the KFF Import Utility
You can import an archive of a KFF Server that you have exported using the binary format.
If you are importing a pre-defined KFF Library, see Importing Pre-defined KFF Data Libraries (page 294).
To import using the KFF Import Utility
1. On the KFF Server, open the KFF Import Utility.
2. To test the connection to the KFF Server’s Elasticsearch service at the displayed URL, click Connect.
If it connects correctly, no error is shown.
If it is not able to connect, you will get the following error: Failed after retrying 10 times: ‘HEAD
accessdata_threat_indicies’.
3. To import, click Import.
4. Click Browse.
5. Browse to the folder that contains the KFF binary files.
Specifically, select the folder that contains the Export.xml file.
6. Click Start.
7. Close the dialog.
Removing Pre-defined KFF Libraries Using the KFF Import Utility
You can remove a pre-defined KFF Library that you have previously imported.
You cannot see or remove existing custom KFF data (the KFF Index).
To remove pre-defined KFF Libraries
1. On the KFF Server, open the KFF Import Utility.
2. Select the library that you want to remove.
3. Click Remove.
Getting Started with KFF (Known File Filter) Importing KFF Data | 294
Importing Pre-defined KFF Data Libraries
About Importing Pre-defined KFF Data Libraries
After you install the KFF Server, you can import pre-defined NIST NSRL, NDIC HashKeeper, and DHS data
libraries.
See About Pre-defined KFF Hash Libraries on page 284.
In versions 5.5 and earlier, you installed these using an executable file. In versions 5.6 and later, you must import
them. It is recommend that you use the KFF Import Utility.
After importing pre-defined KFF Libraries, you can remove them from the KFF Server.
See Removing Pre-defined KFF Libraries Using the KFF Import Utility on page 293.
See the following sections:
-About Importing the NIST NSRL Library (page 294)
-Importing the NDIC Hashkeeper Library (page 296)
-Importing the DHS Library (page 296)
About Importing the NIST NSRL Library
You can import the NSRL library into your KFF Server. During the import, two KFF Groups are created:
NSRL_Alert and NSRL_Ignore. In FTK-based products, these two groups are automatically added to the Default
KFF Group.
The NSRL libraries are updated from time to time. To import and maintain the NSRL data, you do the following:
Process for Importing and Maintaining the NIST NSRL Library
1. Import the complete
NSRL library. You must first install the most current complete NSRL library. You can later add
updates to it.
To access and import the complete NSRL library, see
Importing the Complete NSRL Library (page 295)
2. Import updates to the
library When updates are made available, import the updates to bring the data up-to
date.
See Installing KFF Updates on page 302.
Important: In order to use the NSRL updates, you must first import the complete
library. When you install an NSRL update, you must keep the previous NSRL
versions installed in order to maintain the complete set of NSRL data.
Available NRSL library files (new format)
NSRL Library
Release Released Information
Complete library
version 2.45
(source .ZIP file)
Nov 2014 For use only with applications version 5.6 and later.
Contains the full NSRL library up through update 2.45.
See Importing the Complete NSRL Library on page 295.

Getting Started with KFF (Known File Filter) Importing KFF Data | 295
Importing the Complete NSRL Library
To add the NSRL library to your KFF Library, you import the data. You start by importing the full NSRL library.
You can then import any updates as they are available.
See About Importing the NIST NSRL Library on page 294.
See Installing KFF Updates on page 302.
Important:
The complete NSRL library data is contained in a large (3.4 GB) .ZIP file. When expanded, the data
is about 18 GB. Make sure that your file system can support files of this size.
Important:
Due to the large amount of NSRL data, it will take 3-4 hours to import the NSRL data using the KFF
Import Utility. If you import from within an application, it will take even longer.
To install the NSRL complete library
1. Extract the NSRLSOURCE_2.45.ZIP file from the KFF Installation disc.
2. On the KFF Server, launch the KFF Import Utility.
See Installing the KFF Import Utility on page 293.
3. Click Import.
4. Click Browse.
5. Browse to and select the NSRLSource_2.45 folder that contains the NSRLFile.txt file.
(Make sure you are selecting the folder and not drilling into the folder to select an individual file. The
import process will drill into the folder to get the proper files for you.)
6. Click Select Folder.
7. Click Start.
8. When the import is complete, click OK.
9. Close the Import Utility dialog and the NSRL library will be listed in the Currently Installed Sets.
Available Legacy NRSL library files
Legacy NSRL
Library Release Released Information
version 2.44
(.EXE file)
Nov 2013 For use with the legacy KFF Server that was used with
applications versions 5.5 and earlier.
Contains the full NSRL library up through update 2.44.
Install this library first.
Note: NSRL updates for the legacy KFF format will end in the
2nd quarter of 2015. From that time, NSRL updates will only
be provided in the new format.

Getting Started with KFF (Known File Filter) Importing KFF Data | 296
Importing the NDIC Hashkeeper Library
You can import the Hashkeeper 9.08 library.
For application versions 5.6 and later, these files are stored in the KFF binary format.
To import the Hashkeeper library
1. Have access the NDIC source files by download the ZIP file from the web:
1a. Go to http://www.accessdata.com/product-download.
1b. Click Known File Filter (KFF).
1c. For KFF Hash Sets, click Download Page.
1d. Click the KFF NDIC library that you want to download.
2. Extract the ZIP file.
3. On the KFF Server, launch the KFF Import Utility.
See Installing the KFF Import Utility on page 293.
4. Click Import.
5. Click Browse.
6. Browse to and select the NDIC source folder that contains the Export.xml file.
(Make sure you are selecting the folder and not drilling into the folder to select an individual file. The
import process will drill into the folder to get the proper files for you.)
7. Click Select Folder.
8. Click Start.
9. When the import is complete, click OK.
10. Close the Import Utility dialog and the NDIC library will be listed in the Currently Installed Sets.
Importing the DHS Library
You can import the DHS 1.08 library.
For application versions 5.6 and later, these files are stored in the KFF binary format.
To import the DHS library
1. Have access the NDIC source files by download the ZIP file from the web:
1a. Go to http://www.accessdata.com/product-download.
1b. Click Known File Filter (KFF).
1c. For KFF Hash Sets, click Download Page.
1d. Click the KFF DHS library that you want to download.
2. Extract the ZIP file.
3. On the KFF Server, launch the KFF Import Utility.
See Installing the KFF Import Utility on page 293.
4. Click Import.
5. Click Browse.
6. Browse to and select the DHS source folder that contains the Export.xml file.
(Make sure you are selecting the folder and not drilling into the folder to select an individual file. The
import process will drill into the folder to get the proper files for you.)

Getting Started with KFF (Known File Filter) Importing KFF Data | 297
7. Click Select Folder.
8. Click Start.
9. When the import is complete, click OK.
10. Close the Import Utility dialog and the DHS library will be listed in the Currently Installed Sets.
Installing the Geolocation (GeoIP) Data
Geolocation (GeoIP) data is used for the Geolocation Visualization feature of several AccessData products.
See About the KFF Server and Geolocation on page 286.
You can also check for and install GeoIP data updates.
If you are upgrading to 5.6 or later from an application 5.5 or earlier, you must install the new KFF Server and the
updated Geolocation data.
The Geolocation data that was used with versions 5.5 and earlier is version 1.0.1 or earlier.
The Geolocation data that is used with versions 5.6 and later is version 2014.10 or later.
To install the Geolocation IP Data
1. On the copmuter where you have installed the KFF Server, access the KFF Installation disc, and run the
autorun.exe.
2. Click the 64 bit or 32 bit Install Geolocation Data.
3. Complete the installation wizard.

Getting Started with KFF (Known File Filter) About CSV and Binary Formats | 298
About CSV and Binary Formats
When you export and import KFF data, you can use one of two formats:
-CSV
-KFF Binary
About the CSV Format
When you use the .CSV format, you use a single .CSV file. The .CSV file contains the hashes that you import or
export.
When you export to a CSV file, it contains the hashes as well as all of the information about any associated Hash
Sets and KFF Groups. You can only use the CSV format when exporting individual Hash Sets and KFF Groups.
When you import using a CSV file, it can be a simple file containing only the hashes of files, or it can contain
additional information about Hash Sets and KFF Groups.
However, CSV files will usually take a little longer to export and import.
To view the sample of a .CSV file that contains binaries and Hash Sets and KFF Groups, perform a CSV export
and view the file in Excel.
You can also use the format of CSV files that were exported in previous versions.
To import .CSV files, use the application’s KFF Import feature.
About the KFF Binary Format
When you use the KFF binary format, you use a set of files that are in an internal KFF Server (Elasticsearch)
format that is referred to as a Snapshot. The binary format is essentially a snapshot of one of the indices
contained in the KFF Server. You can only have one binary format snapshot for each index.
See Components of KFF Data on page 282.
The benefit of the binary format is that it is able to support larger amounts of data than the CSV format. For large
data sets, the binary format will export and import faster than the CSV format.
For example, when you import the DHC or NDIC Hashkeeper libraries, they are imported from a KFF binary
format.
If you export your custom Hash Sets or KFF Groups using the KFF binary format, everything in the KFF Index is
included.
See About Choosing to Export in CSV or KFF Binary Format on page 299.
When exporting in a Binary format, you specify an existing parent folder and then the name of a new sub-folder
for the binary data. The new sub-folder must not previously exist and will be created by the export process.
After export, the binary export folder contains the following:
-Indices sub-folder - The folder contains the exported KFF data
-Export.xml - This file is the only file that is not an Elasticsearch file and is created by the export feature
and contains the KFF Group and Hash Set definitions for the index.
Getting Started with KFF (Known File Filter) About CSV and Binary Formats | 299
-Index - an index file generated by Elasticsearch
-metadata-snaphot file with the data and time it was created
-snapshot-snaphot file with the data and time it was created
Note: The binary format is dependent on the version of the KFF Server. When exporting and importing the
binary format, the systems must be using the same version of the KFF Server.
When new versions of the KFF Server are released in the future, an upgrade process will also be
provided.
About Choosing to Export in CSV or KFF Binary Format
When you export your own KFF data, you have the option of using either the CSV or the binary format. The
results are different based on the format that you use:
CSV format
Exporting in
CSV format When you export KFF data using the CSV format, you can export specific specific
pieces of KFF data, such as one or more Hash Sets or one or more KFF Groups.
The exported data is contained in one .CSV file.
The benefits of the CSV format are that CSV files can be easily viewed and can
be manually edited. They are also less dependent on the version of the KFF
Server.
Importing
from CSV
format
When you import a CSV file, the data in the file is data is added to your existing
KFF data that is in the KFF Index.
See Components of KFF Data on page 282.
For example, suppose you started by manually created four Hash Sets and one
KFF Group. That would be the only contents in your KFF Index. Suppose you
import a .CSV file that contains five hash sets and two KFF Groups. They will be
added together for a total of nine Hash Sets and three KFF Groups.
To import .CSV files, use the KFF Import feature in your application.
See Using the Known File Feature chapter.
KFF binary format
Exporting in
KFF binary
format
If you export your KFF data using the KFF binary format, all of the data that you
have in the KFF Index will be exported together. You cannot use this format to
export individual Hash Sets or KFF Groups.
See Components of KFF Data on page 282.
You will only want to use this format if you intend to export all of the data in the
KFF Index and import it as a whole. This can be useful in making an archive of
your KFF data or copying KFF data from one KFF Server to another.
Because NSRL, NIST, and DHC data is contained in their own indexes, when you
do an export using this format, those sets are not included. Only the data in the
KFF Index is exported.

Getting Started with KFF (Known File Filter) About CSV and Binary Formats | 300
Importing KFF
binary format IMPORTANT: When you import a KFF binary format, it will import the complete
index and will replace any data that is currently in that index on the KFF Server.
For example, if you import the DHC library, and then later you import the DHC
library again, the DHC index will be replaced with the new import.
If you have a KFF binary format snapshot of custom KFF data (which would have
come from a binary format export) it will replace all KFF data that already exists in
your KFF Index.
For example, suppose you manually created four Hash Sets and one KFF Group.
Suppose you then import a binary format that has five hash sets and two KFF
Groups. The binary format will be imported as a complete index and will replace
the existing data. The result will be only be the imported five Hash Sets and two
KFF libraries.
When importing KFF binary files, it is recommend that you use the KFF Import
Utility.
See Installing the KFF Import Utility on page 293.
Getting Started with KFF (Known File Filter) Uninstalling KFF | 301
Uninstalling KFF
You can uninstall KFF application components independently of the KFF Data.
Main version Description
Applications 5.6
and later For applications version 5.6 and later, you uninstall the following components:
-AccessData Elasticsearch Windows Service (KFF Server) v1.2.7 and later
Note: Elasticsearch is used by multiple features in various applications, use caution
when uninstalling this service or the related data.
-AccessData KFF Import Utility (v5.6 and later)
-AccessData KFF Migration Tool (v1.0 and later)
-AccessData Geo Location Data (v2014.10 and later)
Note: This component is not used by the KFF feature, but with the KFF Server for the
the geolocation visualization feature.
The location of the KFF data is configured when the AccessData Elasticsearch Windows
Service was installed. By default, it is lactated at
C:\Program Files\AccessData\Elacticsearch\Data.
Applications 5.5
and earlier For applications version 5.5 and earlier, you can uninstall the following components:
-KFF Server (v1.2.7 and earlier)
Note: The KFF Server is also used by the geolocation visualization feature.
-AccessData Geo Location Data (1.0.1 and earlier)
This component is not used by the KFF feature, but with the KFF Server for the the
geolocation visualization feature.
The location of the KFF data was configured when the KFF Server was installed. You can
view the location of the data by running the KFF.Config.exe on the KFF Server.
If you are upgrading from 5.5 to 5.6, you can migrate your KFF data before uninstalling the
KFF Server.

Getting Started with KFF (Known File Filter) Installing KFF Updates | 302
Installing KFF Updates
From time to time, AccessData will release updates to the KFF Server and the KFF data libraries.
Some of the KFF data updates may require you to update the version of the KFF Server.
To check for updates, do the following:
1. Go to the AccessData Product Download website at http://www.accessdata.com/product-download.
2. On the Product Downloads page, click Known File Filter (KFF).
3. Open the Download page.
4. Check for updates.
-See About KFF Server Versions on page 287.
-See About Importing the NIST NSRL Library on page 294.
5. If there are updates, download them.
6. Install or import the updates.

Getting Started with KFF (Known File Filter) KFF Library Reference Information | 303
KFF Library Reference Information
About KFF Pre-Defined Hash Libraries
This section includes a description of pre-defined hash collections that can be added as AccessData KFF data.
The following pre-defined libraries are currently available for KFF and come from one of three federal
government agencies:
-NIST NSRL (The default library installed with KFF)
-NDIC HashKeeper (An optional library that can be downloaded from the AccessData Downloads page)
-DHS (An optional library that can be downloaded from the AccessData Downloads page)
Note: Because KFF is now multi-sourced, it is no longer maintained in HashKeeper format. Therefore, you
cannot modify KFF data in the HashKeeper program. However, the HashKeeper format continues to be
compatible with the AccessData KFF data.
Use the following information to help identify the origin of any hash set within the KFF
-The NSRL hash sets do not begin with “ZZN” or “ZN”. In addition, in the AD Lab KFF, all the NSRL hash
set names are appended (post-fixed) with multi-digit numeric identifier. For example: “Password Manager
& Form Filler 9722.”
-All HashKeeper Alert sets begin with “ZZ”, and all HashKeeper Ignore sets begin with “Z”. (There are a
few exceptions. See below.) These prefixes are often followed by numeric characters (“ZZN” or “ZN”
where N is any single digit, or group of digits, 0-9), and then the rest of the hash set name. Two examples
of HashKeeper Alert sets are:
“ZZ00001 Suspected child porn”
“ZZ14W”
An example of a HashKeeper Ignore set is:
“Z00048 Corel Draw 6”
-The DHS collection is broken down as follows:
In 1.81.4 and later there are two sets named “DHS-ICE Child Exploitation JAN-1-08 CSV” and
“DHS-ICE Child Exploitation JAN-1-08 HASH”.
In AD Lab there is just one such set, and it is named “DHS-ICE Child Exploitation JAN-1-08”.
Once an investigator has identified the vendor from which a hash set has come, he/she may need to consider
the vendor’s philosophy on collecting and categorizing hash sets, and the methods used by the vendor to gather
hash values into sets, in order to determine the relevance of Alert (and Ignore) hits to his/her project. The
following descriptions may be useful in assessing hits.
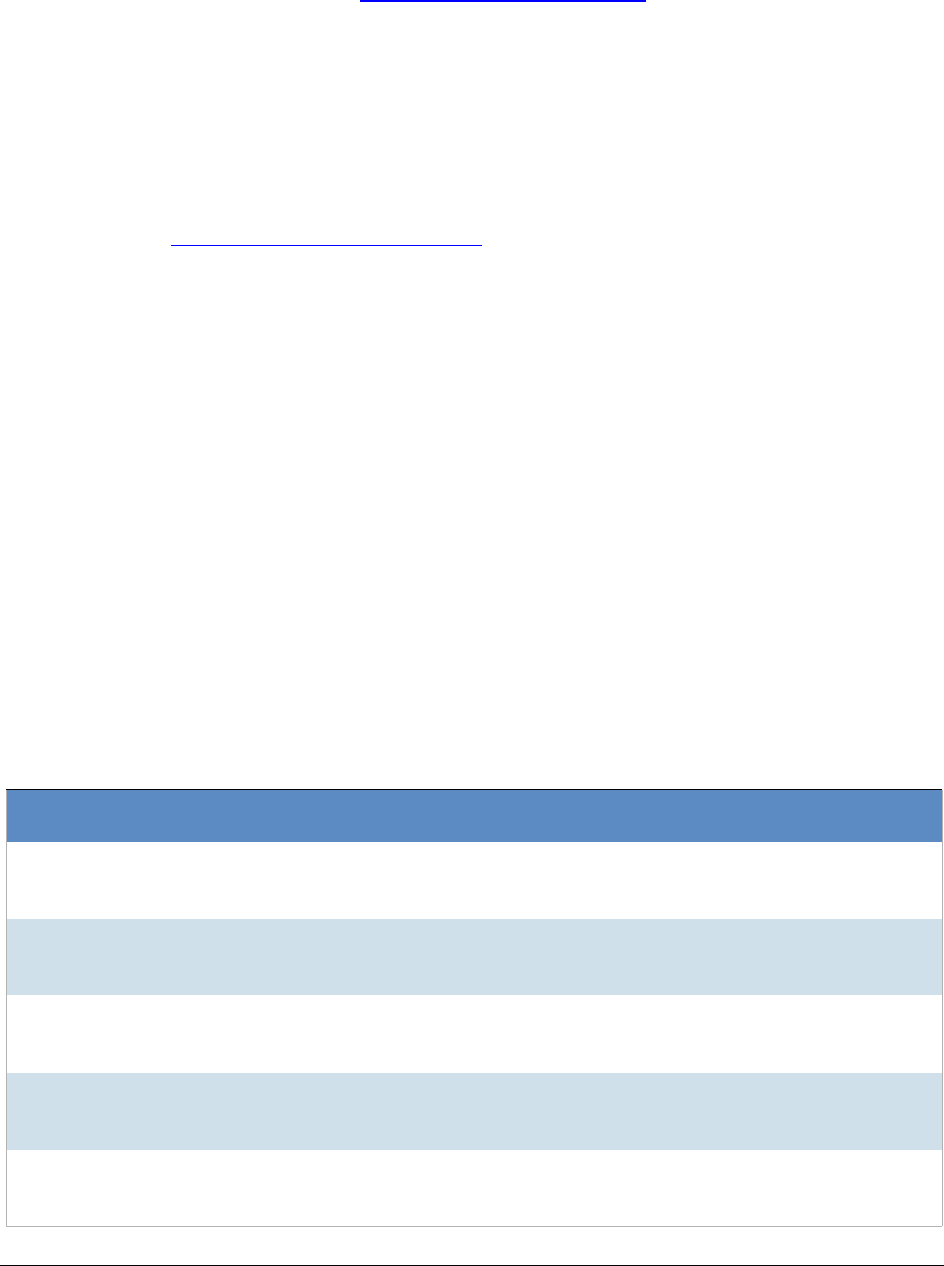
Getting Started with KFF (Known File Filter) KFF Library Reference Information | 304
NIST NSRL
The NIST NSRL collection is described at: http://www.nsrl.nist.gov/index.html. This collection is much larger than
HashKeeper in terms of the number of sets and the total number of hashes. It is composed entirely of hash sets
being generated from application software. So, all of its hash sets are given Ignore status by AccessData staff
except for those whose names make them sound as though they could be used for illicit purposes.
The NSRL collection divides itself into many sub-collections of hash sets with similar names. In addition, many of
these hash sets are “empty”, that is, they are not accompanied by any hash values. The size of the NSRL
collection, combined with the similarity in set naming and the problem of empty sets, allows AccessData to
modify (or selectively alter) NSRL’s own set names to remove ambiguity and redundancy.
Find contact info at http://www.nsrl.nist.gov/Contacts.htm.
NDIC HashKeeper
NDIC’s HashKeeper collection uses the Alert/Ignore designation. The Alert sets are hash values contributed by
law enforcement agents working in various jurisdictions within the US - and a few that apparently come from
Luxemburg. All of the Alert sets were contributed because they were believed by the contributor to be connected
to child pornography. The Ignore sets within HashKeeper are computed from files belonging to application
software.
During the creation of KFF, AccessData staff retains the Alert and Ignore designations given by the NDIC, with
the following exceptions. AccessData labels the following sets Alert even though HashKeeper had assigned
them as Ignore: “Z00045 PGP files”, “Z00046 Steganos”, “Z00065 Cyber Lock”, “Z00136 PGP Shareware”,
“Z00186 Misc Steganography Programs”, “Z00188 Wiping Programs”. The names of these sets may
suggest the intent to conceal data on the part of the suspect, and AccessData marks them Alert with the
assumption that investigators would want to be “alerted” to the presence of data obfuscation or elimination
software that had been installed by the suspect.
The following table lists actual HashKeeper Alert Set origins:
A Sample of HashKeeper KFF Contributions
Hash Contributor Location Contact Information Case/Source
ZZ00001
Suspected child
porn
Det. Mike McNown
& Randy Stone Wichita PD
ZZ00002
Identified Child
Porn
Det. Banks Union County
(NJ) Prosecutor's
Office
(908) 527-4508 case 2000S-0102
ZZ00003
Suspected child
porn
Illinois State Police
ZZ00004
Identified Child
Porn
SA Brad Kropp,
AFOSI, Det 307 (609) 754-3354 Case # 00307D7-
S934831
ZZ00000,
suspected child
porn
NDIC
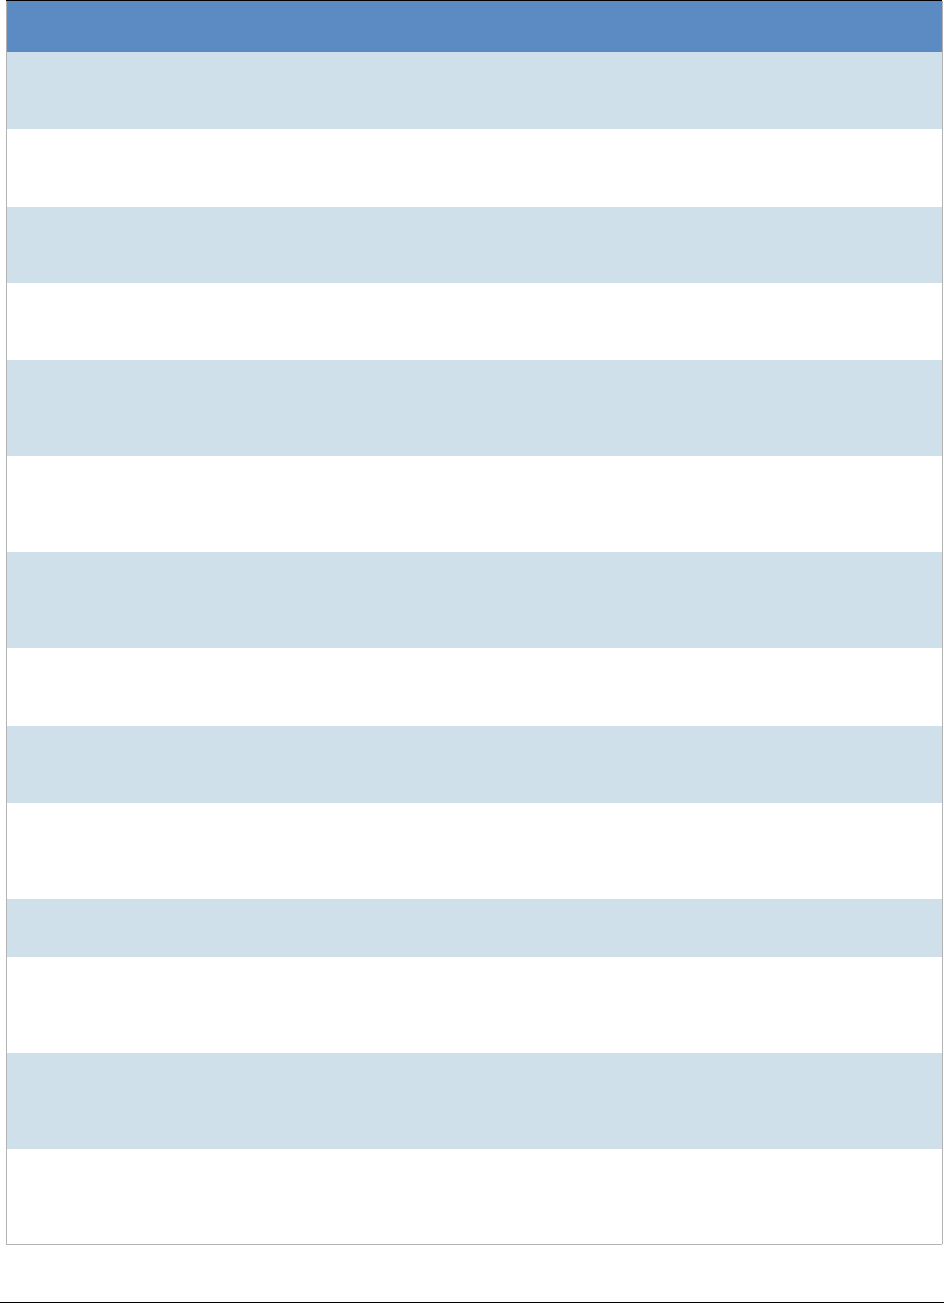
Getting Started with KFF (Known File Filter) KFF Library Reference Information | 305
ZZ00005
Suspected Child
Porn
Rene Moes,
Luxembourg Police rene.moes@police.eta
t.lu
ZZ00006
Suspected Child
Porn
Illinois State Police
ZZ00007b
Suspected KP
(US Federal)
ZZ00007a
Suspected KP
Movies
ZZ00007c
Suspected KP
(Alabama 13A-12-
192)
ZZ00008
Suspected Child
Pornography or
Erotica
Sergeant Purcell Seminole County
Sheriff's Office
(Orlando, FL,
USA)
(407) 665-6948,
dpurcell@seminoleshe
riff.org
suspected child
pornogrpahy from
20010000850
ZZ00009 Known
Child
Pornography
Sergeant Purcell Seminole County
Sheriff's Office
(Orlando, FL,
USA)
(407) 665-6948,
dpurcell@seminoleshe
riff.org
200100004750
ZZ10 Known Child
Porn Detective Richard
Voce CFCE Tacoma Police
Department (253)594-7906,
rvoce@ci.tacoma.wa.u
s
ZZ00011
Identified CP
images
Detective Michael
Forsyth Baltimore County
Police
Department
(410)887-1866,
mick410@hotmail.com
ZZ00012
Suspected CP
images
Sergeant Purcell Seminole County
Sheriff's Office
(Orlando, FL,
USA)
(407) 665-6948,
dpurcell@seminoleshe
riff.org
ZZ0013 Identified
CP images Det. J. Hohl Yuma Police
Department 928-373-4694 YPD02-70707
ZZ14W Sgt Stephen May
Tamara.Chandler@oa
g.state.tx.us,
(512)936-2898
TXOAG
41929134
ZZ14U Sgt Chris Walling
Tamara.Chandler@oa
g.state.tx.us,
(512)936-2898
TXOAG
41919887
ZZ14X Sgt Jeff Eckert
Tamara.Chandler@oa
g.state.tx.us,
(512)936-2898
TXOAG Internal
A Sample of HashKeeper KFF Contributions (Continued)
Hash Contributor Location Contact Information Case/Source
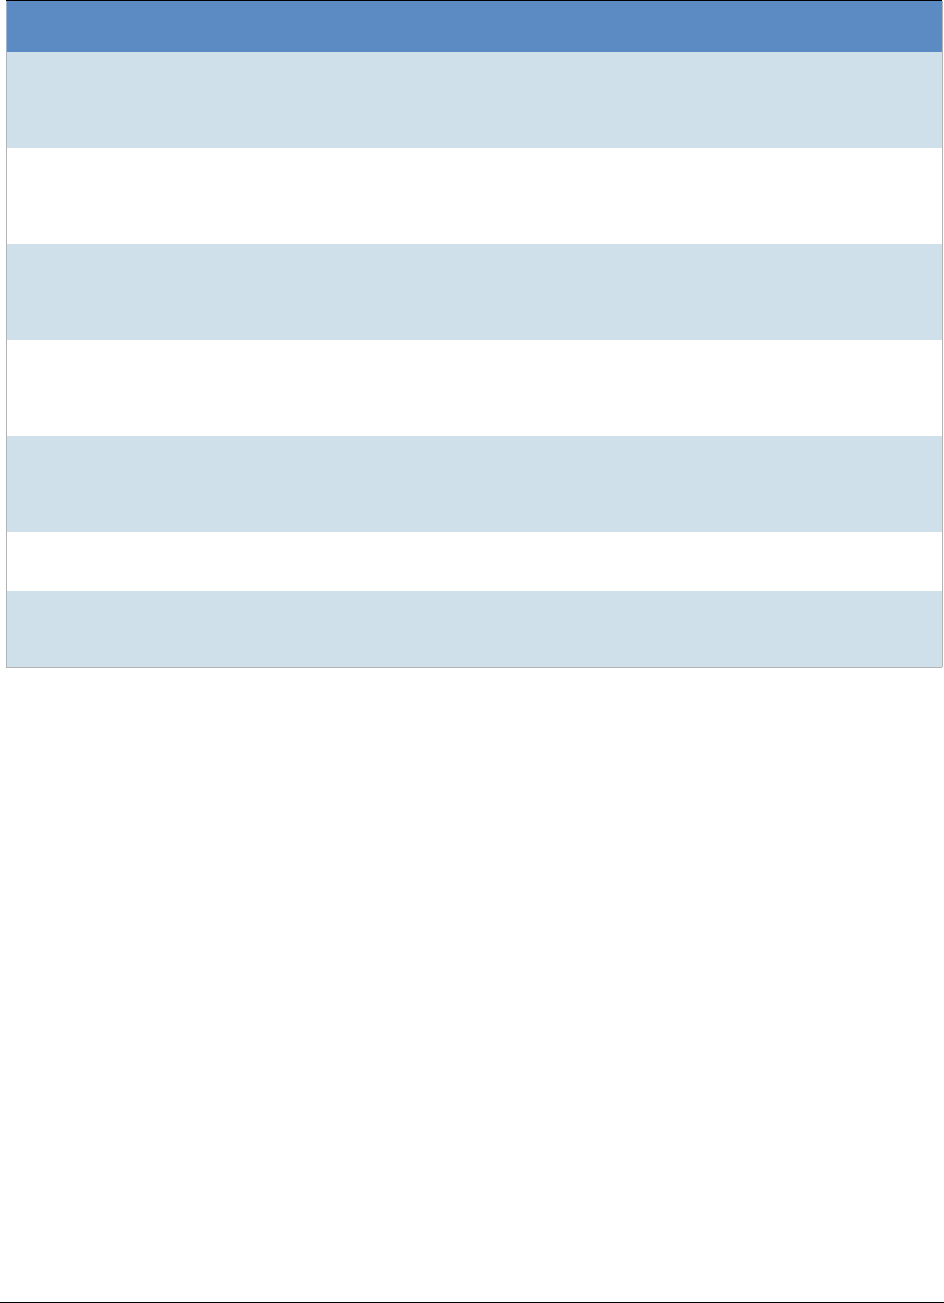
Getting Started with KFF (Known File Filter) KFF Library Reference Information | 306
The basic rule is to always consider the source when using KFF in your investigations. You should consider the
origin of the hash set to which the hit belongs. In addition, you should consider the underlying nature of hash
values in order to evaluate a hit’s authenticity.
Higher Level KFF Structure and Usage
Since hash set groups have the properties just described (and because custom hash sets and groups can be
defined by the investigator) the KFF mechanism can be leveraged in creative ways. For example:
-You could define a group of hash sets created from encryption software and another group of hash sets
created from child pornography files. Then, you would apply only those groups while processing.
-You could also use the Ignore status. You are about to process a hard drive image, but your search
warrant does not allow inspection of certain files within the image that have been previously identified.
You could do the following and still observe the warrant:
6a. Open the image in Imager, navigate to each of the prohibited files, and cause an MD5 hash value
to be computed for each.
6b. Import these hash values into custom hash sets (one or more), add those sets to a custom group,
and give the group Ignore status.
6c. Process the image with the MD5 and KFF options, and with AD_Alert, AD_Ignore, and the new,
custom group selected.
ZZ14I Sgt Stephen May
Tamara.Chandler@oa
g.state.tx.us,
(512)936-2898
TXOAG
041908476
ZZ14B Robert Britt, SA,
FBI
Tamara.Chandler@oa
g.state.tx.us,
(512)936-2898
TXOAG
031870678
ZZ14S Sgt Stephen May
Tamara.Chandler@oa
g.state.tx.us,
(512)936-2898
TXOAG
041962689
ZZ14Q Sgt Cody Smirl
Tamara.Chandler@oa
g.state.tx.us,
(512)936-2898
TXOAG
041952839
ZZ14V Sgt Karen McKay
Tamara.Chandler@oa
g.state.tx.us,
(512)936-2898
TXOAG
41924143
ZZ00015 Known
CP Images Det. J. Hohl Yuma Police
Department 928-373-4694 YPD04-38144
ZZ00016 Marion County
Sheriff's
Department
(317) 231-8506 MP04-0216808
A Sample of HashKeeper KFF Contributions (Continued)
Hash Contributor Location Contact Information Case/Source
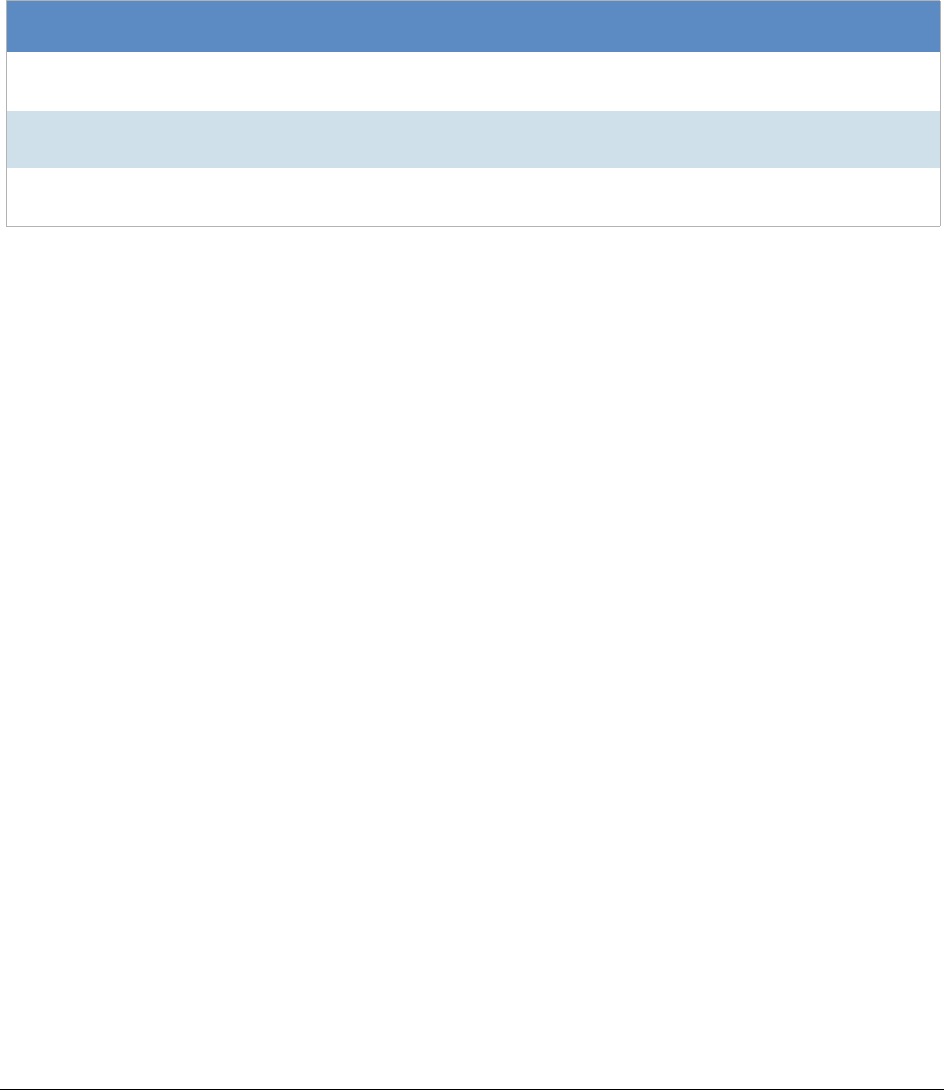
Getting Started with KFF (Known File Filter) KFF Library Reference Information | 307
6d. During post-processing analysis, filter file lists to eliminate rows representing files with Ignore
status.
Hash Set Categories
The highest level of the KFF’s logical structure is the categorizing of hash sets by owner and scope. The
categories are AccessData, Project Specific, and Shared.
Important:
Coordination among other investigators is essential when altering Shared groups in a lab
deployment. Each investigator must consider how other investigators will be affected when Shared
groups are modified.
Hash Set Categories
Category Description
AccessData The sets shipped with as the Library. Custom groups can be created from these sets, but
the sets and their status values are read only.
Project
Specific Sets and groups created by the investigator to be applied only within an individual project.
Shared Sets and groups created by the investigator for use within multiple projects all stored in the
same database, and within the same application schema.
Getting Started with KFF (Known File Filter) What has Changed in Version 5.6 | 308
What has Changed in Version 5.6
WIth the 5.6 release of Resolution1, Summation, and FTK-based products, the KFF feature has been updated.
If you used KFF with applications version 5.5 or earlier, you will want to be aware of the following changes in the
KFF functionality.
Changes from version 5.5 to 5.6
Item Description
KFF Server KFF Server now runs a different service.
-In 5.5 and earlier, the KFF Server ran as the KFF Server service.
-In 5.6 and later, the KFF Server uses the AccessData Elasticsearch
Windows Service.
For applications version 5.6 and later, all KFF data must be created in or
imported into the new KFF Server .
KFF Migration Tool This is a new tool that lets you migrate custom KFF data from 5.5 and earlier to
the new KFF Server.
NIST NSRL, NDIC HashKeeper, or DHS library data from 5.5 will not be
migrated. You must re-import it.
See Migrating Legacy KFF Data on page 289.
KFF Import Utility This is a new utility that lets you import large amounts of KFF data quicker than
using the import feature in the application.
See Using the KFF Import Utility on page 292.
KFF Libraries, Templates,
and Groups In 5.5, all Hash Sets were configured within KFF Libraries. KFF Libraries could
then contain KFF Groups and KFF Templates.
KFF Libraries and Templates have been eliminated. You now simply create or
import KFF Groups and add Hash Sets to the groups.
You can now nest KFF Groups.
NIST NSRL, NDIC
HashKeeper, or DHS
libraries
In 5.5 and earlier, to use these libraries, you ran an installation wizard for each
library. You now import these libraries using the KFF Import Utility.
See About Importing Pre-defined KFF Data Libraries on page 294.
Import Log FTK-based products no longer include the Import Log.
Resolution1 and Summation products did not have it previously.
Export When you export KFF data you can now choose two formats:
-CSV format which replaced XML format
-A new binary format
See About CSV and Binary Formats on page 298.

Using KFF (Known File Filter) About KFF and De-NIST Terminology | 309
Chapter 29
Using KFF (Known File Filter)
This chapter explains how to configure and use KFF and has the following sections:
-See About KFF and De-NIST Terminology on page 309.
-See Process for Using KFF on page 310.
-See Configuring KFF Permissions on page 310.
-See Adding Hashes to the KFF Server on page 311.
-See Using KFF Groups to Organize Hash Sets on page 317.
-See Exporting KFF Data on page 328.
-See Enabling a Project to Use KFF on page 321.
-See Reviewing KFF Results on page 323.
-See Re-Processing KFF on page 327.
About KFF and De-NIST Terminology
You can configure the interface to display either the term “KFF” (Known File Filter) or “De-NIST”. For example,
this can change references of a “KFF Group” to a “De-NIST Group.”
This does not affect the functionality of KFF, but only the term that is displayed. This allows users in forensic
environments to see the term “KFF” while users in legal environments can see the term “De-NIST.”
By default, the KFF term is used in the interface.
This setting only affects text in the interface. The following new icon is used with either setting:
In this manual, the KFF term is used.
To change the KFF and De-NIST terminology
1. In the web.config file, in the <ReviewOptions> section, add or modify the following entry:
<add key="KFFAlternateName" value="KFF" />
2. To change the setting to use De-NIST terminology, change the value= from “KFF” to “De-NIST”.
Using KFF (Known File Filter) Process for Using KFF | 310
Process for Using KFF
To use the KFF feature, you perform the following steps:
Configuring KFF Permissions
In order to create and manage KFF libraries, sets, templates, and groups, you must have one of the following
permissions:
-Administrator
-Manage KFF
You assign the Manage KFF permission to an Admin Role and then associate that role with users.
See Configuring and Managing System Users, User Groups, and Roles on page 46.
A user with project management permissions does not require the Manage KFF permission in order to enable
KFF for a new project.
Process for using KFF
Step 1. Install and configure the KFF Server.
See Installing the KFF Server on page 287.
Step 2. Configure KFF permissions.
Configuring KFF Permissions (page 310)
Step 3. Add and manage KFF hashes on the KFF Server.
See Adding Hashes to the KFF Server on page 311.
Step 4. Add and manage KFF Groups to organize KFF Hash Sets.
Using KFF Groups to Organize Hash Sets (page 317)
Step 5. Configure a project to use KFF.
See Enabling a Project to Use KFF on page 321.
Step 6. Review KFF results in Project Review.
See Reviewing KFF Results on page 323.
Step 7. (Optional) Re-process the KFF data using different hashes.
See Re-Processing KFF on page 327.
Step 8. (Optional) Archive or export KFF data to share with other KFF Servers.
See Exporting KFF Data on page 328.
Using KFF (Known File Filter) Adding Hashes to the KFF Server | 311
Adding Hashes to the KFF Server
You must add the hashes of the files that you want to compare against your evidence data. When adding hashes
to the KFF Serer, you add them in KFF Hash Sets.
See Components of KFF Data on page 282.
You can use the following methods to add hashes to the KFF Library:
About the Manage KFF Hash Sets Page
To configure KFF data, you use the KFF Hash Sets and KFF Groups pages.
To open the KFF Hash Sets page
1. Log in as an Administrator or user with Manage KFF permissions.
2. Click Management > Hash Sets
If the feature does not function properly, check the following:
-The KFF Server is installed.
See Installing the KFF Server on page 287.
-The application has been configured for the KFF Server.
See Configuring the Location of the KFF Server on page 288.
-The KFF Service is running.
In the Windows Services manager, make sure that the AccessData Elasticsearch service is started.
Migrate legacy KFF Server
data You can migrate legacy KFF data that is in a KFF Server in applications
versions 5.5 and earlier.
See Migrating Legacy KFF Data on page 289.
Import hashes You can import previously configured KFF hashes from .CSV files.
See Importing KFF Data on page 312.
Manually create and manage
Hash Sets You can manually add hashes to a Hash Set.
See Manually Creating and Managing KFF Hash Sets on page 314.
Create hashes from evidence
files in Review You can add hashes from the files in your evidence using Review.
See Adding Hashes to Hash Sets Using Project Review on page 315.
Elements of the KFF Hash Sets page
Element Description
Hash Sets Displays all of the Hash Sets that have been imported or created in the KFF Server.
Lets you create a Hash Set.
See Manually Creating and Managing KFF Hash Sets on page 314.
Using KFF (Known File Filter) Adding Hashes to the KFF Server | 312
Importing KFF Data
About Importing KFF Data
To understand the methods and formats for importing KFF data, first see About Importing KFF Data (page 291).
This chapter explains how to import KFF data using the application’s management console.
Importing KFF Hashes
You can import KFF data from the following:
-KFF export CSV files
-KFF binary files
Warning: Importing KFF binary files will replace your existing KFF data.
See About CSV and Binary Formats on page 298.
It is recommended that you use the external KFF Import Utility to import KFF binary files.
See Using the KFF Import Utility on page 292.
When importing KFF data, you can enter default values for the following fields:
-Default Status
-Default Vendor
-Default Version
Lets you edit the active Hash Set.
See Manually Creating and Managing KFF Hash Sets on page 314.
Lets you delete the active Hash Set.
Warning: You are not prompted to confirm the deletion.
See Manually Creating and Managing KFF Hash Sets on page 314.
Delete Lets you delete one or more checked Hash Sets.
View Hashes
Lets you view and manage the hashes in the Hash Set.
See Searching For, Viewing, and Managing Hashes in a Hash Set on page 315.
Import File Lets you import KFF data.
See Importing KFF Data on page 312.
Export Lets you export KFF data.
See Exporting KFF Data on page 328.
Refreshes the Hash Sets list.
Elements of the KFF Hash Sets page
Element Description
Using KFF (Known File Filter) Adding Hashes to the KFF Server | 313
-Default Package
These are default values that will be used if they import file does not contain the information.
When importing hash lists using the CSV import, each hash within the CSV can have the same, different or no
status. During the import process you must choose a default status of Alert or Ignore. This default status will
have no affect on any hash in your CSV that already contains a status, however, any hash that does not have a
pre-assigned status will have this default status assigned to them.
The override status for the hash sets that you import will be automatically set to No Override. This is to ensure
that if your hash set contains both Alert and Ignore hashes, the program will not override the original status. You
can, however, choose to override the individual hash status within a set by choosing to set the whole set to Alert
or Ignore.
You can use these value to organize your hashes. For example, you can filter or sort data based on these
values.
To import KFF hashes from files
1. Log in as an Administrator or user with Manage KFF permissions.
2. Click Management > Hash Sets.
3. Click Import File.
4. On the KFF Import File dialog, click Add File.
5. Browse to and select the file.
6. Click Select.
7. Specify a Default Status.
This sets a default status only for the hashes that do not have a status specified in the file.
8. (Optional) Specify a default Vendor, Version, and Package.
This sets values only for the hashes that do not have a value specified in the file.
9. (Optional) Add other files.
10. Click Import.
11. View the Import Summary to see the results of the Import.
12. Click Close.
To import KFF data from a binary format
Warning: This process may replace your existing KFF data.
See About the KFF Binary Format on page 298.
1. Log in as an Administrator or user with Manage KFF permissions.
2. Click Management > Hash Sets.
3. Click Import File.
4. On the KFF Import File dialog, click Binary Import.
5. Browse to the folder that contains the binary files (specifically the Export.xml file) and click Select.
6. Click Import.
Using KFF (Known File Filter) Adding Hashes to the KFF Server | 314
Manually Creating and Managing KFF Hash Sets
You can manually create Hash Sets and then add hashes to them. You can also edit and delete Hash Sets.
You can also add, edit, or delete the hashes in Hash Sets.
Note: You cannot manually add, edit, and delete hash values that were imported from NSRL, NDIC
HashKeeper, and DHS libraries.
To manually create a Hash Set
1. Log in as an Administrator or user with Manage KFF permissions.
2. Click Management > Hash Sets.
3. On the KFF Hash Sets page, in the right pane, click Add .
4. Enter a name for the Hash Set.
5. Select the status for the Hash Set: Alert, Ignore, or No Override.
6. (Optional) Enter a package, vendor, or version.
These are not required, but you can use these values for sorting and filtering results.
7. Click Save.
To manually manage Hash Sets
1. Click Management > Hash Sets.
2. Do one of the following:
-To edit a Hash Set, select a set a set, and click Edit .
-To delete a single Hash Set, select a set, and click Delete .
-To delete a multiple Hash Sets, select the sets, and click Delete .
To manage hashes in a hash set
1. On the KFF Hash Sets page, select a Hash Set.
2. Click View Hashes.
To add hashes to a hash set
1. On the KFF Hash Sets page, select a Hash Set.
2. Click View Hashes.
3. In the KFF Hash Finder dialog, click Add .
4. Enter the KFF hash value.
5. Enter the filename for the hash.
6. (Optional) Enter other reference information about the hash.
7. Click Save.
The new hash is displayed.

Using KFF (Known File Filter) Adding Hashes to the KFF Server | 315
Searching For, Viewing, and Managing Hashes in a Hash Set
Due to the large number of hashes that may be in a Hash Set, a list of hashes is not displayed. (However, you
can export a KFF Group that contains the Hash Set and view the hashes in the export file.)
You can use the KFF Hash Finder dialog to search for hash values within a hash set. You search by entering a
complete hash value. You can only search within one hash set at a time.
While the the KFF Hash Finder does not display a list of hashes, it does display the number of hashes in the set.
To search for hashes in a hash set
1. On the KFF Hash Sets page, select a Hash Set.
2. Click View Hashes.
3. In the KFF Hash Finder dialog, enter the complete hash value that you want to search for.
4. Click Search.
If the has is found, it is displayed in the hash list.
If the hash is not found a message is displayed.
To edit hashes in a hash set
1. In the KFF Hash Finder dialog, search for the hash that you want to edit.
2. Click Edit .
3. Enter the hash information.
4. Click Save.
The edited hash is displayed.
To delete hashes from a hash set
1. In the KFF Hash Finder dialog, search for the hash that you want to delete.
2. Click Delete .
Adding Hashes to Hash Sets Using Project Review
You may identify files that in exist in a project as files that you want to add to your KFF hashes. For example, you
may find a graphics file that you want to either alert for or ignore in this or other projects. Using Project Review,
you can select files and then add them to existing or new KFF Hash Sets.
When you add hashes using Project Review, it starts a job that adds the hashes to the KFF Library.
To use Project Review to add hashes to Hash Sets
1. Log in as an Administrator or user with Manage KFF permissions.
2. Select a project and enter Project Review.
3. Select the files that you want to add to a hash set.
4. In the Actions drop-down, select Add to KFF.
5. Click Go.
6. In the Add Hash to Set dialog, select a status for the hash.
Using KFF (Known File Filter) Adding Hashes to the KFF Server | 316
7. Specify a Hash Set.
You can select an existing set or create a new set.
To create a new set, do the following:
7a. Select [Add New].
7b. Enter the name of the new set.
7c. Enter a name for the hash set.
7d. (Optional) Add other information.
7e. Click Save.
To use an existing set, do the following:
7a. Select the existing set.
By default, you will only see the sets that match the status that you select.
To see Hash Sets that have a No Override status as well, enable the Display hash sets with no
override status option.
7b. Click Save.
To verify that hashes were added to the KFF Server
1. Click to exit Review.
2. On the Home page, select the project that you are using.
3. Click Work List .
See Monitoring the Work List on page 277.
Click Refresh to see the current status.
4. View the Add Hash to KFF job types.
5. Click Refresh to see the current status.
6. When the jobs are completed, at the bottom of the page, you can view the results.
It will show the number of files that were added or any errors generated.
7. From the KFF Hash Sets tab on the Management page, you can view the Hash Sets.
See Searching For, Viewing, and Managing Hashes in a Hash Set on page 315.

Using KFF (Known File Filter) Using KFF Groups to Organize Hash Sets | 317
Using KFF Groups to Organize Hash Sets
About KFF Groups
KFF groups are containers for one or more Hash Sets. When you create a group, you then add Hash Sets to the
group. KFF Groups can also contain other KFF Groups.
When you enable KFF for a project, you select which KFF Group to use during processing.
Within a KFF group, you can manually edit custom Hash Sets.
About KFF Groups Status Override Settings
When you create a KFF Group, you can choose to use the default status of the Hash Set (Alert or Ignore) or
override it. You do this by setting one of the following Status Override settings:
-Alert - All Hash Sets within the KFF Group will be set to Alert regardless of the status of the individual
Hash Sets.
-Ignore - All Hash Sets within the KFF Group will be set to Ignore regardless of the status of the individual
Hash Sets.
-No Override - All Hash Sets will maintain their default status.
For example, if you have a Hash Set with a status of Alert, if you set the KFF Group to No Override, then the
default status of Alert is used. If you set the KFF Group with a status of Ignore, the the Hash Set Alert status is
overridden and Ignore is used.
As a result, use caution when setting the Status Override for a KFF Group.
About Nesting KFF Groups
KFF Groups can contain Hash Sets or they can contain other KFF Groups. When one KFF Group includes
another KFF Group, it is called nesting.
The reason that you may want to nest KFF Groups is that you can use multiple KFF Groups when processing
your data. When you enable KFF for a case, you can only select one KFF Group. By nesting, you can use
multiple KFF Groups.
For example, you may have one KFF Group that contains Hash Sets with an Alert status. You may have a
second KFF Group that contains Hash Sets with an Ignore status. When processing a case, you may want to
use both of those KFF Groups. To accomplish this, you can create another KFF Group as a parent and then add
the other two KFF Groups to it. When processing, you would select the parent KFF Group.
When nesting KFF Groups you must be mindful of the Status Override of the parent KFF Group. The Status
Override for the highest KFF Group in the hierarchy is used when nesting KFF Groups. In most cases, you will
want to set the parent KFF Group with a status of None. That way, the status of each child KFF Group (or their
Hash Sets) is used. If you select an Alert or Ignore status for the parent KFF Group, then all child KFF Groups
and their Hash Sets will use that status.
Using KFF (Known File Filter) Using KFF Groups to Organize Hash Sets | 318
Creating a KFF Group
You create KFF groups to organize your Hash Sets. When you create a KFF Group, you add one ore more Hash
Sets to it. You can later edit the KFF Group to add or remove Hash Sets.
To create a KFF Group
1. Log in as an Administrator or user with Manage KFF permissions.
2. Click Management > Groups.
3. Click Add .
4. Enter a Name.
5. Set the Status Override.
6. See About KFF Groups Status Override Settings on page 317.
7. (Optional) Enter a Package, Vendor, and Version.
8. Click Save.
To add a Hash Sets to a KFF Group
1. Click Management > Groups.
2. In the Groups list, select the group that you want to add Hash Sets to.
3. In the Groups and Hash Sets pane, click Add.
4. Select the Hash Sets that you want to add to the group.
5. You can filter the list of Hash Sets to help you find the hash sets that you want.
6. After selecting the sets, click OK.
Viewing the Contents of a KFF Group
On the KFF Groups page, you can select a KFF Group and in the Groups and Hash Sets pane, view the Hash
Sets and child KFF Groups that are contained in that KFF Group.
Managing KFF Groups
You can edit KFF Groups and do the following:
-Rename the group
-Change the Override Status
-Add or remove Hash Sets and KFF Groups
You can also do the following:
-Delete the group
-Export the group
See Exporting KFF Data on page 328.
Using KFF (Known File Filter) Using KFF Groups to Organize Hash Sets | 319
To manage a KFF Group
1. Click Management > Groups.
2. In the Groups list, select a KFF Group that you want to manage.
3. Do one of the following:
-Click Edit.
-Click Delete.
-Click Export.
See Exporting KFF Data on page 328.
About the Manage KFF Groups Page
To configure KFF Groups, you use the KFF Groups page.
To open the KFF Groups page
1. Log in as an Administrator or user with Manage KFF permissions.
2. Click Management > Groups
If the feature does not function properly, check the following:
-The KFF Server is installed.
See Installing the KFF Server on page 287.
-The application has been configured for the KFF Server.
See Configuring the Location of the KFF Server on page 288.
-The KFF Service is running.
In the Windows Services manager, make sure that the AccessData Elasticsearch service is started.
Elements of the KFF Groups page
Tab Element Description
KFF Groups pane KFF Groups Displays all of the KFF Groups that have been
imported or created in the KFF Server.
Lets you create a KFF Group.
See Creating a KFF Group on page 318.
Lets you edit the active KFF Group.
See Managing KFF Groups on page 318.
Lets you delete the active KFF Group.
See Managing KFF Groups on page 318.
Delete Lets you delete one or more checked KFF Groups.
Using KFF (Known File Filter) Using KFF Groups to Organize Hash Sets | 320
Export Lets you export KFF data.
See Exporting KFF Data on page 328.
Refreshes the KFF Groups list.
Groups and Hash
Sets Pane Lets you add and remote Hash Sets from KFF Groups.
See Managing KFF Groups on page 318.
Add Displays the list of Hash Sets that you can add to a
KFF Group.
See Managing KFF Groups on page 318.
Remove Lets you remove Hash Sets from a KFF Group.
See Managing KFF Groups on page 318.
View Hashes Lets you view and manage the hashes in the Hash
Set.
See Searching For, Viewing, and Managing Hashes
in a Hash Set on page 315.
Elements of the KFF Groups page
Tab Element Description
Using KFF (Known File Filter) Enabling a Project to Use KFF | 321
Enabling a Project to Use KFF
When you create a project, you can enable KFF and configure the KFF settings for the project.
About Enabling and Configuring KFF
To use KFF in a project you do the following:
Enabling and Configuring KFF
To enable and configure KFF for a project
1. Log in as an Administrator or user with Create/Edit Projects permissions.
2. Create a new project.
3. In Processing Options, select Enable KFF.
A Options tab option displays.
4. In Processing Options, select how to handle ignorable files.
5. Click Options.
The KFF Options window displays.
Process for enabling and configuring KFF
1. Create a new Project If you want to use KFF you must enable it when you create the project. You
cannot enable KFF for a project after it has been created.
2. Enable KFF Enable the KFF processing option.
See Enabling and Configuring KFF on page 321.
2. Configure how to
process ignorable files You can choose how to process ignorable files:
-Skip Ignorable Files - This option will not process any files determined to be
Ignorable. Any files that are ignorable will not be included or visible in the
project.
This is the default option.
-Process and Flag Ignorable Files - This option will process ignorable files, but
flag them as Ignorable. Any files that are Ignorable will be included and visi-
ble in the project, but can be filtered.
See Using Quick Filters on page 324.
4. Select a KFF Group When enabling KFF for a project, you select one KFF Group that you want to
use. You do not create KFF Group at that time. You can only select an existing
group. Because of this, you must have at least one KFF Group created before
creating a project.
See Using KFF Groups to Organize Hash Sets on page 317.
However, after processing, you can re-process the data using a different KFF
template. This lets you create and use different templates after you initially
process the project.
See Re-Processing KFF on page 327.

Using KFF (Known File Filter) Enabling a Project to Use KFF | 322
6. In the drop-down menu, select the KFF Group that you want to use.
See Using KFF Groups to Organize Hash Sets on page 317.
7. In the Hash Sets pane, verify that this template has the hash sets that you want. Otherwise select a
different template.
8. Click Create Project and Import Evidence or click Create Project and add evidence later.

Using KFF (Known File Filter) Reviewing KFF Results | 323
Reviewing KFF Results
KFF results are displayed in Project Review.
You can use the following tools to see KFF results:
-Project Details page
-Project Review
KFF Information Quick Columns
KFF Quick Filters
KFF facets
KFF Details
You can also create and modify KFF libraries and hash sets using files in Review.
See Adding Hashes to Hash Sets Using Project Review on page 315.
Viewing KFF Data Shown on the Project Details Page
To View KFF Data on the Project Details page
1. Click the Home tab.
2. Click the Project Details tab.
3. In the right column, you can view the number of KFF known files.
About KFF Data Shown in the Review Item List
You can identify and view files that are either Known or Unknown based on KFF results.
Depending on the KFF configuration options, there are two or three possible KFF statuses in Project Review:
-Alert (2) - Files that matched hashes in the template with an Alert status
-Ignore (1) - Files that matched hashes in the template with an Ignore status (not shown in the Item List by
default)
-Unknown (0) - Files that did not match hashes in the template
If you configured the project to skip ignorable files, files configured to be ignored (Ignore status) are not included
in the data and are not viewable in the Project Review.
See Enabling and Configuring KFF on page 321.
Using the KFF Information Quick Columns
You can use the KFF Information Quick Columns to view and and sort and filter on KFF values. For example,
you can sort on the KFF Status column to quickly see all the files with the Alert status.
See Using Document Viewing Panels on page 76.
To see the KFF columns, activate the KFF Information Quick Columns.
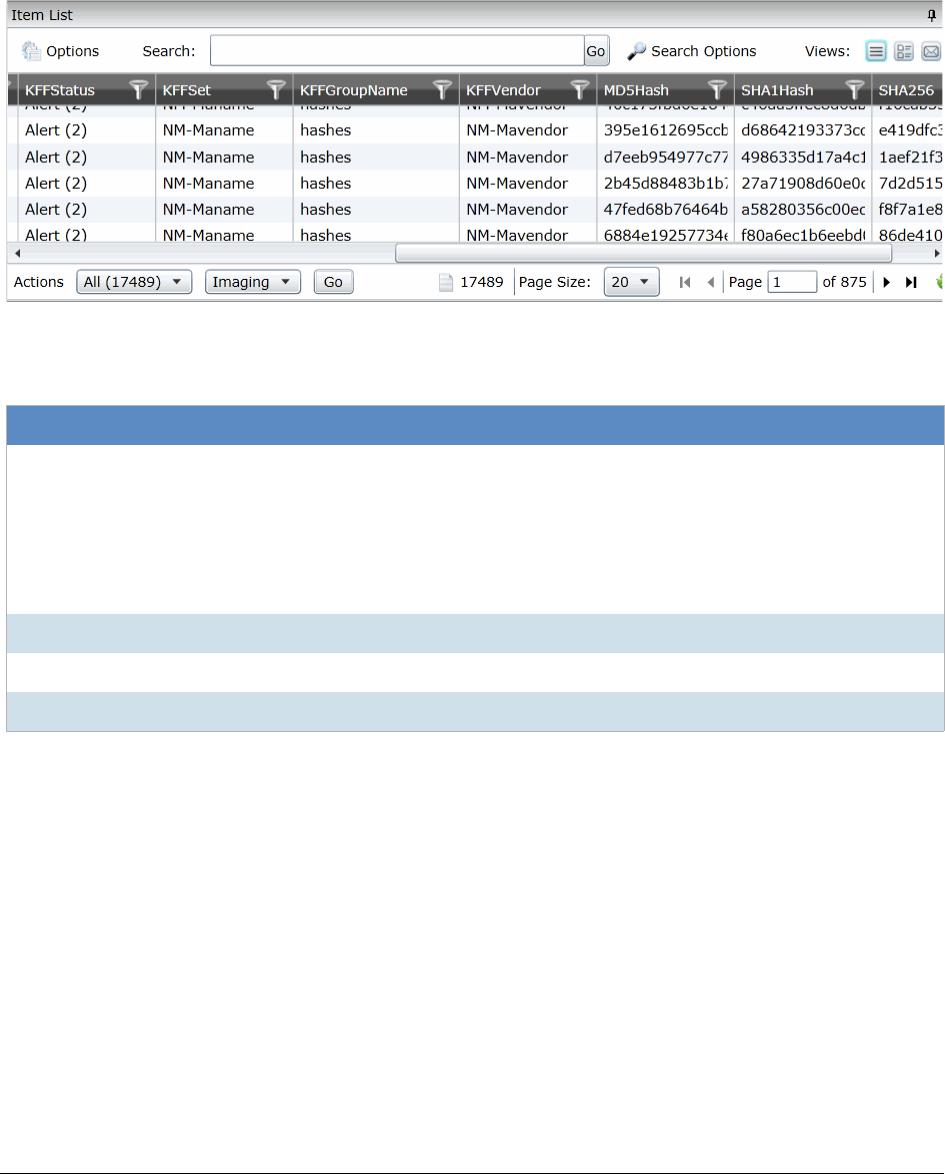
Using KFF (Known File Filter) Reviewing KFF Results | 324
To activate the KFF Information Quick Columns
1. From the Item List in the Review window, click Options.
2. Click Quick Columns > KFF > KFF Information.
The KFF Columns display.
Item List with KFF Tabs displayed
See Filtering by Column in the Item List Panel on page 139.
Using Quick Filters
You can use Quick Filters to quickly show or hide KFF Ignorable files.
You can toggle the quick filter to do the following:
-Hide Ignorables - enabled by default
-Show Ignorables
The Hide Ignorables Quick Filter is set by default. As a result, even if you selected to process and flag Ignorable
files for the project, they are not included in the Item List by default.
To show ignorable files in the Item list, change the Quick Filter to Show Ignorables.
KFF Columns
Column Description
KFF Status Displays the status of the file as it pertains to KFF. The three options are
Unknown (0), Ignore (1), and Alert (2).
-If you configured the project to skip Ignorable files, these files are not
included in the data.
-If you configured the project to flag Ignorable files, and the Hide Ignorables
Quick Filter is set, these files are in the data, but are not displayed.
See Using Quick Filters on page 324.
KFF Set Displays the KFF Hash Set to which the file belongs.
KFF Group Name Displays the name created for the KFF Group in the project.
KFF Vendor Displays the KFF vendor.

Using KFF (Known File Filter) Reviewing KFF Results | 325
Note: If you configured the project to skip ignorable files, files configured to be ignored (Ignore status) will not
be shown, even if you select to Show Ignorables.
To change the KFF Quick Filters
1. From the Item List in the Review window, click Options.
2. Click Quick Filters > Show Ignorables.
Using the KFF Facets
You can use the KFF facets to filter data based on KFF values. For example, you can apply a facet to only
display items with an Alert status or with a certain KFF set.
See About Filtering Data with Facets on page 124.
Note: If you configured the project to skip Ignorable files, these files are not included in the data and the Ignore
facet is not available. If you configured the project to flag Ignorable files, and the Hide Ignorables Quick
Filter is set, the Ignore facet is available, but the files will not be displayed.
See Using Quick Filters on page 324.
You can use the following KFF facets:
-KFF Vendors
-KFFGroups
-KFF Statuses
-KFF Sets
Within a facet, only the filters that are available in the project are available. For example, if no files with the Alert
status are in the project, the Alter filter will not be available in the KFF Statuses facet.
To apply KFF facets
1. From the Item List in the Review window, open the facets pane.
2. Expand KFF.
3. Select the facets that you want to apply.
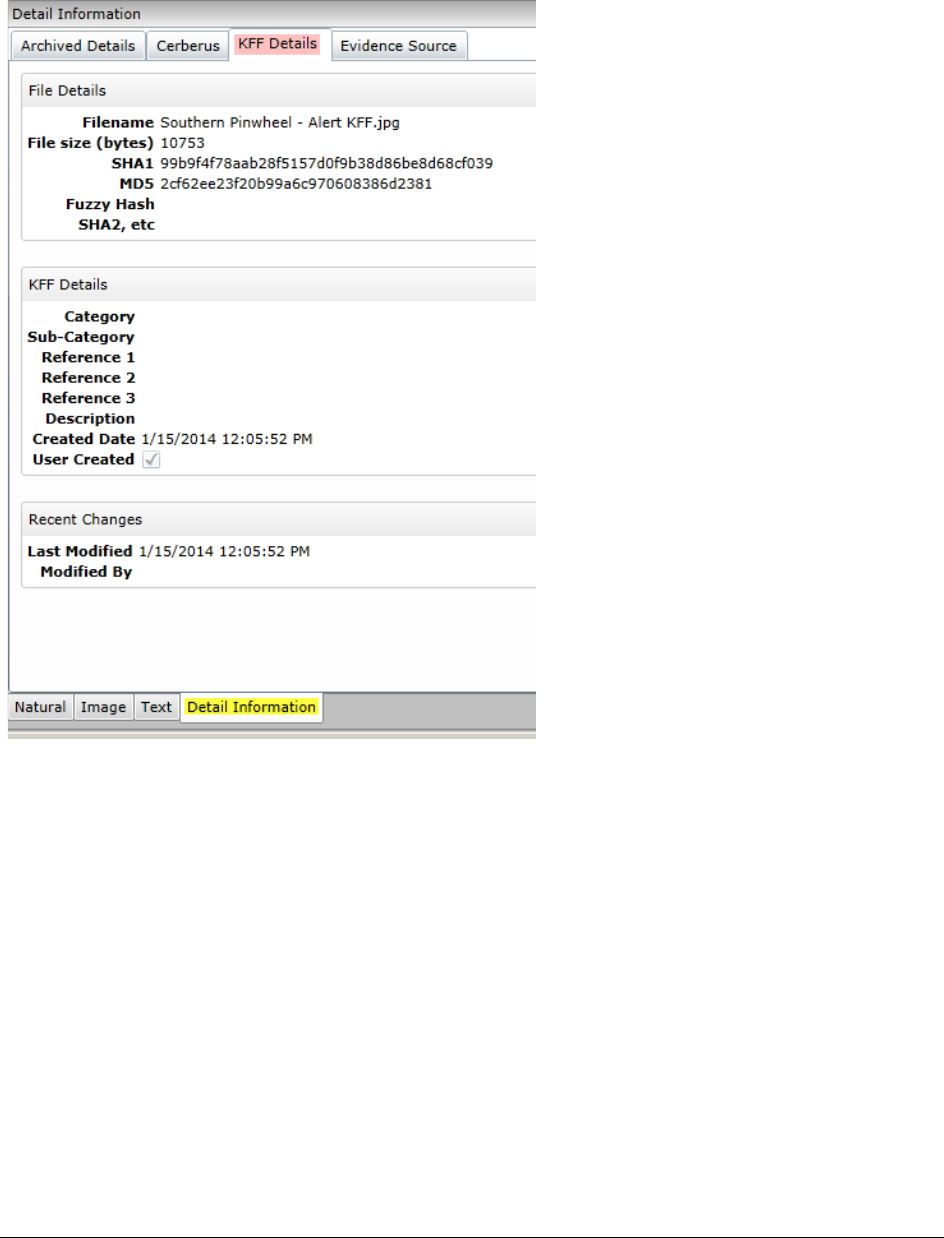
Using KFF (Known File Filter) Reviewing KFF Results | 326
Viewing Detailed KFF Data
You can view KFF results details for an individual file.
To view the KFF Details
1. For a project that you have run KFF, open Project Review.
2. Under Layouts, select the CIRT Layout.
See Managing Saved Custom Layouts on page 55.
3. In Project Review, select a file in the Item List panel.
4. In the view panel, click the Detail Information view tab.
5. Click the KFF Details tab.
Using KFF (Known File Filter) Re-Processing KFF | 327
Re-Processing KFF
After you have processed a project with KFF enabled, you can re-process your data using an updated or
different KFF Group. This is useful in re-examining a project after adding or editing hash sets.
See Adding Hashes to Hash Sets Using Project Review on page 315.
If you want to re-process KFF with updated hash sets, be sure that the selected KFF Group has the desired sets.
You can only select from existing KFF Groups.
To re-process KFF
1. From the Home page, select a project that you want to re-process.
2. Click the tab.
The currently selected group is displayed along with its corresponding hash sets.
3. (Optional) If you want to change the KFF Group, in the the drop-down menu, select a different KFF
Group and click Save.
4. In the Hash Sets pane, verify that the desired sets are included.
5. Click Process KFF.
6. (Optional) On the Home page, for the project, click Work Lists , and verify that the KFF job starts
and completes.
See Monitoring the Work List on page 277.
7. Click Refresh to see the current status.
8. Review the KFF results.
See Reviewing KFF Results on page 323.

Using KFF (Known File Filter) Exporting KFF Data | 328
Exporting KFF Data
About Exporting KFF Data
You can share KFF Hash Sets and KFF Groups with other KFF Servers by exporting KFF data on one KFF
Server and importing it on another. You can also use export as a way of archiving your KFF data.
You can export data in one of the following ways:
-Exporting Hash Sets - This exports the selected Hash Sets with any included hashes. (CSV format only)
-Exporting KFF Groups - This exports the selected KFF Groups with any included sub-groups and any
included hashes. (CSV format only)
-Exporting an archive of all custom KFF data - This exports all the KFF data except NSRL, NIST, and DHC
data (in a binary format).
When exporting KFF Groups or Hash Sets, you can export in the following formats:
-CSV file
-Binary format
Important: Even though it appears that you can select and export one Hash Set or one KFF Group, if
you export using the KFF binary format, all of the data that you have in the KFF Index will be exported
together. You cannot use this format to export individual Hash Sets or KFF Groups. Use the CSV format
instead.
See About CSV and Binary Formats on page 298.
Exporting KFF Groups and Hash Sets
You can share KFF hashes by exporting KFF Hash Sets or KFF Groups. Exports are saved in a CSV file that can
be imported.
To export a one or more KFF Groups or Hash Sets
1. Do one of the following:
-Click Management > Hash Sets.
-Click Management > Groups.
2. Select one or more KFF Groups or Hash Sets that you want to export.
3. Click Export.
4. Select CSV (do not select Export Binary).
5. Browse to and select the location to which you want to save the exported file.
6. Click Select.
7. Enter a name for the exported file.
8. Click OK.
9. In the Export Summaries dialog, view the status of the export.
10. Click Close.
Using KFF (Known File Filter) Exporting KFF Data | 329
To create an archive of all your custom Hash Sets and Groups
1. Do one of the following:
-Click Management > Hash Sets.
-Click Management > Groups.
2. Select a KFF Group or Hash Set.
3. Click Export.
4. Select Export Binary.
5. Browse to and select the location to which you want to save the exported files.
6. Click Select.
7. Enter a name for the folder to contain the binary files (This is a new folder created by the export).
8. Click OK.
9. In the Export Summaries dialog, view the status of the export.
10. Click Close.
To view the Export History
1. Do one of the following:
-Click Management > Hash Sets.
-Click Management > Groups.
2. Click Export.
3. Select View Export History.
4. In the Export Summaries dialog, view the status of the export.
5. Click Close.
Integrating with AccessData Forensics Products | 330
Chapter 30
Integrating with AccessData Forensics
Products
Web-based products (Summation, Resolution1, Resolution1 eDiscovery, and Resolution1 CyberSecurity) can
work collaboratively with FTK-based forensics products, (FTK, Lab, FTK Pro, and Enterprise).
Note: For brevity, in this chapter, all FTK-based products will be referenced as FTK and all Summation and
Resolution1 applications will be referenced as Summation.
You can access the same project data on the same database to perform legal review and forensic examination
simultaneously. The benefit of this compatibility is that FTK provides some features that are not available in the
web-based products. For example, you can create projects in Summation and then open, review, and perform
additional tasks in FTK and then continue your work in Summation.
Using FTK, you can do the following with Summation projects:
-Open and review a project
-Backup and restore a project
-Add and remove evidence
-Perform Additional Analysis after the initial processing
-Search, index, and label data
-View graphics and videos
-Export data
Important:
For compatibility, the version of the web-based product and the version for FTK must be the same--
both must be 5.0.x or be 5.1.x. For example:
Summation 5.2.x must be used with FTK 5.2.x
Resolution1 5.5 must be used with FTK 5.5

Integrating with AccessData Forensics Products Installation | 331
Installation
You can install FTK and Summation on either the same computer or on different computers. The key is that they
share a common database. The database that the data is stored in is unified so that the data can be shared
between products.
It is recommended that you install the web-based product first, configure the database, and then install FTK and
point FTK to that database. The administrator account for the web-based product is the administrative account
for the database for FTK.
When launching FTK and logging into the database, you use the administrator credentials from the web-based
product.
Important:
For compatibility, the version for Summation and the version for FTK must be the same.
Important:
Note that FTK and Summation may use different versions of the processing engine. If this is the case
there will be information in the Release Notes.
Managing User Accounts and Permissions Between
FTK and Summation/Resolution1 eDiscovery
You can create a user account in either product and then use that user name in the other product.
Permissions
When users are assigned permissions in one application, such as Summation, the permissions of the user in
FTK are not affected.
Creating and Viewing Projects
Using either product, you can create projects and add evidence to that project. You can then use either product
to open the project and perform tasks on the project data.
You can have users in each program reviewing the data at the same time.
Managing Evidence in FTK
Adding Evidence using FTK
You can use FTK to add evidence to a project that was created in Summation. Reviewers in Summation can
then review the new evidence. Using FTK, you can add live evidence and static evidence. When you add
evidence, you can add image files (such as AD1, E01), individual files, physical drives, and logical drives.
Important:
When you collect volatile data in FTK, you cannot see it in Summation.

Integrating with AccessData Forensics Products Creating and Viewing Projects | 332
Processing Evidence using FTK
FTK provides processing options that are not available in Summation. You can utilize the processing abilities of
FTK and then review the data in Summation/Resolution1 eDiscovery. You can do all processing in FTK or you
can perform an Additional Analysis in FTK after an initial processing.
The following are examples of additional processing options that are available in FTK:
-Processing Profiles
-Known File Filter (KFF)
-Automatic File Decryption
-Create Thumbnails for Video
-Generate Common Video File
-Explicit Image Detection
-PhotoDNA
-Cerberus Analysis
When you create a project with specific processing options, those options are maintained when the project is
viewed in the other product. (15940)
Important:
If you create a project in Summation, process the evidence, then add more evidence using FTK, if
you compare the JobInformation.log files, the processing options applied by FTK are different from
Summation.
Managing Evidence Groups in FTK and People in Summation
It is important to note that FTK does not use people, but rather has evidence groups. Evidence groups let you
create and modify groups of evidence. In FTK, you can share groups of evidence with other projects, or make
them specific to a single project.
When you create people in a project in Summation, and then look at the project in FTK, the people will be listed
as evidence groups. The opposite is also true. If you create an evidence group in FTK, it will be listed as a
person in Summation.
Important:
When you use FTK to add data to an evidence group that was an existing Summation person, two
child entries of the same person are created for the data. When you look at the person data in
Summation, there will be two child objects under the person with the same name, one with
Summation data and the other with FTK data.
Reviewing Evidence in FTK
Searching Evidence using FTK
You can use FTK to search evidence in Summation projects. The search capabilities in FTK are more robust
than Summation. In FTK, you can perform an index search as well as a live search. Live search includes options
such as text searching, pattern searching, and hexadecimal searching.
Important: Note the following issue:

Integrating with AccessData Forensics Products Creating and Viewing Projects | 333
-Issue: The search results counts for the same project may be different when viewed in the different
products due to the way search options are executed in the respective products. For example:
Summation only search columns that are visible to the user. FTK will search columns that are not
visible to a Resolution1 user.
Re-indexing the data will change the search results.
-Because of FTK’s Live Search feature, FTK will return more search results hits than in Summation.
Labeling Evidence Using FTK
After searching and identifying data in FTK, you can label the data and then review the project in Summation and
see the labeled data. You can then perform additional review, culling, and export tasks.
Viewing Labeled Evidence in FTK
When reviewing data in Summation, you can label data, and then that labeled data is viewable in FTK. This can
be useful in workflow management. For example, when reviewing the data, you can label data indicating that it
needs additional analysis. When the project is opened in FTK, the labeled data is visible.
Exporting Data using FTK
You can review and cull data in Summation and then export the data from FTK using its export capabilities.
The following are examples of what you can export using FTK:
-Export files to an AD1 Image file
-Save file list information
-Export the contents of the project list to a word list
-Export hashes from a project
-Export search hits
-Export emails to PST or MSG
Viewing Documents Groups and Review Sets in FTK
Important: In Summation, there are separate views and permissions defined for Document Groups and Review
Sets. In FTK, Document Groups and Review Sets that were created in Summation are displayed within the
Manage Labels dialog.
Reviewing FTK Data in Summation
You can use the following review features in Summation to help manage the workflow of working with data that
was added and processed using FTK.
-Review the data by reviewers in the Web console.
-Cull the data and get the desired data set.
-Export the data using Summation using its export capabilities.

Integrating with AccessData Forensics Products Known Issues with FTK Compatibility | 334
Known Issues with FTK Compatibility
See the product’s and FTK Release Notes for a list of known issues with FTK Compatibility.
