FIRECARES User Guide
User Manual: Pdf
Open the PDF directly: View PDF ![]() .
.
Page Count: 20

User and Implementation Guide
Version 1.5 • January 16, 2018
Analyze how fire department resources
are deployed to match a community’s risks.


i
Contents
Contents ............................................................................................................i
List of Figures....................................................................................................ii
List of Acronyms ..............................................................................................ii
1. Introduction to FireCARES ..........................................................................1
2. FireCARES Scores ..........................................................................................2
2.1 Community Risk ..................................................................................................2
2.2 Fire Department Performance Score................................................................3
2.3 Safe Grade ..........................................................................................................5
3. Using FireCARES.org ....................................................................................6
3.1 Logging In............................................................................................................ 7
3.2 Department Details ..........................................................................................11
3.3 Annual Structure Fires......................................................................................13
3.4 Station Detail Page ..........................................................................................14
3.5 Interactive Fires Heat Map ..............................................................................16
3.6 Interactive Parcel Data ....................................................................................17
3.7 Predicted Fire Estimates ..................................................................................18
4. Checking Your Department’s Data ..........................................................20
5. Project Partners..........................................................................................21
References

ii
List of Charts and Figures
2.1 Community Risk Scores ..................................................................................2
2.2 Performance Score ..........................................................................................3
3.1 FireCARES Homepage ......................................................................................4
3.2 FireCARES Search Results................................................................................5
3.3 FireCARES Department Landing Page (without login) ................................5
3.4 FireCARES Login Dialog....................................................................................5
3.5 FireCARES Register Dialog ..............................................................................6
3.6 FireCARES Department Landing Page............................................................6
3.7 Department Protected Population and Area ................................................7
3.8 Department Summary ....................................................................................7
3.9 Annual Counts of Structure Fires
(completed structure fire module in NFIRS and total fire calls) ................ 7
3.10 GIS-Based Response Polygons for 0-4 Minute Travel Times
(4-6 minute travel times, and 6-8 minute travel times) ..............................8
3.11 Apparatus and Staffing Table..........................................................................8
3.12 Interactive Geospatial Map of Fires
(sortable by time and parcel hazard level) ....................................................9
3.13 Interactive Map Showing Hazard Level of Parcels (as well as parcel
specific informationsuch as age, footprint, number of floors) ..................9
3.14 Estimated Prediction of Number of Fires, Fire Size, and
Number of Causalities ..................................................................................10

iii
List of Acronyms
DHS Department of Homeland Security
ERF Effective Response Force
FDID Fire Department ID
FEMA Federal Emergency Management Agency
IAFC International Association of Fire Chiefs
IAFF International Association of Fire Fighters
UL FSRI UL Firefighter Safety Research Institute
NIST National Institute of Standards and Technology
NFIRS National Fire Incident Reporting System


1
A fire department’s relationship with data and performance should be
seen as a continuum. Statements regarding a department’s need to have
good data and good performance are numerous. However, these
statements are not the same. e beginning of the quality performance
continuum is for a department to have good data. Good data is defined
as data that are based on factual incidents, reported accurately, and can
be accessed and manipulated easily. It can take a department a long
time to work on its data, but it is important to recognize its ability to
quantify impact before instituting change. Without good data there is
no assurance that improvement efforts actually work.
Once a department has improved its data quality, it can begin working
on having good performance. Good performance is the end of the
quality improvement continuum. For example, improving fire station
layouts to reduce turnout time, working with the communications
center to streamline call processing, conducting targeted staff training,
investing in community risk reduction efforts, and deploying
additional/alternate resources within a jurisdiction are all ways to
improve performance. A knee-jerk reaction to observing a given
performance metric for a department may be to say that “the metric is
wrong.” However, in determining the root cause, it is important to
distinguish whether the data used in the calculations are wrong or the
performance itself is poor.
FireCARES is designed to analyze how fire department resources are
deployed to match community risks. Local government decision
makers oen alter fire department resources faster than fire service
leaders can evaluate the potential impact. ese decisions can leave a
community without sufficient resources to respond to emergency calls
safely, efficiently, and effectively. ese decisions can have even greater
impact on vulnerable populations, including the elderly, young
children, and people with disabilities. FireCARES — Community
Assessment, Response Evaluation System — is an analytical system
designed to evaluate community risk and fire department operational
performance using national data layers in a geographic-based system.
e FireCARES project provides fire departments the ability to add a
technical basis to what has historically been an anecdotal discussion
regarding community hazards and risks, as well as the impact of
changes to fire department resource levels. FireCARES includes more
than a decade of research on structure fires and related injuries and
deaths, as well as building footprints, housing and mobile home units,
public health and census data, and locations of vulnerable populations.
e goal of the project, which is funded by DHS/FEMA’s Assistance to
Firefighters Grant program is to aggregate national and local data to
provide answers that both public and fire service leaders have not
previously had. To accomplish this task, FireCARES provides three
scores for each community dependent on the available data: the
Community Risk Score, the Fire Department Performance Score, and
1. Introduction to FireCARES
2
To assess risk and fire department performance, it was important to
establish filters that define comparisons between departments. A small
rural department does not face the same risks or have the same
resources as a major metropolitan department. erefore, it would be
unfair to both departments for that comparison to occur. Currently,
department comparison groups are determined by NFPA geographical
region (Northeast, South, Midwest, and West) and population protected
class (there are 10 NFPA population protected classes).
2.1 Community Risk
e community risk score was developed as a function of the
socio-demographic and geographic characteristics of the locations
(census tracts) of reported structure fires over a seven-year period
(2008-2014), according to available National Fire Incident Reporting
System (NFIRS) data. e community risk score is determined by
assessing variables that are known to contribute to fire, such as
building materials, population demographics, and smokers. e
socio-demographic attributes include:
• Population characteristics (e.g., size category of the department,
population, number of males, age group counts, race counts)
• Housing characteristics (e.g., total housing units, total vacancies, size
of home, number of renters, age of units)
• Household characteristics (e.g., median household income, social
vulnerability index)
• Geographic region
Community risk assessment scores are calculated for the community as
a whole. e community risk scores actually contain three separate
scores:
• Risk of Fire
• Risk of Fire Spread
• Risk of Death and Injury
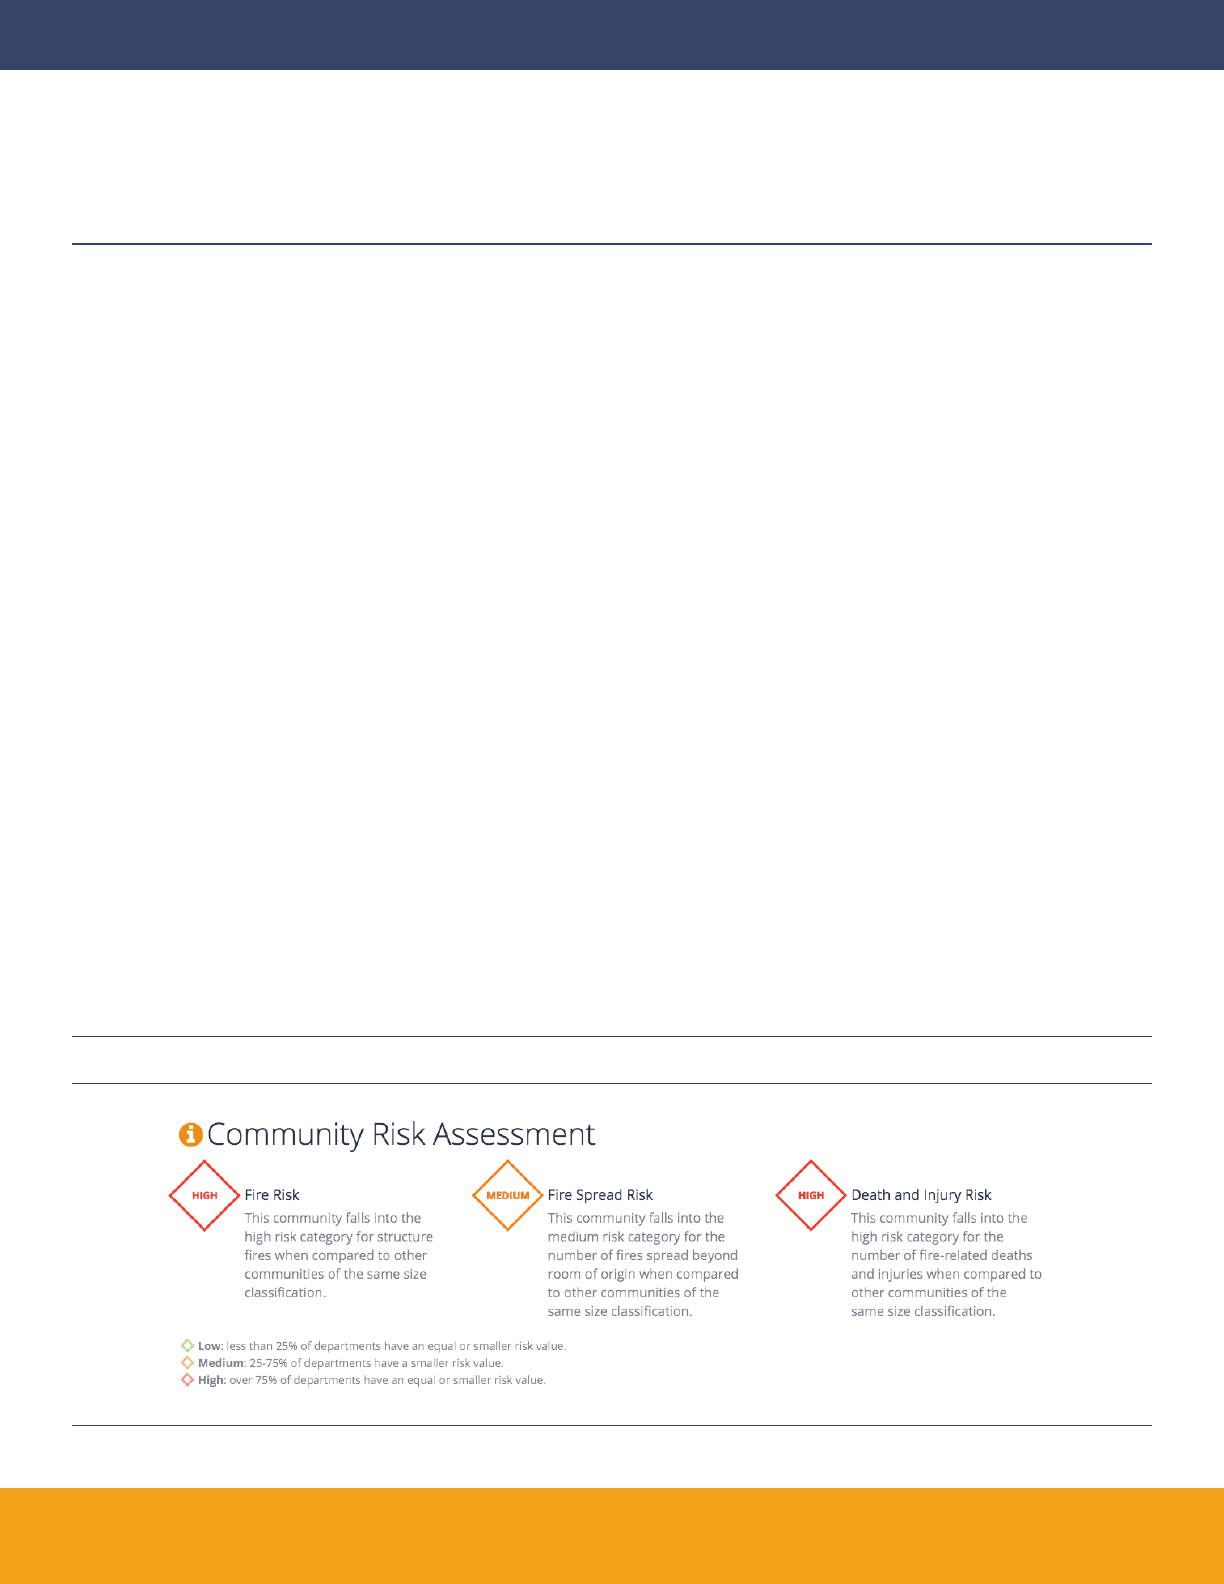
Once scores are determined for each jurisdiction, the jurisdictions are
grouped with similar areas and populations. e grouping then allows a
comparison of community risk scores between each jurisdiction. e
jurisdictions in the like group are then ranked into the top 25%, the
medium 50%, and the lower 25% in their group. Figure 2.1 shows how
the community risk scores are displayed. For this example department,
the community risk would read, “the community this department
protects is at a high risk for the occurrence of fire.” at means the
community falls into the bottom quartile (riskiest 25%) compared to
similar jurisdictions.
2. FireCARES Scores
Figure 2.1: Community Risk Scores
3
2.2 Fire Department Performance Score
e goal of the fire department performance score is to assess how well a
fire department performs compared to the standardized version of itself.
One component of this metric is the structure fire spread category from
NFIRS. is category provides information that quantifies the fire spread
in a structure from confined to object of origin through spread beyond
structure of origin. ere are five categories defined in NFIRS, but for
this analysis the data are collapsed into three categories:
room of origin (lumping object and room together); floor of origin
(lumping floor and structure together); and beyond structure of origin.
e resulting distribution (count of fires in each of the three bins) of fire
spread is the basis for comparison for developing the performance score.
e second component of this score is the model that defines how the
fire department would perform if it was acting as a standard, idealized
version of itself. e concept is that there exists a theoretical version of
every fire department where all responses meet or exceed the national
standards governing department performance. Essentially, a fire
department responding to a fire must complete a series of tasks before it
can put water on the fire. For purposes of this model these tasks are
broken up as follows:
• Time to alarm - Time required before the fire is noticed, and some
form of action is taken [NIST TN 1661 [1], NIST TN 1797 [2]]
• Time to dispatch - Time required for dispatch operator to obtain
enough information regarding the fire and location to issue a dispatch
[NFPA 1710/1720 [3, 4]]
• Time to turnout - Time required for fire fighter turnout [NFPA
1710/1720 [3, 4]]
• Time to arrival - Transit time required for engine between station and
fire location [NFPA 1710/1720 [3, 4], GIS]
• Time to ascend - Transit time required for fire fighters to ascend to the
staging floor for fires in buildings. Data for ascent was gathered from
timed 27-story climb experiments with 35 fire fighters of varying age,
height, weight, and gender. Note this parameter is only enacted when
staging would occur above ground level.
• Time to suppress - Time required for fire fighters on scene to put
water onto fire (includes size-up, hose connection, etc.) [NIST TN
1661 [1], NIST TN 1797 [2]]
When water is put onto a fire, the idealized fire is assumed to have
reached the peak size. e growth time for the fire is equivalent to the
sum of the tasks the fire department must perform to suppress the fire.
is time to suppression is coupled to a simple exponential area damage
growth model previously is consistent with fire statistics literature. A
distribution of fire spread is generated using the same three NFIRS bins
discussed above, based on the modeled area of fire damage at the
suppression time. Distributions of the room and building sizes are
estimated from the American Housing Survey’s (AHS) national survey
of residential homes. Where available, it is possible to use the AHS
metropolitan statistical areas to refine room and building distributions
for larger metropolitan areas.
e concept is that there exists an average time correction for all fire
department structure fire responses routed through the idealized fire
department model that “corrects” the fire damage outcomes expected
from national standards to the particular outcomes observed by a given
fire department. is average correction time is known as the fire
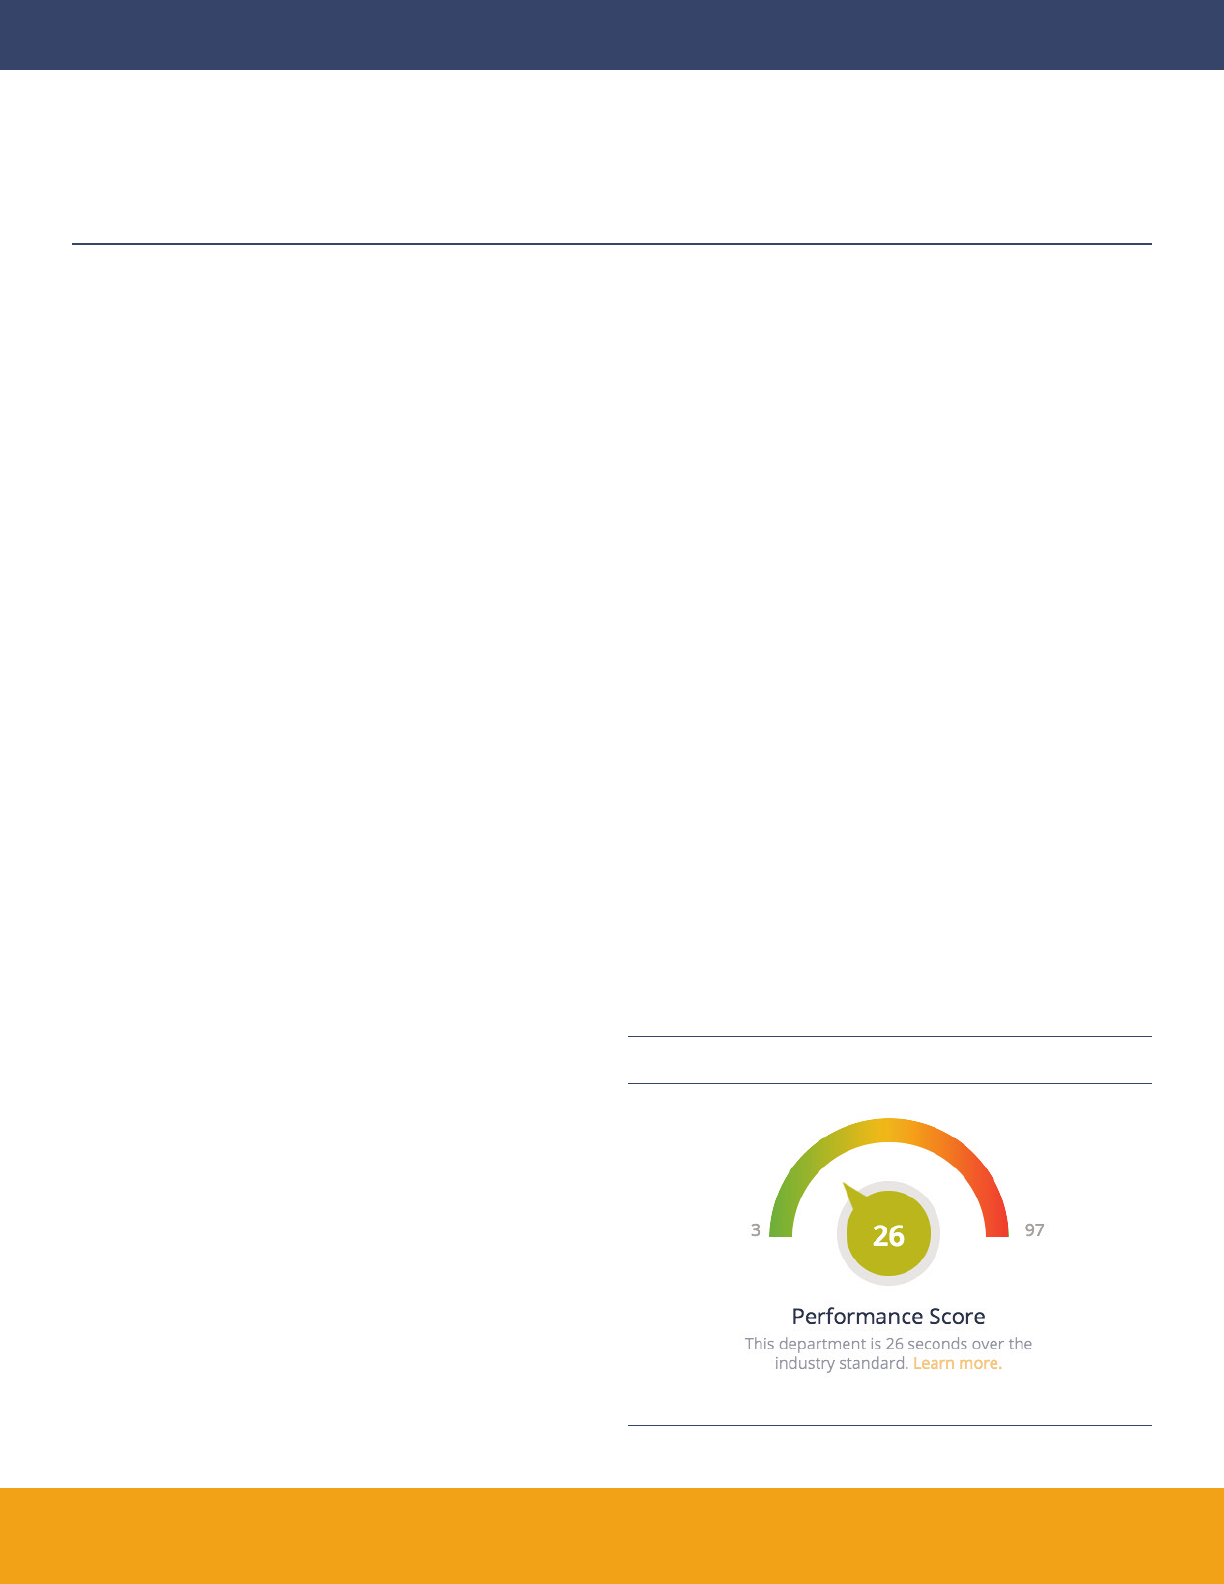
department performance score. Figure 2.2 shows the performance score
for an example department. e number in the center of the dial is
performance, or average time in seconds the department is over its
idealized performance. e numbers on the le and right side of the
dial are the minimum and maximum performance scores for the
departments in the same grouping (location and size).
e gauge indicates whether the performance score is good, fair, or
poor. e colors green, yellow, and red indicate good (top 25%), fair
(middle 50%) and poor (bottom 25%) quartiles. is gauge compares
the department to other similar departments and, as you can see, this
department falls in the green quartile.
Figure 2.2: Performance Score
4
2.3 Safe Grade
A community’s set of safe grades represent an assessment of the
number of fires, of fire spread, and of civilian and fire fighter injury or
death based on how well the fire department resources (performance
score) match the level of risks within the community (risk score).
erefore, given your community risk assessment score and given your
fire department’s historic response capabilities and performance, the
safe grade is either good, fair, or poor, depending on how well you
match resources deployed to the risks in the community. ere are
three safe grade comparison categories:
• Performance based on number of fires
• Performance based on fire spread
• Performance based on injury and death
For each category, your department is compared against similar
departments and based on the risk group (low, medium, high) the
community falls within for the respective category (see above).
Based on your performance score relative to those other departments,
your safe grade is either good, fair, or poor. A good, safe grade
represents the top 25%, a fair safe grade represents
the median 50%, and a poor safe grade represents the bottom 25%.
Note that all three scores can be filtered by the hazard level of
structures: low, medium, and high as defined by NFPA. is is filterable
on the department landing page by clicking on the the hazard level bar
above the performance score.
2. FireCARES Scores (continued)
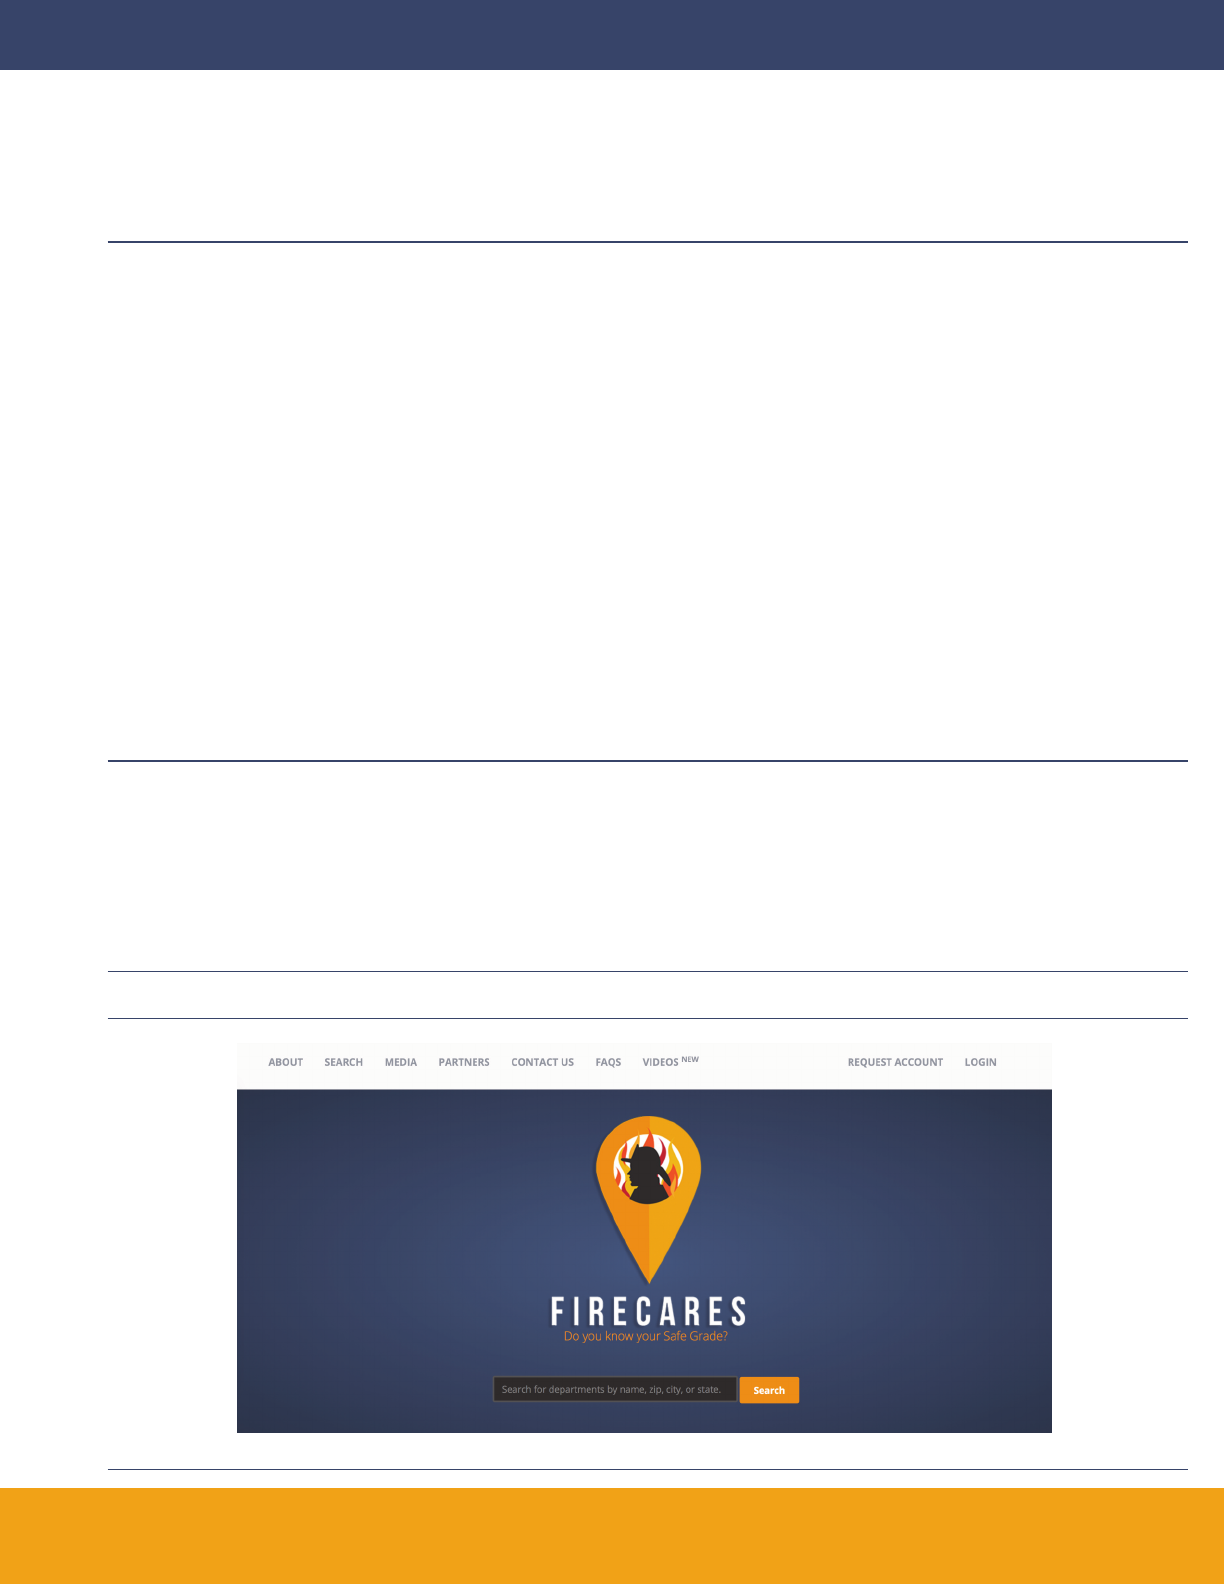
Figure 3.1: FireCARES Homepage
Go to FireCARES.org and begin by typing a fire department name or
municipality in the search bar (Figure 3.1).
If you know the department you are looking for, enter it in the search
bar and click the dialog box. If you leave the bar blank, results will be
returned for all of the departments in FireCARES. ere are 27,000+
fire departments in FireCARES. e goal is to have a landing page for
every fire department, anywhere in the United States. On the le hand
side of Figure 3.2, you can see that search results can be filtered by
department name, FDID, state, geographical region, performance score
or protected population. You can also search through all of the fields by
entering your query in the top box.
3. Using FireCARES.org
5
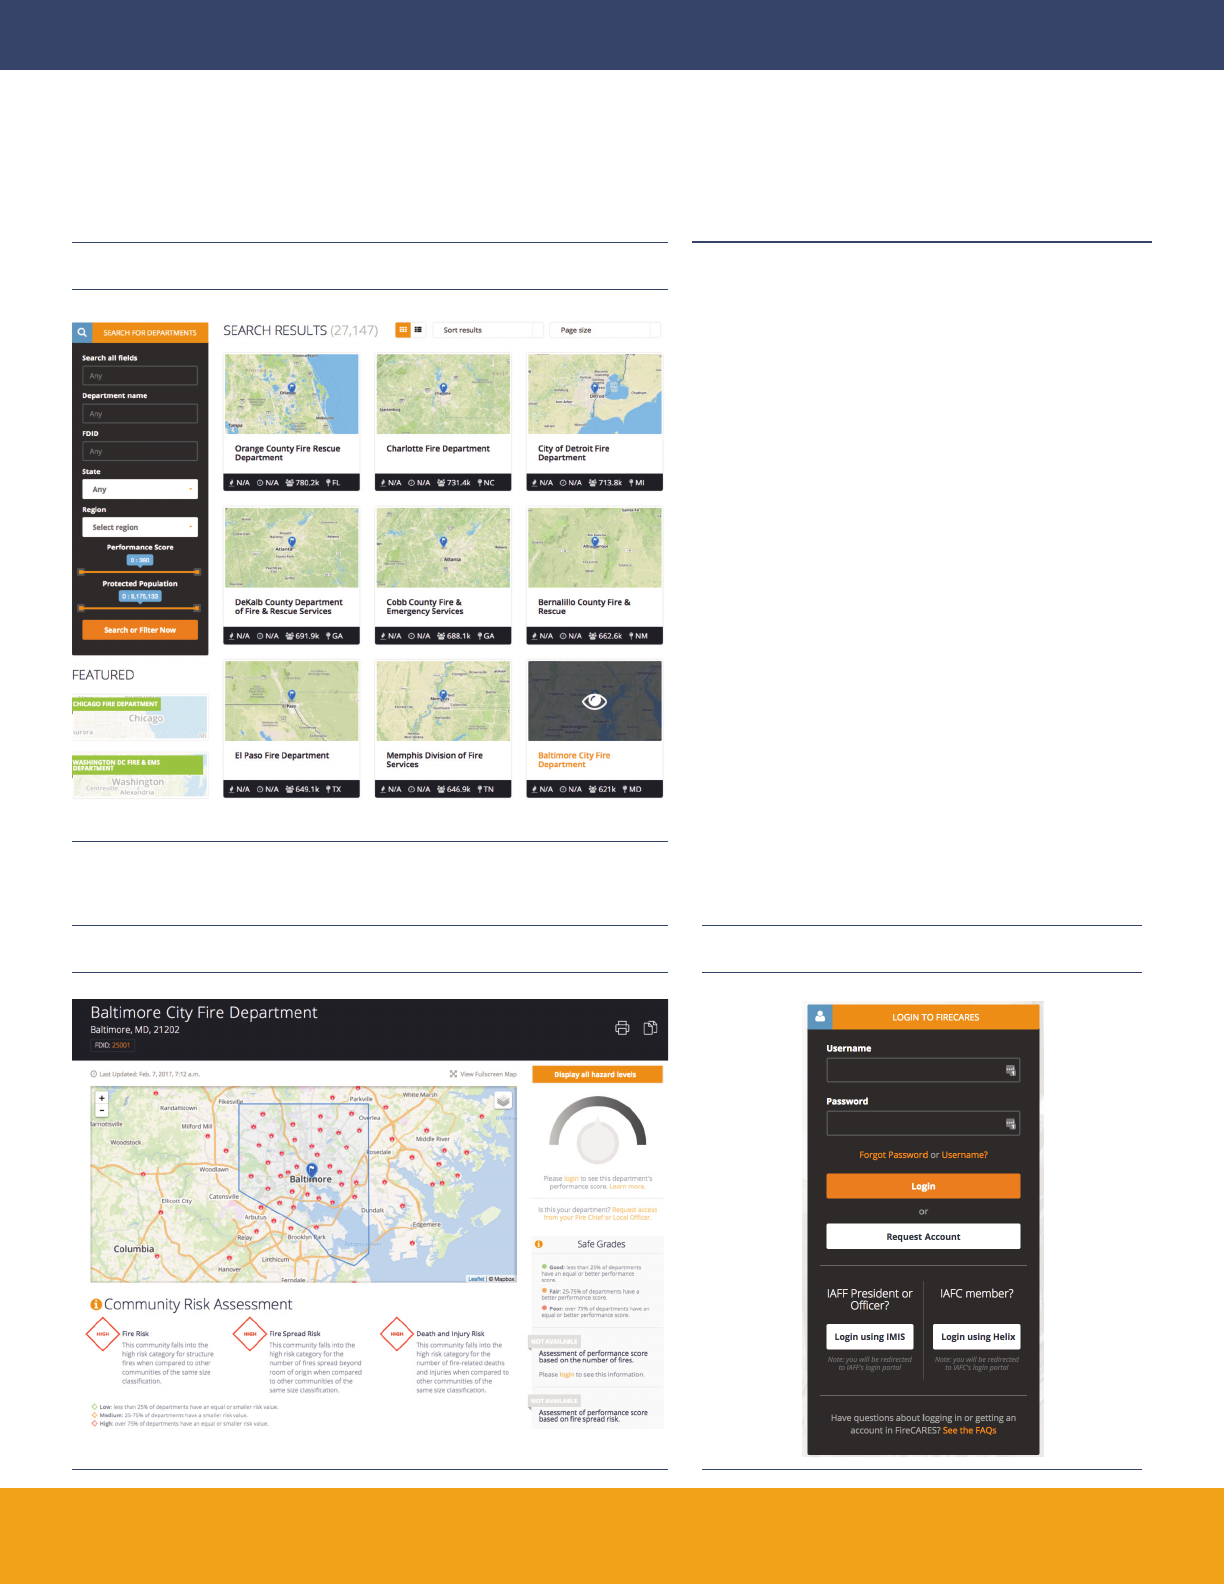
Figure 3.2: FireCARES Search Results
Figure 3.3: FireCARES department landing page without login Figure 3.4: FireCARES Login Dialog
Clicking on a department’s map image or name will take you
to that department’s landing page. Note that if you are not
logged in, the department page will look like Figure 3.3. Note
that of the three scores generated by FireCARES, only the
community risk scores are available without login. e fire
department performance score and safe grades are only
available upon login.
3.1 Logging In
Login credentials are granted to the fire chief, the local union
president (when applicable) and/or their designees. If you are
an IAFF president or an IAFF officer, you can login using
your iMIS credentials. If you are an IAFC member, you can
login using your Helix credentials. Figure 3.4 shows the
FireCARES login dialog box.
If you do not have an account, are not sure if you have an
account, or iMIS/Helix do not apply, click on the request
account box. Enter your email and click the check
registration box. If you don’t have an account, a request for
an account from that email address will be made. If an
account associated with that email exists, then you will be
redirected back to the login page.
6
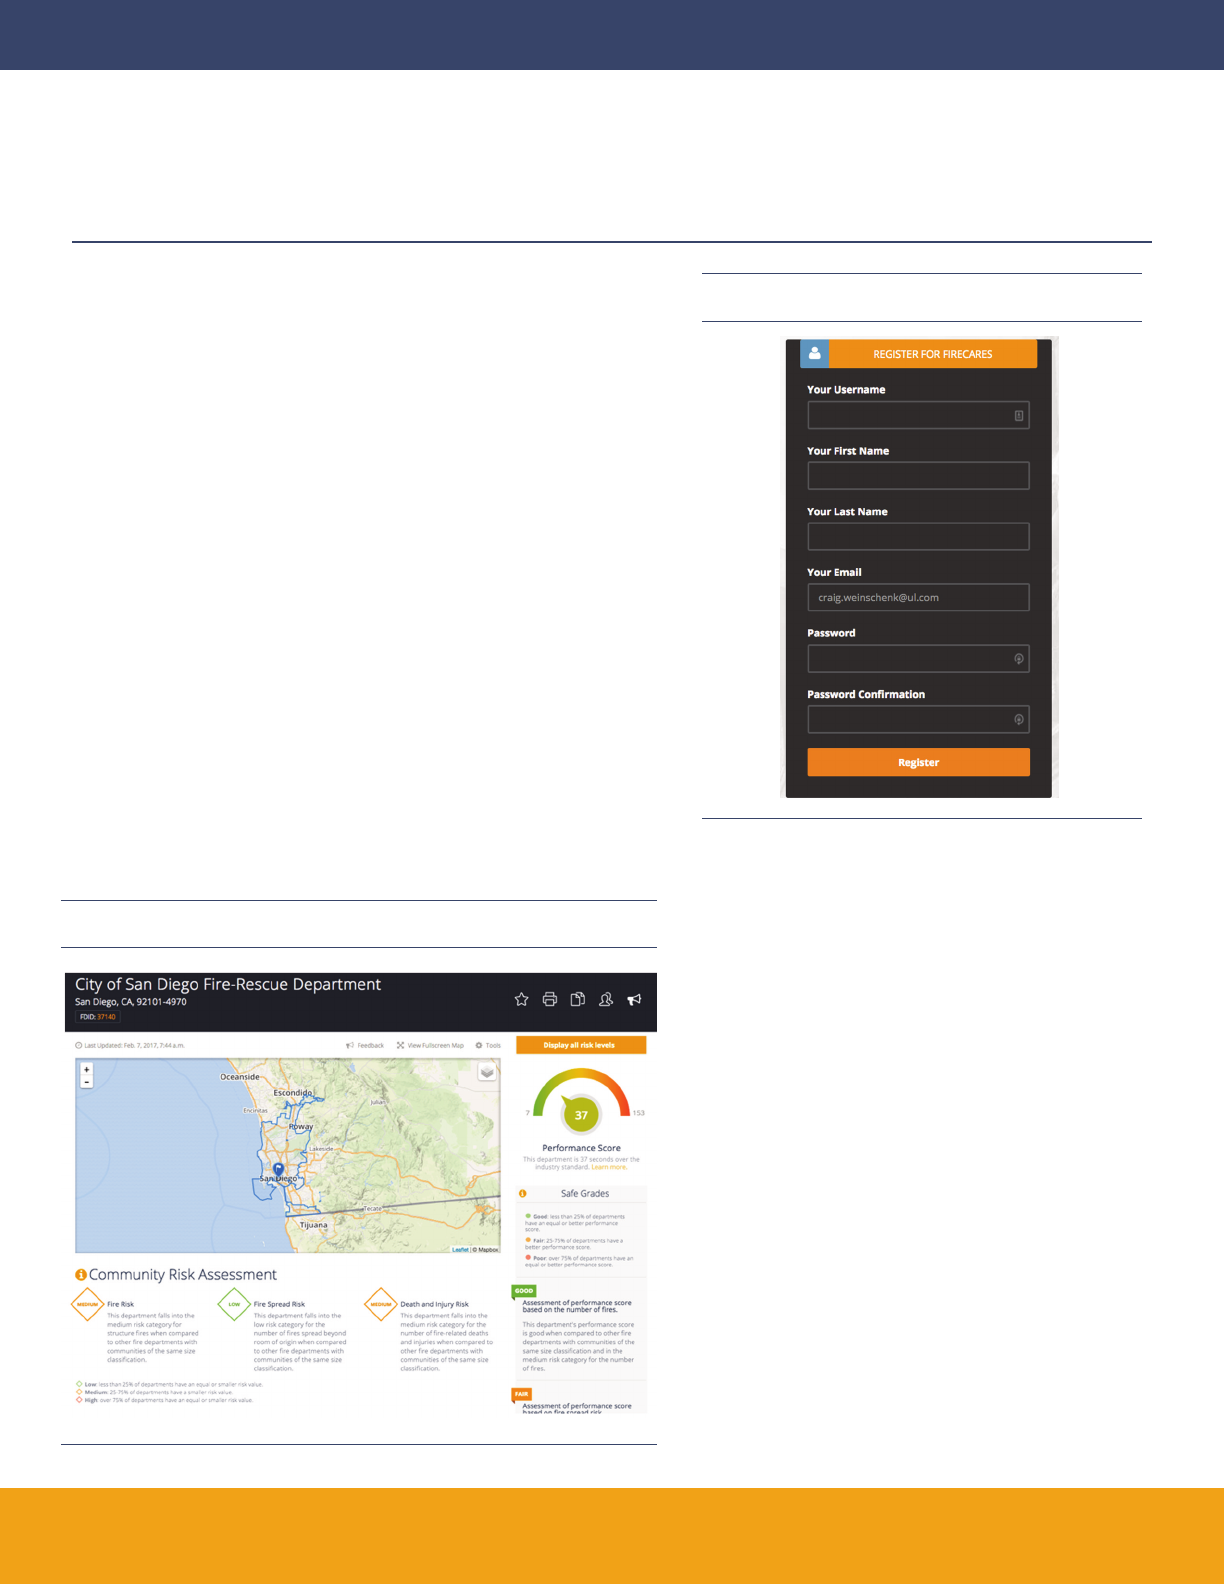
Once an email has been approved, the user will be directed to the
registration screen. is dialog box will require you to enter your name,
email address, login username and password. Following entry of these
attributes, the user will click the Register icon (cf. Figure 3.5). Users will
then be able to log into FireCARES.
An authenticated user can provide login authority to others in their
department as they deem necessary and appropriate, but must keep a
record of those authorized. To provide login authority, the chief and/or
local union president will provide a list of eligible emails to FireCARES
administration. Upon receipt, logins will be created for each email
provided.
To minimize shared logins, a robust password should be implemented
upon registration. Changing passwords on 90 day cycles is strongly
encouraged but will not initially be required.
3.2 Department Details
Once logged in, users will now see the two additional scores
(performance score and safe grades), as well as other features for the
department. From Figure 3.6, you can see that the performance
score and safe grades are also active along with the publicly available
community risk score.
When viewing your department’s page, the first item to check
is to ensure that your department’s jurisdictional boundary
(the blue outline in Figure 3.6) is present and correct. From
your boundary, both your protected area and protected
population are calculated (cf. Figure 3.7). e protected
population is determined using U.S. Census data. If you
notice differences in your population, your protected area, or
if your boundary has changed, send an email to: Contact Us:
Boundaries. Be sure to include your fire department name
and FDID as it is specified on FireCARES.org. If you send an
updated GIS shapefile for your jurisdictional boundary, the
preferred projection is WGS84, however, FireCARES can
convert if the existing projection is specified.
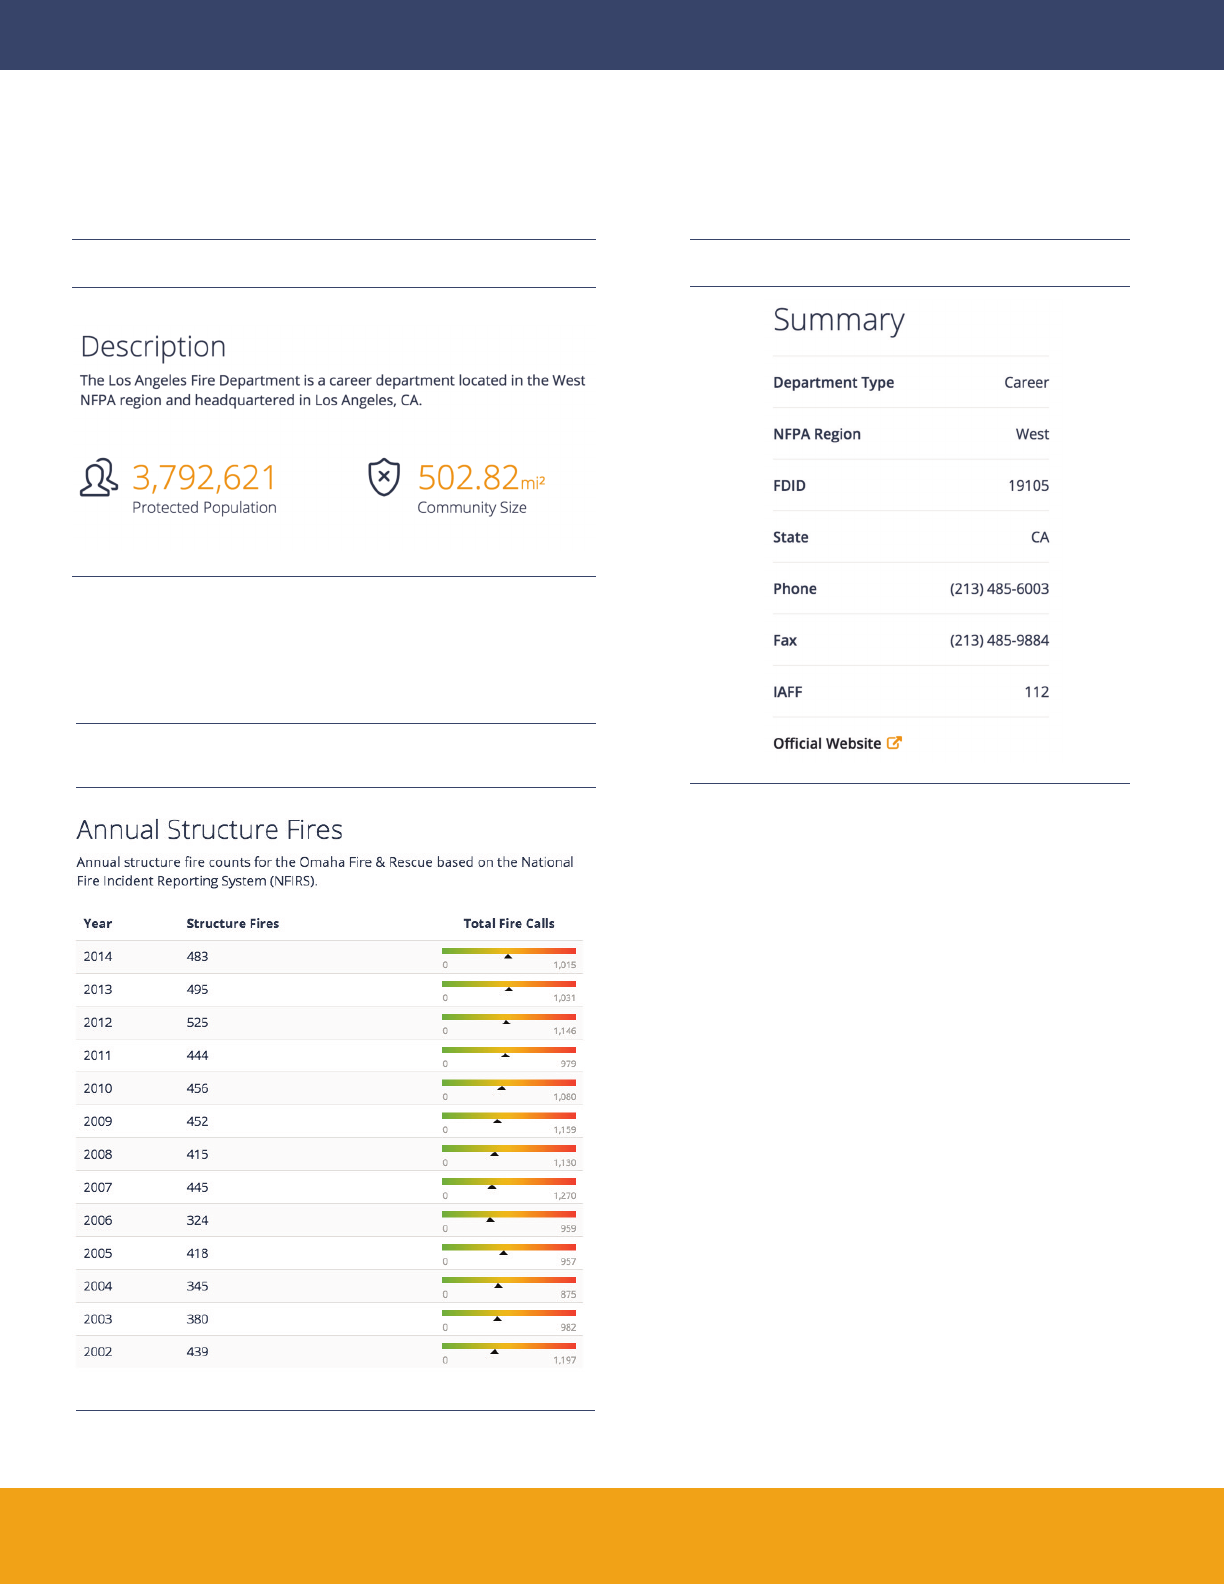
Additional descriptive features about your department are:
• Department Type [USFA]
• NFPA Region [NFPA]
• FDID [USFA/NFIRS]
• State
• Phone/Fax [USFA Census]
• Website Link
(as shown in figure 3.8)
Figure 3.6: FireCARES department landing page
Figure 3.5: FireCARES Register Dialog
3. Using FireCARES.org (continued)
7
Figure 3.7: Department protected population and area
3.3 Annual Structure Fires
e annual structure fire counts are determined by the data sent
by each department to the National Fire Incident Reporting
System (NFIRS). In Figure 3.9, when available, NFIRS data is
shown from 2002 to 2014. e middle column represents fires
coded as structure fires within the NFIRS system. e right
column shows a color bar where the maximum value is the total
number of fire calls in NFIRS for that specific calendar year, and
the black triangle indicates the number of structure fires. is
allows users to visualize consistency in data from year to year in
both number of fire calls and percentage of structure fires. Note
that data is based on the publicly available NFIRS data. If your
department would like to send newer NFIRS data, FireCARES can
directly ingest NFIRS exchange files. is can be done using the
paper icon in the upper right of your department landing page.
Figure 3.8: Department Summary
Figure 3.9: Annual counts of structure fires (completed structure
fire module in NFIRS and total fire calls.)
8
3.4 Station Detail Page
On each department page, the department’s list of stations is
included by station name and address. If there are missing
stations, stations that are no longer active, or if the station
list is wrong, either the station name or station address,
please send an email to: Contact Us: Stations.
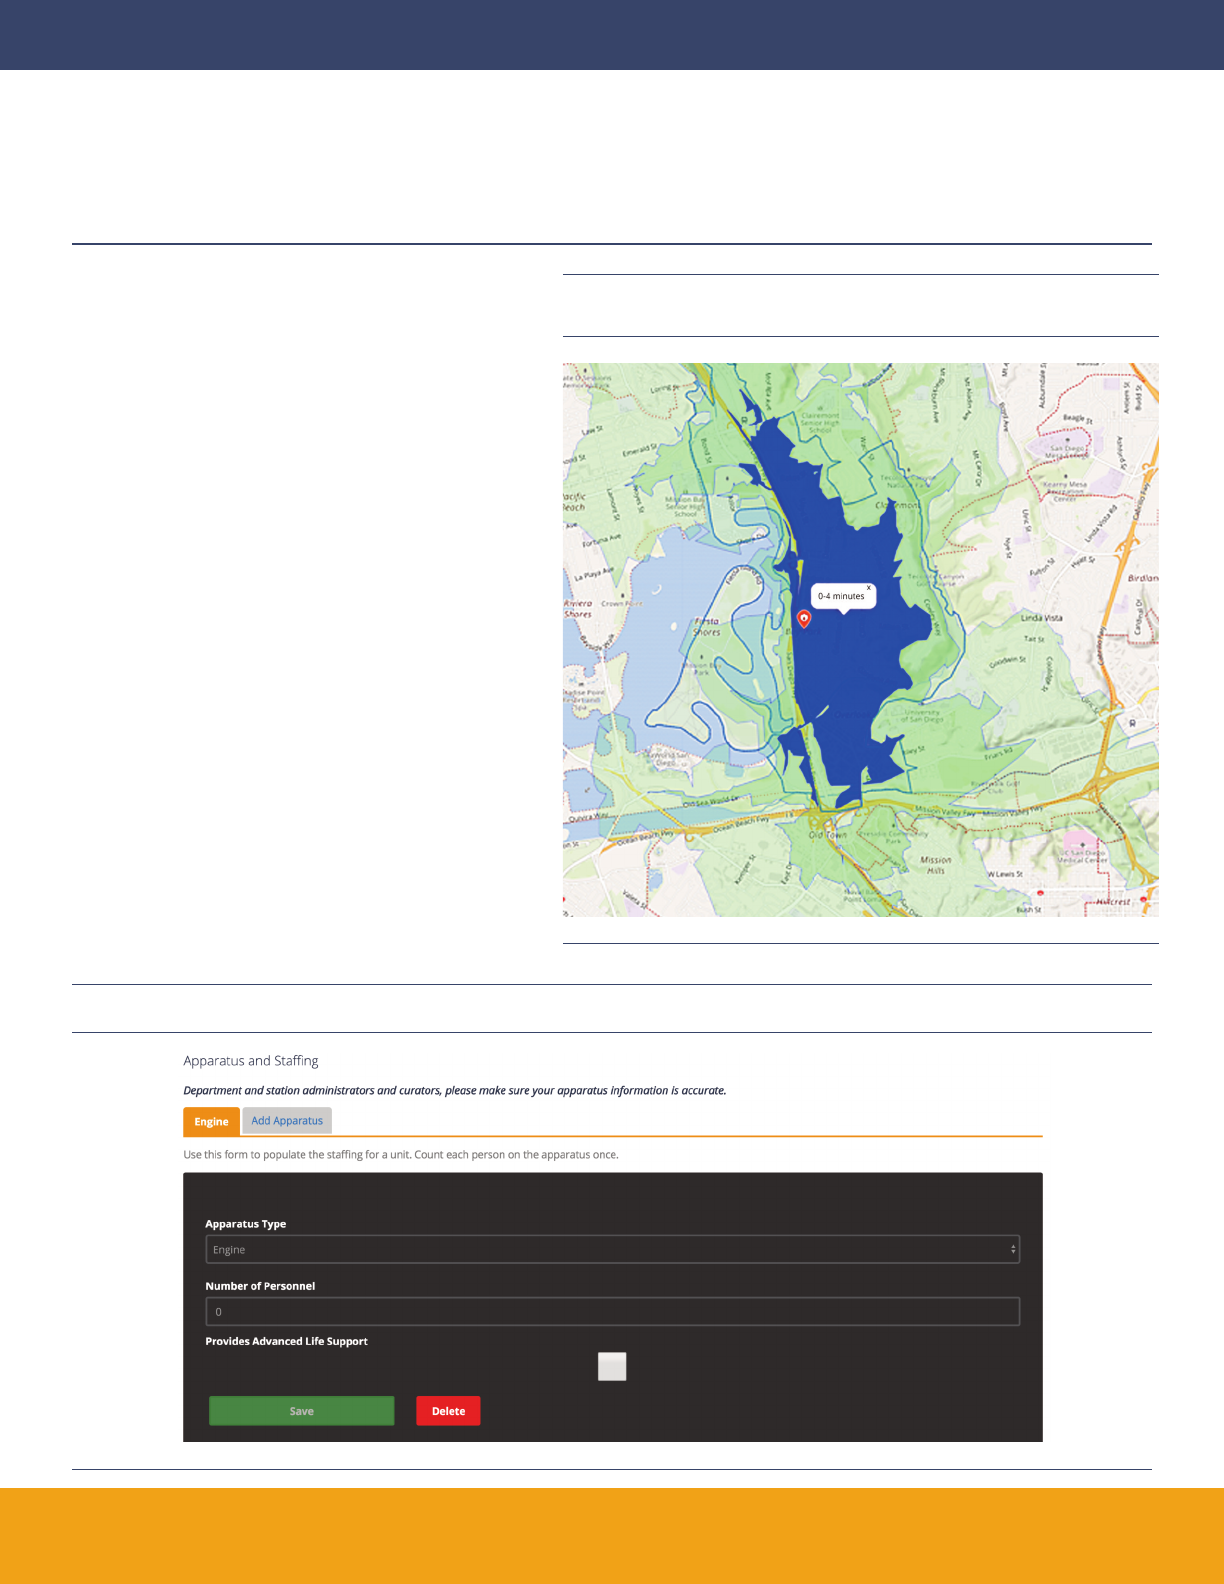
Users can also select a particular station from the station list
and that station will open into its own landing page. If first
due areas have been provided, the stations first due area will
also appear. In this view, users can click the GIS layer box
(stack of paper icon in the upper right corner of the map) to
turn on Service Area to see GIS mapping from that station
for 4-minute, 6-minute, and 8-minute travel time. All maps
are printable using the printer icon at the top of the page.
Figure 3.10 shows an example service area calculation.
In addition to the service area calculations, apparatus and
staffing tables can be completed on each station detail page.
Departments are requested to complete station tables so that
additional GIS features such as effective response force (ERF)
assembly times by hazard levels — which is coming soon —
can be completed. e ERF is calculated by hazard levels.
Figure 3.11 shows an example of the form for entering your
staffing data. Users can select an apparatus type, the number
of personnel, and whether advanced life support is provided,
when applicable. Aer entering the data, remember to click
Save before clicking on the Add Apparatus tab.
Figure 3.10: GIS based response polygons for 0-4 minute travel times, 4-6
minute travel times, and 6-8 minute travel times.
3. Using FireCARES.org (continued)
Figure 3.11: Apparatus and Staffing Table
9
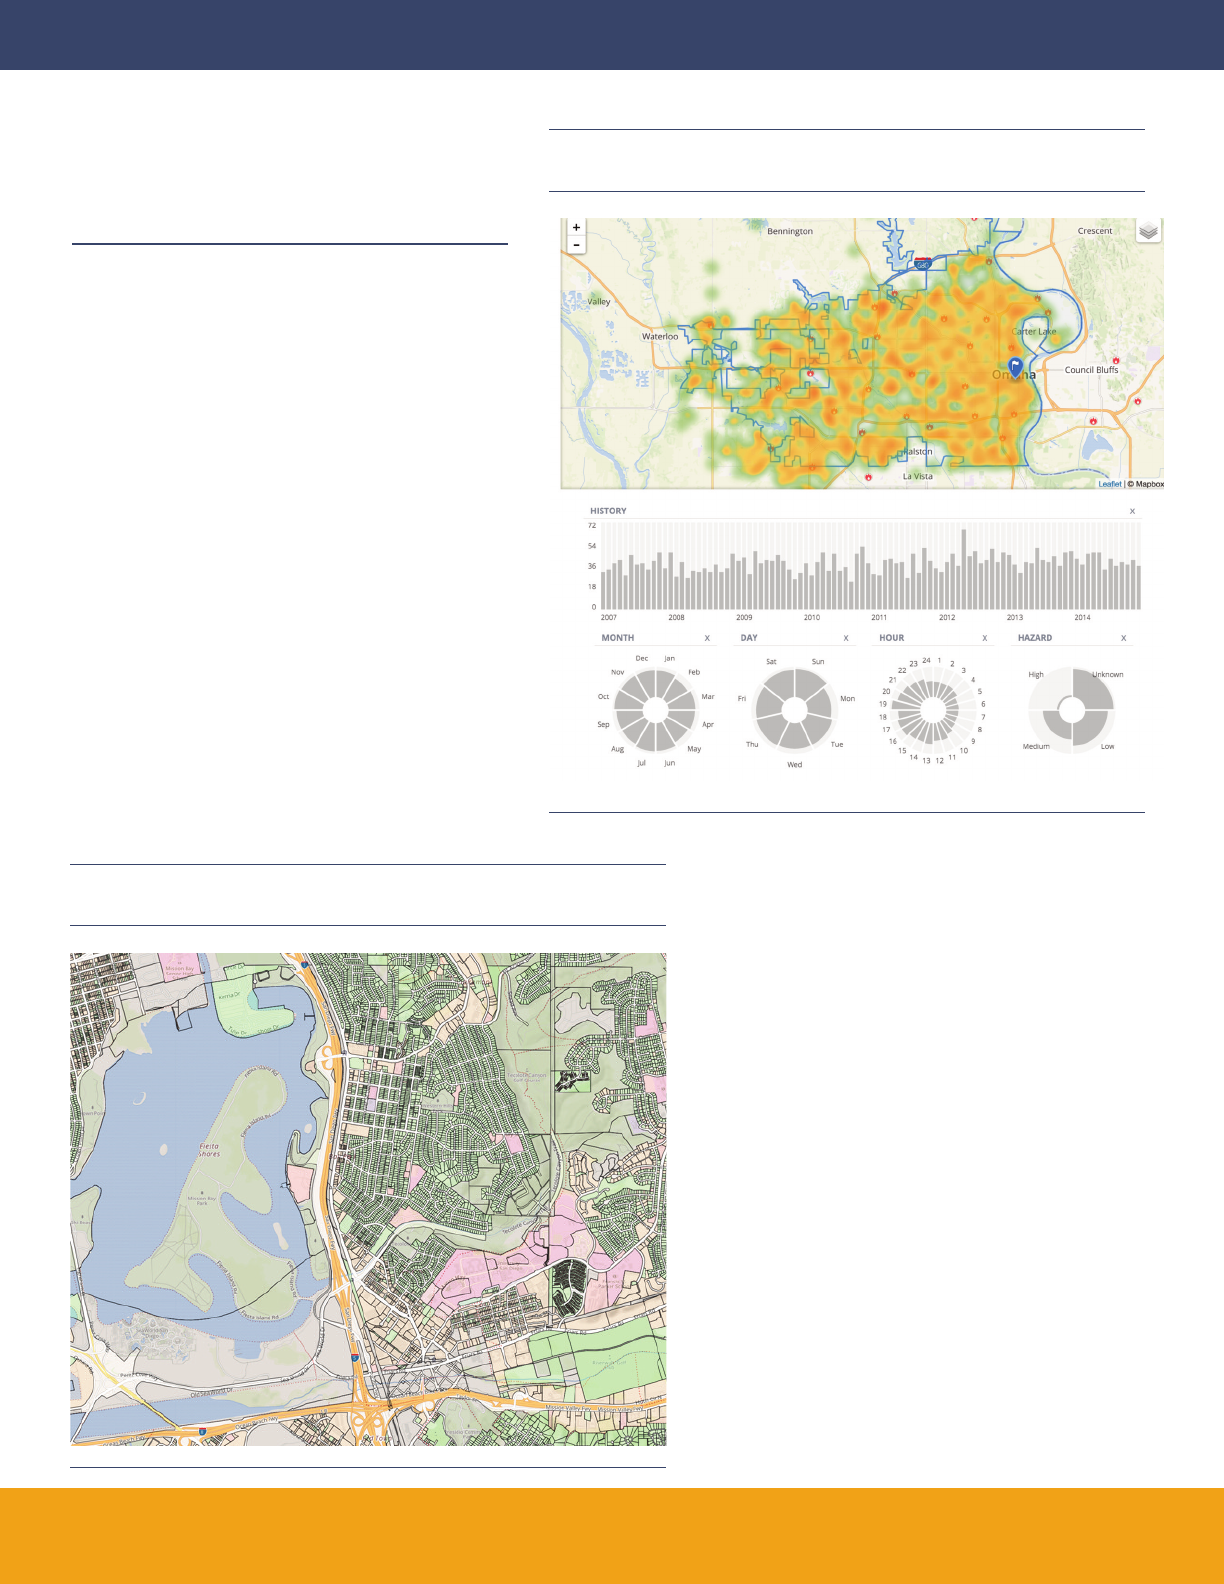
3.5 Interactive Fires Heat Map
Click the heat map to view more than 12 years of fires that
occur in the community. e feature is turned on by
hovering over the stack of paper icon in the upper right
corner of the map and clicking on the Fires Heatmap radio
button. Call volume is indicated by green, yellow, and red
areas. High call volume is indicated by red areas and low
call volume by green. If you zoom in on the map, the
coloring will dynamically adjust based on the calls that
occurred within the boundaries of the map window. When
this feature is turned on, a dashboard will appear below the
map (cf. Figure 3.12)
Clicking on any of the features on the dashboard will filter
the heat map data accordingly. Users can filter the data by
time (month, year, hour) or by structure hazard level (low,
medium, high, or unknown). Any of these filters can be
applied at the same time. To remove a filter, click the
respective x icon nearest the applied filter. e filters
include history, month, day, hour, and hazard.
Figure 3.12: Interactive geospatial map of fires
that is sortable by time and parcel hazard level.
Figure 3.13: Interactive map showing hazard level of parcels as well as
parcel specific information such as age, footprint, number of floors.
3.6 Interactive Parcel Data
Data specific to each parcel within the community are
provided by hovering over the stack of paper icon in
the upper right corner of the map and clicking on the
Parcels radio button. To view the parcels, please zoom
in on the map 4 levels. If the parcels do not show up
right away, allow a moment for the data to load.
Parcels are color coded by hazard level: green = low,
orange = medium, and red= high. If you uncheck the
Jurisdiction Boundary radio button, then you can
click on any parcel and any of the known parcel
attributes will appear. Figure 3.13 shows an example
of a department map with the parcel data loaded.
10
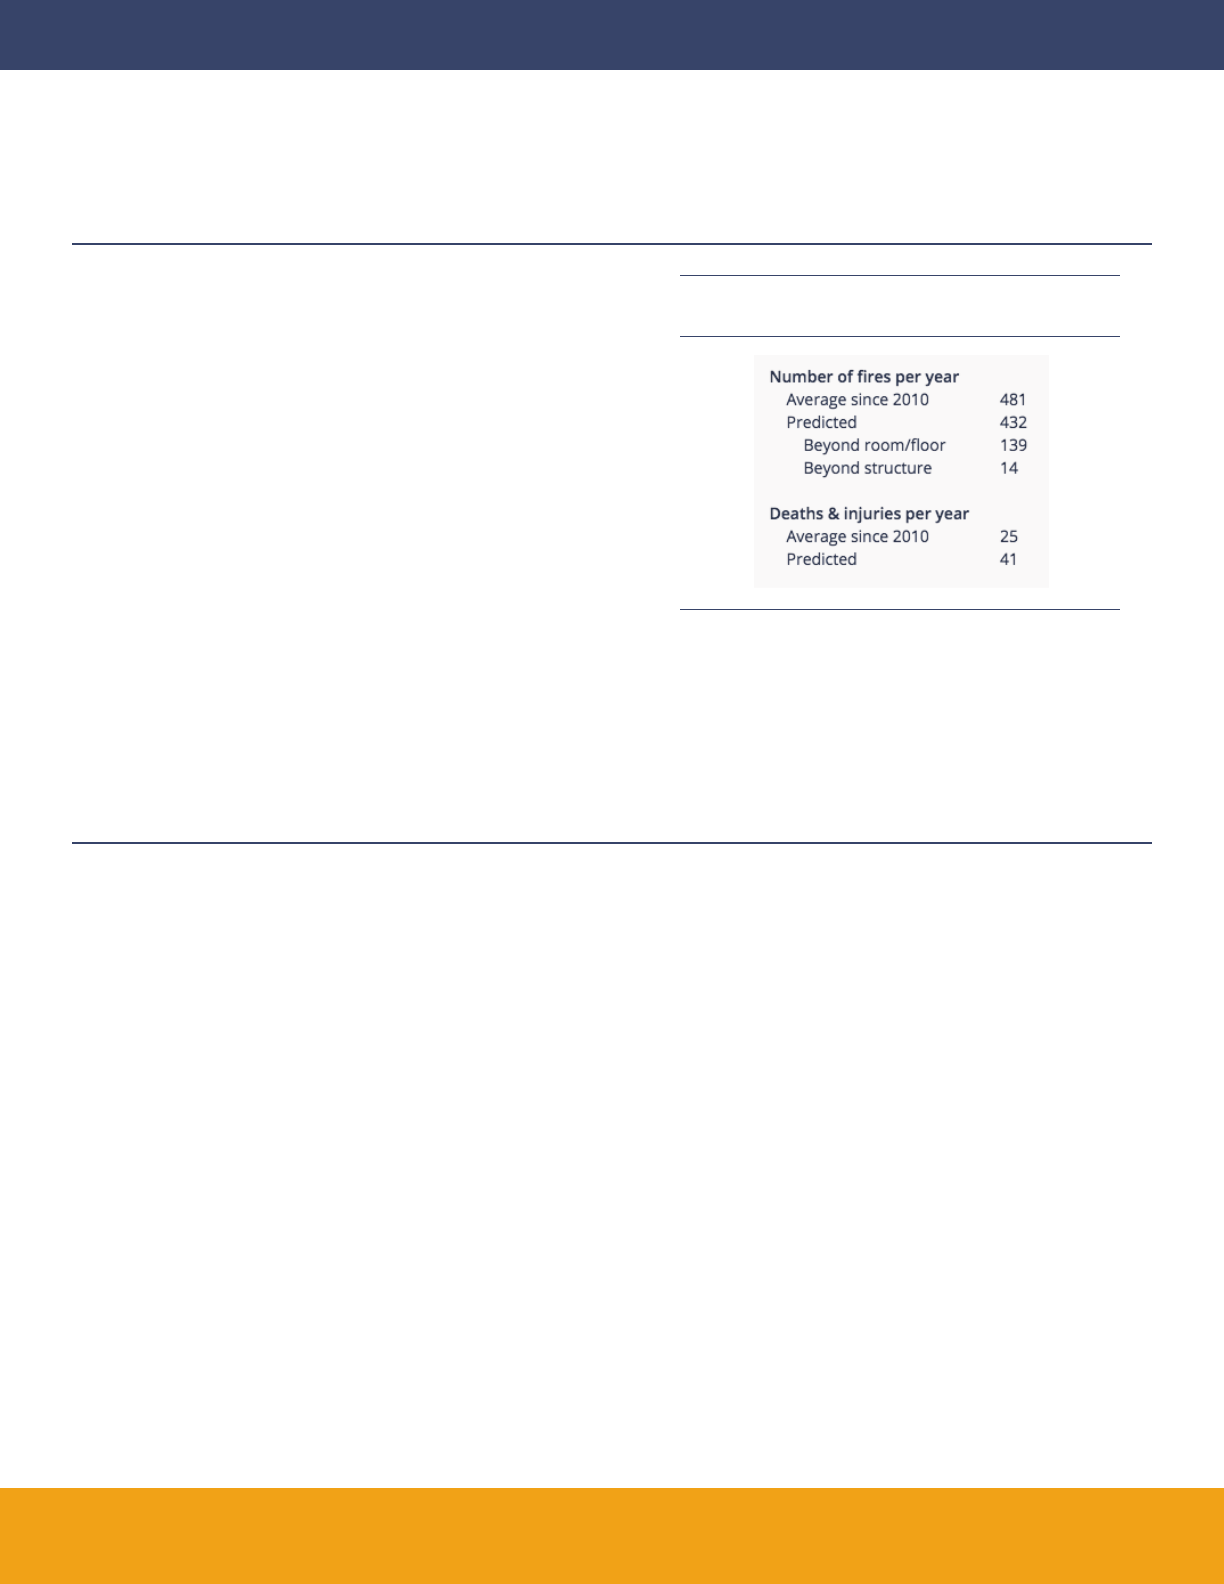
3.7 Predicted Fire Estimates
Using historical fire data (NFIRS) and characteristics about your
community (community risk), estimates can be made regarding the
number of fires, how big those fires may be, and the number
of casualties. Figure 3.14 shows an example dialog box of these
predictions.
Ensure that your department has the most accurate data.
1. Check the jurisdiction border. Please send an email to: Contact Us:
Boundaries. Be sure to include your fire department name and FDID
as it is specified on FireCARES.org. e map will be used to update
your border.
2. Check your fire station list and corresponding addresses. If the
station list on your department’s page is incorrect, please send an
email to: Contact Us: Stations. Be sure to include your fire
department name and FDID as it is specified on FireCARES.org.
3. Station Apparatus and Staffing Tables. Department
Administrators/Users have necessary permissions to add data in the
station apparatus and staffing tables to assure that your data are
available for new GIS calculation features being implemented.
4. Fire Data as a source of information. NFIRS data were used as the
national source of fire incidents. For each department, the available
NFIRS data were loaded and analyzed in the system. As you can see,
the most recent data available at the national level are two years old.
Departments may send NFIRS transaction files directly to
FireCARES for loading to assure that all scores using attributes from
this data are up to date.
Connect FireCARES to your NFORS data. As departments link to
NFORS data modules, their data are not only real time for NFORS
analytics, but can also be used to populate the FireCARES system for
real time feature updates. Go to NFORS.org for more information on
how to access the NFORS module at no costs.
3. Using FireCARES.org (continued)
4. Checking Your Department’s Data
Figure 3.14: Estimated prediction of number of fires,
fire size, and number of causalities.

11
is work has been funded by DHS/FEMA’s Assistance to Firefighters
grant program. e work is a collaboration among several organizations
to make FireCARES a tool for the fire service.
• Commission on Fire Accreditation International (CFAI-Risk)
• International Association of Fire Fighters (IAFF)
• Metropolitan Fire Chiefs Association
• International Association of Fire Chiefs (IAFC)
• Underwriters Laboratories Firefighter Safety Research Institute (ULFSRI)
• National Institute of Standards and Technology (NIST)
• Urban Institute
• e University of Texas at Austin
Other organizations that have helped with this project include the
International Association of Fire Chiefs (IAFC), Metropolitan Fire
Chiefs, and Worcester Polytechnic University (WPI).
5. Project Partners

12
[1] J. Averill, L. Moore-Merrell, A. Barowy, R. Santos, R. Peacock, K.
Notarianni, and D. Wissoker. Report on Residential Fireground
Field Experiments. NIST Technical Note 1661, National Institute of
Standards and Technology, Gaithersburg, Maryland, 2010.
[2] J. Averill, L. Moore-Merrell, R. Ranellone, C. Weinschenk, N. Taylor,
R. Goldstein, Wissoker D. Santos, R., and K. Notarianni. Report on
High-Rise Fireground Field Experiments. NIST Technical Note
1797, National Institute of Standards and Technology, Gaithersburg,
Maryland, 2013.
[3] National Fire Protection Association, Quincy, Massachusetts. NFPA
1710, Standard for the Organization and Deployment of Fire
Suppression Operations, Emergency Medical Operations, and
Special Operations to the Public by Career Fire Departments, 2016.
[4] National Fire Protection Association, Quincy, Massachusetts. NFPA
1720, Standard for the Organization and Deployment of Fire
Suppression Operations, Emergency Medical Operations, and Special
Operations to the Public by Volunteer Fire Departments, 2014.
References