Exercise 04 Python Script GTFS Analysis Scripts Instructions
User Manual: Pdf
Open the PDF directly: View PDF ![]() .
.
Page Count: 11
1
Alison Link
GIS 5572
10 May 2018
Exercise 04: Python Scripts for GTFS Data
Introduction
This project offers a suite of tools for performing a number of basic data management and analytic
tasks that are helpful for analyzing GTFS data. We start by leveraging existing ESRI GTFS tools to
transform data from standard GTFS .txt files into Arc-ready point and line feature classes representing
stops and routes in a transit system. Then, we use custom-coded scripts for managing a variety of
GTFS-related tasks, from auto-projecting data into UTM zones, to basic statistics about a GTFS service
area, to summary statistics about the route types that are present in a GTFS dataset.
Estimated time to complete this assignment: 30 hours
Use ESRI GTFS tools to parse routes and shapes files
To start working with our GTFS data, we first need to take advantage of some free tools provided by
ESRI for displaying GTFS data in ArcGIS. These tools do some of the heavy lifting to help convert the
various “.txt” files that come as part of a GTFS dataset into ArcGIS-compatible formats.
1. To get started, download some GTFS data for a transit network you are interested in:
https://transitfeeds.com/ (Note: Be sure to select regular “GTFS” data, and not real-time GTFS
feeds.)
2. Next, download the Display GTFS in ArcGIS toolkit from ESRI: https://esri.github.io/public-
transit-tools/DisplayGTFSinArcGIS.html
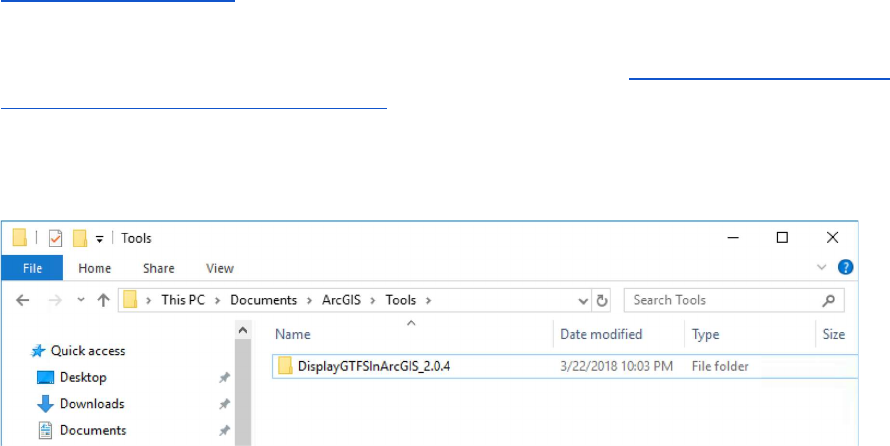
3. Unzip the toolkit to a location on your computring that you can easily remember. One easy way
to keep toolkits organized is to create a “Tools” folder underneath the “ArcGIS” folder in your
Documents folder and unzip the toolkit there:
4. Next, open up an ArcGIS Pro project.
2
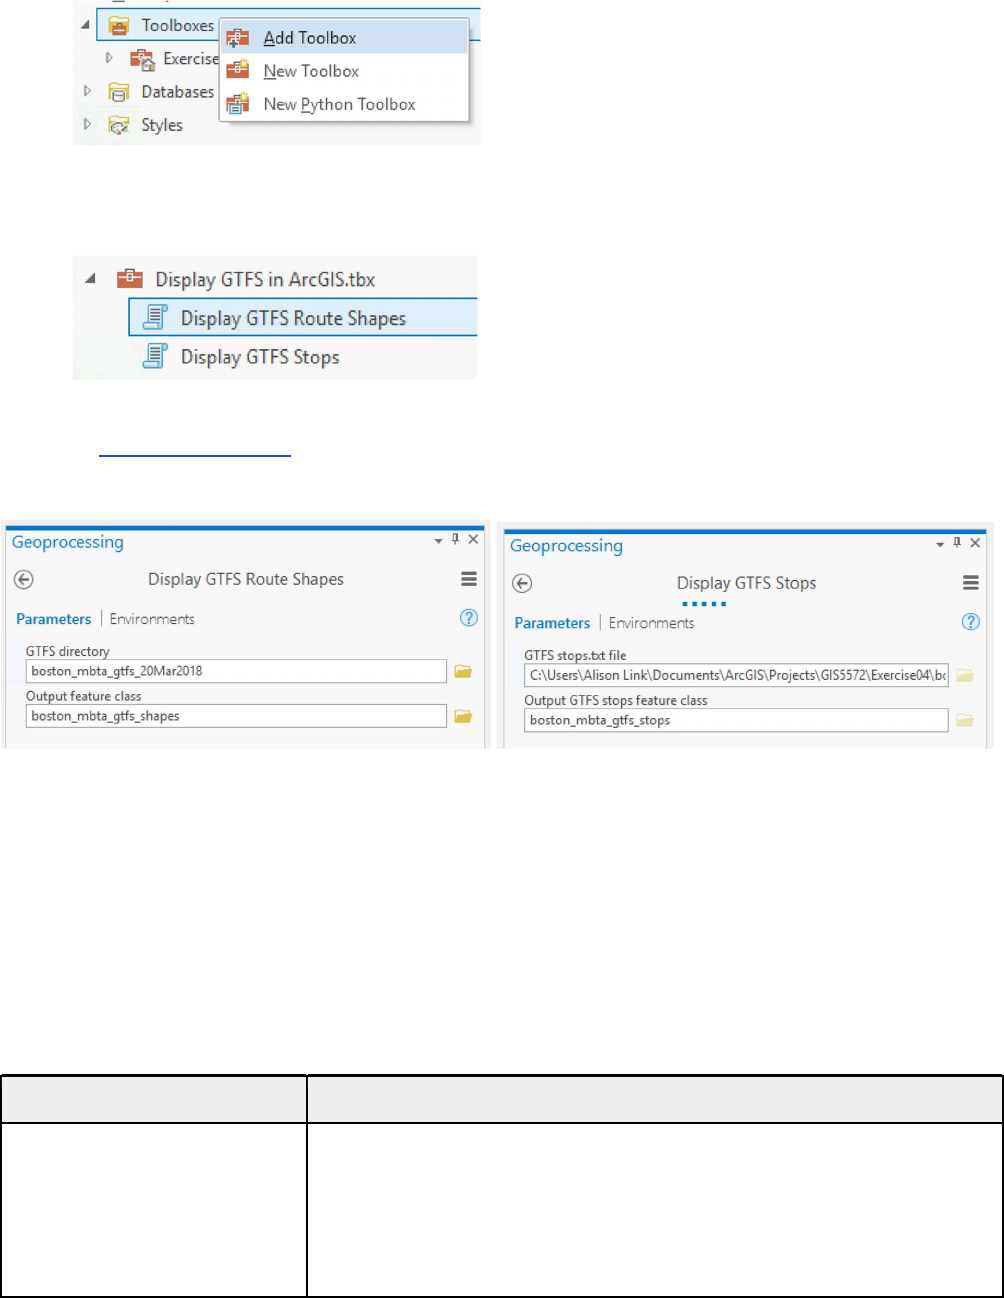
5. Load the toolbox into the project. From the Catalog pane, right-click Toolboxes, then choose
Add Toolbox:
6. Navigate to the place where you stored the downloaded and unzipped toolbox. Open the
toolbox, and it should display in your list of toolboxes. From there, you can expand the toolbox
to reveal the two tools inside:
Leverage ESRI’s user’s guide for further instructions on how to load the shapes and stops files from the
GTFS dataset you’ve downloaded and coerce this data into ArcGIS points and line feature classes. For
example, here’s a glimpse of how to run each of the tools using Boston MBTA’s GTFS data:
When the tools are done running, the route shapes will show up as a line feature class and the stops
will show up as a point feature class in your project’s main map pane.
Run stand-alone custom scripts in the Python console
Now that the GTFS data is loaded into Arc-ready formats using ESRI’s GTFS tools, it’s time to conduct
some analysis on this data using custom-built scripts. This project offers a suite of Python scripts for
GTFS-related tasks; here’s a summary of each script and what it does:
Script name
What it does
auto_project_to_UTM.py Takes an unprojected route shapes or stops feature class and auto-
detects the appropriate UTM zone for the region where this transit
system is located. It then projects the data to this UTM zone and
stores the output to a new, projected feature class. This script
should be used to project any route shapes and stops feature
classes prior to running any of the statistics computation scripts

3
below.
service_area_stats.py Takes a stops feature class and computes three statistics:
1) The total coverage area, based on a convex hull envelope
around all of the stops in the GTFS dataset
2) The “near-transit” area, based on a 0.5 mile buffer around
each transit stop
3) The stop density, computed as the number of stops divided
by the total coverage area
route_type_stats.py Takes a route shapes feature class and computes percentages of
each route type (bus, metro, train, etc.) that are present in the
dataset
route_type_stats_toolbox.py Same as the “route_type_stats” script, but is able to run as a toolbox
within ArcGIS Pro
At this point, you should download all of the scripts at: https://github.com/linkalis/
GTFS_analysis_scripts. Then, unzip them into a folder on your hard drive, remember where you saved
them, and follow the instructions below to get up and running with these scripts.
Run “Auto-project to UTM” script
The “auto_project_to_UTM.py” script requires a reference UTM feature class in order to detect the
proper UTM projection zone for each input feature class. To load this reference “utm” dataset:
1. Add the “utm_reference” file geodatabase to your project. Right-click the Databases folder in
the Catalog pane, choose Add Database, then navigate to the “utm_reference.gdb” file and
open it.
2. Import the “utm” feature class contained in the “utm_reference” geodatabase into your project’s
default geodatabase. Right-click on your project’s default geodatabase and choosing Import >
Feature Class. Navigate to the “utm_reference.gdb” geodatabase and select the “utm” feature
class within it. Make sure the Output Location is set to be your default project database, and
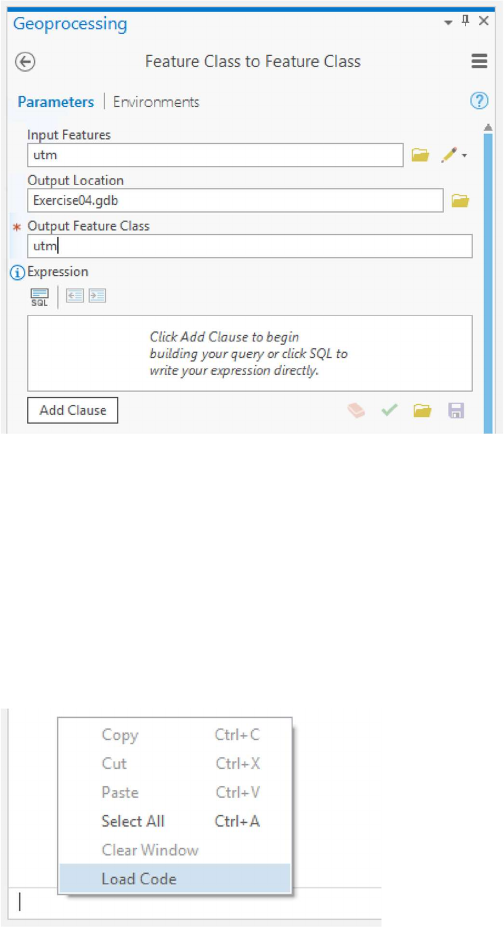
4
name the Output Feature Class “utm” to match the original dataset:
Now that the “utm” feature class is stored to your default project geodatabase, it is ready to be used as
a reference file for detecting the correct UTM zone to project your GTFS datasets into. You can now
run the auto-projection script:
1. Drag a GTFS route shapes or stops feature class into the map pane
2. Right-click in the input box within the Python console and choose Load Code, then navigate to
the place where you saved the script and open it up in the Python console:
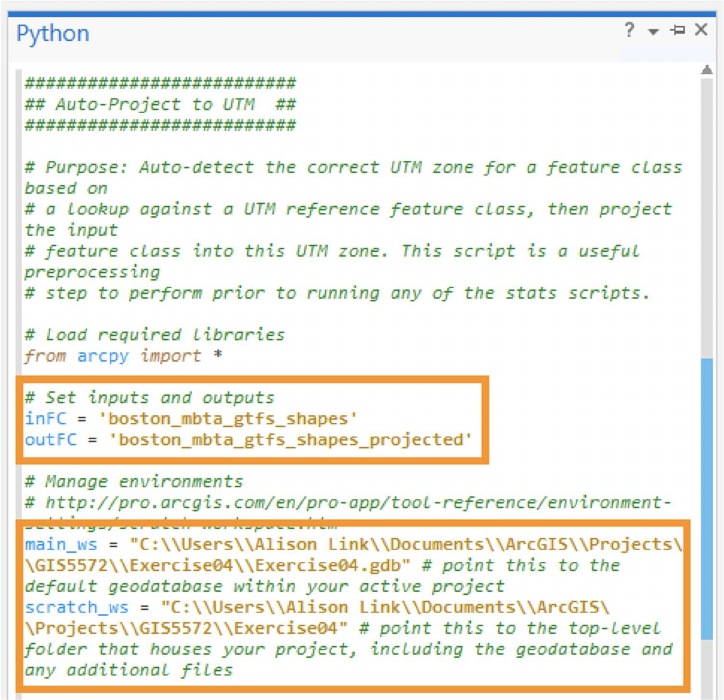
3. Be sure to edit the following values (highlighted in orange in the screenshot below):
- inFC = the name of your input route shapes feature class
- outFC = the name you want to use for the projected output feature class
- main_ws = point to wherever your project’s default geodatabase is stored on your hard drive
- scratch_ws = point to your project’s top-level folder on your hard drive
5
Note: If you are having trouble running the code and are getting a “Unicode” error, make sure to
add double backslashes (“\\”) instead of single backslashes when pointing to your workspace
locations on your hard drive. Alternatively, try adding a “u” in front of the first set of quotation
marks before you list the “C:\\...”.
4. Finally, type CTRL + ENTER to run the script and project the feature class
5. When it’s finished, you can look at the output layer’s Properties > Source > Spatial Reference
to see that it has been projected to an appropriate UTM zone:
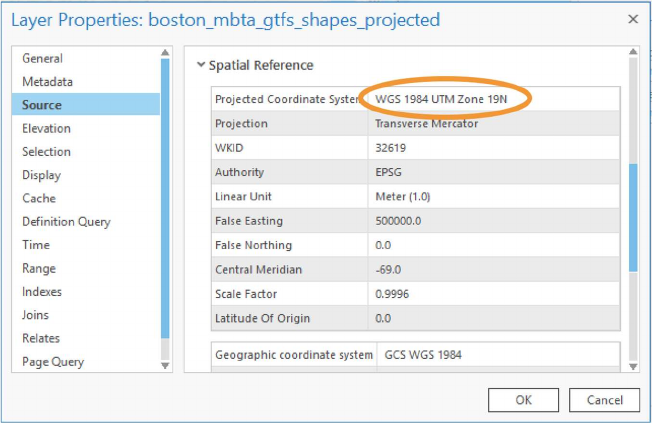
6
Run “Service area statistics” script
Once your GTFS-based feature classes are projected, you can start running the statistics scripts. For
example, let’s try the script that calculates services area statistics to understand more about the
coverage area of your GTFS dataset:
1. Right-click in the input box within the Python console and choose Load Code, then navigate to
the place where you saved the “service_area_stats.py” script and open it up in the Python
console.
2. Be sure to edit the following values (highlighted in orange in the screenshot below):
- main_ws = point to wherever your project’s default geodatabase is stored on your hard drive
- inFC = the name of your input stops feature class
- outFC_buffer = the name you want to use for the output polygon feature class representing
the “near-transit” area buffers
- outFC_envelope = the name you want to use for the output polygon feature class
representing the convex hull envelope around all stops within the GTFS dataset
- You may also change the buffer distance to something other than the default of 0.5 miles, if
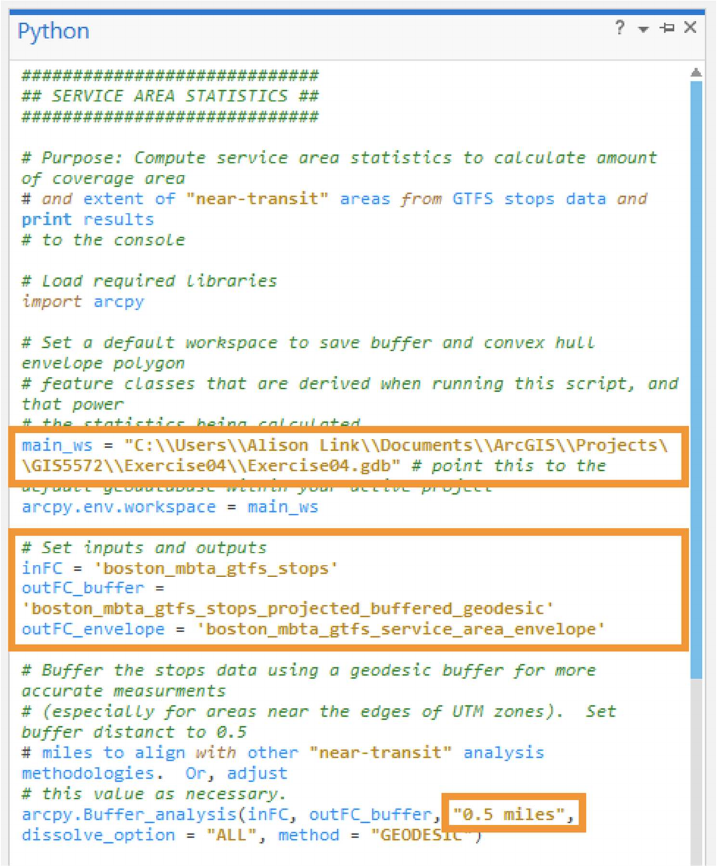
7
desired.
3. Type CTRL + ENTER to run the script
8
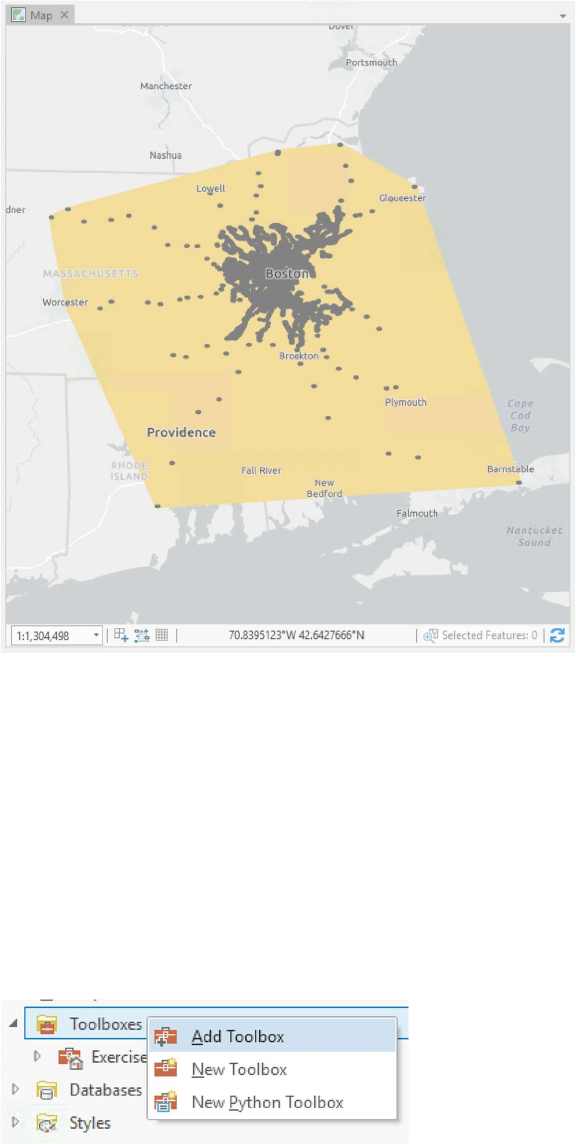
4. The result will be two polygon feature classes—one representing the service area’s convex hull
envelope, and one showing the “near-transit” buffer areas:
Run “Calculate Route Type Stats” script tool as an ArcGIS toolbox
One of the scripts provided—the route_type_stats.py script—has been adapted into a more user-
friendly toolbox script that can be loaded as a toolbox in the ArcGIS Catalog interface and run like any
other Geoprocessing toolkit script. The user can input parameters via the standard Geoprocessing
GUI, and the script runs behind the scenes and returns a table as an output. To get started with this
script, load the toolbox into a project in ArcGIS Pro:
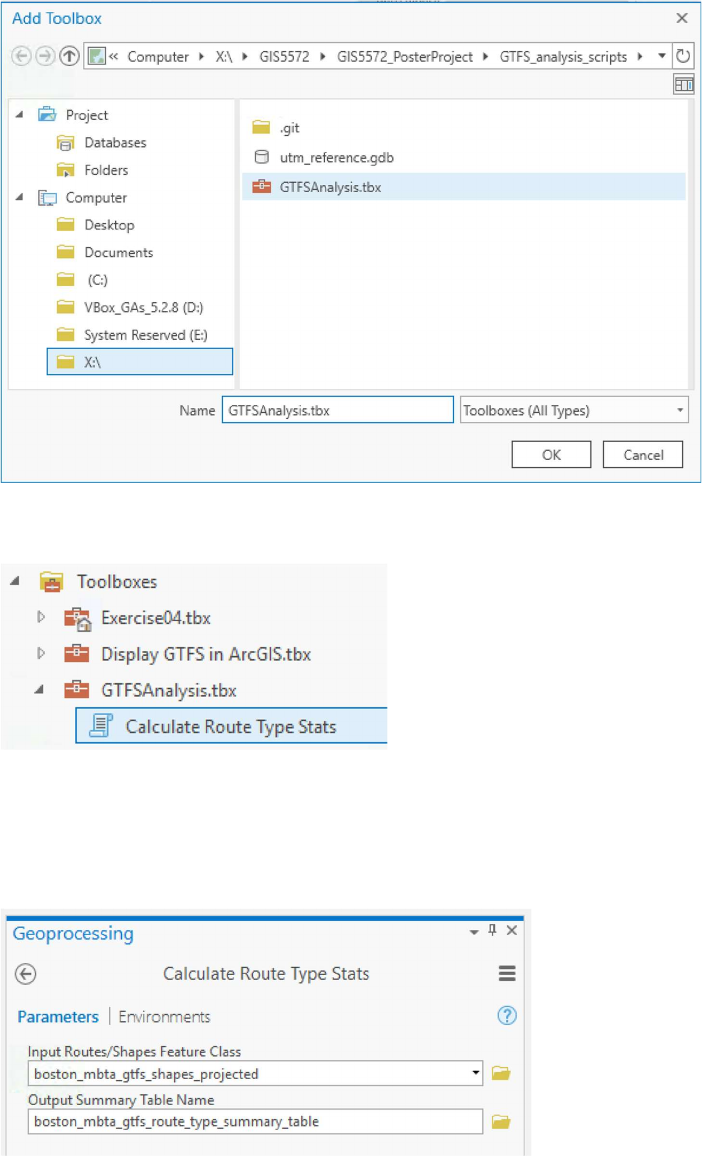
1. From the Catalog pane, right-click Toolboxes, then choose Add Toolbox:
9
2. Navigate to the place where you downloaded the script files. Within this folder, you should see
a toolbox called “GTFSAnalysis.tbx”:
3. Open this toolbox and it will display in the Toolboxes folder in the Catalog window, with one
script inside of it:
4. Double-click on the Calculate Route Type Stats script to launch the script in the
Geoprocessing window
5. Drag a projected route shapes feature class onto the Input Routes/Shapes Feature Class
input. Type in a name for the output table that will contain the route type summary statistics:
6. Click Run to run the tool

10
7. When it’s finished, you should see a new table in your project’s default geodatabase. You can
drag this table onto the map area, then right-click to open it and view the summary results:
Troubleshoot an ArcGIS toolbox script
Sometimes an underlying script file can get disassociated from its Toolbox .tbx file when you are
running a custom toolbox script. If this happens to you, you’ll see the following error after trying to run
the toolbox script:
If this happens, the toolbox simply needs to be recoupled with its script file. To reassociate the toolbox
with its script file, do the following:
1. Right-click on the script within the toolbox and choose Properties:
2. In the Script File properties box, click the folder icon to the right and navigate to the place on
your hard drive where the toolbox’s corresponding script file is stored. In this case, the script file
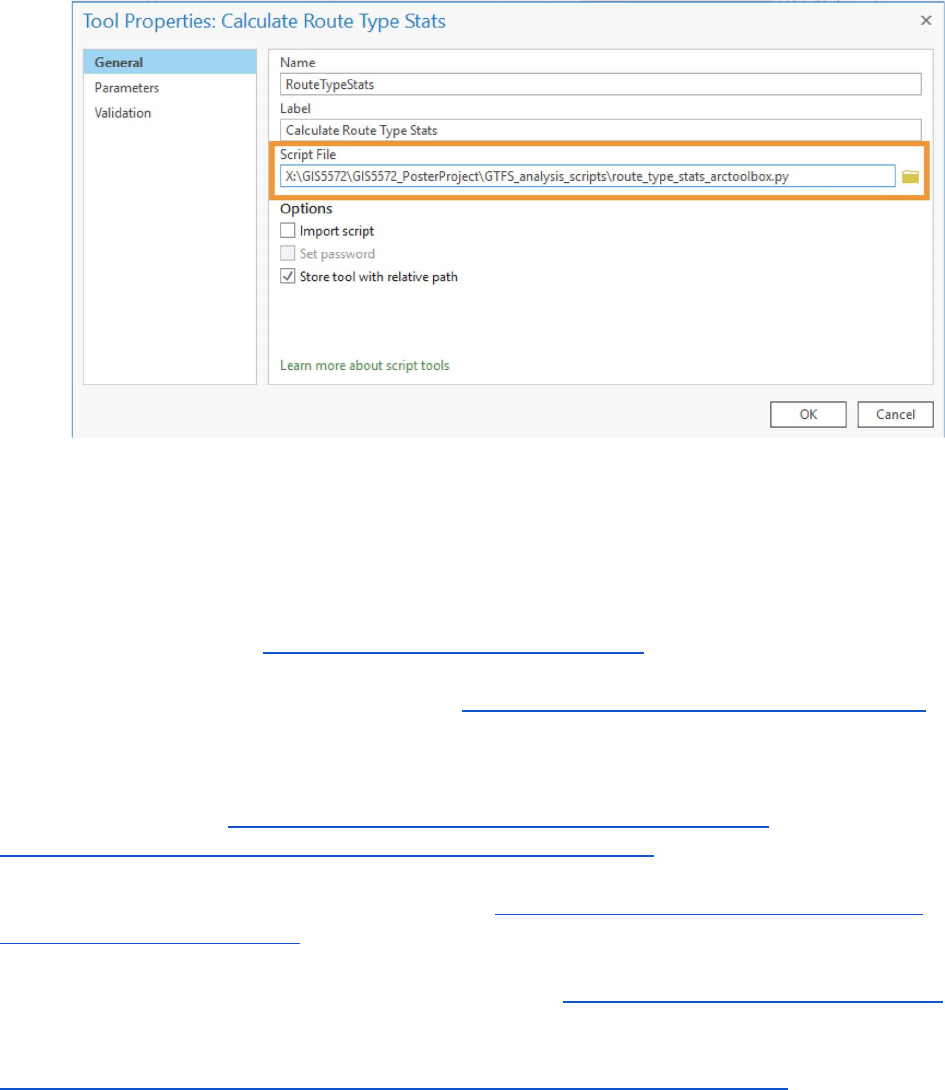
11
will be called “route_type_stats_arctoolbox.py”:
3. Try running the tool again, and this time it should work!
References
ESRI Public Transit Tools. https://esri.github.io/public-transit-tools/
GIS Stat Analysis Py Tutor [GitHub repository]. https://github.com/Esri/gis-stat-analysis-py-tutor
nicksan, (2016, 2 Dec) ‘arcpy.NumPyArrayToFeatureClass exception: “TypeError: narray.fields
require”’.
[GIS Stack Exchange]. https://gis.stackexchange.com/questions/219917/arcpy-
numpyarraytofeatureclass-exception-typeerror-narray-fields-require
NumpyArrayToTable [ArcGIS Pro documentation]. http://pro.arcgis.com/en/pro-app/arcpy/data-
access/numpyarraytotable.htm
“Regular expression operations” [Python documentation]. https://docs.python.org/2/library/re.html
Viger, R. (2015, 25 Nov). “pandas.DataFrame to ArcGIS Table”.
https://my.usgs.gov/confluence/display/cdi/pandas.DataFrame+to+ArcGIS+Table
