Graylog Hitchhiker's Guide To The Galaxy
User Manual: Pdf
Open the PDF directly: View PDF ![]() .
.
Page Count: 17

Graylog Hitchhiker's
Guide to the Galaxy
Resources/Sources 3
Logging basics 3
What to search 3
Graylog components 3
Resource/sources 3
Graylog stream 4
Graylog inputs 4
Graylog alerts 5
Graylog Extractors/grok patterns 6
Install/Setup Graylog 7
Install/Setup Graylog 7
Install/Setup MongoDB 7
Install/Setup Elasticsearch 8
Install/Setup Graylog 8
Install/Setup Nginx and OpenSSL 9
Install/Setup FirewallD 9
Graylog Client Setup 10
Install/Setup Filebeat on CentOS 7 64-bit 10
Install/Setup Packetbeat on Centos 7 64-bit 11
Install/Setup Winlogbeat on Windows 7 64-bit 11
Graylog searching How-to 11
Resources/sources 11
Search by timeframe 12
String based searches 12
Search by key:value pair 14
Multiple key:value pairs 14
Graylog Create an alert 15
Resources/sources 15


Resources/Sources
●http://docs.graylog.org/en/2.2/
●http://edbaker.weebly.com/blog/windows-and-logstash-quick-n-dirty
●https://github.com/elastic/beats/blob/master/winlogbeat/docs/getting-started.asciidoc
● http://docs.graylog.org/en/2.2/pages/getting_started/stream_alerts.html
Logging basics
● Log - A saved event of an observable occurrence in an information system that actually
happened at some point in time.
●Elements of a log
○ Who, When, or What performed the activity
○ Type of action
■ Ex: Authorize, create, read, update, delete, and accept such as a network
connection
○ Identifiers - Files accessed, query parameters, and etc
○ Before and after values of action performed
●
What to search
● Step one: know what to look for.
○ It seems simple in theory but in practice/real life it’s not. So break things down.
○ If we know they comprised a Windows system then only look at Windows logs.
○ We may know the account compromised so we can lookup authorized user
logins.
○ We may know the data they exfiltrated from the network then we can look up who
has access to that file.
● When logging is done correctly we should have records of all events and the before and
after value/result of each event.
Graylog components
Resource/sources
● http://docs.graylog.org/en/2.2/pages/streams.html
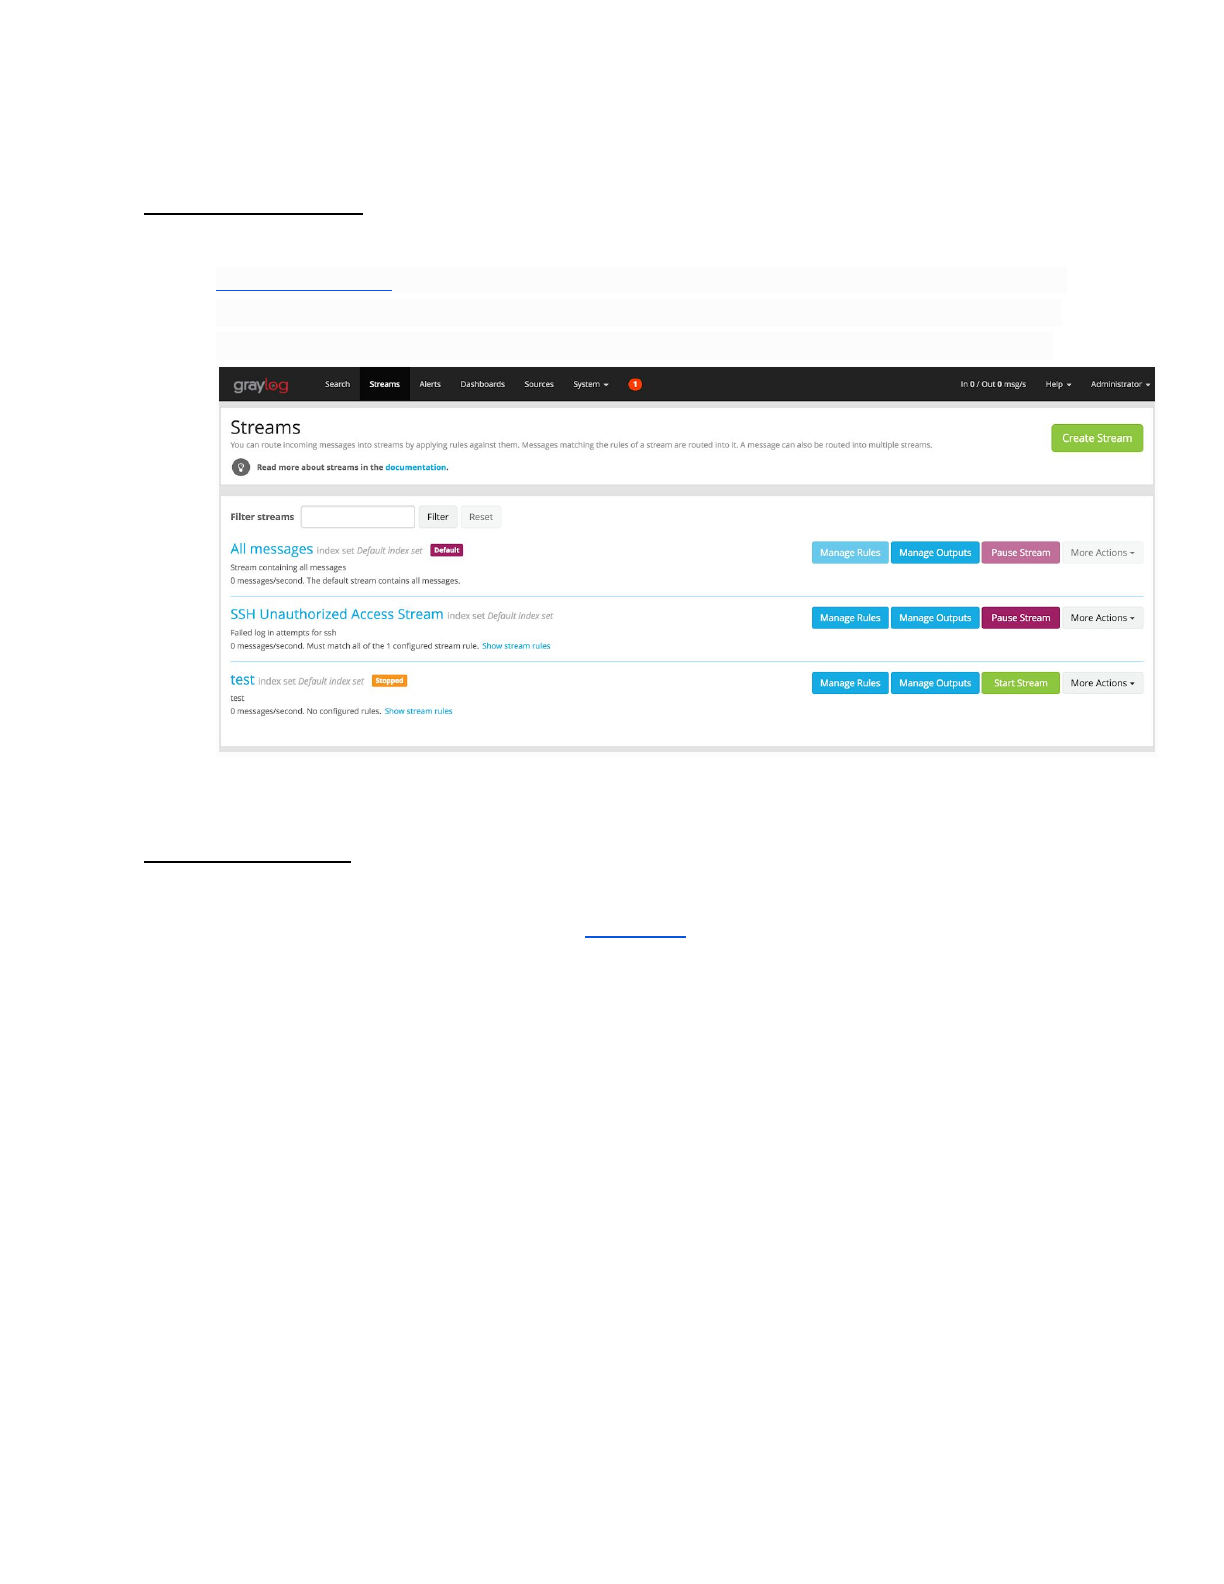
Graylog stream
● Graylog > Streams
●Graylog streams are a mechanism to route messages into categories in realtime
while they are processed. You define rules that instruct Graylog which message
to route into which streams. Imagine sending these three messages to Graylog
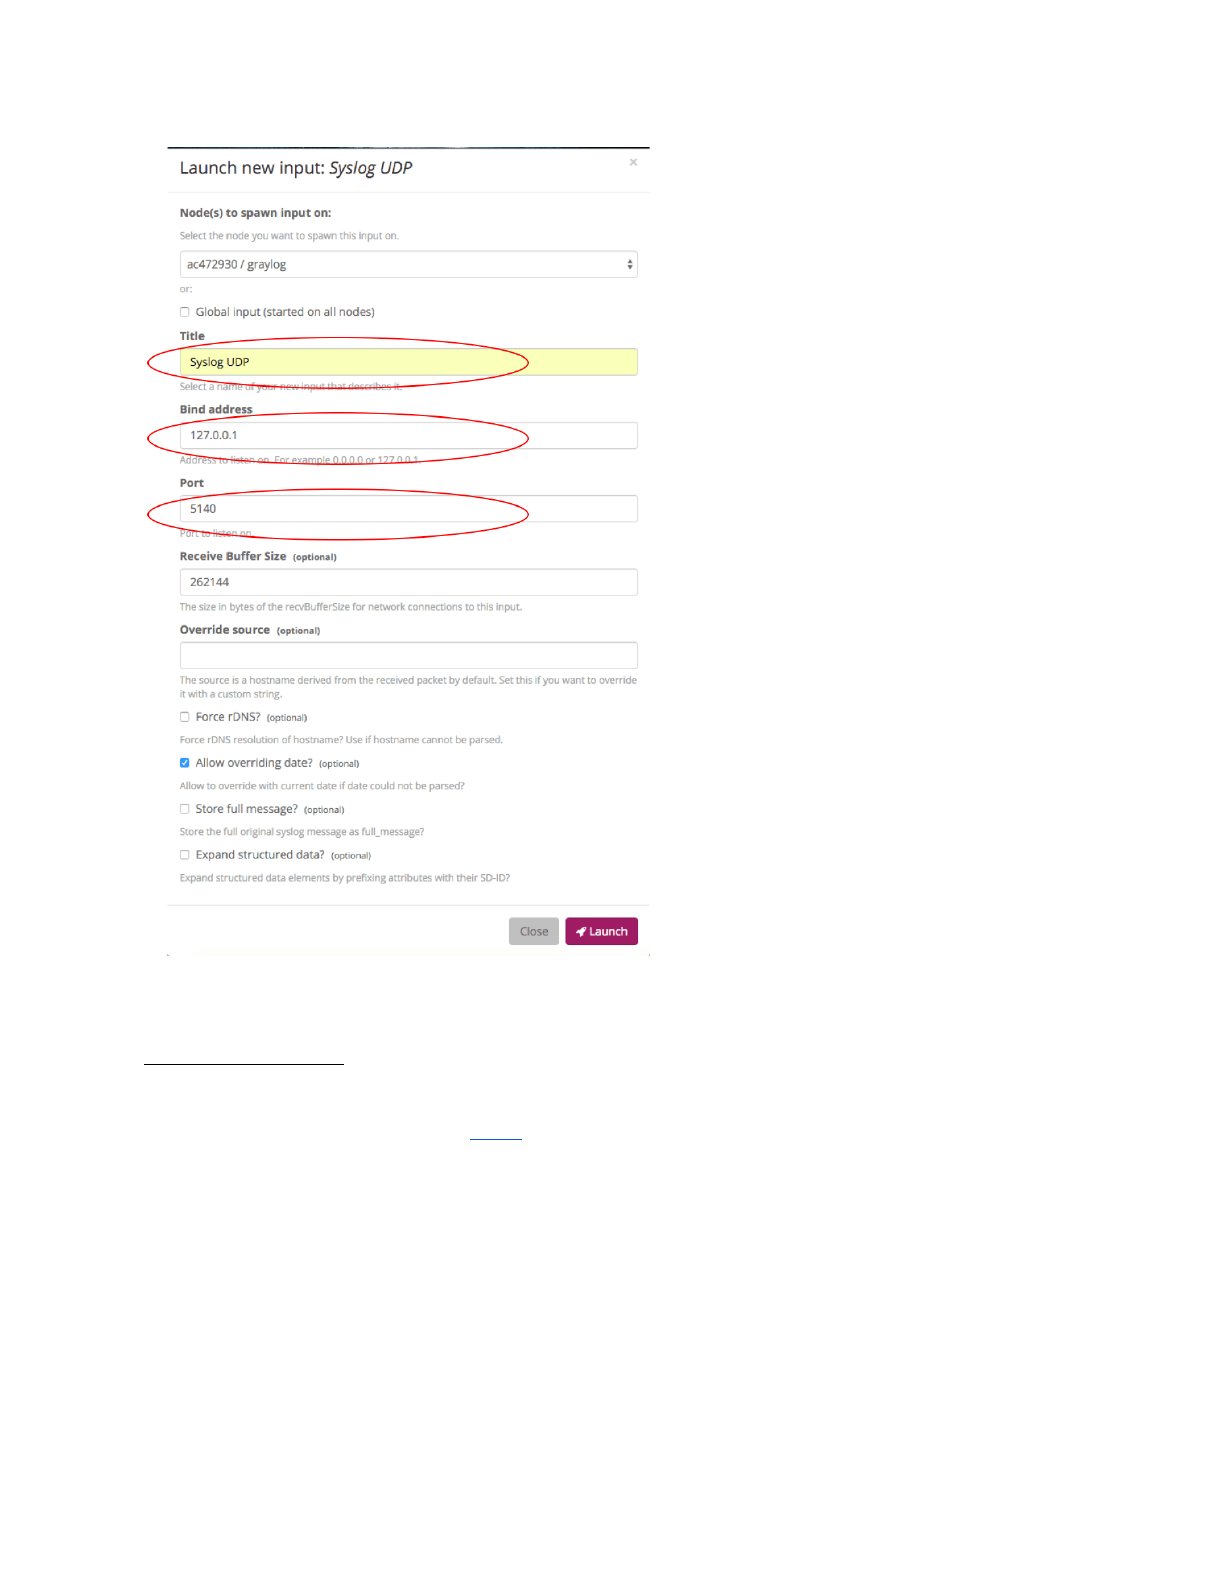
Graylog inputs
● Graylog > System > inputs
● This will tell Graylog to accept the log messages.
● Input types
○ Beats (Filebeat, Packetbeat, Winlogbeat)
○ Syslog
○ Json via HTTP
○ GELF
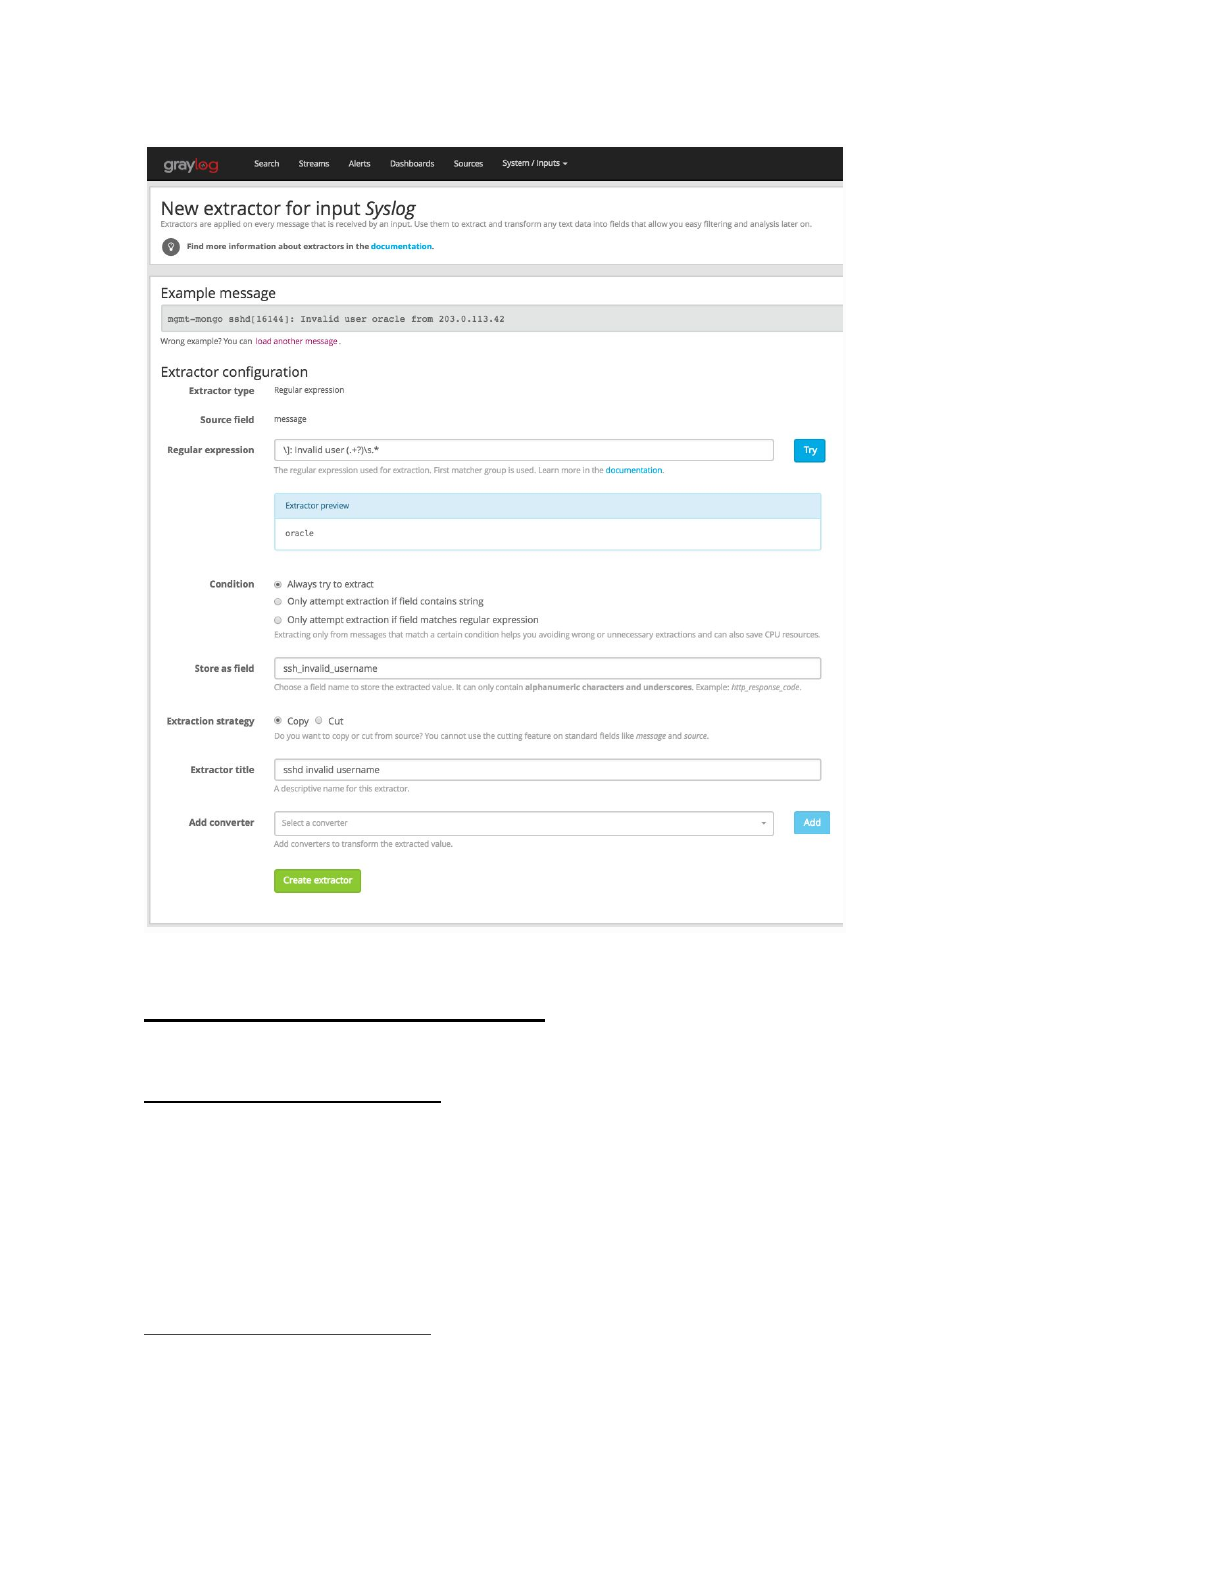
Graylog Extractors/grok patterns
● Graylog > System> Grok patterns
●Extractors allow you to instruct Graylog nodes about how to extract data from
any text in the received message (no matter from which format or if an already
extracted field) to message fields.
○ There are a lot of analysis possibilities with full text searches but the real power
of log analytics unveils when you can run queries like
“http_response_code:>=500 AND user_id:9001” to get all internal server errors
that were triggered by a specific user.
●Grok debugger/creator
Install/Setup Graylog
Install/Setup Graylog
1. yum update -y && yum install upgrade -y
2. yum install epel-release -y && yum update -y
3. yum install -y vim net-tools pwgen
4. yum install java-1.8.0-openjdk-headless.x86_64
Install/Setup MongoDB
5. cat > /etc/yum.repos.d/mongodb-org-3.2.repo << EOF

[mongodb-org-3.2]
name=MongoDB Repository
baseurl=https://repo.mongodb.org/yum/redhat/\$releasever/mongodb-org/3.2/x86_64/
gpgcheck=1
enabled=1
gpgkey=https://www.mongodb.org/static/pgp/server-3.2.asc
EOF
6. yum install -y mongodb-org
7. chkconfig --add mongod
8. systemctl daemon-reload
9. systemctl enable mongod.service
10. systemctl start mongod.service
Install/Setup Elasticsearch
1. rpm --import https://packages.elastic.co/GPG-KEY-elasticsearch
2. cat > /etc/yum.repos.d/elasticsearch.repo << EOF
[elasticsearch-2.x]
name=Elasticsearch repository for 2.x packages
baseurl=https://packages.elastic.co/elasticsearch/2.x/centos
gpgcheck=1
gpgkey=https://packages.elastic.co/GPG-KEY-elasticsearch
enabled=1
EOF
3. yum install -y elasticsearch
4. yum update --exclude=elasticsearch-2.x
a. GRAYLOG NEEDS ELASTICSEARCH 2
5. sed -i ‘s/# cluster.name: my-application/cluster.name: graylog/g’
/etc/elasticsearch/elasticsearch.yml
6. chkconfig --add elasticsearch
7. systemctl daemon-reload
8. systemctl enable elasticsearch.service
9. systemctl restart elasticsearch.service
Install/Setup Graylog
1. rpm -Uvh https://packages.graylog2.org/repo/packages/graylog-2.1-repository_latest.rpm
2. yum install graylog-server
3. echo -n yourpassword | sha256sum
a. Copy output text
4. sed -i ‘s/root_password_sha2 =/root_password_sha2 = <hash from above>/g’
/etc/graylog/server/server.conf

5. pwgen -N 1 -s 96
a. Copy output text
6. sed -i ‘s/password_secret =/password_secret = <pwgen output> /g’
/etc/graylog/server/server.conf
7. chkconfig --add graylog-server
8. systemctl daemon-reload
9. systemctl enable graylog-server.service
10. systemctl start graylog-server.service
Install/Setup Nginx and OpenSSL
1. yum install nginx -y
2. mkdir /etc/nginx/ssl
3. openssl req -x509 -nodes -days 365 -newkey rsa:2048 -keyout /etc/nginx/ssl/nginx.key
-out /etc/nginx/ssl/nginx.crt
4. openssl dhparam -out /etc/ssl/certs/dhparam.pem 2048
5. sed -i -e '38,87d' /etc/nginx/nginx.conf
6. cat > /etc/nginx/conf.d/graylog.conf << EOF
a. See resource above for examples
7. sudo setsebool -P httpd_can_network_connect 1
8. systemctl enable nginx
9. systemctl start nginx
Install/Setup FirewallD
1. yum install firewalld -y
2. systemctl enable firewalld
3. systemctl start firewalld
4. firewall-cmd --permanent --add-service=ssh
5. firewall-cmd --permanent --add-service=http
6. firewall-cmd --permanent --add-service=https
7. firewall-cmd --permanent --add-port=5044/tcp
8. firewall-cmd --reload
Graylog Client Setup
Install/Setup Filebeat on CentOS 7 64-bit
● Filebeat helps you keep the simple things simple by offering a lightweight way to forward
and centralize logs and files.

● Operating System: Linux and Windows
1. yum update -y && yum upgrade -y
2. sudo rpm --import https://packages.elastic.co/GPG-KEY-elasticsearch
3. cat > /etc/yum.repos.d/elastic.repo << EOF
[elastic-5.x]
name=Elastic repository for 5.x packages
baseurl=https://artifacts.elastic.co/packages/5.x/yum
gpgcheck=1
gpgkey=https://artifacts.elastic.co/GPG-KEY-elasticsearch
enabled=1
autorefresh=1
type=rpm-md
EOF
4. yum install filebeat -y
5. mkdir /etc/filebeat/conf.d/
6. cp /etc/filebeat/filebeat.yml /etc/filebeat/filebeat.yml.bak
7. cat > /etc/filebeat/filebeat.yml << EOF
filebeat:
registry_file: /var/lib/filebeat/registry
config_dir: /etc/filebeat/conf.d
output.logstash:
hosts: ["<hostname/IP Addr>:5044"]
EOF
8. cat > /etc/filebeat/conf.d/logging.yml << EOF
filebeat.prospectors:
- paths:
- /var/log/*
input_type: log
EOF
9. systemctl enable filebeat
10. systemctl start filebeat
Install/Setup Packetbeat on Centos 7 64-bit
● Packetbeat is a lightweight network packet analyzer that sends data to Logstash or
Elasticsearch.
● Operating system: Linux and Windows

Install/Setup Winlogbeat on Windows 7 64-bit
● Winlogbeat
● Operating system: Windows
1. Download the Winlogbeat zip file from the downloads page.
2. Extract the contents into C:\Program Files.
3. Rename the winlogbeat-<version> directory to Winlogbeat.
4. Open a PowerShell prompt as an Administrator (right-click on the PowerShell icon and
select Run As Administrator).
a. If you are running Windows XP, you may need to download and install
PowerShell.
5. cd 'C:\Program Files\Winlogbeat'
6. .\install-service-winlogbeat.ps1
a. Run ExecutionPolicy UnRestricted
7. Edit winlogbeat.yml
a. Comment out “#output.elasticsearch:
#hosts:
# - localhost:9200”
b. Uncomment “output.elasticsearch:
hosts:
- <IP Addr of graylog>:9200”
c. Save, exit
8. Start-Service winlogbeat
Graylog searching How-to
Resources/sources
●https://www.youtube.com/watch?v=vxmAIDZe1j0
Search by timeframe
1. Select the “Search” tab
2. Select the drop menu for time
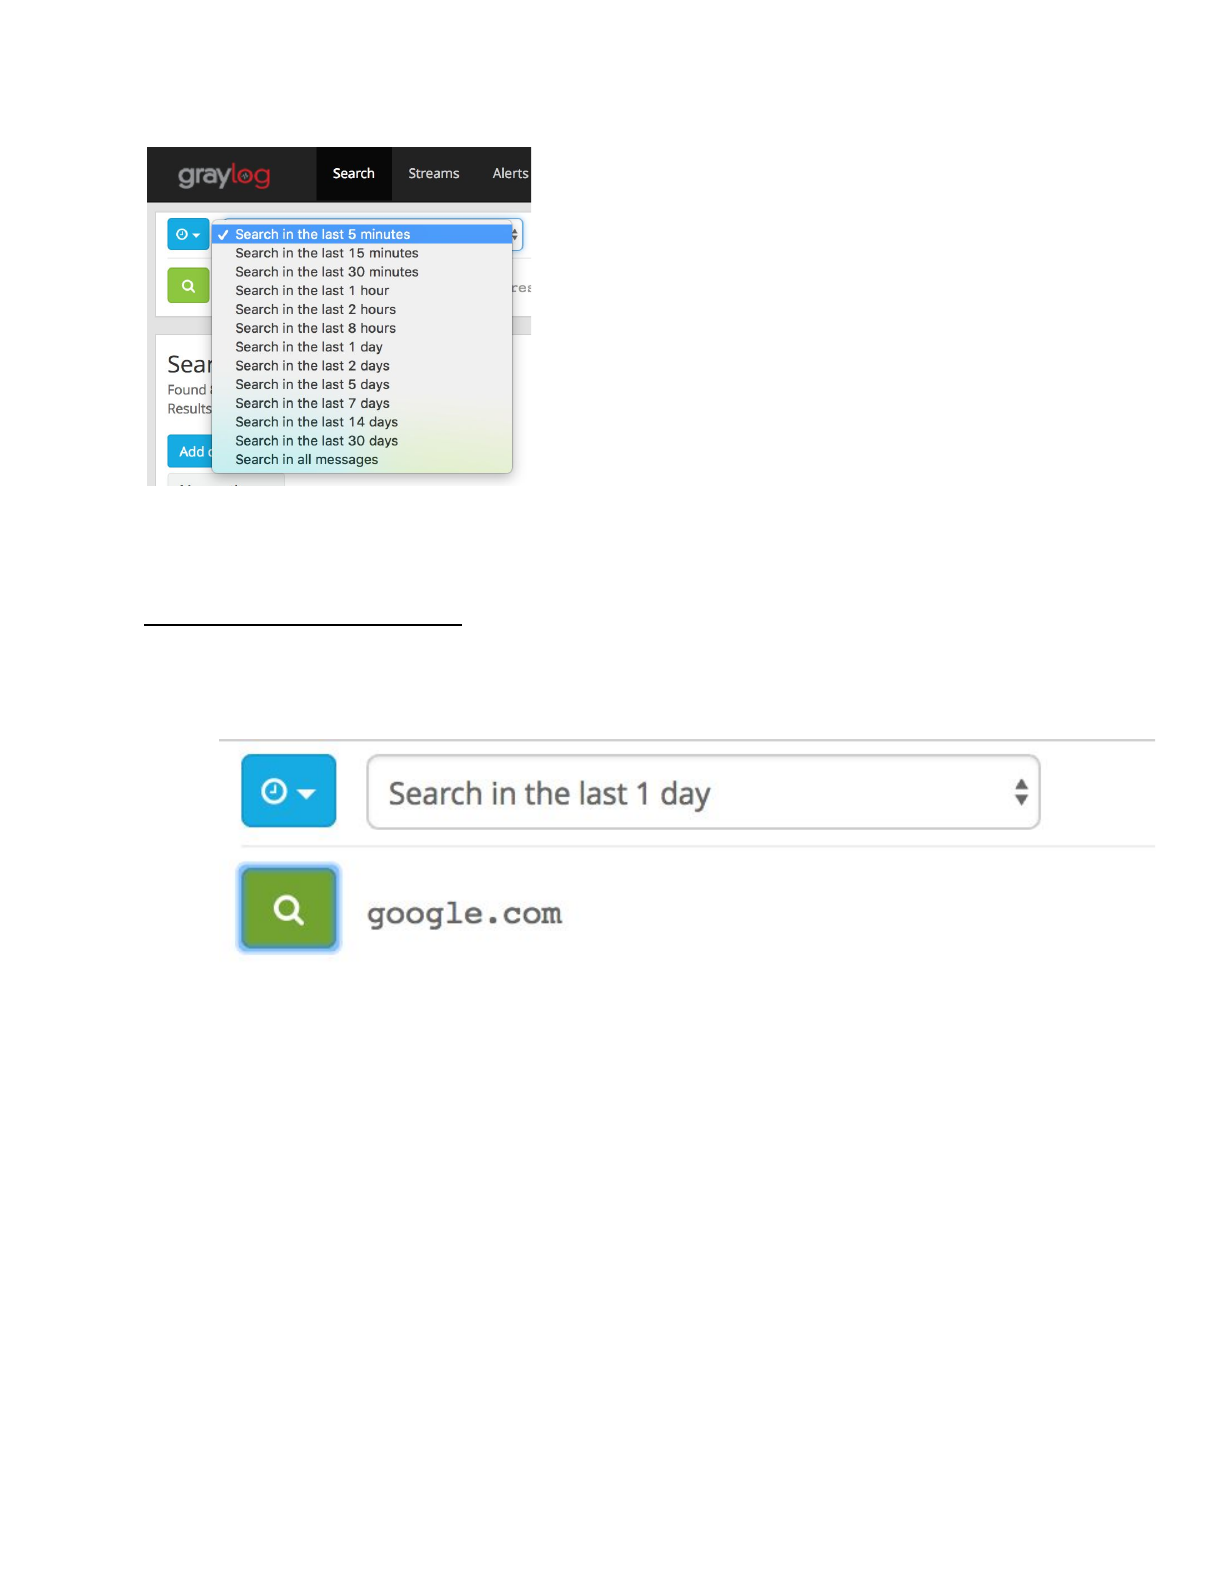
String based searches
● Let’s search for domain names
1. Enter “google.com” into the search.
2. Select the search icon
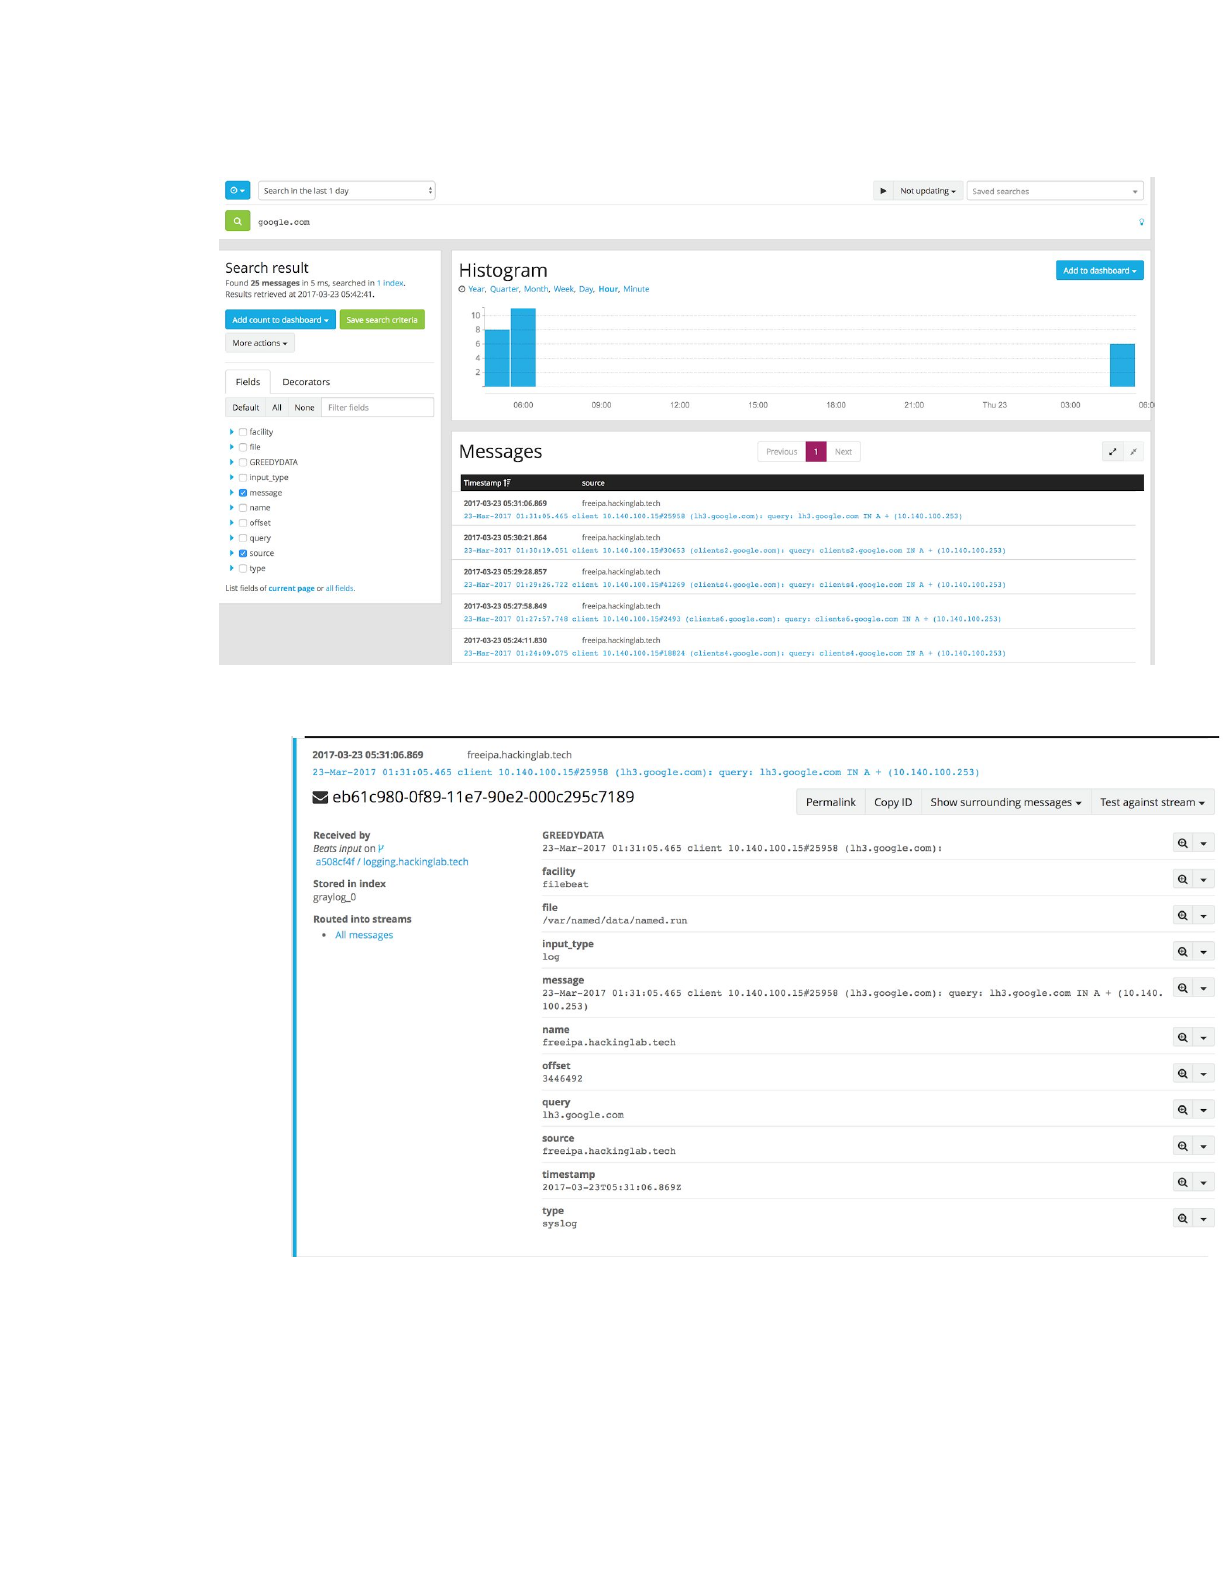
3. This search will populate results within the specified time frame
4. Select an entry from above to see all the detail
a. We can see below that all entries are a key:value pair
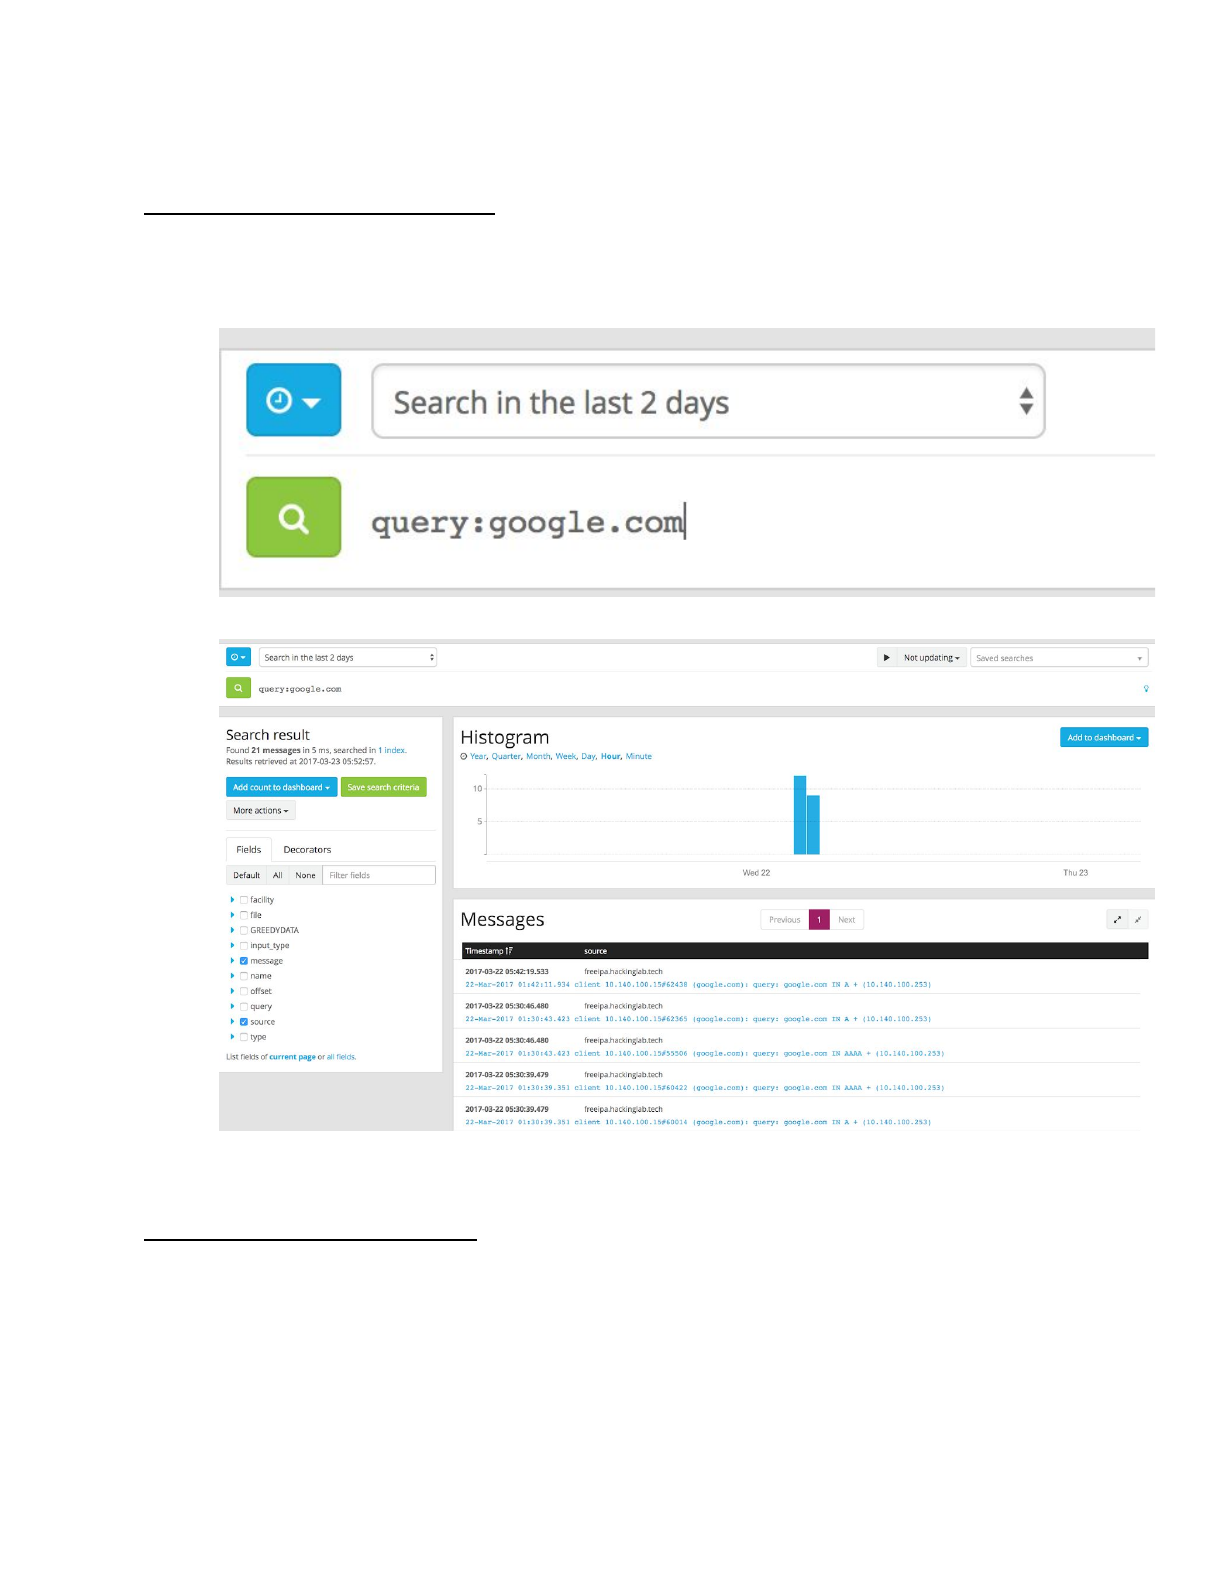
Search by key:value pair
● Let’s search for every log entry where the key is query and the value is google.com
1. Enter “query:google.com” into the search
2. Select the search icon
3. The search will populate entries
Multiple key:value pairs
● Let’s search for every log entry where the key is and the values google.com
Graylog Create an alert
Resources/sources
● http://docs.graylog.org/en/2.2/pages/getting_started/stream_alerts.html
Create Graylog stream to filter logs
1. Login into graylog
2. Select “Stream” tab
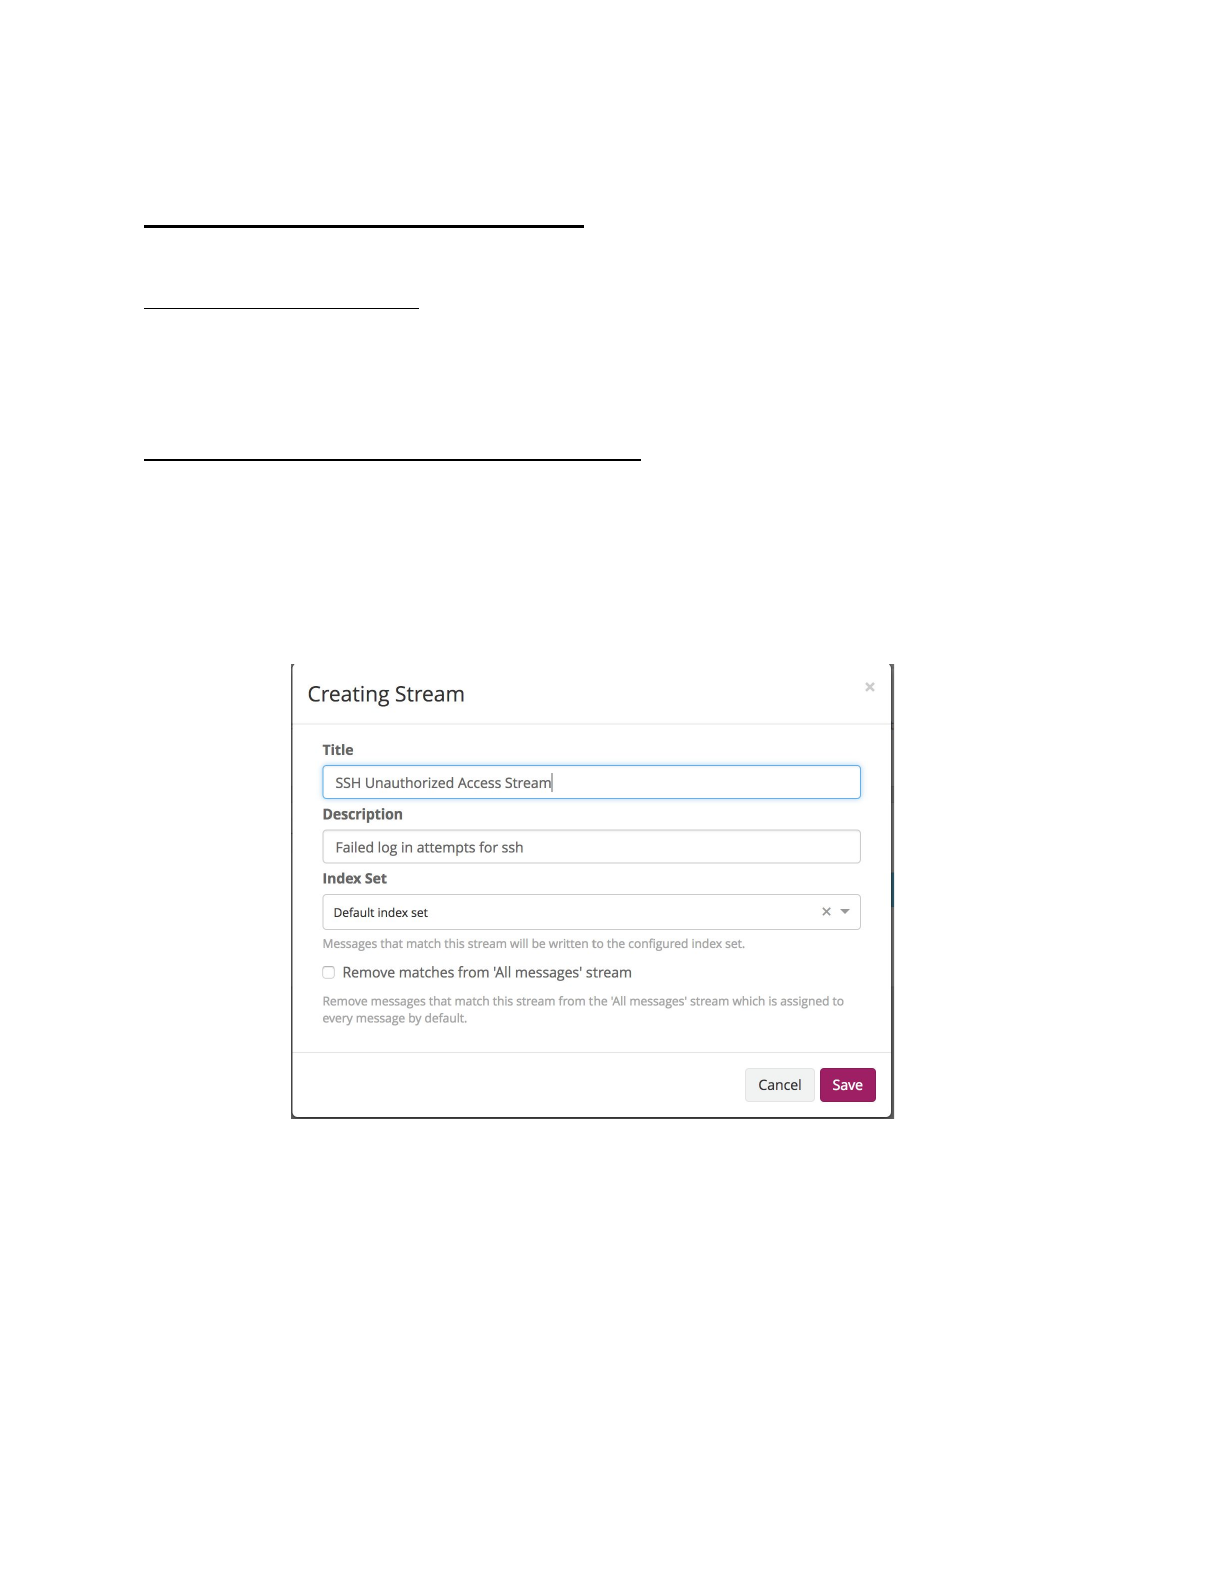
3. Select “Create Stream”
a. Enter “SSH Unauthorized Access Stream” for title
b. Enter “Failed login attempts for ssh” for description
c. Select “Default index” for index
d. Select “Save”
4. Select “Manage rules” for “SSH Unauthorized Access Stream”
5. Select “Add stream rule”
a. Enter “message” for field
b. Select “contain” for type
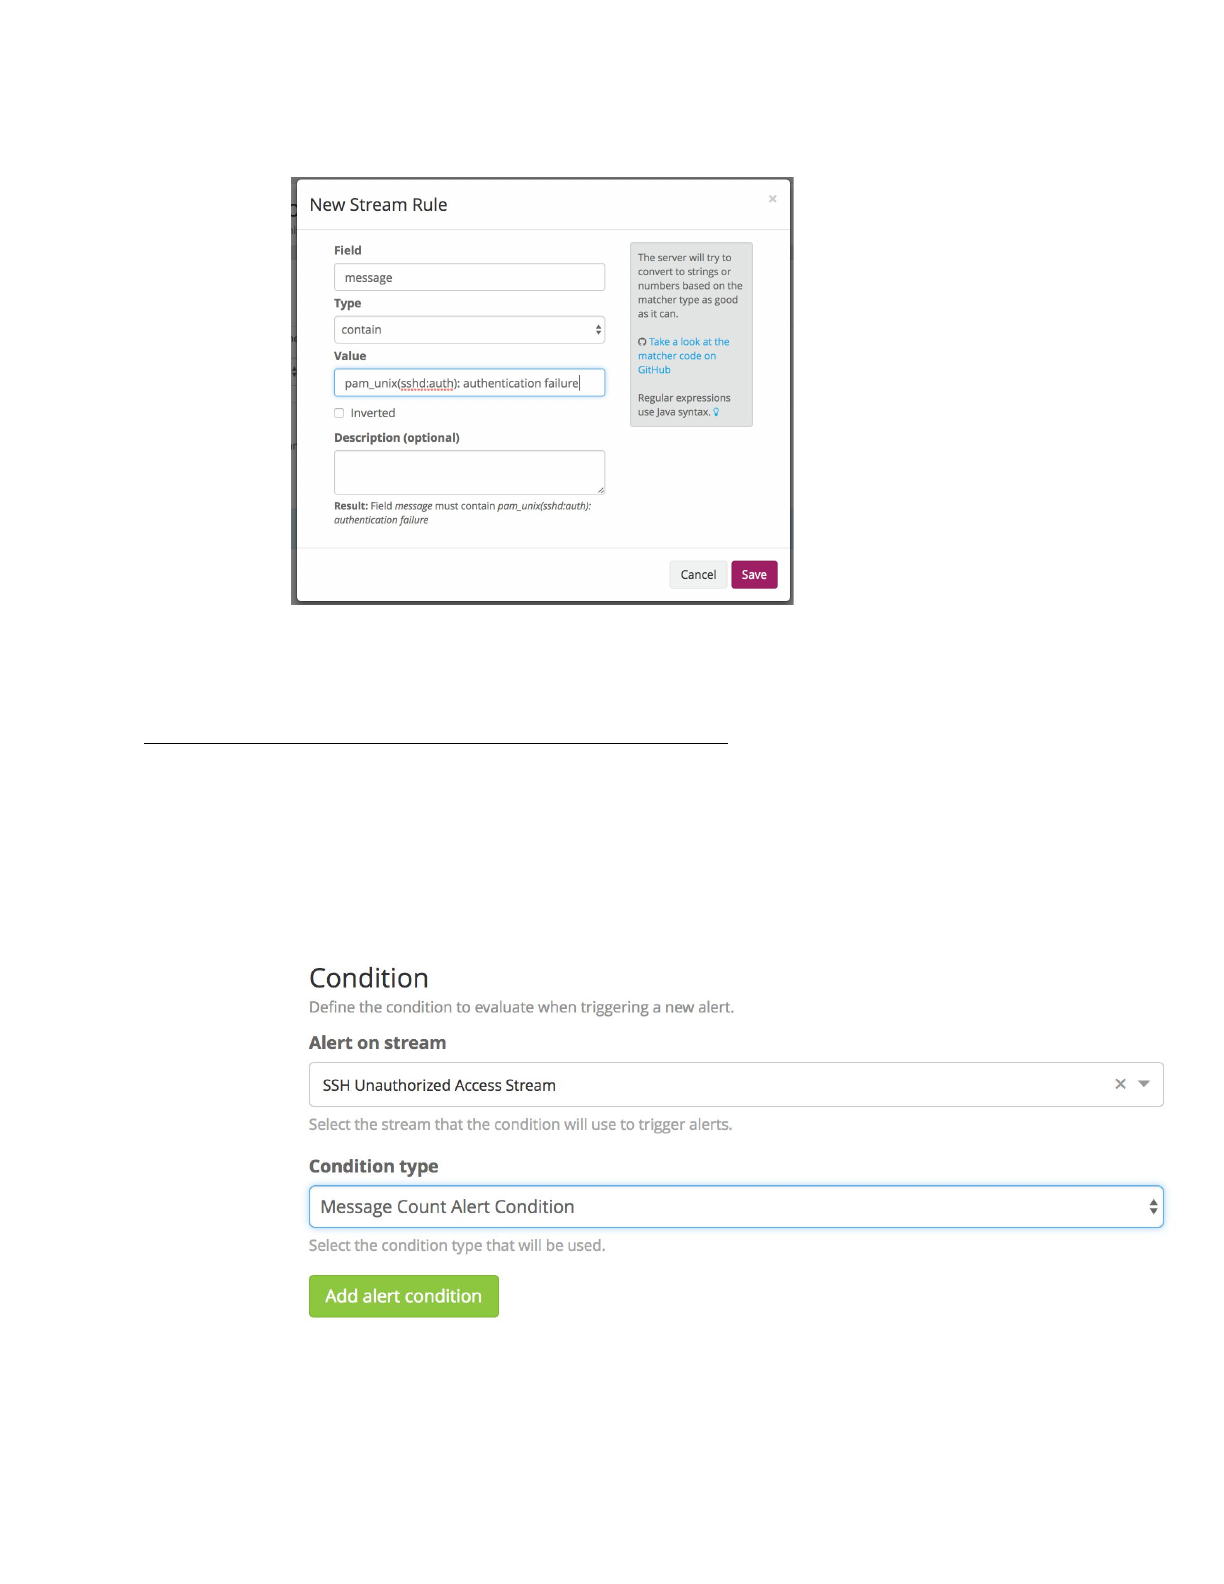
c. Enter “pam_unix(sshd:auth): authentication failure” for value
d. Select “Save”
6. Select “I’m done”
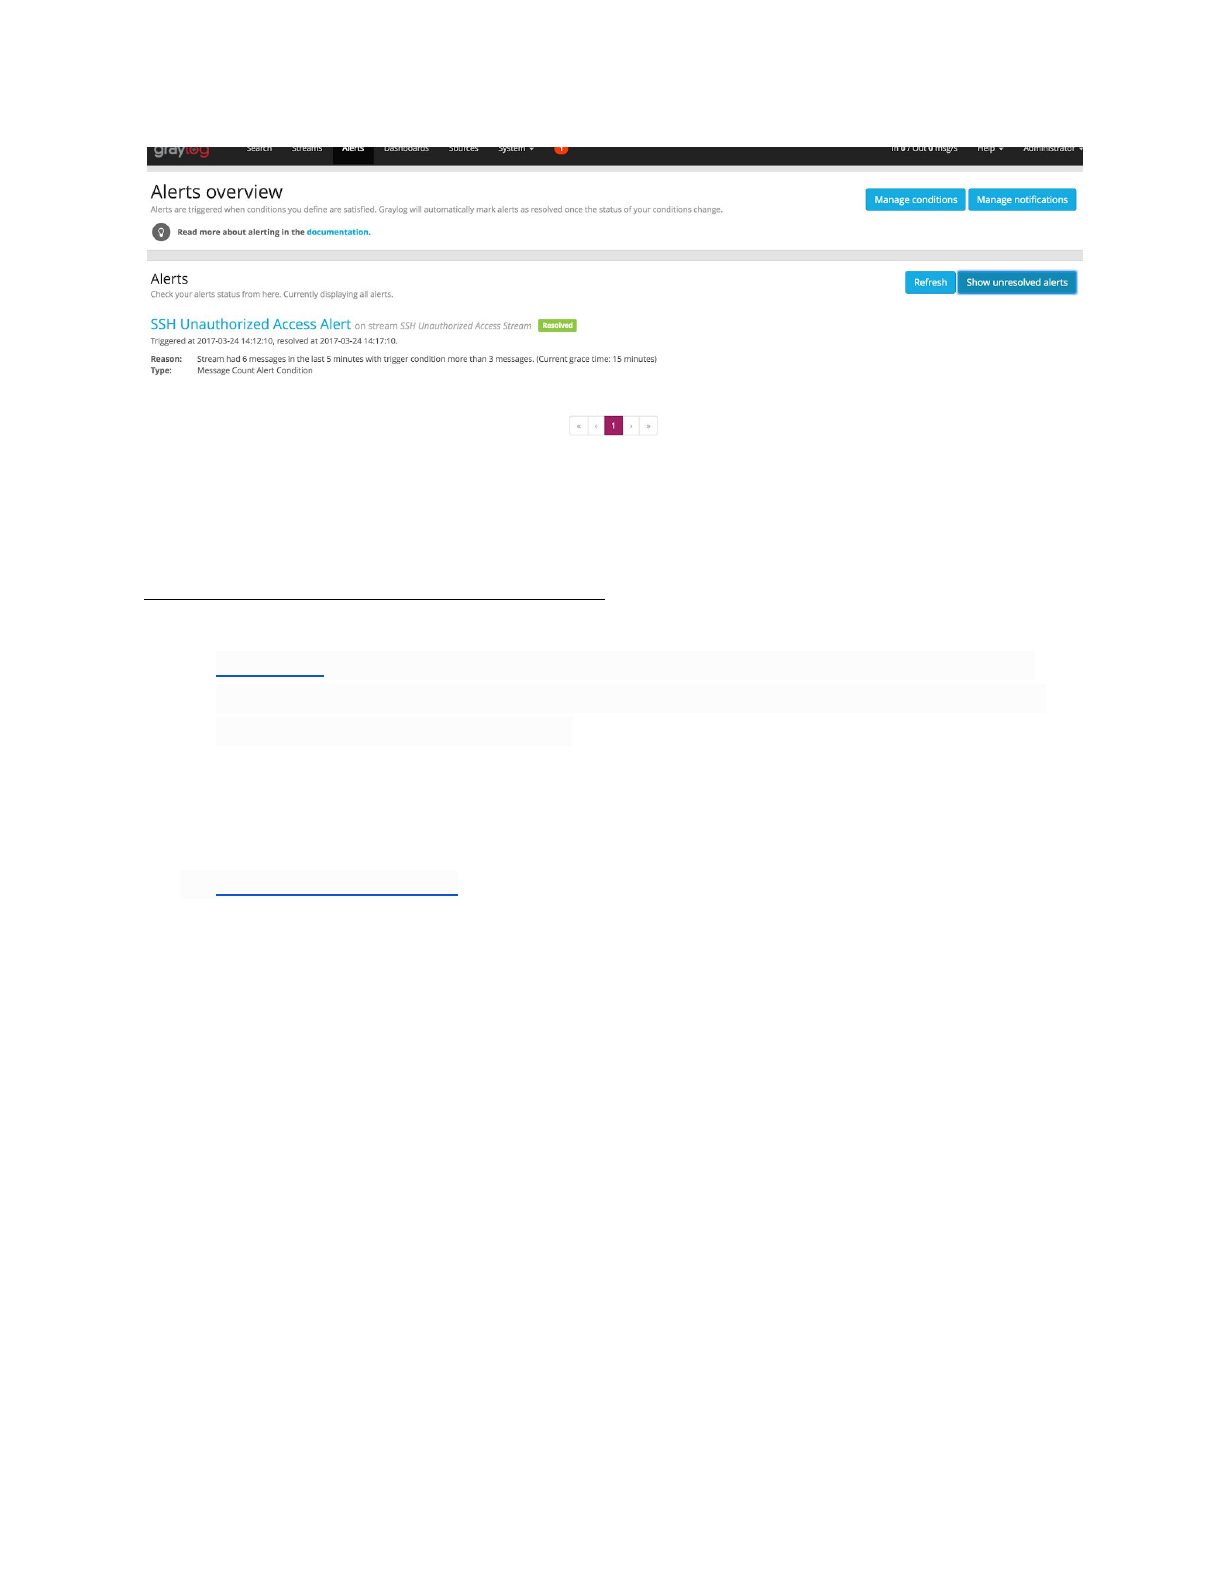
Creating alert for unauthorized SSH login
1. Log into graylog
2. Select the “Alert” tab
3. Select “Manage conditions”
4. Select “Add new condition”
a. Select “SSH Unauthorized Access Stream” for Alert of stream
b. For this example select “Message Count Alert Condition”
c. Select “Add alert condition”
5. Field content for rule
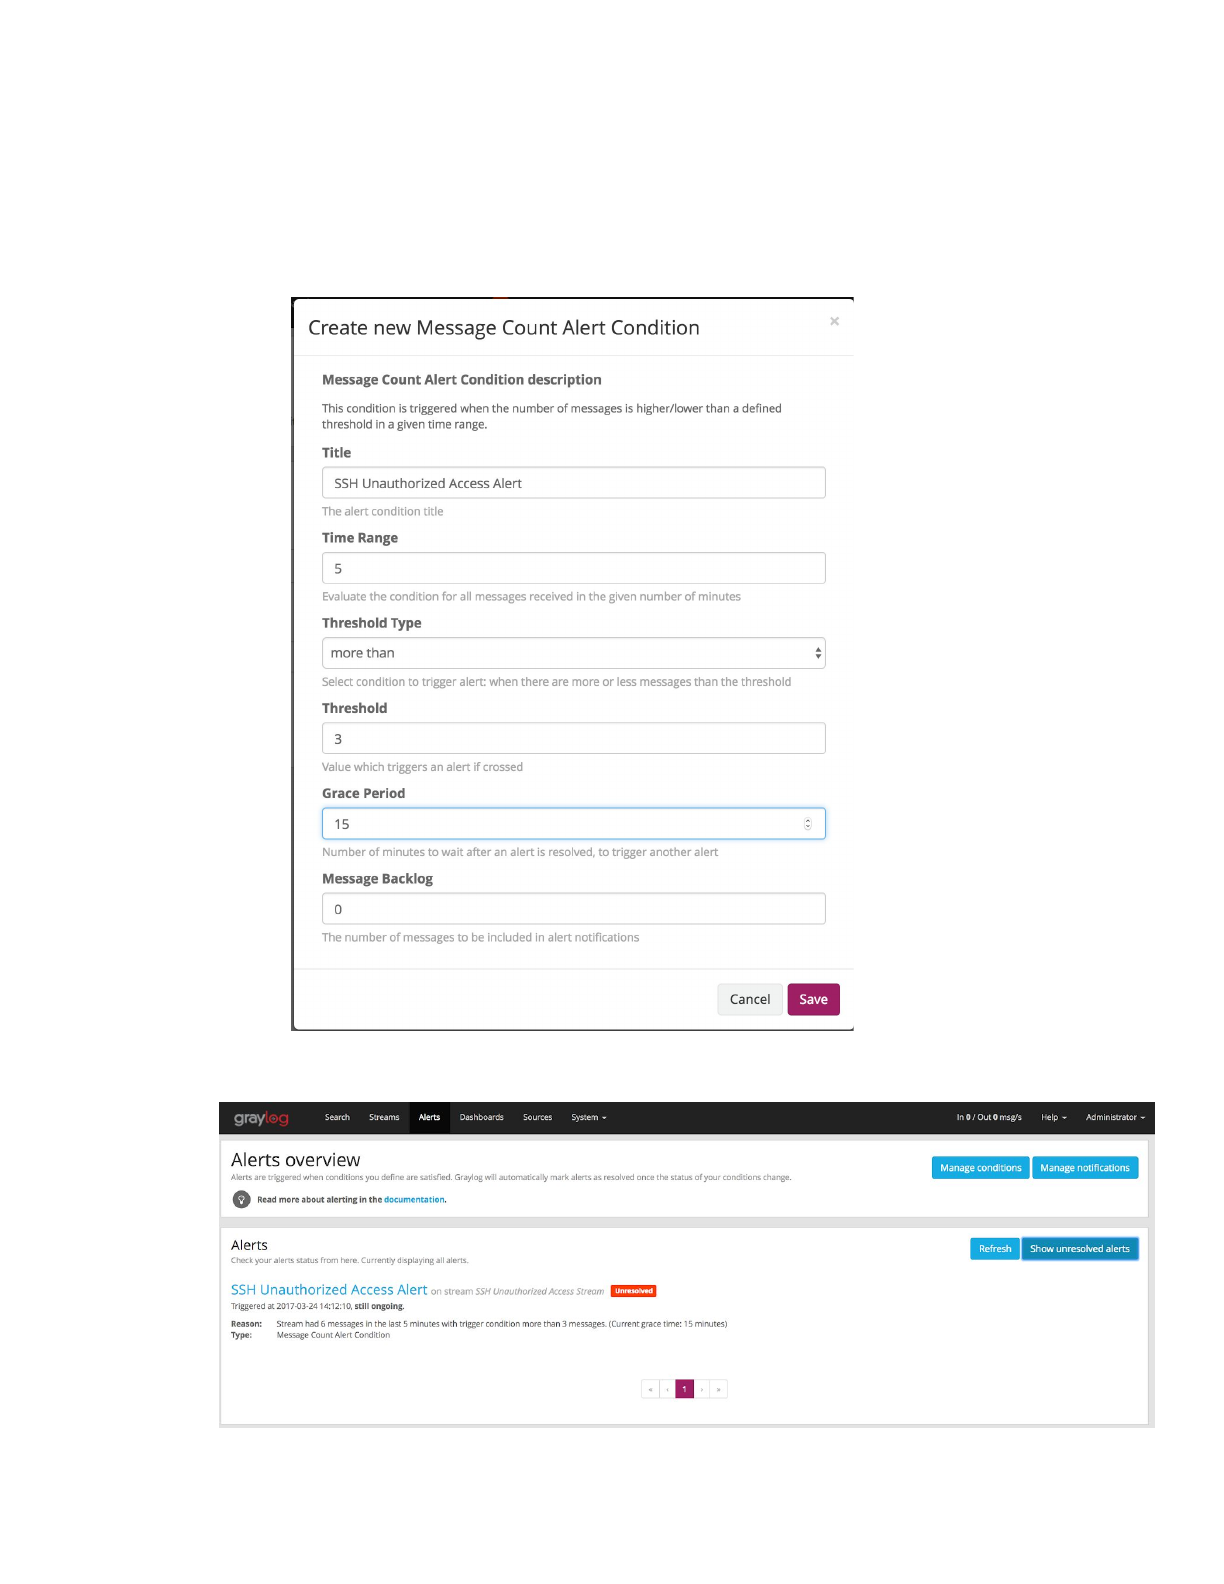
a. Enter “SSH Unauthorized Access Alert” for title
b. Enter “5” for time range events occur in
c. Select “more than” for threshold type
d. Enter “3” for threshold
e. Enter “15” for grace period
f. Select “Save”
6. Select “Alert” tab
