ISSG Syllabus
2013-08-05
: Pdf Issg Syllabus ISSG_Syllabus 8 2013 pdf
Open the PDF directly: View PDF ![]() .
.
Page Count: 80
7/31/2013
1
Overview of ISSG and Health
Impact of Adult Spinal Deformity
Shay Bess, MD
News from the Frontlines of Adult Spinal Deformity
Research and Treatment
VuMedi Webinar
August 2013
Disclosures Shay Bess
•Consulting= Depuy/Synthes, Medtronic,
Allosource, K2M, Alphatec
•Royalties= Pioneer Spine, K2M
•Research support= Depuy/Synthes,
Medtronic, K2M
•Scientific advisory board= Allosource
“It is essential that
community physicians and
the public recognize that LIS
is likely to cause little
physical impairment other
than back pain and cosmetic
concerns.”
Adult Spinal Deformity and Disability
•Traditional teaching= scoliosis is
not painful
• “Supporting evidence”
–Weinstein SL, et al. JAMA 2003
–Weinstein SL. JBJS 2000
•Results
–LIS =more pain and cosmetic vs
controls
–LIS 68%= little or moderate pain
(similar to controls)
–No effect on function, marital
status
7/31/2013
2
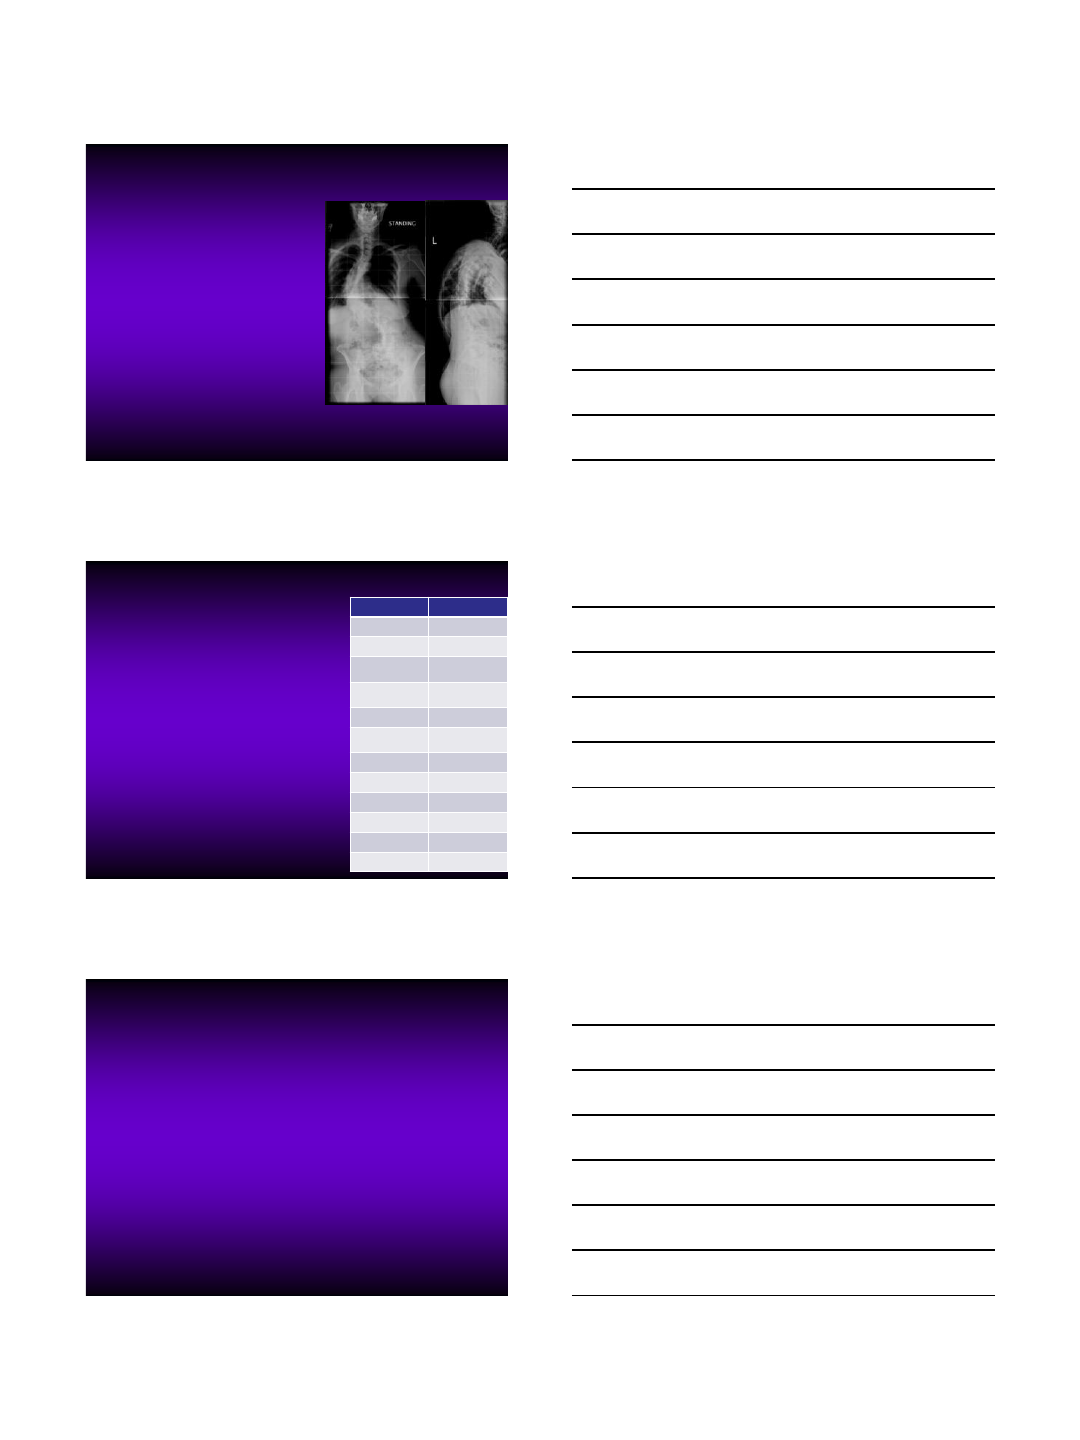
Adult Spinal Deformity and Disability
•Problems Weinstein Studies
1. No standardized HRQOL
–Modified pain, depression,
function and cosmesis scores
2. No sagittal analysis
–All patients= PA only
–Fundamental ASD
evaluation
3. Sagittal spinopelvic
malalignment
–Foundation pain and disability
spinal deformity
–Primary reason for not
diagnosing pain ASD
International Spine Study Group
•ASD research needs:
–Standardized clinical/radiographic
evaluation
–HRQOL correlations
–Best practice guidelines
•Clinical, economic, complications
•ISSG: Multi-center research group
–13 sites
–Evaluation & treatment ASD
–Radiographic, psychological, HRQOL
–Cost effectiveness
–Heath impact vs. disease states
–Preoperative planning
–Complications
Site Members
OHSC Hart
UC Davis Gupta, Klineberg
UCSF Ames, Deviren,
Mummaneni
San Diego Akbarnia,
Mundis, Eastlack
Colorado Bess. Line
Baylor Hostin, O’Brien,
McCarthy
Kansas Burton
Johns Hopkins Kebaish
Washington Univ
Buchowski
HSS Boachie, Kim
NYU/HJD Lafage, Schwab
Virginia Shaffrey, Smith
ISSG Structure
•Independent private foundation (ISSGF 501 3c formed
2010)
•Online database (initiated 2009)
–Host site data entry; central data QA
•Centralized radiographic measures (initiated 2009)
–Upload to FTP server (NYU site); measurements
SpineView software
•Personnel
–Central coordinator
–Accountants and legal
–Health economists (JHU faculty and Baylor)
7/31/2013
3
ISSG Projects
1. Prospective Operative vs. NonOp for ASD
–Consecutive enrollment ASD (scoliosis ≥20°, SVA≥5cm, PT≥25°,
or TK> 60°)
–Total =906; OP=415; NON=491
2. Three Column Osteotomy Database (3CO)
–Total =776 (data collection on going)
–Complete radiographic data=572
3. Proximal Junctional Failure (PJF); initiated 8/2012
–Retrospective analysis PJF in ASD
–Definition, incidence, risk factors, treatment
4. Prospective Cervical Deformity (PCD); initiated 1/1/2013
–Operative treatment adult PCD
5. Low grade adult spondylolisthesis; funding approved 2/2013
6. Cost effectiveness OP vs. NON for ASD; funding pending
7. Root cause analysis for success and failure of ASD surgery; pending
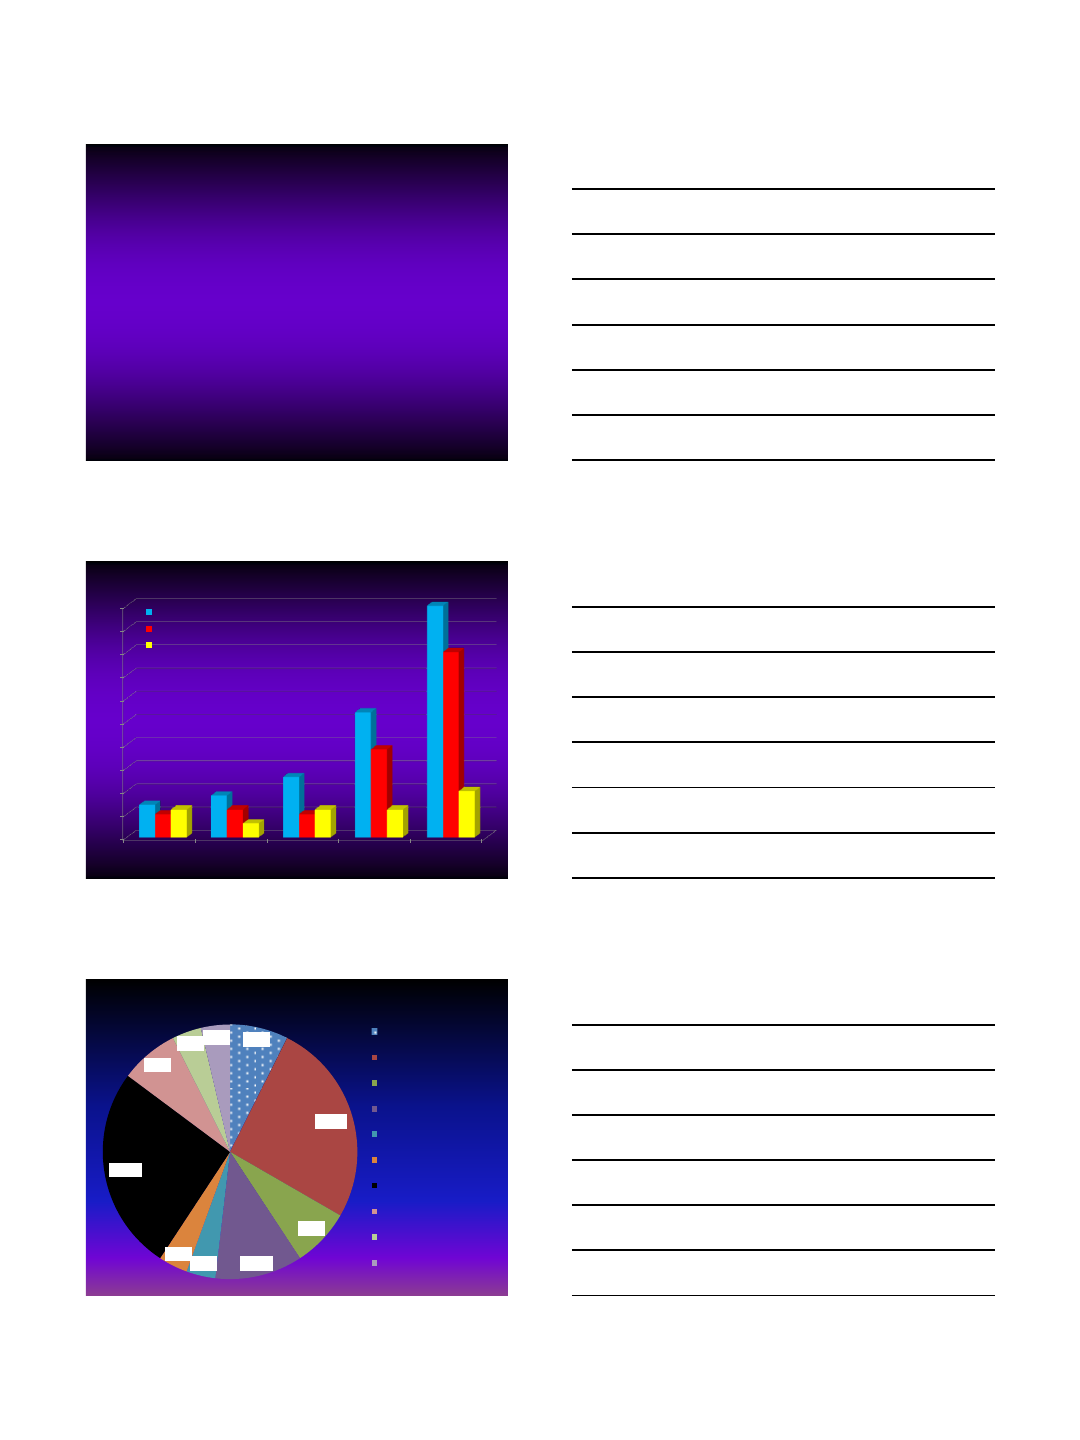
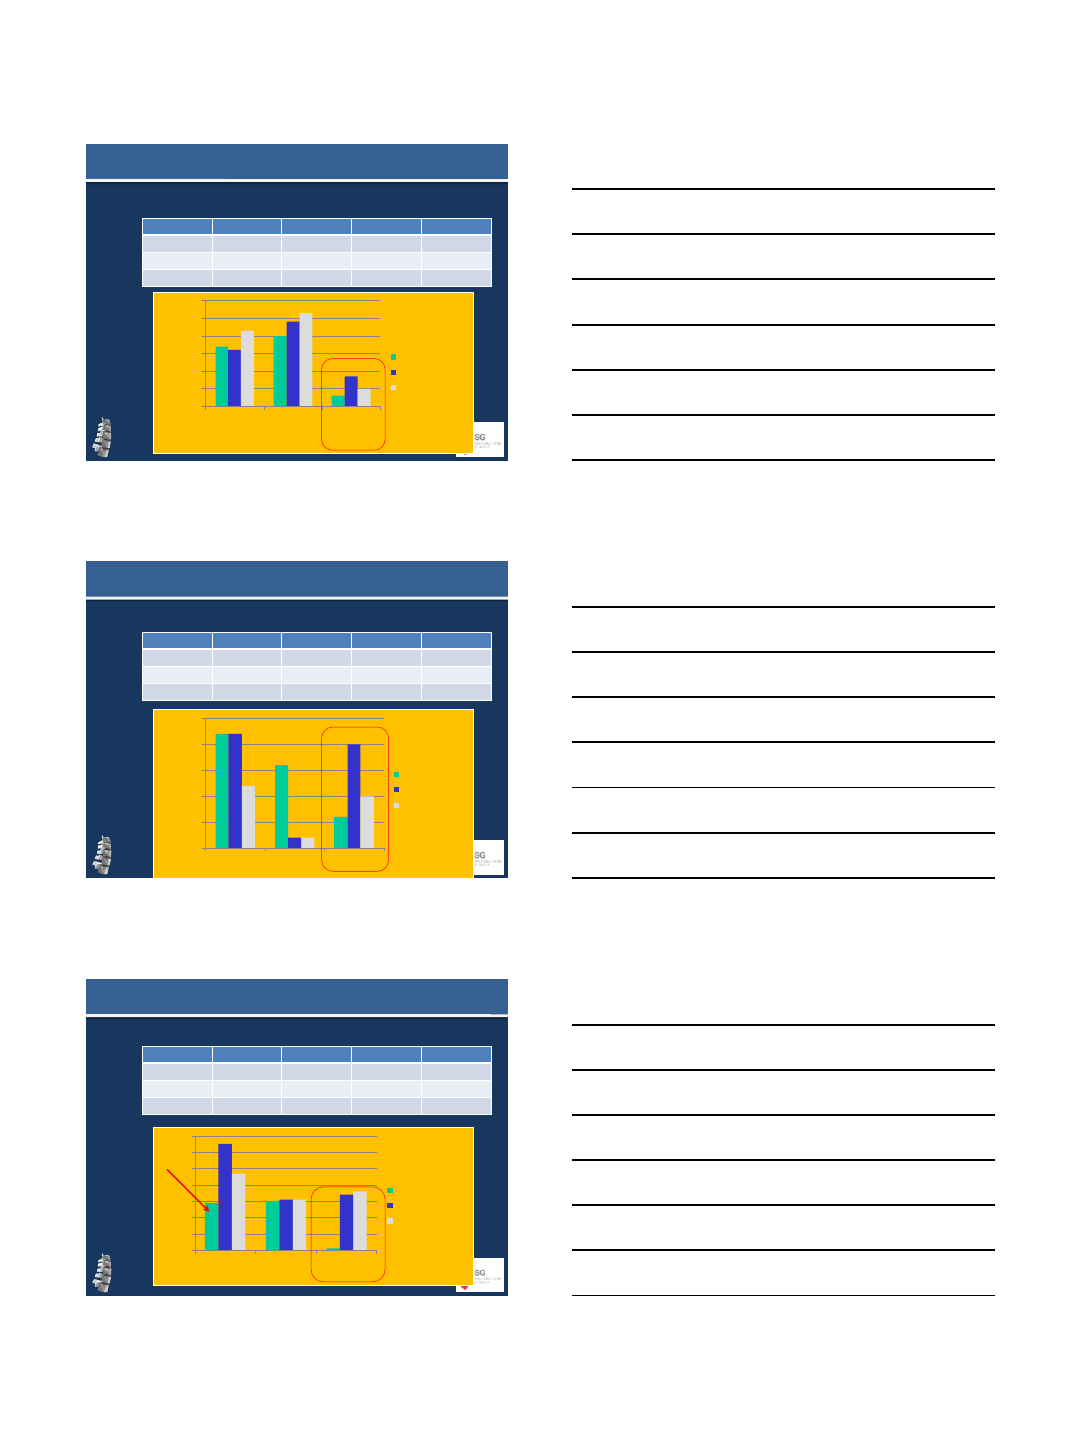
ISSG Abstract Productivity SRS/IMAST Submissions
0
5
10
15
20
25
30
35
40
45
50
2009 2010 2011 2012 2013
7 9
13
27
52
5 6 5
19
40
6 3 6 6
10
Submitted
AcceptedPodium
Accepted Poster
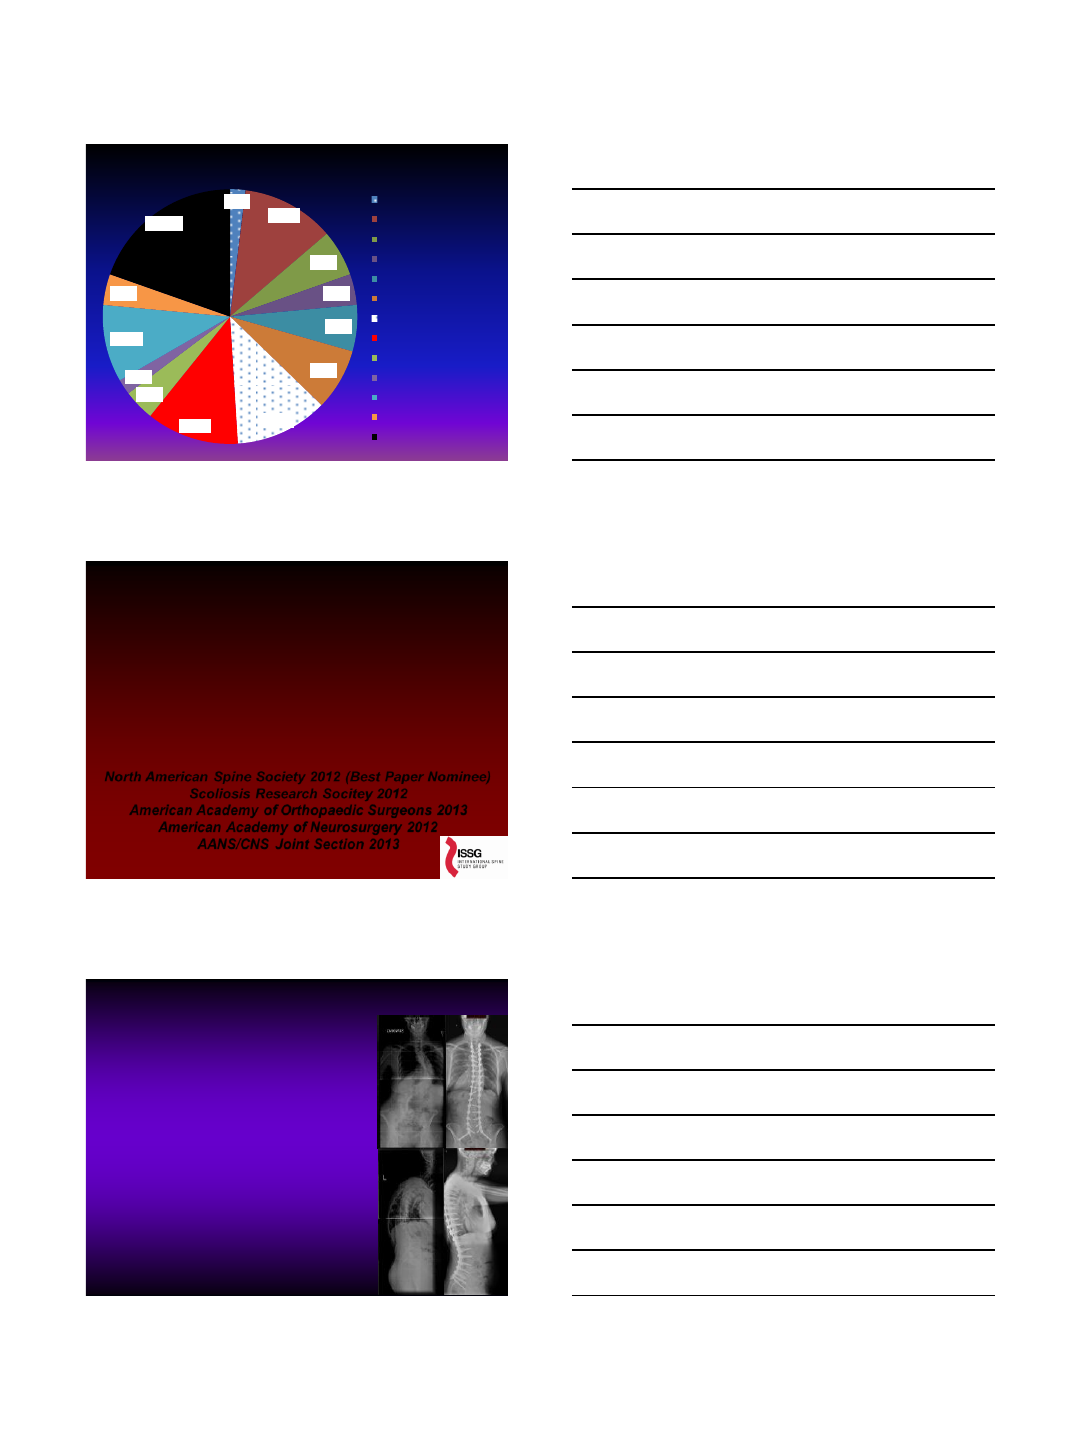
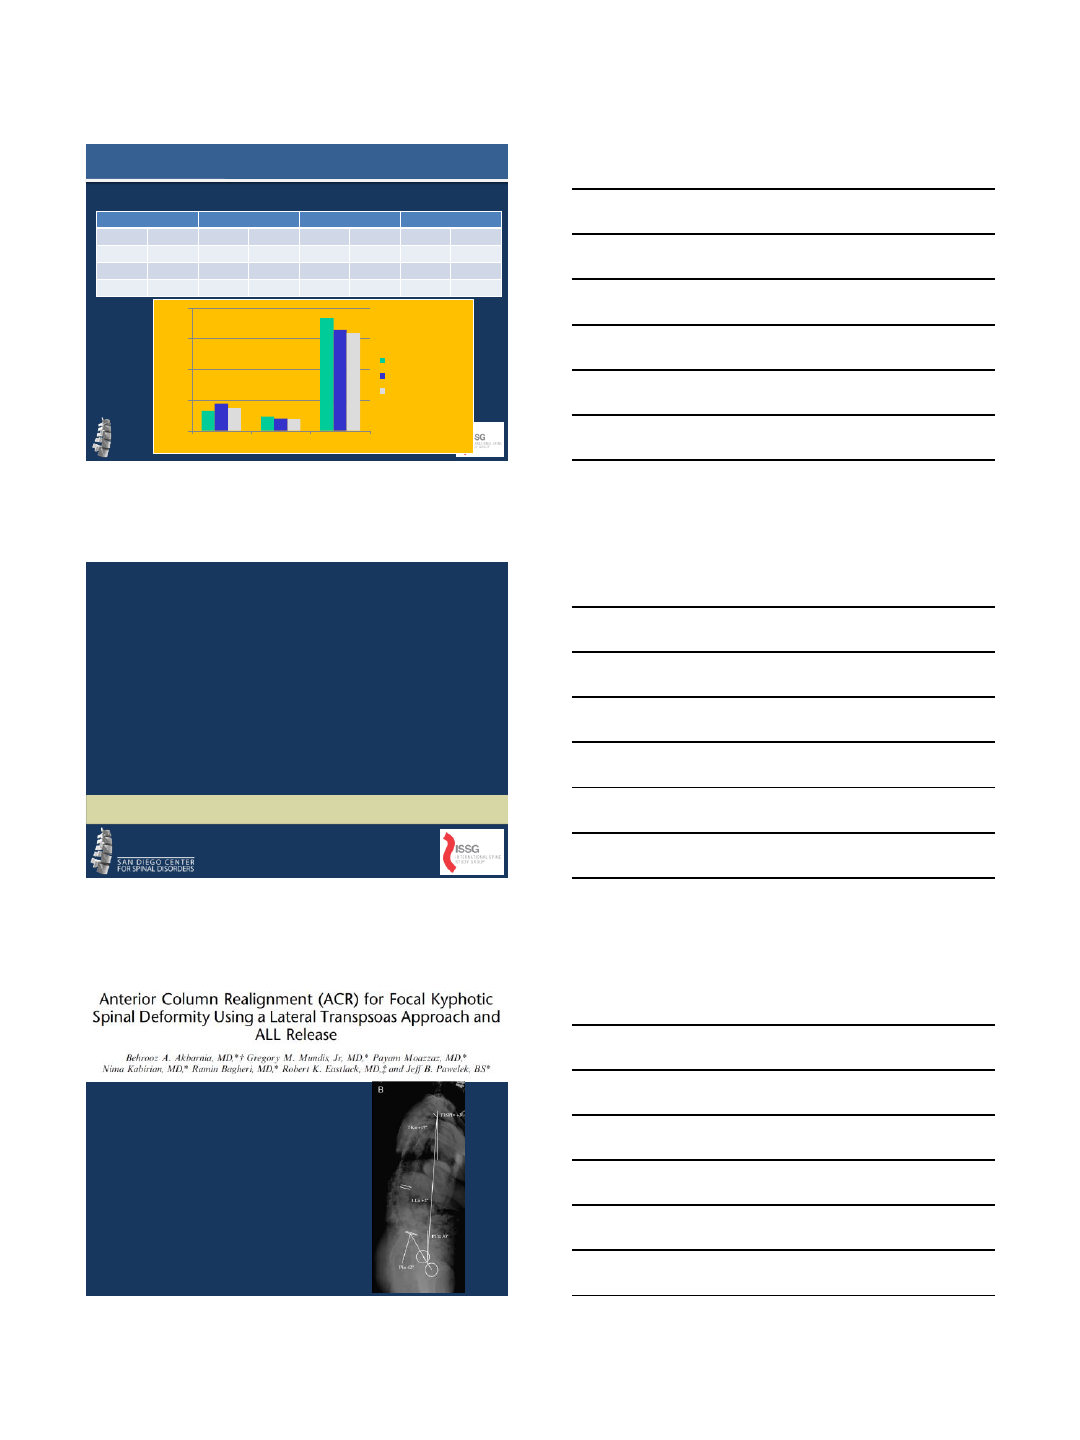
2012 ISSG Production and Topic Distribution
2; 7%
7; 26%
2; 7%
3; 11% 1; 4%
1; 4%
7; 26%
2; 7%
1; 4% 1; 4% SRS-Schwab ASD
Classification
ASD Treatment/Outcomes
BMP Complications
PJK/PJF
Health Impact ASD
Cervical Deformity
3 Column Osteotomy
Surgical Complications
Coronal Alignment
Economics
7/31/2013
4
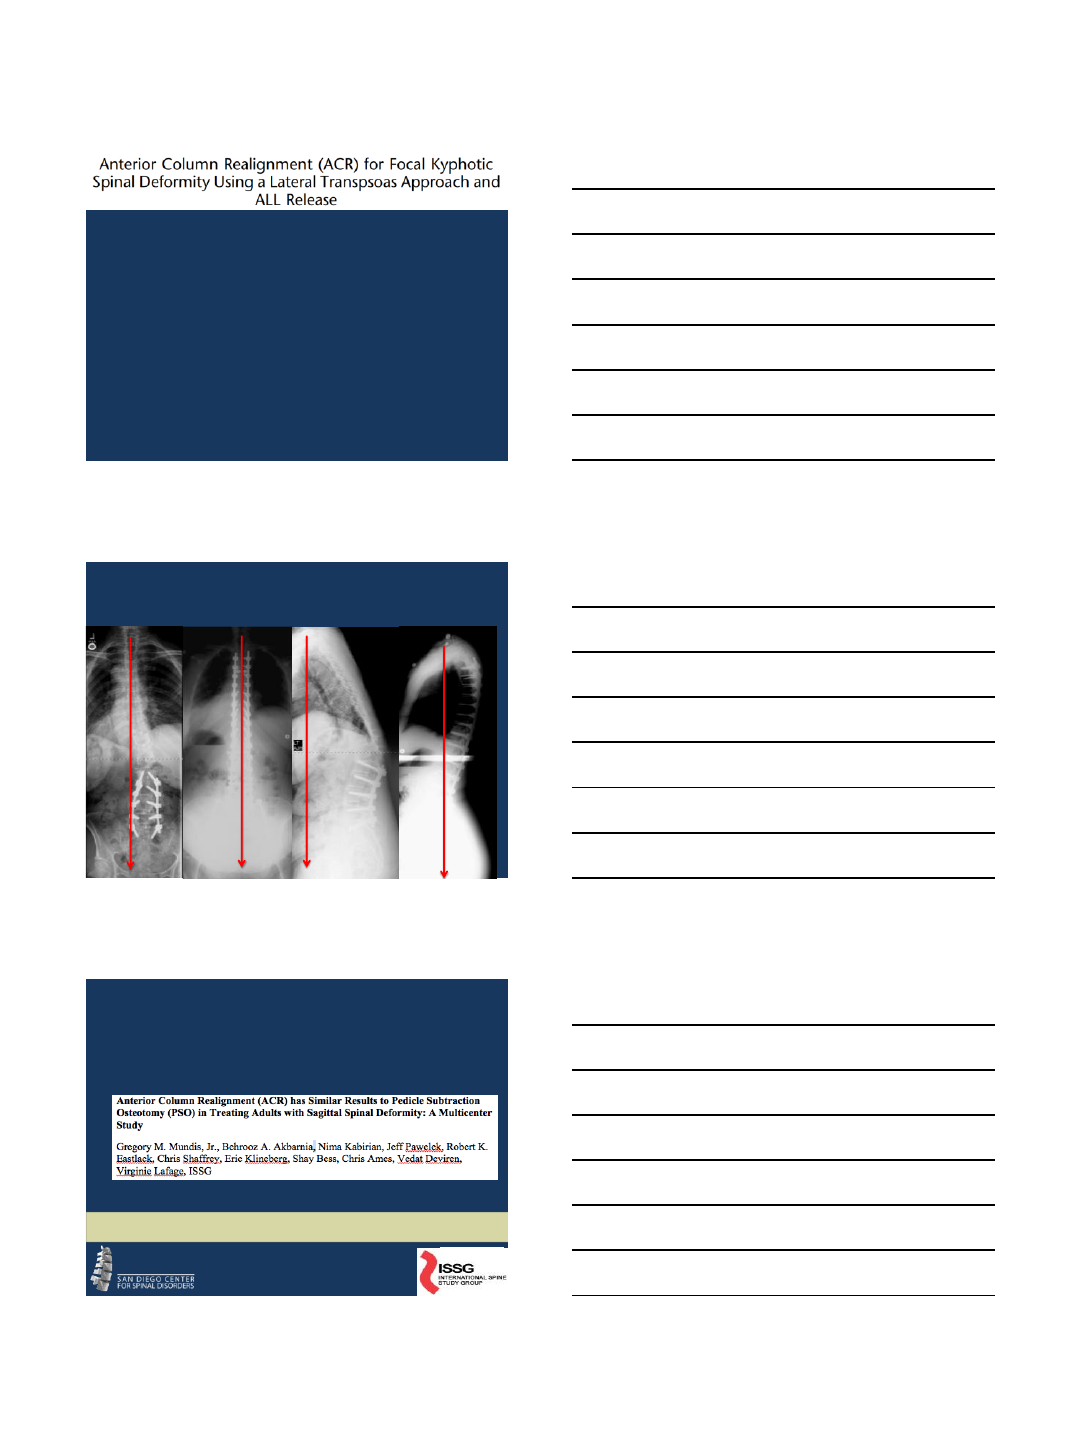
2013 ISSG Production and Topic Distribution
1; 2%
6; 11%
3; 6%
2; 4%
3; 6%
4; 8%
6; 12%
6; 12%
2; 4%
1; 2%
5; 10%
2; 4%
10; 19%
Pelvic Fixation
ASD Treatment/Outcomes
BMP Complications
PJK/PJF
Health Impact ASD
Cervical Deformity
3 Column Osteotomy
Surgical Complications
Sagittal Alignment
Coronal Alignment
Economics
Psychology/Mental Health
MIS for ASD
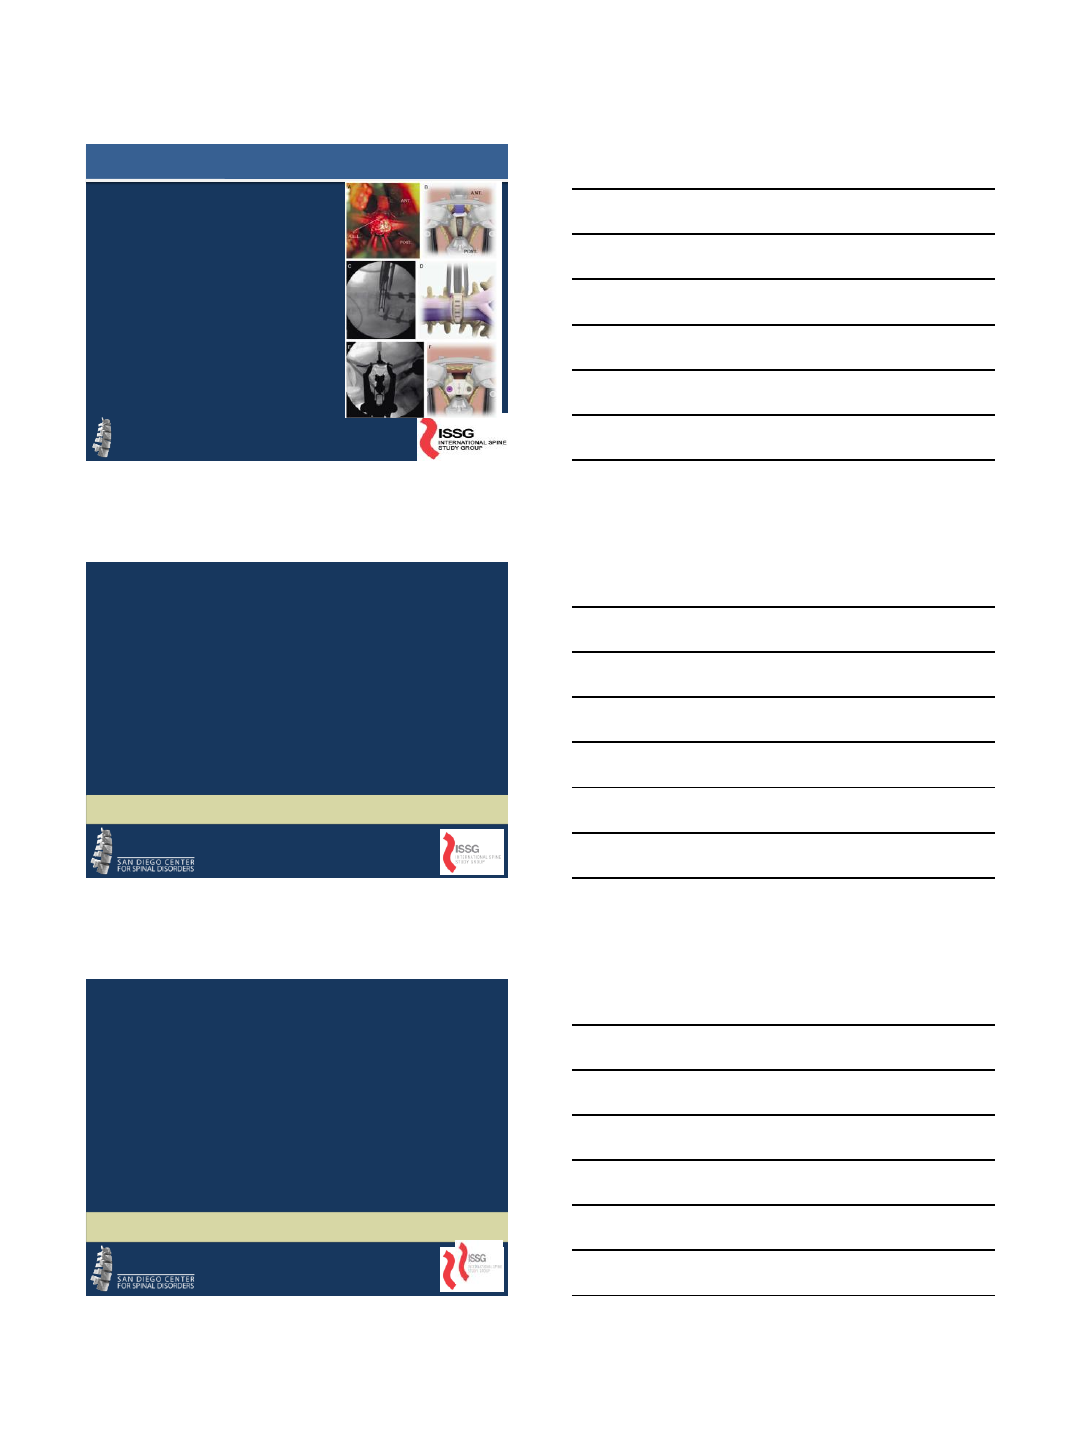
Health Impact Comparison of Different
Disease States and Population Norms to
Adult Spinal Deformity (ASD): A Call for
Medical Attention
Kai-Ming Fu MD, Shay Bess MD, Frank Schwab MD, Christopher
Shaffrey MD, Virgine Lafage PhD, Justin Smith MD, Christopher Ames
MD, Oheneba Boachie-Adjei MD, Douglas Burton MD, Robert Hart MD,
Eric Klineberg MD, Richard Hostin MD, Gregory Mundis MD, Praveen
Mummaneni MD, and the International Spine Study Group.
North American Spine Society 2012 (Best Paper Nominee)
Scoliosis Research Socitey 2012
American Academy of Orthopaedic Surgeons 2013
American Academy of Neurosurgery 2012
AANS/CNS Joint Section 2013
Background Information
•SF-36 for ASD
–Little data comparing disease impact
ASD vs. other disease states
•Study Purpose
–Use SF-36 baseline values
–Consecutive cohort ASD patients
–No prior spine surgery
–Compare ASD SF-36 values
•United States general population
•United States generational norms
•United States disease specific
norms
–Compare disease impact using MCID
values
7/31/2013
5
Materials and Methods
•Data collection
–Demographic, radiographic,
HRQOL
•ASD SF-36
–Physical component score (PCS)
–Mental component score (MCS)
–Compared to United States (US)
•Total population norms
•Age generational norms
•Disease specific norms
–Norm based scoring (NBS)
–MCID values (cross-sectional)
•PCS= 3 NBS points
•MCS= 3 NBS points
Results: Total
•ASD Demographic &
Radiographic
–N=497
–Age 50.4 years
–Scoliosis= 45.3°
–PT= 18.8°
–SVA= 19.9mm
•ASD vs. U.S. total
population
–PCS=-9 NBS (3 MCID)
–MCS= similar
•ASD vs. U.S. generational
norms: PCS
–Minimum 2 MCID lower
–<25th percentile
–All generations except
18-24yrs; (-2.2 NBS)
–More rapid decline than
U.S. general
ASD (n=497)
Mean values (SD)
Age; years
50.4 (16.9)
BMI
25.6 (6.4)
SVA; mm
19.9 (58.1)
PT; degrees
18.8 (10.2)
PT
-LL mismatch;
degrees
4.21 (17.6)
Maximal scoliosis;
degrees
45.3 (18.3)
SF
-36 PCS 40.8 (11.2)
SF
-36 MCS 49.4 (11.3)
ODI
27.0 (18.6)
SRS
-22; total score 3.39 (0.7)
SRS
-22r; function 3.40 (0.8)
SRS
-22r; pain 2.94 (0.7)
SRS
-22r; self-image 3.31 (0.8)
SRS
-22; mental health 3.86 (0.8)
Leg Pain; NRS
2.63 (3.1)
Generational
Age Groups
(n=total ASD
patients)
ASD
PCS;
NBS
value
(SD)
US
Population
PCS; NBS
value
PCS
Difference
(percentile
US ge neral
population)
ASD
MCS;
NBS
value
(SD)
US
Population
MCS; NBS
value
MCS
difference
18
-
24 years
(n=42)
51.3
(8) 53.5 -2.2
(<50th ) 48.2
(10.5)
46.1 +2.2
25
-
34 years
(n=75)
46.9
(9.2)
53.6 -6.7
(<25th ) 50.8
(9.6) 49.1 +1.7
35
-
44 years
(n=52)
42.3
(9.5)
52.3 -10
(<25th ) 49.7
(9.0) 49.1 +0.6
45
-
54 years
(n=88)
41.9
(10.5)
49.7 -7.8
(<25th ) 50.4
(10.9)
50.6 -0.2
55
-
64 years
(n=138)
38.7
(10.6)
47.4 -8.7
(<25th ) 47.1
(13.1)
51.6 -4.5
65
-
74 years
(n=73)
33.6
(10.3)
44.7 -11.1
(<25th ) 50.9
(11.7)
52.8 -1.9
≥75 years
(n=29)
31.7
(9.5)
39.9 -8.2
(<25th ) 52.8
(8.5) 50.2 +2.6
Total
population
(n=497)
40.9
(11.2)
50 -9.1
(<25th ) 49.4
(11.3)
50 -0.6
Results: ASD No Other Comorbidities
•ASD No Other
Comorbidities vs. U.S.
Total and Generational
Norms
•PCS
–Minimum one MCID
lower U.S. norms
–<25th percentile
–ASD generations
(except 18-24 yr)
–More rapid decline
than U.S. general
•MCS
–Similar
Generational
Age Groups
(n=total ASD
patients)
ASD PCS;
NBS
value (SD)
US General
Population
PCS; NBS
value
PCS Difference
(percentile US
general
population)
ASD MCS:
NBS value
(SD)
US General
Population
MCS; NBS
value
18
-
24 years
(n=30)
52.7
(7.3) 53.5 -0.8 (<50th ) 48.8
(10.7) 46.1
25
-
34 years
(n=58)
46.8
(9.6) 53.6 -6.5 (<25th ) 51.2 (8.9)
49.1
35
-
44 years
(n=34)
43.2
(10.3) 52.3 -9.1 (<25th ) 50.2 (9.6)
49.1
45
-
54 years
(n=47)
43.2
(10.8) 49.7 -6.5 (<25th )
49.9 (11.3)
50.6
55
-
64 years
(n=57)
42.4
(9.7) 47.4 -5.0 (<25th )
48.9 (11.4)
51.6
65
-
74 years
(n=14)
35.8
(11.1) 44.7 -8.9 (<25th ) 51.9
(12.2) 52.8
≥75 years
(n=6)
36.8
(10.8) 39.9 -3.1 (<25th ) 51.4 (9.3)
50.2
Total
population
(n=246)
44.4
(10.5) 50 -5.6 (<25th ) 50.2
(10.5) 50
7/31/2013
6
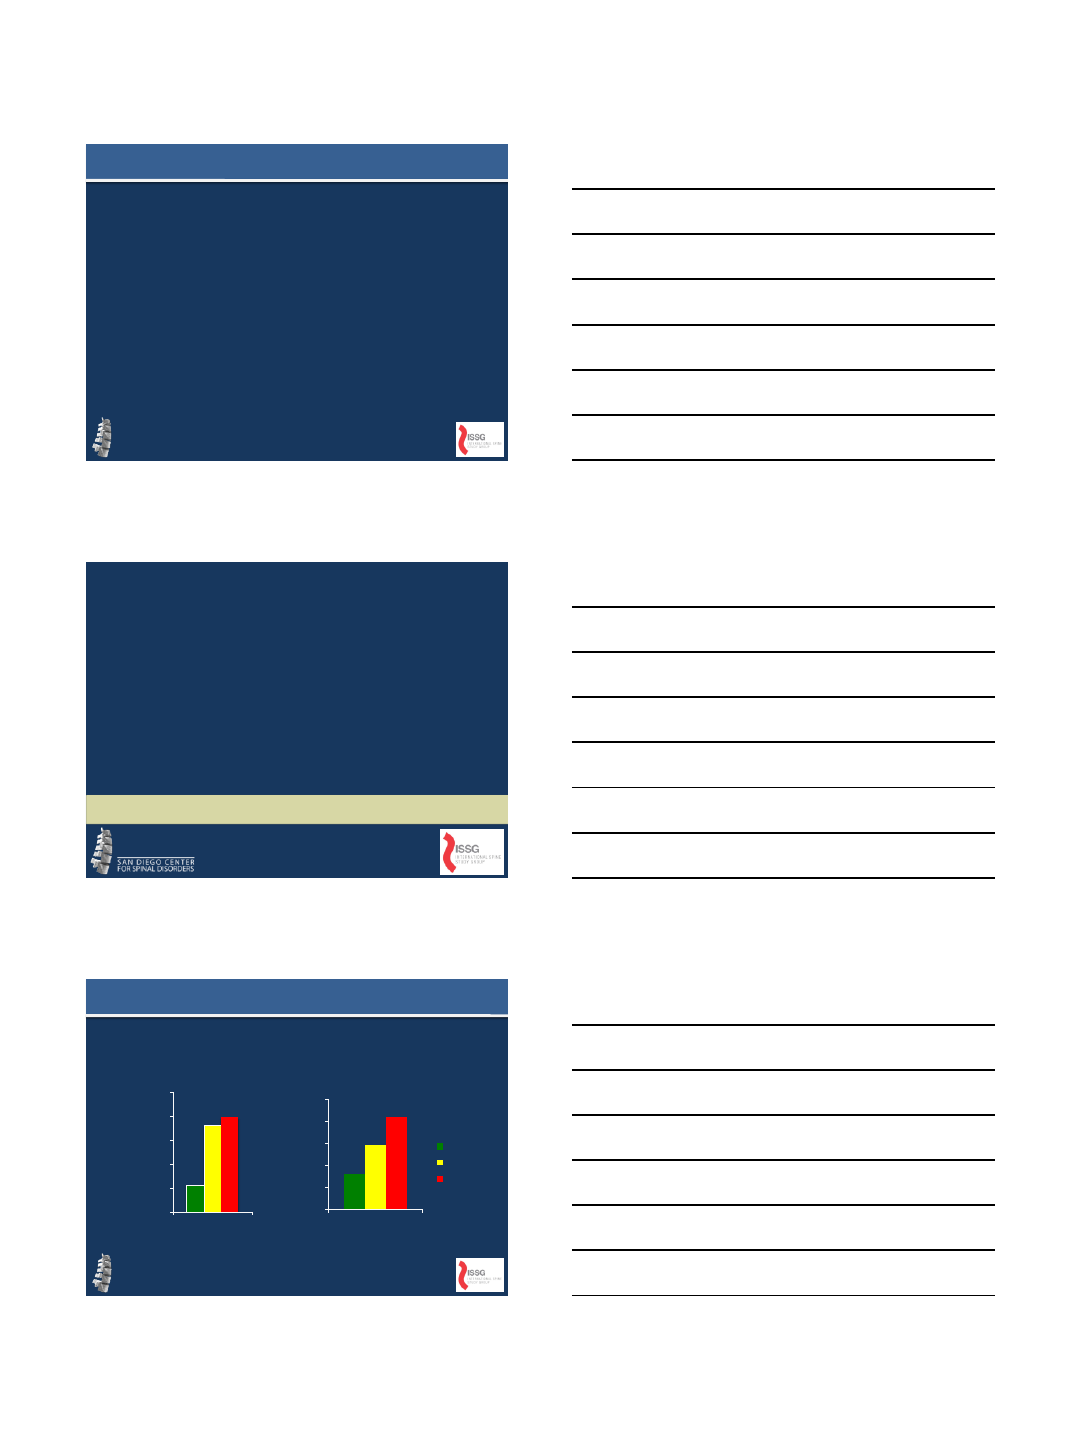
Results: ASD vs. U.S. Disease Norms
•ASD vs. U.S Healthy and
Disease Norms
•PCS
–Healthy US<14.5 NBS
(4 MCID )
–Back pain/Sciatica
<4.8 NBS (one MCID)
– Hypertension<3.1 NBS
(one MCID)
–Similar
•Cancer
•Diabetes
•Heart disease
•Limited use arms or
legs
•Lung disease
Disease State
PCS;
mean
NBS
points
MCS;
mean
NBS
points
US Total Population
50 49.9
US Healthy Population
55.4 52.9
ASD
40.9 49.4
Back Pain
45.7 47.6
Cancer
40.9 47.6
Depression
45.4 36.3
Diabetes
41.1 47.8
Heart Disease
38.9 48.3
Hypertension
44.0 49.7
Limited Use Arms
Legs
39.0 43.0
Lung Disease
38.3 45.6
Disease State Correlates for Type and
Severity of Adult Spinal Deformity;
Assessment Guidelines for Health Care
Providers
Shay Bess, Kai-Ming Fu, Virginie Lafage, Frank Schwab, Christopher
Shaffrey, Christopher Ames, Robert Hart, Eric Klineberg, Gregory
Mundis, Richard Hostin, Douglas Burton, Munish Gupta, Oheneba
Boachie-Adjei, Justin Smith, and the International Spine Study Group.
20th International Meeting on Advanced Spine Technologies
Annual Meeting
Vancouver, Canada
July 2013
Purpose, Materials and Methods
•Study Purpose
–Compare types/severity ASD
–Other disease states
•Materials and Methods
–Consecutive cohort ASD patients
–No prior surgery
–ISSG prospective, multi-center database
–ASD organized
•Sagittal vs. coronal deformity
•Deformity severity
–ASD baseline SF-36 compared
•United States general population
•United States disease specific norms
–Disease impact compared using MCID
values
7/31/2013
7
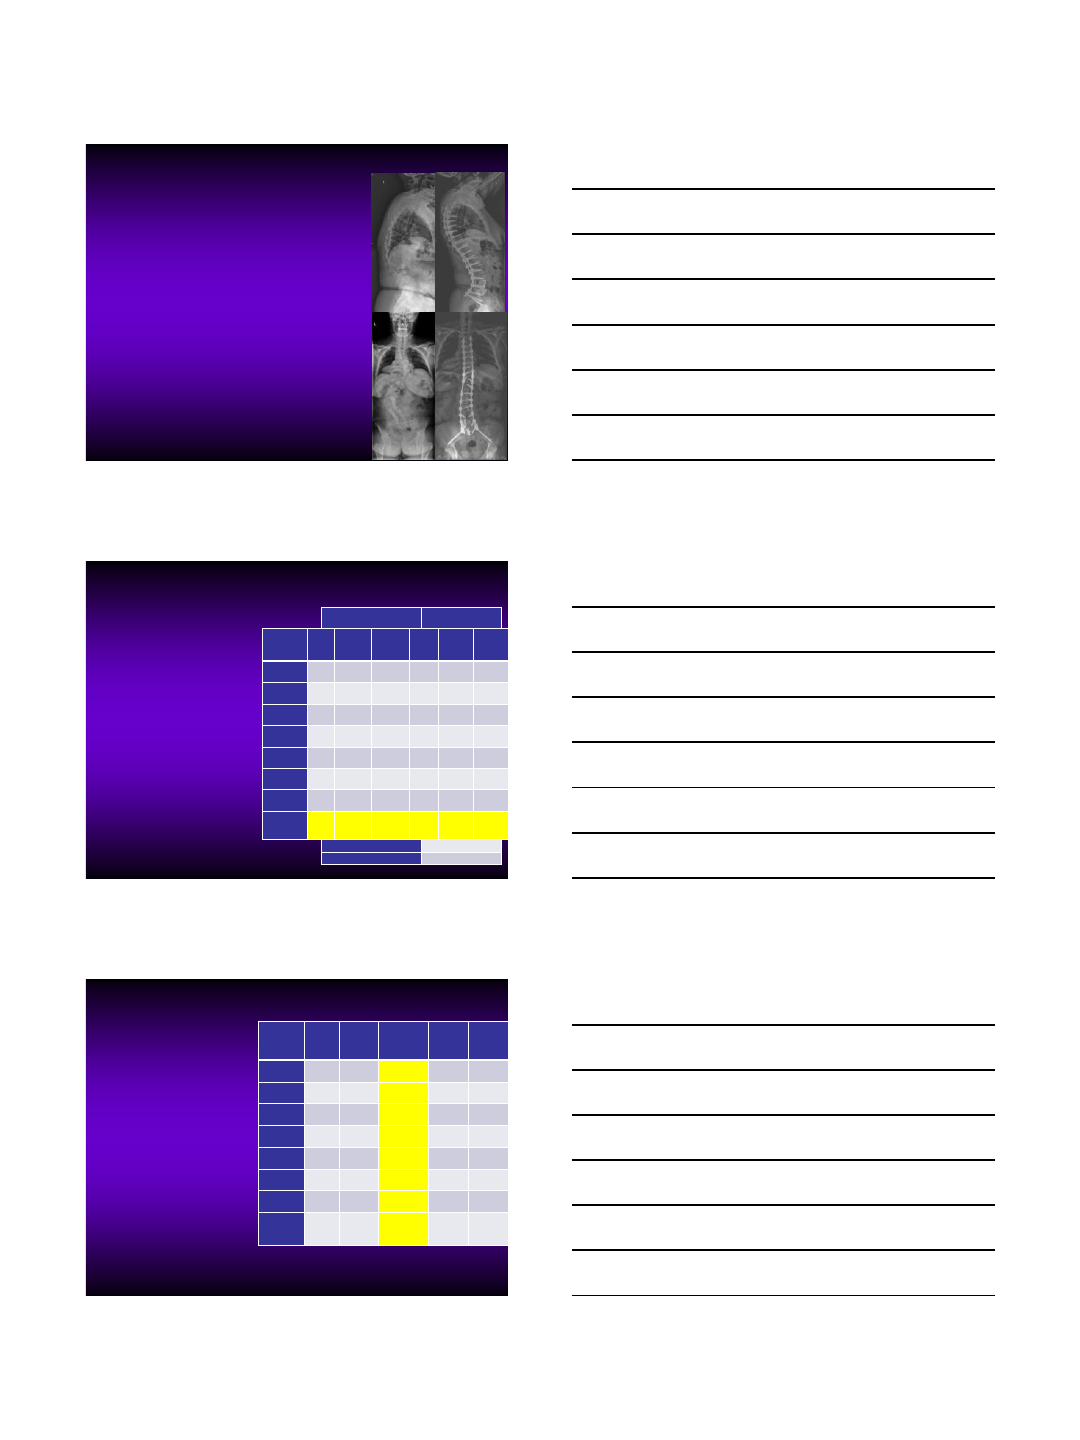
Results: ASD Deformity Type and Disability
•ASD Demographic
–N=497
–Age 50.4 years
–Scoliosis= 45.3°
–PT= 18.8°
–SVA= 19.9mm
•ASD PCS
•PCS worsens
–Curve location
–Sagittal
malalignment
•Multivariate analysis
worsening PCS
–PI-LL (R=-0.44)
–SVA (R=-0.40)
–PT (R=-0.38)
ASD (n=497) Mean values (SD)
Age; years
50.4 (16.9)
BMI
25.6 (6.4)
SVA; mm
19.9 (58.1)
PT; degrees
18.8 (10.2)
PT
-LL mismatch; degrees 4.21 (17.6)
Maximal scoliosis; degrees
45.3 (18.3)
SF
-36 PCS 40.8 (11.2)
SF
-36 MCS 49.4 (11.3)
ODI
27.0 (18.6)
SRS
-22; total score 3.39 (0.7)
SRS
-22r; function 3.40 (0.8)
SRS
-22r; pain 2.94 (0.7)
SRS
-22r; self-image 3.31 (0.8)
SRS
-22; mental health 3.86 (0.8)
Leg Pain; NRS
2.63 (3.1)
0
10
20
30
40
50
60
US
general ASD total Scoliosis
MT Scoliosis
TL Scoliosis
LScoliosis
>20; SVA
<5
Scoliosis
<20; SVA
>5
SVA >10 SVA >10;
Scoliosis
L
Deformity Type and ASD
Disability: SF-36 PCS
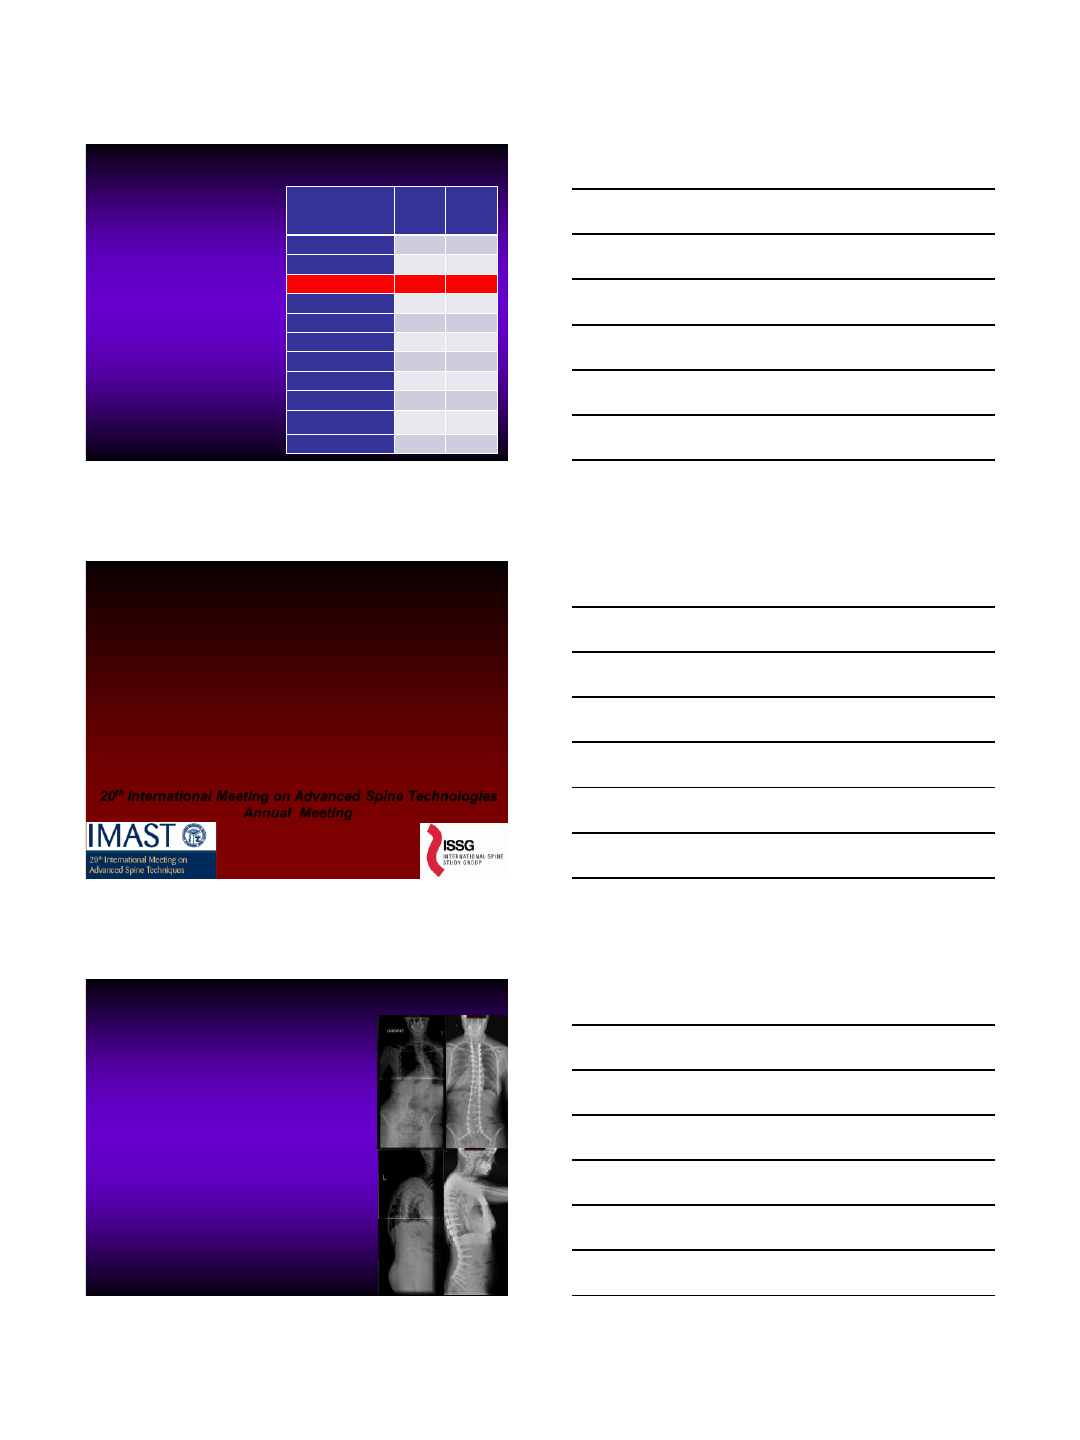
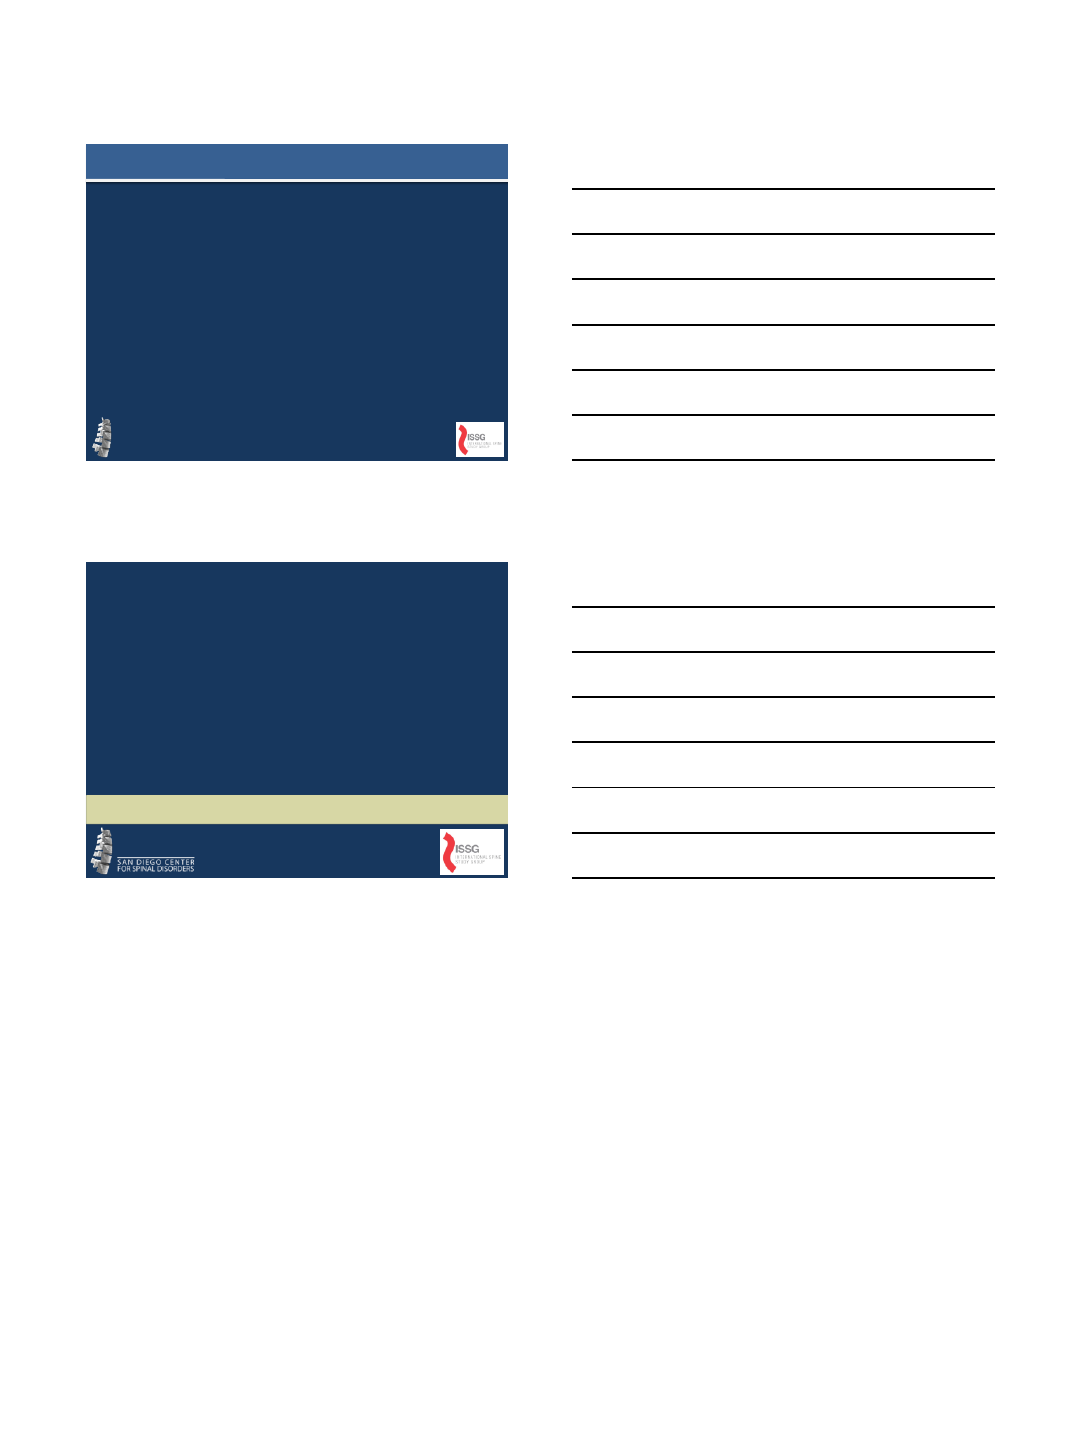
Results: ASD Type, Severity and Disease Correlates
ASD Deformity Type:
• Scoliosis Thoracic=2 MCID below General Population
• Scoliosis Lumbar =5 MCID below General Population
•L curve + Severe SSM; SVA>10=PCS lower ANY RECORDED VALUE!!
40.9
45.5
36.7
30.4 28.5 29.3
24.7
0
5
10
15
20
25
30
35
40
45
50
US general ASD total vs
cancer and
diabetes
MT curve vs.
US total and
back pain
L curve vs. OA
and heart
disease
SVA >5 vs.
25th OA and
25th RA
SVA>10 vs.
25th limited
vision and 25th
lung disease
L curve +
SVA>5 vs. 25th
limited use
arms legs
L curve +
SVA>10= No
comparable
disease value
ASD PCS
Disease 1 PCS
Disease 2 PCS
Conclusions and References
•ASD worsening impact
–Deformity location
–Deformity type
–Deformity severity
•ASD vs. other disease states
–Greater impact more recognized diseases
•Future work
–Dissemination: medical community &
Federal funding sources
–Cost effectiveness ASD vs. other disease
states
•References
–Schwab F, Dubey A, Pagala M, et al. Adult
scoliosis: a health assessment analysis by SF-
36. Spine 2003;28:602-6.
–Weinstein SL, Dolan LA, Spratt KF, et al. Health
and function of patients with untreated idiopathic
scoliosis: a 50-year natural history study. Jama
2003;289:559-67.

7/31/2013
8
Thank You
8/2/2013
1
Proximal Junctional Failure:
What is it?
Can it be prevented?
Novel Approach with VEPTR
Robert Hart, MD
OHSU Orthopaedics
Portland OR
Conflicts
Consultant Depuy Spine, Medtronic
Royalties Seaspine, Depuy
Stockholder SpineConnect
Research/Fellowship Support Depuy,
Medtronic, Synthes, OREF, MRF, ISSG
Proximal Junctional Failure =
Post-operative Fracture and/or Soft Tissue Disruption
at Upper Instrumented or Next Adjacent Segment
Following Long Instrumented Fusion
Distinct from
“Proximal Junctional
Kyphosis”
“Topping Off Syndrome”
Proximal Junctional Fracture
Fracture above all
Pedicle Screw Construct
(FPSC)
Proximal Junctional Acute
Collapse
8/2/2013
2
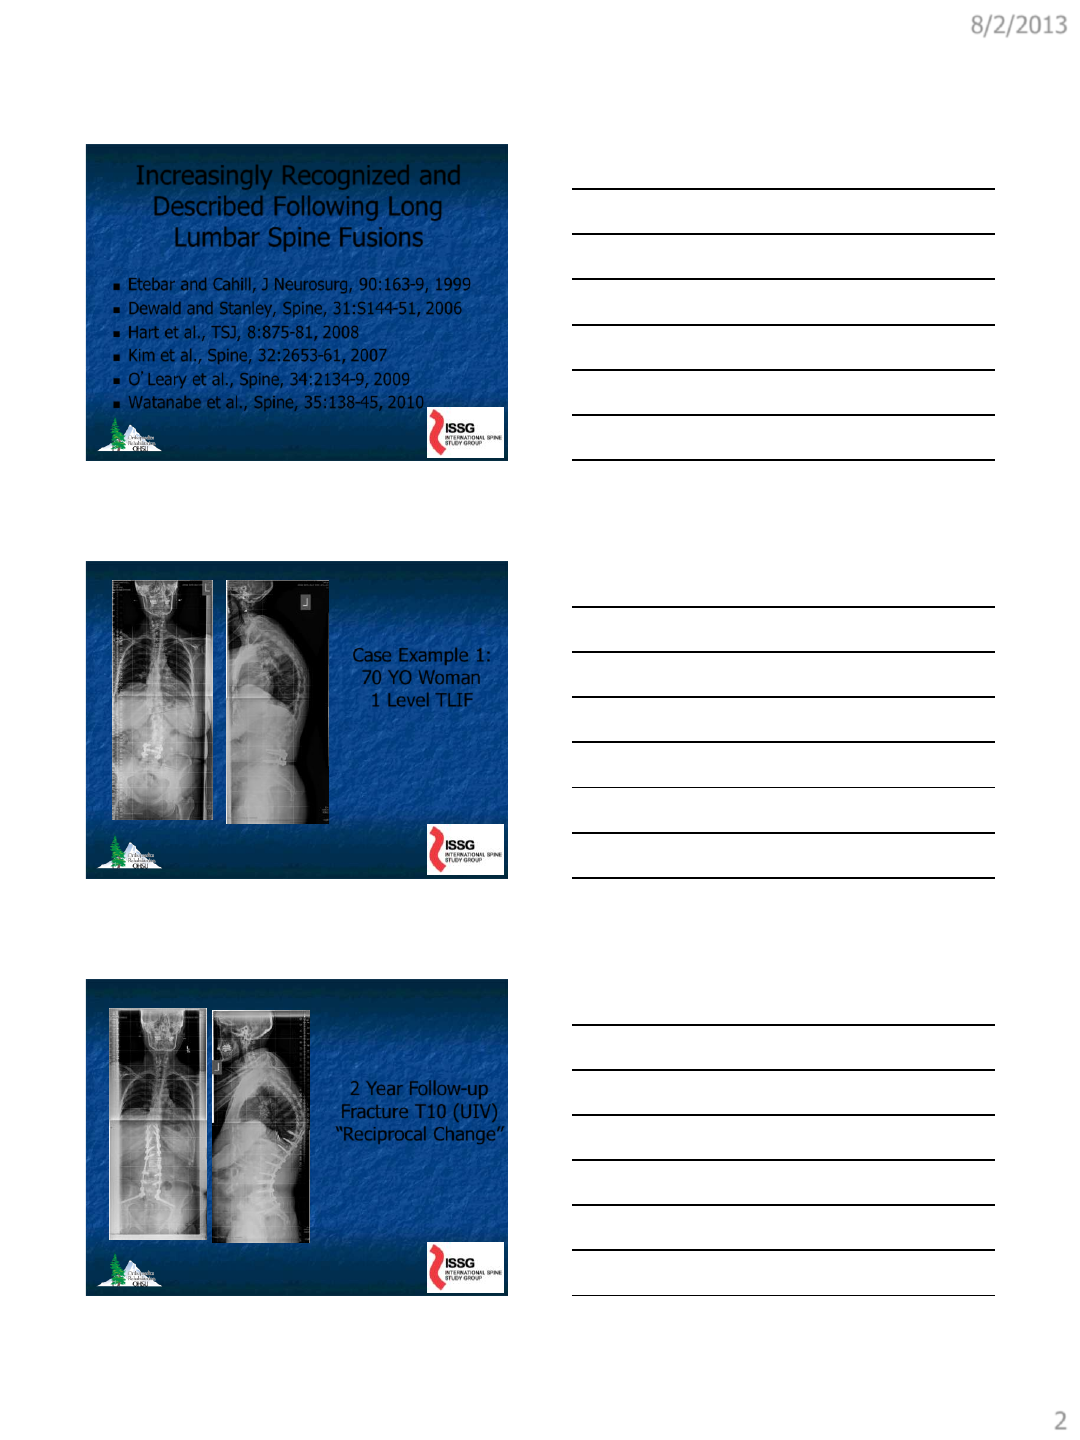
Increasingly Recognized and
Described Following Long
Lumbar Spine Fusions
Etebar and Cahill, J Neurosurg, 90:163-9, 1999
Dewald and Stanley, Spine, 31:S144-51, 2006
Hart et al., TSJ, 8:875-81, 2008
Kim et al., Spine, 32:2653-61, 2007
O’Leary et al., Spine, 34:2134-9, 2009
Watanabe et al., Spine, 35:138-45, 2010
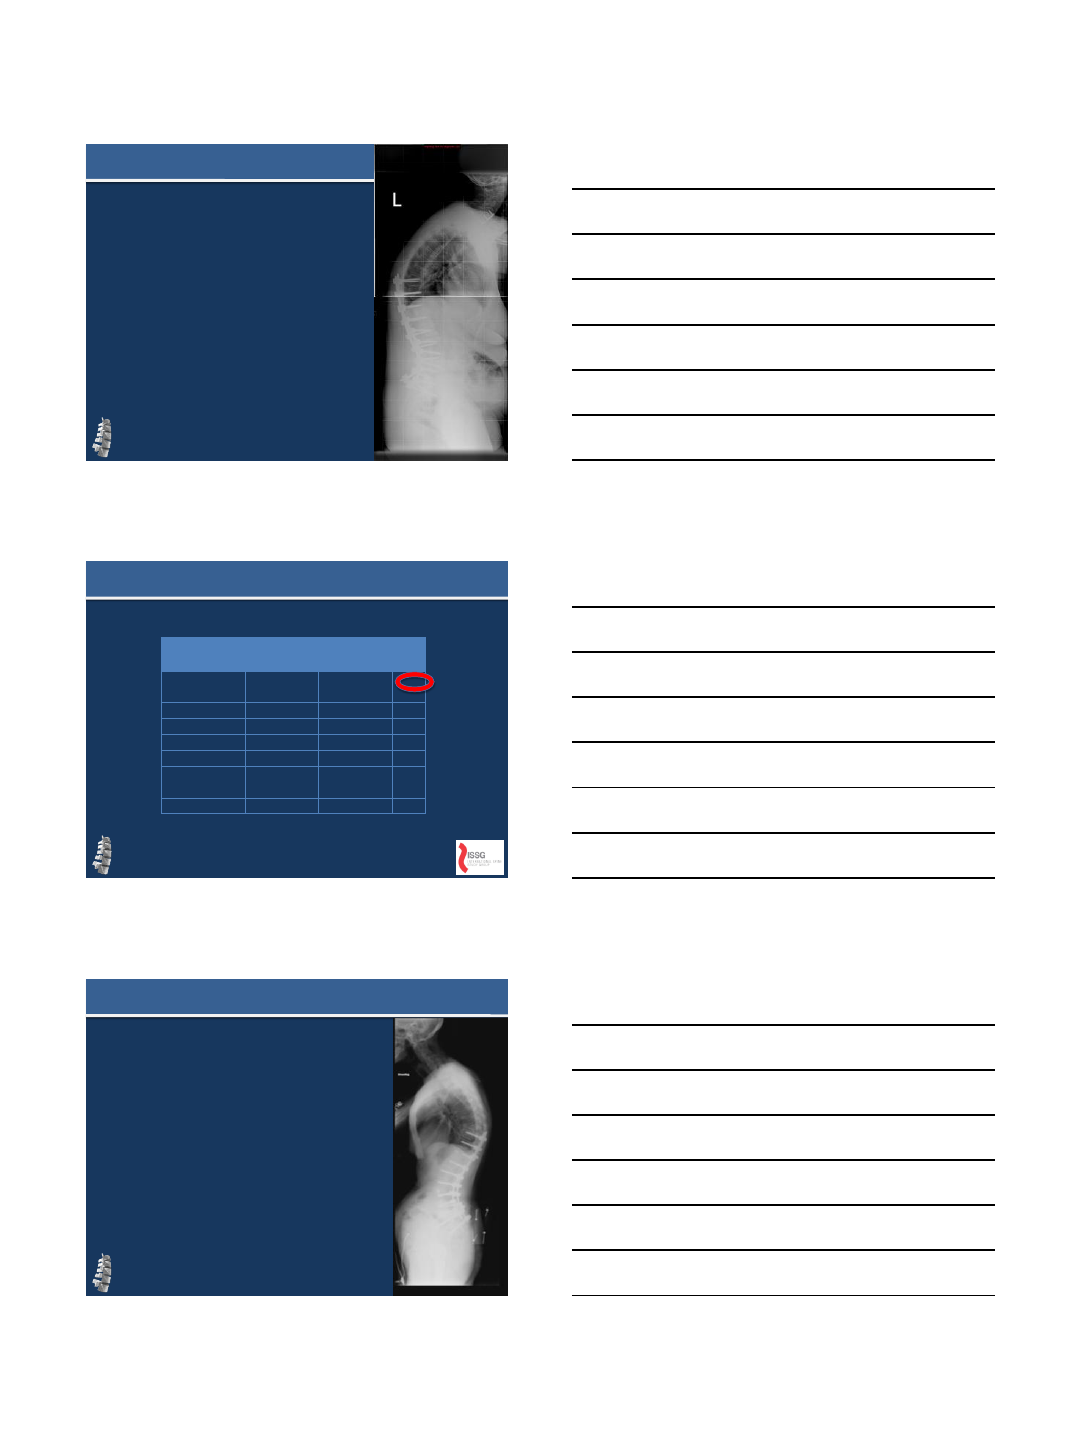
Case Example 1:
70 YO Woman
1 Level TLIF
2 Year Follow-up
Fracture T10 (UIV)
“Reciprocal Change”
8/2/2013
3
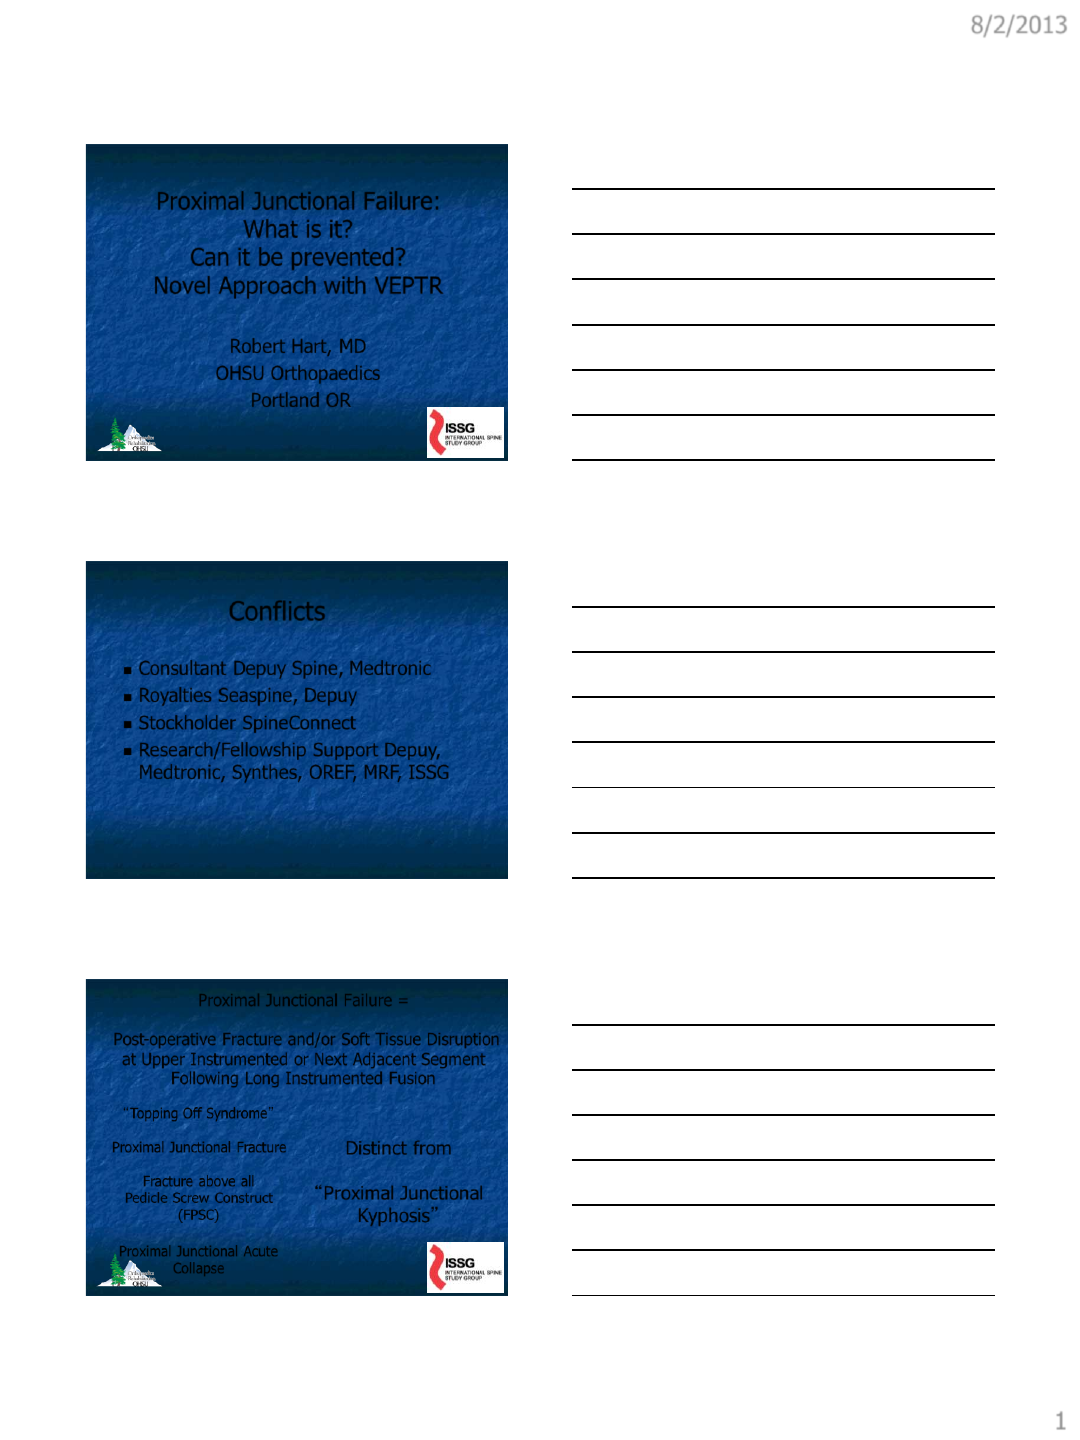
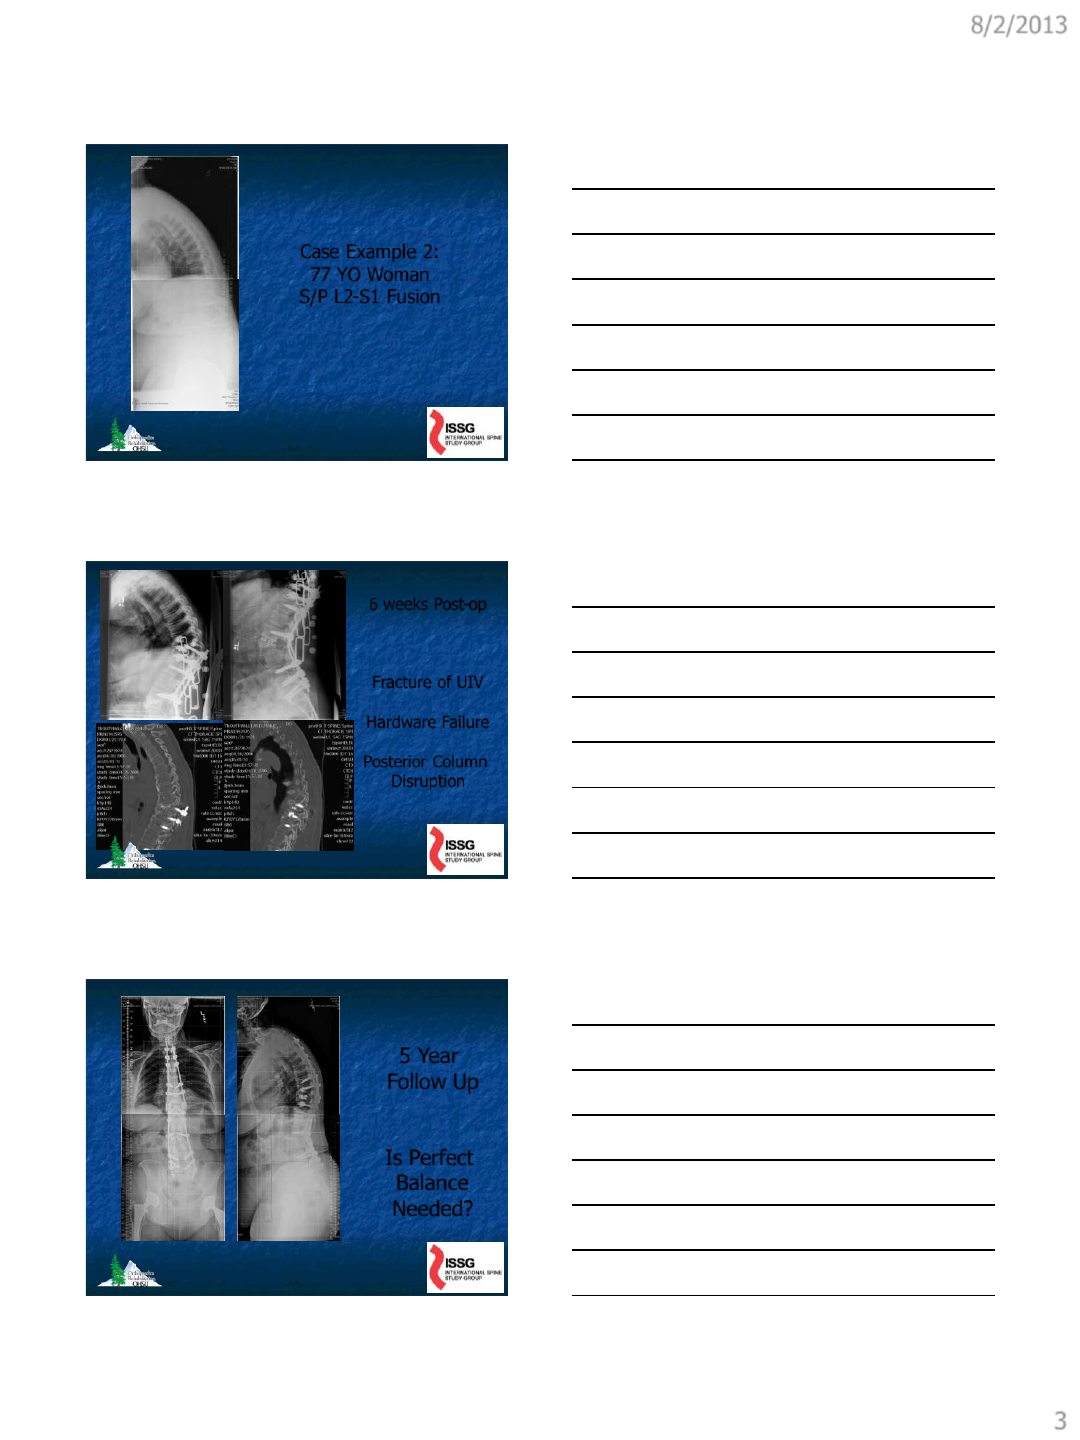
Case Example 2:
77 YO Woman
S/P L2-S1 Fusion
6 weeks Post-op
Fracture of UIV
Hardware Failure
Posterior Column
Disruption
5 Year
Follow Up
Is Perfect
Balance
Needed?
8/2/2013
4
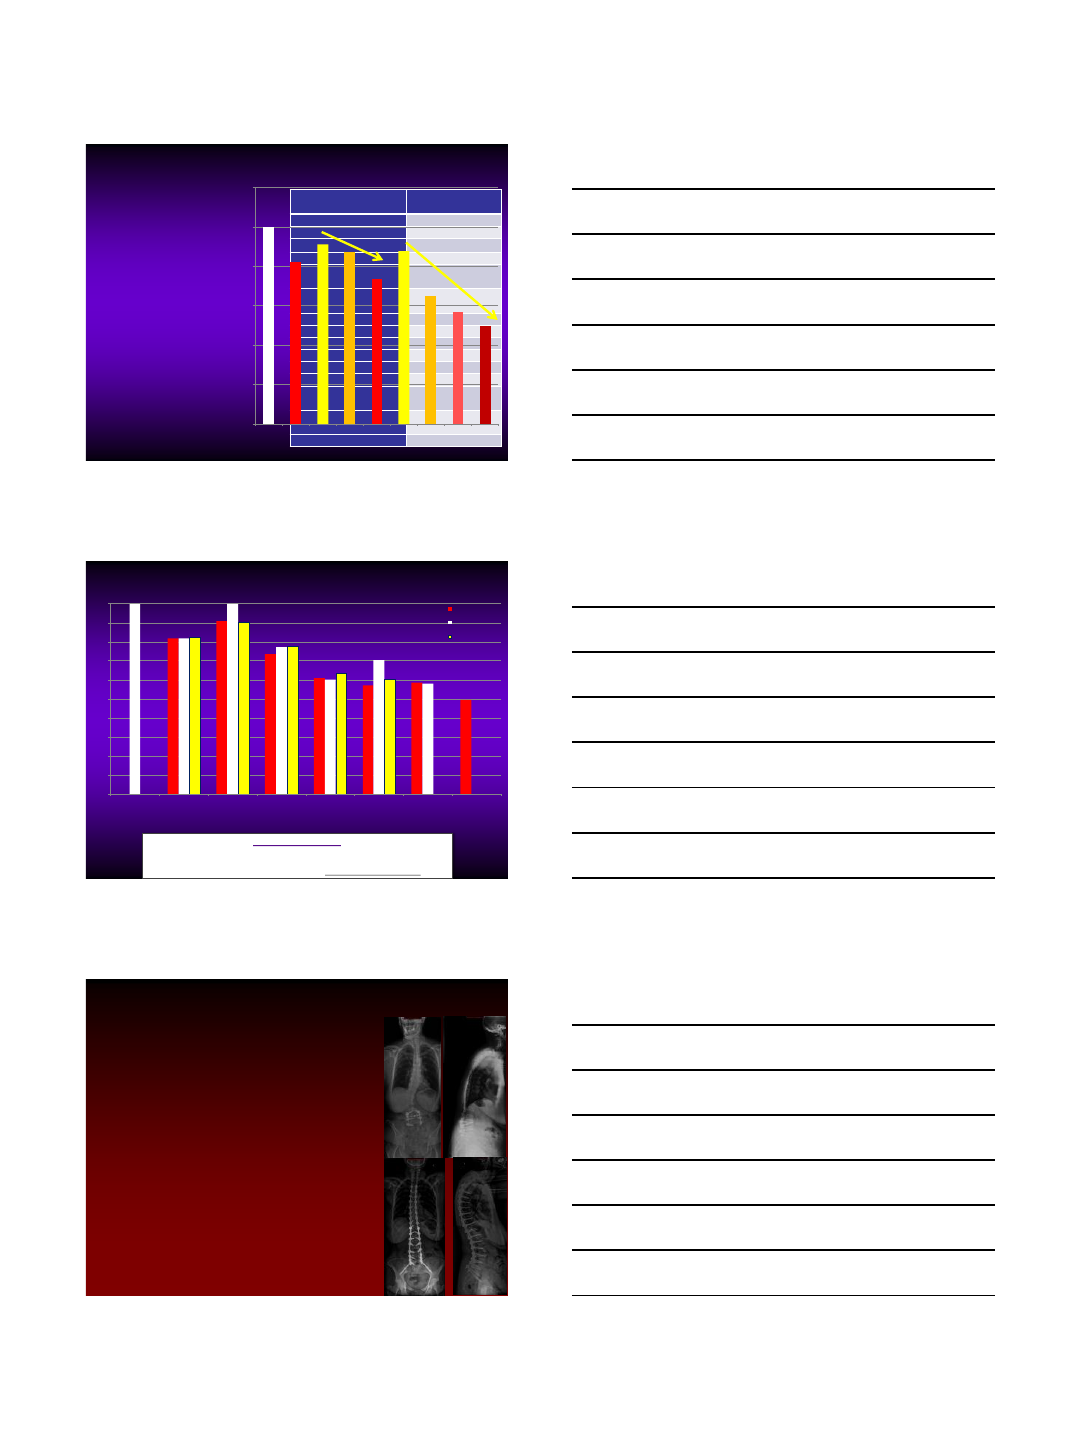
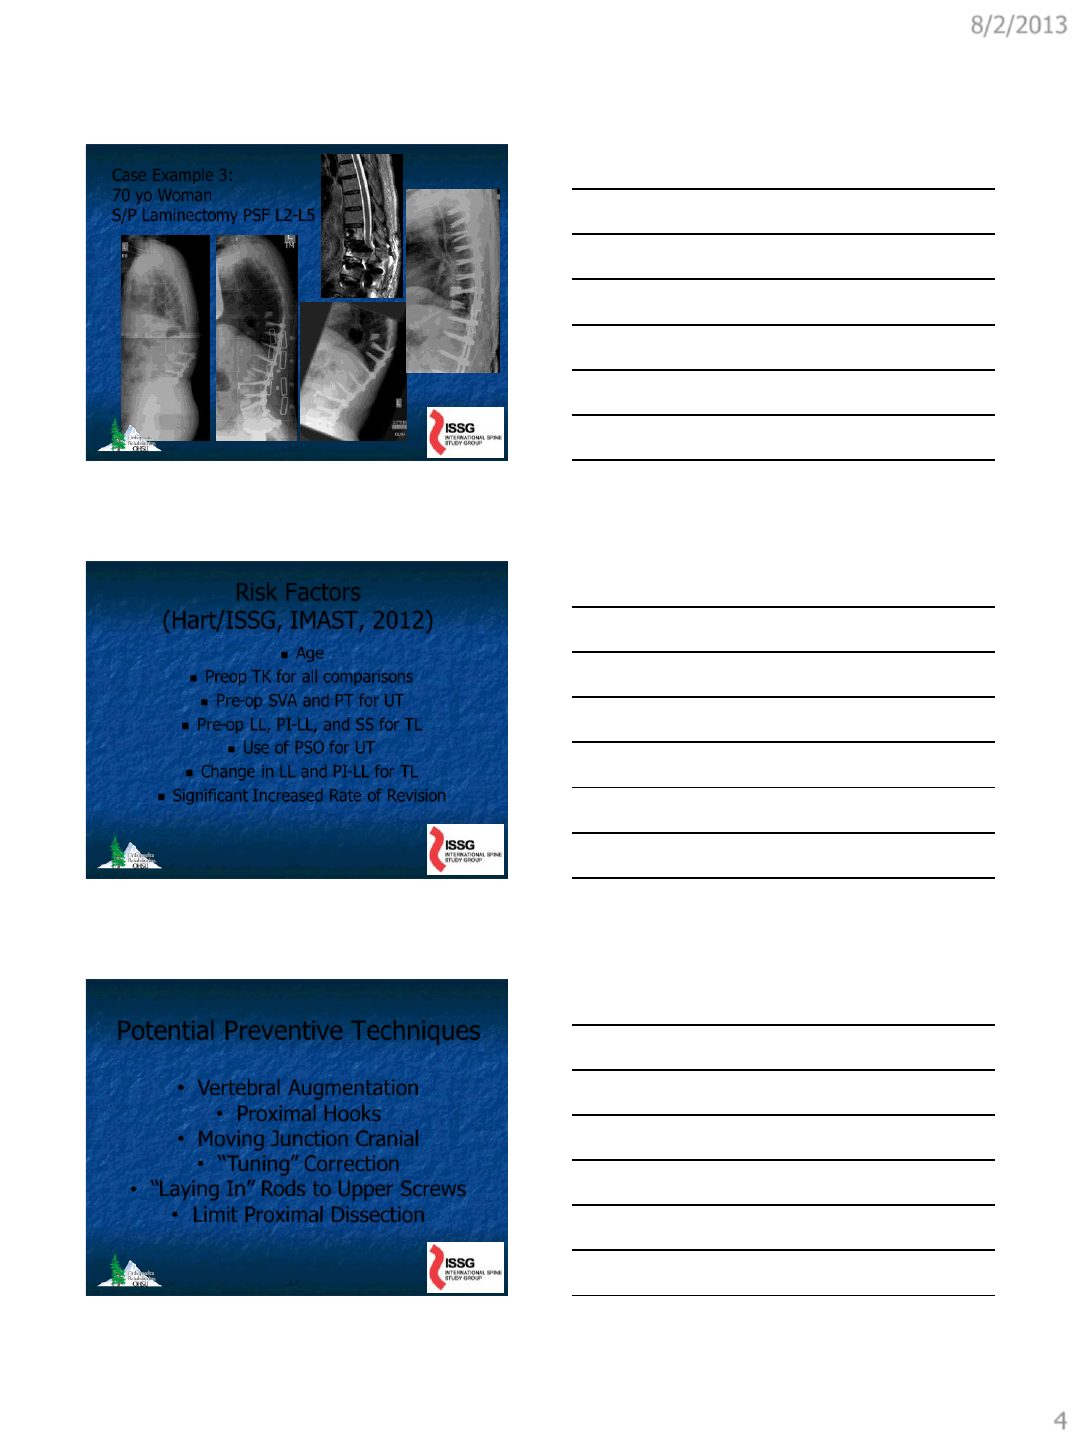
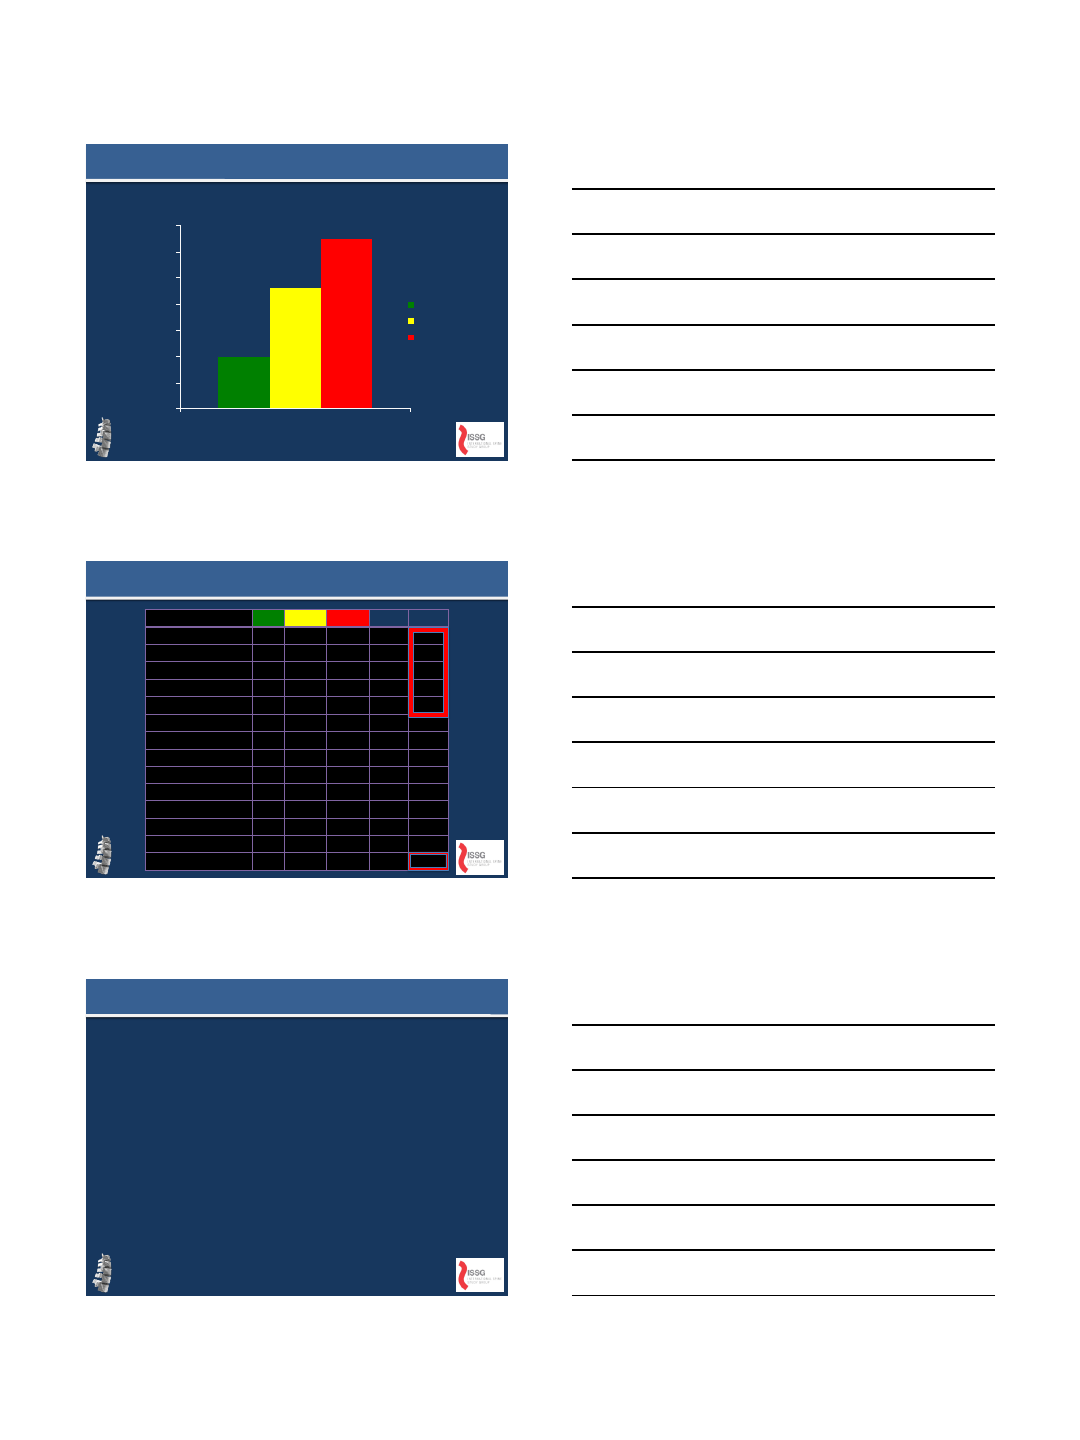
Case Example 3:
70 yo Woman
S/P Laminectomy PSF L2-L5
Risk Factors
(Hart/ISSG, IMAST, 2012)
Age
Preop TK for all comparisons
Pre-op SVA and PT for UT
Pre-op LL, PI-LL, and SS for TL
Use of PSO for UT
Change in LL and PI-LL for TL
Significant Increased Rate of Revision
Potential Preventive Techniques
•Vertebral Augmentation
•Proximal Hooks
•Moving Junction Cranial
•“Tuning” Correction
•“Laying In” Rods to Upper Screws
•Limit Proximal Dissection
8/2/2013
5
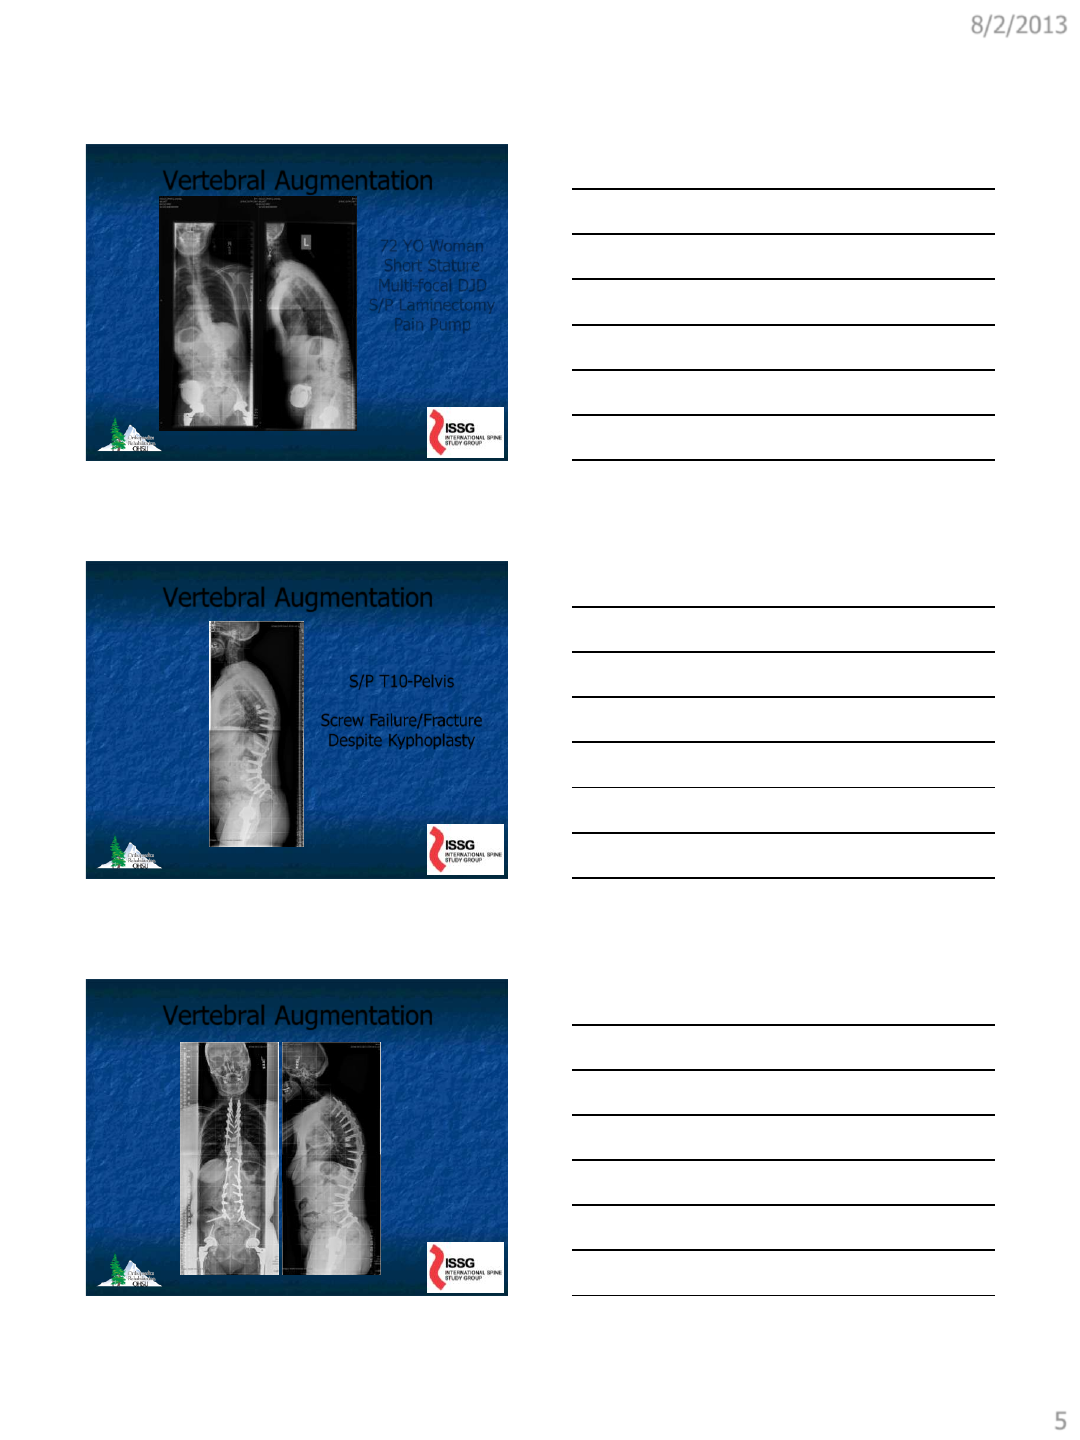
Vertebral Augmentation
72 YO Woman
Short Stature
Multi-focal DJD
S/P Laminectomy
Pain Pump
Vertebral Augmentation
S/P T10-Pelvis
Screw Failure/Fracture
Despite Kyphoplasty
Vertebral Augmentation
8/2/2013
6
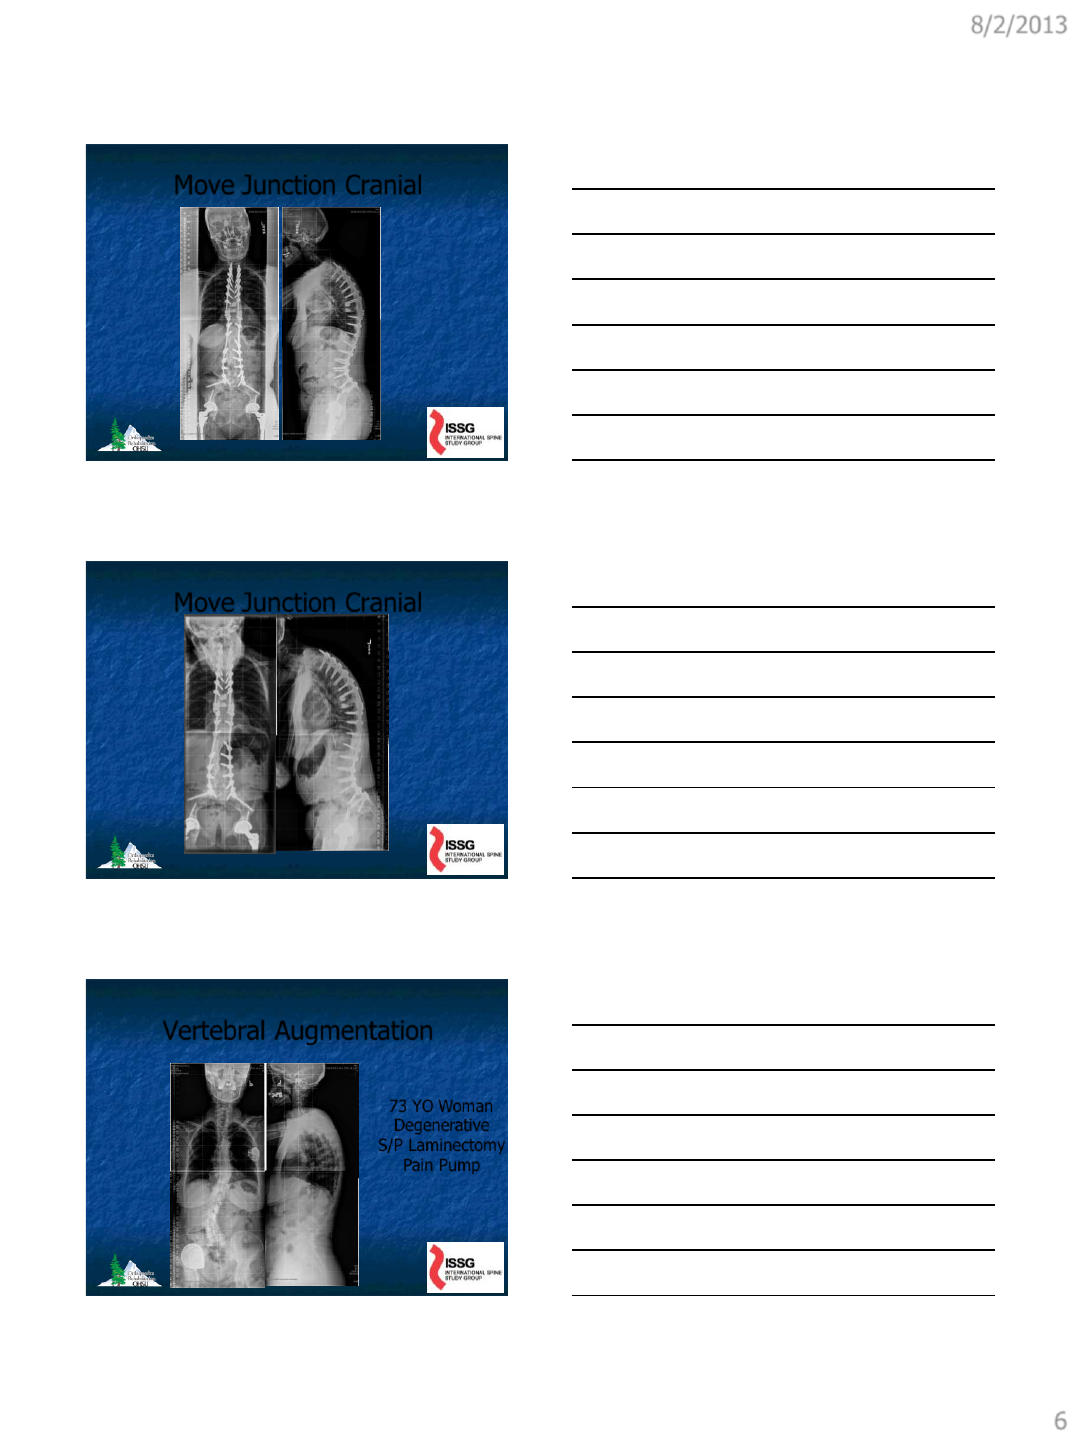
Move Junction Cranial
Move Junction Cranial
Vertebral Augmentation
73 YO Woman
Degenerative
S/P Laminectomy
Pain Pump
8/2/2013
7
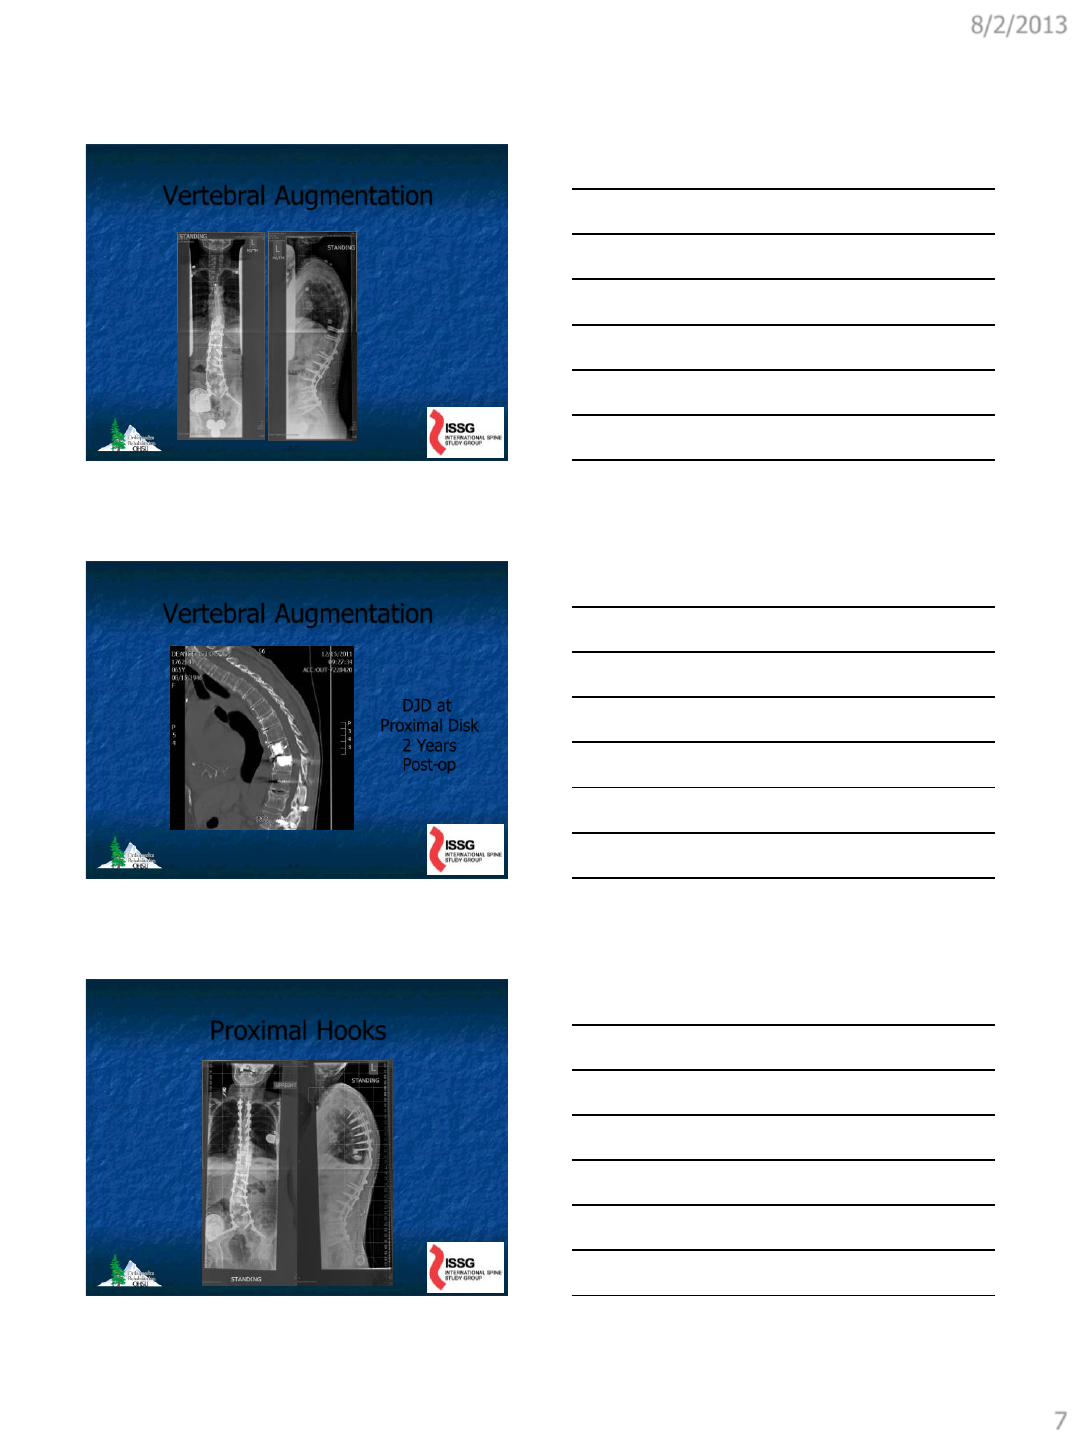
Vertebral Augmentation
Vertebral Augmentation
DJD at
Proximal Disk
2 Years
Post-op
Proximal Hooks
8/2/2013
8
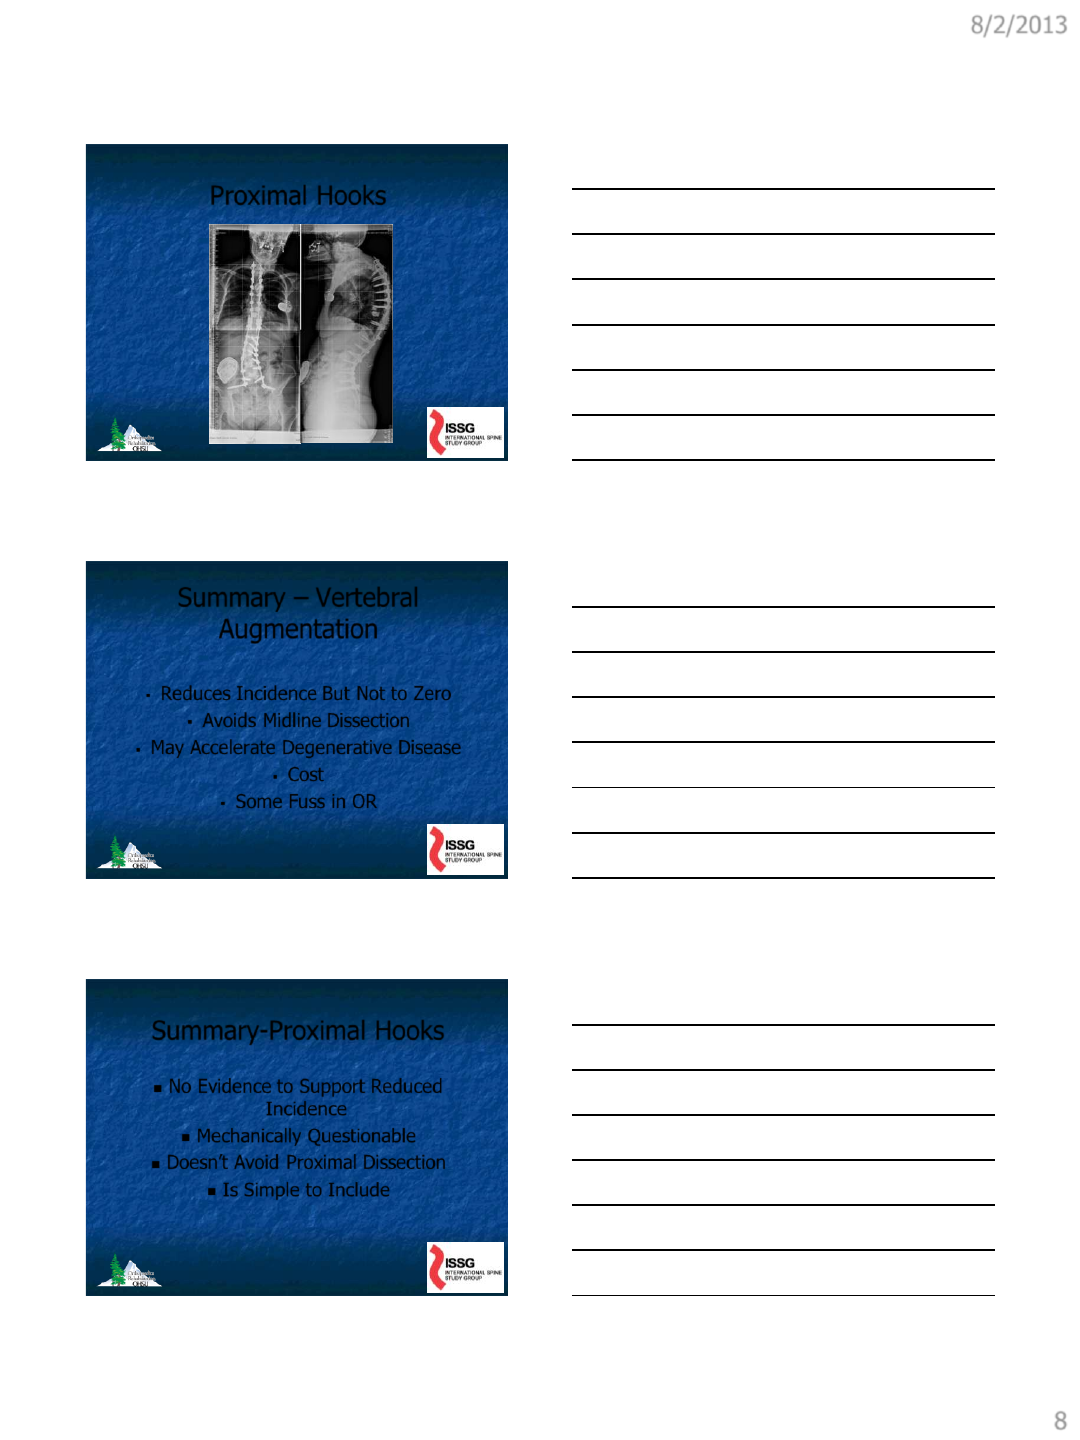
Proximal Hooks
Summary – Vertebral
Augmentation
Reduces Incidence But Not to Zero
Avoids Midline Dissection
May Accelerate Degenerative Disease
Cost
Some Fuss in OR
Summary-Proximal Hooks
No Evidence to Support Reduced
Incidence
Mechanically Questionable
Doesn’t Avoid Proximal Dissection
Is Simple to Include
8/2/2013
9
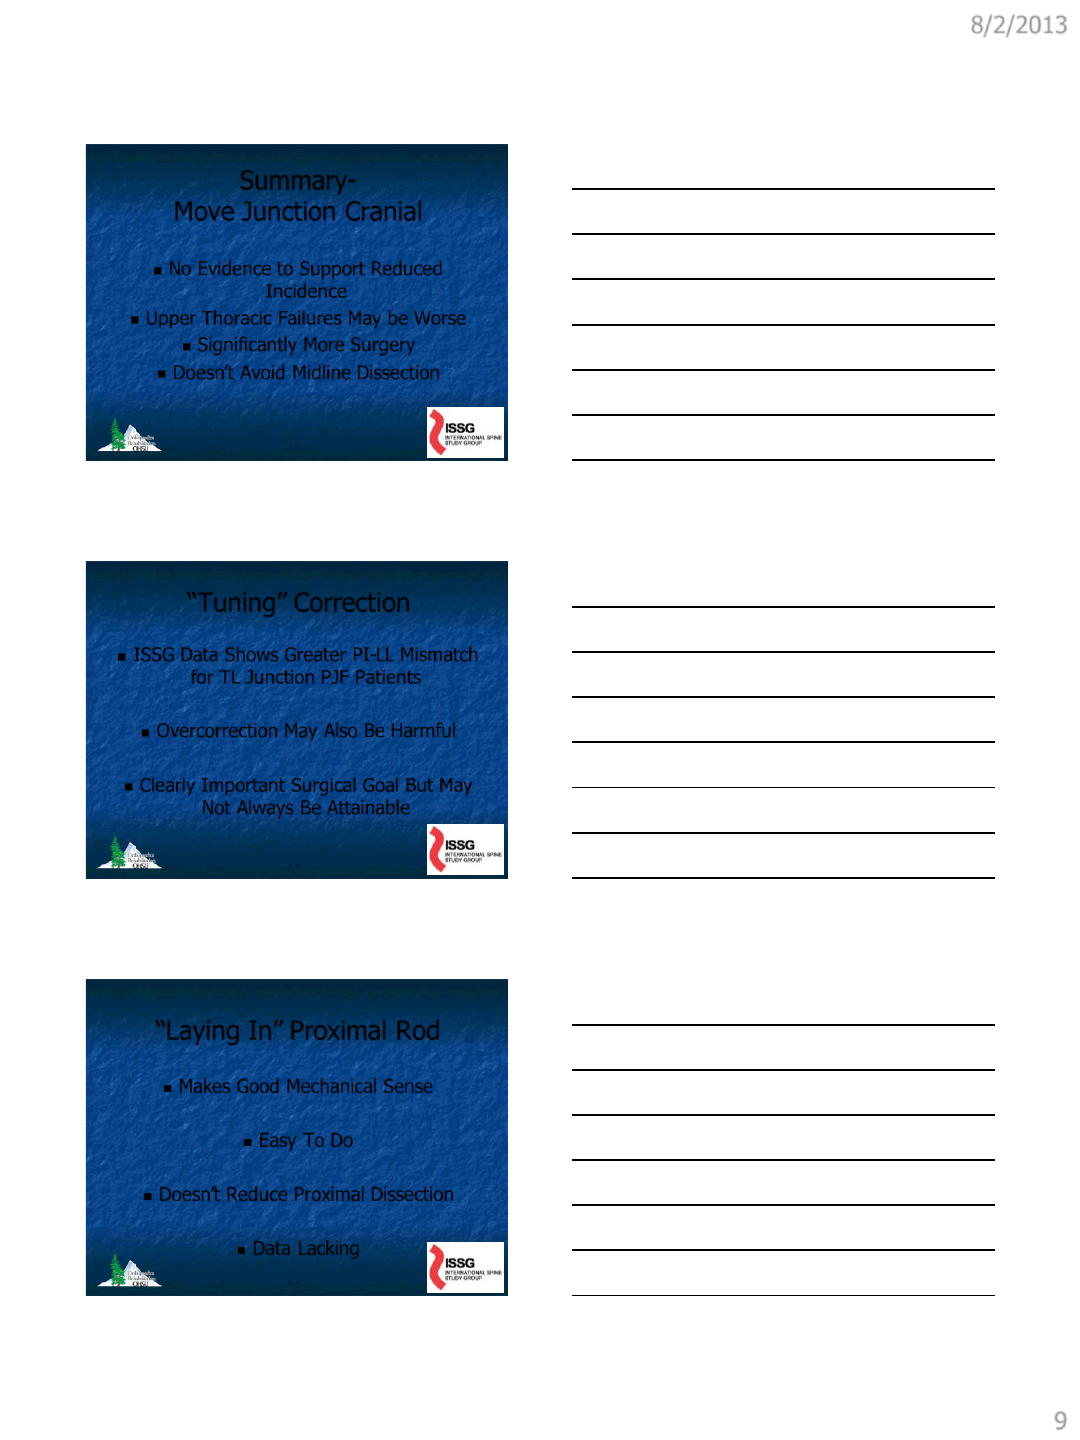
Summary-
Move Junction Cranial
No Evidence to Support Reduced
Incidence
Upper Thoracic Failures May be Worse
Significantly More Surgery
Doesn’t Avoid Midline Dissection
“Tuning” Correction
ISSG Data Shows Greater PI-LL Mismatch
for TL Junction PJF Patients
Overcorrection May Also Be Harmful
Clearly Important Surgical Goal But May
Not Always Be Attainable
“Laying In” Proximal Rod
Makes Good Mechanical Sense
Easy To Do
Doesn’t Reduce Proximal Dissection
Data Lacking
8/2/2013
10
Limiting Proximal Dissection
Makes Good Biologic Sense
Doesn’t Change Mechanical Effects
Some Fuss in OR
Data to Support Pending
VEPTR Device
Indications
The device is indicated for the treatment of
thoracic insufficiency syndrome (TIS) in
skeletally immature patients. TIS is defined as
the inability of the thorax to support normal
respiration or lung growth. For the purpose of
identifying potential TIS patients, the
categories in which TIS patients fall are as
follows:
– Flail chest syndrome
– Constrictive chest wall syndrome, including
– Rib fusion and scoliosis
– Hypoplastic thorax syndrome, including
– Jeune’s syndrome
– Achondroplasia
– Jarcho-Levin syndrome
– Ellis van Creveld syndrome
– Progressive scoliosis of congenital or
neurogenic origin without rib anomaly
Proximal Rib Fixation with
VEPTR
Reduces Proximal Dissection –
Good Biological Sense
Extends Moment Arm Lateral –
Good Mechanical Sense
Allows Other Surgical Techniques
Some OR Fuss
8/2/2013
11
VEPTR Device - Technique
Rib Attachment UIV+1 Level
Separate Lateral Incisions
Blunt Muscle Dissection
Offset Connection
Personal Experience
6 Patients
5 Female/1 Male
Age Range 62-77
BMI 20.4-42.0
1 PJF Without Collapse
1 Distal Fracture
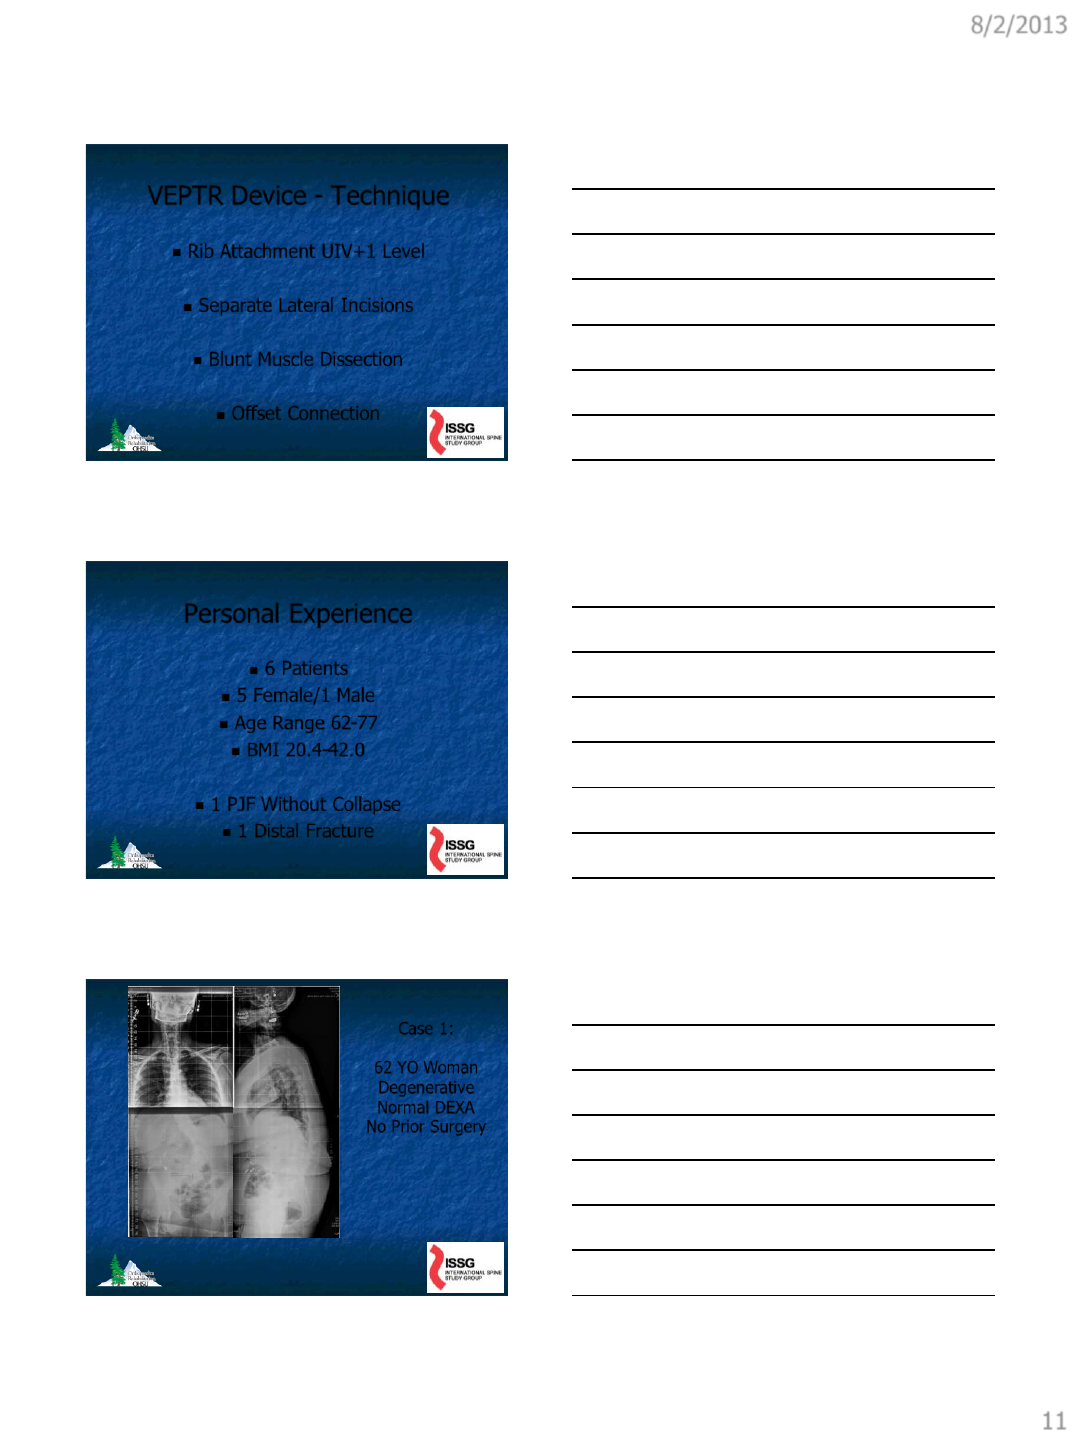
Case 1:
62 YO Woman
Degenerative
Normal DEXA
No Prior Surgery
8/2/2013
12
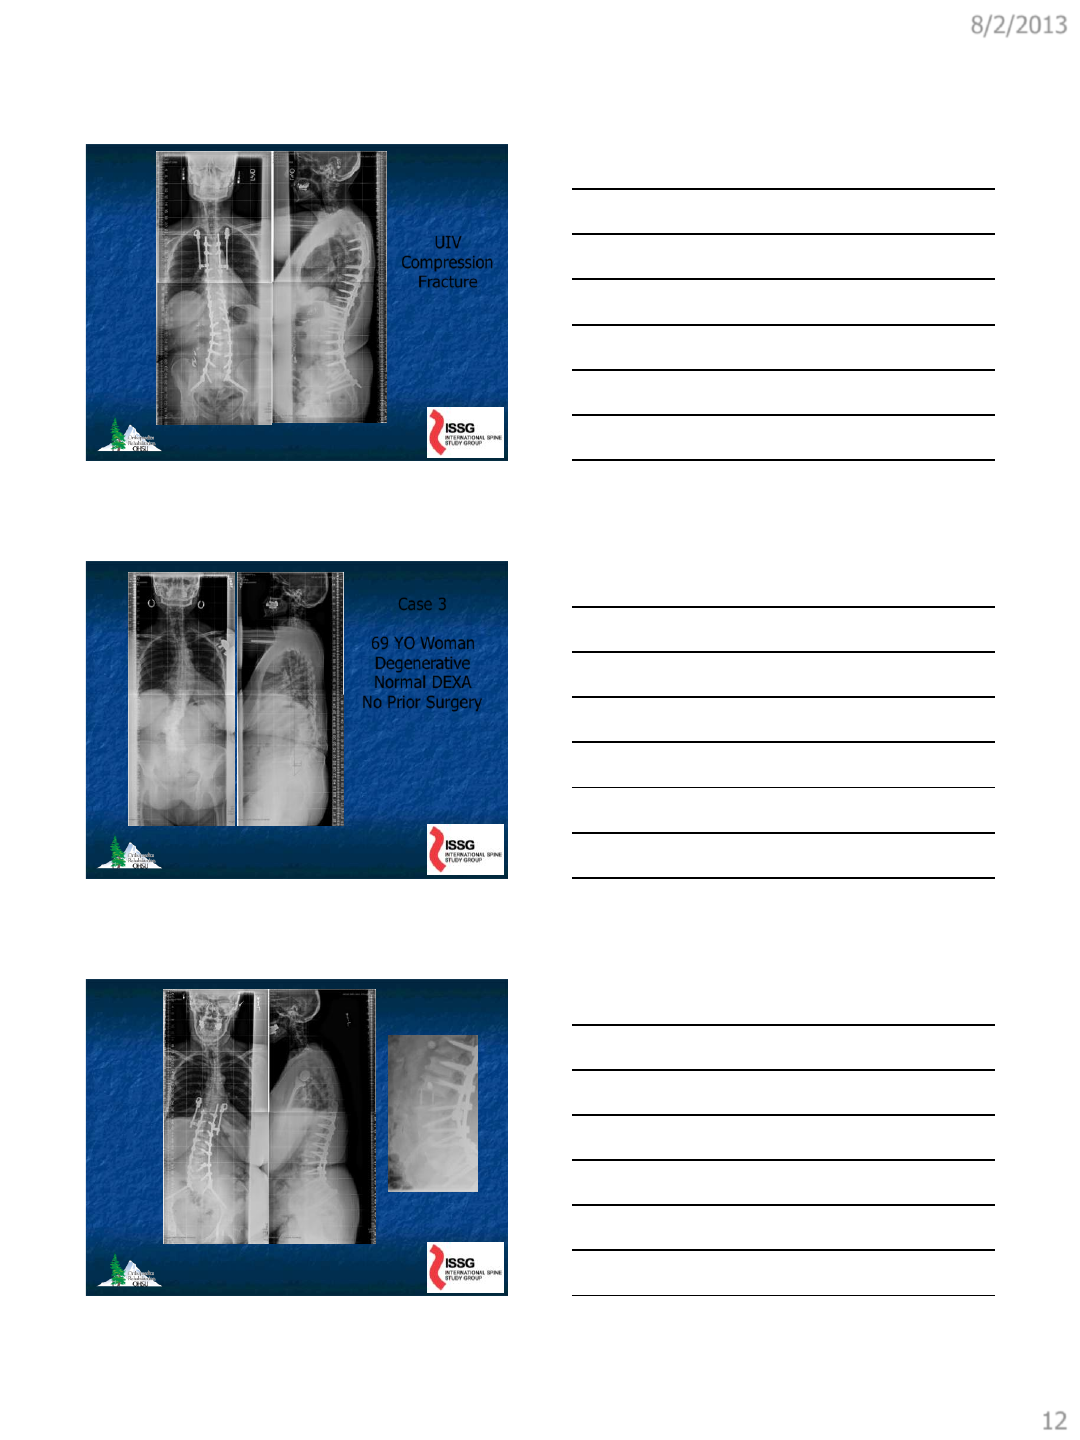
UIV
Compression
Fracture
Case 3
69 YO Woman
Degenerative
Normal DEXA
No Prior Surgery
8/2/2013
13
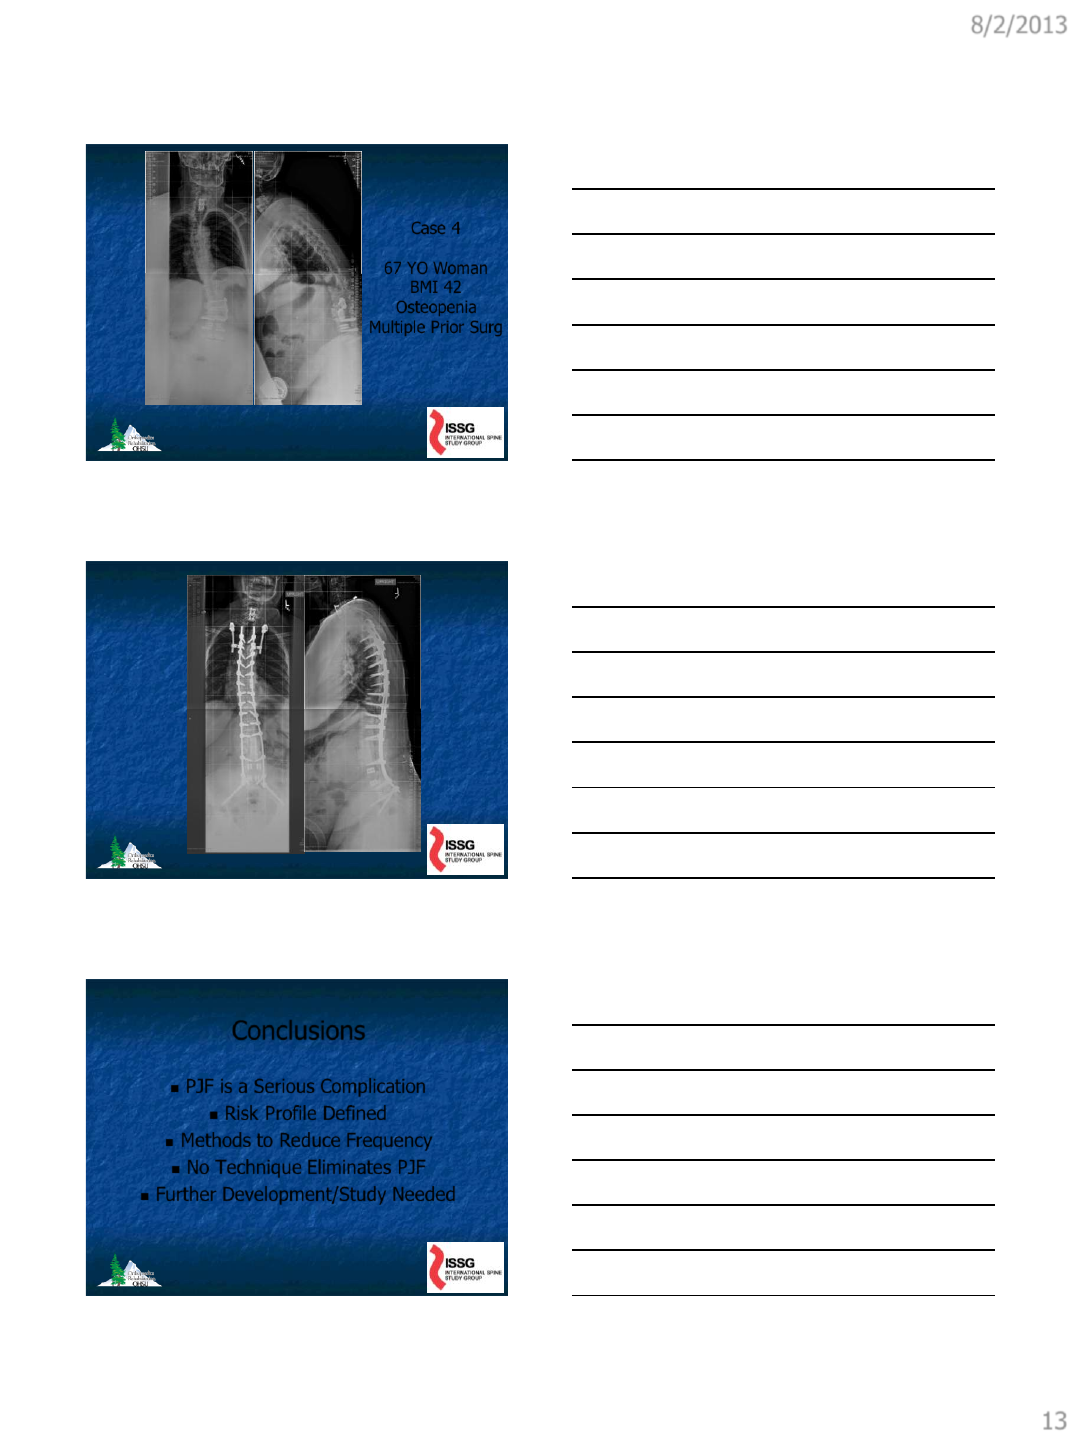
Case 4
67 YO Woman
BMI 42
Osteopenia
Multiple Prior Surg
Conclusions
PJF is a Serious Complication
Risk Profile Defined
Methods to Reduce Frequency
No Technique Eliminates PJF
Further Development/Study Needed
8/2/2013
14
THANK YOU
8/4/2013
1
Christopher Ames MD
Professor
Director of Spine Tumor and Deformity Surgery
UCSF Department of Neurosurgery
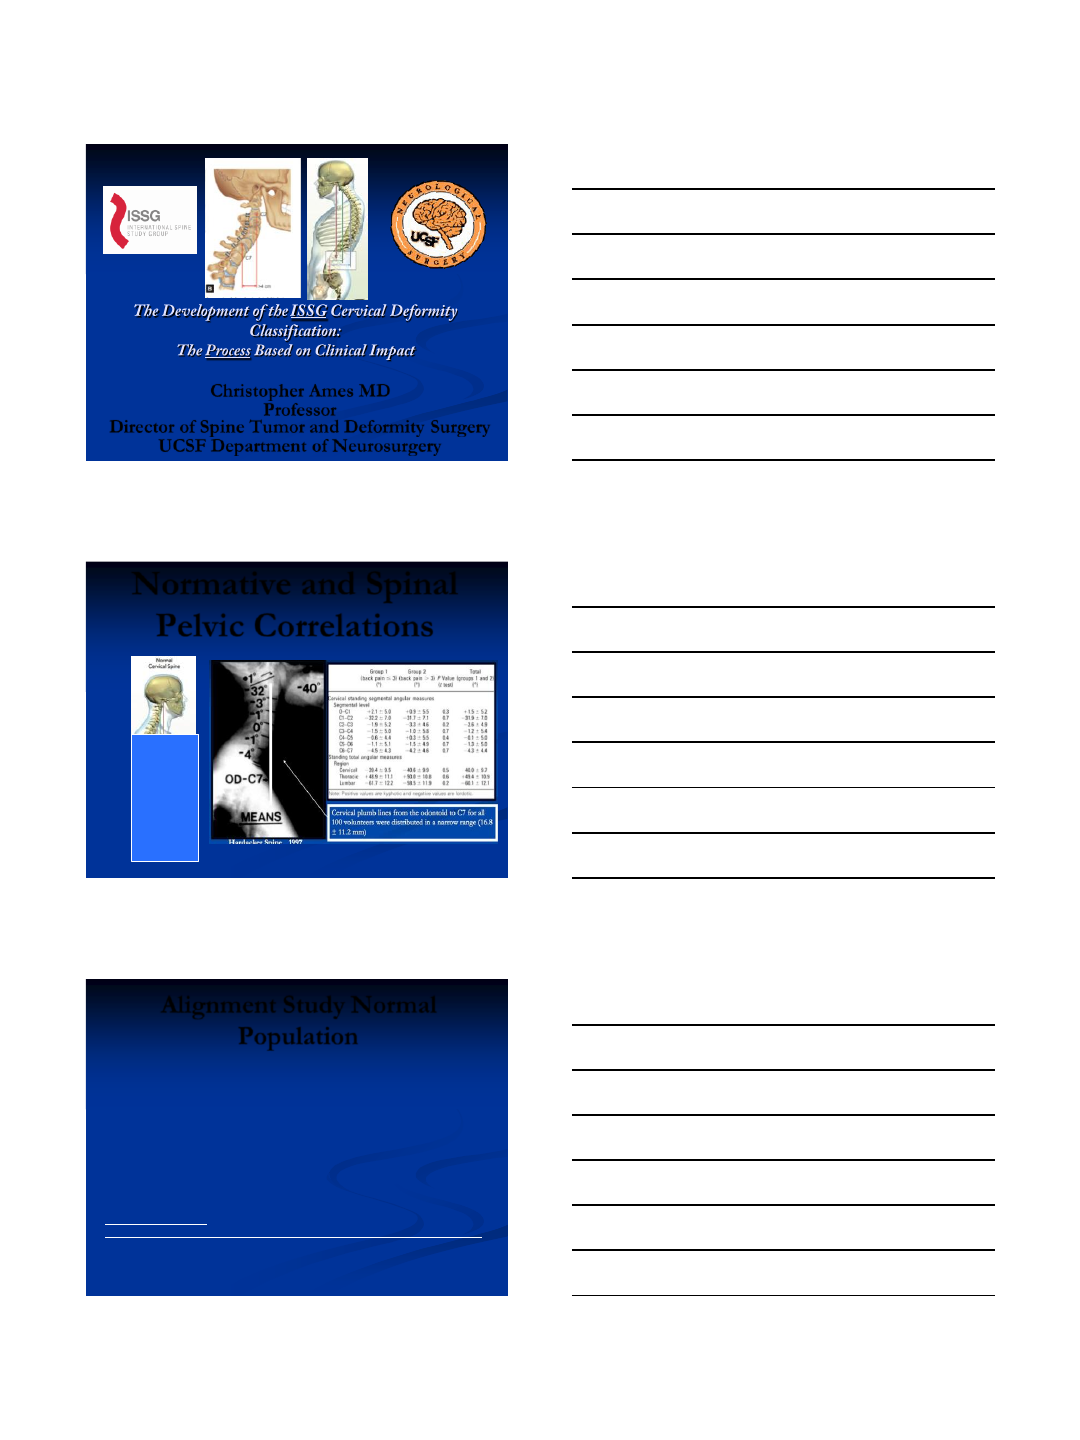
Normative and Spinal
Pelvic Correlations
Alignment Study Normal
Population
55 asymptomatic volunteers (27 men, 28 women; mean age=45
years) were evaluated by full-length standing radiographs using a
standardized protocol. All radiographs were analyzed using
validated image analysis software for C2-C7 cervical lordosis
(CL), T4-T12 thoracic kyphosis (TK), L1-S1 lumbar lordosis
(LL), pelvic tilt (PT), sagittal vertical axis (SVA), pelvic incidence
(PI) and PI-LL mismatch. Statistical analysis was performed for
the study population and after stratification by age (20-39yo, 40-
59yo and ≥60yo).
Spine Focus Issue 2013
Age related cervical and spino-pelvic parameters variations in a volunteer population
Benjamin Blondel, MD1,2 Frank Schwab, MD1 Christopher Ames, MD3 Jean-Charles Le Huec,
MD PhD4, Justin S. Smith, MD PhD5 Jason Demakakos, MS1 Bertrand Moal, MS1 Patrick
Tropiano, MD PhD2 Virginie Lafage, PhD1
8/4/2013
2
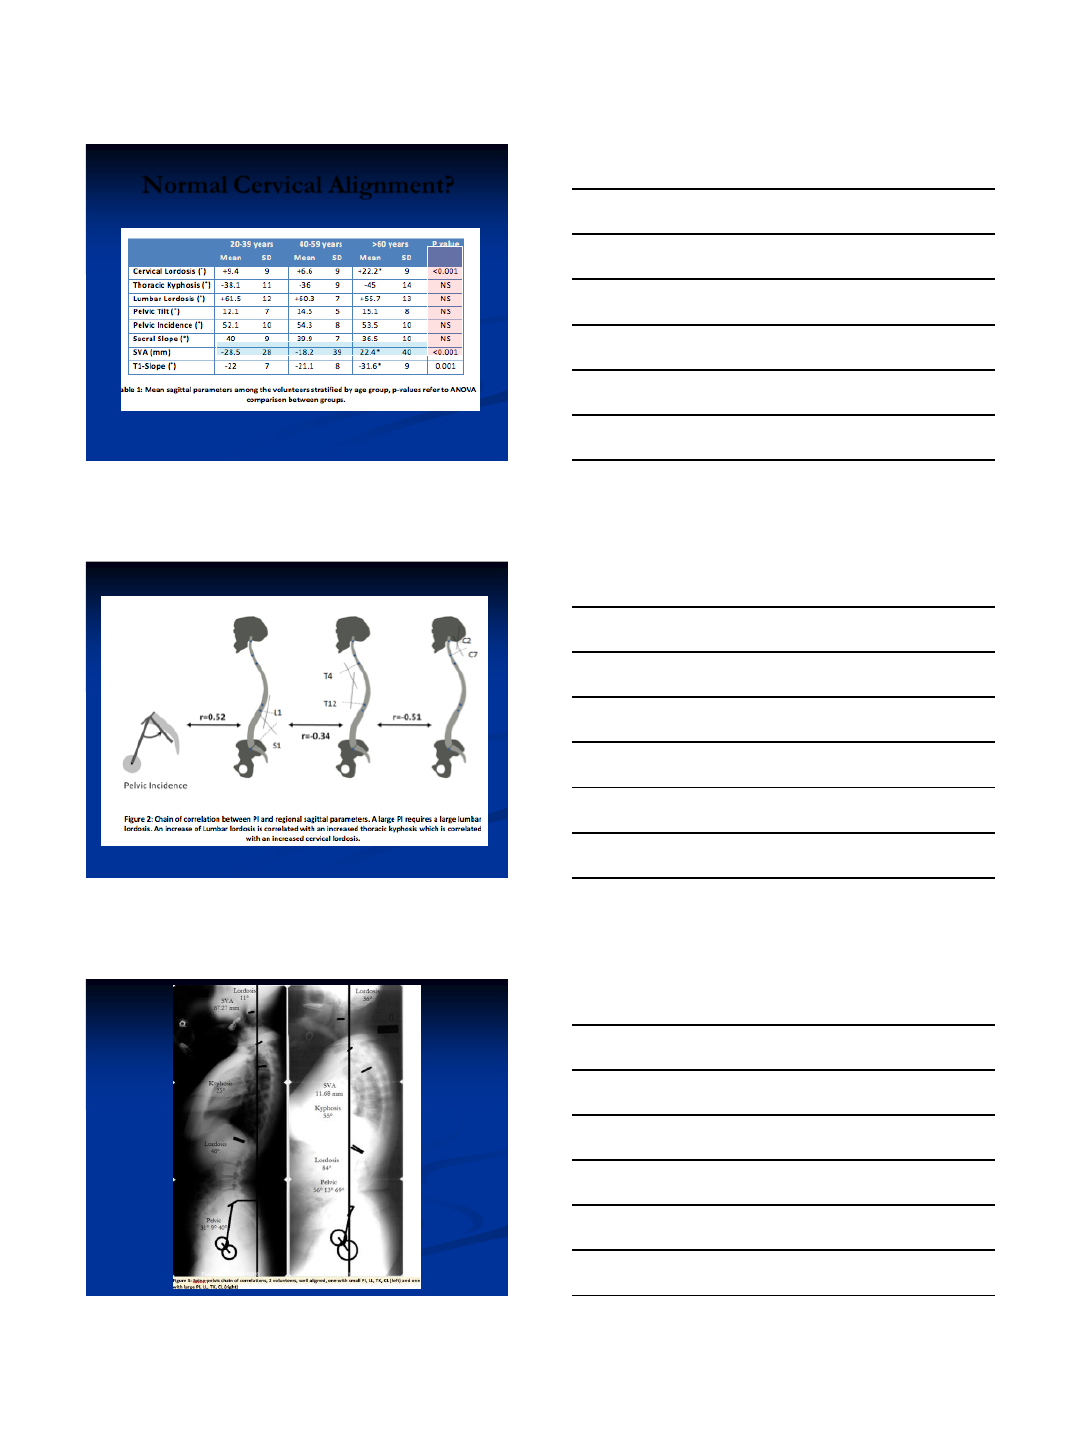
Normal Cervical Alignment?
8/4/2013
3
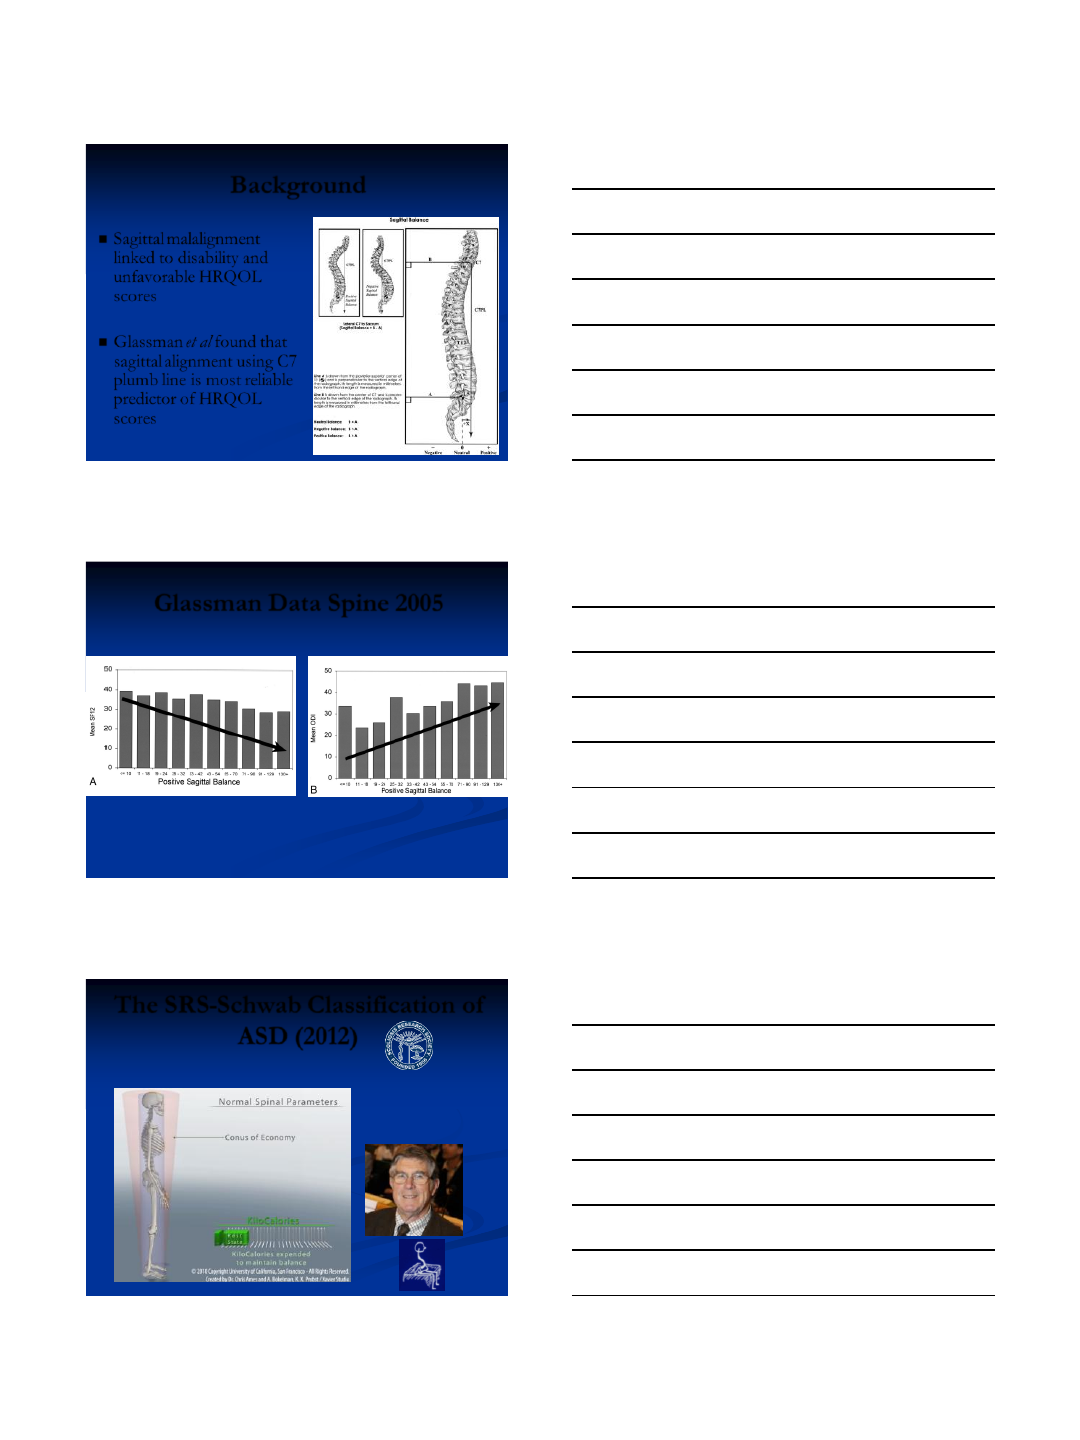
Background
Sagittal malalignment
linked to disability and
unfavorable HRQOL
scores
Glassman et al found that
sagittal alignment using C7
plumb line is most reliable
predictor of HRQOL
scores
Glassman Data Spine 2005
Changing our Treatment Strategies for all T/L patients
The SRS-Schwab Classification of
ASD (2012)
Jean Dubousset
8/4/2013
4
125 patients
•Lafage Schwab
•Spine 2009
•All Curves
•SRS, ODI
•Xray & clinical
analysis
•One site
492 patients
•ISSG
•SRS 2011
•All curves
•SRS, ODI
•Xray vs clinical
correlation
•Multi-center
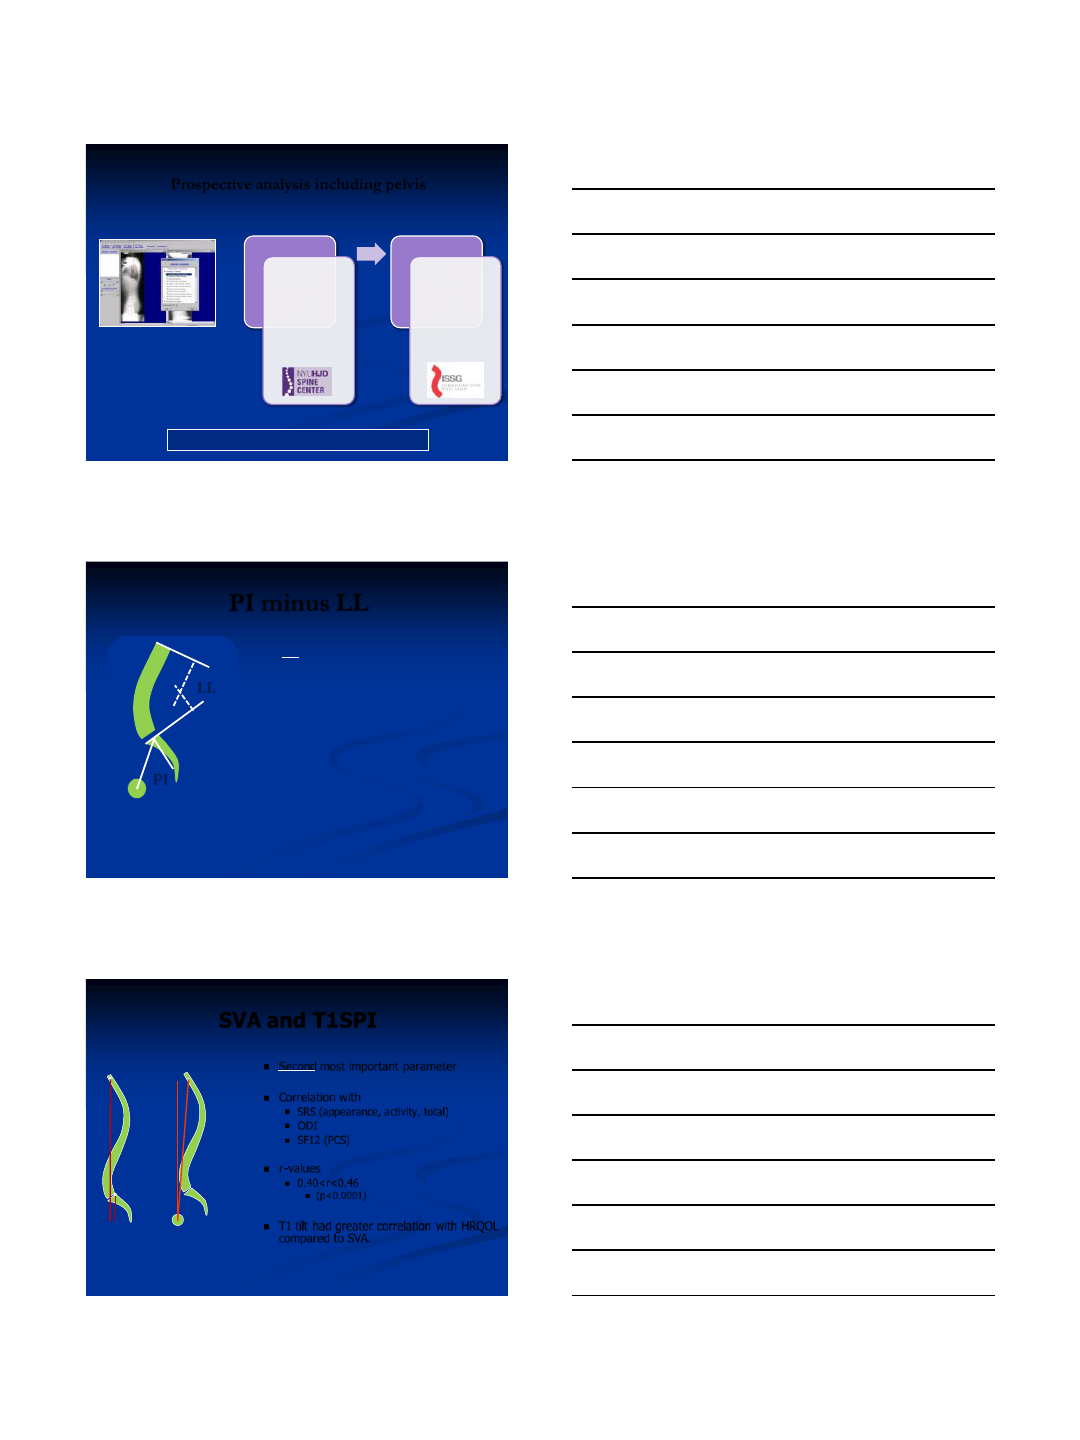
Prospective analysis including pelvis
What are the disability / pain generators ?
Schwab, Lafage, Shaffrey, Bess, Ames
SpineView®
300 parameters
* Frank Schwab
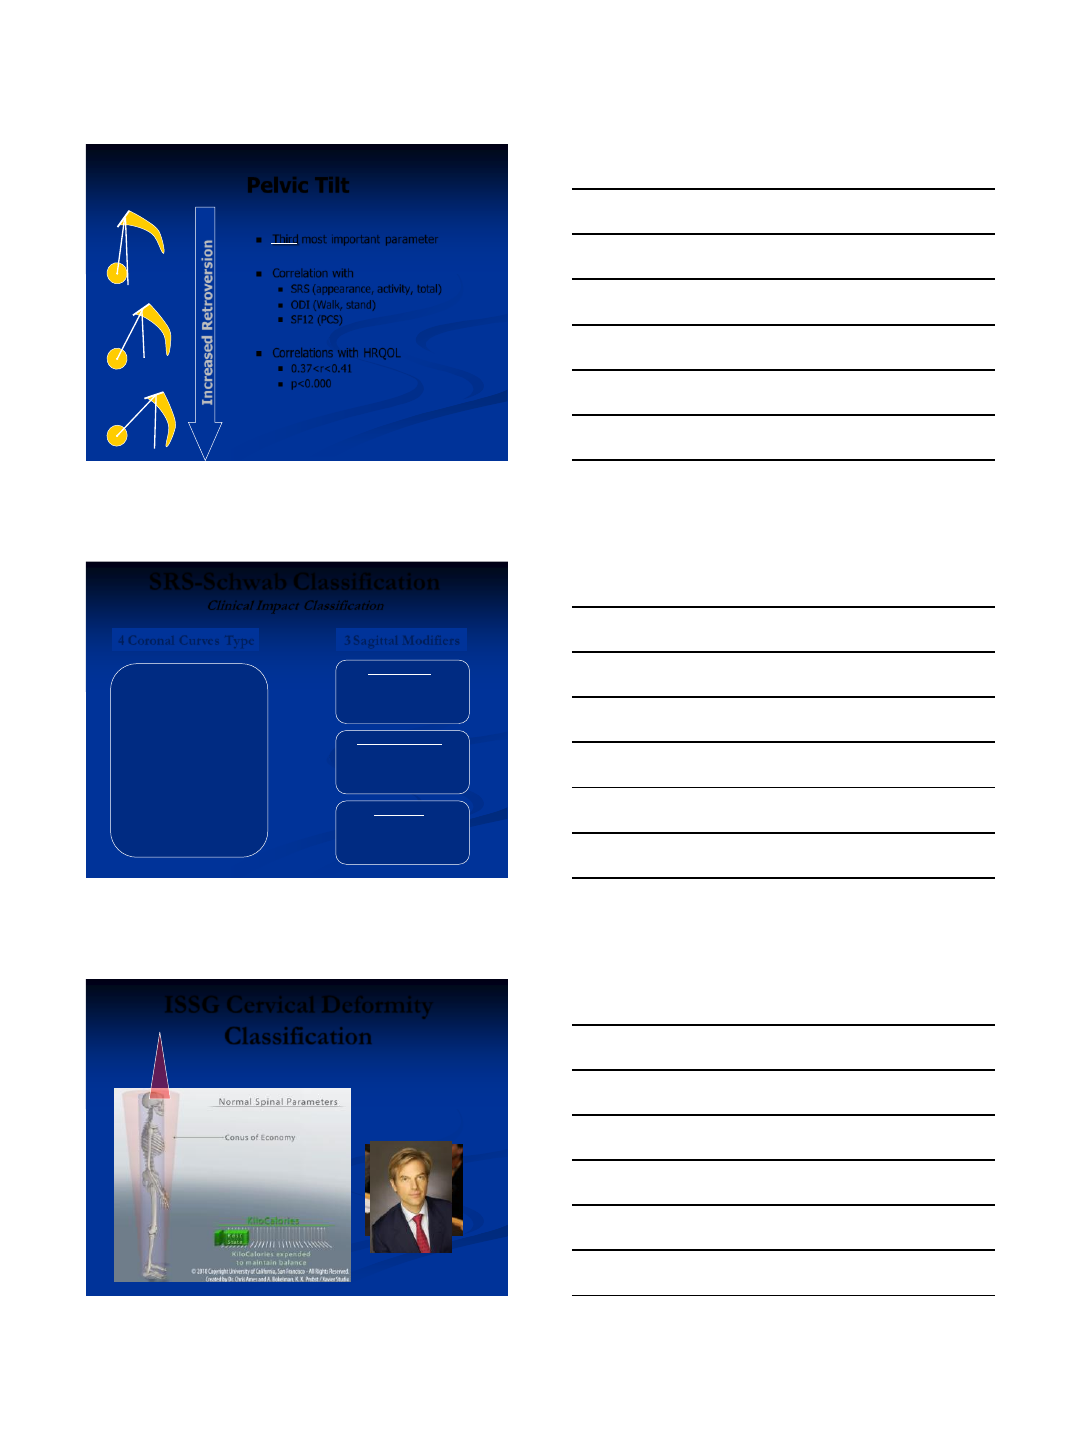
PI minus LL
LL
PI
•#1 most important parameter
•Correlation with
–SRS (appearance, activity, total)
–ODI (Walk, stand)
–SF12 (PCS)
•r-values
–0.42<r<0.482
–p<0.000
* Frank Schwab
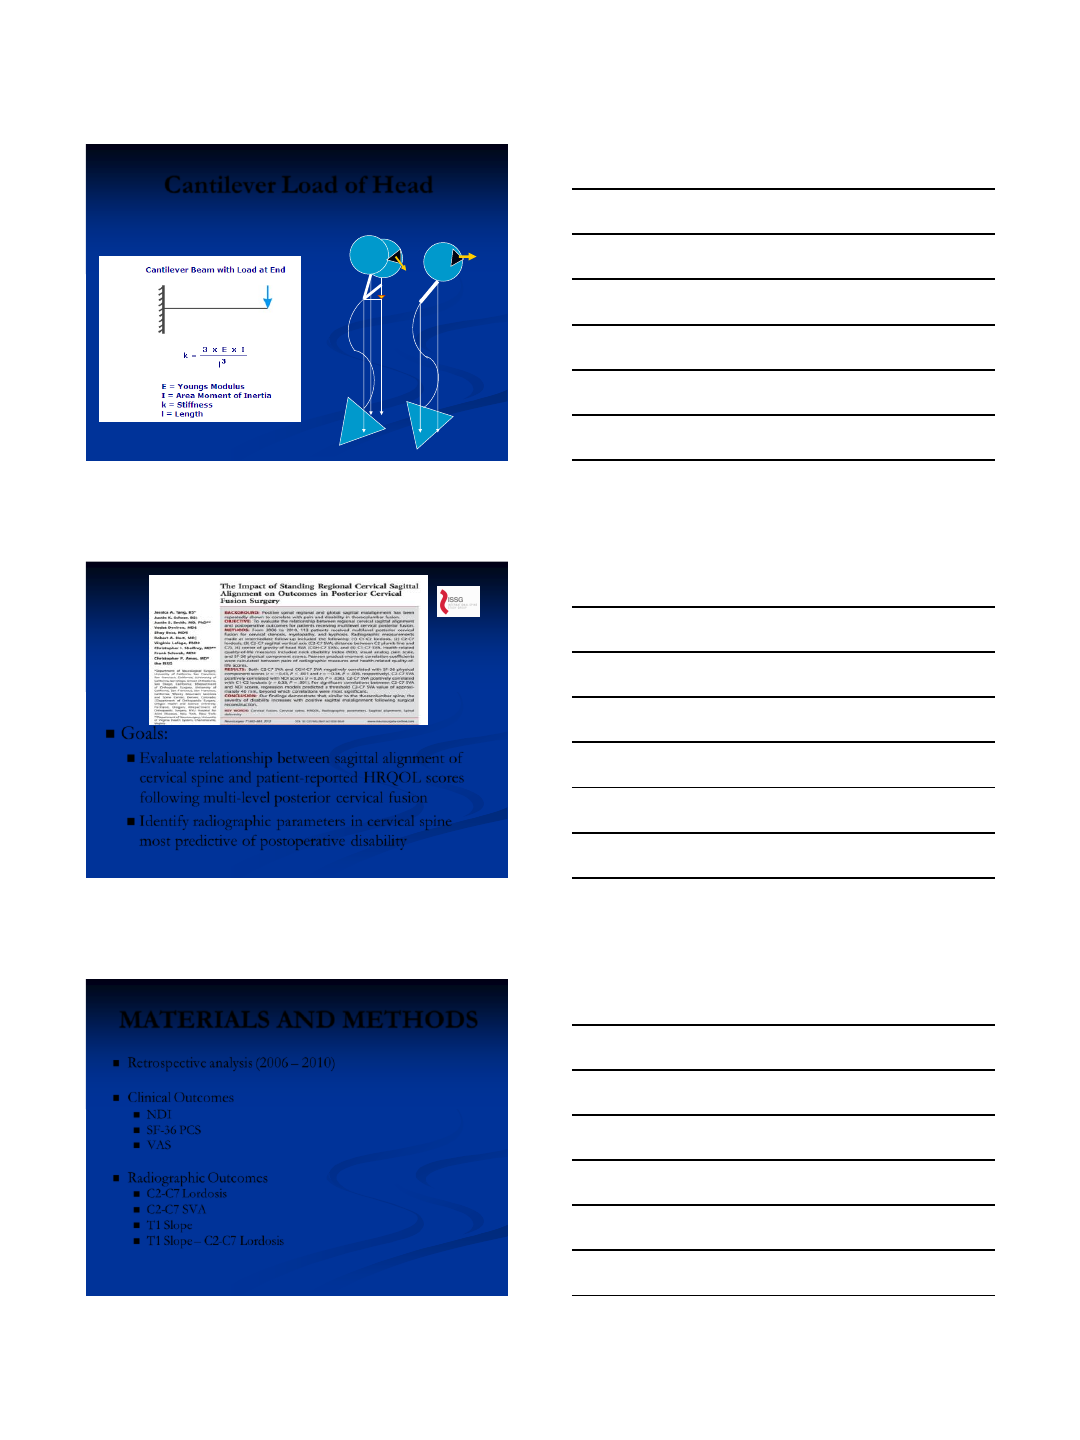
SVA and T1SPI
Second most important parameter
Correlation with
SRS (appearance, activity, total)
ODI
SF12 (PCS)
r-values
0.40<r<0.46
(p<0.0001)
T1 tilt had greater correlation with HRQOL
compared to SVA.
SVA
C7 T1
T1 Tilt
* Frank Schwab
8/4/2013
5
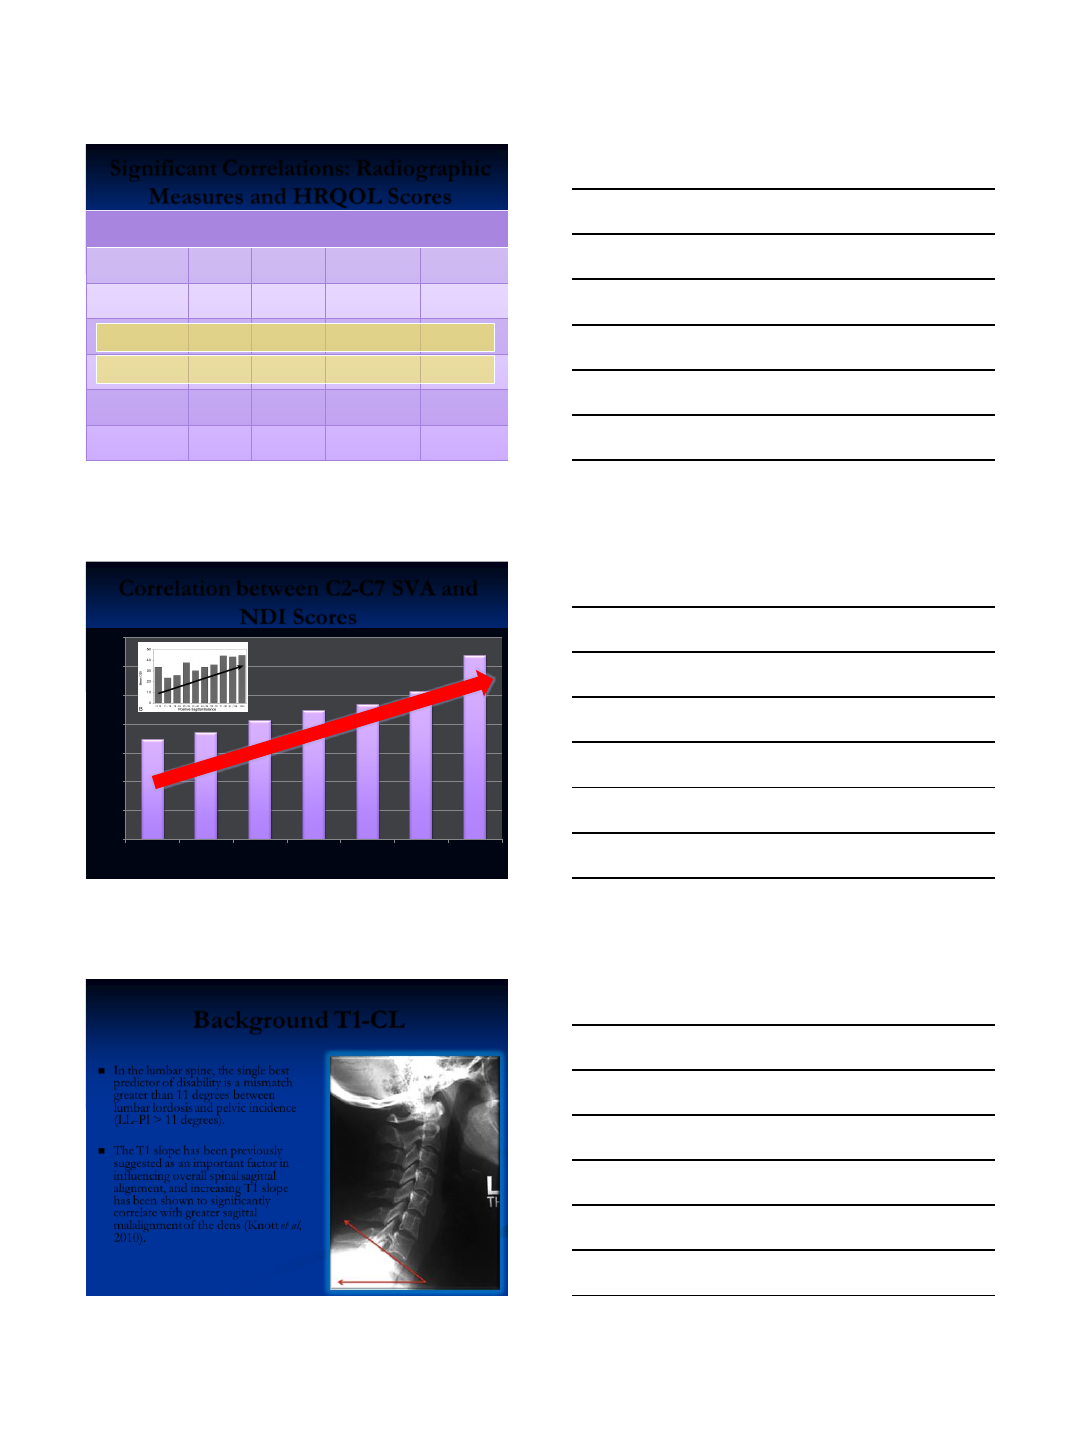
Pelvic Tilt
Third most important parameter
Correlation with
SRS (appearance, activity, total)
ODI (Walk, stand)
SF12 (PCS)
Correlations with HRQOL
0.37<r<0.41
p<0.000
Increased Retroversion
* Frank Schwab
T Thoracic only
with lumbar curve < 30°
L TL / Lumbar only
with thoracic curve <30°
D Double Curve
with at least one T and one TL/L,
both > 30°
N No Coronal Curve
All coronal curves <30 °
4 Coronal Curves Type
Global alignment
0 : SVA < 4cm
+ : SVA 4 to 9.5cm
++ : SVA > 9.5cm
3 Sagittal Modifiers
Pelvic Tilt
0 : PT<20°
+ : PT 20-30°
++ : PT>30°
PI minus LL
0 : within 10°
+: moderate 10-20°
++ : marked >20°
SRS-Schwab Classification
Clinical Impact Classification
ISSG Cervical Deformity
Classification
Jean Dubousset
8/4/2013
6
Cantilever Load of Head
4.5kg
2
7
4.5kg 4.5kg
High
PT
L
B
P
Goals:
Evaluate relationship between sagittal alignment of
cervical spine and patient-reported HRQOL scores
following multi-level posterior cervical fusion
Identify radiographic parameters in cervical spine
most predictive of postoperative disability
MATERIALS AND METHODS
Retrospective analysis (2006 – 2010)
Clinical Outcomes
NDI
SF-36 PCS
VAS
Radiographic Outcomes
C2-C7 Lordosis
C2-C7 SVA
T1 Slope
T1 Slope – C2-C7 Lordosis

8/4/2013
7
Patient Demographics
113 patients (M=61, F=52)
Mean age: 59 ± 12 years
Most common indications for long segment cervical
fusion:
Cervical stenosis (n = 65)
Myelopathy (n = 38)
Deformity (n = 14)
Degenerative disc (n = 13)
Mean number of levels fused: 5.6 ± 1.9
Average follow-up time: 187 ± 108 days
Cervical Measurements
C1-C2 lordosis
C2-C7 lordosis
CGH-C7 SVA
C1-C7 SVA
C2-C7 SVA
Measurement of cervical SVA
C2-C7 SVA
Distance between
plumb line
dropped from
centroid of C2
and C7
8/4/2013
8
Significant Correlations: Radiographic
Measures and HRQOL Scores
Radiographic
Measure
HRQOL
Score
No. Cases
Pearson's
coefficient
P-value
C1-C7 SVA
NDI
108
0.1863
0.0535
C1-C7 SVA
PCS
58
-0.4097
0.0014*
C2-C7 SVA
NDI
108
0.2015
0.0365*
C2-C7 SVA
PCS
58
-0.4262
0.0009*
CGH-C7 SVA
NDI
108
0.1873
0.0522
CGH-C7 SVA
PCS
58
-0.3613
0.0053*
Correlation between C2-C7 SVA and
NDI Scores
0
5
10
15
20
25
30
35
<10
20-30
30-40
40-50
50-60
60-70
>70
NDI Score
C2-C7 SVA (mm)
Background T1-CL
In the lumbar spine, the single best
predictor of disability is a mismatch
greater than 11 degrees between
lumbar lordosis and pelvic incidence
(LL–PI > 11 degrees).
The T1 slope has been previously
suggested as an important factor in
influencing overall spinal sagittal
alignment, and increasing T1 slope
has been shown to significantly
correlate with greater sagittal
malalignment of the dens (Knott et al,
2010).
8/4/2013
9
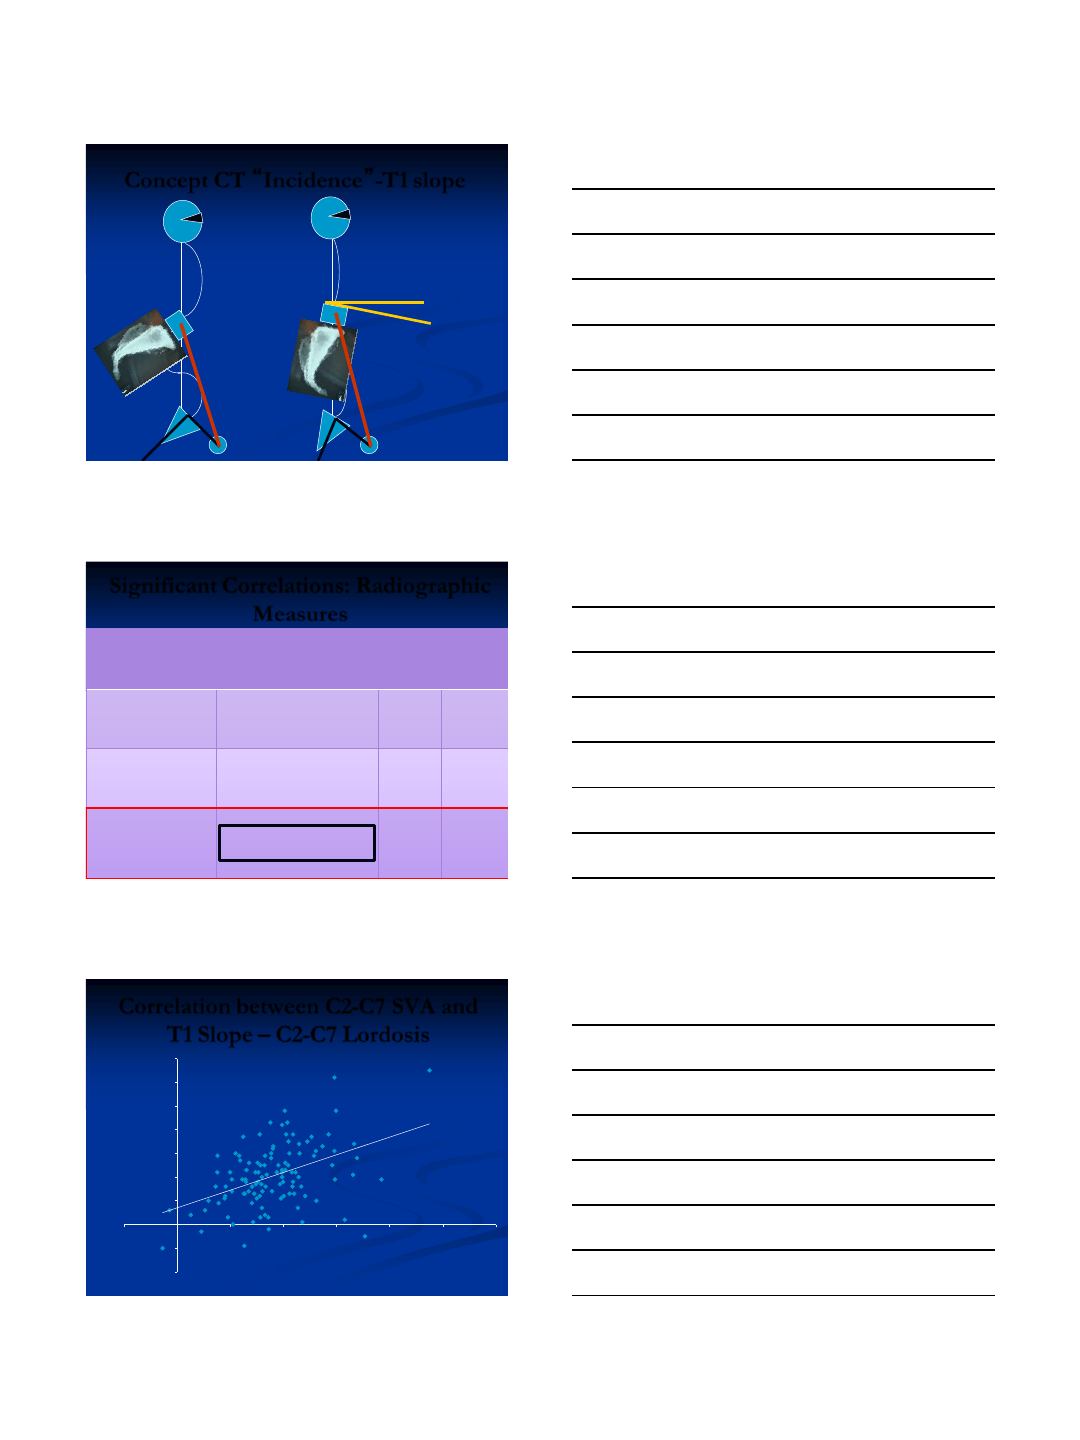
T1 T1
Concept CT “Incidence”-T1 slope
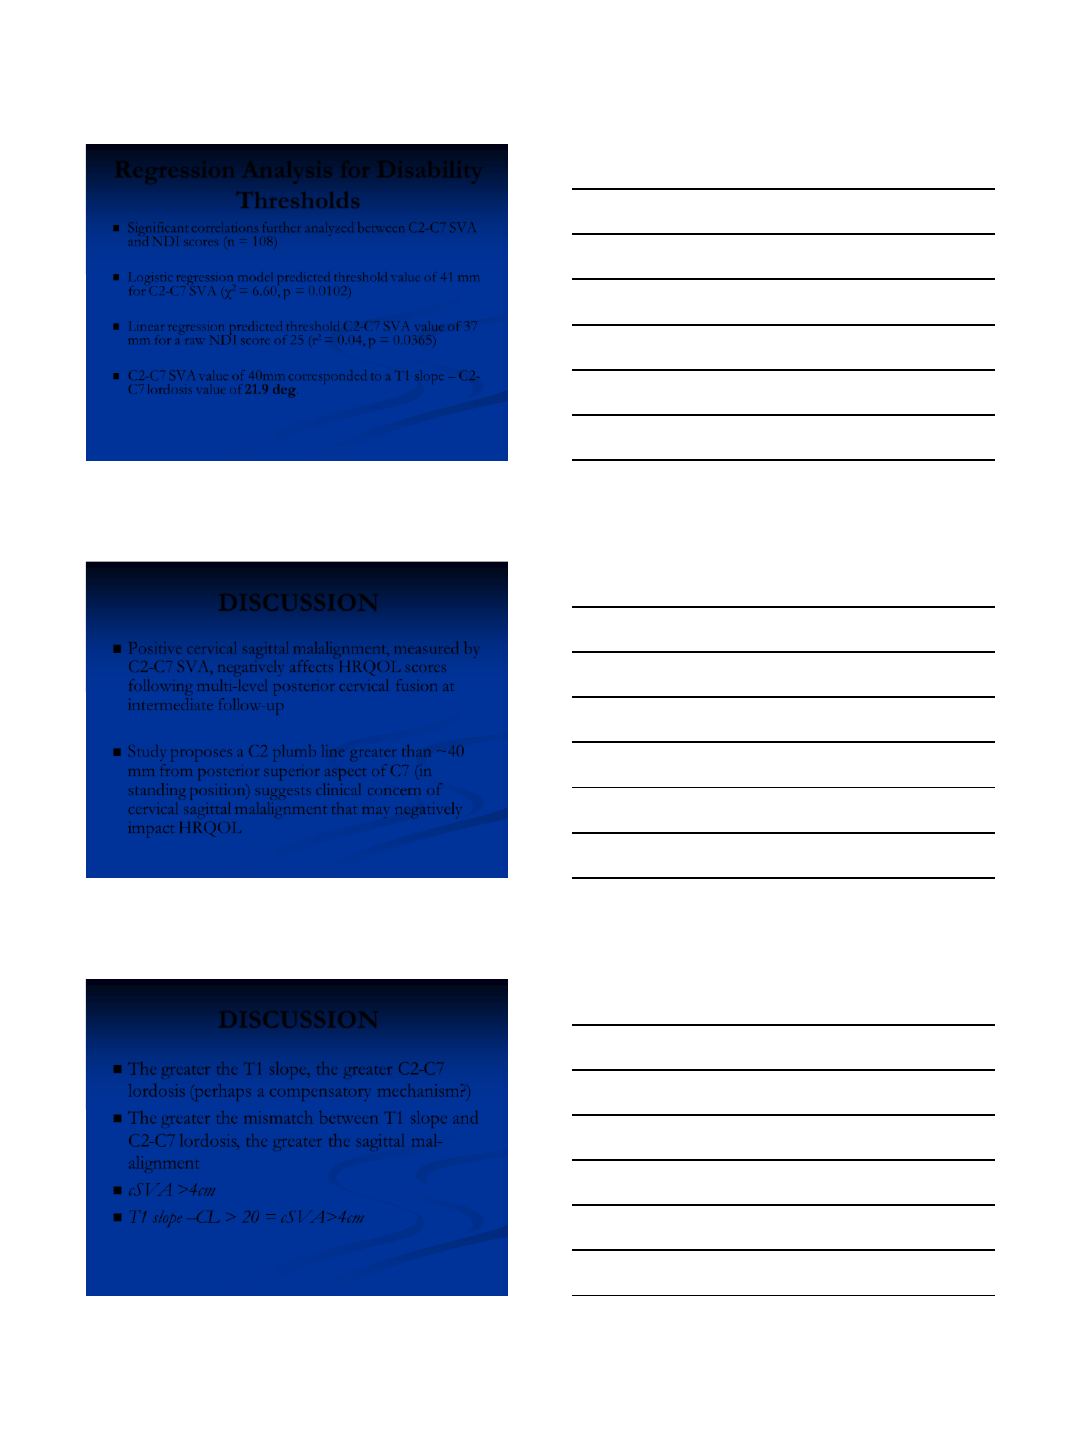
Significant Correlations: Radiographic
Measures
Radiographic Measure
Radiographic Measure
Pearson's
coefficient
P-value
C2-C7 Lordosis
T1 Slope
0.38
<0.0001*
C2-C7 SVA
T1 Slope
0.44
<0.0001*
C2-C7 SVA
T1 Slope – C2-C7 Lordosis
0.45
<0.0001*
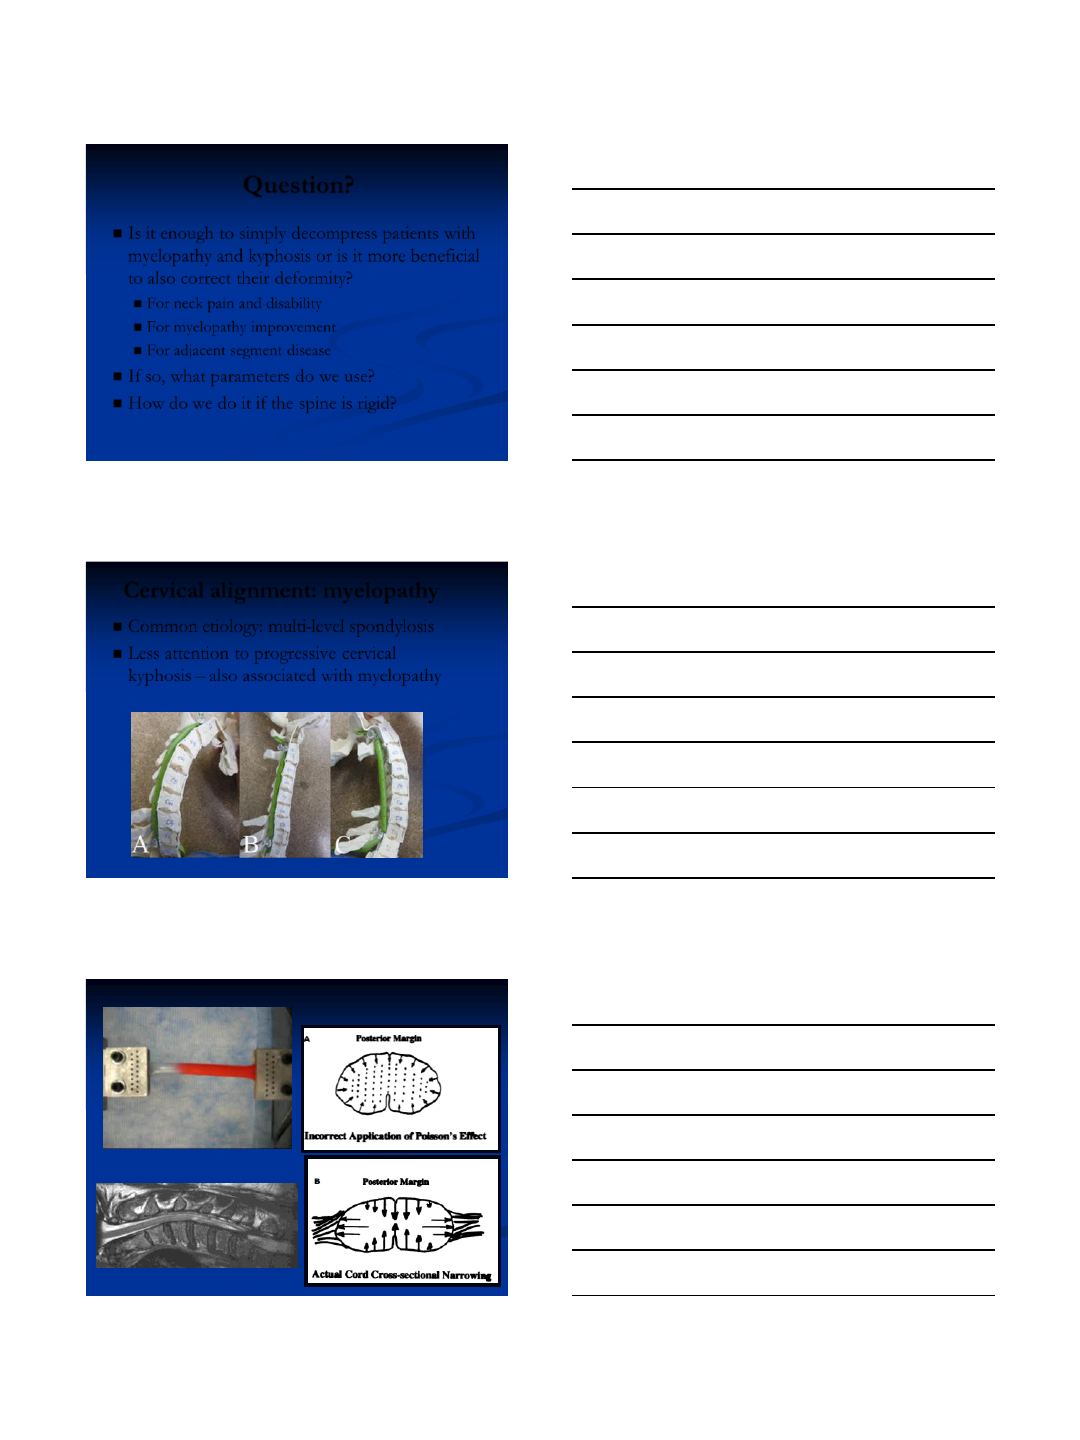
Correlation between C2-C7 SVA and
T1 Slope – C2-C7 Lordosis
y = 0.3732x + 6.9998
R² = 0.1986
-20
-10
0
10
20
30
40
50
60
70
-20 0 20 40 60 80 100 120
T1 slope – C2-C7 lordosis (deg)
C2-C7 SVA (mm)
8/4/2013
10
Regression Analysis for Disability
Thresholds
Significant correlations further analyzed between C2-C7 SVA
and NDI scores (n = 108)
Logistic regression model predicted threshold value of 41 mm
for C2-C7 SVA (χ2 = 6.60, p = 0.0102)
Linear regression predicted threshold C2-C7 SVA value of 37
mm for a raw NDI score of 25 (r2 = 0.04, p = 0.0365)
C2-C7 SVA value of 40mm corresponded to a T1 slope – C2-
C7 lordosis value of 21.9 deg.
DISCUSSION
Positive cervical sagittal malalignment, measured by
C2-C7 SVA, negatively affects HRQOL scores
following multi-level posterior cervical fusion at
intermediate follow-up
Study proposes a C2 plumb line greater than ~40
mm from posterior superior aspect of C7 (in
standing position) suggests clinical concern of
cervical sagittal malalignment that may negatively
impact HRQOL
DISCUSSION
The greater the T1 slope, the greater C2-C7
lordosis (perhaps a compensatory mechanism?)
The greater the mismatch between T1 slope and
C2-C7 lordosis, the greater the sagittal mal-
alignment
cSVA >4cm
T1 slope –CL > 20 = cSVA>4cm
8/4/2013
11
Question?
Is it enough to simply decompress patients with
myelopathy and kyphosis or is it more beneficial
to also correct their deformity?
For neck pain and disability
For myelopathy improvement
For adjacent segment disease
If so, what parameters do we use?
How do we do it if the spine is rigid?
Cervical alignment: myelopathy
Common etiology: multi-level spondylosis
Less attention to progressive cervical
kyphosis – also associated with myelopathy
8/4/2013
12
Analysis of 56 Preoperative cases from the AOSpine
North America Myelopathy Study
Association of Myelopathy
Scores with Cervical Sagittal
Balance and Normalized
Spinal Cord Volume
Justin Smith, MD, PhD
Virginie Lafage, PhD
Christopher Shaffrey, MD
Frank Schwab, MD
Dan Riew, MD
VincentTraynelis
Alex Vaccaro, MD, PhD
*Michael Fehlings, MD, PhD
Christopher Ames, MD
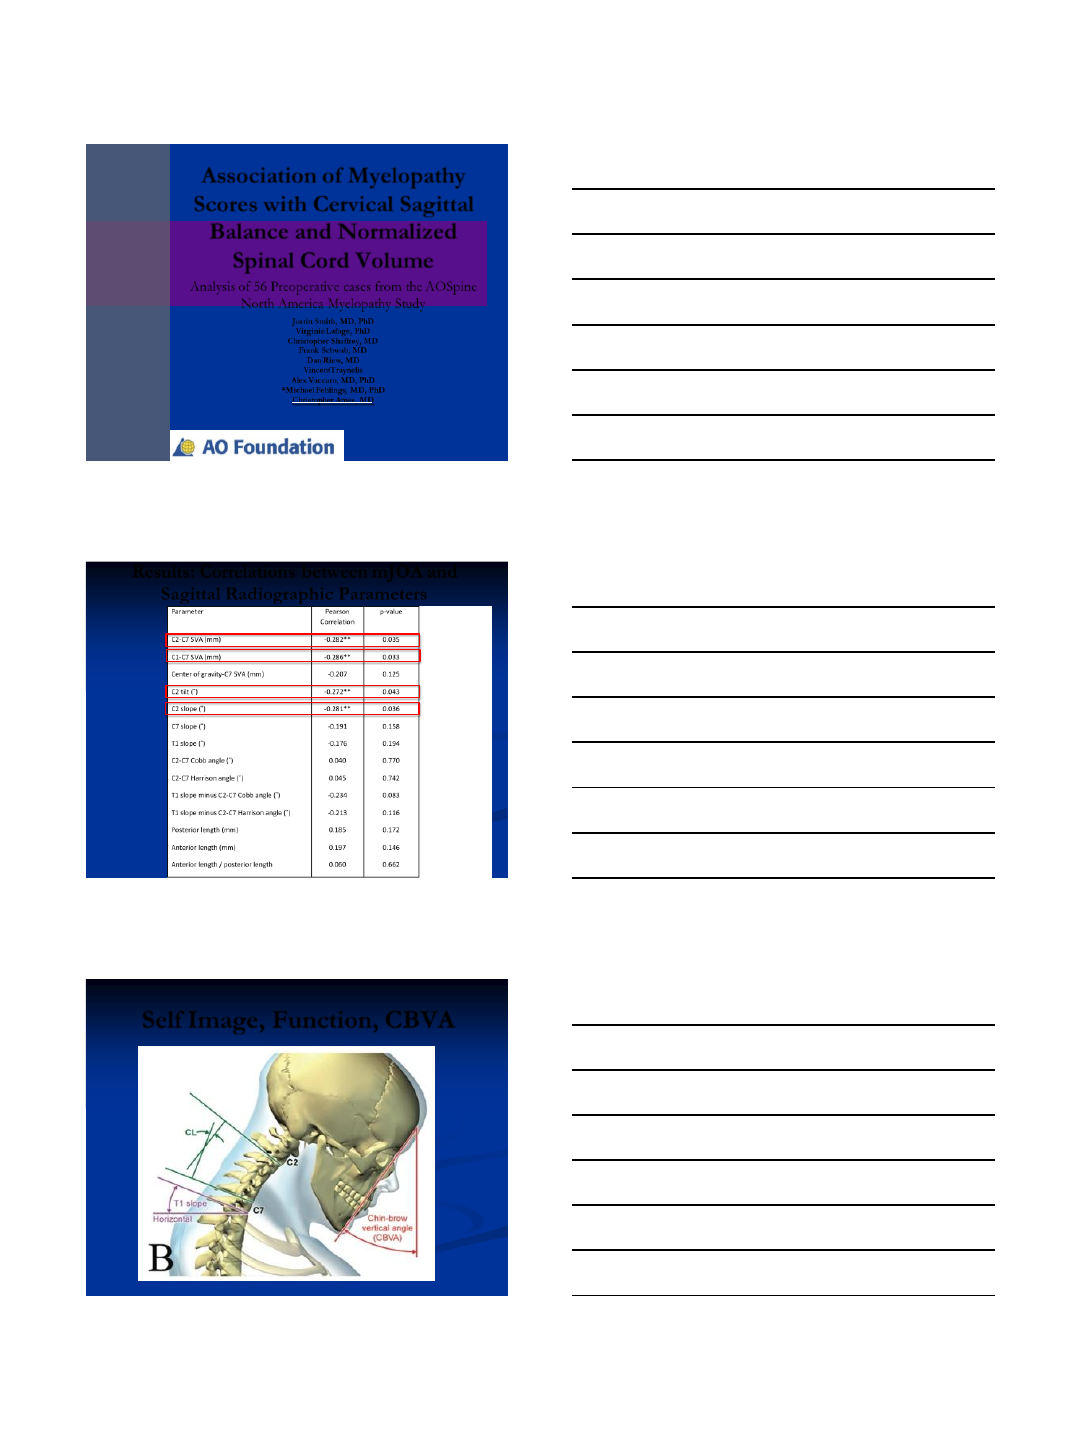
Results: Correlations between mJOA and
Sagittal Radiographic Parameters
Self Image, Function, CBVA
8/4/2013
13
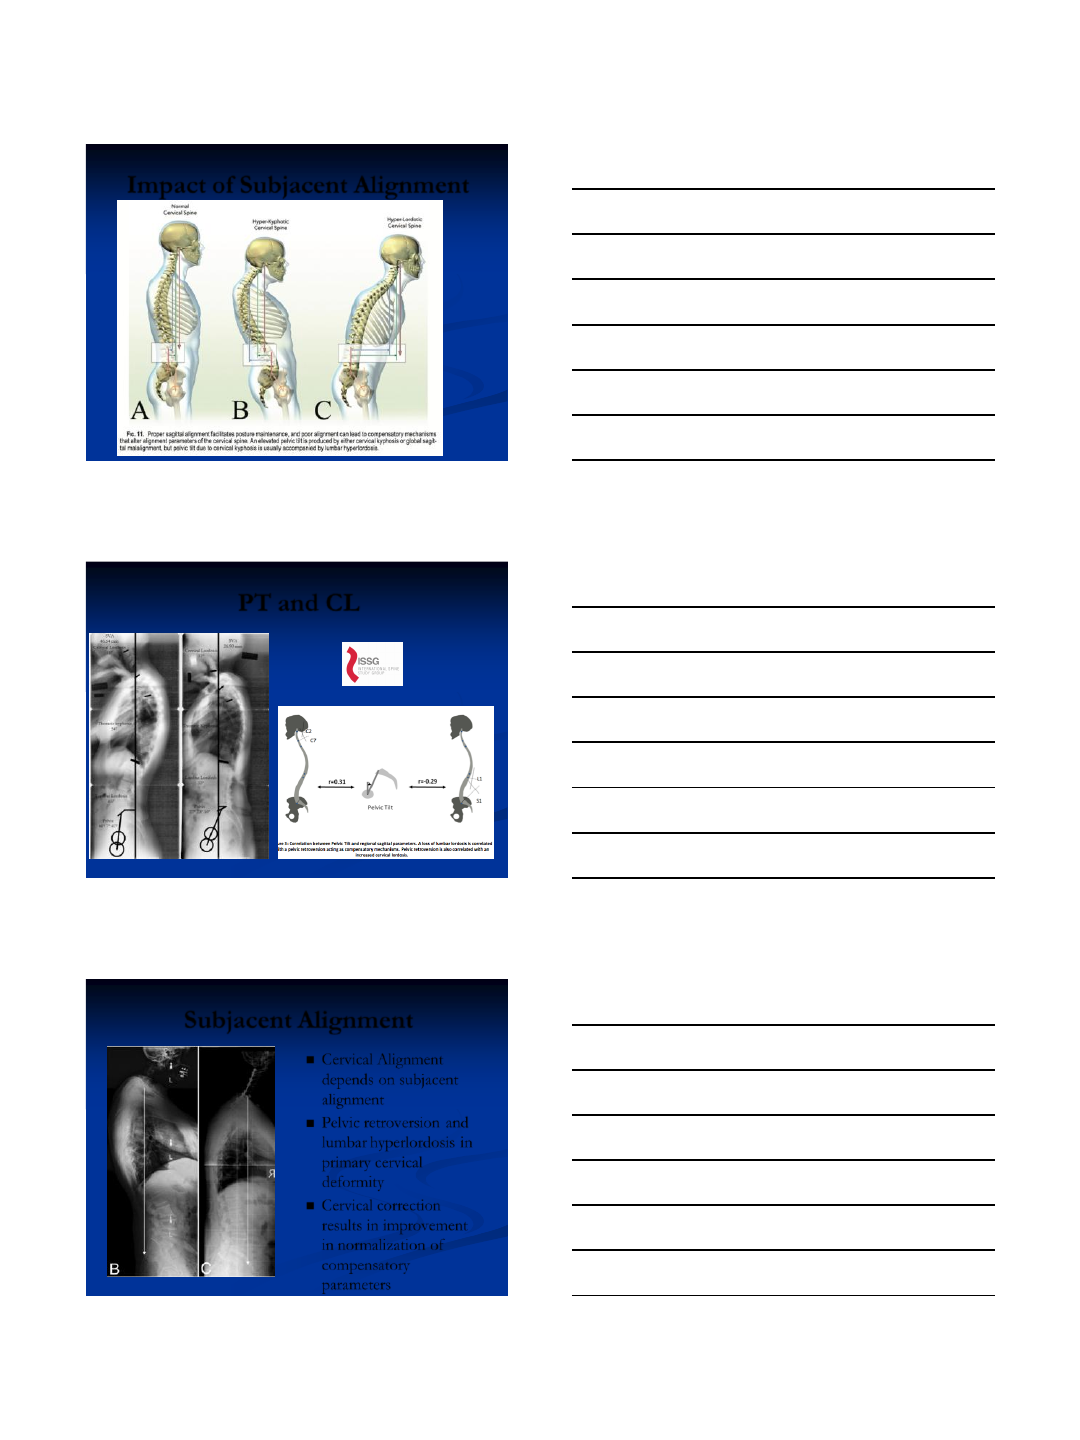
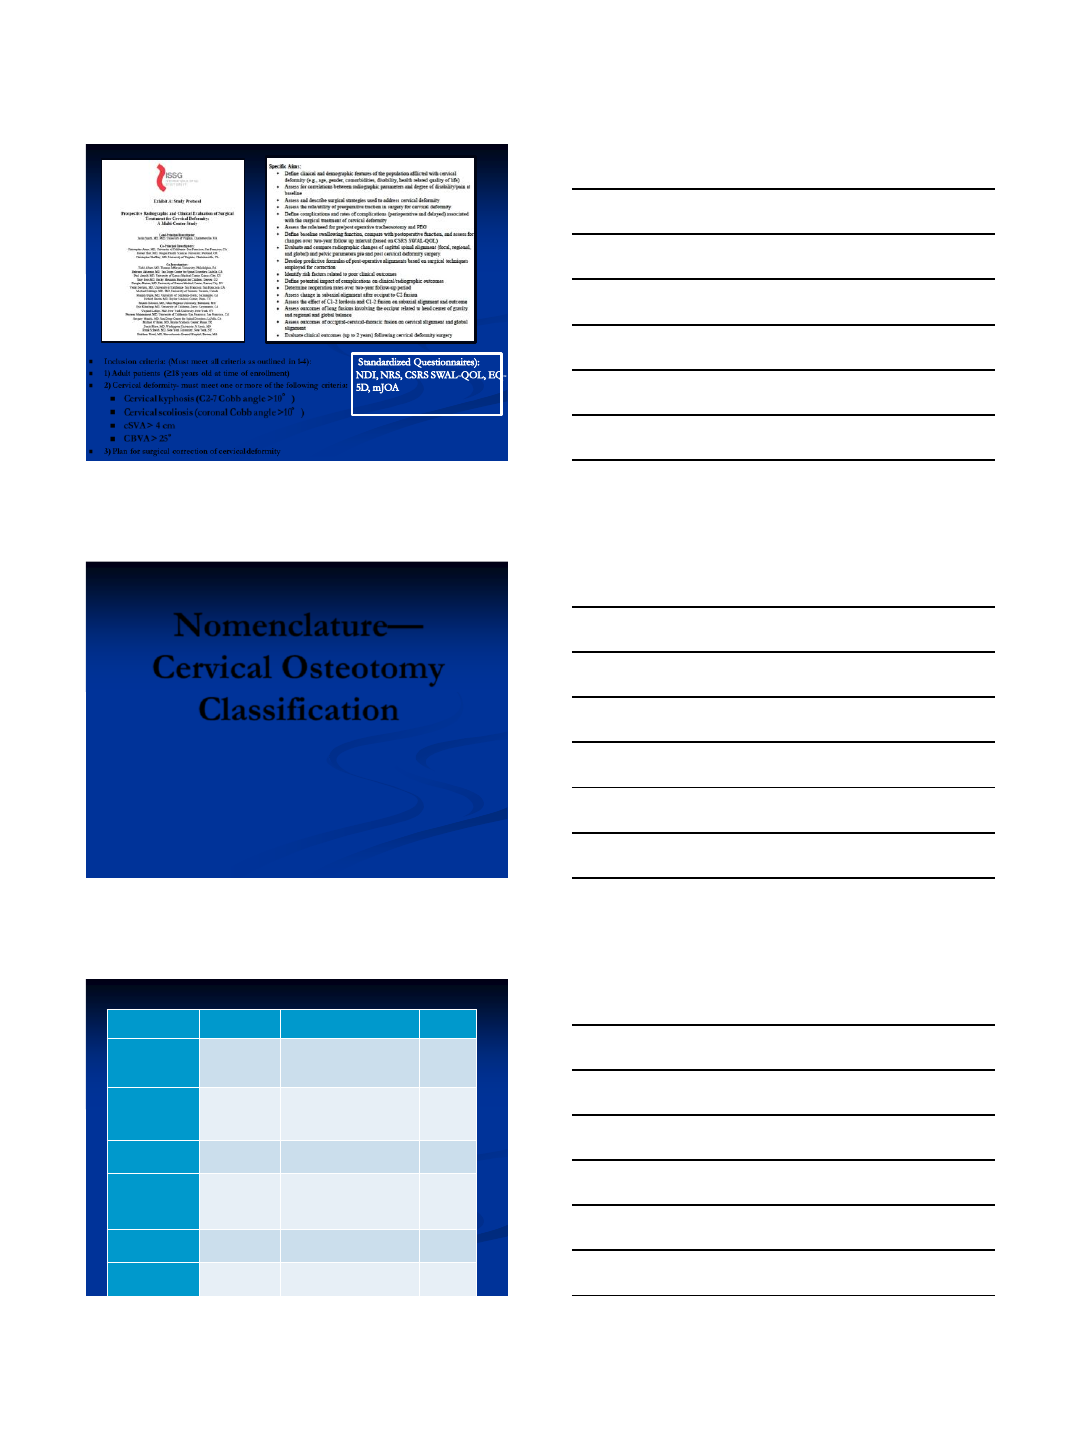
Impact of Subjacent Alignment
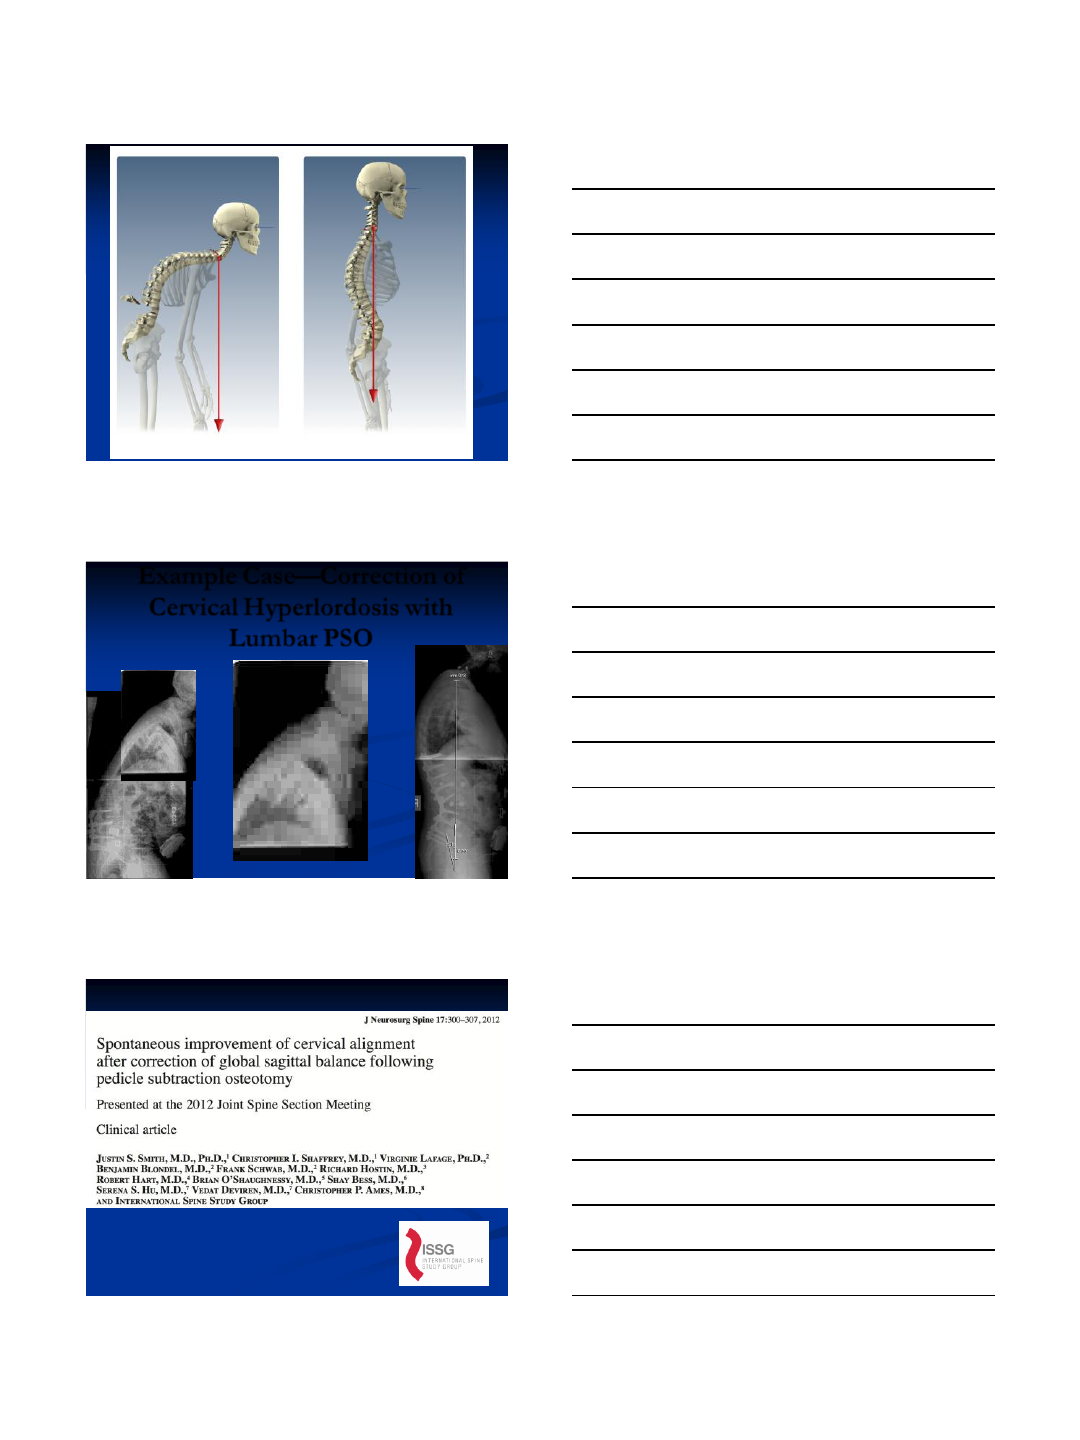
PT and CL
Subjacent Alignment
Cervical Alignment
depends on subjacent
alignment
Pelvic retroversion and
lumbar hyperlordosis in
primary cervical
deformity
Cervical correction
results in improvement
in normalization of
compensatory
parameters
8/4/2013
14
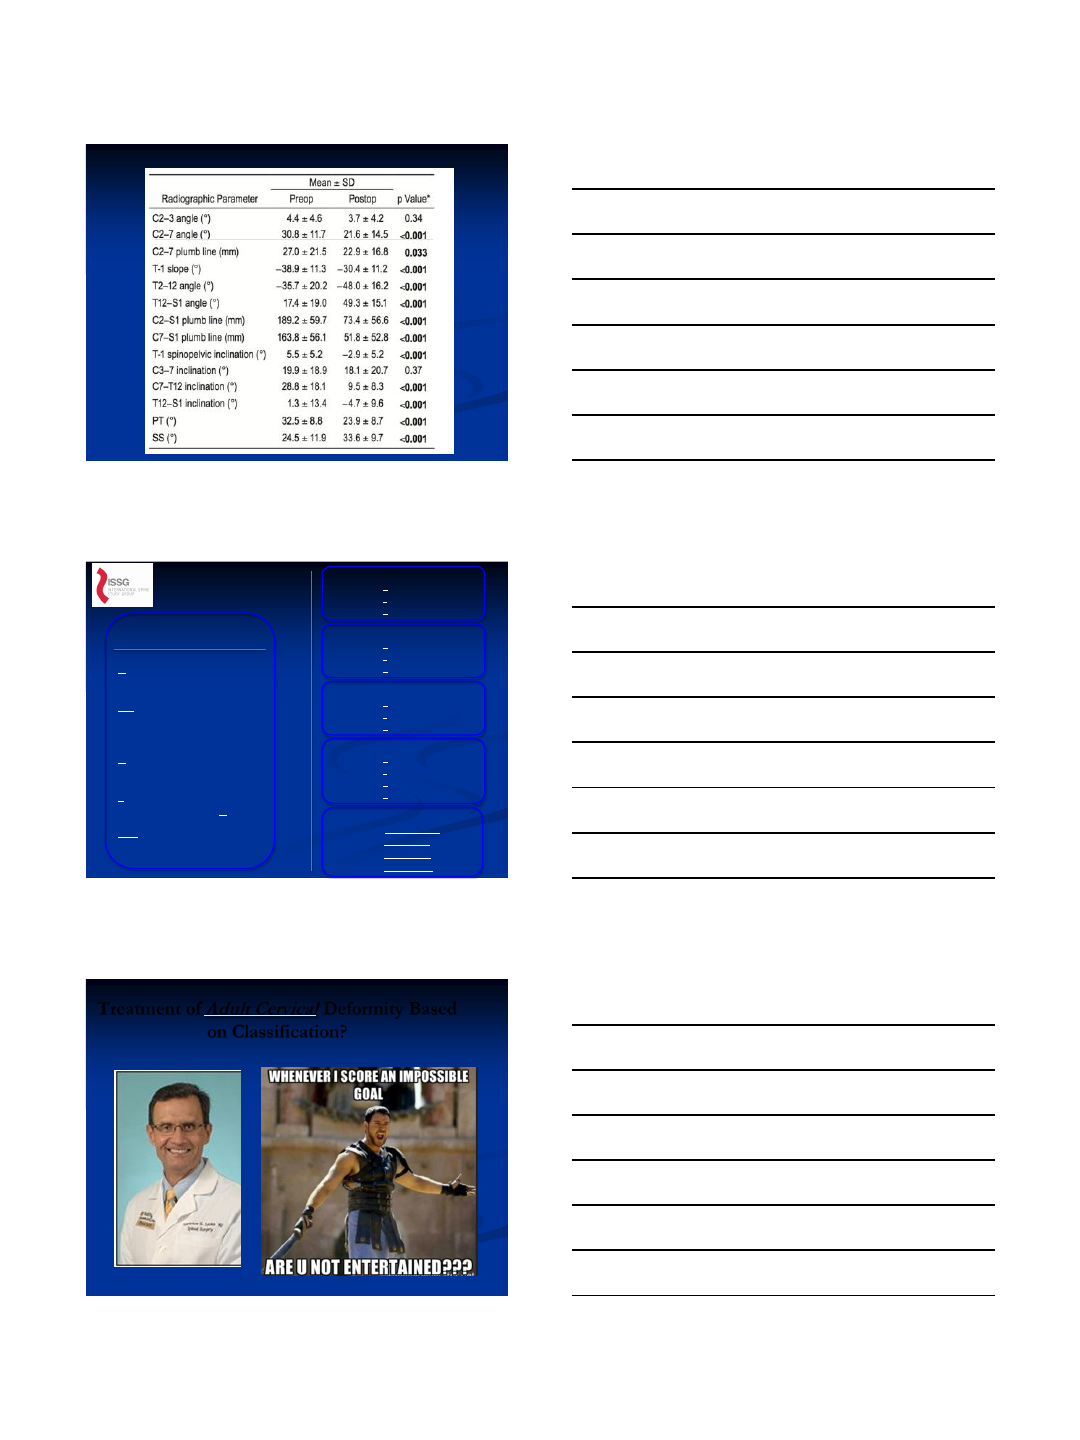
Example Case—Correction of
Cervical Hyperlordosis with
Lumbar PSO
8/4/2013
15
Deformity Descriptor
CVJ- Primary Cranio-Vertebral
Junction Deformity
5 Modifiers
C2-C7 sagittal vertical axis (SVA)
0: C2-C7 SVA < 4cm
1: C2-C7 SVA 4 to 8cm
2: C2-C7 SVA > 8cm
Myelopathy
0: mJOA=18 (None)
1: mJOA=15-17 (Mild)
2: mJOA=12-14 (Moderate)
3: mJOA<12 (Severe)
Horizontal Gaze
0: CBVA < ° 10
1: CBVA 10 to 25°
2: CBVA > 25 °
SRS-Schwab Classification
T, L, D, or S: Curve Type
A, B, or C: LL minus PI
L, M, or H: Pelvic Tilt
N, P, or VP: C7-S1 SVA
C- Primary Sagittal Deformity
Apex in Cervical Spine
CT- Primary Sagittal Deformity
Apex at Cervico-Thoracic
Junction
T- Primary Sagittal Deformity
Apex in Thoracic Spine
S- Primary Coronal Deformity
(C2-C7 Cobb > 15°)
Cervical Deformity
Classification
Cervical Lordosis Minus T1 Slope
0: CL-T1 < ° 15
1: CL-T1 15-to 20 °
2: CL-T1 >20 °
Treatment of
Adult Cervical
Deformity Based
on Classification?
8/4/2013
16
Inclusion criteria: (Must meet all criteria as outlined in 1-4):
1) Adult patients (≥18 years old at time of enrollment)
2) Cervical deformity- must meet one or more of the following criteria:
Cervical kyphosis (C2-7 Cobb angle >10°)
Cervical scoliosis (coronal Cobb angle >10°)
cSVA > 4 cm
CBVA > 25°
3) Plan for surgical correction of cervical deformity
Nomenclature—
Cervical Osteotomy
Classification
Resection
Description
Surgical
approach
Grade 1
Partial Facet Joint
Resection of the inferior facet and joint capsule
at a given spinal level
A/P
(a nterior soft tissue
rel ease combined
wi th posterior
res ection)
P (pos terior)
Grade 2
Complete Facet
Joint
Both superior and inferior facets at a given
spinal segment are resected; other posterior
elements of the vertebra including the lamina,
and the spinous processes may also be resected
A/P
(anterior soft tissue
release combined
with posterior
resection)
P (posterior)
Grade 3
Partial Body
Partial wedge resection of a segment of the
vertebral body and a portion of the posterior
vertebral elements
A (anterior release)
P (posterior release)
A/P (both)
Grade 4
Partial Body and
Disc
wedge resection through the vertebral body;
includes a substantial portion of the vertebral
body, posterior elements and includes resection
of at least a portion of one endplate with the
adjacent intervertebral disc
A (anterior release)
P (posterior release)
A/P (both)
Grade 5
Complete Body
and Disc
Complete removal of a vertebral body and both
adjacent discs (rib resection in the thoracic
region)
A (anterior release)
P (posterior release)
A/P (both)
Grade 6
Multiple Adjacent
Body
Resection of more than one entire vertebral
body and discs. Grade 5 resection and additional
adjacent vertebral resection
A (anterior release)
P (posterior release)
A/P (both)
Osteotomy Grades and Surgical Approach Modifiers-Schwab
8/4/2013
17
Osteotomy Grade Representation-Schwab
Resection
Description
Surgical
approach
Grade 1
Partial Facet
Resection or ACD
Anterior cervical discectomy including partial
uncovertebral joint resection, posterior facet
capsule resection or partial facet resection
A, P, PA, AP, APA, PAP
Grade 2
Complete Facet
Joint/Ponte
Osteotomy
Both superior and inferior facets at a given spinal
segment are resected; other posterior elements of
the vertebra including the lamina, and the spinous
processes may also be resected
A,P, PA, AP, APA,
PAP
Grade 3
Partial Body,
Corpectomy
Partial Corpectomy Including discs above and
below
A,P, AP, PA, APA,
PAP
Grade 4
Complete
Uncovertebral
Joint Resection to
Foramen
Transversarium
Anterior osteotomy through lateral body and
uncovertebral joints and into foramen
transversarium
A,P, AP, PA, APA,
PAP
Grade 5
Opening Wedge
Osteotomy
Complete posterior element resection with
osteoclastic fracture and open wedge creation
A, P, AP, PA, APA,
PAP
Grade 6
Closing Wedge
Osteotomy
Complete posterior element resection and pedicle
resection with closing wedge creation
A, P, AP, PA, APA,
PAP
Grade 7
Complete
Vertebral Column
Resection
Resection of one or more entire vertebral body
and discs including complete uncovertebral joint
and posterior lamina and facets
A, P, AP, PA, APA,
PAP
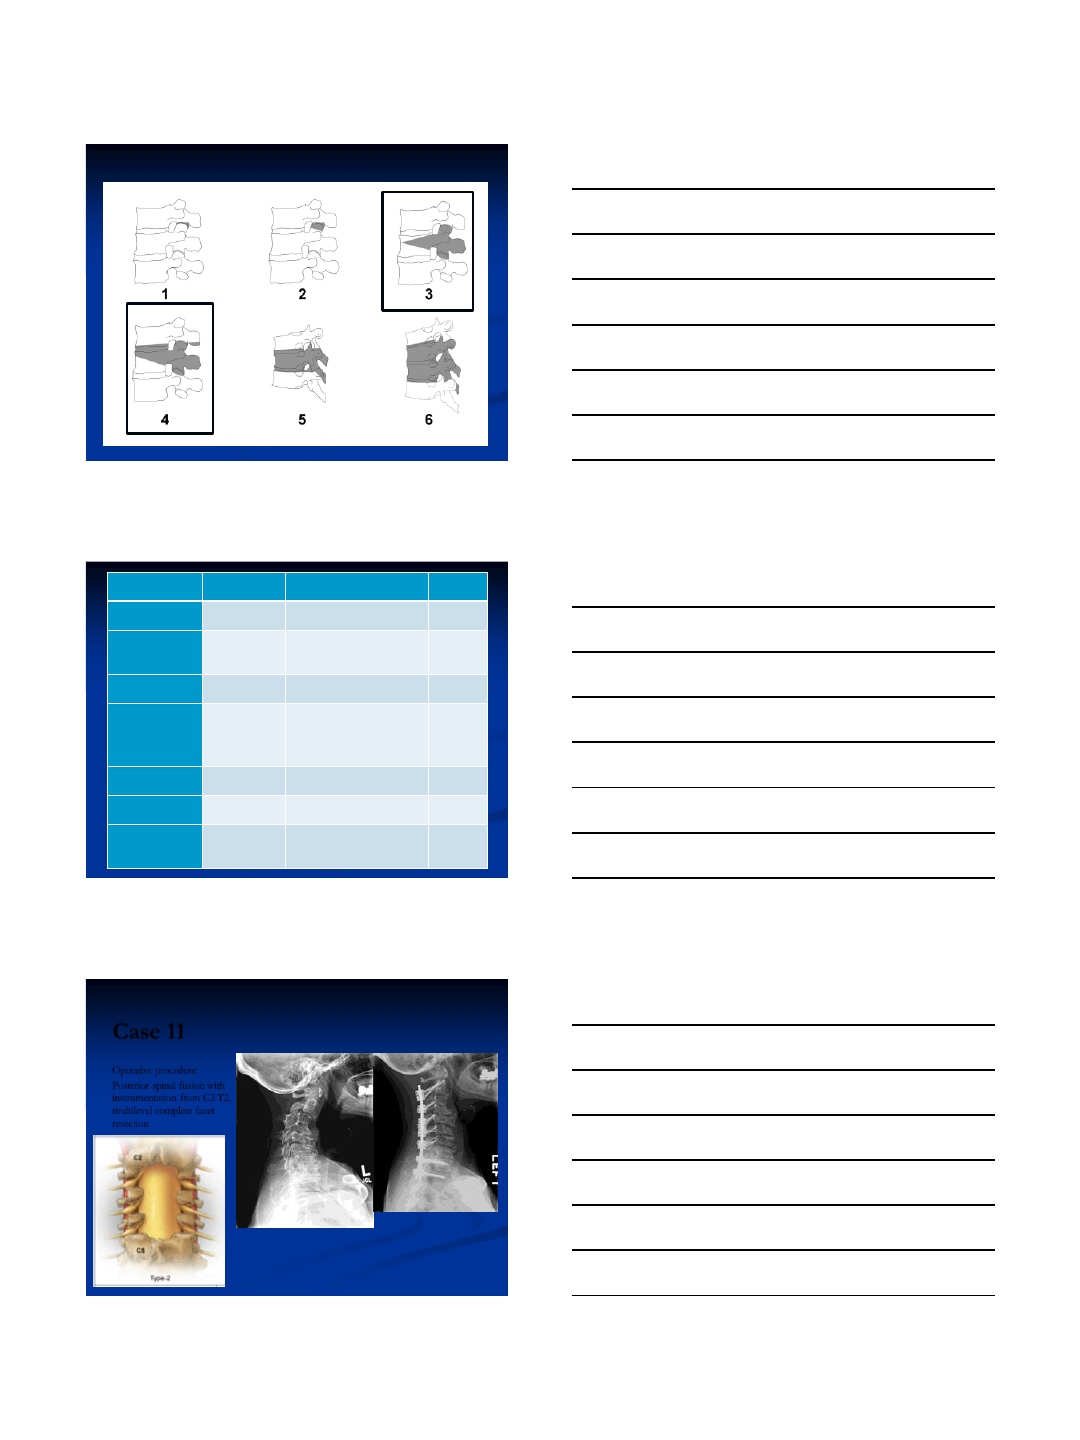
Case 11
Operative procedure:
Posterior spinal fusion with
instrumentation from C2-T2,
multilevel complete facet
resection
8/4/2013
18
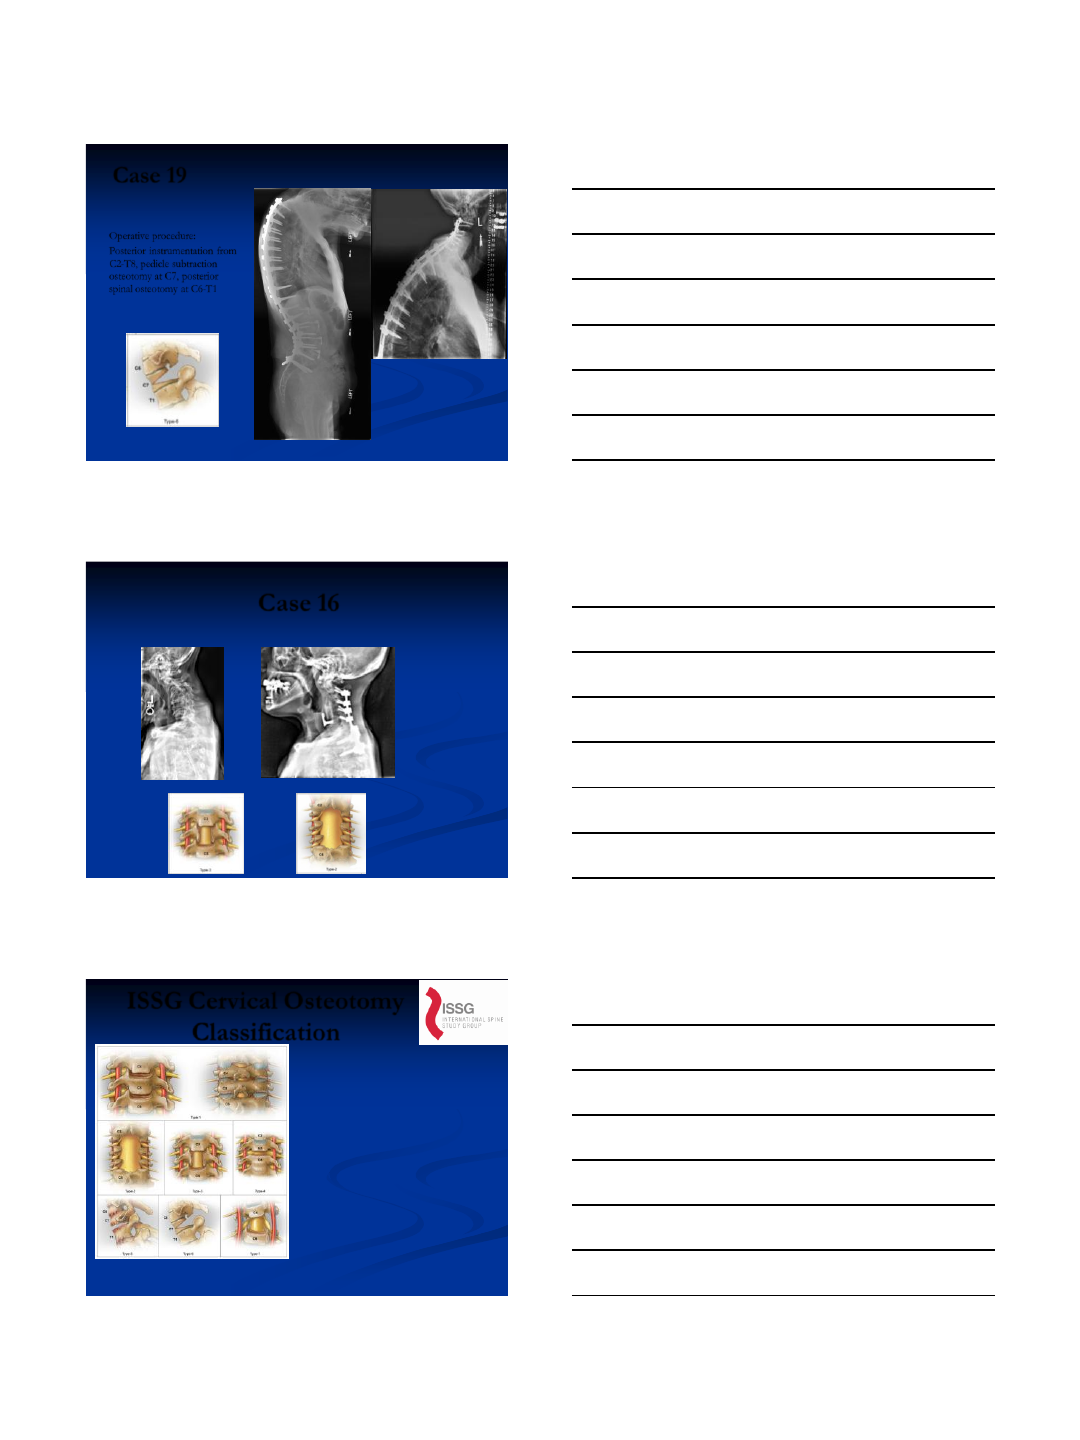
Case 19
Operative procedure:
Posterior instrumentation from
C2-T8, pedicle subtraction
osteotomy at C7, posterior
spinal osteotomy at C6-T1
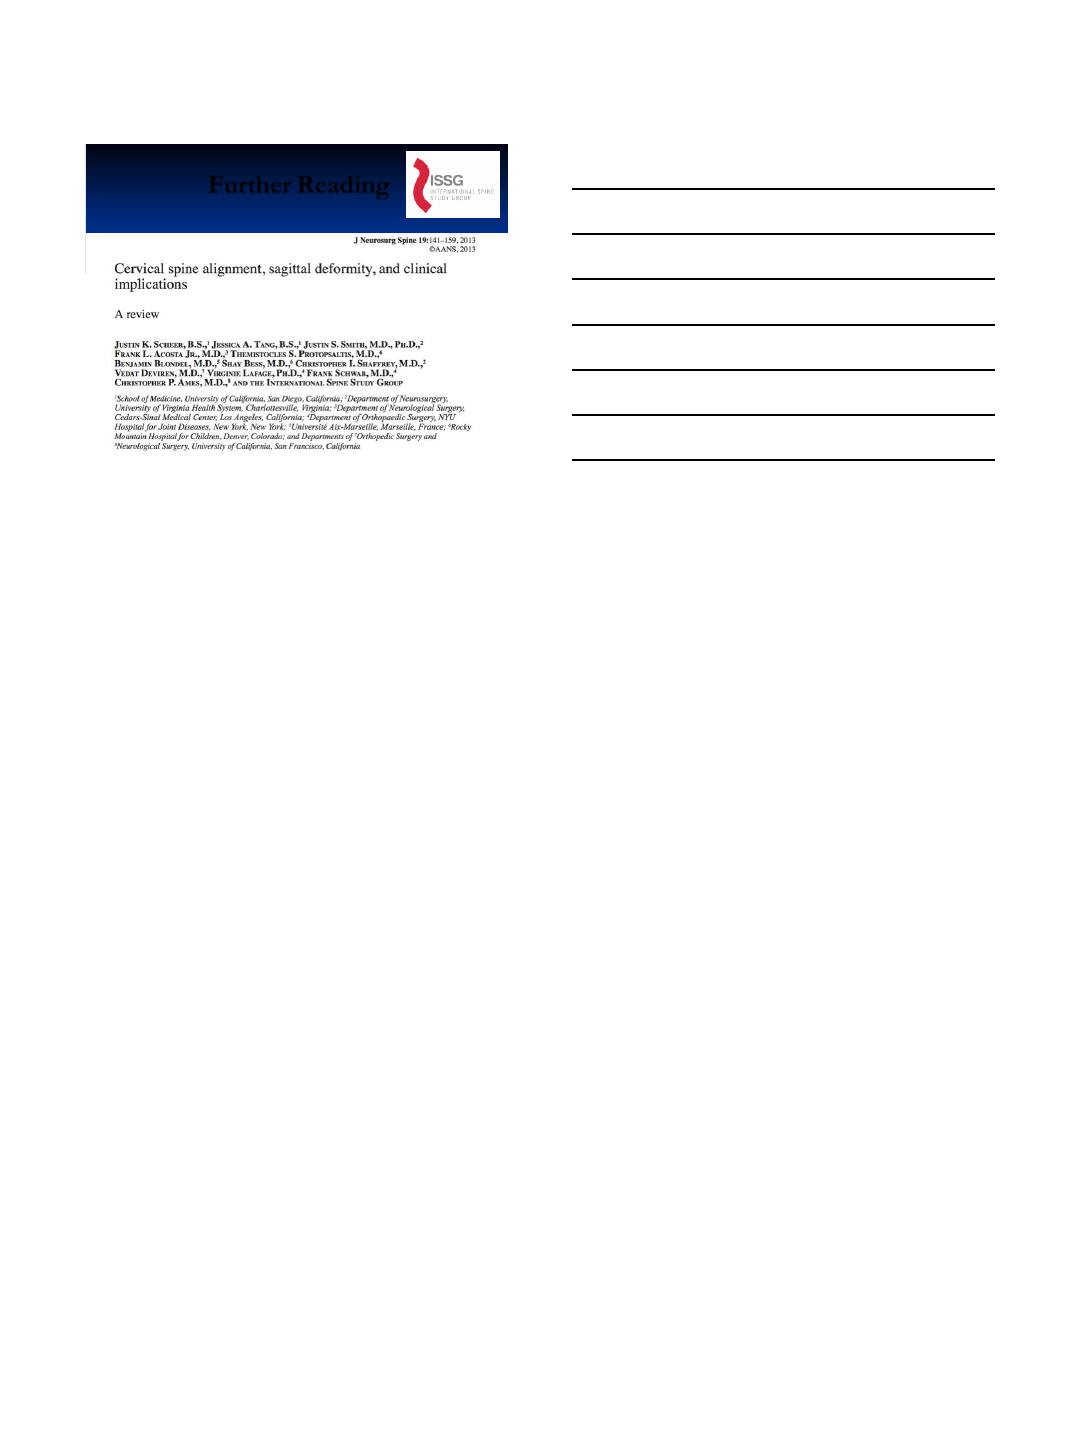
Case 16
Stage 1: C4-5 corpectomy followed by
Stage 2: Posterior spinal fusion with instrumentation from C2-T2 and ponte osteotomy
+
ISSG Cervical Osteotomy
Classification
Analysis of major
osteotomy +
approach modifier
yielded a
classification that
was “almost perfect”
with average intra-
rater reliability of
0.91 (0.82-1.0) and
inter-rater reliability
of 0.87 and 0.86 for
the 2 reviews.
JNS Spine September 2013
8/4/2013
19
Further Reading
8/4/2013
1
Surgical Treatment of Pathological Loss of Lumbar
Lordosis (Flatback) in the Setting of Normal SVA
Achieves Similar Clinical Improvement as Surgical
Treatment for Elevated SVA
Justin S. Smith, Manish Singh, Eric Klineberg, Christopher I.
Shaffrey, Virginie Lafage, Frank Schwab, Themi Protopsaltis,
David Ibrahimi, Justin K. Scheer, Greg Mundis, Munish Gupta,
Richard Hostin, Vedat Deviren, Khaled Kebaish, Robert Hart,
Doug Burton, Shay Bess, Christopher Ames
Disclosures
• Biomet: consultant, honorarium for
teaching
• Medtronic: consultant, honorarium
• DePuy: consultant, research study
group support
• Globus: honorarium for educational
course
• AANS/CNS Joint Spine Section:
research grant support
Background
• Sagittal spinal malalignment is a
key driver of pain and disability
in adult spinal deformity
• Role of the pelvis as a key
regulator of spinal alignment
and a source of compensation
• More recently has become clear
that SVA alone does not fully
account for global alignment
8/4/2013
2
Global Sagittal
Alignment
SVA=Sagittal Vertical Axis
SDSG Radiographic
Measurement Manual
+26 cm
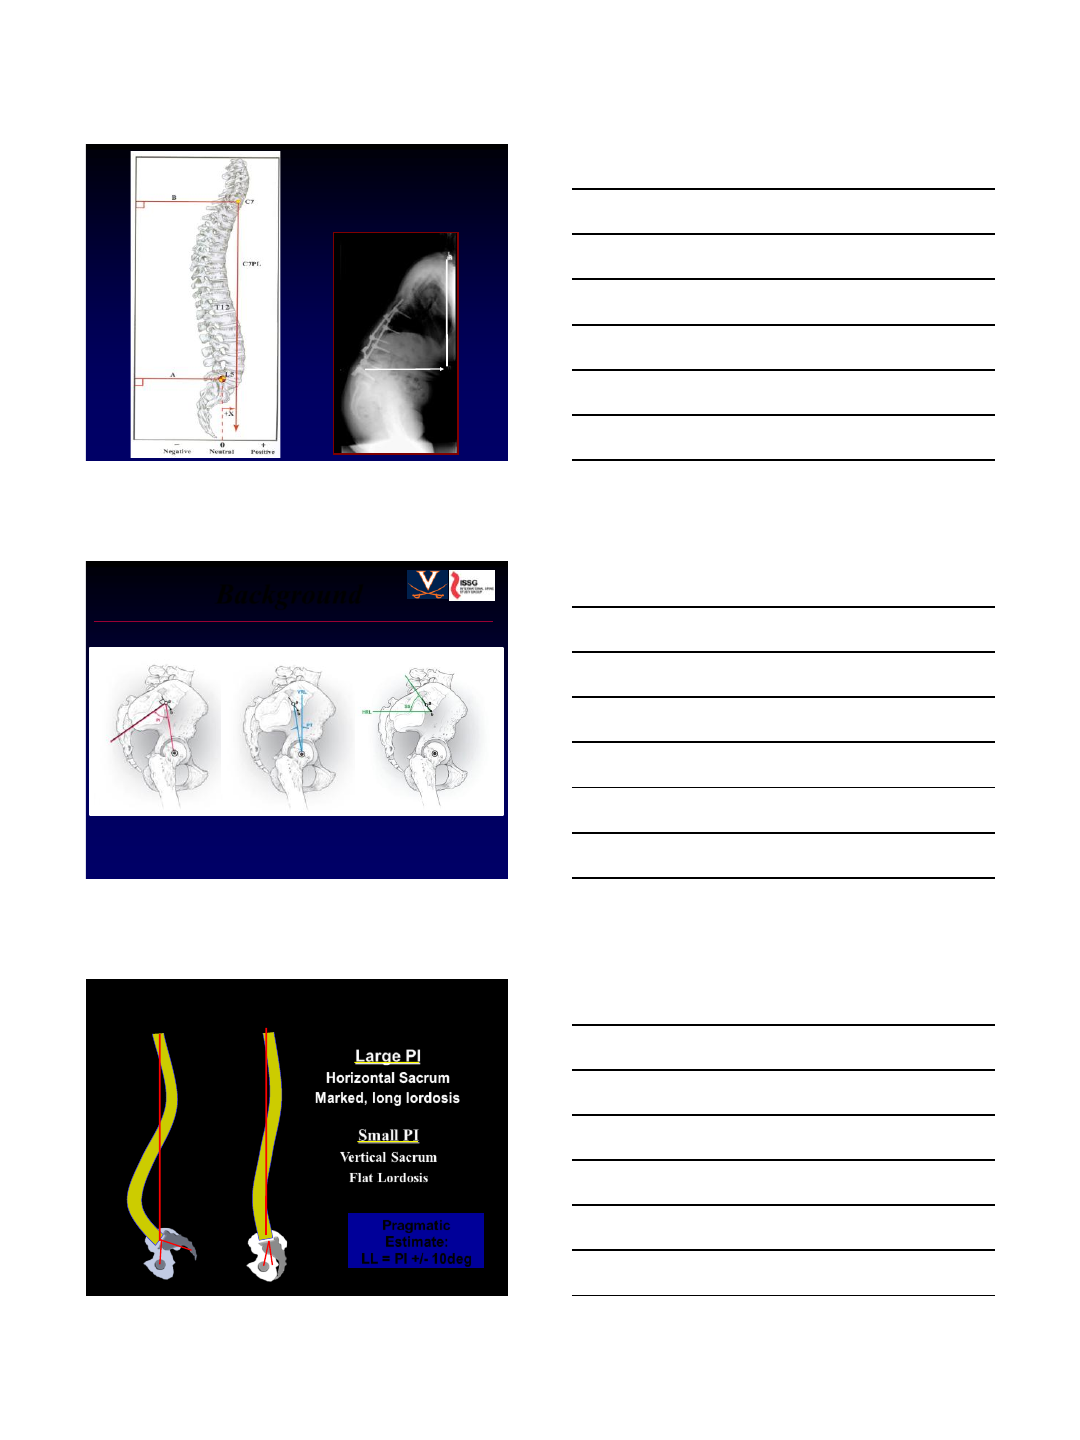
Background
Ames CP, et al. JNS Spine 16:547-64, 2013.
Small PI
Vertical Sacrum
Flat Lordosis
Large PI
Horizontal Sacrum
Marked, long lordosis
Pelvic Incidence and Lordosis
Pragmatic
Estimate:
LL = PI +/- 10deg
8/4/2013
3
Background
• Based on 492 adults with spinal
deformity, the top radiographic
parameters with strongest
correlations to HRQOL scores:
PI minus LL
Schwab FL, et al. Spine 38(13):E803-12, 2013.
#1. PI minus LL
#2. SVA (C7 plumbline)
#3. Pelvic tilt (PT)
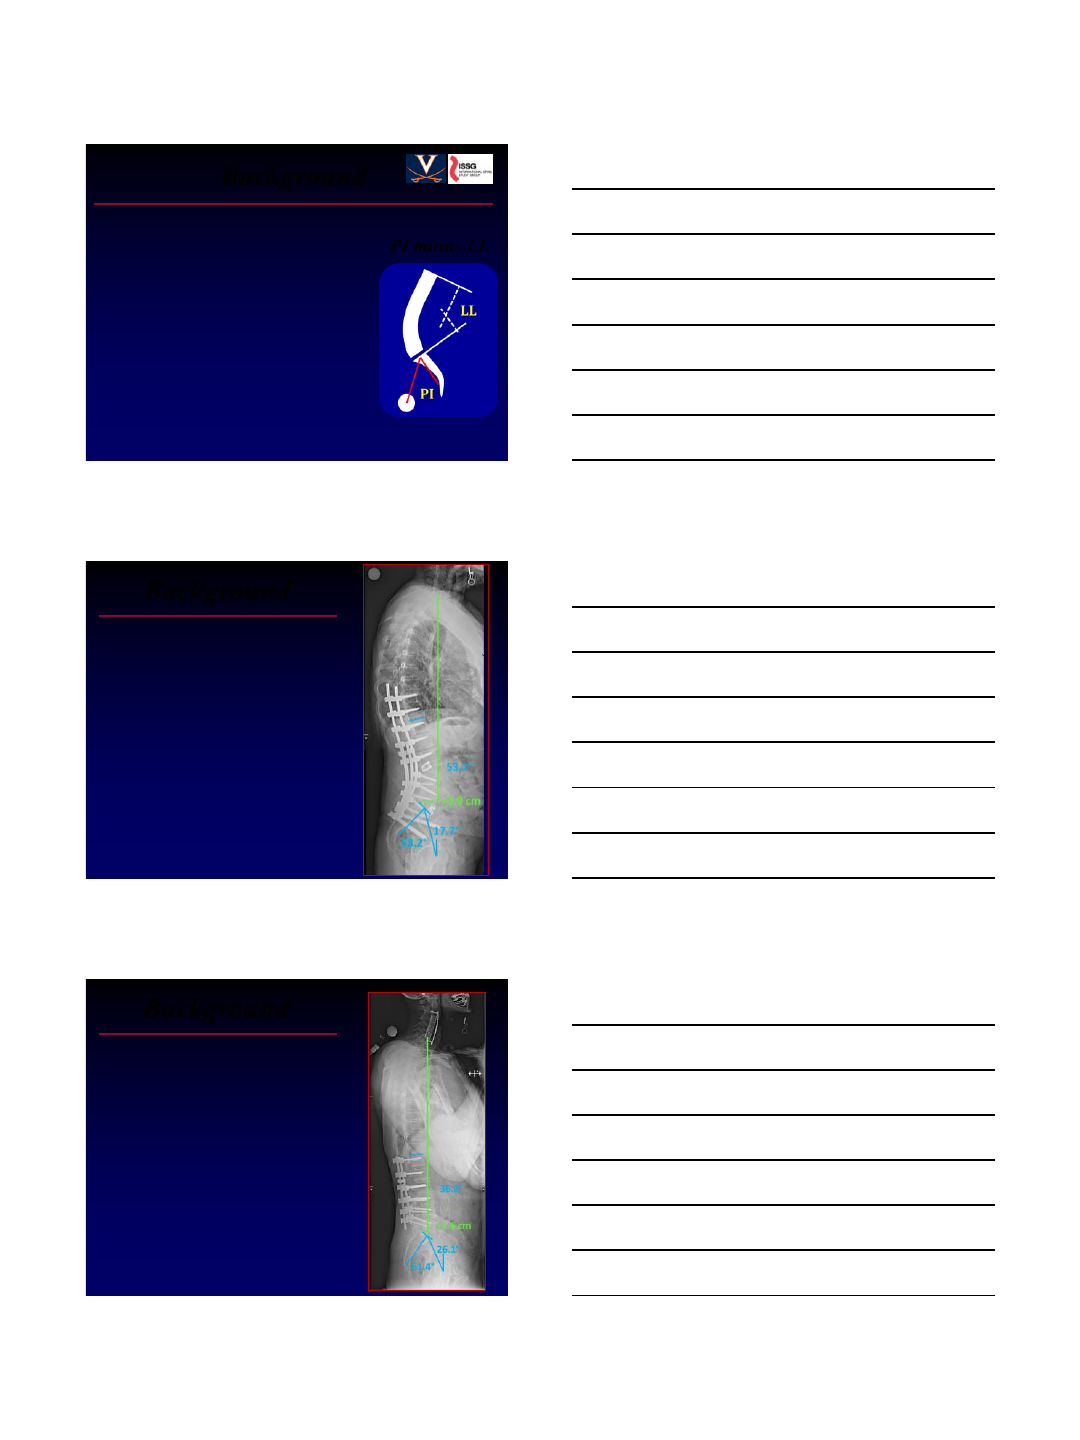
Background
• “Sagittal imbalance” (SVA
>5cm) is a recognized
driver of disability and a
primary indication for
surgical correction
SVA = +21cm
PI-LL = 54°
• Multiple studies have
demonstrated improvement
in HRQOL with correction
of “sagittal imbalance”
SVA = +3.9cm
PI-LL = 5°
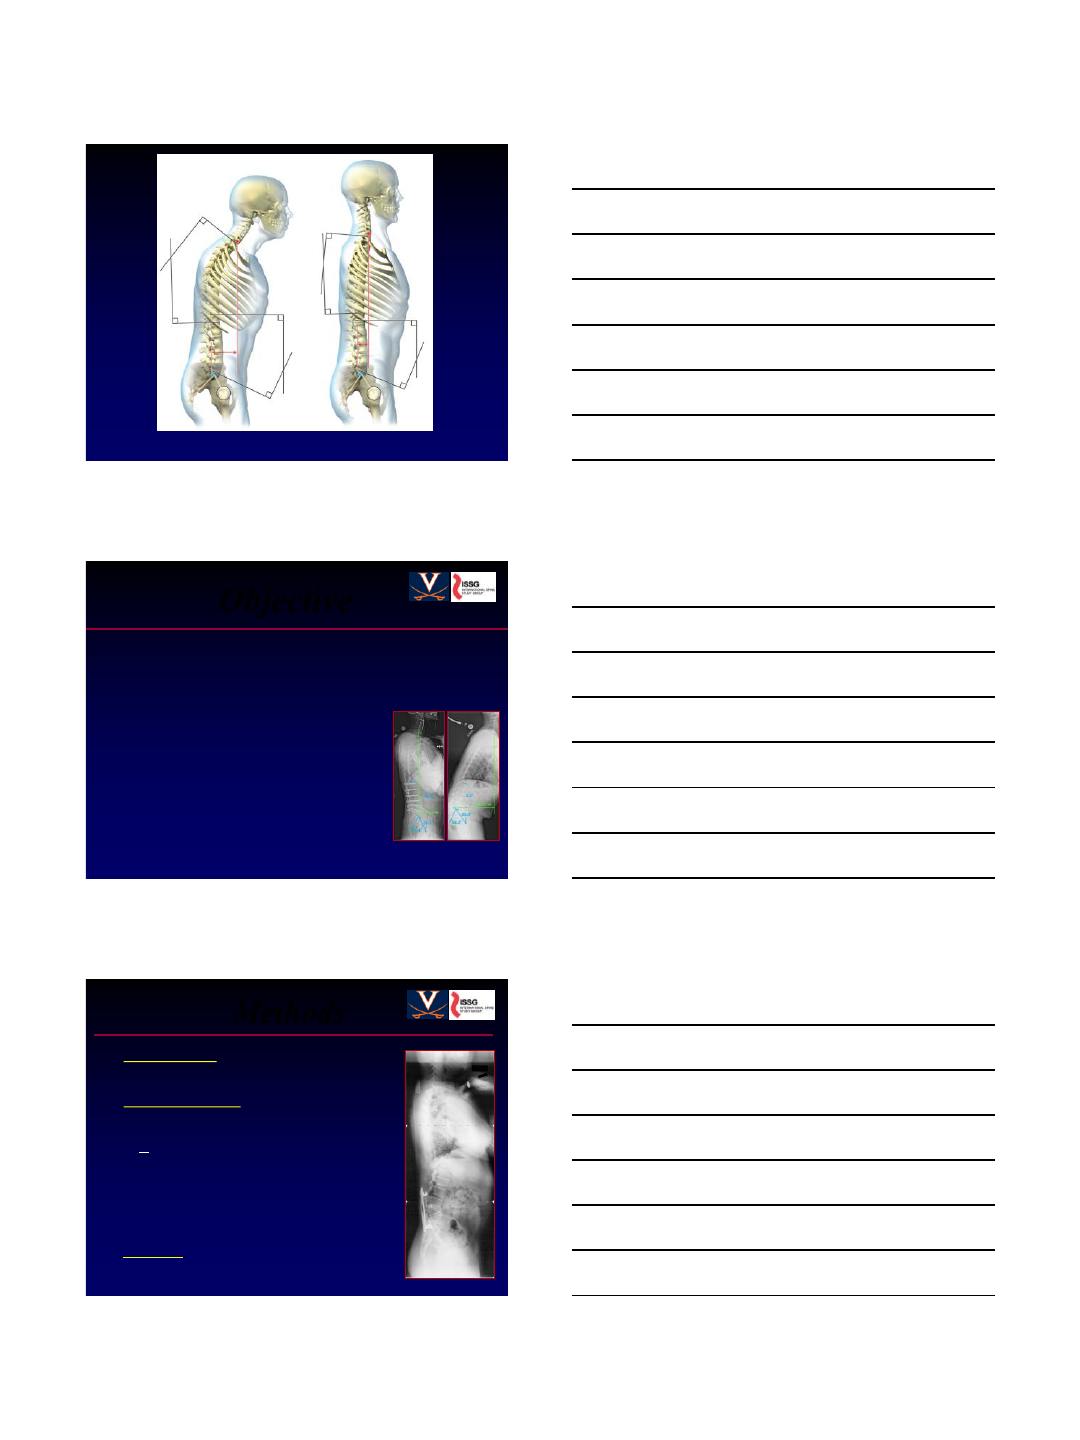
Background
• Subset of patients with sagittal
spino-pelvic malalignment and
flat back deformity but remains
sagittally compensated with
normal SVA
• Few data exist for patients
with “compensated flatback”
(SVA <5cm, PI-LL >10°)
SVA = +1.6cm
PI-LL = 25°
• Does surgical treatment offer
improvement in HRQOL?
8/4/2013
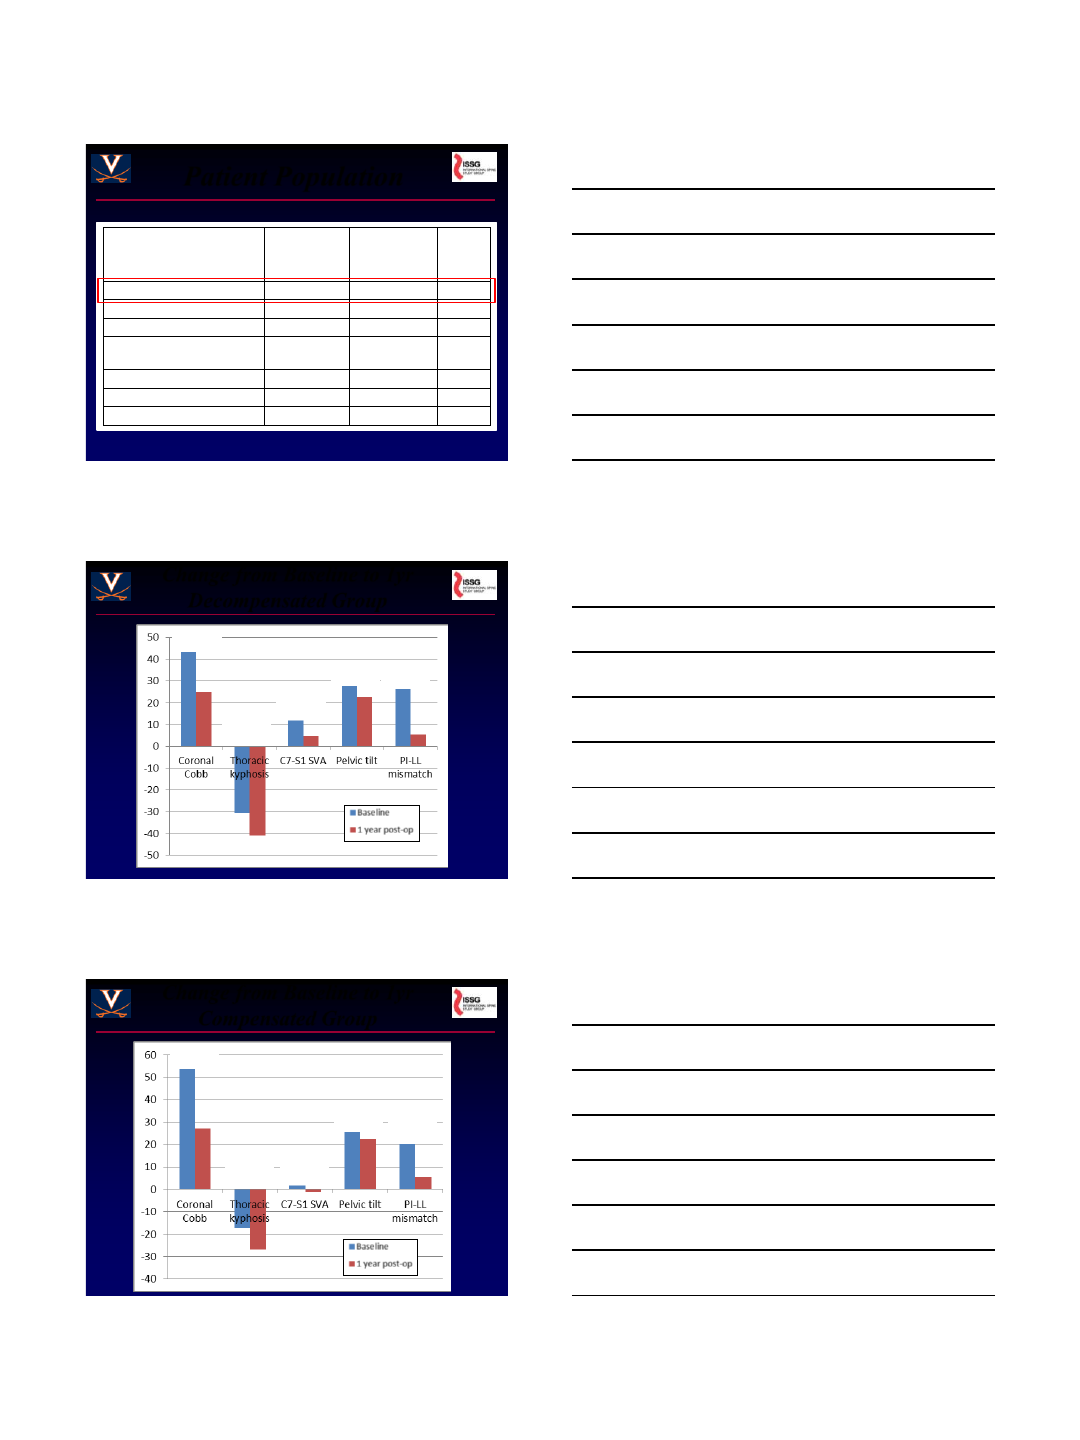
4
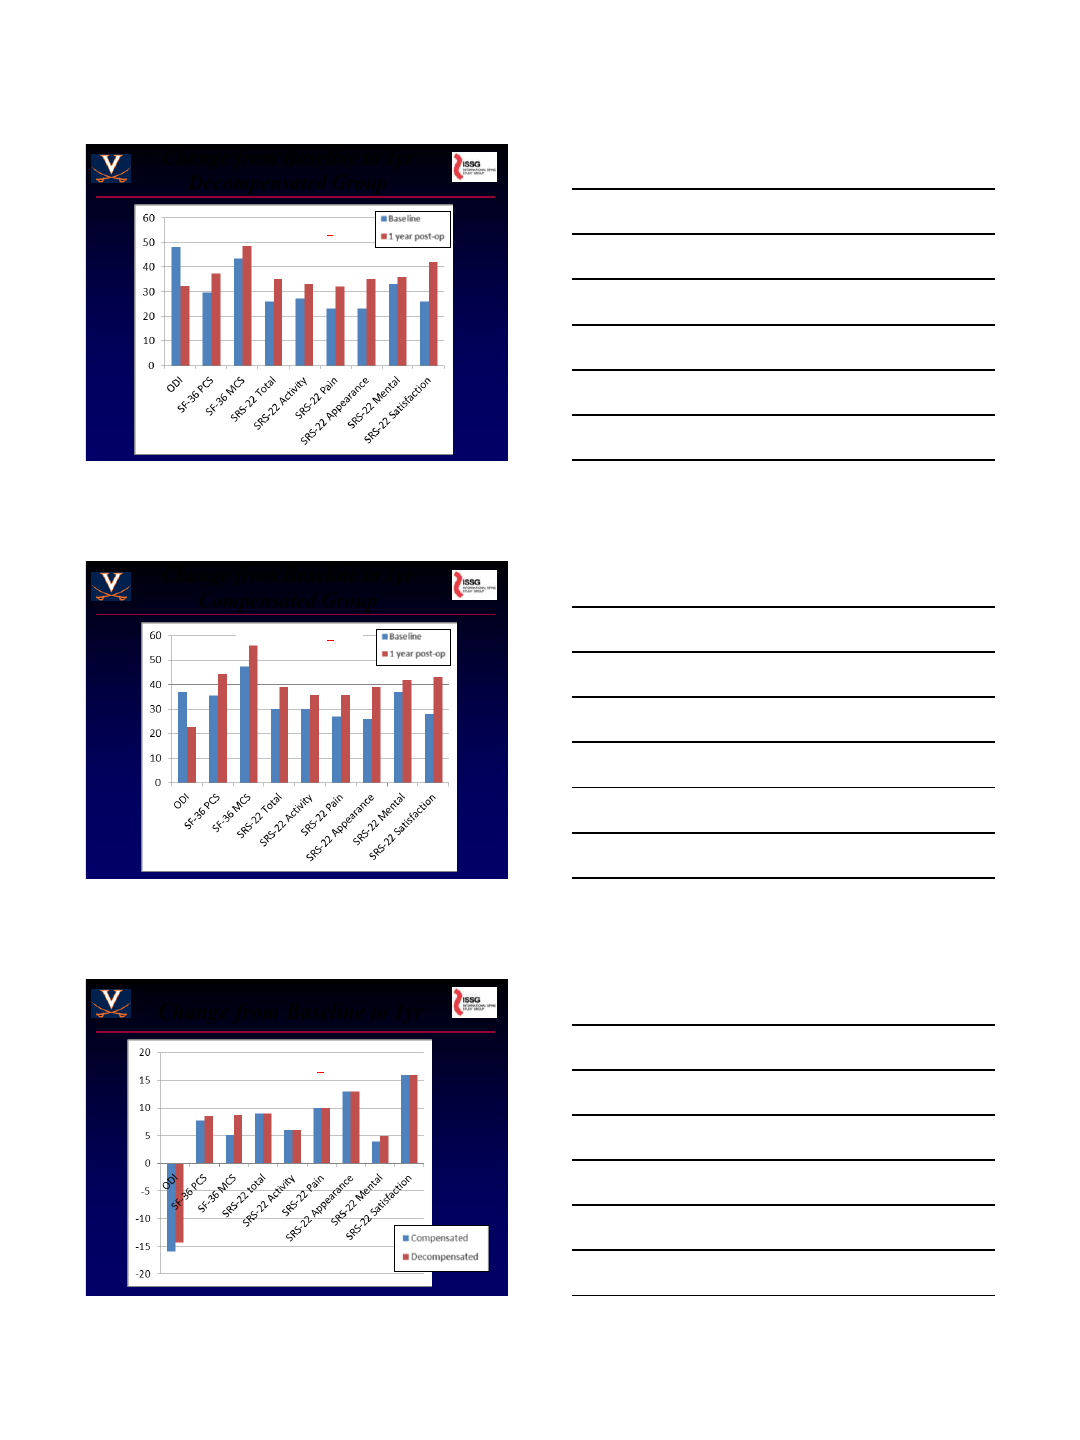
Decompensated Compensated
Objective
To compare baseline disability and
treatment outcomes for patients
with sagittal spino-pelvic
malalignment who are:
•
Compensated
(PI-LL>10° & SVA<5cm)
Decompensated
(SVA>5cm)
▪
▪
• Study design: Prospective, multi-
center (ISSG), consecutive cases
• Inclusion criteria:
Methods
- min 1yr follow-up
- ASD (age >18)
- >5 levels posterior instrumentation
• Analysis: Comparisons between
compensated and decompensated
- SVA>5cm (decompensated) OR
SVA<5cm with PI-LL>10°
(compensated)
8/4/2013
5
Patient Population
Parameter
SVA > 5cm
(n=98)
SVA <5cm &
PI-LL >10°
(n=27)
P-value
Mean age, years (SD) 62.9 (12.4) 55.1 (12.1) 0.004
Gender, percent women 76 93 0.063
Mean BMI (SD) 28.6 (5.1) 26.6 (5.9) 0.097
Mean Charlson
Comorbidity Index (SD) 1.6 (1.7) 1.1 (1.2) 0.083
Mean pain score, 0-10 (SD)
Back pain 7.7 (2.0) 6.8 (2.4) 0.060
Leg pain 4.6 (3.2) 4.6 (3.6) 0.97
Change from Baseline to 1yr
Decompensated Group
P<0.001
P<0.001
P<0.001
P<0.001 P<0.001
Change from Baseline to 1yr
Compensated Group
P=0.005
P<0.001 P=0.009
P=0.034 P<0.001
8/4/2013
6
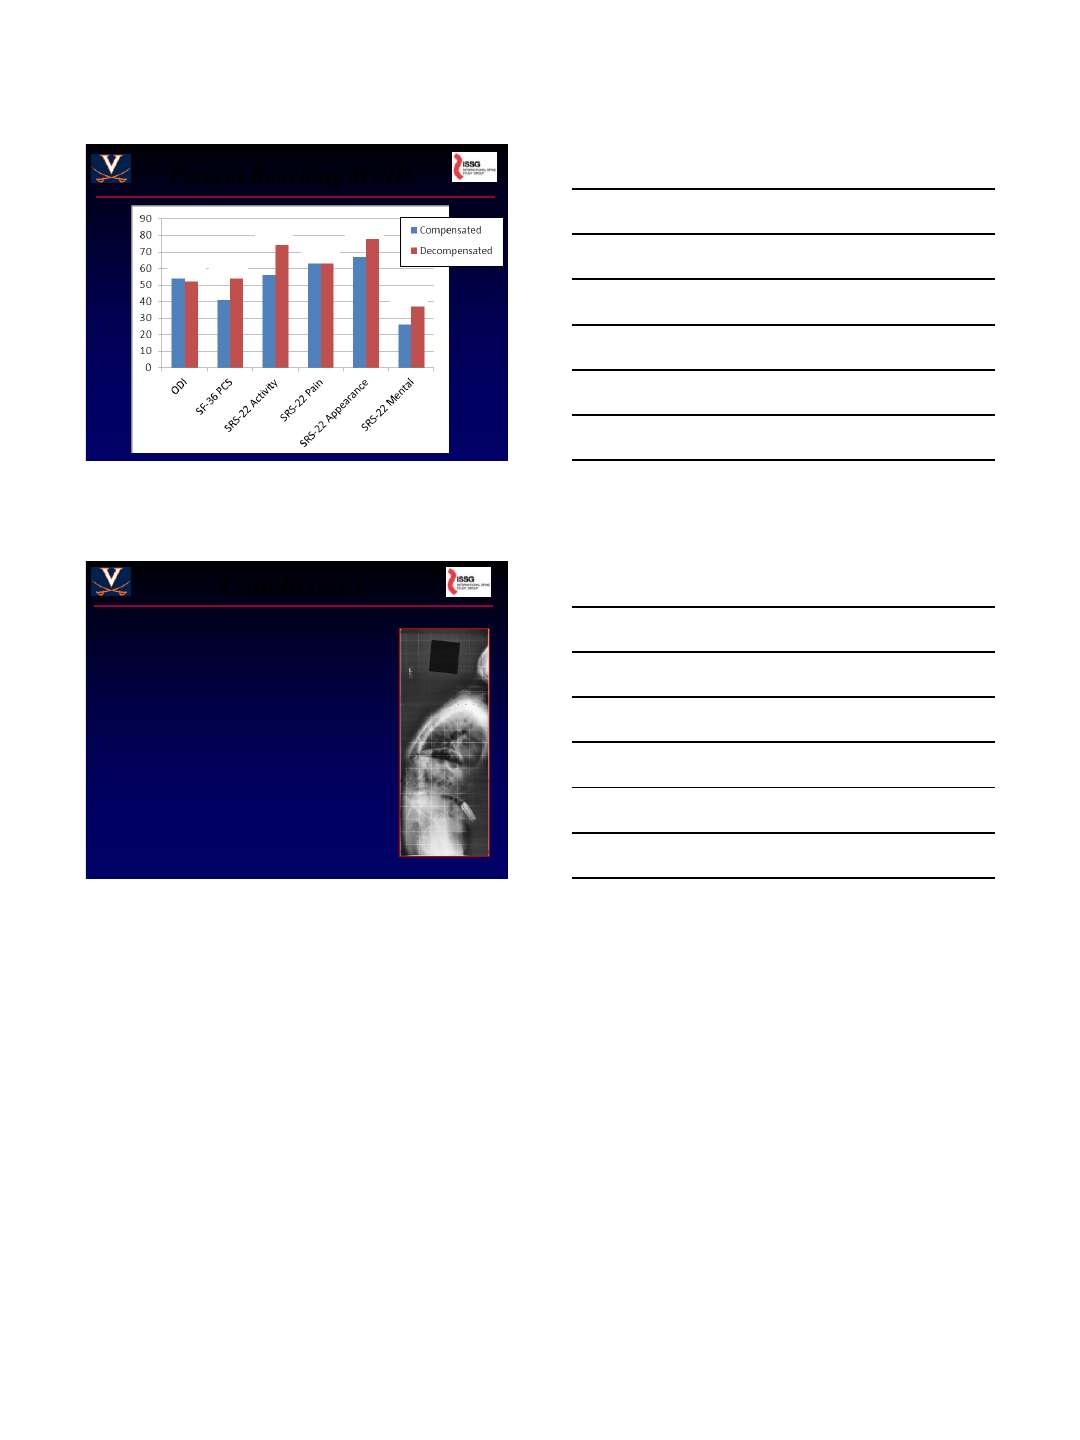
Change from Baseline to 1yr
Decompensated Group
All comparisons: P<0.001
Change from Baseline to 1yr
Compensated Group
All comparisons: P<0.007
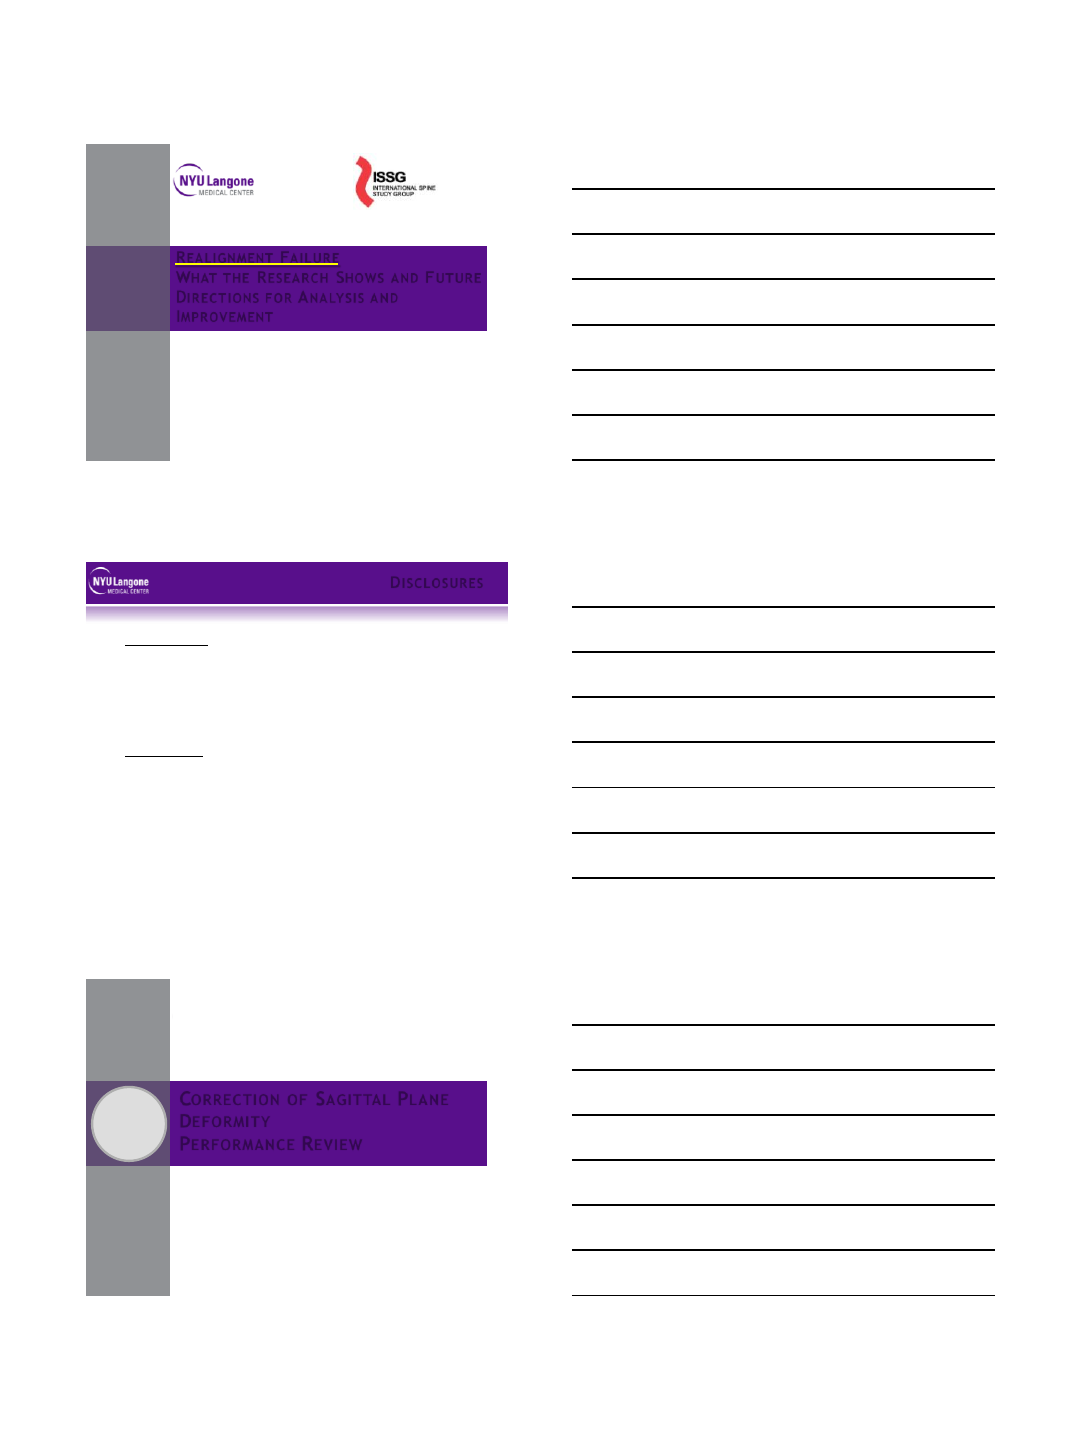
Change from Baseline to 1yr
All comparisons: P>0.24
8/4/2013
7
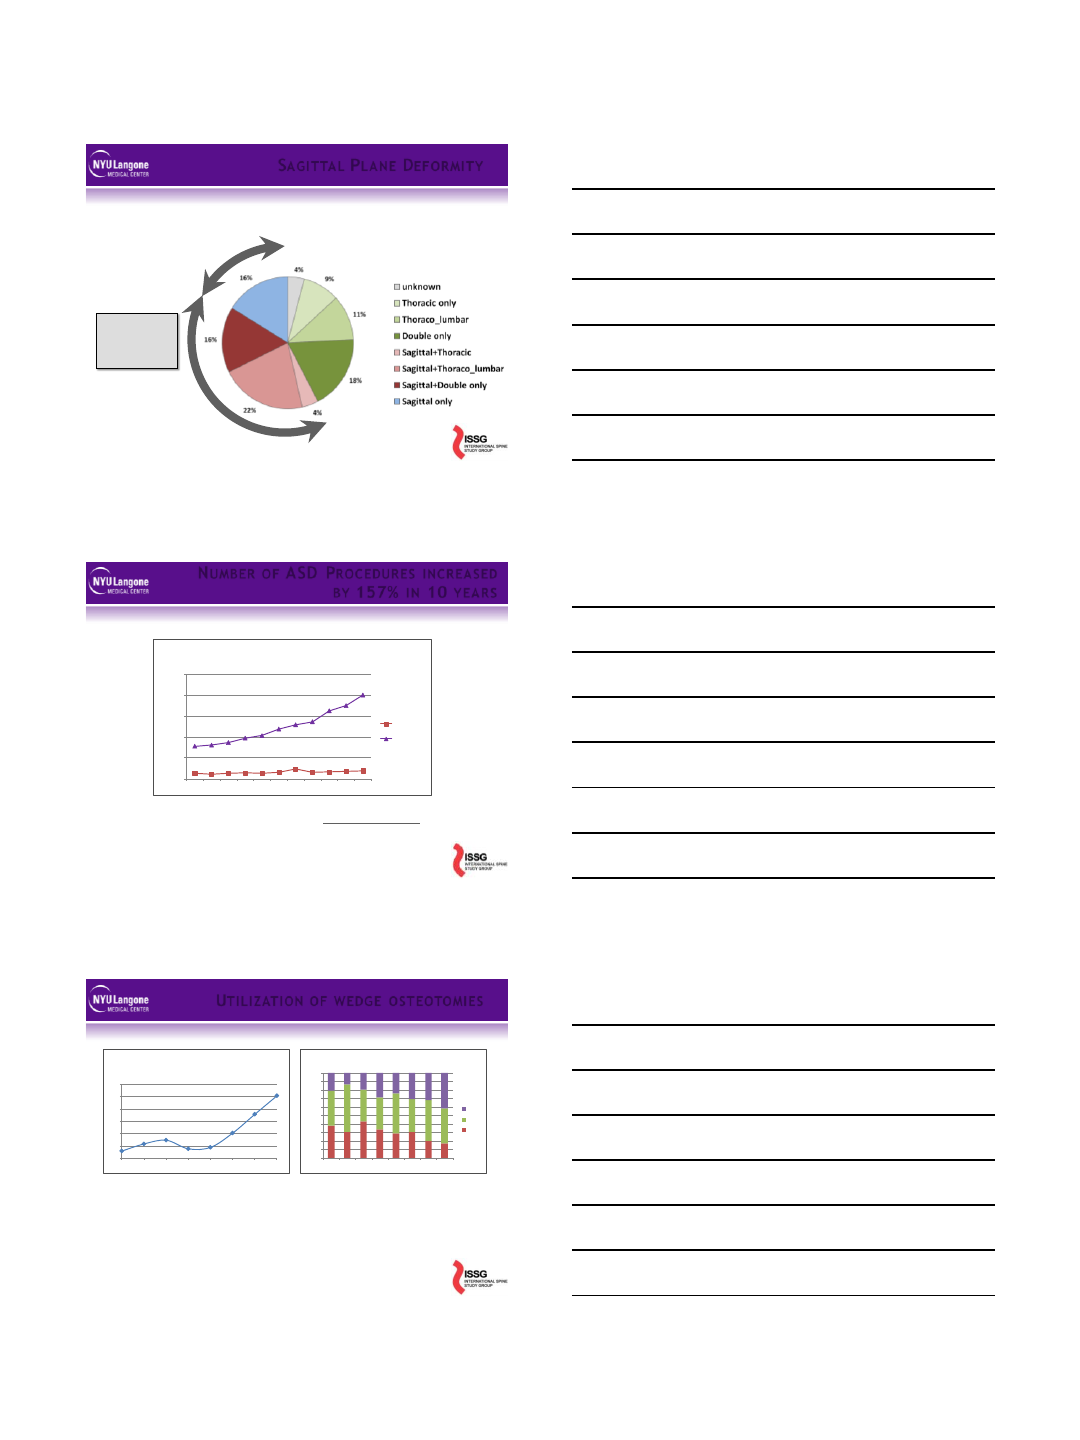
Percent Reaching MCID
P=0.49
P=0.42 P=0.98
P=0.28
P=0.15
P=0.87
Conclusions
• Sagittal spino-pelvic malalignment is
a key driver of pain and disability in
adult spinal deformity.
• PI-LL mismatch should be evaluated
for adult deformity patients and can
be considered a primary surgical
indication.
• Surgical correction of sagittal spino-
pelvic malalignment for compensated
and decompensated patients had
similar radiographic and HRQOL
improvement.
8/4/2013
1
REA LIGNMENT FA ILURE
WHAT T HE RESEA RC H SHOWS A ND FUTURE
DIRECTI ON S FOR ANA LYSI S AND
IMPR OV EMENT
Virginie Lafage, PhD
Frank Schwab, MD
DISCLOSURES
Virginie Lafage
(a) SRS
(b) Medtronic
(c) Nemaris
(f) DepuySpine, Medtronic, K2M, Globus
Frank Schwab
(a) DePuy Spine, Medtronic
(b) Medtronic
(c) Nemaris
(f) Medtronic
a. Grants/Research Support
b. Consultant
c. Stock/Shareholder
d. Royalties
e. Board member
f. Payment for lectures
CORRECTION OF SAGITTAL PLANE
DEFORMITY
PERFORMANCE REVIEW
1
8/4/2013
2
SAGIT TAL PLANE DEFORMIT Y
Prospective Surgical ASD database
~60% of all
ASD patients
with sagittal
deformity
NUMBER OF ASD PR OCEDUR ES INCR EA SED
BY 157% IN 10 YEA R S
0
50,000
100,000
150,000
200,000
250,000
1999
2000
2001
2002
2003
2004
2005
2006
2007
2008
2009
Number of discharges with at least one diagnosis of
spinal curvature' (ICD-9 code 737.0 to 737.9)
Children
Adult
Healthcare Costs and Utilization Project (HCUP http://hcupnet.ahrq.gov),
UTILI ZAT I ON OF WEDGE OST EOTOMIES
200
300
400
500
600
700
800
2003 2004 2005 2006 2007 2008 2009 2010
# Wedge Osteotomies
(77.29 ICD-9-CM)
0%
10%
20%
30%
40%
50%
60%
70%
80%
90%
100%
2003
2004
2005
2006
2007
2008
2009
2010
Wedge Osteotomies by age group
>65
45-64
18-44
Increases on 275% in less than 10 years
~250 procedures in 2003
~700 procedures in 2012
Increase proportion of patients >65yo
~20% in 2003
~40% in 2012
8/4/2013
3
125 patients
•Lafage Schwab
•Spine 2009
•All Curves
•SRS, ODI
•Xray & clinical
analysis
•One site
492 patients
•ISSG
•SRS 2011
•All curves
•SRS, ODI
•Xray vs clinical
correlation
•Multi-center
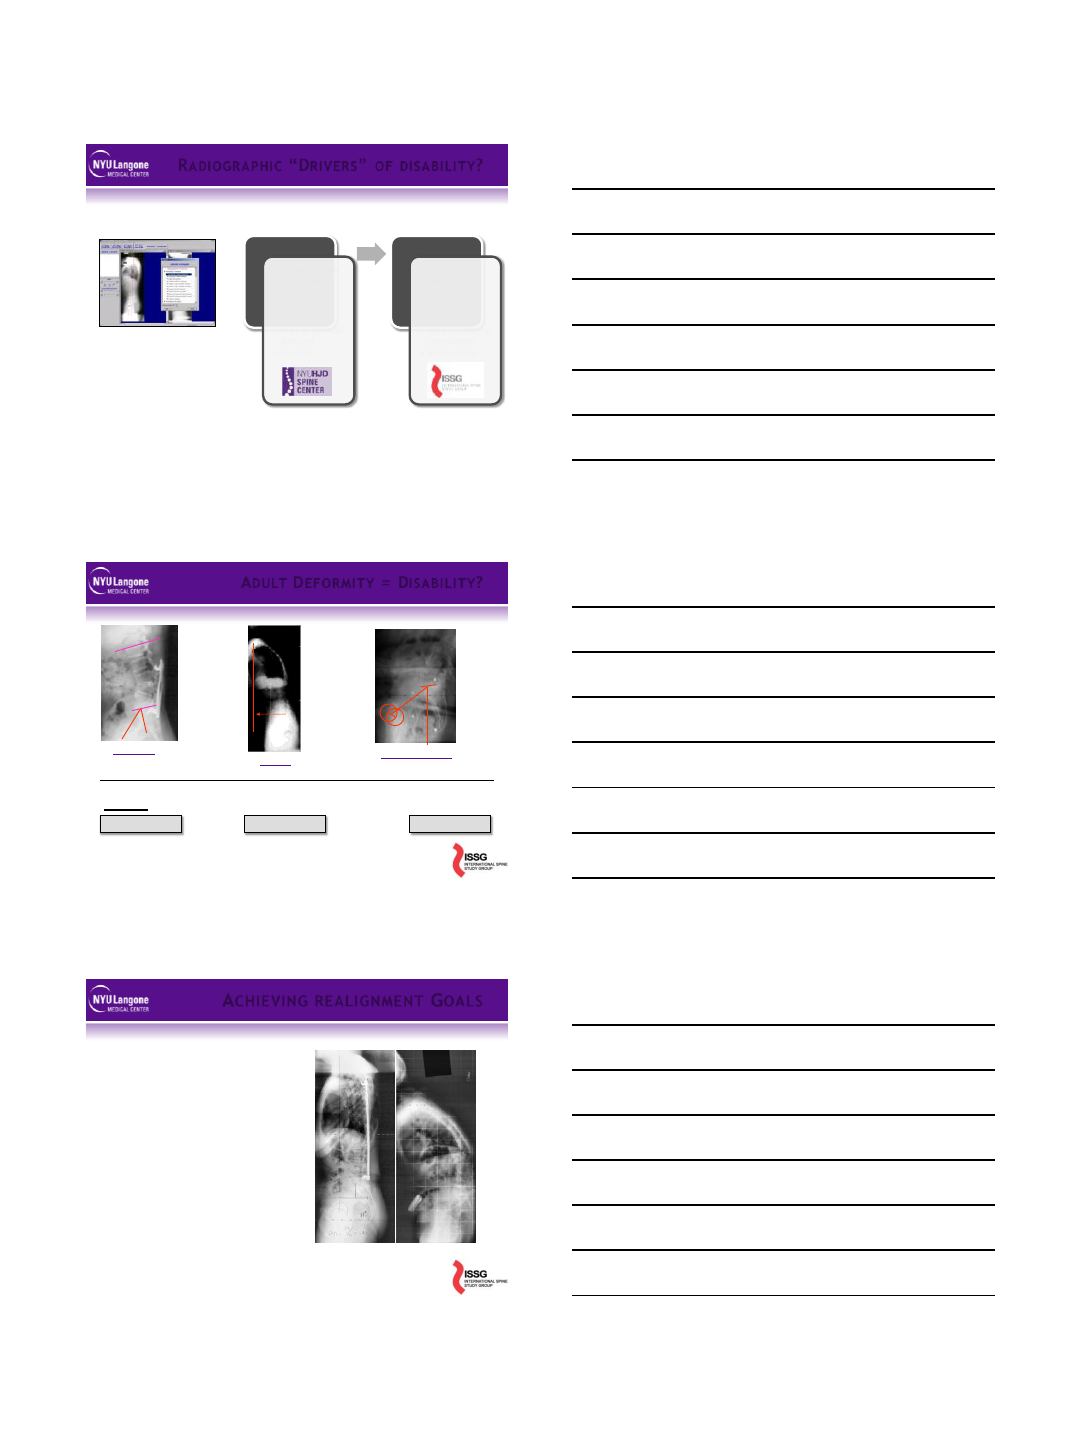
RADIOGRA PHI C “DR I VER S” OF DI SA BI L I TY ?
Schwab, Lafage, Shaffrey, Bess, Ames …
SpineView®
300 parameters
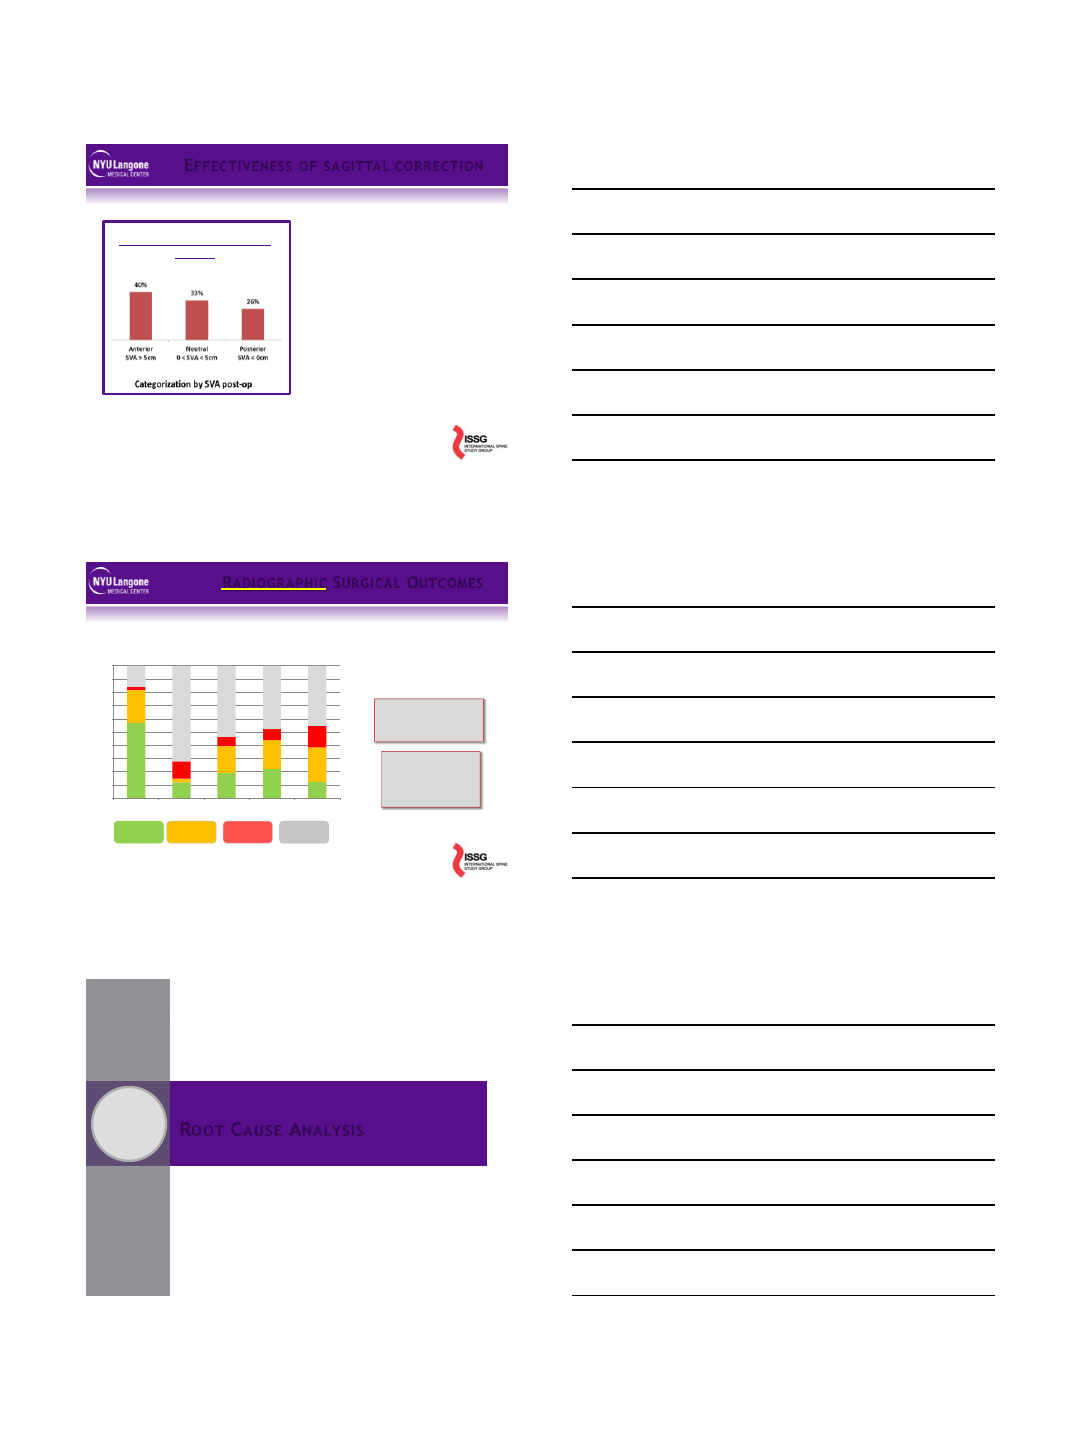
ADULT DEF OR MI TY = DISA BI LITY ?
Regional
Loss of lordosis
Versus PI
Global
SVA
Compensatory
Pelvic tilt
PI-LL < 10° SVA < 5cm PT < 20-25°
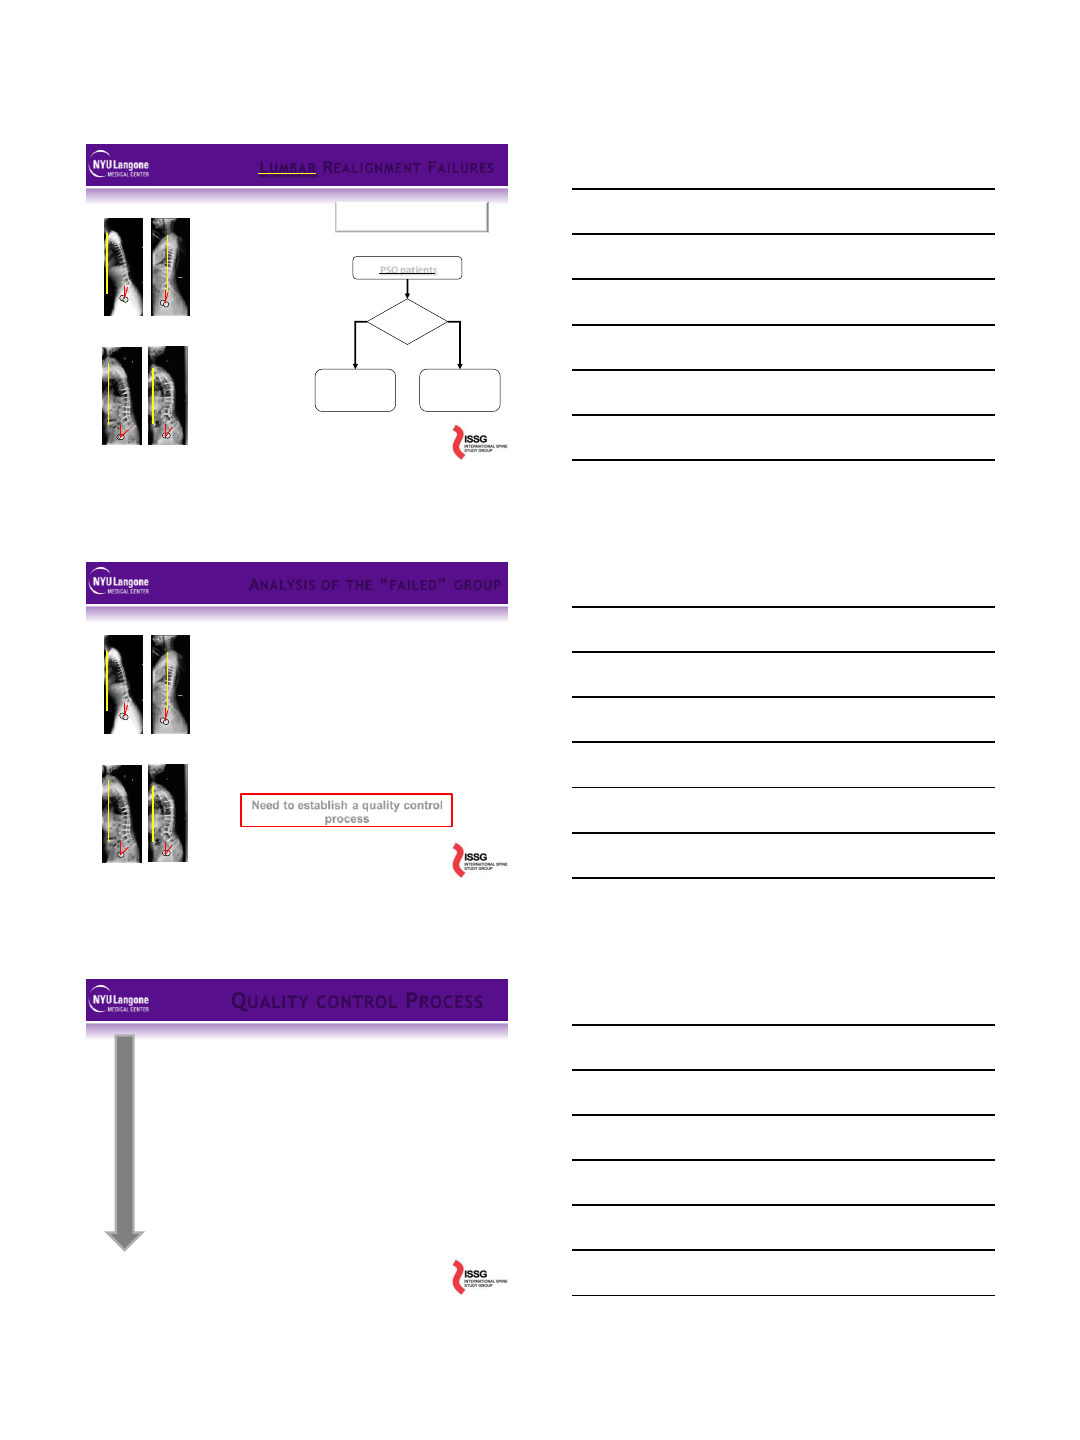
Goals
ACHIEVING REALIGNMENT GOALS
As a Surgeon, I know the
“alignment objectives”
LL within 10deg of PI
PT <20-25deg
SVA < 5cm
As a Surgeon, I can change
focal alignment
Impact on region
Impact on global
Reset compensation
8/4/2013
4
Outcomes after major realignment
surgeries
Under-correction (SVA)
40% at 3m following index
procedure
Analysis of risk factors
Lack of lordosis versus PI
80% can be predicted
Root Cause analysis?
Poor planning
Poor execution,
Intra-op complications
Unrealistic Planning
Poor intra-op feedback ….
EFFEC TIVENESS OF SA GI TTAL C OR RECTI O N
RADIOGRA PHI C SURGIC AL OUTCOMES
0%
10%
20%
30%
40%
50%
60%
70%
80%
90%
100%
Max Cobb
Cor_Imb
SVA
IL
PT
Radiographic
Correction
Lack of
Correction
No Pre or Post
Deformity
Radiographic
Deterioration
Prospective Surgical ASD database (pre / 1y post-op)
High Frequency of
inadequate sagittal
correction
Where does
the ‘problem’
come from?
ROOT CAUSE ANALYSIS
2
8/4/2013
5
LUMBA R REA LIGNMENT FA I LUR ES
Sagittal Correction
HRQOL
Improvement
Sub-optimal SVA
Correction
Risk factors for realignment
failure?
PSO patients
Post-op
SVA?
‘Successful’
Rx Outcome
‘Failed’
Rx Outcome
< 5cm > 10cm
ANA LY S I S OF T HE “FA I LED” GR OUP
Same Pre-op curvatures
Lordosis, kyphosis
More Pre-op spino-pelvic mal-alignment
Proportion Lordosis vs Pelvic Incidence
Pelvic retroversion
SVA (C7 plumbline)
Same Surgical Procedure !
Need to establish a quality control
process
Pre-op Analysis
Evaluate the severity of the deformity
Identify / Quantify compensatory mechanisms
Pre-op Planning to reach alignment objectives
Changes in lumbar lordosis
Changes in thoracic kyphosis
Fused segments
Reciprocal changes
Intra-op monitoring
Patient ;-)
Regional alignments
Post-op Analysis
Repeat Pre-op analysis
Comparison with planning and intra-op xrays
QUALITY CONTROL PROCESS
8/4/2013
6
Requirements
Full length AP / Sagittal Xrays
Free standing position
Cervical Spine to Acetabulum
Spino-Pelvic Parameters
Global Alignment
Driver of the deformity
Lordosis versus Pelvic Incidence
Compensatory mechanism
Pelvic Tilt
Cervical …
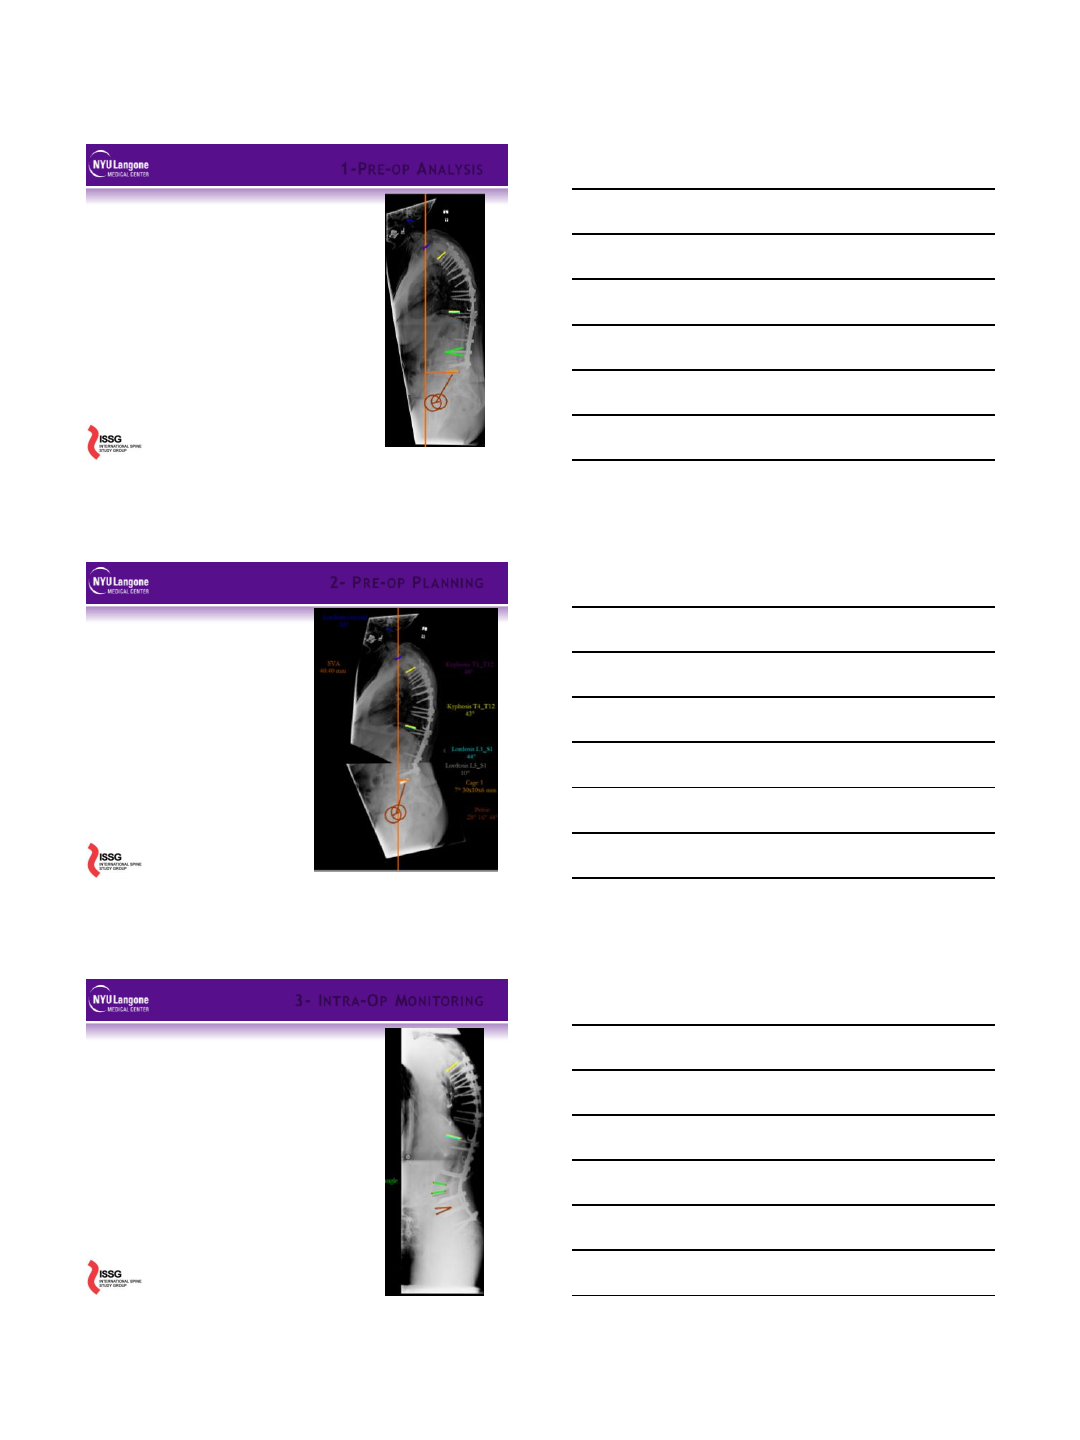
1-PRE-OP ANA LYSI S
Objectives
Correct regional / Focal
deformity
Correct Global alignment
Restore hip extension reserve
i.e. correct PT
Concept
Direct correction of regional
spinal curvatures (LL and TK)
Indirect correction of PT and SVA
Formula(s)
Takes into account correlations
between parameters
Complex
As easy as matching LL with PI
2- PRE-OP PLA NNING
PI-LL < 10°
SVA < 5cm
PT < 20-25°
PT = 1.14 + 0.71*(PI) – 0.52*(Max
LL) – 0.19*(Max TK)
SVA = -52.87 + 5.90*(PI) -
5.13*(Max LL) - 4.45*(PT) –
2.09*(Max TK) + 0.566*(Age)
PI ~ LL
Fluoro
During Surgery
Lordosis / Kyphosis
Focal
Regional
Long Cassettes
At the end of the case
Sagittal and Coronal plane
Regional curves
Compare with planning
Surgery vs. objectives
Several methods to reach objectives!
Tracking of adverse events
3- INTR A-OP MONITOR I NG
8/4/2013
7
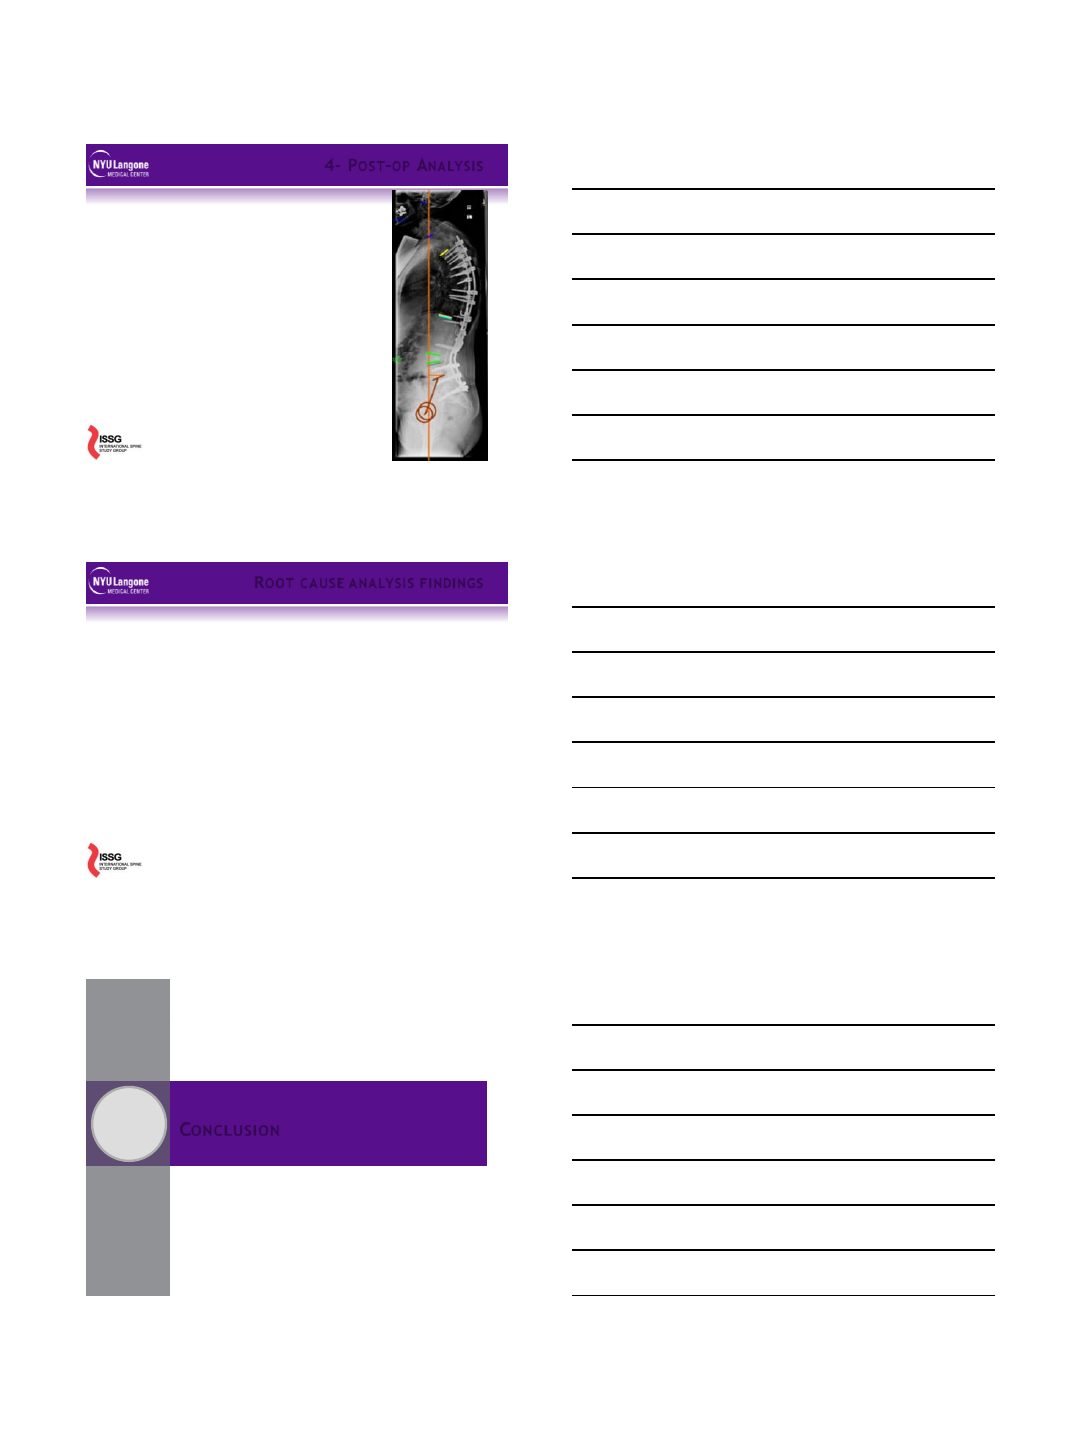
Radiographic analysis
Spino-pelvic parameters below/above
‘ideal’ tresholds?
Compensatory mechanisms
Pelvis
Cervical spine
…
Root cause analysis
Post-op versus Planning
Post-op versus Intra-op
…..
4- POS T -OP ANA LY SIS
Complex deformity can be analyzed by key parameters
Formulas permit prediction of alignment outcome
Pre operative planning optimizes chance of success
Gaps From theory to operative intervention and follow up
Quality of intra op images can limit verification
Reciprocal changes in non-fused portions of spine
Junctional issues
Other?
Next steps:
Improved patient specific models including reciprocal changes
Improved intra op feedback on alignment with pre op plan
ROOT CA USE A NALY SIS FI NDINGS
CONCLUSION
3
8/4/2013
8
A new landscape
Substantial increase in ASD patients seeking treatment
Life expectancy, quality of life expectation
Increased rate of complex surgery (osteotomies)
Scrutiny on outcomes, complications, cost
Better understanding of ASD
Health impact, disability drivers
Ability to quantify, classify, treat: spino-pelvic parameters
How can we reduce realignment failure
Education is key
Patient evaluation
Surgical strategy: planning
Research translation into practice
Optimizing patient modeling, planning, technique
Defining acceptable trade-offs: risk vs. benefit
CONC LUSI ON
8/5/2013
1
Gregory M. Mundis Jr., M.D.
San Diego Center for Spinal Disorders
La Jolla, CA
Minimally Invasive Treatment of
Adult Deformity:
Research Update and Treatment
VuMedi Webinar, August 5, 2013
•Consulting: NuVasive, K2M
•Royalties: NuVasive, K2M
•Research/Fellowship support: NuVasive,
Pioneer, OREF, ISSGF
DISCLOSURES
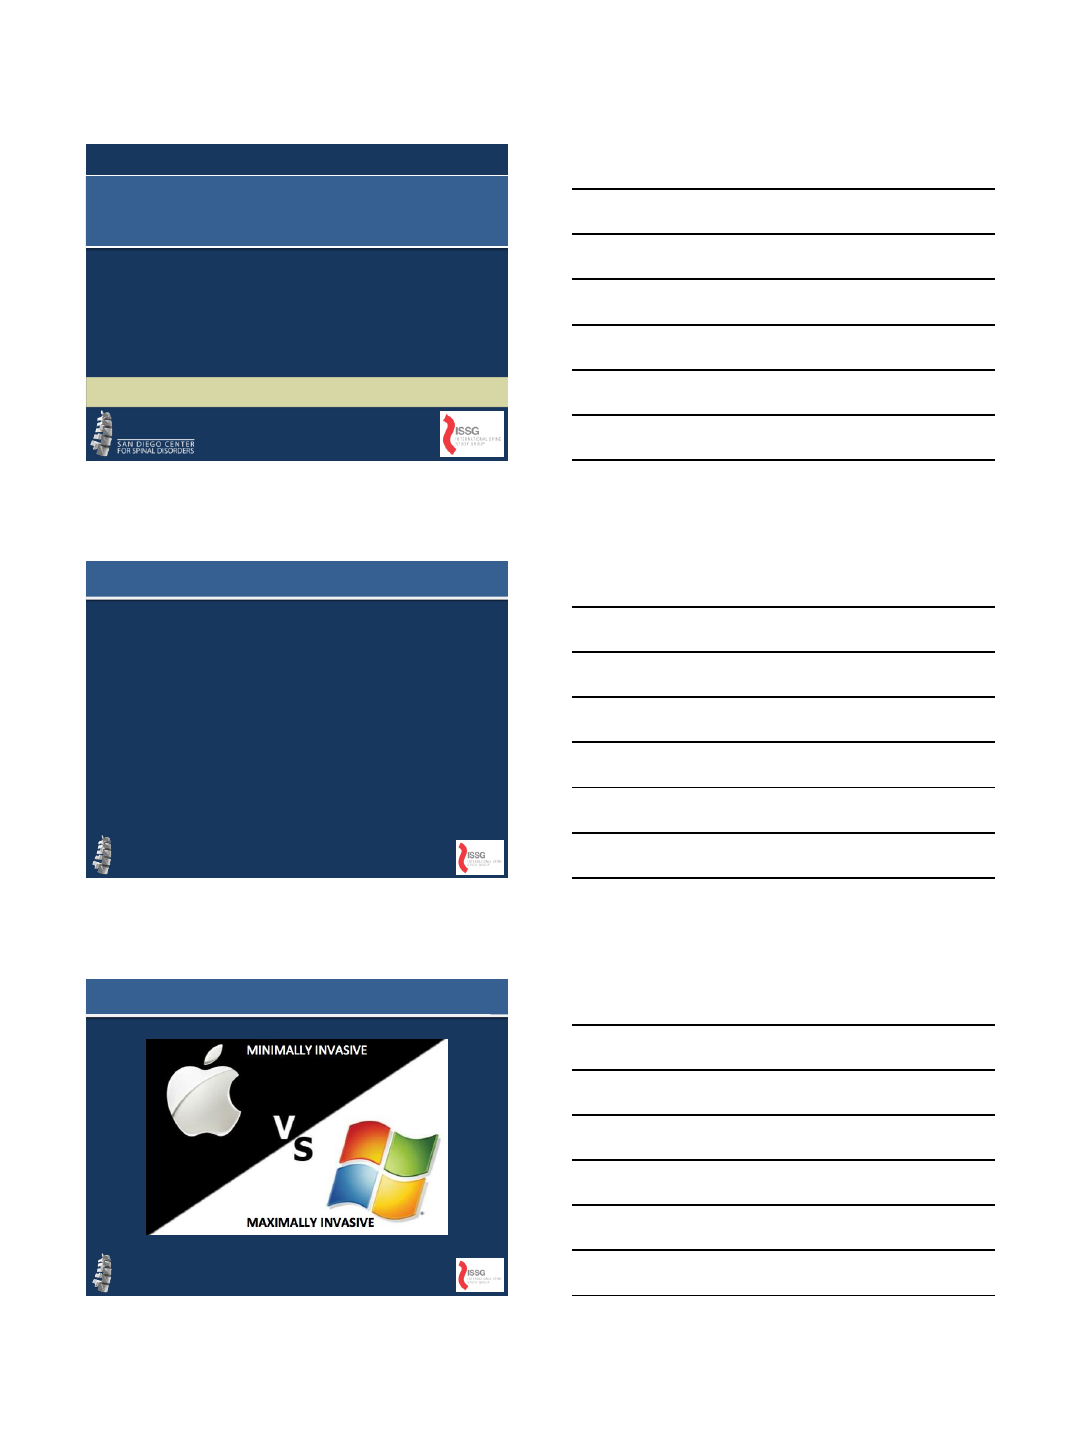
MIS like a MAC?
8/5/2013
2
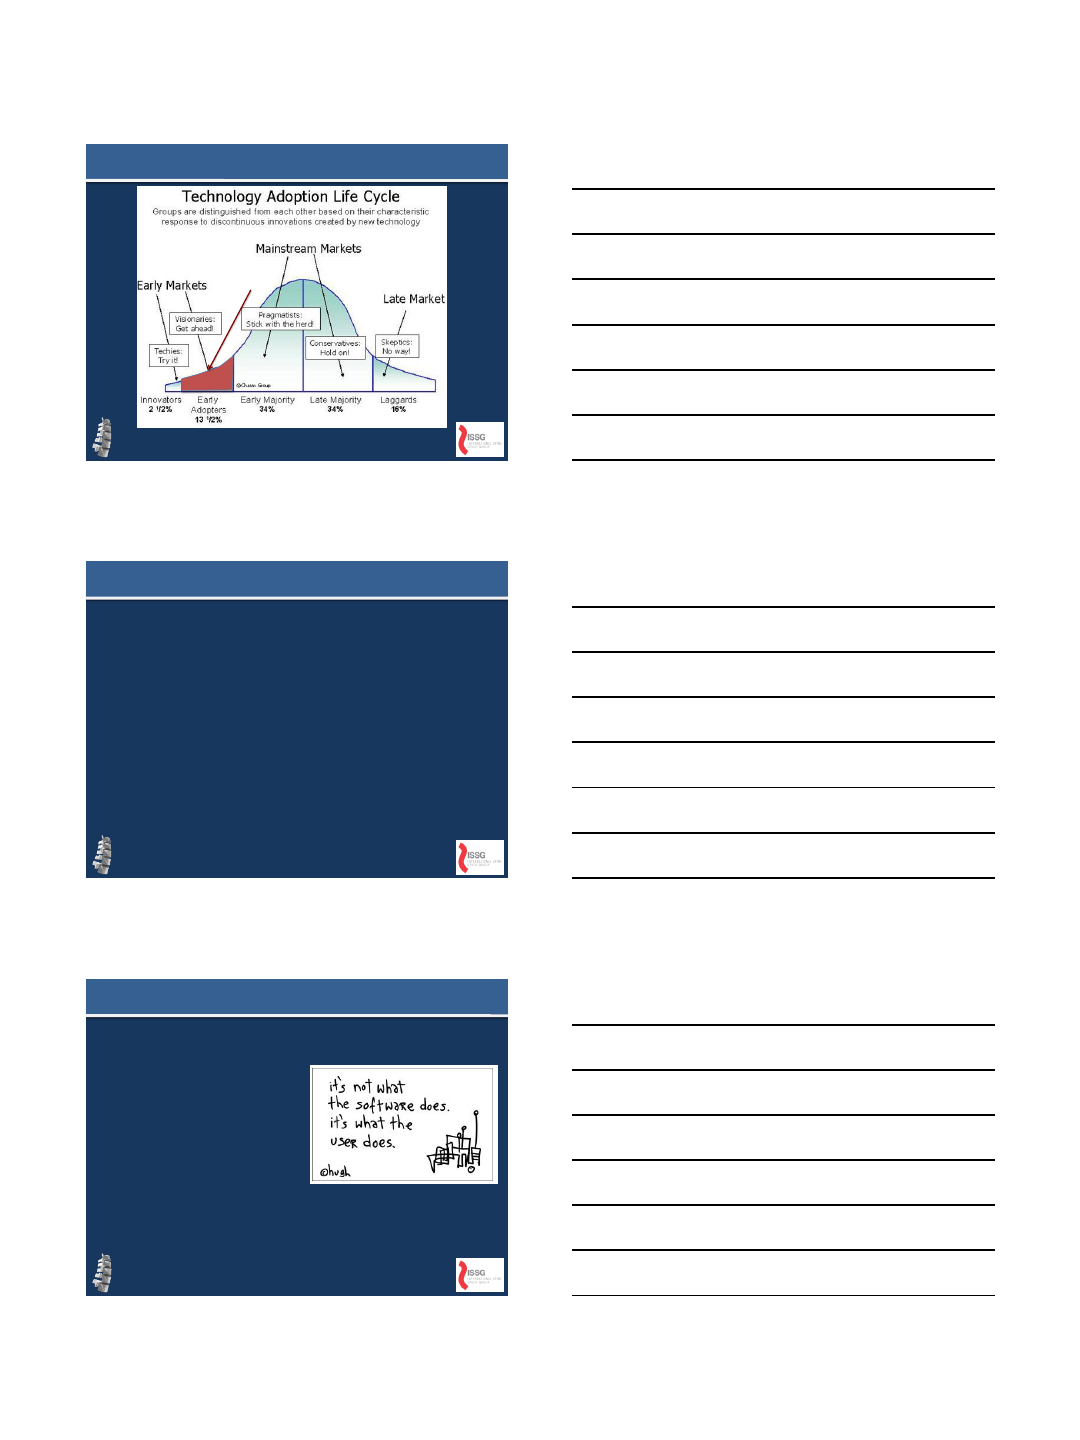
The Chasm
Geoffrey Moore, Crossing the Chasm, 1999
MIS
•Lit Search: 2021 articles with minimally
invasive spine surgery
•Predominantly single center retrospective
studies
•Little long term data
•No prospective Level 1 data to date
An Exploratory Effort
Literature search as of August 3, 2013
MIS The Answer?
•Perhaps a means
to an end
•Cannot abandon
the principles of
deformity
correction
•MIS is an approach
to reach the same
goal
8/5/2013
3
1. Measure all key parameters
2. Quantify the deformity (sagittal
and coronal)
3. Evaluate clinical options
–Fixation options
–Osteotomies
–Biologic issues
4. Execute plan…
–The value of intraoperative
scoliosis xrays
PLANNING, PLANNING, PLANNING
•Coronal
•Sagittal
•Long
segment/pelvic
fixation
•Osteotomies
•Fusion/Biology
What are the limitations?
IMAST 2013
Vancouver, British Columbia
Is There a Patient Profile That
Characterizes a Patient as a Candidate
for Minimally Invasive Surgery (MIS) to
Treat Adult Spinal Deformity (ASD)?
Robert K. Eastlack, MD; Gregory M. Mundis, Jr., MD; Michael Y. Wang, MD;
Praveen V. Mummaneni, MD; Juan S. Uribe, MD; David O. Okonkwo, MD, PhD;
Behrooz A. Akbarnia, MD; Neel Anand, MD; Adam S. Kanter, MD; Paul Park, MD;
Virginie Lafage, PhD; Christopher I. Shaffrey, MD; Richard G. Fessler, MD; Vedat
Deviren, MD; International Spine Study Group
8/5/2013
4
RESULTS
OPEN
MIS
p
value =
n
118
46
Age (
yrs)
60.6
64.1
0.022
(*)
Preop
NSR Back
7.0
6.4
0.109
Preop
NSR Leg
4.2
4.6
0.564
Preop
ODI
41.4
42.7
0.624
Postop NSR Back
3.3
3.2
0.744
Postop
NSR Leg
2.3
2.4
0.872
Postop ODI
25.1
23.7
0.653
Diff ODI
15.6
17.7
0.504
OPEN
MIS
p
value =
n
118
46
Thoracic
Kyphosis
33
31.9
0.707
Cobb
-lumbar (°)
42.8
32.4
0.0001 (*)
SVA (cm)
5.8
3.4
0.03 (*)
LL (
°)
41.1
34.4
0.033 (*)
PI
-LL mismatch (°)
13.6
21.4
0.014
(*)
PT (
°)
23.6
27.7
0.024 (*)
Results
* = p < 0.05
•Profile of ASD patients undergoing MIS
correction
–Less severe Cobb
–Less severe global sagittal malalignment
–Worse spinopelvic parameters (PT, PI-LL)
–MIS patients tend to be older
•Greater PI-LL mismatch in MIS patients (increased
lumbopelvic compensation in MIS patients?)
•Prospective, randomized trials necessary
•Other factors—BMI, EBL, revisions, complexity of
deformities, complications, etc.
Conclusions
8/5/2013
5
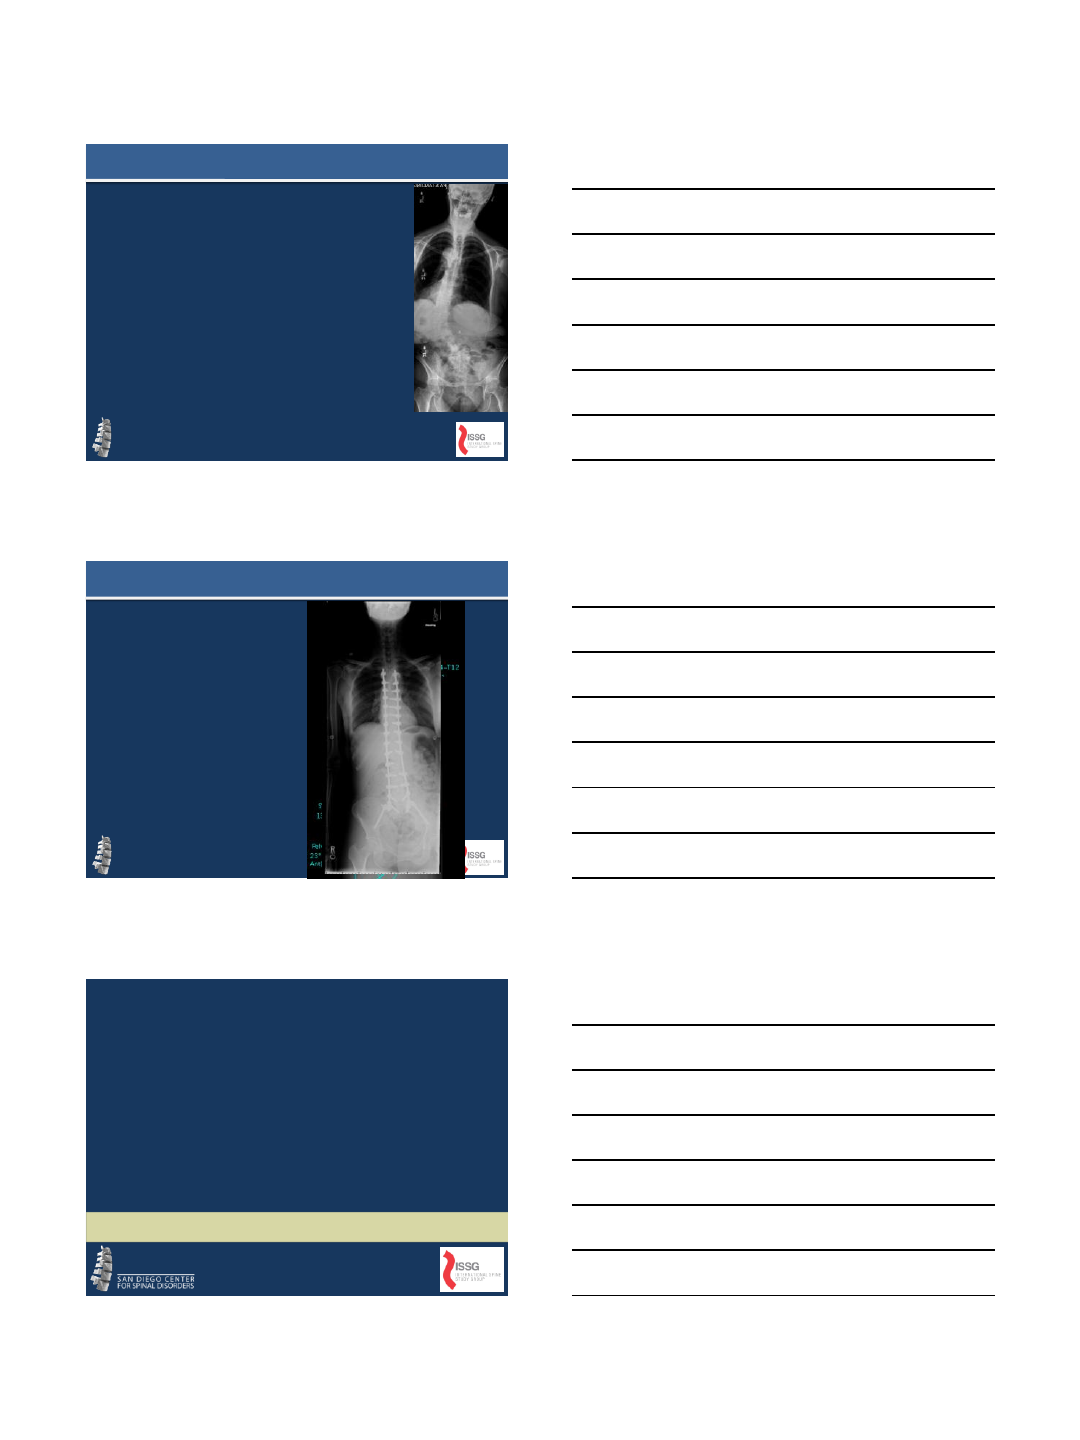
CORONAL
•16 patients with
minimum 2 year follow
up
•All with VAS, ODI, and
SRS-22 improvement
•All with LIF and open
posterior
GM 2010
CORONAL CORRECTION LIF
8/5/2013
6
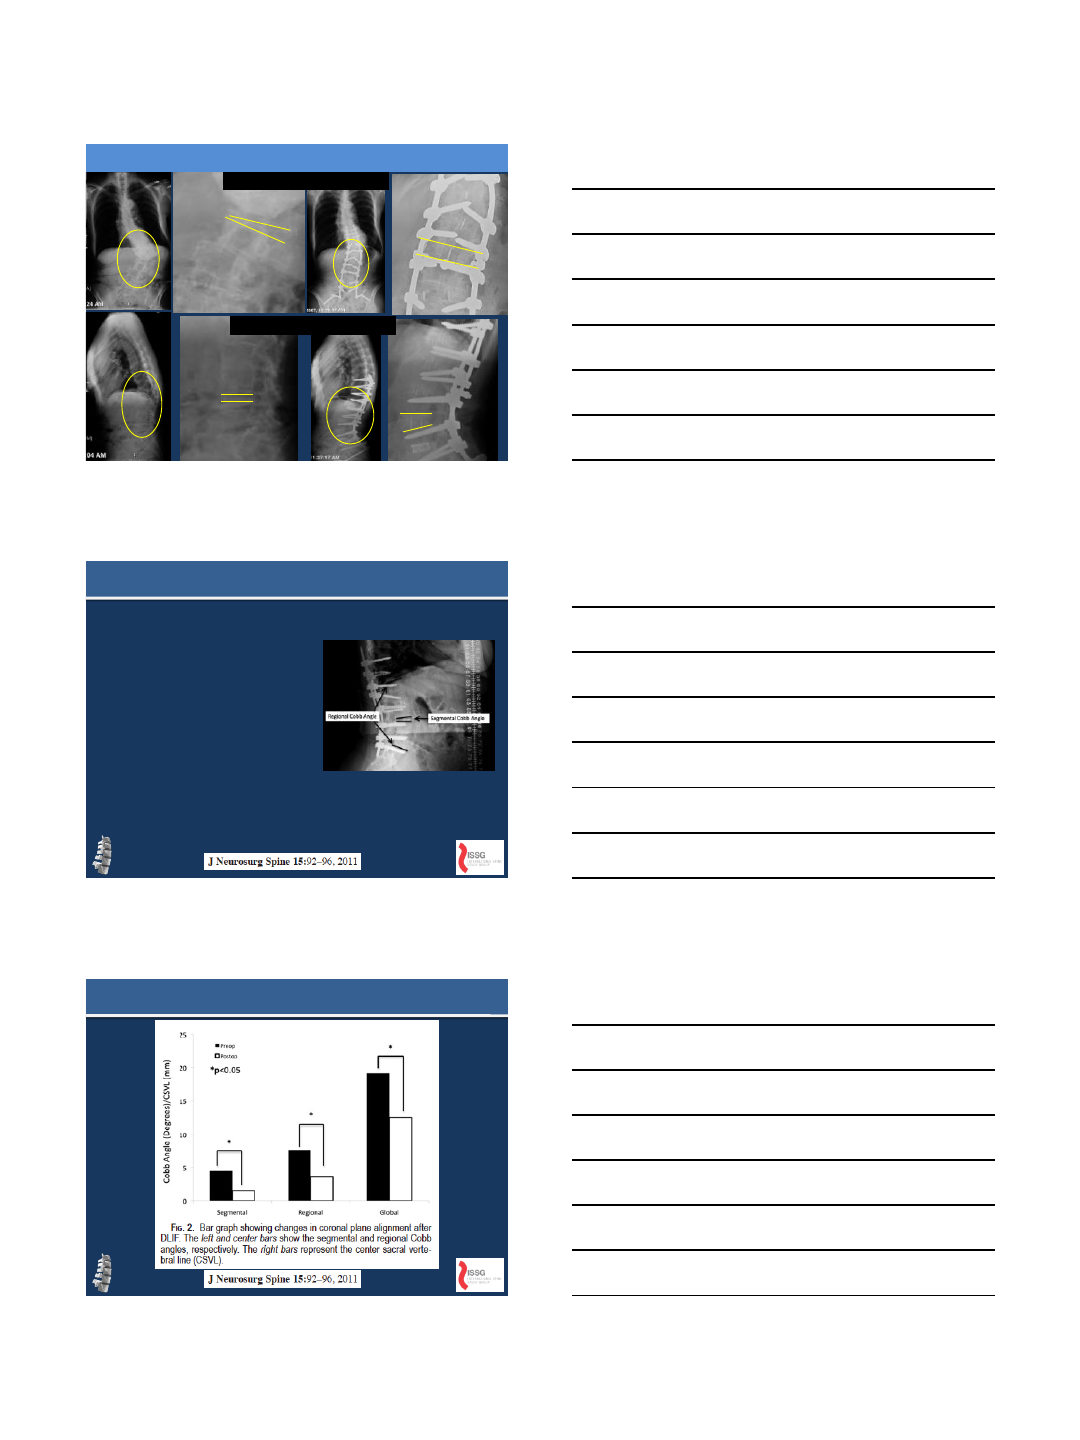
LIF Segmental Correction
Segmental Coronal
Correction
Segmental Lordosis
Restoration
Mundis et al. Spine, 2010
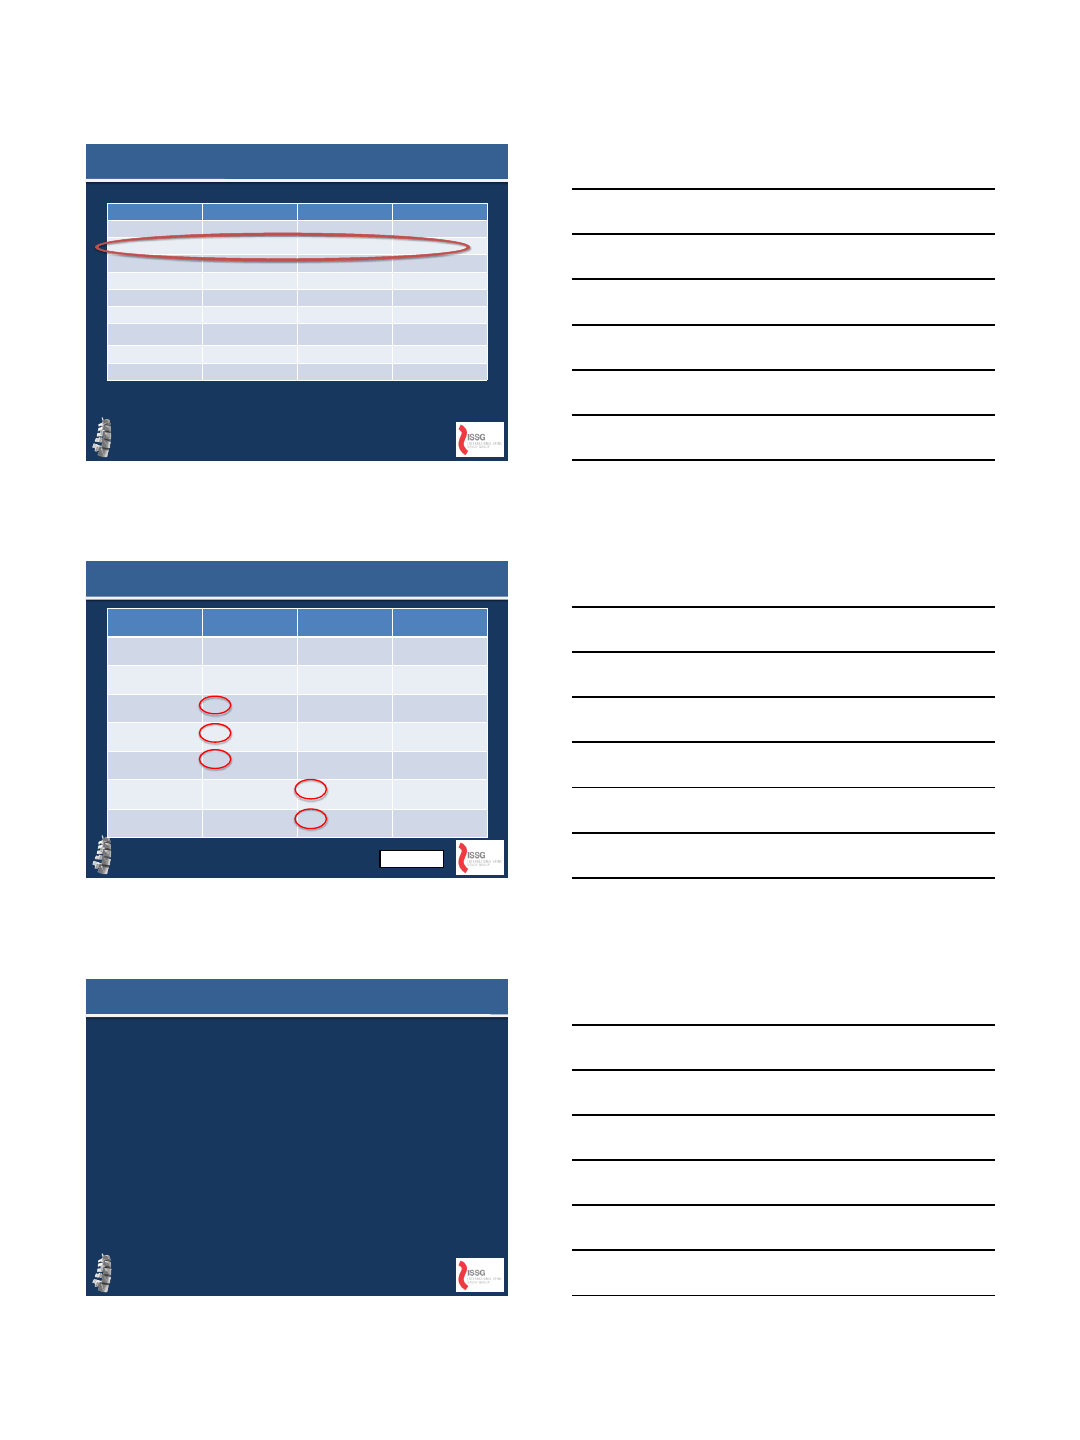
•36 patients (66 levels)
•7 with scoliosis
•21.4 9.7 degrees
(p<0.05)
•VAS and ODI both
significantly improved
Acosta et. al
Acosta et. al.
8/5/2013
7
•Propensity matched data by age, ODI,
SVA and major Cobb
•31 Open; 31 Hybrid; 31 MIS
•NO difference in Cobb correction between
3 groups
How does MIS compare to OPEN
IMAST Vancouver 2013, Podium Presentation
Wang et al. IMAST 2013
•85 patients evaluated with 3 different
techniques
–Stand alone lateral, circumferencial MIS, Hybrid
•Stand alone 23 degrees
•Circumferencial: 34 degrees
•Hybrid: 50 degrees
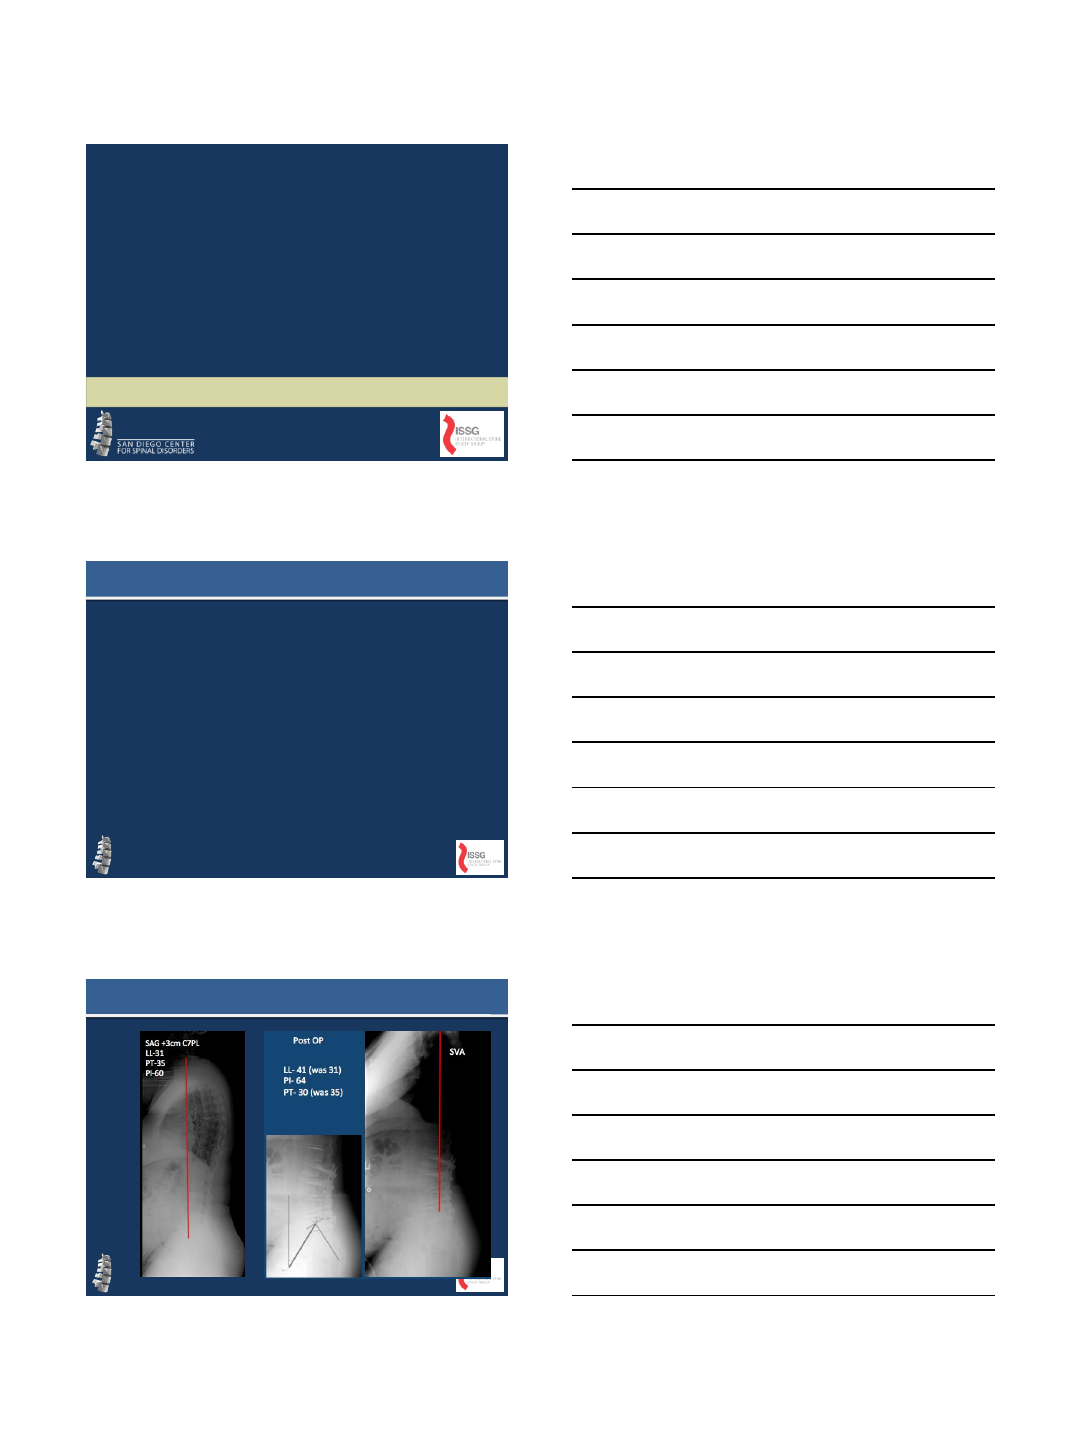
Is there a ceiling effect to MIS?
Major
Cobb
SVA
PI
-LL
LL
OVERALL
(n=99)
38
15
4.9
3.1
23
11
33
44
HYBRID (n=51)
44
17
6.7
3.2
22
3
32
48
SaMIS
(n=8)
33
31
4.2
4.8
23
13.5
32
38.5
cMIS (n=40)
32
10
2.9
2.9
21
16
34
40
*ODI and VAS significantly improved in all 3
groups.
8/5/2013
8
SAGITTAL
•Historically poor showing
•WHY?
–Ignorance?
–Surgeon planning error?
–Implant limitations?
–Technique limitations?
–Education/training error?
AN EVOLVING MIS FRONTIER
INCOMPLETE CORRECTION
8/5/2013
9
•23 pts: LL improved from 37 47.5
–Wang et al. 201
•35 pts: LL improved 42 46
–Acosta et al.
•8 pts: 40 47
–Tormenti et al.
•16 pts: 31 44
–Akbarnia et al.
Regional Improvement
•Global Alignment?
•Regional Alignment?
•Segmental Alignment?
•What about Surgeon
Goals?
WHAT IS THE CORRECT QUESTION?
Comparison of Radiographic Results
after Minimally Invasive, Hybrid and
Open Surgery for Adult Spinal
Deformity: A multicenter Study of
184 patients
Raqeeb Haque, Gregory M. Mundis Jr., Yousef Ahmed,
Tarek Y. El Ahmadieh, Michael Wang, Praveen
Mummaneni, Juan Uribe, David Okonkwo, Robert
Eastlack, Neel Anand, Adam Kanter, Frank LaMarca,
Behrooz Akbarnia, Paul Park, Virginie Lafage, Jamie
Terran, Christopher Shaffrey, Eric Klineberg, Vedat
Deviren, Richard G. Fessler, ISSG
8/5/2013
10
•Retrospective review of prospectively
collected databases
•Inclusion criteria:
–Age > 45yrs
–Lumbar Cobb > 20 degrees
–Minimum 1 year f/u
METHODS
METHODS
•OPEN
–Open correction of scoliosis using posterior
technique for osteotomy and instrumentation
•MIS
–Combination of LLIF/TLIF/facet fusion with
percutaneous posterior instrumentation
•HYB
–Combination LLIF/TLIF with OPEN posterior
instrumentation
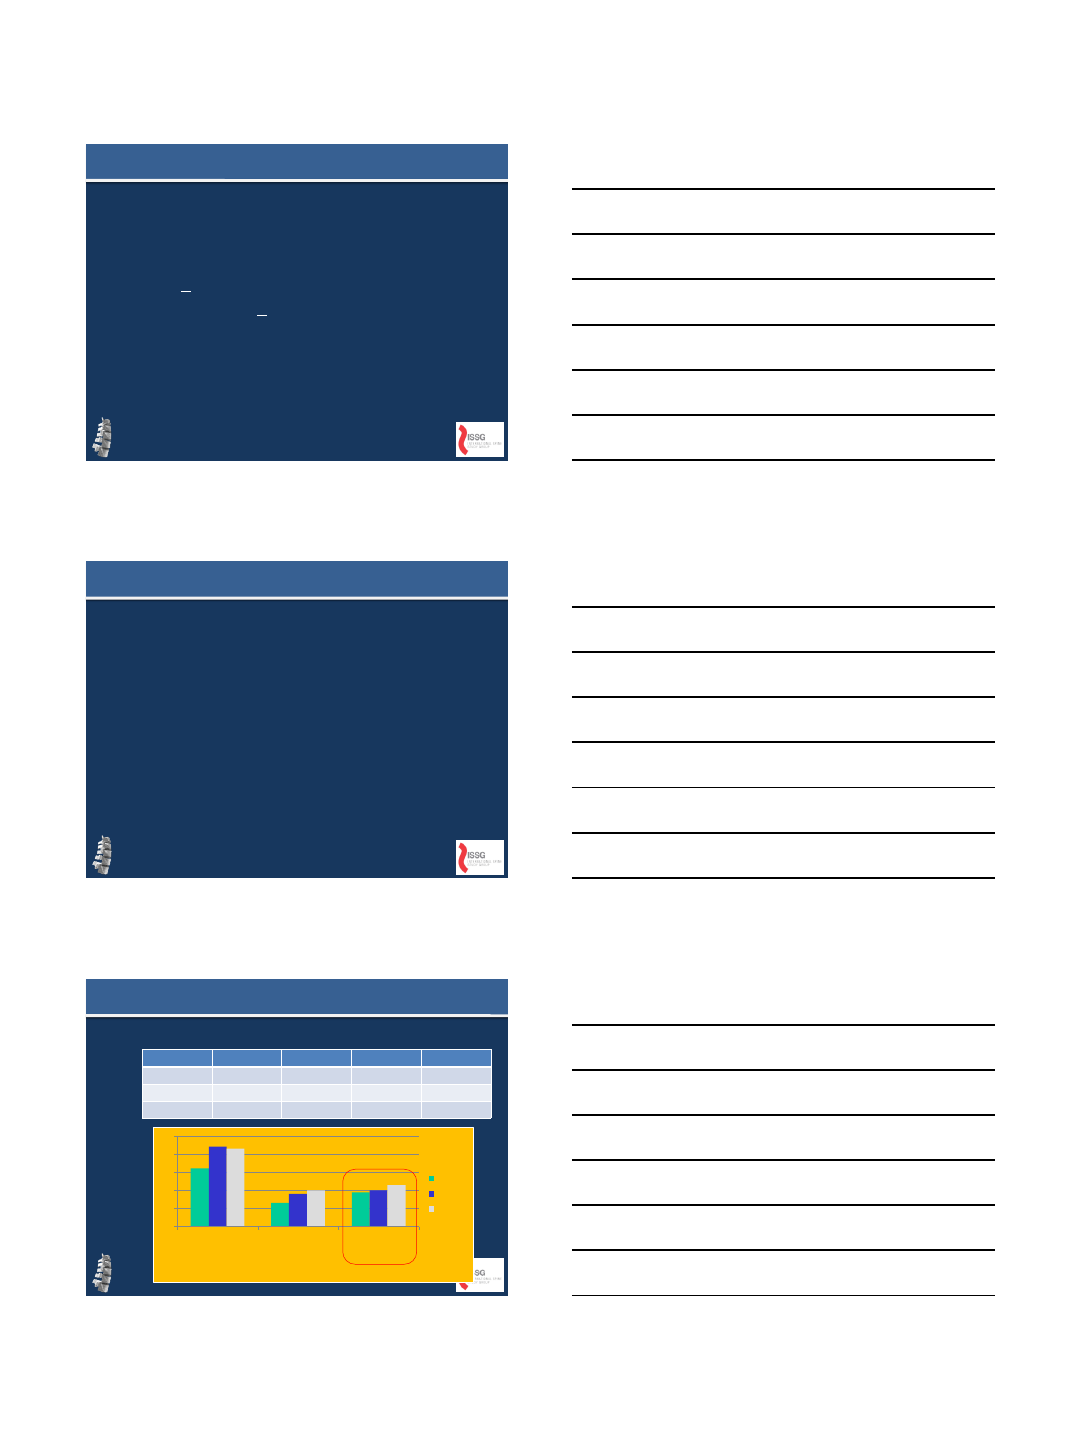
RESULTS
MIS HYB OPEN
PRE-OP 32.1* 44.3 43.2
COBB ANGLE
POST-OP 13.1* 17.7 20.4
∆ 18.8 26.6* 22.8
0
10
20
30
40
50
PRE OP POST OP CHANGE IN
DEGREES
MIS
HYB
OPEN
8/5/2013
11
RESULTS
MIS HYB OPEN
PRE-OP 33.8 31.9 42.7
LORDOSIS
POST-OP 39.4 48.5 53.2
∆ 5.8 17.4* 10.5
0
10
20
30
40
50
60
PRE -OP POST-OP CHANGE
IN
DEGREES
MIS
HYB
OPEN
RESULTS
MIS HYB OPEN
PRE-OP 21.6 22.0 12.3
PI
-LL POST-OP 16.1 2.1 2.0
∆ 5.5 20.6* 10.2
0
5
10
15
20
25
PRE OP POST OP CHANGE
MIS
HYB
OPEN
RESULTS
MIS HYB OPEN
PRE-OP 29 65 47
SVA
POST-OP 30 31 31
∆ 1* 34 36
0
10
20
30
40
50
60
70
PRE OP POST OP CHANGE IN
DEGREES
MIS
HYB
OPEN
8/5/2013
12
RESULTS
MIS HYB OPEN
MEAN SD MEAN SD MEAN SD
∆ VAS-B -3.2 2.1 -4.4 3.3 -3.7 3.0
PRE to VAS-L -2.3 3.8 -2.0 3.9 -1.9 3.8
POST ODI -18.3 17.0 -16.4 13.9 -15.9 17.4
0
5
10
15
20
VAS-B VAS-L ODI
MIS
HYB
OPEN
NS
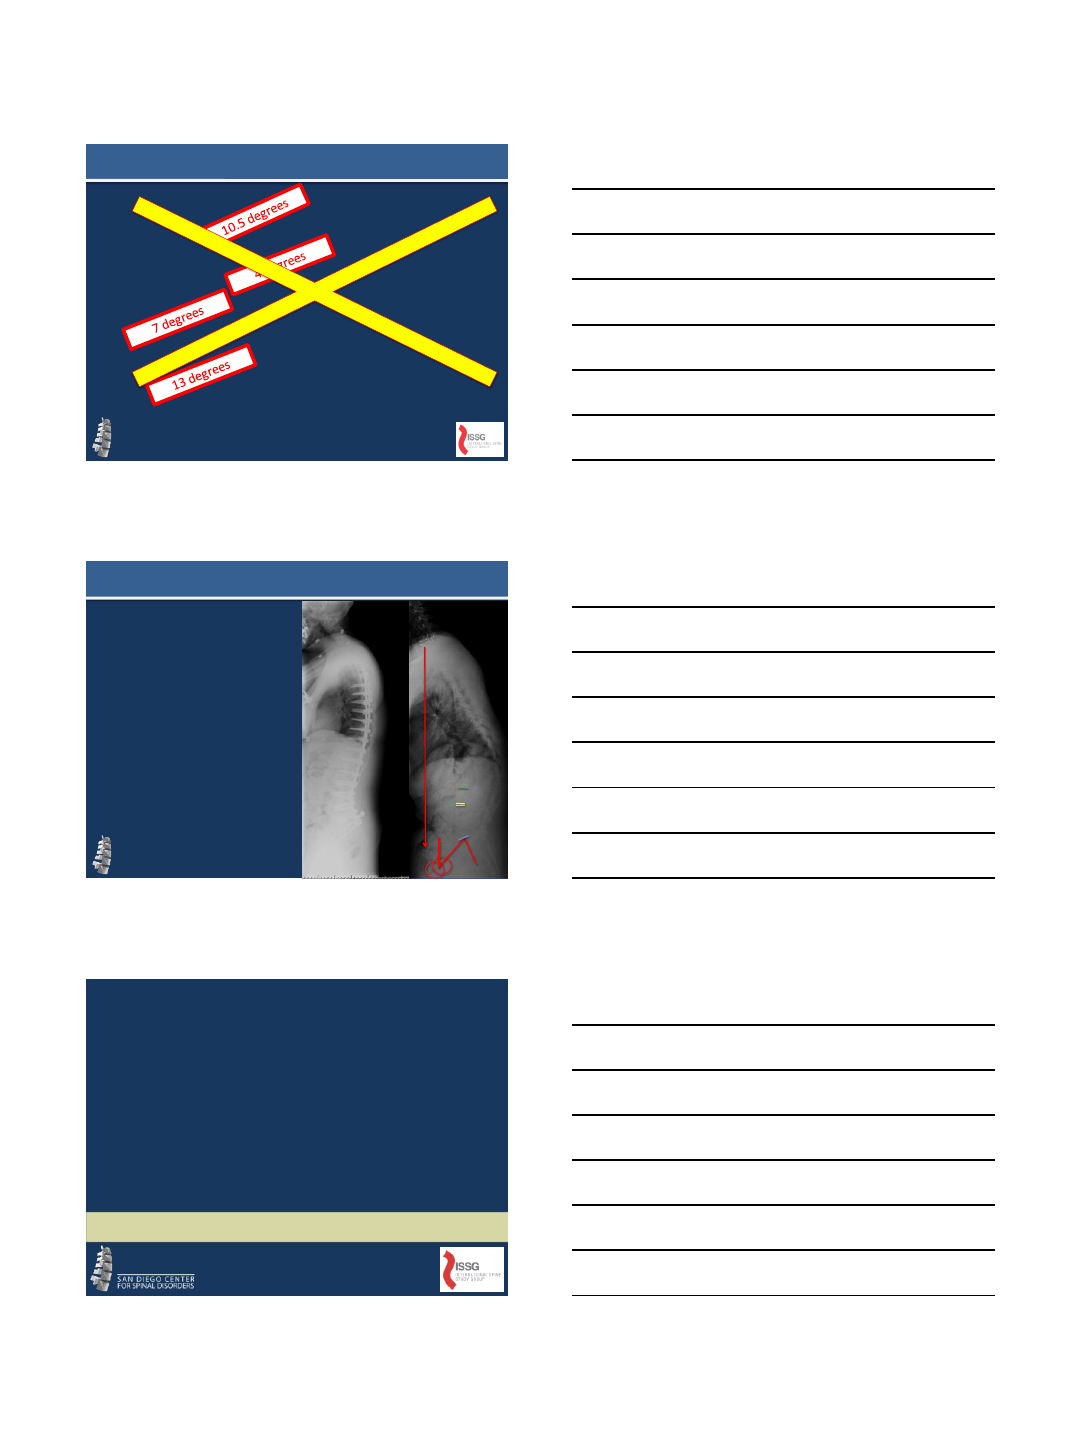
WHAT IF YOU NEED MORE?
•17 consecutive pts
•24 mo f/u
•14 with previous spine surgery
•71% treated for ASD
•All had open posterior fusion
•15/17 had a posterior release at
the level of the ACR
JSDT 2013
8/5/2013
13
•T1SPI:
–-6 to -2 (p<0.05)
•LL:
–16 38 (ACR) 45
after PSFI
•PT:
–34 24 (ACR)
•SRS-22, VAS
improved pre post
(p<0.05)
•8/17 complications
•4 ACR related
–2 neurologic
–1 vascular (approach
surgeon removing
lateral plate)
72 YO F PJK S/P L1-S1
DOES IT COMPARE TO
PSO?
8/5/2013
14
•PROPENSITY MATCHED
–PI, LL, TK
•17 patients in each group
•KEY FINDINGS:
–Groups comparable
–PSO with better T1SPI
correction (SVA)
–ACR with improved PT
correction but no PSO
–No difference in complication
rate
–ACR with less EBL
ACR v PSO
HOW ABOUT
COMPLICATIONS? PJK?
Praveen Mummaneni, Michael Wang, Virginie Lafage, Kai-Ming Fu,
John Ziewacz, Jamie Terran, David Okonkwo, Juan Uribe, Neel Anand,
Richard Fessler, Adam Kanter, Frank LaMarca, Christopher Shaffrey,
Vedat Deviren, Gregory Mundis, ISSG
Does Minimally Invasive Posterior
Instrumentation (PPI) Prevent Proximal
Junctional Kyphosis (PJK) in Adult
Spinal Deformity (ASD) Surgery? A
Prospectively Acquired Propensity
Matched Cohort Analysis
8/5/2013
15
RESULTS
•31 patients propensity matched in each
group (CMIS, Hybrid)
•No significant difference in Age (65.6 vs
63.5, P=0.6)
•No significant difference in ASA score (1.8
vs 2.3 P=0.05)
•CMIS patients had lower ODI and VAS
back pain scores but similar leg pain
scores
•ODI: 39.1 vs 48.1 (P=0.045)
•VAS back: 6.1 vs 7.4 (P=0.013)
•VAS leg: 4.1 vs 4.6 ( P=0.53)
POST OP RESULTS
CMIS HYB T-
test
Mean
SD
Mean
SD
P
Maximum Coronal
Cobb
31.3
11.1
45.3
19.0
.001
Thoracic Kyphosis
31.1
10.0
30.4
16.6
.849
Lumbar Lordosis
32.7
11.5
34.8
17.5
.593
Pelvic Tilt
25.9
11.8
27.4
11.1
.597
Pelvic Incidence
52.6
13.9
55.4
12.2
.389
Sagittal Vertical
Axis
29.2
41.7
53.3
61.4
.076
PI
-LL
19.8
11.7
20.7
21.4
.845
•Junctional segment analysis
revealed that CMIS had a smaller
change in PJA (1.3degrees vs 6
degrees, P=0.005)
•PJK developed in 19.4% of patients
in the hybrid group by 1 year
•No PJK was detected at 1 year in
the CMIS group.
PJK RESULTS
8/5/2013
16
•CMIS and Hybrid approaches resulted in similar sagittal plane
radiographic and in HRQL results
•Radiographic PJK was detected in fewer patients in the CMIS group
at 1 year
•PPI may provide benefit in reducing PJK in adult deformity
procedures
CONCLUSION
Are Complications in Adult Spinal Deformity
(ASD) Surgery Related to Approach or Patient
Characteristics?
A Prospective Propensity Matched Cohort Analysis of
Minimally Invasive (MIS), Hybrid (HYB), and Open (OPEN)
Approaches
Juan S. Uribe, Praveen Mummaneni, Gregory Mundis, Virginie Lafage,
Behrooz Akbarnia, Paul Park, Robert Eastlack, Michael Wang, Neel Anand,
David Okonkwo, Adam Kanter, Frank La Marca, Vedat Deviren,
Richard Fessler, Chris Shaffrey, ISSG
OPERATIVE DATA
0
500
1000
1500
2000
2500
EBL
0
20
40
60
80
100
% TRANSFUSION
MIS
HYB
OPEN
p<0.003 *
*
*
8/5/2013
17
TOTAL COMPLICATIONS
0
10
20
30
40
50
60
70
COMPLICATIONS %
MIS
HYB
OPEN
P=0.004
Complication
MIS
HYB
OPEN
Total
Chi
With
any
20%
46%
65%
45.2%
0.004
Intraoperative
16.7%
27.6%
15.5%
0.020
Postoperative
20%
36.7%
55.2%
38.1%
0.029
Major
12%
33.3%
44.8%
31%
0.032
Minor
8%
33.3%
41.4%
28.6%
0.020
DVT
10%
3.6%
0.061
PE
6.7%
3.4%
3.6%
0.414
Implant failure
8%
3.3%
6.9%
6%
0.740
Neuro deficit
13.3%
3.4%
6%
0.090
Pneumonia
3.3%
1.2%
0.402
Wound dehiscence
3.3%
1.2%
0.402
Wound infection
3.3%
3.4%
2.4%
0.648
PJK
3.3%
3.4%
2.4%
0.648
Other major
6.7%
34.5%
14.3%
0.000
COMPLICATIONS
CONCLUSION
•The surgical approach did matter when
evaluating for complications
•The MIS group had significantly fewer
complications (P=0.004) than did the HYB
group or the OPEN group
•If the goals of ASD surgery can be achieved,
consideration should be given to less invasive
techniques in order to reduce complications.
8/5/2013
18
• MIS Spine surgery for deformity has it’s
limitations
–Surgeon technique
–Unknown fusion rates
–Severity of deformity
•The present and potential benefits warrant
further investigation
–The inventors and early adopters should be
encouraged to continue to drive the market to
see if they can cross the chasm
SUMMARY
THANK YOU

7/30/2013
1
Health Economic Analysis of
Adult Spinal Deformity
Ian McCarthy, PhD
Institute for Health Care Research and Improvement
Baylor Health Care System
Baylor Scoliosis Center
Southern Methodist University
Department of Economics
VuMedi Webinar
August 2013
•Patterns and determinants of health care utilization and
production
•Impact and calculation of alternative reimbursement models
•Studies of market structure
•Health care labor markets
•Assessing the value of surgical treatment
Role of Health Economics in Spine
Surgery
•Outcomes: Survival, readmissions, complications, health-
related quality-of-life (HRQOL), quality-adjusted life-years
(QALYs)
•Costs: Indirect vs direct, sometimes difficult to measure
•Methods of analysis: Decision analysis, incremental cost-
effectiveness, comparative-effectiveness
Measuring Value

7/30/2013
2
•Measuring quality of life
–Generic health profiles: SF-36, EQ-5D, Health Utilities Index
(HUI)
–Disease specific questionnaires: ODI, SRS-22
–Utility-based quality-of-life for estimation of quality-adjusted
life-years (QALYs): SF-6D, EQ-5D, HUI
Quality-of-Life Outcomes
•QALYs are fundamentally grounded in economic theory and
expected utility theory in particular…cannot be estimated
from every HRQOL questionnaire
•Collapses HRQOL profiles over time into a single number
•Each year of life is weighted by the “quality” of that year, with
the quality factor derived by applying the relevant scoring
algorithm to the HRQOL responses
•Quality factor generally ranges from 0 to 1, with 1
representing perfect health and 0 representing death
–Values < 0 are also possible
•Two years of life at a quality of 0.5 yields 1 QALY
QALYs
•Clear selection issues into surgery, making comparisons
between operative and non-operative patients empirically
difficult
•Many patients have lived with condition for years and may not
present particularly poor baseline HRQOL
•Difficult to quantify the reduction in HRQOL that would have
happened without surgical intervention
–Relates to argument that surgery should be pursued earlier while
patient can appropriately recover. Need evidence-based justifications
for this approach (how much would HRQOL deteriorate without
surgery?)
Estimating QALYs in ASD

7/30/2013
3
Direct Costs: Resources consumed for the care of the patient.
Indirect Costs/Benefits: Time of patients or families consumed
or freed by the program in question.
Some confusion as the term “indirect costs” is used in
accounting to denote overhead. For economic evaluation of
health care programs, overhead is generally considered part
of the direct cost of care, although the allocation of overhead
to a specific surgery will tend to differ across hospitals.
Defining Costs
•Hospital Costs
–Direct costs of patient care plus overhead and operational costs. Many
studies unclear as to whether overhead/operational costs are included
in calculation.
–High quality data but difficult to access for most authors.
•Payments/ Reimbursements
–Medicare formulas easy to replicate, but will differ dramatically from
managed care payments
–Very difficult or expensive to access managed care claims data
•Charges
–Poor measure of costs or reimbursements (monopoly money)
–Cost to charge ratios can be used for adjustments. Should be
performed at service level and not simply at hospital level.
Measuring Costs
•Hospital Costs
–Accessed from hospital accounting records. Often unclear as to
whether costs include overhead or operational costs.
–In many states, hospital costs will exclude surgeon, anesthesiologist,
and internist fees (anyone who is not an employee of the hospital).
–Excludes follow-up costs (rehab, prescription drugs, outpatient visits)
•Payments/ Reimbursements
–Medicare inpatient reimbursement rates by DRG available from
MedPAR, and physician fees can be estimated from CPT codes
–Actual Medicare claims available from CMS
–Managed care claims potentially available from HCCI and MarketScan
Claims database (expensive)
•Charges
–Department level cost to charge adjustments can be estimated from
publically available HCUP data.
Sources of Data

7/30/2013
4
Current Research: Costs of ASD
Aggregate Data from NIS (Healthcare Cost and Utilization Project)
•Inpatient stays in 2010
–20,600 based on principal diagnosis
–223,000 including secondary diagnoses
•Cost per inpatient stay
–$56,000 (3x more expensive than all other spine diagnoses)
•Annual costs
–$4.5 billion including secondary diagnoses
–Underestimate due to readmissions, rehab, prescription drugs, and
indirect costs
Current Research: Costs of ASD
Current Literature
•Average cost of $77,432 for revision surgery following proximal
junctional failure (Hart et al., 2008)
•Total hospital costs average $120,000 including subsequent
readmissions, with reimbursements averaging $200,000 (BSC
Data)
–$100,000 per-patient for primary surgery ($70,000 - $80,000 excluding
hospital overhead)
–$70,000 per-patient for readmissions
•Implant costs average $40,000 and account for 40% of total
hospital costs on average (BSC Data)
•No current studies of follow-up or indirect costs
Current Research: Costs of ASD
Why Does it Matter
•Measure of costs will dramatically change conclusions on CE of
surgery
•Hospital costs of $120,000 versus reimbursements of $200,000
(including readmissions)
–CE much worse when using actual reimbursements rather than hospital
costs
•Primary surgery costs of $100,000, increases to over $120,000
on average per patient after accounting for readmissions
–20% reduction in CE
•Rehab and prescription drug costs likely to be significant, in
addition to indirect costs
7/30/2013
5
•Cost-effectiveness analysis is generally considered to be an
incremental analysis…need to compare one treatment to
another
•Most common measure of incremental cost-effectiveness:
Cost-effectiveness
Operative Costs – Non-operative Costs
Operative QALYs – Non-operative QALYs
ICER =
•Statistical analysis of ICERs is difficult since denominator may
= 0 and sign of ratio may be uninformative
•Common presentation of results:
–ICER and 95% confidence interval
•Standard confidence interval formulae are not appropriate
•Confidence interval calculated based on alternative formula or bootstrap
technique
–Cost-effectiveness Acceptability Curves (CEAC): probability of ICER
falling below various dollar values
Cost-Effectiveness Analysis
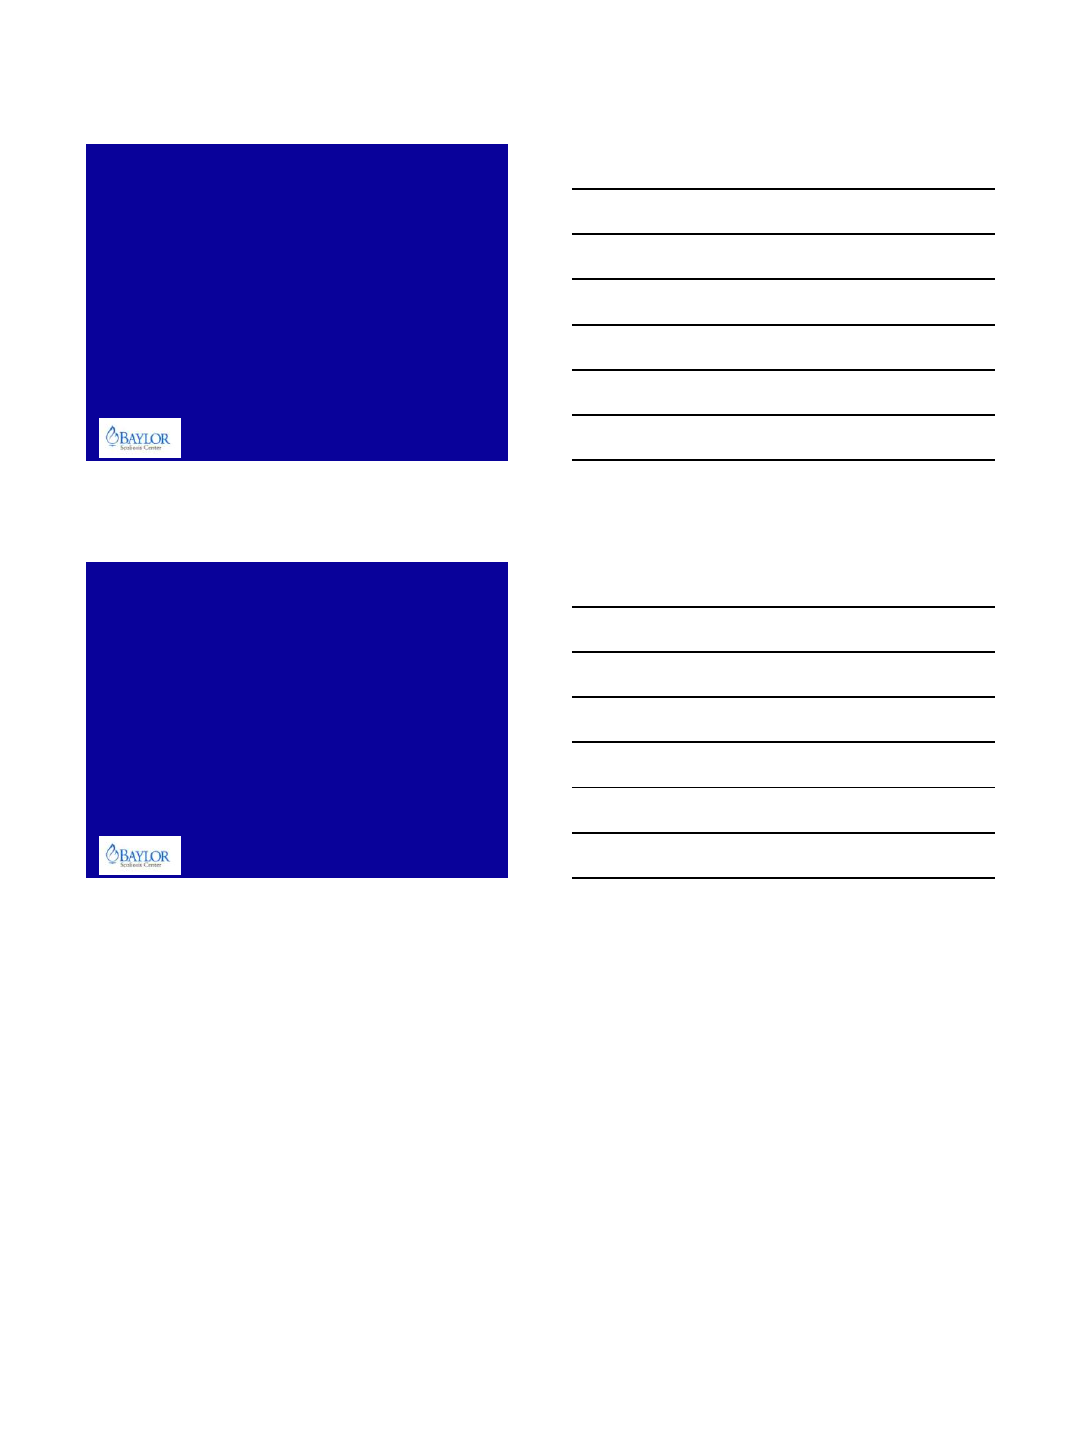
0.2 .4 .6 .8 1
Probability Intervention is Cost-Effective
$80,000 $90,000 $100,000 $110,000 $120,000 $130,000
Value of Health Effect (Willingness to Pay)
Worst Case
–Across ISSG centers, average baseline SF-6D ranges from 0.47 to 0.68.
Two-year follow-up ranges from 0.58 to 0.78
–Average gain of 0.16 QALYs after two-years, projected 0.4 QALYs after 5
years
–At $200,000 in reimbursements over 5-yr period, incremental CE is
$500,000 per QALY (excluding rehab and prescription drugs)
Best Case
–Predicted QALYs gained = 0.7 after 5 years
–At $200,000 in reimbursements over 5-yr period, incremental CE still
exceeds $280,000 per QALY (excluding rehab and prescription drugs)
Current Cost-Effectiveness
Even with a high CE threshold of $140,000 (World Health
Organization recommendation of 3x per-capita GDP), ASD surgery
is not cost-effective without more formal empirical analysis and
extended or projected follow-up
7/30/2013
6
1. Need to appropriately quantify hypothetical QALYs without surgery
2. Investigate cost drivers
–Most costs incurred at index, but readmissions play important role both by
increasing costs and decreasing incremental QALYs
–Implants are biggest single category of cost drivers…a 10% reduction in
implant costs is equivalent to a 13% reduction in readmissions
–Potential conflicting incentives for cost reduction in states where managed
care remains a cost-plus reimbursement system
3. Prolonged evaluation period
–Assess long-term durability of ASD surgery
–Surgery begins to look cost-effective at 10+ years
4. Selection of surgical patients
–Baseline HRQOL is perhaps the most relevant predictor of future cost-
effectiveness…many patients report similar post-operative HRQOL values, so
baseline values are biggest differentiating factor
How to Improve CE Results?
Thank You
